UNITED STATES
SECURITIES AND EXCHANGE COMMISSION
Washington, D.C. 20549
FORM N-CSR
CERTIFIED SHAREHOLDER REPORT OF REGISTERED
MANAGEMENT INVESTMENT COMPANIES
Investment Company Act file number 811-08789
VALIC Company II
(Exact name of registrant as specified in charter)
2929 Allen Parkway, Houston, TX 77019
(Address of principal executive offices) (Zip code)
John T. Genoy
President
SunAmerica Asset Management, LLC
Harborside 5
185 Hudson Street, Suite 3300
Jersey City, NJ 07311
(Name and address of agent for service)
Registrant’s telephone number, including area code: (201) 324-6414
Date of fiscal year end: August 31
Date of reporting period: August 31, 2018
Item 1. Reports to Stockholders

VALIC Company II
Annual Report, August 31, 2018
SAVING :INVESTING :PLANNING
VALIC Company II
ANNUAL REPORT AUGUST 31, 2018
TABLE OF CONTENTS
VALIC Company II
PRESIDENT’S LETTER
Dear Valued Investor:
We are pleased to provide you with the following Annual Report for VALIC Company II. The report contains the investment portfolio information and the financial statements of VALIC Company II for the twelve-month period ending August 31, 2018. We encourage you to carefully read this report and hope you find it informative and helpful.
Domestically, the total return for the S&P 500® Index,* widely regarded as the best single gauge of the U.S. equity market, rose 19.66%. The fourth quarter of 2017 ended with global equity markets delivering exceptionally strong returns and signs that synchronized global growth would continue into 2018. The passage of a tax cut and continued strength in both jobs numbers and U.S. economic readings provided optimism entering into 2018. However, after a tranquil 2017 in the equity markets, marked by low volatility and strong returns, 2018 came in with a vengeance. Strong equity performance in January was followed by negative returns in February and March, leaving the S&P 500 slightly negative at -0.76% for the first quarter, its first quarterly loss since 2015. The S&P 500 has since picked up steam with a year to date return of 9.94% through August 31, 2018. In fact, it was the best August in four years for U.S. equities as U.S. stocks lifted major stock market indices of large, mid, and small caps to record levels. Though profit growth and a strong labor market have appeared to boost sentiment, investors face a multitude of conflicting currents in navigating the markets today. Strength in the jobs market, a Federal Reserve committed to increasing interest rates, and the threat of a burgeoning trade war between the U.S. and China are but some of the issues facing the economy and markets.
In June, the Federal Reserve (the “Fed”) raised interest rates by a quarter of a point for the second time this year bringing the Federal Funds rate to a range of 1.75 - 2.00%. The Fed remains on course to raise rates twice more this year; however, it faces a number of conflicting realities. While the jobs market in the U.S. is very strong, labor costs continue to appear under control – decreasing the probability of runaway inflation. This is clearly a positive sign, but more troubling has been the flattening of the yield curve, bringing the spread between the two-year Treasury note and the 10-year Treasury bond to a level not seen in over 10 years. In fact, the spread between the 2-year and 10-year Treasury notes narrowed to 24 bps at the end of August, from a difference of over 50 bps at the start of the year. The flattening yield curve is sending two powerful messages. First, the fact that investors are demanding a smaller premium for committing capital for a longer period signals they don’t anticipate interest rates rising much in the future. The second message is less positive: an inversion of the yield curve (with short-term rates greater than long-term rates) has historically forecast recession.
Fixed income markets were mixed over the reporting period. The Bloomberg Barclays U.S. Aggregate Bond Index**, a broad measure of the bond market, fell -1.05%. Long Treasuries, as measured by the Bloomberg Barclays U.S. Treasury Long Index***, declined -2.76% for the period. Risk assets, such as high yield assets, as measured by the Bloomberg Barclays U.S. Corporate High Yield Bond Index,**** continued to gain ground, rising 3.40%.
The MSCI EAFE Index (net)*****, designed to measure the equity market performance of developed foreign markets (Europe, Australasia, Far East), excluding the U.S. and Canada, rose 4.39% for the twelve-month period but has declined -2.28% year-to-date. 2017 was a strong year for global equities, sustained by synchronized economic growth in many regions. Throughout 2018, however, there has been a divergence in growth across the globe. Emerging markets stocks fell in recent months as trade tensions and financial crises in Argentina and Turkey drove a currency sell-off across the developing world, reducing the interest of riskier assets. Additionally, the U.S./China trade conflicts intensified as each country imposed previously announced tariffs on the other’s imports, abating hopes for an agreement before the U.S. midterm elections.
Planning for your financial future in such an uncertain world should be a top priority. Your investment with VALIC Company II is an important step to help you reach your long-term financial goals. Another important step, we believe, is to meet with your financial advisor periodically to ensure that you maintain a diversified portfolio appropriate for your goals and risk tolerance.
We appreciate being part of your investment program and thank you for your ongoing confidence in us. We look forward to helping you meet your investment goals in the years ahead.
Sincerely,

John T. Genoy, President
VALIC Company II
Past performance is no guarantee of future results.
| * | The S&P 500® Index is an index of the stocks of 500 major large-cap U.S. corporations, chosen for market size, liquidity, and industry group representation. It is a market-value weighted index, with each stock’s percentage in the Index in proportion to its market value. |
| ** | The Bloomberg Barclays U.S. Aggregate Bond Index is an unmanaged index that measures the investment grade, U.S. dollar-denominated, fixed-rate taxable bond market, including Treasuries, government-related and corporate securities, mortgage- and asset-backed securities and commercial mortgage-backed securities. |
| *** | The Bloomberg Barclays U.S. Treasury Long Index measures U.S. dollar-denominated, fixed-rate, nominal debt issued by the US Treasury. Treasury bills are excluded by the maturity constraint, but are part of a separate Short Treasury Index. STRIPS are excluded from the index because their inclusion would result in double-counting. |
| **** | The Bloomberg Barclays U.S. Corporate High Yield Bond Index measures the USD-denominated, high yield, fixed-rate corporate bond market. Securities are classified as high yield if the middle rating of Moody’s, Fitch and S&P is Ba1/BB+/BB+ or below. Bonds from issuers with an emerging markets country of risk, based on Barclays EM country definition, are excluded. |
| ***** | The MSCI EAFE Index (net) is a free float-adjusted market capitalization index that is designed to measure the equity market performance of developed markets, excluding the U.S. and Canada. The MSCI EAFE Index consists of the following 21 developed market country indexes: Australia, Austria, Belgium, Denmark, Finland, France, Germany, Hong Kong, Ireland, Israel, Italy, Japan, the Netherlands, New Zealand, Norway, Portugal, Singapore, Spain, Sweden, Switzerland, and the United Kingdom. Net total return indices reinvest dividends after the deduction of withholding taxes, using (for international indices) a tax rate applicable to non-resident institutional investors who do not benefit from double taxation treaties. |
Indices are not managed and an investor cannot invest directly into an index. Past performance of an index does not guarantee the future performance of any investment.
VALIC Company II
EXPENSE EXAMPLE — August 31, 2018 (unaudited)
Disclosure of Fund Expenses in Shareholder Reports
As a shareholder of a Fund in VALIC Company II (“VC II”), you incur ongoing costs, including management fees and other Fund expenses. This Example is intended to help you understand your ongoing costs (in dollars) of investing in the Funds and to compare these costs with the ongoing costs of investing in other mutual funds. The Example is based on an investment of $1,000 invested at March 1, 2018 and held until August 31, 2018. Shares of VC II are currently issued and redeemed only in connection with investments in and payments under variable annuity contracts and variable life insurance policies (“Variable Contracts”), qualified retirement plans (the “Plans”) and Individual Retirement Accounts (“IRA”) offered by The Variable Annuity Life Insurance Company (“VALIC”), the investment adviser to VC II and other life insurance companies affiliated with VALIC. The fees and expenses associated with the Variable Contracts, Plans and IRA’s are not included in these Examples, and had such fees and expenses been included, your costs would have been higher. Please see your Variable Contract prospectus or Plan/IRA documents for more details on the fees associated with your Variable Contract, Plan or IRAs.
Actual Expenses
The “Actual” section of the table provides information about your actual account values and actual expenses. You may use the information in these columns, together with the amount you invested, to estimate the expenses that you paid over the period. Simply divide your account value by $1,000 (for example, an $8,600 account value divided by $1,000 = 8.6), then multiply the result by the number in the column under the heading entitled “Expenses Paid During the Six Months Ended August 31, 2018” to estimate the expenses you paid on your account during this period. The “Expenses Paid During the Six Months Ended August 31, 2018” column and the “Annualized Expense Ratio” column do not include fees and expenses that may be charged by the Variable Contracts, Plans and IRAs, in which the Funds are offered. Had these fees and expenses been included, the “Expenses Paid During the Six Months Ended August 31, 2018” column would have been higher and the “Ending Account Value” column would have been lower.
Hypothetical Example for Comparison Purposes
The “Hypothetical” section of the table provides information about hypothetical account values and hypothetical expenses based on each Fund’s actual expense ratio and an annual rate of return of 5% before expenses, which is not the Fund’s actual return. The hypothetical account values and expenses may not be used to estimate the actual ending account balance or expenses you paid for the period. You may use this information to compare the ongoing costs of investing in the Funds and other funds. To do so, compare this 5% hypothetical example with the 5% hypothetical examples that appear in the shareholder reports of other funds. The “Expenses Paid During the Six Months Ended August 31, 2018” column and the “Annualized Expense Ratio” column do not include fees and expenses that may be charged by the Variable Contracts, Plans or IRAs in which the Funds are offered. Had these fees and expenses been included, the “Expenses Paid During the Six Months Ended August 31, 2018” column would have been higher and the “Ending Account Value” column would have been lower.
Please note that the expenses shown in the table are meant to highlight your ongoing costs only and do not reflect any fees and expenses that may be charged by the Variable Contracts, Plans or IRAs. Please refer to your Variable Contract prospectus or Plan/IRA document for more information. Therefore, the “hypothetical” example is useful in comparing ongoing costs and will not help you determine the relative total costs of owning different funds. In addition, if these fees and expenses were included, your costs would have been higher.
VALIC Company II
EXPENSE EXAMPLE — August 31, 2018 (unaudited) — (continued)
| | | | | | | | | | | | | | | | | | | | | | | | | | | | |
| | | Actual
| | | Hypothetical
| |
Fund
| | Beginning
Account Value
at March 1,
2018
| | | Ending
Account Value
Using Actual
Return at
August 31,
2018
| | | Expenses Paid
During the Six
Months Ended
August 31,
2018*
| | | Beginning
Account Value
at March 1,
2018
| | | Ending
Account Value
Using a
Hypothetical
5% Annual
Return at
August 31,
2018
| | | Expenses Paid
During the
Six Months Ended
August 31,
2018*
| | | Annualized
Expense
Ratio
| |
Aggressive Growth Lifestyle# | | $ | 1,000.00 | | | $ | 1,048.14 | | | $ | 0.52 | | | $ | 1,000.00 | | | $ | 1,024.70 | | | $ | 0.51 | | | | 0.10 | % |
Capital Appreciation# | | $ | 1,000.00 | | | $ | 1,143.27 | | | $ | 4.59 | | | $ | 1,000.00 | | | $ | 1,020.92 | | | $ | 4.33 | | | | 0.85 | % |
Conservative Growth Lifestyle# | | $ | 1,000.00 | | | $ | 1,023.91 | | | $ | 0.51 | | | $ | 1,000.00 | | | $ | 1,024.70 | | | $ | 0.51 | | | | 0.10 | % |
Core Bond# | | $ | 1,000.00 | | | $ | 1,002.96 | | | $ | 3.89 | | | $ | 1,000.00 | | | $ | 1,021.32 | | | $ | 3.92 | | | | 0.77 | % |
Government Money Market II# | | $ | 1,000.00 | | | $ | 1,006.07 | | | $ | 2.78 | | | $ | 1,000.00 | | | $ | 1,022.43 | | | $ | 2.80 | | | | 0.55 | % |
High Yield Bond# | | $ | 1,000.00 | | | $ | 1,014.51 | | | $ | 4.87 | | | $ | 1,000.00 | | | $ | 1,020.37 | | | $ | 4.89 | | | | 0.96 | % |
International Opportunities# | | $ | 1,000.00 | | | $ | 998.36 | | | $ | 5.04 | | | $ | 1,000.00 | | | $ | 1,020.16 | | | $ | 5.09 | | | | 1.00 | % |
Large Cap Value# | | $ | 1,000.00 | | | $ | 1,048.25 | | | $ | 4.18 | | | $ | 1,000.00 | | | $ | 1,021.12 | | | $ | 4.13 | | | | 0.81 | % |
Mid Cap Growth# | | $ | 1,000.00 | | | $ | 1,113.67 | | | $ | 4.53 | | | $ | 1,000.00 | | | $ | 1,020.92 | | | $ | 4.33 | | | | 0.85 | % |
Mid Cap Value | | $ | 1,000.00 | | | $ | 1,046.23 | | | $ | 5.47 | | | $ | 1,000.00 | | | $ | 1,019.86 | | | $ | 5.40 | | | | 1.06 | % |
Moderate Growth Lifestyle# | | $ | 1,000.00 | | | $ | 1,041.01 | | | $ | 0.51 | | | $ | 1,000.00 | | | $ | 1,024.70 | | | $ | 0.51 | | | | 0.10 | % |
Small Cap Growth# | | $ | 1,000.00 | | | $ | 1,201.46 | | | $ | 6.44 | | | $ | 1,000.00 | | | $ | 1,019.36 | | | $ | 5.90 | | | | 1.16 | % |
Small Cap Value# | | $ | 1,000.00 | | | $ | 1,117.57 | | | $ | 5.07 | | | $ | 1,000.00 | | | $ | 1,020.42 | | | $ | 4.84 | | | | 0.95 | % |
Socially Responsible# | | $ | 1,000.00 | | | $ | 1,067.75 | | | $ | 2.92 | | | $ | 1,000.00 | | | $ | 1,022.38 | | | $ | 2.85 | | | | 0.56 | % |
Strategic Bond | | $ | 1,000.00 | | | $ | 994.76 | | | $ | 4.32 | | | $ | 1,000.00 | | | $ | 1,020.87 | | | $ | 4.38 | | | | 0.86 | % |
| * | Expenses are equal to each Fund‘s annualized expense ratio multiplied by the average account value over the period, multiplied by 184 days then divided by 365 days (to reflect the one-half year period) . These ratios do not reflect fees and expenses associated with the Variable Contracts, Plans or IRA‘s. If such fees and expenses had been included, the expenses would have been higher. Please refer to your Variable Contract prospectus for details on the expenses that apply to the Variable Contracts or your Plan/IRA document for details on the administration fees charged by your Plan sponsor. |
| # | During the stated period, the investment adviser waived a portion of or all fees and assumed a portion of or all expenses for the Fund. As a result, if these fees and expenses had not been waived or assumed, the “Actual/Hypothetical Ending Account Value” would have been lower and the “Actual/Hypothetical Expenses Paid During the Six Months Ended August 31, 2018” and the “Annualized Expense Ratio” would have been higher. |
3
VALIC Company II Aggressive Growth Lifestyle Fund
PORTFOLIO PROFILE — August 31, 2018 (unaudited)
Industry Allocation*
| | | | |
Domestic Equity Investment Companies | | | 57.3 | % |
International Equity Investment Companies | | | 17.7 | |
Domestic Fixed Income Investment Companies | | | 15.6 | |
Real Estate Investment Companies | | | 7.0 | |
International Fixed Income Investment Companies | | | 2.4 | |
| | |
|
|
|
| | | | 100.0 | % |
| | |
|
|
|
| * | Calculated as a percentage of net assets |
VALIC Company II Aggressive Growth Lifestyle Fund
PORTFOLIO OF INVESTMENTS — August 31, 2018
| | | | | | | | |
| | |
| Security Description | | Shares | | | Value
(Note 2) | |
| |
AFFILIATED REGISTERED INVESTMENT COMPANIES#(1) — 100.0% | |
Domestic Equity Investment Companies — 57.3% | |
VALIC Co. I Blue Chip Growth Fund | | | 512,151 | | | $ | 11,369,749 | |
VALIC Co. I Dividend Value Fund | | | 2,329,120 | | | | 30,651,225 | |
VALIC Co. I Large Cap Core Fund | | | 509,150 | | | | 6,400,013 | |
VALIC Co. I Large Capital Growth Fund | | | 188,718 | | | | 3,070,439 | |
VALIC Co. I Mid Cap Index Fund | | | 790,468 | | | | 23,358,328 | |
VALIC Co. I Mid Cap Strategic Growth Fund | | | 589,091 | | | | 10,038,114 | |
VALIC Co. I Nasdaq-100 Index Fund | | | 1,037,863 | | | | 15,941,576 | |
VALIC Co. I Science & Technology Fund | | | 669,910 | | | | 22,147,228 | |
VALIC Co. I Small Cap Index Fund | | | 318,892 | | | | 7,771,408 | |
VALIC Co. I Small Cap Special Values Fund | | | 1,360,924 | | | | 20,114,463 | |
VALIC Co. I Stock Index Fund | | | 1,202,649 | | | | 51,100,555 | |
VALIC Co. I Value Fund | | | 648,159 | | | | 12,120,568 | |
VALIC Co. II Capital Appreciation Fund | | | 1,112,190 | | | | 22,388,386 | |
VALIC Co. II Large Cap Value Fund | | | 1,341,057 | | | | 30,522,454 | |
VALIC Co. II Mid Cap Growth Fund | | | 939,168 | | | | 10,058,488 | |
VALIC Co. II Mid Cap Value Fund | | | 1,089,631 | | | | 24,113,525 | |
VALIC Co. II Small Cap Growth Fund | | | 539,912 | | | | 12,585,346 | |
VALIC Co. II Small Cap Value Fund | | | 2,219,610 | | | | 34,936,655 | |
| | | | | | |
|
|
|
Total Domestic Equity Investment Companies | |
(cost $304,149,576) | | | | | | | 348,688,520 | |
| | | | | | |
|
|
|
Domestic Fixed Income Investment Companies — 15.6% | |
VALIC Co. I Capital Conservation Fund | | | 1,139,970 | | | | 10,920,916 | |
VALIC Co. I Inflation Protected Fund | | | 2,494,798 | | | | 27,168,351 | |
VALIC Co. II Core Bond Fund | | | 987,570 | | | | 10,606,501 | |
VALIC Co. II High Yield Bond Fund | | | 2,235,827 | | | | 16,835,780 | |
VALIC Co. II Strategic Bond Fund | | | 2,726,880 | | | | 29,613,913 | |
| | | | | | |
|
|
|
Total Domestic Fixed Income Investment Companies | |
(cost $97,045,645) | | | | | | | 95,145,461 | |
| | | | | | |
|
|
|
| | | | | | | | |
| | |
| Security Description | | Shares | | | Value
(Note 2) | |
| |
| | | | | | | | | |
International Equity Investment Companies — 17.7% | |
VALIC Co. I Emerging Economies Fund | | | 1,956,617 | | | $ | 16,083,395 | |
VALIC Co. I Foreign Value Fund | | | 2,813,302 | | | | 29,258,337 | |
VALIC Co. I International Equities Index Fund | | | 3,983,100 | | | | 29,235,953 | |
VALIC Co. I International Growth Fund | | | 821,363 | | | | 12,180,810 | |
VALIC Co. II International Opportunities Fund | | | 982,446 | | | | 20,935,917 | |
| | | | | | |
|
|
|
Total International Equity Investment Companies | |
(cost $108,812,068) | | | | | | | 107,694,412 | |
| | | | | | |
|
|
|
International Fixed Income Investment Companies — 2.4% | |
VALIC Co. I International Government Bond Fund
(cost $15,182,325) | | | 1,290,587 | | | | 14,790,122 | |
| | | | | | |
|
|
|
Real Estate Investment Companies — 7.0% | |
VALIC Co. I Global Real Estate Fund
(cost $42,481,058) | | | 5,424,853 | | | | 42,476,598 | |
| | | | | | |
|
|
|
TOTAL INVESTMENTS | | | | | | | | |
(cost $567,670,672)(2) | | | 100.0 | % | | | 608,795,113 | |
Liabilities in excess of other assets | | | (0.0 | ) | | | (86,112 | ) |
| | |
|
|
| |
|
|
|
NET ASSETS | | | 100.0 | % | | $ | 608,709,001 | |
| | |
|
|
| |
|
|
|
| # | The Aggressive Growth Lifestyle Fund invests in various VALIC Company I or VALIC Company II Funds, some of which are not presented in this report. Additional information on the underlying funds including such fund’s prospectuses and shareholder reports is available at our website, www.valic.com. |
| (2) | See Note 5 for cost of investments on a tax basis. |
The following is a summary of the inputs used to value the Fund’s net assets as of August 31, 2018 (see Note 2):
| | | | | | | | | | | | | | | | |
| | | Level 1 - Unadjusted
Quoted Prices
| | | Level 2 - Other
Observable Inputs
| | | Level 3 - Significant
Unobservable Inputs
| | | Total
| |
ASSETS: | | | | | | | | | | | | | | | | |
Investments at Value:* | | | | | | | | | | | | | | | | |
Affiliated Registered Investment Companies | | $ | 608,795,113 | | | $ | — | | | $ | — | | | $ | 608,795,113 | |
| | |
|
|
| |
|
|
| |
|
|
| |
|
|
|
| * | For a detailed presentation of investments, please refer to the Portfolio of Investments. |
The Fund’s policy is to recognize transfers between Levels as of the end of the reporting period. There were no transfers between Levels during the reporting period.
See Notes to Financial Statements
VALIC Company II Capital Appreciation Fund
PORTFOLIO PROFILE — August 31, 2018 (unaudited)
Industry Allocation*
| | | | |
Finance — Credit Card | | | 8.6 | % |
Applications Software | | | 8.2 | |
Medical — Drugs | | | 6.5 | |
E-Commerce/Products | | | 6.4 | |
Computers | | | 5.8 | |
Web Portals/ISP | | | 4.6 | |
Medical — Biomedical/Gene | | | 4.0 | |
Real Estate Investment Trusts | | | 3.4 | |
Electronic Forms | | | 2.7 | |
Retail — Apparel/Shoe | | | 2.4 | |
Aerospace/Defense | | | 2.4 | |
Electronic Components — Semiconductors | | | 2.3 | |
Distribution/Wholesale | | | 2.2 | |
Internet Security | | | 2.1 | |
Computer Data Security | | | 2.0 | |
Cable/Satellite TV | | | 1.8 | |
Computers — Memory Devices | | | 1.6 | |
Transport — Rail | | | 1.5 | |
Medical — HMO | | | 1.4 | |
Retail — Discount | | | 1.4 | |
Retail — Auto Parts | | | 1.3 | |
Containers — Paper/Plastic | | | 1.3 | |
Internet Infrastructure Software | | | 1.3 | |
Building Products — Wood | | | 1.2 | |
Apparel Manufacturers | | | 1.2 | |
Enterprise Software/Service | | | 1.2 | |
Oil Companies — Exploration & Production | | | 1.2 | |
Banks — Super Regional | | | 1.2 | |
Medical Instruments | | | 1.1 | |
Commercial Services — Finance | | | 1.1 | |
Shipbuilding | | | 1.0 | |
Cosmetics & Toiletries | | | 1.0 | |
Internet Content — Entertainment | | | 0.9 | |
Radio | | | 0.9 | |
Airlines | | | 0.9 | |
Oil — Field Services | | | 0.9 | |
Food — Wholesale/Distribution | | | 0.9 | |
Finance — Investment Banker/Broker | | | 0.9 | |
Insurance — Multi-line | | | 0.8 | |
E-Commerce/Services | | | 0.8 | |
Insurance — Property/Casualty | | | 0.8 | |
Web Hosting/Design | | | 0.7 | |
Semiconductor Equipment | | | 0.6 | |
Chemicals — Diversified | | | 0.6 | |
Retail — Major Department Stores | | | 0.6 | |
Footwear & Related Apparel | | | 0.6 | |
Auto/Truck Parts & Equipment — Original | | | 0.5 | |
Commercial Services | | | 0.5 | |
Computer Software | | | 0.5 | |
Food — Retail | | | 0.5 | |
Data Processing/Management | | | 0.4 | |
| | |
|
|
|
| | | | 98.7 | % |
| | |
|
|
|
| * | Calculated as a percentage of net assets |
VALIC Company II Capital Appreciation Fund
PORTFOLIO OF INVESTMENTS — August 31, 2018
| | | | | | | | |
| | |
| Security Description | | Shares | | | Value
(Note 2) | |
| |
COMMON STOCKS — 98.7% | |
Aerospace/Defense — 2.4% | |
Boeing Co. | | | 7,762 | | | $ | 2,660,736 | |
| | | | | | |
|
|
|
Airlines — 0.9% | |
Southwest Airlines Co. | | | 16,135 | | | | 989,076 | |
| | | | | | |
|
|
|
Apparel Manufacturers — 1.2% | |
Michael Kors Holdings, Ltd.† | | | 18,444 | | | | 1,339,403 | |
| | | | | | |
|
|
|
Applications Software — 8.2% | |
Microsoft Corp. | | | 51,958 | | | | 5,836,442 | |
Red Hat, Inc.† | | | 5,510 | | | | 813,992 | |
salesforce.com, Inc.† | | | 15,664 | | | | 2,391,580 | |
| | | | | | |
|
|
|
| | | | | | | | 9,042,014 | |
| | | | | | |
|
|
|
Auto/Truck Parts & Equipment - Original — 0.5% | |
Allison Transmission Holdings, Inc. | | | 11,198 | | | | 556,093 | |
| | | | | | |
|
|
|
Banks - Super Regional — 1.2% | |
US Bancorp | | | 23,697 | | | | 1,282,245 | |
| | | | | | |
|
|
|
Building Products - Wood — 1.2% | |
Masco Corp. | | | 35,332 | | | | 1,341,556 | |
| | | | | | |
|
|
|
Cable/Satellite TV — 1.8% | |
Comcast Corp., Class A | | | 53,975 | | | | 1,996,535 | |
| | | | | | |
|
|
|
Chemicals - Diversified — 0.6% | |
Westlake Chemical Corp. | | | 7,208 | | | | 681,661 | |
| | | | | | |
|
|
|
Commercial Services — 0.5% | |
CoStar Group, Inc.† | | | 1,253 | | | | 554,026 | |
| | | | | | |
|
|
|
Commercial Services - Finance — 1.1% | |
S&P Global, Inc. | | | 3,603 | | | | 746,001 | |
Sabre Corp. | | | 16,685 | | | | 435,646 | |
| | | | | | |
|
|
|
| | | | | | | | 1,181,647 | |
| | | | | | |
|
|
|
Computer Data Security — 2.0% | |
Fortinet, Inc.† | | | 25,941 | | | | 2,172,818 | |
| | | | | | |
|
|
|
Computer Software — 0.5% | |
Akamai Technologies, Inc.† | | | 6,967 | | | | 523,500 | |
| | | | | | |
|
|
|
Computers — 5.8% | |
Apple, Inc. | | | 27,769 | | | | 6,321,057 | |
| | | | | | |
|
|
|
Computers - Memory Devices — 1.6% | |
NetApp, Inc. | | | 20,212 | | | | 1,754,604 | |
| | | | | | |
|
|
|
Containers - Paper/Plastic — 1.3% | |
Berry Global Group, Inc.† | | | 29,783 | | | | 1,421,543 | |
| | | | | | |
|
|
|
Cosmetics & Toiletries — 1.0% | |
Estee Lauder Cos., Inc., Class A | | | 7,769 | | | | 1,088,592 | |
| | | | | | |
|
|
|
Data Processing/Management — 0.4% | |
Dun & Bradstreet Corp. | | | 3,199 | | | | 457,201 | |
| | | | | | |
|
|
|
Distribution/Wholesale — 2.2% | |
KAR Auction Services, Inc. | | | 8,721 | | | | 546,719 | |
WW Grainger, Inc. | | �� | 5,266 | | | | 1,864,533 | |
| | | | | | |
|
|
|
| | | | | | | | 2,411,252 | |
| | | | | | |
|
|
|
E-Commerce/Products — 6.4% | |
Amazon.com, Inc.† | | | 3,488 | | | | 7,020,332 | |
| | | | | | |
|
|
|
E-Commerce/Services — 0.8% | |
Expedia Group, Inc. | | | 6,658 | | | | 868,869 | |
| | | | | | |
|
|
|
Electronic Components - Semiconductors — 2.3% | |
Intel Corp. | | | 36,230 | | | | 1,754,619 | |
Texas Instruments, Inc. | | | 6,828 | | | | 767,467 | |
| | | | | | |
|
|
|
| | | | | | | | 2,522,086 | |
| | | | | | |
|
|
|
| | | | | | | | |
| | |
| Security Description | | Shares | | | Value
(Note 2) | |
| |
| | | | | | | | | |
Electronic Forms — 2.7% | |
Adobe Systems, Inc.† | | | 11,347 | | | $ | 2,990,048 | |
| | | | | | |
|
|
|
Enterprise Software/Service — 1.2% | |
Black Knight, Inc.† | | | 11,501 | | | | 614,154 | |
Veeva Systems, Inc., Class A† | | | 6,731 | | | | 702,447 | |
| | | | | | |
|
|
|
| | | | | | | | 1,316,601 | |
| | | | | | |
|
|
|
Finance - Credit Card — 8.6% | |
Alliance Data Systems Corp. | | | 6,291 | | | | 1,500,907 | |
American Express Co. | | | 21,719 | | | | 2,301,780 | |
Mastercard, Inc., Class A | | | 13,747 | | | | 2,963,303 | |
Visa, Inc., Class A | | | 18,016 | | | | 2,646,370 | |
| | | | | | |
|
|
|
| | | | | | | | 9,412,360 | |
| | | | | | |
|
|
|
Finance - Investment Banker/Broker — 0.9% | |
Evercore, Inc., Class A | | | 8,792 | | | | 933,271 | |
| | | | | | |
|
|
|
Food - Retail — 0.5% | |
Sprouts Farmers Market, Inc.† | | | 18,965 | | | | 502,004 | |
| | | | | | |
|
|
|
Food - Wholesale/Distribution — 0.9% | |
Sysco Corp. | | | 12,795 | | | | 957,322 | |
| | | | | | |
|
|
|
Footwear & Related Apparel — 0.6% | |
Deckers Outdoor Corp.† | | | 5,229 | | | | 637,101 | |
| | | | | | |
|
|
|
Insurance - Multi-line — 0.8% | |
Allstate Corp. | | | 9,065 | | | | 911,667 | |
| | | | | | |
|
|
|
Insurance - Property/Casualty — 0.8% | |
Progressive Corp. | | | 12,365 | | | | 835,008 | |
| | | | | | |
|
|
|
Internet Content - Entertainment — 0.9% | |
Facebook, Inc., Class A† | | | 5,881 | | | | 1,033,468 | |
| | | | | | |
|
|
|
Internet Infrastructure Software — 1.3% | |
F5 Networks, Inc.† | | | 7,444 | | | | 1,407,809 | |
| | | | | | |
|
|
|
Internet Security — 2.1% | |
Palo Alto Networks, Inc.† | | | 9,825 | | | | 2,271,049 | |
| | | | | | |
|
|
|
Medical Instruments — 1.1% | |
Edwards Lifesciences Corp.† | | | 3,634 | | | | 524,168 | |
Intuitive Surgical, Inc.† | | | 1,229 | | | | 688,240 | |
| | | | | | |
|
|
|
| | | | | | | | 1,212,408 | |
| | | | | | |
|
|
|
Medical - Biomedical/Gene — 4.0% | |
Amgen, Inc. | | | 9,575 | | | | 1,913,181 | |
Celgene Corp.† | | | 25,989 | | | | 2,454,661 | |
| | | | | | |
|
|
|
| | | | | | | | 4,367,842 | |
| | | | | | |
|
|
|
Medical - Drugs — 6.5% | |
AbbVie, Inc. | | | 27,502 | | | | 2,639,642 | |
Eli Lilly & Co. | | | 24,772 | | | | 2,617,162 | |
Jazz Pharmaceuticals PLC† | | | 4,576 | | | | 782,130 | |
Zoetis, Inc. | | | 11,519 | | | | 1,043,621 | |
| | | | | | |
|
|
|
| | | | | | | | 7,082,555 | |
| | | | | | |
|
|
|
Medical - HMO — 1.4% | |
Cigna Corp. | | | 8,368 | | | | 1,576,029 | |
| | | | | | |
|
|
|
Oil Companies - Exploration & Production — 1.2% | |
Occidental Petroleum Corp. | | | 9,253 | | | | 739,037 | |
Pioneer Natural Resources Co. | | | 3,139 | | | | 548,383 | |
| | | | | | |
|
|
|
| | | | | | | | 1,287,420 | |
| | | | | | |
|
|
|
Oil - Field Services — 0.9% | |
Schlumberger, Ltd. | | | 15,160 | | | | 957,506 | |
| | | | | | |
|
|
|
Radio — 0.9% | |
Sirius XM Holdings, Inc.# | | | 141,779 | | | | 1,006,631 | |
| | | | | | |
|
|
|
VALIC Company II Capital Appreciation Fund
PORTFOLIO OF INVESTMENTS — August 31, 2018 — (continued)
| | | | | | | | |
| | |
| Security Description | | Shares | | | Value
(Note 2) | |
| |
COMMON STOCKS (continued) | |
Real Estate Investment Trusts — 3.4% | |
Alexandria Real Estate Equities, Inc. | | | 12,195 | | | $ | 1,565,228 | |
Douglas Emmett, Inc. | | | 25,481 | | | | 995,288 | |
Equinix, Inc. | | | 603 | | | | 262,987 | |
Essex Property Trust, Inc. | | | 3,779 | | | | 930,692 | |
| | | | | | |
|
|
|
| | | | | | | | 3,754,195 | |
| | | | | | |
|
|
|
Retail - Apparel/Shoe — 2.4% | |
Burlington Stores, Inc.† | | | 6,784 | | | | 1,140,933 | |
Lululemon Athletica, Inc.† | | | 9,847 | | | | 1,525,596 | |
| | | | | | |
|
|
|
| | | | | | | | 2,666,529 | |
| | | | | | |
|
|
|
Retail - Auto Parts — 1.3% | |
O’Reilly Automotive, Inc.† | | | 4,314 | | | | 1,447,002 | |
| | | | | | |
|
|
|
Retail - Discount — 1.4% | |
Walmart, Inc. | | | 15,639 | | | | 1,499,155 | |
| | | | | | |
|
|
|
Retail - Major Department Stores — 0.6% | |
Nordstrom, Inc. | | | 10,339 | | | | 649,806 | |
| | | | | | |
|
|
|
Semiconductor Equipment — 0.6% | |
Applied Materials, Inc. | | | 16,163 | | | | 695,332 | |
| | | | | | |
|
|
|
Shipbuilding — 1.0% | |
Huntington Ingalls Industries, Inc. | | | 4,514 | | | | 1,103,538 | |
| | | | | | |
|
|
|
Transport - Rail — 1.5% | |
Genesee & Wyoming, Inc., Class A† | | | 19,115 | | | | 1,680,017 | |
| | | | | | |
|
|
|
| | | | | | | | |
| | |
| Security Description | | Shares | | | Value
(Note 2) | |
| |
| | | | | | | |
Web Hosting/Design — 0.7% | | | | | | | | |
VeriSign, Inc.† | | | 4,762 | | | $ | 755,301 | |
| | | | | | |
|
|
|
Web Portals/ISP — 4.6% | | | | | | | | |
Alphabet, Inc., Class A† | | | 1,051 | | | | 1,294,622 | |
Alphabet, Inc., Class C† | | | 3,114 | | | | 3,793,443 | |
| | | | | | |
|
|
|
| | | | | | | | 5,088,065 | |
| | | | | | |
|
|
|
TOTAL INVESTMENTS | | | | | | | | |
(cost $90,440,736)(1) | | | 98.7 | % | | | 108,223,885 | |
Other assets less liabilities | | | 1.3 | | | | 1,472,822 | |
| | |
|
|
| |
|
|
|
NET ASSETS | | | 100.0 | % | | $ | 109,696,707 | |
| | |
|
|
| |
|
|
|
| † | Non-income producing security |
| # | The security or a portion thereof is out on loan (see Note 2). |
At August 31, 2018, the Fund had loaned securities with a total value of $779,367. This was secured by collateral of $793,165 received in the form of fixed income pooled securities, which the Fund cannot sell or repledge and accordingly are not reflected in the Fund’s assets and liabilities.
The components of the fixed income pooled securities referenced above are as follows:
| | | | | | | | |
Securities
| | Coupon Range
| | Maturity Date Range
| | Value as of
August 31, 2018
| |
United States Treasury Notes/Bonds | | 0.13% to 8.50% | | 10/15/2018 to 02/15/2047 | | $ | 793,165 | |
| (1) | See Note 5 for cost of investments on a tax basis. |
The following is a summary of the inputs used to value the Fund’s net assets as of August 31, 2018 (see Note 2):
| | | | | | | | | | | | | | | | |
| | | Level 1 - Unadjusted
Quoted Prices
| | | Level 2 - Other
Observable Inputs
| | | Level 3 - Significant
Unobservable Inputs
| | | Total
| |
ASSETS: | | | | | | | | | | | | | | | | |
Investments at Value:* | | | | | | | | | | | | | | | | |
Common Stocks | | $ | 108,223,885 | | | $ | — | | | $ | — | | | $ | 108,223,885 | |
| | |
|
|
| |
|
|
| |
|
|
| |
|
|
|
| * | For a detailed presentation of investments, please refer to the Portfolio of Investments. |
The Fund’s policy is to recognize transfers between Levels as of the end of the reporting period. There were no transfers between Levels during the reporting period.
See Notes to Financial Statements
VALIC Company II Conservative Growth Lifestyle Fund
PORTFOLIO PROFILE — August 31, 2018 (unaudited)
Industry Allocation*
| | | | |
Domestic Fixed Income Investment Companies | | | 50.8 | % |
Domestic Equity Investment Companies | | | 31.0 | |
International Equity Investment Companies | | | 11.7 | |
International Fixed Income Investment Companies | | | 4.5 | |
Real Estate Investment Companies | | | 2.0 | |
| | |
|
|
|
| | | | 100.0 | % |
| | |
|
|
|
| * | Calculated as a percentage of net assets |
VALIC Company II Conservative Growth Lifestyle Fund
PORTFOLIO OF INVESTMENTS — August 31, 2018
| | | | | | | | |
| | |
| Security Description | | Shares | | | Value
(Note 2) | |
| |
AFFILIATED REGISTERED INVESTMENT COMPANIES#(1) — 100.0% | |
Domestic Equity Investment Companies — 31.0% | |
VALIC Co. I Blue Chip Growth Fund | | | 16,015 | | | $ | 355,523 | |
VALIC Co. I Dividend Value Fund | | | 916,649 | | | | 12,063,106 | |
VALIC Co. I Large Cap Core Fund | | | 231,738 | | | | 2,912,942 | |
VALIC Co. I Large Capital Growth Fund | | | 53,024 | | | | 862,699 | |
VALIC Co. I Mid Cap Index Fund | | | 250,183 | | | | 7,392,919 | |
VALIC Co. I Mid Cap Strategic Growth Fund | | | 52,406 | | | | 893,003 | |
VALIC Co. I Nasdaq-100 Index Fund | | | 402,104 | | | | 6,176,313 | |
VALIC Co. I Science & Technology Fund | | | 213,591 | | | | 7,061,333 | |
VALIC Co. I Small Cap Index Fund | | | 79,427 | | | | 1,935,641 | |
VALIC Co. I Small Cap Special Values Fund | | | 657,374 | | | | 9,715,985 | |
VALIC Co. I Stock Index Fund | | | 369,401 | | | | 15,695,830 | |
VALIC Co. I Value Fund | | | 182,136 | | | | 3,405,935 | |
VALIC Co. II Capital Appreciation Fund | | | 273,489 | | | | 5,505,327 | |
VALIC Co. II Large Cap Value Fund | | | 376,796 | | | | 8,575,886 | |
VALIC Co. II Mid Cap Growth Fund | | | 82,222 | | | | 880,603 | |
VALIC Co. II Mid Cap Value Fund | | | 320,342 | | | | 7,089,162 | |
VALIC Co. II Small Cap Growth Fund | | | 160,400 | | | | 3,738,931 | |
VALIC Co. II Small Cap Value Fund | | | 691,221 | | | | 10,879,821 | |
| | | | | | |
|
|
|
Total Domestic Equity Investment Companies
| | | | | |
(cost $95,799,103) | | | | | | | 105,140,959 | |
| | | | | | |
|
|
|
Domestic Fixed Income Investment Companies — 50.8% | |
VALIC Co. I Capital Conservation Fund | | | 1,565,744 | | | | 14,999,827 | |
VALIC Co. I Inflation Protected Fund | | | 1,401,628 | | | | 15,263,733 | |
VALIC Co. II Core Bond Fund | | | 2,153,028 | | | | 23,123,524 | |
VALIC Co. II High Yield Bond Fund | | | 5,966,680 | | | | 44,929,098 | |
VALIC Co. II Strategic Bond Fund | | | 6,806,443 | | | | 73,917,970 | |
| | | | | | |
|
|
|
Total Domestic Fixed Income Investment Companies | | | | | | | | |
(cost $177,104,230) | | | | | | | 172,234,152 | |
| | | | | | |
|
|
|
| | | | | | | | |
| | |
| Security Description | | Shares | | | Value
(Note 2) | |
| |
| | | | | | | | | |
International Equity Investment Companies — 11.7% | |
VALIC Co. I Emerging Economies Fund | | | 469,370 | | | $ | 3,858,220 | |
VALIC Co. I Foreign Value Fund | | | 1,187,643 | | | | 12,351,492 | |
VALIC Co. I International Equities Index Fund | | | 1,803,395 | | | | 13,236,917 | |
VALIC Co. I International Growth Fund | | | 230,991 | | | | 3,425,602 | |
VALIC Co. II International Opportunities Fund | | | 315,446 | | | | 6,722,148 | |
| | | | | | |
|
|
|
Total International Equity Investment Companies | | | | | | | | |
(cost $40,996,217) | | | | | | | 39,594,379 | |
| | | | | | |
|
|
|
International Fixed Income Investment Companies — 4.5% | |
VALIC Co. I International Government Bond Fund | | | | | | | | |
(cost $15,429,558) | | | 1,311,975 | | | | 15,035,233 | |
| | | | | | |
|
|
|
Real Estate Investment Companies — 2.0% | |
VALIC Co. I Global Real Estate Fund | | | | | | | | |
(cost $6,855,323) | | | 874,441 | | | | 6,846,871 | |
| | | | | | |
|
|
|
TOTAL INVESTMENTS | | | | | | | | |
(cost $336,184,431)(2) | | | 100.0 | % | | | 338,851,594 | |
Liabilities in excess of other assets | | | (0.0 | ) | | | (58,695 | ) |
| | |
|
|
| |
|
|
|
NET ASSETS | | | 100.0 | % | | $ | 338,792,899 | |
| | |
|
|
| |
|
|
|
| # | The Conservative Growth Lifestyle Fund invests in various VALIC Company I or VALIC Company II Funds, some of which are not presented in this report. Additional information on the underlying funds including such fund’s prospectuses and shareholder reports is available at our website, www.valic.com. |
| (2) | See Note 5 for cost of investments on a tax basis. |
The following is a summary of the inputs used to value the Fund’s net assets as of August 31, 2018 (see Note 2):
| | | | | | | | | | | | | | | | |
| | | Level 1 - Unadjusted
Quoted Prices
| | | Level 2 - Other
Observable Inputs
| | | Level 3 - Significant
Unobservable Inputs
| | | Total
| |
ASSETS: | | | | | | | | | | | | | | | | |
Investments at Value:* | | | | | | | | | | | | | | | | |
Affiliated Registered Investment Companies | | $ | 338,851,594 | | | $ | — | | | $ | — | | | $ | 338,851,594 | |
| | |
|
|
| |
|
|
| |
|
|
| |
|
|
|
| * | For a detailed presentation of investments, please refer to the Portfolio of Investments. |
The Fund’s policy is to recognize transfers between Levels as of the end of the reporting period. There were no transfers between Levels during the reporting period.
See Notes to Financial Statements
VALIC Company II Core Bond Fund
PORTFOLIO PROFILE — August 31, 2018 (unaudited)
Industry Allocation*
| | | | |
Federal National Mtg. Assoc. | | | 22.1 | % |
Federal Home Loan Mtg. Corp. | | | 10.8 | |
United States Treasury Notes | | | 7.5 | |
Diversified Banking Institutions | | | 5.6 | |
Registered Investment Companies | | | 3.9 | |
Sovereign | | | 3.9 | |
Banks — Commercial | | | 3.5 | |
Government National Mtg. Assoc. | | | 3.1 | |
United States Treasury Bonds | | | 3.0 | |
Diversified Financial Services | | | 2.6 | |
Electric — Integrated | | | 2.5 | |
Pipelines | | | 1.9 | |
Auto — Cars/Light Trucks | | | 1.8 | |
Telephone — Integrated | | | 1.6 | |
Oil Companies — Exploration & Production | | | 1.5 | |
Banks — Super Regional | | | 1.1 | |
Cable/Satellite TV | | | 1.0 | |
Oil Companies — Integrated | | | 1.0 | |
Brewery | | | 0.7 | |
Cellular Telecom | | | 0.6 | |
Real Estate Investment Trusts | | | 0.6 | |
Insurance — Life/Health | | | 0.6 | |
Insurance — Multi-line | | | 0.6 | |
Computer Services | | | 0.5 | |
Paper & Related Products | | | 0.5 | |
Medical — HMO | | | 0.5 | |
Savings & Loans/Thrifts | | | 0.5 | |
Medical — Drugs | | | 0.5 | |
Medical Labs & Testing Services | | | 0.5 | |
Aerospace/Defense — Equipment | | | 0.5 | |
Machinery — Farming | | | 0.5 | |
Finance — Other Services | | | 0.4 | |
Transport — Rail | | | 0.4 | |
Computers | | | 0.4 | |
Pharmacy Services | | | 0.4 | |
Electric — Generation | | | 0.4 | |
Beverages — Non-alcoholic | | | 0.4 | |
Auto/Truck Parts & Equipment — Original | | | 0.3 | |
Networking Products | | | 0.3 | |
Broadcast Services/Program | | | 0.3 | |
Agricultural Chemicals | | | 0.3 | |
Medical — Generic Drugs | | | 0.3 | |
Insurance — Mutual | | | 0.3 | |
Enterprise Software/Service | | | 0.3 | |
Oil — Field Services | | | 0.3 | |
Satellite Telecom | | | 0.3 | |
Diversified Manufacturing Operations | | | 0.3 | |
Finance — Consumer Loans | | | 0.2 | |
Finance — Credit Card | | | 0.2 | |
Machinery — Construction & Mining | | | 0.2 | |
Television | | | 0.2 | |
Retail — Restaurants | | | 0.2 | |
Building & Construction Products — Misc. | | | 0.2 | |
Insurance — Property/Casualty | | | 0.2 | |
Building Products — Wood | | | 0.2 | |
Machinery — General Industrial | | | 0.2 | |
Building Products — Cement | | | 0.2 | |
Retail — Discount | | | 0.2 | |
Food — Retail | | | 0.2 | |
Banks — Special Purpose | | | 0.2 | |
SupraNational Banks | | | 0.2 | |
Oil & Gas Drilling | | | 0.2 | |
Chemicals — Diversified | | | 0.2 | |
Metal Processors & Fabrication | | | 0.2 | |
Chemicals — Specialty | | | 0.2 | |
Metal — Copper | | | 0.2 | |
Gambling (Non-Hotel) | | | 0.1 | |
Building — Residential/Commercial | | | 0.1 | |
Transport — Services | | | 0.1 | |
| | | | |
Medical — Hospitals | | | 0.1 | |
Electric — Distribution | | | 0.1 | |
Real Estate Management/Services | | | 0.1 | |
Medical — Biomedical/Gene | | | 0.1 | |
Machinery — Electrical | | | 0.1 | |
Electronic Components — Semiconductors | | | 0.1 | |
Trucking/Leasing | | | 0.1 | |
Medical Instruments | | | 0.1 | |
Tools — Hand Held | | | 0.1 | |
Retail — Automobile | | | 0.1 | |
Aerospace/Defense | | | 0.1 | |
Electronic Measurement Instruments | | | 0.1 | |
Food — Meat Products | | | 0.1 | |
Commercial Services | | | 0.1 | |
Steel — Producers | | | 0.1 | |
Computers — Integrated Systems | | | 0.1 | |
Containers — Paper/Plastic | | | 0.1 | |
Auto — Heavy Duty Trucks | | | 0.1 | |
Semiconductor Components — Integrated Circuits | | | 0.1 | |
Food — Misc./Diversified | | | 0.1 | |
Finance — Investment Banker/Broker | | | 0.1 | |
Hotels/Motels | | | 0.1 | |
Banks — Money Center | | | 0.1 | |
Rental Auto/Equipment | | | 0.1 | |
Batteries/Battery Systems | | | 0.1 | |
Gold Mining | | | 0.1 | |
Containers — Metal/Glass | | | 0.1 | |
Cosmetics & Toiletries | | | 0.1 | |
Building & Construction — Misc. | | | 0.1 | |
Transport — Marine | | | 0.1 | |
Petrochemicals | | | 0.1 | |
Radio | | | 0.1 | |
Printing — Commercial | | | 0.1 | |
Coal | | | 0.1 | |
Retail — Office Supplies | | | 0.1 | |
Building Societies | | | 0.1 | |
Quarrying | | | 0.1 | |
Physicians Practice Management | | | 0.1 | |
Electronic Parts Distribution | | | 0.1 | |
Energy — Alternate Sources | | | 0.1 | |
Machinery — Pumps | | | 0.1 | |
Security Services | | | 0.1 | |
Schools | | | 0.1 | |
Publishing — Books | | | 0.1 | |
Internet Connectivity Services | | | 0.1 | |
Transport — Equipment & Leasing | | | 0.1 | |
Building — Heavy Construction | | | 0.1 | |
Finance — Mortgage Loan/Banker | | | 0.1 | |
Distribution/Wholesale | | | 0.1 | |
Circuit Boards | | | 0.1 | |
Independent Power Producers | | | 0.1 | |
Diversified Minerals | | | 0.1 | |
Retail — Appliances | | | 0.1 | |
Computers — Memory Devices | | | 0.1 | |
Marine Services | | | 0.1 | |
Computer Software | | | 0.1 | |
Retail — Leisure Products | | | 0.1 | |
Racetracks | | | 0.1 | |
Internet Content — Entertainment | | | 0.1 | |
Metal — Iron | | | 0.1 | |
Telecom Services | | | 0.1 | |
Tennessee Valley Authority | | | 0.1 | |
| | |
|
|
|
| | | | 101.2 | % |
| | |
|
|
|
| * | Calculated as a percentage of net assets |
VALIC Company II Core Bond Fund
PORTFOLIO PROFILE — August 31, 2018 (unaudited) — (continued)
Credit Quality†#
| | | | |
Aaa | | | 50.5 | % |
Aa | | | 3.4 | |
A | | | 11.5 | |
Baa | | | 17.0 | |
Ba | | | 6.8 | |
B | | | 6.4 | |
Caa | | | 1.2 | |
Not Rated@ | | | 3.2 | |
| | |
|
|
|
| | | | 100.0 | % |
| | |
|
|
|
| # | Calculated as percentage of total debt issues, excluding short-term securities. |
| @ | Represent debt issues that either have no rating, or the rating is unavailable from the data source. |
VALIC Company II Core Bond Fund
PORTFOLIO OF INVESTMENTS — August 31, 2018
| | | | | | | | |
| | |
| Security Description | | Principal
Amount | | | Value
(Note 2) | |
| |
ASSET BACKED SECURITIES — 2.3% | |
Diversified Financial Services — 2.3% | |
American Express Credit Account Master Trust FRS
Series 2018-5, Class A
2.40% (1 ML+0.34%)
due 12/15/2025 | | $ | 262,000 | | | $ | 261,920 | |
American Express Credit Account Master Trust
Series 2018-4, Class A
2.99% due 12/15/2023 | | | 150,000 | | | | 150,072 | |
Americredit Automobile Receivables Trust
Series 2018-2, Class D
4.01% due 07/18/2024 | | | 580,000 | | | | 582,138 | |
Avis Budget Rental Car Funding AESOP LLC
Series 2015-1A, Class A
2.50% due 07/20/2021* | | | 850,000 | | | | 839,489 | |
BA Credit Card Trust
Series 2018-A2, Class A2
3.00% due 09/15/2023 | | | 512,000 | | | | 512,415 | |
Benchmark Mtg. Trust
Series 2018-B1, Class A2
3.57% due 01/15/2051(1) | | | 1,233,000 | | | | 1,247,432 | |
CarMax Auto Owner Trust
Series 2016-4, Class A4
1.60% due 06/15/2022 | | | 1,042,000 | | | | 1,011,153 | |
CarMax Auto Owner Trust
Series 2014-4, Class C
2.44% due 11/16/2020 | | | 1,000,000 | | | | 998,837 | |
Chase Mtg. Finance Trust VRS
Series 2016-2, Class M2
3.75% due 12/25/2045*(2)(3) | | | 1,675,620 | | | | 1,654,263 | |
Citibank Credit Card Issuance Trust
Series 2017-A3, Class A3
1.92% due 04/07/2022 | | | 1,554,000 | | | | 1,530,637 | |
Citibank Credit Card Issuance Trust
Series 2018-A6, Class A6
3.21% due 12/07/2024 | | | 150,000 | | | | 150,538 | |
COMM Mtg. Trust VRS
Series 2016-787S, Class B
3.96% due 02/10/2036*(1)(3) | | | 754,000 | | | | 746,694 | |
Core Industrial Trust
Series 2015-CALW, Class A
3.04% due 02/10/2034*(1) | | | 5,692 | | | | 5,663 | |
CSAIL Commercial Mtg. Trust
Series 2017-C8, Class A2
2.99% due 06/15/2050(1) | | | 1,770,000 | | | | 1,752,053 | |
CSMC Trust
Series 2015-GLPA, Class A
3.88% due 11/15/2037*(1) | | | 1,483,372 | | | | 1,511,396 | |
DBCG Mtg. Trust FRS
Series 2017-BBG, Class A
2.76% (1 ML+0.70%)
due 06/15/2034*(1) | | | 300,000 | | | | 299,906 | |
Discover Card Execution Note Trust
Series 2015-A4, Class A4
2.19% due 04/17/2023 | | | 2,256,000 | | | | 2,222,225 | |
Ford Credit Auto Owner Trust/Ford Credit
Series 2018-2, Class A
3.47% due 01/15/2030* | | | 400,000 | | | | 402,191 | |
Ford Credit Floorplan Master Owner Trust
Series 2017-1, Class A1
2.07% due 05/15/2022 | | | 1,023,000 | | | | 1,008,103 | |
GM Financial Consumer Automobile Receivables Trust
Series 2017-3A, Class 4A
2.13% due 03/16/2023* | | | 1,000,000 | | | | 975,723 | |
GS Mtg. Securities Trust
Series 2015-GC28, Class A2
2.90% due 02/10/2048(1) | | | 61,000 | | | | 60,971 | |
Morgan Stanley Bank of America Merrill Lynch Trust
Series 2015-C23, Class A2
2.98% due 07/15/2050(1) | | | 1,000,000 | | | | 998,409 | |
| | | | | | | | |
| | |
| Security Description | | Principal
Amount | | | Value
(Note 2) | |
| |
| | | | | | | | | |
Diversified Financial Services (continued) | |
Morgan Stanley Capital Barclays Bank Trust
Series 2016-MART, Class A
2.20% due 09/13/2031*(1) | | $ | 2,397,000 | | | $ | 2,324,687 | |
MSDB Trust VRS
Series 2017-712F, Class A
3.43% due 07/11/2039*(1)(3) | | | 4,520,000 | | | | 4,375,468 | |
Nissan Auto Receivables Owner Trust
Series 2016-C, Class A3
1.18% due 01/15/2021 | | | 412,364 | | | | 408,502 | |
Synchrony Credit Card Master Note Trust
Series 2016-3, Class B
1.91% due 09/15/2022 | | | 1,200,000 | | | | 1,187,227 | |
Synchrony Credit Card Master Note Trust
Series 2016-2, Class A
2.21% due 05/15/2024 | | | 850,000 | | | | 829,110 | |
Toyota Auto Receivables Owner Trust
Series 2018-A, Class A3
2.35% due 05/16/2022 | | | 125,000 | | | | 123,775 | |
Verizon Owner Trust
Series 2018-1A, Class C
3.20% due 09/20/2022* | | | 300,000 | | | | 298,700 | |
World Financial Network Credit Card Master Trust
Series 2016-A, Class A
2.03% due 04/15/2025 | | | 446,000 | | | | 432,132 | |
World Financial Network Credit Card Master Trust
Series 2017-C, Class A
2.31% due 08/15/2024 | | | 200,000 | | | | 196,693 | |
| | | | | | |
|
|
|
Total Asset Backed Securities | | | | | | | | |
(cost $29,697,074) | | | | | | | 29,098,522 | |
| | | | | | |
|
|
|
U.S. CORPORATE BONDS & NOTES — 32.1% | |
Advertising Agencies — 0.0% | |
Interpublic Group of Cos., Inc.
Senior Notes
4.20% due 04/15/2024 | | | 563,000 | | | | 563,609 | |
| | | | | | |
|
|
|
Aerospace/Defense — 0.1% | |
General Dynamics Corp.
Company Guar. Notes
2.88% due 05/11/2020 | | | 1,622,000 | | | | 1,621,067 | |
| | | | | | |
|
|
|
Aerospace/Defense - Equipment — 0.5% | |
Harris Corp.
Senior Notes
4.40% due 06/15/2028 | | | 1,466,000 | | | | 1,489,565 | |
Moog, Inc.
Company Guar. Notes
5.25% due 12/01/2022* | | | 459,000 | | | | 465,311 | |
Triumph Group, Inc.
Company Guar. Notes
4.88% due 04/01/2021 | | | 821,000 | | | | 786,108 | |
United Technologies Corp.
Senior Notes
1.90% due 05/04/2020 | | | 1,019,000 | | | | 997,618 | |
United Technologies Corp.
Senior Notes
3.95% due 08/16/2025 | | | 799,000 | | | | 803,122 | |
United Technologies Corp.
Senior Notes
4.63% due 11/16/2048 | | | 1,566,000 | | | | 1,585,039 | |
| | | | | | |
|
|
|
| | | | | | | | 6,126,763 | |
| | | | | | |
|
|
|
Agricultural Chemicals — 0.1% | |
Mosaic Co.
Senior Notes
3.25% due 11/15/2022 | | | 709,000 | | | | 695,893 | |
| | | | | | |
|
|
|
VALIC Company II Core Bond Fund
PORTFOLIO OF INVESTMENTS — August 31, 2018 — (continued)
| | | | | | | | |
| | |
| Security Description | | Principal
Amount | | | Value
(Note 2) | |
| |
U.S. CORPORATE BONDS & NOTES (continued) | |
Airlines — 0.0% | |
Atlas Air, Inc.
Pass-Through Certs.
Series 1999-1, Class B
7.63% due 01/02/2019(4) | | $ | 37,452 | | | $ | 37,587 | |
United Airlines Pass-Through Trust
Pass-Through Certs.
Series 2014-2, Class B
4.63% due 03/03/2024 | | | 512,420 | | | | 515,802 | |
| | | | | | |
|
|
|
| | | | | | | | 553,389 | |
| | | | | | |
|
|
|
Applications Software — 0.0% | |
CDK Global, Inc.
Senior Notes
5.88% due 06/15/2026 | | | 549,000 | | | | 563,625 | |
| | | | | | |
|
|
|
Auto - Cars/Light Trucks — 1.7% | |
BMW US Capital LLC
Company Guar. Notes
3.10% due 04/12/2021* | | | 2,545,000 | | | | 2,530,838 | |
Daimler Finance North America LLC
Company Guar. Notes
2.00% due 07/06/2021* | | | 1,595,000 | | | | 1,534,315 | |
Daimler Finance North America LLC
Company Guar. Notes
2.45% due 05/18/2020* | | | 1,689,000 | | | | 1,668,879 | |
Daimler Finance North America LLC
Company Guar. Notes
3.10% due 05/04/2020* | | | 4,982,000 | | | | 4,972,793 | |
Ford Motor Credit Co. LLC
Senior Notes
2.34% due 11/02/2020 | | | 3,108,000 | | | | 3,012,779 | |
Nissan Motor Acceptance Corp.
Senior Notes
2.15% due 09/28/2020* | | | 2,213,000 | | | | 2,158,339 | |
Nissan Motor Acceptance Corp.
Senior Notes
2.65% due 07/13/2022* | | | 1,619,000 | | | | 1,563,153 | |
Toyota Motor Credit Corp.
Senior Notes
2.95% due 04/13/2021 | | | 3,955,000 | | | | 3,948,622 | |
| | | | | | |
|
|
|
| | | | | | | | 21,389,718 | |
| | | | | | |
|
|
|
Auto - Heavy Duty Trucks — 0.1% | |
Allison Transmission, Inc.
Senior Notes
5.00% due 10/01/2024* | | | 569,000 | | | | 560,465 | |
JB Poindexter & Co., Inc.
Senior Notes
7.13% due 04/15/2026* | | | 790,000 | | | | 816,662 | |
| | | | | | |
|
|
|
| | | | | | | | 1,377,127 | |
| | | | | | |
|
|
|
Banks - Commercial — 2.1% | |
Associated Bank NA
Senior Notes
3.50% due 08/13/2021 | | | 1,439,000 | | | | 1,437,206 | |
BankUnited, Inc.
Senior Notes
4.88% due 11/17/2025 | | | 4,133,000 | | | | 4,230,208 | |
Citizens Bank NA
Senior Notes
2.55% due 05/13/2021 | | | 514,000 | | | | 501,801 | |
Citizens Financial Group, Inc.
Sub. Notes
4.15% due 09/28/2022* | | | 1,570,000 | | | | 1,573,566 | |
Discover Bank
Sub. Notes
4.68% due 08/09/2028 | | | 938,000 | | | | 937,400 | |
| | | | | | | | |
| | |
| Security Description | | Principal
Amount | | | Value
(Note 2) | |
| |
| | | | | | | | | |
Banks - Commercial (continued) | |
First Horizon National Corp.
Senior Notes
3.50% due 12/15/2020 | | $ | 3,421,000 | | | $ | 3,429,531 | |
First Tennessee Bank NA
Senior Notes
2.95% due 12/01/2019 | | | 979,000 | | | | 977,965 | |
KeyBank NA
Senior Notes
3.35% due 06/15/2021 | | | 694,000 | | | | 696,859 | |
Regions Bank
Senior Notes
3.37% due 08/13/2021 | | | 1,878,000 | | | | 1,878,410 | |
Regions Financial Corp.
Senior Notes
2.75% due 08/14/2022 | | | 1,023,000 | | | | 992,461 | |
Regions Financial Corp.
Sub. Notes
7.38% due 12/10/2037 | | | 4,209,000 | | | | 5,492,254 | |
Santander Holdings USA, Inc.
Senior Notes
3.40% due 01/18/2023 | | | 1,608,000 | | | | 1,563,248 | |
SunTrust Bank
Senior Notes
3.50% due 08/02/2022 | | | 1,201,000 | | | | 1,201,499 | |
Synovus Financial Corp.
Senior Notes
3.13% due 11/01/2022 | | | 707,000 | | | | 676,952 | |
ZB NA
Senior Notes
3.50% due 08/27/2021 | | | 676,000 | | | | 675,247 | |
| | | | | | |
|
|
|
| | | | | | | | 26,264,607 | |
| | | | | | |
|
|
|
Banks - Super Regional — 1.0% | |
Capital One Financial Corp.
Sub. Notes
3.75% due 07/28/2026# | | | 1,067,000 | | | | 1,002,101 | |
Citibank NA
Senior Notes
2.13% due 10/20/2020 | | | 2,073,000 | | | | 2,028,814 | |
Huntington National Bank
Senior Notes
2.38% due 03/10/2020 | | | 1,255,000 | | | | 1,241,429 | |
Wells Fargo & Co.
Senior Notes
3.00% due 02/19/2025 | | | 4,047,000 | | | | 3,860,316 | |
Wells Fargo & Co.
Sub. Notes
4.75% due 12/07/2046 | | | 504,000 | | | | 500,399 | |
Wells Fargo Bank NA
Senior Notes
2.60% due 01/15/2021 | | | 2,100,000 | | | | 2,071,707 | |
Wells Fargo Bank NA
Senior Notes
3.55% due 08/14/2023 | | | 2,196,000 | | | | 2,203,945 | |
| | | | | | |
|
|
|
| | | | | | | | 12,908,711 | |
| | | | | | |
|
|
|
Batteries/Battery Systems — 0.1% | |
Energizer Gamma Acquisition, Inc.
Senior Sec. Notes
6.38% due 07/15/2026*# | | | 625,000 | | | | 646,094 | |
EnerSys
Company Guar. Notes
5.00% due 04/30/2023* | | | 528,000 | | | | 533,280 | |
| | | | | | |
|
|
|
| | | | | | | | 1,179,374 | |
| | | | | | |
|
|
|
VALIC Company II Core Bond Fund
PORTFOLIO OF INVESTMENTS — August 31, 2018 — (continued)
| | | | | | | | |
| | |
| Security Description | | Principal
Amount | | | Value
(Note 2) | |
| |
U.S. CORPORATE BONDS & NOTES (continued) | |
Beverages - Non-alcoholic — 0.4% | |
Keurig Dr Pepper, Inc.
Company Guar. Notes
4.06% due 05/25/2023* | | $ | 759,000 | | | $ | 763,670 | |
Keurig Dr Pepper, Inc.
Company Guar. Notes
4.42% due 05/25/2025* | | | 1,962,000 | | | | 1,988,244 | |
Keurig Dr Pepper, Inc.
Company Guar. Notes
4.60% due 05/25/2028* | | | 1,076,000 | | | | 1,092,111 | |
Keurig Dr Pepper, Inc.
Company Guar. Notes
4.99% due 05/25/2038* | | | 660,000 | | | | 674,669 | |
| | | | | | |
|
|
|
| | | | | | | | 4,518,694 | |
| | | | | | |
|
|
|
Brewery — 0.7% | |
Anheuser-Busch InBev Finance, Inc.
Company Guar. Notes
2.65% due 02/01/2021 | | | 1,989,000 | | | | 1,966,246 | |
Anheuser-Busch InBev Finance, Inc.
Company Guar. Notes
3.65% due 02/01/2026 | | | 1,461,000 | | | | 1,430,747 | |
Anheuser-Busch InBev Finance, Inc.
Company Guar. Notes
4.70% due 02/01/2036 | | | 613,000 | | | | 622,575 | |
Anheuser-Busch InBev Finance, Inc.
Company Guar. Notes
4.90% due 02/01/2046 | | | 3,256,000 | | | | 3,341,105 | |
Anheuser-Busch InBev Worldwide, Inc.
Company Guar. Notes
4.60% due 04/15/2048 | | | 966,000 | | | | 951,250 | |
| | | | | | |
|
|
|
| | | | | | | | 8,311,923 | |
| | | | | | |
|
|
|
Broadcast Services/Program — 0.3% | |
Discovery Communications LLC
Company Guar. Notes
3.50% due 06/15/2022* | | | 1,419,000 | | | | 1,406,626 | |
Discovery Communications LLC
Company Guar. Notes
3.90% due 11/15/2024* | | | 1,565,000 | | | | 1,545,245 | |
Discovery Communications LLC
Company Guar. Notes
5.00% due 09/20/2037 | | | 503,000 | | | | 490,446 | |
Univision Communications, Inc.
Senior Sec. Notes
5.13% due 05/15/2023* | | | 714,000 | | | | 678,300 | |
| | | | | | |
|
|
|
| | | | | | | | 4,120,617 | |
| | | | | | |
|
|
|
Building & Construction Products - Misc. — 0.2% | |
Owens Corning
Senior Notes
4.30% due 07/15/2047 | | | 1,924,000 | | | | 1,596,710 | |
Owens Corning
Company Guar. Notes
4.40% due 01/30/2048 | | | 608,000 | | | | 512,124 | |
Standard Industries, Inc.
Senior Notes
6.00% due 10/15/2025* | | | 625,000 | | | | 639,175 | |
| | | | | | |
|
|
|
| | | | | | | | 2,748,009 | |
| | | | | | |
|
|
|
Building & Construction - Misc. — 0.1% | |
frontdoor, Inc.
Senior Notes
6.75% due 08/15/2026* | | | 99,000 | | | | 101,351 | |
| | | | | | | | |
| | |
| Security Description | | Principal
Amount | | | Value
(Note 2) | |
| |
| | | | | | | | | |
Building & Construction - Misc. (continued) | |
Weekley Homes LLC/Weekley Finance Corp.
Senior Notes
6.00% due 02/01/2023 | | $ | 1,000,000 | | | $ | 970,000 | |
| | | | | | |
|
|
|
| | | | | | | | 1,071,351 | |
| | | | | | |
|
|
|
Building Products - Cement — 0.2% | |
CRH America Finance, Inc.
Company Guar. Notes
3.95% due 04/04/2028* | | | 932,000 | | | | 911,435 | |
Martin Marietta Materials, Inc.
Senior Notes
4.25% due 12/15/2047 | | | 453,000 | | | | 400,646 | |
Vulcan Materials Co.
Senior Notes
4.70% due 03/01/2048* | | | 1,197,000 | | | | 1,131,933 | |
| | | | | | |
|
|
|
| | | | | | | | 2,444,014 | |
| | | | | | |
|
|
|
Building Products - Wood — 0.2% | |
Boise Cascade Co.
Company Guar. Notes
5.63% due 09/01/2024* | | | 625,000 | | | | 640,625 | |
Masco Corp.
Senior Notes
4.45% due 04/01/2025 | | | 1,231,000 | | | | 1,250,885 | |
Masco Corp.
Senior Notes
4.50% due 05/15/2047 | | | 706,000 | | | | 628,277 | |
| | | | | | |
|
|
|
| | | | | | | | 2,519,787 | |
| | | | | | |
|
|
|
Building - Heavy Construction — 0.1% | |
Tutor Perini Corp.
Company Guar. Notes
6.88% due 05/01/2025*# | | | 795,000 | | | | 808,912 | |
| | | | | | |
|
|
|
Building - Residential/Commercial — 0.1% | |
Toll Brothers Finance Corp.
Company Guar. Notes
4.35% due 02/15/2028 | | | 1,252,000 | | | | 1,145,580 | |
William Lyon Homes, Inc.
Company Guar. Notes
6.00% due 09/01/2023* | | | 600,000 | | | | 579,180 | |
| | | | | | |
|
|
|
| | | | | | | | 1,724,760 | |
| | | | | | |
|
|
|
Cable/Satellite TV — 0.7% | |
Block Communications, Inc.
Senior Notes
6.88% due 02/15/2025* | | | 1,224,000 | | | | 1,248,786 | |
CCO Holdings LLC/CCO Holdings Capital Corp.
Senior Notes
5.00% due 02/01/2028* | | | 361,000 | | | | 338,087 | |
CCO Holdings LLC/CCO Holdings Capital Corp.
Senior Notes
5.38% due 05/01/2025* | | | 420,000 | | | | 417,375 | |
CCO Holdings LLC/CCO Holdings Capital Corp.
Senior Notes
5.88% due 04/01/2024* | | | 538,000 | | | | 548,760 | |
Charter Communications Operating LLC/Charter Communications Operating Capital
Senior Sec. Notes
5.38% due 04/01/2038 | | | 181,000 | | | | 174,535 | |
Charter Communications Operating LLC/Charter Communications Operating Capital
Senior Sec. Notes
5.38% due 05/01/2047 | | | 370,000 | | | | 348,556 | |
VALIC Company II Core Bond Fund
PORTFOLIO OF INVESTMENTS — August 31, 2018 — (continued)
| | | | | | | | |
| | |
| Security Description | | Principal
Amount | | | Value
(Note 2) | |
| |
U.S. CORPORATE BONDS & NOTES (continued) | |
Cable/Satellite TV (continued) | |
Charter Communications Operating LLC/Charter Communications Operating Capital
Senior Sec. Notes
5.75% due 04/01/2048 | | $ | 702,000 | | | $ | 691,808 | |
Charter Communications Operating LLC/Charter Communications Operating Capital
Senior Sec. Notes
6.38% due 10/23/2035 | | | 602,000 | | | | 644,409 | |
Comcast Corp.
Company Guar. Notes
3.60% due 03/01/2024 | | | 2,130,000 | | | | 2,130,889 | |
Comcast Corp.
Company Guar. Notes
3.90% due 03/01/2038 | | | 403,000 | | | | 373,924 | |
Comcast Corp.
Company Guar. Notes
4.00% due 03/01/2048 | | | 841,000 | | | | 761,876 | |
CSC Holdings LLC
Company Guar. Notes
5.50% due 04/15/2027* | | | 630,000 | | | | 613,462 | |
CSC Holdings LLC
Senior Notes
6.75% due 11/15/2021 | | | 575,000 | | | | 609,500 | |
DISH DBS Corp.
Company Guar. Notes
6.75% due 06/01/2021 | | | 590,000 | | | | 598,850 | |
| | | | | | |
|
|
|
| | | | | | | | 9,500,817 | |
| | | | | | |
|
|
|
Cellular Telecom — 0.5% | |
Sprint Corp.
Company Guar. Notes
7.25% due 09/15/2021 | | | 1,165,000 | | | | 1,221,433 | |
Sprint Corp.
Company Guar. Notes
7.88% due 09/15/2023 | | | 2,282,000 | | | | 2,456,002 | |
Sprint Spectrum Co. LLC/Sprint Spectrum Co. II LLC/Sprint Spectrum Co. III LLC
Senior Sec. Notes
4.74% due 09/20/2029* | | | 2,980,000 | | | | 2,980,000 | |
| | | | | | |
|
|
|
| | | | | | | | 6,657,435 | |
| | | | | | |
|
|
|
Chemicals - Specialty — 0.2% | |
GCP Applied Technologies, Inc.
Company Guar. Notes
5.50% due 04/15/2026* | | | 520,000 | | | | 509,600 | |
Kraton Polymers LLC/Kraton Polymers Capital Corp.
Company Guar. Notes
7.00% due 04/15/2025* | | | 680,000 | | | | 701,250 | |
Lubrizol Corp.
Company Guar. Notes
6.50% due 10/01/2034 | | | 507,000 | | | | 663,585 | |
| | | | | | |
|
|
|
| | | | | | | | 1,874,435 | |
| | | | | | |
|
|
|
Circuit Boards — 0.1% | |
TTM Technologies, Inc.
Company Guar. Notes
5.63% due 10/01/2025* | | | 745,000 | | | | 741,275 | |
| | | | | | |
|
|
|
Coal — 0.1% | |
SunCoke Energy Partners LP/SunCoke Energy Partners Finance Corp.
Company Guar. Notes
7.50% due 06/15/2025* | | | 930,000 | | | | 969,525 | |
| | | | | | |
|
|
|
| | | | | | | | |
| | |
| Security Description | | Principal
Amount | | | Value
(Note 2) | |
| |
| | | | | | | | | |
Coatings/Paint — 0.0% | |
RPM International, Inc.
Senior Notes
4.25% due 01/15/2048 | | $ | 160,000 | | | $ | 142,614 | |
| | | | | | |
|
|
|
Commercial Services — 0.1% | |
Ecolab, Inc.
Senior Notes
2.38% due 08/10/2022 | | | 1,412,000 | | | | 1,361,800 | |
Nielsen Finance LLC/Nielsen Finance Co.
Company Guar. Notes
5.00% due 04/15/2022* | | | 189,000 | | | | 183,529 | |
| | | | | | |
|
|
|
| | | | | | | | 1,545,329 | |
| | | | | | |
|
|
|
Computer Services — 0.5% | |
Harland Clarke Holdings Corp.
Senior Sec. Notes
8.38% due 08/15/2022* | | | 1,144,000 | | | | 1,072,500 | |
IBM Credit LLC
Senior Notes
1.63% due 09/06/2019 | | | 1,722,000 | | | | 1,704,403 | |
IBM Credit LLC
Senior Notes
2.65% due 02/05/2021 | | | 4,010,000 | | | | 3,975,046 | |
| | | | | | |
|
|
|
| | | | | | | | 6,751,949 | |
| | | | | | |
|
|
|
Computer Software — 0.1% | |
Rackspace Hosting, Inc.
Company Guar. Notes
8.63% due 11/15/2024*# | | | 640,000 | | | | 630,000 | |
| | | | | | |
|
|
|
Computers — 0.4% | |
Apple, Inc.
Senior Notes
2.85% due 05/06/2021 | | | 995,000 | | | | 993,262 | |
Diamond 1 Finance Corp./Diamond 2 Finance Corp.
Senior Sec. Notes
6.02% due 06/15/2026* | | | 590,000 | | | | 625,476 | |
Diamond 1 Finance Corp./Diamond 2 Finance Corp.
Senior Sec. Notes
8.10% due 07/15/2036* | | | 2,616,000 | | | | 3,093,506 | |
Hewlett Packard Enterprise Co.
Senior Notes
6.20% due 10/15/2035 | | | 50,000 | | | | 51,753 | |
| | | | | | |
|
|
|
| | | | | | | | 4,763,997 | |
| | | | | | |
|
|
|
Computers - Integrated Systems — 0.1% | |
Diebold Nixdorf, Inc.
Company Guar. Notes
8.50% due 04/15/2024# | | | 834,000 | | | | 589,012 | |
Everi Payments, Inc.
Company Guar. Notes
7.50% due 12/15/2025* | | | 825,000 | | | | 838,200 | |
| | | | | | |
|
|
|
| | | | | | | | 1,427,212 | |
| | | | | | |
|
|
|
Consumer Products - Misc. — 0.0% | |
Central Garden & Pet Co.
Company Guar. Notes
5.13% due 02/01/2028 | | | 617,000 | | | | 580,751 | |
| | | | | | |
|
|
|
Containers - Metal/Glass — 0.1% | |
Crown Cork & Seal Co., Inc.
Company Guar. Notes
7.38% due 12/15/2026 | | | 383,000 | | | | 417,470 | |
Owens-Brockway Glass Container, Inc.
Company Guar. Notes
5.38% due 01/15/2025* | | | 726,000 | | | | 716,925 | |
| | | | | | |
|
|
|
| | | | | | | | 1,134,395 | |
| | | | | | |
|
|
|
VALIC Company II Core Bond Fund
PORTFOLIO OF INVESTMENTS — August 31, 2018 — (continued)
| | | | | | | | |
| | |
| Security Description | | Principal
Amount | | | Value
(Note 2) | |
| |
U.S. CORPORATE BONDS & NOTES (continued) | |
Containers - Paper/Plastic — 0.1% | |
Crown Americas LLC/Crown Americas Capital Corp. VI
Company Guar. Notes
4.75% due 02/01/2026*# | | $ | 256,000 | | | $ | 245,760 | |
Multi-Color Corp.
Company Guar. Notes
4.88% due 11/01/2025* | | | 725,000 | | | | 676,062 | |
Multi-Color Corp.
Company Guar. Notes
6.13% due 12/01/2022* | | | 449,000 | | | | 459,103 | |
| | | | | | |
|
|
|
| | | | | | | | 1,380,925 | |
| | | | | | |
|
|
|
Cosmetics & Toiletries — 0.1% | |
Coty, Inc.
Senior Notes
6.50% due 04/15/2026*# | | | 600,000 | | | | 564,375 | |
First Quality Finance Co., Inc.
Company Guar. Notes
5.00% due 07/01/2025* | | | 593,000 | | | | 555,937 | |
| | | | | | |
|
|
|
| | | | | | | | 1,120,312 | |
| | | | | | |
|
|
|
Distribution/Wholesale — 0.1% | |
H&E Equipment Services, Inc.
Company Guar. Notes
5.63% due 09/01/2025 | | | 750,000 | | | | 744,600 | |
| | | | | | |
|
|
|
Diversified Banking Institutions — 2.9% | |
Bank of America Corp.
Senior Notes
3.55% due 03/05/2024 | | | 1,997,000 | | | | 1,984,773 | |
Bank of America Corp.
Senior Notes
3.86% due 07/23/2024 | | | 1,703,000 | | | | 1,711,728 | |
Bank of America Corp.
Sub. Notes
4.18% due 11/25/2027 | | | 4,333,000 | | | | 4,236,192 | |
Bank of America Corp.
Sub. Notes
6.11% due 01/29/2037 | | | 1,549,000 | | | | 1,793,216 | |
Citigroup, Inc.
Senior Notes
2.88% due 07/24/2023 | | | 1,466,000 | | | | 1,421,865 | |
Citigroup, Inc.
Sub. Notes
4.45% due 09/29/2027 | | | 3,160,000 | | | | 3,133,010 | |
Citigroup, Inc.
Senior Notes
4.65% due 07/23/2048 | | | 1,141,000 | | | | 1,165,871 | |
Citigroup, Inc.
Sub. Notes
4.75% due 05/18/2046 | | | 595,000 | | | | 588,092 | |
Citigroup, Inc.
Sub. Notes
6.00% due 10/31/2033 | | | 573,000 | | | | 651,559 | |
Goldman Sachs Group, Inc.
Senior Notes
2.91% due 06/05/2023 | | | 1,702,000 | | | | 1,656,012 | |
Goldman Sachs Group, Inc.
Senior Notes
4.02% due 10/31/2038 | | | 1,745,000 | | | | 1,629,680 | |
Goldman Sachs Group, Inc.
Senior Notes
6.13% due 02/15/2033 | | | 1,499,000 | | | | 1,736,989 | |
Goldman Sachs Group, Inc.
Sub. Notes
6.75% due 10/01/2037 | | | 2,073,000 | | | | 2,512,784 | |
| | | | | | | | |
| | |
| Security Description | | Principal
Amount | | | Value
(Note 2) | |
| |
| | | | | | | | | |
Diversified Banking Institutions (continued) | |
JPMorgan Chase & Co.
Senior Notes
2.55% due 03/01/2021 | | $ | 2,401,000 | | | $ | 2,364,134 | |
JPMorgan Chase & Co.
Senior Notes
3.88% due 07/24/2038 | | | 2,145,000 | | | | 2,003,946 | |
Morgan Stanley
Sub. Notes
5.00% due 11/24/2025 | | | 8,382,000 | | | | 8,719,543 | |
| | | | | | |
|
|
|
| | | | | | | | 37,309,394 | |
| | | | | | |
|
|
|
Diversified Manufacturing Operations — 0.1% | |
Carlisle Cos., Inc.
Senior Notes
3.75% due 12/01/2027 | | | 1,126,000 | | | | 1,086,379 | |
| | | | | | |
|
|
|
Electric - Distribution — 0.1% | |
Entergy Louisiana LLC
Collateral Trust Bonds
4.20% due 09/01/2048 | | | 1,255,000 | | | | 1,268,789 | |
| | | | | | |
|
|
|
Electric - Generation — 0.2% | |
Basin Electric Power Cooperative
1st Mtg. Notes
4.75% due 04/26/2047* | | | 2,403,000 | | | | 2,494,576 | |
| | | | | | |
|
|
|
Electric - Integrated — 1.9% | |
Dominion Resources, Inc.
Senior Notes
5.25% due 08/01/2033 | | | 1,345,000 | | | | 1,450,314 | |
Duke Energy Progress LLC
1st Mtg. Notes
2.80% due 05/15/2022 | | | 938,000 | | | | 924,724 | |
Exelon Corp.
Junior Sub. Notes
3.50% due 06/01/2022 | | | 1,341,000 | | | | 1,325,163 | |
Exelon Generation Co. LLC
Senior Notes
2.95% due 01/15/2020 | | | 723,000 | | | | 720,405 | |
FirstEnergy Corp.
Senior Notes
3.90% due 07/15/2027 | | | 1,535,000 | | | | 1,508,764 | |
FirstEnergy Corp.
Senior Notes
4.85% due 07/15/2047 | | | 1,627,000 | | | | 1,672,523 | |
FirstEnergy Corp.
Senior Notes
7.38% due 11/15/2031 | | | 3,655,000 | | | | 4,742,046 | |
Georgia Power Co.
Senior Notes
2.00% due 09/08/2020 | | | 864,000 | | | | 843,629 | |
Indiana Michigan Power Co.
Senior Notes
4.25% due 08/15/2048 | | | 1,068,000 | | | | 1,076,053 | |
Massachusetts Electric Co.
Notes
4.00% due 08/15/2046* | | | 1,539,000 | | | | 1,487,150 | |
Nevada Power Co.
General Ref. Mtg.
2.75% due 04/15/2020 | | | 1,076,000 | | | | 1,074,396 | |
Pacific Gas & Electric Co.
Senior Notes
3.30% due 12/01/2027 | | | 1,231,000 | | | | 1,130,741 | |
Public Service Co. of Colorado
1st Mtg. Bonds
3.70% due 06/15/2028 | | | 1,482,000 | | | | 1,495,947 | |
VALIC Company II Core Bond Fund
PORTFOLIO OF INVESTMENTS — August 31, 2018 — (continued)
| | | | | | | | |
| | |
| Security Description | | Principal
Amount | | | Value
(Note 2) | |
| |
U.S. CORPORATE BONDS & NOTES (continued) | |
Electric - Integrated (continued) | |
Public Service Co. of Colorado
1st Mtg. Bonds
4.10% due 06/15/2048 | | $ | 1,018,000 | | | $ | 1,031,351 | |
South Carolina Electric & Gas Co.
1st Mtg. Notes
4.35% due 02/01/2042 | | | 674,000 | | | | 657,338 | |
South Carolina Electric & Gas Co.
1st Mtg. Bonds
5.10% due 06/01/2065 | | | 2,303,000 | | | | 2,362,788 | |
Southern California Edison Co.
1st Mtg. Notes
4.13% due 03/01/2048 | | | 1,016,000 | | | | 990,721 | |
| | | | | | |
|
|
|
| | | | | | | | 24,494,053 | |
| | | | | | |
|
|
|
Electronic Components - Misc. — 0.0% | |
Jabil, Inc.
Senior Notes
3.95% due 01/12/2028# | | | 164,000 | | | | 156,686 | |
| | | | | | |
|
|
|
Electronic Components - Semiconductors — 0.1% | |
Intel Corp.
Senior Notes
2.45% due 07/29/2020 | | | 1,762,000 | | | | 1,750,811 | |
| | | | | | |
|
|
|
Electronic Measurement Instruments — 0.1% | |
Trimble, Inc.
Senior Notes
4.90% due 06/15/2028 | | | 1,576,000 | | | | 1,608,129 | |
| | | | | | |
|
|
|
Electronic Parts Distribution — 0.1% | |
Ingram Micro, Inc.
Senior Notes
5.45% due 12/15/2024 | | | 940,000 | | | | 929,301 | |
| | | | | | |
|
|
|
Electronic Security Devices — 0.0% | |
Allegion US Holding Co., Inc.
Company Guar. Notes
3.20% due 10/01/2024 | | | 436,000 | | | | 411,816 | |
| | | | | | |
|
|
|
Energy - Alternate Sources — 0.1% | |
Pattern Energy Group, Inc.
Company Guar. Notes
5.88% due 02/01/2024* | | | 897,000 | | | | 903,727 | |
| | | | | | |
|
|
|
Enterprise Software/Service — 0.3% | |
Donnelley Financial Solutions, Inc.
Company Guar. Notes
8.25% due 10/15/2024# | | | 907,000 | | | | 950,083 | |
Infor US, Inc.
Company Guar. Notes
6.50% due 05/15/2022 | | | 349,000 | | | | 353,527 | |
Oracle Corp.
Senior Notes
2.95% due 11/15/2024 | | | 2,073,000 | | | | 2,016,928 | |
Oracle Corp.
Senior Notes
3.90% due 05/15/2035 | | | 285,000 | | | | 279,633 | |
| | | | | | |
|
|
|
| | | | | | | | 3,600,171 | |
| | | | | | |
|
|
|
Finance - Auto Loans — 0.0% | |
Credit Acceptance Corp.
Company Guar. Notes
7.38% due 03/15/2023# | | | 481,000 | | | | 504,449 | |
| | | | | | |
|
|
|
Finance - Consumer Loans — 0.2% | |
Enova International, Inc.
Company Guar. Notes
8.50% due 09/01/2024* | | | 880,000 | | | | 915,200 | |
| | | | | | | | |
| | |
| Security Description | | Principal
Amount | | | Value
(Note 2) | |
| |
| | | | | | | | | |
Finance - Consumer Loans (continued) | |
SLM Corp.
Senior Notes
5.63% due 08/01/2033 | | $ | 1,133,000 | | | $ | 951,720 | |
Springleaf Finance Corp.
Company Guar. Notes
6.88% due 03/15/2025 | | | 925,000 | | | | 925,278 | |
Springleaf Finance Corp.
Company Guar. Notes
7.13% due 03/15/2026 | | | 275,000 | | | | 273,644 | |
| | | | | | |
|
|
|
| | | | | | | | 3,065,842 | |
| | | | | | |
|
|
|
Finance - Credit Card — 0.2% | |
Alliance Data Systems Corp.
Company Guar. Notes
5.88% due 11/01/2021* | | | 800,000 | | | | 818,000 | |
American Express Co.
Senior Notes
2.50% due 08/01/2022 | | | 2,406,000 | | | | 2,317,432 | |
| | | | | | |
|
|
|
| | | | | | | | 3,135,432 | |
| | | | | | |
|
|
|
Finance - Investment Banker/Broker — 0.1% | |
Jefferies Group LLC/Jefferies Group Capital Finance, Inc.
Senior Notes
4.15% due 01/23/2030 | | | 870,000 | | | | 793,381 | |
Lehman Brothers Holdings, Inc.
Escrow Notes
6.75% due 12/28/2017†(4)(5) | | | 179,000 | | | | 18 | |
Lehman Brothers Holdings, Inc.
Escrow Notes
7.50% due 05/11/2038†(4)(5) | | | 230,000 | | | | 23 | |
LPL Holdings, Inc.
Company Guar. Notes
5.75% due 09/15/2025* | | | 570,000 | | | | 557,175 | |
| | | | | | |
|
|
|
| | | | | | | | 1,350,597 | |
| | | | | | |
|
|
|
Finance - Mortgage Loan/Banker — 0.1% | |
Quicken Loans, Inc.
Company Guar. Notes
5.75% due 05/01/2025* | | | 800,000 | | | | 792,000 | |
| | | | | | |
|
|
|
Finance - Other Services — 0.3% | |
Intercontinental Exchange, Inc.
Senior Notes
4.25% due 09/21/2048 | | | 547,000 | | | | 548,271 | |
National Rural Utilities Cooperative Finance Corp.
Collateral Trust Bonds
2.30% due 11/01/2020 | | | 2,230,000 | | | | 2,193,543 | |
National Rural Utilities Cooperative Finance Corp.
Senior Notes
2.30% due 09/15/2022 | | | 951,000 | | | | 916,825 | |
National Rural Utilities Cooperative Finance Corp.
Collateral Trust Notes
2.40% due 04/25/2022 | | | 709,000 | | | | 689,663 | |
| | | | | | |
|
|
|
| | | | | | | | 4,348,302 | |
| | | | | | |
|
|
|
Food - Meat Products — 0.0% | |
Smithfield Foods, Inc.
Senior Notes
2.65% due 10/03/2021* | | | 553,000 | | | | 528,573 | |
| | | | | | |
|
|
|
Food - Misc./Diversified — 0.1% | |
Kraft Heinz Foods Co.
Sec. Notes
4.88% due 02/15/2025* | | | 1,328,000 | | | | 1,353,151 | |
| | | | | | |
|
|
|
VALIC Company II Core Bond Fund
PORTFOLIO OF INVESTMENTS — August 31, 2018 — (continued)
| | | | | | | | |
| | |
| Security Description | | Principal
Amount | | | Value
(Note 2) | |
| |
U.S. CORPORATE BONDS & NOTES (continued) | |
Food - Retail — 0.2% | |
Albertsons Cos. LLC/Safeway, Inc./New Albertson’s, Inc./Albertson’s LLC
Company Guar. Notes
5.75% due 03/15/2025 | | $ | 1,181,000 | | | $ | 1,068,805 | |
Kroger Co.
Senior Notes
4.65% due 01/15/2048# | | | 1,403,000 | | | | 1,347,838 | |
| | | | | | |
|
|
|
| | | | | | | | 2,416,643 | |
| | | | | | |
|
|
|
Funeral Services & Related Items — 0.0% | |
Carriage Services, Inc.
Company Guar. Notes
6.63% due 06/01/2026* | | | 309,000 | | | | 314,408 | |
| | | | | | |
|
|
|
Gambling (Non-Hotel) — 0.0% | |
Scientific Games International, Inc.
Senior Sec. Notes
5.00% due 10/15/2025* | | | 401,000 | | | | 380,950 | |
Waterford Gaming LLC/Waterford Gaming Financial Corp.
Escrow Notes
8.63% due 09/15/2014*†(4)(5) | | | 5,223 | | | | 89 | |
| | | | | | |
|
|
|
| | | | | | | | 381,039 | |
| | | | | | |
|
|
|
Gas - Distribution — 0.0% | |
NiSource, Inc.
Senior Notes
4.38% due 05/15/2047 | | | 450,000 | | | | 445,383 | |
| | | | | | |
|
|
|
Hotels/Motels — 0.1% | |
Wyndham Worldwide Corp.
Senior Sec. Notes
4.15% due 04/01/2024 | | | 630,000 | | | | 622,440 | |
Wyndham Worldwide Corp.
Senior Sec. Notes
4.50% due 04/01/2027# | | | 719,000 | | | | 686,861 | |
| | | | | | |
|
|
|
| | | | | | | | 1,309,301 | |
| | | | | | |
|
|
|
Independent Power Producers — 0.1% | |
NRG Yield Operating LLC
Company Guar. Notes
5.38% due 08/15/2024 | | | 730,000 | | | | 733,650 | |
| | | | | | |
|
|
|
Insurance - Life/Health — 0.1% | |
AXA Equitable Holdings, Inc.
Senior Notes
5.00% due 04/20/2048* | | | 491,000 | | | | 462,452 | |
Brighthouse Financial, Inc.
Senior Notes
4.70% due 06/22/2047 | | | 334,000 | | | | 279,856 | |
| | | | | | |
|
|
|
| | | | | | | | 742,308 | |
| | | | | | |
|
|
|
Insurance - Multi-line — 0.3% | |
Assurant, Inc.
Senior Notes
6.75% due 02/15/2034 | | | 794,000 | | | | 922,980 | |
Metropolitan Life Global Funding I
Sec. Notes
2.30% due 04/10/2019* | | | 2,603,000 | | | | 2,599,122 | |
| | | | | | |
|
|
|
| | | | | | | | 3,522,102 | |
| | | | | | |
|
|
|
Insurance - Mutual — 0.3% | |
Massachusetts Mutual Life Insurance Co.
Sub. Notes
4.50% due 04/15/2065* | | | 360,000 | | | | 347,701 | |
MassMutual Global Funding II
Senior Sec. Notes
2.75% due 06/22/2024* | | | 908,000 | | | | 873,051 | |
| | | | | | | | |
| | |
| Security Description | | Principal
Amount | | | Value
(Note 2) | |
| |
| | | | | | | | | |
Insurance - Mutual (continued) | |
New York Life Global Funding
Sec. Notes
1.95% due 09/28/2020* | | $ | 2,468,000 | | | $ | 2,415,620 | |
| | | | | | |
|
|
|
| | | | | | | | 3,636,372 | |
| | | | | | |
|
|
|
Insurance - Property/Casualty — 0.2% | |
ACE INA Holdings, Inc.
Company Guar. Notes
2.88% due 11/03/2022 | | | 1,453,000 | | | | 1,429,818 | |
AmWINS Group, Inc.
Company Guar. Notes
7.75% due 07/01/2026* | | | 645,000 | | | | 679,669 | |
| | | | | | |
|
|
|
| | | | | | | | 2,109,487 | |
| | | | | | |
|
|
|
Internet Connectivity Services — 0.1% | |
Cogent Communications Group, Inc.
Senior Sec. Notes
5.38% due 03/01/2022* | | | 800,000 | | | | 814,000 | |
| | | | | | |
|
|
|
Internet Content - Entertainment — 0.1% | |
Netflix, Inc.
Senior Notes
5.88% due 02/15/2025 | | | 595,000 | | | | 614,338 | |
| | | | | | |
|
|
|
Investment Companies — 0.0% | |
FS Energy & Power Fund
Senior Sec. Notes
7.50% due 08/15/2023* | | | 522,000 | | | | 534,241 | |
| | | | | | |
|
|
|
Machinery - Construction & Mining — 0.2% | |
Caterpillar Financial Services Corp.
Senior Notes
2.55% due 11/29/2022 | | | 977,000 | | | | 951,874 | |
Caterpillar Financial Services Corp.
Senior Notes
3.45% due 05/15/2023 | | | 1,495,000 | | | | 1,506,959 | |
Terex Corp.
Company Guar. Notes
5.63% due 02/01/2025* | | | 640,000 | | | | 635,200 | |
| | | | | | |
|
|
|
| | | | | | | | 3,094,033 | |
| | | | | | |
|
|
|
Machinery - Electrical — 0.1% | |
ABB Finance USA, Inc.
Company Guar. Notes
3.38% due 04/03/2023 | | | 1,776,000 | | | | 1,774,011 | |
| | | | | | |
|
|
|
Machinery - Farming — 0.3% | |
CNH Industrial Capital LLC
Company Guar. Notes
4.20% due 01/15/2024 | | | 875,000 | | | | 877,760 | |
CNH Industrial Capital LLC
Company Guar. Notes
4.38% due 04/05/2022 | | | 1,147,000 | | | | 1,161,911 | |
John Deere Capital Corp.
Senior Notes
2.35% due 01/08/2021 | | | 1,190,000 | | | | 1,172,318 | |
| | | | | | |
|
|
|
| | | | | | | | 3,211,989 | |
| | | | | | |
|
|
|
Machinery - General Industrial — 0.2% | |
Roper Technologies, Inc.
Senior Notes
4.20% due 09/15/2028 | | | 2,458,000 | | | | 2,457,566 | |
| | | | | | |
|
|
|
Machinery - Thermal Process — 0.0% | |
Cleaver-Brooks, Inc.
Senior Sec. Notes
7.88% due 03/01/2023* | | | 480,000 | | | | 495,600 | |
| | | | | | |
|
|
|
VALIC Company II Core Bond Fund
PORTFOLIO OF INVESTMENTS — August 31, 2018 — (continued)
| | | | | | | | |
| | |
| Security Description | | Principal
Amount | | | Value
(Note 2) | |
| |
U.S. CORPORATE BONDS & NOTES (continued) | |
Marine Services — 0.1% | |
Great Lakes Dredge & Dock Corp.
Company Guar. Notes
8.00% due 05/15/2022 | | $ | 630,000 | | | $ | 647,325 | |
| | | | | | |
|
|
|
Medical Instruments — 0.1% | |
Medtronic, Inc.
Company Guar. Notes
2.50% due 03/15/2020 | | | 1,691,000 | | | | 1,680,126 | |
| | | | | | |
|
|
|
Medical Labs & Testing Services — 0.5% | |
Laboratory Corp. of America Holdings
Senior Notes
3.25% due 09/01/2024 | | | 1,645,000 | | | | 1,589,713 | |
Roche Holdings, Inc.
Company Guar. Notes
1.75% due 01/28/2022* | | | 1,811,000 | | | | 1,726,801 | |
Roche Holdings, Inc.
Company Guar. Notes
2.25% due 09/30/2019* | | | 1,595,000 | | | | 1,587,938 | |
Roche Holdings, Inc.
Company Guar. Notes
2.88% due 09/29/2021* | | | 1,240,000 | | | | 1,233,205 | |
| | | | | | |
|
|
|
| | | | | | | | 6,137,657 | |
| | | | | | |
|
|
|
Medical - Biomedical/Gene — 0.1% | |
Celgene Corp.
Senior Notes
3.63% due 05/15/2024 | | | 974,000 | | | | 962,677 | |
Celgene Corp.
Senior Notes
4.55% due 02/20/2048 | | | 869,000 | | | | 822,222 | |
| | | | | | |
|
|
|
| | | | | | | | 1,784,899 | |
| | | | | | |
|
|
|
Medical - Drugs — 0.3% | |
Bayer US Finance II LLC
Company Guar. Notes
4.63% due 06/25/2038* | | | 2,590,000 | | | | 2,525,023 | |
Endo Finance LLC/Endo Finco, Inc.
Company Guar. Notes
5.38% due 01/15/2023* | | | 351,000 | | | | 300,105 | |
GlaxoSmithKline Capital, Inc.
Company Guar. Notes
3.38% due 05/15/2023 | | | 1,122,000 | | | | 1,123,958 | |
| | | | | | |
|
|
|
| | | | | | | | 3,949,086 | |
| | | | | | |
|
|
|
Medical - Generic Drugs — 0.3% | |
Actavis, Inc.
Company Guar. Notes
3.25% due 10/01/2022 | | | 686,000 | | | | 673,741 | |
Mylan, Inc.
Company Guar. Notes
5.20% due 04/15/2048* | | | 3,202,000 | | | | 2,998,488 | |
| | | | | | |
|
|
|
| | | | | | | | 3,672,229 | |
| | | | | | |
|
|
|
Medical - HMO — 0.5% | |
Centene Corp.
Senior Notes
4.75% due 01/15/2025 | | | 375,000 | | | | 376,875 | |
Centene Corp.
Senior Notes
5.38% due 06/01/2026* | | | 609,000 | | | | 628,689 | |
UnitedHealth Group, Inc.
Senior Bonds
2.38% due 10/15/2022 | | | 4,976,000 | | | | 4,804,782 | |
| | | | | | | | |
| | |
| Security Description | | Principal
Amount | | | Value
(Note 2) | |
| |
| | | | | | | | | |
Medical - HMO (continued) | |
UnitedHealth Group, Inc.
Senior Notes
3.75% due 07/15/2025 | | $ | 825,000 | | | $ | 833,928 | |
| | | | | | |
|
|
|
| | | | | | | | 6,644,274 | |
| | | | | | |
|
|
|
Medical - Hospitals — 0.1% | |
CHS/Community Health Systems, Inc.
Senior Sec. Notes
5.13% due 08/01/2021# | | | 775,000 | | | | 747,875 | |
HCA, Inc.
Senior Sec. Notes
5.25% due 06/15/2026 | | | 513,000 | | | | 528,390 | |
HCA, Inc.
Senior Sec. Notes
6.50% due 02/15/2020 | | | 550,000 | | | | 570,900 | |
| | | | | | |
|
|
|
| | | | | | | | 1,847,165 | |
| | | | | | |
|
|
|
Medical - Wholesale Drug Distribution — 0.0% | |
Allergan Sales LLC
Company Guar. Notes
4.88% due 02/15/2021* | | | 488,000 | | | | 503,461 | |
| | | | | | |
|
|
|
Metal Processors & Fabrication — 0.2% | |
Grinding Media, Inc./Moly-Cop AltaSteel, Ltd.
Senior Sec. Notes
7.38% due 12/15/2023* | | | 427,000 | | | | 448,218 | |
Novelis Corp.
Company Guar. Notes
5.88% due 09/30/2026* | | | 220,000 | | | | 214,236 | |
Novelis Corp.
Company Guar. Notes
6.25% due 08/15/2024* | | | 739,000 | | | | 748,237 | |
Timken Co.
Senior Notes
4.50% due 12/15/2028 | | | 685,000 | | | | 684,460 | |
| | | | | | |
|
|
|
| | | | | | | | 2,095,151 | |
| | | | | | |
|
|
|
Metal - Copper — 0.1% | |
Freeport-McMoRan Copper & Gold, Inc.
Company Guar. Notes
3.88% due 03/15/2023# | | | 715,000 | | | | 687,294 | |
| | | | | | |
|
|
|
Metal - Iron — 0.1% | |
Cleveland-Cliffs, Inc.
Company Guar. Notes
5.75% due 03/01/2025 | | | 625,000 | | | | 613,788 | |
| | | | | | |
|
|
|
Multimedia — 0.0% | |
E.W. Scripps Co.
Company Guar. Notes
5.13% due 05/15/2025* | | | 419,000 | | | | 400,145 | |
Time Warner, Inc.
Company Guar. Notes
4.85% due 07/15/2045 | | | 166,000 | | | | 155,428 | |
| | | | | | |
|
|
|
| | | | | | | | 555,573 | |
| | | | | | |
|
|
|
Networking Products — 0.3% | |
Cisco Systems, Inc.
Senior Notes
2.20% due 02/28/2021 | | | 4,259,000 | | | | 4,189,078 | |
| | | | | | |
|
|
|
Oil Companies - Exploration & Production — 1.1% | |
Anadarko Petroleum Corp.
Senior Notes
6.45% due 09/15/2036 | | | 1,442,000 | | | | 1,675,547 | |
Apache Corp.
Senior Notes
4.38% due 10/15/2028 | | | 1,162,000 | | | | 1,145,510 | |
VALIC Company II Core Bond Fund
PORTFOLIO OF INVESTMENTS — August 31, 2018 — (continued)
| | | | | | | | |
| | |
| Security Description | | Principal
Amount | | | Value
(Note 2) | |
| |
U.S. CORPORATE BONDS & NOTES (continued) | |
Oil Companies - Exploration & Production (continued) | |
Callon Petroleum Co.
Company Guar. Notes
6.38% due 07/01/2026 | | $ | 635,000 | | | $ | 650,875 | |
Chaparral Energy, Inc.
Senior Notes
8.75% due 07/15/2023* | | | 625,000 | | | | 621,875 | |
Continental Resources, Inc.
Company Guar. Notes
4.50% due 04/15/2023 | | | 1,566,000 | | | | 1,602,191 | |
Endeavor Energy Resources LP/EER Finance, Inc.
Senior Notes
5.50% due 01/30/2026* | | | 750,000 | | | | 748,125 | |
Extraction Oil & Gas, Inc.
Company Guar. Notes
5.63% due 02/01/2026* | | | 625,000 | | | | 585,156 | |
Hess Corp.
Senior Notes
5.60% due 02/15/2041 | | | 1,231,000 | | | | 1,249,132 | |
Hilcorp Energy I LP/Hilcorp Finance Co.
Senior Notes
5.00% due 12/01/2024* | | | 1,011,000 | | | | 976,879 | |
Lonestar Resources America, Inc.
Company Guar. Notes
11.25% due 01/01/2023* | | | 565,000 | | | | 613,025 | |
Marathon Oil Corp.
Senior Notes
6.60% due 10/01/2037 | | | 1,281,000 | | | | 1,513,646 | |
Newfield Exploration Co.
Senior Notes
5.38% due 01/01/2026 | | | 509,000 | | | | 530,633 | |
QEP Resources, Inc.
Senior Notes
5.63% due 03/01/2026# | | | 730,000 | | | | 698,063 | |
Sanchez Energy Corp.
Company Guar. Notes
6.13% due 01/15/2023 | | | 383,000 | | | | 216,261 | |
Southwestern Energy Co.
Company Guar. Notes
7.50% due 04/01/2026# | | | 550,000 | | | | 576,125 | |
WildHorse Resource Development Corp.
Company Guar. Notes
6.88% due 02/01/2025 | | | 612,000 | | | | 616,590 | |
| | | | | | |
|
|
|
| | | | | | | | 14,019,633 | |
| | | | | | |
|
|
|
Oil Companies - Integrated — 0.3% | |
Chevron Corp.
Senior Notes
2.36% due 12/05/2022 | | | 1,106,000 | | | | 1,071,837 | |
Chevron Corp.
Senior Notes
3.19% due 06/24/2023 | | | 3,226,000 | | | | 3,226,828 | |
| | | | | | |
|
|
|
| | | | | | | | 4,298,665 | |
| | | | | | |
|
|
|
Oil Field Machinery & Equipment — 0.0% | |
Forum Energy Technologies, Inc.
Company Guar. Notes
6.25% due 10/01/2021 | | | 580,000 | | | | 580,000 | |
| | | | | | |
|
|
|
Oil Refining & Marketing — 0.0% | |
PBF Holding Co. LLC/PBF Finance Corp.
Company Guar. Notes
7.25% due 06/15/2025 | | | 523,000 | | | | 551,765 | |
| | | | | | |
|
|
|
| | | | | | | | |
| | |
| Security Description | | Principal
Amount | | | Value
(Note 2) | |
| |
| | | | | | | | | |
Oil - Field Services — 0.2% | |
Apergy Corp.
Company Guar. Notes
6.38% due 05/01/2026* | | $ | 348,000 | | | $ | 355,830 | |
Calfrac Holdings LP
Senior Notes
8.50% due 06/15/2026* | | | 950,000 | | | | 904,875 | |
Halliburton Co.
Senior Notes
4.85% due 11/15/2035 | | | 350,000 | | | | 366,928 | |
Pioneer Energy Services Corp.
Company Guar. Notes
6.13% due 03/15/2022 | | | 660,000 | | | | 577,500 | |
USA Compression Partners LP/USA Compression Finance Corp.
Senior Notes
6.88% due 04/01/2026* | | | 527,000 | | | | 545,445 | |
| | | | | | |
|
|
|
| | | | | | | | 2,750,578 | |
| | | | | | |
|
|
|
Paper & Related Products — 0.5% | |
Domtar Corp.
Company Guar. Notes
6.75% due 02/15/2044 | | | 2,001,000 | | | | 2,127,995 | |
Georgia-Pacific LLC
Senior Notes
3.73% due 07/15/2023* | | | 2,700,000 | | | | 2,732,999 | |
Georgia-Pacific LLC
Company Guar. Notes
5.40% due 11/01/2020* | | | 679,000 | | | | 709,721 | |
International Paper Co.
Senior Notes
5.00% due 09/15/2035 | | | 508,000 | | | | 524,191 | |
| | | | | | |
|
|
|
| | | | | | | | 6,094,906 | |
| | | | | | |
|
|
|
Petrochemicals — 0.1% | |
Chevron Phillips Chemical Co. LLC/Chevron Phillips Chemical Co. LP
Senior Notes
3.30% due 05/01/2023* | | | 1,023,000 | | | | 1,016,811 | |
| | | | | | |
|
|
|
Pharmacy Services — 0.4% | |
CVS Health Corp.
Senior Notes
4.78% due 03/25/2038 | | | 2,508,000 | | | | 2,499,478 | |
CVS Health Corp.
Senior Notes
5.05% due 03/25/2048 | | | 912,000 | | | | 930,685 | |
CVS Pass-Through Trust
Pass-Through Certs.
4.70% due 01/10/2036* | | | 499,559 | | | | 496,227 | |
CVS Pass-Through Trust
Pass-Through Certs.
5.77% due 01/10/2033* | | | 253,245 | | | | 270,193 | |
CVS Pass-Through Trust
Pass-Through Certs.
5.93% due 01/10/2034* | | | 442,090 | | | | 475,201 | |
| | | | | | |
|
|
|
| | | | | | | | 4,671,784 | |
| | | | | | |
|
|
|
Physicians Practice Management — 0.1% | |
MEDNAX, Inc.
Company Guar. Notes
5.25% due 12/01/2023* | | | 938,000 | | | | 935,655 | |
| | | | | | |
|
|
|
Pipelines — 1.6% | |
Andeavor Logistics LP/Tesoro Logistics Finance Corp.
Company Guar. Notes
5.20% due 12/01/2047 | | | 1,913,000 | | | | 1,902,595 | |
VALIC Company II Core Bond Fund
PORTFOLIO OF INVESTMENTS — August 31, 2018 — (continued)
| | | | | | | | |
| | |
| Security Description | | Principal
Amount | | | Value
(Note 2) | |
| |
U.S. CORPORATE BONDS & NOTES (continued) | |
Pipelines (continued) | |
Cheniere Corpus Christi Holdings LLC
Senior Sec. Notes
5.13% due 06/30/2027 | | $ | 850,000 | | | $ | 864,875 | |
Cheniere Corpus Christi Holdings LLC
Senior Sec. Notes
7.00% due 06/30/2024 | | | 231,000 | | | | 255,544 | |
Cheniere Energy Partners LP
Senior Sec. Notes
5.25% due 10/01/2025 | | | 251,000 | | | | 251,000 | |
Energy Transfer Equity LP
Senior Sec. Notes
4.25% due 03/15/2023 | | | 595,000 | | | | 596,666 | |
Energy Transfer Partners LP
Company Guar. Notes
4.90% due 03/15/2035 | | | 277,000 | | | | 258,232 | |
Energy Transfer Partners LP
Company Guar. Notes
6.05% due 06/01/2041 | | | 102,000 | | | | 106,628 | |
Energy Transfer Partners LP
Company Guar. Notes
6.63% due 10/15/2036 | | | 764,000 | | | | 854,778 | |
EnLink Midstream Partners LP
Senior Notes
4.85% due 07/15/2026 | | | 839,000 | | | | 815,071 | |
EnLink Midstream Partners LP
Senior Notes
5.05% due 04/01/2045 | | | 961,000 | | | | 813,811 | |
Genesis Energy LP/Genesis Energy Finance Corp.
Company Guar. Notes
5.63% due 06/15/2024 | | | 400,000 | | | | 373,000 | |
Genesis Energy LP/Genesis Energy Finance Corp.
Company Guar. Notes
6.00% due 05/15/2023 | | | 500,000 | | | | 491,875 | |
Holly Energy Partners LP/Holly Energy Finance Corp.
Company Guar. Notes
6.00% due 08/01/2024* | | | 632,000 | | | | 643,060 | |
Kinder Morgan Energy Partners LP
Company Guar. Notes
4.30% due 05/01/2024 | | | 1,290,000 | | | | 1,306,454 | |
Kinder Morgan Energy Partners LP
Company Guar. Notes
6.95% due 01/15/2038 | | | 783,000 | | | | 923,847 | |
Kinder Morgan, Inc.
Company Guar. Notes
5.00% due 02/15/2021* | | | 596,000 | | | | 617,338 | |
MPLX LP
Senior Notes
4.00% due 03/15/2028 | | | 1,839,000 | | | | 1,773,618 | |
NGPL PipeCo LLC
Senior Notes
4.38% due 08/15/2022* | | | 1,107,000 | | | | 1,115,302 | |
Northern Natural Gas Co.
Senior Notes
4.30% due 01/15/2049* | | | 641,000 | | | | 638,901 | |
SemGroup Corp./Rose Rock Finance Corp.
Company Guar. Notes
5.63% due 07/15/2022 | | | 937,000 | | | | 928,801 | |
SemGroup Corp./Rose Rock Finance Corp.
Company Guar. Notes
5.63% due 11/15/2023 | | | 217,000 | | | | 209,948 | |
Summit Midstream Holdings LLC/Summit Midstream Finance Corp.
Company Guar. Notes
5.50% due 08/15/2022 | | | 765,000 | | | | 761,175 | |
| | | | | | | | |
| | |
| Security Description | | Principal
Amount | | | Value
(Note 2) | |
| |
| | |
Pipelines (continued) | |
Western Gas Partners LP
Senior Notes
4.65% due 07/01/2026 | | $ | 890,000 | | | $ | 891,625 | |
Williams Cos., Inc.
Senior Notes
3.70% due 01/15/2023 | | | 2,202,000 | | | | 2,179,980 | |
Williams Cos., Inc.
Senior Notes
5.75% due 06/24/2044 | | | 1,073,000 | | | | 1,153,475 | |
| | | | | | |
|
|
|
| | | | | | | | 20,727,599 | |
| | | | | | |
|
|
|
Poultry — 0.0% | |
Pilgrim’s Pride Corp.
Senior Notes
5.88% due 09/30/2027* | | | 575,000 | | | | 546,250 | |
| | | | | | |
|
|
|
Publishing - Books — 0.1% | |
McGraw-Hill Global Education Holdings LLC/McGraw-Hill Global Education Finance
Senior Notes
7.88% due 05/15/2024*# | | | 945,000 | | | | 831,600 | |
| | | | | | |
|
|
|
Quarrying — 0.1% | |
Hi-Crush Partners LP
Senior Notes
9.50% due 08/01/2026* | | | 975,000 | | | | 936,000 | |
| | | | | | |
|
|
|
Racetracks — 0.1% | |
GLP Capital LP/GLP Financing II, Inc.
Company Guar. Notes
5.38% due 04/15/2026 | | | 600,000 | | | | 623,070 | |
| | | | | | |
|
|
|
Radio — 0.1% | |
Sirius XM Radio, Inc.
Company Guar. Notes
5.38% due 07/15/2026* | | | 981,000 | | | | 978,547 | |
| | | | | | |
|
|
|
Real Estate Investment Trusts — 0.6% | |
CTR Partnership LP/CareTrust Capital Corp.
Company Guar. Notes
5.25% due 06/01/2025 | | | 616,000 | | | | 600,600 | |
EPR Properties
Company Guar. Notes
4.95% due 04/15/2028 | | | 464,000 | | | | 461,157 | |
ESH Hospitality, Inc.
Company Guar. Notes
5.25% due 05/01/2025* | | | 1,000,000 | | | | 968,750 | |
GEO Group, Inc.
Company Guar. Notes
5.13% due 04/01/2023 | | | 650,000 | | | | 627,250 | |
Iron Mountain, Inc.
Company Guar. Notes
4.88% due 09/15/2027* | | | 665,000 | | | | 616,189 | |
iStar, Inc.
Senior Notes
5.25% due 09/15/2022 | | | 639,000 | | | | 632,610 | |
iStar, Inc.
Senior Notes
6.00% due 04/01/2022 | | | 289,000 | | | | 291,529 | |
Kimco Realty Corp.
Senior Notes
4.25% due 04/01/2045 | | | 618,000 | | | | 560,352 | |
MPT Operating Partnership LP/MPT Finance Corp.
Company Guar. Notes
5.00% due 10/15/2027 | | | 787,000 | | | | 771,260 | |
Sabra Health Care LP
Company Guar. Notes
5.13% due 08/15/2026 | | | 300,000 | | | | 291,113 | |
VALIC Company II Core Bond Fund
PORTFOLIO OF INVESTMENTS — August 31, 2018 — (continued)
| | | | | | | | |
| | |
| Security Description | | Principal
Amount | | | Value
(Note 2) | |
| |
U.S. CORPORATE BONDS & NOTES (continued) | |
Real Estate Investment Trusts (continued) | |
Starwood Property Trust, Inc.
Senior Notes
4.75% due 03/15/2025# | | $ | 975,000 | | | $ | 926,250 | |
Washington Prime Group LP
Senior Notes
5.95% due 08/15/2024# | | | 659,000 | | | | 639,161 | |
Welltower, Inc.
Senior Notes
3.95% due 09/01/2023 | | | 828,000 | | | | 833,980 | |
| | | | | | |
|
|
|
| | | | | | | | 8,220,201 | |
| | | | | | |
|
|
|
Real Estate Management/Services — 0.1% | |
Kennedy-Wilson, Inc.
Company Guar. Notes
5.88% due 04/01/2024 | | | 1,000,000 | | | | 991,250 | |
Realogy Group LLC/Realogy Co-Issuer Corp.
Company Guar. Notes
4.88% due 06/01/2023* | | | 860,000 | | | | 804,100 | |
| | | | | | |
|
|
|
| | | | | | | | 1,795,350 | |
| | | | | | |
|
|
|
Real Estate Operations & Development — 0.0% | |
Greystar Real Estate Partners LLC
Senior Sec. Notes
5.75% due 12/01/2025* | | | 590,000 | | | | 576,725 | |
| | | | | | |
|
|
|
Rental Auto/Equipment — 0.1% | |
Ahern Rentals, Inc.
Sec. Notes
7.38% due 05/15/2023* | | | 650,000 | | | | 639,470 | |
Jurassic Holdings III, Inc.
Sec. Notes
6.88% due 02/15/2021*# | | | 638,000 | | | | 622,050 | |
| | | | | | |
|
|
|
| | | | | | | | 1,261,520 | |
| | | | | | |
|
|
|
Retail - Appliances — 0.1% | |
Conn’s, Inc.
Company Guar. Notes
7.25% due 07/15/2022# | | | 692,000 | | | | 695,322 | |
| | | | | | |
|
|
|
Retail - Automobile — 0.1% | |
Asbury Automotive Group, Inc.
Company Guar. Notes
6.00% due 12/15/2024 | | | 423,000 | | | | 424,058 | |
AutoNation, Inc.
Company Guar. Notes
3.50% due 11/15/2024 | | | 1,307,000 | | | | 1,245,885 | |
| | | | | | |
|
|
|
| | | | | | | | 1,669,943 | |
| | | | | | |
|
|
|
Retail - Discount — 0.2% | |
Wal-Mart Stores, Inc.
Senior Bonds
1.90% due 12/15/2020 | | | 2,477,000 | | | | 2,430,310 | |
| | | | | | |
|
|
|
Retail - Leisure Products — 0.1% | |
Party City Holdings, Inc.
Company Guar. Notes
6.63% due 08/01/2026* | | | 623,000 | | | | 627,673 | |
| | | | | | |
|
|
|
Retail - Office Supplies — 0.1% | |
Staples, Inc.
Company Guar. Notes
8.50% due 09/15/2025*# | | | 1,007,000 | | | | 951,514 | |
| | | | | | |
|
|
|
Retail - Pawn Shops — 0.0% | |
FirstCash, Inc.
Company Guar. Notes
5.38% due 06/01/2024* | | | 487,000 | | | | 487,000 | |
| | | | | | |
|
|
|
| | | | | | | | |
| | |
| Security Description | | Principal
Amount | | | Value
(Note 2) | |
| |
| | | | | | | | | |
Retail - Restaurants — 0.2% | |
Brinker International, Inc.
Company Guar. Notes
5.00% due 10/01/2024* | | $ | 403,000 | | | $ | 388,895 | |
Golden Nugget, Inc.
Company Guar. Notes
8.75% due 10/01/2025* | | | 378,000 | | | | 398,790 | |
KFC Holding Co./Pizza Hut Holdings LLC/Taco Bell of America LLC
Company Guar. Notes
5.00% due 06/01/2024* | | | 620,000 | | | | 618,450 | |
McDonald’s Corp.
Senior Notes
4.45% due 03/01/2047 | | | 1,364,000 | | | | 1,367,318 | |
| | | | | | |
|
|
|
| | | | | | | | 2,773,453 | |
| | | | | | |
|
|
|
Satellite Telecom — 0.1% | |
Hughes Satellite Systems Corp.
Company Guar. Notes
6.63% due 08/01/2026 | | | 781,000 | | | | 747,808 | |
| | | | | | |
|
|
|
Savings & Loans/Thrifts — 0.5% | |
Astoria Financial Corp.
Senior Notes
3.50% due 06/08/2020 | | | 2,075,000 | | | | 2,074,201 | |
First Niagara Financial Group, Inc.
Senior Notes
6.75% due 03/19/2020 | | | 2,152,000 | | | | 2,258,990 | |
First Niagara Financial Group, Inc.
Sub. Notes
7.25% due 12/15/2021 | | | 2,037,000 | | | | 2,261,815 | |
| | | | | | |
|
|
|
| | | | | | | | 6,595,006 | |
| | | | | | |
|
|
|
Schools — 0.1% | |
Graham Holdings Co.
Company Guar. Notes
5.75% due 06/01/2026* | | | 830,000 | | | | 848,675 | |
| | | | | | |
|
|
|
Security Services — 0.1% | |
ADT Corp.
Senior Sec. Notes
4.13% due 06/15/2023 | | | 425,000 | | | | 404,281 | |
ADT Corp.
Senior Sec. Notes
6.25% due 10/15/2021 | | | 442,000 | | | | 466,310 | |
| | | | | | |
|
|
|
| | | | | | | | 870,591 | |
| | | | | | |
|
|
|
Semiconductor Components - Integrated Circuits — 0.1% | |
QUALCOMM, Inc.
Senior Notes
3.45% due 05/20/2025 | | | 1,411,000 | | | | 1,374,429 | |
| | | | | | |
|
|
|
Steel Pipe & Tube — 0.0% | |
Valmont Industries, Inc.
Company Guar. Notes
5.00% due 10/01/2044 | | | 482,000 | | | | 445,303 | |
| | | | | | |
|
|
|
Steel - Producers — 0.1% | |
AK Steel Corp.
Company Guar. Notes
6.38% due 10/15/2025# | | | 550,000 | | | | 511,500 | |
Commercial Metals Co.
Senior Notes
5.75% due 04/15/2026* | | | 505,000 | | | | 487,325 | |
United States Steel Corp.
Senior Notes
6.88% due 08/15/2025 | | | 525,000 | | | | 532,875 | |
| | | | | | |
|
|
|
| | | | | | | | 1,531,700 | |
| | | | | | |
|
|
|
VALIC Company II Core Bond Fund
PORTFOLIO OF INVESTMENTS — August 31, 2018 — (continued)
| | | | | | | | |
| | |
| Security Description | | Principal
Amount | | | Value
(Note 2) | |
| |
U.S. CORPORATE BONDS & NOTES (continued) | |
Telephone - Integrated — 1.0% | |
AT&T, Inc.
Senior Notes
4.50% due 05/15/2035 | | $ | 3,419,000 | | | $ | 3,178,878 | |
AT&T, Inc.
Senior Notes
4.90% due 08/15/2037* | | | 3,359,000 | | | | 3,217,352 | |
CenturyLink, Inc.
Senior Notes
6.75% due 12/01/2023# | | | 910,000 | | | | 948,675 | |
Citizens Communications Co.
Senior Notes
9.00% due 08/15/2031# | | | 1,000,000 | | | | 592,500 | |
Verizon Communications, Inc.
Senior Notes
4.40% due 11/01/2034 | | | 451,000 | | | | 436,323 | |
Verizon Communications, Inc.
Senior Notes
5.25% due 03/16/2037 | | | 4,296,000 | | | | 4,549,932 | |
| | | | | | |
|
|
|
| | | | | | | | 12,923,660 | |
| | | | | | |
|
|
|
Television — 0.2% | |
Belo Corp.
Company Guar. Notes
7.75% due 06/01/2027 | | | 594,000 | | | | 635,580 | |
CBS Corp.
Company Guar. Notes
3.70% due 08/15/2024 | | | 1,466,000 | | | | 1,428,300 | |
Gray Television, Inc.
Company Guar. Notes
5.13% due 10/15/2024* | | | 552,000 | | | | 540,960 | |
Gray Television, Inc.
Company Guar. Notes
5.88% due 07/15/2026* | | | 118,000 | | | | 118,000 | |
| | | | | | |
|
|
|
| | | | | | | | 2,722,840 | |
| | | | | | |
|
|
|
Transport - Equipment & Leasing — 0.1% | |
GATX Corp.
Senior Notes
3.25% due 09/15/2026 | | | 874,000 | | | | 809,846 | |
| | | | | | |
|
|
|
Transport - Marine — 0.1% | |
Kirby Corp.
Senior Notes
4.20% due 03/01/2028 | | | 1,068,000 | | | | 1,055,432 | |
| | | | | | |
|
|
|
Transport - Rail — 0.1% | |
Norfolk Southern Corp.
Senior Notes
5.10% due 08/01/2118 | | | 1,435,000 | | | | 1,427,549 | |
| | | | | | |
|
|
|
Transport - Services — 0.1% | |
CH Robinson Worldwide, Inc.
Senior Notes
4.20% due 04/15/2028 | | | 1,111,000 | | | | 1,101,958 | |
FedEx Corp.
Company Guar. Notes
4.05% due 02/15/2048 | | | 835,000 | | | | 763,048 | |
| | | | | | |
|
|
|
| | | | | | | | 1,865,006 | |
| | | | | | |
|
|
|
Trucking/Leasing — 0.1% | |
Penske Truck Leasing Co. LP/PTL Finance Corp.
Senior Notes
3.95% due 03/10/2025* | | | 1,714,000 | | | | 1,697,003 | |
| | | | | | |
|
|
|
| | | | | | | | |
| | |
| Security Description | | Principal
Amount | | | Value
(Note 2) | |
| |
| | | | | | | | | |
Vitamins & Nutrition Products — 0.0% | |
HLF Financing SARL LLC/Herbalife International, Inc.
Senior Notes
7.25% due 08/15/2026* | | $ | 102,000 | | | $ | 103,438 | |
| | | | | | |
|
|
|
Total U.S. Corporate Bonds & Notes | | | | | | | | |
(cost $416,550,011) | | | | | | | 412,253,436 | |
| | | | | | |
|
|
|
FOREIGN CORPORATE BONDS & NOTES — 9.6% | |
Agricultural Chemicals — 0.2% | |
Consolidated Energy Finance SA
Senior Notes
6.88% due 06/15/2025* | | | 560,000 | | | | 577,780 | |
Nufarm Australia, Ltd./Nufarm Americas, Inc.
Company Guar. Notes
5.75% due 04/30/2026* | | | 515,000 | | | | 478,950 | |
OCI NV
Senior Sec. Notes
6.63% due 04/15/2023* | | | 669,000 | | | | 692,415 | |
Syngenta Finance NV
Company Guar. Notes
4.44% due 04/24/2023* | | | 1,330,000 | | | | 1,334,358 | |
| | | | | | |
|
|
|
| | | | | | | | 3,083,503 | |
| | | | | | |
|
|
|
Auto - Cars/Light Trucks — 0.1% | |
Hyundai Capital Services, Inc.
Senior Notes
3.00% due 08/29/2022* | | | 1,283,000 | | | | 1,241,288 | |
| | | | | | |
|
|
|
Auto/Truck Parts & Equipment - Original — 0.3% | |
Delphi Jersey Holdings PLC
Company Guar. Notes
5.00% due 10/01/2025* | | | 595,000 | | | | 562,007 | |
Toyota Industries Corp.
Senior Notes
3.24% due 03/16/2023* | | | 3,752,000 | | | | 3,725,778 | |
| | | | | | |
|
|
|
| | | | | | | | 4,287,785 | |
| | | | | | |
|
|
|
Banks - Commercial — 1.2% | |
Australia & New Zealand Banking Group, Ltd.
Senior Notes
1.60% due 07/15/2019 | | | 728,000 | | | | 721,350 | |
Canadian Imperial Bank of Commerce
Senior Notes
2.10% due 10/05/2020 | | | 2,416,000 | | | | 2,364,186 | |
Credit Suisse AG
Senior Notes
3.00% due 10/29/2021 | | | 1,094,000 | | | | 1,082,685 | |
Danske Bank A/S
Senior Notes
3.88% due 09/12/2023*# | | | 1,407,000 | | | | 1,400,773 | |
DBS Group Holdings, Ltd.
Senior Notes
2.25% due 07/16/2019* | | | 1,529,000 | | | | 1,517,473 | |
Intesa Sanpaolo SpA
Senior Notes
3.88% due 01/12/2028* | | | 1,121,000 | | | | 953,405 | |
Intesa Sanpaolo SpA
Sub. Notes
5.71% due 01/15/2026* | | | 1,662,000 | | | | 1,509,027 | |
National Australia Bank, Ltd.
Senior Notes
3.63% due 06/20/2023 | | | 2,013,000 | | | | 2,014,317 | |
Toronto-Dominion Bank
Senior Notes
1.85% due 09/11/2020 | | | 1,445,000 | | | | 1,412,552 | |
United Overseas Bank, Ltd.
Senior Notes
3.20% due 04/23/2021* | | | 916,000 | | | | 913,589 | |
VALIC Company II Core Bond Fund
PORTFOLIO OF INVESTMENTS — August 31, 2018 — (continued)
| | | | | | | | |
| | |
| Security Description | | Principal
Amount | | | Value
(Note 2) | |
| |
FOREIGN CORPORATE BONDS & NOTES (continued) | |
Banks - Commercial (continued) | |
Westpac Banking Corp.
Senior Notes
3.05% due 05/15/2020# | | $ | 1,061,000 | | | $ | 1,060,124 | |
| | | | | | |
|
|
|
| | | | | | | | 14,949,481 | |
| | | | | | |
|
|
|
Building Societies — 0.1% | |
Nationwide Building Society
Sub. Notes
4.13% due 10/18/2032* | | | 1,018,000 | | | | 940,225 | |
| | | | | | |
|
|
|
Building - Residential/Commercial — 0.0% | |
Mattamy Group Corp.
Senior Notes
6.50% due 10/01/2025*# | | | 616,000 | | | | 606,883 | |
| | | | | | |
|
|
|
Cable/Satellite TV — 0.3% | |
Altice Financing SA
Senior Sec. Notes
7.50% due 05/15/2026* | | | 945,000 | | | | 902,475 | |
Altice France SA
Senior Sec. Notes
8.13% due 02/01/2027* | | | 215,000 | | | | 218,225 | |
Altice Luxembourg SA
Company Guar. Notes
7.63% due 02/15/2025*# | | | 1,245,000 | | | | 1,150,741 | |
SFR Group SA
Senior Sec. Notes
7.38% due 05/01/2026* | | | 1,040,000 | | | | 1,021,800 | |
UPCB Finance IV, Ltd.
Senior Sec. Notes
5.38% due 01/15/2025* | | | 950,000 | | | | 938,220 | |
| | | | | | |
|
|
|
| | | | | | | | 4,231,461 | |
| | | | | | |
|
|
|
Cellular Telecom — 0.1% | |
C&W Senior Financing Designated Activity Co.
Senior Notes
6.88% due 09/15/2027* | | | 817,000 | | | | 810,872 | |
SK Telecom Co., Ltd.
Senior Notes
3.75% due 04/16/2023* | | | 590,000 | | | | 589,229 | |
Vodafone Group PLC
Senior Notes
3.75% due 01/16/2024 | | | 528,000 | | | | 524,413 | |
| | | | | | |
|
|
|
| | | | | | | | 1,924,514 | |
| | | | | | |
|
|
|
Chemicals - Diversified — 0.2% | |
Braskem Netherlands Finance BV
Company Guar. Notes
4.50% due 01/10/2028* | | | 971,000 | | | | 890,893 | |
NOVA Chemicals Corp.
Senior Notes
5.00% due 05/01/2025* | | | 825,000 | | | | 796,125 | |
Trinseo Materials Operating SCA/Trinseo Materials Finance, Inc.
Company Guar. Notes
5.38% due 09/01/2025* | | | 565,000 | | | | 554,406 | |
| | | | | | |
|
|
|
| | | | | | | | 2,241,424 | |
| | | | | | |
|
|
|
Computers - Memory Devices — 0.1% | |
Seagate HDD Cayman
Company Guar. Notes
4.75% due 01/01/2025 | | | 725,000 | | | | 694,931 | |
| | | | | | |
|
|
|
Diversified Banking Institutions — 1.7% | |
Banco Santander SA
Senior Notes
3.85% due 04/12/2023 | | | 800,000 | | | | 787,062 | |
| | | | | | | | |
| | |
| Security Description | | Principal
Amount | | | Value
(Note 2) | |
| |
| | | | | | | | | |
Diversified Banking Institutions (continued) | |
Barclays PLC
Sub. Notes
4.84% due 05/09/2028 | | $ | 1,815,000 | | | $ | 1,725,140 | |
BNP Paribas SA
Senior Notes
3.80% due 01/10/2024* | | | 1,576,000 | | | | 1,551,018 | |
Credit Suisse Group AG
Senior Notes
4.21% due 06/12/2024* | | | 1,187,000 | | | | 1,193,151 | |
Macquarie Group, Ltd.
Senior Notes
3.76% due 11/28/2028* | | | 497,000 | | | | 464,347 | |
Mitsubishi UFJ Financial Group, Inc.
Senior Notes
2.67% due 07/25/2022 | | | 1,175,000 | | | | 1,139,623 | |
Mitsubishi UFJ Financial Group, Inc.
Senior Notes
2.95% due 03/01/2021 | | | 653,000 | | | | 646,416 | |
Mitsubishi UFJ Financial Group, Inc.
Senior Notes
3.78% due 03/02/2025 | | | 442,000 | | | | 442,114 | |
Mizuho Financial Group, Inc.
Senior Notes
2.27% due 09/13/2021 | | | 1,816,000 | | | | 1,753,483 | |
Mizuho Financial Group, Inc.
Senior Notes
3.55% due 03/05/2023# | | | 3,863,000 | | | | 3,847,888 | |
Royal Bank of Scotland Group PLC
Senior Notes
3.50% due 05/15/2023 | | | 587,000 | | | | 570,797 | |
Royal Bank of Scotland Group PLC
Senior Notes
3.88% due 09/12/2023 | | | 454,000 | | | | 442,615 | |
Royal Bank of Scotland Group PLC
Senior Notes
4.52% due 06/25/2024 | | | 816,000 | | | | 818,064 | |
UBS Group Funding Switzerland AG
Company Guar. Notes
3.49% due 05/23/2023* | | | 2,337,000 | | | | 2,307,500 | |
UBS Group Funding Switzerland AG
Company Guar. Notes
4.13% due 09/24/2025* | | | 269,000 | | | | 270,199 | |
UniCredit SpA
Sub. Notes
5.86% due 06/19/2032* | | | 4,063,000 | | | | 3,548,523 | |
| | | | | | |
|
|
|
| | | | | | | | 21,507,940 | |
| | | | | | |
|
|
|
Diversified Financial Services — 0.3% | |
GE Capital International Funding Co. ULC
Company Guar. Notes
2.34% due 11/15/2020 | | | 2,421,000 | | | | 2,371,594 | |
GE Capital International Funding Co. ULC
Company Guar. Notes
4.42% due 11/15/2035 | | | 2,029,000 | | | | 1,955,894 | |
| | | | | | |
|
|
|
| | | | | | | | 4,327,488 | |
| | | | | | |
|
|
|
Diversified Manufacturing Operations — 0.2% | |
Siemens Financieringsmaatschappij NV
Company Guar. Notes
2.20% due 03/16/2020* | | | 2,165,000 | | | | 2,139,752 | |
| | | | | | |
|
|
|
Diversified Minerals — 0.1% | |
Anglo American Capital PLC
Company Guar. Notes
4.00% due 09/11/2027* | | | 773,000 | | | | 713,056 | |
| | | | | | |
|
|
|
VALIC Company II Core Bond Fund
PORTFOLIO OF INVESTMENTS — August 31, 2018 — (continued)
| | | | | | | | |
| | |
| Security Description | | Principal
Amount | | | Value
(Note 2) | |
| |
FOREIGN CORPORATE BONDS & NOTES (continued) | |
Electric - Generation — 0.2% | |
Electricite de France SA
Senior Notes
2.35% due 10/13/2020* | | $ | 1,329,000 | | | $ | 1,308,582 | |
Electricite de France SA
Senior Notes
6.00% due 01/22/2114* | | | 312,000 | | | | 328,322 | |
Korea East-West Power Co., Ltd.
Senior Notes
3.88% due 07/19/2023* | | | 515,000 | | | | 516,822 | |
| | | | | | |
|
|
|
| | | | | | | | 2,153,726 | |
| | | | | | |
|
|
|
Electric - Integrated — 0.5% | |
EDP Finance BV
Senior Notes
3.63% due 07/15/2024* | | | 1,831,000 | | | | 1,765,622 | |
Enel Finance International NV
Company Guar. Notes
3.50% due 04/06/2028* | | | 2,194,000 | | | | 1,977,408 | |
Enel Finance International NV
Company Guar. Notes
3.63% due 05/25/2027* | | | 2,426,000 | | | | 2,234,005 | |
| | | | | | |
|
|
|
| | | | | | | | 5,977,035 | |
| | | | | | |
|
|
|
Finance - Consumer Loans — 0.0% | |
goeasy, Ltd.
Company Guar. Notes
7.88% due 11/01/2022* | | | 190,000 | | | | 198,550 | |
| | | | | | |
|
|
|
Finance - Other Services — 0.0% | |
Travelport Corporate Finance PLC
Senior Sec. Notes
6.00% due 03/15/2026* | | | 458,000 | | | | 466,015 | |
| | | | | | |
|
|
|
Food - Meat Products — 0.1% | | | | | | | | |
JBS USA LUX SA/JBS USA Finance, Inc.
Company Guar. Notes
5.75% due 06/15/2025* | | | 207,000 | | | | 195,615 | |
JBS USA LUX SA/JBS USA Finance, Inc.
Company Guar. Notes
5.88% due 07/15/2024* | | | 893,000 | | | | 859,513 | |
| | | | | | |
|
|
|
| | | | | | | | 1,055,128 | |
| | | | | | |
|
|
|
Gambling (Non-Hotel) — 0.1% | |
International Game Technology PLC
Senior Sec. Notes
6.50% due 02/15/2025* | | | 605,000 | | | | 635,250 | |
LHMC Finco SARL
Senior Sec. Notes
7.88% due 12/20/2023* | | | 670,000 | | | | 672,982 | |
Stars Group Holdings BV/Stars Group US Co-Borrower LLC
Company Guar. Notes
7.00% due 07/15/2026* | | | 635,000 | | | | 660,400 | |
| | | | | | |
|
|
|
| | | | | | | | 1,968,632 | |
| | | | | | |
|
|
|
Gold Mining — 0.1% | |
Goldcorp, Inc.
Senior Notes
3.70% due 03/15/2023 | | | 498,000 | | | | 495,094 | |
Kinross Gold Corp.
Company Guar. Notes
4.50% due 07/15/2027 | | | 711,000 | | | | 645,233 | |
| | | | | | |
|
|
|
| | | | | | | | 1,140,327 | |
| | | | | | |
|
|
|
Insurance - Life/Health — 0.2% | |
AIA Group, Ltd.
Senior Notes
4.50% due 03/16/2046* | | | 495,000 | | | | 517,338 | |
| | | | | | | | |
| | |
| Security Description | | Principal
Amount | | | Value
(Note 2) | |
| |
| | | | | | | | | |
Insurance - Life/Health (continued) | |
Athene Holding, Ltd.
Senior Notes
4.13% due 01/12/2028 | | $ | 2,869,000 | | | $ | 2,693,935 | |
| | | | | | |
|
|
|
| | | | | | | | 3,211,273 | |
| | | | | | |
|
|
|
Insurance - Multi-line — 0.1% | |
XLIT, Ltd.
Company Guar. Notes
5.50% due 03/31/2045 | | | 911,000 | | | | 981,015 | |
| | | | | | |
|
|
|
Insurance - Property/Casualty — 0.0% | |
Enstar Group, Ltd.
Senior Notes
4.50% due 03/10/2022 | | | 491,000 | | | | 495,396 | |
| | | | | | |
|
|
|
Machinery - Farming — 0.2% | |
CNH Industrial NV
Senior Notes
3.85% due 11/15/2027 | | | 1,353,000 | | | | 1,302,097 | |
CNH Industrial NV
Senior Notes
4.50% due 08/15/2023 | | | 940,000 | | | | 959,439 | |
| | | | | | |
|
|
|
| | | | | | | | 2,261,536 | |
| | | | | | |
|
|
|
Machinery - Pumps — 0.1% | |
Nvent Finance SARL
Company Guar. Notes
4.55% due 04/15/2028* | | | 890,000 | | | | 879,532 | |
| | | | | | |
|
|
|
Medical - Drugs — 0.2% | |
Shire Acquisitions Investments Ireland DAC
Company Guar. Notes
2.88% due 09/23/2023 | | | 962,000 | | | | 918,650 | |
Valeant Pharmaceuticals International, Inc.
Company Guar. Notes
5.88% due 05/15/2023* | | | 1,510,000 | | | | 1,443,560 | |
| | | | | | |
|
|
|
| | | | | | | | 2,362,210 | |
| | | | | | |
|
|
|
Metal - Copper — 0.1% | |
First Quantum Minerals, Ltd.
Company Guar. Notes
6.50% due 03/01/2024* | | | 308,000 | | | | 289,520 | |
First Quantum Minerals, Ltd.
Company Guar. Notes
7.25% due 04/01/2023* | | | 320,000 | | | | 312,800 | |
Hudbay Minerals, Inc.
Company Guar. Notes
7.25% due 01/15/2023*# | | | 560,000 | | | | 569,800 | |
| | | | | | |
|
|
|
| | | | | | | | 1,172,120 | |
| | | | | | |
|
|
|
Oil & Gas Drilling — 0.2% | |
Noble Holding International, Ltd.
Company Guar. Notes
7.75% due 01/15/2024# | | | 377,000 | | | | 368,517 | |
Noble Holding International, Ltd.
Company Guar. Notes
7.88% due 02/01/2026* | | | 437,000 | | | | 447,925 | |
Shelf Drilling Holdings, Ltd.
Company Guar. Notes
8.25% due 02/15/2025* | | | 615,000 | | | | 630,375 | |
Trinidad Drilling, Ltd.
Company Guar. Notes
6.63% due 02/15/2025* | | | 875,000 | | | | 866,250 | |
| | | | | | |
|
|
|
| | | | | | | | 2,313,067 | |
| | | | | | |
|
|
|
VALIC Company II Core Bond Fund
PORTFOLIO OF INVESTMENTS — August 31, 2018 — (continued)
| | | | | | | | |
| | |
| Security Description | | Principal
Amount | | | Value
(Note 2) | |
| |
FOREIGN CORPORATE BONDS & NOTES (continued) | |
Oil Companies - Exploration & Production — 0.4% | |
Anadarko Finance Co.
Company Guar. Notes
7.50% due 05/01/2031 | | $ | 628,000 | | | $ | 786,993 | |
CNOOC Curtis Funding No. 1 Pty, Ltd.
Company Guar. Notes
4.50% due 10/03/2023 | | | 1,350,000 | | | | 1,387,722 | |
MEG Energy Corp.
Company Guar. Notes
6.38% due 01/30/2023* | | | 897,000 | | | | 814,027 | |
MEG Energy Corp.
Sec. Notes
6.50% due 01/15/2025*# | | | 939,000 | | | | 934,305 | |
Sinopec Group Overseas Development 2015, Ltd.
Company Guar. Notes
2.50% due 04/28/2020 | | | 1,500,000 | | | | 1,479,590 | |
| | | | | | |
|
|
|
| | | | | | | | 5,402,637 | |
| | | | | | |
|
|
|
Oil Companies - Integrated — 0.7% | |
BP Capital Markets PLC
Company Guar. Notes
3.25% due 05/06/2022 | | | 1,041,000 | | | | 1,039,412 | |
Cenovus Energy, Inc.
Senior Notes
4.25% due 04/15/2027 | | | 1,404,000 | | | | 1,357,281 | |
Petroleos Mexicanos
Company Guar. Notes
4.88% due 01/24/2022 | | | 1,400,000 | | | | 1,408,050 | |
Petroleos Mexicanos
Company Guar. Notes
6.63% due 06/15/2035 | | | 1,400,000 | | | | 1,354,500 | |
Petroleos Mexicanos
Company Guar. Notes
6.75% due 09/21/2047 | | | 3,767,000 | | | | 3,487,036 | |
Suncor Energy, Inc.
Senior Notes
5.95% due 12/01/2034 | | | 650,000 | | | | 759,689 | |
| | | | | | |
|
|
|
| | | | | | | | 9,405,968 | |
| | | | | | |
|
|
|
Oil - Field Services — 0.1% | |
KCA Deutag UK Finance PLC
Senior Sec. Notes
9.88% due 04/01/2022* | | | 679,000 | | | | 677,303 | |
| | | | | | |
|
|
|
Paper & Related Products — 0.0% | |
Cascades, Inc.
Company Guar. Notes
5.50% due 07/15/2022* | | | 425,000 | | | | 425,000 | |
Cascades, Inc.
Company Guar. Notes
5.75% due 07/15/2023* | | | 179,000 | | | | 179,018 | |
| | | | | | |
|
|
|
| | | | | | | | 604,018 | |
| | | | | | |
|
|
|
Printing - Commercial — 0.1% | |
Cimpress NV
Company Guar. Notes
7.00% due 06/15/2026* | | | 955,000 | | | | 972,906 | |
| | | | | | |
|
|
|
Satellite Telecom — 0.2% | |
Inmarsat Finance PLC
Company Guar. Notes
6.50% due 10/01/2024*# | | | 635,000 | | | | 652,462 | |
Intelsat Jackson Holdings SA
Company Guar. Notes
5.50% due 08/01/2023# | | | 1,430,000 | | | | 1,304,446 | |
| | | | | | | | |
| | |
| Security Description | | Principal
Amount | | | Value
(Note 2) | |
| |
| | | | | | | | | |
Satellite Telecom (continued) | |
Telesat Canada/Telesat LLC
Company Guar. Notes
8.88% due 11/15/2024* | | $ | 635,000 | | | $ | 680,244 | |
| | | | | | |
|
|
|
| | | | | | | | 2,637,152 | |
| | | | | | |
|
|
|
SupraNational Banks — 0.2% | |
European Investment Bank
Senior Notes
1.63% due 08/14/2020 | | | 2,399,000 | | | | 2,347,877 | |
| | | | | | |
|
|
|
Telephone - Integrated — 0.6% | |
Telecom Italia Capital SA
Company Guar. Notes
7.72% due 06/04/2038 | | | 4,845,000 | | | | 5,305,275 | |
Telefonica Emisiones SAU
Company Guar. Notes
4.67% due 03/06/2038 | | | 1,833,000 | | | | 1,752,962 | |
Telefonica Emisiones SAU
Company Guar. Notes
5.21% due 03/08/2047 | | | 1,107,000 | | | | 1,099,590 | |
| | | | | | |
|
|
|
| | | | | | | | 8,157,827 | |
| | | | | | |
|
|
|
Transport - Rail — 0.3% | |
Canadian National Railway Co.
Senior Notes
2.85% due 12/15/2021 | | | 1,087,000 | | | | 1,077,288 | |
Canadian Pacific Railway Co.
Senior Notes
6.13% due 09/15/2115 | | | 574,000 | | | | 687,818 | |
Kazakhstan Temir Zholy Finance BV
Company Guar. Notes
6.95% due 07/10/2042 | | | 1,600,000 | | | | 1,752,000 | |
| | | | | | |
|
|
|
| | | | | | | | 3,517,106 | |
| | | | | | |
|
|
|
Total Foreign Corporate Bonds & Notes | | | | | | | | |
(cost $126,864,766) | | | | | | | 123,248,087 | |
| | | | | | |
|
|
|
FOREIGN GOVERNMENT OBLIGATIONS — 4.1% | |
Banks - Special Purpose — 0.2% | |
Brazilian Development Bank
Senior Notes
5.50% due 07/12/2020 | | | 2,300,000 | | | | 2,363,273 | |
| | | | | | |
|
|
|
Sovereign — 3.9% | |
Dominican Republic
Senior Bonds
7.45% due 04/30/2044 | | | 2,100,000 | | | | 2,257,500 | |
Federative Republic of Brazil
Senior Notes
8.25% due 01/20/2034# | | | 550,000 | | | | 627,688 | |
Government of Egypt
Senior Notes
7.50% due 01/31/2027 | | | 1,400,000 | | | | 1,396,500 | |
Government of Egypt
Senior Notes
8.50% due 01/31/2047 | | | 1,500,000 | | | | 1,465,734 | |
Government of Ukraine
Senior Notes
7.38% due 09/25/2032* | | | 1,600,000 | | | | 1,352,000 | |
Government of Ukraine
Senior Notes
7.75% due 09/01/2027 | | | 750,000 | | | | 681,523 | |
Kingdom of Saudi Arabia
Senior Notes
5.00% due 04/17/2049 | | | 1,500,000 | | | | 1,482,990 | |
Lebanese Republic
Senior Notes
6.38% due 03/09/2020 | | | 300,000 | | | | 288,718 | |
VALIC Company II Core Bond Fund
PORTFOLIO OF INVESTMENTS — August 31, 2018 — (continued)
| | | | | | | | |
| | |
| Security Description | | Principal
Amount | | | Value
(Note 2) | |
| |
FOREIGN GOVERNMENT OBLIGATIONS (continued) | |
Sovereign (continued) | |
Oriental Republic of Uruguay
Senior Notes
4.38% due 10/27/2027 | | $ | 900,000 | | | $ | 919,800 | |
Republic of Argentina
Senior Notes
6.88% due 04/22/2021 | | | 1,100,000 | | | | 980,661 | |
Republic of Argentina
Senior Notes
6.88% due 01/26/2027 | | | 300,000 | | | | 234,750 | |
Republic of Argentina
Senior Notes
8.28% due 12/31/2033 | | | 2,032,955 | | | | 1,697,518 | |
Republic of Chile
Senior Notes
3.24% due 02/06/2028 | | | 2,073,000 | | | | 1,990,080 | |
Republic of Colombia
Senior Notes
8.13% due 05/21/2024 | | | 2,300,000 | | | | 2,771,500 | |
Republic of Croatia
Senior Notes
6.38% due 03/24/2021 | | | 1,550,000 | | | | 1,644,541 | |
Republic of Ecuador
Senior Notes
9.63% due 06/02/2027 | | | 1,700,000 | | | | 1,619,250 | |
Republic of Guatemala
Senior Notes
4.88% due 02/13/2028 | | | 695,000 | | | | 674,060 | |
Republic of Honduras
Senior Notes
6.25% due 01/19/2027 | | | 1,150,000 | | | | 1,176,944 | |
Republic of Hungary
Senior Notes
5.38% due 02/21/2023 | | | 2,200,000 | | | | 2,343,000 | |
Republic of Indonesia
Senior Notes
2.95% due 01/11/2023 | | | 1,270,000 | | | | 1,219,990 | |
Republic of Indonesia
Senior Notes
5.88% due 01/15/2024 | | | 500,000 | | | | 539,365 | |
Republic of Ivory Coast
Senior Notes
5.75% due 12/31/2032 | | | 1,110,000 | | | | 999,013 | |
Republic of Peru
Senior Notes
8.75% due 11/21/2033 | | | 700,000 | | | | 1,038,800 | |
Republic of Poland
Senior Notes
5.13% due 04/21/2021 | | | 700,000 | | | | 733,530 | |
Republic of Senegal
Bonds
6.25% due 05/23/2033 | | | 1,200,000 | | | | 1,079,880 | |
Republic of Senegal
Senior Notes
6.75% due 03/13/2048* | | | 750,000 | | | | 640,725 | |
Republic of Serbia
Senior Bonds
4.88% due 02/25/2020 | | | 1,500,000 | | | | 1,520,811 | |
Republic of South Africa
Senior Notes
5.65% due 09/27/2047 | | | 1,500,000 | | | | 1,340,325 | |
Republic of South Africa
Senior Notes
5.88% due 09/16/2025 | | | 1,500,000 | | | | 1,520,655 | |
Republic of Sri Lanka
Senior Notes
6.83% due 07/18/2026 | | | 1,900,000 | | | | 1,881,591 | |
| | | | | | | | |
| | |
| Security Description | | Principal
Amount | | | Value
(Note 2) | |
| |
| | | | | | | | | |
Sovereign (continued) | |
Republic of the Philippines
Senior Notes
4.00% due 01/15/2021 | | $ | 950,000 | | | $ | 963,972 | |
Republic of Turkey
Senior Notes
7.00% due 06/05/2020 | | | 1,100,000 | | | | 1,057,725 | |
Republic of Turkey
Senior Bonds
11.88% due 01/15/2030 | | | 1,400,000 | | | | 1,666,000 | |
Russian Federation
Senior Notes
4.75% due 05/27/2026 | | | 1,400,000 | | | | 1,389,998 | |
State of Qatar
Senior Notes
4.50% due 01/20/2022 | | | 1,500,000 | | | | 1,543,500 | |
Sultanate of Oman
Senior Notes
4.75% due 06/15/2026 | | | 1,500,000 | | | | 1,390,374 | |
Sultanate of Oman
Senior Notes
6.75% due 01/17/2048 | | | 1,400,000 | | | | 1,312,209 | |
United Mexican States
Senior Notes
4.35% due 01/15/2047 | | | 1,378,000 | | | | 1,250,535 | |
United Mexican States
Senior Bonds
4.75% due 03/08/2044 | | | 1,080,000 | | | | 1,031,940 | |
| | | | | | |
|
|
|
| | | | | | | | 49,725,695 | |
| | | | | | |
|
|
|
Total Foreign Government Obligations | | | | | | | | |
(cost $54,779,918) | | | | | | | 52,088,968 | |
| | | | | | |
|
|
|
U.S. GOVERNMENT AGENCIES — 36.1% | |
Federal Home Loan Mtg. Corp. — 10.8% | |
2.50% due 01/01/2028 | | | 663,716 | | | | 649,489 | |
2.50% due 04/01/2028 | | | 1,415,965 | | | | 1,385,602 | |
2.50% due 03/01/2031 | | | 843,704 | | | | 819,939 | |
2.50% due 10/01/2032 | | | 4,513,583 | | | | 4,385,908 | |
3.00% due 08/01/2027 | | | 282,152 | | | | 281,984 | |
3.00% due 10/01/2042 | | | 1,448,699 | | | | 1,415,342 | |
3.00% due 11/01/2042 | | | 1,173,200 | | | | 1,145,972 | |
3.00% due 02/01/2043 | | | 1,503,932 | | | | 1,458,883 | |
3.00% due 04/01/2043 | | | 1,701,381 | | | | 1,660,354 | |
3.00% due 05/01/2043 | | | 575,844 | | | | 562,048 | |
3.00% due 08/01/2043 | | | 6,037,426 | | | | 5,892,385 | |
3.00% due 07/01/2045 | | | 10,617,262 | | | | 10,311,759 | |
3.00% due 10/01/2045 | | | 6,313,124 | | | | 6,126,325 | |
3.00% due 08/01/2046 | | | 5,931,505 | | | | 5,749,482 | |
3.50% due 01/01/2032 | | | 4,891,161 | | | | 4,952,778 | |
3.50% due 03/01/2042 | | | 4,194,095 | | | | 4,203,649 | |
3.50% due 04/01/2042 | | | 1,767,366 | | | | 1,771,391 | |
3.50% due 08/01/2042 | | | 1,399,770 | | | | 1,402,948 | |
3.50% due 09/01/2043 | | | 1,395,596 | | | | 1,398,775 | |
3.50% due 03/01/2045 | | | 1,244,909 | | | | 1,242,605 | |
3.50% due 07/01/2045 | | | 8,068,957 | | | | 8,047,386 | |
3.50% due 08/01/2045 | | | 2,356,927 | | | | 2,353,720 | |
3.50% due 11/01/2045 | | | 4,456,651 | | | | 4,444,732 | |
3.50% due 01/01/2046 | | | 2,706,699 | | | | 2,699,112 | |
3.50% due 11/01/2047 | | | 13,506,517 | | | | 13,443,002 | |
3.50% due 03/01/2048 | | | 10,231,631 | | | | 10,205,806 | |
4.00% due 03/01/2023 | | | 68,514 | | | | 70,193 | |
4.00% due 09/01/2040 | | | 1,380,395 | | | | 1,418,016 | |
4.00% due 07/01/2044 | | | 96,897 | | | | 98,988 | |
4.00% due 10/01/2045 | | | 3,632,834 | | | | 3,706,871 | |
4.00% due 01/01/2046 | | | 780,836 | | | | 799,792 | |
4.50% due 11/01/2018 | | | 757 | | | | 765 | |
VALIC Company II Core Bond Fund
PORTFOLIO OF INVESTMENTS — August 31, 2018 — (continued)
| | | | | | | | |
| | |
| Security Description | | Principal
Amount | | | Value
(Note 2) | |
| |
U.S. GOVERNMENT AGENCIES (continued) | |
Federal Home Loan Mtg. Corp. (continued) | |
4.50% due 02/01/2019 | | $ | 2,562 | | | $ | 2,587 | |
4.50% due 12/01/2039 | | | 527,703 | | | | 553,149 | |
4.50% due 07/01/2044 | | | 1,350,978 | | | | 1,408,095 | |
4.50% due 09/01/2044 | | | 5,294,230 | | | | 5,507,499 | |
5.00% due 10/01/2033 | | | 1,226 | | | | 1,303 | |
5.00% due 07/01/2040 | | | 578,052 | | | | 614,775 | |
5.00% due 11/01/2043 | | | 3,021,530 | | | | 3,226,700 | |
5.50% due 11/01/2018 | | | 66 | | | | 66 | |
5.50% due 11/01/2032 | | | 8,375 | | | | 9,092 | |
5.50% due 07/01/2034 | | | 26,831 | | | | 29,119 | |
5.50% due 02/01/2035 | | | 36,102 | | | | 38,591 | |
5.50% due 07/01/2035 | | | 1,064 | | | | 1,157 | |
5.50% due 01/01/2036 | | | 180,428 | | | | 196,016 | |
5.50% due 05/01/2037 | | | 31,328 | | | | 33,860 | |
6.00% due 07/01/2035 | | | 82,041 | | | | 88,996 | |
6.00% due 03/01/2040 | | | 153,106 | | | | 169,059 | |
6.50% due 02/01/2036 | | | 12,740 | | | | 14,181 | |
6.50% due 09/01/2036 | | | 318 | | | | 351 | |
6.50% due 05/01/2037 | | | 38,960 | | | | 43,989 | |
Federal Home Loan Mtg. Corp. FRS
3.99% (6 ML+1.49%)
due 02/01/2037 | | | 191,960 | | | | 197,968 | |
4.09% (12 ML+1.88%)
due 11/01/2037 | | | 1,423,004 | | | | 1,498,604 | |
Federal Home Loan Mtg. Corp. REMIC | |
Series 4740, Class BA
3.00% due 09/15/2045(2) | | | 3,905,349 | | | | 3,849,106 | |
Series 4800, Class KG
3.50% due 11/15/2045(2) | | | 4,000,000 | | | | 3,963,733 | |
Series 3820, Class DA
4.00% due 11/15/2035(2) | | | 2,767,968 | | | | 2,790,203 | |
Federal Home Loan Mtg. Corp. REMIC FRS
Series 3572, Class JS
4.74% (6.80%-1 ML)
due 09/15/2039(2)(6)(7) | | | 993,894 | | | | 95,255 | |
Federal Home Loan Mtg. Corp. Structured Agency Credit Risk FRS | | | | | | | | |
Series 2017-HQA1, Class M1
3.26% (1 ML+1.20%)
due 08/25/2029(2) | | | 2,447,198 | | | | 2,463,396 | |
Series 2015-DNA1, Class M2
3.91% (1 ML+1.85%)
due 10/25/2027(2) | | | 908,039 | | | | 924,616 | |
Series 2014-DN1, Class M2
4.26% (1 ML+2.20%)
due 02/25/2024(2) | | | 1,284,831 | | | | 1,320,682 | |
Series 2014-HQ2, Class M2
4.26% (1 ML+2.20%)
due 09/25/2024(2) | | | 3,045,239 | | | | 3,139,782 | |
Series 2015-HQ1, Class M2
4.26% (1 ML+2.20%)
due 03/25/2025(2) | | | 2,949 | | | | 2,958 | |
Series 2015-HQA1, Class M2
4.71% (1 ML+2.65%)
due 03/25/2028(2) | | | 464,826 | | | | 472,628 | |
Series 2016-HQA1, Class M2
4.81% (1 ML+2.75%)
due 09/25/2028(2) | | | 1,043,031 | | | | 1,065,422 | |
Series 2015-HQA2, Class M2
4.86% (1 ML+2.80%)
due 05/25/2028(2) | | | 643,957 | | | | 661,632 | |
| | | | | | |
|
|
|
| | | | | | | | 138,490,571 | |
| | | | | | |
|
|
|
| | | | | | | | |
| | |
| Security Description | | Principal
Amount | | | Value
(Note 2) | |
| |
| | | | | | | | | |
Federal National Mtg. Assoc. — 22.1% | |
Federal National Mtg. Assoc.
2.50% due 02/01/2028 | | $ | 1,424,371 | | | $ | 1,395,700 | |
2.50% due 04/01/2028 | | | 371,608 | | | | 363,893 | |
2.50% due 08/01/2031 | | | 15,145,195 | | | | 14,728,495 | |
2.50% due 01/01/2032 | | | 2,578,520 | | | | 2,507,575 | |
3.00% due 04/01/2027 | | | 1,005,099 | | | | 1,005,196 | |
3.00% due 10/01/2027 | | | 168,354 | | | | 168,371 | |
3.00% due 01/01/2028 | | | 1,439,911 | | | | 1,440,057 | |
3.00% due 10/01/2030 | | | 2,687,969 | | | | 2,681,623 | |
3.00% due 10/01/2032 | | | 11,044,955 | | | | 10,986,575 | |
3.00% due 03/01/2042 | | | 2,885,745 | | | | 2,819,005 | |
3.00% due 12/01/2042 | | | 2,671,245 | | | | 2,609,730 | |
3.00% due 05/01/2043 | | | 3,178,045 | | | | 3,101,844 | |
3.00% due 05/01/2046 | | | 3,763,190 | | | | 3,646,476 | |
3.00% due 08/01/2046 | | | 7,610,087 | | | | 7,385,068 | |
3.00% due 09/01/2046 | | | 1,710,044 | | | | 1,656,566 | |
3.00% due 01/01/2047 | | | 4,265,958 | | | | 4,131,885 | |
3.00% due 02/01/2048 | | | 10,456,741 | | | | 10,127,550 | |
3.50% due 08/01/2026 | | | 1,096,212 | | | | 1,108,706 | |
3.50% due 09/01/2026 | | | 982,576 | | | | 993,851 | |
3.50% due 08/01/2027 | | | 114,905 | | | | 116,215 | |
3.50% due 10/01/2028 | | | 2,320,853 | | | | 2,355,305 | |
3.50% due 03/01/2033 | | | 1,895,036 | | | | 1,917,529 | |
3.50% due 08/01/2033 | | | 5,497,400 | | | | 5,560,052 | |
3.50% due 12/01/2041 | | | 413,806 | | | | 414,786 | |
3.50% due 03/01/2042 | | | 577,626 | | | | 578,994 | |
3.50% due 08/01/2042 | | | 3,914,477 | | | | 3,923,746 | |
3.50% due 09/01/2042 | | | 553,192 | | | | 554,503 | |
3.50% due 02/01/2043 | | | 2,772,582 | | | | 2,786,228 | |
3.50% due 07/01/2045 | | | 1,703,703 | | | | 1,698,248 | |
3.50% due 08/01/2045 | | | 2,350,984 | | | | 2,343,445 | |
3.50% due 09/01/2045 | | | 507,576 | | | | 505,948 | |
3.50% due 10/01/2045 | | | 3,199,073 | | | | 3,188,812 | |
3.50% due 11/01/2045 | | | 7,384,427 | | | | 7,361,912 | |
3.50% due 12/01/2045 | | | 12,656,960 | | | | 12,616,366 | |
3.50% due 02/01/2046 | | | 2,155,544 | | | | 2,148,409 | |
3.50% due 03/01/2046 | | | 10,135,926 | | | | 10,084,691 | |
3.50% due 07/01/2046 | | | 6,628,682 | | | | 6,613,586 | |
3.50% due 01/01/2047 | | | 5,838,681 | | | | 5,812,124 | |
3.50% due 12/01/2047 | | | 6,653,365 | | | | 6,632,474 | |
3.50% due 04/01/2048 | | | 10,967,293 | | | | 10,925,308 | |
4.00% due 11/01/2025 | | | 81,701 | | | | 83,898 | |
4.00% due 09/01/2040 | | | 113,424 | | | | 116,329 | |
4.00% due 10/01/2040 | | | 231,122 | | | | 237,053 | |
4.00% due 12/01/2040 | | | 2,015,428 | | | | 2,066,735 | |
4.00% due 10/01/2041 | | | 1,212,753 | | | | 1,243,940 | |
4.00% due 11/01/2041 | | | 1,305,002 | | | | 1,338,899 | |
4.00% due 01/01/2043 | | | 2,218,569 | | | | 2,279,334 | |
4.00% due 10/01/2043 | | | 2,994,342 | | | | 3,066,604 | |
4.00% due 10/01/2044 | | | 3,870,708 | | | | 3,949,826 | |
4.00% due 02/01/2045 | | | 4,129,842 | | | | 4,234,730 | |
4.00% due 02/01/2046 | | | 2,843,216 | | | | 2,898,091 | |
4.00% due 06/01/2046 | | | 268,081 | | | | 273,189 | |
4.00% due 01/01/2047 | | | 4,698,342 | | | | 4,786,564 | |
4.00% due 05/01/2047 | | | 4,681,150 | | | | 4,768,880 | |
4.00% due 07/01/2047 | | | 16,557,905 | | | | 16,867,372 | |
4.00% due 08/01/2047 | | | 6,929,811 | | | | 7,058,961 | |
4.00% due 06/01/2048 | | | 9,437,628 | | | | 9,645,105 | |
4.50% due 10/01/2024 | | | 359,850 | | | | 372,560 | |
4.50% due 03/01/2025 | | | 532,448 | | | | 551,326 | |
4.50% due 06/01/2039 | | | 154,114 | | | | 160,635 | |
4.50% due 01/01/2040 | | | 368,385 | | | | 383,636 | |
4.50% due 02/01/2040 | | | 1,119,267 | | | | 1,178,780 | |
4.50% due 05/01/2040 | | | 312,073 | | | | 327,914 | |
4.50% due 11/01/2040 | | | 327,465 | | | | 342,688 | |
VALIC Company II Core Bond Fund
PORTFOLIO OF INVESTMENTS — August 31, 2018 — (continued)
| | | | | | | | |
| | |
| Security Description | | Principal
Amount | | | Value
(Note 2) | |
| |
U.S. GOVERNMENT AGENCIES (continued) | |
Federal National Mtg. Assoc. (continued) | |
4.50% due 12/01/2040 | | $ | 304,695 | | | $ | 318,889 | |
4.50% due 05/01/2041 | | | 697,034 | | | | 729,049 | |
4.50% due 03/01/2042 | | | 3,102,269 | | | | 3,242,492 | |
4.50% due 08/01/2045 | | | 8,369,398 | | | | 8,830,925 | |
4.50% due 04/01/2047 | | | 2,074,115 | | | | 2,154,326 | |
4.50% due 11/01/2047 | | | 5,230,156 | | | | 5,432,417 | |
5.00% due 09/01/2018 | | | 23 | | | | 23 | |
5.00% due 10/01/2018 | | | 43 | | | | 44 | |
5.00% due 03/01/2020 | | | 1,242 | | | | 1,276 | |
5.00% due 06/01/2022 | | | 37,091 | | | | 38,239 | |
5.00% due 10/01/2024 | | | 190,076 | | | | 194,833 | |
5.00% due 09/01/2033 | | | 583,363 | | | | 623,553 | |
5.00% due 04/01/2040 | | | 289,109 | | | | 305,859 | |
5.00% due 05/01/2040 | | | 626,018 | | | | 670,668 | |
5.00% due 06/01/2040 | | | 2,825,352 | | | | 3,026,809 | |
5.00% due 07/01/2040 | | | 686,080 | | | | 733,033 | |
5.00% due 02/01/2045 | | | 1,679,787 | | | | 1,798,856 | |
5.50% due 12/01/2029 | | | 150,090 | | | | 160,965 | |
5.50% due 12/01/2033 | | | 30,182 | | | | 32,802 | |
5.50% due 07/01/2037 | | | 32,766 | | | | 35,405 | |
5.50% due 08/01/2037 | | | 1,420,326 | | | | 1,538,635 | |
5.50% due 06/01/2038 | | | 160,632 | | | | 174,021 | |
5.50% due 09/01/2039 | | | 552,683 | | | | 599,356 | |
6.00% due 08/01/2034 | | | 25,577 | | | | 28,204 | |
6.00% due 11/01/2035 | | | 40,900 | | | | 44,578 | |
6.00% due 06/01/2036 | | | 60,814 | | | | 67,188 | |
6.00% due 12/01/2036 | | | 99,687 | | | | 110,079 | |
6.00% due 07/01/2038 | | | 481,923 | | | | 531,963 | |
6.00% due 09/01/2038 | | | 272,034 | | | | 300,439 | |
6.00% due 11/01/2038 | | | 157,033 | | | | 173,488 | |
Federal National Mtg. Assoc. FRS | | | | | | | | |
3.57% (12 ML+1.82%)
due 10/01/2040 | | | 310,688 | | | | 326,582 | |
3.58% (12 ML+1.76%)
due 05/01/2040 | | | 1,332,035 | | | | 1,394,999 | |
3.58% (12 ML+1.83%)
due 10/01/2040 | | | 749,711 | | | | 788,220 | |
3.59% (6 ML+1.54%)
due 09/01/2035 | | | 1,142,506 | | | | 1,182,295 | |
3.75% (12 ML+1.57%)
due 05/01/2037 | | | 268,927 | | | | 281,208 | |
3.91% (12 ML+1.66%)
due 07/01/2039 | | | 913,924 | | | | 957,115 | |
3.94% (1 Yr USTYCR+2.19%)
due 10/01/2035 | | | 1,331,980 | | | | 1,401,751 | |
4.17% (1 Yr USTYCR+2.26%)
due 11/01/2036 | | | 520,302 | | | | 548,374 | |
4.20% (12 ML+1.91%)
due 08/01/2035 | | | 809,894 | | | | 856,357 | |
Federal National Mtg. Assoc. REMIC | |
Series 2017-94, Class DA
3.00% due 06/25/2045(2) | | | 5,890,308 | | | | 5,797,924 | |
Series 2017-100, Class NP
3.00% due 12/25/2047(2) | | | 4,936,986 | | | | 4,749,868 | |
Series 2018-27, Class EA
3.00% due 05/25/2048(2) | | | 4,332,080 | | | | 4,202,782 | |
Fannie Mae Connecticut Avenue Securities FRS | |
Series 2014-C01, Class M1
3.66% (1 ML+1.60%)
due 01/25/2024(2) | | | 234,180 | | | | 235,695 | |
Series 2013-C01, Class M1
4.06% (1 ML+2.00%)
due 10/25/2023(2) | | | 5,069 | | | | 5,082 | |
| | | | | | |
|
|
|
| | | | | | | | 283,856,562 | |
| | | | | | |
|
|
|
| | | | | | | | |
| | |
| Security Description | | Principal
Amount | | | Value
(Note 2) | |
| |
| | | | | | | | | |
Government National Mtg. Assoc. — 3.1% | |
3.00% due 02/20/2045 | | $ | 1,991,808 | | | $ | 1,964,164 | |
3.00% due 05/20/2045 | | | 1,551,486 | | | | 1,523,556 | |
3.00% due 07/20/2045 | | | 388,483 | | | | 381,410 | |
3.00% due 11/20/2045 | | | 3,314,510 | | | | 3,252,787 | |
3.00% due 12/20/2045 | | | 2,643,919 | | | | 2,594,412 | |
3.00% due 09/20/2047 | | | 4,734,676 | | | | 4,634,952 | |
3.50% due 03/20/2045 | | | 1,347,854 | | | | 1,356,332 | |
3.50% due 07/20/2045 | | | 661,703 | | | | 665,865 | |
3.50% due 03/20/2047 | | | 4,289,555 | | | | 4,309,205 | |
4.00% due 03/20/2044 | | | 835,627 | | | | 862,302 | |
4.00% due 07/20/2045 | | | 2,373,138 | | | | 2,448,908 | |
4.00% due 10/20/2045 | | | 862,827 | | | | 890,407 | |
4.00% due 05/20/2048 | | | 4,957,792 | | | | 5,081,917 | |
4.50% due 05/15/2039 | | | 614,126 | | | | 651,681 | |
4.50% due 04/20/2047 | | | 5,517,303 | | | | 5,763,204 | |
5.00% due 05/15/2034 | | | 188,834 | | | | 201,791 | |
5.00% due 01/15/2040 | | | 527,449 | | | | 565,748 | |
5.50% due 12/15/2039 | | | 701,855 | | | | 764,802 | |
6.00% due 10/15/2039 | | | 461,059 | | | | 499,529 | |
7.00% due 09/15/2028 | | | 3,405 | | | | 3,443 | |
Government National Mtg. Assoc. REMIC VRS
Series 2013-118, Class B
2.50% due 10/16/2043(1)(3) | | | 1,700,000 | | | | 1,595,534 | |
| | | | | | |
|
|
|
| | | | | | | | 40,011,949 | |
| | | | | | |
|
|
|
Tennessee Valley Authority — 0.1% | |
1.75% due 10/15/2018 | | | 565,000 | | | | 564,781 | |
| | | | | | |
|
|
|
Total U.S. Government Agencies | | | | | | | | |
(cost $473,755,352) | | | | | | | 462,923,863 | |
| | | | | | |
|
|
|
U.S. GOVERNMENT TREASURIES — 10.5% | |
United States Treasury Bonds — 3.0% | |
2.50% due 02/15/2045 | | | 1,189,000 | | | | 1,078,553 | |
2.50% due 05/15/2046# | | | 1,426,000 | | | | 1,289,137 | |
2.75% due 08/15/2047 | | | 1,300,000 | | | | 1,234,492 | |
3.00% due 05/15/2045 | | | 595,000 | | | | 594,280 | |
3.00% due 11/15/2045 | | | 3,499,000 | | | | 3,494,490 | |
3.00% due 05/15/2047# | | | 13,750,000 | | | | 13,725,293 | |
3.00% due 02/15/2048 | | | 6,785,000 | | | | 6,772,278 | |
3.13% due 11/15/2041 | | | 815,000 | | | | 833,178 | |
3.13% due 02/15/2042 | | | 1,908,000 | | | | 1,950,781 | |
3.13% due 08/15/2044 | | | 310,000 | | | | 316,600 | |
3.13% due 05/15/2048 | | | 1,175,000 | | | | 1,202,310 | |
3.63% due 08/15/2043 | | | 476,000 | | | | 527,523 | |
3.75% due 08/15/2041 | | | 37,000 | | | | 41,665 | |
3.88% due 08/15/2040 | | | 140,000 | | | | 160,295 | |
4.25% due 11/15/2040 | | | 713,000 | | | | 859,806 | |
4.38% due 05/15/2040 | | | 2,990,000 | | | | 3,660,180 | |
4.38% due 05/15/2041 | | | 452,000 | | | | 555,377 | |
4.63% due 02/15/2040 | | | 68,000 | | | | 85,863 | |
5.25% due 11/15/2028 | | | 375,000 | | | | 453,721 | |
| | | | | | |
|
|
|
| | | | | | | | 38,835,822 | |
| | | | | | |
|
|
|
United States Treasury Notes — 7.5% | |
0.13% due 04/15/2019 TIPS(8) | | | 297,872 | | | | 295,529 | |
0.13% due 04/15/2020 TIPS(8) | | | 290,517 | | | | 286,788 | |
1.00% due 06/30/2019 | | | 37,200,000 | | | | 36,778,594 | |
1.38% due 12/31/2018 | | | 476,000 | | | | 474,772 | |
1.38% due 02/28/2019 | | | 3,865,000 | | | | 3,848,091 | |
1.63% due 12/31/2019 | | | 584,000 | | | | 576,905 | |
1.63% due 08/31/2022 | | | 5,000,000 | | | | 4,791,992 | |
1.88% due 01/31/2022 | | | 2,587,000 | | | | 2,516,262 | |
2.00% due 11/15/2021 | | | 238,000 | | | | 232,877 | |
2.00% due 07/31/2022 | | | 492,000 | | | | 478,758 | |
2.00% due 11/15/2026 | | | 7,000,000 | | | | 6,574,258 | |
VALIC Company II Core Bond Fund
PORTFOLIO OF INVESTMENTS — August 31, 2018 — (continued)
| | | | | | | | |
| | |
| Security Description | | Shares/
Principal
Amount | | | Value
(Note 2) | |
| |
U.S. GOVERNMENT TREASURIES (continued) | |
United States Treasury Notes (continued) | |
2.13% due 12/31/2021 | | $ | 473,000 | | | $ | 464,205 | |
2.25% due 12/31/2024 | | | 4,800,000 | | | | 4,650,375 | |
2.25% due 08/15/2027# | | | 4,202,000 | | | | 4,003,062 | |
2.25% due 11/15/2027 | | | 11,770,000 | | | | 11,198,052 | |
2.63% due 06/30/2023 | | | 2,100,000 | | | | 2,089,172 | |
2.75% due 05/31/2023 | | | 1,105,000 | | | | 1,105,734 | |
2.75% due 06/30/2025 | | | 773,000 | | | | 770,373 | |
2.75% due 02/15/2028 | | | 1,250,000 | | | | 1,238,818 | |
2.88% due 04/30/2025 | | | 5,800,000 | | | | 5,826,734 | |
2.88% due 07/31/2025 | | | 4,129,000 | | | | 4,147,387 | |
2.88% due 05/15/2028 | | | 587,000 | | | | 587,688 | |
2.88% due 08/15/2028 | | | 3,050,000 | | | | 3,055,838 | |
3.38% due 11/15/2019 | | | 262,000 | | | | 264,548 | |
| | | | | | |
|
|
|
| | | | | | | | 96,256,812 | |
| | | | | | |
|
|
|
Total U.S. Government Treasuries | | | | | | | | |
(cost $136,655,578) | | | | | | | 135,092,634 | |
| | | | | | |
|
|
|
COMMON STOCKS — 0.0% | |
Television — 0.0% | |
ION Media Networks, Inc.†(4)(5)(9)
(cost $1) | | | 79 | | | | 63,410 | |
| | | | | | |
|
|
|
PREFERRED SECURITIES — 0.1% | |
Electric - Distribution — 0.0% | |
Entergy Louisiana LLC
4.70% | | | 22,875 | | | | 543,053 | |
| | | | | | |
|
|
|
Sovereign Agency — 0.0% | |
Federal Home Loan Mtg. Corp.
Series Z
8.38%† | | | 6,900 | | | | 43,746 | |
| | | | | | |
|
|
|
Telecom Services — 0.1% | |
Qwest Corp.
6.13% | | | 27,125 | | | | 612,211 | |
| | | | | | |
|
|
|
Total Preferred Securities | | | | | | | | |
(cost $1,356,414) | | | | | | | 1,199,010 | |
| | | | | | |
|
|
|
PREFERRED SECURITIES/CAPITAL SECURITIES — 2.5% | |
Banks - Commercial — 0.2% | |
Banco Bilbao Vizcaya Argentaria SA
6.13% due 11/16/2027#(10) | | | 1,000,000 | | | | 882,070 | |
Cooperatieve Rabobank UA
11.00% due 06/30/2019*(10) | | | 958,000 | | | | 1,014,282 | |
| | | | | | |
|
|
|
| | | | | | | | 1,896,352 | |
| | | | | | |
|
|
|
Banks - Money Center — 0.1% | |
BBVA Bancomer SA
5.13% due 01/18/2033* | | | 1,407,000 | | | | 1,285,660 | |
| | | | | | |
|
|
|
Banks - Super Regional — 0.1% | |
Huntington Bancshares, Inc.
Series E
5.70% due 04/15/2023(10) | | | 975,000 | | | | 972,562 | |
Wells Fargo Capital X
5.95% due 12/01/2086 | | | 381,000 | | | | 407,670 | |
| | | | | | |
|
|
|
| | | | | | | | 1,380,232 | |
| | | | | | |
|
|
|
Diversified Banking Institutions — 1.0% | |
BAC Capital Trust XIII VRS
Series F
4.00% due 09/24/2018(3)(10) | | | 794,000 | | | | 678,870 | |
Bank of Nova Scotia
4.65% due 10/12/2022(10) | | | 2,783,000 | | | | 2,584,711 | |
HSBC Holdings PLC
6.00% due 05/22/2027(10) | | | 1,763,000 | | | | 1,707,994 | |
| | | | | | | | |
| | |
| Security Description | |
Principal
Amount | | | Value
(Note 2) | |
| |
| | | | | | | | | |
Diversified Banking Institutions (continued) | |
HSBC Holdings PLC
6.25% due 03/23/2023(10) | | $ | 3,051,000 | | | $ | 3,062,594 | |
JPMorgan Chase & Co.
Series CC
4.63% due 11/01/2022#(10) | | | 2,241,000 | | | | 2,124,785 | |
JPMorgan Chase & Co.
Series U
6.13% due 04/30/2024(10) | | | 1,621,000 | | | | 1,685,840 | |
Royal Bank of Scotland Group PLC
8.00% due 08/10/2025(10) | | | 425,000 | | | | 450,500 | |
Societe Generale SA
7.88% due 12/18/2023*#(10) | | | 993,000 | | | | 1,042,650 | |
| | | | | | |
|
|
|
| | | | | | | | 13,337,944 | |
| | | | | | |
|
|
|
Electric - Integrated — 0.1% | |
Dominion Resources, Inc.
5.75% due 10/01/2054 | | | 695,000 | | | | 724,538 | |
| | | | | | |
|
|
|
Finance - Investment Banker/Broker — 0.0% | |
Lehman Brothers Holdings Capital Trust VII
Escrow Security
0.00%†(4)(5) | | | 148,000 | | | | 15 | |
| | | | | | |
|
|
|
Finance - Other Services — 0.1% | |
National Rural Utilities Cooperative Finance Corp.
4.75% due 04/30/2043 | | | 753,000 | | | | 758,563 | |
| | | | | | |
|
|
|
Food - Dairy Products — 0.0% | |
Land O’Lakes Capital Trust I
7.45% due 03/15/2028* | | | 299,000 | | | | 328,153 | |
| | | | | | |
|
|
|
Insurance - Life/Health — 0.3% | |
Hanwha Life Insurance Co., Ltd.
4.70% due 04/23/2048* | | | 2,462,000 | | | | 2,323,552 | |
Prudential Financial, Inc.
4.50% due 09/15/2047# | | | 574,000 | | | | 533,102 | |
Prudential Financial, Inc.
5.63% due 06/15/2043 | | | 849,000 | | | | 887,825 | |
| | | | | | |
|
|
|
| | | | | | | | 3,744,479 | |
| | | | | | |
|
|
|
Insurance - Multi-line — 0.2% | |
Assurant, Inc.
7.00% due 03/27/2048 | | | 1,791,000 | | | | 1,826,820 | |
MetLife, Inc.
6.40% due 12/15/2066 | | | 970,000 | | | | 1,035,475 | |
| | | | | | |
|
|
|
| | | | | | | | 2,862,295 | |
| | | | | | |
|
|
|
Pipelines — 0.3% | |
Energy Transfer Partners LP
6.25% due 02/15/2023(10) | | | 1,086,000 | | | | 1,050,705 | |
EnLink Midstream Partners LP
6.00% due 12/15/2022(10) | | | 926,000 | | | | 851,142 | |
Enterprise Products Operating LLC
5.25% due 08/16/2077 | | | 682,000 | | | | 644,490 | |
TransCanada Trust
5.30% due 03/15/2077 | | | 707,000 | | | | 677,836 | |
TransCanada Trust
5.63% due 05/20/2075 | | | 452,000 | | | | 449,740 | |
| | | | | | |
|
|
|
| | | | | | | | 3,673,913 | |
| | | | | | |
|
|
|
Tools - Hand Held — 0.1% | |
Stanley Black & Decker, Inc.
5.75% due 12/15/2053 | | | 1,675,000 | | | | 1,677,094 | |
| | | | | | |
|
|
|
Total Preferred Securities/Capital Securities | | | | | |
(cost $32,026,633) | | | | | | | 31,669,238 | |
| | | | | | |
|
|
|
Total Long-Term Investment Securities | | | | | | | | |
(cost $1,271,685,747) | | | | | | | 1,247,637,168 | |
| | | | | | |
|
|
|
VALIC Company II Core Bond Fund
PORTFOLIO OF INVESTMENTS — August 31, 2018 — (continued)
| | | | | | | | |
| | |
| Security Description | | Shares | | | Value
(Note 2) | |
| |
SHORT-TERM INVESTMENT SECURITIES — 3.9% | |
Registered Investment Companies — 3.9% | |
State Street Institutional U.S. Government Money Market Fund, Premier Class
1.87%(11) | | | 34,781,416 | | | $ | 34,781,416 | |
State Street Navigator Securities Lending Government Money Market Portfolio
1.93%(11)(12) | | | 15,226,497 | | | | 15,226,497 | |
| | | | | | |
|
|
|
| | | | | | | | 50,007,913 | |
| | | | | | |
|
|
|
Total Short-Term Investment Securities | | | | | |
(cost $50,007,913) | | | | | | | 50,007,913 | |
| | | | | | |
|
|
|
TOTAL INVESTMENTS | | | | | | | | |
(cost $1,321,693,660)(13) | | | 101.2 | % | | | 1,297,645,081 | |
Liabilities in excess of other assets | | | (1.2 | ) | | | (15,059,326 | ) |
| | |
|
|
| |
|
|
|
NET ASSETS | | | 100.0 | % | | $ | 1,282,585,755 | |
| | |
|
|
| |
|
|
|
| * | Securities exempt from registration under Rule 144A of the Securities Act of 1933. These securities may be sold in transactions exempt from registration, normally to qualified institutional buyers. The Fund has no right to demand registration of these securities. At August 31, 2018, the aggregate value of these securities was $198,485,375 representing 15.5% of net assets. Unless otherwise indicated, these securities are not considered to be illiquid. |
| † | Non-income producing security |
| # | The security or a portion thereof is out on loan (see Note 2). |
| (1) | Commercial Mortgage Backed Security |
| (2) | Collateralized Mortgage Obligation |
| (3) | Certain variable rate securities are not based on a published reference rate and spread but are determined by the issuer or agent and are based on current market conditions. These securities do not indicate a reference rate and spread in their description above. |
| (4) | Securities classified as Level 3 (see Note 2). |
| (5) | Illiquid security. At August 31, 2018, the aggregate value of these securities was $63,555 representing 0.0% of net assets. |
| (7) | Inverse Floating Rate Security that pays interest that varies inversely to changes in the market interest rates. The interest rate shown is the current interest rate at August 31, 2018. |
| (8) | Principal amount of security is adjusted for inflation. |
| (9) | Denotes a restricted security that: (a) cannot be offered for public sale without first being registered, or being able to take advantage of an exemption from registration, under the Securities Act of 1933, as amended (the “1933 Act”); (b) is subject to a contractual restriction on public sales; or (c) is otherwise subject to a restriction on sales by operation of applicable law. Restricted securities are valued pursuant to Note 2. Certain restricted securities held by the Fund may not be sold except in exempt transactions or in a public offering registered under the 1933 Act. The Fund has no right to demand registration of these securities. The risk of investing in certain restricted securities is greater than the risk of investing in the securities of widely held, publicly traded companies. To the extent applicable, lack of a secondary market and resale restrictions may result in the inability of |
| | a Fund to sell a security at a fair price and may substantially delay the sale of the security. In addition, certain restricted securities may exhibit greater price volatility than securities for which secondary markets exist. As of August 31, 2018, the Fund held the following restricted securities: |
| | | | | | | | | | | | | | | | | | | | | | | | |
Description
| | Acquisition
Date
| | | Shares
| | | Acquisition
Cost
| | | Value
| | | Value
Per Share
| | | % of
Net Assets
| |
Common Stocks | | | | | | | | | | | | | | | | | | | | | | | | |
ION Media Networks, Inc. | | | 03/05/2014 | | | | 79 | | | $ | 1 | | | $ | 63,410 | | | $ | 802.66 | | | | 0.00 | % |
| | | | | | | | | | | | | | |
|
|
| | | | | |
|
|
|
| (10) | Perpetual maturity — maturity date reflects the next call date. |
| (11) | The rate shown is the 7-day yield as of August 31, 2018. |
| (12) | At August 31, 2018, the Fund had loaned securities with a total value of $45,353,452. This was secured by collateral of $15,226,497, which was received in cash and subsequently invested in short-term investments currently valued at $15,226,497 as reported in the Portfolio of Investments. Additional collateral of $32,103,415 was received in the form of fixed income pooled securities, which the Fund cannot sell or repledge and accordingly are not reflected in the Fund’s assets and liabilities. |
| | The components of the fixed income pooled securities referenced above are as follows: |
| | | | | | | | |
Securities
| | Coupon Range
| | Maturity Date Range
| | Value as of
August 31, 2018
| |
Federal Home Loan Mtg. Corp. | | zero coupon to 16.29% | | 02/15/2023 to 06/15/2048 | | $ | 8,530,009 | |
Federal National Mtg. Assoc. | | 1.25% to 31.86% | | 07/01/2021 to 08/25/2057 | | | 10,876,001 | |
Government National Mtg. Assoc. | | 3.47% to 18.11% | | 03/20/2043 to 07/20/2048 | | | 148,533 | |
United States Treasury Notes/Bonds | | 0.13% to 8.13% | | 01/15/2019 to 05/15/2048 | | | 12,548,872 | |
| (13) | See Note 5 for cost of investments on a tax basis. |
REMIC—Real Estate Mortgage Investment Conduit
TIPS—Treasury Inflation Protected Securities
ULC—Unlimited Liability Corp.
FRS—Floating Rate Security
VRS—Variable Rate Security
The rates shown on FRS and VRS are the current interest rates at August 31, 2018 and unless noted otherwise, the dates are the original maturity dates.
Index Legend
1 ML—1 Month USD LIBOR
6 ML—6 Month USD LIBOR
12 ML—12 Month USD LIBOR
1 Yr USTYCR—1 Year US Treasury Yield Curve Rate
VALIC Company II Core Bond Fund
PORTFOLIO OF INVESTMENTS — August 31, 2018 — (continued)
The following is a summary of the inputs used to value the Fund’s net assets as of August 31, 2018 (see Note 2):
| | | | | | | | | | | | | | | | |
| | | Level 1 - Unadjusted
Quoted Prices
| | | Level 2 - Other
Observable Inputs
| | | Level 3 - Significant
Unobservable Inputs
| | | Total
| |
ASSETS: | | | | | | | | | | | | | | | | |
Investments at Value:* | | | | | | | | | | | | | | | | |
Asset Backed Securities | | $ | — | | | $ | 29,098,522 | | | $ | — | | | $ | 29,098,522 | |
U.S. Corporate Bonds & Notes: | | | | | | | | | | | | | | | | |
Airlines | | | — | | | | 515,802 | | | | 37,587 | | | | 553,389 | |
Finance - Investment Banker/Broker | | | — | | | | 1,350,556 | | | | 41 | | | | 1,350,597 | |
Gambling (Non-Hotel) | | | — | | | | 380,950 | | | | 89 | | | | 381,039 | |
Other Industries | | | — | | | | 409,968,411 | | | | — | | | | 409,968,411 | |
Foreign Corporate Bonds & Notes | | | — | | | | 123,248,087 | | | | — | | | | 123,248,087 | |
Foreign Government Obligations | | | — | | | | 52,088,968 | | | | — | | | | 52,088,968 | |
U.S. Government Agencies | | | — | | | | 462,923,863 | | | | — | | | | 462,923,863 | |
U.S. Government Treasuries | | | — | | | | 135,092,634 | | | | — | | | | 135,092,634 | |
Common Stocks | | | — | | | | — | | | | 63,410 | | | | 63,410 | |
Preferred Securities | | | 1,199,010 | | | | — | | | | — | | | | 1,199,010 | |
Preferred Securities/Capital Securities: | | | | | | | | | | | | | | | | |
Finance - Investment Banker/Broker | | | — | | | | — | | | | 15 | | | | 15 | |
Other Industries | | | — | | | | 31,669,223 | | | | — | | | | 31,669,223 | |
Short-Term Investment Securities | | | 50,007,913 | | | | — | | | | — | | | | 50,007,913 | |
| | |
|
|
| |
|
|
| |
|
|
| |
|
|
|
Total Investments at Value | | $ | 51,206,923 | | | $ | 1,246,337,016 | | | $ | 101,142 | | | $ | 1,297,645,081 | |
| | |
|
|
| |
|
|
| |
|
|
| |
|
|
|
| * | For a detailed presentation of investments, please refer to the Portfolio of Investments. |
The Fund’s policy is to recognize transfers between Levels as of the end of the reporting period. There were no transfers between Levels during the reporting period.
At the beginning and end of the reporting period, Level 3 investments were not considered a material portion of the Fund.
See Notes to Financial Statements
VALIC Company II Government Money Market II Fund
PORTFOLIO PROFILE — August 31, 2018 (unaudited)
Industry Allocation*
| | | | |
U.S. Government Agencies | | | 51.4 | % |
U.S. Government Treasuries | | | 48.8 | |
| | |
|
|
|
| | | | 100.2 | % |
| | |
|
|
|
| |
Credit Quality@# | | | | |
A-1+ | | | 100.0 | % |
| | |
|
|
|
| * | Calculated as a percentage of net assets |
| @ | Source: Standards & Poor’s |
| # | Calculated as a percentage of total debt issues |
Weighted Average days to Maturity—32.8 days
VALIC Company II Government Money Market II Fund
PORTFOLIO OF INVESTMENTS — August 31, 2018
| | | | | | | | |
| | |
| Security Description | | Principal
Amount | | | Value
(Note 2) | |
| |
SHORT-TERM INVESTMENT SECURITIES — 100.2% | |
U.S. Government Agencies — 51.4% | |
Federal Farm Credit Bank
0.85% due 10/25/2018 | | $ | 2,100,000 | | | $ | 2,096,360 | |
Federal Farm Credit Bank FRS
1.92% (1 ML-0.15%)
due 10/11/2018 | | | 8,000,000 | | | | 7,999,977 | |
Federal Home Loan Bank
1.25% due 01/16/2019 | | | 1,200,000 | | | | 1,197,168 | |
1.91% due 09/21/2018 | | | 3,000,000 | | | | 2,996,827 | |
1.93% due 09/20/2018 | | | 4,000,000 | | | | 3,995,926 | |
1.93% due 09/26/2018 | | | 1,800,000 | | | | 1,797,587 | |
1.94% due 09/21/2018 | | | 3,800,000 | | | | 3,795,915 | |
1.96% due 10/05/2018 | | | 1,215,000 | | | | 1,212,751 | |
Federal Home Loan Bank FRS
1.93% (1 ML-0.14%)
due 10/12/2018 | | | 4,000,000 | | | | 3,999,984 | |
1.93% (1 ML-0.14%) due 01/28/2019 | | | 2,000,000 | | | | 2,000,000 | |
1.95% (1 ML-0.13%) due 11/16/2018 | | | 2,000,000 | | | | 1,999,974 | |
1.95% (1 ML-0.12%) due 11/21/2018 | | | 2,000,000 | | | | 2,000,000 | |
2.15% (3 ML-0.16%) due 05/24/2019 | | | 2,000,000 | | | | 2,000,654 | |
Federal Home Loan Mtg. Corp.
0.88% due 10/12/2018 | | | 1,334,000 | | | | 1,332,689 | |
Federal National Mtg. Assoc.
1.13% due 12/14/2018 | | | 1,200,000 | | | | 1,197,701 | |
1.78% due 09/04/2018 | | | 30,800,000 | | | | 30,795,431 | |
| | | | | | |
|
|
|
Total U.S. Government Agencies | | | | | | | | |
(amortized cost $70,418,944) | | | | | | | 70,418,944 | |
| | | | | | |
|
|
|
U.S. Government Treasuries — 48.8% | | | | | | | | |
United States Treasury Bills
1.87% due 09/20/2018 | | | 3,000,000 | | | | 2,997,040 | |
1.89% due 09/06/2018 | | | 13,500,000 | | | | 13,496,470 | |
1.90% due 09/13/2018 | | | 5,400,000 | | | | 5,396,598 | |
1.91% due 10/04/2018 | | | 5,000,000 | | | | 4,991,292 | |
1.92% due 09/06/2018 | | | 5,100,000 | | | | 5,098,651 | |
1.94% due 10/11/2018 | | | 9,600,000 | | | | 9,579,360 | |
1.98% due 10/25/2018 | | | 4,000,000 | | | | 3,988,180 | |
1.98% due 11/01/2018 | | | 3,000,000 | | | | 2,989,960 | |
2.01% due 11/08/2018 | | | 3,000,000 | | | | 2,988,664 | |
2.01% due 11/23/2018 | | | 2,000,000 | | | | 1,990,778 | |
2.05% due 11/23/2018 | | | 2,000,000 | | | | 1,990,612 | |
2.07% due 11/23/2018 | | | 3,000,000 | | | | 2,985,720 | |
2.10% due 12/27/2018 | | | 2,000,000 | | | | 1,986,441 | |
| | | | | | | | |
| | |
| Security Description | | Principal
Amount | | | Value
(Note 2) | |
| |
| | | | | | | | | |
U.S. Government Treasuries (continued) | | | | | | | | |
United States Treasury Notes
1.13% due 01/31/2019 | | $ | 1,800,000 | | | $ | 1,794,140 | |
1.25% due 01/31/2019 | | | 2,000,000 | | | | 1,994,759 | |
1.38% due 12/31/2018 | | | 1,600,000 | | | | 1,597,617 | |
1.50% due 01/31/2019 | | | 1,000,000 | | | | 998,206 | |
| | | | | | |
|
|
|
Total U.S. Government Treasuries | |
(amortized cost $66,864,488) | | | | | | | 66,864,488 | |
| | | | | | |
|
|
|
TOTAL INVESTMENTS | |
(amortized cost $137,283,432)(1) | | | 100.2 | % | | | 137,283,432 | |
Liabilities in excess of other assets | | | (0.2 | ) | | | (296,562 | ) |
| | |
|
|
| |
|
|
|
NET ASSETS | | | 100.0 | % | | $ | 136,986,870 | |
| | |
|
|
| |
|
|
|
| (1) | See Note 5 for cost of investments on a tax basis. |
FRS—Floating Rate Security
The rates shown on FRS are the current interest rates at August 31, 2018 and unless noted otherwise, the dates shown are the original maturity dates.
Index Legend
1 ML—1 Month USD LIBOR
3 ML—3 Month USD LIBOR
The following is a summary of the inputs used to value the Fund’s net assets as of August 31, 2018 (see Note 2):
| | | | | | | | | | | | | | | | |
| | | Level 1 - Unadjusted
Quoted Prices
| | | Level 2 - Other
Observable Inputs
| | | Level 3 - Significant
Unobservable Inputs
| | | Total
| |
ASSETS: | | | | | | | | | | | | | | | | |
Investments at Value:* | | | | | | | | | | | | | | | | |
Short-Term Investment Securities | | $ | — | | | | 137,283,432 | | | $ | — | | | $ | 137,283,432 | |
| | |
|
|
| |
|
|
| |
|
|
| |
|
|
|
| * | For a detailed presentation of investments, please refer to the Portfolio of Investments. |
The Fund’s policy is to recognize transfers between Levels as of the end of the reporting period. There were no transfers between Levels during the reporting period.
See Notes to Financial Statements
VALIC Company II High Yield Bond Fund
PORTFOLIO PROFILE — August 31, 2018 (unaudited)
Industry Allocation*
| | | | |
Registered Investment Companies | | | 5.9 | % |
Oil Companies — Exploration & Production | | | 5.6 | |
Cable/Satellite TV | | | 5.6 | |
Medical — Drugs | | | 4.5 | |
Finance — Consumer Loans | | | 4.3 | |
Repurchase Agreements | | | 3.5 | |
Containers — Paper/Plastic | | | 3.2 | |
Television | | | 3.2 | |
Rental Auto/Equipment | | | 3.1 | |
Cellular Telecom | | | 3.0 | |
Gambling (Non-Hotel) | | | 2.8 | |
Building — Residential/Commercial | | | 2.5 | |
Diversified Banking Institutions | | | 2.5 | |
Coal | | | 2.4 | |
Banks — Commercial | | | 2.4 | |
Casino Hotels | | | 2.2 | |
Medical — Hospitals | | | 2.2 | |
Pipelines | | | 2.1 | |
Food — Misc./Diversified | | | 2.1 | |
Telephone — Integrated | | | 2.1 | |
Security Services | | | 1.6 | |
Data Processing/Management | | | 1.6 | |
Medical Labs & Testing Services | | | 1.3 | |
Retail — Restaurants | | | 1.2 | |
Steel — Producers | | | 1.2 | |
Electronic Components — Semiconductors | | | 1.1 | |
Metal — Aluminum | | | 1.0 | |
Hazardous Waste Disposal | | | 1.0 | |
Enterprise Software/Service | | | 0.9 | |
Insurance Brokers | | | 0.9 | |
Disposable Medical Products | | | 0.9 | |
Metal — Copper | | | 0.8 | |
Real Estate Investment Trusts | | | 0.8 | |
Finance — Other Services | | | 0.8 | |
Electric — Integrated | | | 0.8 | |
Containers — Metal/Glass | | | 0.7 | |
Aerospace/Defense | | | 0.7 | |
Metal Processors & Fabrication | | | 0.7 | |
Casino Services | | | 0.7 | |
Racetracks | | | 0.7 | |
Internet Connectivity Services | | | 0.7 | |
Semiconductor Equipment | | | 0.6 | |
Insurance — Property/Casualty | | | 0.6 | |
Machinery — Material Handling | | | 0.6 | |
Insurance — Multi-line | | | 0.6 | |
Machinery — Construction & Mining | | | 0.6 | |
Soap & Cleaning Preparation | | | 0.5 | |
Commercial Services — Finance | | | 0.5 | |
Transport — Equipment & Leasing | | | 0.5 | |
Banks — Mortgage | | | 0.5 | |
Retail — Leisure Products | | | 0.5 | |
Chemicals — Specialty | | | 0.5 | |
E-Commerce/Services | | | 0.5 | |
Commercial Services | | | 0.5 | |
Textile — Products | | | 0.5 | |
Building Products — Cement | | | 0.5 | |
Building — Heavy Construction | | | 0.5 | |
Broadcast Services/Program | | | 0.5 | |
Metal Products — Fasteners | | | 0.5 | |
Batteries/Battery Systems | | | 0.5 | |
Retail — Propane Distribution | | | 0.5 | |
Internet Content — Entertainment | | | 0.5 | |
Cosmetics & Toiletries | | | 0.5 | |
Building & Construction Products — Misc. | | | 0.4 | |
Office Automation & Equipment | | | 0.4 | |
Oil — Field Services | | | 0.4 | |
Retail — Office Supplies | | | 0.4 | |
Applications Software | | | 0.4 | |
Music | | | 0.4 | |
| | | | |
Computers — Memory Devices | | | 0.4 | |
Financial Guarantee Insurance | | | 0.3 | |
Retail — Pet Food & Supplies | | | 0.3 | |
Medical Information Systems | | | 0.3 | |
Retail — Building Products | | | 0.3 | |
Medical — Generic Drugs | | | 0.3 | |
Theaters | | | 0.3 | |
Finance — Credit Card | | | 0.3 | |
Rubber — Tires | | | 0.3 | |
Gold Mining | | | 0.3 | |
Agricultural Chemicals | | | 0.2 | |
Computer Software | | | 0.2 | |
Machinery — General Industrial | | | 0.2 | |
Non-Hazardous Waste Disposal | | | 0.2 | |
E-Commerce/Products | | | 0.2 | |
Oil Refining & Marketing | | | 0.2 | |
Auto — Cars/Light Trucks | | | 0.1 | |
Medical — Biomedical/Gene | | | 0.1 | |
Funeral Services & Related Items | | | 0.1 | |
Wireless Equipment | | | 0.1 | |
Medical — HMO | | | 0.1 | |
Food — Flour & Grain | | | 0.1 | |
Oil & Gas Drilling | | | 0.1 | |
Building Products — Doors & Windows | | | 0.1 | |
Diamonds/Precious Stones | | | 0.1 | |
| | |
|
|
|
| | | | 104.4 | % |
| | |
|
|
|
Credit Quality†#
| | | | |
Baa | | | 0.5 | % |
Ba | | | 25.2 | |
B | | | 52.6 | |
Caa | | | 16.9 | |
Not Rated@ | | | 4.8 | |
| | |
|
|
|
| | | | 100.0 | % |
| | |
|
|
|
| * | Calculated as a percentage of net assets |
| # | Calculated as a percentage of total debt issues, excluding short-term securities. |
| @ | Represents debt issues that either have no rating, or the rating is unavailable from the data source. |
VALIC Company II High Yield Bond Fund
PORTFOLIO OF INVESTMENTS — August 31, 2018
| | | | | | | | |
| | |
| Security Description | | Principal
Amount(14) | | | Value
(Note 2) | |
| |
CONVERTIBLE BONDS & NOTES — 1.5% | |
Cable/Satellite TV — 0.3% | |
DISH Network Corp.
Senior Notes
3.38% due 08/15/2026 | | $ | 1,520,000 | | | $ | 1,429,717 | |
| | | | | | |
|
|
|
Casino Hotels — 0.2% | |
Caesars Entertainment Corp.
Senior Notes
5.00% due 10/01/2024 | | | 720,000 | | | | 1,174,032 | |
| | | | | | |
|
|
|
Commercial Services - Finance — 0.2% | |
Cardtronics, Inc.
Company Guar. Notes
1.00% due 12/01/2020(1) | | | 1,360,000 | | | | 1,331,950 | |
| | | | | | |
|
|
|
Computers - Memory Devices — 0.4% | |
Western Digital Corp.
Company Guar. Notes
1.50% due 02/01/2024#* | | | 2,015,000 | | | | 1,934,471 | |
| | | | | | |
|
|
|
Electronic Components - Semiconductors — 0.4% | |
Microchip Technology, Inc.
Senior Sub. Notes
1.63% due 02/15/2027 | | | 1,068,000 | | | | 1,212,500 | |
Microchip Technology, Inc.
Junior Sub. Notes
2.25% due 02/15/2037(1) | | | 1,113,000 | | | | 1,268,820 | |
| | | | | | |
|
|
|
| | | | | | | | 2,481,320 | |
| | | | | | |
|
|
|
Oil Companies - Exploration & Production — 0.0% | |
Cobalt International Energy, Inc.
Senior Notes
2.63% due 12/01/2019†#(2)(3) | | | 1,465,000 | | | | 1,904 | |
| | | | | | |
|
|
|
Total Convertible Bonds & Notes | | | | | | | | |
(cost $10,600,133) | | | | | | | 8,353,394 | |
| | | | | | |
|
|
|
U.S. CORPORATE BONDS & NOTES — 66.5% | |
Agricultural Chemicals — 0.2% | |
CF Industries, Inc.
Company Guar. Notes
5.15% due 03/15/2034 | | | 1,403,000 | | | | 1,322,328 | |
| | | | | | |
|
|
|
Auto - Cars/Light Trucks — 0.1% | |
Tesla, Inc.
Company Guar. Notes
5.30% due 08/15/2025#* | | | 1,000,000 | | | | 865,000 | |
| | | | | | |
|
|
|
Banks - Mortgage — 0.5% | |
Freedom Mtg. Corp.
Senior Notes
8.13% due 11/15/2024* | | | 3,045,000 | | | | 2,949,844 | |
| | | | | | |
|
|
|
Broadcast Services/Program — 0.5% | |
Liberty Interactive LLC
Senior Notes
8.25% due 02/01/2030 | | | 2,620,000 | | | | 2,790,300 | |
| | | | | | |
|
|
|
Building & Construction Products - Misc. — 0.4% | |
Standard Industries, Inc.
Senior Notes
5.38% due 11/15/2024* | | | 2,465,000 | | | | 2,468,081 | |
| | | | | | |
|
|
|
Building Products - Cement — 0.5% | |
CEMEX Finance LLC
Senior Sec. Notes
6.00% due 04/01/2024* | | | 2,755,000 | | | | 2,820,459 | |
| | | | | | |
|
|
|
Building Products - Doors & Windows — 0.1% | |
Jeld-Wen, Inc.
Company Guar. Notes
4.63% due 12/15/2025* | | | 170,000 | | | | 158,525 | |
| | | | | | | | |
| | |
| Security Description | | Principal
Amount(14) | | | Value
(Note 2) | |
| |
| | | | | | | | | |
Building Products - Doors & Windows (continued) | |
Jeld-Wen, Inc.
Company Guar. Notes
4.88% due 12/15/2027* | | $ | 270,000 | | | $ | 251,775 | |
| | | | | | |
|
|
|
| | | | | | | | 410,300 | |
| | | | | | |
|
|
|
Building - Heavy Construction — 0.5% | |
Brand Industrial Services, Inc.
Senior Notes
8.50% due 07/15/2025* | | | 2,727,000 | | | | 2,801,992 | |
| | | | | | |
|
|
|
Building - Residential/Commercial — 2.5% | |
AV Homes, Inc.
Company Guar. Notes
6.63% due 05/15/2022 | | | 3,215,000 | | | | 3,287,337 | |
Beazer Homes USA, Inc.
Company Guar. Notes
5.88% due 10/15/2027 | | | 1,560,000 | | | | 1,329,900 | |
Beazer Homes USA, Inc.
Company Guar. Notes
6.75% due 03/15/2025 | | | 1,145,000 | | | | 1,070,575 | |
KB Home
Company Guar. Notes
7.00% due 12/15/2021 | | | 2,905,000 | | | | 3,057,513 | |
KB Home
Company Guar. Notes
8.00% due 03/15/2020 | | | 1,461,000 | | | | 1,545,008 | |
M/I Homes, Inc.
Company Guar. Notes
5.63% due 08/01/2025 | | | 690,000 | | | | 646,875 | |
M/I Homes, Inc.
Company Guar. Notes
6.75% due 01/15/2021 | | | 3,295,000 | | | | 3,368,742 | |
| | | | | | |
|
|
|
| | | | | | | | 14,305,950 | |
| | | | | | |
|
|
|
Cable/Satellite TV — 3.9% | |
CCO Holdings LLC/CCO Holdings Capital Corp.
Senior Notes
5.13% due 02/15/2023 | | | 150,000 | | | | 150,188 | |
CCO Holdings LLC/CCO Holdings Capital Corp.
Senior Notes
5.13% due 05/01/2023* | | | 3,695,000 | | | | 3,695,000 | |
CCO Holdings LLC/CCO Holdings Capital Corp.
Senior Notes
5.75% due 09/01/2023 | | | 715,000 | | | | 727,512 | |
CCO Holdings LLC/CCO Holdings Capital Corp.
Senior Notes
5.75% due 01/15/2024 | | | 360,000 | | | | 366,239 | |
CCO Holdings LLC/CCO Holdings Capital Corp.
Senior Notes
5.75% due 02/15/2026* | | | 3,740,000 | | | | 3,740,000 | |
CCO Holdings LLC/CCO Holdings Capital Corp.
Senior Notes
5.88% due 04/01/2024* | | | 1,490,000 | | | | 1,519,800 | |
Cequel Communications Holdings I LLC/Cequel Capital Corp.
Senior Notes
5.13% due 12/15/2021* | | | 1,730,000 | | | | 1,727,820 | |
CSC Holdings LLC
Senior Notes
5.25% due 06/01/2024 | | | 1,900,000 | | | | 1,843,000 | |
CSC Holdings LLC
Senior Notes
10.88% due 10/15/2025* | | | 886,000 | | | | 1,031,082 | |
DISH DBS Corp.
Company Guar. Notes
5.00% due 03/15/2023# | | | 1,695,000 | | | | 1,508,550 | |
VALIC Company II High Yield Bond Fund
PORTFOLIO OF INVESTMENTS — August 31, 2018 — (continued)
| | | | | | | | |
| | |
| Security Description | | Principal
Amount(14) | | | Value
(Note 2) | |
| |
U.S. CORPORATE BONDS & NOTES (continued) | |
Cable/Satellite TV (continued) | |
DISH DBS Corp.
Company Guar. Notes
6.75% due 06/01/2021 | | $ | 5,951,000 | | | $ | 6,040,265 | |
| | | | | | |
|
|
|
| | | | | | | | 22,349,456 | |
| | | | | | |
|
|
|
Casino Hotels — 2.0% | |
Boyd Gaming Corp.
Company Guar. Notes
6.00% due 08/15/2026 | | | 960,000 | | | | 967,200 | |
Boyd Gaming Corp.
Company Guar. Notes
6.38% due 04/01/2026 | | | 2,695,000 | | | | 2,759,006 | |
Jack Ohio Finance LLC/Jack Ohio Finance 1 Corp.
Senior Sec. Notes
6.75% due 11/15/2021* | | | 3,015,000 | | | | 3,120,525 | |
Station Casinos LLC
Company Guar. Notes
5.00% due 10/01/2025* | | | 2,125,000 | | | | 2,053,281 | |
Sugarhouse HSP Gaming Prop Mezz LP/Sugarhouse HSP Gaming Finance Corp.
Senior Sec. Notes
5.88% due 05/15/2025* | | | 3,020,000 | | | | 2,819,925 | |
| | | | | | |
|
|
|
| | | | | | | | 11,719,937 | |
| | | | | | |
|
|
|
Casino Services — 0.7% | |
Eldorado Resorts, Inc.
Company Guar. Notes
6.00% due 04/01/2025# | | | 2,695,000 | | | | 2,738,794 | |
Rivers Pittsburgh Borrower LP/Rivers Pittsburgh Finance Corp.
Senior Sec. Notes
6.13% due 08/15/2021* | | | 1,300,000 | | | | 1,300,000 | |
| | | | | | |
|
|
|
| | | | | | | | 4,038,794 | |
| | | | | | |
|
|
|
Cellular Telecom — 3.0% | |
Sprint Corp.
Company Guar. Notes
7.13% due 06/15/2024 | | | 4,544,000 | | | | 4,714,400 | |
Sprint Corp.
Company Guar. Notes
7.25% due 09/15/2021 | | | 4,340,000 | | | | 4,550,229 | |
Sprint Corp.
Company Guar. Notes
7.63% due 02/15/2025 | | | 2,415,000 | | | | 2,562,919 | |
Sprint Corp.
Company Guar. Notes
7.88% due 09/15/2023 | | | 5,051,000 | | | | 5,436,139 | |
| | | | | | |
|
|
|
| | | | | | | | 17,263,687 | |
| | | | | | |
|
|
|
Chemicals - Specialty — 0.5% | |
Chemours Co.
Company Guar. Notes
6.63% due 05/15/2023 | | | 2,260,000 | | | | 2,367,350 | |
Chemours Co.
Company Guar. Notes
7.00% due 05/15/2025 | | | 455,000 | | | | 485,712 | |
| | | | | | |
|
|
|
| | | | | | | | 2,853,062 | |
| | | | | | |
|
|
|
Coal — 2.4% | |
Cloud Peak Energy Resources LLC/Cloud Peak Energy Finance Corp.
Sec. Notes
12.00% due 11/01/2021(1) | | | 2,605,000 | | | | 2,631,050 | |
Foresight Energy LLC/Foresight Energy Finance Corp.
Sec. Notes
11.50% due 04/01/2023*(1) | | | 4,270,000 | | | | 3,789,625 | |
| | | | | | | | |
| | |
| Security Description | | Principal
Amount(14) | | | Value
(Note 2) | |
| |
| | | | | | | | | |
Coal (continued) | |
Peabody Energy Corp.
Senior Sec. Notes
6.38% due 03/31/2025#* | | $ | 4,660,000 | | | $ | 4,724,075 | |
Warrior Met Coal, Inc.
Senior Sec. Notes
8.00% due 11/01/2024* | | | 2,835,000 | | | | 2,920,050 | |
| | | | | | |
|
|
|
| | | | | | | | 14,064,800 | |
| | | | | | |
|
|
|
Commercial Services - Finance — 0.1% | |
ACE Cash Express, Inc.
Senior Sec. Notes
12.00% due 12/15/2022* | | | 689,000 | | | | 736,865 | |
| | | | | | |
|
|
|
Containers - Paper/Plastic — 3.2% | |
Berry Plastics Corp.
Sec. Notes
6.00% due 10/15/2022 | | | 2,760,000 | | | | 2,839,350 | |
Crown Americas LLC/Crown Americas Capital Corp. VI
Company Guar. Notes
4.75% due 02/01/2026#* | | | 2,005,000 | | | | 1,924,800 | |
Flex Acquisition Co, Inc.
Senior Notes
6.88% due 01/15/2025* | | | 3,720,000 | | | | 3,580,500 | |
Flex Acquisition Co., Inc.
Senior Notes
7.88% due 07/15/2026* | | | 1,340,000 | | | | 1,341,675 | |
Multi-Color Corp.
Company Guar. Notes
4.88% due 11/01/2025* | | | 2,835,000 | | | | 2,643,637 | |
Plastipak Holdings, Inc.
Senior Notes
6.25% due 10/15/2025* | | | 810,000 | | | | 746,213 | |
Reynolds Group Issuer, Inc./Reynolds Group Issuer LLC
Senior Sec. Notes
5.13% due 07/15/2023* | | | 3,080,000 | | | | 3,068,450 | |
Reynolds Group Issuer, Inc./Reynolds Group Issuer LLC
Company Guar. Notes
7.00% due 07/15/2024* | | | 2,320,000 | | | | 2,357,120 | |
| | | | | | |
|
|
|
| | | | | | | | 18,501,745 | |
| | | | | | |
|
|
|
Cosmetics & Toiletries — 0.5% | |
Revlon Consumer Products Corp.
Company Guar. Notes
6.25% due 08/01/2024 | | | 4,530,000 | | | | 2,627,400 | |
| | | | | | |
|
|
|
Data Processing/Management — 1.6% | |
First Data Corp.
Senior Sec. Notes
5.38% due 08/15/2023* | | | 3,305,000 | | | | 3,363,333 | |
First Data Corp.
Sec. Notes
5.75% due 01/15/2024* | | | 2,415,000 | | | | 2,463,300 | |
First Data Corp.
Company Guar. Notes
7.00% due 12/01/2023* | | | 3,245,000 | | | | 3,376,423 | |
| | | | | | |
|
|
|
| | | | | | | | 9,203,056 | |
| | | | | | |
|
|
|
Disposable Medical Products — 0.9% | |
Sotera Health Holdings LLC
Senior Notes
6.50% due 05/15/2023* | | | 5,015,000 | | | | 5,162,441 | |
| | | | | | |
|
|
|
Electric - Integrated — 0.8% | |
AES Corp.
Senior Notes
5.13% due 09/01/2027 | | | 4,355,000 | | | | 4,398,550 | |
VALIC Company II High Yield Bond Fund
PORTFOLIO OF INVESTMENTS — August 31, 2018 — (continued)
| | | | | | | | |
| | |
| Security Description | | Principal
Amount(14) | | | Value
(Note 2) | |
| |
U.S. CORPORATE BONDS & NOTES (continued) | |
Electric - Integrated (continued) | |
Texas Competitive Electric Holdings Co. LLC/TCEH Finance, Inc.
Escrow Notes
11.50% due 10/01/2020†(1) | | $ | 5,553,748 | | | $ | 55,537 | |
| | | | | | |
|
|
|
| | | | | | | | 4,454,087 | |
| | | | | | |
|
|
|
Electronic Components - Semiconductors — 0.5% | |
Micron Technology, Inc.
Senior Notes
5.50% due 02/01/2025 | | | 2,800,000 | | | | 2,897,720 | |
| | | | | | |
|
|
|
Enterprise Software/Service — 0.9% | |
Infor Software Parent LLC/Infor Software Parent, Inc.
Senior Notes
7.13% due 05/01/2021*(4) | | | 595,000 | | | | 600,396 | |
Infor US, Inc.
Senior Sec. Notes
5.75% due 08/15/2020* | | | 165,000 | | | | 167,475 | |
Infor US, Inc.
Company Guar. Notes
6.50% due 05/15/2022 | | | 4,478,000 | | | | 4,536,080 | |
| | | | | | |
|
|
|
| | | | | | | | 5,303,951 | |
| | | | | | |
|
|
|
Finance - Consumer Loans — 3.8% | |
Navient Corp.
Senior Notes
5.88% due 10/25/2024# | | | 4,481,000 | | | | 4,335,367 | |
Navient Corp.
Senior Notes
6.50% due 06/15/2022 | | | 2,629,000 | | | | 2,718,517 | |
SLM Corp.
Senior Notes
5.50% due 01/25/2023 | | | 1,707,000 | | | | 1,687,779 | |
SLM Corp.
Senior Notes
5.63% due 08/01/2033 | | | 350,000 | | | | 294,000 | |
SLM Corp.
Senior Notes
6.13% due 03/25/2024 | | | 3,270,000 | | | | 3,245,475 | |
Springleaf Finance Corp.
Company Guar. Notes
5.25% due 12/15/2019 | | | 970,000 | | | | 983,338 | |
Springleaf Finance Corp.
Company Guar. Notes
6.13% due 05/15/2022 | | | 165,000 | | | | 169,538 | |
Springleaf Finance Corp.
Company Guar. Notes
6.88% due 03/15/2025 | | | 1,120,000 | | | | 1,120,336 | |
Springleaf Finance Corp.
Company Guar. Notes
7.13% due 03/15/2026 | | | 2,710,000 | | | | 2,696,640 | |
Springleaf Finance Corp.
Company Guar. Notes
7.75% due 10/01/2021 | | | 2,585,000 | | | | 2,791,800 | |
Springleaf Finance Corp.
Company Guar. Notes
8.25% due 12/15/2020 | | | 1,845,000 | | | | 1,994,906 | |
| | | | | | |
|
|
|
| | | | | | | | 22,037,696 | |
| | | | | | |
|
|
|
Finance - Other Services — 0.8% | |
Tempo Acquisition LLC/Tempo Acquisition Finance Corp.
Senior Notes
6.75% due 06/01/2025* | | | 4,240,000 | | | | 4,123,400 | |
| | | | | | | | |
| | |
| Security Description | | Principal
Amount(14) | | | Value
(Note 2) | |
| |
| | | | | | | | | |
Finance - Other Services (continued) | |
Vantiv LLC/Vanity Issuer Corp.
Company Guar. Notes
4.38% due 11/15/2025* | | $ | 550,000 | | | $ | 523,875 | |
| | | | | | |
|
|
|
| | | | | | | | 4,647,275 | |
| | | | | | |
|
|
|
Financial Guarantee Insurance — 0.3% | |
MGIC Investment Corp.
Senior Notes
5.75% due 08/15/2023 | | | 680,000 | | | | 711,212 | |
Radian Group, Inc.
Senior Notes
4.50% due 10/01/2024 | | | 1,270,000 | | | | 1,250,950 | |
| | | | | | |
|
|
|
| | | | | | | | 1,962,162 | |
| | | | | | |
|
|
|
Food - Misc./Diversified — 2.1% | |
Post Holdings, Inc.
Company Guar. Notes
5.00% due 08/15/2026* | | | 4,040,000 | | | | 3,878,400 | |
Post Holdings, Inc.
Company Guar. Notes
5.63% due 01/15/2028* | | | 2,974,000 | | | | 2,873,627 | |
Post Holdings, Inc.
Company Guar. Notes
5.75% due 03/01/2027* | | | 1,440,000 | | | | 1,422,000 | |
TreeHouse Foods, Inc.
Company Guar. Notes
4.88% due 03/15/2022 | | | 2,405,000 | | | | 2,401,994 | |
TreeHouse Foods, Inc.
Company Guar. Notes
6.00% due 02/15/2024#* | | | 1,230,000 | | | | 1,245,375 | |
| | | | | | |
|
|
|
| | | | | | | | 11,821,396 | |
| | | | | | |
|
|
|
Funeral Services & Related Items — 0.1% | |
Service Corp. International
Senior Notes
4.63% due 12/15/2027 | | | 735,000 | | | | 705,600 | |
| | | | | | |
|
|
|
Gambling (Non-Hotel) — 2.2% | |
Caesars Resort Collection LLC/CRC Finco, Inc.
Company Guar. Notes
5.25% due 10/15/2025* | | | 2,075,000 | | | | 1,984,219 | |
Jacobs Entertainment, Inc.
Sec. Notes
7.88% due 02/01/2024* | | | 3,020,000 | | | | 3,186,100 | |
Pinnacle Entertainment, Inc.
Senior Notes
5.63% due 05/01/2024 | | | 3,165,000 | | | | 3,323,250 | |
Scientific Games International, Inc.
Senior Sec. Notes
5.00% due 10/15/2025* | | | 350,000 | | | | 332,500 | |
Scientific Games International, Inc.
Company Guar. Notes
6.63% due 05/15/2021 | | | 2,265,000 | | | | 2,242,350 | |
Scientific Games International, Inc.
Company Guar. Notes
10.00% due 12/01/2022 | | | 1,740,000 | | | | 1,840,224 | |
| | | | | | |
|
|
|
| | | | | | | | 12,908,643 | |
| | | | | | |
|
|
|
Hazardous Waste Disposal — 0.2% | |
Clean Harbors, Inc.
Company Guar. Notes
5.13% due 06/01/2021 | | | 1,320,000 | | | | 1,323,300 | |
| | | | | | |
|
|
|
Insurance Brokers — 0.6% | |
USIS Merger Sub, Inc.
Senior Notes
6.88% due 05/01/2025* | | | 3,495,000 | | | | 3,477,525 | |
| | | | | | |
|
|
|
VALIC Company II High Yield Bond Fund
PORTFOLIO OF INVESTMENTS — August 31, 2018 — (continued)
| | | | | | | | |
| | |
| Security Description | | Principal
Amount(14) | | | Value
(Note 2) | |
| |
U.S. CORPORATE BONDS & NOTES (continued) | |
Insurance - Multi-line — 0.5% | |
Genworth Holdings, Inc.
Company Guar. Notes
4.80% due 02/15/2024 | | $ | 260,000 | | | $ | 231,400 | |
Genworth Holdings, Inc.
Company Guar. Notes
4.90% due 08/15/2023 | | | 1,215,000 | | | | 1,090,462 | |
Genworth Holdings, Inc.
Company Guar. Notes
7.20% due 02/15/2021 | | | 990,000 | | | | 1,022,175 | |
Genworth Holdings, Inc.
Company Guar. Notes
7.63% due 09/24/2021 | | | 539,000 | | | | 557,865 | |
Genworth Holdings, Inc.
Company Guar. Notes
7.70% due 06/15/2020 | | | 86,000 | | | | 89,440 | |
| | | | | | |
|
|
|
| | | | | | | | 2,991,342 | |
| | | | | | |
|
|
|
Internet Connectivity Services — 0.7% | |
Zayo Group LLC/Zayo Capital, Inc.
Company Guar. Notes
6.00% due 04/01/2023 | | | 3,765,000 | | | | 3,880,473 | |
| | | | | | |
|
|
|
Internet Content - Entertainment — 0.5% | |
Netflix, Inc.
Senior Notes
5.88% due 02/15/2025 | | | 2,570,000 | | | | 2,653,525 | |
| | | | | | |
|
|
|
Machinery - Construction & Mining — 0.6% | |
BlueLine Rental Finance Corp./BlueLine Rental LLC
Sec. Notes
9.25% due 03/15/2024* | | | 3,165,000 | | | | 3,323,250 | |
| | | | | | |
|
|
|
Machinery - Material Handling — 0.6% | |
Cloud Crane LLC
Sec. Notes
10.13% due 08/01/2024* | | | 3,300,000 | | | | 3,588,750 | |
| | | | | | |
|
|
|
Medical Information Systems — 0.3% | |
Change Healthcare Holdings LLC/Change Healthcare Finance, Inc.
Senior Notes
5.75% due 03/01/2025* | | | 1,890,000 | | | | 1,847,475 | |
| | | | | | |
|
|
|
Medical Labs & Testing Services — 1.0% | |
Catalent Pharma Solutions, Inc.
Company Guar. Notes
4.88% due 01/15/2026* | | | 520,000 | | | | 495,950 | |
Charles River Laboratories International, Inc.
Company Guar. Notes
5.50% due 04/01/2026* | | | 600,000 | | | | 609,000 | |
West Street Merger Sub, Inc.
Senior Notes
6.38% due 09/01/2025* | | | 4,570,000 | | | | 4,478,600 | |
| | | | | | |
|
|
|
| | | | | | | | 5,583,550 | |
| | | | | | |
|
|
|
Medical - Biomedical/Gene — 0.1% | |
Sterigenics-Nordion Topco LLC
Senior Notes
8.13% due 11/01/2021*(4) | | | 745,000 | | | | 752,450 | |
| | | | | | |
|
|
|
Medical - Drugs — 0.0% | |
Valeant Pharmaceuticals International, Inc.
Company Guar. Notes
8.50% due 01/31/2027* | | | 20,000 | | | | 20,550 | |
| | | | | | |
|
|
|
Medical - Generic Drugs — 0.3% | |
Teva Pharmaceutical Finance IV LLC
Company Guar. Notes
2.25% due 03/18/2020 | | | 1,725,000 | | | | 1,684,358 | |
| | | | | | |
|
|
|
| | | | | | | | |
| | |
| Security Description | | Principal
Amount(14) | | | Value
(Note 2) | |
| |
| | | | | | | | | |
Medical - HMO — 0.1% | |
MPH Acquisition Holdings LLC
Company Guar. Notes
7.13% due 06/01/2024* | | $ | 540,000 | | | $ | 558,900 | |
| | | | | | |
|
|
|
Medical - Hospitals — 2.2% | |
Amsurg Corp.
Company Guar. Notes
5.63% due 07/15/2022 | | | 2,075,000 | | | | 2,126,875 | |
Envision Healthcare Corp.
Company Guar. Notes
5.13% due 07/01/2022* | | | 690,000 | | | | 700,350 | |
HCA Healthcare, Inc.
Senior Notes
6.25% due 02/15/2021 | | | 5,000,000 | | | | 5,225,000 | |
HCA, Inc.
Company Guar. Notes
5.38% due 02/01/2025 | | | 2,140,000 | | | | 2,164,460 | |
HCA, Inc.
Company Guar. Notes
5.38% due 09/01/2026 | | | 420,000 | | | | 422,100 | |
HCA, Inc.
Company Guar. Notes
7.50% due 11/15/2095 | | | 1,820,000 | | | | 1,783,600 | |
| | | | | | |
|
|
|
| | | | | | | | 12,422,385 | |
| | | | | | |
|
|
|
Metal Processors & Fabrication — 0.7% | |
Novelis Corp.
Company Guar. Notes
5.88% due 09/30/2026* | | | 1,145,000 | | | | 1,115,001 | |
Novelis Corp.
Company Guar. Notes
6.25% due 08/15/2024* | | | 2,920,000 | | | | 2,956,500 | |
| | | | | | |
|
|
|
| | | | | | | | 4,071,501 | |
| | | | | | |
|
|
|
Metal Products - Fasteners — 0.5% | |
TriMas Corp.
Company Guar. Notes
4.88% due 10/15/2025* | | | 2,825,000 | | | | 2,719,062 | |
| | | | | | |
|
|
|
Metal - Aluminum — 0.3% | |
Kaiser Aluminum Corp.
Company Guar. Notes
5.88% due 05/15/2024 | | | 1,940,000 | | | | 1,988,500 | |
| | | | | | |
|
|
|
Music — 0.4% | |
WMG Acquisition Corp.
Senior Sec. Notes
5.00% due 08/01/2023* | | | 555,000 | | | | 550,838 | |
WMG Acquisition Corp.
Company Guar. Notes
5.50% due 04/15/2026* | | | 1,578,000 | | | | 1,550,385 | |
| | | | | | |
|
|
|
| | | | | | | | 2,101,223 | |
| | | | | | |
|
|
|
Non-Hazardous Waste Disposal — 0.2% | |
Waste Pro USA, Inc.
Senior Notes
5.50% due 02/15/2026* | | | 1,095,000 | | | | 1,056,675 | |
| | | | | | |
|
|
|
Office Automation & Equipment — 0.4% | |
CDW LLC/CDW Finance Corp.
Company Guar. Notes
5.00% due 09/01/2023 | | | 1,410,000 | | | | 1,438,200 | |
Pitney Bowes, Inc.
Senior Notes
4.63% due 03/15/2024# | | | 570,000 | | | | 511,119 | |
VALIC Company II High Yield Bond Fund
PORTFOLIO OF INVESTMENTS — August 31, 2018 — (continued)
| | | | | | | | |
| | |
| Security Description | | Principal
Amount(14) | | | Value
(Note 2) | |
| |
U.S. CORPORATE BONDS & NOTES (continued) | |
Office Automation & Equipment (continued) | |
Pitney Bowes, Inc.
Senior Notes
4.70% due 04/01/2023 | | $ | 540,000 | | | $ | 481,950 | |
| | | | | | |
|
|
|
| | | | | | | | 2,431,269 | |
| | | | | | |
|
|
|
Oil Companies - Exploration & Production — 4.6% | |
California Resources Corp.
Sec. Notes
8.00% due 12/15/2022#* | | | 2,090,000 | | | | 1,873,162 | |
Continental Resources, Inc.
Company Guar. Notes
3.80% due 06/01/2024 | | | 665,000 | | | | 654,906 | |
Continental Resources, Inc.
Company Guar. Notes
4.50% due 04/15/2023 | | | 415,000 | | | | 424,591 | |
Continental Resources, Inc.
Company Guar. Notes
5.00% due 09/15/2022 | | | 425,000 | | | | 430,266 | |
Energen Corp.
Senior Notes
4.63% due 09/01/2021 | | | 2,170,000 | | | | 2,191,700 | |
Jagged Peak Energy LLC
Company Guar. Notes
5.88% due 05/01/2026* | | | 1,575,000 | | | | 1,551,375 | |
Laredo Petroleum, Inc.
Company Guar. Notes
5.63% due 01/15/2022 | | | 3,216,000 | | | | 3,207,960 | |
QEP Resources, Inc.
Senior Notes
5.25% due 05/01/2023 | | | 2,516,000 | | | | 2,453,100 | |
QEP Resources, Inc.
Senior Notes
5.38% due 10/01/2022 | | | 206,000 | | | | 207,092 | |
QEP Resources, Inc.
Senior Notes
5.63% due 03/01/2026# | | | 900,000 | | | | 860,625 | |
QEP Resources, Inc.
Senior Notes
6.80% due 03/01/2020 | | | 245,000 | | | | 256,025 | |
SM Energy Co.
Senior Notes
5.00% due 01/15/2024# | | | 3,150,000 | | | | 3,055,500 | |
SM Energy Co.
Senior Notes
6.13% due 11/15/2022# | | | 365,000 | | | | 375,494 | |
SM Energy Co.
Senior Notes
6.63% due 01/15/2027# | | | 1,275,000 | | | | 1,314,895 | |
Vine Oil & Gas LP / Vine Oil & Gas Finance Corp.
Company Guar. Notes
8.75% due 04/15/2023#* | | | 3,410,000 | | | | 3,294,912 | |
WPX Energy, Inc.
Senior Notes
5.25% due 09/15/2024 | | | 1,420,000 | | | | 1,430,650 | |
WPX Energy, Inc.
Senior Notes
5.75% due 06/01/2026 | | | 740,000 | | | | 746,475 | |
WPX Energy, Inc.
Senior Notes
6.00% due 01/15/2022 | | | 841,000 | | | | 868,333 | |
WPX Energy, Inc.
Senior Notes
8.25% due 08/01/2023 | | | 970,000 | | | | 1,100,950 | |
| | | | | | |
|
|
|
| | | | | | | | 26,298,011 | |
| | | | | | |
|
|
|
| | | | | | | | |
| | |
| Security Description | | Principal
Amount(14) | | | Value
(Note 2) | |
| |
| | | | | | | | | |
Oil Refining & Marketing — 0.2% | |
Sunoco LP/Sunoco Finance Corp.
Company Guar. Notes
5.50% due 02/15/2026* | | $ | 600,000 | | | $ | 574,500 | |
Sunoco LP/Sunoco Finance Corp.
Company Guar. Notes
5.88% due 03/15/2028* | | | 375,000 | | | | 359,063 | |
| | | | | | |
|
|
|
| | | | | | | | 933,563 | |
| | | | | | |
|
|
|
Pipelines — 2.1% | |
Blue Racer Midstream LLC/Blue Racer Finance Corp.
Company Guar. Notes
6.13% due 11/15/2022* | | | 4,060,000 | | | | 4,141,119 | |
Cheniere Corpus Christi Holdings LLC
Senior Sec. Notes
5.13% due 06/30/2027 | | | 985,000 | | | | 1,002,238 | |
Energy Transfer Equity LP
Senior Sec. Notes
5.50% due 06/01/2027 | | | 3,605,000 | | | | 3,780,744 | |
Energy Transfer Equity LP
Senior Sec. Notes
7.50% due 10/15/2020 | | | 1,350,000 | | | | 1,452,937 | |
Targa Resources Partners LP/Targa Resources Partners Finance Corp.
Company Guar. Notes
6.75% due 03/15/2024 | | | 1,650,000 | | | | 1,732,500 | |
| | | | | | |
|
|
|
| | | | | | | | 12,109,538 | |
| | | | | | |
|
|
|
Racetracks — 0.7% | |
Penn National Gaming, Inc.
Senior Notes
5.63% due 01/15/2027* | | | 4,135,000 | | | | 3,983,121 | |
| | | | | | |
|
|
|
Real Estate Investment Trusts — 0.8% | |
FelCor Lodging LP
Company Guar. Notes
6.00% due 06/01/2025 | | | 4,525,000 | | | | 4,672,062 | |
| | | | | | |
|
|
|
Rental Auto/Equipment — 3.1% | |
Avis Budget Car Rental LLC/Avis Budget Finance, Inc.
Company Guar. Notes
5.25% due 03/15/2025* | | | 4,290,000 | | | | 4,021,875 | |
Avis Budget Car Rental LLC/Avis Budget Finance, Inc.
Company Guar. Notes
5.50% due 04/01/2023# | | | 2,060,000 | | | | 2,049,700 | |
Herc Rentals, Inc.
Sec. Notes
7.50% due 06/01/2022* | | | 1,372,000 | | | | 1,435,455 | |
Herc Rentals, Inc.
Sec. Notes
7.75% due 06/01/2024#* | | | 2,114,000 | | | | 2,279,844 | |
United Rentals North America, Inc.
Company Guar. Notes
4.63% due 10/15/2025 | | | 970,000 | | | | 948,175 | |
United Rentals North America, Inc.
Company Guar. Notes
4.88% due 01/15/2028 | | | 6,370,000 | | | | 6,071,406 | |
United Rentals North America, Inc.
Company Guar. Notes
5.88% due 09/15/2026 | | | 1,025,000 | | | | 1,055,750 | |
| | | | | | |
|
|
|
| | | | | | | | 17,862,205 | |
| | | | | | |
|
|
|
Retail - Building Products — 0.3% | |
Beacon Roofing Supply, Inc.
Company Guar. Notes
4.88% due 11/01/2025* | | | 1,995,000 | | | | 1,840,388 | |
| | | | | | |
|
|
|
VALIC Company II High Yield Bond Fund
PORTFOLIO OF INVESTMENTS — August 31, 2018 — (continued)
| | | | | | | | |
| | |
| Security Description | | Principal
Amount(14) | | | Value
(Note 2) | |
| |
U.S. CORPORATE BONDS & NOTES (continued) | |
Retail - Leisure Products — 0.5% | |
Party City Holdings, Inc.
Company Guar. Notes
6.13% due 08/15/2023#* | | $ | 2,830,000 | | | $ | 2,872,450 | |
| | | | | | |
|
|
|
Retail - Office Supplies — 0.4% | |
Staples, Inc.
Company Guar. Notes
8.50% due 09/15/2025#* | | | 2,280,000 | | | | 2,154,372 | |
| | | | | | |
|
|
|
Retail - Pet Food & Supplies — 0.3% | |
PetSmart, Inc.
Senior Sec. Notes
5.88% due 06/01/2025* | | | 2,365,000 | | | | 1,918,606 | |
| | | | | | |
|
|
|
Retail - Propane Distribution — 0.5% | |
Ferrellgas LP/Ferrellgas Finance Corp.
Senior Notes
6.50% due 05/01/2021(1) | | | 513,000 | | | | 469,395 | |
Ferrellgas LP/Ferrellgas Finance Corp.
Senior Notes
6.75% due 01/15/2022(1) | | | 1,271,000 | | | | 1,131,190 | |
Ferrellgas LP/Ferrellgas Finance Corp.
Company Guar. Notes
6.75% due 06/15/2023(1) | | | 1,242,000 | | | | 1,068,120 | |
| | | | | | |
|
|
|
| | | | | | | | 2,668,705 | |
| | | | | | |
|
|
|
Rubber - Tires — 0.3% | |
Goodyear Tire & Rubber Co.
Company Guar. Notes
5.00% due 05/31/2026# | | | 1,640,000 | | | | 1,539,550 | |
| | | | | | |
|
|
|
Rubber/Plastic Products — 0.0% | |
Venture Holdings Co. LLC
Company Guar. Notes
11.00% due 06/01/2007†(1)(3)(5)(6) | | | 50,000 | | | | 0 | |
| | | | | | |
|
|
|
Security Services — 1.1% | |
APX Group, Inc.
Company Guar. Notes
7.63% due 09/01/2023# | | | 2,155,000 | | | | 1,942,194 | |
APX Group, Inc.
Senior Sec. Notes
7.88% due 12/01/2022# | | | 4,390,000 | | | | 4,483,287 | |
| | | | | | |
|
|
|
| | | | | | | | 6,425,481 | |
| | | | | | |
|
|
|
Semiconductor Equipment — 0.1% | |
Entegris, Inc.
Company Guar. Notes
4.63% due 02/10/2026* | | | 890,000 | | | | 857,738 | |
| | | | | | |
|
|
|
Steel - Producers — 1.2% | |
AK Steel Corp.
Company Guar. Notes
7.00% due 03/15/2027# | | | 2,400,000 | | | | 2,274,000 | |
AK Steel Corp.
Company Guar. Notes
7.63% due 10/01/2021 | | | 1,130,000 | | | | 1,152,600 | |
Commercial Metals Co.
Senior Notes
5.75% due 04/15/2026* | | | 1,070,000 | | | | 1,032,550 | |
Steel Dynamics, Inc.
Company Guar. Notes
4.13% due 09/15/2025 | | | 390,000 | | | | 371,475 | |
Steel Dynamics, Inc.
Company Guar. Notes
5.13% due 10/01/2021 | | | 915,000 | | | | 927,810 | |
| | | | | | | | |
| | |
| Security Description | | Principal
Amount(14) | | | Value
(Note 2) | |
| |
| | | | | | | | | |
Steel - Producers (continued) | |
Steel Dynamics, Inc.
Company Guar. Notes
5.50% due 10/01/2024 | | $ | 1,130,000 | | | $ | 1,158,250 | |
| | | | | | |
|
|
|
| | | | | | | | 6,916,685 | |
| | | | | | |
|
|
|
Telephone - Integrated — 1.6% | |
CenturyLink, Inc.
Senior Notes
5.63% due 04/01/2025# | | | 4,100,000 | | | | 4,007,750 | |
CenturyLink, Inc.
Senior Notes
7.50% due 04/01/2024# | | | 890,000 | | | | 952,300 | |
Frontier Communications Corp.
Sec. Notes
8.50% due 04/01/2026* | | | 2,920,000 | | | | 2,747,136 | |
Sprint Capital Corp.
Company Guar. Notes
6.88% due 11/15/2028 | | | 1,240,000 | | | | 1,230,700 | |
| | | | | | |
|
|
|
| | | | | | | | 8,937,886 | |
| | | | | | |
|
|
|
Television — 2.6% | |
Gray Television, Inc.
Company Guar. Notes
5.13% due 10/15/2024* | | | 2,490,000 | | | | 2,440,200 | |
Gray Television, Inc.
Company Guar. Notes
5.88% due 07/15/2026* | | | 1,060,000 | | | | 1,060,000 | |
Sinclair Television Group, Inc.
Company Guar. Notes
5.13% due 02/15/2027#* | | | 1,015,000 | | | | 938,875 | |
Sinclair Television Group, Inc.
Company Guar. Notes
5.88% due 03/15/2026* | | | 1,585,000 | | | | 1,565,187 | |
Sinclair Television Group, Inc.
Company Guar. Notes
6.13% due 10/01/2022 | | | 600,000 | | | | 615,120 | |
TEGNA, Inc.
Company Guar. Notes
4.88% due 09/15/2021* | | | 2,990,000 | | | | 2,997,475 | |
TEGNA, Inc.
Company Guar. Notes
5.13% due 10/15/2019 | | | 2,380,000 | | | | 2,380,000 | |
Tribune Media Co.
Company Guar. Notes
5.88% due 07/15/2022 | | | 3,153,000 | | | | 3,200,295 | |
| | | | | | |
|
|
|
| | | | | | | | 15,197,152 | |
| | | | | | |
|
|
|
Transport - Equipment & Leasing — 0.3% | |
DAE Funding LLC
Company Guar. Notes
4.50% due 08/01/2022* | | | 675,000 | | | | 664,875 | |
DAE Funding LLC
Company Guar. Notes
5.00% due 08/01/2024* | | | 1,345,000 | | | | 1,321,463 | |
| | | | | | |
|
|
|
| | | | | | | | 1,986,338 | |
| | | | | | |
|
|
|
Total U.S. Corporate Bonds & Notes | | | | | | | | |
(cost $384,973,914) | | | | | | | 383,643,941 | |
| | | | | | |
|
|
|
FOREIGN CORPORATE BONDS & NOTES — 17.1% | |
Aerospace/Defense — 0.7% | |
Bombardier, Inc.
Senior Notes
6.13% due 01/15/2023* | | | 4,075,000 | | | | 4,105,563 | |
| | | | | | |
|
|
|
VALIC Company II High Yield Bond Fund
PORTFOLIO OF INVESTMENTS — August 31, 2018 — (continued)
| | | | | | | | |
| | |
| Security Description | | Principal
Amount(14) | | | Value
(Note 2) | |
| |
FOREIGN CORPORATE BONDS & NOTES (continued) | |
Batteries/Battery Systems — 0.5% | |
Energizer Gamma Acquisition BV
Senior Sec. Notes
4.63% due 07/15/2026* | | EUR | 2,255,000 | | | $ | 2,699,366 | |
| | | | | | |
|
|
|
Cable/Satellite TV — 1.4% | |
Altice Financing SA
Senior Sec. Notes
6.63% due 02/15/2023* | | | 600,000 | | | | 603,744 | |
Altice Financing SA
Senior Sec. Notes
7.50% due 05/15/2026* | | | 2,210,000 | | | | 2,110,550 | |
Altice France SA
Senior Sec. Notes
8.13% due 02/01/2027* | | | 2,855,000 | | | | 2,897,825 | |
Altice Luxembourg SA
Company Guar. Notes
7.75% due 05/15/2022#* | | | 910,000 | | | | 877,012 | |
Quebecor Media, Inc.
Senior Notes
5.75% due 01/15/2023 | | | 1,415,000 | | | | 1,464,525 | |
| | | | | | |
|
|
|
| | | | | | | | 7,953,656 | |
| | | | | | |
|
|
|
Computer Software — 0.2% | |
Camelot Finance SA
Senior Notes
7.88% due 10/15/2024#* | | | 1,309,000 | | | | 1,304,091 | |
| | | | | | |
|
|
|
Containers - Metal/Glass — 0.7% | |
ARD Finance SA
Senior Sec. Notes
7.13% due 09/15/2023(4) | | | 2,305,000 | | | | 2,336,694 | |
Ardagh Packaging Finance PLC/Ardagh Holdings USA, Inc.
Company Guar. Notes
7.25% due 05/15/2024* | | | 845,000 | | | | 888,306 | |
OI European Group BV
Company Guar. Notes
4.00% due 03/15/2023* | | | 1,090,000 | | | | 1,034,138 | |
| | | | | | |
|
|
|
| | | | | | | | 4,259,138 | |
| | | | | | |
|
|
|
Diamonds/Precious Stones — 0.1% | |
Northwest Acquisitions ULC/Dominion Finco, Inc.
Sec. Notes
7.13% due 11/01/2022* | | | 355,000 | | | | 362,544 | |
| | | | | | |
|
|
|
Finance - Consumer Loans — 0.5% | |
goeasy, Ltd.
Company Guar. Notes
7.88% due 11/01/2022* | | | 2,885,000 | | | | 3,014,825 | |
| | | | | | |
|
|
|
Gold Mining — 0.3% | |
New Gold, Inc.
Company Guar. Notes
6.25% due 11/15/2022* | | | 160,000 | | | | 142,000 | |
New Gold, Inc.
Company Guar. Notes
6.38% due 05/15/2025#* | | | 1,620,000 | | | | 1,377,000 | |
| | | | | | |
|
|
|
| | | | | | | | 1,519,000 | |
| | | | | | |
|
|
|
Hazardous Waste Disposal — 0.8% | |
Tervita Escrow Corp.
Sec. Notes
7.63% due 12/01/2021* | | | 4,285,000 | | | | 4,440,331 | |
| | | | | | |
|
|
|
Medical - Drugs — 4.5% | |
Endo, Ltd./Endo Finance LLC/Endo Finco, Inc.
Company Guar. Notes
6.00% due 07/15/2023* | | | 3,995,000 | | | | 3,435,700 | |
| | | | | | | | |
| | |
| Security Description | | Principal
Amount(14) | | | Value
(Note 2) | |
| |
| | | | | | | | | |
Medical - Drugs (continued) | |
Endo, Ltd./Endo Finance LLC/Endo Finco, Inc.
Company Guar. Notes
6.00% due 02/01/2025* | | $ | 2,535,000 | | | $ | 2,097,712 | |
Teva Pharmaceutical Finance Netherlands III BV
Company Guar. Notes
3.15% due 10/01/2026 | | | 1,490,000 | | | | 1,235,967 | |
Teva Pharmaceutical Finance Netherlands III BV
Company Guar. Notes
6.75% due 03/01/2028# | | | 1,350,000 | | | | 1,408,592 | |
Valeant Pharmaceuticals International, Inc.
Company Guar. Notes
5.50% due 03/01/2023* | | | 2,990,000 | | | | 2,818,464 | |
Valeant Pharmaceuticals International, Inc.
Company Guar. Notes
5.88% due 05/15/2023* | | | 12,885,000 | | | | 12,318,060 | |
Valeant Pharmaceuticals International, Inc.
Company Guar. Notes
6.13% due 04/15/2025* | | | 2,035,000 | | | | 1,892,550 | |
Valeant Pharmaceuticals International, Inc.
Senior Sec. Notes
7.00% due 03/15/2024* | | | 455,000 | | | | 480,025 | |
Valeant Pharmaceuticals International, Inc.
Company Guar. Notes
9.00% due 12/15/2025* | | | 445,000 | | | | 470,588 | |
| | | | | | |
|
|
|
| | | | | | | | 26,157,658 | |
| | | | | | |
|
|
|
Metal - Aluminum — 0.7% | |
Alcoa Nederland Holding BV
Company Guar. Notes
6.13% due 05/15/2028* | | | 1,400,000 | | | | 1,445,500 | |
Constellium NV
Company Guar. Notes
5.88% due 02/15/2026* | | | 2,870,000 | | | | 2,812,600 | |
| | | | | | |
|
|
|
| | | | | | | | 4,258,100 | |
| | | | | | |
|
|
|
Metal - Copper — 0.8% | |
First Quantum Minerals, Ltd.
Company Guar. Notes
7.00% due 02/15/2021#* | | | 3,585,000 | | | | 3,546,909 | |
First Quantum Minerals, Ltd.
Company Guar. Notes
7.25% due 04/01/2023* | | | 390,000 | | | | 381,225 | |
First Quantum Minerals, Ltd.
Company Guar. Notes
7.50% due 04/01/2025* | | | 850,000 | | | | 818,125 | |
| | | | | | |
|
|
|
| | | | | | | | 4,746,259 | |
| | | | | | |
|
|
|
Oil & Gas Drilling — 0.1% | |
Transocean, Inc.
Company Guar. Notes
9.35% due 12/15/2041(1) | | | 444,000 | | | | 440,670 | |
| | | | | | |
|
|
|
Oil Companies - Exploration & Production — 1.0% | |
MEG Energy Corp.
Company Guar. Notes
6.38% due 01/30/2023* | | | 1,680,000 | | | | 1,524,600 | |
MEG Energy Corp.
Sec. Notes
6.50% due 01/15/2025* | | | 1,490,000 | | | | 1,482,550 | |
MEG Energy Corp.
Company Guar. Notes
7.00% due 03/31/2024* | | | 1,190,000 | | | | 1,079,925 | |
Tullow Oil PLC
Company Guar. Notes
6.25% due 04/15/2022* | | | 1,745,000 | | | | 1,727,550 | |
| | | | | | |
|
|
|
| | | | | | | | 5,814,625 | |
| | | | | | |
|
|
|
VALIC Company II High Yield Bond Fund
PORTFOLIO OF INVESTMENTS — August 31, 2018 — (continued)
| | | | | | | | |
| | |
| Security Description | | Principal
Amount(14) | | | Value
(Note 2) | |
| |
FOREIGN CORPORATE BONDS & NOTES (continued) | |
Oil - Field Services — 0.4% | |
Weatherford International, Ltd.
Company Guar. Notes
5.95% due 04/15/2042(1) | | $ | 640,000 | | | $ | 449,600 | |
Weatherford International, Ltd.
Company Guar. Notes
6.50% due 08/01/2036 | | | 1,700,000 | | | | 1,262,250 | |
Weatherford International, Ltd.
Company Guar. Notes
7.00% due 03/15/2038(1) | | | 640,000 | | | | 486,400 | |
| | | | | | |
|
|
|
| | | | | | | | 2,198,250 | |
| | | | | | |
|
|
|
Retail - Restaurants — 1.2% | |
1011778 B.C. ULC / New Red Finance, Inc.
Sec. Notes
5.00% due 10/15/2025* | | | 7,185,000 | | | | 6,933,525 | |
| | | | | | |
|
|
|
Security Services — 0.5% | |
Garda World Security Corp.
Senior Notes
8.75% due 05/15/2025* | | | 2,855,000 | | | | 2,812,175 | |
| | | | | | |
|
|
|
Semiconductor Equipment — 0.5% | |
Sensata Technologies BV
Company Guar. Notes
5.00% due 10/01/2025* | | | 1,435,000 | | | | 1,431,413 | |
Sensata Technologies BV
Company Guar. Notes
5.63% due 11/01/2024* | | | 1,430,000 | | | | 1,480,050 | |
| | | | | | |
|
|
|
| | | | | | | | 2,911,463 | |
| | | | | | |
|
|
|
Soap & Cleaning Preparation — 0.4% | |
Diamond BC BV
Senior Notes
5.63% due 08/15/2025* | | EUR | 2,385,000 | | | | 2,590,381 | |
| | | | | | |
|
|
|
Special Purpose Entity — 0.0% | |
Hellas Telecommunications Luxembourg II SCA
Sub. Notes
8.46% due 01/15/2015†*(1)(3)(5)(6) | | | 925,000 | | | | 0 | |
| | | | | | |
|
|
|
Telephone - Integrated — 0.5% | |
Telecom Italia SpA
Senior Notes
5.30% due 05/30/2024* | | | 2,890,000 | | | | 2,882,775 | |
| | | | | | |
|
|
|
Television — 0.5% | |
Videotron, Ltd.
Company Guar. Notes
5.00% due 07/15/2022 | | | 2,720,000 | | | | 2,767,600 | |
| | | | | | |
|
|
|
Textile - Products — 0.5% | |
Eagle Intermediate Global Holding BV/Ruyi US Finance LLC
Senior Sec. Notes
7.50% due 05/01/2025* | | | 2,830,000 | | | | 2,822,925 | |
| | | | | | |
|
|
|
Transport - Equipment & Leasing — 0.2% | |
Fly Leasing, Ltd.
Senior Notes
5.25% due 10/15/2024 | | | 1,140,000 | | | | 1,088,700 | |
| | | | | | |
|
|
|
Wireless Equipment — 0.1% | |
Nokia OYJ
Senior Notes
3.38% due 06/12/2022 | | | 290,000 | | | | 283,440 | |
| | | | | | | | |
| | |
| Security Description | | Principal
Amount(14) | | | Value
(Note 2) | |
| |
| | | | | | | | | |
Wireless Equipment (continued) | |
Nokia OYJ
Senior Notes
4.38% due 06/12/2027 | | $ | 305,000 | | | $ | 293,181 | |
| | | | | | |
|
|
|
| | | | | | | | 576,621 | |
| | | | | | |
|
|
|
Total Foreign Corporate Bonds & Notes | | | | | | | | |
(cost $99,707,588) | | | | | | | 98,660,241 | |
| | | | | | |
|
|
|
LOANS(7)(8)(9) — 4.9% | |
Applications Software — 0.4% | |
SS&C European Holdings SARL FRS
BTL-B4
4.33% (1 ML + 2.25%)
due 04/16/2025(1) | | | 488,444 | | | | 488,673 | |
SS&C Technologies, Inc. FRS
BTL-B3
4.33% (1 ML + 2.25%)
due 04/16/2025(1) | | | 1,255,641 | | | | 1,256,230 | |
SS&C Technologies, Inc. FRS
BTL
coupon TBD
due 04/16/2025(1) | | | 365,000 | | | | 365,076 | |
| | | | | | |
|
|
|
| | | | | | | | 2,109,979 | |
| | | | | | |
|
|
|
Building - Residential/Commercial — 0.0% | |
TOUSA, Inc.
Escrow Loans
12.25% due 08/15/2011†(1)(6) | | | 2,037,810 | | | | 0 | |
| | | | | | |
|
|
|
Commercial Services — 0.5% | |
AVSC Holding Corp. FRS
BTL-B
5.42%(2 ML + 3.25%)
due 03/01/2025(1) | | | 788,032 | | | | 784,091 | |
AVSC Holding Corp. FRS
BTL-B
5.59%(3 ML + 3.25%)
due 03/01/2025(1) | | | 2,059,831 | | | | 2,049,532 | |
| | | | | | |
|
|
|
| | | | | | | | 2,833,623 | |
| | | | | | |
|
|
|
Commercial Services - Finance — 0.2% | |
Trans Union LLC FRS
BTL-B4
4.08% (1 ML + 2.00%)
due 06/19/2025(1) | | | 1,330,000 | | | | 1,333,800 | |
| | | | | | |
|
|
|
E-Commerce/Products — 0.2% | |
Lands’ End, Inc. FRS
BTL-B
5.32% (1 ML + 3.25%)
due 04/04/2021(1) | | | 995,123 | | | | 955,318 | |
| | | | | | |
|
|
|
E-Commerce/Services — 0.5% | |
Shutterfly, Inc. FRS
BTL-B2
4.83% (1 ML + 2.75%)
due 08/17/2024(1) | | | 2,830,806 | | | | 2,835,052 | |
| | | | | | |
|
|
|
Electronic Components - Semiconductors — 0.2% | |
Microchip Technology, Inc. FRS
1st Lien
4.08% (1 ML + 2.00%)
due 05/29/2025(1) | | | 1,290,000 | | | | 1,287,313 | |
| | | | | | |
|
|
|
Finance - Credit Card — 0.3% | |
Blackhawk Network Holdings LLC FRS
1st Lien
5.18% (1 ML + 3.00%)
due 06/15/2025(1) | | | 1,575,000 | | | | 1,578,937 | |
| | | | | | |
|
|
|
VALIC Company II High Yield Bond Fund
PORTFOLIO OF INVESTMENTS — August 31, 2018 — (continued)
| | | | | | | | |
| | |
| Security Description | | Shares/
Principal
Amount(14) | | | Value
(Note 2) | |
| |
LOANS(7)(8)(9) (continued) | |
Food - Flour & Grain — 0.1% | |
C.H. Guenther & Son, Inc. FRS
BTL-B
4.83% (1 ML + 2.75%)
due 03/31/2025(1) | | $ | 495,000 | | | $ | 494,691 | |
| | | | | | |
|
|
|
Gambling (Non-Hotel) — 0.6% | |
Golden Entertainment, Inc. FRS
BTL-B
5.08% (1 ML + 3.00%)
due 10/20/2024(1) | | | 3,532,250 | | | | 3,536,665 | |
| | | | | | |
|
|
|
Insurance Brokers — 0.3% | |
HUB International, Ltd. FRS
BTL-B
5.16 %-5.34% (3 ML + 3.00%)
due 04/25/2025(1) | | | 1,710,000 | | | | 1,707,743 | |
| | | | | | |
|
|
|
Insurance - Multi-line — 0.1% | |
Genworth Holdings, Inc. FRS
1st Lien
6.57% (1 ML + 4.50)
due 03/07/2023(1) | | | 349,125 | | | | 356,108 | |
| | | | | | |
|
|
|
Insurance - Property/Casualty — 0.6% | |
Asurion LLC FRS
BTL-B7
5.08% (1 ML + 3.00%)
due 11/03/2024(1) | | | 3,700,000 | | | | 3,707,267 | |
| | | | | | |
|
|
|
Machinery - General Industrial — 0.2% | |
Gardner Denver, Inc. FRS
BTL-B1
4.83% (1 ML + 2.75%)
due 07/30/2024(1) | | | 1,170,598 | | | | 1,174,512 | |
| | | | | | |
|
|
|
Medical Labs & Testing Services — 0.3% | |
Syneos Health, Inc. FRS
BTL-B
4.33% (3 ML + 2.00%)
due 08/01/2024(1) | | | 2,005,219 | | | | 2,003,965 | |
| | | | | | |
|
|
|
Soap & Cleaning Preparation — 0.1% | |
Diamond BC BV FRS
1st Lien
5.08% (2 ML + 3.00%)
due 09/06/2024(1) | | | 860,675 | | | | 842,386 | |
| | | | | | |
|
|
|
Theaters — 0.3% | |
Cineworld, Ltd. FRS
BTL-B
4.58% (1 ML + 2.50%)
due 02/28/2025(1) | | | 1,645,875 | | | | 1,638,788 | |
| | | | | | |
|
|
|
Total Loans | | | | | | | | |
(cost $28,400,111) | | | | | | | 28,396,147 | |
| | | | | | |
|
|
|
COMMON STOCKS — 0.1% | |
Electric - Generation — 0.0% | |
Vistra Energy Corp. CVR†(1)(10) | | | 93,359 | | | | 63,951 | |
| | | | | | |
|
|
|
Multimedia — 0.0% | |
Haights Cross Communication, Inc.(1)(6)(10) | | | 10,439 | | | | 0 | |
| | | | | | |
|
|
|
Television — 0.1% | |
ION Media Networks, Inc.†(1)(6)(10) | | | 616 | | | | 494,436 | |
| | | | | | |
|
|
|
Total Common Stocks | | | | | | | | |
(cost $82,165) | | | | | | | 558,387 | |
| | | | | | |
|
|
|
| | | | | | | | |
| | |
| Security Description | | Shares/
Principal
Amount(14) | | | Value
(Note 2) | |
| |
PREFERRED SECURITIES — 0.2% | |
Diversified Banking Institutions — 0.2% | |
GMAC Capital Trust I FRS
Series 2
8.10% (3 ML + 5.79%)
(cost $800,527) | | | 30,550 | | | $ | 818,740 | |
| | | | | | |
|
|
|
PREFERRED SECURITIES/CAPITAL SECURITIES — 4.7% | |
Banks - Commercial — 2.4% | |
Banco Bilbao Vizcaya Argentaria SA
6.13% due 11/16/2027#(11) | | $ | 4,400,000 | | | | 3,881,108 | |
Banco Bilbao Vizcaya Argentaria SA
7.00% due 02/19/2019(11) | | EUR | 1,000,000 | | | | 1,171,615 | |
Banco Bilbao Vizcaya Argentaria SA
8.88% due 04/14/2021(11) | | EUR | 1,800,000 | | | | 2,308,230 | |
Banco de Sabadell SA
6.50% due 05/18/2022(11) | | EUR | 4,400,000 | | | | 5,170,855 | |
Intesa Sanpaolo SpA
7.70% due 09/17/2025#*(11) | | | 1,435,000 | | | | 1,327,547 | |
| | | | | | |
|
|
|
| | | | | | | | 13,859,355 | |
| | | | | | |
|
|
|
Diversified Banking Institutions — 2.3% | |
BNP Paribas SA
5.13% due 11/15/2027*(11) | | | 1,855,000 | | | | 1,630,081 | |
BNP Paribas SA
7.63% due 03/30/2021*(11) | | | 1,040,000 | | | | 1,105,000 | |
Credit Agricole SA
8.13% due 12/23/2025*(11) | | | 2,520,000 | | | | 2,772,312 | |
Credit Suisse Group AG
6.25% due 12/18/2024(11) | | | 4,435,000 | | | | 4,423,913 | |
Royal Bank of Scotland Group PLC FRS
Series U
4.65% (3 ML + 2.32%)
due 09/30/2027#(11) | | | 1,800,000 | | | | 1,686,600 | |
UniCredit SpA
8.00% due 06/03/2024(11) | | | 1,949,000 | | | | 1,785,440 | |
| | | | | | |
|
|
|
| | | | | | | | 13,403,346 | |
| | | | | | |
|
|
|
Total Preferred Securities/Capital Securities | | | | | | | | |
(cost $27,923,152) | | | | | | | 27,262,701 | |
| | | | | | |
|
|
|
Total Long-Term Investment Securities | | | | | | | | |
(cost $552,487,590) | | | | | | | 547,693,551 | |
| | | | | | |
|
|
|
SHORT-TERM INVESTMENT SECURITIES — 5.9% | |
Registered Investment Companies — 5.9% | |
State Street Navigator Securities Lending Government Money Market Portfolio
1.93%(12)(13)
(cost $33,786,258) | | | 33,786,258 | | | | 33,786,258 | |
| | | | | | |
|
|
|
REPURCHASE AGREEMENTS — 3.5% | |
Fixed Income Clearing Corp., bearing interest at 0.35%, dated 08/31/2018, to be repurchased 09/04/2018 in the Amount of $20,406,794 and collateralized by $18,220,000 of United States Treasury Bonds bearing interest at 3.75%, due 11/15/2043 and have an approximate value of $20,815,348 | | | | | | | | |
(cost $20,406,000) | | $ | 20,406,000 | | | | 20,406,000 | |
| | | | | | |
|
|
|
TOTAL INVESTMENTS | | | | | | | | |
(cost $606,679,848)(15) | | | 104.4 | % | | | 601,885,809 | |
Liabilities in excess of other assets | | | (4.4 | ) | | | (25,332,733 | ) |
| | |
|
|
| |
|
|
|
NET ASSETS | | | 100.0 | % | | $ | 576,553,076 | |
| | |
|
|
| |
|
|
|
VALIC Company II High Yield Bond Fund
PORTFOLIO OF INVESTMENTS — August 31, 2018 — (continued)
| # | The security or a portion thereof is out on loan (see Note 2). |
| * | Securities exempt from registration under Rule 144A of the Securities Act of 1933. These securities may be sold in transactions exempt from registration, normally to qualified institutional buyers. The Fund has no right to demand registration of these securities. At August 31, 2018, the aggregate value of these securities was $267,498,019 representing 46.4% of net assets. Unless otherwise indicated, these securities are not considered to be illiquid. |
| † | Non-income producing security |
| (1) | Illiquid security. At August 31, 2018, the aggregate value of these securities was $42,076,891 representing 7.3% of net assets. |
| (2) | Security in default of interest. |
| (3) | Company has filed for bankruptcy protection. |
| (4) | PIK (“Payment-in-Kind”) security — Income may be paid in additional securities or cash at the discretion of the issuer. The security is currently paying interest in cash at the coupon rate listed. |
| (5) | Security in default of interest and principal at maturity. |
| (6) | Securities classified as Level 3 (see Note 2). |
| (7) | The Fund invests in senior loans which generally pay interest at rates which are periodically re-determined by reference to a base lending rate plus a premium. These base lending rates are generally either the lending rate offered by one or more major European banks, such as the London Inter-Bank Offer Rate (“LIBOR”) or the prime rate offered by one or more major United States banks, or the certificate of deposit rate. Senior loans are generally considered to be restrictive in that the Fund is ordinarily contractually obligated to receive approval from the Agent Bank and/or borrower prior to the disposition of a senior loan. |
| (8) | All loans in the Fund were purchased through assignment agreements unless otherwise indicated. |
| (9) | Senior loans in the Fund are generally subject to mandatory and/or optional prepayment. Because of these mandatory prepayment conditions and because there may be significant economic incentives for a borrower to prepay, prepayments may occur. As a result, the actual remaining maturity may be substantially less than the stated maturities shown. |
| (10) | Denotes a restricted security that: (a) cannot be offered for public sale without first being registered, or being able to take advantage of an exemption from registration, under the Securities Act of 1933, as amended (the “1933 Act”); (b) is subject to a contractual restriction on public sales; or (c) is otherwise subject to a restriction on sales by operation of applicable law. Restricted securities are valued pursuant to Note 2. Certain restricted securities held by the Fund may not be sold except in exempt transactions or in a public offering registered under the 1933 Act. The Fund has no right to demand registration of these securities. The risk of investing in certain restricted securities is greater than the risk of investing in the securities of widely held, publicly traded companies. To the extent applicable, lack of a secondary market and resale restrictions may result in the inability of a Fund to sell a security at a fair price and may substantially delay the sale of the security. In addition, certain restricted securities may exhibit greater price volatility than securities for which secondary markets exist. As of August 31, 2018, the Fund held the following restricted securities: |
| | | | | | | | | | | | | | | | | | | | | | | | |
Description
| | Acquisition
Date
| | | Shares
| | | Acquisition
Cost
| | | Value
| | | Value
Per Share
| | | % of
Net Assets
| |
Common Stocks | | | | | | | | | | | | | | | | | | | | | | | | |
Haights Cross Communications, Inc. | | | 08/07/2003 | | | | 2,983 | | | $ | 23,474 | | | $ | 0.00 | | | $ | 0.00 | | | | 0.00 | % |
| | | | 01/27/2004 | | | | 4,474 | | | | 35,211 | | | | 0.00 | | | | 0.00 | | | | 0.00 | |
| | | | 06/06/2005 | | | | 2,982 | | | | 23,474 | | | | 0.00 | | | | 0.00 | | | | 0.00 | |
| | | | | | |
|
|
| |
|
|
| | | | | | | | | | | | |
| | | | | | | | 10,439 | | | | 82,159 | | | | 0.00 | | | | 0.00 | | | | 0.00 | |
ION Media Networks, Inc. | | | 12/21/2016 | | | | 616 | | | | 6 | | | | 494,436 | | | | 802.66 | | | | 0.09 | |
Vistra Energy Corp. CVR | | | 10/06/2016 | | | | 93,359 | | | | – | | | | 63,951 | | | | 0.69 | | | | 0.01 | |
| | | | | | | | | | | | | | |
|
|
| | | | | |
|
|
|
| | | | | | | | | | | | | | | $ | 558,387 | | | | | | | | 0.10 | % |
| | | | | | | | | | | | | | |
|
|
| | | | | |
|
|
|
| (11) | Perpetual maturity — maturity date reflects the next call date. |
| (12) | The rate shown is the 7-day yield as of August 31, 2018. |
| (13) | At August 31, 2018, the Fund had loaned securities with a total value of $44,315,599. This was secured by collateral of $33,786,258, which was received in cash and subsequently invested in short-term investments currently valued at $33,786,258 as reported in the Portfolio of Investments. Additional collateral of $11,525,287 was received in the form of fixed income pooled securities, which the Fund cannot sell or repledge and accordingly are not reflected in the Fund’s assets and liabilities. The components of the fixed income pooled securities referenced above are as follows: |
| | | | | | |
Securities
| | Coupon Range
| | Maturity Date Range
| | Value as of
August 31, 2018
|
United States Treasury Notes/Bonds | | 0.13% to 8.13% | | 01/15/2019 to 05/15/2047 | | $11,525,287 |
| (14) | Denominated in United States dollars unless otherwise indicated. |
| (15) | See Note 5 for cost of investments on a tax basis. |
BTL—Bank Term Loan
CVR—Contingent Value Rights
TBD—Senior loan purchased on a when-issued or delayed-delivery basis. Certain details associated with this purchase are not known prior to the settlement date of the transaction. In addition, senior loans typically trade without accrued interest and therefore a coupon rate is not available prior to the settlement.
ULC—Unlimited Liability Corp.
FRS—Floating Rate Security
The rates shown on FRS are the current interest rates at August 31, 2018 and unless noted otherwise, the dates shown are the original maturity dates.
Currency Legend
EUR—Euro Currency
Index Legend
1 ML—1 Month USD Libor
2 ML—2 Month USD Libor
3 ML—3 Month USD Libor
| | | | | | | | | | | | | | | | | | | | | | | | | | | | |
| Forward Foreign Currency Contracts | |
| Counterparty | | Contract to Deliver | | | In Exchange For | | | Delivery Date | | | Unrealized
Appreciation | | | Unrealized
Depreciation | |
Citibank N.A. | | | EUR | | | | 11,923,000 | | | | USD | | | | 13,842,567 | | | | 09/28/2018 | | | $ | — | | | $ | (20,596 | ) |
| | | | | | | | | | | | | | | | | | | | | | |
|
|
| |
|
|
|
EUR—Euro Currency
USD—United States Dollars
VALIC Company II High Yield Bond Fund
PORTFOLIO OF INVESTMENTS — August 31, 2018 — (continued)
The following is a summary of the inputs used to value the Fund’s net assets as of August 31, 2018 (see Note 2):
| | | | | | | | | | | | | | | | |
| | | Level 1 - Unadjusted
Quoted Prices
| | | Level 2 - Other
Observable Inputs
| | | Level 3 - Significant
Unobservable Inputs
| | | Total
| |
ASSETS: | | | | | | | | | | | | | | | | |
Investments at Value:* | | | | | | | | | | | | | | | | |
Convertible Bonds & Notes | | $ | — | | | $ | 8,353,394 | | | $ | — | | | $ | 8,353,394 | |
U.S. Corporate Bonds & Notes: | | | | | | | | | | | | | | | | |
Rubber/Plastic Products | | | — | | | | — | | | | 0 | | | | 0 | |
Other Industries | | | — | | | | 383,643,941 | | | | — | | | | 383,643,941 | |
Foreign Corporate Bonds & Notes: | | | | | | | | | | | | | | | | |
Special Purpose Entity | | | — | | | | — | | | | 0 | | | | 0 | |
Other Industries | | | — | | | | 98,660,241 | | | | — | | | | 98,660,241 | |
Loans: | | | | | | | | | | | | | | | | |
Building-Residential/Commercial | | | — | | | | — | | | | 0 | | | | 0 | |
Other Industries | | | — | | | | 28,396,147 | | | | — | | | | 28,396,147 | |
Common Stocks: | | | | | | | | | | | | | | | | |
Electria-Generation | | | — | | | | 63,951 | | | | — | | | | 63,951 | |
Other Industries | | | — | | | | — | | | | 494,436 | | | | 494,436 | |
Preferred Securities | | | 818,740 | | | | — | | | | — | | | | 818,740 | |
Preferred Securities/Capital Securities | | | — | | | | 27,262,701 | | | | — | | | | 27,262,701 | |
Short-Term Investment Securities | | | 33,786,258 | | | | — | | | | — | | | | 33,786,258 | |
Repurchase Agreements | | | — | | | | 20,406,000 | | | | — | | | | 20,406,000 | |
| | |
|
|
| |
|
|
| |
|
|
| |
|
|
|
Total Investments at Value | | $ | 34,604,998 | | | $ | 566,786,375 | | | $ | 494,436 | | | $ | 601,885,809 | |
| | |
|
|
| |
|
|
| |
|
|
| |
|
|
|
LIABILITIES: | | | | | | | | | | | | | | | | |
Other Financial Instruments:+ | | | | | | | | | | | | | | | | |
Forward Foreign Currency Contracts | | $ | — | | | $ | 20,596 | | | $ | — | | | $ | 20,596 | |
| | |
|
|
| |
|
|
| |
|
|
| |
|
|
|
| * | For a detailed presentation of investments, please refer to the Portfolio of Investments. |
| + | Other financial instruments are derivative instruments, not reflected in the Portfolio of Investments, such as futures, forward, swap and written option contracts, which are valued at the unrealized appreciation (depreciation) on the instrument. |
The Fund’s policy is to recognize transfers between Levels as of the end of the reporting period. There were no transfers between Levels during the reporting period.
At the beginning and end of the reporting period, Level 3 investments were not considered a material portion of the Fund.
See Notes to Financial Statements
VALIC Company II International Opportunities Fund
PORTFOLIO PROFILE — August 31, 2018 (unaudited)
Industry Allocation*
| | | | |
Registered Investment Companies | | | 2.9 | % |
Auto/Truck Parts & Equipment — Original | | | 2.8 | |
Banks — Commercial | | | 2.5 | |
Beverages — Non-alcoholic | | | 2.3 | |
Building Products — Cement | | | 2.2 | |
Insurance — Property/Casualty | | | 1.9 | |
Oil Companies — Exploration & Production | | | 1.8 | |
Finance — Other Services | | | 1.7 | |
Chemicals — Diversified | | | 1.7 | |
Cosmetics & Toiletries | | | 1.7 | |
Retail — Drug Store | | | 1.7 | |
E-Commerce/Services | | | 1.6 | |
Brewery | | | 1.6 | |
Medical Products | | | 1.6 | |
Enterprise Software/Service | | | 1.6 | |
Commercial Services | | | 1.6 | |
Real Estate Operations & Development | | | 1.5 | |
Consulting Services | | | 1.5 | |
Fisheries | | | 1.5 | |
Retail — Discount | | | 1.4 | |
Medical — Biomedical/Gene | | | 1.4 | |
Hotels/Motels | | | 1.3 | |
Beverages — Wine/Spirits | | | 1.3 | |
Computers — Integrated Systems | | | 1.3 | |
Gambling (Non-Hotel) | | | 1.2 | |
Electronic Components — Semiconductors | | | 1.2 | |
Repurchase Agreements | | | 1.2 | |
Retail — Restaurants | | | 1.2 | |
Machinery — General Industrial | | | 1.2 | |
Applications Software | | | 1.2 | |
Transport — Services | | | 1.1 | |
Engineering/R&D Services | | | 1.1 | |
Transactional Software | | | 1.1 | |
Chemicals — Specialty | | | 1.1 | |
Electronic Components — Misc. | | | 1.1 | |
Transport — Marine | | | 1.0 | |
Finance — Credit Card | | | 1.0 | |
Diversified Operations | | | 1.0 | |
Medical Labs & Testing Services | | | 0.9 | |
Building & Construction Products — Misc. | | | 0.9 | |
Building — Residential/Commercial | | | 0.9 | |
E-Services/Consulting | | | 0.9 | |
Distribution/Wholesale | | | 0.9 | |
Real Estate Investment Trusts | | | 0.9 | |
Food — Retail | | | 0.9 | |
Computer Services | | | 0.9 | |
Oil — Field Services | | | 0.9 | |
Investment Management/Advisor Services | | | 0.8 | |
Human Resources | | | 0.8 | |
E-Commerce/Products | | | 0.8 | |
Forestry | | | 0.8 | |
Veterinary Products | | | 0.8 | |
Medical — Drugs | | | 0.8 | |
Multimedia | | | 0.8 | |
Retail — Misc./Diversified | | | 0.8 | |
Food — Catering | | | 0.7 | |
Lasers — System/Components | | | 0.7 | |
Machine Tools & Related Products | | | 0.7 | |
Instruments — Controls | | | 0.7 | |
Transport — Truck | | | 0.7 | |
Containers — Paper/Plastic | | | 0.7 | |
Insurance — Life/Health | | | 0.6 | |
Agricultural Operations | | | 0.6 | |
Computers — Periphery Equipment | | | 0.6 | |
Commercial Services — Finance | | | 0.6 | |
Textile — Products | | | 0.6 | |
Building & Construction — Misc. | | | 0.6 | |
U.S. Government Agencies | | | 0.6 | |
Power Converter/Supply Equipment | | | 0.6 | |
| | | | |
Machinery — Material Handling | | | 0.6 | |
Building Products — Wood | | | 0.6 | |
Chemicals — Other | | | 0.5 | |
Diversified Financial Services | | | 0.5 | |
Medical Instruments | | | 0.5 | |
Food — Confectionery | | | 0.5 | |
Educational Software | | | 0.5 | |
Retail — Consumer Electronics | | | 0.5 | |
Industrial Automated/Robotic | | | 0.5 | |
Food — Misc./Diversified | | | 0.4 | |
Appliances | | | 0.4 | |
Aerospace/Defense | | | 0.4 | |
Food — Meat Products | | | 0.4 | |
Insurance Brokers | | | 0.4 | |
Machinery — Print Trade | | | 0.4 | |
Shipbuilding | | | 0.4 | |
Internet Financial Services | | | 0.4 | |
Miscellaneous Manufacturing | | | 0.4 | |
Gas — Distribution | | | 0.4 | |
Coatings/Paint | | | 0.3 | |
Retail — Automobile | | | 0.3 | |
Transport — Rail | | | 0.3 | |
Oil Refining & Marketing | | | 0.3 | |
Leisure Products | | | 0.3 | |
Airport Development/Maintenance | | | 0.3 | |
Casino Hotels | | | 0.3 | |
Aerospace/Defense — Equipment | | | 0.3 | |
Retail — Apparel/Shoe | | | 0.2 | |
Food — Flour & Grain | | | 0.2 | |
Satellite Telecom | | | 0.2 | |
Building — Maintenance & Services | | | 0.2 | |
Finance — Commercial | | | 0.2 | |
Dental Supplies & Equipment | | | 0.2 | |
Real Estate Management/Services | | | 0.2 | |
Theaters | | | 0.2 | |
Tobacco | | | 0.2 | |
Electronic Measurement Instruments | | | 0.2 | |
Diversified Manufacturing Operations | | | 0.2 | |
Telephone — Integrated | | | 0.2 | |
Rubber/Plastic Products | | | 0.2 | |
Audio/Video Products | | | 0.2 | |
Electronic Connectors | | | 0.2 | |
Explosives | | | 0.2 | |
Auto — Heavy Duty Trucks | | | 0.2 | |
Soap & Cleaning Preparation | | | 0.2 | |
Hazardous Waste Disposal | | | 0.2 | |
MRI/Medical Diagnostic Imaging | | | 0.2 | |
Paper & Related Products | | | 0.2 | |
Metal Processors & Fabrication | | | 0.2 | |
Rental Auto/Equipment | | | 0.1 | |
Electric Products — Misc. | | | 0.1 | |
Web Portals/ISP | | | 0.1 | |
E-Marketing/Info | | | 0.1 | |
Machinery — Construction & Mining | | | 0.1 | |
Gold Mining | | | 0.1 | |
Electric — Integrated | | | 0.1 | |
Retail — Home Furnishings | | | 0.1 | |
Metal — Iron | | | 0.1 | |
Resorts/Theme Parks | | | 0.1 | |
Semiconductor Equipment | | | 0.1 | |
Finance — Consumer Loans | | | 0.1 | |
Apparel Manufacturers | | | 0.1 | |
Finance — Investment Banker/Broker | | | 0.1 | |
Diversified Minerals | | | 0.1 | |
Medical — Hospitals | | | 0.1 | |
Water | | | 0.1 | |
Internet Content — Information/News | | | 0.1 | |
Home Furnishings | | | 0.1 | |
Schools | | | 0.1 | |
VALIC Company II International Opportunities Fund
PORTFOLIO PROFILE — August 31, 2018 (unaudited) — (continued)
Industry Allocation* (continued)
| | | | |
Cable/Satellite TV | | | 0.1 | % |
Machinery — Thermal Process | | | 0.1 | |
Wireless Equipment | | | 0.1 | |
Instruments — Scientific | | | 0.1 | |
Investment Companies | | | 0.1 | |
Television | | | 0.1 | |
Diagnostic Equipment | | | 0.1 | |
Security Services | | | 0.1 | |
Consumer Products — Misc. | | | 0.1 | |
Electric — Distribution | | | 0.1 | |
Footwear & Related Apparel | | | 0.1 | |
Computers | | | 0.1 | |
Steel — Producers | | | 0.1 | |
Industrial Gases | | | 0.1 | |
Medical Information Systems | | | 0.1 | |
Building Products — Air & Heating | | | 0.1 | |
| | |
|
|
|
| | | | 100.7 | % |
| | |
|
|
|
Country Allocation*
| | | | |
Japan | | | 19.4 | % |
United Kingdom | | | 16.5 | |
Germany | | | 6.2 | |
Canada | | | 6.1 | |
United States | | | 5.5 | |
Cayman Islands | | | 4.5 | |
Ireland | | | 3.4 | |
Australia | | | 3.3 | |
France | | | 3.1 | |
Switzerland | | | 3.1 | |
Bermuda | | | 3.1 | |
Denmark | | | 2.8 | |
Italy | | | 2.7 | |
Spain | | | 2.1 | |
Norway | | | 2.0 | |
South Korea | | | 1.9 | |
India | | | 1.4 | |
Hong Kong | | | 1.3 | |
Taiwan | | | 1.3 | |
Guernsey | | | 1.3 | |
Brazil | | | 1.2 | |
Netherlands | | | 1.1 | |
Israel | | | 1.0 | |
Sweden | | | 1.0 | |
Singapore | | | 0.7 | |
Philippines | | | 0.7 | |
Mexico | | | 0.7 | |
Indonesia | | | 0.5 | |
Finland | | | 0.5 | |
Faroe Islands | | | 0.3 | |
Thailand | | | 0.3 | |
Malaysia | | | 0.3 | |
South Africa | | | 0.3 | |
Mauritius | | | 0.2 | |
Belgium | | | 0.2 | |
Luxembourg | | | 0.2 | |
Greece | | | 0.1 | |
Austria | | | 0.1 | |
New Zealand | | | 0.1 | |
Portugal | | | 0.1 | |
Chile | | | 0.1 | |
| | |
|
|
|
| | | | 100.7 | % |
| | |
|
|
|
| * | Calculated as a percentage of net assets |
VALIC Company II International Opportunities Fund
PORTFOLIO OF INVESTMENTS — August 31, 2018
| | | | | | | | |
| | |
| Security Description | | Shares | | | Value
(Note 2) | |
| |
COMMON STOCKS — 96.0% | |
Argentina — 0.0% | |
Grupo Supervielle SA ADR# | | | 10,994 | | | $ | 75,199 | |
| | | | | | |
|
|
|
Australia — 3.3% | |
Afterpay Touch Group, Ltd.†# | | | 486,130 | | | | 6,336,052 | |
Ansell, Ltd. | | | 72,429 | | | | 1,306,937 | |
APA Group | | | 31,653 | | | | 227,553 | |
ASX, Ltd. | | | 7,859 | | | | 382,155 | |
AUB Group, Ltd. | | | 151,441 | | | | 1,578,629 | |
Computershare, Ltd. | | | 75,167 | | | | 1,038,602 | |
Costa Group Holdings, Ltd. | | | 760,167 | | | | 3,951,080 | |
Crown Resorts, Ltd. | | | 37,023 | | | | 377,945 | |
Domino’s Pizza Enterprises, Ltd.# | | | 16,941 | | | | 658,878 | |
DuluxGroup, Ltd. | | | 144,379 | | | | 815,821 | |
Iluka Resources, Ltd. | | | 115,032 | | | | 767,423 | |
IPH, Ltd.# | | | 243,737 | | | | 995,264 | |
Orica, Ltd. | | | 96,652 | | | | 1,222,208 | |
Ramsay Health Care, Ltd. | | | 19,160 | | | | 767,219 | |
Reliance Worldwide Corp., Ltd. | | | 410,690 | | | | 1,567,751 | |
Sonic Healthcare, Ltd. | | | 57,080 | | | | 1,074,702 | |
WiseTech Global, Ltd.# | | | 60,850 | | | | 934,395 | |
| | | | | | |
|
|
|
| | | | | | | | 24,002,614 | |
| | | | | | |
|
|
|
Austria — 0.1% | |
Mayr-Melnhof Karton AG | | | 6,847 | | | | 880,600 | |
| | | | | | |
|
|
|
Belgium — 0.2% | |
Fagron | | | 67,737 | | | | 1,288,676 | |
| | | | | | |
|
|
|
Bermuda — 3.1% | |
BW Offshore, Ltd.† | | | 956,809 | | | | 6,822,818 | |
Cafe de Coral Holdings, Ltd. | | | 902,000 | | | | 2,197,323 | |
China Resources Gas Group, Ltd. | | | 288,000 | | | | 1,311,801 | |
Credicorp, Ltd. | | | 5,783 | | | | 1,260,810 | |
Dairy Farm International Holdings, Ltd. | | | 230,000 | | | | 2,132,100 | |
Esprit Holdings, Ltd.†# | | | 335,550 | | | | 79,519 | |
Geopark, Ltd.† | | | 28,822 | | | | 520,814 | |
Hiscox, Ltd. | | | 190,730 | | | | 4,166,532 | |
Midland Holdings, Ltd. | | | 2,340,000 | | | | 626,087 | |
Peace Mark Holdings, Ltd.†(1)(3) | | | 686,000 | | | | 0 | |
Shangri-La Asia, Ltd. | | | 734,000 | | | | 1,131,569 | |
VTech Holdings, Ltd. | | | 113,849 | | | | 1,259,791 | |
XL Group, Ltd. | | | 9,232 | | | | 529,824 | |
| | | | | | |
|
|
|
| | | | | | | | 22,038,988 | |
| | | | | | |
|
|
|
Brazil — 1.2% | |
Anima Holding SA | | | 57,728 | | | | 184,249 | |
BRF SA† | | | 43,800 | | | | 216,467 | |
Cia de Saneamento Basico do Estado de Sao Paulo | | | 48,000 | | | | 287,545 | |
Cyrela Brazil Realty SA Empreendimentos e Participacoes | | | 78,200 | | | | 209,846 | |
Embraer SA ADR | | | 15,888 | | | | 304,891 | |
Equatorial Energia SA | | | 29,300 | | | | 410,032 | |
Fibria Celulose SA | | | 22,600 | | | | 439,338 | |
Gerdau SA (Preference Shares) | | | 93,100 | | | | 366,631 | |
Instituto Hermes Pardini SA | | | 71,400 | | | | 258,737 | |
Kroton Educacional SA | | | 176,588 | | | | 443,085 | |
Linx SA | | | 119,800 | | | | 505,895 | |
Localiza Rent a Car SA | | | 54,633 | | | | 288,785 | |
Lojas Americanas SA (Preference Shares)† | | | 139,800 | | | | 535,435 | |
Lojas Renner SA | | | 67,100 | | | | 465,883 | |
Movida Participacoes SA | | | 114,200 | | | | 168,786 | |
Multiplan Empreendimentos Imobiliarios SA | | | 123,151 | | | | 563,282 | |
Qualicorp Consultoria e Corretora de Seguros SA | | | 44,337 | | | | 171,553 | |
Raia Drogasil SA | | | 16,530 | | | | 312,492 | |
Rumo SA† | | | 486,400 | | | | 1,699,313 | |
Suzano Papel e Celulose SA | | | 44,900 | | | | 521,524 | |
| | | | | | |
|
|
|
| | | | | | | | 8,353,769 | |
| | | | | | |
|
|
|
| | | | | | | | |
| | |
| Security Description | | Shares | | | Value
(Note 2) | |
| |
| | | | | | | | | |
British Virgin Islands — 0.0% | |
Luxoft Holding, Inc.† | | | 3,810 | | | $ | 177,546 | |
| | | | | | |
|
|
|
Canada — 6.1% | |
Agnico Eagle Mines, Ltd.# | | | 31,327 | | | | 1,079,761 | |
Descartes Systems Group, Inc.† | | | 178,497 | | | | 6,231,665 | |
Dollarama, Inc. | | | 116,378 | | | | 4,400,961 | |
Enerplus Corp. | | | 485,700 | | | | 6,007,048 | |
Finning International, Inc. | | | 155,000 | | | | 3,602,414 | |
Interfor Corp.† | | | 336,700 | | | | 5,794,852 | |
Norbord, Inc.# | | | 105,700 | | | | 4,022,270 | |
Parex Resources, Inc.† | | | 331,800 | | | | 4,767,241 | |
Quebecor, Inc., Class B | | | 282,400 | | | | 5,686,952 | |
Seven Generations Energy, Ltd., Class A† | | | 36,593 | | | | 430,704 | |
TMX Group, Ltd. | | | 24,211 | | | | 1,623,343 | |
TORC Oil & Gas, Ltd.# | | | 41,371 | | | | 222,231 | |
| | | | | | |
|
|
|
| | | | | | | | 43,869,442 | |
| | | | | | |
|
|
|
Cayman Islands — 4.5% | |
51job, Inc. ADR† | | | 13,349 | | | | 1,032,011 | |
Airtac International Group | | | 192,535 | | | | 1,849,188 | |
Ajisen China Holdings, Ltd. | | | 671,000 | | | | 282,121 | |
China Resources Cement Holdings, Ltd. | | | 8,332,000 | | | | 9,723,984 | |
Chinasoft International, Ltd. | | | 5,036,000 | | | | 3,593,133 | |
Gourmet Master Co., Ltd. | | | 299,184 | | | | 2,142,943 | |
Kingdee International Software Group Co., Ltd. | | | 5,676,000 | | | | 6,465,162 | |
Microport Scientific Corp. | | | 1,922,000 | | | | 2,426,758 | |
Midland IC&I, Ltd.† | | | 1,176,000 | | | | 43,452 | |
Pacific Textiles Holdings, Ltd. | | | 2,110,000 | | | | 1,599,554 | |
Shenguan Holdings Group, Ltd. | | | 706,000 | | | | 36,880 | |
Silicon Motion Technology Corp. ADR | | | 28,000 | | | | 1,649,200 | |
Stella International Holdings, Ltd. | | | 384,500 | | | | 389,460 | |
Tingyi Cayman Islands Holding Corp. | | | 924,000 | | | | 1,650,515 | |
| | | | | | |
|
|
|
| | | | | | | | 32,884,361 | |
| | | | | | |
|
|
|
Chile — 0.1% | |
Aguas Andinas SA, Class A | | | 863,873 | | | | 465,113 | |
| | | | | | |
|
|
|
Denmark — 2.8% | |
Carlsberg A/S, Class B | | | 7,897 | | | | 964,038 | |
Dfds A/S | | | 10,552 | | | | 556,666 | |
DSV A/S | | | 21,816 | | | | 2,044,295 | |
GN Store Nord A/S | | | 131,117 | | | | 6,800,640 | |
Jyske Bank A/S | | | 33,599 | | | | 1,704,487 | |
Royal Unibrew A/S | | | 83,661 | | | | 7,210,358 | |
Sydbank A/S | | | 17,451 | | | | 510,851 | |
William Demant Holding A/S† | | | 16,197 | | | | 658,755 | |
| | | | | | |
|
|
|
| | | | | | | | 20,450,090 | |
| | | | | | |
|
|
|
Faroe Islands — 0.3% | |
Bakkafrost P/F | | | 43,523 | | | | 2,484,908 | |
| | | | | | |
|
|
|
Finland — 0.5% | |
Tikkurila Oyj | | | 7,832 | | | | 134,547 | |
Valmet Oyj | | | 159,724 | | | | 3,502,199 | |
| | | | | | |
|
|
|
| | | | | | | | 3,636,746 | |
| | | | | | |
|
|
|
France — 3.1% | |
Alten SA | | | 60,461 | | | | 6,242,520 | |
Edenred | | | 10,885 | | | | 414,799 | |
Elior Group SA#* | | | 41,781 | | | | 654,228 | |
Legrand SA | | | 12,769 | | | | 961,923 | |
LISI | | | 28,339 | | | | 1,164,465 | |
Plastic Omnium SA | | | 16,715 | | | | 661,994 | |
Remy Cointreau SA | | | 36,673 | | | | 5,137,980 | |
SEB SA | | | 5,701 | | | | 1,062,760 | |
Sodexo SA | | | 11,219 | | | | 1,168,375 | |
SOITEC† | | | 48,321 | | | | 3,743,914 | |
VALIC Company II International Opportunities Fund
PORTFOLIO OF INVESTMENTS — August 31, 2018 — (continued)
| | | | | | | | |
| | |
| Security Description | | Shares | | | Value
(Note 2) | |
| |
COMMON STOCKS (continued) | |
France (continued) | |
Somfy SA | | | 3,479 | | | $ | 323,060 | |
Virbac SA† | | | 5,490 | | | | 844,996 | |
| | | | | | |
|
|
|
| | | | | | | | 22,381,014 | |
| | | | | | |
|
|
|
Germany — 6.2% | |
Amadeus Fire AG | | | 9,857 | | | | 1,136,142 | |
Beiersdorf AG | | | 10,418 | | | | 1,212,897 | |
Brenntag AG | | | 23,881 | | | | 1,439,770 | |
CTS Eventim AG & Co. KGaA | | | 44,036 | | | | 1,952,585 | |
Deutsche Wohnen SE | | | 15,623 | | | | 789,572 | |
Evotec AG† | | | 270,873 | | | | 6,936,013 | |
FUCHS PETROLUB SE (Preference Shares) | | | 32,430 | | | | 1,899,095 | |
GEA Group AG | | | 49,903 | | | | 1,895,882 | |
Hella GmbH & Co. KGaA | | | 21,537 | | | | 1,299,952 | |
Henkel AG & Co. KGaA (Preference Shares) | | | 9,236 | | | | 1,178,739 | |
Infineon Technologies AG | | | 28,980 | | | | 737,357 | |
Koenig & Bauer AG | | | 42,715 | | | | 2,962,491 | |
LEG Immobilien AG | | | 28,521 | | | | 3,481,070 | |
MTU Aero Engines AG | | | 8,364 | | | | 1,833,938 | |
Rocket Internet SE†* | | | 138,908 | | | | 4,801,651 | |
Scout24 AG* | | | 10,647 | | | | 550,695 | |
Symrise AG | | | 53,814 | | | | 5,025,901 | |
TAG Immobilien AG | | | 217,620 | | | | 5,355,171 | |
Zalando SE†* | | | 6,520 | | | | 342,986 | |
| | | | | | |
|
|
|
| | | | | | | | 44,831,907 | |
| | | | | | |
|
|
|
Greece — 0.1% | |
Hellenic Telecommunications Organization SA | | | 72,455 | | | | 924,282 | |
| | | | | | |
|
|
|
Guernsey — 1.3% | |
Burford Capital, Ltd. | | | 365,171 | | | | 9,459,052 | |
| | | | | | |
|
|
|
Hong Kong — 1.3% | |
China Resources Beer Holdings Co., Ltd. | | | 762,000 | | | | 3,242,656 | |
Melco International Development, Ltd. | | | 1,912,000 | | | | 5,091,358 | |
Techtronic Industries Co., Ltd. | | | 219,000 | | | | 1,339,322 | |
| | | | | | |
|
|
|
| | | | | | | | 9,673,336 | |
| | | | | | |
|
|
|
India — 1.4% | |
Bharat Heavy Electricals, Ltd. | | | 926,931 | | | | 1,054,664 | |
CESC, Ltd.† | | | 65,789 | | | | 921,076 | |
Dabur India, Ltd.† | | | 250,571 | | | | 1,689,580 | |
Federal Bank, Ltd. | | | 1,000,767 | | | | 1,141,496 | |
Mahindra & Mahindra, Ltd. | | | 88,347 | | | | 1,202,395 | |
MOIL, Ltd. | | | 331,457 | | | | 862,217 | |
PVR, Ltd.† | | | 72,124 | | | | 1,395,169 | |
Shriram Transport Finance Co., Ltd.† | | | 79,664 | | | | 1,506,317 | |
Tata Global Beverages, Ltd. | | | 180,259 | | | | 596,363 | |
| | | | | | |
|
|
|
| | | | | | | | 10,369,277 | |
| | | | | | |
|
|
|
Indonesia — 0.5% | |
Astra Agro Lestari Tbk PT | | | 876,100 | | | | 802,943 | |
Indocement Tunggal Prakarsa Tbk PT | | | 1,092,500 | | | | 1,314,634 | |
Kalbe Farma Tbk PT | | | 15,214,900 | | | | 1,389,276 | |
Semen Indonesia Persero Tbk PT | | | 229,800 | | | | 147,428 | |
XL Axiata Tbk PT† | | | 515,600 | | | | 111,311 | |
| | | | | | |
|
|
|
| | | | | | | | 3,765,592 | |
| | | | | | |
|
|
|
Ireland — 3.4% | |
Bank of Ireland Group PLC | | | 49,884 | | | | 407,636 | |
C&C Group PLC | | | 979,267 | | | | 3,876,093 | |
Cairn Homes PLC (ISE)† | | | 331,982 | | | | 616,557 | |
Cairn Homes PLC (LSE)† | | | 1,442,215 | | | | 2,628,260 | |
Dalata Hotel Group PLC† | | | 883,532 | | | | 7,322,496 | |
DCC PLC | | | 21,965 | | | | 1,980,543 | |
Greencore Group PLC | | | 67,476 | | | | 152,214 | |
Hibernia REIT PLC | | | 2,388,684 | | | | 4,158,997 | |
| | | | | | | | |
| | |
| Security Description | | Shares | | | Value
(Note 2) | |
| |
| | | | | | | | | |
Ireland (continued) | | | | | | | | |
Kerry Group PLC, Class A | | | 12,324 | | | $ | 1,405,474 | |
Paddy Power Betfair PLC | | | 25,860 | | | | 2,351,863 | |
| | | | | | |
|
|
|
| | | | | | | | 24,900,133 | |
| | | | | | |
|
|
|
Israel — 1.0% | |
Bezeq The Israeli Telecommunication Corp., Ltd. | | | 325,850 | | | | 389,574 | |
Israel Discount Bank, Ltd., Class A | | | 2,035,140 | | | | 7,113,110 | |
| | | | | | |
|
|
|
| | | | | | | | 7,502,684 | |
| | | | | | |
|
|
|
Italy — 2.7% | |
Cerved Group SpA | | | 251,090 | | | | 2,617,245 | |
Davide Campari-Milano SpA | | | 110,785 | | | | 980,527 | |
El.En. SpA | | | 154,924 | | | | 4,988,429 | |
Enav SpA* | | | 136,290 | | | | 673,610 | |
Fincantieri SpA | | | 1,989,394 | | | | 2,946,525 | |
FinecoBank Banca Fineco SpA | | | 137,890 | | | | 1,642,973 | |
Infrastrutture Wireless Italiane SpA* | | | 74,457 | | | | 566,954 | |
Italgas SpA | | | 191,194 | | | | 1,032,855 | |
Reply SpA | | | 57,543 | | | | 3,807,203 | |
| | | | | | |
|
|
|
| | | | | | | | 19,256,321 | |
| | | | | | |
|
|
|
Japan — 19.4% | |
ABC-Mart, Inc.# | | | 19,400 | | | | 1,058,087 | |
Aeon Delight Co., Ltd. | | | 15,400 | | | | 554,406 | |
AEON Financial Service Co., Ltd. | | | 39,000 | | | | 798,533 | |
Air Water, Inc. | | | 20,400 | | | | 365,735 | |
Amano Corp. | | | 35,841 | | | | 749,335 | |
Anicom Holdings, Inc. | | | 115,100 | | | | 3,889,843 | |
As One Corp. | | | 4,700 | | | | 338,826 | |
Asante, Inc. | | | 9,000 | | | | 190,028 | |
Bic Camera, Inc.# | | | 245,900 | | | | 3,297,552 | |
Chiba Bank, Ltd. | | | 135,700 | | | | 891,558 | |
Cosmos Pharmaceutical Corp. | | | 3,000 | | | | 628,296 | |
Daifuku Co., Ltd. | | | 77,900 | | | | 4,045,387 | |
Daikyonishikawa Corp. | | | 17,687 | | | | 219,834 | |
Daiseki Co., Ltd. | | | 42,300 | | | | 1,115,081 | |
Daiwa Securities Group, Inc. | | | 128,000 | | | | 767,701 | |
Doshisha Co., Ltd. | | | 7,500 | | | | 153,024 | |
Ezaki Glico Co., Ltd. | | | 23,400 | | | | 1,177,266 | |
Fancl Corp. | | | 99,300 | | | | 5,103,078 | |
Fuji Seal International, Inc. | | | 94,400 | | | | 3,330,465 | |
Fujitsu General, Ltd.# | | | 33,000 | | | | 544,109 | |
GMO Payment Gateway, Inc.# | | | 36,900 | | | | 4,390,406 | |
Hamakyorex Co., Ltd. | | | 1,800 | | | | 60,589 | |
Heian Ceremony Service Co., Ltd. | | | 20,200 | | | | 163,440 | |
Hirose Electric Co., Ltd. | | | 4,700 | | | | 559,212 | |
Hitachi Transport System, Ltd.† | | | 15,400 | | | | 424,120 | |
Hogy Medical Co., Ltd. | | | 4,200 | | | | 145,153 | |
Iriso Electronics Co., Ltd. | | | 11,800 | | | | 665,881 | |
Japan Exchange Group, Inc. | | | 7,700 | | | | 135,691 | |
Japan Meat Co, Ltd.# | | | 13,100 | | | | 255,138 | |
Japan Pure Chemical Co., Ltd. | | | 2,200 | | | | 47,461 | |
Jeol, Ltd. | | | 54,000 | | | | 561,336 | |
JGC Corp. | | | 13,660 | | | | 275,143 | |
Kakaku.com, Inc. | | | 15,400 | | | | 284,687 | |
Kansai Paint Co., Ltd. | | | 55,400 | | | | 1,095,435 | |
Kikkoman Corp. | | | 13,700 | | | | 686,788 | |
Kintetsu World Express, Inc. | | | 14,800 | | | | 292,643 | |
Kobayashi Pharmaceutical Co., Ltd. | | | 14,000 | | | | 1,005,490 | |
Koito Manufacturing Co., Ltd. | | | 33,800 | | | | 2,089,875 | |
Kusuri no Aoki Holdings Co., Ltd. | | | 61,000 | | | | 4,452,435 | |
Lion Corp. | | | 38,400 | | | | 809,058 | |
Maeda Corp. | | | 361,000 | | | | 4,311,466 | |
Matsumotokiyoshi Holdings Co., Ltd. | | | 142,800 | | | | 5,397,894 | |
Meitec Corp. | | | 15,400 | | | | 742,903 | |
VALIC Company II International Opportunities Fund
PORTFOLIO OF INVESTMENTS — August 31, 2018 — (continued)
| | | | | | | | |
| | |
| Security Description | | Shares | | | Value
(Note 2) | |
| |
COMMON STOCKS (continued) | |
Japan (continued) | |
Milbon Co., Ltd. | | | 16,200 | | | $ | 736,297 | |
Miraca Holdings, Inc. | | | 5,300 | | | | 146,441 | |
Mitsubishi Pencil Co., Ltd. | | | 12,100 | | | | 219,000 | |
MonotaRO Co., Ltd.# | | | 17,900 | | | | 1,016,551 | |
Morinaga & Co., Ltd. | | | 17,800 | | | | 692,071 | |
Nabtesco Corp. | | | 32,500 | | | | 847,381 | |
Nakanishi, Inc. | | | 74,800 | | | | 1,503,944 | |
NGK Spark Plug Co., Ltd. | | | 44,800 | | | | 1,274,125 | |
Nihon Kohden Corp. | | | 27,900 | | | | 816,083 | |
Nihon Parkerizing Co., Ltd. | | | 53,900 | | | | 715,530 | |
Nippon Television Holdings, Inc. | | | 32,600 | | | | 539,861 | |
Nissei ASB Machine Co., Ltd.# | | | 12,700 | | | | 570,934 | |
Nitori Holdings Co., Ltd. | | | 6,000 | | | | 910,989 | |
NOF Corp. | | | 4,400 | | | | 146,125 | |
Nomura Research Institute, Ltd. | | | 48,000 | | | | 2,388,984 | |
NS Solutions Corp. | | | 14,900 | | | | 482,094 | |
Obara Group, Inc. | | | 6,600 | | | | 328,485 | |
OBIC Business Consultants Co., Ltd. | | | 13,800 | | | | 1,131,473 | |
OBIC Co., Ltd. | | | 90,200 | | | | 8,475,277 | |
Omron Corp. | | | 10,600 | | | | 474,620 | |
Park24 Co., Ltd. | | | 18,400 | | | | 539,861 | |
Persol Holdings Co., Ltd. | | | 203,600 | | | | 4,553,560 | |
Proto Corp. | | | 30,500 | | | | 438,381 | |
Rakuten, Inc. | | | 6,400 | | | | 48,955 | |
Rinnai Corp. | | | 4,800 | | | | 357,268 | |
Ryohin Keikaku Co., Ltd. | | | 2,800 | | | | 831,608 | |
S Foods, Inc. | | | 11,000 | | | | 431,149 | |
San-A Co, Ltd. | | | 7,900 | | | | 368,302 | |
Santen Pharmaceutical Co., Ltd. | | | 108,100 | | | | 1,665,622 | |
SCREEN Holdings Co., Ltd. | | | 55,100 | | | | 4,170,561 | |
Seino Holdings Co., Ltd. | | | 248,900 | | | | 3,810,448 | |
Senko Group Holdings Co., Ltd.† | | | 49,000 | | | | 403,960 | |
Seria Co., Ltd.# | | | 114,134 | | | | 4,673,834 | |
SG Holdings Co., Ltd. | | | 115,900 | | | | 2,742,337 | |
Shima Seiki Manufacturing, Ltd. | | | 9,800 | | | | 457,763 | |
Shimamura Co., Ltd. | | | 2,900 | | | | 268,050 | |
Shimano, Inc. | | | 1,800 | | | | 277,671 | |
Shizuoka Bank, Ltd. | | | 54,500 | | | | 481,676 | |
SK Kaken Co., Ltd. | | | 3,000 | | | | 264,603 | |
SMS Co., Ltd. | | | 158,400 | | | | 3,005,195 | |
Sohgo Security Services Co., Ltd. | | | 10,900 | | | | 479,714 | |
Sony Financial Holdings, Inc. | | | 46,800 | | | | 932,967 | |
Stanley Electric Co., Ltd. | | | 45,700 | | | | 1,581,464 | |
Sundrug Co., Ltd. | | | 30,000 | | | | 1,077,311 | |
Taisei Lamick Co, Ltd.† | | | 12,100 | | | | 347,939 | |
TechnoPro Holdings, Inc. | | | 120,500 | | | | 7,515,660 | |
Terumo Corp. | | | 19,600 | | | | 1,081,343 | |
THK Co., Ltd. | | | 121,700 | | | | 3,259,645 | |
Tokai Carbon Co., Ltd.# | | | 221,100 | | | | 3,951,981 | |
Toshiba Plant Systems & Services Corp. | | | 15,500 | | | | 335,082 | |
TOTO, Ltd. | | | 7,600 | | | | 321,483 | |
Unicharm Corp. | | | 62,600 | | | | 2,046,289 | |
USS Co., Ltd. | | | 118,800 | | | | 2,239,996 | |
Yamato Holdings Co., Ltd.# | | | 105,900 | | | | 3,149,074 | |
Zojirushi Corp.# | | | 38,900 | | | | 521,654 | |
| | | | | | |
|
|
|
| | | | | | | | 140,119,059 | |
| | | | | | |
|
|
|
Luxembourg — 0.2% | |
B&M European Value Retail SA | | | 175,680 | | | | 939,511 | |
Globant SA† | | | 3,629 | | | | 235,450 | |
| | | | | | |
|
|
|
| | | | | | | | 1,174,961 | |
| | | | | | |
|
|
|
Malaysia — 0.3% | |
Genting Bhd | | | 698,900 | | | | 1,465,998 | |
| | | | | | | | |
| | |
| Security Description | | Shares | | | Value
(Note 2) | |
| |
| | | | | | | | | |
Malaysia (continued) | |
Public Bank Bhd | | | 111,400 | | | $ | 680,951 | |
| | | | | | |
|
|
|
| | | | | | | | 2,146,949 | |
| | | | | | |
|
|
|
Mauritius — 0.2% | |
MakeMyTrip, Ltd.†# | | | 42,978 | | | | 1,360,254 | |
| | | | | | |
|
|
|
Mexico — 0.7% | |
Arca Continental SAB de CV | | | 103,815 | | | | 642,009 | |
Concentradora Fibra Danhos SA de CV | | | 329,337 | | | | 545,756 | |
Concentradora Fibra Hotelera Mexicana SA de CV* | | | 268,797 | | | | 169,676 | |
Genomma Lab Internacional SAB de CV, Class B†# | | | 493,799 | | | | 427,755 | |
GMexico Transportes SAB de CV* | | | 270,500 | | | | 436,787 | |
Grupo Aeroportuario del Centro Norte SAB de CV | | | 74,888 | | | | 492,283 | |
Grupo Aeroportuario del Sureste SAB de CV ADR# | | | 4,138 | | | | 776,247 | |
Grupo Financiero Inbursa SAB de CV, Class O | | | 336,246 | | | | 535,030 | |
Mexichem SAB de CV | | | 89,301 | | | | 301,343 | |
PLA Administradora Industrial S de RL de CV | | | 112,915 | | | | 169,326 | |
Prologis Property Mexico SA de CV | | | 155,026 | | | | 305,098 | |
| | | | | | |
|
|
|
| | | | | | | | 4,801,310 | |
| | | | | | |
|
|
|
Netherlands — 1.1% | |
Aalberts Industries NV | | | 12,991 | | | | 557,030 | |
Adyen NV†* | | | 121 | | | | 84,832 | |
ASM International NV | | | 14,917 | | | | 803,758 | |
IMCD NV | | | 53,647 | | | | 4,010,236 | |
Takeaway.com NV†* | | | 31,635 | | | | 2,500,654 | |
| | | | | | |
|
|
|
| | | | | | | | 7,956,510 | |
| | | | | | |
|
|
|
New Zealand — 0.1% | |
Fisher & Paykel Healthcare Corp., Ltd. | | | 39,358 | | | | 426,783 | |
Fletcher Building, Ltd. | | | 104,764 | | | | 440,824 | |
| | | | | | |
|
|
|
| | | | | | | | 867,607 | |
| | | | | | |
|
|
|
Norway — 2.0% | |
Aker Solutions ASA† | | | 157,431 | | | | 1,074,552 | |
Leroy Seafood Group ASA | | | 713,239 | | | | 5,432,971 | |
Marine Harvest ASA# | | | 39,043 | | | | 843,371 | |
Norway Royal Salmon ASA | | | 90,499 | | | | 2,185,275 | |
TGS NOPEC Geophysical Co. ASA | | | 112,908 | | | | 4,288,165 | |
XXL ASA#* | | | 56,038 | | | | 311,725 | |
| | | | | | |
|
|
|
| | | | | | | | 14,136,059 | |
| | | | | | |
|
|
|
Philippines — 0.7% | |
Bloomberry Resorts Corp. | | | 16,614,600 | | | | 2,967,559 | |
Jollibee Foods Corp. | | | 91,470 | | | | 492,694 | |
Metropolitan Bank & Trust Co. | | | 1,083,250 | | | | 1,484,029 | |
| | | | | | |
|
|
|
| | | | | | | | 4,944,282 | |
| | | | | | |
|
|
|
Portugal — 0.1% | |
NOS SGPS SA | | | 101,768 | | | | 580,713 | |
| | | | | | |
|
|
|
Singapore — 0.7% | |
Ascendas India Trust | | | 1,732,100 | | | | 1,451,251 | |
City Developments, Ltd. | | | 164,700 | | | | 1,113,560 | |
Singapore Technologies Engineering, Ltd. | | | 665,100 | | | | 1,618,472 | |
Venture Corp., Ltd. | | | 84,663 | | | | 1,117,079 | |
| | | | | | |
|
|
|
| | | | | | | | 5,300,362 | |
| | | | | | |
|
|
|
South Africa — 0.3% | |
AVI, Ltd. | | | 227,441 | | | | 1,795,538 | |
| | | | | | |
|
|
|
South Korea — 1.9% | |
Cafe24 Corp.† | | | 11,523 | | | | 1,674,906 | |
Coway Co., Ltd. | | | 22,074 | | | | 1,812,481 | |
Doosan Bobcat, Inc. | | | 33,949 | | | | 1,085,734 | |
Hotel Shilla Co., Ltd. | | | 35,959 | | | | 3,488,813 | |
Lock&Lock Co., Ltd. | | | 27,609 | | | | 435,285 | |
VALIC Company II International Opportunities Fund
PORTFOLIO OF INVESTMENTS — August 31, 2018 — (continued)
| | | | | | | | |
| | |
| Security Description | | Shares | | |
Value
(Note 2) | |
| |
COMMON STOCKS (continued) | |
South Korea (continued) | |
LS Industrial Systems Co., Ltd. | | | 29,543 | | | $ | 1,900,264 | |
Orion Corp. | | | 17,582 | | | | 1,690,045 | |
Samsung Fire & Marine Insurance Co., Ltd. | | | 4,772 | | | | 1,136,037 | |
TK Corp. | | | 44,932 | | | | 518,687 | |
| | | | | | |
|
|
|
| | | | | | | | 13,742,252 | |
| | | | | | |
|
|
|
Spain — 2.1% | |
Amadeus IT Group SA | | | 87,196 | | | | 8,088,923 | |
Cellnex Telecom SA#* | | | 60,145 | | | | 1,544,270 | |
CEMEX Latam Holdings SA† | | | 99,822 | | | | 206,450 | |
CIE Automotive SA | | | 149,610 | | | | 4,591,565 | |
Viscofan SA | | | 13,106 | | | | 954,603 | |
| | | | | | |
|
|
|
| | | | | | | | 15,385,811 | |
| | | | | | |
|
|
|
Sweden — 1.0% | |
Ahlsell AB* | | | 146,950 | | | | 844,406 | |
Essity AB, Class B | | | 24,890 | | | | 645,034 | |
Evolution Gaming Group AB* | | | 48,781 | | | | 3,736,526 | |
Saab AB, Series B | | | 10,700 | | | | 494,801 | |
Swedish Match AB | | | 25,844 | | | | 1,381,621 | |
| | | | | | |
|
|
|
| | | | | | | | 7,102,388 | |
| | | | | | |
|
|
|
Switzerland — 3.1% | |
Coca-Cola HBC AG | | | 17,181 | | | | 587,596 | |
DKSH Holding AG | | | 2,733 | | | | 199,071 | |
Dufry AG# | | | 8,264 | | | | 1,022,289 | |
Geberit AG | | | 1,923 | | | | 874,551 | |
Georg Fischer AG | | | 5,229 | | | | 6,846,119 | |
Julius Baer Group, Ltd. | | | 17,571 | | | | 933,978 | |
Logitech International SA | | | 92,155 | | | | 4,548,564 | |
Lonza Group AG | | | 1,560 | | | | 502,000 | |
Sika AG | | | 26,292 | | | | 3,898,025 | |
Sonova Holding AG | | | 8,489 | | | | 1,610,655 | |
Temenos AG | | | 4,946 | | | | 893,010 | |
VAT Group AG* | | | 2,882 | | | | 372,571 | |
| | | | | | |
|
|
|
| | | | | | | | 22,288,429 | |
| | | | | | |
|
|
|
Taiwan — 1.3% | |
Advantech Co., Ltd. | | | 55,256 | | | | 375,989 | |
E.Sun Financial Holding Co., Ltd. | | | 3,250,194 | | | | 2,391,483 | |
Formosa Sumco Technology Corp. | | | 780,000 | | | | 2,793,424 | |
PChome Online, Inc.† | | | 267,932 | | | | 1,238,689 | |
Voltronic Power Technology Corp. | | | 72,950 | | | | 1,256,407 | |
Yuanta Financial Holding Co., Ltd. | | | 2,830,807 | | | | 1,433,145 | |
| | | | | | |
|
|
|
| | | | | | | | 9,489,137 | |
| | | | | | |
|
|
|
Thailand — 0.3% | |
AEON Thana Sinsap Thailand PCL | | | 145,100 | | | | 797,983 | |
PTT Global Chemical PCL | | | 339,200 | | | | 847,223 | |
Thai Beverage PCL# | | | 1,615,400 | | | | 729,699 | |
| | | | | | |
|
|
|
| | | | | | | | 2,374,905 | |
| | | | | | |
|
|
|
Turkey — 0.0% | |
Ford Otomotiv Sanayi AS | | | 15,583 | | | | 158,887 | |
Tofas Turk Otomobil Fabrikasi AS | | | 26,487 | | | | 92,375 | |
| | | | | | |
|
|
|
| | | | | | | | 251,262 | |
| | | | | | |
|
|
|
United Kingdom — 16.5% | |
Abcam PLC | | | 499,369 | | | | 9,814,691 | |
Admiral Group PLC | | | 19,042 | | | | 513,490 | |
Ashtead Group PLC | | | 27,989 | | | | 857,083 | |
Auto Trader Group PLC* | | | 366,126 | | | | 2,131,717 | |
Babcock International Group PLC | | | 83,098 | | | | 768,563 | |
Beazley PLC | | | 824,306 | | | | 6,353,253 | |
Bellway PLC | | | 8,557 | | | | 323,715 | |
Britvic PLC | | | 39,077 | | | | 412,890 | |
Bunzl PLC | | | 181,462 | | | | 5,641,450 | |
| | | | | | | | |
| | |
| Security Description | | Shares/
Principal
Amount | | | Value
(Note 2) | |
| |
| | | | | | | | | |
United Kingdom (continued) | |
Burberry Group PLC | | | 27,188 | | | $ | 788,143 | |
Coats Group PLC | | | 2,544,069 | | | | 2,750,748 | |
Cobham PLC† | | | 294,089 | | | | 474,302 | |
Compass Group PLC | | | 149,805 | | | | 3,221,051 | |
Countryside Properties PLC* | | | 833,003 | | | | 3,632,941 | |
Cranswick PLC† | | | 59,157 | | | | 2,477,220 | |
Croda International PLC | | | 84,682 | | | | 5,599,086 | |
Dechra Pharmaceuticals PLC | | | 122,135 | | | | 4,940,269 | |
Domino’s Pizza Group PLC | | | 374,461 | | | | 1,412,718 | |
Elementis PLC | | | 50,036 | | | | 165,546 | |
EMIS Group PLC | | | 29,163 | | | | 364,473 | |
Fevertree Drinks PLC | | | 283,239 | | | | 13,671,052 | |
Forterra PLC* | | | 45,266 | | | | 160,797 | |
Greggs PLC | | | 88,432 | | | | 1,218,705 | |
Halma PLC | | | 74,297 | | | | 1,379,336 | |
Hargreaves Lansdown PLC | | | 45,919 | | | | 1,309,697 | |
Howden Joinery Group PLC | | | 106,811 | | | | 682,267 | |
Ibstock PLC* | | | 1,439,894 | | | | 4,584,740 | |
IG Group Holdings PLC | | | 74,035 | | | | 867,683 | |
IMI PLC | | | 51,495 | | | | 806,469 | |
Intertek Group PLC | | | 29,765 | | | | 1,981,151 | |
Jardine Lloyd Thompson Group PLC | | | 79,321 | | | | 1,484,948 | |
Just Eat PLC† | | | 244,921 | | | | 2,434,169 | |
Keywords Studios PLC | | | 418,837 | | | | 10,816,586 | |
Learning Technologies Group PLC | | | 2,174,651 | | | | 3,298,612 | |
Meggitt PLC | | | 86,155 | | | | 601,146 | |
Melrose Industries PLC | | | 192,055 | | | | 554,998 | |
Merlin Entertainments PLC* | | | 172,784 | | | | 833,078 | |
Moneysupermarket.com Group PLC | | | 296,742 | | | | 1,092,580 | |
PZ Cussons PLC | | | 21,723 | | | | 67,591 | |
Rathbone Brothers PLC | | | 50,455 | | | | 1,722,962 | |
Rightmove PLC | | | 503,690 | | | | 3,213,131 | |
Rotork PLC | | | 1,086,884 | | | | 4,762,727 | |
Schroders PLC | | | 62,073 | | | | 2,474,592 | |
Shaftesbury PLC | | | 33,219 | | | | 397,722 | |
Smith & Nephew PLC | | | 97,114 | | | | 1,709,139 | |
Spectris PLC | | | 18,232 | | | | 556,412 | |
Spirax-Sarco Engineering PLC | | | 14,948 | | | | 1,381,747 | |
Stagecoach Group PLC | | | 136,855 | | | | 288,494 | |
Tate & Lyle PLC | | | 26,219 | | | | 227,880 | |
TechnipFMC PLC | | | 24,704 | | | | 756,164 | |
UNITE Group PLC | | | 64,527 | | | | 741,611 | |
Whitbread PLC | | | 16,330 | | | | 973,021 | |
| | | | | | |
|
|
|
| | | | | | | | 119,694,556 | |
| | | | | | |
|
|
|
United States — 0.8% | | | | | | | | |
Autoliv, Inc. SDR | | | 4,330 | | | | 385,409 | |
EPAM Systems, Inc.† | | | 18,161 | | | | 2,595,751 | |
Gran Tierra Energy, Inc.† | | | 260,520 | | | | 900,341 | |
Veoneer, Inc. SDR† | | | 4,330 | | | | 212,590 | |
Yum China Holdings, Inc. | | | 36,407 | | | | 1,408,223 | |
| | | | | | |
|
|
|
| | | | | | | | 5,502,314 | |
| | | | | | |
|
|
|
Total Long-Term Investment Securities | | | | | | | | |
(cost $544,196,814) | | | | | | | 694,686,308 | |
| | | | | | |
|
|
|
SHORT-TERM INVESTMENT SECURITIES — 3.5% | | | | | | | | |
Registered Investment Companies — 2.9% | | | | | | | | |
State Street Navigator Securities Lending Government Money Market Portfolio
1.93%(2)(4) | | | 20,966,764 | | | | 20,966,764 | |
| | | | | | |
|
|
|
U.S. Government Agencies — 0.6% | | | | | | | | |
Federal Home Loan Bank
Disc. Notes
1.83% due 09/04/2018 | | $ | 4,212,000 | | | | 4,212,000 | |
| | | | | | |
|
|
|
Total Short-Term Investment Securities | |
(cost $25,178,122) | | | | | | | 25,178,764 | |
| | | | | | |
|
|
|
VALIC Company II International Opportunities Fund
PORTFOLIO OF INVESTMENTS — August 31, 2018 — (continued)
| | | | | | | | |
| | |
| Security Description | | Principal
Amount | | | Value
(Note 2) | |
| |
REPURCHASE AGREEMENTS — 1.2% | |
Agreement with Fixed Income Clearing Corp., bearing interest at 0.35%, dated 08/31/2018, to be repurchased 09/04/2018 in the amount of $8,901,346 and collateralized by $7,950,000 of U.S. Treasury Bonds, bearing interest at 3.75%, due 11/15/2043 and having an approximate value of $9,082,438.
(cost $8,901,000) | | $ | 8,901,000 | | | $ | 8,901,000 | |
| | | | | | |
|
|
|
TOTAL INVESTMENTS | | | | | | | | |
(cost $578,275,936)(5) | | | 100.7 | % | | | 728,766,072 | |
Liabilities in excess of other assets | | | (0.7 | ) | | | (4,738,688 | ) |
| | |
|
|
| |
|
|
|
NET ASSETS | | | 100.0 | % | | $ | 724,027,384 | |
| | |
|
|
| |
|
|
|
| # | The security or a portion thereof is out on loan (see Note 2). |
| † | Non-income producing security |
| * | Securities exempt from registration under Rule 144A of the Securities Act of 1933. These securities may be sold in transactions exempt from registration, normally to qualified institutional buyers. The Fund has no right to demand registration of these securities. At August 31, 2018, the aggregate value of these securities was $28,934,844 representing 4.0% of net assets. Unless otherwise indicated, these securities are not considered to be illiquid. |
| (1) | Securities classified as Level 3 (see Note 2). |
| (2) | The rate shown is the 7-day yield as of August 31, 2018. |
| (3) | Illiquid security. At August 31, 2018, the aggregate value of these securities was $0 representing 0.0% of net assets. |
| (4) | At August 31, 2018, the Fund had loaned securities with a total value of $33,464,718. This was secured by collateral of $20,966,764, which was received in cash and subsequently invested in short-term investments currently valued at $20,966,764 as reported in the Portfolio of Investments. Additional collateral of $14,379,297 was received in the form of fixed income pooled securities, which the Fund cannot sell or repledge and accordingly are not reflected in the Fund’s assets and liabilities. |
The components of the fixed income pooled securities referenced above are as follows:
| | | | | | | | |
Securities
| | Coupon Range
| | Maturity Date Range
| | Value as of
August 31, 2018
| |
Federal Home Loan Mtg. Corp. | | 3.00% to 3.50% | | 11/01/2034 to 12/01/2047 | | $ | 141,811 | |
Federal National Mtg. Assoc. | | 3.00% to 4.00% | | 01/01/2033 to 05/01/2048 | | | 105,420 | |
Government National Mtg. Assoc. | | 4.00% | | 03/20/2048 to 03/20/2048 | | | 7,372 | |
United States Treasury Bills | | 0.00% | | 09/06/2018 to 02/28/2019 | | | 1,142,120 | |
United States Treasury Notes/Bonds | | zero coupon to 8.75% | | 09/15/2018 to 11/15/2047 | | | 12,982,574 | |
| (5) | See Note 5 for cost of investments on a tax basis. |
ADR—American Depositary Receipt
ISE—Irish Stock Exchange
LSE—London Stock Exchange
SDR—Swedish Depositary Receipt
The following is a summary of the inputs used to value the Fund’s net assets as of August 31, 2018 (see Note 2):
| | | | | | | | | | | | | | | | |
| | | Level 1 - Unadjusted
Quoted Prices
| | | Level 2 - Other
Observable Inputs
| | | Level 3 - Significant
Unobservable Inputs
| | | Total
| |
ASSETS: | | | | | | | | | | | | | | | | |
Investments at Value:* | | | | | | | | | | | | | | | | |
Common Stocks: | | | | | | | | | | | | | | | | |
Bermuda | | $ | 22,038,988 | | | $ | — | | | $ | 0 | | | $ | 22,038,988 | |
Other Countries | | | 672,647,320 | | | | — | | | | — | | | | 672,647,320 | |
Short Term Investment Securities: | | | | | | | | | | | | | | | | |
Registered Investment Companies | | | 20,966,764 | | | | — | | | | — | | | | 20,966,764 | |
U.S. Government Agencies | | | — | | | | 4,212,000 | | | | — | | | | 4,212,000 | |
Repurchase Agreements | | | — | | | | 8,901,000 | | | | — | | | | 8,901,000 | |
| | |
|
|
| |
|
|
| |
|
|
| |
|
|
|
Total Investments at Value | | $ | 715,653,072 | | | $ | 13,113,000 | | | $ | 0 | | | $ | 728,766,072 | |
| | |
|
|
| |
|
|
| |
|
|
| |
|
|
|
| * | For a detailed presentation of investments, please refer to the Portfolio of Investments. |
The Fund’s policy is to recognize transfers between Levels as of the end of the reporting period. Securities currently valued at $450,343,655 were transferred from Level 2 to Level 1 due to foreign equity securities whose values were previously adjusted for fair value pricing procedures for foreign equity securities. There were no additional transfers between Levels during the reporting period.
At the beginning and the end of the reporting period, Level 3 investments in securities were not considered a material portion of the Fund.
See Notes to Financial Statements
VALIC Company II Large Cap Value Fund
PORTFOLIO PROFILE — August 31, 2018 (unaudited)
Industry Allocation*
| | | | |
Diversified Banking Institutions | | | 7.8 | % |
Medical — Drugs | | | 6.7 | |
Banks — Super Regional | | | 6.1 | |
Oil Companies — Exploration & Production | | | 5.2 | |
Oil Refining & Marketing | | | 4.3 | |
Insurance — Property/Casualty | | | 4.3 | |
Insurance — Multi-line | | | 4.1 | |
Telephone — Integrated | | | 3.8 | |
Food — Misc./Diversified | | | 3.4 | |
Agricultural Chemicals | | | 2.4 | |
Networking Products | | | 2.4 | |
Aerospace/Defense — Equipment | | | 2.4 | |
Investment Management/Advisor Services | | | 1.9 | |
Beverages — Non-alcoholic | | | 1.9 | |
Building Products — Cement | | | 1.8 | |
Electric — Integrated | | | 1.8 | |
Computer Services | | | 1.7 | |
Oil — Field Services | | | 1.7 | |
Banks — Commercial | | | 1.6 | |
Enterprise Software/Service | | | 1.5 | |
Cosmetics & Toiletries | | | 1.5 | |
Instruments — Controls | | | 1.4 | |
Medical Instruments | | | 1.3 | |
Medical Labs & Testing Services | | | 1.3 | |
Electric — Distribution | | | 1.3 | |
Chemicals — Diversified | | | 1.3 | |
Commercial Paper | | | 1.2 | |
Medical — HMO | | | 1.1 | |
Airlines | | | 1.1 | |
Medical — Biomedical/Gene | | | 1.1 | |
Diversified Manufacturing Operations | | | 1.1 | |
Aerospace/Defense | | | 1.1 | |
Electronic Components — Semiconductors | | | 1.1 | |
Semiconductor Components — Integrated Circuits | | | 0.9 | |
Cable/Satellite TV | | | 0.9 | |
Medical Products | | | 0.9 | |
Containers — Metal/Glass | | | 0.8 | |
Pharmacy Services | | | 0.8 | |
Auto/Truck Parts & Equipment — Original | | | 0.7 | |
Real Estate Investment Trusts | | | 0.7 | |
Computers | | | 0.6 | |
Banks — Fiduciary | | | 0.6 | |
Multimedia | | | 0.5 | |
Advertising Agencies | | | 0.5 | |
Computer Data Security | | | 0.5 | |
Metal — Copper | | | 0.5 | |
Web Portals/ISP | | | 0.5 | |
Auto — Cars/Light Trucks | | | 0.5 | |
Insurance — Reinsurance | | | 0.5 | |
Finance — Credit Card | | | 0.4 | |
Medical — Hospitals | | | 0.4 | |
Oil Companies — Integrated | | | 0.4 | |
Retail — Auto Parts | | | 0.4 | |
Commercial Services — Finance | | | 0.4 | |
Office Automation & Equipment | | | 0.4 | |
Cellular Telecom | | | 0.4 | |
Insurance — Life/Health | | | 0.4 | |
Exchange-Traded Funds | | | 0.4 | |
Gold Mining | | | 0.4 | |
Medical — Generic Drugs | | | 0.3 | |
Casino Hotels | | | 0.3 | |
Electric Products — Misc. | | | 0.3 | |
Commercial Services | | | 0.3 | |
Dialysis Centers | | | 0.3 | |
Medical — Wholesale Drug Distribution | | | 0.3 | |
Retail — Drug Store | | | 0.2 | |
Transport — Rail | | | 0.2 | |
Medical Information Systems | | | 0.2 | |
| | | | |
Non-Hazardous Waste Disposal | | | 0.2 | |
Transport — Truck | | | 0.2 | |
| | |
|
|
|
| | | | 99.9 | % |
| | |
|
|
|
| * | Calculated as a percentage of net assets |
VALIC Company II Large Cap Value Fund
PORTFOLIO OF INVESTMENTS — August 31, 2018
| | | | | | | | |
| | |
| Security Description | | Shares | | | Value
(Note 2) | |
| |
COMMON STOCKS — 98.3% | |
Advertising Agencies — 0.5% | |
Omnicom Group, Inc.# | | | 22,160 | | | $ | 1,536,131 | |
| | | | | | |
|
|
|
Aerospace/Defense — 1.1% | |
Northrop Grumman Corp. | | | 5,022 | | | | 1,499,017 | |
Raytheon Co. | | | 7,627 | | | | 1,521,129 | |
| | | | | | |
|
|
|
| | | | | | | | 3,020,146 | |
| | | | | | |
|
|
|
Aerospace/Defense - Equipment — 2.4% | |
Harris Corp. | | | 6,067 | | | | 985,948 | |
L3 Technologies, Inc. | | | 6,968 | | | | 1,489,201 | |
United Technologies Corp. | | | 32,033 | | | | 4,218,746 | |
| | | | | | |
|
|
|
| | | | | | | | 6,693,895 | |
| | | | | | |
|
|
|
Agricultural Chemicals — 2.4% | |
CF Industries Holdings, Inc. | | | 73,506 | | | | 3,818,637 | |
Mosaic Co. | | | 70,334 | | | | 2,199,344 | |
Nutrien, Ltd. | | | 15,497 | | | | 877,595 | |
| | | | | | |
|
|
|
| | | | | | | | 6,895,576 | |
| | | | | | |
|
|
|
Airlines — 1.1% | |
Delta Air Lines, Inc. | | | 53,990 | | | | 3,157,335 | |
| | | | | | |
|
|
|
Auto - Cars/Light Trucks — 0.5% | |
General Motors Co. | | | 41,056 | | | | 1,480,069 | |
| | | | | | |
|
|
|
Auto/Truck Parts & Equipment - Original — 0.7% | |
Aptiv PLC | | | 9,996 | | | | 879,748 | |
Delphi Technologies PLC | | | 28,060 | | | | 988,554 | |
| | | | | | |
|
|
|
| | | | | | | | 1,868,302 | |
| | | | | | |
|
|
|
Banks - Commercial — 1.6% | |
BB&T Corp. | | | 60,597 | | | | 3,130,441 | |
Citizens Financial Group, Inc. | | | 34,040 | | | | 1,401,086 | |
| | | | | | |
|
|
|
| | | | | | | | 4,531,527 | |
| | | | | | |
|
|
|
Banks - Fiduciary — 0.6% | |
Bank of New York Mellon Corp. | | | 30,208 | | | | 1,575,347 | |
| | | | | | |
|
|
|
Banks - Super Regional — 6.1% | |
Capital One Financial Corp. | | | 15,615 | | | | 1,547,290 | |
PNC Financial Services Group, Inc. | | | 14,370 | | | | 2,062,670 | |
SunTrust Banks, Inc. | | | 35,446 | | | | 2,607,408 | |
US Bancorp | | | 88,056 | | | | 4,764,710 | |
Wells Fargo & Co. | | | 107,010 | | | | 6,257,945 | |
| | | | | | |
|
|
|
| | | | | | | | 17,240,023 | |
| | | | | | |
|
|
|
Beverages - Non-alcoholic — 1.9% | |
Coca-Cola Co. | | | 21,667 | | | | 965,698 | |
Coca-Cola European Partners PLC | | | 23,780 | | | | 1,013,979 | |
PepsiCo, Inc. | | | 29,337 | | | | 3,286,038 | |
| | | | | | |
|
|
|
| | | | | | | | 5,265,715 | |
| | | | | | |
|
|
|
Building Products - Cement — 1.8% | |
Martin Marietta Materials, Inc.# | | | 15,445 | | | | 3,069,230 | |
Vulcan Materials Co.# | | | 18,801 | | | | 2,083,151 | |
| | | | | | |
|
|
|
| | | | | | | | 5,152,381 | |
| | | | | | |
|
|
|
Cable/Satellite TV — 0.9% | |
Comcast Corp., Class A | | | 71,075 | | | | 2,629,064 | |
| | | | | | |
|
|
|
Casino Hotels — 0.3% | |
Las Vegas Sands Corp. | | | 14,987 | | | | 980,450 | |
| | | | | | |
|
|
|
Cellular Telecom — 0.4% | |
Vodafone Group PLC ADR | | | 48,364 | | | | 1,045,146 | |
| | | | | | |
|
|
|
Chemicals - Diversified — 1.3% | |
DowDuPont, Inc. | | | 51,613 | | | | 3,619,620 | |
| | | | | | |
|
|
|
| | | | | | | | |
| | |
| Security Description | | Shares | | | Value
(Note 2) | |
| |
| | | | | | | | | |
Commercial Services — 0.3% | |
Quanta Services, Inc.† | | | 27,573 | | | $ | 953,750 | |
| | | | | | |
|
|
|
Commercial Services - Finance — 0.4% | |
Total System Services, Inc. | | | 10,883 | | | | 1,057,175 | |
| | | | | | |
|
|
|
Computer Data Security — 0.5% | |
Check Point Software Technologies, Ltd.† | | | 13,201 | | | | 1,533,824 | |
| | | | | | |
|
|
|
Computer Services — 1.7% | |
International Business Machines Corp. | | | 26,534 | | | | 3,886,700 | |
Teradata Corp.†# | | | 25,421 | | | | 1,054,209 | |
| | | | | | |
|
|
|
| | | | | | | | 4,940,909 | |
| | | | | | |
|
|
|
Computers — 0.6% | |
Apple, Inc. | | | 7,227 | | | | 1,645,082 | |
| | | | | | |
|
|
|
Containers - Metal/Glass — 0.8% | |
Crown Holdings, Inc.†# | | | 53,397 | | | | 2,285,926 | |
| | | | | | |
|
|
|
Cosmetics & Toiletries — 1.5% | |
Colgate-Palmolive Co. | | | 16,455 | | | | 1,092,777 | |
Procter & Gamble Co. | | | 20,594 | | | | 1,708,272 | |
Unilever PLC ADR# | | | 26,179 | | | | 1,488,800 | |
| | | | | | |
|
|
|
| | | | | | | | 4,289,849 | |
| | | | | | |
|
|
|
Dialysis Centers — 0.3% | |
DaVita, Inc.† | | | 13,075 | | | | 905,967 | |
| | | | | | |
|
|
|
Diversified Banking Institutions — 7.8% | |
Bank of America Corp. | | | 229,942 | | | | 7,112,106 | |
Citigroup, Inc. | | | 59,681 | | | | 4,251,674 | |
Goldman Sachs Group, Inc. | | | 8,716 | | | | 2,072,752 | |
JPMorgan Chase & Co. | | | 75,308 | | | | 8,628,791 | |
| | | | | | |
|
|
|
| | | | | | | | 22,065,323 | |
| | | | | | |
|
|
|
Diversified Manufacturing Operations — 1.1% | |
Carlisle Cos., Inc. | | | 8,891 | | | | 1,127,468 | |
Dover Corp. | | | 12,365 | | | | 1,061,783 | |
General Electric Co. | | | 72,426 | | | | 937,192 | |
| | | | | | |
|
|
|
| | | | | | | | 3,126,443 | |
| | | | | | |
|
|
|
Electric Products - Misc. — 0.3% | |
AMETEK, Inc. | | | 12,547 | | | | 965,617 | |
| | | | | | |
|
|
|
Electric - Distribution — 1.3% | |
PPL Corp.# | | | 123,579 | | | | 3,675,239 | |
| | | | | | |
|
|
|
Electric - Integrated — 1.8% | |
Evergy, Inc. | | | 34,777 | | | | 1,984,028 | |
FirstEnergy Corp.# | | | 69,281 | | | | 2,589,724 | |
PG&E Corp. | | | 11,836 | | | | 546,586 | |
| | | | | | |
|
|
|
| | | | | | | | 5,120,338 | |
| | | | | | |
|
|
|
Electronic Components - Semiconductors — 1.1% | |
Broadcom, Inc. | | | 4,865 | | | | 1,065,581 | |
Texas Instruments, Inc. | | | 17,226 | | | | 1,936,202 | |
| | | | | | |
|
|
|
| | | | | | | | 3,001,783 | |
| | | | | | |
|
|
|
Enterprise Software/Service — 1.5% | |
Oracle Corp. | | | 89,464 | | | | 4,346,161 | |
| | | | | | |
|
|
|
Finance - Credit Card — 0.4% | |
Discover Financial Services | | | 14,572 | | | | 1,138,365 | |
| | | | | | |
|
|
|
Food - Misc./Diversified — 3.4% | |
Conagra Brands, Inc. | | | 113,964 | | | | 4,188,177 | |
Kellogg Co. | | | 50,084 | | | | 3,595,530 | |
Kraft Heinz Co. | | | 16,674 | | | | 971,594 | |
Mondelez International, Inc., Class A | | | 23,891 | | | | 1,020,624 | |
| | | | | | |
|
|
|
| | | | | | | | 9,775,925 | |
| | | | | | |
|
|
|
VALIC Company II Large Cap Value Fund
PORTFOLIO OF INVESTMENTS — August 31, 2018 — (continued)
| | | | | | | | |
| | |
| Security Description | | Shares | | | Value
(Note 2) | |
| |
COMMON STOCKS (continued) | |
Gold Mining — 0.4% | |
Newmont Mining Corp. | | | 32,482 | | | $ | 1,007,916 | |
| | | | | | |
|
|
|
Instruments - Controls — 1.4% | |
Honeywell International, Inc. | | | 25,486 | | | | 4,053,803 | |
| | | | | | |
|
|
|
Insurance - Life/Health — 0.4% | |
Athene Holding, Ltd., Class A† | | | 21,038 | | | | 1,044,747 | |
| | | | | | |
|
|
|
Insurance - Multi-line — 4.1% | |
Assurant, Inc. | | | 14,163 | | | | 1,456,239 | |
Chubb, Ltd. | | | 15,146 | | | | 2,048,345 | |
Hartford Financial Services Group, Inc. | | | 110,964 | | | | 5,589,257 | |
Voya Financial, Inc. | | | 50,041 | | | | 2,505,553 | |
| | | | | | |
|
|
|
| | | | | | | | 11,599,394 | |
| | | | | | |
|
|
|
Insurance - Property/Casualty — 4.3% | |
Berkshire Hathaway, Inc., Class B† | | | 53,722 | | | | 11,212,856 | |
XL Group, Ltd. | | | 15,130 | | | | 868,311 | |
| | | | | | |
|
|
|
| | | | | | | | 12,081,167 | |
| | | | | | |
|
|
|
Insurance - Reinsurance — 0.5% | |
RenaissanceRe Holdings, Ltd. | | | 10,648 | | | | 1,415,758 | |
| | | | | | |
|
|
|
Investment Management/Advisor Services — 1.9% | |
Ameriprise Financial, Inc. | | | 11,072 | | | | 1,571,781 | |
Invesco, Ltd. | | | 42,630 | | | | 1,027,383 | |
LPL Financial Holdings, Inc. | | | 20,724 | | | | 1,372,758 | |
Raymond James Financial, Inc. | | | 15,070 | | | | 1,402,113 | |
| | | | | | |
|
|
|
| | | | | | | | 5,374,035 | |
| | | | | | |
|
|
|
Medical Information Systems — 0.2% | |
Cerner Corp.† | | | 9,086 | | | | 591,589 | |
| | | | | | |
|
|
|
Medical Instruments — 1.3% | |
Boston Scientific Corp.† | | | 45,973 | | | | 1,634,800 | |
Medtronic PLC | | | 22,817 | | | | 2,199,787 | |
| | | | | | |
|
|
|
| | | | | | | | 3,834,587 | |
| | | | | | |
|
|
|
Medical Labs & Testing Services — 1.3% | |
Laboratory Corp. of America Holdings† | | | 10,030 | | | | 1,733,886 | |
Quest Diagnostics, Inc. | | | 17,917 | | | | 1,970,512 | |
| | | | | | |
|
|
|
| | | | | | | | 3,704,398 | |
| | | | | | |
|
|
|
Medical Products — 0.9% | |
Abbott Laboratories | | | 39,020 | | | | 2,608,097 | |
| | | | | | |
|
|
|
Medical - Biomedical/Gene — 1.1% | |
Biogen, Inc.† | | | 3,011 | | | | 1,064,358 | |
Gilead Sciences, Inc. | | | 27,359 | | | | 2,071,897 | |
| | | | | | |
|
|
|
| | | | | | | | 3,136,255 | |
| | | | | | |
|
|
|
Medical - Drugs — 6.7% | |
Bristol-Myers Squibb Co. | | | 17,624 | | | | 1,067,133 | |
Johnson & Johnson | | | 18,721 | | | | 2,521,531 | |
Merck & Co., Inc. | | | 91,681 | | | | 6,288,400 | |
Novartis AG ADR | | | 14,073 | | | | 1,168,200 | |
Pfizer, Inc. | | | 193,028 | | | | 8,014,523 | |
| | �� | | | | |
|
|
|
| | | | | | | | 19,059,787 | |
| | | | | | |
|
|
|
Medical - Generic Drugs — 0.3% | |
Mylan NV† | | | 25,312 | | | | 990,459 | |
| | | | | | |
|
|
|
Medical - HMO — 1.1% | |
Humana, Inc. | | | 4,738 | | | | 1,578,986 | |
UnitedHealth Group, Inc. | | | 5,907 | | | | 1,585,793 | |
| | | | | | |
|
|
|
| | | | | | | | 3,164,779 | |
| | | | | | |
|
|
|
Medical - Hospitals — 0.4% | |
HCA Healthcare, Inc. | | | 8,085 | | | | 1,084,279 | |
| | | | | | |
|
|
|
| | | | | | | | |
| | |
| Security Description | | Shares | | | Value
(Note 2) | |
| |
| | | | | | | | | |
Medical - Wholesale Drug Distribution — 0.3% | |
McKesson Corp. | | | 6,577 | | | $ | 846,789 | |
| | | | | | |
|
|
|
Metal - Copper — 0.5% | |
Freeport-McMoRan, Inc. | | | 107,660 | | | | 1,512,623 | |
| | | | | | |
|
|
|
Multimedia — 0.5% | |
Twenty-First Century Fox, Inc., Class B | | | 34,666 | | | | 1,556,503 | |
| | | | | | |
|
|
|
Networking Products — 2.4% | |
Cisco Systems, Inc. | | | 141,642 | | | | 6,766,238 | |
| | | | | | |
|
|
|
Non-Hazardous Waste Disposal — 0.2% | |
Republic Services, Inc. | | | 7,551 | | | | 553,941 | |
| | | | | | |
|
|
|
Office Automation & Equipment — 0.4% | |
Xerox Corp. | | | 37,529 | | | | 1,045,558 | |
| | | | | | |
|
|
|
Oil Companies - Exploration & Production — 5.2% | |
Anadarko Petroleum Corp. | | | 40,930 | | | | 2,635,892 | |
Cimarex Energy Co. | | | 12,345 | | | | 1,042,906 | |
Hess Corp.# | | | 39,138 | | | | 2,635,553 | |
Noble Energy, Inc. | | | 49,526 | | | | 1,471,913 | |
Occidental Petroleum Corp. | | | 86,134 | | | | 6,879,522 | |
| | | | | | |
|
|
|
| | | | | | | | 14,665,786 | |
| | | | | | |
|
|
|
Oil Companies - Integrated — 0.4% | |
Chevron Corp. | | | 9,125 | | | | 1,080,947 | |
| | | | | | |
|
|
|
Oil Refining & Marketing — 4.3% | |
Marathon Petroleum Corp. | | | 57,397 | | | | 4,723,199 | |
Phillips 66 | | | 32,274 | | | | 3,824,792 | |
Valero Energy Corp. | | | 32,050 | | | | 3,778,054 | |
| | | | | | |
|
|
|
| | | | | | | | 12,326,045 | |
| | | | | | |
|
|
|
Oil - Field Services — 1.7% | |
Apergy Corp.† | | | 35,897 | | | | 1,623,262 | |
Schlumberger, Ltd. | | | 50,379 | | | | 3,181,938 | |
| | | | | | |
|
|
|
| | | | | | | | 4,805,200 | |
| | | | | | |
|
|
|
Pharmacy Services — 0.8% | |
CVS Health Corp. | | | 30,280 | | | | 2,278,267 | |
| | | | | | |
|
|
|
Real Estate Investment Trusts — 0.7% | |
Equity Residential | | | 27,339 | | | | 1,852,217 | |
| | | | | | |
|
|
|
Retail - Auto Parts — 0.4% | |
Advance Auto Parts, Inc. | | | 6,539 | | | | 1,072,592 | |
| | | | | | |
|
|
|
Retail - Drug Store — 0.2% | |
Walgreens Boots Alliance, Inc. | | | 9,448 | | | | 647,755 | |
| | | | | | |
|
|
|
Semiconductor Components - Integrated Circuits — 0.9% | |
QUALCOMM, Inc. | | | 38,973 | | | | 2,677,835 | |
| | | | | | |
|
|
|
Telephone - Integrated — 3.8% | |
AT&T, Inc. | | | 105,734 | | | | 3,377,144 | |
Verizon Communications, Inc. | | | 135,748 | | | | 7,380,619 | |
| | | | | | |
|
|
|
| | | | | | | | 10,757,763 | |
| | | | | | |
|
|
|
Transport - Rail — 0.2% | |
Union Pacific Corp. | | | 4,294 | | | | 646,762 | |
| | | | | | |
|
|
|
Transport - Truck — 0.2% | |
Knight-Swift Transportation Holdings, Inc.# | | | 15,445 | | | | 527,138 | |
| | | | | | |
|
|
|
Web Portals/ISP — 0.5% | |
Alphabet, Inc., Class A† | | | 1,202 | | | | 1,480,624 | |
| | | | | | |
|
|
|
Total Common Stocks | | | | | |
(cost $250,800,600) | | | | | | | 279,370,036 | |
| | | | | | |
|
|
|
VALIC Company II Large Cap Value Fund
PORTFOLIO OF INVESTMENTS — August 31, 2018 — (continued)
| | | | | | | | |
| | |
| Security Description | | Shares/
Principal
Amount | | | Value
(Note 2) | |
| |
EXCHANGE-TRADED FUNDS — 0.4% | |
iShares Russell 1000 Value ETF
(cost $1,015,599) | | | 8,121 | | | $ | 1,032,179 | |
| | | | | | |
|
|
|
Total Long-Term Investment Securities | | | | | | | | |
(cost $251,816,199) | | | | | | | 280,402,215 | |
| | | | | | |
|
|
|
SHORT-TERM INVESTMENT SECURITIES — 1.2% | |
Commercial Paper — 1.2% | |
Credit Agricole Corporate and Investment Bank
1.88% due 09/04/2018
(cost $3,399,467) | | $ | 3,400,000 | | | | 3,399,331 | |
| | | | | | |
|
|
|
TOTAL INVESTMENTS | | | | | | | | |
(cost $255,215,666)(1) | | | 99.9 | % | | | 283,801,546 | |
Other assets less liabilities | | | 0.1 | | | | 284,921 | |
| | |
|
|
| |
|
|
|
NET ASSETS | | | 100.0 | % | | $ | 284,086,467 | |
| | |
|
|
| |
|
|
|
| † | Non-income producing security |
| # | The security or a portion thereof is out on loan (see Note 2). |
At August 31, 2018, the Fund had loaned securities with a total value of $18,598,783. This was secured by collateral of $19,170,819 received in the form of fixed income pooled securities, which the Fund cannot sell or repledge.
The components of the fixed income pooled securities referenced above are as follows:
| | | | | | | | |
Securities
| | Coupon Range
| | Maturity Date Range
| | Value as of
August 31, 2018
| |
Federal Home Loan Mtg. Corp. | | 3.00% to 4.50% | | 07/15/2042 to 05/01/2048 | | $ | 4,336,228 | |
Federal National Mtg. Assoc. | | 3.00% to 4.50% | | 10/25/2039 to 06/01/2048 | | | 4,068,990 | |
Government National Mtg. Assoc. | | 2.50% | | 09/20/2046 | | | 648,296 | |
United States Treasury Bills | | 0.00% | | 09/06/2018 to 02/28/2019 | | | 662,192 | |
United States Treasury Notes/Bonds | | zero coupon to 8.75% | | 09/15/2018 to 11/15/2047 | | | 9,455,113 | |
| (1) | See Note 5 for cost of investments on a tax basis. |
ADR—American Depositary Receipt
ETF—Exchange-Traded Funds
The following is a summary of the inputs used to value the Fund’s net assets as of August 31, 2018 (see Note 2):
| | | | | | | | | | | | | | | | |
| | | Level 1 - Unadjusted
Quoted Prices
| | | Level 2 - Other
Observable Inputs
| | | Level 3 - Significant
Unobservable Inputs
| | | Total
| |
ASSETS: | | | | | | | | | | | | | | | | |
Investments at Value:* | | | | | | | | | | | | | | | | |
Common Stocks | | $ | 279,370,036 | | | $ | — | | | $ | — | | | $ | 279,370,036 | |
Exchange-Traded Funds | | | 1,032,179 | | | | — | | | | — | | | | 1,032,179 | |
Short-Term Investment Securities | | | — | | | | 3,399,331 | | | | — | | | | 3,399,331 | |
| | |
|
|
| |
|
|
| |
|
|
| |
|
|
|
Total Investments at Value | | $ | 280,402,215 | | | $ | 3,399,331 | | | $ | — | | | $ | 283,801,546 | |
| | |
|
|
| |
|
|
| |
|
|
| |
|
|
|
| * | For a detailed presentation of investments, please refer to the Portfolio of Investments. |
The Fund’s policy is to recognize transfers between Levels as of the end of the reporting period. There were no transfers between Levels during the reporting period.
See Notes to Financial Statements
VALIC Company II Mid Cap Growth Fund
PORTFOLIO PROFILE — August 31, 2018 (unaudited)
Industry Allocation*
| | | | |
Medical — Biomedical/Gene | | | 7.0 | % |
Commercial Services — Finance | | | 6.6 | |
Banks — Commercial | | | 6.2 | |
Enterprise Software/Service | | | 4.6 | |
Insurance — Property/Casualty | | | 4.5 | |
Oil Companies — Exploration & Production | | | 4.0 | |
Computer Services | | | 3.8 | |
Medical — Drugs | | | 2.9 | |
Electronic Measurement Instruments | | | 2.8 | |
Medical Instruments | | | 2.5 | |
E-Commerce/Services | | | 2.4 | |
Commercial Services | | | 2.3 | |
Machinery — General Industrial | | | 2.3 | |
Distribution/Wholesale | | | 1.9 | |
Therapeutics | | | 1.9 | |
Web Hosting/Design | | | 1.8 | |
E-Services/Consulting | | | 1.8 | |
Building Products — Air & Heating | | | 1.8 | |
Gas — Distribution | | | 1.7 | |
Containers — Metal/Glass | | | 1.6 | |
Airlines | | | 1.6 | |
Medical Products | | | 1.5 | |
Retail — Automobile | | | 1.4 | |
Electronic Components — Semiconductors | | | 1.4 | |
Computer Software | | | 1.3 | |
Transport — Rail | | | 1.3 | |
Lasers — System/Components | | | 1.3 | |
Containers — Paper/Plastic | | | 1.2 | |
Telecommunication Equipment | | | 1.2 | |
Building — Residential/Commercial | | | 1.1 | |
Finance — Auto Loans | | | 1.1 | |
Applications Software | | | 1.1 | |
Multimedia | | | 1.0 | |
Hotels/Motels | | | 1.0 | |
Instruments — Controls | | | 1.0 | |
Machine Tools & Related Products | | | 1.0 | |
Internet Infrastructure Software | | | 1.0 | |
Disposable Medical Products | | | 1.0 | |
Human Resources | | | 1.0 | |
Non-Hazardous Waste Disposal | | | 1.0 | |
Rental Auto/Equipment | | | 1.0 | |
Semiconductor Equipment | | | 0.9 | |
Aerospace/Defense — Equipment | | | 0.9 | |
Banks — Fiduciary | | | 0.9 | |
Educational Software | | | 0.9 | |
Real Estate Investment Trusts | | | 0.8 | |
Insurance — Reinsurance | | | 0.7 | |
Data Processing/Management | | | 0.7 | |
Auto — Heavy Duty Trucks | | | 0.6 | |
Printing — Commercial | | | 0.6 | |
Retail — Misc./Diversified | | | 0.6 | |
Registered Investment Companies | | | 0.6 | |
Food — Catering | | | 0.6 | |
Real Estate Management/Services | | | 0.6 | |
Apparel Manufacturers | | | 0.5 | |
Linen Supply & Related Items | | | 0.5 | |
Electric — Integrated | | | 0.4 | |
E-Commerce/Products | | | 0.4 | |
Diagnostic Equipment | | | 0.2 | |
| | |
|
|
|
| | | | 100.3 | % |
| | |
|
|
|
| * | Calculated as a percentage of net assets |
VALIC Company II Mid Cap Growth Fund
PORTFOLIO OF INVESTMENTS — August 31, 2018
| | | | | | | | |
| | |
| Security Description | | Shares | | | Value
(Note 2) | |
| |
COMMON STOCKS — 99.7% | |
Aerospace/Defense - Equipment — 0.9% | |
HEICO Corp., Class A | | | 27,518 | | | $ | 2,050,091 | |
| | | | | | |
|
|
|
Airlines — 1.6% | |
JetBlue Airways Corp.† | | | 88,667 | | | | 1,691,767 | |
Spirit Airlines, Inc.†# | | | 37,735 | | | | 1,793,167 | |
| | | | | | |
|
|
|
| | | | | | | | 3,484,934 | |
| | | | | | |
|
|
|
Apparel Manufacturers — 0.5% | |
Under Armour, Inc., Class C†# | | | 63,104 | | | | 1,197,083 | |
| | | | | | |
|
|
|
Applications Software — 1.1% | |
PTC, Inc.† | | | 23,237 | | | | 2,322,306 | |
| | | | | | |
|
|
|
Auto - Heavy Duty Trucks — 0.6% | |
PACCAR, Inc. | | | 20,558 | | | | 1,406,578 | |
| | | | | | |
|
|
|
Banks - Commercial — 6.2% | |
Cullen/Frost Bankers, Inc. | | | 17,324 | | | | 1,921,058 | |
East West Bancorp, Inc. | | | 14,088 | | | | 893,038 | |
First Citizens BancShares, Inc., Class A | | | 3,565 | | | | 1,693,411 | |
First Republic Bank# | | | 25,754 | | | | 2,616,349 | |
M&T Bank Corp. | | | 14,513 | | | | 2,570,978 | |
Pinnacle Financial Partners, Inc. | | | 14,822 | | | | 956,760 | |
Prosperity Bancshares, Inc. | | | 21,163 | | | | 1,583,839 | |
South State Corp. | | | 16,932 | | | | 1,396,044 | |
| | | | | | |
|
|
|
| | | | | | | | 13,631,477 | |
| | | | | | |
|
|
|
Banks - Fiduciary — 0.9% | |
Northern Trust Corp. | | | 18,342 | | | | 1,971,031 | |
| | | | | | |
|
|
|
Building Products - Air & Heating — 1.8% | |
Lennox International, Inc. | | | 17,336 | | | | 3,862,634 | |
| | | | | | |
|
|
|
Building - Residential/Commercial — 1.1% | |
NVR, Inc.† | | | 947 | | | | 2,527,022 | |
| | | | | | |
|
|
|
Commercial Services — 2.3% | |
Cintas Corp. | | | 11,423 | | | | 2,437,326 | |
CoStar Group, Inc.† | | | 6,026 | | | | 2,664,456 | |
| | | | | | |
|
|
|
| | | | | | | | 5,101,782 | |
| | | | | | |
|
|
|
Commercial Services - Finance — 6.6% | |
Global Payments, Inc. | | | 26,955 | | | | 3,358,054 | |
Total System Services, Inc. | | | 22,475 | | | | 2,183,222 | |
TransUnion | | | 52,800 | | | | 3,975,840 | |
WEX, Inc.† | | | 26,461 | | | | 5,033,411 | |
| | | | | | |
|
|
|
| | | | | | | | 14,550,527 | |
| | | | | | |
|
|
|
Computer Services — 3.8% | |
EPAM Systems, Inc.† | | | 4,631 | | | | 661,909 | |
Genpact, Ltd. | | | 152,202 | | | | 4,663,469 | |
Teradata Corp.†# | | | 74,869 | | | | 3,104,818 | |
| | | | | | |
|
|
|
| | | | | | | | 8,430,196 | |
| | | | | | |
|
|
|
Computer Software — 1.3% | |
Akamai Technologies, Inc.† | | | 39,332 | | | | 2,955,406 | |
| | | | | | |
|
|
|
Containers - Metal/Glass — 1.6% | |
Ball Corp.# | | | 62,206 | | | | 2,605,187 | |
Silgan Holdings, Inc. | | | 35,706 | | | | 972,989 | |
| | | | | | |
|
|
|
| | | | | | | | 3,578,176 | |
| | | | | | |
|
|
|
Containers - Paper/Plastic — 1.2% | |
Packaging Corp. of America | | | 24,848 | | | | 2,731,292 | |
| | | | | | |
|
|
|
Data Processing/Management — 0.7% | |
Dun & Bradstreet Corp. | | | 6,144 | | | | 878,100 | |
Fair Isaac Corp.† | | | 2,709 | | | | 625,725 | |
| | | | | | |
|
|
|
| | | | | | | | 1,503,825 | |
| | | | | | |
|
|
|
| | | | | | | | |
| | |
| Security Description | | Shares | | | Value
(Note 2) | |
| |
| | | | | | | | | |
Diagnostic Equipment — 0.2% | |
Repligen Corp.†# | | | 6,168 | | | $ | 338,500 | |
| | | | | | |
|
|
|
Disposable Medical Products — 1.0% | |
STERIS PLC | | | 18,711 | | | | 2,140,913 | |
| | | | | | |
|
|
|
Distribution/Wholesale — 1.9% | |
Fastenal Co.# | | | 34,607 | | | | 2,019,665 | |
KAR Auction Services, Inc. | | | 34,248 | | | | 2,147,007 | |
| | | | | | |
|
|
|
| | | | | | | | 4,166,672 | |
| | | | | | |
|
|
|
E-Commerce/Products — 0.4% | |
Etsy, Inc.† | | | 18,572 | | | | 904,271 | |
| | | | | | |
|
|
|
E-Commerce/Services — 2.4% | |
Cargurus, Inc.†# | | | 6,861 | | | | 338,385 | |
TripAdvisor, Inc.†# | | | 45,240 | | | | 2,456,984 | |
Zillow Group, Inc., Class A†# | | | 19,000 | | | | 913,900 | |
Zillow Group, Inc., Class C†# | | | 33,396 | | | | 1,624,715 | |
| | | | | | |
|
|
|
| | | | | | | | 5,333,984 | |
| | | | | | |
|
|
|
E-Services/Consulting — 1.8% | |
CDW Corp. | | | 44,525 | | | | 3,898,609 | |
| | | | | | |
|
|
|
Educational Software — 0.9% | |
2U, Inc.† | | | 21,342 | | | | 1,907,121 | |
| | | | | | |
|
|
|
Electric - Integrated — 0.4% | |
Black Hills Corp.# | | | 16,550 | | | | 973,967 | |
| | | | | | |
|
|
|
Electronic Components - Semiconductors — 1.4% | |
Monolithic Power Systems, Inc. | | | 7,405 | | | | 1,109,787 | |
Silicon Laboratories, Inc.† | | | 19,706 | | | | 1,931,188 | |
| | | | | | |
|
|
|
| | | | | | | | 3,040,975 | |
| | | | | | |
|
|
|
Electronic Measurement Instruments — 2.8% | |
Keysight Technologies, Inc.† | | | 47,538 | | | | 3,084,741 | |
National Instruments Corp. | | | 65,755 | | | | 3,139,801 | |
| | | | | | |
|
|
|
| | | | | | | | 6,224,542 | |
| | | | | | |
|
|
|
Enterprise Software/Service — 4.6% | |
Black Knight, Inc.† | | | 29,469 | | | | 1,573,645 | |
Blackbaud, Inc. | | | 30,318 | | | | 3,170,353 | |
Guidewire Software, Inc.†# | | | 25,944 | | | | 2,609,188 | |
Veeva Systems, Inc., Class A† | | | 27,439 | | | | 2,863,534 | |
| | | | | | |
|
|
|
| | | | | | | | 10,216,720 | |
| | | | | | |
|
|
|
Finance - Auto Loans — 1.1% | |
Credit Acceptance Corp.†# | | | 5,361 | | | | 2,448,422 | |
| | | | | | |
|
|
|
Food - Catering — 0.6% | |
Aramark | | | 31,533 | | | | 1,295,376 | |
| | | | | | |
|
|
|
Gas - Distribution — 1.7% | |
NiSource, Inc. | | | 33,225 | | | | 899,401 | |
UGI Corp. | | | 51,856 | | | | 2,802,817 | |
| | | | | | |
|
|
|
| | | | | | | | 3,702,218 | |
| | | | | | |
|
|
|
Hotels/Motels — 1.0% | |
Choice Hotels International, Inc. | | | 28,509 | | | | 2,225,127 | |
| | | | | | |
|
|
|
Human Resources — 1.0% | |
Robert Half International, Inc. | | | 27,159 | | | | 2,123,291 | |
| | | | | | |
|
|
|
Instruments - Controls — 1.0% | |
Mettler-Toledo International, Inc.† | | | 3,768 | | | | 2,202,245 | |
| | | | | | |
|
|
|
Insurance - Property/Casualty — 4.5% | |
Alleghany Corp. | | | 2,630 | | | | 1,661,581 | |
Fidelity National Financial, Inc. | | | 31,847 | | | | 1,277,065 | |
Markel Corp.† | | | 3,296 | | | | 3,984,205 | |
White Mountains Insurance Group, Ltd. | | | 1,773 | | | | 1,645,255 | |
WR Berkley Corp. | | | 18,147 | | | | 1,420,184 | |
| | | | | | |
|
|
|
| | | | | | | | 9,988,290 | |
| | | | | | |
|
|
|
VALIC Company II Mid Cap Growth Fund
PORTFOLIO OF INVESTMENTS — August 31, 2018 — (continued)
| | | | | | | | |
| | |
| Security Description | | Shares | | | Value
(Note 2) | |
| |
COMMON STOCKS (continued) | |
Insurance - Reinsurance — 0.7% | |
Fairfax Financial Holdings, Ltd. | | | 3,014 | | | $ | 1,654,721 | |
| | | | | | |
|
|
|
Internet Infrastructure Software — 1.0% | |
F5 Networks, Inc.† | | | 11,558 | | | | 2,185,849 | |
| | | | | | |
|
|
|
Lasers - System/Components — 1.3% | |
II-VI, Inc.†# | | | 55,724 | | | | 2,772,269 | |
| | | | | | |
|
|
|
Linen Supply & Related Items — 0.5% | |
UniFirst Corp. | | | 5,682 | | | | 1,052,306 | |
| | | | | | |
|
|
|
Machine Tools & Related Products — 1.0% | |
Lincoln Electric Holdings, Inc. | | | 23,311 | | | | 2,194,964 | |
| | | | | | |
|
|
|
Machinery - General Industrial — 2.3% | |
IDEX Corp. | | | 24,201 | | | | 3,707,835 | |
Middleby Corp.†# | | | 11,413 | | | | 1,387,136 | |
| | | | | | |
|
|
|
| | | | | | | | 5,094,971 | |
| | | | | | |
|
|
|
Medical Instruments — 2.5% | |
Bio-Techne Corp. | | | 5,750 | | | | 1,104,977 | |
Integra LifeSciences Holdings Corp.† | | | 28,154 | | | | 1,674,318 | |
Teleflex, Inc.# | | | 10,655 | | | | 2,636,367 | |
| | | | | | |
|
|
|
| | | | | | | | 5,415,662 | |
| | | | | | |
|
|
|
Medical Products — 1.5% | |
Hill-Rom Holdings, Inc. | | | 11,304 | | | | 1,099,540 | |
Varian Medical Systems, Inc.† | | | 19,131 | | | | 2,143,055 | |
| | | | | | |
|
|
|
| | | | | | | | 3,242,595 | |
| | | | | | |
|
|
|
Medical - Biomedical/Gene — 7.0% | |
Alnylam Pharmaceuticals, Inc.†# | | | 15,897 | | | | 1,950,085 | |
BeiGene, Ltd. ADR† | | | 8,074 | | | | 1,433,377 | |
Bluebird Bio, Inc.†# | | | 11,619 | | | | 1,955,478 | |
Ionis Pharmaceuticals, Inc.†# | | | 49,100 | | | | 2,243,379 | |
Sage Therapeutics, Inc.†# | | | 15,667 | | | | 2,573,461 | |
Seattle Genetics, Inc.†# | | | 23,643 | | | | 1,814,837 | |
Spark Therapeutics, Inc.†# | | | 21,391 | | | | 1,317,900 | |
Ultragenyx Pharmaceutical, Inc.†# | | | 25,651 | | | | 2,173,409 | |
| | | | | | |
|
|
|
| | | | | | | | 15,461,926 | |
| | | | | | |
|
|
|
Medical - Drugs — 2.9% | |
Aerie Pharmaceuticals, Inc.†# | | | 32,349 | | | | 1,984,611 | |
Alkermes PLC†# | | | 47,465 | | | | 2,128,331 | |
Ironwood Pharmaceuticals, Inc.†# | | | 74,535 | | | | 1,434,053 | |
PRA Health Sciences, Inc.† | | | 9,010 | | | | 951,456 | |
| | | | | | |
|
|
|
| | | | | | | | 6,498,451 | |
| | | | | | |
|
|
|
Multimedia — 1.0% | |
FactSet Research Systems, Inc. | | | 10,060 | | | | 2,307,663 | |
| | | | | | |
|
|
|
Non-Hazardous Waste Disposal — 1.0% | |
Waste Connections, Inc. | | | 26,688 | | | | 2,118,760 | |
| | | | | | |
|
|
|
Oil Companies - Exploration & Production — 4.0% | |
Diamondback Energy, Inc. | | | 17,605 | | | | 2,131,613 | |
Newfield Exploration Co.† | | | 82,842 | | | | 2,259,930 | |
WPX Energy, Inc.† | | | 235,317 | | | | 4,487,495 | |
| | | | | | |
|
|
|
| | | | | | | | 8,879,038 | |
| | | | | | |
|
|
|
Printing - Commercial — 0.6% | |
Cimpress NV† | | | 10,039 | | | | 1,405,460 | |
| | | | | | |
|
|
|
Real Estate Investment Trusts — 0.8% | |
Equity Commonwealth† | | | 53,587 | | | | 1,717,999 | |
| | | | | | |
|
|
|
Real Estate Management/Services — 0.6% | |
Redfin Corp.†# | | | 63,669 | | | | 1,261,283 | |
| | | | | | |
|
|
|
Rental Auto/Equipment — 1.0% | |
AMERCO | | | 5,620 | | | | 2,106,882 | |
| | | | | | |
|
|
|
| | | | | | | | |
| | |
| Security Description | | Shares | | |
Value
(Note 2) | |
| |
| | | | | | | | | |
Retail - Automobile — 1.4% | |
CarMax, Inc.†# | | | 39,127 | | | $ | 3,053,863 | |
| | | | | | |
|
|
|
Retail - Misc./Diversified — 0.6% | |
PriceSmart, Inc.# | | | 15,269 | | | | 1,326,113 | |
| | | | | | |
|
|
|
Semiconductor Equipment — 0.9% | |
MKS Instruments, Inc. | | | 22,198 | | | | 2,062,194 | |
| | | | | | |
|
|
|
Telecommunication Equipment — 1.2% | |
CommScope Holding Co., Inc.† | | | 80,733 | | | | 2,558,429 | |
| | | | | | |
|
|
|
Therapeutics — 1.9% | |
Agios Pharmaceuticals, Inc.†# | | | 26,048 | | | | 2,102,595 | |
Neurocrine Biosciences, Inc.†# | | | 16,299 | | | | 2,003,962 | |
| | | | | | |
|
|
|
| | | | | | | | 4,106,557 | |
| | | | | | |
|
|
|
Transport - Rail — 1.3% | |
Genesee & Wyoming, Inc., Class A† | | | 33,336 | | | | 2,929,901 | |
| | | | | | |
|
|
|
Web Hosting/Design — 1.8% | |
VeriSign, Inc.† | | | 24,729 | | | | 3,922,267 | |
| | | | | | |
|
|
|
Total Long-Term Investment Securities | | | | | | | | |
(cost $185,977,288) | | | | | | | 219,765,726 | |
| | | | | | |
|
|
|
SHORT-TERM INVESTMENT SECURITIES — 0.6% | |
Registered Investment Companies — 0.6% | |
State Street Navigator Securities Lending Government Money Market Portfolio
1.93%(1)(2)
(cost $1,319,787) | | | 1,319,787 | | | | 1,319,787 | |
| | | | | | |
|
|
|
TOTAL INVESTMENTS | | | | | | | | |
(cost $187,297,075)(3) | | | 100.3 | % | | | 221,085,513 | |
Liabilities in excess of other assets | | | (0.3 | ) | | | (641,698 | ) |
| | |
|
|
| |
|
|
|
NET ASSETS | | | 100.0 | % | | $ | 220,443,815 | |
| | |
|
|
| |
|
|
|
| † | Non-income producing security |
| # | The security or a portion thereof is out on loan (see Note 2). |
| (1) | At August 31, 2018, the Fund had loaned securities with a total value of $42,447,394. This was secured by collateral of $1,319,787, which was received in cash and subsequently invested in short-term investments currently valued at $1,319,787 as reported in the Portfolio of Investments. Additional collateral of $42,230,822 was received in the form of fixed income pooled securities, which the Fund cannot sell or repledge and accordingly are not reflected in the Fund’s assets and liabilities. |
The components of the fixed income pooled securities referenced above are as follows:
| | | | | | | | |
Securities
| | Coupon Range
| | Maturity Date Range
| | Value as of
August 31, 2018
| |
Federal Home Loan Mtg. Corp. | | 3.00% to 4.50% | | 07/15/2042 to 05/01/2048 | | $ | 3,413,254 | |
Federal National Mtg. Assoc. | | 3.00% to 4.50% | | 10/25/2039 to 06/01/2048 | | | 3,202,898 | |
Government National Mtg. Assoc. | | 2.50% to 2.50% | | 09/20/2046 to 09/20/2046 | | | 510,305 | |
United States Treasury Bills | | 0.00% | | 09/06/2018 to 03/28/2019 | | | 3,555,526 | |
United States Treasury Notes/Bonds | | zero coupon to 8.75% | | 09/15/2018 to 11/15/2047 | | | 31,548,839 | |
| (2) | The rate shown is the 7-day yield as of August 31, 2018. |
| (3) | See Note 5 for cost of investments on a tax basis. |
ADR—American Depositary Receipt
VALIC Company II Mid Cap Growth Fund
PORTFOLIO OF INVESTMENTS — August 31, 2018 — (continued)
The following is a summary of the inputs used to value the Fund’s net assets as of August 31, 2018 (see Note 2):
| | | | | | | | | | | | | | | | |
| | | Level 1 - Unadjusted
Quoted Prices
| | | Level 2 - Other
Observable Inputs
| | | Level 3 - Significant
Unobservable Inputs
| | | Total
| |
ASSETS: | | | | | | | | | | | | | | | | |
Investments at Value:* | | | | | | | | | | | | | | | | |
Common Stocks | | $ | 219,765,726 | | | $ | — | | | $ | — | | | $ | 219,765,726 | |
Short-Term Investment Securities | | | 1,319,787 | | | | — | | | | — | | | | 1,319,787 | |
| | |
|
|
| |
|
|
| |
|
|
| |
|
|
|
Total Investments at Value | | $ | 221,085,513 | | | $ | — | | | $ | — | | | $ | 221,085,513 | |
| | |
|
|
| |
|
|
| |
|
|
| |
|
|
|
| * | For a detailed presentation of investments, please refer to the Portfolio of Investments. |
The Fund’s policy is to recognize transfers between Levels as of the end of the reporting period. There were no transfers between Levels during the reporting period.
See Notes to Financial Statements
VALIC Company II Mid Cap Value Fund
PORTFOLIO PROFILE — August 31, 2018 (unaudited)
Industry Allocation*
| | | | |
Real Estate Investment Trusts | | | 9.1 | % |
Oil Companies — Exploration & Production | | | 6.1 | |
Banks — Commercial | | | 5.3 | |
Electric — Integrated | | | 4.8 | |
Banks — Super Regional | | | 3.8 | |
Aerospace/Defense — Equipment | | | 2.8 | |
Insurance — Property/Casualty | | | 2.7 | |
Diversified Manufacturing Operations | | | 2.5 | |
Chemicals — Diversified | | | 2.2 | |
Insurance — Reinsurance | | | 1.9 | |
Computer Services | | | 1.9 | |
Steel — Producers | | | 1.6 | |
Insurance — Multi-line | | | 1.6 | |
Airlines | | | 1.6 | |
Insurance Brokers | | | 1.4 | |
Electronic Parts Distribution | | | 1.4 | |
Finance — Credit Card | | | 1.4 | |
Registered Investment Companies | | | 1.3 | |
Gas — Distribution | | | 1.2 | |
Data Processing/Management | | | 1.2 | |
Oil Refining & Marketing | | | 1.2 | |
Insurance — Life/Health | | | 1.2 | |
Finance — Investment Banker/Broker | | | 1.2 | |
Semiconductor Equipment | | | 1.1 | |
Food — Misc./Diversified | | | 1.1 | |
Electronic Components — Semiconductors | | | 1.0 | |
Medical Labs & Testing Services | | | 1.0 | |
Human Resources | | | 1.0 | |
Power Converter/Supply Equipment | | | 1.0 | |
Medical — Hospitals | | | 1.0 | |
Building Products — Doors & Windows | | | 0.9 | |
Chemicals — Specialty | | | 0.9 | |
Auto/Truck Parts & Equipment — Original | | | 0.9 | |
Medical Products | | | 0.9 | |
Electronic Measurement Instruments | | | 0.8 | |
Repurchase Agreements | | | 0.8 | |
Computers | | | 0.8 | |
Electric Products — Misc. | | | 0.8 | |
Transport — Rail | | | 0.7 | |
Hazardous Waste Disposal | | | 0.7 | |
Electronic Components — Misc. | | | 0.7 | |
Finance — Consumer Loans | | | 0.7 | |
Agricultural Chemicals | | | 0.7 | |
Electronic Connectors | | | 0.7 | |
Food — Wholesale/Distribution | | | 0.7 | |
Machine Tools & Related Products | | | 0.7 | |
Savings & Loans/Thrifts | | | 0.7 | |
Computer Software | | | 0.7 | |
Hotels/Motels | | | 0.7 | |
Distribution/Wholesale | | | 0.6 | |
Medical — Wholesale Drug Distribution | | | 0.6 | |
Containers — Paper/Plastic | | | 0.6 | |
Web Hosting/Design | | | 0.6 | |
Consulting Services | | | 0.6 | |
Investment Management/Advisor Services | | | 0.6 | |
Building Products — Wood | | | 0.5 | |
Building Products — Cement | | | 0.5 | |
Cellular Telecom | | | 0.5 | |
Commercial Services — Finance | | | 0.5 | |
Building — Heavy Construction | | | 0.5 | |
Disposable Medical Products | | | 0.5 | |
Industrial Automated/Robotic | | | 0.5 | |
Retail — Apparel/Shoe | | | 0.4 | |
Oil — Field Services | | | 0.4 | |
Building — Residential/Commercial | | | 0.4 | |
Entertainment Software | | | 0.4 | |
Transport — Truck | | | 0.4 | |
Telecom Equipment — Fiber Optics | | | 0.4 | |
Metal — Aluminum | | | 0.4 | |
| | | | |
Semiconductor Components — Integrated Circuits | | | 0.4 | |
Office Automation & Equipment | | | 0.4 | |
E-Commerce/Services | | | 0.4 | |
Cruise Lines | | | 0.4 | |
E-Commerce/Products | | | 0.4 | |
Auto — Heavy Duty Trucks | | | 0.4 | |
Engines — Internal Combustion | | | 0.3 | |
Building & Construction Products — Misc. | | | 0.3 | |
Applications Software | | | 0.3 | |
Batteries/Battery Systems | | | 0.3 | |
Computers — Memory Devices | | | 0.3 | |
Finance — Leasing Companies | | | 0.3 | |
Rubber — Tires | | | 0.3 | |
Beverages — Non-alcoholic | | | 0.3 | |
Shipbuilding | | | 0.3 | |
Engineering/R&D Services | | | 0.3 | |
Capacitors | | | 0.3 | |
Television | | | 0.3 | |
Home Decoration Products | | | 0.3 | |
Metal Processors & Fabrication | | | 0.2 | |
Wire & Cable Products | | | 0.2 | |
Containers — Metal/Glass | | | 0.2 | |
Retail — Major Department Stores | | | 0.2 | |
Banks — Fiduciary | | | 0.2 | |
Toys | | | 0.2 | |
Retail — Gardening Products | | | 0.2 | |
Commercial Services | | | 0.2 | |
Aerospace/Defense | | | 0.2 | |
Dialysis Centers | | | 0.2 | |
Medical Instruments | | | 0.2 | |
Medical — Drugs | | | 0.2 | |
Retirement/Aged Care | | | 0.2 | |
Footwear & Related Apparel | | | 0.2 | |
Advertising Agencies | | | 0.1 | |
Medical — Biomedical/Gene | | | 0.1 | |
| | |
|
|
|
| | | | 100.3 | % |
| | |
|
|
|
| * | Calculated as a percentage of net assets |
VALIC Company II Mid Cap Value Fund
PORTFOLIO OF INVESTMENTS — August 31, 2018
| | | | | | | | |
| | |
| Security Description | | Shares | | | Value
(Note 2) | |
| |
COMMON STOCKS — 98.2% | |
Advertising Agencies — 0.1% | |
Omnicom Group, Inc.# | | | 14,583 | | | $ | 1,010,894 | |
| | | | | | |
|
|
|
Aerospace/Defense — 0.2% | |
Spirit AeroSystems Holdings, Inc., Class A | | | 20,260 | | | | 1,732,230 | |
| | | | | | |
|
|
|
Aerospace/Defense - Equipment — 2.8% | |
Arconic, Inc. | | | 69,810 | | | | 1,562,348 | |
Curtiss-Wright Corp. | | | 30,229 | | | | 4,049,174 | |
Harris Corp. | | | 73,717 | | | | 11,979,750 | |
L3 Technologies, Inc. | | | 12,126 | | | | 2,591,569 | |
Moog, Inc., Class A | | | 69,733 | | | | 5,502,631 | |
| | | | | | |
|
|
|
| | | | | | | | 25,685,472 | |
| | | | | | |
|
|
|
Agricultural Chemicals — 0.7% | |
Mosaic Co. | | | 96,029 | | | | 3,002,827 | |
Nutrien, Ltd. | | | 61,936 | | | | 3,507,436 | |
| | | | | | |
|
|
|
| | | | | | | | 6,510,263 | |
| | | | | | |
|
|
|
Airlines — 1.6% | |
Delta Air Lines, Inc. | | | 84,166 | | | | 4,922,028 | |
JetBlue Airways Corp.† | | | 235,042 | | | | 4,484,601 | |
Southwest Airlines Co. | | | 78,699 | | | | 4,824,249 | |
| | | | | | |
|
|
|
| | | | | | | | 14,230,878 | |
| | | | | | |
|
|
|
Applications Software — 0.3% | |
CDK Global, Inc. | | | 50,075 | | | | 3,120,674 | |
| | | | | | |
|
|
|
Auto - Heavy Duty Trucks — 0.4% | |
PACCAR, Inc. | | | 47,463 | | | | 3,247,418 | |
| | | | | | |
|
|
|
Auto/Truck Parts & Equipment - Original — 0.9% | |
BorgWarner, Inc. | | | 43,450 | | | | 1,901,807 | |
Lear Corp. | | | 18,100 | | | | 2,935,820 | |
WABCO Holdings, Inc.† | | | 24,055 | | | | 2,960,689 | |
| | | | | | |
|
|
|
| | | | | | | | 7,798,316 | |
| | | | | | |
|
|
|
Banks - Commercial — 5.3% | |
BancorpSouth Bank | | | 128,154 | | | | 4,459,759 | |
Bank OZK# | | | 97,086 | | | | 3,928,100 | |
East West Bancorp, Inc. | | | 119,798 | | | | 7,593,995 | |
First Midwest Bancorp, Inc. | | | 120,947 | | | | 3,287,340 | |
IBERIABANK Corp. | | | 77,364 | | | | 6,703,591 | |
Pinnacle Financial Partners, Inc. | | | 40,147 | | | | 2,591,489 | |
Regions Financial Corp. | | | 244,231 | | | | 4,752,735 | |
South State Corp. | | | 58,358 | | | | 4,811,617 | |
Western Alliance Bancorp† | | | 85,333 | | | | 4,919,447 | |
Zions Bancorporation# | | | 105,289 | | | | 5,610,851 | |
| | | | | | |
|
|
|
| | | | | | | | 48,658,924 | |
| | | | | | |
|
|
|
Banks - Fiduciary — 0.2% | |
State Street Corp. | | | 24,305 | | | | 2,112,348 | |
| | | | | | |
|
|
|
Banks - Super Regional — 3.8% | |
Comerica, Inc. | | | 92,881 | | | | 9,054,040 | |
Fifth Third Bancorp | | | 222,525 | | | | 6,548,911 | |
Huntington Bancshares, Inc. | | | 497,684 | | | | 8,067,458 | |
KeyCorp | | | 181,309 | | | | 3,820,180 | |
SunTrust Banks, Inc. | | | 100,745 | | | | 7,410,802 | |
| | | | | | |
|
|
|
| | | | | | | | 34,901,391 | |
| | | | | | |
|
|
|
Batteries/Battery Systems — 0.3% | |
EnerSys | | | 37,185 | | | | 3,085,983 | |
| | | | | | |
|
|
|
Beverages - Non-alcoholic — 0.3% | |
Coca-Cola European Partners PLC | | | 59,839 | | | | 2,551,535 | |
| | | | | | |
|
|
|
Building & Construction Products - Misc. — 0.3% | |
Owens Corning | | | 55,167 | | | | 3,123,556 | |
| | | | | | |
|
|
|
| | | | | | | | |
| | |
| Security Description | | Shares | | | Value
(Note 2) | |
| |
| | | | | | | | | |
Building Products - Cement — 0.5% | |
Buzzi Unicem SpA# | | | 154,095 | | | $ | 3,097,955 | |
Cemex SAB de CV ADR†# | | | 225,307 | | | | 1,597,427 | |
| | | | | | |
|
|
|
| | | | | | | | 4,695,382 | |
| | | | | | |
|
|
|
Building Products - Doors & Windows — 0.9% | |
JELD-WEN Holding, Inc.† | | | 136,673 | | | | 3,323,887 | |
Sanwa Holdings Corp. | | | 423,621 | | | | 4,857,287 | |
| | | | | | |
|
|
|
| | | | | | | | 8,181,174 | |
| | | | | | |
|
|
|
Building Products - Wood — 0.5% | |
Masco Corp. | | | 125,780 | | | | 4,775,867 | |
| | | | | | |
|
|
|
Building - Heavy Construction — 0.5% | |
Granite Construction, Inc. | | | 74,796 | | | | 3,416,681 | |
MasTec, Inc.† | | | 25,111 | | | | 1,099,862 | |
| | | | | | |
|
|
|
| | | | | | | | 4,516,543 | |
| | | | | | |
|
|
|
Building - Residential/Commercial — 0.4% | |
D.R. Horton, Inc. | | | 16,444 | | | | 731,923 | |
Lennar Corp., Class A | | | 30,669 | | | | 1,584,667 | |
Toll Brothers, Inc. | | | 47,284 | | | | 1,713,099 | |
| | | | | | |
|
|
|
| | | | | | | | 4,029,689 | |
| | | | | | |
|
|
|
Capacitors — 0.3% | |
KEMET Corp.† | | | 91,844 | | | | 2,373,249 | |
| | | | | | |
|
|
|
Cellular Telecom — 0.5% | |
Millicom International Cellular SA SDR | | | 79,341 | | | | 4,567,780 | |
| | | | | | |
|
|
|
Chemicals - Diversified — 2.2% | |
Celanese Corp., Series A | | | 65,690 | | | | 7,674,563 | |
FMC Corp. | | | 104,361 | | | | 8,917,647 | |
Olin Corp. | | | 87,751 | | | | 2,696,588 | |
Westlake Chemical Corp. | | | 9,358 | | | | 884,986 | |
| | | | | | |
|
|
|
| | | | | | | | 20,173,784 | |
| | | | | | |
|
|
|
Chemicals - Specialty — 0.9% | |
Cabot Corp. | | | 96,911 | | | | 6,291,462 | |
Versum Materials, Inc. | | | 46,746 | | | | 1,860,023 | |
| | | | | | |
|
|
|
| | | | | | | | 8,151,485 | |
| | | | | | |
|
|
|
Commercial Services — 0.2% | |
Atento SA | | | 260,392 | | | | 1,874,822 | |
| | | | | | |
|
|
|
Commercial Services - Finance — 0.5% | |
Moody’s Corp. | | | 17,219 | | | | 3,065,326 | |
Western Union Co.# | | | 77,402 | | | | 1,464,446 | |
| | | | | | |
|
|
|
| | | | | | | | 4,529,772 | |
| | | | | | |
|
|
|
Computer Services — 1.9% | |
Amdocs, Ltd. | | | 70,733 | | | | 4,617,450 | |
Cognizant Technology Solutions Corp., Class A | | | 13,280 | | | | 1,041,550 | |
DXC Technology Co. | | | 79,286 | | | | 7,222,162 | |
Leidos Holdings, Inc. | | | 67,911 | | | | 4,806,062 | |
| | | | | | |
|
|
|
| | | | | | | | 17,687,224 | |
| | | | | | |
|
|
|
Computer Software — 0.7% | |
SS&C Technologies Holdings, Inc. | | | 103,163 | | | | 6,121,692 | |
| | | | | | |
|
|
|
Computers — 0.8% | |
Hewlett Packard Enterprise Co. | | | 58,224 | | | | 962,443 | |
HP, Inc. | | | 252,702 | | | | 6,229,104 | |
| | | | | | |
|
|
|
| | | | | | | | 7,191,547 | |
| | | | | | |
|
|
|
Computers - Memory Devices — 0.3% | |
NetApp, Inc. | | | 21,751 | | | | 1,888,204 | |
Western Digital Corp. | | | 17,109 | | | | 1,081,973 | |
| | | | | | |
|
|
|
| | | | | | | | 2,970,177 | |
| | | | | | |
|
|
|
VALIC Company II Mid Cap Value Fund
PORTFOLIO OF INVESTMENTS — August 31, 2018 — (continued)
| | | | | | | | |
| | |
| Security Description | | Shares | | | Value
(Note 2) | |
| |
COMMON STOCKS (continued) | |
Consulting Services — 0.6% | |
Booz Allen Hamilton Holding Corp. | | | 99,840 | | | $ | 5,107,814 | |
| | | | | | |
|
|
|
Containers - Metal/Glass — 0.2% | |
Crown Holdings, Inc.†# | | | 50,897 | | | | 2,178,901 | |
| | | | | | |
|
|
|
Containers - Paper/Plastic — 0.6% | |
Berry Global Group, Inc.† | | | 42,464 | | | | 2,026,807 | |
Graphic Packaging Holding Co. | | | 243,850 | | | | 3,467,547 | |
| | | | | | |
|
|
|
| | | | | | | | 5,494,354 | |
| | | | | | |
|
|
|
Cruise Lines — 0.4% | |
Norwegian Cruise Line Holdings, Ltd.† | | | 63,297 | | | | 3,393,352 | |
| | | | | | |
|
|
|
Data Processing/Management — 1.2% | |
Dun & Bradstreet Corp. | | | 21,824 | | | | 3,119,086 | |
Fidelity National Information Services, Inc. | | | 71,256 | | | | 7,707,762 | |
| | | | | | |
|
|
|
| | | | | | | | 10,826,848 | |
| | | | | | |
|
|
|
Dialysis Centers — 0.2% | |
DaVita, Inc.† | | | 24,234 | | | | 1,679,174 | |
| | | | | | |
|
|
|
Disposable Medical Products — 0.5% | |
STERIS PLC | | | 39,177 | | | | 4,482,632 | |
| | | | | | |
|
|
|
Distribution/Wholesale — 0.6% | |
KAR Auction Services, Inc. | | | 27,066 | | | | 1,696,768 | |
WESCO International, Inc.† | | | 65,650 | | | | 4,014,497 | |
| | | | | | |
|
|
|
| | | | | | | | 5,711,265 | |
| | | | | | |
|
|
|
Diversified Manufacturing Operations — 2.5% | |
Dover Corp. | | | 45,859 | | | | 3,937,912 | |
Eaton Corp. PLC | | | 58,445 | | | | 4,859,117 | |
Ingersoll-Rand PLC | | | 18,910 | | | | 1,915,394 | |
ITT, Inc. | | | 30,104 | | | | 1,779,448 | |
Parker-Hannifin Corp. | | | 30,700 | | | | 5,390,920 | |
Textron, Inc. | | | 68,386 | | | | 4,720,686 | |
| | | | | | |
|
|
|
| | | | | | | | 22,603,477 | |
| | | | | | |
|
|
|
E-Commerce/Products — 0.4% | |
eBay, Inc.† | | | 98,003 | | | | 3,391,884 | |
| | | | | | |
|
|
|
E-Commerce/Services — 0.4% | |
Expedia Group, Inc. | | | 17,140 | | | | 2,236,770 | |
IAC/InterActiveCorp† | | | 6,859 | | | | 1,352,595 | |
| | | | | | |
|
|
|
| | | | | | | | 3,589,365 | |
| | | | | | |
|
|
|
Electric Products - Misc. — 0.8% | |
AMETEK, Inc. | | | 91,696 | | | | 7,056,924 | |
| | | | | | |
|
|
|
Electric - Integrated — 4.8% | |
Alliant Energy Corp. | | | 254,963 | | | | 10,922,615 | |
DTE Energy Co. | | | 38,796 | | | | 4,311,787 | |
Edison International | | | 37,000 | | | | 2,432,010 | |
Entergy Corp. | | | 66,461 | | | | 5,555,475 | |
Evergy, Inc. | | | 96,256 | | | | 5,491,405 | |
PG&E Corp. | | | 28,327 | | | | 1,308,141 | |
Pinnacle West Capital Corp. | | | 87,161 | | | | 6,846,496 | |
Xcel Energy, Inc. | | | 139,735 | | | | 6,714,267 | |
| | | | | | |
|
|
|
| | | | | | | | 43,582,196 | |
| | | | | | |
|
|
|
Electronic Components - Misc. — 0.7% | |
Flex, Ltd.† | | | 122,720 | | | | 1,692,309 | |
Sensata Technologies Holding PLC†# | | | 93,810 | | | | 4,967,239 | |
| | | | | | |
|
|
|
| | | | | | | | 6,659,548 | |
| | | | | | |
|
|
|
Electronic Components - Semiconductors — 1.0% | |
Qorvo, Inc.† | | | 20,825 | | | | 1,667,874 | |
Silicon Motion Technology Corp. ADR | | | 131,254 | | | | 7,730,861 | |
| | | | | | |
|
|
|
| | | | | | | | 9,398,735 | |
| | | | | | |
|
|
|
| | | | | | | | |
| | |
| Security Description | | Shares | | | Value
(Note 2) | |
| |
| | | | | | | | | |
Electronic Connectors — 0.7% | |
TE Connectivity, Ltd. | | | 70,082 | | | $ | 6,425,118 | |
| | | | | | |
|
|
|
Electronic Measurement Instruments — 0.8% | |
Itron, Inc.† | | | 19,400 | | | | 1,288,160 | |
Keysight Technologies, Inc.† | | | 95,760 | | | | 6,213,866 | |
| | | | | | |
|
|
|
| | | | | | | | 7,502,026 | |
| | | | | | |
|
|
|
Electronic Parts Distribution — 1.4% | |
Arrow Electronics, Inc.† | | | 169,802 | | | | 13,164,749 | |
| | | | | | |
|
|
|
Engineering/R&D Services — 0.3% | |
Fluor Corp. | | | 43,382 | | | | 2,490,561 | |
| | | | | | |
|
|
|
Engines - Internal Combustion — 0.3% | |
Cummins, Inc. | | | 22,170 | | | | 3,143,706 | |
| | | | | | |
|
|
|
Entertainment Software — 0.4% | |
Activision Blizzard, Inc. | | | 34,166 | | | | 2,463,369 | |
NetEase, Inc. ADR | | | 7,726 | | | | 1,527,507 | |
| | | | | | |
|
|
|
| | | | | | | | 3,990,876 | |
| | | | | | |
|
|
|
Finance - Consumer Loans — 0.7% | |
Navient Corp. | | | 132,888 | | | | 1,812,593 | |
SLM Corp.† | | | 222,524 | | | | 2,607,981 | |
Synchrony Financial | | | 68,582 | | | | 2,171,992 | |
| | | | | | |
|
|
|
| | | | | | | | 6,592,566 | |
| | | | | | |
|
|
|
Finance - Credit Card — 1.4% | |
Alliance Data Systems Corp. | | | 9,175 | | | | 2,188,971 | |
Discover Financial Services | | | 130,838 | | | | 10,221,065 | |
| | | | | | |
|
|
|
| | | | | | | | 12,410,036 | |
| | | | | | |
|
|
|
Finance - Investment Banker/Broker — 1.2% | |
E*TRADE Financial Corp.† | | | 72,917 | | | | 4,291,895 | |
TD Ameritrade Holding Corp. | | | 106,871 | | | | 6,259,434 | |
| | | | | | |
|
|
|
| | | | | | | | 10,551,329 | |
| | | | | | |
|
|
|
Finance - Leasing Companies — 0.3% | |
Air Lease Corp. | | | 63,989 | | | | 2,956,932 | |
| | | | | | |
|
|
|
Food - Misc./Diversified — 1.1% | |
Ingredion, Inc. | | | 23,620 | | | | 2,387,273 | |
Nomad Foods, Ltd.† | | | 120,879 | | | | 2,520,327 | |
Post Holdings, Inc.† | | | 53,169 | | | | 5,171,217 | |
| | | | | | |
|
|
|
| | | | | | | | 10,078,817 | |
| | | | | | |
|
|
|
Food - Wholesale/Distribution — 0.7% | |
US Foods Holding Corp.† | | | 196,392 | | | | 6,400,415 | |
| | | | | | |
|
|
|
Footwear & Related Apparel — 0.2% | |
Skechers U.S.A., Inc., Class A† | | | 50,172 | | | | 1,479,071 | |
| | | | | | |
|
|
|
Gas - Distribution — 1.2% | |
UGI Corp. | | | 207,445 | | | | 11,212,402 | |
| | | | | | |
|
|
|
Hazardous Waste Disposal — 0.7% | |
Clean Harbors, Inc.† | | | 99,050 | | | | 6,793,839 | |
| | | | | | |
|
|
|
Home Decoration Products — 0.3% | |
Newell Brands, Inc.# | | | 106,100 | | | | 2,304,492 | |
| | | | | | |
|
|
|
Hotels/Motels — 0.7% | |
Wyndham Hotels & Resorts, Inc. | | | 57,223 | | | | 3,247,405 | |
Wyndham Worldwide Corp.† | | | 63,714 | | | | 2,816,159 | |
| | | | | | |
|
|
|
| | | | | | | | 6,063,564 | |
| | | | | | |
|
|
|
Human Resources — 1.0% | |
ManpowerGroup, Inc. | | | 29,926 | | | | 2,804,964 | |
Robert Half International, Inc. | | | 82,312 | | | | 6,435,152 | |
| | | | | | |
|
|
|
| | | | | | | | 9,240,116 | |
| | | | | | |
|
|
|
VALIC Company II Mid Cap Value Fund
PORTFOLIO OF INVESTMENTS — August 31, 2018 — (continued)
| | | | | | | | |
| | |
| Security Description | | Shares | | | Value
(Note 2) | |
| |
COMMON STOCKS (continued) | |
Industrial Automated/Robotic — 0.5% | |
Ichor Holdings, Ltd.†# | | | 159,365 | | | $ | 4,132,334 | |
| | | | | | |
|
|
|
Insurance Brokers — 1.4% | |
Aon PLC | | | 37,262 | | | | 5,423,857 | |
Jardine Lloyd Thompson Group PLC | | | 298,664 | | | | 5,591,211 | |
Marsh & McLennan Cos., Inc. | | | 25,768 | | | | 2,180,746 | |
| | | | | | |
|
|
|
| | | | | | | | 13,195,814 | |
| | | | | | |
|
|
|
Insurance - Life/Health — 1.2% | |
CNO Financial Group, Inc. | | | 238,486 | | | | 5,153,683 | |
Torchmark Corp. | | | 19,160 | | | | 1,684,547 | |
Unum Group | | | 103,047 | | | | 3,800,373 | |
| | | | | | |
|
|
|
| | | | | | | | 10,638,603 | |
| | | | | | |
|
|
|
Insurance - Multi-line — 1.6% | |
Allstate Corp. | | | 68,256 | | | | 6,864,506 | |
Assurant, Inc. | | | 45,054 | | | | 4,632,452 | |
Loews Corp. | | | 61,457 | | | | 3,091,902 | |
| | | | | | |
|
|
|
| | | | | | | | 14,588,860 | |
| | | | | | |
|
|
|
Insurance - Property/Casualty — 2.7% | |
Alleghany Corp. | | | 13,210 | | | | 8,345,814 | |
Hanover Insurance Group, Inc. | | | 33,724 | | | | 4,130,853 | |
Lancashire Holdings, Ltd. | | | 585,179 | | | | 4,608,831 | |
Travelers Cos., Inc. | | | 24,738 | | | | 3,255,521 | |
WR Berkley Corp. | | | 61,828 | | | | 4,838,659 | |
| | | | | | |
|
|
|
| | | | | | | | 25,179,678 | |
| | | | | | |
|
|
|
Insurance - Reinsurance — 1.9% | |
Everest Re Group, Ltd. | | | 17,646 | | | | 3,935,411 | |
Reinsurance Group of America, Inc. | | | 97,446 | | | | 13,920,161 | |
| | | | | | |
|
|
|
| | | | | | | | 17,855,572 | |
| | | | | | |
|
|
|
Investment Management/Advisor Services — 0.6% | |
Raymond James Financial, Inc. | | | 54,728 | | | | 5,091,893 | |
| | | | | | |
|
|
|
Machine Tools & Related Products — 0.7% | |
Milacron Holdings Corp.† | | | 300,348 | | | | 6,367,378 | |
| | | | | | |
|
|
|
Medical Instruments — 0.2% | |
Boston Scientific Corp.† | | | 46,510 | | | | 1,653,896 | |
| | | | | | |
|
|
|
Medical Labs & Testing Services — 1.0% | |
ICON PLC† | | | 28,584 | | | | 4,259,587 | |
Laboratory Corp. of America Holdings† | | | 28,886 | | | | 4,993,523 | |
| | | | | | |
|
|
|
| | | | | | | | 9,253,110 | |
| | | | | | |
|
|
|
Medical Products — 0.9% | |
Hill-Rom Holdings, Inc. | | | 62,379 | | | | 6,067,605 | |
Zimmer Biomet Holdings, Inc. | | | 13,922 | | | | 1,721,177 | |
| | | | | | |
|
|
|
| | | | | | | | 7,788,782 | |
| | | | | | |
|
|
|
Medical - Biomedical/Gene — 0.1% | |
Five Prime Therapeutics, Inc.† | | | 38,707 | | | | 541,898 | |
| | | | | | |
|
|
|
Medical - Drugs — 0.2% | |
Jazz Pharmaceuticals PLC† | | | 9,346 | | | | 1,597,418 | |
| | | | | | |
|
|
|
Medical - Hospitals — 1.0% | |
Acadia Healthcare Co., Inc.†# | | | 146,974 | | | | 6,103,830 | |
Universal Health Services, Inc., Class B | | | 20,367 | | | | 2,650,969 | |
| | | | | | |
|
|
|
| | | | | | | | 8,754,799 | |
| | | | | | |
|
|
|
Medical - Wholesale Drug Distribution — 0.6% | |
McKesson Corp. | | | 43,833 | | | | 5,643,499 | |
| | | | | | |
|
|
|
Metal Processors & Fabrication — 0.2% | |
Timken Co. | | | 45,649 | | | | 2,220,824 | |
| | | | | | |
|
|
|
Metal - Aluminum — 0.4% | |
Alcoa Corp.† | | | 83,625 | | | | 3,735,529 | |
| | | | | | |
|
|
|
| | | | | | | | |
| | |
| Security Description | | Shares | | | Value
(Note 2) | |
| |
| | | | | | | | | |
Office Automation & Equipment — 0.4% | |
Xerox Corp. | | | 130,910 | | | $ | 3,647,153 | |
| | | | | | |
|
|
|
Oil Companies - Exploration & Production — 6.1% | |
Anadarko Petroleum Corp. | | | 47,099 | | | | 3,033,176 | |
Cimarex Energy Co. | | | 45,418 | | | | 3,836,913 | |
Diamondback Energy, Inc. | | | 122,718 | | | | 14,858,695 | |
Energen Corp.† | | | 77,091 | | | | 5,978,407 | |
Enerplus Corp. | | | 103,907 | | | | 1,285,329 | |
EQT Corp. | | | 116,460 | | | | 5,941,789 | |
Laredo Petroleum, Inc.† | | | 202,499 | | | | 1,678,717 | |
Newfield Exploration Co.† | | | 274,210 | | | | 7,480,449 | |
Noble Energy, Inc. | | | 112,640 | | | | 3,347,661 | |
Pioneer Natural Resources Co. | | | 26,140 | | | | 4,566,658 | |
WPX Energy, Inc.† | | | 226,461 | | | | 4,318,611 | |
| | | | | | |
|
|
|
| | | | | | | | 56,326,405 | |
| | | | | | |
|
|
|
Oil Refining & Marketing — 1.2% | |
Andeavor | | | 28,313 | | | | 4,325,943 | |
Delek US Holdings, Inc. | | | 44,508 | | | | 2,425,686 | |
Marathon Petroleum Corp. | | | 48,603 | | | | 3,999,541 | |
| | | | | | |
|
|
|
| | | | | | | | 10,751,170 | |
| | | | | | |
|
|
|
Oil - Field Services — 0.4% | |
Apergy Corp.† | | | 49,721 | | | | 2,248,384 | |
TechnipFMC PLC | | | 60,124 | | | | 1,841,598 | |
| | | | | | |
|
|
|
| | | | | | | | 4,089,982 | |
| | | | | | |
|
|
|
Power Converter/Supply Equipment — 1.0% | |
Hubbell, Inc. | | | 72,684 | | | | 9,184,350 | |
| | | | | | |
|
|
|
Real Estate Investment Trusts — 9.1% | |
American Assets Trust, Inc. | | | 51,019 | | | | 2,015,251 | |
American Homes 4 Rent, Class A | | | 88,439 | | | | 2,051,785 | |
Boston Properties, Inc. | | | 51,994 | | | | 6,782,617 | |
Brixmor Property Group, Inc. | | | 335,795 | | | | 6,118,185 | |
Corporate Office Properties Trust | | | 204,407 | | | | 6,291,647 | |
Douglas Emmett, Inc. | | | 105,133 | | | | 4,106,495 | |
Duke Realty Corp. | | | 161,353 | | | | 4,596,947 | |
Equity LifeStyle Properties, Inc. | | | 32,345 | | | | 3,133,584 | |
Equity Residential | | | 69,121 | | | | 4,682,948 | |
Extra Space Storage, Inc. | | | 37,597 | | | | 3,466,819 | |
Kilroy Realty Corp.# | | | 24,680 | | | | 1,805,095 | |
Life Storage, Inc. | | | 35,840 | | | | 3,497,984 | |
Park Hotels & Resorts, Inc. | | | 182,975 | | | | 6,120,514 | |
Prologis, Inc. | | | 44,429 | | | | 2,984,759 | |
PS Business Parks, Inc. | | | 49,080 | | | | 6,401,504 | |
Regency Centers Corp. | | | 74,075 | | | | 4,891,172 | |
SL Green Realty Corp.# | | | 62,050 | | | | 6,478,020 | |
STORE Capital Corp. | | | 278,720 | | | | 8,029,923 | |
| | | | | | |
|
|
|
| | | | | | | | 83,455,249 | |
| | | | | | |
|
|
|
Retail - Apparel/Shoe — 0.4% | |
Caleres, Inc. | | | 101,708 | | | | 4,117,140 | |
| | | | | | |
|
|
|
Retail - Gardening Products — 0.2% | |
Tractor Supply Co. | | | 21,364 | | | | 1,886,014 | |
| | | | | | |
|
|
|
Retail - Major Department Stores — 0.2% | |
Nordstrom, Inc.# | | | 33,833 | | | | 2,126,404 | |
| | | | | | |
|
|
|
Retirement/Aged Care — 0.2% | |
Brookdale Senior Living, Inc.† | | | 159,461 | | | | 1,581,853 | |
| | | | | | |
|
|
|
Rubber - Tires — 0.3% | |
Goodyear Tire & Rubber Co. | | | 112,977 | | | | 2,563,448 | |
| | | | | | |
|
|
|
Savings & Loans/Thrifts — 0.7% | |
Sterling Bancorp | | | 275,723 | | | | 6,300,271 | |
| | | | | | |
|
|
|
VALIC Company II Mid Cap Value Fund
PORTFOLIO OF INVESTMENTS — August 31, 2018 — (continued)
| | | | | | | | |
| | |
| Security Description | | Shares | | | Value
(Note 2) | |
| |
COMMON STOCKS (continued) | |
Semiconductor Components - Integrated Circuits — 0.4% | |
Marvell Technology Group, Ltd. | | | 180,371 | | | $ | 3,730,072 | |
| | | | | | |
|
|
|
Semiconductor Equipment — 1.1% | |
Axcelis Technologies, Inc.† | | | 107,813 | | | | 2,177,823 | |
KLA-Tencor Corp. | | | 27,259 | | | | 3,167,768 | |
Teradyne, Inc. | | | 122,187 | | | | 5,032,883 | |
| | | | | | |
|
|
|
| | | | | | | | 10,378,474 | |
| | | | | | |
|
|
|
Shipbuilding — 0.3% | |
Huntington Ingalls Industries, Inc. | | | 10,350 | | | | 2,530,265 | |
| | | | | | |
|
|
|
Steel - Producers — 1.6% | |
Commercial Metals Co. | | | 157,580 | | | | 3,403,728 | |
Reliance Steel & Aluminum Co. | | | 74,086 | | | | 6,511,419 | |
Steel Dynamics, Inc. | | | 108,551 | | | | 4,964,037 | |
| | | | | | |
|
|
|
| | | | | | | | 14,879,184 | |
| | | | | | |
|
|
|
Telecom Equipment - Fiber Optics — 0.4% | |
Acacia Communications, Inc.†# | | | 92,872 | | | | 3,786,391 | |
| | | | | | |
|
|
|
Television — 0.3% | |
TEGNA, Inc. | | | 202,568 | | | | 2,357,892 | |
| | | | | | |
|
|
|
Toys — 0.2% | |
Hasbro, Inc.# | | | 19,235 | | | | 1,910,228 | |
| | | | | | |
|
|
|
Transport - Rail — 0.7% | |
Genesee & Wyoming, Inc., Class A† | | | 78,006 | | | | 6,855,947 | |
| | | | | | |
|
|
|
Transport - Truck — 0.4% | |
Knight-Swift Transportation Holdings, Inc.# | | | 79,825 | | | | 2,724,427 | |
Schneider National, Inc., Class B | | | 39,595 | | | | 1,071,045 | |
| | | | | | |
|
|
|
| | | | | | | | 3,795,472 | |
| | | | | | |
|
|
|
Web Hosting/Design — 0.6% | |
VeriSign, Inc.† | | | 34,576 | | | | 5,484,099 | |
| | | | | | |
|
|
|
Wire & Cable Products — 0.2% | |
Belden, Inc.# | | | 30,325 | | | | 2,205,234 | |
| | | | | | |
|
|
|
Total Long-Term Investment Securities | | | | | |
(cost $770,364,300) | | | | | | | 899,749,737 | |
| | | | | | |
|
|
|
SHORT-TERM INVESTMENT SECURITIES — 1.3% | |
Registered Investment Companies — 1.3% | |
State Street Institutional Liquid Reserves Fund, Administration Class
1.82%(3) | | | 10,393,279 | | | | 10,394,318 | |
State Street Navigator Securities Lending Government Money Market Portfolio
1.93%(1)(3) | | | 1,545,425 | | | | 1,545,425 | |
| | | | | | |
|
|
|
Total Short-Term Investment Securities | | | | | | | | |
(cost $11,939,743) | | | | | | | 11,939,743 | |
| | | | | | |
|
|
|
| | | | | | | | |
| | |
| Security Description | | Principal
Amount | | | Value
(Note 2) | |
| |
REPURCHASE AGREEMENTS — 0.8% | |
Agreement with Fixed Income Clearing Corp., bearing interest at 0.35%, dated 08/31/2018, to be repurchased 09/04/2018 in the amount of $7,422,289 collateralized by $6,695,000 of United States Treasury Notes, bearing interest at 3.75% due 11/15/2043 and having an approximate value of $7,648,669
(cost $7,422,000) | | $ | 7,422,000 | | | $ | 7,422,000 | |
| | | | | | |
|
|
|
TOTAL INVESTMENTS | | | | | | | | |
(cost $789,726,043)(2) | | | 100.3 | % | | | 919,111,480 | |
Liabilities in excess of other assets | | | (0.3 | ) | | | (2,827,203 | ) |
| | |
|
|
| |
|
|
|
NET ASSETS | | | 100.0 | % | | $ | 916,284,277 | |
| | |
|
|
| |
|
|
|
| # | The security or a portion thereof is out on loan (see Note 2) |
| † | Non-income producing security |
| (1) | At August 31, 2018, the Fund had loaned securities with a total value of $43,355,754. This was secured by collateral of $1,545,425, which was received in cash and subsequently invested in short-term investments currently valued at $1,545,425 as reported in the Portfolio of Investments. Additional collateral of $42,612,937 was received in the form of fixed income pooled securities, which the Fund cannot sell or repledge and accordingly are not reflected in the Fund’s assets and liabilities. |
The components of the fixed income pooled securities referenced above are as follows:
| | | | | | | | |
Securities
| | Coupon Range
| | Maturity Date Range
| | Value as of
August 31, 2018
| |
Federal Home Loan Mtg. Corp. | | 3.00% to 4.50% | | 11/01/2034 to 05/01/2048 | | $ | 4,013,783 | |
Federal National Mtg. Assoc. | | 3.00% to 4.50% | | 01/01/2033 to 06/01/2048 | | | 3,724,709 | |
Government National Mtg. Assoc. | | 2.50% to 4.00% | | 09/20/2046 to 03/20/2048 | | | 579,228 | |
United States Treasury Bills | | 0.00% | | 09/13/2018 to 03/28/2019 | | | 722,295 | |
United States Treasury Notes/Bonds | | zero coupon to 8.75% | | 09/15/2018 to 11/15/2047 | | | 33,572,922 | |
| (2) | See Note 5 for cost of investments on a tax basis. |
| (3) | The rate shown is the 7-day yield as of August 31, 2018. |
ADR—American Depository Receipt
SDR—Swedish Depositary Receipt
The following is a summary of the inputs used to value the Fund’s net assets as of August 31, 2018 (see Note 2):
| | | | | | | | | | | | | | | | |
| | | Level 1 - Unadjusted
Quoted Prices
| | | Level 2 - Other
Observable Inputs
| | | Level 3 - Significant
Unobservable Inputs
| | | Total
| |
ASSETS: | | | | | | | | | | | | | | | | |
Investments at Value:* | | | | | | | | | | | | | | | | |
Common Stocks | | $ | 899,749,737 | | | $ | — | | | $ | — | | | $ | 899,749,737 | |
Short-Term Investment Securities . . . . . . . . . . . . . . . . . . . . . . . . . . . . . . . . . . . . . . . . . . . .. | | | 11,939,743 | | | | — | | | | — | | | | 11,939,743 | |
Repurchase Agreements . . . . . . . . . . . . . . . . . . . . . . . . . . . . . . . . . . . . . . . . . . . . . . . . . . .. | | | — | | | | 7,422,000 | | | | — | | | | 7,422,000 | |
| | |
|
|
| |
|
|
| |
|
|
| |
|
|
|
Total Investments at Value | | $ | 911,689,480 | | | $ | 7,422,000 | | | $ | — | | | $ | 919,111,480 | |
| | |
|
|
| |
|
|
| |
|
|
| |
|
|
|
| * | For a detailed presentation of investments, please refer to the Portfolio of Investments. |
The Fund’s policy is to recognize transfers between Levels as of the end of the reporting period. Securities currently valued at $9,425,067 were transferred from Level 2 to Level 1 due to foreign equity securities whose values were previously adjusted for fair value pricing procedures for foreign equity securities. There were no additional transfers between Levels during the reporting period.
See Notes to Financial Statements
VALIC Company II Moderate Growth Lifestyle Fund
PORTFOLIO PROFILE — August 31, 2018 (unaudited)
Industry Allocation*
| | | | |
Domestic Equity Investment Companies | | | 47.4 | % |
Domestic Fixed Income Investment Companies | | | 32.1 | |
International Equity Investment Companies | | | 13.8 | |
Real Estate Investment Companies | | | 4.0 | |
International Fixed Income Investment Companies | | | 2.7 | |
| | |
|
|
|
| | | | 100.0 | % |
| | |
|
|
|
| * | Calculated as a percentage of net assets |
VALIC Company II Moderate Growth Lifestyle Fund
PORTFOLIO OF INVESTMENTS — August 31, 2018
| | | | | | | | |
| | |
| Security Description | | Shares | | | Value
(Note 2) | |
| |
AFFILIATED REGISTERED INVESTMENT COMPANIES#(1) — 100.0% | |
Domestic Equity Investment Companies — 47.4% | |
VALIC Co. I Blue Chip Growth Fund | | | 789,626 | | | $ | 17,529,694 | |
VALIC Co. I Dividend Value Fund | | | 3,001,946 | | | | 39,505,611 | |
VALIC Co. I Large Cap Core Fund | | | 719,871 | | | | 9,048,778 | |
VALIC Co. I Large Capital Growth Fund | | | 239,452 | | | | 3,895,884 | |
VALIC Co. I Mid Cap Index Fund | | | 1,216,743 | | | | 35,954,768 | |
VALIC Co. I Mid Cap Strategic Growth Fund | | | 645,314 | | | | 10,996,154 | |
VALIC Co. I Nasdaq-100 Index Fund | | | 1,320,032 | | | | 20,275,685 | |
VALIC Co. I Science & Technology Fund | | | 912,502 | | | | 30,167,305 | |
VALIC Co. I Small Cap Index Fund | | | 303,674 | | | | 7,400,536 | |
VALIC Co. I Small Cap Special Values Fund | | | 1,989,404 | | | | 29,403,393 | |
VALIC Co. I Stock Index Fund | | | 1,444,186 | | | | 61,363,473 | |
VALIC Co. I Value Fund | | | 771,292 | | | | 14,423,156 | |
VALIC Co. II Capital Appreciation Fund | | | 1,334,500 | | | | 26,863,489 | |
VALIC Co. II Large Cap Value Fund | | | 2,021,159 | | | | 46,001,586 | |
VALIC Co. II Mid Cap Growth Fund | | | 1,040,371 | | | | 11,142,378 | |
VALIC Co. II Mid Cap Value Fund | | | 1,394,314 | | | | 30,856,167 | |
VALIC Co. II Small Cap Growth Fund | | | 678,914 | | | | 15,825,486 | |
VALIC Co. II Small Cap Value Fund | | | 2,954,640 | | | | 46,506,035 | |
| | | | | | |
|
|
|
Total Domestic Equity Investment Companies | |
(cost $400,577,771) | | | | | | | 457,159,578 | |
| | | | | | |
|
|
|
Domestic Fixed Income Investment Companies — 32.1% | |
VALIC Co. I Capital Conservation Fund | | | 3,013,209 | | | | 28,866,538 | |
VALIC Co. I Inflation Protected Fund | | | 3,957,754 | | | | 43,099,943 | |
VALIC Co. II Core Bond Fund | | | 5,244,331 | | | | 56,324,113 | |
VALIC Co. II High Yield Bond Fund | | | 5,711,491 | | | | 43,007,529 | |
VALIC Co. II Strategic Bond Fund | | | 12,788,044 | | | | 138,878,160 | |
| | | | | | |
|
|
|
Total Domestic Fixed Income Investment Companies | |
(cost $316,282,972) | | | | | | | 310,176,283 | |
| | | | | | |
|
|
|
| | | | | | | | |
| | |
| Security Description | | Shares | | | Value
(Note 2) | |
| |
| | | | | | | | | |
International Equity Investment Companies — 13.8% | |
VALIC Co. I Emerging Economies Fund | | | 1,552,133 | | | $ | 12,758,533 | |
VALIC Co. I Foreign Value Fund | | | 3,622,263 | | | | 37,671,537 | |
VALIC Co. I International Equities Index Fund | | | 5,735,602 | | | | 42,099,317 | |
VALIC Co. I International Growth Fund | | | 975,518 | | | | 14,466,933 | |
VALIC Co. II International Opportunities Fund | | | 1,225,207 | | | | 26,109,153 | |
| | | | | | |
|
|
|
Total International Equity Investment Companies | |
(cost $131,164,702) | | | | | | | 133,105,473 | |
| | | | | | |
|
|
|
International Fixed Income Investment Companies — 2.7% | |
VALIC Co. I International Government Bond Fund
(cost $26,612,598) | | | 2,250,537 | | | | 25,791,156 | |
| | | | | | |
|
|
|
Real Estate Investment Companies — 4.0% | |
VALIC Co. I Global Real Estate Fund
($38,625,863) | | | 4,919,258 | | | | 38,517,791 | |
| | | | | | |
|
|
|
TOTAL INVESTMENTS | | | | | | | | |
(cost $913,263,906)(2) | | | 100.0 | % | | | 964,750,281 | |
Liabilities in excess of other assets | | | (0.0 | ) | | | (142,806 | ) |
| | |
|
|
| |
|
|
|
NET ASSETS | | | 100.0 | % | | $ | 964,607,475 | |
| | |
|
|
| |
|
|
|
| # | The Moderate Growth Lifestyle Fund invests in various VALIC Company I or VALIC Company II Funds, some of which are not presented in this report. Additional information of the underlying funds including such fund’s prospectuses and shareholder reports is available at our website, www.valic.com |
| (2) | See Note 5 for cost of investments on a tax basis. |
The following is a summary of the inputs used to value the Fund’s net assets as of August 31, 2018 (see Note 2):
| | | | | | | | | | | | | | | | |
| | | Level 1 - Unadjusted
Quoted Prices
| | | Level 2 - Other
Observable Inputs
| | | Level 3 - Significant
Unobservable Inputs
| | | Total
| |
ASSETS: | | | | | | | | | | | | | | | | |
Investments at Value:* | | | | | | | | | | | | | | | | |
Affiliated Registered Investment Companies | | $ | 964,750,281 | | | $ | — | | | $ | — | | | $ | 964,750,281 | |
| | |
|
|
| |
|
|
| |
|
|
| |
|
|
|
| * | For a detailed presentation of investments, please refer to the Portfolio of Investments. |
The Fund’s policy is to recognize transfers between Levels as of the end of the reporting period. There were no transfers between Levels during the reporting period.
See Notes to Financial Statements
VALIC Company II Small Cap Growth Fund
PORTFOLIO PROFILE — August 31, 2018 (unaudited)
Industry Allocation*
| | | | |
Medical — Biomedical/Gene | | | 7.8 | % |
Enterprise Software/Service | | | 6.2 | |
Medical — Drugs | | | 3.7 | |
Registered Investment Companies | | | 3.4 | |
Medical Products | | | 2.9 | |
Semiconductor Equipment | | | 2.7 | |
Electronic Components — Semiconductors | | | 2.6 | |
Building & Construction Products — Misc. | | | 2.6 | |
Computer Software | | | 2.5 | |
Internet Application Software | | | 2.4 | |
Distribution/Wholesale | | | 2.3 | |
Medical Labs & Testing Services | | | 2.0 | |
Banks — Commercial | | | 1.9 | |
Applications Software | | | 1.8 | |
Educational Software | | | 1.8 | |
Retail — Automobile | | | 1.8 | |
Retail — Discount | | | 1.7 | |
Internet Security | | | 1.7 | |
Therapeutics | | | 1.6 | |
Non-Hazardous Waste Disposal | | | 1.6 | |
Retail — Vision Service Center | | | 1.5 | |
Food — Wholesale/Distribution | | | 1.5 | |
Footwear & Related Apparel | | | 1.5 | |
Finance — Investment Banker/Broker | | | 1.5 | |
Schools | | | 1.4 | |
Casino Hotels | | | 1.4 | |
Medical — Outpatient/Home Medical | | | 1.4 | |
Miscellaneous Manufacturing | | | 1.4 | |
Aerospace/Defense — Equipment | | | 1.4 | |
Retail — Misc./Diversified | | | 1.3 | |
Television | | | 1.3 | |
Internet Telephone | | | 1.2 | |
Transport — Truck | | | 1.2 | |
Steel Pipe & Tube | | | 1.2 | |
Chemicals — Specialty | | | 1.2 | |
Diversified Manufacturing Operations | | | 1.1 | |
Retail — Restaurants | | | 1.1 | |
Building Products — Air & Heating | | | 1.1 | |
Drug Delivery Systems | | | 1.1 | |
Patient Monitoring Equipment | | | 1.1 | |
Electric Products — Misc. | | | 1.0 | |
Machinery — General Industrial | | | 0.9 | |
Real Estate Investment Trusts | | | 0.9 | |
Machinery — Pumps | | | 0.9 | |
Oil Companies — Exploration & Production | | | 0.9 | |
Telecom Equipment — Fiber Optics | | | 0.9 | |
Transport — Marine | | | 0.8 | |
Telecommunication Equipment | | | 0.8 | |
Retail — Pet Food & Supplies | | | 0.8 | |
Machinery — Construction & Mining | | | 0.8 | |
Advanced Materials | | | 0.8 | |
Water Treatment Systems | | | 0.7 | |
Medical — Hospitals | | | 0.7 | |
Real Estate Management/Services | | | 0.7 | |
E-Commerce/Products | | | 0.7 | |
Retail — Floor Coverings | | | 0.7 | |
Gambling (Non-Hotel) | | | 0.6 | |
Computers | | | 0.6 | |
E-Commerce/Services | | | 0.6 | |
Savings & Loans/Thrifts | | | 0.6 | |
Building — residential/Commercial | | | 0.6 | |
Building — Mobile Home/Manufactured Housing | | | 0.6 | |
Medical — HMO | | | 0.5 | |
Beverages — Non-alcoholic | | | 0.5 | |
Diagnostic Equipment | | | 0.5 | |
Data Processing/Management | | | 0.5 | |
Investment Companies | | | 0.5 | |
Medical Instruments | | | 0.4 | |
| | | | |
Building Products — Cement | | | 0.4 | |
Oil Field Machinery & Equipment | | | 0.3 | |
Retail — Apparel/Shoe | | | 0.3 | |
Investment Management/Advisor Services | | | 0.2 | |
| | |
|
|
|
| | | | 101.6 | % |
| | |
|
|
|
| * | Calculated as a percentage of net assets |
VALIC Company II Small Cap Growth Fund
PORTFOLIO OF INVESTMENTS — August 31, 2018
| | | | | | | | |
| | |
| Security Description | | Shares | | | Value
(Note 2) | |
| |
COMMON STOCKS — 98.2% | |
Advanced Materials — 0.8% | |
Hexcel Corp. | | | 24,822 | | | $ | 1,641,231 | |
| | | | | | |
|
|
|
Aerospace/Defense - Equipment — 1.4% | |
HEICO Corp. | | | 32,235 | | | | 2,923,070 | |
| | | | | | |
|
|
|
Applications Software — 1.8% | |
HubSpot, Inc.†# | | | 19,776 | | | | 2,841,811 | |
Smartsheet, Inc., Class A†# | | | 36,129 | | | | 1,074,115 | |
| | | | | | |
|
|
|
| | | | | | | | 3,915,926 | |
| | | | | | |
|
|
|
Banks - Commercial — 1.9% | |
Bank OZK | | | 21,816 | | | | 882,675 | |
Signature Bank | | | 5,090 | | | | 589,117 | |
Texas Capital Bancshares, Inc.† | | | 28,639 | | | | 2,546,007 | |
| | | | | | |
|
|
|
| | | | | | | | 4,017,799 | |
| | | | | | |
|
|
|
Beverages - Non-alcoholic — 0.5% | |
Primo Water Corp.† | | | 53,019 | | | | 1,060,380 | |
| | | | | | |
|
|
|
Building & Construction Products - Misc. — 2.6% | |
Summit Materials, Inc., Class A† | | | 91,716 | | | | 1,950,800 | |
Trex Co., Inc.† | | | 42,046 | | | | 3,561,296 | |
| | | | | | |
|
|
|
| | | | | | | | 5,512,096 | |
| | | | | | |
|
|
|
Building Products - Air & Heating — 1.1% | |
Lennox International, Inc. | | | 10,515 | | | | 2,342,847 | |
| | | | | | |
|
|
|
Building Products - Cement — 0.4% | |
Eagle Materials, Inc. | | | 9,962 | | | | 919,791 | |
| | | | | | |
|
|
|
Building Products - Doors & Windows — 0.0% | |
Masonite International Corp.† | | | 547 | | | | 36,622 | |
| | | | | | |
|
|
|
Building - Mobile Home/Manufactured Housing — 0.6% | |
Winnebago Industries, Inc. | | | 32,265 | | | | 1,192,192 | |
| | | | | | |
|
|
|
Building - Residential/Commercial — 0.6% | |
TRI Pointe Group, Inc.† | | | 85,327 | | | | 1,236,388 | |
| | | | | | |
|
|
|
Casino Hotels — 1.4% | |
Boyd Gaming Corp. | | | 83,861 | | | | 3,054,218 | |
| | | | | | |
|
|
|
Chemicals - Specialty — 1.2% | |
Ferro Corp.† | | | 114,305 | | | | 2,508,995 | |
| | | | | | |
|
|
|
Computer Software — 2.5% | |
Cloudera, Inc.†# | | | 110,356 | | | | 1,656,444 | |
Envestnet, Inc.† | | | 59,820 | | | | 3,780,624 | |
| | | | | | |
|
|
|
| | | | | | | | 5,437,068 | |
| | | | | | |
|
|
|
Computers — 0.6% | |
Nutanix, Inc., Class A† | | | 24,291 | | | | 1,368,069 | |
| | | | | | |
|
|
|
Data Processing/Management — 0.5% | |
DocuSign, Inc.†# | | | 16,557 | | | | 1,033,819 | |
| | | | | | |
|
|
|
Diagnostic Equipment — 0.5% | |
GenMark Diagnostics, Inc.†# | | | 121,720 | | | | 1,041,923 | |
| | | | | | |
|
|
|
Distribution/Wholesale — 2.3% | |
H&E Equipment Services, Inc. | | | 45,608 | | | | 1,587,614 | |
Pool Corp. | | | 13,245 | | | | 2,175,624 | |
SiteOne Landscape Supply, Inc.†# | | | 14,249 | | | | 1,287,682 | |
| | | | | | |
|
|
|
| | | | | | | | 5,050,920 | |
| | | | | | |
|
|
|
Diversified Manufacturing Operations — 1.1% | |
ITT, Inc. | | | 40,241 | | | | 2,378,646 | |
| | | | | | |
|
|
|
Drug Delivery Systems — 1.1% | |
Nektar Therapeutics† | | | 15,309 | | | | 1,017,895 | |
Revance Therapeutics, Inc.† | | | 46,570 | | | | 1,276,018 | |
| | | | | | |
|
|
|
| | | | | | | | 2,293,913 | |
| | | | | | |
|
|
|
| | | | | | | | |
| | |
| Security Description | | Shares | | | Value
(Note 2) | |
| |
| | | | | | | | | |
E-Commerce/Products — 0.7% | |
Wayfair, Inc., Class A†# | | | 11,326 | | | $ | 1,530,935 | |
| | | | | | |
|
|
|
E-Commerce/Services — 0.6% | |
Groupon, Inc.†# | | | 314,709 | | | | 1,343,807 | |
| | | | | | |
|
|
|
Educational Software — 1.8% | |
2U, Inc.† | | | 21,390 | | | | 1,911,410 | |
Instructure, Inc.†# | | | 48,562 | | | | 1,988,614 | |
| | | | | | |
|
|
|
| | | | | | | | 3,900,024 | |
| | | | | | |
|
|
|
Electric Products - Misc. — 1.0% | |
Littelfuse, Inc. | | | 9,675 | | | | 2,162,943 | |
| | | | | | |
|
|
|
Electronic Components - Semiconductors — 2.6% | |
Inphi Corp.†# | | | 79,929 | | | | 2,962,968 | |
Monolithic Power Systems, Inc. | | | 18,003 | | | | 2,698,110 | |
| | | | | | |
|
|
|
| | | | | | | | 5,661,078 | |
| | | | | | |
|
|
|
Enterprise Software/Service — 6.2% | |
Domo, Inc., Class B†# | | | 26,588 | | | | 625,084 | |
Evolent Health, Inc., Class A†# | | | 92,573 | | | | 2,360,612 | |
Guidewire Software, Inc.† | | | 8,534 | | | | 858,264 | |
ManTech International Corp., Class A | | | 8,001 | | | | 530,626 | |
Paycom Software, Inc.†# | | | 17,254 | | | | 2,676,440 | |
Pluralsight, Inc., Class A†# | | | 58,409 | | | | 1,995,836 | |
SailPoint Technologies Holding, Inc.† | | | 83,516 | | | | 2,583,150 | |
Tyler Technologies, Inc.† | | | 6,692 | | | | 1,652,589 | |
| | | | | | |
|
|
|
| | | | | | | | 13,282,601 | |
| | | | | | |
|
|
|
Finance - Investment Banker/Broker — 1.5% | |
Evercore, Inc., Class A | | | 29,562 | | | | 3,138,006 | |
| | | | | | |
|
|
|
Food - Wholesale/Distribution — 1.5% | |
Performance Food Group Co.† | | | 100,398 | | | | 3,323,174 | |
| | | | | | |
|
|
|
Footwear & Related Apparel — 1.5% | |
Wolverine World Wide, Inc. | | | 82,834 | | | | 3,245,436 | |
| | | | | | |
|
|
|
Gambling (Non-Hotel) — 0.6% | |
Red Rock Resorts, Inc., Class A | | | 42,332 | | | | 1,381,716 | |
| | | | | | |
|
|
|
Internet Application Software — 2.4% | |
Okta, Inc.† | | | 40,997 | | | | 2,534,845 | |
Zendesk, Inc.† | | | 37,151 | | | | 2,559,332 | |
| | | | | | |
|
|
|
| | | | | | | | 5,094,177 | |
| | | | | | |
|
|
|
Internet Security — 1.7% | |
Proofpoint, Inc.† | | | 20,335 | | | | 2,412,748 | |
Zscaler, Inc.†# | | | 27,763 | | | | 1,187,979 | |
| | | | | | |
|
|
|
| | | | | | | | 3,600,727 | |
| | | | | | |
|
|
|
Internet Telephone — 1.2% | |
RingCentral, Inc., Class A† | | | 27,830 | | | | 2,592,364 | |
| | | | | | |
|
|
|
Investment Companies — 0.5% | |
PennantPark Investment Corp. | | | 129,506 | | | | 1,007,557 | |
| | | | | | |
|
|
|
Investment Management/Advisor Services — 0.2% | |
WisdomTree Investments, Inc.# | | | 46,092 | | | | 378,876 | |
| | | | | | |
|
|
|
Machinery - Construction & Mining — 0.8% | |
Oshkosh Corp. | | | 24,354 | | | | 1,711,112 | |
| | | | | | |
|
|
|
Machinery - General Industrial — 0.9% | |
Applied Industrial Technologies, Inc. | | | 25,483 | | | | 1,963,465 | |
| | | | | | |
|
|
|
Machinery - Pumps — 0.9% | |
Graco, Inc. | | | 41,456 | | | | 1,948,847 | |
| | | | | | |
|
|
|
Medical Instruments — 0.4% | |
TransEnterix, Inc.†# | | | 161,284 | | | | 935,447 | |
| | | | | | |
|
|
|
VALIC Company II Small Cap Growth Fund
PORTFOLIO OF INVESTMENTS — August 31, 2018 — (continued)
| | | | | | | | |
| | |
| Security Description | | Shares | | |
Value
(Note 2) | |
| |
COMMON STOCKS (continued) | |
Medical Labs & Testing Services — 2.0% | |
Teladoc Health, Inc.†# | | | 55,109 | | | $ | 4,273,703 | |
| | | | | | |
|
|
|
Medical Products — 2.9% | |
iRhythm Technologies, Inc.† | | | 25,084 | | | | 2,335,070 | |
K2M Group Holdings, Inc.†# | | | 74,883 | | | | 2,047,301 | |
Nevro Corp.†# | | | 26,507 | | | | 1,787,102 | |
| | | | | | |
|
|
|
| | | | | | | | 6,169,473 | |
| | | | | | |
|
|
|
Medical - Biomedical/Gene — 7.8% | |
ACADIA Pharmaceuticals, Inc.†# | | | 21,821 | | | | 310,295 | |
Adverum Biotechnologies, Inc.† | | | 131,750 | | | | 1,001,300 | |
Atara Biotherapeutics, Inc.†# | | | 31,005 | | | | 1,269,655 | |
Avrobio, Inc.†# | | | 25,643 | | | | 880,837 | |
Bellicum Pharmaceuticals, Inc.†# | | | 89,940 | | | | 650,266 | |
Biohaven Pharmaceutical Holding Co., Ltd.†# | | | 38,638 | | | | 1,462,835 | |
Exact Sciences Corp.†# | | | 19,810 | | | | 1,483,571 | |
FibroGen, Inc.† | | | 30,428 | | | | 1,860,672 | |
Halozyme Therapeutics, Inc.†# | | | 96,582 | | | | 1,778,075 | |
Homology Medicines, Inc.†# | | | 66,159 | | | | 1,101,547 | |
Insmed, Inc.†# | | | 13,822 | | | | 275,472 | |
REGENXBIO, Inc.† | | | 25,774 | | | | 1,815,778 | |
Rubius Therapeutics, Inc.†# | | | 14,778 | | | | 371,223 | |
Sage Therapeutics, Inc.†# | | | 6,606 | | | | 1,085,102 | |
Spark Therapeutics, Inc.†# | | | 21,804 | | | | 1,343,344 | |
| | | | | | |
|
|
|
| | | | | | | | 16,689,972 | |
| | | | | | |
|
|
|
Medical - Drugs — 3.7% | |
Clementia Pharmaceuticals, Inc.†# | | | 49,528 | | | | 479,431 | |
Clovis Oncology, Inc.†# | | | 13,409 | | | | 479,372 | |
Coherus Biosciences, Inc.†# | | | 44,655 | | | | 899,798 | |
Global Blood Therapeutics, Inc.†# | | | 9,231 | | | | 451,858 | |
Horizon Pharma PLC† | | | 97,746 | | | | 2,066,350 | |
Optinose, Inc.†# | | | 59,661 | | | | 887,159 | |
TherapeuticsMD, Inc.†# | | | 260,806 | | | | 1,690,023 | |
Tricida, Inc.† | | | 32,659 | | | | 1,006,877 | |
| | | | | | |
|
|
|
| | | | | | | | 7,960,868 | |
| | | | | | |
|
|
|
Medical - HMO — 0.5% | |
WellCare Health Plans, Inc.† | | | 3,577 | | | | 1,082,293 | |
| | | | | | |
|
|
|
Medical - Hospitals — 0.7% | |
Acadia Healthcare Co., Inc.†# | | | 38,443 | | | | 1,596,538 | |
| | | | | | |
|
|
|
Medical - Outpatient/Home Medical — 1.4% | |
Amedisys, Inc.† | | | 24,088 | | | | 3,011,241 | |
| | | | | | |
|
|
|
Miscellaneous Manufacturing — 1.4% | |
John Bean Technologies Corp. | | | 24,860 | | | | 2,940,938 | |
| | | | | | |
|
|
|
Non-Hazardous Waste Disposal — 1.6% | |
Advanced Disposal Services, Inc.† | | | 128,154 | | | | 3,419,149 | |
| | | | | | |
|
|
|
Oil Companies - Exploration & Production — 0.9% | |
Centennial Resource Development, Inc., Class A†# | | | 38,528 | | | | 742,434 | |
Jagged Peak Energy, Inc.†# | | | 86,903 | | | | 1,147,989 | |
| | | | | | |
|
|
|
| | | | | | | | 1,890,423 | |
| | | | | | |
|
|
|
Oil Field Machinery & Equipment — 0.3% | |
Forum Energy Technologies, Inc.† | | | 60,423 | | | | 722,055 | |
| | | | | | |
|
|
|
Patient Monitoring Equipment — 1.1% | |
Insulet Corp.†# | | | 21,928 | | | | 2,286,433 | |
| | | | | | |
|
|
|
Real Estate Investment Trusts — 0.9% | |
CubeSmart | | | 30,055 | | | | 918,180 | |
Highwoods Properties, Inc. | | | 20,891 | | | | 1,039,119 | |
| | | | | | |
|
|
|
| | | | | | | | 1,957,299 | |
| | | | | | |
|
|
|
Real Estate Management/Services — 0.7% | |
RE/MAX Holdings, Inc., Class A | | | 32,308 | | | | 1,591,169 | |
| | | | | | |
|
|
|
| | | | | | | | |
| | |
| Security Description | | Shares | | | Value
(Note 2) | |
| |
| | | | | | | | | |
Retail - Apparel/Shoe — 0.3% | |
Burlington Stores, Inc.† | | | 3,947 | | | $ | 663,806 | |
| | | | | | |
|
|
|
Retail - Automobile — 1.8% | |
Lithia Motors, Inc., Class A# | | | 19,602 | | | | 1,693,613 | |
Rush Enterprises, Inc., Class A | | | 51,329 | | | | 2,205,094 | |
| | | | | | |
|
|
|
| | | | | | | | 3,898,707 | |
| | | | | | |
|
|
|
Retail - Discount — 1.7% | |
Ollie’s Bargain Outlet Holdings, Inc.† | | | 41,739 | | | | 3,635,467 | |
| | | | | | |
|
|
|
Retail - Floor Coverings — 0.7% | |
Floor & Decor Holdings, Inc., Class A†# | | | 40,731 | | | | 1,497,272 | |
| | | | | | |
|
|
|
Retail - Misc./Diversified — 1.3% | |
Hudson, Ltd., Class A† | | | 140,834 | | | | 2,901,180 | |
| | | | | | |
|
|
|
Retail - Pet Food & Supplies — 0.8% | |
Freshpet, Inc.†# | | | 46,172 | | | | 1,715,290 | |
| | | | | | |
|
|
|
Retail - Restaurants — 1.1% | |
Texas Roadhouse, Inc. | | | 34,447 | | | | 2,375,121 | |
| | | | | | |
|
|
|
Retail - Vision Service Center — 1.5% | |
National Vision Holdings, Inc.† | | | 75,321 | | | | 3,332,954 | |
| | | | | | |
|
|
|
Savings & Loans/Thrifts — 0.6% | |
BofI Holding, Inc.†# | | | 35,819 | | | | 1,333,900 | |
| | | | | | |
|
|
|
Schools — 1.4% | |
Bright Horizons Family Solutions, Inc.† | | | 25,817 | | | | 3,083,324 | |
| | | | | | |
|
|
|
Semiconductor Equipment — 2.7% | |
Entegris, Inc. | | | 96,359 | | | | 3,266,570 | |
MKS Instruments, Inc. | | | 27,296 | | | | 2,535,798 | |
| | �� | | | | |
|
|
|
| | | | | | | | 5,802,368 | |
| | | | | | |
|
|
|
Steel Pipe & Tube — 1.2% | |
Advanced Drainage Systems, Inc. | | | 82,572 | | | | 2,588,632 | |
| | | | | | |
|
|
|
Telecom Equipment - Fiber Optics — 0.9% | |
Ciena Corp.† | | | 58,783 | | | | 1,856,367 | |
| | | | | | |
|
|
|
Telecommunication Equipment — 0.8% | |
Quantenna Communications, Inc.† | | | 94,392 | | | | 1,724,542 | |
| | | | | | |
|
|
|
Television — 1.3% | |
World Wrestling Entertainment, Inc., Class A# | | | 31,330 | | | | 2,738,555 | |
| | | | | | |
|
|
|
Therapeutics — 1.6% | |
G1 Therapeutics, Inc.† | | | 25,148 | | | | 1,525,981 | |
Neurocrine Biosciences, Inc.† | | | 11,361 | | | | 1,396,835 | |
Portola Pharmaceuticals, Inc.†# | | | 18,903 | | | | 564,254 | |
| | | | | | |
|
|
|
| | | | | | | | 3,487,070 | |
| | | | | | |
|
|
|
Transport - Marine — 0.8% | |
Kirby Corp.† | | | 20,648 | | | | 1,802,570 | |
| | | | | | |
|
|
|
Transport - Truck — 1.2% | |
Saia, Inc.† | | | 32,682 | | | | 2,590,049 | |
| | | | | | |
|
|
|
Water Treatment Systems — 0.7% | |
Evoqua Water Technologies Corp.†# | | | 82,755 | | | | 1,603,792 | |
| | | | | | |
|
|
|
Total Long-Term Investment Securities | | | | | | | | |
(cost $164,381,740) | | | | | | | 211,390,725 | |
| | | | | | |
|
|
|
SHORT-TERM INVESTMENT SECURITIES — 3.4% | |
Registered Investment Companies — 3.4% | |
State Street Navigator Securities Lending Government Money Market Portfolio
1.93%(1)(2)
(cost $7,401,942) | | | 7,401,942 | | | | 7,401,942 | |
| | | | | | |
|
|
|
TOTAL INVESTMENTS | | | | | | | | |
(cost $171,783,682)(3) | | | 101.6 | % | | | 218,792,667 | |
Liabilities in excess of other assets | | | (1.6 | ) | | | (3,408,930 | ) |
| | |
|
|
| |
|
|
|
NET ASSETS | | | 100.0 | % | | $ | 215,383,737 | |
| | |
|
|
| |
|
|
|
VALIC Company II Small Cap Growth Fund
PORTFOLIO OF INVESTMENTS — August 31, 2018 — (continued)
| # | The security or a portion thereof is out on loan (see Note 2). |
| † | Non-income producing security |
| (1) | At August 31, 2018, the Fund had loaned securities with a total value of $45,957,341. This was secured by collateral of $7,401,942, which was received in cash and subsequently invested in short-term investments currently valued at $7,401,942 as reported in the Portfolio of Investments. Additional collateral of $39,336,187 was received in the form of fixed income pooled securities, which the Fund cannot sell or repledge and accordingly are not reflected in the Fund’s assets and liabilities. |
The components of the fixed income pooled securities referenced above are as follows:
| | | | | | | | |
Securities
| | Coupon Range
| | Maturity Date Range
| | Value as of
August 31, 2018
| |
Federal Home Loan Mtg. Corp. | | 3.00% to 4.50% | | 07/15/2042 to 05/01/2048 | | $ | 670,169 | |
Federal National Mtg. Assoc. | | 3.00% to 4.50% | | 10/25/2039 to 06/01/2048 | | | 628,867 | |
Government National Mtg. Assoc. | | 2.50% to 2.50% | | 09/20/2046 to 09/20/2046 | | | 100,195 | |
United States Treasury Bills | | 0.00% | | 09/13/2018 to 03/28/2019 | | | 752,351 | |
United States Treasury Notes/Bonds | | zero coupon to 8.75% | | 09/15/2018 to 02/15/2048 | | | 37,184,605 | |
| (2) | The rate shown is the 7-day yield as of August 31, 2018. |
| (3) | See Note 5 for cost of investments on a tax basis. |
The following is a summary of the inputs used to value the Fund’s net assets as of August 31, 2018 (see Note 2):
| | | | | | | | | | | | | | | | |
| | | Level 1 - Unadjusted
Quoted Prices
| | | Level 2 - Other
Observable Inputs
| | | Level 3 - Significant
Unobservable Inputs
| | | Total
| |
ASSETS: | | | | | | | | | | | | | | | | |
Investments at Value:* | | | | | | | | | | | | | | | | |
Common Stocks | | $ | 211,390,725 | | | $ | — | | | $ | — | | | $ | 211,390,725 | |
Short-Term Investment Securities | | | 7,401,942 | | | | — | | | | — | | | | 7,401,942 | |
| | |
|
|
| |
|
|
| |
|
|
| |
|
|
|
Total Investments at Value | | $ | 218,792,667 | | | $ | — | | | $ | — | | | $ | 218,792,667 | |
| | |
|
|
| |
|
|
| |
|
|
| |
|
|
|
| * | For a detailed presentation of investments, please refer to the Portfolio of Investments. |
The Fund’s policy is to recognize transfers between Levels as of the end of the reporting period. There were no transfers between Levels during the reporting period.
See Notes to Financial Statements
VALIC Company II Small Cap Value Fund
PORTFOLIO PROFILE — August 31, 2018 (unaudited)
Industry Allocation*
| | | | |
Banks — Commercial | | | 15.3 | % |
Real Estate Investment Trusts | | | 11.9 | |
Repurchase Agreements | | | 2.9 | |
Savings & Loans/Thrifts | | | 2.7 | |
Oil Companies — Exploration & Production | | | 2.4 | |
Electric — Integrated | | | 2.3 | |
Consulting Services | | | 1.8 | |
Insurance — Life/Health | | | 1.8 | |
Oil — Field Services | | | 1.7 | |
Electronic Components — Misc. | | | 1.7 | |
Computer Services | | | 1.6 | |
Insurance — Property/Casualty | | | 1.6 | |
Electronic Components — Semiconductors | | | 1.5 | |
Gas — Distribution | | | 1.5 | |
Medical — Biomedical/Gene | | | 1.4 | |
Building — Residential/Commercial | | | 1.4 | |
Coal | | | 1.3 | |
Paper & Related Products | | | 1.2 | |
Retail — Apparel/Shoe | | | 1.2 | |
Medical — HMO | | | 1.2 | |
Human Resources | | | 1.2 | |
Medical — Drugs | | | 1.2 | |
Transport — Truck | | | 1.1 | |
Auto/Truck Parts & Equipment — Original | | | 1.1 | |
Building & Construction — Misc. | | | 1.0 | |
Oil Refining & Marketing | | | 1.0 | |
Printing — Commercial | | | 0.9 | |
Office Supplies & Forms | | | 0.9 | |
Electronic Parts Distribution | | | 0.9 | |
Engineering/R&D Services | | | 0.8 | |
Registered Investment Companies | | | 0.7 | |
Financial Guarantee Insurance | | | 0.7 | |
Enterprise Software/Service | | | 0.7 | |
Energy — Alternate Sources | | | 0.7 | |
Rubber/Plastic Products | | | 0.7 | |
Semiconductor Components — Integrated Circuits | | | 0.7 | |
E-Commerce/Services | | | 0.7 | |
Aerospace/Defense — Equipment | | | 0.7 | |
Investment Management/Advisor Services | | | 0.6 | |
Gambling (Non-Hotel) | | | 0.6 | |
Machinery — General Industrial | | | 0.6 | |
Medical — Wholesale Drug Distribution | | | 0.6 | |
Commercial Services — Finance | | | 0.6 | |
Publishing — Newspapers | | | 0.6 | |
Consumer Products — Misc. | | | 0.6 | |
Retail — Restaurants | | | 0.6 | |
Computers — Integrated Systems | | | 0.6 | |
Retail — Regional Department Stores | | | 0.6 | |
Medical — Generic Drugs | | | 0.6 | |
Steel — Producers | | | 0.5 | |
Retail — Jewelry | | | 0.5 | |
Independent Power Producers | | | 0.5 | |
Distribution/Wholesale | | | 0.5 | |
Medical — Hospitals | | | 0.5 | |
Auto — Truck Trailers | | | 0.5 | |
Metal Processors & Fabrication | | | 0.4 | |
Real Estate Operations & Development | | | 0.4 | |
Data Processing/Management | | | 0.4 | |
Food — Misc./Diversified | | | 0.4 | |
Oil & Gas Drilling | | | 0.4 | |
Retail — Office Supplies | | | 0.4 | |
Footwear & Related Apparel | | | 0.4 | |
Racetracks | | | 0.4 | |
Capacitors | | | 0.4 | |
Airlines | | | 0.4 | |
Food — Wholesale/Distribution | | | 0.3 | |
Transport — Marine | | | 0.3 | |
Retail — Discount | | | 0.3 | |
Finance — Consumer Loans | | | 0.3 | |
| | | | |
Auto/Truck Parts & Equipment — Replacement | | | 0.3 | |
Metal — Aluminum | | | 0.3 | |
Electronic Measurement Instruments | | | 0.3 | |
Water | | | 0.3 | |
Diversified Manufacturing Operations | | | 0.3 | |
Metal Products — Distribution | | | 0.3 | |
Applications Software | | | 0.3 | |
Finance — Investment Banker/Broker | | | 0.3 | |
Dialysis Centers | | | 0.3 | |
Medical Information Systems | | | 0.3 | |
Chemicals — Specialty | | | 0.3 | |
Wireless Equipment | | | 0.2 | |
Telecom Equipment — Fiber Optics | | | 0.2 | |
Retail — Sporting Goods | | | 0.2 | |
Cosmetics & Toiletries | | | 0.2 | |
Retail — Misc./Diversified | | | 0.2 | |
Oil Field Machinery & Equipment | | | 0.2 | |
Telephone — Integrated | | | 0.2 | |
Retail — Appliances | | | 0.2 | |
Semiconductor Equipment | | | 0.2 | |
Building — Maintenance & Services | | | 0.2 | |
Travel Services | | | 0.2 | |
Broadcast Services/Program | | | 0.2 | |
Schools | | | 0.2 | |
Finance — Mortgage Loan/Banker | | | 0.2 | |
Toys | | | 0.2 | |
Medical Imaging Systems | | | 0.2 | |
Banks — Mortgage | | | 0.2 | |
E-Services/Consulting | | | 0.2 | |
Medical Products | | | 0.2 | |
Internet Content — Entertainment | | | 0.2 | |
Retail — Pawn Shops | | | 0.2 | |
Machinery — Farming | | | 0.2 | |
Publishing — Books | | | 0.2 | |
Building Products — Wood | | | 0.2 | |
Metal — Iron | | | 0.1 | |
Electric — Generation | | | 0.1 | |
Containers — Paper/Plastic | | | 0.1 | |
Electric — Distribution | | | 0.1 | |
Retail — Hair Salons | | | 0.1 | |
Power Converter/Supply Equipment | | | 0.1 | |
Insurance — Reinsurance | | | 0.1 | |
Machinery — Pumps | | | 0.1 | |
Telecommunication Equipment | | | 0.1 | |
Networking Products | | | 0.1 | |
E-Marketing/Info | | | 0.1 | |
Insurance — Multi-line | | | 0.1 | |
Pipelines | | | 0.1 | |
Circuit Boards | | | 0.1 | |
Textile — Apparel | | | 0.1 | |
Machine Tools & Related Products | | | 0.1 | |
Commercial Services | | | 0.1 | |
Communications Software | | | 0.1 | |
Medical Instruments | | | 0.1 | |
Retirement/Aged Care | | | 0.1 | |
Building — Heavy Construction | | | 0.1 | |
Dental Supplies & Equipment | | | 0.1 | |
Engines — Internal Combustion | | | 0.1 | |
Tobacco | | | 0.1 | |
Diagnostic Kits | | | 0.1 | |
Television | | | 0.1 | |
Home Furnishings | | | 0.1 | |
Agricultural Operations | | | 0.1 | |
Housewares | | | 0.1 | |
Industrial Automated/Robotic | | | 0.1 | |
Food — Dairy Products | | | 0.1 | |
Computer Software | | | 0.1 | |
Telecom Services | | | 0.1 | |
Appliances | | | 0.1 | |
VALIC Company II Small Cap Value Fund
PORTFOLIO PROFILE — August 31, 2018 (unaudited) — (continued)
Industry Allocation* (continued)
| | | | |
Finance — Leasing Companies | | | 0.1 | % |
Machinery — Construction & Mining | | | 0.1 | |
| | |
|
|
|
| | | | 100.6 | % |
| | |
|
|
|
| * | Calculated as a percentage of net assets |
VALIC Company II Small Cap Value Fund
PORTFOLIO OF INVESTMENTS — August 31, 2018
| | | | | | | | |
| | |
| Security Description | | Shares | | | Value
(Note 2) | |
| |
COMMON STOCKS — 97.0% | | | | | | | | |
Advertising Agencies — 0.0% | | | | | | | | |
MDC Partners, Inc., Class A†# | | | 39,800 | | | $ | 193,030 | |
| | | | | | |
|
|
|
Aerospace/Defense - Equipment — 0.7% | | | | | | | | |
Curtiss-Wright Corp. | | | 11,500 | | | | 1,540,425 | |
Moog, Inc., Class A | | | 25,100 | | | | 1,980,641 | |
| | | | | | |
|
|
|
| | | | | | | | 3,521,066 | |
| | | | | | |
|
|
|
Agricultural Operations — 0.1% | | | | | | | | |
Limoneira Co. | | | 13,300 | | | | 410,305 | |
| | | | | | |
|
|
|
Airlines — 0.4% | | | | | | | | |
SkyWest, Inc. | | | 29,300 | | | | 1,913,290 | |
| | | | | | |
|
|
|
Appliances — 0.1% | | | | | | | | |
Hamilton Beach Brands Holding Co., Class A | | | 13,500 | | | | 312,525 | |
| | | | | | |
|
|
|
Applications Software — 0.3% | | | | | | | | |
Progress Software Corp. | | | 36,300 | | | | 1,485,759 | |
| | | | | | |
|
|
|
Auto - Truck Trailers — 0.5% | | | | | | | | |
Wabash National Corp.# | | | 138,600 | | | | 2,528,064 | |
| | | | | | |
|
|
|
Auto/Truck Parts & Equipment - Original — 1.1% | | | | | | | | |
Cooper-Standard Holding, Inc.† | | | 17,100 | | | | 2,367,153 | |
Dana, Inc. | | | 62,900 | | | | 1,230,953 | |
Meritor, Inc.† | | | 88,700 | | | | 1,921,242 | |
Modine Manufacturing Co.† | | | 5,700 | | | | 96,045 | |
| | | | | | |
|
|
|
| | | | | | | | 5,615,393 | |
| | | | | | |
|
|
|
Auto/Truck Parts & Equipment - Replacement — 0.3% | | | | | | | | |
Douglas Dynamics, Inc. | | | 37,300 | | | | 1,708,340 | |
| | | | | | |
|
|
|
Banks - Commercial — 15.3% | | | | | | | | |
1st Source Corp. | | | 17,020 | | | | 952,950 | |
Allegiance Bancshares, Inc.† | | | 4,600 | | | | 204,930 | |
American National Bankshares, Inc. | | | 900 | | | | 37,035 | |
BancFirst Corp. | | | 17,780 | | | | 1,134,364 | |
Bancorp, Inc.† | | | 88,000 | | | | 882,640 | |
BancorpSouth Bank | | | 38,800 | | | | 1,350,240 | |
Bank of Commerce Holdings | | | 3,500 | | | | 45,150 | |
Bank of Hawaii Corp.# | | | 23,380 | | | | 1,943,579 | |
Bank of Marin Bancorp | | | 600 | | | | 52,890 | |
Bank of N.T. Butterfield & Son, Ltd. | | | 41,600 | | | | 2,198,144 | |
Banner Corp. | | | 25,900 | | | | 1,666,147 | |
Bryn Mawr Bank Corp. | | | 4,400 | | | | 214,720 | |
Cadence BanCorp# | | | 2,400 | | | | 67,800 | |
Cathay General Bancorp | | | 37,290 | | | | 1,577,367 | |
Central Pacific Financial Corp. | | | 63,300 | | | | 1,793,289 | |
Central Valley Community Bancorp | | | 7,100 | | | | 153,431 | |
Century Bancorp, Inc., Class A | | | 1,218 | | | | 86,783 | |
Chemung Financial Corp. | | | 900 | | | | 37,800 | |
Citizens & Northern Corp. | | | 2,800 | | | | 78,428 | |
City Holding Co. | | | 20,700 | | | | 1,678,356 | |
Community Bank System, Inc.# | | | 19,480 | | | | 1,288,212 | |
Community Trust Bancorp, Inc. | | | 23,518 | | | | 1,161,789 | |
Customers Bancorp, Inc.† | | | 10,800 | | | | 266,760 | |
East West Bancorp, Inc. | | | 7,673 | | | | 486,391 | |
Enterprise Financial Services Corp. | | | 40,800 | | | | 2,297,040 | |
Farmers National Banc Corp. | | | 13,000 | | | | 206,050 | |
FCB Financial Holdings, Inc., Class A† | | | 35,200 | | | | 1,823,360 | |
Fidelity Southern Corp. | | | 35,700 | | | | 867,510 | |
Financial Institutions, Inc. | | | 30,400 | | | | 981,920 | |
First Bancorp, Inc./North Carolina | | | 9,900 | | | | 413,028 | |
First BanCorp./Puerto Rico† | | | 474,300 | | | | 4,150,125 | |
First Bancshares, Inc. | | | 3,300 | | | | 135,465 | |
First Business Financial Services, Inc. | | | 7,900 | | | | 175,064 | |
First Citizens BancShares, Inc., Class A | | | 2,140 | | | | 1,016,521 | |
First Commonwealth Financial Corp. | | | 188,000 | | | | 3,149,000 | |
First Community Bancshares, Inc. | | | 17,900 | | | | 600,903 | |
| | | | | | | | |
| | |
| Security Description | | Shares | | | Value
(Note 2) | |
| |
| | | | | | | | | |
Banks - Commercial (continued) | | | | | | | | |
First Financial Bancorp | | | 53,239 | | | $ | 1,671,705 | |
First Financial Bankshares, Inc.# | | | 10,860 | | | | 655,944 | |
First Financial Corp. | | | 5,000 | | | | 257,250 | |
First Hawaiian, Inc. | | | 21,200 | | | | 614,588 | |
First Interstate BancSystem, Inc., Class A | | | 13,970 | | | | 648,906 | |
First Merchants Corp. | | | 24,700 | | | | 1,188,564 | |
First Midwest Bancorp, Inc. | | | 12,900 | | | | 350,622 | |
Franklin Financial Network, Inc.† | | | 5,200 | | | | 200,980 | |
Fulton Financial Corp. | | | 47,100 | | | | 857,220 | |
Glacier Bancorp, Inc. | | | 30,300 | | | | 1,384,104 | |
Great Southern Bancorp, Inc. | | | 13,800 | | | | 818,340 | |
Great Western Bancorp, Inc. | | | 14,500 | | | | 631,330 | |
Green Bancorp, Inc. | | | 33,600 | | | | 806,400 | |
Hancock Holding Co.† | | | 57,021 | | | | 2,939,433 | |
Hanmi Financial Corp. | | | 60,800 | | | | 1,586,880 | |
Heartland Financial USA, Inc. | | | 11,800 | | | | 717,440 | |
Heritage Commerce Corp. | | | 7,900 | | | | 125,136 | |
Hope Bancorp, Inc. | | | 74,796 | | | | 1,309,678 | |
IBERIABANK Corp. | | | 30,600 | | | | 2,651,490 | |
Independent Bank Corp./Massachusetts | | | 5,800 | | | | 528,380 | |
Independent Bank Corp./Michigan | | | 27,900 | | | | 696,105 | |
Lakeland Financial Corp. | | | 5,970 | | | | 294,142 | |
MB Financial, Inc. | | | 2,400 | | | | 116,304 | |
Mercantile Bank Corp. | | | 2,700 | | | | 95,607 | |
Midland States Bancorp, Inc. | | | 4,300 | | | | 148,049 | |
Northrim BanCorp, Inc. | | | 3,600 | | | | 160,380 | |
OFG Bancorp | | | 114,300 | | | | 1,851,660 | |
Old Second Bancorp, Inc. | | | 14,500 | | | | 224,025 | |
Pacific Mercantile Bancorp† | | | 6,900 | | | | 69,690 | |
PacWest Bancorp | | | 28,135 | | | | 1,420,536 | |
Peoples Bancorp, Inc. | | | 11,300 | | | | 405,218 | |
Preferred Bank | | | 19,000 | | | | 1,162,990 | |
Premier Financial Bancorp, Inc. | | | 2,625 | | | | 51,188 | |
Republic Bancorp, Inc., Class A | | | 5,900 | | | | 286,799 | |
S&T Bancorp, Inc. | | | 3,180 | | | | 148,379 | |
Shore Bancshares, Inc. | | | 3,400 | | | | 63,886 | |
Sierra Bancorp | | | 4,900 | | | | 145,383 | |
Simmons First National Corp., Class A | | | 5,278 | | | | 166,785 | |
South State Corp. | | | 2,570 | | | | 211,896 | |
State Bank Financial Corp. | | | 8,200 | | | | 267,156 | |
Stock Yards Bancorp, Inc. | | | 2,750 | | | | 106,425 | |
Tompkins Financial Corp. | | | 3,148 | | | | 276,615 | |
Towne Bank | | | 2,900 | | | | 94,540 | |
TriCo Bancshares | | | 31,300 | | | | 1,216,944 | |
TriState Capital Holdings, Inc.† | | | 7,200 | | | | 214,200 | |
Triumph Bancorp, Inc.† | | | 7,100 | | | | 301,395 | |
TrustCo Bank Corp. | | | 33,900 | | | | 313,575 | |
Trustmark Corp. | | | 55,200 | | | | 1,958,496 | |
UMB Financial Corp. | | | 31,860 | | | | 2,397,146 | |
Umpqua Holdings Corp. | | | 129,414 | | | | 2,769,460 | |
Union Bankshares Corp. | | | 16,919 | | | | 703,830 | |
United Community Banks, Inc. | | | 64,800 | | | | 1,966,032 | |
Washington Trust Bancorp, Inc. | | | 5,480 | | | | 328,800 | |
Webster Financial Corp. | | | 16,000 | | | | 1,046,080 | |
West Bancorporation, Inc. | | | 5,630 | | | | 135,965 | |
Westamerica Bancorporation# | | | 47,624 | | | | 3,049,365 | |
Wintrust Financial Corp. | | | 23,200 | | | | 2,054,360 | |
| | | | | | |
|
|
|
| | | | | | | | 82,038,977 | |
| | | | | | |
|
|
|
Banks - Fiduciary — 0.0% | | | | | | | | |
Boston Private Financial Holdings, Inc. | | | 6,000 | | | | 86,700 | |
| | | | | | |
|
|
|
Banks - Mortgage — 0.2% | | | | | | | | |
Walker & Dunlop, Inc. | | | 17,500 | | | | 953,750 | |
| | | | | | |
|
|
|
VALIC Company II Small Cap Value Fund
PORTFOLIO OF INVESTMENTS — August 31, 2018 — (continued)
| | | | | | | | |
| | |
| Security Description | | Shares | | | Value
(Note 2) | |
| | | | | | | | |
COMMON STOCKS (continued) | | | | | | | | |
Broadcast Services/Program — 0.2% | | | | | | | | |
Hemisphere Media Group, Inc.† | | | 50,800 | | | $ | 695,960 | |
MSG Networks, Inc., Class A† | | | 15,900 | | | | 386,370 | |
| | | | | | |
|
|
|
| | | | | | | | 1,082,330 | |
| | | | | | |
|
|
|
Building & Construction Products - Misc. — 0.0% | | | | | | | | |
Armstrong Flooring, Inc.† | | | 3,300 | | | | 57,783 | |
Gibraltar Industries, Inc.† | | | 1,253 | | | | 56,886 | |
Louisiana-Pacific Corp. | | | 2,600 | | | | 75,816 | |
| | | | | | |
|
|
|
| | | | | | | | 190,485 | |
| | | | | | |
|
|
|
Building & Construction - Misc. — 1.0% | | | | | | | | |
EMCOR Group, Inc. | | | 58,898 | | | | 4,717,730 | |
MYR Group, Inc.† | | | 24,800 | | | | 862,296 | |
| | | | | | |
|
|
|
| | | | | | | | 5,580,026 | |
| | | | | | |
|
|
|
Building Products - Wood — 0.1% | | | | | | | | |
Boise Cascade Co. | | | 7,400 | | | | 323,380 | |
Universal Forest Products, Inc. | | | 12,200 | | | | 457,012 | |
| | | | | | |
|
|
|
| | | | | | | | 780,392 | |
| | | | | | |
|
|
|
Building - Heavy Construction — 0.1% | | | | | | | | |
Tutor Perini Corp.† | | | 22,100 | | | | 449,735 | |
| | | | | | |
|
|
|
Building - Maintenance & Services — 0.2% | | | | | | | | |
ABM Industries, Inc. | | | 22,200 | | | | 704,184 | |
Brightview Holdings, Inc.† | | | 23,700 | | | | 420,912 | |
| | | | | | |
|
|
|
| | | | | | | | 1,125,096 | |
| | | | | | |
|
|
|
Building - Residential/Commercial — 1.4% | | | | | | | | |
AV Homes, Inc.†# | | | 4,200 | | | | 90,090 | |
Beazer Homes USA, Inc.† | | | 137,600 | | | | 1,762,656 | |
Hovnanian Enterprises, Inc., Class A†# | | | 366,300 | | | | 571,428 | |
KB Home | | | 168,900 | | | | 4,197,165 | |
TRI Pointe Group, Inc.† | | | 57,300 | | | | 830,277 | |
| | | | | | |
|
|
|
| | | | | | | | 7,451,616 | |
| | | | | | |
|
|
|
Capacitors — 0.4% | | | | | | | | |
KEMET Corp.† | | | 75,700 | | | | 1,956,088 | |
| | | | | | |
|
|
|
Chemicals - Fibers — 0.0% | | | | | | | | |
Rayonier Advanced Materials, Inc. | | | 8,300 | | | | 173,470 | |
| | | | | | |
|
|
|
Chemicals - Specialty — 0.3% | | | | | | | | |
Chemours Co. | | | 4,400 | | | | 191,840 | |
Minerals Technologies, Inc. | | | 14,960 | | | | 1,004,564 | |
Tronox, Ltd., Class A | | | 10,600 | | | | 171,614 | |
| | | | | | |
|
|
|
| | | | | | | | 1,368,018 | |
| | | | | | |
|
|
|
Circuit Boards — 0.1% | | | | | | | | |
TTM Technologies, Inc.† | | | 29,300 | | | | 547,910 | |
| | | | | | |
|
|
|
Coal — 1.3% | | | | | | | | |
Arch Coal, Inc., Class A# | | | 33,500 | | | | 2,970,445 | |
NACCO Industries, Inc., Class A | | | 8,300 | | | | 291,745 | |
Peabody Energy Corp. | | | 36,100 | | | | 1,491,291 | |
Ramaco Resources, Inc.† | | | 22,900 | | | | 182,055 | |
SunCoke Energy, Inc.† | | | 54,400 | | | | 607,104 | |
Warrior Met Coal, Inc. | | | 60,000 | | | | 1,443,000 | |
| | | | | | |
|
|
|
| | | | | | | | 6,985,640 | |
| | | | | | |
|
|
|
Commercial Services — 0.1% | | | | | | | | |
Acacia Research Corp.† | | | 124,109 | | | | 484,025 | |
| | | | | | |
|
|
|
Commercial Services - Finance — 0.6% | | | | | | | | |
EVERTEC, Inc. | | | 17,100 | | | | 411,255 | |
Green Dot Corp., Class A† | | | 2,700 | | | | 231,309 | |
Travelport Worldwide, Ltd. | | | 135,100 | | | | 2,508,807 | |
| | | | | | |
|
|
|
| | | | | | | | 3,151,371 | |
| | | | | | |
|
|
|
| | | | | | | | |
| | |
| Security Description | | Shares | | | Value
(Note 2) | |
| | | | | | | | |
| | | | | | | | | |
Communications Software — 0.1% | | | | | | | | |
Ribbon Communications, Inc.† | | | 69,000 | | | $ | 477,480 | |
| | | | | | |
|
|
|
Computer Services — 1.6% | | | | | | | | |
Engility Holdings, Inc.† | | | 12,400 | | | | 430,404 | |
Insight Enterprises, Inc.† | | | 37,400 | | | | 2,062,236 | |
Perspecta, Inc. | | | 28,200 | | | | 655,932 | |
Sykes Enterprises, Inc.† | | | 27,500 | | | | 831,600 | |
Syntel, Inc.† | | | 30,525 | | | | 1,243,588 | |
Unisys Corp.†# | | | 159,150 | | | | 2,960,190 | |
Virtusa Corp.† | | | 8,500 | | | | 495,210 | |
| | | | | | |
|
|
|
| | | | | | | | 8,679,160 | |
| | | | | | |
|
|
|
Computer Software — 0.1% | | | | | | | | |
TiVo Corp. | | | 23,300 | | | | 318,045 | |
| | | | | | |
|
|
|
Computers - Integrated Systems — 0.6% | | | | | | | | |
NetScout Systems, Inc.† | | | 120,800 | | | | 3,020,000 | |
| | | | | | |
|
|
|
Consulting Services — 1.8% | | | | | | | | |
CRA International, Inc. | | | 8,800 | | | | 503,008 | |
FTI Consulting, Inc.† | | | 46,700 | | | | 3,559,474 | |
Huron Consulting Group, Inc.† | | | 31,400 | | | | 1,554,300 | |
ICF International, Inc. | | | 8,900 | | | | 726,685 | |
Kelly Services, Inc., Class A | | | 29,900 | | | | 753,779 | |
Navigant Consulting, Inc. | | | 54,300 | | | | 1,297,227 | |
Vectrus, Inc.† | | | 39,100 | | | | 1,283,262 | |
| | | | | | |
|
|
|
| | | | | | | | 9,677,735 | |
| | | | | | |
|
|
|
Consumer Products - Misc. — 0.6% | | | | | | | | |
Central Garden & Pet Co., Class A† | | | 71,160 | | | | 2,585,243 | |
Helen of Troy, Ltd.† | | | 4,000 | | | | 475,800 | |
| | | | | | |
|
|
|
| | | | | | | | 3,061,043 | |
| | | | | | |
|
|
|
Containers - Paper/Plastic — 0.1% | | | | | | | | |
Graphic Packaging Holding Co. | | | 52,410 | | | | 745,270 | |
| | | | | | |
|
|
|
Cosmetics & Toiletries — 0.2% | | | | | | | | |
Edgewell Personal Care Co.† | | | 23,000 | | | | 1,298,810 | |
| | | | | | |
|
|
|
Data Processing/Management — 0.4% | | | | | | | | |
Fair Isaac Corp.† | | | 9,920 | | | | 2,291,322 | |
| | | | | | |
|
|
|
Dental Supplies & Equipment — 0.1% | | | | | | | | |
Patterson Cos., Inc.# | | | 19,700 | | | | 444,235 | |
| | | | | | |
|
|
|
Diagnostic Kits — 0.1% | | | | | | | | |
Meridian Bioscience, Inc. | | | 27,000 | | | | 423,900 | |
| | | | | | |
|
|
|
Dialysis Centers — 0.3% | | | | | | | | |
American Renal Associates Holdings, Inc.† | | | 63,100 | | | | 1,385,045 | |
| | | | | | |
|
|
|
Distribution/Wholesale — 0.5% | | | | | | | | |
Essendant, Inc. | | | 57,978 | | | | 836,623 | |
Nexeo Solutions, Inc.† | | | 15,800 | | | | 158,158 | |
Titan Machinery, Inc.† | | | 71,100 | | | | 1,284,066 | |
Veritiv Corp.† | | | 9,500 | | | | 453,625 | |
| | | | | | |
|
|
|
| | | | | | | | 2,732,472 | |
| | | | | | |
|
|
|
Diversified Manufacturing Operations — 0.3% | | | | | | | | |
Fabrinet† | | | 14,000 | | | | 670,180 | |
Harsco Corp.† | | | 31,300 | | | | 884,225 | |
| | | | | | |
|
|
|
| | | | | | | | 1,554,405 | |
| | | | | | |
|
|
|
E-Commerce/Services — 0.7% | | | | | | | | |
Liberty Expedia Holdings, Inc., Class A† | | | 76,500 | | | | 3,530,475 | |
| | | | | | |
|
|
|
E-Marketing/Info — 0.1% | | | | | | | | |
New Media Investment Group, Inc. | | | 38,900 | | | | 618,510 | |
| | | | | | |
|
|
|
E-Services/Consulting — 0.2% | | | | | | | | |
Perficient, Inc.† | | | 30,900 | | | | 887,757 | |
| | | | | | |
|
|
|
VALIC Company II Small Cap Value Fund
PORTFOLIO OF INVESTMENTS — August 31, 2018 — (continued)
| | | | | | | | |
| | |
| Security Description | | Shares | | | Value
(Note 2) | |
| |
COMMON STOCKS (continued) | | | | | | | | |
Electric Products - Misc. — 0.0% | | | | | | | | |
Graham Corp. | | | 3,700 | | | $ | 102,897 | |
| | | | | | |
|
|
|
Electric - Distribution — 0.1% | | | | | | | | |
Spark Energy, Inc., Class A# | | | 44,700 | | | | 393,360 | |
Unitil Corp. | | | 6,800 | | | | 343,740 | |
| | | | | | |
|
|
|
| | | | | | | | 737,100 | |
| | | | | | |
|
|
|
Electric - Generation — 0.1% | | | | | | | | |
Atlantic Power Corp.†# | | | 339,500 | | | | 746,900 | |
| | | | | | |
|
|
|
Electric - Integrated — 2.3% | | | | | | | | |
Avista Corp. | | | 35,480 | | | | 1,820,479 | |
El Paso Electric Co. | | | 46,700 | | | | 2,862,710 | |
IDACORP, Inc. | | | 14,200 | | | | 1,389,470 | |
MGE Energy, Inc. | | | 4,600 | | | | 301,070 | |
NorthWestern Corp. | | | 28,718 | | | | 1,721,931 | |
PNM Resources, Inc. | | | 1,400 | | | | 54,530 | |
Portland General Electric Co. | | | 84,500 | | | | 3,920,800 | |
| | | | | | |
|
|
|
| | | | | | | | 12,070,990 | |
| | | | | | |
|
|
|
Electronic Components - Misc. — 1.7% | | | | | | | | |
Bel Fuse, Inc., Class B | | | 27,900 | | | | 799,335 | |
Benchmark Electronics, Inc. | | | 177,821 | | | | 4,596,673 | |
Kimball Electronics, Inc.† | | | 23,200 | | | | 459,360 | |
OSI Systems, Inc.† | | | 10,400 | | | | 810,056 | |
Plexus Corp.† | | | 5,500 | | | | 348,095 | |
Sanmina Corp.† | | | 26,100 | | | | 803,880 | |
Vishay Intertechnology, Inc.# | | | 24,000 | | | | 571,200 | |
Vishay Precision Group, Inc.† | | | 11,600 | | | | 502,280 | |
| | | | | | |
|
|
|
| | | | | | | | 8,890,879 | |
| | | | | | |
|
|
|
Electronic Components - Semiconductors — 1.5% | | | | | | | | |
Alpha & Omega Semiconductor, Ltd.† | | | 55,900 | | | | 794,339 | |
Amkor Technology, Inc.† | | | 181,600 | | | | 1,585,368 | |
Rambus, Inc.† | | | 180,317 | | | | 2,203,474 | |
SMART Global Holdings, Inc.†# | | | 21,200 | | | | 699,388 | |
Synaptics, Inc.†# | | | 17,100 | | | | 825,246 | |
Xperi Corp. | | | 124,800 | | | | 1,959,360 | |
| | | | | | |
|
|
|
| | | | | | | | 8,067,175 | |
| | | | | | |
|
|
|
Electronic Measurement Instruments — 0.3% | | | | | | | | |
Stoneridge, Inc.† | | | 56,500 | | | | 1,691,045 | |
| | | | | | |
|
|
|
Electronic Parts Distribution — 0.9% | | | | | | | | |
Tech Data Corp.† | | | 64,850 | | | | 4,717,837 | |
| | | | | | |
|
|
|
Energy - Alternate Sources — 0.7% | | | | | | | | |
First Solar, Inc.† | | | 5,200 | | | | 270,816 | |
FutureFuel Corp. | | | 38,500 | | | | 570,955 | |
Pattern Energy Group, Inc., Class A# | | | 39,600 | | | | 807,048 | |
Renewable Energy Group, Inc.†# | | | 33,866 | | | | 912,689 | |
REX American Resources Corp.† | | | 15,700 | | | | 1,265,106 | |
| | | | | | |
|
|
|
| | | | | | | | 3,826,614 | |
| | | | | | |
|
|
|
Engineering/R&D Services — 0.8% | | | | | | | | |
Argan, Inc. | | | 5,100 | | | | 202,980 | |
KBR, Inc. | | | 135,100 | | | | 2,834,398 | |
VSE Corp. | | | 27,800 | | | | 1,072,524 | |
| | | | | | |
|
|
|
| | | | | | | | 4,109,902 | |
| | | | | | |
|
|
|
Engines - Internal Combustion — 0.1% | | | | | | | | |
Briggs & Stratton Corp. | | | 21,900 | | | | 441,504 | |
| | | | | | |
|
|
|
Enterprise Software/Service — 0.7% | | | | | | | | |
Donnelley Financial Solutions, Inc.† | | | 47,550 | | | | 993,319 | |
MicroStrategy, Inc., Class A† | | | 14,900 | | | | 2,220,100 | |
Verint Systems, Inc.† | | | 13,900 | | | | 674,845 | |
| | | | | | |
|
|
|
| | | | | | | | 3,888,264 | |
| | | | | | |
|
|
|
| | | | | | | | |
| | |
| Security Description | | Shares | | | Value
(Note 2) | |
| |
| | | | | | | | | |
Finance - Consumer Loans — 0.3% | | | | | | | | |
Enova International, Inc.† | | | 29,000 | | | $ | 962,800 | |
Nelnet, Inc., Class A | | | 13,000 | | | | 749,450 | |
| | | | | | |
|
|
|
| | | | | | | | 1,712,250 | |
| | | | | | |
|
|
|
Finance - Investment Banker/Broker — 0.3% | | | | | | | | |
Arlington Asset Investment Corp., Class A# | | | 6,200 | | | | 63,054 | |
Houlihan Lokey, Inc. | | | 4,500 | | | | 211,635 | |
Investment Technology Group, Inc. | | | 27,300 | | | | 597,324 | |
Ladenburg Thalmann Financial Services, Inc. | | | 19,300 | | | | 66,585 | |
Oppenheimer Holdings, Inc., Class A | | | 10,000 | | | | 312,000 | |
Piper Jaffray Cos. | | | 2,600 | | | | 200,200 | |
| | | | | | |
|
|
|
| | | | | | | | 1,450,798 | |
| | | | | | |
|
|
|
Finance - Leasing Companies — 0.1% | | | | | | | | |
Marlin Business Services Corp. | | | 10,600 | | | | 303,160 | |
| | | | | | |
|
|
|
Finance-Mortgage Loan/Banker — 0.2% | | | | | | | | |
PennyMac Financial Services, Inc., Class A | | | 49,000 | | | | 1,036,350 | |
| | | | | | |
|
|
|
Finance - Other Services — 0.1% | | | | | | | | |
BGC Partners, Inc., Class A | | | 36,100 | | | | 448,362 | |
HomeStreet, Inc.† | | | 9,300 | | | | 273,885 | |
| | | | | | |
|
|
|
| | | | | | | | 722,247 | |
| | | | | | |
|
|
|
Financial Guarantee Insurance — 0.7% | | | | | | | | |
MBIA, Inc.†# | | | 185,400 | | | | 1,904,058 | |
MGIC Investment Corp.† | | | 110,700 | | | | 1,408,104 | |
Radian Group, Inc. | | | 32,400 | | | | 658,692 | |
| | | | | | |
|
|
|
| | | | | | | | 3,970,854 | |
| | | | | | |
|
|
|
Food - Dairy Products — 0.1% | | | | | | | | |
Dean Foods Co. | | | 41,800 | | | | 318,516 | |
| | | | | | |
|
|
|
Food - Misc./Diversified — 0.4% | | | | | | | | |
Darling Ingredients, Inc.† | | | 111,600 | | | | 2,207,448 | |
| | | | | | |
|
|
|
Food - Wholesale/Distribution — 0.3% | | | | | | | | |
Fresh Del Monte Produce, Inc. | | | 12,050 | | | | 451,152 | |
SpartanNash Co. | | | 47,200 | | | | 1,007,720 | |
United Natural Foods, Inc.† | | | 10,400 | | | | 369,304 | |
| | | | | | |
|
|
|
| | | | | | | | 1,828,176 | |
| | | | | | |
|
|
|
Footwear & Related Apparel — 0.4% | | | | | | | | |
Deckers Outdoor Corp.† | | | 16,500 | | | | 2,010,360 | |
Weyco Group, Inc. | | | 900 | | | | 31,923 | |
| | | | | | |
|
|
|
| | | | | | | | 2,042,283 | |
| | | | | | |
|
|
|
Gambling (Non-Hotel) — 0.6% | | | | | | | | |
Pinnacle Entertainment, Inc.† | | | 96,100 | | | | 3,290,464 | |
| | | | | | |
|
|
|
Gas - Distribution — 1.5% | | | | | | | | |
New Jersey Resources Corp. | | | 28,100 | | | | 1,281,360 | |
Northwest Natural Gas Co. | | | 31,900 | | | | 2,070,310 | |
Southwest Gas Holdings, Inc. | | | 38,840 | | | | 3,003,109 | |
Spire, Inc. | | | 20,300 | | | | 1,513,365 | |
| | | | | | |
|
|
|
| | | | | | | | 7,868,144 | |
| | | | | | |
|
|
|
Home Furnishings — 0.1% | | | | | | | | |
Hooker Furniture Corp. | | | 9,900 | | | | 416,295 | |
| | | | | | |
|
|
|
Housewares — 0.1% | | | | | | | | |
Lifetime Brands, Inc. | | | 29,300 | | | | 341,345 | |
| | | | | | |
|
|
|
Human Resources — 1.2% | | | | | | | | |
Barrett Business Services, Inc. | | | 16,000 | | | | 1,200,480 | |
Cross Country Healthcare, Inc.† | | | 28,400 | | | | 284,284 | |
Heidrick & Struggles International, Inc. | | | 27,800 | | | | 1,228,760 | |
VALIC Company II Small Cap Value Fund
PORTFOLIO OF INVESTMENTS — August 31, 2018 — (continued)
| | | | | | | | |
| | |
| Security Description | | Shares | | | Value
(Note 2) | |
| |
COMMON STOCKS (continued) | | | | | | | | |
Human Resources (continued) | | | | | | | | |
Korn/Ferry International | | | 25,000 | | | $ | 1,678,250 | |
TrueBlue, Inc.† | | | 63,800 | | | | 1,869,340 | |
| | | | | | |
|
|
|
| | | | | | | | 6,261,114 | |
| | | | | | |
|
|
|
Independent Power Producers — 0.5% | | | | | | | | |
NRG Yield, Inc., Class A | | | 5,000 | | | | 98,450 | |
NRG Yield, Inc., Class C | | | 47,900 | | | | 950,815 | |
Vistra Energy Corp.† | | | 72,759 | | | | 1,712,747 | |
| | | | | | |
|
|
|
| | | | | | | | 2,762,012 | |
| | | | | | |
|
|
|
Industrial Automated/Robotic — 0.1% | | | | | | | | |
Hurco Cos., Inc. | | | 7,800 | | | | 334,620 | |
| | | | | | |
|
|
|
Insurance - Life/Health — 1.8% | | | | | | | | |
American Equity Investment Life Holding Co. | | | 64,000 | | | | 2,373,760 | |
CNO Financial Group, Inc. | | | 190,509 | | | | 4,116,899 | |
Primerica, Inc. | | | 24,500 | | | | 2,995,125 | |
| | | | | | |
|
|
|
| | | | | | | | 9,485,784 | |
| | | | | | |
|
|
|
Insurance - Multi-line — 0.1% | | | | | | | | |
Horace Mann Educators Corp. | | | 10,680 | | | | 494,484 | |
United Fire Group, Inc. | | | 2,100 | | | | 104,013 | |
| | | | | | |
|
|
|
| | | | | | | | 598,497 | |
| | | | | | |
|
|
|
Insurance - Property/Casualty — 1.6% | | | | | | | | |
FedNat Holding Co. | | | 14,200 | | | | 373,460 | |
First American Financial Corp. | | | 16,200 | | | | 921,132 | |
Global Indemnity, Ltd. | | | 1,700 | | | | 67,031 | |
Hallmark Financial Services, Inc.† | | | 10,500 | | | | 117,915 | |
HCI Group, Inc. | | | 11,700 | | | | 473,850 | |
Heritage Insurance Holdings, Inc.# | | | 93,000 | | | | 1,362,450 | |
Kinsale Capital Group, Inc. | | | 1,800 | | | | 109,386 | |
National General Holdings Corp. | | | 4,100 | | | | 111,971 | |
Navigators Group, Inc. | | | 8,300 | | | | 581,000 | |
ProAssurance Corp. | | | 18,080 | | | | 874,168 | |
Selective Insurance Group, Inc. | | | 10,800 | | | | 693,360 | |
Stewart Information Services Corp. | | | 17,100 | | | | 765,738 | |
Third Point Reinsurance, Ltd.† | | | 56,200 | | | | 753,080 | |
Universal Insurance Holdings, Inc. | | | 32,200 | | | | 1,436,120 | |
| | | | | | |
|
|
|
| | | | | | | | 8,640,661 | |
| | | | | | |
|
|
|
Insurance - Reinsurance — 0.1% | | | | | | | | |
Argo Group International Holdings, Ltd.† | | | 10,675 | | | | 679,998 | |
| | | | | | |
|
|
|
Internet Content-Entertainment — 0.2% | | | | | | | | |
Limelight Networks, Inc.† | | | 167,200 | | | | 847,704 | |
| | | | | | |
|
|
|
Investment Management/Advisor Services — 0.6% | | | | | | | | |
Associated Capital Group, Inc., Class A | | | 1,600 | | | | 59,840 | |
BrightSphere Investment Group PLC | | | 19,000 | | | | 241,110 | |
GAMCO Investors, Inc., Class A | | | 2,700 | | | | 69,795 | |
Hilltop Holdings, Inc. | | | 29,100 | | | | 603,825 | |
Stifel Financial Corp. | | | 25,500 | | | | 1,424,685 | |
Virtus Investment Partners, Inc. | | | 7,500 | | | | 967,500 | |
| | | | | | |
|
|
|
| | | | | | | | 3,366,755 | |
| | | | | | |
|
|
|
Machine Tools & Related Products — 0.1% | | | | | | | | |
Milacron Holdings Corp.† | | | 23,400 | | | | 496,080 | |
| | | | | | |
|
|
|
Machinery - Construction & Mining — 0.1% | | | | | | | | |
Hyster-Yale Materials Handling, Inc. | | | 4,700 | | | | 289,990 | |
| | | | | | |
|
|
|
Machinery - Electrical — 0.0% | | | | | | | | |
Bloom Energy Corp. Class A†# | | | 3,500 | | | | 104,825 | |
| | | | | | |
|
|
|
Machinery - Farming — 0.2% | | | | | | | | |
AGCO Corp. | | | 13,560 | | | | 808,990 | |
| | | | | | |
|
|
|
| | | | | | | | |
| | |
| Security Description | | Shares | | | Value
(Note 2) | |
| |
| | | | | | | | | |
Machinery - General Industrial — 0.6% | | | | | | | | |
Applied Industrial Technologies, Inc. | | | 1,200 | | | $ | 92,460 | |
DXP Enterprises, Inc.† | | | 31,800 | | | | 1,459,302 | |
Kadant, Inc. | | | 16,050 | | | | 1,621,852 | |
| | | | | | |
|
|
|
| | | | | | | | 3,173,614 | |
| | | | | | |
|
|
|
Machinery - Pumps — 0.1% | | | | | | | | |
SPX FLOW, Inc.† | | | 14,000 | | | | 671,160 | |
| | | | | | |
|
|
|
Medical Imaging Systems — 0.2% | | | | | | | | |
Lantheus Holdings, Inc.† | | | 59,700 | | | | 961,170 | |
| | | | | | |
|
|
|
Medical Information Systems — 0.3% | | | | | | | | |
Allscripts Healthcare Solutions, Inc.† | | | 93,700 | | | | 1,368,957 | |
| | | | | | |
|
|
|
Medical Instruments — 0.1% | | | | | | | | |
AngioDynamics, Inc.† | | | 21,200 | | | | 475,304 | |
| | | | | | |
|
|
|
Medical Products — 0.2% | | | | | | | | |
FONAR Corp.† | | | 5,700 | | | | 149,340 | |
Haemonetics Corp.† | | | 5,300 | | | | 591,692 | |
Integer Holdings Corp.† | | | 1,700 | | | | 135,830 | |
| | | | | | |
|
|
|
| | | | | | | | 876,862 | |
| | | | | | |
|
|
|
Medical - Biomedical/Gene — 1.4% | | | | | | | | |
Abeona Therapeutics, Inc.† | | | 17,300 | | | | 266,420 | |
Acceleron Pharma, Inc.†# | | | 4,400 | | | | 237,688 | |
Acorda Therapeutics, Inc.† | | | 11,100 | | | | 319,680 | |
AMAG Pharmaceuticals, Inc.†# | | | 43,960 | | | | 1,072,624 | |
Arcus Biosciences, Inc.†# | | | 47,765 | | | | 687,816 | |
Ardelyx, Inc.† | | | 65,609 | | | | 282,119 | |
BioCryst Pharmaceuticals, Inc.†# | | | 72,600 | | | | 519,816 | |
Corvus Pharmaceuticals, Inc.†# | | | 19,400 | | | | 212,624 | |
Endocyte, Inc.†# | | | 22,400 | | | | 441,728 | |
Epizyme, Inc.† | | | 35,300 | | | | 416,540 | |
Fate Therapeutics, Inc.†# | | | 43,400 | | | | 559,426 | |
Five Prime Therapeutics, Inc.† | | | 23,000 | | | | 322,000 | |
Iovance Biotherapeutics, Inc.†# | | | 41,200 | | | | 729,240 | |
Karyopharm Therapeutics, Inc.† | | | 19,400 | | | | 408,370 | |
Medicines Co.†# | | | 16,600 | | | | 657,526 | |
Tocagen, Inc.†# | | | 36,700 | | | | 357,825 | |
| | | | | | |
|
|
|
| | | | | | | | 7,491,442 | |
| | | | | | |
|
|
|
Medical - Drugs — 1.2% | | | | | | | | |
Enanta Pharmaceuticals, Inc.† | | | 5,000 | | | | 454,650 | |
Immune Design Corp.† | | | 68,400 | | | | 259,920 | |
Intra-Cellular Therapies, Inc.† | | | 18,900 | | | | 414,666 | |
Kala Pharmaceuticals, Inc.†# | | | 14,600 | | | | 197,246 | |
Lannett Co., Inc.†# | | | 32,000 | | | | 171,200 | |
Mallinckrodt PLC† | | | 72,900 | | | | 2,512,134 | |
Minerva Neurosciences, Inc.† | | | 49,000 | | | | 509,600 | |
Prestige Brands Holdings, Inc.†# | | | 23,200 | | | | 893,200 | |
Spero Therapeutics, Inc.†# | | | 27,400 | | | | 312,634 | |
Vanda Pharmaceuticals, Inc.† | | | 3,800 | | | | 73,435 | |
Zogenix, Inc.†# | | | 7,300 | | | | 352,590 | |
| | | | | | |
|
|
|
| | | | | | | | 6,151,275 | |
| | | | | | |
|
|
|
Medical - Generic Drugs — 0.6% | | | | | | | | |
Amphastar Pharmaceuticals, Inc.† | | | 18,200 | | | | 345,436 | |
Endo International PLC†# | | | 133,800 | | | | 2,294,670 | |
Momenta Pharmaceuticals, Inc.† | | | 12,100 | | | | 320,650 | |
| | | | | | |
|
|
|
| | | | | | | | 2,960,756 | |
| | | | | | |
|
|
|
Medical - HMO — 1.2% | | | | | | | | |
Magellan Health, Inc.† | | | 17,400 | | | | 1,278,900 | |
Molina Healthcare, Inc.† | | | 15,800 | | | | 2,180,400 | |
Tivity Health, Inc.†# | | | 6,600 | | | | 227,040 | |
Triple-S Management Corp., Class B† | | | 55,500 | | | | 1,208,235 | |
WellCare Health Plans, Inc.† | | | 4,600 | | | | 1,391,822 | |
| | | | | | |
|
|
|
| | | | | | | | 6,286,397 | |
| | | | | | |
|
|
|
VALIC Company II Small Cap Value Fund
PORTFOLIO OF INVESTMENTS — August 31, 2018 — (continued)
| | | | | | | | |
| | |
| Security Description | | Shares | | | Value
(Note 2) | |
| |
COMMON STOCKS (continued) | | | | | | | | |
Medical - Hospitals — 0.5% | | | | | | | | |
Community Health Systems, Inc.†# | | | 337,200 | | | $ | 1,308,336 | |
LifePoint Health, Inc.† | | | 21,450 | | | | 1,381,380 | |
| | | | | | |
|
|
|
| | | | | | | | 2,689,716 | |
| | | | | | |
|
|
|
Medical - Wholesale Drug Distribution — 0.6% | | | | | | | | |
Diplomat Pharmacy, Inc.†# | | | 36,000 | | | | 743,760 | |
Owens & Minor, Inc.# | | | 142,850 | | | | 2,425,593 | |
| | | | | | |
|
|
|
| | | | | | | | 3,169,353 | |
| | | | | | |
|
|
|
Metal Processors & Fabrication — 0.4% | | | | | | | | |
Global Brass & Copper Holdings, Inc. | | | 56,400 | | | | 2,174,220 | |
LB Foster Co., Class A† | | | 8,500 | | | | 193,375 | |
| | | | | | |
|
|
|
| | | | | | | | 2,367,595 | |
| | | | | | |
|
|
|
Metal Products - Distribution — 0.3% | | | | | | | | |
Worthington Industries, Inc. | | | 33,340 | | | | 1,552,977 | |
| | | | | | |
|
|
|
Metal - Aluminum — 0.3% | | | | | | | | |
Kaiser Aluminum Corp. | | | 15,500 | | | | 1,698,645 | |
| | | | | | |
|
|
|
Metal - Iron — 0.1% | | | | | | | | |
Cleveland-Cliffs, Inc.†# | | | 74,900 | | | | 752,745 | |
| | | | | | |
|
|
|
Miscellaneous Manufacturing — 0.0% | | | | | | | | |
FreightCar America, Inc. | | | 5,200 | | | | 87,932 | |
| | | | | | |
|
|
|
Networking Products — 0.1% | | | | | | | | |
NETGEAR, Inc.† | | | 8,800 | | | | 623,480 | |
| | | | | | |
|
|
|
Office Furnishings - Original — 0.0% | | | | | | | | |
Kimball International, Inc., Class B | | | 8,100 | | | | 141,507 | |
| | | | | | |
|
|
|
Office Supplies & Forms — 0.9% | | | | | | | | |
ACCO Brands Corp. | | | 392,400 | | | | 4,865,760 | |
| | | | | | |
|
|
|
Oil & Gas Drilling — 0.4% | | | | | | | | |
Diamond Offshore Drilling, Inc.†# | | | 18,500 | | | | 322,270 | |
Noble Corp. PLC† | | | 236,100 | | | | 1,440,210 | |
Ocean Rig UDW, Inc., Class A†# | | | 11,800 | | | | 319,544 | |
| | | | | | |
|
|
|
| | | | | | | | 2,082,024 | |
| | | | | | |
|
|
|
Oil Companies - Exploration & Production — 2.4% | | | | | | | | |
Abraxas Petroleum Corp.† | | | 333,200 | | | | 749,700 | |
Denbury Resources, Inc.†# | | | 623,100 | | | | 3,470,667 | |
EP Energy Corp., Class A†# | | | 266,228 | | | | 465,899 | |
Exterran Corp.† | | | 21,400 | | | | 586,146 | |
Gulfport Energy Corp.† | | | 278,000 | | | | 3,269,280 | |
Midstates Petroleum Co., Inc.† | | | 12,300 | | | | 143,049 | |
PDC Energy, Inc.† | | | 25,100 | | | | 1,322,519 | |
Sanchez Energy Corp.†# | | | 55,700 | | | | 146,491 | |
Southwestern Energy Co.† | | | 76,900 | | | | 432,178 | |
Unit Corp.† | | | 26,000 | | | | 683,540 | |
W&T Offshore, Inc.† | | | 253,900 | | | | 1,718,903 | |
| | | | | | |
|
|
|
| | | | | | | | 12,988,372 | |
| | | | | | |
|
|
|
Oil Field Machinery & Equipment — 0.2% | | | | | | | | |
Natural Gas Services Group, Inc.† | | | 6,300 | | | | 139,230 | |
US Silica Holdings, Inc.# | | | 52,300 | | | | 1,108,237 | |
| | | | | | |
|
|
|
| | | | | | | | 1,247,467 | |
| | | | | | |
|
|
|
Oil Refining & Marketing — 1.0% | | | | | | | | |
Delek US Holdings, Inc. | | | 73,000 | | | | 3,978,500 | |
Murphy USA, Inc.† | | | 17,100 | | | | 1,418,958 | |
| | | | | | |
|
|
|
| | | | | | | | 5,397,458 | |
| | | | | | |
|
|
|
Oil - Field Services — 1.7% | | | | | | | | |
Archrock, Inc. | | | 112,800 | | | | 1,426,920 | |
FTS International, Inc.† | | | 38,800 | | | | 427,964 | |
Mammoth Energy Services, Inc.# | | | 4,600 | | | | 126,408 | |
Matrix Service Co.† | | | 13,300 | | | | 277,970 | |
| | | | | | | | |
| | |
| Security Description | | Shares | | | Value
(Note 2) | |
| |
| | | | | | | | | |
Oil - Field Services (continued) | | | | | | | | |
McDermott International, Inc.†# | | | 57,533 | | | $ | 1,112,688 | |
MRC Global, Inc.† | | | 179,400 | | | | 3,697,434 | |
Nine Energy Service, Inc.† | | | 29,200 | | | | 875,416 | |
NOW, Inc.† | | | 31,700 | | | | 544,923 | |
Oil States International, Inc.† | | | 21,701 | | | | 734,579 | |
| | | | | | |
|
|
|
| | | | | | | | 9,224,302 | |
| | | | | | |
|
|
|
Paper & Related Products — 1.2% | | | | | | | | |
Domtar Corp. | | | 14,140 | | | | 719,726 | |
Schweitzer-Mauduit International, Inc. | | | 70,800 | | | | 2,880,852 | |
Verso Corp., Class A† | | | 97,300 | | | | 3,054,247 | |
| | | | | | |
|
|
|
| | | | | | | | 6,654,825 | |
| | | | | | |
|
|
|
Pipelines — 0.1% | | | | | | | | |
SemGroup Corp., Class A# | | | 23,600 | | | | 571,120 | |
| | | | | | |
|
|
|
Poultry — 0.0% | | | | | | | | |
Sanderson Farms, Inc. | | | 1,200 | | | | 126,912 | |
| | | | | | |
|
|
|
Power Converter/Supply Equipment — 0.1% | | | | | | | | |
Powell Industries, Inc. | | | 17,500 | | | | 685,125 | |
| | | | | | |
|
|
|
Printing - Commercial — 0.9% | | | | | | | | |
Ennis, Inc. | | | 11,900 | | | | 259,420 | |
LSC Communications, Inc. | | | 109,400 | | | | 1,337,962 | |
Quad/Graphics, Inc. | | | 146,600 | | | | 3,338,082 | |
RR Donnelley & Sons Co. | | | 2,700 | | | | 13,662 | |
| | | | | | |
|
|
|
| | | | | | | | 4,949,126 | |
| | | | | | |
|
|
|
Publishing - Books — 0.2% | | | | | | | | |
Houghton Mifflin Harcourt Co.† | | | 125,300 | | | | 808,185 | |
| | | | | | |
|
|
|
Publishing - Newspapers — 0.6% | | | | | | | | |
Gannett Co., Inc. | | | 206,000 | | | | 2,117,680 | |
Tronc, Inc.† | | | 58,600 | | | | 966,900 | |
| | | | | | |
|
|
|
| | | | | | | | 3,084,580 | |
| | | | | | |
|
|
|
Racetracks — 0.4% | | | | | | | | |
Penn National Gaming, Inc.† | | | 55,400 | | | | 1,909,084 | |
Speedway Motorsports, Inc. | | | 5,800 | | | | 103,762 | |
| | | | | | |
|
|
|
| | | | | | | | 2,012,846 | |
| | | | | | |
|
|
|
Real Estate Investment Trusts — 11.9% | | | | | | | | |
AG Mtg. Investment Trust, Inc. | | | 64,400 | | | | 1,210,720 | |
American Assets Trust, Inc. | | | 72,600 | | | | 2,867,700 | |
Apartment Investment & Management Co., Class A | | | 28,079 | | | | 1,229,860 | |
Armada Hoffler Properties, Inc. | | | 62,900 | | | | 980,611 | |
ARMOUR Residential REIT, Inc.# | | | 16,800 | | | | 395,136 | |
Ashford Hospitality Trust, Inc. | | | 317,380 | | | | 2,059,796 | |
Bluerock Residential Growth REIT, Inc.# | | | 6,500 | | | | 64,285 | |
Braemar Hotels & Resorts, Inc. | | | 89,000 | | | | 1,027,950 | |
Capstead Mtg. Corp. | | | 249,500 | | | | 2,095,800 | |
CBL & Associates Properties, Inc.# | | | 51,640 | | | | 230,314 | |
Cedar Realty Trust, Inc. | | | 55,100 | | | | 246,297 | |
Cherry Hill Mtg. Investment Corp. | | | 48,329 | | | | 898,919 | |
Chesapeake Lodging Trust | | | 13,500 | | | | 444,285 | |
City Office REIT, Inc. | | | 12,100 | | | | 156,211 | |
CoreCivic, Inc. | | | 114,200 | | | | 2,956,638 | |
CorEnergy Infrastructure Trust, Inc.# | | | 12,700 | | | | 475,361 | |
CoreSite Realty Corp. | | | 15,900 | | | | 1,851,873 | |
Cousins Properties, Inc. | | | 99,260 | | | | 928,081 | |
DiamondRock Hospitality Co.# | | | 274,334 | | | | 3,281,035 | |
Dynex Capital, Inc. | | | 81,600 | | | | 523,056 | |
EastGroup Properties, Inc. | | | 1,300 | | | | 126,451 | |
EPR Properties | | | 4,900 | | | | 343,882 | |
First Industrial Realty Trust, Inc. | | | 50,918 | | | | 1,652,798 | |
Franklin Street Properties Corp.# | | | 50,800 | | | | 435,356 | |
GEO Group, Inc. | | | 201,950 | | | | 5,123,472 | |
VALIC Company II Small Cap Value Fund
PORTFOLIO OF INVESTMENTS — August 31, 2018 — (continued)
| | | | | | | | |
| | |
| Security Description | | Shares | | | Value
(Note 2) | |
| |
COMMON STOCKS (continued) | | | | | | | | |
Real Estate Investment Trusts (continued) | | | | | | | | |
Getty Realty Corp. | | | 56,246 | | | $ | 1,637,321 | |
Gladstone Commercial Corp. | | | 10,400 | | | | 207,064 | |
Global Medical REIT, Inc. | | | 18,100 | | | | 173,217 | |
Hersha Hospitality Trust | | | 24,100 | | | | 568,760 | |
Highwoods Properties, Inc. | | | 14,200 | | | | 706,308 | |
Hospitality Properties Trust | | | 22,740 | | | | 659,233 | |
Hudson Pacific Properties, Inc. | | | 6,700 | | | | 226,728 | |
InfraREIT, Inc.† | | | 80,800 | | | | 1,687,912 | |
Invesco Mtg. Capital, Inc. | | | 128,400 | | | | 2,083,932 | |
Kite Realty Group Trust | | | 39,400 | | | | 688,712 | |
LaSalle Hotel Properties | | | 11,278 | | | | 395,971 | |
LTC Properties, Inc. | | | 14,120 | | | | 655,874 | |
Mack-Cali Realty Corp. | | | 60,500 | | | | 1,321,320 | |
NexPoint Residential Trust, Inc. | | | 10,895 | | | | 351,909 | |
Pebblebrook Hotel Trust# | | | 47,500 | | | | 1,833,975 | |
Pennsylvania Real Estate Investment Trust# | | | 77,680 | | | | 792,336 | |
Piedmont Office Realty Trust, Inc., Class A | | | 122,300 | | | | 2,426,432 | |
Preferred Apartment Communities, Inc., Class A | | | 63,900 | | | | 1,138,698 | |
Prologis, Inc. | | | 0 | | | | 13 | |
PS Business Parks, Inc. | | | 7,500 | | | | 978,225 | |
Ramco-Gershenson Properties Trust# | | | 23,000 | | | | 321,080 | |
Redwood Trust, Inc. | | | 69,600 | | | | 1,181,808 | |
Retail Opportunity Investments Corp.# | | | 13,700 | | | | 270,438 | |
Rexford Industrial Realty, Inc.# | | | 12,800 | | | | 416,000 | |
RLJ Lodging Trust | | | 29,426 | | | | 644,724 | |
Saul Centers, Inc. | | | 1,700 | | | | 102,000 | |
Select Income REIT | | | 10,400 | | | | 213,720 | |
STAG Industrial, Inc. | | | 17,100 | | | | 493,677 | |
Summit Hotel Properties, Inc. | | | 12,300 | | | | 168,879 | |
Sun Communities, Inc. | | | 4,500 | | | | 464,310 | |
Sunstone Hotel Investors, Inc. | | | 136,372 | | | | 2,288,322 | |
Taubman Centers, Inc. | | | 1,900 | | | | 122,759 | |
Tier REIT, Inc. | | | 63,900 | | | | 1,523,376 | |
Two Harbors Investment Corp. | | | 97,805 | | | | 1,527,714 | |
Urstadt Biddle Properties, Inc., Class A | | | 21,400 | | | | 486,850 | |
Washington Prime Group, Inc.# | | | 93,253 | | | | 721,778 | |
Washington Real Estate Investment Trust | | | 1,300 | | | | 41,028 | |
Xenia Hotels & Resorts, Inc. | | | 100,200 | | | | 2,430,852 | |
| | | | | | |
|
|
|
| | | | | | | | 63,559,142 | |
| | | | | | |
|
|
|
Real Estate Operations & Development — 0.4% | | | | | | | | |
Alexander & Baldwin, Inc. | | | 28,475 | | | | 668,308 | |
Cushman & Wakefield PLC† | | | 95,200 | | | | 1,681,232 | |
| | | | | | |
|
|
|
| | | | | | | | 2,349,540 | |
| | | | | | |
|
|
|
Retail - Apparel/Shoe — 1.2% | | | | | | | | |
Abercrombie & Fitch Co., Class A | | | 4,100 | | | | 88,847 | |
American Eagle Outfitters, Inc. | | | 32,400 | | | | 841,104 | |
Caleres, Inc. | | | 16,200 | | | | 655,776 | |
Cato Corp., Class A | | | 42,000 | | | | 900,900 | |
Chico’s FAS, Inc. | | | 26,800 | | | | 244,416 | |
Children’s Place, Inc.# | | | 17,550 | | | | 2,470,162 | |
Tailored Brands, Inc.# | | | 59,600 | | | | 1,402,984 | |
| | | | | | |
|
|
|
| | | | | | | | 6,604,189 | |
| | | | | | |
|
|
|
Retail - Appliances — 0.2% | | | | | | | | |
Conn’s, Inc.†# | | | 28,700 | | | | 1,176,700 | |
| | | | | | |
|
|
|
Retail - Discount — 0.3% | | | | | | | | |
BJ’s Wholesale Club Holdings, Inc.†# | | | 45,700 | | | | 1,348,150 | |
Citi Trends, Inc. | | | 12,400 | | | | 383,656 | |
| | | | | | |
|
|
|
| | | | | | | | 1,731,806 | |
| | | | | | |
|
|
|
Retail - Hair Salons — 0.1% | | | | | | | | |
Regis Corp.† | | | 32,403 | | | | 693,100 | |
| | | | | | |
|
|
|
| | | | | | | | |
| | |
| Security Description | | Shares | | | Value
(Note 2) | |
| |
| | | | | | | | | |
Retail - Home Furnishings — 0.0% | | | | | | | | |
Pier 1 Imports, Inc. | | | 17,149 | | | $ | 31,554 | |
| | | | | | |
|
|
|
Retail - Jewelry — 0.5% | | | | | | | | |
Movado Group, Inc. | | | 38,300 | | | | 1,631,580 | |
Signet Jewelers, Ltd. | | | 18,000 | | | | 1,155,600 | |
| | | | | | |
|
|
|
| | | | | | | | 2,787,180 | |
| | | | | | |
|
|
|
Retail - Leisure Products — 0.0% | | | | | | | | |
Party City Holdco, Inc.†# | | | 8,000 | | | | 122,800 | |
| | | | | | |
|
|
|
Retail - Misc./Diversified — 0.2% | | | | | | | | |
Hudson, Ltd., Class A† | | | 33,200 | | | | 683,920 | |
Sally Beauty Holdings, Inc.† | | | 36,900 | | | | 568,260 | |
| | | | | | |
|
|
|
| | | | | | | | 1,252,180 | |
| | | | | | |
|
|
|
Retail - Office Supplies — 0.4% | | | | | | | | |
Office Depot, Inc. | | | 612,500 | | | | 2,051,875 | |
| | | | | | |
|
|
|
Retail - Pawn Shops — 0.2% | | | | | | | | |
FirstCash, Inc. | | | 10,200 | | | | 829,260 | |
| | | | | | |
|
|
|
Retail - Regional Department Stores — 0.6% | | | | | | | | |
Dillard’s, Inc., Class A | | | 38,090 | | | | 2,993,112 | |
| | | | | | |
|
|
|
Retail - Restaurants — 0.6% | | | | | | | | |
Brinker International, Inc. | | | 27,600 | | | | 1,222,128 | |
Cannae Holdings, Inc.† | | | 32,100 | | | | 624,024 | |
Ruth’s Hospitality Group, Inc. | | | 38,972 | | | | 1,200,338 | |
| | | | | | |
|
|
|
| | | | | | | | 3,046,490 | |
| | | | | | |
|
|
|
Retail - Sporting Goods — 0.2% | | | | | | | | |
Hibbett Sports, Inc.†# | | | 42,600 | | | | 875,430 | |
Zumiez, Inc.† | | | 13,700 | | | | 426,755 | |
| | | | | | |
|
|
|
| | | | | | | | 1,302,185 | |
| | | | | | |
|
|
|
Retirement/Aged Care — 0.1% | | | | | | | | |
Brookdale Senior Living, Inc.† | | | 47,900 | | | | 475,168 | |
| | | | | | |
|
|
|
Rubber/Plastic Products — 0.7% | | | | | | | | |
Myers Industries, Inc. | | | 7,858 | | | | 174,840 | |
Trinseo SA | | | 46,300 | | | | 3,572,045 | |
| | | | | | |
|
|
|
| | | | | | | | 3,746,885 | |
| | | | | | |
|
|
|
Savings & Loans/Thrifts — 2.7% | | | | | | | | |
BankFinancial Corp. | | | 18,900 | | | | 301,455 | |
Beneficial Bancorp, Inc. | | | 163,358 | | | | 2,875,101 | |
Berkshire Hills Bancorp, Inc. | | | 3,100 | | | | 130,975 | |
Charter Financial Corp. | | | 45,500 | | | | 1,133,405 | |
Dime Community Bancshares, Inc. | | | 21,100 | | | | 382,965 | |
First Defiance Financial Corp. | | | 18,500 | | | | 591,815 | |
Flagstar Bancorp, Inc.† | | | 12,600 | | | | 416,430 | |
Flushing Financial Corp. | | | 27,000 | | | | 699,840 | |
HomeTrust Bancshares, Inc.† | | | 4,500 | | | | 129,600 | |
Investors Bancorp, Inc. | | | 139,300 | | | | 1,783,040 | |
Meridian Bancorp, Inc. | | | 44,400 | | | | 794,760 | |
Meta Financial Group, Inc. | | | 9,300 | | | | 805,380 | |
Northfield Bancorp, Inc. | | | 87,900 | | | | 1,431,012 | |
Oritani Financial Corp. | | | 3,900 | | | | 63,180 | |
Riverview Bancorp, Inc. | | | 11,300 | | | | 111,305 | |
Territorial Bancorp, Inc. | | | 2,300 | | | | 68,724 | |
United Community Financial Corp. | | | 17,300 | | | | 179,055 | |
United Financial Bancorp, Inc. | | | 13,800 | | | | 245,226 | |
Washington Federal, Inc. | | | 50,300 | | | | 1,715,230 | |
Waterstone Financial, Inc. | | | 12,600 | | | | 212,940 | |
WSFS Financial Corp. | | | 4,074 | | | | 198,811 | |
| | | | | | |
|
|
|
| | | | | | | | 14,270,249 | |
| | | | | | |
|
|
|
Schools — 0.2% | | | | | | | | |
K12, Inc.† | | | 63,500 | | | | 1,051,560 | |
| | | | | | |
|
|
|
VALIC Company II Small Cap Value Fund
PORTFOLIO OF INVESTMENTS — August 31, 2018 — (continued)
| | | | | | | | |
| | |
| Security Description | | Shares | | | Value
(Note 2) | |
| |
COMMON STOCKS (continued) | | | | | | | | |
Semiconductor Components - Integrated Circuits — 0.7% | | | | | | | | |
Cirrus Logic, Inc.† | | | 74,600 | | | $ | 3,278,670 | |
Cypress Semiconductor Corp. | | | 23,622 | | | | 406,535 | |
| | | | | | |
|
|
|
| | | | | | | | 3,685,205 | |
| | | | | | |
|
|
|
Semiconductor Equipment — 0.2% | | | | | | | | |
Photronics, Inc.† | | | 42,200 | | | | 451,540 | |
Ultra Clean Holdings, Inc.† | | | 45,500 | | | | 694,330 | |
| | | | | | |
|
|
|
| | | | | | | | 1,145,870 | |
| | | | | | |
|
|
|
Steel - Producers — 0.5% | | | | | | | | |
AK Steel Holding Corp.†# | | | 62,500 | | | | 277,500 | |
Carpenter Technology Corp. | | | 23,900 | | | | 1,426,113 | |
Commercial Metals Co. | | | 37,200 | | | | 803,520 | |
Schnitzer Steel Industries, Inc., Class A | | | 12,000 | | | | 316,200 | |
| | | | | | |
|
|
|
| | | | | | | | 2,823,333 | |
| | | | | | |
|
|
|
Telecom Equipment - Fiber Optics — 0.2% | | | | | | | | |
Ciena Corp.† | | | 42,000 | | | | 1,326,360 | |
| | | | | | |
|
|
|
Telecom Services — 0.1% | | | | | | | | |
HC2 Holdings, Inc.†# | | | 42,600 | | | | 267,102 | |
Spok Holdings, Inc. | | | 3,100 | | | | 47,585 | |
| | | | | | |
|
|
|
| | | | | | | | 314,687 | |
| | | | | | |
|
|
|
Telecommunication Equipment — 0.1% | | | | | | | | |
ADTRAN, Inc. | | | 9,900 | | | | 170,280 | |
Comtech Telecommunications Corp. | | | 12,800 | | | | 458,880 | |
| | | | | | |
|
|
|
| | | | | | | | 629,160 | |
| | | | | | |
|
|
|
Telephone - Integrated — 0.2% | | | | | | | | |
Frontier Communications Corp.# | | | 172,700 | | | | 898,040 | |
Windstream Holdings, Inc.†# | | | 68,560 | | | | 322,918 | |
| | | | | | |
|
|
|
| | | | | | | | 1,220,958 | |
| | | | | | |
|
|
|
Television — 0.1% | | | | | | | | |
Gray Television, Inc.† | | | 16,800 | | | | 293,160 | |
Sinclair Broadcast Group, Inc., Class A | | | 4,300 | | | | 124,485 | |
| | | | | | |
|
|
|
| | | | | | | | 417,645 | |
| | | | | | |
|
|
|
Textile - Apparel — 0.1% | | | | | | | | |
Perry Ellis International, Inc.† | | | 18,800 | | | | 517,564 | |
| | | | | | |
|
|
|
Theaters — 0.0% | | | | | | | | |
National CineMedia, Inc. | | | 15,100 | | | | 137,410 | |
| | | | | | |
|
|
|
Tobacco — 0.1% | | | | | | | | |
Vector Group, Ltd.# | | | 28,300 | | | | 439,499 | |
| | | | | | |
|
|
|
Toys — 0.2% | | | | | | | | |
Funko, Inc., Class A† | | | 40,100 | | | | 1,019,342 | |
| | | | | | |
|
|
|
Transactional Software — 0.0% | | | | | | | | |
Synchronoss Technologies, Inc.† | | | 33,116 | | | | 206,644 | |
| | | | | | |
|
|
|
Transport - Marine — 0.3% | | | | | | | | |
Costamare, Inc. | | | 221,098 | | | | 1,554,319 | |
Ship Finance International, Ltd. | | | 16,500 | | | | 234,300 | |
| | | | | | |
|
|
|
| | | | | | | | 1,788,619 | |
| | | | | | |
|
|
|
| | | | | | | | |
| | |
| Security Description | | Shares/
Principal
Amount | | | Value
(Note 2) | |
| |
| | | | | | | | | |
Transport - Truck — 1.1% | | | | | | | | |
ArcBest Corp. | | | 82,320 | | | $ | 3,959,592 | |
Covenant Transportation Group, Inc., Class A† | | | 10,700 | | | | 319,609 | |
YRC Worldwide, Inc.† | | | 148,300 | | | | 1,419,231 | |
| | | | | | |
|
|
|
| | | | | | | | 5,698,432 | |
| | | | | | |
|
|
|
Travel Services — 0.2% | | | | | | | | |
Liberty TripAdvisor Holdings, Inc., Class A† | | | 69,100 | | | | 1,095,235 | |
| | | | | | |
|
|
|
Water — 0.3% | | | | | | | | |
American States Water Co. | | | 20,300 | | | | 1,226,729 | |
Artesian Resources Corp., Class A | | | 1,700 | | | | 61,081 | |
California Water Service Group | | | 2,860 | | | | 117,689 | |
Consolidated Water Co., Ltd. | | | 15,400 | | | | 207,900 | |
| | | | | | |
|
|
|
| | | | | | | | 1,613,399 | |
| | | | | | |
|
|
|
Wireless Equipment — 0.2% | | | | | | | | |
InterDigital, Inc. | | | 16,100 | | | | 1,329,860 | |
| | | | | | |
|
|
|
Total Common Stocks | | | | | | | | |
(cost $422,072,901) | | | | | | | 518,398,718 | |
| | | | | | |
|
|
|
WARRANTS — 0.0% | | | | | | | | |
Finance other services — 0.0% | | | | | | | | |
Emergent Capital, Inc.
Expires 10/01/2019
(strike price $10.75)
(cost $0)†(4) | | | 994 | | | | 0 | |
| | | | | | |
|
|
|
Total Long-Term Investment Securities
| | | | | | | | |
(cost $422,072,901) | | | | | | | 518,398,718 | |
| | | | | | |
|
|
|
SHORT-TERM INVESTMENT SECURITIES — 0.7% | | | | | | | | |
Registered Investment Companies — 0.7% | | | | | | | | |
State Street Navigator Securities Lending Government Money Market Portfolio
1.93%(1)(3)
(cost $4,127,318) | | | 4,127,318 | | | | 4,127,318 | |
| | | | | | |
|
|
|
REPURCHASE AGREEMENTS — 2.9% | | | | | | | | |
Agreement with Fixed Income Clearing Corp., bearing interest at 0.35%, dated 08/31/2018, to be repurchased 09/04/2018 in the amount of $15,473,602 collateralized by $13,820,000 of United States Treasury Notes, bearing interest at 3.75% due 11/15/2043 and having an approximate value of $15,788,590
(cost $15,473,000) | | $ | 15,473,000 | | | | 15,473,000 | |
| | | | | | |
|
|
|
TOTAL INVESTMENTS | | | | | | | | |
(cost $441,673,219)(2) | | | 100.6 | % | | | 537,999,036 | |
Liabilities in excess of other assets | | | (0.6 | ) | | | (3,451,091 | ) |
| | |
|
|
| |
|
|
|
NET ASSETS | | | 100.0 | % | | $ | 534,547,945 | |
| | |
|
|
| |
|
|
|
| † | Non-income producing security |
| # | The security or a portion thereof is out on loan (see Note 2). |
| (1) | At August 31, 2018, the Fund had loaned securities with a total value of $46,543,316. This was secured by collateral of $4,127,318, which was received in cash and subsequently invested in short-term investments currently valued at $4,127,318 as reported in the Portfolio of Investments. Additional collateral of $43,245,627 was received in the form of fixed income pooled securities, which the Fund cannot sell or repledge and accordingly are not reflected in the Fund’s assets and liabilities. |
VALIC Company II Small Cap Value Fund
PORTFOLIO OF INVESTMENTS — August 31, 2018 — (continued)
The components of the fixed income pooled secutities referenced above are as follows:
| | | | | | | | |
Securities
| | Coupon Range
| | Maturity Date Range
| | Value as of
August 31, 2018
| |
Federal Home Loan Mtg. Corp. | | 3.00% to 4.50% | | 07/15/2042 to 05/01/2048 | | $ | 1,193,240 | |
Federal National Mtg. Assoc. | | 3.00% to 4.50% | | 10/25/2039 to 06/01/2048 | | | 1,119,702 | |
Government National Mtg. Assoc. | | 2.50% | | 09/20/2046 | | | 178,398 | |
United States Treasury Bills | | 0.00% | | 09/13/2018 to 03/28/2019 | | | 3,718,282 | |
United States Treasury Notes/Bonds | | zero coupon to 8.75% | | 09/15/2018 to 02/15/2048 | | | 37,036,005 | |
| (2) | See Note 5 for cost of investments on a tax basis. |
| (3) | The rate shown is the 7-day yield as of August 31, 2018 |
| (4) | Illiquid security. At August 31, 2018, the aggregate value of these secutities was $0 representing 0.0% of net assets. |
| | | | | | | | | | | | | | | | | | | | | | |
| Futures Contracts | | | | | | | | | | |
Number of
Contracts | | | Type | | Description | | Expiration
Month | | | Notional
Basis# | | | Notional
Value# | | | Unrealized
Appreciation
(Depreciation) | |
| | 176 | | | Long | | Russell 2000 E-Mini Index | | | September 2018 | | | $ | 15,023,662 | | | $ | 15,317,280 | | | $ | 293,618 | |
| | | | | | | | | | | | | | | | | | | | |
|
|
|
| # | Notional basis refers to the contractual amount agreed upon at inception of the open contract; notional value represents the current value of the open contract. |
The following is a summary of the inputs used to value the Fund’s net assets as of August 31, 2018 (see Note 2):
| | | | | | | | | | | | | | | | |
| | | Level 1 - Unadjusted
Quoted Prices
| | | Level 2 - Other
Observable Inputs
| | | Level 3 - Significant
Unobservable Inputs
| | | Total
| |
ASSETS: | | | | | | | | | | | | | | | | |
Investments at Value:* | | | | | | | | | | | | | | | | |
Common Stocks | | $ | 518,398,718 | | | $ | — | | | $ | — | | | $ | 518,398,718 | |
Warrants | | | — | | | | 0 | | | | — | | | | 0 | |
Short-Term Investment Securities | | | 4,127,318 | | | | — | | | | — | | | | 4,127,318 | |
Repurchase Agreements | | | — | | | | 15,473,000 | | | | — | | | | 15,473,000 | |
| | |
|
|
| |
|
|
| |
|
|
| |
|
|
|
Total Investments at Value | | $ | 522,526,036 | | | $ | 15,473,000 | | | $ | — | | | $ | 537,999,036 | |
| | |
|
|
| |
|
|
| |
|
|
| |
|
|
|
Other Financial Instruments:+ | | | | | | | | | | | | | | | | |
Futures Contracts | | $ | 293,618 | | | $ | — | | | $ | — | | | $ | 293,618 | |
| | |
|
|
| |
|
|
| |
|
|
| |
|
|
|
| * | For a detailed presentation of investments, please refer to the Portfolio of Investments. |
| + | Other financial instruments are derivative instruments, not reflected in the Portfolio of Investments, such as futures, forward, swap and written option contracts, which are valued at the unrealized appreciation (depreciation) on the instrument. |
The Fund’s policy is to recognize transfers between Levels as of the end of the reporting period. There were no transfers between Levels during the reporting period.
See Notes to Financial Statements
VALIC Company II Socially Responsible Fund
PORTFOLIO PROFILE — August 31, 2018 (unaudited)
Industry Allocation*
| | | | |
Applications Software | | | 5.6 | % |
Real Estate Investment Trusts | | | 5.3 | |
Finance — Credit Card | | | 4.9 | |
Banks — Super Regional | | | 4.7 | |
Electronic Components — Semiconductors | | | 4.3 | |
Web Portals/ISP | | | 4.3 | |
Medical — Biomedical/Gene | | | 3.9 | |
Oil Companies — Exploration & Production | | | 3.4 | |
Insurance — Property/Casualty | | | 2.9 | |
Medical Products | | | 2.7 | |
Beverages — Non-alcoholic | | | 2.4 | |
Cosmetics & Toiletries | | | 2.3 | |
Commercial Services — Finance | | | 1.9 | |
Medical — Drugs | | | 1.8 | |
Banks — Commercial | | | 1.8 | |
Transport — Rail | | | 1.8 | |
Diagnostic Equipment | | | 1.8 | |
Insurance — Multi-line | | | 1.7 | |
Networking Products | | | 1.7 | |
Enterprise Software/Service | | | 1.4 | |
Multimedia | | | 1.3 | |
Retail — Restaurants | | | 1.2 | |
Electric — Integrated | | | 1.2 | |
Retail — Major Department Stores | | | 1.1 | |
Diversified Manufacturing Operations | | | 1.1 | |
Computer Services | | | 1.1 | |
Cable/Satellite TV | | | 1.1 | |
Investment Management/Advisor Services | | | 1.1 | |
Semiconductor Components — Integrated Circuits | | | 1.1 | |
Insurance — Life/Health | | | 1.0 | |
Transport — Services | | | 1.0 | |
Electronic Forms | | | 1.0 | |
Non-Hazardous Waste Disposal | | | 0.9 | |
Commercial Services | | | 0.9 | |
Food — Misc./Diversified | | | 0.8 | |
Machinery — Construction & Mining | | | 0.8 | |
Electric — Distribution | | | 0.8 | |
Oil — Field Services | | | 0.8 | |
Retail — Building Products | | | 0.8 | |
Finance — Other Services | | | 0.8 | |
Internet Content — Entertainment | | | 0.8 | |
Data Processing/Management | | | 0.6 | |
Retail — Apparel/Shoe | | | 0.6 | |
Airlines | | | 0.6 | |
Finance — Investment Banker/Broker | | | 0.6 | |
Banks — Fiduciary | | | 0.6 | |
Electric Products — Misc. | | | 0.6 | |
E-Commerce/Services | | | 0.6 | |
U.S. Government Treasuries | | | 0.6 | |
Machinery — Farming | | | 0.5 | |
Semiconductor Equipment | | | 0.5 | |
Retail — Drug Store | | | 0.5 | |
Medical — HMO | | | 0.5 | |
Computers | | | 0.5 | |
Repurchase Agreements | | | 0.4 | |
Pipelines | | | 0.4 | |
Electronic Components — Misc. | | | 0.4 | |
Auto — Cars/Light Trucks | | | 0.4 | |
Food — Retail | | | 0.4 | |
Apparel Manufacturers | | | 0.4 | |
Electronic Measurement Instruments | | | 0.4 | |
Building Products — Air & Heating | | | 0.3 | |
Dental Supplies & Equipment | | | 0.3 | |
Chemicals — Diversified | | | 0.3 | |
Medical — Hospitals | | | 0.3 | |
Entertainment Software | | | 0.3 | |
Insurance Brokers | | | 0.3 | |
Retail — Regional Department Stores | | | 0.3 | |
Oil Field Machinery & Equipment | | | 0.3 | |
| | | | |
Medical Instruments | | | 0.3 | |
Computers — Memory Devices | | �� | 0.3 | |
Telephone — Integrated | | | 0.3 | |
Paper & Related Products | | | 0.2 | |
Industrial Automated/Robotic | | | 0.2 | |
Auto — Heavy Duty Trucks | | | 0.2 | |
Medical Labs & Testing Services | | | 0.2 | |
Retail — Auto Parts | | | 0.2 | |
Agricultural Chemicals | | | 0.2 | |
Industrial Gases | | | 0.2 | |
Engines — Internal Combustion | | | 0.2 | |
Tools — Hand Held | | | 0.2 | |
Auto/Truck Parts & Equipment-Original | | | 0.2 | |
Advertising Agencies | | | 0.2 | |
Consumer Products — Misc. | | | 0.2 | |
Retail — Discount | | | 0.2 | |
Finance — Consumer Loans | | | 0.1 | |
Aerospace/Defense | | | 0.1 | |
Building Products — Cement | | | 0.1 | |
Oil Refining & Marketing | | | 0.1 | |
Independent Power Producers | | | 0.1 | |
Medical Information Systems | | | 0.1 | |
Television | | | 0.1 | |
Steel — Producers | | | 0.1 | |
Textile — Home Furnishings | | | 0.1 | |
Home Decoration Products | | | 0.1 | |
Gas — Distribution | | | 0.1 | |
Distribution/Wholesale | | | 0.1 | |
Electronic Connectors | | | 0.1 | |
Wireless Equipment | | | 0.1 | |
Water | | | 0.1 | |
Computer Aided Design | | | 0.1 | |
Retail — Perfume & Cosmetics | | | 0.1 | |
Medical — Generic Drugs | | | 0.1 | |
Water Treatment Systems | | | 0.1 | |
E-Commerce/Products | | | 0.1 | |
Retail — Consumer Electronics | | | 0.1 | |
Containers — Paper/Plastic | | | 0.1 | |
Appliances | | | 0.1 | |
Hotels/Motels | | | 0.1 | |
Office Automation & Equipment | | | 0.1 | |
Building Products — Wood | | | 0.1 | |
Food — Confectionery | | | 0.1 | |
| | |
|
|
|
| | | | 100.0 | % |
| | |
|
|
|
| * | Calculated as a percentage of net assets |
VALIC Company II Socially Responsible Fund
PORTFOLIO OF INVESTMENTS — August 31, 2018
| | | | | | | | |
| | |
| Security Description | | Shares | | | Value
(Note 2) | |
| |
COMMON STOCKS — 99.0% | |
Advertising Agencies — 0.2% | |
Omnicom Group, Inc. | | | 17,654 | | | $ | 1,223,775 | |
| | | | | | |
|
|
|
Aerospace/Defense — 0.1% | |
TransDigm Group, Inc.† | | | 3,219 | | | | 1,126,650 | |
| | | | | | |
|
|
|
Agricultural Chemicals — 0.2% | |
CF Industries Holdings, Inc. | | | 15,780 | | | | 819,771 | |
Mosaic Co. | | | 22,701 | | | | 709,860 | |
| | | | | | |
|
|
|
| | | | | | | | 1,529,631 | |
| | | | | | |
|
|
|
Airlines — 0.6% | |
American Airlines Group, Inc.# | | | 22,156 | | | | 896,875 | |
Delta Air Lines, Inc. | | | 25,882 | | | | 1,513,579 | |
Southwest Airlines Co. | | | 28,427 | | | | 1,742,575 | |
United Continental Holdings, Inc.† | | | 7,225 | | | | 631,610 | |
| | | | | | |
|
|
|
| | | | | | | | 4,784,639 | |
| | | | | | |
|
|
|
Apparel Manufacturers — 0.4% | |
Hanesbrands, Inc.# | | | 38,249 | | | | 670,888 | |
Michael Kors Holdings, Ltd.† | | | 3,967 | | | | 288,084 | |
PVH Corp. | | | 6,033 | | | | 863,684 | |
Ralph Lauren Corp. | | | 4,915 | | | | 652,761 | |
Under Armour, Inc., Class C†# | | | 18,930 | | | | 359,102 | |
| | | | | | |
|
|
|
| | | | | | | | 2,834,519 | |
| | | | | | |
|
|
|
Appliances — 0.1% | |
Whirlpool Corp. | | | 4,020 | | | | 502,420 | |
| | | | | | |
|
|
|
Applications Software — 5.6% | |
Intuit, Inc. | | | 11,549 | | | | 2,534,659 | |
Microsoft Corp. | | | 332,127 | | | | 37,307,826 | |
Red Hat, Inc.† | | | 1,210 | | | | 178,753 | |
salesforce.com, Inc.† | | | 28,397 | | | | 4,335,654 | |
| | | | | | |
|
|
|
| | | | | | | | 44,356,892 | |
| | | | | | |
|
|
|
Auto - Cars/Light Trucks — 0.4% | |
Ford Motor Co. | | | 315,203 | | | | 2,988,124 | |
| | | | | | |
|
|
|
Auto - Heavy Duty Trucks — 0.2% | |
PACCAR, Inc. | | | 27,275 | | | | 1,866,156 | |
| | | | | | |
|
|
|
Auto/Truck Parts & Equipment - Original — 0.2% | |
Aptiv PLC | | | 14,263 | | | | 1,255,287 | |
| | | | | | |
|
|
|
Banks - Commercial — 1.8% | |
BB&T Corp. | | | 126,664 | | | | 6,543,462 | |
Citizens Financial Group, Inc. | | | 26,503 | | | | 1,090,864 | |
M&T Bank Corp. | | | 27,750 | | | | 4,915,913 | |
Regions Financial Corp. | | | 68,927 | | | | 1,341,319 | |
| | | | | | |
|
|
|
| | | | | | | | 13,891,558 | |
| | | | | | |
|
|
|
Banks - Fiduciary — 0.6% | |
Bank of New York Mellon Corp. | | | 52,495 | | | | 2,737,614 | |
Northern Trust Corp. | | | 17,400 | | | | 1,869,804 | |
| | | | | | |
|
|
|
| | | | | | | | 4,607,418 | |
| | | | | | |
|
|
|
Banks - Super Regional — 4.7% | |
Capital One Financial Corp. | | | 56,655 | | | | 5,613,944 | |
Comerica, Inc. | | | 13,291 | | | | 1,295,607 | |
Fifth Third Bancorp | | | 111,890 | | | | 3,292,923 | |
Huntington Bancshares, Inc. | | | 39,535 | | | | 640,862 | |
KeyCorp | | | 47,778 | | | | 1,006,682 | |
PNC Financial Services Group, Inc. | | | 72,817 | | | | 10,452,152 | |
SunTrust Banks, Inc. | | | 42,601 | | | | 3,133,730 | |
US Bancorp | | | 222,792 | | | | 12,055,275 | |
| | | | | | |
|
|
|
| | | | | | | | 37,491,175 | |
| | | | | | |
|
|
|
Beverages - Non-alcoholic — 2.4% | |
Keurig Dr Pepper, Inc. | | | 9,753 | | | | 222,369 | |
| | | | | | | | |
| | |
| Security Description | | Shares | | | Value
(Note 2) | |
| |
| | | | | | | | | |
Beverages - Non-alcoholic (continued) | |
Monster Beverage Corp.† | | | 14,955 | | | $ | 910,610 | |
PepsiCo, Inc. | | | 161,536 | | | | 18,093,647 | |
| | | | | | |
|
|
|
| | | | | | | | 19,226,626 | |
| | | | | | |
|
|
|
Building Products - Air & Heating — 0.3% | |
Johnson Controls International PLC | | | 70,812 | | | | 2,674,569 | |
| | | | | | |
|
|
|
Building Products - Cement — 0.1% | |
Martin Marietta Materials, Inc. | | | 1,197 | | | | 237,868 | |
Vulcan Materials Co.# | | | 7,853 | | | | 870,112 | |
| | | | | | |
|
|
|
| | | | | | | | 1,107,980 | |
| | | | | | |
|
|
|
Building Products - Wood — 0.1% | |
Masco Corp. | | | 11,158 | | | | 423,669 | |
| | | | | | |
|
|
|
Cable/Satellite TV — 1.1% | |
Comcast Corp., Class A | | | 234,352 | | | | 8,668,680 | |
| | | | | | |
|
|
|
Chemicals - Diversified — 0.3% | |
Eastman Chemical Co. | | | 18,069 | | | | 1,753,235 | |
LyondellBasell Industries NV, Class A | | | 6,980 | | | | 787,204 | |
| | | | | | |
|
|
|
| | | | | | | | 2,540,439 | |
| | | | | | |
|
|
|
Chemicals - Specialty — 0.0% | |
International Flavors & Fragrances, Inc. | | | 417 | | | | 54,331 | |
| | | | | | |
|
|
|
Commercial Services — 0.9% | |
Cintas Corp. | | | 11,063 | | | | 2,360,512 | |
Ecolab, Inc. | | | 26,830 | | | | 4,037,379 | |
Nielsen Holdings PLC | | | 21,104 | | | | 548,704 | |
| | | | | | |
|
|
|
| | | | | | | | 6,946,595 | |
| | | | | | |
|
|
|
Commercial Services - Finance — 1.9% | |
Automatic Data Processing, Inc. | | | 29,610 | | | | 4,345,267 | |
H&R Block, Inc.# | | | 2,176 | | | | 58,883 | |
IHS Markit, Ltd.† | | | 16,877 | | | | 928,235 | |
Moody’s Corp. | | | 5,537 | | | | 985,697 | |
PayPal Holdings, Inc.† | | | 56,424 | | | | 5,209,628 | |
S&P Global, Inc. | | | 16,068 | | | | 3,326,879 | |
| | | | | | |
|
|
|
| | | | | | | | 14,854,589 | |
| | | | | | |
|
|
|
Computer Aided Design — 0.1% | |
Autodesk, Inc.† | | | 4,569 | | | | 705,225 | |
| | | | | | |
|
|
|
Computer Services — 1.1% | |
Accenture PLC, Class A | | | 36,868 | | | | 6,233,273 | |
Cognizant Technology Solutions Corp., Class A | | | 22,285 | | | | 1,747,812 | |
DXC Technology Co. | | | 8,856 | | | | 806,693 | |
| | | | | | |
|
|
|
| | | | | | | | 8,787,778 | |
| | | | | | |
|
|
|
Computer Software — 0.0% | |
Citrix Systems, Inc.† | | | 3,287 | | | | 374,784 | |
| | | | | | |
|
|
|
Computers — 0.5% | |
Hewlett Packard Enterprise Co. | | | 74,536 | | | | 1,232,080 | |
HP, Inc. | | | 98,583 | | | | 2,430,071 | |
| | | | | | |
|
|
|
| | | | | | | | 3,662,151 | |
| | | | | | |
|
|
|
Computers - Memory Devices — 0.3% | |
NetApp, Inc. | | | 6,491 | | | | 563,483 | |
Seagate Technology PLC | | | 14,483 | | | | 775,420 | |
Western Digital Corp. | | | 10,824 | | | | 684,510 | |
| | | | | | |
|
|
|
| | | | | | | | 2,023,413 | |
| | | | | | |
|
|
|
Consumer Products - Misc. — 0.2% | |
Kimberly-Clark Corp. | | | 10,557 | | | | 1,219,756 | |
| | | | | | |
|
|
|
Containers - Paper/Plastic — 0.1% | |
WestRock Co. | | | 9,182 | | | | 505,745 | |
| | | | | | |
|
|
|
VALIC Company II Socially Responsible Fund
PORTFOLIO OF INVESTMENTS — August 31, 2018 — (continued)
| | | | | | | | |
| | |
| Security Description | | Shares | | | Value
(Note 2) | |
| |
COMMON STOCKS (continued) | |
Cosmetics & Toiletries — 2.3% | |
Colgate-Palmolive Co. | | | 67,155 | | | $ | 4,459,764 | |
Procter & Gamble Co. | | | 168,361 | | | | 13,965,545 | |
| | | | | | |
|
|
|
| | | | | | | | 18,425,309 | |
| | | | | | |
|
|
|
Data Processing/Management — 0.6% | |
Fidelity National Information Services, Inc. | | | 20,892 | | | | 2,259,888 | |
Fiserv, Inc.† | | | 30,746 | | | | 2,461,832 | |
Paychex, Inc. | | | 3,899 | | | | 285,602 | |
| | | | | | |
|
|
|
| | | | | | | | 5,007,322 | |
| | | | | | |
|
|
|
Dental Supplies & Equipment — 0.3% | |
Align Technology, Inc.† | | | 4,440 | | | | 1,716,016 | |
DENTSPLY SIRONA, Inc. | | | 23,282 | | | | 929,417 | |
| | | | | | |
|
|
|
| | | | | | | | 2,645,433 | |
| | | | | | |
|
|
|
Diagnostic Equipment — 1.8% | |
Danaher Corp. | | | 70,115 | | | | 7,259,707 | |
Thermo Fisher Scientific, Inc. | | | 27,451 | | | | 6,563,534 | |
| | | | | | |
|
|
|
| | | | | | | | 13,823,241 | |
| | | | | | |
|
|
|
Distribution/Wholesale — 0.1% | |
Fastenal Co. | | | 13,935 | | | | 813,247 | |
| | | | | | |
|
|
|
Diversified Manufacturing Operations — 1.1% | |
Eaton Corp. PLC | | | 38,539 | | | | 3,204,133 | |
Illinois Tool Works, Inc. | | | 32,047 | | | | 4,450,687 | |
Parker-Hannifin Corp. | | | 6,755 | | | | 1,186,178 | |
| | | | | | |
|
|
|
| | | | | | | | 8,840,998 | |
| | | | | | |
|
|
|
E-Commerce/Products — 0.1% | |
eBay, Inc.† | | | 16,246 | | | | 562,274 | |
| | | | | | |
|
|
|
E-Commerce/Services — 0.6% | |
Booking Holdings, Inc.† | | | 2,128 | | | | 4,152,898 | |
Expedia Group, Inc. | | | 2,568 | | | | 335,124 | |
| | | | | | |
|
|
|
| | | | | | | | 4,488,022 | |
| | | | | | |
|
|
|
Electric Products - Misc. — 0.6% | |
Emerson Electric Co. | | | 59,578 | | | | 4,571,420 | |
| | | | | | |
|
|
|
Electric - Distribution — 0.8% | |
CenterPoint Energy, Inc. | | | 99,472 | | | | 2,764,327 | |
PPL Corp.# | | | 127,576 | | | | 3,794,110 | |
| | | | | | |
|
|
|
| | | | | | | | 6,558,437 | |
| | | | | | |
|
|
|
Electric - Integrated — 1.2% | |
AES Corp. | | | 36,772 | | | | 494,951 | |
CMS Energy Corp. | | | 54,193 | | | | 2,668,463 | |
Eversource Energy | | | 57,471 | | | | 3,587,915 | |
WEC Energy Group, Inc. | | | 42,449 | | | | 2,868,703 | |
| | | | | | |
|
|
|
| | | | | | | | 9,620,032 | |
| | | | | | |
|
|
|
Electronic Components - Misc. — 0.4% | |
Corning, Inc. | | | 69,801 | | | | 2,339,031 | |
Garmin, Ltd. | | | 14,235 | | | | 969,973 | |
| | | | | | |
|
|
|
| | | | | | | | 3,309,004 | |
| | | | | | |
|
|
|
Electronic Components - Semiconductors — 4.3% | |
Advanced Micro Devices, Inc.†# | | | 11,302 | | | | 284,471 | |
Broadcom, Inc. | | | 18,072 | | | | 3,958,310 | |
Intel Corp. | | | 243,234 | | | | 11,779,823 | |
Microchip Technology, Inc.# | | | 6,913 | | | | 594,725 | |
Micron Technology, Inc.† | | | 36,234 | | | | 1,903,010 | |
NVIDIA Corp. | | | 21,960 | | | | 6,163,733 | |
Qorvo, Inc.† | | | 3,356 | | | | 268,782 | |
Skyworks Solutions, Inc. | | | 3,892 | | | | 355,340 | |
Texas Instruments, Inc. | | | 79,878 | | | | 8,978,287 | |
| | | | | | |
|
|
|
| | | | | | | | 34,286,481 | |
| | | | | | |
|
|
|
| | | | | | | | |
| | |
| Security Description | | Shares | | | Value
(Note 2) | |
| |
| | | | | | | | | |
Electronic Connectors — 0.1% | |
TE Connectivity, Ltd. | | | 8,332 | | | $ | 763,878 | |
| | | | | | |
|
|
|
Electronic Forms — 1.0% | |
Adobe Systems, Inc.† | | | 29,047 | | | | 7,654,175 | |
| | | | | | |
|
|
|
Electronic Measurement Instruments — 0.4% | |
Agilent Technologies, Inc. | | | 10,123 | | | | 683,708 | |
Fortive Corp. | | | 24,941 | | | | 2,094,545 | |
| | | | | | |
|
|
|
| | | | | | | | 2,778,253 | |
| | | | | | |
|
|
|
Engines - Internal Combustion — 0.2% | |
Cummins, Inc. | | | 9,405 | | | | 1,333,629 | |
| | | | | | |
|
|
|
Enterprise Software/Service — 1.4% | |
CA, Inc. | | | 11,342 | | | | 496,780 | |
Oracle Corp. | | | 221,581 | | | | 10,764,405 | |
| | | | | | |
|
|
|
| | | | | | | | 11,261,185 | |
| | | | | | |
|
|
|
Entertainment Software — 0.3% | |
Activision Blizzard, Inc. | | | 17,380 | | | | 1,253,098 | |
Electronic Arts, Inc.† | | | 9,818 | | | | 1,113,459 | |
| | | | | | |
|
|
|
| | | | | | | | 2,366,557 | |
| | | | | | |
|
|
|
Finance - Consumer Loans — 0.1% | |
Synchrony Financial | | | 37,102 | | | | 1,175,020 | |
| | | | | | |
|
|
|
Finance - Credit Card — 4.9% | |
American Express Co. | | | 53,344 | | | | 5,653,397 | |
Discover Financial Services | | | 21,767 | | | | 1,700,438 | |
Mastercard, Inc., Class A | | | 64,303 | | | | 13,861,155 | |
Visa, Inc., Class A# | | | 120,489 | | | | 17,698,629 | |
| | | | | | |
|
|
|
| | | | | | | | 38,913,619 | |
| | | | | | |
|
|
|
Finance - Investment Banker/Broker — 0.6% | |
Charles Schwab Corp. | | | 58,050 | | | | 2,948,360 | |
Jefferies Financial Group, Inc. | | | 77,029 | | | | 1,788,613 | |
| | | | | | |
|
|
|
| | | | | | | | 4,736,973 | |
| | | | | | |
|
|
|
Finance - Other Services — 0.8% | |
CME Group, Inc. | | | 22,519 | | | | 3,934,745 | |
Intercontinental Exchange, Inc. | | | 30,551 | | | | 2,328,903 | |
| | | | | | |
|
|
|
| | | | | | | | 6,263,648 | |
| | | | | | |
|
|
|
Food - Confectionery — 0.1% | |
J.M. Smucker Co. | | | 4,077 | | | | 421,480 | |
| | | | | | |
|
|
|
Food - Misc./Diversified — 0.8% | |
Campbell Soup Co.# | | | 18,234 | | | | 719,331 | |
General Mills, Inc. | | | 74,910 | | | | 3,446,609 | |
Kraft Heinz Co. | | | 43,620 | | | | 2,541,738 | |
| | | | | | |
|
|
|
| | | | | | | | 6,707,678 | |
| | | | | | |
|
|
|
Food - Retail — 0.4% | |
Kroger Co. | | | 94,675 | | | | 2,982,263 | |
| | | | | | |
|
|
|
Gas - Distribution — 0.1% | |
NiSource, Inc. | | | 34,038 | | | | 921,409 | |
| | | | | | |
|
|
|
Home Decoration Products — 0.1% | |
Newell Brands, Inc.# | | | 43,043 | | | | 934,894 | |
| | | | | | |
|
|
|
Hotels/Motels — 0.1% | |
Wyndham Worldwide Corp.† | | | 11,315 | | | | 500,123 | |
| | | | | | |
|
|
|
Independent Power Producers — 0.1% | |
NRG Energy, Inc. | | | 28,636 | | | | 1,013,428 | |
| | | | | | |
|
|
|
Industrial Automated/Robotic — 0.2% | |
Rockwell Automation, Inc. | | | 10,486 | | | | 1,897,547 | |
| | | | | | |
|
|
|
Industrial Gases — 0.2% | |
Air Products & Chemicals, Inc. | | | 8,077 | | | | 1,343,124 | |
| | | | | | |
|
|
|
VALIC Company II Socially Responsible Fund
PORTFOLIO OF INVESTMENTS — August 31, 2018 — (continued)
| | | | | | | | |
| | |
| Security Description | | Shares | | | Value
(Note 2) | |
| |
COMMON STOCKS (continued) | |
Insurance Brokers — 0.3% | |
Aon PLC | | | 4,058 | | | $ | 590,682 | |
Marsh & McLennan Cos., Inc. | | | 15,619 | | | | 1,321,836 | |
Willis Towers Watson PLC | | | 2,359 | | | | 347,410 | |
| | | | | | |
|
|
|
| | | | | | | | 2,259,928 | |
| | | | | | |
|
|
|
Insurance - Life/Health — 1.0% | |
Aflac, Inc. | | | 65,430 | | | | 3,025,483 | |
Lincoln National Corp. | | | 8,101 | | | | 531,264 | |
Principal Financial Group, Inc. | | | 10,663 | | | | 588,491 | |
Prudential Financial, Inc. | | | 40,314 | | | | 3,960,850 | |
| | | | | | |
|
|
|
| | | | | | | | 8,106,088 | |
| | | | | | |
|
|
|
Insurance - Multi-line — 1.7% | |
Allstate Corp. | | | 34,665 | | | | 3,486,259 | |
Chubb, Ltd. | | | 53,489 | | | | 7,233,852 | |
Cincinnati Financial Corp. | | | 5,565 | | | | 426,669 | |
Loews Corp. | | | 51,055 | | | | 2,568,577 | |
| | | | | | |
|
|
|
| | | | | | | | 13,715,357 | |
| | | | | | |
|
|
|
Insurance - Property/Casualty — 2.9% | |
Berkshire Hathaway, Inc., Class B† | | | 99,189 | | | | 20,702,728 | |
Travelers Cos., Inc. | | | 18,754 | | | | 2,468,026 | |
| | | | | | |
|
|
|
| | | | | | | | 23,170,754 | |
| | | | | | |
|
|
|
Internet Content - Entertainment — 0.8% | |
Netflix, Inc.† | | | 16,196 | | | | 5,954,945 | |
| | | | | | |
|
|
|
Investment Management/Advisor Services — 1.1% | |
Ameriprise Financial, Inc. | | | 11,281 | | | | 1,601,451 | |
BlackRock, Inc. | | | 10,957 | | | | 5,249,061 | |
Franklin Resources, Inc. | | | 18,949 | | | | 601,441 | |
Invesco, Ltd. | | | 12,634 | | | | 304,479 | |
T. Rowe Price Group, Inc. | | | 6,933 | | | | 803,465 | |
| | | | | | |
|
|
|
| | | | | | | | 8,559,897 | |
| | | | | | |
|
|
|
Machinery - Construction & Mining — 0.8% | |
Caterpillar, Inc. | | | 48,092 | | | | 6,677,574 | |
| | | | | | |
|
|
|
Machinery - Farming — 0.5% | |
Deere & Co. | | | 27,794 | | | | 3,996,777 | |
| | | | | | |
|
|
|
Machinery - General Industrial — 0.0% | |
Roper Technologies, Inc. | | | 1,074 | | | | 320,449 | |
| | | | | | |
|
|
|
Medical Information Systems — 0.1% | |
Cerner Corp.† | | | 15,166 | | | | 987,458 | |
| | | | | | |
|
|
|
Medical Instruments — 0.3% | |
Edwards Lifesciences Corp.† | | | 14,194 | | | | 2,047,343 | |
| | | | | | |
|
|
|
Medical Labs & Testing Services — 0.2% | |
Laboratory Corp. of America Holdings† | | | 6,643 | | | | 1,148,375 | |
Quest Diagnostics, Inc. | | | 5,358 | | | | 589,273 | |
| | | | | | |
|
|
|
| | | | | | | | 1,737,648 | |
| | | | | | |
|
|
|
Medical Products — 2.7% | |
Abbott Laboratories | | | 170,338 | | | | 11,385,392 | |
Baxter International, Inc. | | | 47,320 | | | | 3,519,188 | |
Stryker Corp. | | | 36,919 | | | | 6,255,186 | |
| | | | | | |
|
|
|
| | | | | | | | 21,159,766 | |
| | | | | | |
|
|
|
Medical - Biomedical/Gene — 3.9% | |
Alexion Pharmaceuticals, Inc.† | | | 13,779 | | | | 1,684,345 | |
Amgen, Inc. | | | 48,120 | | | | 9,614,857 | |
Biogen, Inc.† | | | 10,561 | | | | 3,733,208 | |
Celgene Corp.† | | | 44,955 | | | | 4,246,000 | |
Gilead Sciences, Inc. | | | 62,850 | | | | 4,759,630 | |
Illumina, Inc.† | | | 5,865 | | | | 2,081,078 | |
Incyte Corp.† | | | 5,150 | | | | 380,637 | |
| | | | | | | | |
| | |
| Security Description | | Shares | | | Value
(Note 2) | |
| |
| | | | | | | | | |
Medical - Biomedical/Gene (continued) | |
Regeneron Pharmaceuticals, Inc.† | | | 3,848 | | | $ | 1,565,174 | |
Vertex Pharmaceuticals, Inc.† | | | 13,073 | | | | 2,410,661 | |
| | | | | | |
|
|
|
| | | | | | | | 30,475,590 | |
| | | | | | |
|
|
|
Medical - Drugs — 1.8% | |
AbbVie, Inc. | | | 95,672 | | | | 9,182,599 | |
Zoetis, Inc. | | | 57,355 | | | | 5,196,363 | |
| | | | | | |
|
|
|
| | | | | | | | 14,378,962 | |
| | | | | | |
|
|
|
Medical - Generic Drugs — 0.1% | |
Perrigo Co. PLC# | | | 7,648 | | | | 585,148 | |
| | | | | | |
|
|
|
Medical - HMO — 0.5% | |
Centene Corp.† | | | 4,887 | | | | 715,848 | |
Humana, Inc. | | | 8,985 | | | | 2,994,341 | |
| | | | | | |
|
|
|
| | | | | | | | 3,710,189 | |
| | | | | | |
|
|
|
Medical - Hospitals — 0.3% | |
HCA Healthcare, Inc. | | | 18,462 | | | | 2,475,939 | |
| | | | | | |
|
|
|
Multimedia — 1.3% | |
Walt Disney Co. | | | 92,714 | | | | 10,385,822 | |
| | | | | | |
|
|
|
Networking Products — 1.7% | |
Cisco Systems, Inc. | | | 282,051 | | | | 13,473,576 | |
| | | | | | |
|
|
|
Non-Hazardous Waste Disposal — 0.9% | |
Republic Services, Inc. | | | 39,658 | | | | 2,909,311 | |
Waste Management, Inc. | | | 47,094 | | | | 4,280,844 | |
| | | | | | |
|
|
|
| | | | | | | | 7,190,155 | |
| | | | | | |
|
|
|
Office Automation & Equipment — 0.1% | |
Xerox Corp. | | | 15,961 | | | | 444,673 | |
| | | | | | |
|
|
|
Oil Companies - Exploration & Production — 3.4% | |
Anadarko Petroleum Corp. | | | 32,829 | | | | 2,114,188 | |
Apache Corp. | | | 22,668 | | | | 993,539 | |
Cabot Oil & Gas Corp. | | | 15,359 | | | | 366,005 | |
Concho Resources, Inc.† | | | 2,045 | | | | 280,472 | |
Devon Energy Corp. | | | 27,039 | | | | 1,160,784 | |
EOG Resources, Inc. | | | 28,543 | | | | 3,374,639 | |
EQT Corp. | | | 7,272 | | | | 371,017 | |
Hess Corp. | | | 43,533 | | | | 2,931,512 | |
Marathon Oil Corp. | | | 125,177 | | | | 2,692,557 | |
Noble Energy, Inc. | | | 18,857 | | | | 560,430 | |
Occidental Petroleum Corp. | | | 139,999 | | | | 11,181,720 | |
Pioneer Natural Resources Co. | | | 5,966 | | | | 1,042,260 | |
| | | | | | |
|
|
|
| | | | | | | | 27,069,123 | |
| | | | | | |
|
|
|
Oil Field Machinery & Equipment — 0.3% | |
National Oilwell Varco, Inc. | | | 47,119 | | | | 2,217,891 | |
| | | | | | |
|
|
|
Oil Refining & Marketing — 0.1% | |
Valero Energy Corp. | | | 9,011 | | | | 1,062,217 | |
| | | | | | |
|
|
|
Oil - Field Services — 0.8% | |
Baker Hughes a GE Co., LLC | | | 28,806 | | | | 949,734 | |
Schlumberger, Ltd. | | | 87,337 | | | | 5,516,205 | |
| | | | | | |
|
|
|
| | | | | | | | 6,465,939 | |
| | | | | | |
|
|
|
Paper & Related Products — 0.2% | |
International Paper Co. | | | 38,510 | | | | 1,969,401 | |
| | | | | | |
|
|
|
Pipelines — 0.4% | |
Kinder Morgan, Inc. | | | 101,219 | | | | 1,791,576 | |
ONEOK, Inc. | | | 23,891 | | | | 1,574,656 | |
| | | | | | |
|
|
|
| | | | | | | | 3,366,232 | |
| | | | | | |
|
|
|
Real Estate Investment Trusts — 5.3% | |
American Tower Corp. | | | 55,188 | | | | 8,229,634 | |
VALIC Company II Socially Responsible Fund
PORTFOLIO OF INVESTMENTS — August 31, 2018 — (continued)
| | | | | | | | |
| | |
| Security Description | | Shares | | |
Value
(Note 2) | |
| |
COMMON STOCKS (continued) | |
Real Estate Investment Trusts (continued) | |
AvalonBay Communities, Inc. | | | 8,118 | | | $ | 1,487,948 | |
Boston Properties, Inc. | | | 3,844 | | | | 501,450 | |
Crown Castle International Corp. | | | 42,552 | | | | 4,852,205 | |
Digital Realty Trust, Inc. | | | 4,980 | | | | 618,914 | |
Equinix, Inc. | | | 4,380 | | | | 1,910,249 | |
Equity Residential | | | 14,584 | | | | 988,066 | |
Essex Property Trust, Inc. | | | 738 | | | | 181,755 | |
HCP, Inc. | | | 58,725 | | | | 1,587,337 | |
Host Hotels & Resorts, Inc. | | | 76,822 | | | | 1,653,978 | |
Prologis, Inc. | | | 32,868 | | | | 2,208,072 | |
Public Storage | | | 10,585 | | | | 2,250,159 | |
Realty Income Corp. | | | 10,326 | | | | 604,794 | |
Simon Property Group, Inc. | | | 32,543 | | | | 5,956,345 | |
Ventas, Inc. | | | 36,569 | | | | 2,189,386 | |
Vornado Realty Trust | | | 11,795 | | | | 908,215 | |
Welltower, Inc. | | | 28,684 | | | | 1,913,510 | |
Weyerhaeuser Co. | | | 98,324 | | | | 3,412,826 | |
| | | | | | |
|
|
|
| | | | | | | | 41,454,843 | |
| | | | | | |
|
|
|
Real Estate Operations & Development — 0.0% | |
Brookfield Property Partners LP | | | 12,284 | | | | 245,433 | |
| | | | | | |
|
|
|
Retail - Apparel/Shoe — 0.6% | |
L Brands, Inc. | | | 24,823 | | | | 656,072 | |
Ross Stores, Inc. | | | 33,037 | | | | 3,164,284 | |
Tapestry, Inc. | | | 22,263 | | | | 1,128,511 | |
| | | | | | |
|
|
|
| | | | | | | | 4,948,867 | |
| | | | | | |
|
|
|
Retail - Auto Parts — 0.2% | |
O’Reilly Automotive, Inc.† | | | 4,645 | | | | 1,558,026 | |
| | | | | | |
|
|
|
Retail - Automobile — 0.0% | |
CarMax, Inc.†# | | | 3,401 | | | | 265,448 | |
| | | | | | |
|
|
|
Retail - Building Products — 0.8% | |
Lowe’s Cos., Inc. | | | 57,637 | | | | 6,268,024 | |
| | | | | | |
|
|
|
Retail - Consumer Electronics — 0.1% | |
Best Buy Co., Inc. | | | 6,713 | | | | 534,086 | |
| | | | | | |
|
|
|
Retail - Discount — 0.2% | |
Dollar Tree, Inc.† | | | 14,975 | | | | 1,205,637 | |
| | | | | | |
|
|
|
Retail - Drug Store — 0.5% | |
Walgreens Boots Alliance, Inc. | | | 54,203 | | | | 3,716,158 | |
| | | | | | |
|
|
|
Retail - Jewelry — 0.0% | |
Tiffany & Co. | | | 1,709 | | | | 209,609 | |
| | | | | | |
|
|
|
Retail - Major Department Stores — 1.1% | |
TJX Cos., Inc. | | | 80,947 | | | | 8,901,742 | |
| | | | | | |
|
|
|
Retail - Perfume & Cosmetics — 0.1% | |
Ulta Beauty, Inc.† | | | 2,353 | | | | 611,780 | |
| | | | | | |
|
|
|
Retail - Regional Department Stores — 0.3% | |
Kohl’s Corp.# | | | 18,312 | | | | 1,448,663 | |
Macy’s, Inc. | | | 21,755 | | | | 795,145 | |
| | | | | | |
|
|
|
| | | | | | | | 2,243,808 | |
| | | | | | |
|
|
|
Retail - Restaurants — 1.2% | |
Chipotle Mexican Grill, Inc.† | | | 670 | | | | 318,371 | |
Darden Restaurants, Inc. | | | 6,198 | | | | 719,216 | |
Starbucks Corp. | | | 104,397 | | | | 5,580,020 | |
Yum! Brands, Inc. | | | 34,715 | | | | 3,016,386 | |
| | | | | | |
|
|
|
| | | | | | | | 9,633,993 | |
| | | | | | |
|
|
|
Semiconductor Components - Integrated Circuits — 1.1% | |
Analog Devices, Inc. | | | 26,987 | | | | 2,667,665 | |
QUALCOMM, Inc. | | | 82,967 | | | | 5,700,663 | |
| | | | | | |
|
|
|
| | | | | | | | 8,368,328 | |
| | | | | | |
|
|
|
| | | | | | | | |
| | |
| Security Description | | Shares/
Principal
Amount | | | Value
(Note 2) | |
| |
| | | | | | | | | |
Semiconductor Equipment — 0.5% | |
Applied Materials, Inc. | | | 59,913 | | | $ | 2,577,457 | |
KLA-Tencor Corp. | | | 9,541 | | | | 1,108,760 | |
Lam Research Corp. | | | 1,330 | | | | 230,210 | |
| | | | | | |
|
|
|
| | | | | | | | 3,916,427 | |
| | | | | | |
|
|
|
Steel - Producers — 0.1% | |
Nucor Corp. | | | 15,225 | | | | 951,563 | |
| | | | | | |
|
|
|
Telephone - Integrated — 0.3% | |
CenturyLink, Inc.# | | | 93,307 | | | | 1,993,038 | |
| | | | | | |
|
|
|
Television — 0.1% | |
CBS Corp., Class B | | | 18,409 | | | | 976,045 | |
| | | | | | |
|
|
|
Textile - Home Furnishings — 0.1% | |
Mohawk Industries, Inc.† | | | 4,926 | | | | 943,772 | |
| | | | | | |
|
|
|
Tools - Hand Held — 0.2% | |
Stanley Black & Decker, Inc. | | | 9,281 | | | | 1,304,259 | |
| | | | | | |
|
|
|
Toys — 0.0% | |
Mattel, Inc.# | | | 12,200 | | | | 188,246 | |
| | | | | | |
|
|
|
Transport - Rail — 1.8% | |
CSX Corp. | | | 48,391 | | | | 3,588,677 | |
Norfolk Southern Corp. | | | 16,548 | | | | 2,876,704 | |
Union Pacific Corp. | | | 49,148 | | | | 7,402,672 | |
| | | | | | |
|
|
|
| | | | | | | | 13,868,053 | |
| | | | | | |
|
|
|
Transport - Services — 1.0% | |
United Parcel Service, Inc., Class B | | | 62,827 | | | | 7,720,182 | |
| | | | | | |
|
|
|
Water — 0.1% | |
American Water Works Co., Inc. | | | 8,483 | | | | 742,517 | |
| | | | | | |
|
|
|
Water Treatment Systems — 0.1% | | | | | | | | |
Pentair PLC | | | 13,035 | | | | 566,762 | |
| | | | | | |
|
|
|
Web Portals/ISP — 4.3% | | | | | | | | |
Alphabet, Inc., Class A† | | | 15,193 | | | | 18,714,737 | |
Alphabet, Inc., Class C† | | | 12,416 | | | | 15,125,047 | |
| | | | | | |
|
|
|
| | | | | | | | 33,839,784 | |
| | | | | | |
|
|
|
Wireless Equipment — 0.1% | | | | | | | | |
Motorola Solutions, Inc. | | | 5,823 | | | | 747,440 | |
| | | | | | |
|
|
|
Total Long-Term Investment Securities | | | | | | | | |
(cost $490,660,603) | | | | | | | 781,043,388 | |
| | | | | | |
|
|
|
SHORT-TERM INVESTMENT SECURITIES — 0.6% | | | | | | | | |
Registered Investment Companies — 0.0% | | | | | | | | |
State Street Navigator Securities Lending Government Money Market Portfolio
1.93%(1)(2) | | | 228,345 | | | | 228,345 | |
| | | | | | |
|
|
|
U.S. Government Treasuries — 0.6% | | | | | | | | |
United States Treasury Bills | | | | | | | | |
1.97% due 11/01/2018(3) | | $ | 1,000,000 | | | | 996,758 | |
2.02% due 11/29/2018(3) | | | 555,000 | | | | 552,259 | |
2.04% due 11/29/2018(3) | | | 400,000 | | | | 398,024 | |
2.11% due 01/03/2019(3) | | | 2,500,000 | | | | 2,482,144 | |
| | | | | | |
|
|
|
| | | | | | | | 4,429,185 | |
| | | | | | |
|
|
|
Total Short-Term Investment Securities | | | | | | | | |
(cost $4,657,209) | | | | | | | 4,657,530 | |
| | | | | | |
|
|
|
VALIC Company II Socially Responsible Fund
PORTFOLIO OF INVESTMENTS — August 31, 2018 — (continued)
| | | | | | | | |
| | |
| Security Description | | Principal
Amount | | | Value
(Note 2) | |
| |
REPURCHASE AGREEMENTS — 0.4% | |
Agreement with Fixed Income Clearing Corp., bearing interest at 0.35%, dated 08/31/2018, to be repurchased 09/04/2018 in the amount of $3,559,138 collateralized by $3,180,000 of United States Treasury Notes, bearing interest at 3.75% due 11/15/2043 and having an approximate value of $3,632,975.
(cost $3,559,000) | | $ | 3,559,000 | | | $ | 3,559,000 | |
| | | | | | |
|
|
|
TOTAL INVESTMENTS | | | | | | | | |
(cost $498,876,812)(4) | | | 100.0 | % | | | 789,259,918 | |
Liabilities in excess of other assets | | | (0.0 | ) | | | (141,778 | ) |
| | |
|
|
| |
|
|
|
NET ASSETS | | | 100.0 | % | | $ | 789,118,140 | |
| | |
|
|
| |
|
|
|
| † | Non-income producing security |
| # | The security or a portion thereof is out on loan. |
| (1) | The rate shown is the 7-day yield as of August 31, 2018. |
| (2) | At August 31, 2018, the Fund had loaned securities with a total value of $31,031,625. This was secured by collateral of $228,345, which was received in cash and subsequently invested in short-term investments currently valued at $228,345 as reported in the Portfolio of Investments. Additional collateral of $31,471,353 was received in the form of fixed income pooled securities, which the Fund cannot sell or repledge and accordingly are not reflected in the Fund’s assets and liabilities. The components of the fixed income pooled securities referenced above are as follows: |
| | | | | | | | |
Securities
| | Coupon Range
| | Maturity Date Range
| | Value as of
August 31, 2018
| |
Federal Home Loan Mtg. Corp. | | 3.00% to 4.50% | | 07/15/2042 to 05/01/2048 | | $ | 2,059,769 | |
Federal National Mtg. Assoc. | | 3.00% to 4.50% | | 10/25/2039 to 06/01/2048 | | | 1,932,827 | |
Government National Mtg. Assoc. | | 2.50% | | 09/20/2046 | | | 307,950 | |
United States Treasury Bills | | 0.00% | | 09/13/2018 to 03/28/2019 | | | 1,041,171 | |
United States Treasury Notes/Bonds | | zero coupon to 8.75% | | 09/15/2018 to 11/15/2047 | | | 26,129,636 | |
| (3) | The security or a portion thereof was pledged as collateral to cover margin requirements for open futures contracts. |
| (4) | See Note 5 for cost of investments on a tax basis. |
| | | | | | | | | | | | | | | | | | | | | | |
| Futures Contracts | | | | | | | | | | |
Number of
Contracts | | | Type | | Description | | Expiration
Month | | | Notional
Basis# | | | Notional
Value# | | | Unrealized
Appreciation
(Depreciation) | |
| | 59 | | | Long | | S&P 500 E-Mini Index | | | September 2018 | | | $ | 8,208,784 | | | $ | 8,561,195 | | | $ | 352,411 | |
| | | | | | | | | | | | | | | | | | | | |
|
|
|
| # | Notional basis refers to the contractual amount agreed upon at inception of the open contract; notional value represents the current value of the open contract. |
The following is a summary of the inputs used to value the Fund’s net assets as of August 31, 2018 (see Note 2):
| | | | | | | | | | | | | | | | |
| | | Level 1 - Unadjusted
Quoted Prices
| | | Level 2 - Other
Observable Inputs
| | | Level 3 - Significant
Unobservable Inputs
| | | Total
| |
ASSETS: | | | | | | | | | | | | | | | | |
Investments at Value:* | | | | | | | | | | | | | | | | |
Common Stocks | | $ | 781,043,388 | | | $ | — | | | $ | — | | | $ | 781,043,388 | |
Short Term Investment Securities: | | | | | | | | | | | | | | | | |
Registered Investment Companies | | | 228,345 | | | | — | | | | — | | | | 228,345 | |
U.S. Government Treasuries | | | — | | | | 4,429,185 | | | | — | | | | 4,429,185 | |
Repurchase Agreements | | | — | | | | 3,559,000 | | | | — | | | | 3,559,000 | |
| | |
|
|
| |
|
|
| |
|
|
| |
|
|
|
Total Investments at Value | | $ | 781,271,733 | | | $ | 7,988,185 | | | $ | — | | | $ | 789,259,918 | |
| | |
|
|
| |
|
|
| |
|
|
| |
|
|
|
Other Financial Instruments:+ | | | | | | | | | | | | | | | | |
Futures Contracts | | $ | 352,411 | | | $ | — | | | $ | — | | | $ | 352,411 | |
| | |
|
|
| |
|
|
| |
|
|
| |
|
|
|
| * | For a detailed presentation of investments, please refer to the Portfolio of Investments. |
| + | Other financial instruments are derivative instruments, not reflected in the Portfolio of Investments, such as futures, forward, swap and written option contracts, which are valued at the unrealized appreciation (depreciation) on the instrument. |
The Fund’s policy is to recognize transfers between Levels as of the end of the reporting period. There were no transfers between Levels during the reporting period.
See Notes to Financial Statements
VALIC Company II Strategic Bond Fund
PORTFOLIO PROFILE — August 31, 2018 (unaudited)
Industry Allocation*
| | | | |
Sovereign | | | 16.2 | % |
Federal National Mtg. Assoc. | | | 12.0 | |
Registered Investment Companies | | | 6.9 | |
Federal Home Loan Mtg. Corp. | | | 5.0 | |
United States Treasury Notes | | | 3.3 | |
Oil Companies — Exploration & Production | | | 3.0 | |
Diversified Banking Institutions | | | 2.8 | |
Oil Companies — Integrated | | | 2.4 | |
Cable/Satellite TV | | | 2.3 | |
Banks — Commercial | | | 2.2 | |
Pipelines | | | 2.0 | |
Government National Mtg. Assoc. | | | 1.7 | |
Real Estate Investment Trusts | | | 1.5 | |
Telephone — Integrated | | | 1.5 | |
Cellular Telecom | | | 1.4 | |
Electric — Integrated | | | 1.2 | |
Diversified Financial Services | | | 1.2 | |
Transport — Rail | | | 1.1 | |
Medical — Drugs | | | 0.9 | |
Satellite Telecom | | | 0.8 | |
Finance — Consumer Loans | | | 0.7 | |
Oil — Field Services | | | 0.7 | |
Chemicals — Diversified | | | 0.7 | |
Oil & Gas Drilling | | | 0.6 | |
Gambling (Non-Hotel) | | | 0.6 | |
Metal Processors & Fabrication | | | 0.6 | |
Agricultural Chemicals | | | 0.5 | |
Computer Services | | | 0.5 | |
Auto — Cars/Light Trucks | | | 0.5 | |
Steel — Producers | | | 0.5 | |
Enterprise Software/Service | | | 0.5 | |
Metal — Copper | | | 0.5 | |
Transport — Marine | | | 0.4 | |
Paper & Related Products | | | 0.4 | |
Electric — Distribution | | | 0.4 | |
Insurance — Property/Casualty | | | 0.4 | |
Real Estate Management/Services | | | 0.4 | |
Central Bank | | | 0.4 | |
Aerospace/Defense — Equipment | | | 0.4 | |
Computers | | | 0.4 | |
Containers — Paper/Plastic | | | 0.4 | |
Chemicals — Specialty | | | 0.4 | |
Broadcast Services/Program | | | 0.4 | |
Building — Residential/Commercial | | | 0.4 | |
Metal — Diversified | | | 0.4 | |
Insurance — Life/Health | | | 0.3 | |
Electric — Generation | | | 0.3 | |
Television | | | 0.3 | |
Computers — Integrated Systems | | | 0.3 | |
Building & Construction Products — Misc. | | | 0.3 | |
Auto — Heavy Duty Trucks | | | 0.3 | |
Food — Retail | | | 0.3 | |
Medical — Hospitals | | | 0.3 | |
Batteries/Battery Systems | | | 0.3 | |
Rental Auto/Equipment | | | 0.3 | |
Insurance — Multi-line | | | 0.3 | |
Hotels/Motels | | | 0.3 | |
Publishing — Books | | | 0.3 | |
Cosmetics & Toiletries | | | 0.3 | |
Containers — Metal/Glass | | | 0.3 | |
Medical — HMO | | | 0.3 | |
Building Products — Wood | | | 0.3 | |
United States Treasury Bonds | | | 0.3 | |
Auto/Truck Parts & Equipment — Original | | | 0.3 | |
Building & Construction — Misc. | | | 0.3 | |
Retail — Office Supplies | | | 0.3 | |
Finance — Credit Card | | | 0.3 | |
Physicians Practice Management | | | 0.3 | |
Electronic Parts Distribution | | | 0.3 | |
| | | | |
Food — Meat Products | | | 0.3 | |
Marine Services | | | 0.3 | |
Brewery | | | 0.3 | |
Finance — Other Services | | | 0.2 | |
Banks — Super Regional | | | 0.2 | |
Computer Software | | | 0.2 | |
Finance — Investment Banker/Broker | | | 0.2 | |
Quarrying | | | 0.2 | |
Computers — Memory Devices | | | 0.2 | |
Coal | | | 0.2 | |
Building — Heavy Construction | | | 0.2 | |
Savings & Loans/Thrifts | | | 0.2 | |
Security Services | | | 0.2 | |
Platinum | | | 0.2 | |
Commercial Services | | | 0.2 | |
Airlines | | | 0.2 | |
Finance — Mortgage Loan/Banker | | | 0.2 | |
Diversified Manufacturing Operations | | | 0.2 | |
Banks — Export/Import | | | 0.2 | |
Energy — Alternate Sources | | | 0.2 | |
Circuit Boards | | | 0.2 | |
Printing — Commercial | | | 0.2 | |
Retail — Restaurants | | | 0.2 | |
Medical — Generic Drugs | | | 0.2 | |
Machinery — Construction & Mining | | | 0.2 | |
Machinery — General Industrial | | | 0.2 | |
Medical — Nursing Homes | | | 0.2 | |
Diversified Operations | | | 0.2 | |
Retail — Automobile | | | 0.2 | |
Internet Financial Services | | | 0.2 | |
Retail — Appliances | | | 0.2 | |
Real Estate Operations & Development | | | 0.2 | |
Metal — Iron | | | 0.2 | |
Internet Content — Entertainment | | | 0.2 | |
Oil Field Machinery & Equipment | | | 0.2 | |
Internet Connectivity Services | | | 0.2 | |
Retail — Discount | | | 0.2 | |
E-Commerce/Services | | | 0.2 | |
Diversified Minerals | | | 0.2 | |
Radio | | | 0.2 | |
Applications Software | | | 0.2 | |
Distribution/Wholesale | | | 0.2 | |
Retail — Leisure Products | | | 0.2 | |
Building Products — Cement | | | 0.2 | |
Schools | | | 0.2 | |
Machinery — Farming | | | 0.2 | |
Machinery — Pumps | | | 0.1 | |
Retail — Major Department Stores | | | 0.1 | |
Consumer Products — Misc. | | | 0.1 | |
Poultry | | | 0.1 | |
Water | | | 0.1 | |
Internet Application Software | | | 0.1 | |
Transport — Services | | | 0.1 | |
Retail — Pawn Shops | | | 0.1 | |
Oil Refining & Marketing | | | 0.1 | |
Beverages — Non-alcoholic | | | 0.1 | |
Racetracks | | | 0.1 | |
Insurance Brokers | | | 0.1 | |
Investment Companies | | | 0.1 | |
Gas — Distribution | | | 0.1 | |
Independent Power Producers | | | 0.1 | |
Finance — Auto Loans | | | 0.1 | |
Insurance — Mutual | | | 0.1 | |
Telecom Services | | | 0.1 | |
Machinery — Thermal Process | | | 0.1 | |
Banks — Special Purpose | | | 0.1 | |
Finance — Commercial | | | 0.1 | |
Commercial Services — Finance | | | 0.1 | |
Multimedia | | | 0.1 | |
VALIC Company II Strategic Bond Fund
PORTFOLIO PROFILE — August 31, 2018 (unaudited) — (continued)
Industry Allocation* (continued)
| | | | |
Retail — Sporting Goods | | | 0.1 | % |
Retail — Petroleum Products | | | 0.1 | |
Leisure Products | | | 0.1 | |
Transport — Truck | | | 0.1 | |
Building Products — Doors & Windows | | | 0.1 | |
Theaters | | | 0.1 | |
Resorts/Theme Parks | | | 0.1 | |
Footwear & Related Apparel | | | 0.1 | |
Retail — Hypermarkets | | | 0.1 | |
Soap & Cleaning Preparation | | | 0.1 | |
Dialysis Centers | | | 0.1 | |
Building Products — Air & Heating | | | 0.1 | |
Building Societies | | | 0.1 | |
Advertising Services | | | 0.1 | |
Medical Products | | | 0.1 | |
Food — Dairy Products | | | 0.1 | |
Non-Ferrous Metals | | | 0.1 | |
Funeral Services & Related Items | | | 0.1 | |
Pharmacy Services | | | 0.1 | |
Transport — Equipment & Leasing | | | 0.1 | |
Medical Labs & Testing Services | | | 0.1 | |
Diamonds/Precious Stones | | | 0.1 | |
Electronic Components — Misc. | | | 0.1 | |
Tools — Hand Held | | | 0.1 | |
Medical Instruments | | | 0.1 | |
Trucking/Leasing | | | 0.1 | |
| | |
|
|
|
| | | | 103.1 | % |
| | |
|
|
|
Credit Quality†#
| | | | |
Aaa | | | 24.2 | % |
Aa | | | 2.3 | |
A | | | 7.1 | |
Baa | | | 15.9 | |
Ba | | | 13.6 | |
B | | | 25.9 | |
Caa | | | 4.7 | |
Not Rated@ | | | 6.3 | |
| | |
|
|
|
| | | | 100.0 | % |
| | |
|
|
|
| * | Calculated as a percentage of net assets. |
| # | Calculated as a percentage of total debt issues, excluding short-term securities |
| @ | Represents debt issues that either have no rating, or the rating is unavailable from the data source. |
VALIC Company II Strategic Bond Fund
PORTFOLIO OF INVESTMENTS — August 31, 2018
| | | | | | | | |
| | |
| Security Description | | Principal
Amount(9) | | | Value
(Note 2) | |
| |
ASSET BACKED SECURITIES — 1.1% | |
Diversified Financial Services — 1.1% | |
American Express Credit Account Master Trust FRS
Series 2018-5, Class A
2.40% (1 ML+0.34%)
due 12/15/2025 | | $ | 475,000 | | | $ | 474,854 | |
American Express Credit Account Master Trust
Series 2018-4, Class A
2.99% due 12/15/2023 | | | 225,000 | | | | 225,109 | |
Americredit Automobile Receivables Trust
Series 2018-2, Class D
4.01% due 07/18/2024 | | | 200,000 | | | | 200,737 | |
Avis Budget Rental Car Funding AESOP LLC
Series 2015-1A, Class A
2.50% due 07/20/2021* | | | 400,000 | | | | 395,053 | |
BA Credit Card Trust
Series 2018-A2, Class A2
3.00% due 09/15/2023 | | | 168,000 | | | | 168,136 | |
BX Trust FRS
Series 2018-MCSF, Class A
2.64% (1 ML + 0.58%)
due 04/15/2035*(1) | | | 900,000 | | | | 896,897 | |
CarMax Auto Owner Trust
Series 2016-3, Class A4
1.60% due 01/18/2022 | | | 500,000 | | | | 487,775 | |
CarMax Auto Owner Trust
Series 2016-4, Class A4
1.60% due 06/15/2022 | | | 175,000 | | | | 169,819 | |
Chase Mtg. Finance Trust VRS
Series 2016-2, Class M2
3.75% due 12/25/2045*(2)(3) | | | 820,651 | | | | 810,192 | |
Citibank Credit Card Issuance Trust
Series 2018-A6, Class A6
3.21% due 12/07/2024 | | | 100,000 | | | | 100,359 | |
Citigroup Commercial Mtg. Trust
Series 2018-C5, Class A4
4.23% due 06/10/2051(1) | | | 1,000,000 | | | | 1,040,285 | |
COMM Mtg. Trust VRS
Series 2015-CR22, Class XA
1.12% due 03/10/2048(1)(3) | | | 3,091,980 | | | | 127,727 | |
DBCG Mtg. Trust FRS
Series 2017-BBG, Class A
2.76% (1 ML+0.70%)
due 06/15/2034*(1) | | | 1,000,000 | | | | 999,686 | |
DBGS Mtg. Trust FRS
Series 2018-BIOD, Class A
2.87% (3 ML+0.80%)
due 05/15/2035*(1) | | | 946,651 | | | | 946,648 | |
Discover Card Execution Note Trust
Series 2015-A4, Class A4
2.19% due 04/17/2023 | | | 100,000 | | | | 98,503 | |
Ford Credit Auto Owner Trust
Series 2016-C, Class B
1.73% due 03/15/2022 | | | 115,000 | | | | 112,170 | |
Ford Credit Auto Owner Trust/Ford Credit
Series 2018-2, Class A
3.47% due 01/15/2030* | | | 100,000 | | | | 100,548 | |
Ford Credit Floorplan Master Owner Trust
Series 2017-1, Class A1
2.07% due 05/15/2022 | | | 129,000 | | | | 127,121 | |
Ford Credit Floorplan Master Owner Trust
Series 2017-3, Class A
2.48% due 09/15/2024 | | | 250,000 | | | | 243,021 | |
GM Financial Consumer Automobile Receivables Trust
Series 2017-3A, Class 4A
2.13% due 03/16/2023* | | | 200,000 | | | | 195,145 | |
| | | | | | | | |
| | |
| Security Description | | Principal
Amount(9) | | | Value
(Note 2) | |
| |
| | | | | | | | | |
Diversified Financial Services (continued) | |
GS Mtg. Securities Trust
Series 2015-GC28, Class A2
2.90% due 02/10/2048(1) | | $ | 75,000 | | | $ | 74,965 | |
Synchrony Credit Card Master Note Trust
Series 2016-2, Class A
2.21% due 05/15/2024 | | | 100,000 | | | | 97,542 | |
Toyota Auto Receivables Owner Trust
Series 2018-A, Class A3
2.35% due 05/16/2022 | | | 200,000 | | | | 198,040 | |
Verizon Owner Trust
Series 2017-3A, Class A1A
2.06% due 04/20/2022* | | | 250,000 | | | | 246,304 | |
Verizon Owner Trust
Series 2018-1A, Class C
3.20% due 09/20/2022* | | | 100,000 | | | | 99,567 | |
World Financial Network Credit Card Master Trust
Series 2016-A, Class A
2.03% due 04/15/2025 | | | 270,000 | | | | 261,605 | |
World Financial Network Credit Card Master Trust
Series 2017-C, Class A
2.31% due 08/15/2024 | | | 200,000 | | | | 196,693 | |
| | | | | | |
|
|
|
Total Asset Backed Securities | | | | | | | | |
(cost $9,145,993) | | | | | | | 9,094,501 | |
| | | | | | |
|
|
|
U.S. CORPORATE BONDS & NOTES — 31.1% | |
Advertising Agencies — 0.0% | |
Interpublic Group of Cos., Inc.
Senior Notes
4.20% due 04/15/2024 | | | 108,000 | | | | 108,117 | |
| | | | | | |
|
|
|
Aerospace/Defense — 0.0% | |
General Dynamics Corp.
Company Guar. Notes
2.88% due 05/11/2020 | | | 248,000 | | | | 247,857 | |
| | | | | | |
|
|
|
Aerospace/Defense - Equipment — 0.4% | |
Harris Corp.
Senior Notes
4.40% due 06/15/2028 | | | 225,000 | | | | 228,617 | |
Triumph Group, Inc.
Company Guar. Notes
4.88% due 04/01/2021 | | | 1,535,000 | | | | 1,469,763 | |
United Technologies Corp.
Senior Notes
1.15% due 05/18/2024 | | EUR | 300,000 | | | | 352,161 | |
United Technologies Corp.
Senior Notes
1.90% due 05/04/2020 | | | 260,000 | | | | 254,544 | |
United Technologies Corp.
Senior Notes
2.15% due 05/18/2030 | | EUR | 300,000 | | | | 357,393 | |
United Technologies Corp.
Senior Notes
3.95% due 08/16/2025 | | | 174,000 | | | | 174,898 | |
United Technologies Corp.
Senior Notes
4.63% due 11/16/2048 | | | 341,000 | | | | 345,146 | |
| | | | | | |
|
|
|
| | | | | | | | 3,182,522 | |
| | | | | | |
|
|
|
Agricultural Chemicals — 0.0% | |
Mosaic Co.
Senior Notes
3.25% due 11/15/2022 | | | 179,000 | | | | 175,691 | |
| | | | | | |
|
|
|
VALIC Company II Strategic Bond Fund
PORTFOLIO OF INVESTMENTS — August 31, 2018 — (continued)
| | | | | | | | |
| | |
| Security Description | | Principal
Amount(9) | | | Value
(Note 2) | |
| |
U.S. CORPORATE BONDS & NOTES (continued) | |
Airlines — 0.1% | |
Atlas Air, Inc.
Pass-Through Certs.
Series 1999-1, Class B
7.63% due 01/02/2019(5) | | $ | 47,508 | | | $ | 47,679 | |
United Airlines Pass-Through Trust
Pass-Through Certs.
Series 2014-2, Class B
4.63% due 03/03/2024 | | | 917,767 | | | | 923,825 | |
| | | | | | |
|
|
|
| | | | | | | | 971,504 | |
| | | | | | |
|
|
|
Applications Software — 0.2% | |
CDK Global, Inc.
Senior Notes
5.88% due 06/15/2026 | | | 1,266,000 | | | | 1,299,726 | |
| | | | | | |
|
|
|
Auto - Cars/Light Trucks — 0.4% | |
BMW US Capital LLC
Company Guar. Notes
3.10% due 04/12/2021* | | | 396,000 | | | | 393,797 | |
Daimler Finance North America LLC
Company Guar. Notes
2.00% due 07/06/2021* | | | 273,000 | | | | 262,613 | |
Daimler Finance North America LLC
Company Guar. Notes
2.45% due 05/18/2020* | | | 687,000 | | | | 678,816 | |
Daimler Finance North America LLC
Company Guar. Notes
3.10% due 05/04/2020* | | | 473,000 | | | | 472,126 | |
Ford Motor Credit Co. LLC
Senior Notes
2.34% due 11/02/2020 | | | 489,000 | | | | 474,018 | |
Nissan Motor Acceptance Corp.
Senior Notes
2.15% due 09/28/2020* | | | 563,000 | | | | 549,094 | |
Nissan Motor Acceptance Corp.
Senior Notes
2.65% due 07/13/2022* | | | 412,000 | | | | 397,788 | |
Toyota Motor Credit Corp.
Senior Notes
2.95% due 04/13/2021 | | | 444,000 | | | | 443,284 | |
| | | | | | |
|
|
|
| | | | | | | | 3,671,536 | |
| | | | | | |
|
|
|
Auto - Heavy Duty Trucks — 0.3% | |
Allison Transmission, Inc.
Senior Notes
5.00% due 10/01/2024* | | | 1,329,000 | | | | 1,309,065 | |
JB Poindexter & Co., Inc.
Senior Notes
7.13% due 04/15/2026* | | | 1,234,000 | | | | 1,275,647 | |
| | | | | | |
|
|
|
| | | | | | | | 2,584,712 | |
| | | | | | |
|
|
|
Banks - Commercial — 0.7% | |
Associated Bank NA
Senior Notes
3.50% due 08/13/2021 | | | 244,000 | | | | 243,696 | |
BankUnited, Inc.
Senior Notes
4.88% due 11/17/2025 | | | 677,000 | | | | 692,923 | |
Citizens Bank NA
Senior Notes
2.55% due 05/13/2021 | | | 268,000 | | | | 261,639 | |
Citizens Financial Group, Inc.
Sub. Notes
4.15% due 09/28/2022* | | | 238,000 | | | | 238,541 | |
| | | | | | | | |
| | |
| Security Description | | Principal
Amount(9) | | | Value
(Note 2) | |
| |
| | | | | | | | | |
Banks - Commercial (continued) | |
Discover Bank
Sub. Notes
4.68% due 08/09/2028 | | $ | 268,000 | | | $ | 267,828 | |
First Horizon National Corp.
Senior Notes
3.50% due 12/15/2020 | | | 443,000 | | | | 444,105 | |
KeyBank NA
Senior Notes
3.35% due 06/15/2021 | | | 265,000 | | | | 266,092 | |
Regions Bank
Senior Notes
3.37% due 08/13/2021 | | | 324,000 | | | | 324,071 | |
Regions Financial Corp.
Senior Notes
2.75% due 08/14/2022 | | | 286,000 | | | | 277,462 | |
Regions Financial Corp.
Sub. Notes
7.38% due 12/10/2037 | | | 1,198,000 | | | | 1,563,250 | |
Santander Holdings USA, Inc.
Senior Notes
3.40% due 01/18/2023 | | | 442,000 | | | | 429,699 | |
SunTrust Bank
Senior Notes
3.50% due 08/02/2022 | | | 308,000 | | | | 308,128 | |
Synovus Financial Corp.
Senior Notes
3.13% due 11/01/2022 | | | 179,000 | | | | 171,393 | |
ZB NA
Senior Notes
3.50% due 08/27/2021 | | | 250,000 | | | | 249,721 | |
| | | | | | |
|
|
|
| | | | | | | | 5,738,548 | |
| | | | | | |
|
|
|
Banks - Super Regional — 0.2% | |
Capital One Financial Corp.
Sub. Notes
3.75% due 07/28/2026# | | | 165,000 | | | | 154,964 | |
Wells Fargo & Co.
Senior Notes
3.00% due 02/19/2025 | | | 684,000 | | | | 652,448 | |
Wells Fargo & Co.
Sub. Notes
4.75% due 12/07/2046 | | | 466,000 | | | | 462,671 | |
Wells Fargo Bank NA
Senior Notes
2.60% due 01/15/2021 | | | 317,000 | | | | 312,729 | |
Wells Fargo Bank NA
Senior Notes
3.55% due 08/14/2023 | | | 382,000 | | | | 383,382 | |
| | | | | | |
|
|
|
| | | | | | | | 1,966,194 | |
| | | | | | |
|
|
|
Batteries/Battery Systems — 0.3% | |
Energizer Gamma Acquisition, Inc.
Senior Sec. Notes
6.38% due 07/15/2026*# | | | 1,450,000 | | | | 1,498,937 | |
EnerSys
Company Guar. Notes
5.00% due 04/30/2023* | | | 1,293,000 | | | | 1,305,930 | |
| | | | | | |
|
|
|
| | | | | | | | 2,804,867 | |
| | | | | | |
|
|
|
Beverages - Non-alcoholic — 0.1% | |
Keurig Dr Pepper, Inc.
Company Guar. Notes
4.06% due 05/25/2023* | | | 188,000 | | | | 189,157 | |
VALIC Company II Strategic Bond Fund
PORTFOLIO OF INVESTMENTS — August 31, 2018 — (continued)
| | | | | | | | |
| | |
| Security Description | | Principal
Amount(9) | | | Value
(Note 2) | |
| |
U.S. CORPORATE BONDS & NOTES (continued) | |
Beverages - Non-alcoholic (continued) | |
Keurig Dr Pepper, Inc.
Company Guar. Notes
4.42% due 05/25/2025* | | $ | 498,000 | | | $ | 504,661 | |
Keurig Dr Pepper, Inc.
Company Guar. Notes
4.60% due 05/25/2028* | | | 263,000 | | | | 266,938 | |
Keurig Dr Pepper, Inc.
Company Guar. Notes
4.99% due 05/25/2038* | | | 134,000 | | | | 136,978 | |
| | | | | | |
|
|
|
| | | | | | | | 1,097,734 | |
| | | | | | |
|
|
|
Brewery — 0.2% | |
Anheuser-Busch InBev Finance, Inc.
Company Guar. Notes
2.65% due 02/01/2021 | | | 341,000 | | | | 337,099 | |
Anheuser-Busch InBev Finance, Inc.
Company Guar. Notes
3.65% due 02/01/2026 | | | 233,000 | | | | 228,175 | |
Anheuser-Busch InBev Finance, Inc.
Company Guar. Notes
4.70% due 02/01/2036 | | | 119,000 | | | | 120,859 | |
Anheuser-Busch InBev Finance, Inc.
Company Guar. Notes
4.90% due 02/01/2046 | | | 443,000 | | | | 454,579 | |
Anheuser-Busch InBev Worldwide, Inc.
Company Guar. Notes
4.60% due 04/15/2048 | | | 148,000 | | | | 145,740 | |
| | | | | | |
|
|
|
| | | | | | | | 1,286,452 | |
| | | | | | |
|
|
|
Broadcast Services/Program — 0.3% | |
Discovery Communications LLC
Company Guar. Notes
3.50% due 06/15/2022* | | | 224,000 | | | | 222,047 | |
Discovery Communications LLC
Company Guar. Notes
3.90% due 11/15/2024* | | | 369,000 | | | | 364,342 | |
Discovery Communications LLC
Company Guar. Notes
5.00% due 09/20/2037 | | | 81,000 | | | | 78,978 | |
Univision Communications, Inc.
Senior Sec. Notes
5.13% due 05/15/2023* | | | 1,569,000 | | | | 1,490,550 | |
| | | | | | |
|
|
|
| | | | | | | | 2,155,917 | |
| | | | | | |
|
|
|
Building & Construction Products - Misc. — 0.2% | |
Owens Corning
Senior Notes
4.30% due 07/15/2047 | | | 499,000 | | | | 414,115 | |
Owens Corning
Company Guar. Notes
4.40% due 01/30/2048 | | | 151,000 | | | | 127,189 | |
Standard Industries, Inc.
Senior Notes
6.00% due 10/15/2025* | | | 1,425,000 | | | | 1,457,319 | |
| | | | | | |
|
|
|
| | | | | | | | 1,998,623 | |
| | | | | | |
|
|
|
Building & Construction - Misc. — 0.2% | |
frontdoor, Inc.
Senior Notes
6.75% due 08/15/2026* | | | 196,000 | | | | 200,655 | |
Weekley Homes LLC/Weekley Finance Corp.
Senior Notes
6.00% due 02/01/2023 | | | 1,253,000 | | | | 1,215,410 | |
| | | | | | |
|
|
|
| | | | | | | | 1,416,065 | |
| | | | | | |
|
|
|
| | | | | | | | |
| | |
| Security Description | | Principal
Amount(9) | | | Value
(Note 2) | |
| |
| | | | | | | | | |
Building Products - Cement — 0.1% | |
CRH America Finance, Inc.
Company Guar. Notes
3.95% due 04/04/2028* | | $ | 215,000 | | | $ | 210,256 | |
Martin Marietta Materials, Inc.
Senior Notes
4.25% due 12/15/2047 | | | 111,000 | | | | 98,171 | |
Vulcan Materials Co.
Senior Notes
4.70% due 03/01/2048* | | | 271,000 | | | | 256,269 | |
| | | | | | |
|
|
|
| | | | | | | | 564,696 | |
| | | | | | |
|
|
|
Building Products - Wood — 0.3% | |
Boise Cascade Co.
Company Guar. Notes
5.63% due 09/01/2024* | | | 1,890,000 | | | | 1,937,250 | |
Masco Corp.
Senior Notes
4.45% due 04/01/2025 | | | 382,000 | | | | 388,170 | |
Masco Corp.
Senior Notes
4.50% due 05/15/2047 | | | 182,000 | | | | 161,964 | |
| | | | | | |
|
|
|
| | | | | | | | 2,487,384 | |
| | | | | | |
|
|
|
Building - Heavy Construction — 0.2% | |
Tutor Perini Corp.
Company Guar. Notes
6.88% due 05/01/2025*# | | | 1,900,000 | | | | 1,933,250 | |
| | | | | | |
|
|
|
Building - Residential/Commercial — 0.2% | |
Toll Brothers Finance Corp.
Company Guar. Notes
4.35% due 02/15/2028 | | | 304,000 | | | | 278,160 | |
William Lyon Homes, Inc.
Company Guar. Notes
6.00% due 09/01/2023* | | | 1,253,000 | | | | 1,209,521 | |
| | | | | | |
|
|
|
| | | | | | | | 1,487,681 | |
| | | | | | |
|
|
|
Cable/Satellite TV — 1.1% | |
Block Communications, Inc.
Senior Notes
6.88% due 02/15/2025* | | | 2,148,000 | | | | 2,191,497 | |
CCO Holdings LLC/CCO Holdings Capital Corp.
Senior Notes
5.00% due 02/01/2028* | | | 556,000 | | | | 520,711 | |
CCO Holdings LLC/CCO Holdings Capital Corp.
Senior Notes
5.38% due 05/01/2025* | | | 980,000 | | | | 973,875 | |
CCO Holdings LLC/CCO Holdings Capital Corp.
Senior Notes
5.88% due 04/01/2024* | | | 957,000 | | | | 976,140 | |
Charter Communications Operating LLC/Charter Communications Operating Capital
Senior Sec. Notes
5.38% due 04/01/2038 | | | 29,000 | | | | 27,964 | |
Charter Communications Operating LLC/Charter Communications Operating Capital
Senior Sec. Notes
5.38% due 05/01/2047 | | | 60,000 | | | | 56,523 | |
Charter Communications Operating LLC/Charter Communications Operating Capital
Senior Sec. Notes
5.75% due 04/01/2048 | | | 109,000 | | | | 107,417 | |
Charter Communications Operating LLC/Charter Communications Operating Capital
Senior Sec. Notes
6.38% due 10/23/2035 | | | 98,000 | | | | 104,904 | |
VALIC Company II Strategic Bond Fund
PORTFOLIO OF INVESTMENTS — August 31, 2018 — (continued)
| | | | | | | | |
| | |
| Security Description | | Principal
Amount(9) | | | Value
(Note 2) | |
| |
U.S. CORPORATE BONDS & NOTES (continued) | |
Cable/Satellite TV (continued) | |
Comcast Corp.
Company Guar. Notes
3.60% due 03/01/2024 | | $ | 340,000 | | | $ | 340,142 | |
Comcast Corp.
Company Guar. Notes
3.90% due 03/01/2038 | | | 60,000 | | | | 55,671 | |
Comcast Corp.
Company Guar. Notes
4.00% due 03/01/2048 | | | 198,000 | | | | 179,371 | |
CSC Holdings LLC
Company Guar. Notes
5.50% due 04/15/2027* | | | 1,450,000 | | | | 1,411,938 | |
CSC Holdings LLC
Senior Notes
6.75% due 11/15/2021 | | | 865,000 | | | | 916,900 | |
DISH DBS Corp.
Company Guar. Notes
6.75% due 06/01/2021 | | | 1,375,000 | | | | 1,395,625 | |
| | | | | | |
|
|
|
| | | | | | | | 9,258,678 | |
| | | | | | |
|
|
|
Cellular Telecom — 1.0% | |
Sprint Corp.
Company Guar. Notes
7.25% due 09/15/2021 | | | 2,095,000 | | | | 2,196,482 | |
Sprint Corp.
Company Guar. Notes
7.88% due 09/15/2023 | | | 5,277,000 | | | | 5,679,371 | |
Sprint Spectrum Co. LLC/Sprint Spectrum Co. II LLC/Sprint Spectrum Co. III LLC
Senior Sec. Notes
4.74% due 09/20/2029* | | | 730,000 | | | | 730,000 | |
| | | | | | |
|
|
|
| | | | | | | | 8,605,853 | |
| | | | | | |
|
|
|
Chemicals - Specialty — 0.3% | |
GCP Applied Technologies, Inc.
Company Guar. Notes
5.50% due 04/15/2026* | | | 1,039,000 | | | | 1,018,220 | |
Kraton Polymers LLC/Kraton Polymers Capital Corp.
Company Guar. Notes
7.00% due 04/15/2025* | | | 865,000 | | | | 892,031 | |
Lubrizol Corp.
Company Guar. Notes
6.50% due 10/01/2034 | | | 155,000 | | | | 202,872 | |
| | | | | | |
|
|
|
| | | | | | | | 2,113,123 | |
| | | | | | |
|
|
|
Circuit Boards — 0.2% | |
TTM Technologies, Inc.
Company Guar. Notes
5.63% due 10/01/2025* | | | 1,690,000 | | | | 1,681,550 | |
| | | | | | |
|
|
|
Coal — 0.2% | |
SunCoke Energy Partners LP/SunCoke Energy Partners Finance Corp.
Company Guar. Notes
7.50% due 06/15/2025* | | | 1,865,000 | | | | 1,944,262 | |
| | | | | | |
|
|
|
Coatings/Paint — 0.0% | |
RPM International, Inc.
Senior Notes
4.25% due 01/15/2048 | | | 40,000 | | | | 35,653 | |
| | | | | | |
|
|
|
Commercial Services — 0.2% | |
Ecolab, Inc.
Senior Notes
1.00% due 01/15/2024 | | | EUR1,000,000 | | | | 1,177,604 | |
| | | | | | | | |
| | |
| Security Description | | Principal
Amount(9) | | | Value
(Note 2) | |
| |
| | | | | | | | | |
Commercial Services (continued) | |
Ecolab, Inc.
Senior Notes
2.38% due 08/10/2022 | | $ | 228,000 | | | $ | 219,894 | |
Nielsen Finance LLC/Nielsen Finance Co.
Company Guar. Notes
5.00% due 04/15/2022* | | | 436,000 | | | | 423,378 | |
| | | | | | |
|
|
|
| | | | | | | | 1,820,876 | |
| | | | | | |
|
|
|
Computer Services — 0.4% | |
Harland Clarke Holdings Corp.
Senior Sec. Notes
8.38% due 08/15/2022* | | | 2,618,000 | | | | 2,454,375 | |
IBM Credit LLC
Senior Notes
1.63% due 09/06/2019 | | | 278,000 | | | | 275,159 | |
IBM Credit LLC
Senior Notes
2.65% due 02/05/2021 | | | 611,000 | | | | 605,674 | |
| | | | | | |
|
|
|
| | | | | | | | 3,335,208 | |
| | | | | | |
|
|
|
Computer Software — 0.1% | |
Rackspace Hosting, Inc.
Company Guar. Notes
8.63% due 11/15/2024*# | | | 1,265,000 | | | | 1,245,234 | |
| | | | | | |
|
|
|
Computers — 0.4% | |
Apple, Inc.
Senior Notes
1.38% due 05/24/2029 | | EUR | 800,000 | | | | 949,022 | |
Apple, Inc.
Senior Notes
2.85% due 05/06/2021 | | | 183,000 | | | | 182,680 | |
Diamond 1 Finance Corp./Diamond 2 Finance Corp.
Senior Sec. Notes
6.02% due 06/15/2026* | | | 1,355,000 | | | | 1,436,474 | |
Diamond 1 Finance Corp./Diamond 2 Finance Corp.
Senior Sec. Notes
8.10% due 07/15/2036* | | | 457,000 | | | | 540,418 | |
Hewlett Packard Enterprise Co.
Senior Notes
6.20% due 10/15/2035 | | | 57,000 | | | | 58,998 | |
| | | | | | |
|
|
|
| | | | | | | | 3,167,592 | |
| | | | | | |
|
|
|
Computers - Integrated Systems — 0.3% | |
Diebold Nixdorf, Inc.
Company Guar. Notes
8.50% due 04/15/2024# | | | 1,821,000 | | | | 1,286,081 | |
Everi Payments, Inc.
Company Guar. Notes
7.50% due 12/15/2025* | | | 1,650,000 | | | | 1,676,400 | |
| | | | | | |
|
|
|
| | | | | | | | 2,962,481 | |
| | | | | | |
|
|
|
Consumer Products - Misc. — 0.1% | |
Central Garden & Pet Co.
Company Guar. Notes
5.13% due 02/01/2028 | | | 1,336,000 | | | | 1,257,510 | |
| | | | | | |
|
|
|
Containers - Metal/Glass — 0.3% | |
Crown Cork & Seal Co., Inc.
Company Guar. Notes
7.38% due 12/15/2026 | | | 854,000 | | | | 930,860 | |
Owens-Brockway Glass Container, Inc.
Company Guar. Notes
5.38% due 01/15/2025* | | | 1,584,000 | | | | 1,564,200 | |
| | | | | | |
|
|
|
| | | | | | | | 2,495,060 | |
| | | | | | |
|
|
|
VALIC Company II Strategic Bond Fund
PORTFOLIO OF INVESTMENTS — August 31, 2018 — (continued)
| | | | | | | | |
| | |
| Security Description | | Principal
Amount(9) | | | Value
(Note 2) | |
| |
U.S. CORPORATE BONDS & NOTES (continued) | |
Containers - Paper/Plastic — 0.4% | |
Crown Americas LLC/Crown Americas Capital Corp. VI
Company Guar. Notes
4.75% due 02/01/2026*# | | $ | 609,000 | | | $ | 584,640 | |
Multi-Color Corp.
Company Guar. Notes
4.88% due 11/01/2025* | | | 1,700,000 | | | | 1,585,250 | |
Multi-Color Corp.
Company Guar. Notes
6.13% due 12/01/2022* | | | 934,000 | | | | 955,015 | |
| | | | | | |
|
|
|
| | | | | | | | 3,124,905 | |
| | | | | | |
|
|
|
Cosmetics & Toiletries — 0.3% | |
Coty, Inc.
Senior Notes
6.50% due 04/15/2026*# | | | 1,425,000 | | | | 1,340,391 | |
First Quality Finance Co., Inc.
Company Guar. Notes
5.00% due 07/01/2025* | | | 1,274,000 | | | | 1,194,375 | |
| | | | | | |
|
|
|
| | | | | | | | 2,534,766 | |
| | | | | | |
|
|
|
Distribution/Wholesale — 0.2% | |
H&E Equipment Services, Inc.
Company Guar. Notes
5.63% due 09/01/2025 | | | 1,300,000 | | | | 1,290,640 | |
| | | | | | |
|
|
|
Diversified Banking Institutions — 1.4% | |
Bank of America Corp.
Senior Notes
0.75% due 07/26/2023 | | EUR | 1,000,000 | | | | 1,163,116 | |
Bank of America Corp.
Senior Notes
3.55% due 03/05/2024 | | | 304,000 | | | | 302,139 | |
Bank of America Corp.
Senior Notes
3.86% due 07/23/2024 | | | 269,000 | | | | 270,379 | |
Bank of America Corp.
Sub. Notes
4.18% due 11/25/2027 | | | 951,000 | | | | 929,753 | |
Bank of America Corp.
Sub. Notes
6.11% due 01/29/2037 | | | 196,000 | | | | 226,901 | |
Citigroup, Inc.
Senior Notes
2.88% due 07/24/2023 | | | 833,000 | | | | 807,922 | |
Citigroup, Inc.
Sub. Notes
4.45% due 09/29/2027 | | | 738,000 | | | | 731,697 | |
Citigroup, Inc.
Senior Notes
4.65% due 07/23/2048 | | | 180,000 | | | | 183,924 | |
Citigroup, Inc.
Sub. Notes
4.75% due 05/18/2046 | | | 91,000 | | | | 89,943 | |
Citigroup, Inc.
Sub. Notes
6.00% due 10/31/2033 | | | 104,000 | | | | 118,258 | |
Goldman Sachs Group, Inc.
Senior Notes
1.25% due 05/01/2025 | | EUR | 900,000 | | | | 1,036,647 | |
Goldman Sachs Group, Inc.
Senior Notes
2.13% due 09/30/2024 | | EUR | 700,000 | | | | 855,376 | |
Goldman Sachs Group, Inc.
Senior Notes
2.91% due 06/05/2023 | | | 315,000 | | | | 306,489 | |
| | | | | | | | |
| | |
| Security Description | | Principal
Amount(9) | | | Value
(Note 2) | |
| |
| | | | | | | | | |
Diversified Banking Institutions (continued) | |
Goldman Sachs Group, Inc.
Senior Notes
4.02% due 10/31/2038 | | $ | 274,000 | | | $ | 255,892 | |
Goldman Sachs Group, Inc.
Senior Notes
6.13% due 02/15/2033 | | | 284,000 | | | | 329,089 | |
Goldman Sachs Group, Inc.
Sub. Notes
6.75% due 10/01/2037 | | | 225,000 | | | | 272,733 | |
JPMorgan Chase & Co.
Senior Notes
2.55% due 03/01/2021 | | | 882,000 | | | | 868,457 | |
JPMorgan Chase & Co.
Senior Notes
3.88% due 07/24/2038 | | | 574,000 | | | | 536,254 | |
Morgan Stanley
Senior Notes
1.75% due 03/11/2024 | | EUR | 350,000 | | | | 421,108 | |
Morgan Stanley
Sub. Notes
5.00% due 11/24/2025 | | | 1,812,000 | | | | 1,884,969 | |
| | | | | | |
|
|
|
| | | | | | | | 11,591,046 | |
| | | | | | |
|
|
|
Diversified Manufacturing Operations — 0.0% | |
Carlisle Cos., Inc.
Senior Notes
3.75% due 12/01/2027 | | | 172,000 | | | | 165,948 | |
| | | | | | |
|
|
|
Electric - Distribution — 0.0% | |
Entergy Louisiana LLC
Collateral Trust Bonds
4.20% due 09/01/2048 | | | 213,000 | | | | 215,340 | |
| | | | | | |
|
|
|
Electric - Generation — 0.1% | |
Basin Electric Power Cooperative
1st Mtg. Notes
4.75% due 04/26/2047* | | | 554,000 | | | | 575,112 | |
| | | | | | |
|
|
|
Electric - Integrated — 0.6% | |
Dominion Resources, Inc.
Senior Notes
5.25% due 08/01/2033 | | | 272,000 | | | | 293,298 | |
Duke Energy Progress LLC
1st Mtg. Notes
2.80% due 05/15/2022 | | | 160,000 | | | | 157,735 | |
Exelon Corp.
Junior Sub. Notes
3.50% due 06/01/2022 | | | 215,000 | | | | 212,461 | |
FirstEnergy Corp.
Senior Notes
3.90% due 07/15/2027 | | | 221,000 | | | | 217,223 | |
FirstEnergy Corp.
Senior Notes
4.85% due 07/15/2047 | | | 404,000 | | | | 415,304 | |
FirstEnergy Corp.
Senior Notes
7.38% due 11/15/2031 | | | 931,000 | | | | 1,207,892 | |
Georgia Power Co.
Senior Notes
2.00% due 09/08/2020 | | | 224,000 | | | | 218,719 | |
Indiana Michigan Power Co.
Senior Notes
4.25% due 08/15/2048 | | | 181,000 | | | | 182,365 | |
Massachusetts Electric Co.
Notes
4.00% due 08/15/2046* | | | 432,000 | | | | 417,446 | |
VALIC Company II Strategic Bond Fund
PORTFOLIO OF INVESTMENTS — August 31, 2018 — (continued)
| | | | | | | | |
| | |
| Security Description | | Principal
Amount(9) | | | Value
(Note 2) | |
| |
U.S. CORPORATE BONDS & NOTES (continued) | |
Electric - Integrated (continued) | |
Nevada Power Co.
General Ref. Mtg.
2.75% due 04/15/2020 | | $ | 167,000 | | | $ | 166,751 | |
Pacific Gas & Electric Co.
Senior Notes
3.30% due 12/01/2027 | | | 260,000 | | | | 238,824 | |
Public Service Co. of Colorado
1st Mtg. Bonds
3.70% due 06/15/2028 | | | 366,000 | | | | 369,444 | |
Public Service Co. of Colorado
1st Mtg. Bonds
4.10% due 06/15/2048 | | | 251,000 | | | | 254,292 | |
South Carolina Electric & Gas Co.
1st Mtg. Notes
4.35% due 02/01/2042 | | | 166,000 | | | | 161,896 | |
South Carolina Electric & Gas Co.
1st Mtg. Bonds
5.10% due 06/01/2065 | | | 562,000 | | | | 576,590 | |
Southern California Edison Co.
1st Mtg. Notes
4.13% due 03/01/2048 | | | 239,000 | | | | 233,053 | |
| | | | | | |
|
|
|
| | | | | | | | 5,323,293 | |
| | | | | | |
|
|
|
Electronic Components - Misc. — 0.0% | |
Jabil, Inc.
Senior Notes
3.95% due 01/12/2028# | | | 40,000 | | | | 38,216 | |
| | | | | | |
|
|
|
Electronic Components - Semiconductors — 0.0% | |
Intel Corp.
Senior Notes
2.45% due 07/29/2020 | | | 333,000 | | | | 330,885 | |
| | | | | | |
|
|
|
Electronic Measurement Instruments — 0.0% | |
Trimble, Inc.
Senior Notes
4.90% due 06/15/2028 | | | 348,000 | | | | 355,095 | |
| | | | | | |
|
|
|
Electronic Parts Distribution — 0.3% | |
Ingram Micro, Inc.
Senior Notes
5.45% due 12/15/2024 | | | 2,149,000 | | | | 2,124,540 | |
| | | | | | |
|
|
|
Electronic Security Devices — 0.0% | |
Allegion US Holding Co., Inc.
Company Guar. Notes
3.20% due 10/01/2024 | | | 95,000 | | | | 89,731 | |
| | | | | | |
|
|
|
Energy - Alternate Sources — 0.2% | |
Pattern Energy Group, Inc.
Company Guar. Notes
5.88% due 02/01/2024* | | | 1,719,000 | | | | 1,731,893 | |
| | | | | | |
|
|
|
Enterprise Software/Service — 0.4% | |
Donnelley Financial Solutions, Inc.
Company Guar. Notes
8.25% due 10/15/2024# | | | 1,835,000 | | | | 1,922,163 | |
Infor US, Inc.
Company Guar. Notes
6.50% due 05/15/2022 | | | 697,000 | | | | 706,040 | |
Oracle Corp.
Senior Notes
2.95% due 11/15/2024 | | | 519,000 | | | | 504,962 | |
Oracle Corp.
Senior Notes
3.90% due 05/15/2035 | | | 84,000 | | | | 82,418 | |
| | | | | | |
|
|
|
| | | | | | | | 3,215,583 | |
| | | | | | |
|
|
|
| | | | | | | | |
| | |
| Security Description | | Principal
Amount(9) | | | Value
(Note 2) | |
| |
| | | | | | | | | |
Finance - Auto Loans — 0.1% | |
Credit Acceptance Corp.
Company Guar. Notes
7.38% due 03/15/2023 | | $ | 974,000 | | | $ | 1,021,483 | |
| | | | | | |
|
|
|
Finance - Consumer Loans — 0.7% | |
Enova International, Inc.
Company Guar. Notes
8.50% due 09/01/2024* | | | 1,753,000 | | | | 1,823,120 | |
SLM Corp.
Senior Notes
5.63% due 08/01/2033 | | | 2,289,000 | | | | 1,922,760 | |
Springleaf Finance Corp.
Company Guar. Notes
6.88% due 03/15/2025 | | | 1,850,000 | | | | 1,850,555 | |
Springleaf Finance Corp.
Company Guar. Notes
7.13% due 03/15/2026 | | | 549,000 | | | | 546,293 | |
| | | | | | |
|
|
|
| | | | | | | | 6,142,728 | |
| | | | | | |
|
|
|
Finance - Credit Card — 0.3% | |
Alliance Data Systems Corp.
Company Guar. Notes
5.88% due 11/01/2021* | | | 1,730,000 | | | | 1,768,925 | |
American Express Co.
Senior Notes
2.50% due 08/01/2022 | | | 402,000 | | | | 387,202 | |
| | | | | | |
|
|
|
| | | | | | | | 2,156,127 | |
| | | | | | |
|
|
|
Finance - Investment Banker/Broker — 0.2% | |
Jefferies Group LLC/Jefferies Group Capital Finance, Inc.
Senior Notes
4.15% due 01/23/2030 | | | 211,000 | | | | 192,418 | |
Lehman Brothers Holdings, Inc.
Escrow Notes
5.50% due 04/04/2016† | | | 97,000 | | | | 2,871 | |
Lehman Brothers Holdings, Inc.
Escrow Notes
6.75% due 12/28/2017†(5)(6) | | | 111,000 | | | | 11 | |
Lehman Brothers Holdings, Inc.
Escrow Notes
7.50% due 05/11/2038†(5)(6) | | | 143,000 | | | | 14 | |
LPL Holdings, Inc.
Company Guar. Notes
5.75% due 09/15/2025* | | | 1,730,000 | | | | 1,691,075 | |
| | | | | | |
|
|
|
| | | | | | | | 1,886,389 | |
| | | | | | |
|
|
|
Finance - Mortgage Loan/Banker — 0.2% | |
Quicken Loans, Inc.
Company Guar. Notes
5.75% due 05/01/2025* | | | 1,775,000 | | | | 1,757,250 | |
| | | | | | |
|
|
|
Finance - Other Services — 0.1% | |
Intercontinental Exchange, Inc.
Senior Notes
4.25% due 09/21/2048 | | | 93,000 | | | | 93,216 | |
National Rural Utilities Cooperative Finance Corp.
Collateral Trust Bonds
2.30% due 11/01/2020 | | | 457,000 | | | | 449,529 | |
National Rural Utilities Cooperative Finance Corp.
Senior Notes
2.30% due 09/15/2022 | | | 248,000 | | | | 239,088 | |
National Rural Utilities Cooperative Finance Corp.
Collateral Trust Notes
2.40% due 04/25/2022 | | | 168,000 | | | | 163,418 | |
| | | | | | |
|
|
|
| | | | | | | | 945,251 | |
| | | | | | |
|
|
|
VALIC Company II Strategic Bond Fund
PORTFOLIO OF INVESTMENTS — August 31, 2018 — (continued)
| | | | | | | | |
| | |
| Security Description | | Principal
Amount(9) | | | Value
(Note 2) | |
| |
U.S. CORPORATE BONDS & NOTES (continued) | |
Food - Meat Products — 0.0% | |
Smithfield Foods, Inc.
Senior Notes
2.65% due 10/03/2021* | | $ | 140,000 | | | $ | 133,816 | |
| | | | | | |
|
|
|
Food - Misc./Diversified — 0.0% | |
Kraft Heinz Foods Co.
Sec. Notes
4.88% due 02/15/2025* | | | 349,000 | | | | 355,610 | |
| | | | | | |
|
|
|
Food - Retail — 0.3% | |
Albertsons Cos. LLC/Safeway, Inc./New Albertson’s, Inc./Albertson’s LLC
Company Guar. Notes
5.75% due 03/15/2025 | | | 2,724,000 | | | | 2,465,220 | |
Kroger Co.
Senior Notes
4.65% due 01/15/2048# | | | 357,000 | | | | 342,964 | |
| | | | | | |
|
|
|
| | | | | | | | 2,808,184 | |
| | | | | | |
|
|
|
Funeral Services & Related Items — 0.1% | |
Carriage Services, Inc.
Company Guar. Notes
6.63% due 06/01/2026* | | | 711,000 | | | | 723,443 | |
| | | | | | |
|
|
|
Gambling (Non-Hotel) — 0.1% | |
Scientific Games International, Inc.
Senior Sec. Notes
5.00% due 10/15/2025* | | | 788,000 | | | | 748,600 | |
Waterford Gaming LLC/Waterford Gaming Financial Corp.
Escrow Notes
8.63% due 09/15/2014*†(5)(6) | | | 272,905 | | | | 4,639 | |
| | | | | | |
|
|
|
| | | | | | | | 753,239 | |
| | | | | | |
|
|
|
Gas - Distribution — 0.0% | |
NiSource, Inc.
Senior Notes
4.38% due 05/15/2047 | | | 122,000 | | | | 120,748 | |
| | | | | | |
|
|
|
Hotels/Motels — 0.3% | |
Wyndham Worldwide Corp.
Senior Sec. Notes
4.15% due 04/01/2024 | | | 1,460,000 | | | | 1,442,480 | |
Wyndham Worldwide Corp.
Senior Sec. Notes
4.50% due 04/01/2027# | | | 1,195,000 | | | | 1,141,583 | |
| | | | | | |
|
|
|
| | | | | | | | 2,584,063 | |
| | | | | | |
|
|
|
Independent Power Producers — 0.1% | |
NRG Yield Operating LLC
Company Guar. Notes
5.38% due 08/15/2024 | | | 1,020,000 | | | | 1,025,100 | |
| | | | | | |
|
|
|
Insurance - Life/Health — 0.0% | |
AXA Equitable Holdings, Inc.
Senior Notes
5.00% due 04/20/2048* | | | 76,000 | | | | 71,581 | |
Brighthouse Financial, Inc.
Senior Notes
4.70% due 06/22/2047 | | | 64,000 | | | | 53,625 | |
| | | | | | |
|
|
|
| | | | | | | | 125,206 | |
| | | | | | |
|
|
|
Insurance - Multi-line — 0.1% | |
Assurant, Inc.
Senior Notes
6.75% due 02/15/2034 | | | 144,000 | | | | 167,392 | |
| | | | | | | | |
| | |
| Security Description | | Principal
Amount(9) | | | Value
(Note 2) | |
| |
| | | | | | | | | |
Insurance - Multi-line (continued) | |
Metropolitan Life Global Funding I
Sec. Notes
2.30% due 04/10/2019* | | $ | 700,000 | | | $ | 698,957 | |
| | | | | | |
|
|
|
| | | | | | | | 866,349 | |
| | | | | | |
|
|
|
Insurance - Mutual — 0.1% | |
Massachusetts Mutual Life Insurance Co.
Sub. Notes
4.50% due 04/15/2065* | | | 118,000 | | | | 113,968 | |
MassMutual Global Funding II
Senior Sec. Notes
2.75% due 06/22/2024* | | | 287,000 | | | | 275,953 | |
New York Life Global Funding
Sec. Notes
1.95% due 09/28/2020* | | | 628,000 | | | | 614,672 | |
| | | | | | |
|
|
|
| | | | | | | | 1,004,593 | |
| | | | | | |
|
|
|
Insurance - Property/Casualty — 0.3% | |
ACE INA Holdings, Inc.
Company Guar. Notes
2.88% due 11/03/2022 | | | 232,000 | | | | 228,298 | |
AmWINS Group, Inc.
Company Guar. Notes
7.75% due 07/01/2026* | | | 1,265,000 | | | | 1,332,994 | |
Chubb INA Holdings, Inc.
Company Guar. Notes
2.50% due 03/15/2038 | | EUR | 950,000 | | | | 1,123,135 | |
| | | | | | |
|
|
|
| | | | | | | | 2,684,427 | |
| | | | | | |
|
|
|
Internet Connectivity Services — 0.2% | |
Cogent Communications Group, Inc.
Senior Sec. Notes
5.38% due 03/01/2022* | | | 894,000 | | | | 909,645 | |
Cogent Communications Group, Inc.
Senior Sec. Notes
5.38% due 03/01/2022* | | | 465,000 | | | | 473,138 | |
| | | | | | |
|
|
|
| | | | | | | | 1,382,783 | |
| | | | | | |
|
|
|
Internet Content - Entertainment — 0.2% | |
Netflix, Inc.
Senior Notes
5.88% due 02/15/2025 | | | 1,375,000 | | | | 1,419,688 | |
| | | | | | |
|
|
|
Investment Companies — 0.1% | |
FS Energy & Power Fund
Senior Sec. Notes
7.50% due 08/15/2023* | | | 1,045,000 | | | | 1,069,505 | |
| | | | | | |
|
|
|
Machinery - Construction & Mining — 0.2% | |
Caterpillar Financial Services Corp.
Senior Notes
2.55% due 11/29/2022 | | | 150,000 | | | | 146,142 | |
Caterpillar Financial Services Corp.
Senior Notes
3.45% due 05/15/2023# | | | 228,000 | | | | 229,824 | |
Terex Corp.
Company Guar. Notes
5.63% due 02/01/2025* | | | 1,264,000 | | | | 1,254,520 | |
| | | | | | |
|
|
|
| | | | | | | | 1,630,486 | |
| | | | | | |
|
|
|
Machinery - Electrical — 0.0% | |
ABB Finance USA, Inc.
Company Guar. Notes
3.38% due 04/03/2023 | | | 276,000 | | | | 275,691 | |
| | | | | | |
|
|
|
VALIC Company II Strategic Bond Fund
PORTFOLIO OF INVESTMENTS — August 31, 2018 — (continued)
| | | | | | | | |
| | |
| Security Description | | Principal
Amount(9) | | | Value
(Note 2) | |
| |
U.S. CORPORATE BONDS & NOTES (continued) | |
Machinery - Farming — 0.1% | |
CNH Industrial Capital LLC
Company Guar. Notes
4.20% due 01/15/2024 | | $ | 190,000 | | | $ | 190,599 | |
CNH Industrial Capital LLC
Company Guar. Notes
4.38% due 04/05/2022 | | | 273,000 | | | | 276,549 | |
John Deere Capital Corp.
Senior Notes
2.35% due 01/08/2021 | | | 180,000 | | | | 177,326 | |
| | | | | | |
|
|
|
| | | | | | | | 644,474 | |
| | | | | | |
|
|
|
Machinery - General Industrial — 0.1% | |
Roper Technologies, Inc.
Senior Notes
4.20% due 09/15/2028 | | | 533,000 | | | | 532,906 | |
| | | | | | |
|
|
|
Machinery - Thermal Process — 0.1% | |
Cleaver-Brooks, Inc.
Senior Sec. Notes
7.88% due 03/01/2023* | | | 966,000 | | | | 997,395 | |
| | | | | | |
|
|
|
Marine Services — 0.2% | |
Great Lakes Dredge & Dock Corp.
Company Guar. Notes
8.00% due 05/15/2022 | | | 1,256,000 | | | | 1,290,540 | |
| | | | | | |
|
|
|
Medical Instruments — 0.1% | |
Medtronic, Inc.
Company Guar. Notes
2.50% due 03/15/2020 | | | 433,000 | | | | 430,216 | |
| | | | | | |
|
|
|
Medical Labs & Testing Services — 0.1% | |
Laboratory Corp. of America Holdings
Senior Notes
3.25% due 09/01/2024 | | | 418,000 | | | | 403,951 | |
Roche Holdings, Inc.
Company Guar. Notes
1.75% due 01/28/2022* | | | 226,000 | | | | 215,493 | |
| | | | | | |
|
|
|
| | | | | | | | 619,444 | |
| | | | | | |
|
|
|
Medical - Biomedical/Gene — 0.0% | |
Celgene Corp.
Senior Notes
3.63% due 05/15/2024 | | | 167,000 | | | | 165,059 | |
Celgene Corp.
Senior Notes
4.55% due 02/20/2048 | | | 130,000 | | | | 123,002 | |
| | | | | | |
|
|
|
| | | | | | | | 288,061 | |
| | | | | | |
|
|
|
Medical - Drugs — 0.2% | |
Bayer US Finance II LLC
Company Guar. Notes
4.63% due 06/25/2038* | | | 391,000 | | | | 381,191 | |
Endo Finance LLC/Endo Finco, Inc.
Company Guar. Notes
5.38% due 01/15/2023* | | | 567,000 | | | | 484,785 | |
GlaxoSmithKline Capital, Inc.
Company Guar. Notes
3.38% due 05/15/2023 | | | 170,000 | | | | 170,296 | |
Johnson & Johnson
Senior Notes
1.65% due 05/20/2035 | | EUR | 375,000 | | | | 451,474 | |
| | | | | | |
|
|
|
| | | | | | | | 1,487,746 | |
| | | | | | |
|
|
|
Medical - Generic Drugs — 0.1% | |
Actavis, Inc.
Company Guar. Notes
3.25% due 10/01/2022 | | | 124,000 | | | | 121,784 | |
| | | | | | | | |
| | |
| Security Description | | Principal
Amount(9) | | | Value
(Note 2) | |
| |
| | | | | | | | | |
Medical - Generic Drugs (continued) | |
Mylan, Inc.
Company Guar. Notes
5.20% due 04/15/2048* | | $ | 751,000 | | | $ | 703,268 | |
| | | | | | |
|
|
|
| | | | | | | | 825,052 | |
| | | | | | |
|
|
|
Medical - HMO — 0.2% | |
Centene Corp.
Senior Notes
5.38% due 06/01/2026* | | | 248,000 | | | | 256,018 | |
UnitedHealth Group, Inc.
Senior Bonds
2.38% due 10/15/2022 | | | 1,242,000 | | | | 1,199,264 | |
UnitedHealth Group, Inc.
Senior Notes
3.75% due 07/15/2025 | | | 224,000 | | | | 226,424 | |
| | | | | | |
|
|
|
| | | | | | | | 1,681,706 | |
| | | | | | |
|
|
|
Medical - Hospitals — 0.3% | |
CHS/Community Health Systems, Inc.
Senior Sec. Notes
5.13% due 08/01/2021# | | | 1,800,000 | | | | 1,737,000 | |
HCA, Inc.
Senior Sec. Notes
5.25% due 06/15/2026 | | | 1,039,000 | | | | 1,070,170 | |
| | | | | | |
|
|
|
| | | | | | | | 2,807,170 | |
| | | | | | |
|
|
|
Medical - Wholesale Drug Distribution — 0.0% | |
Allergan Sales LLC
Company Guar. Notes
4.88% due 02/15/2021* | | | 99,000 | | | | 102,137 | |
| | | | | | |
|
|
|
Metal Processors & Fabrication — 0.3% | |
Grinding Media, Inc./Moly-Cop AltaSteel, Ltd.
Senior Sec. Notes
7.38% due 12/15/2023* | | | 853,000 | | | | 895,385 | |
Novelis Corp.
Company Guar. Notes
6.25% due 08/15/2024* | | | 1,508,000 | | | | 1,526,850 | |
Timken Co.
Senior Notes
4.50% due 12/15/2028 | | | 149,000 | | | | 148,883 | |
| | | | | | |
|
|
|
| | | | | | | | 2,571,118 | |
| | | | | | |
|
|
|
Metal - Copper — 0.2% | |
Freeport-McMoRan Copper & Gold, Inc.
Company Guar. Notes
3.88% due 03/15/2023# | | | 1,358,000 | | | | 1,305,378 | |
| | | | | | |
|
|
|
Metal - Iron — 0.2% | |
Cleveland-Cliffs, Inc.
Company Guar. Notes
5.75% due 03/01/2025# | | | 1,450,000 | | | | 1,423,987 | |
| | | | | | |
|
|
|
Multimedia — 0.1% | |
E.W. Scripps Co.
Company Guar. Notes
5.13% due 05/15/2025* | | | 837,000 | | | | 799,335 | |
Time Warner, Inc.
Company Guar. Notes
4.85% due 07/15/2045 | | | 66,000 | | | | 61,797 | |
| | | | | | |
|
|
|
| | | | | | | | 861,132 | |
| | | | | | |
|
|
|
Networking Products — 0.0% | |
Cisco Systems, Inc.
Senior Notes
2.20% due 02/28/2021 | | | 371,000 | | | | 364,909 | |
| | | | | | |
|
|
|
VALIC Company II Strategic Bond Fund
PORTFOLIO OF INVESTMENTS — August 31, 2018 — (continued)
| | | | | | | | |
| | |
| Security Description | | Principal
Amount(9) | | | Value
(Note 2) | |
| |
U.S. CORPORATE BONDS & NOTES (continued) | |
Oil Companies - Exploration & Production — 1.8% | |
Anadarko Petroleum Corp.
Senior Notes
6.45% due 09/15/2036 | | $ | 174,000 | | | $ | 202,181 | |
Apache Corp.
Senior Notes
4.38% due 10/15/2028 | | | 252,000 | | | | 248,424 | |
Callon Petroleum Co.
Company Guar. Notes
6.38% due 07/01/2026 | | | 1,460,000 | | | | 1,496,500 | |
Chaparral Energy, Inc.
Senior Notes
8.75% due 07/15/2023* | | | 1,175,000 | | | | 1,169,125 | |
Continental Resources, Inc.
Company Guar. Notes
4.50% due 04/15/2023 | | | 249,000 | | | | 254,755 | |
Endeavor Energy Resources LP/EER Finance, Inc.
Senior Notes
5.50% due 01/30/2026* | | | 1,300,000 | | | | 1,296,750 | |
Extraction Oil & Gas, Inc.
Company Guar. Notes
5.63% due 02/01/2026* | | | 1,475,000 | | | | 1,380,969 | |
Hess Corp.
Senior Notes
5.60% due 02/15/2041 | | | 214,000 | | | | 217,152 | |
Hilcorp Energy I LP/Hilcorp Finance Co.
Senior Notes
5.00% due 12/01/2024* | | | 1,929,000 | | | | 1,863,896 | |
Lonestar Resources America, Inc.
Company Guar. Notes
11.25% due 01/01/2023* | | | 1,323,000 | | | | 1,435,455 | |
Marathon Oil Corp.
Senior Notes
6.60% due 10/01/2037 | | | 349,000 | | | | 412,383 | |
Newfield Exploration Co.
Senior Notes
5.38% due 01/01/2026 | | | 763,000 | | | | 795,428 | |
QEP Resources, Inc.
Senior Notes
5.63% due 03/01/2026# | | | 1,665,000 | | | | 1,592,156 | |
Sanchez Energy Corp.
Company Guar. Notes
6.13% due 01/15/2023 | | | 782,000 | | | | 441,556 | |
Southwestern Energy Co.
Company Guar. Notes
7.50% due 04/01/2026 | | | 1,250,000 | | | | 1,309,375 | |
WildHorse Resource Development Corp.
Company Guar. Notes
6.88% due 02/01/2025 | | | 1,415,000 | | | | 1,425,612 | |
| | | | | | |
|
|
|
| | | | | | | | 15,541,717 | |
| | | | | | |
|
|
|
Oil Companies - Integrated — 0.0% | |
Chevron Corp.
Senior Notes
3.19% due 06/24/2023 | | | 358,000 | | | | 358,092 | |
| | | | | | |
|
|
|
Oil Field Machinery & Equipment — 0.2% | |
Forum Energy Technologies, Inc.
Company Guar. Notes
6.25% due 10/01/2021 | | | 1,409,000 | | | | 1,409,000 | |
| | | | | | |
|
|
|
Oil Refining & Marketing — 0.1% | |
PBF Holding Co. LLC/PBF Finance Corp.
Company Guar. Notes
7.25% due 06/15/2025 | | | 1,049,000 | | | | 1,106,695 | |
| | | | | | |
|
|
|
| | | | | | | | |
| | |
| Security Description | | Principal
Amount(9) | | | Value
(Note 2) | |
| |
| | | | | | | | | |
Oil - Field Services — 0.5% | |
Apergy Corp.
Company Guar. Notes
6.38% due 05/01/2026* | | $ | 741,000 | | | $ | 757,673 | |
Calfrac Holdings LP
Senior Notes
8.50% due 06/15/2026* | | | 1,455,000 | | | | 1,385,887 | |
Halliburton Co.
Senior Notes
4.85% due 11/15/2035 | | | 59,000 | | | | 61,854 | |
Pioneer Energy Services Corp.
Company Guar. Notes
6.13% due 03/15/2022 | | | 1,322,000 | | | | 1,156,750 | |
USA Compression Partners LP/USA Compression Finance Corp.
Senior Notes
6.88% due 04/01/2026* | | | 1,230,000 | | | | 1,273,050 | |
| | | | | | |
|
|
|
| | | | | | | | 4,635,214 | |
| | | | | | |
|
|
|
Paper & Related Products — 0.1% | |
Domtar Corp.
Company Guar. Notes
6.75% due 02/15/2044 | | | 500,000 | | | | 531,733 | |
Georgia-Pacific LLC
Senior Notes
3.73% due 07/15/2023* | | | 473,000 | | | | 478,781 | |
Georgia-Pacific LLC
Company Guar. Notes
5.40% due 11/01/2020* | | | 135,000 | | | | 141,108 | |
International Paper Co.
Senior Notes
5.00% due 09/15/2035 | | | 85,000 | | | | 87,709 | |
| | | | | | |
|
|
|
| | | | | | | | 1,239,331 | |
| | | | | | |
|
|
|
Petrochemicals — 0.0% | |
Chevron Phillips Chemical Co. LLC/Chevron Phillips Chemical Co. LP
Senior Notes
3.30% due 05/01/2023* | | | 157,000 | | | | 156,050 | |
| | | | | | |
|
|
|
Pharmacy Services — 0.1% | |
CVS Health Corp.
Senior Notes
4.78% due 03/25/2038 | | | 220,000 | | | | 219,252 | |
CVS Health Corp.
Senior Notes
5.05% due 03/25/2048 | | | 139,000 | | | | 141,848 | |
CVS Pass-Through Trust
Pass-Through Certs.
4.70% due 01/10/2036* | | | 101,472 | | | | 100,796 | |
CVS Pass-Through Trust
Pass-Through Certs.
5.77% due 01/10/2033* | | | 63,507 | | | | 67,757 | |
CVS Pass-Through Trust
Pass-Through Certs.
5.93% due 01/10/2034* | | | 137,229 | | | | 147,507 | |
| | | | | | |
|
|
|
| | | | | | | | 677,160 | |
| | | | | | |
|
|
|
Physicians Practice Management — 0.3% | |
MEDNAX, Inc.
Company Guar. Notes
5.25% due 12/01/2023* | | | 2,144,000 | | | | 2,138,640 | |
| | | | | | |
|
|
|
Pipelines — 1.8% | |
Andeavor Logistics LP/Tesoro Logistics Finance Corp.
Company Guar. Notes
5.20% due 12/01/2047 | | | 292,000 | | | | 290,412 | |
VALIC Company II Strategic Bond Fund
PORTFOLIO OF INVESTMENTS — August 31, 2018 — (continued)
| | | | | | | | |
| | |
| Security Description | | Principal
Amount(9) | | | Value
(Note 2) | |
| |
U.S. CORPORATE BONDS & NOTES (continued) | |
Pipelines (continued) | |
Cheniere Corpus Christi Holdings LLC
Senior Sec. Notes
7.00% due 06/30/2024 | | $ | 1,955,000 | | | $ | 2,162,719 | |
Cheniere Energy Partners LP
Senior Sec. Notes
5.25% due 10/01/2025 | | | 551,000 | | | | 551,000 | |
Energy Transfer Equity LP
Senior Sec. Notes
4.25% due 03/15/2023 | | | 1,320,000 | | | | 1,323,696 | |
Energy Transfer Partners LP
Company Guar. Notes
4.90% due 03/15/2035 | | | 113,000 | | | | 105,344 | |
Energy Transfer Partners LP
Company Guar. Notes
6.05% due 06/01/2041 | | | 17,000 | | | | 17,771 | |
Energy Transfer Partners LP
Company Guar. Notes
6.63% due 10/15/2036 | | | 168,000 | | | | 187,962 | |
EnLink Midstream Partners LP
Senior Notes
4.85% due 07/15/2026 | | | 107,000 | | | | 103,948 | |
EnLink Midstream Partners LP
Senior Notes
5.05% due 04/01/2045 | | | 175,000 | | | | 148,197 | |
Genesis Energy LP/Genesis Energy Finance Corp.
Company Guar. Notes
5.63% due 06/15/2024 | | | 1,403,000 | | | | 1,308,297 | |
Genesis Energy LP/Genesis Energy Finance Corp.
Company Guar. Notes
6.00% due 05/15/2023 | | | 678,000 | | | | 666,983 | |
Holly Energy Partners LP/Holly Energy Finance Corp.
Company Guar. Notes
6.00% due 08/01/2024* | | | 1,252,000 | | | | 1,273,910 | |
Kinder Morgan Energy Partners LP
Company Guar. Notes
4.30% due 05/01/2024 | | | 280,000 | | | | 283,571 | |
Kinder Morgan Energy Partners LP
Company Guar. Notes
6.95% due 01/15/2038 | | | 110,000 | | | | 129,787 | |
Kinder Morgan, Inc.
Company Guar. Notes
1.50% due 03/16/2022 | | EUR | 550,000 | | | | 658,861 | |
Kinder Morgan, Inc.
Company Guar. Notes
5.00% due 02/15/2021* | | | 244,000 | | | | 252,736 | |
MPLX LP
Senior Notes
4.00% due 03/15/2028 | | | 433,000 | | | | 417,605 | |
NGPL PipeCo LLC
Senior Notes
4.38% due 08/15/2022* | | | 288,000 | | | | 290,160 | |
Northern Natural Gas Co.
Senior Notes
4.30% due 01/15/2049* | | | 101,000 | | | | 100,669 | |
SemGroup Corp./Rose Rock Finance Corp.
Company Guar. Notes
5.63% due 07/15/2022 | | | 2,179,000 | | | | 2,159,934 | |
Summit Midstream Holdings LLC/Summit Midstream Finance Corp.
Company Guar. Notes
5.50% due 08/15/2022 | | | 1,743,000 | | | | 1,734,285 | |
Western Gas Partners LP
Senior Notes
4.65% due 07/01/2026 | | | 248,000 | | | | 248,453 | |
| | | | | | | | |
| | |
| Security Description | | Principal
Amount(9) | | | Value
(Note 2) | |
| |
| | | | | | | | | |
Pipelines (continued) | |
Williams Cos., Inc.
Senior Notes
3.70% due 01/15/2023 | | $ | 527,000 | | | $ | 521,730 | |
Williams Cos., Inc.
Senior Notes
5.75% due 06/24/2044 | | | 265,000 | | | | 284,875 | |
| | | | | | |
|
|
|
| | | | | | | | 15,222,905 | |
| | | | | | |
|
|
|
Platinum — 0.2% | |
Stillwater Mining Co.
Company Guar. Notes
7.13% due 06/27/2025 | | | 890,000 | | | | 824,318 | |
Stillwater Mining Co.
Company Guar. Notes
7.13% due 06/27/2025*# | | | 1,125,000 | | | | 1,041,975 | |
| | | | | | |
|
|
|
| | | | | | | | 1,866,293 | |
| | | | | | |
|
|
|
Poultry — 0.1% | |
Pilgrim’s Pride Corp.
Senior Notes
5.88% due 09/30/2027* | | | 1,290,000 | | | | 1,225,500 | |
| | | | | | |
|
|
|
Publishing - Books — 0.2% | |
McGraw-Hill Global Education Holdings LLC/McGraw-Hill Global Education Finance
Senior Notes
7.88% due 05/15/2024*# | | | 2,190,000 | | | | 1,927,200 | |
| | | | | | |
|
|
|
Quarrying — 0.2% | |
Hi-Crush Partners LP
Senior Notes
9.50% due 08/01/2026* | | | 1,950,000 | | | | 1,872,000 | |
| | | | | | |
|
|
|
Racetracks — 0.1% | |
GLP Capital LP/GLP Financing II, Inc.
Company Guar. Notes
5.38% due 04/15/2026 | | | 1,035,000 | | | | 1,074,796 | |
| | | | | | |
|
|
|
Radio — 0.2% | |
Sirius XM Radio, Inc.
Company Guar. Notes
5.38% due 07/15/2026* | | | 1,310,000 | | | | 1,306,725 | |
| | | | | | |
|
|
|
Real Estate Investment Trusts — 1.5% | |
American Tower Corp.
Senior Notes
1.95% due 05/22/2026 | | EUR | 400,000 | | | | 470,429 | |
CTR Partnership LP/CareTrust Capital Corp.
Company Guar. Notes
5.25% due 06/01/2025 | | | 1,672,000 | | | | 1,630,200 | |
EPR Properties
Company Guar. Notes
4.95% due 04/15/2028 | | | 72,000 | | | | 71,559 | |
ESH Hospitality, Inc.
Company Guar. Notes
5.25% due 05/01/2025* | | | 1,990,000 | | | | 1,927,812 | |
GEO Group, Inc.
Company Guar. Notes
5.13% due 04/01/2023 | | | 1,045,000 | | | | 1,008,425 | |
Iron Mountain, Inc.
Company Guar. Notes
4.88% due 09/15/2027* | | | 1,290,000 | | | | 1,195,314 | |
iStar, Inc.
Senior Notes
5.25% due 09/15/2022# | | | 1,385,000 | | | | 1,371,150 | |
iStar, Inc.
Senior Notes
6.00% due 04/01/2022 | | | 616,000 | | | | 621,390 | |
VALIC Company II Strategic Bond Fund
PORTFOLIO OF INVESTMENTS — August 31, 2018 — (continued)
| | | | | | | | |
| | |
| Security Description | | Principal
Amount(9) | | | Value
(Note 2) | |
| |
U.S. CORPORATE BONDS & NOTES (continued) | |
Real Estate Investment Trusts (continued) | |
Kimco Realty Corp.
Senior Notes
4.25% due 04/01/2045 | | $ | 158,000 | | | $ | 143,262 | |
MPT Operating Partnership LP/MPT Finance Corp.
Company Guar. Notes
5.00% due 10/15/2027 | | | 1,364,000 | | | | 1,336,720 | |
Sabra Health Care LP
Company Guar. Notes
5.13% due 08/15/2026 | | | 700,000 | | | | 679,264 | |
Starwood Property Trust, Inc.
Senior Notes
4.75% due 03/15/2025# | | | 2,250,000 | | | | 2,137,500 | |
Washington Prime Group LP
Senior Notes
5.95% due 08/15/2024# | | | 172,000 | | | | 166,822 | |
Welltower, Inc.
Senior Notes
3.95% due 09/01/2023 | | | 180,000 | | | | 181,300 | |
| | | | | | |
|
|
|
| | | | | | | | 12,941,147 | |
| | | | | | |
|
|
|
Real Estate Management/Services — 0.4% | |
Kennedy-Wilson, Inc.
Company Guar. Notes
5.88% due 04/01/2024 | | | 2,006,000 | | | | 1,988,447 | |
Realogy Group LLC/Realogy Co-Issuer Corp.
Company Guar. Notes
4.88% due 06/01/2023* | | | 1,595,000 | | | | 1,491,325 | |
| | | | | | |
|
|
|
| | | | | | | | 3,479,772 | |
| | | | | | |
|
|
|
Real Estate Operations & Development — 0.2% | |
Greystar Real Estate Partners LLC
Senior Sec. Notes
5.75% due 12/01/2025* | | | 1,310,000 | | | | 1,280,525 | |
| | | | | | |
|
|
|
Rental Auto/Equipment — 0.3% | |
Ahern Rentals, Inc.
Sec. Notes
7.38% due 05/15/2023* | | | 1,294,000 | | | | 1,273,037 | |
Jurassic Holdings III, Inc.
Sec. Notes
6.88% due 02/15/2021*# | | | 1,460,000 | | | | 1,423,500 | |
| | | | | | |
|
|
|
| | | | | | | | 2,696,537 | |
| | | | | | |
|
|
|
Retail - Appliances — 0.2% | |
Conn’s, Inc.
Company Guar. Notes
7.25% due 07/15/2022# | | | 1,492,000 | | | | 1,499,162 | |
| | | | | | |
|
|
|
Retail - Automobile — 0.2% | |
Asbury Automotive Group, Inc.
Company Guar. Notes
6.00% due 12/15/2024 | | | 1,265,000 | | | | 1,268,163 | |
AutoNation, Inc.
Company Guar. Notes
3.50% due 11/15/2024 | | | 308,000 | | | | 293,598 | |
| | | | | | |
|
|
|
| | | | | | | | 1,561,761 | |
| | | | | | |
|
|
|
Retail - Discount — 0.2% | |
Wal-Mart Stores, Inc.
Senior Bonds
1.90% due 12/15/2020 | | | 629,000 | | | | 617,144 | |
Wal-Mart Stores, Inc.
Senior Notes
2.55% due 04/08/2026 | | EUR | 575,000 | | | | 749,963 | |
| | | | | | |
|
|
|
| | | | | | | | 1,367,107 | |
| | | | | | |
|
|
|
| | | | | | | | |
| | |
| Security Description | | Principal
Amount(9) | | | Value
(Note 2) | |
| |
| | | | | | | | | |
Retail - Leisure Products — 0.2% | |
Party City Holdings, Inc.
Company Guar. Notes
6.63% due 08/01/2026* | | $ | 1,264,000 | | | $ | 1,273,480 | |
| | | | | | |
|
|
|
Retail - Office Supplies — 0.3% | |
Staples, Inc.
Company Guar. Notes
8.50% due 09/15/2025*# | | | 2,315,000 | | | | 2,187,443 | |
| | | | | | |
|
|
|
Retail - Pawn Shops — 0.1% | |
FirstCash, Inc.
Company Guar. Notes
5.38% due 06/01/2024* | | | 1,163,000 | | | | 1,163,000 | |
| | | | | | |
|
|
|
Retail - Restaurants — 0.2% | |
Brinker International, Inc.
Company Guar. Notes
5.00% due 10/01/2024* | | | 952,000 | | | | 918,680 | |
Golden Nugget, Inc.
Company Guar. Notes
8.75% due 10/01/2025* | | | 711,000 | | | | 750,105 | |
| | | | | | |
|
|
|
| | | | | | | | 1,668,785 | |
| | | | | | |
|
|
|
Rubber/Plastic Products — 0.0% | |
Venture Holdings Co. LLC
Company Guar. Notes
11.00% due 06/01/2007†(5)(6)(7)(8) | | | 25,000 | | | | 0 | |
| | | | | | |
|
|
|
Satellite Telecom — 0.2% | |
Hughes Satellite Systems Corp.
Company Guar. Notes
6.63% due 08/01/2026 | | | 1,684,000 | | | | 1,612,430 | |
| | | | | | |
|
|
|
Savings & Loans/Thrifts — 0.2% | |
Astoria Financial Corp.
Senior Notes
3.50% due 06/08/2020 | | | 500,000 | | | | 499,808 | |
First Niagara Financial Group, Inc.
Senior Notes
6.75% due 03/19/2020 | | | 447,000 | | | | 469,223 | |
First Niagara Financial Group, Inc.
Sub. Notes
7.25% due 12/15/2021 | | | 824,000 | | | | 914,941 | |
| | | | | | |
|
|
|
| | | | | | | | 1,883,972 | |
| | | | | | |
|
|
|
Schools — 0.2% | |
Graham Holdings Co.
Company Guar. Notes
5.75% due 06/01/2026* | | | 1,235,000 | | | | 1,262,788 | |
| | | | | | |
|
|
|
Security Services — 0.2% | |
ADT Corp.
Senior Sec. Notes
4.13% due 06/15/2023 | | | 842,000 | | | | 800,953 | |
ADT Corp.
Senior Sec. Notes
6.25% due 10/15/2021 | | | 1,013,000 | | | | 1,068,715 | |
| | | | | | |
|
|
|
| | | | | | | | 1,869,668 | |
| | | | | | |
|
|
|
Semiconductor Components - Integrated Circuits — 0.0% | |
QUALCOMM, Inc.
Senior Notes
3.45% due 05/20/2025 | | | 361,000 | | | | 351,643 | |
| | | | | | |
|
|
|
Steel Pipe & Tube — 0.0% | |
Valmont Industries, Inc.
Company Guar. Notes
5.00% due 10/01/2044 | | | 119,000 | | | | 109,940 | |
| | | | | | |
|
|
|
VALIC Company II Strategic Bond Fund
PORTFOLIO OF INVESTMENTS — August 31, 2018 — (continued)
| | | | | | | | |
| | |
| Security Description | | Principal
Amount(9) | | | Value
(Note 2) | |
| |
U.S. CORPORATE BONDS & NOTES (continued) | |
Steel - Producers — 0.4% | |
AK Steel Corp.
Company Guar. Notes
6.38% due 10/15/2025# | | $ | 1,125,000 | | | $ | 1,046,250 | |
Commercial Metals Co.
Senior Notes
5.75% due 04/15/2026* | | | 1,169,000 | | | | 1,128,085 | |
United States Steel Corp.
Senior Notes
6.88% due 08/15/2025 | | | 1,235,000 | | | | 1,253,525 | |
| | | | | | |
|
|
|
| | | | | | | | 3,427,860 | |
| | | | | | |
|
|
|
Telephone - Integrated — 0.8% | |
AT&T, Inc.
Senior Notes
3.15% due 09/04/2036 | | EUR | 600,000 | | | | 695,163 | |
AT&T, Inc.
Senior Notes
4.50% due 05/15/2035 | | | 884,000 | | | | 821,915 | |
AT&T, Inc.
Senior Notes
4.90% due 08/15/2037* | | | 511,000 | | | | 489,451 | |
CenturyLink, Inc.
Senior Notes
6.75% due 12/01/2023# | | | 1,795,000 | | | | 1,871,288 | |
Citizens Communications Co.
Senior Notes
9.00% due 08/15/2031# | | | 2,310,000 | | | | 1,368,675 | |
Verizon Communications, Inc.
Senior Bonds
2.88% due 01/15/2038 | | EUR | 330,000 | | | | 381,370 | |
Verizon Communications, Inc.
Senior Notes
4.40% due 11/01/2034 | | | 152,000 | | | | 147,053 | |
Verizon Communications, Inc.
Senior Notes
5.25% due 03/16/2037 | | | 996,000 | | | | 1,054,873 | |
| | | | | | |
|
|
|
| | | | | | | | 6,829,788 | |
| | | | | | |
|
|
|
Television — 0.3% | |
Belo Corp.
Company Guar. Notes
7.75% due 06/01/2027 | | | 1,320,000 | | | | 1,412,400 | |
CBS Corp.
Company Guar. Notes
3.70% due 08/15/2024 | | | 231,000 | | | | 225,060 | |
Gray Television, Inc.
Company Guar. Notes
5.13% due 10/15/2024* | | | 855,000 | | | | 837,900 | |
Gray Television, Inc.
Company Guar. Notes
5.88% due 07/15/2026* | | | 273,000 | | | | 273,000 | |
| | | | | | |
|
|
|
| | | | | | | | 2,748,360 | |
| | | | | | |
|
|
|
Transport - Equipment & Leasing — 0.0% | |
GATX Corp.
Senior Notes
3.25% due 09/15/2026 | | | 142,000 | | | | 131,577 | |
| | | | | | |
|
|
|
Transport - Marine — 0.0% | |
Kirby Corp.
Senior Notes
4.20% due 03/01/2028 | | | 261,000 | | | | 257,929 | |
| | | | | | |
|
|
|
Transport - Rail — 0.1% | |
Canadian National Railway Co.
Senior Notes
2.85% due 12/15/2021 | | | 173,000 | | | | 171,454 | |
| | | | | | | | |
| | |
| Security Description | | Principal
Amount(9) | | | Value
(Note 2) | |
| |
| | | | | | | | | |
Transport - Rail (continued) | |
Norfolk Southern Corp.
Senior Notes
5.10% due 12/31/2049 | | $ | 338,000 | | | $ | 336,245 | |
| | | | | | |
|
|
|
| | | | | | | | 507,699 | |
| | | | | | |
|
|
|
Transport - Services — 0.0% | |
CH Robinson Worldwide, Inc.
Senior Notes
4.20% due 04/15/2028 | | | 173,000 | | | | 171,592 | |
FedEx Corp.
Company Guar. Notes
4.05% due 02/15/2048 | | | 133,000 | | | | 121,539 | |
| | | | | | |
|
|
|
| | | | | | | | 293,131 | |
| | | | | | |
|
|
|
Trucking/Leasing — 0.1% | |
Penske Truck Leasing Co. LP/PTL Finance Corp.
Senior Notes
3.95% due 03/10/2025* | | | 422,000 | | | | 417,815 | |
| | | | | | |
|
|
|
Vitamins & Nutrition Products — 0.0% | |
HLF Financing SARL LLC/Herbalife International, Inc.
Senior Notes
7.25% due 08/15/2026* | | | 199,000 | | | | 201,806 | |
| | | | | | |
|
|
|
Total U.S. Corporate Bonds & Notes | | | | | |
(cost $269,814,532) | | | | | | | 265,697,122 | |
| | | | | | |
|
|
|
FOREIGN CORPORATE BONDS & NOTES — 17.8% | |
Agricultural Chemicals — 0.5% | |
Consolidated Energy Finance SA
Senior Notes
6.88% due 06/15/2025*# | | | 1,540,000 | | | | 1,588,895 | |
Nufarm Australia, Ltd./Nufarm Americas, Inc.
Company Guar. Notes
5.75% due 04/30/2026* | | | 1,194,000 | | | | 1,110,420 | |
OCI NV
Senior Sec. Notes
6.63% due 04/15/2023* | | | 1,467,000 | | | | 1,518,345 | |
Syngenta Finance NV
Company Guar. Notes
4.44% due 04/24/2023* | | | 309,000 | | | | 310,013 | |
| | | | | | |
|
|
|
| | | | | | | | 4,527,673 | |
| | | | | | |
|
|
|
Airlines — 0.1% | |
Gol Finance, Inc.
Company Guar. Notes
7.00% due 01/31/2025* | | | 950,000 | | | | 789,460 | |
| | | | | | |
|
|
|
Auto - Cars/Light Trucks — 0.1% | |
Volkswagen International Finance NV
Company Guar. Notes
1.88% due 03/30/2027 | | EUR | 600,000 | | | | 689,098 | |
| | | | | | |
|
|
|
Auto/Truck Parts & Equipment - Original — 0.3% | |
Delphi Jersey Holdings PLC
Company Guar. Notes
5.00% due 10/01/2025* | | | 1,510,000 | | | | 1,426,271 | |
Toyota Industries Corp.
Senior Notes
3.24% due 03/16/2023* | | | 924,000 | | | | 917,542 | |
| | | | | | |
|
|
|
| | | | | | | | 2,343,813 | |
| | | | | | |
|
|
|
Banks - Commercial — 1.4% | |
ABN AMRO Bank NV
Sub. Notes
7.13% due 07/06/2022 | | EUR | 1,050,000 | | | | 1,498,741 | |
VALIC Company II Strategic Bond Fund
PORTFOLIO OF INVESTMENTS — August 31, 2018 — (continued)
| | | | | | | | |
| | |
| Security Description | | Principal
Amount(9) | | | Value
(Note 2) | |
| |
FOREIGN CORPORATE BONDS & NOTES (continued) | |
Banks - Commercial (continued) | | | | | | | | |
Banco Bilbao Vizcaya Argentaria SA
Senior Notes
1.38% due 05/14/2025 | | EUR | 1,000,000 | | | $ | 1,130,118 | |
Bank of China, Ltd.
Sub. Notes
5.00% due 11/13/2024 | | | 890,000 | | | | 916,607 | |
Barclays Bank PLC
Sub. Notes
6.63% due 03/30/2022# | | EUR | 600,000 | | | | 816,501 | |
CaixaBank SA
Senior Notes
0.75% due 04/18/2023 | | EUR | 1,000,000 | | | | 1,140,086 | |
Canadian Imperial Bank of Commerce
Senior Notes
2.10% due 10/05/2020 | | | 381,000 | | | | 372,829 | |
Credit Suisse AG
Senior Notes
3.00% due 10/29/2021 | | | 425,000 | | | | 420,604 | |
Credit Suisse AG
Sub. Notes
5.75% due 09/18/2025 | | EUR | 1,515,000 | | | | 1,934,355 | |
HSBC France SA
Senior Notes
0.60% due 03/20/2023 | | EUR | 600,000 | | | | 699,027 | |
Intesa Sanpaolo SpA
Senior Notes
3.88% due 01/12/2028* | | | 206,000 | | | | 175,202 | |
Intesa Sanpaolo SpA
Sub. Notes
5.71% due 01/15/2026* | | | 307,000 | | | | 278,743 | |
National Australia Bank, Ltd.
Senior Notes
3.63% due 06/20/2023 | | | 456,000 | | | | 456,298 | |
Standard Chartered PLC
Senior Notes
1.63% due 10/03/2027 | | EUR | 750,000 | | | | 855,415 | |
Toronto-Dominion Bank
Senior Notes
1.85% due 09/11/2020 | | | 402,000 | | | | 392,973 | |
United Overseas Bank, Ltd.
Senior Notes
3.20% due 04/23/2021* | | | 215,000 | | | | 214,434 | |
Westpac Banking Corp.
Senior Notes
3.05% due 05/15/2020# | | | 260,000 | | | | 259,785 | |
Yapi ve Kredi Bankasi AS
Senior Notes
5.75% due 02/24/2022 | | | 950,000 | | | | 705,168 | |
| | | | | | |
|
|
|
| | | | | | | | 12,266,886 | |
| | | | | | |
|
|
|
Brewery — 0.1% | |
Anheuser-Busch InBev SA/NV
Company Guar. Notes
2.75% due 03/17/2036 | | EUR | 360,000 | | | | 436,573 | |
| | | | | | |
|
|
|
Building Products - Cement — 0.1% | |
CIMPOR Financial Operations BV
Company Guar. Notes
5.75% due 07/17/2024 | | | 960,000 | | | | 698,400 | |
| | | | | | |
|
|
|
Building Societies — 0.0% | |
Nationwide Building Society
Sub. Notes
4.13% due 10/18/2032* | | | 279,000 | | | | 257,684 | |
| | | | | | |
|
|
|
| | | | | | | | |
| | |
| Security Description | | Principal
Amount(9) | | | Value
(Note 2) | |
| |
| | | | | | | | | |
Building - Residential/Commercial — 0.2% | |
Mattamy Group Corp.
Senior Notes
6.50% due 10/01/2025* | | $ | 1,431,000 | | | $ | 1,409,821 | |
| | | | | | |
|
|
|
Cable/Satellite TV — 0.9% | |
Altice Financing SA
Senior Sec. Notes
7.50% due 05/15/2026* | | | 2,170,000 | | | | 2,072,350 | |
Altice France SA
Senior Sec. Notes
8.13% due 02/01/2027* | | | 419,000 | | | | 425,285 | |
Altice Luxembourg SA
Company Guar. Notes
7.63% due 02/15/2025*# | | | 2,665,000 | | | | 2,463,233 | |
SFR Group SA
Senior Sec. Notes
7.38% due 05/01/2026* | | | 1,645,000 | | | | 1,616,212 | |
UPCB Finance IV, Ltd.
Senior Sec. Notes
5.38% due 01/15/2025* | | | 1,325,000 | | | | 1,308,570 | |
| | | | | | |
|
|
|
| | | | | | | | 7,885,650 | |
| | | | | | |
|
|
|
Cellular Telecom — 0.4% | |
C&W Senior Financing Designated Activity Co.
Senior Notes
6.88% due 09/15/2027* | | | 1,654,000 | | | | 1,641,595 | |
GTH Finance BV
Company Guar. Notes
7.25% due 04/26/2023* | | | 225,000 | | | | 233,631 | |
GTH Finance BV
Company Guar. Notes
7.25% due 04/26/2023 | | | 325,000 | | | | 337,467 | |
Millicom International Cellular SA
Senior Notes
6.00% due 03/15/2025# | | | 880,000 | | | | 889,900 | |
SK Telecom Co., Ltd.
Senior Notes
3.75% due 04/16/2023* | | | 200,000 | | | | 199,738 | |
Vodafone Group PLC
Senior Notes
3.75% due 01/16/2024 | | | 130,000 | | | | 129,117 | |
| | | | | | |
|
|
|
| | | | | | | | 3,431,448 | |
| | | | | | |
|
|
|
Chemicals - Diversified — 0.7% | |
Braskem Netherlands Finance BV
Company Guar. Notes
4.50% due 01/10/2028* | | | 290,000 | | | | 266,075 | |
Cydsa SAB de CV
Company Guar. Notes
6.25% due 10/04/2027# | | | 1,210,000 | | | | 1,141,889 | |
NOVA Chemicals Corp.
Senior Notes
5.00% due 05/01/2025* | | | 1,555,000 | | | | 1,500,575 | |
Petkim Petrokimya Holding AS
Senior Notes
5.88% due 01/26/2023* | | | 930,000 | | | | 789,682 | |
Solvay SA
Senior Notes
1.63% due 12/02/2022 | | EUR | 1,000,000 | | | | 1,219,170 | |
Trinseo Materials Operating SCA/Trinseo Materials Finance, Inc.
Company Guar. Notes
5.38% due 09/01/2025* | | | 915,000 | | | | 897,844 | |
| | | | | | |
|
|
|
| | | | | | | | 5,815,235 | |
| | | | | | |
|
|
|
VALIC Company II Strategic Bond Fund
PORTFOLIO OF INVESTMENTS — August 31, 2018 — (continued)
| | | | | | | | |
| | |
| Security Description | | Principal
Amount(9) | | | Value
(Note 2) | |
| |
FOREIGN CORPORATE BONDS & NOTES (continued) | |
Computers - Memory Devices — 0.2% | |
Seagate HDD Cayman
Company Guar. Notes
4.75% due 01/01/2025# | | $ | 2,050,000 | | | $ | 1,964,977 | |
| | | | | | |
|
|
|
Diamonds/Precious Stones — 0.1% | |
Petra Diamonds US Treasury PLC
Sec. Notes
7.25% due 05/01/2022 | | | 520,000 | | | | 500,500 | |
| | | | | | |
|
|
|
Diversified Banking Institutions — 1.1% | |
Banco Santander SA
Senior Notes
3.85% due 04/12/2023 | | | 200,000 | | | | 196,766 | |
Barclays PLC
Sub. Notes
4.84% due 05/09/2028 | | | 292,000 | | | | 277,543 | |
BNP Paribas SA
Senior Notes
3.80% due 01/10/2024* | | | 271,000 | | | | 266,704 | |
Credit Agricole SA
Senior Notes
1.88% due 12/20/2026 | | EUR | 700,000 | | | | 818,383 | |
Credit Suisse Group AG
Senior Notes
4.21% due 06/12/2024* | | | 276,000 | | | | 277,430 | |
Lloyds Banking Group PLC
Sub. Notes
1.75% due 09/07/2028 | | EUR | 600,000 | | | | 673,594 | |
Macquarie Group, Ltd.
Senior Notes
3.76% due 11/28/2028* | | | 121,000 | | | | 113,050 | |
Mitsubishi UFJ Financial Group, Inc.
Senior Notes
2.67% due 07/25/2022 | | | 300,000 | | | | 290,968 | |
Mitsubishi UFJ Financial Group, Inc.
Senior Notes
2.95% due 03/01/2021 | | | 222,000 | | | | 219,762 | |
Mitsubishi UFJ Financial Group, Inc.
Senior Notes
3.78% due 03/02/2025 | | | 88,000 | | | | 88,023 | |
Mizuho Financial Group, Inc.
Senior Notes
2.27% due 09/13/2021 | | | 329,000 | | | | 317,674 | |
Mizuho Financial Group, Inc.
Senior Notes
3.55% due 03/05/2023# | | | 1,103,000 | | | | 1,098,685 | |
Natwest Markets PLC
Senior Notes
0.63% due 03/02/2022 | | EUR | 350,000 | | | | 400,785 | |
Royal Bank of Scotland Group PLC
Senior Notes
1.75% due 03/02/2026 | | EUR | 675,000 | | | | 765,658 | |
Royal Bank of Scotland Group PLC
Senior Notes
2.50% due 03/22/2023 | | EUR | 425,000 | | | | 516,117 | |
Royal Bank of Scotland Group PLC
Senior Notes
3.50% due 05/15/2023 | | | 200,000 | | | | 194,479 | |
UBS AG
Sub. Notes
4.75% due 02/12/2026 | | EUR | 1,200,000 | | | | 1,514,779 | |
UBS Group Funding Switzerland AG
Company Guar. Notes
3.49% due 05/23/2023* | | | 828,000 | | | | 817,548 | |
| | | | | | | | |
| | |
| Security Description | | Principal
Amount(9) | | | Value
(Note 2) | |
| |
| | | | | | | | | |
Diversified Banking Institutions (continued) | |
UniCredit SpA
Sub. Notes
5.86% due 06/19/2032* | | $ | 931,000 | | | $ | 813,112 | |
| | | | | | |
|
|
|
| | | | | | | | 9,661,060 | |
| | | | | | |
|
|
|
Diversified Financial Services — 0.1% | |
GE Capital International Funding Co. ULC
Company Guar. Notes
2.34% due 11/15/2020 | | | 378,000 | | | | 370,286 | |
GE Capital International Funding Co. ULC
Company Guar. Notes
4.42% due 11/15/2035 | | | 315,000 | | | | 303,650 | |
| | | | | | |
|
|
|
| | | | | | | | 673,936 | |
| | | | | | |
|
|
|
Diversified Manufacturing Operations — 0.2% | |
Siemens Financieringsmaatschappij NV
Company Guar. Notes
2.20% due 03/16/2020* | | | 783,000 | | | | 773,869 | |
Siemens Financieringsmaatschappij NV
Company Guar. Notes
2.88% due 03/10/2028 | | EUR | 600,000 | | | | 811,188 | |
| | | | | | |
|
|
|
| | | | | | | | 1,585,057 | |
| | | | | | |
|
|
|
Diversified Minerals — 0.2% | |
Anglo American Capital PLC
Company Guar. Notes
3.25% due 04/03/2023 | | EUR | 1,075,000 | | | | 1,343,947 | |
| | | | | | |
|
|
|
Diversified Operations — 0.2% | |
Grupo KUO SAB De CV
Senior Notes
5.75% due 07/07/2027 | | | 920,000 | | | | 869,400 | |
Grupo KUO SAB De CV
Senior Notes
5.75% due 07/07/2027* | | | 735,000 | | | | 694,575 | |
| | | | | | |
|
|
|
| | | | | | | | 1,563,975 | |
| | | | | | |
|
|
|
Electric - Distribution — 0.4% | |
State Grid Overseas Investment, Ltd.
Company Guar. Notes
3.13% due 05/22/2023* | | | 3,000,000 | | | | 2,928,184 | |
State Grid Overseas Investment, Ltd.
Company Guar. Notes
4.13% due 05/07/2024*# | | | 300,000 | | | | 304,730 | |
| | | | | | |
|
|
|
| | | | | | | | 3,232,914 | |
| | | | | | |
|
|
|
Electric - Generation — 0.1% | |
Electricite de France SA
Senior Notes
1.00% due 10/13/2026 | | EUR | 600,000 | | | | 683,535 | |
Electricite de France SA
Senior Notes
2.35% due 10/13/2020* | | | 209,000 | | | | 205,789 | |
Electricite de France SA
Senior Notes
6.00% due 01/22/2114* | | | 21,000 | | | | 22,098 | |
Korea East-West Power Co., Ltd.
Senior Notes
3.88% due 07/19/2023* | | | 208,000 | | | | 208,736 | |
| | | | | | |
|
|
|
| | | | | | | | 1,120,158 | |
| | | | | | |
|
|
|
Electric - Integrated — 0.5% | |
Capex SA
Senior Notes
6.88% due 05/15/2024 | | | 900,000 | | | | 747,009 | |
VALIC Company II Strategic Bond Fund
PORTFOLIO OF INVESTMENTS — August 31, 2018 — (continued)
| | | | | | | | |
| | |
| Security Description | | Principal
Amount(9) | | | Value
(Note 2) | |
| |
FOREIGN CORPORATE BONDS & NOTES (continued) | |
Electric - Integrated (continued) | |
EDP Finance BV
Senior Notes
2.00% due 04/22/2025 | | EUR | 1,000,000 | | | $ | 1,190,256 | |
EDP Finance BV
Senior Notes
3.63% due 07/15/2024* | | | 207,000 | | | | 199,609 | |
Enel Finance International NV
Company Guar. Notes
3.50% due 04/06/2028* | | | 376,000 | | | | 338,881 | |
Enel Finance International NV
Company Guar. Notes
3.63% due 05/25/2027* | | | 389,000 | | | | 358,214 | |
Gas Natural Fenosa Finance BV
Company Guar. Notes
1.38% due 01/21/2025 | | EUR | 600,000 | | | | 710,870 | |
Iberdrola Finanzas SA
Company Guar. Notes
1.00% due 03/07/2025 | | EUR | 900,000 | | | | 1,052,105 | |
| | | | | | |
|
|
|
| | | | | | | | 4,596,944 | |
| | | | | | |
|
|
|
Finance - Commercial — 0.1% | |
Unifin Financiera SAB de CV
Company Guar. Notes
7.25% due 09/27/2023 | | | 910,000 | | | | 902,038 | |
| | | | | | |
|
|
|
Finance - Consumer Loans — 0.0% | |
goeasy, Ltd.
Company Guar. Notes
7.88% due 11/01/2022* | | | 373,000 | | | | 389,785 | |
| | | | | | |
|
|
|
Finance - Other Services — 0.1% | |
Travelport Corporate Finance PLC
Senior Sec. Notes
6.00% due 03/15/2026* | | | 1,049,000 | | | | 1,067,358 | |
| | | | | | |
|
|
|
Food - Meat Products — 0.3% | |
JBS USA LUX SA/JBS USA Finance, Inc.
Company Guar. Notes
5.88% due 07/15/2024* | | | 2,059,000 | | | | 1,981,787 | |
| | | | | | |
|
|
|
Food - Misc./Diversified — 0.0% | |
Yasar Holding AS
Company Guar. Notes
8.88% due 05/06/2020 | | | 440,000 | | | | 286,829 | |
| | | | | | |
|
|
|
Gambling (Non-Hotel) — 0.5% | |
International Game Technology PLC
Senior Sec. Notes
6.50% due 02/15/2025* | | | 1,200,000 | | | | 1,260,000 | |
LHMC Finco SARL
Senior Sec. Notes
7.88% due 12/20/2023* | | | 1,540,000 | | | | 1,546,853 | |
Stars Group Holdings BV/Stars Group US Co-Borrower LLC
Company Guar. Notes
7.00% due 07/15/2026* | | | 1,244,000 | | | | 1,293,760 | |
| | | | | | |
|
|
|
| | | | | | | | 4,100,613 | |
| | | | | | |
|
|
|
Gold Mining — 0.0% | |
Goldcorp, Inc.
Senior Notes
3.70% due 03/15/2023 | | | 76,000 | | | | 75,557 | |
Kinross Gold Corp.
Company Guar. Notes
4.50% due 07/15/2027 | | | 200,000 | | | | 181,500 | |
| | | | | | |
|
|
|
| | | | | | | | 257,057 | |
| | | | | | |
|
|
|
| | | | | | | | |
| | |
| Security Description | | Principal
Amount(9) | | | Value
(Note 2) | |
| |
| | | | | | | | | |
Insurance - Life/Health — 0.1% | |
Athene Holding, Ltd.
Senior Notes
4.13% due 01/12/2028 | | $ | 808,000 | | | $ | 758,696 | |
| | | | | | |
|
|
|
Insurance - Multi-line — 0.0% | |
XLIT, Ltd.
Company Guar. Notes
5.50% due 03/31/2045 | | | 231,000 | | | | 248,754 | |
| | | | | | |
|
|
|
Insurance - Property/Casualty — 0.0% | |
Enstar Group, Ltd.
Senior Notes
4.50% due 03/10/2022 | | | 83,000 | | | | 83,743 | |
| | | | | | |
|
|
|
Internet Application Software — 0.1% | |
Tencent Holdings, Ltd.
Senior Notes
3.60% due 01/19/2028* | | | 1,250,000 | | | | 1,188,195 | |
| | | | | | |
|
|
|
Machinery - Farming — 0.1% | |
CNH Industrial NV
Senior Notes
3.85% due 11/15/2027 | | | 305,000 | | | | 293,525 | |
CNH Industrial NV
Senior Notes
4.50% due 08/15/2023 | | | 222,000 | | | | 226,591 | |
| | | | | | |
|
|
|
| | | | | | | | 520,116 | |
| | | | | | |
|
|
|
Machinery - Pumps — 0.0% | |
Nvent Finance SARL
Company Guar. Notes
4.55% due 04/15/2028* | | | 165,000 | | | | 163,059 | |
| | | | | | |
|
|
|
Medical - Drugs — 0.5% | |
Bayer Capital Corp BV
Company Guar. Notes
1.50% due 06/26/2026 | | EUR | 500,000 | | | | 579,465 | |
Novartis Finance SA
Company Guar. Notes
1.63% due 11/09/2026 | | EUR | 730,000 | | | | 899,239 | |
Shire Acquisitions Investments Ireland DAC
Company Guar. Notes
2.88% due 09/23/2023 | | | 244,000 | | | | 233,005 | |
Valeant Pharmaceuticals International, Inc.
Company Guar. Notes
5.88% due 05/15/2023* | | | 2,636,000 | | | | 2,520,016 | |
| | | | | | |
|
|
|
| | | | | | | | 4,231,725 | |
| | | | | | |
|
|
|
Metal - Copper — 0.3% | |
First Quantum Minerals, Ltd.
Company Guar. Notes
6.50% due 03/01/2024* | | | 725,000 | | | | 681,500 | |
First Quantum Minerals, Ltd.
Company Guar. Notes
7.25% due 04/01/2023* | | | 814,000 | | | | 795,685 | |
Hudbay Minerals, Inc.
Company Guar. Notes
7.25% due 01/15/2023* | | | 1,251,000 | | | | 1,272,893 | |
| | | | | | |
|
|
|
| | | | | | | | 2,750,078 | |
| | | | | | |
|
|
|
Metal - Diversified — 0.3% | |
Glencore Canada Financial Corp.
Company Guar. Notes
7.38% due 05/27/2020 | | GBP | 300,000 | | | | 424,541 | |
Glencore Finance Europe, Ltd.
Company Guar. Notes
1.75% due 03/17/2025 | | EUR | 865,000 | | | | 984,179 | |
VALIC Company II Strategic Bond Fund
PORTFOLIO OF INVESTMENTS — August 31, 2018 — (continued)
| | | | | | | | |
| | |
| Security Description | | Principal
Amount(9) | | | Value
(Note 2) | |
| |
FOREIGN CORPORATE BONDS & NOTES (continued) | |
Metal - Diversified (continued) | |
Vedanta Resources PLC
Senior Notes
6.13% due 08/09/2024 | | $ | 930,000 | | | $ | 841,280 | |
| | | | | | |
|
|
|
| | | | | | | | 2,250,000 | |
| | | | | | |
|
|
|
Non-Ferrous Metals — 0.1% | |
Codelco, Inc.
Senior Notes
3.00% due 07/17/2022# | | | 750,000 | | | | 730,028 | |
| | | | | | |
|
|
|
Oil & Gas Drilling — 0.6% | |
Noble Holding International, Ltd.
Company Guar. Notes
7.75% due 01/15/2024# | | | 939,000 | | | | 917,872 | |
Noble Holding International, Ltd.
Company Guar. Notes
7.88% due 02/01/2026* | | | 1,007,000 | | | | 1,032,175 | |
Shelf Drilling Holdings, Ltd.
Company Guar. Notes
8.25% due 02/15/2025* | | | 1,400,000 | | | | 1,435,000 | |
Trinidad Drilling, Ltd.
Company Guar. Notes
6.63% due 02/15/2025* | | | 1,650,000 | | | | 1,633,500 | |
| | | | | | |
|
|
|
| | | | | | | | 5,018,547 | |
| | | | | | |
|
|
|
Oil Companies - Exploration & Production — 1.1% | |
Anadarko Finance Co.
Company Guar. Notes
7.50% due 05/01/2031 | | | 194,000 | | | | 243,115 | |
Geopark, Ltd.
Senior Sec. Notes
6.50% due 09/21/2024 | | | 910,000 | | | | 907,725 | |
Medco Platinum Road Pte, Ltd.
Senior Sec. Notes
6.75% due 01/30/2025* | | | 950,000 | | | | 871,683 | |
MEG Energy Corp.
Company Guar. Notes
6.38% due 01/30/2023* | | | 2,060,000 | | | | 1,869,450 | |
MEG Energy Corp.
Sec. Notes
6.50% due 01/15/2025*# | | | 2,164,000 | | | | 2,153,180 | |
Nostrum Oil & Gas Finance BV
Company Guar. Notes
7.00% due 02/16/2025* | | | 1,240,000 | | | | 1,102,360 | |
Sinopec Group Overseas Development 2015, Ltd.
Company Guar. Notes
2.50% due 04/28/2020 | | | 2,000,000 | | | | 1,972,787 | |
| | | | | | |
|
|
|
| | | | | | | | 9,120,300 | |
| | | | | | |
|
|
|
Oil Companies - Integrated — 2.4% | |
BP Capital Markets PLC
Company Guar. Notes
2.97% due 02/27/2026 | | EUR | 1,200,000 | | | | 1,579,046 | |
BP Capital Markets PLC
Company Guar. Notes
3.25% due 05/06/2022 | | | 257,000 | | | | 256,608 | |
Cenovus Energy, Inc.
Senior Notes
4.25% due 04/15/2027 | | | 218,000 | | | | 210,746 | |
Pertamina Persero PT
Senior Notes
4.30% due 05/20/2023 | | | 4,550,000 | | | | 4,554,441 | |
Pertamina Persero PT
Senior Notes
4.88% due 05/03/2022* | | | 600,000 | | | | 614,439 | |
| | | | | | | | |
| | |
| Security Description | | Principal
Amount(9) | | | Value
(Note 2) | |
| |
| | | | | | | | | |
Oil Companies - Integrated (continued) | |
Petrobras Global Finance BV
Company Guar. Notes
6.00% due 01/27/2028 | | $ | 470,000 | | | $ | 422,060 | |
Petroleos del Peru SA
Senior Notes
5.63% due 06/19/2047 | | | 1,950,000 | | | | 1,959,750 | |
Petroleos Mexicanos
Company Guar. Notes
4.88% due 01/24/2022 | | | 1,000,000 | | | | 1,005,750 | |
Petroleos Mexicanos
Company Guar. Notes
6.63% due 06/15/2035 | | | 3,000,000 | | | | 2,902,500 | |
Petroleos Mexicanos
Company Guar. Notes
6.75% due 09/21/2047 | | | 4,764,000 | | | | 4,409,939 | |
Petronas Capital, Ltd.
Company Guar. Notes
7.88% due 05/22/2022 | | | 1,200,000 | | | | 1,372,496 | |
Suncor Energy, Inc.
Senior Notes
5.95% due 12/01/2034 | | | 141,000 | | | | 164,794 | |
YPF SA
Senior Notes
6.95% due 07/21/2027 | | | 900,000 | | | | 735,894 | |
| | | | | | |
|
|
|
| | | | | | | | 20,188,463 | |
| | | | | | |
|
|
|
Oil - Field Services — 0.2% | |
KCA Deutag UK Finance PLC
Senior Sec. Notes
9.88% due 04/01/2022* | | | 1,793,000 | | | | 1,788,518 | |
| | | | | | |
|
|
|
Paper & Related Products — 0.3% | |
Cascades, Inc.
Company Guar. Notes
5.50% due 07/15/2022* | | | 535,000 | | | | 535,000 | |
Cascades, Inc.
Company Guar. Notes
5.75% due 07/15/2023* | | | 868,000 | | | | 868,087 | |
Fibria Overseas Finance, Ltd.
Company Guar. Notes
5.50% due 01/17/2027 | | | 1,100,000 | | | | 1,086,261 | |
| | | | | | |
|
|
|
| | | | | | | | 2,489,348 | |
| | | | | | |
|
|
|
Printing - Commercial — 0.2% | |
Cimpress NV
Company Guar. Notes
7.00% due 06/15/2026* | | | 1,640,000 | | | | 1,670,750 | |
| | | | | | |
|
|
|
Retail - Major Department Stores — 0.1% | |
El Puerto de Liverpool SAB de CV
Company Guar. Notes
3.88% due 10/06/2026 | | | 1,300,000 | | | | 1,210,625 | |
| | | | | | |
|
|
|
Satellite Telecom — 0.6% | |
Inmarsat Finance PLC
Company Guar. Notes
6.50% due 10/01/2024*# | | | 905,000 | | | | 929,888 | |
Intelsat Jackson Holdings SA
Company Guar. Notes
5.50% due 08/01/2023 | | | 2,830,000 | | | | 2,581,526 | |
Telesat Canada/Telesat LLC
Company Guar. Notes
8.88% due 11/15/2024* | | | 1,180,000 | | | | 1,264,075 | |
| | | | | | |
|
|
|
| | | | | | | | 4,775,489 | |
| | | | | | |
|
|
|
VALIC Company II Strategic Bond Fund
PORTFOLIO OF INVESTMENTS — August 31, 2018 — (continued)
| | | | | | | | |
| | |
| Security Description | | Principal
Amount(9) | | | Value
(Note 2) | |
| |
FOREIGN CORPORATE BONDS & NOTES (continued) | |
Special Purpose Entity — 0.0% | |
Hellas Telecommunications Luxembourg II SCA
Sub. Notes
8.46% due 01/15/2015*†(5)(6)(7)(8) | | $ | 560,000 | | | $ | 0 | |
| | | | | | |
|
|
|
Telephone - Integrated — 0.5% | |
Orange SA
Senior Notes
1.38% due 03/20/2028 | | EUR | 400,000 | | | | 464,896 | |
Telecom Italia Capital SA
Company Guar. Notes
7.72% due 06/04/2038 | | | 1,253,000 | | | | 1,372,035 | |
Telefonica Emisiones SAU
Company Guar. Notes
1.46% due 04/13/2026 | | EUR | 600,000 | | | | 690,450 | |
Telefonica Emisiones SAU
Company Guar. Notes
2.93% due 10/17/2029 | | EUR | 600,000 | | | | 746,650 | |
Telefonica Emisiones SAU
Company Guar. Notes
4.67% due 03/06/2038 | | | 562,000 | | | | 537,460 | |
Telefonica Emisiones SAU
Company Guar. Notes
5.21% due 03/08/2047 | | | 457,000 | | | | 453,941 | |
| | | | | | |
|
|
|
| | | | | | | | 4,265,432 | |
| | | | | | |
|
|
|
Transport - Marine — 0.4% | |
PT Pelabuhan Indonesia II
Senior Notes
4.25% due 05/05/2025 | | | 3,300,000 | | | | 3,220,800 | |
PT Pelabuhan Indonesia II
Senior Notes
4.25% due 05/05/2025 | | | 475,000 | | | | 463,600 | |
| | | | | | |
|
|
|
| | | | | | | | 3,684,400 | |
| | | | | | |
|
|
|
Transport - Rail — 1.0% | |
Canadian Pacific Railway Co.
Senior Notes
6.13% due 09/15/2115 | | | 172,000 | | | | 206,106 | |
Kazakhstan Temir Zholy Finance BV
Company Guar. Notes
6.95% due 07/10/2042 | | | 6,800,000 | | | | 7,446,000 | |
Transnet SOC, Ltd.
Senior Notes
4.00% due 07/26/2022 | | | 700,000 | | | | 657,300 | |
| | | | | | |
|
|
|
| | | | | | | | 8,309,406 | |
| | | | | | |
|
|
|
Transport - Services — 0.1% | |
Rumo Luxembourg SARL
Company Guar. Notes
7.38% due 02/09/2024 | | | 870,000 | | | | 869,870 | |
| | | | | | |
|
|
|
Total Foreign Corporate Bonds & Notes
| | | | | | | | |
(cost $157,496,096) | | | | | | | 152,096,218 | |
| | | | | | |
|
|
|
FOREIGN GOVERNMENT OBLIGATIONS — 16.9% | |
Banks - Export/Import — 0.2% | |
Export Credit Bank of Turkey
Senior Notes
4.25% due 09/18/2022* | | | 2,300,000 | | | | 1,734,430 | |
| | | | | | |
|
|
|
Banks - Special Purpose — 0.1% | |
Hungarian Development Bank
Government Guar. Notes
6.25% due 10/21/2020 | | | 900,000 | | | | 945,450 | |
| | | | | | |
|
|
|
Central Bank — 0.4% | |
Central Bank of Tunisia
Senior Notes
5.75% due 01/30/2025 | | | 3,800,000 | | | | 3,320,250 | |
| | | | | | |
|
|
|
| | | | | | | | |
| | |
| Security Description | | Principal
Amount(9) | | | Value
(Note 2) | |
| |
| | | | | | | | | |
Sovereign — 16.2% | |
Dominican Republic
Senior Bonds
5.88% due 04/18/2024 | | $ | 495,000 | | | $ | 508,598 | |
Dominican Republic
Senior Bonds
6.85% due 01/27/2045 | | | 2,800,000 | | | | 2,818,228 | |
Dominican Republic
Senior Bonds
6.88% due 01/29/2026* | | | 400,000 | | | | 429,912 | |
Dominican Republic
Senior Bonds
7.45% due 04/30/2044 | | | 3,500,000 | | | | 3,762,500 | |
Dominican Republic
Senior Bonds
8.63% due 04/20/2027 | | | 600,000 | | | | 678,000 | |
Federative Republic of Brazil
Senior Notes
5.00% due 01/27/2045 | | | 2,200,000 | | | | 1,703,900 | |
Federative Republic of Brazil
Bonds
8.25% due 01/20/2034# | | | 2,064,000 | | | | 2,355,540 | |
Federative Republic of Brazil
Notes
8.25% due 01/20/2034 | | | 1,536,000 | | | | 1,752,960 | |
Government of Egypt
Senior Notes
6.59% due 02/21/2028 | | | 1,850,000 | | | | 1,728,307 | |
Government of Egypt
Senior Notes
7.50% due 01/31/2027 | | | 2,700,000 | | | | 2,693,250 | |
Government of Egypt
Senior Notes
8.50% due 01/31/2047 | | | 4,250,000 | | | | 4,152,913 | |
Government of Ukraine
Senior Notes
7.38% due 09/25/2032* | | | 2,150,000 | | | | 1,816,750 | |
Government of Ukraine
Senior Notes
7.75% due 09/01/2027 | | | 6,150,000 | | | | 5,588,493 | |
Kingdom of Jordan
Senior Notes
5.75% due 01/31/2027* | | | 900,000 | | | | 838,170 | |
Kingdom of Jordan
Senior Notes
5.75% due 01/31/2027 | | | 900,000 | | | | 838,170 | |
Kingdom of Saudi Arabia
Senior Notes
4.00% due 04/17/2025 | | | 3,000,000 | | | | 3,003,180 | |
Kingdom of Saudi Arabia
Senior Notes
5.00% due 04/17/2049 | | | 3,000,000 | | | | 2,965,980 | |
Lebanese Republic
Senior Notes
6.38% due 03/09/2020 | | | 1,000,000 | | | | 962,394 | |
Oriental Republic of Uruguay
Senior Notes
4.38% due 10/27/2027 | | | 850,000 | | | | 868,700 | |
Republic of Argentina
Senior Notes
5.88% due 01/11/2028 | | | 725,000 | | | | 526,713 | |
Republic of Argentina
Senior Notes
6.88% due 01/26/2027 | | | 3,500,000 | | | | 2,738,750 | |
Republic of Argentina
Senior Notes
8.28% due 12/31/2033 | | | 4,766,929 | | | | 3,980,386 | |
VALIC Company II Strategic Bond Fund
PORTFOLIO OF INVESTMENTS — August 31, 2018 — (continued)
| | | | | | | | |
| | |
| Security Description | | Principal
Amount(9) | | | Value
(Note 2) | |
| |
FOREIGN GOVERNMENT OBLIGATIONS (continued) | |
Sovereign (continued) | |
Republic of Colombia
Senior Notes
4.00% due 02/26/2024 | | $ | 3,000,000 | | | $ | 3,012,000 | |
Republic of Colombia
Senior Notes
4.38% due 07/12/2021 | | | 500,000 | | | | 512,000 | |
Republic of Colombia
Senior Notes
8.13% due 05/21/2024 | | | 3,300,000 | | | | 3,976,500 | |
Republic of Croatia
Senior Notes
6.38% due 03/24/2021 | | | 3,650,000 | | | | 3,872,628 | |
Republic of Ecuador
Senior Notes
9.63% due 06/02/2027 | | | 2,700,000 | | | | 2,571,750 | |
Republic of Ecuador
Senior Notes
9.65% due 12/13/2026* | | | 1,700,000 | | | | 1,627,750 | |
Republic of Ecuador
Senior Notes
10.75% due 03/28/2022 | | | 1,500,000 | | | | 1,548,750 | |
Republic of Guatemala
Senior Notes
4.88% due 02/13/2028 | | | 1,045,000 | | | | 1,013,514 | |
Republic of Honduras
Senior Notes
6.25% due 01/19/2027 | | | 4,200,000 | | | | 4,298,406 | |
Republic of Hungary
Senior Notes
5.38% due 02/21/2023 | | | 1,200,000 | | | | 1,278,000 | |
Republic of Hungary
Senior Bonds
6.38% due 03/29/2021 | | | 1,900,000 | | | | 2,034,463 | |
Republic of Indonesia
Senior Notes
3.70% due 01/08/2022 | | | 1,500,000 | | | | 1,495,453 | |
Republic of Indonesia
Senior Bonds
5.88% due 01/15/2024 | | | 600,000 | | | | 647,238 | |
Republic of Ireland
Bonds
2.00% due 02/18/2045 | | EUR | 440,000 | | | | 543,761 | |
Republic of Ivory Coast
Senior Notes
6.13% due 06/15/2033 | | | 1,300,000 | | | | 1,124,058 | |
Republic of Ivory Coast
Senior Notes
6.13% due 06/15/2033* | | | 3,300,000 | | | | 2,853,378 | |
Republic of Ivory Coast
Senior Notes
6.38% due 03/03/2028 | | | 750,000 | | | | 693,984 | |
Republic of Lithuania
Senior Notes
6.63% due 02/01/2022 | | | 800,000 | | | | 884,600 | |
Republic of Lithuania
Senior Notes
7.38% due 02/11/2020 | | | 1,275,000 | | | | 1,354,449 | |
Republic of Nigeria
Senior Notes
7.14% due 02/23/2030* | | | 1,300,000 | | | | 1,227,291 | |
Republic of Nigeria
Senior Notes
7.63% due 11/28/2047 | | | 1,650,000 | | | | 1,497,012 | |
Republic of Panama
Senior Notes
3.75% due 03/16/2025 | | | 1,550,000 | | | | 1,550,000 | |
| | | | | | | | |
| | |
| Security Description | | Principal
Amount(9) | | | Value
(Note 2) | |
| |
| | | | | | | | | |
Sovereign (continued) | |
Republic of Poland
Senior Notes
5.13% due 04/21/2021 | | $ | 1,800,000 | | | $ | 1,886,220 | |
Republic of Senegal
Bonds
6.25% due 05/23/2033 | | | 2,200,000 | | | | 1,979,780 | |
Republic of Senegal
Senior Notes
6.75% due 03/13/2048* | | | 1,700,000 | | | | 1,452,310 | |
Republic of South Africa
Senior Notes
5.65% due 09/27/2047 | | | 2,250,000 | | | | 2,010,487 | |
Republic of South Africa
Senior Notes
5.88% due 09/16/2025 | | | 2,000,000 | | | | 2,027,540 | |
Republic of South Africa
Senior Notes
6.25% due 03/08/2041 | | | 2,000,000 | | | | 1,956,000 | |
Republic of Sri Lanka
Senior Notes
5.75% due 04/18/2023* | | | 2,900,000 | | | | 2,826,717 | |
Republic of Sri Lanka
Senior Notes
6.83% due 07/18/2026* | | | 550,000 | | | | 544,671 | |
Republic of Sri Lanka
Senior Notes
6.83% due 07/18/2026 | | | 2,800,000 | | | | 2,772,871 | |
Republic of Sri Lanka
Senior Notes
6.85% due 11/03/2025 | | | 450,000 | | | | 447,978 | |
Republic of Sri Lanka
Senior Notes
6.85% due 11/03/2025* | | | 700,000 | | | | 696,854 | |
Republic of the Philippines
Senior Notes
4.00% due 01/15/2021 | | | 2,750,000 | | | | 2,790,444 | |
Republic of Turkey
Senior Notes
5.75% due 05/11/2047 | | | 950,000 | | | | 665,057 | |
Republic of Turkey
Notes
6.63% due 02/17/2045 | | | 2,550,000 | | | | 1,953,249 | |
Republic of Turkey
Senior Notes
7.00% due 06/05/2020 | | | 4,000,000 | | | | 3,846,272 | |
Russian Federation
Senior Notes
4.75% due 05/27/2026 | | | 4,800,000 | | | | 4,765,709 | |
State of Qatar
Senior Notes
4.50% due 01/20/2022 | | | 2,900,000 | | | | 2,984,100 | |
State of Qatar
Senior Notes
4.50% due 04/23/2028 | | | 3,000,000 | | | | 3,064,500 | |
Sultanate of Oman
Senior Notes
4.75% due 06/15/2026 | | | 5,500,000 | | | | 5,098,038 | |
Sultanate of Oman
Senior Notes
6.75% due 01/17/2048 | | | 4,000,000 | | | | 3,749,168 | |
United Kingdom Gilt Treasury
Bonds
2.00% due 07/22/2020 | | GBP | 1,000,000 | | | | 1,327,046 | |
United Kingdom Gilt Treasury
Bonds
3.50% due 01/22/2045 | | GBP | 250,000 | | | | 439,673 | |
VALIC Company II Strategic Bond Fund
PORTFOLIO OF INVESTMENTS — August 31, 2018 — (continued)
| | | | | | | | |
| | |
| Security Description | | Principal
Amount(9) | | | Value
(Note 2) | |
| |
FOREIGN GOVERNMENT OBLIGATIONS (continued) | |
Sovereign (continued) | |
United Kingdom Gilt Treasury
Bonds
4.50% due 09/07/2034 | | GBP | 1,185,000 | | | $ | 2,151,057 | |
United Mexican States
Senior Notes
4.35% due 01/15/2047 | | | 321,000 | | | | 291,308 | |
United Mexican States
Senior Bonds
4.75% due 03/08/2044 | | | 210,000 | | | | 200,655 | |
| | | | | | |
|
|
|
| | | | | | | | 138,256,483 | |
| | | | | | |
|
|
|
Total Foreign Government Obligations | | | | | | | | |
(cost $152,222,759) | | | | | | | 144,256,613 | |
| | | | | | |
|
|
|
U.S. GOVERNMENT AGENCIES — 18.7% | |
Federal Home Loan Mtg. Corp. — 5.0% | |
2.50% due 01/01/2028 | | | 206,096 | | | | 201,679 | |
2.50% due 04/01/2028 | | | 456,038 | | | | 446,259 | |
2.50% due 03/01/2031 | | | 290,343 | | | | 282,165 | |
2.50% due 10/01/2032 | | | 3,904,114 | | | | 3,793,680 | |
2.50% due 11/01/2032 | | | 1,800,252 | | | | 1,749,328 | |
3.00% due 10/01/2032 | | | 1,033,189 | | | | 1,025,400 | |
3.00% due 04/01/2043 | | | 456,080 | | | | 445,082 | |
3.00% due 11/01/2046 | | | 10,534,491 | | | | 10,222,450 | |
3.50% due 03/01/2042 | | | 299,904 | | | | 300,587 | |
3.50% due 04/01/2042 | | | 563,016 | | | | 564,299 | |
3.50% due 08/01/2042 | | | 500,097 | | | | 501,232 | |
3.50% due 09/01/2043 | | | 48,850 | | | | 48,962 | |
3.50% due 07/01/2045 | | | 5,068,962 | | | | 5,055,400 | |
3.50% due 11/01/2047 | | | 2,361,004 | | | | 2,349,902 | |
3.50% due 03/01/2048 | | | 12,934,326 | | | | 12,901,679 | |
4.00% due 01/01/2046 | | | 342,472 | | | | 350,786 | |
4.00% due 01/01/2047 | | | 80,698 | | | | 82,739 | |
4.50% due 02/01/2020 | | | 2,237 | | | | 2,259 | |
4.50% due 08/01/2020 | | | 1,750 | | | | 1,767 | |
4.50% due 03/01/2023 | | | 17,589 | | | | 17,757 | |
5.00% due 05/01/2034 | | | 63,344 | | | | 67,879 | |
5.00% due 11/01/2043 | | | 49,214 | | | | 52,555 | |
5.50% due 06/01/2022 | | | 15,779 | | | | 16,218 | |
5.50% due 07/01/2035 | | | 18,000 | | | | 19,563 | |
6.00% due 03/01/2040 | | | 49,062 | | | | 54,174 | |
6.50% due 02/01/2036 | | | 9,432 | | | | 10,499 | |
Federal Home Loan Mtg. Corp. FRS
3.99% (6 ML+1.49%)
due 02/01/2037 | | | 21,048 | | | | 21,706 | |
4.09% (12 ML+1.89%) due 11/01/2037 | | | 152,547 | | | | 160,651 | |
Federal Home Loan Mtg. Corp. REMIC | |
Series 4740, Class BA 3.00% due 09/15/2045(2) | | | 507,810 | | | | 500,497 | |
Series 4800, Class KG 3.50% due 11/15/2045(2) | | | 200,000 | | | | 198,187 | |
Series 3820, Class DA 4.00% due 11/15/2035(2) | | | 1,326,117 | | | | 1,336,770 | |
Federal Home Loan Mtg. Corp. REMIC FRS
Series 3572, Class JS
4.74% (6.80%-1 ML)
due 09/15/2039(2)(4)(10) | | | 165,190 | | | | 15,832 | |
| | | | | | |
|
|
|
| | | | | | | | 42,797,943 | |
| | | | | | |
|
|
|
Federal National Mtg. Assoc. — 12.0% | |
2.50% due 12/01/2026 | | | 697,126 | | | | 683,589 | |
2.50% due 08/01/2031 | | | 3,502,326 | | | | 3,405,964 | |
2.50% due 02/01/2032 | | | 1,306,081 | | | | 1,270,146 | |
3.00% due 10/01/2027 | | | 247,790 | | | | 247,814 | |
3.00% due 12/01/2027 | | | 233,419 | | | | 232,867 | |
| | | | | | | | |
| | |
| Security Description | | Principal
Amount(9) | | | Value
(Note 2) | |
| |
| | | | | | | | | |
Federal National Mtg. Assoc. (continued) | |
3.00% due 10/01/2030 | | $ | 359,755 | | | $ | 358,906 | |
3.00% due 10/01/2032 | | | 1,790,542 | | | | 1,781,077 | |
3.00% due 12/01/2042 | | | 158,979 | | | | 155,345 | |
3.00% due 08/01/2046 | | | 10,602,818 | | | | 10,289,309 | |
3.00% due 01/01/2047 | | | 4,715,006 | | | | 4,566,820 | |
3.00% due 02/01/2048 | | | 4,423,207 | | | | 4,283,959 | |
3.50% due 09/01/2026 | | | 196,515 | | | | 198,770 | |
3.50% due 08/01/2027 | | | 49,380 | | | | 49,943 | |
3.50% due 10/01/2028 | | | 217,423 | | | | 220,654 | |
3.50% due 03/01/2033 | | | 1,931,989 | | | | 1,954,921 | |
3.50% due 08/01/2033 | | | 4,168,252 | | | | 4,215,755 | |
3.50% due 08/01/2042 | | | 260,014 | | | | 257,183 | |
3.50% due 10/01/2045 | | | 507,830 | | | | 506,201 | |
3.50% due 11/01/2045 | | | 421,449 | | | | 420,164 | |
3.50% due 07/01/2046 | | | 5,374,815 | | | | 5,362,574 | |
3.50% due 01/01/2047 | | | 871,445 | | | | 867,481 | |
3.50% due 12/01/2047 | | | 14,960,566 | | | | 14,913,592 | |
3.50% due 04/01/2048 | | | 4,051,424 | | | | 4,035,914 | |
4.00% due 11/01/2025 | | | 106,105 | | | | 108,959 | |
4.00% due 12/01/2040 | | | 35,830 | | | | 36,742 | |
4.00% due 01/01/2043 | | | 2,108,796 | | | | 2,166,554 | |
4.00% due 10/01/2043 | | | 560,546 | | | | 574,073 | |
4.00% due 10/01/2044 | | | 280,601 | | | | 286,337 | |
4.00% due 02/01/2045 | | | 3,124,709 | | | | 3,210,323 | |
4.00% due 06/01/2046 | | | 670,202 | | | | 682,972 | |
4.00% due 01/01/2047 | | | 26,352 | | | | 26,847 | |
4.00% due 05/01/2047 | | | 665,566 | | | | 678,040 | |
4.00% due 07/01/2047 | | | 5,403,106 | | | | 5,504,090 | |
4.00% due 08/01/2047 | | | 8,196,477 | | | | 8,349,235 | |
4.00% due 06/01/2048 | | | 4,259,969 | | | | 4,353,620 | |
4.50% due 06/01/2019 | | | 1,992 | | | | 2,013 | |
4.50% due 03/01/2042 | | | 260,017 | | | | 271,770 | |
4.50% due 08/01/2045 | | | 4,231,718 | | | | 4,465,075 | |
4.50% due 11/01/2047 | | | 2,641,229 | | | | 2,743,371 | |
5.00% due 01/01/2023 | | | 32,521 | | | | 33,507 | |
5.00% due 04/01/2023 | | | 26,896 | | | | 27,916 | |
5.00% due 03/01/2037 | | | 7,114 | | | | 7,526 | |
5.00% due 05/01/2040 | | | 189,605 | | | | 203,131 | |
5.00% due 06/01/2040 | | | 61,919 | | | | 66,334 | |
5.00% due 07/01/2040 | | | 21,150 | | | | 22,643 | |
5.00% due 02/01/2045 | | | 575,927 | | | | 616,751 | |
5.50% due 08/01/2037 | | | 243,192 | | | | 263,449 | |
5.50% due 06/01/2038 | | | 29,963 | | | | 32,460 | |
6.00% due 02/01/2032 | | | 3,175 | | | | 3,441 | |
6.00% due 10/01/2034 | | | 123 | | | | 133 | |
6.00% due 09/01/2038 | | | 60,015 | | | | 66,266 | |
6.00% due 11/01/2038 | | | 17,069 | | | | 18,857 | |
6.00% due 06/01/2040 | | | 14,352 | | | | 15,832 | |
6.50% due 11/01/2037 | | | 41,590 | | | | 46,471 | |
Federal National Mtg. Assoc. FRS
3.57% (12 ML+1.82%)
due 10/01/2040 | | | 34,017 | | | | 35,757 | |
3.58% (12 ML+1.83%) due 10/01/2040 | | | 82,512 | | | | 86,750 | |
3.58% (12 ML+1.77%) due 05/01/2040 | | | 142,799 | | | | 149,549 | |
3.59% (6 ML+1.54%) due 09/01/2035 | | | 119,877 | | | | 124,052 | |
3.75% (12 ML+1.57%) due 05/01/2037 | | | 29,543 | | | | 30,892 | |
3.91% (12 ML+1.66%) due 07/01/2039 | | | 106,150 | | | | 111,166 | |
3.94% (1 Yr USTYCR+2.19%) due 10/01/2035 | | | 139,356 | | | | 146,656 | |
VALIC Company II Strategic Bond Fund
PORTFOLIO OF INVESTMENTS — August 31, 2018 — (continued)
| | | | | | | | |
| | |
| Security Description | | Principal
Amount(9) | | | Value
(Note 2) | |
| |
U.S. GOVERNMENT AGENCIES (continued) | |
Federal National Mtg. Assoc. (continued) | |
4.17% (1 Yr USTYCR+2.26%) due 11/01/2036 | | $ | 61,119 | | | $ | 64,416 | |
4.20% (12 ML+1.91%) due 08/01/2035 | | | 91,985 | | | | 97,262 | |
Federal National Mtg. Assoc. REMIC | |
Series 2017-94, Class DA 3.00% due 06/25/2045(2) | | | 2,180,542 | | | | 2,146,343 | |
Series 2017-100, Class NP 3.00% due 12/25/2047(2) | | | 1,210,959 | | | | 1,165,062 | |
Series 2018-27, Class EA 3.00% due 05/25/2048(2) | | | 2,920,503 | | | | 2,833,336 | |
| | | | | | |
|
|
|
| | | | | | | | 102,154,927 | |
| | | | | | |
|
|
|
Government National Mtg. Assoc. — 1.7% | |
3.00% due 03/20/2046 | | | 413,218 | | | | 405,288 | |
3.50% due 03/20/2047 | | | 467,982 | | | | 470,125 | |
4.00% due 05/20/2048 | | | 4,838,805 | | | | 4,959,951 | |
4.50% due 10/20/2045 | | | 4,703,540 | | | | 4,953,368 | |
4.50% due 04/20/2047 | | | 3,678,202 | | | | 3,842,136 | |
| | | | | | |
|
|
|
| | | | | | | | 14,630,868 | |
| | | | | | |
|
|
|
Total U.S. Government Agencies | | | | | |
(cost $161,448,946) | | | | | | | 159,583,738 | |
| | | | | | |
|
|
|
U.S. GOVERNMENT TREASURIES — 3.6% | |
United States Treasury Bonds — 0.3% | |
3.00% due 02/15/2048 | | | 2,096,000 | | | | 2,092,070 | |
3.13% due 05/15/2048 | | | 350,000 | | | | 358,135 | |
| | | | | | |
|
|
|
| | | | | | | | 2,450,205 | |
| | | | | | |
|
|
|
United States Treasury Notes — 3.3% | |
1.38% due 08/31/2020 | | | 282,000 | | | | 275,137 | |
1.63% due 08/31/2019 | | | 1,000,000 | | | | 991,602 | |
2.25% due 02/29/2020 | | | 620,000 | | | | 617,021 | |
2.25% due 11/15/2027 | | | 10,000,000 | | | | 9,514,062 | |
2.38% due 04/30/2020 | | | 1,000,000 | | | | 996,211 | |
2.50% due 05/31/2020 | | | 13,000,000 | | | | 12,973,086 | |
2.88% due 07/31/2025 | | | 635,000 | | | | 637,828 | |
2.88% due 05/15/2028 | | | 1,193,000 | | | | 1,194,398 | |
2.88% due 08/15/2028 | | | 1,000,000 | | | | 1,001,914 | |
| | | | | | |
|
|
|
| | | | | | | | 28,201,259 | |
| | | | | | |
|
|
|
Total U.S. Government Treasuries
| | | | | | | | |
(cost $30,832,742) | | | | | | | 30,651,464 | |
| | | | | | |
|
|
|
LOANS(11)(12)(13) — 5.3% | |
Advertising Services — 0.1% | |
Advantage Sales & Marketing, Inc. FRS
1st Lien
5.33% (1 ML+3.25%)
due 07/23/2021 | | | 840,633 | | | | 784,731 | |
| | | | | | |
|
|
|
Auto - Heavy Duty Trucks — 0.0% | |
Navistar Financial Corp. FRS
BTL-B
5.88% (1 ML + 3.75%)
due 08/03/2025 | | | 233,321 | | | | 233,904 | |
| | | | | | |
|
|
|
Broadcast Services/Program — 0.1% | |
Univision Communications, Inc. FRS
BTL
4.83% (1 ML+2.75%)
due 03/15/2024 | | | 842,703 | | | | 808,863 | |
| | | | | | |
|
|
|
Building & Construction Products - Misc. — 0.1% | |
Forterra Finance LLC FRS
BTL
5.08% (1 ML+3.00%)
due 10/25/2023 | | | 910,367 | | | | 851,762 | |
| | | | | | |
|
|
|
| | | | | | | | |
| | |
| Security Description | | Principal
Amount(9) | | | Value
(Note 2) | |
| |
| | | | | | | | | |
Building & Construction - Misc. — 0.1% | |
ATS Consolidated, Inc. FRS
BTL-B
5.82% (1 ML + 3.75%)
due 02/28/2025 | | $ | 842,887 | | | $ | 847,065 | |
ATS Consolidated, Inc. FRS
coupon TBD
due 02/28/2025 | | | 64,380 | | | | 64,738 | |
| | | | | | |
|
|
|
| | | | | | | | 911,803 | |
| | | | | | |
|
|
|
Building Products - Air & Heating — 0.1% | |
Thermasys Corp. FRS
BTL
6.33% (3 ML + 4.00%)
due 05/03/2019 | | | 833,014 | | | | 793,480 | |
Thermasys Corp. FRS
BTL
8.00% (USFRBPLR + 3.00%)
due 05/03/2019 | | | 5,993 | | | | 5,674 | |
| | | | | | |
|
|
|
| | | | | | | | 799,154 | |
| | | | | | |
|
|
|
Building Products - Doors & Windows — 0.1% | |
CHI Doors Holding Corp. FRS
BTL
5.33% (1 ML + 3.25%)
due 07/29/2022 | | | 840,689 | | | | 842,091 | |
| | | | | | |
|
|
|
Cable/Satellite TV — 0.3% | |
Altice France SA FRS
BTL-B13
coupon TBD
due 08/14/2026 | | | 445,000 | | | | 432,624 | |
Cogeco Communications USA II LP FRS
BTL-B
4.45% (1 ML +2.38%)
due 01/03/2025 | | | 219,450 | | | | 218,810 | |
CSC Holdings LLC FRS
BTL-B
4.56% (1 ML +2.50%)
due 01/25/2026 | | | 842,888 | | | | 840,078 | |
Ziggo Secured Finance FRS
BTL-E
4.56% (1 ML +2.50%)
due 04/15/2025 | | | 845,000 | | | | 829,684 | |
| | | | | | |
|
|
|
| | | | | | | | 2,321,196 | |
| | | | | | |
|
|
|
Casino Services — 0.0% | |
Stars Group Holdings BV FRS
BTL-B3
5.83% (3 ML + 3.50%)
due 04/06/2025 | | | 81,641 | | | | 81,539 | |
Stars Group Holdings BV FRS
BTL
5.83% (3 ML + 3.50%)
due 07/10/2025 | | | 65,000 | | | | 65,464 | |
| | | | | | |
|
|
|
| | | | | | | | 147,003 | |
| | | | | | |
|
|
|
Chemicals - Diversified — 0.0% | |
Schenectady International Group, Inc. FRS
1st Lien
coupon TBD
due 08/10/2025 | | | 122,536 | | | | 120,392 | |
| | | | | | |
|
|
|
Chemicals - Specialty — 0.1% | |
LTI Holdings, Inc. FRS
1st Lien
5.58% (1 ML + 3.50%)
due 05/16/2024 | | | 842,888 | | | | 842,888 | |
VALIC Company II Strategic Bond Fund
PORTFOLIO OF INVESTMENTS — August 31, 2018 — (continued)
| | | | | | | | |
| | |
| Security Description | | Principal
Amount(9) | | | Value
(Note 2) | |
| |
LOANS(11)(12)(13) (continued) | | | | | | | | |
Chemicals - Specialty (continued) | |
LTI Holdings, Inc. FRS
1st Lien
coupon TBD
due 08/10/2025 | | $ | 93,505 | | | $ | 93,505 | |
LTI Holdings, Inc. FRS
2nd Lien
coupon TBD
due 08/10/2026 | | | 16,595 | | | | 16,560 | |
| | | | | | |
|
|
|
| | | | | | | | 952,953 | |
| | | | | | |
|
|
|
Commercial Services - Finance — 0.1% | |
MoneyGram International, Inc. FRS
BTL-B
5.58% (3 ML + 3.25%)
due 03/27/2020 | | | 840,465 | | | | 814,200 | |
Verscend Holding Corp. FRS
BTL
coupon TBD
due 08/27/2025 | | | 86,919 | | | | 87,408 | |
| | | | | | |
|
|
|
| | | | | | | | 901,608 | |
| | | | | | |
|
|
|
Computer Services — 0.1% | |
Alion Science & Tech Corp. FRS
BTL
6.58% (1 ML + 4.50%)
due 08/19/2021 | | | 845,000 | | | | 848,521 | |
Banff Merger Sub, Inc. FRS
BTL
coupon TBD
due 09/01/2025 | | | 268,288 | | | | 268,369 | |
| | | | | | |
|
|
|
| | | | | | | | 1,116,890 | |
| | | | | | |
|
|
|
Computer Software — 0.1% | |
Rackspace Hosting, Inc. FRS
BTL-B
5.18% (2 ML + 3.00%)
due 11/03/2023 | | | 2,123 | | | | 2,090 | |
Rackspace Hosting, Inc. FRS
BTL-B
5.35% (3 ML + 3.00%)
due 11/03/2023 | | | 838,631 | | | | 833,803 | |
Vertafore, Inc. FRS
9.33% (1 ML + 7.25%)
due 07/02/2026 | | | 106,071 | | | | 105,851 | |
| | | | | | |
|
|
|
| | | | | | | | 941,744 | |
| | | | | | |
|
|
|
Consulting Services — 0.0% | |
Stiphout Finance LLC FRS
5.08% (1 ML + 3.00%)
due 10/26/2022 | | | 78,550 | | | | 79,237 | |
| | | | | | |
|
|
|
Dialysis Centers — 0.1% | |
U.S. Renal Care, Inc. FRS
BTL
6.58% (3 ML+4.25%)
due 12/31/2022 | | | 840,689 | | | | 817,570 | |
| | | | | | |
|
|
|
E-Commerce/Services — 0.2% | |
RentPath LLC FRS
2nd Lien
11.07% (1 ML + 9.00%)
due 12/17/2022 | | | 2,178,597 | | | | 1,361,623 | |
| | | | | | |
|
|
|
Electronic Components - Misc. — 0.1% | |
AI Ladder Luxembourg Subco SARL FRS
BTL
7.02% (5 ML + 4.50%)
due 07/09/2025 | | | 464,322 | | | | 462,001 | |
| | | | | | |
|
|
|
| | | | | | | | |
| | |
| Security Description | | Principal
Amount(9) | | | Value
(Note 2) | |
| |
| | | | | | | | | |
Electronic Design Automation — 0.0% | |
Verifone Systems, Inc. FRS
6.32% (3 ML + 4.00%)
due 08/20/2025 | | $ | 216,649 | | | $ | 216,919 | |
| | | | | | |
|
|
|
Enterprise Software/Service — 0.1% | |
Focus Financial Partners LLC FRS
BTL
5.33% (1 ML + 3.25%)
due 08/05/2022 | | | 840,763 | | | | 844,216 | |
| | | | | | |
|
|
|
Finance - Investment Banker/Broker — 0.0% | |
Deerfield Holdings Corp. Acquisition FRS
BTL
5.58% (3 ML + 3.25%)
due 02/13/2025 | | | 285,416 | | | | 285,773 | |
| | | | | | |
|
|
|
Finance - Other Services — 0.0% | |
Pi US Mergerco, Inc. FRS
1st Lien
5.58% (1 ML + 3.50%)
due 12/20/2024 | | | 214,626 | | | | 213,392 | |
| | | | | | |
|
|
|
Footwear & Related Apparel — 0.1% | |
Calceus Acquisition, Inc. FRS
BTL
6.08% (1 ML + 4.00%)
due 02/01/2020 | | | 840,569 | | | | 830,062 | |
| | | | | | |
|
|
|
Hotels/Motels — 0.0% | |
Marriott Ownership Resorts, Inc . FRS
BTL-B
coupon TBD
due 08/29/2025 | | | 42,130 | | | | 42,183 | |
| | | | | | |
|
|
|
Insurance Brokers — 0.1% | |
HUB International, Ltd. FRS
BTL
5.16% (2 ML + 3.00%)
due 04/25/2025 | | | 584 | | | | 582 | |
HUB International, Ltd. FRS
BTL
5.34% (3 ML + 3.00%)
due 04/25/2025 | | | 232,710 | | | | 232,403 | |
USI, Inc. FRS
BTL-B
5.33% (3 ML + 3.00%)
due 05/16/2024 | | | 840,764 | | | | 838,488 | |
| | | | | | |
|
|
|
| | | | | | | | 1,071,473 | |
| | | | | | |
|
|
|
Insurance - Multi-line — 0.1% | |
York Risk Services Holdings Corp. FRS
BTL
5.83% (1 ML + 3.75%)
due 10/01/2021 | | | 840,633 | | | | 810,160 | |
| | | | | | |
|
|
|
Insurance - Property/Casualty — 0.1% | |
Asurion LLC FRS
BTL-B6
5.08% (1 ML + 3.00%)
due 11/03/2023 | | | 816,203 | | | | 817,903 | |
Asurion LLC FRS
2nd Lien
8.58% (1 ML + 6.50%)
due 08/04/2025 | | | 16,737 | | | | 17,239 | |
| | | | | | |
|
|
|
| | | | | | | | 835,142 | |
| | | | | | |
|
|
|
VALIC Company II Strategic Bond Fund
PORTFOLIO OF INVESTMENTS — August 31, 2018 — (continued)
| | | | | | | | |
| | |
| Security Description | | Principal
Amount(9) | | | Value
(Note 2) | |
| |
LOANS(11)(12)(13) (continued) | |
Internet Financial Services — 0.2% | |
Diamond U.S. Holdings LLC FRS
BTL
5.08% (1 ML + 3.00%)
due 12/23/2024 | | $ | 832,828 | | | $ | 832,828 | |
ION Trading Finance, Ltd. FRS
BTL
6.08% (1 ML + 4.00%)
due 11/21/2024 | | | 708,094 | | | | 704,554 | |
| | | | | | |
|
|
|
| | | | | | | | 1,537,382 | |
| | | | | | |
|
|
|
Investment Management/Advisor Services — 0.0% | |
Advisor Group, Inc. FRS
5.81% (1 ML + 3.75%)
due 08/15/2025 | | | 67,587 | | | | 67,925 | |
Brookfield Wec Holdings, Inc. FRS
5.83% (1 ML + 3.75%)
due 08/01/2025 | | | 13,991 | | | | 14,071 | |
| | | | | | |
|
|
|
| | | | | | | | 81,996 | |
| | | | | | |
|
|
|
Leisure Products — 0.1% | |
Hayward Industries, Inc. FRS
BTL-B
5.58% (1 ML+3.50%)
due 08/05/2024 | | | 840,764 | | | | 842,866 | |
| | | | | | |
|
|
|
Machinery - General Industrial — 0.1% | |
Duravant LLC FRS
BTL
5.58% (3 ML+3.25%)
due 07/19/2024 | | | 840,775 | | | | 838,322 | |
Waterjet Holdings, Inc. FRS
BTL
5.07% (1ML + 3.00%)
due 04/03/2025 | | | 180,426 | | | | 180,202 | |
Waterjet Holdings, Inc. FRS
BTL
5.31% (3ML + 3.00%)
due 04/03/2025 | | | 22,554 | | | | 22,525 | |
Waterjet Holdings, Inc. FRS
BTL
5.50% (6ML + 3.00%)
due 04/03/2025 | | | 22,554 | | | | 22,525 | |
| | | | | | |
|
|
|
| | | | | | | | 1,063,574 | |
| | | | | | |
|
|
|
Machinery - Pumps — 0.1% | |
STS Operating, Inc. FRS
1st Lien
6.33% (1 ML+ 4.25%)
due 12/11/2024 | | | 467,178 | | | | 463,286 | |
Titan Acquisition, Ltd. FRS
BTL-B
5.00% (1 ML+3.00%)
due 03/28/2025 | | | 842,888 | | | | 796,660 | |
| | | | | | |
|
|
|
| | | | | | | | 1,259,946 | |
| | | | | | |
|
|
|
Marine Services — 0.1% | |
Drew Marine Group, Inc. FRS
BTL
5.33% (1 ML+3.25%)
due 11/19/2020 | | | 605,807 | | | | 602,778 | |
| | | | | | |
|
|
|
Medical Products — 0.1% | |
Auris Luxembourg III SARL FRS
BTL-B
coupon TBD
due 07/20/2025 | | | 51,251 | | | | 51,603 | |
| | | | | | | | |
| | |
| Security Description | | Principal
Amount(9) | | | Value
(Note 2) | |
| |
| | | | | | | | | |
Medical Products (continued) | |
Greatbatch, Ltd. FRS
BTL-B
5.07% (1 ML+3.00%)
due 10/27/2022 | | $ | 695,395 | | | $ | 698,872 | |
| | | | | | |
|
|
|
| | | | | | | | 750,475 | |
| | | | | | |
|
|
|
Medical - Drugs — 0.2% | |
Akorn, Inc. FRS
BTL
6.88% (1 ML+ 4.75%)
due 04/16/2021 | | | 845,000 | | | | 815,425 | |
Alphabet Holding Co., Inc. FRS
BTL
coupon TBD
due 09/26/2024 | | | 450,000 | | | | 425,025 | |
Valeant Pharmaceuticals International, Inc. FRS
5.08% (1 ML+3.00%)
due 06/02/2025 | | | 56,821 | | | | 56,999 | |
| | | | | | |
|
|
|
| | | | | | | | 1,297,449 | |
| | | | | | |
|
|
|
Medical - Generic Drugs — 0.1% | |
Alvogen Pharma US, Inc. FRS
1st Lien
6.83% (1 ML+ 4.75%)
due 04/02/2022 | | | 817,887 | | | | 822,658 | |
| | | | | | |
|
|
|
Medical - HMO — 0.1% | |
MultiPlan, Inc. FRS
BTL-B
5.08% (3 ML + 2.75%)
due 06/07/2023 | | | 807,660 | | | | 806,650 | |
| | | | | | |
|
|
|
Medical - Nursing Homes — 0.2% | |
Kindred Healthcare, Inc. FRS
1st Lien
7.38% (3 ML + 5.00%)
due 06/19/2025 | | | 1,588,849 | | | | 1,579,912 | |
| | | | | | |
|
|
|
Metal Processors & Fabrication — 0.3% | |
CIRCOR International, Inc. FRS
1st Lien
5.57% (1 ML + 3.50%)
due 12/11/2024 | | | 840,775 | | | | 842,667 | |
Crosby US Acquisition Corp. FRS
1st Lien
5.07% (1 ML + 3.00%)
due 11/23/2020 | | | 840,599 | | | | 830,617 | |
Doncasters Group, Ltd. FRS
BTL
5.83% (3 ML + 3.50%)
due 04/09/2020 | | | 610,652 | | | | 564,853 | |
| | | | | | |
|
|
|
| | | | | | | | 2,238,137 | |
| | | | | | |
|
|
|
Metal - Diversified — 0.1% | |
Unimin Corp. FRS
BTL
6.05% (3 ML + 3.75%)
due 06/01/2025 | | | 420,000 | | | | 414,750 | |
| | | | | | |
|
|
|
Oil Companies - Exploration & Production — 0.1% | |
Osum Production Corp. FRS
BTL
7.83% (3 ML + 5.50%)
due 07/28/2020 | | | 979,910 | | | | 886,818 | |
| | | | | | |
|
|
|
VALIC Company II Strategic Bond Fund
PORTFOLIO OF INVESTMENTS — August 31, 2018 — (continued)
| | | | | | | | |
| | |
| Security Description | | Principal
Amount(9) | | | Value
(Note 2) | |
| |
LOANS(11)(12)(13) (continued) | |
Pipelines — 0.1% | |
Medallion Midland Acquisition LLC FRS
1st Lien
5.33% (1 ML+ 3.25%)
due 10/30/2024 | | $ | 840,775 | | | $ | 832,017 | |
| | | | | | |
|
|
|
Quarrying — 0.0% | |
US Silica Co. FRS
BTL-B
6.13% (1 ML + 4.00%)
due 05/01/2025 | | | 188,363 | | | | 187,939 | |
| | | | | | |
|
|
|
Real Estate Operations & Development — 0.0% | |
DTZ U. S. Borrower LLC FRS
5.32% (1 ML + 3.25%)
due 08/21/2025 | | | 153,435 | | | | 152,924 | |
| | | | | | |
|
|
|
Resort/Theme Parks — 0.1% | |
SW Acquisitions Co., Inc. FRS
BTL
5.08% (1 ML + 3.00%)
due 03/31/2024 | | | 840,743 | | | | 836,839 | |
| | | | | | |
|
|
|
Retail - Hypermarkets — 0.1% | |
Smart & Final Stores LLC FRS
BTL
5.58% (1 ML + 3.50%)
due 11/15/2022 | | | 845,000 | | | | 825,724 | |
| | | | | | |
|
|
|
Retail - Major Department Stores — 0.0% | |
Hudson’s Bay Co. FRS
BTL-B
coupon TBD
due 09/30/2022 | | | 200,011 | | | | 191,210 | |
| | | | | | |
|
|
|
Retail - Petroleum Products — 0.1% | |
EG Dutch Finance Co. FRS
6.33% (3 ML + 4.00%)
due 02/07/2025 | | | 842,888 | | | | 843,941 | |
| | | | | | |
|
|
|
Retail - Sporting Goods — 0.1% | |
Bass Pro Group LLC FRS
BTL-B
7.00% (1 ML+5.00%)
due 09/25/2024 | | | 840,764 | | | | 847,491 | |
| | | | | | |
|
|
|
Soap & Cleaning Preparation — 0.1% | |
Diamond BC BV FRS
BTL
5.08% (1 ML+3.00%)
due 09/06/2024 | | | 840,775 | | | | 822,908 | |
| | | | | | |
|
|
|
Steel - Producers — 0.1% | |
Helix Acquisition Holdings, Inc. FRS
1st Lien
5.83% (3 ML + 3.50%)
due 09/29/2024 | | | 895,407 | | | | 897,646 | |
| | | | | | |
|
|
|
Telecom Services — 0.1% | |
GTT Communications, Inc. FRS
BTL
4.83% (1 ML+ 2.75%)
due 05/31/2025 | | | 380,729 | | | | 372,815 | |
GTT Communications, Inc. FRS
BTL
coupon TBD
due 09/29/2014 | | | 44,271 | | | | 43,366 | |
West Corp. FRS
BTL-B1
5.58% (1 ML+ 3.50%)
due 10/10/2024 | | | 398,585 | | | | 395,430 | |
| | | | | | |
|
|
|
| | | | | | | | 811,611 | |
| | | | | | |
|
|
|
| | | | | | | | |
| | |
| Security Description | | Principal
Amount(9) | | | Value
(Note 2) | |
| |
| | | | | | | | | |
Telephone - Integrated — 0.1% | |
CenturyLink, Inc. FRS
BTL-B
4.83% (1 ML+2.75%)
due 01/31/2025 | | $ | 840,775 | | | $ | 830,616 | |
TDC A/S FRS
BTL-B2
coupon TBD
due 05/31/2025 | | | 299,554 | | | | 301,988 | |
| | | | | | |
|
|
|
| | | | | | | | 1,132,604 | |
| | | | | | |
|
|
|
Theaters — 0.1% | |
Cineworld, Ltd. FRS
BTL-B
4.58% (1 ML+ 2.50%)
due 02/28/2025 | | | 842,888 | | | | 839,258 | |
| | | | | | |
|
|
|
Transport - Equipment & Leasing — 0.1% | |
Goodpack, Ltd. FRS
1st Lien
6.08% (3 ML + 3.75%)
due 09/11/2023 | | | 430,746 | | | | 432,721 | |
Goodpack, Ltd. FRS
2nd Lien
9.33% (3 ML + 7.00%)
due 09/11/2024 | | | 60,359 | | | | 60,560 | |
| | | | | | |
|
|
|
| | | | | | | | 493,281 | |
| | | | | | |
|
|
|
Transport - Truck — 0.1% | |
Pods LLC FRS
BTL-B4
4.82% (1 ML + 2.75%)
due 12/06/2024 | | | 840,765 | | | | 842,236 | |
| | | | | | |
|
|
|
Total Loans
| | | | | |
(cost $45,495,945) | | | | | | | 44,346,865 | |
| | | | | | |
|
|
|
COMMON STOCKS — 0.0% | |
Television — 0.0% | |
ION Media Networks, Inc.(5)(6)(14)
(cost $3) | | | 316 | | | | 253,639 | |
| | | | | | |
|
|
|
PREFERRED SECURITIES — 0.0% | |
Electric - Distribution — 0.0% | |
Entergy Louisiana LLC
4.70% | | | 7,075 | | | | 167,960 | |
| | | | | | |
|
|
|
Sovereign Agency — 0.0% | |
Federal Home Loan Mtg. Corp.
Series Z
8.38% | | | 2,642 | | | | 16,750 | |
| | | | | | |
|
|
|
Telecom Services — 0.0% | |
Qwest Corp.6.13% | | | 8,475 | | | | 191,281 | |
| | | | | | |
|
|
|
Total Preferred Securities | | | | | | | | |
(cost $429,542) | | | | | | | 375,991 | |
| | | | | | |
|
|
|
PREFERRED SECURITIES/CAPITAL SECURITIES — 1.6% | |
Banks - Commercial — 0.1% | |
Banco Bilbao Vizcaya Argentaria SA
6.13% due 11/16/2027#(15) | | $ | 200,000 | | | | 176,414 | |
Cooperatieve Rabobank UA
11.00% due 06/30/2019*(15) | | | 311,000 | | | | 329,271 | |
| | | | | | |
|
|
|
| | | | | | | | 505,685 | |
| | | | | | |
|
|
|
Banks - Super Regional — 0.0% | |
Huntington Bancshares, Inc.
Series E
5.70% due 04/15/2023(15) | | | 149,000 | | | | 148,628 | |
VALIC Company II Strategic Bond Fund
PORTFOLIO OF INVESTMENTS — August 31, 2018 — (continued)
| | | | | | | | |
| | |
| Security Description | | Principal
Amount(9) | | | Value
(Note 2) | |
| |
PREFERRED SECURITIES/CAPITAL SECURITIES (continued) | |
Banks - Super Regional (continued) | |
Wells Fargo Capital X
5.95% due 12/01/2086 | | $ | 134,000 | | | $ | 143,380 | |
| | | | | | |
|
|
|
| | | | | | | | 292,008 | |
| | | | | | |
|
|
|
Building Societies — 0.1% | |
Nationwide Building Society
6.88% due 06/20/2019(15) | | GBP | 400,000 | | | | 532,131 | |
| | | | | | |
|
|
|
Diversified Banking Institutions — 0.3% | |
Bank of Nova Scotia
4.65% due 10/12/2022(15) | | | 440,000 | | | | 408,650 | |
HSBC Holdings PLC
6.00% due 05/22/2027(15) | | | 349,000 | | | | 338,111 | |
HSBC Holdings PLC
6.25% due 03/23/2023(15) | | | 470,000 | | | | 471,786 | |
JPMorgan Chase & Co.
Series CC
4.63% due 11/01/2022#(15) | | | 7,000 | | | | 6,637 | |
JPMorgan Chase & Co.
Series U
6.13% due 04/30/2024(15) | | | 487,000 | | | | 506,480 | |
Royal Bank of Scotland Group PLC
8.00% due 08/10/2025(15) | | | 245,000 | | | | 259,700 | |
Societe Generale SA
7.88% due 12/18/2023*#(15) | | | 551,000 | | | | 578,550 | |
| | | | | | |
|
|
|
| | | | | | | | 2,569,914 | |
| | | | | | |
|
|
|
Electric - Generation — 0.1% | |
Engie SA
4.63% due 01/10/2019(15) | | GBP | 1,000,000 | | | | 1,308,378 | |
| | | | | | |
|
|
|
Electric - Integrated — 0.1% | |
Dominion Resources, Inc.
5.75% due 10/01/2054 | | | 139,000 | | | | 144,907 | |
Gas Natural Fenosa Finance BV
3.38% due 04/24/2024(15) | | EUR | 400,000 | | | | 459,657 | |
| | | | | | |
|
|
|
| | | | | | | | 604,564 | |
| | | | | | |
|
|
|
Finance - Investment Banker/Broker — 0.0% | |
Lehman Brothers Holdings Capital Trust VII
Escrow Security
0.00%†(5)(6) | | | 101,000 | | | | 10 | |
| | | | | | |
|
|
|
Finance - Other Services — 0.0% | |
National Rural Utilities Cooperative Finance Corp.
4.75% due 04/30/2043 | | | 331,000 | | | | 333,445 | |
| | | | | | |
|
|
|
Food - Dairy Products — 0.1% | |
Land O’Lakes Capital Trust I
7.45% due 03/15/2028* | | | 667,000 | | | | 732,032 | |
| | | | | | |
|
|
|
Gas - Distribution — 0.1% | |
Centrica PLC
3.00% due 04/10/2076 | | EUR | 780,000 | | | | 925,847 | |
| | | | | | |
|
|
|
Insurance - Life/Health — 0.2% | |
Aviva PLC
6.13% due 07/05/2043 | | EUR | 635,000 | | | | 865,240 | |
Hanwha Life Insurance Co., Ltd.
4.70% due 04/23/2048* | | | 575,000 | | | | 542,665 | |
Prudential Financial, Inc.
4.50% due 09/15/2047# | | | 149,000 | | | | 138,384 | |
Prudential Financial, Inc.
5.63% due 06/15/2043 | | | 671,000 | | | | 701,685 | |
| | | | | | |
|
|
|
| | | | | | | | 2,247,974 | |
| | | | | | |
|
|
|
| | | | | | | | |
| | |
| Security Description | | Shares/
Principal
Amount(9) | | | Value
(Note 2) | |
| |
| | | | | | | | | |
Insurance - Multi-line — 0.1% | |
Assurant, Inc.
7.00% due 03/27/2048 | | $ | 342,000 | | | $ | 348,840 | |
MetLife, Inc.
6.40% due 12/15/2066 | | | 366,000 | | | | 390,705 | |
| | | | | | |
|
|
|
| | | | | | | | 739,545 | |
| | | | | | |
|
|
|
Pipelines — 0.1% | |
Energy Transfer Partners LP
6.25% due 02/15/2023(15) | | | 152,000 | | | | 147,060 | |
EnLink Midstream Partners LP
6.00% due 12/15/2022(15) | | | 149,000 | | | | 136,955 | |
Enterprise Products Operating LLC
5.25% due 08/16/2077 | | | 110,000 | | | | 103,950 | |
TransCanada Trust
5.30% due 03/15/2077 | | | 192,000 | | | | 184,080 | |
TransCanada Trust
5.63% due 05/20/2075 | | | 139,000 | | | | 138,305 | |
| | | | | | |
|
|
|
| | | | | | | | 710,350 | |
| | | | | | |
|
|
|
Telephone - Integrated — 0.1% | |
Orange SA
5.25% due 02/07/2024(15) | | EUR | 425,000 | | | | 552,512 | |
| | | | | | |
|
|
|
Tools - Hand Held — 0.1% | |
Stanley Black & Decker, Inc.
5.75% due 12/15/2053 | | | 441,000 | | | | 441,553 | |
| | | | | | |
|
|
|
Water — 0.1% | |
Suez
3.00% due 06/23/2020(15) | | EUR | 1,000,000 | | | | 1,205,959 | |
| | | | | | |
|
|
|
Total Preferred Securities/Capital Securities | | | | | | | | |
(cost $13,911,012) | | | | | | | 13,701,907 | |
| | | | | | |
|
|
|
Total Long-Term Investment Securities | | | | | | | | |
(cost $840,797,570) | | | | | | | 820,058,058 | |
| | | | | | |
|
|
|
SHORT-TERM INVESTMENT SECURITIES — 6.9% | |
Registered Investment Companies — 6.9% | |
State Street Institutional U.S. Government Money Market Fund, Premier Class
1.87%(18) | | | 33,035,910 | | | | 33,035,910 | |
State Street Navigator Securities Lending Government Money Market Portfolio
1.93%(16)(18) | | | 25,837,615 | | | | 25,837,615 | |
| | | | | | |
|
|
|
| | | | | | | | 58,873,525 | |
| | | | | | |
|
|
|
U.S. Government Treasuries — 0.0% | | | | | | | | |
United States Treasury Bills
2.15% due 01/24/2019 | | $ | 500,000 | | | | 495,705 | |
| | | | | | |
|
|
|
Total Short-Term Investment Securities | | | | | | | | |
(cost $59,369,233) | | | | | | | 59,369,230 | |
| | | | | | |
|
|
|
TOTAL INVESTMENTS | | | | | | | | |
(cost $900,166,803)(17) | | | 103.1 | % | | | 879,427,288 | |
Liabilities in excess of other assets | | | (3.1 | ) | | | (26,025,714 | ) |
| | |
|
|
| |
|
|
|
NET ASSETS | | | 100.0 | % | | $ | 853,401,574 | |
| | |
|
|
| |
|
|
|
| * | Securities exempt from registration under Rule 144A of the Securities Act of 1933. These securities may be sold in transactions exempt from registration, normally to qualified institutional buyers. The Fund has no right to demand registration of these securities. At August 31, 2018, the aggregate value of these securities was $200,636,561 representing 23.5% of net assets. Unless otherwise indicated, these securities are not considered to be illiquid. |
| # | The security or a portion thereof is out on loan (see Note 2). |
| † | Non-income producing security |
| (1) | Commercial Mortgage Backed Security |
VALIC Company II Strategic Bond Fund
PORTFOLIO OF INVESTMENTS — August 31, 2018 — (continued)
| (2) | Collateralized Mortgage Obligation |
| (3) | Certain variable rate securities are not based on a published reference rate and spread but are determined by the issuer or agent and are based on current market conditions. These securities do not indicate a reference rate and spread in their description above. |
| (5) | Securities classified as Level 3 (see Note 2). |
| (6) | Illiquid security. At August 31, 2018, the aggregate value of these securities was $258,313 representing 0.0% of net assets. |
| (7) | Company has filed for bankruptcy protection. |
| (8) | Security in default of interest and principal at maturity. |
| (9) | Denominated in United States Dollars unless otherwise indicated. |
| (10) | Inverse Floating Rate Security that pays interest that varies inversely to changes in the market interest rates. The interest rate shown is the current interest rate at August 31, 2018. |
| (11) | Senior loans in the Fund are generally subject to mandatory and/or optional prepayment. Because of these mandatory prepayment conditions and because there may be significant economic incentives for a borrower to prepay, prepayments may occur. As a result, the actual remaining maturity may be substantially less than the stated maturities shown. |
| (12) | The Fund invests in senior loans which generally pay interest at rates which are periodically re-determined by reference to a base lending rate plus a premium. These base lending rates are generally either the lending rate offered by one or more major European banks, such as the London Inter-Bank Offer Rate (“LIBOR”) or the prime rate offered by one or more major United States banks, or the certificate of deposit rate. Senior loans are generally considered to be restrictive in that the Fund is ordinarily contractually obligated to receive approval from the Agent Bank and/or borrower prior to the disposition of a senior loan. |
| (13) | All loans in the Fund were purchased through assignment agreements unless otherwise indicated. |
| (14) | Denotes a restricted security that: (a) cannot be offered for public sale without first being registered, or being able to take advantage of an exemption from registration, under the Securities Act of 1933, as amended (the “1933 Act”); (b) is subject to a contractual restriction on public sales; or (c) is otherwise subject to a restriction on sales by operation of applicable law. Restricted securities are valued pursuant to Note 2. Certain restricted securities held by the Fund may not be sold except in exempt transactions or in a public offering registered under the 1933 Act. The Fund has no right to demand registration of these securities. The risk of investing in certain restricted securities is greater than the risk of investing in the securities of widely held, publicly traded companies. To the extent applicable, lack of a secondary market and resale restrictions may result in the inability of a Fund to sell a security at a fair price and may substantially delay the sale of the security. In addition, certain restricted securities may exhibit greater price volatility than securities for which secondary markets exist. As of August 31, 2018, the Fund held the following restricted securities: |
| | | | | | | | | | | | | | | | | | | | | | | | |
Description
| | Acquisition
Date
| | | Shares
| | | Acquisition
Cost
| | | Value
| | | Value
Per Share
| | | % of
Net Assets
| |
Common Stocks | | | | | | | | | | | | | | | | | | | | | |
ION Media Networks, Inc. | | | 3/5/2014 | | | | 316 | | | $ | 3 | | | $ | 253,639 | | | $ | 802.66 | | | | 0.03 | % |
| | | | | | | | | | | | | | |
|
|
| | | | | |
|
|
|
| (15) | Perpetual maturity — maturity date reflects the next call date. |
| (16) | At August 31, 2018, the Fund had loaned securities with a total value of $37,967,371. This was secured by collateral of $25,837,615, which was received in cash and subsequently invested in short-term investments currently valued at $25,837,615 as reported in the Portfolio of Investments. Additional collateral of $12,968,640 was received in the form of fixed income pooled securities, which the Fund cannot sell or repledge and accordingly are not reflected in the Fund’s assets and liabilities. The components of the fixed income pooled securities referenced above are as follows: |
| | | | | | |
Securities
| | Coupon Range
| | Maturity Date Range
| | Value as of
August 31, 2018
|
United States Treasury Notes/Bonds | | 0.13% to 8.13% | | 01/15/2019 to 05/15/2047 | | $12,968,640 |
| (17) | See Note 5 for cost of investments on a tax basis. |
| (18) | The rate shown is a 7-day yield as of August 31, 2018. |
BTL—Bank Term Loan
REMIC—Real Estate Mortgage Investment Conduit
TBD—Senior loan purchased on a when-issued or delayed-delivery basis. Certain details associated with this purchase are not known prior to the settlement date of the transaction. In addition, senior loans typically trade without accrued interest and therefore a coupon rate is not available prior to the settlement.
ULC—Unlimited Liability Corp.
FRS—Floating Rate Security
VRS—Variable Rate Security
The rates shown on FRS and VRS are the current interest rates at August 31, 2018 and unless noted otherwise, the dates are the original maturity dates.
Currency Legend
EUR—Euro Currency
GBP—British Pound
Index Legend
1 ML—1 Month USD LIBOR
2 ML—2 Month USD LIBOR
3 ML—3 Month USD LIBOR
5 ML—5 Month USD LIBOR
6 ML—6 Month USD LIBOR
12 ML—12 Month USD LIBOR
1 Yr USTYCR—1 Year US Treasury Yield Curve Rate
USFRBPLR—US Federal Reserve Bank Loan Rate
| | | | | | | | | | | | | | | | | | | | | | | | | | | | |
| Forward Foreign Currency Contracts | | | | | | | | | | | | | | | | | | | | | |
| Counterparty | | Contract to Deliver | | | In Exchange For | | | Delivery Date | | | Unrealized
Appreciation | | | Unrealized
Depreciation | |
JPMorgan Chase Bank N.A | | | EUR | | | | 7,125,000 | | | | USD | | | | 8,316,922 | | | | 09/27/2018 | | | $ | 33,137 | | | $ | – | |
| | | | EUR | | | | 29,625,000 | | | | USD | | | | 34,813,798 | | | | 10/25/2018 | | | | 294,665 | | | | – | |
| | | | GBP | | | | 4,840,000 | | | | USD | | | | 6,246,930 | | | | 09/27/2018 | | | | – | | | | (33,431 | ) |
| | | | | | | | | | | | | | | | | | | | | | |
|
|
| |
|
|
|
Net Unrealized Appreciation/(Depreciation) | | | | | | | | | | | | | | | | | | | | | | $ | 327,802 | | | $ | (33,431 | ) |
| | | | | | | | | | | |
|
|
| |
|
|
|
VALIC Company II Strategic Bond Fund
PORTFOLIO OF INVESTMENTS — August 31, 2018 — (continued)
The following is a summary of the inputs used to value the Fund’s net assets as of August 31, 2018 (see Note 2):
| | | | | | | | | | | | | | | | |
| | | Level 1 - Unadjusted
Quoted Prices
| | | Level 2 - Other
Observable Inputs
| | | Level 3 - Significant
Unobservable Inputs
| | | Total
| |
ASSETS: | | | | | | | | | | | | | | | | |
Investments at Value:* | | | | | | | | | | | | | | | | |
Asset Backed Securities | | $ | — | | | $ | 9,094,501 | | | $ | — | | | $ | 9,094,501 | |
U.S. Corporate Bonds & Notes: | | | | | | | | | | | | | | | | |
Airlines | | | — | | | | 923,825 | | | | 47,679 | | | | 971,504 | |
Finance-Investment Banker/Broker | | | — | | | | 1,886,364 | | | | 25 | | | | 1,886,389 | |
Gambling (Non-Hotel) . . . . . . . . . . . . . . . . . . . . . . | | | — | | | | 748,600 | | | | 4,639 | | | | 753,239 | |
Rubber/Plastic Products . . . . . . . . . . . . . . . . . . . . | | | — | | | | — | | | | 0 | | | | 0 | |
Other Industries . . . . . . . . . . . . . . . . . . . . . . . . . . | | | — | | | | 262,085,990 | | | | — | | | | 262,085,990 | |
Foreign Corporate Bonds & Notes: | | | | | | | | | | | | | | | | |
Special Purpose Entity . . . . . . . . . . . . . . . . . . . . . . | | | — | | | | — | | | | 0 | | | | 0 | |
Other Industries . . . . . . . . . . . . . . . . . . . . . . . . . . | | | — | | | | 152,096,218 | | | | — | | | | 152,096,218 | |
Foreign Government Obligations . . . . . . . . . . . . . . . . | | | — | | | | 144,256,613 | | | | — | | | | 144,256,613 | |
U.S. Government Agencies . . . . . . . . . . . . . . . . . . . . . | | | — | | | | 159,583,738 | | | | — | | | | 159,583,738 | |
U.S. Government Treasuries . . . . . . . . . . . . . . . . . . . . | | | — | | | | 30,651,464 | | | | — | | | | 30,651,464 | |
Loans . . . . . . . . . . . . . . . . . . . . . . . . . . . . . . . . . . . . . . | | | — | | | | 44,346,865 | | | | — | | | | 44,346,865 | |
Common Stocks . . . . . . . . . . . . . . . . . . . . . . . . . . . . | | | — | | | | — | | | | 253,639 | | | | 253,639 | |
Preferred Securities . . . . . . . . . . . . . . . . . . . . . . . . . . | | | 375,991 | | | | — | | | | — | | | | 375,991 | |
Preferred Securities/Capital Securities : | | | | | | | | | | | | | | | | |
Finance Investment Banker/Broker | | | — | | | | — | | | | 10 | | | | 10 | |
Other Industries . . . . . . . . . . . . . . . . . . . . . . . . . . | | | — | | | | 13,701,897 | | | | — | | | | 13,701,897 | |
Short-Term Investment Securities: | | | | | | | | | | | | | | | | |
Registered Investment Companies | | | 58,873,525 | | | | — | | | | — | | | | 58,873,525 | |
U.S. Government Treasuries | | | — | | | | 495,705 | | | | — | | | | 495,705 | |
| | |
|
|
| |
|
|
| |
|
|
| |
|
|
|
Total Investments at Value . . . . . . . . . . . . . . . . . . . . | | $ | 59,249,516 | | | $ | 819,871,780 | | | $ | 305,992 | | | $ | 879,427,288 | |
| | |
|
|
| |
|
|
| |
|
|
| |
|
|
|
Other Financial Instruments:+ | | | | | | | | | | | | | | | | |
Forward Foreign Currency Contracts . . . . . . . . . . . . . . | | $ | — | | | $ | 327,802 | | | $ | — | | | $ | 327,802 | |
| | |
|
|
| |
|
|
| |
|
|
| |
|
|
|
LIABILITIES: | | | | | | | | | | | | | | | | |
Other Financial Instruments:+ | | | | | | | | | | | | | | | | |
Forward Foreign Currency Contracts . . . . . . . . . . . . . . | | $ | — | | | $ | 33,431 | | | $ | — | | | $ | 33,431 | |
| | |
|
|
| |
|
|
| |
|
|
| |
|
|
|
| * | For a detailed presentation of investments, please refer to the Portfolio of Investments. |
| + | Other financial instruments are derivative instruments, not reflected in the Portfolio of Investments, such as futures, forward, swap and written option contracts, which are valued at the unrealized appreciation (depreciation) on the instrument. |
The Fund’s policy is to recognize transfers between Levels as of the end of the reporting period. There were no transfers between Levels during the reporting period.
At the beginning and end of the reporting period, Level 3 investments were not considered a material portion of the Fund.
See Notes to Financial Statements
VALIC Company II
STATEMENTS OF ASSETS AND LIABILITIES — August 31, 2018
| | | | | | | | | | | | | | | | | | | | |
| | | AGGRESSIVE
GROWTH
LIFESTYLE FUND | | | CAPITAL
APPRECIATION
FUND | | | CONSERVATIVE
GROWTH
LIFESTYLE FUND | | | CORE BOND
FUND | | | GOVERNMENT
MONEY MARKET II
FUND | |
ASSETS: | | | | | | | | | | | | | | | | | | | | |
Investment at value (unaffiliated)*† | | $ | – | | | $ | 108,223,885 | | | $ | – | | | $ | 1,297,645,081 | | | $ | 137,283,432 | |
Investment at value (affiliated)*† | | | 608,795,113 | | | | – | | | | 338,851,594 | | | | – | | | | – | |
Repurchase agreements (cost equals market value) | | | – | | | | – | | | | – | | | | – | | | | – | |
Cash | | | 22,637 | | | | 1,411,883 | | | | 16,665 | | | | – | | | | 28,948 | |
Foreign cash* | | | – | | | | – | | | | – | | | | – | | | | – | |
Cash collateral for futures contracts | | | – | | | | – | | | | – | | | | – | | | | – | |
Due from broker | | | – | | | | – | | | | – | | | | – | | | | – | |
Receivable for: | | | | | | | | | | | | | | | | | | | | |
Fund shares sold | | | 92,512 | | | | 60,693 | | | | 1,015 | | | | 699,856 | | | | 140,391 | |
Dividends and interest | | | – | | | | 129,981 | | | | – | | | | 9,738,021 | | | | 41,980 | |
Investments sold | | | – | | | | – | | | | 35,293 | | | | 2,996,532 | | | | – | |
Investments sold on an extended settlement basis | | | – | | | | – | | | | – | | | | 1,639,735 | | | | – | |
Securities lending income | | | – | | | | 981 | | | | – | | | | 17,981 | | | | – | |
Prepaid expenses and other assets | | | 23,690 | | | | 14,470 | | | | 17,449 | | | | 45,213 | | | | 27,629 | |
Due from investment adviser for expense reimbursements/fee waivers | | | 38,711 | | | | 26,401 | | | | 24,953 | | | | 65,820 | | | | 16,499 | |
Variation margin on futures contracts | | | – | | | | – | | | | – | | | | – | | | | – | |
Unrealized appreciation on forward foreign currency contracts | | | – | | | | – | | | | – | | | | – | | | | – | |
| | |
|
|
| |
|
|
| |
|
|
| |
|
|
| |
|
|
|
TOTAL ASSETS | | | 608,972,663 | | | | 109,868,294 | | | | 338,946,969 | | | | 1,312,848,239 | | | | 137,538,879 | |
| | |
|
|
| |
|
|
| |
|
|
| |
|
|
| |
|
|
|
LIABILITIES: | | | | | | | | | | | | | | | | | | | | |
Payable for: | | | | | | | | | | | | | | | | | | | | |
Fund shares reacquired | | | 11,989 | | | | 19,132 | | | | 35,887 | | | | 67,276 | | | | 400,654 | |
Investments purchased | | | 80,062 | | | | – | | | | – | | | | 7,508,080 | | | | – | |
Investments purchased on an extended settlement basis | | | – | | | | – | | | | – | | | | 6,348,555 | | | | – | |
Investment advisory and management fees | | | 51,390 | | | | 49,485 | | | | 28,786 | | | | 461,179 | | | | 28,385 | |
Shareholder services | | | – | | | | 22,493 | | | | – | | | | 269,658 | | | | 28,385 | |
Administrative service fees | | | – | | | | 5,992 | | | | – | | | | 71,835 | | | | 7,562 | |
Transfer agent fees and expenses | | | 489 | | | | 979 | | | | 489 | | | | 979 | | | | 367 | |
Trustees’ fees and expenses | | | 21,024 | | | | 7,610 | | | | 13,487 | | | | 41,890 | | | | 20,265 | |
Other accrued expenses | | | 98,708 | | | | 65,896 | | | | 75,421 | | | | 202,078 | | | | 66,391 | |
Accrued foreign tax on capital gains | | | – | | | | – | | | | – | | | | – | | | | – | |
Collateral upon return of securities loaned | | | – | | | | – | | | | – | | | | 15,226,497 | | | | – | |
Due to custodian | | | – | | | | – | | | | – | | | | 64,457 | | | | – | |
Due to broker | | | – | | | | – | | | | – | | | | – | | | | – | |
Unrealized depreciation on forward foreign currency contracts | | | – | | | | – | | | | – | | | | – | | | | – | |
| | |
|
|
| |
|
|
| |
|
|
| |
|
|
| |
|
|
|
TOTAL LIABILITIES | | | 263,662 | | | | 171,587 | | | | 154,070 | | | | 30,262,484 | | | | 552,009 | |
| | |
|
|
| |
|
|
| |
|
|
| |
|
|
| |
|
|
|
NET ASSETS | | $ | 608,709,001 | | | $ | 109,696,707 | | | $ | 338,792,899 | | | $ | 1,282,585,755 | | | $ | 136,986,870 | |
| | |
|
|
| |
|
|
| |
|
|
| |
|
|
| |
|
|
|
NET ASSETS REPRESENTED BY: | | | | | | | | | | | | | | | | | | | | |
Trust shares at par value of $0.01 per share | | $ | 536,599 | | | $ | 54,493 | | | $ | 275,164 | | | $ | 1,194,315 | | | $ | 1,369,660 | |
Additional paid in capital | | | 507,755,775 | | | | 65,320,499 | | | | 314,527,180 | | | | 1,281,890,431 | | | | 135,625,542 | |
Accumulated undistributed net investment income (loss) | | | 11,262,193 | | | | 239,819 | | | | 9,190,135 | | | | 36,208,371 | | | | (840 | ) |
Accumulated undistributed net realized gain (loss) on investments, swap contracts, futures contracts, options contracts, securities sold short, foreign exchange transactions and capital gain distributions from underlying funds | | | 48,029,993 | | | | 26,298,747 | | | | 12,133,257 | | | | (12,658,783 | ) | | | (7,492 | ) |
Unrealized appreciation (depreciation) on investments | | | 41,124,441 | | | | 17,783,149 | | | | 2,667,163 | | | | (24,048,579 | ) | | | – | |
Unrealized appreciation (depreciation) on futures contracts, written options contracts and swap contracts | | | – | | | | – | | | | – | | | | – | | | | – | |
Unrealized foreign exchange gain (loss) on other assets and liabilities | | | – | | | | – | | | | – | | | | – | | | | – | |
Accrued capital gains tax on unrealized appreciation (depreciation) | | | – | | | | – | | | | – | | | | – | | | | – | |
| | |
|
|
| |
|
|
| |
|
|
| |
|
|
| |
|
|
|
NET ASSETS | | $ | 608,709,001 | | | $ | 109,696,707 | | | $ | 338,792,899 | | | $ | 1,282,585,755 | | | $ | 136,986,870 | |
| | |
|
|
| |
|
|
| |
|
|
| |
|
|
| |
|
|
|
SHARES OF BENEFICIAL INTEREST: | | | | | | | | | | | | | | | | | | | | |
Authorized (Par value $0.01 per share) | | | 1,000,000,000 | | | | 1,000,000,000 | | | | 1,000,000,000 | | | | 1,000,000,000 | | | | 1,000,000,000 | |
Outstanding | | | 53,659,924 | | | | 5,449,276 | | | | 27,516,408 | | | | 119,431,472 | | | | 136,965,981 | |
NET ASSET VALUE, OFFERING AND REDEMPTION PRICE PER SHARE | | $ | 11.34 | | | $ | 20.13 | | | $ | 12.31 | | | $ | 10.74 | | | $ | 1.00 | |
| | |
|
|
| |
|
|
| |
|
|
| |
|
|
| |
|
|
|
* Cost | | | | | | | | | | | | | | | | | | | | |
Investments (unaffiliated) | | $ | – | | | $ | 90,440,736 | | | $ | – | | | $ | 1,321,693,660 | | | $ | 137,283,432 | |
| | |
|
|
| |
|
|
| |
|
|
| |
|
|
| |
|
|
|
Investments (affiliated) | | $ | 567,670,672 | | | $ | – | | | $ | 336,184,431 | | | $ | – | | | $ | – | |
| | |
|
|
| |
|
|
| |
|
|
| |
|
|
| |
|
|
|
Foreign cash | | $ | – | | | $ | – | | | $ | – | | | $ | – | | | $ | – | |
| | |
|
|
| |
|
|
| |
|
|
| |
|
|
| |
|
|
|
† Including securities on loan | | $ | – | | | $ | 779,367 | | | $ | – | | | $ | 45,353,452 | | | $ | – | |
| | |
|
|
| |
|
|
| |
|
|
| |
|
|
| |
|
|
|
See Notes to Financial Statements
VALIC Company II
STATEMENTS OF ASSETS AND LIABILITIES — August 31, 2018 — (continued)
| | | | | | | | | | | | | | | | | | | | |
| | | HIGH YIELD
BOND FUND | | | INTERNATIONAL
OPPORTUNITIES
FUND | | | LARGE CAP
VALUE FUND | | | MID CAP
GROWTH FUND | | | MID CAP
VALUE FUND | |
ASSETS: | | | | | | | | | | | | | | | | | | | | |
Investment at value (unaffiliated)*† | | $ | 581,479,809 | | | $ | 719,865,072 | | | $ | 283,801,546 | | | $ | 221,085,513 | | | $ | 911,689,480 | |
Investment at value (affiliated)*† | | | – | | | | – | | | | – | | | | – | | | | – | |
Repurchase agreements (cost equals market value) | | | 20,406,000 | | | | 8,901,000 | | | | – | | | | – | | | | 7,422,000 | |
Cash | | | 65,115 | | | | 1,350 | | | | 3,724,446 | | | | 740,455 | | | | 455 | |
Foreign cash* | | | 227,526 | | | | 5,552,921 | | | | – | | | | 153 | | | | 30 | |
Cash collateral for futures contracts | | | – | | | | – | | | | – | | | | – | | | | – | |
Due from broker | | | – | | | | – | | | | – | | | | – | | | | – | |
Receivable for: | | | | | | | | | | | | | | | | | | | | |
Fund shares sold | | | 159,680 | | | | 194,957 | | | | 3,973 | | | | 134,507 | | | | 182,204 | |
Dividends and interest | | | 8,906,605 | | | | 2,058,342 | | | | 568,951 | | | | 114,848 | | | | 1,022,447 | |
Investments sold | | | 31,214 | | | | 18,267,350 | | | | – | | | | 311,359 | | | | 2,182,687 | |
Investments sold on an extended settlement basis | | | – | | | | 389,518 | | | | – | | | | – | | | | – | |
Securities lending income | | | 43,705 | | | | 16,985 | | | | 1,667 | | | | 7,872 | | | | 8,733 | |
Prepaid expenses and other assets | | | 30,387 | | | | 51,716 | | | | 37,401 | | | | 19,412 | | | | 63,742 | |
Due from investment adviser for expense reimbursements/fee waivers | | | 15,997 | | | | 168,415 | | | | 38,022 | | | | 67,407 | | | | – | |
Variation margin on futures contracts | | | – | | | | – | | | | – | | | | – | | | | – | |
Unrealized appreciation on forward foreign currency contracts | | | – | | | | – | | | | – | | | | – | | | | – | |
| | |
|
|
| |
|
|
| |
|
|
| |
|
|
| |
|
|
|
TOTAL ASSETS | | | 611,366,038 | | | | 755,467,626 | | | | 288,176,006 | | | | 222,481,526 | | | | 922,571,778 | |
| | |
|
|
| |
|
|
| |
|
|
| |
|
|
| |
|
|
|
LIABILITIES: | | | | | | | | | | | | | | | | | | | | |
Payable for: | | | | | | | | | | | | | | | | | | | | |
Fund shares reacquired | | | 11,507 | | | | 231,496 | | | | 398,961 | | | | 129,612 | | | | 477,223 | |
Investments purchased | | | 15,764 | | | | 8,762,953 | | | | 3,399,290 | | | | 315,758 | | | | 3,233,945 | |
Investments purchased on an extended settlement basis | | | 364,088 | | | | 385,935 | | | | – | | | | – | | | | – | |
Investment advisory and management fees | | | 300,360 | | | | 499,547 | | | | 118,398 | | | | 133,723 | | | | 536,714 | |
Shareholder services | | | 123,981 | | | | 153,454 | | | | 59,199 | | | | 45,483 | | | | 193,362 | |
Administrative service fees | | | 33,029 | | | | 40,880 | | | | 15,772 | | | | 12,113 | | | | 51,515 | |
Transfer agent fees and expenses | | | 979 | | | | 857 | | | | 857 | | | | 857 | | | | 1,101 | |
Trustees’ fees and expenses | | | 26,172 | | | | 47,597 | | | | 18,425 | | | | 12,667 | | | | 63,517 | |
Other accrued expenses | | | 130,228 | | | | 233,597 | | | | 78,637 | | | | 67,711 | | | | 184,699 | |
Accrued foreign tax on capital gains | | | – | | | | 117,162 | | | | – | | | | – | | | | – | |
Collateral upon return of securities loaned | | | 33,786,258 | | | | 20,966,764 | | | | – | | | | 1,319,787 | | | | 1,545,425 | |
Due to custodian | | | – | | | | – | | | | – | | | | – | | | | – | |
Due to broker | | | – | | | | – | | | | – | | | | – | | | | – | |
Unrealized depreciation on forward foreign currency contracts | | | 20,596 | | | | – | | | | – | | | | – | | | | – | |
| | |
|
|
| |
|
|
| |
|
|
| |
|
|
| |
|
|
|
TOTAL LIABILITIES | | | 34,812,962 | | | | 31,440,242 | | | | 4,089,539 | | | | 2,037,711 | | | | 6,287,501 | |
| | |
|
|
| |
|
|
| |
|
|
| |
|
|
| |
|
|
|
NET ASSETS | | $ | 576,553,076 | | | $ | 724,027,384 | | | $ | 284,086,467 | | | $ | 220,443,815 | | | $ | 916,284,277 | |
| | |
|
|
| |
|
|
| |
|
|
| |
|
|
| |
|
|
|
NET ASSETS REPRESENTED BY: | | | | | | | | | | | | | | | | | | | | |
Trust shares at par value of $0.01 per share | | $ | 765,249 | | | $ | 339,835 | | | $ | 124,799 | | | $ | 205,842 | | | $ | 414,113 | |
Additional paid in capital | | | 562,708,176 | | | | 548,955,478 | | | | 230,902,752 | | | | 178,645,988 | | | | 649,964,562 | |
Accumulated undistributed net investment income (loss) | | | 29,385,984 | | | | 2,592,614 | | | | 3,397,308 | | | | (242,887 | ) | | | 4,027,098 | |
Accumulated undistributed net realized gain (loss) on investments, swap contracts, futures contracts, options contracts, securities sold short, foreign exchange transactions and capital gain distributions from underlying funds | | | (11,492,077 | ) | | | 21,781,184 | | | | 21,075,728 | | | | 8,046,434 | | | | 132,491,996 | |
Unrealized appreciation (depreciation) on investments | | | (4,794,039 | ) | | | 150,490,136 | | | | 28,585,880 | | | | 33,788,438 | | | | 129,385,437 | |
Unrealized appreciation (depreciation) on futures contracts, written options contracts and swap contracts | | | – | | | | – | | | | – | | | | – | | | | – | |
Unrealized foreign exchange gain (loss) on other assets and liabilities | | | (20,217 | ) | | | (14,701 | ) | | | – | | | | – | | | | 1,071 | |
Accrued capital gains tax on unrealized appreciation (depreciation) | | | – | | | | (117,162 | ) | | | – | | | | – | | | | – | |
| | |
|
|
| |
|
|
| |
|
|
| |
|
|
| |
|
|
|
NET ASSETS | | $ | 576,553,076 | | | $ | 724,027,384 | | | $ | 284,086,467 | | | $ | 220,443,815 | | | $ | 916,284,277 | |
| | |
|
|
| |
|
|
| |
|
|
| |
|
|
| |
|
|
|
SHARES OF BENEFICIAL INTEREST: | | | | | | | | | | | | | | | | | | | | |
Authorized (Par value $0.01 per share) | | | 1,000,000,000 | | | | 1,000,000,000 | | | | 1,000,000,000 | | | | 1,000,000,000 | | | | 1,000,000,000 | |
Outstanding | | | 76,524,881 | | | | 33,983,530 | | | | 12,479,856 | | | | 20,584,234 | | | | 41,411,269 | |
NET ASSET VALUE, OFFERING AND REDEMPTION PRICE PER SHARE | | $ | 7.53 | | | $ | 21.31 | | | $ | 22.76 | | | $ | 10.71 | | | $ | 22.13 | |
| | |
|
|
| |
|
|
| |
|
|
| |
|
|
| |
|
|
|
* Cost | | | | | | | | | | | | | | | | | | | | |
Investments (unaffiliated) | | $ | 586,273,848 | | | $ | 569,374,936 | | | $ | 255,215,666 | | | $ | 187,297,075 | | | $ | 782,304,043 | |
| | |
|
|
| |
|
|
| |
|
|
| |
|
|
| |
|
|
|
Investments (affiliated) | | $ | – | | | $ | – | | | $ | – | | | $ | – | | | $ | – | |
| | |
|
|
| |
|
|
| |
|
|
| |
|
|
| |
|
|
|
Foreign cash | | $ | 227,310 | | | $ | 5,564,239 | | | $ | – | | | $ | 153 | | | $ | 30 | |
| | |
|
|
| |
|
|
| |
|
|
| |
|
|
| |
|
|
|
† Including securities on loan | | $ | 44,315,599 | | | $ | 33,464,718 | | | $ | 18,598,783 | | | $ | 42,447,394 | | | $ | 43,355,754 | |
| | |
|
|
| |
|
|
| |
|
|
| |
|
|
| |
|
|
|
See Notes to Financial Statements
VALIC Company II
STATEMENTS OF ASSETS AND LIABILITIES — August 31, 2018 — (continued)
| | | | | | | | | | | | | | | | | | | | |
| | | MODERATE
GROWTH
LIFESTYLE FUND | | | SMALL CAP
GROWTH
FUND | | | SMALL CAP
VALUE FUND | | | SOCIALLY
RESPONSIBLE
FUND | | | STRATEGIC
BOND FUND | |
ASSETS: | | | | | | | | | | | | | | | | | | | | |
Investment at value (unaffiliated)*† | | $ | – | | | $ | 218,792,667 | | | $ | 522,526,036 | | | $ | 785,700,918 | | | $ | 879,427,288 | |
Investment at value (affiliated)*† | | | 964,750,281 | | | | – | | | | – | | | | – | | | | – | |
Repurchase agreements (cost equals market value) | | | – | | | | – | | | | 15,473,000 | | | | 3,559,000 | | | | – | |
Cash | | | 15,032 | | | | 3,762,041 | | | | 1,301 | | | | 498 | | | | – | |
Foreign cash* | | | – | | | | – | | | | – | | | | – | | | | 2,106 | |
Cash collateral for futures contracts | | | – | | | | – | | | | 769,000 | | | | – | | | | – | |
Due from broker | | | – | | | | – | | | | – | | | | – | | | | – | |
Receivable for: | | | | | | | | | | | | | | | | | | | | |
Fund shares sold | | | 89,765 | | | | 172,524 | | | | 61,738 | | | | 51,992 | | | | 250,245 | |
Dividends and interest | | | – | | | | 55,392 | | | | 495,543 | | | | 1,126,844 | | | | 9,735,243 | |
Investments sold | | | – | | | | 409,342 | | | | 4,015,674 | | | | – | | | | 796,927 | |
Investments sold on an extended settlement basis | | | – | | | | – | | | | – | | | | – | | | | 7,074,219 | |
Securities lending income | | | – | | | | 33,144 | | | | 19,997 | | | | 3,149 | | | | 27,033 | |
Prepaid expenses and other assets | | | 33,640 | | | | 15,360 | | | | 41,634 | | | | 56,635 | | | | 44,435 | |
Due from investment adviser for expense reimbursements/fee waivers | | | 53,577 | | | | 18,005 | | | | 52,049 | | | | 41,996 | | | | – | |
Variation margin on futures contracts | | | – | | | | – | | | | 50,160 | | | | 295 | | | | – | |
Unrealized appreciation on forward foreign currency contracts | | | – | | | | – | | | | – | | | | – | | | | 327,802 | |
| | |
|
|
| |
|
|
| |
|
|
| |
|
|
| |
|
|
|
TOTAL ASSETS | | | 964,942,295 | | | | 223,258,475 | | | | 543,506,132 | | | | 790,541,327 | | | | 897,685,298 | |
| | |
|
|
| |
|
|
| |
|
|
| |
|
|
| |
|
|
|
LIABILITIES: | | | | | | | | | | | | | | | | | | | | |
Payable for: | | | | | | | | | | | | | | | | | | | | |
Fund shares reacquired | | | 69,772 | | | | 8,814 | | | | 242,919 | | | | 622,665 | | | | 15,851 | |
Investments purchased | | | 19,477 | | | | 194,042 | | | | 3,987,858 | | | | – | | | | 6,232,420 | |
Investments purchased on an extended settlement basis | | | – | | | | – | | | | – | | | | – | | | | 11,213,681 | |
Investment advisory and management fees | | | 81,419 | | | | 142,226 | | | | 293,790 | | | | 166,640 | | | | 366,956 | |
Shareholder services | | | – | | | | 43,119 | | | | 111,363 | | | | 166,640 | | | | 182,631 | |
Administrative service fees | | | – | | | | 11,484 | | | | 29,666 | | | | 44,393 | | | | 48,647 | |
Transfer agent fees and expenses | | | 489 | | | | 979 | | | | 857 | | | | 489 | | | | 1,346 | |
Trustees’ fees and expenses | | | 32,616 | | | | 7,998 | | | | 33,452 | | | | 52,993 | | | | 40,505 | |
Other accrued expenses | | | 131,047 | | | | 64,134 | | | | 130,964 | | | | 137,733 | | | | 169,450 | |
Accrued foreign tax on capital gains | | | – | | | | – | | | | – | | | | – | | | | – | |
Collateral upon return of securities loaned | | | – | | | | 7,401,942 | | | | 4,127,318 | | | | 228,345 | | | | 25,837,615 | |
Due to custodian | | | – | | | | – | | | | – | | | | – | | | | 141,191 | |
Due to broker | | | – | | | | – | | | | – | | | | 3,289 | | | | – | |
Unrealized depreciation on forward foreign currency contracts | | | – | | | | – | | | | – | | | | – | | | | 33,431 | |
| | |
|
|
| |
|
|
| |
|
|
| |
|
|
| |
|
|
|
TOTAL LIABILITIES | | | 334,820 | | | | 7,874,738 | | | | 8,958,187 | | | | 1,423,187 | | | | 44,283,724 | |
| | |
|
|
| |
|
|
| |
|
|
| |
|
|
| |
|
|
|
NET ASSETS | | $ | 964,607,475 | | | $ | 215,383,737 | | | $ | 534,547,945 | | | $ | 789,118,140 | | | $ | 853,401,574 | |
| | |
|
|
| |
|
|
| |
|
|
| |
|
|
| |
|
|
|
NET ASSETS REPRESENTED BY: | | | | | | | | | | | | | | | | | | | | |
Trust shares at par value of $0.01 per share | | $ | 642,970 | | | $ | 92,392 | | | $ | 339,707 | | | $ | 341,746 | | | $ | 785,739 | |
Additional paid in capital | | | 832,012,121 | | | | 125,136,424 | | | | 382,448,759 | | | | 437,070,965 | | | | 867,439,074 | |
Accumulated undistributed net investment income (loss) | | | 19,675,029 | | | | (806,590 | ) | | | 5,293,998 | | | | 11,090,287 | | | | 29,551,218 | |
Accumulated undistributed net realized gain (loss) on investments, swap contracts, futures contracts, options contracts, securities sold short, foreign exchange transactions and capital gain distributions from underlying funds | | | 60,790,980 | | | | 43,952,526 | | | | 49,846,046 | | | | 49,879,625 | | | | (23,916,433 | ) |
Unrealized appreciation (depreciation) on investments | | | 51,486,375 | | | | 47,008,985 | | | | 96,325,817 | | | | 290,383,106 | | | | (20,739,515 | ) |
Unrealized appreciation (depreciation) on futures contracts, written options contracts and swap contracts | | | – | | | | – | | | | 293,618 | | | | 352,411 | | | | – | |
Unrealized foreign exchange gain (loss) on other assets and liabilities | | | – | | | | – | | | | – | | | | – | | | | 281,491 | |
Accrued capital gains tax on unrealized appreciation (depreciation) | | | – | | | | – | | | | – | | | | – | | | | – | |
| | |
|
|
| |
|
|
| |
|
|
| |
|
|
| |
|
|
|
NET ASSETS | | $ | 964,607,475 | | | $ | 215,383,737 | | | $ | 534,547,945 | | | $ | 789,118,140 | | | $ | 853,401,574 | |
| | |
|
|
| |
|
|
| |
|
|
| |
|
|
| |
|
|
|
SHARES OF BENEFICIAL INTEREST: | | | | | | | | | | | | | | | | | | | | |
Authorized (Par value $0.01 per share) | | | 1,000,000,000 | | | | 1,000,000,000 | | | | 1,000,000,000 | | | | 1,000,000,000 | | | | 1,000,000,000 | |
Outstanding | | | 64,297,030 | | | | 9,239,222 | | | | 33,970,725 | | | | 34,174,579 | | | | 78,573,948 | |
NET ASSET VALUE, OFFERING AND REDEMPTION PRICE PER SHARE | | $ | 15.00 | | | $ | 23.31 | | | $ | 15.74 | | | $ | 23.09 | | | $ | 10.86 | |
| | |
|
|
| |
|
|
| |
|
|
| |
|
|
| |
|
|
|
* Cost | | | | | | | | | | | | | | | | | | | | |
Investments (unaffiliated) | | $ | – | | | $ | 171,783,682 | | | $ | 426,200,219 | | | $ | 495,317,812 | | | $ | 900,166,803 | |
| | |
|
|
| |
|
|
| |
|
|
| |
|
|
| |
|
|
|
Investments (affiliated) | | $ | 913,263,906 | | | $ | – | | | $ | – | | | $ | – | | | $ | – | |
| | |
|
|
| |
|
|
| |
|
|
| |
|
|
| |
|
|
|
Foreign cash | | $ | – | | | $ | – | | | $ | – | | | $ | – | | | $ | 2,513 | |
| | |
|
|
| |
|
|
| |
|
|
| |
|
|
| |
|
|
|
† Including securities on loan | | $ | – | | | $ | 45,957,341 | | | $ | 46,543,316 | | | $ | 31,031,625 | | | $ | 37,967,371 | |
| | |
|
|
| |
|
|
| |
|
|
| |
|
|
| |
|
|
|
See Notes to Financial Statements
VALIC Company II
STATEMENTS OF OPERATIONS — For the Year Ended August 31, 2018
| | | | | | | | | | | | | | | | | | | | |
| | | AGGRESSIVE
GROWTH
LIFESTYLE FUND | | | CAPITAL
APPRECIATION
FUND | | | CONSERVATIVE
GROWTH
LIFESTYLE FUND | | | CORE BOND
FUND | | | GOVERNMENT
MONEY MARKET II
FUND | |
INVESTMENT INCOME: | | | | | | | | | | | | | | | | | | | | |
Dividends (unaffiliated) | | $ | – | | | $ | 1,028,638 | | | $ | – | | | $ | 68,413 | | | $ | – | |
Dividends (affiliated) | | | 9,452,915 | | | | – | | | | 8,722,445 | | | | – | | | | – | |
Securities lending income | | | – | | | | 19,096 | | | | – | | | | 225,922 | | | | – | |
Interest (unaffiliated) | | | – | | | | 2,750 | | | | – | | | | 42,535,418 | | | | 1,885,539 | |
| | |
|
|
| |
|
|
| |
|
|
| |
|
|
| |
|
|
|
Total investment income* | | | 9,452,915 | | | | 1,050,484 | | | | 8,722,445 | | | | 42,829,753 | | | | 1,885,539 | |
| | |
|
|
| |
|
|
| |
|
|
| |
|
|
| |
|
|
|
EXPENSES: | | | | | | | | | | | | | | | | | | | | |
Investment advisory and management fees | | | 595,569 | | | | 541,681 | | | | 338,741 | | | | 5,154,285 | | | | 322,963 | |
Administrative service fee | | | – | | | | 66,098 | | | | – | | | | 806,087 | | | | 86,685 | |
Shareholder services fee | | | – | | | | 246,219 | | | | – | | | | 3,002,678 | | | | 322,963 | |
Transfer agent fees and expenses | | | 1,479 | | | | 2,958 | | | | 1,479 | | | | 2,958 | | | | 1,109 | |
Custodian and accounting fees | | | 12,000 | | | | 15,183 | | | | 12,000 | | | | 97,028 | | | | 13,121 | |
Reports to shareholders | | | 75,967 | | | | 15,686 | | | | 42,345 | | | | 139,825 | | | | 15,349 | |
Audit and tax fees | | | 32,615 | | | | 43,958 | | | | 31,217 | | | | 38,048 | | | | 40,296 | |
Legal fees | | | 42,056 | | | | 19,095 | | | | 30,690 | | | | 66,309 | | | | 20,418 | |
Trustees’ fees and expenses | | | 46,269 | | | | 7,561 | | | | 26,150 | | | | 91,500 | | | | 9,576 | |
Interest expense | | | – | | | | – | | | | – | | | | – | | | | – | |
Other expenses | | | 17,069 | | | | 14,312 | | | | 12,496 | | | | 28,560 | | | | 10,781 | |
| | |
|
|
| |
|
|
| |
|
|
| |
|
|
| |
|
|
|
Total expenses before fee waivers, expense reimbursements, fees paid indirectly | | | 823,024 | | | | 972,751 | | | | 495,118 | | | | 9,427,278 | | | | 843,261 | |
| | |
|
|
| |
|
|
| |
|
|
| |
|
|
| |
|
|
|
Fees waived and expenses reimbursed by investment adviser (Note 3) | | | (227,453 | ) | | | (135,608 | ) | | | (156,376 | ) | | | (179,030 | ) | | | (132,742 | ) |
Fees paid indirectly (Note 7) | | | – | | | | (6,005 | ) | | | – | | | | – | | | | – | |
| | |
|
|
| |
|
|
| |
|
|
| |
|
|
| |
|
|
|
Net expenses | | | 595,571 | | | | 831,138 | | | | 338,742 | | | | 9,248,248 | | | | 710,519 | |
| | |
|
|
| |
|
|
| |
|
|
| |
|
|
| |
|
|
|
Net investment income (loss) | | | 8,857,344 | | | | 219,346 | | | | 8,383,703 | | | | 33,581,505 | | | | 1,175,020 | |
| | |
|
|
| |
|
|
| |
|
|
| |
|
|
| |
|
|
|
REALIZED AND UNREALIZED GAIN (LOSS) ON INVESTMENTS AND FOREIGN CURRENCIES: | | | | | | | | | | | | | | | | | | | | |
Net realized gain (loss) on: | | | | | | | | | | | | | | | | | | | | |
Investments (unaffiliated)** | | | – | | | | 26,494,594 | | | | – | | | | (7,802,673 | ) | | | (7,492 | ) |
Investments (affiliated) | | | 35,959,453 | | | | – | | | | 9,279,556 | | | | – | | | | – | |
Futures contracts | | | – | | | | – | | | | – | | | | – | | | | – | |
Forward contracts | | | – | | | | – | | | | – | | | | – | | | | – | |
Swap contracts | | | – | | | | – | | | | – | | | | – | | | | – | |
Net realized foreign exchange gain (loss) on other assets and liabilities | | | – | | | | – | | | | – | | | | – | | | | – | |
Net realized gain (loss) on capital gain distributions received from underlying funds (affiliated) | | | 17,642,662 | | | | – | | | | 4,987,613 | | | | – | | | | – | |
| | |
|
|
| |
|
|
| |
|
|
| |
|
|
| |
|
|
|
Net realized gain (loss) on investments and foreign currencies | | | 53,602,115 | | | | 26,494,594 | | | | 14,267,169 | | | | (7,802,673 | ) | | | (7,492 | ) |
| | |
|
|
| |
|
|
| |
|
|
| |
|
|
| |
|
|
|
Change in unrealized appreciation (depreciation) on: | | | | | | | | | | | | | | | | | | | | |
Investments (unaffiliated) | | | – | | | | (2,110,223 | ) | | | – | | | | (41,645,334 | ) | | | – | |
Investments (affiliated) | | | 1,524,189 | | | | – | | | | (6,137,864 | ) | | | – | | | | – | |
Futures contracts | | | – | | | | – | | | | – | | | | – | | | | – | |
Forward contracts | | | – | | | | – | | | | – | | | | – | | | | – | |
Swap contracts | | | – | | | | – | | | | – | | | | – | | | | – | |
Change in net unrealized foreign exchange gain (loss) on other assets and liabilities | | | – | | | | – | | | | – | | | | – | | | | – | |
Change in accrued capital gains tax on unrealized appreciation (depreciation) | | | – | | | | – | | | | – | | | | – | | | | – | |
| | |
|
|
| |
|
|
| |
|
|
| |
|
|
| |
|
|
|
Net unrealized gain (loss) on investments and foreign currencies | | | 1,524,189 | | | | (2,110,223 | ) | | | (6,137,864 | ) | | | (41,645,334 | ) | | | – | |
| | |
|
|
| |
|
|
| |
|
|
| |
|
|
| |
|
|
|
Net realized and unrealized gain (loss) on investments and foreign currencies | | | 55,126,304 | | | | 24,384,371 | | | | 8,129,305 | | | | (49,448,007 | ) | | | (7,492 | ) |
| | |
|
|
| |
|
|
| |
|
|
| |
|
|
| |
|
|
|
NET INCREASE (DECREASE) IN NET ASSETS RESULTING FROM OPERATIONS | | $ | 63,983,648 | | | $ | 24,603,717 | | | $ | 16,513,008 | | | $ | (15,866,502 | ) | | $ | 1,167,528 | |
| | |
|
|
| |
|
|
| |
|
|
| |
|
|
| |
|
|
|
* Net of foreign withholding taxes on interest and dividends of | | $ | – | | | $ | – | | | $ | – | | | $ | (2,141 | ) | | $ | – | |
| | |
|
|
| |
|
|
| |
|
|
| |
|
|
| |
|
|
|
** Net of foreign withholding taxes on capital gains of | | $ | – | | | $ | – | | | $ | – | | | $ | – | | | $ | – | |
| | |
|
|
| |
|
|
| |
|
|
| |
|
|
| |
|
|
|
See Notes to Financial Statements
VALIC Company II
STATEMENTS OF OPERATIONS — For the Year Ended August 31, 2018 — (continued)
| | | | | | | | | | | | | | | | | | | | |
| | | HIGH YIELD
BOND FUND | | | INTERNATIONAL
OPPORTUNITIES
FUND | | | LARGE CAP
VALUE FUND | | | MID CAP
GROWTH FUND | | | MID CAP
VALUE FUND | |
INVESTMENT INCOME: | | | | | | | | | | | | | | | | | | | | |
Dividends (unaffiliated) | | $ | 64,387 | | | $ | 11,029,372 | | | $ | 5,379,201 | | | $ | 1,025,289 | | | $ | 13,903,255 | |
Dividends (affiliated) | | | – | | | | – | | | | – | | | | – | | | | – | |
Securities lending income | | | 422,416 | | | | 696,380 | | | | 15,422 | | | | 65,769 | | | | 637,292 | |
Interest (unaffiliated) | | | 34,683,519 | | | | 122,128 | | | | 43,248 | | | | 2,211 | | | | 14,965 | |
| | |
|
|
| |
|
|
| |
|
|
| |
|
|
| |
|
|
|
Total investment income* | | | 35,170,322 | | | | 11,847,880 | | | | 5,437,871 | | | | 1,093,269 | | | | 14,555,512 | |
| | |
|
|
| |
|
|
| |
|
|
| |
|
|
| |
|
|
|
EXPENSES: | | | | | | | | | | | | | | | | | | | | |
Investment advisory and management fees | | | 3,487,890 | | | | 5,977,322 | | | | 1,261,161 | | | | 1,225,388 | | | | 6,909,280 | |
Administrative service fee | | | 385,894 | | | | 493,153 | | | | 169,267 | | | | 110,288 | | | | 672,065 | |
Shareholder services fee | | | 1,437,677 | | | | 1,836,663 | | | | 630,581 | | | | 410,853 | | | | 2,503,569 | |
Transfer agent fees and expenses | | | 2,958 | | | | 2,525 | | | | 2,463 | | | | 2,588 | | | | 3,328 | |
Custodian and accounting fees | | | 44,221 | | | | 196,997 | | | | 14,662 | | | | 11,325 | | | | 81,611 | |
Reports to shareholders | | | 69,284 | | | | 95,861 | | | | 37,980 | | | | 43,675 | | | | 127,664 | |
Audit and tax fees | | | 45,661 | | | | 67,520 | | | | 36,505 | | | | 40,813 | | | | 40,127 | |
Legal fees | | | 39,647 | | | | 61,852 | | | | 26,172 | | | | 24,368 | | | | 59,582 | |
Trustees’ fees and expenses | | | 42,834 | | | | 59,496 | | | | 18,939 | | | | 12,149 | | | | 79,968 | |
Interest expense | | | – | | | | – | | | | 1,222 | | | | – | | | | – | |
Other expenses | | | 22,415 | | | | 34,620 | | | | 30,916 | | | | 14,139 | | | | 35,586 | |
| | |
|
|
| |
|
|
| |
|
|
| |
|
|
| |
|
|
|
Total expenses before fee waivers, expense reimbursements, fees paid indirectly | | | 5,578,481 | | | | 8,826,009 | | | | 2,229,868 | | | | 1,895,586 | | | | 10,512,780 | |
| | |
|
|
| |
|
|
| |
|
|
| |
|
|
| |
|
|
|
Fees waived and expenses reimbursed by investment adviser (Note 3) | | | (57,800 | ) | | | (1,479,357 | ) | | | (186,784 | ) | | | (498,687 | ) | | | – | |
Fees paid indirectly (Note 7) | | | – | | | | – | | | | (25,454 | ) | | | (618 | ) | | | (3,204 | ) |
| | |
|
|
| |
|
|
| |
|
|
| |
|
|
| |
|
|
|
Net expenses | | | 5,520,681 | | | | 7,346,652 | | | | 2,017,630 | | | | 1,396,281 | | | | 10,509,576 | |
| | |
|
|
| |
|
|
| |
|
|
| |
|
|
| |
|
|
|
Net investment income (loss) | | | 29,649,641 | | | | 4,501,228 | | | | 3,420,241 | | | | (303,012 | ) | | | 4,045,936 | |
| | |
|
|
| |
|
|
| |
|
|
| |
|
|
| |
|
|
|
REALIZED AND UNREALIZED GAIN (LOSS) ON INVESTMENTS AND FOREIGN CURRENCIES: | | | | | | | | | | | | | | | | | | | | |
Net realized gain (loss) on: | | | | | | | | | | | | | | | | | | | | |
Investments (unaffiliated)** | | | 3,520,243 | | | | 82,714,806 | | | | 22,214,795 | | | | 8,380,945 | | | | 139,598,947 | |
Investments (affiliated) | | | – | | | | – | | | | – | | | | – | | | | – | |
Futures contracts | | | – | | | | – | | | | – | | | | – | | | | – | |
Forward contracts | | | 565,687 | | | | – | | | | – | | | | – | | | | – | |
Swap contracts | | | 362,228 | | | | – | | | | – | | | | – | | | | – | |
Net realized foreign exchange gain (loss) on other assets and liabilities | | | (6,313 | ) | | | (549,555 | ) | | | – | | | | (100 | ) | | | (136,198 | ) |
Net realized gain (loss) on capital gain distributions received from underlying funds (affiliated) | | | – | | | | – | | | | – | | | | – | | | | – | |
| | |
|
|
| |
|
|
| |
|
|
| |
|
|
| |
|
|
|
Net realized gain (loss) on investments and foreign currencies | | | 4,441,845 | | | | 82,165,251 | | | | 22,214,795 | | | | 8,380,845 | | | | 139,462,749 | |
| | |
|
|
| |
|
|
| |
|
|
| |
|
|
| |
|
|
|
Change in unrealized appreciation (depreciation) on: | | | | | | | | | | | | | | | | | | | | |
Investments (unaffiliated) | | | (17,325,996 | ) | | | (12,580,747 | ) | | | 9,558,207 | | | | 28,304,083 | | | | (17,893,684 | ) |
Investments (affiliated) | | | – | | | | – | | | | – | | | | – | | | | – | |
Futures contracts | | | – | | | | – | | | | – | | | | – | | | | – | |
Forward contracts | | | 64,062 | | | | – | | | | – | | | | – | | | | – | |
Swap contracts | | | (64,506 | ) | | | – | | | | – | | | | – | | | | – | |
Change in net unrealized foreign exchange gain (loss) on other assets and liabilities | | | (877 | ) | | | (23,503 | ) | | | – | | | | (10 | ) | | | 1,013 | |
Change in accrued capital gains tax on unrealized appreciation (depreciation) | | | – | | | | 2,903 | | | | – | | | | – | | | | – | |
| | |
|
|
| |
|
|
| |
|
|
| |
|
|
| |
|
|
|
Net unrealized gain (loss) on investments and foreign currencies | | | (17,327,317 | ) | | | (12,601,347 | ) | | | 9,558,207 | | | | 28,304,073 | | | | (17,892,671 | ) |
| | |
|
|
| |
|
|
| |
|
|
| |
|
|
| |
|
|
|
Net realized and unrealized gain (loss) on investments and foreign currencies | | | (12,885,472 | ) | | | 69,563,904 | | | | 31,773,002 | | | | 36,684,918 | | | | 121,570,078 | |
| | |
|
|
| |
|
|
| |
|
|
| |
|
|
| |
|
|
|
NET INCREASE (DECREASE) IN NET ASSETS RESULTING FROM OPERATIONS | | $ | 16,764,169 | | | $ | 74,065,132 | | | $ | 35,193,243 | | | $ | 36,381,906 | | | $ | 125,616,014 | |
| | |
|
|
| |
|
|
| |
|
|
| |
|
|
| |
|
|
|
* Net of foreign withholding taxes on interest and dividends of | | $ | – | | | $ | 1,153,007 | | | $ | 9,201 | | | $ | 5,763 | | | $ | 42,087 | |
| | |
|
|
| |
|
|
| |
|
|
| |
|
|
| |
|
|
|
** Net of foreign withholding taxes on capital gains of | | $ | – | | | $ | 230,439 | | | $ | – | | | $ | – | | | $ | – | |
| | |
|
|
| |
|
|
| |
|
|
| |
|
|
| |
|
|
|
See Notes to Financial Statements
VALIC Company II
STATEMENTS OF OPERATIONS — For the Year Ended August 31, 2018 — (continued)
| | | | | | | | | | | | | | | | | | | | |
| | | MODERATE
GROWTH
LIFESTYLE FUND | | | SMALL CAP
GROWTH
FUND | | | SMALL CAP
VALUE FUND | | | SOCIALLY
RESPONSIBLE
FUND | | | STRATEGIC
BOND FUND | |
INVESTMENT INCOME: | | | | | | | | | | | | | | | | | | | | |
Dividends (unaffiliated) | | $ | – | | | $ | 630,568 | | | $ | 10,012,662 | | | $ | 15,152,114 | | | $ | 23,956 | |
Dividends (affiliated) | | | 17,339,592 | | | | – | | | | – | | | | – | | | | – | |
Securities lending income | | | – | | | | 334,283 | | | | 519,509 | | | | 47,109 | | | | 308,798 | |
Interest (unaffiliated) | | | – | | | | 7,792 | | | | 33,448 | | | | 101,114 | | | | 36,478,311 | |
| | |
|
|
| |
|
|
| |
|
|
| |
|
|
| |
|
|
|
Total investment income* | | | 17,339,592 | | | | 972,643 | | | | 10,565,619 | | | | 15,300,337 | | | | 36,811,065 | |
| | |
|
|
| |
|
|
| |
|
|
| |
|
|
| |
|
|
|
EXPENSES: | | | | | | | | | | | | | | | | | | | | |
Investment advisory and management fees | | | 935,964 | | | | 1,468,820 | | | | 3,649,668 | | | | 1,980,886 | | | | 4,050,652 | |
Administrative service fee | | | – | | | | 119,054 | | | | 371,665 | | | | 531,738 | | | | 536,920 | |
Shareholder services fee | | | – | | | | 443,381 | | | | 1,384,488 | | | | 1,980,886 | | | | 2,000,362 | |
Transfer agent fees and expenses | | | 1,479 | | | | 2,958 | | | | 2,588 | | | | 1,479 | | | | 4,067 | |
Custodian and accounting fees | | | 11,950 | | | | 11,917 | | | | 68,546 | | | | 33,626 | | | | 93,630 | |
Reports to shareholders | | | 119,157 | | | | 23,931 | | | | 71,877 | | | | 95,679 | | | | 84,136 | |
Audit and tax fees | | | 35,585 | | | | 34,133 | | | | 45,234 | | | | 38,220 | | | | 45,764 | |
Legal fees | | | 57,231 | | | | 22,564 | | | | 38,454 | | | | 49,644 | | | | 49,845 | |
Trustees’ fees and expenses | | | 72,327 | | | | 13,750 | | | | 43,711 | | | | 61,391 | | | | 57,472 | |
Interest expense | | | – | | | | 382 | | | | 534 | | | | 722 | | | | – | |
Other expenses | | | 20,747 | | | | 15,325 | | | | 29,898 | | | | 27,064 | | | | 24,637 | |
| | |
|
|
| |
|
|
| |
|
|
| |
|
|
| |
|
|
|
Total expenses before fee waivers, expense reimbursements, fees paid indirectly | | | 1,254,440 | | | | 2,156,215 | | | | 5,706,663 | | | | 4,801,335 | | | | 6,947,485 | |
| | |
|
|
| |
|
|
| |
|
|
| |
|
|
| |
|
|
|
Fees waived and expenses reimbursed by investment adviser (Note 3) | | | (318,474 | ) | | | (98,925 | ) | | | (445,609 | ) | | | (364,152 | ) | | | – | |
Fees paid indirectly (Note 7) | | | – | | | | (5,822 | ) | | | (27,102 | ) | | | – | | | | – | |
| | |
|
|
| |
|
|
| |
|
|
| |
|
|
| |
|
|
|
Net expenses | | | 935,966 | | | | 2,051,468 | | | | 5,233,952 | | | | 4,437,183 | | | | 6,947,485 | |
| | |
|
|
| |
|
|
| |
|
|
| |
|
|
| |
|
|
|
Net investment income (loss) | | | 16,403,626 | | | | (1,078,825 | ) | | | 5,331,667 | | | | 10,863,154 | | | | 29,863,580 | |
| | |
|
|
| |
|
|
| |
|
|
| |
|
|
| |
|
|
|
REALIZED AND UNREALIZED GAIN (LOSS) ON INVESTMENTS AND FOREIGN CURRENCIES: | | | | | | | | | | | | | | | | | | | | |
Net realized gain (loss) on: | | | | | | | | | | | | | | | | | | | | |
Investments (unaffiliated)** | | | – | | | | 45,046,628 | | | | 50,194,230 | | | | 46,285,378 | | | | (4,319,942 | ) |
Investments (affiliated) | | | 46,150,706 | | | | – | | | | – | | | | – | | | | – | |
Futures contracts | | | – | | | | – | | | | 1,831,719 | | | | 5,303,858 | | | | – | |
Forward contracts | | | – | | | | – | | | | – | | | | – | | | | 932,623 | |
Swap contracts | | | – | | | | – | | | | – | | | | – | | | | – | |
Net realized foreign exchange gain (loss) on other assets and liabilities | | | – | | | | – | | | | – | | | | – | | | | (117,629 | ) |
Net realized gain (loss) on capital gain distributions received from underlying funds (affiliated) | | | 23,511,727 | | | | – | | | | – | | | | – | | | | – | |
| | |
|
|
| |
|
|
| |
|
|
| |
|
|
| |
|
|
|
Net realized gain (loss) on investments and foreign currencies | | | 69,662,433 | | | | 45,046,628 | | | | 52,025,949 | | | | 51,589,236 | | | | (3,504,948 | ) |
| | |
|
|
| |
|
|
| |
|
|
| |
|
|
| |
|
|
|
Change in unrealized appreciation (depreciation) on: | | | | | | | | | | | | | | | | | | | | |
Investments (unaffiliated) | | | – | | | | 17,234,244 | | | | 30,129,884 | | | | 72,455,984 | | | | (34,871,732 | ) |
Investments (affiliated) | | | (1,720,543 | ) | | | – | | | | – | | | | – | | | | – | |
Futures contracts | | | – | | | | – | | | | 224,800 | | | | 26,657 | | | | – | |
Forward contracts | | | – | | | | – | | | | – | | | | – | | | | 1,112,011 | |
Swap contracts | | | – | | | | – | | | | – | | | | – | | | | – | |
Change in net unrealized foreign exchange gain (loss) on other assets and liabilities | | | – | | | | – | | | | – | | | | – | | | | (48,539 | ) |
Change in accrued capital gains tax on unrealized appreciation (depreciation) | | | – | | | | – | | | | – | | | | – | | | | – | |
| | |
|
|
| |
|
|
| |
|
|
| |
|
|
| |
|
|
|
Net unrealized gain (loss) on investments and foreign currencies | | | (1,720,543 | ) | | | 17,234,244 | | | | 30,354,684 | | | | 72,482,641 | | | | (33,808,260 | ) |
| | |
|
|
| |
|
|
| |
|
|
| |
|
|
| |
|
|
|
Net realized and unrealized gain (loss) on investments and foreign currencies | | | 67,941,890 | | | | 62,280,872 | | | | 82,380,633 | | | | 124,071,877 | | | | (37,313,208 | ) |
| | |
|
|
| |
|
|
| |
|
|
| |
|
|
| |
|
|
|
NET INCREASE (DECREASE) IN NET ASSETS RESULTING FROM OPERATIONS | | $ | 84,345,516 | | | $ | 61,202,047 | | | $ | 87,712,300 | | | $ | 134,935,031 | | | $ | (7,449,628 | ) |
| | |
|
|
| |
|
|
| |
|
|
| |
|
|
| |
|
|
|
* Net of foreign withholding taxes on interest and dividends of | | $ | – | | | $ | – | | | $ | 2,759 | | | $ | – | | | $ | 3,461 | |
| | |
|
|
| |
|
|
| |
|
|
| |
|
|
| |
|
|
|
** Net of foreign withholding taxes on capital gains of | | $ | – | | | $ | – | | | $ | – | | | $ | – | | | $ | – | |
| | |
|
|
| |
|
|
| |
|
|
| |
|
|
| |
|
|
|
See Notes to Financial Statements
VALIC Company II
STATEMENTS OF CHANGES IN NET ASSETS
| | | | | | | | | | | | | | | | | | | | | | | | | | | | | | | | |
| | | AGGRESSIVE GROWTH
LIFESTYLE FUND
| | | CAPITAL APPRECIATION
FUND
| | | CONSERVATIVE GROWTH
LIFESTYLE FUND
| | | CORE BOND
FUND
| |
| | | For the
Year Ended
August 31,
2018
| | | For the
Year Ended
August 31,
2017
| | | For the
Year Ended
August 31,
2018
| | | For the
Year Ended
August 31,
2017
| | | For the
Year Ended
August 31,
2018
| | | For the
Year Ended
August 31,
2017
| | | For the
Year Ended
August 31,
2018
| | | For the
Year Ended
August 31,
2017
| |
INCREASE (DECREASE) IN NET ASSETS | |
OPERATIONS: | | | | | | | | | | | | | | | | | | | | | | | | | | | | | | | | |
Net investment income (loss) | | $ | 8,857,344 | | | $ | 8,039,961 | | | $ | 219,346 | | | $ | 439,879 | | | $ | 8,383,703 | | | $ | 7,627,324 | | | $ | 33,581,505 | | | $ | 25,708,094 | |
Net realized gain (loss) on investments and foreign currencies | | | 53,602,115 | | | | 20,287,656 | | | | 26,494,594 | | | | 6,860,463 | | | | 14,267,169 | | | | 2,464,717 | | | | (7,802,673 | ) | | | 5,729,800 | |
Net unrealized gain (loss) on investments and foreign currencies | | | 1,524,189 | | | | 26,787,375 | | | | (2,110,223 | ) | | | 4,264,888 | | | | (6,137,864 | ) | | | 8,295,447 | | | | (41,645,334 | ) | | | (19,018,763 | ) |
| | |
|
|
| |
|
|
| |
|
|
| |
|
|
| |
|
|
| |
|
|
| |
|
|
| |
|
|
|
Net increase (decrease) in net assets resulting from operations | | | 63,983,648 | | | | 55,114,992 | | | | 24,603,717 | | | | 11,565,230 | | | | 16,513,008 | | | | 18,387,488 | | | | (15,866,502 | ) | | | 12,419,131 | |
| | |
|
|
| |
|
|
| |
|
|
| |
|
|
| |
|
|
| |
|
|
| |
|
|
| |
|
|
|
DISTRIBUTIONS TO SHAREHOLDERS FROM: | | | | | | | | | | | | | | | | | |
Net investment income | | | (8,100,720 | ) | | | (10,175,052 | ) | | | (434,154 | ) | | | (426,761 | ) | | | (7,646,556 | ) | | | (8,581,634 | ) | | | (29,295,082 | ) | | | (27,768,658 | ) |
Net realized gain on securities | | | (20,317,452 | ) | | | (30,381,170 | ) | | | (4,650,345 | ) | | | (7,982,648 | ) | | | (1,927,139 | ) | | | (2,821,833 | ) | | | (450,265 | ) | | | – | |
| | |
|
|
| |
|
|
| |
|
|
| |
|
|
| |
|
|
| |
|
|
| |
|
|
| |
|
|
|
Total distributions to shareholders | | | (28,418,172 | ) | | | (40,556,222 | ) | | | (5,084,499 | ) | | | (8,409,409 | ) | | | (9,573,695 | ) | | | (11,403,467 | ) | | | (29,745,347 | ) | | | (27,768,658 | ) |
| | |
|
|
| |
|
|
| |
|
|
| |
|
|
| |
|
|
| |
|
|
| |
|
|
| |
|
|
|
Net increase (decrease) in net assets resulting from capital share transactions (Note 6) | | | 5,300,297 | | | | 18,039,259 | | | | (1,401,691 | ) | | | 3,477,697 | | | | (2,053,403 | ) | | | (1,466,664 | ) | | | 212,261,412 | | | | (71,629,262 | ) |
| | |
|
|
| |
|
|
| |
|
|
| |
|
|
| |
|
|
| |
|
|
| |
|
|
| |
|
|
|
TOTAL INCREASE (DECREASE) IN NET ASSETS | | | 40,865,773 | | | | 32,598,029 | | | | 18,117,527 | | | | 6,633,518 | | | | 4,885,910 | | | | 5,517,357 | | | | 166,649,563 | | | | (86,978,789 | ) |
NET ASSETS: | | | | | | | | | | | | | | | | | | | | | | | | | | | | | | | | |
Beginning of period | | | 567,843,228 | | | | 535,245,199 | | | | 91,579,180 | | | | 84,945,662 | | | | 333,906,989 | | | | 328,389,632 | | | | 1,115,936,192 | | | | 1,202,914,981 | |
| | |
|
|
| |
|
|
| |
|
|
| |
|
|
| |
|
|
| |
|
|
| |
|
|
| |
|
|
|
End of period† | | $ | 608,709,001 | | | $ | 567,843,228 | | | $ | 109,696,707 | | | $ | 91,579,180 | | | $ | 338,792,899 | | | $ | 333,906,989 | | | $ | 1,282,585,755 | | | $ | 1,115,936,192 | |
| | |
|
|
| |
|
|
| |
|
|
| |
|
|
| |
|
|
| |
|
|
| |
|
|
| |
|
|
|
† Includes accumulated undistributed net investment income (loss) of | | $ | 11,262,193 | | | $ | 8,091,596 | | | $ | 239,819 | | | $ | 454,627 | | | $ | 9,190,135 | | | $ | 7,640,570 | | | $ | 36,208,371 | | | $ | 29,326,047 | |
| | |
|
|
| |
|
|
| |
|
|
| |
|
|
| |
|
|
| |
|
|
| |
|
|
| |
|
|
|
See Notes to Financial Statements
VALIC Company II
STATEMENTS OF CHANGES IN NET ASSETS — (continued)
| | | | | | | | | | | | | | | | | | | | | | | | | | | | | | | | |
| | | GOVERNMENT MONEY MARKET II
FUND
| | | HIGH YIELD BOND
FUND
| | | INTERNATIONAL
OPPORTUNITIES FUND
| | | LARGE CAP
VALUE FUND
| |
| | | For the
Year Ended
August 31,
2018
| | | For the
Year Ended
August 31,
2017
| | | For the
Year Ended
August 31,
2018
| | | For the
Year Ended
August 31,
2017
| | | For the
Year Ended
August 31,
2018
| | | For the
Year Ended
August 31,
2017
| | | For the
Year Ended
August 31,
2018
| | | For the
Year Ended
August 31,
2017
| |
INCREASE (DECREASE) IN NET ASSETS | | | | | | | | | | | | | | | | | | | | | | | | | | | | | | | | |
OPERATIONS: | | | | | | | | | | | | | | | | | | | | | | | | | | | | | | | | |
Net investment income (loss) | | $ | 1,175,020 | | | $ | 215,117 | | | $ | 29,649,641 | | | $ | 31,598,543 | | | $ | 4,501,228 | | | $ | 4,850,356 | | | $ | 3,420,241 | | | $ | 2,882,419 | |
Net realized gain (loss) on investments and foreign currencies | | | (7,492 | ) | | | 835 | | | | 4,441,845 | | | | 7,771,336 | | | | 82,165,251 | | | | 50,182,602 | | | | 22,214,795 | | | | 28,035,120 | |
Net unrealized gain (loss) on investments and foreign currencies | | | – | | | | – | | | | (17,327,317 | ) | | | 4,614,284 | | | | (12,601,347 | ) | | | 69,213,570 | | | | 9,558,207 | | | | (669,760 | ) |
| | |
|
|
| |
|
|
| |
|
|
| |
|
|
| |
|
|
| |
|
|
| |
|
|
| |
|
|
|
Net increase (decrease) in net assets resulting from operations | | | 1,167,528 | | | | 215,952 | | | | 16,764,169 | | | | 43,984,163 | | | | 74,065,132 | | | | 124,246,528 | | | | 35,193,243 | | | | 30,247,779 | |
| | |
|
|
| |
|
|
| |
|
|
| |
|
|
| |
|
|
| |
|
|
| |
|
|
| |
|
|
|
DISTRIBUTIONS TO SHAREHOLDERS FROM: | | | | | | | | | | | | | | | | | | | | | | | | | | | | | | | | |
Net investment income | | | (1,175,020 | ) | | | (215,117 | ) | | | (32,204,893 | ) | | | (27,551,970 | ) | | | (5,841,813 | ) | | | (8,336,334 | ) | | | (2,959,420 | ) | | | (3,093,065 | ) |
Net realized gain on securities | | | – | | | | – | | | | – | | | | – | | | | – | | | | – | | | | (8,272,969 | ) | | | – | |
| | |
|
|
| |
|
|
| |
|
|
| |
|
|
| |
|
|
| |
|
|
| |
|
|
| |
|
|
|
Total distributions to shareholders | | | (1,175,020 | ) | | | (215,117 | ) | | | (32,204,893 | ) | | | (27,551,970 | ) | | | (5,841,813 | ) | | | (8,336,334 | ) | | | (11,232,389 | ) | | | (3,093,065 | ) |
| | |
|
|
| |
|
|
| |
|
|
| |
|
|
| |
|
|
| |
|
|
| |
|
|
| |
|
|
|
Net increase (decrease) in net assets resulting from capital share transactions (Note 6) | | | 4,050,214 | | | | (8,347,410 | ) | | | 30,514,165 | | | | (45,631,105 | ) | | | (15,293,377 | ) | | | (40,867,899 | ) | | | 33,499,196 | | | | (31,372,481 | ) |
| | |
|
|
| |
|
|
| |
|
|
| |
|
|
| |
|
|
| |
|
|
| |
|
|
| |
|
|
|
TOTAL INCREASE (DECREASE) IN NET ASSETS | | | 4,042,722 | | | | (8,346,575 | ) | | | 15,073,441 | | | | (29,198,912 | ) | | | 52,929,942 | | | | 75,042,295 | | | | 57,460,050 | | | | (4,217,767 | ) |
NET ASSETS: | | | | | | | | | | | | | | | | | | | | | | | | | | | | | | | | |
Beginning of period | | | 132,944,148 | | | | 141,290,723 | | | | 561,479,635 | | | | 590,678,547 | | | | 671,097,442 | | | | 596,055,147 | | | | 226,626,417 | | | | 230,844,184 | |
| | |
|
|
| |
|
|
| |
|
|
| |
|
|
| |
|
|
| |
|
|
| |
|
|
| |
|
|
|
End of period† | | $ | 136,986,870 | | | $ | 132,944,148 | | | $ | 576,553,076 | | | $ | 561,479,635 | | | $ | 724,027,384 | | | $ | 671,097,442 | | | $ | 284,086,467 | | | $ | 226,626,417 | |
| | |
|
|
| |
|
|
| |
|
|
| |
|
|
| |
|
|
| |
|
|
| |
|
|
| |
|
|
|
† Includes accumulated undistributed net investment income (loss) of | | $ | (840 | ) | | $ | (1,675 | ) | | $ | 29,385,984 | | | $ | 31,058,600 | | | $ | 2,592,614 | | | $ | 1,700,178 | | | $ | 3,397,308 | | | $ | 2,936,487 | |
| | |
|
|
| |
|
|
| |
|
|
| |
|
|
| |
|
|
| |
|
|
| |
|
|
| |
|
|
|
See Notes to Financial Statements
VALIC Company II
STATEMENTS OF CHANGES IN NET ASSETS — (continued)
| | | | | | | | | | | | | | | | | | | | | | | | | | | | | | | | |
| | | MID CAP
GROWTH FUND
| | | MID CAP VALUE
FUND
| | | MODERATE GROWTH
LIFESTYLE FUND
| | | SMALL CAP GROWTH
FUND
| |
| | | For the
Year Ended
August 31,
2018
| | | For the
Year Ended
August 31,
2017
| | | For the
Year Ended
August 31,
2018
| | | For the
Year Ended
August 31,
2017
| | | For the
Year Ended
August 31,
2018
| | | For the
Year Ended
August 31,
2017
| | | For the
Year Ended
August 31,
2018
| | | For the
Year Ended
August 31,
2017
| |
INCREASE (DECREASE) IN NET ASSETS | | | | | | | | | | | | | | | | | | | | | | | | | | | | | | | | |
OPERATIONS: | | | | | | | | | | | | | | | | | | | | | | | | | | | | | | | | |
Net investment income (loss) | | $ | (303,012 | ) | | $ | 50,663 | | | $ | 4,045,936 | | | $ | 3,371,970 | | | $ | 16,403,626 | | | $ | 14,588,402 | | | $ | (1,078,825 | ) | | $ | (595,878 | ) |
Net realized gain (loss) on investments and foreign currencies | | | 8,380,845 | | | | 29,162,133 | | | | 139,462,749 | | | | 75,004,096 | | | | 69,662,433 | | | | 19,600,743 | | | | 45,046,628 | | | | 8,062,842 | |
Net unrealized gain (loss) on investments and foreign currencies | | | 28,304,073 | | | | (7,436,232 | ) | | | (17,892,671 | ) | | | 29,953,316 | | | | (1,720,543 | ) | | | 36,118,299 | | | | 17,234,244 | | | | 19,389,509 | |
| | |
|
|
| |
|
|
| |
|
|
| |
|
|
| |
|
|
| |
|
|
| |
|
|
| |
|
|
|
Net increase (decrease) in net assets resulting from operations | | | 36,381,906 | | | | 21,776,564 | | | | 125,616,014 | | | | 108,329,382 | | | | 84,345,516 | | | | 70,307,444 | | | | 61,202,047 | | | | 26,856,473 | |
| | |
|
|
| |
|
|
| |
|
|
| |
|
|
| |
|
|
| |
|
|
| |
|
|
| |
|
|
|
DISTRIBUTIONS TO SHAREHOLDERS FROM: | | | | | | | | | |
Net investment income | | | (219,879 | ) | | | – | | | | (3,732,456 | ) | | | (6,004,897 | ) | | | (14,676,075 | ) | | | (18,966,348 | ) | | | – | | | | – | |
Net realized gain on securities | | | (26,169,722 | ) | | | – | | | | (68,024,640 | ) | | | (62,435,557 | ) | | | (20,388,078 | ) | | | (34,930,260 | ) | | | (6,146,636 | ) | | | (6,507,357 | ) |
| | |
|
|
| |
|
|
| |
|
|
| |
|
|
| |
|
|
| |
|
|
| |
|
|
| |
|
|
|
Total distributions to shareholders | | | (26,389,601 | ) | | | – | | | | (71,757,096 | ) | | | (68,440,454 | ) | | | (35,064,153 | ) | | | (53,896,608 | ) | | | (6,146,636 | ) | | | (6,507,357 | ) |
| | |
|
|
| |
|
|
| |
|
|
| |
|
|
| |
|
|
| |
|
|
| |
|
|
| |
|
|
|
Net increase (decrease) in net assets resulting from capital share transactions (Note 6) | | | 76,463,063 | | | | (8,561,660 | ) | | | (183,620,229 | ) | | | 8,580,475 | | | | 18,980,604 | | | | 32,960,768 | | | | 22,997,976 | | | | 17,097,650 | |
| | |
|
|
| |
|
|
| |
|
|
| |
|
|
| |
|
|
| |
|
|
| |
|
|
| |
|
|
|
TOTAL INCREASE (DECREASE) IN NET ASSETS | | | 86,455,368 | | | | 13,214,904 | | | | (129,761,311 | ) | | | 48,469,403 | | | | 68,261,967 | | | | 49,371,604 | | | | 78,053,387 | | | | 37,446,766 | |
NET ASSETS: | | | | | | | | | | | | | | | | | | | | | | | | | | | | | | | | |
Beginning of period | | | 133,988,447 | | | | 120,773,543 | | | | 1,046,045,588 | | | | 997,576,185 | | | | 896,345,508 | | | | 846,973,904 | | | | 137,330,350 | | | | 99,883,584 | |
| | |
|
|
| |
|
|
| |
|
|
| |
|
|
| |
|
|
| |
|
|
| |
|
|
| |
|
|
|
End of period† | | $ | 220,443,815 | | | $ | 133,988,447 | | | $ | 916,284,277 | | | $ | 1,046,045,588 | | | $ | 964,607,475 | | | $ | 896,345,508 | | | $ | 215,383,737 | | | $ | 137,330,350 | |
| | |
|
|
| |
|
|
| |
|
|
| |
|
|
| |
|
|
| |
|
|
| |
|
|
| |
|
|
|
† Includes accumulated undistributed net investment income (loss) of | | $ | (242,887 | ) | | $ | 65,304 | | | $ | 4,027,098 | | | $ | 3,847,744 | | | $ | 19,675,029 | | | $ | 14,661,865 | | | $ | (806,590 | ) | | $ | (471,542 | ) |
| | |
|
|
| |
|
|
| |
|
|
| |
|
|
| |
|
|
| |
|
|
| |
|
|
| |
|
|
|
See Notes to Financial Statements
VALIC Company II
STATEMENTS OF CHANGES IN NET ASSETS — (continued)
| | | | | | | | | | | | | | | | | | | | | | | | |
| | | SMALL CAP VALUE FUND
| | | SOCIALLY RESPONSIBLE FUND
| | | STRATEGIC BOND FUND
| |
| | | For the
Year Ended
August 31,
2018
| | | For the
Year Ended
August 31,
2017
| | | For the
Year Ended
August 31,
2018
| | | For the
Year Ended
August 31,
2017
| | | For the
Year Ended
August 31,
2018
| | | For the
Year Ended
August 31,
2017
| |
INCREASE (DECREASE) IN NET ASSETS OPERATIONS: | | | | | | | | | | | | | | | | | | | | | | | | |
Net investment income (loss) | | $ | 5,331,667 | | | $ | 3,854,924 | | | $ | 10,863,154 | | | $ | 11,471,912 | | | $ | 29,863,580 | | | $ | 27,856,794 | |
Net realized gain (loss) on investments and foreign currencies | | | 52,025,949 | | | | 48,420,076 | | | | 51,589,236 | | | | 15,358,164 | | | | (3,504,948 | ) | | | 11,427,449 | |
Net unrealized gain (loss) on investments and foreign currencies | | | 30,354,684 | | | | 6,888,705 | | | | 72,482,641 | | | | 75,594,017 | | | | (33,808,260 | ) | | | (3,545,329 | ) |
| | |
|
|
| |
|
|
| |
|
|
| |
|
|
| |
|
|
| |
|
|
|
Net increase (decrease) in net assets resulting from operations | | | 87,712,300 | | | | 59,163,705 | | | | 134,935,031 | | | | 102,424,093 | | | | (7,449,628 | ) | | | 35,738,914 | |
| | |
|
|
| |
|
|
| |
|
|
| |
|
|
| |
|
|
| |
|
|
|
DISTRIBUTIONS TO SHAREHOLDERS FROM: | | | | | | | | | |
Net investment income | | | (4,198,015 | ) | | | (4,928,560 | ) | | | (12,121,511 | ) | | | (10,837,307 | ) | | | (30,340,988 | ) | | | (28,271,122 | ) |
Net realized gain on securities | | | (36,713,546 | ) | | | (19,876,650 | ) | | | (13,836,208 | ) | | | (53,375,309 | ) | | | – | | | | – | |
| | |
|
|
| |
|
|
| |
|
|
| |
|
|
| |
|
|
| |
|
|
|
Total distributions to shareholders | | | (40,911,561 | ) | | | (24,805,210 | ) | | | (25,957,719 | ) | | | (64,212,616 | ) | | | (30,340,988 | ) | | | (28,271,122 | ) |
| | |
|
|
| |
|
|
| |
|
|
| |
|
|
| |
|
|
| |
|
|
|
Net increase (decrease) in net assets resulting from capital share transactions (Note 6) | | | (41,757,567 | ) | | | (18,636,828 | ) | | | (119,757,020 | ) | | | 4,865,815 | | | | 142,137,238 | | | | (81,877,029 | ) |
| | |
|
|
| |
|
|
| |
|
|
| |
|
|
| |
|
|
| |
|
|
|
TOTAL INCREASE (DECREASE) IN NET ASSETS | | | 5,043,172 | | | | 15,721,667 | | | | (10,779,708 | ) | | | 43,077,292 | | | | 104,346,622 | | | | (74,409,237 | ) |
NET ASSETS: | | | | | | | | | | | | | | | | | | | | | | | | |
Beginning of period | | | 529,504,773 | | | | 513,783,106 | | | | 799,897,848 | | | | 756,820,556 | | | | 749,054,952 | | | | 823,464,189 | |
| | |
|
|
| |
|
|
| |
|
|
| |
|
|
| |
|
|
| |
|
|
|
End of period† | | $ | 534,547,945 | | | $ | 529,504,773 | | | $ | 789,118,140 | | | $ | 799,897,848 | | | $ | 853,401,574 | | | $ | 749,054,952 | |
| | |
|
|
| |
|
|
| |
|
|
| |
|
|
| |
|
|
| |
|
|
|
† Includes accumulated undistributed net investment income (loss) of | | $ | 5,293,998 | | | $ | 3,833,697 | | | $ | 11,090,287 | | | $ | 12,348,644 | | | $ | 29,551,218 | | | $ | 25,906,780 | |
| | |
|
|
| |
|
|
| |
|
|
| |
|
|
| |
|
|
| |
|
|
|
See Notes to Financial Statements
VALIC Company II
NOTES TO FINANCIAL STATEMENTS
Note 1 — Organization
VALIC Company II (the “Series” or “VC II”) was organized as a Delaware statutory trust on May 6, 1998, by The Variable Annuity Life Insurance Company (“VALIC” or the “Adviser”). VALIC, the investment adviser to VC II, is an indirect wholly-owned subsidiary of American International Group, Inc. (“AIG”). VC II is registered under the Investment Company Act of 1940, as amended (the “1940 Act”), as an open-end, management investment company. The Series consists of 15 separate mutual funds (collectively, the “Funds,” or each, a “Fund”), each of which issues its own class of shares of beneficial interest:
| | |
| Aggressive Growth Lifestyle Fund* | | Mid Cap Growth Fund |
| Capital Appreciation Fund | | Mid Cap Value Fund |
| Conservative Growth Lifestyle Fund* | | Moderate Growth Lifestyle Fund* |
| Core Bond Fund | | Small Cap Growth Fund |
| Government Money Market II Fund | | Small Cap Value Fund |
| High Yield Bond Fund | | Socially Responsible Fund |
| International Opportunities Fund | | Strategic Bond Fund |
| Large Cap Value Fund | | |
| * | The Lifestyle Funds represent “Fund of Funds” which invest in either the VALIC Company I (“VC I”) or VC II mutual funds. |
Each Fund is diversified as defined by the 1940 Act.
Indemnifications. Under VC II’s organizational documents, its officers and trustees are indemnified against certain liabilities arising out of the performance of their duties to the Funds. In addition, in the normal course of business, VC II enters into contracts that contain the obligation to indemnify others. The Funds’ maximum exposure under these arrangements is unknown. Currently, however, VC II expects the risk of loss to be remote.
Note 2 — Significant Accounting Policies
The preparation of financial statements in accordance with U.S. generally accepted accounting principles (“GAAP”) requires management to make estimates and assumptions that affect the reported amounts and disclosures in the financial statements. Actual results could differ from those estimates and those differences could be significant. The Funds are considered investment companies under GAAP and follow the accounting and reporting guidance applicable to investment companies. The following is a summary of significant accounting policies consistently followed by the Series in the preparation of its financial statements:
A. Security Valuation
In accordance with the authoritative guidance on fair value measurements and disclosures under GAAP, the Funds disclose the fair value of their investments in a hierarchy that prioritizes the inputs to valuation techniques used to measure the fair value. In accordance with GAAP, fair value is defined as the price that the Funds would receive upon selling an asset or transferring a liability in a timely transaction to an independent third party in the principal or most advantageous market. GAAP establishes a three-tier hierarchy to provide more transparency around the inputs used to measure fair value and to establish classification of fair value measurements for disclosure purposes. Inputs refer broadly to the assumptions that market participants would use in pricing the asset or liability, including assumptions about risk. Inputs may be observable or unobservable. Observable inputs are inputs that reflect the assumptions market participants would use in pricing the asset or liability developed based on market data obtained from sources independent of the reporting entity. Unobservable inputs are inputs that reflect the reporting entity’s own assumptions about the assumptions market participants would use in pricing the asset or liability developed based on the best information available in the circumstances. The three-tiers are as follows:
Level 1 — Unadjusted quoted prices in active markets for identical securities
Level 2 — Other significant observable inputs (including quoted prices for similar securities, interest rates, prepayment speeds, credit risk, referenced indices, quoted prices in inactive markets, adjusted quoted prices in active markets, adjusted quoted prices on foreign equity securities that were adjusted in accordance with pricing procedures approved by the Board of Trustees (the “Board”) , etc.)
Level 3 — Significant unobservable inputs (includes inputs that reflect the Funds’ own assumptions about the assumptions market participants would use in pricing the security, developed based on the best information available under the circumstances)
Changes in valuation techniques may result in transfers in or out of an investment’s assigned Level within the hierarchy. The methodology used for valuing investments is not necessarily an indication of the risk associated with investing in those investments and the determination of the significance of a particular input to the fair value measurement in its entirety requires judgment and consideration of factors specific to each security.
The availability of observable inputs can vary from security to security and is affected by a wide variety of factors, including, for example, the type of security, whether the security is recently issued and not yet established in the marketplace, the liquidity of markets, and other characteristics particular to the security. To the extent that valuation is based on models or inputs that are less observable or unobservable in the market, the determination of fair value requires more judgment. Accordingly, the degree of judgment exercised in determining fair value is greatest for instruments categorized in Level 3.
The summary of the Funds’ assets and liabilities classified in the fair value hierarchy as of August 31, 2018, is reported on a schedule at the end of each Fund’s Portfolio of Investments.
Stocks are generally valued based upon closing sales prices reported on recognized securities exchanges on which the securities are principally traded and are generally categorized as Level 1. Stocks listed on the NASDAQ are valued using the NASDAQ Official Closing Price (“NOCP”). Generally, the NOCP will be the last sale price unless the
VALIC Company II
NOTES TO FINANCIAL STATEMENTS — (continued)
reported trade for the stock is outside the range of the bid/ask price. In such cases, the NOCP will be normalized to the nearer of the bid or ask price. For listed securities having no sales reported and for unlisted securities, such securities will be valued based upon the last reported bid price.
As of the close of regular trading on the New York Stock Exchange (“NYSE”), securities traded primarily on security exchanges outside the United States are valued at the last sale price on such exchanges on the day of valuation, or if there is no sale on the day of valuation, at the last-reported bid price. If a security’s price is available from more than one exchange, the Funds use the exchange that is the primary market for the security. Such securities are generally categorized as Level 1. However, depending on the foreign market, closing prices may be up to 15 hours old when they are used to price a Fund’s shares, and a Fund may determine that certain closing prices do not reflect the fair value of the security. This determination will be based on the review of a number of factors, including developments in foreign markets, the performance of U.S. securities markets, and the performance of instruments trading in U.S. markets that represent foreign securities and baskets of foreign securities. If a Fund determines that closing prices do not reflect the fair value of the securities, the Fund will adjust the previous closing prices in accordance with pricing procedures approved by the Board to reflect what it believes to be the fair value of the securities as of the close of regular trading on the NYSE. The Funds may also fair value securities in other situations, for example, when a particular foreign market is closed but a Fund is open. For foreign equity securities and foreign equity futures contracts, the Funds use an outside pricing service to provide it with closing market prices and information used for adjusting those prices, and when so adjusted, such securities and futures are generally categorized as Level 2.
Bonds, debentures and other debt securities are valued at evaluated bid prices obtained for the day of valuation from a Board-approved pricing service, and are generally categorized as Level 2. The pricing service may use valuation models or matrix pricing which considers information with respect to comparable bond and note transactions, quotations from bond dealers, or by reference to other securities that are considered comparable in such characteristics as rating, interest rate, and maturity date, option adjusted spread models, prepayments projections, interest rate spreads, and yield curves to determine current value. If a price is unavailable from a Board-approved pricing service, the securities may be priced at the mean of two independent quotes obtained from brokers.
Senior floating rate loans (“Loans”) are valued at the average of available bids in the market for such Loans, as provided by a Board-approved loan pricing service, and are generally categorized as Level 2.
Investments in registered investment companies that do not trade on an exchange are valued at the end of day net asset value per share. Investments in registered investment companies that trade on an exchange are valued at the last sales price or official closing price as of the close of the customary trading session on the exchange where the security is principally traded. Investments in registered investment companies are generally categorized as Level 1.
Futures contracts traded on national securities exchanges are valued at the quoted daily settlement price established by the exchange on which they trade reported by a Board-approved pricing service, and are generally categorized as Level 1. Swap contracts traded on national securities exchanges are valued at the closing price of the exchange on which they are traded or if a closing price of the exchange is not available, the swap will be valued using a mid valuation provided by a Board-approved pricing service, and are generally categorized as Level 2. Swap contracts traded in the over-the-counter (“OTC”) market are valued at a mid valuation provided by a Board-approved pricing service, and are generally categorized as Level 2. Forward foreign currency contracts (“forward contracts”) are valued at the 4:00 p.m. Eastern Time forward rate and are generally categorized as Level 2.
For the Government Money Market II Fund, securities are valued at amortized cost, which approximates market value and are generally categorized as Level 2. The amortized cost method involves valuing a security at its cost on the date of purchase and thereafter assuming a constant amortization to maturity of any discount or premium. In accordance with Rule 2a-7 under the 1940 Act, the Board has adopted procedures intended to stabilize the Government Money Market II Fund’s net asset value per share at $1.00. These procedures include the determination, at such intervals as the Board deems appropriate and reasonable in light of current market conditions, of the extent, if any, to which the Government Money Market II Fund market-based net asset value per share deviates from the Fund’s amortized cost per share. The calculation of such deviation is referred to as “shadow pricing.” For purposes of these market-based valuations, securities for which market quotations are not readily available are fair valued, as determined pursuant to procedures adopted in good faith by the Board.
Other securities are valued on the basis of last sale or bid price (if a last sale price is not available) which is, in the opinion of the Adviser, the broadest and most representative market, that may be either a securities exchange or OTC market, and are generally categorized as Level 1 or Level 2.
The Board is responsible for the share valuation process and has adopted policies and procedures (the “PRC Procedures”) for valuing the securities and other assets held by the Funds, including procedures for the fair valuation of securities and other assets for which market quotations are not readily available or are unreliable. The PRC Procedures provide for the establishment of a pricing review committee, which is responsible for, among other things, making certain determinations in connection with the Series’ fair valuation procedures. Securities for which market quotations are not readily available or the values of which may be significantly impacted by the occurrence of developments or significant events are generally categorized as Level 3. There is no single standard for making fair value determinations, which may result in prices that vary from those of other funds.
B. Derivative Instruments
Forward Foreign Currency Contracts: During the period, the High Yield Bond Fund and Strategic Bond Fund used forward contracts to attempt to protect the value of securities and related receivables and payables against changes in future foreign exchange rates.
A forward contract is an agreement between two parties to buy or sell currency at a set price on a future date. The market value of the contract will fluctuate with changes in currency exchange rates. The contract is marked-to-market daily using the forward rate and the cumulative change in market value is recorded by a Fund as unrealized appreciation or depreciation. On the settlement date, a Fund records either realized gains or losses equal to the difference between the value of the contract at the time it was opened and the value at the time it was closed.
Risks to the Funds of entering into forward contracts include counterparty risk, market risk and illiquidity risk. Counterparty risk arises upon entering into these contracts from the potential inability of counterparties to meet the terms of their contracts. If the counterparty defaults, a Fund’s loss will generally consist of the net amount of contractual
VALIC Company II
NOTES TO FINANCIAL STATEMENTS — (continued)
payments that the Fund has not yet received though the Fund’s maximum exposure due to counterparty risk could extend to the notional amount of the contract. Market risk is the risk that the value of the forward contract will depreciate due to unfavorable changes in the exchange rates. These contracts may involve market risk in excess of the unrealized appreciation or depreciation reported on the Statements of Assets and Liabilities. Illiquidity risk arises because the secondary market for forwards may have less liquidity relative to markets for other securities. Currency transactions are also subject to risks different from those of other portfolio transactions. Because currency control is of great importance to the issuing governments and influences economic planning and policy, purchases and sales of currency and related instruments can be adversely affected by government exchange controls, limitations or restrictions on repatriation of currency, and manipulations or exchange restrictions imposed by governments.
Forward foreign currency contracts outstanding at the end of the period, if any, are reported on a schedule at the end of each Fund’s Portfolio of Investments.
Futures: During the period, the Small Cap Value Fund and Socially Responsible Fund used equity futures contracts to equitize cash, providing exposure to equity markets.
A futures contract is an agreement between two parties to buy and sell a financial instrument at a set price on a future date. Upon entering into a futures transaction, a Fund will be required to segregate an initial margin payment of cash or other liquid securities with the futures commission merchant (the “broker”). Subsequent payments are made or received by the Fund as a result of changes in the value of the contract and/or changes in the value of the initial margin requirement. Such receipts or payments are recorded in the Statements of Assets and Liabilities as variation margin for changes in the value of the contracts and as cash collateral for futures contracts for the changes in the value of the initial margin requirement. When a contract is closed, the Funds record a realized gain or loss equal to the difference between the value of the contract at the time it was opened and the value at the time it was closed.
The primary risk to the Funds of entering into futures contracts is market risk. Market risk is the risk that there will be an unfavorable change in the interest rate, value or currency rate of the underlying security or securities. Futures contracts involve, to varying degrees, risk of loss in excess of the variation margin disclosed on the Statements of Assets and Liabilities. There may also be trading restrictions or limitations imposed by an exchange, and government regulations may restrict trading in futures contracts. While the Funds will generally only purchase exchange-traded futures, due to market conditions, there may not always be a liquid secondary market for a futures contract and, as a result, a Fund may be unable to close out its futures contracts at a time which is advantageous. In addition, if a Fund has insufficient cash to meet margin requirements, the Fund may need to sell other investments, including at disadvantageous times. There is generally minimal counterparty risk to the Funds since the futures contracts are generally exchange-traded.
Futures contracts outstanding at the end of the period, if any, are reported on a schedule at the end of each Fund’s Portfolio of Investments.
Swap Contracts: Certain Funds may enter into credit default, interest rate, equity and/or total return swap contracts. Swap contracts are privately negotiated in the OTC market and may be entered into as a bilateral contract or a centrally cleared contract (“centrally cleared swaps”). In a centrally cleared swap, immediately following execution of the swap contract, the swap contract is novated to a central counterparty (the “CCP”) and a Fund faces the CCP through a broker. Upon entering into a centrally cleared swap, the Funds are required to deposit initial margin with the broker in the form of cash or securities in an amount that varies depending on the size and risk profile of the particular swap. Securities deposited as initial margin are designated on the Portfolio of Investments and cash deposited is recorded on the Statements of Assets and Liabilities as cash collateral for centrally cleared swap contracts. Unlike a bilateral swap contract, for centrally cleared swaps, the Funds have no credit exposure to the counterparty as the CCP stands between the Funds and the counterparty. Swaps are marked-to-market daily and the changes in value are recorded as an unrealized gain (loss). The daily change in valuation of swap contracts, if any, is recorded as unrealized appreciation (depreciation) on swap contracts. When the swap is terminated, the Funds will record a realized gain or loss equal to the difference between the proceeds from (or cost of) the closing transaction and the Funds’ basis in the contract, if any. Generally, the basis of the contracts is the premium received or paid. The Funds amortize upfront payments and receipts on the swap contracts on a daily basis. Net periodic payments made or received by the Funds are included as part of realized gain (loss).
Credit Default Swap Agreements: During the period, the High Yield Bond Fund used credit default swaps to manage credit risk (i.e., hedging), enhance returns, and as a substitute for physical securities.
Credit default swaps are generally contracts in which one party makes periodic fixed-rate payments or a one time premium payment (referred to as the buyer of protection) to another party (the seller of protection) in exchange for the right to receive a specified payment in the event of a default or other credit event for the referenced entity, obligation or index. As a seller of protection on credit default swaps, a Fund will generally receive from the buyer of protection a fixed rate of income throughout the term of the swap provided that there is no credit event. As the seller, a Fund would effectively add leverage to its Fund because, in addition to its total net assets, a Fund would be subject to investment exposure on the notional amount of the swap. If a Fund is a seller of protection and a credit event occurs, as defined under the terms of that particular swap agreement, a Fund will either (i) pay to the buyer of protection an amount equal to the notional amount of the swap and take delivery of the referenced obligation, other deliverable obligations or underlying securities comprising the referenced index or (ii) pay a net settlement amount in the form of cash or securities equal to the notional amount of the swap less the recovery value of the referenced obligation or underlying securities comprising the referenced index. As a buyer of protection on credit default swaps, a Fund will make periodic payments, similar to an insurance premium and the seller of protection agrees to compensate the Fund for future potential losses as a result of a credit event on the reference bond or other asset. A Fund effectively transfers the credit event risk of the reference bond or asset from it to the seller of protection. If a Fund is a buyer of protection and a credit event occurs, as defined under the terms of that particular swap agreement, the Fund will either (i) receive from the seller of protection an amount equal to the notional amount of the swap and deliver the referenced obligation, other deliverable obligations or underlying securities comprising the referenced index or (ii) receive a net settlement amount in the form of cash or securities equal to the notional amount of the swap less the recovery value of the referenced obligation or underlying securities comprising the referenced index. Recovery values are assumed by market makers considering either industry standard recovery rates or entity specific factors and considerations until a credit event occurs. If a credit event has occurred, the recovery value is determined by a facilitated auction whereby a minimum number of allowable broker bids, together with a specified valuation method, are used to calculate the settlement value.
Credit default swaps on corporate issues or sovereign issues of an emerging market country are contracts in which the buyer of protection makes periodic fixed payments or a one time premium payment to the seller of protection in exchange for the right to receive a specified payment in the event of a default or other credit event. If a credit event occurs and cash settlement is not elected, a variety of other deliverable obligations may be delivered in lieu of the specific referenced obligation. The ability to deliver other obligations may result in a cheapest-to deliver option (the buyer of protection’s right to choose the deliverable obligation with the lowest value following a credit event). A Fund may use credit
VALIC Company II
NOTES TO FINANCIAL STATEMENTS — (continued)
default swaps on corporate issues or sovereign issues of an emerging market country to provide a measure of protection against defaults of the issuers (i.e., to reduce credit risk where a Fund owns or has exposure to the referenced obligation) or to take a speculative credit position with an active long or short position with respect to the likelihood of a particular issuer’s default.
Credit default swaps on asset-backed securities are contracts in which the buyer of protection makes periodic fixed-rate payments or a one time premium payment to the seller of protection in exchange for the right to receive a specified payment in the event of a default or other credit event. Unlike credit default swaps on corporate issues or sovereign issues of an emerging market country, deliverable obligations in most instances would be limited to the specific referenced obligation as performance for asset-backed securities can vary across deals. Prepayments, principal paydowns, and other writedown or loss events on the underlying mortgage loans will reduce the outstanding principal balance of the referenced obligation. These reductions may be temporary or permanent as defined under the terms of the swap agreement and the notional amount for the swap agreement will be adjusted by corresponding amounts. A Fund may use credit default swaps on asset-backed securities to provide a measure of protection against defaults of the referenced obligation or to take a speculative credit position with an active long or short position with respect to the likelihood of a particular referenced obligation’s default.
Credit default swaps on credit indices are generally contracts in which the buyer of protection makes periodic fixed-rate payments or a one time premium payment to the seller of protection in exchange for the right to receive a specified payment in the event of a write-down, principal shortfall, interest shortfall or default of all or part of the referenced entities comprising the credit index. A credit index is a list of a basket of credit instruments or exposures designed to be representative of some part of the credit market as a whole. These indices are made up of reference credits that are judged by a poll of dealers to be the most liquid entities in the credit default swap market based on the sector of the index. Components of the indices may include, but are not limited to, investment grade securities, high yield securities, asset backed securities, emerging markets, and/or various credit ratings within each sector. Credit indices are traded using credit default swaps with standardized terms including a fixed spread and standard maturity dates. An index credit default swap references all the names in the index, and if there is a default, the credit event is settled based on that name’s weight in the index. The composition of the indices changes periodically, usually every six months, and for most indices, each name has an equal weight in the index. A Fund may use credit default swaps on credit indices to hedge a Fund of credit default swaps or bonds which is less expensive than it would be to enter into many credit default swaps to achieve a similar effect. Credit-default swaps on indices are used for protecting investors owning bonds against default, and also to speculate on changes in credit quality.
Implied credit spreads, represented in absolute terms, utilized in determining the market value of credit default swaps on corporate issues or sovereign issues of an emerging market country as of period end are disclosed in the footnotes to the Portfolio of Investments and serve as an indicator of the current status of the payment/performance risk and represent the likelihood or risk of default for the credit derivative. The implied credit spread of a particular referenced entity reflects the cost of buying/selling protection and may include upfront payments required to be made to enter into the agreement. For credit default swaps on asset-based securities and credit indices, the quoted market prices and resulting values serve as the indicator of the current status of the payment/performance risk. Wider credit spreads and increasing market values, in absolute terms when compared to the notional amount of the swap, represent a deterioration of the referenced entity’s credit soundness and a greater likelihood or risk of default or other credit event occurring as defined under the terms of the agreement. The maximum potential amount of future payments (undiscounted) that a Fund as a seller of protection could be required to make under a credit default swap would be an amount equal to the notional amount of the agreement. Notional amounts of all credit default swaps outstanding at the end of the period, for which a Fund is the seller of protection, if any, are disclosed on a schedule at the end of the Fund’s Portfolio of Investments. These potential amounts would be partially offset by any recovery values of the respective referenced obligations, upfront payments received upon entering into the agreement, or net amounts received from the settlement of buy protection credit default swaps entered into by a Fund for the same referenced entity or entities.
Credit default swap contracts outstanding at the end of the period, if any, are reported on a schedule at the end of each Fund’s Portfolio of Investments.
Risks of Entering into Swap Agreements: Risks to a Fund of entering into credit default swaps, equity swaps and interest rate swaps, include credit risk, market risk, counterparty risk, liquidity risk and documentation risk. By entering into swap agreements, the Funds may be exposed to risk of potential loss due to unfavorable changes in interest rates, the price of the underlying security or index, or the underlying referenced asset’s perceived or actual credit, that the counterparty may default on its obligation to perform or the possibility that there is no liquid market for these agreements. There is also the risk that the parties may disagree as to the meaning of contractual terms in the swap agreement. In addition, to the extent that a subadviser does not accurately analyze and predict the underlying economic factors influencing the value of the swap, the Fund may suffer a loss, which may be in excess of the amount reflected on the statement of assets and liabilities.
Master Agreements: Certain Funds that hold derivative instruments and other financial instruments may be a party to ISDA (International Swaps and Derivatives Association, Inc.) Master Agreements or similar agreements (“Master Agreements”) with certain counterparties that govern such instruments. Master Agreements may contain provisions regarding, among other things, the parties’ general obligations, representations, agreements, collateral requirements, events of default and early termination. Collateral can be in the form of cash or securities as agreed to by a Fund and applicable counterparty. Collateral requirements are generally determined based on a Fund’s net position with each counterparty. Master Agreements may also include certain provisions that require a Fund to post additional collateral upon the occurrence of certain events, such as when a Fund’s net assets fall below a specified level. In addition, Master Agreements typically specify certain standard termination events, such as failure of a party to pay or deliver, credit support defaults and other events of default. Termination events applicable to a Fund may also occur upon a decline in a Fund’s net assets below a specified level over a certain period of time. Additional termination events applicable to counterparties may occur upon a decline in a counterparty’s long-term and short-term credit ratings below a specified level, or upon a decline in the ratings of a counterparty’s credit support provider. Upon the occurrence of a termination event, the other party may elect to terminate early and cause settlement of all instruments outstanding pursuant to a particular Master Agreement, including the payment of any losses and costs resulting from such early termination, as reasonably determined by the terminating party. Any decision by one or more of a Fund’s counterparties to elect early termination could cause a Fund to accelerate the payment of liabilities, which settlement amounts could be in excess of the amount of assets that are already posted as collateral. Typically, the Master Agreement will permit a single net payment in the event of default. Note, however, that bankruptcy or insolvency laws of a particular jurisdiction may impose restrictions on or prohibitions against the right of offset in bankruptcy, insolvency or other events. As a result, the early termination with respect to derivative instruments subject to Master Agreements that are in a net liability position could be material to a Fund’s financial statements. See additional information on specific types of derivative instruments and other financial instruments as disclosed in the Notes to Financial Statements. The Funds do not offset derivative assets and derivative liabilities that are subject to netting arrangements in the Statements of Assets and Liabilities.
VALIC Company II
NOTES TO FINANCIAL STATEMENTS — (continued)
The following tables represent the value of derivatives held as of August 31, 2018, by their primary underlying risk exposure and the respective location on the Statement of Assets and Liabilities and the effect of derivatives on the Statement of Operations for the year ended August 31, 2018. The derivative contracts held during the period are not accounted for as hedging instruments under GAAP. For a detailed presentation of derivatives held as of August 31, 2018, please refer to the schedule at the end of each Fund’s Portfolio of Investments.
| | | | | | | | | | | | | | | | |
| | | Asset Derivatives
| |
| | | Equity
Contracts
| | | Credit
Contracts
| | | Foreign
Exchange
Contracts
| | | Total
| |
Fund
| | Futures
Contracts(1)(6)
| | | Swap
Contracts(2)
| | | Forward
Foreign
Currency
Contracts(3)
| |
High Yield Bond | | $ | — | | | $ | — | | | $ | — | | | $ | — | |
Small Cap Value | | | 50,160 | | | | — | | | | — | | | | 50,160 | |
Socially Responsible | | | 295 | | | | — | | | | — | | | | 295 | |
Strategic Bond | | | — | | | | — | | | | 327,802 | | | | 327,802 | |
| |
| | | Liability Derivatives
| |
| | | Equity
Contracts
| | | Credit
Contracts
| | | Foreign
Exchange
Contracts
| | | Total
| |
Fund
| | Futures
Contracts(1)(6)
| | | Swap
Contracts(4)
| | | Forward
Foreign
Currency
Contracts(5)
| |
High Yield Bond | | $ | — | | | $ | — | | | $ | 20,596 | | | $ | 20,596 | |
Small Cap Value | | | — | | | | — | | | | — | | | | — | |
Socially Responsible | | | — | | | | — | | | | — | | | | — | |
Strategic Bond | | | — | | | | — | | | | 33,431 | | | | 33,431 | |
Statement of Assets and Liabilities Location:
| (1) | Variation margin on futures contracts |
| (2) | Unrealized appreciation on swap contracts |
| (3) | Unrealized appreciation on forward foreign currency contracts |
| (4) | Unrealized depreciation on swap contracts |
| (5) | Unrealized depreciation on forward foreign currency contracts |
| (6) | The variation margin on futures contracts is included in the cumulative unrealized appreciation (depreciation) as reported on each Fund’s Portfolio of Investments in the following amounts: |
| | | | |
Fund
| | Cumulative
Unrealized
Appreciation
(Depreciation)
| |
Small Cap Value | | $ | 293,618 | |
Socially Responsible | | | 352,411 | |
VALIC Company II
NOTES TO FINANCIAL STATEMENTS — (continued)
| | | | | | | | | | | | | | | | |
| | | Realized Gain (Loss) on Derivatives Recognized in
Statement of Operations
| |
| | | Equity
Contracts
| | | Credit
Contracts
| | | Foreign
Exchange
Contracts
| | | Total
| |
Fund
| | Futures
Contracts(1)
| | | Swap
Contracts(2)
| | | Forward
Foreign
Currency
Contracts(3)
| |
High Yield Bond | | $ | — | | | $ | 362,228 | | | $ | 565,687 | | | $ | 927,915 | |
Small Cap Value | | | 1,831,719 | | | | — | | | | — | | | | 1,831,719 | |
Socially Responsible | | | 5,303,858 | | | | — | | | | — | | | | 5,303,858 | |
Strategic Bond | | | — | | | | — | | | | 932,623 | | | | 932,623 | |
| | | | | | | | | | | | | | | | |
| | | Change in Unrealized Appreciation (Depreciation) on Derivatives
Recognized in Statement of Operations
| |
| | | Equity
Contracts
| | | Credit
Contracts
| | | Foreign
Exchange
Contracts
| | | Total
| |
Fund
| | Futures
Contracts(4)
| | | Swap
Contracts(5)
| | | Forward
Foreign
Currency
Contracts(6)
| |
High Yield Bond | | $ | — | | | $ | (64,506 | ) | | $ | 64,062 | | | $ | (444 | ) |
Small Cap Value | | | 224,800 | | | | — | | | | — | | | | 224,800 | |
Socially Responsible | | | 26,657 | | | | — | | | | — | | | | 26,657 | |
Strategic Bond | | | — | | | | — | | | | 1,112,011 | | | | 1,112,011 | |
Statement of Operations Location:
| (1) | Net realized gain (loss) on futures contracts |
| (2) | Net realized gain (loss) on swap contracts |
| (3) | Net realized gain (loss) on forward contracts |
| (4) | Change in unrealized appreciation (depreciation) on futures contracts |
| (5) | Change in unrealized appreciation (depreciation) on swap contracts |
| (6) | Change in unrealized appreciation (depreciation) on forward contracts |
The following table represents the average monthly balances of derivatives held during the year ended August 31, 2018.
| | | | | | | | | | | | |
| | | Average Amount Outstanding During the Year
| |
Fund
| | Futures
Contracts(1)
| | | Credit Swap
Contracts(1)
| | | Foreign
Exchange
Contracts(1)
| |
High Yield Bond | | $ | — | | | $ | 3,346,667 | | | $ | 12,144,252 | |
Small Cap Value | | | 13,347,280 | | | | — | | | | — | |
Socially Responsible | | | 27,953,594 | | | | — | | | | — | |
Strategic Bond | | | — | | | | — | | | | 53,006,919 | |
| (1) | Amounts represent notional amounts in U.S. dollars. |
VALIC Company II
NOTES TO FINANCIAL STATEMENTS — (continued)
The following tables set forth the Funds’ derivative assets and liabilities by counterparty, net of amounts available for offset under Master Agreements and net of the related collateral pledged/(received) as of August 31, 2018. The repurchase agreements held by the Funds and securities on loan as of August 31, 2018, are also subject to Master Agreements but are not included in the following tables. See the Portfolio of Investments of each Fund and the Notes to the Financial Statements for more information about the Funds’ holdings in repurchase agreements and securities on loan.
| | | | | | | | | | | | | | | | | | | | | | | | | | | | | | | | | | | | | | | | | | | | |
| | | High Yield Bond Fund
| | | | | | | | | | |
| | | Derivative Assets(1)
| | | Derivative Liabilities(1)
| | | | | | | | | | |
| Counterparty | | Forward
Foreign
Currency
Contracts
| | | OTC
Swaps
| | | Options
Purchased
| | | Total
| | | Forward
Foreign
Currency
Contracts
| | | OTC
Swaps
| | | Options
Written
| | | Total
| | | Net
Derivative
Assets
(Liabilities)
| | | Collateral
Pledged/
(Received)(2)
| | | Net
Amount(3)
| |
Citibank N.A. | | $ | — | | | $ | — | | | $ | — | | | $ | — | | | $ | 20,596 | | | $ | — | | | $ | — | | | $ | 20,596 | | | $ | (20,596 | ) | | $ | — | | | $ | (20,596 | ) |
| | |
|
|
| |
|
|
| |
|
|
| |
|
|
| |
|
|
| |
|
|
| |
|
|
| |
|
|
| |
|
|
| |
|
|
| |
|
|
|
| (1) | Gross amounts of recognized assets and liabilities not offset in the Statements of Assets and Liabilities. |
| (2) | For each respective counterparty, collateral pledged or (received) is limited to an amount not to exceed 100% of the net amount of the derivative asset/liability in the table above. |
| (3) | Net amount represents the net amount due (to)/from counterparty in the event of a default based on the contractual set-off rights under the agreement. |
C. Stripped Mortgage-Backed Securities
Stripped Mortgage-Backed Securities (“SMBS”) are multiple-class mortgage-backed securities. SMBS are often structured with two classes that receive different proportions of the interest and principal distributions on a pool of mortgage assets. SMBS have greater market volatility than other types of U.S. government securities in which a Fund invests. A common type of SMBS has one class receiving some of the interest and all or most of the principal (the “principal only” class) from the mortgage pool, while the other class will receive all or most of the interest (the “interest only” class). The yield to maturity on an interest only class is extremely sensitive not only to changes in prevailing interest rates, but also to the rate of principal payments, including principal prepayments, on the underlying pool of mortgage assets, and a rapid rate of principal payment may have a material adverse effect on a Fund‘s yield.
D. Mortgage-Backed Dollar Rolls
During the year ended August 31, 2018, the Core Bond Fund and the Strategic Bond Fund entered into dollar rolls using “to be announced” (“TBA”) mortgage-backed securities (“TBA Rolls”). TBA Roll transactions involve the sale of mortgage or other asset backed securities with the commitment to purchase substantially similar securities on a specified future date. The Funds’ policy is to record the components of TBA Rolls as purchase/sale transactions. Any difference between the purchase and sale price is recorded as a realized gain or loss on the date the transaction is entered into. TBA Roll transactions involve the risk that the market value of the securities held by a Fund may decline below the price of the securities that the Fund has sold but is obligated to repurchase under the agreement. In the event that the buyer of securities in a TBA Roll transaction files bankruptcy or becomes insolvent, a Fund‘s use of the proceeds from the sale of the securities may be restricted pending a determination by the other party, or its trustee or receiver, whether to enforce the Fund‘s obligation to repurchase the securities. Mortgage-Backed Dollar Rolls outstanding at the end of the period, if any, are included in investments purchased/sold on an extended settlement basis in the Statement of Assets and Liabilities.
E. When-Issued Securities and Forward Commitments
Certain Funds may purchase or sell when-issued securities, including TBA securities that have been authorized, but not yet issued in the market. In addition, a Fund may purchase or sell securities on a forward commitment basis. A forward commitment involves entering into a contract to purchase or sell securities, typically on an extended settlement basis, for a fixed price at a future date. The Funds may engage in when-issued or forward commitment transactions in order to secure what is considered to be an advantageous price and yield at the time of entering into the obligation. The purchase of securities on a when-issued or forward commitment basis involves a risk of loss if the value of the security to be purchased declines before the settlement date. Conversely, the sale of securities on a when-issued or forward commitment basis involves the risk that the value of the securities sold may increase before the settlement date. For the year ended August 31, 2018, the Core Bond Fund and the Strategic Bond Fund purchased and/or sold when-issued securities. Securities purchased or sold on a when-issued or forward commitment basis outstanding at the end of the period, if any, are included in investments purchased/sold on an extended settlement basis in the Statement of Assets and Liabilities.
F. Loans
The Fund invests in senior loans which generally consist of direct debt obligations of companies (collectively, “Borrowers”), primarily U.S. companies and their affiliates, undertaken to finance the growth of the Borrower’s business internally and externally, or to finance a capital restructuring. Transactions in senior loans may settle on a delayed basis. Unsettled loans at the end of the period, if any, are included in investments purchased/sold on an extended settlement basis in the Statement of Assets and Liabilities.
G. Inflation-Indexed Bonds
Certain Funds may purchase inflation-indexed bonds. Inflation-indexed bonds are fixed income securities whose principal value is adjusted periodically according to the rate of inflation. Two structures are common. The U.S. Treasury and certain other issuers use a structure that reflects inflation in the principal value of the bond. Other issuers pay out any inflation related accruals as part of a semiannual coupon. The value of inflation-indexed bonds is expected to change in response to changes in real interest rates. Real interest rates, in turn, are tied to the relationship between nominal interest rates (i.e., stated interest rates) and the rate of inflation. Therefore, if the rate of inflation rises at a faster rate than nominal interest rates, real interest rates (i.e., nominal interest rates minus inflation) might decline, leading to an increase in value of inflation-indexed bonds. In contrast, if nominal interest rates increase at a faster rate than inflation, real interest rates might rise, leading to a decrease in value of inflation-indexed bonds. There can be no assurance, however, that the value of inflation-indexed bonds will be directly correlated to changes in nominal interest rates, and short-term increases in inflation may lead to a decline in
VALIC Company II
NOTES TO FINANCIAL STATEMENTS — (continued)
their value. Coupon payments received from inflation-indexed bonds are recorded in the Statements of Operations as interest income. In addition, any increase or decrease in the principal amount of an inflation-indexed bond will be recorded in the Statements of Operations as an increase or decrease to interest income, even though principal is not paid until maturity.
H. Repurchase Agreements
The Funds, along with other affiliated registered investment companies, pursuant to procedures adopted by the Board and applicable guidance from the Securities and Exchange Commission (“SEC”), may transfer uninvested cash balances into a single joint account, the daily aggregate balance of which is invested in one or more repurchase agreements collateralized by U.S. Treasury or federal agency obligations.
In a repurchase agreement, the seller of a security agrees to repurchase the security at a mutually agreed-upon time and price, which reflects the effective rate of return for the term of the agreement. For repurchase agreements and joint repurchase agreements, the Series’ custodian takes possession of the collateral pledged for investments in such repurchase agreements (“repo” or collectively “repos”). The underlying collateral is valued daily on a mark to market basis, plus accrued interest to ensure that the value, at the time the agreement is entered into, is equal to at least 102% of the repurchase price, including accrued interest. In the event of default of the obligation to repurchase, a Fund has the right to liquidate the collateral and apply the proceeds in satisfaction of the obligation. If the seller defaults and the value of the collateral declines or if bankruptcy proceedings are commenced with respect to the seller of the security, realization of the collateral by a Fund may be delayed or limited.
I. Investment Securities Loaned
To realize additional income, a Fund, except for Aggressive Growth Lifestyle Fund, Conservative Growth Lifestyle Fund, Moderate Growth Lifestyle Fund, and the Government Money Market II Fund, may lend portfolio securities with a value of up to 30% of its total assets. Securities lending arrangements are generally governed by master securities lending authorization agreements which typically provide the securities lending agent with the right to make loans of a Fund’s available securities to an approved list of borrowers. These master securities lending agreements are considered to be Master Agreements as discussed in the Notes to the Financial Statements. Loans made pursuant to these agreements will be continuously secured by collateral in an amount at least equal to the market value of the securities loaned. Such collateral will be cash, U.S. government securities, or other collateral as deemed appropriate. A Fund may use the cash collateral received to invest in short-term investments. The description of the short-term investments made with cash collateral from securities lending is included in the applicable Fund’s Portfolio of Investments. Loans by a Fund will only be made to broker-dealers deemed by the securities lending agent to be creditworthy and will not be made unless, in the judgment of VALIC, the consideration to be earned from such loans would justify the risk. It is the Series’ policy to obtain additional collateral from or return excess collateral to the borrower by the end of the next business day. Therefore, the value of the collateral may be temporarily more or less than the value of the securities on loan. Each Fund receives income from the investment of cash collateral, in addition to lending fees and rebates paid by the borrower, less expenses associated with the loan. In the event of a borrower default, including if the borrower fails to maintain the requisite amount of collateral, the securities lending agent will terminate all outstanding loans to that particular borrower and the lending Fund is permitted to use the collateral to replace the securities while holding the borrower liable for any excess of replacement cost over collateral. The securities lending agent is also required to indemnify a Fund against certain losses resulting from a borrower default. Although risk is mitigated by the collateral and indemnification, the risks in lending fund securities, as with other extensions of secured credit, include possible delays in receiving additional collateral or in the recovery of the securities or possible loss of rights in the collateral should the borrower fail financially as well as risk of loss in the value of collateral or the value of the investments made with the collateral. Income and fees are recorded in the Statements of Operations as securities lending income. Loans of securities are terminable at any time and the borrower, after notice, is required to return borrowed securities within the standard time period for settlement of securities transactions.
J. Securities Transactions, Investment Income, Expenses, Dividends and Distributions to Shareholders
Security transactions are recorded on a trade date basis. Realized gains and losses on the sale of investments are calculated on the identified cost basis. For financial statement purposes, the Funds amortize all premiums and accrete all discounts on fixed income securities.
Interest income is accrued daily from settlement date except when collection is not expected. Dividend income is recorded on the ex-dividend date except for certain dividends from foreign securities, which are recorded as soon as a Fund is informed after the ex-dividend date. Paydown gains and losses on mortgage and asset-backed securities are recorded as components of interest income on the Statement of Operations. For the Lifestyle Funds, distributions from income from the Underlying Funds, if any, are recorded to income on the ex-dividend date. Distributions from net realized capital gains from the Underlying Funds, if any, are recorded to realized gains on the ex-dividend date.
Funds which earn foreign income and capital gains may be subject to foreign withholding taxes and capital gains taxes at various rates. Under applicable foreign law, a withholding of tax may be imposed on interest, dividends, and capital gains from the sale of foreign securities at various rates. India, Thailand, and certain other countries’ tax regulations require that taxes be paid on capital gains realized by a Fund.
Distributions received from Real Estate Investment Trusts (“REIT”) investments are recharacterized based on information provided by the REIT into the following categories: ordinary income, long-term and short-term capital gains, and return of capital. If information is not available on a timely basis from the REIT, the recharacterization will be based on available information which may include the previous year’s allocation. If new or additional information becomes available from the REIT at a later date, a recharacterization will be made in the following year. The amount recharacterized as ordinary income is recorded as dividend income and the amount recharacterized as capital gain is recorded as realized gain in the Statement of Operations. The amount recharacterized as return of capital is recorded as a reduction to the cost of investments in the Statement of Assets and Liabilities. These recharacterizations are reflected in the accompanying financial statements.
Expenses common to all Funds are allocated among the Funds based upon relative net assets or other appropriate allocation methods. In all other respects, expenses are charged to each Fund as incurred on a specific identification basis. For the Lifestyle Funds, the expenses included in the accompanying financial statements reflect the expenses of the Lifestyle Funds and do not include any expenses associated with the Underlying Funds.
VALIC Company II
NOTES TO FINANCIAL STATEMENTS — (continued)
Dividends from net investment income, if any, are normally paid annually, except for the Government Money Market II Fund, which declares daily and pays monthly. Distributions from net realized capital gains, if any, are normally declared and paid annually. The Funds record dividends and distributions to their shareholders on the ex-dividend date.
The amount of dividends and distributions from net investment income and net realized capital gains are determined in accordance with federal income tax regulations, which may differ from GAAP. These “book/tax” differences are either considered temporary or permanent in nature. To the extent these differences are permanent in nature, such amounts are reclassified within the capital accounts at fiscal year end based on their federal tax-basis treatment; temporary differences do not require reclassification. Net assets are not affected by these reclassifications.
Each Fund is considered a separate entity for tax purposes and intends to comply with the requirements of the Internal Revenue Code, as amended, applicable to regulated investment companies and distribute all of its taxable income, including any net capital gains on investments, to its shareholders. Each Fund also intends to distribute sufficient net investment income and net capital gains, if any, so that it will not be subject to excise tax on undistributed income and gains. Therefore, no federal income tax or excise tax provision is required.
The Funds recognize the tax benefits of uncertain tax positions only when the position is more likely than not to be sustained, assuming examination by tax authorities. Management has analyzed each Fund’s tax positions and concluded that no liability for unrecognized tax benefits should be recorded related to uncertain tax positions taken on returns filed for open tax years 2015 — 2017 or expected to be taken in each Fund’s 2018 tax return. The Funds are not aware of any tax provisions for which it is reasonably possible that the total amounts of unrecognized tax benefits will change materially in the next twelve months. The Funds file U.S. federal and certain state income tax returns. With few exceptions, the Funds are no longer subject to U.S. federal and state tax examinations by tax authorities for tax returns ending before 2015.
K. Foreign Currency Translation
The books and records of the Funds are maintained in U.S. dollars. Assets and liabilities denominated in foreign currencies and commitments under forward foreign currency contracts are translated into U.S. dollars based on the exchange rate of such currencies against U.S. dollars on the date of valuation.
The Funds do not isolate that portion of the results of operations arising as a result of changes in the foreign exchange rates from the changes in the market prices of securities held at the end of the period. Similarly, the Funds do not isolate the effect of changes in foreign exchange rates from the changes in the market prices of portfolio securities sold during the period.
Realized foreign exchange gains and losses on other assets and liabilities and change in unrealized foreign exchange gains and losses on other assets and liabilities located in the Statements of Operations include realized foreign exchange gains and losses from currency gains or losses between the trade and the settlement dates of securities transactions, the difference between the amounts of interest, dividends and foreign withholding taxes recorded on the Funds’ books and the U.S. dollar equivalent amounts actually received or paid and changes in the unrealized foreign exchange gains and losses relating to the other assets and liabilities arising as a result of changes in the exchange rates.
L. New Accounting Pronouncements
In August 2018, the SEC adopted amendments to certain financial statement disclosure requirements to conform them to GAAP for investment companies. The final rule becomes effective on November 5, 2018. Management is currently evaluating the amendments and their impact, if any, on the Funds’ financial statements.
In August 2018, the FASB issued Accounting Standards Update (“ASU”) No. 2018-13 “Disclosure Framework — Changes to the Disclosure Requirements for Fair Value Measurement”. The ASU eliminates, modifies, and adds disclosure requirements for fair value measurements and is effective for fiscal years, and interim periods within those fiscal years, beginning after December 15, 2019. Management is currently evaluating the amendments and their impact, if any, on the Funds’ financial statements.
Note 3 — Advisory Fees and Other Transactions with Affiliates
VALIC serves as investment adviser to VC II. Certain officers and trustees of VC II are officers and directors of VALIC or affiliates of VALIC. VALIC receives from VC II a monthly fee based on each Fund’s average daily net asset value at the following annual rates:
| | |
| Aggressive Growth Lifestyle Fund | | 0.10% |
| Capital Appreciation Fund | | 0.55% on first $1 billion |
| | | 0.525% on assets over $1 billion |
| Conservative Growth Lifestyle Fund | | 0.10% |
| Core Bond Fund | | 0.50% on the first $200 million |
| | | 0.45% on the next $300 million |
| | | 0.40% on assets over $500 million |
| Government Money Market II Fund | | 0.25% |
| High Yield Bond Fund | | 0.65% on the first $150 million |
| | | 0.60% on the next $350 million |
| | | 0.55% on assets over $500 million |
| International Opportunities Fund | | 0.90% on the first $100 million |
| | | 0.80% on the next $650 million |
| | | 0.75% on assets over $750 million |
| Large Cap Value Fund | | 0.50% on the first $500 million |
| | | 0.475% on assets over $500 million |
VALIC Company II
NOTES TO FINANCIAL STATEMENTS — (continued)
| | |
| Mid Cap Growth Fund | | 0.80% on the first $50 million |
| | | 0.75% on the next $50 million |
| | | 0.70% on the next $150 million |
| | | 0.65% on the next $250 million |
| | | 0.60% on assets over $500 million |
| Mid Cap Value Fund | | 0.75% on the first $100 million |
| | | 0.725% on the next $150 million |
| | | 0.70% on the next $250 million |
| | | 0.675% on the next $250 million |
| | | 0.65% on assets over $750 million |
| Moderate Growth Lifestyle Fund | | 0.10% |
| Small Cap Growth Fund | | 0.85% on the first $100 million |
| | | 0.80% on assets over $100 million |
| Small Cap Value Fund | | 0.75% on the first $50 million |
| | | 0.65% on assets over $50 million |
| Socially Responsible Fund | | 0.25% on the first $1 billion |
| | | 0.24% on assets over $1 billion |
| Strategic Bond Fund | | 0.60% on the first $200 million |
| | | 0.50% on the next $300 million |
| | | 0.45% on assets over $500 million |
VALIC has entered into subadvisory agreements with the following:
BMO Asset Management Corp. (“BMO AM”)—subadvisor for the Capital Appreciation Fund.(1)
Delaware Investments Fund Advisers (“Delaware Investments”)—subadviser for a portion of the International Opportunities Fund.
J.P. Morgan Investment Management Inc. (“JPMIM”)—subadviser for the Small Cap Growth Fund and the Small Cap Value Fund.
Janus Capital Management, LLC (“Janus”)—subadviser for a portion of the Large Cap Value Fund.
Massachusetts Financial Services Company (“MFS”)—subadviser for a portion of the International Opportunities Fund.
PineBridge Investments, LLC (“PineBridge”)—subadviser for the Strategic Bond Fund, Core Bond Fund, Aggressive, Moderate and Conservative Growth Lifestyle Funds.
Boston Partners Global Investors, Inc. d/b/a Boston Partners (“Boston Partners”)—subadviser for a portion of the Mid Cap Value Fund.
SunAmerica Asset Management, LLC (“SunAmerica”)—subadviser for the Government Money Market II Fund and the Socially Responsible Fund.
The Boston Company Asset Management, LLC (“The Boston Co.”)—subadviser for a portion of the Large Cap Value Fund.
Wellington Management Company LLP—subadviser for the High Yield Bond Fund, Mid Cap Growth Fund and a portion of the Mid Cap Value Fund.
| (1) | Effective June 7, 2018, BMO Asset Management Corp. replaced The Boston Company Asset Management, LLC as the subadvisor for the Capital Appreciation Fund. |
The subadvisers are compensated for their services by VALIC.
VALIC has contractually agreed to waive fees and/or reimburse expenses, if necessary, to keep annual operating expenses at or below the following percentages of each Fund’s average daily net assets through December 31, 2019. For the purposes of waived fee and/or reimbursed expense calculations, annual fund operating expenses shall not include extraordinary expenses (i.e., expenses that are unusual in nature and/or infrequent in occurrence, such as litigation), or acquired fund fees and expenses, brokerage commissions and other transactional expenses relating to the purchase and sale of portfolio securities, interest, taxes and governmental fees, and other expenses not incurred in the ordinary course of the Fund’s business. The contractual expense waivers and fee reimbursements will continue until December 31, 2019, subject to termination by the Board, including a majority of the Trustees who are not interested persons of the Fund or VALIC as defined by Section 2(a)(19) of the 1940 Act (the “Disinterested Trustees”).
| | | | |
Fund
| | Expense
Limitation
| |
Aggressive Growth Lifestyle | | | 0.10 | % |
Capital Appreciation | | | 0.85 | % |
Conservative Growth Lifestyle | | | 0.10 | % |
Core Bond | | | 0.77 | % |
Government Money Market II | | | 0.55 | % |
High Yield Bond | | | 0.96 | % |
International Opportunities | | | 1.00 | % |
Large Cap Value | | | 0.81 | % |
Mid Cap Growth | | | 0.85 | % |
Mid Cap Value | | | 1.05 | % |
Moderate Growth Lifestyle | | | 0.10 | % |
Small Cap Growth | | | 1.16 | % |
Small Cap Value | | | 0.95 | % |
Socially Responsible | | | 0.56 | % |
Strategic Bond | | | 0.89 | % |
VALIC Company II
NOTES TO FINANCIAL STATEMENTS — (continued)
For the year ended August 31, 2018, pursuant to the contractual expense limitations in the above table, VALIC waived fees and/or reimbursed expenses as follows:
| | | | |
Fund
| | Amount
| |
Aggressive Growth Lifestyle | | $ | 227,453 | |
Capital Appreciation | | | 135,608 | |
Conservative Growth Lifestyle | | | 156,376 | |
Core Bond | | | 179,030 | |
Government Money Market II | | | 132,742 | |
High Yield Bond | | | 57,800 | |
International Opportunities | | | 1,479,357 | |
Large Cap Value | | | 186,784 | |
Mid Cap Growth | | | 498,687 | |
Moderate Growth Lifestyle | | | 318,474 | |
Small Cap Growth | | | 98,925 | |
Small Cap Value | | | 445,609 | |
Socially Responsible | | | 364,152 | |
VALIC may also voluntarily waive fees and/or reimburse expenses to avoid a negative yield on the Government Money Market II Fund. The voluntary waivers and/or reimbursements may be terminated at any time at the option of VALIC. The exact amount of the voluntary waivers and/or reimbursements may change on a day-to-day basis. There is no guarantee that the Government Money Market II Fund will be able to avoid a negative yield. For the year ended August 31, 2018, VALIC did not voluntarily waive expenses to avoid a negative yield for the Government Money Market II Fund.
VC II, on behalf of each Fund, other than the Lifestyle Funds, has entered into an Administrative Services Agreement with SunAmerica (“Administrator”), an affiliate of VALIC. SunAmerica receives from each Fund in the Series, other than the Lifestyle Funds, an annual fee of 0.06% based upon each Fund’s average daily net assets, plus the following Accounting Basis Point Fee†: 0.0061% on the first $25 billion; 0.0070% on the next $75 billion; and 0.0050% in excess of $100 billion. Pursuant to the Administrative Services Agreement, SunAmerica provides administrative services to the Funds, regulatory reporting, internal legal and compliance services, fund accounting and related portfolio accounting services, all necessary office space, equipment, personnel, compensation and facilities for handling the affairs of the Funds and other services. Without limiting the generality of the foregoing, the Administrator (or its appointed service provider): assists with the preparation of prospectuses, statements of additional information, registration statements, and proxy materials; develops and prepares communications to shareholders, including the annual and semi-annual reports to shareholders; coordinates and supervises the preparation and filing of Fund tax returns; assists with the design, development, and operation of the Funds; prepares the Funds’ financial statements; determines the net asset value of the Funds’ shares; supervises the Funds’ transfer agent with respect to the payment of dividends and other distributions to shareholders; and calculates performance data of the Funds. For the year ended August 31, 2018, the Administrator earned fees as reflected in the Statements of Operations based upon the aforementioned rate.
VC II, on behalf of each Fund, entered into a Master Transfer Agency and Services Agreement with VALIC Retirement Services Company (“VRSCO”), an affiliate of VALIC. VRSCO receives from the Series and VC I an annual fee of $132,510, which is allocated to each Fund in the Series and VC I based on shareholder accounts. Under this agreement, VRSCO provides services which include the issuance and redemption of shares, acting as dividend disbursing agent, and certain shareholder reporting services including confirmation of transactions, statements of account and tax reporting. In addition to the above, VRSCO provides “Blue Sky” registration and reporting in applicable states for each Fund that is sold outside of a variable annuity or variable life contract in order to effect and maintain, as the case may be, including but not limited to, the qualification of shares for sale under the applicable securities laws of such jurisdictions to qualified plans. For the year ended August 31, 2018, VRSCO earned fees as reflected in the Statement of Operations based upon the aforementioned rate.
VC II, on behalf of each Fund, other than the Lifestyle Funds, has entered into a Shareholder Services Agreement with VALIC. Under the agreement, VALIC provides record keeping, account maintenance, and other administrative and shareholder services for contract owners and participants. VALIC receives from each Fund, other than the Lifestyle Funds, an annual fee of 0.25% based on average daily net assets of the Fund. For the year ended August 31, 2018, VALIC earned fees as reflected in the Statements of Operations based upon the aforementioned rate.
On January 23, 2001, the Board ratified a Deferred Compensation Plan for its independent trustees who are not officers, directors, or employees of VALIC, or an affiliate of VALIC. The effective date of the plan was January 1, 2001. The first deferred payment was made in March of 2001. Under the deferred compensation plan, Trustees may elect to defer all or a portion of their compensation. Amounts deferred may be invested in affiliated mutual funds that are specified in the plan as selected by the trustees. Obligations under the deferred compensation plan represents unsecured claims against the general assets of the Funds. For the year ended August 31, 2018, VC II has deferred $23,225 of trustee compensation.
| † | Accounting Basis Point Fee is calculated based upon all assets in all registered management investment companies managed and/or administered by the Administrator and VALIC, other than “Funds-of-Funds” and “Feeder Funds.” |
VALIC Company II
NOTES TO FINANCIAL STATEMENTS — (continued)
At August 31, 2018, the following affiliates owned outstanding shares of the following Funds:
| | | | | | | | | | | | | | | | | | | | | | | | | | | | |
| | | Holder
| |
Fund
| | American
General Life
Insurance Co.
| | | The United
States Life
Insurance Co.
| | | VALIC
| | | VALIC Co. I
Dynamic
Allocation Fund
| | | VCII
Aggressive
Growth Lifestyle
| | | VCII
Conservative
Growth Lifestyle
| | | VCII
Moderate
Growth Lifestyle
| |
Aggressive Growth Lifestyle | | | — | % | | | — | % | | | 100.00 | % | | | — | % | | | — | % | | | — | % | | | — | % |
Capital Appreciation | | | — | | | | — | | | | 43.50 | | | | 6.58 | | | | 20.41 | | | | 5.02 | | | | 24.49 | |
Conservative Growth Lifestyle | | | — | | | | — | | | | 100.00 | | | | — | | | | — | | | | — | | | | — | |
Core Bond | | | — | | | | — | | | | 91.90 | | | | 1.08 | | | | 0.83 | | | | 1.80 | | | | 4.39 | |
Government Money Market II | | | — | | | | — | | | | 100.00 | | | | — | | | | — | | | | — | | | | — | |
High Yield Bond | | | 0.01 | | | | — | | | | 81.47 | | | | 0.34 | | | | 2.92 | | | | 7.80 | | | | 7.46 | |
International Opportunities | | | — | | | | — | | | | 92.36 | | | | 0.22 | | | | 2.89 | | | | 0.93 | | | | 3.60 | |
Large Cap Value | | | — | | | | — | | | | 68.63 | | | | 1.41 | | | | 10.75 | | | | 3.02 | | | | 16.19 | |
Mid Cap Growth | | | — | | | | — | | | | 88.63 | | | | 1.35 | | | | 4.56 | | | | 0.40 | | | | 5.06 | |
Mid Cap Value | | | 0.30 | | | | — | | | | 92.61 | | | | 0.32 | | | | 2.63 | | | | 0.77 | | | | 3.37 | |
Moderate Growth Lifestyle | | | — | | | | — | | | | 100.00 | | | | — | | | | — | | | | — | | | | — | |
Small Cap Growth | | | — | | | | — | | | | 82.96 | | | | 2.11 | | | | 5.84 | | | | 1.74 | | | | 7.35 | |
Small Cap Value | | | — | | | | — | | | | 81.89 | | | | 0.84 | | | | 6.53 | | | | 2.04 | | | | 8.70 | |
Socially Responsible | | | 0.01 | | | | — | | | | 99.99 | | | | — | | | | — | | | | — | | | | — | |
Strategic Bond | | | 0.05 | | | | 0.01 | | | | 71.14 | | | | 0.39 | | | | 3.47 | | | | 8.66 | | | | 16.28 | |
The VC I Dynamic Allocation Fund and the VC II Lifestyle Funds do not invest in the underlying funds for the purpose of exercising management or control; however, investments by the VC I Dynamic Allocation Fund and the VC II Lifestyle Funds within the set limits across their asset allocations may represent a significant portion of net assets of the underlying funds.
As disclosed in the Portfolio of Investments, certain Funds own shares of various VC I or VC II Funds and securities issued by AIG or an affiliate thereof. During the year ended August 31, 2018, transactions in these securities were as follows:
Aggressive Growth Lifestyle Fund
| | | | | | | | | | | | | | | | | | | | | | | | | | | | | | | | |
Security
| | Income
| | | Capital Gain
Distribution
Received
| | | Value at
08/31/2017
| | | Cost of
Purchases†
| | | Proceeds
from Sales
| | | Realized
Gain/(Loss)
| | | Change in
Unrealized
Gain/(Loss)
| | | Value at
08/31/2018
| |
VALIC Co. I Blue Chip Growth Fund | | $ | 7,643 | | | $ | 728,502 | | | $ | 16,730,155 | | | $ | 736,145 | | | $ | 8,725,826 | | | $ | 1,198,865 | | | $ | 1,430,410 | | | $ | 11,369,749 | |
VALIC Co. I Capital Conservation Fund | | | 264,873 | | | | 35,359 | | | | 12,632,750 | | | | 1,442,520 | | | | 2,616,465 | | | | (112,155 | ) | | | (425,734 | ) | | | 10,920,916 | |
VALIC Co. I Dividend Value Fund | | | 496,139 | | | | 960,934 | | | | 19,508,946 | | | | 15,824,062 | | | | 5,503,625 | | | | 898,526 | | | | (76,684 | ) | | | 30,651,225 | |
VALIC Co. I Emerging Economies Fund | | | 232,698 | | | | — | | | | — | | | | 19,671,866 | | | | 533,231 | | | | (96,032 | ) | | | (2,959,208 | ) | | | 16,083,395 | |
VALIC Co. I Foreign Value Fund | | | 638,181 | | | | — | | | | 27,018,339 | | | | 6,738,007 | | | | 3,457,273 | | | | (162,140 | ) | | | (878,596 | ) | | | 29,258,337 | |
VALIC Co. I Global Real Estate Fund | | | 896,768 | | | | 271,362 | | | | 31,816,933 | | | | 20,020,007 | | | | 9,600,671 | | | | (425,525 | ) | | | 665,854 | | | | 42,476,598 | |
VALIC Co. I Government Securities Fund | | | 248,441 | | | | — | | | | 12,197,539 | | | | 248,441 | | | | 11,938,929 | | | | (440,475 | ) | | | (66,576 | ) | | | — | |
VALIC Co. I Inflation Protected Fund | | | 673,702 | | | | 322,368 | | | | 44,831,484 | | | | 2,391,919 | | | | 19,063,585 | | | | 290,664 | | | | (1,282,131 | ) | | | 27,168,351 | |
VALIC Co. I International Equities Index Fund | | | 933,243 | | | | — | | | | 19,340,521 | | | | 29,650,438 | | | | 18,381,268 | | | | 3,089,420 | | | | (4,463,158 | ) | | | 29,235,953 | |
VALIC Co. I International Government Bond Fund | | | 55,059 | | | | 2,001 | | | | 4,632,914 | | | | 10,659,371 | | | | — | | | | — | | | | (502,163 | ) | | | 14,790,122 | |
VALIC Co. I International Growth Fund | | | 141,682 | | | | 159,491 | | | | 10,726,137 | | | | 6,060,933 | | | | 5,580,053 | | | | 403,469 | | | | 570,324 | | | | 12,180,810 | |
VALIC Co. I Large Cap Core Fund | | | 42,226 | | | | 210,666 | | | | 3,466,268 | | | | 2,571,147 | | | | — | | | | — | | | | 362,598 | | | | 6,400,013 | |
VALIC Co. I Large Capital Growth Fund | | | — | | | | — | | | | — | | | | 3,013,824 | | | | — | | | | — | | | | 56,615 | | | | 3,070,439 | |
VALIC Co. I Mid Cap Index Fund | | | 221,482 | | | | 1,308,377 | | | | 40,309,262 | | | | 14,841,833 | | | | 36,508,568 | | | | 5,000,893 | | | | (285,092 | ) | | | 23,358,328 | |
VALIC Co. I Mid Cap Strategic Growth Fund | | | 6,396 | | | | 332,210 | | | | 5,960,702 | | | | 2,804,360 | | | | — | | | | — | | | | 1,273,052 | | | | 10,038,114 | |
VALIC Co. I Nasdaq-100 Index Fund | | | 39,154 | | | | 340,298 | | | | 8,171,760 | | | | 9,432,896 | | | | 3,668,303 | | | | 1,583,701 | | | | 421,522 | | | | 15,941,576 | |
VALIC Co. I Science & Technology Fund | | | — | | | | 745,528 | | | | 6,770,137 | | | | 15,339,738 | | | | 1,892,253 | | | | 361,212 | | | | 1,568,394 | | | | 22,147,228 | |
VALIC Co. I Small Cap Index Fund | | | 283,728 | | | | 1,605,966 | | | | 53,102,000 | | | | 1,889,694 | | | | 52,352,039 | | | | 5,324,210 | | | | (192,457 | ) | | | 7,771,408 | |
VALIC Co. I Small Cap Special Values Fund | | | 329,508 | | | | 2,050,515 | | | | 23,628,564 | | | | 4,316,968 | | | | 10,769,540 | | | | 2,533,040 | | | | 405,431 | | | | 20,114,463 | |
VALIC Co. I Stock Index Fund | | | 206,213 | | | | 451,407 | | | | 11,085,532 | | | | 51,004,311 | | | | 14,026,124 | | | | 1,536,926 | | | | 1,499,910 | | | | 51,100,555 | |
VALIC Co. I Value Fund | | | 80,765 | | | | — | | | | 3,730,271 | | | | 7,805,833 | | | | — | | | | — | | | | 584,464 | | | | 12,120,568 | |
VALIC Co. II Capital Appreciation Fund | | | 87,973 | | | | 942,302 | | | | 19,206,654 | | | | 1,030,275 | | | | 1,929,181 | | | | 1,273,220 | | | | 2,807,418 | | | | 22,388,386 | |
VALIC Co. II Core Bond Fund | | | 422,530 | | | | 6,494 | | | | 17,266,793 | | | | 1,556,410 | | | | 7,531,768 | | | | (245,285 | ) | | | (439,649 | ) | | | 10,606,501 | |
VALIC Co. II High Yield Bond Fund | | | 927,638 | | | | — | | | | 11,432,397 | | | | 9,534,913 | | | | 3,523,940 | | | | 140,776 | | | | (748,366 | ) | | | 16,835,780 | |
VALIC Co. II International Opportunities Fund | | | 204,060 | | | | — | | | | 17,729,802 | | | | 6,028,155 | | | | 4,802,095 | | | | 1,245,010 | | | | 735,045 | | | | 20,935,917 | |
VALIC Co. II Large Cap Value Fund | | | 246,994 | | | | 690,464 | | | | 12,595,944 | | | | 16,371,281 | | | | — | | | | — | | | | 1,555,229 | | | | 30,522,454 | |
VALIC Co. II Mid Cap Growth Fund | | | 10,977 | | | | 1,306,484 | | | | 6,315,418 | | | | 3,286,621 | | | | — | | | | — | | | | 456,449 | | | | 10,058,488 | |
VALIC Co. II Mid Cap Value Fund | | | 102,149 | | | | 1,861,678 | | | | 54,391,014 | | | | 14,391,466 | | | | 49,334,655 | | | | 8,525,752 | | | | (3,860,052 | ) | | | 24,113,525 | |
VALIC Co. II Small Cap Growth Fund | | | — | | | | 424,562 | | | | 14,494,119 | | | | 1,132,087 | | | | 7,904,163 | | | | 2,237,864 | | | | 2,625,439 | | | | 12,585,346 | |
VALIC Co. II Small Cap Value Fund | | | 329,965 | | | | 2,885,694 | | | | 44,326,574 | | | | 6,634,322 | | | | 19,993,049 | | | | 2,177,469 | | | | 1,791,339 | | | | 34,936,655 | |
VALIC Co. II Strategic Bond Fund | | | 1,322,728 | | | | — | | | | 14,514,910 | | | | 33,023,061 | | | | 16,438,668 | | | | (379,952 | ) | | | (1,105,438 | ) | | | 29,613,913 | |
| | |
|
|
| |
|
|
| |
|
|
| |
|
|
| |
|
|
| |
|
|
| |
|
|
| |
|
|
|
| | | $ | 9,452,915 | | | $ | 17,642,662 | | | $ | 567,933,839 | | | $ | 319,452,904 | | | $ | 316,075,272 | | | $ | 35,959,453 | | | $ | 1,524,189 | | | $ | 608,795,113 | |
| | |
|
|
| |
|
|
| |
|
|
| |
|
|
| |
|
|
| |
|
|
| |
|
|
| |
|
|
|
| † | Includes reinvestment of distributions paid. |
VALIC Company II
NOTES TO FINANCIAL STATEMENTS — (continued)
Conservative Growth Lifestyle Fund
| | | | | | | | | | | | | | | | | | | | | | | | | | | | | | | | |
Security
| | Income
| | | Capital Gain
Distribution
Received
| | | Value at
08/31/2017
| | | Cost of
Purchases†
| | | Proceeds
from Sales
| | | Realized
Gain/(Loss)
| | | Change in
Unrealized
Gain/(Loss)
| | | Value at
08/31/2018
| |
VALIC Co. I Blue Chip Growth Fund | | $ | — | | | $ | — | | | $ | 2,031,075 | | | $ | 334,864 | | | $ | 2,157,471 | | | $ | 360,514 | | | $ | (213,459 | ) | | $ | 355,523 | |
VALIC Co. I Capital Conservation Fund | | | 351,931 | | | | 46,981 | | | | 16,948,814 | | | | 1,752,383 | | | | 2,991,203 | | | | (151,126 | ) | | | (559,041 | ) | | | 14,999,827 | |
VALIC Co. I Dividend Value Fund | | | 170,817 | | | | 330,843 | | | | 8,096,520 | | | | 4,415,421 | | | | 1,017,440 | | | | 92,642 | | | | 475,963 | | | | 12,063,106 | |
VALIC Co. I Emerging Economies Fund | | | 60,040 | | | | — | | | | — | | | | 5,501,990 | | | | 873,620 | | | | (157,334 | ) | | | (612,816 | ) | | | 3,858,220 | |
VALIC Co. I Foreign Value Fund | | | 230,478 | | | | — | | | | 5,452,745 | | | | 7,689,329 | | | | — | | | | — | | | | (790,582 | ) | | | 12,351,492 | |
VALIC Co. I Global Real Estate Fund | | | 345,124 | | | | 104,435 | | | | 8,640,984 | | | | 449,559 | | | | 2,214,306 | | | | (156,535 | ) | | | 127,169 | | | | 6,846,871 | |
VALIC Co. I Government Securities Fund | | | — | | | | — | | | | 1,131,202 | | | | — | | | | 1,126,437 | | | | 8,086 | | | | (12,851 | ) | | | — | |
VALIC Co. I Inflation Protected Fund | | | 586,255 | | | | 280,524 | | | | 36,953,090 | | | | 866,780 | | | | 21,714,788 | | | | 65,486 | | | | (906,835 | ) | | | 15,263,733 | |
VALIC Co. I International Equities Index Fund | | | 342,087 | | | | — | | | | 1,855,422 | | | | 18,443,586 | | | | 6,130,948 | | | | 123,734 | | | | (1,054,877 | ) | | | 13,236,917 | |
VALIC Co. I International Government Bond Fund | | | 61,071 | | | | 2,220 | | | | 6,182,038 | | | | 9,408,243 | | | | — | | | | — | | | | (555,048 | ) | | | 15,035,233 | |
VALIC Co. I International Growth Fund | | | 17,846 | | | | 20,089 | | | | 1,837,975 | | | | 3,897,895 | | | | 2,561,397 | | | | 555,283 | | | | (304,154 | ) | | | 3,425,602 | |
VALIC Co. I Large Cap Core Fund | | | 17,217 | | | | 85,894 | | | | 1,378,510 | | | | 1,371,201 | | | | — | | | | — | | | | 163,231 | | | | 2,912,942 | |
VALIC Co. I Large Capital Growth Fund | | | — | | | | — | | | | — | | | | 846,792 | | | | — | | | | — | | | | 15,907 | | | | 862,699 | |
VALIC Co. I Mid Cap Index Fund | | | 65,152 | | | | 384,878 | | | | 13,705,807 | | | | 10,243,435 | | | | 18,429,091 | | | | 1,175,138 | | | | 697,630 | | | | 7,392,919 | |
VALIC Co. I Mid Cap Strategic Growth Fund | | | 308 | | | | 16,019 | | | | 530,039 | | | | 500,054 | | | | 257,100 | | | | 30,791 | | | | 89,219 | | | | 893,003 | |
VALIC Co. I Nasdaq-100 Index Fund | | | 6,903 | | | | 59,992 | | | | 858,874 | | | | 5,834,522 | | | | 904,949 | | | | 311,125 | | | | 76,741 | | | | 6,176,313 | |
VALIC Co. I Science & Technology Fund | | | — | | | | 117,478 | | | | 896,985 | | | | 6,759,132 | | | | 965,153 | | | | 240,726 | | | | 129,643 | | | | 7,061,333 | |
VALIC Co. I Small Cap Index Fund | | | 41,956 | | | | 237,479 | | | | 16,618,443 | | | | 2,708,474 | | | | 19,084,458 | | | | 1,937,024 | | | | (243,842 | ) | | | 1,935,641 | |
VALIC Co. I Small Cap Special Values Fund | | | 175,107 | | | | 1,089,681 | | | | 11,778,047 | | | | 2,928,535 | | | | 6,474,979 | | | | 1,141,540 | | | | 342,842 | | | | 9,715,985 | |
VALIC Co. I Stock Index Fund | | | 5,674 | | | | 12,420 | | | | — | | | | 15,110,792 | | | | — | | | | — | | | | 585,038 | | | | 15,695,830 | |
VALIC Co. I Value Fund | | | 19,355 | | | | — | | | | 934,943 | | | | 2,293,444 | | | | — | | | | — | | | | 177,548 | | | | 3,405,935 | |
VALIC Co. II Capital Appreciation Fund | | | 21,633 | | | | 231,713 | | | | 4,063,849 | | | | 950,965 | | | | 390,739 | | | | 266,478 | | | | 614,774 | | | | 5,505,327 | |
VALIC Co. II Core Bond Fund | | | 812,198 | | | | 12,483 | | | | 48,091,167 | | | | 1,687,694 | | | | 25,178,311 | | | | (565,253 | ) | | | (911,773 | ) | | | 23,123,524 | |
VALIC Co. II High Yield Bond Fund | | | 2,503,710 | | | | — | | | | 32,784,328 | | | | 16,054,936 | | | | 2,408,435 | | | | (7,405 | ) | | | (1,494,326 | ) | | | 44,929,098 | |
VALIC Co. II International Opportunities Fund | | | 56,534 | | | | — | | | | 4,667,617 | | | | 3,066,218 | | | | 1,602,135 | | | | 432,482 | | | | 157,966 | | | | 6,722,148 | |
VALIC Co. II Large Cap Value Fund | | | 70,434 | | | | 196,896 | | | | 3,866,886 | | | | 4,147,067 | | | | — | | | | — | | | | 561,933 | | | | 8,575,886 | |
VALIC Co. II Mid Cap Growth Fund | | | 1,120 | | | | 133,304 | | | | 794,957 | | | | 611,756 | | | | 566,903 | | | | 77,559 | | | | (36,766 | ) | | | 880,603 | |
VALIC Co. II Mid Cap Value Fund | | | 29,290 | | | | 533,811 | | | | 20,983,477 | | | | 5,652,616 | | | | 21,187,629 | | | | 2,015,314 | | | | (374,616 | ) | | | 7,089,162 | |
VALIC Co. II Small Cap Growth Fund | | | — | | | | 156,607 | | | | 1,571,929 | | | | 3,495,060 | | | | 2,337,011 | | | | 657,753 | | | | 351,200 | | | | 3,738,931 | |
VALIC Co. II Small Cap Value Fund | | | 106,783 | | | | 933,866 | | | | 14,675,997 | | | | 2,871,943 | | | | 8,000,826 | | | | 966,693 | | | | 366,014 | | | | 10,879,821 | |
VALIC Co. II Strategic Bond Fund | | | 2,623,422 | | | | — | | | | 66,611,658 | | | | 23,047,160 | | | | 12,599,993 | | | | (141,159 | ) | | | (2,999,696 | ) | | | 73,917,970 | |
| | |
|
|
| |
|
|
| |
|
|
| |
|
|
| |
|
|
| |
|
|
| |
|
|
| |
|
|
|
| | | $ | 8,722,445 | | | $ | 4,987,613 | | | $ | 333,943,378 | | | $ | 162,941,846 | | | $ | 161,175,322 | | | $ | 9,279,556 | | | $ | (6,137,864 | ) | | $ | 338,851,594 | |
| | |
|
|
| |
|
|
| |
|
|
| |
|
|
| |
|
|
| |
|
|
| |
|
|
| |
|
|
|
| † | Includes reinvestment of distributions paid. |
Moderate Growth Lifestyle Fund
| | | | | | | | | | | | | | | | | | | | | | | | | | | | | | | | |
Security
| | Income
| | | Capital Gain
Distribution
Received
| | | Value at
08/31/2017
| | | Cost of
Purchases†
| | | Proceeds
from Sales
| | | Realized
Gain/(Loss)
| | | Change in
Unrealized
Gain/(Loss)
| | | Value at
08/31/2018
| |
VALIC Co. I Blue Chip Growth Fund | | $ | 11,730 | | | $ | 1,118,063 | | | $ | 19,386,223 | | | $ | 1,129,791 | | | $ | 6,633,302 | | | $ | 1,111,194 | | | | 2,535,788 | | | $ | 17,529,694 | |
VALIC Co. I Capital Conservation Fund | | | 717,864 | | | | 95,830 | | | | 37,327,158 | | | | 813,693 | | | | 7,822,404 | | | | (457,393 | ) | | | (994,516 | ) | | | 28,866,538 | |
VALIC Co. I Dividend Value Fund | | | 626,785 | | | | 1,213,972 | | | | 26,043,347 | | | | 13,918,781 | | | | 2,083,863 | | | | 370,986 | | | | 1,256,360 | | | | 39,505,611 | |
VALIC Co. I Emerging Economies Fund | | | 190,902 | | | | — | | | | — | | | | 15,493,266 | | | | 224,270 | | | | (40,390 | ) | | | (2,470,073 | ) | | | 12,758,533 | |
VALIC Co. I Foreign Value Fund | | | 750,560 | | | | — | | | | 29,680,670 | | | | 14,030,497 | | | | 4,595,381 | | | | (203,392 | ) | | | (1,240,857 | ) | | | 37,671,537 | |
VALIC Co. I Global Real Estate Fund | | | 993,441 | | | | 300,615 | | | | 34,353,087 | | | | 14,366,879 | | | | 10,385,944 | | | | (226,992 | ) | | | 410,761 | | | | 38,517,791 | |
VALIC Co. I Government Securities Fund | | | 107,283 | | | | — | | | | 12,902,011 | | | | 1,316,775 | | | | 13,899,076 | | | | (116,031 | ) | | | (203,679 | ) | | | — | |
VALIC Co. I Inflation Protected Fund | | | 1,227,325 | | | | 587,278 | | | | 79,813,437 | | | | 1,946,750 | | | | 36,895,685 | | | | 571,799 | | | | (2,336,358 | ) | | | 43,099,943 | |
VALIC Co. I International Equities Index Fund | | | 1,158,549 | | | | — | | | | 25,271,227 | | | | 35,072,805 | | | | 17,223,277 | | | | 3,734,631 | | | | (4,756,069 | ) | | | 42,099,317 | |
VALIC Co. I International Government Bond Fund | | | 106,737 | | | | 3,880 | | | | 5,480,105 | | | | 21,250,105 | | | | — | | | | — | | | | (939,054 | ) | | | 25,791,156 | |
VALIC Co. I International Growth Fund | | | 123,264 | | | | 138,759 | | | | 10,314,923 | | | | 7,790,977 | | | | 4,504,900 | | | | 412,427 | | | | 453,506 | | | | 14,466,933 | |
VALIC Co. I Large Cap Core Fund | | | 56,794 | | | | 283,344 | | | | 4,571,525 | | | | 3,969,188 | | | | — | | | | — | | | | 508,065 | | | | 9,048,778 | |
VALIC Co. I Large Capital Growth Fund | | | — | | | | — | | | | — | | | | 3,824,048 | | | | — | | | | — | | | | 71,836 | | | | 3,895,884 | |
VALIC Co. I Mid Cap Index Fund | | | 261,843 | | | | 1,546,808 | | | | 62,734,673 | | | | 26,775,282 | | | | 60,855,940 | | | | 7,011,466 | | | | 289,287 | | | | 35,954,768 | |
VALIC Co. I Mid Cap Strategic Growth Fund | | | 5,025 | | | | 261,010 | | | | 6,099,996 | | | | 4,541,922 | | | | 1,036,761 | | | | (79,654 | ) | | | 1,470,651 | | | | 10,996,154 | |
VALIC Co. I Nasdaq-100 Index Fund | | | 55,978 | | | | 486,516 | | | | 9,314,923 | | | | 10,809,948 | | | | 2,504,978 | | | | 1,275,521 | | | | 1,380,271 | | | | 20,275,685 | |
VALIC Co. I Science & Technology Fund | | | — | | | | 1,036,194 | | | | 8,931,132 | | | | 20,101,639 | | | | 1,571,780 | | | | 297,545 | | | | 2,408,769 | | | | 30,167,305 | |
VALIC Co. I Small Cap Index Fund | | | 349,130 | | | | 1,976,151 | | | | 79,710,727 | | | | 2,325,281 | | | | 81,955,568 | | | | 8,801,402 | | | | (1,481,306 | ) | | | 7,400,536 | |
VALIC Company II
NOTES TO FINANCIAL STATEMENTS — (continued)
Moderate Growth Lifestyle Fund (continued)
| | | | | | | | | | | | | | | | | | | | | | | | | | | | | | | | |
Security
| | Income
| | | Capital Gain
Distribution
Received
| | | Value at
08/31/2017
| | | Cost of
Purchases†
| | | Proceeds
from Sales
| | | Realized
Gain/(Loss)
| | | Change in
Unrealized
Gain/(Loss)
| | | Value at
08/31/2018
| |
VALIC Co. I Small Cap Special Values Fund | | $ | 488,396 | | | $ | 3,039,270 | | | $ | 35,071,582 | | | $ | 6,653,128 | | | $ | 16,674,029 | | | $ | 3,846,201 | | | $ | 506,511 | | | $ | 29,403,393 | |
VALIC Co. I Stock Index Fund | | | 62,386 | | | | 136,564 | | | | 2,667,687 | | | | 58,057,485 | | | | 2,709,353 | | | | 134,807 | | | | 3,212,847 | | | | 61,363,473 | |
VALIC Co. I Value Fund | | | 93,890 | | | | — | | | | 4,696,249 | | | | 8,897,403 | | | | — | | | | — | | | | 829,504 | | | | 14,423,156 | |
VALIC Co. II Capital Appreciation Fund | | | 105,557 | | | | 1,130,654 | | | | 22,429,483 | | | | 1,236,211 | | | | 1,573,517 | | | | 1,020,348 | | | | 3,750,964 | | | | 26,863,489 | |
VALIC Co. II Core Bond Fund | | | 1,974,769 | | | | 30,352 | | | | 86,215,945 | | | | 27,820,922 | | | | 54,603,577 | | | | (1,384,179 | ) | | | (1,724,998 | ) | | | 56,324,113 | |
VALIC Co. II High Yield Bond Fund | | | 2,369,680 | | | | — | | | | 41,450,293 | | | | 8,553,502 | | | | 5,741,612 | | | | 358,653 | | | | (1,613,307 | ) | | | 43,007,529 | |
VALIC Co. II International Opportunities Fund | | | 237,228 | | | | — | | | | 21,791,826 | | | | 5,906,573 | | | | 3,818,219 | | | | 986,913 | | | | 1,242,060 | | | | 26,109,153 | |
VALIC Co. II Large Cap Value Fund | | | 361,271 | | | | 1,009,921 | | | | 15,056,629 | | | | 28,676,376 | | | | — | | | | — | | | | 2,268,581 | | | | 46,001,586 | |
VALIC Co. II Mid Cap Growth Fund | | | 12,507 | | | | 1,488,600 | | | | 6,599,696 | | | | 4,975,306 | | | | 757,484 | | | | 178,721 | | | | 146,139 | | | | 11,142,378 | |
VALIC Co. II Mid Cap Value Fund | | | 168,645 | | | | 3,073,581 | | | | 77,160,262 | | | | 16,139,784 | | | | 68,825,946 | | | | 12,315,618 | | | | (5,933,551 | ) | | | 30,856,167 | |
VALIC Co. II Small Cap Growth Fund | | | — | | | | 638,411 | | | | 11,804,840 | | | | 7,363,182 | | | | 8,660,940 | | | | 2,349,046 | | | | 2,969,358 | | | | 15,825,486 | |
VALIC Co. II Small Cap Value Fund | | | 447,770 | | | | 3,915,954 | | | | 58,935,035 | | | | 12,593,738 | | | | 30,653,380 | | | | 3,838,628 | | | | 1,792,014 | | | | 46,506,035 | |
VALIC Co. II Strategic Bond Fund | | | 4,274,283 | | | | — | | | | 60,670,802 | | | | 92,756,989 | | | | 9,062,415 | | | | 42,831 | | | | (5,530,047 | ) | | | 138,878,160 | |
| | |
|
|
| |
|
|
| |
|
|
| |
|
|
| |
|
|
| |
|
|
| |
|
|
| |
|
|
|
| | | $ | 17,339,592 | | | $ | 23,511,727 | | | $ | 896,485,493 | | | $ | 479,108,226 | | | $ | 455,273,601 | | | $ | 46,150,706 | | | $ | (1,720,543 | ) | | $ | 964,750,281 | |
| | |
|
|
| |
|
|
| |
|
|
| |
|
|
| |
|
|
| |
|
|
| |
|
|
| |
|
|
|
| † | Includes reinvestment of distributions paid. |
Note 4 — Purchases and Sales of Investment Securities
The cost of purchases and proceeds from sales and maturities of long-term investments during the year ended August 31, 2018 were as follows:
| | | | | | | | | | | | | | | | |
Fund
| | Purchases of
Investment
Securities
(Excluding U.S.
Government
Securities)
| | | Sales of
Investment
Securities
(Excluding U.S.
Government
Securities)
| | | Purchase of U.S.
Government
Securities
| | | Sales of U.S.
Government
Securities
| |
Aggressive Growth Lifestyle | | $ | 292,357,327 | | | $ | 316,075,272 | | | $ | — | | | $ | — | |
Capital Appreciation | | | 120,163,708 | | | | 125,925,203 | | | | — | | | | — | |
Conservative Growth Lifestyle | | | 149,231,788 | | | | 161,175,322 | | | | — | | | | — | |
Core Bond | | | 754,899,713 | | | | 661,890,903 | | | | 351,803,335 | | | | 201,643,295 | |
Government Money Market II | | | — | | | | — | | | | — | | | | — | |
High Yield Bond | | | 184,282,396 | | | | 140,960,425 | | | | — | | | | — | |
International Opportunities | | | 325,387,057 | | | | 348,012,784 | | | | — | | | | — | |
Large Cap Value | | | 249,410,033 | | | | 224,104,778 | | | | — | | | | — | |
Mid Cap Growth | | | 106,857,681 | | | | 56,945,527 | | | | — | | | | — | |
Mid Cap Value | | | 429,494,342 | | | | 677,626,907 | | | | — | | | | — | |
Moderate Growth Lifestyle | | | 438,256,907 | | | | 455,273,601 | | | | — | | | | — | |
Small Cap Growth | | | 126,510,232 | | | | 109,146,355 | | | | — | | | | — | |
Small Cap Value | | | 247,988,247 | | | | 316,882,368 | | | | — | | | | — | |
Socially Responsible | | | 40,165,744 | | | | 152,775,438 | | | | — | | | | — | |
Strategic Bond | | | 921,991,879 | | | | 868,954,418 | | | | 254,643,029 | | | | 155,274,173 | |
Note 5 — Federal Income Taxes
The following details the tax basis of distributions as well as the components of distributable earnings. The tax basis components of distributable earnings differ from the amounts reflected in the Statements of Assets and Liabilities by temporary book/tax differences primarily arising from wash sales, post October losses, investments in passive foreign investment companies, treatment of deferred compensation, late year ordinary losses, straddles, treatment of defaulted securities and derivative transactions.
The information in the following table is presented on the basis of cost for Federal Income Tax purposes at August 31, 2018.
| | | | | | | | | | | | | | | | |
Fund
| | Identified Cost
of Investments
Owned
| | | Gross
Unrealized
Appreciation
| | | Gross
Unrealized
Depreciation
| | | Net Unrealized
Appreciation
(Depreciation)@
| |
Aggressive Growth Lifestyle | | $ | 569,929,852 | | | $ | 50,013,495 | | | $ | (11,148,234 | ) | | $ | 38,865,261 | |
Capital Appreciation | | | 90,444,176 | | | | 19,181,111 | | | | (1,401,402 | ) | | | 17,779,709 | |
Conservative Growth Lifestyle | | | 337,594,667 | | | | 10,351,655 | | | | (9,094,728 | ) | | | 1,256,927 | |
Core Bond | | | 1,321,797,604 | | | | 5,496,874 | | | | (29,649,397 | ) | | | (24,152,523 | ) |
Government Money Market II | | | 137,283,432 | | | | — | | | | — | | | | — | |
VALIC Company II
NOTES TO FINANCIAL STATEMENTS — (continued)
| | | | | | | | | | | | | | | | |
Fund
| | Identified Cost
of Investments
Owned
| | | Gross
Unrealized
Appreciation@
| | | Gross
Unrealized
Depreciation@
| | | Net Unrealized
Appreciation
(Depreciation)@
| |
High Yield Bond | | $ | 606,974,859 | | | $ | 10,719,963 | | | $ | (15,809,013 | ) | | $ | (5,089,050 | ) |
International Opportunities | | | 582,192,836 | | | | 176,811,557 | | | | (30,238,272 | ) | | | 146,573,285 | |
Large Cap Value | | | 257,017,638 | | | | 34,445,124 | | | | (7,661,216 | ) | | | 26,783,908 | |
Mid Cap Growth | | | 187,438,590 | | | | 35,488,652 | | | | (1,841,729 | ) | | | 33,646,923 | |
Mid Cap Value | | | 795,253,307 | | | | 149,623,025 | | | | (25,764,852 | ) | | | 123,858,173 | |
Moderate Growth Lifestyle | | | 917,549,848 | | | | 64,361,562 | | | | (17,161,129 | ) | | | 47,200,433 | |
Small Cap Growth | | | 173,002,074 | | | | 52,215,866 | | | | (6,425,273 | ) | | | 45,790,593 | |
Small Cap Value | | | 445,371,086 | | | | 113,573,062 | | | | (20,945,112 | ) | | | 92,627,950 | |
Socially Responsible | | | 500,220,920 | | | | 310,970,571 | | | | (21,931,574 | ) | | | 289,038,997 | |
Strategic Bond | | | 900,575,657 | | | | 4,153,112 | | | | (25,301,481 | ) | | | (21,148,369 | ) |
| @ | Unrealized appreciation (depreciation) includes amounts for derivatives. |
The tax character of distributions paid may differ from the Statement of Changes in Net Assets due to short-term gains treated as ordinary income distributions for tax purposes.
The tax basis distributable earnings at August 31, 2018 and the tax character of distributions paid during the year ended August 31, 2018 were as follows:
| | | | | | | | | | | | | | | | | | | | |
| | | Distributable Earnings
| | | Tax Distributions
| |
| | | For the year ended August 31, 2018
| |
Fund
| | Ordinary
Income
| | | Long-term
Capital Gains
and Other
Losses
| | | Unrealized
Appreciation
(Depreciation)@
| | | Ordinary
Income
| | | Long-Term
Capital
Gains
| |
Aggressive Growth Lifestyle | | $ | 11,408,394 | | | $ | 50,153,748 | | | $ | 38,865,261 | | | $ | 9,804,295 | | | $ | 18,613,877 | |
Capital Appreciation | | | 4,245,900 | | | | 22,299,719 | | | | 17,779,709 | | | | 434,154 | | | | 4,650,345 | |
Conservative Growth Lifestyle | | | 10,490,382 | | | | 12,250,183 | | | | 1,256,927 | | | | 8,269,513 | | | | 1,304,182 | |
Core Bond | | | 36,081,103 | | | | (471,632 | ) | | | (24,152,523 | ) | | | 29,745,347 | | | | — | |
Government Money Market II | | | 7,922 | | | | — | | | | — | | | | 1,175,017 | | | | 3 | |
High Yield Bond | | | 29,483,669 | | | | (11,302,652 | ) | | | (5,088,671 | ) | | | 32,204,893 | | | | — | |
International Opportunities | | | 5,797,758 | | | | 22,610,854 | | | | 146,441,422 | | | | 5,841,813 | | | | — | |
Large Cap Value | | | 7,370,515 | | | | 18,912,710 | | | | 26,783,908 | | | | 2,959,420 | | | | 8,272,969 | |
Mid Cap Growth | | | 2,607,082 | | | | 5,580,867 | | | | 33,646,923 | | | | 3,368,041 | | | | 23,021,560 | |
Mid Cap Value | | | 10,149,977 | | | | 132,034,978 | | | | 123,859,244 | | | | 3,732,456 | | | | 68,024,640 | |
Moderate Growth Lifestyle | | | 20,315,546 | | | | 64,453,213 | | | | 47,200,433 | | | | 16,737,065 | | | | 18,327,088 | |
Small Cap Growth | | | 6,683,473 | | | | 38,487,003 | | | | 45,790,593 | | | | — | | | | 6,146,636 | |
Small Cap Value | | | 11,991,137 | | | | 47,156,311 | | | | 92,627,950 | | | | 17,762,025 | | | | 23,149,536 | |
Socially Responsible | | | 12,859,450 | | | | 49,830,219 | | | | 289,038,997 | | | | 13,352,654 | | | | 12,605,065 | |
Strategic Bond | | | 29,934,832 | | | | (12,755,986 | ) | | | (21,161,249 | ) | | | 30,340,988 | | | | — | |
| @ | Unrealized appreciation (depreciation) includes amounts for derivatives and other assets and liabilities denominated in foreign currency. |
The tax character of distributions paid during the year ended August 31, 2017 were as follows:
| | | | | | | | |
| | | Tax Distributions
| |
Fund
| | Ordinary
Income
| | | Long-Term
Capital Gains
| |
Aggressive Growth Lifestyle | | $ | 10,175,052 | | | $ | 30,381,170 | |
Capital Appreciation | | | 426,761 | | | | 7,982,648 | |
Conservative Growth Lifestyle | | | 8,581,634 | | | | 2,821,833 | |
Core Bond | | | 27,768,658 | | | | — | |
Government Money Market II | | | 215,117 | | | | — | |
High Yield Bond | | | 27,551,970 | | | | — | |
International Opportunities | | | 8,336,334 | | | | — | |
Large Cap Value | | | 3,093,065 | | | | — | |
Mid Cap Growth | | | — | | | | — | |
Mid Cap Value | | | 6,004,897 | | | | 62,435,557 | |
Moderate Growth Lifestyle | | | 18,966,348 | | | | 34,930,260 | |
Small Cap Growth | | | — | | | | 6,507,357 | |
Small Cap Value | | | 4,928,560 | | | | 19,876,650 | |
Socially Responsible | | | 12,099,423 | | | | 52,113,193 | |
Strategic Bond | | | 28,271,122 | | | | — | |
VALIC Company II
NOTES TO FINANCIAL STATEMENTS — (continued)
As of August 31, 2018, for Federal income tax purposes, the Funds indicated below have capital loss carryforwards, which are available to offset future capital gains, if any:
| | | | | | | | |
| | | Unlimited†
| |
Fund
| | ST
| | | LT
| |
Aggressive Growth Lifestyle | | $ | — | | | $ | — | |
Capital Appreciation | | | — | | | | — | |
Conservative Growth Lifestyle | | | — | | | | — | |
Core Bond | | | 471,632 | | | | — | |
Government Money Market II | | | — | | | | — | |
High Yield Bond | | | 2,050,851 | | | | 9,251,801 | |
International Opportunities | | | — | | | | — | |
Large Cap Value | | | — | | | | — | |
Mid Cap Growth | | | — | | | | — | |
Mid Cap Value | | | — | | | | — | |
Moderate Growth Lifestyle | | | — | | | | — | |
Small Cap Growth | | | — | | | | — | |
Small Cap Value | | | — | | | | — | |
Socially Responsible | | | — | | | | — | |
Strategic Bond | | | — | | | | 12,755,986 | |
| † | On December 22, 2010, the Regulated Investment Company Modernization Act of 2010 (the “Act”) was enacted, which changed various technical rules governing the tax treatment of regulated investment companies. The changes are generally effective for taxable years beginning after the date of enactment. Under the Act, the fund will be permitted to carry forward capital losses incurred in taxable years beginning after the date of enactment for an unlimited period. However, any losses incurred during those future taxable years will be required to be utilized prior to the losses incurred in pre-enactment taxable years, which carry an expiration date. As a result of this ordering rule, pre-enactment capital loss carryforwards may be more likely to expire unused. Additionally, post-enactment capital losses that are carried forward will retain their character as either short-term or long-term losses rather than being considered all short-term as under previous law. |
The Funds indicated below utilized capital loss carryforwards, which offset net taxable gains realized in the current year.
| | | | | | | | |
Fund
| | Capital Loss
Carryforward
Utilized
| | | Capital Loss
Carryforward
Expired
| |
Aggressive Growth Lifestyle | | $ | — | | | $ | — | |
Capital Appreciation | | | — | | | | — | |
Conservative Growth Lifestyle | | | — | | | | — | |
Core Bond | | | — | | | | — | |
Government Money Market II | | | — | | | | — | |
High Yield Bond | | | 3,549,441 | | | | 25,316,663 | |
International Opportunities | | | 55,462,523 | | | | — | |
Large Cap Value | | | — | | | | — | |
Mid Cap Growth | | | — | | | | — | |
Mid Cap Value | | | — | | | | — | |
Moderate Growth Lifestyle | | | — | | | | — | |
Small Cap Growth | | | — | | | | — | |
Small Cap Value | | | — | | | | — | |
Socially Responsible | | | — | | | | — | |
Strategic Bond | | | 2,734,461 | | | | — | |
Under the current tax law, capital losses realized after October 31 and late year ordinary losses may be deferred and treated as occurring on the first day of the following year.
For the fiscal year ended August 31, 2018, the Funds elected to defer late year ordinary losses and post October capital losses as follows:
| | | | | | | | | | | | |
Fund
| | Deferred Late Year
Ordinary Loss
| | | Deferred Post-October
Short-Term
Capital Loss
| | | Deferred Post-October
Long-Term
Capital Loss
| |
Aggressive Growth Lifestyle | | $ | — | | | $ | — | | | $ | — | |
Capital Appreciation | | | — | | | | — | | | | — | |
Conservative Growth Lifestyle | | | — | | | | — | | | | — | |
Core Bond | | | — | | | | 8,192,783 | | | | 3,680,765 | |
Government Money Market II | | | — | | | | 7,492 | | | | — | |
High Yield Bond | | | — | | | | — | | | | — | |
International Opportunities | | | — | | | | — | | | | — | |
VALIC Company II
NOTES TO FINANCIAL STATEMENTS — (continued)
| | | | | | | | | | | | |
Fund
| | Deferred Late Year
Ordinary Loss
| | | Deferred Post-October
Short-Term
Capital Loss
| | | Deferred Post-October
Long-Term
Capital Loss
| |
Large Cap Value | | $ | — | | | $ | — | | | $ | — | |
Mid Cap Growth | | | 236,748 | | | | — | | | | — | |
Mid Cap Value | | | 110,267 | | | | — | | | | — | |
Moderate Growth Lifestyle | | | — | | | | — | | | | — | |
Small Cap Growth | | | 801,899 | | | | — | | | | — | |
Small Cap Value | | | — | | | | — | | | | — | |
Socially Responsible | | | — | | | | — | | | | — | |
Strategic Bond | | | — | | | | 9,210,959 | | | | 1,568,953 | |
For the period ended August 31, 2018, the reclassifications arising from book/tax differences resulted in increases (decreases) that were primarily due to tax treatment of net investment losses, distributions from underlying investments, principal paydown adjustments, expiration of capital loss carryforwards, derivative transactions, disposition of passive foreign investment companies securities, and foreign currency transactions to the components of net assets as follows:
| | | | | | | | | | | | |
Fund
| | Accumulated
Undistributed Net
Investment Income
(Loss)
| | | Accumulated
Undistributed Net
Realized Gain
(Loss)
| | | Capital
Paid-in
| |
Aggressive Growth Lifestyle | | $ | 2,413,973 | | | $ | (2,413,973 | ) | | $ | — | |
Capital Appreciation | | | — | | | | — | | | | — | |
Conservative Growth Lifestyle | | | 812,418 | | | | (812,418 | ) | | | — | |
Core Bond | | | 2,595,901 | | | | (2,595,901 | ) | | | — | |
Government Money Market II | | | 835 | | | | (835 | ) | | | — | |
High Yield Bond | | | 882,636 | | | | 24,434,027 | | | | (25,316,663 | ) |
International Opportunities | | | 2,233,021 | | | | (2,233,021 | ) | | | — | |
Large Cap Value | | | — | | | | — | | | | — | |
Mid Cap Growth | | | 214,700 | | | | (214,700 | ) | | | — | |
Mid Cap Value | | | (134,126 | ) | | | 134,126 | | | | — | |
Moderate Growth Lifestyle | | | 3,285,613 | | | | (3,285,613 | ) | | | — | |
Small Cap Growth | | | 743,777 | | | | (743,777 | ) | | | — | |
Small Cap Value | | | 326,649 | | | | (326,649 | ) | | | — | |
Socially Responsible | | | — | | | | — | | | | — | |
Strategic Bond | | | 4,121,846 | | | | (4,121,846 | ) | | | — | |
Note 6 — Capital Share Transactions
Transactions in capital shares of each class of each Fund were as follows:
| | | | | | | | | | | | | | | | | | | | | | | | | | | | | | | | |
| | | Aggressive Growth Lifestyle
| | | Capital Appreciation
| |
| | | For the year ended
August 31, 2018
| | | For the year ended
August 31, 2017
| | | For the year ended
August 31, 2018
| | | For the year ended
August 31, 2017
| |
| | | Shares
| | | Amount
| | | Shares
| | | Amount
| | | Shares
| | | Amount
| | | Shares
| | | Amount
| |
Shares sold | | | 2,261,629 | | | $ | 25,539,244 | | | | 2,288,345 | | | $ | 24,431,926 | | | | 333,830 | | | $ | 6,131,430 | | | | 160,693 | | | $ | 2,642,739 | |
Reinvested dividends | | | 2,530,559 | | | | 28,418,172 | | | | 3,884,696 | | | | 40,556,222 | | | | 270,452 | | | | 5,084,499 | | | | 525,588 | | | | 8,409,409 | |
Shares redeemed | | | (4,299,771 | ) | | | (48,657,119 | ) | | | (4,415,461 | ) | | | (46,948,889 | ) | | | (689,625 | ) | | | (12,617,620 | ) | | | (464,903 | ) | | | (7,574,451 | ) |
| | |
|
|
| |
|
|
| |
|
|
| |
|
|
| |
|
|
| |
|
|
| |
|
|
| |
|
|
|
Net increase (decrease) | | | 492,417 | | | $ | 5,300,297 | | | | 1,757,580 | | | $ | 18,039,259 | | | | (85,343 | ) | | $ | (1,401,691 | ) | | | 221,378 | | | $ | 3,477,697 | |
| | |
|
|
| |
|
|
| |
|
|
| |
|
|
| |
|
|
| |
|
|
| |
|
|
| |
|
|
|
| | |
| | | Conservative Growth Lifestyle
| | | Core Bond
| |
| | | For the year ended
August 31, 2018
| | | For the year ended
August 31, 2017
| | | For the year ended
August 31, 2018
| | | For the year ended
August 31, 2017
| |
| | | Shares
| | | Amount
| | | Shares
| | | Amount
| | | Shares
| | | Amount
| | | Shares
| | | Amount
| |
Shares sold | | | 2,377,368 | | | $ | 29,437,020 | | | | 1,936,936 | | | $ | 23,049,619 | | | | 29,511,097 | | | $ | 323,398,151 | | | | 14,147,011 | | | $ | 156,951,575 | |
Reinvested dividends | | | 784,086 | | | | 9,573,695 | | | | 965,577 | | | | 11,403,467 | | | | 2,798,245 | | | | 29,745,347 | | | | 2,552,266 | | | | 27,768,658 | |
Shares redeemed | | | (3,319,276 | ) | | | (41,064,118 | ) | | | (3,007,486 | ) | | | (35,919,750 | ) | | | (12,929,573 | ) | | | (140,882,086 | ) | | | (23,081,613 | ) | | | (256,349,495 | ) |
| | |
|
|
| |
|
|
| |
|
|
| |
|
|
| |
|
|
| |
|
|
| |
|
|
| |
|
|
|
Net increase (decrease) | | | (157,822 | ) | | $ | (2,053,403 | ) | | | (104,973 | ) | | $ | (1,466,664 | ) | | | 19,379,769 | | | $ | 212,261,412 | | | | (6,382,336 | ) | | $ | (71,629,262 | ) |
| | |
|
|
| |
|
|
| |
|
|
| |
|
|
| |
|
|
| |
|
|
| |
|
|
| |
|
|
|
VALIC Company II
NOTES TO FINANCIAL STATEMENTS — (continued)
| | | | | | | | | | | | | | | | | | | | | | | | | | | | | | | | |
| | | Government Money Market II
| | | High Yield Bond
| |
| | | For the year ended
August 31, 2018
| | | For the year ended
August 31, 2017
| | | For the year ended
August 31, 2018
| | | For the year ended
August 31, 2017
| |
| | | Shares
| | | Amount
| | | Shares
| | | Amount
| | | Shares
| | | Amount
| | | Shares
| | | Amount
| |
Shares sold | | | 68,624,800 | | | $ | 68,624,800 | | | | 55,580,362 | | | $ | 55,580,362 | | | | 11,100,701 | | | $ | 86,814,583 | | | | 11,605,187 | | | $ | 88,808,510 | |
Reinvested dividends | | | 1,175,020 | | | | 1,175,020 | | | | 215,117 | | | | 215,117 | | | | 4,322,804 | | | | 32,204,893 | | | | 3,630,036 | | | | 27,551,970 | |
Shares redeemed | | | (65,749,606 | ) | | | (65,749,606 | ) | | | (64,142,889 | ) | | | (64,142,889 | ) | | | (11,359,541 | ) | | | (88,505,311 | ) | | | (20,922,297 | ) | | | (161,991,585 | ) |
| | |
|
|
| |
|
|
| |
|
|
| |
|
|
| |
|
|
| |
|
|
| |
|
|
| |
|
|
|
Net increase (decrease) | | | 4,050,214 | | | $ | 4,050,214 | | | | (8,347,410 | ) | | $ | (8,347,410 | ) | | | 4,063,964 | | | $ | 30,514,165 | | | | (5,687,074 | ) | | $ | (45,631,105 | ) |
| | |
|
|
| |
|
|
| |
|
|
| |
|
|
| |
|
|
| |
|
|
| |
|
|
| |
|
|
|
| | |
| | | International Opportunities
| | | Large Cap Value
| |
| | | For the year ended
August 31, 2018
| | | For the year ended
August 31, 2017
| | | For the year ended
August 31, 2018
| | | For the year ended
August 31, 2017
| |
| | | Shares
| | | Amount
| | | Shares
| | | Amount
| | | Shares
| | | Amount
| | | Shares
| | | Amount
| |
Shares sold | | | 3,699,729 | | | $ | 76,917,051 | | | | 1,797,806 | | | $ | 31,899,280 | | | | 2,543,267 | | | $ | 56,659,816 | | | | 1,026,540 | | | $ | 20,768,454 | |
Reinvested dividends | | | 265,537 | | | | 5,841,813 | | | | 471,512 | | | | 8,336,334 | | | | 505,508 | | | | 11,232,389 | | | | 151,844 | | | | 3,093,065 | |
Shares redeemed | | | (4,618,761 | ) | | | (98,052,241 | ) | | | (4,892,126 | ) | | | (81,103,513 | ) | | | (1,537,976 | ) | | | (34,393,009 | ) | | | (2,748,947 | ) | | | (55,234,000 | ) |
| | |
|
|
| |
|
|
| |
|
|
| |
|
|
| |
|
|
| |
|
|
| |
|
|
| |
|
|
|
Net increase (decrease) | | | (653,495 | ) | | $ | (15,293,377 | ) | | | (2,622,808 | ) | | $ | (40,867,899 | ) | | | 1,510,799 | | | $ | 33,499,196 | | | | (1,570,563 | ) | | $ | (31,372,481 | ) |
| | |
|
|
| |
|
|
| |
|
|
| |
|
|
| |
|
|
| |
|
|
| |
|
|
| |
|
|
|
| | |
| | | Mid Cap Growth
| | | Mid Cap Value
| |
| | | For the year ended
August 31, 2018
| | | For the year ended
August 31, 2017
| | | For the year ended
August 31, 2018
| | | For the year ended
August 31, 2017
| |
| | | Shares
| | | Amount
| | | Shares
| | | Amount
| | | Shares
| | | Amount
| | | Shares
| | | Amount
| |
Shares sold | | | 6,349,160 | | | $ | 67,710,409 | | | | 643,016 | | | $ | 6,143,554 | | | | 2,219,283 | | | $ | 48,598,719 | | | | 3,113,074 | | | $ | 67,383,250 | |
Reinvested dividends | | | 2,513,295 | | | | 26,389,601 | | | | — | | | | — | | | | 3,290,101 | | | | 71,757,096 | | | | 3,262,176 | | | | 68,440,454 | |
Shares redeemed | | | (1,591,525 | ) | | | (17,636,947 | ) | | | (1,668,191 | ) | | | (14,705,214 | ) | | | (13,359,809 | ) | | | (303,976,044 | ) | | | (5,889,950 | ) | | | (127,243,229 | ) |
| | |
|
|
| |
|
|
| |
|
|
| |
|
|
| |
|
|
| |
|
|
| |
|
|
| |
|
|
|
Net increase (decrease) | | | 7,270,930 | | | $ | 76,463,063 | | | | (1,025,175 | ) | | $ | (8,561,660 | ) | | | (7,850,425 | ) | | $ | (183,620,229 | ) | | | 485,300 | | | $ | 8,580,475 | |
| | |
|
|
| |
|
|
| |
|
|
| |
|
|
| |
|
|
| |
|
|
| |
|
|
| |
|
|
|
| | |
| | | Moderate Growth Lifestyle
| | | Small Cap Growth
| |
| | | For the year ended
August 31, 2018
| | | For the year ended
August 31, 2017
| | | For the year ended
August 31, 2018
| | | For the year ended
August 31, 2017
| |
| | | Shares
| | | Amount
| | | Shares
| | | Amount
| | | Shares
| | | Amount
| | | Shares
| | | Amount
| |
Shares sold | | | 3,727,590 | | | $ | 55,563,392 | | | | 3,618,038 | | | $ | 51,313,871 | | | | 3,205,402 | | | $ | 65,066,801 | | | | 1,617,443 | | | $ | 25,583,272 | |
Reinvested dividends | | | 2,364,407 | | | | 35,064,153 | | | | 3,871,883 | | | | 53,896,608 | | | | 275,881 | | | | 6,146,636 | | | | 409,525 | | | | 6,507,357 | |
Shares redeemed | | | (4,798,128 | ) | | | (71,646,941 | ) | | | (5,068,152 | ) | | | (72,249,711 | ) | | | (2,330,204 | ) | | �� | (48,215,461 | ) | | | (974,006 | ) | | | (14,992,979 | ) |
| | |
|
|
| |
|
|
| |
|
|
| |
|
|
| |
|
|
| |
|
|
| |
|
|
| |
|
|
|
Net increase (decrease) | | | 1,293,869 | | | $ | 18,980,604 | | | | 2,421,769 | | | $ | 32,960,768 | | | | 1,151,079 | | | $ | 22,997,976 | | | | 1,052,962 | | | $ | 17,097,650 | |
| | |
|
|
| |
|
|
| |
|
|
| |
|
|
| |
|
|
| |
|
|
| |
|
|
| |
|
|
|
| | |
| | | Small Cap Value
| | | Socially Responsible
| |
| | | For the year ended
August 31, 2018
| | | For the year ended
August 31, 2017
| | | For the year ended
August 31, 2018
| | | For the year ended
August 31, 2017
| |
| | | Shares
| | | Amount
| | | Shares
| | | Amount
| | | Shares
| | | Amount
| | | Shares
| | | Amount
| |
Shares sold | | | 2,328,908 | | | $ | 35,596,185 | | | | 4,836,536 | | | $ | 72,821,109 | | | | 742,747 | | | $ | 16,277,508 | | | | 1,584,241 | | | $ | 31,264,582 | |
Reinvested dividends | | | 2,630,969 | | | | 40,911,561 | | | | 1,687,429 | | | | 24,805,210 | | | | 1,164,545 | | | | 25,957,719 | | | | 3,292,955 | | | | 64,212,616 | |
Shares redeemed | | | (7,571,033 | ) | | | (118,265,313 | ) | | | (7,807,916 | ) | | | (116,263,147 | ) | | | (7,434,125 | ) | | | (161,992,247 | ) | | | (4,535,980 | ) | | | (90,611,383 | ) |
| | |
|
|
| |
|
|
| |
|
|
| |
|
|
| |
|
|
| |
|
|
| |
|
|
| |
|
|
|
Net increase (decrease) | | | (2,611,156 | ) | | $ | (41,757,567 | ) | | | (1,283,951 | ) | | $ | (18,636,828 | ) | | | (5,526,833 | ) | | $ | (119,757,020 | ) | | | 341,216 | | | $ | 4,865,815 | |
| | |
|
|
| |
|
|
| |
|
|
| |
|
|
| |
|
|
| |
|
|
| |
|
|
| |
|
|
|
| | | | | |
| | | Strategic Bond
| | | | | | | | | | | | | |
| | | For the year ended
August 31, 2018
| | | For the year ended
August 31, 2017
| | | | | | | | | | | | | |
| | | Shares
| | | Amount
| | | Shares
| | | Amount
| | | | | | | | | | | | | |
Shares sold | | | 17,840,623 | | | $ | 200,318,993 | | | | 5,464,340 | | | $ | 61,469,082 | | | | | | | | | | | | | | | | | |
Reinvested dividends | | | 2,814,563 | | | | 30,340,988 | | | | 2,551,545 | | | | 28,271,122 | | | | | | | | | | | | | | | | | |
Shares redeemed | | | (7,925,949 | ) | | | (88,522,743 | ) | | | (15,154,000 | ) | | | (171,617,233 | ) | | | | | | | | | | | | | | | | |
| | |
|
|
| |
|
|
| |
|
|
| |
|
|
| | | | | | | | | | | | | | | | |
Net increase (decrease) | | | 12,729,237 | | | $ | 142,137,238 | | | | (7,138,115 | ) | | $ | (81,877,029 | ) | | | | | | | | | | | | | | | | |
| | |
|
|
| |
|
|
| |
|
|
| |
|
|
| | | | | | | | | | | | | | | | |
VALIC Company II
NOTES TO FINANCIAL STATEMENTS — (continued)
Note 7 — Expense Reductions
Through expense offset arrangements resulting from broker commission recapture, a portion of the expenses of certain Funds have been reduced. For the year ended August 31, 2018, the amount of expense reductions received by each Fund used to offset non-affiliated expenses are reflected as Fees paid indirectly in the Statement of Operations.
Note 8 — Investment Concentration
The High Yield Bond Fund’s investment in high yield securities, whether rated or unrated, may be considered speculative and subject to greater market fluctuations and risk of loss of income and principal than lower-yielding, higher-rated, fixed-income securities. The risk of loss due to default by the issuer may be significantly greater for the holders of high yield securities, because such securities are generally unsecured and are often subordinated to other creditors of the issuer.
The Funds may invest in obligations issued by agencies and instrumentalities of the U.S. Government that may vary in the level of support they receive from the government. The government may choose not to provide financial support to government sponsored agencies or instrumentalities if it is not legally obligated to do so, and if the issuer defaults, a fund holding securities of such issuer might not be able to recover its investments from the U.S. Government. As a result of the Core Bond Fund, Government Money Market II Fund and Strategic Bond Fund’s concentration in such investments, these funds may be subject to risks associated with the U.S. Government agencies or instrumentalities.
The International Opportunities Fund invests internationally, including in “emerging market” countries. Emerging market securities involve risks not typically associated with investing in securities of issuers in more developed markets. The markets of emerging market countries are typically more volatile and potentially less liquid than more developed countries. These securities may be denominated in currencies other than U.S. dollars. While investing internationally may reduce portfolio risk by increasing the diversification of portfolio investments, the value of the investment may be affected by fluctuating currency values, changing local and regional economic, political and social conditions, and greater market volatility.
Each Fund, except the Government Money Market II Fund, the Lifestyle Funds and the Small Cap Value Fund, may invest in international bonds, which include U.S. dollar-denominated bonds issued by foreign corporations for which the primary trading market is in the United States (“Yankee Bonds”), or for which the primary trading market is abroad (“Euro Bonds”). International bonds may involve special risks and considerations not typically associated with investing in U.S. companies, including differences in accounting, auditing and financial reporting standards; generally higher commission rates on foreign portfolio transactions; the possibility of nationalization, expropriation or confiscatory taxation; adverse changes in investment or exchange control regulations (which may include suspension of the ability to transfer currency from a country); and political instability which could affect U.S. investments in foreign countries. As a result of the Strategic Bond Fund’s concentration in such investments, it may be subject to risks associated with the international bonds.
Note 9 — Line of Credit
The Series, along with certain other funds managed by the Adviser, has access to a $85 million committed unsecured line of credit and a $40 million uncommitted unsecured line of credit. The committed and uncommitted lines of credit are renewable on an annual basis with State Street Bank and Trust Company (“State Street”), the Series’ custodian. Interest is currently payable under the committed line of credit at the higher of the Federal Funds Rate (but not less than zero) plus 125 basis points or the One-Month London Interbank Offered Rate (but not less than zero) plus 125 basis points and State Street’s discretionary bid rate on the uncommitted line of credit. The Series, on behalf of each of the Funds, has paid State Street for its own account, such Fund’s ratable portion of an upfront fee in an amount equal to $25,000 in the aggregate for the uncommitted lines of credit made available by State Street to the Series and certain other funds managed by the Adviser, which are also party to the uncommitted lines of credit. There is also a commitment fee of 25 basis points per annum on the daily unused portion of the committed line of credit. For the year ended August 31, 2018, the following Funds had borrowings:
| | | | | | | | | | | | | | | | |
Fund
| | Days
Outstanding
| | | Interest
Charges
| | | Average
Debt
Utilized
| | | Weighted
Average
Interest
| |
Large Cap Value | | | 26 | | | $ | 1,222 | | | $ | 588,302 | | | | 2.87 | % |
Small Cap Growth | | | 3 | | | | 382 | | | | 1,590,207 | | | | 3.12 | |
Small Cap Value | | | 3 | | | | 534 | | | | 1,931,284 | | | | 3.32 | |
Socially Responsible | | | 4 | | | | 722 | | | | 2,609,317 | | | | 2.49 | |
At August 31, 2018, there were no borrowings outstanding.
Note 10 — Interfund Lending Agreement
Pursuant to the exemptive relief granted by the SEC, the Funds are permitted to participate in an interfund lending program among investment companies advised by VALIC or an affiliate. The interfund lending program allows the participating Funds to borrow money from and lend money to each other for temporary or emergency purposes. An interfund loan will be made under this facility only if the participating Funds receive a more favorable interest rate than would otherwise be available from a typical bank for a comparable transaction.
For the year ended August 31, 2018, none of the Funds participated in this program.
VALIC Company II
NOTES TO FINANCIAL STATEMENTS — (continued)
Note 11 — Security Transactions with Affiliated Portfolios
The Funds are permitted to transfer securities by purchasing from and/or selling to other affiliated funds under certain conditions approved by the Board. The affiliated funds involved in such transactions must have a common investment adviser or investment advisers which are affiliated persons of each other, common Trustees, and/or common officers in compliance with Rule 17a-7 of the 1940 Act. Pursuant to the Act, such a transaction must be either a purchase or a sale, for no consideration other than cash payment against prompt delivery of the security at the current market price. No brokerage commission or fee (except for customary transfer fees), or other remuneration is paid in connection with such transactions.
For the year ended August 31, 2018, the following Funds engaged in security transactions with affiliated Funds:
| | | | | | | | | | | | |
Fund
| | Cost of
Purchases
| | | Proceeds
from Sales
| | | Realized
Gain/
(Loss)
| |
International Opportunities | | $ | 67,896 | | | $ | 27,111 | | | $ | 1,372 | |
Mid Cap Growth | | | 278,093 | | | | — | | | | — | |
Mid Cap Value | | | 679,652 | | | | — | | | | — | |
VALIC Company II
FINANCIAL HIGHLIGHTS
Per share data is for a share of beneficial interest outstanding throughout the period. Total return includes reinvestment of distributions on the reinvestment date.
| | | | | | | | | | | | | | | | | | | | | | | | | | | | | | | | | | | | | | | | |
| | | Aggressive Growth Lifestyle Fund
| | | Capital Appreciation Fund
| |
| | | Year Ended August 31,
| | | Year Ended August 31,
| |
| | | 2018
| | | 2017
| | | 2016
| | | 2015
| | | 2014
| | | 2018
| | | 2017
| | | 2016
| | | 2015
| | | 2014
| |
| | | | | | | | | | |
PER SHARE DATA | | | | | | | | | | | | | | | | | | | | | | | | | | | | | | | | | | | | | | | | |
Net asset value at beginning of period | | $ | 10.68 | | | $ | 10.41 | | | $ | 10.67 | | | $ | 12.04 | | | $ | 10.30 | | | $ | 16.55 | | | $ | 15.99 | | | $ | 16.35 | | | $ | 15.88 | | | $ | 12.82 | |
| | |
|
|
| |
|
|
|
Income (loss) from investment operations: | | | | | | | | | | | | | | | | | | | | | | | | | | | | | | | | | | | | | | | | |
Net investment income (loss)(d) | | | 0.17 | | | | 0.16 | | | | 0.19 | | | | 0.20 | | | | 0.18 | | | | 0.04 | | | | 0.08 | | | | 0.09 | | | | 0.06 | | | | 0.05 | |
Net realized and unrealized gain (loss) on investments and foreign currencies | | | 1.04 | | | | 0.93 | | | | 0.56 | | | | (0.52 | ) | | | 1.77 | | | | 4.51 | | | | 2.12 | | | | 1.20 | | | | 0.46 | | | | 3.08 | |
Net increase from payments by affiliates | | | – | | | | – | | | | – | | | | – | | | | – | | | | – | | | | – | | | | – | | | | – | | | | – | |
| | |
|
|
| |
|
|
|
Total income (loss) from investment operations | | | 1.21 | | | | 1.09 | | | | 0.75 | | | | (0.32 | ) | | | 1.95 | | | | 4.55 | | | | 2.20 | | | | 1.29 | | | | 0.52 | | | | 3.13 | |
| | |
|
|
| |
|
|
|
Distributions from: | | | | | | | | | | | | | | | | | | | | | | | | | | | | | | | | | | | | | | | | |
Net investment income | | | (0.16 | ) | | | (0.21 | ) | | | (0.23 | ) | | | (0.19 | ) | | | (0.11 | ) | | | (0.08 | ) | | | (0.08 | ) | | | (0.06 | ) | | | (0.05 | ) | | | (0.07 | ) |
Net realized gain on securities | | | (0.39 | ) | | | (0.61 | ) | | | (0.78 | ) | | | (0.86 | ) | | | (0.10 | ) | | | (0.89 | ) | | | (1.56 | ) | | | (1.59 | ) | | | – | | | | – | |
| | |
|
|
| |
|
|
|
Total distributions | | | (0.55 | ) | | | (0.82 | ) | | | (1.01 | ) | | | (1.05 | ) | | | (0.21 | ) | | | (0.97 | ) | | | (1.64 | ) | | | (1.65 | ) | | | (0.05 | ) | | | (0.07 | ) |
| | |
|
|
| |
|
|
|
Net asset value at end of period | | $ | 11.34 | | | $ | 10.68 | | | $ | 10.41 | | | $ | 10.67 | | | $ | 12.04 | | | $ | 20.13 | | | $ | 16.55 | | | $ | 15.99 | | | $ | 16.35 | | | $ | 15.88 | |
| | |
|
|
| |
|
|
|
TOTAL RETURN(a) | | | 11.39 | % | | | 10.61 | % | | | 7.53 | % | | | (3.17 | )% | | | 19.03 | % | | | 27.94 | % | | | 14.13 | % | | | 8.33 | % | | | 3.28 | % | | | 24.43 | % |
| | |
|
|
| |
|
|
|
| | | | | | | | | | |
RATIOS/SUPPLEMENTAL DATA | | | | | | | | | | | | | | | | | | | | | | | | | | | | | | | | | | | | | | | | |
Ratio of expenses to average net assets(b) | | | 0.10 | %(e) | | | 0.10 | %(e) | | | 0.10 | %(e) | | | 0.10 | %(e) | | | 0.10 | %(e) | | | 0.85 | % | | | 0.85 | % | | | 0.85 | % | | | 0.85 | % | | | 0.85 | % |
Ratio of expenses to average net assets(c) | | | 0.14 | %(e) | | | 0.14 | %(e) | | | 0.15 | %(e) | | | 0.14 | %(e) | | | 0.14 | %(e) | | | 0.99 | % | | | 0.99 | % | | | 1.00 | % | | | 0.98 | % | | | 0.99 | % |
Ratio of expense reductions to average net assets | | | – | | | | – | | | | – | | | | – | | | | �� | | | | 0.01 | % | | | 0.01 | % | | | 0.01 | % | | | 0.01 | % | | | 0.01 | % |
Ratio of net investment income (loss) to average net assets(b) | | | 1.49 | %(e) | | | 1.47 | %(e) | | | 1.78 | %(e) | | | 1.71 | %(e) | | | 1.56 | %(e) | | | 0.22 | % | | | 0.50 | % | | | 0.52 | % | | | 0.36 | % | | | 0.31 | % |
Ratio of net investment income (loss) to average net assets(c) | | | 1.45 | %(e) | | | 1.44 | %(e) | | | 1.73 | %(e) | | | 1.67 | %(e) | | | 1.52 | %(e) | | | 0.08 | % | | | 0.36 | % | | | 0.37 | % | | | 0.23 | % | | | 0.17 | % |
Portfolio turnover rate | | | 49 | % | | | 36 | % | | | 24 | % | | | 31 | % | | | 32 | % | | | 124 | % | | | 66 | % | | | 54 | % | | | 44 | % | | | 44 | % |
Number of shares outstanding at end of period (000’s) | | | 53,660 | | | | 53,168 | | | | 51,410 | | | | 47,707 | | | | 42,546 | | | | 5,449 | | | | 5,535 | | | | 5,313 | | | | 5,014 | | | | 5,491 | |
Net assets at the end of period (000’s) | | $ | 608,709 | | | $ | 567,843 | | | $ | 535,245 | | | $ | 508,890 | | | $ | 512,113 | | | $ | 109,697 | | | $ | 91,579 | | | $ | 84,946 | | | $ | 81,961 | | | $ | 87,214 | |
| (a) | Total return includes, if any, expense reimbursements and expense reductions. The effect of fees and charges incurred at the separate account level are not reflected in these performance figures. If such expenses had been included, the total return would have been lower for each period presented. |
| (b) | Includes expense reimbursements, but excludes expense reductions. |
| (c) | Excludes expense reimbursements and expense reductions. |
| (d) | The per share amounts are calculated using the average share method. |
| (e) | Does not include underlying fund expenses that the Fund bears indirectly. |
See Notes to Financial Statements
VALIC Company II
FINANCIAL HIGHLIGHTS — (continued)
Per share data is for a share of beneficial interest outstanding throughout the period. Total return includes reinvestment of distributions on the reinvestment date.
| | | | | | | | | | | | | | | | | | | | | | | | | | | | | | | | | | | | | | | | |
| | | Conservative Growth Lifestyle Fund
| | | Core Bond Fund
| |
| | | Year Ended August 31,
| | | Year Ended August 31,
| |
| | | 2018
| | | 2017
| | | 2016
| | | 2015
| | | 2014
| | | 2018
| | | 2017
| | | 2016
| | | 2015
| | | 2014
| |
| | | | | | | | | | |
PER SHARE DATA | | | | | | | | | | | | | | | | | | | | | | | | | | | | | | | | | | | | | | | | |
Net asset value at beginning of period | | $ | 12.07 | | | $ | 11.82 | | | $ | 11.95 | | | $ | 13.12 | | | $ | 12.13 | | | $ | 11.15 | | | $ | 11.30 | | | $ | 10.93 | | | $ | 11.09 | | | $ | 10.69 | |
| | |
|
|
| |
|
|
|
Income (loss) from investment operations: | | | | | | | | | | | | | | | | | | | | | | | | | | | | | | | | | | | | | | | | |
Net investment income (loss)(d) | | | 0.31 | | | | 0.28 | | | | 0.30 | | | | 0.31 | | | | 0.29 | | | | 0.30 | | | | 0.27 | | | | 0.24 | | | | 0.23 | | | | 0.24 | |
Net realized and unrealized gain (loss) on investments and foreign currencies | | | 0.28 | | | | 0.39 | | | | 0.41 | | | | (0.62 | ) | | | 1.31 | | | | (0.45 | ) | | | (0.12 | ) | | | 0.38 | | | | (0.16 | ) | | | 0.44 | |
Net increase from payments by affiliates | | | – | | | | – | | | | – | | | | – | | | | – | | | | – | | | | – | | | | – | | | | – | | | | – | |
| | |
|
|
| |
|
|
|
Total income (loss) from investment operations | | | 0.59 | | | | 0.67 | | | | 0.71 | | | | (0.31 | ) | | | 1.60 | | | | (0.15 | ) | | | 0.15 | | | | 0.62 | | | | 0.07 | | | | 0.68 | |
| | |
|
|
| |
|
|
|
Distributions from: | | | | | | | | | | | | | | | | | | | | | | | | | | | | | | | | | | | | | | | | |
Net investment income | | | (0.28 | ) | | | (0.32 | ) | | | (0.34 | ) | | | (0.29 | ) | | | (0.26 | ) | | | (0.26 | ) | | | (0.30 | ) | | | (0.22 | ) | | | (0.23 | ) | | | (0.20 | ) |
Net realized gain on securities | | | (0.07 | ) | | | (0.10 | ) | | | (0.50 | ) | | | (0.57 | ) | | | (0.35 | ) | | | (0.00 | ) | | | – | | | | (0.03 | ) | | | – | | | | (0.08 | ) |
| | |
|
|
| |
|
|
|
Total distributions | | | (0.35 | ) | | | (0.42 | ) | | | (0.84 | ) | | | (0.86 | ) | | | (0.61 | ) | | | (0.26 | ) | | | (0.30 | ) | | | (0.25 | ) | | | (0.23 | ) | | | (0.28 | ) |
| | |
|
|
| |
|
|
|
Net asset value at end of period | | $ | 12.31 | | | $ | 12.07 | | | $ | 11.82 | | | $ | 11.95 | | | $ | 13.12 | | | $ | 10.74 | | | $ | 11.15 | | | $ | 11.30 | | | $ | 10.93 | | | $ | 11.09 | |
| | |
|
|
| |
|
|
|
TOTAL RETURN(a) | | | 4.94 | % | | | 5.76 | % | | | 6.19 | % | | | (2.65 | )% | | | 13.34 | % | | | (1.32 | )% | | | 1.37 | % | | | 5.78 | % | | | 0.62 | % | | | 6.44 | % |
| | |
|
|
| |
|
|
|
| | | | | | | | | | |
RATIOS/SUPPLEMENTAL DATA | | | | | | | | | | | | | | | | | | | | | | | | | | | | | | | | | | | | | | | | |
Ratio of expenses to average net assets(b) | | | 0.10 | %(e) | | | 0.10 | %(e) | | | 0.10 | %(e) | | | 0.10 | %(e) | | | 0.10 | %(e) | | | 0.77 | % | | | 0.77 | % | | | 0.77 | % | | | 0.77 | % | | | 0.77 | % |
Ratio of expenses to average net assets(c) | | | 0.15 | %(e) | | | 0.15 | %(e) | | | 0.15 | %(e) | | | 0.14 | %(e) | | | 0.15 | %(e) | | | 0.78 | % | | | 0.80 | % | | | 0.79 | % | | | 0.79 | % | | | 0.80 | % |
Ratio of expense reductions to average net assets | | | – | | | | – | | | | – | | | | – | | | | – | | | | – | | | | – | | | | – | | | | – | | | | – | |
Ratio of net investment income (loss) to average net assets(b) | | | 2.47 | %(e) | | | 2.31 | %(e) | | | 2.51 | %(e) | | | 2.45 | %(e) | | | 2.26 | %(e) | | | 2.80 | % | | | 2.40 | % | | | 2.16 | % | | | 2.10 | % | | | 2.24 | % |
Ratio of net investment income (loss) to average net assets(c) | | | 2.43 | %(e) | | | 2.27 | %(e) | | | 2.46 | %(e) | | | 2.40 | %(e) | | | 2.22 | %(e) | | | 2.78 | % | | | 2.37 | % | | | 2.15 | % | | | 2.08 | % | | | 2.21 | % |
Portfolio turnover rate | | | 44 | % | | | 38 | % | | | 27 | % | | | 33 | % | | | 31 | % | | | 73 | % | | | 76 | % | | | 139 | % | | | 153 | % | | | 169 | % |
Number of shares outstanding at end of period (000’s) | | | 27,516 | | | | 27,674 | | | | 27,779 | | | | 27,270 | | | | 24,601 | | | | 119,431 | | | | 100,052 | | | | 106,434 | | | | 97,489 | | | | 85,364 | |
Net assets at the end of period (000’s) | | $ | 338,793 | | | $ | 333,907 | | | $ | 328,390 | | | $ | 325,797 | | | $ | 322,764 | | | $ | 1,282,586 | | | $ | 1,115,936 | | | $ | 1,202,915 | | | $ | 1,065,803 | | | $ | 946,699 | |
| (a) | Total return includes, if any, expense reimbursements and expense reductions. The effect of fees and charges incurred at the separate account level are not reflected in these performance figures. If such expenses had been included, the total return would have been lower for each period presented. |
| (b) | Includes expense reimbursements, but excludes expense reductions. |
| (c) | Excludes expense reimbursements and expense reductions. |
| (d) | The per share amounts are calculated using the average share method. |
| (e) | Does not include underlying fund expenses that the Fund bears indirectly. |
See Notes to Financial Statements
VALIC Company II
FINANCIAL HIGHLIGHTS — (continued)
Per share data is for a share of beneficial interest outstanding throughout the period. Total return includes reinvestment of distributions on the reinvestment date.
| | | | | | | | | | | | | | | | | | | | | | | | | | | | | | | | | | | | | | | | |
| | | Government Money Market II Fund
| | | High Yield Bond Fund
| |
| | | Year Ended August 31,
| | | Year Ended August 31,
| |
| | | 2018
| | | 2017
| | | 2016
| | | 2015
| | | 2014
| | | 2018
| | | 2017
| | | 2016
| | | 2015
| | | 2014
| |
| | | | | | | | | | |
PER SHARE DATA | | | | | | | | | | | | | | | | | | | | | | | | | | | | | | | | | | | | | | | | |
Net asset value at beginning of period | | $ | 1.00 | | | $ | 1.00 | | | $ | 1.00 | | | $ | 1.00 | | | $ | 1.00 | | | $ | 7.75 | | | $ | 7.56 | | | $ | 7.40 | | | $ | 7.93 | | | $ | 7.63 | |
| | |
|
|
| |
|
|
|
Income (loss) from investment operations: | | | | | | | | | | | | | | | | | | | | | | | | | | | | | | | | | | | | | | | | |
Net investment income (loss)(d) | | | 0.01 | | | | 0.00 | | | | 0.00 | | | | 0.00 | | | | 0.00 | | | | 0.40 | | | | 0.41 | | | | 0.37 | | | | 0.38 | | | | 0.41 | |
Net realized and unrealized gain (loss) on investments and foreign currencies | | | (0.00 | ) | | | 0.00 | | | | 0.00 | | | | 0.00 | | | | 0.00 | | | | (0.18 | ) | | | 0.15 | | | | 0.13 | | | | (0.53 | ) | | | 0.28 | |
Net increase from payments by affiliates | | | – | | | | – | | | | – | | | | 0.00 | | | | – | | | | – | | | | – | | | | – | | | | – | | | | – | |
| | |
|
|
| |
|
|
|
Total income (loss) from investment operations | | | 0.01 | | | | 0.00 | | | | 0.00 | | | | 0.00 | | | | 0.00 | | | | 0.22 | | | | 0.56 | | | | 0.50 | | | | (0.15 | ) | | | 0.69 | |
| | |
|
|
| |
|
|
|
Distributions from: | | | | | | | | | | | | | | | | | | | | | | | | | | | | | | | | | | | | | | | | |
Net investment income | | | (0.01 | ) | | | (0.00 | ) | | | (0.00 | ) | | | (0.00 | ) | | | (0.00 | ) | | | (0.44 | ) | | | (0.37 | ) | | | (0.34 | ) | | | (0.38 | ) | | | (0.39 | ) |
Net realized gain on securities | | | – | | | | – | | | | – | | | | – | | | | – | | | | – | | | | – | | | | – | | | | – | | | | – | |
| | |
|
|
| |
|
|
|
Total distributions | | | (0.01 | ) | | | (0.00 | ) | | | (0.00 | ) | | | (0.00 | ) | | | (0.00 | ) | | | (0.44 | ) | | | (0.37 | ) | | | (0.34 | ) | | | (0.38 | ) | | | (0.39 | ) |
| | |
|
|
| |
|
|
|
Net asset value at end of period | | $ | 1.00 | | | $ | 1.00 | | | $ | 1.00 | | | $ | 1.00 | | | $ | 1.00 | | | $ | 7.53 | | | $ | 7.75 | | | $ | 7.56 | | | $ | 7.40 | | | $ | 7.93 | |
| | |
|
|
| |
|
|
|
TOTAL RETURN(a) | | | 0.91 | % | | | 0.16 | % | | | 0.01 | % | | | 0.01 | %(e) | | | 0.01 | % | | | 2.89 | % | | | 7.54 | % | | | 7.07 | % | | | (2.02 | )% | | | 9.10 | % |
| | |
|
|
| |
|
|
|
| | | | | | | | | | |
RATIOS/SUPPLEMENTAL DATA | | | | | | | | | | | | | | | | | | | | | | | | | | | | | | | | | | | | | | | | |
Ratio of expenses to average net assets(b) | | | 0.55 | % | | | 0.50 | % | | | 0.32 | % | | | 0.15 | % | | | 0.15 | % | | | 0.96 | % | | | 0.96 | % | | | 0.96 | % | | | 0.96 | % | | | 0.96 | % |
Ratio of expenses to average net assets(c) | | | 0.65 | % | | | 0.70 | % | | | 0.66 | % | | | 0.64 | % | | | 0.63 | % | | | 0.97 | % | | | 0.97 | % | | | 0.99 | % | | | 0.98 | % | | | 0.99 | % |
Ratio of expense reductions to average net assets | | | – | | | | – | | | | – | | | | – | | | | – | | | | – | | | | – | | | | – | | | | – | | | | – | |
Ratio of net investment income (loss) to average net assets(b) | | | 0.91 | % | | | 0.16 | % | | | 0.01 | % | | | 0.01 | % | | | 0.01 | % | | | 5.16 | % | | | 5.27 | % | | | 5.16 | % | | | 5.00 | % | | | 5.25 | % |
Ratio of net investment income (loss) to average net assets(c) | | | 0.81 | % | | | (0.04 | )% | | | (0.33 | )% | | | (0.48 | )% | | | (0.47 | )% | | | 5.15 | % | | | 5.26 | % | | | 5.13 | % | | | 4.97 | % | | | 5.22 | % |
Portfolio turnover rate | | | N/A | | | | N/A | | | | N/A | | | | N/A | | | | N/A | | | | 26 | % | | | 52 | % | | | 36 | % | | | 36 | % | | | 37 | % |
Number of shares outstanding at end of period (000’s) | | | 136,966 | | | | 132,916 | | | | 141,263 | | | | 159,882 | | | | 170,830 | | | | 76,525 | | | | 72,461 | | | | 78,148 | | | | 63,332 | | | | 53,018 | |
Net assets at the end of period (000’s) | | $ | 136,987 | | | $ | 132,944 | | | $ | 141,291 | | | $ | 159,905 | | | $ | 170,575 | | | $ | 576,553 | | | $ | 561,480 | | | $ | 590,679 | | | $ | 468,855 | | | $ | 420,459 | |
| (a) | Total return includes, if any, expense reimbursements and expense reductions. The effect of fees and charges incurred at the separate account level are not reflected in these performance figures. If such expenses had been included, the total return would have been lower for each period presented. |
| (b) | Includes expense reimbursements, but excludes expense reductions. |
| (c) | Excludes expense reimbursements and expense reductions. |
| (d) | The per share amounts are calculated using the average share method. |
| (e) | The Fund’s performance figure was increased by less than 0.01% from the effect of payments by an affiliate. |
See Notes to Financial Statements
VALIC Company II
FINANCIAL HIGHLIGHTS — (continued)
Per share data is for a share of beneficial interest outstanding throughout the period. Total return includes reinvestment of distributions on the reinvestment date.
| | | | | | | | | | | | | | | | | | | | | | | | | | | | | | | | | | | | | | | | |
| | | International Opportunities Fund
| | | Large Cap Value Fund
| |
| | | Year Ended August 31,
| | | Year Ended August 31,
| |
| | | 2018
| | | 2017
| | | 2016
| | | 2015
| | | 2014
| | | 2018
| | | 2017
| | | 2016
| | | 2015
| | | 2014
| |
| | | | | | | | | | |
PER SHARE DATA | | | | | | | | | | | | | | | | | | | | | | | | | | | | | | | | | | | | | | | | |
Net asset value at beginning of period | | $ | 19.38 | | | $ | 16.00 | | | $ | 15.08 | | | $ | 15.50 | | | $ | 13.78 | | | $ | 20.66 | | | $ | 18.41 | | | $ | 17.08 | | | $ | 17.58 | | | $ | 14.51 | |
| | |
|
|
| |
|
|
|
Income (loss) from investment operations: | | | | | | | | | | | | | | | | | | | | | | | | | | | | | | | | | | | | | | | | |
Net investment income (loss)(d) | | | 0.13 | | | | 0.14 | | | | 0.14 | | | | 0.16 | | | | 0.16 | | | | 0.30 | | | | 0.24 | | | | 0.27 | | | | 0.20 | | | | 0.22 | |
Net realized and unrealized gain (loss) on investments and foreign currencies | | | 1.97 | | | | 3.49 | | | | 0.94 | | | | (0.38 | ) | | | 1.75 | | | | 2.80 | | | | 2.27 | | | | 1.27 | | | | (0.46 | ) | | | 3.04 | |
Net increase from payments by affiliates | | | – | | | | – | | | | – | | | | – | | | | – | | | | – | | | | – | | | | – | | | | – | | | | – | |
| | |
|
|
| |
|
|
|
Total income (loss) from investment operations | | | 2.10 | | | | 3.63 | | | | 1.08 | | | | (0.22 | ) | | | 1.91 | | | | 3.10 | | | | 2.51 | | | | 1.54 | | | | (0.26 | ) | | | 3.26 | |
| | |
|
|
| |
|
|
|
Distributions from: | | | | | | | | | | | | | | | | | | | | | | | | | | | | | | | | | | | | | | | | |
Net investment income | | | (0.17 | ) | | | (0.25 | ) | | | (0.16 | ) | | | (0.20 | ) | | | (0.19 | ) | | | (0.26 | ) | | | (0.26 | ) | | | (0.21 | ) | | | (0.24 | ) | | | (0.19 | ) |
Net realized gain on securities | | | – | | | | – | | | | – | | | | – | | | | – | | | | (0.74 | ) | | | – | | | | – | | | | – | | | | – | |
| | |
|
|
| |
|
|
|
Total distributions | | | (0.17 | ) | | | (0.25 | ) | | | (0.16 | ) | | | (0.20 | ) | | | (0.19 | ) | | | (1.00 | ) | | | (0.26 | ) | | | (0.21 | ) | | | (0.24 | ) | | | (0.19 | ) |
| | |
|
|
| |
|
|
|
Net asset value at end of period | | $ | 21.31 | | | $ | 19.38 | | | $ | 16.00 | | | $ | 15.08 | | | $ | 15.50 | | | $ | 22.76 | | | $ | 20.66 | | | $ | 18.41 | | | $ | 17.08 | | | $ | 17.58 | |
| | |
|
|
| |
|
|
|
TOTAL RETURN(a) | | | 10.81 | % | | | 22.81 | % | | | 7.23 | % | | | (1.50 | )% | | | 13.88 | % | | | 15.12 | % | | | 13.66 | % | | | 9.09 | % | | | (1.56 | )% | | | 22.55 | % |
| | |
|
|
| |
|
|
|
| | | | | | | | | | |
RATIOS/SUPPLEMENTAL DATA | | | | | | | | | | | | | | | | | | | | | | | | | | | | | | | | | | | | | | | | |
Ratio of expenses to average net assets(b) | | | 1.00 | % | | | 1.00 | % | | | 1.00 | % | | | 1.00 | % | | | 1.00 | % | | | 0.81 | % | | | 0.81 | % | | | 0.81 | % | | | 0.81 | % | | | 0.81 | % |
Ratio of expenses to average net assets(c) | | | 1.20 | % | | | 1.22 | % | | | 1.21 | % | | | 1.21 | % | | | 1.21 | % | | | 0.88 | % | | | 0.88 | % | | | 0.89 | % | | | 0.88 | % | | | 0.88 | % |
Ratio of expense reductions to average net assets | | | – | | | | – | | | | 0.00 | % | | | 0.01 | % | | | 0.00 | % | | | 0.01 | % | | | 0.01 | % | | | 0.01 | % | | | 0.01 | % | | | 0.01 | % |
Ratio of net investment income (loss) to average net assets(b) | | | 0.61 | % | | | 0.82 | % | | | 0.91 | % | | | 1.02 | % | | | 1.05 | % | | | 1.35 | % | | | 1.21 | % | | | 1.59 | % | | | 1.11 | % | | | 1.31 | % |
Ratio of net investment income (loss) to average net assets(c) | | | 0.41 | % | | | 0.60 | % | | | 0.70 | % | | | 0.81 | % | | | 0.84 | % | | | 1.27 | % | | | 1.14 | % | | | 1.51 | % | | | 1.04 | % | | | 1.24 | % |
Portfolio turnover rate | | | 46 | % | | | 62 | % | | | 58 | % | | | 59 | % | | | 72 | % | | | 90 | % | | | 77 | % | | | 71 | % | | | 72 | % | | | 54 | % |
Number of shares outstanding at end of period (000’s) | | | 33,984 | | | | 34,637 | | | | 37,260 | | | | 39,548 | | | | 37,851 | | | | 12,480 | | | | 10,969 | | | | 12,540 | | | | 11,333 | | | | 12,597 | |
Net assets at the end of period (000’s) | | $ | 724,027 | | | $ | 671,097 | | | $ | 596,055 | | | $ | 596,301 | | | $ | 586,631 | | | $ | 284,086 | | | $ | 226,626 | | | $ | 230,844 | | | $ | 193,602 | | | $ | 221,453 | |
| (a) | Total return includes, if any, expense reimbursements and expense reductions. The effect of fees and charges incurred at the separate account level are not reflected in these performance figures. If such expenses had been included, the total return would have been lower for each period presented. |
| (b) | Includes expense reimbursements, but excludes expense reductions. |
| (c) | Excludes expense reimbursements and expense reductions. |
| (d) | The per share amounts are calculated using the average share method. |
See Notes to Financial Statements
VALIC Company II
FINANCIAL HIGHLIGHTS — (continued)
Per share data is for a share of beneficial interest outstanding throughout the period. Total return includes reinvestment of distributions on the reinvestment date.
| | | | | | | | | | | | | | | | | | | | | | | | | | | | | | | | | | | | | | | | |
| | | Mid Cap Growth Fund
| | | Mid Cap Value Fund
| |
| | | Year Ended August 31,
| | | Year Ended August 31,
| |
| | | 2018
| | | 2017
| | | 2016
| | | 2015
| | | 2014
| | | 2018
| | | 2017
| | | 2016
| | | 2015
| | | 2014
| |
| | | | | | | | | | |
PER SHARE DATA | | | | | | | | | | | | | | | | | | | | | | | | | | | | | | | | | | | | | | | | |
Net asset value at beginning of period | | $ | 10.06 | | | $ | 8.42 | | | $ | 8.81 | | | $ | 10.13 | | | $ | 9.76 | | | $ | 21.23 | | | $ | 20.45 | | | $ | 21.82 | | | $ | 25.15 | | | $ | 21.66 | |
| | |
|
|
| |
|
|
|
Income (loss) from investment operations: | | | | | | | | | | | | | | | | | | | | | | | | | | | | | | | | | | | | | | | | |
Net investment income (loss)(d) | | | (0.02 | ) | | | 0.00 | | | | (0.02 | ) | | | (0.02 | ) | | | (0.05 | ) | | | 0.09 | | | | 0.07 | | | | 0.14 | | | | 0.07 | | | | 0.05 | |
Net realized and unrealized gain (loss) on investments and foreign currencies | | | 2.56 | | | | 1.64 | | | | 0.24 | | | | 0.27 | | | | 1.33 | | | | 2.62 | | | | 2.17 | | | | 1.73 | | | | (0.82 | ) | | | 5.06 | |
Net increase from payments by affiliates | | | – | | | | – | | | | – | | | | – | | | | – | | | | – | | | | – | | | | – | | | | – | | | | – | |
| | |
|
|
| |
|
|
|
Total income (loss) from investment operations | | | 2.54 | | | | 1.64 | | | | 0.22 | | | | 0.25 | | | | 1.28 | | | | 2.71 | | | | 2.24 | | | | 1.87 | | | | (0.75 | ) | | | 5.11 | |
| | |
|
|
| |
|
|
|
Distributions from: | | | | | | | | | | | | | | | | | | | | | | | | | | | | | | | | | | | | | | | | |
Net investment income | | | (0.02 | ) | | | – | | | | – | | | | – | | | | (0.01 | ) | | | (0.09 | ) | | | (0.13 | ) | | | (0.06 | ) | | | (0.05 | ) | | | (0.08 | ) |
Net realized gain on securities | | | (1.87 | ) | | | – | | | | (0.61 | ) | | | (1.57 | ) | | | (0.90 | ) | | | (1.72 | ) | | | (1.33 | ) | | | (3.18 | ) | | | (2.53 | ) | | | (1.54 | ) |
| | |
|
|
| |
|
|
|
Total distributions | | | (1.89 | ) | | | – | | | | (0.61 | ) | | | (1.57 | ) | | | (0.91 | ) | | | (1.81 | ) | | | (1.46 | ) | | | (3.24 | ) | | | (2.58 | ) | | | (1.62 | ) |
| | |
|
|
| |
|
|
|
Net asset value at end of period | | $ | 10.71 | | | $ | 10.06 | | | $ | 8.42 | | | $ | 8.81 | | | $ | 10.13 | | | $ | 22.13 | | | $ | 21.23 | | | $ | 20.45 | | | $ | 21.82 | | | $ | 25.15 | |
| | |
|
|
| |
|
|
|
TOTAL RETURN(a) | | | 25.54 | % | | | 19.48 | % | | | 3.01 | % | | | 1.66 | % | | | 13.86 | % | | | 12.90 | % | | | 11.02 | % | | | 9.62 | % | | | (3.61 | )% | | | 23.97 | % |
| | |
|
|
| |
|
|
|
| | | | | | | | | | |
RATIOS/SUPPLEMENTAL DATA | | | | | | | | | | | | | | | | | | | | | | | | | | | | | | | | | | | | | | | | |
Ratio of expenses to average net assets(b) | | | 0.85 | % | | | 0.85 | % | | | 0.85 | % | | | 0.85 | % | | | 0.85 | % | | | 1.05 | % | | | 1.05 | % | | | 1.05 | % | | | 1.05 | % | | | 1.05 | % |
Ratio of expenses to average net assets(c) | | | 1.15 | % | | | 1.17 | % | | | 1.17 | % | | | 1.14 | % | | | 1.17 | % | | | 1.05 | % | | | 1.05 | % | | | 1.06 | % | | | 1.06 | % | | | 1.05 | % |
Ratio of expense reductions to average net assets | | | 0.00 | % | | | 0.00 | % | | | 0.01 | % | | | 0.01 | % | | | 0.01 | % | | | 0.00 | % | | | 0.00 | % | | | 0.00 | % | | | 0.00 | % | | | 0.00 | % |
Ratio of net investment income (loss) to average net assets(b) | | | (0.18 | )% | | | 0.04 | % | | | (0.27 | )% | | | (0.26 | )% | | | (0.47 | )% | | | 0.40 | % | | | 0.32 | % | | | 0.65 | % | | | 0.28 | % | | | 0.22 | % |
Ratio of net investment income (loss) to average net assets(c) | | | (0.49 | )% | | | (0.28 | )% | | | (0.59 | )% | | | (0.54 | )% | | | (0.79 | )% | | | 0.40 | % | | | 0.32 | % | | | 0.64 | % | | | 0.27 | % | | | 0.22 | % |
Portfolio turnover rate | | | 35 | % | | | 162 | % | | | 92 | % | | | 102 | % | | | 175 | % | | | 44 | % | | | 44 | % | | | 44 | % | | | 56 | % | | | 29 | % |
Number of shares outstanding at end of period (000’s) | | | 20,584 | | | | 13,313 | | | | 14,338 | | | | 17,507 | | | | 16,118 | | | | 41,411 | | | | 49,262 | | | | 48,776 | | | | 42,460 | | | | 38,551 | |
Net assets at the end of period (000’s) | | $ | 220,444 | | | $ | 133,988 | | | $ | 120,774 | | | $ | 154,291 | | | $ | 163,273 | | | $ | 916,284 | | | $ | 1,046,046 | | | $ | 997,576 | | | $ | 926,580 | | | $ | 969,591 | |
| (a) | Total return includes, if any, expense reimbursements and expense reductions. The effect of fees and charges incurred at the separate account level are not reflected in these performance figures. If such expenses had been included, the total return would have been lower for each period presented. |
| (b) | Includes expense reimbursements, but excludes expense reductions. |
| (c) | Excludes expense reimbursements and expense reductions. |
| (d) | The per share amounts are calculated using the average share method. |
See Notes to Financial Statements
VALIC Company II
FINANCIAL HIGHLIGHTS — (continued)
Per share data is for a share of beneficial interest outstanding throughout the period. Total return includes reinvestment of distributions on the reinvestment date.
| | | | | | | | | | | | | | | | | | | | | | | | | | | | | | | | | | | | | | | | |
| | | Moderate Growth Lifestyle Fund
| | | Small Cap Growth Fund
| |
| | | Year Ended August 31,
| | | Year Ended August 31,
| |
| | | 2018
| | | 2017
| | | 2016
| | | 2015
| | | 2014
| | | 2018
| | | 2017
| | | 2016
| | | 2015
| | | 2014
| |
| | | | | | | | | | |
PER SHARE DATA | | | | | | | | | | | | | | | | | | | | | | | | | | | | | | | | | | | | | | | | |
Net asset value at beginning of period | | $ | 14.23 | | | $ | 13.98 | | | $ | 14.09 | | | $ | 15.61 | | | $ | 13.93 | | | $ | 16.98 | | | $ | 14.20 | | | $ | 15.31 | | | $ | 16.27 | | | $ | 16.11 | |
| | |
|
|
| |
|
|
|
Income (loss) from investment operations: | | | | | | | | | | | | | | | | | | | | | | | | | | | | | | | | | | | | | | | | |
Net investment income (loss)(d) | | | 0.26 | | | | 0.24 | | | | 0.30 | | | | 0.29 | | | | 0.28 | | | | (0.12 | ) | | | (0.08 | ) | | | (0.03 | ) | | | (0.04 | ) | | | (0.14 | ) |
Net realized and unrealized gain (loss) on investments and foreign currencies | | | 1.08 | | | | 0.92 | | | | 0.70 | | | | (0.65 | ) | | | 1.99 | | | | 7.14 | | | | 3.72 | | | | 0.42 | | | | 0.97 | | | | 1.68 | |
Net increase from payments by affiliates | | | – | | | | – | | | | – | | | | – | | | | – | | | | – | | | | – | | | | – | | | | – | | | | – | |
| | |
|
|
| |
|
|
|
Total income (loss) from investment operations | | | 1.34 | | | | 1.16 | | | | 1.00 | | | | (0.36 | ) | | | 2.27 | | | | 7.02 | | | | 3.64 | | | | 0.39 | | | | 0.93 | | | | 1.54 | |
| | |
|
|
| |
|
|
|
Distributions from: | | | | | | | | | | | | | | | | | | | | | | | | | | | | | | | | | | | | | | | | |
Net investment income | | | (0.24 | ) | | | (0.32 | ) | | | (0.32 | ) | | | (0.28 | ) | | | (0.20 | ) | | | – | | | | – | | | | – | | | | – | | | | – | |
Net realized gain on securities | | | (0.33 | ) | | | (0.59 | ) | | | (0.79 | ) | | | (0.88 | ) | | | (0.39 | ) | | | (0.69 | ) | | | (0.86 | ) | | | (1.50 | ) | | | (1.89 | ) | | | (1.38 | ) |
| | |
|
|
| |
|
|
|
Total distributions | | | (0.57 | ) | | | (0.91 | ) | | | (1.11 | ) | | | (1.16 | ) | | | (0.59 | ) | | | (0.69 | ) | | | (0.86 | ) | | | (1.50 | ) | | | (1.89 | ) | | | (1.38 | ) |
| | |
|
|
| |
|
|
|
Net asset value at end of period | | $ | 15.00 | | | $ | 14.23 | | | $ | 13.98 | | | $ | 14.09 | | | $ | 15.61 | | | $ | 23.31 | | | $ | 16.98 | | | $ | 14.20 | | | $ | 15.31 | | | $ | 16.27 | |
| | |
|
|
| |
|
|
|
TOTAL RETURN(a) | | | 9.44 | % | | | 8.42 | % | | | 7.48 | % | | | (2.68 | )% | | | 16.46 | % | | | 41.51 | % | | | 26.05 | % | | | 4.40 | % | | | 5.26 | % | | | 10.33 | % |
| | |
|
|
| |
|
|
|
| | | | | | | | | | |
RATIOS/SUPPLEMENTAL DATA | | | | | | | | | | | | | | | | | | | | | | | | | | | | | | | | | | | | | | | | |
Ratio of expenses to average net assets(b) | | | 0.10 | %(e) | | | 0.10 | %(e) | | | 0.10 | %(e) | | | 0.10 | %(e) | | | 0.10 | %(e) | | | 1.16 | % | | | 1.16 | % | | | 1.16 | % | | | 1.16 | % | | | 1.16 | % |
Ratio of expenses to average net assets(c) | | | 0.13 | %(e) | | | 0.14 | %(e) | | | 0.14 | %(e) | | | 0.13 | %(e) | | | 0.13 | %(e) | | | 1.22 | % | | | 1.25 | % | | | 1.29 | % | | | 1.25 | % | | | 1.26 | % |
Ratio of expense reduction to average net assets | | | – | | | | – | | | | – | | | | – | | | | – | | | | 0.00 | % | | | 0.00 | % | | | 0.01 | % | | | 0.01 | % | | | 0.00 | % |
Ratio of net investment income (loss) to average net assets(b) | | | 1.75 | %(e) | | | 1.68 | %(e) | | | 2.15 | %(e) | | | 1.92 | %(e) | | | 1.84 | %(e) | | | (0.61 | )% | | | (0.53 | )% | | | (0.22 | )% | | | (0.25 | )% | | | (0.83 | )% |
Ratio of net investment income (loss) to average net assets(c) | | | 1.72 | %(e) | | | 1.65 | %(e) | | | 2.11 | %(e) | | | 1.89 | %(e) | | | 1.81 | %(e) | | | (0.67 | )% | | | (0.62 | )% | | | (0.35 | )% | | | (0.34 | )% | | | (0.93 | )% |
Portfolio turnover rate | | | 47 | % | | | 36 | % | | | 33 | % | | | 30 | % | | | 27 | % | | | 63 | % | | | 40 | % | | | 39 | % | | | 49 | % | | | 63 | % |
Number of shares outstanding at end of period (000’s) | | | 64,297 | | | | 63,003 | | | | 60,581 | | | | 56,655 | | | | 51,152 | | | | 9,239 | | | | 8,088 | | | | 7,035 | | | | 7,185 | | | | 7,001 | |
Net assets at the end of period (000’s) | | $ | 964,607 | | | $ | 896,346 | | | $ | 846,974 | | | $ | 798,444 | | | $ | 798,521 | | | $ | 215,384 | | | $ | 137,330 | | | $ | 99,884 | | | $ | 110,029 | | | $ | 113,907 | |
| (a) | Total return includes, if any, expense reimbursements and expense reductions. The effect of fees and charges incurred at the separate account level are not reflected in these performance figures. If such expenses had been included, the total return would have been lower for each period presented. |
| (b) | Includes expense reimbursements, but excludes expense reductions. |
| (c) | Excludes expense reimbursements and expense reductions. |
| (d) | The per share amounts are calculated using the average share method. |
| (e) | Does not include underlying fund expenses that the Fund bears indirectly. |
See Notes to Financial Statements
VALIC Company II
FINANCIAL HIGHLIGHTS — (continued)
Per share data is for a share of beneficial interest outstanding throughout the period. Total return includes reinvestment of distributions on the reinvestment date.
| | | | | | | | | | | | | | | | | | | | | | | | | | | | | | | | | | | | | | | | |
| | | Small Cap Value Fund
| | | Socially Responsible Fund
| |
| | | Year Ended August 31,
| | | Year Ended August 31,
| |
| | | 2018
| | | 2017
| | | 2016
| | | 2015
| | | 2014
| | | 2018
| | | 2017
| | | 2016
| | | 2015
| | | 2014
| |
| | | | | | | | | | |
PER SHARE DATA | | | | | | | | | | | | | | | | | | | | | | | | | | | | | | | | | | | | | | | | |
Net asset value at beginning of period | | $ | 14.47 | | | $ | 13.57 | | | $ | 14.01 | | | $ | 16.65 | | | $ | 15.83 | | | $ | 20.15 | | | $ | 19.23 | | | $ | 18.55 | | | $ | 18.56 | | | $ | 14.84 | |
| | |
|
|
| |
|
|
|
Income (loss) from investment operations: | | | | | | | | | | | | | | | | | | | | | | | | | | | | | | | | | | | | | | | | |
Net investment income (loss)(d) | | | 0.15 | | | | 0.11 | | | | 0.13 | | | | 0.17 | | | | 0.09 | | | | 0.30 | | | | 0.29 | | | | 0.28 | | | | 0.26 | | | | 0.22 | |
Net realized and unrealized gain (loss) on investments and foreign currencies | | | 2.36 | | | | 1.48 | | | | 1.27 | | | | (0.56 | ) | | | 2.70 | | | | 3.39 | | | | 2.33 | | | | 1.89 | | | | (0.05 | ) | | | 3.74 | |
Net increase from payments by affiliates | | | – | | | | – | | | | – | | | | – | | | | – | | | | – | | | | – | | | | – | | | | – | | | | – | |
| | |
|
|
| |
|
|
|
Total income (loss) from investment operations | | | 2.51 | | | | 1.59 | | | | 1.40 | | | | (0.39 | ) | | | 2.79 | | | | 3.69 | | | | 2.62 | | | | 2.17 | | | | 0.21 | | | | 3.96 | |
| | |
|
|
| |
|
|
|
Distributions from: | | | | | | | | | | | | | | | | | | | | | | | | | | | | | | | | | | | | | | | | |
Net investment income | | | (0.13 | ) | | | (0.14 | ) | | | (0.17 | ) | | | (0.10 | ) | | | (0.17 | ) | | | (0.35 | ) | | | (0.29 | ) | | | (0.28 | ) | | | (0.22 | ) | | | (0.24 | ) |
Net realized gain on securities | | | (1.11 | ) | | | (0.55 | ) | | | (1.67 | ) | | | (2.15 | ) | | | (1.80 | ) | | | (0.40 | ) | | | (1.41 | ) | | | (1.21 | ) | | | – | | | | – | |
| | |
|
|
| |
|
|
|
Total distributions | | | (1.24 | ) | | | (0.69 | ) | | | (1.84 | ) | | | (2.25 | ) | | | (1.97 | ) | | | (0.75 | ) | | | (1.70 | ) | | | (1.49 | ) | | | (0.22 | ) | | | (0.24 | ) |
| | |
|
|
| |
|
|
|
Net asset value at end of period | | $ | 15.74 | | | $ | 14.47 | | | $ | 13.57 | | | $ | 14.01 | | | $ | 16.65 | | | $ | 23.09 | | | $ | 20.15 | | | $ | 19.23 | | | $ | 18.55 | | | $ | 18.56 | |
| | |
|
|
| |
|
|
|
TOTAL RETURN(a) | | | 17.40 | % | | | 11.61 | % | | | 11.27 | % | | | (3.38 | )% | | | 18.39 | % | | | 18.49 | % | | | 13.90 | % | | | 12.16 | % | | | 1.06 | % | | | 26.82 | % |
| | |
|
|
| |
|
|
|
| | | | | | | | | | |
RATIOS/SUPPLEMENTAL DATA | | | | | | | | | | | | | | | | | | | | | | | | | | | | | | | | | | | | | | | | |
Ratio of expenses to average net assets(b) | | | 0.95 | % | | | 0.95 | % | | | 0.95 | % | | | 0.95 | % | | | 0.95 | % | | | 0.56 | % | | | 0.56 | % | | | 0.56 | % | | | 0.56 | % | | | 0.56 | % |
Ratio of expenses to average net assets(c) | | | 1.03 | % | | | 1.03 | % | | | 1.04 | % | | | 1.03 | % | | | 1.03 | % | | | 0.61 | % | | | 0.61 | % | | | 0.61 | % | | | 0.61 | % | | | 0.61 | % |
Ratio of expense reductions to average net assets | | | 0.00 | % | | | 0.00 | % | | | 0.00 | % | | | 0.00 | % | | | 0.01 | % | | | – | | | | – | | | | – | | | | – | | | | – | |
Ratio of net investment income (loss) to average net assets(b) | | | 0.96 | % | | | 0.71 | % | | | 0.98 | % | | | 1.02 | % | | | 0.54 | % | | | 1.37 | % | | | 1.46 | % | | | 1.47 | % | | | 1.35 | % | | | 1.29 | % |
Ratio of net investment income (loss) to average net assets(c) | | | 0.88 | % | | | 0.62 | % | | | 0.89 | % | | | 0.95 | % | | | 0.46 | % | | | 1.33 | % | | | 1.41 | % | | | 1.42 | % | | | 1.31 | % | | | 1.25 | % |
Portfolio turnover rate | | | 46 | % | | | 79 | % | | | 59 | % | | | 50 | % | | | 47 | % | | | 5 | % | | | 0 | % | | | 25 | % | | | 31 | % | | | 26 | % |
Number of shares outstanding at end of period (000’s) | | | 33,971 | | | | 36,582 | | | | 37,866 | | | | 34,784 | | | | 33,516 | | | | 34,175 | | | | 39,701 | | | | 39,360 | | | | 39,153 | | | | 36,604 | |
Net assets at the end of period (000’s) | | $ | 534,548 | | | $ | 529,505 | | | $ | 513,783 | | | $ | 487,157 | | | $ | 558,170 | | | $ | 789,118 | | | $ | 799,898 | | | $ | 756,821 | | | $ | 726,460 | | | $ | 679,235 | |
| (a) | Total return includes, if any, expense reimbursements and expense reductions. The effect of fees and charges incurred at the separate account level are not reflected in these performance figures. If such expenses had been included, the total return would have been lower for each period presented. |
| (b) | Includes expense reimbursements, but excludes expense reductions. |
| (c) | Excludes expense reimbursements and expense reductions. |
| (d) | The per share amounts are calculated using the average share method. |
See Notes to Financial Statements
VALIC Company II
FINANCIAL HIGHLIGHTS — (continued)
Per share data is for a share of beneficial interest outstanding throughout the period. Total return includes reinvestment of distributions on the reinvestment date.
| | | | | | | | | | | | | | | | | | | | |
| | | Strategic Bond Fund
| |
| | | Year Ended August 31,
| |
| | | 2018
| | | 2017
| | | 2016
| | | 2015
| | | 2014
| |
| | | | | |
PER SHARE DATA | | | | | | | | | | | | | | | | | | | | |
Net asset value at beginning of period | | $ | 11.38 | | | $ | 11.28 | | | $ | 11.00 | | | $ | 11.77 | | | $ | 11.23 | |
| | |
|
|
|
Income (loss) from investment operations: | | | | | | | | | | | | | | | | | | | | |
Net investment income (loss)(b) | | | 0.42 | | | | 0.39 | | | | 0.38 | | | | 0.42 | | | | 0.48 | |
Net realized and unrealized gain (loss) on investments and foreign currencies | | | (0.53 | ) | | | 0.13 | | | | 0.39 | | | | (0.68 | ) | | | 0.62 | |
Net increase from payments by affiliates | | | – | | | | – | | | | – | | | | – | | | | – | |
| | |
|
|
|
Total income (loss) from investment operations | | | (0.11 | ) | | | 0.52 | | | | 0.77 | | | | (0.26 | ) | | | 1.10 | |
| | |
|
|
|
Distributions from: | | | | | | | | | | | | | | | | | | | | |
Net investment income | | | (0.41 | ) | | | (0.42 | ) | | | (0.45 | ) | | | (0.41 | ) | | | (0.44 | ) |
Net realized gain on securities | | | – | | | | – | | | | (0.04 | ) | | | (0.10 | ) | | | (0.12 | ) |
| | |
|
|
|
Total distributions | | | (0.41 | ) | | | (0.42 | ) | | | (0.49 | ) | | | (0.51 | ) | | | (0.56 | ) |
| | |
|
|
|
Net asset value at end of period | | $ | 10.86 | | | $ | 11.38 | | | $ | 11.28 | | | $ | 11.00 | | | $ | 11.77 | |
| | |
|
|
|
TOTAL RETURN(a) | | | (0.96 | )% | | | 4.75 | % | | | 7.15 | % | | | (2.32 | )% | | | 9.89 | % |
| | |
|
|
|
| | | | | |
RATIOS/SUPPLEMENTAL DATA | | | | | | | | | | | | | | | | | | | | |
Ratio of expenses to average net assets | | | 0.87 | % | | | 0.88 | % | | | 0.88 | % | | | 0.87 | % | | | 0.88 | % |
Ratio of expenses to average net assets | | | 0.87 | % | | | 0.88 | % | | | 0.88 | % | | | 0.87 | % | | | 0.88 | % |
Ratio of expense reductions to average net assets | | | – | | | | – | | | | – | | | | – | | | | – | |
Ratio of net investment income (loss) to average net assets | | | 3.73 | % | | | 3.48 | % | | | 3.51 | % | | | 3.67 | % | | | 4.11 | % |
Ratio of net investment income (loss) to average net assets | | | 3.73 | % | | | 3.48 | % | | | 3.51 | % | | | 3.67 | % | | | 4.11 | % |
Portfolio turnover rate | | | 133 | % | | | 118 | % | | | 162 | % | | | 132 | % | | | 150 | % |
Number of shares outstanding at end of period (000’s) | | | 78,574 | | | | 65,845 | | | | 72,983 | | | | 71,428 | | | | 64,149 | |
Net assets at the end of period (000’s) | | $ | 853,401 | | | $ | 749,055 | | | $ | 823,464 | | | $ | 785,635 | | | $ | 755,092 | |
| (a) | Total return includes, if any, expense reimbursements and expense reductions. The effect of fees and charges incurred at the separate account level are not reflected in these performance figures. If such expenses had been included, the total return would have been lower for each period presented. |
| (b) | The per share amounts are calculated using the average share method. |
See Notes to Financial Statements
VALIC Company II
REPORT OF INDEPENDENT REGISTERED PUBLIC ACCOUNTING FIRM
To the Board of Trustees of VALIC Company II and Shareholders of each of the fifteen funds listed in the table below
Opinions on the Financial Statements
We have audited the accompanying statements of assets and liabilities, including the schedules of investments, of each of the funds listed in the table below (fifteen funds constituting VALIC Company II, hereafter collectively referred to as the “Funds”) as of August 31, 2018, the related statements of operations for the year ended August 31, 2018, the statements of changes in net assets for each of the two years in the period ended August 31, 2018, including the related notes, and the financial highlights for each of the five years in the period ended August 31, 2018 (collectively referred to as the “financial statements”). In our opinion, the financial statements present fairly, in all material respects, the financial position of each of the Funds as of August 31, 2018, the results of each of their operations for the year then ended, the changes in each of their net assets for each of the two years in the period ended August 31, 2018 and each of the financial highlights for each of the five years in the period ended August 31, 2018 in conformity with accounting principles generally accepted in the United States of America.
VALIC Company II
Aggressive Growth Lifestyle Fund
Capital Appreciation Fund
Conservative Growth Lifestyle Fund
Core Bond Fund
Government Money Market II Fund
High Yield Bond Fund
International Opportunities Fund
Large Cap Value Fund
Mid Cap Growth Fund
Mid Cap Value Fund
Moderate Growth Lifestyle Fund
Small Cap Growth Fund
Small Cap Value Fund
Socially Responsible Fund
Strategic Bond Fund
Basis for Opinions
These financial statements are the responsibility of the Funds’ management. Our responsibility is to express an opinion on the Funds’ financial statements based on our audits. We are a public accounting firm registered with the Public Company Accounting Oversight Board (United States) (“PCAOB”) and are required to be independent with respect to the Funds in accordance with the U.S. federal securities laws and the applicable rules and regulations of the Securities and Exchange Commission and the PCAOB.
We conducted our audits of these financial statements in accordance with the standards of the PCAOB. Those standards require that we plan and perform the audit to obtain reasonable assurance about whether the financial statements are free of material misstatement, whether due to error or fraud.
Our audits included performing procedures to assess the risks of material misstatement of the financial statements, whether due to error or fraud, and performing procedures that respond to those risks. Such procedures included examining, on a test basis, evidence regarding the amounts and disclosures in the financial statements. Our audits also included evaluating the accounting principles used and significant estimates made by management, as well as evaluating the overall presentation of the financial statements.
Our procedures included confirmation of securities owned as of August 31, 2018 by correspondence with the custodian, transfer agents and brokers; when replies were not received from brokers, we performed other auditing procedures. We believe that our audits provide a reasonable basis for our opinions.
/s/ PricewaterhouseCoopers LLP
Houston, Texas
October 25, 2018
We have served as the auditor of one or more investment companies in the VALIC family of funds since 2008.
VALIC Company II
APPROVAL OF ADVISORY AGREEMENTS (unaudited)
At an in-person meeting held on August 6-7, 2018, the Board of Trustees (the “Board”) of VALIC Company II (“VC II”), including the Trustees that are not interested persons of VC II, as such term is defined in the Investment Company Act of 1940, as amended (the “1940 Act”) (the “Independent Trustees”), approved the Investment Advisory Agreement with respect to each series of VC II (each a “Fund,” and collectively, the “Funds”) between The Variable Annuity Life Insurance Company (“VALIC”) and VC II (the “Advisory Agreement”) and the Investment Sub-Advisory Agreements between VALIC and each of the following sub-advisers of VC II (collectively, the “Sub-advisory Agreements”): BNY Mellon Asset Management North America Corporation (“BNY”), Boston Partners Global Investors, Inc. (“Boston Bartners”), Delaware Investments Fund Advisers (“Delaware”), Janus Capital Management, LLC (“Janus”), J.P. Morgan Investment Management, Inc. (“JPMIM”), Massachusetts Financial Services Company (“MFS”), Perkins Investment Management, LLC (“Perkins”),1 PineBridge Investments, LLC (“PineBridge”), SunAmerica Asset Management, LLC (“SunAmerica”) and Wellington Management Company LLP (“Wellington”) (collectively referred to as the “Sub-advisers”). The Advisory Agreement and Sub-advisory Agreements are collectively referred to as the “Advisory Contracts.” Prior to the August 6-7, 2018 meeting at which the Advisory Contracts were approved, the Board also discussed and considered information regarding the proposed continuation of the Advisory Contracts at an in-person meeting held on July 16-17, 2018.
In connection with the approval of the Advisory Contracts, the Board received materials relating to certain factors the Board considered in determining to renew such Advisory Contracts. Those factors included: (1) the nature, extent and quality of services provided by VALIC and the Sub-advisers; (2) the advisory fee and sub-advisory fees charged in connection with VALIC’s and the Sub-advisers’ management of each Fund, compared to advisory fee rates and sub-advisory fee rates of a group of funds with similar investment objectives (respectively, the “Expense Group/Universe” and the “Subadvisory Expense Group/Universe”), as selected by an independent third-party provider of mutual fund data; (3) the investment performance of the Funds compared to performance of comparable funds as selected by an independent third-party provider of investment company data (“Performance Group/Universe”) and against each Fund’s benchmarks; (4) the costs of services and the benefits potentially derived by VALIC, the Sub-advisers and their respective affiliates; (5) a comparison of advisory fee schedules and performance with respect to other mutual funds and accounts with similar investment strategies and/or objectives to the Funds, as applicable, and which are advised or managed by VALIC or SunAmerica, an affiliated Sub-adviser; (6) whether the Funds will benefit from possible economies of scale from engaging VALIC and the Sub-advisers; (7) the profitability of VALIC, the Sub-advisers and their respective affiliates, including amounts retained by VALIC after payment of sub-advisory fees; (8) the terms of the Advisory Contracts; (9) information regarding VALIC’s and the Sub-advisers’ compliance and regulatory history; and (10) information about the services VALIC provides in connection with the oversight of the Sub-advisers.
The Independent Trustees were separately represented by counsel that is independent of VALIC in connection with their consideration of approval of the Advisory Contracts. The matters discussed below were also considered separately by the Independent Trustees in an executive session at an in-person special meeting held on July 16-17, 2018 and executive sessions held during the August 2018 meeting during which such independent counsel provided guidance to the Independent Trustees. Following the July 16-17, 2018 meeting, the Independent Trustees submitted questions and requests for additional information to management, and considered management’s responses thereto at the August 2018 meeting. The continuation of all Advisory Contracts was approved at the August 2018 meeting for a one-year term beginning September 1, 2018 and ending August 31, 2019.
Nature, Extent and Quality of Services. The Board considered the nature, extent and quality of services to be provided to the Funds by VALIC and the Sub-advisers. The Board reviewed information provided by VALIC relating to its operations and personnel. The Board also took into account their knowledge of VALIC’s management and the quality of the performance of VALIC’s duties, through Board meetings, discussions and reports during the preceding year and through VALIC’s long history of service to VC II. The Board considered that VALIC is responsible for the management of the day-to-day operations of VC II, including but not limited to, general supervision of and coordination of the services provided by the Sub-advisers, and is also responsible for monitoring and reviewing the activities of the Sub-advisers and other third-party service providers. The Board also noted that VALIC’s and the Sub-advisers’ management of VC II is subject to the oversight of the Board, and must be made in accordance with the investment objectives, policies and restrictions set forth in VC II’s prospectus and statement of additional information. The Board noted that VALIC monitors the performance of the Funds and from time-to-time recommends Sub-adviser changes and/or other changes designed to improve the performance of the Funds.
The Board noted that VALIC personnel meet on a regular basis to discuss the performance of VC II, as well as the positioning of the insurance products, employer-sponsored retirement plans and the Funds generally vis-à -vis competitors. The Board also considered VALIC’s financial condition and whether it had the financial wherewithal to provide the services under the Advisory Agreement with respect to each Fund. The Board also considered VALIC’s risk management processes.
With respect to the services provided by the Sub-advisers, the Board considered information provided to them regarding the services provided by each Sub-adviser, including information presented throughout the previous year. The Board noted that each Sub-adviser (i) determines the securities to be purchased or sold on behalf of the Funds it manages as may be necessary in connection therewith; (ii) provides VALIC with records concerning its activities, which VALIC or the Funds are required to maintain; and (iii) renders regular reports to VALIC and to officers and Trustees of VC II concerning its discharge of the foregoing responsibilities. The Board reviewed each Sub-adviser’s history and investment experience as well as information regarding the qualifications, background and responsibilities of the Sub-adviser’s investment, compliance and other personnel who provide services to the Funds. The Board also took into account the financial condition of each Sub-adviser. The Board also reviewed each Sub-adviser’s brokerage practices and considered each Sub-adviser’s risk management processes.
The Board reviewed VALIC’s and SunAmerica’s compliance program and personnel. The Board noted that SunAmerica is an affiliated company of VALIC and serves as the administrator to the Funds, as well as sub-advises certain VALIC Company I and VC II Funds. The Board also considered VALIC’s and each Sub-adviser’s regulatory history, including information regarding whether it was currently involved in any regulatory actions or investigations as well as material litigation.
The Board concluded that the scope and quality of the advisory services provided by VALIC and the Sub-advisers were satisfactory and that there was a reasonable basis on which to conclude that each would provide a high quality of investment services to the Funds.
| 1 | Effective June 7, 2010, Perkins became a sub-sub-adviser pursuant to a Sub-Sub-Advisory Agreement between Janus and Perkins. The Board’s consideration and approval of VALIC’s Investment Sub-Advisory Agreement with Janus included a consideration and approval of this Sub-Sub-Advisory Agreement. |
VALIC Company II
APPROVAL OF ADVISORY AGREEMENTS (unaudited) — (continued)
Fees and Expenses; Investment Performance. The Board received and reviewed information regarding each Fund’s total expenses, advisory and sub-advisory fees, and other expenses compared against the expenses and fees of the funds in its Expense Group/Universe and Subadvisory Expense Universe and, in some cases as noted below, the Subadvisory Expense Group. The Board noted that VALIC negotiates the sub-advisory fees with each of the unaffiliated Sub-advisers at arms-length. The Board also considered that the sub-advisory fees are paid by VALIC out of its advisory fees it receives from the Funds and is not paid by the Funds, and that sub-advisory fees may vary widely within the Subadvisory Expense Group/Universe for various reasons, including market pricing demands, existing relationships, experience and success, and individual client needs. The Board noted the affiliation of SunAmerica with VALIC, noting any potential conflicts of interest. The Board also noted that VALIC annually waives a portion of its advisory fee and/or reimburses the expenses of each of the Funds.
The Sub-advisers provided and the Board also considered expense information of comparable accounts managed by the Sub-advisers, as applicable, which accounts may include one or more of the following types of accounts: retail mutual funds, mutual funds sold through variable annuity and variable insurance products, and other institutional-type accounts.
The total expense information, advisory fee information, and sub-advisory fee information considered by the Board, among other fee and expense data, is summarized below. Expense ratio data included in the independent third-party report was based on unaudited data from the semi-annual report dated February 28, 2018.
The Board received and reviewed information prepared by management and by an independent third-party regarding the Funds’ investment performance compared against their benchmarks and their respective Performance Groups/Universes. The Board noted that performance information provided by the independent third-party was for the period ended April 30, 2018, and that the benchmark information provided by management was for the period ended May 31, 2018. The Board also noted that it regularly reviews the performance of the Funds throughout the year. The Board further noted that, although it monitors the Funds’ performance closely, it generally attaches more importance to performance over relatively long periods of time, typically three to five years. The Board considered the following expense and performance information in its evaluation of each Fund:
| | • | | Aggressive Growth Lifestyle Fund (PineBridge). The Fund’s actual management fees and actual sub-advisory fees were above the medians of its Expense Group/Universe and Sub-advisory Expense Universe, as applicable. The Fund’s total net expenses were equal to the median of its Expense Group and below the median of its Expense Universe. The Board took into account management’s discussion of the Fund’s expenses. The Board noted that the expense limitation on total expenses was extended contractually through December 31, 2019. |
The Fund outperformed its Lipper peer index and the medians of its Performance Universe/Group for the one-, three- and five-year periods. The Fund outperformed its blended benchmark for the one-year period and underperformed its blended benchmark for the three- and five-year periods. The Board took into account management’s discussion of the Fund’s performance.
| | • | | Capital Appreciation Fund (BMO AM). The Fund’s total net expenses, actual management fees and actual sub-advisory fees were below the medians of its Expense Group/Universe and Sub-advisory Expense Group/Universe, as applicable. The Board noted that the expense limitation on total expenses was also extended contractually through December 31, 2019. |
The Fund underperformed its Lipper peer index and the medians of its Performance Group/Universe for the one-, three- and five-year periods. The Fund underperformed its benchmark for the one-, three- and five-year periods. The Board took into account management’s discussion of the Fund’s performance.
| | • | | Conservative Growth Lifestyle Fund (PineBridge). The Fund’s actual management fees and actual sub-advisory fees were above the medians of its Expense Group/Universe and Sub-advisory Expense Universe, as applicable. The Fund’s total net expenses were equal to the median of its Expense Group and below the median of its Expense Universe. The Board took into account management’s discussion of the Fund’s expenses. The Board noted the expense limitation on total expenses was extended contractually through December 31, 2019. |
The Fund outperformed its Lipper peer index and the median of its Performance Universe for the one-, three- and five-year periods. The Fund outperformed the median of its Performance Group for the one-year period and underperformed the median of its Performance Group for the three- and five-year periods. The Fund outperformed its blended benchmark for the one-year period and underperformed its blended benchmark for the three- and five-year periods. The Board took into account management’s discussion of the Fund’s performance.
| | • | | Core Bond Fund (PineBridge). The Fund’s actual management fees were above the medians of its Expense Group/Universe. The Fund’s total net expenses were below the median of its Expense Group/ and above the median of its Expense Universe. The Fund’s actual sub-advisory fees were above the median of its Sub-advisory Expense Group and equal to the median of its Sub-advisory Expense Universe. The Board took into account management’s discussion of the Fund’s expenses. The Board noted that the expense limitation on total expenses was extended contractually through December 31, 2019. |
The Fund outperformed its Lipper peer index for the one- and five-year periods and underperformed its Lipper peer index for the three-year period. The Fund outperformed the medians of its Performance Group/Universe for the one-, three- and five-year periods. The Fund underperformed its benchmark for the one-, three- and five-year periods. The Board took into account management’s discussion of the Fund’s performance.
| | • | | Government Money Market II Fund (SunAmerica). The Fund’s actual management fees were above the median of its Expense Group and below the median of its Expense Universe. The Fund’s total net expenses were below the medians of its Expense Group/Universe. The Fund’s actual sub-advisory fees were below the median of its Sub-advisory Expense Universe. The Board took into account management’s discussion of the Fund’s expenses. The Board noted that the expense limitation on total expenses was extended contractually through December 31, 2019. |
The Fund underperformed its Lipper peer index and Performance Universe for the one-, three- and five-year periods. The Fund outperformed the median of its Performance Group for the one-, three- and five-year periods. The Fund underperformed its benchmark for the one-, three- and five-year periods. The Board took into account management’s discussion of the Fund’s performance.
VALIC Company II
APPROVAL OF ADVISORY AGREEMENTS (unaudited) — (continued)
| | • | | High Yield Bond Fund (Wellington). The Fund’s actual management fees and total net expenses were above the medians of its Expense Group/Universe. The Fund’s actual sub-advisory fees were below the median of its Sub-advisory Expense Group and above the median of its Sub-advisory Expense Universe. The Board took into account management’s discussion of the Fund’s expenses. The Board noted that the expense limitation on total expenses was extended contractually through December 31, 2019. |
The Fund outperformed its Lipper peer index for the one- and three-year periods and underperformed its Lipper peer index for the five-year period. The Fund outperformed the medians of its Performance Group/Universe for the one-, three- and five-year periods. The Fund underperformed its benchmark for the one-, three- and five-year periods. The Board took into account management’s discussion of the Fund’s performance.
| | • | | International Opportunities Fund (MFS/Delaware Investments Fund Advisers). The Fund’s actual management fees were above the median of its Expense Group and equal to the median of its Expense Universe. The Fund’s total net expenses were below the medians of its Expense Group/Universe. The Fund’s actual sub-advisory fees were equal to the medians of its Sub-advisory Expense Group/Universe. The Board took into account management’s discussion of the Fund’s expenses. The Board noted that the expense limitation on total expenses was extended contractually through December 31, 2019. |
The Fund’s performance was above the medians of its Performance Group/Universe for the one-, three- and five-year periods. The Fund outperformed its benchmark for the one- and three-year periods and underperformed its benchmark for the five-year period. The Board took into account management’s discussion of the Fund’s performance.
| | • | | Large-Cap Value Fund (Janus Capital Management LLC/Perkins Capital Management LLC/BNY). The Fund’s actual management fees, total net expenses and actual sub-advisory fees were below the medians of its Expense Group/Universe and Sub-advisory Expense Group/Universe, as applicable. The Board noted that the expense limitation on total expenses was also extended contractually through December 31, 2019. |
The Fund outperformed its Lipper peer index and the medians of its Performance Group/Universe for the one-, three- and five-year periods. The Fund outperformed its benchmark for the one-, three- and five-year periods.
| | • | | Mid-Cap Growth Fund (Wellington). The Fund’s actual management fees a were above the medians of its Expense Group/Universe. The Fund’s total net expenses were below the medians of its Expense Group/Universe. The Fund’s actual sub-advisory fees were above the median of its Sub-advisory Expense Group and equal to the median of its Sub-advisory Expense Universe. The Board took into account management’s discussion of the Fund’s expenses. The Board noted that the expense limitation on total expenses was also extended contractually through December 31, 2019. |
The Fund outperformed its Lipper peer index and Performance Group/Universe for the one- and three-year periods and underperformed its Lipper peer index and Performance Group/Universe for the five-year period. The Fund outperformed its benchmark for the one- and three-year periods and underperformed its benchmark for the five-year period. The Board took into account management’s discussion of the Fund’s performance.
| | • | | Mid-Cap Value Fund (Wellington/Boston Partners Global Investors, Inc.). The Fund’s actual management fees, total net expenses and actual sub-advisory fees were below the medians of its Expense Group/Universe and Sub-advisory Expense Group/Universe, as applicable. The expense limitation on total expenses was also extended contractually through December 31, 2019. |
The Fund outperformed its Lipper peer index for the one-year period and underperformed its Lipper peer index for the three- and five-year periods. The Fund outperformed the median of its Performance Group for the one- and three-year periods and underperformed the median of its Performance Group for the five-year period. The Fund outperformed the median of its Performance Universe for the one-, three- and five-year periods. The Fund outperformed its benchmark for the one-year period and underperformed its benchmark for the three- and five-year periods. The Board took into account management’s discussion of the Fund’s performance.
| | • | | Moderate Growth Lifestyle Fund (PineBridge). The Fund’s actual management fees and actual sub-advisory fees were above the medians of its Expense Group/Universe and Sub-advisory Expense Universe, as applicable. The Fund’s total net expenses were above the median of its Expense Group and below the median of its Expense Universe. The Board took into account management’s discussion of the Fund’s expenses. The Board noted that the expense limitation on total expenses was extended contractually through December 31, 2019. |
The Fund outperformed its Lipper peer index and the median of its Performance Universe for the one-, three- and five-year periods. The Fund equaled the performance of the median of its Performance Group for the one-year period and outperformed the median of its Performance Group for the three- and five-year periods. The Fund outperformed its blended benchmark for the one- and three-year periods and underperformed its blended benchmark for the five-year period. The Board took into account management’s discussion of the Fund’s performance.
| | • | | Small-Cap Growth Fund (JPMIM). The Fund’s actual management fees and actual sub-advisory fees were above the medians of its Expense Group/Universe and Sub-advisory Expense Group/Universe, as applicable. The Fund’s total net expenses were below the median of its Expense Group and above the median of its Expense Universe. The Board took into account management’s discussion of the Fund’s expenses. The Board noted that the expense limitation on total expenses was extended contractually through December 31, 2019. |
The Fund outperformed its Lipper peer index and the medians of its Performance Group/Universe for the one-, three- and five-year periods. The Fund outperformed its benchmark for the one-, three- and five-year periods.
| | • | | Small-Cap Value Fund (JPMIM). The Fund’s actual management fees, total net expenses and actual sub-advisory fees were below the medians of its Expense Group/Universe and Sub-advisory Expense Group/Universe. The expense limitation on total expenses was also extended contractually through December 31, 2019. |
The Fund underperformed its Lipper peer index for the one-year period and outperformed its Lipper peer index for the three- and five-year periods. The Fund underperformed the median of its Performance Group for the one- and three-year periods and equaled the performance of the median of its Performance Group for the
VALIC Company II
APPROVAL OF ADVISORY AGREEMENTS (unaudited) — (continued)
five-year period. The Fund underperformed the median of its Performance Universe for the one- and three-year periods and outperformed the median of its Performance Universe for the five-year period. The Fund underperformed its benchmark for the one-, three- and five-year periods. The Board took into account management’s discussion of the Fund’s performance.
| | • | | Socially Responsible Fund (SunAmerica). The Fund’s actual management fees, total net expenses and actual sub-advisory fees were below the medians of its Expense Group/Universe and Sub-advisory Expense Group/Universe, as applicable. The expense limitation on total expenses was also extended contractually through December 31, 2019. |
The Fund outperformed its Lipper peer index and the median of its Performance Universe for the one-, three- and five-year periods. The Fund’s performance was equal to the median of its Performance Group for the one-year period and outperformed the median of its Performance Group for the three- and five-year periods. The Fund underperformed its benchmark for the one- and three-year periods and outperformed its benchmark for the five-year period. The Board took into account management’s discussion of the Fund’s performance.
| | • | | Strategic Bond Fund (PineBridge). The Fund’s actual management fees and actual sub-advisory fees were above the medians of its Expense Group/Universe and Sub-advisory Expense Group/Universe, as applicable. The Fund’s total net expenses were below the medians of its Expense Group/Universe. The Board took into account management’s discussion of the Fund’s expenses. The Board noted that the expense limitation on total expenses was extended contractually through December 31, 2019. |
The Fund outperformed its Lipper peer index for the one-, three- and five-year periods. The Fund underperformed the median of its Performance Group for the one-, three- and five-year periods. The Fund underperformed the median of its Performance Universe for the one-year period, equaled the performance of the median of its Performance Universe for the three-year period, and outperformed the median of its Performance Universe for the five-year period. The Fund outperformed its benchmark for the one-, three- and five-year periods. The Board took into account management’s discussion of the Fund’s performance.
The Board considered management’s discussion of each Fund’s expenses and performance and concluded that each Fund’s overall performance was satisfactory in light of the circumstances or was being appropriately addressed by management. The Board further concluded that the advisory fee and sub-advisory fee for each Fund are fair and reasonable in light of the usual and customary charges made for services of the same nature and quality and the other factors considered.
Cost of Services and Indirect Benefits/Profitability. The Board was provided information related to the cost of services and profits realized in connection with the Advisory Agreement. The Board considered the costs that are borne by the Funds. For its services, VALIC receives a fee, payable monthly from each Fund in an amount that is calculated as a percentage of the average monthly net assets of the respective Fund.
The Board was previously apprised that VALIC generally reviews a number of factors in determining appropriate sub-advisory fee levels. Such factors may include a review of (1) style class peers primarily within the variable annuity and qualified plan universe; (2) key competitor analysis; (3) analysis of the strategies managed by the sub-advisers; (4) product suitability; and (5) special considerations such as competitor sub-account characteristics, uniqueness of the product and prestige of the manager.
The Board considered that VALIC, or its affiliates, will receive benefits in addition to the advisory fee to be paid by the Funds, which include transfer agency fees, administrative services fees, and sub-advisory fees. The Board considered that the transfer agency fees are paid by the Funds for the provision of recordkeeping and shareholder services to contract owners and participants. The transfer agency services are provided at cost, and the payment for such services is allocated to each Fund based on the number of accounts serviced. The Board also noted that VC II pays SunAmerica, an affiliate of VALIC, an annual fee based on each Fund���s average daily net assets, for the provision of certain accounting and administrative services. Out of the fee SunAmerica receives from the Funds, SunAmerica compensates VALIC for certain administrative services, and the Funds’ custodian, State Street Bank and Trust Company, for calculation of the daily net asset value. The Board also noted that SunAmerica receives sub-advisory fees for those Funds for which it serves as sub-adviser. The Board also considered that VC II pays VALIC an annual fee of 0.25% on average daily net assets of each Fund (other than the Lifestyle Funds) pursuant to a Shareholder Services Agreement.
The Board also considered that VALIC may exclude from its taxable income a portion of the ordinary dividends paid by underlying U.S. equities in the Funds to the same extent the Funds receive certain dividends with respect to shares of stock issued by domestic corporations, subject to applicable tax laws and regulations. In addition, it was noted that VALIC may receive foreign tax credits with respect to certain foreign securities held or to be held in certain Funds that benefit VALIC. These benefits can be material. The Board also noted that VALIC and its affiliates may receive revenue sharing payments from certain sub-advisers to the Funds in connection with certain administrative, marketing and other servicing activities, which payments help offset costs for education, marketing activities and training to support sales of the Funds, including sales through variable annuity contracts and variable life insurance policies (“Variable Contracts”) issued by VALIC, as well as occasional gifts, entertainment or other compensation as incentives. In addition, the Board considered that, because shares of the Funds are offered as investment options through Variable Contracts issued by VALIC and its affiliated life insurers (collectively, the “Life Companies”), the investment objectives, strategies and performance of the Funds may positively or negatively impact a Life Company’s ability to hedge and the related hedging costs associated with guarantees that the Life Company may provide as the issuer of the Variable Contracts.
In considering the profitability to VALIC and its affiliates in connection with their relationship with the Funds, the Board reviewed information provided by VALIC setting forth the revenues and other benefits, both direct and indirect, received by VALIC and its affiliates attributable to managing each Fund, the cost of providing such services, and the resulting profitability to VALIC and its affiliates from these relationships. The Board also reviewed VALIC’s profitability on a Fund-by-Fund basis, as well as an Investment Management Profitability Analysis prepared by an independent information service, Broadridge, noting that VALIC’s profitability was generally in the range of the profitability of companies contained in the report. The Board received and reviewed information prepared by VALIC that reflects an allocation of costs that result in a reasonable determination of profitability of VALIC and its affiliates, as adviser, as transfer agent and/or as shareholder servicing agent, as applicable. The Board further considered the amount of sub-advisory fees paid out by VALIC and the amount of the advisory fees that it retained and determined that these amounts were reasonable in light of the services performed by VALIC and the sub-advisers, respectively. In addition, the Board considered the profitability of SunAmerica in its role as the administrator of the Funds and as sub-adviser to certain Funds. The Board concluded that the profitability to VALIC and its affiliates from their relationship with the Funds was reasonable.
VALIC Company II
APPROVAL OF ADVISORY AGREEMENTS (unaudited) — (continued)
In considering the profitability to the Sub-advisers in connection with their relationship to the Funds, the Trustees noted that the fees under the Sub-Advisory Agreements are paid by VALIC out of the advisory fees that VALIC receives under the Advisory Agreement. With respect to the unaffiliated Sub-advisers, the Board also relied on the ability of VALIC to negotiate the Sub-Advisory Agreements and the fees thereunder at arm’s length.
For each of the above reasons, the Trustees determined that the profitability to the Sub-advisers from their relationship with the Funds was not a material factor in their deliberations with respect to consideration of approval of the Investment Sub-Advisory Agreements.
Economies of Scale. The Board noted that the advisory fee rate and sub-advisory fee rates payable to VALIC and each of the Sub-advisers with respect to most of the Funds contain breakpoints, which allow the Funds to participate in any economies of scale. The Board also took into account management’s discussion of the Funds’ advisory fee and sub-advisory fee structure, including with respect to the Funds that do not currently have breakpoints. The Board also considered the effect of each Fund’s growth and size on its performance and fees, noting that if the Funds’ assets increase over time, the Funds may realize other economies of scale if assets increase proportionally more than expenses. The Board further noted that VALIC has agreed to cap the total annual operating expenses of certain Funds. The Board also observed that expense caps and fee waivers benefitted shareholders by limiting total fees even in the absence of breakpoints. The Board concluded that no changes to the advisory fee structure of the Funds were necessary.
For similar reasons as stated above with respect to the Sub-advisers’ profitability and the costs of their providing services, the Board concluded that the potential for economies of scale in the Sub-advisers’ management of the Funds are not a material factor to the approval of the Sub-advisory Agreements, although it was noted that most of the Funds have breakpoints at the sub-advisory fee level.
Terms of the Advisory Contracts. The Board reviewed the terms of the Advisory Contracts including the duties and responsibilities undertaken. The Board also reviewed the terms of payment for services rendered by VALIC and the Sub-advisers and noted that VALIC would compensate the Sub-advisers out of the advisory fees it receives from the Funds. The Board noted that the Sub-Advisory Agreements provide that each Sub-adviser will pay all of its own expenses in connection with the performance of their respective duties as well as the cost of maintaining the staff and personnel as necessary for it to perform its obligations. The Board also considered the termination and liability provisions of the Advisory Contracts and other terms contained therein. The Board concluded that the terms of each of the Advisory Contracts were reasonable.
Compliance. The Board reviewed VALIC’s and the Sub-advisers’ compliance personnel and regulatory history, including information whether it was currently involved in any regulatory actions or investigations. In addition, the Board reviewed information concerning each entities’ compliance staff that would be responsible for providing compliance functions on behalf of the Funds and concluded that there was no information provided that would have a material adverse effect on their abilities to provide services to the Funds.
Conclusions. In reaching its decision to approve the Advisory Contracts, the Board did not identify any single factor as being controlling, but based its recommendation on each of the factors it considered. Each Trustee may have contributed different weight to the various factors. Based upon the materials reviewed, the representations made and the considerations described above, and as part of their deliberations, the Board, including the Independent Trustees, concluded that VALIC and each Sub-adviser possess the capability and resources to perform the duties required of them under their respective Advisory Contracts.
Further, based upon its review of the Advisory Contracts, the materials provided, and the considerations described above, the Board, including the Independent Trustees, concluded that (1) the terms of the Advisory Contracts are reasonable, fair and in the best interests of each of the Funds and its respective shareholders, and (2) the fee rates payable under the Advisory Contracts are fair and reasonable in light of the usual and customary charges made for services of the same nature and quality.
VALIC Company II
APPROVAL OF ADVISORY AGREEMENTS (unaudited) — (continued)
VALIC COMPANY II CAPITAL APPRECIATION FUND APPROVAL OF SUBADVISORY AGREEMENT
At an in-person meeting held on April 23-24, 2018 (the “Meeting”), the Board of Trustees (the “Board”) of VALIC Company II (“VC II”), including the Trustees that are not interested persons of VC II, as such term is defined in the Investment Company Act of 1940, as amended (the “1940 Act”) (the “Independent Trustees”), approved an Investment Sub-Advisory Agreement (the “Sub-Advisory Agreement”) between The Variable Annuity Life Insurance Company (“VALIC”) and BMO Asset Management Corp. (“BMO AM”) with respect to the Capital Appreciation Fund (the “Fund”). In connection with the approval of the Sub-Advisory Agreement with BMO AM, the Board approved the termination of the existing Investment Sub-Advisory Agreement between VALIC and BNY Mellon Asset Management North America Corporation (formerly, The Boston Company Asset Management, LLC) (“BNY”) with respect to the Fund.
In connection with the approval of the Sub-Advisory Agreement, the Board, including the Independent Trustees, received materials relating to certain factors the Board considered in determining whether to approve the Sub-Advisory Agreement. Those factors included: (1) the nature, extent and quality of the services to be provided to the Fund by BMO AM; (2) the sub-advisory fees proposed to be charged in connection with BMO AM’s management of the Fund, compared to sub-advisory fee rates of a group of funds with similar investment objectives, as selected by an independent third-party provider of investment company data (“Subadvisory Expense Group/Universe”); (3) the investment performance of comparable funds as selected by an independent third-party provider of investment company data (“Performance Group”), and the performance of a comparable fund and accounts managed by BMO AM; (4) the costs of services and the benefits potentially to be derived by BMO AM; (5) whether the Fund will benefit from possible economies of scale from engaging BMO AM; (6) information regarding BMO AM’s brokerage and trading practices and compliance and regulatory history; and (7) the terms of the proposed Sub-Advisory Agreement.
In considering whether to approve the Sub-Advisory Agreement, the Board also took into account a presentation made at the Meeting by members of management as well as a presentation made by representatives from BMO AM who responded to questions posed by the Board and management. The Independent Trustees were separately represented by counsel that is independent of VALIC in connection with their consideration of approval of the Sub-Advisory Agreement. The matters discussed below were also considered separately by the Independent Trustees in executive sessions with their independent legal counsel, at which no representatives of management were present.
Nature, Extent and Quality of Services. The Board considered the nature, extent and quality of services to be provided to the Fund by BMO AM. The Board reviewed information provided by BMO AM relating to its operations and personnel. The Board also noted that BMO AM’s management of the Fund will be subject to the oversight of VALIC and the Board, and must be made in accordance with the investment objectives, policies and restrictions set forth in the Fund’s prospectus and statement of additional information.
The Board considered information provided to them regarding the services to be provided by BMO AM. The Board noted that BMO AM will (i) manage the investment and reinvestment of the Fund’s assets; (ii) determine in its discretion the securities and other investments to be purchased or sold; (iii) maintain a trading desk and place orders for the purchase and sale of portfolio securities (or arrange for another entity to provide a trading desk and to place orders) with brokers or dealers selected by BMO AM, subject to its control, direction, and supervision, which may include affiliated brokers or dealers; (iv) keep records adequately demonstrating compliance with its obligations under the Sub-Advisory Agreement; and (v) render regular reports to the Board as VALIC and the Board may reasonably request. The Board reviewed BMO AM’s history and investment experience as well as information regarding the qualifications, background and responsibilities of BMO AM’s investment personnel who would provide services to the Fund. The Board also reviewed BMO AM’s brokerage practices. The Board also noted that it received information on BMO AM’s financial condition and compliance function of BMO AM. The Board also considered BMO AM’s risk management processes and regulatory history, including information regarding whether it was currently involved in any regulatory actions or investigations as well as material litigation that may affect its ability to service the Fund.
The Board concluded that the scope and quality of the sub-advisory services to be provided by BMO AM were expected to be satisfactory and that there was a reasonable basis to conclude that BMO AM would provide a high quality of investment services to the Fund.
Fees and Expenses; Investment Performance. The Board noted that the subadvisory fee rate payable with respect to the Fund would decline as a result of the change in subadviser. The Board considered information received regarding the subadvisory fees paid with respect to the Fund for sub-advisory services compared against the sub-advisory fees of the funds in the Fund’s Subadvisory Expense Group/Universe. The Board also considered expense information of a comparable fund managed by BMO AM; however, the Board noted that BMO AM served as the investment adviser to the comparable fund and, thus, the services provided to the comparable fund were different than the proposed services to be provided to the Fund. The Board noted that VALIC negotiated the sub-advisory fee with BMO AM at arm’s length.
The Board also considered that the sub-advisory fees will be paid by VALIC out of the advisory fees it receives from the Fund, that the sub-advisory fees are not paid by the Fund, and that sub-advisory fees may vary widely for various reasons, including market pricing demands, existing relationships, experience and success, and individual client needs. The Board considered that the appointment of BMO AM will not result in any change to the management fee paid by the Fund to VALIC.
The Board considered that the subadvisory fees paid to BNY, which were paid at a higher rate than the proposed subadvisory fee payable to BMO AM, were below the median of the Fund’s Subadvisory Expense Group/Universe. The Board also considered that the sub-advisory fee rate payable to BMO AM contains breakpoints. The Board also took account of management’s discussion of the Fund’s proposed sub-advisory fees and concluded in light of all factors considered that such fees were reasonable.
The Board also received and reviewed information prepared by an independent third-party provider of mutual fund data regarding the Fund’s investment performance compared against the Performance Group as of the period ended February 28, 2018. The Board also considered the performance of another fund managed by BMO AM using a similar investment strategy as that which BMO AM will use to manage the Fund. The Board noted that such comparable fund outperformed the benchmark index provided for the three- and five-year periods ended February 28, 2018, and underperformed the benchmark index for the year-to-date and one-year periods. The Board also noted that BMO AM’s comparable fund outperformed the Fund for the one-, three- and five-year periods ended February 28, 2018.
Cost of Services and Indirect Benefits/Profitability. The Board considered the cost of services and profits expected to be realized in connection with the Sub-Advisory Agreement. The Board was previously apprised that VALIC generally reviews a number of factors in determining appropriate sub-advisory fee levels. Such factors may include a
VALIC Company II
APPROVAL OF ADVISORY AGREEMENTS (unaudited) — (continued)
review of (1) style class peers primarily within the variable annuity and qualified plan universe; (2) key competitor analysis; (3) analysis of the strategies managed by the subadvisers; (4) product suitability; and (5) special considerations such as competitor sub-account characteristics, uniqueness of the product and prestige of the manager.
The Board considered that the sub-advisory fee payable by VALIC with respect to the Fund would be reduced as a result of the replacement of the Fund’s current subadvisers with BMO AM. The Board, therefore, reviewed information provided by VALIC with respect to the expected impact on its profitability if BMO AM is retained as the Fund’s subadviser. The Board also considered that the sub-advisory fee rate was negotiated with BMO AM at arm’s length. In considering the anticipated profitability to BMO AM in connection with its relationship to the Fund, the Trustees noted that the fees under the Sub-Advisory Agreement will be paid by VALIC out of the advisory fees that VALIC will receive from the Fund.
In light of all the factors considered, the Trustees determined that the anticipated profitability to VALIC was reasonable. The Board also concluded that the anticipated profitability of BMO AM from its relationship with the Fund was not material to their deliberations with respect to consideration of approval of the Sub-Advisory Agreement.
Economies of Scale. For similar reasons as stated above with respect to BMO AM’s anticipated profitability and its costs of providing services, the Board concluded that the potential for economies of scale in BMO AM’s management of the Fund are not a material factor to the approval of the Sub-Advisory Agreement, although the Board noted that the Fund has breakpoints at the sub-advisory fee level.
Terms of the Sub-Advisory Agreement. The Board reviewed the terms of the Sub-Advisory Agreement including the duties and responsibilities to be undertaken. The Board noted that the Sub-Advisory Agreement contained several material changes to the current subadvisory agreement between VALIC and BNY, including, but not limited to, (i) the name of the subadviser; (ii) the effective date of the agreement; (iii) express terms relating to VALIC’s voting of proxies; (iv) BMO AM’s ability to use an affiliate as a broker-dealer or futures commission merchant to effect Fund transactions; (v) terms relating to the indemnity arrangements between VALIC and the subadviser; and (vi) governing law. The Board concluded that the terms of the Sub-Advisory Agreement were reasonable.
Conclusions. In reaching its decision to approve the Sub-Advisory Agreement, the Board did not identify any single factor as being controlling, but based its recommendation on each of the factors it considered. Each Trustee may have contributed different weight to the various factors. Based upon the materials reviewed, the representations made and the considerations described above, and as part of their deliberations, the Board, including the Independent Trustees, concluded that BMO AM possesses the capability and resources to perform the duties required of it under the Sub-Advisory Agreement.
VALIC Company II
TRUSTEE AND OFFICER INFORMATION — August 31, 2018 (unaudited)
| | | | | | | | | | | | | | |
Name, Age
and Address at August 31, 2018* | | Position
Held With
VALIC Complex | | Term of Office
and Length of
Time Served(4) | | | Principal Occupations During Past Five Years | | Number of
Funds in
Fund Complex
Overseen by
Trustee(2) | | | Other Directorships
Held by Trustee(3) |
Independent Trustees | | | | | | | | | | | | | | |
Thomas J. Brown
Age: 72 | | Trustee | |
| 2005-
Present
|
| | Retired | | | 49 | | | Trustee, Virtus Funds (2011-Present). |
Dr. Judith L. Craven
Age: 72 | | Trustee | |
| 1998-
Present |
| | Retired | | | 76 | | | Director, A.G. Belo Corporation, a media company (1992-2014); Director, SYSCO Corporation, a food marketing and distribution company (1996-Present); Director, Luby’s Restaurant (1998-Present). |
William F. Devin
Age: 79 | | Chairman and Trustee(5) | |
| 2001-
Present |
| | Retired | | | 76 | | | None |
Dr. Timothy J. Ebner
Age: 69 | | Trustee | |
| 1998-
Present |
| | Professor and Head, Department of Neuroscience Medical School (1980-Present), and Visscher Chair of Physiology, University of Minnesota (1999-2013); Pickworth Chair (2000-Present) and Scientific Director, Society for Research on the Cerebellum (2008-Present); President, Association of Medical School Neuroscience Department Chairpersons (2011-2014). | | | 49 | | | Trustee, Minnesota Medical Foundation (2003-2013). |
Judge Gustavo E. Gonzales, Jr.
Age: 78 | | Trustee | |
| 1998-
Present |
| | Semi-Retired. Attorney At Law, Criminal Defense and General Practice (2004-2014). Retired Municipal Court Judge, Dallas, TX (since 2004). | | | 49 | | | None. |
Kenneth J. Lavery
Age: 68 | | Trustee | |
| 2001-
Present |
| | Retired, Vice President, Massachusetts Capital Resources Co. (1982-2013). | | | 49 | | | None. |
Dr. John E. Maupin, Jr.
Age: 71 | | Trustee | |
| 1998-
Present |
| | Retired, President, Morehouse School of Medicine, Atlanta, Georgia (2006-2014). | | | 49 | | | Director, LifePoint Hospitals, Inc., hospital management (1999-Present); Director, HealthSouth, Corporation, rehabilitation health care services (2004-Present); Director, Regions Financials Inc., bank holding company (2007-Present). |
Interested Trustees | | | | | | | | | | | | | | |
Peter A. Harbeck(1)
Age: 64 | | Trustee | |
| 2001-
Present |
| | President, CEO and Director, SunAmerica (1995-Present); Director, AIG Capital Services, Inc. (“ACS”) (1993-Present); Chairman, President and CEO, Advisor Group, Inc. (2004-2016) | | | 157 | | | None. |
Eric S. Levy
Age: 53(1) | | Trustee | |
| 2017-
Present
|
| | Executive Vice President, VALIC (2015-Present); Executive Vice President, Group Retirement, AIG (2015-Present); and Senior Vice President, Lincoln Financial Group (2010-2015). | | | 49 | | | None |
Officers | | | | | | | | | | | | | | |
John T. Genoy
Age: 49 | | President and Principal Executive Officer | |
| 2014-
Present |
| | Chief Financial Officer (2002-Present), Senior Vice President, (2003-Present), Chief Operating Officer (2006-Present) and Director (2014-Present), SunAmerica. | | | N/A | | | N/A |
VALIC Company II
TRUSTEE AND OFFICER INFORMATION — August 31, 2018 (unaudited) — (continued)
| | | | | | | | | | | | | | |
Name, Age
and Address at August 31, 2018* | | Position
Held With
VALIC Complex | | Term of Office
and Length of
Time Served(4) | | | Principal Occupations During Past Five Years | | Number of
Funds in
Fund Complex
Overseen by
Trustee(2) | | | Other Directorships
Held by Trustee(3) |
Officers | | | | | | | | | | | | | | |
John Packs
Age: 62 | | Vice President and Senior Investment Officer | |
| 2001-
Present |
| | Senior Investment Officer, VALIC (2001-2013); Senior Vice President, SunAmerica (2008-Present). | | | N/A | | | N/A |
Gregory R. Kingston
Age: 52 | | Treasurer and Principal Financial Officer | |
| 2000-
Present |
| | Vice President (2001-Present) and Head of Mutual Fund Administration (2014-Present), SunAmerica. | |
| N/A
|
| | N/A
|
Gregory N. Bressler
Age: 51 | | Vice President | |
| 2005-
Present |
| | Senior Vice President, General Counsel (2005-Present) and Assistant Secretary (2013-Present), SunAmerica. | | | N/A | | | N/A |
Christopher C. Joe
Age: 48 | | Chief Compliance Officer | |
| 2017 to
Present |
| | Chief Compliance Officer, AIG Funds, Anchor Series Trust, Seasons Series Trust, SunAmerica Series Trust, VALIC Company I and VALIC Company II (2017-Present); Chief Compliance Officer, VALIC Retirement Services Company (2017-Present); Chief Compliance Officer, Invesco PowerShares (2012-2017); Chief Compliance Officer, Invesco Investment Advisers, LLC (2010-2013); U.S. Compliance Director, Invesco Ltd. (2006-2014); Deputy Chief Compliance Officer, Invesco Advisers, LLC (2014-2015). | | | N/A | | | N/A |
Matthew J. Hackethal
Age: 46 | | Anti-Money Laundering (“AML”) Compliance Officer | |
| 2007-
Present |
| | Chief Compliance Officer, SunAmerica (2006-Present), Vice President (2011-Present) and Acting Chief Compliance Officer (2016-2017); AML Compliance Officer, SunAmerica Fund Complex (2006-Present). | | | N/A | | | N/A |
Thomas M. Ward
Age: 51 | | Vice President | |
| 2008-
Present |
| | Vice President (2009-Present), VALIC and VALIC Financial Advisors, Inc. | | | N/A | | | N/A |
Kathleen D. Fuentes
Age: 49 | | Chief Legal Officer, Vice President and Secretary | |
| 2015-
Present |
| | Vice President and Deputy General Counsel, SunAmerica (2006-Present). | | | N/A | | | N/A |
Shawn Parry
Age: 45 | | Vice President and Assistant Treasurer | |
| 2014-
Present |
| | Vice President (2014-Present) and Assistant Vice President (2005-2014), SunAmerica. | | | N/A | | | N/A |
Donna McManus
Age: 57 | | Vice President and Assistant Treasurer | |
| 2014-
Present |
| | Vice President, SunAmerica (2014-Present); Managing Director, BNY Mellon (2009-2014). | | | N/A | | | N/A |
| * | The business address for each Trustee and Officer is, 2929 Allen Parkway, Houston, TX, 77019. |
| (1) | Mr. Harbeck is an “interested trustee,” as defined under the Investment Company Act of 1940, as amended (the “1940 Act”), because Mr. Harbeck is an officer of SunAmerica, which is an affiliate of VALIC, the Funds’ investment adviser. Mr. Levy is an interested trustee because he is an officer of VALIC. |
| (2) | The “Fund Complex” consists of all registered investment company portfolios for which VALIC or an affiliated person of VALIC serves as investment adviser or administrator. The “Fund Complex” includes the Series (15 funds), SunAmerica Speciality Series (6 funds), SunAmerica Equity Funds (2 funds), SunAmerica Income Funds (3 funds), SunAmerica Money Market Funds, Inc. (1 fund), SunAmerica Senior Floating Rate Fund, Inc. (1 fund), SunAmerica Series, Inc. (6 funds), Anchor Series Trust (8 portfolios), Seasons Series Trust (20 portfolios), SunAmerica Series Trust (61 portfolios), and VALIC Company I (34 funds). |
| (3) | Directorships of companies required to report to the Securities and Exchange Commission under the Securities Exchange Act of 1934 (i.e. “public companies”) or other investment companies registered under the 1940 Act. |
| (4) | Trustees serve until their successors are duly elected and qualified. |
| (5) | Effective July 27, 2005, Mr. Devin became Chairman of the Board. |
Additional Information concerning the Trustees and Officers is contained in the Statement of Additional Information and is available without charge by calling 1-800-448-2542.
VALIC Company II
SHAREHOLDERS TAX INFORMATION — August 31, 2018 (unaudited)
Certain tax information regarding the VALIC Company II is required to be provided to the shareholders based upon each Fund’s income and capital gain distributions for the taxable year ended August 31, 2018.
During the year ended August 31, 2018, the Funds paid the following long-term capital gains along with the percentage of ordinary income dividends that qualified for the dividends received deductions for corporations:
| | | | | | | | | | | | | | | | |
Fund
| | Net
Long-Term
Capital Gains
| | | Foreign
Tax Credit*
| | | Foreign
Source Income
| | | Qualifying % for the
Dividends Received
Deduction
| |
Aggressive Growth Lifestyle | | $ | 18,613,877 | | | $ | 181,275 | | | $ | 2,129,374 | | | | 24.33 | % |
Capital Appreciation | | | 4,650,345 | | | | — | | | | — | | | | 100.00 | |
Conservative Growth Lifestyle | | | 1,304,182 | | | | 96,743 | | | | 777,386 | | | | 8.20 | |
Core Bond | | | — | | | | — | | | | — | | | | 0.07 | |
Government Money Market II | | | 3 | | | | — | | | | — | | | | — | |
High Yield Bond | | | — | | | | — | | | | — | | | | 0.17 | |
International Opportunities | | | — | | | | 1,073,203 | | | | 10,984,195 | | | | 0.18 | |
Large Cap Value | | | 8,272,969 | | | | — | | | | — | | | | 100.00 | |
Mid Cap Growth | | | 23,021,560 | | | | — | | | | — | | | | 19.89 | |
Mid Cap Value | | | 68,024,640 | | | | — | | | | — | | | | 100.00 | |
Moderate Growth Lifestyle | | | 18,327,088 | | | | 266,894 | | | | 2,500,879 | | | | 18.60 | |
Small Cap Growth | | | 6,146,636 | | | | — | | | | — | | | | — | |
Small Cap Value | | | 23,149,536 | | | | — | | | | — | | | | 29.08 | |
Socially Responsible | | | 12,605,065 | | | | — | | | | — | | | | 89.05 | |
Strategic Bond | | | — | | | | — | | | | — | | | | 0.28 | |
| * | The Funds make an election under the Internal Revenue Code Section 853 to pass through foreign taxes paid to the shareholders. |
VALIC Company II
COMPARISONS: FUNDS VS. INDEXES (unaudited)
In the following pages, we have included graphs that compare each Fund’s performance with certain market indices. These graphs show the hypothetical growth of a $10,000 investment in each Fund versus the same $10,000 investment in comparable market indices. Descriptions of these market indices are provided below the individual graphs. It is important to note that the VC II Funds are professionally managed mutual funds while the indices are not available for investment and are unmanaged.
Please note that the graphs and tables that accompany the following investment comments include all fund expenses, but do not reflect the charges imposed by the variable annuity contracts or variable life insurance policies (collectively, the “Contracts”), qualifying employer-sponsored retirement plans (the “Plans”), or Individual Retirement Accounts (“IRAs”). All dividends are assumed to be reinvested. No expenses are deducted from the performance of the indices.
Investments in stocks and bonds are subject to risk, including stock market and interest rate fluctuations. Investments in non-U.S. stocks are subject to additional risks, including political and social instability, differing securities regulations and accounting standards, and limited public information. Mortgage-backed securities are subject to prepayment, which can result in reinvestment of principal at lower yields. Money market instruments generally offer stability and income, but an investment in these securities, like investments in other portfolios, are not guaranteed by the U.S. government or any other federal government entity. Lower rated high yield, high-risk securities generally involve more credit risk. These securities may also be subject to greater market price fluctuations than lower yielding, higher rated debt securities. The common stocks of medium-sized companies may be more volatile than those of larger, more established companies. Investing in real estate involves special risks, which may not be associated with investing in stocks, including possible declines in real estate values, adverse economic conditions, and changes in interest rates. Investments in small capitalization and emerging growth companies involve greater than average risk. Such securities may have limited marketability and the issuers may have limited product lines, markets and financial resources. The value of such investments may fluctuate more widely than investments in larger, more established companies. The technology industry can be significantly affected by obsolescence, short product cycles, falling prices and profits, and competition from new market participants. Funding choices that primarily invest in one sector are more volatile than those that diversify across many industry sectors and companies.
VALIC Company II Aggressive Growth Lifestyle Fund
COMPARISON: FUND VS. INDEX (unaudited)
MANAGEMENT OVERVIEW
A discussion with PineBridge Investments, LLC
For the twelve-months ended August 31, 2018, the Aggressive Growth Lifestyle Fund returned 11.39%, compared to 19.66% for the S&P 500® Index and 11.51% for the blended index. The blended index is comprised of 54% Russell 3000 Index, 13% MSCI EAFE Index (net), 25% Bloomberg Barclays U.S. Aggregate Bond Index, and 8% FTSE EPRA/NAREIT Developed Index.
The Aggressive Growth Lifestyle Fund invests in a combination of funds, also known as ‘fund of funds’. The Fund does not select specific sectors, securities, or countries and thus these factors do not influence performance. Rather, the key indicators of performance are asset allocation and manager selection.
The Fund underperformed its benchmark primarily due to its overweight allocation to international equities, which lagged in performance relative to U.S. equities. Asset allocation was a contributor to relative performance, whereas manager selection was a detractor.
The largest contributors to relative performance were VCI Small Cap Index, VCI Mid Cap Index, and VCI Small Cap Special Values. Top individual detractors included VCI Global Real Estate, VCII Core Bond, and VCI Government Securities.
VALIC Company II Aggressive Growth Lifestyle Fund
COMPARISON: FUND VS. INDEX (unaudited) — (continued)
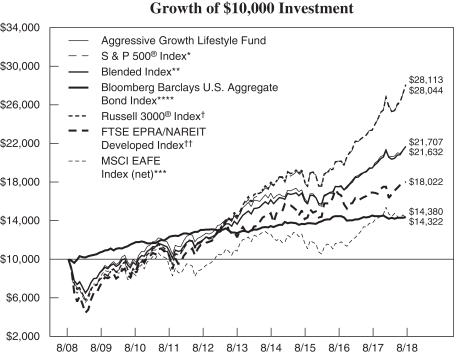
For the year ended August 31, 2018, the Aggressive Growth Lifestyle Fund returned 11.39% compared to 19.66% for the S&P 500® Index and 11.51% for the Blended Index.
| * | The S&P 500® Index is an index of the stocks of 500 major large-cap U.S. corporations, chosen for market size, liquidity, and industry group representation. It is a market-value weighted index, with each stock’s percentage in the Index in proportion to its market value. |
| ** | The Fund’s Blended Index consists of the Russell 3000® Index (54%), MSCI EAFE Index (net) (13%), the Bloomberg Barclays U.S. Aggregate Bond Index (25%) and the FTSE/EPRA NAREIT Developed Index (8%). |
| *** | The MSCI EAFE Index (Europe, Australasia, Far East) (net) is a free float-adjusted market capitalization index that is designed to measure the equity market performance of developed markets, excluding the U.S. & Canada. The MSCI EAFE Index consists of the following 21 developed market country indexes: Australia, Austria, Belgium, Denmark, Finland, France, Germany, Hong Kong, Ireland, Israel, Italy, Japan, the Netherlands, New Zealand, Norway, Portugal, Singapore, Spain, Sweden, Switzerland, and the United Kingdom. The net index approximates the minimum possible dividend reinvestment and assumes that the dividend is reinvested after the deduction of withholding tax, applying the rate to nonresident individuals who do not benefit from double taxation treaties. |
| **** | The Bloomberg Barclays U.S. Aggregate Bond Index is an unmanaged index that measures the investment grade, U.S. dollar-denominated, fixed-rate taxable bond market, including Treasuries, government-related and corporate securities, mortgage- and asset-backed securities and commercial mortgage-backed securities. |
| † | The Russell 3000® Index follows the 3,000 largest U.S. companies, based on total market capitalization. |
| †† | The FTSE EPRA/NAREIT Developed Index is a global market capitalization weighted index composed of listed real estate securities in the North American, European and Asian real estate markets. |
| | | | |
| Average Annual Total Return as of August 31, 2018 |
| 1 Year | | 5 Years | | 10 Years |
| 11.39% | | 8.84% | | 8.02% |
Past performance is not predictive of future performance. The performance data quoted represents past performance; past performance does not guarantee future results; the investment return and principal value of an investment will fluctuate so that an investor’s shares, when redeemed, may be worth more or less than their original cost; current performance may be lower or higher than the performance data quoted.
The Fund’s returns reflect investment management fees and other Fund expenses. Charges imposed by the Variable Contracts, Plans or IRAs that invest in the Fund are not included in the Fund’s returns.
Indices are not managed and an investor can not invest directly into an index.
VALIC Company II Capital Appreciation Fund
COMPARISON: FUND VS. INDEX (unaudited)
MANAGEMENT OVERVIEW
The Capital Appreciation Fund posted a return of 27.94% for the twelve-month period ending August 31, 2018, compared to a return of 27.23% for the Russell 1000® Growth Index.
A discussion with The Boston Company Asset Management, LLC (“The Boston Co.”).
The Boston Co. managed the Fund from the beginning of the fiscal year through June 6, 2018 and during this period, the Fund underperformed the benchmark slightly. Sector allocation relative to the benchmark was additive for the period. Security selection was just slightly additive for the period.
Strong stock selection in the information technology and consumer staples sectors was additive to overall results. As was the lack of exposure to the real estate sector.
Top individual contributors during the period included positions in Square, Inc., Class A, Nvidia Corp., and Fortinet, Inc.
Weak selection within consumer discretionary and the industrials sectors detracted from overall results.
The bottom performing names included limited exposure to Newell Brands, Inc., not owning Netflix, Inc. and Charter Communications, Inc., Class A.
A discussion with BMO Asset Management, LLC (“BMO AM”).
For the period since BMO AM began managing the fund on June 7, 2018 through August 31, 2018, the fund outperformed the benchmark.
The Fund outperformed the benchmark for the period due to strong stock selection relative to the benchmark. Sector allocation was slightly negative for the period.
The strategy’s underweight position in industrials and overweight position in real estate added to returns, while an overweight position in energy detracted.
The Fund outperformance was driven by the strategy’s multifactor stock selection. The strategy’s emphasis on companies with attractive valuations was a significant driver of performance. The allocation to more reasonably priced securities in the large cap growth universe was additive during the period.
Top individual contributors during the period included positions in Fortinet, Inc., Eli Lilly & Co., and Facebook, Inc., Class A.
The bottom performing names included Red Hat, Inc., Estee Lauder Cos., Inc., Class A and Intel Corp.
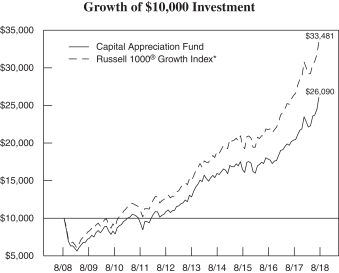
For the year ended August 31, 2018, the Capital Appreciation Fund returned 27.94% compared to 27.23% for the Russell 1000® Growth Index.
| * | The Russell 1000® Growth Index measures the performance of those Russell 1000 companies with higher price-to-book ratios and higher forecasted growth values. |
| | | | |
| Average Annual Total Return as of August 31, 2018 |
| 1 Year | | 5 Years | | 10 Years |
| 27.94% | | 15.25% | | 10.06% |
Past performance is not predictive of future performance. The performance data quoted represents past performance; past performance does not guarantee future results; the investment return and principal value of an investment will fluctuate so that an investor’s shares, when redeemed, may be worth more or less than their original cost; current performance may be lower or higher than the performance data quoted.
The Fund’s returns reflect investment management fees and other Fund expenses. Charges imposed by the Variable Contracts, Plans or IRAs that invest in the Fund are not included in the Fund’s returns.
Indices are not managed and an investor can not invest directly into an index.
VALIC Company II Conservative Growth Lifestyle Fund
COMPARISON: FUND VS. INDEX (unaudited)
MANAGEMENT OVERVIEW
A discussion with PineBridge Investments, LLC
For the twelve-months ended August 31, 2018, the Conservative Growth Lifestyle Fund returned 4.94%, compared to 19.66% for the S&P 500® Index and 4.49% for the blended index. The blended index is comprised of 24% Russell 3000 Index, 8% MSCI EAFE Index (net), 65% Bloomberg Barclays U.S. Aggregate Bond Index, and 3% FTSE EPRA/NAREIT Developed Index.
The Conservative Growth Lifestyle Fund invests in a combination of funds, also known as ‘fund of funds’. The Fund does not select specific sectors, securities, or countries and thus these factors do not influence performance. Rather, the key indicators of performance are asset allocation and manager selection.
The Fund underperformed versus the S&P 500® Index and outperformed versus the blended index. The outperformance versus the blended index was primarily due to its underweight allocation to high yield and emerging market debt. Within fixed income, in the past year, the Fund has largely been in credit assets such as high yield. Overall, asset allocation (in terms of overweighting equities rather than underweighting bonds) was a contributor to relative performance whereas manager selection was a slight detractor.
The largest contributors to relative performance were VCI Small Cap Special Values, VCI Mid Cap Index, and VCI Small Cap Index. Top individual detractors included VCI Emerging Economies, VCI International Equities, and VCII Core Bond.
VALIC Company II Conservative Growth Lifestyle Fund
COMPARISON: FUND VS. INDEX (unaudited) — (continued)
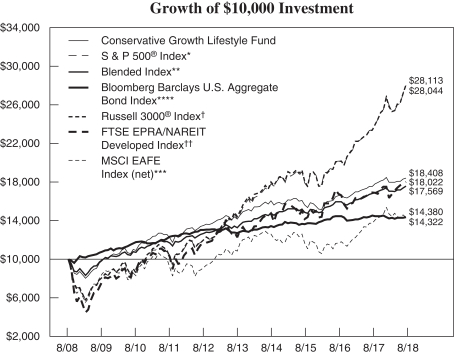
For the year ended August 31, 2018, the Conservative Growth Lifestyle Fund returned 4.94% compared to 19.66% for the S&P 500® Index and 4.49% for the Blended Index.
| * | The S&P 500® Index is an index of the stocks of 500 major large-cap U.S. corporations, chosen for market size, liquidity, and industry group representation. It is a market-value weighted index, with each stock’s percentage in the Index in proportion to its market value. |
| ** | The Fund’s Blended Index consists of the Russell 3000® Index (24%), MSCI EAFE Index (net) (8%), the Bloomberg Barclays U.S. Aggregate Bond Index (65%) and the FTSE EPRA/NAREIT Developed Index (3%). |
| *** | The MSCI EAFE Index (Europe, Australasia, Far East) (net) is a free float-adjusted market capitalization index that is designed to measure the equity market performance of developed markets, excluding the U.S. & Canada. The MSCI EAFE Index consists of the following 21 developed market country indexes: Australia, Austria, Belgium, Denmark, Finland, France, Germany, Hong Kong, Ireland, Israel, Italy, Japan, the Netherlands, New Zealand, Norway, Portugal, Singapore, Spain, Sweden, Switzerland, and the United Kingdom. The net index approximates the minimum possible dividend reinvestment and assumes that the dividend is reinvested after the deduction of withholding tax, applying the rate to nonresident individuals who do not benefit from double taxation treaties. |
| **** | The Bloomberg Barclays U.S. Aggregate Bond Index is an unmanaged index that measures the investment grade, U.S. dollar-denominated, fixed-rate taxable bond market, including Treasuries, government-related and corporate securities, mortgage- and asset-backed securities and commercial mortgage-backed securities. |
| † | The Russell 3000® Index follows the 3,000 largest U.S. companies, based on total market capitalization. |
| †† | The FTSE EPRA/NAREIT Developed Index is a global market capitalization weighted index composed of listed real estate securities in the North American, European and Asian real estate markets. |
| | | | |
| Average Annual Total Return as of August 31, 2018 |
| 1 Year | | 5 Years | | 10 Years |
| 4.94% | | 5.39% | | 6.29% |
Past performance is not predictive of future performance. The performance data quoted represents past performance; past performance does not guarantee future results; the investment return and principal value of an investment will fluctuate so that an investor’s shares, when redeemed, may be worth more or less than their original cost; current performance may be lower or higher than the performance data quoted.
The Fund’s returns reflect investment management fees and other Fund expenses. Charges imposed by the Variable Contracts, Plans or IRAs that invest in the Fund are not included in the Fund’s returns.
Indices are not managed and an investor can not invest directly into an index.
VALIC Company II Core Bond Fund
COMPARISON: FUND VS. INDEX (unaudited)
MANAGEMENT OVERVIEW
A discussion with PineBridge Investments, LLC.
The Core Bond Fund posted a return of -1.32% for the twelve-month period ending August 31, 2018, compared to a return of -1.05% for the Bloomberg Barclays U.S. Aggregate Bond Index.
In aggregate, sector selection had a positive effect on the relative performance of the fund. An underweight allocation to treasuries and overweight allocations to industrials contributed to performance. The fund’s overweight non-corporate credit detracted from performance. Non-corporate credit refers to the entire government related sector including supranational and quasi-sovereigns as well as sovereign and munis.
Security selection was a key driver of outperformance during the year, accounting for a large portion of the fund’s excess returns. Security selection within the industrial and financial sectors was the primary driver of excess returns for the year.
The Fund’s yield curve positioning detracted from performance as rates were rising during the period.
Top individual contributors include Valeant Pharmaceuticals International, Inc. (5.88% due 05/15/2023), Marathon Oil Corp. (6.60% due 10/01/2037) and AT&T, Inc. (4.90% due 08/14/2037).
Top individual detractors include Telecom Italia Capital SA (7.72% due 06/04/2038), UniCredit SpA (5.86% due 06/19/2027) and Republic of Argentina (8.28% due 12/31/2033).
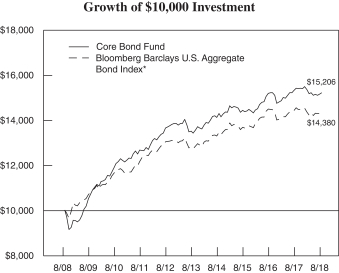
For the year ended August 31, 2018, the Core Bond Fund returned -1.32% compared to -1.05% for the Bloomberg Barclays U.S. Aggregate Bond Index.
| * | The Bloomberg Barclays U.S. Aggregate Bond Index is an unmanaged index that measures the investment grade, U.S. dollar-denominated, fixed-rate taxable bond market, including Treasuries, government-related and corporate securities, mortgage- and asset-backed securities and commercial mortgage-backed securities. |
| | | | |
| Average Annual Total Return as of August 31, 2018 |
| 1 Year | | 5 Years | | 10 Years |
| -1.32% | | 2.53% | | 4.28% |
Past performance is not predictive of future performance. The performance data quoted represents past performance; past performance does not guarantee future results; the investment return and principal value of an investment will fluctuate so that an investor’s shares, when redeemed, may be worth more or less than their original cost; current performance may be lower or higher than the performance data quoted.
The Fund’s returns reflect investment management fees and other Fund expenses. Charges imposed by the Variable Contracts, Plans or IRAs that invest in the Fund are not included in the Fund’s returns.
Indices are not managed and an investor can not invest directly into an index.
VALIC Company II Government Money Market II Fund
COMPARISON: FUND VS. INDEX (unaudited)
MANAGEMENT OVERVIEW
A discussion with SunAmerica Asset Management, LLC
The Government Money Market II Fund posted a return of 0.91% for the twelve-month period ending August 31, 2018, compared to a return of 1.49% for the FTSE Treasury Bill 3 Month Index.
Throughout the year, the Federal Open Market Committee (FOMC) raised rates multiple times.
The Fund was overweight in government agencies, especially Federal Home Loan Bank (FHLB) and Federal National Mtg. Assoc. (FNMA) securities, which positively attributed to performance. The Federal Home Loan Bank had higher funding needs throughout the year and had more attractive levels versus other securities.
The Fund’s positions in Federal Farm Credit (FFCB) securities detracted from relative performance. While the FFCB holdings had an overall positive return, however, they did not perform as well as other holdings.
| | | | |
| Average Annual Total Return as of August 31, 2018 |
| 1 Year | | 5 Years | | 10 Years |
| 0.91% | | 0.22% | | 0.20% |
Past performance is not predictive of future performance. The performance data quoted represents past performance; past performance does not guarantee future results; the investment return and principal value of an investment will fluctuate so that an investor’s shares, when redeemed, may be worth more or less than their original cost; current performance may be lower or higher than the performance data quoted.
The Fund’s returns reflect investment management fees and other Fund expenses. Charges imposed by the Variable Contracts, Plans or IRAs that invest in the Fund are not included in the Fund’s returns.
VALIC Company II High Yield Bond Fund
COMPARISON: FUND VS. INDEX (unaudited)
MANAGEMENT OVERVIEW
A discussion with Wellington Management Company LLP.
The High Yield Bond Fund posted a return of 2.89% for the twelve-month period ending August 31, 2018, compared to its benchmark, the FTSE US High-Yield Market Index, which returned 3.55%.
Security selection contributed favorable to relative performance over the trailing 12-month period. Selection within the energy, pharmaceuticals, and technology contributed to relative performance. Selection within the consumer products, financial institutions, and restaurants detracted from performance for the period.
Overall sector allocation detracted from performance of the Fund for the period. An underweight position in energy as well as overweight positions in the gaming and packaging sectors detracted most from relative performance. In contrast, underweight positions in the retailers and automotive sectors as well as an overweight position in pharmaceuticals positively contributed to relative performance.
Top individual contributors during the period included positions in Bausch Health Cos, Inc, Continental Resources, Inc, and Denbury Resources. Top individual detractors from relative performance included positions in Revlon Consumer Products Corp., Banco Bilbaco Vizcaya Argentaria SA, and EchoStar Corp.
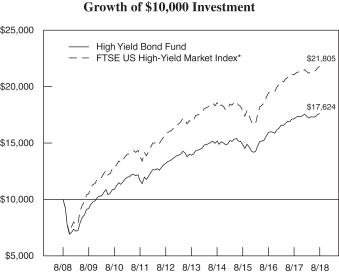
For the year ended August 31, 2018, the High Yield Bond Fund returned 2.89% compared to 3.55% for the FTSE US High-Yield Market Index.
| * | The FTSE US High-Yield Market Index measures the performance of below investment grade debt issued by corporations domiciled in the U.S or Canada. All of the bonds in such index are publicly placed, have a fixed coupon, and are nonconvertible. Effective July 31, 2018, Citigroup High-Yield Market Index changed names to FTSE US High-Yield Market Index. |
| | | | |
| Average Annual Total Return as of August 31, 2018 |
| 1 Year | | 5 Years | | 10 Years |
| 2.89% | | 4.84% | | 5.83% |
Past performance is not predictive of future performance. The performance data quoted represents past performance; past performance does not guarantee future results; the investment return and principal value of an investment will fluctuate so that an investor’s shares, when redeemed, may be worth more or less than their original cost; current performance may be lower or higher than the performance data quoted.
The Fund’s returns reflect investment management fees and other Fund expenses. Charges imposed by the Variable Contracts, Plans or IRAs that invest in the Fund are not included in the Fund’s returns.
Indices are not managed and an investor can not invest directly into an index.
VALIC Company II International Opportunities Fund
COMPARISON: FUND VS. INDEX (unaudited)
MANAGEMENT OVERVIEW
The International Opportunities Fund posted a return of 10.81% for the twelve-month period ending August 31, 2018, compared to a return of 7.46% for the MSCI EAFE Small Cap Index (net).
A discussion with Massachusetts Financial Services Company – regarding their portion of the Fund (the “portfolio”)
The portfolio outperformed the benchmark for the twelve-month period, driven primarily by stock selection. Sector allocation was a detractor to relative performance for the same period.
Stock selection within the information technology, industrials, and consumer staples sectors were the biggest contributors to performance for the period.
The top individual contributors to performance included OBIC Co., Ltd., Amadeus IT Group SA, and EPAM Systems, Inc.
Stock selection within the consumer discretionary and health care sectors as well as underweight allocation to energy were the biggest detractors from performance during the period.
The top individual detractors from performance included Dignity PLC, Elior Group SA, and not owning Ocado Group PLC.
A discussion with Delaware Investments Fund Advisers – regarding their portion of the Fund (the “portfolio”)
The portfolio outperformed the benchmark for the twelve-month period, driven primarily by stock selection. Sector allocation was a detractor to relative performance for the same period.
Stock selection within the real estate, financials, and consumer staples sectors were the biggest contributors to performance for the period.
The top individual contributors to performance included Fevertree Drinks PLC, Kingdee International Software Group Co., Ltd., and Royal Unibrew A/S.
Stock selection within the consumer discretionary, telecommunication services, and utilities sectors were the largest detractors from performance during the period.
The top individual detractors from performance included Azul S.A. Sponsored ADR Pfd, Trevali Mining Corporation, and Scandic Hotels Group AB.
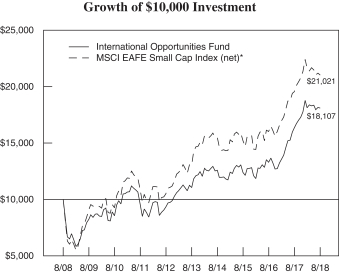
For the year ended August 31, 2018, the International Opportunities Fund returned 10.81% compared to 7.46% for the MSCI EAFE Small Cap Index (net).
| * | The MSCI EAFE Small Cap Index (net) is an unmanaged index considered representative of small-cap stocks of Europe, Australasia and the Far East. The net index approximates the minimum possible dividend reinvestment and assumes that the dividend is reinvested after the deduction of withholding tax, applying the rate to non-resident individuals who do not benefit from double taxation treaties. |
| | | | |
| Average Annual Total Return as of August 31, 2018 |
| 1 Year | | 5 Years | | 10 Years |
| 10.81% | | 10.36% | | 6.12% |
Past performance is not predictive of future performance. The performance data quoted represents past performance; past performance does not guarantee future results; the investment return and principal value of an investment will fluctuate so that an investor’s shares, when redeemed, may be worth more or less than their original cost; current performance may be lower or higher than the performance data quoted.
The Fund’s returns reflect investment management fees and other Fund expenses. Charges imposed by the Variable Contracts, Plans or IRAs that invest in the Fund are not included in the Fund’s returns.
Indices are not managed and an investor can not invest directly into an index.
VALIC Company II Large Cap Value Fund
COMPARISON: FUND VS. INDEX (unaudited)
MANAGEMENT OVERVIEW
The Large Cap Value Fund posted a return of 15.12% for the twelve-month period ending August 31, 2018, compared to a return of 12.47% for the Russell 1000® Value Index.
A discussion with Perkins Investment Management, LLC a Janus Henderson Global Investors plc Company – regarding their portion of the Fund (the “portfolio”)
Overall, both stock selection and sector allocation contributed to the portfolio’s underperformance versus the benchmark. Stock selection in the financials, materials, and energy sectors detracted from relative returns. Relative contributors were led by stock selection in the industrials and consumer staples sectors. An overweight to the strong information technology sector was another contributor.
The largest individual detractors included Crown Holdings, Delphi Technologies PLC, and PPL Corp. Among the leading individual contributors were XL Group Ltd.,
Twenty-First Century Fox, Inc., Class B and Occidental Petroleum Corp.
A discussion with The Boston Company Asset Management, LLC – regarding their portion of the Fund (the “portfolio”)
Overall, both stock selection and sector allocation contributed to the portfolio’s outperformance versus the benchmark. On a sector basis, stock selection in energy and industrials delivered strong relative results. Another large contributor was an underweight to the underperforming utilities sector. Larger detractors included stock selection in the real estate and consumer discretionary sectors. An overweight to the underperforming industrials sector also detracted from results.
Among individual positions, some of the largest positive contributions were made by holdings in Cisco Systems, Inc., JPMorgan Chase & Co., and Occidental Petroleum Corp. Holdings in Exxon Mobil Corporation, Kraft Heinz Company, and Comcast Corp., Class A were large detractors.
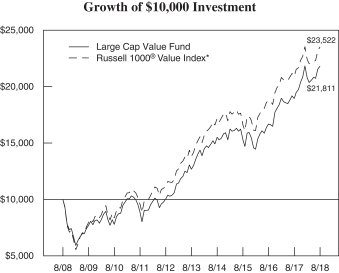
For the year ended August 31, 2018, the Large Cap Value Fund returned 15.12% as compared to 12.47% for the Russell 1000® Value Index.
| * | The Russell 1000® Value Index measures the performance of those Russell 1000 companies with lower price-to-book ratios and lower forecasted growth values. |
| | | | |
| Average Annual Total Return as of August 31, 2018 |
| 1 Year | | 5 Years | | 10 Years |
| 15.12% | | 11.48% | | 8.11% |
Past performance is not predictive of future performance. The performance data quoted represents past performance; past performance does not guarantee future results; the investment return and principal value of an investment will fluctuate so that an investor’s shares, when redeemed, may be worth more or less than their original cost; current performance may be lower or higher than the performance data quoted.
The Fund’s returns reflect investment management fees and other Fund expenses. Charges imposed by the Variable Contracts, Plans or IRAs that invest in the Fund are not included in the Fund’s returns.
Indices are not managed and an investor can not invest directly into an index.
VALIC Company II Mid Cap Growth Fund
COMPARISON: FUND VS. INDEX (unaudited)
MANAGEMENT OVERVIEW
The Mid Cap Growth Fund posted a return of 25.54% for the twelve-month period ending August 31, 2018, compared to a return of 20.00% for the S&P Mid Cap 400® Index.
A discussion with Wellington Management Company LLP.
The Fund outperformed the benchmark for the period due to strong stock selection relative to the benchmark. Sector allocation was also positive for the period.
The Fund’s overweight allocations to the health care and information technology sectors and underweight allocation to the real estate sector aided relative performance.
Top relative contributors included Sage Therapeutics, Inc., TransUnion, and Neurocrine Biosciences, Inc.
An underweight allocation to the energy sector, along with a fractional cash balance, partially offset positive relative performance.
Top relative detractors included TESARO and Ionis Pharmaceuticals, Inc., as well as our lack of holdings in Abiomed.
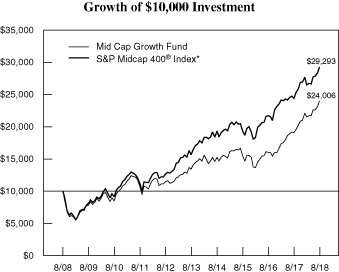
For the year ended August 31, 2018, the Mid Cap Growth Fund returned 25.54% compared to 20.00% for the S&P MidCap 400® Index.
| * | The S&P MidCap 400® Index is an index of the stocks of 400 domestic stocks chosen for market size, liquidity, and industry group representation. It is a market value weighted index, with each stock’s percentage in the Index in proportion to its market value. |
| | | | |
| Average Annual Total Return as of August 31, 2018 |
| 1 Year | | 5 Years | | 10 Years |
| 25.54% | | 12.33% | | 9.15% |
Past performance is not predictive of future performance. The performance data quoted represents past performance; past performance does not guarantee future results; the investment return and principal value of an investment will fluctuate so that an investor’s shares, when redeemed, may be worth more or less than their original cost; current performance may be lower or higher than the performance data quoted.
The Fund’s returns reflect investment management fees and other Fund expenses. Charges imposed by the Variable Contracts, Plans or IRAs that invest in the Fund are not included in the Fund’s returns.
Indices are not managed and an investor can not invest directly into an index.
VALIC Company II Mid Cap Value Fund
COMPARISON: FUND VS. INDEX (unaudited)
MANAGEMENT OVERVIEW
The Mid Cap Value Fund posted a return of 12.90% for the twelve-month period ending August 31, 2018, compared to a return of 12.67% for the Russell Mid Cap Value Index.
A discussion with Wellington Management Company LLP – regarding their portion of the Fund (the “portfolio”)
Overall, sector allocation was the primary contributor to the portfolio’s outperformance versus the benchmark. The portfolio’s overweight allocation to the strong information technology sector, as well as an underweight allocation to the real estate sector aided relative performance. Another strong contribution to performance was security selection in the real estate sector.
Overall stock selection detracted from relative performance. Weak selection in the healthcare, energy, and telecommunication services sectors were larger detractors.
Top individual contributors to performance included Comerica Inc., XL Group, and Microsemi. Top individual detractors included Acacia Communications, Goodyear Tire & Rubber, and lack of exposure to Twitter Inc.
A discussion with Boston Partners – regarding their portion of the Fund (the “portfolio”)
Overall, sector allocation was the primary contributor to the portfolio’s outperformance versus the benchmark. The overweight positioning in the information technology sector was a strong contributing factor. Also, strong security selection in financials and industrials made significant contributions.
Security selection was negative overall during the period, primarily due to stock selections in the information technology, utilities, and materials sectors.
Among the largest individual contributors were Discover Financial Services, Huntington Bancshares Incorporated, and XL Group Ltd. Larger individual detractors included a lack of exposure to Twitter, Inc. and active weights in eBay Inc. and Arrow Electronics, Inc.
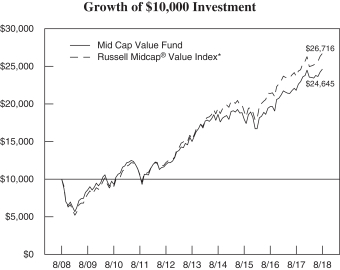
For the year ended August 31, 2018, the Mid Cap Value Fund returned 12.90% compared to 12.67% for the Russell Midcap® Value Index.
| * | The Russell Midcap® Value Index measures the performance of the mid-cap value segment of the U.S. equity universe. It includes those Russell Midcap Index companies with lower price-to-book ratios and lower forecasted growth values. The Russell Midcap® Value Index is constructed to provide a comprehensive and unbiased barometer of the mid-cap value market. The index is completely reconstituted annually to ensure larger stocks do not distort the performance and characteristics of the true mid-cap value market. |
| | | | |
| Average Annual Total Return as of August 31, 2018 |
| 1 Year | | 5 Years | | 10 Years |
| 12.90% | | 10.42% | | 9.44% |
Past performance is not predictive of future performance. The performance data quoted represents past performance; past performance does not guarantee future results; the investment return and principal value of an investment will fluctuate so that an investor’s shares, when redeemed, may be worth more or less than their original cost; current performance may be lower or higher than the performance data quoted.
The Fund’s returns reflect investment management fees and other Fund expenses. Charges imposed by the Variable Contracts, Plans or IRAs that invest in the Fund are not included in the Fund’s returns.
Indices are not managed and an investor can not invest directly into an index.
VALIC Company II Moderate Growth Lifestyle Fund
COMPARISON: FUND VS. INDEX (unaudited)
MANAGEMENT OVERVIEW
A discussion with PineBridge Investments, LLC
For the twelve-month period ended August 31, 2018, the Moderate Growth Lifestyle Fund returned 9.44%, compared to 19.66% for the S&P 500® Index and 8.10% for the Fund’s Blended Index. The blended index is comprised of 40% Russell 3000 Index, 10% MSCI EAFE Index (net), 45% Bloomberg Barclays U.S. Aggregate Bond Index, and 5% FTSE EPRA/NAREIT Developed Index.
The Moderate Growth Lifestyle Fund invests in a combination of funds, also known as ‘fund of funds’. The Fund does not select specific sectors, securities, or countries and thus these factors do not influence performance. Rather, the key indicators of performance are asset allocation and manager selection.
The Fund underperformed versus the S&P 500® Index and outperformed versus the blended index. The outperformance versus the blended index was due to asset allocation primarily due to its overweight allocation to U.S. equities, particularly in the strong U.S. small cap equity segment and the science and technology sector. Overall, manager selection detracted from relative performance.
The largest contributors to relative performance were VCI Small Cap Index, VCI Mid Cap Index, and VCI Small Cap Special Values. Top individual detractors included VCI Emerging Economies, VCII Core Bond, and VCII Strategic Bond.
VALIC Company II Moderate Growth Lifestyle Fund
COMPARISON: FUND VS. INDEX (unaudited) — (continued)
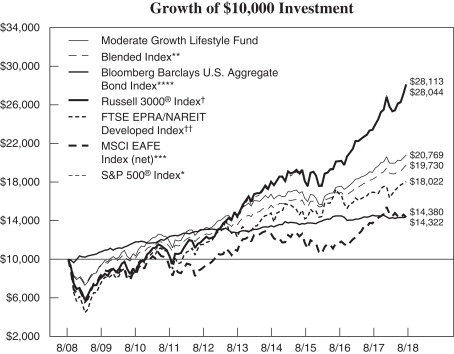
For the year ended August 31, 2018, the Moderate Growth Lifestyle Fund returned 9.44% compared to 19.66% for the S&P 500® Index and 8.10% for the Blended Index.
| * | The S&P 500® Index is an index of the stocks of 500 major large-cap U.S. corporations, chosen for market size, liquidity, and industry group representation. It is a market-value weighted index, with each stock’s percentage in the Index in proportion to its market value. |
| ** | The Blended Index consists of the Russell 3000® Index (40%), MSCI EAFE Index (net) (10%), the Bloomberg Barclays U.S. Aggregate Bond Index (45%) and the FTSE EPRA/NAREIT Developed Index (5%). |
| *** | The MSCI EAFE Index (Europe, Australasia, Far East) (net) is a free float-adjusted market capitalization index that is designed to measure the equity market performance of developed markets, excluding the U.S. & Canada. The MSCI EAFE Index consists of the following 21 developed market country indexes: Australia, Austria, Belgium, Denmark, Finland, France, Germany, Hong Kong, Ireland, Israel, Italy, Japan, the Netherlands, New Zealand, Norway, Portugal, Singapore, Spain, Sweden, Switzerland, and the United Kingdom. The net index approximates the minimum possible dividend reinvestment and assumes that the dividend is reinvested after the deduction of withholding tax, applying the rate to nonresident individuals who do not benefit from double taxation treaties. |
| **** | The Bloomberg Barclays U.S. Aggregate Bond Index is an unmanaged index that measures the investment grade, U.S. dollar-denominated, fixed-rate taxable bond market, including Treasuries, government-related and corporate securities, mortgage- and asset-backed securities and commercial mortgage-backed securities. |
| † | The Russell 3000® Index follows the 3,000 largest U.S. companies, based on total market capitalization. |
| †† | The FTSE EPRA/NAREIT Developed Index is a global market capitalization weighted index composed of listed real estate securities in the North American, European and Asian real estate markets. |
| | | | |
| Average Annual Total Return as of August 31, 2018 |
| 1 Year | | 5 Years | | 10 Years |
| 9.44% | | 7.65% | | 7.58% |
Past performance is not predictive of future performance. The performance data quoted represents past performance; past performance does not guarantee future results; the investment return and principal value of an investment will fluctuate so that an investor’s shares, when redeemed, may be worth more or less than their original cost; current performance may be lower or higher than the performance data quoted.
The Fund’s returns reflect investment management fees and other Fund expenses. Charges imposed by the Variable Contracts, Plans or IRAs that invest in the Fund are not included in the Fund’s returns.
Indices are not managed and an investor can not invest directly into an index.
VALIC Company II Small Cap Growth Fund
COMPARISON: FUND VS. INDEX (unaudited)
MANAGEMENT OVERVIEW
A discussion with J.P. Morgan Investment Management Inc.
The Small Cap Growth Fund posted a return of 41.51% for the twelve-month period ending August 31, 2018, compared to a return of 30.72% for the Russell 2000 Growth Index.
The Fund outperformed the benchmark for the period. Stock selection was the primary driver of outperformance during the period. Sector allocation was also additive for the period.
The top performing names included; Nektar Therapeutics (a non-benchmark holding), Teladoc Health, Inc., and Nutanix, Inc. (also a non-benchmark holding).
Stock selection was the primary driver of outperformance during the period. Stock selection within information technology, as well as the health care sector, were the largest contributors to performance
The bottom performing names included; Summit Materials Inc., Class A, Lithis Mtrs Inc., and lack of exposure to Trade Desk, Inc., Class A.
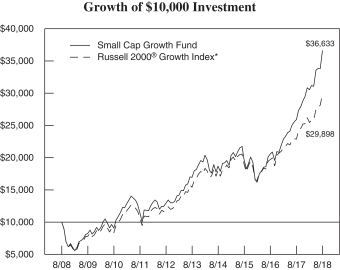
For the year ended August 31, 2018, the Small Cap Growth Fund returned 41.51% compared to 30.72% for the Russell 2000® Growth Index.
| * | The Russell 2000® Growth Index measures the performance of those Russell 2000® companies with higher price-to-book ratios and higher forecasted growth values. |
| | | | |
| Average Annual Total Return as of August 31, 2018 |
| 1 Year | | 5 Years | | 10 Years |
| 41.51% | | 16.68% | | 13.86% |
Past performance is not predictive of future performance. The performance data quoted represents past performance; past performance does not guarantee future results; the investment return and principal value of an investment will fluctuate so that an investor’s shares, when redeemed, may be worth more or less than their original cost; current performance may be lower or higher than the performance data quoted.
The Fund’s returns reflect investment management fees and other Fund expenses. Charges imposed by the Variable Contracts, Plans or IRAs that invest in the Fund are not included in the Fund’s returns.
Indices are not managed and an investor can not invest directly into an index.
VALIC Company II Small Cap Value Fund
COMPARISON: FUND VS. INDEX (unaudited)
MANAGEMENT OVERVIEW
The Small Cap Value Fund posted a return of 17.40% for the twelve-month period ending August 31, 2018, compared to a return of 20.05% for the Russell 2000® Value Index.
A discussion with J.P. Morgan Investment Management Inc. – regarding the Quality/Development of capital prudently/Valuation strategy portion of the Fund (the “portfolio”)
Stock selection was mainly responsible for the underperformance versus the benchmark. Poor stock selection in the healthcare, consumer discretionary, and telecommunication services sectors detracted from results. Alternatively, stock selection in the energy and materials sectors contributed to performance. An overweight to the strong healthcare sector was another strong contributor to performance.
At the individual stock level, positions in Consolidated Communications Holdings, Inc. and Tech Data Corp. detracted from performance. Not owning strong performer Cree, Inc. was an additional significant detractor. Individual contributors to performance included the portfolio’s positions in FTI Consulting, Inc., Delek U.S. Holdings, Inc., and Denbury Resources, Inc.
A discussion with J.P. Morgan Investment Management Inc. – regarding the Trends/Momentum/Valuation strategy portion of the Fund (the “portfolio”)
Stock selection was mainly responsible for the underperformance versus the benchmark. Stock selection in the healthcare, consumer discretionary, and information technology sectors detracted the most from performance. Alternatively, strong stock selection in the energy and materials sectors, and an overweight to the strong industrials sector contributed to results.
At the individual stock level, positions in Community Health Systems, Inc. and Iconix Brand Group, Inc. detracted from performance. Not owning strong performer Cree, Inc. was an additional significant detractor. Individual contributors to performance included the portfolio’s positions in Denbury Resources, Inc., General Cable Corp., and ArcBest Corp.
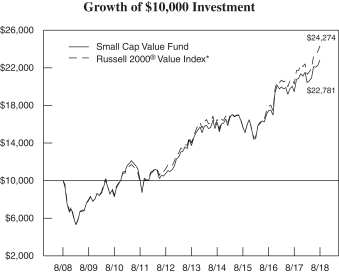
For the year ended August 31, 2018, the Small Cap Value Fund returned 17.40% compared to 20.05% for the Russell 2000® Value Index.
| * | The Russell 2000® Value Index measures the performance of those Russell 2000® companies with lower price-to-book ratios and lower forecasted growth values. |
| | | | |
| Average Annual Total Return as of August 31, 2018 |
| 1 Year | | 5 Years | | 10 Years |
| 17.40% | | 10.77% | | 8.58% |
Past performance is not predictive of future performance. The performance data quoted represents past performance; past performance does not guarantee future results; the investment return and principal value of an investment will fluctuate so that an investor’s shares, when redeemed, may be worth more or less than their original cost; current performance may be lower or higher than the performance data quoted.
The Fund’s returns reflect investment management fees and other Fund expenses. Charges imposed by the Variable Contracts, Plans or IRAs that invest in the Fund are not included in the Fund’s returns.
Indices are not managed and an investor can not invest directly into an index.
VALIC Company II Socially Responsible Fund
COMPARISON: FUND VS. INDEX (unaudited)
MANAGEMENT OVERVIEW
A discussion with SunAmerica Asset Management, LLC.
The Socially Responsible Fund posted a return of 18.49% for the twelve-month period ending August 31, 2018, compared to its benchmark, the S&P 500 Index, which returned 19.66%.
The VALIC Company II Socially Responsible Fund is an optimized portfolio which tries to track the S&P 500 Index, while investing in socially compliant companies. As with all Socially Responsible Funds, there will be performance discrepancies due to social criteria, trading, cash, and pricing effects. The Fund’s social criteria screen eliminates companies that significantly participate in the alcohol, firearms, gambling, tobacco, nuclear power, weapons, labor/employee relations and environmental performance industries.
The Fund benefited from security selection in the industrial, healthcare, and energy sectors. Underweight allocation and stock selection in the telecom sector also proved beneficial, as did an overweight to technology. In terms of positioning, not owning General Electric Company and Philip Morris International Inc. also proved advantageous.
While, on the whole stock selection and sector allocation positively contributed to overall performance, select names within Consumer Discretionary offset much of those gains. Factors offsetting gains included: 1) underweight exposure and stock selection in consumer staples; 2) sector investments among consumer staples and financial companies; and 3) an overweight in the real estate sector. Not owning Amazon.com, Inc. and Apple Inc. also negatively impacted performance.
On an absolute basis, investments in Microsoft Corp., Mastercard, Inc., Class A, and Visa, Inc., Class A positively contributed to relative performance. The top detractors to relative performance for the period included Celgene Corp., Facebook, Inc., Class A, and Newell Brands, Inc.
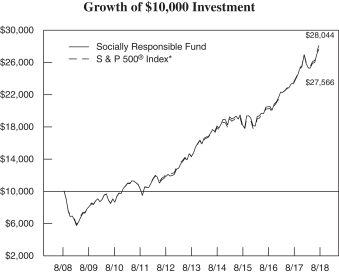
For the year ended August 31, 2018, the Socially Responsible Fund returned 18.49% compared to 19.66% for the S&P 500® Index.
| * | The S&P 500® Index is an index of the stocks of 500 major large-cap U.S. corporations, chosen for market size, liquidity, and industry group representation. It is a market-value weighted index, with each stock’s percentage in the Index in proportion to its market value. |
| | | | |
| Average Annual Total Return as of August 31, 2018 |
| 1 Year | | 5 Years | | 10 Years |
| 18.49% | | 14.17% | | 10.67% |
Past performance is not predictive of future performance. The performance data quoted represents past performance; past performance does not guarantee future results; the investment return and principal value of an investment will fluctuate so that an investor’s shares, when redeemed, may be worth more or less than their original cost; current performance may be lower or higher than the performance data quoted.
The Fund’s returns reflect investment management fees and other Fund expenses. Charges imposed by the Variable Contracts, Plans or IRAs that invest in the Fund are not included in the Fund’s returns.
Indices are not managed and an investor can not invest directly into an index.
VALIC Company II Strategic Bond Fund
COMPARISON: FUND VS. INDEX (unaudited)
MANAGEMENT OVERVIEW
A discussion with PineBridge Investments, LLC
The Strategic Bond Fund posted a return of -0.96% for the twelve-month period ending August 31, 2018, compared to its benchmark, the Bloomberg Barclays Capital U.S. Aggregate Bond Index, which returned -1.05%.
Sector selection contributed to performance for the period. The fund benefitted from an underweight allocation to treasuries and an overweight allocation to Energy. An underweight allocation to 30-year agency MBS detracted from performance during the period.
Security selection also contributed to performance during the year. The largest contributions came from holdings in the energy and consumer cyclical services sectors. Security selection among sovereign issuers detracted from performance.
Currency forwards were the only derivatives utilized during the period. They were used to hedge non-dollar positions and not for speculative purposes and contributed positively to the Fund’s total return.
Yield curve positioning contributed to performance marginally during this period.
Top individual contributors include Bausch Health Co., (5.88% due 05/15/2023), Meg Energy Corp., (6.38% due 01/30/2023), and Intel Corp., (8.13% due 06/01/2023).
Top detractors include Turkey Treasury, (6.63% due 02/17/2045), Diebold Inc., (8.50% due 04/15/2024), and Argentina Treasury, (8.28% due 12/31/2033).
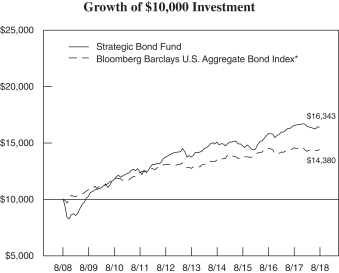
For the year ended August 31, 2018, the Strategic Bond Fund returned -0.96% compared to -1.05% for the Bloomberg Barclays U.S. Aggregate Bond Index.
| * | The Bloomberg Barclays U.S. Aggregate Bond Index is an unmanaged index that measures the investment grade, U.S. dollar-denominated, fixed-rate taxable bond market, including Treasuries, government-related and corporate securities, mortgage- and asset-backed securities and commercial mortgage-backed securities. |
| | | | |
| Average Annual Total Return as of August 31, 2018 |
| 1 Year | | 5 Years | | 10 Years |
| -0.96% | | 3.60% | | 5.03% |
Past performance is not predictive of future performance. The performance data quoted represents past performance; past performance does not guarantee future results; the investment return and principal value of an investment will fluctuate so that an investor’s shares, when redeemed, may be worth more or less than their original cost; current performance may be lower or higher than the performance data quoted.
The Fund’s returns reflect investment management fees and other Fund expenses. Charges imposed by the Variable Contracts, Plans or IRAs that invest in the Fund are not included in the Fund’s returns.
Indices are not managed and an investor can not invest directly into an index.
VALIC Company II
SUPPLEMENTS TO THE PROSPECTUS
THE SUPPLEMENTS ARE NOT PART OF ANNUAL REPORT.
VALIC COMPANY II
SOCIALLY RESPONSIBLE FUND
(the “Fund”)
SUPPLEMENT DATED MAY 7, 2018, TO THE FUND’S
PROSPECTUS DATED JANUARY 1, 2018, AS AMENDED
Effective May 7, 2018:
In the section entitled “Fund Summary: Socially Responsible Fund — Investment Adviser,” the table under the heading “Portfolio Managers” is deleted in its entirety and replaced with the following:
| | | | |
Name and Title
| | Portfolio Manager of
the Fund Since
| |
Timothy Campion Lead Portfolio Manager | | | 2012 | |
Jane Bayar Algieri Co-Portfolio Manager | | | 2015 | |
In the section entitled “Management — Investment Subadvisers,” the third paragraph with respect to SunAmerica Asset Management, LLC (“SunAmerica”) on page 81 of the Prospectus is deleted in its entirety and replaced with the following:
The Socially Responsible Fund is managed by a team consisting of Timothy Campion and Jane Bayar Algieri, with Mr. Campion serving as team leader. Mr. Campion is a Senior Vice President and Portfolio Manager at SunAmerica. He is responsible for the management and trading of a wide variety of social and domestic equity index funds. Mr. Campion joined SunAmerica in 2012. Prior to joining SunAmerica, he was Vice President and Portfolio Manager at PineBridge since 1999. Ms. Bayar Algieri joined SunAmerica in 2004. She is a Portfolio Manager on index and social funds. Previously at SunAmerica, Ms. Bayar Algieri was an equity analyst and assistant portfolio manager on fixed income funds. Ms. Bayar Algieri received her B.A. from Baruch College and her M.B.A. from Rutgers School of Business.
Capitalized terms used but not defined herein shall have the meanings assigned to them by the Prospectus.
Please retain this supplement for future reference.
VALIC Company II
BOARD OF TRUSTEES
Thomas J. Brown
Judith L. Craven
William F. Devin
Timothy J. Ebner
Gustavo E. Gonzales, Jr.
Peter A. Harbeck
Kenneth J. Lavery
Eric S. Levy
John E. Maupin, Jr.
CUSTODIAN
State Street Bank and Trust Company
One Lincoln Street
Boston, Massachusetts 02111
INVESTMENT ADVISER
The Variable Annuity
Life Insurance Company (VALIC)
2929 Allen Parkway
Houston, Texas 77019
INVESTMENT SUBADVISERS
BMO Asset Management Corp.
115 S. LaSalle Street
Chicago, Illinois 60603
Delaware Investments Fund Advisers
2005 Market Street
Philadelphia, PA 19103
J.P. Morgan Investment Management Inc.
270 Park Avenue
New York, New York 10017
Janus Capital Management, LLC
151 Detroit Street
Denver, Colorado 80206
Massachusetts Financial Services Company
111 Huntington Avenue
Boston, MA 02199
PineBridge Investments, LLC
399 Park Avenue
New York, New York 10022
Boston Partners Global Investors, Inc. d/b/a Boston Partners
909 Third Avenue, 32nd Floor
New York, New York 10022
SunAmerica Asset Management, LLC
Haborside 5
185 Hudson Street, Suite 3300
Jersey City, New Jersey 07311
The Boston Company Asset Management, LLC
One Boston Place
Boston, Massachusetts 02108
Wellington Management Company LLP
280 Congress Street
Boston, Massachusetts 02210
INDEPENDENT REGISTERED PUBLIC ACCOUNTING FIRM
PricewaterhouseCoopers LLP
1000 Louisiana Street, Suite 5800
Houston, Texas 77002
TRANSFER AND SHAREHOLDER SERVICE AGENT
VALIC Retirement
Services Company (VRSCO)
2929 Allen Parkway
Houston, Texas 77019
OFFICERS
John T. Genoy,
President and Principal Executive Officer
John Packs,
Vice President and Senior Investment Officer
Gregory R. Kingston,
Treasurer and Principal Financial Officer
Kathleen Fuentes,
Vice President, Chief Legal Officer and Secretary
Gregory N. Bressler,
Vice President
Thomas M. Ward,
Vice President
Shawn Parry,
Vice President and Assistant Treasurer
Donna McManus,
Vice President and Assistant Treasurer
Christopher C. Joe,
Chief Compliance Officer
Matthew J. Hackethal,
Anti-Money Laundering Compliance Officer
Christopher J. Tafone,
Assistant Secretary
DISCLOSURE OF QUARTERLY FUND PORTFOLIO HOLDINGS
VC II is required to file its complete schedule of portfolio holdings with the U.S. Securities and Exchange Commission for its first and third fiscal quarters on Form N-Q. VC II’s Forms N-Q are available on the U.S. Securities and Exchange Commission’s website at www.sec.gov. You can also review and obtain copies of Forms N-Q at the U.S. Securities and Exchange Commission’s Public Reference Room in Washington, DC (information on the operation of the Public Reference Room may be obtained by calling 1-800-SEC-0330).
VOTING PROXIES ON VALIC COMPANY II PORTFOLIO SECURITIES
A description of the policies and procedures that VC II uses to determine how to vote proxies related to securities held in the Fund’s portfolios, which is available in VC II’s Statement of Additional Information, may be obtained without charge upon request, by calling 800-448-2542. This information is also available from the EDGAR database on the U.S. Securities and Exchange Commission’s website at http://www.sec.gov.
PROXY VOTING RECORD ON VALIC COMPANY II PORTFOLIO SECURITIES
Information regarding how VC II voted proxies relating to securities held in the VC II Funds portfolios during the most recent twelve month period ended June 30, is available, once filed with the U.S. Securities and Exchange Commission without charge, upon request, by calling 800-448-2542 or on the U.S. Securities and Exchange Commission’s website at http://www.sec.gov.
This report is for the information of the shareholders and variable contract owners investing in VC II. It is authorized for distribution to other persons only when preceded or accompanied by an effective prospectus which contains information on how to purchase shares and other pertinent information.
If you would like further information about this material or products issued by VALIC or American General Life Insurance Company, please contact your financial professional.
VALIC.com — Account access
| | |
You will need to create an online security profile with a unique user ID and password. With your PIN, you can also access your account via the 24-hour VALIC automated phone line at 1-800-448-2542. | | Manage your account online • Print and download account transaction confirmations and tax statements • View transaction history and download it to Quicken using Direct ConnectSM • Use the Account Aggregation feature to display information from other accounts in addition to your VALIC accounts • Easily manage your personal profile to update your contact information (phone, address, email), update your beneficiaries, reset your password, and more |
| | With VALIC.com, you can initiate account transactions including: • Change allocation • Transfer money among investment options • Rebalance account to your desired allocation mix • Change contributions • Automate future contribution increases |
| | | Start exploring VALIC.com today! |
| | | • Visit VALIC.com • Register for online access • Follow steps to create a security profile |
| | | PersonalDeliver-e® |
| | | • It’s easy to sign up • Simply visit VALIC.com today to get started |
| | | Please note: Email delivery is not accessible to certain VALIC annuity contract owners. |
Easy and secure. Sign up for PersonalDeliver-e® today. CLICK VALIC.com CALL 1-800-448-2542 VISIT your financial advisor | | Sign up today at VALIC.com We know privacy is important to you, so please be assured that your email address and other information you share with us is kept private and never sold. Review our Privacy Policy online for more information. Securities and investment advisory services offered through VALIC Financial Advisors, Inc. (“VFA”), member FINRA, SIPC and an SEC-registered investment advisor. VFA registered representatives offer securities and other products under retirement plans and IRAs, and to clients outside of such arrangements. Annuities issued by The Variable Annuity Life Insurance Company (“VALIC”). Variable annuities distributed by its affiliate, AIG Capital Services, Inc. (“ACS”), member FINRA. VALIC, VFA and ACS are members of American International Group, Inc. (“AIG”). |
| | | Copyright © The Variable Annuity Life Insurance Company. All rights reserved. VC 23800 (06/2017) J102011 EE |
| | |
VALIC Company II P.O. Box 3206 Houston, TX 77253-3206 | | PRST STD U.S. POSTAGE PAID LANCASTER, PA PERMIT NO. 1765 |
VC 11288 (09/2018) J102713
VALIC Company II (the “registrant”) has adopted a Code of Ethics applicable to its Principal Executive and Principal Accounting Officers pursuant to Section 406 of the Sarbanes-Oxley Act of 2002 (the Code”). During the fiscal year ended August 31, 2018, there were no reportable waivers or implicit waivers to a provision of the Code that applies to the registrant’s Principal Executive and Principal Accounting Officers (the “Covered Officers”).
| Item 3. | Audit Committee Financial Expert. |
The registrant’s Board of Trustees has determined that Thomas J. Brown, the Chairman of the registrant’s Audit Committee, qualifies as an audit committee financial expert, as defined in instructions to Item 3(b) of Form N-CSR. Mr. Brown is considered to be “independent” for purposes of Item 3(a)(2) of Form N-CSR.
| Item 4. | Principal Accountant Fees and Services. |
(a) - (d) Aggregate fees billed to the registrant for the last two fiscal years for professional services rendered by the registrant’s principal accountant were as follows:
| | | | | | | | |
| | | 2017 | | | 2018 | |
(a) Audit Fees | | $ | 421,625 | | | $ | 434,275 | |
(b) Audit-Related Fees | | $ | 0 | | | $ | 0 | |
(c) Tax Fees | | $ | 0 | | | $ | 0 | |
(d) All Other Fees | | $ | 0 | | | $ | 0 | |
Audit Fees include amounts related to the audit of the registrant’s annual financial statements and services normally provided by the principal accountant in connection with statutory and regulatory filings.
Aggregate fees billed to the investment adviser and Adviser Affiliates (as defined below in Item 4(e)) that are required to be pre-approved pursuant to paragraph (c)(7)(ii) of Rule 2-01 of Regulation S-X for the last two fiscal years for services rendered by the registrant’s principal accountant were as follows:
| | | | | | | | |
| | | 2017 | | | 2018 | |
(b) Audit-Related Fees | | $ | 0 | | | $ | 0 | |
(c) Tax Fees | | $ | 0 | | | $ | 0 | |
(d) All Other Fees | | $ | 296,820 | | | $ | 269,506 | |
All other fees are for professional services rendered by the registrant’s principal accountant for services associated with issuing a SSAE16 report and Third Party Assurance report.
| | (e) (1) | The registrant’s audit committee pre-approves all audit services provided by the registrant’s principal accountant for the registrant and all non-audit services provided by the registrant’s principal accountant for the |
| | registrant, its investment adviser and any entity controlling, controlled by, or under common control with the investment adviser (“Adviser Affiliates”) that provides ongoing services to the registrant, if the engagement by the investment adviser or Adviser Affiliate relates directly to the operations and financial reporting of the registrant. The audit committee has not presently established any pre-approval policies and procedures that permit the pre-approval of the above services other than by the full audit committee. Certain de minimis exceptions are allowed for non-audit services in accordance with Rule 2-01(c)(7)(i)(C) of Regulation S-X as set forth in the registrant's audit committee charter. |
| | (2) | No services included in (b) - (d) above in connection with fees billed to the registrant or the investment adviser or Adviser Affiliates were approved pursuant to paragraph (c)(7)(i)(C) of Rule 2-01 of Regulation S-X. |
| | (g) | The aggregate fees billed for the most recent fiscal year and the preceding fiscal year by the registrant’s principal accountant for non-audit services rendered to the registrant, its investment adviser, and Adviser Affiliates that provides ongoing services to the registrant for 2017 and 2018 were $322,505 and $295,961, respectively. |
| | (h) | Non-audit services rendered to the registrant’s investment adviser and any Adviser Affiliates that provides ongoing services to the registrant that were not pre-approved pursuant to paragraph (c)(7)(ii) of Rule 2-01 of Regulation S-X were considered by the registrant’s audit committee as to whether they were compatible with maintaining the principal accountant’s independence. |
| Item 5. | Audit Committee of Listed Registrants. |
Not applicable.
Included in Item 1 to the Form.
| Item 7. | Disclosure of Proxy Voting Policies and Procedures for Closed-End Management Investment Companies. |
Not applicable.
| Item 8. | Portfolio Managers of Closed-End Management Investment Companies. |
Not applicable.
| Item 9. | Purchases of Equity Securities by Closed-End Management Investment Company and Affiliated Purchasers. |
Not applicable.
| Item 10. | Submission of Matters to a Vote of Security Holders. |
There were no material changes to the procedures by which shareholders may recommend nominees to the registrant’s Board of Trustees that were implemented after the registrant last provided disclosure in response to the requirements of Item 407(c)(2)(iv) of Regulation S-K (17 CFR 229.407) (as required by 22(b)(15)) of Schedule 14A (17 CFR 240.14a-101), or this Item 10.
| Item 11. | Controls and Procedures. |
| | (a) | An evaluation was performed within 90 days of the filing of this report, under the supervision and with the participation of the registrant’s management, including the President and Treasurer, of the effectiveness of the design and operation of the registrant’s disclosure controls and procedures (as defined under Rule 30a-3(c) under the Investment Company Act of 1940 (17 CFR 270.30a-3(c))). Based on that evaluation, the registrant’s management, including the President and Treasurer, concluded that the registrant’s disclosure controls and procedures are effective. |
| | (b) | There was no change in the registrant’s internal control over financial reporting (as defined in Rule 30a-3(d) under the Investment Company Act of 1940 (17 CFR 270.3a-3(d))) that occurred during the registrant’s last fiscal quarter of the period covered by this report that has materially affected, or is reasonably likely to materially affect, the registrant’s internal control over financial reporting. |
| Item 12. | Disclosure of Securities Lending Activities for Closed-End Management Investment Companies. |
Not applicable.
| | (a) | (1) Code of Ethics applicable to its Principal Executive and Principal Accounting Officers pursuant to Section 406 of the Sarbanes-Oxley Act of 2002 attached hereto as Exhibit 99.406.Code of Ethics. |
| | | (2) Certifications pursuant to Rule 30a-2(a) under the Investment Company Act of 1940 (17 CFR 270.30a-2(a)) attached hereto as Exhibit 99.CERT. |
| | (b) | Certification pursuant to Rule 30a-2 (b) under the Investment Company Act of 1940 (17 CFR 270.30a-2 (a)) and Section 906 of the Sarbanes-Oxley Act of 2002 attached hereto as Exhibit 99.906.CERT. |
SIGNATURES
Pursuant to the requirements of the Securities Exchange Act of 1934 and the Investment Company Act of 1940, the registrant has duly caused this report to be signed on its behalf by the undersigned, thereunto duly authorized.
| | |
| VALIC Company II |
| |
| By: | | /s/ John T. Genoy |
| | John T. Genoy |
| | President |
Date: November 08, 2018
Pursuant to the requirements of the Securities Exchange Act of 1934 and the Investment Company Act of 1940, this report has been signed below by the following persons on behalf of the registrant and in the capacities and on the dates indicated.
| | |
| By: | | /s/ John T. Genoy |
| | John T. Genoy |
| | President |
Date: November 08, 2018
| | |
| By: | | /s/ Gregory R. Kingston |
| | Gregory R. Kingston |
| | Treasurer |
Date: November 08, 2018