UNITED STATES
SECURITIES AND EXCHANGE COMMISSION
Washington, D.C. 20549
FORMN-CSR
CERTIFIED SHAREHOLDER REPORT OF REGISTERED
MANAGEMENT INVESTMENT COMPANIES
Investment Company Act file number811-08789
VALIC Company II
(Exact name of registrant as specified in charter)
2929 Allen Parkway, Houston, TX 77019
(Address of principal executive offices) (Zip code)
John T. Genoy
President
SunAmerica Asset Management, LLC
Harborside 5
185 Hudson Street, Suite 3300
Jersey City, NJ 07311
(Name and address of agent for service)
Registrant’s telephone number, including area code: (201) 324-6414
Date of fiscal year end: August 31
Date of reporting period: August 31, 2019
Item 1. Reports to Stockholders

VALIC Company II
Annual Report, August 31, 2019
SAVING : INVESTING : PLANNING
This disclosure does not apply to investors who own fund shares beneficially through a variable insurance contract. Each applicable insurance company will provide information regarding delivery of fund shareholder reports to its contract owners.
Beginning on January 1, 2021, as permitted by regulations adopted by the Securities and Exchange Commission, paper copies of the Registrant’s shareholder reports like this one will no longer be sent by mail, unless you specifically request paper copies of the reports from the Registrant. Instead, the reports will be made available on a website, and you will be notified by mail each time a report is posted and provided with a website link to access the report. If you already elected to receive shareholder reports electronically, you will not be affected by this change and you need not take any action. You may elect to receive shareholder reports and other communications from the Registrant or VALIC Retirement Services Company (VRSCO), as your retirement plan recordkeeper, electronically by contacting us at1-800-448-2542 or logging into your account at VALIC Online at www.valic.com.
You may elect to receive all future reports in paper free of charge. You can inform the Registrant or VRSCO that you wish to continue receiving paper copies of your shareholder reports by contacting1-866-345-5954 or visiting FundReports.com and providing the20-digit unique ID located above or below your mailing address. Your election to receive reports in paper will apply to all funds held within your employer-sponsored retirement plan account with VRSCO.
VALIC Company II
ANNUAL REPORT AUGUST 31, 2019
TABLE OF CONTENTS
VALIC Company II
PRESIDENT’S LETTER
Dear Valued Investor:
We are pleased to provide you with the following Annual Report for VALIC Company II consisting of investment portfolio information and financial statements for the twelve-month period ending August 31, 2019. We encourage you to carefully read this report.
We continue to believe that maintaining a well-diversified investment portfolio focused on the long-term can help smooth the inevitableups-and-downs of market performance. Your financial advisor can assist by reviewing your financial situation and tax considerations to develop a plan that employs appropriate investment strategies and a diversified allocation among asset classes.
Our highest priority is to assist you in improving the likelihood of reaching your long-term investment goals.
Thank you for your investment.
Sincerely,

John T. Genoy, President
VALIC Company II
Note: All performance figures quoted are for the VALIC Company II Funds. They do not reflect fees and charges associated with the variable annuity. Past performance is no guarantee of future results. Annuities are long-term investment vehicles designed for retirement purposes. Early withdrawal may be subject to withdrawal charges and if taken prior to age 591/2, a 10% federal tax penalty may apply. An investment in a variable annuity involves investment risk, including possible loss of principal. The contract, when redeemed, may be worth more or less than the total amount invested.
Investments in stocks and bonds are subject to risks, including stock market and interest rate fluctuations. Investments in growth stocks as well as small andmid-cap company stocks may be subject to volatile price swings and therefore present a greater potential for loss than other investments. Investments innon-U.S. stocks and bonds are subject to additional risks such as fluctuations in foreign currencies, political and economic instability, differences in securities regulation and accounting standards, foreign tax laws, and limited availability of public information. Income seeking investment strategies may not be realized due to changes in dividend policies or the availability of capital resources.
Investments that concentrate on one economic sector or geographic region are generally subject to greater volatility than more diverse investments. Investments in real estate investment trusts (REITs) involve risks such as refinancing, economic conditions in the real estate industry, changes in property values, dependency on real estate management, and other risks associated with a concentration in one sector or geographic region. Investments in securities related to gold and other precious metals and minerals are speculative and impacted by a host of worldwide economic, financial and political factors.
Investments in debt securities are subject to credit risk (i.e., the risk that an issuer might not pay interest when due or repay principal at maturity of the obligation). Investments in lower-rated bonds and “junk bonds” are considered speculative due to the heightened risk of default and are subject to unpredictable losses as a result of changes in the issuer’s creditworthiness.
Investments in derivatives are subject to heightened risk; gains or losses fromnon-hedging positions may be substantially greater than the cost of the position. Active trading may result in high portfolio turnover and correspondingly greater transaction costs for the portfolio and underlying portfolios.
There can be no assurance that the Portfolios will meet their investment objectives. A full description of the investment goals, principal strategies, and risks for each Portfolio are provided in the prospectus.
Investments are not guaranteed or endorsed by any bank, is not a deposit or obligation of any bank, and is not federally insured by Federal Deposit Corporation (FDIC), the Federal Reserve Board or any other federal government agency.
* Not FDIC or NCUA/NCUSIF Insured
* May Lose Value * No Bank of Credit Union Guarantee
* Not a Deposit * Not insured by any Federal Government Agency
VALIC Company II
EXPENSE EXAMPLE —August 31, 2019 (unaudited)
Disclosure of Fund Expenses in Shareholder Reports
As a shareholder of a Fund in VALIC Company II (“VC II”), you incur ongoing costs, including management fees and other Fund expenses. This Example is intended to help you understand your ongoing costs (in dollars) of investing in the Funds and to compare these costs with the ongoing costs of investing in other mutual funds. The Example is based on an investment of $1,000 invested at March 1, 2019 and held until August 31, 2019. Shares of VC II are currently issued and redeemed only in connection with investments in and payments under variable annuity contracts and variable life insurance policies (“Variable Contracts”), qualified retirement plans (the “Plans”) and Individual Retirement Accounts (“IRA”) offered by The Variable Annuity Life Insurance Company (“VALIC”), the investment adviser to VC II and other life insurance companies affiliated with VALIC. The fees and expenses associated with the Variable Contracts, Plans and IRA’s are not included in these Examples, and had such fees and expenses been included, your costs would have been higher. Please see your Variable Contract prospectus or Plan/IRA documents for more details on the fees associated with your Variable Contract, Plan or IRAs.
Actual Expenses
The “Actual” section of the table provides information about your actual account values and actual expenses. You may use the information in these columns, together with the amount you invested, to estimate the expenses that you paid over the period. Simply divide your account value by $1,000 (for example, an $8,600 account value divided by $1,000 = 8.6), then multiply the result by the number in the column under the heading entitled “Expenses Paid During the Six Months Ended August 31, 2019” to estimate the expenses you paid on your account during this period. The “Expenses Paid During the Six Months Ended August 31, 2019” column and the “Annualized Expense Ratio” column do not include fees and expenses that may be charged by the Variable Contracts, Plans and IRAs, in which the Funds are offered. Had these fees and expenses been included, the “Expenses Paid During the Six Months Ended August 31, 2019” column would have been higher and the “Ending Account Value” column would have been lower.
Hypothetical Example for Comparison Purposes
The “Hypothetical” section of the table provides information about hypothetical account values and hypothetical expenses based on each Fund’s actual expense ratio and an annual rate of return of 5% before expenses, which is not the Fund’s actual return. The hypothetical account values and expenses may not be used to estimate the actual ending account balance or expenses you paid for the period. You may use this information to compare the ongoing costs of investing in the Funds and other funds. To do so, compare this 5% hypothetical example with the 5% hypothetical examples that appear in the shareholder reports of other funds. The “Expenses Paid During the Six Months Ended August 31, 2019” column and the “Annualized Expense Ratio” column do not include fees and expenses that may be charged by the Variable Contracts, Plans or IRAs in which the Funds are offered. Had these fees and expenses been included, the “Expenses Paid During the Six Months Ended August 31, 2019” column would have been higher and the “Ending Account Value” column would have been lower.
Please note that the expenses shown in the table are meant to highlight your ongoing costs only and do not reflect any fees and expenses that may be charged by the Variable Contracts, Plans or IRAs. Please refer to your Variable Contract prospectus or Plan/IRA document for more information. Therefore, the “hypothetical” example is useful in comparing ongoing costs and will not help you determine the relative total costs of owning different funds. In addition, if these fees and expenses were included, your costs would have been higher.
VALIC Company II
EXPENSE EXAMPLE —August 31, 2019 (unaudited) — (continued)
| | | | | | | | | | | | | | | | | | | | | | | | | | | | |
| | | Actual
| | | Hypothetical
| |
Fund
| | Beginning
Account Value
at March 1,
2019
| | | Ending
Account Value
Using Actual
Return at
August 31,
2019
| | | Expenses Paid
During the Six
Months Ended
August 31,
2019*
| | | Beginning
Account Value
at March 1,
2019
| | | Ending
Account Value
Using a
Hypothetical
5% Annual
Return at
August 31,
2019
| | | Expenses Paid
During the
Six Months Ended
August 31,
2019*
| | | Annualized
Expense
Ratio
| |
Aggressive Growth Lifestyle# | | $ | 1,000.00 | | | $ | 1,027.44 | | | $ | 0.51 | | | $ | 1,000.00 | | | $ | 1,024.70 | | | $ | 0.51 | | | | 0.10 | % |
Capital Appreciation# | | $ | 1,000.00 | | | $ | 1,044.19 | | | $ | 4.38 | | | $ | 1,000.00 | | | $ | 1,020.92 | | | $ | 4.33 | | | | 0.85 | % |
Conservative Growth Lifestyle# | | $ | 1,000.00 | | | $ | 1,043.63 | | | $ | 0.52 | | | $ | 1,000.00 | | | $ | 1,024.70 | | | $ | 0.51 | | | | 0.10 | % |
Core Bond# | | $ | 1,000.00 | | | $ | 1,077.31 | | | $ | 4.03 | | | $ | 1,000.00 | | | $ | 1,021.32 | | | $ | 3.92 | | | | 0.77 | % |
Government Money Market II# | | $ | 1,000.00 | | | $ | 1,009.10 | | | $ | 2.79 | | | $ | 1,000.00 | | | $ | 1,022.43 | | | $ | 2.80 | | | | 0.55 | % |
High Yield Bond# | | $ | 1,000.00 | | | $ | 1,043.93 | | | $ | 4.95 | | | $ | 1,000.00 | | | $ | 1,020.37 | | | $ | 4.89 | | | | 0.96 | % |
International Opportunities# | | $ | 1,000.00 | | | $ | 1,009.36 | | | $ | 5.06 | | | $ | 1,000.00 | | | $ | 1,020.16 | | | $ | 5.09 | | | | 1.00 | % |
Large Cap Value# | | $ | 1,000.00 | | | $ | 1,028.48 | | | $ | 4.14 | | | $ | 1,000.00 | | | $ | 1,021.12 | | | $ | 4.13 | | | | 0.81 | % |
Mid Cap Growth# | | $ | 1,000.00 | | | $ | 1,057.70 | | | $ | 4.41 | | | $ | 1,000.00 | | | $ | 1,020.92 | | | $ | 4.33 | | | | 0.85 | % |
Mid Cap Value# | | $ | 1,000.00 | | | $ | 1,015.51 | | | $ | 5.33 | | | $ | 1,000.00 | | | $ | 1,019.91 | | | $ | 5.35 | | | | 1.05 | % |
Moderate Growth Lifestyle# | | $ | 1,000.00 | | | $ | 1,040.67 | | | $ | 0.51 | | | $ | 1,000.00 | | | $ | 1,024.70 | | | $ | 0.51 | | | | 0.10 | % |
Small Cap Growth# | | $ | 1,000.00 | | | $ | 1,008.02 | | | $ | 5.87 | | | $ | 1,000.00 | | | $ | 1,019.36 | | | $ | 5.90 | | | | 1.16 | % |
Small Cap Value# | | $ | 1,000.00 | | | $ | 916.76 | | | $ | 4.59 | | | $ | 1,000.00 | | | $ | 1,020.42 | | | $ | 4.84 | | | | 0.95 | % |
Strategic Bond | | $ | 1,000.00 | | | $ | 1,058.36 | | | $ | 4.57 | | | $ | 1,000.00 | | | $ | 1,020.77 | | | $ | 4.48 | | | | 0.88 | % |
U.S. Socially Responsible#† | | $ | 1,000.00 | | | $ | 1,072.03 | | | $ | 2.92 | | | $ | 1,000.00 | | | $ | 1,022.38 | | | $ | 2.85 | | | | 0.56 | % |
| * | Expenses are equal to each Fund‘s annualized expense ratio multiplied by the average account value over the period, multiplied by 184 days then divided by 365 days (to reflect the one-half year period) . These ratios do not reflect fees and expenses associated with the Variable Contracts, Plans or IRA‘s. If such fees and expenses had been included, the expenses would have been higher. Please refer to your Variable Contract prospectus for details on the expenses that apply to the Variable Contracts or your Plan/IRA document for details on the administration fees charged by your Plan sponsor. |
| # | During the stated period, the investment adviser waived a portion of or all fees and assumed a portion of or all expenses for the Fund. As a result, if these fees and expenses had not been waived or assumed, the “Actual/Hypothetical Ending Account Value” would have been lower and the “Actual/Hypothetical Expenses Paid During the Six Months Ended August 31, 2019” and the “Annualized Expense Ratio” would have been higher. |
| † | See Note 1 to Financial Statements |
VALIC Company II Aggressive Growth Lifestyle Fund
PORTFOLIO PROFILE —August 31, 2019 (unaudited)
Industry Allocation*
| | | | |
Domestic Equity Investment Companies | | | 54.2 | % |
Domestic Fixed Income Investment Companies | | | 18.4 | |
International Equity Investment Companies | | | 16.6 | |
Domestic Money Market Investment Companies | | | 4.3 | |
Real Estate Investment Companies | | | 3.6 | |
International Fixed Income Investment Companies | | | 2.9 | |
| | |
|
|
|
| | | | 100.0 | % |
| | |
|
|
|
| * | Calculated as a percentage of net assets |
VALIC Company II Aggressive Growth Lifestyle Fund
PORTFOLIO OF INVESTMENTS —August 31, 2019
| | | | | | | | |
| | |
| Security Description | | Shares | | | Value
(Note 2) | |
| |
AFFILIATED REGISTERED INVESTMENT COMPANIES#(2) — 100.0% | |
Domestic Equity Investment Companies — 54.2% | |
VALIC Co. I Blue Chip Growth Fund | | | 430 | | | $ | 8,736 | |
VALIC Co. I Dividend Value Fund | | | 2,531,299 | | | | 28,578,366 | |
VALIC Co. I Large Cap Core Fund | | | 800,788 | | | | 9,433,280 | |
VALIC Co. I Large Capital Growth Fund | | | 410,087 | | | | 7,008,381 | |
VALIC Co. I Mid Cap Index Fund | | | 925,502 | | | | 22,693,321 | |
VALIC Co. I Mid Cap Strategic Growth Fund | | | 647,715 | | | | 10,777,983 | |
VALIC Co. INasdaq-100 Index Fund | | | 930,224 | | | | 14,148,711 | |
VALIC Co. I Science & Technology Fund | | | 757,870 | | | | 21,296,134 | |
VALIC Co. I Small Cap Index Fund | | | 731,251 | | | | 14,025,396 | |
VALIC Co. I Small Cap Special Values Fund | | | 400,479 | | | | 4,577,480 | |
VALIC Co. I Stock Index Fund | | | 1,441,266 | | | | 60,403,472 | |
VALIC Co. I Value Fund | | | 722,583 | | | | 13,230,486 | |
VALIC Co. II Capital Appreciation Fund | | | 1,476,808 | | | | 21,989,673 | |
VALIC Co. II Large Cap Value Fund | | | 1,737,544 | | | | 34,942,017 | |
VALIC Co. II Mid Cap Growth Fund | | | 972,583 | | | | 10,231,569 | |
VALIC Co. II Mid Cap Value Fund | | | 1,342,473 | | | | 23,077,118 | |
VALIC Co. II Small Cap Growth Fund | | | 540,215 | | | | 9,124,232 | |
VALIC Co. II Small Cap Value Fund | | | 777,567 | | | | 8,366,619 | |
| | | | | | |
|
|
|
Total Domestic Equity Investment Companies | | | | | | | | |
(cost $316,433,116) | | | | | | | 313,912,974 | |
| | | | | | |
|
|
|
Domestic Fixed Income Investment Companies — 18.4% | |
VALIC Co. I Capital Conservation Fund | | | 939,477 | | | | 9,667,217 | |
VALIC Co. I Government Securities Fund | | | 543,719 | | | | 5,948,285 | |
VALIC Co. I Inflation Protected Fund | | | 2,140,159 | | | | 24,440,615 | |
VALIC Co. II Core Bond Fund | | | 1,082,407 | | | | 12,480,152 | |
VALIC Co. II High Yield Bond Fund | | | 3,228,774 | | | | 24,732,412 | |
VALIC Co. II Strategic Bond Fund | | | 2,587,308 | | | | 29,365,950 | |
| | | | | | |
|
|
|
Total Domestic Fixed Income Investment Companies | | | | | | | | |
(cost $103,768,973) | | | | | | | 106,634,631 | |
| | | | | | |
|
|
|
Domestic Money Market Investment Companies — 4.3% | |
VALIC Co. I Government Money Market I Fund | | | | | | | | |
(cost $24,726,765)(3) | | | 24,726,765 | | | | 24,726,765 | |
| | | | | | |
|
|
|
| | | | | | | | |
| | |
| Security Description | | Shares | | | Value
(Note 2) | |
| |
| | | | | | | | | |
International Equity Investment Companies — 16.6% | | | | | | | | |
VALIC Co. I Emerging Economies Fund | | | 4,006,018 | | | $ | 30,886,401 | |
VALIC Co. I International Equities Index Fund | | | 1,642,244 | | | | 11,232,950 | |
VALIC Co. I International Growth Fund | | | 769,682 | | | | 9,012,975 | |
VALIC Co. I International Value Fund | | | 2,873,275 | | | | 25,859,475 | |
VALIC Co. II International Opportunities Fund | | | 1,049,048 | | | | 19,344,439 | |
| | | | | | |
|
|
|
Total International Equity Investment Companies | | | | | | | | |
(cost $103,541,554) | | | | | | | 96,336,240 | |
| | | | | | |
|
|
|
International Fixed Income Investment Companies — 2.9% | |
VALIC Co. I International Government Bond Fund | | | | | | | | |
(cost $15,551,321) | | | 1,328,788 | | | | 16,463,683 | |
| | | | | | |
|
|
|
Real Estate Investment Companies — 3.6% | | | | | | | | |
VALIC Co. I Global Real Estate Fund | | | | | | | | |
(cost $19,486,632) | | | 2,499,829 | | | | 20,898,566 | |
| | | | | | |
|
|
|
TOTAL INVESTMENTS | | | | | | | | |
(cost $583,508,361)(1) | | | 100.0 | % | | | 578,972,859 | |
Other assets less liabilities | | | 0.0 | | | | 75,752 | |
| | |
|
|
| |
|
|
|
NET ASSETS | | | 100.0 | % | | $ | 579,048,611 | |
| | |
|
|
| |
|
|
|
| # | The Aggressive Growth Lifestyle Fund invests in various VALIC Company I or VALIC Company II Funds, some of which are not presented in this report. Additional information on the underlying funds including such fund’s prospectuses and shareholder reports is available at our website, www.valic.com. |
| (1) | See Note 5 for cost of investments on a tax basis. |
| (3) | The 7-day yield as of August 31, 2019 is 1.60%. |
The following is a summary of the inputs used to value the Fund’s net assets as of August 31, 2019 (see Note 2):
| | | | | | | | | | | | | | | | |
| | | Level 1 - Unadjusted
Quoted Prices
| | | Level 2 - Other
Observable Inputs
| | | Level 3 - Significant
Unobservable Inputs
| | | Total
| |
ASSETS: | | | | | | | | | | | | | | | | |
Investments at Value:* | | | | | | | | | | | | | | | | |
| | | | |
Affiliated Registered Investment Companies | | $ | 578,972,859 | | | $ | — | | | $ | — | | | $ | 578,972,859 | |
| | |
|
|
| |
|
|
| |
|
|
| |
|
|
|
| * | For a detailed presentation of investments, please refer to the Portfolio of Investments. |
See Notes to Financial Statements
VALIC Company II Capital Appreciation Fund
PORTFOLIO PROFILE —August 31, 2019 (unaudited)
Industry Allocation*
| | | | |
Applications Software | | | 9.2 | % |
Finance — Credit Card | | | 8.7 | |
Medical — Drugs | | | 7.4 | |
E-Commerce/Products | | | 5.2 | |
Computers | | | 4.8 | |
Web Portals/ISP | | | 4.5 | |
Internet Content — Entertainment | | | 3.4 | |
Retail — Restaurants | | | 3.2 | |
Cable/Satellite TV | | | 2.8 | |
E-Commerce/Services | | | 2.4 | |
Medical — Biomedical/Gene | | | 2.4 | |
Medical Products | | | 2.0 | |
Insurance — Multi-line | | | 1.9 | |
Retail — Auto Parts | | | 1.8 | |
Food — Confectionery | | | 1.8 | |
Cosmetics & Toiletries | | | 1.8 | |
Electronic Components — Semiconductors | | | 1.7 | |
Computer Data Security | | | 1.6 | |
Retail — Discount | | | 1.6 | |
Building Products — Wood | | | 1.6 | |
Airlines | | | 1.6 | |
Real Estate Investment Trusts | | | 1.6 | |
Enterprise Software/Service | | | 1.5 | |
Internet Security | | | 1.5 | |
Food — Misc./Diversified | | | 1.5 | |
Transport — Rail | | | 1.4 | |
Oil Companies — Exploration & Production | | | 1.4 | |
Insurance — Property/Casualty | | | 1.4 | |
Commercial Services — Finance | | | 1.4 | |
Auto/Truck Parts & Equipment — Original | | | 1.4 | |
Computer Software | | | 1.4 | |
Semiconductor Equipment | | | 1.4 | |
Computer Aided Design | | | 1.3 | |
Distribution/Wholesale | | | 1.3 | |
Electronic Forms | | | 1.2 | |
Containers — Paper/Plastic | | | 1.2 | |
Internet Infrastructure Software | | | 1.0 | |
Machinery — Construction & Mining | | | 0.9 | |
Software Tools | | | 0.8 | |
Medical Instruments | | | 0.7 | |
Apparel Manufacturers | | | 0.7 | |
Rental Auto/Equipment | | | 0.6 | |
Engines — Internal Combustion | | | 0.5 | |
Aerospace/Defense | | | 0.5 | |
Investment Management/Advisor Services | | | 0.4 | |
Computers — Memory Devices | | | 0.4 | |
| | |
|
|
|
| | | | 98.8 | % |
| | |
|
|
|
| * | Calculated as a percentage of net assets |
VALIC Company II Capital Appreciation Fund
PORTFOLIO OF INVESTMENTS —August 31, 2019
| | | | | | | | |
| | |
| Security Description | | Shares | | | Value (Note 2) | |
| |
COMMON STOCKS — 98.8% | | | | | | | | |
Aerospace/Defense — 0.5% | |
TransDigm Group, Inc. | | | 886 | | | $ | 476,952 | |
| | | | | | |
|
|
|
Airlines — 1.6% | | | | | | | | |
Southwest Airlines Co. | | | 31,143 | | | | 1,629,402 | |
| | | | | | |
|
|
|
Apparel Manufacturers — 0.7% | | | | | | | | |
Deckers Outdoor Corp.† | | | 4,871 | | | | 718,229 | |
| | | | | | |
|
|
|
Applications Software — 9.2% | | | | | | | | |
Microsoft Corp. | | | 48,397 | | | | 6,672,011 | |
salesforce.com, Inc.† | | | 9,729 | | | | 1,518,405 | |
ServiceNow, Inc.† | | | 5,105 | | | | 1,336,693 | |
| | | | | | |
|
|
|
| | | | | | | | 9,527,109 | |
| | | | | | |
|
|
|
Auto/Truck Parts & Equipment - Original — 1.4% | | | | | | | | |
Allison Transmission Holdings, Inc. | | | 32,259 | | | | 1,433,267 | |
| | | | | | |
|
|
|
Building Products - Wood — 1.6% | | | | | | | | |
Masco Corp. | | | 40,483 | | | | 1,648,873 | |
| | | | | | |
|
|
|
Cable/Satellite TV — 2.8% | | | | | | | | |
Altice USA, Inc., Class A† | | | 31,996 | | | | 924,044 | |
Comcast Corp., Class A | | | 43,441 | | | | 1,922,699 | |
| | | | | | |
|
|
|
| | | | | | | | 2,846,743 | |
| | | | | | |
|
|
|
Commercial Services - Finance — 1.4% | | | | | | | | |
FleetCor Technologies, Inc.† | | | 4,855 | | | | 1,448,732 | |
| | | | | | |
|
|
|
Computer Aided Design — 1.3% | | | | | | | | |
Cadence Design Systems, Inc.† | | | 20,012 | | | | 1,370,422 | |
| | | | | | |
|
|
|
Computer Data Security — 1.6% | | | | | | | | |
Fortinet, Inc.† | | | 21,337 | | | | 1,689,464 | |
| | | | | | |
|
|
|
Computer Software — 1.4% | | | | | | | | |
Akamai Technologies, Inc.† | | | 15,996 | | | | 1,425,723 | |
| | | | | | |
|
|
|
Computers — 4.8% | | | | | | | | |
Apple, Inc. | | | 23,807 | | | | 4,969,473 | |
| | | | | | |
|
|
|
Computers - Memory Devices — 0.4% | | | | | | | | |
NetApp, Inc. | | | 8,748 | | | | 420,429 | |
| | | | | | |
|
|
|
Containers - Paper/Plastic — 1.2% | | | | | | | | |
Berry Global Group, Inc.† | | | 31,371 | | | | 1,227,861 | |
| | | | | | |
|
|
|
Cosmetics & Toiletries — 1.8% | | | | | | | | |
Estee Lauder Cos., Inc., Class A | | | 9,132 | | | | 1,808,045 | |
| | | | | | |
|
|
|
Distribution/Wholesale — 1.3% | | | | | | | | |
WW Grainger, Inc. | | | 4,906 | | | | 1,342,527 | |
| | | | | | |
|
|
|
E-Commerce/Products — 5.2% | | | | | | | | |
Amazon.com, Inc.† | | | 2,998 | | | | 5,325,317 | |
| | | | | | |
|
|
|
E-Commerce/Services — 2.4% | | | | | | | | |
Expedia Group, Inc. | | | 13,391 | | | | 1,742,169 | |
TripAdvisor, Inc.† | | | 19,383 | | | | 736,360 | |
| | | | | | |
|
|
|
| | | | | | | | 2,478,529 | |
| | | | | | |
|
|
|
Electronic Components - Semiconductors — 1.7% | | | | | | | | |
Broadcom, Inc. | | | 6,292 | | | | 1,778,371 | |
| | | | | | |
|
|
|
Electronic Forms — 1.2% | | | | | | | | |
Adobe, Inc.† | | | 4,401 | | | | 1,252,129 | |
| | | | | | |
|
|
|
Engines - Internal Combustion — 0.5% | | | | | | | | |
Cummins, Inc. | | | 3,631 | | | | 541,999 | |
| | | | | | |
|
|
|
Enterprise Software/Service — 1.5% | | | | | | | | |
Oracle Corp. | | | 18,469 | | | | 961,496 | |
Veeva Systems, Inc., Class A† | | | 3,794 | | | | 608,482 | |
| | | | | | |
|
|
|
| | | | | | | | 1,569,978 | |
| | | | | | |
|
|
|
| | | | | | | | |
| | |
| Security Description | | Shares | | | Value (Note 2) | |
| |
| | | | | | | | | |
Finance - Credit Card — 8.7% | | | | | | | | |
American Express Co. | | | 14,316 | | | $ | 1,723,217 | |
Discover Financial Services | | | 12,791 | | | | 1,022,896 | |
Mastercard, Inc., Class A | | | 12,806 | | | | 3,603,224 | |
Visa, Inc., Class A | | | 14,618 | | | | 2,643,227 | |
| | | | | | |
|
|
|
| | | | | | | | 8,992,564 | |
| | | | | | |
|
|
|
Food - Confectionery — 1.8% | | | | | | | | |
Hershey Co. | | | 11,755 | | | | 1,862,932 | |
| | | | | | |
|
|
|
Food - Misc./Diversified — 1.5% | | | | | | | | |
Post Holdings, Inc.† | | | 15,336 | | | | 1,528,846 | |
| | | | | | |
|
|
|
Insurance - Multi-line — 1.9% | | | | | | | | |
Allstate Corp. | | | 18,721 | | | | 1,916,843 | |
| | | | | | |
|
|
|
Insurance - Property/Casualty — 1.4% | | | | | | | | |
Progressive Corp. | | | 19,259 | | | | 1,459,832 | |
| | | | | | |
|
|
|
Internet Content - Entertainment — 3.4% | | | | | | | | |
Facebook, Inc., Class A† | | | 11,211 | | | | 2,081,547 | |
Twitter, Inc.† | | | 32,011 | | | | 1,365,269 | |
| | | | | | |
|
|
|
| | | | | | | | 3,446,816 | |
| | | | | | |
|
|
|
Internet Infrastructure Software — 1.0% | | | | | | | | |
F5 Networks, Inc.† | | | 8,250 | | | | 1,062,023 | |
| | | | | | |
|
|
|
Internet Security — 1.5% | | | | | | | | |
Palo Alto Networks, Inc.† | | | 7,703 | | | | 1,568,485 | |
| | | | | | |
|
|
|
Investment Management/Advisor Services — 0.4% | | | | | | | | |
Ameriprise Financial, Inc. | | | 3,290 | | | | 424,344 | |
| | | | | | |
|
|
|
Machinery - Construction & Mining — 0.9% | | | | | | | | |
Caterpillar, Inc. | | | 7,752 | | | | 922,488 | |
| | | | | | |
|
|
|
Medical Instruments — 0.7% | | | | | | | | |
Edwards Lifesciences Corp.† | | | 3,385 | | | | 750,928 | |
| | | | | | |
|
|
|
Medical Products — 2.0% | | | | | | | | |
Abbott Laboratories | | | 9,394 | | | | 801,496 | |
Cooper Cos., Inc. | | | 2,280 | | | | 706,230 | |
Hologic, Inc.† | | | 10,273 | | | | 507,178 | |
| | | | | | |
|
|
|
| | | | | | | | 2,014,904 | |
| | | | | | |
|
|
|
Medical - Biomedical/Gene — 2.4% | | | | | | | | |
Amgen, Inc. | | | 8,709 | | | | 1,816,872 | |
Exelixis, Inc.† | | | 32,257 | | | | 640,301 | |
| | | | | | |
|
|
|
| | | | | | | | 2,457,173 | |
| | | | | | |
|
|
|
Medical - Drugs — 7.4% | | | | | | | | |
AbbVie, Inc. | | | 18,871 | | | | 1,240,580 | |
Eli Lilly & Co. | | | 19,291 | | | | 2,179,304 | |
Jazz Pharmaceuticals PLC† | | | 6,368 | | | | 816,059 | |
Merck & Co., Inc. | | | 39,273 | | | | 3,395,936 | |
| | | | | | |
|
|
|
| | | | | | | | 7,631,879 | |
| | | | | | |
|
|
|
Oil Companies - Exploration & Production — 1.4% | | | | | | | | |
ConocoPhillips | | | 28,039 | | | | 1,463,075 | |
| | | | | | |
|
|
|
Real Estate Investment Trusts — 1.6% | | | | | | | | |
Essex Property Trust, Inc. | | | 3,173 | | | | 1,019,358 | |
Lamar Advertising Co., Class A | | | 7,802 | | | | 598,023 | |
| | | | | | |
|
|
|
| | | | | | | | 1,617,381 | |
| | | | | | |
|
|
|
Rental Auto/Equipment — 0.6% | | | | | | | | |
United Rentals, Inc.† | | | 5,440 | | | | 612,326 | |
| | | | | | |
|
|
|
Retail - Auto Parts — 1.8% | | | | | | | | |
AutoZone, Inc.† | | | 1,699 | | | | 1,871,771 | |
| | | | | | |
|
|
|
Retail - Discount — 1.6% | | | | | | | | |
Walmart, Inc. | | | 14,566 | | | | 1,664,311 | |
| | | | | | |
|
|
|
VALIC Company II Capital Appreciation Fund
PORTFOLIO OF INVESTMENTS —August 31, 2019 — (continued)
| | | | | | | | |
| | |
| Security Description | | Shares | | | Value (Note 2) | |
| |
COMMON STOCKS (continued) | | | | | | | | |
Retail - Restaurants — 3.2% | | | | | | | | |
Chipotle Mexican Grill, Inc.† | | | 1,088 | | | $ | 912,201 | |
Starbucks Corp. | | | 24,451 | | | | 2,360,989 | |
| | | | | | |
|
|
|
| | | | | | | | 3,273,190 | |
| | | | | | |
|
|
|
Semiconductor Equipment — 1.4% | | | | | | | | |
Lam Research Corp. | | | 6,656 | | | | 1,401,155 | |
| | | | | | |
|
|
|
Software Tools — 0.8% | | | | | | | | |
VMware, Inc., Class A | | | 6,125 | | | | 866,320 | |
| | | | | | |
|
|
|
Transport - Rail — 1.4% | | | | | | | | |
Union Pacific Corp. | | | 9,098 | | | | 1,473,512 | |
| | | | | | |
|
|
|
| | | | | | | | |
| | |
| Security Description | | Shares | | | Value (Note 2) | |
| |
| | | | | | | | | |
Web Portals/ISP — 4.5% | | | | | | | | |
Alphabet, Inc., Class A† | | | 979 | | | $ | 1,165,529 | |
Alphabet, Inc., Class C† | | | 2,901 | | | | 3,446,678 | |
| | | | | | |
|
|
|
| | | | | | | | 4,612,207 | |
| | | | | | |
|
|
|
TOTAL INVESTMENTS | | | | | | | | |
(cost $87,465,156)(1) | | | 98.8 | % | | | 101,824,879 | |
Other assets less liabilities | | | 1.2 | | | | 1,255,432 | |
| | |
|
|
| |
|
|
|
NET ASSETS | | | 100.0 | % | | $ | 103,080,311 | |
| | |
|
|
| |
|
|
|
| † | Non-income producing security |
| (1) | See Note 5 for cost of investments on a tax basis. |
The following is a summary of the inputs used to value the Fund’s net assets as of August 31, 2019 (see Note 2):
| | | | | | | | | | | | | | | | |
| | | Level 1 - Unadjusted
Quoted Prices
| | | Level 2 - Other
Observable Inputs
| | | Level 3 - Significant
Unobservable Inputs
| | | Total
| |
ASSETS: | | | | | | | | | | | | | | | | |
Investments at Value:* | | | | | | | | | | | | | | | | |
| | | | |
Common Stocks | | $ | 101,824,879 | | | $ | — | | | $ | — | | | $ | 101,824,879 | |
| | |
|
|
| |
|
|
| |
|
|
| |
|
|
|
| * | For a detailed presentation of investments, please refer to the Portfolio of Investments. |
See Notes to Financial Statements
VALIC Company II Conservative Growth Lifestyle Fund
PORTFOLIO PROFILE —August 31, 2019 (unaudited)
Industry Allocation*
| | | | |
Domestic Fixed Income Investment Companies | | | 54.0 | % |
Domestic Equity Investment Companies | | | 27.2 | |
International Equity Investment Companies | | | 6.9 | |
International Fixed Income Investment Companies | | | 5.0 | |
Domestic Money Market Investment Companies | | | 4.2 | |
Real Estate Investment Companies | | | 2.7 | |
| | |
|
|
|
| | | | 100.0 | % |
| | |
|
|
|
| * | Calculated as a percentage of net assets |
VALIC Company II Conservative Growth Lifestyle Fund
PORTFOLIO OF INVESTMENTS —August 31, 2019
| | | | | | | | |
| | |
| Security Description | |
Shares | | | Value
(Note 2) | |
| |
AFFILIATED REGISTERED INVESTMENT COMPANIES#(2) — 100.0% | |
Domestic Equity Investment Companies — 27.2% | |
VALIC Co. I Dividend Value Fund | | | 1,184,464 | | | $ | 13,372,604 | |
VALIC Co. I Large Cap Core Fund | | | 216,568 | | | | 2,551,173 | |
VALIC Co. I Large Capital Growth Fund | | | 692 | | | | 11,827 | |
VALIC Co. I Mid Cap Index Fund | | | 248,758 | | | | 6,099,542 | |
VALIC Co. I Mid Cap Strategic Growth Fund | | | 115,494 | | | | 1,921,814 | |
VALIC Co. INasdaq-100 Index Fund | | | 287,296 | | | | 4,369,772 | |
VALIC Co. I Science & Technology Fund | | | 235,012 | | | | 6,603,825 | |
VALIC Co. I Small Cap Index Fund | | | 153,587 | | | | 2,945,793 | |
VALIC Co. I Small Cap Special Values Fund | | | 191,569 | | | | 2,189,629 | |
VALIC Co. I Stock Index Fund | | | 415,501 | | | | 17,413,662 | |
VALIC Co. I Value Fund | | | 157,219 | | | | 2,878,686 | |
VALIC Co. II Capital Appreciation Fund | | | 361,788 | | | | 5,387,016 | |
VALIC Co. II Large Cap Value Fund | | | 454,980 | | | | 9,149,653 | |
VALIC Co. II Mid Cap Growth Fund | | | 253,338 | | | | 2,665,112 | |
VALIC Co. II Mid Cap Value Fund | | | 449,212 | | | | 7,721,956 | |
VALIC Co. II Small Cap Growth Fund | | | 105,584 | | | | 1,783,314 | |
VALIC Co. II Small Cap Value Fund | | | 95,931 | | | | 1,032,222 | |
| | | | | | |
|
|
|
Total Domestic Equity Investment Companies | | | | | | | | |
(cost $90,199,691) | | | | | | | 88,097,600 | |
| | | | | | |
|
|
|
Domestic Fixed Income Investment Companies — 54.0% | |
VALIC Co. I Capital Conservation Fund | | | 1,737,574 | | | | 17,879,637 | |
VALIC Co. I Government Securities Fund | | | 841,846 | | | | 9,209,796 | |
VALIC Co. I Inflation Protected Fund | | | 1,799,288 | | | | 20,547,869 | |
VALIC Co. II Core Bond Fund | | | 4,712,907 | | | | 54,339,812 | |
VALIC Co. II High Yield Bond Fund | | | 3,676,251 | | | | 28,160,084 | |
VALIC Co. II Strategic Bond Fund | | | 3,972,827 | | | | 45,091,584 | |
| | | | | | |
|
|
|
Total Domestic Fixed Income Investment Companies | | | | | | | | |
(cost $169,128,691) | | | | | | | 175,228,782 | |
| | | | | | |
|
|
|
Domestic Money Market Investment Companies — 4.2% | | | | | | | | |
VALIC Co. I Government Money Market I Fund | | | | | | | | |
(cost $13,486,882)(3) | | | 13,486,882 | | | | 13,486,882 | |
| | | | | | |
|
|
|
| | | | | | | | |
| | |
| Security Description | |
Shares | | | Value
(Note 2) | |
| |
| | | | | | | | | |
International Equity Investment Companies — 6.9% | | | | | | | | |
VALIC Co. I Emerging Economies Fund | | | 1,011,372 | | | $ | 7,797,679 | |
VALIC Co. I International Equities Index Fund | | | 1,146 | | | | 7,839 | |
VALIC Co. I International Growth Fund | | | 122,680 | | | | 1,436,588 | |
VALIC Co. I International Value Fund | | | 718,196 | | | | 6,463,767 | |
VALIC Co. II International Opportunities Fund | | | 375,936 | | | | 6,932,257 | |
| | | | | | |
|
|
|
Total International Equity Investment Companies | | | | | | | | |
(cost $24,491,264) | | | | | | | 22,638,130 | |
| | | | | | |
|
|
|
International Fixed Income Investment Companies — 5.0% | |
VALIC Co. I International Government Bond Fund | | | | | | | | |
(cost $15,308,988) | | | 1,307,761 | | | | 16,203,162 | |
| | | | | | |
|
|
|
Real Estate Investment Companies — 2.7% | | | | | | | | |
VALIC Co. I Global Real Estate Fund | | | | | | | | |
(cost $8,025,256) | | | 1,054,264 | | | | 8,813,645 | |
| | | | | | |
|
|
|
TOTAL INVESTMENTS | | | | | | | | |
(cost $320,640,772)(1) | | | 100.0 | % | | | 324,468,201 | |
Liabilities in excess of other assets | | | (0.0 | ) | | | (31,844 | ) |
| | |
|
|
| |
|
|
|
NET ASSETS | | | 100.0 | % | | $ | 324,436,357 | |
| | |
|
|
| |
|
|
|
| # | The Conservative Growth Lifestyle Fund invests in various VALIC Company I or VALIC Company II Funds, some of which are not presented in this report. Additional Information on the underlying funds including such fund’s prospectuses and shareholder reports is available at our website, www.valic.com. |
| (1) | See Note 5 for cost of investments on a tax basis. |
| (3) | The 7-day yield as of August 31, 2019 is 1.60%. |
The following is a summary of the inputs used to value the Fund’s net assets as of August 31, 2019 (see Note 2):
| | | | | | | | | | | | | | | | |
| | | Level 1 - Unadjusted
Quoted Prices
| | | Level 2 - Other
Observable Inputs
| | | Level 3 - Significant
Unobservable Inputs
| | | Total
| |
ASSETS: | | | | | | | | | | | | | | | | |
Investments at Value:* | | | | | | | | | | | | | | | | |
| | | | |
Affiliated Registered Investment Companies | | $ | 324,468,201 | | | $ | — | | | $ | — | | | $ | 324,468,201 | |
| | |
|
|
| |
|
|
| |
|
|
| |
|
|
|
| * | For a detailed presentation of investments, please refer to the Portfolio of Investments. |
See Notes to Financial Statements
VALIC Company II Core Bond Fund
PORTFOLIO PROFILE —August 31, 2019 (unaudited)
Industry Allocation*
| | | | |
Federal National Mtg. Assoc. | | | 25.4 | % |
Federal Home Loan Mtg. Corp. | | | 7.3 | |
Diversified Banking Institutions | | | 5.6 | |
Government National Mtg. Assoc. | | | 5.3 | |
Diversified Financial Services | | | 4.9 | |
United States Treasury Notes | | | 4.3 | |
United States Treasury Bonds | | | 3.5 | |
Banks — Commercial | | | 2.6 | |
Electric — Integrated | | | 2.5 | |
Registered Investment Companies | | | 2.0 | |
Pipelines | | | 1.7 | |
Oil Companies — Exploration & Production | | | 1.6 | |
Telephone — Integrated | | | 1.4 | |
Real Estate Investment Trusts | | | 1.3 | |
Cable/Satellite TV | | | 1.2 | |
Auto — Cars/Light Trucks | | | 1.0 | |
Banks — Super Regional | | | 1.0 | |
Electric — Distribution | | | 1.0 | |
Oil Companies — Integrated | | | 0.9 | |
Food — Misc./Diversified | | | 0.9 | |
Cellular Telecom | | | 0.8 | |
Machinery — Farming | | | 0.8 | |
Medical — HMO | | | 0.7 | |
Medical — Drugs | | | 0.7 | |
Finance — Consumer Loans | | | 0.6 | |
Medical Labs & Testing Services | | | 0.6 | |
Retail — Restaurants | | | 0.5 | |
Pharmacy Services | | | 0.5 | |
Paper & Related Products | | | 0.5 | |
Insurance — Life/Health | | | 0.5 | |
Computer Services | | | 0.4 | |
Brewery | | | 0.4 | |
Electric — Generation | | | 0.4 | |
Insurance — Property/Casualty | | | 0.4 | |
Electronic Components — Semiconductors | | | 0.3 | |
Television | | | 0.3 | |
Machinery — General Industrial | | | 0.3 | |
Savings & Loans/Thrifts | | | 0.3 | |
Containers — Metal/Glass | | | 0.3 | |
Chemicals — Diversified | | | 0.3 | |
Medical — Hospitals | | | 0.3 | |
Aerospace/Defense | | | 0.3 | |
Networking Products | | | 0.3 | |
Computers | | | 0.3 | |
Diversified Manufacturing Operations | | | 0.3 | |
Retail — Discount | | | 0.3 | |
Transport — Rail | | | 0.3 | |
Building & Construction Products — Misc. | | | 0.3 | |
SupraNational Banks | | | 0.3 | |
Machinery — Construction & Mining | | | 0.3 | |
Medical — Biomedical/Gene | | | 0.3 | |
Beverages — Non-alcoholic | | | 0.3 | |
Oil — Field Services | | | 0.3 | |
Chemicals — Specialty | | | 0.2 | |
Retail — Mail Order | | | 0.2 | |
Energy — Alternate Sources | | | 0.2 | |
Multimedia | | | 0.2 | |
Enterprise Software/Service | | | 0.2 | |
Trucking/Leasing | | | 0.2 | |
Insurance — Mutual | | | 0.2 | |
Food — Meat Products | | | 0.2 | |
Banks — Special Purpose | | | 0.2 | |
Broadcast Services/Program | | | 0.2 | |
Insurance — Multi-line | | | 0.2 | |
Gas — Distribution | | | 0.2 | |
Beverages — Wine/Spirits | | | 0.2 | |
Satellite Telecom | | | 0.2 | |
Agricultural Chemicals | | | 0.2 | |
Sovereign | | | 0.2 | |
Security Services | | | 0.2 | |
| | | | |
Electronic Measurement Instruments | | | 0.2 | |
Sovereign Agency | | | 0.2 | |
Food — Retail | | | 0.2 | |
Medical — Wholesale Drug Distribution | | | 0.2 | |
Finance — Credit Card | | | 0.2 | |
Internet Content — Entertainment | | | 0.2 | |
Electronic Parts Distribution | | | 0.2 | |
Auto/Truck Parts & Equipment — Original | | | 0.2 | |
Transport — Equipment & Leasing | | | 0.2 | |
Metal — Copper | | | 0.2 | |
Metal — Diversified | | | 0.1 | |
Batteries/Battery Systems | | | 0.1 | |
Radio | | | 0.1 | |
Rental Auto/Equipment | | | 0.1 | |
Insurance Brokers | | | 0.1 | |
Machinery — Electrical | | | 0.1 | |
Retail — Regional Department Stores | | | 0.1 | |
Diversified Minerals | | | 0.1 | |
Transport — Truck | | | 0.1 | |
Cosmetics & Toiletries | | | 0.1 | |
Data Processing/Management | | | 0.1 | |
Computers — Integrated Systems | | | 0.1 | |
Investment Management/Advisor Services | | | 0.1 | |
Medical — Generic Drugs | | | 0.1 | |
Non-Hazardous Waste Disposal | | | 0.1 | |
Commercial Services | | | 0.1 | |
Building Products — Cement | | | 0.1 | |
Banks — Fiduciary | | | 0.1 | |
Applications Software | | | 0.1 | |
Distribution/Wholesale | | | 0.1 | |
Metal — Iron | | | 0.1 | |
Banks — Money Center | | | 0.1 | |
Coatings/Paint | | | 0.1 | |
Tools — Hand Held | | | 0.1 | |
Hotels/Motels | | | 0.1 | |
Finance — Leasing Companies | | | 0.1 | |
Casino Services | | | 0.1 | |
Independent Power Producers | | | 0.1 | |
Real Estate Operations & Development | | | 0.1 | |
Finance — Mortgage Loan/Banker | | | 0.1 | |
E-Commerce/Products | | | 0.1 | |
Building — Heavy Construction | | | 0.1 | |
Transport — Marine | | | 0.1 | |
Containers — Paper/Plastic | | | 0.1 | |
Petrochemicals | | | 0.1 | |
Dialysis Centers | | | 0.1 | |
Diagnostic Equipment | | | 0.1 | |
Building — Residential/Commercial | | | 0.1 | |
Retail — Appliances | | | 0.1 | |
Building Societies | | | 0.1 | |
Computer Software | | | 0.1 | |
Consumer Products — Misc. | | | 0.1 | |
Retail — Petroleum Products | | | 0.1 | |
Office Supplies & Forms | | | 0.1 | |
Retail — Drug Store | | | 0.1 | |
E-Commerce/Services | | | 0.1 | |
Poultry | | | 0.1 | |
Building & Construction — Misc. | | | 0.1 | |
Real Estate Management/Services | | | 0.1 | |
Semiconductor Components — Integrated Circuits | | | 0.1 | |
Oil Field Machinery & Equipment | | | 0.1 | |
Coal | | | 0.1 | |
Finance — Auto Loans | | | 0.1 | |
Internet Connectivity Services | | | 0.1 | |
Finance — Investment Banker/Broker | | | 0.1 | |
Retail — Automobile | | | 0.1 | |
| | |
|
|
|
| | | | 99.9 | % |
| | |
|
|
|
| * | Calculated as a percentage of net assets |
VALIC Company II Core Bond Fund
PORTFOLIO PROFILE —August 31, 2019 (unaudited) — (continued)
Credit Quality†#
| | | | |
Aaa | | | 49.1 | % |
Aa | | | 2.6 | |
A | | | 10.9 | |
Baa | | | 21.6 | |
Ba | | | 6.0 | |
B | | | 4.3 | |
Caa | | | 1.0 | |
Not Rated@ | | | 4.5 | |
| | |
|
|
|
| | | | 100.0 | % |
| | |
|
|
|
| # | Calculated as percentage of total debt issues, excluding short-term securities. |
| @ | Represent debt issues that either have no rating, or the rating is unavailable from the data source. |
VALIC Company II Core Bond Fund
PORTFOLIO OF INVESTMENTS —August 31, 2019
| | | | | | | | |
| | |
| Security Description | | Principal
Amount | | | Value
(Note 2) | |
| |
ASSET BACKED SECURITIES — 4.5% | |
Diversified Financial Services — 4.5% | |
American Express Credit Account Master Trust
Series2019-2, Class A
2.67% due 11/15/2024 | | $ | 2,000,000 | | | $ | 2,050,292 | |
American Express Credit Account Master Trust
Series2018-4, Class A
2.99% due 12/15/2023 | | | 150,000 | | | | 153,115 | |
American Express Credit Account Master Trust
Series2018-8, Class A
3.18% due 04/15/2024 | | | 167,000 | | | | 171,863 | |
Americredit Automobile Receivables Trust
Series2019-1, Class A3
2.97% due 11/20/2023 | | | 1,000,000 | | | | 1,019,886 | |
BA Credit Card Trust
Series2018-A2, Class A2
3.00% due 09/15/2023 | | | 1,332,000 | | | | 1,358,517 | |
BANK
Series 2019-BN19, Class A3
3.18% due 08/15/2061(1) | | | 1,570,000 | | | | 1,691,863 | |
BANK
Series 2019-BN16, Class A2
3.93% due 02/15/2052(1) | | | 2,377,000 | | | | 2,554,333 | |
Benchmark Mtg. Trust
Series2018-B1, Class A2
3.57% due 01/15/2051(1) | | | 1,233,000 | | | | 1,289,917 | |
Benchmark Mtg. Trust
Series2019-B9, Class AAB
3.93% due 03/15/2052(1) | | | 2,985,000 | | | | 3,315,880 | |
BMW Vehicle Lease Trust
Series2019-1, Class A4
2.92% due 08/22/2022 | | | 1,050,000 | | | | 1,066,787 | |
BX Commercial Mtg. Trust FRS
Series2019-IMC, Class A
3.20% (1 ML+1.00%)
due 04/15/2034*(1) | | | 2,500,000 | | | | 2,499,995 | |
CAMB Commercial Mtg. Trust FRS
Series 2019-LIFE, Class A
3.27% (1 ML+1.07%)
due 12/15/2037*(1) | | | 750,000 | | | | 751,164 | |
Capital One Multi-Asset Execution Trust
Series2019-A2, Class A2
1.72% due 08/15/2024 | | | 1,000,000 | | | | 999,748 | |
Capital One Multi-Asset Execution Trust
Series2019-A3, Class A3
2.06% due 08/15/2028 | | | 150,000 | | | | 149,960 | |
CarMax Auto Owner Trust
Series2019-3, Class A3
2.18% due 08/15/2024 | | | 1,030,000 | | | | 1,039,887 | |
CarMax Auto Owner Trust
Series2019-2, Class A3
2.68% due 03/15/2024 | | | 1,125,000 | | | | 1,145,405 | |
CarMax Auto Owner Trust
Series2018-4, Class A3
3.36% due 09/15/2023 | | | 1,000,000 | | | | 1,026,331 | |
Chase Mtg. Finance Trust VRS
Series2016-2, Class M2
3.75% due 12/25/2045*(2)(3) | | | 1,494,766 | | | | 1,566,310 | |
Citibank Credit Card Issuance Trust
Series2017-A3, Class A3
1.92% due 04/07/2022 | | | 1,554,000 | | | | 1,553,286 | |
Citibank Credit Card Issuance Trust
Series2018-A1, Class A1
2.49% due 01/20/2023 | | | 150,000 | | | | 151,480 | |
Citibank Credit Card Issuance Trust
Series2018-A7, Class A7
3.96% due 10/13/2030 | | | 250,000 | | | | 289,046 | |
| | | | | | | | |
| | |
| Security Description | | Principal
Amount | | | Value
(Note 2) | |
| |
| | | | | | | | | |
Diversified Financial Services (continued) | |
COMM Mtg. Trust VRS
Series 2016-787S, Class B
3.96% due 02/10/2036*(1)(3) | | $ | 1,254,000 | | | $ | 1,364,629 | |
Core Industrial Trust
Series 2015-CALW, Class A
3.04% due 02/10/2034*(1) | | | 5,692 | | | | 5,839 | |
CSAIL Commercial Mtg. Trust
Series2017-C8, Class A2
2.99% due 06/15/2050(1) | | | 1,770,000 | | | | 1,810,113 | |
CSMC Trust
Series 2015-GLPA, Class A
3.88% due 11/15/2037*(1) | | | 1,447,366 | | | | 1,599,059 | |
Discover Card Execution Note Trust
Series2015-A4, Class A4
2.19% due 04/17/2023 | | | 1,256,000 | | | | 1,260,361 | |
Discover Card Execution Note Trust
Series2019-A1, Class A1
3.04% due 07/15/2024 | | | 500,000 | | | | 515,716 | |
Ford Credit Auto Owner Trust
Series2018-2, Class A
3.47% due 01/15/2030* | | | 400,000 | | | | 422,404 | |
GM Financial Consumer Automobile Receivables Trust
Series2017-3A, Class 4A
2.13% due 03/16/2023* | | | 1,000,000 | | | | 1,004,073 | |
GM Financial Consumer Automobile Receivables Trust
Series2019-3, Class A3
2.18% due 04/16/2024 | | | 1,075,000 | | | | 1,086,073 | |
GS Mtg. Securities Trust
Series 2015-GC28, Class A2
2.90% due 02/10/2048(1) | | | 557,331 | | | | 557,471 | |
Honda Auto Receivables Owner Trust
Series 2019-1, Class A3
2.83% due 03/20/2023 | | | 700,000 | | | | 714,918 | |
ILPT Trust
Series 2019-SURF, Class A
4.15% due 02/11/2041*(1) | | | 5,570,000 | | | | 6,436,613 | |
JP Morgan Mtg. Trust VRS
Series2017-6, Class A6
3.00% due 12/25/2048*(2)(3) | | | 2,240,454 | | | | 2,232,841 | |
JP Morgan Mtg. Trust VRS
Series2018-1, Class A5
3.50% due 06/25/2048*(2)(3) | | | 2,806,596 | | | | 2,851,367 | |
Mercedes-Benz Auto Lease Trust
Series2019-A, Class A4
3.25% due 10/15/2024 | | | 188,000 | | | | 191,960 | |
Morgan Stanley Bank of America Merrill Lynch Trust
Series2015-C23, Class A2
2.98% due 07/15/2050(1) | | | 1,000,000 | | | | 1,001,496 | |
Morgan Stanley Capital Barclays Bank Trust
Series 2016-MART, Class A
2.20% due 09/13/2031*(1) | | | 2,397,000 | | | | 2,402,645 | |
MSDB Trust VRS
Series 2017-712F, Class A
3.43% due 07/11/2039*(1)(3) | | | 4,520,000 | | | | 4,819,254 | |
MTRO Commercial Mtg. Trust-TECH FRS
Series 2019 -TECH, Class A
3.10% (1 ML+0.90%)
due 12/15/2033*(1) | | | 2,950,000 | | | | 2,949,995 | |
Nissan Auto Receivables Owner Trust
Series2016-C, Class A3
1.18% due 01/15/2021 | | | 108,587 | | | | 108,348 | |
One Bryant Park Trust
Series2019-OBP, Class A
2.52% due 09/13/2049*(1) | | | 3,720,000 | | | | 3,785,118 | |
VALIC Company II Core Bond Fund
PORTFOLIO OF INVESTMENTS —August 31, 2019 — (continued)
| | | | | | | | |
| | |
| Security Description | | Principal
Amount | | | Value
(Note 2) | |
| |
ASSET BACKED SECURITIES (continued) | |
Diversified Financial Services (continued) | |
ShellpointCo-Originator Trust VRS
Series2017-2, Class A1
3.50% due 10/25/2047*(2)(3) | | $ | 1,755,168 | | | $ | 1,773,611 | |
Stonemont Portfolio Trust FRS
Series 2017-MONT, Class A
3.02% (1 ML+0.85%)
due 08/20/2030*(1) | | | 966,295 | | | | 965,978 | |
Synchrony Credit Card Master Note Trust
Series2016-2, Class A
2.21% due 05/15/2024 | | | 850,000 | | | | 855,996 | |
Toyota Auto Loan Extended Note Trust
Series2019-1A, Class A
2.56% due 11/25/2031* | | | 900,000 | | | | 928,201 | |
Toyota Auto Receivables Owner Trust
Series2019-B, Class A3
2.57% due 08/15/2023 | | | 3,000,000 | | | | 3,049,033 | |
Toyota Auto Receivables Owner Trust
Series2018-C, Class A4
3.13% due 02/15/2024 | | | 125,000 | | | | 129,074 | |
Verizon Owner Trust
Series2018-1A, Class C
3.20% due 09/20/2022* | | | 300,000 | | | | 305,556 | |
Volkswagen Auto Loan Enhanced Trust
Series2018-2, Class A4
3.33% due 02/20/2025 | | | 500,000 | | | | 519,542 | |
| | | | | | |
|
|
|
Total Asset Backed Securities | | | | | | | | |
(cost $69,255,960) | | | | | | | 71,492,349 | |
| | | |
|
|
|
U.S. CORPORATE BONDS & NOTES — 37.0% | |
Advertising Agencies — 0.0% | |
Interpublic Group of Cos., Inc.
Senior Notes
4.20% due 04/15/2024 | | | 628,000 | | | | 678,719 | |
Interpublic Group of Cos., Inc.
Senior Notes
5.40% due 10/01/2048 | | | 74,000 | | | | 89,818 | |
| | | | | | |
|
|
|
| | | | | | | | 768,537 | |
| | | | | | |
|
|
|
Aerospace/Defense — 0.3% | |
BAE Systems Holdings, Inc.
Company Guar. Notes
3.85% due 12/15/2025* | | | 2,982,000 | | | | 3,157,724 | |
General Dynamics Corp.
Company Guar. Notes
2.88% due 05/11/2020 | | | 1,851,000 | | | | 1,862,102 | |
| | | | | | |
|
|
|
| | | | | | | | 5,019,826 | |
| | | | | | |
|
|
|
Agricultural Chemicals — 0.1% | |
Mosaic Co.
Senior Notes
5.63% due 11/15/2043 | | | 826,000 | | | | 917,748 | |
| | | | | | |
|
|
|
Airlines — 0.0% | |
Atlas Air, Inc.
Pass-Through Certs.
Series1999-1, Class B
7.63% due 01/02/2020(4) | | | 23,396 | | | | 23,532 | |
United Airlines Pass-Through Trust
Pass-Through Certs.
Series2014-2, Class B
4.63% due 03/03/2024 | | | 450,600 | | | | 465,965 | |
| | | | | | |
|
|
|
| | | | | | | | 489,497 | |
| | | | | | |
|
|
|
| | | | | | | | |
| | |
| Security Description | | Principal
Amount | | | Value
(Note 2) | |
| |
| | | | | | | | | |
Applications Software — 0.1% | |
CDK Global, Inc.
Senior Notes
5.88% due 06/15/2026 | | $ | 679,000 | | | $ | 721,166 | |
SS&C Technologies, Inc.
Company Guar. Notes
5.50% due 09/30/2027* | | | 802,000 | | | | 842,100 | |
| | | | | | |
|
|
|
| | | | | | | | 1,563,266 | |
| | | | | | |
|
|
|
Auto - Cars/Light Trucks — 1.0% | |
BMW US Capital LLC
Company Guar. Notes
3.10% due 04/12/2021* | | | 2,595,000 | | | | 2,632,282 | |
Daimler Finance North America LLC
Company Guar. Notes
2.00% due 07/06/2021* | | | 888,000 | | | | 882,436 | |
Daimler Finance North America LLC
Company Guar. Notes
2.45% due 05/18/2020* | | | 702,000 | | | | 703,027 | |
Ford Motor Credit Co. LLC
Senior Notes
3.10% due 05/04/2023 | | | 3,639,000 | | | | 3,605,905 | |
General Motors Financial Co., Inc.
Company Guar. Notes
3.70% due 05/09/2023 | | | 2,067,000 | | | | 2,120,156 | |
Hyundai Capital America
Senior Notes
3.40% due 06/20/2024* | | | 2,705,000 | | | | 2,772,025 | |
Nissan Motor Acceptance Corp.
Senior Notes
2.65% due 07/13/2022* | | | 1,500,000 | | | | 1,506,594 | |
Toyota Motor Credit Corp.
Senior Notes
3.45% due 09/20/2023 | | | 1,993,000 | | | | 2,109,600 | |
| | | | | | |
|
|
|
| | | | | | | | 16,332,025 | |
| | | | | | |
|
|
|
Auto - Heavy Duty Trucks — 0.0% | |
Allison Transmission, Inc.
Senior Notes
5.00% due 10/01/2024* | | | 559,000 | | | | 575,127 | |
| | | | | | |
|
|
|
Auto/Truck Parts & Equipment-Original — 0.1% | |
Lear Corp.
Senior Notes
5.25% due 05/15/2049 | | | 1,606,000 | | | | 1,677,416 | |
| | | | | | |
|
|
|
Banks - Commercial — 1.5% | |
BankUnited, Inc.
Senior Notes
4.88% due 11/17/2025 | | | 6,134,000 | | | | 6,748,227 | |
Citizens Financial Group, Inc.
Sub. Notes
4.15% due 09/28/2022* | | | 1,570,000 | | | | 1,638,810 | |
Citizens Financial Group, Inc.
Sub. Notes
4.30% due 12/03/2025 | | | 1,000,000 | | | | 1,080,358 | |
Regions Financial Corp.
Sub. Notes
7.38% due 12/10/2037 | | | 3,140,000 | | | | 4,574,960 | |
SunTrust Bank
Senior Notes
3.20% due 04/01/2024 | | | 4,415,000 | | | | 4,621,774 | |
SunTrust Bank
Senior Notes
3.50% due 08/02/2022 | | | 1,401,000 | | | | 1,434,114 | |
VALIC Company II Core Bond Fund
PORTFOLIO OF INVESTMENTS —August 31, 2019 — (continued)
| | | | | | | | |
| | |
| Security Description | | Principal
Amount | | | Value
(Note 2) | |
| |
U.S. CORPORATE BONDS & NOTES (continued) | |
Banks - Commercial (continued) | |
Webster Financial Corp.
Senior Notes
4.10% due 03/25/2029 | | $ | 2,871,000 | | | $ | 3,100,356 | |
| | | | | | |
|
|
|
| | | | | | | | 23,198,599 | |
| | | | | | |
|
|
|
Banks - Fiduciary — 0.1% | |
Bank of New York Mellon Corp.
Senior Notes
1.95% due 08/23/2022 | | | 1,565,000 | | | | 1,563,674 | |
| | | | | | |
|
|
|
Banks - Super Regional — 1.0% | |
Bank of America NA
Senior Notes
3.34% due 01/25/2023 | | | 2,622,000 | | | | 2,702,346 | |
Wells Fargo & Co.
Senior Notes
3.20% due 06/17/2027 | | | 3,088,000 | | | | 3,216,074 | |
Wells Fargo & Co.
Senior Notes
3.55% due 09/29/2025 | | | 9,224,000 | | | | 9,812,845 | |
| | | | | | |
|
|
|
| | | | | | | | 15,731,265 | |
| | | | | | |
|
|
|
Batteries/Battery Systems — 0.1% | |
Energizer Holdings, Inc.
Company Guar. Notes
6.38% due 07/15/2026* | | | 1,090,000 | | | | 1,148,587 | |
EnerSys
Company Guar. Notes
5.00% due 04/30/2023* | | | 1,150,000 | | | | 1,184,500 | |
| | | | | | |
|
|
|
| | | | | | | | 2,333,087 | |
| | | | | | |
|
|
|
Beverages-Non-alcoholic — 0.3% | |
Keurig Dr Pepper, Inc.
Company Guar. Notes
4.06% due 05/25/2023 | | | 40,000 | | | | 42,473 | |
Keurig Dr Pepper, Inc.
Company Guar. Notes
4.42% due 05/25/2025 | | | 2,223,000 | | | | 2,431,690 | |
PepsiCo., Inc.
Senior Notes
2.75% due 04/30/2025 | | | 1,649,000 | | | | 1,725,308 | |
| | | | | | |
|
|
|
| | | | | | | | 4,199,471 | |
| | | | | | |
|
|
|
Beverages - Wine/Spirits — 0.2% | |
Constellation Brands, Inc.
Company Guar. Notes
3.15% due 08/01/2029 | | | 1,930,000 | | | | 1,990,915 | |
Constellation Brands, Inc.
Company Guar. Notes
5.25% due 11/15/2048 | | | 905,000 | | | | 1,147,527 | |
| | | | | | |
|
|
|
| | | | | | | | 3,138,442 | |
| | | | | | |
|
|
|
Brewery — 0.4% | |
Anheuser-Busch Cos. LLC/Anheuser-Busch InBev Worldwide, Inc.
Company Guar. Notes
3.65% due 02/01/2026 | | | 42,000 | | | | 45,109 | |
Anheuser-Busch Cos. LLC/Anheuser-Busch InBev Worldwide, Inc.
Company Guar. Notes
4.90% due 02/01/2046 | | | 1,363,000 | | | | 1,624,883 | |
Anheuser-Busch InBev Worldwide, Inc.
Company Guar. Notes
4.60% due 04/15/2048 | | | 730,000 | | | | 848,255 | |
| | | | | | | | |
| | |
| Security Description | | Principal
Amount | | | Value
(Note 2) | |
| |
| | | | | | | | | |
Brewery (continued) | |
Anheuser-Busch InBev Worldwide, Inc.
Company Guar. Notes
5.55% due 01/23/2049 | | $ | 3,179,000 | | | $ | 4,175,587 | |
| | | | | | |
|
|
|
| | | | | | | | 6,693,834 | |
| | | | | | |
|
|
|
Broadcast Services/Program — 0.2% | |
Fox Corp.
Senior Notes
5.48% due 01/25/2039* | | | 1,170,000 | | | | 1,464,572 | |
Fox Corp.
Senior Notes
5.58% due 01/25/2049* | | | 1,437,000 | | | | 1,871,487 | |
| | | | | | |
|
|
|
| | | | | | | | 3,336,059 | |
| | | | | | |
|
|
|
Building & Construction Products - Misc. — 0.3% | |
Owens Corning
Senior Notes
3.95% due 08/15/2029 | | | 1,085,000 | | | | 1,121,935 | |
Owens Corning
Senior Notes
4.30% due 07/15/2047 | | | 2,370,000 | | | | 2,168,856 | |
Standard Industries, Inc.
Senior Notes
6.00% due 10/15/2025* | | | 1,100,000 | | | | 1,156,375 | |
| | | | | | |
|
|
|
| | | | | | | | 4,447,166 | |
| | | | | | |
|
|
|
Building & Construction - Misc. — 0.1% | |
Frontdoor, Inc.
Senior Notes
6.75% due 08/15/2026* | | | 801,000 | | | | 869,085 | |
| | | | | | |
|
|
|
Building Products - Cement — 0.1% | |
Martin Marietta Materials, Inc.
Senior Notes
3.50% due 12/15/2027 | | | 1,533,000 | | | | 1,582,596 | |
| | | | | | |
|
|
|
Building - Heavy Construction — 0.1% | |
Tutor Perini Corp.
Company Guar. Notes
6.88% due 05/01/2025*# | | | 1,285,000 | | | | 1,196,669 | |
| | | | | | |
|
|
|
Building - Residential/Commercial — 0.1% | |
Toll Brothers Finance Corp.
Company Guar. Notes
4.35% due 02/15/2028 | | | 979,000 | | | | 1,023,055 | |
| | | | | | |
|
|
|
Cable/Satellite TV — 1.1% | |
Block Communications, Inc.
Senior Notes
6.88% due 02/15/2025* | | | 1,027,000 | | | | 1,078,350 | |
CCO Holdings LLC/CCO Holdings Capital Corp.
Senior Notes
5.00% due 02/01/2028* | | | 361,000 | | | | 379,050 | |
CCO Holdings LLC/CCO Holdings Capital Corp.
Senior Notes
5.38% due 05/01/2025* | | | 420,000 | | | | 436,275 | |
CCO Holdings LLC/CCO Holdings Capital Corp.
Senior Notes
5.38% due 06/01/2029* | | | 295,000 | | | | 315,281 | |
CCO Holdings LLC/CCO Holdings Capital Corp.
Senior Notes
5.50% due 05/01/2026* | | | 802,000 | | | | 845,108 | |
CCO Holdings LLC/CCO Holdings Capital Corp.
Senior Notes
5.88% due 04/01/2024* | | | 263,000 | | | | 273,849 | |
VALIC Company II Core Bond Fund
PORTFOLIO OF INVESTMENTS —August 31, 2019 — (continued)
| | | | | | | | |
| | |
| Security Description | | Principal
Amount | | | Value
(Note 2) | |
| |
U.S. CORPORATE BONDS & NOTES (continued) | |
Cable/Satellite TV (continued) | |
Charter Communications Operating LLC/Charter Communications Operating Capital FRS
Senior Sec. Notes
3.90% (3 ML+1.65%)
due 02/01/2024 | | $ | 821,000 | | | $ | 833,711 | |
Charter Communications Operating LLC/Charter Communications Operating Capital
Senior Sec. Notes
5.05% due 03/30/2029 | | | 1,760,000 | | | | 1,989,091 | |
Charter Communications Operating LLC/Charter Communications Operating Capital
Senior Sec. Notes
5.38% due 04/01/2038 | | | 184,000 | | | | 207,476 | |
Charter Communications Operating LLC/Charter Communications Operating Capital
Senior Sec. Notes
6.38% due 10/23/2035 | | | 702,000 | | | | 856,681 | |
Comcast Corp.
Company Guar. Notes
3.15% due 03/01/2026 | | | 2,661,000 | | | | 2,806,450 | |
Comcast Corp.
Company Guar. Notes
3.90% due 03/01/2038 | | | 469,000 | | | | 525,705 | |
Comcast Corp.
Company Guar. Notes
4.60% due 10/15/2038 | | | 1,928,000 | | | | 2,332,787 | |
Comcast Corp.
Company Guar. Notes
4.70% due 10/15/2048 | | | 607,000 | | | | 760,543 | |
CSC Holdings LLC
Senior Notes
5.25% due 06/01/2024 | | | 755,000 | | | | 807,850 | |
CSC Holdings LLC
Company Guar. Notes
5.38% due 07/15/2023* | | | 225,000 | | | | 231,246 | |
CSC Holdings LLC
Company Guar. Notes
5.50% due 04/15/2027* | | | 2,520,000 | | | | 2,696,400 | |
| | | | | | |
|
|
|
| | | | | | | | 17,375,853 | |
| | | | | | |
|
|
|
Casino Services — 0.1% | |
Eldorado Resorts, Inc.
Company Guar. Notes
6.00% due 09/15/2026 | | | 1,195,000 | | | | 1,307,031 | |
| | | | | | |
|
|
|
Cellular Telecom — 0.4% | |
Sprint Corp.
Company Guar. Notes
7.88% due 09/15/2023 | | | 4,406,000 | | | | 4,956,750 | |
Sprint Spectrum Co. LLC/Sprint Spectrum Co. II LLC/Sprint Spectrum Co. III LLC
Senior Sec. Notes
4.74% due 09/20/2029* | | | 1,231,000 | | | | 1,304,860 | |
T-Mobile USA, Inc.
Company Guar. Notes
6.38% due 03/01/2025 | | | 355,000 | | | | 367,603 | |
T-Mobile USA, Inc.
Company Guar. Notes
6.50% due 01/15/2024 | | | 429,000 | | | | 447,112 | |
| | | | | | |
|
|
|
| | | | | | | | 7,076,325 | |
| | | | | | |
|
|
|
Chemicals - Diversified — 0.2% | |
Dow Chemical Co.
Senior Notes
4.80% due 05/15/2049* | | | 1,202,000 | | | | 1,361,334 | |
| | | | | | | | |
| | |
| Security Description | | Principal
Amount | | | Value
(Note 2) | |
| |
| | | | | | | | | |
Chemicals - Diversified (continued) | |
Dow Chemical Co.
Senior Notes
5.55% due 11/30/2048* | | $ | 1,436,000 | | | $ | 1,777,245 | |
DowDuPont, Inc.
Senior Notes
5.32% due 11/15/2038 | | | 62,000 | | | | 76,362 | |
DowDuPont, Inc.
Senior Notes
5.42% due 11/15/2048 | | | 327,000 | | | | 421,116 | |
| | | | | | |
|
|
|
| | | | | | | | 3,636,057 | |
| | | | | | |
|
|
|
Chemicals - Plastics — 0.0% | |
Neon Holdings, Inc.
Senior Sec. Notes
10.13% due 04/01/2026* | | | 685,000 | | | | 671,300 | |
| | | | | | |
|
|
|
Chemicals - Specialty — 0.2% | |
Ecolab, Inc.
Senior Notes
2.38% due 08/10/2022 | | | 1,476,000 | | | | 1,491,247 | |
Huntsman International LLC
Senior Notes
4.50% due 05/01/2029 | | | 1,625,000 | | | | 1,730,711 | |
Lubrizol Corp.
Company Guar. Notes
6.50% due 10/01/2034 | | | 459,000 | | | | 659,244 | |
| | | | | | |
|
|
|
| | | | | | | | 3,881,202 | |
| | | | | | |
|
|
|
Coal — 0.1% | |
SunCoke Energy Partners LP/SunCoke Energy Partners Finance Corp.
Company Guar. Notes
7.50% due 06/15/2025* | | | 886,000 | | | | 838,931 | |
| | | | | | |
|
|
|
Coatings/Paint — 0.1% | |
RPM International, Inc.
Senior Notes
4.25% due 01/15/2048 | | | 136,000 | | | | 134,586 | |
Sherwin-Williams Co.
Senior Notes
2.95% due 08/15/2029 | | | 1,321,000 | | | | 1,343,064 | |
| | | | | | |
|
|
|
| | | | | | | | 1,477,650 | |
| | | | | | |
|
|
|
Commercial Services — 0.1% | |
Harsco Corp.
Company Guar. Notes
5.75% due 07/31/2027* | | | 571,000 | | | | 591,699 | |
Nielsen Finance LLC/Nielsen Finance Co.
Company Guar. Notes
5.00% due 04/15/2022* | | | 1,025,000 | | | | 1,030,125 | |
| | | | | | |
|
|
|
| | | | | | | | 1,621,824 | |
| | | | | | |
|
|
|
Computer Services — 0.4% | |
IBM Credit LLC
Senior Notes
3.00% due 02/06/2023 | | | 5,630,000 | | | | 5,792,860 | |
International Business Machines Corp.
Senior Notes
2.50% due 01/27/2022 | | | 1,104,000 | | | | 1,118,417 | |
| | | | | | |
|
|
|
| | | | | | | | 6,911,277 | |
| | | | | | |
|
|
|
Computer Software — 0.1% | |
Rackspace Hosting, Inc.
Company Guar. Notes
8.63% due 11/15/2024*# | | | 1,085,000 | | | | 995,487 | |
| | | | | | |
|
|
|
VALIC Company II Core Bond Fund
PORTFOLIO OF INVESTMENTS —August 31, 2019 — (continued)
| | | | | | | | |
| | |
| Security Description | | Principal
Amount | | | Value
(Note 2) | |
| |
U.S. CORPORATE BONDS & NOTES (continued) | |
Computers — 0.3% | |
Apple, Inc.
Senior Notes
2.85% due 05/06/2021 | | $ | 1,162,000 | | | $ | 1,181,735 | |
Dell International LLC/EMC Corp.
Senior Sec. Notes
6.02% due 06/15/2026* | | | 1,900,000 | | | | 2,143,892 | |
Dell International LLC/EMC Corp.
Senior Sec. Notes
8.10% due 07/15/2036* | | | 1,268,000 | | | | 1,607,489 | |
Hewlett Packard Enterprise Co.
Senior Notes
6.20% due 10/15/2035 | | | 58,000 | | | | 67,495 | |
| | | | | | |
|
|
|
| | | | | | | | 5,000,611 | |
| | | | | | |
|
|
|
Computers - Integrated Systems — 0.1% | |
Diebold Nixdorf, Inc.
Company Guar. Notes
8.50% due 04/15/2024# | | | 1,000,000 | | | | 932,500 | |
NCR Corp.
Company Guar. Notes
5.75% due 09/01/2027* | | | 367,000 | | | | 387,574 | |
NCR Corp.
Company Guar. Notes
6.13% due 09/01/2029* | | | 587,000 | | | | 623,024 | |
| | | | | | |
|
|
|
| | | | | | | | 1,943,098 | |
| | | | | | |
|
|
|
Consumer Products - Misc. — 0.1% | |
Central Garden & Pet Co.
Company Guar. Notes
5.13% due 02/01/2028 | | | 975,000 | | | | 979,875 | |
| | | | | | |
|
|
|
Containers - Metal/Glass — 0.2% | |
Crown Americas LLC/Crown Americas Capital Corp.
Company Guar. Notes
4.50% due 01/15/2023 | | | 150,000 | | | | 157,500 | |
Crown Cork & Seal Co., Inc.
Company Guar. Notes
7.38% due 12/15/2026 | | | 583,000 | | | | 708,345 | |
Owens-Brockway Glass Container, Inc.
Company Guar. Notes
5.38% due 01/15/2025* | | | 1,126,000 | | | | 1,165,410 | |
Silgan Holdings, Inc.
Senior Notes
4.75% due 03/15/2025 | | | 1,025,000 | | | | 1,052,009 | |
| | | | | | |
|
|
|
| | | | | | | | 3,083,264 | |
| | | | | | |
|
|
|
Containers - Paper/Plastic — 0.0% | |
Sealed Air Corp.
Company Guar. Notes
5.13% due 12/01/2024* | | | 298,000 | | | | 319,232 | |
| | | | | | |
|
|
|
Cosmetics & Toiletries — 0.1% | |
Coty, Inc.
Company Guar. Notes
6.50% due 04/15/2026*# | | | 1,365,000 | | | | 1,289,925 | |
First Quality Finance Co., Inc.
Company Guar. Notes
5.00% due 07/01/2025* | | | 734,000 | | | | 761,525 | |
| | | | | | |
|
|
|
| | | | | | | | 2,051,450 | |
| | | | | | |
|
|
|
Data Processing/Management — 0.1% | |
Fiserv, Inc.
Senior Notes
4.40% due 07/01/2049 | | | 1,741,000 | | | | 2,003,406 | |
| | | | | | |
|
|
|
| | | | | | | | |
| | |
| Security Description | | Principal
Amount | | | Value
(Note 2) | |
| |
| | | | | | | | | |
Diagnostic Equipment — 0.1% | |
Ortho-Clinical Diagnostics, Inc.
Senior Notes
6.63% due 05/15/2022* | | $ | 1,190,000 | | | $ | 1,148,350 | |
| | | | | | |
|
|
|
Dialysis Centers — 0.1% | |
DaVita HealthCare Partners, Inc.
Company Guar. Notes
5.13% due 07/15/2024 | | | 1,132,000 | | | | 1,151,482 | |
| | | | | | |
|
|
|
Distribution/Wholesale — 0.1% | |
Anixter, Inc.
Company Guar. Notes
6.00% due 12/01/2025 | | | 565,000 | | | | 624,325 | |
H&E Equipment Services, Inc.
Company Guar. Notes
5.63% due 09/01/2025 | | | 882,000 | | | | 923,895 | |
| | | | | | |
|
|
|
| | | | | | | | 1,548,220 | |
| | | | | | |
|
|
|
Diversified Banking Institutions — 2.7% | |
Bank of America Corp.
Senior Notes
3.71% due 04/24/2028 | | | 2,112,000 | | | | 2,278,184 | |
Bank of America Corp.
Senior Notes
3.86% due 07/23/2024 | | | 1,989,000 | | | | 2,111,794 | |
Bank of America Corp.
Sub. Notes
4.18% due 11/25/2027 | | | 2,082,000 | | | | 2,265,018 | |
Bank of America Corp.
Sub. Notes
6.11% due 01/29/2037 | | | 1,830,000 | | | | 2,449,106 | |
Citigroup, Inc.
Senior Notes
3.20% due 10/21/2026 | | | 3,555,000 | | | | 3,708,947 | |
Citigroup, Inc.
Senior Notes
3.98% due 03/20/2030 | | | 1,202,000 | | | | 1,326,553 | |
Citigroup, Inc.
Sub. Notes
4.45% due 09/29/2027 | | | 2,634,000 | | | | 2,897,949 | |
Citigroup, Inc.
Sub. Notes
5.88% due 02/22/2033 | | | 1,279,000 | | | | 1,605,253 | |
Citigroup, Inc.
Sub. Notes
6.00% due 10/31/2033 | | | 684,000 | | | | 869,905 | |
Goldman Sachs Group, Inc.
Senior Notes
2.35% due 11/15/2021 | | | 3,306,000 | | | | 3,312,120 | |
Goldman Sachs Group, Inc.
Senior Notes
3.69% due 06/05/2028 | | | 2,027,000 | | | | 2,155,023 | |
Goldman Sachs Group, Inc.
Sub. Notes
4.25% due 10/21/2025 | | | 1,978,000 | | | | 2,133,199 | |
Goldman Sachs Group, Inc.
Sub. Notes
6.75% due 10/01/2037 | | | 2,419,000 | | | | 3,313,303 | |
JPMorgan Chase & Co.
Senior Notes
3.21% due 04/01/2023 | | | 4,922,000 | | | | 5,060,236 | |
JPMorgan Chase & Co.
Senior Notes
3.88% due 07/24/2038 | | | 653,000 | | | | 731,815 | |
Morgan Stanley
Senior Notes
3.63% due 01/20/2027 | | | 4,230,000 | | | | 4,524,515 | |
VALIC Company II Core Bond Fund
PORTFOLIO OF INVESTMENTS —August 31, 2019 — (continued)
| | | | | | | | |
| | |
| Security Description | | Principal
Amount | | | Value
(Note 2) | |
| |
U.S. CORPORATE BONDS & NOTES (continued) | |
Diversified Banking Institutions (continued) | |
Morgan Stanley
Senior Notes
5.50% due 07/24/2020 | | $ | 2,640,000 | | | $ | 2,718,261 | |
| | | | | | |
|
|
|
| | | | | | | | 43,461,181 | |
| | | | | | |
|
|
|
Diversified Financial Services — 0.1% | |
USAA Capital Corp.
Senior Notes
2.63% due 06/01/2021* | | | 1,719,000 | | | | 1,739,304 | |
| | | | | | |
|
|
|
Diversified Manufacturing Operations — 0.1% | |
Illinois Tool Works, Inc.
Senior Notes
3.50% due 03/01/2024 | | | 1,435,000 | | | | 1,519,224 | |
| | | | | | |
|
|
|
E-Commerce/Products — 0.1% | |
Amazon.com, Inc.
Senior Notes
4.80% due 12/05/2034 | | | 951,000 | | | | 1,207,627 | |
| | | | | | |
|
|
|
E-Commerce/Services — 0.1% | |
GrubHub Holdings, Inc.
Company Guar. Notes
5.50% due 07/01/2027* | | | 848,000 | | | | 886,160 | |
| | | | | | |
|
|
|
Electric - Distribution — 0.9% | |
CenterPoint Energy, Inc.
Senior Notes
2.95% due 03/01/2030 | | | 1,149,000 | | | | 1,163,942 | |
National Rural Utilities Cooperative Finance Corp.
Collateral Trust Bonds
2.85% due 01/27/2025 | | | 5,354,000 | | | | 5,549,311 | |
NextEra Energy Operating Partners LP
Company Guar. Notes
4.25% due 07/15/2024* | | | 875,000 | | | | 899,062 | |
Oglethorpe Power Corp.
1st Mtg. Notes
5.05% due 10/01/2048 | | | 3,164,000 | | | | 3,942,585 | |
Sempra Energy
Senior Notes
3.40% due 02/01/2028 | | | 2,456,000 | | | | 2,559,081 | |
| | | | | | |
|
|
|
| | | | | | | | 14,113,981 | |
| | | | | | |
|
|
|
Electric - Generation — 0.2% | |
Basin Electric Power Cooperative
1st Mtg. Notes
4.75% due 04/26/2047* | | | 157,000 | | | | 188,608 | |
Emera US Finance LP
Company Guar. Notes
4.75% due 06/15/2046 | | | 1,522,000 | | | | 1,803,505 | |
Vistra Operations Co. LLC
Company Guar. Notes
5.00% due 07/31/2027* | | | 880,000 | | | | 908,600 | |
| | | | | | |
|
|
|
| | | | | | | | 2,900,713 | |
| | | | | | |
|
|
|
Electric - Integrated — 2.4% | |
AEP Texas, Inc.
Senior Notes
4.15% due 05/01/2049 | | | 731,000 | | | | 867,631 | |
Consolidated Edison Co. of New York, Inc.
Senior Notes
4.45% due 06/15/2020 | | | 1,814,000 | | | | 1,845,322 | |
Dominion Resources, Inc.
Senior Notes
5.25% due 08/01/2033 | | | 1,645,000 | | | | 2,031,289 | |
DPL, Inc.
Senior Notes
4.35% due 04/15/2029* | | | 542,000 | | | | 541,208 | |
| | | | | | | | |
| | |
| Security Description | | Principal
Amount | | | Value
(Note 2) | |
| |
| | | | | | | | | |
Electric - Integrated (continued) | |
DTE Electric Co.
General Refunding Mtg.
3.95% due 03/01/2049 | | $ | 2,864,000 | | | $ | 3,436,294 | |
DTE Energy Co.
Senior Notes
3.40% due 06/15/2029 | | | 1,116,000 | | | | 1,180,868 | |
Duke Energy Progress LLC
1st Mtg. Notes
2.80% due 05/15/2022 | | | 957,000 | | | | 977,339 | |
Edison International
Senior Notes
4.13% due 03/15/2028 | | | 1,618,000 | | | | 1,688,256 | |
Edison International
Senior Notes
5.75% due 06/15/2027 | | | 316,000 | | | | 358,554 | |
Entergy Texas, Inc.
1st Mtg. Notes
4.50% due 03/30/2039 | | | 3,143,000 | | | | 3,781,685 | |
FirstEnergy Corp.
Senior Notes
7.38% due 11/15/2031 | | | 4,265,000 | | | | 6,113,571 | |
Georgia Power Co.
Senior Notes
2.00% due 09/08/2020 | | | 881,000 | | | | 881,266 | |
Mississippi Power Co.
Senior Notes
4.25% due 03/15/2042 | | | 1,746,000 | | | | 1,930,542 | |
Nevada Power Co.
General Refunding Mtg.
2.75% due 04/15/2020 | | | 1,228,000 | | | | 1,233,315 | |
Public Service Co. of Colorado
1st Mtg. Bonds
3.70% due 06/15/2028 | | | 1,537,000 | | | | 1,717,054 | |
Public Service Co. of Colorado
1st Mtg. Bonds
4.10% due 06/15/2048 | | | 1,136,000 | | | | 1,365,199 | |
Puget Sound Energy, Inc.
Senior Sec. Notes
3.25% due 09/15/2049 | | | 398,000 | | | | 410,824 | |
South Carolina Electric & Gas Co.
1st Mtg. Bonds
5.10% due 06/01/2065 | | | 1,689,000 | | | | 2,296,258 | |
Southern California Edison Co.
1st Mtg. Notes
Class C
4.13% due 03/01/2048 | | | 817,000 | | | | 913,436 | |
Southern California Edison Co.
1st Mtg. Notes
4.65% due 10/01/2043 | | | 798,000 | | | | 945,383 | |
Southern California Edison Co.
1st Mtg. Bonds
4.88% due 03/01/2049 | | | 2,171,000 | | | | 2,696,620 | |
Talen Energy Supply LLC
Senior Sec. Notes
6.63% due 01/15/2028* | | | 335,000 | | | | 324,113 | |
Talen Energy Supply LLC
Senior Sec. Notes
7.25% due 05/15/2027* | | | 382,000 | | | | 379,135 | |
| | | | | | |
|
|
|
| | | | | | | | 37,915,162 | |
| | | | | | |
|
|
|
Electronic Components - Semiconductors — 0.2% | |
Amkor Technology, Inc.
Senior Notes
6.63% due 09/15/2027* | | | 857,000 | | | | 933,042 | |
VALIC Company II Core Bond Fund
PORTFOLIO OF INVESTMENTS —August 31, 2019 — (continued)
| | | | | | | | |
| | |
| Security Description | | Principal
Amount | | | Value
(Note 2) | |
| |
U.S. CORPORATE BONDS & NOTES (continued) | |
Electronic Components - Semiconductors (continued) | |
Intel Corp.
Senior Notes
2.45% due 07/29/2020 | | $ | 2,012,000 | | | $ | 2,021,119 | |
Texas Instruments, Inc.
Senior Notes
2.25% due 09/04/2029 | | | 767,000 | | | | 769,583 | |
| | | | | | |
|
|
|
| | | | | | | | 3,723,744 | |
| | | | | | |
|
|
|
Electronic Measurement Instruments — 0.2% | |
Trimble, Inc.
Senior Notes
4.75% due 12/01/2024 | | | 168,000 | | | | 181,581 | |
Trimble, Inc.
Senior Notes
4.90% due 06/15/2028 | | | 2,503,000 | | | | 2,743,190 | |
| | | | | | |
|
|
|
| | | | | | | | 2,924,771 | |
| | | | | | |
|
|
|
Electronic Parts Distribution — 0.2% | |
Arrow Electronics, Inc.
Senior Notes
4.00% due 04/01/2025 | | | 1,008,000 | | | | 1,053,662 | |
Ingram Micro, Inc.
Senior Notes
5.45% due 12/15/2024 | | | 1,425,000 | | | | 1,473,695 | |
| | | | | | |
|
|
|
| | | | | | | | 2,527,357 | |
| | | | | | |
|
|
|
Energy - Alternate Sources — 0.2% | |
Hanwha Energy USA Holdings Corp.
Company Guar. Notes
2.38% due 07/30/2022* | | | 2,335,000 | | | | 2,347,192 | |
Pattern Energy Group, Inc.
Company Guar. Notes
5.88% due 02/01/2024* | | | 1,297,000 | | | | 1,342,395 | |
| | | | | | |
|
|
|
| | | | | | | | 3,689,587 | |
| | | | | | |
|
|
|
Enterprise Software/Service — 0.2% | |
Donnelley Financial Solutions, Inc.
Company Guar. Notes
8.25% due 10/15/2024 | | | 1,025,000 | | | | 1,060,875 | |
Oracle Corp.
Senior Notes
2.95% due 11/15/2024 | | | 2,419,000 | | | | 2,532,986 | |
| | | | | | |
|
|
|
| | | | | | | | 3,593,861 | |
| | | | | | |
|
|
|
Finance - Auto Loans — 0.1% | |
Credit Acceptance Corp.
Company Guar. Notes
6.63% due 03/15/2026* | | | 770,000 | | | | 833,048 | |
| | | | | | |
|
|
|
Finance - Consumer Loans — 0.6% | |
Enova International, Inc.
Company Guar. Notes
8.50% due 09/01/2024* | | | 1,080,000 | | | | 1,039,500 | |
Enova International, Inc.
Company Guar. Notes
8.50% due 09/15/2025* | | | 621,000 | | | | 596,160 | |
SLM Corp.
Senior Notes
5.63% due 08/01/2033 | | | 970,000 | | | | 819,650 | |
Springleaf Finance Corp.
Company Guar. Notes
6.88% due 03/15/2025 | | | 1,225,000 | | | | 1,388,844 | |
Synchrony Financial
Senior Notes
2.85% due 07/25/2022 | | | 645,000 | | | | 653,703 | |
| | | | | | | | |
| | |
| Security Description | | Principal
Amount | | | Value
(Note 2) | |
| |
| | | | | | | | | |
Finance - Consumer Loans (continued) | |
Synchrony Financial
Senior Notes
4.25% due 08/15/2024 | | $ | 3,804,000 | | | $ | 4,044,778 | |
Synchrony Financial
Senior Notes
4.38% due 03/19/2024 | | | 1,035,000 | | | | 1,105,404 | |
| | | | | | |
|
|
|
| | | | | | | | 9,648,039 | |
| | | | | | |
|
|
|
Finance - Credit Card — 0.2% | |
American Express Co.
Senior Notes
3.40% due 02/22/2024 | | | 1,443,000 | | | | 1,521,827 | |
American Express Co.
Senior Notes
4.20% due 11/06/2025 | | | 979,000 | | | | 1,087,636 | |
| | | | | | |
|
|
|
| | | | | | | | 2,609,463 | |
| | | | | | |
|
|
|
Finance - Investment Banker/Broker — 0.1% | | | | | | | | |
Lehman Brothers Holdings, Inc.
Escrow Notes
6.75% due 12/28/2017†(4) | | | 179,000 | | | | 18 | |
Lehman Brothers Holdings, Inc.
Escrow Notes
7.50% due 05/11/2038†(4) | | | 230,000 | | | | 23 | |
LPL Holdings, Inc.
Company Guar. Notes
5.75% due 09/15/2025* | | | 782,000 | | | | 823,055 | |
| | | | | | |
|
|
|
| | | | | | | | 823,096 | |
| | | | | | |
|
|
|
Finance - Mortgage Loan/Banker — 0.1% | |
Quicken Loans, Inc.
Company Guar. Notes
5.75% due 05/01/2025* | | | 1,160,000 | | | | 1,209,300 | |
| | | | | | |
|
|
|
Food - Dairy Products — 0.0% | |
Land O’ Lakes, Inc.
Junior Sub. Notes
7.00% due 09/18/2028*(5) | | | 250,000 | | | | 237,500 | |
| | | | | | |
|
|
|
Food - Meat Products — 0.1% | |
Smithfield Foods, Inc.
Senior Notes
2.65% due 10/03/2021* | | | 550,000 | | | | 544,160 | |
Smithfield Foods, Inc.
Senior Notes
5.20% due 04/01/2029* | | | 676,000 | | | | 756,279 | |
Tyson Foods, Inc.
Senior Notes
5.10% due 09/28/2048 | | | 673,000 | | | | 837,945 | |
| | | | | | |
|
|
|
| | | | | | | | 2,138,384 | |
| | | | | | |
|
|
|
Food - Misc./Diversified — 0.9% | |
Conagra Brands, Inc.
Senior Notes
5.40% due 11/01/2048 | | | 2,006,000 | | | | 2,387,388 | |
Conagra Brands, Inc.
Senior Notes
7.00% due 10/01/2028 | | | 1,447,000 | | | | 1,830,680 | |
General Mills, Inc.
Senior Notes
4.55% due 04/17/2038 | | | 818,000 | | | | 944,122 | |
General Mills, Inc.
Senior Notes
4.70% due 04/17/2048 | | | 1,550,000 | | | | 1,834,387 | |
Kraft Heinz Foods Co.
Sec. Notes
4.88% due 02/15/2025* | | | 1,449,000 | | | | 1,495,337 | |
VALIC Company II Core Bond Fund
PORTFOLIO OF INVESTMENTS —August 31, 2019 — (continued)
| | | | | | | | |
| | |
| Security Description | | Principal
Amount | | | Value
(Note 2) | |
| |
U.S. CORPORATE BONDS & NOTES (continued) | |
Food - Misc./Diversified (continued) | |
Lamb Weston Holdings, Inc.
Company Guar. Notes
4.63% due 11/01/2024* | | $ | 585,000 | | | $ | 611,565 | |
Mondelez International, Inc.
Senior Notes
3.63% due 02/13/2026 | | | 2,035,000 | | | | 2,191,978 | |
Nestle Holdings, Inc.
Company Guar. Notes
3.50% due 09/24/2025* | | | 1,921,000 | | | | 2,077,064 | |
Post Holdings, Inc.
Company Guar. Notes
5.50% due 03/01/2025* | | | 850,000 | | | | 889,312 | |
| | | | | | |
|
|
|
| | | | | | | | 14,261,833 | |
| | | | | | |
|
|
|
Food - Retail — 0.2% | |
Albertsons Cos. LLC/Safeway, Inc./New Albertsons LP/Albertson’s LLC
Company Guar. Notes
5.75% due 03/15/2025 | | | 802,000 | | | | 822,050 | |
Albertsons Cos. LLC/Safeway, Inc./New Albertsons LP/Albertson’s LLC
Company Guar. Notes
5.88% due 02/15/2028* | | | 522,000 | | | | 550,115 | |
Kroger Co.
Senior Notes
5.40% due 01/15/2049 | | | 1,234,000 | | | | 1,472,397 | |
| | | | | | |
|
|
|
| | | | | | | | 2,844,562 | |
| | | | | | |
|
|
|
Gambling (Non-Hotel) — 0.0% | |
Twin River Worldwide Holdings, Inc.
Senior Notes
6.75% due 06/01/2027* | | | 509,000 | | | | 536,359 | |
Waterford Gaming LLC/Waterford Gaming Financial Corp.
Escrow Notes
8.63% due 09/15/2014*†(4) | | | 5,223 | | | | 302 | |
| | | | | | |
|
|
|
| | | | | | | | 536,661 | |
| | | | | | |
|
|
|
Gas - Distribution — 0.2% | |
NiSource, Inc.
Senior Notes
2.95% due 09/01/2029 | | | 1,757,000 | | | | 1,798,872 | |
NiSource, Inc.
Senior Notes
5.65% due 02/01/2045 | | | 1,075,000 | | | | 1,423,979 | |
| | | | | | |
|
|
|
| | | | | | | | 3,222,851 | |
| | | | | | |
|
|
|
Hazardous Waste Disposal — 0.0% | |
Clean Harbors, Inc.
Senior Notes
4.88% due 07/15/2027* | | | 572,000 | | | | 604,890 | |
| | | | | | |
|
|
|
Hotels/Motels — 0.1% | |
Hilton Grand Vacations Borrower LLC/Hilton Grand Vacations Borrower, Inc.
Company Guar. Notes
6.13% due 12/01/2024 | | | 538,000 | | | | 571,625 | |
Wyndham Worldwide Corp.
Senior Sec. Notes
5.40% due 04/01/2024 | | | 316,000 | | | | 331,701 | |
Wyndham Worldwide Corp.
Senior Sec. Notes
5.75% due 04/01/2027 | | | 509,000 | | | | 543,358 | |
| | | | | | |
|
|
|
| | | | | | | | 1,446,684 | |
| | | | | | |
|
|
|
| | | | | | | | |
| | |
| Security Description | | Principal
Amount | | | Value
(Note 2) | |
| |
| | | | | | | | | |
Independent Power Producers — 0.1% | | | | | | | | |
Clearway Energy Operating LLC
Company Guar. Notes
5.75% due 10/15/2025* | | $ | 757,000 | | | $ | 789,188 | |
NRG Yield Operating LLC
Company Guar. Notes
5.00% due 09/15/2026 | | | 488,000 | | | | 494,100 | |
| | | | | | |
|
|
|
| | | | | | | | 1,283,288 | |
| | | | | | |
|
|
|
Insurance Brokers — 0.1% | |
Marsh & McLennan Cos., Inc.
Senior Notes
3.50% due 12/29/2020 | | | 929,000 | | | | 945,783 | |
Willis North America, Inc.
Company Guar. Notes
5.05% due 09/15/2048 | | | 979,000 | | | | 1,182,135 | |
| | | | | | |
|
|
|
| | | | | | | | 2,127,918 | |
| | | | | | |
|
|
|
Insurance - Life/Health — 0.1% | |
Brighthouse Financial, Inc.
Senior Notes
4.70% due 06/22/2047 | | | 1,418,000 | | | | 1,276,351 | |
| | | | | | |
|
|
|
Insurance - Multi-line — 0.1% | |
Assurant, Inc.
Senior Notes
3.70% due 02/22/2030 | | | 1,918,000 | | | | 1,928,109 | |
Assurant, Inc.
Senior Notes
6.75% due 02/15/2034 | | | 154,000 | | | | 193,554 | |
| | | | | | |
|
|
|
| | | | | | | | 2,121,663 | |
| | | | | | |
|
|
|
Insurance - Mutual — 0.2% | |
MassMutual Global Funding II
Senior Sec. Notes
2.75% due 06/22/2024* | | | 908,000 | | | | 935,265 | |
New York Life Global Funding
Sec. Notes
1.95% due 09/28/2020* | | | 2,560,000 | | | | 2,560,560 | |
| | | | | | |
|
|
|
| | | | | | | | 3,495,825 | |
| | | | | | |
|
|
|
Insurance - Property/Casualty — 0.2% | |
ACE INA Holdings, Inc.
Company Guar. Notes
2.88% due 11/03/2022 | | | 1,481,000 | | | | 1,524,884 | |
AmWINS Group, Inc.
Company Guar. Notes
7.75% due 07/01/2026* | | | 845,000 | | | | 887,250 | |
| | | | | | |
|
|
|
| | | | | | | | 2,412,134 | |
| | | | | | |
|
|
|
Internet Connectivity Services — 0.1% | |
Cogent Communications Group, Inc.
Senior Sec. Notes
5.38% due 03/01/2022* | | | 800,000 | | | | 830,000 | |
| | | | | | |
|
|
|
Internet Content - Entertainment — 0.2% | |
Netflix, Inc.
Senior Notes
4.38% due 11/15/2026 | | | 1,431,000 | | | | 1,464,986 | |
Netflix, Inc.
Senior Notes
5.88% due 02/15/2025 | | | 1,019,000 | | | | 1,124,721 | |
| | | | | | |
|
|
|
| | | | | | | | 2,589,707 | |
| | | | | | |
|
|
|
Investment Companies — 0.0% | |
FS Energy & Power Fund
Senior Sec. Notes
7.50% due 08/15/2023* | | | 627,000 | | | | 622,297 | |
| | | | | | |
|
|
|
VALIC Company II Core Bond Fund
PORTFOLIO OF INVESTMENTS —August 31, 2019 — (continued)
| | | | | | | | |
| | |
| Security Description | | Principal
Amount | | | Value
(Note 2) | |
| |
U.S. CORPORATE BONDS & NOTES (continued) | |
Investment Management/Advisor Services — 0.1% | |
Ameriprise Financial, Inc.
Senior Notes
3.00% due 03/22/2022 | | $ | 1,643,000 | | | $ | 1,678,667 | |
| | | | | | |
|
|
|
Machinery - Construction & Mining — 0.3% | |
Caterpillar Financial Services Corp.
Senior Notes
2.55% due 11/29/2022 | | | 1,116,000 | | | | 1,135,393 | |
Caterpillar Financial Services Corp.
Senior Notes
3.15% due 09/07/2021 | | | 814,000 | | | | 835,253 | |
Caterpillar Financial Services Corp.
Senior Notes
3.45% due 05/15/2023# | | | 1,524,000 | | | | 1,602,265 | |
Terex Corp.
Company Guar. Notes
5.63% due 02/01/2025* | | | 666,000 | | | | 677,702 | |
| | | | | | |
|
|
|
| | | | | | | | 4,250,613 | |
| | | | | | |
|
|
|
Machinery - Electrical — 0.1% | |
ABB Finance USA, Inc.
Company Guar. Notes
3.38% due 04/03/2023 | | | 2,026,000 | | | | 2,118,316 | |
| | | | | | |
|
|
|
Machinery - Farming — 0.7% | |
CNH Industrial Capital LLC
Company Guar. Notes
4.20% due 01/15/2024 | | | 2,596,000 | | | | 2,738,921 | |
John Deere Capital Corp.
Senior Notes
2.35% due 01/08/2021 | | | 1,212,000 | | | | 1,219,663 | |
John Deere Capital Corp.
Senior Notes
2.80% due 07/18/2029 | | | 1,053,000 | | | | 1,094,117 | |
John Deere Capital Corp.
Senior Notes
2.95% due 04/01/2022 | | | 3,045,000 | | | | 3,117,162 | |
John Deere Capital Corp.
Senior Notes
3.45% due 01/10/2024 | | | 1,993,000 | | | | 2,112,662 | |
John Deere Capital Corp.
Senior Notes
3.65% due 10/12/2023 | | | 883,000 | | | | 943,462 | |
| | | | | | |
|
|
|
| | | | | | | | 11,225,987 | |
| | | | | | |
|
|
|
Machinery - General Industrial — 0.3% | |
Roper Technologies, Inc.
Senior Notes
2.95% due 09/15/2029 | | | 788,000 | | | | 799,138 | |
Roper Technologies, Inc.
Senior Notes
4.20% due 09/15/2028 | | | 2,870,000 | | | | 3,186,541 | |
Wabtec Corp.
Company Guar. Notes
4.95% due 09/15/2028 | | | 1,236,000 | | | | 1,379,448 | |
| | | | | | |
|
|
|
| | | | | | | | 5,365,127 | |
| | | | | | |
|
|
|
Medical Labs & Testing Services — 0.6% | |
Catalent Pharma Solutions, Inc.
Company Guar. Notes
5.00% due 07/15/2027* | | | 446,000 | | | | 467,234 | |
Laboratory Corp. of America Holdings
Senior Notes
3.25% due 09/01/2024 | | | 1,864,000 | | | | 1,940,584 | |
Laboratory Corp. of America Holdings
Senior Notes
4.70% due 02/01/2045 | | | 883,000 | | | | 1,003,285 | |
| | | | | | | | |
| | |
| Security Description | | Principal
Amount | | | Value
(Note 2) | |
| |
| | | | | | | | | |
Medical Labs & Testing Services (continued) | |
Roche Holdings, Inc.
Company Guar. Notes
1.75% due 01/28/2022* | | $ | 2,427,000 | | | $ | 2,416,003 | |
Roche Holdings, Inc.
Company Guar. Notes
2.25% due 09/30/2019* | | | 1,795,000 | | | | 1,795,117 | |
Roche Holdings, Inc.
Company Guar. Notes
2.88% due 09/29/2021* | | | 1,440,000 | | | | 1,466,595 | |
| | | | | | |
|
|
|
| | | | | | | | 9,088,818 | |
| | | | | | |
|
|
|
Medical Products — 0.0% | |
Hologic, Inc.
Company Guar. Notes
4.38% due 10/15/2025* | | | 625,000 | | | | 639,062 | |
| | | | | | |
|
|
|
Medical - Biomedical/Gene — 0.3% | |
Amgen, Inc.
Senior Notes
4.66% due 06/15/2051 | | | 791,000 | | | | 940,824 | |
Celgene Corp.
Senior Notes
3.63% due 05/15/2024 | | | 1,865,000 | | | | 1,975,343 | |
Celgene Corp.
Senior Notes
4.63% due 05/15/2044 | | | 1,087,000 | | | | 1,323,208 | |
| | | | | | |
|
|
|
| | | | | | | | 4,239,375 | |
| | | | | | |
|
|
|
Medical - Drugs — 0.2% | |
Bristol-Myers Squibb Co.
Senior Notes
4.13% due 06/15/2039* | | | 1,098,000 | | | | 1,279,648 | |
GlaxoSmithKline Capital, Inc.
Company Guar. Notes
3.38% due 05/15/2023 | | | 1,310,000 | | | | 1,373,101 | |
| | | | | | |
|
|
|
| | | | | | | | 2,652,749 | |
| | | | | | |
|
|
|
Medical - Generic Drugs — 0.1% | |
Mylan, Inc.
Company Guar. Notes
4.55% due 04/15/2028 | | | 1,551,000 | | | | 1,669,317 | |
| | | | | | |
|
|
|
Medical - HMO — 0.7% | |
Humana, Inc.
Senior Notes
3.95% due 08/15/2049 | | | 982,000 | | | | 1,024,937 | |
MPH Acquisition Holdings LLC
Company Guar. Notes
7.13% due 06/01/2024* | | | 1,125,000 | | | | 1,005,536 | |
UnitedHealth Group, Inc.
Senior Bonds
2.38% due 10/15/2022 | | | 5,428,000 | | | | 5,499,877 | |
UnitedHealth Group, Inc.
Senior Notes
3.50% due 08/15/2039 | | | 1,094,000 | | | | 1,167,267 | |
UnitedHealth Group, Inc.
Senior Notes
3.75% due 07/15/2025 | | | 943,000 | | | | 1,025,760 | |
UnitedHealth Group, Inc.
Senior Notes
3.88% due 08/15/2059 | | | 1,204,000 | | | | 1,332,255 | |
| | | | | | |
|
|
|
| | | | | | | | 11,055,632 | |
| | | | | | |
|
|
|
Medical - Hospitals — 0.3% | |
HCA, Inc.
Senior Sec. Notes
5.25% due 06/15/2026 | | | 1,281,000 | | | | 1,445,648 | |
VALIC Company II Core Bond Fund
PORTFOLIO OF INVESTMENTS —August 31, 2019 — (continued)
| | | | | | | | |
| | |
| Security Description | | Principal
Amount | | | Value
(Note 2) | |
| |
U.S. CORPORATE BONDS & NOTES (continued) | |
Medical - Hospitals (continued) | |
HCA, Inc.
Senior Sec. Notes
5.25% due 06/15/2049 | | $ | 879,000 | | | $ | 981,309 | |
HCA, Inc.
Company Guar. Notes
5.38% due 02/01/2025 | | | 2,350,000 | | | | 2,608,500 | |
| | | | | | |
|
|
|
| | | | | | | | 5,035,457 | |
| | | | | | |
|
|
|
Medical - Wholesale Drug Distribution — 0.2% | |
Allergan Sales LLC
Company Guar. Notes
4.88% due 02/15/2021* | | | 509,000 | | | | 524,144 | |
Cardinal Health, Inc.
Senior Notes
4.60% due 03/15/2043 | | | 2,201,000 | | | | 2,143,555 | |
| | | | | | |
|
|
|
| | | | | | | | 2,667,699 | |
| | | | | | |
|
|
|
Metal - Copper — 0.1% | |
Freeport-McMoRan Copper & Gold, Inc.
Company Guar. Notes
3.88% due 03/15/2023 | | | 1,065,000 | | | | 1,076,076 | |
Freeport-McMoRan, Inc.
Company Guar. Notes
5.25% due 09/01/2029 | | | 527,000 | | | | 522,526 | |
| | | | | | |
|
|
|
| | | | | | | | 1,598,602 | |
| | | | | | |
|
|
|
Metal - Diversified — 0.1% | |
Glencore Funding LLC
Company Guar. Notes
4.13% due 03/12/2024* | | | 2,249,000 | | | | 2,367,578 | |
| | | | | | |
|
|
|
Metal - Iron — 0.0% | |
Cleveland-Cliffs, Inc.
Company Guar. Notes
5.75% due 03/01/2025 | | | 699,000 | | | | 700,747 | |
| | | | | | |
|
|
|
Multimedia — 0.2% | |
E.W. Scripps Co.
Company Guar. Notes
5.13% due 05/15/2025* | | | 1,394,000 | | | | 1,404,455 | |
Viacom, Inc.
Senior Notes
4.38% due 03/15/2043 | | | 2,120,000 | | | | 2,247,544 | |
| | | | | | |
|
|
|
| | | | | | | | 3,651,999 | |
| | | | | | |
|
|
|
Networking Products — 0.3% | |
Cisco Systems, Inc.
Senior Notes
2.20% due 02/28/2021 | | | 4,969,000 | | | | 5,001,657 | |
| | | | | | |
|
|
|
Non-Hazardous Waste Disposal — 0.1% | |
Waste Management, Inc.
Company Guar. Notes
4.15% due 07/15/2049 | | | 1,375,000 | | | | 1,636,430 | |
| | | | | | |
|
|
|
Office Supplies & Forms — 0.1% | |
Avery Dennison Corp.
Senior Notes
4.88% due 12/06/2028 | | | 788,000 | | | | 898,141 | |
| | | | | | |
|
|
|
Oil Companies - Exploration & Production — 1.4% | |
Anadarko Petroleum Corp.
Senior Notes
6.45% due 09/15/2036 | | | 1,787,000 | | | | 2,248,512 | |
Apache Corp.
Senior Notes
4.75% due 04/15/2043 | | | 3,427,000 | | | | 3,311,806 | |
| | | | | | | | |
| | |
| Security Description | | Principal
Amount | | | Value
(Note 2) | |
| |
| | | | | | | | | |
Oil Companies - Exploration & Production (continued) | |
Brazos Valley Longhorn LLC/Brazos Valley Longhorn Finance Corp.
Company Guar. Notes
6.88% due 02/01/2025 | | $ | 1,189,000 | | | $ | 1,058,210 | |
Callon Petroleum Co.
Company Guar. Notes
6.38% due 07/01/2026 | | | 835,000 | | | | 809,950 | |
Centennial Resource Production LLC
Company Guar. Notes
6.88% due 04/01/2027* | | | 825,000 | | | | 825,000 | |
Chaparral Energy, Inc.
Senior Notes
8.75% due 07/15/2023*# | | | 1,630,000 | | | | 709,865 | |
Cimarex Energy Co.
Senior Notes
4.38% due 03/15/2029 | | | 1,658,000 | | | | 1,761,981 | |
Concho Resources, Inc.
Company Guar. Notes
4.85% due 08/15/2048 | | | 835,000 | | | | 970,019 | |
Extraction Oil & Gas, Inc.
Company Guar. Notes
5.63% due 02/01/2026* | | | 965,000 | | | | 636,900 | |
Hilcorp Energy I LP/Hilcorp Finance Co.
Senior Notes
5.00% due 12/01/2024* | | | 1,494,000 | | | | 1,378,215 | |
Lonestar Resources America, Inc.
Company Guar. Notes
11.25% due 01/01/2023* | | | 1,165,000 | | | | 1,001,900 | |
Marathon Oil Corp.
Senior Notes
6.60% due 10/01/2037 | | | 916,000 | | | | 1,151,714 | |
Marathon Oil Corp.
Senior Notes
6.80% due 03/15/2032 | | | 1,146,000 | | | | 1,445,014 | |
Noble Energy, Inc.
Senior Notes
4.95% due 08/15/2047 | | | 1,781,000 | | | | 1,980,751 | |
Occidental Petroleum Corp.
Senior Notes
4.30% due 08/15/2039 | | | 1,197,000 | | | | 1,254,501 | |
Occidental Petroleum Corp.
Senior Notes
4.40% due 08/15/2049 | | | 1,141,000 | | | | 1,189,111 | |
Southwestern Energy Co.
Company Guar. Notes
7.50% due 04/01/2026 | | | 650,000 | | | | 568,880 | |
| | | | | | |
|
|
|
| | | | | | | | 22,302,329 | |
| | | | | | |
|
|
|
Oil Companies - Integrated — 0.3% | |
Chevron Corp.
Senior Notes
2.36% due 12/05/2022 | | | 1,292,000 | | | | 1,314,647 | |
Chevron Corp.
Senior Notes
2.90% due 03/03/2024 | | | 3,747,000 | | | | 3,908,208 | |
| | | | | | |
|
|
|
| | | | | | | | 5,222,855 | |
| | | | | | |
|
|
|
Oil Field Machinery & Equipment — 0.1% | |
Forum Energy Technologies, Inc.
Company Guar. Notes
6.25% due 10/01/2021 | | | 46,000 | | | | 37,865 | |
Hi-Crush Partners LP
Company Guar. Notes
9.50% due 08/01/2026* | | | 1,315,000 | | | | 802,150 | |
| | | | | | |
|
|
|
| | | | | | | | 840,015 | |
| | | | | | |
|
|
|
VALIC Company II Core Bond Fund
PORTFOLIO OF INVESTMENTS —August 31, 2019 — (continued)
| | | | | | | | |
| | |
| Security Description | | Principal
Amount | | | Value
(Note 2) | |
| |
U.S. CORPORATE BONDS & NOTES (continued) | |
Oil Refining & Marketing — 0.0% | |
Valero Energy Corp.
Senior Notes
4.00% due 04/01/2029 | | $ | 658,000 | | | $ | 701,940 | |
| | | | | | |
|
|
|
Oil- Field Services — 0.3% | |
Calfrac Holdings LP
Company Guar. Notes
8.50% due 06/15/2026* | | | 950,000 | | | | 598,500 | |
Nine Energy Service, Inc.
Senior Notes
8.75% due 11/01/2023* | | | 385,000 | | | | 347,462 | |
Pioneer Energy Services Corp.
Company Guar. Notes
6.13% due 03/15/2022 | | | 1,209,000 | | | | 427,684 | |
Schlumberger Holdings Corp.
Senior Notes
4.00% due 12/21/2025* | | | 1,514,000 | | | | 1,625,052 | |
SESI LLC
Company Guar. Notes
7.75% due 09/15/2024 | | | 1,174,000 | | | | 704,400 | |
USA Compression Partners LP/USA Compression Finance Corp.
Company Guar. Notes
6.88% due 04/01/2026 | | | 461,000 | | | | 472,525 | |
| | | | | | |
|
|
|
| | | | | | | | 4,175,623 | |
| | | | | | |
|
|
|
Paper & Related Products — 0.4% | |
Domtar Corp.
Company Guar. Notes
6.75% due 02/15/2044 | | | 2,401,000 | | | | 2,703,076 | |
Georgia-Pacific LLC
Senior Notes
3.73% due 07/15/2023* | | | 2,447,000 | | | | 2,588,706 | |
Georgia-Pacific LLC
Company Guar. Notes
5.40% due 11/01/2020* | | | 694,000 | | | | 719,606 | |
| | | | | | |
|
|
|
| | | | | | | | 6,011,388 | |
| | | | | | |
|
|
|
Petrochemicals — 0.1% | |
Chevron Phillips Chemical Co. LLC/Chevron Phillips Chemical Co. LP
Senior Notes
3.30% due 05/01/2023* | | | 1,135,000 | | | | 1,174,590 | |
| | | | | | |
|
|
|
Pharmacy Services — 0.5% | |
Cigna Corp.
Company Guar. Notes
4.80% due 08/15/2038 | | | 1,556,000 | | | | 1,798,395 | |
CVS Health Corp.
Senior Notes
4.78% due 03/25/2038 | | | 5,553,000 | | | | 6,212,010 | |
| | | | | | |
|
|
|
| | | | | | | | 8,010,405 | |
| | | | | | |
|
|
|
Pipelines — 1.5% | |
Antero Midstream Partners LP/Antero Midstream Finance Corp.
Company Guar. Notes
5.75% due 03/01/2027* | | | 389,000 | | | | 356,908 | |
Cheniere Corpus Christi Holdings LLC
Senior Sec. Notes
5.88% due 03/31/2025 | | | 1,260,000 | | | | 1,404,900 | |
Cheniere Corpus Christi Holdings LLC
Senior Sec. Notes
7.00% due 06/30/2024 | | | 231,000 | | | | 266,516 | |
Cheniere Energy Partners LP
Senior Sec. Notes
5.25% due 10/01/2025 | | | 617,000 | | | | 637,824 | |
| | | | | | | | |
| | |
| Security Description | | Principal
Amount | | | Value
(Note 2) | |
| |
| | | | | | | | | |
Pipelines (continued) | |
Enable Midstream Partners LP
Senior Notes
4.95% due 05/15/2028 | | $ | 1,105,000 | | | $ | 1,172,663 | |
Energy Transfer Operating LP
Company Guar. Notes
4.25% due 03/15/2023 | | | 952,000 | | | | 999,774 | |
Energy Transfer Operating LP
Company Guar. Notes
4.50% due 04/15/2024 | | | 1,280,000 | | | | 1,372,123 | |
Energy Transfer Operating LP
Company Guar. Notes
4.90% due 03/15/2035 | | | 1,054,000 | | | | 1,103,147 | |
Energy Transfer Operating LP
Company Guar. Notes
5.25% due 04/15/2029 | | | 1,404,000 | | | | 1,606,728 | |
EnLink Midstream LLC
Company Guar. Notes
5.38% due 06/01/2029 | | | 1,200,000 | | | | 1,174,200 | |
EnLink Midstream Partners LP
Senior Notes
4.85% due 07/15/2026 | | | 875,000 | | | | 857,500 | |
EnLink Midstream Partners LP
Senior Notes
5.05% due 04/01/2045 | | | 207,000 | | | | 170,775 | |
Genesis Energy LP/Genesis Energy Finance Corp.
Company Guar. Notes
5.63% due 06/15/2024 | | | 900,000 | | | | 859,500 | |
Genesis Energy LP/Genesis Energy Finance Corp.
Company Guar. Notes
6.00% due 05/15/2023 | | | 500,000 | | | | 496,250 | |
Holly Energy Partners LP/Holly Energy Finance Corp.
Company Guar. Notes
6.00% due 08/01/2024* | | | 677,000 | | | | 709,496 | |
MPLX LP
Senior Notes
4.00% due 03/15/2028 | | | 1,165,000 | | | | 1,221,314 | |
MPLX LP
Senior Notes
4.80% due 02/15/2029 | | | 91,000 | | | | 101,196 | |
MPLX LP
Senior Notes
5.50% due 02/15/2049 | | | 1,070,000 | | | | 1,226,000 | |
NGPL PipeCo LLC
Senior Notes
4.38% due 08/15/2022* | | | 1,234,000 | | | | 1,271,020 | |
SemGroup Corp./Rose Rock Finance Corp.
Company Guar. Notes
5.63% due 07/15/2022 | | | 458,000 | | | | 441,288 | |
SemGroup Corp./Rose Rock Finance Corp.
Company Guar. Notes
5.63% due 11/15/2023 | | | 1,132,000 | | | | 1,069,740 | |
Summit Midstream Holdings LLC/Summit Midstream Finance Corp.
Company Guar. Notes
5.50% due 08/15/2022 | | | 1,315,000 | | | | 1,236,100 | |
Western Midstream Operating LP
Senior Notes
5.50% due 08/15/2048 | | | 1,078,000 | | | | 1,006,644 | |
Williams Cos., Inc.
Senior Notes
4.85% due 03/01/2048 | | | 1,249,000 | | | | 1,365,912 | |
Williams Cos., Inc.
Senior Notes
5.75% due 06/24/2044 | | | 1,170,000 | | | | 1,401,574 | |
| | | | | | |
|
|
|
| | | | | | | | 23,529,092 | |
| | | | | | |
|
|
|
VALIC Company II Core Bond Fund
PORTFOLIO OF INVESTMENTS —August 31, 2019 — (continued)
| | | | | | | | |
| | |
| Security Description | | Principal
Amount | | | Value
(Note 2) | |
| |
U.S. CORPORATE BONDS & NOTES (continued) | |
Poultry — 0.1% | |
Pilgrim’s Pride Corp.
Company Guar. Notes
5.88% due 09/30/2027* | | $ | 820,000 | | | $ | 883,550 | |
| | | | | | |
|
|
|
Radio — 0.1% | |
Sirius XM Radio, Inc.
Company Guar. Notes
4.63% due 07/15/2024* | | | 1,750,000 | | | | 1,826,563 | |
Sirius XM Radio, Inc.
Company Guar. Notes
5.38% due 07/15/2026* | | | 473,000 | | | | 499,606 | |
| | | | | | |
|
|
|
| | | | | | | | 2,326,169 | |
| | | | | | |
|
|
|
Real Estate Investment Trusts — 1.3% | |
American Tower Corp.
Senior Notes
4.00% due 06/01/2025 | | | 1,423,000 | | | | 1,530,655 | |
AvalonBay Communities, Inc.
Senior Notes
3.30% due 06/01/2029 | | | 1,045,000 | | | | 1,123,897 | |
Boston Properties LP
Senior Notes
3.40% due 06/21/2029 | | | 778,000 | | | | 824,678 | |
Columbia Property Trust Operating Partnership LP
Company Guar. Notes
4.15% due 04/01/2025 | | | 2,211,000 | | | | 2,317,080 | |
Crown Castle International Corp.
Senior Notes
5.20% due 02/15/2049# | | | 1,515,000 | | | | 1,919,183 | |
CTR Partnership LP/CareTrust Capital Corp.
Company Guar. Notes
5.25% due 06/01/2025 | | | 1,051,000 | | | | 1,082,719 | |
ESH Hospitality, Inc.
Company Guar. Notes
5.25% due 05/01/2025* | | | 792,000 | | | | 818,730 | |
GLP Capital LP/GLP Financing II, Inc.
Company Guar. Notes
5.38% due 04/15/2026 | | | 600,000 | | | | 658,596 | |
HAT Holdings I LLC/HAT Holdings II LLC
Company Guar. Notes
5.25% due 07/15/2024* | | | 521,000 | | | | 548,873 | |
HCP, Inc.
Senior Notes
3.50% due 07/15/2029 | | | 758,000 | | | | 800,503 | |
Iron Mountain, Inc.
Company Guar. Notes
4.88% due 09/15/2027* | | | 815,000 | | | | 836,907 | |
iStar, Inc.
Senior Notes
5.25% due 09/15/2022 | | | 1,039,000 | | | | 1,064,975 | |
MGM Growth Properties Operating Partnership LP/MGP FinanceCo-Issuer, Inc.
Company Guar. Notes
5.75% due 02/01/2027* | | | 764,000 | | | | 843,418 | |
MPT Operating Partnership LP/MPT Finance Corp.
Company Guar. Notes
5.00% due 10/15/2027 | | | 787,000 | | | | 840,122 | |
Sabra Health Care LP
Company Guar. Notes
5.13% due 08/15/2026 | | | 1,206,000 | | | | 1,301,873 | |
Sabra Health Care LP/Sabra Capital Corp.
Company Guar. Notes
4.80% due 06/01/2024 | | | 1,064,000 | | | | 1,115,529 | |
Simon Property Group LP
Senior Notes
4.13% due 12/01/2021 | | | 1,778,000 | | | | 1,851,151 | |
| | | | | | | | |
| | |
| Security Description | | Principal
Amount | | | Value
(Note 2) | |
| |
| | | | | | | | | |
Real Estate Investment Trusts (continued) | |
Starwood Property Trust, Inc.
Senior Notes
4.75% due 03/15/2025 | | $ | 870,000 | | | $ | 891,750 | |
| | | | | | |
|
|
|
| | | | | | | | 20,370,639 | |
| | | | | | |
|
|
|
Real Estate Management/Services — 0.1% | |
Newmark Group, Inc.
Senior Notes
6.13% due 11/15/2023 | | | 777,000 | | | | 843,742 | |
| | | | | | |
|
|
|
Real Estate Operations & Development — 0.1% | |
Kennedy-Wilson, Inc.
Company Guar. Notes
5.88% due 04/01/2024 | | | 1,200,000 | | | | 1,228,500 | |
| | | | | | |
|
|
|
Rental Auto/Equipment — 0.1% | |
Ahern Rentals, Inc.
Sec. Notes
7.38% due 05/15/2023* | | | 1,145,000 | | | | 987,562 | |
Capitol Investment Merger Sub 2 LLC
Sec. Notes
10.00% due 08/01/2024* | | | 630,000 | | | | 653,625 | |
Herc Holdings, Inc.
Company Guar. Notes
5.50% due 07/15/2027* | | | 632,000 | | | | 654,120 | |
| | | | | | |
|
|
|
| | | | | | | | 2,295,307 | |
| | | | | | |
|
|
|
Retail - Appliances — 0.1% | |
Conn’s, Inc.
Company Guar. Notes
7.25% due 07/15/2022 | | | 1,024,000 | | | | 1,018,880 | |
| | | | | | |
|
|
|
Retail - Automobile — 0.1% | |
Lithia Motors, Inc.
Company Guar. Notes
5.25% due 08/01/2025* | | | 785,000 | | | | 812,475 | |
| | | | | | |
|
|
|
Retail - Building Products — 0.0% | |
Home Depot, Inc.
Senior Notes
4.50% due 12/06/2048 | | | 62,000 | | | | 78,862 | |
| | | | | | |
|
|
|
Retail - Discount — 0.3% | |
Walmart, Inc.
Senior Notes
2.55% due 04/11/2023 | | | 2,493,000 | | | | 2,555,493 | |
Walmart, Inc.
Senior Notes
3.05% due 07/08/2026 | | | 2,166,000 | | | | 2,316,708 | |
| | | | | | |
|
|
|
| | | | | | | | 4,872,201 | |
| | | | | | |
|
|
|
Retail - Drug Store — 0.1% | |
Walgreens Boots Alliance, Inc.
Senior Notes
4.80% due 11/18/2044 | | | 836,000 | | | | 886,474 | |
| | | | | | |
|
|
|
Retail - Mail Order — 0.2% | |
QVC, Inc.
Senior Sec. Notes
4.85% due 04/01/2024 | | | 3,598,000 | | | | 3,821,990 | |
| | | | | | |
|
|
|
Retail - Regional Department Stores — 0.1% | |
Kohl’s Corp.
Senior Notes
5.55% due 07/17/2045 | | | 2,014,000 | | | | 2,099,376 | |
| | | | | | |
|
|
|
Retail - Restaurants — 0.5% | |
Brinker International, Inc.
Company Guar. Notes
5.00% due 10/01/2024* | | | 1,012,000 | | | | 1,042,360 | |
VALIC Company II Core Bond Fund
PORTFOLIO OF INVESTMENTS —August 31, 2019 — (continued)
| | | | | | | | |
| | |
| Security Description | | Principal
Amount | | | Value
(Note 2) | |
| |
U.S. CORPORATE BONDS & NOTES (continued) | |
Retail - Restaurants (continued) | |
Darden Restaurants, Inc.
Senior Notes
4.55% due 02/15/2048 | | $ | 2,744,000 | | | $ | 2,945,151 | |
McDonald’s Corp.
Senior Notes
3.63% due 09/01/2049 | | | 1,536,000 | | | | 1,588,932 | |
McDonald’s Corp.
Senior Notes
4.45% due 03/01/2047 | | | 2,557,000 | | | | 3,003,440 | |
| | | | | | |
|
|
|
| | | | | | | | 8,579,883 | |
| | | | | | |
|
|
|
Satellite Telecom — 0.1% | |
Hughes Satellite Systems Corp.
Company Guar. Notes
6.63% due 08/01/2026 | | | 1,024,000 | | | | 1,103,360 | |
| | | | | | |
|
|
|
Savings & Loans/Thrifts — 0.3% | |
First Niagara Financial Group, Inc.
Sub. Notes
7.25% due 12/15/2021 | | | 2,158,000 | | | | 2,388,322 | |
New York Community Bancorp, Inc.
Sub. Notes
5.90% due 11/06/2028 | | | 2,719,000 | | | | 2,864,818 | |
| | | | | | |
|
|
|
| | | | | | | | 5,253,140 | |
| | | | | | |
|
|
|
Security Services — 0.1% | |
Prime Security Services Borrower LLC/Prime Finance, Inc.
Senior Sec. Notes
5.25% due 04/15/2024* | | | 1,102,000 | | | | 1,138,267 | |
Prime Security Services Borrower LLC/Prime Finance, Inc.
Senior Sec. Notes
5.75% due 04/15/2026* | | | 653,000 | | | | 680,752 | |
| | | | | | |
|
|
|
| | | | | | | | 1,819,019 | |
| | | | | | |
|
|
|
Semiconductor Components - Integrated Circuits — 0.1% | |
QUALCOMM, Inc.
Senior Notes
4.30% due 05/20/2047 | | | 742,000 | | | | 840,853 | |
| | | | | | |
|
|
|
Steel - Producers — 0.0% | |
Commercial Metals Co.
Senior Notes
5.75% due 04/15/2026 | | | 720,000 | | | | 738,000 | |
| | | | | | |
|
|
|
Telephone - Integrated — 1.2% | |
AT&T, Inc.
Senior Notes
4.30% due 02/15/2030 | | | 1,478,000 | | | | 1,642,705 | |
AT&T, Inc.
Senior Notes
4.50% due 05/15/2035 | | | 4,574,000 | | | | 5,088,602 | |
AT&T, Inc.
Senior Notes
4.85% due 07/15/2045 | | | 1,079,000 | | | | 1,235,138 | |
AT&T, Inc.
Senior Notes
4.90% due 08/15/2037 | | | 2,569,000 | | | | 2,948,824 | |
CenturyLink, Inc.
Senior Notes
7.50% due 04/01/2024 | | | 2,025,000 | | | | 2,247,710 | |
Frontier Communications Corp.
Senior Notes
7.63% due 04/15/2024 | | | 1,357,000 | | | | 678,907 | |
Frontier Communications Corp.
Senior Notes
8.75% due 04/15/2022 | | | 1,605,000 | | | | 834,600 | |
| | | | | | | | |
| | |
| Security Description | | Principal
Amount | | | Value
(Note 2) | |
| |
| | | | | | | | | |
Telephone - Integrated (continued) | |
Verizon Communications, Inc.
Senior Notes
4.27% due 01/15/2036 | | $ | 819,000 | | | $ | 938,481 | |
Verizon Communications, Inc.
Senior Notes
4.40% due 11/01/2034 | | | 488,000 | | | | 565,060 | |
Verizon Communications, Inc.
Senior Notes
5.25% due 03/16/2037 | | | 2,624,000 | | | | 3,318,688 | |
| | | | | | |
|
|
|
| | | | | | | | 19,498,715 | |
| | | | | | |
|
|
|
Television — 0.3% | |
Belo Corp.
Company Guar. Notes
7.25% due 09/15/2027 | | | 460,000 | | | | 510,600 | |
Belo Corp.
Company Guar. Notes
7.75% due 06/01/2027 | | | 1,110,000 | | | | 1,248,750 | |
CBS Corp.
Company Guar. Notes
3.70% due 06/01/2028 | | | 2,211,000 | | | | 2,342,283 | |
Gray Television, Inc.
Company Guar. Notes
5.13% due 10/15/2024* | | | 606,000 | | | | 625,695 | |
Tribune Media Co.
Company Guar. Notes
5.88% due 07/15/2022 | | | 840,000 | | | | 852,340 | |
| | | | | | |
|
|
|
| | | | | | | | 5,579,668 | |
| | | | | | |
|
|
|
Tools - Hand Held — 0.1% | |
Stanley Black & Decker, Inc.
Senior Notes
3.40% due 03/01/2026 | | | 1,356,000 | | | | 1,454,318 | |
| | | | | | |
|
|
|
Transport - Equipment & Leasing — 0.2% | |
GATX Corp.
Senior Notes
4.35% due 02/15/2024 | | | 2,289,000 | | | | 2,467,105 | |
| | | | | | |
|
|
|
Transport - Marine — 0.1% | |
Kirby Corp.
Senior Notes
4.20% due 03/01/2028 | | | 1,108,000 | | | | 1,196,649 | |
| | | | | | |
|
|
|
Transport - Rail — 0.2% | |
Kansas City Southern
Company Guar. Notes
4.70% due 05/01/2048 | | | 746,000 | | | | 914,580 | |
Norfolk Southern Corp.
Senior Notes
5.10% due 08/01/2118 | | | 1,463,000 | | | | 1,873,681 | |
| | | | | | |
|
|
|
| | | | | | | | 2,788,261 | |
| | | | | | |
|
|
|
Transport - Services — 0.0% | |
United Parcel Service, Inc.
Senior Notes
3.40% due 09/01/2049 | | | 635,000 | | | | 663,781 | |
| | | | | | |
|
|
|
Transport - Truck — 0.1% | |
JB Hunt Transport Services, Inc.
Company Guar. Notes
3.88% due 03/01/2026 | | | 1,940,000 | | | | 2,087,633 | |
| | | | | | |
|
|
|
Trucking/Leasing — 0.2% | |
Penske Truck Leasing Co. LP/PTL Finance Corp.
Senior Notes
3.40% due 11/15/2026* | | | 1,479,000 | | | | 1,524,592 | |
VALIC Company II Core Bond Fund
PORTFOLIO OF INVESTMENTS —August 31, 2019 — (continued)
| | | | | | | | |
| | |
| Security Description | | Principal
Amount | | | Value
(Note 2) | |
| |
U.S. CORPORATE BONDS & NOTES (continued) | |
Trucking/Leasing (continued) | |
Penske Truck Leasing Co. LP/PTL Finance Corp.
Senior Notes
3.95% due 03/10/2025* | | $ | 1,869,000 | | | $ | 1,988,636 | |
| | | | | | |
|
|
|
| | | | | | | | 3,513,228 | |
| | | | | | |
|
|
|
Total U.S. Corporate Bonds & Notes | | | | | | | | |
(cost $554,794,631) | | | | | | | 587,688,523 | |
| | | |
|
|
|
FOREIGN CORPORATE BONDS & NOTES — 9.0% | |
Agricultural Chemicals — 0.1% | |
Consolidated Energy Finance SA
Senior Notes
6.88% due 06/15/2025* | | | 1,110,000 | | | | 1,132,200 | |
OCI NV
Senior Sec. Notes
6.63% due 04/15/2023* | | | 883,000 | | | | 931,565 | |
| | | | | | |
|
|
|
| | | | | | | | 2,063,765 | |
| | | | | | |
|
|
|
Auto/Truck Parts & Equipment-Original — 0.1% | |
Delphi Jersey Holdings PLC
Company Guar. Notes
5.00% due 10/01/2025* | | | 985,000 | | | | 849,563 | |
| | | | | | |
|
|
|
Banks - Commercial — 1.1% | |
Canadian Imperial Bank of Commerce
Senior Notes
2.10% due 10/05/2020 | | | 2,680,000 | | | | 2,684,924 | |
Danske Bank A/S
Senior Notes
3.88% due 09/12/2023* | | | 1,607,000 | | | | 1,669,600 | |
Danske Bank A/S
Senior Notes
5.38% due 01/12/2024* | | | 2,695,000 | | | | 2,971,811 | |
DBS Group Holdings, Ltd.
Senior Notes
2.85% due 04/16/2022* | | | 1,572,000 | | | | 1,598,270 | |
ING Groep NV
Senior Notes
4.63% due 01/06/2026* | | | 763,000 | | | | 849,227 | |
Intesa Sanpaolo SpA
Sub. Notes
5.71% due 01/15/2026* | | | 3,012,000 | | | | 3,177,277 | |
National Australia Bank, Ltd.
Sub. Notes
3.93% due 08/02/2034* | | | 844,000 | | | | 872,185 | |
Shinhan Bank Co., Ltd.
Sub. Notes
4.00% due 04/23/2029* | | | 1,286,000 | | | | 1,389,553 | |
Westpac Banking Corp.
Sub. Notes
4.11% due 07/24/2034 | | | 1,172,000 | | | | 1,235,135 | |
Westpac Banking Corp.
Sub. Notes
4.42% due 07/24/2039 | | | 989,000 | | | | 1,108,036 | |
| | | | | | |
|
|
|
| | | | | | | | 17,556,018 | |
| | | | | | |
|
|
|
Banks - Special Purpose — 0.2% | |
Kreditanstalt fuer Wiederaufbau
Government Guar. Notes
1.63% due 03/15/2021 | | | 3,391,000 | | | | 3,390,593 | |
| | | | | | |
|
|
|
Building Societies — 0.1% | |
Nationwide Building Society
Sub. Notes
4.13% due 10/18/2032* | | | 1,018,000 | | | | 1,011,495 | |
| | | | | | |
|
|
|
| | | | | | | | |
| | |
| Security Description | | Principal
Amount | | | Value
(Note 2) | |
| |
| | | | | | | | | |
Cable/Satellite TV — 0.1% | |
Altice Financing SA
Senior Sec. Notes
7.50% due 05/15/2026* | | $ | 665,000 | | | $ | 708,225 | |
Altice Luxembourg SA
Company Guar. Notes
7.63% due 02/15/2025*# | | | 1,130,000 | | | | 1,168,137 | |
UPCB Finance IV, Ltd.
Senior Sec. Notes
5.38% due 01/15/2025* | | | 551,000 | | | | 567,117 | |
| | | | | | |
|
|
|
| | | | | | | | 2,443,479 | |
| | | | | | |
|
|
|
Cellular Telecom — 0.4% | |
Altice France SA
Senior Sec. Notes
8.13% due 02/01/2027* | | | 215,000 | | | | 237,037 | |
C&W Senior Financing Designated Activity Co.
Senior Notes
6.88% due 09/15/2027* | | | 1,067,000 | | | | 1,136,238 | |
Numericable-SFR SA
Senior Sec. Notes
7.38% due 05/01/2026* | | | 1,434,000 | | | | 1,530,795 | |
SK Telecom Co., Ltd.
Senior Notes
3.75% due 04/16/2023* | | | 590,000 | | | | 618,631 | |
Vodafone Group PLC
Senior Notes
4.88% due 06/19/2049 | | | 1,471,000 | | | | 1,698,407 | |
Vodafone Group PLC
Senior Notes
5.25% due 05/30/2048 | | | 1,429,000 | | | | 1,709,835 | |
| | | | | | |
|
|
|
| | | | | | | | 6,930,943 | |
| | | | | | |
|
|
|
Chemicals - Diversified — 0.1% | |
Braskem Netherlands Finance BV
Company Guar. Notes
4.50% due 01/10/2028* | | | 971,000 | | | | 969,252 | |
NOVA Chemicals Corp.
Senior Notes
5.00% due 05/01/2025* | | | 471,000 | | | | 481,598 | |
| | | | | | |
|
|
|
| | | | | | | | 1,450,850 | |
| | | | | | |
|
|
|
Computers - Memory Devices — 0.0% | |
Seagate HDD Cayman
Company Guar. Notes
4.75% due 01/01/2025# | | | 760,000 | | | | 791,035 | |
| | | | | | |
|
|
|
Containers - Metal/Glass — 0.1% | |
Ardagh Packaging Finance PLC/Ardagh Holdings USA, Inc.
Company Guar. Notes
5.25% due 08/15/2027* | | | 825,000 | | | | 833,250 | |
Trivium Packaging Finance BV
Senior Sec. Notes
5.50% due 08/15/2026* | | | 416,000 | | | | 439,920 | |
Trivium Packaging Finance BV
Company Guar. Notes
8.50% due 08/15/2027* | | | 825,000 | | | | 886,875 | |
| | | | | | |
|
|
|
| | | | | | | | 2,160,045 | |
| | | | | | |
|
|
|
Containers - Paper/Plastic — 0.1% | |
Intertape Polymer Group, Inc.
Company Guar. Notes
7.00% due 10/15/2026* | | | 838,000 | | | | 869,425 | |
| | | | | | |
|
|
|
Diversified Banking Institutions — 2.4% | |
Banco Santander SA
Senior Notes
3.31% due 06/27/2029 | | | 1,800,000 | | | | 1,884,382 | |
VALIC Company II Core Bond Fund
PORTFOLIO OF INVESTMENTS —August 31, 2019 — (continued)
| | | | | | | | |
| | |
| Security Description | | Principal
Amount | | | Value
(Note 2) | |
| |
FOREIGN CORPORATE BONDS & NOTES (continued) | |
Diversified Banking Institutions (continued) | |
Barclays PLC
Sub. Notes
5.09% due 06/20/2030 | | $ | 1,226,000 | | | $ | 1,273,151 | |
BNP Paribas SA
Senior Notes
4.71% due 01/10/2025* | | | 4,234,000 | | | | 4,587,558 | |
Deutsche Bank AG
Senior Notes
4.25% due 02/04/2021 | | | 965,000 | | | | 975,835 | |
HSBC Holdings PLC
Senior Notes
3.40% due 03/08/2021 | | | 2,323,000 | | | | 2,360,092 | |
Mitsubishi UFJ Financial Group, Inc.
Senior Notes
3.41% due 03/07/2024 | | | 5,415,000 | | | | 5,691,385 | |
Mizuho Financial Group, Inc.
Senior Notes
3.15% due 07/16/2030 | | | 1,751,000 | | | | 1,824,359 | |
Mizuho Financial Group, Inc.
Senior Notes
3.92% due 09/11/2024 | | | 2,945,000 | | | | 3,121,715 | |
NatWest Markets PLC
Senior Notes
3.63% due 09/29/2022* | | | 2,117,000 | | | | 2,166,134 | |
Royal Bank of Scotland Group PLC
Senior Notes
4.27% due 03/22/2025 | | | 2,457,000 | | | | 2,566,309 | |
Royal Bank of Scotland Group PLC
Senior Notes
4.52% due 06/25/2024 | | | 2,008,000 | | | | 2,107,724 | |
UBS Group Funding Switzerland AG
Company Guar. Notes
3.49% due 05/23/2023* | | | 1,016,000 | | | | 1,046,774 | |
UBS Group Funding Switzerland AG
Company Guar. Notes
4.13% due 09/24/2025* | | | 269,000 | | | | 292,704 | |
UniCredit SpA
Sub. Notes
5.86% due 06/19/2032* | | | 3,339,000 | | | | 3,410,228 | |
UniCredit SpA
Senior Notes
6.57% due 01/14/2022* | | | 1,048,000 | | | | 1,126,901 | |
UniCredit SpA
Sub. Notes
7.30% due 04/02/2034* | | | 2,850,000 | | | | 3,217,706 | |
| | | | | | |
|
|
|
| | | | | | | | 37,652,957 | |
| | | | | | |
|
|
|
Diversified Financial Services — 0.3% | |
Fairstone Financial, Inc.
Senior Notes
7.88% due 07/15/2024* | | | 715,000 | | | | 745,388 | |
GE Capital International Funding Co. ULC
Company Guar. Notes
3.37% due 11/15/2025 | | | 4,527,000 | | | | 4,585,618 | |
| | | | | | |
|
|
|
| | | | | | | | 5,331,006 | |
| | | | | | |
|
|
|
Diversified Manufacturing Operations — 0.2% | |
Siemens Financieringsmaatschappij NV
Company Guar. Notes
3.25% due 05/27/2025* | | | 3,222,000 | | | | 3,396,500 | |
| | | | | | |
|
|
|
Diversified Minerals — 0.1% | |
Anglo American Capital PLC
Company Guar. Notes
4.00% due 09/11/2027* | | | 1,173,000 | | | | 1,210,040 | |
| | | | | | | | |
| | |
| Security Description | | Principal
Amount | | | Value
(Note 2) | |
| |
| | | | | | | | | |
Diversified Minerals (continued) | |
FMG Resources August 2006 Pty, Ltd.
Company Guar. Notes
5.13% due 03/15/2023* | | $ | 845,000 | | | $ | 878,800 | |
| | | | | | |
|
|
|
| | | | | | | | 2,088,840 | |
| | | | | | |
|
|
|
Electric - Generation — 0.2% | |
Electricite de France SA
Senior Notes
4.50% due 09/21/2028* | | | 1,140,000 | | | | 1,281,935 | |
Electricite de France SA
Senior Notes
5.00% due 09/21/2048* | | | 1,433,000 | | | | 1,750,345 | |
| | | | | | |
|
|
|
| | | | | | | | 3,032,280 | |
| | | | | | |
|
|
|
Electric - Integrated — 0.1% | |
Enel Finance International NV
Company Guar. Notes
4.75% due 05/25/2047* | | | 1,490,000 | | | | 1,622,565 | |
| | | | | | |
|
|
|
Electronic Components - Semiconductors — 0.1% | |
NXP BV/NXP Funding LLC/NXP USA, Inc.
Company Guar. Notes
4.30% due 06/18/2029* | | | 1,866,000 | | | | 2,001,097 | |
| | | | | | |
|
|
|
Finance - Leasing Companies — 0.1% | |
Avolon Holdings Funding, Ltd.
Company Guar. Notes
5.13% due 10/01/2023* | | | 850,000 | | | | 902,445 | |
Avolon Holdings Funding, Ltd.
Company Guar. Notes
5.25% due 05/15/2024* | | | 405,000 | | | | 434,443 | |
| | | | | | |
|
|
|
| | | | | | | | 1,336,888 | |
| | | | | | |
|
|
|
Food - Meat Products — 0.1% | |
JBS USA LUX SA/JBS USA Finance, Inc.
Company Guar. Notes
5.75% due 06/15/2025* | | | 347,000 | | | | 360,883 | |
JBS USA LUX SA/JBS USA Finance, Inc.
Company Guar. Notes
5.88% due 07/15/2024* | | | 893,000 | | | | 919,790 | |
| | | | | | |
|
|
|
| | | | | | | | 1,280,673 | |
| | | | | | |
|
|
|
Insurance - Life/Health — 0.2% | |
Athene Holding, Ltd.
Senior Notes
4.13% due 01/12/2028 | | | 1,605,000 | | | | 1,641,633 | |
Manulife Financial Corp.
Sub. Notes
4.06% due 02/24/2032 | | | 980,000 | | | | 1,031,237 | |
| | | | | | |
|
|
|
| | | | | | | | 2,672,870 | |
| | | | | | |
|
|
|
Insurance - Property/Casualty — 0.2% | |
Enstar Group, Ltd.
Senior Notes
4.95% due 06/01/2029 | | | 2,930,000 | | | | 3,100,001 | |
| | | | | | |
|
|
|
Machinery - Farming — 0.1% | |
CNH Industrial NV
Senior Notes
3.85% due 11/15/2027 | | | 983,000 | | | | 1,023,023 | |
CNH Industrial NV
Senior Notes
4.50% due 08/15/2023 | | | 1,024,000 | | | | 1,093,294 | |
| | | | | | |
|
|
|
| | | | | | | | 2,116,317 | |
| | | | | | |
|
|
|
VALIC Company II Core Bond Fund
PORTFOLIO OF INVESTMENTS —August 31, 2019 — (continued)
| | | | | | | | |
| | |
| Security Description | | Principal
Amount | | | Value
(Note 2) | |
| |
FOREIGN CORPORATE BONDS & NOTES (continued) | |
Medical - Drugs — 0.5% | |
Bausch Health Cos., Inc.
Company Guar. Notes
6.13% due 04/15/2025* | | $ | 2,040,000 | | | $ | 2,101,200 | |
GlaxoSmithKline Capital PLC
Company Guar. Notes
3.13% due 05/14/2021 | | | 2,077,000 | | | | 2,114,342 | |
Shire Acquisitions Investments Ireland DAC
Company Guar. Notes
3.20% due 09/23/2026 | | | 3,400,000 | | | | 3,535,553 | |
| | | | | | |
|
|
|
| | | | | | | | 7,751,095 | |
| | | | | | |
|
|
|
Metal - Copper — 0.1% | |
First Quantum Minerals, Ltd.
Company Guar. Notes
6.50% due 03/01/2024* | | | 308,000 | | | | 279,510 | |
First Quantum Minerals, Ltd.
Company Guar. Notes
7.25% due 04/01/2023* | | | 620,000 | | | | 582,800 | |
| | | | | | |
|
|
|
| | | | | | | | 862,310 | |
| | | | | | |
|
|
|
Metal - Iron — 0.1% | |
Mineral Resources, Ltd.
Senior Notes
8.13% due 05/01/2027* | | | 824,000 | | | | 841,510 | |
| | | | | | |
|
|
|
Oil & Gas Drilling — 0.0% | |
Noble Holding International, Ltd.
Company Guar. Notes
7.88% due 02/01/2026* | | | 329,000 | | | | 265,668 | |
| | | | | | |
|
|
|
Oil Companies - Exploration & Production — 0.2% | |
Anadarko Finance Co.
Company Guar. Notes
7.50% due 05/01/2031 | | | 685,000 | | | | 912,206 | |
Canadian Natural Resources, Ltd.
Senior Notes
3.90% due 02/01/2025 | | | 1,564,000 | | | | 1,648,223 | |
MEG Energy Corp.
Sec. Notes
6.50% due 01/15/2025* | | | 1,039,000 | | | | 1,044,195 | |
| | | | | | |
|
|
|
| | | | | | | | 3,604,624 | |
| | | | | | |
|
|
|
Oil Companies - Integrated — 0.6% | |
BP Capital Markets PLC
Company Guar. Notes
3.51% due 03/17/2025 | | | 4,677,000 | | | | 4,986,417 | |
Cenovus Energy, Inc.
Senior Notes
4.25% due 04/15/2027# | | | 1,662,000 | | | | 1,735,135 | |
Petro-Canada
Senior Notes
5.95% due 05/15/2035 | | | 751,000 | | | | 977,844 | |
Total Capital International SA
Company Guar. Notes
3.46% due 07/12/2049 | | | 1,656,000 | | | | 1,786,425 | |
| | | | | | |
|
|
|
| | | | | | | | 9,485,821 | |
| | | | | | |
|
|
|
Paper & Related Products — 0.1% | |
Cascades, Inc.
Company Guar. Notes
5.50% due 07/15/2022* | | | 425,000 | | | | 428,188 | |
Cascades, Inc.
Company Guar. Notes
5.75% due 07/15/2023* | | | 679,000 | | | | 687,487 | |
| | | | | | |
|
|
|
| | | | | | | | 1,115,675 | |
| | | | | | |
|
|
|
| | | | | | | | |
| | |
| Security Description | | Principal
Amount | | | Value
(Note 2) | |
| |
| | | | | | | | | |
Retail - Petroleum Products — 0.1% | |
eG Global Finance PLC
Senior Sec. Notes
6.75% due 02/07/2025* | | $ | 955,000 | | | $ | 921,575 | |
| | | | | | |
|
|
|
Satellite Telecom — 0.1% | |
Intelsat Jackson Holdings SA
Company Guar. Notes
5.50% due 08/01/2023 | | | 1,244,000 | | | | 1,132,040 | |
Telesat Canada/Telesat LLC
Company Guar. Notes
8.88% due 11/15/2024* | | | 708,000 | | | | 765,964 | |
| | | | | | |
|
|
|
| | | | | | | | 1,898,004 | |
| | | | | | |
|
|
|
Security Services — 0.1% | |
Garda World Security Corp.
Senior Notes
8.75% due 05/15/2025* | | | 1,080,000 | | | | 1,114,063 | |
| | | | | | |
|
|
|
SupraNational Banks — 0.3% | |
European Investment Bank
Senior Notes
1.63% due 08/14/2020 | | | 2,445,000 | | | | 2,440,728 | |
International Bank for Reconstruction & Development
Senior Notes
3.13% due 11/20/2025 | | | 1,664,000 | | | | 1,822,902 | |
| | | | | | |
|
|
|
| | | | | | | | 4,263,630 | |
| | | | | | |
|
|
|
Telephone - Integrated — 0.2% | |
Telecom Italia Capital SA
Company Guar. Notes
7.72% due 06/04/2038 | | | 1,247,000 | | | | 1,440,285 | |
Telefonica Emisiones SAU
Company Guar. Notes
4.67% due 03/06/2038 | | | 2,202,000 | | | | 2,434,371 | |
| | | | | | |
|
|
|
| | | | | | | | 3,874,656 | |
| | | | | | |
|
|
|
Transport - Rail — 0.1% | |
Canadian National Railway Co.
Senior Notes
2.85% due 12/15/2021 | | | 1,058,000 | | | | 1,074,789 | |
Canadian Pacific Railway Co.
Senior Notes
6.13% due 09/15/2115 | | | 622,000 | | | | 939,282 | |
| | | | | | |
|
|
|
| | | | | | | | 2,014,071 | |
| | | | | | |
|
|
|
Total Foreign Corporate Bonds & Notes | | | | | | | | |
(cost $136,206,943) | | | | | | | 143,161,907 | |
| | | |
|
|
|
FOREIGN GOVERNMENT OBLIGATIONS — 0.4% | |
Sovereign — 0.2% | |
United Mexican States
Senior Notes
4.50% due 04/22/2029 | | | 1,608,000 | | | | 1,774,846 | |
United Mexican States
Senior Bonds
4.75% due 03/08/2044 | | | 1,092,000 | | | | 1,206,333 | |
| | | | | | |
|
|
|
| | | | | | | | 2,981,179 | |
| | | | | | |
|
|
|
Sovereign Agency — 0.2% | |
Kommunalbanken AS
Senior Notes
1.75% due 09/15/2020* | | | 2,832,000 | | | | 2,831,490 | |
| | | | | | |
|
|
|
Total Foreign Government Obligations | | | | | |
(cost $5,475,179) | | | | | | | 5,812,669 | |
| | | |
|
|
|
VALIC Company II Core Bond Fund
PORTFOLIO OF INVESTMENTS —August 31, 2019 — (continued)
| | | | | | | | |
| | |
| Security Description | | Principal
Amount | | | Value
(Note 2) | |
| |
U.S. GOVERNMENT AGENCIES — 38.0% | |
Federal Home Loan Mtg. Corp. — 7.3% | |
2.50% due 01/01/2028 | | $ | 565,496 | | | $ | 575,633 | |
2.50% due 04/01/2028 | | | 1,148,120 | | | | 1,168,716 | |
2.50% due 03/01/2031 | | | 716,434 | | | | 726,967 | |
2.50% due 10/01/2032 | | | 3,896,359 | | | | 3,953,787 | |
3.00% due 08/01/2027 | | | 250,502 | | | | 258,105 | |
3.00% due 10/01/2042 | | | 1,289,497 | | | | 1,340,243 | |
3.00% due 11/01/2042 | | | 1,062,188 | | | | 1,098,734 | |
3.00% due 02/01/2043 | | | 1,378,778 | | | | 1,416,006 | |
3.00% due 04/01/2043 | | | 1,545,624 | | | | 1,603,115 | |
3.00% due 05/01/2043 | | | 522,384 | | | | 542,944 | |
3.00% due 08/01/2043 | | | 5,410,183 | | | | 5,594,928 | |
3.00% due 10/01/2045 | | | 5,704,749 | | | | 5,883,149 | |
3.50% due 01/01/2032 | | | 4,119,937 | | | | 4,282,584 | |
3.50% due 03/01/2042 | | | 3,584,969 | | | | 3,751,750 | |
3.50% due 04/01/2042 | | | 1,583,623 | | | | 1,657,287 | |
3.50% due 08/01/2042 | | | 1,238,678 | | | | 1,302,794 | |
3.50% due 09/01/2043 | | | 1,141,930 | | | | 1,201,035 | |
3.50% due 03/01/2045 | | | 1,117,319 | | | | 1,167,594 | |
3.50% due 07/01/2045 | | | 7,084,415 | | | | 7,402,779 | |
3.50% due 08/01/2045 | | | 2,063,661 | | | | 2,162,046 | |
3.50% due 11/01/2045 | | | 3,964,695 | | | | 4,142,394 | |
3.50% due 01/01/2046 | | | 2,514,593 | | | | 2,627,244 | |
3.50% due 03/01/2046 | | | 5,939,663 | | | | 6,202,003 | |
3.50% due 11/01/2047 | | | 12,315,533 | | | | 12,746,886 | |
3.50% due 03/01/2048 | | | 9,299,403 | | | | 9,741,636 | |
4.00% due 03/01/2023 | | | 16,785 | | | | 17,469 | |
4.00% due 09/01/2040 | | | 1,196,350 | | | | 1,278,940 | |
4.00% due 07/01/2044 | | | 88,654 | | | | 93,793 | |
4.00% due 10/01/2045 | | | 3,051,248 | | | | 3,221,872 | |
4.00% due 01/01/2046 | | | 657,117 | | | | 698,799 | |
4.50% due 12/01/2039 | | | 485,635 | | | | 530,410 | |
4.50% due 07/01/2044 | | | 1,346,825 | | | | 1,458,086 | |
4.50% due 05/01/2048 | | | 5,973,906 | | | | 6,317,188 | |
5.00% due 10/01/2033 | | | 844 | | | | 930 | |
5.00% due 07/01/2040 | | | 537,875 | | | | 591,243 | |
5.00% due 11/01/2043 | | | 2,615,741 | | | | 2,912,112 | |
5.50% due 11/01/2032 | | | 6,319 | | | | 7,056 | |
5.50% due 07/01/2034 | | | 24,405 | | | | 27,546 | |
5.50% due 02/01/2035 | | | 34,737 | | | | 37,514 | |
5.50% due 07/01/2035 | | | 914 | | | | 1,034 | |
5.50% due 01/01/2036 | | | 148,277 | | | | 167,607 | |
5.50% due 05/01/2037 | | | 26,972 | | | | 30,342 | |
6.00% due 07/01/2035 | | | 76,757 | | | | 84,842 | |
6.00% due 03/01/2040 | | | 132,516 | | | | 151,950 | |
6.50% due 02/01/2036 | | | 10,835 | | | | 12,719 | |
6.50% due 09/01/2036 | | | 166 | | | | 184 | |
6.50% due 05/01/2037 | | | 30,883 | | | | 36,293 | |
Federal Home Loan Mtg. Corp. FRS
4.02% (6 ML+1.49%)
due 02/01/2037 | | | 114,343 | | | | 118,201 | |
4.83% (12 ML+1.88%)
due 11/01/2037 | | | 1,098,267 | | | | 1,162,885 | |
Federal Home Loan Mtg. Corp. REMIC | |
Series 4740, Class BA
3.00% due 09/15/2045(2) | | | 3,529,341 | | | | 3,644,444 | |
Series 4800, Class KG
3.50% due 11/15/2045(2) | | | 4,000,000 | | | | 4,152,439 | |
Series 3820, Class DA
4.00% due 11/15/2035(2) | | | 685,734 | | | | 686,622 | |
Federal Home Loan Mtg. Corp. REMIC FRS
Series 3572, Class JS
4.60%(6.80%-1 ML)
due 09/15/2039(2)(6)(7) | | | 732,877 | | | | 103,704 | |
| | | | | | | | |
| | |
| Security Description | | Principal
Amount | | | Value
(Note 2) | |
| |
| | | | | | | | | |
Federal Home Loan Mtg. Corp. (continued) | |
Federal Home Loan Mtg. Corp. Structured Agency Credit Risk FRS | |
Series 2017-HQA1, Class M1
3.35% (1 ML+1.20%)
due 08/25/2029(2) | | $ | 1,112,620 | | | $ | 1,114,428 | |
Series 2015-DNA1, Class M2
4.00% (1 ML+1.85%)
due 10/25/2027(2) | | | 592,407 | | | | 596,968 | |
Series2014-DN1, Class M2
4.35% (1 ML+2.20%)
due 02/25/2024(2) | | | 896,084 | | | | 906,229 | |
Series2014-HQ2, Class M2
4.35% (1 ML+2.20%)
due 09/25/2024(2) | | | 2,086,859 | | | | 2,114,792 | |
Series 2015-HQA1, Class M2
4.80% (1 ML+2.65%)
due 03/25/2028(2) | | | 215,759 | | | | 216,625 | |
Series 2016-HQA1, Class M2
4.90% (1 ML+2.75%)
due 09/25/2028(2) | | | 456,077 | | | | 458,459 | |
Series 2015-HQA2, Class M2
4.95% (1 ML+2.80%)
due 05/25/2028(2) | | | 353,516 | | | | 355,882 | |
| | | | | | |
|
|
|
| | | | | | | | 115,859,966 | |
| | | | | | |
|
|
|
Federal National Mtg. Assoc. — 25.4% | |
2.50% due 02/01/2028 | | | 1,147,032 | | | | 1,167,090 | |
2.50% due 04/01/2028 | | | 300,538 | | | | 305,792 | |
2.50% due 08/01/2031 | | | 14,315,766 | | | | 14,519,797 | |
2.50% due 01/01/2032 | | | 2,227,227 | | | | 2,259,046 | |
3.00% due 10/01/2027 | | | 138,464 | | | | 142,610 | |
3.00% due 01/01/2028 | | | 1,284,654 | | | | 1,323,290 | |
3.00% due 10/01/2030 | | | 2,291,178 | | | | 2,358,296 | |
3.00% due 10/01/2032 | | | 7,204,097 | | | | 7,400,158 | |
3.00% due 02/01/2033 | | | 11,722,817 | | | | 12,049,391 | |
3.00% due 03/01/2042 | | | 2,635,516 | | | | 2,724,847 | |
3.00% due 12/01/2042 | | | 2,351,249 | | | | 2,431,984 | |
3.00% due 02/01/2043 | | | 5,522,382 | | | | 5,708,182 | |
3.00% due 05/01/2043 | | | 2,819,349 | | | | 2,914,758 | |
3.00% due 05/01/2046 | | | 3,394,464 | | | | 3,497,953 | |
3.00% due 08/01/2046 | | | 6,757,945 | | | | 6,974,491 | |
3.00% due 09/01/2046 | | | 1,548,395 | | | | 1,592,894 | |
3.00% due 09/01/2048 | | | 7,323,740 | | | | 7,525,650 | |
3.50% due 08/01/2026 | | | 823,097 | | | | 852,585 | |
3.50% due 09/01/2026 | | | 799,294 | | | | 832,311 | |
3.50% due 08/01/2027 | | | 103,152 | | | | 106,866 | |
3.50% due 10/01/2028 | | | 1,855,974 | | | | 1,931,645 | |
3.50% due 03/01/2033 | | | 1,612,718 | | | | 1,675,604 | |
3.50% due 12/01/2041 | | | 386,705 | | | | 406,519 | |
3.50% due 03/01/2042 | | | 523,097 | | | | 547,153 | |
3.50% due 08/01/2042 | | | 3,636,473 | | | | 3,812,319 | |
3.50% due 09/01/2042 | | | 464,707 | | | | 486,082 | |
3.50% due 02/01/2043 | | | 2,465,395 | | | | 2,616,432 | |
3.50% due 07/01/2045 | | | 1,524,352 | | | | 1,590,890 | |
3.50% due 08/01/2045 | | | 2,069,237 | | | | 2,161,517 | |
3.50% due 09/01/2045 | | | 459,014 | | | | 479,107 | |
3.50% due 10/01/2045 | | | 2,848,680 | | | | 2,995,353 | |
3.50% due 11/01/2045 | | | 6,256,188 | | | | 6,543,175 | |
3.50% due 12/01/2045 | | | 11,366,814 | | | | 11,862,130 | |
3.50% due 02/01/2046 | | | 1,899,821 | | | | 1,982,563 | |
3.50% due 03/01/2046 | | | 8,874,600 | | | | 9,246,806 | |
3.50% due 07/01/2046 | | | 5,677,517 | | | | 5,944,922 | |
3.50% due 01/01/2047 | | | 5,195,655 | | | | 5,400,865 | |
3.50% due 12/01/2047 | | | 14,642,040 | | | | 15,228,452 | |
3.50% due 04/01/2048 | | | 27,044,376 | | | | 28,081,102 | |
3.50% due 04/01/2049 | | | 7,684,676 | | | | 7,907,577 | |
VALIC Company II Core Bond Fund
PORTFOLIO OF INVESTMENTS —August 31, 2019 — (continued)
| | | | | | | | |
| | |
| Security Description | | Principal
Amount | | | Value
(Note 2) | |
| |
U.S. GOVERNMENT AGENCIES (continued) | |
Federal National Mtg. Assoc. (continued) | |
3.50% due 05/01/2049 | | $ | 6,355,723 | | | $ | 6,529,702 | |
4.00% due 11/01/2025 | | | 58,982 | | | | 61,514 | |
4.00% due 03/01/2039 | | | 5,625,730 | | | | 5,884,879 | |
4.00% due 09/01/2040 | | | 98,572 | | | | 105,350 | |
4.00% due 10/01/2040 | | | 195,819 | | | | 209,250 | |
4.00% due 12/01/2040 | | | 1,651,052 | | | | 1,764,648 | |
4.00% due 10/01/2041 | | | 1,079,030 | | | | 1,153,235 | |
4.00% due 11/01/2041 | | | 1,079,274 | | | | 1,153,498 | |
4.00% due 01/01/2043 | | | 1,947,502 | | | | 2,083,675 | |
4.00% due 10/01/2043 | | | 2,689,634 | | | | 2,872,291 | |
4.00% due 10/01/2044 | | | 3,475,759 | | | | 3,673,981 | |
4.00% due 02/01/2045 | | | 3,475,492 | | | | 3,708,913 | |
4.00% due 02/01/2046 | | | 2,284,207 | | | | 2,408,951 | |
4.00% due 06/01/2046 | | | 675,268 | | | | 711,005 | |
4.00% due 01/01/2047 | | | 3,985,748 | | | | 4,185,781 | |
4.00% due 05/01/2047 | | | 4,160,106 | | | | 4,362,798 | |
4.00% due 06/01/2047 | | | 4,958,953 | | | | 5,270,443 | |
4.00% due 07/01/2047 | | | 11,036,767 | | | | 11,532,534 | |
4.00% due 08/01/2047 | | | 6,051,467 | | | | 6,340,662 | |
4.00% due 06/01/2048 | | | 12,223,708 | | | | 12,915,183 | |
4.00% due 09/01/2048 | | | 11,567,467 | | | | 12,074,877 | |
4.00% due 11/01/2048 | | | 5,227,872 | | | | 5,436,694 | |
4.00% due 01/01/2049 | | | 13,298,355 | | | | 13,878,096 | |
4.00% due 03/01/2049 | | | 15,743,720 | | | | 16,333,564 | |
4.50% due 10/01/2024 | | | 265,822 | | | | 276,202 | |
4.50% due 03/01/2025 | | | 412,809 | | | | 434,678 | |
4.50% due 02/01/2040 | | | 963,931 | | | | 1,065,852 | |
4.50% due 05/01/2040 | | | 297,774 | | | | 326,897 | |
4.50% due 08/01/2045 | | | 7,187,787 | | | | 7,942,281 | |
4.50% due 06/01/2048 | | | 11,844,811 | | | | 12,518,582 | |
4.50% due 10/01/2048 | | | 10,635,828 | | | | 11,219,462 | |
4.50% due 11/01/2048 | | | 9,510,007 | | | | 10,025,459 | |
4.50% due 12/01/2048 | | | 16,552,282 | | | | 17,434,311 | |
5.00% due 03/01/2020 | | | 248 | | | | 256 | |
5.00% due 06/01/2022 | | | 22,602 | | | | 23,297 | |
5.00% due 10/01/2024 | | | 149,542 | | | | 154,142 | |
5.00% due 09/01/2033 | | | 486,228 | | | | 541,016 | |
5.00% due 04/01/2040 | | | 281,906 | | | | 300,876 | |
5.00% due 05/01/2040 | | | 551,739 | | | | 605,348 | |
5.00% due 06/01/2040 | | | 2,399,262 | | | | 2,644,938 | |
5.00% due 07/01/2040 | | | 238,123 | | | | 258,318 | |
5.00% due 02/01/2045 | | | 1,442,748 | | | | 1,582,716 | |
5.50% due 12/01/2029 | | | 119,725 | | | | 129,236 | |
5.50% due 12/01/2033 | | | 25,743 | | | | 29,103 | |
5.50% due 07/01/2037 | | | 28,060 | | | | 31,528 | |
5.50% due 08/01/2037 | | | 1,223,085 | | | | 1,379,280 | |
5.50% due 06/01/2038 | | | 137,256 | | | | 154,438 | |
5.50% due 09/01/2039 | | | 457,679 | | | | 515,118 | |
6.00% due 08/01/2034 | | | 21,123 | | | | 24,214 | |
6.00% due 11/01/2035 | | | 24,492 | | | | 27,002 | |
6.00% due 06/01/2036 | | | 47,328 | | | | 54,229 | |
6.00% due 12/01/2036 | | | 83,948 | | | | 96,208 | |
6.00% due 07/01/2038 | | | 406,700 | | | | 465,993 | |
6.00% due 09/01/2038 | | | 218,984 | | | | 250,704 | |
6.00% due 11/01/2038 | | | 129,999 | | | | 148,836 | |
Federal National Mtg. Assoc. FRS
4.28% (6 ML+1.54%)
due 09/01/2035 | | | 977,529 | | | | 1,011,018 | |
4.44% (12 ML+1.57%)
due 05/01/2037 | | | 198,444 | | | | 207,424 | |
4.56% (12 ML+1.66%)
due 07/01/2039 | | | 690,715 | | | | 723,827 | |
4.57% (12 ML+1.82%)
due 10/01/2040 | | | 217,851 | | | | 228,742 | |
| | | | | | | | |
| | |
| Security Description | | Principal
Amount | | | Value
(Note 2) | |
| |
| | | | | | | | | |
Federal National Mtg. Assoc. (continued) | |
4.63% (1 Yr USTYCR+2.21%)
due 10/01/2035 | | $ | 921,500 | | | $ | 972,678 | |
4.67% (12 ML+1.83%)
due 10/01/2040 | | | 493,982 | | | | 517,110 | |
4.71% (1 Yr USTYCR+2.26%)
due 11/01/2036 | | | 348,704 | | | | 368,830 | |
4.71% (12 ML+1.77%)
due 05/01/2040 | | | 928,390 | | | | 977,543 | |
4.73% (12 ML+1.91%)
due 08/01/2035 | | | 626,815 | | | | 662,270 | |
Federal National Mtg. Assoc. REMIC | |
Series2017-100, Class NP
3.00% due 12/25/2047(2) | | | 4,485,102 | | | | 4,627,952 | |
Series2018-27, Class EA
3.00% due 05/25/2048(2) | | | 3,940,684 | | | | 4,075,501 | |
Series2018-35, Class CD
3.00% due 05/25/2048(2) | | | 6,422,012 | | | | 6,558,412 | |
Fannie Mae Connecticut Avenue Securities FRS
Series2014-C01, Class M1
3.75% (1 ML+1.60%)
due 01/25/2024(2) | | | 12,847 | | | | 12,854 | |
| | | | | | |
|
|
|
| | | | | | | | 403,844,409 | |
| | | | | | |
|
|
|
Government National Mtg. Assoc. — 5.3% | |
3.00% due 02/20/2045 | | | 5,298,928 | | | | 5,507,966 | |
3.00% due 05/20/2045 | | | 1,308,613 | | | | 1,355,463 | |
3.00% due 07/20/2045 | | | 331,240 | | | | 343,103 | |
3.00% due 11/20/2045 | | | 2,834,226 | | | | 2,935,834 | |
3.00% due 12/20/2045 | | | 2,252,874 | | | | 2,333,592 | |
3.00% due 01/20/2046 | | | 5,329,069 | | | | 5,526,571 | |
3.00% due 05/20/2046 | | | 14,210,953 | | | | 14,693,519 | |
3.00% due 09/20/2047 | | | 10,397,450 | | | | 10,732,192 | |
3.50% due 03/20/2045 | | | 1,117,467 | | | | 1,169,038 | |
3.50% due 07/20/2045 | | | 550,601 | | | | 575,355 | |
3.50% due 03/20/2047 | | | 3,671,903 | | | | 3,832,228 | |
4.00% due 03/20/2044 | | | 696,508 | | | | 744,063 | |
4.00% due 07/20/2045 | | | 1,940,566 | | | | 2,066,273 | |
4.00% due 05/20/2048 | | | 22,884,647 | | | | 23,875,451 | |
4.50% due 05/15/2039 | | | 537,366 | | | | 592,443 | |
4.50% due 04/20/2047 | | | 4,492,453 | | | | 4,732,502 | |
5.00% due 05/15/2034 | | | 155,703 | | | | 171,999 | |
5.00% due 01/15/2040 | | | 513,301 | | | | 574,633 | |
5.50% due 12/15/2039 | | | 641,294 | | | | 719,856 | |
6.00% due 10/15/2039 | | | 324,134 | | | | 356,331 | |
Government National Mtg. Assoc. REMIC VRS
Series2013-118, Class B
2.50% due 10/16/2043(1)(3) | | | 1,700,000 | | | | 1,704,513 | |
| | | | | | |
|
|
|
| | | | | | | | 84,542,925 | |
| | | | | | |
|
|
|
Total U.S. Government Agencies | | | | | | | | |
(cost $591,925,128) | | | | | | | 604,247,300 | |
| | | |
|
|
|
U.S. GOVERNMENT TREASURIES — 7.8% | |
United States Treasury Bonds — 3.5% | |
2.50% due 02/15/2045 | | | 1,189,000 | | | | 1,318,908 | |
2.50% due 05/15/2046 | | | 1,426,000 | | | | 1,584,531 | |
2.75% due 08/15/2047# | | | 1,300,000 | | | | 1,518,664 | |
2.88% due 05/15/2049 | | | 2,524,000 | | | | 3,039,744 | |
3.00% due 05/15/2045 | | | 595,000 | | | | 721,135 | |
3.00% due 05/15/2047 | | | 13,750,000 | | | | 16,801,318 | |
3.00% due 02/15/2049 | | | 165,000 | | | | 203,176 | |
3.13% due 11/15/2041 | | | 815,000 | | | | 996,560 | |
3.13% due 02/15/2042 | | | 1,908,000 | | | | 2,335,884 | |
3.13% due 08/15/2044 | | | 281,000 | | | | 346,409 | |
3.38% due 11/15/2048 | | | 15,000,000 | | | | 19,722,070 | |
3.63% due 08/15/2043 | | | 476,000 | | | | 631,016 | |
VALIC Company II Core Bond Fund
PORTFOLIO OF INVESTMENTS —August 31, 2019 — (continued)
| | | | | | | | |
| | |
| Security Description | | Shares/
Principal
Amount | | | Value
(Note 2) | |
| |
U.S. GOVERNMENT TREASURIES (continued) | | | | | | | | |
United States Treasury Bonds (continued) | |
3.75% due 08/15/2041 | | $ | 37,000 | | | $ | 49,418 | |
3.88% due 08/15/2040 | | | 140,000 | | | | 189,536 | |
4.25% due 11/15/2040 | | | 713,000 | | | | 1,013,017 | |
4.38% due 05/15/2040 | | | 2,990,000 | | | | 4,304,199 | |
4.38% due 05/15/2041 | | | 452,000 | | | | 654,500 | |
4.63% due 02/15/2040 | | | 68,000 | | | | 100,733 | |
5.25% due 11/15/2028 | | | 375,000 | | | | 495,806 | |
| | | | | | |
|
|
|
| | | | | | | | 56,026,624 | |
| | | | | | |
|
|
|
United States Treasury Notes — 4.3% | |
0.13% due 04/15/2020 TIPS(8) | | | 295,321 | | | | 292,523 | |
1.25% due 08/31/2024 | | | 4,000,000 | | | | 3,972,969 | |
1.63% due 08/15/2029 | | | 12,526,000 | | | | 12,663,982 | |
1.75% due 07/31/2021 | | | 1,830,000 | | | | 1,837,506 | |
1.88% due 01/31/2022 | | | 2,087,000 | | | | 2,106,158 | |
2.25% due 08/15/2027# | | | 4,202,000 | | | | 4,446,405 | |
2.25% due 11/15/2027 | | | 5,770,000 | | | | 6,111,467 | |
2.50% due 02/28/2026 | | | 10,000,000 | | | | 10,644,922 | |
2.63% due 12/31/2025 | | | 2,719,000 | | | | 2,910,604 | |
2.63% due 02/15/2029# | | | 5,000,000 | | | | 5,489,648 | |
2.75% due 02/15/2028 | | | 1,250,000 | | | | 1,375,000 | |
2.88% due 04/30/2025 | | | 5,600,000 | | | | 6,035,531 | |
2.88% due 11/30/2025 | | | 3,932,000 | | | | 4,264,838 | |
2.88% due 08/15/2028 | | | 3,000,000 | | | | 3,343,477 | |
3.00% due 10/31/2025 | | | 1,558,000 | | | | 1,699,559 | |
| | | | | | |
|
|
|
| | | �� | | | | | 67,194,589 | |
| | | | | | |
|
|
|
Total U.S. Government Treasuries | | | | | | | | |
(cost $110,415,544) | | | | | | | 123,221,213 | |
| | | |
|
|
|
COMMON STOCKS — 0.0% | |
Television — 0.0% | |
ION Media Networks, Inc.†(4)(9)
(cost $1) | | | 79 | | | | 70,744 | |
| | | | | | |
|
|
|
PREFERRED SECURITIES — 0.0% | |
Electric - Distribution — 0.0% | |
Entergy Louisiana LLC
4.70% | | | 22,875 | | | | 583,770 | |
| | | | | | |
|
|
|
Sovereign Agency — 0.0% | |
Federal Home Loan Mtg. Corp.
Series Z
8.38%† | | | 6,900 | | | | 83,076 | |
| | | | | | |
|
|
|
Total Preferred Securities | | | | | | | | |
(cost $678,289) | | | | | | | 666,846 | |
| | | |
|
|
|
PREFERRED SECURITIES/CAPITAL SECURITIES — 1.2% | |
Banks - Money Center — 0.1% | |
BBVA Bancomer SA
5.13% due 01/18/2033* | | $ | 1,607,000 | | | | 1,538,703 | |
| | | | | | |
|
|
|
Banks - Super Regional — 0.0% | |
Wells Fargo Capital X
5.95% due 12/01/2086 | | | 445,000 | | | | 554,786 | |
| | | | | | |
|
|
|
Diversified Banking Institutions — 0.5% | |
Bank of Nova Scotia
4.65% due 10/12/2022(5) | | | 2,897,000 | | | | 2,852,444 | |
HSBC Holdings PLC
6.00% due 05/22/2027(5) | | | 1,963,000 | | | | 1,967,907 | |
JPMorgan Chase & Co.
Series U
6.13% due 04/30/2024(5) | | | 1,891,000 | | | | 2,035,189 | |
Royal Bank of Scotland Group PLC
8.00% due 08/10/2025(5) | | | 425,000 | | | | 452,413 | |
| | | | | | | | |
| | |
| Security Description | | Shares/
Principal
Amount | | | Value
(Note 2) | |
| |
| | | | | | | | | |
Diversified Banking Institutions (continued) | |
Societe Generale SA
7.88% due 12/18/2023*(5) | | $ | 993,000 | | | $ | 1,071,199 | |
| | | | | | |
|
|
|
| | | | | | | | 8,379,152 | |
| | | | | | |
|
|
|
Electric - Distribution — 0.1% | |
National Rural Utilities Cooperative Finance Corp.
4.75% due 04/30/2043 | | | 840,000 | | | | 850,348 | |
| | | | | | |
|
|
|
Electric - Integrated — 0.0% | |
Dominion Resources, Inc.
5.75% due 10/01/2054 | | | 720,000 | | | | 762,811 | |
| | | | | | |
|
|
|
Finance - Investment Banker/Broker — 0.0% | |
Lehman Brothers Holdings Capital Trust VII
Escrow Security
0.00%†(4) | | | 148,000 | | | | 15 | |
| | | | | | |
|
|
|
Food - Dairy Products — 0.0% | |
Land O’Lakes Capital Trust I
7.45% due 03/15/2028* | | | 603,000 | | | | 662,546 | |
| | | | | | |
|
|
|
Insurance - Life/Health — 0.2% | |
Prudential Financial, Inc.
5.63% due 06/15/2043 | | | 926,000 | | | | 992,302 | |
Prudential Financial, Inc.
5.70% due 09/15/2048 | | | 1,970,000 | | | | 2,151,161 | |
| | | | | | |
|
|
|
| | | | | | | | 3,143,463 | |
| | | | | | |
|
|
|
Insurance - Multi-line — 0.1% | |
Voya Financial, Inc.
Company Guar. Notes
4.70% due 01/23/2048 | | | 1,193,000 | | | | 1,113,069 | |
| | | | | | |
|
|
|
Pipelines — 0.2% | |
EnLink Midstream Partners LP
6.00% due 12/15/2022(5) | | | 926,000 | | | | 694,500 | |
Enterprise Products Operating LLC
5.25% due 08/16/2077 | | | 744,000 | | | | 734,700 | |
TransCanada Trust
5.30% due 03/15/2077 | | | 788,000 | | | | 782,090 | |
TransCanada Trust
5.63% due 05/20/2075 | | | 503,000 | | | | 516,832 | |
| | | | | | |
|
|
|
| | | | | | | | 2,728,122 | |
| | | | | | |
|
|
|
Total Preferred Securities/Capital Securities | | | | | | | | |
(cost $19,232,439) | | | | | | | 19,733,015 | |
| | | |
|
|
|
Total Long-Term Investment Securities | | | | | | | | |
(cost $1,487,984,114) | | | | | | | 1,556,094,566 | |
| | | |
|
|
|
SHORT-TERM INVESTMENT SECURITIES — 2.0% | |
Registered Investment Companies — 2.0% | |
State Street Institutional U.S. Government Money Market Fund, Premier Class
2.07%(10) | | | 27,060,254 | | | | 27,060,254 | |
State Street Navigator Securities Lending Government Money Market Portfolio
2.12%(10)(12) | | | 4,651,380 | | | | 4,651,380 | |
| | | | | | |
|
|
|
Total Short-Term Investment Securities | | | | | | | | |
(cost $31,711,634) | | | | | | | 31,711,634 | |
| | | |
|
|
|
TOTAL INVESTMENTS | | | | | | | | |
(cost $1,519,695,748)(11) | | | 99.9 | % | | | 1,587,806,200 | |
Other assets less liabilities | | | 0.1 | | | | 1,411,352 | |
| | |
|
|
| |
|
|
|
NET ASSETS | | | 100.0 | % | | $ | 1,589,217,552 | |
| | |
|
|
| |
|
|
|
VALIC Company II Core Bond Fund
PORTFOLIO OF INVESTMENTS —August 31, 2019 — (continued)
| * | Securities exempt from registration under Rule 144A of the Securities Act of 1933. These securities may be sold in transactions exempt from registration, normally to qualified institutional buyers. The Fund has no right to demand registration of these securities. At August 31, 2019, the aggregate value of these securities was $234,998,093 representing 14.8% of net assets. |
| # | The security or a portion thereof is out on loan (see Note 2). |
| † | Non-income producing security |
| (1) | Commercial Mortgage Backed Security |
| (2) | Collateralized Mortgage Obligation |
| (3) | Certain variable rate securities are not based on a published reference rate and spread but are determined by the issuer or agent and are based on current market conditions. These securities do not indicate a reference rate and spread in their description above. |
| (4) | Securities classified as Level 3 (see Note 2). |
| (5) | Perpetual maturity — maturity date reflects the next call date. |
| (7) | Inverse Floating Rate Security that pays interest that varies inversely to changes in the market interest rates. The interest rate shown is the current interest rate at August 31, 2019. |
| (8) | Principal amount of security is adjusted for inflation. |
| (9) | Denotes a restricted security that: (a) cannot be offered for public sale without first being registered, or being able to take advantage of an exemption from registration, under the Securities Act of 1933, as amended (the “1933 Act”); (b) is subject to a contractual restriction on public sales; or (c) is otherwise subject to a restriction on sales by operation of applicable law. Restricted securities are valued pursuant to Note 2. Certain restricted securities held by the Fund may not be sold except in exempt transactions or in a public offering registered under the 1933 Act. The Fund has no right to demand registration of these securities. The risk of investing in certain restricted securities is greater than the risk of investing in the securities of widely held, publicly traded companies. To the extent applicable, lack of a secondary market and resale restrictions may result in the inability of a Fund to sell a security at a fair price and may substantially delay the sale of the security. In addition, certain restricted securities may exhibit greater price volatility than securities for which secondary markets exist. As of August 31, 2019, the Fund held the following restricted securities: |
| | | | | | | | | | | | | | | | | | | | | | | | |
Description
| | Acquisition
Date
| | | Shares
| | | Acquisition
Cost
| | | Value
| | | Value
Per Share
| | | % of
Net Assets
| |
Common Stocks | | | | | | | | | | | | | | | | | | | | | | | | |
| | | | | | |
ION Media Networks, Inc. | | | 03/05/2014 | | | | 79 | | | $ | 1 | | | $ | 70,744 | | | $ | 895.50 | | | | 0.00 | % |
| | | | | | | | | | | | | | |
|
|
| | | | | |
|
|
|
| (10) | The rate shown is the7-day yield as of August 31, 2019. |
| (11) | See Note 5 for cost of investments on a tax basis. |
| (12) | At August 31, 2019, the Fund had loaned securities with a total value of $18,414,166. This was secured by collateral of $4,651,380, which was received in cash and subsequently invested in short-term investments currently valued at $4,651,380 as reported in the Portfolio of Investments. Additional collateral of $14,330,939 was received in the form of fixed income pooled securities, which the Fund cannot sell or repledge and accordingly, are not reflected in the Fund’s assets and liabilities. |
The components of the fixed income pooled securities referenced above are as follows:
| | | | | | | | |
Securities
| | Coupon Range
| | Maturity Date Range
| | Value as of
August 31, 2019
| |
Federal Home Loan Mtg. Corp. | | zero coupon to 16.77% | | 02/01/2021 to 08/25/2056 | | $ | 1,922,069 | |
Federal National Mtg. Assoc. | | 0.90% to 31.90% | | 07/01/2020 to 05/25/2059 | | | 3,048,956 | |
Government National Mtg. Assoc. | | 2.00% to 26.51% | | 07/15/2020 to 07/20/2069 | | | 1,257,633 | |
United States Treasury Bills | | 0.00% | | 11/07/2019 to 01/09/2020 | | | 75,566 | |
United States Treasury Notes/Bonds | | zero coupon to 8.75% | | 09/30/2019 to 02/15/2049 | | | 8,026,715 | |
REMIC—Real Estate Mortgage Investment Conduit
TIPS—Treasury Inflation Protected Securities
ULC—Unlimited Liability Corp.
FRS—Floating Rate Security
VRS—Variable Rate Security
The rates shown on FRS and VRS are the current interest rates at August 31, 2019 and unless noted otherwise, the dates are the original maturity dates.
Index Legend
1 ML—1 Month USD LIBOR
3 ML—3 Month USD LIBOR
6 ML—6 Month USD LIBOR
12 ML—12 Month USD LIBOR
1 Yr USTYCR—1 Year US Treasury Yield Curve Rate
The following is a summary of the inputs used to value the Fund’s net assets as of August 31, 2019 (see Note 2):
| | | | | | | | | | | | | | | | |
| | | Level 1 - Unadjusted
Quoted Prices
| | | Level 2 - Other
Observable Inputs
| | | Level 3 - Significant
Unobservable Inputs
| | | Total
| |
ASSETS: | | | | | | | | | | | | | | | | |
Investments at Value:* | | | | | | | | | | | | | | | | |
| | | | |
Asset Backed Securities | | $ | — | | | $ | 71,492,349 | | | $ | — | | | $ | 71,492,349 | |
U.S. Corporate Bonds & Notes: | | | | | | | | | | | | | | | | |
Airlines | | | — | | | | 465,965 | | | | 23,532 | | | | 489,497 | |
Finance - Investment Banker/Broker | | | — | | | | 823,055 | | | | 41 | | | | 823,096 | |
Gambling(Non-Hotel) | | | — | | | | 536,359 | | | | 302 | | | | 536,661 | |
Other Industries | | | — | | | | 585,839,269 | | | | — | | | | 585,839,269 | |
Foreign Corporate Bonds & Notes | | | — | | | | 143,161,907 | | | | — | | | | 143,161,907 | |
Foreign Government Obligations | | | — | | | | 5,812,669 | | | | — | | | | 5,812,669 | |
U.S. Government Agencies | | | — | | | | 604,247,300 | | | | — | | | | 604,247,300 | |
U.S. Government Treasuries | | | — | | | | 123,221,213 | | | | — | | | | 123,221,213 | |
Common Stocks | | | — | | | | — | | | | 70,744 | | | | 70,744 | |
Preferred Securities | | | 666,846 | | | | — | | | | — | | | | 666,846 | |
Preferred Securities/Capital Securities: | | | | | | | | | | | | | | | | |
Finance - Investment Banker/Broker | | | — | | | | — | | | | 15 | | | | 15 | |
Other Industries | | | — | | | | 19,733,000 | | | | — | | | | 19,733,000 | |
Short-Term Investment Securities | | | 31,711,634 | | | | — | | | | — | | | | 31,711,634 | |
| | |
|
|
| |
|
|
| |
|
|
| |
|
|
|
Total Investments at Value | | $ | 32,378,480 | | | $ | 1,555,333,086 | | | $ | 94,634 | | | $ | 1,587,806,200 | |
| | |
|
|
| |
|
|
| |
|
|
| |
|
|
|
| * | For a detailed presentation of investments, please refer to the Portfolio of Investments. |
At the beginning and end of the reporting period, Level 3 investments in securities were not considered a material portion of the Fund. There were no Level 3 transfers during the reporting period.
See Notes to Financial Statements
VALIC Company II Government Money Market II Fund
PORTFOLIO PROFILE —August 31, 2019 (unaudited)
Industry Allocation*
| | | | |
U.S. Government Agencies | | | 64.2 | % |
U.S. Government Treasuries | | | 34.0 | |
| | |
|
|
|
| | | | 98.2 | % |
| | |
|
|
|
Credit Quality@#
| | | | |
A-1+ . . . . . . . . . . . . . . . . . . . . . . . . . . . . . . . . . . .. | | | 100.0 | % |
| | |
|
|
|
| * | Calculated as a percentage of net assets |
| @ | Source: Standards & Poor’s |
| # | Calculated as a percentage of total debt issues |
| | | | |
Weighted Average days to Maturity — 15.9 days | | | | |
VALIC Company II Government Money Market II Fund
PORTFOLIO OF INVESTMENTS —August 31, 2019
| | | | | | | | |
| | |
| Security Description | | Principal
Amount | | | Value
(Note 2) | |
| |
SHORT-TERM INVESTMENT SECURITIES — 98.2% | |
U.S. Government Agencies — 64.2% | |
Federal Farm Credit Bank FRS
2.38% (1 ML+0.18%)
due 10/11/2019 | | $ | 2,000,000 | | | $ | 2,000,462 | |
Federal Home Loan Bank
1.93% due 09/03/2019 | | | 3,500,000 | | | | 3,499,631 | |
2.03% due 09/04/2019 | | | 1,100,000 | | | | 1,099,817 | |
2.05% due 09/20/2019 | | | 3,000,000 | | | | 2,996,802 | |
2.06% due 10/01/2019 | | | 3,000,000 | | | | 2,994,937 | |
2.06% due 10/10/2019 | | | 1,000,000 | | | | 997,806 | |
2.06% due 09/26/2019 | | | 3,000,000 | | | | 2,995,771 | |
2.07% due 10/01/2019 | | | 3,000,000 | | | | 2,994,912 | |
2.07% due 09/25/2019 | | | 3,100,000 | | | | 3,095,784 | |
2.15% due 09/05/2019 | | | 2,500,000 | | | | 2,499,411 | |
2.18% due 09/10/2019 | | | 1,000,000 | | | | 999,465 | |
2.25% due 09/04/2019 | | | 3,000,000 | | | | 2,999,446 | |
Federal Home Loan Bank FRS
2.13% (SOFR + 0.01%)
due 11/13/2019 | | | 1,500,000 | | | | 1,499,997 | |
2.14% (1 ML - 0.06%)
due 01/14/2020 | | | 2,000,000 | | | | 1,999,835 | |
2.14% (SOFR + 0.02%)
due 05/22/2020 | | | 3,000,000 | | | | 3,000,000 | |
Federal Home Loan Mtg. Corp. FRS
2.12% (SOFR + 0.00%)
due 04/13/2020 | | | 3,000,000 | | | | 3,000,000 | |
2.13% (SOFR + 0.01%)
due 09/05/2019 | | | 2,000,000 | | | | 2,000,000 | |
2.13% (SOFR + 0.01%)
due 05/20/2020 | | | 3,000,000 | | | | 3,000,000 | |
2.13% (SOFR + 0.01%)
due 08/07/2020 | | | 3,000,000 | | | | 3,000,000 | |
2.13% (SOFR + 0.01%)
due 02/21/2020 | | | 3,000,000 | | | | 3,000,000 | |
2.13% (SOFR + 0.01%)
due 07/22/2020 | | | 3,000,000 | | | | 3,000,000 | |
2.14% (SOFR + 0.02%)
due 06/05/2020 | | | 2,000,000 | | | | 2,000,000 | |
2.15% (SOFR + 0.03%)
due 10/01/2019 | | | 3,000,000 | | | | 3,000,000 | |
2.19% (SOFR + 0.03%)
due 06/02/2020 | | | 2,000,000 | | | | 2,000,000 | |
Federal National Mtg. Assoc.
1.97% due 09/03/2019 | | | 15,000,000 | | | | 14,998,383 | |
2.34% due 09/04/2019 | | | 2,000,000 | | | | 1,999,618 | |
| | | | | | |
|
|
|
Total U.S. Government Agencies | | | | | | | | |
(amortized cost $76,672,077) | | | | | | | 76,672,077 | |
| | | | | | |
|
|
|
| | | | | | | | |
| | |
| Security Description | | Principal
Amount | | | Value
(Note 2) | |
| |
| | | | | | | | | |
U.S. Government Treasuries — 34.0% | |
United States Cash Management Bill
2.03% due 09/16/2019 | | $ | 3,000,000 | | | $ | 2,997,463 | |
United States Treasury Bills
1.94% due 09/24/2019 | | | 2,500,000 | | | | 2,496,899 | |
1.96% due 09/10/2019 | | | 4,000,000 | | | | 3,998,476 | |
1.98% due 10/03/2019 | | | 4,000,000 | | | | 3,993,400 | |
1.98% due 10/08/2019 | | | 2,000,000 | | | | 1,996,164 | |
1.99% due 10/01/2019 | | | 4,000,000 | | | | 3,993,824 | |
2.00% due 09/17/2019 | | | 2,500,000 | | | | 2,497,778 | |
2.13% due 09/03/2019 | | | 2,000,000 | | | | 1,999,765 | |
United States Treasury Notes
0.88% due 09/15/2019 | | | 1,000,000 | | | | 999,534 | |
1.00% due 09/30/2019 | | | 2,000,000 | | | | 1,998,366 | |
1.00% due 11/30/2019 | | | 6,200,000 | | | | 6,180,232 | |
1.25% due 10/31/2019 | | | 2,400,000 | | | | 2,396,698 | |
1.38% due 09/30/2019 | | | 4,000,000 | | | | 3,996,701 | |
1.50% due 11/30/2019 | | | 1,000,000 | | | | 997,642 | |
| | | | | | |
|
|
|
Total U.S. Government Treasuries | | | | | | | | |
(amortized cost $40,542,942) | | | | | | | 40,542,942 | |
| | | | | | |
|
|
|
TOTAL INVESTMENTS | | | | | | | | |
(amortized cost $117,215,019)(1) | | | 98.2 | % | | | 117,215,019 | |
Other assets less liabilities | | | 1.8 | | | | 2,151,403 | |
| | |
|
|
| |
|
|
|
NET ASSETS | | | 100.0 | % | | $ | 119,366,422 | |
| | |
|
|
| |
|
|
|
| (1) | See Note 5 for cost of investments on a tax basis. |
FRS—Floating Rate Security
The rates shown on FRS are the current interest rates at August 31, 2019 and unless noted otherwise, the dates shown are the original maturity dates.
Index Legend
1 ML—1 month USD LIBOR
SOFR—Secured Overnight Financing Rate
The following is a summary of the inputs used to value the Fund’s net assets as of August 31, 2019 (see Note 2):
| | | | | | | | | | | | | | | | |
| | | Level 1 - Unadjusted
Quoted Prices
| | | Level 2 - Other
Observable Inputs
| | | Level 3 - Significant
Unobservable Inputs
| | | Total
| |
ASSETS: | | | | | | | | | | | | | | | | |
Investments at Value:* | | | | | | | | | | | | | | | | |
| | | | |
Short-Term Investment Securities | | $ | — | | | $ | 117,215,019 | | | $ | — | | | $ | 117,215,019 | |
| | |
|
|
| |
|
|
| |
|
|
| |
|
|
|
| * | For a detailed presentation of investments, please refer to the Portfolio of Investments. |
See Notes to Financial Statements
VALIC Company II High Yield Bond Fund
PORTFOLIO PROFILE —August 31, 2019 (unaudited)
Industry Allocation*
| | | | |
Oil Companies — Exploration & Production | | | 6.8 | % |
Cable/Satellite TV | | | 6.7 | |
Pipelines | | | 4.5 | |
Registered Investment Companies | | | 3.8 | |
Cellular Telecom | | | 3.4 | |
Finance — Consumer Loans | | | 3.3 | |
Medical — Hospitals | | | 3.0 | |
Containers — Paper/Plastic | | | 2.9 | |
Casino Hotels | | | 2.9 | |
Television | | | 2.7 | |
Telephone — Integrated | | | 2.7 | |
Repurchase Agreements | | | 2.6 | |
Gambling(Non-Hotel) | | | 2.2 | |
Containers — Metal/Glass | | | 2.2 | |
Food — Misc./Diversified | | | 2.1 | |
Medical — Drugs | | | 2.1 | |
Rental Auto/Equipment | | | 2.0 | |
Building — Residential/Commercial | | | 1.8 | |
Retail — Restaurants | | | 1.8 | |
Hazardous Waste Disposal | | | 1.7 | |
Insurance — Multi-line | | | 1.7 | |
Electronic Components — Semiconductors | | | 1.6 | |
Metal — Aluminum | | | 1.5 | |
Diversified Banking Institutions | | | 1.3 | |
Aerospace/Defense | | | 1.2 | |
Applications Software | | | 1.1 | |
Aerospace/Defense — Equipment | | | 1.1 | |
Banks — Commercial | | | 1.1 | |
Office Automation & Equipment | | | 1.0 | |
Diagnostic Equipment | | | 1.0 | |
Data Processing/Management | | | 0.9 | |
Auto/Truck Parts & Equipment — Original | | | 0.9 | |
Real Estate Investment Trusts | | | 0.8 | |
Computer Services | | | 0.8 | |
Electric — Integrated | | | 0.8 | |
Finance — Auto Loans | | | 0.8 | |
Medical Information Systems | | | 0.8 | |
Medical Labs & Testing Services | | | 0.8 | |
Radio | | | 0.8 | |
Soap & Cleaning Preparation | | | 0.8 | |
Music | | | 0.8 | |
Gas — Distribution | | | 0.7 | |
Racetracks | | | 0.7 | |
Enterprise Software/Service | | | 0.7 | |
Hotels/Motels | | | 0.7 | |
Distribution/Wholesale | | | 0.7 | |
Casino Services | | | 0.7 | |
Steel — Producers | | | 0.7 | |
Retail — Propane Distribution | | | 0.6 | |
Commercial Services | | | 0.6 | |
Disposable Medical Products | | | 0.6 | |
Insurance — Property/Casualty | | | 0.6 | |
Semiconductor Equipment | | | 0.6 | |
Finance — Leasing Companies | | | 0.5 | |
Security Services | | | 0.5 | |
Toys | | | 0.5 | |
Transport — Equipment & Leasing | | | 0.5 | |
Retail — Apparel/Shoe | | | 0.5 | |
Electronic Components — Misc. | | | 0.5 | |
Medical — Generic Drugs | | | 0.5 | |
Oil Refining & Marketing | | | 0.5 | |
Commercial Services — Finance | | | 0.4 | |
Metal Products — Fasteners | | | 0.4 | |
Retail — Leisure Products | | | 0.4 | |
Computers — Memory Devices | | | 0.4 | |
Agricultural Chemicals | | | 0.4 | |
Machinery — Material Handling | | | 0.4 | |
Banks — Mortgage | | | 0.4 | |
Cosmetics & Toiletries | | | 0.4 | |
| | | | |
Building & Construction Products — Misc. | | | 0.4 | |
Telecom Services | | | 0.3 | |
E-Commerce/Services | | | 0.3 | |
Theaters | | | 0.3 | |
Retail — Building Products | | | 0.3 | |
Electric — Distribution | | | 0.3 | |
Broadcast Services/Program | | | 0.3 | |
Advertising Services | | | 0.3 | |
Insurance Brokers | | | 0.2 | |
Building Products — Wood | | | 0.2 | |
Finance — Credit Card | | | 0.2 | |
Funeral Services & Related Items | | | 0.2 | |
Building — Heavy Construction | | | 0.2 | |
Non-Hazardous Waste Disposal | | | 0.2 | |
Coal | | | 0.2 | |
Insurance — Life/Health | | | 0.2 | |
Machinery — General Industrial | | | 0.1 | |
E-Commerce/Products | | | 0.1 | |
Industrial Gases | | | 0.1 | |
Auto/Truck Parts & Equipment — Replacement | | | 0.1 | |
Food — Flour & Grain | | | 0.1 | |
| | |
|
|
|
| | | | 102.5 | % |
| | |
|
|
|
Credit Quality†#
| | | | |
Baa | | | 2.9 | % |
Ba | | | 35.4 | |
B | | | 48.0 | |
Caa | | | 10.9 | |
Ca | | | 0.2 | |
Not Rated@ | | | 2.6 | |
| | |
|
|
|
| | | | 100.0 | % |
| | |
|
|
|
| * | Calculated as a percentage of net assets |
| # | Calculated as a percentage of total debt issues, excluding short-term securities. |
| @ | Represents debt issues that either have no rating, or the rating is unavailable from the data source. |
VALIC Company II High Yield Bond Fund
PORTFOLIO OF INVESTMENTS —August 31, 2019
| | | | | | | | |
| | |
| Security Description | | Principal
Amount(13) | | | Value
(Note 2) | |
| |
CONVERTIBLE BONDS & NOTES — 0.7% | |
Casino Hotels — 0.2% | |
Caesars Entertainment Corp.
Senior Notes
5.00% due 10/01/2024 | | $ | 660,000 | | | $ | 1,111,366 | |
| | | | | | |
|
|
|
Commercial Services - Finance — 0.2% | |
Cardtronics, Inc.
Company Guar. Notes
1.00% due 12/01/2020 | | | 1,360,000 | | | | 1,324,817 | |
| | | | | | |
|
|
|
Computers - Memory Devices — 0.3% | |
Western Digital Corp.
Company Guar. Notes
1.50% due 02/01/2024* | | | 2,015,000 | | | | 1,898,325 | |
| | | | | | |
|
|
|
Total Convertible Bonds & Notes | | | | | | | | |
(cost $4,957,339) | | | | | | | 4,334,508 | |
| | | |
|
|
|
U.S. CORPORATE BONDS & NOTES — 72.9% | |
Advertising Services — 0.3% | |
Lamar Media Corp.
Company Guar. Notes
5.75% due 02/01/2026 | | | 1,785,000 | | | | 1,892,100 | |
| | | | | | |
|
|
|
Aerospace/Defense - Equipment — 1.1% | |
TransDigm, Inc.
Senior Sec. Notes
6.25% due 03/15/2026* | | | 6,910,000 | | | | 7,454,024 | |
| | | | | | |
|
|
|
Agricultural Chemicals — 0.4% | |
CF Industries, Inc.
Company Guar. Notes
4.95% due 06/01/2043 | | | 325,000 | | | | 319,312 | |
CF Industries, Inc.
Company Guar. Notes
5.15% due 03/15/2034 | | | 1,793,000 | | | | 1,837,825 | |
CF Industries, Inc.
Company Guar. Notes
5.38% due 03/15/2044 | | | 515,000 | | | | 520,449 | |
| | | | | | |
|
|
|
| | | | | | | | 2,677,586 | |
| | | | | | |
|
|
|
Applications Software — 0.9% | |
CDK Global, Inc.
Senior Notes
5.25% due 05/15/2029* | | | 1,620,000 | | | | 1,672,650 | |
SS&C Technologies, Inc.
Company Guar. Notes
5.50% due 09/30/2027* | | | 4,215,000 | | | | 4,425,750 | |
| | | | | | |
|
|
|
| | | | | | | | 6,098,400 | |
| | | | | | |
|
|
|
Auto/Truck Parts & Equipment - Replacement — 0.1% | |
Adient US LLC
Senior Sec. Notes
7.00% due 05/15/2026* | | | 505,000 | | | | 516,363 | |
| | | | | | |
|
|
|
Banks - Mortgage — 0.4% | |
Freedom Mtg. Corp.
Senior Notes
8.13% due 11/15/2024* | | | 3,045,000 | | | | 2,649,150 | |
| | | | | | |
|
|
|
Broadcast Services/Program — 0.3% | |
iHeartCommunications, Inc.
Senior Sec. Notes
5.25% due 08/15/2027* | | | 1,810,000 | | | | 1,903,088 | |
| | | | | | |
|
|
|
Building & Construction Products - Misc. — 0.4% | |
Standard Industries, Inc.
Senior Notes
5.38% due 11/15/2024* | | | 2,465,000 | | | | 2,535,869 | |
| | | | | | |
|
|
|
| | | | | | | | |
| | |
| Security Description | | Principal
Amount(13) | | | Value
(Note 2) | |
| |
| | | | | | | | | |
Building - Heavy Construction — 0.2% | |
Brand Industrial Services, Inc.
Senior Notes
8.50% due 07/15/2025*# | | $ | 1,677,000 | | | $ | 1,477,856 | |
| | | | | | |
|
|
|
Building - Residential/Commercial — 1.8% | |
KB Home
Company Guar. Notes
7.00% due 12/15/2021 | | | 2,905,000 | | | | 3,150,850 | |
M/I Homes, Inc.
Company Guar. Notes
5.63% due 08/01/2025 | | | 1,750,000 | | | | 1,811,250 | |
M/I Homes, Inc.
Company Guar. Notes
6.75% due 01/15/2021 | | | 3,295,000 | | | | 3,340,306 | |
Taylor Morrison Communities, Inc.
Company Guar. Notes
5.75% due 01/15/2028* | | | 3,460,000 | | | | 3,676,250 | |
| | | | | | |
|
|
|
| | | | | | | | 11,978,656 | |
| | | | | | |
|
|
|
Cable/Satellite TV — 5.3% | |
CCO Holdings LLC/CCO Holdings Capital Corp.
Senior Notes
5.13% due 02/15/2023 | | | 150,000 | | | | 152,438 | |
CCO Holdings LLC/CCO Holdings Capital Corp.
Senior Notes
5.13% due 05/01/2023* | | | 3,695,000 | | | | 3,779,985 | |
CCO Holdings LLC/CCO Holdings Capital Corp.
Senior Notes
5.75% due 01/15/2024 | | | 360,000 | | | | 368,100 | |
CCO Holdings LLC/CCO Holdings Capital Corp.
Senior Notes
5.75% due 02/15/2026* | | | 3,740,000 | | | | 3,959,725 | |
CCO Holdings LLC/CCO Holdings Capital Corp.
Senior Notes
5.88% due 04/01/2024* | | | 1,490,000 | | | | 1,551,463 | |
CSC Holdings LLC
Senior Notes
5.13% due 12/15/2021* | | | 1,730,000 | | | | 1,732,162 | |
CSC Holdings LLC
Senior Notes
5.25% due 06/01/2024 | | | 1,900,000 | | | | 2,033,000 | |
CSC Holdings LLC
Company Guar. Notes
5.50% due 04/15/2027* | | | 825,000 | | | | 882,750 | |
CSC Holdings LLC
Company Guar. Notes
6.50% due 02/01/2029* | | | 7,250,000 | | | | 8,124,531 | |
CSC Holdings LLC
Senior Notes
10.88% due 10/15/2025* | | | 886,000 | | | | 1,005,610 | |
DISH DBS Corp.
Company Guar. Notes
5.00% due 03/15/2023 | | | 2,345,000 | | | | 2,301,031 | |
DISH DBS Corp.
Company Guar. Notes
5.88% due 11/15/2024 | | | 1,120,000 | | | | 1,065,456 | |
DISH DBS Corp.
Company Guar. Notes
6.75% due 06/01/2021 | | | 7,536,000 | | | | 7,937,669 | |
| | | | | | |
|
|
|
| | | | | | | | 34,893,920 | |
| | | | | | |
|
|
|
Casino Hotels — 2.7% | |
Boyd Gaming Corp.
Company Guar. Notes
6.00% due 08/15/2026 | | | 960,000 | | | | 1,014,000 | |
VALIC Company II High Yield Bond Fund
PORTFOLIO OF INVESTMENTS —August 31, 2019 — (continued)
| | | | | | | | |
| | |
| Security Description | | Principal
Amount(13) | | | Value
(Note 2) | |
| |
U.S. CORPORATE BONDS & NOTES (continued) | |
Casino Hotels (continued) | |
Boyd Gaming Corp.
Company Guar. Notes
6.38% due 04/01/2026 | | $ | 4,505,000 | | | $ | 4,775,300 | |
Jack Ohio Finance LLC/Jack Ohio Finance 1 Corp.
Senior Sec. Notes
6.75% due 11/15/2021* | | | 3,015,000 | | | | 3,082,837 | |
MGM Resorts International
Company Guar. Notes
5.50% due 04/15/2027 | | | 1,890,000 | | | | 2,048,288 | |
Sugarhouse HSP Gaming Prop Mezz LP/Sugarhouse HSP Gaming Finance Corp.
Senior Sec. Notes
5.88% due 05/15/2025* | | | 3,020,000 | | | | 2,989,800 | |
Wynn Las Vegas LLC
Company Guar. Notes
5.50% due 03/01/2025* | | | 3,650,000 | | | | 3,850,750 | |
| | | | | | |
|
|
|
| | | | | | | | 17,760,975 | |
| | | | | | |
|
|
|
Casino Services — 0.7% | |
Eldorado Resorts, Inc.
Company Guar. Notes
6.00% due 04/01/2025 | | | 2,695,000 | | | | 2,856,700 | |
Eldorado Resorts, Inc.
Company Guar. Notes
6.00% due 09/15/2026 | | | 1,370,000 | | | | 1,498,438 | |
| | | | | | |
|
|
|
| | | | | | | | 4,355,138 | |
| | | | | | |
|
|
|
Cellular Telecom — 2.6% | |
Sprint Corp.
Company Guar. Notes
7.13% due 06/15/2024 | | | 4,189,000 | | | | 4,630,772 | |
Sprint Corp.
Company Guar. Notes
7.25% due 09/15/2021 | | | 4,340,000 | | | | 4,668,538 | |
Sprint Corp.
Company Guar. Notes
7.63% due 02/15/2025 | | | 2,125,000 | | | | 2,377,344 | |
Sprint Corp.
Company Guar. Notes
7.88% due 09/15/2023 | | | 4,576,000 | | | | 5,148,000 | |
| | | | | | |
|
|
|
| | | | | | | | 16,824,654 | |
| | | | | | |
|
|
|
Coal — 0.2% | |
Cloud Peak Energy Resources LLC/Cloud Peak Energy Finance Corp.
Sec. Notes
12.00% due 11/01/2021†(1)(2) | | | 525,000 | | | | 147,000 | |
Foresight Energy LLC/Foresight Energy Finance Corp.
Sec. Notes
11.50% due 04/01/2023* | | | 3,395,000 | | | | 882,700 | |
| | | | | | |
|
|
|
| | | | | | | | 1,029,700 | |
| | | | | | |
|
|
|
Commercial Services - Finance — 0.0% | |
Cardtronics, Inc./Cardtronics USA, Inc.
Company Guar. Notes
5.50% due 05/01/2025* | | | 260,000 | | | | 260,000 | |
| | | | | | |
|
|
|
Computer Services — 0.8% | |
Tempo Acquisition LLC/Tempo Acquisition Finance Corp.
Senior Notes
6.75% due 06/01/2025* | | | 5,310,000 | | | | 5,454,963 | |
| | | | | | |
|
|
|
Computers - Memory Devices — 0.1% | |
Western Digital Corp.
Company Guar. Notes
4.75% due 02/15/2026 | | | 794,000 | | | | 812,619 | |
| | | | | | |
|
|
|
| | | | | | | | |
| | |
| Security Description | | Principal
Amount(13) | | | Value
(Note 2) | |
| |
| | | | | | | | | |
Containers - Metal/Glass — 0.5% | |
Owens-Brockway Glass Container, Inc.
Company Guar. Notes
5.38% due 01/15/2025* | | $ | 3,090,000 | | | $ | 3,198,150 | |
| | | | | | |
|
|
|
Containers - Paper/Plastic — 2.4% | |
Berry Global Escrow Corp.
Sec. Notes
5.63% due 07/15/2027* | | | 1,010,000 | | | | 1,060,500 | |
Berry Plastics Corp.
Sec. Notes
6.00% due 10/15/2022 | | | 2,760,000 | | | | 2,811,750 | |
Crown Americas LLC/Crown Americas Capital Corp.
Company Guar. Notes
4.75% due 02/01/2026 | | | 3,195,000 | | | | 3,354,750 | |
Flex Acquisition Co., Inc.
Senior Notes
6.88% due 01/15/2025* | | | 4,620,000 | | | | 4,158,000 | |
Flex Acquisition Co., Inc.
Senior Notes
7.88% due 07/15/2026* | | | 1,340,000 | | | | 1,212,700 | |
Reynolds Group Issuer, Inc./Reynolds Group Issuer LLC
Senior Sec. Notes
5.13% due 07/15/2023* | | | 3,080,000 | | | | 3,166,394 | |
| | | | | | |
|
|
|
| | | | | | | | 15,764,094 | |
| | | | | | |
|
|
|
Cosmetics & Toiletries — 0.4% | |
Revlon Consumer Products Corp.
Company Guar. Notes
6.25% due 08/01/2024 | | | 4,530,000 | | | | 2,604,750 | |
| | | | | | |
|
|
|
Diagnostic Equipment — 1.0% | |
Avantor, Inc.
Senior Sec. Notes
6.00% due 10/01/2024* | | | 6,050,000 | | | | 6,488,625 | |
| | | | | | |
|
|
|
Disposable Medical Products — 0.6% | |
Sotera Health Holdings LLC
Senior Notes
6.50% due 05/15/2023* | | | 3,665,000 | | | | 3,729,138 | |
| | | | | | |
|
|
|
Distribution/Wholesale — 0.7% | |
American Builders & Contractors Supply Co., Inc.
Senior Notes
5.75% due 12/15/2023* | | | 3,070,000 | | | | 3,181,287 | |
IAA Spinco, Inc.
Senior Notes
5.50% due 06/15/2027* | | | 1,185,000 | | | | 1,262,025 | |
| | | | | | |
|
|
|
| | | | | | | | 4,443,312 | |
| | | | | | |
|
|
|
Electric - Distribution — 0.3% | |
NextEra Energy Operating Partners LP
Company Guar. Notes
4.25% due 07/15/2024* | | | 1,865,000 | | | | 1,916,288 | |
| | | | | | |
|
|
|
Electric - Integrated — 0.8% | |
AES Corp.
Senior Notes
5.13% due 09/01/2027 | | | 4,925,000 | | | | 5,279,748 | |
Texas Competitive Electric Holdings Co. LLC/TCEH Finance, Inc.
Escrow Notes
11.50% due 10/01/2020† | | | 3,873,748 | | | | 5,810 | |
| | | | | | |
|
|
|
| | | | | | | | 5,285,558 | |
| | | | | | |
|
|
|
VALIC Company II High Yield Bond Fund
PORTFOLIO OF INVESTMENTS —August 31, 2019 — (continued)
| | | | | | | | |
| | |
| Security Description | | Principal
Amount(13) | | | Value
(Note 2) | |
| |
U.S. CORPORATE BONDS & NOTES (continued) | |
Electronic Components - Semiconductors — 1.5% | |
Micron Technology, Inc.
Senior Notes
4.64% due 02/06/2024 | | $ | 785,000 | | | $ | 836,791 | |
Micron Technology, Inc.
Senior Notes
4.98% due 02/06/2026 | | | 2,050,000 | | | | 2,208,155 | |
Micron Technology, Inc.
Senior Notes
5.50% due 02/01/2025 | | | 1,490,000 | | | | 1,521,029 | |
Qorvo, Inc.
Company Guar. Notes
5.50% due 07/15/2026 | | | 4,870,000 | | | | 5,198,822 | |
| | | | | | |
|
|
|
| | | | | | | | 9,764,797 | |
| | | | | | |
|
|
|
Enterprise Software/Service — 0.7% | |
Infor US, Inc.
Company Guar. Notes
6.50% due 05/15/2022 | | | 4,478,000 | | | | 4,550,767 | |
| | | | | | |
|
|
|
Finance - Auto Loans — 0.8% | |
Ally Financial, Inc.
Senior Notes
3.88% due 05/21/2024 | | | 3,365,000 | | | | 3,545,869 | |
Credit Acceptance Corp.
Company Guar. Notes
6.63% due 03/15/2026* | | | 1,565,000 | | | | 1,693,142 | |
| | | | | | |
|
|
|
| | | | | | | | 5,239,011 | |
| | | | | | |
|
|
|
Finance - Consumer Loans — 2.8% | |
Navient Corp.
Senior Notes
5.88% due 10/25/2024 | | | 1,446,000 | | | | 1,521,178 | |
Navient Corp.
Senior Notes
6.50% due 06/15/2022 | | | 2,629,000 | | | | 2,845,892 | |
Navient Corp.
Senior Notes
7.25% due 09/25/2023 | | | 1,460,000 | | | | 1,620,600 | |
SLM Corp.
Senior Notes
5.50% due 01/25/2023 | | | 1,707,000 | | | | 1,792,862 | |
SLM Corp.
Senior Notes
5.63% due 08/01/2033 | | | 350,000 | | | | 295,750 | |
SLM Corp.
Senior Notes
6.13% due 03/25/2024 | | | 740,000 | | | | 785,325 | |
Springleaf Finance Corp.
Company Guar. Notes
6.13% due 05/15/2022 | | | 165,000 | | | | 177,788 | |
Springleaf Finance Corp.
Company Guar. Notes
6.13% due 03/15/2024 | | | 485,000 | | | | 528,650 | |
Springleaf Finance Corp.
Company Guar. Notes
6.88% due 03/15/2025 | | | 1,120,000 | | | | 1,269,800 | |
Springleaf Finance Corp.
Company Guar. Notes
7.13% due 03/15/2026 | | | 2,710,000 | | | | 3,090,755 | |
Springleaf Finance Corp.
Company Guar. Notes
7.75% due 10/01/2021# | | | 2,585,000 | | | | 2,824,112 | |
Springleaf Finance Corp.
Company Guar. Notes
8.25% due 12/15/2020 | | | 1,845,000 | | | | 1,973,873 | |
| | | | | | |
|
|
|
| | | | | | | | 18,726,585 | |
| | | | | | |
|
|
|
| | | | | | | | |
| | |
| Security Description | | Principal
Amount(13) | | | Value
(Note 2) | |
| |
| | | | | | | | | |
Food - Misc./Diversified — 2.1% | |
Post Holdings, Inc.
Company Guar. Notes
5.00% due 08/15/2026* | | $ | 4,710,000 | | | $ | 4,910,175 | |
Post Holdings, Inc.
Company Guar. Notes
5.50% due 03/01/2025 | | | 715,000 | | | | 748,069 | |
Post Holdings, Inc.
Company Guar. Notes
5.63% due 01/15/2028* | | | 2,974,000 | | | | 3,167,310 | |
Post Holdings, Inc.
Company Guar. Notes
5.75% due 03/01/2027* | | | 1,440,000 | | | | 1,530,000 | |
TreeHouse Foods, Inc.
Company Guar. Notes
4.88% due 03/15/2022 | | | 2,405,000 | | | | 2,420,031 | |
TreeHouse Foods, Inc.
Company Guar. Notes
6.00% due 02/15/2024* | | | 1,230,000 | | | | 1,277,662 | |
| | | | | | |
|
|
|
| | | | | | | | 14,053,247 | |
| | | | | | |
|
|
|
Funeral Services & Related Items — 0.2% | |
Service Corp. International
Senior Notes
4.63% due 12/15/2027 | | | 735,000 | | | | 766,238 | |
Service Corp. International
Senior Notes
5.13% due 06/01/2029 | | | 725,000 | | | | 775,750 | |
| | | | | | |
|
|
|
| | | | | | | | 1,541,988 | |
| | | | | | |
|
|
|
Gambling(Non-Hotel) — 1.7% | |
Caesars Resort Collection LLC/CRC Finco, Inc.
Company Guar. Notes
5.25% due 10/15/2025* | | | 4,875,000 | | | | 4,960,312 | |
Golden Entertainment, Inc.
Senior Notes
7.63% due 04/15/2026* | | | 1,630,000 | | | | 1,695,363 | |
Jacobs Entertainment, Inc.
Sec. Notes
7.88% due 02/01/2024* | | | 4,420,000 | | | | 4,696,250 | |
| | | | | | |
|
|
|
| | | | | | | | 11,351,925 | |
| | | | | | |
|
|
|
Gas- Distribution — 0.7% | |
AmeriGas Partners LP/AmeriGas Finance Corp.
Senior Notes
5.50% due 05/20/2025 | | | 731,000 | | | | 773,033 | |
AmeriGas Partners LP/AmeriGas Finance Corp.
Senior Notes
5.75% due 05/20/2027 | | | 875,000 | | | | 925,837 | |
AmeriGas Partners LP/AmeriGas Finance Corp.
Senior Notes
5.88% due 08/20/2026 | | | 2,904,000 | | | | 3,153,599 | |
| | | | | | |
|
|
|
| | | | | | | | 4,852,469 | |
| | | | | | |
|
|
|
Hazardous Waste Disposal — 0.9% | |
Clean Harbors, Inc.
Senior Notes
4.88% due 07/15/2027* | | | 2,609,000 | | | | 2,759,017 | |
Clean Harbors, Inc.
Senior Notes
5.13% due 07/15/2029* | | | 1,157,000 | | | | 1,232,205 | |
Stericycle, Inc.
Company Guar. Notes
5.38% due 07/15/2024* | | | 1,925,000 | | | | 1,973,125 | |
| | | | | | |
|
|
|
| | | | | | | | 5,964,347 | |
| | | | | | |
|
|
|
VALIC Company II High Yield Bond Fund
PORTFOLIO OF INVESTMENTS —August 31, 2019 — (continued)
| | | | | | | | |
| | |
| Security Description | | Principal
Amount(13) | | | Value
(Note 2) | |
| |
U.S. CORPORATE BONDS & NOTES (continued) | |
Hotels/Motels — 0.7% | |
Hilton Domestic Operating Co., Inc.
Company Guar. Notes
4.25% due 09/01/2024 | | $ | 4,416,000 | | | $ | 4,504,320 | |
| | | | | | |
|
|
|
Insurance - Life/Health — 0.2% | |
CNO Financial Group, Inc.
Senior Notes
5.25% due 05/30/2029 | | | 925,000 | | | | 1,022,125 | |
| | | | | | |
|
|
|
Insurance - Multi-line — 1.6% | |
Acrisure LLC/Acrisure Finance, Inc.
Senior Sec. Notes
8.13% due 02/15/2024* | | | 4,030,000 | | | | 4,342,325 | |
Acrisure LLC/Acrisure Finance, Inc.
Senior Notes
10.13% due 08/01/2026* | | | 1,675,000 | | | | 1,721,062 | |
Genworth Holdings, Inc.
Company Guar. Notes
4.80% due 02/15/2024 | | | 260,000 | | | | 246,350 | |
Genworth Holdings, Inc.
Company Guar. Notes
4.90% due 08/15/2023# | | | 1,215,000 | | | | 1,157,288 | |
Genworth Holdings, Inc.
Company Guar. Notes
7.20% due 02/15/2021# | | | 2,345,000 | | | | 2,409,487 | |
Genworth Holdings, Inc.
Company Guar. Notes
7.63% due 09/24/2021# | | | 539,000 | | | | 561,908 | |
Genworth Holdings, Inc.
Company Guar. Notes
7.70% due 06/15/2020# | | | 86,000 | | | | 88,498 | |
| | | | | | |
|
|
|
| | | | | | | | 10,526,918 | |
| | | | | | |
|
|
|
Machinery - Material Handling — 0.4% | |
Cloud Crane LLC
Sec. Notes
10.13% due 08/01/2024* | | | 2,466,000 | | | | 2,650,950 | |
| | | | | | |
|
|
|
Medical Information Systems — 0.8% | |
Change Healthcare Holdings LLC/Change Healthcare Finance, Inc.
Senior Notes
5.75% due 03/01/2025* | | | 1,890,000 | | | | 1,902,209 | |
IQVIA, Inc.
Company Guar. Notes
2.25% due 01/15/2028* | | EUR | 1,120,000 | | | | 1,280,173 | |
IQVIA, Inc.
Company Guar. Notes
5.00% due 05/15/2027* | | | 1,840,000 | | | | 1,943,500 | |
| | | | | | |
|
|
|
| | | | | | | | 5,125,882 | |
| | | | | | |
|
|
|
Medical Labs & Testing Services — 0.6% | |
Catalent Pharma Solutions, Inc.
Company Guar. Notes
4.88% due 01/15/2026* | | | 520,000 | | | | 527,800 | |
Catalent Pharma Solutions, Inc.
Company Guar. Notes
5.00% due 07/15/2027* | | | 545,000 | | | | 570,947 | |
West Street Merger Sub, Inc.
Senior Notes
6.38% due 09/01/2025* | | | 3,140,000 | | | | 2,795,542 | |
| | | | | | |
|
|
|
| | | | | | | | 3,894,289 | |
| | | | | | |
|
|
|
| | | | | | | | |
| | |
| Security Description | | Principal
Amount(13) | | | Value
(Note 2) | |
| |
| | | | | | | | | |
Medical - Drugs — 0.0% | |
Bausch Health Americas, Inc.
Company Guar. Notes
8.50% due 01/31/2027* | | $ | 20,000 | | | $ | 22,200 | |
| | | | | | |
|
|
|
Medical - Generic Drugs — 0.5% | |
Teva Pharmaceutical Finance IV LLC
Company Guar. Notes
2.25% due 03/18/2020 | | | 3,085,000 | | | | 3,061,863 | |
| | | | | | |
|
|
|
Medical - Hospitals — 3.0% | |
CHS/Community Health Systems, Inc.
Sec. Notes
8.13% due 06/30/2024* | | | 1,810,000 | | | | 1,375,600 | |
HCA Healthcare, Inc.
Senior Notes
6.25% due 02/15/2021 | | | 5,000,000 | | | | 5,252,000 | |
HCA, Inc.
Company Guar. Notes
5.38% due 02/01/2025 | | | 3,520,000 | | | | 3,907,200 | |
HCA, Inc.
Company Guar. Notes
5.38% due 09/01/2026 | | | 4,065,000 | | | | 4,532,475 | |
HCA, Inc.
Company Guar. Notes
5.63% due 09/01/2028 | | | 105,000 | | | | 119,470 | |
HCA, Inc.
Company Guar. Notes
5.88% due 05/01/2023 | | | 1,535,000 | | | | 1,695,216 | |
HCA, Inc.
Company Guar. Notes
5.88% due 02/01/2029 | | | 905,000 | | | | 1,041,881 | |
HCA, Inc.
Company Guar. Notes
7.50% due 11/15/2095 | | | 1,820,000 | | | | 2,002,000 | |
| | | | | | |
|
|
|
| | | | | | | | 19,925,842 | |
| | | | | | |
|
|
|
Metal Products - Fasteners — 0.4% | |
TriMas Corp.
Company Guar. Notes
4.88% due 10/15/2025* | | | 2,825,000 | | | | 2,860,313 | |
| | | | | | |
|
|
|
Metal - Aluminum — 1.0% | |
Novelis Corp.
Company Guar. Notes
5.88% due 09/30/2026* | | | 3,315,000 | | | | 3,501,469 | |
Novelis Corp.
Company Guar. Notes
6.25% due 08/15/2024* | | | 2,920,000 | | | | 3,058,700 | |
| | | | | | |
|
|
|
| | | | | | | | 6,560,169 | |
| | | | | | |
|
|
|
Music — 0.8% | |
WMG Acquisition Corp.
Senior Sec. Notes
5.00% due 08/01/2023* | | | 555,000 | | | | 568,875 | |
WMG Acquisition Corp.
Company Guar. Notes
5.50% due 04/15/2026* | | | 4,278,000 | | | | 4,481,205 | |
| | | | | | |
|
|
|
| | | | | | | | 5,050,080 | |
| | | | | | |
|
|
|
Non-Hazardous Waste Disposal — 0.2% | |
Waste Pro USA, Inc.
Senior Notes
5.50% due 02/15/2026* | | | 1,095,000 | | | | 1,138,800 | |
| | | | | | |
|
|
|
VALIC Company II High Yield Bond Fund
PORTFOLIO OF INVESTMENTS —August 31, 2019 — (continued)
| | | | | | | | |
| | |
| Security Description | | Principal
Amount(13) | | | Value
(Note 2) | |
| |
U.S. CORPORATE BONDS & NOTES (continued) | |
Office Automation & Equipment — 1.0% | |
Pitney Bowes, Inc.
Senior Notes
4.63% due 03/15/2024# | | $ | 570,000 | | | $ | 520,125 | |
Pitney Bowes, Inc.
Senior Notes
4.70% due 04/01/2023 | | | 2,270,000 | | | | 2,156,500 | |
Xerox Corp.
Senior Notes
4.13% due 03/15/2023 | | | 4,060,000 | | | | 4,131,050 | |
| | | | | | |
|
|
|
| | | | | | | | 6,807,675 | |
| | | | | | |
|
|
|
Oil Companies - Exploration & Production — 6.1% | |
California Resources Corp.
Sec. Notes
8.00% due 12/15/2022*# | | | 1,845,000 | | | | 1,060,875 | |
Centennial Resource Production LLC
Company Guar. Notes
5.38% due 01/15/2026* | | | 1,635,000 | | | | 1,557,338 | |
Chesapeake Energy Corp.
Company Guar. Notes
7.00% due 10/01/2024 | | | 3,970,000 | | | | 3,027,125 | |
Chesapeake Energy Corp.
Company Guar. Notes
7.50% due 10/01/2026 | | | 2,545,000 | | | | 1,743,325 | |
Chesapeake Energy Corp.
Company Guar. Notes
8.00% due 06/15/2027# | | | 2,650,000 | | | | 1,914,651 | |
Energen Corp.
Senior Notes
4.63% due 09/01/2021 | | | 2,170,000 | | | | 2,240,916 | |
EP Energy LLC/Everest Acquisition Finance, Inc.
Senior Sec. Notes
7.75% due 05/15/2026* | | | 640,000 | | | | 534,400 | |
Jagged Peak Energy LLC
Company Guar. Notes
5.88% due 05/01/2026 | | | 3,615,000 | | | | 3,627,652 | |
Laredo Petroleum, Inc.
Company Guar. Notes
5.63% due 01/15/2022# | | | 3,216,000 | | | | 3,015,000 | |
Matador Resources Co.
Company Guar. Notes
5.88% due 09/15/2026 | | | 2,400,000 | | | | 2,325,000 | |
QEP Resources, Inc.
Senior Notes
5.25% due 05/01/2023 | | | 2,516,000 | | | | 2,201,500 | |
QEP Resources, Inc.
Senior Notes
5.38% due 10/01/2022 | | | 206,000 | | | | 185,400 | |
QEP Resources, Inc.
Senior Notes
5.63% due 03/01/2026# | | | 2,810,000 | | | | 2,276,100 | |
QEP Resources, Inc.
Senior Notes
6.80% due 03/01/2020 | | | 245,000 | | | | 245,000 | |
SM Energy Co.
Senior Notes
5.00% due 01/15/2024 | | | 3,860,000 | | | | 3,377,500 | |
SM Energy Co.
Senior Notes
5.63% due 06/01/2025 | | | 1,100,000 | | | | 935,000 | |
SM Energy Co.
Senior Notes
6.13% due 11/15/2022 | | | 365,000 | | | | 339,450 | |
| | | | | | | | |
| | |
| Security Description | | Principal
Amount(13) | | | Value
(Note 2) | |
| |
| | | | | | | | | |
Oil Companies - Exploration & Production (continued) | |
SM Energy Co.
Senior Notes
6.63% due 01/15/2027# | | $ | 1,275,000 | | | $ | 1,083,750 | |
Vine Oil & Gas LP/Vine Oil & Gas Finance Corp.
Company Guar. Notes
8.75% due 04/15/2023* | | | 3,340,000 | | | | 1,803,600 | |
WPX Energy, Inc.
Senior Notes
5.25% due 09/15/2024 | | | 3,540,000 | | | | 3,593,100 | |
WPX Energy, Inc.
Senior Notes
5.75% due 06/01/2026 | | | 740,000 | | | | 767,750 | |
WPX Energy, Inc.
Senior Notes
6.00% due 01/15/2022 | | | 841,000 | | | | 864,128 | |
WPX Energy, Inc.
Senior Notes
8.25% due 08/01/2023 | | | 970,000 | | | | 1,079,125 | |
| | | | | | |
|
|
|
| | | | | | | | 39,797,685 | |
| | | | | | |
|
|
|
Oil Refining & Marketing — 0.5% | |
Sunoco LP/Sunoco Finance Corp.
Company Guar. Notes
5.50% due 02/15/2026 | | | 600,000 | | | | 622,500 | |
Sunoco LP/Sunoco Finance Corp.
Company Guar. Notes
5.88% due 03/15/2028 | | | 375,000 | | | | 390,000 | |
Sunoco LP/Sunoco Finance Corp.
Company Guar. Notes
6.00% due 04/15/2027 | | | 1,900,000 | | | | 1,999,750 | |
| | | | | | |
|
|
|
| | | | | | | | 3,012,250 | |
| | | | | | |
|
|
|
Pipelines — 4.5% | |
Blue Racer Midstream LLC/Blue Racer Finance Corp.
Company Guar. Notes
6.13% due 11/15/2022* | | | 4,950,000 | | | | 4,974,750 | |
Cheniere Corpus Christi Holdings LLC
Senior Sec. Notes
5.13% due 06/30/2027 | | | 4,102,000 | | | | 4,527,582 | |
Cheniere Corpus Christi Holdings LLC
Senior Sec. Notes
5.88% due 03/31/2025 | | | 1,830,000 | | | | 2,040,450 | |
DCP Midstream Operating LP
Company Guar. Notes
5.38% due 07/15/2025 | | | 3,790,000 | | | | 4,007,925 | |
Energy Transfer Operating LP
Company Guar. Notes
5.50% due 06/01/2027 | | | 3,605,000 | | | | 4,142,452 | |
Energy Transfer Operating LP
Company Guar. Notes
7.50% due 10/15/2020 | | | 1,350,000 | | | | 1,422,810 | |
Tallgrass Energy Partners LP/Tallgrass Energy Finance Corp.
Company Guar. Notes
4.75% due 10/01/2023* | | | 1,980,000 | | | | 1,962,675 | |
Targa Resources Partners LP/Targa Resources Partners Finance Corp.
Company Guar. Notes
6.50% due 07/15/2027* | | | 4,360,000 | | | | 4,730,600 | |
Targa Resources Partners LP/Targa Resources Partners Finance Corp.
Company Guar. Notes
6.75% due 03/15/2024 | | | 1,650,000 | | | | 1,713,938 | |
| | | | | | |
|
|
|
| | | | | | | | 29,523,182 | |
| | | | | | |
|
|
|
VALIC Company II High Yield Bond Fund
PORTFOLIO OF INVESTMENTS —August 31, 2019 — (continued)
| | | | | | | | |
| | |
| Security Description | | Principal
Amount(13) | | | Value
(Note 2) | |
| |
U.S. CORPORATE BONDS & NOTES (continued) | |
Racetracks — 0.7% | |
Penn National Gaming, Inc.
Senior Notes
5.63% due 01/15/2027*# | | $ | 4,555,000 | | | $ | 4,675,024 | |
| | | | | | |
|
|
|
Radio — 0.8% | |
Sirius XM Radio, Inc.
Company Guar. Notes
4.63% due 07/15/2024* | | | 1,435,000 | | | | 1,497,781 | |
Sirius XM Radio, Inc.
Company Guar. Notes
5.50% due 07/01/2029* | | | 3,285,000 | | | | 3,579,698 | |
| | | | | | |
|
|
|
| | | | | | | | 5,077,479 | |
| | | | | | |
|
|
|
Real Estate Investment Trusts — 0.8% | |
FelCor Lodging LP
Company Guar. Notes
6.00% due 06/01/2025 | | | 5,360,000 | | | | 5,574,400 | |
| | | | | | |
|
|
|
Rental Auto/Equipment — 2.0% | |
Avis Budget Car Rental LLC/Avis Budget Finance, Inc.
Company Guar. Notes
5.50% due 04/01/2023 | | | 839,000 | | | | 856,829 | |
Herc Holdings, Inc.
Company Guar. Notes
5.50% due 07/15/2027* | | | 3,230,000 | | | | 3,343,050 | |
United Rentals North America, Inc.
Company Guar. Notes
4.63% due 10/15/2025 | | | 970,000 | | | | 997,597 | |
United Rentals North America, Inc.
Company Guar. Notes
4.88% due 01/15/2028 | | | 6,370,000 | | | | 6,680,537 | |
United Rentals North America, Inc.
Company Guar. Notes
5.88% due 09/15/2026 | | | 1,025,000 | | | | 1,099,312 | |
| | | | | | |
|
|
|
| | | | | | | | 12,977,325 | |
| | | | | | |
|
|
|
Retail - Apparel/Shoe — 0.5% | |
L Brands, Inc.
Company Guar. Notes
5.25% due 02/01/2028 | | | 2,895,000 | | | | 2,641,688 | |
L Brands, Inc.
Company Guar. Notes
6.75% due 07/01/2036 | | | 465,000 | | | | 390,600 | |
L Brands, Inc.
Company Guar. Notes
6.88% due 11/01/2035 | | | 205,000 | | | | 173,225 | |
| | | | | | |
|
|
|
| | | | | | | | 3,205,513 | |
| | | | | | |
|
|
|
Retail - Building Products — 0.3% | |
Beacon Roofing Supply, Inc.
Company Guar. Notes
4.88% due 11/01/2025* | | | 1,995,000 | | | | 1,967,569 | |
| | | | | | |
|
|
|
Retail - Leisure Products — 0.4% | |
Party City Holdings, Inc.
Company Guar. Notes
6.13% due 08/15/2023*# | | | 2,830,000 | | | | 2,830,000 | |
| | | | | | |
|
|
|
Retail - Propane Distribution — 0.6% | |
Ferrellgas LP/Ferrellgas Finance Corp.
Senior Notes
6.50% due 05/01/2021 | | | 1,323,000 | | | | 1,124,550 | |
Ferrellgas LP/Ferrellgas Finance Corp.
Senior Notes
6.75% due 01/15/2022 | | | 2,181,000 | | | | 1,842,945 | |
| | | | | | | | |
| | |
| Security Description | | Principal
Amount(13) | | | Value
(Note 2) | |
| |
| | | | | | | | | |
Retail - Propane Distribution (continued) | |
Ferrellgas LP/Ferrellgas Finance Corp.
Company Guar. Notes
6.75% due 06/15/2023 | | $ | 1,242,000 | | | $ | 1,043,280 | |
| | | | | | |
|
|
|
| | | | | | | | 4,010,775 | |
| | | | | | |
|
|
|
Retail - Restaurants — 0.7% | |
KFC Holding Co./Pizza Hut Holdings LLC/Taco Bell of America LLC
Company Guar. Notes
4.75% due 06/01/2027* | | | 1,830,000 | | | | 1,916,925 | |
KFC Holding Co./Pizza Hut Holdings LLC/Taco Bell of America LLC
Company Guar. Notes
5.25% due 06/01/2026* | | | 2,225,000 | | | | 2,352,938 | |
| | | | | | |
|
|
|
| | | | | | | | 4,269,863 | |
| | | | | | |
|
|
|
Rubber/Plastic Products — 0.0% | |
Venture Holdings Co. LLC
Company Guar. Notes
11.00% due 06/01/2007†(1)(3)(4) | | | 50,000 | | | | 0 | |
| | | | | | |
|
|
|
Security Services — 0.5% | |
APX Group, Inc.
Company Guar. Notes
7.63% due 09/01/2023# | | | 2,155,000 | | | | 1,605,475 | |
APX Group, Inc.
Senior Sec. Notes
7.88% due 12/01/2022 | | | 2,065,000 | | | | 1,964,331 | |
| | | | | | |
|
|
|
| | | | | | | | 3,569,806 | |
| | | | | | |
|
|
|
Semiconductor Equipment — 0.6% | |
Entegris, Inc.
Company Guar. Notes
4.63% due 02/10/2026* | | | 3,550,000 | | | | 3,656,500 | |
| | | | | | |
|
|
|
Steel - Producers — 0.7% | |
Steel Dynamics, Inc.
Company Guar. Notes
4.13% due 09/15/2025 | | | 2,170,000 | | | | 2,186,275 | |
Steel Dynamics, Inc.
Company Guar. Notes
5.13% due 10/01/2021 | | | 915,000 | | | | 917,553 | |
Steel Dynamics, Inc.
Company Guar. Notes
5.50% due 10/01/2024 | | | 1,130,000 | | | | 1,164,465 | |
| | | | | | |
|
|
|
| | | | | | | | 4,268,293 | |
| | | | | | |
|
|
|
Telecom Services — 0.3% | |
Embarq Corp.
Senior Notes
8.00% due 06/01/2036 | | | 2,240,000 | | | | 2,196,006 | |
| | | | | | |
|
|
|
Telephone - Integrated — 2.2% | |
CenturyLink, Inc.
Senior Notes
5.63% due 04/01/2025# | | | 5,880,000 | | | | 6,012,300 | |
CenturyLink, Inc.
Senior Notes
7.50% due 04/01/2024# | | | 890,000 | | | | 987,882 | |
Frontier Communications Corp.
Senior Notes
6.88% due 01/15/2025 | | | 2,690,000 | | | | 1,371,900 | |
Frontier Communications Corp.
Sec. Notes
8.50% due 04/01/2026* | | | 3,685,000 | | | | 3,583,663 | |
VALIC Company II High Yield Bond Fund
PORTFOLIO OF INVESTMENTS —August 31, 2019 — (continued)
| | | | | | | | |
| | |
| Security Description | | Principal
Amount(13) | | | Value
(Note 2) | |
| |
U.S. CORPORATE BONDS & NOTES (continued) | |
Telephone - Integrated (continued) | |
Frontier Communications Corp.
Senior Notes
10.50% due 09/15/2022# | | $ | 1,800,000 | | | $ | 936,000 | |
Sprint Capital Corp.
Company Guar. Notes
8.75% due 03/15/2032 | | | 1,425,000 | | | | 1,784,784 | |
| | | | | | |
|
|
|
| | | | | | | | 14,676,529 | |
| | | | | | |
|
|
|
Television — 2.3% | |
Gray Television, Inc.
Company Guar. Notes
5.13% due 10/15/2024* | | | 2,490,000 | | | | 2,570,925 | |
Gray Television, Inc.
Company Guar. Notes
5.88% due 07/15/2026* | | | 1,060,000 | | | | 1,107,700 | |
Nexstar Escrow, Inc.
Senior Sec. Notes
5.63% due 07/15/2027* | | | 2,020,000 | | | | 2,105,850 | |
Scripps Escrow, Inc.
Senior Notes
5.88% due 07/15/2027* | | | 1,820,000 | | | | 1,835,925 | |
Sinclair Television Group, Inc.
Company Guar. Notes
5.13% due 02/15/2027* | | | 1,015,000 | | | | 1,014,797 | |
Sinclair Television Group, Inc.
Company Guar. Notes
5.63% due 08/01/2024* | | | 1,130,000 | | | | 1,163,900 | |
Sinclair Television Group, Inc.
Company Guar. Notes
5.88% due 03/15/2026* | | | 1,585,000 | | | | 1,660,287 | |
Sinclair Television Group, Inc.
Company Guar. Notes
6.13% due 10/01/2022 | | | 600,000 | | | | 608,250 | |
Tribune Media Co.
Company Guar. Notes
5.88% due 07/15/2022 | | | 3,153,000 | | | | 3,199,318 | |
| | | | | | |
|
|
|
| | | | | | | | 15,266,952 | |
| | | | | | |
|
|
|
Toys — 0.5% | |
Mattel, Inc.
Company Guar. Notes
6.75% due 12/31/2025* | | | 3,220,000 | | | | 3,308,550 | |
| | | | | | |
|
|
|
Transport - Equipment & Leasing — 0.3% | |
DAE Funding LLC
Company Guar. Notes
4.50% due 08/01/2022* | | | 675,000 | | | | 688,500 | |
DAE Funding LLC
Company Guar. Notes
5.00% due 08/01/2024* | | | 1,345,000 | | | | 1,407,543 | |
| | | | | | |
|
|
|
| | | | | | | | 2,096,043 | |
| | | | | | |
|
|
|
Total U.S. Corporate Bonds & Notes | | | | | | | | |
(cost $473,013,179) | | | | | | | 479,161,282 | |
| | | |
|
|
|
FOREIGN CORPORATE BONDS & NOTES — 14.9% | |
Aerospace/Defense — 1.2% | |
Bombardier, Inc.
Senior Notes
6.13% due 01/15/2023* | | | 4,605,000 | | | | 4,581,975 | |
Bombardier, Inc.
Senior Notes
7.88% due 04/15/2027* | | | 3,205,000 | | | | 3,104,844 | |
| | | | | | |
|
|
|
| | | | | | | | 7,686,819 | |
| | | | | | |
|
|
|
| | | | | | | | |
| | |
| Security Description | | Principal
Amount(13) | | | Value
(Note 2) | |
| |
| | | | | | | | | |
Auto/Truck Parts & Equipment - Original — 0.6% | |
Adient Global Holdings, Ltd.
Company Guar. Notes
3.50% due 08/15/2024 | | EUR | 2,360,000 | | | $ | 2,115,588 | |
Panther BF Aggregator 2 LP/Panther Finance Co, Inc.
Company Guar. Notes
8.50% due 05/15/2027* | | | 1,630,000 | | | | 1,589,250 | |
| | | | | | |
|
|
|
| | | | | | | | 3,704,838 | |
| | | | | | |
|
|
|
Building Products - Wood — 0.2% | |
Norbord, Inc.
Senior Sec. Notes
5.75% due 07/15/2027* | | | 1,620,000 | | | | 1,648,350 | |
| | | | | | |
|
|
|
Cable/Satellite TV — 1.4% | |
Altice Financing SA
Senior Sec. Notes
6.63% due 02/15/2023* | | | 600,000 | | | | 618,750 | |
Altice Financing SA
Senior Sec. Notes
7.50% due 05/15/2026* | | | 2,210,000 | | | | 2,353,650 | |
Altice Luxembourg SA
Company Guar. Notes
7.63% due 02/15/2025* | | | 1,320,000 | | | | 1,364,550 | |
Altice Luxembourg SA
Senior Sec. Notes
8.00% due 05/15/2027 | | EUR | 1,680,000 | | | | 1,980,895 | |
Quebecor Media, Inc.
Senior Notes
5.75% due 01/15/2023 | | | 1,415,000 | | | | 1,532,205 | |
Ziggo BV
Senior Sec. Notes
5.50% due 01/15/2027* | | | 1,585,000 | | | | 1,672,096 | |
| | | | | | |
|
|
|
| | | | | | | | 9,522,146 | |
| | | | | | |
|
|
|
Cellular Telecom — 0.8% | |
Altice France SA
Senior Sec. Notes
8.13% due 02/01/2027* | | | 4,775,000 | | | | 5,264,437 | |
| | | | | | |
|
|
|
Containers - Metal/Glass — 1.7% | |
ARD Finance SA
Senior Sec. Notes
7.13% due 09/15/2023(5) | | | 5,095,000 | | | | 5,228,744 | |
Ardagh Packaging Finance PLC/Ardagh Holdings USA, Inc.
Senior Sec. Notes
4.13% due 08/15/2026* | | | 650,000 | | | | 657,300 | |
Ardagh Packaging Finance PLC/Ardagh Holdings USA, Inc.
Company Guar. Notes
6.00% due 02/15/2025* | | | 1,315,000 | | | | 1,373,353 | |
OI European Group BV
Company Guar. Notes
4.00% due 03/15/2023* | | | 3,579,000 | | | | 3,605,842 | |
Trivium Packaging Finance BV
Senior Sec. Notes
5.50% due 08/15/2026* | | | 520,000 | | | | 549,900 | |
| | | | | | |
|
|
|
| | | | | | | | 11,415,139 | |
| | | | | | |
|
|
|
Containers - Paper/Plastic — 0.5% | |
Reynolds Group Issuer, Inc./Reynolds Group Issuer LLC
Company Guar. Notes
7.00% due 07/15/2024* | | | 3,080,000 | | | | 3,183,950 | |
| | | | | | |
|
|
|
VALIC Company II High Yield Bond Fund
PORTFOLIO OF INVESTMENTS —August 31, 2019 — (continued)
| | | | | | | | |
| | |
| Security Description | | Principal
Amount(13) | | | Value
(Note 2) | |
| |
FOREIGN CORPORATE BONDS & NOTES (continued) | |
Electronic Components - Misc. — 0.5% | |
Sensata Technologies BV
Company Guar. Notes
5.00% due 10/01/2025* | | $ | 1,435,000 | | | $ | 1,521,100 | |
Sensata Technologies BV
Company Guar. Notes
5.63% due 11/01/2024* | | | 1,430,000 | | | | 1,551,550 | |
| | | | | | |
|
|
|
| | | | | | | | 3,072,650 | |
| | | | | | |
|
|
|
Finance - Consumer Loans — 0.5% | |
goeasy, Ltd.
Company Guar. Notes
7.88% due 11/01/2022* | | | 2,885,000 | | | | 3,007,613 | |
| | | | | | |
|
|
|
Finance - Leasing Companies — 0.5% | |
Avolon Holdings Funding, Ltd.
Company Guar. Notes
3.95% due 07/01/2024* | | | 910,000 | | | | 936,572 | |
Avolon Holdings Funding, Ltd.
Company Guar. Notes
4.38% due 05/01/2026* | | | 380,000 | | | | 394,554 | |
Avolon Holdings Funding, Ltd.
Company Guar. Notes
5.25% due 05/15/2024* | | | 2,125,000 | | | | 2,279,487 | |
| | | | | | |
|
|
|
| | | | | | | | 3,610,613 | |
| | | | | | |
|
|
|
Hazardous Waste Disposal — 0.8% | |
Tervita Escrow Corp.
Sec. Notes
7.63% due 12/01/2021* | | | 5,195,000 | | | | 5,272,925 | |
| | | | | | |
|
|
|
Medical - Drugs — 2.1% | |
Bausch Health Cos., Inc.
Company Guar. Notes
5.88% due 05/15/2023* | | | 4,875,000 | | | | 4,935,937 | |
Bausch Health Cos., Inc.
Company Guar. Notes
6.13% due 04/15/2025* | | | 2,035,000 | | | | 2,096,050 | |
Bausch Health Cos., Inc.
Senior Sec. Notes
7.00% due 03/15/2024* | | | 455,000 | | | | 480,553 | |
Bausch Health Cos., Inc.
Company Guar. Notes
9.00% due 12/15/2025* | | | 445,000 | | | | 498,956 | |
Endo, Ltd./Endo Finance LLC/Endo Finco, Inc.
Company Guar. Notes
6.00% due 07/15/2023* | | | 2,301,000 | | | | 1,518,660 | |
Endo, Ltd./Endo Finance LLC/Endo Finco, Inc.
Company Guar. Notes
6.00% due 02/01/2025* | | | 925,000 | | | | 578,125 | |
Teva Pharmaceutical Finance Netherlands III BV
Company Guar. Notes
3.15% due 10/01/2026 | | | 1,750,000 | | | | 1,289,715 | |
Teva Pharmaceutical Finance Netherlands III BV
Company Guar. Notes
6.75% due 03/01/2028# | | | 1,350,000 | | | | 1,136,228 | |
Valeant Pharmaceuticals International, Inc.
Company Guar. Notes
5.50% due 03/01/2023* | | | 1,236,000 | | | | 1,248,360 | |
| | | | | | |
|
|
|
| | | | | | | | 13,782,584 | |
| | | | | | |
|
|
|
Metal - Aluminum — 0.5% | |
Constellium NV
Company Guar. Notes
5.88% due 02/15/2026*# | | | 3,240,000 | | | | 3,377,700 | |
| | | | | | |
|
|
|
| | | | | | | | |
| | |
| Security Description | | Principal
Amount(13) | | | Value
(Note 2) | |
| |
| | | | | | | | | |
Oil Companies - Exploration & Production — 0.7% | |
MEG Energy Corp.
Company Guar. Notes
6.38% due 01/30/2023* | | $ | 1,680,000 | | | $ | 1,587,600 | |
MEG Energy Corp.
Sec. Notes
6.50% due 01/15/2025* | | | 2,135,000 | | | | 2,145,675 | |
MEG Energy Corp.
Company Guar. Notes
7.00% due 03/31/2024* | | | 1,190,000 | | | | 1,131,987 | |
| | | | | | |
|
|
|
| | | | | | | | 4,865,262 | |
| | | | | | |
|
|
|
Retail - Restaurants — 1.1% | |
1011778 BC ULC/New Red Finance, Inc.
Sec. Notes
5.00% due 10/15/2025* | | | 7,185,000 | | | | 7,418,512 | |
| | | |
|
|
|
Soap & Cleaning Preparation — 0.7% | |
Diamond BC BV
Senior Notes
5.63% due 08/15/2025 | | EUR | 4,595,000 | | | | 4,287,654 | |
| | | | | | |
|
|
|
Special Purpose Entity — 0.0% | |
Hellas Telecommunications Luxembourg II SCA
Sub. Notes
8.46% due 01/15/2015*†(1)(3)(4) | | | 925,000 | | | | 0 | |
| | | | | | |
|
|
|
Telephone - Integrated — 0.5% | |
Telecom Italia SpA
Senior Notes
5.30% due 05/30/2024* | | | 2,890,000 | | | | 3,092,300 | |
| | | | | | |
|
|
|
Television — 0.4% | |
Videotron, Ltd.
Company Guar. Notes
5.00% due 07/15/2022 | | | 2,720,000 | | | | 2,852,600 | |
| | | | | | |
|
|
|
Transport-Equipment & Leasing — 0.2% | |
Fly Leasing, Ltd.
Senior Notes
5.25% due 10/15/2024 | | | 1,140,000 | | | | 1,171,350 | |
| | | | | | |
|
|
|
Total Foreign Corporate Bonds & Notes | | | | | | | | |
(cost $97,560,131) | | | | | | | 98,237,442 | |
| | | |
|
|
|
LOANS(6)(7)(8) — 5.2% | |
Applications Software — 0.2% | |
SS&C European Holdings SARL FRS
BTL-B4
4.36% (1 ML+2.25%)
due 04/16/2025 | | | 416,828 | | | | 416,977 | |
SS&C Technologies, Inc. FRS
BTL-B3
4.36% (1 ML+2.25%)
due 04/16/2025 | | | 616,841 | | | | 617,061 | |
SS&C Technologies, Inc. FRS
BTL-B5
4.36% (1 ML+ 2.25%)
due 04/16/2025 | | | 362,227 | | | | 362,379 | |
| | | | | | |
|
|
|
| | | | | | | | 1,396,417 | |
| | | | | | |
|
|
|
Auto/Truck Parts & Equipment - Original — 0.3% | |
Panther BF Aggregator 2 LP FRS
BTL-B
5.61% (1 ML+3.50%)
due 04/30/2026 | | | 1,860,000 | | | | 1,825,125 | |
| | | | | | |
|
|
|
VALIC Company II High Yield Bond Fund
PORTFOLIO OF INVESTMENTS —August 31, 2019 — (continued)
| | | | | | | | |
| | |
| Security Description | | Principal
Amount(13) | | | Value
(Note 2) | |
| |
LOANS (continued) | |
Commercial Services — 0.6% | |
AVSC Holding Corp. FRS
1st Lien
5.39% (1 WL+3.25%)
due 03/01/2025 | | $ | 1,977,253 | | | $ | 1,915,465 | |
AVSC Holding Corp. FRS
1st Lien
5.48% (1 ML+3.25%)
due 03/01/2025 | | | 1,967,997 | | | | 1,906,496 | |
AVSC Holding Corp. FRS
1st Lien
5.58% (3 ML+3.25%)
due 03/01/2025 | | | 120,906 | | | | 117,127 | |
| | | | | | |
|
|
|
| | | | | | | | 3,939,088 | |
| | | | | | |
|
|
|
Commercial Services - Finance — 0.2% | |
Trans Union LLC FRS
BTL-B4
4.11% (1 ML+2.00%)
due 06/19/2025 | | | 1,316,700 | | | | 1,317,797 | |
| | | | | | |
|
|
|
Data Processing/Management — 0.9% | |
Dun & Bradstreet Corp. FRS
BTL
7.15% (1 ML+5.00%)
due 02/08/2026 | | | 5,610,000 | | | | 5,624,025 | |
| | | | | | |
|
|
|
E-Commerce/Products — 0.1% | |
Lands’ End, Inc. FRS
BTL-B
5.36% (1 ML+3.25%)
due 04/04/2021 | | | 782,926 | | | | 756,175 | |
| | | | | | |
|
|
|
E-Commerce/Services — 0.3% | |
Shutterfly, Inc. FRS
BTL-B2
4.87% (1 ML+ 2.75%)
due 08/17/2024 | | | 2,119,775 | | | | 2,117,621 | |
| | | | | | |
|
|
|
Electronic Components - Semiconductors — 0.1% | |
Microchip Technology, Inc. FRS
BTL-B
4.12% (1 ML+ 2.00%)
due 05/29/2025 | | | 741,610 | | | | 742,228 | |
| | | | | | |
|
|
|
Finance - Credit Card — 0.2% | |
Blackhawk Network Holdings, Inc. FRS
1st Lien
5.11% (1 ML+3.00%)
due 06/15/2025 | | | 1,559,250 | | | | 1,544,493 | |
| | | |
|
|
|
Food - Flour & Grain — 0.1% | |
CHG PPC Parent LLC FRS
BTL-B
4.86% (1 ML+2.75%)
due 03/31/2025 | | | 490,050 | | | | 486,068 | |
| | | | | | |
|
|
|
Gambling(Non-Hotel) — 0.5% | |
Golden Entertainment, Inc. FRS
1st Lien
5.14% (1 ML+ 3.00%)
due 10/21/2024 | | | 3,425,750 | | | | 3,417,186 | |
| | | | | | |
|
|
|
Industrial Gases — 0.1% | |
Messer Industries USA, Inc. FRS
BTL
4.83% (3 ML+ 2.50%)
due 03/01/2026 | | | 573,563 | | | | 569,440 | |
| | | | | | |
|
|
|
| | | | | | | | |
| | |
| Security Description | | Shares/
Principal
Amount(13) | | | Value
(Note 2) | |
| |
| | | | | | | | | |
Insurance Brokers — 0.2% | |
HUB International, Ltd. FRS
BTL-B
5.27%-5.28% (3 ML+3.00%)
due 04/25/2025 | | $ | 1,692,900 | | | $ | 1,658,438 | |
| | | | | | |
|
|
|
Insurance - Multi-line — 0.1% | |
Genworth Holdings, Inc. FRS
1st Lien
6.67% (2 ML+4.50%)
due 03/07/2023 | | | 345,625 | | | | 346,921 | |
| | | | | | |
|
|
|
Insurance - Property/Casualty — 0.6% | |
Asurion LLC FRS
BTL-B7
5.11% (1 ML+3.00%)
due 11/03/2024 | | | 3,663,000 | | | | 3,663,916 | |
| | | | | | |
|
|
|
Machinery - General Industrial — 0.1% | |
Gardner Denver, Inc. FRS
BTL-B
4.86% (1 ML+2.75%)
due 07/30/2024 | | | 923,439 | | | | 924,321 | |
| | | | | | |
|
|
|
Medical Labs & Testing Services — 0.2% | |
Syneos Health, Inc. FRS
BTL-B
4.11% (1 ML+ 2.00%)
due 08/01/2024 | | | 1,208,010 | | | | 1,202,221 | |
| | | | | | |
|
|
|
Soap & Cleaning Preparation — 0.1% | |
Diamond BC BV FRS
BTL
5.26% (2 ML+3.00%)
due 09/06/2024 | | | 2,162 | | | | 1,973 | |
Diamond BC BV FRS
BTL
5.26% (3 ML+3.00%)
due 09/06/2024 | | | 849,863 | | | | 775,500 | |
| | | | | | |
|
|
|
| | | | | | | | 777,473 | |
| | | | | | |
|
|
|
Theaters — 0.3% | |
Cineworld, Ltd. FRS
BTL
4.36% (1 ML+2.25%)
due 02/28/2025 | | | 2,060,497 | | | | 2,044,400 | |
| | | | | | |
|
|
|
Total Loans | | | | | | | | |
(cost $34,588,265) | | | | | | | 34,353,353 | |
| | | |
|
|
|
COMMON STOCKS — 0.0% | |
Television — 0.0% | |
ION Media Networks, Inc.(4)(9)
(cost $6) | | | 616 | | | | 164,792 | |
| | | |
|
|
|
PREFERRED SECURITIES/CAPITAL SECURITIES — 2.4% | |
Banks - Commercial — 1.1% | |
Banco Bilbao Vizcaya Argentaria SA
8.88% due 04/14/2021(10) | | EUR | 1,800,000 | | | | 2,195,861 | |
Banco de Sabadell SA
6.50% due 05/18/2022(10) | | EUR | 4,400,000 | | | | 4,794,134 | |
| | | | | | |
|
|
|
| | | | | | | | 6,989,995 | |
| | | | | | |
|
|
|
Diversified Banking Institutions — 1.3% | |
BNP Paribas SA
7.63% due 03/30/2021*(10) | | | 1,040,000 | | | | 1,099,800 | |
Credit Agricole SA
8.13% due 12/23/2025*(10) | | | 2,520,000 | | | | 2,938,123 | |
VALIC Company II High Yield Bond Fund
PORTFOLIO OF INVESTMENTS —August 31, 2019 — (continued)
| | | | | | | | |
| | |
| Security Description | | Shares/
Principal
Amount(13) | | | Value
(Note 2) | |
| |
PREFERRED SECURITIES/CAPITAL SECURITIES (continued) | |
Diversified Banking Institutions (continued) | |
Credit Suisse Group AG
6.25% due 12/18/2024(10) | | $ | 4,435,000 | | | $ | 4,680,123 | |
| | | | | | |
|
|
|
| | | | | | | | 8,718,046 | |
| | | | | | |
|
|
|
Total Preferred Securities/Capital Securities | | | | | | | | |
(cost $15,243,677) | | | | | | | 15,708,041 | |
| | | |
|
|
|
Total Long-Term Investment Securities | | | | | | | | |
(cost $625,362,597) | | | | | | | 631,959,418 | |
| | | |
|
|
|
SHORT-TERM INVESTMENT SECURITIES — 3.8% | |
Registered Investment Companies — 3.8% | |
State Street Navigator Securities Lending Government Money Market Portfolio
2.12%(11)(12)
(cost $24,944,623) | | | 24,944,623 | | | | 24,944,623 | |
| | | |
|
|
|
REPURCHASE AGREEMENTS — 2.6% | |
Agreement with Fixed Income Clearing Corp., bearing interest at 0.42%, dated 08/30/2019 to be repurchased 09/03/2019 in the amount of $16,751,782, and collateralized by $16,540,000 of United States Treasury Notes, bearing interest at 2.38%, due 03/15/2022 and having an approximate value of $17,088,202 (cost $16,751,000) | | $ | 16,751,000 | | | | 16,751,000 | |
| | | |
|
|
|
TOTAL INVESTMENTS | | | | | | | | |
(cost $667,058,220)(14) | | | 102.5 | % | | | 673,655,041 | |
Liabilities in excess of other assets | | | (2.5 | ) | | | (16,290,629 | ) |
| | |
|
|
| |
|
|
|
NET ASSETS | | | 100.0 | % | | $ | 657,364,412 | |
| | |
|
|
| |
|
|
|
| * | Securities exempt from registration under Rule 144A of the Securities Act of 1933. These securities may be sold in transactions exempt from registration, normally to qualified institutional buyers. The Fund has no right to demand registration of these securities. At August 31, 2019, the aggregate value of these securities was $303,347,688 representing 46.1% of net assets. |
| # | The security or a portion thereof is out on loan (see Note 2). |
| † | Non-income producing security |
| (1) | Company has filed for bankruptcy protection. |
| (2) | Security in default of interest. |
| (3) | Security in default of interest and principal at maturity. |
| (4) | Securities classified as Level 3 (see Note 2). |
| (5) | PIK(“Payment-in-Kind”) security — Income may be paid in additional securities or cash at the discretion of the issuer. The security is currently paying interest in cash at the coupon rate listed. |
| (6) | The Fund invests in senior loans which generally pay interest at rates which are periodicallyre-determined by reference to a base lending rate plus a premium. These base lending rates are generally either the lending rate offered by one or more major European banks, such as the London Inter-Bank Offered Rate (“LIBOR”) or the prime rate offered by one or more major United States banks, or the certificate of deposit rate. Senior loans are generally considered to be restrictive in that the Fund is ordinarily contractually obligated to receive approval from the Agent Bank and/or borrower prior to the disposition of a senior loan. |
| (7) | All loans in the Fund were purchased through assignment agreements unless otherwise indicated. |
| (8) | Senior loans in the Fund are generally subject to mandatory and/or optional prepayment. Because of these mandatory prepayment conditions and because there may be significant economic incentives for a borrower to prepay, prepayments may occur. As a result, the actual remaining maturity may be substantially less than the stated maturities shown. |
| (9) | Denotes a restricted security that: (a) cannot be offered for public sale without first being registered, or being able to take advantage of an exemption from registration, under the Securities Act of 1933, as amended (the “1933 Act”); (b) is subject to a contractual restriction on public sales; or (c) is otherwise subject to a restriction on sales by operation of applicable law. Restricted securities are valued pursuant to Note 2. Certain restricted securities held by the Fund may not be sold except in exempt transactions or in a public offering registered under the 1933 Act. The Fund has no right to demand registration of these securities. The risk of investing in certain restricted securities is greater than the risk of investing in the securities of widely held, publicly traded companies. To the extent applicable, lack of a secondary market and resale restrictions may result in the inability of a Fund to sell a security at a fair price and may substantially delay the sale of the security. In addition, certain restricted securities may exhibit greater price volatility than securities for which secondary markets exist. As of August 31, 2019, the Fund held the following restricted securities: |
| | | | | | | | | | | | | | | | | | | | | | | | |
Description
| | Acquisition
Date
| | | Shares
| | | Acquisition
Cost
| | | Value
| | | Value
Per Share
| | | % of
Net Assets
| |
Common Stocks | | | | | | | | | | | | | | | | | | | | | | | | |
| | | | | | |
ION Media Networks, Inc. | | | 12/21/2016 | | | | 616 | | | $ | 6 | | | $ | 164,792 | | | $ | 267.52 | | | | 0.03 | % |
| | | | | | | | | | | | | | |
|
|
| | | | | |
|
|
|
| (10) | Perpetual maturity — maturity date reflects the next call date. |
| (11) | The rate shown is the7-day yield as of August 31, 2019. |
| (12) | At August 31, 2019, the Fund had loaned securities with a total value of $26,840,167. This was secured by collateral of $24,944,623, which was received in cash and subsequently invested in short-term investments currently valued at $24,944,623 as reported in the Portfolio of Investments. Additional collateral of $2,473,957 was received in the form of fixed income pooled securities, which the Fund cannot sell or repledge and accordingly are not reflected in the Fund’s assets and liabilities. |
The components of the fixed income pooled securities referenced above are as follows:
| | | | | | | | |
Securities
| | Coupon Range
| | Maturity Date Range
| | Value as of
August 31, 2019
| |
United States Treasury Bills | | 0.00% | | 01/09/2020 to 04/23/2020 | | $ | 32,234 | |
United States Treasury Notes/Bonds | | zero coupon to 8.75% | | 09/30/2019 to 02/15/2049 | | | 2,441,723 | |
| (13) | Denominated in United States dollars unless otherwise indicated. |
| (14) | See Note 5 for cost of investments on a tax basis. |
BTL—Bank Term Loan
FRS—Floating Rate Security
The rates shown on FRS are the current interest rates at August 31, 2019 and unless noted otherwise, the dates shown are the original maturity dates.
Currency Legend
EUR—Euro Currency
Index Legend
1 ML—1 Month USD Libor
2 ML—2 Month USD Libor
3 ML—3 Month USD Libor
1 WL—1 Week USD Libor
| | | | | | | | | | | | | | | | | | | | | | | | | | | | |
| Forward Foreign Currency Contracts | |
| Counterparty | | Contract to Deliver | | | In Exchange For | | | Delivery Date | | | Unrealized
Appreciation | | | Unrealized
Depreciation | |
JPMorgan Chase Bank N.A | | | EUR | | | | 15,100,000 | | | | USD | | | | 16,739,981 | | | | 09/30/2019 | | | $ | 110,259 | | | $ | – | |
| | | | | | | | | | | | | | | | | | | | | | |
|
|
| |
|
|
|
VALIC Company II High Yield Bond Fund
PORTFOLIO OF INVESTMENTS —August 31, 2019 — (continued)
| | | | | | | | | | | | | | | | | | | | | | | | | | | | | | | | |
| Centrally Cleared Credit Default Swaps on Corporate Issues — Buy Protection(1) | |
| | | | | | | | | | | | | | | | | | Value(4) | | | | |
| Reference Obligation | | Fixed Deal
(Pay) Rate | | | Payment
Frequency | | | Maturity
Date | | | Implied Credit
Spread at
August 31,
2019(2) | | | Notional
Amount(3)
(000) | | | Upfront
Premiums Paid/
(Received) | | | Unrealized
Appreciation
(Depreciation) | | | | |
Dell, Inc.
7.10% due 04/15/2028 | | | (1.0000 | )% | | | Quarterly | | | | 06/20/2024 | | | | 1.8871 | % | | $ | 1,800 | | | $ | 131,053 | | | $ | (59,214 | ) | | | | |
| | | | | | | | | | | | | | | | | | | | | | |
|
|
| |
|
|
| | | | |
| (1) | If the Fund is a buyer of protection and a credit event occurs, as defined under the terms of that particular swap agreement, the Fund will either (i) receive from the seller of protection an amount equal to the notional amount of the swap and deliver the referenced obligation or underlying securities comprising the referenced index or (ii) receive a net settlement amount in the form of cash or securities equal to the notional amount of the swap less the recovery value of the referenced obligation or underlying securities comprising the referenced index. |
| (2) | Implied credit spreads, represented in absolute terms, utilized in determining the market value of credit default swap agreements on corporate issues or sovereign issues of an emerging market country as of period end serve as an indicator of the current status of the payment/performance risk and represent the likelihood or risk of default for the credit derivative. The implied credit spread of a particular referenced entity reflects the cost of buying/selling protection and may include upfront payments required to be made to enter into the agreement. Wider credit spreads represent a deterioration of the referenced entity’s credit soundness and a greater likelihood or risk of default or other credit event occurring as defined under the terms of the agreement. A credit spread identified as “Defaulted” indicates a credit event has occurred for the referenced entity or obligation. |
| (3) | The maximum potential amount the Fund could be required to make as a seller of credit protection or receive as a buyer of credit protection if a credit event occurs as defined under the terms of that particular swap agreement. |
| (4) | The quoted market prices and resulting values for credit default swap agreements on asset-backed securities and credit indices serve as an indicator of the current status of the payment/performance risk and represent the likelihood of an expected liability (or profit) for the credit derivative should the notional amount of the swap agreement have been closed/sold as of the period end. Increasing market values, in absolute terms when compared to the notional amount of the swap, represent a deterioration of the referenced entity’s credit soundness and a greater likelihood or risk of default or other credit event occurring as defined under the terms of the agreement. |
The following is a summary of the inputs used to value the Fund’s net assets as of August 31, 2019 (see Note 2):
| | | | | | | | | | | | | | | | |
| | | Level 1 - Unadjusted
Quoted Prices
| | | Level 2 - Other
Observable Inputs
| | | Level 3 - Significant
Unobservable Inputs
| | | Total
| |
ASSETS: | | | | | | | | | | | | | | | | |
Investments at Value:* | | | | | | | | | | | | | | | | |
| | | | |
Convertible Bonds & Notes | | $ | — | | | $ | 4,334,508 | | | $ | — | | | $ | 4,334,508 | |
U.S. Corporate Bonds & Notes: | | | | | | | | | | | | | | | | |
Rubber/Plastic Products | | | — | | | | — | | | | 0 | | | | 0 | |
Other Industries | | | — | | | | 479,161,282 | | | | — | | | | 479,161,282 | |
Foreign Corporate Bonds & Notes: | | | | | | | | | | | | | | | | |
Special Purpose Entity | | | — | | | | — | | | | 0 | | | | 0 | |
Other Industries | | | — | | | | 98,237,442 | | | | — | | | | 98,237,442 | |
Loans | | | — | | | | 34,353,353 | | | | — | | | | 34,353,353 | |
Common Stocks | | | — | | | | — | | | | 164,792 | | | | 164,792 | |
Preferred Securities/Capital Securities | | | — | | | | 15,708,041 | | | | — | | | | 15,708,041 | |
Short-Term Investment Securities | | | 24,944,623 | | | | — | | | | — | | | | 24,944,623 | |
Repurchase Agreements | | | — | | | | 16,751,000 | | | | — | | | | 16,751,000 | |
| | |
|
|
| |
|
|
| |
|
|
| |
|
|
|
Total Investments at Value | | $ | 24,944,623 | | | $ | 648,545,626 | | | $ | 164,792 | | | $ | 673,655,041 | |
| | |
|
|
| |
|
|
| |
|
|
| |
|
|
|
Other Financial Instruments:+ | | | | | | | | | | | | | | | | |
| | | | |
Forward Foreign Currency Contracts | | $ | — | | | $ | 110,259 | | | $ | — | | | $ | 110,259 | |
| | |
|
|
| |
|
|
| |
|
|
| |
|
|
|
LIABILITIES: | | | | | | | | | | | | | | | | |
Other Financial Instruments:+ | | | | | | | | | | | | | | | | |
| | | | |
Centrally Cleared Credit Default Swaps on Corporate Inssues - Buy Protection | | $ | — | | | $ | 59,214 | | | $ | — | | | $ | 59,214 | |
| | |
|
|
| |
|
|
| |
|
|
| |
|
|
|
| * | For a detailed presentation of investments, please refer to the Portfolio of Investments. |
| + | Amounts represent unrealized appreciation/depreciation as of the end of the reporting period. |
At the beginning and end of the reporting period, Level 3 investments were not considered a material portion of the Fund. There were no Level 3 transfers during the reporting period.
See Notes to Financial Statements
VALIC Company II International Opportunities Fund
PORTFOLIO PROFILE —August 31, 2019 (unaudited)
Industry Allocation*
| | | | |
Real Estate Operations & Development | | | 3.9 | % |
Banks — Commercial | | | 2.9 | |
Commercial Services | | | 2.9 | |
E-Commerce/Services | | | 2.6 | |
Registered Investment Companies | | | 2.5 | |
Computers — Integrated Systems | | | 2.5 | |
Real Estate Investment Trusts | | | 2.5 | |
Repurchase Agreements | | | 2.4 | |
Machinery — General Industrial | | | 2.3 | |
Cosmetics & Toiletries | | | 2.0 | |
Electronic Components — Misc. | | | 1.9 | |
Retail — Drug Store | | | 1.8 | |
Brewery | | | 1.7 | |
Chemicals — Diversified | | | 1.7 | |
Beverages — Wine/Spirits | | | 1.6 | |
Computer Services | | | 1.5 | |
Medical — Drugs | | | 1.5 | |
Engineering/R&D Services | | | 1.4 | |
Insurance — Property/Casualty | | | 1.4 | |
Applications Software | | | 1.3 | |
Apparel Manufacturers | | | 1.3 | |
Building & Construction Products — Misc. | | | 1.2 | |
Commercial Services — Finance | | | 1.2 | |
Fisheries | | | 1.2 | |
Precious Metals | | | 1.2 | |
Gambling (Non-Hotel) | | | 1.2 | |
Auto/Truck Parts & Equipment — Original | | | 1.2 | |
Medical Labs & Testing Services | | | 1.1 | |
Food — Retail | | | 1.0 | |
Chemicals — Specialty | | | 1.0 | |
Machinery — Material Handling | | | 1.0 | |
Gold Mining | | | 1.0 | |
Retail — Discount | | | 1.0 | |
Electronic Components — Semiconductors | | | 1.0 | |
Finance — Credit Card | | | 0.9 | |
Medical — Biomedical/Gene | | | 0.9 | |
Medical Products | | | 0.9 | |
Energy — Alternate Sources | | | 0.8 | |
Food — Catering | | | 0.8 | |
Electric — Generation | | | 0.8 | |
Building Products — Cement | | | 0.8 | |
Consulting Services | | | 0.8 | |
U.S. Government Agencies | | | 0.8 | |
Hazardous Waste Disposal | | | 0.8 | |
Transport — Marine | | | 0.8 | |
Beverages —Non-alcoholic | | | 0.8 | |
Investment Management/Advisor Services | | | 0.7 | |
Textile — Products | | | 0.7 | |
Entertainment Software | | | 0.7 | |
Leisure Products | | | 0.7 | |
Cable/Satellite TV | | | 0.7 | |
Oil — Field Services | | | 0.7 | |
Human Resources | | | 0.7 | |
Hotels/Motels | | | 0.7 | |
Airport Development/Maintenance | | | 0.7 | |
Transport — Services | | | 0.6 | |
Oil Companies — Exploration & Production | | | 0.6 | |
Containers — Paper/Plastic | | | 0.6 | |
Veterinary Products | | | 0.6 | |
Computers — Periphery Equipment | | | 0.6 | |
Recycling | | | 0.6 | |
Food — Misc./Diversified | | | 0.6 | |
Motion Pictures & Services | | | 0.6 | |
Multimedia | | | 0.6 | |
Finance — Other Services | | | 0.6 | |
E-Services/Consulting | | | 0.6 | |
Publishing — Periodicals | | | 0.6 | |
Dental Supplies & Equipment | | | 0.6 | |
Building — Heavy Construction | | | 0.6 | |
| | | | |
Power Converter/Supply Equipment | | | 0.6 | |
Food — Meat Products | | | 0.6 | |
Food — Confectionery | | | 0.6 | |
Medical — Nursing Homes | | | 0.5 | |
Building — Residential/Commercial | | | 0.5 | |
Aerospace/Defense | | | 0.5 | |
Instruments — Controls | | | 0.5 | |
Transport — Rail | | | 0.5 | |
Retail — Misc./Diversified | | | 0.4 | |
Distribution/Wholesale | | | 0.4 | |
Enterprise Software/Service | | | 0.4 | |
Insurance — Multi-line | | | 0.4 | |
Metal Processors & Fabrication | | | 0.4 | |
Machinery — Construction & Mining | | | 0.3 | |
Electric Products — Misc. | | | 0.3 | |
Retail — Apparel/Shoe | | | 0.3 | |
Diversified Financial Services | | | 0.3 | |
Drug Delivery Systems | | | 0.3 | |
Retail — Automobile | | | 0.3 | |
Computer Software | | | 0.3 | |
Semiconductor Equipment | | | 0.3 | |
Oil Refining & Marketing | | | 0.3 | |
Internet Financial Services | | | 0.3 | |
Medical Instruments | | | 0.3 | |
Retail — Restaurants | | | 0.3 | |
Appliances | | | 0.3 | |
Silver Mining | | | 0.3 | |
Transport — Truck | | | 0.3 | |
Diversified Manufacturing Operations | | | 0.3 | |
Machine Tools & Related Products | | | 0.3 | |
Insurance Brokers | | | 0.2 | |
Industrial Automated/Robotic | | | 0.2 | |
Rental Auto/Equipment | | | 0.2 | |
E-Marketing/Info | | | 0.2 | |
Athletic Equipment | | | 0.2 | |
Audio/Video Products | | | 0.2 | |
Coatings/Paint | | | 0.2 | |
Telephone — Integrated | | | 0.2 | |
Rubber/Plastic Products | | | 0.2 | |
Gas — Distribution | | | 0.2 | |
Aerospace/Defense — Equipment | | | 0.2 | |
Electronic Measurement Instruments | | | 0.2 | |
Food — Flour & Grain | | | 0.2 | |
Tobacco | | | 0.2 | |
Finance — Commercial | | | 0.2 | |
Electric — Integrated | | | 0.2 | |
MRI/Medical Diagnostic Imaging | | | 0.2 | |
Diversified Operations | | | 0.2 | |
Building — Maintenance & Services | | | 0.2 | |
Electronic Connectors | | | 0.2 | |
Insurance — Life/Health | | | 0.2 | |
Internet Content — Information/News | | | 0.2 | |
Web Portals/ISP | | | 0.2 | |
Home Furnishings | | | 0.2 | |
Real Estate Management/Services | | | 0.1 | |
Schools | | | 0.1 | |
E-Commerce/Products | | | 0.1 | |
Finance — Consumer Loans | | | 0.1 | |
Theaters | | | 0.1 | |
Resorts/Theme Parks | | | 0.1 | |
Casino Hotels | | | 0.1 | |
Electronic Parts Distribution | | | 0.1 | |
Soap & Cleaning Preparation | | | 0.1 | |
Computers | | | 0.1 | |
Containers — Metal/Glass | | | 0.1 | |
Water | | | 0.1 | |
Explosives | | | 0.1 | |
Medical — Hospitals | | | 0.1 | |
Motorcycle/Motor Scooter | | | 0.1 | |
VALIC Company II International Opportunities Fund
PORTFOLIO PROFILE —August 31, 2019 (unaudited) — (continued)
Industry Allocation* (continued)
| | | | |
Airlines | | | 0.1 | % |
Medical — HMO | | | 0.1 | |
Retail — Home Furnishings | | | 0.1 | |
Machinery — Pumps | | | 0.1 | |
Instruments — Scientific | | | 0.1 | |
Agricultural Operations | | | 0.1 | |
Auto — Heavy Duty Trucks | | | 0.1 | |
Footwear & Related Apparel | | | 0.1 | |
Security Services | | | 0.1 | |
Finance — Investment Banker/Broker | | | 0.1 | |
Metal — Iron | | | 0.1 | |
Paper & Related Products | | | 0.1 | |
Diversified Minerals | | | 0.1 | |
Circuit Boards | | | 0.1 | |
Miscellaneous Manufacturing | | | 0.1 | |
Retail — Auto Parts | | | 0.1 | |
Television | | | 0.1 | |
Electric — Distribution | | | 0.1 | |
Medical Information Systems | | | 0.1 | |
Machinery — Thermal Process | | | 0.1 | |
Medical — Wholesale Drug Distribution | | | 0.1 | |
Industrial Gases | | | 0.1 | |
| | |
|
|
|
| | | | 102.4 | % |
| | |
|
|
|
Country Allocation*
| | | | |
Japan | | | 21.2 | % |
United Kingdom | | | 13.8 | |
Canada | | | 6.6 | |
Germany | | | 6.0 | |
United States | | | 5.8 | |
France | | | 4.7 | |
Australia | | | 4.3 | |
Brazil | | | 3.4 | |
Bermuda | | | 2.9 | |
Norway | | | 2.8 | |
Sweden | | | 2.3 | |
Switzerland | | | 2.2 | |
Cayman Islands | | | 2.2 | |
Ireland | | | 2.0 | |
Spain | | | 1.8 | |
Italy | | | 1.8 | |
Taiwan | | | 1.7 | |
Denmark | | | 1.6 | |
South Korea | | | 1.6 | |
India | | | 1.5 | |
Israel | | | 1.5 | |
Austria | | | 1.3 | |
Netherlands | | | 1.3 | |
Indonesia | | | 1.0 | |
Singapore | | | 1.0 | |
Hong Kong | | | 0.8 | |
Portugal | | | 0.7 | |
Luxembourg | | | 0.6 | |
Belgium | | | 0.6 | |
Jersey | | | 0.5 | |
Mexico | | | 0.5 | |
Faroe Islands | | | 0.4 | |
Finland | | | 0.3 | |
Philippines | | | 0.2 | |
Thailand | | | 0.2 | |
Greece | | | 0.2 | |
Mauritius | | | 0.2 | |
South Africa | | | 0.2 | |
Chile | | | 0.2 | |
Malaysia | | | 0.1 | |
Czech Republic | | | 0.1 | |
New Zealand | | | 0.1 | |
| | | | |
Colombia | | | 0.1 | |
China | | | 0.1 | |
| | |
|
|
|
| | | | 102.4 | % |
| | |
|
|
|
| * | Calculated as a percentage of net assets |
VALIC Company II International Opportunities Fund
PORTFOLIO OF INVESTMENTS —August 31, 2019
| | | | | | | | |
| | |
| Security Description | | Shares | | |
Value
(Note 2) | |
| |
COMMON STOCKS — 96.7% | |
Argentina — 0.0% | |
Banco Macro SA ADR | | | 1,341 | | | $ | 31,259 | |
| | | | | | |
|
|
|
Australia — 4.3% | |
Afterpay Touch Group, Ltd.† | | | 262,016 | | | | 5,466,567 | |
Ansell, Ltd. | | | 55,708 | | | | 1,022,326 | |
ARB Corp, Ltd.# | | | 37,777 | | | | 478,798 | |
ASX, Ltd. | | | 11,454 | | | | 665,769 | |
AUB Group, Ltd. | | | 115,773 | | | | 870,116 | |
Bapcor, Ltd.# | | | 80,081 | | | | 359,717 | |
Caltex Australia, Ltd. | | | 18,248 | | | | 294,447 | |
Cleanaway Waste Management, Ltd. | | | 2,444,701 | | | | 3,408,015 | |
Iluka Resources, Ltd. | | | 87,703 | | | | 422,305 | |
IPH, Ltd. | | | 289,841 | | | | 1,815,299 | |
Orica, Ltd. | | | 45,840 | | | | 664,652 | |
Ramsay Health Care, Ltd. | | | 14,933 | | | | 660,117 | |
Reliance Worldwide Corp., Ltd.# | | | 409,870 | | | | 1,057,183 | |
Ridley Corp., Ltd.# | | | 472,940 | | | | 343,982 | |
Sonic Healthcare, Ltd. | | | 52,760 | | | | 1,046,395 | |
Steadfast Group, Ltd. | | | 234,181 | | | | 591,410 | |
Tabcorp Holdings, Ltd. | | | 100,223 | | | | 317,902 | |
Technology One, Ltd. | | | 412,271 | | | | 2,104,541 | |
Webjet, Ltd.# | | | 33,659 | | | | 280,399 | |
Westgold Resources, Ltd.† | | | 1,180,231 | | | | 1,859,894 | |
WiseTech Global, Ltd. | | | 47,164 | | | | 1,172,993 | |
| | | | | | |
|
|
|
| | | | | | | | 24,902,827 | |
| | | | | | |
|
|
|
Austria — 1.3% | |
CA Immobilien Anlagen AG | | | 136,087 | | | | 4,816,037 | |
Mayr-Melnhof Karton AG | | | 6,407 | | | | 759,086 | |
Vienna Insurance Group AG Wiener Versicherung Gruppe | | | 82,394 | | | | 2,028,434 | |
| | | | | | |
|
|
|
| | | | | | | | 7,603,557 | |
| | | | | | |
|
|
|
Belgium — 0.6% | |
Fagron | | | 193,604 | | | | 3,470,448 | |
| | | | | | |
|
|
|
Bermuda — 2.9% | |
BW Offshore, Ltd.† | | | 604,710 | | | | 3,925,353 | |
Cafe de Coral Holdings, Ltd. | | | 518,000 | | | | 1,651,702 | |
Credicorp, Ltd. | | | 5,201 | | | | 1,077,231 | |
Dairy Farm International Holdings, Ltd. | | | 221,600 | | | | 1,586,656 | |
Esprit Holdings, Ltd.†# | | | 258,550 | | | | 38,912 | |
Geopark, Ltd.†# | | | 218,128 | | | | 3,738,714 | |
Hiscox, Ltd. | | | 124,983 | | | | 2,357,229 | |
Midland Holdings, Ltd. | | | 1,802,000 | | | | 250,520 | |
Peace Mark Holdings, Ltd.†(1) | | | 686,000 | | | | 0 | |
Shangri-La Asia, Ltd. | | | 920,000 | | | | 961,022 | |
VTech Holdings, Ltd. | | | 159,949 | | | | 1,264,838 | |
| | | | | | |
|
|
|
| | | | | | | | 16,852,177 | |
| | | | | | |
|
|
|
Brazil — 3.4% | |
Anima Holding SA | | | 122,795 | | | | 622,723 | |
BRF SA† | | | 34,100 | | | | 314,072 | |
Cia de Saneamento Basico do Estado de Sao Paulo | | | 21,800 | | | | 272,171 | |
Construtora Tenda SA | | | 605,779 | | | | 3,706,940 | |
Cyrela Brazil Realty SA Empreendimentos e Participacoes | | | 486,436 | | | | 2,959,025 | |
Embraer SA ADR | | | 13,592 | | | | 238,268 | |
Equatorial Energia SA | | | 14,400 | | | | 333,033 | |
Fleury SA | | | 57,226 | | | | 331,665 | |
Gerdau SA (Preference Shares) | | | 80,200 | | | | 249,257 | |
Instituto Hermes Pardini SA | | | 51,800 | | | | 300,217 | |
Kroton Educacional SA | | | 103,388 | | | | 251,666 | |
Linx SA | | | 105,400 | | | | 811,435 | |
Localiza Rent a Car SA | | | 64,633 | | | | 734,203 | |
Lojas Americanas SA (Preference Shares) | | | 119,400 | | | | 540,054 | |
Lojas Renner SA | | | 63,410 | | | | 774,058 | |
Magazine Luiza SA | | | 42,400 | | | | 371,576 | |
| | | | | | | | |
| | |
| Security Description | | Shares | | |
Value
(Note 2) | |
| |
| | | | | | | | | |
Brazil (continued) | |
Minerva SA† | | | 996,143 | | | $ | 2,042,322 | |
Multiplan Empreendimentos Imobiliarios SA | | | 144,609 | | | | 907,604 | |
Notre Dame Intermedica Participacoes SA | | | 41,515 | | | | 562,222 | |
Rumo SA† | | | 491,917 | | | | 2,625,300 | |
Suzano SA | | | 61,800 | | | | 433,988 | |
| | | | | | |
|
|
|
| | | | | | | | 19,381,799 | |
| | | | | | |
|
|
|
Canada — 6.6% | |
Agnico Eagle Mines, Ltd.# | | | 25,805 | | | | 1,613,346 | |
ATS Automation Tooling Systems, Inc.† | | | 272,735 | | | | 3,763,063 | |
Capital Power Corp. | | | 196,339 | | | | 4,502,200 | |
Descartes Systems Group, Inc.† | | | 116,630 | | | | 4,136,449 | |
Dollarama, Inc. | | | 87,947 | | | | 3,365,555 | |
Entertainment One, Ltd. | | | 497,355 | | | | 3,540,311 | |
Fortuna Silver Mines, Inc.†# | | | 357,562 | | | | 1,477,085 | |
Granite Real Estate Investment Trust | | | 67,459 | | | | 3,228,040 | |
Quebecor, Inc., Class B# | | | 154,079 | | | | 3,470,654 | |
Seven Generations Energy, Ltd., Class A† | | | 30,776 | | | | 166,432 | |
SSR Mining, Inc.† | | | 411,166 | | | | 6,753,944 | |
TMX Group, Ltd. | | | 21,442 | | | | 1,857,050 | |
TORC Oil & Gas, Ltd.# | | | 33,268 | | | | 82,708 | |
| | | | | | |
|
|
|
| | | | | | | | 37,956,837 | |
| | | | | | |
|
|
|
Cayman Islands — 2.2% | |
51job, Inc. ADR† | | | 18,228 | | | | 1,311,140 | |
ASM Pacific Technology, Ltd. | | | 66,300 | | | | 759,790 | |
China Literature, Ltd.†#* | | | 64,800 | | | | 199,184 | |
China Resources Cement Holdings, Ltd. | | | 3,092,000 | | | | 2,740,855 | |
Endeavour Mining Corp.† | | | 113,975 | | | | 2,221,460 | |
Haitian International Holdings, Ltd. | | | 690,000 | | | | 1,298,964 | |
Lonking Holdings, Ltd. | | | 2,934,000 | | | | 699,783 | |
Midland IC&I, Ltd.† | | | 906,000 | | | | 14,329 | |
Pacific Textiles Holdings, Ltd. | | | 1,622,000 | | | | 1,094,380 | |
Shenguan Holdings Group, Ltd. | | | 552,000 | | | | 21,825 | |
Silicon Motion Technology Corp. ADR | | | 26,291 | | | | 848,411 | |
Stella International Holdings, Ltd. | | | 273,500 | | | | 449,299 | |
Tingyi Cayman Islands Holding Corp. | | | 812,000 | | | | 1,118,514 | |
| | | | | | |
|
|
|
| | | | | | | | 12,777,934 | |
| | | | | | |
|
|
|
Chile — 0.2% | |
Aguas Andinas SA, Class A | | | 732,153 | | | | 402,806 | |
Compania Cervecerias Unidas SA ADR | | | 23,543 | | | | 532,072 | |
| | | | | | |
|
|
|
| | | | | | | | 934,878 | |
| | | | | | |
|
|
|
China — 0.1% | |
Yunnan Baiyao Group Co., Ltd. | | | 27,000 | | | | 289,827 | |
| | | | | | |
|
|
|
Colombia — 0.1% | |
Bancolombia SA ADR | | | 8,460 | | | | 421,308 | |
| | | | | | |
|
|
|
Czech Republic — 0.1% | |
Komercni banka AS | | | 15,466 | | | | 549,017 | |
| | | | | | |
|
|
|
Denmark — 1.6% | |
Carlsberg A/S, Class B | | | 6,351 | | | | 937,502 | |
Demant A/S†# | | | 13,024 | | | | 394,489 | |
Dfds A/S# | | | 8,692 | | | | 299,020 | |
DSV A/S | | | 7,957 | | | | 788,599 | |
Jyske Bank A/S† | | | 29,560 | | | | 829,129 | |
Royal Unibrew A/S | | | 69,319 | | | | 6,001,574 | |
Sydbank A/S | | | 14,034 | | | | 196,199 | |
| | | | | | |
|
|
|
| | | | | | | | 9,446,512 | |
| | | | | | |
|
|
|
Faroe Islands — 0.4% | |
Bakkafrost P/F | | | 34,999 | | | | 2,056,799 | |
| | | | | | |
|
|
|
Finland — 0.3% | |
Tikkurila Oyj | | | 6,298 | | | | 89,015 | |
VALIC Company II International Opportunities Fund
PORTFOLIO OF INVESTMENTS —August 31, 2019 — (continued)
| | | | | | | | |
| | |
| Security Description | | Shares | | |
Value
(Note 2) | |
| |
COMMON STOCKS (continued) | |
Finland (continued) | |
Valmet Oyj | | | 87,954 | | | $ | 1,591,119 | |
| | | | | | |
|
|
|
| | | | | | | | 1,680,134 | |
| | | | | | |
|
|
|
France — 4.7% | |
Alten SA | | | 61,138 | | | | 7,297,236 | |
Cie Plastic Omnium SA | | | 22,193 | | | | 537,582 | |
Edenred | | | 8,754 | | | | 426,214 | |
Elior Group SA* | | | 33,083 | | | | 421,047 | |
Korian SA | | | 77,024 | | | | 3,071,218 | |
Legrand SA | | | 25,290 | | | | 1,784,993 | |
LISI | | | 27,338 | | | | 730,113 | |
Remy Cointreau SA†# | | | 37,083 | | | | 5,599,882 | |
SEB SA | | | 7,734 | | | | 1,202,757 | |
Sodexo SA | | | 9,405 | | | | 1,065,700 | |
SOITEC† | | | 38,318 | | | | 3,863,903 | |
Somfy SA | | | 2,799 | | | | 245,484 | |
Virbac SA† | | | 4,741 | | | | 878,506 | |
| | | | | | |
|
|
|
| | | | | | | | 27,124,635 | |
| | | | | | |
|
|
|
Germany — 6.0% | |
Amadeus Fire AG | | | 7,927 | | | | 925,232 | |
Beiersdorf AG | | | 8,421 | | | | 1,059,709 | |
Brenntag AG | | | 19,203 | | | | 925,035 | |
CTS Eventim AG & Co. KGaA | | | 60,917 | | | | 3,334,150 | |
Deutsche Wohnen SE | | | 23,859 | | | | 845,929 | |
Evotec SE† | | | 212,087 | | | | 4,687,523 | |
Fuchs Petrolub SE (Preference Shares) | | | 44,343 | | | | 1,548,803 | |
GEA Group AG | | | 74,436 | | | | 2,006,771 | |
Gerresheimer AG | | | 9,229 | | | | 696,326 | |
Hella GmbH & Co. KGaA | | | 22,821 | | | | 950,084 | |
Henkel AG & Co. KGaA (Preference Shares) | | | 7,466 | | | | 747,522 | |
Infineon Technologies AG | | | 23,916 | | | | 413,934 | |
LEG Immobilien AG | | | 29,509 | | | | 3,463,722 | |
MTU Aero Engines AG | | | 6,725 | | | | 1,835,212 | |
Scout24 AG* | | | 22,409 | | | | 1,325,019 | |
Symrise AG | | | 44,437 | | | | 4,147,363 | |
TAG Immobilien AG | | | 237,835 | | | | 5,551,976 | |
| | | | | | |
|
|
|
| | | | | | | | 34,464,310 | |
| | | | | | |
|
|
|
Greece — 0.2% | |
Hellenic Telecommunications Organization SA | | | 80,208 | | | | 1,070,172 | |
| | | | | | |
|
|
|
Hong Kong — 0.8% | |
China Resources Beer Holdings Co., Ltd. | | | 522,000 | | | | 2,962,732 | |
Techtronic Industries Co., Ltd. | | | 207,500 | | | | 1,434,429 | |
| | | | | | |
|
|
|
| | | | | | | | 4,397,161 | |
| | | | | | |
|
|
|
India — 1.5% | |
Bharat Heavy Electricals, Ltd. | | | 604,029 | | | | 428,866 | |
CESC, Ltd. | | | 99,957 | | | | 1,089,753 | |
Dabur India, Ltd. | | | 143,842 | | | | 902,645 | |
Embassy Office Parks REIT | | | 103,200 | | | | 566,529 | |
Federal Bank, Ltd. | | | 1,106,672 | | | | 1,284,008 | |
Hero MotoCorp, Ltd. | | | 17,734 | | | | 635,091 | |
Mahindra & Mahindra, Ltd. | | | 60,971 | | | | 452,367 | |
MOIL, Ltd. | | | 254,536 | | | | 445,748 | |
PVR, Ltd. | | | 38,090 | | | | 816,955 | |
Shriram Transport Finance Co., Ltd. | | | 80,731 | | | | 1,092,128 | |
Spencer’s Retail, Ltd.† | | | 30,235 | | | | 31,968 | |
Tata Global Beverages, Ltd. | | | 271,670 | | | | 1,057,842 | |
| | | | | | |
|
|
|
| | | | | | | | 8,803,900 | |
| | | | | | |
|
|
|
Indonesia — 1.0% | |
Ace Hardware Indonesia Tbk PT | | | 11,878,200 | | | | 1,444,476 | |
Astra Agro Lestari Tbk PT | | | 641,600 | | | | 474,924 | |
Indocement Tunggal Prakarsa Tbk PT | | | 842,300 | | | | 1,290,023 | |
| | | | | | | | |
| | |
| Security Description | | Shares | | |
Value
(Note 2) | |
| |
| | | | | | | | | |
Indonesia (continued) | |
Kalbe Farma Tbk PT | | | 13,955,601 | | | $ | 1,662,669 | |
United Tractors Tbk PT | | | 653,000 | | | | 963,273 | |
| | | | | | |
|
|
|
| | | | | | | | 5,835,365 | |
| | | | | | |
|
|
|
Ireland — 2.0% | |
Bank of Ireland Group PLC | | | 46,500 | | | | 176,928 | |
C&C Group PLC | | | 488,851 | | | | 2,138,341 | |
Dalata Hotel Group PLC | | | 103,931 | | | | 497,451 | |
DCC PLC | | | 17,664 | | | | 1,501,109 | |
Flutter Entertainment PLC | | | 21,456 | | | | 1,766,444 | |
Greencore Group PLC | | | 56,749 | | | | 144,941 | |
Hibernia REIT PLC | | | 2,372,547 | | | | 3,827,879 | |
Kerry Group PLC, Class A | | | 9,910 | | | | 1,179,558 | |
Ryanair Holdings PLC ADR† | | | 9,900 | | | | 567,270 | |
| | | | | | |
|
|
|
| | | | | | | | 11,799,921 | |
| | | | | | |
|
|
|
Israel — 1.5% | |
Bezeq The Israeli Telecommunication Corp., Ltd. | | | 262,028 | | | | 164,566 | |
Israel Discount Bank, Ltd., Class A | | | 2,057,933 | | | | 8,567,076 | |
| | | | | | |
|
|
|
| | | | | | | | 8,731,642 | |
| | | | | | |
|
|
|
Italy — 1.8% | |
Cembre SpA# | | | 17,947 | | | | 394,493 | |
Cerved Group SpA | | | 220,914 | | | | 1,778,477 | |
Davide Campari-Milano SpA | | | 91,427 | | | | 856,616 | |
Enav SpA* | | | 187,783 | | | | 1,060,808 | |
FinecoBank Banca Fineco SpA | | | 107,963 | | | | 1,112,762 | |
Infrastrutture Wireless Italiane SpA* | | | 59,873 | | | | 598,153 | |
Italgas SpA | | | 185,298 | | | | 1,201,545 | |
Reply SpA | | | 58,188 | | | | 3,437,393 | |
| | | | | | |
|
|
|
| | | | | | | | 10,440,247 | |
| | | | | | |
|
|
|
Japan — 21.2% | |
ABC-Mart, Inc.# | | | 15,700 | | | | 1,003,464 | |
Aeon Delight Co., Ltd. | | | 12,900 | | | | 398,287 | |
AEON Financial Service Co., Ltd.# | | | 57,000 | | | | 834,866 | |
Air Water, Inc. | | | 16,300 | | | | 276,947 | |
Amano Corp. | | | 12,441 | | | | 371,819 | |
Anritsu Corp.# | | | 321,900 | | | | 6,026,819 | |
Ariake Japan Co., Ltd. | | | 6,200 | | | | 469,807 | |
As One Corp.# | | | 5,400 | | | | 480,858 | |
Asante, Inc.# | | | 7,400 | | | | 138,826 | |
Chiba Bank, Ltd. | | | 110,300 | | | | 550,280 | |
Comture Corp. | | | 10,500 | | | | 373,606 | |
Cosmos Pharmaceutical Corp.# | | | 2,400 | | | | 489,782 | |
Daifuku Co., Ltd. | | | 121,200 | | | | 5,727,152 | |
Daikyonishikawa Corp. | | | 14,487 | | | | 99,412 | |
Daiseki Co., Ltd. | | | 37,700 | | | | 920,187 | |
Daiwa Securities Group, Inc. | | | 103,800 | | | | 447,307 | |
Doshisha Co., Ltd. | | | 6,200 | | | | 100,323 | |
Eiken Chemical Co., Ltd. | | | 25,400 | | | | 381,831 | |
Ezaki Glico Co., Ltd.# | | | 19,700 | | | | 854,869 | |
Fancl Corp. | | | 200,800 | | | | 4,876,585 | |
Fuji Seal International, Inc. | | | 72,200 | | | | 1,962,758 | |
Fuji Soft, Inc. | | | 5,500 | | | | 236,339 | |
Fujitsu General, Ltd.# | | | 22,800 | | | | 366,998 | |
GMO Payment Gateway, Inc.# | | | 90,700 | | | | 7,026,507 | |
Hamakyorex Co., Ltd. | | | 6,100 | | | | 209,870 | |
Heian Ceremony Service Co., Ltd.# | | | 15,800 | | | | 123,443 | |
Hirose Electric Co., Ltd. | | | 3,800 | | | | 431,741 | |
Hogy Medical Co., Ltd. | | | 3,500 | | | | 95,510 | |
Iriso Electronics Co., Ltd.# | | | 9,500 | | | | 455,170 | |
Japan Elevator Service Holdings Co., Ltd. | | | 168,200 | | | | 4,038,953 | |
Japan Exchange Group, Inc. | | | 6,300 | | | | 99,747 | |
Japan Meat Co, Ltd. | | | 11,000 | | | | 215,268 | |
Japan Pure Chemical Co., Ltd.# | | | 1,800 | | | | 40,715 | |
VALIC Company II International Opportunities Fund
PORTFOLIO OF INVESTMENTS —August 31, 2019 — (continued)
| | | | | | | | |
| | |
| Security Description | | Shares | | |
Value
(Note 2) | |
| |
COMMON STOCKS (continued) | |
Japan (continued) | |
Jeol, Ltd. | | | 21,900 | | | $ | 481,971 | |
JGC Corp.# | | | 11,160 | | | | 129,737 | |
Kakaku.com, Inc. | | | 12,600 | | | | 315,608 | |
Kansai Paint Co., Ltd. | | | 45,100 | | | | 938,637 | |
Katitas Co., Ltd. | | | 78,300 | | | | 2,996,089 | |
Kikkoman Corp.# | | | 11,500 | | | | 517,438 | |
Kintetsu World Express, Inc. | | | 12,000 | | | | 160,399 | |
Kobayashi Pharmaceutical Co., Ltd.# | | | 11,900 | | | | 891,646 | |
Koito Manufacturing Co., Ltd. | | | 28,100 | | | | 1,319,895 | |
Kusuri no Aoki Holdings Co., Ltd. | | | 48,900 | | | | 3,756,050 | |
Lion Corp. | | | 47,000 | | | | 913,588 | |
Matsumotokiyoshi Holdings Co., Ltd. | | | 143,400 | | | | 5,318,360 | |
Meitec Corp. | | | 16,200 | | | | 835,657 | |
Milbon Co., Ltd. | | | 12,400 | | | | 606,956 | |
Miraca Holdings, Inc. | | | 4,300 | | | | 94,836 | |
MISUMI Group, Inc. | | | 9,900 | | | | 224,401 | |
Mitsubishi Pencil Co., Ltd. | | | 10,100 | | | | 157,059 | |
MonotaRO Co., Ltd.# | | | 25,300 | | | | 621,813 | |
Morinaga & Co., Ltd. | | | 19,200 | | | | 948,840 | |
Nabtesco Corp. | | | 21,000 | | | | 603,897 | |
Nakanishi, Inc. | | | 72,800 | | | | 1,195,802 | |
Net One Systems Co., Ltd. | | | 160,600 | | | | 4,305,444 | |
NGK Spark Plug Co., Ltd. | | | 36,400 | | | | 628,396 | |
Nihon Kohden Corp. | | | 22,700 | | | | 629,920 | |
Nihon Parkerizing Co., Ltd. | | | 45,600 | | | | 504,783 | |
Nippon Television Holdings, Inc. | | | 26,500 | | | | 349,475 | |
Nissei ASB Machine Co., Ltd.# | | | 10,100 | | | | 290,446 | |
Nitori Holdings Co., Ltd. | | | 3,500 | | | | 504,895 | |
NOF Corp. | | | 3,600 | | | | 116,741 | |
Nohmi Bosai, Ltd. | | | 12,800 | | | | 260,494 | |
Nomura Research Institute, Ltd. | | | 117,000 | | | | 2,327,114 | |
NS Solutions Corp. | | | 31,400 | | | | 1,049,278 | |
Obara Group, Inc. | | | 5,600 | | | | 180,280 | |
OBIC Business Consultants Co., Ltd. | | | 15,900 | | | | 666,772 | |
OBIC Co., Ltd. | | | 73,400 | | | | 8,394,691 | |
Omron Corp. | | | 9,000 | | | | 445,616 | |
Oracle Corp. Japan | | | 4,300 | | | | 370,358 | |
Park24 Co., Ltd. | | | 15,600 | | | | 319,974 | |
Persol Holdings Co., Ltd. | | | 140,000 | | | | 2,842,566 | |
Proto Corp. | | | 49,400 | | | | 560,798 | |
Rakuten, Inc. | | | 5,200 | | | | 48,997 | |
Rinnai Corp. | | | 3,900 | | | | 244,863 | |
Ryohin Keikaku Co., Ltd.# | | | 43,000 | | | | 741,121 | |
S Foods, Inc.# | | | 21,700 | | | | 615,856 | |
Sagami Rubber Industries Co., Ltd.# | | | 12,200 | | | | 182,825 | |
San-A Co, Ltd.# | | | 3,800 | | | | 157,923 | |
San-Ai Oil Co., Ltd. | | | 18,900 | | | | 175,239 | |
Sankyu, Inc. | | | 12,000 | | | | 607,709 | |
Santen Pharmaceutical Co., Ltd. | | | 88,800 | | | | 1,555,578 | |
SCSK Corp. | | | 11,600 | | | | 572,165 | |
Seino Holdings Co., Ltd. | | | 54,900 | | | | 706,953 | |
Senko Group Holdings Co., Ltd. | | | 40,700 | | | | 323,347 | |
Seria Co., Ltd.# | | | 26,700 | | | | 655,216 | |
SG Holdings Co., Ltd. | | | 44,100 | | | | 1,180,179 | |
Shima Seiki Manufacturing, Ltd. | | | 8,300 | | | | 199,619 | |
Shimadzu Corp. | | | 22,700 | | | | 564,535 | |
Shimamura Co., Ltd. | | | 2,300 | | | | 179,696 | |
Shimano, Inc. | | | 1,500 | | | | 215,607 | |
Shizuoka Bank, Ltd. | | | 44,500 | | | | 300,758 | |
SK Kaken Co., Ltd. | | | 500 | | | | 210,383 | |
SMS Co., Ltd. | | | 231,600 | | | | 5,173,312 | |
Sohgo Security Services Co., Ltd. | | | 8,900 | | | | 449,042 | |
Sony Financial Holdings, Inc. | | | 38,100 | | | | 880,100 | |
Stanley Electric Co., Ltd. | | | 37,900 | | | | 942,193 | |
Sundrug Co., Ltd. | | | 24,300 | | | | 755,980 | |
| | | | | | | | |
| | |
| Security Description | | Shares | | |
Value
(Note 2) | |
| |
| | | | | | | | | |
Japan (continued) | |
T Hasegawa Co., Ltd.# | | | 36,600 | | | $ | 697,651 | |
Taisei Lamick Co, Ltd. | | | 9,600 | | | | 250,313 | |
Taiyo Yuden Co., Ltd.# | | | 95,700 | | | | 1,800,765 | |
Takasago International Corp. | | | 7,100 | | | | 171,026 | |
TechnoPro Holdings, Inc. | | | 121,900 | | | | 7,079,804 | |
Terumo Corp. | | | 31,900 | | | | 926,957 | |
THK Co., Ltd. | | | 9,900 | | | | 229,992 | |
Toshiba Plant Systems & Services Corp. | | | 12,600 | | | | 204,712 | |
TOTO, Ltd.# | | | 6,300 | | | | 228,018 | |
Trancom Co., Ltd. | | | 2,600 | | | | 138,523 | |
Unicharm Corp. | | | 50,800 | | | | 1,561,275 | |
USS Co., Ltd. | | | 99,100 | | | | 1,873,138 | |
Yamato Holdings Co., Ltd. | | | 60,100 | | | | 1,040,372 | |
Zojirushi Corp.# | | | 32,700 | | | | 399,535 | |
| | | | | | |
|
|
|
| | | | | | | | 122,144,043 | |
| | | | | | |
|
|
|
Jersey — 0.5% | |
boohoo Group PLC† | | | 1,004,852 | | | | 2,951,606 | |
| | | | | | |
|
|
|
Luxembourg — 0.6% | |
B&M European Value Retail SA | | | 146,722 | | | | 638,785 | |
Globant SA† | | | 2,200 | | | | 208,846 | |
Solutions 30 SE†# | | | 289,023 | | | | 2,800,090 | |
| | | | | | |
|
|
|
| | | | | | | | 3,647,721 | |
| | | | | | |
|
|
|
Malaysia — 0.1% | |
Genting Bhd | | | 546,100 | | | | 779,123 | |
| | | | | | |
|
|
|
Mauritius — 0.2% | |
MakeMyTrip, Ltd.†# | | | 44,697 | | | | 1,026,690 | |
| | | | | | |
|
|
|
Mexico — 0.5% | |
Arca Continental SAB de CV | | | 58,459 | | | | 305,778 | |
Concentradora Fibra Danhos SA de CV | | | 302,077 | | | | 401,684 | |
Genomma Lab Internacional SAB de CV, Class B†# | | | 438,119 | | | | 367,258 | |
Grupo Aeroportuario del Pacifico SAB de CV, Class B | | | 20,477 | | | | 194,660 | |
Grupo Aeroportuario del Sureste SAB de CV ADR | | | 2,205 | | | | 324,995 | |
Grupo Financiero Inbursa SAB de CV, Class O | | | 237,547 | | | | 292,763 | |
Grupo Lala SAB de CV# | | | 230,257 | | | | 240,580 | |
Mexichem SAB de CV | | | 112,280 | | | | 205,607 | |
Prologis Property Mexico SA de CV | | | 199,499 | | | | 388,417 | |
| | | | | | |
|
|
|
| | | | | | | | 2,721,742 | |
| | | | | | |
|
|
|
Netherlands — 1.3% | |
Aalberts NV | | | 24,500 | | | | 925,202 | |
ASM International NV | | | 12,821 | | | | 1,077,110 | |
Euronext NV* | | | 5,819 | | | | 456,310 | |
IMCD NV | | | 34,492 | | | | 2,418,557 | |
Takeaway.com NV†* | | | 26,319 | | | | 2,512,213 | |
| | | | | | |
|
|
|
| | | | | | | | 7,389,392 | |
| | | | | | |
|
|
|
New Zealand — 0.1% | |
Freightways, Ltd. | | | 48,868 | | | | 245,410 | |
Mainfreight, Ltd. | | | 11,323 | | | | 293,590 | |
| | | | | | |
|
|
|
| | | | | | | | 539,000 | |
| | | | | | |
|
|
|
Norway — 2.8% | |
Aker Solutions ASA† | | | 158,761 | | | | 474,774 | |
Leroy Seafood Group ASA | | | 472,295 | | | | 3,097,424 | |
Mowi ASA# | | | 21,068 | | | | 504,030 | |
Norway Royal Salmon ASA | | | 64,283 | | | | 1,314,979 | |
Scatec Solar ASA* | | | 397,293 | | | | 4,612,893 | |
TGS NOPEC Geophysical Co. ASA | | | 114,173 | | | | 2,754,025 | |
Tomra Systems ASA | | | 128,404 | | | | 3,607,408 | |
| | | | | | |
|
|
|
| | | | | | | | 16,365,533 | |
| | | | | | |
|
|
|
VALIC Company II International Opportunities Fund
PORTFOLIO OF INVESTMENTS —August 31, 2019 — (continued)
| | | | | | | | |
| | |
| Security Description | | Shares | | |
Value
(Note 2) | |
| |
COMMON STOCKS (continued) | |
Philippines — 0.2% | |
Metropolitan Bank & Trust Co. | | | 1,006,940 | | | $ | 1,371,408 | |
| | | | | | |
|
|
|
Portugal — 0.7% | |
Galp Energia SGPS SA | | | 18,904 | | | | 271,340 | |
NOS SGPS SA | | | 648,229 | | | | 3,807,970 | |
| | | | | | |
|
|
|
| | | | | | | | 4,079,310 | |
| | | | | | |
|
|
|
Singapore — 1.0% | |
Ascendas India Trust | | | 1,334,500 | | | | 1,375,129 | |
City Developments, Ltd. | | | 203,800 | | | | 1,406,884 | |
Singapore Technologies Engineering, Ltd. | | | 517,300 | | | | 1,468,681 | |
Venture Corp., Ltd. | | | 114,063 | | | | 1,247,686 | |
| | | | | | |
|
|
|
| | | | | | | | 5,498,380 | |
| | | | | | |
|
|
|
South Africa — 0.2% | |
AVI, Ltd. | | | 184,300 | | | | 1,007,962 | |
| | | | | | |
|
|
|
South Korea — 1.6% | |
Dentium Co., Ltd. | | | 36,023 | | | | 2,040,188 | |
Doosan Bobcat, Inc. | | | 46,087 | | | | 1,364,061 | |
Douzone Bizon Co., Ltd.# | | | 38,906 | | | | 1,843,719 | |
Lock&Lock Co., Ltd. | | | 21,167 | | | | 208,830 | |
LS Industrial Systems Co., Ltd. | | | 27,712 | | | | 1,051,283 | |
Orion Corp. | | | 14,992 | | | | 1,115,195 | |
Samsung Fire & Marine Insurance Co., Ltd. | | | 5,619 | | | | 1,062,333 | |
TK Corp. | | | 34,618 | | | | 300,094 | |
| | | | | | |
|
|
|
| | | | | | | | 8,985,703 | |
| | | | | | |
|
|
|
Spain — 1.8% | |
Aena SME SA* | | | 2,819 | | | | 508,108 | |
Amadeus IT Group SA | | | 71,580 | | | | 5,330,678 | |
Cellnex Telecom SA* | | | 64,003 | | | | 2,560,466 | |
CEMEX Latam Holdings SA† | | | 85,400 | | | | 109,024 | |
CIE Automotive SA | | | 58,900 | | | | 1,364,593 | |
Viscofan SA | | | 15,408 | | | | 717,670 | |
| | | | | | |
|
|
|
| | | | | | | | 10,590,539 | |
| | | | | | |
|
|
|
Sweden — 2.3% | |
Essity AB, Class B | | | 50,169 | | | | 1,564,674 | |
Evolution Gaming Group AB* | | | 245,518 | | | | 4,607,848 | |
MIPS AB | | | 78,343 | | | | 1,317,071 | |
Saab AB, Series B | | | 10,756 | | | | 300,938 | |
Swedish Match AB | | | 27,997 | | | | 1,098,240 | |
THQ Nordic AB† | | | 161,138 | | | | 3,989,601 | |
Thule Group AB* | | | 24,566 | | | | 487,333 | |
| | | | | | |
|
|
|
| | | | | | | | 13,365,705 | |
| | | | | | |
|
|
|
Switzerland — 2.2% | |
Coca-Cola HBC AG | | | 13,816 | | | | 458,949 | |
DKSH Holding AG | | | 2,198 | | | | 107,085 | |
Dufry AG | | | 5,000 | | | | 405,355 | |
Geberit AG | | | 1,578 | | | | 717,613 | |
Julius Baer Group, Ltd. | | | 18,695 | | | | 739,111 | |
Kardex AG | | | 3,872 | | | | 542,999 | |
Logitech International SA | | | 93,188 | | | | 3,776,480 | |
Lonza Group AG | | | 1,287 | | | | 454,855 | |
Sika AG | | | 22,451 | | | | 3,223,326 | |
Sonova Holding AG | | | 5,803 | | | | 1,346,753 | |
Temenos AG | | | 4,577 | | | | 766,726 | |
VAT Group AG* | | | 3,602 | | | | 433,077 | |
| | | | | | |
|
|
|
| | | | | | | | 12,972,329 | |
| | | | | | |
|
|
|
Taiwan — 1.7% | |
Advantech Co., Ltd. | | | 84,256 | | | | 716,216 | |
E.Sun Financial Holding Co., Ltd. | | | 2,272,013 | | | | 1,826,435 | |
Makalot Industrial Co., Ltd. | | | 732,900 | | | | 4,316,667 | |
PChome Online, Inc.† | | | 204,932 | | | | 874,272 | |
| | | | | | | | |
| | |
| Security Description | | Shares | | |
Value
(Note 2) | |
| |
| | | | | | | | | |
Taiwan (continued) | |
Tripod Technology Corp. | | | 103,000 | | | $ | 372,190 | |
Voltronic Power Technology Corp. | | | 71,950 | | | | 1,614,924 | |
Yuanta Financial Holding Co., Ltd. | | | 256,807 | | | | 147,576 | |
| | | | | | |
|
|
|
| | | | | | | | 9,868,280 | |
| | | | | | |
|
|
|
Thailand — 0.2% | |
AEON Thana Sinsap Thailand PCL | | | 115,300 | | | | 825,928 | |
PTT Global Chemical PCL | | | 256,000 | | | | 443,798 | |
| | | | | | |
|
|
|
| | | | | | | | 1,269,726 | |
| | | | | | |
|
|
|
United Kingdom — 13.8% | |
Abcam PLC | | | 343,301 | | | | 4,833,119 | |
Admiral Group PLC | | | 15,313 | | | | 400,047 | |
Ashtead Group PLC | | | 22,506 | | | | 621,920 | |
Auto Trader Group PLC* | | | 231,998 | | | | 1,500,681 | |
Babcock International Group PLC | | | 66,823 | | | | 407,852 | |
Beazley PLC | | | 600,578 | | | | 4,161,810 | |
Bellway PLC | | | 18,357 | | | | 647,990 | |
Britvic PLC | | | 31,424 | | | | 331,703 | |
Bunzl PLC | | | 51,139 | | | | 1,252,608 | |
Burberry Group PLC | | | 27,547 | | | | 725,355 | |
Cairn Energy PLC† | | | 115,599 | | | | 234,904 | |
Clinigen Group PLC | | | 180,814 | | | | 1,947,128 | |
Coats Group PLC | | | 3,371,912 | | | | 3,001,302 | |
Cobham PLC† | | | 236,488 | | | | 464,730 | |
Compass Group PLC | | | 120,463 | | | | 3,053,248 | |
Countryside Properties PLC* | | | 634,165 | | | | 2,308,782 | |
Croda International PLC | | | 81,241 | | | | 4,648,116 | |
Dechra Pharmaceuticals PLC | | | 85,812 | | | | 3,132,480 | |
Electrocomponents PLC | | | 107,154 | | | | 757,537 | |
Elementis PLC | | | 41,281 | | | | 75,296 | |
EMIS Group PLC | | | 23,450 | | | | 316,727 | |
Essentra PLC | | | 235,364 | | | | 1,151,291 | |
Fevertree Drinks PLC | | | 53,494 | | | | 1,471,067 | |
Forterra PLC* | | | 52,931 | | | | 171,321 | |
Future PLC | | | 224,491 | | | | 3,239,684 | |
GB Group PLC | | | 369,324 | | | | 2,592,999 | |
Greggs PLC | | | 66,967 | | | | 1,722,602 | |
Halma PLC | | | 49,629 | | | | 1,185,427 | |
Hargreaves Lansdown PLC | | | 36,925 | | | | 843,792 | |
Howden Joinery Group PLC | | | 132,192 | | | | 865,701 | |
Ibstock PLC* | | | 138,874 | | | | 362,297 | |
IG Group Holdings PLC | | | 59,534 | | | | 391,036 | |
IMI PLC | | | 41,988 | | | | 513,464 | |
Intertek Group PLC | | | 30,223 | | | | 1,996,165 | |
Just Eat PLC† | | | 240,237 | | | | 2,297,053 | |
Keywords Studios PLC | | | 232,658 | | | | 4,492,768 | |
Meggitt PLC | | | 71,081 | | | | 535,381 | |
Merlin Entertainments PLC* | | | 146,872 | | | | 807,250 | |
Moneysupermarket.com Group PLC | | | 290,158 | | | | 1,318,695 | |
PZ Cussons PLC | | | 17,468 | | | | 44,636 | |
Rathbone Brothers PLC | | | 40,734 | | | | 1,105,302 | |
Rightmove PLC | | | 351,637 | | | | 2,291,253 | |
Rotork PLC | | | 718,265 | | | | 2,705,856 | |
Schroders PLC | | | 52,989 | | | | 1,760,222 | |
Shaftesbury PLC | | | 56,719 | | | | 597,676 | |
Smith & Nephew PLC | | | 86,028 | | | | 2,056,939 | |
Spectris PLC | | | 14,661 | | | | 412,271 | |
Spirax-Sarco Engineering PLC | | | 10,860 | | | | 1,060,459 | |
Stagecoach Group PLC | | | 112,910 | | | | 169,400 | |
Tate & Lyle PLC | | | 21,083 | | | | 184,553 | |
TechnipFMC PLC | | | 21,918 | | | | 542,965 | |
UNITE Group PLC | | | 360,014 | | | | 4,586,540 | |
Weir Group PLC | | | 28,110 | | | | 500,921 | |
VALIC Company II International Opportunities Fund
PORTFOLIO OF INVESTMENTS —August 31, 2019 — (continued)
| | | | | | | | |
| | |
| Security Description | | Shares/
Principal
Amount | | | Value
(Note 2) | |
| |
COMMON STOCKS (continued) | |
United Kingdom (continued) | |
Whitbread PLC | | | 13,472 | | | $ | 716,854 | |
| | | | | | |
|
|
|
| | | | | | | | 79,517,175 | |
| | | | | | |
|
|
|
United States — 0.1% | |
Autoliv, Inc. SDR | | | 3,483 | | | | 239,968 | |
Gran Tierra Energy, Inc.†# | | | 107,554 | | | | 152,679 | |
| | | | | | |
|
|
|
| | | | | | | | 392,647 | |
| | | | | | |
|
|
|
Total Long-Term Investment Securities | | | | | | | | |
(cost $482,063,246) | | | | | | | 557,506,680 | |
| | | |
|
|
|
SHORT-TERM INVESTMENT SECURITIES — 3.3% | |
Registered Investment Companies — 2.5% | |
State Street Navigator Securities Lending Government Money Market Portfolio
2.12%(2)(3) | | | 14,312,891 | | | | 14,312,891 | |
| | | | | | |
|
|
|
U.S. Government Agencies — 0.8% | |
Federal Home Loan Bank
1.93% due 09/03/2019 | | $ | 4,472,000 | | | | 4,472,000 | |
| | | | | | |
|
|
|
Total Short-Term Investment Securities | | | | | | | | |
(cost $18,784,419) | | | | | | | 18,784,891 | |
| | | |
|
|
|
REPURCHASE AGREEMENTS — 2.4% | |
Agreement with Fixed Income Clearing Corp., bearing interest at 0.42%, dated 08/30/2019, to be repurchased 09/03/2019 in the amount of $13,635,636, and collateralized by $13,465,000 of United States Treasury Notes, bearing interest at 2.38%, due 03/15/2022 and having an approximate value of $13,911,284 (cost $13,635,000) | | | 13,635,000 | | | | 13,635,000 | |
| | | | | | |
|
|
|
TOTAL INVESTMENTS | | | | | | | | |
(cost $514,482,665)(4) | | | 102.4 | % | | | 589,926,571 | |
Liabilities in excess of other assets | | | (2.4 | ) | | | (13,729,516 | ) |
| | |
|
|
| |
|
|
|
NET ASSETS | | | 100.0 | % | | $ | 576,197,055 | |
| | |
|
|
| |
|
|
|
| † | Non-income producing security |
| # | The security or a portion thereof is out on loan (see Note 2). |
| * | Securities exempt from registration under Rule 144A of the Securities Act of 1933. These securities may be sold in transactions exempt from registration, normally to qualified institutional buyers. The Fund has no right to demand registration of these securities. At August 31, 2019, the aggregate value of these securities was $24,932,790 representing 4.3% of net assets. |
| (1) | Securities classified as Level 3 (see Note 2). |
| (2) | The rate shown is the7-day yield as of August 31, 2019. |
| (3) | At August 31, 2019, the Fund had loaned securities with a total value of $32,595,825. This was secured by collateral of $14,312,891, which was received in cash and subsequently invested in short-term investments currently valued at $14,312,891 as reported in the Portfolio of Investments. Additional collateral of $19,978,849 was received in the form of fixed income pooled securities, which the Fund cannot sell or repledge and accordingly are not reflected in the Fund’s assets and liabilities. |
The components of the fixed income pooled securities referenced above are as follows:
| | | | | | | | |
| | | Coupon Range
| | Maturity Date Range
| | Value as of
August 31, 2019
| |
United States Treasury Bills | | 0.00% | | 09/19/2019 to 12/19/2019 | | $ | 185,490 | |
United States Treasury Notes/Bonds | | zero coupon to��8.75% | | 09/30/2019 to 02/15/2049 | | | 19,793,359 | |
| (4) | See Note 5 for cost of investments on a tax basis. |
ADR—American Depositary Receipt
SDR—Swedish Depositary Receipt
The following is a summary of the inputs used to value the Fund’s net assets as of August 31, 2019 (see Note 2):
| | | | | | | | | | | | | | | | |
| | | Level 1 - Unadjusted
Quoted Prices
| | | Level 2 - Other
Observable Inputs
| | | Level 3 - Significant
Unobservable Inputs
| | | Total
| |
ASSETS: | | | | | | | | | | | | | | | | |
Investments at Value:* | | | | | | | | | | | | | | | | |
| | | | |
Common Stocks: | | | | | | | | | | | | | | | | |
Bermuda | | $ | 16,852,177 | | | $ | — | | | $ | 0 | | | $ | 16,852,177 | |
Other Countries | | | 531,922,861 | | | | 8,731,642 | ** | | | — | | | | 540,654,503 | |
Short Term Investment Securities: | | | | | | | | | | | | | | | | |
Registered Investment Companies | | | 14,312,891 | | | | — | | | | — | | | | 14,312,891 | |
U.S. Government Agencies | | | — | | | | 4,472,000 | | | | — | | | | 4,472,000 | |
Repurchase Agreements | | | — | | | | 13,635,000 | | | | — | | | | 13,635,000 | |
| | |
|
|
| |
|
|
| |
|
|
| |
|
|
|
Total Investments at Value | | $ | 563,087,929 | | | $ | 26,838,642 | | | $ | 0 | | | $ | 589,926,571 | |
| | |
|
|
| |
|
|
| |
|
|
| |
|
|
|
| * | For a detailed presentation of investments, please refer to the Portfolio of Investments. |
| ** | Represents foreign equity securities that have been fair valued in accordance with pricing procedures approved by the Board (see Note 2). |
At the beginning and the end of the reporting period, Level 3 investments in securities were not considered a material portion of the Fund. There were no Level 3 transfers during the reporting period.
See Notes to Financial Statements
VALIC Company II Large Cap Value Fund
PORTFOLIO PROFILE —August 31, 2019 (unaudited)
Industry Allocation*
| | | | |
Diversified Banking Institutions | | | 10.1 | % |
Insurance — Multi-line | | | 7.1 | |
Insurance — Property/Casualty | | | 4.2 | |
Oil Refining & Marketing | | | 4.2 | |
Electric — Integrated | | | 3.8 | |
Banks — Super Regional | | | 3.7 | |
Medical — Drugs | | | 3.4 | |
Building Products — Cement | | | 3.2 | |
Medical Instruments | | | 2.8 | |
Oil Companies — Exploration & Production | | | 2.7 | |
Agricultural Chemicals | | | 2.6 | |
Aerospace/Defense — Equipment | | | 2.6 | |
Cosmetics & Toiletries | | | 2.4 | |
Telephone — Integrated | | | 2.4 | |
Food — Misc./Diversified | | | 2.4 | |
Electronic Components — Semiconductors | | | 2.3 | |
Real Estate Investment Trusts | | | 2.2 | |
Instruments — Controls | | | 1.8 | |
Beverages — Non-alcoholic | | | 1.5 | |
Web Portals/ISP | | | 1.5 | |
Oil Companies — Integrated | | | 1.3 | |
Computer Services | | | 1.3 | |
Medical — HMO | | | 1.3 | |
Networking Products | | | 1.2 | |
Semiconductor Components — Integrated Circuits | | | 1.2 | |
Gold Mining | | | 1.1 | |
Investment Management/Advisor Services | | | 1.1 | |
Commercial Paper | | | 1.1 | |
Finance — Credit Card | | | 1.1 | |
Banks — Commercial | | | 1.1 | |
Enterprise Software/Service | | | 1.1 | |
Aerospace/Defense | | | 1.0 | |
Telecom Equipment — Fiber Optics | | | 0.9 | |
Computer Software | | | 0.9 | |
Medical Products | | | 0.8 | |
Building — Residential/Commercial | | | 0.8 | |
Medical Labs & Testing Services | | | 0.7 | |
Retail — Discount | | | 0.7 | |
Apparel Manufacturers | | | 0.7 | |
Transport — Rail | | | 0.7 | |
Auto — Cars/Light Trucks | | | 0.7 | |
Oil — Field Services | | | 0.7 | |
Chemicals — Diversified | | | 0.7 | |
Airlines | | | 0.7 | |
Advertising Agencies | | | 0.7 | |
Broadcast Services/Program | | | 0.6 | |
Insurance — Reinsurance | | | 0.6 | |
Commercial Services | | | 0.6 | |
Cable/Satellite TV | | | 0.5 | |
Data Processing/Management | | | 0.5 | |
Medical — Biomedical/Gene | | | 0.5 | |
Cellular Telecom | | | 0.5 | |
Commercial Services — Finance | | | 0.4 | |
Computers — Memory Devices | | | 0.4 | |
Semiconductor Equipment | | | 0.4 | |
Agricultural Operations | | | 0.4 | |
Banks — Fiduciary | | | 0.4 | |
Pharmacy Services | | | 0.4 | |
Metal — Copper | | | 0.4 | |
Internet Security | | | 0.3 | |
Auto/Truck Parts & Equipment — Original | | | 0.3 | |
Finance — Investment Banker/Broker | | | 0.3 | |
Diversified Manufacturing Operations | | | 0.3 | |
Non-Hazardous Waste Disposal | | | 0.3 | |
Computer Data Security | | | 0.2 | |
Insurance Brokers | | | 0.2 | |
Exchange-Traded Funds | | | 0.2 | |
Retail — Drug Store | | | 0.2 | |
Agricultural Biotech | | | 0.2 | |
Chemicals — Specialty | | | 0.1 | |
Electronic Measurement Instruments | | | 0.1 | |
| | |
|
|
|
| | | | 99.8 | % |
| | |
|
|
|
| * | Calculated as a percentage of net assets |
VALIC Company II Large Cap Value Fund
PORTFOLIO OF INVESTMENTS —August 31, 2019
| | | | | | | | |
| | |
| Security Description | | Shares | | | Value
(Note 2) | |
| |
COMMON STOCKS — 98.5% | |
Advertising Agencies — 0.7% | |
Omnicom Group, Inc. | | | 23,923 | | | $ | 1,819,583 | |
| | | | | | |
|
|
|
Aerospace/Defense — 1.0% | |
Northrop Grumman Corp. | | | 3,983 | | | | 1,465,226 | |
Raytheon Co. | | | 6,854 | | | | 1,270,184 | |
| | | | | | |
|
|
|
| | | | | | | | 2,735,410 | |
| | | | | | |
|
|
|
Aerospace/Defense - Equipment — 2.6% | |
L3Harris Technologies, Inc. | | | 11,457 | | | | 2,422,124 | |
United Technologies Corp. | | | 35,692 | | | | 4,648,526 | |
| | | | | | |
|
|
|
| | | | | | | | 7,070,650 | |
| | | | | | |
|
|
|
Agricultural Biotech — 0.2% | |
Corteva, Inc. | | | 13,571 | | | | 397,902 | |
| | | | | | |
|
|
|
Agricultural Chemicals — 2.6% | |
CF Industries Holdings, Inc. | | | 102,742 | | | | 4,951,137 | |
Mosaic Co. | | | 82,376 | | | | 1,514,895 | |
Nutrien, Ltd. | | | 13,934 | | | | 701,716 | |
| | | | | | |
|
|
|
| | | | | | | | 7,167,748 | |
| | | | | | |
|
|
|
Agricultural Operations — 0.4% | |
Archer-Daniels-Midland Co. | | | 26,631 | | | | 1,013,310 | |
| | | | | | |
|
|
|
Airlines — 0.7% | |
Delta Air Lines, Inc. | | | 32,085 | | | | 1,856,438 | |
| | | | | | |
|
|
|
Apparel Manufacturers — 0.7% | |
PVH Corp. | | | 25,746 | | | | 1,951,547 | |
| | | | | | |
|
|
|
Auto - Cars/Light Trucks — 0.7% | |
General Motors Co. | | | 51,893 | | | | 1,924,711 | |
| | | | | | |
|
|
|
Auto/Truck Parts & Equipment - Original — 0.3% | |
Aptiv PLC | | | 11,108 | | | | 923,852 | |
| | | | | | |
|
|
|
Banks - Commercial — 1.1% | |
Citizens Financial Group, Inc. | | | 39,988 | | | | 1,349,195 | |
M&T Bank Corp. | | | 10,891 | | | | 1,592,373 | |
| | | | | | |
|
|
|
| | | | | | | | 2,941,568 | |
| | | | | | |
|
|
|
Banks - Fiduciary — 0.4% | |
Bank of New York Mellon Corp. | | | 23,784 | | | | 1,000,355 | |
| | | | | | |
|
|
|
Banks - Super Regional — 3.7% | |
PNC Financial Services Group, Inc. | | | 12,108 | | | | 1,561,084 | |
US Bancorp | | | 111,885 | | | | 5,895,221 | |
Wells Fargo & Co. | | | 57,238 | | | | 2,665,574 | |
| | | | | | |
|
|
|
| | | | | | | | 10,121,879 | |
| | | | | | |
|
|
|
Beverages - Non-alcoholic — 1.5% | |
PepsiCo, Inc. | | | 29,964 | | | | 4,096,978 | |
| | | | | | |
|
|
|
Broadcast Services/Program — 0.6% | |
Fox Corp., Class B | | | 49,534 | | | | 1,624,715 | |
| | | | | | |
|
|
|
Building Products - Cement — 3.2% | |
Martin Marietta Materials, Inc. | | | 17,694 | | | | 4,490,206 | |
Vulcan Materials Co. | | | 30,172 | | | | 4,261,795 | |
| | | | | | |
|
|
|
| | | | | | | | 8,752,001 | |
| | | | | | |
|
|
|
Building - Residential/Commercial — 0.8% | |
Lennar Corp., Class A | | | 43,559 | | | | 2,221,509 | |
| | | | | | |
|
|
|
Cable/Satellite TV — 0.5% | |
Comcast Corp., Class A | | | 33,315 | | | | 1,474,522 | |
| | | | | | |
|
|
|
Cellular Telecom — 0.5% | |
Vodafone Group PLC ADR# | | | 64,413 | | | | 1,212,253 | |
| | | | | | |
|
|
|
Chemicals - Diversified — 0.7% | |
Dow, Inc. | | | 21,116 | | | | 900,175 | |
| | | | | | | | |
| | |
| Security Description | | Shares | | | Value
(Note 2) | |
| |
| | | | | | | | | |
Chemicals - Diversified (continued) | |
DuPont de Nemours, Inc. | | | 14,188 | | | $ | 963,791 | |
| | | | | | |
|
|
|
| | | | | | | | 1,863,966 | |
| | | | | | |
|
|
|
Chemicals - Specialty — 0.1% | |
W.R. Grace & Co. | | | 5,733 | | | | 388,181 | |
| | | | | | |
|
|
|
Commercial Services — 0.6% | |
Quanta Services, Inc. | | | 43,833 | | | | 1,485,939 | |
| | | | | | |
|
|
|
Commercial Services - Finance — 0.4% | |
Total System Services, Inc. | | | 8,554 | | | | 1,148,118 | |
| | | | | | |
|
|
|
Computer Data Security — 0.2% | |
Check Point Software Technologies, Ltd.† | | | 5,846 | | | | 629,614 | |
| | | | | | |
|
|
|
Computer Services — 1.3% | |
Cognizant Technology Solutions Corp., Class A | | | 18,939 | | | | 1,162,665 | |
International Business Machines Corp. | | | 16,823 | | | | 2,280,021 | |
| | | | | | |
|
|
|
| | | | | | | | 3,442,686 | |
| | | | | | |
|
|
|
Computer Software — 0.9% | |
Citrix Systems, Inc. | | | 15,376 | | | | 1,429,660 | |
Teradata Corp.† | | | 32,611 | | | | 1,006,702 | |
| | | | | | |
|
|
|
| | | | | | | | 2,436,362 | |
| | | | | | |
|
|
|
Computers - Memory Devices — 0.4% | |
Western Digital Corp. | | | 17,734 | | | | 1,015,626 | |
| | | | | | |
|
|
|
Cosmetics & Toiletries — 2.4% | |
Colgate-Palmolive Co. | | | 52,081 | | | | 3,861,806 | |
Procter & Gamble Co. | | | 14,238 | | | | 1,711,835 | |
Unilever PLC ADR# | | | 16,640 | | | | 1,051,315 | |
| | | | | | |
|
|
|
| | | | | | | | 6,624,956 | |
| | | | | | |
|
|
|
Data Processing/Management — 0.5% | |
Fiserv, Inc.† | | | 13,682 | | | | 1,463,153 | |
| | | | | | |
|
|
|
Diversified Banking Institutions — 10.1% | |
Bank of America Corp. | | | 173,939 | | | | 4,785,062 | |
Citigroup, Inc. | | | 118,936 | | | | 7,653,532 | |
Goldman Sachs Group, Inc. | | | 21,741 | | | | 4,433,207 | |
JPMorgan Chase & Co. | | | 72,918 | | | | 8,010,771 | |
Morgan Stanley | | | 63,657 | | | | 2,641,129 | |
| | | | | | |
|
|
|
| | | | | | | | 27,523,701 | |
| | | | | | |
|
|
|
Diversified Manufacturing Operations — 0.3% | |
Carlisle Cos., Inc. | | | 5,369 | | | | 778,290 | |
| | | | | | |
|
|
|
Electric - Integrated — 3.8% | |
Edison International | | | 47,350 | | | | 3,421,985 | |
Entergy Corp. | | | 16,350 | | | | 1,844,934 | |
Evergy, Inc. | | | 35,272 | | | | 2,292,680 | |
PPL Corp. | | | 88,626 | | | | 2,618,898 | |
| | | | | | |
|
|
|
| | | | | | | | 10,178,497 | |
| | | | | | |
|
|
|
Electronic Components - Semiconductors — 2.3% | |
Broadcom, Inc. | | | 8,221 | | | | 2,323,584 | |
Microchip Technology, Inc.# | | | 16,746 | | | | 1,445,682 | |
Micron Technology, Inc.† | | | 22,474 | | | | 1,017,398 | |
Texas Instruments, Inc. | | | 11,863 | | | | 1,468,046 | |
| | | | | | |
|
|
|
| | | | | | | | 6,254,710 | |
| | | | | | |
|
|
|
Electronic Measurement Instruments — 0.1% | |
Agilent Technologies, Inc. | | | 5,235 | | | | 372,261 | |
| | | | | | |
|
|
|
Enterprise Software/Service — 1.1% | |
Oracle Corp. | | | 55,512 | | | | 2,889,955 | |
| | | | | | |
|
|
|
Finance - Credit Card — 1.1% | |
American Express Co. | | | 7,850 | | | | 944,905 | |
VALIC Company II Large Cap Value Fund
PORTFOLIO OF INVESTMENTS —August 31, 2019 — (continued)
| | | | | | | | |
| | |
| Security Description | | Shares | | | Value
(Note 2) | |
| |
COMMON STOCKS (continued) | |
Finance - Credit Card (continued) | |
Capital One Financial Corp. | | | 10,542 | | | $ | 913,148 | |
Discover Financial Services | | | 13,825 | | | | 1,105,585 | |
| | | | | | |
|
|
|
| | | | | | | | 2,963,638 | |
| | | | | | |
|
|
|
Finance - Investment Banker/Broker — 0.3% | |
Charles Schwab Corp. | | | 20,732 | | | | 793,414 | |
| | | | | | |
|
|
|
Food - Misc./Diversified — 2.4% | |
Conagra Brands, Inc. | | | 164,149 | | | | 4,655,266 | |
Lamb Weston Holdings, Inc. | | | 13,018 | | | | 916,337 | |
Mondelez International, Inc., Class A | | | 17,939 | | | | 990,591 | |
| | | | | | |
|
|
|
| | | | | | | | 6,562,194 | |
| | | | | | |
|
|
|
Gold Mining — 1.1% | |
Newmont Goldcorp Corp. | | | 75,432 | | | | 3,008,983 | |
| | | | | | |
|
|
|
Instruments - Controls — 1.8% | |
Honeywell International, Inc. | | | 29,282 | | | | 4,820,403 | |
| | | | | | |
|
|
|
Insurance Brokers — 0.2% | |
Arthur J. Gallagher & Co. | | | 82 | | | | 7,436 | |
Willis Towers Watson PLC | | | 2,463 | | | | 486,639 | |
| | | | | | |
|
|
|
| | | | | | | | 494,075 | |
| | | | | | |
|
|
|
Insurance - Multi-line — 7.1% | |
Assurant, Inc. | | | 24,356 | | | | 2,995,788 | |
Chubb, Ltd. | | | 29,004 | | | | 4,532,745 | |
Hartford Financial Services Group, Inc. | | | 150,946 | | | | 8,797,133 | |
Voya Financial, Inc. | | | 61,902 | | | | 3,053,007 | |
| | | | | | |
|
|
|
| | | | | | | | 19,378,673 | |
| | | | | | |
|
|
|
Insurance - Property/Casualty — 4.2% | |
Berkshire Hathaway, Inc., Class B† | | | 56,495 | | | | 11,491,648 | |
| | | | | | |
|
|
|
Insurance - Reinsurance — 0.6% | |
RenaissanceRe Holdings, Ltd. | | | 8,662 | | | | 1,563,924 | |
| | | | | | |
|
|
|
Internet Security — 0.3% | |
Palo Alto Networks, Inc.† | | | 4,604 | | | | 937,467 | |
| | | | | | |
|
|
|
Investment Management/Advisor Services — 1.1% | |
Ameriprise Financial, Inc. | | | 7,744 | | | | 998,821 | |
LPL Financial Holdings, Inc. | | | 13,669 | | | | 1,024,492 | |
Raymond James Financial, Inc. | | | 12,540 | | | | 984,515 | |
| | | | | | |
|
|
|
| | | | | | | | 3,007,828 | |
| | | | | | |
|
|
|
Medical Instruments — 2.8% | |
Boston Scientific Corp.† | | | 34,503 | | | | 1,474,313 | |
Medtronic PLC | | | 55,544 | | | | 5,992,642 | |
| | | | | | |
|
|
|
| | | | | | | | 7,466,955 | |
| | | | | | |
|
|
|
Medical Labs & Testing Services — 0.7% | |
Laboratory Corp. of America Holdings† | | | 11,786 | | | | 1,974,862 | |
| | | | | | |
|
|
|
Medical Products — 0.8% | |
Becton Dickinson and Co. | | | 8,977 | | | | 2,279,440 | |
| | | | | | |
|
|
|
Medical - Biomedical/Gene — 0.5% | |
Gilead Sciences, Inc. | | | 22,749 | | | | 1,445,471 | |
| | | | | | |
|
|
|
Medical - Drugs — 3.4% | |
Johnson & Johnson | | | 9,582 | | | | 1,229,945 | |
Merck & Co., Inc. | | | 47,455 | | | | 4,103,434 | |
Pfizer, Inc. | | | 109,563 | | | | 3,894,965 | |
| | | | | | |
|
|
|
| | | | | | | | 9,228,344 | |
| | | | | | |
|
|
|
Medical - HMO — 1.3% | |
Anthem, Inc. | | | 6,610 | | | | 1,728,647 | |
Humana, Inc. | | | 5,998 | | | | 1,698,694 | |
| | | | | | |
|
|
|
| | | | | | | | 3,427,341 | |
| | | | | | |
|
|
|
| | | | | | | | |
| | |
| Security Description | | Shares | | | Value
(Note 2) | |
| |
| | | | | | | | | |
Metal - Copper — 0.4% | |
Freeport-McMoRan, Inc. | | | 103,470 | | | $ | 950,889 | |
| | | | | | |
|
|
|
Networking Products — 1.2% | |
Cisco Systems, Inc. | | | 69,598 | | | | 3,257,882 | |
| | | | | | |
|
|
|
Non-Hazardous Waste Disposal — 0.3% | |
Republic Services, Inc. | | | 7,551 | | | | 673,927 | |
| | | | | | |
|
|
|
Oil Companies - Exploration & Production — 2.7% | |
Concho Resources, Inc. | | | 10,873 | | | | 795,360 | |
Hess Corp. | | | 71,214 | | | | 4,482,921 | |
Occidental Petroleum Corp. | | | 22,038 | | | | 958,212 | |
Pioneer Natural Resources Co. | | | 8,219 | | | | 1,014,389 | |
| | | | | | |
|
|
|
| | | | | | | | 7,250,882 | |
| | | | | | |
|
|
|
Oil Companies - Integrated — 1.3% | |
Chevron Corp. | | | 16,834 | | | | 1,981,698 | |
Royal Dutch Shell PLC, Class A ADR | | | 27,816 | | | | 1,546,570 | |
| | | | | | |
|
|
|
| | | | | | | | 3,528,268 | |
| | | | | | |
|
|
|
Oil Refining & Marketing — 4.2% | |
Marathon Petroleum Corp. | | | 81,552 | | | | 4,013,174 | |
Phillips 66 | | | 40,057 | | | | 3,950,822 | |
Valero Energy Corp. | | | 44,885 | | | | 3,378,943 | |
| | | | | | |
|
|
|
| | | | | | | | 11,342,939 | |
| | | | | | |
|
|
|
Oil - Field Services — 0.7% | |
Apergy Corp.† | | | 45,087 | | | | 1,171,360 | |
Schlumberger, Ltd. | | | 22,537 | | | | 730,875 | |
| | | | | | |
|
|
|
| | | | | | | | 1,902,235 | |
| | | | | | |
|
|
|
Pharmacy Services — 0.4% | |
Cigna Corp. | | | 6,335 | | | | 975,400 | |
| | | | | | |
|
|
|
Real Estate Investment Trusts — 2.2% | |
Equity Residential | | | 27,514 | | | | 2,332,087 | |
Public Storage | | | 8,718 | | | | 2,308,003 | |
Weyerhaeuser Co. | | | 50,123 | | | | 1,318,736 | |
| | | | | | |
|
|
|
| | | | | | | | 5,958,826 | |
| | | | | | |
|
|
|
Retail - Discount — 0.7% | |
Target Corp. | | | 18,273 | | | | 1,955,942 | |
| | | | | | |
|
|
|
Retail - Drug Store — 0.2% | |
Walgreens Boots Alliance, Inc. | | | 8,588 | | | | 439,620 | |
| | | | | | |
|
|
|
Semiconductor Components - Integrated Circuits — 1.2% | |
QUALCOMM, Inc. | | | 41,872 | | | | 3,256,385 | |
| | | | | | |
|
|
|
Semiconductor Equipment — 0.4% | |
Applied Materials, Inc. | | | 21,127 | | | | 1,014,519 | |
| | | | | | |
|
|
|
Telecom Equipment - Fiber Optics — 0.9% | |
Corning, Inc. | | | 90,803 | | | | 2,528,864 | |
| | | | | | |
|
|
|
Telephone - Integrated — 2.4% | |
AT&T, Inc. | | | 187,813 | | | | 6,622,286 | |
| | | | | | |
|
|
|
Transport - Rail — 0.7% | |
Union Pacific Corp. | | | 11,953 | | | | 1,935,908 | |
| | | | | | |
|
|
|
Web Portals/ISP — 1.5% | |
Alphabet, Inc., Class A† | | | 3,416 | | | | 4,066,851 | |
| | | | | | |
|
|
|
Total Common Stocks | | | | | |
(cost $256,202,132) | | | | | | | 267,309,229 | |
| | | |
|
|
|
EXCHANGE-TRADED FUNDS — 0.2% | |
iShares Russell 1000 Value ETF
(cost $496,593) | | | 3,961 | | | | 493,461 | |
| | | | | | |
|
|
|
Total Long-Term Investment Securities | | | | | |
(cost $256,698,725) | | | | | | | 267,802,690 | |
| | | |
|
|
|
VALIC Company II Large Cap Value Fund
PORTFOLIO OF INVESTMENTS —August 31, 2019 — (continued)
| | | | | | | | |
| | |
| Security Description | | Principal
Amount/
Shares | | | Value
(Note 2) | |
| |
SHORT-TERM INVESTMENT SECURITIES — 1.1% | |
Commercial Paper — 1.1% | |
Credit Agricole Corporate and Investment Bank
2.08% due 09/03/2019
(cost $2,999,653) | | $ | 3,000,000 | | | $ | 2,999,298 | |
| | | | | | |
|
|
|
Registered Investment Companies — 0.0% | |
State Street Navigator Securities Lending Government Money Market Portfolio
2.12%(1)(2)
(cost $36,197) | | | 36,197 | | | | 36,197 | |
| | | | | | |
|
|
|
Total Short-Term Investment Securities | | | | | |
(cost $3,035,850) | | | | | | | 3,035,495 | |
| | | |
|
|
|
TOTAL INVESTMENTS | | | | | | | | |
(cost $259,734,575)(3) | | | 99.8 | % | | | 270,838,185 | |
Other assets less liabilities | | | 0.2 | | | | 648,402 | |
| | |
|
|
| |
|
|
|
NET ASSETS | | | 100.0 | % | | $ | 271,486,587 | |
| | |
|
|
| |
|
|
|
| † | Non-income producing security |
| # | The security or a portion thereof is out on loan (see Note 2). |
| (1) | The rate shown is the7-day yield as of August 31, 2019. |
| (2) | At August 31, 2019, the Fund had loaned securities with a total value of $1,691,741. This was secured by collateral of $36,197, which was received in cash and subsequently invested in short-term investments currently valued at $36,197 as reported in the Portfolio of Investments. Additional collateral of $1,701,099 was received in the form of fixed income pooled securities, which the Fund cannot sell or repledge and accordingly, are not reflected in the Fund’s assets and liabilities. |
The components of the fixed income pooled securities referenced above are as follows:
| | | | | | | | |
Securities
| | Coupon Range
| | Maturity Date Range
| | Value as of
August 31, 2019
| |
United States Treasury Bills | | 0.00% | | 09/05/2019 to 06/18/2020 | | $ | 805,366 | |
United States Treasury Notes/Bonds | | zero coupon to 8.75% | | 09/30/2019 to 02/15/2049 | | | 895,733 | |
| (3) | See Note 5 for cost of investments on a tax basis. |
ADR—American Depositary Receipt
ETF—Exchange-Traded Funds
The following is a summary of the inputs used to value the Fund’s net assets as of August 31, 2019 (see Note 2):
| | | | | | | | | | | | | | | | |
| | | Level 1 - Unadjusted
Quoted Prices
| | | Level 2 - Other
Observable Inputs
| | | Level 3 - Significant
Unobservable Inputs
| | | Total
| |
ASSETS: | | | | | | | | | | | | | | | | |
Investments at Value:* | | | | | | | | | | | | | | | | |
| | | | |
Common Stocks | | $ | 267,309,229 | | | $ | — | | | $ | — | | | $ | 267,309,229 | |
Exchange-Traded Funds | | | 493,461 | | | | — | | | | — | | | | 493,461 | |
Short-Term Investment Securities: | | | | | | | | | | | | | | | | |
Commercial Paper | | | — | | | | 2,999,298 | | | | — | | | | 2,999,298 | |
Registered Investment Companies | | | 36,197 | | | | — | | | | — | | | | 36,197 | |
| | |
|
|
| |
|
|
| |
|
|
| |
|
|
|
Total Investments at Value | | $ | 267,838,887 | | | $ | 2,999,298 | | | $ | — | | | $ | 270,838,185 | |
| | |
|
|
| |
|
|
| |
|
|
| |
|
|
|
| * | For a detailed presentation of investments, please refer to the Portfolio of Investments. |
See Notes to Financial Statements
VALIC Company II Mid Cap Growth Fund
PORTFOLIO PROFILE —August 31, 2019 (unaudited)
Industry Allocation*
| | | | |
Medical — Biomedical/Gene | | | 5.5 | % |
Insurance — Property/Casualty | | | 5.0 | |
Banks — Commercial | | | 5.0 | |
Enterprise Software/Service | | | 5.0 | |
Commercial Services — Finance | | | 4.5 | |
Computer Services | | | 3.9 | |
Medical Instruments | | | 3.2 | |
Distribution/Wholesale | | | 3.2 | |
Disposable Medical Products | | | 2.9 | |
Commercial Services | | | 2.6 | |
Computer Software | | | 2.5 | |
Containers — Metal/Glass | | | 2.4 | |
Electronic Components — Semiconductors | | | 2.1 | |
Web Hosting/Design | | | 2.1 | |
Medical Products | | | 2.0 | |
E-Commerce/Services | | | 1.9 | |
Lasers — System/Components | | | 1.9 | |
Gas — Distribution | | | 1.9 | |
Electronic Measurement Instruments | | | 1.8 | |
Machinery — General Industrial | | | 1.7 | |
Building — Residential/Commercial | | | 1.7 | |
Apparel Manufacturers | | | 1.7 | |
Building Products — Air & Heating | | | 1.6 | |
Transport — Rail | | | 1.6 | |
Hotels/Motels | | | 1.5 | |
Real Estate Investment Trusts | | | 1.5 | |
E-Services/Consulting | | | 1.5 | |
Data Processing/Management | | | 1.5 | |
Funeral Services & Related Items | | | 1.4 | |
Medical — Drugs | | | 1.4 | |
Internet Content — Entertainment | | | 1.1 | |
Finance — Auto Loans | | | 1.0 | |
Patient Monitoring Equipment | | | 1.0 | |
Retail — Automobile | | | 1.0 | |
Oil Companies — Exploration & Production | | | 1.0 | |
Registered Investment Companies | | | 0.9 | |
Multimedia | | | 0.9 | |
Machinery — Pumps | | | 0.9 | |
Semiconductor Equipment | | | 0.9 | |
Internet Infrastructure Software | | | 0.9 | |
Diagnostic Equipment | | | 0.9 | |
Rental Auto/Equipment | | | 0.9 | |
Machine Tools & Related Products | | | 0.9 | |
Banks — Fiduciary | | | 0.8 | |
Computer Aided Design | | | 0.8 | |
Containers — Paper/Plastic | | | 0.8 | |
E-Commerce/Products | | | 0.8 | |
Non-Hazardous Waste Disposal | | | 0.8 | |
Aerospace/Defense — Equipment | | | 0.8 | |
Instruments — Controls | | | 0.8 | |
Auto — Heavy Duty Trucks | | | 0.8 | |
Firearms & Ammunition | | | 0.7 | |
Applications Software | | | 0.7 | |
Computers — Other | | | 0.7 | |
Cable/Satellite TV | | | 0.7 | |
Athletic Equipment | | | 0.7 | |
Electric — Integrated | | | 0.6 | |
Real Estate Management/Services | | | 0.6 | |
Telecommunication Equipment | | | 0.4 | |
Medical — HMO | | | 0.3 | |
Printing — Commercial | | | 0.1 | |
| | |
|
|
|
| | | | 100.7 | % |
| | |
|
|
|
| * | Calculated as a percentage of net assets |
VALIC Company II Mid Cap Growth Fund
PORTFOLIO OF INVESTMENTS —August 31, 2019
| | | | | | | | |
| | |
| Security Description | | Shares | | | Value
(Note 2) | |
| |
COMMON STOCKS — 99.8% | |
Aerospace/Defense - Equipment — 0.8% | |
HEICO Corp., Class A | | | 17,226 | | | $ | 1,901,061 | |
| | | | | | |
|
|
|
Apparel Manufacturers — 1.7% | |
Carter’s, Inc. | | | 28,561 | | | | 2,612,761 | |
Under Armour, Inc., Class C† | | | 82,534 | | | | 1,396,475 | |
| | | | | | |
|
|
|
| | | | | | | | 4,009,236 | |
| | | | | | |
|
|
|
Applications Software — 0.7% | |
PTC, Inc.† | | | 27,467 | | | | 1,798,264 | |
| | | | | | |
|
|
|
Athletic Equipment — 0.7% | |
YETI Holdings, Inc.†# | | | 55,766 | | | | 1,575,390 | |
| | | | | | |
|
|
|
Auto - Heavy Duty Trucks — 0.8% | |
PACCAR, Inc. | | | 28,223 | | | | 1,850,300 | |
| | | | | | |
|
|
|
Banks - Commercial — 5.0% | |
Cullen/Frost Bankers, Inc. | | | 24,267 | | | | 2,014,404 | |
First Citizens BancShares, Inc., Class A | | | 3,824 | | | | 1,700,150 | |
First Republic Bank | | | 27,322 | | | | 2,451,330 | |
M&T Bank Corp. | | | 15,399 | | | | 2,251,488 | |
Pinnacle Financial Partners, Inc. | | | 6,495 | | | | 342,091 | |
Prosperity Bancshares, Inc.# | | | 31,463 | | | | 2,042,578 | |
South State Corp. | | | 18,115 | | | | 1,332,902 | |
| | | | | | |
|
|
|
| | | | | | | | 12,134,943 | |
| | | | | | |
|
|
|
Banks - Fiduciary — 0.8% | |
Northern Trust Corp. | | | 23,319 | | | | 2,050,440 | |
| | | | | | |
|
|
|
Building Products- Air & Heating — 1.6% | |
Lennox International, Inc. | | | 15,698 | | | | 3,983,838 | |
| | | | | | |
|
|
|
Building - Residential/Commercial — 1.7% | |
NVR, Inc.† | | | 1,160 | | | | 4,174,840 | |
| | | | | | |
|
|
|
Cable/Satellite TV — 0.7% | |
Cable One, Inc. | | | 1,363 | | | | 1,768,656 | |
| | | | | | |
|
|
|
Commercial Services — 2.6% | |
Cintas Corp. | | | 8,949 | | | | 2,360,746 | |
CoStar Group, Inc.† | | | 4,578 | | | | 2,814,875 | |
Healthcare Services Group, Inc.# | | | 47,338 | | | | 1,067,472 | |
| | | | | | |
|
|
|
| | | | | | | | 6,243,093 | |
| | | | | | |
|
|
|
Commercial Services - Finance — 4.5% | |
TransUnion | | | 59,394 | | | | 4,968,308 | |
WEX, Inc.† | | | 28,927 | | | | 5,917,018 | |
| | | | | | |
|
|
|
| | | | | | | | 10,885,326 | |
| | | | | | |
|
|
|
Computer Aided Design — 0.8% | |
Aspen Technology, Inc.† | | | 15,292 | | | | 2,036,894 | |
| | | | | | |
|
|
|
Computer Services — 3.9% | |
EPAM Systems, Inc.† | | | 12,641 | | | | 2,418,602 | |
Genpact, Ltd. | | | 169,005 | | | | 6,922,445 | |
| | | | | | |
|
|
|
| | | | | | | | 9,341,047 | |
| | | | | | |
|
|
|
Computer Software — 2.5% | |
Akamai Technologies, Inc.† | | | 34,974 | | | | 3,117,232 | |
Teradata Corp.† | | | 91,364 | | | | 2,820,407 | |
| | | | | | |
|
|
|
| | | | | | | | 5,937,639 | |
| | | | | | |
|
|
|
Computers - Other — 0.7% | |
Lumentum Holdings, Inc.† | | | 32,156 | | | | 1,793,019 | |
| | | | | | |
|
|
|
Containers - Metal/Glass — 2.4% | |
Ball Corp. | | | 56,646 | | | | 4,554,905 | |
Silgan Holdings, Inc. | | | 38,233 | | | | 1,137,814 | |
| | | | | | |
|
|
|
| | | | | | | | 5,692,719 | |
| | | | | | |
|
|
|
| | | | | | | | |
| | |
| Security Description | | Shares | | | Value
(Note 2) | |
| |
| | | | | | | | | |
Containers - Paper/Plastic — 0.8% | |
Packaging Corp. of America | | | 20,222 | | | $ | 2,033,929 | |
| | | | | | |
|
|
|
Data Processing/Management — 1.5% | |
Fair Isaac Corp.† | | | 10,223 | | | | 3,605,857 | |
| | | | | | |
|
|
|
Diagnostic Equipment — 0.9% | |
Repligen Corp.† | | | 22,925 | | | | 2,127,669 | |
| | | | | | |
|
|
|
Disposable Medical Products — 2.9% | |
STERIS PLC | | | 20,098 | | | | 3,103,131 | |
Teleflex, Inc. | | | 11,037 | | | | 4,016,585 | |
| | | | | | |
|
|
|
| | | | | | | | 7,119,716 | |
| | | | | | |
|
|
|
Distribution/Wholesale — 3.2% | |
Fastenal Co. | | | 73,981 | | | | 2,265,298 | |
IAA, Inc.† | | | 56,123 | | | | 2,741,609 | |
KAR Auction Services, Inc. | | | 85,804 | | | | 2,278,954 | |
Watsco, Inc.# | | | 3,056 | | | | 499,809 | |
| | | | | | |
|
|
|
| | | | | | | | 7,785,670 | |
| | | | | | |
|
|
|
E-Commerce/Products — 0.8% | |
Etsy, Inc.† | | | 26,255 | | | | 1,386,001 | |
Wayfair, Inc., Class A†# | | | 4,623 | | | | 521,197 | |
| | | | | | |
|
|
|
| | | | | | | | 1,907,198 | |
| | | | | | |
|
|
|
E-Commerce/Services — 1.9% | |
Cargurus, Inc.†# | | | 43,910 | | | | 1,432,344 | |
GrubHub, Inc.†# | | | 20,938 | | | | 1,242,461 | |
TripAdvisor, Inc.† | | | 50,054 | | | | 1,901,552 | |
| | | | | | |
|
|
|
| | | | | | | | 4,576,357 | |
| | | | | | |
|
|
|
E-Services/Consulting — 1.5% | |
CDW Corp. | | | 32,033 | | | | 3,699,811 | |
| | | | | | |
|
|
|
Electric - Integrated — 0.6% | |
Black Hills Corp. | | | 18,015 | | | | 1,381,931 | |
| | | | | | |
|
|
|
Electronic Components - Semiconductors — 2.1% | |
Monolithic Power Systems, Inc. | | | 16,984 | | | | 2,557,111 | |
Silicon Laboratories, Inc.† | | | 23,609 | | | | 2,573,381 | |
| | | | | | |
|
|
|
| | | | | | | | 5,130,492 | |
| | | | | | |
|
|
|
Electronic Measurement Instruments — 1.8% | |
Keysight Technologies, Inc.† | | | 21,714 | | | | 2,103,218 | |
National Instruments Corp. | | | 55,933 | | | | 2,349,186 | |
| | | | | | |
|
|
|
| | | | | | | | 4,452,404 | |
| | | | | | |
|
|
|
Enterprise Software/Service — 5.0% | |
Black Knight, Inc.† | | | 46,952 | | | | 2,922,762 | |
Blackbaud, Inc. | | | 37,819 | | | | 3,440,394 | |
Guidewire Software, Inc.†# | | | 28,831 | | | | 2,772,966 | |
Veeva Systems, Inc., Class A† | | | 18,015 | | | | 2,889,246 | |
| | | | | | |
|
|
|
| | | | | | | | 12,025,368 | |
| | | | | | |
|
|
|
Finance - Auto Loans — 1.0% | |
Credit Acceptance Corp.† | | | 5,509 | | | | 2,493,649 | |
| | | | | | |
|
|
|
Firearms & Ammunition — 0.7% | |
Axon Enterprise, Inc.† | | | 30,069 | | | | 1,803,238 | |
| | | | | | |
|
|
|
Funeral Services & Related Items — 1.4% | |
Service Corp. International | | | 73,193 | | | | 3,388,836 | |
| | | | | | |
|
|
|
Gas- Distribution — 1.9% | |
NiSource, Inc. | | | 36,242 | | | | 1,070,951 | |
UGI Corp. | | | 71,260 | | | | 3,468,224 | |
| | | | | | |
|
|
|
| | | | | | | | 4,539,175 | |
| | | | | | |
|
|
|
VALIC Company II Mid Cap Growth Fund
PORTFOLIO OF INVESTMENTS —August 31, 2019 — (continued)
| | | | | | | | |
| | |
| Security Description | | Shares | | | Value
(Note 2) | |
| |
COMMON STOCKS (continued) | |
Hotels/Motels — 1.5% | |
Choice Hotels International, Inc. | | | 41,218 | | | $ | 3,750,014 | |
| | | | | | |
|
|
|
Instruments - Controls — 0.8% | |
Mettler-Toledo International, Inc.† | | | 2,830 | | | | 1,858,716 | |
| | | | | | |
|
|
|
Insurance - Property/Casualty — 5.0% | |
Alleghany Corp.† | | | 2,662 | | | | 1,994,663 | |
Fidelity National Financial, Inc. | | | 42,883 | | | | 1,884,279 | |
Markel Corp.† | | | 3,579 | | | | 4,091,084 | |
White Mountains Insurance Group, Ltd. | | | 1,997 | | | | 2,118,218 | |
WR Berkley Corp. | | | 29,185 | | | | 2,079,431 | |
| | | | | | |
|
|
|
| | | | | | | | 12,167,675 | |
| | | | | | |
|
|
|
Internet Content - Entertainment — 1.1% | |
Roku, Inc.†# | | | 16,998 | | | | 2,572,817 | |
| | | | | | |
|
|
|
Internet Infrastructure Software — 0.9% | |
F5 Networks, Inc.† | | | 16,850 | | | | 2,169,101 | |
| | | | | | |
|
|
|
Lasers - System/Components — 1.9% | |
Coherent, Inc.† | | | 12,815 | | | | 1,857,662 | |
II-VI, Inc.†# | | | 71,959 | | | | 2,699,182 | |
| | | | | | |
|
|
|
| | | | | | | | 4,556,844 | |
| | | | | | |
|
|
|
Machine Tools & Related Products — 0.9% | |
Lincoln Electric Holdings, Inc. | | | 24,995 | | | | 2,063,587 | |
| | | | | | |
|
|
|
Machinery - General Industrial — 1.7% | |
IDEX Corp. | | | 25,384 | | | | 4,180,999 | |
| | | | | | |
|
|
|
Machinery - Pumps — 0.9% | |
Gardner Denver Holdings, Inc.† | | | 79,395 | | | | 2,277,049 | |
| | | | | | |
|
|
|
Medical Instruments — 3.2% | |
Bio-Techne Corp. | | | 12,099 | | | | 2,317,805 | |
Integra LifeSciences Holdings Corp.† | | | 44,683 | | | | 2,681,874 | |
NuVasive, Inc.† | | | 45,087 | | | | 2,863,926 | |
| | | | | | |
|
|
|
| | | | | | | | 7,863,605 | |
| | | | | | |
|
|
|
Medical Products — 2.0% | |
Hill-Rom Holdings, Inc. | | | 25,082 | | | | 2,700,830 | |
Varian Medical Systems, Inc.† | | | 19,883 | | | | 2,106,206 | |
| | | | | | |
|
|
|
| | | | | | | | 4,807,036 | |
| | | | | | |
|
|
|
Medical - Biomedical/Gene — 5.5% | |
Alnylam Pharmaceuticals, Inc.† | | | 22,079 | | | | 1,781,554 | |
Bluebird Bio, Inc.†# | | | 16,412 | | | | 1,695,524 | |
Ionis Pharmaceuticals, Inc.†# | | | 35,046 | | | | 2,215,258 | |
Sage Therapeutics, Inc.†# | | | 16,540 | | | | 2,839,422 | |
Seattle Genetics, Inc.† | | | 42,017 | | | | 3,052,115 | |
Ultragenyx Pharmaceutical, Inc.†# | | | 33,965 | | | | 1,850,073 | |
| | | | | | |
|
|
|
| | | | | | | | 13,433,946 | |
| | | | | | |
|
|
|
Medical - Drugs — 1.4% | |
Aerie Pharmaceuticals, Inc.†# | | | 43,639 | | | | 945,221 | |
PRA Health Sciences, Inc.† | | | 24,659 | | | | 2,437,295 | |
| | | | | | |
|
|
|
| | | | | | | | 3,382,516 | |
| | | | | | |
|
|
|
Medical- HMO — 0.3% | |
Molina Healthcare, Inc.† | | | 5,897 | | | | 768,261 | |
| | | | | | |
|
|
|
Multimedia — 0.9% | |
FactSet Research Systems, Inc.# | | | 8,441 | | | | 2,296,712 | |
| | | | | | |
|
|
|
Non-Hazardous Waste Disposal — 0.8% | |
Waste Connections, Inc. | | | 20,688 | | | | 1,901,227 | |
| | | | | | |
|
|
|
Oil Companies - Exploration & Production — 1.0% | |
Diamondback Energy, Inc. | | | 11,880 | | | | 1,165,191 | |
WPX Energy, Inc.† | | | 109,849 | | | | 1,181,975 | |
| | | | | | |
|
|
|
| | | | | | | | 2,347,166 | |
| | | | | | |
|
|
|
| | | | | | | | |
| | |
| Security Description | | Shares | | | Value
(Note 2) | |
| |
| | | | | | | | | |
Patient Monitoring Equipment — 1.0% | |
Masimo Corp.† | | | 15,850 | | | $ | 2,429,012 | |
| | | | | | |
|
|
|
Printing - Commercial — 0.1% | |
Cimpress NV†# | | | 2,000 | | | | 229,380 | |
| | | | | | |
|
|
|
Real Estate Investment Trusts — 1.5% | |
Douglas Emmett, Inc. | | | 41,679 | | | | 1,758,854 | |
Equity Commonwealth | | | 58,319 | | | | 1,963,017 | |
| | | | | | |
|
|
|
| | | | | | | | 3,721,871 | |
| | | | | | |
|
|
|
Real Estate Management/Services — 0.6% | |
Redfin Corp.†# | | | 78,591 | | | | 1,327,402 | |
| | | | | | |
|
|
|
Rental Auto/Equipment — 0.9% | |
AMERCO | | | 5,988 | | | | 2,105,501 | |
| | | | | | |
|
|
|
Retail - Automobile — 1.0% | |
CarMax, Inc.†# | | | 28,656 | | | | 2,386,472 | |
| | | | | | |
|
|
|
Semiconductor Equipment — 0.9% | |
MKS Instruments, Inc. | | | 28,342 | | | | 2,218,895 | |
| | | | | | |
|
|
|
Telecommunication Equipment — 0.4% | |
CommScope Holding Co., Inc.† | | | 94,889 | | | | 1,019,108 | |
| | | | | | |
|
|
|
Transport - Rail — 1.6% | |
Genesee & Wyoming, Inc., Class A† | | | 34,638 | | | | 3,840,661 | |
| | | | | | |
|
|
|
Web Hosting/Design — 2.1% | |
Q2 Holdings, Inc.† | | | 16,041 | | | | 1,442,888 | |
VeriSign, Inc.† | | | 17,633 | | | | 3,594,487 | |
| | | | | | |
|
|
|
| | | | | | | | 5,037,375 | |
| | | | | | |
|
|
|
Total Long-Term Investment Securities | | | | | | | | |
(cost $210,010,020) | | | | | | | 241,960,953 | |
| | | |
|
|
|
SHORT-TERM INVESTMENT SECURITIES — 0.9% | |
Registered Investment Companies — 0.9% | |
State Street Navigator Securities Lending Government Money Market Portfolio
2.12%(1)(2)
(cost $2,341,559) | | | 2,341,559 | | �� | | 2,341,559 | |
| | | | | | |
|
|
|
TOTAL INVESTMENTS | | | | | | | | |
(cost $212,351,579)(3) | | | 100.7 | % | | | 244,302,512 | |
Liabilities in excess of other assets | | | (0.7 | ) | | | (1,790,366 | ) |
| | |
|
|
| |
|
|
|
NET ASSETS | | | 100.0 | % | | $ | 242,512,146 | |
| | |
|
|
| |
|
|
|
| † | Non-income producing security |
| # | The security or a portion thereof is out on loan (see Note 2). |
| (1) | The rate shown is the7-day yield as of August 31, 2019. |
| (2) | At August 31, 2019, the Fund had loaned securities with a total value of $26,638,455. This was secured by collateral of $2,341,559, which was received in cash and subsequently invested in short-term investments currently valued at $2,341,559 as reported in the Portfolio of Investments. Additional collateral of $24,867,131 was received in the form of fixed income pooled securities, which the Fund cannot sell or repledge and accordingly are not reflected in the Fund’s assets and liabilities. |
The components of the fixed income pooled securities referenced above are as follows:
| | | | | | | | |
Securities
| | Coupon Range
| | Maturity Date Range
| | Value as of
August 31, 2019
| |
United States Treasury Bills | | 0.00% | | 09/05/2019 to 06/18/2020 | | $ | 4,319,480 | |
United States Treasury Notes/Bonds | | zero coupon to 8.75% | | 09/30/2019 to 02/15/2049 | | | 20,547,651 | |
| (3) | See Note 5 for cost of investments on a tax basis. |
VALIC Company II Mid Cap Growth Fund
PORTFOLIO OF INVESTMENTS —August 31, 2019 — (continued)
The following is a summary of the inputs used to value the Fund’s net assets as of August 31, 2019 (see Note 2):
| | | | | | | | | | | | | | | | |
| | | Level 1 - Unadjusted
Quoted Prices
| | | Level 2 - Other
Observable Inputs
| | | Level 3 - Significant
Unobservable Inputs
| | | Total
| |
ASSETS: | | | | | | | | | | | | | | | | |
Investments at Value:* | | | | | | | | | | | | | | | | |
| | | | |
Common Stocks | | $ | 241,960,953 | | | $ | — | | | $ | — | | | $ | 241,960,953 | |
Short-Term Investment Securities | | | 2,341,559 | | | | — | | | | — | | | | 2,341,559 | |
| | |
|
|
| |
|
|
| |
|
|
| |
|
|
|
Total Investments at Value | | $ | 244,302,512 | | | $ | — | | | $ | — | | | $ | 244,302,512 | |
| | |
|
|
| |
|
|
| |
|
|
| |
|
|
|
| * | For a detailed presentation of investments, please refer to the Portfolio of Investments. |
See Notes to Financial Statements
VALIC Company II Mid Cap Value Fund
PORTFOLIO PROFILE —August 31, 2019 (unaudited)
Industry Allocation*
| | | | |
Real Estate Investment Trusts | | | 10.5 | % |
Electric — Integrated | | | 5.2 | |
Banks — Commercial | | | 4.9 | |
Insurance — Property/Casualty | | | 3.5 | |
Oil Companies — Exploration & Production | | | 3.4 | |
Banks — Super Regional | | | 3.2 | |
Computer Services | | | 2.6 | |
Chemicals — Diversified | | | 2.3 | |
Insurance — Reinsurance | | | 2.2 | |
Insurance — Multi-line | | | 2.0 | |
Aerospace/Defense — Equipment | | | 2.0 | |
Steel — Producers | | | 1.7 | |
Diversified Manufacturing Operations | | | 1.7 | |
Machinery — Pumps | | | 1.7 | |
Medical Labs & Testing Services | | | 1.5 | |
Medical Products | | | 1.4 | |
Finance — Investment Banker/Broker | | | 1.3 | |
Insurance Brokers | | | 1.2 | |
Semiconductor Equipment | | | 1.1 | |
Airlines | | | 1.1 | |
Oil Refining & Marketing | | | 1.1 | |
Finance — Credit Card | | | 1.1 | |
Distribution/Wholesale | | | 1.0 | |
Electronic Components — Semiconductors | | | 1.0 | |
Gas — Distribution | | | 1.0 | |
Medical — HMO | | | 1.0 | |
Entertainment Software | | | 1.0 | |
Building & Construction Products — Misc. | | | 1.0 | |
Registered Investment Companies | | | 0.9 | |
Electronic Parts Distribution | | | 0.9 | |
Building — Residential/Commercial | | | 0.9 | |
Finance — Consumer Loans | | | 0.9 | |
Insurance — Life/Health | | | 0.9 | |
Data Processing/Management | | | 0.9 | |
Electronic Connectors | | | 0.9 | |
Hazardous Waste Disposal | | | 0.8 | |
Medical — Wholesale Drug Distribution | | | 0.8 | |
Food — Wholesale/Distribution | | | 0.8 | |
Electric Products — Misc. | | | 0.8 | |
Medical — Hospitals | | | 0.8 | |
Repurchase Agreements | | | 0.8 | |
Commercial Services — Finance | | | 0.8 | |
Building Products — Doors & Windows | | | 0.8 | |
Food — Misc./Diversified | | | 0.7 | |
Electronic Components — Misc. | | | 0.7 | |
E-Commerce/Services | | | 0.7 | |
Human Resources | | | 0.7 | |
Electronic Measurement Instruments | | | 0.7 | |
Computers — Other | | | 0.7 | |
Lasers — System/Components | | | 0.6 | |
Transport — Rail | | | 0.6 | |
Computer Software | | | 0.6 | |
E-Commerce/Products | | | 0.6 | |
Savings & Loans/Thrifts | | | 0.6 | |
Physical Therapy/Rehabilitation Centers | | | 0.6 | |
Cable/Satellite TV | | | 0.6 | |
Agricultural Chemicals | | | 0.6 | |
Batteries/Battery Systems | | | 0.5 | |
Cellular Telecom | | | 0.5 | |
Footwear & Related Apparel | | | 0.5 | |
Chemicals — Specialty | | | 0.5 | |
Disposable Medical Products | | | 0.5 | |
Office Supplies & Forms | | | 0.5 | |
Hotels/Motels | | | 0.5 | |
Building Products — Cement | | | 0.5 | |
Auto/Truck Parts & Equipment — Original | | | 0.5 | |
Power Converter/Supply Equipment | | | 0.5 | |
Industrial Automated/Robotic | | | 0.5 | |
Theaters | | | 0.4 | |
| | | | |
Semiconductor Components — Integrated Circuits | | | 0.4 | |
Motion Pictures & Services | | | 0.4 | |
Publishing — Newspapers | | | 0.4 | |
Cruise Lines | | | 0.4 | |
Aerospace/Defense | | | 0.4 | |
Retail — Apparel/Shoe | | | 0.3 | |
Transport — Truck | | | 0.3 | |
Shipbuilding | | | 0.3 | |
Broadcast Services/Program | | | 0.3 | |
Medical Instruments | | | 0.3 | |
Retail — Auto Parts | | | 0.3 | |
Capacitors | | | 0.3 | |
Applications Software | | | 0.3 | |
Food — Meat Products | | | 0.3 | |
Beverages — Non-alcoholic | | | 0.3 | |
Containers — Paper/Plastic | | | 0.3 | |
Medical — Drugs | | | 0.3 | |
Agricultural Biotech | | | 0.3 | |
Transport — Services | | | 0.2 | |
Investment Management/Advisor Services | | | 0.2 | |
Independent Power Producers | | | 0.2 | |
Auto — Heavy Duty Trucks | | | 0.2 | |
Medical Information Systems | | | 0.2 | |
Building Products — Wood | | | 0.2 | |
Computers | | | 0.2 | |
Diagnostic Equipment | | | 0.2 | |
Building — Heavy Construction | | | 0.2 | |
Appliances | | | 0.2 | |
Casino Hotels | | | 0.2 | |
Oil — Field Services | | | 0.2 | |
Office Automation & Equipment | | | 0.2 | |
Finance — Leasing Companies | | | 0.2 | |
Retail — Discount | | | 0.2 | |
Advertising Agencies | | | 0.2 | |
Containers — Metal/Glass | | | 0.2 | |
Banks — Fiduciary | | | 0.2 | |
Computers — Memory Devices | | | 0.2 | |
Dialysis Centers | | | 0.1 | |
| | |
|
|
|
| | | | 100.1 | % |
| | |
|
|
|
| * | Calculated as a percentage of net assets |
VALIC Company II Mid Cap Value Fund
PORTFOLIO OF INVESTMENTS —August 31, 2019
| | | | | | | | |
| | |
| Security Description | | Shares | | | Value
(Note 2) | |
| |
COMMON STOCKS — 98.4% | |
Advertising Agencies — 0.2% | |
Omnicom Group, Inc. | | | 16,846 | | | $ | 1,281,307 | |
| | | | | | |
|
|
|
Aerospace/Defense — 0.4% | |
Spirit AeroSystems Holdings, Inc., Class A | | | 32,283 | | | | 2,602,010 | |
| | | | | | |
|
|
|
Aerospace/Defense - Equipment — 2.0% | |
L3Harris Technologies, Inc. | | | 47,687 | | | | 10,081,509 | |
Moog, Inc., Class A | | | 56,265 | | | | 4,571,531 | |
| | | | | | |
|
|
|
| | | | | | | | 14,653,040 | |
| | | | | | |
|
|
|
Agricultural Biotech — 0.3% | |
Corteva, Inc. | | | 69,044 | | | | 2,024,370 | |
| | | | | | |
|
|
|
Agricultural Chemicals — 0.6% | |
Mosaic Co. | | | 65,557 | | | | 1,205,593 | |
Nutrien, Ltd. | | | 57,089 | | | | 2,875,002 | |
| | | | | | |
|
|
|
| | | | | | | | 4,080,595 | |
| | | | | | |
|
|
|
Airlines — 1.1% | |
JetBlue Airways Corp.† | | | 214,739 | | | | 3,719,280 | |
Southwest Airlines Co. | | | 88,954 | | | | 4,654,073 | |
| | | | | | |
|
|
|
| | | | | | | | 8,373,353 | |
| | | | | | |
|
|
|
Appliances — 0.2% | |
Whirlpool Corp. | | | 10,807 | | | | 1,503,146 | |
| | | | | | |
|
|
|
Applications Software — 0.3% | |
CDK Global, Inc. | | | 51,136 | | | | 2,207,030 | |
| | | | | | |
|
|
|
Auto - Heavy Duty Trucks — 0.2% | |
PACCAR, Inc. | | | 25,424 | | | | 1,666,797 | |
| | | | | | |
|
|
|
Auto/Truck Parts & Equipment - Original — 0.5% | |
Lear Corp. | | | 9,767 | | | | 1,096,443 | |
WABCO Holdings, Inc.† | | | 19,986 | | | | 2,668,331 | |
| | | | | | |
|
|
|
| | | | | | | | 3,764,774 | |
| | | | | | |
|
|
|
Banks - Commercial — 4.9% | |
Atlantic Union Bankshares Corp. | | | 96,121 | | | | 3,470,929 | |
BancorpSouth Bank | | | 98,094 | | | | 2,706,414 | |
East West Bancorp, Inc. | | | 98,661 | | | | 4,057,927 | |
First Midwest Bancorp, Inc. | | | 159,732 | | | | 3,066,854 | |
IBERIABANK Corp. | | | 52,283 | | | | 3,607,004 | |
Regions Financial Corp. | | | 257,579 | | | | 3,765,805 | |
South State Corp. | | | 42,642 | | | | 3,137,598 | |
Synovus Financial Corp. | | | 113,886 | | | | 4,047,509 | |
Western Alliance Bancorp | | | 79,435 | | | | 3,449,068 | |
Zions Bancorp NA# | | | 128,399 | | | | 5,275,915 | |
| | | | | | |
|
|
|
| | | | | | | | 36,585,023 | |
| | | | | | |
|
|
|
Banks - Fiduciary — 0.2% | |
State Street Corp. | | | 22,799 | | | | 1,169,817 | |
| | | | | | |
|
|
|
Banks - Super Regional — 3.2% | |
Comerica, Inc. | | | 55,462 | | | | 3,419,232 | |
Fifth Third Bancorp | | | 182,615 | | | | 4,830,167 | |
Huntington Bancshares, Inc. | | | 432,766 | | | | 5,734,149 | |
KeyCorp | | | 274,422 | | | | 4,555,405 | |
SunTrust Banks, Inc. | | | 90,333 | | | | 5,556,383 | |
| | | | | | |
|
|
|
| | | | | | | | 24,095,336 | |
| | | | | | |
|
|
|
Batteries/Battery Systems — 0.5% | |
EnerSys | | | 71,497 | | | | 4,003,832 | |
| | | | | | |
|
|
|
Beverages-Non-alcoholic — 0.3% | |
Coca-Cola European Partners PLC | | | 38,856 | | | | 2,189,147 | |
| | | | | | |
|
|
|
Broadcast Services/Program — 0.3% | |
Fox Corp., Class A | | | 72,365 | | | | 2,400,347 | |
| | | | | | |
|
|
|
| | | | | | | | |
| | |
| Security Description | | Shares | | | Value
(Note 2) | |
| |
| | | | | | | | | |
Building & Construction Products - Misc. — 1.0% | |
Fortune Brands Home & Security, Inc. | | | 96,259 | | | $ | 4,914,984 | |
Owens Corning | | | 37,516 | | | | 2,151,918 | |
| | | | | | |
|
|
|
| | | | | | | | 7,066,902 | |
| | | | | | |
|
|
|
Building Products - Cement — 0.5% | |
Buzzi Unicem SpA# | | | 130,837 | | | | 2,744,353 | |
Eagle Materials, Inc. | | | 12,615 | | | | 1,062,057 | |
| | | | | | |
|
|
|
| | | | | | | | 3,806,410 | |
| | | | | | |
|
|
|
Building Products - Doors & Windows — 0.8% | |
JELD-WEN Holding, Inc.† | | | 145,851 | | | | 2,517,388 | |
Sanwa Holdings Corp. | | | 287,726 | | | | 3,201,319 | |
| | | | | | |
|
|
|
| | | | | | | | 5,718,707 | |
| | | | | | |
|
|
|
Building Products - Wood — 0.2% | |
Masco Corp. | | | 40,517 | | | | 1,650,257 | |
| | | | | | |
|
|
|
Building - Heavy Construction — 0.2% | |
Granite Construction, Inc. | | | 54,045 | | | | 1,537,040 | |
| | | | | | |
|
|
|
Building - Residential/Commercial — 0.9% | |
Lennar Corp., Class A | | | 134,336 | | | | 6,851,136 | |
| | | | | | |
|
|
|
Cable/Satellite TV — 0.6% | |
Altice USA, Inc., Class A† | | | 82,680 | | | | 2,387,798 | |
Liberty Global PLC, Class C† | | | 66,541 | | | | 1,738,051 | |
| | | | | | |
|
|
|
| | | | | | | | 4,125,849 | |
| | | | | | |
|
|
|
Capacitors — 0.3% | |
KEMET Corp. | | | 134,931 | | | | 2,260,094 | |
| | | | | | |
|
|
|
Casino Hotels — 0.2% | |
Las Vegas Sands Corp. | | | 26,517 | | | | 1,470,898 | |
| | | | | | |
|
|
|
Cellular Telecom — 0.5% | |
Millicom International Cellular SA SDR | | | 78,225 | | | | 3,985,114 | |
| | | | | | |
|
|
|
Chemicals - Diversified — 2.3% | |
Celanese Corp. | | | 55,781 | | | | 6,323,892 | |
FMC Corp. | | | 120,785 | | | | 10,427,369 | |
| | | | | | |
|
|
|
| | | | | | | | 16,751,261 | |
| | | | | | |
|
|
|
Chemicals - Specialty — 0.5% | |
Cabot Corp. | | | 98,040 | | | | 3,921,600 | |
| | | | | | |
|
|
|
Commercial Services - Finance — 0.8% | |
Global Payments, Inc. | | | 16,915 | | | | 2,807,552 | |
Moody’s Corp. | | | 13,736 | | | | 2,961,207 | |
| | | | | | |
|
|
|
| | | | | | | | 5,768,759 | |
| | | | | | |
|
|
|
Computer Services — 2.6% | |
Amdocs, Ltd. | | | 98,116 | | | | 6,352,030 | |
Leidos Holdings, Inc. | | | 120,841 | | | | 10,556,670 | |
Science Applications International Corp. | | | 30,531 | | | | 2,687,033 | |
| | | | | | |
|
|
|
| | | | | | | | 19,595,733 | |
| | | | | | |
|
|
|
Computer Software — 0.6% | |
SS&C Technologies Holdings, Inc. | | | 90,657 | | | | 4,225,523 | |
| | | | | | |
|
|
|
Computers — 0.2% | |
Hewlett Packard Enterprise Co. | | | 116,437 | | | | 1,609,159 | |
| | | | | | |
|
|
|
Computers - Memory Devices — 0.2% | |
Western Digital Corp. | | | 19,761 | | | | 1,131,712 | |
| | | | | | |
|
|
|
Computers - Other — 0.7% | |
Lumentum Holdings, Inc.† | | | 86,703 | | | | 4,834,559 | |
| | | | | | |
|
|
|
Containers - Metal/Glass — 0.2% | |
Crown Holdings, Inc.† | | | 18,252 | | | | 1,201,712 | |
| | | | | | |
|
|
|
VALIC Company II Mid Cap Value Fund
PORTFOLIO OF INVESTMENTS —August 31, 2019 — (continued)
| | | | | | | | |
| | |
| Security Description | | Shares | | | Value
(Note 2) | |
| |
COMMON STOCKS (continued) | |
Containers - Paper/Plastic — 0.3% | |
Graphic Packaging Holding Co. | | | 153,767 | | | $ | 2,123,522 | |
| | | | | | |
|
|
|
Cruise Lines — 0.4% | |
Norwegian Cruise Line Holdings, Ltd.† | | | 52,561 | | | | 2,667,471 | |
| | | | | | |
|
|
|
Data Processing/Management — 0.9% | |
Fidelity National Information Services, Inc. | | | 47,903 | | | | 6,525,347 | |
| | | | | | |
|
|
|
Diagnostic Equipment — 0.2% | |
Avantor, Inc.† | | | 88,126 | | | | 1,542,205 | |
| | | | | | |
|
|
|
Dialysis Centers — 0.1% | |
DaVita, Inc.† | | | 17,581 | | | | 991,041 | |
| | | | | | |
|
|
|
Disposable Medical Products — 0.5% | |
STERIS PLC | | | 25,189 | | | | 3,889,182 | |
| | | | | | |
|
|
|
Distribution/Wholesale — 1.0% | |
HD Supply Holdings, Inc.† | | | 79,180 | | | | 3,080,894 | |
IAA, Inc.† | | | 52,911 | | | | 2,584,702 | |
KAR Auction Services, Inc.# | | | 34,782 | | | | 923,810 | |
WESCO International, Inc.† | | | 24,012 | | | | 1,082,461 | |
| | | | | | |
|
|
|
| | | | | | | | 7,671,867 | |
| | | | | | |
|
|
|
Diversified Manufacturing Operations — 1.7% | |
Eaton Corp. PLC | | | 45,336 | | | | 3,659,522 | |
Ingersoll-Rand PLC | | | 12,278 | | | | 1,486,743 | |
ITT, Inc. | | | 48,110 | | | | 2,738,421 | |
Parker-Hannifin Corp. | | | 21,563 | | | | 3,574,499 | |
Textron, Inc. | | | 25,702 | | | | 1,156,590 | |
| | | | | | |
|
|
|
| | | | | | | | 12,615,775 | |
| | | | | | |
|
|
|
E-Commerce/Products — 0.6% | |
eBay, Inc. | | | 104,061 | | | | 4,192,618 | |
| | | | | | |
|
|
|
E-Commerce/Services — 0.7% | |
Expedia Group, Inc. | | | 39,047 | | | | 5,080,015 | |
| | | | | | |
|
|
|
Electric Products - Misc. — 0.8% | |
AMETEK, Inc. | | | 70,875 | | | | 6,090,289 | |
| | | | | | |
|
|
|
Electric - Integrated — 5.2% | |
Alliant Energy Corp. | | | 126,801 | | | | 6,650,712 | |
American Electric Power Co., Inc. | | | 23,771 | | | | 2,166,727 | |
DTE Energy Co. | | | 41,131 | | | | 5,333,045 | |
Edison International | | | 46,076 | | | | 3,329,912 | |
Entergy Corp. | | | 45,809 | | | | 5,169,088 | |
Evergy, Inc. | | | 91,639 | | | | 5,956,535 | |
FirstEnergy Corp. | | | 58,925 | | | | 2,710,550 | |
Pinnacle West Capital Corp. | | | 14,063 | | | | 1,340,345 | |
Xcel Energy, Inc. | | | 90,535 | | | | 5,814,158 | |
| | | | | | |
|
|
|
| | | | | | | | 38,471,072 | |
| | | | | | |
|
|
|
Electronic Components - Misc. — 0.7% | |
Flex, Ltd.† | | | 141,708 | | | | 1,364,648 | |
Gentex Corp. | | | 46,615 | | | | 1,239,959 | |
Sensata Technologies Holding PLC† | | | 63,043 | | | | 2,873,500 | |
| | | | | | |
|
|
|
| | | | | | | | 5,478,107 | |
| | | | | | |
|
|
|
Electronic Components - Semiconductors — 1.0% | |
Marvell Technology Group, Ltd.# | | | 73,105 | | | | 1,752,327 | |
Qorvo, Inc.† | | | 38,706 | | | | 2,764,770 | |
Silicon Motion Technology Corp. ADR | | | 96,450 | | | | 3,112,441 | |
| | | | | | |
|
|
|
| | | | | | | | 7,629,538 | |
| | | | | | |
|
|
|
Electronic Connectors — 0.9% | |
TE Connectivity, Ltd. | | | 69,999 | | | | 6,385,309 | |
| | | | | | |
|
|
|
Electronic Measurement Instruments — 0.7% | |
Itron, Inc.† | | | 70,029 | | | | 4,863,514 | |
| | | | | | |
|
|
|
| | | | | | | | |
| | |
| Security Description | | Shares | | | Value
(Note 2) | |
| |
| | | | | | | | | |
Electronic Parts Distribution — 0.9% | |
Arrow Electronics, Inc.† | | | 100,099 | | | $ | 6,926,851 | |
| | | | | | |
|
|
|
Entertainment Software — 1.0% | |
Activision Blizzard, Inc. | | | 56,575 | | | | 2,862,695 | |
Electronic Arts, Inc.† | | | 11,783 | | | | 1,103,831 | |
NetEase, Inc. ADR | | | 7,025 | | | | 1,791,375 | |
Take-Two Interactive Software, Inc.† | | | 10,472 | | | | 1,381,990 | |
| | | | | | |
|
|
|
| | | | | | | | 7,139,891 | |
| | | | | | |
|
|
|
Finance - Consumer Loans — 0.9% | |
SLM Corp. | | | 594,835 | | | | 5,020,407 | |
Synchrony Financial | | | 51,401 | | | | 1,647,402 | |
| | | | | | |
|
|
|
| | | | | | | | 6,667,809 | |
| | | | | | |
|
|
|
Finance - Credit Card — 1.1% | |
Alliance Data Systems Corp. | | | 9,480 | | | | 1,165,566 | |
Discover Financial Services | | | 83,800 | | | | 6,701,486 | |
| | | | | | |
|
|
|
| | | | | | | | 7,867,052 | |
| | | | | | |
|
|
|
Finance - Investment Banker/Broker — 1.3% | |
E*TRADE Financial Corp. | | | 101,645 | | | | 4,242,662 | |
TD Ameritrade Holding Corp. | | | 126,854 | | | | 5,633,586 | |
| | | | | | |
|
|
|
| | | | | | | | 9,876,248 | |
| | | | | | |
|
|
|
Finance - Leasing Companies — 0.2% | |
Air Lease Corp. | | | 32,607 | | | | 1,354,495 | |
| | | | | | |
|
|
|
Food - Meat Products — 0.3% | |
Tyson Foods, Inc., Class A | | | 23,659 | | | | 2,201,233 | |
| | | | | | |
|
|
|
Food - Misc./Diversified — 0.7% | |
Nomad Foods, Ltd.† | | | 138,444 | | | | 2,789,646 | |
Post Holdings, Inc.† | | | 27,120 | | | | 2,703,593 | |
| | | | | | |
|
|
|
| | | | | | | | 5,493,239 | |
| | | | | | |
|
|
|
Food - Wholesale/Distribution — 0.8% | |
US Foods Holding Corp.† | | | 151,598 | | | | 6,132,139 | |
| | | | | | |
|
|
|
Footwear & Related Apparel — 0.5% | |
Steven Madden, Ltd. | | | 119,703 | | | | 3,976,534 | |
| | | | | | |
|
|
|
Gas- Distribution — 1.0% | |
UGI Corp. | | | 155,060 | | | | 7,546,770 | |
| | | | | | |
|
|
|
Hazardous Waste Disposal — 0.8% | |
Clean Harbors, Inc.† | | | 84,438 | | | | 6,210,415 | |
| | | | | | |
|
|
|
Hotels/Motels — 0.5% | |
Wyndham Destinations, Inc. | | | 48,444 | | | | 2,148,007 | |
Wyndham Hotels & Resorts, Inc. | | | 32,367 | | | | 1,663,016 | |
| | | | | | |
|
|
|
| | | | | | | | 3,811,023 | |
| | | | | | |
|
|
|
Human Resources — 0.7% | |
ManpowerGroup, Inc. | | | 26,265 | | | | 2,146,901 | |
Robert Half International, Inc. | | | 51,408 | | | | 2,748,786 | |
| | | | | | |
|
|
|
| | | | | | | | 4,895,687 | |
| | | | | | |
|
|
|
Independent Power Producers — 0.2% | |
Vistra Energy Corp. | | | 67,716 | | | | 1,689,514 | |
| | | | | | |
|
|
|
Industrial Automated/Robotic — 0.5% | |
Ichor Holdings, Ltd.† | | | 158,054 | | | | 3,360,228 | |
| | | | | | |
|
|
|
Insurance Brokers — 1.2% | |
Aon PLC | | | 32,961 | | | | 6,422,451 | |
Marsh & McLennan Cos., Inc. | | | 25,423 | | | | 2,539,503 | |
| | | | | | |
|
|
|
| | | | | | | | 8,961,954 | |
| | | | | | |
|
|
|
Insurance - Life/Health — 0.9% | |
CNO Financial Group, Inc. | | | 320,997 | | | | 4,648,037 | |
Globe Life, Inc. | | | 22,128 | | | | 1,975,145 | |
| | | | | | |
|
|
|
| | | | | | | | 6,623,182 | |
| | | | | | |
|
|
|
VALIC Company II Mid Cap Value Fund
PORTFOLIO OF INVESTMENTS —August 31, 2019 — (continued)
| | | | | | | | |
| | |
| Security Description | | Shares | | | Value
(Note 2) | |
| |
COMMON STOCKS (continued) | |
Insurance - Multi-line — 2.0% | |
Allstate Corp. | | | 48,989 | | | $ | 5,015,984 | |
Assurant, Inc. | | | 55,520 | | | | 6,828,960 | |
Kemper Corp. | | | 11,772 | | | | 816,365 | |
Loews Corp. | | | 50,661 | | | | 2,435,274 | |
| | | | | | |
|
|
|
| | | | | | | | 15,096,583 | |
| | | | | | |
|
|
|
Insurance - Property/Casualty — 3.5% | |
Alleghany Corp.† | | | 11,651 | | | | 8,730,211 | |
Hanover Insurance Group, Inc. | | | 45,104 | | | | 6,005,598 | |
Lancashire Holdings, Ltd. | | | 440,697 | | | | 3,651,794 | |
Travelers Cos., Inc. | | | 22,050 | | | | 3,240,468 | |
WR Berkley Corp. | | | 58,177 | | | | 4,145,111 | |
| | | | | | |
|
|
|
| | | | | | | | 25,773,182 | |
| | | | | | |
|
|
|
Insurance - Reinsurance — 2.2% | |
Everest Re Group, Ltd. | | | 13,255 | | | | 3,126,589 | |
Reinsurance Group of America, Inc. | | | 85,343 | | | | 13,140,262 | |
| | | | | | |
|
|
|
| | | | | | | | 16,266,851 | |
| | | | | | |
|
|
|
Investment Management/Advisor Services — 0.2% | |
Raymond James Financial, Inc. | | | 22,294 | | | | 1,750,302 | |
| | | | | | |
|
|
|
Lasers - System/Components — 0.6% | |
Coherent, Inc.†# | | | 33,050 | | | | 4,790,928 | |
| | | | | | |
|
|
|
Machinery - Pumps — 1.7% | |
Curtiss-Wright Corp. | | | 17,796 | | | | 2,182,501 | |
Dover Corp. | | | 63,032 | | | | 5,908,620 | |
SPX FLOW, Inc.† | | | 126,496 | | | | 4,264,180 | |
| | | | | | |
|
|
|
| | | | | | | | 12,355,301 | |
| | | | | | |
|
|
|
Medical Information Systems — 0.2% | |
Change Healthcare, Inc.† | | | 118,707 | | | | 1,665,459 | |
| | | | | | |
|
|
|
Medical Instruments — 0.3% | |
Boston Scientific Corp.† | | | 53,709 | | | | 2,294,986 | |
| | | | | | |
|
|
|
Medical Labs & Testing Services — 1.5% | |
ICON PLC† | | | 24,523 | | | | 3,781,202 | |
IQVIA Holdings, Inc.† | | | 24,460 | | | | 3,794,969 | |
Laboratory Corp. of America Holdings† | | | 20,404 | | | | 3,418,894 | |
| | | | | | |
|
|
|
| | | | | | | | 10,995,065 | |
| | | | | | |
|
|
|
Medical Products — 1.4% | |
Hill-Rom Holdings, Inc. | | | 57,773 | | | | 6,220,997 | |
Zimmer Biomet Holdings, Inc. | | | 29,652 | | | | 4,127,558 | |
| | | | | | |
|
|
|
| | | | | | | | 10,348,555 | |
| | | | | | |
|
|
|
Medical - Drugs — 0.3% | |
Jazz Pharmaceuticals PLC† | | | 16,188 | | | | 2,074,492 | |
| | | | | | |
|
|
|
Medical- HMO — 1.0% | |
Centene Corp.† | | | 56,478 | | | | 2,633,004 | |
Humana, Inc. | | | 11,764 | | | | 3,331,682 | |
Molina Healthcare, Inc.† | | | 9,906 | | | | 1,290,554 | |
| | | | | | |
|
|
|
| | | | | | | | 7,255,240 | |
| | | | | | |
|
|
|
Medical - Hospitals — 0.8% | |
Acadia Healthcare Co., Inc.†# | | | 96,205 | | | | 2,545,584 | |
Universal Health Services, Inc., Class B | | | 23,522 | | | | 3,400,811 | |
| | | | | | |
|
|
|
| | | | | | | | 5,946,395 | |
| | | | | | |
|
|
|
Medical - Wholesale Drug Distribution — 0.8% | |
AmerisourceBergen Corp. | | | 36,358 | | | | 2,991,173 | |
McKesson Corp. | | | 23,061 | | | | 3,188,644 | |
| | | | | | |
|
|
|
| | | | | | | | 6,179,817 | |
| | | | | | |
|
|
|
Metal Processors & Fabrication — 0.0% | |
Timken Co. | | | 6,764 | | | | 271,778 | |
| | | | | | |
|
|
|
| | | | | | | | |
| | |
| Security Description | | Shares | | | Value
(Note 2) | |
| |
| | | | | | | | | |
Motion Pictures & Services — 0.4% | |
IMAX Corp.† | | | 145,923 | | | $ | 3,052,709 | |
| | | | | | |
|
|
|
Office Automation & Equipment — 0.2% | |
Xerox Holdings Corp. | | | 48,106 | | | | 1,394,593 | |
| | | | | | |
|
|
|
Office Supplies & Forms — 0.5% | |
Avery Dennison Corp. | | | 33,614 | | | | 3,884,770 | |
| | | | | | |
|
|
|
Oil Companies - Exploration & Production — 3.4% | |
Cimarex Energy Co. | | | 37,100 | | | | 1,587,138 | |
Diamondback Energy, Inc. | | | 74,055 | | | | 7,263,314 | |
Encana Corp. | | | 612,739 | | | | 2,720,561 | |
Marathon Oil Corp. | | | 100,156 | | | | 1,185,847 | |
Noble Energy, Inc. | | | 290,614 | | | | 6,562,064 | |
Pioneer Natural Resources Co. | | | 12,589 | | | | 1,553,734 | |
Viper Energy Partners LP | | | 73,115 | | | | 2,118,142 | |
WPX Energy, Inc.† | | | 187,059 | | | | 2,012,755 | |
| | | | | | |
|
|
|
| | | | | | | | 25,003,555 | |
| | | | | | |
|
|
|
Oil Refining & Marketing — 1.1% | |
Delek US Holdings, Inc. | | | 81,300 | | | | 2,662,575 | |
Marathon Petroleum Corp. | | | 43,326 | | | | 2,132,073 | |
Valero Energy Corp. | | | 44,373 | | | | 3,340,399 | |
| | | | | | |
|
|
|
| | | | | | | | 8,135,047 | |
| | | | | | |
|
|
|
Oil- Field Services — 0.2% | |
Apergy Corp.† | | | 55,864 | | | | 1,451,347 | |
| | | | | | |
|
|
|
Physical Therapy/Rehabilitation Centers — 0.6% | |
Encompass Health Corp. | | | 68,203 | | | | 4,146,060 | |
| | | | | | |
|
|
|
Power Converter/Supply Equipment — 0.5% | |
Hubbell, Inc. | | | 28,434 | | | | 3,728,835 | |
| | | | | | |
|
|
|
Publishing - Newspapers — 0.4% | |
TEGNA, Inc. | | | 190,999 | | | | 2,733,196 | |
| | | | | | |
|
|
|
Real Estate Investment Trusts — 10.5% | |
American Assets Trust, Inc. | | | 33,359 | | | | 1,563,203 | |
American Homes 4 Rent, Class A | | | 90,052 | | | | 2,303,530 | |
Boston Properties, Inc. | | | 45,144 | | | | 5,797,392 | |
Brixmor Property Group, Inc. | | | 262,816 | | | | 4,843,699 | |
Corporate Office Properties Trust | | | 166,356 | | | | 4,806,025 | |
Douglas Emmett, Inc. | | | 83,474 | | | | 3,522,603 | |
Duke Realty Corp. | | | 119,042 | | | | 3,960,527 | |
Equity LifeStyle Properties, Inc. | | | 21,003 | | | | 2,829,524 | |
Equity Residential | | | 66,644 | | | | 5,648,745 | |
First Industrial Realty Trust, Inc. | | | 93,608 | | | | 3,646,032 | |
Gaming and Leisure Properties, Inc. | | | 124,763 | | | | 4,880,729 | |
Highwoods Properties, Inc. | | | 109,998 | | | | 4,753,014 | |
Kilroy Realty Corp. | | | 28,503 | | | | 2,219,244 | |
Life Storage, Inc. | | | 41,194 | | | | 4,364,916 | |
Park Hotels & Resorts, Inc. | | | 93,550 | | | | 2,203,102 | |
Physicians Realty Trust | | | 265,826 | | | | 4,604,106 | |
Prologis, Inc. | | | 51,303 | | | | 4,289,957 | |
Regency Centers Corp. | | | 61,101 | | | | 3,941,625 | |
Retail Properties of America, Inc., Class A | | | 109,236 | | | | 1,240,921 | |
SL Green Realty Corp. | | | 26,539 | | | | 2,128,959 | |
STORE Capital Corp. | | | 127,460 | | | | 4,812,890 | |
| | | | | | |
|
|
|
| | | | | | | | 78,360,743 | |
| | | | | | |
|
|
|
Retail - Apparel/Shoe — 0.3% | |
Ross Stores, Inc. | | | 24,373 | | | | 2,583,782 | |
| | | | | | |
|
|
|
Retail - Auto Parts — 0.3% | |
AutoZone, Inc.† | | | 2,067 | | | | 2,277,193 | |
| | | | | | |
|
|
|
Retail - Discount — 0.2% | |
Dollar Tree, Inc.† | | | 12,993 | | | | 1,319,179 | |
| | | | | | |
|
|
|
VALIC Company II Mid Cap Value Fund
PORTFOLIO OF INVESTMENTS —August 31, 2019 — (continued)
| | | | | | | | |
| | |
| Security Description | |
Shares | | | Value
(Note 2) | |
| |
COMMON STOCKS (continued) | | | | | | | | |
Savings & Loans/Thrifts — 0.6% | |
Sterling Bancorp | | | 219,615 | | | $ | 4,188,058 | |
| | | | | | |
|
|
|
Semiconductor Components - Integrated Circuits — 0.4% | |
NXP Semiconductors NV | | | 30,101 | | | | 3,074,516 | |
| | | | | | |
|
|
|
Semiconductor Equipment — 1.1% | |
Axcelis Technologies, Inc.† | | | 120,566 | | | | 1,845,865 | |
KLA Corp. | | | 24,524 | | | | 3,627,100 | |
MKS Instruments, Inc. | | | 37,778 | | | | 2,957,640 | |
| | | | | | |
|
|
|
| | | | | | | | 8,430,605 | |
| | | | | | |
|
|
|
Shipbuilding — 0.3% | |
Huntington Ingalls Industries, Inc. | | | 11,955 | | | | 2,498,595 | |
| | | | | | |
|
|
|
Steel - Producers — 1.7% | |
Carpenter Technology Corp. | | | 105,861 | | | | 5,149,079 | |
Commercial Metals Co. | | | 135,453 | | | | 2,122,548 | |
Reliance Steel & Aluminum Co. | | | 57,721 | | | | 5,612,213 | |
| | | | | | |
|
|
|
| | | | | | | | 12,883,840 | |
| | | | | | |
|
|
|
Theaters — 0.4% | |
Cinemark Holdings, Inc. | | | 83,981 | | | | 3,204,715 | |
| | | | | | |
|
|
|
Transport - Rail — 0.6% | |
Kansas City Southern | | | 37,134 | | | | 4,671,457 | |
| | | | | | |
|
|
|
Transport - Services — 0.2% | |
C.H. Robinson Worldwide, Inc.# | | | 21,207 | | | | 1,791,779 | |
| | | | | | |
|
|
|
Transport - Truck — 0.3% | |
Knight-Swift Transportation Holdings, Inc.# | | | 74,818 | | �� | | 2,554,287 | |
| | | | | | |
|
|
|
Total Long-Term Investment Securities | | | | | | | | |
(cost $683,962,000) | | | | | | | 731,497,280 | |
| | | |
|
|
|
SHORT-TERM INVESTMENT SECURITIES — 0.9% | |
Registered Investment Companies — 0.9% | |
State Street Institutional Liquid Reserves Fund, Administration Class
1.94%(2)
(cost $6,954,414) | | | 6,953,678 | | | | 6,954,374 | |
| | | | | | |
|
|
|
| | | | | | | | |
| | |
| Security Description | | Principal
Amount | | | Value
(Note 2) | |
| |
REPURCHASE AGREEMENTS — 0.8% | |
Agreement with Fixed Income Clearing Corp., bearing interest at 0.42%, dated 08/30/2019, to be repurchased 09/03/2019 in the amount of $5,807,271 collateralized by $5,790,000 of United States Treasury Notes, bearing interest at 2.38% due 05/15/2022 and having an approximate value of $5,981,904
(cost $5,807,000) | | $ | 5,807,000 | | | $ | 5,807,000 | |
| | | | | | |
|
|
|
TOTAL INVESTMENTS | | | | | | | | |
(cost $696,723,414)(1) | | | 100.1 | % | | | 744,258,654 | |
Liabilities in excess of other assets | | | (0.1 | ) | | | (798,460 | ) |
| | |
|
|
| |
|
|
|
NET ASSETS | | | 100.0 | % | | $ | 743,460,194 | |
| | |
|
|
| |
|
|
|
| † | Non-income producing security |
| # | The security or a portion thereof is out on loan (see Note 2). |
At August 31, 2019, the Fund had loaned securities with a total value of $13,947,165. This was secured by collateral of $14,407,946 received in the form of fixed income pooled securities, which the Fund cannot sell or repledge and accordingly are not reflected in the Fund’s assets and liabilities.
The components of the fixed income pooled securities referenced above are as follows:
| | | | | | | | |
Securities
| | Coupon Range
| | Maturity Date Range
| | Value as of
August 31, 2019
| |
United States Treasury Bills | | 0.00% | | 09/05/2019 to 06/18/2020 | | $ | 1,144,930 | |
United States Treasury Notes/Bonds | | zero coupon to 8.75% | | 09/30/2019 to 02/15/2049 | | | 13,263,016 | |
| (1) | See Note 5 for cost of investments on a tax basis. |
| (2) | The rate shown is the7-day yield as of August 31, 2019 |
ADR—American Depositary Receipt
SDR—Swedish Depositary Receipt
The following is a summary of the inputs used to value the Fund’s net assets as of August 31, 2019 (see Note 2):
| | | | | | | | | | | | | | | | |
| | | Level 1 - Unadjusted
Quoted Prices
| | | Level 2 - Other
Observable Inputs
| | | Level 3 - Significant
Unobservable Inputs
| | | Total
| |
ASSETS: | | | | | | | | | | | | | | | | |
Investments at Value:* | | | | | | | | | | | | | | | | |
| | | | |
Common Stocks | | $ | 731,497,280 | | | $ | — | | | $ | — | | | $ | 731,497,280 | |
Short-Term Investment Securities | | | 6,954,374 | | | | — | | | | — | | | | 6,954,374 | |
Repurchase Agreements | | | — | | | | 5,807,000 | | | | — | | | | 5,807,000 | |
| | |
|
|
| |
|
|
| |
|
|
| |
|
|
|
Total Investments at Value | | $ | 738,451,654 | | | $ | 5,807,000 | | | $ | — | | | $ | 744,258,654 | |
| | |
|
|
| |
|
|
| |
|
|
| |
|
|
|
| * | For a detailed presentation of investments, please refer to the Portfolio of Investments. |
See Notes to Financial Statements
VALIC Company II Moderate Growth Lifestyle Fund
PORTFOLIO PROFILE —August 31, 2019 (unaudited)
Industry Allocation*
| | | | |
Domestic Equity Investment Companies | | | 45.7 | % |
Domestic Fixed Income Investment Companies | | | 36.1 | |
International Equity Investment Companies | | | 8.6 | |
International Fixed Income Investment Companies | | | 3.6 | |
Domestic Money Market Investment Companies | | | 3.5 | |
Real Estate Investment Companies | | | 2.5 | |
| | |
|
|
|
| | | | 100.0 | % |
| | |
|
|
|
| * | Calculated as a percentage of net assets |
VALIC Company II Moderate Growth Lifestyle Fund
PORTFOLIO OF INVESTMENTS —August 31, 2019
| | | | | | | | |
| | |
| Security Description | | Shares | | | Value
(Note 2) | |
| |
AFFILIATED REGISTERED INVESTMENT COMPANIES#(1) — 100.0% | |
Domestic Equity Investment Companies — 45.7% | |
VALIC Co. I Blue Chip Growth Fund | | | 1,517 | | | $ | 30,820 | |
VALIC Co. I Dividend Value Fund | | | 4,014,981 | | | | 45,329,140 | |
VALIC Co. I Large Cap Core Fund | | | 840,846 | | | | 9,905,165 | |
VALIC Co. I Large Capital Growth Fund | | | 909,755 | | | | 15,547,719 | |
VALIC Co. I Mid Cap Index Fund | | | 1,153,228 | | | | 28,277,158 | |
VALIC Co. I Mid Cap Strategic Growth Fund | | | 709,533 | | | | 11,806,637 | |
VALIC Co. INasdaq-100 Index Fund | | | 1,296,539 | | | | 19,720,362 | |
VALIC Co. I Science & Technology Fund | | | 1,066,979 | | | | 29,982,119 | |
VALIC Co. I Small Cap Index Fund | | | 663,011 | | | | 12,716,553 | |
VALIC Co. I Small Cap Special Values Fund | | | 506,668 | | | | 5,791,218 | |
VALIC Co. I Stock Index Fund | | | 2,370,552 | | | | 99,349,844 | |
VALIC Co. I Value Fund | | | 980,365 | | | | 17,950,475 | |
VALIC Co. II Capital Appreciation Fund | | | 1,781,353 | | | | 26,524,340 | |
VALIC Co. II Large Cap Value Fund | | | 2,623,905 | | | | 52,766,723 | |
VALIC Co. II Mid Cap Growth Fund | | | 1,047,249 | | | | 11,017,055 | |
VALIC Co. II Mid Cap Value Fund | | | 1,725,278 | | | | 29,657,521 | |
VALIC Co. II Small Cap Growth Fund | | | 451,146 | | | | 7,619,859 | |
VALIC Co. II Small Cap Value Fund | | | 604,602 | | | | 6,505,520 | |
| | | | | | |
|
|
|
Total Domestic Equity Investment Companies | | | | | | | | |
(cost $432,538,138) | | | | | | | 430,498,228 | |
| | | | | | |
|
|
|
Domestic Fixed Income Investment Companies — 36.1% | |
VALIC Co. I Capital Conservation Fund | | | 3,155,937 | | | | 32,474,594 | |
VALIC Co. I Government Securities Fund | | | 1,332,004 | | | | 14,572,123 | |
VALIC Co. I Inflation Protected Fund | | | 4,006,454 | | | | 45,753,708 | |
VALIC Co. II Core Bond Fund | | | 10,043,239 | | | | 115,798,540 | |
VALIC Co. II High Yield Bond Fund | | | 5,707,171 | | | | 43,716,930 | |
VALIC Co. II Strategic Bond Fund | | | 7,809,436 | | | | 88,637,096 | |
| | | | | | |
|
|
|
Total Domestic Fixed Income Investment Companies | | | | | | | | |
(cost $327,980,963) | | | | | | | 340,952,991 | |
| | | | | | |
|
|
|
Domestic Money Market Investment Companies — 3.5% | | | | | | | | |
VALIC Co. I Government Money Market I Fund | | | | | | | | |
(cost $33,377,212)(3) | | | 33,377,212 | | | | 33,377,212 | |
| | | | | | |
|
|
|
| | | | | | | | |
| | |
| Security Description | | Shares | | | Value
(Note 2) | |
| |
| | | | | | | | | |
International Equity Investment Companies — 8.6% | |
VALIC Co. I Emerging Economies Fund | | | 3,447,540 | | | $ | 26,580,537 | |
VALIC Co. I International Equities Index Fund | | | 711,885 | | | | 4,869,295 | |
VALIC Co. I International Growth Fund | | | 483,346 | | | | 5,659,987 | |
VALIC Co. I International Value Fund | | | 2,772,738 | | | | 24,954,645 | |
VALIC Co. II International Opportunities Fund | | | 1,022,946 | | | | 18,863,130 | |
| | | | | | |
|
|
|
Total International Equity Investment Companies | | | | | | | | |
(cost $86,016,374) | | | | | | | 80,927,594 | |
| | | | | | |
|
|
|
International Fixed Income Investment Companies — 3.6% | |
VALIC Co. I International Government Bond Fund | | | | | | | | |
(cost $32,470,710) | | | 2,762,608 | | | | 34,228,713 | |
| | | | | | |
|
|
|
Real Estate Investment Companies — 2.5% | | | | | | | | |
VALIC Co. I Global Real Estate Fund | | | | | | | | |
(cost $21,725,351) | | | 2,812,106 | | | | 23,509,206 | |
| | | | | | |
|
|
|
TOTAL INVESTMENTS | | | | | | | | |
(cost $934,108,748)(2) | | | 100.0 | % | | | 943,493,944 | |
Liabilities in excess of other assets | | | (0.0 | ) | | | (182,638 | ) |
| | |
|
|
| |
|
|
|
NET ASSETS | | | 100.0 | % | | $ | 943,311,306 | |
| | |
|
|
| |
|
|
|
| # | The Moderate Growth Lifestyle Fund invests in various VALIC Company I or VALIC Company II Funds, some of which are not presented in this report. Additional information of the underlying funds including such fund’s prospectuses and shareholder reports is available at our website, www.valic.com |
| (2) | See Note 5 for cost of investments on a tax basis. |
| (3) | The 7-day yield as of August 31, 2019 is 1.60%. |
The following is a summary of the inputs used to value the Fund’s net assets as of August 31, 2019 (see Note 2):
| | | | | | | | | | | | | | | | |
| | | Level 1 - Unadjusted
Quoted Prices
| | | Level 2 - Other
Observable Inputs
| | | Level 3 - Significant
Unobservable Inputs
| | | Total
| |
ASSETS: | | | | | | | | | | | | | | | | |
Investments at Value:* | | | | | | | | | | | | | | | | |
| | | | |
Affiliated Registered Investment Companies | | $ | 943,493,944 | | | $ | — | | | $ | — | | | $ | 943,493,944 | |
| | |
|
|
| |
|
|
| |
|
|
| |
|
|
|
| * | For a detailed presentation of investments, please refer to the Portfolio of Investments. |
See Notes to Financial Statements
VALIC Company II Small Cap Growth Fund
PORTFOLIO PROFILE —August 31, 2019 (unaudited)
Industry Allocation*
| | | | |
Medical — Biomedical/Gene | | | 8.4 | % |
Medical — Drugs | | | 4.6 | |
Enterprise Software/Service | | | 4.4 | |
Electronic Components — Semiconductors | | | 4.3 | |
Registered Investment Companies | | | 3.4 | |
Distribution/Wholesale | | | 3.1 | |
Building & Construction Products — Misc. | | | 2.9 | |
Semiconductor Equipment | | | 2.8 | |
Food — Wholesale/Distribution | | | 2.8 | |
Real Estate Investment Trusts | | | 2.7 | |
Medical Products | | | 2.7 | |
Computer Software | | | 2.6 | |
Retail — Automobile | | | 2.3 | |
Banks — Commercial | | | 2.0 | |
Applications Software | | | 2.0 | |
Internet Application Software | | | 2.0 | |
Power Converter/Supply Equipment | | | 1.9 | |
Medical Labs & Testing Services | | | 1.7 | |
Computer Data Security | | | 1.7 | |
Transport — Truck | | | 1.7 | |
Retail — Vision Service Center | | | 1.6 | |
Medical — Outpatient/Home Medical | | | 1.5 | |
Machinery — General Industrial | | | 1.5 | |
Schools | | | 1.5 | |
Tools — Hand Held | | | 1.5 | |
Patient Monitoring Equipment | | | 1.5 | |
Miscellaneous Manufacturing | | | 1.5 | |
Web Hosting/Design | | | 1.3 | |
Steel Pipe & Tube | | | 1.3 | |
Casino Hotels | | | 1.3 | |
Retail — Pet Food & Supplies | | | 1.3 | |
Advanced Materials | | | 1.3 | |
Internet Security | | | 1.2 | |
Publishing — Newspapers | | | 1.2 | |
Finance — Investment Banker/Broker | | | 1.2 | |
Diversified Manufacturing Operations | | | 1.1 | |
Retail — Restaurants | | | 1.1 | |
Telecom Equipment — Fiber Optics | | | 1.1 | |
Footwear & Related Apparel | | | 1.1 | |
Television | | | 1.1 | |
Recreational Centers | | | 1.0 | |
Machinery — Pumps | | | 1.0 | |
Drug Delivery Systems | | | 0.9 | |
Therapeutics | | | 0.9 | |
Computer Services | | | 0.9 | |
Gambling (Non-Hotel) | | | 0.8 | |
Retail — Misc./Diversified | | | 0.8 | |
Building — Mobile Home/Manufactured Housing | | | 0.8 | |
Athletic Equipment | | | 0.8 | |
Retail — Discount | | | 0.7 | |
Electric Products — Misc. | | | 0.7 | |
Building — Residential/Commercial | | | 0.6 | |
Medical — Hospitals | | | 0.6 | |
Security Services | | | 0.6 | |
Entertainment Software | | | 0.6 | |
E-Commerce/Products | | | 0.5 | |
Internet Telephone | | | 0.5 | |
Transport — Marine | | | 0.5 | |
Retail — Apparel/Shoe | | | 0.5 | |
Chemicals — Specialty | | | 0.5 | |
Wireless Equipment | | | 0.5 | |
Machinery — Construction & Mining | | | 0.4 | |
Advertising Services | | | 0.4 | |
Diagnostic Equipment | | | 0.3 | |
Investment Companies | | | 0.3 | |
Insurance Brokers | | | 0.3 | |
Oil Companies — Exploration & Production | | | 0.2 | |
| | |
|
|
|
| | | | 102.8 | % |
| | |
|
|
|
| * | Calculated as a percentage of net assets |
VALIC Company II Small Cap Growth Fund
PORTFOLIO OF INVESTMENTS —August 31, 2019
| | | | | | | | |
| | |
| Security Description | | Shares | | | Value
(Note 2) | |
| |
COMMON STOCKS — 99.4% | |
Advanced Materials — 1.3% | |
Hexcel Corp. | | | 28,632 | | | $ | 2,409,383 | |
| | | | | | |
|
|
|
Advertising Services — 0.4% | |
Trade Desk, Inc., Class A† | | | 3,142 | | | | 772,209 | |
| | | | | | |
|
|
|
Applications Software — 2.0% | |
HubSpot, Inc.† | | | 7,844 | | | | 1,566,290 | |
Medallia, Inc.† | | | 11,348 | | | | 404,216 | |
Smartsheet, Inc., Class A† | | | 37,084 | | | | 1,802,282 | |
| | | | | | |
|
|
|
| | | | | | | | 3,772,788 | |
| | | | | | |
|
|
|
Athletic Equipment — 0.8% | |
Fox Factory Holding Corp.† | | | 20,926 | | | | 1,507,509 | |
| | | | | | |
|
|
|
Banks - Commercial — 2.0% | |
First Financial Bankshares, Inc.# | | | 49,908 | | | | 1,528,183 | |
Signature Bank | | | 11,299 | | | | 1,318,028 | |
Webster Financial Corp. | | | 20,756 | | | | 929,039 | |
| | | | | | |
|
|
|
| | | | | | | | 3,775,250 | |
| | | | | | |
|
|
|
Building & Construction Products - Misc. — 2.9% | |
Simpson Manufacturing Co., Inc. | | | 39,625 | | | | 2,543,925 | |
Trex Co., Inc.†# | | | 35,768 | | | | 3,059,237 | |
| | | | | | |
|
|
|
| | | | | | | | 5,603,162 | |
| | | | | | |
|
|
|
Building - Mobile Home/Manufactured Housing — 0.8% | |
Winnebago Industries, Inc.# | | | 48,527 | | | | 1,553,834 | |
| | | | | | |
|
|
|
Building - Residential/Commercial — 0.6% | |
TRI Pointe Group, Inc.†# | | | 87,978 | | | | 1,231,692 | |
| | | | | | |
|
|
|
Casino Hotels — 1.3% | |
Boyd Gaming Corp. | | | 104,502 | | | | 2,512,228 | |
| | | | | | |
|
|
|
Chemicals - Specialty — 0.5% | |
Ferro Corp.† | | | 86,767 | | | | 884,156 | |
| | | | | | |
|
|
|
Computer Data Security — 1.7% | |
CyberArk Software, Ltd.† | | | 14,236 | | | | 1,599,272 | |
Zscaler, Inc.† | | | 24,503 | | | | 1,684,336 | |
| | | | | | |
|
|
|
| | | | | | | | 3,283,608 | |
| | | | | | |
|
|
|
Computer Services — 0.9% | |
Elastic NV†# | | | 18,720 | | | | 1,645,301 | |
| | | | | | |
|
|
|
Computer Software — 2.6% | |
Dynatrace, Inc.† | | | 33,053 | | | | 759,558 | |
Envestnet, Inc.† | | | 48,295 | | | | 2,762,957 | |
MongoDB, Inc.†# | | | 9,214 | | | | 1,403,384 | |
| | | | | | |
|
|
|
| | | | | | | | 4,925,899 | |
| | | | | | |
|
|
|
Diagnostic Equipment — 0.3% | |
Adaptive Biotechnologies Corp.† | | | 12,081 | | | | 614,319 | |
| | | | | | |
|
|
|
Distribution/Wholesale — 3.1% | |
H&E Equipment Services, Inc. | | | 53,013 | | | | 1,287,685 | |
Pool Corp. | | | 12,018 | | | | 2,360,095 | |
SiteOne Landscape Supply, Inc.†# | | | 30,079 | | | | 2,352,178 | |
| | | | | | |
|
|
|
| | | | | | | | 5,999,958 | |
| | | | | | |
|
|
|
Diversified Manufacturing Operations — 1.1% | |
ITT, Inc. | | | 38,291 | | | | 2,179,524 | |
| | | | | | |
|
|
|
Drug Delivery Systems — 0.9% | |
Heron Therapeutics, Inc.†# | | | 52,404 | | | | 970,522 | |
Revance Therapeutics, Inc.† | | | 69,850 | | | | 740,410 | |
| | | | | | |
|
|
|
| | | | | | | | 1,710,932 | |
| | | | | | |
|
|
|
E-Commerce/Products — 0.5% | |
Farfetch, Ltd., Class A†# | | | 83,549 | | | | 817,109 | |
RealReal, Inc.†# | | | 18,094 | | | | 236,489 | |
| | | | | | |
|
|
|
| | | | | | | | 1,053,598 | |
| | | | | | |
|
|
|
| | | | | | | | |
| | |
| Security Description | | Shares | | | Value
(Note 2) | |
| |
| | | | | | | | | |
Electric Products - Misc. — 0.7% | |
Littelfuse, Inc. | | | 9,089 | | | $ | 1,418,520 | |
| | | | | | |
|
|
|
Electronic Components - Semiconductors — 4.3% | |
Inphi Corp.† | | | 51,414 | | | | 3,146,023 | |
Monolithic Power Systems, Inc. | | | 20,661 | | | | 3,110,720 | |
Semtech Corp.† | | | 49,157 | | | | 2,063,119 | |
| | | | | | |
|
|
|
| | | | | | | | 8,319,862 | |
| | | | | | |
|
|
|
Enterprise Software/Service — 4.4% | |
Coupa Software, Inc.†# | | | 10,160 | | | | 1,411,529 | |
Evolent Health, Inc., Class A† | | | 96,480 | | | | 662,818 | |
ManTech International Corp., Class A | | | 41,689 | | | | 2,929,903 | |
New Relic, Inc.† | | | 9,098 | | | | 521,679 | |
Pluralsight, Inc., Class A†# | | | 62,822 | | | | 1,011,434 | |
SailPoint Technologies Holding, Inc.† | | | 84,899 | | | | 1,912,774 | |
| | | | | | |
|
|
|
| | | | | | | | 8,450,137 | |
| | | | | | |
|
|
|
Entertainment Software — 0.6% | |
Glu Mobile, Inc.† | | | 132,005 | | | | 586,102 | |
Sciplay Corp., Class A† | | | 53,054 | | | | 504,544 | |
| | | | | | |
|
|
|
| | | | | | | | 1,090,646 | |
| | | | | | |
|
|
|
Finance - Investment Banker/Broker — 1.2% | |
Evercore, Inc., Class A | | | 27,847 | | | | 2,221,077 | |
| | | | | | |
|
|
|
Food - Wholesale/Distribution — 2.8% | |
Grocery Outlet Holding Corp.† | | | 24,145 | | | | 976,665 | |
Performance Food Group Co.† | | | 94,485 | | | | 4,420,953 | |
| | | | | | |
|
|
|
| | | | | | | | 5,397,618 | |
| | | | | | |
|
|
|
Footwear & Related Apparel — 1.1% | |
Wolverine World Wide, Inc. | | | 80,036 | | | | 2,076,934 | |
| | | | | | |
|
|
|
Gambling(Non-Hotel) — 0.8% | |
Red Rock Resorts, Inc., Class A | | | 75,233 | | | | 1,568,608 | |
| | | | | | |
|
|
|
Insurance Brokers — 0.3% | |
eHealth, Inc.† | | | 5,942 | | | | 495,028 | |
| | | | | | |
|
|
|
Internet Application Software — 2.0% | |
Anaplan, Inc.† | | | 43,549 | | | | 2,366,017 | |
Zendesk, Inc.† | | | 17,538 | | | | 1,406,548 | |
| | | | | | |
|
|
|
| | | | | | | | 3,772,565 | |
| | | | | | |
|
|
|
Internet Security — 1.2% | |
Proofpoint, Inc.† | | | 20,616 | | | | 2,342,184 | |
| | | | | | |
|
|
|
Internet Telephone — 0.5% | |
RingCentral, Inc., Class A† | | | 7,292 | | | | 1,029,120 | |
| | | | | | |
|
|
|
Investment Companies — 0.3% | |
PennantPark Investment Corp. | | | 87,637 | | | | 552,989 | |
| | | | | | |
|
|
|
Machinery - Construction & Mining — 0.4% | |
Oshkosh Corp. | | | 11,200 | | | | 787,024 | |
| | | | | | |
|
|
|
Machinery - General Industrial — 1.5% | |
Applied Industrial Technologies, Inc. | | | 27,915 | | | | 1,490,382 | |
Chart Industries, Inc.† | | | 22,450 | | | | 1,410,758 | |
| | | | | | |
|
|
|
| | | | | | | | 2,901,140 | |
| | | | | | |
|
|
|
Machinery - Pumps — 1.0% | |
Graco, Inc. | | | 42,620 | | | | 1,942,193 | |
| | | | | | |
|
|
|
Medical Labs & Testing Services — 1.7% | |
Personalis, Inc.† | | | 20,788 | | | | 402,248 | |
Teladoc Health, Inc.†# | | | 49,998 | | | | 2,893,884 | |
| | | | | | |
|
|
|
| | | | | | | | 3,296,132 | |
| | | | | | |
|
|
|
Medical Products — 2.7% | |
iRhythm Technologies, Inc.† | | | 28,875 | | | | 2,197,965 | |
VALIC Company II Small Cap Growth Fund
PORTFOLIO OF INVESTMENTS —August 31, 2019 — (continued)
| | | | | | | | |
| | |
| Security Description | | Shares | | | Value
(Note 2) | |
| |
COMMON STOCKS (continued) | |
Medical Products (continued) | |
Nevro Corp.† | | | 30,692 | | | $ | 2,569,841 | |
Shockwave Medical, Inc.†# | | | 11,884 | | | | 497,346 | |
| | | | | | |
|
|
|
| | | | | | | | 5,265,152 | |
| | | | | | |
|
|
|
Medical - Biomedical/Gene — 8.4% | |
ACADIA Pharmaceuticals, Inc.†# | | | 34,523 | | | | 954,906 | |
Adverum Biotechnologies, Inc.† | | | 39,103 | | | | 403,934 | |
Atara Biotherapeutics, Inc.†# | | | 60,028 | | | | 810,378 | |
Avrobio, Inc.† | | | 54,689 | | | | 1,065,342 | |
Biohaven Pharmaceutical Holding Co., Ltd.† | | | 40,153 | | | | 1,573,596 | |
Bridgebio Pharma, Inc.†# | | | 15,354 | | | | 467,990 | |
FibroGen, Inc.† | | | 48,902 | | | | 2,183,963 | |
Halozyme Therapeutics, Inc.† | | | 131,979 | | | | 2,180,293 | |
Homology Medicines, Inc.†# | | | 56,555 | | | | 1,069,455 | |
Intercept Pharmaceuticals, Inc.†# | | | 17,108 | | | | 1,097,991 | |
REGENXBIO, Inc.†# | | | 29,913 | | | | 1,031,699 | |
Rubius Therapeutics, Inc.†# | | | 29,199 | | | | 270,967 | |
Sage Therapeutics, Inc.†# | | | 6,222 | | | | 1,068,131 | |
Spark Therapeutics, Inc.† | | | 2,838 | | | | 276,450 | |
Twist Bioscience Corp.† | | | 58,498 | | | | 1,698,197 | |
| | | | | | |
|
|
|
| | | | | | | | 16,153,292 | |
| | | | | | |
|
|
|
Medical - Drugs — 4.6% | |
Clementia Pharmaceuticals, Inc. CVR†(1) | | | 70,624 | | | | 0 | |
Coherus Biosciences, Inc.†# | | | 100,919 | | | | 2,239,393 | |
Global Blood Therapeutics, Inc.†# | | | 11,160 | | | | 513,137 | |
Horizon Therapeutics PLC† | | | 105,326 | | | | 2,910,157 | |
Optinose, Inc.†# | | | 72,237 | | | | 553,335 | |
TherapeuticsMD, Inc.†# | | | 306,020 | | | | 884,398 | |
Tricida, Inc.†# | | | 47,381 | | | | 1,653,123 | |
| | | | | | |
|
|
|
| | | | | | | | 8,753,543 | |
| | | | | | |
|
|
|
Medical - Hospitals — 0.6% | |
Acadia Healthcare Co., Inc.†# | | | 46,065 | | | | 1,218,880 | |
| | | | | | |
|
|
|
Medical - Outpatient/Home Medical — 1.5% | |
Amedisys, Inc.† | | | 22,832 | | | | 2,938,707 | |
| | | | | | |
|
|
|
Miscellaneous Manufacturing — 1.5% | |
John Bean Technologies Corp. | | | 27,627 | | | | 2,826,795 | |
| | | | | | |
|
|
|
Oil Companies - Exploration & Production — 0.2% | |
Centennial Resource Development, Inc., Class A† | | | 75,747 | | | | 365,100 | |
| | | | | | |
|
|
|
Patient Monitoring Equipment — 1.5% | |
Insulet Corp.†# | | | 18,412 | | | | 2,838,578 | |
| | | | | | |
|
|
|
Power Converter/Supply Equipment — 1.9% | |
Generac Holdings, Inc.† | | | 47,531 | | | | 3,706,943 | |
| | | | | | |
|
|
|
Publishing - Newspapers — 1.2% | |
New York Times Co., Class A | | | 79,290 | | | | 2,315,268 | |
| | | | | | |
|
|
|
Real Estate Investment Trusts — 2.7% | |
CubeSmart | | | 35,189 | | | | 1,262,933 | |
EastGroup Properties, Inc. | | | 12,220 | | | | 1,521,635 | |
National Health Investors, Inc. | | | 13,820 | | | | 1,146,507 | |
Terreno Realty Corp. | | | 26,752 | | | | 1,352,581 | |
| | | | | | |
|
|
|
| | | | | | | | 5,283,656 | |
| | | | | | |
|
|
|
Recreational Centers — 1.0% | |
Planet Fitness, Inc., Class A† | | | 28,220 | | | | 1,992,614 | |
| | | | | | |
|
|
|
Retail - Apparel/Shoe — 0.5% | |
American Eagle Outfitters, Inc. | | | 54,761 | | | | 921,080 | |
| | | | | | |
|
|
|
Retail - Automobile — 2.3% | |
Lithia Motors, Inc., Class A# | | | 18,651 | | | | 2,444,587 | |
Rush Enterprises, Inc., Class A | | | 56,774 | | | | 2,050,109 | |
| | | | | | |
|
|
|
| | | | | | | | 4,494,696 | |
| | | | | | |
|
|
|
| | | | | | | | |
| | |
| Security Description | | Shares | | | Value
(Note 2) | |
| |
| | | | | | | | | |
Retail - Discount — 0.7% | |
Ollie’s Bargain Outlet Holdings, Inc.† | | | 25,868 | | | $ | 1,434,381 | |
| | | | | | |
|
|
|
Retail - Misc./Diversified — 0.8% | |
Hudson, Ltd., Class A† | | | 143,793 | | | | 1,560,154 | |
| | | | | | |
|
|
|
Retail- Pet Food & Supplies — 1.3% | |
Freshpet, Inc.† | | | 50,967 | | | | 2,501,460 | |
| | | | | | |
|
|
|
Retail - Restaurants — 1.1% | |
Texas Roadhouse, Inc. | | | 42,073 | | | | 2,165,077 | |
| | | | | | |
|
|
|
Retail - Vision Service Center — 1.6% | |
National Vision Holdings, Inc.† | | | 109,399 | | | | 3,102,556 | |
| | | | | | |
|
|
|
Schools — 1.5% | |
Bright Horizons Family Solutions, Inc.† | | | 17,521 | | | | 2,891,841 | |
| | | | | | |
|
|
|
Security Services — 0.6% | |
Brink’s Co. | | | 16,028 | | | | 1,206,107 | |
| | | | | | |
|
|
|
Semiconductor Equipment — 2.8% | |
Entegris, Inc. | | | 65,134 | | | | 2,789,689 | |
MKS Instruments, Inc. | | | 33,761 | | | | 2,643,149 | |
| | | | | | |
|
|
|
| | | | | | | | 5,432,838 | |
| | | | | | |
|
|
|
Steel Pipe & Tube — 1.3% | |
Advanced Drainage Systems, Inc. | | | 80,540 | | | | 2,528,151 | |
| | | | | | |
|
|
|
Telecom Equipment - Fiber Optics — 1.1% | |
Ciena Corp.† | | | 52,413 | | | | 2,145,264 | |
| | | | | | |
|
|
|
Television — 1.1% | |
World Wrestling Entertainment, Inc., Class A# | | | 28,737 | | | | 2,052,684 | |
| | | | | | |
|
|
|
Therapeutics — 0.9% | |
G1 Therapeutics, Inc.†# | | | 45,637 | | | | 1,656,623 | |
| | | | | | |
|
|
|
Tools - Hand Held — 1.5% | |
MSA Safety, Inc. | | | 27,002 | | | | 2,852,221 | |
| | | | | | |
|
|
|
Transport - Marine — 0.5% | |
Kirby Corp.† | | | 12,554 | | | | 923,849 | |
| | | | | | |
|
|
|
Transport - Truck — 1.7% | |
Saia, Inc.† | | | 37,587 | | | | 3,215,192 | |
| | | | | | |
|
|
|
Web Hosting/Design — 1.3% | |
Wix.com, Ltd.† | | | 18,127 | | | | 2,542,312 | |
| | | | | | |
|
|
|
Wireless Equipment — 0.5% | |
PagerDuty, Inc.†# | | | 22,277 | | | | 874,818 | |
| | | | | | |
|
|
|
Total Long-Term Investment Securities | | | | | | | | |
(cost $179,249,520) | | | | | | | 191,256,959 | |
| | | |
|
|
|
SHORT-TERM INVESTMENT SECURITIES — 3.4% | |
Registered Investment Companies — 3.4% | |
State Street Navigator Securities Lending Government Money Market Portfolio
2.12%(2)(3)
(cost $6,431,724) | | | 6,431,724 | | | | 6,431,724 | |
| | | | | | |
|
|
|
TOTAL INVESTMENTS | | | | | | | | |
(cost $185,681,244)(4) | | | 102.8 | % | | | 197,688,683 | |
Liabilities in excess of other assets | | | (2.8 | ) | | | (5,347,460 | ) |
| | |
|
|
| |
|
|
|
NET ASSETS | | | 100.0 | % | | $ | 192,341,223 | |
| | |
|
|
| |
|
|
|
| † | Non-income producing security |
| # | The security or a portion thereof is out on loan (see Note 2). |
| (1) | Securities classified as Level 3 (see Note 2). |
| (2) | At August 31, 2019, the Fund had loaned securities with a total value of $33,019,784. This was secured by collateral of $6,431,724, which was received in cash and subsequently invested in short-term investments currently valued at $6,431,724 as reported in the Portfolio of Investments. Additional collateral of $27,425,059 was received in the form of fixed income pooled securities, which the Fund cannot sell or repledge and accordingly are not reflected in the Fund’s assets and liabilities. |
VALIC Company II Small Cap Growth Fund
PORTFOLIO OF INVESTMENTS —August 31, 2019 — (continued)
The components of the fixed income pooled securities referenced above are as follows:
| | | | | | | | |
Securities
| | Coupon Range
| | Maturity Date Range
| | Value as of
August 31, 2019
| |
Federal National Mtg. Assoc. | | 3.50% to 3.50% | | 12/01/2047 to 12/01/2047 | | $ | 144,092 | |
United States Treasury Bills | | 0.00% | | 09/12/2019 to 01/16/2020 | | | 5,326,938 | |
United States Treasury Notes/Bonds | | zero coupon to 8.75% | | 09/30/2019 to 02/15/2049 | | | 21,954,029 | |
| (3) | The rate shown is the7-day yield as of August 31, 2019. |
| (4) | See Note 5 for cost of investments on a tax basis. |
CVR — Contingent Value Rights
The following is a summary of the inputs used to value the Fund’s net assets as of August 31, 2019 (see Note 2):
| | | | | | | | | | | | | | | | |
| | | Level 1 - Unadjusted
Quoted Prices
| | | Level 2 - Other
Observable Inputs
| | | Level 3 - Significant
Unobservable Inputs
| | | Total
| |
ASSETS: | | | | | | | | | | | | | | | | |
Investments at Value:* | | | | | | | | | | | | | | | | |
| | | | |
Common Stocks: | | | | | | | | | | | | | | | | |
Medical-Drugs | | $ | 8,753,543 | | | $ | — | | | $ | 0 | | | $ | 8,753,543 | |
Other Industries | | | 182,503,416 | | | | — | | | | — | | | | 182,503,416 | |
Short-Term Investment Securities | | | 6,431,724 | | | | — | | | | — | | | | 6,431,724 | |
| | |
|
|
| |
|
|
| |
|
|
| |
|
|
|
Total Investments at Value | | $ | 197,688,683 | | | $ | — | | | $ | 0 | | | $ | 197,688,683 | |
| | |
|
|
| |
|
|
| |
|
|
| |
|
|
|
| * | For a detailed presentation of investments, please refer to the Portfolio of Investments. |
At the beginning and end of the reporting period, Level 3 investments in securities were not considered a material portion of the Fund. There were no Level 3 transfers during the reporting period.
See Notes to Financial Statements
VALIC Company II Small Cap Value Fund
PORTFOLIO PROFILE —August 31, 2019 (unaudited)
Industry Allocation*
| | | | |
Banks — Commercial | | | 16.1 | % |
Real Estate Investment Trusts | | | 12.4 | |
Savings & Loans/Thrifts | | | 3.5 | |
Electric — Integrated | | | 2.7 | |
Repurchase Agreements | | | 2.3 | |
Consulting Services | | | 2.3 | |
Electronic Components — Semiconductors | | | 2.3 | |
Building — Residential/Commercial | | | 2.2 | |
Gas — Distribution | | | 2.0 | |
Oil — Field Services | | | 1.7 | |
Coal | | | 1.7 | |
Electronic Components — Misc. | | | 1.4 | |
Building & Construction — Misc. | | | 1.4 | |
Electronic Parts Distribution | | | 1.3 | |
Oil Refining & Marketing | | | 1.3 | |
Medical — Biomedical/Gene | | | 1.3 | |
Auto/Truck Parts & Equipment — Original | | | 1.2 | |
Building & Construction Products — Misc. | | | 1.2 | |
Financial Guarantee Insurance | | | 1.2 | |
Independent Power Producers | | | 1.2 | |
Medical — HMO | | | 1.2 | |
Registered Investment Companies | | | 1.1 | |
Oil Companies — Exploration & Production | | | 1.1 | |
Distribution/Wholesale | | | 1.0 | |
Insurance — Property/Casualty | | | 1.0 | |
Human Resources | | | 1.0 | |
Engineering/R&D Services | | | 1.0 | |
Computer Services | | | 0.9 | |
Investment Management/Advisor Services | | | 0.9 | |
Energy — Alternate Sources | | | 0.9 | |
Television | | | 0.9 | |
Insurance — Reinsurance | | | 0.8 | |
Medical — Drugs | | | 0.8 | |
Insurance — Life/Health | | | 0.8 | |
Paper & Related Products | | | 0.8 | |
Office Supplies & Forms | | | 0.8 | |
Consumer Products — Misc. | | | 0.7 | |
Building — Maintenance & Services | | | 0.7 | |
Retail — Building Products | | | 0.7 | |
Transport — Truck | | | 0.7 | |
Poultry | | | 0.7 | |
Schools | | | 0.7 | |
Retail — Sporting Goods | | | 0.7 | |
Auto — Truck Trailers | | | 0.7 | |
Semiconductor Components — Integrated Circuits | | | 0.6 | |
Retail — Apparel/Shoe | | | 0.6 | |
Medical Information Systems | | | 0.6 | |
Rubber/Plastic Products | | | 0.5 | |
Building — Heavy Construction | | | 0.5 | |
Retail — Restaurants | | | 0.5 | |
Oil Field Machinery & Equipment | | | 0.5 | |
Dental Supplies & Equipment | | | 0.5 | |
Banks — Mortgage | | | 0.4 | |
Medical — Wholesale Drug Distribution | | | 0.4 | |
Finance — Mortgage Loan/Banker | | | 0.4 | |
Rental Auto/Equipment | | | 0.4 | |
Computer Software | | | 0.4 | |
Aerospace/Defense — Equipment | | | 0.4 | |
Transport — Services | | | 0.4 | |
Apparel Manufacturers | | | 0.4 | |
Audio/Video Products | | | 0.4 | |
Building Products — Wood | | | 0.4 | |
Food — Wholesale/Distribution | | | 0.4 | |
Chemicals — Specialty | | | 0.3 | |
Printing — Commercial | | | 0.3 | |
Cable/Satellite TV | | | 0.3 | |
Transactional Software | | | 0.3 | |
Retail — Automobile | | | 0.3 | |
Auto/Truck Parts & Equipment — Replacement | | | 0.3 | |
| | | | |
Computers — Other | | | 0.3 | |
Transport — Marine | | | 0.3 | |
Airlines | | | 0.3 | |
Metal Products — Distribution | | | 0.3 | |
Retail — Office Supplies | | | 0.3 | |
E-Commerce/Services | | | 0.3 | |
Diversified Manufacturing Operations | | | 0.3 | |
Retail — Bookstores | | | 0.3 | |
Machinery — Farming | | | 0.2 | |
Finance — Commercial | | | 0.2 | |
Data Processing/Management | | | 0.2 | |
Telecom Services | | | 0.2 | |
Water | | | 0.2 | |
Finance — Consumer Loans | | | 0.2 | |
Electric — Distribution | | | 0.2 | |
Publishing — Newspapers | | | 0.2 | |
Semiconductor Equipment | | | 0.2 | |
Electric — Generation | | | 0.2 | |
Commercial Services — Finance | | | 0.2 | |
Enterprise Software/Service | | | 0.2 | |
Machinery — General Industrial | | | 0.2 | |
Telecom Equipment — Fiber Optics | | | 0.2 | |
Electronic Measurement Instruments | | | 0.2 | |
Building Products — Doors & Windows | | | 0.2 | |
Power Converter/Supply Equipment | | | 0.2 | |
X-Ray Equipment | | | 0.2 | |
Private Equity | | | 0.2 | |
Linen Supply & Related Items | | | 0.2 | |
Steel — Producers | | | 0.2 | |
E-Services/Consulting | | | 0.1 | |
Capacitors | | | 0.1 | |
Broadcast Services/Program | | | 0.1 | |
Commercial Services | | | 0.1 | |
Publishing — Books | | | 0.1 | |
Industrial Automated/Robotic | | | 0.1 | |
Medical Imaging Systems | | | 0.1 | |
Office Furnishings — Original | | | 0.1 | |
Computers — Integrated Systems | | | 0.1 | |
Dialysis Centers | | | 0.1 | |
Finance — Leasing Companies | | | 0.1 | |
Retail — Jewelry | | | 0.1 | |
Theaters | | | 0.1 | |
Tobacco | | | 0.1 | |
E-Marketing/Info | | | 0.1 | |
Communications Software | | | 0.1 | |
Casino Hotels | | | 0.1 | |
Publishing — Periodicals | | | 0.1 | |
Pastoral & Agricultural | | | 0.1 | |
Networking Products | | | 0.1 | |
Machinery — Construction & Mining | | | 0.1 | |
Internet Content — Entertainment | | | 0.1 | |
Wire & Cable Products | | | 0.1 | |
Retail — Discount | | | 0.1 | |
Finance — Other Services | | | 0.1 | |
Home Furnishings | | | 0.1 | |
| | |
|
|
|
| | | | 101.0 | % |
| | |
|
|
|
| * | Calculated as a percentage of net assets |
VALIC Company II Small Cap Value Fund
PORTFOLIO OF INVESTMENTS —August 31, 2019
| | | | | | | | |
| | |
| Security Description | | Shares | | | Value
(Note 2) | |
| |
COMMON STOCKS — 97.6% | |
Advertising Sales — 0.0% | |
National CineMedia, Inc. | | | 11,800 | | | $ | 96,760 | |
| | | | | | |
|
|
|
Advertising Services — 0.0% | |
Fluent, Inc.† | | | 34,800 | | | | 103,704 | |
| | | | | | |
|
|
|
Aerospace/Defense - Equipment — 0.4% | |
Moog, Inc., Class A | | | 15,900 | | | | 1,291,875 | |
| | | | | | |
|
|
|
Airlines — 0.3% | |
SkyWest, Inc. | | | 16,200 | | | | 927,612 | |
| | | | | | |
|
|
|
Apparel Manufacturers — 0.4% | |
Deckers Outdoor Corp.† | | | 8,625 | | | | 1,271,756 | |
| | | | | | |
|
|
|
Appliances — 0.0% | |
Hamilton Beach Brands Holding Co., Class A | | | 2,700 | | | | 38,259 | |
| | | | | | |
|
|
|
Audio/Video Products — 0.4% | |
Sonos, Inc.†# | | | 87,400 | | | | 1,269,048 | |
| | | | | | |
|
|
|
Auto - Truck Trailers — 0.7% | |
Wabash National Corp. | | | 155,200 | | | | 2,116,928 | |
| | | | | | |
|
|
|
Auto/Truck Parts & Equipment - Original — 1.2% | |
Adient PLC | | | 42,200 | | | | 851,174 | |
Cooper-Standard Holdings, Inc.† | | | 900 | | | | 33,696 | |
Dana, Inc. | | | 61,500 | | | | 782,895 | |
Gentherm, Inc.† | | | 14,400 | | | | 528,480 | |
Meritor, Inc.† | | | 58,700 | | | | 987,334 | |
Methode Electronics, Inc. | | | 8,600 | | | | 272,964 | |
Modine Manufacturing Co.† | | | 4,400 | | | | 44,924 | |
Tower International, Inc. | | | 12,900 | | | | 398,997 | |
| | | | | | |
|
|
|
| | | | | | | | 3,900,464 | |
| | | | | | |
|
|
|
Auto/Truck Parts & Equipment - Replacement — 0.3% | |
Commercial Vehicle Group, Inc.† | | | 40,600 | | | | 257,810 | |
Douglas Dynamics, Inc. | | | 17,200 | | | | 718,272 | |
| | | | | | |
|
|
|
| | | | | | | | 976,082 | |
| | | | | | |
|
|
|
Banks - Commercial — 16.1% | |
1st Source Corp. | | | 13,620 | | | | 604,319 | |
Amalgamated Bank, Class A | | | 2,700 | | | | 43,335 | |
American National Bankshares, Inc. | | | 700 | | | | 23,940 | |
Ameris Bancorp | | | 22,400 | | | | 788,256 | |
Atlantic Union Bankshares Corp. | | | 1,000 | | | | 36,110 | |
BancFirst Corp. | | | 14,280 | | | | 767,836 | |
Bancorp, Inc.† | | | 69,000 | | | | 629,970 | |
BancorpSouth Bank | | | 8,800 | | | | 242,792 | |
Bank of Commerce Holdings | | | 2,700 | | | | 27,000 | |
Bank of N.T. Butterfield & Son, Ltd. | | | 12,000 | | | | 330,720 | |
Banner Corp. | | | 9,300 | | | | 501,363 | |
Bridgewater Bancshares, Inc.† | | | 5,700 | | | | 63,441 | |
Bryn Mawr Bank Corp. | | | 3,500 | | | | 119,350 | |
Cadence BanCorp | | | 1,900 | | | | 29,203 | |
Cathay General Bancorp | | | 29,590 | | | | 982,092 | |
Central Pacific Financial Corp. | | | 50,900 | | | | 1,416,038 | |
Central Valley Community Bancorp | | | 5,600 | | | | 109,648 | |
Century Bancorp, Inc., Class A | | | 418 | | | | 33,858 | |
Chemung Financial Corp. | | | 700 | | | | 28,133 | |
Citizens & Northern Corp. | | | 2,200 | | | | 52,184 | |
City Holding Co. | | | 12,800 | | | | 951,680 | |
Columbia Banking System, Inc. | | | 16,600 | | | | 572,866 | |
Community Bank System, Inc. | | | 15,480 | | | | 944,125 | |
Community Trust Bancorp, Inc. | | | 18,618 | | | | 724,240 | |
ConnectOne Bancorp, Inc. | | | 25,700 | | | | 526,336 | |
Customers Bancorp, Inc.† | | | 57,100 | | | | 1,078,619 | |
East West Bancorp, Inc. | | | 5,773 | | | | 237,443 | |
Enterprise Financial Services Corp. | | | 24,100 | | | | 950,022 | |
Farmers National Banc Corp. | | | 10,200 | | | | 137,700 | |
Financial Institutions, Inc. | | | 23,900 | | | | 694,534 | |
| | | | | | | | |
| | |
| Security Description | | Shares | | | Value
(Note 2) | |
| |
| | | | | | | | | |
Banks - Commercial (continued) | |
First Bancorp | | | 7,700 | | | $ | 271,194 | |
First BanCorp./Puerto Rico | | | 304,200 | | | | 2,914,236 | |
First Business Financial Services, Inc. | | | 6,200 | | | | 139,810 | |
First Citizens BancShares, Inc., Class A | | | 1,640 | | | | 729,144 | |
First Commonwealth Financial Corp. | | | 120,600 | | | | 1,491,822 | |
First Community Bankshares, Inc. | | | 6,900 | | | | 219,489 | |
First Financial Corp. | | | 8,600 | | | | 349,160 | |
First Hawaiian, Inc. | | | 16,400 | | | | 421,480 | |
First Interstate BancSystem, Inc., Class A | | | 11,270 | | | | 439,530 | |
Franklin Financial Network, Inc. | | | 1,700 | | | | 49,181 | |
Fulton Financial Corp. | | | 19,800 | | | | 315,810 | |
Glacier Bancorp, Inc. | | | 24,100 | | | | 956,529 | |
Great Southern Bancorp, Inc. | | | 10,900 | | | | 614,106 | |
Great Western Bancorp, Inc. | | | 11,600 | | | | 346,028 | |
Hancock Whitney Corp. | | | 44,721 | | | | 1,570,154 | |
Hanmi Financial Corp. | | | 47,800 | | | | 856,098 | |
Heartland Financial USA, Inc. | | | 9,300 | | | | 406,689 | |
Heritage Commerce Corp. | | | 6,200 | | | | 71,858 | |
Hilltop Holdings, Inc. | | | 45,400 | | | | 1,078,250 | |
Home BancShares, Inc. | | | 43,800 | | | | 776,136 | |
HomeStreet, Inc.† | | | 7,300 | | | | 192,501 | |
Hope Bancorp, Inc. | | | 72,927 | | | | 977,951 | |
IBERIABANK Corp. | | | 24,000 | | | | 1,655,760 | |
Independent Bank Corp./Michigan | | | 21,900 | | | | 425,517 | |
Lakeland Financial Corp. | | | 4,770 | | | | 201,914 | |
LCNB Corp. | | | 5,700 | | | | 95,589 | |
Luther Burbank Corp. | | | 23,600 | | | | 246,856 | |
Mercantile Bank Corp. | | | 2,200 | | | | 67,694 | |
Midland States Bancorp, Inc. | | | 3,400 | | | | 87,618 | |
Northrim BanCorp, Inc. | | | 2,800 | | | | 101,360 | |
OFG Bancorp | | | 55,300 | | | | 1,134,756 | |
Old Second Bancorp, Inc. | | | 11,400 | | | | 134,406 | |
Orrstown Financial Services, Inc. | | | 4,200 | | | | 89,628 | |
Pacific Mercantile Bancorp† | | | 10,700 | | | | 81,320 | |
PacWest Bancorp | | | 5,335 | | | | 181,817 | |
Peoples Bancorp, Inc. | | | 13,500 | | | | 414,585 | |
Preferred Bank | | | 2,000 | | | | 99,920 | |
Premier Financial Bancorp, Inc. | | | 2,125 | | | | 32,938 | |
Republic Bancorp, Inc., Class A | | | 4,600 | | | | 195,270 | |
S&T Bancorp, Inc. | | | 2,480 | | | | 84,866 | |
SB One Bancorp | | | 5,000 | | | | 111,600 | |
Shore Bancshares, Inc. | | | 2,700 | | | | 41,472 | |
Sierra Bancorp | | | 3,900 | | | | 96,096 | |
Simmons First National Corp., Class A | | | 4,078 | | | | 97,872 | |
South State Corp. | | | 18,770 | | | | 1,381,097 | |
Stock Yards Bancorp, Inc. | | | 2,150 | | | | 78,045 | |
Tompkins Financial Corp. | | | 2,548 | | | | 201,547 | |
TriCo Bancshares | | | 24,600 | | | | 869,856 | |
TriState Capital Holdings, Inc.† | | | 5,600 | | | | 110,600 | |
Trustmark Corp. | | | 65,500 | | | | 2,140,540 | |
UMB Financial Corp. | | | 25,260 | | | | 1,574,203 | |
Umpqua Holdings Corp. | | | 102,214 | | | | 1,605,782 | |
United Bankshares, Inc. | | | 55,700 | | | | 2,054,216 | |
United Community Banks, Inc. | | | 50,900 | | | | 1,344,269 | |
Veritex Holdings, Inc. | | | 32,222 | | | | 760,439 | |
Washington Trust Bancorp, Inc. | | | 4,280 | | | | 198,592 | |
Webster Financial Corp. | | | 12,700 | | | | 568,452 | |
West Bancorporation, Inc. | | | 4,330 | | | | 90,237 | |
Westamerica Bancorporation | | | 34,324 | | | | 2,114,702 | |
Wintrust Financial Corp. | | | 18,100 | | | | 1,137,223 | |
| | | | | | |
|
|
|
| | | | | | | | 50,742,963 | |
| | | | | | |
|
|
|
Banks - Mortgage — 0.4% | |
Flagstar Bancorp, Inc. | | | 11,300 | | | | 410,755 | |
VALIC Company II Small Cap Value Fund
PORTFOLIO OF INVESTMENTS —August 31, 2019 — (continued)
| | | | | | | | |
| | |
| Security Description | | Shares | | | Value
(Note 2) | |
| |
COMMON STOCKS (continued) | |
Banks - Mortgage (continued) | |
Walker & Dunlop, Inc. | | | 17,500 | | | $ | 977,550 | |
| | | | | | |
|
|
|
| | | | | | | | 1,388,305 | |
| | | | | | |
|
|
|
Broadcast Services/Program — 0.1% | |
Hemisphere Media Group, Inc.† | | | 34,100 | | | | 404,767 | |
| | | | | | |
|
|
|
Building & Construction Products - Misc. — 1.2% | |
Armstrong Flooring, Inc.† | | | 16,100 | | | | 108,997 | |
Builders FirstSource, Inc.† | | | 133,900 | | | | 2,604,355 | |
Louisiana-Pacific Corp. | | | 47,700 | | | | 1,146,708 | |
| | | | | | |
|
|
|
| | | | | | | | 3,860,060 | |
| | | | | | |
|
|
|
Building & Construction - Misc. — 1.4% | |
EMCOR Group, Inc. | | | 42,248 | | | | 3,694,165 | |
MYR Group, Inc.† | | | 19,700 | | | | 564,799 | |
| | | | | | |
|
|
|
| | | | | | | | 4,258,964 | |
| | | | | | |
|
|
|
Building Products - Doors & Windows — 0.2% | |
JELD-WEN Holding, Inc.† | | | 4,700 | | | | 81,122 | |
Masonite International Corp.† | | | 7,800 | | | | 416,442 | |
| | | | | | |
|
|
|
| | | | | | | | 497,564 | |
| | | | | | |
|
|
|
Building Products - Wood — 0.4% | |
Boise Cascade Co. | | | 36,600 | | | | 1,149,240 | |
Universal Forest Products, Inc. | | | 700 | | | | 27,370 | |
| | | | | | |
|
|
|
| | | | | | | | 1,176,610 | |
| | | | | | |
|
|
|
Building - Heavy Construction — 0.5% | |
Great Lakes Dredge & Dock Corp.† | | | 97,700 | | | | 1,059,068 | |
Sterling Construction Co., Inc.† | | | 32,900 | | | | 368,151 | |
Tutor Perini Corp.†# | | | 24,800 | | | | 247,752 | |
| | | | | | |
|
|
|
| | | | | | | | 1,674,971 | |
| | | | | | |
|
|
|
Building - Maintenance & Services — 0.7% | |
ABM Industries, Inc. | | | 62,400 | | | | 2,325,024 | |
| | | | | | |
|
|
|
Building - Residential/Commercial — 2.2% | |
KB Home | | | 102,400 | | | | 2,876,416 | |
Meritage Homes Corp.† | | | 31,500 | | | | 2,058,210 | |
TRI Pointe Group, Inc.†# | | | 152,200 | | | | 2,130,800 | |
| | | | | | |
|
|
|
| | | | | | | | 7,065,426 | |
| | | | | | |
|
|
|
Cable/Satellite TV — 0.3% | |
Liberty Latin America, Ltd., Class A† | | | 41,300 | | | | 678,146 | |
WideOpenWest, Inc.† | | | 55,800 | | | | 313,596 | |
| | | | | | |
|
|
|
| | | | | | | | 991,742 | |
| | | | | | |
|
|
|
Capacitors — 0.1% | |
KEMET Corp. | | | 24,400 | | | | 408,700 | |
| | | | | | |
|
|
|
Casino Hotels — 0.1% | |
Boyd Gaming Corp. | | | 9,900 | | | | 237,996 | |
| | | | | | |
|
|
|
Chemicals - Diversified — 0.0% | |
AdvanSix, Inc.† | | | 5,300 | | | | 118,402 | |
| | | | | | |
|
|
|
Chemicals - Specialty — 0.3% | |
Kraton Corp.† | | | 14,500 | | | | 397,880 | |
Minerals Technologies, Inc. | | | 6,760 | | | | 325,832 | |
Stepan Co. | | | 2,700 | | | | 257,553 | |
Valhi, Inc. | | | 25,500 | | | | 49,725 | |
| | | | | | |
|
|
|
| | | | | | | | 1,030,990 | |
| | | | | | |
|
|
|
Coal — 1.7% | |
Arch Coal, Inc., Class A# | | | 32,100 | | | | 2,457,576 | |
CONSOL Energy, Inc.† | | | 4,400 | | | | 73,744 | |
Peabody Energy Corp. | | | 55,000 | | | | 1,013,650 | |
Ramaco Resources, Inc.† | | | 17,900 | | | | 76,254 | |
| | | | | | | | |
| | |
| Security Description | | Shares | | | Value
(Note 2) | |
| |
| | | | | | | | | |
Coal (continued) | |
Warrior Met Coal, Inc. | | | 77,400 | | | $ | 1,617,660 | |
| | | | | | |
|
|
|
| | | | | | | | 5,238,884 | |
| | | | | | |
|
|
|
Commercial Services — 0.1% | |
Acacia Research Corp.† | | | 88,972 | | | | 232,217 | |
Harsco Corp.† | | | 8,900 | | | | 159,310 | |
| | | | | | |
|
|
|
| | | | | | | | 391,527 | |
| | | | | | |
|
|
|
Commercial Services - Finance — 0.2% | |
CBIZ, Inc.† | | | 20,800 | | | | 464,672 | |
EVERTEC, Inc. | | | 3,800 | | | | 132,468 | |
| | | | | | |
|
|
|
| | | | | | | | 597,140 | |
| | | | | | |
|
|
|
Communications Software — 0.1% | |
Avaya Holdings Corp.†# | | | 17,500 | | | | 247,100 | |
| | | | | | |
|
|
|
Computer Services — 0.9% | |
CACI International, Inc., Class A† | | | 900 | | | | 200,061 | |
Insight Enterprises, Inc.† | | | 26,400 | | | | 1,268,784 | |
Perspecta, Inc. | | | 51,300 | | | | 1,331,235 | |
Unisys Corp.† | | | 20,500 | | | | 134,070 | |
| | | | | | |
|
|
|
| | | | | | | | 2,934,150 | |
| | | | | | |
|
|
|
Computer Software — 0.4% | |
TiVo Corp. | | | 176,600 | | | | 1,329,798 | |
| | | | | | |
|
|
|
Computers - Integrated Systems — 0.1% | |
NetScout Systems, Inc.† | | | 14,000 | | | | 310,100 | |
| | | | | | |
|
|
|
Computers - Other — 0.3% | |
Lumentum Holdings, Inc.† | | | 17,100 | | | | 953,496 | |
| | | | | | |
|
|
|
Consulting Services — 2.3% | |
CRA International, Inc. | | | 3,900 | | | | 151,671 | |
FTI Consulting, Inc.† | | | 19,600 | | | | 2,119,544 | |
Huron Consulting Group, Inc.† | | | 21,100 | | | | 1,291,531 | |
Kelly Services, Inc., Class A | | | 48,912 | | | | 1,184,159 | |
Navigant Consulting, Inc. | | | 40,400 | | | | 1,125,948 | |
Vectrus, Inc.† | | | 31,600 | | | | 1,278,536 | |
| | | | | | |
|
|
|
| | | | | | | | 7,151,389 | |
| | | | | | |
|
|
|
Consumer Products - Misc. — 0.7% | |
Central Garden & Pet Co., Class A† | | | 48,900 | | | | 1,176,534 | |
Helen of Troy, Ltd.† | | | 7,600 | | | | 1,166,676 | |
| | | | | | |
|
|
|
| | | | | | | | 2,343,210 | |
| | | | | | |
|
|
|
Data Processing/Management — 0.2% | |
Fair Isaac Corp.† | | | 2,020 | | | | 712,494 | |
| | | | | | |
|
|
|
Dental Supplies & Equipment — 0.5% | |
Patterson Cos., Inc.# | | | 86,100 | | | | 1,439,592 | |
| | | | | | |
|
|
|
Dialysis Centers — 0.1% | |
American Renal Associates Holdings, Inc.† | | | 50,000 | | | | 310,000 | |
| | | | | | |
|
|
|
Distribution/Wholesale — 1.0% | |
Anixter International, Inc.† | | | 3,100 | | | | 185,907 | |
Core-Mark Holding Co., Inc. | | | 51,171 | | | | 1,657,429 | |
Fossil Group, Inc.†# | | | 30,400 | | | | 389,120 | |
G-III Apparel Group, Ltd.† | | | 3,300 | | | | 67,683 | |
Titan Machinery, Inc.† | | | 42,500 | | | | 640,050 | |
Veritiv Corp.† | | | 21,100 | | | | 349,416 | |
| | | | | | |
|
|
|
| | | | | | | | 3,289,605 | |
| | | | | | |
|
|
|
Diversified Manufacturing Operations — 0.3% | |
EnPro Industries, Inc. | | | 2,300 | | | | 143,244 | |
Fabrinet† | | | 12,900 | | | | 651,321 | |
| | | | | | |
|
|
|
| | | | | | | | 794,565 | |
| | | | | | |
|
|
|
VALIC Company II Small Cap Value Fund
PORTFOLIO OF INVESTMENTS —August 31, 2019 — (continued)
| | | | | | | | |
| | |
| Security Description | | Shares | | | Value
(Note 2) | |
| |
COMMON STOCKS (continued) | |
E-Commerce/Services — 0.3% | |
Stamps.com, Inc.† | | | 12,700 | | | $ | 817,372 | |
| | | | | | |
|
|
|
E-Marketing/Info — 0.1% | |
New Media Investment Group, Inc.# | | | 30,900 | | | | 271,302 | |
| | | | | | |
|
|
|
E-Services/Consulting — 0.1% | |
Perficient, Inc.† | | | 11,400 | | | | 419,976 | |
| | | | | | |
|
|
|
Electric Products - Misc. — 0.0% | |
Graham Corp. | | | 6,300 | | | | 115,983 | |
| | | | | | |
|
|
|
Electric - Distribution — 0.2% | |
Spark Energy, Inc., Class A# | | | 35,300 | | | | 333,938 | |
Unitil Corp. | | | 5,300 | | | | 319,961 | |
| | | | | | |
|
|
|
| | | | | | | | 653,899 | |
| | | | | | |
|
|
|
Electric - Generation — 0.2% | |
Atlantic Power Corp.†# | | | 271,900 | | | | 622,651 | |
| | | | | | |
|
|
|
Electric - Integrated — 2.7% | |
Avista Corp. | | | 17,480 | | | | 819,812 | |
Black Hills Corp. | | | 22,000 | | | | 1,687,620 | |
IDACORP, Inc. | | | 13,000 | | | | 1,427,530 | |
NorthWestern Corp. | | | 4,600 | | | | 333,224 | |
PNM Resources, Inc. | | | 9,200 | | | | 469,292 | |
Portland General Electric Co. | | | 65,900 | | | | 3,749,051 | |
| | | | | | |
|
|
|
| | | | | | | | 8,486,529 | |
| | | | | | |
|
|
|
Electronic Components - Misc. — 1.4% | |
Bel Fuse, Inc., Class B | | | 9,300 | | | | 102,300 | |
Benchmark Electronics, Inc. | | | 81,621 | | | | 2,161,324 | |
Comtech Telecommunications Corp. | | | 4,000 | | | | 107,000 | |
Kimball Electronics, Inc.† | | | 3,100 | | | | 40,951 | |
OSI Systems, Inc.† | | | 1,300 | | | | 136,513 | |
Sanmina Corp.† | | | 51,800 | | | | 1,497,020 | |
Vishay Intertechnology, Inc. | | | 9,500 | | | | 150,385 | |
Vishay Precision Group, Inc.† | | | 2,200 | | | | 68,750 | |
| | | | | | |
|
|
|
| | | | | | | | 4,264,243 | |
| | | | | | |
|
|
|
Electronic Components - Semiconductors — 2.3% | |
Alpha & Omega Semiconductor, Ltd.† | | | 43,900 | | | | 517,142 | |
Amkor Technology, Inc.† | | | 143,400 | | | | 1,254,750 | |
Photronics, Inc.† | | | 33,100 | | | | 357,480 | |
Rambus, Inc.† | | | 262,600 | | | | 3,293,004 | |
Synaptics, Inc.† | | | 21,900 | | | | 701,238 | |
Xperi Corp. | | | 56,000 | | | | 1,025,920 | |
| | | | | | |
|
|
|
| | | | | | | | 7,149,534 | |
| | | | | | |
|
|
|
Electronic Measurement Instruments — 0.2% | |
Stoneridge, Inc.† | | | 17,500 | | | | 537,425 | |
| | | | | | |
|
|
|
Electronic Parts Distribution — 1.3% | |
Tech Data Corp.† | | | 45,650 | | | | 4,233,124 | |
| | | | | | |
|
|
|
Energy - Alternate Sources — 0.9% | |
FutureFuel Corp. | | | 31,000 | | | | 334,180 | |
Green Plains, Inc. | | | 33,500 | | | | 275,035 | |
Renewable Energy Group, Inc.†# | | | 86,700 | | | | 1,055,139 | |
REX American Resources Corp.† | | | 15,100 | | | | 1,037,068 | |
| | | | | | |
|
|
|
| | | | | | | | 2,701,422 | |
| | | | | | |
|
|
|
Engineering/R&D Services — 1.0% | |
KBR, Inc. | | | 99,300 | | | | 2,534,136 | |
VSE Corp. | | | 16,500 | | | | 525,360 | |
| | | | | | |
|
|
|
| | | | | | | | 3,059,496 | |
| | | | | | |
|
|
|
| | | | | | | | |
| | |
| Security Description | | Shares | | | Value
(Note 2) | |
| |
| | | | | | | | | |
Enterprise Software/Service — 0.2% | |
Donnelley Financial Solutions, Inc.† | | | 20,500 | | | $ | 217,915 | |
MicroStrategy, Inc., Class A† | | | 2,500 | | | | 358,225 | |
| | | | | | |
|
|
|
| | | | | | | | 576,140 | |
| | | | | | |
|
|
|
Finance - Commercial — 0.2% | |
Hannon Armstrong Sustainable Infrastructure Capital, Inc. | | | 20,100 | | | | 555,363 | |
Marlin Business Services Corp. | | | 8,300 | | | | 179,529 | |
| | | | | | |
|
|
|
| | | | | | | | 734,892 | |
| | | | | | |
|
|
|
Finance - Consumer Loans — 0.2% | |
Nelnet, Inc., Class A | | | 10,300 | | | | 690,615 | |
| | | | | | |
|
|
|
Finance - Credit Card — 0.0% | |
Meta Financial Group, Inc. | | | 2,200 | | | | 68,002 | |
| | | | | | |
|
|
|
Finance - Investment Banker/Broker — 0.0% | |
Houlihan Lokey, Inc. | | | 1,700 | | | | 75,106 | |
Oppenheimer Holdings, Inc., Class A | | | 1,700 | | | | 47,192 | |
| | | | | | |
|
|
|
| | | | | | | | 122,298 | |
| | | | | | |
|
|
|
Finance - Leasing Companies — 0.1% | |
Aircastle, Ltd. | | | 13,900 | | | | 303,715 | |
| | | | | | |
|
|
|
Finance - Mortgage Loan/Banker — 0.4% | |
PennyMac Financial Services, Inc.† | | | 46,800 | | | | 1,384,812 | |
| | | | | | |
|
|
|
Finance - Other Services — 0.1% | |
BGC Partners, Inc., Class A | | | 27,700 | | | | 141,270 | |
| | | | | | |
|
|
|
Financial Guarantee Insurance — 1.2% | |
MBIA, Inc.† | | | 45,500 | | | | 409,500 | |
MGIC Investment Corp. | | | 149,000 | | | | 1,884,850 | |
Radian Group, Inc. | | | 66,600 | | | | 1,501,830 | |
| | | | | | |
|
|
|
| | | | | | | | 3,796,180 | |
| | | | | | |
|
|
|
Food - Wholesale/Distribution — 0.4% | |
Fresh Del Monte Produce, Inc. | | | 9,450 | | | | 246,078 | |
Grocery Outlet Holding Corp.† | | | 11,300 | | | | 457,085 | |
SpartanNash Co. | | | 37,000 | | | | 398,490 | |
| | | | | | |
|
|
|
| | | | | | | | 1,101,653 | |
| | | | | | |
|
|
|
Footwear & Related Apparel — 0.0% | |
Weyco Group, Inc. | | | 700 | | | | 17,171 | |
| | | | | | |
|
|
|
Gas - Distribution — 2.0% | |
New Jersey Resources Corp. | | | 10,400 | | | | 475,696 | |
Northwest Natural Holding Co. | | | 15,400 | | | | 1,098,944 | |
ONE Gas, Inc. | | | 9,700 | | | | 888,617 | |
Southwest Gas Holdings, Inc. | | | 30,740 | | | | 2,804,410 | |
Spire, Inc. | | | 11,600 | | | | 984,840 | |
| | | | | | |
|
|
|
| | | | | | | | 6,252,507 | |
| | | | | | |
|
|
|
Home Furnishings — 0.1% | |
Hooker Furniture Corp. | | | 7,700 | | | | 137,522 | |
| | | | | | |
|
|
|
Hotels/Motels — 0.0% | |
Red Lion Hotels Corp.† | | | 21,700 | | | | 113,708 | |
| | | | | | |
|
|
|
Housewares — 0.0% | |
Lifetime Brands, Inc. | | | 16,000 | | | | 123,520 | |
| | | | | | |
|
|
|
Human Resources — 1.0% | |
Barrett Business Services, Inc. | | | 12,700 | | | | 1,106,551 | |
Cross Country Healthcare, Inc.† | | | 65,300 | | | | 669,325 | |
Heidrick & Struggles International, Inc. | | | 6,000 | | | | 159,300 | |
Korn Ferry | | | 3,500 | | | | 136,780 | |
TrueBlue, Inc.† | | | 58,700 | | | | 1,139,367 | |
| | | | | | |
|
|
|
| | | | | | | | 3,211,323 | |
| | | | | | |
|
|
|
VALIC Company II Small Cap Value Fund
PORTFOLIO OF INVESTMENTS —August 31, 2019 — (continued)
| | | | | | | | |
| | |
| Security Description | | Shares | | | Value
(Note 2) | |
| |
COMMON STOCKS (continued) | |
Independent Power Producers — 1.2% | |
Clearway Energy, Inc., Class A | | | 79,900 | | | $ | 1,339,124 | |
Clearway Energy, Inc., Class C | | | 69,000 | | | | 1,221,300 | |
Vistra Energy Corp. | | | 48,229 | | | | 1,203,314 | |
| | | | | | |
|
|
|
| | | | | | | | 3,763,738 | |
| | | | | | |
|
|
|
Industrial Automated/Robotic — 0.1% | |
Hurco Cos., Inc. | | | 11,400 | | | | 363,774 | |
| | | | | | |
|
|
|
Insurance - Life/Health — 0.8% | |
American Equity Investment Life Holding Co. | | | 67,000 | | | | 1,443,850 | |
CNO Financial Group, Inc. | | | 70,120 | | | | 1,015,338 | |
Primerica, Inc. | | | 1,200 | | | | 143,004 | |
| | | | | | |
|
|
|
| | | | | | | | 2,602,192 | |
| | | | | | |
|
|
|
Insurance - Multi-line — 0.0% | |
Horace Mann Educators Corp. | | | 2,480 | | | | 108,798 | |
| | | | | | |
|
|
|
Insurance - Property/Casualty — 1.0% | |
Ambac Financial Group, Inc.† | | | 23,700 | | | | 427,548 | |
AMERISAFE, Inc. | | | 10,900 | | | | 748,830 | |
FedNat Holding Co. | | | 11,100 | | | | 135,753 | |
First American Financial Corp. | | | 12,700 | | | | 742,315 | |
Hallmark Financial Services, Inc.† | | | 8,300 | | | | 145,914 | |
Heritage Insurance Holdings, Inc. | | | 38,400 | | | | 503,424 | |
National General Holdings Corp. | | | 3,200 | | | | 75,456 | |
Safety Insurance Group, Inc. | | | 3,900 | | | | 376,116 | |
Stewart Information Services Corp. | | | 3,400 | | | | 121,788 | |
| | | | | | |
|
|
|
| | | | | | | | 3,277,144 | |
| | | | | | |
|
|
|
Insurance - Reinsurance — 0.8% | |
Argo Group International Holdings, Ltd. | | | 2,675 | | | | 175,801 | |
Essent Group, Ltd. | | | 39,800 | | | | 1,930,300 | |
Global Indemnity, Ltd. | | | 1,300 | | | | 33,475 | |
Third Point Reinsurance, Ltd.† | | | 55,500 | | | | 522,810 | |
| | | | | | |
|
|
|
| | | | | | | | 2,662,386 | |
| | | | | | |
|
|
|
Internet Content - Entertainment — 0.1% | |
Limelight Networks, Inc.† | | | 81,400 | | | | 197,802 | |
| | | | | | |
|
|
|
Investment Management/Advisor Services — 0.9% | |
Associated Capital Group, Inc., Class A# | | | 300 | | | | 10,428 | |
Boston Private Financial Holdings, Inc. | | | 54,900 | | | | 583,038 | |
Brightsphere Investment Group, Inc. | | | 89,200 | | | | 810,828 | |
Columbia Financial, Inc.† | | | 13,900 | | | | 210,724 | |
Stifel Financial Corp. | | | 24,100 | | | | 1,287,422 | |
| | | | | | |
|
|
|
| | | | | | | | 2,902,440 | |
| | | | | | |
|
|
|
Linen Supply & Related Items — 0.2% | |
UniFirst Corp. | | | 2,400 | | | | 470,184 | |
| | | | | | |
|
|
|
Machinery - Construction & Mining — 0.1% | |
Hyster-Yale Materials Handling, Inc. | | | 3,700 | | | | 201,835 | |
| | | | | | |
|
|
|
Machinery - Electrical — 0.0% | |
Bloom Energy Corp. Class A†# | | | 1,500 | | | | 6,720 | |
| | | | | | |
|
|
|
Machinery - Farming — 0.2% | |
AGCO Corp. | | | 10,760 | | | | 743,731 | |
| | | | | | |
|
|
|
Machinery - General Industrial — 0.2% | |
Applied Industrial Technologies, Inc. | | | 900 | | | | 48,051 | |
DXP Enterprises, Inc.† | | | 16,100 | | | | 522,445 | |
| | | | | | |
|
|
|
| | | | | | | | 570,496 | |
| | | | | | |
|
|
|
Medical Imaging Systems — 0.1% | |
Lantheus Holdings, Inc.† | | | 16,200 | | | | 352,512 | |
| | | | | | |
|
|
|
| | | | | | | | |
| | |
| Security Description | | Shares | | | Value
(Note 2) | |
| |
| | | | | | | | | |
Medical Information Systems — 0.6% | |
Allscripts Healthcare Solutions, Inc.† | | | 170,400 | | | $ | 1,547,232 | |
Computer Programs & Systems, Inc. | | | 14,000 | | | | 296,100 | |
| | | | | | |
|
|
|
| | | | | | | | 1,843,332 | |
| | | | | | |
|
|
|
Medical - Biomedical/Gene — 1.3% | |
Acceleron Pharma, Inc.†# | | | 6,700 | | | | 300,897 | |
Acorda Therapeutics, Inc.†# | | | 8,800 | | | | 28,424 | |
AMAG Pharmaceuticals, Inc.†# | | | 6,500 | | | | 70,980 | |
Arcus Biosciences, Inc.† | | | 37,565 | | | | 293,383 | |
BioCryst Pharmaceuticals, Inc.†# | | | 40,300 | | | | 120,497 | |
Epizyme, Inc.†# | | | 34,000 | | | | 440,980 | |
Fate Therapeutics, Inc.† | | | 19,700 | | | | 321,504 | |
Five Prime Therapeutics, Inc.† | | | 18,300 | | | | 99,369 | |
Iovance Biotherapeutics, Inc.†# | | | 32,700 | | | | 687,027 | |
Karyopharm Therapeutics, Inc.†# | | | 28,400 | | | | 245,376 | |
Medicines Co.†# | | | 24,000 | | | | 1,007,040 | |
Scholar Rock Holding Corp.†# | | | 22,300 | | | | 236,157 | |
Tocagen, Inc.† | | | 35,200 | | | | 114,400 | |
| | | | | | |
|
|
|
| | | | | | | | 3,966,034 | |
| | | | | | |
|
|
|
Medical - Drugs — 0.8% | |
Enanta Pharmaceuticals, Inc.† | | | 4,000 | | | | 282,200 | |
Intra-Cellular Therapies, Inc.†# | | | 15,000 | | | | 128,400 | |
Kala Pharmaceuticals, Inc.†# | | | 37,600 | | | | 154,536 | |
Lannett Co., Inc.†# | | | 79,400 | | | | 817,820 | |
Minerva Neurosciences, Inc.† | | | 44,800 | | | | 319,872 | |
Prestige Consumer Healthcare, Inc.†# | | | 18,400 | | | | 586,592 | |
Spero Therapeutics, Inc.† | | | 21,500 | | | | 213,925 | |
Zogenix, Inc.† | | | 3,500 | | | | 149,415 | |
| | | | | | |
|
|
|
| | | | | | | | 2,652,760 | |
| | | | | | |
|
|
|
Medical - HMO — 1.2% | |
Magellan Health, Inc.† | | | 26,100 | | | | 1,644,561 | |
Molina Healthcare, Inc.† | | | 2,400 | | | | 312,672 | |
Triple-S Management Corp., Class B† | | | 85,894 | | | | 1,762,545 | |
| | | | | | |
|
|
|
| | | | | | | | 3,719,778 | |
| | | | | | |
|
|
|
Medical - Wholesale Drug Distribution — 0.4% | |
Diplomat Pharmacy, Inc.† | | | 116,978 | | | | 679,642 | |
Owens & Minor, Inc. | | | 139,197 | | | | 707,121 | |
| | | | | | |
|
|
|
| | | | | | | | 1,386,763 | |
| | | | | | |
|
|
|
Metal Processors & Fabrication — 0.0% | |
LB Foster Co., Class A† | | | 6,700 | | | | 133,397 | |
| | | | | | |
|
|
|
Metal Products - Distribution — 0.3% | |
Worthington Industries, Inc. | | | 26,540 | | | | 920,938 | |
| | | | | | |
|
|
|
Metal - Iron — 0.0% | |
Cleveland-Cliffs, Inc.# | | | 7,400 | | | | 58,756 | |
| | | | | | |
|
|
|
Multimedia — 0.0% | |
E.W. Scripps Co., Class A | | | 6,900 | | | | 85,284 | |
| | | | | | |
|
|
|
Networking Products — 0.1% | |
NeoPhotonics Corp.† | | | 33,000 | | | | 206,580 | |
| | | | | | |
|
|
|
Office Furnishings - Original — 0.1% | |
Kimball International, Inc., Class B | | | 19,200 | | | | 336,960 | |
| | | | | | |
|
|
|
Office Supplies & Forms — 0.8% | |
ACCO Brands Corp. | | | 258,502 | | | | 2,396,314 | |
| | | | | | |
|
|
|
Oil Companies - Exploration & Production — 1.1% | |
Abraxas Petroleum Corp.† | | | 135,700 | | | | 70,822 | |
Amplify Energy Corp. | | | 77,100 | | | | 459,516 | |
CNX Resources Corp.† | | | 37,800 | | | | 301,266 | |
Denbury Resources, Inc.†# | | | 76,700 | | | | 82,836 | |
Evolution Petroleum Corp. | | | 19,500 | | | | 115,440 | |
VALIC Company II Small Cap Value Fund
PORTFOLIO OF INVESTMENTS —August 31, 2019 — (continued)
| | | | | | | | |
| | |
| Security Description | | Shares | | | Value
(Note 2) | |
| |
COMMON STOCKS (continued) | |
Oil Companies - Exploration & Production (continued) | |
Gulfport Energy Corp.† | | | 327,800 | | | $ | 786,720 | |
Southwestern Energy Co.†# | | | 60,400 | | | | 95,432 | |
W&T Offshore, Inc.† | | | 301,600 | | | | 1,321,008 | |
Whiting Petroleum Corp.†# | | | 27,500 | | | | 182,325 | |
| | | | | | |
|
|
|
| | | | | | | | 3,415,365 | |
| | | | | | |
|
|
|
Oil Field Machinery & Equipment — 0.5% | |
Dril-Quip, Inc.† | | | 30,000 | | | | 1,375,500 | |
Forum Energy Technologies, Inc.† | | | 53,500 | | | | 75,435 | |
| | | | | | |
|
|
|
| | | | | | | | 1,450,935 | |
| | | | | | |
|
|
|
Oil Refining & Marketing — 1.3% | |
CVR Energy, Inc. | | | 14,700 | | | | 584,766 | |
Delek US Holdings, Inc. | | | 91,300 | | | | 2,990,075 | |
Murphy USA, Inc.† | | | 3,800 | | | | 339,720 | |
Par Pacific Holdings, Inc.† | | | 9,600 | | | | 208,704 | |
| | | | | | |
|
|
|
| | | | | | | | 4,123,265 | |
| | | | | | |
|
|
|
Oil - Field Services — 1.7% | |
C&J Energy Services, Inc.† | | | 5,800 | | | | 55,448 | |
FTS International, Inc.† | | | 122,400 | | | | 307,224 | |
Keane Group, Inc.† | | | 10,000 | | | | 53,000 | |
Matrix Service Co.† | | | 75,700 | | | | 1,504,159 | |
McDermott International, Inc.†# | | | 6,633 | | | | 31,308 | |
MRC Global, Inc.† | | | 107,300 | | | | 1,348,761 | |
Nine Energy Service, Inc.† | | | 22,900 | | | | 125,492 | |
NOW, Inc.† | | | 109,100 | | | | 1,297,199 | |
Select Energy Services, Inc., Class A† | | | 70,600 | | | | 576,096 | |
| | | | | | |
|
|
|
| | | | | | | | 5,298,687 | |
| | | | | | |
|
|
|
Paper & Related Products — 0.8% | |
Domtar Corp. | | | 9,640 | | | | 317,638 | |
Schweitzer-Mauduit International, Inc. | | | 55,800 | | | | 1,871,532 | |
Verso Corp., Class A† | | | 39,700 | | | | 405,337 | |
| | | | | | |
|
|
|
| | | | | | | | 2,594,507 | |
| | | | | | |
|
|
|
Pastoral & Agricultural — 0.1% | |
Darling Ingredients, Inc.† | | | 12,000 | | | | 223,200 | |
| | | | | | |
|
|
|
Poultry — 0.7% | |
Sanderson Farms, Inc.# | | | 15,225 | | | | 2,277,964 | |
| | | | | | |
|
|
|
Power Converter/Supply Equipment — 0.2% | |
Powell Industries, Inc. | | | 13,600 | | | | 493,952 | |
| | | | | | |
|
|
|
Printing - Commercial — 0.3% | |
Ennis, Inc. | | | 9,500 | | | | 191,045 | |
Quad/Graphics, Inc.# | | | 78,500 | | | | 705,715 | |
RR Donnelley & Sons Co.# | | | 55,100 | | | | 133,342 | |
| | | | | | |
|
|
|
| | | | | | | | 1,030,102 | |
| | | | | | |
|
|
|
Private Equity — 0.2% | |
Kennedy-Wilson Holdings, Inc. | | | 22,600 | | | | 474,148 | |
| | | | | | |
|
|
|
Publishing - Books — 0.1% | |
Houghton Mifflin Harcourt Co.† | | | 62,300 | | | | 370,685 | |
| | | | | | |
|
|
|
Publishing - Newspapers — 0.2% | |
TEGNA, Inc. | | | 44,800 | | | | 641,088 | |
| | | | | | |
|
|
|
Publishing - Periodicals — 0.1% | |
Meredith Corp.# | | | 5,200 | | | | 227,656 | |
| | | | | | |
|
|
|
Real Estate Investment Trusts — 12.4% | |
Acadia Realty Trust | | | 15,400 | | | | 421,190 | |
AG Mortgage Investment Trust, Inc. | | | 68,400 | | | | 1,025,316 | |
Alexander & Baldwin, Inc. | | | 22,575 | | | | 516,742 | |
American Assets Trust, Inc. | | | 38,700 | | | | 1,813,482 | |
Armada Hoffler Properties, Inc. | | | 55,600 | | | | 964,104 | |
ARMOUR Residential REIT, Inc.# | | | 39,100 | | | | 642,022 | |
| | | | | | | | |
| | |
| Security Description | | Shares | | | Value
(Note 2) | |
| |
| | | | | | | | | |
Real Estate Investment Trusts (continued) | |
Ashford Hospitality Trust, Inc. | | | 201,880 | | | $ | 565,264 | |
Braemar Hotels & Resorts, Inc. | | | 70,200 | | | | 643,734 | |
Capstead Mtg. Corp. | | | 77,500 | | | | 563,425 | |
Cedar Realty Trust, Inc. | | | 43,600 | | | | 103,332 | |
Cherry Hill Mtg. Investment Corp. | | | 28,400 | | | | 341,652 | |
City Office REIT, Inc. | | | 9,400 | | | | 127,276 | |
CoreCivic, Inc. | | | 73,100 | | | | 1,239,045 | |
CorEnergy Infrastructure Trust, Inc.# | | | 6,208 | | | | 280,043 | |
CorePoint Lodging, Inc. | | | 19,000 | | | | 172,900 | |
CoreSite Realty Corp. | | | 9,675 | | | | 1,124,041 | |
Cousins Properties, Inc. | | | 37,449 | | | | 1,299,480 | |
DiamondRock Hospitality Co. | | | 216,734 | | | | 2,052,471 | |
Easterly Government Properties, Inc. | | | 30,900 | | | | 634,995 | |
Essential Properties Realty Trust, Inc. | | | 4,600 | | | | 104,466 | |
First Industrial Realty Trust, Inc. | | | 31,500 | | | | 1,226,925 | |
Franklin Street Properties Corp. | | | 20,300 | | | | 153,671 | |
Front Yard Residential Corp. | | | 6,162 | | | | 68,337 | |
GEO Group, Inc. | | | 125,450 | | | | 2,152,722 | |
Getty Realty Corp. | | | 37,946 | | | | 1,205,165 | |
Gladstone Commercial Corp. | | | 14,700 | | | | 333,249 | |
Hersha Hospitality Trust | | | 7,000 | | | | 97,300 | |
Highwoods Properties, Inc. | | | 11,300 | | | | 488,273 | |
Hospitality Properties Trust | | | 18,040 | | | | 435,486 | |
Hudson Pacific Properties, Inc. | | | 5,300 | | | | 180,200 | |
Industrial Logistics Properties Trust | | | 4,174 | | | | 89,282 | |
Invesco Mtg. Capital, Inc. | | | 86,800 | | | | 1,304,604 | |
Jernigan Capital, Inc. | | | 9,300 | | | | 179,583 | |
Kite Realty Group Trust | | | 17,100 | | | | 244,359 | |
KKR Real Estate Finance Trust, Inc. | | | 27,600 | | | | 521,916 | |
Ladder Capital Corp. | | | 27,924 | | | | 468,565 | |
Lexington Realty Trust | | | 26,300 | | | | 273,257 | |
Mack-Cali Realty Corp. | | | 48,000 | | | | 977,760 | |
New Senior Investment Group, Inc. | | | 91,400 | | | | 571,250 | |
Pebblebrook Hotel Trust | | | 46,793 | | | | 1,262,007 | |
Piedmont Office Realty Trust, Inc., Class A | | | 34,500 | | | | 681,030 | |
PotlatchDeltic Corp.# | | | 26,300 | | | | 1,012,024 | |
PS Business Parks, Inc. | | | 4,900 | | | | 880,089 | |
Redwood Trust, Inc. | | | 46,000 | | | | 763,600 | |
Rexford Industrial Realty, Inc. | | | 14,200 | | | | 627,498 | |
RLJ Lodging Trust | | | 43,526 | | | | 705,556 | |
Saul Centers, Inc. | | | 1,300 | | | | 65,299 | |
STAG Industrial, Inc. | | | 7,900 | | | | 229,732 | |
Sun Communities, Inc. | | | 2,800 | | | | 413,840 | |
Sunstone Hotel Investors, Inc. | | | 205,172 | | | | 2,695,960 | |
Terreno Realty Corp. | | | 9,700 | | | | 490,432 | |
Two Harbors Investment Corp. | | | 77,605 | | | | 980,151 | |
Urban Edge Properties | | | 34,400 | | | | 602,344 | |
Urstadt Biddle Properties, Inc., Class A | | | 13,400 | | | | 281,266 | |
Washington Real Estate Investment Trust | | | 1,000 | | | | 26,490 | |
Xenia Hotels & Resorts, Inc. | | | 99,000 | | | | 2,000,790 | |
| | | | | | |
|
|
|
| | | | | | | | 39,324,992 | |
| | | | | | |
|
|
|
Real Estate Management/Services — 0.0% | |
Newmark Group, Inc., Class A | | | 13,129 | | | | 113,960 | |
| | | | | | |
|
|
|
Rental Auto/Equipment — 0.4% | |
Rent-A-Center, Inc.† | | | 53,200 | | | | 1,358,196 | |
| | | | | | |
|
|
|
Retail - Apparel/Shoe — 0.6% | |
Abercrombie & Fitch Co., Class A# | | | 77,600 | | | | 1,134,512 | |
Cato Corp., Class A | | | 34,100 | | | | 584,133 | |
Chico’s FAS, Inc. | | | 21,300 | | | | 66,456 | |
Express, Inc.†# | | | 62,500 | | | | 132,500 | |
| | | | | | |
|
|
|
| | | | | | | | 1,917,601 | |
| | | | | | |
|
|
|
VALIC Company II Small Cap Value Fund
PORTFOLIO OF INVESTMENTS —August 31, 2019 — (continued)
| | | | | | | | |
| | |
| Security Description | | Shares | | | Value
(Note 2) | |
| |
COMMON STOCKS (continued) | |
Retail - Automobile — 0.3% | |
Lithia Motors, Inc., Class A# | | | 2,600 | | | $ | 340,782 | |
Rush Enterprises, Inc., Class A | | | 17,600 | | | | 635,536 | |
| | | | | | |
|
|
|
| | | | | | | | 976,318 | |
| | | | | | |
|
|
|
Retail - Bookstores — 0.3% | |
Barnes & Noble Education, Inc.† | | | 201,700 | | | | 786,630 | |
| | | | | | |
|
|
|
Retail - Building Products — 0.7% | |
BMC Stock Holdings, Inc.† | | | 54,600 | | | | 1,388,478 | |
GMS, Inc.† | | | 31,400 | | | | 925,044 | |
| | | | | | |
|
|
|
| | | | | | | | 2,313,522 | |
| | | | | | |
|
|
|
Retail - Discount — 0.1% | |
Citi Trends, Inc. | | | 9,600 | | | | 161,376 | |
| | | | | | |
|
|
|
Retail - Drug Store — 0.0% | |
Rite Aid Corp.†# | | | 6,604 | | | | 42,662 | |
| | | | | | |
|
|
|
Retail - Home Furnishings — 0.0% | |
Bassett Furniture Industries, Inc. | | | 6,500 | | | | 79,170 | |
| | | | | | |
|
|
|
Retail - Jewelry — 0.1% | |
Movado Group, Inc. | | | 13,700 | | | | 294,824 | |
| | | | | | |
|
|
|
Retail - Misc./Diversified — 0.0% | |
Sally Beauty Holdings, Inc.†# | | | 3,900 | | | | 47,697 | |
| | | | | | |
|
|
|
Retail - Office Supplies — 0.3% | |
Office Depot, Inc. | | | 660,200 | | | | 858,260 | |
| | | | | | |
|
|
|
Retail - Restaurants — 0.5% | |
Brinker International, Inc.# | | | 39,300 | | | | 1,493,400 | |
| | | | | | |
|
|
|
Retail - Sporting Goods — 0.7% | |
Hibbett Sports, Inc.†# | | | 103,100 | | | | 1,705,274 | |
Zumiez, Inc.† | | | 18,300 | | | | 475,434 | |
| | | | | | |
|
|
|
| | | | | | | | 2,180,708 | |
| | | | | | |
|
|
|
Rubber/Plastic Products — 0.5% | |
Myers Industries, Inc. | | | 6,158 | | | | 103,639 | |
Trinseo SA | | | 45,800 | | | | 1,607,122 | |
| | | | | | |
|
|
|
| | | | | | | | 1,710,761 | |
| | | | | | |
|
|
|
Savings & Loans/Thrifts — 3.5% | |
BankFinancial Corp. | | | 25,600 | | | | 298,496 | |
Berkshire Hills Bancorp, Inc. | | | 13,200 | | | | 387,156 | |
Brookline Bancorp, Inc. | | | 12,500 | | | | 175,500 | |
Dime Community Bancshares, Inc. | | | 16,600 | | | | 329,178 | |
First Defiance Financial Corp. | | | 14,600 | | | | 381,790 | |
Flushing Financial Corp. | | | 21,300 | | | | 410,877 | |
FS Bancorp, Inc. | | | 1,500 | | | | 72,600 | |
HomeTrust Bancshares, Inc. | | | 3,500 | | | | 88,270 | |
Investors Bancorp, Inc. | | | 268,300 | | | | 2,978,130 | |
Meridian Bancorp, Inc. | | | 35,200 | | | | 615,296 | |
Northfield Bancorp, Inc. | | | 70,700 | | | | 1,097,264 | |
Oritani Financial Corp. | | | 3,100 | | | | 53,103 | |
Pacific Premier Bancorp, Inc. | | | 21,300 | | | | 627,498 | |
Riverview Bancorp, Inc. | | | 9,300 | | | | 65,565 | |
Territorial Bancorp, Inc. | | | 2,900 | | | | 79,315 | |
United Community Financial Corp. | | | 19,800 | | | | 191,070 | |
United Financial Bancorp, Inc. | | | 11,000 | | | | 137,500 | |
Washington Federal, Inc. | | | 68,400 | | | | 2,435,040 | |
Waterstone Financial, Inc. | | | 10,000 | | | | 165,900 | |
WSFS Financial Corp. | | | 10,956 | | | | 451,606 | |
| | | | | | |
|
|
|
| | | | | | | | 11,041,154 | |
| | | | | | |
|
|
|
Schools — 0.7% | |
American Public Education, Inc.† | | | 9,600 | | | | 232,608 | |
| | | | | | | | |
| | |
| Security Description | | Shares | | | Value
(Note 2) | |
| |
| | | | | | | | | |
Schools (continued) | |
K12, Inc.† | | | 76,200 | | | $ | 2,007,870 | |
| | | | | | |
|
|
|
| | | | | | | | 2,240,478 | |
| | | | | | |
|
|
|
Semiconductor Components - Integrated Circuits — 0.6% | |
Cirrus Logic, Inc.† | | | 37,700 | | | | 2,022,228 | |
| | | | | | |
|
|
|
Semiconductor Equipment — 0.2% | |
Ultra Clean Holdings, Inc.† | | | 16,700 | | | | 199,398 | |
Veeco Instruments, Inc.† | | | 46,400 | | | | 429,664 | |
| | | | | | |
|
|
|
| | | | | | | | 629,062 | |
| | | | | | |
|
|
|
Steel - Producers — 0.2% | |
Commercial Metals Co. | | | 29,200 | | | | 457,564 | |
| | | | | | |
|
|
|
Telecom Equipment - Fiber Optics — 0.2% | |
Ciena Corp.† | | | 13,300 | | | | 544,369 | |
| | | | | | |
|
|
|
Telecom Services — 0.2% | |
Consolidated Communications Holdings, Inc.# | | | 168,700 | | | | 679,861 | |
Spok Holdings, Inc. | | | 2,500 | | | | 29,375 | |
| | | | | | |
|
|
|
| | | | | | | | 709,236 | |
| | | | | | |
|
|
|
Telephone - Integrated — 0.0% | |
IDT Corp., Class B† | | | 1,500 | | | | 13,230 | |
| | | | | | |
|
|
|
Television — 0.9% | |
Gray Television, Inc.† | | | 20,900 | | | | 319,770 | |
Sinclair Broadcast Group, Inc., Class A | | | 52,800 | | | | 2,353,296 | |
| | | | | | |
|
|
|
| | | | | | | | 2,673,066 | |
| | | | | | |
|
|
|
Textile - Products — 0.0% | |
Culp, Inc. | | | 4,000 | | | | 56,160 | |
| | | | | | |
|
|
|
Theaters — 0.1% | |
AMC Entertainment Holdings, Inc., Class A# | | | 25,100 | | | | 278,861 | |
| | | | | | |
|
|
|
Tobacco — 0.1% | |
Vector Group, Ltd.# | | | 23,515 | | | | 274,655 | |
| | | | | | |
|
|
|
Transactional Software — 0.3% | |
ACI Worldwide, Inc.† | | | 28,500 | | | | 848,730 | |
Synchronoss Technologies, Inc.† | | | 17,500 | | | | 139,300 | |
| | | | | | |
|
|
|
| | | | | | | | 988,030 | |
| | | | | | |
|
|
|
Transport - Marine — 0.3% | |
SEACOR Holdings, Inc.† | | | 19,800 | | | | 930,006 | |
| | | | | | |
|
|
|
Transport - Services — 0.4% | |
Echo Global Logistics, Inc.† | | | 64,000 | | | | 1,282,560 | |
| | | | | | |
|
|
|
Transport - Truck — 0.7% | |
ArcBest Corp. | | | 66,720 | | | | 1,975,579 | |
Covenant Transportation Group, Inc., Class A† | | | 8,400 | | | | 120,792 | |
YRC Worldwide, Inc.†# | | | 97,028 | | | | 211,521 | |
| | | | | | |
|
|
|
| | | | | | | | 2,307,892 | |
| | | | | | |
|
|
|
Water — 0.2% | |
American States Water Co. | | | 5,100 | | | | 471,903 | |
Artesian Resources Corp., Class A | | | 1,300 | | | | 47,320 | |
Consolidated Water Co., Ltd. | | | 12,100 | | | | 177,386 | |
| | | | | | |
|
|
|
| | | | | | | | 696,609 | |
| | | | | | |
|
|
|
Wire & Cable Products — 0.1% | |
Encore Wire Corp. | | | 3,000 | | | | 161,970 | |
| | | | | | |
|
|
|
X-Ray Equipment — 0.2% | |
Varex Imaging Corp.† | | | 18,400 | | | | 484,840 | |
| | | | | | |
|
|
|
Total Long-Term Investment Securities | | | | | | | | |
(cost $306,486,563) | | | | | | | 308,330,555 | |
| | | |
|
|
|
VALIC Company II Small Cap Value Fund
PORTFOLIO OF INVESTMENTS —August 31, 2019 — (continued)
| | | | | | | | |
| | |
| Security Description | | Shares/
Principal
Amount | | | Value
(Note 2) | |
| |
SHORT-TERM INVESTMENT SECURITIES — 1.1% | |
Registered Investment Companies — 1.1% | |
State Street Navigator Securities Lending Government Money Market Portfolio
2.12%(1)(2)
(cost $3,476,575) | | | 3,476,575 | | | $ | 3,476,575 | |
| | | | | | |
|
|
|
REPURCHASE AGREEMENTS — 2.3% | |
Agreement with Fixed Income Clearing Corp., bearing interest at 0.42%, dated 08/30/2019, to be repurchased 09/03/2019 in the amount of $7,282,340 and collateralized by $7,305,000 of United States Treasury Notes, bearing interest at 1.88% due 03/31/2022 and having an approximate value of $7,433,035
(cost $7,282,000) | | $ | 7,282,000 | | | | 7,282,000 | |
| | | | | | |
|
|
|
TOTAL INVESTMENTS | | | | | | | | |
(cost $317,245,138)(3) | | | 101.0 | % | | | 319,089,130 | |
Liabilities in excess of other assets | | | (1.0 | ) | | | (3,047,260 | ) |
| | |
|
|
| |
|
|
|
NET ASSETS | | | 100.0 | % | | $ | 316,041,870 | |
| | |
|
|
| |
|
|
|
| † | Non-income producing security |
| # | The security or a portion thereof is out on loan (see Note 2). |
| (1) | At August 31, 2019, the Fund had loaned securities with a total value of $18,404,375. This was secured by collateral of $3,476,575, which was received in cash and subsequently invested in short-term investments currently valued at $3,476,575 as reported in the Portfolio of Investments. Additional collateral of $15,271,398 was received in the form of fixed income pooled securities, which the Fund cannot sell or repledge and accordingly, are not reflected in the Fund’s assets and liabilities. |
The components of the fixed income pooled securities referenced above are as follows:
| | | | | | | | |
Securities
| | Coupon Range
| | Maturity Date Range
| | Value as of
August 31, 2019
| |
United States Treasury Bills | | 0.00% | | 09/12/2019 to 01/16/2020 | | $ | 3,277,932 | |
United States Treasury Notes/Bonds | | zero coupon to 8.75% | | 09/30/2019 to 02/15/2049 | | | 11,993,466 | |
| (2) | The rate shown is the7-day yield as of August 31, 2019. |
| (3) | See Note 5 for cost of investments on a tax basis. |
| | | | | | | | | | | | | | | | | | | | | | |
| Futures Contracts | | | | | | | | | | |
Number of
Contracts | | | Type | | Description | | Expiration
Month | | | Notional
Basis# | | | Notional
Value# | | | Unrealized
Appreciation
(Depreciation) | |
| | 96 | | | Long | | Russell 2000E-Mini Index | | | September 2019 | | | $ | 7,311,375 | | | $ | 7,172,160 | | | $ | (139,215 | ) |
| | | | | | | | | | | | | | | | | | | | |
|
|
|
| # | Notional basis refers to the contractual amount agreed upon at inception of the open contract. Notional value represents the current value of the open contract. |
The following is a summary of the inputs used to value the Fund’s net assets as of August 31, 2019 (see Note 2):
| | | | | | | | | | | | | | | | |
| | | Level 1 - Unadjusted
Quoted Prices
| | | Level 2 - Other
Observable Inputs
| | | Level 3 - Significant
Unobservable Inputs
| | | Total
| |
ASSETS: | | | | | | | | | | | | | | | | |
Investments at Value:* | | | | | | | | | | | | | | | | |
| | | | |
Common Stocks | | $ | 308,330,555 | | | $ | — | | | $ | — | | | $ | 308,330,555 | |
Short-Term Investment Securities | | | 3,476,575 | | | | — | | | | — | | | | 3,476,575 | |
Repurchase Agreements | | | — | | | | 7,282,000 | | | | — | | | | 7,282,000 | |
| | |
|
|
| |
|
|
| |
|
|
| |
|
|
|
Total Investments at Value | | $ | 311,807,130 | | | $ | 7,282,000 | | | $ | — | | | $ | 319,089,130 | |
| | |
|
|
| |
|
|
| |
|
|
| |
|
|
|
LIABILITIES: | | | | | | | | | | | | | | | | |
Other Financial Instruments:+ | | | | | | | | | | | | | | | | |
| | | | |
Futures Contracts | | $ | 139,215 | | | $ | — | | | $ | — | | | $ | 139,215 | |
| | |
|
|
| |
|
|
| |
|
|
| |
|
|
|
| * | For a detailed presentation of investments, please refer to the Portfolio of Investments. |
| + | Amounts represent unrealized appreciation/depreciation as of the end of the reporting period. |
See Notes to Financial Statements
VALIC Company II Strategic Bond Fund
PORTFOLIO PROFILE —August 31, 2019 (unaudited)
Industry Allocation*
| | | | |
Federal National Mtg. Assoc. | | | 20.2 | % |
Sovereign | | | 8.5 | |
Federal Home Loan Mtg. Corp. | | | 5.8 | |
Registered Investment Companies | | | 4.1 | |
Diversified Financial Services | | | 3.3 | |
Diversified Banking Institutions | | | 3.0 | |
Cable/Satellite TV | | | 2.3 | |
Government National Mtg. Assoc. | | | 2.2 | |
Oil Companies — Exploration & Production | | | 2.1 | |
Cellular Telecom | | | 2.0 | |
Pipelines | | | 2.0 | |
Real Estate Investment Trusts | | | 1.9 | |
Banks — Commercial | | | 1.7 | |
Electric — Integrated | | | 1.5 | |
Telephone — Integrated | | | 1.5 | |
United States Treasury Notes | | | 1.3 | |
Containers — Metal/Glass | | | 1.1 | |
Oil Companies — Integrated | | | 1.0 | |
Medical — Drugs | | | 0.9 | |
Finance — Consumer Loans | | | 0.9 | |
Television | | | 0.7 | |
Food — Misc./Diversified | | | 0.7 | |
Satellite Telecom | | | 0.6 | |
Electric — Generation | | | 0.6 | |
Cosmetics & Toiletries | | | 0.6 | |
Auto — Cars/Light Trucks | | | 0.6 | |
Medical — HMO | | | 0.6 | |
Enterprise Software/Service | | | 0.5 | |
Security Services | | | 0.5 | |
Electric — Distribution | | | 0.5 | |
Oil — Field Services | | | 0.5 | |
Medical — Hospitals | | | 0.5 | |
Banks — Super Regional | | | 0.5 | |
Chemicals — Diversified | | | 0.5 | |
Applications Software | | | 0.5 | |
Computers | | | 0.5 | |
Internet Content — Entertainment | | | 0.5 | |
Batteries/Battery Systems | | | 0.5 | |
Insurance — Property/Casualty | | | 0.5 | |
Metal — Copper | | | 0.4 | |
Retail — Restaurants | | | 0.4 | |
Distribution/Wholesale | | | 0.4 | |
Radio | | | 0.4 | |
Diversified Manufacturing Operations | | | 0.4 | |
Agricultural Chemicals | | | 0.4 | |
Rental Auto/Equipment | | | 0.4 | |
Computers — Integrated Systems | | | 0.4 | |
Machinery — Farming | | | 0.3 | |
Finance — Leasing Companies | | | 0.3 | |
Multimedia | | | 0.3 | |
Paper & Related Products | | | 0.3 | |
Building & Construction Products — Misc. | | | 0.3 | |
Diversified Minerals | | | 0.3 | |
Electronic Parts Distribution | | | 0.3 | |
Commercial Services | | | 0.3 | |
Computer Software | | | 0.3 | |
Food — Retail | | | 0.3 | |
Energy — Alternate Sources | | | 0.3 | |
Metal — Iron | | | 0.3 | |
Transport — Rail | | | 0.3 | |
Building & Construction — Misc. | | | 0.3 | |
Food — Meat Products | | | 0.3 | |
Containers — Paper/Plastic | | | 0.3 | |
Retail — Petroleum Products | | | 0.3 | |
Hotels/Motels | | | 0.3 | |
Real Estate Management/Services | | | 0.3 | |
Finance — Investment Banker/Broker | | | 0.3 | |
Electronic Components — Semiconductors | | | 0.2 | |
Disposable Medical Products | | | 0.2 | |
| | | | |
Casino Services | | | 0.2 | |
Real Estate Operations & Development | | | 0.2 | |
Dialysis Centers | | | 0.2 | |
Diagnostic Equipment | | | 0.2 | |
Airport Development/Maintenance | | | 0.2 | |
Independent Power Producers | | | 0.2 | |
Medical Products | | | 0.2 | |
Finance — Mortgage Loan/Banker | | | 0.2 | |
Building — Heavy Construction | | | 0.2 | |
Gambling (Non-Hotel) | | | 0.2 | |
Retail — Appliances | | | 0.2 | |
Insurance — Life/Health | | | 0.2 | |
Metal — Diversified | | | 0.2 | |
Machinery — General Industrial | | | 0.2 | |
Computer Services | | | 0.2 | |
Chemicals — Specialty | | | 0.2 | |
E-Commerce/Services | | | 0.2 | |
Machinery — Construction & Mining | | | 0.2 | |
Medical Labs & Testing Services | | | 0.2 | |
Savings & Loans/Thrifts | | | 0.2 | |
Computers — Memory Devices | | | 0.2 | |
Banks — Export/Import | | | 0.2 | |
Pharmacy Services | | | 0.2 | |
Internet Connectivity Services | | | 0.2 | |
Retail — Automobile | | | 0.2 | |
Data Processing/Management | | | 0.2 | |
Auto — Heavy Duty Trucks | | | 0.2 | |
Consumer Products — Misc. | | | 0.2 | |
Finance — Auto Loans | | | 0.2 | |
Hazardous Waste Disposal | | | 0.2 | |
Oil Field Machinery & Equipment | | | 0.2 | |
Poultry | | | 0.2 | |
Beverages — Non-alcoholic | | | 0.2 | |
Insurance Brokers | | | 0.2 | |
Broadcast Services/Program | | | 0.2 | |
Finance — Credit Card | | | 0.2 | |
Theaters | | | 0.1 | |
Auto/Truck Parts & Equipment — Original | | | 0.1 | |
Food — Dairy Products | | | 0.1 | |
Metal Processors & Fabrication | | | 0.1 | |
Aerospace/Defense — Equipment | | | 0.1 | |
Brewery | | | 0.1 | |
Transport — Truck | | | 0.1 | |
Steel — Producers | | | 0.1 | |
Coal | | | 0.1 | |
Insurance — Multi-line | | | 0.1 | |
Chemicals — Plastics | | | 0.1 | |
Medical — Generic Drugs | | | 0.1 | |
Water | | | 0.1 | |
Banks — Money Center | | | 0.1 | |
Medical Instruments | | | 0.1 | |
Investment Companies | | | 0.1 | |
Insurance — Mutual | | | 0.1 | |
Casino Hotels | | | 0.1 | |
Airlines | | | 0.1 | |
Retail — Discount | | | 0.1 | |
Publishing — Periodicals | | | 0.1 | |
United States Treasury Bonds | | | 0.1 | |
Aerospace/Defense | | | 0.1 | |
Telecom Services | | | 0.1 | |
Commercial Services — Finance | | | 0.1 | |
Transport — Marine | | | 0.1 | |
Auto Repair Centers | | | 0.1 | |
Trucking/Leasing | | | 0.1 | |
Human Resources | | | 0.1 | |
Retail — Mail Order | | | 0.1 | |
Building Societies | | | 0.1 | |
Medical — Biomedical/Gene | | | 0.1 | |
Banks — Special Purpose | | | 0.1 | |
VALIC Company II Strategic Bond Fund
PORTFOLIO PROFILE —August 31, 2019 (unaudited) — (continued)
Industry Allocation* (continued)
| | | | |
Electronic Measurement Instruments | | | 0.1 | % |
Gas — Distribution | | | 0.1 | |
Beverages — Wine/Spirits | | | 0.1 | |
Platinum | | | 0.1 | |
Finance — Commercial | | | 0.1 | |
Sovereign Agency | | | 0.1 | |
Physicians Practice Management | | | 0.1 | |
Medical — Wholesale Drug Distribution | | | 0.1 | |
Soap & Cleaning Preparation | | | 0.1 | |
Publishing — Books | | | 0.1 | |
Diamonds/Precious Stones | | | 0.1 | |
Medical — Outpatient/Home Medical | | | 0.1 | |
Quarrying | | | 0.1 | |
Computer Data Security | | | 0.1 | |
Diversified Operations | | | 0.1 | |
Retail — Major Department Stores | | | 0.1 | |
Building Products — Doors & Windows | | | 0.1 | |
Machinery — Pumps | | | 0.1 | |
Internet Financial Services | | | 0.1 | |
Transport — Equipment & Leasing | | | 0.1 | |
Resorts/Theme Parks | | | 0.1 | |
| | |
|
|
|
| | | | 99.9 | % |
| | |
|
|
|
Credit Quality†#
| | | | |
Aaa | | | 32.5 | % |
Aa | | | 1.2 | |
A | | | 6.6 | |
Baa | | | 14.2 | |
Ba | | | 15.4 | |
B | | | 19.6 | |
Caa | | | 3.3 | |
Not Rated@ | | | 7.2 | |
| | |
|
|
|
| | | | 100.0 | % |
| | |
|
|
|
| * | Calculated as a percentage of net assets. |
| # | Calculated as a percentage of total debt issues, excluding short-term securities |
| @ | Represents debt issues that either have no rating, or the rating is unavailable from the data source |
VALIC Company II Strategic Bond Fund
PORTFOLIO OF INVESTMENTS —August 31, 2019
| | | | | | | | |
| | |
| Security Description | | Principal
Amount(10) | | | Value
(Note 2) | |
| |
ASSET BACKED SECURITIES — 3.1% | |
Diversified Financial Services — 3.1% | |
American Express Credit Account Master Trust FRS
Series2018-5, Class A
2.54% (1 ML+0.34%)
due 12/15/2025 | | $ | 520,000 | | | $ | 517,578 | |
American Express Credit Account Master Trust
Series2019-2, Class A
2.67% due 11/15/2024 | | | 500,000 | | | | 512,573 | |
American Express Credit Account Master Trust
Series2018-4, Class A
2.99% due 12/15/2023 | | | 225,000 | | | | 229,672 | |
American Express Credit Account Master Trust
Series2018-8, Class A
3.18% due 04/15/2024 | | | 303,000 | | | | 311,824 | |
Americredit Automobile Receivables Trust
Series2019-1, Class A3
2.97% due 11/20/2023 | | | 500,000 | | | | 509,943 | |
BA Credit Card Trust
Series2018-A2, Class A2
3.00% due 09/15/2023 | | | 318,000 | | | | 324,330 | |
BANK
Series 2019-BN19, Class A3
3.18% due 08/15/2061(1) | | | 1,250,000 | | | | 1,347,025 | |
BANK
Series 2019-BN16, Class A2
3.93% due 02/15/2052(1) | | | 680,000 | | | | 730,730 | |
Benchmark Mtg. Trust
Series2019-B9, Class AAB
3.93% due 03/15/2052(1) | | | 850,000 | | | | 944,221 | |
Benchmark Mtg. Trust
Series2018-B7, Class A4
4.51% due 05/15/2053(1) | | | 2,000,000 | | | | 2,361,684 | |
BMW Vehicle Lease Trust
Series2019-1, Class A4
3.38% due 08/22/2022 | | | 350,000 | | | | 355,596 | |
BX Commercial Mtg. Trust FRS
Series2019-IMC, Class A
3.20% (1 ML+1.00%)
due 04/15/2034*(1) | | | 700,000 | | | | 699,999 | |
BX Trust FRS
Series 2018-MCSF, Class A
2.77% (1 ML+0.58%)
due 04/15/2035*(1) | | | 1,235,000 | | | | 1,231,143 | |
Capital One Multi-Asset Execution Trust
Series2019-A2, Class A2
1.72% due 08/15/2024 | | | 500,000 | | | | 499,874 | |
Capital One Multi-Asset Execution Trust
Series2019-A3, Class A3
2.06% due 08/15/2028 | | | 250,000 | | | | 249,934 | |
CarMax Auto Owner Trust
Series2019-3, Class A3
2.18% due 08/15/2024 | | | 200,000 | | | | 201,920 | |
CarMax Auto Owner Trust
Series2019-2, Class A3
2.90% due 03/15/2024 | | | 250,000 | | | | 254,534 | |
CarMax Auto Owner Trust
Series2018-4, Class A3
3.36% due 09/15/2023 | | | 400,000 | | | | 410,533 | |
Chase Mtg. Finance Trust VRS
Series2016-2, Class M2
3.74% due 12/25/2045*(2)(3) | | | 732,076 | | | | 767,115 | |
Citibank Credit Card Issuance Trust
Series2018-A1, Class A1
2.49% due 01/20/2023 | | | 100,000 | | | | 100,986 | |
| | | | | | | | |
| | |
| Security Description | | Principal
Amount(10) | | | Value
(Note 2) | |
| |
| | | | | | | | | |
Diversified Financial Services (continued) | |
Citibank Credit Card Issuance Trust
Series2018-A7, Class A7
3.96% due 10/13/2030 | | $ | 100,000 | | | $ | 115,618 | |
Citigroup Commercial Mtg. Trust VRS
Series2018-C5, Class A4
4.23% due 06/10/2051(1)(3) | | | 1,000,000 | | | | 1,152,724 | |
COMM Mtg. Trust VRS
Series 2015-CR22, Class XA
1.09% due 03/10/2048(1)(3)(4) | | | 4,831,147 | | | | 165,580 | |
COMM Mtg. Trust VRS
Series 2016-787S, Class B
3.96% due 02/10/2036*(1)(3) | | | 250,000 | | | | 272,055 | |
CSAIL Commercial Mtg. Trust
Series2017-C8, Class A2
2.99% due 06/15/2050(1) | | | 150,000 | | | | 153,399 | |
CSAIL Commercial Mtg. Trust
Series2015-C1, Class A4
3.51% due 04/15/2050(1) | | | 490,000 | | | | 523,919 | |
Discover Card Execution Note Trust
Series2015-A4, Class A4
2.19% due 04/17/2023 | | | 100,000 | | | | 100,347 | |
Discover Card Execution Note Trust
Series2019-A1, Class A1
3.04% due 07/15/2024 | | | 470,000 | | | | 484,773 | |
Ford Credit Auto Owner Trust
Series2016-C, Class B
1.73% due 03/15/2022 | | | 115,000 | | | | 114,455 | |
Ford Credit Auto Owner Trust
Series2018-2, Class A
3.47% due 01/15/2030* | | | 100,000 | | | | 105,601 | |
Ford Credit Floorplan Master Owner Trust
Series2017-3, Class A
2.48% due 09/15/2024 | | | 250,000 | | | | 255,002 | |
GM Financial Consumer Automobile Receivables Trust
Series2017-3A, Class 4A
2.13% due 03/16/2023* | | | 200,000 | | | | 200,815 | |
GM Financial Consumer Automobile Receivables Trust
Series2019-3, Class A3
2.18% due 04/16/2024 | | | 132,000 | | | | 133,360 | |
GS Mtg. Securities Trust
Series 2015-GC28, Class A2
2.90% due 02/10/2048(1) | | | 571,239 | | | | 571,383 | |
Honda Auto Receivables Owner Trust
Series 2019-1, Class A3
2.83% due 03/20/2023 | | | 233,000 | | | | 237,966 | |
ILPT Trust
Series 2019-SURF, Class A
4.15% due 02/11/2041*(1) | | | 960,000 | | | | 1,109,362 | |
JP Morgan Mtg. Trust VRS
Series2017-6, Class A6
3.00% due 12/25/2048*(2)(3) | | | 2,375,040 | | | | 2,366,969 | |
JP Morgan Mtg. Trust VRS
Series2018-1, Class A5
3.50% due 06/25/2048*(2)(3) | | | 1,592,395 | | | | 1,617,797 | |
Mercedes-Benz Auto Lease Trust
Series2019-A, Class A4
3.25% due 10/15/2024 | | | 62,000 | | | | 63,306 | |
Mercedes-Benz Auto Lease Trust
Series2018-B, Class A4
3.31% due 07/15/2024 | | | 367,000 | | | | 374,336 | |
MTRO Commercial Mtg. Trust-TECH FRS
Series 2019 -TECH, Class A
3.10% (1 ML+0.90%)
due 12/15/2033*(1) | | | 550,000 | | | | 549,999 | |
VALIC Company II Strategic Bond Fund
PORTFOLIO OF INVESTMENTS —August 31, 2019 — (continued)
| | | | | | | | |
| | |
| Security Description | | Principal
Amount(10) | | | Value
(Note 2) | |
| |
ASSET BACKED SECURITIES (continued) | |
Diversified Financial Services (continued) | |
One Bryant Park Trust
Series2019-OBP, Class A
2.52% due 09/13/2049*(1) | | $ | 640,000 | | | $ | 651,203 | |
ShellpointCo-Originator Trust VRS
Series2017-2, Class A1
3.50% due 10/25/2047*(2)(3) | | | 841,807 | | | | 850,652 | |
Stonemont Portfolio Trust FRS
Series 2017-MONT, Class A
3.02% (1 ML+0.85%)
due 08/20/2030*(1) | | | 483,148 | | | | 482,989 | |
Synchrony Credit Card Master Note Trust
Series2016-2, Class A
2.21% due 05/15/2024 | | | 100,000 | | | | 100,705 | |
Toyota Auto Loan Extended Note Trust
Series2019-1A, Class A
2.56% due 11/25/2031* | | | 425,000 | | | | 438,317 | |
Toyota Auto Receivables Owner Trust
Series2018-C, Class A4
3.13% due 02/15/2024 | | | 200,000 | | | | 206,518 | |
Verizon Owner Trust
Series2018-1A, Class C
3.20% due 09/20/2022* | | | 100,000 | | | | 101,852 | |
Volkswagen Auto Loan Enhanced Trust
Series2018-2, Class A4
3.33% due 02/20/2025 | | | 150,000 | | | | 155,863 | |
| | | | | | |
|
|
|
Total Asset Backed Securities | | | | | | | | |
(cost $25,161,209) | | | | | | | 26,218,079 | |
| | | |
|
|
|
U.S. CORPORATE BONDS & NOTES — 35.0% | |
Advertising Agencies — 0.0% | |
Interpublic Group of Cos., Inc.
Senior Notes
4.20% due 04/15/2024 | | | 106,000 | | | | 114,561 | |
| | | | | | |
|
|
|
Aerospace/Defense — 0.1% | |
BAE Systems Holdings, Inc.
Company Guar. Notes
3.85% due 12/15/2025* | | | 519,000 | | | | 549,584 | |
General Dynamics Corp.
Company Guar. Notes
2.88% due 05/11/2020 | | | 244,000 | | | | 245,463 | |
| | | | | | |
|
|
|
| | | | | | | | 795,047 | |
| | | | | | |
|
|
|
Aerospace/Defense - Equipment — 0.1% | |
United Technologies Corp.
Senior Notes
1.15% due 05/18/2024 | | EUR | 1,050,000 | | | | 1,214,392 | |
| | | | | | |
|
|
|
Agricultural Chemicals — 0.0% | |
Mosaic Co.
Senior Notes
5.63% due 11/15/2043 | | | 144,000 | | | | 159,995 | |
| | | | | | |
|
|
|
Airlines — 0.1% | |
Atlas Air, Inc.
Pass-Through Certs.
Series1999-1, Class B
7.63% due 01/02/2020(5) | | | 29,678 | | | | 29,850 | |
United Airlines Pass-Through Trust
Pass-Through Certs.
Series2014-2, Class B
4.63% due 03/03/2024 | | | 807,044 | | | | 834,565 | |
| | | | | | |
|
|
|
| | | | | | | | 864,415 | |
| | | | | | |
|
|
|
| | | | | | | | |
| | |
| Security Description | | Principal
Amount(10) | | | Value
(Note 2) | |
| |
| | | | | | | | | |
Applications Software — 0.5% | |
CDK Global, Inc.
Senior Notes
5.88% due 06/15/2026 | | $ | 1,266,000 | | | $ | 1,344,619 | |
Microsoft Corp.
Senior Notes
3.13% due 12/06/2028 | | EUR | 750,000 | | | | 1,056,464 | |
SS&C Technologies, Inc.
Company Guar. Notes
5.50% due 09/30/2027* | | | 1,322,000 | | | | 1,388,100 | |
| | | | | | |
|
|
|
| | | | | | | | 3,789,183 | |
| | | | | | |
|
|
|
Auto - Cars/Light Trucks — 0.5% | |
BMW US Capital LLC
Company Guar. Notes
3.10% due 04/12/2021* | | | 401,000 | | | | 406,761 | |
Daimler Finance North America LLC
Company Guar. Notes
2.45% due 05/18/2020* | | | 518,000 | | | | 518,758 | |
Ford Motor Credit Co. LLC
Senior Notes
2.39% due 02/17/2026 | | EUR | 600,000 | | | | 677,066 | |
Ford Motor Credit Co. LLC
Senior Notes
3.10% due 05/04/2023 | | | 410,000 | | | | 406,271 | |
Ford Motor Credit Co. LLC
Senior Notes
4.54% due 03/06/2025 | | GBP | 400,000 | | | | 521,354 | |
General Motors Financial Co., Inc.
Company Guar. Notes
3.70% due 05/09/2023 | | | 372,000 | | | | 381,567 | |
Hyundai Capital America
Senior Notes
3.40% due 06/20/2024* | | | 489,000 | | | | 501,117 | |
Nissan Motor Acceptance Corp.
Senior Notes
2.65% due 07/13/2022*# | | | 405,000 | | | | 406,780 | |
Toyota Motor Credit Corp.
Senior Notes
3.45% due 09/20/2023 | | | 357,000 | | | | 377,886 | |
| | | | | | |
|
|
|
| | | | | | | | 4,197,560 | |
| | | | | | |
|
|
|
Auto - Heavy Duty Trucks — 0.2% | |
Allison Transmission, Inc.
Senior Notes
5.00% due 10/01/2024* | | | 1,329,000 | | | | 1,367,342 | |
| | | | | | |
|
|
|
Auto/Truck Parts & Equipment - Original — 0.0% | |
Lear Corp.
Senior Notes
5.25% due 05/15/2049 | | | 286,000 | | | | 298,718 | |
| | | | | | |
|
|
|
Banks - Commercial — 0.5% | |
BankUnited, Inc.
Senior Notes
4.88% due 11/17/2025 | | | 1,021,000 | | | | 1,123,238 | |
Citizens Financial Group, Inc.
Sub. Notes
4.30% due 12/03/2025 | | | 187,000 | | | | 202,027 | |
Regions Financial Corp.
Sub. Notes
7.38% due 12/10/2037 | | | 565,000 | | | | 823,201 | |
SunTrust Bank
Senior Notes
3.20% due 04/01/2024 | | | 786,000 | | | | 822,812 | |
VALIC Company II Strategic Bond Fund
PORTFOLIO OF INVESTMENTS —August 31, 2019 — (continued)
| | | | | | | | |
| | |
| Security Description | | Principal
Amount(10) | | | Value
(Note 2) | |
| |
U.S. CORPORATE BONDS & NOTES (continued) | |
Banks - Commercial (continued) | |
SunTrust Bank
Senior Notes
3.50% due 08/02/2022 | | $ | 302,000 | | | $ | 309,138 | |
Webster Financial Corp.
Senior Notes
4.10% due 03/25/2029 | | | 527,000 | | | | 569,101 | |
| | | | | | |
|
|
|
| | | | | | | | 3,849,517 | |
| | | | | | |
|
|
|
Banks - Fiduciary — 0.0% | |
Bank of New York Mellon Corp.
Senior Notes
1.95% due 08/23/2022 | | | 281,000 | | | | 280,762 | |
| | | | | | |
|
|
|
Banks - Super Regional — 0.5% | |
Bank of America NA
Senior Notes
3.34% due 01/25/2023 | | | 426,000 | | | | 439,054 | |
Wells Fargo & Co.
Senior Notes
1.00% due 02/02/2027 | | EUR | 900,000 | | | | 1,049,069 | |
Wells Fargo & Co.
Senior Notes
3.20% due 06/17/2027 | | | 559,000 | | | | 582,184 | |
Wells Fargo & Co.
Senior Notes
3.55% due 09/29/2025 | | | 1,388,000 | | | | 1,476,608 | |
Wells Fargo Bank NA
Sub. Notes
5.25% due 08/01/2023 | | GBP | 400,000 | | | | 551,660 | |
| | | | | | |
|
|
|
| | | | | | | | 4,098,575 | |
| | | | | | |
|
|
|
Batteries/Battery Systems — 0.5% | |
Energizer Holdings, Inc.
Company Guar. Notes
6.38% due 07/15/2026*# | | | 1,730,000 | | | | 1,822,987 | |
EnerSys
Company Guar. Notes
5.00% due 04/30/2023* | | | 1,893,000 | | | | 1,949,790 | |
| | | | | | |
|
|
|
| | | | | | | | 3,772,777 | |
| | | | | | |
|
|
|
Beverages-Non-alcoholic — 0.2% | |
Coca-Cola Co.
Senior Notes
1.25% due 03/08/2031 | | EUR | 370,000 | | | | 453,590 | |
Keurig Dr Pepper, Inc.
Company Guar. Notes
4.42% due 05/25/2025 | | | 504,000 | | | | 551,314 | |
PepsiCo., Inc.
Senior Notes
2.75% due 04/30/2025 | | | 283,000 | | | | 296,096 | |
| | | | | | |
|
|
|
| | | | | | | | 1,301,000 | |
| | | | | | |
|
|
|
Beverages - Wine/Spirits — 0.1% | |
Constellation Brands, Inc.
Company Guar. Notes
3.15% due 08/01/2029 | | | 362,000 | | | | 373,425 | |
Constellation Brands, Inc.
Company Guar. Notes
5.25% due 11/15/2048 | | | 158,000 | | | | 200,342 | |
| | | | | | |
|
|
|
| | | | | | | | 573,767 | |
| | | | | | |
|
|
|
| | | | | | | | |
| | |
| Security Description | | Principal
Amount(10) | | | Value
(Note 2) | |
| |
| | | | | | | | | |
Brewery — 0.1% | |
Anheuser-Busch Cos. LLC/Anheuser-Busch InBev Worldwide, Inc.
Company Guar. Notes
4.90% due 02/01/2046 | | $ | 218,000 | | | $ | 259,886 | |
Anheuser-Busch InBev Worldwide, Inc.
Company Guar. Notes
4.60% due 04/15/2048 | | | 122,000 | | | | 141,763 | |
Anheuser-Busch InBev Worldwide, Inc.
Company Guar. Notes
5.55% due 01/23/2049 | | | 618,000 | | | | 811,737 | |
| | | | | | |
|
|
|
| | | | | | | | 1,213,386 | |
| | | | | | |
|
|
|
Broadcast Services/Program — 0.1% | |
Fox Corp.
Senior Notes
5.48% due 01/25/2039* | | | 199,000 | | | | 249,102 | |
Fox Corp.
Senior Notes
5.58% due 01/25/2049* | | | 252,000 | | | | 328,194 | |
| | | | | | |
|
|
|
| | | | | | | | 577,296 | |
| | | | | | |
|
|
|
Building & Construction Products - Misc. — 0.3% | |
Owens Corning
Senior Notes
3.95% due 08/15/2029 | | | 203,000 | | | | 209,911 | |
Owens Corning
Senior Notes
4.30% due 07/15/2047 | | | 474,000 | | | | 433,771 | |
Standard Industries, Inc.
Senior Notes
6.00% due 10/15/2025* | | | 1,825,000 | | | | 1,918,531 | |
| | | | | | |
|
|
|
| | | | | | | | 2,562,213 | |
| | | | | | |
|
|
|
Building & Construction - Misc. — 0.2% | |
Frontdoor, Inc.
Senior Notes
6.75% due 08/15/2026* | | | 1,258,000 | | | | 1,364,930 | |
| | | | | | |
|
|
|
Building Products - Cement — 0.0% | |
Martin Marietta Materials, Inc.
Senior Notes
3.50% due 12/15/2027 | | | 287,000 | | | | 296,285 | |
| | | | | | |
|
|
|
Building - Heavy Construction — 0.2% | |
Tutor Perini Corp.
Company Guar. Notes
6.88% due 05/01/2025*# | | | 1,900,000 | | | | 1,769,394 | |
| | | | | | |
|
|
|
Building - Residential/Commercial — 0.0% | |
Toll Brothers Finance Corp.
Company Guar. Notes
4.35% due 02/15/2028 | | | 222,000 | | | | 231,990 | |
| | | | | | |
|
|
|
Cable/Satellite TV — 1.6% | |
Block Communications, Inc.
Senior Notes
6.88% due 02/15/2025* | | | 1,614,000 | | | | 1,694,700 | |
CCO Holdings LLC/CCO Holdings Capital Corp.
Senior Notes
5.00% due 02/01/2028* | | | 556,000 | | | | 583,800 | |
CCO Holdings LLC/CCO Holdings Capital Corp.
Senior Notes
5.38% due 05/01/2025* | | | 980,000 | | | | 1,017,975 | |
CCO Holdings LLC/CCO Holdings Capital Corp.
Senior Notes
5.38% due 06/01/2029* | | | 685,000 | | | | 732,094 | |
VALIC Company II Strategic Bond Fund
PORTFOLIO OF INVESTMENTS —August 31, 2019 — (continued)
| | | | | | | | |
| | |
| Security Description | | Principal
Amount(10) | | | Value
(Note 2) | |
| |
U.S. CORPORATE BONDS & NOTES (continued) | |
Cable/Satellite TV (continued) | |
CCO Holdings LLC/CCO Holdings Capital Corp.
Senior Notes
5.50% due 05/01/2026* | | $ | 394,000 | | | $ | 415,178 | |
CCO Holdings LLC/CCO Holdings Capital Corp.
Senior Notes
5.88% due 04/01/2024* | | | 472,000 | | | | 491,470 | |
Charter Communications Operating LLC/Charter Communications Operating Capital FRS
Senior Sec. Notes
3.90% (3 ML+1.65%)
due 02/01/2024 | | | 1,290,000 | | | | 1,309,972 | |
Charter Communications Operating LLC/Charter Communications Operating Capital
Senior Sec. Notes
5.05% due 03/30/2029 | | | 362,000 | | | | 409,120 | |
Charter Communications Operating LLC/Charter Communications Operating Capital
Senior Sec. Notes
5.38% due 04/01/2038 | | | 29,000 | | | | 32,700 | |
Charter Communications Operating LLC/Charter Communications Operating Capital
Senior Sec. Notes
6.38% due 10/23/2035 | | | 99,000 | | | | 120,814 | |
Comcast Corp.
Company Guar. Notes
3.15% due 03/01/2026 | | | 465,000 | | | | 490,417 | |
Comcast Corp.
Company Guar. Notes
3.90% due 03/01/2038 | | | 60,000 | | | | 67,254 | |
Comcast Corp.
Company Guar. Notes
4.60% due 10/15/2038 | | | 345,000 | | | | 417,433 | |
Comcast Corp.
Company Guar. Notes
4.70% due 10/15/2048 | | | 101,000 | | | | 126,548 | |
CSC Holdings LLC
Senior Notes
5.25% due 06/01/2024 | | | 785,000 | | | | 839,950 | |
CSC Holdings LLC
Company Guar. Notes
5.38% due 07/15/2023* | | | 265,000 | | | | 272,357 | |
CSC Holdings LLC
Company Guar. Notes
5.50% due 04/15/2027* | | | 4,095,000 | | | | 4,381,650 | |
| | | | | | |
|
|
|
| | | | | | | | 13,403,432 | |
| | | | | | |
|
|
|
Casino Services — 0.2% | |
Eldorado Resorts, Inc.
Company Guar. Notes
6.00% due 09/15/2026 | | | 1,660,000 | | | | 1,815,625 | |
| | | | | | |
|
|
|
Cellular Telecom — 1.1% | |
Sprint Corp.
Company Guar. Notes
7.88% due 09/15/2023 | | | 6,765,000 | | | | 7,610,625 | |
Sprint Spectrum Co. LLC/Sprint Spectrum Co. II LLC/Sprint Spectrum Co. III LLC
Senior Sec. Notes
4.74% due 09/20/2029* | | | 432,000 | | | | 457,920 | |
T-Mobile USA, Inc.
Company Guar. Notes
6.38% due 03/01/2025 | | | 555,000 | | | | 574,703 | |
| | | | | | | | |
| | |
| Security Description | | Principal
Amount(10) | | | Value
(Note 2) | |
| |
| | | | | | | | | |
Cellular Telecom (continued) | |
T-Mobile USA, Inc.
Company Guar. Notes
6.50% due 01/15/2024 | | $ | 660,000 | | | $ | 687,865 | |
| | | | | | |
|
|
|
| | | | | | | | 9,331,113 | |
| | | | | | |
|
|
|
Chemicals - Diversified — 0.2% | |
Dow Chemical Co.
Senior Notes
4.80% due 05/15/2049* | | | 220,000 | | | | 249,163 | |
Dow Chemical Co.
Senior Notes
5.55% due 11/30/2048* | | | 246,000 | | | | 304,458 | |
DowDuPont, Inc.
Senior Notes
5.42% due 11/15/2048 | | | 26,000 | | | | 33,483 | |
Eastman Chemical Co.
Senior Notes
1.50% due 05/26/2023 | | EUR | 575,000 | | | | 670,284 | |
Westlake Chemical Corp.
Senior Notes
1.63% due 07/17/2029 | | EUR | 500,000 | | | | 569,962 | |
| | | | | | |
|
|
|
| | | | | | | | 1,827,350 | |
| | | | | | |
|
|
|
Chemicals - Plastics — 0.1% | |
Neon Holdings, Inc.
Senior Sec. Notes
10.13% due 04/01/2026* | | | 1,127,000 | | | | 1,104,460 | |
| | | | | | |
|
|
|
Chemicals - Specialty — 0.1% | |
Ecolab, Inc.
Senior Notes
2.38% due 08/10/2022 | | | 224,000 | | | | 226,314 | |
Huntsman International LLC
Senior Notes
4.50% due 05/01/2029 | | | 283,000 | | | | 301,410 | |
Lubrizol Corp.
Company Guar. Notes
6.50% due 10/01/2034 | | | 152,000 | | | | 218,311 | |
| | | | | | |
|
|
|
| | | | | | | | 746,035 | |
| | | | | | |
|
|
|
Coal — 0.1% | |
SunCoke Energy Partners LP/SunCoke Energy Partners Finance Corp.
Company Guar. Notes
7.50% due 06/15/2025* | | | 1,235,000 | | | | 1,169,391 | |
| | | | | | |
|
|
|
Coatings/Paint — 0.0% | |
RPM International, Inc.
Senior Notes
4.25% due 01/15/2048 | | | 29,000 | | | | 28,699 | |
Sherwin-Williams Co.
Senior Notes
2.95% due 08/15/2029 | | | 237,000 | | | | 240,958 | |
| | | | | | |
|
|
|
| | | | | | | | 269,657 | |
| | | | | | |
|
|
|
Commercial Services — 0.3% | |
Harsco Corp.
Company Guar. Notes
5.75% due 07/31/2027* | | | 869,000 | | | | 900,501 | |
Nielsen Finance LLC/Nielsen Finance Co.
Company Guar. Notes
5.00% due 04/15/2022* | | | 1,525,000 | | | | 1,532,625 | |
| | | | | | |
|
|
|
| | | | | | | | 2,433,126 | |
| | | | | | |
|
|
|
VALIC Company II Strategic Bond Fund
PORTFOLIO OF INVESTMENTS —August 31, 2019 — (continued)
| | | | | | | | |
| | |
| Security Description | | Principal
Amount(10) | | | Value
(Note 2) | |
| |
U.S. CORPORATE BONDS & NOTES (continued) | |
Computer Services — 0.1% | |
IBM Credit LLC
Senior Notes
3.00% due 02/06/2023 | | $ | 796,000 | | | $ | 819,026 | |
International Business Machines Corp.
Senior Notes
2.50% due 01/27/2022 | | | 329,000 | | | | 333,297 | |
| | | | | | |
|
|
|
| | | | | | | | 1,152,323 | |
| | | | | | |
|
|
|
Computer Software — 0.2% | |
Rackspace Hosting, Inc.
Company Guar. Notes
8.63% due 11/15/2024*# | | | 1,670,000 | | | | 1,532,225 | |
| | | | | | |
|
|
|
Computers — 0.5% | |
Apple, Inc.
Senior Notes
2.85% due 05/06/2021 | | | 186,000 | | | | 189,159 | |
Dell International LLC/EMC Corp.
Senior Sec. Notes
6.02% due 06/15/2026* | | | 3,115,000 | | | | 3,514,854 | |
Dell International LLC/EMC Corp.
Senior Sec. Notes
8.10% due 07/15/2036* | | | 244,000 | | | | 309,328 | |
Hewlett Packard Enterprise Co.
Senior Notes
6.20% due 10/15/2035 | | | 57,000 | | | | 66,331 | |
| | | | | | |
|
|
|
| | | | | | | | 4,079,672 | |
| | | | | | |
|
|
|
Computers - Integrated Systems — 0.4% | |
Diebold Nixdorf, Inc.
Company Guar. Notes
8.50% due 04/15/2024# | | | 1,651,000 | | | | 1,539,558 | |
NCR Corp.
Company Guar. Notes
5.75% due 09/01/2027* | | | 579,000 | | | | 611,459 | |
NCR Corp.
Company Guar. Notes
6.13% due 09/01/2029* | | | 901,000 | | | | 956,294 | |
| | | | | | |
|
|
|
| | | | | | | | 3,107,311 | |
| | | | | | |
|
|
|
Consumer Products - Misc. — 0.2% | |
Central Garden & Pet Co.
Company Guar. Notes
5.13% due 02/01/2028 | | | 1,350,000 | | | | 1,356,750 | |
| | | | | | |
|
|
|
Containers - Metal/Glass — 0.6% | |
Crown Americas LLC/Crown Americas Capital Corp.
Company Guar. Notes
4.50% due 01/15/2023 | | | 750,000 | | | | 787,500 | |
Crown Cork & Seal Co., Inc.
Company Guar. Notes
7.38% due 12/15/2026 | | | 854,000 | | | | 1,037,610 | |
Owens-Brockway Glass Container, Inc.
Company Guar. Notes
5.38% due 01/15/2025* | | | 1,684,000 | | | | 1,742,940 | |
Silgan Holdings, Inc.
Senior Notes
4.75% due 03/15/2025 | | | 1,300,000 | | | | 1,334,255 | |
| | | | | | |
|
|
|
| | | | | | | | 4,902,305 | |
| | | | | | |
|
|
|
Containers - Paper/Plastic — 0.1% | |
Sealed Air Corp.
Company Guar. Notes
5.13% due 12/01/2024* | | | 460,000 | | | | 492,775 | |
| | | | | | |
|
|
|
| | | | | | | | |
| | |
| Security Description | | Principal
Amount(10) | | | Value
(Note 2) | |
| |
| | | | | | | | | |
Cosmetics & Toiletries — 0.5% | |
Coty, Inc.
Company Guar. Notes
6.50% due 04/15/2026*# | | $ | 1,875,000 | | | $ | 1,771,875 | |
First Quality Finance Co., Inc.
Company Guar. Notes
5.00% due 07/01/2025* | | | 1,328,000 | | | | 1,377,800 | |
Procter & Gamble Co.
Senior Notes
1.88% due 10/30/2038 | | EUR | 700,000 | | | | 975,175 | |
| | | | | | |
|
|
|
| | | | | | | | 4,124,850 | |
| | | | | | |
|
|
|
Data Processing/Management — 0.1% | |
Fiserv, Inc.
Senior Notes
1.63% due 07/01/2030 | | EUR | 480,000 | | | | 576,230 | |
Fiserv, Inc.
Senior Notes
4.40% due 07/01/2049 | | | 315,000 | | | | 362,477 | |
| | | | | | |
|
|
|
| | | | | | | | 938,707 | |
| | | | | | |
|
|
|
Diagnostic Equipment — 0.2% | |
Ortho-Clinical Diagnostics, Inc.
Senior Notes
6.63% due 05/15/2022* | | | 1,482,000 | | | | 1,430,130 | |
Thermo Fisher Scientific, Inc.
Senior Notes
2.88% due 07/24/2037 | | EUR | 380,000 | | | | 538,532 | |
| | | | | | |
|
|
|
| | | | | | | | 1,968,662 | |
| | | | | | |
|
|
|
Dialysis Centers — 0.2% | |
DaVita HealthCare Partners, Inc.
Company Guar. Notes
5.13% due 07/15/2024 | | | 1,950,000 | | | | 1,983,559 | |
| | | | | | |
|
|
|
Distribution/Wholesale — 0.3% | |
Anixter, Inc.
Company Guar. Notes
6.00% due 12/01/2025 | | | 931,000 | | | | 1,028,755 | |
H&E Equipment Services, Inc.
Company Guar. Notes
5.63% due 09/01/2025 | | | 1,641,000 | | | | 1,718,947 | |
| | | | | | |
|
|
|
| | | | | | | | 2,747,702 | |
| | | | | | |
|
|
|
Diversified Banking Institutions — 1.4% | |
Bank of America Corp.
Senior Notes
0.75% due 07/26/2023 | | EUR | 700,000 | | | | 794,492 | |
Bank of America Corp.
Senior Notes
2.38% due 06/19/2024 | | EUR | 900,000 | | | | 1,105,171 | |
Bank of America Corp.
Senior Notes
3.71% due 04/24/2028 | | | 372,000 | | | | 401,271 | |
Bank of America Corp.
Senior Notes
3.86% due 07/23/2024 | | | 272,000 | | | | 288,792 | |
Bank of America Corp.
Sub. Notes
4.18% due 11/25/2027 | | | 640,000 | | | | 696,259 | |
Bank of America Corp.
Sub. Notes
6.11% due 01/29/2037 | | | 296,000 | | | | 396,140 | |
Citigroup, Inc.
Senior Notes
2.75% due 01/24/2024 | | GBP | 400,000 | | | | 513,016 | |
VALIC Company II Strategic Bond Fund
PORTFOLIO OF INVESTMENTS —August 31, 2019 — (continued)
| | | | | | | | |
| | |
| Security Description | | Principal
Amount(10) | | | Value
(Note 2) | |
| |
U.S. CORPORATE BONDS & NOTES (continued) | |
Diversified Banking Institutions (continued) | |
Citigroup, Inc.
Senior Notes
3.20% due 10/21/2026 | | $ | 842,000 | | | $ | 878,462 | |
Citigroup, Inc.
Senior Notes
3.98% due 03/20/2030 | | | 211,000 | | | | 232,864 | |
Citigroup, Inc.
Sub. Notes
4.45% due 09/29/2027 | | | 519,000 | | | | 571,008 | |
Citigroup, Inc.
Sub. Notes
5.88% due 02/22/2033 | | | 264,000 | | | | 331,342 | |
Citigroup, Inc.
Sub. Notes
6.00% due 10/31/2033 | | | 105,000 | | | | 133,538 | |
Goldman Sachs Group, Inc.
Senior Notes
2.00% due 11/01/2028 | | EUR | 325,000 | | | | 402,821 | |
Goldman Sachs Group, Inc.
Senior Notes
2.35% due 11/15/2021 | | | 580,000 | | | | 581,074 | |
Goldman Sachs Group, Inc.
Senior Notes
3.13% due 07/25/2029 | | GBP | 400,000 | | | | 531,804 | |
Goldman Sachs Group, Inc.
Senior Notes
3.69% due 06/05/2028 | | | 357,000 | | | | 379,548 | |
Goldman Sachs Group, Inc.
Sub. Notes
4.25% due 10/21/2025 | | | 335,000 | | | | 361,285 | |
Goldman Sachs Group, Inc.
Sub. Notes
6.75% due 10/01/2037 | | | 228,000 | | | | 312,292 | |
JPMorgan Chase & Co.
Senior Notes
3.21% due 04/01/2023 | | | 878,000 | | | | 902,659 | |
JPMorgan Chase & Co.
Senior Notes
3.88% due 07/24/2038 | | | 218,000 | | | | 244,312 | |
Morgan Stanley
Senior Notes
3.63% due 01/20/2027 | | | 826,000 | | | | 883,510 | |
Morgan Stanley
Senior Notes
5.50% due 07/24/2020 | | | 495,000 | | | | 509,674 | |
| | | | | | |
|
|
|
| | | | | | | | 11,451,334 | |
| | | | | | |
|
|
|
Diversified Financial Services — 0.0% | |
USAA Capital Corp.
Senior Notes
2.63% due 06/01/2021* | | | 311,000 | | | | 314,673 | |
| | | | | | |
|
|
|
Diversified Manufacturing Operations — 0.2% | |
General Electric Co.
Senior Notes
1.25% due 05/26/2023 | | EUR | 600,000 | | | | 664,765 | |
Illinois Tool Works, Inc.
Senior Notes
0.63% due 12/05/2027 | | EUR | 585,000 | | | | 670,582 | |
Illinois Tool Works, Inc.
Senior Notes
3.50% due 03/01/2024 | | | 240,000 | | | | 254,086 | |
| | | | | | |
|
|
|
| | | | | | | | 1,589,433 | |
| | | | | | |
|
|
|
| | | | | | | | |
| | |
| Security Description | | Principal
Amount(10) | | | Value
(Note 2) | |
| |
| | | | | | | | | |
E-Commerce/Products — 0.0% | |
Amazon.com, Inc.
Senior Notes
4.80% due 12/05/2034 | | $ | 158,000 | | | $ | 200,636 | |
| | | | | | |
|
|
|
E-Commerce/Services — 0.2% | |
GrubHub Holdings, Inc.
Company Guar. Notes
5.50% due 07/01/2027* | | | 1,249,000 | | | | 1,305,205 | |
| | | | | | |
|
|
|
Electric Products - Misc. — 0.0% | |
Emerson Electric Co.
Senior Notes
0.38% due 05/22/2024 | | EUR | 325,000 | | | | 366,841 | |
| | | | | | |
|
|
|
Electric - Distribution — 0.4% | |
CenterPoint Energy, Inc.
Senior Notes
2.95% due 03/01/2030 | | | 216,000 | | | | 218,809 | |
National Rural Utilities Cooperative Finance Corp.
Collateral Trust Bonds
2.85% due 01/27/2025 | | | 776,000 | | | | 804,308 | |
NextEra Energy Operating Partners LP
Company Guar. Notes
4.25% due 07/15/2024* | | | 1,275,000 | | | | 1,310,062 | |
Oglethorpe Power Corp.
1st Mtg. Notes
5.05% due 10/01/2048 | | | 573,000 | | | | 714,002 | |
Sempra Energy
Senior Notes
3.40% due 02/01/2028 | | | 429,000 | | | | 447,006 | |
| | | | | | |
|
|
|
| | | | | | | | 3,494,187 | |
| | | | | | |
|
|
|
Electric - Generation — 0.2% | |
Basin Electric Power Cooperative
1st Mtg. Notes
4.75% due 04/26/2047* | | | 19,000 | | | | 22,825 | |
Emera US Finance LP
Company Guar. Notes
4.75% due 06/15/2046 | | | 282,000 | | | | 334,158 | |
Vistra Operations Co. LLC
Company Guar. Notes
5.00% due 07/31/2027* | | | 1,280,000 | | | | 1,321,600 | |
| | | | | | |
|
|
|
| | | | | | | | 1,678,583 | |
| | | | | | |
|
|
|
Electric - Integrated — 1.0% | |
AEP Texas, Inc.
Senior Notes
4.15% due 05/01/2049 | | | 127,000 | | | | 150,738 | |
Consolidated Edison Co. of New York, Inc.
Senior Notes
4.45% due 06/15/2020 | | | 339,000 | | | | 344,854 | |
Dominion Resources, Inc.
Senior Notes
5.25% due 08/01/2033 | | | 275,000 | | | | 339,577 | |
DPL, Inc.
Senior Notes
4.35% due 04/15/2029* | | | 96,000 | | | | 95,860 | |
DTE Electric Co.
General Refunding Mtg.
3.95% due 03/01/2049 | | | 515,000 | | | | 617,909 | |
DTE Energy Co.
Senior Notes
3.40% due 06/15/2029 | | | 202,000 | | | | 213,741 | |
Duke Energy Progress LLC
1st Mtg. Notes
2.80% due 05/15/2022 | | | 162,000 | | | | 165,443 | |
VALIC Company II Strategic Bond Fund
PORTFOLIO OF INVESTMENTS —August 31, 2019 — (continued)
| | | | | | | | |
| | |
| Security Description | | Principal
Amount(10) | | | Value
(Note 2) | |
| |
U.S. CORPORATE BONDS & NOTES (continued) | |
Electric - Integrated (continued) | |
Edison International
Senior Notes
4.13% due 03/15/2028 | | $ | 300,000 | | | $ | 313,027 | |
Edison International
Senior Notes
5.75% due 06/15/2027 | | | 58,000 | | | | 65,811 | |
Entergy Texas, Inc.
1st Mtg. Notes
4.50% due 03/30/2039 | | | 583,000 | | | | 701,471 | |
FirstEnergy Corp.
Senior Notes
7.38% due 11/15/2031 | | | 942,000 | | | | 1,350,289 | |
Georgia Power Co.
Senior Notes
2.00% due 09/08/2020 | | | 220,000 | | | | 220,066 | |
Mississippi Power Co.
Senior Notes
4.25% due 03/15/2042 | | | 326,000 | | | | 360,456 | |
Nevada Power Co.
General Refunding Mtg.
2.75% due 04/15/2020 | | | 164,000 | | | | 164,710 | |
Public Service Co. of Colorado
1st Mtg. Bonds
3.70% due 06/15/2028 | | | 359,000 | | | | 401,055 | |
Public Service Co. of Colorado
1st Mtg. Bonds
4.10% due 06/15/2048 | | | 254,000 | | | | 305,247 | |
Puget Sound Energy, Inc.
Senior Sec. Notes
3.25% due 09/15/2049 | | | 71,000 | | | | 73,288 | |
South Carolina Electric & Gas Co.
1st Mtg. Bonds
5.10% due 06/01/2065 | | | 390,000 | | | | 530,219 | |
Southern California Edison Co.
1st Mtg. Notes
Class C
4.13% due 03/01/2048 | | | 148,000 | | | | 165,469 | |
Southern California Edison Co.
1st Mtg. Notes
4.65% due 10/01/2043 | | | 151,000 | | | | 178,888 | |
Southern California Edison Co.
1st Mtg. Bonds
4.88% due 03/01/2049 | | | 386,000 | | | | 479,454 | |
Talen Energy Supply LLC
Senior Sec. Notes
6.63% due 01/15/2028* | | | 503,000 | | | | 486,653 | |
Talen Energy Supply LLC
Senior Sec. Notes
7.25% due 05/15/2027* | | | 568,000 | | | | 563,740 | |
| | | | | | |
|
|
|
| | | | | | | | 8,287,965 | |
| | | | | | |
|
|
|
Electronic Components - Semiconductors — 0.2% | |
Amkor Technology, Inc.
Senior Notes
6.63% due 09/15/2027* | | | 1,284,000 | | | | 1,397,930 | |
Intel Corp.
Senior Notes
2.45% due 07/29/2020 | | | 327,000 | | | | 328,482 | |
Texas Instruments, Inc.
Senior Notes
2.25% due 09/04/2029 | | | 139,000 | | | | 139,468 | |
| | | | | | |
|
|
|
| | | | | | | | 1,865,880 | |
| | | | | | |
|
|
|
| | | | | | | | |
| | |
| Security Description | | Principal
Amount(10) | | | Value
(Note 2) | |
| |
| | | | | | | | | |
Electronic Measurement Instruments — 0.1% | |
Trimble, Inc.
Senior Notes
4.75% due 12/01/2024 | | $ | 32,000 | | | $ | 34,587 | |
Trimble, Inc.
Senior Notes
4.90% due 06/15/2028 | | | 500,000 | | | | 547,980 | |
| | | | | | |
|
|
|
| | | | | | | | 582,567 | |
| | | | | | |
|
|
|
Electronic Parts Distribution — 0.3% | |
Arrow Electronics, Inc.
Senior Notes
4.00% due 04/01/2025 | | | 180,000 | | | | 188,154 | |
Ingram Micro, Inc.
Senior Notes
5.45% due 12/15/2024 | | | 2,199,000 | | | | 2,274,145 | |
| | | | | | |
|
|
|
| | | | | | | | 2,462,299 | |
| | | | | | |
|
|
|
Energy - Alternate Sources — 0.3% | |
Hanwha Energy USA Holdings Corp.
Company Guar. Notes
2.38% due 07/30/2022* | | | 420,000 | | | | 422,193 | |
Pattern Energy Group, Inc.
Company Guar. Notes
5.88% due 02/01/2024* | | | 1,869,000 | | | | 1,934,415 | |
| | | | | | |
|
|
|
| | | | | | | | 2,356,608 | |
| | | | | | |
|
|
|
Enterprise Software/Service — 0.3% | |
Donnelley Financial Solutions, Inc.
Company Guar. Notes
8.25% due 10/15/2024 | | | 1,709,000 | | | | 1,768,815 | |
Oracle Corp.
Senior Notes
2.95% due 11/15/2024 | | | 525,000 | | | | 549,739 | |
| | | | | | |
|
|
|
| | | | | | | | 2,318,554 | |
| | | | | | |
|
|
|
Finance - Auto Loans — 0.2% | |
Credit Acceptance Corp.
Company Guar. Notes
6.63% due 03/15/2026* | | | 1,229,000 | | | | 1,329,631 | |
| | | | | | |
|
|
|
Finance - Consumer Loans — 0.9% | |
Enova International, Inc.
Company Guar. Notes
8.50% due 09/01/2024* | | | 1,753,000 | | | | 1,687,263 | |
Enova International, Inc.
Company Guar. Notes
8.50% due 09/15/2025* | | | 1,079,000 | | | | 1,035,840 | |
SLM Corp.
Senior Notes
5.63% due 08/01/2033 | | | 1,487,000 | | | | 1,256,515 | |
Springleaf Finance Corp.
Company Guar. Notes
6.88% due 03/15/2025 | | | 1,850,000 | | | | 2,097,437 | |
Synchrony Financial
Senior Notes
2.85% due 07/25/2022 | | | 120,000 | | | | 121,619 | |
Synchrony Financial
Senior Notes
4.25% due 08/15/2024 | | | 665,000 | | | | 707,092 | |
Synchrony Financial
Senior Notes
4.38% due 03/19/2024 | | | 204,000 | | | | 217,877 | |
| | | | | | |
|
|
|
| | | | | | | | 7,123,643 | |
| | | | | | |
|
|
|
VALIC Company II Strategic Bond Fund
PORTFOLIO OF INVESTMENTS —August 31, 2019 — (continued)
| | | | | | | | |
| | |
| Security Description | | Principal
Amount(10) | | | Value
(Note 2) | |
| |
U.S. CORPORATE BONDS & NOTES (continued) | |
Finance - Credit Card — 0.1% | |
American Express Co.
Senior Notes
3.40% due 02/22/2024 | | $ | 234,000 | | | $ | 246,783 | |
American Express Co.
Senior Notes
4.20% due 11/06/2025 | | | 173,000 | | | | 192,197 | |
| | | | | | |
|
|
|
| | | | | | | | 438,980 | |
| | | | | | |
|
|
|
Finance - Investment Banker/Broker — 0.2% | |
Lehman Brothers Holdings, Inc.
Escrow Notes
5.50% due 04/04/2016† | | | 97,000 | | | | 1,310 | |
Lehman Brothers Holdings, Inc.
Escrow Notes
6.75% due 12/28/2017(5)† | | | 111,000 | | | | 11 | |
Lehman Brothers Holdings, Inc.
Escrow Notes
7.50% due 05/11/2038(5)† | | | 143,000 | | | | 14 | |
LPL Holdings, Inc.
Company Guar. Notes
5.75% due 09/15/2025* | | | 1,289,000 | | | | 1,356,672 | |
| | | | | | |
|
|
|
| | | | | | | | 1,358,007 | |
| | | | | | |
|
|
|
Finance - Mortgage Loan/Banker — 0.2% | |
Quicken Loans, Inc.
Company Guar. Notes
5.75% due 05/01/2025* | | | 1,775,000 | | | | 1,850,437 | |
| | | | | | |
|
|
|
Food - Dairy Products — 0.0% | |
Land O’ Lakes, Inc.
Junior Sub. Notes
7.00% due 09/18/2028*(6) | | | 110,000 | | | | 104,500 | |
| | | | | | |
|
|
|
Food - Meat Products — 0.1% | |
Smithfield Foods, Inc.
Senior Notes
2.65% due 10/03/2021* | | | 137,000 | | | | 135,546 | |
Smithfield Foods, Inc.
Senior Notes
5.20% due 04/01/2029* | | | 114,000 | | | | 127,538 | |
Tyson Foods, Inc.
Senior Notes
5.10% due 09/28/2048 | | | 102,000 | | | | 126,999 | |
| | | | | | |
|
|
|
| | | | | | | | 390,083 | |
| | | | | | |
|
|
|
Food - Misc./Diversified — 0.6% | |
Conagra Brands, Inc.
Senior Notes
5.40% due 11/01/2048 | | | 362,000 | | | | 430,825 | |
Conagra Brands, Inc.
Senior Notes
7.00% due 10/01/2028 | | | 275,000 | | | | 347,918 | |
General Mills, Inc.
Senior Notes
4.55% due 04/17/2038 | | | 148,000 | | | | 170,819 | |
General Mills, Inc.
Senior Notes
4.70% due 04/17/2048 | | | 285,000 | | | | 337,290 | |
Kraft Heinz Foods Co.
Sec. Notes
4.88% due 02/15/2025* | | | 353,000 | | | | 364,288 | |
Lamb Weston Holdings, Inc.
Company Guar. Notes
4.63% due 11/01/2024* | | | 865,000 | | | | 904,280 | |
| | | | | | | | |
| | |
| Security Description | | Principal
Amount(10) | | | Value
(Note 2) | |
| |
| | | | | | | | | |
Food - Misc./Diversified (continued) | |
Mondelez International, Inc.
Senior Notes
3.63% due 02/13/2026 | | $ | 349,000 | | | $ | 375,922 | |
Nestle Holdings, Inc.
Company Guar. Notes
3.50% due 09/24/2025* | | | 335,000 | | | | 362,216 | |
Post Holdings, Inc.
Company Guar. Notes
5.50% due 03/01/2025* | | | 1,290,000 | | | | 1,349,662 | |
| | | | | | |
|
|
|
| | | | | | | | 4,643,220 | |
| | | | | | |
|
|
|
Food - Retail — 0.3% | |
Albertsons Cos. LLC/Safeway, Inc./New Albertsons LP/Albertson’s LLC
Company Guar. Notes
5.75% due 03/15/2025 | | | 1,325,000 | | | | 1,358,125 | |
Albertsons Cos. LLC/Safeway, Inc./New Albertsons LP/Albertson’s LLC
Company Guar. Notes
5.88% due 02/15/2028* | | | 709,000 | | | | 747,187 | |
Kroger Co.
Senior Notes
5.40% due 01/15/2049 | | | 211,000 | | | | 251,763 | |
| | | | | | |
|
|
|
| | | | | | | | 2,357,075 | |
| | | | | | |
|
|
|
Gambling(Non-Hotel) — 0.1% | |
Twin River Worldwide Holdings, Inc.
Senior Notes
6.75% due 06/01/2027* | | | 763,000 | | | �� | 804,011 | |
Waterford Gaming LLC/Waterford Gaming Financial Corp.
Escrow Notes
8.63% due 09/15/2014†*(5) | | | 272,905 | | | | 15,774 | |
| | | | | | |
|
|
|
| | | | | | | | 819,785 | |
| | | | | | |
|
|
|
Gas- Distribution — 0.1% | |
NiSource, Inc.
Senior Notes
2.95% due 09/01/2029 | | | 329,000 | | | | 336,841 | |
NiSource, Inc.
Senior Notes
5.65% due 02/01/2045 | | | 182,000 | | | | 241,083 | |
| | | | | | |
|
|
|
| | | | | | | | 577,924 | |
| | | | | | |
|
|
|
Hazardous Waste Disposal — 0.1% | |
Clean Harbors, Inc.
Senior Notes
4.88% due 07/15/2027* | | | 833,000 | | | | 880,897 | |
| | | | | | |
|
|
|
Hotels/Motels — 0.3% | |
Hilton Grand Vacations Borrower LLC/Hilton Grand Vacations Borrower, Inc.
Company Guar. Notes
6.13% due 12/01/2024 | | | 761,000 | | | | 808,563 | |
Wyndham Worldwide Corp.
Senior Sec. Notes
5.40% due 04/01/2024 | | | 671,000 | | | | 704,340 | |
Wyndham Worldwide Corp.
Senior Sec. Notes
5.75% due 04/01/2027 | | | 620,000 | | | | 661,850 | |
| | | | | | |
|
|
|
| | | | | | | | 2,174,753 | |
| | | | | | |
|
|
|
Independent Power Producers — 0.2% | |
Clearway Energy Operating LLC
Company Guar. Notes
5.75% due 10/15/2025* | | | 1,130,000 | | | | 1,178,048 | |
VALIC Company II Strategic Bond Fund
PORTFOLIO OF INVESTMENTS —August 31, 2019 — (continued)
| | | | | | | | |
| | |
| Security Description | | Principal
Amount(10) | | | Value
(Note 2) | |
| |
U.S. CORPORATE BONDS & NOTES (continued) | |
Independent Power Producers (continued) | |
NRG Yield Operating LLC
Company Guar. Notes
5.00% due 09/15/2026 | | $ | 721,000 | | | $ | 730,012 | |
| | | | | | |
|
|
|
| | | | | | | | 1,908,060 | |
| | | | | | |
|
|
|
Insurance Brokers — 0.1% | |
Marsh & McLennan Cos., Inc.
Senior Notes
3.50% due 12/29/2020 | | | 169,000 | | | | 172,053 | |
Willis North America, Inc.
Company Guar. Notes
5.05% due 09/15/2048 | | | 183,000 | | | | 220,971 | |
| | | | | | |
|
|
|
| | | | | | | | 393,024 | |
| | | | | | |
|
|
|
Insurance - Life/Health — 0.0% | |
Brighthouse Financial, Inc.
Senior Notes
4.70% due 06/22/2047 | | | 267,000 | | | | 240,328 | |
| | | | | | |
|
|
|
Insurance - Multi-line — 0.0% | |
Assurant, Inc.
Senior Notes
3.70% due 02/22/2030 | | | 344,000 | | | | 345,813 | |
Assurant, Inc.
Senior Notes
6.75% due 02/15/2034 | | | 24,000 | | | | 30,164 | |
| | | | | | |
|
|
|
| | | | | | | | 375,977 | |
| | | | | | |
|
|
|
Insurance - Mutual — 0.1% | |
MassMutual Global Funding II
Senior Sec. Notes
2.75% due 06/22/2024* | | | 287,000 | | | | 295,618 | |
New York Life Global Funding
Sec. Notes
1.95% due 09/28/2020* | | | 635,000 | | | | 635,139 | |
| | | | | | |
|
|
|
| | | | | | | | 930,757 | |
| | | | | | |
|
|
|
Insurance - Property/Casualty — 0.3% | |
ACE INA Holdings, Inc.
Company Guar. Notes
2.88% due 11/03/2022 | | | 235,000 | | | | 241,963 | |
AmWINS Group, Inc.
Company Guar. Notes
7.75% due 07/01/2026* | | | 1,265,000 | | | | 1,328,250 | |
Chubb INA Holdings, Inc.
Company Guar. Notes
2.50% due 03/15/2038 | | EUR | 400,000 | | | | 548,910 | |
| | | | | | |
|
|
|
| | | | | | | | 2,119,123 | |
| | | | | | |
|
|
|
Internet Connectivity Services — 0.2% | |
Cogent Communications Group, Inc.
Senior Sec. Notes
5.38% due 03/01/2022* | | | 1,359,000 | | | | 1,409,962 | |
| | | | | | |
|
|
|
Internet Content - Entertainment — 0.5% | |
Netflix, Inc.
Senior Notes
4.38% due 11/15/2026# | | | 1,957,000 | | | | 2,003,479 | |
Netflix, Inc.
Senior Notes
5.88% due 02/15/2025 | | | 1,667,000 | | | | 1,839,951 | |
| | | | | | |
|
|
|
| | | | | | | | 3,843,430 | |
| | | | | | |
|
|
|
| | | | | | | | |
| | |
| Security Description | | Principal
Amount(10) | | | Value
(Note 2) | |
| |
| | | | | | | | | |
Investment Companies — 0.1% | |
FS Energy & Power Fund
Senior Sec. Notes
7.50% due 08/15/2023* | | $ | 960,000 | | | $ | 952,800 | |
| | | | | | |
|
|
|
Investment Management/Advisor Services — 0.0% | |
Ameriprise Financial, Inc.
Senior Notes
3.00% due 03/22/2022 | | | 293,000 | | | | 299,361 | |
| | | | | | |
|
|
|
Machinery - Construction & Mining — 0.2% | |
Caterpillar Financial Services Corp.
Senior Notes
2.55% due 11/29/2022 | | | 147,000 | | | | 149,555 | |
Caterpillar Financial Services Corp.
Senior Notes
3.15% due 09/07/2021 | | | 148,000 | | | | 151,864 | |
Caterpillar Financial Services Corp.
Senior Notes
3.45% due 05/15/2023# | | | 224,000 | | | | 235,503 | |
Terex Corp.
Company Guar. Notes
5.63% due 02/01/2025* | | | 995,000 | | | | 1,012,482 | |
| | | | | | |
|
|
|
| | | | | | | | 1,549,404 | |
| | | | | | |
|
|
|
Machinery - Electrical — 0.0% | |
ABB Finance USA, Inc.
Company Guar. Notes
3.38% due 04/03/2023 | | | 279,000 | | | | 291,713 | |
| | | | | | |
|
|
|
Machinery - Farming — 0.2% | |
CNH Industrial Capital LLC
Company Guar. Notes
4.20% due 01/15/2024 | | | 455,000 | | | | 480,050 | |
John Deere Capital Corp.
Senior Notes
2.35% due 01/08/2021 | | | 177,000 | | | | 178,119 | |
John Deere Capital Corp.
Senior Notes
2.80% due 07/18/2029 | | | 197,000 | | | | 204,692 | |
John Deere Capital Corp.
Senior Notes
2.95% due 04/01/2022 | | | 542,000 | | | | 554,844 | |
John Deere Capital Corp.
Senior Notes
3.45% due 01/10/2024 | | | 338,000 | | | | 358,294 | |
John Deere Capital Corp.
Senior Notes
3.65% due 10/12/2023 | | | 156,000 | | | | 166,682 | |
| | | | | | |
|
|
|
| | | | | | | | 1,942,681 | |
| | | | | | |
|
|
|
Machinery - General Industrial — 0.1% | |
Roper Technologies, Inc.
Senior Notes
2.95% due 09/15/2029 | | | 141,000 | | | | 142,993 | |
Roper Technologies, Inc.
Senior Notes
4.20% due 09/15/2028 | | | 539,000 | | | | 598,448 | |
Wabtec Corp.
Company Guar. Notes
4.95% due 09/15/2028 | | | 222,000 | | | | 247,765 | |
| | | | | | |
|
|
|
| | | | | | | | 989,206 | |
| | | | | | |
|
|
|
Medical Labs & Testing Services — 0.2% | |
Catalent Pharma Solutions, Inc.
Company Guar. Notes
5.00% due 07/15/2027* | | | 650,000 | | | | 680,946 | |
VALIC Company II Strategic Bond Fund
PORTFOLIO OF INVESTMENTS —August 31, 2019 — (continued)
| | | | | | | | |
| | |
| Security Description | | Principal
Amount(10) | | | Value
(Note 2) | |
| |
U.S. CORPORATE BONDS & NOTES (continued) | |
Medical Labs & Testing Services (continued) | |
Laboratory Corp. of America Holdings
Senior Notes
3.25% due 09/01/2024 | | $ | 410,000 | | | $ | 426,845 | |
Laboratory Corp. of America Holdings
Senior Notes
4.70% due 02/01/2045 | | | 147,000 | | | | 167,025 | |
Roche Holdings, Inc.
Company Guar. Notes
1.75% due 01/28/2022* | | | 226,000 | | | | 224,976 | |
| | | | | | |
|
|
|
| | | | | | | | 1,499,792 | |
| | | | | | |
|
|
|
Medical Products — 0.1% | |
Hologic, Inc.
Company Guar. Notes
4.38% due 10/15/2025* | | | 1,025,000 | | | | 1,048,062 | |
| | | | | | |
|
|
|
Medical - Biomedical/Gene — 0.1% | |
Amgen, Inc.
Senior Notes
4.66% due 06/15/2051 | | | 143,000 | | | | 170,086 | |
Celgene Corp.
Senior Notes
3.63% due 05/15/2024 | | | 279,000 | | | | 295,507 | |
Celgene Corp.
Senior Notes
4.63% due 05/15/2044 | | | 130,000 | | | | 158,249 | |
| | | | | | |
|
|
|
| | | | | | | | 623,842 | |
| | | | | | |
|
|
|
Medical - Drugs — 0.1% | |
Bristol-Myers Squibb Co.
Senior Notes
4.13% due 06/15/2039* | | | 197,000 | | | | 229,591 | |
GlaxoSmithKline Capital, Inc.
Company Guar. Notes
3.38% due 05/15/2023 | | | 172,000 | | | | 180,285 | |
Johnson & Johnson
Senior Notes
5.50% due 11/06/2024 | | GBP | 400,000 | | | | 598,052 | |
| | | | | | |
|
|
|
| | | | | | | | 1,007,928 | |
| | | | | | |
|
|
|
Medical - Generic Drugs — 0.0% | |
Mylan, Inc.
Company Guar. Notes
4.55% due 04/15/2028 | | | 266,000 | | | | 286,292 | |
| | | | | | |
|
|
|
Medical- HMO — 0.5% | |
Centene Corp.
Senior Notes
4.75% due 01/15/2025 | | | 463,000 | | | | 480,363 | |
Humana, Inc.
Senior Notes
3.95% due 08/15/2049 | | | 184,000 | | | | 192,045 | |
MPH Acquisition Holdings LLC
Company Guar. Notes
7.13% due 06/01/2024* | | | 1,775,000 | | | | 1,586,513 | |
UnitedHealth Group, Inc.
Senior Bonds
2.38% due 10/15/2022 | | | 1,257,000 | | | | 1,273,645 | |
UnitedHealth Group, Inc.
Senior Notes
3.50% due 08/15/2039 | | | 205,000 | | | | 218,729 | |
UnitedHealth Group, Inc.
Senior Notes
3.75% due 07/15/2025 | | | 227,000 | | | | 246,922 | |
| | | | | | | | |
| | |
| Security Description | | Principal
Amount(10) | | | Value
(Note 2) | |
| |
| | | | | | | | | |
Medical- HMO (continued) | |
UnitedHealth Group, Inc.
Senior Notes
3.88% due 08/15/2059 | | $ | 225,000 | | | $ | 248,968 | |
| | | | | | |
|
|
|
| | | | | | | | 4,247,185 | |
| | | | | | |
|
|
|
Medical - Hospitals — 0.5% | |
HCA, Inc.
Senior Sec. Notes
5.25% due 06/15/2026 | | | 223,000 | | | | 251,662 | |
HCA, Inc.
Senior Sec. Notes
5.25% due 06/15/2049 | | | 159,000 | | | | 177,507 | |
HCA, Inc.
Company Guar. Notes
5.38% due 02/01/2025 | | | 3,475,000 | | | | 3,857,250 | |
| | | | | | |
|
|
|
| | | | | | | | 4,286,419 | |
| | | | | | |
|
|
|
Medical - Wholesale Drug Distribution — 0.1% | |
Allergan Sales LLC
Company Guar. Notes
4.88% due 02/15/2021* | | | 100,000 | | | | 102,975 | |
Cardinal Health, Inc.
Senior Notes
4.60% due 03/15/2043 | | | 371,000 | | | | 361,317 | |
| | | | | | |
|
|
|
| | | | | | | | 464,292 | |
| | | | | | |
|
|
|
Metal - Copper — 0.3% | |
Freeport-McMoRan Copper & Gold, Inc.
Company Guar. Notes
3.88% due 03/15/2023 | | | 1,558,000 | | | | 1,574,203 | |
Freeport-McMoRan, Inc.
Company Guar. Notes
5.25% due 09/01/2029 | | | 815,000 | | | | 808,081 | |
| | | | | | |
|
|
|
| | | | | | | | 2,382,284 | |
| | | | | | |
|
|
|
Metal - Diversified — 0.1% | |
Glencore Funding LLC
Company Guar. Notes
4.13% due 03/12/2024* | | | 401,000 | | | | 422,143 | |
| | | | | | |
|
|
|
Metal - Iron — 0.1% | |
Cleveland-Cliffs, Inc.
Company Guar. Notes
5.75% due 03/01/2025 | | | 1,022,000 | | | | 1,024,555 | |
| | | | | | |
|
|
|
Multimedia — 0.3% | |
E.W. Scripps Co.
Company Guar. Notes
5.13% due 05/15/2025* | | | 2,033,000 | | | | 2,048,248 | |
Viacom, Inc.
Senior Notes
4.38% due 03/15/2043 | | | 383,000 | | | | 406,042 | |
| | | | | | |
|
|
|
| | | | | | | | 2,454,290 | |
| | | | | | |
|
|
|
Networking Products — 0.0% | |
Cisco Systems, Inc.
Senior Notes
2.20% due 02/28/2021 | | | 375,000 | | | | 377,465 | |
| | | | | | |
|
|
|
Non-Hazardous Waste Disposal — 0.0% | |
Waste Management, Inc.
Company Guar. Notes
4.15% due 07/15/2049 | | | 248,000 | | | | 295,152 | |
| | | | | | |
|
|
|
VALIC Company II Strategic Bond Fund
PORTFOLIO OF INVESTMENTS —August 31, 2019 — (continued)
| | | | | | | | |
| | |
| Security Description | | Principal
Amount(10) | | | Value
(Note 2) | |
| |
U.S. CORPORATE BONDS & NOTES (continued) | |
Office Supplies & Forms — 0.0% | |
Avery Dennison Corp.
Senior Notes
4.88% due 12/06/2028 | | $ | 135,000 | | | $ | 153,869 | |
| | | | | | |
|
|
|
Oil Companies - Exploration & Production — 1.6% | |
Anadarko Petroleum Corp.
Senior Notes
6.45% due 09/15/2036 | | | 227,000 | | | | 285,625 | |
Apache Corp.
Senior Notes
4.75% due 04/15/2043 | | | 621,000 | | | | 600,126 | |
Brazos Valley Longhorn LLC/Brazos Valley Longhorn Finance Corp.
Company Guar. Notes
6.88% due 02/01/2025 | | | 1,574,000 | | | | 1,400,860 | |
Callon Petroleum Co.
Company Guar. Notes
6.38% due 07/01/2026 | | | 1,460,000 | | | | 1,416,200 | |
Centennial Resource Production LLC
Company Guar. Notes
6.88% due 04/01/2027* | | | 1,275,000 | | | | 1,275,000 | |
Chaparral Energy, Inc.
Senior Notes
8.75% due 07/15/2023*# | | | 2,264,000 | | | | 985,972 | |
Cimarex Energy Co.
Senior Notes
4.38% due 03/15/2029 | | | 309,000 | | | | 328,379 | |
Concho Resources, Inc.
Company Guar. Notes
4.85% due 08/15/2048 | | | 141,000 | | | | 163,800 | |
Extraction Oil & Gas, Inc.
Company Guar. Notes
5.63% due 02/01/2026* | | | 1,700,000 | | | | 1,122,000 | |
Hilcorp Energy I LP/Hilcorp Finance Co.
Senior Notes
5.00% due 12/01/2024* | | | 1,914,000 | | | | 1,765,665 | |
Lonestar Resources America, Inc.
Company Guar. Notes
11.25% due 01/01/2023* | | | 1,498,000 | | | | 1,288,280 | |
Marathon Oil Corp.
Senior Notes
6.60% due 10/01/2037 | | | 144,000 | | | | 181,055 | |
Marathon Oil Corp.
Senior Notes
6.80% due 03/15/2032 | | | 215,000 | | | | 271,098 | |
Noble Energy, Inc.
Senior Notes
4.95% due 08/15/2047# | | | 298,000 | | | | 331,423 | |
Occidental Petroleum Corp.
Senior Notes
4.30% due 08/15/2039 | | | 224,000 | | | | 234,760 | |
Occidental Petroleum Corp.
Senior Notes
4.40% due 08/15/2049 | | | 214,000 | | | | 223,023 | |
Southwestern Energy Co.
Company Guar. Notes
7.50% due 04/01/2026 | | | 1,250,000 | | | | 1,094,000 | |
| | | | | | |
|
|
|
| | | | | | | | 12,967,266 | |
| | | | | | |
|
|
|
Oil Companies - Integrated — 0.0% | |
Chevron Corp.
Senior Notes
2.90% due 03/03/2024 | | | 360,000 | | | | 375,488 | |
| | | | | | |
|
|
|
| | | | | | | | |
| | |
| Security Description | | Principal
Amount(10) | | | Value
(Note 2) | |
| |
| | | | | | | | | |
Oil Field Machinery & Equipment — 0.2% | |
Forum Energy Technologies, Inc.
Company Guar. Notes
6.25% due 10/01/2021 | | $ | 98,000 | | | $ | 80,669 | |
Hi-Crush Partners LP
Company Guar. Notes
9.50% due 08/01/2026* | | | 2,020,000 | | | | 1,232,200 | |
| | | | | | |
|
|
|
| | | | | | | | 1,312,869 | |
| | | | | | |
|
|
|
Oil Refining & Marketing — 0.0% | |
Valero Energy Corp.
Senior Notes
4.00% due 04/01/2029 | | | 122,000 | | | | 130,147 | |
| | | | | | |
|
|
|
Oil- Field Services — 0.5% | |
Calfrac Holdings LP
Company Guar. Notes
8.50% due 06/15/2026* | | | 1,455,000 | | | | 916,650 | |
Nine Energy Service, Inc.
Senior Notes
8.75% due 11/01/2023* | | | 745,000 | | | | 672,362 | |
Pioneer Energy Services Corp.
Company Guar. Notes
6.13% due 03/15/2022 | | | 1,588,000 | | | | 561,755 | |
Schlumberger Holdings Corp.
Senior Notes
4.00% due 12/21/2025* | | | 273,000 | | | | 293,025 | |
SESI LLC
Company Guar. Notes
7.75% due 09/15/2024 | | | 1,774,000 | | | | 1,064,400 | |
USA Compression Partners LP/USA Compression Finance Corp.
Company Guar. Notes
6.88% due 04/01/2026 | | | 852,000 | | | | 873,300 | |
| | | | | | |
|
|
|
| | | | | | | | 4,381,492 | |
| | | | | | |
|
|
|
Paper & Related Products — 0.1% | |
Domtar Corp.
Company Guar. Notes
6.75% due 02/15/2044 | | | 506,000 | | | | 569,661 | |
Georgia-Pacific LLC
Senior Notes
3.73% due 07/15/2023* | | | 464,000 | | | | 490,870 | |
Georgia-Pacific LLC
Company Guar. Notes
5.40% due 11/01/2020* | | | 136,000 | | | | 141,018 | |
| | | | | | |
|
|
|
| | | | | | | | 1,201,549 | |
| | | | | | |
|
|
|
Petrochemicals — 0.0% | |
Chevron Phillips Chemical Co. LLC/Chevron Phillips Chemical Co. LP
Senior Notes
3.30% due 05/01/2023* | | | 154,000 | | | | 159,372 | |
| | | | | | |
|
|
|
Pharmacy Services — 0.2% | |
Cigna Corp.
Company Guar. Notes
4.80% due 08/15/2038 | | | 272,000 | | | | 314,373 | |
CVS Health Corp.
Senior Notes
4.78% due 03/25/2038 | | | 861,000 | | | | 963,180 | |
CVS Health Corp.
Senior Notes
5.05% due 03/25/2048 | | | 140,000 | | | | 163,058 | |
| | | | | | |
|
|
|
| | | | | | | | 1,440,611 | |
| | | | | | |
|
|
|
VALIC Company II Strategic Bond Fund
PORTFOLIO OF INVESTMENTS —August 31, 2019 — (continued)
| | | | | | | | |
| | |
| Security Description | | Principal
Amount(10) | | | Value
(Note 2) | |
| |
U.S. CORPORATE BONDS & NOTES (continued) | |
Pipelines — 1.8% | |
Antero Midstream Partners LP/Antero Midstream Finance Corp.
Company Guar. Notes
5.75% due 03/01/2027* | | $ | 756,000 | | | $ | 693,630 | |
Cheniere Corpus Christi Holdings LLC
Senior Sec. Notes
5.88% due 03/31/2025 | | | 60,000 | | | | 66,900 | |
Cheniere Corpus Christi Holdings LLC
Senior Sec. Notes
7.00% due 06/30/2024 | | | 1,955,000 | | | | 2,255,581 | |
Cheniere Energy Partners LP
Senior Sec. Notes
5.25% due 10/01/2025 | | | 1,007,000 | | | | 1,040,986 | |
Enable Midstream Partners LP
Senior Notes
4.95% due 05/15/2028 | | | 226,000 | | | | 239,839 | |
Energy Transfer Operating LP
Company Guar. Notes
4.25% due 03/15/2023 | | | 166,000 | | | | 174,330 | |
Energy Transfer Operating LP
Company Guar. Notes
4.50% due 04/15/2024 | | | 224,000 | | | | 240,122 | |
Energy Transfer Operating LP
Company Guar. Notes
4.90% due 03/15/2035 | | | 259,000 | | | | 271,077 | |
Energy Transfer Operating LP
Company Guar. Notes
5.25% due 04/15/2029 | | | 245,000 | | | | 280,376 | |
EnLink Midstream LLC
Company Guar. Notes
5.38% due 06/01/2029 | | | 211,000 | | | | 206,464 | |
EnLink Midstream Partners LP
Senior Notes
4.85% due 07/15/2026 | | | 105,000 | | | | 102,900 | |
EnLink Midstream Partners LP
Senior Notes
5.05% due 04/01/2045 | | | 18,000 | | | | 14,850 | |
Genesis Energy LP/Genesis Energy Finance Corp.
Company Guar. Notes
5.63% due 06/15/2024 | | | 1,403,000 | | | | 1,339,865 | |
Genesis Energy LP/Genesis Energy Finance Corp.
Company Guar. Notes
6.00% due 05/15/2023 | | | 678,000 | | | | 672,915 | |
Holly Energy Partners LP/Holly Energy Finance Corp.
Company Guar. Notes
6.00% due 08/01/2024* | | | 1,243,000 | | | | 1,302,664 | |
Kinder Morgan, Inc.
Company Guar. Notes
1.50% due 03/16/2022 | | EUR | 840,000 | | | | 961,190 | |
MPLX LP
Senior Notes
4.00% due 03/15/2028 | | | 269,000 | | | | 282,003 | |
MPLX LP
Senior Notes
5.50% due 02/15/2049 | | | 181,000 | | | | 207,389 | |
NGPL PipeCo LLC
Senior Notes
4.38% due 08/15/2022* | | | 292,000 | | | | 300,760 | |
SemGroup Corp./Rose Rock Finance Corp.
Company Guar. Notes
5.63% due 07/15/2022 | | | 1,066,000 | | | | 1,027,102 | |
SemGroup Corp./Rose Rock Finance Corp.
Company Guar. Notes
5.63% due 11/15/2023 | | | 977,000 | | | | 923,265 | |
| | | | | | | | |
| | |
| Security Description | | Principal
Amount(10) | | | Value
(Note 2) | |
| |
| | | | | | | | | |
Pipelines (continued) | |
Summit Midstream Holdings LLC/Summit Midstream Finance Corp.
Company Guar. Notes
5.50% due 08/15/2022 | | $ | 1,743,000 | | | $ | 1,638,420 | |
Western Midstream Operating LP
Senior Notes
5.50% due 08/15/2048 | | | 190,000 | | | | 177,423 | |
Williams Cos., Inc.
Senior Notes
4.85% due 03/01/2048 | | | 232,000 | | | | 253,716 | |
Williams Cos., Inc.
Senior Notes
5.75% due 06/24/2044 | | | 268,000 | | | | 321,044 | |
| | | | | | |
|
|
|
| | | | | | | | 14,994,811 | |
| | | | | | |
|
|
|
Platinum — 0.1% | |
Stillwater Mining Co.
Company Guar. Notes
7.13% due 06/27/2025 | | | 530,000 | | | | 533,922 | |
| | | | | | |
|
|
|
Poultry — 0.2% | |
Pilgrim’s Pride Corp.
Company Guar. Notes
5.88% due 09/30/2027* | | | 1,210,000 | | | | 1,303,775 | |
| | | | | | |
|
|
|
Radio — 0.4% | |
Sirius XM Radio, Inc.
Company Guar. Notes
4.63% due 07/15/2024* | | | 2,460,000 | | | | 2,567,625 | |
Sirius XM Radio, Inc.
Company Guar. Notes
5.38% due 07/15/2026* | | | 809,000 | | | | 854,506 | |
| | | | | | |
|
|
|
| | | | | | | | 3,422,131 | |
| | | | | | |
|
|
|
Real Estate Investment Trusts — 1.9% | |
American Tower Corp.
Senior Notes
4.00% due 06/01/2025 | | | 244,000 | | | | 262,460 | |
AvalonBay Communities, Inc.
Senior Notes
3.30% due 06/01/2029 | | | 188,000 | | | | 202,194 | |
Boston Properties LP
Senior Notes
3.40% due 06/21/2029 | | | 140,000 | | | | 148,400 | |
Columbia Property Trust Operating Partnership LP
Company Guar. Notes
4.15% due 04/01/2025 | | | 388,000 | | | | 406,616 | |
Crown Castle International Corp.
Senior Notes
5.20% due 02/15/2049# | | | 252,000 | | | | 319,230 | |
CTR Partnership LP/CareTrust Capital Corp.
Company Guar. Notes
5.25% due 06/01/2025 | | | 1,362,000 | | | | 1,403,105 | |
ESH Hospitality, Inc.
Company Guar. Notes
5.25% due 05/01/2025* | | | 1,219,000 | | | | 1,260,141 | |
GLP Capital LP/GLP Financing II, Inc.
Company Guar. Notes
5.38% due 04/15/2026 | | | 1,035,000 | | | | 1,136,078 | |
HAT Holdings I LLC/HAT Holdings II LLC
Company Guar. Notes
5.25% due 07/15/2024* | | | 784,000 | | | | 825,944 | |
HCP, Inc.
Senior Notes
3.50% due 07/15/2029 | | | 141,000 | | | | 148,906 | |
VALIC Company II Strategic Bond Fund
PORTFOLIO OF INVESTMENTS —August 31, 2019 — (continued)
| | | | | | | | |
| | |
| Security Description | | Principal
Amount(10) | | | Value
(Note 2) | |
| |
U.S. CORPORATE BONDS & NOTES (continued) | |
Real Estate Investment Trusts (continued) | |
Iron Mountain, Inc.
Company Guar. Notes
4.88% due 09/15/2027* | | $ | 1,290,000 | | | $ | 1,324,675 | |
iStar, Inc.
Senior Notes
5.25% due 09/15/2022 | | | 1,385,000 | | | | 1,419,625 | |
iStar, Inc.
Senior Notes
6.00% due 04/01/2022 | | | 616,000 | | | | 632,170 | |
MGM Growth Properties Operating Partnership LP/MGP FinanceCo-Issuer, Inc.
Company Guar. Notes
5.75% due 02/01/2027* | | | 1,176,000 | | | | 1,298,245 | |
MPT Operating Partnership LP/MPT Finance Corp.
Company Guar. Notes
5.00% due 10/15/2027 | | | 1,364,000 | | | | 1,456,070 | |
Sabra Health Care LP
Company Guar. Notes
5.13% due 08/15/2026 | | | 1,945,000 | | | | 2,099,620 | |
Sabra Health Care LP/Sabra Capital Corp.
Company Guar. Notes
4.80% due 06/01/2024 | | | 189,000 | | | | 198,153 | |
Simon Property Group LP
Senior Notes
4.13% due 12/01/2021 | | | 321,000 | | | | 334,207 | |
Starwood Property Trust, Inc.
Senior Notes
4.75% due 03/15/2025 | | | 1,275,000 | | | | 1,306,875 | |
| | | | | | |
|
|
|
| | | | | | | | 16,182,714 | |
| | | | | | |
|
|
|
Real Estate Management/Services — 0.2% | |
Newmark Group, Inc.
Senior Notes
6.13% due 11/15/2023 | | | 1,269,000 | | | | 1,378,004 | |
| | | | | | |
|
|
|
Real Estate Operations & Development — 0.2% | |
Kennedy-Wilson, Inc.
Company Guar. Notes
5.88% due 04/01/2024 | | | 2,006,000 | | | | 2,053,642 | |
| | | | | | |
|
|
|
Rental Auto/Equipment — 0.4% | |
Ahern Rentals, Inc.
Sec. Notes
7.38% due 05/15/2023* | | | 1,469,000 | | | | 1,267,012 | |
Capitol Investment Merger Sub 2 LLC
Sec. Notes
10.00% due 08/01/2024* | | | 975,000 | | | | 1,011,563 | |
Herc Holdings, Inc.
Company Guar. Notes
5.50% due 07/15/2027* | | | 929,000 | | | | 961,515 | |
| | | | | | |
|
|
|
| | | | | | | | 3,240,090 | |
| | | | | | |
|
|
|
Retail - Appliances — 0.2% | |
Conn’s, Inc.
Company Guar. Notes
7.25% due 07/15/2022 | | | 1,722,000 | | | | 1,713,390 | |
| | | | | | |
|
|
|
Retail - Automobile — 0.2% | |
Lithia Motors, Inc.
Company Guar. Notes
5.25% due 08/01/2025* | | | 1,356,000 | | | | 1,403,460 | |
| | | | | | |
|
|
|
Retail - Discount — 0.1% | |
Walmart, Inc.
Senior Notes
2.55% due 04/11/2023 | | | 433,000 | | | | 443,854 | |
| | | | | | | | |
| | |
| Security Description | | Principal
Amount(10) | | | Value
(Note 2) | |
| |
| | | | | | | | | |
Retail - Discount (continued) | |
Walmart, Inc.
Senior Notes
3.05% due 07/08/2026 | | $ | 381,000 | | | $ | 407,510 | |
| | | | | | |
|
|
|
| | | | | | | | 851,364 | |
| | | | | | |
|
|
|
Retail - Drug Store — 0.0% | |
Walgreens Boots Alliance, Inc.
Senior Notes
4.80% due 11/18/2044 | | | 151,000 | | | | 160,117 | |
| | | | | | |
|
|
|
Retail - Mail Order — 0.1% | |
QVC, Inc.
Senior Sec. Notes
4.85% due 04/01/2024 | | | 660,000 | | | | 701,088 | |
| | | | | | |
|
|
|
Retail - Regional Department Stores — 0.0% | |
Kohl’s Corp.
Senior Notes
5.55% due 07/17/2045 | | | 337,000 | | | | 351,286 | |
| | | | | | |
|
|
|
Retail - Restaurants — 0.3% | |
Brinker International, Inc.
Company Guar. Notes
5.00% due 10/01/2024* | | | 1,450,000 | | | | 1,493,500 | |
Darden Restaurants, Inc.
Senior Notes
4.55% due 02/15/2048 | | | 474,000 | | | | 508,747 | |
McDonald’s Corp.
Senior Notes
3.63% due 09/01/2049 | | | 288,000 | | | | 297,925 | |
McDonald’s Corp.
Senior Notes
4.45% due 03/01/2047 | | | 175,000 | | | | 205,554 | |
McDonald’s Corp.
Senior Notes
4.45% due 09/01/2048 | | | 255,000 | | | | 302,913 | |
| | | | | | |
|
|
|
| | | | | | | | 2,808,639 | |
| | | | | | |
|
|
|
Rubber/Plastic Products — 0.0% | |
Venture Holdings Co. LLC
Company Guar. Notes
11.00% due 06/01/2007†(5)(7)(8) | | | 25,000 | | | | 0 | |
| | | | | | |
|
|
|
Satellite Telecom — 0.2% | |
Hughes Satellite Systems Corp.
Company Guar. Notes
6.63% due 08/01/2026 | | | 1,615,000 | | | | 1,740,162 | |
| | | | | | |
|
|
|
Savings & Loans/Thrifts — 0.2% | |
First Niagara Financial Group, Inc.
Sub. Notes
7.25% due 12/15/2021 | | | 834,000 | | | | 923,012 | |
New York Community Bancorp, Inc.
Sub. Notes
5.90% due 11/06/2028 | | | 522,000 | | | | 549,995 | |
| | | | | | |
|
|
|
| | | | | | | | 1,473,007 | |
| | | | | | |
|
|
|
Security Services — 0.3% | |
Prime Security Services Borrower LLC/Prime Finance, Inc.
Senior Sec. Notes
5.25% due 04/15/2024* | | | 1,512,000 | | | | 1,561,760 | |
Prime Security Services Borrower LLC/Prime Finance, Inc.
Senior Sec. Notes
5.75% due 04/15/2026* | | | 1,041,000 | | | | 1,085,242 | |
| | | | | | |
|
|
|
| | | | | | | | 2,647,002 | |
| | | | | | |
|
|
|
VALIC Company II Strategic Bond Fund
PORTFOLIO OF INVESTMENTS —August 31, 2019 — (continued)
| | | | | | | | |
| | |
| Security Description | | Principal
Amount(10) | | | Value
(Note 2) | |
| |
U.S. CORPORATE BONDS & NOTES (continued) | |
Semiconductor Components - Integrated Circuits — 0.0% | |
QUALCOMM, Inc.
Senior Notes
4.30% due 05/20/2047 | | $ | 131,000 | | | $ | 148,453 | |
| | | | | | |
|
|
|
Steel - Producers — 0.1% | |
Commercial Metals Co.
Senior Notes
5.75% due 04/15/2026 | | | 1,169,000 | | | | 1,198,225 | |
| | | | | | |
|
|
|
Telephone - Integrated — 1.1% | |
AT&T, Inc.
Senior Notes
3.15% due 09/04/2036 | | EUR | 430,000 | | | | 583,897 | |
AT&T, Inc.
Senior Notes
4.30% due 02/15/2030 | | | 228,000 | | | | 253,408 | |
AT&T, Inc.
Senior Notes
4.50% due 05/15/2035 | | | 1,001,000 | | | | 1,113,618 | |
AT&T, Inc.
Senior Notes
4.85% due 07/15/2045 | | | 232,000 | | | | 265,572 | |
AT&T, Inc.
Senior Notes
4.90% due 08/15/2037 | | | 372,000 | | | | 427,000 | |
CenturyLink, Inc.
Senior Notes
7.50% due 04/01/2024# | | | 3,060,000 | | | | 3,396,539 | |
Frontier Communications Corp.
Senior Notes
7.63% due 04/15/2024 | | | 2,350,000 | | | | 1,175,705 | |
Frontier Communications Corp.
Senior Notes
8.75% due 04/15/2022 | | | 1,980,000 | | | | 1,029,600 | |
Verizon Communications, Inc.
Senior Notes
2.50% due 04/08/2031 | | GBP | 300,000 | | | | 390,797 | |
Verizon Communications, Inc.
Senior Notes
4.27% due 01/15/2036 | | | 148,000 | | | | 169,591 | |
Verizon Communications, Inc.
Senior Notes
4.40% due 11/01/2034 | | | 154,000 | | | | 178,318 | |
Verizon Communications, Inc.
Senior Notes
5.25% due 03/16/2037 | | | 410,000 | | | | 518,545 | |
| | | | | | |
|
|
|
| | | | | | | | 9,502,590 | |
| | | | | | |
|
|
|
Television — 0.6% | |
Belo Corp.
Company Guar. Notes
7.25% due 09/15/2027 | | | 830,000 | | | | 921,300 | |
Belo Corp.
Company Guar. Notes
7.75% due 06/01/2027 | | | 1,530,000 | | | | 1,721,250 | |
CBS Corp.
Company Guar. Notes
3.70% due 06/01/2028 | | | 371,000 | | | | 393,029 | |
Gray Television, Inc.
Company Guar. Notes
5.13% due 10/15/2024* | | | 884,000 | | | | 912,730 | |
Tribune Media Co.
Company Guar. Notes
5.88% due 07/15/2022 | | | 1,235,000 | | | | 1,253,142 | |
| | | | | | |
|
|
|
| | | | | | | | 5,201,451 | |
| | | | | | |
|
|
|
| | | | | | | | |
| | |
| Security Description | | Principal
Amount(10) | | | Value
(Note 2) | |
| |
| | | | | | | | | |
Tools - Hand Held — 0.0% | |
Stanley Black & Decker, Inc.
Senior Notes
3.40% due 03/01/2026 | | $ | 232,000 | | | $ | 248,821 | |
| | | | | | |
|
|
|
Transport - Equipment & Leasing — 0.1% | |
GATX Corp.
Senior Notes
4.35% due 02/15/2024 | | | 400,000 | | | | 431,124 | |
| | | | | | |
|
|
|
Transport - Marine — 0.0% | |
Kirby Corp.
Senior Notes
4.20% due 03/01/2028 | | | 256,000 | | | | 276,482 | |
| | | | | | |
|
|
|
Transport - Rail — 0.1% | |
Kansas City Southern
Company Guar. Notes
4.70% due 05/01/2048 | | | 216,000 | | | | 264,812 | |
Norfolk Southern Corp.
Senior Notes
5.10% due 12/31/2049 | | | 342,000 | | | | 438,003 | |
| | | | | | |
|
|
|
| | | | | | | | 702,815 | |
| | | | | | |
|
|
|
Transport - Services — 0.0% | |
United Parcel Service, Inc.
Senior Notes
3.40% due 09/01/2049 | | | 119,000 | | | | 124,394 | |
| | | | | | |
|
|
|
Transport - Truck — 0.0% | |
JB Hunt Transport Services, Inc.
Company Guar. Notes
3.88% due 03/01/2026 | | | 348,000 | | | | 374,483 | |
| | | | | | |
|
|
|
Trucking/Leasing — 0.1% | |
Penske Truck Leasing Co. LP/PTL Finance Corp.
Senior Notes
3.40% due 11/15/2026* | | | 283,000 | | | | 291,724 | |
Penske Truck Leasing Co. LP/PTL Finance Corp.
Senior Notes
3.95% due 03/10/2025* | | | 427,000 | | | | 454,332 | |
| | | | | | |
|
|
|
| | | | | | | | 746,056 | |
| | | | | | |
|
|
|
Total U.S. Corporate Bonds & Notes | | | | | |
(cost $286,678,069) | | | | | | | 293,205,523 | |
| | | |
|
|
|
FOREIGN CORPORATE BONDS & NOTES — 12.5% | |
Agricultural Chemicals — 0.4% | |
Consolidated Energy Finance SA
Senior Notes
6.88% due 06/15/2025* | | | 1,715,000 | | | | 1,749,300 | |
OCI NV
Senior Sec. Notes
6.63% due 04/15/2023* | | | 1,279,000 | | | | 1,349,345 | |
| | | | | | |
|
|
|
| | | | | | | | 3,098,645 | |
| | | | | | |
|
|
|
Airport Development/Maintenance — 0.2% | |
Heathrow Funding, Ltd.
Senior Sec. Notes
6.75% due 12/03/2028 | | GBP | 400,000 | | | | 658,961 | |
Mexico City Airport Trust
Senior Sec. Notes
4.25% due 10/31/2026 | | | 1,300,000 | | | | 1,298,375 | |
| | | | | | |
|
|
|
| | | | | | | | 1,957,336 | |
| | | | | | |
|
|
|
VALIC Company II Strategic Bond Fund
PORTFOLIO OF INVESTMENTS —August 31, 2019 — (continued)
| | | | | | | | |
| | |
| Security Description | | Principal
Amount(10) | | | Value
(Note 2) | |
| |
FOREIGN CORPORATE BONDS & NOTES (continued) | |
Auto-Cars/Light Trucks — 0.1% | |
Volkswagen International Finance NV
Company Guar. Notes
1.88% due 03/30/2027 | | EUR | 600,000 | | | $ | 705,660 | |
| | | | | | |
|
|
|
Auto/Truck Parts & Equipment-Original — 0.1% | |
Delphi Jersey Holdings PLC
Company Guar. Notes
5.00% due 10/01/2025* | | | 1,460,000 | | | | 1,259,250 | |
| | | | | | |
|
|
|
Banks - Commercial — 1.2% | |
Banco Bilbao Vizcaya Argentaria SA
Senior Notes
1.38% due 05/14/2025 | | EUR | 300,000 | | | | 352,035 | |
Banco de Credito e Inversiones SA
Senior Notes
3.50% due 10/12/2027 | | | 970,000 | | | | 1,011,225 | |
Banco do Brasil SA
Senior Notes
4.75% due 03/20/2024* | | | 1,330,000 | | | | 1,394,412 | |
BPCE SA
Sub. Notes
4.63% due 07/18/2023 | | EUR | 900,000 | | | | 1,160,314 | |
Canadian Imperial Bank of Commerce
Senior Notes
2.10% due 10/05/2020 | | | 374,000 | | | | 374,687 | |
Credit Suisse AG
Sub. Notes
5.75% due 09/18/2025 | | EUR | 1,100,000 | | | | 1,279,420 | |
Danske Bank A/S
Senior Notes
0.88% due 05/22/2023 | | EUR | 1,200,000 | | | | 1,348,666 | |
Danske Bank A/S
Senior Notes
5.38% due 01/12/2024* | | | 522,000 | | | | 575,616 | |
DBS Group Holdings, Ltd.
Senior Notes
2.85% due 04/16/2022* | | | 277,000 | | | | 281,629 | |
ING Groep NV
Senior Notes
4.63% due 01/06/2026* | | | 220,000 | | | | 244,862 | |
Intesa Sanpaolo SpA
Sub. Notes
5.71% due 01/15/2026* | | | 557,000 | | | | 587,564 | |
Malayan Banking Bhd
Sub. Notes
3.91% due 10/29/2026 | | | 550,000 | | | | 561,952 | |
National Australia Bank, Ltd.
Sub. Notes
3.93% due 08/02/2034* | | | 200,000 | | | | 206,679 | |
Shinhan Bank Co., Ltd.
Sub. Notes
4.00% due 04/23/2029* | | | 210,000 | | | | 226,910 | |
Westpac Banking Corp.
Sub. Notes
4.11% due 07/24/2034 | | | 212,000 | | | | 223,420 | |
Westpac Banking Corp.
Sub. Notes
4.42% due 07/24/2039 | | | 179,000 | | | | 200,544 | |
| | | | | | |
|
|
|
| | | | | | | | 10,029,935 | |
| | | | | | |
|
|
|
Banks - Export/Import — 0.2% | |
Export-Import Bank of India
Senior Notes
3.38% due 08/05/2026 | | | 1,400,000 | | | | 1,441,433 | |
| | | | | | |
|
|
|
| | | | | | | | |
| | |
| Security Description | | Principal
Amount(10) | | | Value
(Note 2) | |
| |
| | | | | | | | | |
Banks - Special Purpose — 0.1% | |
Kreditanstalt fuer Wiederaufbau
Government Guar. Notes
1.63% due 03/15/2021 | | $ | 595,000 | | | $ | 594,929 | |
| | | | | | |
|
|
|
Building Societies — 0.1% | |
Nationwide Building Society
Senior Notes
1.50% due 03/08/2026 | | EUR | 350,000 | | | | 398,758 | |
Nationwide Building Society
Sub. Notes
4.13% due 10/18/2032* | | | 279,000 | | | | 277,217 | |
| | | | | | |
|
|
|
| | | | | | | | 675,975 | |
| | | | | | |
|
|
|
Cable/Satellite TV — 0.6% | |
Altice Financing SA
Senior Sec. Notes
7.50% due 05/15/2026* | | | 1,050,000 | | | | 1,118,250 | |
Altice Luxembourg SA
Company Guar. Notes
7.63% due 02/15/2025* | | | 1,645,000 | | | | 1,700,519 | |
Sky, Ltd.
Company Guar. Notes
2.50% due 09/15/2026 | | EUR | 700,000 | | | | 897,693 | |
UPCB Finance IV, Ltd.
Senior Sec. Notes
5.38% due 01/15/2025* | | | 1,279,000 | | | | 1,316,411 | |
| | | | | | |
|
|
|
| | | | | | | | 5,032,873 | |
| | | | | | |
|
|
|
Cellular Telecom — 0.8% | |
Altice France SA
Senior Sec. Notes
8.13% due 02/01/2027* | | | 419,000 | | | | 461,947 | |
America Movil SAB de CV
Senior Notes
0.75% due 06/26/2027 | | EUR | 800,000 | | | | 910,377 | |
C&W Senior Financing Designated Activity Co.
Senior Notes
6.88% due 09/15/2027* | | | 1,854,000 | | | | 1,974,306 | |
Millicom International Cellular SA
Senior Notes
6.63% due 10/15/2026* | | | 200,000 | | | | 218,000 | |
Numericable-SFR SA
Senior Sec. Notes
7.38% due 05/01/2026* | | | 2,176,000 | | | | 2,322,880 | |
SK Telecom Co., Ltd.
Senior Notes
3.75% due 04/16/2023* | | | 200,000 | | | | 209,706 | |
Vodafone Group PLC
Senior Notes
4.88% due 06/19/2049 | | | 266,000 | | | | 307,122 | |
Vodafone Group PLC
Senior Notes
5.25% due 05/30/2048 | | | 267,000 | | | | 319,472 | |
| | | | | | |
|
|
|
| | | | | | | | 6,723,810 | |
| | | | | | |
|
|
|
Chemicals - Diversified — 0.2% | |
Braskem Netherlands Finance BV
Company Guar. Notes
4.50% due 01/10/2028* | | | 290,000 | | | | 289,478 | |
NOVA Chemicals Corp.
Senior Notes
5.00% due 05/01/2025* | | | 715,000 | | | | 731,087 | |
VALIC Company II Strategic Bond Fund
PORTFOLIO OF INVESTMENTS —August 31, 2019 — (continued)
| | | | | | | | |
| | |
| Security Description | | Principal
Amount(10) | | | Value
(Note 2) | |
| |
FOREIGN CORPORATE BONDS & NOTES (continued) | |
Chemicals - Diversified (continued) | |
Petkim Petrokimya Holding AS
Senior Notes
5.88% due 01/26/2023* | | $ | 930,000 | | | $ | 897,056 | |
| | | | | | |
|
|
|
| | | | | | | | 1,917,621 | |
| | | | | | |
|
|
|
Computers - Memory Devices — 0.2% | |
Seagate HDD Cayman
Company Guar. Notes
4.75% due 01/01/2025# | | | 1,385,000 | | | | 1,441,556 | |
| | | | | | |
|
|
|
Containers - Metal/Glass — 0.4% | |
Ardagh Packaging Finance PLC/Ardagh Holdings USA, Inc.
Company Guar. Notes
5.25% due 08/15/2027* | | | 1,275,000 | | | | 1,287,750 | |
Trivium Packaging Finance BV
Senior Sec. Notes
5.50% due 08/15/2026* | | | 616,000 | | | | 651,420 | |
Trivium Packaging Finance BV
Company Guar. Notes
8.50% due 08/15/2027* | | | 1,250,000 | | | | 1,343,750 | |
| | | | | | |
|
|
|
| | | | | | | | 3,282,920 | |
| | | | | | |
|
|
|
Containers - Paper/Plastic — 0.1% | |
Intertape Polymer Group, Inc.
Company Guar. Notes
7.00% due 10/15/2026* | | | 1,238,000 | | | | 1,284,425 | |
| | | | | | |
|
|
|
Cosmetics & Toiletries — 0.0% | |
Unilever PLC
Company Guar. Notes
1.38% due 09/15/2024 | | GBP | 300,000 | | | | 373,071 | |
| | | | | | |
|
|
|
Diamonds/Precious Stones — 0.1% | |
Petra Diamonds US Treasury PLC
Sec. Notes
7.25% due 05/01/2022 | | | 520,000 | | | | 452,400 | |
| | | | | | |
|
|
|
Disposable Medical Products — 0.1% | |
Becton Dickinson Euro Finance SARL
Company Guar. Notes
1.21% due 06/04/2026 | | EUR | 680,000 | | | | 781,675 | |
| | | | | | |
|
|
|
Diversified Banking Institutions — 1.3% | |
Banco Santander SA
Senior Notes
3.31% due 06/27/2029 | | | 400,000 | | | | 418,752 | |
Barclays PLC
Sub. Notes
5.09% due 06/20/2030 | | | 219,000 | | | | 227,423 | |
BNP Paribas SA
Senior Notes
3.38% due 01/23/2026 | | GBP | 300,000 | | | | 398,827 | |
BNP Paribas SA
Senior Notes
4.71% due 01/10/2025* | | | 676,000 | | | | 732,449 | |
Credit Suisse Group AG
Senior Notes
1.25% due 07/17/2025 | | EUR | 550,000 | | | | 634,883 | |
Deutsche Bank AG
Senior Notes
4.25% due 02/04/2021 | | | 201,000 | | | | 203,257 | |
HSBC Holdings PLC
Senior Notes
3.00% due 07/22/2028 | | GBP | 450,000 | | | | 582,889 | |
| | | | | | | | |
| | |
| Security Description | | Principal
Amount(10) | | | Value
(Note 2) | |
| |
| | | | | | | | | |
Diversified Banking Institutions (continued) | |
HSBC Holdings PLC
Senior Notes
3.40% due 03/08/2021 | | $ | 406,000 | | | $ | 412,483 | |
Lloyds Banking Group PLC
Senior Notes
0.63% due 01/15/2024 | | EUR | 350,000 | | | | 385,193 | |
Mitsubishi UFJ Financial Group, Inc.
Senior Notes
3.41% due 03/07/2024 | | | 928,000 | | | | 975,366 | |
Mizuho Financial Group, Inc.
Senior Notes
3.15% due 07/16/2030 | | | 304,000 | | | | 316,736 | |
Mizuho Financial Group, Inc.
Senior Notes
3.92% due 09/11/2024 | | | 566,000 | | | | 599,963 | |
NatWest Markets PLC
Senior Notes
3.63% due 09/29/2022* | | | 383,000 | | | | 391,889 | |
Royal Bank of Scotland Group PLC
Senior Notes
4.27% due 03/22/2025 | | | 412,000 | | | | 430,329 | |
Royal Bank of Scotland Group PLC
Senior Notes
4.52% due 06/25/2024 | | | 260,000 | | | | 272,912 | |
UBS AG
Sub. Notes
4.75% due 02/12/2026 | | EUR | 750,000 | | | | 875,393 | |
UBS Group Funding Switzerland AG
Company Guar. Bonds
1.25% due 09/01/2026 | | EUR | 650,000 | | | | 770,897 | |
UBS Group Funding Switzerland AG
Company Guar. Notes
3.49% due 05/23/2023* | | | 293,000 | | | | 301,875 | |
UniCredit SpA
Sub. Notes
5.86% due 06/19/2032* | | | 606,000 | | | | 618,927 | |
UniCredit SpA
Senior Notes
6.57% due 01/14/2022* | | | 377,000 | | | | 405,383 | |
UniCredit SpA
Sub. Notes
7.30% due 04/02/2034* | | | 519,000 | | | | 585,961 | |
| | | | | | |
|
|
|
| | | | | | | | 10,541,787 | |
| | | | | | |
|
|
|
Diversified Financial Services — 0.2% | |
Fairstone Financial, Inc.
Senior Notes
7.88% due 07/15/2024* | | | 1,055,000 | | | | 1,099,838 | |
GE Capital International Funding Co. ULC
Company Guar. Notes
3.37% due 11/15/2025 | | | 793,000 | | | | 803,268 | |
| | | | | | |
|
|
|
| | | | | | | | 1,903,106 | |
| | | | | | |
|
|
|
Diversified Manufacturing Operations — 0.2% | |
Siemens Financieringsmaatschappij NV
Company Guar. Notes
2.88% due 03/10/2028 | | EUR | 900,000 | | | | 1,227,721 | |
Siemens Financieringsmaatschappij NV
Company Guar. Notes
3.25% due 05/27/2025* | | | 518,000 | | | | 546,054 | |
| | | | | | |
|
|
|
| | | | | | | | 1,773,775 | |
| | | | | | |
|
|
|
VALIC Company II Strategic Bond Fund
PORTFOLIO OF INVESTMENTS —August 31, 2019 — (continued)
| | | | | | | | |
| | |
| Security Description | | Principal
Amount(10) | | | Value
(Note 2) | |
| |
FOREIGN CORPORATE BONDS & NOTES (continued) | |
Diversified Minerals — 0.3% | |
Anglo American Capital PLC
Company Guar. Notes
3.25% due 04/03/2023 | | EUR | 675,000 | | | $ | 825,733 | |
FMG Resources August 2006 Pty, Ltd.
Company Guar. Notes
5.13% due 03/15/2023* | | | 1,250,000 | | | | 1,300,000 | |
| | | | | | |
|
|
|
| | | | | | | | 2,125,733 | |
| | | | | | |
|
|
|
Electric - Distribution — 0.1% | |
OmGrid Funding, Ltd.
Company Guar. Notes
5.20% due 05/16/2027 | | | 510,000 | | | | 483,862 | |
| | | | | | |
|
|
|
Electric - Generation — 0.3% | |
Electricite de France SA
Senior Notes
4.50% due 09/21/2028* | | | 269,000 | | | | 302,492 | |
Electricite de France SA
Senior Notes
5.00% due 09/21/2048* | | | 200,000 | | | | 244,291 | |
Electricite de France SA
Senior Notes
6.25% due 05/30/2028 | | GBP | 700,000 | | | | 1,172,003 | |
SPIC Luxembourg Latin America Renewable Energy Investment Co. SARL
Company Guar. Notes
4.65% due 10/30/2023 | | | 650,000 | | | | 694,083 | |
| | | | | | |
|
|
|
| | | | | | | | 2,412,869 | |
| | | | | | |
|
|
|
Electric - Integrated — 0.4% | |
EDP Finance BV
Senior Notes
2.00% due 04/22/2025 | | EUR | 1,020,000 | | | | 1,241,562 | |
Enel Finance International NV
Company Guar. Notes
4.75% due 05/25/2047* | | | 278,000 | | | | 302,733 | |
Gas Natural Fenosa Finance BV
Company Guar. Notes
1.38% due 01/21/2025 | | EUR | 600,000 | | | | 711,438 | |
Iberdrola Finanzas SA
Company Guar. Notes
1.00% due 03/07/2025 | | EUR | 900,000 | | | | 1,052,636 | |
Perusahaan Listrik Negara PT
Senior Notes
4.88% due 07/17/2049* | | | 200,000 | | | | 224,700 | |
| | | | | | |
|
|
|
| | | | | | | | 3,533,069 | |
| | | | | | |
|
|
|
Electronic Components - Semiconductors — 0.0% | |
NXP BV/NXP Funding LLC/NXP USA, Inc.
Company Guar. Notes
4.30% due 06/18/2029* | | | 338,000 | | | | 362,471 | |
| | | | | | |
|
|
|
Finance - Commercial — 0.1% | |
Unifin Financiera SAB de CV
Company Guar. Notes
7.25% due 09/27/2023 | | | 520,000 | | | | 529,755 | |
| | | | | | |
|
|
|
Finance - Leasing Companies — 0.3% | |
Avolon Holdings Funding, Ltd.
Company Guar. Notes
5.13% due 10/01/2023* | | | 1,775,000 | | | | 1,884,517 | |
Avolon Holdings Funding, Ltd.
Company Guar. Notes
5.25% due 05/15/2024* | | | 374,000 | | | | 401,190 | |
| | | | | | | | |
| | |
| Security Description | | Principal
Amount(10) | | | Value
(Note 2) | |
| |
| | | | | | | | | |
Finance - Leasing Companies (continued) | |
ICBCIL Finance Co., Ltd.
Senior Notes
3.63% due 11/15/2027 | | $ | 500,000 | | | $ | 518,587 | |
| | | | | | |
|
|
|
| | | | | | | | 2,804,294 | |
| | | | | | |
|
|
|
Food - Meat Products — 0.2% | |
JBS USA LUX SA/JBS USA Finance, Inc.
Company Guar. Notes
5.88% due 07/15/2024* | | | 1,809,000 | | | | 1,863,270 | |
| | | | | | |
|
|
|
Food - Misc./Diversified — 0.1% | |
Grupo KUO SAB De CV
Senior Notes
5.75% due 07/07/2027# | | | 720,000 | | | | 724,507 | |
| | | | | | |
|
|
|
Insurance - Life/Health — 0.1% | |
Athene Holding, Ltd.
Senior Notes
4.13% due 01/12/2028 | | | 298,000 | | | | 304,802 | |
Manulife Financial Corp.
Sub. Notes
4.06% due 02/24/2032 | | | 178,000 | | | | 187,306 | |
| | | | | | |
|
|
|
| | | | | | | | 492,108 | |
| | | | | | |
|
|
|
Insurance - Property/Casualty — 0.1% | |
Enstar Group, Ltd.
Senior Notes
4.95% due 06/01/2029 | | | 533,000 | | | | 563,925 | |
| | | | | | |
|
|
|
Machinery - Farming — 0.1% | |
CNH Industrial Finance Europe SA
Company Guar. Notes
1.88% due 01/19/2026 | | EUR | 600,000 | | | | 704,773 | |
CNH Industrial NV
Senior Notes
3.85% due 11/15/2027 | | | 159,000 | | | | 165,474 | |
CNH Industrial NV
Senior Notes
4.50% due 08/15/2023 | | | 218,000 | | | | 232,752 | |
| | | | | | |
|
|
|
| | | | | | | | 1,102,999 | |
| | | | | | |
|
|
|
Medical Instruments — 0.1% | |
Medtronic Global Holdings SCA
Company Guar. Notes
1.75% due 07/02/2049 | | EUR | 365,000 | | | | 426,899 | |
Medtronic Global Holdings SCA
Company Guar. Notes
2.25% due 03/07/2039 | | EUR | 400,000 | | | | 529,087 | |
| | | | | | |
|
|
|
| | | | | | | | 955,986 | |
| | | | | | |
|
|
|
Medical - Drugs — 0.6% | |
Bausch Health Cos., Inc.
Company Guar. Notes
6.13% due 04/15/2025* | | | 2,970,000 | | | | 3,059,100 | |
GlaxoSmithKline Capital PLC
Company Guar. Notes
3.13% due 05/14/2021 | | | 365,000 | | | | 371,562 | |
Novartis Finance SA
Company Guar. Notes
1.63% due 11/09/2026 | | EUR | 1,000,000 | | | | 1,243,025 | |
| | | | | | |
|
|
|
| | | | | | | | 4,673,687 | |
| | | | | | |
|
|
|
Metal - Copper — 0.1% | |
First Quantum Minerals, Ltd.
Company Guar. Notes
6.50% due 03/01/2024* | | | 525,000 | | | | 476,437 | |
VALIC Company II Strategic Bond Fund
PORTFOLIO OF INVESTMENTS —August 31, 2019 — (continued)
| | | | | | | | |
| | |
| Security Description | | Principal
Amount(10) | | | Value
(Note 2) | |
| |
FOREIGN CORPORATE BONDS & NOTES (continued) | |
Metal - Copper (continued) | |
First Quantum Minerals, Ltd.
Company Guar. Notes
7.25% due 04/01/2023* | | $ | 814,000 | | | $ | 765,160 | |
| | | | | | |
|
|
|
| | | | | | | | 1,241,597 | |
| | | | | | |
|
|
|
Metal - Diversified — 0.1% | |
Chinalco Capital Holdings, Ltd.
Company Guar. Notes
4.25% due 04/21/2022 | | | 800,000 | | | | 799,884 | |
Glencore Finance Europe, Ltd.
Company Guar. Notes
1.50% due 10/15/2026 | | EUR | 350,000 | | | | 398,600 | |
| | | | | | |
|
|
|
| | | | | | | | 1,198,484 | |
| | | | | | |
|
|
|
Metal - Iron — 0.2% | |
Mineral Resources, Ltd.
Senior Notes
8.13% due 05/01/2027* | | | 1,299,000 | | | | 1,326,604 | |
| | | | | | |
|
|
|
Oil & Gas Drilling — 0.0% | |
Noble Holding International, Ltd.
Company Guar. Notes
7.88% due 02/01/2026* | | | 472,000 | | | | 381,140 | |
| | | | | | |
|
|
|
Oil Companies - Exploration & Production — 0.4% | |
Anadarko Finance Co.
Company Guar. Notes
7.50% due 05/01/2031 | | | 190,000 | | | | 253,021 | |
Canadian Natural Resources, Ltd.
Senior Notes
3.90% due 02/01/2025 | | | 293,000 | | | | 308,778 | |
MEG Energy Corp.
Sec. Notes
6.50% due 01/15/2025* | | | 1,979,000 | | | | 1,988,895 | |
Saka Energi Indonesia PT
Senior Notes
4.45% due 05/05/2024 | | | 1,000,000 | | | | 1,005,250 | |
| | | | | | |
|
|
|
| | | | | | | | 3,555,944 | |
| | | | | | |
|
|
|
Oil Companies - Integrated — 0.8% | |
BP Capital Markets PLC
Company Guar. Notes
2.27% due 07/03/2026 | | GBP | 700,000 | | | | 909,238 | |
BP Capital Markets PLC
Company Guar. Notes
2.97% due 02/27/2026 | | EUR | 400,000 | | | | 523,719 | |
BP Capital Markets PLC
Company Guar. Notes
3.51% due 03/17/2025 | | | 829,000 | | | | 883,844 | |
Cenovus Energy, Inc.
Senior Notes
4.25% due 04/15/2027# | | | 235,000 | | | | 245,341 | |
Ecopetrol SA
Senior Notes
4.13% due 01/16/2025 | | | 1,200,000 | | | | 1,258,500 | |
Petro-Canada
Senior Notes
5.95% due 05/15/2035 | | | 151,000 | | | | 196,611 | |
Petrobras Global Finance BV
Company Guar. Notes
6.75% due 01/27/2041 | | | 600,000 | | | | 679,500 | |
Petroleos Mexicanos
Company Guar. Notes
6.63% due 06/15/2035 | | | 1,100,000 | | | | 1,069,750 | |
| | | | | | | | |
| | |
| Security Description | | Principal
Amount(10) | | | Value
(Note 2) | |
| |
| | | | | | | | | |
Oil Companies - Integrated (continued) | |
Petroleos Mexicanos
Company Guar. Notes
6.75% due 09/21/2047 | | $ | 1,000,000 | | | $ | 952,500 | |
Total Capital International SA
Company Guar. Notes
3.46% due 07/12/2049 | | | 308,000 | | | | 332,258 | |
| | | | | | |
|
|
|
| | | | | | | | 7,051,261 | |
| | | | | | |
|
|
|
Paper & Related Products — 0.2% | |
Cascades, Inc.
Company Guar. Notes
5.50% due 07/15/2022* | | | 535,000 | | | | 539,012 | |
Cascades, Inc.
Company Guar. Notes
5.75% due 07/15/2023* | | | 868,000 | | | | 878,850 | |
| | | | | | |
|
|
|
| | | | | | | | 1,417,862 | |
| | | | | | |
|
|
|
Retail - Petroleum Products — 0.2% | |
eG Global Finance PLC
Senior Sec. Notes
6.75% due 02/07/2025* | | | 1,432,000 | | | | 1,381,880 | |
| | | | | | |
|
|
|
Satellite Telecom — 0.3% | |
Intelsat Jackson Holdings SA
Company Guar. Notes
5.50% due 08/01/2023 | | | 1,863,000 | | | | 1,695,330 | |
Telesat Canada/Telesat LLC
Company Guar. Notes
8.88% due 11/15/2024* | | | 1,165,000 | | | | 1,260,379 | |
| | | | | | |
|
|
|
| | | | | | | | 2,955,709 | |
| | | | | | |
|
|
|
Security Services — 0.2% | |
Garda World Security Corp.
Senior Notes
8.75% due 05/15/2025* | | | 1,690,000 | | | | 1,743,303 | |
| | | | | | |
|
|
|
Special Purpose Entity — 0.0% | |
Hellas Telecommunications Luxembourg II SCA
Sub. Notes
8.46% due 01/15/2015*†(5)(7)(8) | | | 560,000 | | | | 0 | |
| | | | | | |
|
|
|
SupraNational Banks — 0.0% | |
International Bank for Reconstruction & Development
Senior Notes
3.13% due 11/20/2025 | | | 326,000 | | | | 357,131 | |
| | | | | | |
|
|
|
Telephone - Integrated — 0.3% | |
Orange SA
Senior Notes
1.88% due 09/12/2030 | | EUR | 600,000 | | | | 761,374 | |
Telecom Italia Capital SA
Company Guar. Notes
7.72% due 06/04/2038 | | | 227,000 | | | | 262,185 | |
Telefonica Emisiones SA
Company Guar. Notes
5.45% due 10/08/2029 | | GBP | 400,000 | | | | 640,016 | |
Telefonica Emisiones SAU
Company Guar. Notes
4.67% due 03/06/2038 | | | 562,000 | | | | 621,306 | |
| | | | | | |
|
|
|
| | | | | | | | 2,284,881 | |
| | | | | | |
|
|
|
Transport - Marine — 0.1% | |
PT Pelabuhan Indonesia II
Senior Notes
4.25% due 05/05/2025* | | | 475,000 | | | | 504,094 | |
| | | | | | |
|
|
|
VALIC Company II Strategic Bond Fund
PORTFOLIO OF INVESTMENTS —August 31, 2019 — (continued)
| | | | | | | | |
| | |
| Security Description | | Principal
Amount(10) | | | Value
(Note 2) | |
| |
FOREIGN CORPORATE BONDS & NOTES (continued) | |
Transport - Rail — 0.2% | |
Canadian National Railway Co.
Senior Notes
2.85% due 12/15/2021 | | $ | 170,000 | | | $ | 172,698 | |
Canadian Pacific Railway Co.
Senior Notes
6.13% due 09/15/2115 | | | 174,000 | | | | 262,757 | |
Kazakhstan Temir Zholy Finance BV
Company Guar. Notes
6.95% due 07/10/2042 | | | 850,000 | | | | 1,163,743 | |
| | | | | | |
|
|
|
| | | | | | | | 1,599,198 | |
| | | | | | |
|
|
|
Total Foreign Corporate Bonds & Notes | | | | | | | | |
(cost $102,419,089) | | | | | | | 104,899,805 | |
| | | |
|
|
|
FOREIGN GOVERNMENT OBLIGATIONS — 8.6% | |
Sovereign — 8.5% | |
Abu Dhabi Government
Senior Notes
3.13% due 10/11/2027 | | | 1,950,000 | | | | 2,110,875 | |
Arab Republic of Egypt
Senior Notes
7.60% due 03/01/2029 | | | 1,400,000 | | | | 1,510,306 | |
Arab Republic of Egypt
Senior Notes
8.50% due 01/31/2047 | | | 1,320,000 | | | | 1,432,675 | |
Dominican Republic
Senior Bonds
6.85% due 01/27/2045 | | | 1,900,000 | | | | 2,173,144 | |
Federal Republic of Nigeria
Senior Notes
9.25% due 01/21/2049 | | | 650,000 | | | | 714,735 | |
Gabones Republic
Senior Notes
6.95% due 06/16/2025 | | | 730,000 | | | | 707,355 | |
Government of France
Bonds
0.50% due 05/25/2029 | | EUR | 745,000 | | | | 892,984 | |
Government of France
Bonds
1.50% due 05/25/2050* | | EUR | 600,000 | | | | 864,011 | |
Government of Jamaica
Senior Notes
6.75% due 04/28/2028 | | | 1,100,000 | | | | 1,281,500 | |
Government of Jamaica
Senior Notes
8.00% due 03/15/2039 | | | 680,000 | | | | 878,057 | |
Government of Mongolia
Senior Notes
5.13% due 12/05/2022 | | | 1,000,000 | | | | 995,848 | |
Government of Mongolia
Senior Notes
5.63% due 05/01/2023 | | | 1,000,000 | | | | 1,004,607 | |
Government of Ukraine
Senior Notes
7.75% due 09/01/2023 | | | 800,000 | | | | 849,600 | |
Government of Ukraine
Senior Notes
9.75% due 11/01/2028 | | | 1,800,000 | | | | 2,116,008 | |
Kingdom of Bahrain
Senior Notes
7.00% due 10/12/2028 | | | 1,300,000 | | | | 1,489,704 | |
Kingdom of Bahrain
Senior Notes
7.50% due 09/20/2047 | | | 900,000 | | | | 1,041,210 | |
| | | | | | | | |
| | |
| Security Description | | Principal
Amount(10) | | | Value
(Note 2) | |
| |
| | | | | | | | | |
Sovereign (continued) | |
Kingdom of Jordan
Senior Notes
5.75% due 01/31/2027*# | | $ | 900,000 | | | $ | 913,050 | |
Kingdom of Spain
Senior Notes
0.25% due 07/30/2024* | | EUR | 750,000 | | | | 849,169 | |
Oriental Republic of Uruguay
Senior Notes
5.10% due 06/18/2050 | | | 850,000 | | | | 1,054,009 | |
Republic of Angola
Senior Notes
9.38% due 05/08/2048 | | | 540,000 | | | | 569,590 | |
Republic of Argentina
Senior Notes
8.28% due 12/31/2033 | | | 2,313,363 | | | | 942,695 | |
Republic of Colombia
Senior Notes
8.13% due 05/21/2024 | | | 1,100,000 | | | | 1,376,386 | |
Republic of Colombia
Senior Notes
10.38% due 01/28/2033 | | | 1,200,000 | | | | 1,969,800 | |
Republic of Ecuador
Senior Notes
7.88% due 01/23/2028 | | | 1,900,000 | | | | 1,775,550 | |
Republic of Ecuador
Senior Notes
10.75% due 03/28/2022 | | | 1,170,000 | | | | 1,273,849 | |
Republic of El Salvador
Senior Notes
6.38% due 01/18/2027 | | | 1,390,000 | | | | 1,421,289 | |
Republic of El Salvador
Senior Notes
7.63% due 02/01/2041 | | | 1,250,000 | | | | 1,334,387 | |
Republic of Ghana
Government Guar. Notes
10.75% due 10/14/2030 | | | 730,000 | | | | 907,492 | |
Republic of Guatemala
Senior Notes
4.88% due 02/13/2028 | | | 1,195,000 | | | | 1,289,118 | |
Republic of Guatemala
Senior Notes
4.90% due 06/01/2030* | | | 700,000 | | | | 751,940 | |
Republic of Honduras
Senior Notes
6.25% due 01/19/2027 | | | 1,870,000 | | | | 2,026,631 | |
Republic of Hungary
Senior Notes
7.63% due 03/29/2041 | | | 600,000 | | | | 1,008,660 | |
Republic of Indonesia
Senior Notes
3.70% due 01/08/2022 | | | 1,000,000 | | | | 1,029,169 | |
Republic of Indonesia
Senior Bonds
4.13% due 01/15/2025 | | | 2,200,000 | | | | 2,350,327 | |
Republic of Ivory Coast
Senior Notes
5.75% due 12/31/2032 | | | 1,126,400 | | | | 1,115,271 | |
Republic of Ivory Coast
Senior Notes
6.13% due 06/15/2033* | | | 900,000 | | | | 849,555 | |
Republic of Kazakhstan
Senior Notes
3.88% due 10/14/2024 | | | 1,800,000 | | | | 1,917,000 | |
VALIC Company II Strategic Bond Fund
PORTFOLIO OF INVESTMENTS —August 31, 2019 — (continued)
| | | | | | | | |
| | |
| Security Description | | Principal
Amount(10) | | | Value
(Note 2) | |
| |
FOREIGN GOVERNMENT OBLIGATIONS (continued) | |
Sovereign (continued) | |
Republic of Kazakhstan
Senior Notes
6.50% due 07/21/2045 | | $ | 700,000 | | | $ | 1,019,949 | |
Republic of Kenya
Senior Notes
6.88% due 06/24/2024 | | | 900,000 | | | | 962,478 | |
Republic of Kenya
Senior Notes
7.00% due 05/22/2027 | | | 670,000 | | | | 706,147 | |
Republic of Lebanon
Senior Notes
6.65% due 02/26/2030 | | | 600,000 | | | | 397,500 | |
Republic of Lebanon
Senior Notes
6.85% due 03/23/2027 | | | 1,180,000 | | | | 785,880 | |
Republic of Lebanon
Senior Notes
8.25% due 04/12/2021 | | | 950,000 | | | | 801,591 | |
Republic of Panama
Senior Notes
3.87% due 07/23/2060 | | | 900,000 | | | | 1,033,650 | |
Republic of Panama
Senior Notes
4.50% due 05/15/2047 | | | 900,000 | | | | 1,116,009 | |
Republic of Panama
Senior Notes
6.70% due 01/26/2036 | | | 780,000 | | | | 1,139,783 | |
Republic of South Africa
Senior Bonds
4.88% due 04/14/2026 | | | 660,000 | | | | 689,700 | |
Republic of Sri Lanka
Senior Notes
7.55% due 03/28/2030* | | | 2,310,000 | | | | 2,296,345 | |
Republic of the Philippines
Senior Notes
7.75% due 01/14/2031 | | | 1,080,000 | | | | 1,637,158 | |
Republic of Turkey
Senior Notes
6.35% due 08/10/2024 | | | 1,600,000 | | | | 1,589,696 | |
Russian Federation
Senior Notes
4.38% due 03/21/2029* | | | 1,800,000 | | | | 1,935,011 | |
State of Kuwait
Senior Notes
2.75% due 03/20/2022 | | | 1,600,000 | | | | 1,630,275 | |
State of Qatar
Senior Notes
4.50% due 04/23/2028 | | | 1,000,000 | | | | 1,171,250 | |
State of Qatar
Senior Notes
5.10% due 04/23/2048 | | | 500,000 | | | | 666,180 | |
Sultanate of Oman
Senior Notes
6.00% due 08/01/2029* | | | 1,060,000 | | | | 1,054,170 | |
Sultanate of Oman
Senior Notes
6.75% due 01/17/2048 | | | 900,000 | | | | 845,183 | |
United Kingdom Gilt Treasury
Bonds
4.50% due 09/07/2034 | | GBP | 360,000 | | | | 674,293 | |
United Mexican States
Senior Notes
4.50% due 04/22/2029 | | | 255,000 | | | | 281,459 | |
| | | | | | | | |
| | |
| Security Description | | Principal
Amount(10) | | | Value
(Note 2) | |
| |
| | | | | | | | | |
Sovereign (continued) | |
United Mexican States
Senior Bonds
4.75% due 03/08/2044 | | $ | 214,000 | | | $ | 236,406 | |
United Mexican States
Senior Notes
5.55% due 01/21/2045 | | | 1,600,000 | | | | 1,966,080 | |
| | | | | | |
|
|
|
| | | | | | | | 71,423,749 | |
| | | | | | |
|
|
|
Sovereign Agency — 0.1% | |
Kommunalbanken AS
Senior Notes
1.75% due 09/15/2020* | | | 468,000 | | | | 467,916 | |
| | | | | | |
|
|
|
Total Foreign Government Obligations | | | | | | | | |
(cost $70,314,581) | | | | | | | 71,891,665 | |
| | | |
|
|
|
U.S. GOVERNMENT AGENCIES — 28.2% | |
Federal Home Loan Mtg. Corp. — 5.8% | |
2.50% due 01/01/2028 | | | 175,597 | | | | 178,745 | |
2.50% due 04/01/2028 | | | 369,773 | | | | 376,407 | |
2.50% due 03/01/2031 | | | 246,546 | | | | 250,171 | |
2.50% due 10/01/2032 | | | 3,370,234 | | | | 3,419,908 | |
2.50% due 11/01/2032 | | | 1,552,769 | | | | 1,582,829 | |
3.00% due 04/01/2043 | | | 414,327 | | | | 429,738 | |
3.00% due 11/01/2046 | | | 9,356,324 | | | | 9,660,900 | |
3.00% due 08/01/2049 | | | 3,988,336 | | | | 4,067,114 | |
3.50% due 03/01/2042 | | | 256,348 | | | | 268,274 | |
3.50% due 04/01/2042 | | | 504,483 | | | | 527,949 | |
3.50% due 08/01/2042 | | | 442,543 | | | | 465,450 | |
3.50% due 09/01/2043 | | | 39,971 | | | | 42,040 | |
3.50% due 07/01/2045 | | | 4,530,769 | | | | 4,735,649 | |
3.50% due 11/01/2047 | | | 2,138,504 | | | | 2,213,406 | |
3.50% due 03/01/2048 | | | 11,755,849 | | | | 12,314,898 | |
3.50% due 08/01/2049 | | | 6,270,906 | | | | 6,454,921 | |
4.00% due 01/01/2046 | | | 288,209 | | | | 306,491 | |
4.00% due 01/01/2047 | | | 69,234 | | | | 74,113 | |
4.50% due 02/01/2020 | | | 455 | | | | 468 | |
4.50% due 08/01/2020 | | | 739 | | | | 760 | |
4.50% due 03/01/2023 | | | 14,073 | | | | 14,473 | |
5.00% due 05/01/2034 | | | 51,573 | | | | 57,337 | |
5.00% due 11/01/2043 | | | 42,604 | | | | 47,431 | |
5.50% due 06/01/2022 | | | 9,049 | | | | 9,302 | |
5.50% due 07/01/2035 | | | 15,462 | | | | 17,495 | |
6.00% due 03/01/2040 | | | 42,464 | | | | 48,691 | |
6.50% due 02/01/2036 | | | 8,022 | | | | 9,417 | |
Federal Home Loan Mtg. Corp. FRS
4.02% (6 ML+1.49%)
due 02/01/2037 | | | 12,537 | | | | 12,960 | |
4.83% (12 ML+1.88%)
due 11/01/2037 | | | 117,735 | | | | 124,662 | |
Federal Home Loan Mtg. Corp. REMIC | |
Series 4740, Class BA
3.00% due 09/15/2045(2) | | | 458,918 | | | | 473,885 | |
Series 4800, Class KG
3.50% due 11/15/2045(2) | | | 200,000 | | | | 207,622 | |
Series 3820, Class DA
4.00% due 11/15/2035(2) | | | 328,531 | | | | 328,957 | |
Federal Home Loan Mtg. Corp. REMIC FRS
Series 3572, Class JS
4.60%(6.80%-1 ML)
due 09/15/2039(2)(4)(11) | | | 121,808 | | | | 17,236 | |
VALIC Company II Strategic Bond Fund
PORTFOLIO OF INVESTMENTS —August 31, 2019 — (continued)
| | | | | | | | |
| | |
| Security Description | | Principal
Amount(10) | | | Value
(Note 2) | |
| |
U.S. GOVERNMENT AGENCIES (continued) | |
Federal Home Loan Mtg. Corp. (continued) | |
Federal Home Loan Mtg. Corp. Structured Agency Credit Risk FRS
Series 2015-HQA2, Class M2
4.95% (1 ML+2.80%)
due 05/25/2028(2) | | $ | 67,984 | | | $ | 68,439 | |
| | | | | | |
|
|
|
| | | | | | | | 48,808,138 | |
| | | | | | |
|
|
|
Federal National Mtg. Assoc. — 20.2% | |
2.50% due 12/01/2026 | | | 551,878 | | | | 560,394 | |
2.50% due 08/01/2031 | | | 2,987,048 | | | | 3,029,620 | |
2.50% due 02/01/2032 | | | 1,141,431 | | | | 1,159,845 | |
3.00% due 10/01/2027 | | | 148,700 | | | | 152,627 | |
3.00% due 12/01/2027 | | | 208,985 | | | | 215,267 | |
3.00% due 10/01/2030 | | | 306,649 | | | | 315,632 | |
3.00% due 02/01/2033 | | | 4,636,459 | | | | 4,760,271 | |
3.00% due 12/01/2042 | | | 137,783 | | | | 142,539 | |
3.00% due 08/01/2046 | | | 9,415,564 | | | | 9,717,268 | |
3.00% due 01/01/2047 | | | 3,001,561 | | | | 3,084,743 | |
3.00% due 04/01/2047 | | | 3,264,983 | | | | 3,355,113 | |
3.00% due 09/01/2048 | | | 5,070,281 | | | | 5,210,065 | |
3.50% due 09/01/2026 | | | 159,859 | | | | 166,462 | |
3.50% due 08/01/2027 | | | 44,329 | | | | 45,925 | |
3.50% due 10/01/2028 | | | 173,883 | | | | 181,828 | |
3.50% due 03/01/2033 | | | 1,644,166 | | | | 1,708,278 | |
3.50% due 08/01/2033 | | | 3,456,192 | | | | 3,588,591 | |
3.50% due 08/01/2042 | | | 253,371 | | | | 258,849 | |
3.50% due 10/01/2045 | | | 452,208 | | | | 475,491 | |
3.50% due 11/01/2045 | | | 357,057 | | | | 373,436 | |
3.50% due 07/01/2046 | | | 4,603,570 | | | | 4,820,393 | |
3.50% due 01/01/2047 | | | 775,471 | | | | 806,099 | |
3.50% due 12/01/2047 | | | 21,318,530 | | | | 22,229,996 | |
3.50% due 04/01/2048 | | | 10,106,758 | | | | 10,493,762 | |
4.00% due 11/01/2025 | | | 76,600 | | | | 79,888 | |
4.00% due 03/01/2039 | | | 3,873,454 | | | | 4,051,884 | |
4.00% due 12/01/2040 | | | 29,352 | | | | 31,371 | |
4.00% due 01/01/2043 | | | 1,851,142 | | | | 1,980,577 | |
4.00% due 10/01/2043 | | | 503,504 | | | | 537,698 | |
4.00% due 10/01/2044 | | | 251,970 | | | | 266,340 | |
4.00% due 02/01/2045 | | | 2,682,139 | | | | 2,870,014 | |
4.00% due 06/01/2046 | | | 559,924 | | | | 589,557 | |
4.00% due 01/01/2047 | | | 22,355 | | | | 23,477 | |
4.00% due 05/01/2047 | | | 591,484 | | | | 620,303 | |
4.00% due 07/01/2047 | | | 3,954,377 | | | | 4,132,006 | |
4.00% due 08/01/2047 | | | 7,157,585 | | | | 7,499,641 | |
4.00% due 06/01/2048 | | | 3,869,116 | | | | 4,087,986 | |
4.00% due 07/01/2048 | | | 4,518,365 | | | | 4,697,045 | |
4.00% due 09/01/2048 | | | 936,864 | | | | 979,736 | |
4.00% due 10/01/2048 | | | 8,183,333 | | | | 8,500,859 | |
4.00% due 01/01/2049 | | | 8,559,956 | | | | 8,934,590 | |
4.00% due 03/01/2049 | | | 8,096,771 | | | | 8,400,118 | |
4.50% due 08/01/2045 | | | 3,634,274 | | | | 4,015,760 | |
4.50% due 10/01/2048 | | | 1,929,598 | | | | 2,035,483 | |
4.50% due 11/01/2048 | | | 4,462,061 | | | | 4,703,910 | |
4.50% due 12/01/2048 | | | 5,786,918 | | | | 6,095,288 | |
4.50% due 03/01/2049 | | | 8,423,450 | | | | 8,922,165 | |
5.00% due 01/01/2023 | | | 17,089 | | | | 17,650 | |
5.00% due 04/01/2023 | | | 17,696 | | | | 18,343 | |
5.00% due 03/01/2037 | | | 6,890 | | | | 7,350 | |
5.00% due 05/01/2040 | | | 167,969 | | | | 184,383 | |
5.00% due 06/01/2040 | | | 52,581 | | | | 57,965 | |
5.00% due 02/01/2045 | | | 494,657 | | | | 542,645 | |
5.50% due 08/01/2037 | | | 209,420 | | | | 236,164 | |
5.50% due 06/01/2038 | | | 25,602 | | | | 28,807 | |
6.00% due 02/01/2032 | | | 2,969 | | | | 3,267 | |
| | | | | | | | |
| | |
| Security Description | | Principal
Amount(10) | | | Value
(Note 2) | |
| |
| | | | | | | | | |
Federal National Mtg. Assoc. (continued) | |
6.00% due 10/01/2034 | | $ | 113 | | | $ | 125 | |
6.00% due 09/01/2038 | | | 46,441 | | | | 53,174 | |
6.00% due 11/01/2038 | | | 14,130 | | | | 16,178 | |
6.00% due 06/01/2040 | | | 11,986 | | | | 13,731 | |
6.50% due 11/01/2037 | | | 38,876 | | | | 45,603 | |
Federal National Mtg. Assoc. FRS
4.28% (6 ML+1.54%)
due 09/01/2035 | | | 102,567 | | | | 106,081 | |
4.44% (12 ML+1.57%)
due 05/01/2037 | | | 21,800 | | | | 22,787 | |
4.56% (12 ML+1.66%)
due 07/01/2039 | | | 80,225 | | | | 84,071 | |
4.57% (12 ML+1.82%)
due 10/01/2040 | | | 23,852 | | | | 25,045 | |
4.63% (1 Yr USTYCR+2.21%)
due 10/01/2035 | | | 96,410 | | | | 101,765 | |
4.67% (12 ML+1.83%)
due 10/01/2040 | | | 54,367 | | | | 56,912 | |
4.71% (1 Yr USTYCR+2.26%)
due 11/01/2036 | | | 40,961 | | | | 43,326 | |
4.71% (12 ML+1.76%)
due 05/01/2040 | | | 99,527 | | | | 104,796 | |
4.73% (12 ML+1.91%)
due 08/01/2035 | | | 71,192 | | | | 75,219 | |
Federal National Mtg. Assoc. REMIC | |
Series2017-100, Class NP
3.00% due 12/25/2047(2) | | | 1,100,119 | | | | 1,135,158 | |
Series2018-27, Class EA
3.00% due 05/25/2048(2) | | | 2,656,641 | | | | 2,747,529 | |
Series2018-35, Class CD
3.00% due 05/25/2048(2) | | | 2,258,092 | | | | 2,306,052 | |
| | | | | | |
|
|
|
| | | | | | | | 168,942,316 | |
| | | | | | |
|
|
|
Government National Mtg. Assoc. — 2.2% | |
3.00% due 03/20/2046 | | | 350,958 | | | | 363,500 | |
3.00% due 05/20/2046 | | | 5,052,783 | | | | 5,224,362 | |
3.50% due 03/20/2047 | | | 400,597 | | | | 418,088 | |
4.00% due 05/20/2048 | | | 3,988,468 | | | | 4,161,151 | |
4.00% due 03/20/2049 | | | 945,455 | | | | 987,314 | |
4.50% due 10/20/2045 | | | 3,875,402 | | | | 4,126,978 | |
4.50% due 04/20/2047 | | | 2,937,941 | | | | 3,094,926 | |
| | | | | | |
|
|
|
| | | | | | | | 18,376,319 | |
| | | | | | |
|
|
|
Total U.S. Government Agencies | | | | | | | | |
(cost $230,222,824) | | | | | | | 236,126,773 | |
| | | |
|
|
|
U.S. GOVERNMENT TREASURIES — 1.4% | |
United States Treasury Bonds — 0.1% | |
3.00% due 08/15/2048 | | | 196,000 | | | | 240,575 | |
3.00% due 02/15/2049 | | | 186,000 | | | | 229,034 | |
3.38% due 11/15/2048 | | | 269,000 | | | | 353,683 | |
| | | | | | |
|
|
|
| | | | | | | | 823,292 | |
| | | | | | |
|
|
|
United States Treasury Notes — 1.3% | |
1.38% due 08/31/2020 | | | 242,000 | | | | 241,017 | |
1.63% due 08/15/2029 | | | 3,256,000 | | | | 3,291,867 | |
1.75% due 07/31/2021 | | | 2,217,000 | | | | 2,226,093 | |
2.38% due 05/15/2029 | | | 1,000,000 | | | | 1,077,695 | |
2.50% due 05/31/2020 | | | 3,000,000 | | | | 3,014,062 | |
2.88% due 10/31/2020 | | | 1,300,000 | | | | 1,316,809 | |
| | | | | | |
|
|
|
| | | | | | | | 11,167,543 | |
| | | | | | |
|
|
|
Total U.S. Government Treasuries | | | | | | | | |
(cost $11,738,754) | | | | | | | 11,990,835 | |
| | | |
|
|
|
VALIC Company II Strategic Bond Fund
PORTFOLIO OF INVESTMENTS —August 31, 2019 — (continued)
| | | | | | | | |
| | |
| Security Description | | Principal
Amount(10) | | | Value
(Note 2) | |
| |
LOANS(12)(13)(14) — 5.6% | |
Applications Software — 0.0% | |
Corel Corp. FRS
BTL
7.32% (3 ML+5.00%)
due 06/26/2026 | | $ | 366,791 | | | $ | 352,119 | |
| | | |
|
|
|
Auto Repair Centers — 0.1% | |
Mavis Tire Express Services Corp. FRS
Delayed Draw
5.39% (3 ML+3.00%)
due 03/20/2025(9) | | | 38,131 | | | | 37,345 | |
Mavis Tire Express Services Corp. FRS
Delayed Draw
5.36% (1 ML+3.25%)
due 03/20/2025 | | | 11,104 | | | | 10,874 | |
Mavis Tire Express Services Corp. FRS
1st Lien
5.36% (1 ML+3.25%)
due 03/20/2025 | | | 387,827 | | | | 379,828 | |
Wand NewCo 3, Inc. FRS
1st Lien
5.71% (1 ML+3.50%)
due 02/05/2026 | | | 330,777 | | | | 332,018 | |
| | | | | | |
|
|
|
| | | | | | | | 760,065 | |
| | | | | | |
|
|
|
Broadcast Services/Program — 0.1% | |
NEP Group, Inc. FRS
1st Lien
5.36% (1 ML+3.25%)
due 10/20/2025 | | | 442,800 | | | | 431,730 | |
| | | | | | |
|
|
|
Building & Construction - Misc. — 0.0% | |
Verra Mobility Corp. FRS
1st Lien
5.86% (1 ML+3.75%)
due 02/28/2025 | | | 415,775 | | | | 416,555 | |
| | | | | | |
|
|
|
Building Products- Air & Heating — 0.0% | |
API Heat Transfer ThermaSys Corp. FRS
1st Lien
8.33% (3 ML+6.00%)
due 12/31/2023 | | | 380,314 | | | | 342,282 | |
| | | | | | |
|
|
|
Building Products - Doors & Windows — 0.1% | |
CHI Doors Holdings Corp. FRS
1st Lien
5.36% (1 ML+3.25%)
due 07/29/2022 | | | 438,109 | | | | 437,562 | |
| | | | | | |
|
|
|
Cable/Satellite TV — 0.1% | |
CSC Holdings LLC FRS
BTL-B
4.70% (1 ML+2.50%)
due 01/25/2026 | | | 834,438 | | | | 832,873 | |
| | | | | | |
|
|
|
Casino Hotels — 0.1% | |
Caesars Resort Collection LLC FRS
BTL-B
4.86% (1 ML+2.75%)
due 12/22/2024 | | | 444,742 | | | | 437,724 | |
CityCenter Holdings LLC FRS
BTL-B
4.36% (1 ML+2.25%)
due 04/18/2024 | | | 447,716 | | | | 447,436 | |
| | | | | | |
|
|
|
| | | | | | | | 885,160 | |
| | | | | | |
|
|
|
Casino Services — 0.0% | |
Stars Group Holdings FRS
BTL
5.83% (3 ML+3.50%)
due 07/10/2025 | | | 386,344 | | | | 387,126 | |
| | | | | | |
|
|
|
| | | | | | | | |
| | |
| Security Description | | Principal
Amount(10) | | | Value
(Note 2) | |
| |
| | | | | | | | | |
Cellular Telecom — 0.1% | |
Altice France SA FRS
BTL-B13
6.20% (1 ML+4.00%)
due 08/14/2026 | | $ | 441,663 | | | $ | 437,356 | |
Sprint Communications, Inc. FRS
BTL-B
5.13% (1 ML+3.00%)
due 02/02/2024 | | | 433,299 | | | | 432,352 | |
| | | | | | |
|
|
|
| | | | | | | | 869,708 | |
| | | | | | |
|
|
|
Chemicals - Diversified — 0.1% | |
Hexion, Inc. FRS
BTL
5.82% (3 ML+3.50%)
due 07/01/2026 | | | 449,848 | | | | 448,724 | |
| | | | | | |
|
|
|
Chemicals - Specialty — 0.1% | |
LTI Holdings, Inc. FRS
1st Lien
5.61% (1 ML+3.50%)
due 09/06/2025 | | | 286,826 | | | | 271,230 | |
LTI Holdings, Inc. FRS
2nd Lien
8.86% (1 ML+6.75%)
due 09/06/2026 | | | 161,595 | | | | 144,358 | |
Starfruit US HoldCo. LLC FRS
BTL-B
5.46% (1 ML+3.25%)
due 10/01/2025 | | | 435,497 | | | | 419,574 | |
| | | | | | |
|
|
|
| | | | | | | | 835,162 | |
| | | | | | |
|
|
|
Commercial Services - Finance — 0.1% | |
Financial & Risk US Holdings, Inc. FRS
BTL
5.86% (1 ML+3.75%)
due 10/01/2025 | | | 439,948 | | | | 441,755 | |
MoneyGram International, Inc. FRS
BTL
8.33% (3 ML+6.00%)
due 06/30/2023 | | | 348,980 | | | | 342,873 | |
| | | | | | |
|
|
|
| | | | | | | | 784,628 | |
| | | | | | |
|
|
|
Computer Data Security — 0.1% | |
McAfee LLC FRS
BTL-B1
5.87% (1 ML+3.75%)
due 09/30/2024 | | | 441,752 | | | | 441,844 | |
| | | | | | |
|
|
|
Computer Services — 0.1% | |
Tempo Acquisition LLC FRS
BTL-B
5.11% (1 ML+3.00%)
due 05/01/2024 | | | 440,751 | | | | 440,531 | |
| | | | | | |
|
|
|
Computer Software — 0.1% | |
Rackspace Hosting, Inc. FRS
1st Lien
5.27% (2 ML+3.00%)
due 11/03/2023 | | | 1,146 | | | | 1,059 | |
Rackspace Hosting, Inc. FRS
1st Lien
5.29% (3 ML+3.00%)
due 11/03/2023 | | | 448,070 | | | | 414,184 | |
Rackspace Hosting, Inc. FRS
1st Lien
coupon TBD
due 11/03/2023 | | | 39,000 | | | | 36,051 | |
VALIC Company II Strategic Bond Fund
PORTFOLIO OF INVESTMENTS —August 31, 2019 — (continued)
| | | | | | | | |
| | |
| Security Description | | Principal
Amount(10) | | | Value
(Note 2) | |
| |
LOANS (continued) | |
Computer Software (continued) | |
Vertafore, Inc. FRS
1st Lein
5.36% (1 ML+3.25%)
due 07/02/2025 | | $ | 223,875 | | | $ | 215,960 | |
Vertafore, Inc. FRS
2nd Lien
9.36% (1 ML+7.25%)
due 07/02/2026 | | | 216,071 | | | | 212,290 | |
| | | | | | |
|
|
|
| | | | | | | | 879,544 | |
| | | | | | |
|
|
|
Consulting Services — 0.0% | |
AlixPartners LLP FRS
BTL
4.86% (1 ML+2.75%)
due 04/04/2024 | | | 218,325 | | | | 218,489 | |
Stiphout Finance LLC FRS
1st Lien
5.11% (1 ML+3.00%)
due 10/26/2022 | | | 77,747 | | | | 76,969 | |
| | | | | | |
|
|
|
| | | | | | | | 295,458 | |
| | | | | | |
|
|
|
Containers - Metal/Glass — 0.1% | |
BWAY Corp. FRS
BTL
5.59% (3 ML+3.25%)
due 04/03/2024 | | | 455,706 | | | | 442,319 | |
| | | | | | |
|
|
|
Containers - Paper/Plastic — 0.1% | |
Charter NEX US, Inc. FRS
1st Lien
5.11% (1 ML+3.00%)
due 05/16/2024 | | | 442,741 | | | | 434,772 | |
| | | | | | |
|
|
|
Cosmetics & Toiletries — 0.1% | |
Sunshine Luxembourg VII SARL FRS
BTL
coupon TBD
due 07/16/2026 | | | 451,596 | | | | 451,314 | |
| | | | | | |
|
|
|
Data Processing/Management — 0.1% | |
CCC Information Services, Inc. FRS
1st Lien
4.87% (1 ML+2.75%)
due 04/26/2024 | | | 443,736 | | | | 439,946 | |
| | | | | | |
|
|
|
Disposable Medical Products — 0.1% | |
Sotera Health Holdings LLC FRS
BTL
5.11% (1 ML+3.00%)
due 05/15/2022 | | | 1,688,273 | | | | 1,655,914 | |
| | | | | | |
|
|
|
Distribution/Wholesale — 0.1% | |
Fastlane Parent Co., Inc. FRS
1st Lien
6.83% (3 ML+4.50%)
due 02/04/2026 | | | 343,000 | | | | 336,569 | |
Univar USA, Inc. FRS
BTL-B3
4.36% (1 ML+2.25%)
due 07/01/2024 | | | 446,662 | | | | 446,731 | |
| | | | | | |
|
|
|
| | | | | | | | 783,300 | |
| | | | | | |
|
|
|
Diversified Operations — 0.1% | |
Travelport Finance Luxembourg SARL FRS
BTL
7.54% (3 ML+5.00%)
due 05/29/2026 | | | 478,536 | | | | 440,492 | |
| | | | | | |
|
|
|
| | | | | | | | |
| | |
| Security Description | | Principal
Amount(10) | | | Value
(Note 2) | |
| |
| | | | | | | | | |
E-Commerce/Services — 0.0% | |
RentPath LLC FRS
2nd Lien
11.12% (1 ML+9.00%)
due 12/17/2022 | | $ | 2,178,597 | | | $ | 250,539 | |
| | | | | | |
|
|
|
Electric - Generation — 0.0% | |
Vistra Operations Co. LLC FRS
BTL
4.11% (1 ML+2.00%)
due 08/04/2023 | | | 227,486 | | | | 227,593 | |
| | | | | | |
|
|
|
Electronic Components - Misc. — 0.0% | |
AI Ladder Luxembourg Subco SARL FRS
BTL
6.83% (3 ML+4.50%)
due 07/09/2025 | | | 432,051 | | | | 416,389 | |
| | | | | | |
|
|
|
Electronic Components - Semiconductors — 0.0% | |
Bright Bidco BV FRS
BTL
5.61% (1 ML+3.50%) | | | 187,701 | | | | 110,743 | |
Bright Bidco BV FRS
BTL-B
5.83% (3 ML+3.50%)
due 06/30/2024 | | | 388,766 | | | | 229,372 | |
| | | | | | |
|
|
|
| | | | | | | | 340,115 | |
| | | | | | |
|
|
|
Enterprise Software/Service — 0.2% | |
Applied Systems, Inc. FRS
1st Lein
5.33% (3 ML+3.00%)
due 09/19/2024 | | | 427,823 | | | | 426,178 | |
Digicert Holdings, Inc. FRS
BTL-B
coupon TBD
due 08/31/2026 | | | 337,610 | | | | 337,188 | |
Epicor Software Corp. FRS
1st Lien
5.37% (1 ML+3.25%)
due 06/01/2022 | | | 429,055 | | | | 428,250 | |
Finastra USA, Inc. FRS
BTL-B
5.70% (1 ML+3.50%)
due 06/13/2024 | | | 321,130 | | | | 309,489 | |
Finastra USA, Inc. FRS
BTL-B
5.70% (2 ML+3.50%)
due 06/13/2024 | | | 125,274 | | | | 120,733 | |
Greeneden US Holdings II LLC FRS
BTL
5.36% (1 ML+3.25%)
due 12/01/2023 | | | 444,744 | | | | 438,999 | |
Informatica LLC FRS
BTL
5.36% (1 ML+3.25%)
due 08/05/2022 | | | 440,285 | | | | 440,395 | |
Kronos, Inc. FRS
1st Lien
5.25% (3 ML+3.00%)
due 11/01/2023 | | | 447,000 | | | | 446,628 | |
MYOB US Borrower LLC FRS
BTL
6.11% (1 ML+4.00%)
due 05/06/2026 | | | 332,080 | | | | 331,872 | |
Sophia LP FRS
BTL-B
5.58% (3 ML+3.25%)
due 09/30/2022 | | | 416,163 | | | | 415,539 | |
VALIC Company II Strategic Bond Fund
PORTFOLIO OF INVESTMENTS —August 31, 2019 — (continued)
| | | | | | | | |
| | |
| Security Description | | Principal
Amount(10) | | | Value
(Note 2) | |
| |
LOANS (continued) | |
Enterprise Software/Service (continued) | |
Ultimate Software Group, Inc. FRS
1st Lien
6.08% (3 ML+3.75%)
due 05/04/2026 | | $ | 332,090 | | | $ | 332,644 | |
| | | | | | |
|
|
|
| | | | | | | | 4,027,915 | |
| | | | | | |
|
|
|
Finance - Credit Card — 0.1% | |
Pi US Mergerco, Inc. FRS
1st Lien
5.36% (1 ML+3.25%)
due 01/03/2025 | | | 433,356 | | | | 428,029 | |
| | | | | | |
|
|
|
Finance - Investment Banker/Broker — 0.1% | |
Deerfield Dakota Holding LLC FRS
BTL-B
5.36% (1 ML+3.25%)
due 02/13/2025 | | | 445,728 | | | | 432,436 | |
| | | | | | |
|
|
|
Gambling(Non-Hotel) — 0.1% | |
Mohegan Tribal Gaming Authority FRS
BTL-B
6.11% (1 ML+4.00%)
due 10/13/2023 | | | 484,664 | | | | 445,083 | |
Scientific Games International, Inc. FRS
BTL-B5
4.86% (1 ML+2.75%)
due 08/14/2024 | | | 89,841 | | | | 88,701 | |
Scientific Games International, Inc. FRS
BTL-B5
4.90% (2 ML+2.75%)
due 08/14/2024 | | | 367,145 | | | | 362,490 | |
| | | | | | |
|
|
|
| | | | | | | | 896,274 | |
| | | | | | |
|
|
|
Hazardous Waste Disposal — 0.1% | |
GFL Environmental, Inc. FRS
BTL
5.11% (1 ML+3.00%)
due 05/30/2025 | | | 450,724 | | | | 445,991 | |
| | | | | | |
|
|
|
Human Resources — 0.1% | |
Team Health Holdings, Inc. FRS
1st Lien
4.86% (1 ML+2.75%)
due 02/06/2024 | | | 870,371 | | | | 705,000 | |
| | | | | | |
|
|
|
Insurance Brokers — 0.1% | |
Alliant Holdings Intermediate LLC FRS
BTL-B1
5.15% (1 ML+3.00%)
due 05/09/2025 | | | 447,739 | | | | 434,446 | |
HUB International, Ltd. FRS
BTL-B
5.27% - 5.28% (3 ML+3.00%)
due 04/25/2025 | | | 443,885 | | | | 434,849 | |
| | | | | | |
|
|
|
| | | | | | | | 869,295 | |
| | | | | | |
|
|
|
Insurance - Multi-line — 0.1% | |
York Risk Services Holding Corp. FRS
BTL-B
5.86% (1 ML+3.75%)
due 10/01/2021 | | | 523,708 | | | | 522,562 | |
| | | | | | |
|
|
|
Insurance - Property/Casualty — 0.1% | |
Asurion LLC FRS
BTL-B6
5.11% (1 ML+3.00%)
due 11/03/2023 | | | 415,803 | | | | 416,149 | |
| | | | | | | | |
| | |
| Security Description | | Principal
Amount(10) | | | Value
(Note 2) | |
| |
| | | | | | | | | |
Insurance - Property/Casualty (continued) | |
Asurion LLC FRS
2nd Lien
8.61% (1 ML+6.50%)
due 08/04/2025 | | $ | 16,737 | | | $ | 16,951 | |
Sedgwick Claims Management Services, Inc. FRS
BTL
5.36% (1 ML+3.25%)
due 12/31/2025 | | | 322,913 | | | | 313,226 | |
| | | | | | |
|
|
|
| | | | | | | | 746,326 | |
| | | | | | |
|
|
|
Internet Financial Services — 0.1% | |
ION Trading Finance, Ltd. FRS
BTL
6.65% (3 ML+4.00%)
due 11/21/2024 | | | 451,566 | | | | 435,761 | |
| | | | | | |
|
|
|
Machinery - Electrical — 0.0% | |
Brookfield WEC Holdings, Inc. FRS
1st Lien
5.61% (1 ML+3.50%)
due 08/01/2025 | | | 328,350 | | | | 328,624 | |
| | | | | | |
|
|
|
Machinery - General Industrial — 0.1% | |
Shape Technologies Group, Inc. FRS
BTL
5.26% (3 ML+3.00%)
due 04/21/2025 | | | 316,869 | | | | 285,182 | |
Welbilt, Inc. FRS
BTL-B
4.61% (1 ML+2.50%)
due 10/23/2025 | | | 343,000 | | | | 339,427 | |
| | | | | | |
|
|
|
| | | | | | | | 624,609 | |
| | | | | | |
|
|
|
Machinery - Pumps — 0.1% | |
STS Operating, Inc. FRS
BTL
6.36% (1 ML+4.25%)
due 12/11/2024 | | | 441,589 | | | | 436,621 | |
| | | | | | |
|
|
|
Medical Products — 0.1% | |
Greatbatch, Ltd. FRS
BTL-B
5.22% (1 ML+3.00%)
due 10/27/2022 | | | 580,392 | | | | 582,673 | |
VVC Holding Corp. FRS
BTL-B
6.68% (3 ML+4.50%)
due 02/11/2026 | | | 226,198 | | | | 224,783 | |
VVC Holding Corp. FRS
BTL-B
6.70% (1 ML+4.50%)
due 02/11/2026 | | | 721 | | | | 717 | |
| | | | | | |
|
|
|
| | | | | | | | 808,173 | |
| | | | | | |
|
|
|
Medical - Drugs — 0.1% | |
Akorn, Inc. FRS
BTL-B
8.37% (3 ML+6.25%)
due 04/16/2021 | | | 361,866 | | | | 334,726 | |
Akorn, Inc. FRS
BTL-B
coupon TBD
due 04/16/2021 | | | 226 | | | | 209 | |
Alphabet Holding Co., Inc. FRS
1st Lien
5.61% (1 ML+3.50%)
due 09/26/2024 | | | 445,466 | | | | 414,005 | |
VALIC Company II Strategic Bond Fund
PORTFOLIO OF INVESTMENTS —August 31, 2019 — (continued)
| | | | | | | | |
| | |
| Security Description | | Principal
Amount(10) | | | Value
(Note 2) | |
| |
LOANS (continued) | |
Medical - Drugs (continued) | |
Bausch Health Americas, Inc. FRS
BTL
4.95% (1 ML+2.75%)
due 11/27/2025 | | $ | 270,153 | | | $ | 269,882 | |
Bausch Health Americas, Inc. FRS
BTL
5.20% (1 ML+3.00%)
due 06/02/2025 | | | 51,177 | | | | 51,220 | |
| | | | | | |
|
|
|
| | | | | | | | 1,070,042 | |
| | | | | | |
|
|
|
Medical - Generic Drugs — 0.1% | |
Alvogen Pharma US, Inc. FRS
BTL-B
6.86% (1 ML+4.75%)
due 04/02/2022 | | | 435,529 | | | | 394,879 | |
Amneal Pharmaceuticals LLC FRS
BTL-B
5.63% (1 ML+3.50%)
due 05/04/2025 | | | 431,819 | | | | 391,516 | |
| | | | | | |
|
|
|
| | | | | | | | 786,395 | |
| | | | | | |
|
|
|
Medical- HMO — 0.1% | |
MPH Acquisition Holdings LLC FRS
BTL-B
5.08% (3 ML+2.75%)
due 06/07/2023 | | | 474,574 | | | | 440,761 | |
| | | | | | |
|
|
|
Medical - Outpatient/Home Medical — 0.1% | |
HC Group Holdings III, Inc. FRS
BTL-B
6.61% (1 ML+4.50%)
due 05/21/2026 | | | 449,932 | | | | 447,683 | |
| | | | | | |
|
|
|
Metal Processors & Fabrication — 0.1% | |
Crosby US Acquisition Corp. FRS
BTL-B
6.92% (1 ML+4.75%)
due 06/26/2026 | | | 336,673 | | | | 329,518 | |
Doncasters US Finance LLC FRS
BTL
5.83% (3 ML+3.50%)
due 04/09/2020 | | | 68,110 | | | | 46,485 | |
Form Technologies LLC FRS
BTL
5.58% (3 ML+3.25%)
due 01/28/2022 | | | 439,704 | | | | 421,017 | |
SEI Holdings I Corp. FRS
1st Lien
6.11% (1 ML+4.00%)
due 03/27/2021 | | | 452,612 | | | | 446,954 | |
| | | | | | |
|
|
|
| | | | | | | | 1,243,974 | |
| | | | | | |
|
|
|
Miscellaneous Manufacturing — 0.0% | |
Excelitas Technologies Corp. FRS
2nd Lien
9.83% (3 ML+7.50%)
due 12/01/2025 | | | 338,000 | | | | 337,155 | |
| | | | | | |
|
|
|
Multimedia — 0.0% | |
EW Scripps Co. FRS
BTL-B1
4.86% (1 ML+2.75%)
due 05/01/2026 | | | 332,007 | | | | 331,903 | |
| | | | | | |
|
|
|
| | | | | | | | |
| | |
| Security Description | | Principal
Amount(10) | | | Value
(Note 2) | |
| |
| | | | | | | | | |
Oil Companies - Exploration & Production — 0.1% | |
Osum Production Corp. FRS
BTL
11.83% (3 ML+9.50%)
due 07/31/2022 | | $ | 484,248 | | | $ | 445,508 | |
| | | | | | |
|
|
|
Physicians Practice Management — 0.1% | |
Sound Inpatient Physicians, Inc. FRS
1st Lien
4.86% (1 ML+2.75%)
due 06/27/2025 | | | 475,337 | | | | 469,692 | |
| | | | | | |
|
|
|
Pipelines — 0.1% | |
Blackstone CQP Holdco LP FRS
BTL-B
5.89% (3 ML+3.50%)
due 09/30/2024 | | | 334,037 | | | | 333,898 | |
Lucid Energy Group II Borrower LLC FRS
1st Lien
5.11% (1 ML+3.00%)
due 02/17/2025 | | | 463,652 | | | | 426,946 | |
Medallion Midland Acquisition LLC FRS
BTL
5.36% (1 ML+3.25%)
due 10/30/2024 | | | 446,285 | | | | 426,481 | |
| | | | | | |
|
|
|
| | | | | | | | 1,187,325 | |
| | | | | | |
|
|
|
Publishing - Books — 0.1% | |
Houghton Mifflin Harcourt Publishers, Inc. FRS
BTL
5.11% (1 ML+3.00%)
due 05/31/2021 | | | 467,565 | | | | 453,421 | |
| | | | | | |
|
|
|
Publishing - Periodicals — 0.1% | |
Meredith Corp. FRS
BTL-B1
4.86% (1 ML+2.75%)
due 01/31/2025 | | | 373,385 | | | | 373,852 | |
Nielsen Finance LLC FRS
BTL-B4
4.21% (1 ML+2.00%)
due 10/04/2023 | | | 453,839 | | | | 451,144 | |
| | | | | | |
|
|
|
| | | | | | | | 824,996 | |
| | | | | | |
|
|
|
Quarrying — 0.1% | |
US Silica Co. FRS
BTL-B
6.13% (1 ML+4.00%)
due 05/01/2025 | | | 475,013 | | | | 444,336 | |
| | | | | | |
|
|
|
Real Estate Management/Services — 0.1% | |
DTZ U. S. Borrower LLC FRS
BTL-B
5.36% (1 ML+3.25%)
due 08/21/2025 | | | 440,569 | | | | 440,129 | |
| | | | | | |
|
|
|
Research & Development — 0.0% | |
PAREXEL International Corp. FRS
BTL
4.86% (1 ML+2.75%)
due 09/27/2024 | | | 413,602 | | | | 388,786 | |
| | | | | | |
|
|
|
Resort/Theme Parks — 0.1% | |
SeaWorld Parks & Entertainment, Inc. FRS
BTL-B5
5.11% (1 ML+3.00%)
due 03/31/2024 | | | 428,295 | | | | 427,581 | |
| | | | | | |
|
|
|
VALIC Company II Strategic Bond Fund
PORTFOLIO OF INVESTMENTS —August 31, 2019 — (continued)
| | | | | | | | |
| | |
| Security Description | | Principal
Amount(10) | | | Value
(Note 2) | |
| |
LOANS (continued) | |
Retail - Major Department Stores — 0.1% | |
Hudson’s Bay Co. FRS
BTL-B
5.49% (1 ML+3.25%)
due 09/30/2022 | | $ | 440,007 | | | $ | 439,457 | |
| | | | | | |
|
|
|
Retail - Petroleum Products — 0.1% | |
EG America LLC FRS
BTL
6.33% (3 ML+4.00%)
due 02/07/2025 | | | 834,441 | | | | 820,186 | |
| | | | | | |
|
|
|
Retail - Restaurants — 0.1% | |
IRB Holding Corp. FRS
BTL-B
5.55% - 5.56% (3 ML+3.25%)
due 02/05/2025 | | | 442,758 | | | | 439,714 | |
Wok Holdings, Inc. FRS
BTL
8.70% (6 ML+6.50%)
due 03/01/2026 | | | 103,660 | | | | 98,866 | |
Wok Holdings, Inc. FRS
BTL
8.83% (3 ML+6.50%)
due 03/01/2026 | | | 260 | | | | 248 | |
Wok Holdings, Inc. FRS
BTL
coupon TBD
due 03/01/2026 | | | 252,079 | | | | 240,421 | |
| | | | | | |
|
|
|
| | | | | | | | 779,249 | |
| | | | | | |
|
|
|
Retail - Sporting Goods — 0.0% | |
Bass Pro Group LLC FRS
BTL
7.11% (1 ML+5.00%)
due 09/25/2024 | | | 435,314 | | | | 413,684 | |
| | | | | | |
|
|
|
Rubber/Plastic Products — 0.0% | |
Gates Global LLC FRS
BTL-B2
coupon TBD
due 04/01/2024 | | | 338,000 | | | | 329,286 | |
| | | | | | |
|
|
|
Satellite Telecom — 0.1% | |
Intelsat Jackson Holdings SA FRS
BTL-B3
5.90% (1 ML+3.75%)
due 11/27/2023 | | | 435,000 | | | | 434,456 | |
| | | | | | |
|
|
|
Security Services — 0.0% | |
Prime Security Services Borrower LLC FRS
BTL-B1
4.86% (1 ML+2.75%)
due 05/02/2022 | | | 366,201 | | | | 365,809 | |
| | | | | | |
|
|
|
Soap & Cleaning Preparation — 0.1% | |
Diamond BC BV FRS
BTL
5.26% (2 ML+3.00%)
due 09/06/2024 | | | 1,264 | | | | 1,154 | |
Diamond BC BV FRS
BTL
5.26% (3 ML+3.00%)
due 09/06/2024 | | | 496,894 | | | | 453,415 | |
| | | | | | |
|
|
|
| | | | | | | | 454,569 | |
| | | | | | |
|
|
|
Software Tools — 0.0% | |
RP Crown Parent LLC FRS
BTL
4.86% (1 ML+2.75%)
due 10/12/2023 | | | 340,000 | | | | 338,831 | |
| | | | | | |
|
|
|
| | | | | | | | |
| | |
| Security Description | | Shares/
Principal
Amount(10) | | | Value
(Note 2) | |
| |
| | | | | | | | | |
Telecom Services — 0.1% | |
Level 3 Parent LLC FRS
BTL-B
4.36% (1 ML+2.25%)
due 02/22/2024 | | $ | 435,000 | | | $ | 435,272 | |
West Corp. FRS
BTL-B1
5.61% (1 ML+3.50%)
due 10/10/2024 | | | 394,599 | | | | 350,207 | |
| | | | | | |
|
|
|
| | | | | | | | 785,479 | |
| | | | | | |
|
|
|
Telecommunication Equipment — 0.0% | |
CommScope, Inc. FRS
BTL-B
5.36% (1 ML+3.25%)
due 04/06/2026 | | | 221,774 | | | | 220,665 | |
| | | | | | |
|
|
|
Telephone - Integrated — 0.1% | |
CenturyLink, Inc. FRS
BTL-B
4.86% (1 ML+2.75%)
due 01/31/2025 | | | 439,320 | | | | 432,730 | |
| | | | | | |
|
|
|
Television — 0.1% | |
Ion Media Networks, Inc. FRS
Term Loan B
5.13% (1 ML+3.00%)
due 12/18/2024 | | | 451,383 | | | | 450,678 | |
| | | | | | |
|
|
|
Theaters — 0.1% | |
AMC Entertainment Holdings, Inc. FRS
BTL-B
5.23% (6 ML+3.00%)
due 04/22/2026 | | | 439,315 | | | | 440,597 | |
Cineworld, Ltd. FRS
BTL
4.36% (1 ML+2.25%)
due 02/28/2025 | | | 450,579 | | | | 447,059 | |
William Morris Endeavor Entertainment LLC FRS
BTL-B1
4.87% (1 ML+2.75%)
due 05/18/2025 | | | 1,808,035 | | | | 1,753,794 | |
| | | | | | |
|
|
|
| | | | | | | | 2,641,450 | |
| | | | | | |
|
|
|
Transport - Truck — 0.1% | |
Pods LLC FRS
1st Lien
5.05% (1 ML+2.75%)
due 12/06/2024 | | | 832,297 | | | | 823,974 | |
| | | | | | |
|
|
|
Total Loans | | | | | | | | |
(cost $49,615,091) | | | | | | | 46,901,570 | |
| | | |
|
|
|
COMMON STOCKS — 0.0% | |
Building Products- Air & Heating — 0.0% | |
API Heat Transfer, Inc. †(15) | | | 407,576 | | | | 121,254 | |
| | | |
|
|
|
Television — 0.0% | |
ION Media Networks, Inc.†(5)(15) | | | 316 | | | | 282,978 | |
| | | |
|
|
|
Total Common Stocks | | | | | | | | |
(cost $134,503) | | | | | | | 404,232 | |
| | | |
|
|
|
PREFERRED SECURITIES — 0.0% | |
Building Products- Air & Heating — 0.0% | |
API Heat Transfer, Inc.
Class A(15) | | | 86,869 | | | | 68,518 | |
| | | |
|
|
|
Electric - Distribution — 0.0% | |
Entergy Louisiana LLC
4.70% | | | 7,075 | | | | 180,554 | |
| | | |
|
|
|
VALIC Company II Strategic Bond Fund
PORTFOLIO OF INVESTMENTS —August 31, 2019 — (continued)
| | | | | | | | |
| | |
| Security Description | | Shares/
Principal
Amount(10) | | | Value
(Note 2) | |
| |
PREFERRED SECURITIES (continued) | |
Sovereign Agency — 0.0% | |
Federal Home Loan Mtg. Corp.
Series Z
8.38% | | $ | 2,642 | | | $ | 31,810 | |
| | | |
|
|
|
Total Preferred Securities | | | | | | | | |
(cost $304,537) | | | | | | | 280,882 | |
| | | |
|
|
|
PREFERRED SECURITIES/CAPITAL SECURITIES — 1.4% | |
Banks - Money Center — 0.1% | |
National Westminster Bank PLC
1.80% due 01/05/2020(6) | | EUR | 900,000 | | | | 977,443 | |
| | | | | | |
|
|
|
Banks - Super Regional — 0.0% | |
Wells Fargo Capital X
5.95% due 12/01/2086 | | $ | 135,000 | | | | 168,306 | |
| | | | | | |
|
|
|
Building & Construction - Misc. — 0.1% | |
China Minmetals Corp.
3.75% due 11/13/2022(6) | | | 485,000 | | | | 483,632 | |
| | | | | | |
|
|
|
Diversified Banking Institutions — 0.3% | |
Bank of Nova Scotia
4.65% due 10/12/2022(6) | | | 432,000 | | | | 425,356 | |
HSBC Holdings PLC
6.00% due 05/22/2027(6) | | | 349,000 | | | | 349,872 | |
JPMorgan Chase & Co.
Series U
6.13% due 04/30/2024(6) | | | 493,000 | | | | 530,591 | |
Royal Bank of Scotland Group PLC
8.00% due 08/10/2025(6) | | | 245,000 | | | | 260,803 | |
Societe Generale SA
7.88% due 12/18/2023*(6) | | | 551,000 | | | | 594,391 | |
| | | | | | |
|
|
|
| | | | | | | | 2,161,013 | |
| | | | | | |
|
|
|
Diversified Minerals — 0.0% | |
BHP Billiton Finance, Ltd.
5.63% due 10/22/2079 | | EUR | 300,000 | | | | 403,868 | |
| | | | | | |
|
|
|
Electric - Distribution — 0.0% | |
National Rural Utilities Cooperative Finance Corp.
4.75% due 04/30/2043 | | | 335,000 | | | | 339,127 | |
| | | | | | |
|
|
|
Electric - Generation — 0.1% | |
Electricite de France SA
4.25% due 01/29/2020(6) | | EUR | 700,000 | | | | 782,244 | |
| | | | | | |
|
|
|
Electric - Integrated — 0.1% | |
Dominion Resources, Inc.
5.75% due 10/01/2054 | | | 136,000 | | | | 144,087 | |
Gas Natural Fenosa Finance BV
3.38% due 04/24/2024(6) | | EUR | 300,000 | | | | 351,485 | |
| | | | | | |
|
|
|
| | | | | | | | 495,572 | |
| | | | | | |
|
|
|
Finance - Investment Banker/Broker — 0.0% | |
Lehman Brothers Holdings Capital Trust VII
Escrow Security
0.00%†(5) | | | 101,000 | | | | 10 | |
| | | |
|
|
|
Food - Dairy Products — 0.1% | |
Land O’Lakes Capital Trust I
7.45% due 03/15/2028* | | | 1,115,000 | | | | 1,225,106 | |
| | | | | | |
|
|
|
Insurance - Life/Health — 0.1% | |
Aviva PLC
6.13% due 07/05/2043 | | EUR | 300,000 | | | | 387,768 | |
Prudential Financial, Inc.
5.63% due 06/15/2043 | | | 351,000 | | | | 376,132 | |
Prudential Financial, Inc.
5.70% due 09/15/2048 | | | 146,000 | | | | 159,426 | |
| | | | | | |
|
|
|
| | | | | | | | 923,326 | |
| | | | | | |
|
|
|
| | | | | | | | |
| | |
| Security Description | | Shares/
Principal
Amount(10) | | | Value
(Note 2) | |
| |
| | | | | | | | | |
Insurance - Multi-line — 0.0% | |
Voya Financial, Inc.
Company Guar. Notes
4.70% due 01/23/2048 | | $ | 224,000 | | | $ | 208,992 | |
| | | | | | |
|
|
|
Medical - Drugs — 0.1% | |
Bayer AG
3.00% due 07/01/2075 | | EUR | 600,000 | | | | 669,321 | |
| | | | | | |
|
|
|
Oil Companies - Integrated — 0.2% | |
TOTAL SA
2.71% due 05/05/2023(6) | | EUR | 1,100,000 | | | | 1,302,649 | |
| | | | | | |
|
|
|
Pipelines — 0.1% | |
EnLink Midstream Partners LP
6.00% due 12/15/2022(6) | | | 149,000 | | | | 111,750 | |
Enterprise Products Operating LLC
5.25% due 08/16/2077 | | | 108,000 | | | | 106,650 | |
TransCanada Trust
5.30% due 03/15/2077 | | | 194,000 | | | | 192,545 | |
TransCanada Trust
5.63% due 05/20/2075 | | | 136,000 | | | | 139,740 | |
| | | | | | |
|
|
|
| | | | | | | | 550,685 | |
| | | | | | |
|
|
|
Water — 0.1% | |
Suez
3.00% due 06/23/2020(6) | | EUR | 900,000 | | | | 1,010,227 | |
| | | | | | |
|
|
|
Total Preferred Securities/Capital Securities | | | | | | | | |
(cost $11,609,925) | | | | | | | 11,701,521 | |
| | | |
|
|
|
Total Long-Term Investment Securities | | | | | |
(cost $788,198,582) | | | | | | | 803,620,885 | |
| | | |
|
|
|
SHORT-TERM INVESTMENT SECURITIES — 4.1% | |
Registered Investment Companies — 4.1% | |
State Street Institutional U.S. Government Money Market Fund, Premier Class
2.07%(17) | | | 26,669,672 | | | | 26,669,672 | |
State Street Navigator Securities Lending Government Money Market Portfolio
2.12%(16)(17) | | | 7,573,660 | | | | 7,573,660 | |
| | | | | | |
|
|
|
Total Short-Term Investment Securities | | | | | |
(cost $34,243,332) | | | | | | | 34,243,332 | |
| | | |
|
|
|
TOTAL INVESTMENTS | | | | | | | | |
(cost $822,441,914)(18) | | | 99.9 | % | | | 837,864,217 | |
Other assets less liabilities | | | 0.1 | | | | 694,608 | |
| | |
|
|
| |
|
|
|
NET ASSETS | | | 100.0 | % | | $ | 838,558,825 | |
| | |
|
|
| |
|
|
|
| * | Securities exempt from registration under Rule 144A of the Securities Act of 1933. These securities may be sold in transactions exempt from registration, normally to qualified institutional buyers. The Fund has no right to demand registration of these securities. At August 31, 2019, the aggregate value of these securities was $184,571,855 representing 22.0% of net assets. |
| # | The security or a portion thereof is out on loan (see Note 2). |
| † | Non-income producing security |
| (1) | Commercial Mortgage Backed Security |
| (2) | Collateralized Mortgage Obligation |
| (3) | Certain variable rate securities are not based on a published reference rate and spread but are determined by the issuer or agent and are based on current market conditions. These securities do not indicate a reference rate and spread in their description above. |
| (5) | Securities classified as Level 3 (see Note 2). |
| (6) | Perpetual maturity — maturity date reflects the next call date. |
| (7) | Company has filed for bankruptcy protection. |
| (8) | Security in default of interest and principal at maturity. |
| (9) | All or a portion of this holding is subject to unfunded loan commitments (See Note 12). |
VALIC Company II Strategic Bond Fund
PORTFOLIO OF INVESTMENTS —August 31, 2019 — (continued)
| (10) | Denominated in United States Dollars unless otherwise indicated. |
| (11) | Inverse Floating Rate Security that pays interest that varies inversely to changes in the market interest rates. The interest rate shown is the current interest rate at August 31, 2019. |
| (12) | Senior loans in the Fund are generally subject to mandatory and/or optional prepayment. Because of these mandatory prepayment conditions and because there may be significant economic incentives for a borrower to prepay, prepayments may occur. As a result, the actual remaining maturity may be substantially less than the stated maturities shown. |
| (13) | The Fund invests in senior loans which generally pay interest at rates which are periodicallyre-determined by reference to a base lending rate plus a premium. These base lending rates are generally either the lending rate offered by one or more major European banks, such as the London Inter-Bank Offered Rate (“LIBOR”) or the prime rate offered by one or more major United States banks, or the certificate of deposit rate. Senior loans are generally considered to be restrictive in that the Fund is ordinarily contractually obligated to receive approval from the Agent Bank and/or borrower prior to the disposition of a senior loan. |
| (14) | All loans in the Fund were purchased through assignment agreements unless otherwise indicated. |
| (15) | Denotes a restricted security that: (a) cannot be offered for public sale without first being registered, or being able to take advantage of an exemption from registration, under the Securities Act of 1933, as amended (the “1933 Act”); (b) is subject to a contractual restriction on public sales; or (c) is otherwise subject to a restriction on sales by operation of applicable law. Restricted securities are valued pursuant to Note 2. Certain restricted securities held by the Fund may not be sold except in exempt transactions or in a public offering registered under the 1933 Act. The Fund has no right to demand registration of these securities. The risk of investing in certain restricted securities is greater than the risk of investing in the securities of widely held, publicly traded companies. To the extent applicable, lack of a secondary market and resale restrictions may result in the inability of a Fund to sell a security at a fair price and may substantially delay the sale of the security. In addition, certain restricted securities may exhibit greater price volatility than securities for which secondary markets exist. As of August 31, 2019, the Fund held the following restricted securities: |
| | | | | | | | | | | | | | | | | | | | | | | | |
Name
| | Acquisition
Date
| | | Shares
| | | Acquisition
Cost
| | | Value
| | | Value
per Share
| | | % of
Net Assets
| |
Common Stocks | | | | | | | | | | | | | | | | | | | | | | | | |
| | | | | | |
API Heat Transfer, Inc. | | | 12/31/2018 | | | | 407,576 | | | $ | 134,500 | | | $ | 121,254 | | | $ | 0.30 | | | | 0.01 | % |
ION Media Networks, Inc. | | | 03/05/2014 | | | | 316 | | | | 3 | | | | 282,978 | | | | 895.50 | | | | 0.03 | % |
Preferred Securities | | | | | | | | | | | | | | | | | | | | | | | | |
| | | | | | |
API Heat Transfer, Inc., Class A | | | 12/31/2018 | | | | 86,869 | | | | 86,869 | | | | 68,518 | | | | 0.79 | | | | 0.01 | % |
| | | | | | | | | | | | | | |
|
|
| | | | | |
|
|
|
| | | | | | | | | | | | | | | $ | 472,750 | | | | | | | | 0.05 | % |
| | | | | | | | | | | | | | |
|
|
| | | | | |
|
|
|
| (16) | At August 31, 2019, the Fund had loaned securities with a total value of $10,196,082. This was secured by collateral of $7,573,660, which was received in cash and subsequently invested in short-term investments currently valued at $7,573,660 as reported in the Portfolio of Investments. Additional collateral of $2,842,662 was received in the form of fixed income pooled securities, which the Fund cannot sell or repledge and accordingly are not reflected in the Fund’s assets and liabilities. |
The components of the fixed income pooled securities referenced above are as follows:
| | | | | | |
Securities
| | Coupon Range
| | Maturity Date Range
| | Value as of
August 31, 2019
|
United States Treasury Bills | | 0.00% | | 01/09/2020 | | $ 34,658 |
United States Treasury Notes/Bonds | | zero coupon to 8.75% | | 09/30/2019 to 02/15/2049 | | 2,808,004 |
| (17) | The rate shown is the7-day yield as of August 31, 2019. |
| (18) | See Note 5 for cost of investments on a tax basis. |
BTL—Bank Term Loan
REMIC—Real Estate Mortgage Investment Conduit
TBD—Senior loan purchased on a when-issued or delayed-delivery basis. Certain details associated with this purchase are not known prior to the settlement date of the transaction. In addition, senior loans typically trade without accrued interest and therefore a coupon rate is not available prior to the settlement.
ULC—Unlimited Liability Corp.
FRS—Floating Rate Security
VRS—Variable Rate Security
The rates shown on FRS and VRS are the current interest rates at August 31, 2019 and unless noted otherwise, the dates are the original maturity dates.
Currency Legend
EUR—Euro Currency
GBP—British Pound
Index Legend
1 ML—1 Month USD LIBOR
2 ML—2 Month USD LIBOR
3 ML—3 Month USD LIBOR
6 ML—6 Month USD LIBOR
12 ML—12 Month USD LIBOR
1 Yr USTYCR—1 Year US Treasury Yield Curve Rate
| | | | | | | | | | | | | | | | | | | | | | | | | | | | |
| Forward Foreign Currency Contracts | | | | | | | | | | |
| Counterparty | | Contract to Deliver | | | In Exchange For | | | Delivery Date | | | Unrealized
Appreciation | | | Unrealized
Depreciation | |
JPMorgan Chase Bank N.A. | | | EUR | | | | 31,225,000 | | | | USD | | | | 35,355,070 | | | | 09/06/2019 | | | $ | 1,032,073 | | | $ | – | |
| | | | EUR | | | | 12,058,000 | | | | USD | | | | 13,628,402 | | | | 11/07/2019 | | | | 309,953 | | | | – | |
| | | | GBP | | | | 9,900,000 | | | | USD | | | | 12,596,528 | | | | 09/06/2019 | | | | 549,194 | | | | – | |
| | | | USD | | | | 1,870,449 | | | | EUR | | | | 1,650,000 | | | | 09/06/2019 | | | | – | | | | (56,744 | ) |
| | | | USD | | | | 3,590,386 | | | | GBP | | | | 2,865,000 | | | | 09/06/2019 | | | | – | | | | (103,961 | ) |
| | | | USD | | | | 3,182,682 | | | | EUR | | | | 2,836,000 | | | | 11/07/2019 | | | | – | | | | (50,229 | ) |
| | | | | | | | | | | | | | | | | | | | | | |
|
|
| |
|
|
|
Net Unrealized Appreciation/(Depreciation) | | | | | | | | | | | | | | | | | | | | | | $ | 1,891,220 | | | $ | (210,934 | ) |
| | | | | | | | | | | |
|
|
| |
|
|
|
EUR—Euro Currency
GBP—British Pound
USD—United States Dollar
VALIC Company II Strategic Bond Fund
PORTFOLIO OF INVESTMENTS —August 31, 2019 — (continued)
The following is a summary of the inputs used to value the Fund’s net assets as of August 31, 2019 (see Note 2):
| | | | | | | | | | | | | | | | |
| | | Level 1 - Unadjusted
Quoted Prices
| | | Level 2 - Other
Observable Inputs
| | | Level 3 - Significant
Unobservable Inputs
| | | Total
| |
ASSETS: | | | | | | | | | | | | | | | | |
Investments at Value:* | | | | | | | | | | | | | | | | |
| | | | |
Asset Backed Securities | | $ | — | | | $ | 26,218,079 | | | $ | — | | | $ | 26,218,079 | |
U.S. Corporate Bonds & Notes: | | | | | | | | | | | | | | | | |
Airlines | | | — | | | | 834,565 | | | | 29,850 | | | | 864,415 | |
Finance - Investment Banker/Broker | | | — | | | | 1,357,982 | | | | 25 | | | | 1,358,007 | |
Gambling(Non-Hotel) | | | — | | | | 804,011 | | | | 15,774 | | | | 819,785 | |
Rubber/Plastic Products | | | — | | | | — | | | | 0 | | | | 0 | |
Other Industries | | | — | | | | 290,163,316 | | | | — | | | | 290,163,316 | |
Foreign Corporate Bonds & Notes: | | | | | | | | | | | | | | | | |
Special Purpose Entity | | | — | | | | — | | | | 0 | | | | 0 | |
Other Industries | | | — | | | | 104,899,805 | | | | — | | | | 104,899,805 | |
Foreign Government Obligations | | | — | | | | 71,891,665 | | | | — | | | | 71,891,665 | |
U.S. Government Agencies | | | — | | | | 236,126,773 | | | | — | | | | 236,126,773 | |
U.S. Government Treasuries | | | — | | | | 11,990,835 | | | | — | | | | 11,990,835 | |
Loans | | | — | | | | 46,901,570 | | | | — | | | | 46,901,570 | |
Common Stocks: | | | | | | | | | | | | | | | | |
Building Products - Air & Heating | | | — | | | | 121,254 | | | | — | | | | 121,254 | |
Television | | | — | | | | — | | | | 282,978 | | | | 282,978 | |
Preferred Securities: | | | | | | | | | | | | | | | | |
Building Products- Air & Heating | | | — | | | | 68,518 | | | | — | | | | 68,518 | |
Others | | | 212,364 | | | | — | | | | — | | | | 212,364 | |
Preferred Securities/Capital Securities: | | | | | | | | | | | | | | | | |
Finance Investment Banker/Broker | | | — | | | | — | | | | 10 | | | | 10 | |
Other Industries | | | — | | | | 11,701,511 | | | | — | | | | 11,701,511 | |
Short-Term Investment Securities | | | 34,243,332 | | | | — | | | | — | | | | 34,243,332 | |
| | |
|
|
| |
|
|
| |
|
|
| |
|
|
|
Total Investments at Value | | $ | 34,455,696 | | | $ | 803,079,884 | | | $ | 328,637 | | | $ | 837,864,217 | |
| | |
|
|
| |
|
|
| |
|
|
| |
|
|
|
Other Financial Instruments:+ | | | | | | | | | | | | | | | | |
| | | | |
Forward Foreign Currency Contracts | | $ | — | | | $ | 1,891,220 | | | $ | — | | | $ | 1,891,220 | |
| | |
|
|
| |
|
|
| |
|
|
| |
|
|
|
LIABILITIES: | | | | | | | | | | | | | | | | |
Other Financial Instruments:+ | | | | | | | | | | | | | | | | |
| | | | |
Forward Foreign Currency Contracts | | $ | — | | | $ | 210,934 | | | $ | — | | | $ | 210,934 | |
| | |
|
|
| |
|
|
| |
|
|
| |
|
|
|
| * | For a detailed presentation of investments, please refer to the Portfolio of Investments. |
| + | Amounts represent unrealized appreciation/depreciation as of the end of the reporting period. |
At the beginning and end of the reporting period, Level 3 investments in securities were not considered a material portion of the Fund. There were no Level 3 transfers during the reporting period.
See Notes to Financial Statements
VALIC Company II U.S. Socially Responsible Fund@
PORTFOLIO PROFILE —August 31, 2019 (unaudited)
Industry Allocation*
| | | | |
Applications Software | | | 6.0 | % |
Finance — Credit Card | | | 4.8 | |
Computers | | | 4.4 | |
Repurchase Agreements | | | 4.2 | |
Web Portals/ISP | | | 3.7 | |
Real Estate Investment Trusts | | | 3.6 | |
Medical — Biomedical/Gene | | | 3.2 | |
Cosmetics & Toiletries | | | 2.9 | |
Commercial Services — Finance | | | 2.9 | |
Banks — Super Regional | | | 2.8 | |
Electric — Integrated | | | 2.7 | |
Electronic Components — Semiconductors | | | 2.3 | |
Medical Products | | | 2.3 | |
Retail — Building Products | | | 2.1 | |
Oil Companies — Exploration & Production | | | 1.9 | |
Medical — Drugs | | | 1.7 | |
Beverages — Non — alcoholic | | | 1.7 | |
Telephone — Integrated | | | 1.7 | |
Diagnostic Equipment | | | 1.6 | |
Retail — Restaurants | | | 1.6 | |
Multimedia | | | 1.5 | |
E-Commerce/Services | | | 1.4 | |
Insurance — Multi — line | | | 1.4 | |
Banks — Commercial | | | 1.3 | |
Diversified Manufacturing Operations | | | 1.3 | |
Finance — Other Services | | | 1.3 | |
Cable/Satellite TV | | | 1.3 | |
Investment Management/Advisor Services | | | 1.2 | |
Networking Products | | | 1.2 | |
Insurance — Life/Health | | | 1.2 | |
Food — Misc./Diversified | | | 1.1 | |
Medical — HMO | | | 1.0 | |
Industrial Gases | | | 1.0 | |
Pipelines | | | 1.0 | |
Medical Labs & Testing Services | | | 0.9 | |
Internet Content — Entertainment | | | 0.9 | |
Data Processing/Management | | | 0.9 | |
Banks — Fiduciary | | | 0.9 | |
Electronic Forms | | | 0.8 | |
Finance — Investment Banker/Broker | | | 0.7 | |
Insurance Brokers | | | 0.7 | |
Insurance — Property/Casualty | | | 0.7 | |
Semiconductor Components — Integrated Circuits | | | 0.7 | |
Transport — Rail | | | 0.6 | |
Airlines | | | 0.6 | |
Machinery — General Industrial | | | 0.6 | |
Transport — Services | | | 0.6 | |
Non-Hazardous Waste Disposal | | | 0.6 | |
Electric Products — Misc. | | | 0.6 | |
Water | | | 0.6 | |
Retail — Major Department Stores | | | 0.5 | |
Chemicals — Specialty | | | 0.5 | |
E-Commerce/Products | | | 0.5 | |
Oil — Field Services | | | 0.5 | |
Machinery — Construction & Mining | | | 0.5 | |
Medical — Hospitals | | | 0.5 | |
Chemicals — Diversified | | | 0.4 | |
Retail — Drug Store | | | 0.4 | |
Semiconductor Equipment | | | 0.4 | |
Consumer Products — Misc. | | | 0.4 | |
Electronic Measurement Instruments | | | 0.4 | |
Oil Refining & Marketing | | | 0.4 | |
Machinery — Farming | | | 0.3 | |
U.S. Government Treasuries | | | 0.3 | |
Entertainment Software | | | 0.3 | |
Steel — Producers | | | 0.3 | |
Building Products — Cement | | | 0.3 | |
Retail — Auto Parts | | | 0.3 | |
Building Products — Air & Heating | | | 0.3 | |
| | | | |
Apparel Manufacturers | | | 0.2 | |
Medical Instruments | | | 0.2 | |
Distribution/Wholesale | | | 0.2 | |
Computer Aided Design | | | 0.2 | |
Auto — Cars/Light Trucks | | | 0.2 | |
Retail — Discount | | | 0.2 | |
Engines — Internal Combustion | | | 0.2 | |
Auto — Heavy Duty Trucks | | | 0.2 | |
Retail — Apparel/Shoe | | | 0.2 | |
Containers — Metal/Glass | | | 0.2 | |
Containers — Paper/Plastic | | | 0.2 | |
Food — Retail | | | 0.2 | |
Registered Investment Companies | | | 0.2 | |
Medical — Generic Drugs | | | 0.2 | |
Paper & Related Products | | | 0.2 | |
Computers — Memory Devices | | | 0.2 | |
Food — Meat Products | | | 0.2 | |
Consulting Services | | | 0.2 | |
Decision Support Software | | | 0.1 | |
Medical Information Systems | | | 0.1 | |
Finance — Consumer Loans | | | 0.1 | |
Electric — Distribution | | | 0.1 | |
Web Hosting/Design | | | 0.1 | |
Tools — Hand Held | | | 0.1 | |
Diagnostic Kits | | | 0.1 | |
Industrial Automated/Robotic | | | 0.1 | |
Dental Supplies & Equipment | | | 0.1 | |
Advertising Agencies | | | 0.1 | |
Food — Confectionery | | | 0.1 | |
Electronic Connectors | | | 0.1 | |
Wireless Equipment | | | 0.1 | |
Instruments — Controls | | | 0.1 | |
Retail — Regional Department Stores | | | 0.1 | |
Broadcast Services/Program | | | 0.1 | |
Commercial Services | | | 0.1 | |
Computer Software | | | 0.1 | |
Instruments — Scientific | | | 0.1 | |
Respiratory Products | | | 0.1 | |
Agricultural Chemicals | | | 0.1 | |
Oil Field Machinery & Equipment | | | 0.1 | |
Computer Services | | | 0.1 | |
Retail — Consumer Electronics | | | 0.1 | |
| | |
|
|
|
| | | | 100.2% | |
| | |
|
|
|
| * | Calculated as a percentage of net assets |
VALIC Company II U.S. Socially Responsible Fund@
PORTFOLIO OF INVESTMENTS —August 31, 2019
| | | | | | | | |
| | |
| Security Description | | Shares | | | Value
(Note 2) | |
| |
COMMON STOCKS — 95.5% | |
Advertising Agencies — 0.1% | |
Omnicom Group, Inc. | | | 9,177 | | | $ | 698,003 | |
| | | | | | |
|
|
|
Agricultural Chemicals — 0.1% | |
CF Industries Holdings, Inc. | | | 2,726 | | | | 131,366 | |
Mosaic Co. | | | 19,096 | | | | 351,175 | |
| | | | | | |
|
|
|
| | | | | | | | 482,541 | |
| | | | | | |
|
|
|
Airlines — 0.6% | |
American Airlines Group, Inc. | | | 7,532 | | | | 198,167 | |
Delta Air Lines, Inc. | | | 37,348 | | | | 2,160,955 | |
Southwest Airlines Co. | | | 23,848 | | | | 1,247,727 | |
United Airlines Holdings, Inc.† | | | 11,783 | | | | 993,425 | |
| | | | | | |
|
|
|
| | | | | | | | 4,600,274 | |
| | | | | | |
|
|
|
Apparel Manufacturers — 0.2% | |
Capri Holdings, Ltd.† | | | 5,742 | | | | 151,474 | |
Hanesbrands, Inc. | | | 11,970 | | | | 163,510 | |
PVH Corp. | | | 6,293 | | | | 477,009 | |
Ralph Lauren Corp. | | | 3,701 | | | | 326,946 | |
Tapestry, Inc. | | | 14,993 | | | | 309,606 | |
Under Armour, Inc., Class C† | | | 13,824 | | | | 233,902 | |
| | | | | | |
|
|
|
| | | | | | | | 1,662,447 | |
| | | | | | |
|
|
|
Applications Software — 6.0% | |
Intuit, Inc. | | | 11,025 | | | | 3,179,169 | |
Microsoft Corp. | | | 252,832 | | | | 34,855,420 | |
salesforce.com, Inc.† | | | 32,472 | | | | 5,067,905 | |
| | | | | | |
|
|
|
| | | | | | | | 43,102,494 | |
| | | | | | |
|
|
|
Auto - Cars/Light Trucks — 0.2% | |
Ford Motor Co. | | | 169,907 | | | | 1,558,047 | |
| | | | | | |
|
|
|
Auto - Heavy Duty Trucks — 0.2% | |
PACCAR, Inc. | | | 23,182 | | | | 1,519,812 | |
| | | | | | |
|
|
|
Banks - Commercial — 1.3% | |
BB&T Corp. | | | 75,031 | | | | 3,575,227 | |
Citizens Financial Group, Inc. | | | 57,379 | | | | 1,935,967 | |
First Republic Bank | | | 5,200 | | | | 466,544 | |
M&T Bank Corp. | | | 11,350 | | | | 1,659,484 | |
Regions Financial Corp. | | | 105,393 | | | | 1,540,846 | |
Zions Bancorp NA | | | 3,779 | | | | 155,279 | |
| | | | | | |
|
|
|
| | | | | | | | 9,333,347 | |
| | | | | | |
|
|
|
Banks - Fiduciary — 0.9% | |
Bank of New York Mellon Corp. | | | 78,546 | | | | 3,303,645 | |
Northern Trust Corp. | | | 15,678 | | | | 1,378,567 | |
State Street Corp. | | | 31,582 | | | | 1,620,472 | |
| | | | | | |
|
|
|
| | | | | | | | 6,302,684 | |
| | | | | | |
|
|
|
Banks - Super Regional — 2.8% | |
Comerica, Inc. | | | 5,656 | | | | 348,692 | |
Fifth Third Bancorp | | | 73,408 | | | | 1,941,642 | |
Huntington Bancshares, Inc. | | | 76,405 | | | | 1,012,366 | |
KeyCorp | | | 75,485 | | | | 1,253,051 | |
PNC Financial Services Group, Inc. | | | 45,872 | | | | 5,914,277 | |
SunTrust Banks, Inc. | | | 34,441 | | | | 2,118,466 | |
US Bancorp | | | 138,276 | | | | 7,285,763 | |
| | | | | | |
|
|
|
| | | | | | | | 19,874,257 | |
| | | | | | |
|
|
|
Beverages-Non-alcoholic — 1.7% | |
Monster Beverage Corp.† | | | 18,884 | | | | 1,107,924 | |
PepsiCo, Inc. | | | 80,439 | | | | 10,998,425 | |
| | | | | | |
|
|
|
| | | | | | | | 12,106,349 | |
| | | | | | |
|
|
|
Broadcast Services/Program — 0.1% | |
Discovery, Inc., Class A†# | | | 18,616 | | | | 513,802 | |
| | | | | | |
|
|
|
| | | | | | | | |
| | |
| Security Description | | Shares | | | Value
(Note 2) | |
| |
| | | | | | | | | |
Building Products- Air & Heating — 0.3% | |
Johnson Controls International PLC | | | 45,988 | | | $ | 1,963,228 | |
| | | | | | |
|
|
|
Building Products - Cement — 0.3% | |
Martin Marietta Materials, Inc. | | | 3,842 | | | | 974,984 | |
Vulcan Materials Co. | | | 7,568 | | | | 1,068,980 | |
| | | | | | |
|
|
|
| | | | | | | | 2,043,964 | |
| | | | | | |
|
|
|
Cable/Satellite TV — 1.3% | |
Comcast Corp., Class A | | | 198,646 | | | | 8,792,072 | |
DISH Network Corp., Class A† | | | 9,071 | | | | 304,423 | |
| | | | | | |
|
|
|
| | | | | | | | 9,096,495 | |
| | | | | | |
|
|
|
Chemicals - Diversified — 0.4% | |
Eastman Chemical Co. | | | 6,646 | | | | 434,449 | |
LyondellBasell Industries NV, Class A | | | 19,503 | | | | 1,509,142 | |
PPG Industries, Inc. | | | 11,277 | | | | 1,249,379 | |
| | | | | | |
|
|
|
| | | | | | | | 3,192,970 | |
| | | | | | |
|
|
|
Chemicals - Specialty — 0.5% | |
Ecolab, Inc. | | | 16,521 | | | | 3,408,448 | |
International Flavors & Fragrances, Inc.# | | | 3,427 | | | | 376,113 | |
| | | | | | |
|
|
|
| | | | | | | | 3,784,561 | |
| | | | | | |
|
|
|
Commercial Services — 0.1% | |
Cintas Corp. | | | 1,335 | | | | 352,173 | |
Nielsen Holdings PLC | | | 7,541 | | | | 156,551 | |
| | | | | | |
|
|
|
| | | | | | | | 508,724 | |
| | | | | | |
|
|
|
Commercial Services - Finance — 2.9% | |
Automatic Data Processing, Inc. | | | 26,191 | | | | 4,448,279 | |
FleetCor Technologies, Inc.† | | | 3,186 | | | | 950,702 | |
H&R Block, Inc. | | | 13,643 | | | | 330,434 | |
IHS Markit, Ltd.† | | | 21,641 | | | | 1,419,866 | |
Moody’s Corp. | | | 12,713 | | | | 2,740,669 | |
PayPal Holdings, Inc.† | | | 45,357 | | | | 4,946,181 | |
S&P Global, Inc. | | | 19,453 | | | | 5,061,476 | |
Total System Services, Inc. | | | 6,195 | | | | 831,493 | |
| | | | | | |
|
|
|
| | | | | | | | 20,729,100 | |
| | | | | | |
|
|
|
Computer Aided Design — 0.2% | |
Autodesk, Inc.† | | | 8,651 | | | | 1,235,536 | |
Synopsys, Inc.† | | | 2,329 | | | | 330,275 | |
| | | | | | |
|
|
|
| | | | | | | | 1,565,811 | |
| | | | | | |
|
|
|
Computer Services — 0.1% | |
DXC Technology Co. | | | 13,055 | | | | 433,687 | |
| | | | | | |
|
|
|
Computer Software — 0.1% | |
Akamai Technologies, Inc.† | | | 2,705 | | | | 241,097 | |
Citrix Systems, Inc. | | | 2,776 | | | | 258,112 | |
| | | | | | |
|
|
|
| | | | | | | | 499,209 | |
| | | | | | |
|
|
|
Computers — 4.4% | |
Apple, Inc. | | | 141,522 | | | | 29,541,302 | |
Hewlett Packard Enterprise Co. | | | 93,259 | | | | 1,288,839 | |
HP, Inc. | | | 65,285 | | | | 1,194,063 | |
| | | | | | |
|
|
|
| | | | | | | | 32,024,204 | |
| | | | | | |
|
|
|
Computers - Memory Devices — 0.2% | |
NetApp, Inc. | | | 5,154 | | | | 247,701 | |
Seagate Technology PLC | | | 6,229 | | | | 312,758 | |
Western Digital Corp. | | | 10,547 | | | | 604,027 | |
| | | | | | |
|
|
|
| | | | | | | | 1,164,486 | |
| | | | | | |
|
|
|
Consulting Services — 0.2% | |
Verisk Analytics, Inc. | | | 7,041 | | | | 1,137,403 | |
| | | | | | |
|
|
|
VALIC Company II U.S. Socially Responsible Fund@
PORTFOLIO OF INVESTMENTS —August 31, 2019 — (continued)
| | | | | | | | |
| | |
| Security Description | | Shares | | | Value
(Note 2) | |
| |
COMMON STOCKS (continued) | |
Consumer Products - Misc. — 0.4% | |
Clorox Co. | | | 3,229 | | | $ | 510,698 | |
Kimberly-Clark Corp. | | | 15,588 | | | | 2,199,623 | |
| | | | | | |
|
|
|
| | | | | | | | 2,710,321 | |
| | | | | | |
|
|
|
Containers - Metal/Glass — 0.2% | |
Ball Corp. | | | 17,251 | | | | 1,387,153 | |
| | | | | | |
|
|
|
Containers - Paper/Plastic — 0.2% | |
Packaging Corp. of America | | | 4,437 | | | | 446,273 | |
WestRock Co. | | | 27,050 | | | | 924,569 | |
| | | | | | |
|
|
|
| | | | | | | | 1,370,842 | |
| | | | | | |
|
|
|
Cosmetics & Toiletries — 2.9% | |
Colgate-Palmolive Co. | | | 51,982 | | | | 3,854,465 | |
Coty, Inc., Class A | | | 19,988 | | | | 190,886 | |
Estee Lauder Cos., Inc., Class A | | | 12,927 | | | | 2,559,417 | |
Procter & Gamble Co. | | | 120,084 | | | | 14,437,699 | |
| | | | | | |
|
|
|
| | | | | | | | 21,042,467 | |
| | | | | | |
|
|
|
Data Processing/Management — 0.9% | |
Fidelity National Information Services, Inc. | | | 21,934 | | | | 2,987,849 | |
Fiserv, Inc.† | | | 18,776 | | | | 2,007,905 | |
Paychex, Inc. | | | 17,745 | | | | 1,449,767 | |
| | | | | | |
|
|
|
| | | | | | | | 6,445,521 | |
| | | | | | |
|
|
|
Decision Support Software — 0.1% | |
MSCI, Inc. | | | 4,279 | | | | 1,003,982 | |
| | | | | | |
|
|
|
Dental Supplies & Equipment — 0.1% | |
Align Technology, Inc.† | | | 2,114 | | | | 387,094 | |
DENTSPLY SIRONA, Inc. | | | 7,006 | | | | 365,363 | |
| | | | | | |
|
|
|
| | | | | | | | 752,457 | |
| | | | | | |
|
|
|
Diagnostic Equipment — 1.6% | |
Danaher Corp. | | | 34,694 | | | | 4,929,671 | |
Thermo Fisher Scientific, Inc. | | | 23,618 | | | | 6,779,783 | |
| | | | | | |
|
|
|
| | | | | | | | 11,709,454 | |
| | | | | | |
|
|
|
Diagnostic Kits — 0.1% | |
IDEXX Laboratories, Inc.† | | | 2,935 | | | | 850,387 | |
| | | | | | |
|
|
|
Disposable Medical Products — 0.0% | |
Teleflex, Inc. | | | 978 | | | | 355,914 | |
| | | | | | |
|
|
|
Distribution/Wholesale — 0.2% | |
Fastenal Co. | | | 21,358 | | | | 653,982 | |
LKQ Corp.† | | | 19,468 | | | | 511,424 | |
WW Grainger, Inc. | | | 1,749 | | | | 478,614 | |
| | | | | | |
|
|
|
| | | | | | | | 1,644,020 | |
| | | | | | |
|
|
|
Diversified Manufacturing Operations — 1.3% | |
Eaton Corp. PLC | | | 40,239 | | | | 3,248,092 | |
Illinois Tool Works, Inc. | | | 22,564 | | | | 3,381,441 | |
Ingersoll-Rand PLC | | | 11,309 | | | | 1,369,407 | |
Parker-Hannifin Corp. | | | 8,013 | | | | 1,328,315 | |
| | | | | | |
|
|
|
| | | | | | | | 9,327,255 | |
| | | | | | |
|
|
|
E-Commerce/Products — 0.5% | |
eBay, Inc. | | | 92,972 | | | | 3,745,842 | |
| | | | | | |
|
|
|
E-Commerce/Services — 1.4% | |
Booking Holdings, Inc.† | | | 3,110 | | | | 6,115,535 | |
Expedia Group, Inc. | | | 24,442 | | | | 3,179,904 | |
TripAdvisor, Inc.† | | | 19,292 | | | | 732,903 | |
| | | | | | |
|
|
|
| | | | | | | | 10,028,342 | |
| | | | | | |
|
|
|
Electric Products - Misc. — 0.6% | |
AMETEK, Inc. | | | 13,887 | | | | 1,193,310 | |
Emerson Electric Co. | | | 51,448 | | | | 3,065,786 | |
| | | | | | |
|
|
|
| | | | | | | | 4,259,096 | |
| | | | | | |
|
|
|
| | | | | | | | |
| | |
| Security Description | | Shares | | | Value
(Note 2) | |
| |
| | | | | | | | | |
Electric - Distribution — 0.1% | |
CenterPoint Energy, Inc. | | | 33,728 | | | $ | 933,928 | |
| | | | | | |
|
|
|
Electric - Integrated — 2.7% | |
AES Corp. | | | 79,632 | | | | 1,220,759 | |
CMS Energy Corp. | | | 30,437 | | | | 1,919,053 | |
Consolidated Edison, Inc. | | | 67,546 | | | | 6,004,839 | |
Eversource Energy | | | 43,425 | | | | 3,479,645 | |
PPL Corp. | | | 51,826 | | | | 1,531,458 | |
WEC Energy Group, Inc. | | | 57,656 | | | | 5,521,715 | |
| | | | | | |
|
|
|
| | | | | | | | 19,677,469 | |
| | | | | | |
|
|
|
Electronic Components - Semiconductors — 2.3% | |
Advanced Micro Devices, Inc.†# | | | 22,897 | | | | 720,111 | |
Broadcom, Inc. | | | 13,309 | | | | 3,761,656 | |
Microchip Technology, Inc.# | | | 5,842 | | | | 504,340 | |
Micron Technology, Inc.† | | | 46,050 | | | | 2,084,683 | |
NVIDIA Corp. | | | 19,578 | | | | 3,279,511 | |
Texas Instruments, Inc. | | | 45,718 | | | | 5,657,602 | |
Xilinx, Inc. | | | 5,584 | | | | 581,071 | |
| | | | | | |
|
|
|
| | | | | | | | 16,588,974 | |
| | | | | | |
|
|
|
Electronic Connectors — 0.1% | |
TE Connectivity, Ltd. | | | 6,980 | | | | 636,716 | |
| | | | | | |
|
|
|
Electronic Forms — 0.8% | |
Adobe, Inc.† | | | 21,351 | | | | 6,074,573 | |
| | | | | | |
|
|
|
Electronic Measurement Instruments — 0.4% | |
Agilent Technologies, Inc. | | | 20,294 | | | | 1,443,106 | |
Fortive Corp. | | | 17,623 | | | | 1,249,471 | |
| | | | | | |
|
|
|
| | | | | | | | 2,692,577 | |
| | | | | | |
|
|
|
Engines - Internal Combustion — 0.2% | |
Cummins, Inc. | | | 10,280 | | | | 1,534,496 | |
| | | | | | |
|
|
|
Entertainment Software — 0.3% | |
Activision Blizzard, Inc. | | | 25,373 | | | | 1,283,874 | |
Electronic Arts, Inc.† | | | 9,558 | | | | 895,393 | |
| | | | | | |
|
|
|
| | | | | | | | 2,179,267 | |
| | | | | | |
|
|
|
Finance - Consumer Loans — 0.1% | |
Synchrony Financial | | | 30,072 | | | | 963,808 | |
| | | | | | |
|
|
|
Finance - Credit Card — 4.8% | |
American Express Co. | | | 47,208 | | | | 5,682,427 | |
Discover Financial Services | | | 15,933 | | | | 1,274,162 | |
Mastercard, Inc., Class A | | | 41,397 | | | | 11,647,874 | |
Visa, Inc., Class A# | | | 87,746 | | | | 15,866,232 | |
| | | | | | |
|
|
|
| | | | | | | | 34,470,695 | |
| | | | | | |
|
|
|
Finance - Investment Banker/Broker — 0.7% | |
Charles Schwab Corp. | | | 75,974 | | | | 2,907,525 | |
E*TRADE Financial Corp. | | | 12,545 | | | | 523,628 | |
Jefferies Financial Group, Inc. | | | 96,190 | | | | 1,792,982 | |
| | | | | | |
|
|
|
| | | | | | | | 5,224,135 | |
| | | | | | |
|
|
|
Finance - Other Services — 1.3% | |
Cboe Global Markets, Inc. | | | 3,314 | | | | 394,896 | |
CME Group, Inc. | | | 18,529 | | | | 4,026,166 | |
Intercontinental Exchange, Inc. | | | 42,606 | | | | 3,982,809 | |
Nasdaq, Inc. | | | 8,369 | | | | 835,561 | |
| | | | | | |
|
|
|
| | | | | | | | 9,239,432 | |
| | | | | | |
|
|
|
Food - Confectionery — 0.1% | |
J.M. Smucker Co. | | | 6,558 | | | | 689,639 | |
| | | | | | |
|
|
|
Food - Meat Products — 0.2% | |
Hormel Foods Corp.# | | | 26,725 | | | | 1,138,752 | |
| | | | | | |
|
|
|
VALIC Company II U.S. Socially Responsible Fund@
PORTFOLIO OF INVESTMENTS —August 31, 2019 — (continued)
| | | | | | | | |
| | |
| Security Description | | Shares | | | Value
(Note 2) | |
| |
COMMON STOCKS (continued) | |
Food - Misc./Diversified — 1.1% | |
Campbell Soup Co.# | | | 9,621 | | | $ | 432,945 | |
General Mills, Inc. | | | 38,065 | | | | 2,047,897 | |
Kellogg Co. | | | 21,216 | | | | 1,332,365 | |
Kraft Heinz Co. | | | 110,796 | | | | 2,827,514 | |
Lamb Weston Holdings, Inc. | | | 4,731 | | | | 333,015 | |
McCormick & Co., Inc. | | | 6,723 | | | | 1,094,975 | |
| | | | | | |
|
|
|
| | | | | | | | 8,068,711 | |
| | | | | | |
|
|
|
Food - Retail — 0.2% | |
Kroger Co. | | | 57,715 | | | | 1,366,691 | |
| | | | | | |
|
|
|
Gas- Distribution — 0.0% | |
NiSource, Inc. | | | 11,502 | | | | 339,884 | |
| | | | | | |
|
|
|
Industrial Automated/Robotic — 0.1% | |
Rockwell Automation, Inc. | | | 5,355 | | | | 818,190 | |
| | | | | | |
|
|
|
Industrial Gases — 1.0% | |
Air Products & Chemicals, Inc. | | | 12,730 | | | | 2,875,961 | |
Linde PLC | | | 22,258 | | | | 4,204,759 | |
| | | | | | |
|
|
|
| | | | | | | | 7,080,720 | |
| | | | | | |
|
|
|
Instruments - Controls — 0.1% | |
Mettler-Toledo International, Inc.† | | | 860 | | | | 564,839 | |
| | | | | | |
|
|
|
Instruments - Scientific — 0.1% | |
Waters Corp.† | | | 2,314 | | | | 490,313 | |
| | | | | | |
|
|
|
Insurance Brokers — 0.7% | |
Aon PLC | | | 9,773 | | | | 1,904,269 | |
Marsh & McLennan Cos., Inc. | | | 24,830 | | | | 2,480,269 | |
Willis Towers Watson PLC | | | 4,071 | | | | 805,936 | |
| | | | | | |
|
|
|
| | | | | | | | 5,190,474 | |
| | | | | | |
|
|
|
Insurance - Life/Health — 1.2% | |
Aflac, Inc. | | | 73,809 | | | | 3,703,736 | |
Lincoln National Corp. | | | 14,184 | | | | 750,050 | |
Principal Financial Group, Inc. | | | 7,911 | | | | 421,023 | |
Prudential Financial, Inc. | | | 42,975 | | | | 3,441,868 | |
| | | | | | |
|
|
|
| | | | | | | | 8,316,677 | |
| | | | | | |
|
|
|
Insurance - Multi-line — 1.4% | |
Allstate Corp. | | | 26,877 | | | | 2,751,936 | |
Chubb, Ltd. | | | 34,738 | | | | 5,428,855 | |
Loews Corp. | | | 37,143 | | | | 1,785,464 | |
| | | | | | |
|
|
|
| | | | | | | | 9,966,255 | |
| | | | | | |
|
|
|
Insurance - Property/Casualty — 0.7% | |
Progressive Corp. | | | 21,133 | | | | 1,601,882 | |
Travelers Cos., Inc. | | | 21,868 | | | | 3,213,721 | |
| | | | | | |
|
|
|
| | | | | | | | 4,815,603 | |
| | | | | | |
|
|
|
Internet Content - Entertainment — 0.9% | |
Netflix, Inc.† | | | 18,045 | | | | 5,300,719 | |
Twitter, Inc.† | | | 30,534 | | | | 1,302,275 | |
| | | | | | |
|
|
|
| | | | | | | | 6,602,994 | |
| | | | | | |
|
|
|
Investment Management/Advisor Services — 1.2% | |
Ameriprise Financial, Inc. | | | 7,397 | | | | 954,065 | |
BlackRock, Inc. | | | 11,151 | | | | 4,711,966 | |
Franklin Resources, Inc. | | | 23,895 | | | | 627,961 | |
Invesco, Ltd. | | | 34,146 | | | | 536,092 | |
T. Rowe Price Group, Inc. | | | 14,879 | | | | 1,645,915 | |
| | | | | | |
|
|
|
| | | | | | | | 8,475,999 | |
| | | | | | |
|
|
|
Machinery - Construction & Mining — 0.5% | |
Caterpillar, Inc. | | | 29,098 | | | | 3,462,662 | |
| | | | | | |
|
|
|
| | | | | | | | |
| | |
| Security Description | | Shares | | | Value
(Note 2) | |
| |
| | | | | | | | | |
Machinery - Farming — 0.3% | |
Deere & Co. | | | 15,738 | | | $ | 2,437,974 | |
| | | | | | |
|
|
|
Machinery - General Industrial — 0.6% | |
Roper Technologies, Inc. | | | 10,855 | | | | 3,981,180 | |
Wabtec Corp.# | | | 6,717 | | | | 464,883 | |
| | | | | | |
|
|
|
| | | | | | | | 4,446,063 | |
| | | | | | |
|
|
|
Medical Information Systems — 0.1% | |
Cerner Corp. | | | 14,269 | | | | 983,277 | |
| | | | | | |
|
|
|
Medical Instruments — 0.2% | |
Edwards Lifesciences Corp.† | | | 7,432 | | | | 1,648,715 | |
| | | | | | |
|
|
|
Medical Labs & Testing Services — 0.9% | |
IQVIA Holdings, Inc.† | | | 10,304 | | | | 1,598,665 | |
Laboratory Corp. of America Holdings† | | | 15,339 | | | | 2,570,203 | |
Quest Diagnostics, Inc. | | | 25,527 | | | | 2,613,199 | |
| | | | | | |
|
|
|
| | | | | | | | 6,782,067 | |
| | | | | | |
|
|
|
Medical Products — 2.3% | |
Abbott Laboratories | | | 89,323 | | | | 7,621,038 | |
ABIOMED, Inc.† | | | 866 | | | | 167,199 | |
Baxter International, Inc. | | | 31,832 | | | | 2,799,624 | |
Cooper Cos., Inc. | | | 1,049 | | | | 324,928 | |
Henry Schein, Inc.† | | | 24,376 | | | | 1,502,049 | |
Hologic, Inc.† | | | 3,385 | | | | 167,117 | |
Stryker Corp. | | | 17,248 | | | | 3,805,944 | |
| | | | | | |
|
|
|
| | | | | | | | 16,387,899 | |
| | | | | | |
|
|
|
Medical - Biomedical/Gene — 3.2% | |
Alexion Pharmaceuticals, Inc.† | | | 11,556 | | | | 1,164,382 | |
Amgen, Inc. | | | 33,601 | | | | 7,009,841 | |
Biogen, Inc.† | | | 9,355 | | | | 2,055,761 | |
Celgene Corp.† | | | 29,832 | | | | 2,887,738 | |
Gilead Sciences, Inc. | | | 64,917 | | | | 4,124,826 | |
Illumina, Inc.† | | | 5,811 | | | | 1,634,867 | |
Incyte Corp.† | | | 6,245 | | | | 510,966 | |
Nektar Therapeutics†# | | | 15,073 | | | | 264,833 | |
Regeneron Pharmaceuticals, Inc.† | | | 4,038 | | | | 1,171,222 | |
Vertex Pharmaceuticals, Inc.† | | | 11,817 | | | | 2,127,296 | |
| | | | | | |
|
|
|
| | | | | | | | 22,951,732 | |
| | | | | | |
|
|
|
Medical - Drugs — 1.7% | |
AbbVie, Inc. | | | 56,346 | | | | 3,704,186 | |
Zoetis, Inc. | | | 69,804 | | | | 8,824,622 | |
| | | | | | |
|
|
|
| | | | | | | | 12,528,808 | |
| | | | | | |
|
|
|
Medical - Generic Drugs — 0.2% | |
Perrigo Co. PLC | | | 27,196 | | | | 1,272,229 | |
| | | | | | |
|
|
|
Medical- HMO — 1.0% | |
Centene Corp.† | | | 42,086 | | | | 1,962,049 | |
Humana, Inc. | | | 14,797 | | | | 4,190,659 | |
WellCare Health Plans, Inc.† | | | 5,154 | | | | 1,395,394 | |
| | | | | | |
|
|
|
| | | | | | | | 7,548,102 | |
| | | | | | |
|
|
|
Medical - Hospitals — 0.5% | |
HCA Healthcare, Inc. | | | 28,338 | | | | 3,406,228 | |
| | | | | | |
|
|
|
Multimedia — 1.5% | |
Viacom, Inc., Class B | | | 17,691 | | | | 441,921 | |
Walt Disney Co. | | | 74,174 | | | | 10,181,123 | |
| | | | | | |
|
|
|
| | | | | | | | 10,623,044 | |
| | | | | | |
|
|
|
Networking Products — 1.2% | |
Cisco Systems, Inc. | | | 181,070 | | | | 8,475,887 | |
| | | | | | |
|
|
|
Non-Hazardous Waste Disposal — 0.6% | |
Republic Services, Inc. | | | 13,841 | | | | 1,235,309 | |
VALIC Company II U.S. Socially Responsible Fund@
PORTFOLIO OF INVESTMENTS —August 31, 2019 — (continued)
| | | | | | | | |
| | |
| Security Description | | Shares | | | Value
(Note 2) | |
| |
COMMON STOCKS (continued) | |
Non-Hazardous Waste Disposal (continued) | |
Waste Management, Inc. | | | 25,979 | | | $ | 3,100,594 | |
| | | | | | |
|
|
|
| | | | | | | | 4,335,903 | |
| | | | | | |
|
|
|
Office Automation & Equipment — 0.0% | |
Xerox Holdings Corp. | | | 1,856 | | | | 53,805 | |
| | | | | | |
|
|
|
Oil Companies - Exploration & Production — 1.9% | |
Apache Corp. | | | 32,866 | | | | 708,919 | |
Cabot Oil & Gas Corp. | | | 23,072 | | | | 394,993 | |
Concho Resources, Inc. | | | 11,438 | | | | 836,690 | |
Devon Energy Corp. | | | 37,818 | | | | 831,618 | |
Diamondback Energy, Inc. | | | 11,259 | | | | 1,104,283 | |
EOG Resources, Inc. | | | 37,827 | | | | 2,806,385 | |
Hess Corp. | | | 22,443 | | | | 1,412,787 | |
Marathon Oil Corp. | | | 87,271 | | | | 1,033,289 | |
Noble Energy, Inc. | | | 40,121 | | | | 905,932 | |
Occidental Petroleum Corp. | | | 55,030 | | | | 2,392,704 | |
Pioneer Natural Resources Co. | | | 11,137 | | | | 1,374,528 | |
| | | | | | |
|
|
|
| | | | | | | | 13,802,128 | |
| | | | | | |
|
|
|
Oil Field Machinery & Equipment — 0.1% | |
National Oilwell Varco, Inc. | | | 23,125 | | | | 472,444 | |
| | | | | | |
|
|
|
Oil Refining & Marketing — 0.4% | |
HollyFrontier Corp. | | | 15,614 | | | | 692,637 | |
Valero Energy Corp. | | | 25,324 | | | | 1,906,391 | |
| | | | | | |
|
|
|
| | | | | | | | 2,599,028 | |
| | | | | | |
|
|
|
Oil- Field Services — 0.5% | |
Baker Hughes a GE Co., LLC | | | 23,595 | | | | 511,776 | |
Schlumberger, Ltd. | | | 84,189 | | | | 2,730,249 | |
TechnipFMC PLC | | | 13,548 | | | | 336,532 | |
| | | | | | |
|
|
|
| | | | | | | | 3,578,557 | |
| | | | | | |
|
|
|
Paper & Related Products — 0.2% | |
International Paper Co. | | | 30,908 | | | | 1,208,503 | |
| | | | | | |
|
|
|
Pipelines — 1.0% | |
Kinder Morgan, Inc. | | | 199,493 | | | | 4,043,723 | |
ONEOK, Inc. | | | 41,170 | | | | 2,934,598 | |
| | | | | | |
|
|
|
| | | | | | | | 6,978,321 | |
| | | | | | |
|
|
|
Real Estate Investment Trusts — 3.6% | |
American Tower Corp. | | | 22,813 | | | | 5,251,325 | |
AvalonBay Communities, Inc. | | | 8,202 | | | | 1,743,417 | |
Crown Castle International Corp. | | | 21,917 | | | | 3,181,691 | |
Digital Realty Trust, Inc. | | | 6,018 | | | | 744,005 | |
Equinix, Inc. | | | 2,750 | | | | 1,529,770 | |
Equity Residential | | | 22,094 | | | | 1,872,687 | |
Host Hotels & Resorts, Inc. | | | 10,957 | | | | 175,750 | |
Prologis, Inc. | | | 38,909 | | | | 3,253,571 | |
Public Storage | | | 5,782 | | | | 1,530,727 | |
Realty Income Corp. | | | 3,948 | | | | 291,402 | |
SBA Communications Corp. | | | 1,762 | | | | 462,402 | |
Simon Property Group, Inc. | | | 18,038 | | | | 2,686,580 | |
Ventas, Inc. | | | 10,965 | | | | 804,721 | |
Welltower, Inc. | | | 19,038 | | | | 1,705,043 | |
Weyerhaeuser Co. | | | 20,645 | | | | 543,170 | |
| | | | | | |
|
|
|
| | | | | | | | 25,776,261 | |
| | | | | | |
|
|
|
Rental Auto/Equipment — 0.0% | |
United Rentals, Inc.† | | | 3,004 | | | | 338,130 | |
| | | | | | |
|
|
|
Respiratory Products — 0.1% | |
ResMed, Inc. | | | 3,508 | | | | 488,664 | |
| | | | | | |
|
|
|
Retail - Apparel/Shoe — 0.2% | |
Ross Stores, Inc. | | | 13,305 | | | | 1,410,463 | |
| | | | | | |
|
|
|
| | | | | | | | |
| | |
| Security Description | | Shares | | | Value
(Note 2) | |
| |
| | | | | | | | | |
Retail - Auto Parts — 0.3% | |
Genuine Parts Co. | | | 9,801 | | | $ | 884,932 | |
O’Reilly Automotive, Inc.† | | | 3,012 | | | | 1,155,885 | |
| | | | | | |
|
|
|
| | | | | | | | 2,040,817 | |
| | | | | | |
|
|
|
Retail - Automobile — 0.0% | |
CarMax, Inc.†# | | | 3,763 | | | | 313,383 | |
| | | | | | |
|
|
|
Retail - Building Products — 2.1% | |
Home Depot, Inc. | | | 49,298 | | | | 11,235,507 | |
Lowe’s Cos., Inc. | | | 32,658 | | | | 3,664,228 | |
| | | | | | |
|
|
|
| | | | | | | | 14,899,735 | |
| | | | | | |
|
|
|
Retail - Consumer Electronics — 0.1% | |
Best Buy Co., Inc. | | | 5,858 | | | | 372,862 | |
| | | | | | |
|
|
|
Retail - Discount — 0.2% | |
Dollar Tree, Inc.† | | | 15,271 | | | | 1,550,465 | |
| | | | | | |
|
|
|
Retail - Drug Store — 0.4% | |
Walgreens Boots Alliance, Inc. | | | 61,264 | | | | 3,136,104 | |
| | | | | | |
|
|
|
Retail - Jewelry — 0.0% | |
Tiffany & Co. | | | 1,583 | | | | 134,349 | |
| | | | | | |
|
|
|
Retail - Major Department Stores — 0.5% | |
Nordstrom, Inc.# | | | 10,376 | | | | 300,593 | |
TJX Cos., Inc. | | | 64,835 | | | | 3,563,980 | |
| | | | | | |
|
|
|
| | | | | | | | 3,864,573 | |
| | | | | | |
|
|
|
Retail - Perfume & Cosmetics — 0.0% | |
Ulta Beauty, Inc.† | | | 1,019 | | | | 242,247 | |
| | | | | | |
|
|
|
Retail - Regional Department Stores — 0.1% | |
Macy’s, Inc. | | | 35,257 | | | | 520,393 | |
| | | | | | |
|
|
|
Retail - Restaurants — 1.6% | |
Chipotle Mexican Grill, Inc.† | | | 969 | | | | 812,429 | |
Darden Restaurants, Inc. | | | 5,238 | | | | 633,693 | |
Starbucks Corp. | | | 65,140 | | | | 6,289,918 | |
Yum! Brands, Inc. | | | 30,242 | | | | 3,531,661 | |
| | | | | | |
|
|
|
| | | | | | | | 11,267,701 | |
| | | | | | |
|
|
|
Semiconductor Components - Integrated Circuits — 0.7% | |
Analog Devices, Inc. | | | 16,100 | | | | 1,768,263 | |
QUALCOMM, Inc. | | | 38,023 | | | | 2,957,049 | |
| | | | | | |
|
|
|
| | | | | | | | 4,725,312 | |
| | | | | | |
|
|
|
Semiconductor Equipment — 0.4% | |
Applied Materials, Inc. | | | 33,167 | | | | 1,592,679 | |
KLA Corp. | | | 2,402 | | | | 355,256 | |
Lam Research Corp. | | | 4,599 | | | | 968,136 | |
| | | | | | |
|
|
|
| | | | | | | | 2,916,071 | |
| | | | | | |
|
|
|
Steel - Producers — 0.3% | |
Nucor Corp. | | | 42,868 | | | | 2,099,675 | |
| | | | | | |
|
|
|
Telecom Equipment - Fiber Optics — 0.0% | |
Corning, Inc. | | | 10,702 | | | | 298,051 | |
| | | | | | |
|
|
|
Telephone - Integrated — 1.7% | |
CenturyLink, Inc. | | | 79,220 | | | | 901,524 | |
Verizon Communications, Inc. | | | 189,333 | | | | 11,011,607 | |
| | | | | | |
|
|
|
| | | | | | | | 11,913,131 | |
| | | | | | |
|
|
|
Tools - Hand Held — 0.1% | |
Stanley Black & Decker, Inc. | | | 6,411 | | | | 851,765 | |
| | | | | | |
|
|
|
Transport - Rail — 0.6% | |
CSX Corp. | | | 37,275 | | | | 2,498,170 | |
Norfolk Southern Corp. | | | 12,079 | | | | 2,102,350 | |
| | | | | | |
|
|
|
| | | | | | | | 4,600,520 | |
| | | | | | |
|
|
|
VALIC Company II U.S. Socially Responsible Fund@
PORTFOLIO OF INVESTMENTS —August 31, 2019 — (continued)
| | | | | | | | |
| | |
| Security Description | | Shares/
Principal
Amount | | | Value
(Note 2) | |
| |
COMMON STOCKS (continued) | |
Transport - Services — 0.6% | |
United Parcel Service, Inc., Class B | | | 37,252 | | | $ | 4,420,322 | |
| | | | | | |
|
|
|
Water — 0.6% | |
American Water Works Co., Inc. | | | 32,084 | | | | 4,084,935 | |
| | | | | | |
|
|
|
Web Hosting/Design — 0.1% | |
VeriSign, Inc.† | | | 4,340 | | | | 884,709 | |
| | | | | | |
|
|
|
Web Portals/ISP — 3.7% | |
Alphabet, Inc., Class A† | | | 22,364 | | | | 26,625,013 | |
| | | | | | |
|
|
|
Wireless Equipment — 0.1% | |
Motorola Solutions, Inc. | | | 3,492 | | | | 631,738 | |
| | | | | | |
|
|
|
Total Long-Term Investment Securities | | | | | | | | |
(cost $502,024,277) | | | | | | | 687,063,528 | |
| | | |
|
|
|
SHORT-TERM INVESTMENT SECURITIES — 0.5% | |
Registered Investment Companies — 0.2% | |
State Street Navigator Securities Lending Government Money Market Portfolio
2.12%(1)(2) | | | 1,353,802 | | | | 1,353,802 | |
| | | | | | |
|
|
|
U.S. Government Treasuries — 0.3% | |
United States Treasury Bills
2.10% due 09/19/2019(4) | | $ | 2,400,000 | | | | 2,397,914 | |
| | | | | | |
|
|
|
Total Short-Term Investment Securities | | | | | | | | |
(cost $3,751,288) | | | | | | | 3,751,716 | |
| | | |
|
|
|
REPURCHASE AGREEMENTS — 4.2% | |
Agreement with Fixed Income Clearing Corp., bearing interest at 0.42%, dated 08/30/2019, to be repurchased 09/03/2019 in the amount of $30,185,409 collateralized by $27,370,000 of United States Treasury Notes, bearing interest at 0.13% due 01/15/2022 and having an approximate value of $30,792,920
(cost $30,184,000) | | | 30,184,000 | | | | 30,184,000 | |
| | | | | | |
|
|
|
TOTAL INVESTMENTS | | | | | | | | |
(cost $535,959,565)(3) | | | 100.2 | % | | | 720,999,244 | |
Liabilities in excess of other assets | | | (0.2 | ) | | | (1,214,971 | ) |
| | |
|
|
| |
|
|
|
NET ASSETS | | | 100.0 | % | | $ | 719,784,273 | |
| | |
|
|
| |
|
|
|
| † | Non-income producing security |
| # | The security or a portion thereof is out on loan (see Note 2). |
| (1) | The rate shown is the7-day yield as of August 31, 2019. |
| (2) | At August 31, 2019, the Fund had loaned securities with a total value of $20,512,494. This was secured by collateral of $1,353,802, which was received in cash and subsequently invested in short-term investments currently valued at $1,353,802 as reported in the Portfolio of Investments. Additional collateral of $19,584,912 was received in the form of fixed income pooled securities, which the Fund cannot sell or repledge and accordingly are not reflected in the Fund’s assets and liabilities. |
The components of the fixed income pooled securities referenced above are as follows:
| | | | | | | | |
Securities
| | Coupon Range
| | Maturity Date Range
| | Value as of
August 31, 2019
| |
United States Treasury Bills | | 0.00% | | 09/12/2019 to 01/09/2020 | | $ | 482,841 | |
United States Treasury Notes/Bonds | | zero coupon to 8.75% | | 09/30/2019 to 02/15/2049 | | | 19,102,071 | |
| (3) | See Note 5 for cost of investments on a tax basis. |
| (4) | The security or a portion thereof was pledged as collateral to cover margin requirements for open futures contracts. |
| | | | | | | | | | | | | | | | | | | | | | |
| Futures Contracts | | | | | | | | | | |
Number of
Contracts | | | Type | | Description | | Expiration
Month | | | Notional
Basis# | | | Notional
Value# | | | Unrealized
Appreciation
(Depreciation) | |
| | 227 | | | Long | | S&P 500E-Mini Index | | | September 2019 | | | $ | 32,859,256 | | | $ | 33,196,480 | | | $ | 337,224 | |
| | | | | | | | | | | | | | | | | | | | |
|
|
|
| # | Notional basis refers to the contractual amount agreed upon at inception of the open contract; notional value represents the current value of the open contract. |
VALIC Company II U.S. Socially Responsible Fund@
PORTFOLIO OF INVESTMENTS —August 31, 2019 — (continued)
The following is a summary of the inputs used to value the Fund’s net assets as of August 31, 2019 (see Note 2):
| | | | | | | | | | | | | | | | |
| | | Level 1 - Unadjusted
Quoted Prices
| | | Level 2 - Other
Observable Inputs
| | | Level 3 - Significant
Unobservable Inputs
| | | Total
| |
ASSETS: | | | | | | | | | | | | | | | | |
Investments at Value:* | | | | | | | | | | | | | | | | |
| | | | |
Common Stocks | | $ | 687,063,528 | | | $ | — | | | $ | — | | | $ | 687,063,528 | |
Short-Term Investment Securities: | | | | | | | | | | | | | | | | |
Registered Investment Companies | | | 1,353,802 | | | | — | | | | — | | | | 1,353,802 | |
U.S. Government Treasuries | | | — | | | | 2,397,914 | | | | — | | | | 2,397,914 | |
Repurchase Agreements | | | — | | | | 30,184,000 | | | | — | | | | 30,184,000 | |
| | |
|
|
| |
|
|
| |
|
|
| |
|
|
|
Total Investments at Value | | $ | 688,417,330 | | | $ | 32,581,914 | | | $ | — | | | $ | 720,999,244 | |
| | |
|
|
| |
|
|
| |
|
|
| |
|
|
|
Other Financial Instruments:+ | | | | | | | | | | | | | | | | |
| | | | |
Futures Contracts | | $ | 337,224 | | | $ | — | | | $ | — | | | $ | 337,224 | |
| | |
|
|
| |
|
|
| |
|
|
| |
|
|
|
| * | For a detailed presentation of investments, please refer to the Portfolio of Investments. |
| + | Amounts represent unrealized appreciation/depreciation as of the end of the reporting period. |
See Notes to Financial Statements
VALIC Company II
STATEMENTS OF ASSETS AND LIABILITIES —August 31, 2019
| | | | | | | | | | | | | | | | | | | | | | | | | | | | |
| | | AGGRESSIVE
GROWTH
LIFESTYLE FUND | | | CAPITAL
APPRECIATION
FUND | | | CONSERVATIVE
GROWTH
LIFESTYLE FUND | | | CORE BOND
FUND | | | GOVERNMENT
MONEY MARKET II
FUND | | | HIGH YIELD
BOND FUND | | | INTERNATIONAL
OPPORTUNITIES
FUND | |
ASSETS: | | | | | | | | | | | | | | | | | | | | | | | | | | | | |
Investment at value (unaffiliated)*+ | | $ | – | | | $ | 101,824,879 | | | $ | – | | | $ | 1,587,806,200 | | | $ | 117,215,019 | | | $ | 656,904,041 | | | $ | 576,291,571 | |
Investment at value (affiliated)*+ | | | 578,972,859 | | | | – | | | | 324,468,201 | | | | – | | | | – | | | | – | | | | – | |
Repurchase agreements (cost equals market value) | | | – | | | | – | | | | – | | | | – | | | | – | | | | 16,751,000 | | | | 13,635,000 | |
Cash | | | 209,444 | | | | 265,028 | | | | 63,738 | | | | 1,740,126 | | | | 18,030,456 | | | | – | | | | 4,003 | |
Foreign cash* | | | – | | | | – | | | | – | | | | – | | | | – | | | | 431,949 | | | | 115,009 | |
Cash collateral for futures contracts | | | – | | | | – | | | | – | | | | – | | | | – | | | | – | | | | – | |
Receivable for: | | | | | | | | | | | | | | | | | | | | | | | | | | | | |
Fund shares sold | | | 188,394 | | | | 3,096 | | | | 48,360 | | | | 677,706 | | | | 55,061 | | | | 225,081 | | | | 38,565 | |
Dividends and interest | | | – | | | | 127,340 | | | | – | | | | 11,850,810 | | | | 245,187 | | | | 9,569,989 | | | | 1,177,649 | |
Investments sold | | | – | | | | 1,023,621 | | | | – | | | | 2,810,056 | | | | – | | | | – | | | | 593,554 | |
Investments sold on an extended settlement basis | | | – | | | | – | | | | – | | | | – | | | | – | | | | – | | | | – | |
Securities lending income | | | – | | | | – | | | | – | | | | 6,544 | | | | – | | | | 10,336 | | | | 32,180 | |
Prepaid expenses and other assets | | | 26,568 | | | | 15,134 | | | | 19,203 | | | | 51,289 | | | | 29,049 | | | | 33,086 | | | | 58,268 | |
Due from investment adviser for expense reimbursements/fee waivers | | | 22,821 | | | | 18,604 | | | | 16,943 | | | | 33,296 | | | | 15,315 | | | | 7,686 | | | | 114,071 | |
Unrealized appreciation on forward foreign currency contracts | | | – | | | | – | | | | – | | | | – | | | | – | | | | 110,259 | | | | – | |
Swap premiums paid | | | – | | | | – | | | | – | | | | – | | | | – | | | | 131,053 | | | | – | |
| | |
|
|
| |
|
|
| |
|
|
| |
|
|
| |
|
|
| |
|
|
| |
|
|
|
TOTAL ASSETS | | | 579,420,086 | | | | 103,277,702 | | | | 324,616,445 | | | | 1,604,976,027 | | | | 135,590,087 | | | | 684,174,480 | | | | 592,059,870 | |
| | |
|
|
| |
|
|
| |
|
|
| |
|
|
| |
|
|
| |
|
|
| |
|
|
|
LIABILITIES: | | | | | | | | | | | | | | | | | | | | | | | | | | | | |
Payable for: | | | | | | | | | | | | | | | | | | | | | | | | | | | | |
Fund shares reacquired | | | 53,265 | | | | 32,895 | | | | 42,411 | | | | 616,649 | | | | 76,805 | | | | 336,338 | | | | 193,856 | |
Investments purchased | | | 137,155 | | | | – | | | | 7,054 | | | | 7,239,320 | | | | 15,981,864 | | | | 717,628 | | | | 303,766 | |
Investments purchased on an extended settlement basis | | | – | | | | – | | | | – | | | | 1,914,323 | | | | – | | | | – | | | | – | |
Payments on swap contracts | | | – | | | | – | | | | – | | | | – | | | | – | | | | 3,650 | | | | – | |
Investment advisory and management fees | | | 49,124 | | | | 48,207 | | | | 27,479 | | | | 583,544 | | | | 25,253 | | | | 339,137 | | | | 398,200 | |
Administrative service fees | | | – | | | | 5,849 | | | | – | | | | 92,391 | | | | 6,740 | | | | 37,798 | | | | 32,506 | |
Shareholder services | | | – | | | | 21,912 | | | | – | | | | 346,137 | | | | 25,253 | | | | 141,607 | | | | 121,783 | |
Transfer agent fees and expenses | | | 241 | | | | 482 | | | | 241 | | | | 482 | | | | 181 | | | | 482 | | | | 422 | |
Trustees’ fees and expenses | | | 22,043 | | | | 8,931 | | | | 14,447 | | | | 43,130 | | | | 21,921 | | | | 26,589 | | | | 49,221 | |
Other accrued expenses | | | 109,647 | | | | 79,115 | | | | 88,456 | | | | 271,119 | | | | 85,648 | | | | 161,628 | | | | 379,052 | |
Accrued foreign tax on capital gains | | | – | | | | – | | | | – | | | | – | | | | – | | | | – | | | | 71,118 | |
Collateral upon return of securities loaned | | | – | | | | – | | | | – | | | | 4,651,380 | | | | – | | | | 24,944,623 | | | | 14,312,891 | |
Variation margin on futures contracts | | | – | | | | – | | | | – | | | | – | | | | – | | | | – | | | | – | |
Due to custodian | | | – | | | | – | | | | – | | | | – | | | | – | | | | 5,879 | | | | – | |
Due to broker | | | – | | | | – | | | | – | | | | – | | | | – | | | | 35,495 | | | | – | |
Commitments (Note 12) | | | – | | | | – | | | | – | | | | – | | | | – | | | | – | | | | – | |
Unrealized depreciation on forward foreign currency contracts | | | – | | | | – | | | | – | | | | – | | | | – | | | | – | | | | – | |
Unrealized depreciation on swap contracts | | | – | | | | – | | | | – | | | | – | | | | – | | | | 59,214 | | | | – | |
| | |
|
|
| |
|
|
| |
|
|
| |
|
|
| |
|
|
| |
|
|
| |
|
|
|
TOTAL LIABILITIES | | | 371,475 | | | | 197,391 | | | | 180,088 | | | | 15,758,475 | | | | 16,223,665 | | | | 26,810,068 | | | | 15,862,815 | |
| | |
|
|
| |
|
|
| |
|
|
| |
|
|
| |
|
|
| |
|
|
| |
|
|
|
NET ASSETS | | $ | 579,048,611 | | | $ | 103,080,311 | | | $ | 324,436,357 | | | $ | 1,589,217,552 | | | $ | 119,366,422 | | | $ | 657,364,412 | | | $ | 576,197,055 | |
| | |
|
|
| |
|
|
| |
|
|
| |
|
|
| |
|
|
| |
|
|
| |
|
|
|
NET ASSETS REPRESENTED BY: | | | | | | | | | | | | | | | | | | | | | | | | | | | | |
Trust shares at par value of $0.01 per share | | $ | 573,774 | | | $ | 69,231 | | | $ | 273,686 | | | $ | 1,378,088 | | | $ | 1,193,447 | | | $ | 858,413 | | | $ | 312,529 | |
Additional paid in capital | | | 543,434,900 | | | | 85,781,094 | | | | 312,186,355 | | | | 1,474,126,786 | | | | 118,180,470 | | | | 633,239,826 | | | | 494,501,744 | |
Total accumulated earnings (loss) | | | 35,039,937 | | | | 17,229,986 | | | | 11,976,316 | | | | 113,712,678 | | | | (7,495 | ) | | | 23,266,173 | | | | 81,382,782 | |
| | |
|
|
| |
|
|
| |
|
|
| |
|
|
| |
|
|
| |
|
|
| |
|
|
|
NET ASSETS | | $ | 579,048,611 | | | $ | 103,080,311 | | | $ | 324,436,357 | | | $ | 1,589,217,552 | | | $ | 119,366,422 | | | $ | 657,364,412 | | | $ | 576,197,055 | |
| | |
|
|
| |
|
|
| |
|
|
| |
|
|
| |
|
|
| |
|
|
| |
|
|
|
SHARES OF BENEFICIAL INTEREST: | | | | | | | | | | | | | | | | | | | | | | | | | | | | |
Authorized (Par value $0.01 per share) | | | 1,000,000,000 | | | | 1,000,000,000 | | | | 1,000,000,000 | | | | 1,000,000,000 | | | | 1,000,000,000 | | | | 1,000,000,000 | | | | 1,000,000,000 | |
Outstanding | | | 57,377,364 | | | | 6,923,084 | | | | 27,368,642 | | | | 137,808,844 | | | | 119,344,696 | | | | 85,841,276 | | | | 31,252,932 | |
NET ASSET VALUE, OFFERING AND REDEMPTION PRICE PER SHARE | | $ | 10.09 | | | $ | 14.89 | | | $ | 11.85 | | | $ | 11.53 | | | $ | 1.00 | | | $ | 7.66 | | | $ | 18.44 | |
| | |
|
|
| |
|
|
| |
|
|
| |
|
|
| |
|
|
| |
|
|
| |
|
|
|
* Cost | | | | | | | | | | | | | | | | | | | | | | | | | | | | |
Investments (unaffiliated) | | $ | – | | | $ | 87,465,156 | | | $ | – | | | $ | 1,519,695,748 | | | $ | 117,215,019 | | | $ | 650,307,220 | | | $ | 500,847,665 | |
| | |
|
|
| |
|
|
| |
|
|
| |
|
|
| |
|
|
| |
|
|
| |
|
|
|
Investments (affiliated) | | $ | 583,508,361 | | | $ | – | | | $ | 320,640,772 | | | $ | – | | | $ | – | | | $ | – | | | $ | – | |
| | |
|
|
| |
|
|
| |
|
|
| |
|
|
| |
|
|
| |
|
|
| |
|
|
|
Foreign cash | | $ | – | | | $ | – | | | $ | – | | | $ | – | | | $ | – | | | $ | 431,910 | | | $ | 114,939 | |
| | |
|
|
| |
|
|
| |
|
|
| |
|
|
| |
|
|
| |
|
|
| |
|
|
|
† Including securities on loan | | $ | – | | | $ | – | | | $ | – | | | $ | 18,414,166 | | | $ | – | | | $ | 26,840,167 | | | $ | 32,595,825 | |
| | |
|
|
| |
|
|
| |
|
|
| |
|
|
| |
|
|
| |
|
|
| |
|
|
|
See Notes to Financial Statements
VALIC Company II
STATEMENTS OF ASSETS AND LIABILITIES —August 31, 2019 — (continued)
| | | | | | | | | | | | | | | | | | | | | | | | | | | | | | | | |
| | | LARGE CAP
VALUE FUND | | | MID CAP
GROWTH FUND | | | MID CAP
VALUE FUND | | | MODERATE
GROWTH
LIFESTYLE FUND | | | SMALL CAP
GROWTH FUND | | | SMALL CAP
VALUE FUND | | | STRATEGIC
BOND FUND | | | U.S. SOCIALLY
RESPONSIBLE
FUND# | |
ASSETS: | | | | | | | | | | | | | | | | | | | | | | | | | | | | | | | | |
Investment at value (unaffiliated)*+ | | $ | 270,838,185 | | | $ | 244,302,512 | | | $ | 738,451,654 | | | $ | – | | | $ | 197,688,683 | | | $ | 311,807,130 | | | $ | 837,864,217 | | | $ | 690,815,244 | |
Investment at value (affiliated)*+ | | | – | | | | – | | | | – | | | | 943,493,944 | | | | – | | | | – | | | | – | | | | – | |
Repurchase agreements (cost equals market value) | | | – | | | | – | | | | 5,807,000 | | | | – | | | | – | | | | 7,282,000 | | | | – | | | | 30,184,000 | |
Cash | | | 438,590 | | | | 504,946 | | | | 493 | | | | 2,735 | | | | 1,241,286 | | | | 220 | | | | 1,346,760 | | | | 529 | |
Foreign cash* | | | – | | | | 150 | | | | 29 | | | | – | | | | – | | | | – | | | | 1,551 | | | | – | |
Cash collateral for futures contracts | | | – | | | | – | | | | – | | | | – | | | | – | | | | 532,000 | | | | – | | | | – | |
Receivable for: | | | | | | | | | | | | | | | | | | | | | | | | | | | | | | | | |
Fund shares sold | | | 3,669 | | | | 106,460 | | | | 6,287 | | | | 87,642 | | | | 21,257 | | | | 23,067 | | | | 332,288 | | | | 19,241 | |
Dividends and interest | | | 590,586 | | | | 161,085 | | | | 975,937 | | | | – | | | | 73,531 | | | | 390,332 | | | | 8,173,056 | | | | 982,111 | |
Investments sold | | | 1,658,713 | | | | 147,875 | | | | 2,228,030 | | | | 155,532 | | | | – | | | | 1,743,309 | | | | 1,445,461 | | | | – | |
Investments sold on an extended settlement basis | | | – | | | | – | | | | – | | | | – | | | | – | | | | – | | | | 15,689,496 | | | | – | |
Securities lending income | | | 1,127 | | | | 7,860 | | | | 1,690 | | | | – | | | | 19,065 | | | | 3,995 | | | | 7,770 | | | | 2,327 | |
Prepaid expenses and other assets | | | 36,521 | | | | 21,128 | | | | 68,866 | | | | 38,113 | | | | 21,830 | | | | 64,011 | | | | 48,467 | | | | 60,572 | |
Due from investment adviser for expense reimbursements/fee waivers | | | 26,492 | | | | 63,756 | | | | 920 | | | | 31,195 | | | | 19,444 | | | | 30,194 | | | | – | | | | 31,995 | |
Unrealized appreciation on forward foreign currency contracts | | | – | | | | – | | | | – | | | | – | | | | – | | | | – | | | | 1,891,220 | | | | – | |
Swap premiums paid | | | – | | | | – | | | | – | | | | – | | | | – | | | | – | | | | – | | | | – | |
| | |
|
|
| |
|
|
| |
|
|
| |
|
|
| |
|
|
| |
|
|
| |
|
|
| |
|
|
|
TOTAL ASSETS | | | 273,593,883 | | | | 245,315,772 | | | | 747,540,906 | | | | 943,809,161 | | | | 199,085,096 | | | | 321,876,258 | | | | 866,800,286 | | | | 722,096,019 | |
| | |
|
|
| |
|
|
| |
|
|
| |
|
|
| |
|
|
| |
|
|
| |
|
|
| |
|
|
|
LIABILITIES: | | | | | | | | | | | | | | | | | | | | | | | | | | | | | | | | |
Payable for: | | | | | | | | | | | | | | | | | | | | | | | | | | | | | | | | |
Fund shares reacquired | | | 107,306 | | | | 43,712 | | | | 322,890 | | | | 243,174 | | | | 13,918 | | | | 117,697 | | | | 267,126 | | | | 379,335 | |
Investments purchased | | | 1,647,430 | | | | 91,409 | | | | 2,848,143 | | | | 2,734 | | | | – | | | | 1,719,635 | | | | 1,925,534 | | | | – | |
Investments purchased on an extended settlement basis | | | – | | | | – | | | | – | | | | – | | | | – | | | | – | | | | 17,332,092 | | | | – | |
Payments on swap contracts | | | – | | | | – | | | | – | | | | – | | | | – | | | | – | | | | – | | | | – | |
Investment advisory and management fees | | | 115,338 | | | | 151,426 | | | | 442,684 | | | | 79,734 | | | | 136,379 | | | | 181,702 | | | | 364,034 | | | | 152,091 | |
Administrative service fees | | | 15,393 | | | | 13,828 | | | | 41,983 | | | | – | | | | 11,022 | | | | 18,218 | | | | 48,315 | | | | 40,596 | |
Shareholder services | | | 57,669 | | | | 51,806 | | | | 157,285 | | | | – | | | | 41,291 | | | | 68,252 | | | | 181,008 | | | | 152,091 | |
Transfer agent fees and expenses | | | 482 | | | | 422 | | | | 542 | | | | 241 | | | | 482 | | | | 422 | | | | 663 | | | | 241 | |
Trustees’ fees and expenses | | | 19,842 | | | | 14,501 | | | | 61,874 | | | | 33,749 | | | | 10,067 | | | | 34,758 | | | | 43,773 | | | | 54,080 | |
Other accrued expenses | | | 107,639 | | | | 94,963 | | | | 205,311 | | | | 138,223 | | | | 98,990 | | | | 200,922 | | | | 256,191 | | | | 157,940 | |
Accrued foreign tax on capital gains | | | – | | | | – | | | | – | | | | – | | | | – | | | | – | | | | – | | | | – | |
Collateral upon return of securities loaned | | | 36,197 | | | | 2,341,559 | | | | – | | | | – | | | | 6,431,724 | | | | 3,476,575 | | | | 7,573,660 | | | | 1,353,802 | |
Variation margin on futures contracts | | | – | | | | – | | | | – | | | | – | | | | – | | | | 14,095 | | | | – | | | | 21,565 | |
Due to custodian | | | – | | | | – | | | | – | | | | – | | | | – | | | | – | | | | – | | | | – | |
Due to broker | | | – | | | | – | | | | – | | | | – | | | | – | | | | 2,112 | | | | – | | | | 5 | |
Commitments (Note 12) | | | – | | | | – | | | | – | | | | – | | | | – | | | | – | | | | 38,131 | | | | – | |
Unrealized depreciation on forward foreign currency contracts | | | – | | | | – | | | | – | | | | – | | | | – | | | | – | | | | 210,934 | | | | – | |
Unrealized depreciation on swap contracts | | | – | | | | – | | | | – | | | | – | | | | – | | | | – | | | | – | | | | – | |
| | |
|
|
| |
|
|
| |
|
|
| |
|
|
| |
|
|
| |
|
|
| |
|
|
| |
|
|
|
TOTAL LIABILITIES | | | 2,107,296 | | | | 2,803,626 | | | | 4,080,712 | | | | 497,855 | | | | 6,743,873 | | | | 5,834,388 | | | | 28,241,461 | | | | 2,311,746 | |
| | |
|
|
| |
|
|
| |
|
|
| |
|
|
| |
|
|
| |
|
|
| |
|
|
| |
|
|
|
NET ASSETS | | $ | 271,486,587 | | | $ | 242,512,146 | | | $ | 743,460,194 | | | $ | 943,311,306 | | | $ | 192,341,223 | | | $ | 316,041,870 | | | $ | 838,558,825 | | | $ | 719,784,273 | |
| | |
|
|
| |
|
|
| |
|
|
| |
|
|
| |
|
|
| |
|
|
| |
|
|
| |
|
|
|
NET ASSETS REPRESENTED BY: | | | | | | | | | | | | | | | | | | | | | | | | | | | | | | | | |
Trust shares at par value of $0.01 per share | | $ | 134,998 | | | $ | 230,482 | | | $ | 432,563 | | | $ | 679,646 | | | $ | 113,859 | | | $ | 293,805 | | | $ | 738,929 | | | $ | 326,755 | |
Additional paid in capital | | | 251,193,467 | | | | 202,657,922 | | | | 660,387,547 | | | | 880,661,939 | | | | 159,371,743 | | | | 306,163,269 | | | | 815,064,356 | | | | 401,056,025 | |
Total accumulated earnings (loss) | | | 20,158,122 | | | | 39,623,742 | | | | 82,640,084 | | | | 61,969,721 | | | | 32,855,621 | | | | 9,584,796 | | | | 22,755,540 | | | | 318,401,493 | |
| | |
|
|
| |
|
|
| |
|
|
| |
|
|
| |
|
|
| |
|
|
| |
|
|
| |
|
|
|
NET ASSETS | | $ | 271,486,587 | | | $ | 242,512,146 | | | $ | 743,460,194 | | | $ | 943,311,306 | | | $ | 192,341,223 | | | $ | 316,041,870 | | | $ | 838,558,825 | | | $ | 719,784,273 | |
| | |
|
|
| |
|
|
| |
|
|
| |
|
|
| |
|
|
| |
|
|
| |
|
|
| |
|
|
|
SHARES OF BENEFICIAL INTEREST: | | | | | | | | | | | | | | | | | | | | | | | | | | | | | | | | |
Authorized (Par value $0.01 per share) | | | 1,000,000,000 | | | | 1,000,000,000 | | | | 1,000,000,000 | | | | 1,000,000,000 | | | | 1,000,000,000 | | | | 1,000,000,000 | | | | 1,000,000,000 | | | | 1,000,000,000 | |
Outstanding | | | 13,499,828 | | | | 23,048,162 | | | | 43,256,316 | | | | 67,964,586 | | | | 11,385,949 | | | | 29,380,533 | | | | 73,892,855 | | | | 32,675,483 | |
NET ASSET VALUE, OFFERING AND REDEMPTION PRICE PER SHARE | | $ | 20.11 | | | $ | 10.52 | | | $ | 17.19 | | | $ | 13.88 | | | $ | 16.89 | | | $ | 10.76 | | | $ | 11.35 | | | $ | 22.03 | |
| | |
|
|
| |
|
|
| |
|
|
| |
|
|
| |
|
|
| |
|
|
| |
|
|
| |
|
|
|
* Cost | | | | | | | | | | | | | | | | | | | | | | | | | | | | | | | | |
Investments (unaffiliated) | | $ | 259,734,575 | | | $ | 212,351,579 | | | $ | 690,916,414 | | | $ | – | | | $ | 185,681,244 | | | $ | 309,963,138 | | | $ | 822,441,914 | | | $ | 505,775,565 | |
| | |
|
|
| |
|
|
| |
|
|
| |
|
|
| |
|
|
| |
|
|
| |
|
|
| |
|
|
|
Investments (affiliated) | | $ | – | | | $ | – | | | $ | – | | | $ | 934,108,748 | | | $ | – | | | $ | – | | | $ | – | | | $ | – | |
| | |
|
|
| |
|
|
| |
|
|
| |
|
|
| |
|
|
| |
|
|
| |
|
|
| |
|
|
|
Foreign cash | | $ | – | | | $ | 151 | | | $ | 29 | | | $ | – | | | $ | – | | | $ | – | | | $ | 1,999 | | | $ | – | |
| | |
|
|
| |
|
|
| |
|
|
| |
|
|
| |
|
|
| |
|
|
| |
|
|
| |
|
|
|
† Including securities on loan | | $ | 1,691,741 | | | $ | 26,638,455 | | | $ | 13,947,165 | | | $ | – | | | $ | 33,019,784 | | | $ | 18,404,375 | | | $ | 10,196,082 | | | $ | 20,512,494 | |
| | |
|
|
| |
|
|
| |
|
|
| |
|
|
| |
|
|
| |
|
|
| |
|
|
| |
|
|
|
See Notes to Financial Statements
VALIC Company II
STATEMENTS OF OPERATIONS —For the Year Ended August 31, 2019
| | | | | | | | | | | | | | | | | | | | | | | | | | | | |
| | | AGGRESSIVE
GROWTH
LIFESTYLE FUND | | | CAPITAL
APPRECIATION
FUND | | | CONSERVATIVE
GROWTH
LIFESTYLE FUND | | | CORE BOND
FUND | | | GOVERNMENT
MONEY MARKET II
FUND | | | HIGH YIELD
BOND FUND | | | INTERNATIONAL
OPPORTUNITIES
FUND | |
INVESTMENT INCOME: | | | | | | | | | | | | | | | | | | | | | | | | | | | | |
Dividends (unaffiliated) | | $ | – | | | $ | 1,240,736 | | | $ | – | | | $ | 71,401 | | | $ | – | | | $ | 269,791 | | | $ | 10,455,601 | |
Dividends (affiliated) | | | 9,582,246 | | | | – | | | | 6,987,827 | | | | – | | | | – | | | | – | | | | – | |
Securities lending income | | | – | | | | 24,074 | | | | – | | | | 147,163 | | | | – | | | | 314,577 | | | | 339,831 | |
Interest (unaffiliated) | | | – | | | | – | | | | – | | | | 57,169,013 | | | | 2,739,478 | | | | 37,149,509 | | | | 166,526 | |
| | |
|
|
| |
|
|
| |
|
|
| |
|
|
| |
|
|
| |
|
|
| |
|
|
|
Total investment income* | | | 9,582,246 | | | | 1,264,810 | | | | 6,987,827 | | | | 57,387,577 | | | | 2,739,478 | | | | 37,733,877 | | | | 10,961,958 | |
| | |
|
|
| |
|
|
| |
|
|
| |
|
|
| |
|
|
| |
|
|
| |
|
|
|
EXPENSES: | | | | | | | | | | | | | | | | | | | | | | | | | | | | |
Investment advisory and management fees | | | 576,725 | | | | 565,284 | | | | 323,046 | | | | 6,452,575 | | | | 300,447 | | | | 3,668,858 | | | | 4,903,772 | |
Administrative service fee | | | – | | | | 68,555 | | | | – | | | | 1,017,646 | | | | 80,160 | | | | 405,530 | | | | 400,513 | |
Shareholder services fee | | | – | | | | 256,947 | | | | – | | | | 3,814,110 | | | | 300,447 | | | | 1,519,935 | | | | 1,501,179 | |
Transfer agent fees and expenses | | | 1,447 | | | | 2,893 | | | | 1,447 | | | | 2,893 | | | | 1,085 | | | | 2,893 | | | | 2,531 | |
Custodian and accounting fees | | | 16,250 | | | | 16,431 | | | | 16,250 | | | | 96,054 | | | | 15,547 | | | | 53,813 | | | | 264,338 | |
Reports to shareholders | | | 64,426 | | | | 16,203 | | | | 35,331 | | | | 160,864 | | | | 13,744 | | | | 64,217 | | | | 70,095 | |
Audit and tax fees | | | 34,897 | | | | 34,531 | | | | 35,596 | | | | 58,053 | | | | 46,502 | | | | 46,360 | | | | 80,902 | |
Legal fees | | | 38,328 | | | | 33,148 | | | | 28,313 | | | | 74,071 | | | | 18,705 | | | | 38,277 | | | | 50,942 | |
Trustees’ fees and expenses | | | 47,044 | | | | 9,341 | | | | 26,742 | | | | 120,912 | | | | 10,868 | | | | 47,934 | | | | 49,624 | |
Interest expense | | | – | | | | 44 | | | | – | | | | – | | | | – | | | | 97 | | | | 206 | |
Other expenses | | | 22,480 | | | | 22,545 | | | | 18,360 | | | | 34,513 | | | | 19,053 | | | | 29,918 | | | | 26,183 | |
| | |
|
|
| |
|
|
| |
|
|
| |
|
|
| |
|
|
| |
|
|
| |
|
|
|
Total expenses before fee waivers, expense reimbursements, fees paid indirectly | | | 801,597 | | | | 1,025,922 | | | | 485,085 | | | | 11,831,691 | | | | 806,558 | | | | 5,877,832 | | | | 7,350,285 | |
| | |
|
|
| |
|
|
| |
|
|
| |
|
|
| |
|
|
| |
|
|
| |
|
|
|
Fees waived and expenses reimbursed by investment adviser (Note 3) | | | (224,872 | ) | | | (152,302 | ) | | | (162,040 | ) | | | (84,233 | ) | | | (145,575 | ) | | | (41,280 | ) | | | (1,345,570 | ) |
Fees paid indirectly (Note 7) | | | – | | | | (468 | ) | | | – | | | | – | | | | – | | | | – | | | | (2,918 | ) |
| | |
|
|
| |
|
|
| |
|
|
| |
|
|
| |
|
|
| |
|
|
| |
|
|
|
Net expenses | | | 576,725 | | | | 873,152 | | | | 323,045 | | | | 11,747,458 | | | | 660,983 | | | | 5,836,552 | | | | 6,001,797 | |
| | |
|
|
| |
|
|
| |
|
|
| |
|
|
| |
|
|
| |
|
|
| |
|
|
|
Net investment income (loss) | | | 9,005,521 | | | | 391,658 | | | | 6,664,782 | | | | 45,640,119 | | | | 2,078,495 | | | | 31,897,325 | | | | 4,960,161 | |
| | |
|
|
| |
|
|
| |
|
|
| |
|
|
| |
|
|
| |
|
|
| |
|
|
|
REALIZED AND UNREALIZED GAIN (LOSS) ON INVESTMENTS AND FOREIGN CURRENCIES: | | | | | | | | | | | | | | | | | | | | | | | | | | | | |
Net realized gain (loss) on: | | | | | | | | | | | | | | | | | | | | | | | | | | | | |
Investments (unaffiliated)** | | | – | | | | 2,487,981 | | | | – | | | | 12,493,622 | | | | 837 | | | | (4,687,314 | ) | | | 5,613,573 | |
Investments (affiliated) | | | (3,168,700 | ) | | | – | | | | (6,928,676 | ) | | | – | | | | – | | | | – | | | | – | |
Futures contracts | | | – | | | | – | | | | – | | | | – | | | | – | | | | – | | | | – | |
Forward contracts | | | – | | | | – | | | | – | | | | – | | | | – | | | | 1,023,854 | | | | – | |
Swap contracts | | | – | | | | – | | | | – | | | | – | | | | – | | | | (2,226 | ) | | | – | |
Net realized foreign exchange gain (loss) on other assets and liabilities | | | – | | | | – | | | | – | | | | – | | | | – | | | | (22,131 | ) | | | (512,296 | ) |
Net realized gain (loss) on capital gain distributions received from underlying funds (affliliated) | | | 36,008,574 | | | | – | | | | 9,829,954 | | | | – | | | | – | | | | – | | | | – | |
| | |
|
|
| |
|
|
| |
|
|
| |
|
|
| |
|
|
| |
|
|
| |
|
|
|
Net realized gain (loss) on investments and foreign currencies | | | 32,839,874 | | | | 2,487,981 | | | | 2,901,278 | | | | 12,493,622 | | | | 837 | | | | (3,687,817 | ) | | | 5,101,277 | |
| | |
|
|
| |
|
|
| |
|
|
| |
|
|
| |
|
|
| |
|
|
| |
|
|
|
Change in unrealized appreciation (depreciation) on: | | | | | | | | | | | | | | | | | | | | | | | | | | | | |
Investments (unaffiliated) | | | – | | | | (3,423,426 | ) | | | – | | | | 92,159,031 | | | | – | | | | 11,390,860 | | | | (75,046,230 | ) |
Investments (affiliated) | | | (45,659,943 | ) | | | – | | | | 1,160,266 | | | | – | | | | – | | | | – | | | | – | |
Futures contracts | | | – | | | | – | | | | – | | | | – | | | | – | | | | – | | | | – | |
Forward contracts | | | – | | | | – | | | | – | | | | – | | | | – | | | | 130,855 | | | | – | |
Swap contracts | | | – | | | | – | | | | – | | | | – | | | | – | | | | (59,214 | ) | | | – | |
Change in net unrealized foreign exchange gain (loss) on other assets and liabilities | | | – | | | | – | | | | – | | | | – | | | | – | | | | (1,818 | ) | | | (1,929 | ) |
Change in accrued capital gains tax on unrealized appreciation (depreciation) | | | – | | | | – | | | | – | | | | – | | | | – | | | | – | | | | 46,044 | |
| | |
|
|
| |
|
|
| |
|
|
| |
|
|
| |
|
|
| |
|
|
| |
|
|
|
Net unrealized gain (loss) on investments and foreign currencies | | | (45,659,943 | ) | | | (3,423,426 | ) | | | 1,160,266 | | | | 92,159,031 | | | | – | | | | 11,460,683 | | | | (75,002,115 | ) |
| | |
|
|
| |
|
|
| |
|
|
| |
|
|
| |
|
|
| |
|
|
| |
|
|
|
Net realized and unrealized gain (loss) on investments and foreign currencies | | | (12,820,069 | ) | | | (935,445 | ) | | | 4,061,544 | | | | 104,652,653 | | | | 837 | | | | 7,772,866 | | | | (69,900,838 | ) |
| | |
|
|
| |
|
|
| |
|
|
| |
|
|
| |
|
|
| |
|
|
| |
|
|
|
NET INCREASE (DECREASE) IN NET ASSETS RESULTING FROM OPERATIONS | | $ | (3,814,548 | ) | | $ | (543,787 | ) | | $ | 10,726,326 | | | $ | 150,292,772 | | | $ | 2,079,332 | | | $ | 39,670,191 | | | $ | (64,940,677 | ) |
| | |
|
|
| |
|
|
| |
|
|
| |
|
|
| |
|
|
| |
|
|
| |
|
|
|
* Net of foreign withholding taxes on interest and dividends of | | $ | – | | | $ | – | | | $ | – | | | $ | 2,449 | | | $ | – | | | $ | – | | | $ | 916,281 | |
| | |
|
|
| |
|
|
| |
|
|
| |
|
|
| |
|
|
| |
|
|
| |
|
|
|
** Net of foreign withholding taxes on capital gains of | | $ | – | | | $ | – | | | $ | – | | | $ | – | | | $ | – | | | $ | – | | | $ | 24,177 | |
| | |
|
|
| |
|
|
| |
|
|
| |
|
|
| |
|
|
| |
|
|
| |
|
|
|
See Notes to Financial Statements
VALIC Company II
STATEMENTS OF OPERATIONS —For the Year Ended August 31, 2019 — (continued)
| | | | | | | | | | | | | | | | | | | | | | | | | | | | | | | | |
| | | LARGE CAP
VALUE FUND | | | MID CAP
GROWTH FUND | | | MID CAP
VALUE FUND | | | MODERATE
GROWTH
LIFESTYLE FUND | | | SMALL CAP
GROWTH
FUND | | | SMALL CAP
VALUE FUND | | | STRATEGIC
BOND FUND | | | U.S. SOCIALLY
RESPONSIBLE
FUND# | |
INVESTMENT INCOME: | | | | | | | | | | | | | | | | | | | | | | | | | | | | | | | | |
Dividends (unaffiliated) | | $ | 6,662,223 | | | $ | 1,643,381 | | | $ | 13,472,611 | | | $ | – | | | $ | 986,767 | | | $ | 7,744,677 | | | $ | 148,114 | | | $ | 12,469,959 | |
Dividends (affiliated) | | | – | | | | – | | | | – | | | | 16,591,740 | | | | – | | | | – | | | | – | | | | – | |
Securities lending income | | | 10,916 | | | | 93,882 | | | | 49,419 | | | | – | | | | 195,502 | | | | 122,334 | | | | 199,288 | | | | 31,479 | |
Interest (unaffiliated) | | | 61,247 | | | | – | | | | 25,968 | | | | – | | | | 14,345 | | | | 48,163 | | | | 40,645,620 | | | | 179,658 | |
| | |
|
|
| |
|
|
| |
|
|
| |
|
|
| |
|
|
| |
|
|
| |
|
|
| |
|
|
|
Total investment income* | | | 6,734,386 | | | | 1,737,263 | | | | 13,547,998 | | | | 16,591,740 | | | | 1,196,614 | | | | 7,915,174 | | | | 40,993,022 | | | | 12,681,096 | |
| | |
|
|
| |
|
|
| |
|
|
| |
|
|
| |
|
|
| |
|
|
| |
|
|
| |
|
|
|
EXPENSES: | | | | | | | | | | | | | | | | | | | | | | | | | | | | | | | | |
Investment advisory and management fees | | | 1,352,285 | | | | 1,652,021 | | | | 5,345,718 | | | | 926,617 | | | | 1,599,067 | | | | 2,595,456 | | | | 4,296,322 | | | | 1,781,328 | |
Administrative service fee | | | 180,400 | | | | 150,277 | | | | 507,836 | | | | – | | | | 129,157 | | | | 261,199 | | | | 570,122 | | | | 475,265 | |
Shareholder services fee | | | 676,142 | | | | 563,234 | | | | 1,903,427 | | | | – | | | | 484,083 | | | | 979,022 | | | | 2,136,846 | | | | 1,781,328 | |
Transfer agent fees and expenses | | | 2,771 | | | | 2,532 | | | | 3,255 | | | | 1,447 | | | | 2,893 | | | | 2,532 | | | | 3,978 | | | | 1,447 | |
Custodian and accounting fees | | | 31,569 | | | | 27,402 | | | | 72,438 | | | | 16,250 | | | | 36,684 | | | | 128,273 | | | | 131,567 | | | | 40,689 | |
Reports to shareholders | | | 32,103 | | | | 16,360 | | | | 76,020 | | | | 103,462 | | | | 24,878 | | | | 45,646 | | | | 103,058 | | | | 79,458 | |
Audit and tax fees | | | 38,418 | | | | 36,251 | | | | 36,476 | | | | 33,413 | | | | 39,857 | | | | 39,075 | | | | 54,208 | | | | 39,712 | |
Legal fees | | | 25,207 | | | | 23,739 | | | | 45,058 | | | | 52,640 | | | | 22,060 | | | | 29,836 | | | | 50,452 | | | | 42,576 | |
Trustees’ fees and expenses | | | 22,609 | | | | 19,327 | | | | 58,756 | | | | 75,021 | | | | 17,468 | | | | 33,146 | | | | 71,007 | | | | 57,263 | |
Interest expense | | | 960 | | | | 119 | | | | 14 | | | | 285 | | | | 301 | | | | 10 | | | | – | | | | 7,316 | |
Other expenses | | | 34,324 | | | | 26,572 | | | | 44,848 | | | | 25,828 | | | | 25,500 | | | | 42,637 | | | | 40,988 | | | | 35,436 | |
| | |
|
|
| |
|
|
| |
|
|
| |
|
|
| |
|
|
| |
|
|
| |
|
|
| |
|
|
|
Total expenses before fee waivers, expense reimbursements, fees paid indirectly | | | 2,396,788 | | | | 2,517,834 | | | | 8,093,846 | | | | 1,234,963 | | | | 2,381,948 | | | | 4,156,832 | | | | 7,458,548 | | | | 4,341,818 | |
| | |
|
|
| |
|
|
| |
|
|
| |
|
|
| |
|
|
| |
|
|
| |
|
|
| |
|
|
|
Fees waived and expenses reimbursed by investment adviser (Note 3) | | | (206,086 | ) | | | (602,837 | ) | | | (99,451 | ) | | | (308,346 | ) | | | (135,804 | ) | | | (436,551 | ) | | | – | | | | (351,643 | ) |
Fees paid indirectly (Note 7) | | | (21,232 | ) | | | (568 | ) | | | (2,563 | ) | | | – | | | | (16,858 | ) | | | (53,781 | ) | | | – | | | | – | |
| | |
|
|
| |
|
|
| |
|
|
| |
|
|
| |
|
|
| |
|
|
| |
|
|
| |
|
|
|
Net expenses | | | 2,169,470 | | | | 1,914,429 | | | | 7,991,832 | | | | 926,617 | | | | 2,229,286 | | | | 3,666,500 | | | | 7,458,548 | | | | 3,990,175 | |
| | |
|
|
| |
|
|
| |
|
|
| |
|
|
| |
|
|
| |
|
|
| |
|
|
| |
|
|
|
Net investment income (loss) | | | 4,564,916 | | | | (177,166 | ) | | | 5,556,166 | | | | 15,665,123 | | | | (1,032,672 | ) | | | 4,248,674 | | | | 33,534,474 | | | | 8,690,921 | |
| | |
|
|
| |
|
|
| |
|
|
| |
|
|
| |
|
|
| |
|
|
| |
|
|
| |
|
|
|
REALIZED AND UNREALIZED GAIN (LOSS) ON INVESTMENTS AND FOREIGN CURRENCIES: | | | | | | | | | | | | | | | | | | | | | | | | | | | | | | | | |
Net realized gain (loss) on: | | | | | | | | | | | | | | | | | | | | | | | | | | | | | | | | |
Investments (unaffiliated)** | | | 6,299,785 | | | | 8,236,835 | | | | 35,118,007 | | | | – | | | | 23,908,552 | | | | 8,101,449 | | | | (6,799,689 | ) | | | 124,635,155 | |
Investments (affiliated) | | | – | | | | – | | | | – | | | | (4,590,690 | ) | | | – | | | | – | | | | – | | | | – | |
Futures contracts | | | – | | | | – | | | | – | | | | – | | | | – | | | | (633,504 | ) | | | – | | | | 1,219,331 | |
Forward contracts | | | – | | | | – | | | | – | | | | – | | | | – | | | | – | | | | 3,229,068 | | | | – | |
Swap contracts | | | – | | | | – | | | | – | | | | – | | | | – | | | | – | | | | – | | | | – | |
Net realized foreign exchange gain (loss) on other assets and liabilities | | | – | | | | (64 | ) | | | 521 | | | | – | | | | – | | | | – | | | | 5,612 | | | | – | |
Net realized gain (loss) on capital gain distributions received from underlying funds (affliliated) | | | – | | | | – | | | | – | | | | 45,812,842 | | | | – | | | | – | | | | – | | | | – | |
| | |
|
|
| |
|
|
| |
|
|
| |
|
|
| |
|
|
| |
|
|
| |
|
|
| |
|
|
|
Net realized gain (loss) on investments and foreign currencies | | | 6,299,785 | | | | 8,236,771 | | | | 35,118,528 | | | | 41,222,152 | | | | 23,908,552 | | | | 7,467,945 | | | | (3,565,009 | ) | | | 125,854,486 | |
| | |
|
|
| |
|
|
| |
|
|
| |
|
|
| |
|
|
| |
|
|
| |
|
|
| |
|
|
|
Change in unrealized appreciation (depreciation) on: | | | | | | | | | | | | | | | | | | | | | | | | | | | | | | | | |
Investments (unaffiliated) | | | (17,482,270 | ) | | | (1,837,505 | ) | | | (81,850,197 | ) | | | – | | | | (35,001,546 | ) | | | (94,481,825 | ) | | | 36,161,818 | | | | (105,343,427 | ) |
Investments (affiliated) | | | – | | | | – | | | | – | | | | (42,101,179 | ) | | | – | | | | – | | | | – | | | | – | |
Futures contracts | | | – | | | | – | | | | – | | | | – | | | | – | | | | (432,833 | ) | | | – | | | | (15,187 | ) |
Forward contracts | | | – | | | | – | | | | – | | | | – | | | | – | | | | – | | | | 1,385,915 | | | | – | |
Swap contracts | | | – | | | | – | | | | – | | | | – | | | | – | | | | – | | | | – | | | | – | |
Change in net unrealized foreign exchange gain (loss) on other assets and liabilities | | | – | | | | (1 | ) | | | (1,052 | ) | | | – | | | | – | | | | – | | | | (3,587 | ) | | | – | |
Change in accrued capital gains tax on unrealized appreciation (depreciation) | | | – | | | | – | | | | – | | | | – | | | | – | | | | – | | | | – | | | | – | |
| | |
|
|
| |
|
|
| |
|
|
| |
|
|
| |
|
|
| |
|
|
| |
|
|
| |
|
|
|
Net unrealized gain (loss) on investments and foreign currencies | | | (17,482,270 | ) | | | (1,837,506 | ) | | | (81,851,249 | ) | | | (42,101,179 | ) | | | (35,001,546 | ) | | | (94,914,658 | ) | | | 37,544,146 | | | | (105,358,614 | ) |
| | |
|
|
| |
|
|
| |
|
|
| |
|
|
| |
|
|
| |
|
|
| |
|
|
| |
|
|
|
Net realized and unrealized gain (loss) on investments and foreign currencies | | | (11,182,485 | ) | | | 6,399,265 | | | | (46,732,721 | ) | | | (879,027 | ) | | | (11,092,994 | ) | | | (87,446,713 | ) | | | 33,979,137 | | | | 20,495,872 | |
| | |
|
|
| |
|
|
| |
|
|
| |
|
|
| |
|
|
| |
|
|
| |
|
|
| |
|
|
|
NET INCREASE (DECREASE) IN NET ASSETS RESULTING FROM OPERATIONS | | $ | (6,617,569 | ) | | $ | 6,222,099 | | | $ | (41,176,555 | ) | | $ | 14,786,096 | | | $ | (12,125,666 | ) | | $ | (83,198,039 | ) | | $ | 67,513,611 | | | $ | 29,186,793 | |
| | |
|
|
| |
|
|
| |
|
|
| |
|
|
| |
|
|
| |
|
|
| |
|
|
| |
|
|
|
* Net of foreign withholding taxes on interest and dividends of | | $ | 16,804 | | | $ | 7,329 | | | $ | 68,434 | | | $ | – | | | $ | – | | | $ | 5,769 | | | $ | 1,992 | | | $ | 19 | |
| | |
|
|
| |
|
|
| |
|
|
| |
|
|
| |
|
|
| |
|
|
| |
|
|
| |
|
|
|
** Net of foreign withholding taxes on capital gains of | | $ | – | | | $ | – | | | $ | – | | | $ | – | | | $ | – | | | $ | – | | | $ | – | | | $ | – | |
| | |
|
|
| |
|
|
| |
|
|
| |
|
|
| |
|
|
| |
|
|
| |
|
|
| |
|
|
|
See Notes to Financial Statements
VALIC Company II
STATEMENTS OF CHANGES IN NET ASSETS
| | | | | | | | | | | | | | | | | | | | | | | | | | | | | | | | |
| | | AGGRESSIVE GROWTH
LIFESTYLE FUND
| | | CAPITAL APPRECIATION
FUND
| | | CONSERVATIVE GROWTH
LIFESTYLE FUND
| | | CORE BOND
FUND
| |
| | | For the
Year Ended
August 31,
2019
| | | For the
Year Ended
August 31,
2018
| | | For the
Year Ended
August 31,
2019
| | | For the
Year Ended
August 31,
2018
| | | For the
Year Ended
August 31,
2019
| | | For the
Year Ended
August 31,
2018
| | | For the
Year Ended
August 31,
2019
| | | For the
Year Ended
August 31,
2018
| |
INCREASE (DECREASE) IN NET ASSETS OPERATIONS: | | | | | | | | | | | | | | | | | | | | | |
Net investment income (loss) | | $ | 9,005,521 | | | $ | 8,857,344 | | | $ | 391,658 | | | $ | 219,346 | | | $ | 6,664,782 | | | $ | 8,383,703 | | | $ | 45,640,119 | | | $ | 33,581,505 | |
Net realized gain (loss) on investments and foreign currencies | | | 32,839,874 | | | | 53,602,115 | | | | 2,487,981 | | | | 26,494,594 | | | | 2,901,278 | | | | 14,267,169 | | | | 12,493,622 | | | | (7,802,673 | ) |
Net unrealized gain (loss) on investments and foreign currencies | | | (45,659,943 | ) | | | 1,524,189 | | | | (3,423,426 | ) | | | (2,110,223 | ) | | | 1,160,266 | | | | (6,137,864 | ) | | | 92,159,031 | | | | (41,645,334 | ) |
| | |
|
|
| |
|
|
| |
|
|
| |
|
|
| |
|
|
| |
|
|
| |
|
|
| |
|
|
|
Net increase (decrease) in net assets resulting from operations | | | (3,814,548 | ) | | | 63,983,648 | | | | (543,787 | ) | | | 24,603,717 | | | | 10,726,326 | | | | 16,513,008 | | | | 150,292,772 | | | | (15,866,502 | ) |
| | |
|
|
| |
|
|
| |
|
|
| |
|
|
| |
|
|
| |
|
|
| |
|
|
| |
|
|
|
DISTRIBUTIONS TO SHAREHOLDERS FROM(1): | | | | | | | | | | | | | | | | | | | | | | | | | | | | | | | | |
Distributable earnings | | | (61,562,142 | ) | | | (28,418,172 | ) | | | (26,547,942 | ) | | | (5,084,499 | ) | | | (22,740,565 | ) | | | (9,573,695 | ) | | | (36,081,103 | ) | | | (29,745,347 | ) |
| | |
|
|
| |
|
|
| |
|
|
| |
|
|
| |
|
|
| |
|
|
| |
|
|
| |
|
|
|
Net increase (decrease) in net assets resulting from capital share transactions (Note 6) | | | 35,716,300 | | | | 5,300,297 | | | | 20,475,333 | | | | (1,401,691 | ) | | | (2,342,303 | ) | | | (2,053,403 | ) | | | 192,420,128 | | | | 212,261,412 | |
| | |
|
|
| |
|
|
| |
|
|
| |
|
|
| |
|
|
| |
|
|
| |
|
|
| |
|
|
|
TOTAL INCREASE (DECREASE) IN NET ASSETS | | | (29,660,390 | ) | | | 40,865,773 | | | | (6,616,396 | ) | | | 18,117,527 | | | | (14,356,542 | ) | | | 4,885,910 | | | | 306,631,797 | | | | 166,649,563 | |
NET ASSETS: | | | | | | | | | | | | | | | | | | | | | | | | | | | | | | | | |
Beginning of period | | | 608,709,001 | | | | 567,843,228 | | | | 109,696,707 | | | | 91,579,180 | | | | 338,792,899 | | | | 333,906,989 | | | | 1,282,585,755 | | | | 1,115,936,192 | |
| | |
|
|
| |
|
|
| |
|
|
| |
|
|
| |
|
|
| |
|
|
| |
|
|
| |
|
|
|
End of period | | $ | 579,048,611 | | | $ | 608,709,001 | | | $ | 103,080,311 | | | $ | 109,696,707 | | | $ | 324,436,357 | | | $ | 338,792,899 | | | $ | 1,589,217,552 | | | $ | 1,282,585,755 | |
| | |
|
|
| |
|
|
| |
|
|
| |
|
|
| |
|
|
| |
|
|
| |
|
|
| |
|
|
|
| (1) | The prior year amounts have been restated to reflect the adoption of amendments to Rule 6-09.3 of regulation S-X. Below are the amounts as stated in the August 31, 2018 annual report. |
| | | | | | | | | | | | | | | | | | | | | | | | | | | | | | | | |
Distributions to shareholders from: | | | | | | | | | | | | | | | | | | | | | | | | | | | | | | | | |
Net investment income | | | | | | $ | (8,100,720 | ) | | | | | | $ | (434,154 | ) | | | | | | $ | (7,646,556 | ) | | | | | | $ | (29,295,082 | ) |
Net realized gain on securities | | | | | | | (20,317,452 | ) | | | | | | | (4,650,345 | ) | | | | | | | (1,927,139 | ) | | | | | | | (450,265 | ) |
| | | | | | |
|
|
| | | | | |
|
|
| | | | | |
|
|
| | | | | |
|
|
|
Total distributions to shareholders | | | | | | $ | (28,418,172 | ) | | | | | | $ | (5,084,499 | ) | | | | | | $ | (9,573,695 | ) | | | | | | $ | (29,745,347 | ) |
| | | | | | |
|
|
| | | | | |
|
|
| | | | | |
|
|
| | | | | |
|
|
|
See Notes to Financial Statements
VALIC Company II
STATEMENTS OF CHANGES IN NET ASSETS —(continued)
| | | | | | | | | | | | | | | | | | | | | | | | | | | | | | | | |
| | | GOVERNMENT MONEY MARKET II
FUND
| | | HIGH YIELD BOND
FUND
| | | INTERNATIONAL
OPPORTUNITIES FUND
| | | LARGE CAP
VALUE FUND
| |
| | | For the
Year Ended
August 31,
2019
| | | For the
Year Ended
August 31,
2018
| | | For the
Year Ended
August 31,
2019
| | | For the
Year Ended
August 31,
2018
| | | For the
Year Ended
August 31,
2019
| | | For the
Year Ended
August 31,
2018
| | | For the
Year Ended
August 31,
2019
| | | For the
Year Ended
August 31,
2018
| |
INCREASE (DECREASE) IN NET ASSETS OPERATIONS: | | | | | | | | | | | | | | | | | | | | | | | | | | | | | | | | |
Net investment income (loss) | | $ | 2,078,495 | | | $ | 1,175,020 | | | $ | 31,897,325 | | | $ | 29,649,641 | | | $ | 4,960,161 | | | $ | 4,501,228 | | | $ | 4,564,916 | | | $ | 3,420,241 | |
Net realized gain (loss) on investments and foreign currencies | | | 837 | | | | (7,492 | ) | | | (3,687,817 | ) | | | 4,441,845 | | | | 5,101,277 | | | | 82,165,251 | | | | 6,299,785 | | | | 22,214,795 | |
Net unrealized gain (loss) on investments and foreign currencies | | | – | | | | – | | | | 11,460,683 | | | | (17,327,317 | ) | | | (75,002,115 | ) | | | (12,601,347 | ) | | | (17,482,270 | ) | | | 9,558,207 | |
| | |
|
|
| |
|
|
| |
|
|
| |
|
|
| |
|
|
| |
|
|
| |
|
|
| |
|
|
|
Net increase (decrease) in net assets resulting from operations | | | 2,079,332 | | | | 1,167,528 | | | | 39,670,191 | | | | 16,764,169 | | | | (64,940,677 | ) | | | 74,065,132 | | | | (6,617,569 | ) | | | 35,193,243 | |
| | |
|
|
| |
|
|
| |
|
|
| |
|
|
| |
|
|
| |
|
|
| |
|
|
| |
|
|
|
DISTRIBUTIONS TO SHAREHOLDERS FROM(1): | | | | | | | | | | | | | | | | | | | | | | | | | | | | | | | | |
Distributable earnings | | | (2,078,495 | ) | | | (1,175,020 | ) | | | (29,483,669 | ) | | | (32,204,893 | ) | | | (28,408,612 | ) | | | (5,841,813 | ) | | | (26,283,225 | ) | | | (11,232,389 | ) |
| | |
|
|
| |
|
|
| |
|
|
| |
|
|
| |
|
|
| |
|
|
| |
|
|
| |
|
|
|
Net increase (decrease) in net assets resulting from capital share transactions (Note 6) | | | (17,621,285 | ) | | | 4,050,214 | | | | 70,624,814 | | | | 30,514,165 | | | | (54,481,040 | ) | | | (15,293,377 | ) | | | 20,300,914 | | | | 33,499,196 | |
| | |
|
|
| |
|
|
| |
|
|
| |
|
|
| |
|
|
| |
|
|
| |
|
|
| |
|
|
|
TOTAL INCREASE (DECREASE) IN NET ASSETS | | | (17,620,448 | ) | | | 4,042,722 | | | | 80,811,336 | | | | 15,073,441 | | | | (147,830,329 | ) | | | 52,929,942 | | | | (12,599,880 | ) | | | 57,460,050 | |
NET ASSETS: | | | | | | | | | | | | | | | | | | | | | | | | | | | | | | | | |
Beginning of period | | | 136,986,870 | | | | 132,944,148 | | | | 576,553,076 | | | | 561,479,635 | | | | 724,027,384 | | | | 671,097,442 | | | | 284,086,467 | | | | 226,626,417 | |
| | |
|
|
| |
|
|
| |
|
|
| |
|
|
| |
|
|
| |
|
|
| |
|
|
| |
|
|
|
End of period | | $ | 119,366,422 | | | $ | 136,986,870 | | | $ | 657,364,412 | | | $ | 576,553,076 | | | $ | 576,197,055 | | | $ | 724,027,384 | | | $ | 271,486,587 | | | $ | 284,086,467 | |
| | |
|
|
| |
|
|
| |
|
|
| |
|
|
| |
|
|
| |
|
|
| |
|
|
| |
|
|
|
| (1) | The prior year amounts have been restated to reflect the adoption of amendments to Rule 6-09.3 of regulation S-X. Below are the amounts as stated in the August 31, 2018 annual report. |
| | | | | | | | | | | | | | | | | | | | | | | | | | | | | | | | |
Distributions to shareholders from: | | | | | | | | | | | | | | | | | | | | | | | | | | | | | | | | |
Net investment income | | | | | | $ | (1,175,020 | ) | | | | | | $ | (32,204,893 | ) | | | | | | $ | (5,841,813 | ) | | | | | | $ | (2,959,420 | ) |
Net realized gain on securities | | | | | | | – | | | | | | | | – | | | | | | | | – | | | | | | | | (8,272,969 | ) |
| | | | | | |
|
|
| | | | | |
|
|
| | | | | |
|
|
| | | | | |
|
|
|
Total distributions to shareholders | | | | | | $ | (1,175,020 | ) | | | | | | $ | (32,204,893 | ) | | | | | | $ | (5,841,813 | ) | | | | | | $ | (11,232,389 | ) |
| | | | | | |
|
|
| | | | | |
|
|
| | | | | |
|
|
| | | | | |
|
|
|
See Notes to Financial Statements
VALIC Company II
STATEMENTS OF CHANGES IN NET ASSETS —(continued)
| | | | | | | | | | | | | | | | | | | | | | | | | | | | | | | | |
| | | MID CAP GROWTH FUND
| | | MID CAP VALUE FUND
| | | MODERATE GROWTH
LIFESTYLE FUND
| | | SMALL CAP GROWTH FUND
| |
| | | For the
Year Ended
August 31,
2019
| | | For the
Year Ended
August 31,
2018
| | | For the
Year Ended
August 31,
2019
| | | For the
Year Ended
August 31,
2018
| | | For the
Year Ended
August 31,
2019
| | | For the
Year Ended
August 31,
2018
| | | For the
Year Ended
August 31,
2019
| | | For the
Year Ended
August 31,
2018
| |
INCREASE (DECREASE) IN NET ASSETS OPERATIONS: | | | | | | | | | | | | | | | | | | | | | | | | | | | | | | | | |
Net investment income (loss) | | $ | (177,166 | ) | | $ | (303,012 | ) | | $ | 5,556,166 | | | $ | 4,045,936 | | | $ | 15,665,123 | | | $ | 16,403,626 | | | $ | (1,032,672 | ) | | $ | (1,078,825 | ) |
Net realized gain (loss) on investments and foreign currencies | | | 8,236,771 | | | | 8,380,845 | | | | 35,118,528 | | | | 139,462,749 | | | | 41,222,152 | | | | 69,662,433 | | | | 23,908,552 | | | | 45,046,628 | |
Net unrealized gain (loss) on investments and foreign currencies | | | (1,837,506 | ) | | | 28,304,073 | | | | (81,851,249 | ) | | | (17,892,671 | ) | | | (42,101,179 | ) | | | (1,720,543 | ) | | | (35,001,546 | ) | | | 17,234,244 | |
| | |
|
|
| |
|
|
| |
|
|
| |
|
|
| |
|
|
| |
|
|
| |
|
|
| |
|
|
|
Net increase (decrease) in net assets resulting from operations | | | 6,222,099 | | | | 36,381,906 | | | | (41,176,555 | ) | | | 125,616,014 | | | | 14,786,096 | | | | 84,345,516 | | | | (12,125,666 | ) | | | 61,202,047 | |
| | |
|
|
| |
|
|
| |
|
|
| |
|
|
| |
|
|
| |
|
|
| |
|
|
| |
|
|
|
DISTRIBUTIONS TO SHAREHOLDERS FROM(1): | | | | | | | | | | | | | | | | | | | | | | | | | | | | | | | | |
Distributable earnings | | | (8,190,342 | ) | | | (26,389,601 | ) | | | (142,088,963 | ) | | | (71,757,096 | ) | | | (84,768,759 | ) | | | (35,064,153 | ) | | | (45,173,634 | ) | | | (6,146,636 | ) |
| | |
|
|
| |
|
|
| |
|
|
| |
|
|
| |
|
|
| |
|
|
| |
|
|
| |
|
|
|
Net increase (decrease) in net assets resulting from capital share transactions (Note 6) | | | 24,036,574 | | | | 76,463,063 | | | | 10,441,435 | | | | (183,620,229 | ) | | | 48,686,494 | | | | 18,980,604 | | | | 34,256,786 | | | | 22,997,976 | |
| | |
|
|
| |
|
|
| |
|
|
| |
|
|
| |
|
|
| |
|
|
| |
|
|
| |
|
|
|
TOTAL INCREASE (DECREASE) IN NET ASSETS | | | 22,068,331 | | | | 86,455,368 | | | | (172,824,083 | ) | | | (129,761,311 | ) | | | (21,296,169 | ) | | | 68,261,967 | | | | (23,042,514 | ) | | | 78,053,387 | |
NET ASSETS: | | | | | | | | | | | | | | | | | | | | | | | | | | | | | | | | |
Beginning of period | | | 220,443,815 | | | | 133,988,447 | | | | 916,284,277 | | | | 1,046,045,588 | | | | 964,607,475 | | | | 896,345,508 | | | | 215,383,737 | | | | 137,330,350 | |
| | |
|
|
| |
|
|
| |
|
|
| |
|
|
| |
|
|
| |
|
|
| |
|
|
| |
|
|
|
End of period | | $ | 242,512,146 | | | $ | 220,443,815 | | | $ | 743,460,194 | | | $ | 916,284,277 | | | $ | 943,311,306 | | | $ | 964,607,475 | | | $ | 192,341,223 | | | $ | 215,383,737 | |
| | |
|
|
| |
|
|
| |
|
|
| |
|
|
| |
|
|
| |
|
|
| |
|
|
| |
|
|
|
| (1) | The prior year amounts have been restated to reflect the adoption of amendments to Rule 6-09.3 of regulation S-X. Below are the amounts as stated in the August 31, 2018 annual report. |
| | | | | | | | | | | | | | | | | | | | | | | | | | | | | | | | |
Distributions to shareholders from: | | | | | | | | | | | | | | | | | | | | | | | | | | | | | | | | |
Net investment income | | | | | | $ | (219,879 | ) | | | | | | $ | (3,732,456 | ) | | | | | | $ | (14,676,075 | ) | | | | | | $ | – | |
Net realized gain on securities | | | | | | | (26,169,722 | ) | | | | | | | (68,024,640 | ) | | | | | | | (20,388,078 | ) | | | | | | | (6,146,636 | ) |
| | | | | | |
|
|
| | | | | |
|
|
| | | | | |
|
|
| | | | | |
|
|
|
Total distributions to shareholders | | | | | | $ | (26,389,601 | ) | | | | | | $ | (71,757,096 | ) | | | | | | $ | (35,064,153 | ) | | | | | | $ | (6,146,636 | ) |
| | | | | | |
|
|
| | | | | |
|
|
| | | | | |
|
|
| | | | | |
|
|
|
See Notes to Financial Statements
VALIC Company II
STATEMENTS OF CHANGES IN NET ASSETS —(continued)
| | | | | | | | | | | | | | | | | | | | | | | | |
| | | SMALL CAP VALUE FUND
| | | STRATEGIC BOND FUND
| | | U.S. SOCIALLY RESPONSIBLE FUND#
| |
| | | For the
Year Ended
August 31,
2019
| | | For the
Year Ended
August 31,
2018
| | | For the
Year Ended
August 31,
2019
| | | For the
Year Ended
August 31,
2018
| | | For the
Year Ended
August 31,
2019
| | | For the
Year Ended
August 31,
2018
| |
INCREASE (DECREASE) IN NET ASSETS OPERATIONS: | | | | | | | | | | | | | | | | | | | | | | | | |
Net investment income (loss) | | $ | 4,248,674 | | | $ | 5,331,667 | | | $ | 33,534,474 | | | $ | 29,863,580 | | | $ | 8,690,921 | | | $ | 10,863,154 | |
Net realized gain (loss) on investments and foreign currencies | | | 7,467,945 | | | | 52,025,949 | | | | (3,565,009 | ) | | | (3,504,948 | ) | | | 125,854,486 | | | | 51,589,236 | |
Net unrealized gain (loss) on investments and foreign currencies | | | (94,914,658 | ) | | | 30,354,684 | | | | 37,544,146 | | | | (33,808,260 | ) | | | (105,358,614 | ) | | | 72,482,641 | |
| | |
|
|
| |
|
|
| |
|
|
| |
|
|
| |
|
|
| |
|
|
|
Net increase (decrease) in net assets resulting from operations | | | (83,198,039 | ) | | | 87,712,300 | | | | 67,513,611 | | | | (7,449,628 | ) | | | 29,186,793 | | | | 134,935,031 | |
| | |
|
|
| |
|
|
| |
|
|
| |
|
|
| |
|
|
| |
|
|
|
DISTRIBUTIONS TO SHAREHOLDERS FROM(1): | | | | | | | | | | | | | | | | | | | | | | | | |
Distributable earnings | | | (58,976,644 | ) | | | (40,911,561 | ) | | | (29,934,832 | ) | | | (30,340,988 | ) | | | (62,490,729 | ) | | | (25,957,719 | ) |
| | |
|
|
| |
|
|
| |
|
|
| |
|
|
| |
|
|
| |
|
|
|
Net increase (decrease) in net assets resulting from capital share transactions (Note 6) | | | (76,331,392 | ) | | | (41,757,567 | ) | | | (52,421,528 | ) | | | 142,137,238 | | | | (36,029,931 | ) | | | (119,757,020 | ) |
| | |
|
|
| |
|
|
| |
|
|
| |
|
|
| |
|
|
| |
|
|
|
TOTAL INCREASE (DECREASE) IN NET ASSETS | | | (218,506,075 | ) | | | 5,043,172 | | | | (14,842,749 | ) | | | 104,346,622 | | | | (69,333,867 | ) | | | (10,779,708 | ) |
NET ASSETS: | | | | | | | | | | | | | | | | | | | | | | | | |
Beginning of period | | | 534,547,945 | | | | 529,504,773 | | | | 853,401,574 | | | | 749,054,952 | | | | 789,118,140 | | | | 799,897,848 | |
| | |
|
|
| |
|
|
| |
|
|
| |
|
|
| |
|
|
| |
|
|
|
End of period | | $ | 316,041,870 | | | $ | 534,547,945 | | | $ | 838,558,825 | | | $ | 853,401,574 | | | $ | 719,784,273 | | | $ | 789,118,140 | |
| | |
|
|
| |
|
|
| |
|
|
| |
|
|
| |
|
|
| |
|
|
|
| (1) | The prior year amounts have been restated to reflect the adoption of amendments to Rule 6-09.3 of regulation S-X. Below are the amounts as stated in the August 31, 2018 annual report. |
| | | | | | | | | | | | | | | | | | | | | | | | |
Distributions to shareholders from: | | | | | | | | | | | | | | | | | | | | | | | | |
Net investment income | | | | | | $ | (4,198,015 | ) | | | | | | $ | (30,340,988 | ) | | | | | | $ | (12,121,511 | ) |
Net realized gain on securities | | | | | | | (36,713,546 | ) | | | | | | | – | | | | | | | | (13,836,208 | ) |
| | | | | | |
|
|
| | | | | |
|
|
| | | | | |
|
|
|
Total distributions to shareholders | | | | | | $ | (40,911,561 | ) | | | | | | $ | (30,340,988 | ) | | | | | | $ | (25,957,719 | ) |
| | | | | | |
|
|
| | | | | |
|
|
| | | | | |
|
|
|
See Notes to Financial Statements
VALIC Company II
NOTES TO FINANCIAL STATEMENTS
Note 1 — Organization
VALIC Company II (the “Series” or “VC II”) was organized as a Delaware statutory trust on May 6, 1998, by The Variable Annuity Life Insurance Company (“VALIC” or the “Adviser”). VALIC, the investment adviser to VC II, is an indirect wholly-owned subsidiary of American International Group, Inc. (“AIG”). VC II is registered under the Investment Company Act of 1940, as amended (the “1940 Act”), as an open-end, management investment company. The Series consists of 15 separate mutual funds (collectively, the “Funds,” or each, a “Fund”), each of which issues its own class of shares of beneficial interest:
| | |
| Aggressive Growth Lifestyle Fund* | | Mid Cap Growth Fund |
| Capital Appreciation Fund | | Mid Cap Value Fund |
| Conservative Growth Lifestyle Fund* | | Moderate Growth Lifestyle Fund* |
| Core Bond Fund | | Small Cap Growth Fund |
| Government Money Market II Fund | | Small Cap Value Fund |
| High Yield Bond Fund | | Strategic Bond Fund |
| International Opportunities Fund | | U.S. Socially Responsible Fund** |
| Large Cap Value Fund | | |
| * | The Lifestyle Funds represent “Fund of Funds” which invest in either VALIC Company I (“VC I”) or VC II mutual funds. |
| ** | Effective June 4, 2019, the name of the Socially Responsible Fund changed to U.S. Socially Responsible Fund. |
Each Fund is diversified as defined by the 1940 Act.
Indemnifications. Under VC II’s organizational documents, its officers and trustees are indemnified against certain liabilities arising out of the performance of their duties to the Funds. In addition, in the normal course of business, VC II enters into contracts that contain the obligation to indemnify others. The Funds’ maximum exposure under these arrangements is unknown. Currently, however, VC II expects the risk of loss to be remote.
Note 2 — Significant Accounting Policies
The preparation of financial statements in accordance with U.S. generally accepted accounting principles (“GAAP”) requires management to make estimates and assumptions that affect the reported amounts and disclosures in the financial statements. Actual results could differ from those estimates and those differences could be significant. The Funds are considered investment companies under GAAP and follow the accounting and reporting guidance applicable to investment companies. The following is a summary of significant accounting policies consistently followed by the Series in the preparation of its financial statements:
A. Security Valuation
In accordance with the authoritative guidance on fair value measurements and disclosures under GAAP, the Funds disclose the fair value of their investments in a hierarchy that prioritizes the inputs to valuation techniques used to measure the fair value. In accordance with GAAP, fair value is defined as the price that the Funds would receive upon selling an asset or transferring a liability in a timely transaction to an independent third party in the principal or most advantageous market. GAAP establishes a three-tier hierarchy to provide more transparency around the inputs used to measure fair value and to establish classification of fair value measurements for disclosure purposes. Inputs refer broadly to the assumptions that market participants would use in pricing the asset or liability, including assumptions about risk. Inputs may be observable or unobservable. Observable inputs are inputs that reflect the assumptions market participants would use in pricing the asset or liability developed based on market data obtained from sources independent of the reporting entity. Unobservable inputs are inputs that reflect the reporting entity’s own assumptions about the assumptions market participants would use in pricing the asset or liability developed based on the best information available in the circumstances. The three-tiers are as follows:
Level 1 — Unadjusted quoted prices in active markets for identical securities
Level 2 — Other significant observable inputs (including quoted prices for similar securities, interest rates, prepayment speeds, credit risk, referenced indices, quoted prices in inactive markets, adjusted quoted prices in active markets, adjusted quoted prices on foreign equity securities that were adjusted in accordance with pricing procedures approved by the Board of Trustees (the “Board”) , etc.)
Level 3 — Significant unobservable inputs (includes inputs that reflect the Funds’ own assumptions about the assumptions market participants would use in pricing the security, developed based on the best information available under the circumstances)
Changes in valuation techniques may result in transfers in or out of an investment’s assigned Level within the hierarchy. The methodology used for valuing investments is not necessarily an indication of the risk associated with investing in those investments and the determination of the significance of a particular input to the fair value measurement in its entirety requires judgment and consideration of factors specific to each security.
The availability of observable inputs can vary from security to security and is affected by a wide variety of factors, including, for example, the type of security, whether the security is recently issued and not yet established in the marketplace, the liquidity of markets, and other characteristics particular to the security. To the extent that valuation is based on models or inputs that are less observable or unobservable in the market, the determination of fair value requires more judgment. Accordingly, the degree of judgment exercised in determining fair value is greatest for instruments categorized in Level 3.
The summary of the Funds’ assets and liabilities classified in the fair value hierarchy as of August 31, 2019, is reported on a schedule at the end of each Fund’s Portfolio of Investments.
Stocks are generally valued based upon closing sales prices reported on recognized securities exchanges on which the securities are principally traded and are generally categorized as Level 1. Stocks listed on the NASDAQ are valued using the NASDAQ Official Closing Price (“NOCP”). Generally, the NOCP will be the last sale price unless the
VALIC Company II
NOTES TO FINANCIAL STATEMENTS—(continued)
reported trade for the stock is outside the range of the bid/ask price. In such cases, the NOCP will be normalized to the nearer of the bid or ask price. For listed securities having no sales reported and for unlisted securities, such securities will be valued based upon the last reported bid price.
As of the close of regular trading on the New York Stock Exchange (“NYSE”), securities traded primarily on security exchanges outside the United States are valued at the last sale price on such exchanges on the day of valuation, or if there is no sale on the day of valuation, at the last-reported bid price. If a security’s price is available from more than one exchange, the Funds use the exchange that is the primary market for the security. Such securities are generally categorized as Level 1. However, depending on the foreign market, closing prices may be up to 15 hours old when they are used to price a Fund’s shares, and a Fund may determine that certain closing prices do not reflect the fair value of the security. This determination will be based on the review of a number of factors, including developments in foreign markets, the performance of U.S. securities markets, and the performance of instruments trading in U.S. markets that represent foreign securities and baskets of foreign securities. If a Fund determines that closing prices do not reflect the fair value of the securities, the Fund will adjust the previous closing prices in accordance with pricing procedures approved by the Board to reflect what it believes to be the fair value of the securities as of the close of regular trading on the NYSE. The Funds may also fair value securities in other situations, for example, when a particular foreign market is closed but a Fund is open. For foreign equity securities and foreign equity futures contracts, the Funds use an outside pricing service to provide it with closing market prices and information used for adjusting those prices, and when so adjusted, such securities and futures are generally categorized as Level 2.
Bonds, debentures and other debt securities are valued at evaluated bid prices obtained for the day of valuation from a Board-approved pricing service, and are generally categorized as Level 2. The pricing service may use valuation models or matrix pricing which considers information with respect to comparable bond and note transactions, quotations from bond dealers, or by reference to other securities that are considered comparable in such characteristics as rating, interest rate, and maturity date, option adjusted spread models, prepayments projections, interest rate spreads, and yield curves to determine current value. If a price is unavailable from a Board-approved pricing service, the securities may be priced at the mean of two independent quotes obtained from brokers.
Senior floating rate loans (“Loans”) are valued at the average of available bids in the market for such Loans, as provided by a Board-approved loan pricing service, and are generally categorized as Level 2.
Investments in registered investment companies that do not trade on an exchange are valued at the end of day net asset value per share. Investments in registered investment companies that trade on an exchange are valued at the last sales price or official closing price as of the close of the customary trading session on the exchange where the security is principally traded. Investments in registered investment companies are generally categorized as Level 1.
Futures contracts traded on national securities exchanges are valued at the quoted daily settlement price established by the exchange on which they trade reported by a Board-approved pricing service, and are generally categorized as Level 1. Swap contracts traded on national securities exchanges are valued at the closing price of the exchange on which they are traded or if a closing price of the exchange is not available, the swap will be valued using a mid valuation provided by a Board-approved pricing service, and are generally categorized as Level 2. Swap contracts traded in the over-the-counter (“OTC”) market are valued at a mid valuation provided by a Board-approved pricing service, and are generally categorized as Level 2. Forward foreign currency contracts (“forward contracts”) are valued at the 4:00 p.m. Eastern Time forward rate and are generally categorized as Level 2.
For the Government Money Market II Fund, securities are valued at amortized cost, which approximates market value and are generally categorized as Level 2. The amortized cost method involves valuing a security at its cost on the date of purchase and thereafter assuming a constant amortization to maturity of any discount or premium. In accordance withRule 2a-7 under the 1940 Act, the Board has adopted procedures intended to stabilize the Government Money Market II Fund’s net asset value per share at $1.00. These procedures include the determination, at such intervals as the Board deems appropriate and reasonable in light of current market conditions, of the extent, if any, to which the Government Money Market II Fund market-based net asset value per share deviates from the Fund’s amortized cost per share. The calculation of such deviation is referred to as “shadow pricing.” For purposes of these market-based valuations, securities for which market quotations are not readily available are fair valued, as determined pursuant to procedures adopted in good faith by the Board.
Other securities are valued on the basis of last sale or bid price (if a last sale price is not available) which is, in the opinion of the Adviser, the broadest and most representative market, that may be either a securities exchange or OTC market, and are generally categorized as Level 1 or Level 2.
The Board is responsible for the share valuation process and has adopted policies and procedures (the “PRC Procedures”) for valuing the securities and other assets held by the Funds, including procedures for the fair valuation of securities and other assets for which market quotations are not readily available or are unreliable. The PRC Procedures provide for the establishment of a pricing review committee, which is responsible for, among other things, making certain determinations in connection with the Series’ fair valuation procedures. Securities for which market quotations are not readily available or the values of which may be significantly impacted by the occurrence of developments or significant events are generally categorized as Level 3. There is no single standard for making fair value determinations, which may result in prices that vary from those of other funds.
B. Derivative Instruments
Forward Foreign Currency Contracts: During the period, the High Yield Bond Fund and Strategic Bond Fund used forward contracts to attempt to protect the value of securities and related receivables and payables against changes in future foreign exchange rates.
A forward contract is an agreement between two parties to buy or sell currency at a set price on a future date. The market value of the contract will fluctuate with changes in currency exchange rates. The contract is marked-to-market daily using the forward rate and the cumulative change in market value is recorded by a Fund as unrealized appreciation or depreciation. On the settlement date, a Fund records either realized gains or losses equal to the difference between the value of the contract at the time it was opened and the value at the time it was closed.
Risks to the Funds of entering into forward contracts include counterparty risk, market risk and illiquidity risk. Counterparty risk arises upon entering into these contracts from the potential inability of counterparties to meet the terms of their contracts. If the counterparty defaults, a Fund’s loss will generally consist of the net amount of contractual
VALIC Company II
NOTES TO FINANCIAL STATEMENTS—(continued)
payments that the Fund has not yet received though the Fund’s maximum exposure due to counterparty risk could extend to the notional amount of the contract. Market risk is the risk that the value of the forward contract will depreciate due to unfavorable changes in the exchange rates. These contracts may involve market risk in excess of the unrealized appreciation or depreciation reported on the Statements of Assets and Liabilities. Illiquidity risk arises because the secondary market for forwards may have less liquidity relative to markets for other securities. Currency transactions are also subject to risks different from those of other portfolio transactions. Because currency control is of great importance to the issuing governments and influences economic planning and policy, purchases and sales of currency and related instruments can be adversely affected by government exchange controls, limitations or restrictions on repatriation of currency, and manipulations or exchange restrictions imposed by governments.
Forward foreign currency contracts outstanding at the end of the period, if any, are reported on a schedule at the end of each Fund’s Portfolio of Investments.
Futures: During the period, the Small Cap Value Fund and U.S. Socially Responsible Fund used equity futures contracts to equitize cash, providing exposure to equity markets.
A futures contract is an agreement between two parties to buy and sell a financial instrument at a set price on a future date. Upon entering into a futures transaction, a Fund will be required to segregate an initial margin payment of cash or other liquid securities with the futures commission merchant (the “broker”). Subsequent payments are made or received by the Fund as a result of changes in the value of the contract and/or changes in the value of the initial margin requirement. Such receipts or payments are recorded in the Statements of Assets and Liabilities as variation margin for changes in the value of the contracts and as cash collateral for futures contracts for the changes in the value of the initial margin requirement. When a contract is closed, the Funds record a realized gain or loss equal to the difference between the value of the contract at the time it was opened and the value at the time it was closed.
The primary risk to the Funds of entering into futures contracts is market risk. Market risk is the risk that there will be an unfavorable change in the interest rate, value or currency rate of the underlying security or securities. Futures contracts involve, to varying degrees, risk of loss in excess of the variation margin disclosed on the Statements of Assets and Liabilities. There may also be trading restrictions or limitations imposed by an exchange, and government regulations may restrict trading in futures contracts. While the Funds will generally only purchase exchange-traded futures, due to market conditions, there may not always be a liquid secondary market for a futures contract and, as a result, a Fund may be unable to close out its futures contracts at a time which is advantageous. In addition, if a Fund has insufficient cash to meet margin requirements, the Fund may need to sell other investments, including at disadvantageous times. There is generally minimal counterparty risk to the Funds since the futures contracts are generally exchange-traded.
Futures contracts outstanding at the end of the period, if any, are reported on a schedule at the end of each Fund’s Portfolio of Investments.
Swap Contracts: Certain Funds may enter into credit default, interest rate, equity and/or total return swap contracts. Swap contracts are privately negotiated in the OTC market and may be entered into as a bilateral contract or a centrally cleared contract (“centrally cleared swaps”). In a centrally cleared swap, immediately following execution of the swap contract, the swap contract is novated to a central counterparty (the “CCP”) and a Fund faces the CCP through a broker. Upon entering into a centrally cleared swap, a Fund is required to deposit initial margin with the broker in the form of cash or securities in an amount that varies depending on the size and risk profile of the particular swap. Securities deposited as initial margin are designated on the Portfolio of Investments and cash deposited is recorded on the Statement of Assets and Liabilities as cash collateral for centrally cleared swap contracts. Unlike a bilateral swap contract, for centrally cleared swaps, a Fund has no credit exposure to the counterparty as the CCP stands between the Funds and the counterparty. Swaps aremarked-to-market daily and the changes in value are recorded as an unrealized gain (loss). The daily change in valuation of swap contracts, if any, is recorded as unrealized appreciation (depreciation) on swap contracts. When the swap is terminated, a Fund will record a realized gain or loss equal to the difference between the proceeds from (or cost of) the closing transaction and the Fund’s basis in the contract, if any. Generally, the basis of the contracts is the premium received or paid. Upfront payments and receipts on swap contracts are amortized on a daily basis. Net periodic payments made or received by a Fund are included as part of realized gain (loss).
Credit Default Swap Agreements: During the period, the High Yield Bond Fund used credit default swaps to manage credit risk and to express active credit views to enhance return.
Credit default swaps are generally contracts in which one party makes periodic fixed-rate payments or a one time premium payment (referred to as the buyer of protection) to another party (the seller of protection) in exchange for the right to receive a specified payment in the event of a default or other credit event for the referenced entity, obligation or index. As a seller of protection on credit default swaps, a Fund will generally receive from the buyer of protection a fixed rate of income throughout the term of the swap provided that there is no credit event. As the seller, a Fund would effectively add leverage to its portfolio because, in addition to its total net assets, the Fund would be subject to investment exposure on the notional amount of the swap. If a Fund is a seller of protection and a credit event occurs, as defined under the terms of that particular swap agreement, the Fund will either (i) pay to the buyer of protection an amount equal to the notional amount of the swap and take delivery of the referenced obligation, other deliverable obligations or underlying securities comprising the referenced index or (ii) pay a net settlement amount in the form of cash or securities equal to the notional amount of the swap less the recovery value of the referenced obligation or underlying securities comprising the referenced index. As a buyer of protection on credit default swaps, a Fund will make periodic payments, similar to an insurance premium and the seller of protection agrees to compensate the Fund for future potential losses as a result of a credit event on the reference bond or other asset. A Fund effectively transfers the credit event risk of the reference bond or asset from it to the seller of protection. If a Fund is a buyer of protection and a credit event occurs, as defined under the terms of that particular swap agreement, the Fund will either (i) receive from the seller of protection an amount equal to the notional amount of the swap and deliver the referenced obligation, other deliverable obligations or underlying securities comprising the referenced index or (ii) receive a net settlement amount in the form of cash or securities equal to the notional amount of the swap less the recovery value of the referenced obligation or underlying securities comprising the referenced index. Recovery values are assumed by market makers considering either industry standard recovery rates or entity specific factors and considerations until a credit event occurs. If a credit event has occurred, the recovery value is determined by a facilitated auction whereby a minimum number of allowable broker bids, together with a specified valuation method, are used to calculate the settlement value.
Credit default swaps on corporate issues or sovereign issues of an emerging market country are contracts in which the buyer of protection makes periodic fixed payments or a one time premium payment to the seller of protection in exchange for the right to receive a specified payment in the event of a default or other credit event. If a credit event occurs and cash settlement is not elected, a variety of other deliverable obligations may be delivered in lieu of the specific referenced obligation. The ability to deliver other obligations
VALIC Company II
NOTES TO FINANCIAL STATEMENTS—(continued)
may result in acheapest-to deliver option (the buyer of protection’s right to choose the deliverable obligation with the lowest value following a credit event). A Fund may use credit default swaps on corporate issues or sovereign issues of an emerging market country to provide a measure of protection against defaults of the issuers (i.e., to reduce credit risk where the Fund owns or has exposure to the referenced obligation) or to take a speculative credit position with an active long or short position with respect to the likelihood of a particular issuer’s default.
Credit default swaps on asset-backed securities are contracts in which the buyer of protection makes periodic fixed-rate payments or a one time premium payment to the seller of protection in exchange for the right to receive a specified payment in the event of a default or other credit event. Unlike credit default swaps on corporate issues or sovereign issues of an emerging market country, deliverable obligations in most instances would be limited to the specific referenced obligation as performance for asset-backed securities can vary across deals. Prepayments, principal paydowns, and other writedown or loss events on the underlying mortgage loans will reduce the outstanding principal balance of the referenced obligation. These reductions may be temporary or permanent as defined under the terms of the swap agreement and the notional amount for the swap agreement will be adjusted by corresponding amounts. A Fund may use credit default swaps on asset-backed securities to provide a measure of protection against defaults of the referenced obligation or to take a speculative credit position with an active long or short position with respect to the likelihood of a particular referenced obligation’s default.
Credit default swaps on credit indices are generally contracts in which the buyer of protection makes periodic fixed-rate payments or a one time premium payment to the seller of protection in exchange for the right to receive a specified payment in the event of a write-down, principal shortfall, interest shortfall or default of all or part of the referenced entities comprising the credit index. A credit index is a list of a basket of credit instruments or exposures designed to be representative of some part of the credit market as a whole. These indices are made up of reference credits that are judged by a poll of dealers to be the most liquid entities in the credit default swap market based on the sector of the index. Components of the indices may include, but are not limited to, investment grade securities, high yield securities, asset backed securities, emerging markets, and/or various credit ratings within each sector. Credit indices are traded using credit default swaps with standardized terms including a fixed spread and standard maturity dates. An index credit default swap references all the names in the index, and if there is a default, the credit event is settled based on that name’s weight in the index. The composition of the indices changes periodically, usually every six months, and for most indices, each name has an equal weight in the index. A Fund may use credit default swaps on credit indices to hedge a portfolio of credit default swaps or bonds which is less expensive than it would be to enter into many credit default swaps to achieve a similar effect. Credit-default swaps on indices are used for protecting investors owning bonds against default, and also to speculate on changes in credit quality.
Implied credit spreads, represented in absolute terms, utilized in determining the market value of credit default swaps on corporate issues or sovereign issues of an emerging market country as of period end are reported on a schedule at the end of each Fund’s Portfolio of Investments and serve as an indicator of the current status of the payment/performance risk and represent the likelihood or risk of default for the credit derivative. The implied credit spread of a particular referenced entity reflects the cost of buying/selling protection and may include upfront payments required to be made to enter into the agreement. For credit default swaps on asset-based securities and credit indices, the quoted market prices and resulting values serve as the indicator of the current status of the payment/ performance risk. Wider credit spreads and increasing market values, in absolute terms when compared to the notional amount of the swap, represent a deterioration of the referenced entity’s credit soundness and a greater likelihood or risk of default or other credit event occurring as defined under the terms of the agreement. The maximum potential amount of future payments (undiscounted) that a Fund as a seller of protection could be required to make under a credit default swap would be an amount equal to the notional amount of the agreement. Notional amounts of all credit default swaps outstanding at the end of the period, for which a Fund is the seller of protection, if any, are disclosed on a schedule following each Fund’s Portfolio of Investments. These potential amounts would be partially offset by any recovery values of the respective referenced obligations, upfront payments received upon entering into the agreement, or net amounts received from the settlement of buy protection credit default swaps entered into by a Fund for the same referenced entity or entities.
Credit default swap contracts outstanding at the end of the period, if any, are reported on a schedule at the end of each Fund’s Portfolio of Investments.
Risks of Entering into Swap Agreements:Risks to a Fund of entering into credit default swaps, equity swaps and interest rate swaps, include credit risk, market risk, counterparty risk, liquidity risk and documentation risk. By entering into swap agreements, a Fund may be exposed to risk of potential loss due to unfavorable changes in interest rates, the price of the underlying security or index, or the underlying referenced asset’s perceived or actual credit, that the counterparty may default on its obligation to perform or the possibility that there is no liquid market for these agreements. There is also the risk that the parties may disagree as to the meaning of contractual terms in the swap agreement. In addition, to the extent that a subadviser does not accurately analyze and predict the underlying economic factors influencing the value of the swap, a Fund may suffer a loss, which may be in excess of the amount reflected on the statement of assets and liabilities.
Master Agreements: Certain Funds that hold derivative instruments and other financial instruments may be a party to ISDA (International Swaps and Derivatives Association, Inc.) Master Agreements or similar agreements (“Master Agreements”) with certain counterparties that govern such instruments. Master Agreements may contain provisions regarding, among other things, the parties’ general obligations, representations, agreements, collateral requirements, events of default and early termination. Collateral can be in the form of cash or securities as agreed to by a Fund and applicable counterparty. Collateral requirements are generally determined based on a Fund’s net position with each counterparty. Master Agreements may also include certain provisions that require a Fund to post additional collateral upon the occurrence of certain events, such as when a Fund’s net assets fall below a specified level. In addition, Master Agreements typically specify certain standard termination events, such as failure of a party to pay or deliver, credit support defaults and other events of default. Termination events applicable to a Fund may also occur upon a decline in a Fund’s net assets below a specified level over a certain period of time. Additional termination events applicable to counterparties may occur upon a decline in a counterparty’s long-term and short-term credit ratings below a specified level, or upon a decline in the ratings of a counterparty’s credit support provider. Upon the occurrence of a termination event, the other party may elect to terminate early and cause settlement of all instruments outstanding pursuant to a particular Master Agreement, including the payment of any losses and costs resulting from such early termination, as reasonably determined by the terminating party. Any decision by one or more of a Fund’s counterparties to elect early termination could cause a Fund to accelerate the payment of liabilities, which settlement amounts could be in excess of the amount of assets that are already posted as collateral. Typically, the Master Agreement will permit a single net payment in the event of default. Note, however, that bankruptcy or insolvency laws of a particular jurisdiction may impose restrictions on or prohibitions against the right of offset in bankruptcy, insolvency or other events. As a result, the early termination with respect to derivative instruments subject to Master Agreements that are in a net liability position could be material to a Fund’s financial statements. See additional information on specific types of derivative instruments and other financial instruments as disclosed in the Notes to Financial Statements. The Funds do not offset derivative assets and derivative liabilities that are subject to netting arrangements in the Statements of Assets and Liabilities.
VALIC Company II
NOTES TO FINANCIAL STATEMENTS—(continued)
The following tables represent the value of derivatives held as of August 31, 2019, by their primary underlying risk exposure and the respective location on the Statement of Assets and Liabilities and the effect of derivatives on the Statement of Operations for the year ended August 31, 2019. The derivative contracts held during the period are not accounted for as hedging instruments under GAAP. For a detailed presentation of derivatives held as of August 31, 2019, please refer to the schedule at the end of each Fund’s Portfolio of Investments.
| | | | | | | | | | | | | | | | | | | | | | | | |
| | | Asset Derivatives
| | | Liability Derivatives
| |
Fund
| | Futures
Contracts(1)(6)
| | | Swap
Contracts(2)
| | | Foreign
Forward
Exchange
Contracts(3)
| | | Futures
Contracts(1)(6)
| | | Swap
Contracts(4)
| | | Foreign
Forward
Exchange
Contracts(5)
| |
| | | Equity Contracts
| | | Equity Contracts
| |
Small Cap Value | | $ | — | | | $ | — | | | $ | — | | | $ | 14,095 | | | $ | — | | | $ | — | |
U.S. Socially Responsible | | | — | | | | — | | | | — | | | | 21,565 | | | | — | | | | — | |
| | |
| | | Credit Contracts
| | | Credit Contracts
| |
High Yield Bond | | | — | | | | — | | | | — | | | | — | | | | 59,214 | | | | — | |
| | |
| | | Foreign Exchange Contracts
| | | Foreign Exchange Contracts
| |
High Yield Bond | | | — | | | | — | | | | 110,259 | | | | — | | | | — | | | | — | |
Strategic Bond | | | — | | | | — | | | | 1,891,220 | | | | — | | | | — | | | | 210,934 | |
Statement of Assets and Liabilities Location:
| (1) | Variation margin on futures contracts |
| (2) | Unrealized appreciation on swap contracts |
| (3) | Unrealized appreciation on forward foreign currency contracts |
| (4) | Unrealized depreciation on swap contracts |
| (5) | Unrealized depreciation on forward foreign currency contracts |
| (6) | The variation margin on futures contracts is included in the cumulative unrealized appreciation (depreciation) as reported on each Fund’s Portfolio of Investments in the following amounts: |
| | | | |
Fund
| | Cumulative
Appreciation
(Depreciation)
| |
Small Cap Value | | $ | (139,215 | ) |
U.S. Socially Responsible | | | 337,224 | |
| | | | | | | | | | | | |
| | | Realized Gain (Loss) on Derivatives Recognized in
Statement of Operations
| |
Fund
| | Futures
Contracts(1)
| | | Swap
Contracts(2)
| | | Foreign
Forward
Exchange
Contracts(3)
| |
| | | Equity Contracts
| |
Small Cap Value | | $ | (633,504 | ) | | $ | — | | | $ | — | |
U.S. Socially Responsible | | | 1,219,331 | | | | — | | | | — | |
| |
| | | Credit Contracts
| |
High Yield Bond | | | — | | | | (2,226 | ) | | | — | |
| |
| | | Foreign Exchange Contracts
| |
High Yield Bond | | | — | | | | — | | | | 1,023,854 | |
Strategic Bond | | | — | | | | — | | | | 3,229,068 | |
VALIC Company II
NOTES TO FINANCIAL STATEMENTS—(continued)
| | | | | | | | | | | | |
| |
| | | Change in Unrealized
Appreciation (Depreciation) on Derivatives
Recognized in Statement of Operations
| |
Fund
| | Futures
Contracts(4)
| | | Swap
Contracts(5)
| | | Foreign
Forward
Exchange
Contracts(6)
| |
| | | Equity Contracts
| |
Small Cap Value | | $ | (432,833 | ) | | $ | — | | | $ | — | |
U.S. Socially Responsible | | | (15,187 | ) | | | — | | | | — | |
| |
| | | Credit Contracts
| |
High Yield Bond | | | — | | | | (59,214 | ) | | | — | |
| |
| | | Foreign Exchange Contracts
| |
High Yield Bond | | | — | | | | — | | | | 130,855 | |
Strategic Bond | | | — | | | | — | | | | 1,385,915 | |
Statement of Operations Location:
| (1) | Net realized gain (loss) on futures contracts |
| (2) | Net realized gain (loss) on swap contracts |
| (3) | Net realized gain (loss) on forward contracts |
| (4) | Change in unrealized appreciation (depreciation) on futures contracts |
| (5) | Change in unrealized appreciation (depreciation) on swap contracts |
| (6) | Change in unrealized appreciation (depreciation) on forward contracts |
The following table represents the average monthly balances of derivatives held during the year ended August 31, 2019.
| | | | | | | | | | | | |
| | | Average Amount Outstanding During the Year
| |
Fund
| | Futures
Contracts(1)
| | | Swap
Contracts(1)
| | | Foreign
Exchange
Contracts(1)
| |
High Yield Bond | | $ | — | | | $ | 150,000 | | | $ | 13,947,840 | |
Small Cap Value | | | 8,810,023 | | | | — | | | | — | |
Strategic Bond | | | — | | | | — | | | | 54,585,145 | |
U.S. Socially Responsible | | | 29,012,487 | | | | — | | | | — | |
| (1) | Amounts represent notional amounts in U.S. dollars. |
The following tables set forth the Funds’ derivative assets and liabilities by counterparty, net of amounts available for offset under Master Agreements and net of the related collateral pledged/(received) as of August 31, 2019. The repurchase agreements held by the Funds and securities on loan as of August 31, 2019, are also subject to Master Agreements but are not included in the following tables. See the Portfolio of Investments of each Fund and the Notes to the Financial Statements for more information about the Funds’ holdings in repurchase agreements and securities on loan.
| | | | | | | | | | | | | | | | | | | | | | | | | | | | | | | | | | | | | | | | | | | | |
| | | High Yield Bond Fund
| | | | | | | | | | |
| | | Derivative Assets(1)
| | | Derivative Liabilities(1)
| | | | | | | | | | |
| Counterparty | | Forward
Foreign
Currency
Contracts
| | | OTC
Swaps
| | | Options
Purchased
| | | Total
| | | Forward
Foreign
Currency
Contracts
| | | OTC
Swaps
| | | Options
Written
| | | Total
| | | Net
Derivative
Assets
(Liabilities)
| | | Collateral
Pledged/
(Received)(2)
| | | Net
Amount(3)
| |
JPMorgan Chase Bank N.A. | | $ | 110,259 | | | $ | — | | | $ | — | | | $ | 110,259 | | | $ | — | | | $ | — | | | $ | — | | | $ | — | | | $ | 110,259 | | | $ | — | | | $ | 110,259 | |
| | |
|
|
| |
|
|
| |
|
|
| |
|
|
| |
|
|
| |
|
|
| |
|
|
| |
|
|
| |
|
|
| |
|
|
| |
|
|
|
| | | | |
| | | Strategic Bond Fund
| | | | | | | | | | |
| | | Derivative Assets(1)
| | | Derivative Liabilities(1)
| | | | | | | | | | |
| Counterparty | | Forward
Foreign
Currency
Contracts
| | | OTC
Swaps
| | | Options
Purchased
| | | Total
| | | Forward
Foreign
Currency
Contracts
| | | OTC
Swaps
| | | Options
Written
| | | Total
| | | Net
Derivative
Assets
(Liabilities)
| | | Collateral
Pledged/
(Received)(2)
| | | Net
Amount(3)
| |
JPMorgan Chase Bank N.A. | | $ | 1,891,220 | | | $ | — | | | $ | — | | | $ | 1,891,220 | | | $ | 210,934 | | | $ | — | | | $ | — | | | $ | 210,934 | | | $ | 1,680,286 | | | $ | — | | | $ | 1,680,286 | |
| | |
|
|
| |
|
|
| |
|
|
| |
|
|
| |
|
|
| |
|
|
| |
|
|
| |
|
|
| |
|
|
| |
|
|
| |
|
|
|
| (1) | Gross amounts of recognized assets and liabilities not offset in the Statement of Assets and Liabilities. |
| (2) | For each respective counterparty, collateral pledged or (received) is limited to an amount not to exceed 100% of the derivative asset/liability in the table above. |
| (3) | Net amount represents the net amount due (to)/from counterparty in the event of a default based on the contractualset-off rights under the agreement. |
VALIC Company II
NOTES TO FINANCIAL STATEMENTS —(continued)
C. Stripped Mortgage-Backed Securities
Stripped Mortgage-Backed Securities (“SMBS”) are multiple-class mortgage-backed securities. SMBS are often structured with two classes that receive different proportions of the interest and principal distributions on a pool of mortgage assets. SMBS have greater market volatility than other types of U.S. government securities in which a Fund invests. A common type of SMBS has one class receiving some of the interest and all or most of the principal (the “principal only” class) from the mortgage pool, while the other class will receive all or most of the interest (the “interest only” class). The yield to maturity on an interest only class is extremely sensitive not only to changes in prevailing interest rates, but also to the rate of principal payments, including principal prepayments, on the underlying pool of mortgage assets, and a rapid rate of principal payment may have a material adverse effect on a Fund‘s yield.
D. Mortgage-Backed Dollar Rolls
Certain Funds may enter into dollar rolls using “to be announced” (“TBA”) mortgage-backed securities (“TBA Rolls”). TBA Roll transactions involve the sale of mortgage or other asset backed securities with the commitment to purchase substantially similar securities on a specified future date. The Funds’ policy is to record the components of TBA Rolls as purchase/sale transactions. Any difference between the purchase and sale price is recorded as a realized gain or loss on the date the transaction is entered into. TBA Roll transactions involve the risk that the market value of the securities held by a Fund may decline below the price of the securities that the Fund has sold but is obligated to repurchase under the agreement. In the event that the buyer of securities in a TBA Roll transaction files bankruptcy or becomes insolvent, a Fund‘s use of the proceeds from the sale of the securities may be restricted pending a determination by the other party, or its trustee or receiver, whether to enforce the Fund‘s obligation to repurchase the securities. Mortgage-Backed Dollar Rolls outstanding at the end of the period, if any, are included in investments purchased/sold on an extended settlement basis in the Statement of Assets and Liabilities.
E. When-Issued Securities and Forward Commitments
Certain Funds may purchase or sell when-issued securities, including TBA securities that have been authorized, but not yet issued in the market. In addition, a Fund may purchase or sell securities on a forward commitment basis. A forward commitment involves entering into a contract to purchase or sell securities, typically on an extended settlement basis, for a fixed price at a future date. The Funds may engage in when-issued or forward commitment transactions in order to secure what is considered to be an advantageous price and yield at the time of entering into the obligation. The purchase of securities on a when-issued or forward commitment basis involves a risk of loss if the value of the security to be purchased declines before the settlement date. Conversely, the sale of securities on a when-issued or forward commitment basis involves the risk that the value of the securities sold may increase before the settlement date. Securities purchased or sold on a when-issued or forward commitment basis outstanding at the end of the period, if any, are included in investments purchased/sold on an extended settlement basis in the Statement of Assets and Liabilities.
F. Loans
Certain Funds invests in senior loans which generally consist of direct debt obligations of companies (collectively, “Borrowers”), primarily U.S. companies and their affiliates, undertaken to finance the growth of the Borrower’s business internally and externally, or to finance a capital restructuring. Transactions in senior loans may settle on a delayed basis. Unsettled loans at the end of the period, if any, are included in investments purchased/sold on an extended settlement basis in the Statement of Assets and Liabilities.
G. Inflation-Indexed Bonds
Certain Funds may purchase inflation-indexed bonds. Inflation-indexed bonds are fixed income securities whose principal value is adjusted periodically according to the rate of inflation. Two structures are common. The U.S. Treasury and certain other issuers use a structure that reflects inflation in the principal value of the bond. Other issuers pay out any inflation related accruals as part of a semiannual coupon. The value of inflation-indexed bonds is expected to change in response to changes in real interest rates. Real interest rates, in turn, are tied to the relationship between nominal interest rates (i.e., stated interest rates) and the rate of inflation. Therefore, if the rate of inflation rises at a faster rate than nominal interest rates, real interest rates (i.e., nominal interest rates minus inflation) might decline, leading to an increase in value of inflation-indexed bonds. In contrast, if nominal interest rates increase at a faster rate than inflation, real interest rates might rise, leading to a decrease in value of inflation-indexed bonds. There can be no assurance, however, that the value of inflation-indexed bonds will be directly correlated to changes in nominal interest rates, and short-term increases in inflation may lead to a decline in their value. Coupon payments received from inflation-indexed bonds are recorded in the Statements of Operations as interest income. In addition, any increase or decrease in the principal amount of an inflation-indexed bond will be recorded in the Statements of Operations as an increase or decrease to interest income, even though principal is not paid until maturity.
H. Repurchase Agreements
The Funds, along with other affiliated registered investment companies, pursuant to procedures adopted by the Board and applicable guidance from the Securities and Exchange Commission (“SEC”), may transfer uninvested cash balances into a single joint account, the daily aggregate balance of which is invested in one or more repurchase agreements collateralized by U.S. Treasury or federal agency obligations.
In a repurchase agreement, the seller of a security agrees to repurchase the security at a mutually agreed-upon time and price, which reflects the effective rate of return for the term of the agreement. For repurchase agreements and joint repurchase agreements, the Series’ custodian takes possession of the collateral pledged for investments in such repurchase agreements (“repo” or collectively “repos”). The underlying collateral is valued daily on a mark to market basis, plus accrued interest to ensure that the value, at the time the agreement is entered into, is equal to at least 102% of the repurchase price, including accrued interest. In the event of default of the obligation to repurchase, a Fund has the right to liquidate the collateral and apply the proceeds in satisfaction of the obligation. If the seller defaults and the value of the collateral declines or if bankruptcy proceedings are commenced with respect to the seller of the security, realization of the collateral by a Fund may be delayed or limited.
I. Investment Securities Loaned
To realize additional income, the Funds, except for Aggressive Growth Lifestyle Fund, Conservative Growth Lifestyle Fund, Moderate Growth Lifestyle Fund, and the Government Money Market II Fund, may lend portfolio securities with a value of up to 30% of its total assets. Securities lending arrangements are generally governed by master securities
VALIC Company II
NOTES TO FINANCIAL STATEMENTS—(continued)
lending authorization agreements which typically provide the securities lending agent with the right to make loans of a Fund’s available securities to an approved list of borrowers. These master securities lending agreements are considered to be Master Agreements as discussed in the Notes to the Financial Statements. Loans made pursuant to these agreements will be continuously secured by collateral in an amount at least equal to the market value of the securities loaned. Such collateral will be cash, U.S. government securities, or other collateral as deemed appropriate. A Fund may use the cash collateral received to invest in short-term investments. The description of the short-term investments made with cash collateral from securities lending is included in the applicable Fund’s Portfolio of Investments. Loans by a Fund will only be made to broker-dealers deemed by the securities lending agent to be creditworthy and will not be made unless, in the judgment of VALIC, the consideration to be earned from such loans would justify the risk. It is the Series’ policy to obtain additional collateral from or return excess collateral to the borrower by the end of the next business day. Therefore, the value of the collateral may be temporarily more or less than the value of the securities on loan. Each Fund receives income from the investment of cash collateral, in addition to lending fees and rebates paid by the borrower, less expenses associated with the loan. In the event of a borrower default, including if the borrower fails to maintain the requisite amount of collateral, the securities lending agent will terminate all outstanding loans to that particular borrower and the lending Fund is permitted to use the collateral to replace the securities while holding the borrower liable for any excess of replacement cost over collateral. The securities lending agent is also required to indemnify a Fund against certain losses resulting from a borrower default. Although risk is mitigated by the collateral and indemnification, the risks in lending fund securities, as with other extensions of secured credit, include possible delays in receiving additional collateral or in the recovery of the securities or possible loss of rights in the collateral should the borrower fail financially as well as risk of loss in the value of collateral or the value of the investments made with the collateral. Income and fees are recorded in the Statements of Operations as securities lending income. Loans of securities are terminable at any time and the borrower, after notice, is required to return borrowed securities within the standard time period for settlement of securities transactions.
J. Securities Transactions, Investment Income, Expenses, Dividends and Distributions to Shareholders
Security transactions are recorded on a trade date basis. Realized gains and losses on the sale of investments are calculated on the identified cost basis. For financial statement purposes, the Funds amortize all premiums and accrete all discounts on fixed income securities.
Interest income is accrued daily from settlement date except when collection is not expected. Dividend income is recorded on the ex-dividend date except for certain dividends from foreign securities, which are recorded as soon as a Fund is informed after the ex-dividend date. Paydown gains and losses on mortgage and asset-backed securities are recorded as components of interest income on the Statement of Operations. For the Lifestyle Funds, distributions from income from the Underlying Funds, if any, are recorded to income on the ex-dividend date. Distributions from net realized capital gains from the Underlying Funds, if any, are recorded to realized gains on the ex-dividend date.
Funds which earn foreign income and capital gains may be subject to foreign withholding taxes and capital gains taxes at various rates. Under applicable foreign law, a withholding of tax may be imposed on interest, dividends, and capital gains from the sale of foreign securities at various rates. India, Thailand, and certain other countries’ tax regulations require that taxes be paid on capital gains realized by a Fund.
Distributions received from Real Estate Investment Trusts (“REIT”) investments are recharacterized based on information provided by the REIT into the following categories: ordinary income, long-term and short-term capital gains, and return of capital. If information is not available on a timely basis from the REIT, the recharacterization will be based on available information which may include the previous year’s allocation. If new or additional information becomes available from the REIT at a later date, a recharacterization will be made in the following year. The amount recharacterized as ordinary income is recorded as dividend income and the amount recharacterized as capital gain is recorded as realized gain in the Statement of Operations. The amount recharacterized as return of capital is recorded as a reduction to the cost of investments in the Statement of Assets and Liabilities. These recharacterizations are reflected in the accompanying financial statements.
Expenses common to all Funds are allocated among the Funds based upon relative net assets or other appropriate allocation methods. In all other respects, expenses are charged to each Fund as incurred on a specific identification basis. For the Lifestyle Funds, the expenses included in the accompanying financial statements reflect the expenses of the Lifestyle Funds and do not include any expenses associated with the Underlying Funds.
Dividends from net investment income, if any, are normally paid annually, except for the Government Money Market II Fund, which declares daily and pays monthly. Distributions from net realized capital gains, if any, are normally declared and paid annually. The Funds record dividends and distributions to their shareholders on the ex-dividend date.
The amount of dividends and distributions from net investment income and net realized capital gains are determined in accordance with federal income tax regulations, which may differ from GAAP. These “book/tax” differences are either considered temporary or permanent in nature. To the extent these differences are permanent in nature, such amounts are reclassified within the capital accounts at fiscal year end based on their federal tax-basis treatment; temporary differences do not require reclassification. Net assets are not affected by these reclassifications.
Each Fund is considered a separate entity for tax purposes and intends to comply with the requirements of the Internal Revenue Code, as amended, applicable to regulated investment companies and distribute all of its taxable income, including any net capital gains on investments, to its shareholders. Each Fund also intends to distribute sufficient net investment income and net capital gains, if any, so that it will not be subject to excise tax on undistributed income and gains. Therefore, no federal income tax or excise tax provision is required.
The Funds recognize the tax benefits of uncertain tax positions only when the position is more likely than not to be sustained, assuming examination by tax authorities. Management has analyzed each Fund’s tax positions and concluded that no liability for unrecognized tax benefits should be recorded related to uncertain tax positions taken on returns filed for open tax years 2016 — 2018 or expected to be taken in each Fund’s 2019 tax return. The Funds are not aware of any tax provisions for which it is reasonably possible that the total amounts of unrecognized tax benefits will change materially in the next twelve months. The Funds file U.S. federal and certain state income tax returns. With few exceptions, the Funds are no longer subject to U.S. federal and state tax examinations by tax authorities for tax returns ending before 2016.
K. Foreign Currency Translation
The books and records of the Funds are maintained in U.S. dollars. Assets and liabilities denominated in foreign currencies and commitments under forward foreign currency contracts are translated into U.S. dollars based on the exchange rate of such currencies against U.S. dollars on the date of valuation.
The Funds do not isolate that portion of the results of operations arising as a result of changes in the foreign exchange rates from the changes in the market prices of securities held at the end of the period. Similarly, the Funds do not isolate the effect of changes in foreign exchange rates from the changes in the market prices of portfolio securities sold during the period.
VALIC Company II
NOTES TO FINANCIAL STATEMENTS—(continued)
Realized foreign exchange gains and losses on other assets and liabilities and change in unrealized foreign exchange gains and losses on other assets and liabilities located in the Statements of Operations include realized foreign exchange gains and losses from currency gains or losses between the trade and the settlement dates of securities transactions, the difference between the amounts of interest, dividends and foreign withholding taxes recorded on the Funds’ books and the U.S. dollar equivalent amounts actually received or paid and changes in the unrealized foreign exchange gains and losses relating to the other assets and liabilities arising as a result of changes in the exchange rates.
L. New Accounting Pronouncements
In August 2018, the SEC adopted amendments to certain financial statement disclosure requirements of Regulation S-X to conform them to GAAP for investment companies. The final rule became effective on November 5, 2018. All required changes have been made in accordance with Regulation S-X.
In August 2018, the FASB issued Accounting Standards Update (“ASU”)No. 2018-13 “Disclosure Framework — Changes to the Disclosure Requirements for Fair Value Measurement”. The ASU eliminates, modifies, and adds disclosure requirements for fair value measurements and is effective for fiscal years, and interim periods within those fiscal years, beginning after December 15, 2019. The ASU allows for early adoption of either the entire standard or only the provisions that eliminate or modify the requirements. Management has elected to early adopt the provisions that eliminate disclosure requirements and is still evaluating the impact of applying the rest of the ASU.
In March 2017, the FASB issued Accounting Standards Update (“ASU”)No. 2017-08, “Premium Amortization on Purchased Callable Debt Securities”, which requires the premiums on certain purchased debt securities withnon-contingent call features to be amortized to the earliest call date and is effective for fiscal years, and interim periods within those fiscal years, beginning after December 15, 2018. Management is currently evaluating the amendments and their impact, if any, on the Funds’ financial statements.
Note 3— Advisory Fees and Other Transactions with Affiliates
VALIC serves as investment adviser to VC II. Certain officers and trustees of VC II are officers and directors of VALIC or affiliates of VALIC. VALIC receives from VC II a monthly fee based on each Fund’s average daily net asset value at the following annual rates:
| | |
| Aggressive Growth Lifestyle Fund | | 0.10% |
| Capital Appreciation Fund | | 0.55% on first $1 billion |
| | | 0.525% on assets over $1 billion |
| Conservative Growth Lifestyle Fund | | 0.10% |
| Core Bond Fund | | 0.50% on the first $200 million |
| | | 0.45% on the next $300 million |
| | | 0.40% on assets over $500 million |
| Government Money Market II Fund | | 0.25% |
| High Yield Bond Fund | | 0.65% on the first $150 million |
| | | 0.60% on the next $350 million |
| | | 0.55% on assets over $500 million |
| International Opportunities Fund | | 0.90% on the first $100 million |
| | | 0.80% on the next $650 million |
| | | 0.75% on assets over $750 million |
| Large Cap Value Fund | | 0.50% on the first $500 million |
| | | 0.475% on assets over $500 million |
| Mid Cap Growth Fund | | 0.80% on the first $50 million |
| | | 0.75% on the next $50 million |
| | | 0.70% on the next $150 million |
| | | 0.65% on the next $250 million |
| | | 0.60% on assets over $500 million |
| Mid Cap Value Fund | | 0.75% on the first $100 million |
| | | 0.725% on the next $150 million |
| | | 0.70% on the next $250 million |
| | | 0.675% on the next $250 million |
| | | 0.65% on assets over $750 million |
| Moderate Growth Lifestyle Fund | | 0.10% |
| Small Cap Growth Fund | | 0.85% on the first $100 million |
| | | 0.80% on assets over $100 million |
| Small Cap Value Fund | | 0.75% on the first $50 million |
| | | 0.65% on assets over $50 million |
| Strategic Bond Fund | | 0.60% on the first $200 million |
| | | 0.50% on the next $300 million |
| | | 0.45% on assets over $500 million |
| U.S. Socially Responsible Fund | | 0.25% on the first $1 billion |
| | | 0.24% on assets over $1 billion |
VALIC Company II
NOTES TO FINANCIAL STATEMENTS—(continued)
VALIC has entered into subadvisory agreements with the following:
BMO Asset Management Corp. (“BMO AM”)—subadviser for the Capital Appreciation Fund.
Delaware Investments Fund Advisers (“Delaware Investments”)—subadviser for a portion of the International Opportunities Fund.
J.P. Morgan Investment Management Inc. (“JPMIM”)—subadviser for the Small Cap Growth Fund and the Small Cap Value Fund.
Janus Capital Management, LLC (“Janus”)—subadviser for a portion of the Large Cap Value Fund.
Massachusetts Financial Services Company (“MFS”)—subadviser for a portion of the International Opportunities Fund.
PineBridge Investments, LLC (“PineBridge”)—subadviser for the Strategic Bond Fund, Core Bond Fund, Aggressive, Moderate and Conservative Growth Lifestyle Funds.
Boston Partners Global Investors, Inc. d/b/a Boston Partners (“Boston Partners”)—subadviser for a portion of the Mid Cap Value Fund.
SunAmerica Asset Management, LLC (“SunAmerica”)—subadviser for the Government Money Market II Fund and the U.S. Socially Responsible Fund.
BNY Mellon Asset Management North America Corporation (“BNY AM”)—subadviser for a portion of the Large Cap Value Fund.
Wellington Management Company LLP—subadviser for the High Yield Bond Fund, Mid Cap Growth Fund and a portion of the Mid Cap Value Fund.
The subadvisers are compensated for their services by VALIC.
VALIC has contractually agreed to waive fees and/or reimburse expenses, if necessary, to keep annual operating expenses at or below the following percentages of each Fund’s average daily net assets through December 31, 2020. For the purposes of waived fee and/or reimbursed expense calculations, annual fund operating expenses shall not include extraordinary expenses (i.e., expenses that are unusual in nature and infrequent in occurrence, such as litigation), or acquired fund fees and expenses, brokerage commissions and other transactional expenses relating to the purchase and sale of portfolio securities, interest, taxes and governmental fees, and other expenses not incurred in the ordinary course of the Fund’s business. The contractual expense waivers and fee reimbursements will continue until December 31, 2020, subject to termination by the Board, including a majority of the Trustees who are not interested persons of the Fund or VALIC as defined by Section 2(a)(19) of the 1940 Act (the “Disinterested Trustees”).
| | | | |
Fund
| | Expense
Limitation
| |
Aggressive Growth Lifestyle | | | 0.10 | % |
Capital Appreciation | | | 0.85 | % |
Conservative Growth Lifestyle | | | 0.10 | % |
Core Bond | | | 0.77 | % |
Government Money Market II | | | 0.55 | % |
High Yield Bond | | | 0.96 | % |
International Opportunities | | | 1.00 | % |
Large Cap Value | | | 0.81 | % |
Mid Cap Growth | | | 0.85 | % |
Mid Cap Value | | | 1.05 | % |
Moderate Growth Lifestyle | | | 0.10 | % |
Small Cap Growth | | | 1.16 | % |
Small Cap Value | | | 0.95 | % |
Strategic Bond | | | 0.89 | % |
U.S. Socially Responsible | | | 0.56 | % |
For the year ended August 31, 2019, pursuant to the contractual expense limitations in the above table, VALIC waived fees and/or reimbursed expenses as follows:
| | | | |
Fund
| | Amount
| |
Aggressive Growth Lifestyle | | $ | 224,872 | |
Capital Appreciation | | | 152,302 | |
Conservative Growth Lifestyle | | | 162,040 | |
Core Bond | | | 84,233 | |
Government Money Market II | | | 145,575 | |
High Yield Bond | | | 41,280 | |
International Opportunities | | | 1,345,570 | |
Large Cap Value | | | 206,086 | |
Mid Cap Growth | | | 602,837 | |
Mid Cap Value | | | 99,451 | |
Moderate Growth Lifestyle | | | 308,346 | |
Small Cap Growth | | | 135,804 | |
Small Cap Value | | | 436,551 | |
U.S. Socially Responsible | | | 351,643 | |
VALIC may also voluntarily waive fees and/or reimburse expenses to avoid a negative yield on the Government Money Market II Fund. The voluntary waivers and/or reimbursements may be terminated at any time at the option of VALIC. The exact amount of the voluntary waivers and/or reimbursements may change on a day-to-day basis. There is no guarantee that the Government Money Market II Fund will be able to avoid a negative yield. For the year ended August 31, 2019, VALIC did not voluntarily waive expenses to avoid a negative yield for the Government Money Market II Fund.
VALIC Company II
NOTES TO FINANCIAL STATEMENTS—(continued)
VC II, on behalf of each Fund, other than the Lifestyle Funds, has entered into an Administrative Services Agreement with SunAmerica (“Administrator”), an affiliate of VALIC. SunAmerica receives from each Fund in the Series, other than the Lifestyle Funds, an annual fee of 0.06% based upon each Fund’s average daily net assets, plus the following Accounting Basis Point Fee†: 0.0061% on the first $25 billion; 0.0070% on the next $75 billion; and 0.0050% in excess of $100 billion. Pursuant to the Administrative Services Agreement, SunAmerica provides administrative services to the Funds, regulatory reporting, internal legal and compliance services, fund accounting and related portfolio accounting services, all necessary office space, equipment, personnel, compensation and facilities for handling the affairs of the Funds and other services. Without limiting the generality of the foregoing, the Administrator (or its appointed service provider): assists with the preparation of prospectuses, statements of additional information, registration statements, and proxy materials; develops and prepares communications to shareholders, including the annual and semi-annual reports to shareholders; coordinates and supervises the preparation and filing of Fund tax returns; assists with the design, development, and operation of the Funds; prepares the Funds’ financial statements; determines the net asset value of the Funds’ shares; supervises the Funds’ transfer agent with respect to the payment of dividends and other distributions to shareholders; and calculates performance data of the Funds. For the year ended August 31, 2019, the Administrator earned fees as reflected in the Statements of Operations based upon the aforementioned rate.
VC II, on behalf of each Fund, entered into a Master Transfer Agency and Services Agreement with VALIC Retirement Services Company (“VRSCO”), an affiliate of VALIC. VRSCO receives from the Series and VC I an annual fee of $132,510, which is allocated to each Fund in the Series and VC I based on shareholder accounts. Under this agreement, VRSCO provides services which include the issuance and redemption of shares, acting as dividend disbursing agent, and certain shareholder reporting services including confirmation of transactions, statements of account and tax reporting. In addition to the above, VRSCO provides “Blue Sky” registration and reporting in applicable states for each Fund that is sold outside of a variable annuity or variable life contract in order to effect and maintain, as the case may be, including but not limited to, the qualification of shares for sale under the applicable securities laws of such jurisdictions to qualified plans. For the year ended August 31, 2019, VRSCO earned fees as reflected in the Statement of Operations based upon the aforementioned rate.
VC II, on behalf of each Fund, other than the Lifestyle Funds, has entered into a Shareholder Services Agreement with VALIC. Under the agreement, VALIC provides record keeping, account maintenance, and other administrative and shareholder services for contract owners and participants. VALIC receives from each Fund, other than the Lifestyle Funds, an annual fee of 0.25% based on average daily net assets of the Fund. For the year ended August 31, 2019, VALIC earned fees as reflected in the Statements of Operations based upon the aforementioned rate.
On January 23, 2001, the Board ratified a Deferred Compensation Plan for its independent trustees who are not officers, directors, or employees of VALIC, or an affiliate of VALIC. The effective date of the plan was January 1, 2001. The first deferred payment was made in March of 2001. Under the deferred compensation plan, Trustees may elect to defer all or a portion of their compensation. Amounts deferred may be invested in affiliated mutual funds that are specified in the plan as selected by the trustees. Obligations under the deferred compensation plan represents unsecured claims against the general assets of the Funds. For the year ended August 31, 2019, VC II has deferred $24,126 of trustee compensation.
During the year ended August 31, 2019, the following Fund incurred brokerage commissions with brokers which are affiliates of asub-advisor:
| | | | |
Affiliated Broker
| | Large Cap Value
| |
Pershing LLC | | $ | 2,566 | |
At August 31, 2019, the following affiliates owned outstanding shares of the following Funds:
| | | | | | | | | | | | | | | | | | | | | | | | | | | | |
| | | Holder
| |
Fund
| | American
General Life
Insurance Co.
| | | The United
States Life
Insurance Co.
| | | VALIC
| | | VALIC Co. I
Dynamic
Allocation Fund
| | | VCII
Aggressive
Growth Lifestyle
| | | VCII
Conservative
Growth Lifestyle
| | | VCII
Moderate
Growth Lifestyle
| |
Aggressive Growth Lifestyle | | | — | % | | | — | % | | | 100.00 | % | | | — | % | | | — | % | | | — | % | | | — | % |
Capital Appreciation | | | — | | | | — | | | | 41.72 | | | | 5.99 | | | | 21.33 | | | | 5.23 | | | | 25.73 | |
Conservative Growth Lifestyle | | | — | | | | — | | | | 100.00 | | | | — | | | | — | | | | — | | | | — | |
Core Bond | | | — | | | | — | | | | 87.79 | | | | 0.72 | | | | 0.78 | | | | 3.42 | | | | 7.29 | |
Government Money Market II | | | — | | | | — | | | | 100.00 | | | | — | | | | — | | | | — | | | | — | |
High Yield Bond | | | 0.01 | | | | — | | | | 85.05 | | | | 0.25 | | | | 3.76 | | | | 4.28 | | | | 6.65 | |
International Opportunities | | | — | | | | — | | | | 92.08 | | | | 0.09 | | | | 3.36 | | | | 1.20 | | | | 3.27 | |
Large Cap Value | | | — | | | | — | | | | 63.15 | | | | 1.17 | | | | 12.87 | | | | 3.37 | | | | 19.44 | |
Mid Cap Growth | | | — | | | | — | | | | 89.11 | | | | 1.03 | | | | 4.22 | | | | 1.10 | | | | 4.54 | |
Mid Cap Value | | | 0.28 | | | | — | | | | 91.26 | | | | 0.33 | | | | 3.10 | | | | 1.04 | | | | 3.99 | |
Moderate Growth Lifestyle | | | — | | | | — | | | | 100.00 | | | | — | | | | — | | | | — | | | | — | |
Small Cap Growth | | | — | | | | — | | | | 88.82 | | | | 1.55 | | | | 4.74 | | | | 0.93 | | | | 3.96 | |
Small Cap Value | | | — | | | | — | | | | 94.06 | | | | 0.91 | | | | 2.65 | | | | 0.33 | | | | 2.05 | |
Strategic Bond | | | 0.06 | | | | 0.01 | | | | 80.14 | | | | 0.34 | | | | 3.50 | | | | 5.38 | | | | 10.57 | |
U.S. Socially Responsible | | | 0.01 | | | | — | | | | 99.99 | | | | — | | | | — | | | | — | | | | — | |
| † | Accounting Basis Point Fee is calculated based upon all assets in all registered management investment companies managed and/or administered by the Administrator and VALIC, other than “Funds-of-Funds” and “Feeder Funds.” |
VALIC Company II
NOTES TO FINANCIAL STATEMENTS—(continued)
The VC I Dynamic Allocation Fund and the VC II Lifestyle Funds do not invest in the underlying funds for the purpose of exercising management or control; however, investments by the VC I Dynamic Allocation Fund and the VC II Lifestyle Funds within the set limits across their asset allocations may represent a significant portion of net assets of the underlying funds.
As disclosed in the Portfolio of Investments, certain Funds own shares of various VC I or VC II Funds and securities issued by AIG or an affiliate thereof. During the year ended August 31, 2019, transactions in these securities were as follows:
Aggressive Growth Lifestyle Fund
| | | | | | | | | | | | | | | | | | | | | | | | | | | | | | | | |
Security
| | Income
| | | Capital Gain
Distribution
Received
| | | Value at
08/31/2018
| | | Cost of
Purchases†
| | | Proceeds
from Sales
| | | Realized
Gain/(Loss)
| | | Change in
Unrealized
Gain/(Loss)
| | | Value at
08/31/2019
| |
VALIC Co. I Blue Chip Growth Fund | | $ | — | | | $ | 245,820 | | | $ | 11,369,749 | | | $ | 1,495,927 | | | $ | 11,281,998 | | | $ | 1,628,526 | | | $ | (3,203,468 | ) | | $ | 8,736 | |
VALIC Co. I Capital Conservation Fund | | | 215,056 | | | | — | | | | 10,920,916 | | | | 1,370,384 | | | | 3,360,496 | | | | (48,059 | ) | | | 784,472 | | | | 9,667,217 | |
VALIC Co. I Dividend Value Fund | | | 613,485 | | | | 3,447,361 | | | | 30,651,225 | | | | 7,568,293 | | | | 5,121,434 | | | | (797,000 | ) | | | (3,722,718 | ) | | | 28,578,366 | |
VALIC Co. I Emerging Economies Fund | | | 501,455 | | | | — | | | | 16,083,395 | | | | 30,177,872 | | | | 13,529,206 | | | | (3,835,802 | ) | | | 1,990,142 | | | | 30,886,401 | |
VALIC Co. I Global Real Estate Fund | | | 1,030,629 | | | | — | | | | 42,476,598 | | | | 1,030,629 | | | | 23,796,139 | | | | (228,916 | ) | | | 1,416,394 | | | | 20,898,566 | |
VALIC Co. I Money Market I Fund | | | 58,470 | | | | — | | | | — | | | | 24,726,765 | | | | — | | | | — | | | | — | | | | 24,726,765 | |
VALIC Co. I Government Securities Fund | | | 115,891 | | | | — | | | | — | | | | 6,330,862 | | | | 808,037 | | | | 22,510 | | | | 402,950 | | | | 5,948,285 | |
VALIC Co. I Inflation Protected Fund | | | 392,029 | | | | 22,415 | | | | 27,168,351 | | | | 3,859,375 | | | | 7,605,923 | | | | (59,595 | ) | | | 1,078,407 | | | | 24,440,615 | |
VALIC Co. I International Equities Index Fund | | | 482,582 | | | | — | | | | 29,235,953 | | | | 7,325,666 | | | | 23,067,139 | | | | (3,187,457 | ) | | | 925,927 | | | | 11,232,950 | |
VALIC Co. I International Government Bond Fund | | | 236,022 | | | | 17,946 | | | | 14,790,122 | | | | 2,019,781 | | | | 1,616,075 | | | | (34,710 | ) | | | 1,304,565 | | | | 16,463,683 | |
VALIC Co. I International Growth Fund | | | 55,634 | | | | 1,990,397 | | | | 12,180,810 | | | | 2,253,232 | | | | 3,553,372 | | | | 404,210 | | | | (2,271,905 | ) | | | 9,012,975 | |
VALIC Co. I International Value Fund | | | 846,673 | | | | — | | | | 29,258,337 | | | | 8,639,111 | | | | 7,706,184 | | | | (1,310,979 | ) | | | (3,020,810 | ) | | | 25,859,475 | |
VALIC Co. I Large Cap Core Fund | | | 81,946 | | | | 686,874 | | | | 6,400,013 | | | | 3,534,020 | | | | — | | | | — | | | | (500,753 | ) | | | 9,433,280 | |
VALIC Co. I Large Capital Growth Fund | | | 24,566 | | | | 271,433 | | | | 3,070,439 | | | | 9,582,428 | | | | 5,625,657 | | | | (625,571 | ) | | | 606,742 | | | | 7,008,381 | |
VALIC Co. I Mid Cap Index Fund | | | 333,778 | | | | 2,323,813 | | | | 23,358,328 | | | | 11,871,038 | | | | 8,632,733 | | | | 90,662 | | | | (3,993,974 | ) | | | 22,693,321 | |
VALIC Co. I Mid Cap Strategic Growth Fund | | | 1,366 | | | | 877,410 | | | | 10,038,114 | | | | 878,776 | | | | — | | | | — | | | | (138,907 | ) | | | 10,777,983 | |
VALIC Co. INasdaq-100® Index Fund | | | 75,143 | | | | 263,901 | | | | 15,941,576 | | | | 3,257,543 | | | | 5,154,563 | | | | 2,183,658 | | | | (2,079,503 | ) | | | 14,148,711 | |
VALIC Co. I Science & Technology Fund | | | — | | | | 5,017,946 | | | | 22,147,228 | | | | 9,946,080 | | | | 7,526,932 | | | | 809,361 | | | | (4,079,603 | ) | | | 21,296,134 | |
VALIC Co. I Small Cap Index Fund | | | 88,949 | | | | 661,968 | | | | 7,771,408 | | | | 16,435,101 | | | | 8,798,142 | | | | 514,347 | | | | (1,897,318 | ) | | | 14,025,396 | |
VALIC Co. I Small Cap Special Values Fund | | | 131,130 | | | | 1,236,441 | | | | 20,114,463 | | | | 1,367,571 | | | | 13,465,503 | | | | (408,637 | ) | | | (3,030,414 | ) | | | 4,577,480 | |
VALIC Co. I Stock Index Fund | | | 856,532 | | | | 1,232,928 | | | | 51,100,555 | | | | 23,091,792 | | | | 13,841,794 | | | | 272,898 | | | | (219,979 | ) | | | 60,403,472 | |
VALIC Co. I Value Fund | | | 185,020 | | | | — | | | | 12,120,568 | | | | 2,919,607 | | | | 1,656,192 | | | | 689,946 | | | | (843,443 | ) | | | 13,230,486 | |
VALIC Co. II Capital Appreciation Fund | | | 50,790 | | | | 5,482,359 | | | | 22,388,386 | | | | 5,533,149 | | | | 317,458 | | | | 217,444 | | | | (5,831,848 | ) | | | 21,989,673 | |
VALIC Co. II Core Bond Fund | | | 146,841 | | | | — | | | | 10,606,501 | | | | 28,394,692 | | | | 27,416,343 | | | | 405,410 | | | | 489,892 | | | | 12,480,152 | |
VALIC Co. II High Yield Bond Fund | | | 1,077,995 | | | | — | | | | 16,835,780 | | | | 12,202,697 | | | | 5,034,951 | | | | 144,148 | | | | 584,738 | | | | 24,732,412 | |
VALIC Co. II International Opportunities Fund | | | 211,191 | | | | 823,629 | | | | 20,935,917 | | | | 5,823,160 | | | | 4,393,956 | | | | 690,330 | | | | (3,711,012 | ) | | | 19,344,439 | |
VALIC Co. II Large Cap Value Fund | | | 445,797 | | | | 2,992,145 | | | | 30,522,454 | | | | 9,878,231 | | | | 1,630,318 | | | | 640,336 | | | | (4,468,686 | ) | | | 34,942,017 | |
VALIC Co. II Mid Cap Growth Fund | | | — | | | | 345,508 | | | | 10,058,488 | | | | 345,508 | | | | — | | | | — | | | | (172,427 | ) | | | 10,231,569 | |
VALIC Co. II Mid Cap Value Fund | | | 118,434 | | | | 4,091,648 | | | | 24,113,525 | | | | 8,289,291 | | | | 4,287,303 | | | | (27,898 | ) | | | (5,010,497 | ) | | | 23,077,118 | |
VALIC Co. II Small Cap Growth Fund | | | — | | | | 2,106,528 | | | | 12,585,346 | | | | 2,205,268 | | | | 2,860,308 | | | | 788,554 | | | | (3,594,628 | ) | | | 9,124,232 | |
VALIC Co. II Small Cap Value Fund | | | 187,534 | | | | 1,870,104 | | | | 34,936,655 | | | | 2,057,638 | | | | 21,841,545 | | | | (1,908,467 | ) | | | (4,877,662 | ) | | | 8,366,619 | |
VALIC Co. II Strategic Bond Fund | | | 1,017,308 | | | | — | | | | 29,613,913 | | | | 3,193,412 | | | | 4,668,809 | | | | (197,949 | ) | | | 1,425,383 | | | | 29,365,950 | |
| | |
|
|
| |
|
|
| |
|
|
| |
|
|
| |
|
|
| |
|
|
| |
|
|
| |
|
|
|
| | | $ | 9,582,246 | | | $ | 36,008,574 | | | $ | 608,795,113 | | | $ | 257,604,899 | | | $ | 238,598,510 | | | $ | (3,168,700 | ) | | $ | (45,659,943 | ) | | $ | 578,972,859 | |
| | |
|
|
| |
|
|
| |
|
|
| |
|
|
| |
|
|
| |
|
|
| |
|
|
| |
|
|
|
Conservative Growth Lifestyle Fund
| | | | | | | | | | | | | | | | | | | | | | | | | | | | | | | | |
Security
| | Income
| | | Capital Gain
Distribution
Received
| | | Value at
08/31/2018
| | | Cost of
Purchases†
| | | Proceeds
from Sales
| | | Realized
Gain/(Loss)
| | | Change in
Unrealized
Gain/(Loss)
| | | Value at
08/31/2019
| |
VALIC Co. I Blue Chip Growth Fund | | $ | — | | | $ | — | | | $ | 355,523 | | | $ | 1,343,674 | | | $ | 1,479,692 | | | $ | (198,846 | ) | | $ | (20,659 | ) | | $ | — | |
VALIC Co. I Capital Conservation Fund | | | 397,749 | | | | — | | | | 14,999,827 | | | | 1,630,084 | | | | — | | | | — | | | | 1,249,726 | | | | 17,879,637 | |
VALIC Co. I Dividend Value Fund | | | 252,055 | | | | 1,416,375 | | | | 12,063,106 | | | | 3,828,777 | | | | 636,108 | | | | (46,242 | ) | | | (1,836,929 | ) | | | 13,372,604 | |
VALIC Co. I Emerging Economies Fund | | | 147,139 | | | | — | | | | 3,858,220 | | | | 9,724,164 | | | | 5,393,066 | | | | (811,630 | ) | | | 419,991 | | | | 7,797,679 | |
VALIC Co. I Global Real Estate Fund | | | 324,333 | | | | — | | | | 6,846,871 | | | | 3,203,004 | | | | 1,923,436 | | | | (109,634 | ) | | | 796,840 | | | | 8,813,645 | |
VALIC Co. I Money Market I Fund | | | 34,414 | | | | — | | | | — | | | | 13,486,882 | | | | — | | | | — | | | | — | | | | 13,486,882 | |
VALIC Co. I Government Securities Fund | | | 192,299 | | | | — | | | | — | | | | 8,544,796 | | | | — | | | | — | | | | 665,000 | | | | 9,209,796 | |
VALIC Co. I Inflation Protected Fund | | | 219,501 | | | | 12,550 | | | | 15,263,733 | | | | 6,019,648 | | | | 1,710,325 | | | | (9,528 | ) | | | 984,341 | | | | 20,547,869 | |
VALIC Co. I International Equities Index Fund | | | 64,073 | | | | — | | | | 13,236,917 | | | | 7,444,127 | | | | 19,694,387 | | | | (1,939,124 | ) | | | 960,306 | | | | 7,839 | |
VALIC Co. I International Government Bond Fund | | | 232,287 | | | | 17,662 | | | | 15,035,233 | | | | 2,080,822 | | | | 2,164,552 | | | | (36,840 | ) | | | 1,288,499 | | | | 16,203,162 | |
VALIC Company II
NOTES TO FINANCIAL STATEMENTS—(continued)
Conservative Growth Lifestyle Fund (continued)
| | | | | | | | | | | | | | | | | | | | | | | | | | | | | | | | |
Security
| | Income
| | | Capital Gain
Distribution
Received
| | | Value at
08/31/2018
| | | Cost of
Purchases†
| | | Proceeds
from Sales
| | | Realized
Gain/(Loss)
| | | Change in
Unrealized
Gain/(Loss)
| | | Value at
08/31/2019
| |
VALIC Co. I International Growth Fund | | $ | 8,868 | | | $ | 317,251 | | | $ | 3,425,602 | | | $ | 369,167 | | | $ | 1,979,904 | | | $ | (43,884 | ) | | $ | (334,393 | ) | | $ | 1,436,588 | |
VALIC Co. I International Value Fund | | | 280,132 | | | | — | | | | 12,351,492 | | | | 4,434,030 | | | | 8,718,237 | | | | (1,470,819 | ) | | | (132,699 | ) | | | 6,463,767 | |
VALIC Co. I Large Cap Core Fund | | | 22,162 | | | | 185,761 | | | | 2,912,942 | | | | 207,923 | | | | 420,058 | | | | 43,856 | | | | (193,490 | ) | | | 2,551,173 | |
VALIC Co. I Large Capital Growth Fund | | | 62 | | | | 689 | | | | 862,699 | | | | 1,003,802 | | | | 1,672,902 | | | | (166,498 | ) | | | (15,274 | ) | | | 11,827 | |
VALIC Co. I Mid Cap Index Fund | | | 83,988 | | | | 584,737 | | | | 7,392,919 | | | | 8,760,559 | | | | 9,188,388 | | | | (53,291 | ) | | | (812,257 | ) | | | 6,099,542 | |
VALIC Co. I Mid Cap Strategic Growth Fund | | | 244 | | | | 156,450 | | | | 893,003 | | | | 958,838 | | | | — | | | | — | | | | 69,973 | | | | 1,921,814 | |
VALIC Co. INasdaq-100® Index Fund | | | 22,713 | | | | 79,768 | | | | 6,176,313 | | | | 901,103 | | | | 2,546,947 | | | | 30,620 | | | | (191,317 | ) | | | 4,369,772 | |
VALIC Co. I Science & Technology Fund | | | — | | | | 1,461,655 | | | | 7,061,333 | | | | 3,673,736 | | | | 3,215,114 | | | | (364,270 | ) | | | (551,860 | ) | | | 6,603,825 | |
VALIC Co. I Small Cap Index Fund | | | 13,623 | | | | 101,386 | | | | 1,935,641 | | | | 4,443,736 | | | | 3,018,801 | | | | (151,036 | ) | | | (263,747 | ) | | | 2,945,793 | |
VALIC Co. I Small Cap Special Values Fund | | | 60,205 | | | | 567,681 | | | | 9,715,985 | | | | 627,885 | | | | 6,501,353 | | | | (430,216 | ) | | | (1,222,672 | ) | | | 2,189,629 | |
VALIC Co. I Stock Index Fund | | | 239,285 | | | | 344,436 | | | | 15,695,830 | | | | 6,851,737 | | | | 5,065,831 | | | | 118,387 | | | | (186,461 | ) | | | 17,413,662 | |
VALIC Co. I Value Fund | | | 43,643 | | | | — | | | | 3,405,935 | | | | 43,643 | | | | 498,323 | | | | 147,424 | | | | (219,993 | ) | | | 2,878,686 | |
VALIC Co. II Capital Appreciation Fund | | | 12,442 | | | | 1,343,065 | | | | 5,505,327 | | | | 1,355,507 | | | | 96,945 | | | | 69,845 | | | | (1,446,718 | ) | | | 5,387,016 | |
VALIC Co. II Core Bond Fund | | | 1,096,616 | | | | — | | | | 23,123,524 | | | | 38,834,538 | | | | 11,156,644 | | | | 262,171 | | | | 3,276,223 | | | | 54,339,812 | |
VALIC Co. II High Yield Bond Fund | | | 1,227,395 | | | | — | | | | 44,929,098 | | | | 8,780,828 | | | | 26,331,347 | | | | (225,782 | ) | | | 1,007,287 | | | | 28,160,084 | |
VALIC Co. II International Opportunities Fund | | | 77,129 | | | | 300,796 | | | | 6,722,148 | | | | 3,906,779 | | | | 2,642,124 | | | | 309,955 | | | | (1,364,501 | ) | | | 6,932,257 | |
VALIC Co. II Large Cap Value Fund | | | 122,830 | | | | 824,425 | | | | 8,575,886 | | | | 2,623,116 | | | | 922,357 | | | | 362,272 | | | | (1,489,264 | ) | | | 9,149,653 | |
VALIC Co. II Mid Cap Growth Fund | | | — | | | | 62,680 | | | | 880,603 | | | | 1,689,111 | | | | — | | | | — | | | | 95,398 | | | | 2,665,112 | |
VALIC Co. II Mid Cap Value Fund | | | 38,949 | | | | 1,345,610 | | | | 7,089,162 | | | | 5,155,532 | | | | 2,990,441 | | | | 16,605 | | | | (1,548,902 | ) | | | 7,721,956 | |
VALIC Co. II Small Cap Growth Fund | | | — | | | | 411,717 | | | | 3,738,931 | | | | 411,717 | | | | 1,627,132 | | | | 45,679 | | | | (785,881 | ) | | | 1,783,314 | |
VALIC Co. II Small Cap Value Fund | | | 29,609 | | | | 295,260 | | | | 10,879,821 | | | | 644,643 | | | | 8,724,988 | | | | (943,360 | ) | | | (823,894 | ) | | | 1,032,222 | |
VALIC Co. II Strategic Bond Fund | | | 1,744,082 | | | | — | | | | 73,917,970 | | | | 11,229,559 | | | | 42,509,048 | | | | (1,334,490 | ) | | | 3,787,593 | | | | 45,091,584 | |
| | |
|
|
| |
|
|
| |
|
|
| |
|
|
| |
|
|
| |
|
|
| |
|
|
| |
|
|
|
| | | $ | 6,987,827 | | | $ | 9,829,954 | | | $ | 338,851,594 | | | $ | 164,213,467 | | | $ | 172,828,450 | | | $ | (6,928,676 | ) | | $ | 1,160,266 | | | $ | 324,468,201 | |
| | |
|
|
| |
|
|
| |
|
|
| |
|
|
| |
|
|
| |
|
|
| |
|
|
| |
|
|
|
Moderate Growth Lifestyle Fund
| | | | | | | | | | | | | | | | | | | | | | | | | | | | | | | | |
Security
| | Income
| | | Capital Gain
Distribution
Received
| | | Value at
08/31/2018
| | | Cost of
Purchases†
| | | Proceeds
from Sales
| | | Realized
Gain/(Loss)
| | | Change in
Unrealized
Gain/(Loss)
| | | Value at
08/31/2019
| |
VALIC Co. I Blue Chip Growth Fund | | $ | — | | | $ | 867,233 | | | $ | 17,529,694 | | | $ | 2,719,387 | | | $ | 17,930,174 | | | $ | 2,340,951 | | | $ | (4,629,038 | ) | | $ | 30,820 | |
VALIC Co. I Capital Conservation Fund | | | 722,428 | | | | — | | | | 28,866,538 | | | | 3,068,311 | | | | 1,744,135 | | | | (88,562 | ) | | | 2,372,442 | | | | 32,474,594 | |
VALIC Co. I Dividend Value Fund | | | 921,788 | | | | 5,179,812 | | | | 39,505,611 | | | | 16,226,511 | | | | 3,641,955 | | | | 249,498 | | | | (7,010,525 | ) | | | 45,329,140 | |
VALIC Co. I Emerging Economies Fund | | | 508,187 | | | | — | | | | 12,758,533 | | | | 32,930,685 | | | | 17,666,458 | | | | (3,127,691 | ) | | | 1,685,468 | | | | 26,580,537 | |
VALIC Co. I Global Real Estate Fund | | | 973,334 | | | | — | | | | 38,517,791 | | | | 2,339,067 | | | | 18,664,803 | | | | (574,776 | ) | | | 1,891,927 | | | | 23,509,206 | |
VALIC Co. I Money Market I Fund | | | 71,020 | | | | — | | | | — | | | | 33,377,212 | | | | — | | | | — | | | | — | | | | 33,377,212 | |
VALIC Co. I Government Securities Fund | | | 294,754 | | | | — | | | | — | | | | 14,821,982 | | | | 1,308,101 | | | | 36,441 | | | | 1,021,801 | | | | 14,572,123 | |
VALIC Co. I Inflation Protected Fund | | | 623,356 | | | | 35,641 | | | | 43,099,943 | | | | 6,214,029 | | | | 5,541,526 | | | | (34,563 | ) | | | 2,015,825 | | | | 45,753,708 | |
VALIC Co. I International Equities Index Fund | | | 354,375 | | | | — | | | | 42,099,317 | | | | 9,656,233 | | | | 43,617,116 | | | | (4,214,547 | ) | | | 945,408 | | | | 4,869,295 | |
VALIC Co. I International Government Bond Fund | | | 490,699 | | | | 37,311 | | | | 25,791,156 | | | | 5,858,112 | | | | — | | | | — | | | | 2,579,445 | | | | 34,228,713 | |
VALIC Co. I International Growth Fund | | | 40,953 | | | | 1,465,165 | | | | 14,466,933 | | | | 1,810,416 | | | | 8,795,991 | | | | 847,052 | | | | (2,668,423 | ) | | | 5,659,987 | |
VALIC Co. I International Value Fund | | | 733,005 | | | | — | | | | 37,671,537 | | | | 11,388,476 | | | | 19,457,790 | | | | (2,961,808 | ) | | | (1,685,770 | ) | | | 24,954,645 | |
VALIC Co. I Large Cap Core Fund | | | 86,046 | | | | 721,234 | | | | 9,048,778 | | | | 1,393,306 | | | | — | | | | — | | | | (536,919 | ) | | | 9,905,165 | |
VALIC Co. I Large Capital Growth Fund | | | 40,452 | | | | 446,961 | | | | 3,895,884 | | | | 19,585,940 | | | | 8,665,022 | | | | (580,365 | ) | | | 1,311,282 | | | | 15,547,719 | |
VALIC Co. I Mid Cap Index Fund | | | 385,366 | | | | 2,682,983 | | | | 35,954,768 | | | | 17,486,393 | | | | 20,415,262 | | | | 7,884 | | | | (4,756,625 | ) | | | 28,277,158 | |
VALIC Co. I Mid Cap Strategic Growth Fund | | | 1,496 | | | | 961,151 | | | | 10,996,154 | | | | 962,647 | | | | — | | | | — | | | | (152,164 | ) | | | 11,806,637 | |
VALIC Co. INasdaq-100® Index Fund | | | 115,094 | | | | 404,211 | | | | 20,275,685 | | | | 8,923,724 | | | | 9,974,216 | | | | 3,740,372 | | | | (3,245,203 | ) | | | 19,720,362 | |
VALIC Co. I Science & Technology Fund | | | — | | | | 7,597,270 | | | | 30,167,305 | | | | 18,174,384 | | | | 13,793,845 | | | | 973,479 | | | | (5,539,204 | ) | | | 29,982,119 | |
VALIC Co. I Small Cap Index Fund | | | 78,759 | | | | 586,137 | | | | 7,400,536 | | | | 18,424,818 | | | | 11,281,472 | | | | (222,743 | ) | | | (1,604,586 | ) | | | 12,716,553 | |
VALIC Co. I Small Cap Special Values Fund | | | 181,090 | | | | 1,707,523 | | | | 29,403,393 | | | | 1,888,613 | | | | 20,620,804 | | | | (1,110,411 | ) | | | (3,769,573 | ) | | | 5,791,218 | |
VALIC Co. I Stock Index Fund | | | 1,325,474 | | | | 1,907,943 | | | | 61,363,473 | | | | 49,207,712 | | | | 11,951,554 | | | | 323,844 | | | | 406,369 | | | | 99,349,844 | |
VALIC Co. I Value Fund | | | 253,582 | | | | — | | | | 14,423,156 | | | | 4,862,786 | | | | 1,183,635 | | | | 496,698 | | | | (648,530 | ) | | | 17,950,475 | |
VALIC Co. II Capital Appreciation Fund | | | 61,263 | | | | 6,612,921 | | | | 26,863,489 | | | | 6,674,184 | | | | 242,546 | | | | 168,390 | | | | (6,939,177 | ) | | | 26,524,340 | |
VALIC Co. II Core Bond Fund | | | 2,068,737 | | | | — | | | | 56,324,113 | | | | 74,233,903 | | | | 21,582,851 | | | | (201,322 | ) | | | 7,024,697 | | | | 115,798,540 | |
VALIC Co. II High Yield Bond Fund | | | 1,905,461 | | | | — | | | | 43,007,529 | | | | 12,431,562 | | | | 12,906,667 | | | | 565,832 | | | | 618,674 | | | | 43,716,930 | |
VALIC Company II
NOTES TO FINANCIAL STATEMENTS—(continued)
Moderate Growth Lifestyle Fund (continued)
| | | | | | | | | | | | | | | | | | | | | | | | | | | | | | | | |
Security
| | Income
| | | Capital Gain
Distribution
Received
| | | Value at
08/31/2018
| | | Cost of
Purchases†
| | | Proceeds
from Sales
| | | Realized
Gain/(Loss)
| | | Change in
Unrealized
Gain/(Loss)
| | | Value at
08/31/2019
| |
VALIC Co. II International Opportunities Fund | | $ | 220,069 | | | $ | 858,252 | | | $ | 26,109,153 | | | $ | 5,672,678 | | | $ | 9,214,688 | | | $ | 1,602,221 | | | $ | (5,306,234 | ) | | $ | 18,863,130 | |
VALIC Co. II Large Cap Value Fund | | | 654,115 | | | | 4,390,353 | | | | 46,001,586 | | | | 13,514,095 | | | | 910,488 | | | | 357,610 | | | | (6,196,080 | ) | | | 52,766,723 | |
VALIC Co. II Mid Cap Growth Fund | | | — | | | | 382,740 | | | | 11,142,378 | | | | 1,930,570 | | | | 1,909,814 | | | | (27,061 | ) | | | (119,018 | ) | | | 11,017,055 | |
VALIC Co. II Mid Cap Value Fund | | | 151,189 | | | | 5,223,245 | | | | 30,856,167 | | | | 13,714,173 | | | | 8,644,479 | | | | (8,126 | ) | | | (6,260,214 | ) | | | 29,657,521 | |
VALIC Co. II Small Cap Growth Fund | | | — | | | | 1,977,603 | | | | 15,825,486 | | | | 1,977,603 | | | | 6,966,696 | | | | 1,690,840 | | | | (4,907,374 | ) | | | 7,619,859 | |
VALIC Co. II Small Cap Value Fund | | | 177,210 | | | | 1,767,153 | | | | 46,506,035 | | | | 1,944,363 | | | | 34,091,181 | | | | (3,828,559 | ) | | | (4,025,138 | ) | | | 6,505,520 | |
VALIC Co. II Strategic Bond Fund | | | 3,152,438 | | | | — | | | | 138,878,160 | | | | 13,484,467 | | | | 68,739,541 | | | | (1,011,268 | ) | | | 6,025,278 | | | | 88,637,096 | |
| | |
|
|
| |
|
|
| |
|
|
| |
|
|
| |
|
|
| |
|
|
| |
|
|
| |
|
|
|
| | | $ | 16,591,740 | | | $ | 45,812,842 | | | $ | 964,750,281 | | | $ | 426,898,342 | | | $ | 401,462,810 | | | $ | (4,590,690 | ) | | $ | (42,101,179 | ) | | $ | 943,493,944 | |
| | |
|
|
| |
|
|
| |
|
|
| |
|
|
| |
|
|
| |
|
|
| |
|
|
| |
|
|
|
| † | Includes reinvestment of distributions paid. |
Note 4 — Purchases and Sales of Investment Securities
The cost of purchases and proceeds from sales and maturities of long-term investments during the year ended August 31, 2019 were as follows:
| | | | | | | | | | | | | | | | |
Fund
| | Purchases of
Investment
Securities
(Excluding U.S.
Government
Securities)
| | | Sales of
Investment
Securities
(Excluding U.S.
Government
Securities)
| | | Purchase of U.S.
Government
Securities
| | | Sales of U.S.
Government
Securities
| |
Aggressive Growth Lifestyle | | $ | 212,014,079 | | | $ | 238,598,510 | | | $ | — | | | $ | — | |
Capital Appreciation | | | 61,120,031 | | | | 66,557,388 | | | | — | | | | — | |
Conservative Growth Lifestyle | | | 147,395,686 | | | | 172,828,450 | | | | — | | | | — | |
Core Bond | | | 1,008,926,859 | | | | 877,781,092 | | | | 650,935,572 | | | | 562,692,070 | |
Government Money Market II | | | — | | | | — | | | | — | | | | — | |
High Yield Bond | | | 280,987,322 | | | | 194,965,080 | | | | — | | | | — | |
International Opportunities | | | 243,060,087 | | | | 308,129,058 | | | | — | | | | — | |
Large Cap Value | | | 217,253,409 | | | | 217,545,033 | | | | — | | | | — | |
Mid Cap Growth | | | 88,749,691 | | | | 72,891,227 | | | | — | | | | — | |
Mid Cap Value | | | 335,157,846 | | | | 452,010,064 | | | | — | | | | — | |
Moderate Growth Lifestyle | | | 364,493,760 | | | | 401,462,810 | | | | — | | | | — | |
Small Cap Growth | | | 115,098,941 | | | | 120,186,995 | | | | — | | | | — | |
Small Cap Value | | | 209,850,852 | | | | 325,717,197 | | | | — | | | | — | |
Strategic Bond | | | 616,811,904 | | | | 705,534,850 | | | | 159,201,578 | | | | 110,082,874 | |
U.S. Socially Responsible | | | 249,300,284 | | | | 357,354,429 | | | | — | | | | — | |
Note 5 — Federal Income Taxes
The following details the tax basis of distributions as well as the components of distributable earnings. The tax basis components of distributable earnings differ from the amounts reflected in the Statements of Assets and Liabilities by temporary book/tax differences primarily arising from wash sales, post October losses, investments in passive foreign investment companies, treatment of deferred compensation, late year ordinary losses, straddles, treatment of defaulted securities and derivative transactions.
VALIC Company II
NOTES TO FINANCIAL STATEMENTS—(continued)
The information in the following table is presented on the basis of cost for Federal Income Tax purposes at August 31, 2019.
| | | | | | | | | | | | | | | | |
Fund
| | Identified Cost
of Investments
Owned
| | | Gross
Unrealized
Appreciation@
| | | Gross
Unrealized
Depreciation@
| | | Net Unrealized
Appreciation
(Depreciation)@
| |
Aggressive Growth Lifestyle | | $ | 587,472,793 | | | $ | 18,107,600 | | | $ | (26,607,534 | ) | | $ | (8,499,934 | ) |
Capital Appreciation | | | 87,499,365 | | | | 18,284,853 | | | | (3,959,339 | ) | | | 14,325,514 | |
Conservative Growth Lifestyle | | | 322,772,271 | | | | 9,758,149 | | | | (8,062,219 | ) | | | 1,695,930 | |
Core Bond | | | 1,520,061,608 | | | | 74,459,642 | | | | (6,715,050 | ) | | | 67,744,592 | |
Government Money Market II | | | 117,215,019 | | | | — | | | | — | | | | — | |
High Yield Bond | | | 667,300,463 | | | | 25,185,217 | | | | (18,699,585 | ) | | | 6,485,632 | |
International Opportunities | | | 517,532,789 | | | | 104,695,885 | | | | (32,302,103 | ) | | | 72,393,782 | |
Large Cap Value | | | 262,148,410 | | | | 24,838,596 | | | | (16,148,821 | ) | | | 8,689,775 | |
Mid Cap Growth | | | 212,632,575 | | | | 43,973,032 | | | | (12,303,095 | ) | | | 31,669,937 | |
Mid Cap Value | | | 702,630,844 | | | | 87,179,931 | | | | (45,552,121 | ) | | | 41,627,810 | |
Moderate Growth Lifestyle | | | 940,094,738 | | | | 32,972,290 | | | | (29,573,083 | ) | | | 3,399,207 | |
Small Cap Growth | | | 187,341,508 | | | | 31,479,311 | | | | (21,132,136 | ) | | | 10,347,175 | |
Small Cap Value | | | 320,838,275 | | | | 37,329,800 | | | | (39,078,945 | ) | | | (1,749,145 | ) |
Strategic Bond | | | 822,701,725 | | | | 29,177,800 | | | | (14,015,308 | ) | | | 15,162,492 | |
U.S. Socially Responsible | | | 536,727,648 | | | | 221,839,596 | | | | (37,567,999 | ) | | | 184,271,597 | |
| @ | Unrealized appreciation (depreciation) includes amounts for derivatives. |
The tax character of distributions paid may differ from the Statement of Changes in Net Assets due to partnership adjustments and short-term gains treated as ordinary income distributions for tax purposes.
The tax basis distributable earnings at August 31, 2019 and the tax character of distributions paid during the year ended August 31, 2019 were as follows:
| | | | | | | | | | | | | | | | | | | | |
| | | Distributable Earnings
| | | Tax Distributions
| |
| | | For the year ended August 31, 2019
| |
Fund
| | Ordinary
Income
| | | Long-
term Capital
Gains and
Other Losses
| | | Unrealized
Appreciation
(Depreciation)@
| | | Ordinary
Income
| | | Long-Term
Capital
Gains
| |
Aggressive Growth Lifestyle | | $ | 14,400,845 | | | $ | 31,582,812 | | | $ | (8,499,934 | ) | | $ | 11,408,394 | | | $ | 50,153,748 | |
Capital Appreciation | | | 391,903 | | | | 3,362,489 | | | | 14,325,514 | | | | 4,246,215 | | | | 22,301,727 | |
Conservative Growth Lifestyle | | | 8,185,706 | | | | 4,727,595 | | | | 1,695,930 | | | | 10,490,382 | | | | 12,250,183 | |
Core Bond | | | 48,241,701 | | | | — | | | | 67,744,592 | | | | 36,081,103 | | | | — | |
Government Money Market II | | | 8,290 | | | | (6,655 | ) | | | — | | | | 2,078,495 | | | | — | |
High Yield Bond | | | 32,918,358 | | | | (11,157,153 | ) | | | 6,484,193 | | | | 29,483,669 | | | | — | |
International Opportunities | | | 3,889,011 | | | | 9,589,309 | | | | 72,306,034 | | | | 5,797,758 | | | | 22,610,854 | |
Large Cap Value | | | 5,706,876 | | | | 11,741,047 | | | | 8,689,775 | | | | 7,371,579 | | | | 18,911,646 | |
Mid Cap Growth | | | 77,627 | | | | 9,498,511 | | | | 31,669,936 | | | | 2,608,627 | | | | 5,581,715 | |
Mid Cap Value | | | 6,164,408 | | | | 42,658,754 | | | | 41,627,829 | | | | 9,993,849 | | | | 132,095,114 | |
Moderate Growth Lifestyle | | | 22,793,531 | | | | 41,673,422 | | | | 3,399,206 | | | | 20,315,546 | | | | 64,453,213 | |
Small Cap Growth | | | 1,685,214 | | | | 21,485,041 | | | | 10,347,175 | | | | 6,684,170 | | | | 38,489,464 | |
Small Cap Value | | | 4,533,901 | | | | 8,997,808 | | | | (1,749,145 | ) | | | 11,730,674 | | | | 47,245,970 | |
Strategic Bond | | | 37,301,485 | | | | (27,049,113 | ) | | | 15,146,025 | | | | 29,934,832 | | | | — | |
U.S. Socially Responsible | | | 12,085,797 | | | | 122,069,476 | | | | 184,271,597 | | | | 12,183,211 | | | | 50,307,518 | |
| @ | Unrealized appreciation (depreciation) includes amounts for derivatives and other assets and liabilities denominated in foreign currency. |
VALIC Company II
NOTES TO FINANCIAL STATEMENTS—(continued)
The tax character of distributions paid during the year ended August 31, 2018 were as follows:
| | | | | | | | |
| | | Tax Distributions
| |
Fund
| | Ordinary
Income
| | | Long-Term
Capital Gains
| |
Aggressive Growth Lifestyle | | $ | 9,804,295 | | | $ | 18,613,877 | |
Capital Appreciation | | | 434,154 | | | | 4,650,345 | |
Conservative Growth Lifestyle | | | 8,269,513 | | | | 1,304,182 | |
Core Bond | | | 29,745,347 | | | | — | |
Government Money Market II | | | 1,175,017 | | | | 3 | |
High Yield Bond | | | 32,204,893 | | | | — | |
International Opportunities | | | 5,841,813 | | | | — | |
Large Cap Value | | | 2,959,420 | | | | 8,272,969 | |
Mid Cap Growth | | | 3,368,041 | | | | 23,021,560 | |
Mid Cap Value | | | 3,732,456 | | | | 68,024,640 | |
Moderate Growth Lifestyle | | | 16,737,065 | | | | 18,327,088 | |
Small Cap Growth | | | — | | | | 6,146,636 | |
Small Cap Value | | | 17,762,025 | | | | 23,149,536 | |
Strategic Bond | | | 30,340,988 | | | | — | |
U.S. Socially Responsible | | | 13,352,654 | | | | 12,605,065 | |
As of August 31, 2019, for Federal income tax purposes, the Funds indicated below have capital loss carryforwards, which are available to offset future capital gains, if any:
| | | | | | | | |
| | | Unlimited
| |
Fund
| | ST
| | | LT
| |
Aggressive Growth Lifestyle | | $ | — | | | $ | — | |
Capital Appreciation | | | — | | | | — | |
Conservative Growth Lifestyle | | | — | | | | — | |
Core Bond | | | — | | | | — | |
Government Money Market II | | | 6,655 | | | | — | |
High Yield Bond | | | 2,191,954 | | | | 8,965,199 | |
International Opportunities | | | — | | | | — | |
Large Cap Value | | | — | | | | — | |
Mid Cap Growth | | | — | | | | — | |
Mid Cap Value | | | — | | | | — | |
Moderate Growth Lifestyle | | | — | | | | — | |
Small Cap Growth | | | — | | | | — | |
Small Cap Value | | | — | | | | — | |
Strategic Bond | | | 11,916,922 | | | | 15,132,191 | |
U.S. Socially Responsible | | | — | | | | — | |
The Funds indicated below utilized capital loss carryforwards, which offset net taxable gains realized in the current year.
| | | | |
Fund
| | Capital Loss
Carryforward
Utilized
| |
Aggressive Growth Lifestyle | | $ | — | |
Capital Appreciation | | | — | |
Conservative Growth Lifestyle | | | — | |
Core Bond | | | 471,632 | |
Government Money Market II | | | — | |
High Yield Bond | | | 145,499 | |
International Opportunities | | | — | |
Large Cap Value | | | — | |
Mid Cap Growth | | | — | |
Mid Cap Value | | | — | |
Moderate Growth Lifestyle | | | — | |
Small Cap Growth | | | — | |
Small Cap Value | | | — | |
Strategic Bond | | | — | |
U.S. Socially Responsible | | | — | |
VALIC Company II
NOTES TO FINANCIAL STATEMENTS—(continued)
Under the current tax law, capital losses realized after October 31 and late year ordinary losses may be deferred and treated as occurring on the first day of the following year. For the fiscal year ended August 31, 2019, the Funds elected to defer late year ordinary losses and post October capital losses as follows:
| | | | | | | | | | | | |
Fund
| | Deferred Late
Year Ordinary
Loss
| | | Deferred Post-October
Short-Term Capital
Loss
| | | Deferred Post-October
Long-Term Capital
Loss
| |
Aggressive Growth Lifestyle | | $ | — | | | $ | 2,431,299 | | | $ | — | |
Capital Appreciation | | | — | | | | 846,005 | | | | — | |
Conservative Growth Lifestyle | | | — | | | | 2,625,014 | | | | — | |
Core Bond | | | — | | | | — | | | | 2,247,296 | |
Government Money Market II | | | — | | | | — | | | | — | |
High Yield Bond | | | — | | | | (536,733 | ) | | | 5,478,316 | |
International Opportunities | | | — | | | | 24,460,479 | | | | (20,117,685 | ) |
Large Cap Value | | | — | | | | 5,970,575 | | | | — | |
Mid Cap Growth | | | 287,207 | | | | 1,328,365 | | | | — | |
Mid Cap Value | | | 63 | | | | 7,780,151 | | | | — | |
Moderate Growth Lifestyle | | | — | | | | 5,876,894 | | | | — | |
Small Cap Growth | | | 656,984 | | | | — | | | | — | |
Small Cap Value | | | — | | | | 13,720,164 | | | | (11,539,632 | ) |
Strategic Bond | | | — | | | | (2,459,155 | ) | | | 5,014,186 | |
U.S. Socially Responsible | | | — | | | | — | | | | — | |
For the period ended August 31, 2019, the reclassifications arising from book/tax differences resulted in increases (decreases) that were primarily due to tax treatment of net investment losses, principal paydown adjustments, partnership adjustments, disposition of passive foreign investment companies securities, swaps, and foreign currency transactions to the components of net assets as follows:
| | | | | | | | | | | | |
Fund
| | Accumulated
Undistributed Net
Investment Income
(Loss)
| | | Accumulated
Undistributed Net
Realized Gain
(Loss)
| | | Capital
Paid-in
| |
Aggressive Growth Lifestyle | | $ | 5,393,613 | | | $ | (5,393,613 | ) | | $ | — | |
Capital Appreciation | | | 200 | | | | (200 | ) | | | — | |
Conservative Growth Lifestyle | | | 1,519,959 | | | | (1,519,959 | ) | | | — | |
Core Bond | | | 2,450,307 | | | | (2,450,307 | ) | | | — | |
Government Money Market II | | | — | | | | — | | | | — | |
High Yield Bond | | | 1,027,860 | | | | (1,027,860 | ) | | | — | |
International Opportunities | | | (91,166 | ) | | | 91,166 | | | | — | |
Large Cap Value | | | — | | | | — | | | | — | |
Mid Cap Growth | | | 126,086 | | | | (126,086 | ) | | | — | |
Mid Cap Value | | | 547,509 | | | | (547,509 | ) | | | — | |
Moderate Growth Lifestyle | | | 7,125,672 | | | | (7,125,672 | ) | | | — | |
Small Cap Growth | | | 1,177,454 | | | | (1,177,454 | ) | | | — | |
Small Cap Value | | | 315,070 | | | | (315,070 | ) | | | — | |
Strategic Bond | | | 2,335,840 | | | | (2,335,840 | ) | | | — | |
U.S. Socially Responsible | | | 3,496 | | | | (3,496 | ) | | | — | |
Note 6— Capital Share Transactions
Transactions in capital shares of each class of each Fund were as follows:
| | | | | | | | | | | | | | | | | | | | | | | | | | | | | | | | |
| | | Aggressive Growth Lifestyle
| | | Capital Appreciation
| |
| | | For the year ended
August 31, 2019
| | | For the year ended
August 31, 2018
| | | For the year ended
August 31, 2019
| | | For the year ended
August 31, 2018
| |
| | | Shares
| | | Amount
| | | Shares
| | | Amount
| | | Shares
| | | Amount
| | | Shares
| | | Amount
| |
Shares sold | | | 2,109,924 | | | $ | 22,475,544 | | | | 2,261,629 | | | $ | 25,539,244 | | | | 394,188 | | | $ | 7,322,698 | | | | 333,830 | | | $ | 6,131,430 | |
Reinvested dividends | | | 6,137,801 | | | | 61,562,142 | | | | 2,530,559 | | | | 28,418,172 | | | | 1,825,856 | | | | 26,547,942 | | | | 270,452 | | | | 5,084,499 | |
Shares redeemed | | | (4,530,285 | ) | | | (48,321,386 | ) | | | (4,299,771 | ) | | | (48,657,119 | ) | | | (746,236 | ) | | | (13,395,307 | ) | | | (689,625 | ) | | | (12,617,620 | ) |
| | |
|
|
| |
|
|
| |
|
|
| |
|
|
| |
|
|
| |
|
|
| |
|
|
| |
|
|
|
Net increase (decrease) | | | 3,717,440 | | | $ | 35,716,300 | | | | 492,417 | | | $ | 5,300,297 | | | | 1,473,808 | | | $ | 20,475,333 | | | | (85,343 | ) | | $ | (1,401,691 | ) |
| | |
|
|
| |
|
|
| |
|
|
| |
|
|
| |
|
|
| |
|
|
| |
|
|
| |
|
|
|
VALIC Company II
NOTES TO FINANCIAL STATEMENTS—(continued)
| | | | | | | | | | | | | | | | | | | | | | | | | | | | | | | | |
| | | Conservative Growth Lifestyle
| | | Core Bond
| |
| | | For the year ended
August 31, 2019
| | | For the year ended
August 31, 2018
| | | For the year ended
August 31, 2019
| | | For the year ended
August 31, 2018
| |
| | | Shares
| | | Amount
| | | Shares
| | | Amount
| | | Shares
| | | Amount
| | | Shares
| | | Amount
| |
Shares sold | | | 1,120,264 | | | $ | 13,470,335 | | | | 2,377,368 | | | $ | 29,437,020 | | | | 57,112,744 | | | $ | 625,559,507 | | | | 29,511,097 | | | $ | 323,398,151 | |
Reinvested dividends | | | 1,953,657 | | | | 22,740,565 | | | | 784,086 | | | | 9,573,695 | | | | 3,247,624 | | | | 36,081,103 | | | | 2,798,245 | | | | 29,745,347 | |
Shares redeemed | | | (3,221,687 | ) | | | (38,553,203 | ) | | | (3,319,276 | ) | | | (41,064,118 | ) | | | (41,982,996 | ) | | | (469,220,482 | ) | | | (12,929,573 | ) | | | (140,882,086 | ) |
| | |
|
|
| |
|
|
| |
|
|
| |
|
|
| |
|
|
| |
|
|
| |
|
|
| |
|
|
|
Net increase (decrease) | | | (147,766 | ) | | $ | (2,342,303 | ) | | | (157,822 | ) | | $ | (2,053,403 | ) | | | 18,377,372 | | | $ | 192,420,128 | | | | 19,379,769 | | | $ | 212,261,412 | |
| | |
|
|
| |
|
|
| |
|
|
| |
|
|
| |
|
|
| |
|
|
| |
|
|
| |
|
|
|
| | |
| | | Government Money Market II
| | | High Yield Bond
| |
| | | For the year ended
August 31, 2019
| | | For the year ended
August 31, 2018
| | | For the year ended
August 31, 2019
| | | For the year ended
August 31, 2018
| |
| | | Shares
| | | Amount
| | | Shares
| | | Amount
| | | Shares
| | | Amount
| | | Shares
| | | Amount
| |
Shares sold | | | 46,210,098 | | | $ | 46,210,098 | | | | 68,624,800 | | | $ | 68,624,800 | | | | 21,616,604 | | | $ | 164,112,365 | | | | 11,100,701 | | | $ | 86,814,583 | |
Reinvested dividends | | | 2,078,495 | | | | 2,078,495 | | | | 1,175,020 | | | | 1,175,020 | | | | 3,936,404 | | | | 29,483,669 | | | | 4,322,804 | | | | 32,204,893 | |
Shares redeemed | | | (65,909,878 | ) | | | (65,909,878 | ) | | | (65,749,606 | ) | | | (65,749,606 | ) | | | (16,236,613 | ) | | | (122,971,220 | ) | | | (11,359,541 | ) | | | (88,505,311 | ) |
| | |
|
|
| |
|
|
| |
|
|
| |
|
|
| |
|
|
| |
|
|
| |
|
|
| |
|
|
|
Net increase (decrease) | | | (17,621,285 | ) | | $ | (17,621,285 | ) | | | 4,050,214 | | | $ | 4,050,214 | | | | 9,316,395 | | | $ | 70,624,814 | | | | 4,063,964 | | | $ | 30,514,165 | |
| | |
|
|
| |
|
|
| |
|
|
| |
|
|
| |
|
|
| |
|
|
| |
|
|
| |
|
|
|
| | |
| | | International Opportunities
| | | Large Cap Value
| |
| | | For the year ended
August 31, 2019
| | | For the year ended
August 31, 2018
| | | For the year ended
August 31, 2019
| | | For the year ended
August 31, 2018
| |
| | | Shares
| | | Amount
| | | Shares
| | | Amount
| | | Shares
| | | Amount
| | | Shares
| | | Amount
| |
Shares sold | | | 2,535,467 | | | $ | 47,560,772 | | | | 3,699,729 | | | $ | 76,917,051 | | | | 1,143,376 | | | $ | 24,532,407 | | | | 2,543,267 | | | $ | 56,659,816 | |
Reinvested dividends | | | 1,510,293 | | | | 28,408,612 | | | | 265,537 | | | | 5,841,813 | | | | 1,318,116 | | | | 26,283,225 | | | | 505,508 | | | | 11,232,389 | |
Shares redeemed | | | (6,776,358 | ) | | | (130,450,424 | ) | | | (4,618,761 | ) | | | (98,052,241 | ) | | | (1,441,520 | ) | | | (30,514,718 | ) | | | (1,537,976 | ) | | | (34,393,009 | ) |
| | |
|
|
| |
|
|
| |
|
|
| |
|
|
| |
|
|
| |
|
|
| |
|
|
| |
|
|
|
Net increase (decrease) | | | (2,730,598 | ) | | $ | (54,481,040 | ) | | | (653,495 | ) | | $ | (15,293,377 | ) | | | 1,019,972 | | | $ | 20,300,914 | | | | 1,510,799 | | | $ | 33,499,196 | |
| | |
|
|
| |
|
|
| |
|
|
| |
|
|
| |
|
|
| |
|
|
| |
|
|
| |
|
|
|
| | |
| | | Mid Cap Growth
| | | Mid Cap Value
| |
| | | For the year ended
August 31, 2019
| | | For the year ended
August 31, 2018
| | | For the year ended
August 31, 2019
| | | For the year ended
August 31, 2018
| |
| | | Shares
| | | Amount
| | | Shares
| | | Amount
| | | Shares
| | | Amount
| | | Shares
| | | Amount
| |
Shares sold | | | 4,935,911 | | | $ | 49,258,920 | | | | 6,349,160 | | | $ | 67,710,409 | | | | 1,579,237 | | | $ | 31,875,533 | | | | 2,219,283 | | | $ | 48,598,719 | |
Reinvested dividends | | | 792,103 | | | | 8,190,342 | | | | 2,513,295 | | | | 26,389,601 | | | | 8,372,950 | | | | 142,088,963 | | | | 3,290,101 | | | | 71,757,096 | |
Shares redeemed | | | (3,264,086 | ) | | | (33,412,688 | ) | | | (1,591,525 | ) | | | (17,636,947 | ) | | | (8,107,140 | ) | | | (163,523,061 | ) | | | (13,359,809 | ) | | | (303,976,044 | ) |
| | |
|
|
| |
|
|
| |
|
|
| |
|
|
| |
|
|
| |
|
|
| |
|
|
| |
|
|
|
Net increase (decrease) | | | 2,463,928 | | | $ | 24,036,574 | | | | 7,270,930 | | | $ | 76,463,063 | | | | 1,845,047 | | | $ | 10,441,435 | | | | (7,850,425 | ) | | $ | (183,620,229 | ) |
| | |
|
|
| |
|
|
| |
|
|
| |
|
|
| |
|
|
| |
|
|
| |
|
|
| |
|
|
|
| | |
| | | Moderate Growth Lifestyle
| | | Small Cap Growth
| |
| | | For the year ended
August 31, 2019
| | | For the year ended
August 31, 2018
| | | For the year ended
August 31, 2019
| | | For the year ended
August 31, 2018
| |
| | | Shares
| | | Amount
| | | Shares
| | | Amount
| | | Shares
| | | Amount
| | | Shares
| | | Amount
| |
Shares sold | | | 2,811,567 | | | $ | 40,461,449 | | | | 3,727,590 | | | $ | 55,563,392 | | | | 1,942,186 | | | $ | 39,526,464 | | | | 3,205,402 | | | $ | 65,066,801 | |
Reinvested dividends | | | 6,196,547 | | | | 84,768,759 | | | | 2,364,407 | | | | 35,064,153 | | | | 2,705,008 | | | | 45,173,634 | | | | 275,881 | | | | 6,146,636 | |
Shares redeemed | | | (5,340,558 | ) | | | (76,543,714 | ) | | | (4,798,128 | ) | | | (71,646,941 | ) | | | (2,500,467 | ) | | | (50,443,312 | ) | | | (2,330,204 | ) | | | (48,215,461 | ) |
| | |
|
|
| |
|
|
| |
|
|
| |
|
|
| |
|
|
| |
|
|
| |
|
|
| |
|
|
|
Net increase (decrease) | | | 3,667,556 | | | $ | 48,686,494 | | | | 1,293,869 | | | $ | 18,980,604 | | | | 2,146,727 | | | $ | 34,256,786 | | | | 1,151,079 | | | $ | 22,997,976 | |
| | |
|
|
| |
|
|
| |
|
|
| |
|
|
| |
|
|
| |
|
|
| |
|
|
| |
|
|
|
| | |
| | | Small Cap Value
| | | Strategic Bond
| |
| | | For the year ended
August 31, 2019
| | | For the year ended
August 31, 2018
| | | For the year ended
August 31, 2019
| | | For the year ended
August 31, 2018
| |
| | | Shares
| | | Amount
| | | Shares
| | | Amount
| | | Shares
| | | Amount
| | | Shares
| | | Amount
| |
Shares sold | | | 2,328,171 | | | $ | 31,448,250 | | | | 2,328,908 | | | $ | 35,596,185 | | | | 13,254,514 | | | $ | 145,988,927 | | | | 17,840,623 | | | $ | 200,318,993 | |
Reinvested dividends | | | 5,337,253 | | | | 58,976,644 | | | | 2,630,969 | | | | 40,911,561 | | | | 2,711,488 | | | | 29,934,832 | | | | 2,814,563 | | | | 30,340,988 | |
Shares redeemed | | | (12,255,616 | ) | | | (166,756,286 | ) | | | (7,571,033 | ) | | | (118,265,313 | ) | | | (20,647,095 | ) | | | (228,345,287 | ) | | | (7,925,949 | ) | | | (88,522,743 | ) |
| | |
|
|
| |
|
|
| |
|
|
| |
|
|
| |
|
|
| |
|
|
| |
|
|
| |
|
|
|
Net increase (decrease) | | | (4,590,192 | ) | | $ | (76,331,392 | ) | | | (2,611,156 | ) | | $ | (41,757,567 | ) | | | (4,681,093 | ) | | $ | (52,421,528 | ) | | | 12,729,237 | | | $ | 142,137,238 | |
| | |
|
|
| |
|
|
| |
|
|
| |
|
|
| |
|
|
| |
|
|
| |
|
|
| |
|
|
|
VALIC Company II
NOTES TO FINANCIAL STATEMENTS—(continued)
| | | | | | | | | | | | | | | | | | | | | | | | | | | | | | | | |
| | | U.S. Socially Responsible
| | | | | | | | | | | | | |
| | | For the year ended
August 31, 2019
| | | For the year ended
August 31, 2018
| | | | | | | | | | | | | |
| | | Shares
| | | Amount
| | | Shares
| | | Amount
| | | | | | | | | | | | | |
Shares sold | | | 664,063 | | | $ | 14,332,859 | | | | 742,747 | | | $ | 16,277,508 | | | | | | | | | | | | | | | | | |
Reinvested dividends | | | 2,899,802 | | | | 62,490,729 | | | | 1,164,545 | | | | 25,957,719 | | | | | | | | | | | | | | | | | |
Shares redeemed | | | (5,062,961 | ) | | | (112,853,519 | ) | | | (7,434,125 | ) | | | (161,992,247 | ) | | | | | | | | | | | | | | | | |
| | |
|
|
| |
|
|
| |
|
|
| |
|
|
| | | | | | | | | | | | | | | | |
Net increase (decrease) | | | (1,499,096 | ) | | $ | (36,029,931 | ) | | | (5,526,833 | ) | | $ | (119,757,020 | ) | | | | | | | | | | | | | | | | |
| | |
|
|
| |
|
|
| |
|
|
| |
|
|
| | | | | | | | | | | | | | | | |
Note 7 — Expense Reductions
Through expense offset arrangements resulting from broker commission recapture, a portion of the expenses of certain Funds have been reduced. For the year ended August 31, 2019, the amount of expense reductions received by each Fund used to offset non-affiliated expenses are reflected as Fees paid indirectly in the Statement of Operations.
Note 8— Investment Concentration
The High Yield Bond Fund’s investment in high yield securities, whether rated or unrated, may be considered speculative and subject to greater market fluctuations and risk of loss of income and principal than lower-yielding, higher-rated, fixed-income securities. The risk of loss due to default by the issuer may be significantly greater for the holders of high yield securities, because such securities are generally unsecured and are often subordinated to other creditors of the issuer.
The Funds may invest in obligations issued by agencies and instrumentalities of the U.S. Government that may vary in the level of support they receive from the government. The government may choose not to provide financial support to government sponsored agencies or instrumentalities if it is not legally obligated to do so, and if the issuer defaults, a fund holding securities of such issuer might not be able to recover its investments from the U.S. Government. As a result of the Core Bond Fund, Government Money Market II Fund and Strategic Bond Fund’s concentration in such investments, these funds may be subject to risks associated with the U.S. Government agencies or instrumentalities.
The International Opportunities Fund invests internationally, including in “emerging market” countries. Emerging market securities involve risks not typically associated with investing in securities of issuers in more developed markets. The markets of emerging market countries are typically more volatile and potentially less liquid than more developed countries. These securities may be denominated in currencies other than U.S. dollars. While investing internationally may reduce portfolio risk by increasing the diversification of portfolio investments, the value of the investment may be affected by fluctuating currency values, changing local and regional economic, political and social conditions, and greater market volatility.
Each Fund, except the Government Money Market II Fund, the Lifestyle Funds and the Small Cap Value Fund, may invest in international bonds, which include U.S. dollar-denominated bonds issued by foreign corporations for which the primary trading market is in the United States (“Yankee Bonds”), or for which the primary trading market is abroad (“Euro Bonds”). International bonds may involve special risks and considerations not typically associated with investing in U.S. companies, including differences in accounting, auditing and financial reporting standards; generally higher commission rates on foreign portfolio transactions; the possibility of nationalization, expropriation or confiscatory taxation; adverse changes in investment or exchange control regulations (which may include suspension of the ability to transfer currency from a country); and political instability which could affect U.S. investments in foreign countries. As a result of the Strategic Bond Fund’s concentration in such investments, it may be subject to risks associated with the international bonds.
Note 9— Line of Credit
The Series, along with certain other funds managed by the Adviser, has access to a $85 million committed unsecured line of credit and a $40 million uncommitted unsecured line of credit. The committed and uncommitted lines of credit are renewable on an annual basis with State Street Bank and Trust Company (“State Street”), the Series’ custodian. Interest is currently payable under the committed line of credit at the higher of the Federal Funds Rate (but not less than zero) plus 125 basis points or the One-Month London Interbank Offered Rate (but not less than zero) plus 125 basis points and State Street’s discretionary bid rate on the uncommitted line of credit. The Series, on behalf of each of the Funds, has paid State Street for its own account, such Fund’s ratable portion of an upfront fee in an amount equal to $25,000 in the aggregate for the uncommitted lines of credit made available by State Street to the Series and certain other funds managed by the Adviser, which are also party to the uncommitted lines of credit. There is also a commitment fee of 25 basis points per annum on the daily unused portion of the committed line of credit. For the year ended August 31, 2019, the following Funds had borrowings:
| | | | | | | | | | | | | | | | |
Fund
| | Days
Outstanding
| | | Interest
Charges
| | | Average
Debt
Utilized
| | | Weighted
Average
Interest
| |
Capital Appreciation | | | 1 | | | $ | 44 | | | $ | 425,000 | | | | 3.69 | % |
High Yield Bond | | | 1 | | | | 97 | | | | 958,295 | | | | 3.63 | |
International Opportunities | | | 2 | | | | 206 | | | | 1,047,303 | | | | 3.56 | |
Large Cap Value | | | 20 | | | | 960 | | | | 488,501 | | | | 3.58 | |
Mid Cap Growth | | | 4 | | | | 119 | | | | 288,553 | | | | 3.66 | |
Mid Cap Value | | | 1 | | | | 14 | | | | 133,974 | | | | 3.63 | |
Moderate Growth Lifestyle | | | 5 | | | | 285 | | | | 580,165 | | | | 3.53 | |
Small Cap Growth | | | 2 | | | | 301 | | | | 1,520,887 | | | | 3.61 | |
Small Cap Value | | | 1 | | | | 10 | | | | 103,358 | | | | 3.63 | |
U.S. Socially Responsible | | | 18 | | | | 7,316 | | | | 4,175,655 | | | | 3.48 | |
At August 31, 2019, there were no borrowings outstanding.
VALIC Company II
NOTES TO FINANCIAL STATEMENTS—(continued)
Note 10— Interfund Lending Agreement
Pursuant to the exemptive relief granted by the SEC, the Funds are permitted to participate in an interfund lending program among investment companies advised by VALIC or an affiliate. The interfund lending program allows the participating Funds to borrow money from and lend money to each other for temporary or emergency purposes. An interfund loan will be made under this facility only if the participating Funds receive a more favorable interest rate than would otherwise be available from a typical bank for a comparable transaction.
For the year ended August 31, 2019, none of the Funds participated in this program.
Note 11— Security Transactions with Affiliated Portfolios
The Funds are permitted to transfer securities by purchasing from and/or selling to other affiliated funds under certain conditions approved by the Board. The affiliated funds involved in such transactions must have a common investment adviser or investment advisers which are affiliated persons of each other, common Trustees, and/or common officers in compliance with Rule 17a-7 of the 1940 Act. Pursuant to the Act, such a transaction must be either a purchase or a sale, for no consideration other than cash payment against prompt delivery of the security at the current market price. No brokerage commission or fee (except for customary transfer fees), or other remuneration is paid in connection with such transactions.
For the year ended August 31, 2019, the following Funds engaged in security transactions with affiliated Funds:
| | | | | | | | | | | | |
Fund
| | Cost of
Purchases
| | | Proceeds
from Sales
| | | Realized
Gain/
(Loss)
| |
International Opportunities | | $ | 61,157 | | | $ | 418,824 | | | $ | 43,237 | |
Mid Cap Growth | | | 210,881 | | | | 309,287 | | | | (12,801 | ) |
Mid Cap Value | | | 524,566 | | | | 200,753 | | | | (43,172 | ) |
Note 12— Unfunded Loan Commitments
At August 31, 2019, Strategic Bond Fund had the following unfunded loan commitments which could be extended at the option of the Borrower:
| | | | | | | | | | | | | | | | |
Borrower
| | Type
| | | Maturity
Date
| | | Principal
Amount
| | | Value
| |
Mavis Tire Express Services Corp., Inc. | | | Delayed Draw | | | | 03/20/2025 | | | $ | 38,131 | | | $ | 37,345 | |
VALIC Company II
FINANCIAL HIGHLIGHTS
| | | | | | | | | | | | | | | | | | | | | | | | | | | | | | | | | | | | | | | | |
| | | Aggressive Growth Lifestyle Fund
| | | Capital Appreciation Fund
| |
| | | Year Ended August 31,
| | | Year Ended August 31,
| |
| | | 2019
| | | 2018
| | | 2017
| | | 2016
| | | 2015
| | | 2019
| | | 2018
| | | 2017
| | | 2016
| | | 2015
| |
| | | | | | | | | | |
PER SHARE DATA | | | | | | | | | | | | | | | | | | | | | | | | | | | | | | | | | | | | | | | | |
Net asset value at beginning of period | | $ | 11.34 | | | $ | 10.68 | | | $ | 10.41 | | | $ | 10.67 | | | $ | 12.04 | | | $ | 20.13 | | | $ | 16.55 | | | $ | 15.99 | | | $ | 16.35 | | | $ | 15.88 | |
| | |
|
|
| |
|
|
|
| | | | | | | | | | |
Income (loss) from investment operations: | | | | | | | | | | | | | | | | | | | | | | | | | | | | | | | | | | | | | | | | |
Net investment income (loss)(d) | | | 0.17 | | | | 0.17 | | | | 0.16 | | | | 0.19 | | | | 0.20 | | | | 0.07 | | | | 0.04 | | | | 0.08 | | | | 0.09 | | | | 0.06 | |
Net realized and unrealized gain (loss) on investments and foreign currencies | | | (0.24 | ) | | | 1.04 | | | | 0.93 | | | | 0.56 | | | | (0.52 | ) | | | (0.26 | ) | | | 4.51 | | | | 2.12 | | | | 1.20 | | | | 0.46 | |
Net increase from payments by affiliates | | | – | | | | – | | | | – | | | | – | | | | – | | | | – | | | | – | | | | – | | | | – | | | | – | |
| | |
|
|
| |
|
|
|
Total income (loss) from investment operations | | | (0.07 | ) | | | 1.21 | | | | 1.09 | | | | 0.75 | | | | (0.32 | ) | | | (0.19 | ) | | | 4.55 | | | | 2.20 | | | | 1.29 | | | | 0.52 | |
| | |
|
|
| |
|
|
|
| | | | | | | | | | |
Distributions from: | | | | | | | | | | | | | | | | | | | | | | | | | | | | | | | | | | | | | | | | |
Net investment income | | | (0.21 | ) | | | (0.16 | ) | | | (0.21 | ) | | | (0.23 | ) | | | (0.19 | ) | | | (0.05 | ) | | | (0.08 | ) | | | (0.08 | ) | | | (0.06 | ) | | | (0.05 | ) |
Net realized gain on securities | | | (0.97 | ) | | | (0.39 | ) | | | (0.61 | ) | | | (0.78 | ) | | | (0.86 | ) | | | (5.00 | ) | | | (0.89 | ) | | | (1.56 | ) | | | (1.59 | ) | | | – | |
| | |
|
|
| |
|
|
|
Total distributions | | | (1.18 | ) | | | (0.55 | ) | | | (0.82 | ) | | | (1.01 | ) | | | (1.05 | ) | | | (5.05 | ) | | | (0.97 | ) | | | (1.64 | ) | | | (1.65 | ) | | | (0.05 | ) |
| | |
|
|
| |
|
|
|
Net asset value at end of period | | $ | 10.09 | | | $ | 11.34 | | | $ | 10.68 | | | $ | 10.41 | | | $ | 10.67 | | | $ | 14.89 | | | $ | 20.13 | | | $ | 16.55 | | | $ | 15.99 | | | $ | 16.35 | |
| | |
|
|
| |
|
|
|
TOTAL RETURN(a) | | | (0.52 | )% | | | 11.39 | % | | | 10.61 | % | | | 7.53 | % | | | (3.17 | )% | | | (0.35 | )% | | | 27.94 | % | | | 14.13 | % | | | 8.33 | % | | | 3.28 | % |
| | |
|
|
| |
|
|
|
| | | | | | | | | | |
RATIOS/SUPPLEMENTAL DATA | | | | | | | | | | | | | | | | | | | | | | | | | | | | | | | | | | | | | | | | |
Ratio of expenses to average net assets(b) | | | 0.10 | %(e) | | | 0.10 | %(e) | | | 0.10 | %(e) | | | 0.10 | %(e) | | | 0.10 | %(e) | | | 0.85 | % | | | 0.85 | % | | | 0.85 | % | | | 0.85 | % | | | 0.85 | % |
Ratio of expenses to average net assets(c) | | | 0.14 | %(e) | | | 0.14 | %(e) | | | 0.14 | %(e) | | | 0.15 | %(e) | | | 0.14 | %(e) | | | 1.00 | % | | | 0.99 | % | | | 0.99 | % | | | 1.00 | % | | | 0.98 | % |
Ratio of expense reductions to average net assets | | | – | | | | – | | | | – | | | | – | | | | – | | | | 0.00 | % | | | 0.01 | % | | | 0.01 | % | | | 0.01 | % | | | 0.01 | % |
Ratio of net investment income (loss) to average net assets(b) | | | 1.56 | %(e) | | | 1.49 | %(e) | | | 1.47 | %(e) | | | 1.78 | %(e) | | | 1.71 | %(e) | | | 0.38 | % | | | 0.22 | % | | | 0.50 | % | | | 0.52 | % | | | 0.36 | % |
Ratio of net investment income (loss) to average net assets(c) | | | 1.52 | %(e) | | | 1.45 | %(e) | | | 1.44 | %(e) | | | 1.73 | %(e) | | | 1.67 | %(e) | | | 0.23 | % | | | 0.08 | % | | | 0.36 | % | | | 0.37 | % | | | 0.23 | % |
Portfolio turnover rate | | | 37 | % | | | 49 | % | | | 36 | % | | | 24 | % | | | 31 | % | | | 60 | % | | | 124 | % | | | 66 | % | | | 54 | % | | | 44 | % |
Number of shares outstanding at end of period (000’s) | | | 57,377 | | | | 53,660 | | | | 53,168 | | | | 51,410 | | | | 47,707 | | | | 6,923 | | | | 5,449 | | | | 5,535 | | | | 5,313 | | | | 5,014 | |
Net assets at the end of period (000’s) | | $ | 579,049 | | | $ | 608,709 | | | $ | 567,843 | | | $ | 535,245 | | | $ | 508,890 | | | $ | 103,080 | | | $ | 109,697 | | | $ | 91,579 | | | $ | 84,946 | | | $ | 81,961 | |
| (a) | Total return includes, if any, expense reimbursements and expense reductions. The effect of fees and charges incurred at the separate account level are not reflected in these performance figures. If such expenses had been included, the total return would have been lower for each period presented. |
| (b) | Includes expense reimbursements, but excludes expense reductions. |
| (c) | Excludes expense reimbursements and expense reductions. |
| (d) | The per share amounts are calculated using the average share method. |
| (e) | Does not include underlying fund expenses that the Fund bears indirectly. |
See Notes to Financial Statements
VALIC Company II
FINANCIAL HIGHLIGHTS —(continued)
| | | | | | | | | | | | | | | | | | | | | | | | | | | | | | | | | | | | | | | | |
| | | Conservative Growth Lifestyle Fund
| | | Core Bond Fund
| |
| | | Year Ended August 31,
| | | Year Ended August 31,
| |
| | | 2019
| | | 2018
| | | 2017
| | | 2016
| | | 2015
| | | 2019
| | | 2018
| | | 2017
| | | 2016
| | | 2015
| |
| | | | | | | | | | |
PER SHARE DATA | | | | | | | | | | | | | | | | | | | | | | | | | | | | | | | | | | | | | | | | |
Net asset value at beginning of period | | $ | 12.31 | | | $ | 12.07 | | | $ | 11.82 | | | $ | 11.95 | | | $ | 13.12 | | | $ | 10.74 | | | $ | 11.15 | | | $ | 11.30 | | | $ | 10.93 | | | $ | 11.09 | |
| | |
|
|
| |
|
|
|
| | | | | | | | | | |
Income (loss) from investment operations: | | | | | | | | | | | | | | | | | | | | | | | | | | | | | | | | | | | | | | | | |
Net investment income (loss)(d) | | | 0.25 | | | | 0.31 | | | | 0.28 | | | | 0.30 | | | | 0.31 | | | | 0.33 | | | | 0.30 | | | | 0.27 | | | | 0.24 | | | | 0.23 | |
Net realized and unrealized gain (loss) on investments and foreign currencies | | | 0.17 | | | | 0.28 | | | | 0.39 | | | | 0.41 | | | | (0.62 | ) | | | 0.70 | | | | (0.45 | ) | | | (0.12 | ) | | | 0.38 | | | | (0.16 | ) |
Net increase from payments by affiliates | | | – | | | | – | | | | – | | | | – | | | | – | | | | – | | | | – | | | | – | | | | – | | | | – | |
| | |
|
|
| |
|
|
|
Total income (loss) from investment operations | | | 0.42 | | | | 0.59 | | | | 0.67 | | | | 0.71 | | | | (0.31 | ) | | | 1.03 | | | | (0.15 | ) | | | 0.15 | | | | 0.62 | | | | 0.07 | |
| | |
|
|
| |
|
|
|
| | | | | | | | | | |
Distributions from: | | | | | | | | | | | | | | | | | | | | | | | | | | | | | | | | | | | | | | | | |
Net investment income | | | (0.36 | ) | | | (0.28 | ) | | | (0.32 | ) | | | (0.34 | ) | | | (0.29 | ) | | | (0.24 | ) | | | (0.26 | ) | | | (0.30 | ) | | | (0.22 | ) | | | (0.23 | ) |
Net realized gain on securities | | | (0.52 | ) | | | (0.07 | ) | | | (0.10 | ) | | | (0.50 | ) | | | (0.57 | ) | | | – | | | | (0.00 | ) | | | – | | | | (0.03 | ) | | | – | |
| | |
|
|
| |
|
|
|
Total distributions | | | (0.88 | ) | | | (0.35 | ) | | | (0.42 | ) | | | (0.84 | ) | | | (0.86 | ) | | | (0.24 | ) | | | (0.26 | ) | | | (0.30 | ) | | | (0.25 | ) | | | (0.23 | ) |
| | |
|
|
| |
|
|
|
Net asset value at end of period | | $ | 11.85 | | | $ | 12.31 | | | $ | 12.07 | | | $ | 11.82 | | | $ | 11.95 | | | $ | 11.53 | | | $ | 10.74 | | | $ | 11.15 | | | $ | 11.30 | | | $ | 10.93 | |
| | |
|
|
| |
|
|
|
TOTAL RETURN(a) | | | 3.52 | % | | | 4.94 | % | | | 5.76 | % | | | 6.19 | % | | | (2.65 | )% | | | 9.64 | % | | | (1.32 | )% | | | 1.37 | % | | | 5.78 | % | | | 0.62 | % |
| | |
|
|
| |
|
|
|
| | | | | | | | | | |
RATIOS/SUPPLEMENTAL DATA | | | | | | | | | | | | | | | | | | | | | | | | | | | | | | | | | | | | | | | | |
Ratio of expenses to average net assets(b) | | | 0.10 | %(e) | | | 0.10 | %(e) | | | 0.10 | %(e) | | | 0.10 | %(e) | | | 0.10 | %(e) | | | 0.77 | % | | | 0.77 | % | | | 0.77 | % | | | 0.77 | % | | | 0.77 | % |
Ratio of expenses to average net assets(c) | | | 0.15 | %(e) | | | 0.15 | %(e) | | | 0.15 | %(e) | | | 0.15 | %(e) | | | 0.14 | %(e) | | | 0.78 | % | | | 0.78 | % | | | 0.80 | % | | | 0.79 | % | | | 0.79 | % |
Ratio of expense reductions to average net assets | | | – | | | | – | | | | – | | | | – | | | | – | | | | – | | | | – | | | | – | | | | – | | | | – | |
Ratio of net investment income (loss) to average net assets(b) | | | 2.06 | %(e) | | | 2.47 | %(e) | | | 2.31 | %(e) | | | 2.51 | %(e) | | | 2.45 | %(e) | | | 2.99 | % | | | 2.80 | % | | | 2.40 | % | | | 2.16 | % | | | 2.10 | % |
Ratio of net investment income (loss) to average net assets(c) | | | 2.01 | %(e) | | | 2.43 | %(e) | | | 2.27 | %(e) | | | 2.46 | %(e) | | | 2.40 | %(e) | | | 2.99 | % | | | 2.78 | % | | | 2.37 | % | | | 2.15 | % | | | 2.08 | % |
Portfolio turnover rate | | | 45 | % | | | 44 | % | | | 38 | % | | | 27 | % | | | 33 | % | | | 97 | % | | | 73 | % | | | 76 | % | | | 139 | % | | | 153 | % |
Number of shares outstanding at end of period (000’s) | | | 27,369 | | | | 27,516 | | | | 27,674 | | | | 27,779 | | | | 27,270 | | | | 137,809 | | | | 119,431 | | | | 100,052 | | | | 106,434 | | | | 97,489 | |
Net assets at the end of period (000’s) | | $ | 324,436 | | | $ | 338,793 | | | $ | 333,907 | | | $ | 328,390 | | | $ | 325,797 | | | $ | 1,589,218 | | | $ | 1,282,586 | | | $ | 1,115,936 | | | $ | 1,202,915 | | | $ | 1,065,803 | |
| (a) | Total return includes, if any, expense reimbursements and expense reductions. The effect of fees and charges incurred at the separate account level are not reflected in these performance figures. If such expenses had been included, the total return would have been lower for each period presented. |
| (b) | Includes expense reimbursements, but excludes expense reductions. |
| (c) | Excludes expense reimbursements and expense reductions. |
| (d) | The per share amounts are calculated using the average share method. |
| (e) | Does not include underlying fund expenses that the Fund bears indirectly. |
See Notes to Financial Statements
VALIC Company II
FINANCIAL HIGHLIGHTS —(continued)
| | | | | | | | | | | | | | | | | | | | | | | | | | | | | | | | | | | | | | | | |
| | | Government Money Market II Fund
| | | High Yield Bond Fund
| |
| | | Year Ended August 31,
| | | Year Ended August 31,
| |
| | | 2019
| | | 2018
| | | 2017
| | | 2016
| | | 2015
| | | 2019
| | | 2018
| | | 2017
| | | 2016
| | | 2015
| |
| | | | | | | | | | |
PER SHARE DATA | | | | | | | | | | | | | | | | | | | | | | | | | | | | | | | | | | | | | | | | |
Net asset value at beginning of period | | $ | 1.00 | | | $ | 1.00 | | | $ | 1.00 | | | $ | 1.00 | | | $ | 1.00 | | | $ | 7.53 | | | $ | 7.75 | | | $ | 7.56 | | | $ | 7.40 | | | $ | 7.93 | |
| | |
|
|
| |
|
|
|
| | | | | | | | | | |
Income (loss) from investment operations: | | | | | | | | | | | | | | | | | | | | | | | | | | | | | | | | | | | | | | | | |
Net investment income (loss)(d) | | | 0.02 | | | | 0.01 | | | | 0.00 | | | | 0.00 | | | | 0.00 | | | | 0.39 | | | | 0.40 | | | | 0.41 | | | | 0.37 | | | | 0.38 | |
Net realized and unrealized gain (loss) on investments and foreign currencies | | | 0.00 | | | | (0.00 | ) | | | 0.00 | | | | 0.00 | | | | 0.00 | | | | 0.09 | | | | (0.18 | ) | | | 0.15 | | | | 0.13 | | | | (0.53 | ) |
Net increase from payments by affiliates | | | – | | | | – | | | | – | | | | – | | | | 0.00 | | | | – | | | | – | | | | – | | | | – | | | | – | |
| | |
|
|
| |
|
|
|
Total income (loss) from investment operations | | | 0.02 | | | | 0.01 | | | | 0.00 | | | | 0.00 | | | | 0.00 | | | | 0.48 | | | | 0.22 | | | | 0.56 | | | | 0.50 | | | | (0.15 | ) |
| | |
|
|
| |
|
|
|
| | | | | | | | | | |
Distributions from: | | | | | | | | | | | | | | | | | | | | | | | | | | | | | | | | | | | | | | | | |
Net investment income | | | (0.02 | ) | | | (0.01 | ) | | | (0.00 | ) | | | (0.00 | ) | | | (0.00 | ) | | | (0.35 | ) | | | (0.44 | ) | | | (0.37 | ) | | | (0.34 | ) | | | (0.38 | ) |
Net realized gain on securities | | | – | | | | – | | | | – | | | | – | | | | – | | | | – | | | | – | | | | – | | | | – | | | | – | |
| | |
|
|
| |
|
|
|
Total distributions | | | (0.02 | ) | | | (0.01 | ) | | | (0.00 | ) | | | (0.00 | ) | | | (0.00 | ) | | | (0.35 | ) | | | (0.44 | ) | | | (0.37 | ) | | | (0.34 | ) | | | (0.38 | ) |
| | |
|
|
| |
|
|
|
Net asset value at end of period | | $ | 1.00 | | | $ | 1.00 | | | $ | 1.00 | | | $ | 1.00 | | | $ | 1.00 | | | $ | 7.66 | | | $ | 7.53 | | | $ | 7.75 | | | $ | 7.56 | | | $ | 7.40 | |
| | |
|
|
| |
|
|
|
TOTAL RETURN(a) | | | 1.75 | % | | | 0.91 | % | | | 0.16 | % | | | 0.01 | % | | | 0.01 | %(e) | | | 6.47 | % | | | 2.89 | % | | | 7.54 | % | | | 7.07 | % | | | (2.02 | )% |
| | |
|
|
| |
|
|
|
| | | | | | | | | | |
RATIOS/SUPPLEMENTAL DATA | | | | | | | | | | | | | | | | | | | | | | | | | | | | | | | | | | | | | | | | |
Ratio of expenses to average net assets(b) | | | 0.55 | % | | | 0.55 | % | | | 0.50 | % | | | 0.32 | % | | | 0.15 | % | | | 0.96 | % | | | 0.96 | % | | | 0.96 | % | | | 0.96 | % | | | 0.96 | % |
Ratio of expenses to average net assets(c) | | | 0.67 | % | | | 0.65 | % | | | 0.70 | % | | | 0.66 | % | | | 0.64 | % | | | 0.97 | % | | | 0.97 | % | | | 0.97 | % | | | 0.99 | % | | | 0.98 | % |
Ratio of expense reductions to average net assets | | | – | | | | – | | | | – | | | | – | | | | – | | | | – | | | | – | | | | – | | | | – | | | | – | |
Ratio of net investment income (loss) to average net assets(b) | | | 1.73 | % | | | 0.91 | % | | | 0.16 | % | | | 0.01 | % | | | 0.01 | % | | | 5.25 | % | | | 5.16 | % | | | 5.27 | % | | | 5.16 | % | | | 5.00 | % |
Ratio of net investment income (loss) to average net assets(c) | | | 1.61 | % | | | 0.81 | % | | | (0.04 | )% | | | (0.33 | )% | | | (0.48 | )% | | | 5.24 | % | | | 5.15 | % | | | 5.26 | % | | | 5.13 | % | | | 4.97 | % |
Portfolio turnover rate | | | N/A | | | | N/A | | | | N/A | | | | N/A | | | | N/A | | | | 34 | % | | | 26 | % | | | 52 | % | | | 36 | % | | | 36 | % |
Number of shares outstanding at end of period (000’s) | | | 119,345 | | | | 136,966 | | | | 132,916 | | | | 141,263 | | | | 159,882 | | | | 85,841 | | | | 76,525 | | | | 72,461 | | | | 78,148 | | | | 63,332 | |
Net assets at the end of period (000’s) | | $ | 119,366 | | | $ | 136,987 | | | $ | 132,944 | | | $ | 141,291 | | | $ | 159,905 | | | $ | 657,364 | | | $ | 576,553 | | | $ | 561,480 | | | $ | 590,679 | | | $ | 468,855 | |
| (a) | Total return includes, if any, expense reimbursements and expense reductions. The effect of fees and charges incurred at the separate account level are not reflected in these performance figures. If such expenses had been included, the total return would have been lower for each period presented. |
| (b) | Includes expense reimbursements, but excludes expense reductions. |
| (c) | Excludes expense reimbursements and expense reductions. |
| (d) | The per share amounts are calculated using the average share method. |
| (e) | The Fund’s performance figure was increased by less than 0.01% from the effect of payments by an affiliate. |
See Notes to Financial Statements
VALIC Company II
FINANCIAL HIGHLIGHTS —(continued)
| | | | | | | | | | | | | | | | | | | | | | | | | | | | | | | | | | | | | | | | |
| | | International Opportunities Fund
| | | Large Cap Value Fund
| |
| | | Year Ended August 31,
| | | Year Ended August 31,
| |
| | | 2019
| | | 2018
| | | 2017
| | | 2016
| | | 2015
| | | 2019
| | | 2018
| | | 2017
| | | 2016
| | | 2015
| |
| | | | | | | | | | |
PER SHARE DATA | | | | | | | | | | | | | | | | | | | | | | | | | | | | | | | | | | | | | | | | |
Net asset value at beginning of period | | $ | 21.31 | | | $ | 19.38 | | | $ | 16.00 | | | $ | 15.08 | | | $ | 15.50 | | | $ | 22.76 | | | $ | 20.66 | | | $ | 18.41 | | | $ | 17.08 | | | $ | 17.58 | |
| | |
|
|
| |
|
|
|
| | | | | | | | | | |
Income (loss) from investment operations: | | | | | | | | | | | | | | | | | | | | | | | | | | | | | | | | | | | | | | | | |
Net investment income (loss)(d) | | | 0.16 | | | | 0.13 | | | | 0.14 | | | | 0.14 | | | | 0.16 | | | | 0.36 | | | | 0.30 | | | | 0.24 | | | | 0.27 | | | | 0.20 | |
Net realized and unrealized gain (loss) on investments and foreign currencies | | | (2.10 | ) | | | 1.97 | | | | 3.49 | | | | 0.94 | | | | (0.38 | ) | | | (0.92 | ) | | | 2.80 | | | | 2.27 | | | | 1.27 | | | | (0.46 | ) |
Net increase from payments by affiliates | | | – | | | | – | | | | – | | | | – | | | | – | | | | – | | | | – | | | | – | | | | – | | | | – | |
| | |
|
|
| |
|
|
|
Total income (loss) from investment operations | | | (1.94 | ) | | | 2.10 | | | | 3.63 | | | | 1.08 | | | | (0.22 | ) | | | (0.56 | ) | | | 3.10 | | | | 2.51 | | | | 1.54 | | | | (0.26 | ) |
| | |
|
|
| |
|
|
|
| | | | | | | | | | |
Distributions from: | | | | | | | | | | | | | | | | | | | | | | | | | | | | | | | | | | | | | | | | |
Net investment income | | | (0.19 | ) | | | (0.17 | ) | | | (0.25 | ) | | | (0.16 | ) | | | (0.20 | ) | | | (0.27 | ) | | | (0.26 | ) | | | (0.26 | ) | | | (0.21 | ) | | | (0.24 | ) |
Net realized gain on securities | | | (0.74 | ) | | | – | | | | – | | | | – | | | | – | | | | (1.82 | ) | | | (0.74 | ) | | | – | | | | – | | | | – | |
| | |
|
|
| |
|
|
|
Total distributions | | | (0.93 | ) | | | (0.17 | ) | | | (0.25 | ) | | | (0.16 | ) | | | (0.20 | ) | | | (2.09 | ) | | | (1.00 | ) | | | (0.26 | ) | | | (0.21 | ) | | | (0.24 | ) |
| | |
|
|
| |
|
|
|
Net asset value at end of period | | $ | 18.44 | | | $ | 21.31 | | | $ | 19.38 | | | $ | 16.00 | | | $ | 15.08 | | | $ | 20.11 | | | $ | 22.76 | | | $ | 20.66 | | | $ | 18.41 | | | $ | 17.08 | |
| | |
|
|
| |
|
|
|
TOTAL RETURN(a) | | | (9.20 | )% | | | 10.81 | % | | | 22.81 | % | | | 7.23 | % | | | (1.50 | )% | | | (2.39 | )% | | | 15.12 | % | | | 13.66 | % | | | 9.09 | % | | | (1.56 | )% |
| | |
|
|
| |
|
|
|
| | | | | | | | | | |
RATIOS/SUPPLEMENTAL DATA | | | | | | | | | | | | | | | | | | | | | | | | | | | | | | | | | | | | | | | | |
Ratio of expenses to average net assets(b) | | | 1.00 | % | | | 1.00 | % | | | 1.00 | % | | | 1.00 | % | | | 1.00 | % | | | 0.81 | % | | | 0.81 | % | | | 0.81 | % | | | 0.81 | % | | | 0.81 | % |
Ratio of expenses to average net assets(c) | | | 1.22 | % | | | 1.20 | % | | | 1.22 | % | | | 1.21 | % | | | 1.21 | % | | | 0.89 | % | | | 0.88 | % | | | 0.88 | % | | | 0.89 | % | | | 0.88 | % |
Ratio of expense reductions to average net assets | | | 0.00 | % | | | – | | | | – | | | | 0.00 | % | | | 0.01 | % | | | 0.01 | % | | | 0.01 | % | | | 0.01 | % | | | 0.01 | % | | | 0.01 | % |
Ratio of net investment income (loss) to average net assets(b) | | | 0.83 | % | | | 0.61 | % | | | 0.82 | % | | | 0.91 | % | | | 1.02 | % | | | 1.68 | % | | | 1.35 | % | | | 1.21 | % | | | 1.59 | % | | | 1.11 | % |
Ratio of net investment income (loss) to average net assets(c) | | | 0.60 | % | | | 0.41 | % | | | 0.60 | % | | | 0.70 | % | | | 0.81 | % | | | 1.60 | % | | | 1.27 | % | | | 1.14 | % | | | 1.51 | % | | | 1.04 | % |
Portfolio turnover rate | | | 41 | % | | | 46 | % | | | 62 | % | | | 58 | % | | | 59 | % | | | 81 | % | | | 90 | % | | | 77 | % | | | 71 | % | | | 72 | % |
Number of shares outstanding at end of period (000’s) | | | 31,253 | | | | 33,984 | | | | 34,637 | | | | 37,260 | | | | 39,548 | | | | 13,500 | | | | 12,480 | | | | 10,969 | | | | 12,540 | | | | 11,333 | |
Net assets at the end of period (000’s) | | $ | 576,197 | | | $ | 724,027 | | | $ | 671,097 | | | $ | 596,055 | | | $ | 596,301 | | | $ | 271,487 | | | $ | 284,086 | | | $ | 226,626 | | | $ | 230,844 | | | $ | 193,602 | |
| (a) | Total return includes, if any, expense reimbursements and expense reductions. The effect of fees and charges incurred at the separate account level are not reflected in these performance figures. If such expenses had been included, the total return would have been lower for each period presented. |
| (b) | Includes expense reimbursements, but excludes expense reductions. |
| (c) | Excludes expense reimbursements and expense reductions. |
| (d) | The per share amounts are calculated using the average share method. |
See Notes to Financial Statements
VALIC Company II
FINANCIAL HIGHLIGHTS —(continued)
| | | | | | | | | | | | | | | | | | | | | | | | | | | | | | | | | | | | | | | | |
| | | Mid Cap Growth Fund
| | | Mid Cap Value Fund
| |
| | | Year Ended August 31,
| | | Year Ended August 31,
| |
| | | 2019
| | | 2018
| | | 2017
| | | 2016
| | | 2015
| | | 2019
| | | 2018
| | | 2017
| | | 2016
| | | 2015
| |
| | | | | | | | | | |
PER SHARE DATA | | | | | | | | | | | | | | | | | | | | | | | | | | | | | | | | | | | | | | | | |
Net asset value at beginning of period | | $ | 10.71 | | | $ | 10.06 | | | $ | 8.42 | | | $ | 8.81 | | | $ | 10.13 | | | $ | 22.13 | | | $ | 21.23 | | | $ | 20.45 | | | $ | 21.82 | | | $ | 25.15 | |
| | |
|
|
| |
|
|
|
| | | | | | | | | | |
Income (loss) from investment operations: | | | | | | | | | | | | | | | | | | | | | | | | | | | | | | | | | | | | | | | | |
Net investment income (loss)(d) | | | (0.01 | ) | | | (0.02 | ) | | | 0.00 | | | | (0.02 | ) | | | (0.02 | ) | | | 0.14 | | | | 0.09 | | | | 0.07 | | | | 0.14 | | | | 0.07 | |
Net realized and unrealized gain (loss) on investments and foreign currencies | | | 0.19 | | | | 2.56 | | | | 1.64 | | | | 0.24 | | | | 0.27 | | | | (1.11 | ) | | | 2.62 | | | | 2.17 | | | | 1.73 | | | | (0.82 | ) |
Net increase from payments by affiliates | | | – | | | | – | | | | – | | | | – | | | | – | | | | – | | | | – | | | | – | | | | – | | | | – | |
| | |
|
|
| |
|
|
|
Total income (loss) from investment operations | | | 0.18 | | | | 2.54 | | | | 1.64 | | | | 0.22 | | | | 0.25 | | | | (0.97 | ) | | | 2.71 | | | | 2.24 | | | | 1.87 | | | | (0.75 | ) |
| | |
|
|
| |
|
|
|
| | | | | | | | | | |
Distributions from: | | | | | | | | | | | | | | | | | | | | | | | | | | | | | | | | | | | | | | | | |
Net investment income | | | – | | | | (0.02 | ) | | | – | | | | – | | | | – | | | | (0.11 | ) | | | (0.09 | ) | | | (0.13 | ) | | | (0.06 | ) | | | (0.05 | ) |
Net realized gain on securities | | | (0.37 | ) | | | (1.87 | ) | | | – | | | | (0.61 | ) | | | (1.57 | ) | | | (3.86 | ) | | | (1.72 | ) | | | (1.33 | ) | | | (3.18 | ) | | | (2.53 | ) |
| | |
|
|
| |
|
|
|
Total distributions | | | (0.37 | ) | | | (1.89 | ) | | | – | | | | (0.61 | ) | | | (1.57 | ) | | | (3.97 | ) | | | (1.81 | ) | | | (1.46 | ) | | | (3.24 | ) | | | (2.58 | ) |
| | |
|
|
| |
|
|
|
Net asset value at end of period | | $ | 10.52 | | | $ | 10.71 | | | $ | 10.06 | | | $ | 8.42 | | | $ | 8.81 | | | $ | 17.19 | | | $ | 22.13 | | | $ | 21.23 | | | $ | 20.45 | | | $ | 21.82 | |
| | |
|
|
| |
|
|
|
TOTAL RETURN(a) | | | 1.72 | % | | | 25.54 | % | | | 19.48 | % | | | 3.01 | % | | | 1.66 | % | | | (4.14 | )% | | | 12.90 | % | | | 11.02 | % | | | 9.62 | % | | | (3.61 | )% |
| | |
|
|
| |
|
|
|
| | | | | | | | | | |
RATIOS/SUPPLEMENTAL DATA | | | | | | | | | | | | | | | | | | | | | | | | | | | | | | | | | | | | | | | | |
Ratio of expenses to average net assets(b) | | | 0.85 | % | | | 0.85 | % | | | 0.85 | % | | | 0.85 | % | | | 0.85 | % | | | 1.05 | % | | | 1.05 | % | | | 1.05 | % | | | 1.05 | % | | | 1.05 | % |
Ratio of expenses to average net assets(c) | | | 1.12 | % | | | 1.15 | % | | | 1.17 | % | | | 1.17 | % | | | 1.14 | % | | | 1.06 | % | | | 1.05 | % | | | 1.05 | % | | | 1.06 | % | | | 1.06 | % |
Ratio of expense reductions to average net assets | | | 0.00 | % | | | 0.00 | % | | | 0.00 | % | | | 0.01 | % | | | 0.01 | % | | | 0.00 | % | | | 0.00 | % | | | 0.00 | % | | | 0.00 | % | | | 0.00 | % |
Ratio of net investment income (loss) to average net assets(b) | | | (0.08 | )% | | | (0.18 | )% | | | 0.04 | % | | | (0.27 | )% | | | (0.26 | )% | | | 0.73 | % | | | 0.40 | % | | | 0.32 | % | | | 0.65 | % | | | 0.28 | % |
Ratio of net investment income (loss) to average net assets(c) | | | (0.35 | )% | | | (0.49 | )% | | | (0.28 | )% | | | (0.59 | )% | | | (0.54 | )% | | | 0.72 | % | | | 0.40 | % | | | 0.32 | % | | | 0.64 | % | | | 0.27 | % |
Portfolio turnover rate | | | 32 | % | | | 35 | % | | | 162 | % | | | 92 | % | | | 102 | % | | | 44 | % | | | 44 | % | | | 44 | % | | | 44 | % | | | 56 | % |
Number of shares outstanding at end of period (000’s) | | | 23,048 | | | | 20,584 | | | | 13,313 | | | | 14,338 | | | | 17,507 | | | | 43,256 | | | | 41,411 | | | | 49,262 | | | | 48,776 | | | | 42,460 | |
Net assets at the end of period (000’s) | | $ | 242,512 | | | $ | 220,444 | | | $ | 133,988 | | | $ | 120,774 | | | $ | 154,291 | | | $ | 743,460 | | | $ | 916,284 | | | $ | 1,046,046 | | | $ | 997,576 | | | $ | 926,580 | |
| (a) | Total return includes, if any, expense reimbursements and expense reductions. The effect of fees and charges incurred at the separate account level are not reflected in these performance figures. If such expenses had been included, the total return would have been lower for each period presented. |
| (b) | Includes expense reimbursements, but excludes expense reductions. |
| (c) | Excludes expense reimbursements and expense reductions. |
| (d) | The per share amounts are calculated using the average share method. |
See Notes to Financial Statements
VALIC Company II
FINANCIAL HIGHLIGHTS —(continued)
| | | | | | | | | | | | | | | | | | | | | | | | | | | | | | | | | | | | | | | | |
| | | Moderate Growth Lifestyle Fund
| | | Small Cap Growth Fund
| |
| | | Year Ended August 31,
| | | Year Ended August 31,
| |
| | | 2019
| | | 2018
| | | 2017
| | | 2016
| | | 2015
| | | 2019
| | | 2018
| | | 2017
| | | 2016
| | | 2015
| |
| | | | | | | | | | |
PER SHARE DATA | | | | | | | | | | | | | | | | | | | | | | | | | | | | | | | | | | | | | | | | |
Net asset value at beginning of period | | $ | 15.00 | | | $ | 14.23 | | | $ | 13.98 | | | $ | 14.09 | | | $ | 15.61 | | | $ | 23.31 | | | $ | 16.98 | | | $ | 14.20 | | | $ | 15.31 | | | $ | 16.27 | |
| | |
|
|
| |
|
|
|
| | | | | | | | | | |
Income (loss) from investment operations: | | | | | | | | | | | | | | | | | | | | | | | | | | | | | | | | | | | | | | | | |
Net investment income (loss)(d) | | | 0.24 | | | | 0.26 | | | | 0.24 | | | | 0.30 | | | | 0.29 | | | | (0.11 | ) | | | (0.12 | ) | | | (0.08 | ) | | | (0.03 | ) | | | (0.04 | ) |
Net realized and unrealized gain (loss) on investments and foreign currencies | | | (0.00 | ) | | | 1.08 | | | | 0.92 | | | | 0.70 | | | | (0.65 | ) | | | (1.22 | ) | | | 7.14 | | | | 3.72 | | | | 0.42 | | | | 0.97 | |
Net increase from payments by affiliates | | | – | | | | – | | | | – | | | | – | | | | – | | | | – | | | | – | | | | – | | | | – | | | | – | |
| | |
|
|
| |
|
|
|
Total income (loss) from investment operations | | | 0.24 | | | | 1.34 | | | | 1.16 | | | | 1.00 | | | | (0.36 | ) | | | (1.33 | ) | | | 7.02 | | | | 3.64 | | | | 0.39 | | | | 0.93 | |
| | |
|
|
| |
|
|
|
| | | | | | | | | | |
Distributions from: | | | | | | | | | | | | | | | | | | | | | | | | | | | | | | | | | | | | | | | | |
Net investment income | | | (0.32 | ) | | | (0.24 | ) | | | (0.32 | ) | | | (0.32 | ) | | | (0.28 | ) | | | – | | | | – | | | | – | | | | – | | | | – | |
Net realized gain on securities | | | (1.04 | ) | | | (0.33 | ) | | | (0.59 | ) | | | (0.79 | ) | | | (0.88 | ) | | | (5.09 | ) | | | (0.69 | ) | | | (0.86 | ) | | | (1.50 | ) | | | (1.89 | ) |
| | |
|
|
| |
|
|
|
Total distributions | | | (1.36 | ) | | | (0.57 | ) | | | (0.91 | ) | | | (1.11 | ) | | | (1.16 | ) | | | (5.09 | ) | | | (0.69 | ) | | | (0.86 | ) | | | (1.50 | ) | | | (1.89 | ) |
| | |
|
|
| |
|
|
|
Net asset value at end of period | | $ | 13.88 | | | $ | 15.00 | | | $ | 14.23 | | | $ | 13.98 | | | $ | 14.09 | | | $ | 16.89 | | | $ | 23.31 | | | $ | 16.98 | | | $ | 14.20 | | | $ | 15.31 | |
| | |
|
|
| |
|
|
|
TOTAL RETURN(a) | | | 1.71 | % | | | 9.44 | % | | | 8.42 | % | | | 7.48 | % | | | (2.68 | )% | | | (5.47 | )% | | | 41.51 | % | | | 26.05 | % | | | 4.40 | % | | | 5.26 | % |
| | |
|
|
| |
|
|
|
| | | | | | | | | | |
RATIOS/SUPPLEMENTAL DATA | | | | | | | | | | | | | | | | | | | | | | | | | | | | | | | | | | | | | | | | |
Ratio of expenses to average net assets(b) | | | 0.10 | %(e) | | | 0.10 | %(e) | | | 0.10 | %(e) | | | 0.10 | %(e) | | | 0.10 | %(e) | | | 1.16 | % | | | 1.16 | % | | | 1.16 | % | | | 1.16 | % | | | 1.16 | % |
Ratio of expenses to average net assets(c) | | | 0.13 | %(e) | | | 0.13 | %(e) | | | 0.14 | %(e) | | | 0.14 | %(e) | | | 0.13 | %(e) | | | 1.23 | % | | | 1.22 | % | | | 1.25 | % | | | 1.29 | % | | | 1.25 | % |
Ratio of expense reduction to average net assets | | | – | | | | – | | | | – | | | | – | | | | – | | | | 0.01 | % | | | 0.00 | % | | | 0.00 | % | | | 0.01 | % | | | 0.01 | % |
Ratio of net investment income (loss) to average net assets(b) | | | 1.69 | %(e) | | | 1.75 | %(e) | | | 1.68 | %(e) | | | 2.15 | %(e) | | | 1.92 | %(e) | | | (0.54 | )% | | | (0.61 | )% | | | (0.53 | )% | | | (0.22 | )% | | | (0.25 | )% |
Ratio of net investment income (loss) to average net assets(c) | | | 1.66 | %(e) | | | 1.72 | %(e) | | | 1.65 | %(e) | | | 2.11 | %(e) | | | 1.89 | %(e) | | | (0.61 | )% | | | (0.67 | )% | | | (0.62 | )% | | | (0.35 | )% | | | (0.34 | )% |
Portfolio turnover rate | | | 39 | % | | | 47 | % | | | 36 | % | | | 33 | % | | | 30 | % | | | 60 | % | | | 63 | % | | | 40 | % | | | 39 | % | | | 49 | % |
Number of shares outstanding at end of period (000’s) | | | 67,965 | | | | 64,297 | | | | 63,003 | | | | 60,581 | | | | 56,655 | | | | 11,386 | | | | 9,239 | | | | 8,088 | | | | 7,035 | | | | 7,185 | |
Net assets at the end of period (000’s) | | $ | 943,311 | | | $ | 964,607 | | | $ | 896,346 | | | $ | 846,974 | | | $ | 798,444 | | | $ | 192,341 | | | $ | 215,384 | | | $ | 137,330 | | | $ | 99,884 | | | $ | 110,029 | |
| (a) | Total return includes, if any, expense reimbursements and expense reductions. The effect of fees and charges incurred at the separate account level are not reflected in these performance figures. If such expenses had been included, the total return would have been lower for each period presented. |
| (b) | Includes expense reimbursements, but excludes expense reductions. |
| (c) | Excludes expense reimbursements and expense reductions. |
| (d) | The per share amounts are calculated using the average share method. |
| (e) | Does not include underlying fund expenses that the Fund bears indirectly. |
See Notes to Financial Statements
VALIC Company II
FINANCIAL HIGHLIGHTS —(continued)
| | | | | | | | | | | | | | | | | | | | | | | | | | | | | | | | | | | | | | | | |
| | | Small Cap Value Fund
| | | Strategic Bond Fund
| |
| | | Year Ended August 31,
| | | Year Ended August 31,
| |
| | | 2019
| | | 2018
| | | 2017
| | | 2016
| | | 2015
| | | 2019
| | | 2018
| | | 2017
| | | 2016
| | | 2015
| |
| | | | | | | | | | |
PER SHARE DATA | | | | | | | | | | | | | | | | | | | | | | | | | | | | | | | | | | | | | | | | |
Net asset value at beginning of period | | $ | 15.74 | | | $ | 14.47 | | | $ | 13.57 | | | $ | 14.01 | | | $ | 16.65 | | | $ | 10.86 | | | $ | 11.38 | | | $ | 11.28 | | | $ | 11.00 | | | $ | 11.77 | |
| | |
|
|
| |
|
|
|
| | | | | | | | | | |
Income (loss) from investment operations: | | | | | | | | | | | | | | | | | | | | | | | | | | | | | | | | | | | | | | | | |
Net investment income (loss)(d) | | | 0.15 | | | | 0.15 | | | | 0.11 | | | | 0.13 | | | | 0.17 | | | | 0.43 | | | | 0.42 | | | | 0.39 | | | | 0.38 | | | | 0.42 | |
Net realized and unrealized gain (loss) on investments and foreign currencies | | | (2.80 | ) | | | 2.36 | | | | 1.48 | | | | 1.27 | | | | (0.56 | ) | | | 0.46 | | | | (0.53 | ) | | | 0.13 | | | | 0.39 | | | | (0.68 | ) |
Net increase from payments by affiliates | | | – | | | | – | | | | – | | | | – | | | | – | | | | – | | | | – | | | | – | | | | – | | | | – | |
| | |
|
|
| |
|
|
|
Total income (loss) from investment operations | | | (2.65 | ) | | | 2.51 | | | | 1.59 | | | | 1.40 | | | | (0.39 | ) | | | 0.89 | | | | (0.11 | ) | | | 0.52 | | | | 0.77 | | | | (0.26 | ) |
| | |
|
|
| |
|
|
|
| | | | | | | | | | |
Distributions from: | | | | | | | | | | | | | | | | | | | | | | | | | | | | | | | | | | | | | | | | |
Net investment income | | | (0.21 | ) | | | (0.13 | ) | | | (0.14 | ) | | | (0.17 | ) | | | (0.10 | ) | | | (0.40 | ) | | | (0.41 | ) | | | (0.42 | ) | | | (0.45 | ) | | | (0.41 | ) |
Net realized gain on securities | | | (2.12 | ) | | | (1.11 | ) | | | (0.55 | ) | | | (1.67 | ) | | | (2.15 | ) | | | – | | | | – | | | | – | | | | (0.04 | ) | | | (0.10 | ) |
| | |
|
|
| |
|
|
|
Total distributions | | | (2.33 | ) | | | (1.24 | ) | | | (0.69 | ) | | | (1.84 | ) | | | (2.25 | ) | | | (0.40 | ) | | | (0.41 | ) | | | (0.42 | ) | | | (0.49 | ) | | | (0.51 | ) |
| | |
|
|
| |
|
|
|
Net asset value at end of period | | $ | 10.76 | | | $ | 15.74 | | | $ | 14.47 | | | $ | 13.57 | | | $ | 14.01 | | | $ | 11.35 | | | $ | 10.86 | | | $ | 11.38 | | | $ | 11.28 | | | $ | 11.00 | |
| | |
|
|
| |
|
|
|
TOTAL RETURN(a) | | | (17.24 | )% | | | 17.40 | % | | | 11.61 | % | | | 11.27 | % | | | (3.38 | )% | | | 8.27 | % | | | (0.96 | )% | | | 4.75 | % | | | 7.15 | % | | | (2.32 | )% |
| | |
|
|
| |
|
|
|
| | | | | | | | | | |
RATIOS/SUPPLEMENTAL DATA | | | | | | | | | | | | | | | | | | | | | | | | | | | | | | | | | | | | | | | | |
Ratio of expenses to average net assets(b) | | | 0.95 | % | | | 0.95 | % | | | 0.95 | % | | | 0.95 | % | | | 0.95 | % | | | 0.87 | % | | | 0.87 | % | | | 0.88 | % | | | 0.88 | % | | | 0.87 | % |
Ratio of expenses to average net assets(c) | | | 1.06 | % | | | 1.03 | % | | | 1.03 | % | | | 1.04 | % | | | 1.03 | % | | | 0.87 | % | | | 0.87 | % | | | 0.88 | % | | | 0.88 | % | | | 0.87 | % |
Ratio of expense reductions to average net assets | | | 0.01 | % | | | 0.00 | % | | | 0.00 | % | | | 0.00 | % | | | 0.00 | % | | | – | | | | – | | | | – | | | | – | | | | – | |
Ratio of net investment income (loss) to average net assets(b) | | | 1.07 | % | | | 0.96 | % | | | 0.71 | % | | | 0.98 | % | | | 1.02 | % | | | 3.92 | % | | | 3.73 | % | | | 3.48 | % | | | 3.51 | % | | | 3.67 | % |
Ratio of net investment income (loss) to average net assets(c) | | | 0.96 | % | | | 0.88 | % | | | 0.62 | % | | | 0.89 | % | | | 0.95 | % | | | 3.92 | % | | | 3.73 | % | | | 3.48 | % | | | 3.51 | % | | | 3.67 | % |
Portfolio turnover rate | | | 55 | % | | | 46 | % | | | 79 | % | | | 59 | % | | | 50 | % | | | 95 | % | | | 133 | % | | | 118 | % | | | 162 | % | | | 132 | % |
Number of shares outstanding at end of period (000’s) | | | 29,381 | | | | 33,971 | | | | 36,582 | | | | 37,866 | | | | 34,784 | | | | 73,893 | | | | 78,574 | | | | 65,845 | | | | 72,983 | | | | 71,428 | |
Net assets at the end of period (000’s) | | $ | 316,042 | | | $ | 534,548 | | | $ | 529,505 | | | $ | 513,783 | | | $ | 487,157 | | | $ | 838,559 | | | $ | 853,401 | | | $ | 749,055 | | | $ | 823,464 | | | $ | 785,635 | |
| (a) | Total return includes, if any, expense reimbursements and expense reductions. The effect of fees and charges incurred at the separate account level are not reflected in these performance figures. If such expenses had been included, the total return would have been lower for each period presented. |
| (b) | Includes expense reimbursements, but excludes expense reductions. |
| (c) | Excludes expense reimbursements and expense reductions. |
| (d) | The per share amounts are calculated using the average share method. |
See Notes to Financial Statements
VALIC Company II
FINANCIAL HIGHLIGHTS —(continued)
| | | | | | | | | | | | | | | | | | | | |
| | | U.S. Socially Responsible Fund*
| |
| | | Year Ended August 31,
| |
| | | 2019
| | | 2018
| | | 2017
| | | 2016
| | | 2015
| |
| | | | | |
PER SHARE DATA | | | | | | | | | | | | | | | | | | | | |
Net asset value at beginning of period | | $ | 23.09 | | | $ | 20.15 | | | $ | 19.23 | | | $ | 18.55 | | | $ | 18.56 | |
| | |
|
|
|
| | | | | |
Income (loss) from investment operations: | | | | | | | | | | | | | | | | | | | | |
Net investment income (loss)(d) | | | 0.27 | | | | 0.30 | | | | 0.29 | | | | 0.28 | | | | 0.26 | |
Net realized and unrealized gain (loss) on investments and foreign currencies | | | 0.72 | | | | 3.39 | | | | 2.33 | | | | 1.89 | | | | (0.05 | ) |
Net increase from payments by affiliates | | | – | | | | – | | | | – | | | | – | | | | – | |
| | |
|
|
|
Total income (loss) from investment operations | | | 0.99 | | | | 3.69 | | | | 2.62 | | | | 2.17 | | | | 0.21 | |
| | |
|
|
|
| | | | | |
Distributions from: | | | | | | | | | | | | | | | | | | | | |
Net investment income | | | (0.34 | ) | | | (0.35 | ) | | | (0.29 | ) | | | (0.28 | ) | | | (0.22 | ) |
Net realized gain on securities | | | (1.71 | ) | | | (0.40 | ) | | | (1.41 | ) | | | (1.21 | ) | | | – | |
| | |
|
|
|
Total distributions | | | (2.05 | ) | | | (0.75 | ) | | | (1.70 | ) | | | (1.49 | ) | | | (0.22 | ) |
| | |
|
|
|
Net asset value at end of period | | $ | 22.03 | | | $ | 23.09 | | | $ | 20.15 | | | $ | 19.23 | | | $ | 18.55 | |
| | |
|
|
|
TOTAL RETURN(a) | | | 4.46 | % | | | 18.49 | % | | | 13.90 | % | | | 12.16 | % | | | 1.06 | % |
| | |
|
|
|
| | | | | |
RATIOS/SUPPLEMENTAL DATA | | | | | | | | | | | | | | | | | | | | |
Ratio of expenses to average net assets(b) | | | 0.56 | % | | | 0.56 | % | | | 0.56 | % | | | 0.56 | % | | | 0.56 | % |
Ratio of expenses to average net assets(c) | | | 0.61 | % | | | 0.61 | % | | | 0.61 | % | | | 0.61 | % | | | 0.61 | % |
Ratio of expense reductions to average net assets | | | – | | | | – | | | | – | | | | – | | | | – | |
Ratio of net investment income (loss) to average net assets(b) | | | 1.22 | % | | | 1.37 | % | | | 1.46 | % | | | 1.47 | % | | | 1.35 | % |
Ratio of net investment income (loss) to average net assets(c) | | | 1.17 | % | | | 1.33 | % | | | 1.41 | % | | | 1.42 | % | | | 1.31 | % |
Portfolio turnover rate | | | 36 | % | | | 5 | % | | | 0 | % | | | 25 | % | | | 31 | % |
Number of shares outstanding at end of period (000’s) | | | 32,675 | | | | 34,175 | | | | 39,701 | | | | 39,360 | | | | 39,153 | |
Net assets at the end of period (000’s) | | $ | 719,784 | | | $ | 789,118 | | | $ | 799,898 | | | $ | 756,821 | | | $ | 726,460 | |
| (a) | Total return includes, if any, expense reimbursements and expense reductions. The effect of fees and charges incurred at the separate account level are not reflected in these performance figures. If such expenses had been included, the total return would have been lower for each period presented. |
| (b) | Includes expense reimbursements, but excludes expense reductions. |
| (c) | Excludes expense reimbursements and expense reductions. |
| (d) | The per share amounts are calculated using the average share method. |
See Notes to Financial Statements
VALIC Company II
REPORT OF INDEPENDENT REGISTERED PUBLIC ACCOUNTING FIRM
To the Board of Trustees of VALIC Company II and
Shareholders of each of the fifteen funds listed in the table below
Opinions on the Financial Statements
We have audited the accompanying statements of assets and liabilities, including the portfolios of investments, of each of the funds listed in the table below (fifteen funds constituting VALIC Company II, hereafter collectively referred to as the “Funds”) as of August 31, 2019, the related statements of operationsfor the year ended August 31, 2019, the statements of changes in net assets for each of the two years in the period ended August 31, 2019, including the related notes,and the financial highlights for each of the five years in the period ended August 31, 2019 (collectively referred to as the “financial statements”). In our opinion, the financial statements present fairly, in all material respects, the financial position of each of the Funds as of August 31, 2019, the results of each of their operations for the year then ended, the changes in each of their net assets for each of the two years in the period ended August 31, 2019 and each of the financial highlights for each of the five years in the period ended August 31, 2019 in conformity with accounting principles generally accepted in the United States of America.
VALIC Company II
| | |
Aggressive Growth Lifestyle Fund | | Mid Cap Growth Fund |
Capital Appreciation Fund | | Mid Cap Value Fund |
Conservative Growth Lifestyle Fund | | Moderate Growth Lifestyle Fund |
Core Bond Fund | | Small Cap Growth Fund |
Government Money Market II Fund | | Small Cap Value Fund |
High Yield Bond Fund | | Strategic Bond Fund |
International Opportunities Fund | | U.S. Socially Responsible Fund (formerly Socially Responsible Fund) |
Large Cap Value Fund | | |
Basis for Opinions
These financial statements are the responsibility of the Funds’ management. Our responsibility is to express an opinion on the Funds’ financial statements based on our audits. We are a public accounting firm registered with the Public Company Accounting Oversight Board (United States) (“PCAOB”) and are required to be independent with respect to the Funds in accordance with the U.S. federal securities laws and the applicable rules and regulations of the Securities and Exchange Commission and the PCAOB.
We conducted our audits of these financial statements in accordance with the standards of the PCAOB. Those standards require that we plan and perform the audit to obtain reasonable assurance about whether the financial statements are free of material misstatement, whether due to error or fraud.
Our audits included performing procedures to assess the risks of material misstatement of the financial statements, whether due to error or fraud, and performing procedures that respond to those risks. Such procedures included examining, on a test basis, evidence regarding the amounts and disclosures in the financial statements. Our audits also included evaluating the accounting principles used and significant estimates made by management, as well as evaluating the overall presentation of the financial statements. Our procedures included confirmation of securities owned as of August 31, 2019 by correspondence with the custodian, transfer agents and brokers; when replies were not received from brokers, we performed other auditing procedures. We believe that our audits provide a reasonable basis for our opinions.
/s/ PricewaterhouseCoopers LLP
Houston, Texas
October 25, 2019
We have served as the auditor of one or more investment companies in the VALIC family of funds since 2008.
VALIC Company II
APPROVAL OF ADVISORY AGREEMENTS(unaudited)
| 1 | Effective June 7, 2010, Perkins became a sub-sub-adviser pursuant to a Sub-Sub-Advisory Agreement between Janus and Perkins. The Board’s consideration and approval of VALIC’s Investment Sub-Advisory Agreement with Janus included a consideration and approval of this Sub-Sub-Advisory Agreement. |
At an in-person meeting held on August 5-6, 2019, the Board of Trustees (the “Board”) of VALIC Company II (“VC II”), including the Trustees that are not interested persons of VC II, as such term is defined in the Investment Company Act of 1940, as amended (the “1940 Act”) (the “Independent Trustees”), approved the Investment Advisory Agreement with respect to each series of VC II (each a “Fund,” and collectively, the “Funds”) between The Variable Annuity Life Insurance Company (“VALIC”) and VC II (the “Advisory Agreement”) and the Investment Sub-Advisory Agreements between VALIC and each of the following sub-advisers of VC II (collectively, the “Sub-advisory Agreements”): BMO Asset Management Corp. (“BMO AM”), BNY Mellon Asset Management North America Corporation (“BNY”), Boston Partners Global Investors, Inc. (“Boston Partners”), Delaware Investments Fund Advisers (“Delaware”), Janus Capital Management, LLC (“Janus”), J.P. Morgan Investment Management, Inc. (“JPMIM”), Massachusetts Financial Services Company (“MFS”), Perkins Investment Management, LLC (“Perkins”),1 PineBridge Investments, LLC (“PineBridge”), SunAmerica Asset Management, LLC (“SunAmerica”) and Wellington Management Company LLP (“Wellington Management”) (collectively referred to as the “Sub-advisers”). The Advisory Agreement and Sub-advisory Agreements are collectively referred to as the “Advisory Contracts.” Prior to the August 5-6, 2019 meeting at which the Advisory Contracts were approved, the Board also discussed and considered information regarding the proposed continuation of the Advisory Contracts at an in-person meeting held on July 8-9, 2019.
In connection with the approval of the Advisory Contracts, the Board received materials relating to certain factors the Board considered in determining to renew such Advisory Contracts. Those factors included: (1) the nature, extent and quality of services provided by VALIC and the Sub-advisers; (2) the advisory fee and sub-advisory fees charged in connection with VALIC’s and the Sub-advisers’ management of each Fund, compared to advisory fee rates and sub-advisory fee rates of a group of funds with similar investment objectives (respectively, the “Expense Group/Universe” and the “Subadvisory Expense Group/Universe”), as selected by an independent third-party provider of mutual fund data; (3) the investment performance of the Funds compared to performance of comparable funds as selected by an independent third-party provider of investment company data (“Performance Group/Universe”) and against each Fund’s benchmarks; (4) the costs of services and the benefits potentially derived by VALIC, the Sub-advisers and their respective affiliates; (5) a comparison of advisory fee schedules and performance with respect to other mutual funds and accounts with similar investment strategies and/or objectives to the Funds, as applicable, and which are advised or managed by VALIC or SunAmerica, an affiliated Sub-adviser; (6) whether the Funds will benefit from possible economies of scale from engaging VALIC and the Sub-advisers; (7) the profitability of VALIC, the Sub-advisers and their respective affiliates, including amounts retained by VALIC after payment of sub-advisory fees; (8) the terms of the Advisory Contracts; (9) information regarding VALIC’s and the Sub-advisers’ compliance and regulatory history; and (10) information about the services VALIC provides in connection with the oversight of the Sub-advisers.
The Independent Trustees were separately represented by counsel that is independent of VALIC in connection with their consideration of approval of the Advisory Contracts. The matters discussed below were also considered separately by the Independent Trustees in an executive session at anin-person special meeting held on July8-9, 2019 and executive sessions held during the August 2019 meeting during which such independent counsel provided guidance to the Independent Trustees. Following the July8-9, 2019 meeting, the Independent Trustees submitted questions and requests for additional information to management, and considered management’s responses thereto at the August 2019 meeting. The continuation of all Advisory Contracts was approved at the August 2019 meeting for aone-year term beginning September 1, 2019 and ending August 31, 2020.
Nature, Extent and Quality of Services. The Board considered the nature, extent and quality of services to be provided to the Funds by VALIC and theSub-advisers. The Board reviewed information provided by VALIC relating to its operations and personnel. The Board also took into account their knowledge of VALIC’s management and the quality of the performance of VALIC’s duties, through Board meetings, discussions and reports during the preceding year and through VALIC’s long history of service to VC II. The Board considered that VALIC is responsible for the management of theday-to-day operations of VC II, including but not limited to, general supervision of and coordination of the services provided by theSub-advisers, and is also responsible for monitoring and reviewing the activities of theSub-advisers and other third-party service providers. The Board also noted that VALIC’s and theSub-advisers’ management of VC II is subject to the oversight of the Board, and must be made in accordance with the investment objectives, policies and restrictions set forth in VC II’s prospectus and statement of additional information. The Board noted that VALIC monitors the performance of the Funds and fromtime-to-time recommendsSub-adviser changes and/or other changes intended to improve the performance of the Funds.
The Board noted that VALIC personnel meet on a regular basis to discuss the performance of VC II, as well as the positioning of the insurance products, employer-sponsored retirement plans and the Funds generallyvis-à-vis competitors. The Board also considered VALIC’s financial condition and whether it had the financial wherewithal to provide the services under the Advisory Agreement with respect to each Fund. The Board also considered VALIC’s risk management processes. The Board also considered the significant risks assumed by VALIC in connection with the services provided to the Funds including entrepreneurial risk in sponsoring new Funds and ongoing risks including operational, compliance, reputational, litigation, regulatory and liquidity risks with respect to all Funds.
With respect to the services provided by theSub-advisers, the Board considered information provided to them regarding the services provided by eachSub-adviser, including information presented throughout the previous year. The Board noted that eachSub-adviser (i) determines the securities to be purchased or sold on behalf of the Funds it manages as may be necessary in connection therewith; (ii) provides VALIC with records concerning its activities, which VALIC or the Funds are required to maintain; and (iii) renders regular reports to VALIC and to officers and Trustees of VC II concerning its discharge of the foregoing responsibilities. The Board reviewed eachSub-adviser’s history and investment experience as well as information regarding the qualifications, background and responsibilities of theSub-adviser’s investment, compliance and other personnel who provide services to the Funds. The Board also took into account the financial condition of eachSub-adviser. The Board also reviewed eachSub-adviser’s brokerage practices and considered eachSub-adviser’s risk management processes.
The Board reviewed VALIC’s and SunAmerica’s compliance program and personnel. The Board noted that SunAmerica is an affiliated company of VALIC and serves as the administrator to the Funds, as well assub-advises certain VALIC Company I and VC II Funds. The Board also considered VALIC’s and eachSub-adviser’s regulatory history, including information regarding whether it was currently involved in any regulatory actions or investigations as well as material litigation.
VALIC Company II
APPROVAL OF ADVISORY AGREEMENTS(unaudited) — (continued)
The Board concluded that the scope and quality of the advisory services provided by VALIC and theSub-advisers were satisfactory and that there was a reasonable basis on which to conclude that each would provide a high quality of investment services to the Funds.
Fees and Expenses; Investment Performance. The Board received and reviewed information regarding each Fund’s total expenses, advisory andsub-advisory fees, and other expenses compared against the expenses and fees of the funds in its Expense Group/Universe and Subadvisory Expense Universe and, in some cases as noted below, the Subadvisory Expense Group. The Board noted that VALIC negotiates thesub-advisory fees with each of the unaffiliatedSub-advisers at arms-length. The Board also considered that thesub-advisory fees are paid by VALIC out of its advisory fees it receives from the Funds and is not paid by the Funds, and thatsub-advisory fees may vary widely within the Subadvisory Expense Group/Universe for various reasons, including market pricing demands, existing relationships, experience and success, and individual client needs. The Board noted the affiliation of SunAmerica with VALIC, noting any potential conflicts of interest. The Board alsonoted that VALIC annually waives a portion of its advisory fee and/or reimburses the expenses of each of the Funds.
TheSub-advisers provided and the Board also considered expense information of comparable accounts managed by theSub-advisers, as applicable, which accounts may include one or more of the following types of accounts: retail mutual funds, mutual funds sold through variable annuity and variable insurance products, and other institutional-type accounts.
The total expense information, advisory fee information, andsub-advisory fee information considered by the Board, among other fee and expense data, is summarized below. Expense ratio data included in the independent third-party report was based on unaudited data from the semi-annual report dated February 28, 2019.
The Board received and reviewed information prepared by management and by an independent third-party regarding the Funds’ investment performance compared against their benchmarks and their respective Performance Groups/Universes. The Board noted that performance information provided by the independent third-party was for the period ended April 30, 2019, and that the benchmark information provided by management was for the period ended May 31, 2019. The Board also noted that it regularly reviews the performance of the Funds throughout the year. The Board further noted that, although it monitors the Funds’ performance closely, it generally attaches more importance to performance over relatively long periods of time, typically three to five years. The Board considered the following expense and performance information in its evaluation of each Fund:
| | • | | Aggressive Growth Lifestyle Fund (PineBridge). The Fund’s actual management fees were above the medians of its Expense Group/Universe. The Fund’s total net expenses were equal to the medians of its Expense Group/Universe. The Board took into account management’s discussion of the Fund’s expenses. The Board noted that the expense limitation on total expenses was extended contractually through December 31, 2020. |
The Fund underperformed its Lipper peer index for theone-year period and outperformed its Lipper peer index for the three- and five-year periods. The Fund equaled the median of the Performance Group for theone-year period and outperformed the median of the Performance Group for the three- and five-year periods. The Fund outperformed the median of the Performance Universe for theone-, three- and five-year periods. The Fund underperformed its blended benchmark for theone-, three- and five-year periods. The Board took into account management’s discussion of the Fund’s performance.
| | • | | Capital Appreciation Fund (BMO AM). The Fund’s total net expenses, actual management fees and actualsub-advisory fees were below the medians of its Expense Group/Universe andSub-advisory Expense Group/Universe, as applicable. The Board noted that the expense limitation on total expenses was also extended contractually through December 31, 2020. |
The Fund outperformed its Lipper peer index and the median of its Performance Universe for theone-year period and underperformed its Lipper peer index and the median of its Performance Universe for the three- and five-year periods. The Fund equaled the median of its Performance Group for theone-year period and underperformed the median of its Performance Group for the three- and five-year periods. The Fund underperformed its benchmark for theone-, three- and five-year periods. The Board took into account management’s discussion of the Fund’s performance.
| | • | | Conservative Growth Lifestyle Fund (PineBridge). The Fund’s actual management fees were above the medians of its Expense Group/Universe. The Fund’s total net expenses were equal to the median of its Expense Group and above the median of its Expense Universe. The Fund’s actualsub-advisory fees were equal to the median of itsSub-advisory Expense Universe. The Board took into account management’s discussion of the Fund’s expenses. The Board noted the expense limitation on total expenses was extended contractually through December 31, 2020. |
The Fund underperformed its Lipper peer index and the median of its Performance Universe for theone-year period and outperformed its Lipper peer index and the median of its Performance Universe for the three- and five-year periods. The Fund underperformed the median of its Performance Group for theone-, three- and five-year periods. The Fund underperformed its blended benchmark for theone-, three- and five-year periods. The Board took into account management’s discussion of the Fund’s performance.
| | • | | Core Bond Fund (PineBridge). The Fund’s actual management fees were below the median of its Expense Group and above the median of its Expense Universe. The Fund’s total net expenses were below the median of its Expense Group and equal to the median of its Expense Universe. The Fund’s actualsub-advisory fees were above the medians of itsSub-advisory Expense Group/Universe. The Board took into account management’s discussion of the Fund’s expenses. The Board noted that the expense limitation on total expenses was extended contractually through December 31, 2020. |
The Fund underperformed its Lipper peer index and the median of its Performance Universe for theone-year period and outperformed its Lipper peer index and the median of its Performance Universe for the three- and five-year periods. The Fund equaled the median of its Performance Group for theone- and five-year periods and outperformed the median of its Performance Group for the three-year period. The Fund underperformed its benchmark for theone- and five-year periods and outperformed its benchmark for the three-year period. The Board took into account management’s discussion of the Fund’s performance.
VALIC Company II
APPROVAL OF ADVISORY AGREEMENTS(unaudited) — (continued)
| | • | | Government Money Market II Fund (SunAmerica). The Fund’s actual management fees were above the medians of its Expense Group/Universe. The Fund’s total net expenses were below the medians of its Expense Group/Universe. The Fund’s actualsub-advisory fees were below the median of itsSub-advisory Expense Universe. The Board took into account management’s discussion of the Fund’s expenses. The Board noted that the expense limitation on total expenses was extended contractually through December 31, 2020. |
The Fund underperformed its Lipper peer index and Performance Universe for theone-, three- and five-year periods. The Fund outperformed the median of its Performance Group for theone-, three- and five-year periods. The Fund underperformed its benchmark for theone-, three- and five-year periods. The Board took into account management’s discussion of the Fund’s performance.
| | • | | High Yield Bond Fund (Wellington Management). The Fund’s actual management fees and total net expenses were above the medians of its Expense Group/Universe. The Fund’s actualsub-advisory fees were below the median of itsSub-advisory Expense Group and above the median of itsSub-advisory Expense Universe. The Board took into account management’s discussion of the Fund’s expenses. The Board noted that the limitation on total expenses was lowered contractually for theone-year period ended December 31, 2020. |
The Fund outperformed its Lipper peer index and the median of its Performance Group for theone-, three- and five-year periods. The Fund outperformed the median of its Performance Universe for theone- and five-year periods and equaled the median of its Performance Universe for the three-year period. The Fund underperformed its benchmark for theone-, three- and five-year periods. The Board took into account management’s discussion of the Fund’s performance.
| | • | | International Opportunities Fund (MFS/Delaware). The Fund’s actual management fees were above the median of its Expense Group and equal to the median of its Expense Universe. The Fund’s total net expenses were below the medians of its Expense Group/Universe. The Fund’s actualsub-advisory fees were above the medians of itsSub-advisory Expense Group/Universe. The Board took into account management’s discussion of the Fund’s expenses. The Board noted the contractual limitation on total expenses that was instituted for theone-year period ended December 31, 2020. |
The Fund outperformed the medians of its Performance Group/Universe for theone-, three- and five-year periods. The Fund outperformed its benchmark for theone-, three- and five-year periods.
| | • | | Large-Cap Value Fund (Janus/Perkins/BNY). The Fund’s actual management fees, total net expenses and actualsub-advisory fees were below the medians of its Expense Group/Universe andSub-advisory Expense Group/Universe, as applicable. |
The Fund underperformed its Lipper peer index and the medians of its Performance Group/Universe for theone-year period and outperformed its Lipper peer index and the medians of its Performance Group/Universe for the three- and five-year periods. The Fund underperformed its benchmark for theone-, three- and five-year periods.
| | • | | Mid-Cap Growth Fund (Wellington Management). The Fund’s actual management fees and actualsub-advisory fees were above the medians of its Expense Group/Universe andSub-advisory Expense Group/Universe, as applicable. The Fund’s total net expenses were below the medians of its Expense Group/Universe. The Board took into account management’s discussion of the Fund’s expenses. The Board noted the contractual limitation on total expenses that was instituted for theone-year period ended December 31, 2020. |
The Fund underperformed its Lipper peer index and the median of its Performance Universe for theone- and five-year periods and outperformed its Lipper peer index and the median of its Performance Universe for the three-year period. The Fund underperformed the median of its Performance Group for theone-year period and equaled the median of its Performance Group for the three- and five-year periods. The Fund outperformed its benchmark for theone-, three- and five-year periods. The Board took into account management’s discussion of the Fund’s performance.
| | • | | Mid-Cap Value Fund (Wellington Management/Boston Partners). The Fund’s actual management fees were equal to the median of its Expense Group and below the median of its Expense Universe. The Fund’s total net expenses were below the medians of its Expense Group/Universe. The Fund’s actualsub-advisory fees were equal to the medians of itsSub-advisory Expense Group/Universe. The expense limitation on total expenses was also extended contractually through December 31, 2020. |
The Fund underperformed its Lipper peer index and the median of its Peer Universe for theone- and five-year periods and outperformed its Lipper peer index and the median of its Peer Universe for the three-year period. The Fund outperformed the median of its Performance Group for theone- and three-year periods and underperformed the median of its Performance Group for the five-year period. The Fund underperformed its benchmark for theone-, three- and five-year periods. The Board took into account management’s discussion of the Fund’s performance.
| | • | | Moderate Growth Lifestyle Fund (PineBridge). The Fund’s actual management fees were equal to the median of its Expense Group and above the median of its Expense Universe. The Fund’s total net expenses were above the median of its Expense Group and below the median of its Expense Universe. The Board took into account management’s discussion of the Fund’s expenses. The Board noted that the expense limitation on total expenses was extended contractually through December 31, 2020. |
The Fund underperformed its Lipper peer index for theone-year period and outperformed its Lipper peer index for the three- and five-year periods. The Fund outperformed the medians of its Performance Group/Universe for theone-, three-, and five-year periods. The Fund underperformed its blended benchmark for theone-, three- and five-year periods. The Board took into account management’s discussion of the Fund’s performance.
| | • | | Small-Cap Growth Fund (JPMIM). The Fund’s actual management fees and actualsub-advisory fees were above the medians of its Expense Group/Universe andSub-advisory Expense Group/Universe, as applicable. The Fund’s total net expenses were below the median of its Expense Group and above the median of its Expense Universe. The Board took into account management’s discussion of the Fund’s expenses, including actions to reduce the Fund’s expenses through fee waivers. The Board noted that the limitation on total expenses was lowered contractually for theone-year period ended December 31, 2020. |
VALIC Company II
APPROVAL OF ADVISORY AGREEMENTS(unaudited) — (continued)
The Fund outperformed its Lipper peer index and the medians of its Performance Group/Universe for theone-, three- and five-year periods. The Fund outperformed its benchmark for theone-, three- and five-year periods.
| | • | | Small-Cap Value Fund (JPMIM). The Fund’s actual management fees were below the median of its Expense Group and above the median of its Expense Universe. The Fund’s total net expenses were below the medians of its Expense Group/Universe. The Fund’s actualsub-advisory fees were above the median of itsSub-advisory Expense Group and below the median of itsSub-advisory Expense Universe. The Board noted the contractual limitation on total expenses that was instituted for theone-year period ended December 31, 2020. |
The Fund underperformed its Lipper peer index for theone- and three-year periods and outperformed its Lipper peer index for the five-year period. The Fund underperformed the medians of its Performance Group/Universe for theone-, three- and five-year periods. The Fund underperformed its benchmark for theone-, three- and five-year periods. The Board took into account management’s discussion of the Fund’s performance.
| | • | | Strategic Bond Fund (PineBridge). The Fund’s actual management fees and actualsub-advisory fees were above the medians of its Expense Group/Universe andSub-advisory Expense Group/Universe, as applicable. The Fund’s total net expenses were below the medians of its Expense Group/Universe. The Board took into account management’s discussion of the Fund’s expenses. The Board noted that the expense limitation on total expenses was extended contractually through December 31, 2020. |
The Fund underperformed its Lipper peer index for theone-year period and outperformed its Lipper peer index for the three- and five-year periods. The Fund outperformed the median of its Performance Group for theone- and five-year periods and underperformed the median of its Performance Group for the three-year period. The Fund outperformed the median of its Performance Universe for theone-, three- and five-year periods. The Fund underperformed its benchmark for theone-year period and outperformed its benchmark for the three- and five-year periods. The Board took into account management’s discussion of the Fund’s performance.
| | • | | U.S. Socially Responsible Fund (formerly, Socially Responsible Fund) (SunAmerica). The Fund’s actual management fees, total net expenses and actualsub-advisory fees were below the medians of its Expense Group/Universe andSub-advisory Expense Group/Universe, as applicable. |
The Fund outperformed its Lipper peer index and the medians of its Performance Group/Universe for theone-, three- and five-year periods. The Fund outperformed its benchmark for theone-year period and underperformed its benchmark for the three- and five-year periods. The Board took into account management’s discussion of the Fund’s performance.
The Board considered management’s discussion of each Fund’s expenses and performance and concluded that each Fund’s overall performance was satisfactory in light of the circumstances or was being appropriately addressed by management. The Board further concluded that the advisory fee andsub-advisory fee for each Fund are fair and reasonable in light of the usual and customary charges made for services of the same nature and quality and the other factors considered.
Cost of Services and Indirect Benefits/Profitability. The Board was provided information related to the cost of services and profits realized in connection with the Advisory Agreement. The Board considered the costs that are borne by the Funds. For its services, VALIC receives a fee, payable monthly from each Fund in an amount that is calculated as a percentage of the average monthly net assets of the respective Fund.
The Board was previously apprised that VALIC generally reviews a number of factors in determining appropriatesub-advisory fee levels. Such factors may include a review of (1) style class peers primarily within the variable annuity and qualified plan universe; (2) key competitor analysis; (3) analysis of the strategies managed by thesub-advisers; (4) product suitability; and (5) special considerations such as competitorsub-account characteristics, uniqueness of the product and prestige of the manager.
The Board considered that VALIC, or its affiliates, will receive benefits in addition to the advisory fee to be paid by the Funds, which include transfer agency fees, administrative services fees, andsub-advisory fees. The Board considered that the transfer agency fees are paid by the Funds for the provision of recordkeeping and shareholder services to contract owners and participants. The transfer agency services are provided for a flat fee based on the estimated cost of providing such services, and the payment for such services is allocated to each Fund based on the number of accounts serviced. The Board also noted that VC II pays SunAmerica, an affiliate of VALIC, an annual fee based on each Fund’s average daily net assets, for the provision of certain accounting and administrative services. Out of the fee SunAmerica receives from the Funds, SunAmerica compensatesVALIC for certain administrative services, and the Funds’ custodian, State Street Bank and Trust Company, for calculation of the daily net asset value. The Board also noted that SunAmerica receivessub-advisory fees for those Funds for which it serves assub-adviser. The Board also considered that VC II pays VALIC an annual fee of 0.25% on average daily net assets of each Fund (other than the Lifestyle Funds) pursuant to a Shareholder Services Agreement.
The Board also considered that VALIC may exclude from its taxable income a portion of the ordinary dividends paid by underlying U.S. equities in the Funds to the same extent the Funds receive certain dividends with respect to shares of stock issued by domestic corporations, subject to applicable tax laws and regulations. In addition, it was noted that VALIC may receive foreign tax credits with respect to certain foreign securities held or to be held in certain Funds that benefit VALIC. These benefits can be material. The Board also noted that VALIC and its affiliates may receive revenue sharing payments from certainsub-advisers to the Funds in connection with certain administrative, marketing and other servicing activities, which payments help offset costs for education, marketing activities and training to support sales of the Funds, including sales through variable annuity contracts and variable life insurance policies (“Variable Contracts”) issued by VALIC, as well as occasional gifts, entertainment or other compensation as incentives. In addition, the Board considered that, because shares of the Funds are offered as investment options through Variable Contracts issued by VALIC and its affiliated life insurers (collectively, the “Life Companies”), the investment objectives, strategies and performance of the Funds may positively or negatively impact a Life Company’s ability to hedge and the related hedging costs associated with guarantees that the Life Company may provide as the issuer of the Variable Contracts.
In considering the profitability to VALIC and its affiliates in connection with their relationship with the Funds, the Board reviewed information provided by VALIC setting forth the revenues and other benefits, both direct and indirect, received by VALIC and its affiliates attributable to managing each Fund, the cost of providing such services, and the resulting profitability to VALIC and its affiliates from these relationships. The Board also reviewed VALIC’s profitability on aFund-by-Fund basis, as well as an Investment Management Profitability Analysis prepared by an independent information service, Broadridge, noting that VALIC’s profitability was generally in the range of the profitability of
VALIC Company II
APPROVAL OF ADVISORY AGREEMENTS(unaudited) — (continued)
companies contained in the report. The Board received and reviewed information prepared by VALIC that reflects an allocation of costs that result in a reasonable determination of profitability of VALIC and its affiliates, as adviser, as transfer agent and/or as shareholder servicing agent, as applicable. The Board further considered the amount ofsub-advisory fees paid out by VALIC and the amount of the advisory fees that it retained and determined that these amounts were reasonable in light of the services performed by VALIC and thesub-advisers, respectively. In addition, the Board considered the profitability of SunAmerica in its role as the administrator of the Funds and assub-adviser to certain Funds. The Board concluded that the profitability to VALIC and its affiliates from their relationship with the Funds was reasonable.
In considering the profitability to theSub-advisers in connection with their relationship to the Funds, the Trustees noted that the fees under theSub-Advisory Agreements are paid by VALIC out of the advisory fees that VALIC receives under the Advisory Agreement. With respect to the unaffiliatedSub-advisers, the Board also relied on the ability of VALIC to negotiate theSub-Advisory Agreements and the fees thereunder at arm’s length.
For each of the above reasons, the Trustees determined that the profitability to theSub-advisers from their relationship with the Funds was not a material factor in their deliberations with respect to consideration of approval of the InvestmentSub-Advisory Agreements.
Economies of Scale.The Board noted that the advisory fee rate andsub-advisory fee rates payable to VALIC and each of theSub-advisers with respect to most of the Funds contain breakpoints, which allow the Funds to participate in any economies of scale. The Board also took into account management’s discussion of the Funds’ advisory fee andsub-advisory fee structure, including with respect to the Funds that do not currently have breakpoints. The Board also considered the effect of each Fund’s growth and size on its performance and fees, noting that if the Funds’ assets increase over time, the Funds may realize other economies of scale if assets increase proportionally more than expenses. The Board further noted that VALIC has agreed to cap the total annual operating expenses of certain Funds. The Board also observed that expense caps and fee waivers benefitted shareholders by limiting total fees even in the absence of breakpoints. The Board concluded that no changes to the advisory fee structure of the Funds were necessary.
For similar reasons as stated above with respect to theSub-advisers’ profitability and the costs of their providing services, the Board concluded that the potential for economies of scale in theSub-advisers’ management of the Funds are not a material factor to the approval of theSub-advisory Agreements, although it was noted that most of the Funds have breakpoints at thesub-advisory fee level.
Terms of the Advisory Contracts. The Board reviewed the terms of the Advisory Contracts including the duties and responsibilities undertaken. The Board also reviewed the terms of payment for services rendered by VALIC and theSub-advisers and noted that VALIC would compensate theSub-advisers out of the advisory fees it receives from the Funds. The Board noted that theSub-Advisory Agreements provide that eachSub-adviser will pay all of its own expenses in connection with the performance of their respective duties as well as the cost of maintaining the staff and personnel as necessary for it to perform its obligations. The Board also considered the termination and liability provisions of the Advisory Contracts and other terms contained therein. The Board concluded that the terms of each of the Advisory Contracts were reasonable.
Compliance. The Board reviewed VALIC’s and theSub-advisers’ compliance personnel and regulatory history, including information whether it was currently involved in any regulatory actions or investigations. In addition, the Board reviewed information concerning each entities’ compliance staff that would be responsible for providing compliance functions on behalf of the Funds and concluded that there was no information provided that would have a material adverse effect on their abilities to provide services to the Funds.
Conclusions. In reaching its decision to approve the Advisory Contracts, the Board did not identify any single factor as being controlling, but based its recommendation on each of the factors it considered. Each Trustee may have contributed different weight to the various factors. Based upon the materials reviewed, the representations made and the considerations described above, and as part of their deliberations, the Board, including the Independent Trustees, concluded that VALIC and eachSub-adviser possess the capability and resources to perform the duties required of them under their respective Advisory Contracts.
Further, based upon its review of the Advisory Contracts, the materials provided, and the considerations described above, the Board, including the Independent Trustees, concluded that (1) the terms of the Advisory Contracts are reasonable, fair and in the best interests of each of the Funds and its respective shareholders, and (2) the fee rates payable under the Advisory Contracts are fair and reasonable in light of the usual and customary charges made for services of the same nature and quality.
VALIC Company II
TRUSTEE AND OFFICER INFORMATION —August 31, 2019 (unaudited)
| | | | | | | | | | | | | | |
Name, Age
and Address at August 31, 2019* | | Position
Held With
VALIC Complex | | Term of Office
and Length of
Time Served(4) | | | Principal Occupations During Past Five Years | | Number of
Funds in
Fund Complex
Overseen by
Trustee(2) | | | Other Directorships
Held by Trustee(3) |
Independent Trustees | | | | | | | | | | | | | | |
Thomas J. Brown
Age: 73 | | Trustee | |
| 2005-
Present
|
| | Retired | | | 49 | | | Trustee, Virtus Funds(2011-Present). |
Dr. Judith L. Craven
Age: 73 | | Trustee | |
| 1998-
Present |
| | Retired | | | 73 | | | Director, A.G. Belo Corporation, a media company (1992-2014); Director, SYSCO Corporation, a food marketing and distribution company (1996-2017); Director, Luby’s Inc.(1998-Present). |
Dr. Timothy J. Ebner
Age: 70 | | Trustee | |
| 1998-
Present |
| | Professor and Head, Department of Neuroscience Medical School(1980-Present), and University of Minnesota, Pickworth Chair (2000-Present); Scientific Director, Society for Research on the Cerebellum (2008-Present); President, Association of Medical School Neuroscience Department Chairpersons (2011-2014). | | | 49 | | | Trustee, Minnesota Medical Foundation (2003-2013). |
Judge Gustavo E. Gonzales, Jr.
Age: 79 | | Trustee | |
| 1998-
Present |
| | Semi-Retired. Attorney At Law, Criminal Defense and General Practice (2004-2014). Retired Municipal Court Judge, Dallas, TX (since 2004). | | | 49 | | | None. |
Kenneth J. Lavery
Age: 69 | | Chairman and Trustee(5) | |
| 2001-
Present |
| | Retired, Vice President, Massachusetts Capital Resources Co. (1982-2013). | | | 49 | | | None. |
Dr. John E. Maupin, Jr.
Age: 72 | | Trustee | |
| 1998-
Present |
| | Retired, President, Morehouse School of Medicine, Atlanta, Georgia (2006-2014). | | | 49 | | | Director, LifePoint Hospitals, Inc., hospital management (1999-Present); Director, HealthSouth, Corporation, rehabilitation health care services (2004-Present); Director, Regions Financials Inc., bank holding company (2007-Present). |
Interested Trustees | | | | | | | | | | | | | | |
Peter A. Harbeck(1)
Age: 65 | | Trustee | |
| 2001-
Present |
| | Retired June 2019; formerly President, CEO (1997-2019) and Director(1992-2019), SunAmerica (1995-2019); Director, AIG Capital Services, Inc. (“ACS”) (1993-2019); Chairman, President and CEO, Advisor Group, Inc. (2004-2016) | | | 73 | | | None. |
Eric S. Levy
Age: 54(1) | | Trustee | |
| 2017-
Present
|
| | Executive Vice President, VALIC (2015-Present); Executive Vice President, Group Retirement, AIG (2015-Present); and Senior Vice President, Lincoln Financial Group (2010-2015). | | | 49 | | | None |
Officers | | | | | | | | | | | | | | |
John T. Genoy
Age: 50 | | President and Principal Executive Officer | |
| 2014-
Present |
| | Chief Financial Officer (2002-Present), Senior Vice President, (2004-Present), Chief Operating Officer(2006-Present) and Director (2014-Present), SunAmerica. | | | N/A | | | N/A |
VALIC Company II
TRUSTEE AND OFFICER INFORMATION —August 31, 2019 (unaudited) — (continued)
| | | | | | | | | | | | | | |
Name, Age
and Address at August 31, 2019* | | Position
Held With
VALIC Complex | | Term of Office
and Length of
Time Served(4) | | | Principal Occupations During Past Five Years | | Number of
Funds in
Fund Complex
Overseen by
Trustee(2) | | | Other Directorships
Held by Trustee(3) |
Officers | | | | | | | | | | | | | | |
John Packs
Age: 63 | | Vice President and Senior Investment Officer | |
| 2001-
Present |
| | Senior Investment Officer, VALIC (2001-2013); Senior Vice President, SunAmerica (2008-Present). | | | N/A | | | N/A |
Gregory R. Kingston
Age: 53 | | Treasurer and Principal Financial Officer | |
| 2000-
Present |
| | Vice President (2001-Present) and Head of Mutual Fund Administration(2014-Present), SunAmerica. | |
| N/A
|
| | N/A
|
Gregory N. Bressler
Age: 52 | | Vice President | |
| 2005-
Present |
| | Senior Vice President, General Counsel (2005-Present) and Assistant Secretary (2013-Present), SunAmerica. | | | N/A | | | N/A |
Christopher C. Joe
Age: 50 | | Chief Compliance Officer | |
| 2017 to
Present |
| | Chief Compliance Officer, SunAmerica Fund Complex(2017-Present); Chief Compliance Officer, VALIC Retirement Services Company(2017-Present); Chief Compliance Officer, Invesco PowerShares (2012-2017); Chief Compliance Officer, Invesco Investment Advisers, LLC (2010-2013); U.S. Compliance Director, Invesco Ltd.(2006-2014); Deputy Chief Compliance Officer, Invesco Advisers, LLC(2014-2015). | | | N/A | | | N/A |
Matthew J. Hackethal
Age: 47 | | Anti-Money Laundering (“AML”) Compliance Officer | |
| 2007-
Present |
| | Chief Compliance Officer (2006-Present), Vice President(2011-Present) and Acting Chief Compliance Officer (2016-2017) SunAmerica; AML Compliance Officer, SunAmerica Fund Complex (2006-Present). | | | N/A | | | N/A |
Thomas M. Ward
Age: 52 | | Vice President | |
| 2008-
Present |
| | Vice President (2009-Present), VALIC and VALIC Financial Advisors, Inc. | | | N/A | | | N/A |
Kathleen D. Fuentes
Age: 50 | | Chief Legal Officer, Vice President and Secretary | |
| 2015-
Present |
| | Vice President and Deputy General Counsel, SunAmerica (2006-Present). | | | N/A | | | N/A |
Shawn Parry
Age: 47 | | Vice President and Assistant Treasurer | |
| 2014-
Present |
| | Vice President (2014-Present) and Assistant Vice President (2005-2014), SunAmerica. | | | N/A | | | N/A |
Donna McManus
Age: 58 | | Vice President and Assistant Treasurer | |
| 2014-
Present |
| | Vice President, SunAmerica (2014-Present); Managing Director, BNY Mellon (2009-2014). | | | N/A | | | N/A |
| * | The business address for each Trustee and Officer is, 2929 Allen Parkway, Houston, TX, 77019. |
| (1) | Mr. Harbeck is considered to be an “interested trustee,” because Mr. Harbeck owns shares of American International Group, Inc., the ultimate parent of the Adviser. Until his retirement on June 28, 2019, he served as President, CEO and Director of SunAmerica and Director of ACS. Mr. Levy is considered to be an interested trustee because he serves as an officer of the Advisor and AIG, the Advisor’s ultimate parent company. |
| (2) | The “Fund Complex” consists of all registered investment company portfolios for which VALIC or an affiliated person of VALIC serves as investment adviser or administrator. The “Fund Complex” includes the Series (15 funds), SunAmerica Speciality Series (6 funds), SunAmerica Equity Funds (2 funds), SunAmerica Income Funds (3 funds), SunAmerica Money Market Funds, Inc. (1 fund), SunAmerica Senior Floating Rate Fund, Inc. (1 fund), SunAmerica Series, Inc. (6 funds), Anchor Series Trust (5 portfolios), Seasons Series Trust (19 portfolios), SunAmerica Series Trust (59 portfolios), and VALIC Company I (34 funds). |
| (3) | Directorships of companies required to report to the Securities and Exchange Commission under the Securities Exchange Act of 1934 (i.e. “public companies”) or other investment companies registered under the 1940 Act. |
| (4) | Trustees serve until their successors are duly elected and qualified. |
| (5) | Effective January 1, 2019, Mr. Lavery became Chairman of the Board. |
Additional Information concerning the Trustees and Officers is contained in the Statement of Additional Information and is available without charge by calling1-800-448-2542.
VALIC Company II
SHAREHOLDERS TAX INFORMATION —August 31, 2019 (unaudited)
Certain tax information regarding the VALIC Company II is required to be provided to the shareholders based upon each Fund’s income and capital gain distributions for the taxable year ended August 31, 2019.
During the year ended August 31, 2019, the Funds paid the following long-term capital gains along with the percentage of ordinary income dividends that qualified for the dividends received deductions for corporations:
| | | | | | | | | | | | | | | | |
Fund
| | Net
Long-Term
Capital Gains
| | | Foreign
Tax Credit*
| | | Foreign
Source Income
| | | Qualifying % for the
Dividends Received
Deduction
| |
Aggressive Growth Lifestyle | | $ | 50,153,748 | | | $ | 265,554 | | | $ | 2,554,462 | | | | 22.68 | % |
Capital Appreciation | | | 22,301,727 | | | | — | | | | — | | | | 22.64 | |
Conservative Growth Lifestyle | | | 12,250,183 | | | | 76,788 | | | | 708,820 | | | | 7.69 | |
Core Bond | | | — | | | | — | | | | — | | | | — | |
Government Money Market II | | | — | | | | — | | | | — | | | | — | |
High Yield Bond | | | — | | | | — | | | | — | | | | 0.02 | |
International Opportunities | | | 22,610,854 | | | | 698,990 | | | | 10,319,529 | | | | 0.44 | |
Large Cap Value | | | 18,911,646 | | | | — | | | | — | | | | 61.71 | |
Mid Cap Growth | | | 5,581,715 | | | | — | | | | — | | | | 31.62 | |
Mid Cap Value | | | 132,095,114 | | | | — | | | | — | | | | 94.31 | |
Moderate Growth Lifestyle | | | 64,453,213 | | | | 245,531 | | | | 2,299,398 | | | | 16.22 | |
Small Cap Growth | | | 38,489,464 | | | | — | | | | — | | | | 7.22 | |
Small Cap Value | | | 47,245,970 | | | | — | | | | — | | | | 45.78 | |
Strategic Bond | | | — | | | | — | | | | — | | | | — | |
U.S. Socially Responsible | | | 50,307,518 | | | | — | | | | — | | | | 93.99 | |
| * | The Funds make an election under the Internal Revenue Code Section 853 to pass through foreign taxes paid to the shareholders. |
VALIC Company II
COMPARISONS: FUNDS VS. INDEXES(unaudited)
In the following pages, we have included graphs that compare each Fund’s performance with certain market indices. These graphs show the hypothetical growth of a $10,000 investment in each Fund versus the same $10,000 investment in comparable market indices. Descriptions of these market indices are provided below the individual graphs. It is important to note that the VC II Funds are professionally managed mutual funds while the indices are not available for investment and are unmanaged.
Please note that the graphs and tables that accompany the following investment comments include all fund expenses, but do not reflect the charges imposed by the variable annuity contracts or variable life insurance policies (collectively, the “Contracts”), qualifying employer-sponsored retirement plans (the “Plans”), or Individual Retirement Accounts (“IRAs”). All dividends are assumed to be reinvested. No expenses are deducted from the performance of the indices.
Investments in stocks and bonds are subject to risk, including stock market and interest rate fluctuations. Investments in non-U.S. stocks are subject to additional risks, including political and social instability, differing securities regulations and accounting standards, and limited public information. Mortgage-backed securities are subject to prepayment, which can result in reinvestment of principal at lower yields. Money market instruments generally offer stability and income, but an investment in these securities, like investments in other portfolios, are not guaranteed by the U.S. government or any other federal government entity. Lower rated high yield, high-risk securities generally involve more credit risk. These securities may also be subject to greater market price fluctuations than lower yielding, higher rated debt securities. The common stocks of medium-sized companies may be more volatile than those of larger, more established companies. Investing in real estate involves special risks, which may not be associated with investing in stocks, including possible declines in real estate values, adverse economic conditions, and changes in interest rates. Investments in small capitalization and emerging growth companies involve greater than average risk. Such securities may have limited marketability and the issuers may have limited product lines, markets and financial resources. The value of such investments may fluctuate more widely than investments in larger, more established companies. The technology industry can be significantly affected by obsolescence, short product cycles, falling prices and profits, and competition from new market participants. Funding choices that primarily invest in one sector are more volatile than those that diversify across many industry sectors and companies.
VALIC Company II Aggressive Growth Lifestyle Fund
COMPARISON: FUND VS. INDEX(unaudited)
MANAGEMENT OVERVIEW
A discussion with PineBridge Investments, LLC
For the twelve-months ended August 31, 2019, the Aggressive Growth Lifestyle Fund returned -0.52%, compared to 2.92% for the S&P 500® Index and 3.85% for the blended index. The blended index is comprised of 54% Russell 3000® Index, 13% MSCI EAFE Index (net), 25% Bloomberg Barclays U.S. Aggregate Bond Index, and 8% FTSE EPRA/NAREIT Developed Index.
The Aggressive Growth Lifestyle Fund invests in a combination of affiliated funds, also known as ‘fund of funds’. The Fund does not select specific sectors, securities, or countries and thus these factors do not influence performance. Rather, the key indicators of performance are asset allocation and manager selection.
During the Period:
| | • | | In aggregate, asset allocations relative to those of the Benchmark detracted from Fund return relative to Benchmark return. |
| | • | | In aggregate, manager selection detracted from Fund return relative to Benchmark return. |
| | • | | The following contributed to Fund return relative to Benchmark return: |
| | O | | VC I Global Real Estate Fund (overweight); VC I Stock Index Fund (overweight); VC II Strategic Bond Fund (overweight) |
| | • | | The following detracted from Fund return relative to Benchmark return: |
| | O | | VC II Small Cap Value Fund (overweight); VC I Small Cap Special Values Fund (overweight); VC I International Value Fund (overweight) |
VALIC Company II Aggressive Growth Lifestyle Fund
COMPARISON: FUND VS. INDEX(unaudited) —(continued)
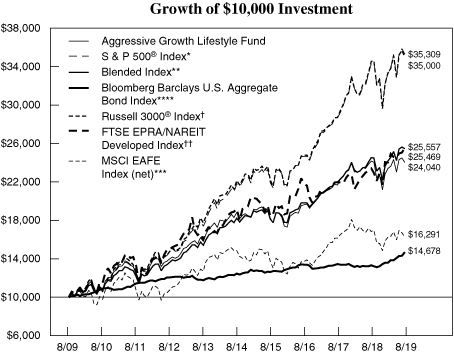
For the year ended August 31, 2019, the Aggressive Growth Lifestyle Fund returned-0.52% compared to 2.92% for the S&P 500® Index and 3.85% for the Blended Index.
| * | The S&P 500® Index is an index of the stocks of 500 major large-cap U.S. corporations, chosen for market size, liquidity, and industry group representation. It is a market-value weighted index, with each stock’s percentage in the Index in proportion to its market value. |
| ** | The Fund’s Blended Index consists of the Russell 3000® Index (54%), MSCI EAFE Index (net) (13%), the Bloomberg Barclays U.S. Aggregate Bond Index (25%) and the FTSE/EPRA NAREIT Developed Index (8%). |
| *** | The MSCI EAFE Index (Europe, Australasia, Far East) (net) is a free float-adjusted market capitalization index that is designed to measure the equity market performance of developed markets, excluding the U.S. & Canada. The MSCI EAFE Index consists of the following 21 developed market country indexes: Australia, Austria, Belgium, Denmark, Finland, France, Germany, Hong Kong, Ireland, Israel, Italy, Japan, the Netherlands, New Zealand, Norway, Portugal, Singapore, Spain, Sweden, Switzerland, and the United Kingdom. The net index approximates the minimum possible dividend reinvestment and assumes that the dividend is reinvested after the deduction of withholding tax, applying the rate to nonresident individuals who do not benefit from double taxation treaties. |
| **** | The Bloomberg Barclays U.S. Aggregate Bond Index is an unmanaged index that measures the investment grade, U.S. dollar-denominated, fixed-rate taxable bond market, including Treasuries, government-related and corporate securities, mortgage- and asset-backed securities and commercial mortgage-backed securities. |
| † | The Russell 3000® Index follows the 3,000 largest U.S. companies, based on total market capitalization. |
| †† | The FTSE EPRA/NAREIT Developed Index is a global market capitalization weighted index composed of listed real estate securities in the North American, European and Asian real estate markets. |
| | | | |
| Average Annual Total Return as of August 31, 2019 |
| 1 Year | | 5 Years | | 10 Years |
| -0.52% | | 5.00% | | 9.17% |
Past performance is not predictive of future performance. The performance data quoted represents past performance; past performance does not guarantee future results; the investment return and principal value of an investment will fluctuate so that an investor’s shares, when redeemed, may be worth more or less than their original cost; current performance may be lower or higher than the performance data quoted.
The Fund’s returns reflect investment management fees and other Fund expenses. Charges imposed by the Variable Contracts, Plans or IRAs that invest in the Fund are not included in the Fund’s returns.
Indices are not managed and an investor can not invest directly into an index.
VALIC Company II Capital Appreciation Fund
COMPARISON: FUND VS. INDEX(unaudited)
MANAGEMENT OVERVIEW
A discussion with BMO Asset Management, LLC (“BMO AM”).
The Capital Appreciation Fund posted a return of -0.35% for the twelve-month period ending August 31, 2019, compared to a return of 4.27% for the Russell 1000® Growth Index.
During the Period:
| | • | | In aggregate, sector allocations relative to those of the Benchmark detracted from Fund return relative to Benchmark return. |
| | • | | In aggregate, position weightings (i.e., security selection) relative to those of the Benchmark detracted from Fund return relative to the Benchmark return. |
| | • | | The following contributed to Fund return relative to Benchmark return: |
| | O | | Sector allocation(s): real estate (overweight); health care (underweight); financials (overweight) |
| | O | | Security selection in the following sector(s): health care |
| | O | | Position weighting(s): Essex Property Trust, Inc.; Mastercard, Inc.; Hershey Co. |
| | • | | The following detracted from Fund return relative to Benchmark return: |
| | O | | Sector allocation(s): energy (overweight); consumer staples (underweight) |
| | O | | Security selection in the following sector(s): information technology; consumer discretionary; materials |
| | O | | Position weighting(s): ConocoPhillips; TripAdvisor, Inc.; F5 Networks, Inc. |
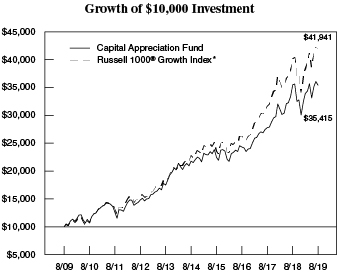
For the year ended August 31, 2019, the Capital Appreciation Fund returned -0.35% compared to 4.27% for the Russell 1000® Growth Index.
| * | The Russell 1000® Growth Index measures the performance of those Russell 1000 companies with higher price-to-book ratios and higher forecasted growth values. |
| | | | |
| Average Annual Total Return as of August 31, 2019 |
| 1 Year | | 5 Years | | 10 Years |
| -0.35% | | 10.24% | | 13.48% |
Past performance is not predictive of future performance. The performance data quoted represents past performance; past performance does not guarantee future results; the investment return and principal value of an investment will fluctuate so that an investor’s shares, when redeemed, may be worth more or less than their original cost; current performance may be lower or higher than the performance data quoted.
The Fund’s returns reflect investment management fees and other Fund expenses. Charges imposed by the Variable Contracts, Plans or IRAs that invest in the Fund are not included in the Fund’s returns.
Indices are not managed and an investor can not invest directly into an index.
VALIC Company II Conservative Growth Lifestyle Fund
COMPARISON: FUND VS. INDEX(unaudited)
MANAGEMENT OVERVIEW
A discussion with PineBridge Investments, LLC
For the twelve-months ended August 31, 2019, the Conservative Growth Lifestyle Fund returned 3.52%, compared to 2.92% for the S&P 500® Index and 7.25% for the blended index. The blended index is comprised of 24% Russell 3000® Index, 8% MSCI EAFE Index (net), 65% Bloomberg Barclays U.S. Aggregate Bond Index, and 3% FTSE EPRA/NAREIT Developed Index.
The Conservative Growth Lifestyle Fund invests in a combination of affiliated funds, also known as ‘fund of funds’. The Fund does not select specific sectors, securities, or countries and thus these factors do not influence performance. Rather, the key indicators of performance are asset allocation and manager selection.
During the Period:
| | • | | In aggregate, asset allocations relative to those of the Benchmark detracted from Fund return relative to Benchmark return. |
| | • | | In aggregate, manager selection detracted from Fund return relative to Benchmark return. |
| | • | | The following contributed to Fund return relative to Benchmark return: |
| | O | | VC II Strategic Bond Fund (overweight); VC II Core Bond Fund (overweight); VC II High Yield Bond Fund (overweight) |
| | • | | The following detracted from Fund return relative to Benchmark return: |
| | O | | VC II Small Cap Value Fund (overweight); VC I Small Cap Special Values Fund (overweight); VC I International Value Fund (overweight) |
VALIC Company II Conservative Growth Lifestyle Fund
COMPARISON: FUND VS. INDEX(unaudited) —(continued)
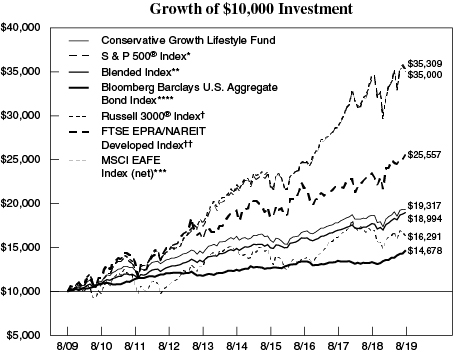
For the year ended August 31, 2019, the Conservative Growth Lifestyle Fund returned 3.52% compared to 2.92% for the S&P 500® Index and 7.25% for the Blended Index.
| * | The S&P 500® Index is an index of the stocks of 500 major large-cap U.S. corporations, chosen for market size, liquidity, and industry group representation. It is a market-value weighted index, with each stock’s percentage in the Index in proportion to its market value. |
| ** | The Fund’s Blended Index consists of the Russell 3000® Index (24%), MSCI EAFE Index (net) (8%), the Bloomberg Barclays U.S. Aggregate Bond Index (65%) and the FTSE EPRA/NAREIT Developed Index (3%). |
| *** | The MSCI EAFE Index (Europe, Australasia, Far East) (net) is a free float-adjusted market capitalization index that is designed to measure the equity market performance of developed markets, excluding the U.S. & Canada. The MSCI EAFE Index consists of the following 21 developed market country indexes: Australia, Austria, Belgium, Denmark, Finland, France, Germany, Hong Kong, Ireland, Israel, Italy, Japan, the Netherlands, New Zealand, Norway, Portugal, Singapore, Spain, Sweden, Switzerland, and the United Kingdom. The net index approximates the minimum possible dividend reinvestment and assumes that the dividend is reinvested after the deduction of withholding tax, applying the rate to nonresident individuals who do not benefit from double taxation treaties. |
| **** | The Bloomberg Barclays U.S. Aggregate Bond Index is an unmanaged index that measures the investment grade, U.S. dollar-denominated, fixed-rate taxable bond market, including Treasuries, government-related and corporate securities, mortgage- and asset-backed securities and commercial mortgage-backed securities. |
| † | The Russell 3000® Index follows the 3,000 largest U.S. companies, based on total market capitalization. |
| †† | The FTSE EPRA/NAREIT Developed Index is a global market capitalization weighted index composed of listed real estate securities in the North American, European and Asian real estate markets. |
| | | | |
| Average Annual Total Return as of August 31, 2019 |
| 1 Year | | 5 Years | | 10 Years |
| 3.52% | | 3.50% | | 6.81% |
Past performance is not predictive of future performance. The performance data quoted represents past performance; past performance does not guarantee future results; the investment return and principal value of an investment will fluctuate so that an investor’s shares, when redeemed, may be worth more or less than their original cost; current performance may be lower or higher than the performance data quoted.
The Fund’s returns reflect investment management fees and other Fund expenses. Charges imposed by the Variable Contracts, Plans or IRAs that invest in the Fund are not included in the Fund’s returns.
Indices are not managed and an investor can not invest directly into an index.
VALIC Company II Core Bond Fund
COMPARISON: FUND VS. INDEX(unaudited)
MANAGEMENT OVERVIEW
A discussion with PineBridge Investments, LLC.
The Core Bond Fund posted a return of 9.64% for the twelve-month period ending August 31, 2019, compared to a return of 10.17% for the Bloomberg Barclays U.S. Aggregate Bond Index.
During the Period:
| | • | | In aggregate, sector allocations relative to those of the Benchmark contributed to Fund return relative to Benchmark return. |
| | • | | In aggregate, position weightings (i.e., security selection) relative to those of the Benchmark contributed to Fund return relative to the Benchmark return. |
| | • | | Yield curve positioning detracted from Fund return. |
| | • | | The following contributed to Fund return relative to Benchmark return: |
| | O | | Sector allocation(s): U.S. Treasuries (underweight); industrials (overweight); financials (overweight) |
| | O | | Security selection in the following sector(s): utilities; financials; sovereigns |
| | O | | Position weighting(s): UniCredit SpA; Republic of Turkey; South Carolina Electric & Gas Co. |
| | • | | The following detracted from Fund return relative to Benchmark return: |
| | O | | Sector allocation(s): utilities (overweight); MBS (Conventional30-year) (overweight) |
| | O | | Security selection in the following sector(s): Industrials; U.S. Treasuries |
| | O | | Position weighting(s): Hi-Crush Partners LP; Pioneer Energy Services Corp. |
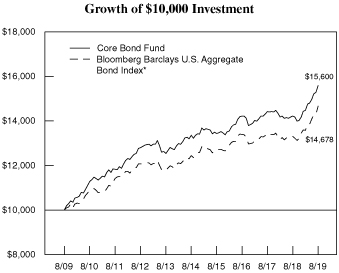
For the year ended August 31, 2019, the Core Bond Fund returned 9.64% compared to 10.17% for the Bloomberg Barclays U.S. Aggregate Bond Index.
| * | The Bloomberg Barclays U.S. Aggregate Bond Index is an unmanaged index that measures the investment grade, U.S. dollar-denominated, fixed-rate taxable bond market, including Treasuries, government-related and corporate securities, mortgage- and asset-backed securities and commercial mortgage-backed securities. |
| | | | |
| Average Annual Total Return as of August 31, 2019 |
| 1 Year | | 5 Years | | 10 Years |
| 9.64% | | 3.14% | | 4.55% |
Past performance is not predictive of future performance. The performance data quoted represents past performance; past performance does not guarantee future results; the investment return and principal value of an investment will fluctuate so that an investor’s shares, when redeemed, may be worth more or less than their original cost; current performance may be lower or higher than the performance data quoted.
The Fund’s returns reflect investment management fees and other Fund expenses. Charges imposed by the Variable Contracts, Plans or IRAs that invest in the Fund are not included in the Fund’s returns.
Indices are not managed and an investor can not invest directly into an index.
VALIC Company II Government Money Market II Fund
COMPARISON: FUND VS. INDEX(unaudited)
MANAGEMENT OVERVIEW
A discussion with SunAmerica Asset Management, LLC
The Government Money Market II Fund posted a return of 1.75% for the twelve-month period ending August 31, 2019, compared to a return of 2.36% for the FTSE Treasury Bill 3 Month Index.
During the Period:
| | • | | The following contributed to Fund return relative to Benchmark return: |
| | O | | Sector allocation(s): U.S. Agencies (overweight) |
| | O | | Security selection in the following sector(s): U.S. Agencies |
| | O | | Position weighting(s): FHLB (Federal Home Loan Bank) |
| | • | | The following detracted from Fund return relative to Benchmark return: |
| | O | | Sector allocation(s): U.S. Treasuries (underweight) |
| | O | | Position weighting(s): FNMA (Federal National Mtg. Assoc.); FFCB (Federal Farm Credit Bank) |
| | | | |
| Average Annual Total Return as of August 31, 2019 |
| 1 Year | | 5 Years | | 10 Years |
| 1.75% | | 0.57% | | 0.29% |
Past performance is not predictive of future performance. The performance data quoted represents past performance; past performance does not guarantee future results; the investment return and principal value of an investment will fluctuate so that an investor’s shares, when redeemed, may be worth more or less than their original cost; current performance may be lower or higher than the performance data quoted.
The Fund’s returns reflect investment management fees and other Fund expenses. Charges imposed by the Variable Contracts, Plans or IRAs that invest in the Fund are not included in the Fund’s returns.
VALIC Company II High Yield Bond Fund
COMPARISON: FUND VS. INDEX(unaudited)
MANAGEMENT OVERVIEW
A discussion with Wellington Management Company LLP.
The High Yield Bond Fund posted a return of 6.47% for the twelve-month period ending August 31, 2019, compared to its benchmark, the FTSE US High-Yield Market Index, which returned 6.10%.
During the Period:
| | • | | In aggregate, sector allocations relative to those of the Benchmark contributed to Fund return relative to Benchmark return. |
| | • | | In aggregate, position weightings (i.e., security selection) relative to those of the Benchmark contributed to Fund return relative to the Benchmark return. |
| | • | | The following contributed to Fund return relative to Benchmark return: |
| | O | | Sector allocation(s): energy (underweight); gaming (overweight); financials (overweight) |
| | O | | Security selection in the following sector(s): energy; wireless; wirelines |
| | O | | Position weighting(s): Weatherford International, Ltd.; EP Energy/Everest Acquisition Finance, Inc.; Frontier Communications Corp. |
| | • | | The following detracted from Fund return relative to Benchmark return: |
| | O | | Sector allocation(s): utilities (underweight); supermarkets (underweight) |
| | O | | Security selection in the following sector(s): metals & mining; consumer products |
| | O | | Position weighting(s): Cloud Peak Energy Resources LLC/Cloud Peak Energy Finance Corp.; Foresight Energy LLC/Foresight Energy Finance Corp.; Chesapeake Energy Corp. |
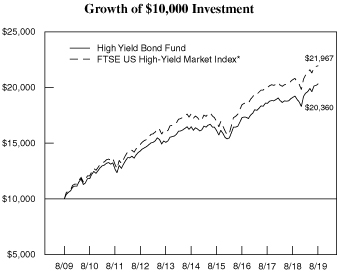
For the year ended August 31, 2019, the High Yield Bond Fund returned 6.47% compared to 6.10% for the FTSE US High-Yield Market Index.
| * | The FTSE US High-Yield Market Index measures the performance of below investment grade debt issued by corporations domiciled in the U.S or Canada. All of the bonds in such index are publicly placed, have a fixed coupon, and are nonconvertible. |
| | | | |
| Average Annual Total Return as of August 31, 2019 |
| 1 Year | | 5 Years | | 10 Years |
| 6.47% | | 4.33% | | 7.37% |
Past performance is not predictive of future performance. The performance data quoted represents past performance; past performance does not guarantee future results; the investment return and principal value of an investment will fluctuate so that an investor’s shares, when redeemed, may be worth more or less than their original cost; current performance may be lower or higher than the performance data quoted.
The Fund’s returns reflect investment management fees and other Fund expenses. Charges imposed by the Variable Contracts, Plans or IRAs that invest in the Fund are not included in the Fund’s returns.
Indices are not managed and an investor can not invest directly into an index.
VALIC Company II International Opportunities Fund
COMPARISON: FUND VS. INDEX(unaudited)
MANAGEMENT OVERVIEW
The International Opportunities Fund posted a return of -9.20% for the twelve-month period ending August 31, 2019, compared to a return of -9.16% for the MSCI EAFE Small Cap Index (net).
A discussion with Massachusetts Financial Services Company – regarding their portion of the Fund (the “portfolio”)
During the Period:
| | • | | In aggregate, sector allocations relative to those of the Benchmark detracted from portfolio return relative to Benchmark return. |
| | • | | In aggregate, position weightings (i.e., security selection) relative to those of the Benchmark contributed portfolio return relative to the Benchmark return. |
| | • | | Holdings of cash and/or cash equivalents contributed to portfolio return. |
| | • | | The following contributed to portfolio return relative to Benchmark return: |
| | O | | Sector allocation(s): consumer staples (overweight); healthcare (underweight); industrials (underweight) |
| | O | | Security selection in the following sector(s): consumer discretionary; industrials; financials; communication services |
| | O | | Position weighting(s): OBIC Co., Ltd.; China Resources Beer Holdings Co., Ltd.; Cellnex Telecom SA; Greggs PLC |
| | • | | The following detracted from portfolio return relative to Benchmark return: |
| | O | | Sector allocation(s): real estate (underweight); energy (underweight) |
| | O | | Security selection in the following sector(s): real estate; consumer discretionary; materials |
| | O | | Position weighting(s): Yamato Holdings Co., Ltd.; Amadeus IT Group SA; Fuchs Petrolub SE; LS Industrial Systems Co., Ltd. |
A discussion with Delaware Investments Fund Advisers – regarding their portion of the Fund (the “portfolio”)
During the Period:
| | • | | In aggregate, sector allocations relative to those of the Benchmark did not meaningfully impact portfolio return relative to Benchmark return. |
| | • | | In aggregate, position weightings (i.e., security selection) relative to those of the Benchmark detracted from portfolio return relative to the Benchmark return. |
| | • | | In aggregate, regional or country exposures relative to those of the Benchmark detracted from portfolio return relative to Benchmark return. |
| | • | | Holdings of cash and/or cash equivalents contributed to portfolio return. |
| | • | | The following contributed to portfolio return relative to Benchmark return: |
| | O | | Sector allocation(s): information technology (overweight); financials (underweight); materials (underweight) |
| | O | | Security selection in the following sector(s): communication services; industrials |
| | O | | Position weighting(s): Afterpay Touch Group Ltd.; Evolution Gaming Group AB; GMO Payment Gateway Inc. |
| | O | | Country allocation(s): China (overweight); Brazil (overweight) |
| | • | | The following detracted from portfolio return relative to Benchmark return: |
| | O | | Sector allocation(s): real estate (underweight); energy (overweight) |
| | O | | Security selection in the following sector(s): healthcare; consumer staples; real estate |
| | O | | Position weighting(s): Fevertree Drinks PLC; Burford Capital Ltd.; Keywords Studios PLC |
| | O | | Country allocation(s): Norway (overweight); South Korea (overweight); Japan (underweight) |
VALIC Company II International Opportunities Fund
COMPARISON: FUND VS. INDEX(unaudited) —(continued)
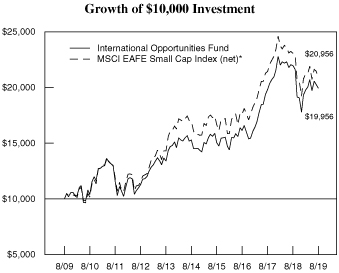
For the year ended August 31, 2019, the International Opportunities Fund returned-9.20% compared to-9.16% for the MSCI EAFE Small Cap Index (net).
| * | The MSCI EAFE Small Cap Index (net) is an unmanaged index considered representative of small-cap stocks of Europe, Australasia and the Far East. The net index approximates the minimum possible dividend reinvestment and assumes that the dividend is reinvested after the deduction of withholding tax, applying the rate to non-resident individuals who do not benefit from double taxation treaties. |
| | | | |
| Average Annual Total Return as of August 31, 2019 |
| 1 Year | | 5 Years | | 10 Years |
| -9.20% | | 5.47% | | 7.15% |
Past performance is not predictive of future performance. The performance data quoted represents past performance; past performance does not guarantee future results; the investment return and principal value of an investment will fluctuate so that an investor’s shares, when redeemed, may be worth more or less than their original cost; current performance may be lower or higher than the performance data quoted.
The Fund’s returns reflect investment management fees and other Fund expenses. Charges imposed by the Variable Contracts, Plans or IRAs that invest in the Fund are not included in the Fund’s returns.
Indices are not managed and an investor can not invest directly into an index.
VALIC Company II Large Cap Value Fund
COMPARISON: FUND VS. INDEX(unaudited)
MANAGEMENT OVERVIEW
The Large Cap Value Fund posted a return of -2.39% for the twelve-month period ending August 31, 2019, compared to a return of 0.62% for the Russell 1000® Value Index.
A discussion with Perkins Investment Management, LLC a Janus Henderson Global Investors plc Company – regarding their portion of the Fund (the “portfolio”)
During the Period:
| | • | | In aggregate, sector allocations relative to those of the Benchmark detracted from portfolio return relative to Benchmark return. |
| | • | | In aggregate, position weightings (i.e., security selection) relative to those of the Benchmark contributed to portfolio return relative to the Benchmark return. |
| | • | | In aggregate, country exposures relative to those of the Benchmark detracted from portfolio return relative to Benchmark return. |
| | • | | The following contributed to portfolio return relative to Benchmark return: |
| | O | | Sector allocation(s): consumer staples (overweight); energy (underweight) |
| | O | | Security selection in the following sector(s): materials; financials; industrials |
| | • | | The following detracted from portfolio return relative to Benchmark return: |
| | O | | Sector allocation(s): communication services; financials; utilities |
| | O | | Security selection in the following sector(s): energy (underweight); consumer discretionary (underweight); communication services (underweight) |
| | O | | Country allocation(s): UK (overweight) |
A discussion with BNY Mellon Asset Management North America Corporation – regarding their portion of the Fund (the “portfolio”)
During the Period:
| | • | | In aggregate, sector allocations relative to those of the Benchmark detracted from portfolio return relative to Benchmark return. |
| | • | | In aggregate, position weightings (i.e., security selection) relative to those of the Benchmark detracted from portfolio return relative to the Benchmark return. |
| | • | | The following contributed to portfolio return relative to Benchmark return: |
| | O | | Sector allocation(s): information technology (overweight) |
| | O | | Security selection in the following sector(s): materials; financials |
| | • | | The following detracted from portfolio return relative to Benchmark return: |
| | O | | Sector allocation(s): energy (underweight); health care (underweight); consumer staples (underweight) |
| | O | | Security selection in the following sector(s): materials; utilities; real estate |
VALIC Company II Large Cap Value Fund
COMPARISON: FUND VS. INDEX(unaudited) — (continued)
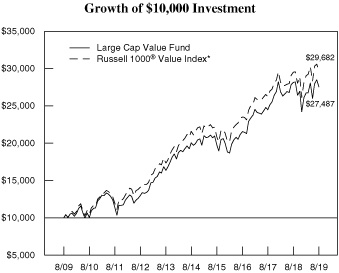
For the year ended August 31, 2019, the Large Cap Value Fund returned -2.39% as compared to 0.62% for the Russell 1000® Value Index.
| * | The Russell 1000® Value Index measures the performance of those Russell 1000 companies with lower price-to-book ratios and lower forecasted growth values. |
| | | | |
| Average Annual Total Return as of August 31, 2019 |
| 1 Year | | 5 Years | | 10 Years |
| -2.39% | | 6.52% | | 10.64% |
Past performance is not predictive of future performance. The performance data quoted represents past performance; past performance does not guarantee future results; the investment return and principal value of an investment will fluctuate so that an investor’s shares, when redeemed, may be worth more or less than their original cost; current performance may be lower or higher than the performance data quoted.
The Fund’s returns reflect investment management fees and other Fund expenses. Charges imposed by the Variable Contracts, Plans or IRAs that invest in the Fund are not included in the Fund’s returns.
Indices are not managed and an investor can not invest directly into an index.
VALIC Company II Mid Cap Growth Fund
COMPARISON: FUND VS. INDEX(unaudited)
MANAGEMENT OVERVIEW
A discussion with Wellington Management Company LLP.
The Mid Cap Growth Fund posted a return of 1.72% for the twelve-month period ending August 31, 2019, compared to a return of -6.43% for the S&P Mid Cap 400® Index.
During the Period:
| | • | | In aggregate, sector allocations relative to those of the Benchmark contributed to Fund return relative to Benchmark return. |
| | • | | In aggregate, position weightings (i.e., security selection) relative to those of the Benchmark contributed to Fund return relative to the Benchmark return. |
| | • | | The following contributed to Fund return relative to Benchmark return: |
| | O | | Sector allocation(s): information technology (overweight); energy (underweight) |
| | O | | Security selection in the following sector(s): industrials; consumer discretionary; health care; materials |
| | O | | Position weighting(s): Ball Corp.; Genpact, Ltd.; Roku, Inc. |
| | • | | The following detracted from Fund return relative to Benchmark return: |
| | O | | Sector allocation(s): real Estate (underweight); utilities (underweight); health care (overweight) |
| | O | | Security selection in the following sector(s): communications services; utilities |
| | O | | Position weighting(s): CommScope Holding Co., Inc.; 2U, Inc.; Aerie Pharmaceuticals, Inc. |
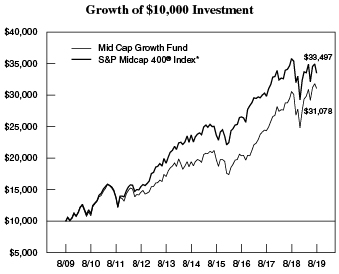
For the year ended August 31, 2019, the Mid Cap Growth Fund returned 1.72% compared to -6.43% for the S&P MidCap 400® Index.
| * | The S&P MidCap 400® Index is an index of the stocks of 400 domestic stocks chosen for market size, liquidity, and industry group representation. It is a market value weighted index, with each stock’s percentage in the Index in proportion to its market value. |
| | | | |
| Average Annual Total Return as of August 31, 2019 |
| 1 Year | | 5 Years | | 10 Years |
| 1.72% | | 9.82% | | 12.01% |
Past performance is not predictive of future performance. The performance data quoted represents past performance; past performance does not guarantee future results; the investment return and principal value of an investment will fluctuate so that an investor’s shares, when redeemed, may be worth more or less than their original cost; current performance may be lower or higher than the performance data quoted.
The Fund’s returns reflect investment management fees and other Fund expenses. Charges imposed by the Variable Contracts, Plans or IRAs that invest in the Fund are not included in the Fund’s returns.
Indices are not managed and an investor can not invest directly into an index.
VALIC Company II Mid Cap Value Fund
COMPARISON: FUND VS. INDEX(unaudited)
MANAGEMENT OVERVIEW
The Mid Cap Value Fund posted a return of -4.14% for the twelve-month period ending August 31, 2019, compared to a return of -3.13% for the Russell Midcap® Value Index.
A discussion with Wellington Management Company LLP – regarding their portion of the Fund (the “portfolio”)
During the Period:
| | • | | In aggregate, sector allocations relative to those of the Benchmark detracted from portfolio return relative to Benchmark return. |
| | • | | In aggregate, position weightings (i.e., security selection) relative to those of the Benchmark detracted from portfolio return relative to the Benchmark return. |
| | • | | Holdings of cash and/or cash equivalents contributed to portfolio return. |
| | • | | The following contributed to portfolio return relative to Benchmark return: |
| | O | | Sector allocation(s): consumer discretionary (underweight); information technology (overweight) |
| | O | | Security selection in the following sector(s): consumer staples; real estate; health care |
| | O | | Position weighting(s): STORE Capital Corp.; Leidos Holdings, Inc.; Jardine Lloyd Thompson Group |
| | • | | The following detracted from portfolio return relative to Benchmark return: |
| | O | | Sector allocation(s): utilities (underweight); materials (overweight); real estate (underweight) |
| | O | | Security selection in the following sector(s): financials; consumer discretionary; industrials; information technology |
| | O | | Position weighting(s): Encana Corp.; Silicon Motor Technology; Caleras, Inc.; Cabot Corp. |
A discussion with Boston Partners – regarding their portion of the Fund (the “portfolio”)
During the Period:
| | • | | In aggregate, sector allocations relative to those of the Benchmark detracted from portfolio return relative to Benchmark return. |
| | • | | In aggregate, position weightings (i.e., security selection) relative to those of the Benchmark contributed to portfolio return relative to the Benchmark return. |
| | • | | The following contributed to portfolio return relative to Benchmark return: |
| | O | | Sector allocation(s): consumer discretionary (underweight); industrials (overweight); information technology (overweight) |
| | O | | Security selection in the following sector(s): consumer discretionary; financials; utilities |
| | O | | Position weighting(s): Aon PLC; Alleghany Corp.; PG&E Corp. |
| | • | | The following detracted from portfolio return relative to Benchmark return: |
| | O | | Sector allocation(s): real estate (underweight); utilities (underweight); financials (overweight) |
| | O | | Security selection in the following sector(s): industrials; real estate |
| | O | | Position weighting(s): Marathon Petroleum Corp.; East West Bancorp, Inc.; Cimarex Energy Co. |
VALIC Company II Mid Cap Value Fund
COMPARISON: FUND VS. INDEX(unaudited) — (continued)
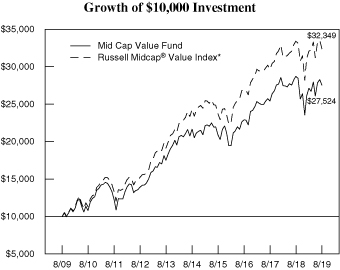
For the year ended August 31, 2019, the Mid Cap Value Fund returned -4.14% compared to -3.13% for the Russell Midcap® Value Index.
| * | The Russell Midcap® Value Index measures the performance of the mid-cap value segment of the U.S. equity universe. It includes those Russell Midcap Index companies with lower price-to-book ratios and lower forecasted growth values. The Russell Midcap® Value Index is constructed to provide a comprehensive and unbiased barometer of the mid-cap value market. The index is completely reconstituted annually to ensure larger stocks do not distort the performance and characteristics of the true mid-cap value market. |
| | | | |
| Average Annual Total Return as of August 31, 2019 |
| 1 Year | | 5 Years | | 10 Years |
| -4.14% | | 4.89% | | 10.66% |
Past performance is not predictive of future performance. The performance data quoted represents past performance; past performance does not guarantee future results; the investment return and principal value of an investment will fluctuate so that an investor’s shares, when redeemed, may be worth more or less than their original cost; current performance may be lower or higher than the performance data quoted.
The Fund’s returns reflect investment management fees and other Fund expenses. Charges imposed by the Variable Contracts, Plans or IRAs that invest in the Fund are not included in the Fund’s returns.
Indices are not managed and an investor can not invest directly into an index.
VALIC Company II Moderate Growth Lifestyle Fund
COMPARISON: FUND VS. INDEX(unaudited)
MANAGEMENT OVERVIEW
A discussion with PineBridge Investments, LLC
For the twelve-month period ended August 31, 2019, the Moderate Growth Lifestyle Fund returned 1.71%, compared to 2.92% for the S&P 500® Index and 5.59% for the Fund’s Blended Index. The blended index is comprised of 40% Russell 3000® Index, 10% MSCI EAFE Index (net), 45% Bloomberg Barclays U.S. Aggregate Bond Index, and 5% FTSE EPRA/NAREIT Developed Index.
The Moderate Growth Lifestyle Fund invests in a combination of affiliated funds, also known as ‘fund of funds’. The Fund does not select specific sectors, securities, or countries and thus these factors do not influence performance. Rather, the key indicators of performance are asset allocation and manager selection.
During the Period:
| | • | | In aggregate, asset allocations relative to those of the Benchmark detracted from Fund return relative to Benchmark return. |
| | • | | In aggregate, manager selection detracted from Fund return relative to Benchmark return. |
| | • | | The following detracted from Fund return relative to Benchmark return: |
| | O | | VC II Small Cap Value Fund (overweight); VC I Small Cap Special Values Fund (overweight); VC I International Value Fund (overweight) |
VALIC Company II Moderate Growth Lifestyle Fund
COMPARISON: FUND VS. INDEX(unaudited) —(continued)
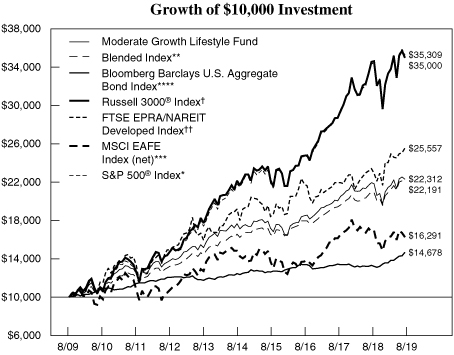
For the year ended August 31, 2019, the Moderate Growth Lifestyle Fund returned 1.71% compared to 2.92% for the S&P 500® Index and 5.59% for the Blended Index.
| * | The S&P 500® Index is an index of the stocks of 500 major large-cap U.S. corporations, chosen for market size, liquidity, and industry group representation. It is a market-value weighted index, with each stock’s percentage in the Index in proportion to its market value. |
| ** | The Blended Index consists of the Russell 3000® Index (40%), MSCI EAFE Index (net) (10%), the Bloomberg Barclays U.S. Aggregate Bond Index (45%) and the FTSE EPRA/NAREIT Developed Index (5%). |
| *** | The MSCI EAFE Index (Europe, Australasia, Far East) (net) is a free float-adjusted market capitalization index that is designed to measure the equity market performance of developed markets, excluding the U.S. & Canada. The MSCI EAFE Index consists of the following 21 developed market country indexes: Australia, Austria, Belgium, Denmark, Finland, France, Germany, Hong Kong, Ireland, Israel, Italy, Japan, the Netherlands, New Zealand, Norway, Portugal, Singapore, Spain, Sweden, Switzerland, and the United Kingdom. The net index approximates the minimum possible dividend reinvestment and assumes that the dividend is reinvested after the deduction of withholding tax, applying the rate to nonresident individuals who do not benefit from double taxation treaties. |
| **** | The Bloomberg Barclays U.S. Aggregate Bond Index is an unmanaged index that measures the investment grade, U.S. dollar-denominated, fixed-rate taxable bond market, including Treasuries, government-related and corporate securities, mortgage- and asset-backed securities and commercial mortgage-backed securities. |
| † | The Russell 3000® Index follows the 3,000 largest U.S. companies, based on total market capitalization. |
| †† | The FTSE EPRA/NAREIT Developed Index is a global market capitalization weighted index composed of listed real estate securities in the North American, European and Asian real estate markets. |
| | | | |
| Average Annual Total Return as of August 31, 2019 |
| 1 Year | | 5 Years | | 10 Years |
| 1.71% | | 4.77% | | 8.36% |
Past performance is not predictive of future performance. The performance data quoted represents past performance; past performance does not guarantee future results; the investment return and principal value of an investment will fluctuate so that an investor’s shares, when redeemed, may be worth more or less than their original cost; current performance may be lower or higher than the performance data quoted.
The Fund’s returns reflect investment management fees and other Fund expenses. Charges imposed by the Variable Contracts, Plans or IRAs that invest in the Fund are not included in the Fund’s returns.
Indices are not managed and an investor can not invest directly into an index.
VALIC Company II Small Cap Growth Fund
COMPARISON: FUND VS. INDEX(unaudited)
MANAGEMENT OVERVIEW
A discussion with J.P. Morgan Investment Management Inc.
The Small Cap Growth Fund posted a return of -5.47% for the twelve-month period ending August 31, 2019, compared to a return of -11.02% for the Russell 2000® Growth Index.
During the Period:
| | • | | In aggregate, sector allocations relative to those of the Benchmark contributed to Fund return relative to Benchmark return. |
| | • | | In aggregate, position weightings (i.e., security selection) relative to those of the Benchmark contributed to Fund return relative to the Benchmark return. |
| | • | | The following contributed to Fund return relative to Benchmark return: |
| | O | | Sector allocation(s): information technology (overweight); energy (underweight); materials (underweight) |
| | O | | Security selection in the following sector(s): health care; information technology; industrials |
| | O | | Position weighting(s): Inphi Corp.; Anaplan, Inc. |
| | • | | The following detracted from Fund return relative to Benchmark return: |
| | O | | Sector allocation(s): utilities (underweight); real estate (underweight) |
| | O | | Security selection in the following sector(s): consumer discretionary; financials; materials |
| | O | | Position weighting(s): Centennial Resource Development, Inc.; Evolent Health, Inc. |
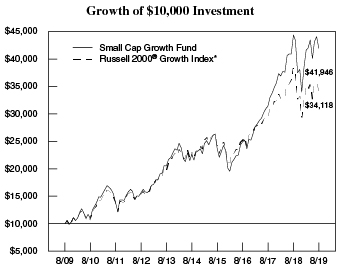
For the year ended August 31, 2019, the Small Cap Growth Fund returned -5.47% compared to -11.02% for the Russell 2000® Growth Index.
| * | The Russell 2000® Growth Index measures the performance of those Russell 2000 companies with higher price-to-book ratios and higher forecasted growth values. |
| | | | |
| Average Annual Total Return as of August 31, 2019 |
| 1 Year | | 5 Years | | 10 Years |
| -5.47% | | 13.13% | | 15.42% |
Past performance is not predictive of future performance. The performance data quoted represents past performance; past performance does not guarantee future results; the investment return and principal value of an investment will fluctuate so that an investor’s shares, when redeemed, may be worth more or less than their original cost; current performance may be lower or higher than the performance data quoted.
The Fund’s returns reflect investment management fees and other Fund expenses. Charges imposed by the Variable Contracts, Plans or IRAs that invest in the Fund are not included in the Fund’s returns.
Indices are not managed and an investor can not invest directly into an index.
VALIC Company II Small Cap Value Fund
COMPARISON: FUND VS. INDEX (unaudited)
MANAGEMENT OVERVIEW
The Small Cap Value Fund posted a return of -17.24% for the twelve-month period ending August 31, 2019, compared to a return of -14.89% for the Russell 2000® Value Index.
A discussion with J.P. Morgan Investment Management Inc. – regarding the Quality/Development of capital prudently/Valuation strategy portion of the Fund (the “portfolio”)
During the Period:
| | • | | In aggregate, sector allocations relative to those of the Benchmark detracted from portfolio return relative to Benchmark return. |
| | • | | In aggregate, position weightings (i.e., security selection) relative to those of the Benchmark contributed to portfolio return relative to the Benchmark return. |
| | • | | The following contributed to portfolio return relative to Benchmark return: |
| | O | | Sector allocation(s): semiconductors (overweight); software & services (overweight) |
| | O | | Security selection in the following sector(s): finance; consumer cyclical; pharmaceutical |
| | O | | Position weighting(s): Medicines Co.; FTI Consulting Inc.; KB Home |
| | • | | The following detracted from portfolio return relative to Benchmark return: |
| | O | | Sector allocation(s): pharmaceutical (overweight); energy (overweight) |
| | O | | Security selection in the following sector(s): REITs; telecommunications; insurance |
| | O | | Position weighting(s): Consolidated Communications Holdings Inc.; Geo Group Inc.; Gamestop Corp. |
A discussion with J.P. Morgan Investment Management Inc. – regarding the Trends/Momentum/Valuation strategy portion of the Fund (the “portfolio”)
During the Period:
| | • | | In aggregate, sector allocations relative to those of the Benchmark detracted from portfolio return relative to Benchmark return. |
| | • | | In aggregate, position weightings (i.e., security selection) relative to those of the Benchmark detracted from portfolio return relative to the Benchmark return. |
| | • | | The following contributed to portfolio return relative to Benchmark return: |
| | O | | Sector allocation(s): energy (overweight); systems hardware (overweight) |
| | O | | Security selection in the following sector(s): systems hardware; finance |
| | O | | Position weighting(s): SemGroup Corp.; Portland General Electric Co.; IDACORP, Inc. |
| | • | | The following detracted from portfolio return relative to Benchmark return: |
| | O | | Sector allocation(s): pharmaceutical (overweight); utilities (underweight); retail (overweight) |
| | O | | Security selection in the following sector(s): consumer cyclical; REITs; health services & systems |
| | O | | Position weighting(s): CoreCivic, Inc.; GEO Group, Inc.; Ashford Hospitality Trust, Inc. |
VALIC Company II Small Cap Value Fund
COMPARISON: FUND VS. INDEX(unaudited) — (continued)
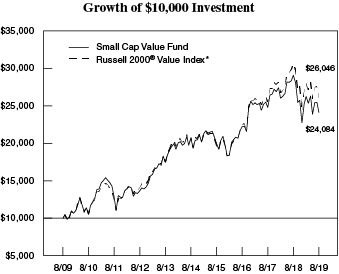
For the year ended August 31, 2019, the Small Cap Value Fund returned -17.24% compared to -14.89% for the Russell 2000® Value Index.
| * | The Russell 2000® Value Index measures t |
| he | performance of those Russell 2000 companies with lower price-to-book ratios and lower forecasted growth values. |
| | | | |
| Average Annual Total Return as of August 31, 2019 |
| 1 Year | | 5 Years | | 10 Years |
| -17.24% | | 3.12% | | 9.19% |
Past performance is not predictive of future performance. The performance data quoted represents past performance; past performance does not guarantee future results; the investment return and principal value of an investment will fluctuate so that an investor’s shares, when redeemed, may be worth more or less than their original cost; current performance may be lower or higher than the performance data quoted.
The Fund’s returns reflect investment management fees and other Fund expenses. Charges imposed by the Variable Contracts, Plans or IRAs that invest in the Fund are not included in the Fund’s returns.
Indices are not managed and an investor can not invest directly into an index.
VALIC Company II Strategic Bond Fund
COMPARISON: FUND VS. INDEX(unaudited)
MANAGEMENT OVERVIEW
A discussion with PineBridge Investments, LLC
The Strategic Bond Fund posted a return of 8.27% for the twelve-month period ending August 31, 2019, compared to its benchmark, the Bloomberg Barclays Capital U.S. Aggregate Bond Index, which returned 10.17%.
During the Period:
| | • | | In aggregate, sector allocations relative to those of the Benchmark contributed to Fund return relative to Benchmark return. |
| | • | | In aggregate, position weightings (i.e., security selection) relative to those of the Benchmark contributed to Fund return relative to the Benchmark return. |
| | • | | Yield curve positioning detracted from Fund return. |
| | • | | The following contributed to Fund return relative to Benchmark return: |
| | O | | Sector allocation(s): sovereigns (overweight); communication (overweight); U.S. Treasuries (underweight) |
| | O | | Security selection in the following sector(s): sovereigns; technology; U.S. Agencies |
| | • | | The following detracted from Fund return relative to Benchmark return: |
| | O | | Sector allocation(s): energy (overweight); MBS (Conventional30-year) (underweight) |
| | O | | Security selection in the following sector(s): energy; basic industry; consumer cyclical |
| | O | | Position weighting(s): Chaparral Energy, Inc.; Republic of Argentina; Rentpath LLC |
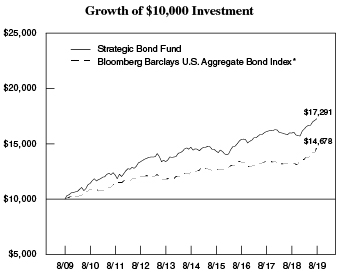
For the year ended August 31, 2019, the Strategic Bond Fund returned 8.27% compared to 10.17% for the Bloomberg Barclays U.S. Aggregate Bond Index.
| * | The Bloomberg Barclays U.S. Aggregate Bond Index is an unmanaged index that measures the investment grade, U.S. dollar-denominated, fixed-rate taxable bond market, including Treasuries, government-related and corporate securities, mortgage- and asset-backed securities and commercial mortgage-backed securities. |
| | | | |
| Average Annual Total Return as of August 31, 2019 |
| 1 Year | | 5 Years | | 10 Years |
| 8.27% | | 3.29% | | 5.63% |
Past performance is not predictive of future performance. The performance data quoted represents past performance; past performance does not guarantee future results; the investment return and principal value of an investment will fluctuate so that an investor’s shares, when redeemed, may be worth more or less than their original cost; current performance may be lower or higher than the performance data quoted.
The Fund’s returns reflect investment management fees and other Fund expenses. Charges imposed by the Variable Contracts, Plans or IRAs that invest in the Fund are not included in the Fund’s returns.
Indices are not managed and an investor can not invest directly into an index.
VALIC Company II U.S. Socially Responsible Fund
COMPARISON: FUND VS. INDEX(unaudited)
MANAGEMENT OVERVIEW
A discussion with SunAmerica Asset Management, LLC.
The U.S. Socially Responsible Fund posted a return of 4.46% for the twelve-month period ending August 31, 2019, compared to its benchmark, the S&P 500® Index, which returned 2.92%.
The Fund is an optimized portfolio which seeks to track the S&P 500® Index while investing in socially responsive companies. The Fund’s criteria do not permit investment in companies whose businesses rely significantly on alcohol, firearms, gambling, tobacco, nuclear power, or production of weaponry. Furthermore, companies deemed to have poor labor/employee relations or environmental records are also screened out of the investable universe. These criteria may create differences in Fund performance relative to that of the Benchmark.
During the Period:
| | • | | In aggregate, sector allocations relative to those of the Benchmark contributed to Fund return relative to Benchmark return. |
| | • | | In aggregate, position weightings (i.e., security selection) relative to those of the Benchmark contributed to Fund return relative to the Benchmark return. |
| | • | | The following contributed to Fund return relative to Benchmark return: |
| | O | | Sector allocation(s): information technology (overweight); industrials (overweight); energy (underweight) |
| | O | | Security selection in the following sector(s): healthcare; financials; industrials |
| | O | | Position weighting(s): Berkshire Hathaway, Inc; Procter & Gamble Co.; Zoetis, Inc. |
| | • | | The following detracted from Fund return relative to Benchmark return: |
| | O | | Sector allocation(s): financials (overweight); real estate (overweight); healthcare (underweight) |
| | O | | Security selection in the following sector(s): energy; telecom |
| | O | | Position weighting(s): Kraft Heinz Co.; Schlumberger, Ltd.; EOG Resources, Inc. |
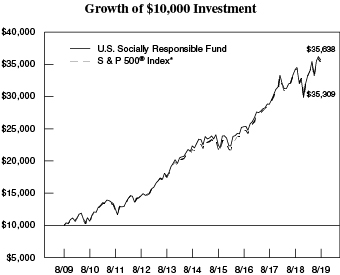
For the year ended August 31, 2019, the U.S. Socially Responsible Fund returned 4.46% compared to 2.92% for the S&P 500® Index.
| * | The S&P 500® Index is an index of the stocks of 500 major large-cap U.S. corporations, chosen for market size, liquidity, and industry group representation. It is a market-value weighted index, with each stock’s percentage in the Index in proportion to its market value. |
| | | | |
| Average Annual Total Return as of August 31, 2019 |
| 1 Year | | 5 Years | | 10 Years |
| 4.46% | | 9.83% | | 13.55% |
Past performance is not predictive of future performance. The performance data quoted represents past performance; past performance does not guarantee future results; the investment return and principal value of an investment will fluctuate so that an investor’s shares, when redeemed, may be worth more or less than their original cost; current performance may be lower or higher than the performance data quoted.
The Fund’s returns reflect investment management fees and other Fund expenses. Charges imposed by the Variable Contracts, Plans or IRAs that invest in the Fund are not included in the Fund’s returns.
Indices are not managed and an investor can not invest directly into an index.
VALIC Company II
SUPPLEMENTS TO THE PROSPECTUS
THE SUPPLEMENTS ARE NOT PART OF ANNUAL REPORT.
Filed under Rule 497(e) and 497(k)
RegistrationNo. 333-53589
VALIC Company II
Small Cap Growth Fund
(the “Fund”)
Supplement dated September 25, 2019, to the Fund’s Summary Prospectus and Prospectus
dated January 1, 2019, as supplemented and amended to date
At anin-person meeting held on August5-6, 2019, the Board of Trustees (the “Board”) of VALIC Company II (“VC II”) approved an amendment to the InvestmentSub-Advisory Agreement (the “Subadvisory Agreement”) between The Variable Annuity Life Insurance Company (“VALIC”) and J.P. Morgan Investment Management Inc. with respect to the Fund. The amendment reduces the fees payable by VALIC under the Subadvisory Agreement.
At the meeting, the Board also approved an Advisory Fee Waiver Agreement (the “Fee Waiver Agreement”) with respect to the Fund. Pursuant to the Fee Waiver Agreement, VALIC is contractually obligated to waive a portion of its advisory fee with respect to the Fund so that the advisory fee rate payable by the Fund to VALIC under the Investment Advisory Agreement with VC II (the “Advisory Agreement”) is 0.82% on the first $100 million and 0.77% on assets over $100 million. This Fee Waiver Agreement will become effective on January 1, 2020, and will continue in effect through December 31, 2020. In addition, the Fee Waiver Agreement will automatically terminate upon the termination of the Investment Advisory Agreement. VALIC may not recoup any advisory fees waived with respect to the Fund pursuant to the Fee Waiver Agreement.
Capitalized terms used but not defined herein shall have the meanings assigned to them by the Prospectus.
PLEASE RETAIN THIS SUPPLEMENT FOR FUTURE REFERENCE.
Filed under Rule 497(e) and 497(k)
RegistrationNo. 333-53589
VALIC Company II
Socially Responsible Fund
(the “Fund”)
Supplement dated May 14, 2019, to the Fund’s
Summary Prospectus, Prospectus and Statement of Additional Information (“SAI”)
dated January 1, 2019, as supplemented and amended to date
At a meeting held on April29-30, 2019, the Board of Trustees of VALIC Company II approved a change of the Fund’s name from the Socially Responsible Fund to the U.S. Socially Responsible Fund. Accordingly, effective on or about June 4, 2019, all references to “Socially Responsible Fund” will be deleted and replaced by “U.S. Socially Responsible Fund.”
Capitalized terms used but not defined herein shall have the meanings assigned to them by the Prospectus or SAI, as applicable.
PLEASE RETAIN THIS SUPPLEMENT FOR FUTURE REFERENCE.
VALIC Company II
BOARD OF TRUSTEES
Thomas J. Brown
Judith L. Craven
Timothy J. Ebner
Gustavo E. Gonzales, Jr.
Peter A. Harbeck
Kenneth J. Lavery
Eric S. Levy
John E. Maupin, Jr.
CUSTODIAN
State Street Bank and Trust Company
One Lincoln Street
Boston, Massachusetts 02111
INVESTMENT ADVISER
The Variable Annuity
Life Insurance Company (VALIC)
2929 Allen Parkway
Houston, Texas 77019
INVESTMENT SUBADVISERS
BMO Asset Management Corp.
115 S. LaSalle Street
Chicago, Illinois 60603
BNY Mellon Asset Management North America Corporation
One Boston Place
Boston, Massachusetts 02108
Delaware Investments Fund Advisers
2005 Market Street
Philadelphia, PA 19103
J.P. Morgan Investment Management Inc.
270 Park Avenue
New York, New York 10017
Janus Capital Management, LLC
151 Detroit Street
Denver, Colorado 80206
Massachusetts Financial Services Company
111 Huntington Avenue
Boston, MA 02199
PineBridge Investments, LLC
399 Park Avenue
New York, New York 10022
Boston Partners Global Investors, Inc. d/b/a Boston Partners
909 Third Avenue, 32nd Floor
New York, New York 10022
SunAmerica Asset Management, LLC
Haborside 5
185 Hudson Street, Suite 3300
Jersey City, New Jersey 07311
Wellington Management Company LLP
280 Congress Street
Boston, Massachusetts 02210
INDEPENDENT REGISTERED PUBLIC ACCOUNTING FIRM
PricewaterhouseCoopers LLP
1000 Louisiana Street, Suite 5800
Houston, Texas 77002
TRANSFER AND SHAREHOLDER SERVICE AGENT
VALIC Retirement
Services Company (VRSCO)
2929 Allen Parkway
Houston, Texas 77019
OFFICERS
John T. Genoy,
President and Principal Executive Officer
John Packs,
Vice President and Senior Investment Officer
Gregory R. Kingston,
Treasurer and Principal Financial Officer
Kathleen Fuentes,
Vice President, Chief Legal Officer and Secretary
Gregory N. Bressler,
Vice President
Thomas M. Ward,
Vice President
Shawn Parry,
Vice President and Assistant Treasurer
Donna McManus,
Vice President and Assistant Treasurer
Christopher C. Joe,
Chief Compliance Officer
Matthew J. Hackethal,
Anti-Money Laundering Compliance Officer
Christopher J. Tafone,
Assistant Secretary
DISCLOSURE OF QUARTERLY FUND PORTFOLIO HOLDINGS
The Series is required to file its complete schedule of portfolio holdings quarterly with the U.S. Securities and Exchange Commission onForm N-PORT. The Series’Forms N-PORT are available on the U.S. Securities and Exchange Commission’s website at http://www.sec.gov.
VOTING PROXIES ON VALIC COMPANY II PORTFOLIO SECURITIES
A description of the policies and procedures that VC II uses to determine how to vote proxies related to securities held in the Fund’s portfolios, which is available in VC II’s Statement of Additional Information, may be obtained without charge upon request, by calling 800-448-2542. This information is also available from the EDGAR database on the U.S. Securities and Exchange Commission’s website at http://www.sec.gov.
PROXY VOTING RECORD ON VALIC COMPANY II PORTFOLIO SECURITIES
Information regarding how VC II voted proxies relating to securities held in the VC II Funds portfolios during the most recent twelve month period ended June 30, is available, once filed with the U.S. Securities and Exchange Commission without charge, upon request, by calling 800-448-2542 or on the U.S. Securities and Exchange Commission’s website at http://www.sec.gov.
This report is for the information of the shareholders and variable contract owners participating in VC II. It is authorized for distribution to other persons only when preceded or accompanied by an effective prospectus which contains information on how to purchase shares and other pertinent information.
If you would like further information about this material or products issued by VALIC or American General Life Insurance Company, please contact your financial professional.
aig.com/RetirementServices — Account access
| | |
You will need to create an online security profile with a unique user ID and password. With your PIN, you can also access your account via the24-hour VALIC automated phone line at1-800-448-2542. | | Manage your account online • Print and download account transaction confirmations and tax statements • View transaction history and download it to Quicken using Direct ConnectSM • Use the Account Aggregation feature to display information from other accounts in addition to your AIG Retirement Services accounts • Easily manage your personal profile to update your contact information (phone, address, email), update your beneficiaries, reset your password and more |
| | Initiate account transactions including: • Change allocation • Transfer money among investment options • Rebalance account to your desired allocation mix • Change contributions |
| | | Start exploring your account online today! |
| | | • Visit aig.com/RetirementServices • Register for online access • Follow steps to create a security profile |
| | | PersonalDeliver-e® |
| | | • It’s easy to sign up • Simply visit aig.com/RetirementServices today to get started |
| | | Please note: Email delivery is not accessible to certain annuity contract owners. |
Your Future is Calling. Sign up for PersonalDeliver-e® today. CLICK aig.com/RetirementServices CALL 1-800-448-2542 VISIT your financial advisor | | Sign up today at aig.com/RetirementServices We know privacy is important to you, so please be assured that your email address and other information you share with us is kept private and never sold. Review our Privacy Policy online for more information. Securities and investment advisory services offered through VALIC Financial Advisors, Inc. (VFA), member FINRA, SIPC and anSEC-registered investment adviser. Annuities are issued by The Variable Annuity Life Insurance Company (VALIC), Houston, TX. Variable annuities are distributed by its affiliate, AIG Capital Services, Inc. (ACS), member FINRA. AIG Retirement Services represents AIG member companies — The Variable Annuity Life Insurance Company (VALIC) and its subsidiaries, VALIC Financial Advisors, Inc. (VFA) and VALIC Retirement Services Company (VRSCO). All are members of American International Group, Inc. (AIG). |
| | | © American International Group, Inc. All rights reserved. VC 23800 (09/2019) J359703 EE |
| | |
VALIC Company II P.O. Box 3206 Houston, TX 77253-3206 | | PRSRT STD U.S. POSTAGE PAID LANCASTER, PA PERMIT NO. 1765 |
VC 11288 (09/2019) J102713
VALIC Company II (the “registrant”) has adopted a Code of Ethics applicable to its Principal Executive and Principal Accounting Officers pursuant to Section 406 of the Sarbanes-Oxley Act of 2002 (the Code”). During the fiscal year ended August 31, 2019, there were no reportable waivers or implicit waivers to a provision of the Code that applies to the registrant’s Principal Executive and Principal Accounting Officers (the “Covered Officers”).
| Item 3. | Audit Committee Financial Expert. |
The registrant’s Board of Trustees has determined that Thomas J. Brown, the Chairman of the registrant’s Audit Committee, qualifies as an audit committee financial expert, as defined in instructions to Item 3(b) of FormN-CSR. Mr. Brown is considered to be “independent” for purposes of Item 3(a)(2) ofForm N-CSR.
| Item 4. | Principal Accountant Fees and Services. |
(a) - (d) Aggregate fees billed to the registrant for the last two fiscal years for professional services rendered by the registrant’s principal accountant were as follows:
| | | | | | | | |
| | | 2018 | | | 2019 | |
(a) Audit Fees | | $ | 434,275 | | | $ | 447,305 | |
(b) Audit-Related Fees | | $ | 0 | | | $ | 0 | |
(c) Tax Fees | | $ | 0 | | | $ | 0 | |
(d) All Other Fees | | $ | 0 | | | $ | 0 | |
Audit Fees include amounts related to the audit of the registrant’s annual financial statements and services normally provided by the principal accountant in connection with statutory and regulatory filings.
Aggregate fees billed to the investment adviser and Adviser Affiliates (as defined below in Item 4(e)) that are required to bepre-approved pursuant to paragraph (c)(7)(ii) of Rule2-01 of RegulationS-X for the last two fiscal years for services rendered by the registrant’s principal accountant were as follows:
| | | | | | | | |
| | | 2018 | | | 2019 | |
(b) Audit-Related Fees | | $ | 0 | | | $ | 0 | |
(c) Tax Fees | | $ | 0 | | | $ | 0 | |
(d) All Other Fees | | $ | 269,506 | | | $ | 267,667 | |
All other fees are for professional services rendered by the registrant’s principal accountant for services associated with issuing a SSAE16 report and Third Party Assurance report.
| | (e) (1) | The registrant’s audit committeepre-approves all audit services provided by the registrant’s principal accountant for the registrant and allnon-audit services provided by the registrant’s principal accountant for the |
| | registrant, its investment adviser and any entity controlling, controlled by, or under common control with the investment adviser (“Adviser Affiliates”) that provides ongoing services to the registrant, if the engagement by the investment adviser or Adviser Affiliate relates directly to the operations and financial reporting of the registrant. The audit committee has not presently established any pre-approval policies and procedures that permit the pre-approval of the above services other than by the full audit committee. Certain de minimis exceptions are allowed for non-audit services in accordance with Rule 2-01(c)(7)(i)(C) of Regulation S-X as set forth in the registrant's audit committee charter. |
| | (2) | No services included in(b) - (d) above in connection with fees billed to the registrant or the investment adviser or Adviser Affiliates were approved pursuant to paragraph (c)(7)(i)(C) of Rule2-01 of RegulationS-X. |
| | (g) | The aggregate fees billed for the most recent fiscal year and the preceding fiscal year by the registrant’s principal accountant fornon-audit services rendered to the registrant, its investment adviser, and Adviser Affiliates that provides ongoing services to the registrant for 2018 and 2019 were $295,961 and $402,408, respectively. |
| | (h) | Non-audit services rendered to the registrant’s investment adviser and any Adviser Affiliates that provides ongoing services to the registrant that were notpre-approved pursuant to paragraph (c)(7)(ii) of Rule2-01 of RegulationS-X were considered by the registrant’s audit committee as to whether they were compatible with maintaining the principal accountant’s independence. |
| Item 5. | Audit Committee of Listed Registrants. |
Not applicable.
Included in Item 1 to the Form.
| Item 7. | Disclosure of Proxy Voting Policies and Procedures forClosed-End Management Investment Companies. |
Not applicable.
| Item 8. | Portfolio Managers ofClosed-End Management Investment Companies. |
Not applicable.
| Item 9. | Purchases of Equity Securities byClosed-End Management Investment Company and Affiliated Purchasers. |
Not applicable.
| Item 10. | Submission of Matters to a Vote of Security Holders. |
There were no material changes to the procedures by which shareholders may recommend nominees to the registrant’s Board of Trustees that were implemented after the registrant last provided disclosure in response to the requirements of Item 407(c)(2)(iv) of RegulationS-K (17 CFR 229.407) (as required by 22(b)(15)) of Schedule 14A (17 CFR 240.14a-101), or this Item 10.
| Item 11. | Controls and Procedures. |
| | (a) | An evaluation was performed within 90 days of the filing of this report, under the supervision and with the participation of the registrant’s management, including the President and Treasurer, of the effectiveness of the design and operation of the registrant’s disclosure controls and procedures (as defined under Rule30a-3(c) under the Investment Company Act of 1940 (17 CFR 270.30a-3(c))). Based on that evaluation, the registrant’s management, including the President and Treasurer, concluded that the registrant’s disclosure controls and procedures are effective. |
| | (b) | There was no change in the registrant’s internal control over financial reporting (as defined in Rule30a-3(d) under the Investment Company Act of 1940 (17 CFR 270.3a-3(d))) that occurred during the most recent fiscal half-year that has materially affected, or is reasonably likely to materially affect, the registrant’s internal control over financial reporting. |
| Item 12. | Disclosure of Securities Lending Activities for Closed-End Management Investment Companies. |
Not applicable.
| | (a) | (1) Code of Ethics applicable to its Principal Executive and Principal Accounting Officers pursuant to Section 406 of the Sarbanes-Oxley Act of 2002 attached hereto as Exhibit 99.406.Code of Ethics. |
| | | (2) Certifications pursuant to Rule30a-2(a) under the Investment Company Act of 1940 (17 CFR 270.30a-2(a)) attached hereto as Exhibit 99.CERT. |
| | (b) | Certification pursuant to Rule30a-2 (b) under the Investment Company Act of 1940 (17 CFR270.30a-2 (a)) and Section 906 of the Sarbanes-Oxley Act of 2002 attached hereto as Exhibit 99.906.CERT. |
SIGNATURES
Pursuant to the requirements of the Securities Exchange Act of 1934 and the Investment Company Act of 1940, the registrant has duly caused this report to be signed on its behalf by the undersigned, thereunto duly authorized.
| | |
| VALIC Company II |
| |
| By: | | /s/ John T. Genoy |
| | John T. Genoy |
| | President |
Date: November 08, 2019
Pursuant to the requirements of the Securities Exchange Act of 1934 and the Investment Company Act of 1940, this report has been signed below by the following persons on behalf of the registrant and in the capacities and on the dates indicated.
| | |
| By: | | /s/ John T. Genoy |
| | John T. Genoy |
| | President |
Date: November 08, 2019
| | |
| By: | | /s/ Gregory R. Kingston |
| | Gregory R. Kingston |
| | Treasurer |
Date: November 08, 2019