UNITEDSTATES
SECURITIESANDEXCHANGECOMMISSION
Washington,D.C.20549
FORM N-CSR
CERTIFIED SHAREHOLDER REPORT OF REGISTERED MANAGEMENT
INVESTMENT COMPANIES
Investment Company Act file number 811-08797 and 811-09049
Name of Fund: BlackRock Small Cap Growth Fund II of BlackRock Series, Inc. and BlackRock
Master Small Cap Growth Portfolio of BlackRock Master LLC
Fund Address: 100 Bellevue Parkway, Wilmington, DE 19809
Name and address of agent for service: Donald C. Burke, Chief Executive Officer, BlackRock Small
Cap Growth Fund II of BlackRock Series, Inc. and BlackRock Master Small Cap Growth
Portfolio of BlackRock Master LLC, 800 Scudders Mill Road, Plainsboro, NJ, 08536.
Mailing address: P.O. Box 9011, Princeton, NJ, 08543-9011
Registrant’s telephone number, including area code: (800) 441-7762
Date of fiscal year end: 05/31/2009
Date of reporting period: 05/31/2009
Item 1 – Report to Stockholders
EQUITIES FIXED INCOME REAL ESTATE LIQUIDITY ALTERNATIVES BLACKROCK SOLUTIONS
BlackRock Small Cap
Growth Fund II
OF BLACKROCK SERIES, INC.
ANNUAL REPORT | MAY 31, 2009
NOT FDIC INSURED
MAY LOSE VALUE
NO BANK GUARANTEE
| Table of Contents | |
| Page | |
| Dear Shareholder | 3 |
| Annual Report: | |
| Fund Summary | 4 |
| About Fund Performance | 6 |
| Disclosure of Expenses | 6 |
| Fund Financial Statements: | |
| Statement of Assets and Liabilities | 7 |
| Statement of Operations | 8 |
| Statements of Changes in Net Assets | 9 |
| Fund Financial Highlights | 10 |
| Fund Notes to Financial Statements | 13 |
| Fund Report of Independent Registered Public Accounting Firm | 17 |
| Portfolio Information | 18 |
| Portfolio Financial Statements: | |
| Schedule of Investments | 19 |
| Statement of Assets and Liabilities | 22 |
| Statement of Operations | 23 |
| Statements of Changes in Net Assets | 24 |
| Portfolio Financial Highlights | 24 |
| Portfolio Notes to Financial Statements | 25 |
| Portfolio Report of Independent Registered Public Accounting Firm | 27 |
| Disclosure of Investment Advisory Agreement and Sub-Advisory Agreement | 28 |
| Officers and Directors | 32 |
| Additional Information | 35 |
| Mutual Fund Family | 38 |
2 BLACKROCK SMALL CAP GROWTH FUND II MAY 31, 2009
Dear Shareholder
The past 12 months reveal a tale of two markets — one of investor pessimism and decided weakness, and another of optimism and some nascent
signs of recovery. The first half of the year was characterized by the former as the global financial crisis erupted into the worst recession in decades.
Economic data were uniformly poor and daily headlines recounted financial sector casualties, volatile swings in global financial markets, and monu-
mental government actions that included widespread (and globally coordinated) monetary and quantitative easing by central banks and large-scale
fiscal stimuli. Sentiment improved noticeably in March, however, on the back of new program announcements by the Treasury and Federal Reserve,
as well as better-than-expected economic data, particularly in retail sales, consumer confidence and select areas of the housing market.
Against this backdrop, US equities contended with unprecedented volatility, posting steep declines early, and then recouping those losses — and more —
in the final three months of the reporting period. The experience in international markets was similar to that in the United States, though there was a
marked divergence in regional performance. Notably, emerging economies, which lagged most developed regions through the downturn, were among
the market leaders during the late-period rally.
In fixed income markets, while risk aversion was a prevalent theme, relatively attractive yields and distressed valuations, alongside a more favorable
macro environment, eventually captured investor attention and led to a sharp recovery in non-Treasury assets. A notable example from the opposite
end of the credit spectrum was the high yield sector, which has firmly outpaced all other taxable asset classes since the start of 2009. At the same
time, the municipal bond market enjoyed a strong return after the exceptional market volatility of 2008, buoyed by a combination of attractive valua-
tions, stable retail investor demand and a slowdown in forced selling. Direct aid to state and local governments via the American Recovery and
Reinvestment Act of 2009 has also lent support.
| All told, results for the major benchmark indices reflected a bifurcated market. | ||
| Total Returns as of May 31, 2009 | 6-month | 12-month |
| US equities (S&P 500 Index) | 4.05% | (32.57)% |
| Small cap US equities (Russell 2000 Index) | 7.02 | (31.79) |
| International equities (MSCI Europe, Australasia, Far East Index) | 15.10 | (36.61) |
| US Treasury securities (Merrill Lynch 10-Year US Treasury Index) | (2.78) | 8.52 |
| Taxable fixed income (Barclays Capital US Aggregate Bond Index) | 5.10 | 5.36 |
| Tax-exempt fixed income (Barclays Capital Municipal Bond Index) | 9.00 | 3.57 |
| High yield bonds (Barclays Capital US Corporate High Yield 2% Issuer Capped Index) | 36.14 | (7.06) |
| Past performance is no guarantee of future results. Index performance shown for illustrative purposes only. You cannot invest directly in an index. | ||
Through periods of market turbulence, as ever, BlackRock’s full resources are dedicated to the management of our clients’ assets. For additional insight
and timely “food for thought,” we invite you to visit our award-winning Shareholder® magazine, now available exclusively online at www.blackrock.com/
shareholdermagazine. We thank you for entrusting BlackRock with your investments, and we look forward to continuing to serve you in the months and
years ahead.

Announcement to Shareholders
On June 16, 2009, BlackRock, Inc. announced that it received written notice from Barclays PLC (“Barclays”) in which Barclays’ Board of Directors had
accepted BlackRock’s offer to acquire Barclays Global Investors (“BGI”). Barclays also notified BlackRock that its Board will recommend the transaction to
Barclays’ shareholders for approval at a special meeting to be held in early August 2009. The combination of BlackRock and BGI will bring together market
leaders in active and index strategies to create one of the preeminent asset management firms. The transaction is expected to close in the fourth quarter
2009 following approval by Barclays’ shareholders, the receipt of client consents and regulatory approvals, and satisfaction of customary closing conditions.
THIS PAGE NOT PART OF YOUR FUND REPORT
3
Fund Summary as of May 31, 2009 BlackRock Small Cap Growth Fund II
Portfolio Management Commentary
How did the Fund perform?
•The Fund, through its investment in BlackRock Master Small Cap Growth
Portfolio (the “Portfolio”), underperformed the benchmark Russell 2000
Growth Index for the 12-month period ended May 31, 2009.
What factors influenced performance?
•Weak stock selection in the health care and consumer discretionary sec-
tors detracted from performance relative to the benchmark.
•The health care sector was the biggest disappointment, as equipment
& supplies company ArthroCare Corp. declined by nearly 85% after the
company announced a restatement of prior-period financial results. Zoll
Medical Corp., a manufacturer of defibrillator devices, pulled back 45%
on increasing concerns about decreased spending in hospital budgets.
Additionally, the Portfolio’s holding in Wright Medical Group, Inc. dipped
more than 40% after slower growth in the company’s artificial knee and
hip replacement business.
•Among the detractors in the consumer discretionary sector were RHI
Entertainment, Inc., a made-for-TV movie database provider that dropped
85% on fears of potential bankruptcy, and ticketing service provider
Ticketmaster Entertainment, which fell by more than 80% after the com-
pany indicated slowing revenues ahead of its potential merger with rival
LiveNation.
•Relative performance was positively affected by stock selection within
the materials sector, including fertilizer producer Agrium Inc., which
gained more than 35% on increased demand and a strong pricing envi-
ronment. Additionally, chemicals company Celanese Corp. surged 38%
on strong financial results for the period. Outside of materials, a notable
contribution to relative performance came from coffee distributor Green
Mountain Coffee Roasters, Inc., whose stock jumped by more than 50%
on strong profits from its Keurig coffee machine business and the com-
pany’s announced distribution relationship with Wal-Mart.
Describe recent portfolio activity.
•During the annual period, we slightly increased exposure to the health
care sector, although this area remains the Portfolio’s largest under-
weight relative to the benchmark due to its limited holdings in the
biotechnology space. We slightly increased exposure to the consumer
discretionary sector, adding Dreamworks Animation SKG, Inc. and
lululemon athletica, inc., among others.
Describe Fund positioning at period end.
•As of May 31, 2009, the Portfolio’s most significant overweight was the
information technology sector. The most significant underweight contin-
ues to be the health care sector.
The views expressed reflect the opinions of BlackRock as of the date of this report and are subject to change based on changes in market, economic or other conditions.
These views are not intended to be a forecast of future events and are no guarantee of future results.
| Expense Example | ||||||
| Actual | Hypothetical2 | |||||
| Beginning | Ending | Beginning | Ending | |||
| Account Value | Account Value | Expenses Paid | Account Value | Account Value | Expenses Paid | |
| December 1, 2008 | May 31, 2009 | During the Period1 | December 1, 2008 | May 31, 2009 | During the Period1 | |
| Institutional | $1,000 | $1,155.90 | $ 7.82 | $1,000 | $1,017.75 | $ 7.31 |
| Investor A | $1,000 | $1,155.60 | $ 8.95 | $1,000 | $1,016.70 | $ 8.37 |
| Investor B | $1,000 | $1,146.20 | $16.47 | $1,000 | $1,009.65 | $15.42 |
| Investor C | $1,000 | $1,147.00 | $15.35 | $1,000 | $1,010.70 | $14.38 |
| Class R | $1,000 | $1,150.40 | $11.99 | $1,000 | $1,013.85 | $11.23 |
1 For each class of the Fund, expenses are equal to the annualized expense ratio for the class (1.45% for Institutional, 1.66% for Investor A, 3.07% for Investor B, 2.86% for
Investor C and 2.23% for Class R), multiplied by the average account value over the period, multiplied by 182/364 (to reflect the one-half year period shown). Because the
Fund is a feeder fund, the expense table example reflects the expenses of both the feeder fund and the master portfolio in which it invests.
2 Hypothetical 5% annual return before expenses is calculated by pro-rating the number of days in the most recent fiscal half year divided by 364.
See “Disclosure of Expenses” on page 6 for further information on how expenses were calculated.
4 BLACKROCK SMALL CAP GROWTH FUND II
MAY 31, 2009
Total Return Based on a $10,000 Investment
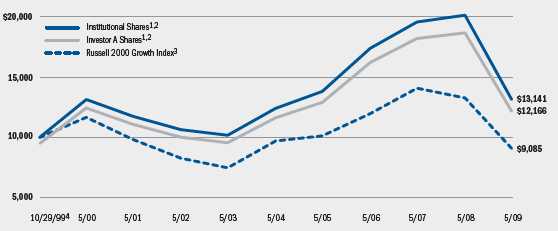
1 Assuming maximum sales charge, if any, transaction costs and other operating expenses, including administration fees. Institutional Shares do
not have a sales charge.
2 The Fund invests all of its assets in BlackRock Master Small Cap Growth Portfolio of BlackRock Master LLC. The Portfolio invests primarily
in a diversified portfolio of equity securities of small cap companies located in the United States that the Manager believes are undervalued or
have good prospects for earnings growth.
3 This unmanaged index measures the performance of those Russell 2000 companies with higher price-to-book ratios and higher forecasted
growth values. Russell 2000 is a registered trademark of the Frank Russell Company.
4 Commencement of operations.
| Performance Summary for the Period Ended May 31, 2009 | |||||||
| Average Annual Total Returns5 | |||||||
| 1 Year | 5 Years | Since Inception6 | |||||
| 6-Month | w/o sales | w/sales | w/o sales | w/sales | w/o sales | w/sales | |
| Total Returns | charge | charge | charge | charge | charge | charge | |
| Institutional | 15.59% | (34.72)% | N/A | 1.15% | N/A | 2.89% | N/A |
| Investor A | 15.56 | (34.82) | (38.24)% | 0.91 | (0.17)% | 2.64 | 2.07% |
| Investor B | 14.62 | (35.76) | (38.65) | (0.06) | (0.37) | 1.97 | 1.97 |
| Investor C | 14.70 | (35.57) | (36.22) | 0.01 | 0.01 | 1.77 | 1.77 |
| Class R | 15.04 | (35.22) | N/A | 0.54 | N/A | 2.43 | N/A |
| Russell 2000 Growth Index | 13.72 | (31.55) | N/A | (1.31) | N/A | (1.00) | N/A |
5 Assuming maximum sales charges, if any. Average annual total returns with and without sales charges reflect reductions for distribution and service fees. See “About Fund
Performance” on page 6 for a detailed description of share classes, including any related sales charges and fees.
6 The Fund commenced operations on 10/29/99.
N/A — Not applicable as share class and index do not have a sales charge.
Past performance is not indicative of future results.
BLACKROCK SMALL CAP GROWTH FUND II
MAY 31, 2009
5
About Fund Performance
•Institutional Shares are not subject to any sales charge. Institutional
Shares bear no ongoing distribution or service fees and are available
only to eligible investors.
•Investor A Shares incur a maximum initial sales charge (front-end load)
of 5.25% and a service fee of 0.25% per year (but no distribution fee).
•Investor B Shares are subject to a maximum contingent deferred sales
charge of 4.50% declining to 0% after six years. In addition, Investor B
Shares are subject to a distribution fee of 0.75% per year and a service
fee of 0.25% per year. These shares automatically convert to Investor A
Shares after approximately eight years. (There is no initial sales charge
for automatic share conversions.) All returns for periods greater than
eight years reflect this conversion. Investor B Shares of the Fund are no
longer available for purchase except through exchanges, dividend rein-
vestments, and for purchase by certain qualified employee benefit plans.
•Investor C Shares are subject to a distribution fee of 0.75% and a service
fee of 0.25% per year. In addition, Investor C Shares are subject to a 1%
contingent deferred sales charge if redeemed within one year of purchase.
•Class R Shares do not incur a maximum initial sales charge (front-end
load) or deferred sales charge. These shares are subject to a distribution
fee of 0.25% per year and a service fee of 0.25% per year. Class R
Shares are available only to certain retirement plans. Prior to inception,
Class R Share performance results are those of Institutional Shares
(which have no distribution or service fees) restated to reflect Class R
Share fees.
Performance information reflects past performance and does not guar-
antee future results. Current performance may be lower or higher than the
performance data quoted. Refer to www.blackrock.com/funds to obtain
performance data current to the most recent month-end. Performance
results do not reflect the deduction of taxes that a shareholder would
pay on fund distributions or the redemption of fund shares. The Fund
may charge a 2% redemption fee for sales or exchanges of shares within
30 days of purchase or exchange. Performance data does not reflect
this potential fee. Figures shown in the performance tables on page 5
assume reinvestment of all dividends and capital gain distributions, if
any, at net asset value on the ex-dividend date. Investment return and
principal value of shares will fluctuate so that shares, when redeemed,
may be worth more or less than their original cost. Dividends paid to each
class of shares will vary because of the different levels of service, distri-
bution and transfer agency fees applicable to each class, which are
deducted from the income available to be paid to shareholders.
Disclosure of Expenses
Shareholders of this Fund may incur the following charges: (a) expenses
related to transactions, including sales charges, redemption fees and
exchange fees; and (b) operating expenses including advisory fees, distri-
bution fees including 12b-1 fees, and other Fund expenses. The expense
example on page 4 (which is based on a hypothetical investment of
$1,000 invested on December 1, 2008 and held through May 31, 2009)
is intended to assist shareholders both in calculating expenses based on
an investment in the Fund and in comparing these expenses with similar
costs of investing in other mutual funds.
The table provides information about actual account values and actual
expenses. In order to estimate the expenses a shareholder paid during the
period covered by this report, shareholders can divide their account value
by $1,000 and then multiply the result by the number corresponding
to their share class under the heading entitled “Expenses Paid During
the Period.”
The table also provides information about hypothetical account values
and hypothetical expenses based on the Fund’s actual expense ratio and
an assumed rate of return of 5% per year before expenses. In order to
assist shareholders in comparing the ongoing expenses of investing in this
Fund and other funds, compare the 5% hypothetical example with the 5%
hypothetical examples that appear in other funds’ shareholder reports.
The expenses shown in the table are intended to highlight shareholders’
ongoing costs only and do not reflect any transactional expenses, such as
sales charges, redemption fees or exchange fees. Therefore, the hypotheti-
cal table is useful in comparing ongoing expenses only, and will not help
shareholders determine the relative total expenses of owning different
funds. If these transactional expenses were included, shareholder expenses
would have been higher.
6 BLACKROCK SMALL CAP GROWTH FUND II
MAY 31, 2009
| Statement of Assets and Liabilities | BlackRock Small Cap Growth Fund II | |
| May 31, 2009 | ||
| Assets | ||
| Investment at value — BlackRock Master Small Cap Growth Portfolio (the “Portfolio”) (cost — $388,316,137) | $ 356,614,282 | |
| Capital shares sold receivable | 464,373 | |
| Withdrawals receivable from the Portfolio | 288,962 | |
| Prepaid expenses | 34,878 | |
| Total assets | 357,402,495 | |
| Liabilities | ||
| Capital shares redeemed payable | 753,335 | |
| Transfer agent fees payable | 241,923 | |
| Distribution fees payable | 96,215 | |
| Administration fees payable | 54,698 | |
| Other affiliates payable | 10,421 | |
| Officer’s and Directors’ fees payable | 21 | |
| Other accrued expenses payable | 32,596 | |
| Total liabilities | 1,189,209 | |
| Net Assets | $ 356,213,286 | |
| Net Assets Consist of | ||
| Paid-in capital | $ 485,600,666 | |
| Undistributed net investment income | 76,016 | |
| Accumulated net realized loss allocated from the Portfolio | (97,761,541) | |
| Net unrealized appreciation/depreciation allocated from the Portfolio | (31,701,855) | |
| Net Assets | $ 356,213,286 | |
| Net Asset Value | ||
| Institutional — Based on net assets of $89,346,089 and 9,633,790 shares outstanding, 100 million shares authorized, $0.0001 par value | $ 9.27 | |
| Investor A — Based on net assets of $161,557,301 and 17,837,520 shares outstanding, 100 million shares authorized, $0.0001 par value | $ 9.06 | |
| Investor B — Based on net assets of $12,196,664 and 1,453,237 shares outstanding, 100 million shares authorized, $0.0001 par value | $ 8.39 | |
| Investor C — Based on net assets of $53,668,244 and 6,425,511 shares outstanding, 100 million shares authorized, $0.0001 par value | $ 8.35 | |
| Class R — Based on net assets of $39,444,988 and 4,521,217 shares outstanding, 100 million shares authorized, $0.0001 par value | $ 8.72 | |
See Notes to Financial Statements.
BLACKROCK SMALL CAP GROWTH FUND II MAY 31, 2009 7
| Statement of Operations | BlackRock Small Cap Growth Fund II |
| Year Ended May 31, 2009 | |
| Investment Loss | |
| Net investment loss allocated from the Portfolio: | |
| Dividends | $ 1,235,903 |
| Foreign tax withheld | (549) |
| Interest | 69,022 |
| Securities lending — affiliated | 1,205,161 |
| Income — affiliated | 1,599 |
| Expenses | (3,029,768) |
| Total loss | (518,632) |
| Expenses | |
| Administration | 774,354 |
| Service — Investor A | 419,478 |
| Service and distribution — Investor B | 171,769 |
| Service and distribution — Investor C | 632,821 |
| Service and distribution — Class R | 168,667 |
| Transfer agent — Institutional | 323,726 |
| Transfer agent — Investor A | 510,146 |
| Transfer agent — Investor B | 145,223 |
| Transfer agent — Investor C | 395,316 |
| Transfer agent — Class R | 192,786 |
| Printing | 94,694 |
| Registration | 70,707 |
| Professional | 39,210 |
| Officer and Directors | 133 |
| Miscellaneous | 16,089 |
| Total expenses | 3,955,119 |
| Net investment loss | (4,473,751) |
| Realized and Unrealized Loss Allocated From the Portfolio | |
| Net realized loss from investments | (97,136,788) |
| Net change in unrealized appreciation/depreciation on investments | (92,607,388) |
| Total realized and unrealized loss | (189,744,176) |
| Net Decrease in Net Assets Resulting from Operations | $ (194,217,927) |
See Notes to Financial Statements.
8 BLACKROCK SMALL CAP GROWTH FUND II MAY 31, 2009
| Statements of Changes in Net Assets | BlackRock Small Cap Growth Fund II | |
| Year Ended May 31, | ||
| Increase (Decrease) in Net Assets: | 2009 | 2008 |
| Operations | ||
| Net investment loss | $ (4,473,751) | $ (5,581,192) |
| Net realized gain (loss) | (97,136,788) | 30,599,653 |
| Net change in unrealized appreciation/depreciation | (92,607,388) | (12,304,369) |
| Net increase (decrease) in net assets resulting from operations | (194,217,927) | 12,714,092 |
| Distributions to Shareholders From | ||
| Net realized gain: | ||
| Institutional | — | (24,799,659) |
| Investor A | — | (31,351,738) |
| Investor B | — | (7,629,805) |
| Investor C | — | (15,093,297) |
| Class R | — | (3,909,293) |
| Tax return of capital: | ||
| Institutional | — | (165,528) |
| Investor A | — | (232,733) |
| Investor B | — | (43,175) |
| Investor C | — | (110,892) |
| Class R | — | (32,423) |
| Decrease in net assets resulting from distributions to shareholders | — | (83,368,543) |
| Capital Share Transactions | ||
| Net increase (decrease) in net assets derived from capital share transactions | (2,749,422) | 85,217,124 |
| Redemption Fee | ||
| Redemption fee | 36,169 | 5,519 |
| Net Assets | ||
| Total increase (decrease) in net assets | (196,931,180) | 14,568,192 |
| Beginning of year | 553,144,466 | 538,576,274 |
| End of year | $ 356,213,286 | $ 553,144,466 |
| End of year undistributed net investment income | $ 76,016 | — |
See Notes to Financial Statements.
BLACKROCK SMALL CAP GROWTH FUND II MAY 31, 2009 9
| Financial Highlights | BlackRock Small Cap Growth Fund II | |||||||||||
| Institutional | Investor A | |||||||||||
| Year Ended May 31, | Year Ended May 31, | |||||||||||
| 2009 | 2008 | 2007 | 2006 | 2005 | 2009 | 2008 | 2007 | 2006 | 2005 | |||
| Per Share Operating Performance | ||||||||||||
| Net asset value, beginning of year | $ 14.20 | $ 16.26 | $ 15.74 | $ 12.50 | $ 11.23 | $ 13.90 | $ 15.96 | $ 15.51 | $ 12.34 | $ 11.12 | ||
| Net investment loss1 | (0.07) | (0.09) | (0.14) | (0.14) | (0.11) | (0.09) | (0.12) | (0.18) | (0.17) | (0.14) | ||
| Net realized and unrealized gain (loss)2 | (4.86) | 0.48 | 1.95 | 3.38 | 1.38 | (4.75) | 0.46 | 1.92 | 3.34 | 1.36 | ||
| Net increase (decrease) from investment | ||||||||||||
| operations | (4.93) | 0.39 | 1.81 | 3.24 | 1.27 | (4.84) | 0.34 | 1.74 | 3.17 | 1.22 | ||
| Distributions from: | ||||||||||||
| Net realized gain | — | (2.43) | (1.29) | — | — | — | (2.38) | (1.29) | — | — | ||
| Tax return of capital | — | (0.02) | — | — | — | — | (0.02) | — | — | — | ||
| Total distributions | — | (2.45) | (1.29) | — | — | — | (2.40) | (1.29) | — | — | ||
| Net asset value, end of year | $ 9.27 | $ 14.20 | $ 16.26 | $ 15.74 | $ 12.50 | $ 9.06 | $ 13.90 | $ 15.96 | $ 15.51 | $ 12.34 | ||
| Total Investment Return3 | ||||||||||||
| Based on net asset value | (34.72)%4 | 2.88% | 12.50% | 25.92% | 11.31% | (34.82)%4 | 2.57% | 12.23% | 25.69% | 10.97% | ||
| Ratios to Average Net Assets5 | ||||||||||||
| Total expenses | 1.35% | 1.25% | 1.28% | 1.22% | 1.25% | 1.59% | 1.51% | 1.54% | 1.47% | 1.50% | ||
| Net investment loss | (0.69)% | (0.59)% | (0.93)% | (0.93)% | (0.95)% | (0.95)% | (0.83)% | (1.18)% | (1.18)% | (1.20)% | ||
| Supplemental Data | ||||||||||||
| Net assets, end of year (000) | $ 89,346 | $157,805 | $162,580 | $167,907 | $125,301 | $161,557 | $232,600 | $194,561 | $154,179 | $114,558 | ||
| Portfolio turnover of the Portfolio | 75% | 70% | 115% | 101% | 129% | 75% | 70% | 115% | 101% | 129% | ||
1 Based on average shares outstanding.
2 Includes a redemption fee, which is less than $0.01 per share.
3 Total investment returns exclude the effects of any sales charges.
4 Total return calculation includes redemption fees received by the Fund. The impact to the return is less than 0.01%.
5 Includes the Fund’s share of the Portfolio’s allocated expenses and/or net investment loss.
See Notes to Financial Statements.
10 BLACKROCK SMALL CAP GROWTH FUND II MAY 31, 2009
| Financial Highlights (continued) | BlackRock Small Cap Growth Fund II | |||||||||||
| Investor B | Investor C | |||||||||||
| Year Ended May 31, | Year Ended May 31, | |||||||||||
| 2009 | 2008 | 2007 | 2006 | 2005 | 2009 | 2008 | 2007 | 2006 | 2005 | |||
| Per Share Operating Performance | ||||||||||||
| Net asset value, beginning of year | $ 13.06 | $ 15.01 | $ 14.78 | $ 11.85 | $ 10.77 | $ 12.96 | $ 14.99 | $ 14.76 | $ 11.84 | $ 10.75 | ||
| Net investment loss1 | (0.21) | (0.26) | (0.28) | (0.27) | (0.23) | (0.18) | (0.24) | (0.28) | (0.28) | (0.23) | ||
| Net realized and unrealized gain (loss)2 | (4.46) | 0.45 | 1.80 | 3.20 | 1.31 | (4.43) | 0.43 | 1.80 | 3.20 | 1.32 | ||
| Net increase (decrease) from investment | ||||||||||||
| operations | (4.67) | 0.19 | 1.52 | 2.93 | 1.08 | (4.61) | 0.19 | 1.52 | 2.92 | 1.09 | ||
| Distributions from: | ||||||||||||
| Net realized gain | — | (2.12) | (1.29) | — | — | — | (2.20) | (1.29) | — | — | ||
| Tax return of capital | — | (0.02) | — | — | — | — | (0.02) | — | — | — | ||
| Total distributions | — | (2.14) | (1.29) | — | — | — | (2.22) | (1.29) | — | — | ||
| Net asset value, end of year | $ 8.39 | $ 13.06 | $ 15.01 | $ 14.78 | $ 11.85 | $ 8.35 | $ 12.96 | $ 14.99 | $ 14.76 | $ 11.84 | ||
| Total Investment Return3 | ||||||||||||
| Based on net asset value | (35.76)%4 | 1.61% | 11.29% | 24.73% | 10.03% | (35.57)%4 | 1.63% | 11.31% | 24.66% | 10.14% | ||
| Ratios to Average Net Assets5 | ||||||||||||
| Total expenses | 2.88% | 2.49% | 2.35% | 2.25% | 2.28% | 2.66% | 2.43% | 2.36% | 2.27% | 2.30% | ||
| Net investment loss | (2.22)% | (1.89)% | (1.99)% | (1.96)% | (1.98)% | (2.01)% | (1.77)% | (2.01)% | (1.98)% | (1.99)% | ||
| Supplemental Data | ||||||||||||
| Net assets, end of year (000) | $ 12,197 | $ 29,045 | $ 60,086 | $ 72,350 | $ 62,827 | $ 53,668 | $ 96,449 | $ 99,938 | $ 75,678 | $ 43,839 | ||
| Portfolio turnover of the Portfolio | 75% | 70% | 115% | 101% | 129% | 75% | 70% | 115% | 101% | 129% | ||
1 Based on average shares outstanding.
2 Includes a redemption fee, which is less than $0.01 per share.
3 Total investment returns exclude the effects of sales charges.
4 Total return calculation includes redemption fees received by the Fund. The impact to the return is less than 0.01%.
5 Includes the Fund’s share of the Portfolio’s allocated expenses and/or net investment loss.
See Notes to Financial Statements.
BLACKROCK SMALL CAP GROWTH FUND II MAY 31, 2009 11
| Financial Highlights (concluded) | BlackRock Small Cap Growth Fund II | |||||
| Class R | ||||||
| Year Ended May 31, | ||||||
| 2009 | 2008 | 2007 | 2006 | 2005 | ||
| Per Share Operating Performance | ||||||
| Net asset value, beginning of year | $ 13.46 | $ 15.54 | $ 15.18 | $ 12.11 | $ 10.94 | |
| Net investment loss1 | (0.14) | (0.17) | (0.22) | (0.21) | (0.17) | |
| Net realized and unrealized gain (loss)2 | (4.60) | 0.44 | 1.87 | 3.28 | 1.34 | |
| Net increase (decrease) from investment operations | (4.74) | 0.27 | 1.65 | 3.07 | 1.17 | |
| Distributions from: | ||||||
| Net realized gain | — | (2.33) | (1.29) | — | — | |
| Total return of capital | — | (0.02) | — | — | — | |
| Total distributions | — | (2.35) | (1.29) | — | — | |
| Net asset value, end of year | $ 8.72 | $ 13.46 | $ 15.54 | $ 15.18 | $ 12.11 | |
| Total Investment Return | ||||||
| Based on net asset value | (35.22)%3 | 2.12% | 11.88% | 25.35% | 10.69% | |
| Ratios to Average Net Assets4 | ||||||
| Total expenses | 2.12% | 1.95% | 1.86% | 1.72% | 1.76% | |
| Net investment loss | (1.49)% | (1.26)% | (1.50)% | (1.43)% | (1.44)% | |
| Supplemental Data | ||||||
| Net assets, end of year (000) | $ 39,445 | $ 37,245 | $ 21,412 | $ 11,423 | $ 2,457 | |
| Portfolio turnover of the Portfolio | 75% | 70% | 115% | 101% | 129% | |
1 Based on average shares outstanding.
2 Includes a redemption fee, which is less than $0.01 per share.
3 Total return calculation includes redemption fees received by the Fund. The impact to the return is less than 0.01%.
4 Includes the Fund’s share of the Portfolio’s allocated expenses and/or net investment loss.
See Notes to Financial Statements.
12 BLACKROCK SMALL CAP GROWTH FUND II MAY 31, 2009
Notes to Financial Statements BlackRock Small Cap Growth Fund II
1. Organization and Significant Accounting Policies:
BlackRock Small Cap Growth Fund II (the “Fund”) of BlackRock Series,
Inc. (the “Corporation”) is registered under the Investment Company
Act of 1940, as amended (the “1940 Act”), as a diversified, open-end
management investment company. The Corporation is organized as a
Maryland corporation. The Fund seeks to achieve its investment objective
by investing all of its assets in BlackRock Master Small Cap Growth
Portfolio (the “Portfolio”) of BlackRock Master LLC (the “Master LLC”),
which has the same investment objective and strategies as the Fund. The
value of the Fund’s investment in the Portfolio reflects the Fund’s propor-
tionate interest in the net assets of the Portfolio. The percentage of the
Portfolio owned by the Fund at May 31, 2009 was 100%. The perform-
ance of the Fund is directly affected by the performance of the Portfolio.
The financial statements of the Portfolio, including the Schedule of
Investments, are included elsewhere in this report and should be read
in conjunction with the Fund’s financial statements. The Fund’s financial
statements are prepared in conformity with accounting principles gener-
ally accepted in the United States of America, which may require the use
of management accruals and estimates. Actual results may differ from
these estimates. The Fund offers multiple classes of shares. Institutional
Shares are sold without a sales charge and only to certain eligible
investors. Investor A Shares are generally sold with a front-end sales
charge. Investor B and Investor C Shares may be subject to a contingent
deferred sales charge. Investor B Shares of the Fund are no longer avail-
able for purchase except through exchanges, dividend reinvestments,
and for purchase by certain qualified employee benefit plans. Class R
Shares are sold only to certain retirement or similar plans. All classes
of shares have identical voting, dividend, liquidation and other rights
and the same terms and conditions, except that Investor A, Investor B,
Investor C and Class R Shares bear certain expenses related to the
shareholder servicing of such shares, and Investor B, Investor C and
Class R Shares also bear certain expenses related to the distribution of
such shares. Each class has exclusive voting rights with respect to mat-
ters relating to its shareholder servicing and distribution expenditures
(except that Investor B shareholders may vote on material changes to
the Investor A distribution plan).
The following is a summary of significant accounting policies followed by
the Fund:
Valuation of Investments: The Fund records its investment in the Portfolio
at fair value. Valuation of securities held by the Portfolio is discussed in
Note 1 of the Portfolio’s Notes to Financial Statements, which are
included elsewhere in this report.
Effective June 1, 2008, the Fund adopted Financial Accounting Standards
Board Statement of Financial Accounting Standards No. 157, “Fair Value
Measurements” (“FAS 157”). FAS 157 clarifies the definition of fair
value, establishes a framework for measuring fair values and requires
additional disclosures about the use of fair value measurements. Various
inputs are used in determining the fair value of investments, which are
as follows:
•Level 1 — price quotations in active markets/exchanges for identical
securities
•Level 2 — other observable inputs (including, but not limited to:
quoted prices for similar assets or liabilities in markets that are
active, quoted prices for identical or similar assets or liabilities in
markets that are not active, inputs other than quoted prices that are
observable for the assets or liabilities (such as interest rates, yield
curves, volatilities, prepayment speeds, loss severities, credit risks
and default rates) or other market corroborated inputs)
•Level 3 — unobservable inputs based on the best information avail-
able in the circumstances, to the extent observable inputs are not
available (including the Fund’s own assumptions used in determining
the fair value of investments)
The inputs or methodology used for valuing securities are not necessarily
an indication of the risk associated with investing in those securities.
The following table summarizes the inputs used as of May 31, 2009 in
determining the fair valuation of the Fund’s investment:
| Investment in | |
| Valuation Inputs | the Master LLC |
| Assets | |
| Level 1 | — |
| Level 2 | $356,614,282 |
| Level 3 | — |
| Total | $356,614,282 |
Investment Transactions and Net Investment Income: Investment trans-
actions in the Portfolio are accounted for on a trade date basis. The
Fund records daily its proportionate share of the Portfolio’s income,
expenses and realized and unrealized gains and losses. In addition,
the Fund accrues its own expenses. Income and realized and unrealized
gains and losses are allocated daily to each class based on its relative
net assets.
Dividends and Distributions: Dividends and distributions paid by the
Fund are recorded on the ex-dividend dates.
Income Taxes: It is the Fund’s policy to comply with the requirements
of the Internal Revenue Code applicable to regulated investment com-
panies and to distribute substantially all of its taxable income to its
shareholders. Therefore, no federal income tax provision is required.
Under the applicable foreign tax laws, a withholding tax may be
imposed on interest, dividends and capital gains at various rates.
The Fund files US federal and various state and local tax returns. No
income tax returns are currently under examination. The statutes of limi-
tations on the Fund’s US federal tax returns remain open for each of the
BLACKROCK SMALL CAP GROWTH FUND II
MAY 31, 2009
13
Notes to Financial Statements (continued) BlackRock Small Cap Growth Fund II
four years ended May 31, 2009. The statutes of limitations on the Fund’s
state and local tax returns may remain open for an additional year
depending upon the jurisdiction.
Other: Expenses directly related to the Fund or its classes are charged to
that Fund or class. Other operating expenses shared by several funds are
pro-rated among those funds on the basis of relative net assets or other
appropriate methods. Other expenses of the Fund are allocated daily to
each class based on its relative net assets.
2. Transactions with Affiliates:
The PNC Financial Services Group, Inc. (“PNC”) and Bank of America
Corporation (“BAC”) are the largest stockholders of BlackRock, Inc.
(“BlackRock”). BAC became a stockholder of BlackRock following its
acquisition of Merrill Lynch & Co., Inc. (“Merrill Lynch”) on January 1,
2009. Prior to that date, both PNC and Merrill Lynch were considered
affiliates of the Fund under the 1940 Act. Subsequent to the acquisition,
PNC remains an affiliate, but due to the restructuring of Merrill Lynch’s
ownership interest of BlackRock, BAC is not deemed to be an affiliate
under the 1940 Act.
The Corporation, on behalf of the Fund, has entered into an Administration
Agreement with BlackRock Advisors, LLC (the “Administrator”), an indirect,
wholly owned subsidiary of BlackRock, to provide administrative services
(other than investment advice and related portfolio activities). For such
services, the Fund pays a monthly fee at an annual rate of 0.20% of the
Fund’s average daily net assets.
Effective October 1, 2008, the Fund has entered into a Distribution
Agreement and Distribution Plans with BlackRock Investments, LLC
(“BIL”), which replaced FAM Distributors, Inc. (“FAMD”) and BlackRock
Distributors, Inc. and its affiliates (“BDI”) (collectively, the “Distributor”)
as the sole distributor of the Fund. FAMD is a wholly owned subsidiary
of Merrill Lynch Group, Inc. BIL and BDI are affiliates of BlackRock. The
service and distribution fees did not change as a result of this transaction.
Pursuant to the Distribution Plans adopted by the Corporation in accor-
dance with Rule 12b-1 under the 1940 Act, the Fund pays the Distributor
ongoing service and distribution fees. The fees are accrued daily and
paid monthly at annual rates based upon the average daily net assets
of the shares as follows:
| Service | Distribution | |
| Fee | Fee | |
| Investor A | 0.25% | — |
| Investor B | 0.25% | 0.75% |
| Investor C | 0.25% | 0.75% |
| Class R | 0.25% | 0.25% |
Pursuant to sub-agreements with the Distributor, broker-dealers, including
Merrill Lynch, Pierce, Fenner & Smith Incorporated (“MLPF&S”), a wholly
owned subsidiary of Merrill Lynch, and the Distributor provide shareholder
servicing and distribution services to the Fund. The ongoing service and/or
distribution fee compensates the Distributor and each broker-dealer for
providing shareholder servicing and/or distribution-related services to
Investor A, Investor B, Investor C and Class R shareholders.
For the year ended May 31, 2009, affiliates earned underwriting dis-
counts, direct commissions and dealer concessions on sales of the
Fund’s Investor A Shares which totaled $12,625. This amount includes
payments to Merrill Lynch from June 1, 2008 to December 31, 2008,
when it was considered an affiliate. Affiliates received contingent
deferred sales charges of $8,528 and $10,525 relating to transactions
in Investor B and Investor C Shares, respectively. Furthermore, affiliates
received contingent deferred sales charges of $687 relating to transac-
tions subject to front-end sales charge waivers on Investor A Shares.
PNC Global Investment Servicing (U.S.) Inc., an indirect, wholly owned
subsidiary of PNC and an affiliate of the Administrator, serves as transfer
agent and dividend disbursing agent. Each class of the Fund bears the
costs of transfer agent fees associated with such respective class.
Transfer agency fees borne by each class of the Fund are comprised
of those fees charged for all shareholder communications including
mailing of shareholder reports, dividend and distribution notices, and
proxy materials for shareholder meetings, as well as per account and per
transaction fees related to servicing and maintenance of shareholder
accounts, including the issuing, redeeming and transferring of shares of
each class of the Fund, 12b-1 fee calculation, check writing, anti-money
laundering services, and customer identification services.
Pursuant to written agreements, certain affiliates provide the Fund with
sub-accounting, recordkeeping, sub-transfer agency and other adminis-
trative services with respect to sub-accounts they service. For these
services, these affiliates receive an annual fee per shareholder account
which will vary depending on share class. For the year ended May 31,
2009, the Fund paid $848,198 in return for these services, which are
included in transfer agent fees in the Statement of Operations. This
amount includes payments to Merrill Lynch from June 1, 2008 to
December 31, 2008, when it was considered an affiliate.
The Fund may earn income on positive cash balances in demand
deposit accounts that are maintained by the transfer agent on behalf of
the Fund. For the year ended May 31, 2009, the Fund earned $232,
which is included in income — affiliated in the Statement of Operations.
The Administrator maintains a call center, which is responsible for pro-
viding certain shareholder services to the Fund, such as responding to
shareholder inquiries and processing transactions based upon instruc-
tions from shareholders with respect to the subscription and redemption
of Fund shares. For the year ended May 31, 2009, the Fund reimbursed
the Administrator the following amounts for costs incurred running the
call center, which are included in transfer agent fees in the Statement
of Operations.
14 BLACKROCK SMALL CAP GROWTH FUND II
MAY 31, 2009
Notes to Financial Statements (continued) BlackRock Small Cap Growth Fund II
| Call Center | |
| Fees | |
| Institutional | $ 2,270 |
| Investor A | $ 4,286 |
| Investor B | $ 651 |
| Investor C | $ 2,456 |
| Class R | $ 1,126 |
Certain officers and/or directors of the Fund are officers and/or directors
of BlackRock or its affiliates. The Fund reimburses the Administrator for
compensation paid to the Corporation’s Chief Compliance Officer.
3. Income Tax Information:
Reclassification: Accounting principles generally accepted in the United
States of America require that certain components of net assets be
adjusted to reflect permanent differences between financial and tax
reporting. These reclassifications have no effect on net assets or net asset
values per share. The following permanent differences as of May 31, 2009
attributable to net operating losses and the classification of settlement
proceeds were reclassified to the following:
| Paid-in capital | $(4,544,224) |
| Undistributed net investment income | $ 4,549,767 |
| Accumulated net realized loss allocated from the Portfolio | $ (5,543) |
The tax character of distributions paid during the years ended May 31,
2009 and 2008 were as follows:
| 5/31/2009 | 5/31/2008 | |
| Ordinary income | — | $27,863,905 |
| Net long-term capital gains | — | 54,919,887 |
| Tax return of capital | — | 584,751 |
| Total | — | $83,368,543 |
As of May 31, 2009, the tax components of accumulated losses were
as follows:
| Capital loss carryforwards | $ (7,466,634) |
| Net unrealized losses* | (121,920,746) |
| Total accumulated net losses | $(129,387,380) |
* The difference between book-basis and tax-basis net unrealized losses is attrib-
utable primarily to the deferral of post-October capital losses for tax purposes,
the tax deferral of losses on wash sales, the timing of income recognition from
partnerships and the difference between the book and tax treatment of certain
stock lending transactions.
As of May 31, 2009, the Fund had capital loss carryforwards of
$7,466,634 available to offset future realized capital gains that expire
on May 31, 2017.
| 4. Capital Share Transactions: | ||||
| Transactions in capital shares for each class were as follows: | ||||
| Year Ended | Year Ended | |||
| May 31, 2009 | May 31, 2008 | |||
| Shares | Amount | Shares | Amount | |
| Institutional Shares | ||||
| Shares sold | 2,564,378 | $ 24,815,863 | 2,111,452 | $ 30,348,284 |
| Shares issued to shareholders in reinvestment of distributions | — | — | 1,661,011 | 23,665,501 |
| Total issued | 2,564,378 | 24,815,863 | 3,772,463 | 54,013,785 |
| Shares redeemed | (4,042,413) | (38,405,355) | (2,656,417) | (38,134,584) |
| Net increase (decrease) | (1,478,035) | $ (13,589,492) | 1,116,046 | $ 15,879,201 |
| Investor A Shares | ||||
| Shares sold and automatic conversion of shares | 6,362,449 | $ 59,602,274 | 5,135,579 | $ 73,660,147 |
| Shares issued to shareholders in reinvestment of distributions | — | — | 2,219,213 | 31,029,679 |
| Total issued | 6,362,449 | 59,602,274 | 7,354,792 | 104,689,826 |
| Shares redeemed | (5,256,942) | (49,769,353) | (2,815,945) | (39,881,982) |
| Net increase | 1,105,507 | $ 9,832,921 | 4,538,847 | $ 64,807,844 |
| Investor B Shares | ||||
| Shares sold | 653,089 | $ 5,923,576 | 794,904 | $ 10,794,113 |
| Shares issued to shareholders in reinvestment of distributions | — | — | 540,676 | 7,094,229 |
| Total issued | 653,089 | 5,923,576 | 1,335,580 | 17,888,342 |
| Shares redeemed and automatic conversion of shares | (1,424,359) | (12,944,331) | (3,113,203) | (42,495,222) |
| Net decrease | (771,270) | $ (7,020,755) | (1,777,623) | $ (24,606,880) |
BLACKROCK SMALL CAP GROWTH FUND II
MAY 31, 2009
15
| Notes to Financial Statements (concluded) | BlackRock Small Cap Growth Fund II | |||||
| Year Ended | Year Ended | |||||
| May 31, 2009 | May 31, 2008 | |||||
| Shares | Amount | Shares | Amount | |||
| Investor C Shares | ||||||
| Shares sold | 1,579,457 | $ 13,611,948 | 1,764,182 | $ 23,555,626 | ||
| Shares issued to shareholders in reinvestment of distributions | — | — | 1,098,647 | 14,374,231 | ||
| Total issued | 1,579,457 | 13,611,948 | 2,862,829 | 37,929,857 | ||
| Shares redeemed | (2,594,133) | (22,682,086) | (2,089,120) | (27,643,349) | ||
| Net increase (decrease) | (1,014,676) | $ (9,070,138) | 773,709 | $ 10,286,508 | ||
| Class R Shares | ||||||
| Shares sold | 3,238,979 | $ 30,484,414 | 1,998,096 | $ 27,208,987 | ||
| Shares issued to shareholders in reinvestment of distributions | — | — | 290,045 | 3,939,967 | ||
| Total issued | 3,238,979 | 30,484,414 | 2,288,141 | 31,148,954 | ||
| Shares redeemed | (1,484,706) | (13,386,372) | (899,419) | (12,298,503) | ||
| Net increase | 1,754,273 | $ 17,098,042 | 1,388,722 | $ 18,850,451 | ||
There is a 2% redemption fee on shares redeemed (or exchanged) that have been held for 30 days or less. The redemption fees are collected and
retained by the Fund for the benefit of the remaining shareholders. The redemption fees are recorded as a credit to paid-in capital.
16 BLACKROCK SMALL CAP GROWTH FUND II MAY 31, 2009
Report of Independent Registered Public Accounting Firm BlackRock Small Cap Growth Fund II
To the Shareholders and Board of Directors
of BlackRock Series, Inc.:
We have audited the accompanying statement of assets and liabilities
of BlackRock Small Cap Growth Fund II, one of the portfolios constitut-
ing BlackRock Series, Inc. (the “Fund”), as of May 31, 2009, and the
related statement of operations for the year then ended, the statements
of changes in net assets for each of the two years in the period then
ended, and the financial highlights for each of the five years in the
period then ended. These financial statements and financial highlights
are the responsibility of the Fund’s management. Our responsibility is to
express an opinion on these financial statements and financial high-
lights based on our audits.
We conducted our audits in accordance with the standards of the Public
Company Accounting Oversight Board (United States). Those standards
require that we plan and perform the audit to obtain reasonable assur-
ance about whether the financial statements and financial highlights are
free of material misstatement. The Fund is not required to have, nor were
we engaged to perform, an audit of its internal control over financial
reporting. Our audits included consideration of internal control over
financial reporting as a basis for designing audit procedures that are
appropriate in the circumstances, but not for the purpose of expressing
an opinion on the effectiveness of the Fund’s internal control over finan-
cial reporting. Accordingly, we express no such opinion. An audit also
includes examining, on a test basis, evidence supporting the amounts
and disclosures in the financial statements, assessing the accounting
principles used and significant estimates made by man-
agement, as well as evaluating the overall financial statement
presentation. We believe that our audits provide a reasonable basis
for our opinion.
In our opinion, the financial statements and financial highlights referred
to above present fairly, in all material respects, the financial position of
BlackRock Small Cap Growth Fund II of BlackRock Series, Inc. as of
May 31, 2009, the results of its operations for the year then ended, the
changes in its net assets for each of the two years in the period then
ended, and the financial highlights for each of the five years in the
period then ended, in conformity with accounting principles generally
accepted in the United States of America.
Deloitte & Touche LLP
Princeton, New Jersey
July 24, 2009
BLACKROCK SMALL CAP GROWTH FUND II MAY 31, 2009 17
| Portfolio Information | BlackRock Master Small Cap Growth Portfolio | ||
| As of May 31, 2009 | |||
| Percent of | Percent of | ||
| Long-Term | Long-Term | ||
| Ten Largest Holdings | Investments | Sector Allocation | Investments |
| SkillSoft Plc | 4% | Information Technology | 32% |
| CKX, Inc. | 3 | Health Care | 19 |
| Scientific Games Corp. Class A | 2 | Consumer Discretionary | 15 |
| TiVo, Inc. | 2 | Industrials | 15 |
| i2 Technologies, Inc. | 2 | Energy | 7 |
| ExlService Holdings, Inc. | 2 | Financials | 7 |
| SonicWALL, Inc. | 2 | Materials | 3 |
| Mednax, Inc. | 2 | Consumer Staples | 2 |
| Forrester Research, Inc. | 2 | For Portfolio compliance purposes, the Portfolio’s sector classifications refer to | |
| BE Aerospace, Inc. | 2 | any one or more of the sector sub-classifications used by one or more widely | |
| recognized market indexes, and/or as defined by Portfolio management. This | |||
| definition may not apply for purposes of this report, which may combine sector | |||
| sub-classifications for reporting ease. These sector classifications are unaudited. | |||
18 BLACKROCK SMALL CAP GROWTH FUND II MAY 31, 2009
Schedule of Investments May 31, 2009 BlackRock Master Small Cap Growth Portfolio
(Percentages shown are based on Net Assets)
| Common Stocks | Shares | Value |
| Aerospace & Defense — 4.1% | ||
| Argon ST, Inc. (a) | 182,052 | $ 3,772,118 |
| BE Aerospace, Inc. (a) | 402,700 | 5,992,176 |
| Hexcel Corp. (a) | 282,700 | 3,022,063 |
| TransDigm Group, Inc. (a) | 47,800 | 1,874,716 |
| 14,661,073 | ||
| Air Freight & Logistics — 0.5% | ||
| Forward Air Corp. | 93,100 | 1,984,892 |
| Biotechnology — 2.4% | ||
| Acorda Therapeutics, Inc. (a) | 87,300 | 2,155,437 |
| Alkermes, Inc. (a) | 194,100 | 1,579,974 |
| Celera Corp. (a) | 199,900 | 1,513,243 |
| Martek Biosciences Corp. | 149,800 | 3,174,262 |
| 8,422,916 | ||
| Building Products — 0.9% | ||
| Griffon Corp. (a) | 351,067 | 3,401,839 |
| Capital Markets — 1.4% | ||
| Knight Capital Group, Inc. Class A (a) | 126,100 | 2,170,181 |
| RiskMetrics Group, Inc. (a) | 167,291 | 2,688,366 |
| 4,858,547 | ||
| Chemicals — 2.0% | ||
| Celanese Corp. Series A | 78,500 | 1,610,035 |
| Intrepid Potash, Inc. (a)(b) | 167,800 | 5,470,280 |
| 7,080,315 | ||
| Commercial Banks — 1.4% | ||
| PrivateBancorp, Inc. | 74,800 | 1,498,244 |
| Signature Bank (a) | 135,500 | 3,665,275 |
| 5,163,519 | ||
| Commercial Services & Supplies — 2.8% | ||
| Clean Harbors, Inc. (a) | 95,600 | 5,212,112 |
| SYKES Enterprises, Inc. (a) | 290,848 | 4,740,822 |
| 9,952,934 | ||
| Communications Equipment — 2.6% | ||
| DG FastChannel, Inc. (a) | 46,100 | 912,319 |
| EMS Technologies, Inc. (a) | 198,678 | 3,884,155 |
| Neutral Tandem, Inc. (a) | 154,500 | 4,480,500 |
| 9,276,974 | ||
| Construction & Engineering — 1.0% | ||
| Chicago Bridge & Iron Co. NV | 265,500 | 3,427,605 |
| Containers & Packaging — 0.7% | ||
| Rock-Tenn Co. Class A | 64,357 | 2,470,022 |
| Diversified Consumer Services — 1.5% | ||
| DeVry, Inc. | 77,176 | 3,362,558 |
| Weight Watchers International, Inc. | 78,400 | 1,836,912 |
| 5,199,470 | ||
| Diversified Financial Services — 2.6% | ||
| Heckmann Corp. (a) | 807,400 | 3,310,340 |
| MSCI, Inc. (a) | 281,700 | 5,991,759 |
| 9,302,099 | ||
| Electrical Equipment — 0.8% | ||
| Energy Conversion Devices, Inc. (a)(b) | 167,200 | 2,877,512 |
| Electronic Equipment, Instruments | ||
| & Components — 1.5% | ||
| Cogent, Inc. (a) | 518,600 | 5,211,930 |
| See Notes to Financial Statements. |
| Common Stocks | Shares | Value |
| Energy Equipment & Services — 2.8% | ||
| IHS, Inc. Class A (a) | 97,707 | $ 4,689,936 |
| Superior Energy Services, Inc. (a) | 226,389 | 5,220,530 |
| 9,910,466 | ||
| Food Products — 0.8% | ||
| American Italian Pasta Co. Class A (a) | 44,000 | 1,216,600 |
| Smart Balance, Inc. (a) | 203,100 | 1,502,940 |
| 2,719,540 | ||
| Health Care Equipment & Supplies — 6.9% | ||
| Hologic, Inc. (a) | 256,607 | 3,251,211 |
| Merit Medical Systems, Inc. (a) | 286,902 | 3,927,688 |
| NuVasive, Inc. (a) | 51,100 | 1,845,732 |
| SonoSite, Inc. (a) | 205,300 | 3,800,103 |
| Symmetry Medical, Inc. (a) | 211,238 | 1,624,420 |
| Thoratec Corp. (a) | 58,700 | 1,472,196 |
| Wright Medical Group, Inc. (a) | 288,000 | 4,492,800 |
| Zoll Medical Corp. (a) | 241,600 | 4,056,464 |
| 24,470,614 | ||
| Health Care Providers & Services — 5.9% | ||
| Amedisys, Inc. (a)(b) | 115,100 | 3,501,342 |
| Lincare Holdings, Inc. (a) | 194,900 | 4,244,922 |
| Magellan Health Services, Inc. (a) | 155,097 | 4,631,197 |
| Mednax, Inc. (a) | 163,300 | 6,613,650 |
| VCA Antech, Inc. (a) | 88,200 | 2,140,614 |
| 21,131,725 | ||
| Health Care Technology — 2.3% | ||
| MedAssets, Inc. (a) | 321,000 | 5,075,010 |
| Omnicell, Inc. (a) | 353,800 | 3,251,422 |
| 8,326,432 | ||
| Hotels, Restaurants & Leisure — 5.0% | ||
| Bally Technologies, Inc. (a) | 130,200 | 3,645,600 |
| The Cheesecake Factory, Inc. (a) | 55,200 | 944,472 |
| P.F. Chang’s China Bistro, Inc. (a)(b) | 97,000 | 3,098,180 |
| Red Robin Gourmet Burgers, Inc. (a) | 137,700 | 2,382,210 |
| Scientific Games Corp. Class A (a) | 440,100 | 7,846,983 |
| 17,917,445 | ||
| Household Durables — 1.0% | ||
| iRobot Corp. (a)(b) | 286,816 | 3,585,200 |
| IT Services — 6.8% | ||
| ExlService Holdings, Inc. (a) | 683,707 | 6,768,699 |
| Forrester Research, Inc. (a) | 260,627 | 6,038,728 |
| Global Cash Access, Inc. (a) | 359,200 | 2,507,216 |
| SRA International, Inc. Class A (a) | 320,691 | 5,689,058 |
| Wright Express Corp. (a) | 128,867 | 3,204,922 |
| 24,208,623 | ||
| Insurance — 0.7% | ||
| Aspen Insurance Holdings Ltd. | 116,200 | 2,683,058 |
| Internet & Catalog Retail — 0.7% | ||
| Shutterfly, Inc. (a) | 165,300 | 2,360,484 |
| Internet Software & Services — 7.6% | ||
| ComScore, Inc. (a) | 337,409 | 3,762,110 |
| Omniture, Inc. (a)(b) | 297,804 | 3,520,043 |
| OpenTable, Inc. (a) | 5,200 | 148,096 |
| SkillSoft Plc (a)(c) | 1,576,464 | 12,879,711 |
| SonicWALL, Inc. (a) | 1,307,900 | 6,683,369 |
| 26,993,329 |
BLACKROCK SMALL CAP GROWTH FUND II
MAY 31, 2009
19
Schedule of Investments (continued) BlackRock Master Small Cap Growth Portfolio
(Percentages shown are based on Net Assets)
| Common Stocks | Shares | Value |
| Machinery — 3.0% | ||
| Bucyrus International, Inc. | 110,364 | $ 3,165,240 |
| IDEX Corp. | 128,500 | 3,000,475 |
| Kaydon Corp. | 129,100 | 4,441,040 |
| 10,606,755 | ||
| Media — 5.7% | ||
| CKX, Inc. (a) | 1,307,434 | 9,112,815 |
| Dolan Media Co. (a) | 294,679 | 4,075,411 |
| DreamWorks Animation SKG, Inc. Class A (a) | 170,200 | 4,741,772 |
| Outdoor Channel Holdings, Inc. (a) | 78,729 | 551,103 |
| RHI Entertainment, Inc. (a) | 641,591 | 2,001,764 |
| 20,482,865 | ||
| Oil, Gas & Consumable Fuels — 4.6% | ||
| Comstock Resources, Inc. (a) | 102,593 | 4,086,279 |
| EXCO Resources, Inc. (a) | 236,600 | 3,641,274 |
| Massey Energy Co. | 160,772 | 3,680,071 |
| Plains Exploration & Production Co. (a) | 179,800 | 5,084,744 |
| 16,492,368 | ||
| Personal Products — 0.8% | ||
| Chattem, Inc. (a)(b) | 49,900 | 2,980,527 |
| Pharmaceuticals — 1.7% | ||
| Medicis Pharmaceutical Corp. Class A | 261,700 | 4,113,924 |
| Santarus, Inc. (a) | 929,800 | 1,878,196 |
| 5,992,120 | ||
| Professional Services — 1.4% | ||
| Diamond Management & Technology Consultants, Inc. | 894,741 | 3,355,279 |
| TrueBlue, Inc. (a) | 186,800 | 1,593,404 |
| 4,948,683 | ||
| Real Estate Investment Trusts (REITs) — 0.7% | ||
| Chimera Investment Corp. | 765,000 | 2,669,850 |
| Semiconductors & Semiconductor Equipment — 5.7% | ||
| FEI Co. (a) | 201,400 | 4,382,464 |
| Microsemi Corp. (a) | 251,900 | 3,390,574 |
| Monolithic Power Systems, Inc. (a) | 178,500 | 3,696,735 |
| ON Semiconductor Corp. (a) | 663,100 | 4,542,235 |
| Silicon Laboratories, Inc. (a) | 97,900 | 3,291,398 |
| Standard Microsystems Corp. (a) | 67,947 | 1,252,943 |
| 20,556,349 | ||
| Software — 7.0% | ||
| Blackboard, Inc. (a) | 150,563 | 4,339,226 |
| DemandTec, Inc. (a) | 574,707 | 5,316,040 |
| i2 Technologies, Inc. (a) | 602,100 | 7,393,788 |
| SolarWinds, Inc. (a) | 30,700 | 460,500 |
| TiVo, Inc. (a) | 1,067,000 | 7,469,000 |
| 24,978,554 | ||
| Specialty Retail — 0.5% | ||
| Dick’s Sporting Goods, Inc. (a) | 97,500 | 1,735,500 |
| Textiles, Apparel & Luxury Goods — 0.9% | ||
| lululemon athletica, inc. (a)(b) | 250,300 | 3,161,289 |
| Total Long-Term Investments | ||
| (Cost — $383,905,278) — 98.7% | 352,203,423 |
| Short-Term Securities | Shares | Value |
| BlackRock Liquidity Funds, TempFund, 0.535% (d)(e) | 3,968,980 | $ 3,968,980 |
| Beneficial | ||
| Interest | ||
| (000) | ||
| BlackRock Liquidity Series, LLC | ||
| Money Market Series, 0.66% (d)(e)(f) | $ 21,594 | 21,593,500 |
| Total Short-Term Securities | ||
| (Cost — $25,562,480) — 7.2% | 25,562,480 | |
| Total Investments (Cost — $409,467,758*) — 105.9% | 377,765,903 | |
| Liabilities in Excess of Other Assets — (5.9)% | (21,151,621) | |
| Net Assets — 100.0% | $356,614,282 |
* The cost and unrealized appreciation (depreciation) of investments as of May 31,
2009, as computed for federal income tax purposes, were as follows:
| Aggregate cost | $414,363,932 |
| Gross unrealized appreciation | $ 29,987,587 |
| Gross unrealized depreciation | (66,585,616) |
| Net unrealized depreciation | $ (36,598,029) |
(a) Non-income producing security.
(b) Security, or a portion of security, is on loan.
(c) Depositary receipts.
(d) Investments in companies considered to be an affiliate of the Portfolio, for
purposes of Section 2(a)(3) of the Investment Company Act of 1940, were
as follows:
| Net | ||
| Affiliate | Activity | Income |
| BlackRock Liquidity Funds, TempFund | 3,968,980 | $ 1,367 |
| BlackRock Liquidity Series, LLC | ||
| Money Market Series | $ 21,593,500 | $1,205,161 |
| FFI Premier Institutional Fund | $(131,772,300) | — |
(e) Represents the current yield as of report date.
(f) Security purchased with cash proceeds from securities loans.
•For Portfolio compliance purposes, the Portfolio’s industry classifications refer to
any one or more of the industry sub-classifications used by one or more widely
recognized market indexes or ratings group indexes, and/or as defined by
Portfolio management. This definition may not apply for purposes of this report,
which may combine industry sub-classifications for reporting ease. These industry
classifications are unaudited.
See Notes to Financial Statements.
20 BLACKROCK SMALL CAP GROWTH FUND II MAY 31, 2009
Schedule of Investments (concluded) BlackRock Master Small Cap Growth Portfolio
•Effective June 1, 2008, the Portfolio adopted Financial Accounting Standards
Board Statement of Financial Accounting Standards No. 157, “Fair Value Measure-
ments” (“FAS 157”). FAS 157 clarifies the definition of fair value, establishes a
framework for measuring fair values and requires additional disclosures about
the use of fair value measurements. Various inputs are used in determining the
fair value of investments, which are as follows:
•Level 1 — price quotations in active markets/exchanges for identical securities
•Level 2 — other observable inputs (including, but not limited to: quoted prices
for similar assets or liabilities in markets that are active, quoted prices for
identical or similar assets or liabilities in markets that are not active, inputs
other than quoted prices that are observable for the assets or liabilities (such
as interest rates, yield curves, volatilities, prepayment speeds, loss severities,
credit risks and default rates) or other market-corroborated inputs)
•Level 3 — unobservable inputs based on the best information available in the
circumstances, to the extent observable inputs are not available (including the
Portfolio’s own assumptions used in determining the fair value of investments)
The inputs or methodology used for valuing securities are not necessarily an
indication of the risk associated with investing in those securities. For inform-
ation about the Portfolio’s policy regarding valuation of investments and
other significant accounting policies, please refer to Note 1 of the Notes to
Financial Statements.
The following table summarizes the inputs used as of May 31, 2009 in determin-
ing the fair valuation of the Portfolio’s investments:
| Valuation | Investments in |
| Inputs | Securities |
| Assets | |
| Level 1 | $356,172,403 |
| Level 2 | 21,593,500 |
| Level 3 | — |
| Total | $377,765,903 |
See Notes to Financial Statements.
BLACKROCK SMALL CAP GROWTH FUND II MAY 31, 2009 21
| Statement of Assets and Liabilities | BlackRock Master Small Cap Growth Portfolio |
| May 31, 2009 | |
| Assets | |
| Investments at value — unaffiliated (including securities loaned of $21,495,100) (cost — $383,905,278) | $ 352,203,423 |
| Investments at value — affiliated (cost — $25,562,480) | 25,562,480 |
| Cash | 18 |
| Investments sold receivable | 2,300,164 |
| Dividends receivable | 67,717 |
| Securities lending income receivable — affiliated | 47,064 |
| Prepaid expenses | 38,757 |
| Other assets | 365 |
| Total assets | 380,219,988 |
| Liabilities | |
| Collateral at value — securities loaned | 21,593,500 |
| Investments purchased payable | 1,467,207 |
| Withdrawals payable to investor | 288,962 |
| Investment advisory fees payable | 191,448 |
| Other affiliates payable | 2,580 |
| Officer’s and Directors’ fees payable | 13 |
| Other accrued expenses payable | 61,996 |
| Total liabilities | 23,605,706 |
| Net Assets | $ 356,614,282 |
| Net Assets Consist of | |
| Investor’s capital | $ 388,316,137 |
| Net unrealized appreciation/depreciation | (31,701,855) |
| Net Assets | $ 356,614,282 |
See Notes to Financial Statements.
22 BLACKROCK SMALL CAP GROWTH FUND II MAY 31, 2009
| Statement of Operations | BlackRock Master Small Cap Growth Portfolio |
| Year Ended May 31, 2009 | |
| Investment Income | |
| Dividends | $ 1,235,903 |
| Foreign tax withheld | (549) |
| Interest | 69,022 |
| Securities lending — affiliated | 1,205,161 |
| Income — affiliated | 1,599 |
| Total income | 2,511,136 |
| Expenses | |
| Investment advisory | 2,712,684 |
| Accounting services | 168,498 |
| Professional | 58,007 |
| Custodian | 53,478 |
| Officer and Directors | 21,258 |
| Printing | 4,422 |
| Miscellaneous | 11,579 |
| Total expenses | 3,029,926 |
| Less fees waived by advisor | (158) |
| Total expenses after fees waived | 3,029,768 |
| Net investment loss | (518,632) |
| Realized and Unrealized Loss | |
| Net realized loss on investments | (97,136,788) |
| Net change in unrealized appreciation/depreciation on investments | (92,607,388) |
| Total realized and unrealized loss | (189,744,176) |
| Net Decrease in Net Assets Resulting from Operations | $ (190,262,808) |
See Notes to Financial Statements.
BLACKROCK SMALL CAP GROWTH FUND II MAY 31, 2009 23
| Statements of Changes in Net Assets | BlackRock Master Small Cap Growth Portfolio | ||||
| Year Ended May 31, | |||||
| Increase (Decrease) in Net Assets: | 2009 | 2008 | |||
| Operations | |||||
| Net investment loss | $ (518,632) | $ (553,271) | |||
| Net realized gain (loss) | (97,136,788) | 30,599,653 | |||
| Net change in unrealized appreciation/depreciation | (92,607,388) | (12,304,369) | |||
| Net increase (decrease) in net assets resulting from operations | (190,262,808) | 17,742,013 | |||
| Capital Transactions | |||||
| Proceeds from contributions | 134,438,075 | 165,567,157 | |||
| Fair value of withdrawals | (141,230,552) | (168,731,616) | |||
| Net decrease in net assets derived from capital transactions | (6,792,477) | (3,164,459) | |||
| Net Assets | |||||
| Total increase (decrease) in net assets | (197,055,285) | 14,577,554 | |||
| Beginning of year | 553,669,567 | 539,092,013 | |||
| End of year | $ 356,614,282 | $ 553,669,567 | |||
| Financial Highlights | BlackRock Master Small Cap Growth Portfolio | ||||
| Year Ended May 31, | |||||
| 2009 | 2008 | 2007 | 2006 | 2005 | |
| Total Investment Return | |||||
| Total investment return | (34.16)% | 3.35% | 13.00% | 26.39% | 11.76% |
| Ratios to Average Net Assets | |||||
| Total expenses | 0.78% | 0.77% | 0.78% | 0.77% | 0.79% |
| Total expenses after fees waived | 0.78% | 0.77% | 0.78% | 0.77% | 0.79% |
| Net investment loss | (0.13)% | (0.10)% | (0.42)% | (0.49)% | (0.48)% |
| Supplemental Data | |||||
| Net assets, end of year (000) | $ 356,614 | $ 553,670 $ | 539,092 | $ 481,934 | $ 349,223 |
| Portfolio turnover | 75% | 70% | 115% | 101% | 129% |
See Notes to Financial Statements.
24 BLACKROCK SMALL CAP GROWTH FUND II MAY 31, 2009
Notes to Financial Statements BlackRock Master Small Cap Growth Portfolio
1. Organization and Significant Accounting Policies:
BlackRock Master Small Cap Growth Portfolio (the “Portfolio”) of
BlackRock Master LLC (the “Master LLC”), is registered under the
Investment Company Act of 1940, as amended (the “1940 Act”), as
a diversified open-end management company and is organized as a
Delaware limited liability company. The Limited Liability Company
Agreement permits the Board of Directors (the “Board”) to issue non-
transferable interests in the Master LLC, subject to certain limitations.
The Portfolio’s financial statements are prepared in conformity with
accounting principles generally accepted in the United States of
America, which may require the use of management accruals and
estimates. Actual results may differ from these estimates.
The following is a summary of significant accounting policies followed by
the Portfolio:
Valuation of Investments: Equity investments traded on a recognized
securities exchange or the NASDAQ Global Market System are valued at
the last reported sale price that day or the NASDAQ official closing price,
if applicable. For equity investments traded on more than one exchange,
the last reported sale price on the exchange where the stock is primarily
traded is used. Equity investments traded on a recognized exchange for
which there were no sales on that day are valued at the last available
bid price. If no bid price is available, the prior day’s price will be used
unless it is determined that such prior day’s price no longer reflects the
fair value of the security. Short-term securities with maturities less than
60 days may be valued at amortized cost, which approximates fair value.
Investments in open-end investment companies are valued at their net
asset value each business day. The Portfolio values its investment in the
BlackRock Liquidity Series, LLC Money Market Series at fair value, which
is ordinarily based upon their pro-rata ownership in the net assets of the
underlying fund.
In the event that application of these methods of valuation results in a
price for an investment which is deemed not to be representative of the
market value of such investment, the investment will be valued by a
method approved by the Board as reflecting fair value (“Fair Value
Assets”). When determining the price for Fair Value Assets, the invest-
ment advisor and/or sub-advisor seeks to determine the price that the
Portfolio might reasonably expect to receive from the current sale of that
asset in an arm’s-length transaction. Fair value determinations shall be
based upon all available factors that the investment advisor and/or sub-
advisor deems relevant. The pricing of all Fair Value Assets is subse-
quently reported to the Board or a committee thereof.
Investment Transactions and Investment Income: Investment transactions
are recorded on the dates the transactions are entered into (the trade
dates). Realized gains and losses on security transactions are deter-
mined on the identified cost basis. Dividend income is recorded on the
ex-dividend dates. Upon notification from issuers, some of the dividend
income received from a real estate investment trust may be redesignated
as a reduction of cost of the related investment and/or realized gain.
Interest income is recognized on the accrual basis.
Securities Lending: The Portfolio may lend securities to financial
institutions that provide cash as collateral, which will be maintained
at all times in an amount equal to at least 100% of the current market
value of the loaned securities. The market value of the loaned securities
is determined at the close of business of the Portfolio and any addi-
tional required collateral is delivered to the Portfolio on the next business
day. The Portfolio typically receives the income on the loaned securities
but does not receive the income on the collateral. The Portfolio may
invest the cash collateral and retain the amount earned on such invest-
ment, net of any amount rebated to the borrower. Loans of securities
are terminable at any time and the borrower, after notice, is required
to return borrowed securities within the standard time period for settle-
ment of securities transactions. The Portfolio may pay reasonable lending
agent, administrative and custodial fees in connection with its loans. In
the event that the borrower defaults on its obligation to return borrowed
securities because of insolvency or for any other reason, the Portfolio
could experience delays and costs in gaining access to the collateral.
The Portfolio also could suffer a loss if the value of an investment
purchased with cash collateral falls below the market value of the
loaned securities.
Income Taxes: The Portfolio is disregarded as an entity separate from its
owner for tax purposes. As such, the owner of the Portfolio is treated as
the owner of the net assets, income, expenses and realized and unreal-
ized gains and losses of the Portfolio. Therefore, no federal tax provision
is required. It is intended that the Portfolio’s assets will be managed so
the owner of the Portfolio can satisfy the requirements of Subchapter M
of the Internal Revenue Code. Under the applicable foreign tax laws, a
withholding tax may be imposed on interest, dividends and capital gains
at various rates.
Other: Expenses directly related to the Portfolio are charged to the
Portfolio. Other operating expenses shared by several funds are pro-
rated among those funds on the basis of relative net assets or other
appropriate methods.
2. Investment Advisory Agreement and Other Transactions
with Affiliates:
The PNC Financial Services Group, Inc. (“PNC”) and Bank of America
Corporation (“BAC”) are the largest stockholders of BlackRock, Inc.
(“BlackRock”). BAC became a stockholder of BlackRock following its
acquisition of Merrill Lynch & Co., Inc. (“Merrill Lynch”) on January 1,
2009. Prior to that date, both PNC and Merrill Lynch were considered
affiliates of the Portfolio under the 1940 Act. Subsequent to the acquisi-
tion, PNC remains an affiliate, but due to the restructuring of Merrill
Lynch’s ownership interest of BlackRock, BAC is not deemed to be an
affiliate under the 1940 Act.
BLACKROCK SMALL CAP GROWTH FUND II
MAY 31, 2009
25
Notes to Financial Statements (concluded) BlackRock Master Small Cap Growth Portfolio
The Master LLC, on behalf of the Portfolio, has entered into an Investment
Advisory Agreement with BlackRock Advisors, LLC (the “Advisor”), an
indirect, wholly owned subsidiary of BlackRock, to provide investment
advisory and administration services.
The Advisor is responsible for the management of the Portfolio’s invest-
ments and provides the necessary personnel, facilities, equipment and
certain other services necessary to the operations of the Portfolio. For
such services, the Portfolio pays the Advisor a monthly fee at an annual
rate of 0.70% of the Portfolio’s average daily net assets.
The Advisor has entered into a separate sub-advisory agreement with
BlackRock Capital Management, Inc., an affiliate of the Advisor, with
respect to the Portfolio, under which the Advisor pays the sub-advisor,
for services it provides, a monthly fee that is a percentage of the invest-
ment advisory fee paid by the Portfolio to the Advisor.
The Advisor has agreed to waive its advisory fee by the amount of invest-
ment advisory fees the Portfolio pays to the Advisor indirectly through its
investment in affiliated money market funds. The amount is shown as
fees waived by advisor in the Statement of Operations.
For the year ended May 31, 2009, the Portfolio reimbursed the Advisor
$7,045 for certain accounting services, which is included in accounting
services in the Statement of Operations.
The Master LLC has received an exemptive order from the Securities and
Exchange Commission permitting it to lend portfolio securities to Merrill
Lynch, Pierce, Fenner & Smith Incorporated (“MLPF&S”), a wholly owned
subsidiary of Merrill Lynch, or its affiliates. Pursuant to that order, the
Portfolio has retained BlackRock Investment Management, LLC (“BIM”)
as the securities lending agent for a fee based on a share of the returns
on investment of cash collateral. BIM may, on behalf of the Portfolio,
invest cash collateral received by the Portfolio for such loans, among
other things, in a private investment company managed by the Advisor or
in registered money market funds advised by the Advisor or its affiliates.
The share of income earned by the Portfolio on such investments is
shown as securities lending — affiliated in the Statement of Operations.
For the year ended May 31, 2009, BIM received $294,563 in securities
lending agent fees.
The Portfolio may earn income on positive cash balances in demand
deposit accounts. For the year ended May 31, 2009, the Portfolio
earned $232, which is included in income — affiliated in the Statement
of Operations.
For the year ended May 31, 2009, Piper Jaffray was considered to be
an affiliate of the Advisor for a portion of the year and during that time
received $8,748 in commissions on the execution of portfolio security
transactions for the Portfolio.
Certain officers and/or directors of the Master LLC are officers and/or
directors of BlackRock or its affiliates. The Portfolio reimburses the Advisor
for compensation paid to the Master LLC’s Chief Compliance Officer.
3. Investments:
Purchases and sales of investments, excluding short-term securities for
the year ended May 31, 2009 were $293,864,522 and $290,555,683,
respectively.
4. Short-Term Borrowings:
The Portfolio, along with certain other funds managed by the Advisor
and its affiliates, is a party to a $500 million credit agreement with a
group of lenders, which expired November 2008 and was subsequently
renewed until November 2009. The Portfolio may borrow under the credit
agreement to fund shareholder redemptions and for other lawful pur-
poses other than for leverage. The Portfolio may borrow up to the maxi-
mum amount allowable under the Portfolio’s current Prospectus and
Statement of Additional Information, subject to various other legal, regu-
latory or contractual limits. The Portfolio paid its pro rata share of a
0.02% upfront fee on the aggregate commitment amount based on its
net assets as of October 31, 2008. The Portfolio pays a commitment
fee of 0.08% per annum based on the Portfolio’s pro rata share of the
unused portion of the credit agreement, which is included in miscella-
neous in the Statement of Operations. Amounts borrowed under the
credit agreement bear interest at a rate equal to the higher of the
(a) federal funds effective rate and (b) reserve adjusted one month
LIBOR, plus, in each case, the higher of (i) 1.50% and (ii) 50% of the
CDX Index (as defined in the credit agreement) in effect from time to
time. The Portfolio did not borrow under the credit agreement during
the year ended May 31, 2009.
5. Market and Credit Risk:
In the normal course of business, the Master LLC invests in securities
and enters into transactions where risks exist due to fluctuations in the
market (market risk) or failure of the issuer of a security to meet all its
obligations (credit risk). The value of securities held by the Master LLC
may decline in response to certain events, including those directly
involving the issuers whose securities are owned by the Master LLC;
conditions affecting the general economy; overall market changes;
local, regional or global political, social or economic instability; and
currency and interest rate and price fluctuations. Similar to credit risk,
the Master LLC may be exposed to counterparty risk, or the risk that an
entity with which the Master LLC has unsettled or open transactions
may default. Financial assets, which potentially expose the Master LLC
to credit and counterparty risks, consist principally of investments and
cash due from counterparties. The extent of the Master LLC’s exposure
to credit and counterparty risks with respect to these financial assets is
approximated by their value recorded in the Master LLC’s Statement of
Assets and Liabilities.
26 BLACKROCK SMALL CAP GROWTH FUND II
MAY 31, 2009
Report of Independent Registered Public Accounting Firm BlackRock Master Small Cap Growth Portfolio
To the Investor and Board of Directors of
BlackRock Master LLC:
We have audited the accompanying statement of assets and liabilities,
including the schedule of investments, of BlackRock Master Small Cap
Growth Portfolio, one of the portfolios constituting BlackRock Master LLC
(the “Master LLC”), as of May 31, 2009, and the related statement of
operations for the year then ended, the statements of changes in net
assets for each of the two years in the period then ended, and the finan-
cial highlights for each of the five years in the period then ended. These
financial statements and financial highlights are the responsibility of the
Master LLC’s management. Our responsibility is to express an opinion on
these financial statements and financial highlights based on our audits.
We conducted our audits in accordance with the standards of the Public
Company Accounting Oversight Board (United States). Those standards
require that we plan and perform the audit to obtain reasonable assur-
ance about whether the financial statements and financial highlights
are free of material misstatement. The Master LLC is not required to
have, nor were we engaged to perform, an audit of its internal control
over financial reporting. Our audits included consideration of internal
control over financial reporting as a basis for designing audit procedures
that are appropriate in the circumstances, but not for the purpose of
expressing an opinion on the effectiveness of the Master LLC’s internal
control over financial reporting. Accordingly, we express no such opinion.
An audit also includes examining, on a test basis, evidence supporting
the amounts and disclosures in the financial statements, assessing the
accounting principles used and significant estimates made by manage-
ment, as well as evaluating the overall financial statement presentation.
Our procedures included confirmation of securities owned as of May 31,
2009, by correspondence with the custodian and brokers; where replies
were not received from brokers, we performed other auditing procedures.
We believe that our audits provide a reasonable basis for our opinion.
In our opinion, the financial statements and financial highlights referred
to above present fairly, in all material respects, the financial position
of BlackRock Master Small Cap Growth Portfolio of BlackRock Master
LLC as of May 31, 2009, the results of its operations for the year then
ended, the changes in its net assets for each of the two years in the
period then ended, and the financial highlights for each of the five
years in the period then ended, in conformity with accounting principles
generally accepted in the United States of America.
Deloitte & Touche LLP
Princeton, New Jersey
July 24, 2009
BLACKROCK SMALL CAP GROWTH FUND II
MAY 31, 2009
27
Disclosure of Investment Advisory Agreement and Sub-Advisory Agreement
The Board of Directors of BlackRock Master LLC (the “Master LLC”) met
on April 16, 2009 and May 21-22, 2009 to consider the approval of the
Master LLC’s investment advisory agreement (the “Advisory Agreement”)
with BlackRock Advisors, LLC (the “Advisor”), the Master LLC’s investment
advisor, on behalf of BlackRock Master Small Cap Growth Portfolio (the
“Master Portfolio”), a series of the Master LLC. The Board of Directors of
the Master LLC also considered the approval of the sub-advisory agree-
ment (the “Sub-Advisory Agreement”) between the Advisor and
BlackRock Capital Management, Inc. (the “Sub-Advisor”). BlackRock
Small Cap Growth Fund II (the “Fund”), a series of BlackRock Series, Inc.
(the “Corporation”), currently invests all of its investable assets in the
Master Portfolio. Accordingly, the Board of Directors of the Corporation
also considered the approval of the Advisory Agreement and the Sub-
Advisory Agreement. The Fund does not require investment advisory serv-
ices, since all investments are made at the Master Portfolio level.
The Advisor and the Sub-Advisor are referred to herein as “BlackRock.”
The Advisory Agreement and the Sub-Advisory Agreement are referred
to herein as the “Agreements.” For ease and clarity of presentation, the
Board of Directors of the Master LLC and the Board of Directors of the
Corporation, each of which are comprised of the same thirteen individu-
als, are herein referred to individually as a “Board” and collectively as
the “Boards” and the members of the Boards are referred to as the
“Board Members.”
Activities and Composition of the Boards
Each Board consists of thirteen individuals, eleven of whom are not
“interested persons” of the Master LLC or the Corporation as defined
in the Investment Company Act of 1940, as amended (the “1940
Act”) (the “Independent Board Members”). The Board Members are
responsible for the oversight of the operations of the Master LLC or the
Corporation, as pertinent, and perform the various duties imposed on
the directors of investment companies by the 1940 Act. The Independent
Board Members have retained independent legal counsel to assist them
in connection with their duties. The Co-Chairs of the Boards are each
Independent Board Members. Each Board has established five standing
committees: an Audit Committee, a Governance and Nominating
Committee, a Compliance Committee, a Performance Oversight and
Contract Committee and an Executive Committee, each of which is
composed of Independent Board Members (except for the Performance
Oversight and Contract Committee and the Executive Committee, which
each have one interested Board Member) and is chaired by Independent
Board Members.
The Agreements
Pursuant to the 1940 Act, the Boards are required to consider the con-
tinuation of the Agreements on an annual basis. In connection with this
process, the Boards assessed, among other things, the nature, scope
and quality of the services provided to the Fund and/or the Master
Portfolio by the personnel of BlackRock and its affiliates, including
investment management, administrative services, shareholder services,
oversight of fund accounting and custody, marketing services and assis-
tance in meeting legal and regulatory requirements.
Throughout the year, the Boards, acting directly and through their com-
mittees, consider at each of their meetings factors that are relevant to
their annual consideration of the renewal of the Agreements, including
the services and support provided by BlackRock to the Fund and/or the
Master Portfolio and their shareholders. Among the matters the Boards
considered were: (a) investment performance for one-, three- and five-
year periods, as applicable, against peer funds, and applicable bench-
marks, if any, as well as senior management and portfolio managers’
analysis of the reasons for any underperformance against its peers;
(b) fees, including advisory, administration, if applicable, and other
amounts paid to BlackRock and its affiliates by the Fund and/or the
Master Portfolio for services, such as transfer agency, marketing and
distribution, call center and fund accounting; (c) Fund and/or Master
Portfolio operating expenses; (d) the resources devoted to and compli-
ance reports relating to the Fund’s and the Master Portfolio’s investment
objective, policies and restrictions, (e) each of the Corporation’s and
the Master LLC’s compliance with its respective Code of Ethics and
compliance policies and procedures; (f) the nature, cost and character
of non-investment management services provided by BlackRock and its
affiliates; (g) BlackRock’s and other service providers’ internal controls;
(h) BlackRock’s implementation of the proxy voting policies approved
by the Board; (i) the use of brokerage commissions and execution qual-
ity; (j) BlackRock’s implementation of the Corporation’s and the Master
LLC’s respective valuation and liquidity procedures; and (k) periodic
updates on BlackRock’s business.
Board Considerations in Approving the Agreements
The Approval Process: Prior to the April 16, 2009 meeting, the Boards
requested and received materials specifically relating to the Agreements.
The Boards are engaged in an ongoing process with BlackRock to con-
tinuously review the nature and scope of the information provided to
better assist their deliberations. These materials provided in connection
with the April meeting included (a) information independently compiled
and prepared by Lipper, Inc. (“Lipper”) on Fund fees and expenses, and
the investment performance of the Fund as compared with a peer group
of funds as determined by Lipper (collectively, “Peers”); (b) information
on the profitability of the Agreements to BlackRock and a discussion
of fall-out benefits to BlackRock and its affiliates and significant share-
holders; (c) a general analysis provided by BlackRock concerning invest-
ment advisory fees charged to other clients, such as institutional and
closed-end funds, under similar investment mandates, as well as the
performance of such other clients; (d) the impact of economies of scale;
28 BLACKROCK SMALL CAP GROWTH FUND II MAY 31, 2009
Disclosure of Investment Advisory Agreement and Sub-Advisory Agreement (continued)
(e) a summary of aggregate amounts paid by the Fund and/or the
Master Portfolio to BlackRock; (f) sales and redemption data regarding
the Fund’s shares; and (g) an internal comparison of management fees
classified by Lipper, if applicable.
At an in-person meeting held on April 16, 2009, the Boards reviewed
materials relating to their consideration of the Agreements. As a result of
the discussions that occurred during the April 16, 2009 meeting, the
Boards presented BlackRock with questions and requests for additional
information and BlackRock responded to these requests with additional
written information in advance of the May 21–22, 2009 Board meeting.
At an in-person meeting held on May 21–22, 2009, the Board Members
of the Master LLC present at the meeting, including the Independent
Board Members, unanimously approved the continuation of the Advisory
Agreement between the Advisor and the Master LLC with respect to the
Master Portfolio and the Sub-Advisory Agreement between the Advisor
and the Sub-Advisor with respect to the Master Portfolio, each for a one-
year term ending June 30, 2010. The Board Members of the Corporation
present at the meeting, including the Independent Board Members pres-
ent at the meeting, also considered the continuation of the Agreements
and found the Agreements to be satisfactory. The Boards considered
all factors they believed relevant with respect to the Fund and/or the
Master Portfolio, as applicable, including, among other factors: (a) the
nature, extent and quality of the services provided by BlackRock;
(b) the investment performance of the Fund and the Master Portfolio
and BlackRock portfolio management; (c) the advisory fee and the
cost of the services and profits to be realized by BlackRock and certain
affiliates from the relationship with the Fund and the Master Portfolio;
(d) economies of scale; and (e) other factors.
The Boards also considered other matters they deemed important to the
approval process, such as payments made to BlackRock or its affiliates
relating to the distribution of Fund shares, services related to the valua-
tion and pricing of portfolio holdings of the Master Portfolio, direct and
indirect benefits to BlackRock and its affiliates from their relationship
with the Fund and the Master Portfolio and advice from independent
legal counsel with respect to the review process and materials submitted
for the Boards’ review. The Boards noted the willingness of BlackRock
personnel to engage in open, candid discussions with the Boards. The
Boards did not identify any particular information as controlling, and
each Board Member may have attributed different weights to the various
items considered.
A. Nature, Extent and Quality of the Services: The Boards, including the
Independent Board Members, reviewed the nature, extent and quality of
services provided by BlackRock, including the investment advisory serv-
ices and the resulting performance of the Fund and the Master Portfolio.
Throughout the year, the Boards compared Fund performance to the
performance of a comparable group of mutual funds, and the perform-
ance of at least one relevant benchmark, if any. The Boards met with
BlackRock’s senior management personnel responsible for investment
operations, including the senior investment officers. The Boards also
reviewed the materials provided by the Master Portfolio’s portfolio man-
agement team discussing Master Portfolio performance and the Master
Portfolio’s investment objective, strategies and outlook.
The Boards considered, among other factors, the number, education
and experience of BlackRock’s investment personnel generally and the
Master Portfolio’s portfolio management team, investments by portfolio
managers in the funds they manage, BlackRock’s portfolio trading capa-
bilities, BlackRock’s use of technology, BlackRock’s commitment to com-
pliance and BlackRock’s approach to training and retaining portfolio
managers and other research, advisory and management personnel. The
Boards also reviewed a general description of BlackRock’s compensation
structure with respect to the Master Portfolio’s portfolio management
team and BlackRock’s ability to attract and retain high-quality talent.
In addition to advisory services, the Boards considered the quality of
the administrative and non-investment advisory services provided to the
Fund and the Master Portfolio. BlackRock and its affiliates provide
the Fund and the Master Portfolio with certain administrative, transfer
agency, shareholder and other services (in addition to any such services
provided to the Fund and the Master Portfolio by third parties) and offi-
cers and other personnel as are necessary for the operations of the
Fund and the Master Portfolio. In addition to investment advisory serv-
ices, BlackRock and its affiliates provide the Fund and the Master
Portfolio with other services, including (i) preparing disclosure docu-
ments, such as the prospectus, the statement of additional information
and periodic shareholder reports; (ii) assisting with daily accounting and
pricing; (iii) overseeing and coordinating the activities of other service
providers; (iv) organizing Board meetings and preparing the materials
for such Board meetings; (v) providing legal and compliance support;
and (vi) performing other administrative functions necessary for the
operation of the Fund and the Master Portfolio, such as tax reporting,
fulfilling regulatory filing requirements, and call center services. The
Boards reviewed the structure and duties of BlackRock’s fund adminis-
tration, accounting, legal and compliance departments and considered
BlackRock’s policies and procedures for assuring compliance with appli-
cable laws and regulations.
B. The Investment Performance of the Fund, the Master Portfolio and
BlackRock: The Boards, including the Independent Board Members, also
reviewed and considered the performance history of the Fund and the
Master Portfolio. In preparation for the April 16, 2009 meeting, the
Boards were provided with reports, independently prepared by Lipper,
which included a comprehensive analysis of the Fund’s performance.
The Boards also reviewed a narrative and statistical analysis of the
BLACKROCK SMALL CAP GROWTH FUND II MAY 31, 2009 29
Disclosure of Investment Advisory Agreement and Sub-Advisory Agreement (continued)
Lipper data that was prepared by BlackRock, which analyzed various
factors that affect Lipper’s rankings. In connection with their review, the
Boards received and reviewed information regarding the investment per-
formance of the Fund as compared to a representative group of similar
funds as determined by Lipper and to all funds in the Fund’s applicable
Lipper category. The Boards were provided with a description of the
methodology used by Lipper to select peer funds. The Boards regularly
review the performance of the Fund and the Master Portfolio throughout
the year. The Boards attach more importance to performance over rela-
tively long periods of time, typically three to five years.
The Boards noted that, in general, the Fund performed better than
its Peers in that the Fund’s performance was at or above the median
of its performance universe in each of the one-, three- and five-year
periods reported.
C. Consideration of the Advisory Fees and the Cost of the Services
and Profits to be Realized by BlackRock and its Affiliates from their
Relationship with the Fund and the Master Portfolio: The Boards, includ-
ing the Independent Board Members, reviewed the Master Portfolio’s
contractual advisory fee rates compared with the other funds in the
Fund’s Lipper category. It also compared the Fund’s total expenses, as
well as actual management fees, to those of other comparable funds.
The Boards considered the services provided and the fees charged by
BlackRock to other types of clients with similar investment mandates,
including separately managed institutional accounts.
The Boards received and reviewed statements relating to BlackRock’s
financial condition and profitability with respect to the services it pro-
vided the Fund and the Master Portfolio. The Boards were also provided
with a profitability analysis that detailed the revenues earned and the
expenses incurred by BlackRock for services provided to the Fund
and/or the Master Portfolio. The Boards reviewed BlackRock’s profitabil-
ity with respect to the Master Portfolio and each fund the Boards cur-
rently oversee for the year ended December 31, 2008 compared to
aggregate profitability data provided for the year ended December 31,
2007. The Boards reviewed BlackRock’s profitability with respect to
other fund complexes managed by the Advisor and/or its affiliates. The
Boards reviewed BlackRock’s assumptions and methodology of allocat-
ing expenses in the profitability analysis, noting the inherent limitations
in allocating costs among various advisory products. The Boards recog-
nized that profitability may be affected by numerous factors including,
among other things, fee waivers and expense reimbursements by the
Advisor, the types of funds managed, expense allocations and business
mix, and therefore comparability of profitability is somewhat limited.
The Boards noted that, in general, individual fund or product line prof-
itability of other advisors is not publicly available. Nevertheless, to the
extent such information is available, the Boards considered BlackRock’s
operating margin in general compared to the operating margin for lead-
ing investment management firms whose operations include advising
open-end funds, among other product types. The comparison indicated
that operating margins for BlackRock with respect to its registered
funds are consistent with margins earned by similarly situated publicly
traded competitors. In addition, the Boards considered, among other
things, certain third party data comparing BlackRock’s operating margin
with that of other publicly-traded asset management firms, which con-
cluded that larger asset bases do not, in themselves, translate to higher
profit margins.
In addition, the Boards considered the cost of the services provided to
the Fund and the Master Portfolio by BlackRock, and BlackRock’s and its
affiliates’ profits relating to the management and distribution of the Fund
and the Master Portfolio and the other funds advised by BlackRock and
its affiliates. As part of their analysis, the Boards reviewed BlackRock’s
methodology in allocating its costs to the management of the Fund and
the Master Portfolio. The Boards also considered whether BlackRock
has the financial resources necessary to attract and retain high quality
investment management personnel to perform its obligations under the
Agreements and to continue to provide the high quality of services that
is expected by the Boards.
The Boards noted that the contractual advisory fees, which do not take
into account any expense reimbursement or fee waivers, were lower than
or equal to the median contractual advisory fees paid by the Fund’s Peers.
D. Economies of Scale: The Boards, including the Independent Board
Members, considered the extent to which economies of scale might be
realized as the assets of the Fund and the Master Portfolio increase and
whether there should be changes in the advisory fee rate or structure in
order to enable the Fund and the Master Portfolio to participate in these
economies of scale, for example through the use of breakpoints in the
advisory fee based upon the assets of the Master Portfolio. The Boards
considered that the funds in the BlackRock fund complex share some
common resources and, as a result, an increase in the overall size of the
complex could permit each fund to incur lower expenses than it would
otherwise as a stand-alone entity. The Boards also considered BlackRock’s
overall operations and its efforts to expand the scale of, and improve the
quality of, its operations.
E. Other Factors: The Boards also took into account other ancillary or
“fall-out” benefits that BlackRock or its affiliates and significant share-
holders may derive from its relationship with the Fund and the Master
Portfolio, both tangible and intangible, such as BlackRock’s ability to
leverage its investment professionals who manage other portfolios, an
increase in BlackRock’s profile in the investment advisory community,
and the engagement of BlackRock’s affiliates as service providers to
the Fund and the Master Portfolio, including for administrative, transfer
30 BLACKROCK SMALL CAP GROWTH FUND II MAY 31, 2009
Disclosure of Investment Advisory Agreement and Sub-Advisory Agreement (concluded)
agency and distribution services. The Boards also noted that BlackRock
may use third party research obtained by soft dollars generated by cer-
tain mutual fund transactions to assist itself in managing all or a num-
ber of its other client accounts.
In connection with their consideration of the Agreements, the Boards
also received information regarding BlackRock’s brokerage and soft
dollar practices. The Boards received reports from BlackRock which
included information on brokerage commissions and trade execution
practices throughout the year.
Conclusion
The Board Members of the Master LLC present at the meeting unani-
mously approved the continuation of the Advisory Agreement between
the Advisor and the Master LLC with respect to the Master Portfolio for
a one-year term ending June 30, 2010 and the Sub-Advisory Agreement
between the Advisor and Sub-Advisor with respect to the Master Portfolio
for a one-year term ending June 30, 2010. Based upon their evaluation
of all these factors in their totality, the Board Members of the Master LLC
present at the meeting, including the Independent Board Members present
at the meeting, were satisfied that the terms of the Agreements were fair
and reasonable and in the best interest of the Master Portfolio and its
shareholders. The Board Members of the Corporation present at the
Meetings, including the Independent Board Members present at the
Meetings, also considered the continuation of the Agreements and
found the Agreements to be satisfactory. In arriving at a decision to
approve the Agreements, the Boards did not identify any single factor
or group of factors as all-important or controlling, but considered all
factors together, and different Board Members may have attributed
different weights to the various factors considered. The Independent
Board Members were also assisted by the advice of independent legal
counsel in making this determination. The contractual fee arrangements
for the Master Portfolio reflect the result of several years of review by
the Board Members and predecessor Board Members, and discussions
between such Board Members (and predecessor Board Members) and
BlackRock. Certain aspects of the arrangements may be the subject of
more attention in some years than in others, and the Board Members’
conclusions may be based in part on their consideration of these
arrangements in prior years.
BLACKROCK SMALL CAP GROWTH FUND II MAY 31, 2009 31
| Officers and Directors | |||||
| Number of | |||||
| Position(s) | Length of | BlackRock- | |||
| Held with | Time | Advised Funds | |||
| Name, Address | Fund/ | Served as | and Portfolios | Public | |
| and Year of Birth | Master LLC | a Director2 | Principal Occupation(s) During Past 5 Years | Overseen | Directorships |
| Non-Interested Directors1 | |||||
| Ronald W. Forbes | Co-Chair of | Since | Professor Emeritus of Finance, School of Business, State University | 34 Funds | None |
| 40 East 52nd Street | the Board | 2007 | of New York at Albany since 2000. | 81 Portfolios | |
| New York, NY 10022 | of Directors | ||||
| 1940 | and Director | ||||
| Rodney D. Johnson | Co-Chair of | Since | President, Fairmount Capital Advisors, Inc. since 1987; Director, Fox | 34 Funds | None |
| 40 East 52nd Street | the Board | 2007 | Chase Cancer Center since 2002; Member of the Archdiocesan | 81 Portfolios | |
| New York, NY 10022 | of Directors | Investment Committee of the Archdiocese of Philadelphia since 2003; | |||
| 1941 | and Director | Director, The Committee of Seventy (civic) since 2006. | |||
| David O. Beim | Director | Since | Professor of Finance and Economics at the Columbia University | 34 Funds | None |
| 40 East 52nd Street | 1999 | Graduate School of Business since 1991; Trustee, Phillips Exeter | 81 Portfolios | ||
| New York, NY 10022 | Academy since 2002; Formerly Chairman, Wave Hill Inc. (public | ||||
| 1940 | garden and cultural center) from 1990 to 2006. | ||||
| Dr. Matina Horner | Director | Since | Formerly Executive Vice President of Teachers Insurance and Annuity | 34 Funds | NSTAR (electric |
| 40 East 52nd Street | 2007 | Association and College Retirement Equities Fund from 1989 to 2003. | 81 Portfolios | and gas utility) | |
| New York, NY 10022 | |||||
| 1939 | |||||
| Herbert I. London | Director and | Since | Professor Emeritus, New York University since 2005; John M. Olin | 34 Funds | AIMS Worldwide, |
| 40 East 52nd Street | Member of | 2007 | Professor of Humanities, New York University from 1993 to 2005 | 81 Portfolios | Inc. (marketing) |
| New York, NY 10022 | the Audit | and Professor thereof from 1980 to 2005; President, Hudson Institute | |||
| 1939 | Committee | (policy research organization) since 1997 and Trustee thereof since | |||
| 1980; Chairman of the Board of Trustees for Grantham University since | |||||
| 2006; Director, InnoCentive, Inc. (strategic solutions company) since | |||||
| 2005; Director, Cerego, LLC (software development and design) | |||||
| since 2005. | |||||
| Cynthia A. Montgomery | Director | Since | Professor, Harvard Business School since 1989; Director, Harvard | 34 Funds | Newell Rubbermaid, |
| 40 East 52nd Street | 2007 | Business School Publishing since 2005; Director, McLean Hospital | 81 Portfolios | Inc. (manufacturing) | |
| New York, NY 10022 | since 2005. | ||||
| 1952 | |||||
| Joseph P. Platt, Jr. | Director | Since | Director, The West Penn Allegheny Health System (a not-for-profit | 34 Funds | Greenlight Capital |
| 40 East 52nd Street | 2007 | health system) since 2008; Director, Jones and Brown (Canadian | 81 Portfolios | Re, Ltd (reinsurance | |
| New York, NY 10022 | insurance broker) since 1998; General Partner, Thorn Partners, LP | company) | |||
| 1947 | (private investment) since 1998; Formerly Partner, Amarna Corporation, | ||||
| LLC (private investment company) from 2002 to 2008. | |||||
| Robert C. Robb, Jr. | Director | Since | Partner, Lewis, Eckert, Robb and Company (management and | 34 Funds | None |
| 40 East 52nd Street | 2007 | financial consulting firm) since 1981. | 81 Portfolios | ||
| New York, NY 10022 | |||||
| 1945 | |||||
| Toby Rosenblatt | Director | Since | President, Founders Investments Ltd. (private investments) since | 34 Funds | A.P. Pharma, Inc. |
| 40 East 52nd Street | 2007 | 1999; Director, Forward Management, LLC since 2007; Director, | 81 Portfolios | (specialty | |
| New York, NY 10022 | The James Irvine Foundation (philanthropic foundation) since 1997; | pharmaceuticals) | |||
| 1938 | Formerly Trustee, State Street Research Mutual Funds from 1990 | ||||
| to 2005; Formerly, Trustee, Metropolitan Series Funds, Inc. from | |||||
| 2001 to 2005. | |||||
32 BLACKROCK SMALL CAP GROWTH FUND II MAY 31, 2009
| Officers and Directors (continued) | |||||
| Number of | |||||
| Position(s) | Length of | BlackRock- | |||
| Held with | Time | Advised Funds | |||
| Name, Address | Fund/ | Served as | and Portfolios | Public | |
| and Year of Birth | Master LLC | a Director2 | Principal Occupation(s) During Past 5 Years | Overseen | Directorships |
| Non-Interested Directors1 (concluded) | |||||
| Kenneth L. Urish | Chairman of | Since | Managing Partner, Urish Popeck & Co., LLC (certified public | 34 Funds | None |
| 40 East 52nd Street | the Audit | 2007 | accountants and consultants) since 1976; Member of External | 81 Portfolios | |
| New York, NY 10022 | Committee | Advisory Board, The Pennsylvania State University Accounting | |||
| 1951 | and Director | Department since 2001; Trustee, The Holy Family Foundation since | |||
| 2001; Committee Member, Professional Ethics Committee of the | |||||
| Pennsylvania Institute of Certified Public Accountants since 2007; | |||||
| Formerly President and Trustee, Pittsburgh Catholic Publishing | |||||
| Associates from 2003 to 2008; Formerly Director, Inter-Tel from | |||||
| 2006 to 2007. | |||||
| Frederick W. Winter | Director and | Since | Professor and Dean Emeritus of the Joseph M. Katz School of | 34 Funds | None |
| 40 East 52nd Street | Member of | 2007 | Business, University of Pittsburgh since 2005 and Dean thereof | 81 Portfolios | |
| New York, NY 10022 | the Audit | from 1997 to 2005. Director, Alkon Corporation (pneumatics) since | |||
| 1945 | Committee | 1992; Director, Tippman Sports (recreation) since 2005; Formerly | |||
| Director, Indotronix International (IT services) from 2004 to 2008. | |||||
| 1 Directors serve until their resignation, removal or death, or until December 31 of the year in which they turn 72. | |||||
| 2 Following the combination of Merrill Lynch Investment Managers, L.P. (“MLIM”) and BlackRock, Inc. (“BlackRock”) in September 2006, the | |||||
| various legacy MLIM and legacy BlackRock Fund boards were realigned and consolidated into three new Fund boards in 2007. As a result, | |||||
| although the chart shows certain directors as joining the Fund’s/Master LLC’s board in 2007, each director first became a member of the | |||||
| board of directors of other legacy MLIM or legacy BlackRock Funds as follows: David O. Beim, 1998; Ronald W. Forbes, 1977; Matina Horner, | |||||
| 2004; Rodney D. Johnson, 1995; Herbert I. London, 1987; Cynthia A. Montgomery, 1994; Joseph P. Platt, Jr., 1999; Robert C. Robb, Jr., 1999; | |||||
| Toby Rosenblatt, 2005; Kenneth L. Urish, 1999 and Frederick W. Winter, 1999. | |||||
| Interested Directors3 | |||||
| Richard S. Davis | Director | Since | Managing Director, BlackRock, Inc. since 2005; Formerly Chief | 175 Funds | None |
| 40 East 52nd Street | 2007 | Executive Officer, State Street Research & Management Company | 285 Portfolios | ||
| New York, NY 10022 | from 2000 to 2005; Formerly Chairman of the Board of Trustees, | ||||
| 1945 | State Street Research Mutual Funds from 2000 to 2005; Formerly | ||||
| Chairman, SSR Realty from 2000 to 2004. | |||||
| Henry Gabbay | Director | Since | Consultant, BlackRock, Inc. from 2007 to 2008; Formerly Managing | 175 Funds | None |
| 40 East 52nd Street | 2007 | Director, BlackRock, Inc. from 1989 to 2007; Formerly Chief | 285 Portfolios | ||
| New York, NY 10022 | Administrative Officer, BlackRock Advisors, LLC from 1998 to 2007; | ||||
| 1947 | Formerly President of BlackRock Funds and BlackRock Bond Allocation | ||||
| Target Shares from 2005 to 2007 and Treasurer of certain closed-end | |||||
| funds in the BlackRock fund complex from 1989 to 2006. | |||||
3 Mr. Davis is an “interested person” as defined in the Investment Company Act of 1940, of the Fund/Master LLC based on his position with
BlackRock, Inc. and its affiliates. Mr. Gabbay is an “interested person” of the Fund/Master LLC based on his former positions with BlackRock,
Inc. and its affiliates as well as his ownership of BlackRock, Inc. and PNC Securities. Directors serve until their resignation, removal or death,
or until December 31 of the year in which they turn 72.
BLACKROCK SMALL CAP GROWTH FUND II MAY 31, 2009 33
| Officers and Directors (concluded) | |||||
| Position(s) | |||||
| Held with | |||||
| Name, Address | Fund/ | Length of | |||
| and Year of Birth | Master LLC | Time Served | Principal Occupation(s) During Past Five Years | ||
| Fund/Master LLC Officers1 | |||||
| Donald C. Burke | President | Since | Managing Director of BlackRock, Inc. since 2006; Formerly Managing Director of Merrill Lynch Investment | ||
| 40 East 52nd Street | and Chief | 2007 | Managers, L.P. (“MLIM”) and Fund Asset Management, L.P. (“FAM”) in 2006, First Vice President thereof from | ||
| New York, NY 10022 | Executive | 1997 to 2005, Treasurer thereof from 1999 to 2006 and Vice President thereof from 1990 to 1997. | |||
| 1960 | Officer | ||||
| Anne F. Ackerley | Vice | Since | Managing Director of BlackRock, Inc. since 2000; Chief Operating Officer of BlackRock’s U.S. Retail Group since | ||
| 40 East 52nd Street | President | 2007 | 2006; Formerly Head of BlackRock’s Mutual Fund Group from 2000 to 2006. | ||
| New York, NY 10022 | |||||
| 1962 | |||||
| Neal J. Andrews | Chief | Since | Managing Director of BlackRock, Inc. since 2006; Formerly Senior Vice President and Line of Business Head of | ||
| 40 East 52nd Street | Financial | 2007 | Fund Accounting and Administration at PNC Global Investment Servicing (U.S.) Inc. (formerly PFPC Inc.) from 1992 | ||
| New York, NY 10022 | Officer | to 2006. | |||
| 1966 | |||||
| Jay M. Fife | Treasurer | Since | Managing Director of BlackRock, Inc. since 2007 and Director in 2006; Formerly Assistant Treasurer of the | ||
| 40 East 52nd Street | 2007 | MLIM/FAM advised funds from 2005 to 2006; Director of MLIM Fund Services Group from 2001 to 2006. | |||
| New York, NY 10022 | |||||
| 1970 | |||||
| Brian P. Kindelan | Chief | Since | Chief Compliance Officer of the BlackRock-advised Funds since 2007; Managing Director and Senior Counsel | ||
| 40 East 52nd Street | Compliance | 2007 | of BlackRock, Inc. since 2005; Formerly Director and Senior Counsel of BlackRock Advisors, Inc. from 2001 | ||
| New York, NY 10022 | Officer | to 2004. | |||
| 1959 | |||||
| Howard B. Surloff | Secretary | Since | Managing Director of BlackRock, Inc. and General Counsel of U.S. Funds at BlackRock, Inc. since 2006; Formerly | ||
| 40 East 52nd Street | 2007 | General Counsel (U.S.) of Goldman Sachs Asset Management, L.P. from 1993 to 2006. | |||
| New York, NY 10022 | |||||
| 1965 | |||||
| 1 Officers of the Fund/Master LLC serve at the pleasure of the Board of Directors. | |||||
| Further information about the Fund’s/Master LLC’s Officers and Directors is available in the Fund’s Statement of Additional Information, which can | |||||
| be obtained without charge by calling (800) 441-7762. | |||||
| Custodian | Transfer Agent | Accounting Agent | Independent Registered Public | Legal Counsel | |
| Brown Brothers | PNC Global Investment | State Street Bank and | Accounting Firm | Sidley Austin LLP | |
| Harriman & Co. | Servicing (U.S.) Inc. | Trust Company | Deloitte & Touche LLP | New York, NY 10019 | |
| Boston, MA 02109 | Wilmington, DE 19809 | Princeton, NJ 08540 | Princeton, NJ 08540 | ||
| Fund Address | |||||
| BlackRock Small Cap Growth Fund II | |||||
| Of BlackRock Series, Inc. | |||||
| 100 Bellevue Parkway | |||||
| Wilmington, DE 19809 | |||||
Effective July 31, 2009, Donald C. Burke, President and Chief Executive Officer of the Fund and Master LLC will retire. The
Fund’s and Master LLC’s Board of Directors wishes Mr. Burke well in his retirement.
Effective August 1, 2009, Anne F. Ackerley will become President and Chief Executive Officer of the Fund and Master LLC.
34 BLACKROCK SMALL CAP GROWTH FUND II MAY 31, 2009
Additional Information
BlackRock Privacy Principles
BlackRock is committed to maintaining the privacy of its current and
former fund investors and individual clients (collectively, “Clients”) and
to safeguarding their non-public personal information. The following infor-
mation is provided to help you understand what personal information
BlackRock collects, how we protect that information and why in certain
cases we share such information with select parties.
If you are located in a jurisdiction where specific laws, rules or regulations
require BlackRock to provide you with additional or different privacy-related
rights beyond what is set forth below, then BlackRock will comply with
those specific laws, rules or regulations.
BlackRock obtains or verifies personal non-public information from and
about you from different sources, including the following: (i) information
we receive from you or, if applicable, your financial intermediary, on appli-
cations, forms or other documents; (ii) information about your trans-
actions with us, our affiliates, or others; (iii) information we receive from
a consumer reporting agency; and (iv) from visits to our Web sites.
BlackRock does not sell or disclose to non-affiliated third parties any non-
public personal information about its Clients, except as permitted by law
or as is necessary to respond to regulatory requests or to service Client
accounts. These non-affiliated third parties are required to protect the
confidentiality and security of this information and to use it only for its
intended purpose.
We may share information with our affiliates to service your account
or to provide you with information about other BlackRock products or
services that may be of interest to you. In addition, BlackRock restricts
access to non-public personal information about its Clients to those
BlackRock employees with a legitimate business need for the information.
BlackRock maintains physical, electronic and procedural safeguards
that are designed to protect the non-public personal information of its
Clients, including procedures relating to the proper storage and disposal
of such information.
BLACKROCK SMALL CAP GROWTH FUND II MAY 31, 2009 35
Additional Information (continued)
General Information
Electronic Delivery
Electronic copies of most financial reports and prospectuses are available
on the Fund’s Web site or shareholders can sign up for e-mail notifications
of quarterly statements, annual and semi-annual reports and prospectuses
by enrolling in the Fund’s electronic delivery program.
To enroll:
Shareholders Who Hold Accounts with Investment Advisors, Banks or
Brokerages:
Please contact your financial advisor. Please note that not all investment
advisers, banks or brokerages may offer this service.
Shareholders Who Hold Accounts Directly with BlackRock:
1) Access the BlackRock Web site at
http://www.blackrock.com/edelivery
2) Select “eDelivery” under the “More Information” section
3) Log into your account
Householding
The Fund will mail only one copy of shareholder documents, including
prospectuses, annual and semi-annual reports and proxy statements, to
shareholders with multiple accounts at the same address. This practice is
commonly called “householding” and it is intended to reduce expenses
and eliminate duplicate mailings of shareholder documents. Mailings of
your shareholder documents may be householded indefinitely unless you
instruct us otherwise. If you do not want the mailing of these documents
to be combined with those for other members of your household, please
contact the Fund at (800) 441-7762.
Availability of Proxy Voting Policies and Procedures
A description of the policies and procedures that the Fund/Master LLC
uses to determine how to vote proxies relating to portfolio securities
is available (1) without charge, upon request, by calling toll-free
(800) 441-7762; (2) at www.blackrock.com; and (3) on the Securities
and Exchange Commission’s (the “SEC”) website at http://www.sec.gov.
36 BLACKROCK SMALL CAP GROWTH FUND II MAY 31, 2009
Additional Information (concluded)
General Information (concluded)
Availability of Proxy Voting Record
Information about how the Fund/Master LLC votes proxies relating to
securities held in the Fund’s/Master LLC’s portfolio during the most
recent 12-month period ended June 30 is available upon request and
without charge (1) at www.blackrock.com or by calling (800) 441-7762
and (2) on the SEC’s website at http://www.sec.gov.
Availability of Quarterly Portfolio Schedule
The Fund/Master LLC files its complete schedule of portfolio holdings
with the SEC for the first and third quarters of each fiscal year on
Form N-Q. The Fund’s/Master LLC’s Forms N-Q are available on the
SEC’s website at http://www.sec.gov and may also be reviewed and
copied at the SEC’s Public Reference Room in Washington, D.C.
Information on the operation of the Public Reference Room may
be obtained by calling (202) 551-8090. The Fund’s Forms N-Q
may also be obtained upon request and without charge by calling
(800) 441-7762.
Shareholder Privileges
Account Information
Call us at (800) 441-7762 from 8:00 AM to 6:00 PM EST to get infor-
mation about your account balances, recent transactions and share
prices. You can also reach us on the Web at www.blackrock.com/funds.
Automatic Investment Plans
Investor Class shareholders who want to invest regularly can arrange to
have $50 or more automatically deducted from their checking or savings
account and invested in any of the BlackRock funds.
Systematic Withdrawal Plans
Investor Class shareholders can establish a systematic withdrawal plan
and receive periodic payments of $50 or more from their BlackRock
funds, as long as their account is at least $10,000.
Retirement Plans
Shareholders may make investments in conjunction with Traditional,
Rollover, Roth, Coverdell, Simple IRAs, SEP IRAs and 403(b) Plans.
BLACKROCK SMALL CAP GROWTH FUND II MAY 31, 2009 37
| A World-Class Mutual Fund Family | ||
| BlackRock offers a diverse lineup of open-end mutual funds crossing all investment styles and managed by experts in equity, fixed income and | ||
| tax-exempt investing. | ||
| Equity Funds | ||
| BlackRock All-Cap Energy & Resources Portfolio | BlackRock Global Opportunities Portfolio | BlackRock Mid-Cap Value Equity Portfolio |
| BlackRock Asset Allocation Portfolio† | BlackRock Global SmallCap Fund | BlackRock Mid Cap Value Opportunities Fund |
| BlackRock Aurora Portfolio | BlackRock Health Sciences Opportunities Portfolio | BlackRock Natural Resources Trust |
| BlackRock Balanced Capital Fund† | BlackRock Healthcare Fund | BlackRock Pacific Fund |
| BlackRock Basic Value Fund | BlackRock Index Equity Portfolio* | BlackRock Science & Technology |
| BlackRock Capital Appreciation Portfolio | BlackRock International Fund | Opportunities Portfolio |
| BlackRock Energy & Resources Portfolio | BlackRock International Diversification Fund | BlackRock Small Cap Core Equity Portfolio |
| BlackRock Equity Dividend Fund | BlackRock International Index Fund | BlackRock Small Cap Growth Equity Portfolio |
| BlackRock EuroFund | BlackRock International Opportunities Portfolio | BlackRock Small Cap Growth Fund II |
| BlackRock Focus Growth Fund | BlackRock International Value Fund | BlackRock Small Cap Index Fund |
| BlackRock Focus Value Fund | BlackRock Large Cap Core Fund | BlackRock Small Cap Value Equity Portfolio* |
| BlackRock Fundamental Growth Fund | BlackRock Large Cap Core Plus Fund | BlackRock Small/Mid-Cap Growth Portfolio |
| BlackRock Global Allocation Fund† | BlackRock Large Cap Growth Fund | BlackRock S&P 500 Index Fund |
| BlackRock Global Dynamic Equity Fund | BlackRock Large Cap Value Fund | BlackRock U.S. Opportunities Portfolio |
| BlackRock Global Emerging Markets Fund | BlackRock Latin America Fund | BlackRock Utilities and Telecommunications Fund |
| BlackRock Global Financial Services Fund | BlackRock Mid-Cap Growth Equity Portfolio | BlackRock Value Opportunities Fund |
| BlackRock Global Growth Fund | ||
| Fixed Income Funds | ||
| BlackRock Bond Portfolio | BlackRock Income Builder Portfolio† | BlackRock Short-Term Bond Fund |
| BlackRock Emerging Market Debt Portfolio | BlackRock Inflation Protected Bond Portfolio | BlackRock Strategic Income Portfolio |
| BlackRock Enhanced Income Portfolio | BlackRock Intermediate Government | BlackRock Total Return Fund |
| BlackRock GNMA Portfolio | Bond Portfolio | BlackRock Total Return Portfolio II |
| BlackRock Government Income Portfolio | BlackRock International Bond Portfolio | BlackRock World Income Fund |
| BlackRock High Income Fund | BlackRock Long Duration Bond Portfolio | |
| BlackRock High Yield Bond Portfolio | BlackRock Low Duration Bond Portfolio | |
| BlackRock Income Portfolio† | BlackRock Managed Income Portfolio | |
| Municipal Bond Funds | ||
| BlackRock AMT-Free Municipal Bond Portfolio | BlackRock Kentucky Municipal Bond Portfolio | BlackRock New York Municipal Bond Fund |
| BlackRock California Municipal Bond Fund | BlackRock Municipal Insured Fund | BlackRock Ohio Municipal Bond Portfolio |
| BlackRock Delaware Municipal Bond Portfolio | BlackRock National Municipal Fund | BlackRock Pennsylvania Municipal Bond Fund |
| BlackRock High Yield Municipal Fund | BlackRock New Jersey Municipal Bond Fund | BlackRock Short-Term Municipal Fund |
| BlackRock Intermediate Municipal Fund | ||
| Target Risk & Target Date Funds | ||
| BlackRock Prepared Portfolios | BlackRock Lifecycle Prepared Portfolios | |
| Conservative Prepared Portfolio | Prepared Portfolio 2010 | Prepared Portfolio 2030 |
| Moderate Prepared Portfolio | Prepared Portfolio 2015 | Prepared Portfolio 2035 |
| Growth Prepared Portfolio | Prepared Portfolio 2020 | Prepared Portfolio 2040 |
| Aggressive Growth Prepared Portfolio | Prepared Portfolio 2025 | Prepared Portfolio 2045 |
| Prepared Portfolio 2050 | ||
| * See the prospectus for information on specific limitations on investments in the fund. | ||
| † Mixed asset fund. | ||
| BlackRock mutual funds are currently distributed by BlackRock Investments, LLC. You should consider the investment objectives, risks, charges and | ||
| expenses of the funds under consideration carefully before investing. Each fund’s prospectus contains this and other information and is available at | ||
| www.blackrock.com or by calling (800) 882-0052 or from your financial advisor. The prospectus should be read carefully before investing. | ||
38 BLACKROCK SMALL CAP GROWTH FUND II MAY 31, 2009

This report is not authorized for use as an offer of sale or a solicita-
tion of an offer to buy shares of the Fund unless accompanied
or preceded by the Fund’s current prospectus. Past performance
results shown in this report should not be considered a representa-
tion of future performance. Investment return and principal value
of shares will fluctuate so that shares, when redeemed, may be
worth more or less than their original cost. Statements and other
information herein are as dated and are subject to change.

#SCGII-5/09
Item 2 – Code of Ethics – The registrant (or the “Fund”) has adopted a code of ethics, as of the end
of the period covered by this report, applicable to the registrant’s principal executive officer,
principal financial officer and principal accounting officer, or persons performing similar
functions. During the period covered by this report, there have been no amendments to or
waivers granted under the code of ethics. A copy of the code of ethics is available without
charge at www.blackrock.com.
Item 3 – Audit Committee Financial Expert – The registrant’s board of directors or trustees, as
applicable (the “board of directors”) has determined that (i) the registrant has the following
audit committee financial expert serving on its audit committee and (ii) each audit
committee financial expert is independent:
Kenneth L. Urish
Under applicable securities laws, a person determined to be an audit committee financial
expert will not be deemed an “expert” for any purpose, including without limitation for the
purposes of Section 11 of the Securities Act of 1933, as a result of being designated or
identified as an audit committee financial expert. The designation or identification as an
audit committee financial expert does not impose on such person any duties, obligations, or
liabilities greater than the duties, obligations, and liabilities imposed on such person as a
member of the audit committee and board of directors in the absence of such designation or
identification.
Item 4 – Principal Accountant Fees and Services
| (a) Audit Fees | (b) Audit-Related Fees1 | (c) Tax Fees2 | (d) All Other Fees3 | |||||
| Current | Previous | Current | Previous | Current | Previous | Current | Previous | |
| Fiscal Year | Fiscal Year | Fiscal Year | Fiscal Year | Fiscal Year | Fiscal Year | Fiscal Year | Fiscal Year | |
| Entity Name | End | End | End | End | End | End | End | End |
| BlackRock Small | $6,800 | $6,800 | $0 | $0 | $6,100 | $6,100 | $1,028 | $1,049 |
| Cap Growth Fund II | ||||||||
| BlackRock Master | ||||||||
| Small Cap Growth | $30,500 | $30,300 | $0 | $0 | $0 | $0 | $0 | $0 |
| Portfolio | ||||||||
1 The nature of the services include assurance and related services reasonably related to the performance of the audit of
financial statements not included in Audit Fees.
2 The nature of the services include tax compliance, tax advice and tax planning.
3 The nature of the services include a review of compliance procedures and attestation thereto.
(e)(1) Audit Committee Pre-Approval Policies and Procedures:
The registrant’s audit committee (the “Committee”) has adopted policies and
procedures with regard to the pre-approval of services. Audit, audit-related and tax
compliance services provided to the registrant on an annual basis require specific pre-
approval by the Committee. The Committee also must approve other non-audit services
provided to the registrant and those non-audit services provided to the registrant’s affiliated
service providers that relate directly to the operations and the financial reporting of the
registrant. Certain of these non-audit services that the Committee believes are a) consistent
with the SEC’s auditor independence rules and b) routine and recurring services that will
not impair the independence of the independent accountants may be approved by the
Committee without consideration on a specific case-by-case basis (“general pre-approval”).
The term of any general pre-approval is 12 months from the date of the pre-approval, unless
the Committee provides for a different period. Tax or other non-audit services provided to
the registrant which have a direct impact on the operation or financial reporting of the
registrant will only be deemed pre-approved provided that any individual project does not
exceed $10,000 attributable to the registrant or $50,000 for all of the registrants the
Committee oversees. For this purpose, multiple projects will be aggregated to determine if
they exceed the previously mentioned cost levels.
Any proposed services exceeding the pre-approved cost levels will require specific
pre-approval by the Committee, as will any other services not subject to general pre-
approval (e.g., unanticipated but permissible services). The Committee is informed of each
service approved subject to general pre-approval at the next regularly scheduled in-person
board meeting. At this meeting, an analysis of such services is presented to the Committee
for ratification. The Committee may delegate to one or more of its members the authority to
approve the provision of and fees for any specific engagement of permitted non-audit
services, including services exceeding pre-approved cost levels.
(e)(2) None of the services described in each of Items 4(b) through (d) were approved by
the audit committee pursuant to paragraph (c)(7)(i)(C) of Rule 2-01 of Regulation S-X.
| (f) Not Applicable | ||
| (g) Affiliates’ Aggregate Non-Audit Fees: | ||
| Current Fiscal Year | Previous Fiscal Year | |
| Entity Name | End | End |
| BlackRock Small Cap Growth | $414,628 | $412,149 |
| Fund II | ||
| BlackRock Master Small Cap | ||
| Growth Portfolio | $407,500 | $405,000 |
(h) The registrant’s audit committee has considered and determined that the provision of
non-audit services that were rendered to the registrant’s investment adviser (not including
any non-affiliated sub-adviser whose role is primarily portfolio management and is
subcontracted with or overseen by the registrant’s investment adviser), and any entity
controlling, controlled by, or under common control with the investment adviser that
provides ongoing services to the registrant that were not pre-approved pursuant to paragraph
(c)(7)(ii) of Rule 2-01 of Regulation S-X is compatible with maintaining the principal
accountant’s independence.
Regulation S-X Rule 2-01(c)(7)(ii) – $407,500, 0%
Item 5 – Audit Committee of Listed Registrants – Not Applicable
Item 6 – Investments
(a) The registrant’s Schedule of Investments is included as part of the Report to
Stockholders filed under Item 1 of this form.
(b) Not Applicable due to no such divestments during the semi-annual period covered since
the previous Form N-CSR filing.
Item 7 – Disclosure of Proxy Voting Policies and Procedures for Closed-End Management
Investment Companies – Not Applicable
Item 8 – Portfolio Managers of Closed-End Management Investment Companies – Not Applicable
Item 9 – Purchases of Equity Securities by Closed-End Management Investment Company and
Affiliated Purchasers – Not Applicable
Item 10 – Submission of Matters to a Vote of Security Holders – The registrant’s Nominating and
Governance Committee will consider nominees to the board of directors recommended by
shareholders when a vacancy becomes available. Shareholders who wish to recommend a
nominee should send nominations which include biographical information and set forth the
qualifications of the proposed nominee to the registrant’s Secretary. There have been no
material changes to these procedures.
Item 11 – Controls and Procedures
11(a) – The registrant’s principal executive and principal financial officers or persons performing
similar functions have concluded that the registrant’s disclosure controls and procedures (as
defined in Rule 30a-3(c) under the Investment Company Act of 1940, as amended (the
“1940 Act”)) are effective as of a date within 90 days of the filing of this report based on the
evaluation of these controls and procedures required by Rule 30a-3(b) under the 1940 Act
and Rule 15(d)-15(b) under the Securities Exchange Act of 1934, as amended.
11(b) – There were no changes in the registrant’s internal control over financial reporting (as
defined in Rule 30a-3(d) under the 1940 Act) that occurred during the second fiscal quarter
of the period covered by this report that have materially affected, or are reasonably likely to
materially affect, the registrant’s internal control over financial reporting.
Item 12 – Exhibits attached hereto
12(a)(1) – Code of Ethics – See Item 2
12(a)(2) – Certifications – Attached hereto
12(a)(3) – Not Applicable
12(b) – Certifications – Attached hereto
Pursuant to the requirements of the Securities Exchange Act of 1934 and the Investment
Company Act of 1940, the registrant has duly caused this report to be signed on its behalf by
the undersigned, thereunto duly authorized.
BlackRock Small Cap Growth Fund II of BlackRock Series, Inc. and BlackRock Master
Small Cap Growth Portfolio of BlackRock Master LLC
By: /s/ Donald C. Burke
Donald C. Burke
Chief Executive Officer of
BlackRock Small Cap Growth Fund II of BlackRock Series, Inc. and BlackRock
Master Small Cap Growth Portfolio of BlackRock Master LLC
Date: July 15, 2009
Pursuant to the requirements of the Securities Exchange Act of 1934 and the Investment
Company Act of 1940, this report has been signed below by the following persons on behalf
of the registrant and in the capacities and on the dates indicated.
By: /s/ Donald C. Burke
Donald C. Burke
Chief Executive Officer (principal executive officer) of
BlackRock Small Cap Growth Fund II of BlackRock Series, Inc. and BlackRock
Master Small Cap Growth Portfolio of BlackRock Master LLC
Date: July 15, 2009
By: /s/ Neal J. Andrews
Neal J. Andrews
Chief Financial Officer (principal financial officer) of
BlackRock Small Cap Growth Fund II of BlackRock Series, Inc. and BlackRock
Master Small Cap Growth Portfolio of BlackRock Master LLC
Date: July 15, 2009