UNITEDSTATES
SECURITIESANDEXCHANGECOMMISSION
Washington,D.C.20549
FORM N-CSR
CERTIFIED SHAREHOLDER REPORT OF REGISTERED MANAGEMENT
INVESTMENT COMPANIES
Investment Company Act file number 811-08797 and 811-09049
Name of Fund: BlackRock Small Cap Growth Fund II of BlackRock Series, Inc. and BlackRock
Master Small Cap Growth Portfolio of BlackRock Master LLC
Fund Address: 100 Bellevue Parkway, Wilmington, DE 19809
Name and address of agent for service: Anne F. Ackerley, Chief Executive Officer, BlackRock Small
Cap Growth Fund II of BlackRock Series, Inc. and BlackRock Master Small Cap Growth
Portfolio of BlackRock Master LLC, 55 East 52nd Street, New York, NY 10055
Registrant’s telephone number, including area code: (800) 441-7762
Date of fiscal year end: 05/31/2010
Date of reporting period: 05/31/2010
Item 1 – Report to Stockholders
BlackRock Small Cap
Growth Fund II
OF BLACKROCK SERIES, INC.
ANNUAL REPORT | MAY 31, 2010
NOT FDIC INSURED
MAY LOSE VALUE
NO BANK GUARANTEE
| Table of Contents | |
| Page | |
| Dear Shareholder | 3 |
| Annual Report: | |
| Fund Summary | 4 |
| About Fund Performance | 6 |
| Disclosure of Expenses | 6 |
| Fund Financial Statements: | |
| Statement of Assets and Liabilities | 7 |
| Statement of Operations | 8 |
| Statements of Changes in Net Assets | 9 |
| Fund Financial Highlights | 10 |
| Fund Notes to Financial Statements | 13 |
| Fund Report of Independent Registered Public Accounting Firm | 17 |
| Portfolio Information | 18 |
| Portfolio Financial Statements: | |
| Schedule of Investments | 19 |
| Statement of Assets and Liabilities | 22 |
| Statement of Operations | 23 |
| Statements of Changes in Net Assets | 24 |
| Portfolio Financial Highlights | 24 |
| Portfolio Notes to Financial Statements | 25 |
| Portfolio Report of Independent Registered Public Accounting Firm | 28 |
| Disclosure of Investment Agreement and Sub-Advisory Agreement | 29 |
| Officers and Directors | 33 |
| Additional Information | 36 |
| Mutual Fund Family | 38 |
2 BLACKROCK SMALL CAP GROWTH FUND II
MAY 31, 2010
Dear Shareholder
Although overall global economic and financial conditions have generally improved over the past year, the past several months have seen high levels of
market volatility and diminishing investor confidence sparked by the sovereign debt crisis in Europe, concerns over the strength of the economic recov-
ery and uncertainty surrounding the future of interest rate policies. Additionally, the increasing likelihood of more stringent financial market regulations
added to the overall sense of investment uncertainty. Despite the uneven nature of recent market conditions, we continue to believe that the “Great
Recession” likely ended at some point last summer, thanks primarily to massive fiscal and monetary stimulus, and that the global economy remains
in recovery mode for most regions of the world.
Global equity markets bottomed in early 2009 and since that time have moved unevenly higher as investors were lured back into the markets by
depressed valuations, desire for higher yields and improvements in corporate earnings prospects. Volatility levels, however, have remained elevated —
reflections of mixed economic data, lingering deflation issues (especially in Europe) and uncertainty surrounding financial regulations. As the period
drew to a close, a significant multi-week correction drove stock prices lower, erasing year-to-date gains in many markets and pushing stocks into
negative territory for the year in others. On a twelve-month basis, however, global equities remain in positive territory thanks to improving corporate
revenues and profits and a generally positive macro backdrop. From a geographic perspective, US equities have significantly outpaced their interna-
tional counterparts over the past six and twelve months, as the domestic economic recovery has been more pronounced and as credit-related
issues have held European markets down. Within the United States, smaller cap stocks have noticeably outperformed large caps.
Regarding fixed income markets, yields have been moving unevenly over the past six and twelve months as improving economic conditions have been
acting to push Treasury yields higher (and prices correspondingly lower), while concerns over ongoing deflation threats have acted as a counterweight.
As the period drew to a close, Treasury yields were falling as investors flocked to the “safe haven” asset class in the face of escalating uncertainty.
Over the course of the last twelve and six months, however, Treasuries underperformed other areas of the bond market, particularly the high yield
sector, which has been benefiting from increased investor demand. Meanwhile, municipal bonds slightly outperformed taxable sectors over both the
six- and twelve-month periods thanks to continued high demand levels, but have continued to face the headwinds of ongoing state and local budget
problems. As in the taxable arena, high yield municipals have been outperforming the rest of the market.
Regarding cash investments, yields on money market securities remain near all-time lows (producing returns only marginally above zero percent), with
the Federal Open Market Committee reiterating that economic circumstances are likely to necessitate an accommodative interest rate stance for an
“extended period.”
| Against this backdrop, the major market averages posted the following returns: | ||
| Total Returns as of May 31, 2010 | 6-month | 12-month |
| US equities (S&P 500 Index) | 0.40% | 20.99% |
| Small cap US equities (Russell 2000 Index) | 14.84 | 33.62 |
| International equities (MSCI Europe, Australasia, Far East Index) | (11.09) | 6.38 |
| 3-month Treasury bill (BofA Merrill Lynch 3-Month Treasury Bill Index) | 0.05 | 0.16 |
| US Treasury securities (BofA Merrill Lynch 10-Year US Treasury Index) | 0.82 | 4.66 |
| Taxable fixed income (Barclays Capital US Aggregate Bond Index) | 2.08 | 8.42 |
| Tax-exempt fixed income (Barclays Capital Municipal Bond Index) | 3.60 | 8.52 |
| High yield bonds (Barclays Capital US Corporate High Yield 2% Issuer Capped Index) | 6.56 | 28.79 |
Past performance is no guarantee of future results. Index performance shown for illustrative purposes only. You cannot invest directly in an index.
Although conditions are certainly better than they were a couple of years ago, global financial markets continue to face high volatility and questions about
the strength and sustainability of the recovery abound. Through periods of uncertainty, as ever, BlackRock’s full resources are dedicated to the manage-
ment of our clients’ assets. For additional market perspective and investment insight, visit www.blackrock.com/shareholdermagazine, where you’ll find the
most recent issue of our award-winning Shareholder® magazine, as well as its quarterly companion newsletter, Shareholder Perspectives. As always, we
thank you for entrusting BlackRock with your investments, and we look forward to your continued partnership in the months and years ahead.

THIS PAGE NOT PART OF YOUR FUND REPORT
3
Fund Summary as of May 31, 2010
BlackRock Small Cap Growth Fund II
Portfolio Management Commentary
How did the Fund perform?
• The Fund, through its investment in BlackRock Master Small Cap Growth
Portfolio (the “Portfolio”), underperformed the benchmark Russell 2000
Growth Index for the 12-month period ended May 31, 2010.
What factors influenced performance?
• Weaker stock selection in the consumer discretionary sector was prima-
rily responsible for holding back relative returns for the period. In partic-
ular, media content provider CKx, Inc. dipped by about 24%, as investors
waited on the results of a new contract negotiation surrounding the
company’s American Idol franchise. Elsewhere within the sector, lottery
gaming provider Scientific Games Corp., Class A fell more than 40%
while questions regarding a renewal of a major client contract went
unanswered for a majority of the period. Aside from consumer discre-
tionary, the Portfolio’s holding in InterMune, Inc., within the health care
sector, also negatively contributed to overall performance. InterMune
stock declined by about 70% after the Federal Drug Administration
reversed a prior panel ruling and rejected approval of the company’s
pulmonary fibrosis drug pending further clinical trial.
• On the positive side, stock selection in the health care sector was the
most significant contributor to the Fund’s returns for the 12 months.
Shares of home oxygen provider Lincare Holdings, Inc. rose steadily
and ultimately ended up by more than 100%. Stock selection in the
biotechnology industry was also beneficial, as cancer drug companies
OSI Pharmaceuticals, Inc. and Dendreon Corp. both jumped by more
than 70%. Elsewhere in the portfolio, network security provider
SonicWALL, Inc. within the information technology sector climbed by
78% on strong financial results.
Describe recent portfolio activity.
• During the period, we increased the Portfolio’s weighting in the health
care sector as we continued to find a number of names with good
risk/reward profiles that we considered high-conviction holdings, includ-
ing HealthSouth Corp. and Emergency Medical Services Corp. among
others. We also decreased the Portfolio’s overall weighting in the con-
sumer discretionary sector, eliminating positions in DreamWorks
Animation SKG, Inc. and lululemon athletica inc.
Describe portfolio positioning at period end.
• At period end, the Portfolio’s most significant overweight relative to the
Russell 2000 Growth Index was in the health care sector (approximately
3%) and its most significant underweight was in the consumer discre-
tionary sector approximately (4%).
The views expressed reflect the opinions of BlackRock as of the date of this report and are subject to change based on changes in market, economic or other conditions.
These views are not intended to be a forecast of future events and are no guarantee of future results.
4 BLACKROCK SMALL CAP GROWTH FUND II
MAY 31, 2010
Total Return Based on a $10,000 Investment
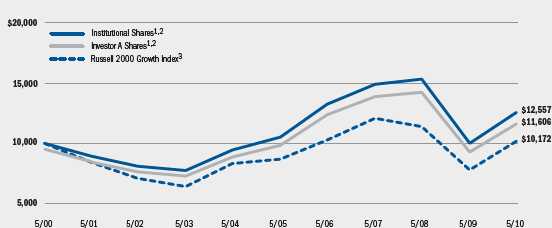
1 Assuming maximum sales charges, transaction costs and other operating expenses, including administration fees, if any. Institutional Shares do
not have a sales charge.
2 The Fund invests all of its assets in the Porfolio. The Portfolio invests primarily in a diversified portfolio of equity securities of small cap compa-
nies located in the United States that the Manager believes are undervalued or have good prospects for earnings growth.
3 This unmanaged index measures the performance of those Russell 2000 companies with higher price-to-book ratios and higher forecasted
growth values.
| Performance Summary for the Period Ended May 31, 2010 | |||||||
| Average Annual Total Returns4 | |||||||
| 1 Year | 5 Years | 10 Years | |||||
| 6-Month | w/o sales | w/sales | w/o sales | w/sales | w/o sales | w/sales | |
| Total Returns | charge | charge | charge | charge | charge | charge | |
| Institutional | 9.50% | 25.57% | N/A | 3.62% | N/A | 2.30% | N/A |
| Investor A | 9.35 | 25.17 | 18.59% | 3.37 | 2.26% | 2.05 | 1.50% |
| Investor B | 8.81 | 23.72 | 19.22 | 2.31 | 1.99 | 1.39 | 1.39 |
| Investor C | 8.83 | 23.95 | 22.95 | 2.41 | 2.41 | 1.17 | 1.17 |
| Class R | 9.13 | 24.77 | N/A | 2.97 | N/A | 1.83 | N/A |
| Russell 2000 Growth Index | 13.68 | 30.54 | N/A | 3.21 | N/A | 0.17 | N/A |
4 Assuming maximum sales charges, if any. Average annual total returns with and without sales charges reflect reductions for distribution and service fees. See “About Fund
Performance” on page 6 for a detailed description of share classes, including any related sales charges and fees.
N/A — Not applicable as share class and index do not have a sales charge.
Past performance is not indicative of future results.
BLACKROCK SMALL CAP GROWTH FUND II
MAY 31, 2010
5
About Fund Performance
• Institutional Shares are not subject to any sales charge. Institutional
Shares bear no ongoing distribution or service fees and are available
only to eligible investors.
• Investor A Shares incur a maximum initial sales charge (front-end load)
of 5.25% and a service fee of 0.25% per year (but no distribution fee).
• Investor B Shares are subject to a maximum contingent deferred sales
charge of 4.50% declining to 0% after six years. In addition, Investor B
Shares are subject to a distribution fee of 0.75% per year and a service
fee of 0.25% per year. These shares automatically convert to Investor A
Shares after approximately eight years. (There is no initial sales charge
for automatic share conversions.) All returns for periods greater than
eight years reflect this conversion. Investor B Shares of the Fund are
only available through exchanges, dividend reinvestment by existing
shareholders or for purchase by certain qualified employee benefit plans.
• Investor C Shares are subject to a 1% contingent deferred sales charge if
redeemed within one year of purchase. In addition, Investor C Shares are
subject to a distribution fee of 0.75% per year and a service fee of 0.25%
per year.
• Class R Shares do not incur a maximum initial sales charge (front-end
load) or deferred sales charge. These shares are subject to a distribution
fee of 0.25% per year and a service fee of 0.25% per year. Class R
Shares are available only to certain retirement plans. Prior to February 4,
2003, Class R Share performance results are those of Institutional
Shares (which have no distribution or service fees) restated to reflect
Class R Share fees.
Performance information reflects past performance and does not guaran-
tee future results. Current performance may be lower or higher than the
performance data quoted. Refer to www.blackrock.com/funds to obtain
performance data current to the most recent month-end. Performance
results do not reflect the deduction of taxes that a shareholder would
pay on fund distributions or the redemption of fund shares. The Fund
may charge a 2% redemption fee for sales or exchanges of shares within
30 days of purchase or exchange. Performance data does not reflect this
potential fee. Figures shown in the performance tables on the previous
page assume reinvestment of all dividends and capital gain distributions,
if any, at net asset value on the ex-dividend date. Investment return and
principal value of shares will fluctuate so that shares, when redeemed,
may be worth more or less than their original cost. Dividends paid to
each class of shares will vary because of the different levels of service,
distribution and transfer agency fees applicable to each class, which
are deducted from the income available to be paid to shareholders.
Disclosure of Expenses
Shareholders of this Fund may incur the following charges: (a) expenses
related to transactions, including sales charges, redemption fees and
exchange fees; and (b) operating expenses including advisory fees, serv-
ice and distribution fees including 12b-1 fees and other Fund expenses.
The expense example below (which is based on a hypothetical investment
of $1,000 invested on December 1, 2009 and held through May 31,
2010) is intended to assist shareholders both in calculating expenses
based on an investment in the Fund and in comparing these expenses
with similar costs of investing in other mutual funds.
The table provides information about actual account values and actual
expenses. In order to estimate the expenses a shareholder paid during the
period covered by this report, shareholders can divide their account value
by $1,000 and then multiply the result by the number corresponding
to their share class under the heading entitled “Expenses Paid During
the Period.”
The table also provides information about hypothetical account values
and hypothetical expenses based on the Fund’s actual expense ratio and
an assumed rate of return of 5% per year before expenses. In order to
assist shareholders in comparing the ongoing expenses of investing in this
Fund and other funds, compare the 5% hypothetical example with the 5%
hypothetical examples that appear in other funds’ shareholder reports.
The expenses shown in the table are intended to highlight shareholders’
ongoing costs only and do not reflect any transactional expenses, such as
sales charges, redemption fees or exchange fees. Therefore, the hypotheti-
cal table is useful in comparing ongoing expenses only, and will not help
shareholders determine the relative total expenses of owning different
funds. If these transactional expenses were included, shareholder expenses
would have been higher.
| Actual | Hypothetical2 | ||||||
| Beginning | Ending | Beginning | Ending | ||||
| Account Value | Account Value | Expenses Paid | Account Value | Account Value | Expenses Paid | Annualized | |
| December 1, 2009 | May 31, 2010 | During the Period1 | December 1, 2009 | May 31, 2010 | During the Period1 | Expense Ratio | |
| Institutional | $1,000 | $1,095.00 | $ 6.63 | $1,000 | $1,018.17 | $ 6.38 | 1.29% |
| Investor A | $1,000 | $1,093.50 | $ 8.01 | $1,000 | $1,016.85 | $ 7.71 | 1.56% |
| Investor B | $1,000 | $1,088.10 | $13.52 | $1,000 | $1,011.55 | $13.02 | 2.64% |
| Investor C | $1,000 | $1,088.30 | $13.06 | $1,000 | $1,011.99 | $12.58 | 2.55% |
| Class R | $1,000 | $1,091.30 | $ 9.95 | $1,000 | $1,014.99 | $ 9.59 | 1.94% |
1 For each class of the Fund, expenses are equal to the annualized expense ratio for the class, multiplied by the average account value over the period, multiplied by 182/365
(to reflect the one-half year period shown). Because the Fund is a feeder fund, the expense table example reflects the expenses of both the feeder fund and the master port-
folio in which it invests.
2 Hypothetical 5% annual return before expenses is calculated by pro rating the number of days in the most recent fiscal half year divided by 365.
6 BLACKROCK SMALL CAP GROWTH FUND II MAY 31, 2010
| Statement of Assets and Liabilities | BlackRock Small Cap Growth Fund II | |
| May 31, 2010 | ||
| Assets | ||
| Investment at value — BlackRock Master Small Cap Growth Portfolio (the “Portfolio”) (cost — $389,207,326) | $ 416,086,847 | |
| Capital shares sold receivable | 563,288 | |
| Withdrawals receivable from the Portfolio | 94,089 | |
| Prepaid expenses | 26,548 | |
| Total assets | 416,770,772 | |
| Liabilities | ||
| Capital shares redeemed payable | 657,377 | |
| Transfer agent fees payable | 249,694 | |
| Distribution fees payable | 112,922 | |
| Administration fees payable | 66,378 | |
| Officer’s fees payable | 35 | |
| Other accrued expenses payable | 7,681 | |
| Total liabilities | 1,094,087 | |
| Net Assets | $ 415,676,685 | |
| Net Assets Consist of | ||
| Paid-in capital | $ 453,640,125 | |
| Undistributed net investment income | 34,286 | |
| Accumulated net realized loss allocated from the Portfolio | (64,877,247) | |
| Net unrealized appreciation/depreciation allocated from the Portfolio | 26,879,521 | |
| Net Assets | $ 415,676,685 | |
| Net Asset Value | ||
| Institutional — Based on net assets of $106,529,809 and 9,149,599 shares outstanding, 100 million shares authorized, $0.0001 par value | $ 11.64 | |
| Investor A — Based on net assets of $184,896,873 and 16,302,069 shares outstanding, 100 million shares authorized, $0.0001 par value | $ 11.34 | |
| Investor B — Based on net assets of $10,712,865 and 1,031,585 shares outstanding, 100 million shares authorized, $0.0001 par value | $ 10.38 | |
| Investor C — Based on net assets of $60,832,943 and 5,876,100 shares outstanding, 100 million shares authorized, $0.0001 par value | $ 10.35 | |
| Class R — Based on net assets of $52,704,195 and 4,843,263 shares outstanding, 100 million shares authorized, $0.0001 par value | $ 10.88 | |
See Notes to Financial Statements.
BLACKROCK SMALL CAP GROWTH FUND II
MAY 31, 2010
7
| Statement of Operations | BlackRock Small Cap Growth Fund II |
| Year Ended May 31, 2010 | |
| Investment Loss | |
| Net investment loss allocated from the Portfolio: | |
| Dividends | $ 1,029,320 |
| Securities lending — affiliated | 85,487 |
| Income — affiliated | 7,760 |
| Expenses | (3,127,869) |
| Total investment loss | (2,005,302) |
| Expenses | |
| Administration | 807,552 |
| Service — Investor A | 446,313 |
| Service and distribution — Investor B | 124,503 |
| Service and distribution — Investor C | 616,901 |
| Service and distribution — Class R | 242,332 |
| Transfer agent — Institutional | 285,254 |
| Transfer agent — Investor A | 506,143 |
| Transfer agent — Investor B | 92,641 |
| Transfer agent — Investor C | 345,770 |
| Transfer agent — Class R | 208,386 |
| Printing | 99,985 |
| Registration | 67,763 |
| Professional | 52,060 |
| Officer | 205 |
| Miscellaneous | 17,923 |
| Total expenses | 3,913,731 |
| Net investment loss | (5,919,033) |
| Realized and Unrealized Gain Allocated from the Portfolio | |
| Net realized gain from investments | 32,884,294 |
| Net change in unrealized appreciation/depreciation on investments | 58,581,376 |
| Total realized and unrealized gain | 91,465,670 |
| Net Increase in Net Assets Resulting from Operations | $ 85,546,637 |
See Notes to Financial Statements.
8 BLACKROCK SMALL CAP GROWTH FUND II
MAY 31, 2010
| Statements of Changes in Net Assets | BlackRock Small Cap Growth Fund II | |
| Year Ended May 31, | ||
| Increase (Decrease) in Net Assets: | 2010 | 2009 |
| Operations | ||
| Net investment loss | $ (5,919,033) | $ (4,473,751) |
| Net realized gain (loss) | 32,884,294 | (97,136,788) |
| Net change in unrealized appreciation/depreciation | 58,581,376 | (92,607,388) |
| Net increase (decrease) in net assets resulting from operations | 85,546,637 | (194,217,927) |
| Capital Share Transactions | ||
| Net decrease in net assets derived from capital share transactions | (26,121,633) | (2,749,422) |
| Redemption Fee | ||
| Redemption fee | 38,395 | 36,169 |
| Net Assets | ||
| Total increase (decrease) in net assets | 59,463,399 | (196,931,180) |
| Beginning of year | 356,213,286 | 553,144,466 |
| End of year | $ 415,676,685 | $ 356,213,286 |
| Undistributed net investment income | $ 34,286 | $ 76,016 |
See Notes to Financial Statements.
BLACKROCK SMALL CAP GROWTH FUND II
MAY 31, 2010
9
| Financial Highlights | BlackRock Small Cap Growth Fund II | ||||||||||||
| Institutional | Investor A | ||||||||||||
| Year Ended May 31, | Year Ended May 31, | ||||||||||||
| 2010 | 2009 | 2008 | 2007 | 2006 | 2010 | 2009 | 2008 | 2007 | 2006 | ||||
| Per Share Operating Performance | |||||||||||||
| Net asset value, beginning of year | $ 9.27 | $ 14.20 | $ 16.26 | $ 15.74 | $ 12.50 | $ 9.06 | $ 13.90 | $ 15.96 | $ 15.51 | $ 12.34 | |||
| Net investment loss1 | (0.11) | (0.07) | (0.09) | (0.14) | (0.14) | (0.14) | (0.09) | (0.12) | (0.18) | (0.17) | |||
| Net realized and unrealized gain (loss)2 | 2.48 | (4.86) | 0.48 | 1.95 | 3.38 | 2.42 | (4.75) | 0.46 | 1.92 | 3.34 | |||
| Net increase (decrease) from investment | |||||||||||||
| operations | 2.37 | (4.93) | 0.39 | 1.81 | 3.24 | 2.28 | (4.84) | 0.34 | 1.74 | 3.17 | |||
| Distributions from: | |||||||||||||
| Net realized gain | — | — | (2.43) | (1.29) | — | — | — | (2.38) | (1.29) | — | |||
| Tax return of capital | — | — | (0.02) | — | — | — | — | (0.02) | — | — | |||
| Total distributions | — | — | (2.45) | (1.29) | — | — | — | (2.40) | (1.29) | — | |||
| Net asset value, end of year | $ 11.64 | $ 9.27 | $ 14.20 | $ 16.26 | $ 15.74 | $ 11.34 | $ 9.06 | $ 13.90 | $ 15.96 | $ 15.51 | |||
| Total Investment Return3 | |||||||||||||
| Based on net asset value | 25.57%4 | (34.72)%5 | 2.88% | 12.50% | 25.92% | 25.17%4 | (34.82)%5 | 2.57% | 12.23% | 25.69% | |||
| Ratios to Average Net Assets6 | |||||||||||||
| Total expenses | 1.31% | 1.35% | 1.25% | 1.28% | 1.22% | 1.57% | 1.59% | 1.51% | 1.54% | 1.47% | |||
| Net investment loss | (1.03)% | (0.69)% | (0.59)% | (0.93)% | (0.93)% | (1.29)% | (0.95)% | (0.83)% | (1.18)% | (1.18)% | |||
| Supplemental Data | |||||||||||||
| Net assets, end of year (000) | $106,530 | $ 89,346 | $157,805 | $162,580 | $167,907 | $184,897 | $161,557 | $232,600 | $194,561 | $154,179 | |||
| Portfolio turnover of the Portfolio | 114% | 75% | 70% | 115% | 101% | 114% | 75% | 70% | 115% | 101% | |||
1 Based on average shares outstanding.
2 Includes a redemption fee, which is less than $0.01 per share.
3 Total investment returns exclude the effects of any sales charges and include the reinvestment of dividends and distributions.
4 Total return calculation includes redemption fees received by the Fund. The impact to the return is approximately 0.01%.
5 Total return calculation includes redemption fees received by the Fund. The impact to the return is less than 0.01%.
6 Includes the Fund’s share of the Portfolio’s allocated expenses and/or net investment loss.
See Notes to Financial Statements.
10 BLACKROCK SMALL CAP GROWTH FUND II
MAY 31, 2010
| Financial Highlights (continued) | BlackRock Small Cap Growth Fund II | ||||||||||||
| Investor B | Investor C | ||||||||||||
| Year Ended May 31, | Year Ended May 31, | ||||||||||||
| 2010 | 2009 | 2008 | 2007 | 2006 | 2010 | 2009 | 2008 | 2007 | 2006 | ||||
| Per Share Operating Performance | |||||||||||||
| Net asset value, beginning of year | $ 8.39 | $ 13.06 | $ 15.01 | $ 14.78 | $ 11.85 | $ 8.35 | $ 12.96 | $ 14.99 | $ 14.76 | $ 11.84 | |||
| Net investment loss1 | (0.25) | (0.21) | (0.26) | (0.28) | (0.27) | (0.23) | (0.18) | (0.24) | (0.28) | (0.28) | |||
| Net realized and unrealized gain (loss)2 | 2.24 | (4.46) | 0.45 | 1.80 | 3.20 | 2.23 | (4.43) | 0.43 | 1.80 | 3.20 | |||
| Net increase (decrease) from investment | |||||||||||||
| operations | 1.99 | (4.67) | 0.19 | 1.52 | 2.93 | 2.00 | (4.61) | 0.19 | 1.52 | 2.92 | |||
| Distributions from: | |||||||||||||
| Net realized gain | — | — | (2.12) | (1.29) | — | — | — | (2.20) | (1.29) | — | |||
| Tax return of capital | — | — | (0.02) | — | — | — | — | (0.02) | — | — | |||
| Total distributions | — | — | (2.14) | (1.29) | — | — | — | (2.22) | (1.29) | — | |||
| Net asset value, end of year | $ 10.38 | $ 8.39 | $ 13.06 | $ 15.01 | $ 14.78 | $ 10.35 | $ 8.35 | $ 12.96 | $ 14.99 | $ 14.76 | |||
| Total Investment Return3 | |||||||||||||
| Based on net asset value | 23.72%4 | (35.76)%5 | 1.61% | 11.29% | 24.73% | 23.95%4 | (35.57)%5 | 1.63% | 11.31% | 24.66% | |||
| Ratios to Average Net Assets6 | |||||||||||||
| Total expenses | 2.78% | 2.88% | 2.49% | 2.35% | 2.25% | 2.59% | 2.66% | 2.43% | 2.36% | 2.27% | |||
| Net investment loss | (2.50)% | (2.22)% | (1.89)% | (1.99)% | (1.96)% | (2.32)% | (2.01)% | (1.77)% | (2.01)% | (1.98)% | |||
| Supplemental Data | |||||||||||||
| Net assets, end of year (000) | $ 10,713 | $ 12,197 | $ 29,045 | $ 60,086 | $ 72,350 | $ 60,833 | $ 53,668 | $ 96,449 | $ 99,938 | $ 75,678 | |||
| Portfolio turnover of the Portfolio | 114% | 75% | 70% | 115% | 101% | 114% | 75% | 70% | 115% | 101% | |||
1 Based on average shares outstanding.
2 Includes a redemption fee, which is less than $0.01 per share.
3 Total investment returns exclude the effects of any sales charges and include the reinvestment of dividends and distributions.
4 Total return calculation includes redemption fees received by the Fund. The impact to the return is approximately 0.01%.
5 Total return calculation includes redemption fees received by the Fund. The impact to the return is less than 0.01%.
6 Includes the Fund’s share of the Portfolio’s allocated expenses and/or net investment loss.
See Notes to Financial Statements.
BLACKROCK SMALL CAP GROWTH FUND II
MAY 31, 2010
11
| Financial Highlights (concluded) | BlackRock Small Cap Growth Fund II | ||||||
| Class R | |||||||
| Year Ended May 31, | |||||||
| 2010 | 2009 | 2008 | 2007 | 2006 | |||
| Per Share Operating Performance | |||||||
| Net asset value, beginning of year | $ 8.72 | $ 13.46 | $ 15.54 | $ 15.18 | $ 12.11 | ||
| Net investment loss1 | (0.17) | (0.14) | (0.17) | (0.22) | (0.21) | ||
| Net realized and unrealized gain (loss)2 | 2.33 | (4.60) | 0.44 | 1.87 | 3.28 | ||
| Net increase (decrease) from investment operations | 2.16 | (4.74) | 0.27 | 1.65 | 3.07 | ||
| Distributions from: | |||||||
| Net realized gain | — | — | (2.33) | (1.29) | — | ||
| Total return of capital | — | — | (0.02) | — | — | ||
| Total distributions | — | — | (2.35) | (1.29) | — | ||
| Net asset value, end of year | $ 10.88 | $ 8.72 | $ 13.46 | $ 15.54 | $ 15.18 | ||
| Total Investment Return3 | |||||||
| Based on net asset value | 24.77%4 | (35.22)%5 | 2.12% | 11.88% | 25.35% | ||
| Ratios to Average Net Assets6 | |||||||
| Total expenses | 1.96% | 2.12% | 1.95% | 1.86% | 1.72% | ||
| Net investment loss | (1.69)% | (1.49)% | (1.26)% | (1.50)% | (1.43)% | ||
| Supplemental Data | |||||||
| Net assets, end of year (000) | $ 52,704 | $ 39,445 | $ 37,245 | $ 21,412 | $ 11,423 | ||
| Portfolio turnover of the Portfolio | 114% | 75% | 70% | 115% | 101% | ||
1 Based on average shares outstanding.
2 Includes a redemption fee, which is less than $0.01 per share.
3 Total investment returns include the reinvestment of dividends and distributions.
4 Total return calculation includes redemption fees received by the Fund. The impact to the return is approximately 0.01%.
5 Total return calculation includes redemption fees received by the Fund. The impact to the return is less than 0.01%.
6 Includes the Fund’s share of the Portfolio’s allocated expenses and/or net investment loss.
See Notes to Financial Statements.
12 BLACKROCK SMALL CAP GROWTH FUND II
MAY 31, 2010
Notes to Financial Statements
BlackRock Small Cap Growth Fund II
1. Organization and Significant Accounting Policies:
BlackRock Small Cap Growth Fund II (the “Fund”) of BlackRock Series,
Inc. (the “Corporation”) is registered under the Investment Company
Act of 1940, as amended (the “1940 Act”), as a diversified, open-end
management investment company. The Corporation is organized as a
Maryland corporation. The Fund seeks to achieve its investment objective
by investing all of its assets in BlackRock Master Small Cap Growth
Portfolio (the “Portfolio”) of BlackRock Master LLC, which has the same
investment objective and strategies as the Fund. The value of the Fund’s
investment in the Portfolio reflects the Fund’s proportionate interest in
the net assets of the Portfolio. The performance of the Fund is directly
affected by the performance of the Portfolio. The financial statements of
the Portfolio, including the Schedule of Investments, are included else-
where in this report and should be read in conjunction with the Fund’s
financial statements. The percentage of the Portfolio owned by the Fund
at May 31, 2010 was 100%. The Fund’s financial statements are pre-
pared in conformity with accounting principles generally accepted in
the United States of America ("US GAAP"), which may require manage-
ment to make estimates and assumptions that affect the reported
amounts and disclosures in the financial statements. Actual results
could differ from those estimates. The Fund offers multiple classes of
shares. Institutional Shares are sold without a sales charge and only to
certain eligible investors. Investor A Shares are generally sold with a
front-end sales charge. Investor B and Investor C Shares may be subject
to a contingent deferred sales charge. Class R Shares are sold without a
sales charge and only to certain retirement and other similar plans. All
classes of shares have identical voting, dividend, liquidation and other
rights and the same terms and conditions, except that Investor A,
Investor B, Investor C and Class R Shares bear certain expenses related
to the shareholder servicing of such shares, and Investor B, Investor C
and Class R Shares also bear certain expenses related to the distribu-
tion of such shares. Investor B Shares automatically convert to Investor A
Shares after approximately eight years. Investor B Shares are only avail-
able through exchanges, dividend reinvestment by existing shareholders
or for purchase by certain qualified employee benefit plans. Each class
has exclusive voting rights with respect to matters relating to its share-
holder servicing and distribution expenditures (except that Investor B
shareholders may vote on material changes to the Investor A
distribution plan).
The following is a summary of significant accounting policies followed by
the Fund:
Valuation: The Fund’s policy is to fair value its financial instruments at
market value. The Fund records its investment in the Portfolio at fair
value. Valuation of securities held by the Portfolio is discussed in Note 1
of the Portfolio’s Notes to Financial Statements, which are included else-
where in this report.
Fair Value Measurements: Various inputs are used in determining the
fair value of investments, which are as follows:
• Level 1 — price quotations in active markets/exchanges for identical
assets and liabilities
• Level 2 — other observable inputs (including, but not limited to:
quoted prices for similar assets or liabilities in markets that are
active, quoted prices for identical or similar assets in markets that
are not active, inputs other than quoted prices that are observable
for the assets or liabilities (such as interest rates, yield curves,
volatilities, prepayment speeds, loss severities, credit risks and
default rates) or other market-corroborated inputs)
• Level 3 — unobservable inputs based on the best information avail-
able in the circumstances, to the extent observable inputs are not
available (including the Fund’s own assumptions used in determining
the fair value of investments)
The inputs or methodologies used for valuing securities are not
necessarily an indication of the risk associated with investing in
those securities.
As of May 31, 2010, the Fund’s investment in the Portfolio was classi-
fied as Level 2. The Fund believes more relevant disclosure regarding fair
value measurements relate to the Portfolio, which is disclosed in Note 1
of the Portfolio’s Notes to Financial Statements included elsewhere in
this report.
Investment Transactions and Investment Income: For financial reporting
purposes, investment transactions in the Portfolio are accounted for
on a trade date basis. The Fund records daily its proportionate share
of the Portfolio’s income, expenses and realized and unrealized gains
and losses. In addition, the Fund accrues its own expenses. Income and
realized and unrealized gains and losses on investments are allocated
daily to each class based on its relative net assets.
Dividends and Distributions: Dividends and distributions paid by the
Fund are recorded on the ex-dividend dates. If the total dividends and
distributions made in any tax year exceeds net investment income and
accumulated realized capital gains, a portion of the total distribution
may be treated as a tax return of capital. The amount and timing of
dividends and distributions are determined in accordance with federal
income tax regulations, which may differ from US GAAP.
Income Taxes: It is the Fund’s policy to comply with the requirements
of the Internal Revenue Code of 1986, as amended, applicable to
regulated investment companies and to distribute substantially all of
its taxable income to its shareholders. Therefore, no federal income tax
provision is required.
BLACKROCK SMALL CAP GROWTH FUND II
MAY 31, 2010
13
Notes to Financial Statements (continued)
BlackRock Small Cap Growth Fund II
The Fund files US federal and various state and local tax returns. No
income tax returns are currently under examination. The statute of
limitations on the Fund’s US federal tax returns remains open for each
of the four years ended May 31, 2010. The statutes of limitations on the
Fund’s state and local tax returns may remain open for an additional
year depending upon the jurisdiction. There are no uncertain tax posi-
tions that require recognition of a tax liability.
Recent Accounting Standard: In January 2010, the Financial Accounting
Standards Board issued amended guidance to improve disclosure about
fair value measurements which will require additional disclosures about
transfers into and out of Levels 1 and 2 and separate disclosures about
purchases, sales, issuances and settlements in the reconciliation for fair
value measurements using significant unobservable inputs (Level 3). It
also clarifies existing disclosure requirements relating to the levels of
disaggregation for fair value measurement and inputs and valuation
techniques used to measure fair value. The amended guidance is effec-
tive for financial statements for fiscal years beginning after December
15, 2009, and interim periods within those fiscal years, except for dis-
closures about purchases, sales, issuances and settlements in the roll-
forward of activity in Level 3 fair value measurements, which are effective
for fiscal years beginning after December 15, 2010 and for interim peri-
ods within those fiscal years. The impact of this guidance on the Fund’s
financial statements and disclosures is currently being assessed.
Other: Expenses directly related to the Fund or its classes are charged to
that Fund or class. Other operating expenses shared by several funds are
pro rated among those funds on the basis of relative net assets or other
appropriate methods. Other expenses of the Fund are allocated daily to
each class based on its relative net assets. The Fund has an arrange-
ment with the custodian whereby fees may be reduced by credits earned
on uninvested cash balances, which if applicable are shown as fees paid
indirectly in the Statement of Operations. The custodian imposes fees on
overdrawn cash balances, which can be offset by accumulated credits
earned or may result in additional custody charges.
2. Administration Agreement and Other Transactions with
Affiliates:
The PNC Financial Services Group, Inc. ("PNC"), Bank of America
Corporation ("BAC") and Barclays Bank PLC ("Barclays") are the largest
stockholders of BlackRock, Inc. ("BlackRock"). Due to the ownership
structure, PNC is an affiliate of the Fund for 1940 Act purposes, but BAC
and Barclays are not.
The Corporation, on behalf of the Fund, entered into an Administration
Agreement with BlackRock Advisors, LLC (the “Administrator”), an indi-
rect, wholly owned subsidiary of BlackRock, to provide administrative
services (other than investment advice and related portfolio activities).
For such services, the Fund pays the Administrator a monthly fee at an
annual rate of 0.20% of the Fund’s average daily net assets. The Fund
does not pay an Advisory or investment management fee.
The Fund entered into a Distribution Agreement and Distribution and
Shareholder Servicing Plans with BlackRock Investments, LLC (”BRIL“),
an affiliate of BlackRock. Pursuant to the Distribution Plans and in
accordance with Rule 12b-1 under the 1940 Act, the Fund pays BRIL
ongoing service and distribution fees. The fees are accrued daily and
paid monthly at annual rates based upon the average daily net assets
of the shares of the Fund as follows:
| Service | Distribution | |
| Fee | Fee | |
| Investor A | 0.25% | — |
| Investor B | 0.25% | 0.75% |
| Investor C | 0.25% | 0.75% |
| Class R | 0.25% | 0.25% |
Pursuant to sub-agreements with BRIL, broker-dealers and BRIL provide
shareholder servicing and distribution services to the Fund. The ongoing
service and/or distribution fee compensates BRIL and each broker-
dealer for providing shareholder servicing and/or distribution related
services to Investor A, Investor B, Investor C and Class R shareholders.
For the year ended May 31, 2010, affiliates earned underwriting dis-
counts, direct commissions and dealer concessions on sales of the
Fund’s Investor A Shares, which totaled $3,188. For the year ended May
31, 2010, affiliates received the following contingent deferred sales
charges relating to transactions in Investor B and Investor C Shares:
| Investor B | $ 7,615 |
| Investor C | $ 4,280 |
Furthermore, affiliates received contingent deferred sale charges of $206
relating to transactions subject to front-end sales charge waivers on
Investor A Shares.
PNC Global Investment Servicing (U.S.) Inc. (“PNCGIS”), an indirect,
wholly owned subsidiary of PNC and an affiliate of the Administrator,
serves as transfer agent and dividend disbursing agent. Subsequent to
May 31, 2010, PNCGIS was sold to The Bank of New York Mellon
Corporation and is no longer considered an affiliate of the Administrator.
At the close of the sale, PNCGIS changed its name to BNY Mellon
Investment Servicing (US) Inc. Transfer agency fees borne by the Fund
are comprised of those fees charged for all shareholder communications
including mailing of shareholder reports, dividend and distribution
notices, and proxy materials for shareholder meetings, as well as per
account and per transaction fees related to servicing and maintenance
of shareholder accounts, including the issuing, redeeming and transfer-
ring of shares, check writing, anti-money laundering services, and cus-
tomer identification services.
The Administrator maintains a call center, which is responsible for pro-
viding certain shareholder services to the Fund, such as responding to
shareholder inquiries and processing transactions based upon instruc-
tions from shareholders with respect to the subscription and redemption
14 BLACKROCK SMALL CAP GROWTH FUND II
MAY 31, 2010
Notes to Financial Statements (continued)
BlackRock Small Cap Growth Fund II
of Fund shares. For the year ended May 31, 2010, the Fund reimbursed
the Administrator the following amounts for costs incurred in running the
call center, which are included in transfer agent — class specific in the
Statement of Operations.
| Institutional | $ 1,450 |
| Investor A | $ 2,443 |
| Investor B | $ 304 |
| Investor C | $ 2,016 |
| Class R | $ 900 |
Certain officers and/or directors of the Fund are officers and/or directors
of BlackRock or its affiliates. The Fund reimburses the Administrator for
compensation paid to the Fund’s Chief Compliance Officer.
3. Income Tax Information:
Reclassifications: US GAAP requires that certain components of net
assets be adjusted to reflect permanent differences between financial
and tax reporting. These reclassifications have no effect on net assets or
net asset values per share. The following permanent differences as of
May 31, 2010 attributable to net operating losses were reclassified to
the following:
| Paid-in capital | $(5,877,303) |
| Undistributed net investment income | $ 5,877,303 |
As of May 31, 2010, the components of net accumulated losses on a
tax basis were as follows:
| Capital loss carryforwards | $(61,763,472) |
| Net unrealized gains* | 23,800,032 |
| Total | $(37,963,440) |
* The differences between book-basis and tax-basis net unrealized gains is attribut-
able primarily to the tax deferral of losses on wash sales and the timing and
recognition of income from partnerships.
As of May 31, 2010, the Fund had capital loss caryforwards avail-
able to offset future realized capital gains through the indicated
expiration dates:
| Expires May 31, | |
| 2017 | $ 7,466,634 |
| 2018 | 54,296,838 |
| Total | $ 61,763,472 |
| 4. Capital Share Transactions: | ||||||
| Transactions in shares for each class were as follows: | ||||||
| Year Ended | Year Ended | |||||
| May 31, 2010 | May 31, 2009 | |||||
| Shares | Amount | Shares | Amount | |||
| Institutional | ||||||
| Shares sold | 2,233,317 | $ 25,332,626 | 2,564,378 | $ 24,815,863 | ||
| Shares redeemed | (2,717,508) | (30,190,722) | (4,042,413) | (38,405,355) | ||
| Net decrease | (484,191) | $ (4,858,096) | (1,478,035) | $ (13,589,492) | ||
| Investor A | ||||||
| Shares sold and automatic conversion of shares | 3,283,380 | $ 35,812,787 | 6,362,449 | $ 59,602,274 | ||
| Shares redeemed | (4,818,831) | (50,693,830) | (5,256,942) | (49,769,353) | ||
| Net increase (decrease) | (1,535,451) | $ (14,881,043) | 1,105,507 | $ 9,832,921 | ||
| Investor B | ||||||
| Shares sold | 432,131 | $ 4,262,889 | 653,089 | $ 5,923,576 | ||
| Shares redeemed and automatic conversion of shares | (853,783) | (8,495,595) | (1,424,359) | (12,944,331) | ||
| Net decrease | (421,652) | $ (4,232,706) | (771,270) | $ (7,020,755) | ||
BLACKROCK SMALL CAP GROWTH FUND II
MAY 31, 2010
15
| Notes to Financial Statements (concluded) | BlackRock Small Cap Growth Fund II | |||||
| Year Ended | Year Ended | |||||
| May 31, 2010 | May 31, 2009 | |||||
| Shares | Amount | Shares | Amount | |||
| Investor C | ||||||
| Shares sold | 1,411,223 | $ 13,879,606 | 1,579,457 | $ 13,611,948 | ||
| Shares redeemed | (1,960,634) | (19,573,116) | (2,594,133) | (22,682,086) | ||
| Net decrease | (549,411) | $ (5,693,510) | (1,014,676) | $ (9,070,138) | ||
| Class R | ||||||
| Shares sold | 2,208,599 | $ 23,274,145 | 3,238,979 | $ 30,484,414 | ||
| Shares redeemed | (1,886,553) | (19,730,423) | (1,484,706) | (13,386,372) | ||
| Net increase | 322,046 | $ 3,543,722 | 1,754,273 | $ 17,098,042 | ||
There is a 2% redemption fee on shares redeemed or exchanged that have been held for 30 days or less. The redemption fees are collected and
retained by the Fund for the benefit of the remaining shareholders. The redemption fees are recorded as a credit to paid-in capital.
5. Subsequent Events:
Management has evaluated the impact of all subsequent events on the Fund through the date the financial statements were issued and has
determined that there were no subsequent events requiring adjustment or additional disclosure in the financial statements.
16 BLACKROCK SMALL CAP GROWTH FUND II
MAY 31, 2010
Report of Independent Registered Public Accounting Firm
BlackRock Small Cap Growth Fund II
To the Shareholders and Board of Directors
of BlackRock Series, Inc.:
We have audited the accompanying statement of assets and liabilities
of BlackRock Small Cap Growth Fund II, one of the portfolios constitut-
ing BlackRock Series, Inc., (the “Fund”), as of May 31, 2010, and the
related statement of operations for the year then ended, the statements
of changes in net assets for each of the two years in the period then
ended, and the financial highlights for each of the five years in the
period then ended. These financial statements and financial highlights
are the responsibility of the Fund’s management. Our responsibility is to
express an opinion on these financial statements and financial high-
lights based on our audits.
We conducted our audits in accordance with the standards of the Public
Company Accounting Oversight Board (United States). Those standards
require that we plan and perform the audit to obtain reasonable assur-
ance about whether the financial statements and financial highlights are
free of material misstatement. The Fund is not required to have, nor were
we engaged to perform, an audit of its internal control over financial
reporting. Our audits included consideration of internal control over
financial reporting as a basis for designing audit procedures that are
appropriate in the circumstances, but not for the purpose of expressing
an opinion on the effectiveness of the Fund’s internal control over finan-
cial reporting. Accordingly, we express no such opinion. An audit also
includes examining, on a test basis, evidence supporting the amounts
and disclosures in the financial statements, assessing the accounting
principles used and significant estimates made by management, as well
as evaluating the overall financial statement presentation. We believe
that our audits provide a reasonable basis for our opinion.
In our opinion, the financial statements and financial highlights referred
to above present fairly, in all material respects, the financial position of
BlackRock Small Cap Growth Fund II of BlackRock Series, Inc. as of
May 31, 2010, the results of its operations for the year then ended, the
changes in its net assets for each of the two years in the period then
ended, and the financial highlights for each of the five years in the
period then ended, in conformity with accounting principles generally
accepted in the United States of America.
Deloitte & Touche LLP
Princeton, New Jersey
July 27, 2010
BLACKROCK SMALL CAP GROWTH FUND II
MAY 31, 2010
17
| Portfolio Information | BlackRock Master Small Cap Growth Portfolio | ||
| As of May 31, 2010 | |||
| Percent of | Percent of | ||
| Ten Largest Holdings | Long-Term Investments | Sector Allocation | Long-Term Investments |
| SonicWALL, Inc. | 3% | Health Care | 28% |
| Lincare Holdings, Inc. | 2 | Information Technology | 25 |
| ExlService Holdings, Inc. | 2 | Industrials | 15 |
| TiVo, Inc. | 2 | Consumer Discretionary | 14 |
| CKx, Inc. | 2 | Consumer Staples | 5 |
| HealthSouth Corp. | 2 | Financials | 5 |
| Heckmann Corp. | 2 | Energy | 4 |
| Emergency Medical Services Corp. | 2 | Materials | 2 |
| Cbeyond Communications, Inc. | 2 | Telecommunication Services | 2 |
| BE Aerospace, Inc. | 2 | For Portfolio compliance purposes, the Portfolio’s sector classifications refer to | |
any one or more of the sector sub-classifications used by one or more widely
recognized market indexes, and/or as defined by Portfolio management. This
definition may not apply for purposes of this report, which may combine sector
sub-classifications for reporting ease.
18 BLACKROCK SMALL CAP GROWTH FUND II
MAY 31, 2010
Schedule of Investments May 31, 2010
BlackRock Master Small Cap Growth Portfolio
(Percentages shown are based on Net Assets)
| Common Stocks | Shares | Value |
| Aerospace & Defense — 3.9% | ||
| Argon ST, Inc. (a) | 187,232 | $ 4,502,930 |
| BE Aerospace, Inc. (a) | 290,300 | 7,872,936 |
| Orbital Sciences Corp. (a) | 254,942 | 4,045,929 |
| 16,421,795 | ||
| Air Freight & Logistics — 3.1% | ||
| Atlas Air Worldwide Holdings, Inc. (a) | 127,700 | 6,674,879 |
| Forward Air Corp. | 231,819 | 6,344,886 |
| 13,019,765 | ||
| Beverages — 2.0% | ||
| Heckmann Corp. (a) | 1,551,600 | 8,285,544 |
| Biotechnology — 9.0% | ||
| Allos Therapeutics, Inc. (a)(b) | 199,200 | 1,426,272 |
| Amylin Pharmaceuticals, Inc. (a)(b) | 242,100 | 3,999,492 |
| BioMarin Pharmaceuticals, Inc. (a) | 116,100 | 2,266,272 |
| Cubist Pharmaceuticals, Inc. (a) | 305,900 | 6,576,850 |
| Dendreon Corp. (a)(b) | 125,500 | 5,446,700 |
| Human Genome Sciences, Inc. (a) | 275,600 | 6,823,856 |
| Incyte Corp. (a)(b) | 243,100 | 3,133,559 |
| Onyx Pharmaceuticals, Inc. (a) | 211,500 | 4,714,335 |
| Pharmasset, Inc. (a) | 105,100 | 3,096,246 |
| 37,483,582 | ||
| Capital Markets — 1.7% | ||
| MF Global Holdings Ltd. (a) | 263,100 | 2,025,870 |
| SWS Group, Inc. | 501,900 | 5,039,076 |
| 7,064,946 | ||
| Chemicals — 1.4% | ||
| Georgia Gulf Corp. (a)(b) | 127,700 | 2,221,980 |
| Intrepid Potash, Inc. (a)(b) | 151,500 | 3,735,990 |
| 5,957,970 | ||
| Commercial Services & Supplies — 2.1% | ||
| Clean Harbors, Inc. (a) | 39,100 | 2,478,549 |
| SYKES Enterprises, Inc. (a) | 362,848 | 6,262,756 |
| 8,741,305 | ||
| Construction & Engineering — 1.1% | ||
| Chicago Bridge & Iron Co. NV (a) | 231,800 | 4,605,866 |
| Consumer Finance — 2.1% | ||
| Cardtronics, Inc. (a) | 114,700 | 1,485,365 |
| Dollar Financial Corp. (a) | 362,800 | 7,328,560 |
| 8,813,925 | ||
| Diversified Consumer Services — 1.5% | ||
| Grand Canyon Education, Inc. (a) | 252,632 | 6,204,642 |
| Diversified Telecommunication Services — 1.9% | ||
| Cbeyond Communications, Inc. (a) | 512,900 | 8,016,627 |
| Electronic Equipment, Instruments | ||
| & Components — 1.3% | ||
| Cogent, Inc. (a) | 621,900 | 5,547,348 |
| Energy Equipment & Services — 1.0% | ||
| Superior Energy Services, Inc. (a) | 201,789 | 4,390,929 |
| Common Stocks | Shares | Value |
| Food Products — 2.8% | ||
| American Italian Pasta Co., Class A (a) | 156,309 | $ 6,081,983 |
| Diamond Foods, Inc. (b) | 130,794 | 5,421,412 |
| 11,503,395 | ||
| Health Care Equipment & Supplies — 6.5% | ||
| Conceptus, Inc. (a) | 144,600 | 2,413,374 |
| Gen-Probe, Inc. (a) | 98,500 | 4,330,060 |
| Haemonetics Corp. (a) | 29,655 | 1,599,591 |
| Inverness Medical Innovations, Inc. (a) | 176,400 | 6,140,484 |
| Merit Medical Systems, Inc. (a) | 175,392 | 2,681,743 |
| Sirona Dental Systems, Inc. (a) | 117,600 | 4,160,688 |
| SonoSite, Inc. (a) | 192,265 | 5,592,989 |
| 26,918,929 | ||
| Health Care Providers & Services — 6.3% | ||
| Emergency Medical Services Corp. (a) | 154,400 | 8,271,208 |
| HealthSouth Corp. (a) | 426,800 | 8,476,248 |
| Lincare Holdings, Inc. (a) | 204,000 | 9,551,280 |
| 26,298,736 | ||
| Health Care Technology — 1.0% | ||
| MedAssets, Inc. (a) | 179,000 | 4,061,510 |
| Hotels, Restaurants & Leisure — 3.5% | ||
| Bally Technologies, Inc. (a)(b) | 55,600 | 2,363,000 |
| Jack in the Box, Inc. (a) | 212,300 | 4,764,012 |
| Scientific Games Corp., Class A (a) | 723,200 | 7,391,104 |
| 14,518,116 | ||
| IT Services — 7.5% | ||
| ExlService Holdings, Inc. (a) | 549,367 | 9,130,480 |
| Gartner, Inc., Class A (a) | 307,446 | 7,609,288 |
| Global Cash Access, Inc. (a) | 963,522 | 7,698,541 |
| RightNow Technologies, Inc. (a) | 28,400 | 413,220 |
| Sapient Corp. | 612,400 | 6,215,860 |
| 31,067,389 | ||
| Insurance — 0.8% | ||
| Aspen Insurance Holdings Ltd. | 127,200 | 3,213,072 |
| Internet & Catalog Retail — 0.7% | ||
| Shutterfly, Inc. (a) | 121,200 | 2,799,720 |
| Internet Software & Services — 2.2% | ||
| Constant Contact, Inc. (a)(b) | 152,065 | 3,263,315 |
| GSI Commerce, Inc. (a) | 206,300 | 5,809,408 |
| 9,072,723 | ||
| Life Sciences Tools & Services — 2.4% | ||
| Bruker BioSciences Corp. (a) | 285,808 | 3,639,765 |
| ICON Plc — ADR (a) | 224,100 | 6,234,462 |
| 9,874,227 | ||
| Machinery — 1.3% | ||
| Manitowoc Co. | 444,400 | 5,301,692 |
| Media — 3.5% | ||
| CKX, Inc. (a) | 1,626,434 | |
| 8,620,100 | ||
| Live Nation, Inc. (a) | 491,081 | 6,005,921 |
| 14,626,021 |
Portfolio Abbreviation
ADR American Depositary Receipts
See Notes to Financial Statements.
BLACKROCK SMALL CAP GROWTH FUND II
MAY 31, 2010
19
Schedule of Investments (continued)
BlackRock Master Small Cap Growth Portfolio
(Percentages shown are based on Net Assets)
| Common Stocks | Shares | Value |
| Metals & Mining — 0.9% | ||
| Century Aluminum Co. (a)(b) | 347,000 | $ 3,646,970 |
| Oil, Gas & Consumable Fuels — 3.3% | ||
| Comstock Resources, Inc. (a) | 134,593 | 4,016,255 |
| Energy XXI Bermuda Ltd. (a) | 304,800 | 4,849,368 |
| Massey Energy Co. | 149,372 | 4,947,201 |
| 13,812,824 | ||
| Pharmaceuticals — 2.1% | ||
| Akorn, Inc. (a) | 1,288,172 | 3,722,817 |
| Auxilium Pharmaceuticals, Inc. (a) | 46,900 | 1,349,782 |
| Cypress Bioscience, Inc. (a) | 489,100 | 2,015,092 |
| Depomed, Inc. (a) | 550,100 | 1,875,841 |
| 8,963,532 | ||
| Professional Services — 3.2% | ||
| Corporate Executive Board Co. | 90,286 | 2,924,364 |
| Diamond Management & Technology Consultants, Inc. | 475,607 | 4,722,777 |
| Heidrick & Struggles International, Inc. | 107,400 | 2,486,310 |
| Kforce, Inc. (a) | 171,300 | 2,315,976 |
| TrueBlue, Inc. (a) | 58,265 | 774,342 |
| 13,223,769 | ||
| Semiconductors & Semiconductor Equipment — 5.5% | ||
| Entegris, Inc. (a) | 979,703 | 5,290,396 |
| Jinkosolar Holding Co Ltd — ADR (a) | 150,900 | 1,576,905 |
| Microsemi Corp. (a) | 282,700 | 4,376,196 |
| Monolithic Power Systems, Inc. (a) | 122,700 | 2,354,613 |
| Netlogic Microsystems, Inc. (a) | 148,600 | 4,275,222 |
| Silicon Laboratories, Inc. (a) | 108,000 | 4,906,440 |
| 22,779,772 | ||
| Software — 8.7% | ||
| Blackboard, Inc. (a)(b) | 160,863 | 6,440,954 |
| DemandTec, Inc. (a) | 531,807 | 3,249,341 |
| SonicWALL, Inc. (a) | 1,129,200 | 10,287,012 |
| Taleo Corp., Class A (a) | 289,700 | 7,256,985 |
| TiVo, Inc. (a) | 990,327 | 8,952,556 |
| 36,186,848 | ||
| Specialty Retail — 4.5% | ||
| The Children’s Place Retail Stores, Inc. (a) | 107,000 | 5,042,910 |
| Express Inc. (a) | 212,000 | 3,031,600 |
| Lumber Liquidators Holdings, Inc. (a)(b) | 181,400 | 5,353,114 |
| The Wet Seal, Inc., Class A (a) | 1,316,200 | 5,396,420 |
| 18,824,044 | ||
| Total Long-Term Investments | ||
| (Cost — $384,368,012) — 98.8% | 411,247,533 |
| Short-Term Securities | Shares | Value |
| BlackRock Liquidity Funds, TempFund, | ||
| Institutional Class, 0.15%, (c)(d) | 564,110 | $ 564,110 |
| Beneficial | ||
| Interest | ||
| (000) | ||
| BlackRock Liquidity Series, LLC | ||
| Money Market Series, 0.28% (c)(d)(e) | 33,911 | 33,911,450 |
| Total Short-Term Securities | ||
| (Cost — $34,475,560) — 8.3% | 34,475,560 | |
| Total Investments (Cost — $418,843,572*) — 107.1% | 445,723,093 | |
| Liabilities in Excess of Other Assets — (7.1)% | (29,636,246) | |
| Net Assets — 100.0% | $416,086,847 |
* The cost and unrealized appreciation (depreciation) of investments as of
May 31, 2010, as computed for federal income tax purposes, were as follows:
| Aggregate cost | $421,923,061 |
| Gross unrealized appreciation | $ 52,919,428 |
| Gross unrealized depreciation | (29,119,396) |
| Net unrealized appreciation | $ 23,800,032 |
(a) Non-income producing security.
(b) Security, or a portion of security, is on loan.
(c) Investments in companies considered to be an affiliate of the Portfolio during the
period, for purposes of Section 2(a)(3) of the Investment Company Act of 1940,
as amended, were as follows:
| Shares/Beneficial | Shares/Beneficial | |||
| Interest Held at | Net | Interest Held at | ||
| Affiliate | May 31, 2009 | Activity | May 31, 2010 | Income |
| BlackRock | ||||
| Liquidity Funds, | ||||
| TempFund, | ||||
| Institutional | ||||
| Class | 3,968,980 | (3,404,870) | 564,110 | $ 7,760 |
| BlackRock | ||||
| Liquidity | ||||
| Series, LLC | ||||
| Money Market | ||||
| Series | 21,593,500 | 12,317,950 | 33,911,450 | $ 85,487 |
(d) Represents the current yield as of report date.
(e) Security was purchased with the cash collateral from loaned securities.
• For Portfolio compliance purposes, the Portfolio’s industry classifications refer to
any one or more of the industry sub-classifications used by one or more widely
recognized market indexes or ratings group indexes, and/or as defined by
Portfolio management. This definition may not apply for purposes of this report,
which may combine industry sub-classifications for reporting ease.
See Notes to Financial Statements.
20 BLACKROCK SMALL CAP GROWTH FUND II
MAY 31, 2010
Schedule of Investments (concluded) BlackRock Master Small Cap Growth Portfolio
• Fair Value Measurements — Various inputs are used in determining the fair value
of investments, which are as follows:
• Level 1 — price quotations in active markets/exchanges for identical assets
and liabilities
• Level 2 — other observable inputs (including, but not limited to: quoted prices
for similar assets or liabilities in markets that are active, quoted prices for
identical or similar assets or liabilities in markets that are not active, inputs
other than quoted prices that are observable for the assets or liabilities (such
as interest rates, yield curves, volatilities, prepayment speeds, loss severities,
credit risks and default rates) or other market-corroborated inputs)
• Level 3 — unobservable inputs based on the best information available in the
circumstances, to the extent observable inputs are not available (including the
Portfolio’s own assumptions used in determining the fair value of investments)
The inputs or methodologies used for valuing securities are not necessarily
an indication of the risk associated with investing in those securities. For
information about the Portfolio’s policy regarding valuation of investments and
other significant accounting policies, please refer to Note 1 of the Notes to
Financial Statements.
The following table summarizes the inputs used as of May 31, 2010 in determin-
ing the fair valuation of the Portfolio’s investments:
| Investments in Securities | ||||
| Valuation Inputs | Level 1 | Level 2 | Level 3 | Total |
| Assets: | ||||
| Long-Term | ||||
| Investments1 | $411,247,533 | — | — | $411,247,533 |
| Short-Term | ||||
| Securities | 564,110 $ | 33,911,450 | — | 34,475,560 |
| Total | $411,811,643 $ | 33,911,450 | — | $445,723,093 |
| 1 See above Schedule of Investments for values in each industry. | ||||
See Notes to Financial Statements.
BLACKROCK SMALL CAP GROWTH FUND II
MAY 31, 2010
21
| Statement of Assets and Liabilities | BlackRock Master Small Cap Growth Portfolio |
| May 31, 2010 | |
| Assets | |
| Investments at value — unaffiliated (including securities loaned of $32,898,231) (cost — $384,368,012) | $ 411,247,533 |
| Investments at value — affiliated (cost — $34,475,560) | 34,475,560 |
| Investments sold receivable | 7,596,003 |
| Dividends receivable | 61,312 |
| Securities lending income receivable — affiliated | 2,410 |
| Prepaid expenses | 9,421 |
| Other assets | 3,608 |
| Total assets | 453,395,847 |
| Liabilities | |
| Collateral at value — securities loaned | 33,911,450 |
| Investments purchased payable | 3,013,877 |
| Investment advisory fees payable | 232,330 |
| Withdrawals payable to investor | 94,089 |
| Other affiliates payable | 1,306 |
| Directors’ fees payable | 498 |
| Other accrued expenses payable | 55,450 |
| Total liabilities | 37,309,000 |
| Net Assets | $ 416,086,847 |
| Net Assets Consist of | |
| Investor’s capital | $ 389,207,326 |
| Net unrealized appreciation/depreciation | 26,879,521 |
| Net Assets | $ 416,086,847 |
See Notes to Financial Statements.
22 BLACKROCK SMALL CAP GROWTH FUND II
MAY 31, 2010
| Statement of Operations | BlackRock Master Small Cap Growth Portfolio |
| Year Ended May 31, 2010 | |
| Investment Income | |
| Dividends | $ 1,029,320 |
| Securities lending — affiliated | 85,487 |
| Income — affiliated | 7,760 |
| Total income | 1,122,567 |
| Expenses | |
| Investment advisory | 2,828,777 |
| Accounting services | 169,988 |
| Custodian | 49,379 |
| Professional | 42,076 |
| Directors | 15,415 |
| Printing | 10,962 |
| Miscellaneous | 13,861 |
| Total expenses | 3,130,458 |
| Less fees waived by advisor | (2,589) |
| Total expenses after fees waived | 3,127,869 |
| Net investment loss | (2,005,302) |
| Realized and Unrealized Gain | |
| Net realized gain from investments | 32,884,294 |
| Net change in unrealized appreciation/depreciation on investments | 58,581,376 |
| Total realized and unrealized gain | 91,465,670 |
| Net Increase in Net Assets Resulting from Operations | $ 89,460,368 |
See Notes to Financial Statements.
BLACKROCK SMALL CAP GROWTH FUND II
MAY 31, 2010
23
| Statements of Changes in Net Assets | BlackRock Master Small Cap Growth Portfolio�� | ||||
| Year Ended May 31, | |||||
| Increase (Decrease) in Net Assets: | 2010 | 2009 | |||
| Operations | |||||
| Net investment loss | $ (2,005,302) | $ (518,632) | |||
| Net realized gain (loss) | 32,884,294 | (97,136,788) | |||
| Net change in unrealized appreciation/depreciation | 58,581,376 | (92,607,388) | |||
| Net increase (decrease) in net assets resulting from operations | 89,460,368 | (190,262,808) | |||
| Capital Transactions | |||||
| Proceeds from contributions | 102,562,384 | 134,438,075 | |||
| Fair value of withdrawals | (132,550,187) | (141,230,552) | |||
| Net decrease in net assets derived from capital transactions | (29,987,803) | (6,792,477) | |||
| Net Assets | |||||
| Total increase (decrease) in net assets | 59,472,565 | (197,055,285) | |||
| Beginning of year | 356,614,282 | 553,669,567 | |||
| End of year | $ 416,086,847 | $ 356,614,282 | |||
| Financial Highlights | BlackRock Master Small Cap Growth Portfolio | ||||
| Year Ended May 31, | |||||
| 2010 | 2009 | 2008 | 2007 | 2006 | |
| Total Investment Return | |||||
| Total investment return | 26.12% | (34.16)% | 3.35% | 13.00% | 26.39% |
| Ratios to Average Net Assets | |||||
| Total expenses | 0.77% | 0.78% | 0.77% | 0.78% | 0.77% |
| Total expenses after fees waived | 0.77% | 0.78% | 0.77% | 0.78% | 0.77% |
| Net investment loss | (0.50)% | (0.13)% | (0.10)% | (0.42)% | (0.49)% |
| Supplemental Data | |||||
| Net assets, end of year (000) | $ 416,087 | $ 356,614 | $ 553,670 | $ 539,092 | $ 481,934 |
| Portfolio turnover | 114% | 75% | 70% | 115% | 101% |
See Notes to Financial Statements.
24 BLACKROCK SMALL CAP GROWTH FUND II
MAY 31, 2010
Notes to Financial Statements
BlackRock Master Small Cap Growth Portfolio
1. Organization and Significant Accounting Policies:
BlackRock Master Small Cap Growth Portfolio (the “Portfolio”) of
BlackRock Master LLC (the “Master LLC”) is registered under the
Investment Company Act of 1940, as amended (the “1940 Act”),
and is organized as a Delaware limited liability company. The Limited
Liability Company Agreement permits the Board of Directors of the
Master LLC (the “Board”) to issue non-transferable interests in the
Master LLC, subject to certain limitations. The Portfolio’s financial state-
ments are prepared in conformity with accounting principles generally
accepted in the United States of America, which may require manage-
ment to make estimates and assumptions that affect the reported
amounts and disclosures in the financial statements. Actual results
could differ from those estimates.
The following is a summary of significant accounting policies followed
by the Portfolio:
Valuation: The Portfolio’s policy is to fair value its financial instruments
at market value using independent dealers or pricing services selected
under the supervision of the Board. Equity investments traded on a
recognized securities exchange or the NASDAQ Global Market System
are valued at the last reported sale price that day or the NASDAQ offi-
cial closing price, if applicable. For equity investments traded on more
than one exchange, the last reported sale price on the exchange where
the stock is primarily traded is used. Equity investments traded on a
recognized exchange for which there were no sales on that day are
valued at the last available bid price. If no bid price is available, the
prior day’s price will be used, unless it is determined that such prior
day’s price no longer reflects the fair value of the security. Investments
in open-end investment companies are valued at net asset value each
business day. Short-term securities with remaining maturities of 60
days or less may be valued at amortized cost, which approximates
fair value.
The Portfolio values its investment in BlackRock Liquidity Series, LLC
Money Market Series (the “Money Market Series”) at fair value, which
is ordinarily based upon its pro rata ownership in the net assets of
the underlying fund. The Money Market Series seeks current income
consistent with maintaining liquidity and preserving capital. Although
the Money Market Series is not registered under the 1940 Act, its
investments will follow the parameters of investments by a money
market fund that is subject to Rule 2a-7 promulgated by the Securities
and Exchange Commission (the “SEC”) under the 1940 Act. The Port-
folio may withdraw up to 25% of its investment daily, although the man-
ager of the Money Market Series, in its sole discretion, may permit an
investor to withdraw more than 25% on any one day.
In the event that application of these methods of valuation results in a
price for an investment which is deemed not to be representative of the
market value of such investment or is not available, the investment will
be valued by a method approved by the Board as reflecting fair value
(“Fair Value Assets”). When determining the price for Fair Value Assets,
the investment advisor and/or the sub-advisor seeks to determine the
price that the Portfolio might reasonably expect to receive from the cur-
rent sale of that asset in an arm’s-length transaction. Fair value deter-
minations shall be based upon all available factors that the investment
advisor and/or sub-advisor deems relevant. The pricing of all Fair Value
Assets is subsequently reported to the Board or a committee thereof.
Investment Transactions and Investment Income: For financial reporting
purposes, investment transactions are recorded on the dates the trans-
actions are entered into (the trade dates). Realized gains and losses
on investment transactions are determined on the identified cost basis.
Dividend income is recorded on the ex-dividend dates. Dividends from
foreign securities where the ex-dividend date may have passed are sub-
sequently recorded when the Portfolio has determined the ex-dividend
date. Upon notification from issuers, some of the dividend income
received from a real estate investment trust may be redesignated as a
reduction of cost of the related investment and/or realized gain. Interest
income, including amortization of premium and accretion of discount
on debt securities, is recognized on the accrual basis.
Securities Lending: The Portfolio may lend securities to financial
institutions that provide cash as collateral, which will be maintained at
all times in an amount equal to at least 100% of the current market
value of the loaned securities. The market value of the loaned securities
is determined at the close of business of the Portfolio and any addi-
tional required collateral is delivered to the Portfolio on the next busi-
ness day. Securities lending income, as disclosed in the Statement of
Operations, represents the income earned from the investment of the
cash collateral, net of rebates paid to, or fees paid by, borrowers and
less the fees paid to the securities lending agent. Loans of securities
are terminable at any time and the borrower, after notice, is required
to return borrowed securities within the standard time period for settle-
ment of securities transactions. In the event that the borrower defaults
on its obligation to return borrowed securities because of insolvency or
for any other reason, the Portfolio could experience delays and costs in
gaining access to the collateral. The Portfolio also could suffer a loss if
the value of an investment purchased with cash collateral falls below
the market value of loaned securities or if the value of an investment
BLACKROCK SMALL CAP GROWTH FUND II
MAY 31, 2010
25
Notes to Financial Statements (continued)
BlackRock Master Small Cap Growth Portfolio
purchased with cash collateral falls below the value of the original cash
collateral received.
Income Taxes: The Portfolio is disregarded as an entity separate from
its owner for tax purposes. As such, the owner of the Portfolio is treated
as the owner of the net assets, income, expenses and realized and
unrealized gains and losses of the Portfolio. Therefore, no federal tax
provision is required. It is intended that the Portfolio’s assets will be
managed so the owner of the Portfolio can satisfy the requirements of
Subchapter M of the Internal Revenue Code of 1986, as amended.
Under the applicable foreign tax laws, a withholding tax may be
imposed on interest, dividends and capital gains at various rates.
Recent Accounting Standard: In January 2010, the Financial
Accounting Standards Board issued amended guidance to improve dis-
closure about fair value measurements which will require additional
disclosures about transfers into and out of Levels 1 and 2 and separate
disclosures about purchases, sales, issuances and settlements in the
reconciliation for fair value measurements using significant unobserv-
able inputs (Level 3). It also clarifies existing disclosure requirements
relating to the levels of disaggregation for fair value measurement and
inputs and valuation techniques used to measure fair value. The
amended guidance is effective for financial statements for fiscal years
beginning after December 15, 2009, and interim periods within those
fiscal years, except for disclosures about purchases, sales, issuances
and settlements in the rollforward of activity in Level 3 fair value meas-
urements, which are effective for fiscal years beginning after December
15, 2010 and for interim periods within those fiscal years. The impact
of this guidance on the Portfolio’s financial statements and disclosures
is currently being assessed.
Other: Expenses directly related to the Portfolio are charged to the
Portfolio. Other operating expenses shared by several funds are pro
rated among those funds on the basis of relative net assets or other
appropriate methods. The Portfolio has an arrangement with the custo-
dian whereby fees may be reduced by credits earned on uninvested
cash balances, which if applicable are shown as fees paid indirectly in
the Statement of Operations. The custodian imposes fees on overdrawn
cash balances, which can be offset by accumulated credits earned or
may result in additional custody charges.
2. Investment Advisory Agreement and Other Transactions
with Affiliates:
The PNC Financial Services Group, Inc. (“PNC”), Bank of America
Corporation (“BAC”) and Barclays Bank PLC (“Barclays”) are the largest
stockholders of BlackRock, Inc. (“BlackRock”). Due to the ownership
structure, PNC is an affiliate of the Portfolio for 1940 Act purposes, but
BAC and Barclays are not.
The Master LLC, on behalf of the Portfolio, entered into an Investment
Advisory Agreement with BlackRock Advisors, LLC (the “Manager”), the
Portfolio’s investment advisor, an indirect, wholly owned subsidiary of
BlackRock, to provide investment advisory and administration services.
The Manager is responsible for the management of the Portfolio’s port-
folio and provides the necessary personnel, facilities, equipment and
certain other services necessary to the operations of the Portfolio. For
such services, the Portfolio pays the Manager a monthly fee at an
annual rate of 0.70% of the Portfolio’s average daily net assets.
The Manager voluntarily agreed to waive its advisory fees by the
amount of investment advisory fees the Portfolio pays to the Manager
indirectly through its investment in affiliated money market funds;
however, the Manager does not waive its advisory fees by the amount
of investment advisory fees paid through its investment in other affili-
ated investment companies, if any. This amount is included in fees
waived by advisor in the Statement of Operations.
The Manager entered into a sub-advisory agreement with BlackRock
Capital Management, Inc. (“BCM”), an affiliate of the Manager, under
which the Manager pays BCM for services it provides, a monthly fee
that is a percentage of the investment advisory fees paid by the
Portfolio to the Manager.
For the year ended May 31, 2010, the Portfolio reimbursed the
Manager $7,806 for certain accounting services, which is included in
accounting services in the Statement of Operations.
The Master LLC received an exemptive order from the SEC permitting it
to, among other things, pay an affiliated securities lending agent a fee
based on a share of the income derived from the securities lending
activities and has retained BlackRock Investment Management, LLC
(“BIM”) as the securities lending agent. BIM may, on behalf of the
Portfolio, invest cash collateral received by the Portfolio for such loans,
among other things, in a private investment company managed by the
Manager or in registered money market funds advised by the Manager
or its affiliates. The market value of securities on loan and the value
of the related collateral are shown in the Statement of Assets and
Liabilities as securities loaned and collateral at value – securities
loaned, respectively. The cash collateral invested by BIM is disclosed
in the Schedule of Investments. The share of income earned by the
Portfolio on such investments is shown as securities lending — affiliated
in the Statement of Operations. For the year ended May 31, 2010, BIM
received $20,472 in securities lending agent fees related to securities
lending activities for the Portfolio.
Certain officers and/or directors of the Master LLC are officers and/or
directors of BlackRock or its affiliates.
26 BLACKROCK SMALL CAP GROWTH FUND II
MAY 31, 2010
Notes to Financial Statements (concluded)
BlackRock Master Small Cap Growth Portfolio
3. Investments:
Purchases and sales of investments, excluding short-term securities
for the year ended May 31, 2010, were $454,843,986 and
$487,186,399, respectively.
4. Short-Term Borrowings:
The Portfolio, along with certain other funds managed by the Manager
and its affiliates, is a party to a $500 million credit agreement with
a group of lenders, which was renewed until November 2010. The
Portfolio may borrow under the credit agreement to fund shareholder
redemptions. Prior to its renewal, the credit agreement had the follow-
ing terms: 0.02% upfront fee on the aggregate commitment amount
which was allocated to the Portfolio based on its net assets as of
October 31, 2008; a commitment fee of 0.08% per annum based on
the Portfolio’s pro rata share of the unused portion of the credit
agreement, which is included in miscellaneous in the Statement of
Operations, and interest at a rate equal to the higher of the (a) federal
funds effective rate and (b) reserve adjusted one-month LIBOR, plus,
in each case, the higher of (i) 1.50% and (ii) 50% of the CDX Index
(as defined in the credit agreement) on amounts borrowed. Effective
November 2009, the credit agreement was renewed with the following
terms: 0.02% upfront fee on the aggregate commitment amount which
was allocated to the Portfolio based on its net assets as of October 31,
2009, a commitment fee of 0.10% per annum based on the Portfolio’s
pro rata share of the unused portion of the credit agreement and
interest at a rate equal to the higher of (a) the one-month LIBOR plus
1.25% per annum and (b) the Fed Funds rate plus 1.25% per annum
on amounts borrowed. The Portfolio did not borrow under the credit
agreement during the year ended May 31, 2010.
5. Concentration, Market and Credit Risk:
The Portfolio invests a significant portion of its assets in securities in
the health care and information technology sectors. Changes in eco-
nomic conditions affecting these sectors would have a greater impact
on the Portfolio and could affect the value, income and/or liquidity of
positions in such securities.
In the normal course of business, the Portfolio invests in securities
and enters into transactions where risks exist due to fluctuations in the
market (market risk) or failure of the issuer of a security to meet all its
obligations (credit risk). The value of securities held by the Portfolio may
decline in response to certain events, including those directly involving
the issuers whose securities are owned by the Portfolio; conditions
affecting the general economy; overall market changes; local, regional
or global political, social or economic instability; and currency and
interest rate and price fluctuations. Similar to credit risk, the Portfolio
may be exposed to counterparty risk, or the risk that an entity with
which the Portfolio has unsettled or open transactions may default.
The Portfolio manages counterparty risk by entering into transactions
only with counterparties that they believe have the financial resources
to honor their obligations and by monitoring the financial stability of
those counterparties. Financial assets, which potentially expose the
Portfolio to credit and counterparty risks, consist principally of invest-
ments and cash due from counterparties. The extent of the Portfolio’s
exposure to credit and counterparty risks with respect to these financial
assets is generally approximated by their value recorded in the
Portfolio’s Statement of Assets and Liabilities, less any collateral held
by the Portfolio.
6. Subsequent Events:
Management has evaluated the impact of all subsequent events on the
Portfolio through the date the financial statements were issued and has
determined that there were no subsequent events requiring adjustment
or additional disclosure in the financial statements.
BLACKROCK SMALL CAP GROWTH FUND II
MAY 31, 2010
27
Report of Independent Registered Public Accounting Firm
BlackRock Master Small Cap Growth Portfolio
To the Investor and Board of Directors of
BlackRock Master LLC:
We have audited the accompanying statement of assets and liabilities,
including the schedule of investments, of BlackRock Master Small Cap
Growth Portfolio, one of the portfolios constituting BlackRock Master
LLC, (the “Master LLC”), as of May 31, 2010, and the related statement
of operations for the year then ended, the statements of changes in net
assets for each of the two years in the period then ended, and the finan-
cial highlights for each of the five years in the period then ended. These
financial statements and financial highlights are the responsibility of the
Master LLC’s management. Our responsibility is to express an opinion on
these financial statements and financial highlights based on our audits.
We conducted our audits in accordance with the standards of the Public
Company Accounting Oversight Board (United States). Those standards
require that we plan and perform the audit to obtain reasonable assur-
ance about whether the financial statements and financial highlights
are free of material misstatement. The Master LLC is not required to
have, nor were we engaged to perform, an audit of its internal control
over financial reporting. Our audits included consideration of internal
control over financial reporting as a basis for designing audit procedures
that are appropriate in the circumstances, but not for the purpose of
expressing an opinion on the effectiveness of the Master LLC’s internal
control over financial reporting. Accordingly, we express no such opinion.
An audit also includes examining, on a test basis, evidence supporting
the amounts and disclosures in the financial statements, assessing the
accounting principles used and significant estimates made by manage-
ment, as well as evaluating the overall financial statement presentation.
Our procedures included confirmation of securities owned as of May 31,
2010, by correspondence with the custodian and brokers; where replies
were not received from brokers, we performed other auditing procedures.
We believe that our audits provide a reasonable basis for our opinion.
In our opinion, the financial statements and financial highlights referred
to above present fairly, in all material respects, the financial position
of BlackRock Master Small Cap Growth Portfolio of BlackRock Master
LLC as of May 31, 2010, the results of its operations for the year then
ended, the changes in its net assets for each of the two years in the
period then ended, and the financial highlights for each of the five
years in the period then ended, in conformity with accounting principles
generally accepted in the United States of America.
Deloitte & Touche LLP
Princeton, New Jersey
July 27, 2010
28 BLACKROCK SMALL CAP GROWTH FUND II
MAY 31, 2010
Disclosure of Investment Advisory Agreement and Sub-Advisory Agreement
The Board of Directors of BlackRock Master LLC (the “Master LLC”)
met on April 20, 2010 and May 18–19, 2010 to consider the approval
of the Master LLC’s investment advisory agreement (the “Advisory
Agreement”) with BlackRock Advisors, LLC (the “Manager”), the Master
LLC’s investment advisor, on behalf of BlackRock Master Small Cap
Growth Portfolio (the “Master Portfolio”), a series of the Master LLC. The
Board of Directors of the Master LLC also considered the approval of the
sub-advisory agreement (the “Sub-Advisory Agreement”) between the
Manager and BlackRock Capital Management, Inc. (the “Sub-Advisor”),
with respect to the Master Portfolio. BlackRock Small Cap Growth Fund II
(the “Fund”), a series of BlackRock Series, Inc. (the “Corporation”), is
a “feeder” fund that invests all of its investable assets in the Master
Portfolio. Accordingly, the Board of Directors of the Corporation also con-
sidered the approval of the Advisory Agreement and the Sub-Advisory
Agreement with respect to the Master Portfolio. The Manager and the
Sub-Advisor are referred to herein as “BlackRock.” The Advisory Agree-
ment and the Sub-Advisory Agreement are referred to herein as the
“Agreements.” For simplicity, the Board of Directors of the Master LLC and
the Board of Directors of the Corporation are referred to herein collec-
tively as the “Board,” and the members of which are referred to as
“Board Members.”
Activities and Composition of the Board
The Board consists of thirteen individuals, eleven of whom are not
“interested persons” of the Master LLC or the Corporation as defined in
the Investment Company Act of 1940, as amended (the “1940 Act”)
(the “Independent Board Members”). The Board Members are responsi-
ble for the oversight of the operations of the Master LLC or the Corpora-
tion, as pertinent, and perform the various duties imposed on the
directors of investment companies by the 1940 Act. The Independent
Board Members have retained independent legal counsel to assist them
in connection with their duties. The Co-Chairs of the Board are each
Independent Board Members. The Board has established five standing
committees: an Audit Committee, a Governance and Nominating
Committee, a Compliance Committee, a Performance Oversight and
Contract Committee and an Executive Committee, each of which is
composed of Independent Board Members (except for the Executive
Committee, which also has one interested Board Member) and is
chaired by Independent Board Members. The Board also has one
ad hoc committee, the Joint Product Pricing Committee, which consists
of Independent Board Members and directors/trustees of the boards
of certain other BlackRock-managed funds, who are not “interested
persons” of their respective funds.
The Agreements
Pursuant to the 1940 Act, the Board is required to consider the contin-
uation of the Agreements on an annual basis. In connection with this
process, the Board assessed, among other things, the nature, scope and
quality of the services provided to the Master Portfolio and the Fund by
the personnel of BlackRock and its affiliates, including investment man-
agement, administrative and shareholder services, oversight of fund
accounting and custody, marketing services and assistance in meeting
applicable legal and regulatory requirements.
From time to time throughout the year, the Board, acting directly and
through its committees, considers at each of its meetings factors that
are relevant to its annual consideration of the renewal of the Agreements,
including the services and support provided by BlackRock to the Master
Portfolio, the Fund and their shareholders. Among the matters the Board
considered were: (a) investment performance for one-, three- and five-
year periods, as applicable, against peer funds, and applicable bench-
marks, if any, as well as senior management and portfolio managers’
analysis of the reasons for any over performance or underperformance
against its peers and/or benchmark, as applicable; (b) fees, including
advisory, administration, if applicable, and other amounts paid to
BlackRock and its affiliates by the Master Portfolio and/or the Fund
for services, such as transfer agency, marketing and distribution, call
center and fund accounting; (c) the Master Portfolio’s and/or the Fund’s
operating expenses; (d) the resources devoted to and compliance
reports relating to the Master Portfolio’s and/or the Fund’s investment
objective, policies and restrictions; (e) the Master LLC’s and the Corp-
oration’s compliance with its respective Code of Ethics and compliance
policies and procedures; (f) the nature, cost and character of non-invest-
ment management services provided by BlackRock and its affiliates;
(g) BlackRock’s and other service providers’ internal controls; (h)
BlackRock’s implementation of the proxy voting policies approved by
the Board; (i) the use of brokerage commissions and execution quality
of portfolio transactions; (j) BlackRock’s implementation of the Master
LLC’s and/or the Corporation’s valuation and liquidity procedures; (k) an
analysis of contractual and actual management fees for products with
similar investment objectives across BlackRock’s open-end fund, closed-
end fund and institutional account product channels; and (l) periodic
updates on BlackRock’s business.
Board Considerations in Approving the Agreements
The Approval Process: Prior to the April 20, 2010 meeting, the Board
requested and received materials specifically relating to the Agreements.
The Board is engaged in a process with BlackRock to periodically review
the nature and scope of the information provided to better assist its
deliberations. The materials provided in connection with the April meet-
ing included (a) information independently compiled and prepared by
Lipper, Inc. (“Lipper”) on fees and expenses of the Master Portfolio and
the Fund, as applicable, and the investment performance of the Fund as
compared with a peer group of funds as determined by Lipper (collec-
tively, “Peers”); (b) information on the profitability of the Agreements to
BlackRock and a discussion of fall-out benefits to BlackRock and its
affiliates and significant shareholders; (c) a general analysis provided by
BlackRock concerning investment advisory fees charged to other clients,
BLACKROCK SMALL CAP GROWTH FUND II
MAY 31, 2010
29
Disclosure of Investment Advisory Agreement and Sub-Advisory Agreement (continued)
such as institutional clients and closed-end funds, under similar invest-
ment mandates, as well as the performance of such other clients, as
applicable; (d) the impact of economies of scale; (e) a summary of
aggregate amounts paid by the Master Portfolio and/or the Fund to
BlackRock; (f) sales and redemption data regarding the Fund’s shares;
and (g) if applicable, a comparison of management fees to similar
BlackRock open-end funds, as classified by Lipper.
At an in-person meeting held on April 20, 2010, the Board reviewed
materials relating to its consideration of the Agreements. As a result of
the discussions that occurred during the April 20, 2010 meeting, the
Board presented BlackRock with questions and requests for additional
information and BlackRock responded to these requests with additional
written information in advance of the May 18–19, 2010 Board meeting.
At an in-person meeting held on May 18–19, 2010, the Board of the
Master LLC, including the Independent Board Members, unanimously
approved the continuation of the Advisory Agreement between the
Manager and the Master LLC with respect to the Master Portfolio and
the Sub-Advisory Agreement between the Manager and the Sub-Advisor
with respect to the Master Portfolio, each for a one-year term ending
June 30, 2011. The Board of the Corporation, including the Independent
Board Members, also considered the continuation of the Agreements
and found the Agreements to be satisfactory. In approving the continua-
tion of the Agreements, the Board considered: (a) the nature, extent and
quality of the services provided by BlackRock; (b) the investment per-
formance of the Master Portfolio, the Fund and BlackRock; (c) the advi-
sory fee and the cost of the services and profits to be realized by
BlackRock and its affiliates from their relationship with the Master
Portfolio and the Fund; (d) economies of scale; and (e) other factors
deemed relevant by the Board Members.
The Board also considered other matters it deemed important to the
approval process, such as payments made to BlackRock or its affiliates
relating to the distribution of Fund shares, services related to the valua-
tion and pricing of portfolio holdings of the Master Portfolio, direct and
indirect benefits to BlackRock and its affiliates and significant share-
holders from their relationship with the Master Portfolio and the Fund
and advice from independent legal counsel with respect to the review
process and materials submitted for the Board’s review. The Board noted
the willingness of BlackRock personnel to engage in open, candid dis-
cussions with the Board. The Board did not identify any particular infor-
mation as controlling, and each Board Member may have attributed
different weights to the various items considered.
A. Nature, Extent and Quality of the Services Provided by BlackRock:
The Board, including the Independent Board Members, reviewed the
nature, extent and quality of services provided by BlackRock, including
the investment advisory services and the resulting performance of the
Fund. Throughout the year, the Board compared the Fund’s performance
to the performance of a comparable group of mutual funds, and the
performance of a relevant benchmark, if any. The Board met with
BlackRock’s senior management personnel responsible for investment
operations, including the senior investment officers. The Board also
reviewed the materials provided by the portfolio management team
discussing performance and the investment objective, strategies
and outlook.
The Board considered, among other factors, the number, education
and experience of BlackRock’s investment personnel generally and the
Master Portfolio’s portfolio management team, investments by portfolio
managers in the funds they manage, BlackRock’s portfolio trading capa-
bilities, BlackRock’s use of technology, BlackRock’s commitment to com-
pliance and BlackRock’s approach to training and retaining portfolio
managers and other research, advisory and management personnel. The
Board also reviewed a general description of BlackRock’s compensation
structure with respect to the Master Portfolio’s portfolio management
team and BlackRock’s ability to attract and retain high-quality talent.
In addition to advisory services, the Board considered the quality of the
administrative and non-investment advisory services provided to the
Master Portfolio and the Fund. BlackRock and its affiliates and signifi-
cant shareholders provide the Master Portfolio and the Fund with certain
administrative, transfer agency, shareholder and other services (in addi-
tion to any such services provided to the Master Portfolio and the Fund
by third parties) and officers and other personnel as are necessary for
the operations of the Master Portfolio and the Fund. In addition to
investment advisory services, BlackRock and its affiliates provide the
Master Portfolio and the Fund with other services, including (i) preparing
disclosure documents, such as the prospectus, the statement of addi-
tional information and periodic shareholder reports; (ii) assisting with
daily accounting and pricing; (iii) overseeing and coordinating the act-
ivities of other service providers; (iv) organizing Board meetings and
preparing the materials for such Board meetings; (v) providing legal and
compliance support; and (vi) performing other administrative functions
necessary for the operation of the Master Portfolio and the Fund, such
as tax reporting, fulfilling regulatory filing requirements, and call center
services. The Board reviewed the structure and duties of BlackRock’s
fund administration, accounting, legal and compliance departments and
considered BlackRock’s policies and procedures for assuring compliance
with applicable laws and regulations.
B. The Investment Performance of the Master Portfolio, the Fund and
BlackRock: The Board, including the Independent Board Members, also
reviewed and considered the performance history of the Master Portfolio
and the Fund, as applicable. The Board noted that the Master Portfolio’s
investment results correspond directly to the investment results of the
Fund. In preparation for the April 20, 2010 meeting, the Board was pro-
vided with reports, independently prepared by Lipper, which included a
comprehensive analysis of the Fund’s performance. The Board also
30 BLACKROCK SMALL CAP GROWTH FUND II
MAY 31, 2010
Disclosure of Investment Advisory Agreement and Sub-Advisory Agreement (continued)
reviewed a narrative and statistical analysis of the Lipper data that
was prepared by BlackRock, which analyzed various factors that affect
Lipper’s rankings. In connection with its review, the Board received and
reviewed information regarding the investment performance of the Fund
as compared to a representative group of similar funds as determined
by Lipper and to all funds in the Fund’s applicable Lipper category. The
Board was provided with a description of the methodology used by
Lipper to select peer funds. The Board regularly reviews the performance
of the Master Portfolio and the Fund, as applicable, throughout the year.
The Board attaches more importance to performance over relatively long
periods of time, typically three to five years.
The Board noted that, in general, the Fund performed better than its
Peers in that the Fund’s performance was at or above the median of
its Lipper Performance Universe in two of the one-, three- and five-year
periods reported.
C. Consideration of the Advisory Fees and the Cost of the Services
and Profits to be Realized by BlackRock and its Affiliates from their
Relationship with the Master Portfolio and the Fund: The Board, includ-
ing the Independent Board Members, reviewed the Master Portfolio’s
contractual advisory fee rates compared with the other funds in the
Fund’s Lipper category. It also compared the Fund’s total expenses, as
well as actual management fees, to those of other funds in its Lipper
category. The Board considered the services provided and the fees
charged by BlackRock to other types of clients with similar investment
mandates, including separately managed institutional accounts.
The Board received and reviewed statements relating to BlackRock’s
financial condition and profitability with respect to the services it pro-
vided the Master Portfolio and the Fund. The Board was also provided
with a profitability analysis that detailed the revenues earned and the
expenses incurred by BlackRock for services provided to the Master
Portfolio and the Fund. The Board reviewed BlackRock’s profitability with
respect to the Master Portfolio and the Fund, as applicable, and other
funds the Board currently oversees for the year ended December 31,
2009 compared to available aggregate profitability data provided for the
year ended December 31, 2008. The Board reviewed BlackRock’s prof-
itability with respect to other fund complexes managed by the Manager
and/or its affiliates. The Board reviewed BlackRock’s assumptions and
methodology of allocating expenses in the profitability analysis, noting
the inherent limitations in allocating costs among various advisory prod-
ucts. The Board recognized that profitability may be affected by numer-
ous factors including, among other things, fee waivers and expense
reimbursements by the Manager, the types of funds managed, expense
allocations and business mix, and the difficulty of comparing profitability
as a result of those factors.
The Board noted that, in general, individual fund or product line prof-
itability of other advisors is not publicly available. Nevertheless, to the
extent such information was available, the Board considered BlackRock’s
operating margin, in general, compared to the operating margin for lead-
ing investment management firms whose operations include advising
open-end funds, among other product types. That data indicates that
operating margins for BlackRock with respect to its registered funds are
generally consistent with margins earned by similarly situated publicly
traded competitors. In addition, the Board considered, among other
things, certain third party data comparing BlackRock’s operating margin
with that of other publicly-traded asset management firms. That third
party data indicates that larger asset bases do not, in themselves, trans-
late to higher profit margins.
In addition, the Board considered the cost of the services provided to
the Master Portfolio and the Fund by BlackRock, and BlackRock’s and
its affiliates’ profits relating to the management and distribution of the
Master Portfolio and the Fund and the other funds advised by BlackRock
and its affiliates. As part of its analysis, the Board reviewed BlackRock’s
methodology in allocating its costs to the management of the Master
Portfolio and the Fund. The Board also considered whether BlackRock
has the financial resources necessary to attract and retain high quality
investment management personnel to perform its obligations under the
Agreements and to continue to provide the high quality of services that
is expected by the Board.
The Board noted that the Fund’s contractual advisory fee rate was lower
than or equal to the median contractual advisory fee rate paid by the
Fund's Peers, in each case, before taking into account any expense
reimbursements or fee waivers.
D. Economies of Scale: The Board, including the Independent Board
Members, considered the extent to which economies of scale might be
realized as the assets of the Master Portfolio and the Fund increase.
The Board also considered the extent to which the Fund benefits from
such economies and whether there should be changes in the advisory
fee rate or structure in order to enable the Master Portfolio and the
Fund to participate in these economies of scale, for example through
the use of breakpoints in the advisory fee based upon the asset level
of the Master Portfolio.
E. Other Factors Deemed Relevant by the Board Members: The Board,
including the Independent Board Members, also took into account other
ancillary or “fall-out” benefits that BlackRock or its affiliates and signifi-
cant shareholders may derive from their respective relationships with the
Master Portfolio and the Fund, both tangible and intangible, such as
BlackRock’s ability to leverage its investment professionals who manage
other portfolios, an increase in BlackRock’s profile in the investment
advisory community, and the engagement of BlackRock’s affiliates and
BLACKROCK SMALL CAP GROWTH FUND II
MAY 31, 2010
31
Disclosure of Investment Advisory Agreement and Sub-Advisory Agreement (concluded)
significant shareholders as service providers to the Master Portfolio and
the Fund, including for administrative, transfer agency and distribution
services. The Board also considered BlackRock’s overall operations and
its efforts to expand the scale of, and improve the quality of, its opera-
tions. The Board also noted that BlackRock may use and benefit from
third party research obtained by soft dollars generated by certain mutual
fund transactions to assist in managing all or a number of its other
client accounts. The Board further noted that BlackRock completed
the acquisition of a complex of exchange-traded funds (“ETFs”) on
December 1, 2009, and that BlackRock’s funds may invest in such
ETFs without any offset against the management fees payable by the
funds to BlackRock.
In connection with its consideration of the Agreements, the Board also
received information regarding BlackRock’s brokerage and soft dollar
practices. The Board received reports from BlackRock which included
information on brokerage commissions and trade execution practices
throughout the year.
The Board noted the competitive nature of the open-end fund market-
place, and that shareholders are able to redeem their Fund shares if
they believe that the Fund’s and/or Master Portfolio’s fees and expenses
are too high or if they are dissatisfied with the performance of the Fund.
Conclusion
The Board of the Master LLC, including the Independent Board
Members, unanimously approved the continuation of the Advisory
Agreement between the Manager and the Master LLC, with respect to
the Master Portfolio, for a one-year term ending June 30, 2011 and the
Sub-Advisory Agreement between the Manager and the Sub-Advisor,
with respect to the Master Portfolio, for a one-year term ending June 30,
2011. As part of its approval, the Board of the Master LLC considered
the detailed review of BlackRock’s fee structure, as it applies to the
Master LLC, being conducted by the ad hoc Joint Product Pricing
Committee. Based upon its evaluation of all of the aforementioned
factors in their totality, the Board of the Master LLC, including the
Independent Board Members, was satisfied that the terms of the
Agreements were fair and reasonable and in the best interest of the
Master Portfolio and its shareholders. The Board of the Corporation,
including the Independent Board Members, also considered the contin-
uation of the Agreements with respect to the Master Portfolio and found
the Agreements to be satisfactory. In arriving at a decision to approve
the Agreements, the Board of the Master LLC did not identify any single
factor or group of factors as all-important or controlling, but considered
all factors together, and different Board Members may have attributed
different weights to the various factors considered. The Independent
Board Members were also assisted by the advice of independent legal
counsel in making this determination. The contractual fee arrangements
for the Master Portfolio reflect the results of several years of review by
the Board Members and predecessor Board Members, and discussions
between such Board Members (and predecessor Board Members) and
BlackRock. Certain aspects of the arrangements may be the subject of
more attention in some years than in others, and the Board Members’
conclusions may be based in part on their consideration of these
arrangements in prior years.
32 BLACKROCK SMALL CAP GROWTH FUND II
MAY 31, 2010
| Officers and Directors | |||||
| Number of BlackRock- | |||||
| Advised Registered | |||||
| Position(s) | Length | Investment Companies | |||
| Held with | of Time | (“RICs”) Consisting of | |||
| Name, Address | Corporation/ | Served as | Investment Portfolios | Public | |
| and Year of Birth | Master LLC | a Director2 | Principal Occupation(s) During Past 5 Years | (“Portfolios”) Overseen | Directorships |
| Non-Interested Directors1 | |||||
| Ronald W. Forbes | Co-Chair of | Since | Professor Emeritus of Finance, School of Business, State University | 36 RICs consisting of | None |
| 55 East 52nd Street | the Board | 2007 | of New York at Albany since 2000. | 105 Portfolios | |
| New York, NY 10055 | and Director | ||||
| 1940 | |||||
| Rodney D. Johnson | Co-Chair of | Since | President, Fairmount Capital Advisors, Inc. since 1987; Director, | 36 RICs consisting of | None |
| 55 East 52nd Street | the Board | 2007 | Fox Chase Cancer Center since 2004; Member of the Archdiocesan | 105 Portfolios | |
| New York, NY 10055 | and Director | Investment Committee of the Archdiocese of Philadelphia since | |||
| 1941 | 2004; Director, The Committee of Seventy (civic) since 2006. | ||||
| David O. Beim | Director | Since | Professor of Finance and Economics at the Columbia University | 36 RICs consisting of | None |
| 55 East 52nd Street | 1999 | Graduate School of Business since 1991; Trustee, Phillips Exeter | 105 Portfolios | ||
| New York, NY 10055 | Academy since 2002; Chairman, Wave Hill, Inc. (public garden and | ||||
| 1940 | cultural center) from 1990 to 2006. | ||||
| Dr. Matina Horner | Director | Since | Executive Vice President of Teachers Insurance and Annuity Associa- | 36 RICs consisting of | NSTAR (electric |
| 55 East 52nd Street | 2007 | tion and College Retirement Equities Fund from 1989 to 2003. | 105 Portfolios | and gas utility) | |
| New York, NY 10055 | |||||
| 1939 | |||||
| Herbert I. London | Director and | Since | Professor Emeritus, New York University since 2005; John M. Olin | 36 RICs consisting of | AIMS Worldwide, |
| 55 East 52nd Street | Member of | 2007 | Professor of Humanities, New York University from 1993 to 2005 | 105 Portfolios | Inc. (marketing) |
| New York, NY 10055 | the Audit | and Professor thereof from 1980 to 2005; President, Hudson | |||
| 1939 | Committee | Institute (policy research organization) since 1997 and Trustee | |||
| thereof since 1980; Chairman of the Board of Trustees for Grantham | |||||
| University since 2006; Director, InnoCentive, Inc. (strategic solutions | |||||
| company) since 2005; Director, Cerego, LLC (software development | |||||
| and design) since 2005. | |||||
| Cynthia A. Montgomery | Director | Since | Professor, Harvard Business School since 1989; Director, Harvard | 36 RICs consisting of | Newell Rubbermaid, |
| 55 East 52nd Street | 2007 | Business School Publishing since 2005; Director, McLean Hospital | 105 Portfolios | Inc. (manufacturing) | |
| New York, NY 10055 | since 2005. | ||||
| 1952 | |||||
| Joseph P. Platt, Jr. | Director | Since | Director, The West Penn Allegheny Health System (a not-for-profit | 36 RICs consisting of | Greenlight Capital |
| 55 East 52nd Street | 2007 | health system) since 2008; Director, Jones and Brown (Canadian | 105 Portfolios | Re, Ltd (reinsurance | |
| New York, NY 10055 | insurance broker) since 1998; General Partner, Thorn Partners, LP | company); WQED | |||
| 1947 | (private investment) since 1998; Partner, Amarna Corporation, LLC | Multi-Media (public | |||
| (private investment company) from 2002 to 2008. | broadcasting not- | ||||
| for-profit) | |||||
| Robert C. Robb, Jr. | Director | Since | Partner, Lewis, Eckert, Robb and Company (management and | 36 RICs consisting of | None |
| 55 East 52nd Street | 2007 | financial consulting firm) since 1981. | 105 Portfolios | ||
| New York, NY 10055 | |||||
| 1945 | |||||
| Toby Rosenblatt | Director | Since | President, Founders Investments Ltd. (private investments) since | 36 RICs consisting of | A.P. Pharma, Inc. |
| 55 East 52nd Street | 2007 | 1999; Director, College Access Foundation of California | 105 Portfolios | (specialty | |
| New York, NY 10055 | (philanthropic foundation) since 2009; Director, Forward | pharmaceuticals) | |||
| 1938 | Management, LLC since 2007; Director, The James Irvine | ||||
| Foundation (philanthropic foundation) from 1998 to 2008. | |||||
BLACKROCK SMALL CAP GROWTH FUND II
MAY 31, 2010
33
| Officers and Directors (continued) | |||||
| Number of BlackRock- | |||||
| Advised Registered | |||||
| Position(s) | Length | Investment Companies | |||
| Held with | of Time | (“RICs”) Consisting of | |||
| Name, Address | Corporation/ | Served as | Investment Portfolios | Public | |
| and Year of Birth | Master LLC | a Director2 | Principal Occupation(s) During Past 5 Years | (“Portfolios”) Overseen | Directorships |
| Non-Interested Directors1 (concluded) | |||||
| Kenneth L. Urish | Chair of | Since | Managing Partner, Urish Popeck & Co., LLC (certified public | 36 RICs consisting of | None |
| 55 East 52nd Street | the Audit | 2007 | accountants and consultants) since 1976; Member of External | 105 Portfolios | |
| New York, NY 10055 | Committee | Advisory Board, The Pennsylvania State University Accounting | |||
| 1951 | and Director | Department since 2001; Trustee, The Holy Family Foundation | |||
| since 2001; Committee Member, Professional Ethics Committee | |||||
| of the Pennsylvania Institute of Certified Public Accountants | |||||
| from 2007 to 2010; President and Trustee, Pittsburgh Catholic | |||||
| Publishing Associates from 2003 to 2008; Director, Inter-Tel from | |||||
| 2006 to 2007. | |||||
| Frederick W. Winter | Director and | Since | Professor and Dean Emeritus of the Joseph M. Katz School of | 36 RICs consisting of | None |
| 55 East 52nd Street | Member of | 2007 | Business, University of Pittsburgh since 2005 and Dean thereof | 105 Portfolios | |
| New York, NY 10055 | the Audit | from 1997 to 2005; Director, Alkon Corporation (pneumatics) | |||
| 1945 | Committee | since 1992; Director, Tippman Sports (recreation) since 2005; | |||
| Director, Indotronix International (IT services) from 2004 to 2008. | |||||
| 1 Directors serve until their resignation, removal or death, or until December 31 of the year in which they turn 72. The Board has approved one-year | |||||
| extensions in terms of Directors who turn 72 prior to December 31, 2013. | |||||
| 2 Date shown is the earliest date a person has served as a director for the Corporation/Master LLC covered by this annual report. Following the combina- | |||||
| tion of Merrill Lynch Investment Managers, L.P. (“MLIM”) and BlackRock, Inc. (“BlackRock”) in September 2006, the various legacy MLIM and legacy | |||||
| BlackRock fund boards were realigned and consolidated into three new fund boards in 2007. As a result, although the chart shows certain directors as | |||||
| joining the Corporation/Master LLC’s board in 2007, each director first became a member of the board of other legacy MLIM or legacy BlackRock | |||||
| funds as follows: David O. Beim, 1998; Ronald W. Forbes, 1977; Matina Horner, 2004; Rodney D. Johnson, 1995; Herbert I. London, 1987; Cynthia A. | |||||
| Montgomery, 1994; Joseph P. Platt, Jr., 1999; Robert C. Robb, Jr., 1998; Toby Rosenblatt, 2005; Kenneth L. Urish, 1999; and Frederick W. Winter, 1999. | |||||
| Interested Directors3 | |||||
| Richard S. Davis | Director | Since | Managing Director, BlackRock, Inc. since 2005; Chief Executive | 169 RICs consisting of | None |
| 55 East 52nd Street | 2007 | Officer, State Street Research & Management Company from 2000 | 299 Portfolios | ||
| New York, NY 10055 | to 2005; Chairman of the Board of Trustees, State Street Research | ||||
| 1945 | Mutual Funds from 2000 to 2005. | ||||
| Henry Gabbay | Director | Since | Consultant, BlackRock, Inc. from 2007 to 2008; Managing Director, | 169 RICs consisting of | None |
| 55 East 52nd Street | 2007 | BlackRock, Inc. from 1989 to 2007; Chief Administrative Officer, | 299 Portfolios | ||
| New York, NY 10055 | BlackRock Advisors, LLC from 1998 to 2007; President of BlackRock | ||||
| 1947 | Funds and BlackRock Bond Allocation Target Shares from 2005 to | ||||
| 2007 and Treasurer of certain closed-end funds in the BlackRock | |||||
| fund complex from 1989 to 2006. | |||||
3 Mr. Davis is an “interested person” as defined in the Investment Company Act of 1940, of the Corporation/Master LLC based on his position with
BlackRock, Inc. and its affiliates. Mr. Gabbay is an “interested person” of the Corporation/Master LLC based on his former positions with BlackRock,
Inc. and its affiliates as well as his ownership of BlackRock, Inc. and The PNC Financial Services Group, Inc. securities. Directors serve until their resig-
nation, removal or death, or until December 31 of the year in which they turn 72. The Board has approved one-year extensions in terms of Directors
who turn 72 prior to December 31, 2013.
34 BLACKROCK SMALL CAP GROWTH FUND II
MAY 31, 2010
| Officers and Directors (concluded) | |||||
| Position(s) | |||||
| Held with | |||||
| Name, Address | Corporation/ | Length of | |||
| and Year of Birth | Master LLC | Time Served | Principal Occupation(s) During Past 5 Years | ||
| Officers1 | |||||
| Anne Ackerley | President and | Since | Managing Director of BlackRock, Inc. since 2000; Vice President of the BlackRock-advised funds from 2007 to | ||
| 55 East 52nd Street | Chief | 20092 | 2009; Chief Operating Officer of BlackRock’s Global Client Group (GCG) since 2009; Chief Operating Officer | ||
| New York, NY 10055 | Executive | of BlackRock’s U.S. Retail Group from 2006 to 2009; Head of BlackRock’s Mutual Fund Group from 2000 | |||
| 1962 | Officer | to 2006. | |||
| Jeffrey Holland, CFA | Vice | Since | Managing Director of BlackRock, Inc. since 2010; Director of BlackRock, Inc. from 2006 to 2009; Chief Operating | ||
| 55 East 52nd Street | President | 2009 | Officer of BlackRock’s U.S. Retail Group since 2009; Co-head of Product Development and Management for | ||
| New York, NY 10055 | BlackRock’s U.S. Retail Group from 2007 to 2009; Product Manager of Raymond James & Associates from | ||||
| 1971 | 2003 to 2006. | ||||
| Brendan Kyne | Vice | Since | Managing Director of BlackRock, Inc. since 2010; Director of BlackRock, Inc. from 2008 to 2009; Head of Product | ||
| 55 East 52nd Street | President | 2009 | Development and Management for BlackRock’s U.S. Retail Group since 2009, Co-head thereof from 2007 to | ||
| New York, NY 10055 | 2009; Vice President of BlackRock, Inc. from 2005 to 2008. | ||||
| 1977 | |||||
| Brian Schmidt | Vice | Since | Managing Director of BlackRock, Inc. since 2004; Various positions with U.S. Trust Company from 1991 to 2003 | ||
| 55 East 52nd Street | President | 2009 | including Director from 2001 to 2003 and Senior Vice President from 1998 to 2003; Vice President, Chief Financial | ||
| New York, NY 10055 | Officer and Treasurer of Excelsior Funds, Inc., Excelsior Tax-Exempt Funds, Inc. and Excelsior Funds Trust from 2001 | ||||
| 1958 | to 2003. | ||||
| Neal Andrews | Chief | Since | Managing Director of BlackRock, Inc. since 2006; Senior Vice President and Line of Business Head of Fund | ||
| 55 East 52nd Street | Financial | 2007 | Accounting and Administration at PNC Global Investment Servicing (U.S.) Inc. from 1992 to 2006. | ||
| New York, NY 10055 | Officer | ||||
| 1966 | |||||
| Jay Fife | Treasurer | Since | Managing Director of BlackRock, Inc. since 2007 and Director in 2006; Assistant Treasurer of the Merrill Lynch | ||
| 55 East 52nd Street | 2007 | Investment Managers, L.P. (“MLIM”) and Fund Asset Management, L.P. advised funds from 2005 to 2006; Director | |||
| New York, NY 10055 | of MLIM Fund Services Group from 2001 to 2006. | ||||
| 1970 | |||||
| Brian Kindelan | Chief | Since | Chief Compliance Officer of the BlackRock-advised funds since 2007; Managing Director and Senior Counsel of | ||
| 55 East 52nd Street | Compliance | 2007 | BlackRock, Inc. since 2005. | ||
| New York, NY 10055 | Officer | ||||
| 1959 | |||||
| Howard Surloff | Secretary | Since | Managing Director and General Counsel of U.S. Funds at BlackRock, Inc. since 2006; General Counsel (U.S.) of | ||
| 55 East 52nd Street | 2007 | Goldman Sachs Asset Management, L.P. from 1993 to 2006. | |||
| New York, NY 10055 | |||||
| 1965 | |||||
| 1 Officers of the Corporation/Master LLC serve at the pleasure of the Board of Directors. | |||||
| 2 Ms. Ackerley has been President and Chief Executive Officer since 2009 and was Vice President from 2007 to 2009. | |||||
| Further information about the Officers and Directors is available in the Corporation’s/Master LLC’s Statement of Additional Information, which can be | |||||
| obtained without charge by calling (800) 441-7762. | |||||
| Investment Advisor | Custodian | Accounting Agent | Distributor | Address of the Fund | |
| BlackRock Advisors, LLC Brown Brothers Harriman & Co. State Street Bank and Trust Company | BlackRock Investments, LLC | 100 Bellevue Parkway | |||
| Wilmington, DE 19809 Boston, MA 02109 | Princeton, NJ 08540 | New York, NY 10022 | Wilmington, DE 19809 | ||
| Sub-Advisor | Transfer Agent | Independent Registered | Legal Counsel | ||
| BlackRock Capital | BNY Mellon Investment | Public Accounting Firm | Sidley Austin LLP | ||
| Management, Inc. | Servicing (US) Inc. | Deloitte & Touche LLP | New York, NY 10019 | ||
| New York, NY 10055 | Wilmington, DE 19809 | Princeton, NJ 08540 | |||
BLACKROCK SMALL CAP GROWTH FUND II
MAY 31, 2010
35
Additional Information
General Information
Electronic Delivery
Electronic copies of most financial reports and prospectuses are available
on the Fund’s website or shareholders can sign up for e-mail notifications
of quarterly statements, annual and semi-annual reports and prospec-
tuses by enrolling in the Fund’s electronic delivery program.
To enroll:
Shareholders Who Hold Accounts with Investment Advisors, Banks or
Brokerages:
Please contact your financial advisor. Please note that not all investment
advisors, banks or brokerages may offer this service.
Shareholders Who Hold Accounts Directly with BlackRock:
1) Access the BlackRock website at
http://www.blackrock.com/edelivery
2) Select “eDelivery” under the “More Information” section
3) Log into your account
Householding
The Fund will mail only one copy of shareholder documents, including
prospectuses, annual and semi-annual reports and proxy statements, to
shareholders with multiple accounts at the same address. This practice is
commonly called “householding” and it is intended to reduce expenses
and eliminate duplicate mailings of shareholder documents. Mailings of
your shareholder documents may be householded indefinitely unless you
instruct us otherwise. If you do not want the mailing of these documents
to be combined with those for other members of your household, please
contact the Fund at (800) 441-7762.
Availability of Quarterly Portfolio Schedule of Investments
The Fund/Portfolio files its complete schedule of portfolio holdings with
the Securities and Exchange Commission (“SEC”) for the first and third
quarters of each fiscal year on Form N-Q. The Fund’s/Portfolio’s Forms
N-Q are available on the SEC’s website at http://www.sec.gov and may
also be reviewed and copied at the SEC’s Public Reference Room in
Washington, D.C. Information on the operation of the Public Reference
Room may be obtained by calling (800) SEC-0330. The Fund’s/
Portfolio’s Forms N-Q may also be obtained upon request and without
charge by calling (800) 441-7762.
Availability of Proxy Voting Policies and Procedures
A description of the policies and procedures that the Fund/Master LLC
uses to determine how to vote proxies relating to portfolio securities is
available (1) without charge, upon request, by calling (800) 441-7762;
(2) at www.blackrock.com; and (3) on the SEC’s website at
http://www.sec.gov.
Availability of Proxy Voting Record
Information about how the Corporation/Master LLC voted proxies relating
to securities held in the Fund’s/Portfolio’s portfolio during the most
recent 12-month period ended June 30 is available (1) without charge,
upon request, by calling (800) 441-7762; (2) at www.blackrock.com; and
(3) on the SEC’s website at http://www.sec.gov.
Shareholder Privileges
Account Information
Call us at (800) 441-7762 8:00 AM to 6:00 PM EST on any business day to
get information about your account balances, recent transactions and share
prices. You can also reach us on the Web at www.blackrock.com/funds.
Automatic Investment Plans
Investor Class shareholders who want to invest regularly can arrange to
have $50 or more automatically deducted from their checking or savings
account and invested in any of the BlackRock funds.
Systematic Withdrawal Plans
Investor Class shareholders can establish a systematic withdrawal plan
and receive periodic payments of $50 or more from their BlackRock
funds, as long as their account balance is at least $10,000.
Retirement Plans
Shareholders may make investments in conjunction with Traditional,
Rollover, Roth, Coverdell, Simple IRAs, SEP IRAs and 403(b) Plans.
36 BLACKROCK SMALL CAP GROWTH FUND II
MAY 31, 2010
Additional Information (concluded)
BlackRock Privacy Principles
BlackRock is committed to maintaining the privacy of its current and
former fund investors and individual clients (collectively, “Clients”) and
to safeguarding their non-public personal information. The following
information is provided to help you understand what personal informa-
tion BlackRock collects, how we protect that information and why in cer-
tain cases we share such information with select parties.
If you are located in a jurisdiction where specific laws, rules or regula-
tions require BlackRock to provide you with additional or different
privacy-related rights beyond what is set forth below, then BlackRock
will comply with those specific laws, rules or regulations.
BlackRock obtains or verifies personal non-public information from and
about you from different sources, including the following: (i) information
we receive from you or, if applicable, your financial intermediary, on
applications, forms or other documents; (ii) information about your
transactions with us, our affiliates, or others; (iii) information we receive
from a consumer reporting agency; and (iv) from visits to our websites.
BlackRock does not sell or disclose to non-affiliated third parties any
non-public personal information about its Clients, except as permitted
by law or as is necessary to respond to regulatory requests or to service
Client accounts. These non-affiliated third parties are required to protect
the confidentiality and security of this information and to use it only for
its intended purpose.
We may share information with our affiliates to service your account or
to provide you with information about other BlackRock products or serv-
ices that may be of interest to you. In addition, BlackRock restricts
access to non-public personal information about its Clients to those
BlackRock employees with a legitimate business need for the informa-
tion. BlackRock maintains physical, electronic and procedural safeguards
that are designed to protect the non-public personal information of its
Clients, including procedures relating to the proper storage and disposal
of such information.
BLACKROCK SMALL CAP GROWTH FUND II
MAY 31, 2010
37
A World-Class Mutual Fund Family
BlackRock offers a diverse lineup of open-end mutual funds crossing all investment styles and managed by experts in equity, fixed income and
tax-exempt investing.
| Equity Funds | ||||
| BlackRock All-Cap Energy & Resources Portfolio | BlackRock Global Opportunities Portfolio | BlackRock Mid Cap Value Opportunities Fund | ||
| BlackRock Asset Allocation Portfolio† | BlackRock Global SmallCap Fund | BlackRock Natural Resources Trust | ||
| BlackRock Aurora Portfolio | BlackRock Health Sciences Opportunities Portfolio | BlackRock Pacific Fund | ||
| BlackRock Balanced Capital Fund† | BlackRock Healthcare Fund | BlackRock Science & Technology | ||
| BlackRock Basic Value Fund | BlackRock Index Equity Portfolio* | Opportunities Portfolio | ||
| BlackRock Capital Appreciation Fund | BlackRock International Fund | BlackRock Small Cap Core Equity Portfolio | ||
| BlackRock Energy & Resources Portfolio | BlackRock International Index Fund | BlackRock Small Cap Growth Equity Portfolio | ||
| BlackRock Equity Dividend Fund | BlackRock International Opportunities Portfolio | BlackRock Small Cap Growth Fund II | ||
| BlackRock EuroFund | BlackRock International Value Fund | BlackRock Small Cap Index Fund | ||
| BlackRock Focus Growth Fund | BlackRock Large Cap Core Fund | BlackRock Small/Mid-Cap Growth Portfolio | ||
| BlackRock Focus Value Fund | BlackRock Large Cap Core Plus Fund | BlackRock S&P 500 Index Fund | ||
| BlackRock Global Allocation Fund† | BlackRock Large Cap Growth Fund | BlackRock U.S. Opportunities Portfolio | ||
| BlackRock Global Dynamic Equity Fund | BlackRock Large Cap Value Fund | BlackRock Utilities and Telecommunications Fund | ||
| BlackRock Global Emerging Markets Fund | BlackRock Latin America Fund | BlackRock Value Opportunities Fund | ||
| BlackRock Global Financial Services Fund | BlackRock Mid-Cap Growth Equity Portfolio | BlackRock World Gold Fund | ||
| BlackRock Global Growth Fund | BlackRock Mid-Cap Value Equity Portfolio | |||
| Fixed Income Funds | ||||
| BlackRock Bond Portfolio | BlackRock Income Builder Portfolio† | BlackRock Managed Income Portfolio | ||
| BlackRock Emerging Market Debt Portfolio | BlackRock Inflation Protected Bond Portfolio | BlackRock Multi-Sector Bond Portfolio | ||
| BlackRock GNMA Portfolio | BlackRock Intermediate Government | BlackRock Short-Term Bond Fund | ||
| BlackRock Government Income Portfolio | Bond Portfolio | BlackRock Strategic Income | ||
| BlackRock High Income Fund | BlackRock International Bond Portfolio | Opportunities Portfolio | ||
| BlackRock High Yield Bond Portfolio | BlackRock Long Duration Bond Portfolio | BlackRock Total Return Fund | ||
| BlackRock Income Portfolio† | BlackRock Low Duration Bond Portfolio | BlackRock Total Return Portfolio II | ||
| BlackRock World Income Fund | ||||
| Municipal Bond Funds | ||||
| BlackRock AMT-Free Municipal Bond Portfolio | BlackRock Kentucky Municipal Bond Portfolio | BlackRock New York Municipal Bond Fund | ||
| BlackRock California Municipal Bond Fund | BlackRock Municipal Insured Fund | BlackRock Ohio Municipal Bond Portfolio | ||
| BlackRock High Yield Municipal Fund | BlackRock National Municipal Fund | BlackRock Pennsylvania Municipal Bond Fund | ||
| BlackRock Intermediate Municipal Fund | BlackRock New Jersey Municipal Bond Fund | BlackRock Short-Term Municipal Fund | ||
| Target Risk & Target Date Funds† | ||||
| BlackRock Prepared Portfolios | BlackRock Lifecycle Prepared Portfolios | BlackRock LifePath Portfolios | ||
| Conservative Prepared Portfolio | 2010 | 2035 | Retirement | 2040 |
| Moderate Prepared Portfolio | 2015 | 2040 | 2020 | 2045 |
| Growth Prepared Portfolio | 2020 | 2045 | 2025 | 2050 |
| Aggressive Growth Prepared Portfolio | 2025 | 2050 | 2030 | 2055 |
| 2030 | 2035 | |||
* See the prospectus for information on specific limitations on investments in the fund.
† Mixed asset fund.
BlackRock mutual funds are currently distributed by BlackRock Investments, LLC. You should consider the investment objectives, risks, charges and
expenses of the funds under consideration carefully before investing. Each fund’s prospectus contains this and other information and is available at
www.blackrock.com or by calling (800) 441-7762 or from your financial advisor. The prospectus should be read carefully before investing.
38 BLACKROCK SMALL CAP GROWTH FUND II
MAY 31, 2010

This report is not authorized for use as an offer of sale or a
solicitation of an offer to buy shares of the Fund unless accom-
panied or preceded by the Fund’s current prospectus. Past per-
formance results shown in this report should not be considered
a representation of future performance. Investment return and
principal value of shares will fluctuate so that shares, when
redeemed, may be worth more or less than their original cost.
Statements and other information herein are as dated and are
subject to change.

Item 2 – Code of Ethics – The registrant (or the “Fund”) has adopted a code of ethics, as of the end
of the period covered by this report, applicable to the registrant’s principal executive officer,
principal financial officer and principal accounting officer, or persons performing similar
functions. During the period covered by this report, there have been no amendments to or
waivers granted under the code of ethics. A copy of the code of ethics is available without
charge at www.blackrock.com.
Item 3 – Audit Committee Financial Expert – The registrant’s board of directors or trustees, as
applicable (the “board of directors”), has determined that (i) the registrant has the following
audit committee financial expert serving on its audit committee and (ii) each audit
committee financial expert is independent:
Kenneth L. Urish
Under applicable securities laws, a person determined to be an audit committee financial
expert will not be deemed an “expert” for any purpose, including without limitation for the
purposes of Section 11 of the Securities Act of 1933, as a result of being designated or
identified as an audit committee financial expert. The designation or identification as an
audit committee financial expert does not impose on such person any duties, obligations, or
liabilities greater than the duties, obligations, and liabilities imposed on such person as a
member of the audit committee and board of directors in the absence of such designation or
identification.
Item 4 – Principal Accountant Fees and Services
| (a) Audit Fees | (b) Audit-Related Fees1 | (c) Tax Fees2 | (d) All Other Fees3 | |||||
| Current | Previous | Current | Previous | Current | Previous | Current | Previous | |
| Fiscal Year | Fiscal Year | Fiscal Year | Fiscal Year | Fiscal Year | Fiscal Year | Fiscal Year | Fiscal Year | |
| Entity Name | End | End | End | End | End | End | End | End |
| BlackRock Small | $6,800 | $6,800 | $0 | $0 | $6,100 | $6,100 | $83 | $1,028 |
| Cap Growth Fund II | ||||||||
| BlackRock Master | ||||||||
| Small Cap Growth | $30,500 | $30,500 | $0 | $0 | $6,100 | $6,100 | $0 | $0 |
| Portfolio | ||||||||
1 The nature of the services include assurance and related services reasonably related to the performance of the audit of
financial statements not included in Audit Fees.
2 The nature of the services include tax compliance, tax advice and tax planning.
3 The nature of the services include a review of compliance procedures and attestation thereto.
(e)(1) Audit Committee Pre-Approval Policies and Procedures:
The registrant’s audit committee (the “Committee”) has adopted policies and
procedures with regard to the pre-approval of services. Audit, audit-related and tax
compliance services provided to the registrant on an annual basis require specific pre-
approval by the Committee. The Committee also must approve other non-audit services
provided to the registrant and those non-audit services provided to the registrant’s affiliated
service providers that relate directly to the operations and the financial reporting of the
registrant. Certain of these non-audit services that the Committee believes are a) consistent
with the SEC’s auditor independence rules and b) routine and recurring services that will
not impair the independence of the independent accountants may be approved by the
Committee without consideration on a specific case-by-case basis (“general pre-approval”).
The term of any general pre-approval is 12 months from the date of the pre-approval, unless
the Committee provides for a different period. Tax or other non-audit services provided to
the registrant which have a direct impact on the operation or financial reporting of the
registrant will only be deemed pre-approved provided that any individual project does not
exceed $10,000 attributable to the registrant or $50,000 per project. For this purpose,
multiple projects will be aggregated to determine if they exceed the previously mentioned
cost levels.
Any proposed services exceeding the pre-approved cost levels will require specific
pre-approval by the Committee, as will any other services not subject to general pre-
approval (e.g., unanticipated but permissible services). The Committee is informed of each
service approved subject to general pre-approval at the next regularly scheduled in-person
board meeting. At this meeting, an analysis of such services is presented to the Committee
for ratification. The Committee may delegate to the Committee Chairman the authority to
approve the provision of and fees for any specific engagement of permitted non-audit
services, including services exceeding pre-approved cost levels.
(e)(2) None of the services described in each of Items 4(b) through (d) were approved by
the audit committee pursuant to paragraph (c)(7)(i)(C) of Rule 2-01 of Regulation S-X.
(f) Not Applicable
(g) Affiliates’ Aggregate Non-Audit Fees:
| Current Fiscal Year | Previous Fiscal Year | |
| Entity Name | End | End |
| BlackRock Small Cap Growth | $16,960 | $409,628 |
| Fund II | ||
| BlackRock Master Small Cap | ||
| Growth Portfolio | $16,877 | $408,600 |
(h) The registrant’s audit committee has considered and determined that the provision of
non-audit services that were rendered to the registrant’s investment adviser (not including
any non-affiliated sub-adviser whose role is primarily portfolio management and is
subcontracted with or overseen by the registrant’s investment adviser), and any entity
controlling, controlled by, or under common control with the investment adviser that
provides ongoing services to the registrant that were not pre-approved pursuant to paragraph
(c)(7)(ii) of Rule 2-01 of Regulation S-X is compatible with maintaining the principal
accountant’s independence.
Regulation S-X Rule 2-01(c)(7)(ii) – $10,777, 0%
Item 5 – Audit Committee of Listed Registrants – Not Applicable
Item 6 – Investments
(a) The registrant’s Schedule of Investments is included as part of the Report to
Stockholders filed under Item 1 of this form.
(b) Not Applicable due to no such divestments during the semi-annual period covered since
the previous Form N-CSR filing.
Item 7 – Disclosure of Proxy Voting Policies and Procedures for Closed-End Management
Investment Companies – Not Applicable
Item 8 – Portfolio Managers of Closed-End Management Investment Companies – Not Applicable
Item 9 – Purchases of Equity Securities by Closed-End Management Investment Company and
Affiliated Purchasers – Not Applicable
Item 10 – Submission of Matters to a Vote of Security Holders – The registrant’s Nominating and
Governance Committee will consider nominees to the board of directors recommended by
shareholders when a vacancy becomes available. Shareholders who wish to recommend a
nominee should send nominations which include biographical information and set forth the
qualifications of the proposed nominee to the registrant’s Secretary. There have been no
material changes to these procedures.
Item 11 – Controls and Procedures
11(a) – The registrant’s principal executive and principal financial officers or persons performing
similar functions have concluded that the registrant’s disclosure controls and procedures (as
defined in Rule 30a-3(c) under the Investment Company Act of 1940, as amended (the
“1940 Act”)) are effective as of a date within 90 days of the filing of this report based on the
evaluation of these controls and procedures required by Rule 30a-3(b) under the 1940 Act
and Rule 15(d)-15(b) under the Securities Exchange Act of 1934, as amended.
11(b) – There were no changes in the registrant’s internal control over financial reporting (as
defined in Rule 30a-3(d) under the 1940 Act) that occurred during the second fiscal quarter
of the period covered by this report that have materially affected, or are reasonably likely to
materially affect, the registrant’s internal control over financial reporting.
Item 12 – Exhibits attached hereto
12(a)(1) – Code of Ethics – See Item 2
12(a)(2) – Certifications – Attached hereto
12(a)(3) – Not Applicable
12(b) – Certifications – Attached hereto
Pursuant to the requirements of the Securities Exchange Act of 1934 and the Investment
Company Act of 1940, the registrant has duly caused this report to be signed on its behalf by
the undersigned, thereunto duly authorized.
BlackRock Small Cap Growth Fund II of BlackRock Series, Inc. and BlackRock Master
Small Cap Growth Portfolio of BlackRock Master LLC
By: /s/ Anne F. Ackerley
Anne F. Ackerley
Chief Executive Officer of
BlackRock Small Cap Growth Fund II of BlackRock Series, Inc. and BlackRock
Master Small Cap Growth Portfolio of BlackRock Master LLC
Date: August 4, 2010
Pursuant to the requirements of the Securities Exchange Act of 1934 and the Investment
Company Act of 1940, this report has been signed below by the following persons on behalf
of the registrant and in the capacities and on the dates indicated.
By: /s/ Anne F. Ackerley
Anne F. Ackerley
Chief Executive Officer (principal executive officer) of
BlackRock Small Cap Growth Fund II of BlackRock Series, Inc. and BlackRock
Master Small Cap Growth Portfolio of BlackRock Master LLC
Date: August 4, 2010
By: /s/ Neal J. Andrews
Neal J. Andrews
Chief Financial Officer (principal financial officer) of
BlackRock Small Cap Growth Fund II of BlackRock Series, Inc. and BlackRock
Master Small Cap Growth Portfolio of BlackRock Master LLC
Date: August 4, 2010