UNITEDSTATES
SECURITIESANDEXCHANGECOMMISSION
Washington,D.C.20549
FORM N-CSR
CERTIFIED SHAREHOLDER REPORT OF REGISTERED MANAGEMENT
INVESTMENT COMPANIES
Investment Company Act file number 811-08797 and 811-09049
Name of Fund: BlackRock Small Cap Growth Fund II of BlackRock Series, Inc. and BlackRock
Master Small Cap Growth Portfolio of BlackRock Master LLC
Fund Address: 100 Bellevue Parkway, Wilmington, DE 19809
Name and address of agent for service: John M. Perlowski, Chief Executive Officer, BlackRock
Small Cap Growth Fund II of BlackRock Series, Inc. and BlackRock Master Small Cap
Growth Portfolio of BlackRock Master LLC, 55 East 52nd Street, New York, NY 10055
Registrants’ telephone number, including area code: (800) 441-7762
Date of fiscal year end: 05/31/2011
Date of reporting period: 05/31/2011
Item 1 – Report to Stockholders
May 31, 2011
Annual Report
BlackRock Small Cap Growth Fund II | of BlackRock Series, Inc.
Not FDIC Insured • No Bank Guarantee • May Lose Value
| Table of Contents | |
| Page | |
| Dear Shareholder | 3 |
| Annual Report: | |
| Fund Summary | 4 |
| About Fund Performance | 6 |
| Disclosure of Expenses | 6 |
| Fund Financial Statements: | |
| Statement of Assets and Liabilities | 7 |
| Statement of Operations | 8 |
| Statements of Changes in Net Assets | 9 |
| Fund Financial Highlights | 10 |
| Fund Notes to Financial Statements | 13 |
| Fund Report of Independent Registered Public Accounting Firm | 16 |
| Portfolio Information | 17 |
| Portfolio Financial Statements: | |
| Schedule of Investments | 18 |
| Statement of Assets and Liabilities | 21 |
| Statement of Operations | 22 |
| Statements of Changes in Net Assets | 23 |
| Portfolio Financial Highlights | 23 |
| Portfolio Notes to Financial Statements | 24 |
| Portfolio Report of Independent Registered Public Accounting Firm | 27 |
| Disclosure of Investment Agreement and Sub-Advisory Agreement | 28 |
| Officers and Directors | 32 |
| Additional Information | 35 |
| Mutual Fund Family | 38 |
| 2 | BLACKROCK SMALL CAP GROWTH FUND II | MAY 31, 2011 |
Dear Shareholder
Investor sentiment has come full circle since this time last year. The same concerns that drove investors to safer assets in the second quarter of
2010 — the debt crisis in Europe, an overheating economy in China, and slowing economic growth in the US — have resurfaced to spark a repeat of
the flight-to-quality in the second quarter of 2011. Between these periods, pivotal events across the globe coaxed investors out of their safe havens,
whetted their appetite for risk and propelled a strong rally in riskier assets before pulling the plug on investor confidence, sending investors back to
shed risk from their portfolios.
Twelve months ago, fears of a double-dip recession fueled investor demand for the relative safety of US Treasury bonds while riskier assets
plummeted. For their part, equities endured a double-digit percentage correction on the back of the Greek credit crisis and a stalling in US jobs
growth. However, financial markets changed direction in the third quarter as the global economy finally gained traction. Investor fear turned to optimism
with the anticipation of a second round of quantitative easing (“QE2”) from the US Federal Reserve Board (the “Fed”) and the general belief that
improving economic data was indicative of a transition from recovery to expansion. Despite the ongoing sovereign debt crisis in Europe and high infla-
tion in developing markets, equity markets recovered their second-quarter losses and rallied strongly through year end. Fixed income markets, however,
saw yields move sharply upward, pushing prices down, especially on the long end of the historically steep yield curve. While high yield bonds benefited
from the risk rally, most fixed income sectors declined in the fourth quarter. The tax-exempt municipal market faced additional headwinds as it became
evident that the Build America Bond program would not be extended and municipal finance troubles raised concerns, leading to heavy outflows.
The new year brought a series of negative surprises. Political turmoil swept across the Middle East/North Africa region and prices of oil and other
commodities soared. Natural disasters in Japan disrupted global supply lines and the ratings outlook for US debt turned negative. Equity markets
reacted to each of these events with a short-term sell-off and solid rebound as investors chose to focus on strong corporate earnings and positive
economic indicators. Global credit markets were surprisingly resilient in the face of these events and yields regained relative stability in 2011. The
tax-exempt market saw relief from its headwinds and staged a steady rebound from its fourth-quarter lows. Equities, commodities and high yield
bonds continued to outperform higher-quality assets as the Fed’s early 2011 commitment to complete QE2 and keep interest rates low compelled
investors to continue adding risk to their portfolios.
However, markets switched direction again in May. The debt crisis in peripheral European countries moved to the forefront of financial news. US
economic growth slowed as the impact of higher oil prices caught up with consumer spending. May employment figures fell short of expectations
and the housing sector continued to struggle. Investors once again shunned risk assets and Treasuries rallied. Stocks ended the period with a down-
turn, but overall performance of global equity markets was remarkably strong for the 12-month period. Fixed income markets moved higher on the
softer economic data near period end and posted gains for the 12 months. Continued low short-term interest rates kept yields on money market
securities near their all-time lows.
| Investor Sentiment Has Come Full Circle: Total Returns as of May 31, 2011 | 6-month | 12-month |
| US large cap equities (S&P 500® Index) | 15.03% | 25.95% |
| US small cap equities (Russell 2000® Index) | 17.34 | 29.75 |
| International equities (MSCI Europe, Australasia, Far East Index) | 14.92 | 30.69 |
| Emerging market equities (MSCI Emerging Markets Index) | 9.76 | 28.84 |
| 3-month Treasury bill (BofA Merrill Lynch 3-Month Treasury Bill Index) | 0.10 | 0.16 |
| US Treasury securities (BofA Merrill Lynch 10-Year US Treasury Index) | (0.30) | 5.82 |
| US investment grade bonds (Barclays Capital US Aggregate Bond Index) | 1.91 | 5.84 |
| Tax-exempt municipal bonds (Barclays Capital Municipal Bond Index) | 2.04 | 3.18 |
| US high yield bonds (Barclays Capital US Corporate High Yield 2% Issuer Capped Index) | 7.93 | 18.10 |
| Past performance is no guarantee of future results. Index performance shown for illustrative purposes only. You cannot invest directly in an index. | ||
For additional market perspective and investment insight, www.blackrock.com/shareholdermagazine, where you’ll find the most recent issue of our
award-winning Shareholder® magazine, as well as its quarterly companion newsletter, Shareholder Perspectives.

| THIS PAGE NOT PART OF YOUR FUND REPORT | 3 |
Fund Summary as of May 31, 2011 BlackRock Small Cap Growth Fund II
Investment Objective
BlackRock Small Cap Growth Fund II's (the “Fund”), a series of BlackRock Series, Inc. (the “Corporation”), investment objective is to seek long-term
capital growth. In other words, the Fund tries to choose investments that will increase in value. Current income from dividends and interest will not be
an important consideration in selecting portfolio securities.
Portfolio Management Commentary
How did the Fund perform?
• The Fund, through its investment in BlackRock Master Small Cap Growth
Portfolio (the “Portfolio”), posted a positive double-digit return, but
underperformed the benchmark Russell 2000® Growth Index for the
12-month period ended May 31, 2011.
What factors influenced performance?
• The Portfolio’s underweight position in the information technology (IT)
sector and weaker stock selection within the sector held back relative
returns for the period. In particular, the Portfolio’s underweight exposure
to communications equipment was the most significant example, as the
industry finished up more than 62% on the strength of the cloud com-
puting movement. In addition to the Portfolio’s lack of exposure to this
industry, weaker stock selection also hampered returns. Optical equip-
ment provider Finisar Corp. sunk close to 40% after announcing an
inventory correction with one of its customers, causing investors to ques-
tion whether the optical equipment cycle had concluded. Also within IT,
casino equipment provider Global Cash Access, Inc. dropped almost
60% after losing a large revenue-producing contract. Elsewhere, second-
ary education provider Grand Canyon Education, Inc. dipped more than
48% as regulatory reform and slowing enrollment rates continued to
negatively affect the education services space.
• On the positive side, stock selection and an overweight position in the
energy sector significantly boosted the Fund’s returns for the 12 months.
The Portfolio’s energy holdings returned more than 90% for the period,
comparing favorably with the Russell 2000® Growth Index’s holdings in
energy, which were up by more than 70%. Most notably, coal producer
Massey Energy Co. finished up more than 80% after announcing the
company’s agreement to be acquired by Alpha Natural Resources, Inc.
Elsewhere, stock selection in the health care sector also contributed to
overall returns. Therapeutics company Jazz Pharmaceuticals, Inc. jumped
more than 180% during the period on increased volumes and higher
prices for the company’s narcolepsy drug. In biotechnology, holding
Cubist Pharmaceuticals, Inc. rose close to 80% after the company
announced a settlement with a generics company regarding the
company’s bacterial antibiotic drug.
Describe recent portfolio activity.
• During the 12-month period, we increased the Portfolio’s overall
weighting in the health care sector. Opportunities in health care were
numerous as the space lagged the overall market for the majority of two
years. New additions within health care included Jazz Pharmaceuticals,
Inc., HealthSpring, Inc. and NxStage Medical, Inc., among others. We
reduced the Portfolio’s underweight position in the consumer discre-
tionary sector by adding positions in Deckers Outdoor Corp. and
Tenneco, Inc., among others.
Describe portfolio positioning at period end.
• At period end, the Portfolio’s most significant overweight relative to the
Russell 2000® Growth Index was in the health care sector and its most
significant underweight was in IT.
The views expressed reflect the opinions of BlackRock as of the date of this report and are subject to change based on changes in market, economic or other conditions.
These views are not intended to be a forecast of future events and are no guarantee of future results.
| 4 | BLACKROCK SMALL CAP GROWTH FUND II | MAY 31, 2011 |
Total Return Based on a $10,000 Investment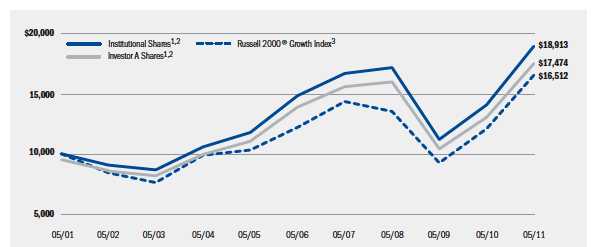
1 Assuming maximum sales charges, transaction costs and other operating expenses, including administration fees, if any. Institutional Shares do
not have a sales charge.
2 The Fund invests all of its assets in the Portfolio. The Portfolio invests primarily in a diversified portfolio of equity securities of small cap
companies located in the United States that Fund management believes have above-average prospects for earnings growth.
3 This index contains those securities with greater-than-average growth orientations, generally having higher price-to-book and price-to-
earnings ratios.
Performance Summary for the Period Ended May 31, 2011
| Average Annual Total Returns4 | |||||||
| 1 Year | 5 Years | 10 Years | |||||
| 6-Month | w/o sales | w/sales | w/o sales | w/sales | w/o sales | w/sales | |
| Total Returns | charge | charge | charge | charge | charge | charge | |
| Institutional | 21.76% | 34.62% | N/A | 5.02% | N/A | 6.58% | N/A |
| Investor A | 21.57 | 34.22 | 27.17% | 4.74 | 3.61% | 6.31 | 5.74% |
| Investor B | 20.90 | 32.66 | 28.16 | 3.58 | 3.26 | 5.55 | 5.55 |
| Investor C | 21.02 | 32.95 | 31.95 | 3.73 | 3.73 | 5.38 | 5.38 |
| Class R | 21.35 | 33.73 | N/A | 4.31 | N/A | 6.07 | N/A |
| Russell 2000® Growth Index | 19.39 | 36.79 | N/A | 6.26 | N/A | 5.14 | N/A |
4 Assuming maximum sales charges, if any. Average annual total returns with and without sales charges reflect reductions for distribution and service fees. See “About Fund
Performance” on page 6 for a detailed description of share classes, including any related sales charges and fees.
N/A — Not applicable as share class and index do not have a sales charge.
Past performance is not indicative of future results.
| BLACKROCK SMALL CAP GROWTH FUND II | MAY 31, 2011 | 5 |
About Fund Performance
• Institutional Shares are not subject to any sales charge. Institutional
Shares bear no ongoing distribution or service fees and are available
only to eligible investors.
• Investor A Shares incur a maximum initial sales charge (front-end load)
of 5.25% and a service fee of 0.25% per year (but no distribution fee).
• Investor B Shares are subject to a maximum contingent deferred sales
charge of 4.50% declining to 0% after six years. In addition, Investor B
Shares are subject to a distribution fee of 0.75% per year and a service
fee of 0.25% per year. These shares automatically convert to Investor A
Shares after approximately eight years. (There is no initial sales charge
for automatic share conversions.) All returns for periods greater than
eight years reflect this conversion. Investor B Shares of the Fund are
only available through exchanges, dividend reinvestment by existing
shareholders or for purchase by certain qualified employee benefit plans.
•I nvestor C Shares are subject to a 1% contingent deferred sales charge if
redeemed within one year of purchase. In addition, Investor C Shares are
subject to a distribution fee of 0.75% per year and a service fee of 0.25%
per year.
• Class R Shares do not incur a maximum initial sales charge (front-end
load) or deferred sales charge. These shares are subject to a distribution
fee of 0.25% per year and a service fee of 0.25% per year. Class R
Shares are available only to certain retirement plans. Prior to February 4,
2003, Class R Share performance results are those of Institutional
Shares (which have no distribution or service fees) restated to reflect
Class R Share fees.
Performance information reflects past performance and does not guaran-
tee future results. Current performance may be lower or higher than the
performance data quoted. Refer to www.blackrock.com/funds to obtain
performance data current to the most recent month end. Performance
results do not reflect the deduction of taxes that a shareholder would
pay on fund distributions or the redemption of fund shares. Figures
shown in the performance tables on the previous page assume reinvest-
ment of all dividends and capital gain distributions, if any, at net asset
value on the ex-dividend date. Investment return and principal value of
shares will fluctuate so that shares, when redeemed, may be worth more
or less than their original cost. Dividends paid to each class of shares
will vary because of the different levels of service, distribution and trans-
fer agency fees applicable to each class, which are deducted from the
income available to be paid to shareholders.
Disclosure of Expenses
Shareholders of this Fund may incur the following charges: (a) expenses
related to transactions, including sales charges and exchange fees; and
(b) operating expenses including advisory fees, service and distribution
fees, including 12b-1 fees, and other Fund expenses. The expense
example below (which is based on a hypothetical investment of $1,000
invested on December 1, 2010 and held through May 31, 2011)
is intended to assist shareholders both in calculating expenses based on
an investment in the Fund and in comparing these expenses with similar
costs of investing in other mutual funds.
The table provides information about actual account values and actual
expenses. In order to estimate the expenses a shareholder paid during the
period covered by this report, shareholders can divide their account value
by $1,000 and then multiply the result by the number corresponding
to their share class under the heading entitled “Expenses Paid During
the Period.”
The table also provides information about hypothetical account values
and hypothetical expenses based on the Fund’s actual expense ratio and
an assumed rate of return of 5% per year before expenses. In order to
assist shareholders in comparing the ongoing expenses of investing in this
Fund and other funds, compare the 5% hypothetical example with the 5%
hypothetical examples that appear in other funds’ shareholder reports.
The expenses shown in the table are intended to highlight shareholders’
ongoing costs only and do not reflect any transactional expenses, such as
sales charges or exchange fees, if any. Therefore, the hypothetical example
is useful in comparing ongoing expenses only, and will not help share-
holders determine the relative total expenses of owning different funds.
If these transactional expenses were included, shareholder expenses
would have been higher.
| Actual | Hypothetical2 | ||||||
| Beginning | Ending | Beginning | Ending | ||||
| Account Value | Account Value | Expenses Paid | Account Value | Account Value | Expenses Paid | Annualized | |
| December 1, 2010 | May 31, 2011 | During the Period1 | December 1, 2010 | May 31, 2011 | During the Period1 | Expense Ratio | |
| Institutional | $1,000.00 | $1,217.60 | $ 6.63 | $1,000.00 | $1,018.90 | $ 6.04 | 1.20% |
| Investor A | $1,000.00 | $1,215.70 | $ 8.23 | $1,000.00 | $1,017.50 | $ 7.49 | 1.49% |
| Investor B | $1,000.00 | $1,209.00 | $14.32 | $1,000.00 | $1,012.00 | $13.04 | 2.60% |
| Investor C | $1,000.00 | $1,210.20 | $13.17 | $1,000.00 | $1,013.00 | $11.99 | 2.39% |
| Class R | $1,000.00 | $1,213.50 | $10.21 | $1,000.00 | $1,015.70 | $ 9.30 | 1.85% |
1 For each class of the Fund, expenses are equal to the annualized expense ratio for the class, multiplied by the average account value over the period, multiplied by 182/365
(to reflect the one-half year period shown). Because the Fund is a feeder fund, the expense table reflects the expenses of both the Fund and the master portfolio in which
it invests.
2 Hypothetical 5% annual return before expenses is calculated by pro rating the number of days in the most recent fiscal half year divided by 365.
6 BLACKROCK SMALL CAP GROWTH FUND II MAY 31, 2011
| Statement of Assets and Liabilities | BlackRock Small Cap Growth Fund II | |
| May 31, 2011 | ||
| Assets | ||
| Investments at value — BlackRock Master Small Cap Growth Portfolio (the “Portfolio”) (cost — $410,756,142) | $ 504,291,540 | |
| Capital shares sold receivable | 908,566 | |
| Prepaid expenses | 26,224 | |
| Total assets | 505,226,330 | |
| Liabilities | ||
| Capital shares redeemed payable | 860,154 | |
| Service and distribution fees payable | 129,123 | |
| Transfer agent fees payable | 246,916 | |
| Administration fees payable | 84,757 | |
| Contributions payable to the Portfolio | 48,412 | |
| Other affiliates payable | 2,512 | |
| Officer’s fees payable | 133 | |
| Other accrued expenses payable | 25,769 | |
| Total liabilities | 1,397,776 | |
| Net Assets | $ 503,828,554 | |
| Net Assets Consist of | ||
| Paid-in capital | $ 403,788,632 | |
| Accumulated net realized gain allocated from the Portfolio | 6,504,524 | |
| Net unrealized appreciation/depreciation allocated from the Portfolio | 93,535,398 | |
| Net Assets | $ 503,828,554 | |
| Net Asset Value | ||
| Institutional — Based on net assets of $155,169,150 and 9,903,476 shares outstanding, 100 million shares authorized, $0.0001 par value | $ 15.67 | |
| Investor A — Based on net assets of $219,005,013 and 14,390,426 shares outstanding, 100 million shares authorized, $0.0001 par value | $ 15.22 | |
| Investor B — Based on net assets of $8,362,764 and 607,212 shares outstanding, 100 million shares authorized, $0.0001 par value | $ 13.77 | |
| Investor C — Based on net assets of $62,040,129 and 4,509,058 shares outstanding, 100 million shares authorized, $0.0001 par value | $ 13.76 | |
| Class R — Based on net assets of $59,251,498 and 4,072,872 shares outstanding, 100 million shares authorized, $0.0001 par value | $ 14.55 | |
| See Notes to Financial Statements. | ||
| BLACKROCK SMALL CAP GROWTH FUND II | MAY 31, 2011 | 7 |
| Statement of Operations | BlackRock Small Cap Growth Fund II |
| Year Ended May 31, 2011 | |
| Investment Loss | |
| Net investment loss allocated from the Portfolio: | |
| Dividends — unaffiliated | $ 1,058,358 |
| Foreign taxes withheld | (13,990) |
| Securities lending — affiliated | 45,514 |
| Dividends — affiliated | 7,745 |
| Expenses | (3,386,147) |
| Fees waived | 3,017 |
| Total investment loss | (2,285,503) |
| Expenses | |
| Administration | 895,219 |
| Service — Investor A | 481,087 |
| Service and distribution — Investor B | 89,672 |
| Service and distribution — Investor C | 585,274 |
| Service and distribution — Class R | 286,924 |
| Transfer agent — Institutional | 301,618 |
| Transfer agent — Investor A | 513,412 |
| Transfer agent — Investor B | 62,686 |
| Transfer agent — Investor C | 274,963 |
| Transfer agent — Class R | 223,184 |
| Printing | 82,234 |
| Registration | 68,480 |
| Professional | 65,653 |
| Officer | 199 |
| Miscellaneous | 19,525 |
| Total expenses | 3,950,130 |
| Net investment loss | (6,235,633) |
| Realized and Unrealized Gain Allocated from the Portfolio | |
| Net realized gain from investments and foreign currency transactions | 71,382,222 |
| Net change in unrealized appreciation/depreciation on investments | 66,655,877 |
| Total realized and unrealized gain | 138,038,099 |
| Net Increase in Net Assets Resulting from Operations | $ 131,802,466 |
| See Notes to Financial Statements. | ||
| 8 | BLACKROCK SMALL CAP GROWTH FUND II | MAY 31, 2011 |
| Statements of Changes in Net Assets | BlackRock Small Cap Growth Fund II | |
| Year Ended May 31, | ||
| Increase (Decrease) in Net Assets: | 2011 | 2010 |
| Operations | ||
| Net investment loss | $ (6,235,633) | $ (5,919,033) |
| Net realized gain | 71,382,222 | 32,884,294 |
| Net change in unrealized appreciation/depreciation | 66,655,877 | 58,581,376 |
| Net increase in net assets resulting from operations | 131,802,466 | 85,546,637 |
| Capital Share Transactions | ||
| Net decrease in net assets derived from capital share transactions | (43,669,484) | (26,121,633) |
| Redemption Fees | ||
| Redemption fees | 18,887 | 38,395 |
| Net Assets | ||
| Total increase in net assets | 88,151,869 | 59,463,399 |
| Beginning of year | 415,676,685 | 356,213,286 |
| End of year | $ 503,828,554 | $ 415,676,685 |
| Undistributed net investment income | — | $ 34,286 |
| See Notes to Financial Statements. | ||
| BLACKROCK SMALL CAP GROWTH FUND II | MAY 31, 2011 | 9 |
| Financial Highlights | BlackRock Small Cap Growth Fund | |||||||||||
| Institutional | Investor A | |||||||||||
| Year Ended May 31, | Year Ended May 31, | |||||||||||
| 2011 | 2010 | 2009 | 2008 | 2007 | 2011 | 2010 | 2009 | 2008 | 2007 | |||
| Per Share Operating Performance | ||||||||||||
| Net asset value, beginning of year | $ 11.64 | $ 9.27 | $ 14.20 | $ 16.26 | $ 15.74 | $ 11.34 | $ 9.06 | $ 13.90 | $ 15.96 | $ 15.51 | ||
| Net investment loss1 | (0.13) | (0.11) | (0.07) | (0.09) | (0.14) | (0.16) | (0.14) | (0.09) | (0.12) | (0.18) | ||
| Net realized and unrealized gain (loss)2 | 4.16 | 2.48 | (4.86) | 0.48 | 1.95 | 4.04 | 2.42 | (4.75) | 0.46 | 1.92 | ||
| Net increase (decrease) from | ||||||||||||
| investment operations | 4.03 | 2.37 | (4.93) | 0.39 | 1.81 | 3.88 | 2.28 | (4.84) | 0.34 | 1.74 | ||
| Distributions from: | ||||||||||||
| Net realized gain | — | — | — | (2.43) | (1.29) | — | — | — | (2.38) | (1.29) | ||
| Tax return of capital | — | — | — | (0.02) | — | — | — | — | (0.02) | — | ||
| Total distributions | — | — | — | (2.45) | (1.29) | — | — | — | (2.40) | (1.29) | ||
| Net asset value, end of year | $ 15.67 | $ 11.64 | $ 9.27 | $ 14.20 | $ 16.26 | $ 15.22 | $ 11.34 | $ 9.06 | $ 13.90 | $ 15.96 | ||
| Total Investment Return3 | ||||||||||||
| Based on net asset value | 34.62%4 | 25.57%5 | (34.72)%4 | 2.88% | 12.50% | 34.22%4 | 25.17%5 | (34.82)%4 | 2.57% | 12.23% | ||
| Ratios to Average Net Assets6 | ||||||||||||
| Total expenses | 1.24%7 | 1.31% | 1.35% | 1.25% | 1.28% | 1.53%7 | 1.57% | 1.59% | 1.51% | 1.54% | ||
| Net investment loss | (0.99)% | (1.03)% | (0.69)% | (0.59)% | (0.93)% | (1.28)% | (1.29)% | (0.95)% | (0.83)% | (1.18)% | ||
| Supplemental Data | ||||||||||||
| Net assets, end of year (000) | $155,169 | $106,530 | $ 89,346 | $157,805 | $162,580 | $219,005 | $184,897 | $161,557 | $232,600 | $194,561 | ||
| Portfolio turnover of the Portfolio | 127% | 114% | 75% | 70% | 115% | 127% | 114% | 75% | 70% | 115% | ||
1 Based on average shares outstanding.
2 Includes a redemption fee, which is less than $0.01 per share.
3 Where applicable, total investment returns exclude the effects of any sales charges and include the reinvestment of dividends and distributions.
4 Total return calculation includes redemption fees received by the Fund. The impact to the return is less than 0.01%.
5 Total return calculation includes redemption fees received by the Fund. The impact to the return is approximately 0.01%.
6 Includes the Fund’s share of the Portfolio’s allocated expenses and/or net investment loss.
7 Ratio includes the Fund’s share of the Portfolio’s allocated fees waived of less than 0.01%.
| See Notes to Financial Statements. | ||
| 10 | BLACKROCK SMALL CAP GROWTH FUND II | MAY 31, 2011 |
| Financial Highlights (continued) | BlackRock Small Cap Growth Fund II | |||||||||||
| Investor B | Investor C | |||||||||||
| Year Ended May 31, | Year Ended May 31, | |||||||||||
| 2011 | 2010 | 2009 | 2008 | 2007 | 2011 | 2010 | 2009 | 2008 | 2007 | |||
| Per Share Operating Performance | ||||||||||||
| Net asset value, beginning of year | $ 10.38 | $ 8.39 | $ 13.06 | $ 15.01 | $ 14.78 | $ 10.35 | $ 8.35 | $ 12.96 | $ 14.99 | $ 14.76 | ||
| Net investment loss1 | (0.28) | (0.25) | (0.21) | (0.26) | (0.28) | (0.26) | (0.23) | (0.18) | (0.24) | (0.28) | ||
| Net realized and unrealized gain (loss)2 | 3.67 | 2.24 | (4.46) | 0.45 | 1.80 | 3.67 | 2.23 | (4.43) | 0.43 | 1.80 | ||
| Net increase (decrease) from investment | ||||||||||||
| operations | 3.39 | 1.99 | (4.67) | 0.19 | 1.52 | 3.41 | 2.00 | (4.61) | 0.19 | 1.52 | ||
| Distributions from: | ||||||||||||
| Net realized gain | — | — | — | (2.12) | (1.29) | — | — | — | (2.20) | (1.29) | ||
| Tax return of capital | — | — | — | (0.02) | — | — | — | — | (0.02) | — | ||
| Total distributions | — | — | — | (2.14) | (1.29) | — | — | — | (2.22) | (1.29) | ||
| Net asset value, end of year | $ 13.77 | $ 10.38 | $ 8.39 | $ 13.06 | $ 15.01 | $ 13.76 | $ 10.35 | $ 8.35 | $ 12.96 | $ 14.99 | ||
| Total Investment Return3 | ||||||||||||
| Based on net asset value | 32.66%4 | 23.72%5 | (35.76)%4 | 1.61% | 11.29% | 32.95%4 | 23.95%5 | (35.57)%4 | 1.63% | 11.31% | ||
| Ratios to Average Net Assets6 | ||||||||||||
| Total expenses | 2.71%7 | 2.78% | 2.88% | 2.49% | 2.35% | 2.48%7 | 2.59% | 2.66% | 2.43% | 2.36% | ||
| Net investment loss | (2.46)% | (2.50)% | (2.22)% | (1.89)% | (1.99)% | (2.24)% | (2.32)% | (2.01)% | (1.77)% | (2.01)% | ||
| Supplemental Data | ||||||||||||
| Net assets, end of year (000) | $ 8,363 | $ 10,713 | $ 12,197 | $29,045 | $ 60,086 | $ 62,040 | $ 60,833 | $ 53,668 | $ 96,449 | $ 99,938 | ||
| Portfolio turnover of the Portfolio | 127% | 114% | 75% | 70% | 115% | 127% | 114% | 75% | 70% | 115% | ||
1 Based on average shares outstanding.
2 Includes a redemption fee, which is less than $0.01 per share.
3 Where applicable, total investment returns exclude the effects of any sales charges and include the reinvestment of dividends and distributions.
4 Total return calculation includes redemption fees received by the Fund. The impact to the return is less than 0.01%.
5 Total return calculation includes redemption fees received by the Fund. The impact to the return is approximately 0.01%.
6 Includes the Fund’s share of the Portfolio’s allocated expenses and/or net investment loss.
7 Ratio includes the Fund’s share of the Portfolio’s allocated fees waived of less than 0.01%.
| See Notes to Financial Statements. | ||
| BLACKROCK SMALL CAP GROWTH FUND II | MAY 31, 2011 | 11 |
| Financial Highlights (concluded) | BlackRock Small Cap Growth Fund II | |||||
| Class R | ||||||
| Year Ended May 31, | ||||||
| 2011 | 2010 | 2009 | 2008 | 2007 | ||
| Per Share Operating Performance | ||||||
| Net asset value, beginning of year | $ 10.88 | $ 8.72 | $ 13.46 | $ 15.54 | $ 15.18 | |
| Net investment loss1 | (0.20) | (0.17) | (0.14) | (0.17) | (0.22) | |
| Net realized and unrealized gain (loss)2 | 3.87 | 2.33 | (4.60) | 0.44 | 1.87 | |
| Net increase (decrease) from investment operations | 3.67 | 2.16 | (4.74) | 0.27 | 1.65 | |
| Distributions from: | ||||||
| Net realized gain | — | — | — | (2.33) | (1.29) | |
| Total return of capital | — | — | — | (0.02) | — | |
| Total distributions | — | — | — | (2.35) | (1.29) | |
| Net asset value, end of year | $ 14.55 | $ 10.88 | $ 8.72 | $ 13.46 | $ 15.54 | |
| Total Investment Return3 | ||||||
| Based on net asset value | 33.73%4 | 24.77%5 | (35.22)%4 | 2.12% | 11.88% | |
| Ratios to Average Net Assets6 | ||||||
| Total expenses | 1.90%7 | 1.96% | 2.12% | 1.95% | 1.86% | |
| Net investment loss | (1.65)% | (1.69)% | (1.49)% | (1.26)% | (1.50)% | |
| Supplemental Data | ||||||
| Net assets, end of year (000) | $ 59,251 | $ 52,704 | $ 39,445 | $ 37,245 | $ 21,412 | |
| Portfolio turnover of the Portfolio | 127% | 114% | 75% | 70% | 115% | |
1 Based on average shares outstanding.
2 Includes a redemption fee, which is less than $0.01 per share.
3 Where applicable, total investment returns include the reinvestment of dividends and distributions.
4 Total return calculation includes redemption fees received by the Fund. The impact to the return is less than 0.01%.
5 Total return calculation includes redemption fees received by the Fund. The impact to the return is approximately 0.01%.
6 Includes the Fund’s share of the Portfolio’s allocated expenses and/or net investment loss.
7 Ratio includes the Fund’s share of the Portfolio’s allocated fees waived of less than 0.01%.
| See Notes to Financial Statements. | ||
| 12 | BLACKROCK SMALL CAP GROWTH FUND II | MAY 31, 2011 |
Notes to Financial Statements BlackRock Small Cap Growth Fund II
1. Organization and Significant Accounting Policies:
BlackRock Small Cap Growth Fund II (the “Fund”), a series of BlackRock
Series, Inc. (the “Corporation”), is registered under the Investment
Company Act of 1940, as amended (the “1940 Act”), as a diversified,
open-end management investment company. The Corporation is organ-
ized as a Maryland corporation. The Fund seeks to achieve its investment
objective by investing all of its assets in BlackRock Master Small Cap
Growth Portfolio (the “Portfolio”) of BlackRock Master LLC, which has
the same investment objective and strategies as the Fund. The value of
the Fund's investment in the Portfolio reflects the Fund's proportionate
interest in the net assets of the Portfolio. The performance of the Fund
is directly affected by the performance of the Portfolio. The percentage of
the Portfolio owned by the Fund at May 31, 2011 was 100%. The finan-
cial statements of the Portfolio, including the Schedule of Investments,
are included elsewhere in this report and should be read in conjunction
with the Fund’s financial statements. The Fund's financial statements
are prepared in conformity with accounting principles generally accepted
in the United States of America ("US GAAP"), which may require man-
agement to make estimates and assumptions that affect the reported
amounts and disclosures in the financial statements. Actual results
could differ from those estimates. The Fund offers multiple classes of
shares. Institutional Shares are sold without a sales charge and only to
certain eligible investors. Investor A Shares are generally sold with a
front-end sales charge. Investor B and Investor C Shares may be subject
to a contingent deferred sales charge. Class R Shares are sold without
a sales charge and only to certain retirement and other similar plans.
All classes of shares have identical voting, dividend, liquidation and
other rights and the same terms and conditions, except that Investor A,
Investor B, Investor C and Class R Shares bear certain expenses related
to the shareholder servicing of such shares, and Investor B, Investor C
and Class R Shares also bear certain expenses related to the distribu-
tion of such shares. Investor B Shares automatically convert to Investor
A Shares after approximately eight years. Investor B Shares are only
available through exchanges, dividend reinvestment by existing share-
holders or for purchase by certain qualified employee benefit plans.
Each class has exclusive voting rights with respect to matters relating
to its shareholder servicing and distribution expenditures (except that
Investor B shareholders may vote on material changes to the Investor
A distribution plan).
The following is a summary of significant accounting policies followed by
the Fund:
Valuation: US GAAP defines fair value as the price the Fund would
receive to sell an asset or pay to transfer a liability in an orderly transac-
tion between market participants at the measurement date. The Fund’s
policy is to fair value its financial instruments at market value. The Fund
records its investment in the Portfolio at fair value based on the Fund’s
proportionate interest in the net assets of the Portfolio. Valuation of
securities held by the Portfolio is discussed in Note 1 of the Portfolio’s
Notes to Financial Statements, which are included elsewhere in
this report.
Investment Transactions and Investment Income: For financial reporting
purposes, contributions to and withdrawals from the Portfolio are
accounted on a trade date basis. The Fund records daily its proportion-
ate share of the Portfolio’s income, expenses and realized and unreal-
ized gains and losses. In addition, the Fund accrues its own expenses.
Income, expenses and realized and unrealized gains and losses are
allocated daily to each class based on its relative net assets.
Dividends and Distributions: Dividends and distributions paid by the
Fund are recorded on the ex-dividend dates. If the total dividends and
distributions made in any tax year exceed net investment income and
accumulated realized capital gains, a portion of the total distribution
may be treated as a tax return of capital. The amount and timing of divi-
dends and distributions are determined in accordance with federal
income tax regulations, which may differ from US GAAP.
Income Taxes: It is the Fund's policy to comply with the requirements
of the Internal Revenue Code of 1986, as amended, applicable to
regulated investment companies and to distribute substantially all of
its taxable income to its shareholders. Therefore, no federal income tax
provision is required.
The Fund files US federal and various state and local tax returns.
No income tax returns are currently under examination. The statute of
limitations on the Fund's US federal tax returns remains open for each
of the four years ended May 31, 2011. The statutes of limitations on the
Fund's state and local tax returns may remain open for an additional
year depending upon the jurisdiction. Management does not believe
there are any uncertain tax positions that require recognition of a
tax liability.
Other: Expenses directly related to the Fund or its classes are charged to
the Fund or class. Other operating expenses shared by several funds are
pro rated among those funds on the basis of relative net assets or other
appropriate methods. Other expenses of the Fund are allocated daily to
each class based on its relative net assets. The Portfolio has an arrange-
ment with the custodian whereby fees may be reduced by credits earned
on uninvested cash balances, which, if applicable, are shown as fees
paid indirectly in the Statement of Operations. The custodian imposes
fees on overdrawn cash balances, which can be offset by accumulated
credits earned or may result in additional custody charges.
2. Administration Agreement and Other Transactions
with Affiliates:
As of May 31, 2011, The PNC Financial Services Group, Inc. ("PNC"),
Bank of America Corporation ("BAC") and Barclays PLC ("Barclays")
| BLACKROCK SMALL CAP GROWTH FUND II | MAY 31, 2011 | 13 |
Notes to Financial Statements (continued) BlackRock Small Cap Growth Fund II
were the largest stockholders of BlackRock, Inc. ("BlackRock"). Due
to the ownership structure, PNC is an affiliate of the Fund for 1940
Act purposes, but BAC and Barclays are not.
The Corporation, on behalf of the Fund, entered into an Administration
Agreement with BlackRock Advisors, LLC (the “Administrator”), an indi-
rect, wholly owned subsidiary of BlackRock, to provide administrative
services (other than investment advice and related portfolio activities).
For such services, the Fund pays the Administrator a monthly fee at an
annual rate of 0.20% of the average daily value of the Fund's net
assets. The Fund does not pay an investment advisory fee or investment
management fee.
The Fund entered into a Distribution Agreement and Distribution and
Service Plan with BlackRock Investments, LLC (”BRIL“), an affiliate of
the Administrator. Pursuant to the Distribution and Service Plan and in
accordance with Rule 12b-1 under the 1940 Act, the Fund pays BRIL
ongoing service and distribution fees. The fees are accrued daily and
paid monthly at annual rates based upon the average daily net assets
of the shares of the Fund as follows:
| Service | Distribution | |
| Fee | Fee | |
| Investor A | 0.25% | — |
| Investor B | 0.25% | 0.75% |
| Investor C | 0.25% | 0.75% |
| Class R | 0.25% | 0.25% |
Pursuant to sub-agreements with BRIL, broker-dealers and BRIL provide
shareholder servicing and distribution services to the Fund. The ongoing
service and/or distribution fee compensates BRIL and each broker-
dealer for providing shareholder servicing and/or distribution related
services to Investor A, Investor B, Investor C and Class R shareholders.
For the year ended May 31, 2011, affiliates earned underwriting dis-
counts, direct commissions and dealer concessions on sales of the
Fund's Investor A Shares, which totaled $3,715.
For the year ended May 31, 2011, affiliates received the following con-
tingent deferred sales charges relating to transactions in Investor B and
Investor C Shares:
| Investor B | $ 4,101 |
| Investor C | $ 4,941 |
Furthermore, affiliates received contingent deferred sales charges of
$1,158 relating to transactions subject to front-end sales charge waivers
on Investor A Shares.
BNY Mellon Investment Servicing (US) Inc. (formerly PNC Global
Investment Servicing (U.S.) Inc. ("PNCGIS")), serves as transfer agent
and dividend disbursing agent. On July 1, 2010, the Bank of New York
Mellon Corporation purchased PNCGIS, which prior to this date was
an indirect, wholly owned subsidiary of PNC and an affiliate of the
Administrator. Transfer agency fees borne by the Fund are comprised of
those fees charged for all shareholder communications including mailing
of shareholder reports, dividend and distribution notices, and proxy
materials for shareholder meetings, as well as per account and per
transaction fees related to servicing and maintenance of shareholder
accounts, including the issuing, redeeming and transferring of shares,
check writing, anti-money laundering services, and customer ident-
ification services. Pursuant to written agreements, certain financial
intermediaries, some of which may be affiliates, provide the Fund with
sub-accounting, recordkeeping, sub-transfer agency and other adminis-
trative services with respect to sub-accounts they service. For these
services, these entities receive an annual fee which will vary depending
on share class and/or net assets. Prior to July 1, 2010, PNCGIS was an
affiliate and earned $2,410 in transfer agency fees for the period from
June 1, 2010 to June 30, 2010, which is included as a component of
transfer agent — class specific in the Statement of Operations.
The Administrator maintains a call center, which is responsible for provid-
ing certain shareholder services to the Fund, such as responding to
shareholder inquiries and processing transactions based upon instruc-
tions from shareholders with respect to the subscription and redemption
of Fund shares. For the year ended May 31, 2011, the Fund reimbursed
the Administrator the following amounts for costs incurred in running the
call center, which are included in transfer agent — class specific in the
Statement of Operations:
| Institutional | $ 1,205 |
| Investor A | $ 2,068 |
| Investor B | $ 203 |
| Investor C | $ 1,698 |
| Class R | $ 969 |
Certain officers and/or directors of the Corporation are officers
and/or directors of BlackRock or its affiliates. The Fund reimburses
the Administrator for compensation paid to the Fund's Chief
Compliance Officer.
3. Income Tax Information:
Reclassifications: US GAAP requires that certain components of net
assets be adjusted to reflect permanent differences between financial
and tax reporting. These reclassifications have no effect on net assets or
net asset values per share. The following permanent differences as of
May 31, 2011 attributable to net operating losses and foreign currency
transactions were reclassified to the following:
| Paid-in capital | $(6,200,896) |
| Undistributed net investment income | $ 6,201,347 |
| Accumulated net realized gain allocated from the Portfolio | $ (451) |
| 14 | BLACKROCK SMALL CAP GROWTH FUND II | MAY 31, 2011 |
Notes to Financial Statements (concluded) BlackRock Small Cap Growth Fund II
As of May 31, 2011, the tax components of undistributed net earnings
were as follows:
| Long-term capital gains | $ 9,485,737 |
| Net unrealized gains* | 90,554,185 |
| Total | $100,039,922 |
* The differences between book-basis and tax-basis net unrealized gains were
attributable primarily to the tax deferral of losses on wash sales.
4. Capital Share Transactions:
Transactions in shares for each class were as follows:
| Year Ended | Year Ended | |||||
| May 31, 2011 | May 31, 2010 | |||||
| Shares | Amount | Shares | Amount | |||
| Institutional | ||||||
| Shares sold | 3,516,192 | $ 44,943,221 | 2,233,317 | $ 25,332,626 | ||
| Shares redeemed | (2,762,315) | (36,007,226) | (2,717,508) | (30,190,722) | ||
| Net increase (decrease) | 753,877 | $ 8,935,995 | (484,191) | $ (4,858,096) | ||
| Investor A | ||||||
| Shares sold and automatic conversion of shares | 2,983,255 | $ 38,732,467 | 3,283,380 | $ 35,812,787 | ||
| Shares redeemed | (4,894,898) | (60,567,716) | (4,818,831) | (50,693,830) | ||
| Net decrease | (1,911,643) | $ (21,835,249) | (1,535,451) | $ (14,881,043) | ||
| Investor B | ||||||
| Shares sold | 179,990 | $ 2,102,389 | 432,131 | $ 4,262,889 | ||
| Shares redeemed and automatic conversion of shares | (604,363) | (6,818,909) | (853,783) | (8,495,595) | ||
| Net decrease | (424,373) | $ (4,716,520) | (421,652) | $ (4,232,706) | ||
| Investor C | ||||||
| Shares sold | 682,696 | $ 7,867,480 | 1,411,223 | $ 13,879,606 | ||
| Shares redeemed | (2,049,738) | (23,358,354) | (1,960,634) | (19,573,116) | ||
| Net decrease | (1,367,042) | $ (15,490,874) | (549,411) | $ (5,693,510) | ||
| Class R | ||||||
| Shares sold | 1,874,033 | $ 22,927,335 | 2,208,599 | $ 23,274,145 | ||
| Shares redeemed | (2,644,424) | (33,490,171) | (1,886,553) | (19,730,423) | ||
| Net increase (decrease) | (770,391) | $ (10,562,836) | 322,046 | $ 3,543,722 | ||
There is a 2% redemption fee on shares redeemed or exchanged that have been held for 30 days or less. The redemption fees are collected and
retained by the Fund for the benefit of the remaining shareholders. The redemption fees are recorded as a credit to paid-in capital. Effective April 1,
2011, the redemption fee was terminated and is no longer charged by the Fund.
5. Subsequent Events:
Management has evaluated the impact of all subsequent events on the Fund through the date the financial statements were issued and has deter-
mined that there were no subsequent events requiring adjustment or additional disclosure in the financial statements.
| BLACKROCK SMALL CAP GROWTH FUND II | MAY 31, 2011 | 15 |
Report of Independent Registered Public Accounting Firm BlackRock Small Cap Growth Fund II
To the Shareholders of BlackRock Small Cap Growth Fund
II and Board of Directors of BlackRock Series, Inc.:
We have audited the accompanying statement of assets and liabilities
of BlackRock Small Cap Growth Fund II (the “Fund”), a series of
BlackRock Series, Inc., as of May 31, 2011, and the related statement
of operations for the year then ended, the statements of changes in net
assets for each of the two years in the period then ended, and the finan-
cial highlights for each of the five years in the period then ended. These
financial statements and financial highlights are the responsibility of the
Fund’s management. Our responsibility is to express an opinion on these
financial statements and financial highlights based on our audits.
We conducted our audits in accordance with the standards of the Public
Company Accounting Oversight Board (United States). Those standards
require that we plan and perform the audit to obtain reasonable assur-
ance about whether the financial statements and financial highlights are
free of material misstatement. The Fund is not required to have, nor were
we engaged to perform, an audit of its internal control over financial
reporting. Our audits included consideration of internal control over
financial reporting as a basis for designing audit procedures that are
appropriate in the circumstances, but not for the purpose of expressing
an opinion on the effectiveness of the Fund’s internal control over finan-
cial reporting. Accordingly, we express no such opinion. An audit also
includes examining, on a test basis, evidence supporting the amounts
and disclosures in the financial statements, assessing the accounting
principles used and significant estimates made by management, as well
as evaluating the overall financial statement presentation. We believe
that our audits provide a reasonable basis for our opinion.
In our opinion, the financial statements and financial highlights referred
to above present fairly, in all material respects, the financial position of
BlackRock Small Cap Growth Fund II of BlackRock Series, Inc. as of
May 31, 2011, the results of its operations for the year then ended, the
changes in its net assets for each of the two years in the period then
ended, and the financial highlights for each of the five years in the
period then ended, in conformity with accounting principles generally
accepted in the United States of America.
Deloitte & Touche LLP
Princeton, New Jersey
July 27, 2011
| 16 | BLACKROCK SMALL CAP GROWTH FUND II | MAY 31, 2011 |
Portfolio Information BlackRock Master Small Cap Growth Portfolio
| As of May 31, 2011 | |
| Percent of | |
| Ten Largest Holdings | Long-Term Investments |
| Cubist Pharmaceuticals, Inc. | 3% |
| TiVo, Inc. | 2 |
| ExlService Holdings, Inc. | 2 |
| Dollar Financial Corp. | 2 |
| Lincare Holdings, Inc. | 2 |
| SonoSite, Inc. | 2 |
| Energy XXI Bermuda Ltd. | 2 |
| BE Aerospace, Inc. | 2 |
| Jazz Pharmaceuticals, Inc. | 2 |
| Corporate Executive Board Co. | 2 |
| Percent of | |
| Sector Allocation | Long-Term Investments |
| Information Technology | 26% |
| Health Care | 23 |
| Consumer Discretionary | 18 |
| Industrials | 16 |
| Energy | 7 |
| Financials | 4 |
| Materials | 3 |
| Consumer Staples | 2 |
| Telecommunication Services | 1 |
For Portfolio compliance purposes, the Portfolio’s sector classifications refer to
any one or more of the sector sub-classifications used by one or more widely
recognized market indexes, and/or as defined by Portfolio management. These
definitions may not apply for purposes of this report, which may combine sector
sub-classifications for reporting ease.
| BLACKROCK SMALL CAP GROWTH FUND II | MAY 31, 2011 | 17 |
Schedule of Investments May 31, 2011 BlackRock Master Small Cap Growth Portfolio
(Percentages shown are based on Net Assets)
| Common Stocks | Shares | Value |
| Aerospace & Defense — 3.7% | ||
| BE Aerospace, Inc. (a) | 219,200 | $ 8,202,464 |
| Hexcel Corp. (a) | 171,900 | 3,553,173 |
| Orbital Sciences Corp. (a) | 366,042 | 6,885,250 |
| 18,640,887 | ||
| Airlines — 0.9% | ||
| Alaska Air Group, Inc. (a) | 66,100 | 4,464,394 |
| Auto Components — 2.4% | ||
| Cooper Tire & Rubber Co. | 125,300 | 3,027,248 |
| Dana Holding Corp. (a) | 121,300 | 2,197,956 |
| Tenneco, Inc. (a) | 161,800 | 6,755,150 |
| 11,980,354 | ||
| Beverages — 1.3% | ||
| Heckmann Corp. (a) | 1,098,768 | 6,592,608 |
| Biotechnology — 7.3% | ||
| ADVENTRX Pharmaceuticals, Inc. (a)(b) | 408,800 | 1,030,176 |
| Affymax, Inc. (a) | 435,300 | 3,081,924 |
| Cubist Pharmaceuticals, Inc. (a) | 349,700 | 13,473,941 |
| Dendreon Corp. (a) | 115,300 | 4,887,567 |
| Dynavax Technologies Corp. (a) | 1,253,300 | 3,459,108 |
| Gentium SpA — ADR (a) | 319,615 | 3,180,169 |
| Sequenom, Inc. (a) | 637,700 | 5,056,961 |
| Targacept, Inc. (a) | 123,640 | 2,781,900 |
| 36,951,746 | ||
| Chemicals — 3.4% | ||
| Ferro Corp. (a) | 320,800 | 4,202,480 |
| Georgia Gulf Corp. (a) | 148,900 | 4,219,826 |
| Koppers Holdings, Inc. | 84,500 | 3,390,985 |
| Solutia, Inc. (a) | 206,600 | 5,158,802 |
| 16,972,093 | ||
| Commercial Banks — 0.8% | ||
| SVB Financial Group (a) | 63,600 | 3,776,568 |
| Commercial Services & Supplies — 2.2% | ||
| ACCO Brands Corp. (a) | 498,002 | 4,133,417 |
| Progressive Waste Solutions, Ltd. | 284,000 | 7,136,920 |
| 11,270,337 | ||
| Communications Equipment — 4.1% | ||
| Acme Packet, Inc. (a) | 21,000 | 1,589,490 |
| Aruba Networks, Inc. (a) | 160,900 | 4,572,778 |
| Ciena Corp. (a)(b) | 243,100 | 6,502,925 |
| Finisar Corp. (a) | 98,100 | 2,356,362 |
| Polycom, Inc. (a) | 48,100 | 2,761,421 |
| Riverbed Technology, Inc. (a) | 81,500 | 3,090,480 |
| 20,873,456 | ||
| Construction & Engineering — 1.2% | ||
| Chicago Bridge & Iron Co. NV | 158,800 | 6,043,928 |
| Consumer Finance — 2.1% | ||
| Dollar Financial Corp. (a) | 460,454 | 10,456,910 |
| Diversified Consumer Services — 0.3% | ||
| Stewart Enterprises, Inc., Class A | 231,100 | 1,721,695 |
| Common Stocks | Shares | Value |
| Diversified Financial Services — 1.1% | ||
| Portfolio Recovery Associates, Inc. (a) | 65,900 | $ 5,708,258 |
| Diversified Telecommunication Services — 1.5% | ||
| Cbeyond Communications, Inc. (a) | 513,700 | 7,376,732 |
| Electronic Equipment, Instruments & Components — 0.4% | ||
| Fabrinet (a) | 89,300 | 2,115,517 |
| Energy Equipment & Services — 3.5% | ||
| Dril-Quip, Inc. (a) | 53,900 | 3,998,302 |
| Global Geophysical Services, Inc. (a) | 156,700 | 2,717,178 |
| Pioneer Drilling Co. (a) | 429,600 | 6,289,344 |
| Superior Energy Services, Inc. (a) | 127,389 | 4,773,266 |
| 17,778,090 | ||
| Food Products — 0.6% | ||
| Sanderson Farms, Inc. | 67,500 | 2,963,925 |
| Health Care Equipment & Supplies — 5.9% | ||
| ArthroCare Corp. (a) | 99,800 | 3,418,150 |
| Conceptus, Inc. (a) | 496,526 | 6,320,776 |
| NxStage Medical, Inc. (a) | 377,000 | 7,091,370 |
| SonoSite, Inc. (a) | 232,165 | 8,290,612 |
| Wright Medical Group, Inc. (a) | 285,900 | 4,445,745 |
| 29,566,653 | ||
| Health Care Providers & Services — 4.1% | ||
| Amedisys, Inc. (a) | 115,500 | 3,615,150 |
| HealthSouth Corp. (a) | 72,000 | 2,021,040 |
| HealthSpring, Inc. (a) | 122,000 | 5,349,700 |
| Lincare Holdings, Inc. | 318,750 | 9,664,500 |
| 20,650,390 | ||
| Hotels, Restaurants & Leisure — 4.7% | ||
| Bravo Brio Restaurant Group, Inc. (a) | 102,700 | 2,279,940 |
| Caribou Coffee Co., Inc. (a) | 248,000 | 2,636,240 |
| Morgans Hotel Group Co. (a) | 320,262 | 2,674,188 |
| Pinnacle Entertainment, Inc. (a) | 301,700 | 4,383,701 |
| Scientific Games Corp., Class A (a) | 640,105 | 6,311,435 |
| Summit Hotel Properties, Inc. | 470,300 | 5,295,578 |
| 23,581,082 | ||
| Household Durables — 0.7% | ||
| Ethan Allen Interiors, Inc. | 43,600 | 1,014,572 |
| SodaStream International Ltd. (a) | 43,700 | 2,539,407 |
| 3,553,979 | ||
| IT Services — 4.6% | ||
| ExlService Holdings, Inc. (a) | 455,665 | 10,699,014 |
| Gartner, Inc. (a) | 180,846 | 7,058,420 |
| Global Cash Access, Inc. (a) | 745,047 | 2,391,601 |
| VeriFone Holdings, Inc. (a) | 64,600 | 3,109,198 |
| 23,258,233 | ||
| Internet Software & Services — 3.9% | ||
| Constant Contact, Inc. (a) | 216,465 | 5,205,983 |
| NIC, Inc. | 549,541 | 7,177,005 |
| RightNow Technologies, Inc. (a) | 223,326 | 7,392,091 |
| 19,775,079 | ||
| Leisure Equipment & Products — 1.0% | ||
| Jakks Pacific, Inc. (a) | 249,800 | 4,953,534 |
| Machinery — 3.6% | ||
| Altra Holdings, Inc. (a) | 245,800 | 6,476,830 |
| Titan International, Inc. | 93,800 | 2,578,562 |
| Valmont Industries, Inc. | 51,900 | 5,201,418 |
| Wabash National Corp. (a) | 395,539 | 3,824,862 |
| 18,081,672 | ||
| Portfolio Abbreviation | |
| ADR | American Depositary Receipts |
See Notes to Financial Statements.
| 18 | BLACKROCK SMALL CAP GROWTH FUND II | MAY 31, 2011 |
Schedule of Investments (continued) BlackRock Master Small Cap Growth Portfolio
(Percentages shown are based on Net Assets)
| Common Stocks | Shares | Value |
| Media — 1.4% | ||
| Function X, Inc. | 780,000 | $ 427,050 |
| Live Nation Entertainment, Inc. (a) | 528,181 | 6,089,927 |
| National CineMedia, Inc. | 41,100 | 731,991 |
| 7,248,968 | ||
| Oil, Gas & Consumable Fuels — 3.3% | ||
| Energy XXI Bermuda Ltd. (a) | 239,700 | 8,224,107 |
| James River Coal Co. (a) | 143,800 | 3,152,096 |
| McMoRan Exploration Co. (a)(b) | 274,800 | 5,061,816 |
| 16,438,019 | ||
| Pharmaceuticals — 5.0% | ||
| Alexza Pharmaceuticals, Inc. (a)(b) | 880,334 | 1,417,338 |
| Biospecifics Technologies (a) | 195,202 | 4,696,560 |
| Elan Corp. Plc — ADR (a) | 409,000 | 3,914,130 |
| Endocyte, Inc. (a) | 407,300 | 4,846,870 |
| Jazz Pharmaceuticals, Inc. (a) | 272,634 | 7,985,450 |
| Obagi Medical Products, Inc. (a) | 222,020 | 2,217,980 |
| 25,078,328 | ||
| Professional Services — 2.4% | ||
| Corporate Executive Board Co. | 185,786 | 7,812,301 |
| Korn/Ferry International (a) | 189,900 | 4,056,264 |
| 11,868,565 | ||
| Real Estate Investment Trusts (REITs) — 0.4% | ||
| Hersha Hospitality Trust | 363,900 | 2,190,678 |
| Road & Rail — 0.7% | ||
| Con-way, Inc. | 83,000 | 3,280,990 |
| Semiconductors & Semiconductor Equipment — 5.3% | ||
| Entegris, Inc. (a) | 252,413 | 2,317,151 |
| JinkoSolar Holding Co., Ltd. - ADR (a)(b) | 80,200 | 2,086,804 |
| Lattice Semiconductor Corp. (a) | 362,300 | 2,387,557 |
| Microsemi Corp. (a) | 249,300 | 5,497,065 |
| Netlogic Microsystems, Inc. (a) | 135,300 | 5,184,696 |
| Semtech Corp. (a) | 198,200 | 5,672,484 |
| TriQuint Semiconductor, Inc. (a) | 292,400 | 3,786,580 |
| 26,932,337 | ||
| Software — 7.2% | ||
| Ariba, Inc. (a) | 120,100 | 4,028,154 |
| Fortinet, Inc. (a) | 61,200 | 2,967,588 |
| Opnet Technologies, Inc. | 61,747 | 2,418,630 |
| RealPage, Inc. (a) | 119,500 | 3,519,275 |
| SuccessFactors, Inc. (a) | 196,900 | 6,905,283 |
| Taleo Corp., Class A (a) | 154,200 | 5,756,286 |
| TiVo, Inc. (a) | 1,055,339 | 10,912,205 |
| 36,507,421 | ||
| Specialty Retail — 4.2% | ||
| The Children's Place Retail Stores, Inc. (a) | 115,200 | 5,787,648 |
| Express, Inc. | 138,200 | 2,918,784 |
| Rue21, Inc. (a) | 128,635 | 4,353,009 |
| Select Comfort Corp. (a) | 226,500 | 3,701,010 |
| Vitamin Shoppe, Inc. (a) | 67,500 | 2,749,275 |
| The Wet Seal, Inc., Class A (a) | 384,100 | 1,651,630 |
| 21,161,356 | ||
| Textiles, Apparel & Luxury Goods — 2.8% | ||
| Carter's, Inc. (a) | 38,700 | 1,226,790 |
| Deckers Outdoor Corp. (a) | 78,100 | 7,114,910 |
| G-III Apparel Group, Ltd. (a) | 138,400 | 5,940,128 |
| 14,281,828 |
| Common Stocks | Shares | Value |
| Trading Companies & Distributors — 0.8% | ||
| H&E Equipment Services, Inc. (a) | 282,700 | $ 4,101,977 |
| Warrants (c) | ||
| Pharmaceuticals — 0.0% | ||
| Alexza Pharmaceuticals, Inc. (Expires 5/6/16) | 287,011 | — |
| Total Warrants — 0.0% | — | |
| Total Long-Term Investments | ||
| (Cost – $404,663,189) — 98.8% | 498,198,587 | |
| Short-Term Securities | ||
| BlackRock Liquidity Funds, TempFund, | ||
| Institutional Class, 0.10% (d)(e) | 3,405,223 | 3,405,223 |
| Beneficial | ||
| Interest | ||
| (000) | ||
| BlackRock Liquidity Series, | ||
| LLC Money Market Series, 0.40% (d)(e)(f) | $ 13,206 | 13,206,099 |
| Total Short-Term Securities | ||
| (Cost — $16,611,322) — 3.3% | 16,611,322 | |
| Total Investments (Cost — $421,274,511*) — 102.1% | 514,809,909 | |
| Liabilities in Excess of Other Assets — (2.1)% | (10,518,369) | |
| Net Assets — 100.0% | $504,291,540 |
* The cost and unrealized appreciation (depreciation) of investments as of May 31,
2011, as computed for federal income tax purposes, were as follows:
| Aggregate cost | $424,255,724 |
| Gross unrealized appreciation | $102,818,802 |
| Gross unrealized depreciation | (12,264,617) |
| Net unrealized appreciation | $ 90,554,185 |
(a) Non-income producing security.
(b) Security, or a portion of security, is on loan.
(c) Warrants entitle the Portfolio to purchase a predetermined number of shares of
Common Stock and are non-income producing. The purchase price and number
of shares are subject to adjustment under certain conditions until the expiration
date, if any.
See Notes to Financial Statements.
| BLACKROCK SMALL CAP GROWTH FUND II | MAY 31, 2011 | 19 |
Schedule of Investments (concluded) BlackRock Master Small Cap Growth Portfolio
(d) Investments in companies considered to be an affiliate of the Portfolio during the
year, for purposes of Section 2(a)(3) of the Investment Company Act of 1940, as
amended, were as follows:
| Shares/Beneficial | Shares/Beneficial | |||
| Interest Held at | Net | Interest Held at | ||
| Affiliate | May 31, 2010 | Activity | May 31, 2011 | Income |
| BlackRock | ||||
| Liquidity Funds, | ||||
| TempFund, | ||||
| Institutional | ||||
| Class | 564,110 | 2,841,113 | 3,405,223 | $ 7,745 |
| BlackRock | ||||
| Liquidity | ||||
| Series, LLC | ||||
| Money Market | ||||
| Series | $33,911,450 $(20,705,351) | $13,206,099 | $ 45,514 | |
(e) Represents the current yield as of report date.
(f) Security was purchased with the cash collateral from loaned securities.
• For Portfolio compliance purposes, the Portfolio’s industry classifications refer to
any one or more of the industry sub-classifications used by one or more widely
recognized market indexes or rating group indexes, and/or as defined by
Portfolio management. These definitions may not apply for purposes of this
report, which may combine such industry sub-classifications for reporting ease.
• Fair Value Measurements - Various inputs are used in determining the fair value
of investments. These inputs are summarized in three broad levels for financial
statement purposes as follows:
• Level 1 — price quotations in active markets/exchanges for identical assets
and liabilities
• Level 2 — other observable inputs (including, but not limited to: quoted
prices for similar assets or liabilities in markets that are active, quoted prices
for identical or similar assets or liabilities in markets that are not active,
inputs other than quoted prices that are observable for the assets or liabili-
ties (such as interest rates, yield curves, volatilities, prepayment speeds, loss
severities, credit risks and default rates) or other market-corroborated inputs)
• Level 3 — unobservable inputs based on the best information available in the
circumstances, to the extent observable inputs are not available (including
the Portfolio's own assumptions used in determining the fair value of invest-
ments)
The inputs or methodologies used for valuing securities are not necessarily an
indication of the risk associated with investing in those securities. For information
about the Portfolio's policy regarding valuation of investments and other
significant accounting policies, please refer to Note 1 of the Notes to
Financial Statements.
The following table summarizes the inputs used as of May 31, 2011 in
determining the fair valuation of the Portfolio's investments:
| Valuation Inputs | Level 1 | Level 2 | Level 3 | Total |
| Assets: | ||||
| Investments: | ||||
| Long-Term | ||||
| Investments1 | $497,771,537 | $ 427,050 | — | $498,198,587 |
| Short-Term | ||||
| Securities | 3,405,223 | 13,206,099 | — | 16,611,322 |
| Total | $501,176,760 | $ 13,633,149 | — | $514,809,909 |
| 1 See above Schedule of Investments for values in each industry. | ||||
See Notes to Financial Statements.
| 20 | BLACKROCK SMALL CAP GROWTH FUND II | MAY 31, 2011 |
| Statement of Assets and Liabilities | BlackRock Master Small Cap Growth Portfolio |
| May 31, 2011 | |
| Assets | |
| Investments at value — unaffiliated (including securities loaned of $12,828,352) (cost — $404,663,189) | $ 498,198,587 |
| Investments at value — affiliated (cost $16,611,322) | 16,611,322 |
| Investments sold receivable | 10,574,397 |
| Contributions receivable from investor | 48,412 |
| Dividends receivable | 31,439 |
| Securities lending income receivable — affiliated | 13,319 |
| Prepaid expenses | 7,651 |
| Other assets | 219 |
| Total assets | 525,485,346 |
| Liabilities | |
| Collateral on securities loaned at value | 13,206,099 |
| Investments purchased payable | 7,573,724 |
| Investment advisory fees payable | 296,272 |
| Other affiliates payable | 3,434 |
| Directors’ fees payable | 177 |
| Other accrued expenses payable | 114,100 |
| Total liabilities | 21,193,806 |
| Net Assets | $ 504,291,540 |
| Net Assets Consist of | |
| Investors' capital | $ 410,756,142 |
| Net unrealized appreciation/depreciation | 93,535,398 |
| Net Assets | $ 504,291,540 |
| See Notes to Financial Statements. | ||
| BLACKROCK SMALL CAP GROWTH FUND II | MAY 31, 2011 | 21 |
| Statement of Operations | BlackRock Master Small Cap Growth Portfolio |
| Year Ended May 31, 2011 | |
| Investment Income | |
| Dividends — unaffiliated | $ 1,058,358 |
| Foreign taxes withheld | (13,990) |
| Securities lending — affiliated | 45,514 |
| Dividends — affiliated | 7,745 |
| Total income | 1,097,627 |
| Expenses | |
| Investment advisory | 3,136,065 |
| Accounting services | 97,595 |
| Professional | 64,564 |
| Custodian | 56,488 |
| Directors | 13,573 |
| Printing | 3,848 |
| Miscellaneous | 14,014 |
| Total expenses | 3,386,147 |
| Less fees waived by advisor | (3,017) |
| Total expenses after fees waived | 3,383,130 |
| Net investment loss | (2,285,503) |
| Realized and Unrealized Gain | |
| Net realized gain from: | |
| Investments | 71,381,771 |
| Foreign currency transactions | 451 |
| 71,382,222 | |
| Net change in unrealized appreciation/depreciation on investments | 66,655,877 |
| Total realized and unrealized gain | 138,038,099 |
| Net Increase in Net Assets Resulting from Operations | $ 135,752,596 |
| See Notes to Financial Statements. | ||
| 22 | BLACKROCK SMALL CAP GROWTH FUND II | MAY 31, 2011 |
| Statements of Changes in Net Assets | BlackRock Master Small Cap Growth Portfolio | |
| Year Ended May 31, | ||
| Increase (Decrease) in Net Assets: | 2011 | 2010 |
| Operations | ||
| Net investment loss | $ (2,285,503) | $ (2,005,302) |
| Net realized gain | 71,382,222 | 32,884,294 |
| Net change in unrealized appreciation/depreciation | 66,655,877 | 58,581,376 |
| Net increase in net assets resulting from operations | 135,752,596 | 89,460,368 |
| Capital Transactions | ||
| Proceeds from contributions | 116,591,779 | 102,562,384 |
| Value of withdrawals | (164,139,682) | (132,550,187) |
| Net decrease in net assets derived from capital transactions | (47,547,903) | (29,987,803) |
| Net Assets | ||
| Total increase in net assets | 88,204,693 | 59,472,565 |
| Beginning of year | 416,086,847 | 356,614,282 |
| End of year | $ 504,291,540 | $ 416,086,847 |
| Financial Highlights | BlackRock Master Small Cap Growth Portfolio | ||||
| Year Ended May 31, | |||||
| 2011 | 2010 | 2009 | 2008 | 2007 | |
| Total Investment Return | |||||
| Total investment return | 35.13% | 26.12% | (34.16)% | 3.35% | 13.00% |
| Ratios to Average Net Assets | |||||
| Total expenses | 0.76% | 0.77% | 0.78% | 0.77% | 0.78% |
| Total expenses after fees waived | 0.76% | 0.77% | 0.78% | 0.77% | 0.78% |
| Net investment loss | (0.51)% | (0.50)% | (0.13)% | (0.10)% | (0.42)% |
| Supplemental Data | |||||
| Net assets, end of year (000) | $ 504,292 | $ 416,087 | $ 356,614 | $ 553,670 | $ 539,092 |
| Portfolio turnover | 127% | 114% | 75% | 70% | 115% |
| See Notes to Financial Statements. | ||
| BLACKROCK SMALL CAP GROWTH FUND II | MAY 31, 2011 | 23 |
Notes to Financial Statements BlackRock Master Small Cap Growth Portfolio
1. Organization and Significant Accounting Policies:
BlackRock Master Small Cap Growth Portfolio (the “Portfolio”), a series
of BlackRock Master LLC (the “Master LLC”), is registered under the
Investment Company Act of 1940, as amended (the “1940 Act”), and is
organized as a Delaware limited liability company. The Limited Liability
Company Agreement permits the Board of Directors of the Master LLC
(the “Board”) to issue non-transferable interests in the Master LLC, sub-
ject to certain limitations. The Portfolio’s financial statements are pre-
pared in conformity with accounting principles generally accepted in the
United States of America (“US GAAP”), which may require management
to make estimates and assumptions that affect the reported amounts
and disclosures in the financial statements. Actual results could differ
from those estimates.
The following is a summary of significant accounting policies followed by
the Portfolio:
Valuation: US GAAP defines fair value as the price the Portfolio would
receive to sell an asset or pay to transfer a liability in an orderly transac-
tion between market participants at the measurement date. The Portfolio
fair values its financial instruments at market value using independent
dealers or pricing services under policies approved by the Board. Equity
investments traded on a recognized securities exchange or the NASDAQ
Global Market System ("NASDAQ") are valued at the last reported sale
price that day or the NASDAQ official closing price, if applicable. For
equity investments traded on more than one exchange, the last reported
sale price on the exchange where the stock is primarily traded is used.
Equity investments traded on a recognized exchange for which there
were no sales on that day are valued at the last available bid price. If
no bid price is available, the prior day’s price will be used, unless it is
determined that such prior day’s price no longer reflects the fair value of
the security. Investments in open-end registered investment companies
are valued at net asset value each business day. Short-term securities
with remaining maturities of 60 days or less may be valued at amortized
cost, which approximates fair value.
The Portfolio values its investments in BlackRock Liquidity Series, LLC
Money Market Series (the “Money Market Series”) at fair value, which is
ordinarily based upon its pro rata ownership in the underlying fund’s net
assets. The Money Market Series seeks current income consistent with
maintaining liquidity and preserving capital. Although the Money Market
Series is not registered under the 1940 Act, its investments will follow
the parameters of investments by a money market fund that is subject to
Rule 2a-7 under the 1940 Act. The Portfolio may withdraw up to 25% of
its investment daily, although the manager of the Money Market Series,
in its sole discretion, may permit an investor to withdraw more than 25%
on any one day.
In the event that application of these methods of valuation results in a
price for an investment which is deemed not to be representative of the
market value of such investment or is not available, the investment will
be valued in accordance with a policy approved by the Board as reflect-
ing fair value (“Fair Value Assets”). When determining the price for Fair
Value Assets, the investment advisor and/or the sub-advisor seeks to
determine the price that the Portfolio might reasonably expect to receive
from the current sale of that asset in an arm’s-length transaction. Fair
value determinations shall be based upon all available factors that the
investment advisor and/or sub-advisor deems relevant. The pricing of
all Fair Value Assets is subsequently reported to the Board or a
committee thereof.
Foreign Currency Transactions: The Portfolio’s books and records are
maintained in US dollars. Purchases and sales of investment securities
are recorded at the rates of exchange prevailing on the date the trans-
actions are entered into. Generally, when the US dollar rises in value
against a foreign currency, the Portfolio’s investments denominated in
that currency will lose value because its currency is worth fewer US
dollars; the opposite effect occurs if the US dollar falls in relative value.
The Portfolio reports realized currency gains (losses) on foreign currency
related transactions as components of net realized gain (loss) for fin-
ancial reporting purposes, whereas such components are treated as
ordinary income for federal income tax purposes.
Investment Transactions and Investment Income: For financial reporting
purposes, investment transactions are recorded on the dates the trans-
actions are entered into (the trade dates). Realized gains and losses
on investment transactions are determined on the identified cost basis.
Dividend income is recorded on the ex-dividend dates. Dividends from
foreign securities where the ex-dividend date may have passed are sub-
sequently recorded when the Portfolio is informed of the ex-dividend
date. Under the applicable foreign tax laws, a withholding tax at various
rates may be imposed on capital gains, dividends and interest. Upon
notification from issuers, some of the dividend income received from a
real estate investment trust may be redesignated as a reduction of cost
of the related investment and/or realized gain. Interest income, including
amortization and accretion of premiums and discounts on debt securi-
ties, is recognized on the accrual basis.
Securities Lending: The Portfolio may lend securities to approved bor-
rowers, such as banks, brokers and other financial institutions. The bor-
rower pledges cash, securities issued or guaranteed by the US
government or irrevocable letters of credit issued by a bank as collateral,
which will be maintained at all times in an amount equal to at least
100% of the current market value of the loaned securities. The market
value of the loaned securities is determined at the close of business of
the Portfolio and any additional required collateral is delivered to the
| 24 | BLACKROCK SMALL CAP GROWTH FUND II | MAY 31, 2011 |
Notes to Financial Statements (continued) BlackRock Master Small Cap Growth Portfolio
Portfolio on the next business day. Securities lending income, as dis-
closed in the Statement of Operations, represents the income earned
from the investment of the cash collateral, net of rebates paid to, or fees
paid by, borrowers and less the fees paid to the securities lending agent.
During the term of the loan, the Portfolio earns dividend and interest
income on the securities loaned but does not receive dividend or inter-
est income on the securities received as collateral. Loans of securities
are terminable at any time and the borrower, after notice, is required to
return borrowed securities within the standard time period for settlement
of securities transactions. In the event that the borrower defaults on its
obligation to return borrowed securities because of insolvency or for any
other reason, the Portfolio could experience delays and costs in gaining
access to the collateral. The Portfolio also could suffer a loss if the value
of an investment purchased with cash collateral falls below the market
value of loaned securities or if the value of an investment purchased
with cash collateral falls below the value of the original cash collateral
received. During the period, the Portfolio accepted only cash collateral
in connection with securities loaned.
Income Taxes: The Portfolio is disregarded as an entity separate from
its owner for tax purposes. As such, the owner of the Portfolio is treated
as the owner of the net assets, income, expenses and realized and
unrealized gains and losses of the Portfolio. Therefore, no federal tax
provision is required. It is intended that the Portfolio's assets will be
managed so the owner of the Portfolio can satisfy the requirements
of Subchapter M of the Internal Revenue Code of 1986, as amended.
Recent Accounting Standard: In May 2011, the Financial Accounting
Standards Board issued amended guidance to improve disclosure about
fair value measurements which will require the following disclosures for
fair value measurements categorized as Level 3: quantitative information
about the unobservable inputs and assumptions used in the fair value
measurement, a description of the valuation policies and procedures
and a narrative description of the sensitivity of the fair value measure-
ment to changes in unobservable inputs and the interrelationships
between those unobservable inputs. In addition, the amounts and rea-
sons for all transfers in and out of Level 1 and Level 2 will be required to
be disclosed. The amended guidance is effective for financial statements
for fiscal years beginning after December 15, 2011 and interim periods
within those fiscal years. Management is evaluating the impact of this
guidance on the Portfolio’s financial statements and disclosures.
Other: Expenses directly related to the Portfolio are charged to the
Portfolio. Other operating expenses shared by several funds are pro
rated among those funds on the basis of relative net assets or other
appropriate methods. The Portfolio has an arrangement with the custo-
dian whereby fees may be reduced by credits earned on uninvested
cash balances, which, if applicable, are shown as fees paid indirectly in
the Statement of Operations. The custodian imposes fees on overdrawn
cash balances, which can be offset by accumulated credits earned or
may result in additional custody charges.
2. Investment Advisory Agreement and Other Transactions
with Affiliates:
As of May 31, 2011, The PNC Financial Services Group, Inc. ("PNC"),
Bank of America Corporation ("BAC") and Barclays Bank PLC
("Barclays") were the largest stockholders of BlackRock, Inc.
("BlackRock"). Due to the ownership structure, PNC is an affiliate of
the Portfolio for 1940 Act purposes, but BAC and Barclays are not.
The Master LLC, on behalf of the Portfolio, entered into an Investment
Advisory Agreement with BlackRock Advisors, LLC (the “Manager”), the
Portfolio's investment advisor, an indirect, wholly owned subsidiary of
BlackRock, to provide investment advisory and administration services.
The Manager is responsible for the management of the Portfolio's port-
folio and provides the necessary personnel, facilities, equipment and
certain other services necessary to the operations of the Portfolio. For
such services, the Portfolio pays the Manager a monthly fee at an
annual rate of 0.70% of the Portfolio's average daily net assets.
The Manager voluntarily agreed to waive its investment advisory fees
by the amount of investment advisory fees the Portfolio pays to the
Manager indirectly through its investment in affiliated money market
funds, however the Manager does not waive its investment advisory fees
by the amount of investment advisory fees paid through the Portfolio's
investment in other affiliated investment companies, if any. This amount
is shown as, or included in, fees waived by advisor in the Statement
of Operations.
The Manager entered into a sub-advisory agreement with BlackRock
Capital Management, Inc. (“BCM”), an affiliate of the Manager. The
Manager pays BCM for services it provides, a monthly fee that is a
percentage of the investment advisory fees paid by the Portfolio to
the Manager.
For the year ended May 31, 2011, the Portfolio reimbursed the Manager
$8,132 for certain accounting services, which are included in account-
ing services in the Statement of Operations.
The Portfolio received an exemptive order from the Securities and
Exchange Commission (“SEC”) permitting it, among other things, to pay
an affiliated securities lending agent a fee based on a share of the
income derived from the securities lending activities and has retained
BlackRock Investment Management, LLC (“BIM”) as the securities lend-
ing agent. BIM may, on behalf of the Portfolio, invest cash collateral
received by the Portfolio for such loans, among other things, in a private
investment company managed by the Manager or in registered money
market funds advised by the Manager or its affiliates. The market value
of securities on loan and the value of the related collateral, if applicable,
| BLACKROCK SMALL CAP GROWTH FUND II | MAY 31, 2011 | 25 |
Notes to Financial Statements (concluded) BlackRock Master Small Cap Growth Portfolio
are shown in the Statement of Assets and Liabilities as securities
loaned at value and collateral on securities loaned at value, respectively.
The cash collateral invested by BIM is disclosed in the Schedule of
Investments. The share of income earned by the Portfolio on such
investments is shown as securities lending — affiliated in the Statement
of Operations. For the year ended May 31, 2011, BIM received $16,810
in securities lending agent fees related to securities lending activity
for the Portfolio.
Certain officers and/or directors of the Master LLC are officers and/or
directors of BlackRock or its affiliates.
3. Investments:
Purchases and sales of investments, excluding short-term securities,
for the year ended May 31, 2011, were $559,437,166 and
$609,920,234, respectively.
4. Borrowings:
The Portfolio, along with certain other funds managed by the Manager
and its affiliates, is a party to a $500 million credit agreement with a
group of lenders, which expired in November 2010. The Portfolio may
borrow under the credit agreement to fund shareholder redemptions.
Effective November 2009, the credit agreement had the following terms:
0.02% upfront fee on the aggregate commitment amount which was
allocated to the Portfolio based on its net assets as of October 31,
2009, a commitment fee of 0.10% per annum based on the Portfolio's
pro rata share of the unused portion of the credit agreement and inter-
est at a rate equal to the higher of (a) the one-month LIBOR plus 1.25%
per annum and (b) the Fed Funds rate plus 1.25% per annum on
amounts borrowed. In addition, the Portfolio paid administration and
arrangement fees which were allocated to the Portfolio based on its net
assets as of October 31, 2009. Effective November 2010, the credit
agreement was renewed until November 2011 with the following terms:
a commitment fee of 0.08% per annum based on the Portfolio's pro rata
share of the unused portion of the credit agreement and interest at a
rate equal to the higher of (a) the one-month LIBOR plus 1.00% per
annum and (b) the Fed Funds rate plus 1.00% per annum on amounts
borrowed. In addition, the Portfolio paid administration and arrangement
fees which were allocated to the Portfolio based on its net assets as
of October 31, 2010. The Portfolio did not borrow under the credit
agreement during the year ended May 31, 2011.
5. Concentration, Market and Credit Risk:
In the normal course of business, the Portfolio invests in securities and
enters into transactions where risks exist due to fluctuations in the mar-
ket (market risk) or failure of the issuer of a security to meet all its obli-
gations (issuer credit risk). The value of securities held by the Portfolio
may decline in response to certain events, including those directly involv-
ing the issuers whose securities are owned by the Portfolio; conditions
affecting the general economy; overall market changes; local, regional or
global political, social or economic instability; and currency and interest
rate and price fluctuations. Similar to issuer credit risk, the Portfolio may
be exposed to counterparty credit risk, or the risk that an entity with
which the Portfolio has unsettled or open transactions may fail to or be
unable to perform on its commitments. The Portfolio manages counter-
party credit risk by entering into transactions only with counterparties
that it believes have the financial resources to honor their obligations
and by monitoring the financial stability of those counterparties.
Financial assets, which potentially expose the Portfolio to market, issuer
and counterparty credit risks, consist principally of financial instruments
and receivables due from counterparties. The extent of the Portfolio's
exposure to market, issuer and counterparty credit risks with respect to
these financial assets is generally approximated by their value recorded
in the Portfolio's Statement of Assets and Liabilities, less any collateral
held by the Portfolio.
As of May 31, 2011, the Portfolio invested a significant portion of its
assets in securities in the information technology and health care
sectors. Changes in economic conditions affecting the information
technology and health care sectors would have a greater impact on
the Portfolio and could affect the value, income and/or liquidity of
positions in such securities.
6. Subsequent Events:
Management has evaluated the impact of all subsequent events on the
Portfolio through the date the financial statements were issued and has
determined that there were no subsequent events requiring adjustment
or additional disclosure in the financial statements.
| 26 | BLACKROCK SMALL CAP GROWTH FUND II | MAY 31, 2011 |
Report of Independent Registered Public Accounting Firm BlackRock Master Small Cap Growth Portfolio
To the Investor of BlackRock Master Small Cap Growth
Portfolio and Board of Directors of BlackRock Master LLC:
We have audited the accompanying statement of assets and liabilities,
including the schedule of investments, of BlackRock Master Small Cap
Growth Portfolio (the “Portfolio”), a series of BlackRock Master LLC, as of
May 31, 2011, and the related statement of operations for the year then
ended, the statements of changes in net assets for each of the two years
in the period then ended, and the financial highlights for each of the
five years in the period then ended. These financial statements and
financial highlights are the responsibility of the Portfolio’s management.
Our responsibility is to express an opinion on these financial statements
and financial highlights based on our audits.
We conducted our audits in accordance with the standards of the Public
Company Accounting Oversight Board (United States). Those standards
require that we plan and perform the audit to obtain reasonable assur-
ance about whether the financial statements and financial highlights
are free of material misstatement. The Portfolio is not required to have,
nor were we engaged to perform, an audit of its internal control over
financial reporting. Our audits included consideration of internal control
over financial reporting as a basis for designing audit procedures that
are appropriate in the circumstances, but not for the purpose of express-
ing an opinion on the effectiveness of the Portfolio’s internal control
over financial reporting. Accordingly, we express no such opinion. An
audit also includes examining, on a test basis, evidence supporting
the amounts and disclosures in the financial statements, assessing the
accounting principles used and significant estimates made by manage-
ment, as well as evaluating the overall financial statement presentation.
Our procedures included confirmation of securities owned as of May 31,
2011, by correspondence with the custodian and brokers; where replies
were not received from brokers, we performed other auditing procedures.
We believe that our audits provide a reasonable basis for our opinion.
In our opinion, the financial statements and financial highlights referred
to above present fairly, in all material respects, the financial position
of BlackRock Master Small Cap Growth Portfolio of BlackRock Master
LLC as of May 31, 2011, the results of its operations for the year then
ended, the changes in its net assets for each of the two years in the
period then ended, and the financial highlights for each of the five
years in the period then ended, in conformity with accounting principles
generally accepted in the United States of America.
Deloitte & Touche LLP
Princeton, New Jersey
July 27, 2011
| BLACKROCK SMALL CAP GROWTH FUND II | MAY 31, 2011 | 27 |
Disclosure of Investment Advisory Agreement and Sub-Advisory Agreement
The Board of Directors of BlackRock Master LLC (the “Master LLC”) met
on April 5, 2011 and May 17—18, 2011 to consider the approval of the
Master LLC’s investment advisory agreement (the “Advisory Agreement”)
with BlackRock Advisors, LLC (the “Manager”), the Master LLC’s invest-
ment advisor, on behalf of BlackRock Master Small Cap Growth Portfolio
(the “Master Portfolio”), a series of the Master LLC. The Board of
Directors of the Master LLC also considered the approval of the sub-
advisory agreement (the “Sub-Advisory Agreement”) between the
Manager and BlackRock Capital Management, Inc. (the “Sub-Advisor”),
with respect to the Master Portfolio. BlackRock Small Cap Growth Fund II
(the “Fund”), a series of BlackRock Series, Inc. (the “Corporation”), is
a “feeder” fund that invests all of its investable assets in the Master
Portfolio. Accordingly, the Board of Directors of the Corporation also
considered the approval of the Advisory Agreement and the Sub-Advisory
Agreement with respect to the Master Portfolio. The Manager and
the Sub-Advisor are referred to herein as “BlackRock.” The Advisory
Agreement and the Sub-Advisory Agreement are referred to herein as
the “Agreements.” For simplicity, the Board of Directors of the Master
LLC and the Board of Directors of the Corporation are referred to
herein collectively as the “Board,” and the members are referred to
as “Board Members.”
Activities and Composition of the Board
The Board consists of thirteen individuals, eleven of whom are not
“interested persons” of the Master LLC or the Corporation as defined
in the Investment Company Act of 1940, as amended (the “1940 Act”)
(the “Independent Board Members”). The Board Members are respon-
sible for the oversight of the operations of the Master LLC or the
Corporation, as pertinent, and perform the various duties imposed on
the directors of investment companies by the 1940 Act. The Independent
Board Members have retained independent legal counsel to assist them
in connection with their duties. The Co-Chairs of the Board are each
Independent Board Members. The Board has established five standing
committees: an Audit Committee, a Governance and Nominating
Committee, a Compliance Committee, a Performance Oversight and
Contract Committee and an Executive Committee, each of which is
composed of Independent Board Members (except for the Executive
Committee, which also has one interested Board Member) and is
chaired by Independent Board Members. The Board also established an
ad hoc committee, the Joint Product Pricing Committee, which consisted
of Independent Board Members and directors/trustees of the boards
of certain other BlackRock-managed funds, who were not “interested
persons” of their respective funds.
The Agreements
Pursuant to the 1940 Act, the Board is required to consider the contin-
uation of the Agreements on an annual basis. In connection with this
process, the Board assessed, among other things, the nature, scope and
quality of the services provided to the Master Portfolio and the Fund by
BlackRock, its personnel and its affiliates, including investment
management, administrative and shareholder services, oversight of
fund accounting and custody, marketing services, risk oversight,
compliance program and assistance in meeting applicable legal
and regulatory requirements.
The Board, acting directly and through its committees, considers at each
of its meetings, and from time to time as appropriate, factors that are
relevant to its annual consideration of the renewal of the Agreements,
including the services and support provided by BlackRock to the Master
Portfolio, the Fund and their shareholders. Among the matters the Board
considered were: (a) investment performance for one-, three- and five-
year periods, as applicable, against peer funds, and applicable bench-
marks, if any, as well as senior management’s and portfolio managers’
analysis of the reasons for any overperformance or underperformance
against its peers and/or benchmark, as applicable; (b) fees, including
advisory, administration, if applicable, and other amounts paid to
BlackRock and its affiliates by the Master Portfolio and/or the Fund
for services, such as transfer agency, marketing and distribution, call
center and fund accounting; (c) the Master Portfolio’s and/or the
Fund’s operating expenses and how BlackRock allocates expenses to
the Master Portfolio and the Fund; (d) the resources devoted to, risk
oversight of, and compliance reports relating to, implementation of the
Master Portfolio’s and the Fund’s investment objective, policies and
restrictions; (e) the Master LLC’s and the Corporation’s compliance with
its respective Code of Ethics and other compliance policies and proce-
dures; (f) the nature, cost and character of non-investment management
services provided by BlackRock and its affiliates; (g) BlackRock’s and
other service providers’ internal controls and risk and compliance over-
sight mechanisms; (h) BlackRock’s implementation of the proxy voting
policies approved by the Board; (i) the use of brokerage commissions
and execution quality of portfolio transactions; (j) BlackRock’s imple-
mentation of the Master LLC’s and/or the Corporation’s valuation and
liquidity procedures; (k) an analysis of contractual and actual manage-
ment fees for products with similar investment objectives across the
open-end fund, exchange traded fund (“ETF”), closed-end fund and
institutional account product channels, as applicable; (l) BlackRock’s
compensation methodology for its investment professionals and the
incentives it creates; and (m) periodic updates on BlackRock’s business.
Board Considerations in Approving the Agreements
The Approval Process: Prior to the April 5, 2011 meeting, the Board
requested and received materials specifically relating to the Agreements.
The Board is engaged in a process with BlackRock to review periodically
the nature and scope of the information provided to better assist its
deliberations. The materials provided in connection with the April meet-
ing included (a) information independently compiled and prepared by
Lipper, Inc. (“Lipper”) on fees and expenses of the Master Portfolio and
the Fund, as applicable, and the investment performance of the Fund as
| 28 | BLACKROCK SMALL CAP GROWTH FUND II | MAY 31, 2011 |
Disclosure of Investment Advisory Agreement and Sub-Advisory Agreement (continued)
compared with a peer group of funds as determined by Lipper (collec-
tively, “Peers”); (b) information on the profitability of the Agreements to
BlackRock and a discussion of fall-out benefits to BlackRock and its
affiliates and significant shareholders; (c) a general analysis provided by
BlackRock concerning investment management fees (a combination of
the advisory fee and the administration fee, if any) charged to other
clients, such as institutional clients, ETFs and closed-end funds, under
similar investment mandates, as well as the performance of such other
clients, as applicable; (d) the impact of economies of scale; (e) a
summary of aggregate amounts paid by the Master Portfolio and/or
the Fund to BlackRock; (f) sales and redemption data regarding the
Fund’s shares; and (g) if applicable, a comparison of management
fees to similar BlackRock open-end funds, as classified by Lipper.
At an in-person meeting held on April 5, 2011, the Board reviewed
materials relating to its consideration of the Agreements. As a result of
the discussions that occurred during the April 5, 2011 meeting, and as
a culmination of the Board’s year-long deliberative process, the Board
presented BlackRock with questions and requests for additional informa-
tion. BlackRock responded to these requests with additional written
information in advance of the May 17—18, 2011 Board meeting.
At an in-person meeting held on May 17—18, 2011, the Board of the
Master LLC, including the Independent Board Members, unanimously
approved the continuation of the Advisory Agreement between the
Manager and the Master LLC with respect to the Master Portfolio and
the Sub-Advisory Agreement between the Manager and the Sub-Advisor
with respect to the Master Portfolio, each for a one-year term ending
June 30, 2012. The Board of the Corporation, including the Independent
Board Members, also considered the continuation of the Agreements
and found the Agreements to be satisfactory. In approving the contin-
uation of the Agreements, the Board of the Master LLC considered:
(a) the nature, extent and quality of the services provided by BlackRock;
(b) the investment performance of the Master Portfolio, the Fund and
BlackRock; (c) the advisory fee and the cost of the services and profits
to be realized by BlackRock and its affiliates from their relationship with
the Master Portfolio and the Fund; (d) economies of scale; (e) fall-out
benefits to BlackRock as a result of its relationship with the Master
Portfolio and the Fund; and (f) other factors deemed relevant by the
Board Members.
The Board also considered other matters it deemed important to the
approval process, such as payments made to BlackRock or its affiliates
relating to the distribution of Fund shares, services related to the valua-
tion and pricing of portfolio holdings of the Master Portfolio, direct and
indirect benefits to BlackRock and its affiliates and significant share-
holders from their relationship with the Master Portfolio and the Fund
and advice from independent legal counsel with respect to the review
process and materials submitted for the Board’s review. The Board noted
the willingness of BlackRock personnel to engage in open, candid
discussions with the Board. The Board did not identify any particular
information as controlling, and each Board Member may have attributed
different weights to the various items considered.
A. Nature, Extent and Quality of the Services Provided by BlackRock:
The Board, including the Independent Board Members, reviewed the
nature, extent and quality of services provided by BlackRock, including
the investment advisory services and the resulting performance of the
Fund. Throughout the year, the Board compared the Fund’s performance
to the performance of a comparable group of mutual funds and/or the
performance of a relevant benchmark, if any. The Board met with
BlackRock’s senior management personnel responsible for investment
operations, including the senior investment officers. The Board also
reviewed the materials provided by the portfolio management team
discussing Master Portfolio performance and the Master Portfolio’s
investment objective, strategies and outlook.
The Board considered, among other factors, the number, education
and experience of BlackRock’s investment personnel generally and the
Master Portfolio’s portfolio management team, investments by portfolio
managers in the funds they manage, BlackRock’s portfolio trading
capabilities, BlackRock’s use of technology, BlackRock’s commitment to
compliance, BlackRock’s credit analysis capabilities, BlackRock’s risk
analysis capabilities and BlackRock’s approach to training and retaining
portfolio managers and other research, advisory and management per-
sonnel. The Board engaged in a review of BlackRock’s compensation
structure with respect to the Master Portfolio’s portfolio management
team and BlackRock’s ability to attract and retain high-quality talent
and create performance incentives.
In addition to advisory services, the Board considered the quality of
the administrative and non-investment advisory services provided to the
Master Portfolio and the Fund. BlackRock and its affiliates and signifi-
cant shareholders provide the Master Portfolio and the Fund with certain
administrative, transfer agency, shareholder and other services (in addi-
tion to any such services provided to the Master Portfolio and the Fund
by third parties) and officers and other personnel as are necessary
for the operations of the Master Portfolio and the Fund. In addition to
investment advisory services, BlackRock and its affiliates provide the
Master Portfolio and the Fund with other services, including (i) preparing
disclosure documents, such as the prospectus, the statement of addi-
tional information and periodic shareholder reports; (ii) assisting with
daily accounting and pricing; (iii) overseeing and coordinating the
activities of other service providers; (iv) organizing Board meetings and
preparing the materials for such Board meetings; (v) providing legal and
compliance support; and (vi) performing other administrative functions
necessary for the operation of the Master Portfolio and the Fund, such
as tax reporting, fulfilling regulatory filing requirements and call center
services. The Board reviewed the structure and duties of BlackRock’s
fund administration, accounting, legal and compliance departments
| BLACKROCK SMALL CAP GROWTH FUND II | MAY 31, 2011 | 29 |
Disclosure of Investment Advisory Agreement and Sub-Advisory Agreement (continued)
and considered BlackRock’s policies and procedures for assuring
compliance with applicable laws and regulations.
B. The Investment Performance of the Master Portfolio, the Fund and
BlackRock: The Board, including the Independent Board Members, also
reviewed and considered the performance history of the Master Portfolio
and the Fund, as applicable. The Board noted that the Master Portfolio’s
investment results correspond directly to the investment results of the
Fund. In preparation for the April 5, 2011 meeting, the Board worked
with BlackRock and Lipper to develop a template for, and was provided
with, reports independently prepared by Lipper, which included a com-
prehensive analysis of the Fund’s performance. The Board also reviewed
a narrative and statistical analysis of the Lipper data that was prepared
by BlackRock, which analyzed various factors that affect Lipper’s rank-
ings. In connection with its review, the Board received and reviewed
information regarding the investment performance of the Fund as com-
pared to funds in the Fund’s applicable Lipper category. The Board was
provided with a description of the methodology used by Lipper to select
peer funds. The Board and the Board’s Performance Oversight and
Contract Committee regularly review and meet with Master Portfolio
management to discuss the performance of the Master Portfolio and
the Fund, as applicable, throughout the year.
The Board noted that the Fund performed below the median of its Lipper
Performance Universe in each of the one-, three-, and five-year periods
reported. The Board and BlackRock reviewed and discussed the reasons
for the Fund’s underperformance during these periods compared with its
Peers. The Board was informed that, among other things, the six-month
period in the middle of 2010 detracted from performance. During 2010
a number of individual events in the second quarter affecting Master
Portfolio holdings, combined with the fact that some high conviction
names held by the Master Portfolio did not participate in the third
quarter market rally, hindered performance.
The Board and BlackRock discussed BlackRock’s strategy for improving
the Fund’s performance and BlackRock’s commitment to providing the
resources necessary to assist the Master Portfolio’s portfolio managers
and to improve the Fund’s performance.
The Board noted that BlackRock has made changes to the organization
of the overall equity group management structure designed to result in a
strengthened leadership team with clearer accountability.
C. Consideration of the Advisory/Management Fees and the Cost of the
Services and Profits to be Realized by BlackRock and its Affiliates from
their Relationship with the Master Portfolio and the Fund: The Board,
including the Independent Board Members, reviewed the Fund’s contrac-
tual management fee ratio compared with the other funds in the Fund’s
Lipper category. It also compared the Fund’s total expense ratio, as well
as actual management fee ratio, to those of other funds in its Lipper cat-
egory. The Board considered the services provided and the fees charged
by BlackRock to other types of clients with similar investment mandates,
including separately managed institutional accounts.
The Board received and reviewed statements relating to BlackRock’s
financial condition and profitability with respect to the services it pro-
vided the Master Portfolio and the Fund. The Board was also provided
with a profitability analysis that detailed the revenues earned and the
expenses incurred by BlackRock for services provided to the Master
Portfolio and the Fund. The Board reviewed BlackRock’s profitability with
respect to the Master Portfolio and the Fund, as applicable, and other
funds the Board currently oversees for the year ended December 31,
2010 compared to available aggregate profitability data provided for the
years ended December 31, 2009 and December 31, 2008. The Board
reviewed BlackRock’s profitability with respect to other fund complexes
managed by the Manager and/or its affiliates. The Board reviewed
BlackRock’s assumptions and methodology of allocating expenses in the
profitability analysis, noting the inherent limitations in allocating costs
among various advisory products. The Board recognized that profitability
may be affected by numerous factors including, among other things, fee
waivers and expense reimbursements by the Manager, the types of funds
managed, expense allocations and business mix, and the difficulty of
comparing profitability as a result of those factors.
The Board noted that, in general, individual fund or product line prof-
itability of other advisors is not publicly available. The Board considered
BlackRock’s operating margin, in general, compared to the operating
margin for leading investment management firms whose operations
include advising open-end funds, among other product types. That data
indicates that operating margins for BlackRock, in general and with
respect to its registered funds, are generally consistent with margins
earned by similarly situated publicly traded competitors. In addition,
the Board considered, among other things, certain third party data com-
paring BlackRock’s operating margin with that of other publicly-traded
asset management firms. That third party data indicates that larger asset
bases do not, in themselves, translate to higher profit margins.
In addition, the Board considered the cost of the services provided to
the Master Portfolio and the Fund by BlackRock, and BlackRock’s and
its affiliates’ profits relating to the management and distribution of the
Master Portfolio and the Fund and the other funds advised by BlackRock
and its affiliates. As part of its analysis, the Board reviewed BlackRock’s
methodology in allocating its costs to the management of the Master
Portfolio and the Fund. The Board also considered whether BlackRock
has the financial resources necessary to attract and retain high quality
investment management personnel to perform its obligations under the
Agreements and to continue to provide the high quality of services that
is expected by the Board.
| 30 | BLACKROCK SMALL CAP GROWTH FUND II | MAY 31, 2011 |
Disclosure of Investment Advisory Agreement and Sub-Advisory Agreement (concluded)
The Board noted that the Fund’s contractual management fee ratio (a
combination of the advisory fee and the administration fee, if any) was
above the median contractual management fee ratio paid by the Fund’s
Peers, in each case before taking into account any expense reimburse-
ments or fee waivers. The Board also noted that effective June 1, 2011,
the Fund will have an advisory fee arrangement that includes break-
points that adjust the fee ratio downward as the size of the Master
Portfolio increases above certain contractually specified levels.
D. Economies of Scale: The Board, including the Independent Board
Members, considered the extent to which economies of scale might be
realized as the assets of the Master Portfolio and the Fund increase.
The Board also considered the extent to which the Master Portfolio and
the Fund benefit from such economies and whether there should be
changes in the advisory fee rate or structure in order to enable the
Master Portfolio and the Fund to participate in these economies of
scale, for example through the use of breakpoints in the advisory fee
based upon the asset level of the Master Portfolio.
E. Other Factors Deemed Relevant by the Board Members: The Board,
including the Independent Board Members, also took into account other
ancillary or “fall-out” benefits that BlackRock or its affiliates and signifi-
cant shareholders may derive from their respective relationships with
the Master Portfolio and the Fund, both tangible and intangible, such
as BlackRock’s ability to leverage its investment professionals who man-
age other portfolios and risk management personnel, an increase in
BlackRock’s profile in the investment advisory community, and the
engagement of BlackRock’s affiliates and significant shareholders as
service providers to the Master Portfolio and the Fund, including for
administrative, transfer agency, distribution and securities lending serv-
ices. The Board also considered BlackRock’s overall operations and its
efforts to expand the scale of, and improve the quality of, its operations.
The Board also noted that BlackRock may use and benefit from third
party research obtained by soft dollars generated by certain registered
fund transactions to assist in managing all or a number of its other
client accounts. The Board further noted that BlackRock’s funds may
invest in affiliated ETFs without any offset against the management fees
payable by the funds to BlackRock.
In connection with its consideration of the Agreements, the Board also
received information regarding BlackRock’s brokerage and soft dollar
practices. The Board received reports from BlackRock which included
information on brokerage commissions and trade execution practices
throughout the year.
The Board noted the competitive nature of the open-end fund market-
place, and that shareholders are able to redeem their Fund shares if
they believe that the Fund’s and/or the Master Portfolio’s fees and
expenses are too high or if they are dissatisfied with the performance
of the Fund.
Conclusion
The Board of the Master LLC, including the Independent Board
Members, unanimously approved the continuation of the Advisory
Agreement between the Manager and the Master LLC, with respect to
the Master Portfolio, for a one-year term ending June 30, 2012 and the
Sub-Advisory Agreement between the Manager and the Sub-Advisor, with
respect to the Master Portfolio, for a one-year term ending June 30,
2012. As part of its approval, the Board of the Master LLC considered
the detailed review of BlackRock’s fee structure, as it applies to the
Master LLC, conducted by the ad hoc Joint Product Pricing Committee.
Based upon its evaluation of all of the aforementioned factors in their
totality, the Board of the Master LLC, including the Independent Board
Members, was satisfied that the terms of the Agreements were fair and
reasonable and in the best interest of the Master Portfolio and its share-
holders. The Board of the Corporation, including the Independent Board
Members, also considered the continuation of the Agreements with
respect to the Master Portfolio and found the Agreements to be satis-
factory. In arriving at its decision to approve the Agreements, the Board
of the Master LLC did not identify any single factor or group of factors
as all-important or controlling, but considered all factors together, and
different Board Members may have attributed different weights to the
various factors considered. The Independent Board Members were also
assisted by the advice of independent legal counsel in making this
determination. The contractual fee arrangements for the Master Portfolio
reflect the results of several years of review by the Board Members and
predecessor Board Members, and discussions between such Board
Members (and predecessor Board Members) and BlackRock. As a
result, the Board Members’ conclusions may be based in part on
their consideration of these arrangements in prior years.
| BLACKROCK SMALL CAP GROWTH FUND II | MAY 31, 2011 | 31 |
| Officers and Directors | |||||
| Number of BlackRock- | |||||
| Advised Registered | |||||
| Position(s) | Length | Investment Companies | |||
| Held with | of Time | (“RICs”) Consisting of | |||
| Name, Address | Corporation/ | Served as | Investment Portfolios | Public | |
| and Year of Birth | Master LLC | a Director2 | Principal Occupation(s) During Past Five Years | (“Portfolios”) Overseen | Directorships |
| Independent Directors1 | |||||
| Ronald W. Forbes | Co-Chair of | Since | Professor Emeritus of Finance, School of Business, State University | 36 RICs consisting of | None |
| 55 East 52nd Street | the Board | 2007 | of New York at Albany since 2000. | 99 Portfolios | |
| New York, NY 10055 | and Director | ||||
| 1940 | |||||
| Rodney D. Johnson | Co-Chair of | Since | President, Fairmount Capital Advisors, Inc. since 1987; Member | 36 RICs consisting of | None |
| 55 East 52nd Street | the Board | 2007 | of the Archdiocesan Investment Committee of the Archdiocese | 99 Portfolios | |
| New York, NY 10055 | and Director | of Philadelphia since 2004; Director, The Committee of Seventy | |||
| 1941 | (civic) since 2006; Director, Fox Chase Cancer Center from | ||||
| 2004 to 2010. | |||||
| David O. Beim | Director | Since | Professor of Professional Practice at the Columbia University | 36 RICs consisting of | None |
| 55 East 52nd Street | 1999 | Graduate School of Business since 1991; Trustee, Phillips Exeter | 99 Portfolios | ||
| New York, NY 10055 | Academy since 2002; Chairman, Wave Hill, Inc. (public garden and | ||||
| 1940 | cultural center) from 1990 to 2006. | ||||
| Dr. Matina S. Horner | Director | Since | Executive Vice President of Teachers Insurance and Annuity Associa- | 36 RICs consisting of | NSTAR (electric |
| 55 East 52nd Street | 2007 | tion and College Retirement Equities Fund from 1989 to 2003. | 99 Portfolios | and gas utility) | |
| New York, NY 10055 | |||||
| 1939 | |||||
| Herbert I. London | Director | Since | Professor Emeritus, New York University since 2005; John M. Olin | 36 RICs consisting of | AIMS Worldwide, |
| 55 East 52nd Street | 2007 | Professor of Humanities, New York University from 1993 to 2005 | 99 Portfolios | Inc. (marketing) | |
| New York, NY 10055 | and Professor thereof from 1980 to 2005; President, Hudson | ||||
| 1939 | Institute (policy research organization) since 1997 and Trustee | ||||
| thereof since 1980; Chairman of the Board of Trustees for Grantham | |||||
| University since 2006; Director, InnoCentive, Inc. (strategic solutions | |||||
| company) since 2005; Director, Cerego, LLC (software development | |||||
| and design) since 2005; Director, Cybersettle (dispute resolution | |||||
| technology) since 2009. | |||||
| Cynthia A. Montgomery | Director | Since | Professor, Harvard Business School since 1989; Director, McLean | 36 RICs consisting of | Newell Rubbermaid, |
| 55 East 52nd Street | 2007 | Hospital since 2005; Director, Harvard Business School | 99 Portfolios | Inc. (manufacturing) | |
| New York, NY 10055 | Publishing from 2005 to 2010. | ||||
| 1952 | |||||
| Joseph P. Platt | Director | Since | Director, The West Penn Allegheny Health System (a not-for-profit | 36 RICs consisting of | Greenlight Capital |
| 55 East 52nd Street | 2007 | health system) since 2008; Director, Jones and Brown (Canadian | 99 Portfolios | Re, Ltd (reinsurance | |
| New York, NY 10055 | insurance broker) since 1998; General Partner, Thorn Partners, LP | company) | |||
| 1947 | (private investment) since 1998; Director, WQED Multi-Media (public | ||||
| broadcasting not-for-profit) since 2001; Partner, Amarna Corporation, | |||||
| LLC (private investment company) from 2002 to 2008. | |||||
| Robert C. Robb, Jr. | Director | Since | Partner, Lewis, Eckert, Robb and Company (management and | 36 RICs consisting of | None |
| 55 East 52nd Street | 2007 | financial consulting firm) since 1981. | 99 Portfolios | ||
| New York, NY 10055 | |||||
| 1945 | |||||
| Toby Rosenblatt | Director | Since | President, Founders Investments Ltd. (private investments) | 36 RICs consisting of | None |
| 55 East 52nd Street | 2007 | since 1999; Director, College Access Foundation of California | 99 Portfolios | ||
| New York, NY 10055 | (philanthropic foundation) since 2009; Director, Forward | ||||
| 1938 | Management, LLC since 2007; Director, A.P. Pharma, Inc. | ||||
| (pharmaceuticals) from 1983 to 2011; Director, The James Irvine | |||||
| Foundation (philanthropic foundation) from 1998 to 2008. | |||||
| 32 | BLACKROCK SMALL CAP GROWTH FUND II | MAY 31, 2011 |
| Officers and Directors (continued) | |||||
| Number of BlackRock- | |||||
| Advised Registered | |||||
| Position(s) | Length | Investment Companies | |||
| Held with | of Time | (“RICs”) Consisting of | |||
| Name, Address | Corporation/ | Served as | Investment Portfolios | Public | |
| and Year of Birth | Master LLC | a Director2 | Principal Occupation(s) During Past Five Years | (“Portfolios”) Overseen | Directorships |
| Independent Directors1 (concluded) | |||||
| Kenneth L. Urish | Director | Since | Managing Partner, Urish Popeck & Co., LLC (certified public | 36 RICs consisting of | None |
| 55 East 52nd Street | 2007 | accountants and consultants) since 1976; Chairman Elect of | 99 Portfolios | ||
| New York, NY 10055 | the Professional Ethics Committee of the Pennsylvania Institute | ||||
| 1951 | of Certified Public Accountants and Committee Member thereof | ||||
| since 2007; Member of External Advisory Board, The Pennsylvania | |||||
| State University Accounting Department since 2001; Trustee, The | |||||
| Holy Family Foundation from 2001 to 2010; President and Trustee, | |||||
| Pittsburgh Catholic Publishing Associates from 2003 to 2008; | |||||
| Director, Inter-Tel from 2006 to 2007. | |||||
| Frederick W. Winter | Director | Since | Professor and Dean Emeritus of the Joseph M. Katz School of | 36 RICs consisting of | None |
| 55 East 52nd Street | 2007 | Business, University of Pittsburgh since 2005 and Dean thereof | 99 Portfolios | ||
| New York, NY 10055 | from 1997 to 2005; Director, Alkon Corporation (pneumatics) | ||||
| 1945 | since 1992; Director, Tippman Sports (recreation) since 2005; | ||||
| Director, Indotronix International (IT services) from 2004 to 2008. | |||||
| 1 Directors serve until their resignation, removal or death, or until December 31 of the year in which they turn 72. The Board has approved one-year | |||||
| extensions in terms of Directors who turn 72 prior to December 31, 2013. | |||||
| 2 Date shown is the earliest date a person has served as a Director for the Corporation/Master LLC covered by this annual report. Following the combi- | |||||
| nation of Merrill Lynch Investment Managers, L.P. (“MLIM”) and BlackRock in September 2006, the various legacy MLIM and legacy BlackRock fund | |||||
| boards were realigned and consolidated into three new fund boards in 2007. As a result, although the chart shows certain Directors as joining the | |||||
| Corporation/Master LLC’s board in 2007, each Director first became a member of the board of other legacy MLIM or legacy BlackRock funds as | |||||
| follows: David O. Beim, 1998; Ronald W. Forbes, 1977; Dr. Matina S. Horner, 2004; Rodney D. Johnson, 1995; Herbert I. London, 1987; Cynthia A. | |||||
| Montgomery, 1994; Joseph P. Platt, 1999; Robert C. Robb, Jr., 1998; Toby Rosenblatt, 2005; Kenneth L. Urish, 1999; and Frederick W. Winter, 1999. | |||||
| Interested Directors3 | |||||
| Richard S. Davis | Director | Since | Managing Director, BlackRock, Inc. since 2005; Chief Executive | 165 RICs consisting of | None |
| 55 East 52nd Street | 2007 | Officer, State Street Research & Management Company from 2000 | 291 Portfolios | ||
| New York, NY 10055 | to 2005; Chairman of the Board of Trustees, State Street Research | ||||
| 1945 | Mutual Funds from 2000 to 2005. | ||||
| Henry Gabbay | Director | Since | Consultant, BlackRock, Inc. from 2007 to 2008; Managing Director, | 165 RICs consisting of | None |
| 55 East 52nd Street | 2007 | BlackRock, Inc. from 1989 to 2007; Chief Administrative Officer, | 291 Portfolios | ||
| New York, NY 10055 | BlackRock Advisors, LLC from 1998 to 2007; President of BlackRock | ||||
| 1947 | Funds and BlackRock Bond Allocation Target Shares from 2005 to | ||||
| 2007 and Treasurer of certain closed-end funds in the BlackRock | |||||
| fund complex from 1989 to 2006. | |||||
| 3 Mr. Davis is an “interested person” as defined in the 1940 Act, of the Corporation/Master LLC based on his position with BlackRock, Inc. and its | |||||
| affiliates. Mr. Gabbay is an “interested person” of the Corporation/Master LLC based on his former positions with BlackRock, Inc. and its affiliates as | |||||
| well as his ownership of BlackRock, Inc. and The PNC Financial Services Group, Inc. securities. Directors serve until their resignation, removal or death, | |||||
| or until December 31 of the year in which they turn 72. The Board has approved one-year extensions in terms of Directors who turn 72 prior to | |||||
| December 31, 2013. | |||||
| BLACKROCK SMALL CAP GROWTH FUND II | MAY 31, 2011 | 33 |
| Officers and Directors (concluded) | |||
| Position(s) | |||
| Held with | |||
| Name, Address | Corporation/ | Length of | |
| and Year of Birth | Master LLC | Time Served | Principal Occupation(s) During Past Five Years |
| Officers1 | |||
| John M. Perlowski | President | Since | Managing Director of BlackRock, Inc. since 2009; Global Head of BlackRock Fund Administration since 2009; |
| 55 East 52nd Street | and Chief | 2010 | Managing Director and Chief Operating Officer of the Global Product Group at Goldman Sachs Asset Management, |
| New York, NY 10055 | Executive | L.P. from 2003 to 2009; Treasurer of Goldman Sachs Mutual Funds from 2003 to 2009 and Senior Vice President | |
| 1964 | Officer | thereof from 2007 to 2009; Director of Goldman Sachs Offshore Funds from 2002 to 2009; Director of Family | |
| Resource Network (charitable foundation) since 2009. | |||
| Brendan Kyne | Vice | Since | Managing Director of BlackRock, Inc. since 2010; Director of BlackRock, Inc. from 2008 to 2009; Head of Product |
| 55 East 52nd Street | President | 2009 | Development and Management for BlackRock’s U.S. Retail Group since 2009, Co-head thereof from 2007 to |
| New York, NY 10055 | 2009; Vice President of BlackRock, Inc. from 2005 to 2008. | ||
| 1977 | |||
| Neal Andrews | Chief | Since | Managing Director of BlackRock, Inc. since 2006; Senior Vice President and Line of Business Head of Fund |
| 55 East 52nd Street | Financial | 2007 | Accounting and Administration at PNC Global Investment Servicing (U.S.) Inc. from 1992 to 2006. |
| New York, NY 10055 | Officer | ||
| 1966 | |||
| Jay Fife | Treasurer | Since | Managing Director of BlackRock, Inc. since 2007 and Director in 2006; Assistant Treasurer of the MLIM and Fund |
| 55 East 52nd Street | 2007 | Asset Management, L.P. advised funds from 2005 to 2006; Director of MLIM Fund Services Group from 2001 | |
| New York, NY 10055 | to 2006. | ||
| 1970 | |||
| Brian Kindelan | Chief | Since | Chief Compliance Officer of the BlackRock-advised funds since 2007; Managing Director and Senior Counsel of |
| 55 East 52nd Street | Compliance | 2007 | BlackRock, Inc. since 2005. |
| New York, NY 10055 | Officer | ||
| 1959 | |||
| Ira P. Shapiro | Secretary | Since | Managing Director of BlackRock, Inc. since 2009; Managing Director and Associate General Counsel of Barclays |
| 55 East 52nd Street | 2010 | Global Investors from 2008 to 2009 and Principal thereof from 2004 to 2008. | |
| New York, NY 10055 | |||
| 1963 | |||
| 1 Officers of the Corporation/Master LLC serve at the pleasure of the Board. | |||
| Further information about the Officers and Directors is available in the Corporation’s Statement of Additional Information, which can be obtained | |||
| without charge by calling (800) 441-7762. | |||
| Investment Advisor | Custodian | Accounting Agent | Distributor | Address of the Fund |
| BlackRock Advisors, LLC | Brown Brothers | State Street Bank | BlackRock Investments, LLC | 100 Bellevue Parkway |
| Wilmington, DE 19809 | Harriman & Co. | and Trust Company | New York, NY 10022 | Wilmington, DE 19809 |
| Boston, MA 02109 | Boston, MA 02116 | |||
| Sub-Advisor | Legal Counsel | |||
| BlackRock Capital | Transfer Agent | Independent Registered | Sidley Austin LLP | |
| Management, Inc. | BNY Mellon Investment | Public Accounting Firm | New York, NY 10019 | |
| Wilmington, DE 19809 | Servicing (US) Inc. | Deloitte & Touche LLP | ||
| Wilmington, DE 19809 | Princeton, NJ 08540 |
| 34 | BLACKROCK SMALL CAP GROWTH FUND II | MAY 31, 2011 |
Additional Information
General Information
Electronic Delivery
Electronic copies of most financial reports and prospectuses are available
on the Fund’s website or shareholders can sign up for e-mail notifications
of quarterly statements, annual and semi-annual reports and prospectuses
by enrolling in the Fund’s electronic delivery program.
To enroll:
Shareholders Who Hold Accounts with Investment Advisors, Banks or
Brokerages:
Please contact your financial advisor. Please note that not all investment
advisors, banks or brokerages may offer this service.
Shareholders Who Hold Accounts Directly with BlackRock:
1) Access the BlackRock Web site at
http://www.blackrock.com/edelivery
2) Select “eDelivery” under the “More Information” section
3) Log into your account
Householding
The Fund will mail only one copy of shareholder documents, including
prospectuses, annual and semi-annual reports and proxy statements, to
shareholders with multiple accounts at the same address. This practice
is commonly called “householding” and is intended to reduce expenses
and eliminate duplicate mailings of shareholder documents. Mailings of
your shareholder documents may be householded indefinitely unless you
instruct us otherwise. If you do not want the mailing of these documents
to be combined with those for other members of your household, please
call (800) 441-7762.
Availability of Quarterly Schedule of Investments
The Fund/Portfolio file their complete schedule of portfolio holdings
with the SEC for the first and third quarters of each fiscal year on Form
N-Q. The Fund’s/Portfolio’s Forms N-Q are available on the SEC’s web-
site at http://www.sec.gov and may also be reviewed and copied at the
SEC’s Public Reference Room in Washington, D.C. Information on how
to access documents on the SEC’s website without charge may be
obtained by calling (800) SEC-0330. The Fund’s/Portfolio’s Forms N-Q
may also be obtained upon request and without charge by calling
(800) 441-7762.
Availability of Proxy Voting Policies and Procedures
A description of the policies and procedures that the Corporation/
Master LLC use to determine how to vote proxies relating to portfolio
securities is available (1) without charge, upon request, by calling
(800) 441-7762; (2) at http://www.blackrock.com; and (3) on the
SEC’s website at http://www.sec.gov.
Availability of Proxy Voting Record
Information about how the Corporation/Master LLC voted proxies
relating to securities held in the Fund’s/Portfolio’s portfolio during the
most recent 12-month period ended June 30 is available upon request
and without charge (1) at http://www.blackrock.com or by calling
(800) 441-7762 and (2) on the SEC’s website at http://www.sec.gov.
| BLACKROCK SMALL CAP GROWTH FUND II | MAY 31, 2011 | 35 |
Additional Information (continued)
Shareholder Privileges
Account Information
Call us at (800) 441-7762 from 8:00 AM to 6:00 PM EST on any
business day to get information about your account balances, recent
transactions and share prices. You can also reach us on the Web at
http://www.blackrock.com/funds.
Automatic Investment Plans
Investor Class shareholders who want to invest regularly can arrange to
have $50 or more automatically deducted from their checking or savings
account and invested in any of the BlackRock funds.
Systematic Withdrawal Plans
Investor Class shareholders can establish a systematic withdrawal plan
and receive periodic payments of $50 or more from their BlackRock
funds, as long as their account balance is at least $10,000.
Retirement Plans
Shareholders may make investments in conjunction with Traditional,
Rollover, Roth, Coverdell, Simple IRAs, SEP IRAs and 403(b) Plans.
| 36 | BLACKROCK SMALL CAP GROWTH FUND II | MAY 31, 2011 |
Additional Information (concluded)
BlackRock Privacy Principles
BlackRock is committed to maintaining the privacy of its current and
former fund investors and individual clients (collectively, “Clients”) and
to safeguarding their non-public personal information. The following infor-
mation is provided to help you understand what personal information
BlackRock collects, how we protect that information and why in certain
cases we share such information with select parties.
If you are located in a jurisdiction where specific laws, rules or regula-
tions require BlackRock to provide you with additional or different privacy-
related rights beyond what is set forth below, then BlackRock will comply
with those specific laws, rules or regulations.
BlackRock obtains or verifies personal non-public information from and
about you from different sources, including the following: (i) information
we receive from you or, if applicable, your financial intermediary, on appli-
cations, forms or other documents; (ii) information about your trans-
actions with us, our affiliates, or others; (iii) information we receive from
a consumer reporting agency; and (iv) from visits to our websites.
BlackRock does not sell or disclose to non-affiliated third parties any non-
public personal information about its Clients, except as permitted by law
or as is necessary to respond to regulatory requests or to service Client
accounts. These non-affiliated third parties are required to protect the
confidentiality and security of this information and to use it only for its
intended purpose.
We may share information with our affiliates to service your account
or to provide you with information about other BlackRock products or
services that may be of interest to you. In addition, BlackRock restricts
access to non-public personal information about its Clients to those
BlackRock employees with a legitimate business need for the information.
BlackRock maintains physical, electronic and procedural safeguards
that are designed to protect the non-public personal information of its
Clients, including procedures relating to the proper storage and disposal
of such information.
| BLACKROCK SMALL CAP GROWTH FUND II | MAY 31, 2011 | 37 |
| A World-Class Mutual Fund Family | ||||||
| BlackRock offers a diverse lineup of open-end mutual funds crossing all investment styles and managed by experts in equity, fixed income and | ||||||
| tax-exempt investing. | ||||||
| Equity Funds | ||||||
| BlackRock ACWI ex-US Index Fund | BlackRock Global Opportunities Portfolio | BlackRock Mid Cap Value Opportunities Fund | ||||
| BlackRock All-Cap Energy & Resources Portfolio | BlackRock Global SmallCap Fund | BlackRock Natural Resources Trust | ||||
| BlackRock Asset Allocation Portfolio† | BlackRock Health Sciences Opportunities Portfolio | BlackRock Pacific Fund | ||||
| BlackRock Balanced Capital Fund† | BlackRock Healthcare Fund | BlackRock Russell 1000 Index Fund | ||||
| BlackRock Basic Value Fund | BlackRock Index Equity Portfolio | BlackRock Science & Technology | ||||
| BlackRock Capital Appreciation Fund | BlackRock India Fund | Opportunities Portfolio | ||||
| BlackRock China Fund | BlackRock International Fund | BlackRock Small Cap Growth Equity Portfolio | ||||
| BlackRock Energy & Resources Portfolio | BlackRock International Index Fund | BlackRock Small Cap Growth Fund II | ||||
| BlackRock Equity Dividend Fund | BlackRock International Opportunities Portfolio | BlackRock Small Cap Index Fund | ||||
| BlackRock EuroFund | BlackRock International Value Fund | BlackRock Small/Mid-Cap Growth Portfolio | ||||
| BlackRock Focus Growth Fund | BlackRock Large Cap Core Fund | BlackRock S&P 500 Index Fund | ||||
| BlackRock Focus Value Fund | BlackRock Large Cap Core Plus Fund | BlackRock S&P 500 Stock Fund | ||||
| BlackRock Global Allocation Fund† | BlackRock Large Cap Growth Fund | BlackRock U.S. Opportunities Portfolio | ||||
| BlackRock Global Dividend Income Portfolio | BlackRock Large Cap Value Fund | BlackRock Utilities and Telecommunications Fund | ||||
| BlackRock Global Dynamic Equity Fund | BlackRock Latin America Fund | BlackRock Value Opportunities Fund | ||||
| BlackRock Global Emerging Markets Fund | BlackRock Mid-Cap Growth Equity Portfolio | BlackRock World Gold Fund | ||||
| BlackRock Global Growth Fund | BlackRock Mid-Cap Value Equity Portfolio | |||||
| Fixed Income Funds | ||||||
| BlackRock Bond Index Fund | BlackRock High Yield Bond Portfolio | BlackRock Multi-Sector Bond Portfolio | ||||
| BlackRock Core Bond Fund | BlackRock Income Portfolio† | BlackRock Strategic Income | ||||
| BlackRock Emerging Market Debt Portfolio | BlackRock Inflation Protected Bond Portfolio | Opportunities Portfolio | ||||
| BlackRock Floating Rate Income Portfolio | BlackRock International Bond Portfolio | BlackRock Total Return Fund | ||||
| BlackRock GNMA Portfolio | BlackRock Long Duration Bond Portfolio | BlackRock US Government Bond Fund | ||||
| BlackRock High Income Fund | BlackRock Low Duration Bond Portfolio | BlackRock World Income Fund | ||||
| Municipal Bond Funds | ||||||
| BlackRock California Municipal Bond Fund | BlackRock National Municipal Fund | BlackRock Pennsylvania Municipal Bond Fund | ||||
| BlackRock High Yield Municipal Fund | BlackRock New Jersey Municipal Bond Fund | BlackRock Short-Term Municipal Fund | ||||
| BlackRock Intermediate Municipal Fund | BlackRock New York Municipal Bond Fund | |||||
| Target Risk & Target Date Funds† | ||||||
| BlackRock Prepared Portfolios | BlackRock Lifecycle Prepared Portfolios | LifePath Portfolios | LifePath Index Portfolios | |||
| Conservative Prepared Portfolio | 2015 | 2035 | Retirement | 2040 | Retirement | 2040 |
| Moderate Prepared Portfolio | 2020 | 2040 | 2020 | 2045 | 2020 | 2045 |
| Growth Prepared Portfolio | 2025 | 2045 | 2025 | 2050 | 2025 | 2050 |
| Aggressive Growth Prepared Portfolio | 2030 | 2050 | 2030 | 2055 | 2030 | 2055 |
| 2035 | 2035 | |||||
† Mixed asset fund.
BlackRock mutual funds are currently distributed by BlackRock Investments, LLC. You should consider the investment objectives, risks, charges and
expenses of the funds under consideration carefully before investing. Each fund’s prospectus contains this and other information and is available at
www.blackrock.com or by calling (800) 441-7762 or from your financial advisor. The prospectus should be read carefully before investing.
| 38 | BLACKROCK SMALL CAP GROWTH FUND II | MAY 31, 2011 |

This report is not authorized for use as an offer of sale or
a solicitation of an offer to buy shares of the Fund unless
accompanied or preceded by the Fund’s current prospec-
tus. Past performance results shown in this report should
not be considered a representation of future performance.
Investment return and principal value of shares will fluctuate
so that shares, when redeemed, may be worth more or less
than their original cost. Statements and other information
herein are as dated and are subject to change.

Item 2 – Code of Ethics – Each registrant (or the “Fund”) has adopted a code of ethics, as of the end
of the period covered by this report, applicable to the registrant’s principal executive officer,
principal financial officer, principal accounting officer, or controller, or persons performing
similar functions. During the period covered by this report, there have been no amendments
to or waivers granted under the code of ethics. A copy of the code of ethics is available
without charge at www.blackrock.com.
Item 3 – Audit Committee Financial Expert – Each registrant’s board of directors (the “board of
directors”), has determined that (i) the registrant has the following audit committee financial
expert serving on its audit committee and (ii) each audit committee financial expert is
independent:
Kenneth L. Urish
Under applicable securities laws, a person determined to be an audit committee financial
expert will not be deemed an “expert” for any purpose, including without limitation for the
purposes of Section 11 of the Securities Act of 1933, as a result of being designated or
identified as an audit committee financial expert. The designation or identification of a
person as an audit committee financial expert does not impose on such person any duties,
obligations, or liabilities greater than the duties, obligations, and liabilities imposed on such
person as a member of the audit committee and board of directors in the absence of such
designation or identification.
Item 4 – Principal Accountant Fees and Services
The following table presents fees billed by Deloitte & Touche LLP (“D&T”) in each of the
last two fiscal years for the services rendered to the Funds:
| (a) Audit Fees | (b) Audit-Related Fees1 | (c) Tax Fees2 | (d) All Other Fees3 | |||||
| Current | Previous | Current | Previous | Current | Previous | Current | Previous | |
| Fiscal Year | Fiscal Year | Fiscal Year | Fiscal Year | Fiscal Year | Fiscal Year | Fiscal Year | Fiscal Year | |
| Entity Name | End | End | End | End | End | End | End | End |
| BlackRock Small | ||||||||
| Cap Growth Fund II | ||||||||
| of BlackRock Series, | $7,000 | $6,800 | $0 | $0 | $12,350 | $6,100 | $0 | $83 |
| Inc. | ||||||||
| BlackRock Master | ||||||||
| Small Cap Growth | ||||||||
| Portfolio of | $31,500 | $30,500 | $0 | $0 | $0 | $6,100 | $0 | $0 |
| BlackRock Master | ||||||||
| LLC | ||||||||
The following table presents fees billed by D&T that were required to be approved by the
registrants’ audit committee (the “Committee”) for services that relate directly to the
operations or financial reporting of the Funds and that are rendered on behalf of BlackRock
Advisors, LLC (“Investment Adviser” or “BlackRock”) and entities controlling, controlled
by, or under common control with BlackRock (not including any sub-adviser whose role is
primarily portfolio management and is subcontracted with or overseen by another investment
adviser) that provide ongoing services to the Funds (“Fund Service Providers”):
| Current Fiscal Year End | Previous Fiscal Year End | |
| (b) Audit-Related Fees1 | $0 | $0 |
| (c) Tax Fees2 | $0 | $0 |
| (d) All Other Fees3 | $3,030,000 | $2,950,000 |
not included in Audit Fees.
2 The nature of the services includes tax compliance, tax advice and tax planning.
3 The nature of the services includes a review of compliance procedures and attestation thereto.
(e)(1) Audit Committee Pre-Approval Policies and Procedures:
The Committee has adopted policies and procedures with regard to the pre-approval
of services. Audit, audit-related and tax compliance services provided to the registrants on
an annual basis require specific pre-approval by the Committee. The Committee also must
approve other non-audit services provided to the registrants and those non-audit services
provided to the Investment Adviser and Fund Service Providers that relate directly to the
operations and the financial reporting of the registrants. Certain of these non-audit services
that the Committee believes are a) consistent with the SEC’s auditor independence rules and
b) routine and recurring services that will not impair the independence of the independent
accountants may be approved by the Committee without consideration on a specific case-
by-case basis (“general pre-approval”). The term of any general pre-approval is 12 months
from the date of the pre-approval, unless the Committee provides for a different period. Tax
or other non-audit services provided to the registrants which have a direct impact on the
operations or financial reporting of the registrants will only be deemed pre-approved
provided that any individual project does not exceed $10,000 attributable to the registrants
or $50,000 per project. For this purpose, multiple projects will be aggregated to determine
if they exceed the previously mentioned cost levels.
Any proposed services exceeding the pre-approved cost levels will require specific
pre-approval by the Committee, as will any other services not subject to general pre-
approval (e.g., unanticipated but permissible services). The Committee is informed of each
service approved subject to general pre-approval at the next regularly scheduled in-person
board meeting. At this meeting, an analysis of such services is presented to the Committee
for ratification. The Committee may delegate to the Committee Chairman the authority to
approve the provision of and fees for any specific engagement of permitted non-audit
services, including services exceeding pre-approved cost levels.
(e)(2) None of the services described in each of Items 4(b) through (d) were approved by
the Committee pursuant to the de minimus exception in paragraph (c)(7)(i)(C) of Rule 2-01
of Regulation S-X.
(f) Not Applicable
(g) The aggregate non-audit fees paid to the accountant for services rendered by the
accountant to the registrants, the Investment Adviser and the Fund Service Providers were:
| Current Fiscal Year | Previous Fiscal Year | |
| Entity Name | End | End |
| BlackRock Small Cap Growth | ||
| Fund II of BlackRock Series, | $12,350 | $16,960 |
| Inc. | ||
| BlackRock Master Small Cap | ||
| Growth Portfolio of BlackRock | $0 | $16,877 |
| Master LLC |
Additionally, SAS No. 70 fees for the current and previous fiscal years of $3,030,000 and
$2,950,000, respectively, were billed by D&T to the Investment Adviser.
(h) The Committee has considered and determined that the provision of non-audit services
that were rendered to the Investment Adviser and the Fund Service Providers that were not
pre-approved pursuant to paragraph (c)(7)(ii) of Rule 2-01 of Regulation S-X is compatible
with maintaining the principal accountant’s independence.
Item 5 – Audit Committee of Listed Registrants – Not Applicable
Item 6 – Investments
(a) The registrants’ Schedule of Investments is included as part of the Reports to
Stockholders filed under Item 1 of this form.
(b) Not Applicable due to no such divestments during the semi-annual period covered since
the previous Form N-CSR filing.
Item 7 – Disclosure of Proxy Voting Policies and Procedures for Closed-End Management
Investment Companies – Not Applicable
Item 8 – Portfolio Managers of Closed-End Management Investment Companies – Not Applicable
Item 9 – Purchases of Equity Securities by Closed-End Management Investment Company and
Affiliated Purchasers – Not Applicable
Item 10 – Submission of Matters to a Vote of Security Holders – There have been no material
changes to these procedures.
Item 11 – Controls and Procedures
11(a) – The registrants’ principal executive and principal financial officers, or persons performing
similar functions, have concluded that the registrants’ disclosure controls and procedures (as
defined in Rule 30a-3(c) under the Investment Company Act of 1940, as amended (the
“1940 Act”)) are effective as of a date within 90 days of the filing of this report based on the
evaluation of these controls and procedures required by Rule 30a-3(b) under the 1940 Act
and Rule 15d-15(b) under the Securities Exchange Act of 1934, as amended.
11(b) – There were no changes in the registrants’ internal control over financial reporting (as
defined in Rule 30a-3(d) under the 1940 Act) that occurred during the second fiscal quarter
of the period covered by this report that have materially affected, or are reasonably likely to
materially affect, the registrants’ internal control over financial reporting.
Item 12 – Exhibits attached hereto
12(a)(1) – Code of Ethics – See Item 2
12(a)(2) – Certifications – Attached hereto
12(a)(3) – Not Applicable
12(b) – Certifications – Attached hereto
Pursuant to the requirements of the Securities Exchange Act of 1934 and the Investment
Company Act of 1940, each registrant has duly caused this report to be signed on its behalf
by the undersigned, thereunto duly authorized.
BlackRock Small Cap Growth Fund II of BlackRock Series, Inc. and BlackRock Master
Small Cap Growth Portfolio of BlackRock Master LLC
By: /S/ John M. Perlowski
John M. Perlowski
Chief Executive Officer (principal executive officer) of
BlackRock Small Cap Growth Fund II of BlackRock Series, Inc. and BlackRock
Master Small Cap Growth Portfolio of BlackRock Master LLC
Date: August 3, 2011
Pursuant to the requirements of the Securities Exchange Act of 1934 and the Investment
Company Act of 1940, this report has been signed below by the following persons on behalf
of the registrants and in the capacities and on the dates indicated.
By: /S/ John M. Perlowski
John M. Perlowski
Chief Executive Officer (principal executive officer) of
BlackRock Small Cap Growth Fund II of BlackRock Series, Inc. and BlackRock
Master Small Cap Growth Portfolio of BlackRock Master LLC
Date: August 3, 2011
By: /S/ Neal J. Andrews
Neal J. Andrews
Chief Financial Officer (principal financial officer) of
BlackRock Small Cap Growth Fund II of BlackRock Series, Inc. and BlackRock
Master Small Cap Growth Portfolio of BlackRock Master LLC
Date: August 3, 2011