Table of Contents
| OMB APPROVAL | ||
| OMB Number: 3235-0570 | ||
| Expires: April 30, 2008 | ||
| Estimated average burden hours per response...............19.4 | ||
SECURITIES AND EXCHANGE COMMISSION
MANAGEMENT INVESTMENT COMPANIES
| 7337 E. Doubletree Ranch Rd., Scottsdale, AZ | 85258 | |
| (Address of principal executive offices) | (Zip code) | |
Table of Contents

| Funds |
| Semi-Annual Report | |
| November 30, 2007 | |
| Classes A, B, C, I, O and Q | |
| Domestic Equity and Income Fund | |
| • ING Real Estate Fund | |
| Domestic Equity Growth Funds | |
| • ING Fundamental Research Fund | |
| • ING LargeCap Growth Fund | |
| • ING MidCap Opportunities Fund | |
| • ING Opportunistic LargeCap Fund | |
| • ING SmallCap Opportunities Fund | |
| Domestic Equity Value Funds | |
| • ING Financial Services Fund | |
| • ING LargeCap Value Fund | |
| • ING SmallCap Value Choice Fund |
| • | ING Value Choice Fund |
 E-Delivery Sign-up – details inside E-Delivery Sign-up – details inside |
| This report is submitted for general information to shareholders of the ING Funds. It is not authorized for distribution to prospective shareholders unless accompanied or preceded by a prospectus which includes details regarding the funds’ investment objectives, risks, charges, expenses and other information. This information should be read carefully. |

| 1 | ||||||||
| 2 | ||||||||
| 4 | ||||||||
| 14 | ||||||||
| 19 | ||||||||
| 25 | ||||||||
| 28 | ||||||||
| 33 | ||||||||
| 59 | ||||||||
| 82 | ||||||||
| Advisory Contract Approval Discussion | 110 | |||||||
| EX-99.CERT | ||||||||
| EX-99.906CERT | ||||||||
| Go Paperless with E-Delivery! | ||
| Sign up now for on-line prospectuses, fund reports, and proxy statements. In less than five minutes, you can help reduce paper mail and lower fund costs. |
Just go to www.ingfunds.com, click on the E-Delivery icon from the home page, follow the directions and complete the quick 5 Steps to Enroll.
You will be notified by e-mail when these communications become available on the internet. Documents that are not available on the internet will continue to be sent by mail.
A description of the policies and procedures that the Funds use to determine how to vote proxies related to portfolio securities is available: (1) without charge, upon request, by calling Shareholder Services toll-free at (800) 992-0180; (2) on the Funds’ website at www.ingfunds.com; and (3) on the U.S. Securities and Exchange Commission (“SEC”) website at www.sec.gov. Information regarding how the Funds voted proxies related to portfolio securities during the most recent 12-month period ended June 30 is available without charge on the Funds’ website at www.ingfunds.com and on the SEC’s website at www.sec.gov.
The Funds file their complete schedule of portfolio holdings with the SEC for the first and third quarters of each fiscal year on Form N-Q. The Funds’ Forms N-Q are available on the SEC’s website at www.sec.gov. The Funds’ Forms N-Q may be reviewed and copied at the SEC’s Public Reference Room in Washington, DC, and information on the operation of the Public Reference Room may be obtained by calling (800) SEC-0330; and is available upon request from the Funds by calling Shareholder Services toll-free at (800) 992-0180.
Table of Contents
(THIS PAGE INTENTIONALLY LEFT BLANK)
Table of Contents

Dear Shareholder,
It is impossible to discuss the current market climate without acknowledging the recent turmoil brought on by problems in the sub-prime mortgage market. Clearly the excesses in this sector of the market and other segments of collateralized debt have created challenges throughout credit markets worldwide.
Amidst the volatility, we at ING Funds remind our shareholders that the creditworthiness and quality of our funds’ holdings is our ultimate priority — whether those holdings are part of our money market funds, fixed income funds or equity funds. Market volatility is an often present component of investing and we believe the best way to manage through turbulent environments is to build a well-balanced, fully-diversified portfolio, which aligns with your goals and risk tolerance.
ING Funds remains committed to developing and offering a diverse array of mutual funds designed to meet the goals of most investors. We urge you to work with your investment professional to make sure you are invested appropriately. Together, you can select the funds that will help you achieve your financial goals. We thank you for choosing ING Funds and look forward to continuing to serve you.
Sincerely,

For more complete information, or to obtain a prospectus for any ING fund, please call your Investment Professional or ING Funds Distributor, LLC at (800) 992-0180 or log on to www.ingfunds.com. The prospectus should be read carefully before investing. Consider the fund’s investment objectives, risks, charges and expenses carefully before investing. The prospectus contains this information and other information about the fund. Check with your Investment Professional to determine which funds are available for sale within their firm. Not all funds are available for sale at all firms.
1
Table of Contents
We started our new fiscal year knowing that the last one would be a hard act to follow, with the equity indices for most of the major regions returning more than 20% in local currencies. Few, however, could have expected the tumult of the first half of the reporting period. After nervous optimism persisted into July 2007, a credit crisis sent investors fleeing stock markets and into Treasuries. The U.S. Federal Reserve Board (the “Fed”) rate cuts provided some solace, but by the end of November 2007, these were no longer enough. For the six-month period ended November 30, 2007, global equities in the form of the Morgan Stanley Capital International World IndexSM(1) (“MSCI World IndexSM”) measured in local currencies, including net reinvested dividends (“MSCI” for regions discussed below) fell 3.4%. In currencies, the view that European interest rates would stay firmer than those in the U.S., supported the pound and euro for most of the period, while the yen continued to be dragged down by the “carry trade”, in which speculators borrow in yen at low interest rates and buy higher yielding securities in other currencies. But in the flight from risk, these trades were unwound and the yen rebounded. For the six months ended November 30, 2007, the dollar fell 9.1%, 4.5% and 9.5% against the euro (repeatedly making new lows), pound and yen, respectively.
The recession in the housing market had taken a new disturbing turn by the summer, as lax lending standards especially in the sub-prime mortgage loan sector were sending foreclosure rates and default provisions soaring, and some lenders into bankruptcy. Furthermore, the huge volumes of securities backed by such loans were declining in value, if they could find a bid at all. Much of this exposure was held by hedge funds and structured investment vehicles, which financed their purchases with investors’ money and by issuing lower yielding short term commercial paper, a variant of the carry trade. In June 2007, the investment bank, Bear Stearns, had to step in to rescue two of its hedge funds in distress over holdings in mortgage bonds.
So far, few observers believed that the sub-prime mortgage problems might lead to recession. But from mid-July 2007, a series of shocks sent investors scurrying for cover. A large mortgage lender, Countrywide, reported that the sub-prime default crisis had spread to other classes of mortgage loans. Worse, by month-end, American Home Mortgage revealed that its creditors had initiated margin calls and that bankruptcy was a possibility. A week later it was fact.
Confirmation that the global asset-backed commercial paper market was close to atrophy came on August 9, 2007 from an unlikely source when French bank BNP Paribas announced similar problems with its own U.S. mortgage-backed structured investment vehicles. Banks were by now reluctant to lend to each other because no-one could be sure where the exposure to tainted securities ultimately lay.
Central banks responded by pouring billions into the inter-bank system. On August 17, 2007, the Fed cut the discount rate, (the rate it will lend to banks), by 50 basis points (0.50%), followed on September 18, 2007, by an unexpectedly soothing 50 basis points (0.50%) federal funds rate reduction and another 50 basis points (0.50%) cut in the discount rate. Finally, on October 31, 2007, the Federal Open Market Committee (“FOMC”) cut both rates by an additional 0.25%.
Yet, as November 2007 wore on, many wondered how much further the FOMC could go, with consumer price inflation above 2%, and even whether rate cutting was the answer to what seemed like a different set of problems. Bank lending standards to businesses and consumers were tightening. The asset-backed commercial paper market continued to shrink. Financial institutions were writing down mortgage backed securities in billions of dollars at a time. Home prices were still falling.
U.S. equities, represented by the Standard & Poor’s 500® Composite Stock Price Index(2) (“S&P 500® Index”) including dividends, had at last breached their March 2000 record in May 2007 and the S&P 500® Index proceeded fitfully to its best level yet on July 19, 2007, reassured by better than expected corporate profits. But the prospect of continued takeover activity, that other great pillar of stock market support worldwide, vanished with the liquidity required to fund it, as the events described above played out. This and general risk aversion took the S&P 500® Index down about 9.5% in the next 19 trading sessions. Recovery was swift after rate cut expectations set in, with a rise of nearly 3% in response to the pleasant surprise on September 18, 2007, and a new all time record close on October 9, 2007. It didn’t last. The financials sector led third quarter S&P 500 earnings lower by about 9% year over year and with growing doubts that any real progress out of the crisis was being made, the same sector dragged the S&P 500® Index down sharply in
2
Table of Contents
November 2007, leading to a return of (2.3)% for the six-month period ended November 30, 2007.
Internationally, the MSCI Japan® Index(3) fell 12.0% in the first half of the fiscal year. As the period started gross domestic product (“GDP”) was already contracting, while consumer prices and wages maintained a downward drift almost without interruption through November 2007. Additionally, the unwinding of carry trades boosted the yen and threatened exports. The MSCI Europe ex UK® Index(4) returned (4.9)% over the same period. A rally on continuing merger and acquisition activity and record low Eurozone unemployment, succumbed to nervousness in mid-July 2007, after another rate increase and turned into a rout as the sub-prime debacle unfolded. The MSCI UK® Index(5) retreated 2.1% after stocks initially surged into the summer, shrugging off a rate increase to a six-year high as a robust service sector and merger and acquisition activity bolstered sentiment. The August 2007 slide then was even more violent than in continental Europe.
(2) The S&P 500® Index is an unmanaged index that measures the performance of securities of approximately 500 of the largest companies in the United States.
(3) The MSCI Japan® Index is a free float-adjusted market capitalization index that is designed to measure developed market equity performance in Japan.
(4) The MSCI Europe ex UK® Index is a free float adjusted market capitalization index that is designed to measure developed market equity performance in Europe, excluding the UK.
(5) The MSCI UK® Index is a free float-adjusted market capitalization index that is designed to measure developed market equity performance in the UK.
All indices are unmanaged and investors cannot invest directly in an index.
Past performance does not guarantee future results. The performance quoted represents past performance. Investment return and principal value of an investment will fluctuate, and shares, when redeemed, may be worth more or less than their original cost. The Funds’ performance is subject to change since the period’s end and may be lower or higher than the performance data shown. Please call (800) 992-0180 or log on to www.ingfunds.com to obtain performance data current to the most recent month end.
Market Perspective reflects the views of ING’s Chief Investment Risk Officer only through the end of the period, and is subject to change based on market and other conditions.
3
Table of Contents
ING Real Estate Fund (the “Fund”) seeks total return consisting of long-term capital appreciation and current income. The Fund is managed by T. Ritson Ferguson, CFA and Joseph P. Smith, CFA, Portfolio Managers, both of ING Clarion Real Estate Securities L.P. — the Sub-Adviser.
Performance: For the six months ended November 30, 2007, the Fund’s Class A shares, excluding sales charges, provided a total return of (14.43)% compared to the Morgan Stanley Capital International U.S. REIT Index(1) (“MSCI U.S. REIT® Index”), which returned (15.02)%, for the same period.
Portfolio Specifics: The last six months have been a difficult period for real estate stocks as concerns regarding an economic slowdown have weighed heavily on the markets. Market angst regarding conditions in the U.S. housing market and the sub-prime lending market washed over to real estate stocks, which we believe to be unwarranted as commercial property fundamentals have remained solid and we continue to see earnings growth in 2008 to be at or above long-term sector averages.
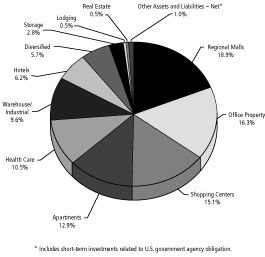
The Fund outperformed its benchmark for the six-month period as the result of strong security selection. The Fund’s exposure to the industrial, mall, shopping center, hotel and healthcare sectors contributed to positive relative performance for the period. The Fund’s exposure to the office sector was the only relative detractor from performance during this period. The Fund maintained an average overweight to the mall, hotel and office sectors during the period and maintained an average underweight to the industrial, shopping center, healthcare, apartment and storage sectors. Allocations to the apartment and mall sectors added to relative performance, while allocations to the industrial and office sectors hindered relative performance. Current sector positioning, at November 30, 2007, is highlighted by overweights to the mall, healthcare, office and shopping center sectors and underweights to the industrial, apartment and storage sectors.
The top performing stock during the period was Hilton Hotels Corp., which appreciated sharply as a result of the announcement during the summer that it would be taken private by the Blackstone Group. Additionally, shopping center real estate investment trusts (“REITs”) Federal Realty and Tanger Factory Outlet Centers, Inc., healthcare REITs Ventas, Inc. and Nationwide Health Properties, Inc., as well as mall REIT Taubman Centers, Inc. were outperformers in a down market, contributing to relative performance. Office REITs SL Green Realty Corp. and Highwoods Properties, Inc., and apartment REIT Post Properties, Inc. were Fund holdings that underperformed during this period.
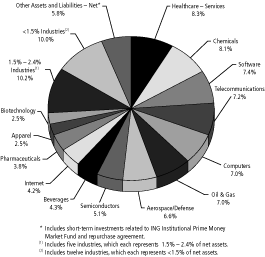
Industry Allocation
Current Strategy and Outlook: When recently assessing Fund strategy, we considered three scenarios which center on different outlooks for the U.S. economy and implications for real estate company performance in the coming months. The most pessimistic scenario assumed the U.S. falls into recession and the most optimistic scenario assumed only a minor slow down in U.S. economic growth, consistent with the prevailing consensus.
In assessing the real estate market environment, the scenario to which we ascribed the greatest probability (50%), sees U.S. gross domestic product (“GDP”) growth at 1.0% in 2008 and no recession. We believe the Federal Reserve will remain accommodative, with up to a further 50 basis point (0.5%) reduction in the federal funds rate over the coming year. From a bottom-up standpoint, we project growth in cash flow per share among the companies we cover and estimate a further rise in cap rates, with a resulting decrease in net asset values (“NAV”). The “good news” from a valuation standpoint is that our increase in cap rates is already reflected in current pricing. The “bad news” is that sentiment remains fragile amid macro-economic crosscurrents.
Fund strategy has seen a shift to a more defensive positioning in recent months, trimming exposure from more economically-sensitive sectors (hotels, apartments and storage) and adding exposure to less economically-sensitive sectors (healthcare, malls and shopping centers), given the current economic environment, our forward earnings outlook, and view of relative valuations.
The rationale for a listed property strategy remains very much intact, including diversification via low correlation to broad equities and bonds, continued strong property fundamentals, and attractive current dividend yields (4.7% average REIT dividend yield, versus a 4% 10-Year Treasury yield). More importantly, current valuations relative to private market real estate are quite favorable, as we estimate U.S. property companies are currently trading at an average 14% discount to their NAV.
The approximate 30% sell-off from February’s peak is reminiscent of the corrections in the early and late 90’s (August 1989 to October 1990 and January 1998 to November 1999), each of which saw a peak-to-trough decline in excess of -20%. Both of these previous corrections were followed by fairly sharp rebounds in the twelve months after the market bottom (36% in the first case and 22% in the second).
It is important to understand the differences between this and previous corrections. Today, the U.S. REIT universe consists primarily of companies that we believe to have strong balance sheets
Top Ten Holdings
| Simon Property Group, Inc. | 9.3% |
| Prologis | 6.9% |
| Boston Properties, Inc. | 6.0% |
| Vornado Realty Trust | 4.6% |
| Federal Realty Investment Trust | 4.4% |
| Regency Centers Corp. | 4.2% |
| General Growth Properties, Inc. | 4.1% |
| Ventas, Inc. | 4.1% |
| Host Hotels & Resorts, Inc. | 3.9% |
| SL Green Realty Corp. | 3.6% |
Portfolio holdings are subject to change daily.
and to have been prudent capital allocators — unlike the 1998-99 situation when many (if not most) REITs were in the midst of huge acquisition programs as part of the “pie-eating” philosophy prevailing at the time encouraging companies to take full advantage of the open equity window offered by Wall Street. In our view, today’s companies have been very sparing issuers of new equity and have had fairly modest acquisition programs, leaving very few in distressed situations.
In our opinion, the market has priced in a pessimistic scenario that is likely beyond what the actual experience will be in terms of economic slowdown and changes in commercial real estate valuations. While it is always possible to imagine scenarios that are even worse than expected, it now appears to us that much of the bad news is already built in to the stock prices and that this is looking like a buying opportunity to us, especially since nobody has the courage to step up and buy. It feels more like capitulation and panic than rational selling. An interesting arbitrage has opened up between public and private market real estate affording investors who are not faint-of-heart, given the high volatility of market prices, an opportunity to buy real estate now in the public market at very attractive relative valuations.
Portfolio holdings and characteristics are subject to change and may not be representative of current holdings and characteristics. The outlook for this Fund may differ from that presented for other ING Funds. Performance for the different classes of shares will vary based on differences in fees associated with each class.
4
Table of Contents
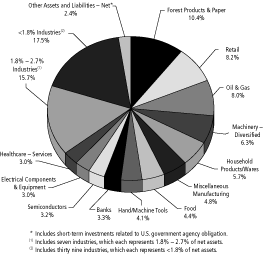
ING Fundamental Research Fund (the “Fund”) seeks to maximize total return. The Fund is managed by Christopher Corapi, Portfolio Manager, of ING Investment Management Co. — the Sub-Adviser.
Performance: For the six months ended November 30, 2007, the Fund’s Class A shares, excluding sales charges, provided a total return of (2.12)% compared to Standard & Poor’s 500® Composite Stock Price Index(1) (“S&P 500® Index”), which returned (2.33)%, for the same period.
Portfolio Specifics: The Fund benefited the most from favorable sector allocation decisions, particularly by underweighting financials and consumer discretionary while overweighting technology. Stock selection in the financial, industrials and healthcare sectors was another contributor to performance. The Fund was hurt by stock selection in the consumer discretionary and consumer staples sectors.
Among the stocks that contributed most to return within financials were Assurant, Inc. and Principal Financial Group, Inc. Assurant, Inc., a niche insurance player, benefited from the turmoil in the sub-prime mortgage market. Their dominant position in the force-placed homeowners market expanded as credit worsened. Principal Financial Group, Inc. had strong fund flows in their 401(k) business. Additionally, their life and health insurance businesses improved dramatically from last quarter.
Within health care, Covance, Inc. and Merck & Co., Inc. contributed meaningfully to results. Pharmaceutical companies are outsourcing research to contract research organizations such as Covance, Inc. Covance, Inc., an industry leader in toxicology services in drug develop-
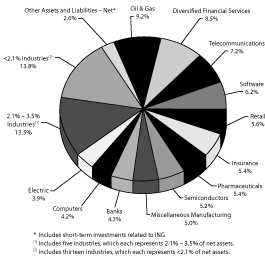
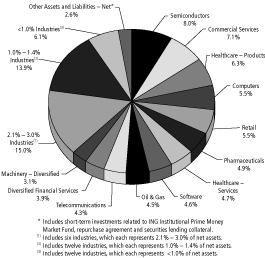
Industry Allocation
ment, is benefiting from this trend, especially as the demand for toxicology services is rising. Merck & Co., Inc. reported positive quarterly results beating Wall Street estimates. The firm has executed well on its pipeline development and gotten drug approvals at the FDA. In industrials, our investment in Foster Wheeler (sold) experienced strong growth abroad and was recently awarded new power contracts.
The stocks that detracted most from return in the consumer discretionary sector were Children’s Place, Liz Claiborne, Inc. and Macy’s, Inc. We exited our position in Children’s Place after the firm violated its newly re-signed contract with Disney. An accounting scandal also surfaced damaging the stock. We sold Macy’s, Inc. as the current credit crunch dampened our thesis that Macy’s, Inc. was a strong takeout candidate. Liz Claiborne, Inc. has suffered along with the entire retail group as fears of a macroeconomic slowdown and poor weather have weighed heavily on the company’s outlook. We believe the firm’s recent business divestures and reallocation of resources to its main brands are positive potential catalysts for the stock.
Within consumer staples, Fomento Economico Mexicano S.A.B. de C.V. (“Fomento”) (sold) was a drag on performance. The hurricanes in Mexico dampened demand for beer. To combat weaker beer sales, Fomento and their competitors aggressively dropped prices pressuring margins.
Current Strategy and Outlook: Currently, the Fund is positioned in companies that we believe have strong or improving competitive positions, robust end markets or superior capital allocation opportunities. We believe each stock possesses an attractive valuation and a clear catalyst to improve it.
Top holdings include XTO Energy, Inc., Google, Inc., Intel Corp., Microsoft Corp. and Merck & Co., Inc. (mentioned above). XTO Energy has consistently grown its reserve base. We believe this low cost producer will continue to generate enough cash to fund its own growth. Furthermore, we have high confidence in XTO’s management. We believe that the Google’s IT invest-
| ExxonMobil Corp. | 5.2% |
| Microsoft Corp. | 3.5% |
| Google, Inc. — Class A | 3.0% |
| AT&T, Inc. | 2.8% |
| Intel Corp. | 2.7% |
| Lehman Brothers Holdings, Inc. | 2.5% |
| Altria Group, Inc. | 2.5% |
| Merck & Co., Inc. | 2.3% |
| General Electric Co. | 2.2% |
| Johnson & Johnson | 2.1% |
| * | Excludes short-term investments related to ING Institutional Prime Money Market Fund. |
Portfolio holdings are subject to change daily.
ments in new product development such as its mobile phone initiatives as well as its online advertising business may help drive growth going forward. We expect the PC cycle to be longer and stronger than Wall Street expectations boosting Intel and Microsoft. Strong unit growth in PC shipments and emerging market growth are potential catalysts.
Portfolio holdings and characteristics are subject to change and may not be representative of current holdings and characteristics. The outlook for this Fund may differ from that presented for other ING Funds. Performance for the different classes of shares will vary based on differences in fees associated with each class.
5
Table of Contents
ING LargeCap Growth Fund (the “Fund”) seeks long-term capital appreciation. The Fund is managed by Andrew J. Schilling, Portfolio Manager of Wellington Management Company, LLP — the Sub-Adviser.
Performance: For the six months ended November 30, 2007, the Fund’s Class A shares, excluding sales charges, provided a total return of 5.46% compared to the Russell 1000® Growth Index(1) and the Russell 1000® Index(2), which returned 2.24% and (2.56)%, respectively, for the same period.
Portfolio Specifics: The Fund’s outperformance was driven by security selection; sector allocation, a result of bottom-up stock selection, had a negligible effect on relative performance, as overweight positions in strong materials and information technology stocks and an underweight in lagging consumer discretionary stocks was largely offset by an overweight among trailing telecommunication services stocks. Selection was particularly strong in the industrials and materials sectors.
Top contributors to relative returns included Suntech Power Holdings Co., Ltd. (industrials), Transocean, Inc. (energy), Fluor (industrials), and Vale, previously known as Cia Vale do Rio Doce, (materials). Chinese solar manufacturer Suntech Power Holdings Co., Ltd. saw its shares gain after higher-than-expected quarterly earnings led to upward earnings revisions. Transocean, Inc., the world’s largest offshore drilling firm, is benefiting from high day rates, strong rig utilization, record backlog, and a strong financial position. We believe the company is well positioned in a strong industry cycle for international oil and gas services. Engineering and construction company Fluor reported solid earnings, led by strength in oil and gas, power generation, and infrastructure projects. Fluor
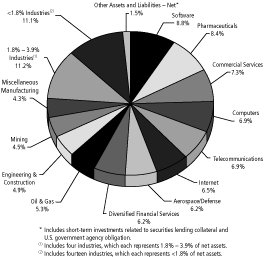
Industry Allocation
remains favorably positioned with a healthy project pipeline and a series of large contract wins. Brazilian metals and mining company Vale’s shares moved sharply higher on strength in iron ore prices. The firm is benefiting from solid iron ore fundamentals as strong Chinese demand sustains tight capacity and a favorable pricing environment. Top absolute contributors during the period included consumer electronics company Apple and search giant Google, Inc.
NII Holdings, Inc. (telecommunication services), Kohl’s Corp. (consumer discretionary), and Manpower, Inc. (industrials) were among the top detractors from relative and absolute performance during the period. NII Holdings, Inc. a wireless communications company primarily serving Latin America, saw its stock fall on concerns of rising push-to-talk competition in Mexico. We believe the market is underestimating subscriber growth trends and margin expansion potential. Specialty department store company Kohl’s Corp. saw its shares decline with disappointing same-store-sales trends and investor concerns about overall consumer spending. We believe that new store growth and margin expansion opportunities could benefit the shares going forward and maintain a position in the stock. Shares in staffing services company Manpower, Inc. moved lower due to concerns of a weaker outlook for U.S. business growth. We believe that the global professional staffing outlook remains favorable, particularly outside the U.S.
Current Strategy and Outlook: Our investment approach is very much a “bottom-up” process: we pick one stock at a time based upon the attractiveness of each company’s valuation and fundamentals. As a result of this bottom-up stock selection, we were most overweight industrials and information technology at the end of the period. Our industrials positions favor capital goods companies such as General Dynamics Corp. and Danaher Corp. Significant information technology holdings include software companies Google, Inc. and Electronic Arts, Inc. We remain broadly underweight consumer stocks amid concerns that consumer spending will be negatively impacted by housing market
| Google, Inc. — Class A | 3.6% |
| General Dynamics Corp. | 2.9% |
| Microsoft Corp. | 2.8% |
| Schering-Plough Corp. | 2.4% |
| Apple, Inc. | 2.3% |
| Oracle Corp. | 2.2% |
| Merck & Co., Inc. | 2.0% |
| Danaher Corp. | 2.0% |
| Apollo Group, Inc. — Class A | 2.0% |
| Fluor Corp. | 1.9% |
| * | Excludes short-term investments related to securities lending collateral and U.S. government agency obligation. |
Portfolio holdings are subject to change daily.
turmoil and a slowing economy. We are also underweight healthcare as we reduced our exposure to pharmaceutical firm Schering-Plough and eliminated our position in medical device company Medtronic, Inc.
(2) The Russell 1000® Index is an unmanaged, comprehensive large- cap index measuring the performance of the largest 1,000 U.S. incorporated companies.
Portfolio holdings and characteristics are subject to change and may not be representative of current holdings and characteristics. The outlook for this Fund may differ from that presented for other ING Funds. Performance for the different classes of shares will vary based on differences in fees associated with each class.
6
Table of Contents
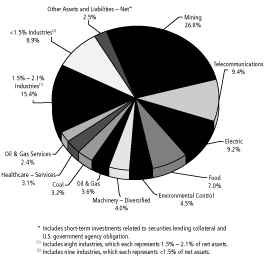
ING MidCap Opportunities Fund (the “Fund”) seeks long term capital appreciation. The Fund is managed by Richard Welsh and Jeff Bianchi, Portfolio Managers, both of ING Investment Management Co. — the Sub-Adviser.
Performance: For the six months ended November 30, 2007, the Fund’s Class A shares, excluding sales charges, provided a total return of 3.91% compared to the Russell Midcap® Growth Index(1) and the Russell Midcap® Index(2), which returned (1.60)% and (5.79)%, respectively, for the same period.
Portfolio Specifics: The market was adversely affected by ongoing sub-prime and credit problems and a spike in crude oil prices, which hovered near $100 a barrel by period-end. The extent of decline was limited by a 0.75% reduction in the federal funds rate, which occurred in two phases. Also helpful was the expectation that additional rate relief was coming, to forestall significant damage to the real economy from the credit crisis.
The telecommunication services and consumer discretionary sectors led the market lower, falling 15% and 11%, respectively. The decline in the telecommunication services sector was due in part to increased price competition and slower line growth overall. Consumer discretionary stocks started discounting slower consumer spending as a consequence of tighter credit standards, higher energy prices and lower confidence. Financials were led lower by overall credit issues and large write-downs of assets.
Rising crude oil prices provided a positive backdrop for the energy sector,
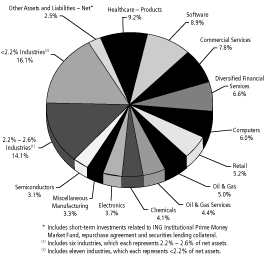
Industry Allocation
which gained the most at nearly 8%. The industrial and health care sectors had modest gains with help from construction and engineering and life sciences industries.
The Fund’s out performance was primarily due to stock selection, particularly in the consumer discretionary, industrials, healthcare and financial sectors. The Fund’s underweighting of the consumer discretionary sector also contributed to return. Growth factors utilized in our stock selection process, such as earnings momentum and price momentum, were effective prognosticators of stock performance.
Kyphon, Inc., Cameron International Corp., and McDermott International, Inc. made equivalent contributions to returns. Kyphon, Inc.’s shares benefited from a takeover by Medtronic, Inc. Cameron International Corp.’s shares reacted to robust demand for oil equipment as indicated by a record deep sea oil equipment order backlog. McDermott International, Inc. is also experiencing strong order backlogs for engineering and construction energy services. The company reported stronger than expected earnings for the second and third quarters.
Peabody Energy Corp. underperformed as mild summer weather hurt coal demand and caused an inventory build-up and pricing pressures. Phillips-Van Heusen shares were weak on concern that the outlook could be hurt by weakness in retail. Gartner performed poorly because earnings expectations were reduced to the low end of the projected range as a consequence of higher discretionary spending.
Current Strategy and Outlook: Following three months of gains, the equity market retreated in November as investors pondered the impact of financial dislocations on the outlook for real growth and profits. We anticipate profit
Top Ten Holdings*
| Hologic, Inc. | 2.7% |
| NRG Energy, Inc. | 2.6% |
| Hess Corp. | 2.3% |
| TJX Cos., Inc. | 2.2% |
| Fiserv, Inc. | 2.2% |
| St. Jude Medical, Inc. | 2.1% |
| Respironics, Inc. | 2.1% |
| Gildan Activewear, Inc. | 2.0% |
| Corrections Corp. of America | 1.9% |
| ITT Corp. | 1.8% |
| * | Excludes short-term investments related to securities lending collateral. |
Portfolio holdings are subject to change daily.
growth to slow into 2008 largely due to, in our opinion, the impact of reduced credit availability on personal spending gains. Despite this, the market, we believe should be supported by strong corporate balance sheets, global growth and rate reductions by central banks. As a result, companies that exhibit the strong business characteristics we find attractive should be rewarded with expanding, if not premium, valuations.
(2) The Russell Midcap® Index is an unmanaged index that measures the performance of the 800 smallest companies in the Russell 1000® Index, which represents approximately 26% of the total market capitalization of the Russell 1000® Index.
Portfolio holdings and characteristics are subject to change and may not be representative of current holdings and characteristics. The outlook for this Fund may differ from that presented for other ING Funds. Performance for the different classes of shares will vary based on differences in fees associated with each class.
7
Table of Contents
ING Opportunistic LargeCap Fund (the “Fund”) seeks capital appreciation. The Fund is managed by Omar Aguilar, Ph.D., Portfolio Manager, and Vincent Costa, CFA both of ING Investment Management Co. — the Sub-Adviser.
Performance: For the six months ended November 30, 2007, the Fund’s Class A shares, excluding sales charges, provided a total return of (1.07)% compared to the Russell 1000® Growth Index(1), which returned 2.24%, for the same period.
Portfolio Specifics: The reporting period was difficult for ING quantitative equity, as most of our strategies underperformed their benchmarks.
The dislocation of quantitative funds was driven by changes in liquidity that impacted the risk and leverage of many quantitative managers. During the latter part of June and early July, we saw a clear transition in market leadership from value to growth and from small-cap to large-cap, in combination with a spike in volatility triggered by turmoil in the sub-prime mortgage market.
Quantitative managers with significant amounts of leverage were forced to unwind positions, which affected all our strategies during the first week of August. In fact, much of our negative
performance came from poorly ranked stocks that were underweighted in our funds, suggesting that quant hedge fund managers were willing to sell their highly ranked stocks to cover their short positions. After a tough summer, performance was bouncing back by the end of November, as we recalibrated factor weights in our quantitative model to adjust to the new “growth” market environment.
Sector positions that detracted from results for the period included underweight positions in the consumer staples and information technology sectors. These losses were partially offset by an underweight position in financials and an overweight position in the materials sector. Security selection detracted from performance in the information technology, healthcare and consumer staples sectors. These losses were partially offset by security selection in the telecommunication and materials sectors.
The most significant detractors for the period were in the healthcare sector, with names like WellCare Group (sold) which lost more than half its value in a day due to fraud investigations by the Securities and Exchange Commission and King Pharmaceuticals Inc. (sold) hurting performance the most. The top contributors included China Mobile Ltd. and Mosaic Co.
Current Strategy and Outlook: Our research builds structured funds of stock with fundamental characteristics that we believe will translate into performance advantage over the benchmark. Our analysis positions the Fund to capitalize on high quality companies with superior business momentum, strong earnings and attractive valuations.
Top Ten Holdings
| Humana, Inc. | 3.8% |
| Microsoft Corp. | 3.6% |
| Lockheed Martin Corp. | 3.4% |
| Amazon.com, Inc. | 3.2% |
| Aetna, Inc. | 3.2% |
| Apple, Inc. | 3.1% |
| Express Scripts, Inc. | 2.9% |
| Intel Corp. | 2.7% |
| Harris Corp. | 2.7% |
| Mosaic Co. | 2.6% |
Portfolio holdings are subject to change daily.
We are currently overweight in the materials and telecom services sectors and underweight in the financials, consumer staples and healthcare sectors.
Portfolio holdings and characteristics are subject to change and may not be representative of current holdings and characteristics. The outlook for this Fund may differ from that presented for other ING Funds. Performance for the different classes of shares will vary based on differences in fees associated with each class.
8
Table of Contents
ING SmallCap Opportunities Fund (the “Fund”) seeks capital appreciation. The Fund is managed by Steve Salopek, Portfolio Manager of ING Investment Management Co. — the Sub-Adviser.
Performance: For the six months ended November 30, 2007, the Fund’s Class A shares, excluding sales charges, provided a total return of (2.83)% compared to the Russell 2000® Growth Index(1) and the Russell 2000® Index(2), which returned (3.25)% and (8.82)%, respectively, for the same period.
Portfolio Specifics: During the reporting period, concerns about credit and global growth hurt smaller U.S. stocks and resulted in increased market volatility. Concerns about credit availability affected banks and financial firms and began to spread into the consumer discretionary sector, including retailers and retail real estate investment trusts (“REITS”).
Utilities was the best performing sector for the period; followed by materials, which benefited from a weakening U.S. dollar and international growth. Telecommunication services and healthcare, which are perceived to be more stable businesses, also helped performance.
Stock selection was the main performance driver over the quarter. Selection within healthcare and financials contributed most to results; selection in consumer discretionary and consumer staples detracted the most.
Kyphon, Inc. and Alexion Pharmaceuticals contributed significantly to performance over the period. Kyphon, Inc. is a global medical device company specializing in the design, manufacture and marketing of medical devices to treat and restore spinal anatomy using minimally invasive technologies. During the reporting period, Kyphon, Inc. and
Industry Allocation
Medtronic, Inc. announced that Medtronic, Inc. will acquire all of the outstanding shares of Kyphon, Inc. for $71 per share, which represents a 34% premium to the stock price. We sold the Fund’s position.
Alexion Pharmaceuticals develops biopharmaceuticals for patients with serious and life-threatening medical conditions. The company’s first product, Soliris, for the treatment of PNH, received approval from the U.S. FDA and the European regulatory during the period. The stock performed well as initial results from the launch of Soliris exceeded market expectations.
Xyratex Ltd. and Pantry, Inc. were two of the largest detractors from performance over the period. Xyratex Ltd., which makes test equipment for disk drives, had a downturn in sales, as its largest customer, Seagate, has temporarily stopped placing orders. Seagate acquired Maxtor, which manufactured disk drives, and is utilizing Maxtor’s test equipment rather than placing new orders. We continue to hold a position in the company, as we believe that business will turn positive again once Seagate has worked through their excess capacity and resumes placing orders with Xyratex.
Pantry, Inc., which operates a convenience store chain in the southeastern United States, reported earnings below expectations due to problems with the level of gas margins they were able to achieve. The Fund continues to hold its position, as we believe the company’s valuation is compelling based on its unchanged longer-term fundamentals. What’s more, we believe the company will be able to achieve better gas margins.
Current Strategy and Outlook: We continue to focus on companies with strong balance sheets and cash flow generation capabilities. We believe the Fund is defensively positioned in the financials sector, with exposure to banks, diversified financials and insurance. We are underweight REITS, as we think the real estate market is overextended. Within healthcare, the Fund remains positioned to gain from strong demand for behavioral health
| FTI Consulting, Inc. | 1.4% |
| Hologic, Inc. | 1.3% |
| Psychiatric Solutions, Inc. | 1.2% |
| Moog, Inc. | 1.1% |
| Verigy Ltd. | 1.1% |
| Greif, Inc. | 1.1% |
| Vistaprint Ltd. | 1.1% |
| Semtech Corp. | 1.1% |
| Formfactor, Inc. | 1.1% |
| Digital Realty Trust, Inc. | 1.1% |
| * | Excludes short-term investments related to ING Institutional Prime Money Market Fund and securities lending collateral. |
providers, healthcare equipment suppliers with niche franchises and disease-management providers. We are underweight biotech stocks due to risk and valuation considerations, and we have no exposure to Medicaid managed-care providers due to the, in our opinion, deteriorating reimbursement environment. Our technology exposure is in software and services, hardware and equipment, and semiconductors.
(2) The Russell 2000® Index is an index that measures the performance of securities of small U.S. companies.
Portfolio holdings and characteristics are subject to change and may not be representative of current holdings and characteristics. The outlook for this Fund may differ from that presented for other ING Funds. Performance for the different classes of shares will vary based on differences in fees associated with each class.
9
Table of Contents
ING Financial Services Fund (the “Fund”) seeks long-term capital appreciation. The Fund is managed by Robert M. Kloss and Steven L. Rayner, Portfolio Managers, of ING Investment Management Co. — the Sub-Adviser.
Performance: For the six months ended November 30, 2007, the Fund’s Class A shares, excluding sales charges, provided a total return of (13.42)% compared to Standard & Poor’s 500 Financials Index(1) (“S&P 500 Financials Index”) and the Standard & Poor’s 500® Composite Stock Price Index(2) (“S&P 500® Index”), which returned (16.79)% and (2.33)%, respectively, for the same period.
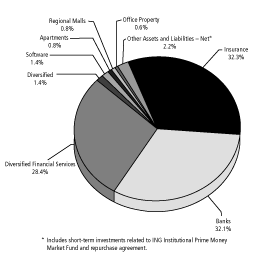
Portfolio Specifics: Financial stocks were hit hard during the six month period, as systemic liquidity and credit concerns emerged and snow-balled. Those financial stocks most directly exposed to housing and credit risk were among the worst performers. The Fund benefited from its significant overweight position in the insurance area, as these stocks generally held up well, largely by virtue of having less exposure to those risks. The Fund’s underweight position in the mortgage finance sub-sector also helped relative performance, as most of these stocks sold off with the declines in the housing and credit outlook.
The Fund’s outperformance arose from security selection. The Fund benefited from positions in life/health insurers AFLAC, Inc., Principal Financial Group and StanCorp Financial Group — these stocks were viewed as havens from the most troublesome areas of credit risk. The Fund also benefited from a position added during the period in niche insurer Assurant Inc., which derives a significant portion of its earnings from businesses that benefit from worsening housing credit conditions.
Among capital markets-oriented financial stocks, some stocks suffered while others, whose earnings streams were viewed as more insulated from direct effects of the crisis, performed well. Stocks fitting the latter description
included Deutsche Bourse AG, the European stock exchange and trading system provider; custodian/securities servicer State Street Corp.; and Lazard Ltd., an international investment banking advisor that takes little direct balance sheet risk compared to traditional investment banks. The Fund also benefited from its position in asset manager Nuveen (sold), which was acquired during the period.
The biggest individual detractor from performance this period was E*Trade Financial Corp. (sold), which declined as the company’s banking operations were forced to take significant asset write-downs and hopes of industry consolidation faded. The Fund’s position in bond guarantor MBIA, Inc. also hurt results as ratings downgrades of securities insured by the company raised questions about its own rating and capital adequacy.
Other individual names that hindered performance included smaller positions in office/industrial REIT Liberty Property Trust, bond insurer Security Capital Assurance, mortgage insurer MGIC and commercial lender CIT Group, the latter three of which we sold during the period.
Current Strategy and Outlook: During the summer and early fall we reduced our credit- and capital markets-exposed holdings in favor of stocks we believe will have defensive characteristics in a vulnerable market.
We remain cautious regarding companies that depend on a more benign credit environment or strong economic growth. Though further federal interest rate relief may be forthcoming, we continue to believe that the housing and credit-related downturn is more likely to worsen and spread to other parts of the economy.
Our primary issue is now this: to what extent has the market already discounted the bad news to come? We are still positioned defensively, but are evaluating the possibility that a combination of Federal Reserve actions, other government attempts to provide relief to the housing market, private equity capital infusions to prominent financial companies, more attractive valuations or improved liquidity in the financial system could combine to cause a turn in financial
| JPMorgan Chase & Co. | 5.8% |
| Wells Fargo & Co. | 5.3% |
| Bank of America Corp. | 5.0% |
| American International Group, Inc. | 4.9% |
| US Bancorp. | 4.5% |
| Citigroup, Inc. | 3.7% |
| Wachovia Corp. | 3.3% |
| PNC Financial Services Group, Inc. | 2.9% |
| State Street Corp. | 2.8% |
| Protective Life Corp. | 2.8% |
Portfolio holdings are subject to change daily.
stocks. Our current assessment is that it’s too early to massively bottom-fish — bad credit results make a tough headwind for financial stocks to overcome — but in the context of an extremely dynamic sector, this view could change at any point.
(2) The S&P 500® Index is an unmanaged index that measures the performance of securities of approximately 500 large-capitalization companies whose securities are traded on major U.S. stock markets.
Portfolio holdings and characteristics are subject to change and may not be representative of current holdings and characteristics. The outlook for this Fund may differ from that presented for other ING Funds. Performance for the different classes of shares will vary based on differences in fees associated with each class.
10
Table of Contents
ING LargeCap Value Fund (the “Fund”) seeks long-term capital appreciation. The Fund is managed by Brandes Investment Partners, L.P. (“Brandes”), the Sub-Adviser. Brandes’ Large Cap Investment Committee is responsible for making day-to-day investment decisions for the Fund. The six voting members of the Large Cap Investment Committee are: Glenn Carlson, CFA, Chief Executive Officer, Brent Woods, CFA, Managing Director — Investments, Amelia Maccoun Morris, CFA, Director — Investments, Keith Colestock, CFA, Director — Investments, W. James Brown, CFA, Director — Investments, and Brent Fredberg, Senior Analyst.
Performance: For the six months ended November 30, 2007, the Fund’s Class A shares, excluding sales charges, provided a total return of (17.24)% compared to the Russell 1000® Value Index(1) and the Russell 1000® Index(2), which returned (7.33)% and (2.56)%, respectively, for the same period.
Portfolio Specifics: Price declines for the Fund’s holdings in the thrifts & mortgage finance industry weighed heaviest on performance during the six-month period. Countrywide Financial Corp., Federal Home Loan Mortgage Corp. (“Freddie Mac”), and Washington Mutual, Inc. were some of the positions from this industry enduring the greatest share price declines. Unfavorable results for securities in the media, commercial banking, and communications equipment industries also had a negative effect on returns. The largest detractors from these industries included Gannett Co., Inc. (media), Popular, Inc. (commercial banking), and Alcatel-Lucent (France — communications equipment). Fund holdings in the household durables, insurance, and IT services industries also tended to lose ground during the period.
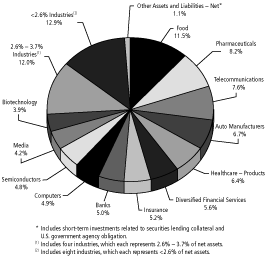
Industry Allocation
While a number of the Fund’s holdings declined over the trailing six months, select positions posted gains. Advances for Intel Corp. (semiconductors & semiconductor equipment), Microsoft Corp. (software), and Johnson & Johnson (pharmaceuticals) helped to offset some of the Fund’s negative results.
On a relative basis, the Fund’s stock selection and allocation within the thrifts & mortgage industry weakened returns. The Fund’s lack of exposure to the oil, gas, & consumable fuels industry, coupled with poor relative performance for holdings in the media and communications equipment industries, proved unfavorable. Keep in mind that industry allocations are not top-down forecasts, but a residual of our company-by-company analysis.
During the period, we sold our positions in companies such as International Business Machines Corp. (computers & peripherals), Tribune Company (media), and Merck & Co., Inc. (pharmaceuticals), to pursue other investment opportunities. We used the proceeds from these sales to purchase shares of new holdings at prices that we consider attractive. During the period, we purchased Countrywide Financial Corp. (thrifts & mortgage finance), Federal Home Loan Mortgage Corp. (thrifts & mortgage finance), and Home Depot, Inc. (specialty retail) at what we believe to be discounts to their true value.
As a result of select buying and selling, as well as changes in the prices of holdings, many of the Fund’s industry exposures shifted. For example, exposure to the thrifts & mortgage finance industry increased as a result of new purchases, while exposure to the computers & peripherals and diversified telecommunication services industries declined amid select parebacks and sales. As of November 30, 2007, the Fund retained its greatest exposure to the pharmaceuticals industry.
Top Ten Holdings*
| Sara Lee Corp. | 4.3% |
| Pfizer, Inc. | 3.9% |
| Amgen, Inc. | 3.9% |
| Boston Scientific Corp. | 3.9% |
| Ford Motor Co. | 3.7% |
| H&R Block, Inc. | 3.7% |
| Safeway, Inc. | 3.6% |
| Micron Technology, Inc. | 3.3% |
| Gannett Co., Inc. | 3.2% |
| Whirlpool Corp. | 3.1% |
| * | Excludes short-term investments related to securities lending collateral. |
Portfolio holdings are subject to change daily.
Current Strategy and Outlook: Keep in mind that industry exposures are the direct result of purchase and sell decisions made on a bottom-up, company-by-company basis. While we continue to monitor short-term events in U.S. equity markets, our investment philosophy focuses on company-by-company analysis. We take a long-term perspective and believe that none or very little of the short-term “market news” provides useful information to investors. Instead, we remain focused on purchasing large-cap stocks at discounts to our estimates of their intrinsic values. We believe that this approach will provide patient investors with favorable returns over the long term.
(2) The Russell 1000® Index measures the performance of the largest 1,000 U.S. incorporated companies.
Portfolio holdings and characteristics are subject to change and may not be representative of current holdings and characteristics. The outlook for this Fund may differ from that presented for other ING Funds. Performance for the different classes of shares will vary based on differences in fees associated with each class.
11
Table of Contents
ING SmallCap Value Choice Fund (the “Fund”) seeks maximum long term capital appreciation. The Fund is managed by Phyllis G. Thomas, CFA, Managing Director, of NWQ Investment Management Company, LLC (“NWQ”), Robert A. Schwarzkopf, CFA & Sandi L. Gleason, CFA both of Kayne Anderson Rudnick Investment Management, LLC (“Kayne”) and Omar Aguilar, Ph.D. & Vincent Costa, CFA both of ING Investment Management Co. (“ING IM”) — the Sub-Advisers.
Performance: For the six months ended November 30, 2007, the Fund’s Class A shares, excluding sales charges, provided a total return of (14.48)% compared to the Russell 2000® Value Index(1) and the Russell 2000® Index(2), which returned (14.38)% and (8.82)%, respectively, for the same period.
Portfolio Specifics: NWQ — The U.S. equity markets experienced significant turbulence during the six months ending November 30, 2007, as concerns over rising defaults within the sub-prime mortgage industry broadened adversely affecting the financial markets. After the extreme market instability in July and August, the stock market rallied strongly into October in anticipation of an additional interest rate cut by the U.S. Federal Reserve Board (the “Fed”). Growing problems in the banking system, however, triggered a renewal of the summer weakness in November as witnessed in the decline of the equity markets and the extreme day-to-day volatility.
The Fund underperformed the Russell 2000® Index and Russell 2000® Value Index over the reporting period. Investments in the financial sector, particularly in the mortgage industry, were the main detractors from performance during the period. The largest detractors included RAIT Financial Trust, Franklin Bank Corp. and Griffon Corp. Helping to partially offset these declines were several investments that posted strong gains, particularly in the energy and consumer discretionary sectors. The Fund’s top performers included Denbury Resources, Inc., Fossil, Inc., and WD-40 Co. Small and mid capitalization companies in general underperformed compared to large capitalization stocks, while growth stocks significantly outperformed value stocks.
Industry Allocation
Kayne — The sixth months ending November 30, 2007, were marked by a renewed focus on risk due to the widespread credit crunch that emerged with the failure of sub-prime mortgage securitizations, a declining housing market, and record high oil prices. The difficulties in the credit markets and economy worked to the advantage of high-quality stocks. Stocks with A rankings by Standard & Poor’s held up better in the market decline, as did those with strong credit ratings. Consumer discretionary and basic materials contributed the most to the Fund’s outperformance due to strong stock selection. Utilities detracted the most from performance due to the Fund’s underweight in this sector.
ING IM — The Fund’s underperformance was primarily due to its “deep value” approach, which fell out of favor during the reporting period. In the last several months, we have seen a rotation in style leadership from value to growth stocks. This rotation and the spike in volatility triggered by the sub-prime turmoil forced quantitative managers with significant amounts of leverage to unwind their positions, which hurt many of our strategies. After a tough summer, performance bounced back in the fourth quarter and the Fund had recovered slightly by the end of the reporting period.
Financials and information technology were the worst performing sectors for the period; the Fund’s underperformance in these sectors was primarily due to stock selection.
In the financials sector, overweight positions in real estate companies such as RAIT Financial Trust (sold) and Newcastle Investment Corp. were the greatest detractors from results, losing more than two-thirds and half of their value, respectively. Their losses were due to the downturn in the real estate market resulting from the sub-prime turmoil. Worst detractors in the information technology sector were overweight positions in CMGI, Inc. and Imation (sold), which slipped as they issued lower earnings guidance.
Current Strategy and Outlook: NWQ — We believe the markets appear to be torn between the positive scenario of additional Fed easing in December and the negative scenario of potential stagflation. Falling interest rates are of little benefit as falling home prices are leaving many homeowners with negative equity and thus an inability to refinance their adjustable rate mortgages. This phenomenon combined with sharply rising energy prices suggests a weakening consumer. The most likely outcome, in our opinion, is more aggressive Fed easing. In this more difficult economic environment, risk premiums have clearly been rising from very low levels this spring. We continue to stress test the valuations of our holdings for a more difficult market environment.
Kayne — Investors heightened their focus on credit risk for the first time in roughly five years. Credit spreads between 10-year high-yield bonds and 10-year Treasury bonds widened from 2.7% at the end of May to 5.0% at the end of November. The Fed lowered the federal funds rate two times during this time period, alleviating some market jitters.
We believe the debt markets have become more rational and investors will increasingly be focused on those companies that can grow in a weaker economy without reliance on cheap financing, much like the high quality businesses that comprise our portfolios. As
Top Ten Holdings
| WD-40 Co. | 3.5% |
| Wausau Paper Corp. | 2.7% |
| Lincoln Electric Holdings, Inc. | 2.6% |
| Warren Resources, Inc. | 2.5% |
| Sauer-Danfoss, Inc. | 2.4% |
| Albany International Corp. | 2.4% |
| Griffon Corp. | 2.4% |
| Community Health Systems, Inc. | 2.3% |
| Bob Evans Farms, Inc. | 2.3% |
| Casey’s General Stores, Inc. | 2.3% |
Portfolio holdings are subject to change daily.
always, we endeavor to manage the Fund with the highest quality businesses, outgrowing their markets, purchased at discount values.
ING IM — Our research builds structured funds of stocks with fundamental characteristics that we believe will translate into a performance advantage over the benchmark. Our analysis positions the Fund to capitalize on high-quality companies with superior business momentum, growing earnings and attractive valuations.
The Fund is currently overweight in the information technology and energy sectors and underweight in the financials, industrials and consumer discretionary sectors.
(1) The Russell 2000® Value Index measures the performance of those Russell 2000 companies with lower price-to-book ratios and lower forecasted growth values.
(2) The Russell 2000® Index is an unmanaged index that measures the performance of securities of small U.S. companies.
Portfolio holdings and characteristics are subject to change and may not be representative of current holdings and characteristics. The outlook for this Fund may differ from that presented for other ING Funds. Performance for the different classes of shares will vary based on differences in fees associated with each class.
12
Table of Contents
ING Value Choice Fund (the “Fund”) seeks long-term capital appreciation. The Fund is managed by David B. Iben, CFA, Chief Investment Officer and Managing Director of Tradewinds Global Investors, LLC — the Sub-Adviser.
Performance: For the six months ended November 30, 2007, the Fund’s Class A shares, excluding sales charges, provided a total return of 1.44% compared to the Russell 3000 Value Index(1), Russell Midcap® Value Index(2) and the Russell Midcap® Index(3), which returned (7.92)%, (10.90)% and (5.79)%, respectively, for the same period.
Portfolio Specifics: The materials & processing sector, the Fund’s largest sector weighting, was the best performing sector during the period. Four of the top six performing portfolio holdings over the past six months were all gold mining companies: Newmont Mining Corp., AngloGold Ashanti Ltd. ADR, Newcrest Mining Corp. and Kinross Gold Corp. During the period, the price of gold reached its highest level in 27 years, and many of the gold producers benefited as a result.
The Fund’s best contributors to performance included holdings in the producer durables and energy sectors. AGCO Corp., a manufacturer and distributor of agricultural equipment and related replacement parts, has benefited from a global boom in the agricultural industry. Coal producer Peabody Energy Corp. also gained during the period upon expectations for higher coal prices and robust demand over the next several years. Demand from emerging market countries such as China and India continues and escalating gas prices may encourage users to turn to coal as a cheaper alternative.
The consumer staples sector was the Fund’s worst performing sector during the period, primarily a result of the performance of Tyson Foods Inc., a leading global producer, distributor and marketer of chicken, beef, pork, and
Industry Allocation
prepared foods. The stock was the Fund’s largest individual detractor from performance during the last six month period. The company announced more recently that it was scaling back beef production, as higher cattle prices have squeezed operating margins.
While the Fund outperformed its primary benchmark, other portfolio holdings detracted from performance. The stock price of Levitt Corp., a homebuilding and real estate development company in the Southeastern United States, surged at the end of January after BFC Financial Corp. said it would pay about $286 million for the homebuilder. These gains were more than erased after BFC announced in August that it terminated its merger agreement. New Mexico energy provider PNM Resources, Inc. also suffered due to restructuring costs, higher energy purchasing prices, and weak contributions from its wholesale business. Sanmina-SCI Corporation shares declined significantly in July after the electronics contract manufacturer provided a weak third quarter report and fourth quarter outlook. AbitibiBowater Incorporated was formed in late October as a result of a merger between Abitibi-Consolidated Incorporated and Bowater Incorporated. The company, a producer of coated and specialty papers and newsprint, was the largest among the few Materials & Processing sector holdings that did not perform well. The paper industry as a whole is suffering from poor supply/demand fundamentals.
Current Strategy and Outlook: As the end of the year approaches, we believe concerns caused by the U.S. sub-prime mortgage meltdown and softening housing conditions will continue to work themselves out, and as such, markets will continue to be volatile. Excess money from Federal Reserve and European Central Bank credit injections should find their way into investments with a scarcity of supply, such as oil, commodities and gold. As such, we continue to believe that the long-term supply and demand fundamentals for gold companies are compelling. While many metals and mining positions have shined -with gold prices reaching a 27-year high in September — in real terms, the price of gold is still less than 50 percent of its 1980
| Anglogold Ashanti Ltd. ADR | 5.6% |
| Newmont Mining Corp. | 4.8% |
| Tyson Foods, Inc. | 4.1% |
| Nippon Telegraph & Telephone Corp. ADR | 3.0% |
| Smithfield Foods, Inc. | 2.9% |
| PNM Resources, Inc. | 2.8% |
| Kinross Gold Corp. | 2.6% |
| Coeur d’Alene Mines Corp., 1.250%, due 01/15/24 | 2.6% |
| Allied Waste Industries, Inc. | 2.6% |
| Apex Silver Mines Ltd. | 2.5% |
| * | Excludes short-term investments related to securities lending collateral and U.S. government agency obligation. |
Portfolio holdings are subject to change daily.
high. We also continue to believe the Fund is well positioned worldwide in other strong business franchises — such as in food, agriculture, and basic materials companies — that have the potential to appreciate over the long-term.
(2) The Russell Midcap® Value Index is an unmanaged index that measures the performance of Russell MidCap companies with lower price-to-book ratios and lower forecasted growth values.
(3) The Russell Midcap® Index measures the performance of the 800 smallest companies in the Russell 1000® Index, which represents approximately 26% of the total market capitalization of the Russell 1000® Index.
Portfolio holdings and characteristics are subject to change and may not be representative of current holdings and characteristics. The outlook for this Fund may differ from that presented for other ING Funds. Performance for the different classes of shares will vary based on differences in fees associated with each class.
13
Table of Contents
As a shareholder of a Fund, you incur two types of costs: (1) transaction costs, including sales charges (loads) on purchase payments, redemption fees, and exchange fees; and (2) ongoing costs, including management fees, distribution and/or service (12b–1) fees, and other Fund expenses. These Examples are intended to help you understand your ongoing costs (in dollars) of investing in a Fund and to compare these costs with the ongoing costs of investing in other mutual funds.
The Examples are based on an investment of $1,000 invested at the beginning of the period and held for the entire period from June 1, 2007 to November 30, 2007. The Funds’ expenses are shown without the imposition of any sales charges or fees. Expenses would have been higher if such charges were included.
Actual Expenses
The first section of the table shown, “Actual Fund Return,” provides information about actual account values and actual expenses. You may use the information in this section, together with the amount you invested, to estimate the expenses that you paid over the period. Simply divide your account value by $1,000 (for example, an $8,600 account value divided by $1,000 = 8.6), then multiply the result by the number in the first section under the heading entitled “Expenses Paid During Period” to estimate the expenses you paid on your account during this period.
Hypothetical Example for Comparison Purposes
The second section of the table shown, “Hypothetical (5% return before expenses),” provides information about hypothetical account values and hypothetical expenses based on the Fund’s actual expense ratio and an assumed rate of return of 5% per year before expenses, which is not the Fund’s actual return. The hypothetical account values and expenses may not be used to estimate the actual ending account balance or expenses you paid for the period. You may use this information to compare the ongoing costs of investing in each Fund and other funds. To do so, compare this 5% hypothetical example with the 5% hypothetical examples that appear in the shareholder reports of the other funds.
Please note that the expenses shown in the table are meant to highlight your ongoing costs only and do not reflect any transactional costs, such as sales charges (loads), redemption fees, or exchange fees. Therefore, the hypothetical lines of the table are useful in comparing ongoing costs only, and will not help you determine the relative total costs of owning different funds. In addition, if these transactional costs were included, your costs would have been higher.
14
Table of Contents
| Beginning | Ending | Expenses Paid | |||||||||||||||
| Account | Account | Annualized | During the | ||||||||||||||
| Value | Value | Expense | Period Ended | ||||||||||||||
| ING Real Estate Fund | June 1, 2007 | November 30, 2007 | Ratio | November 30, 2007* | |||||||||||||
| Actual Fund Return | |||||||||||||||||
| Class A | $ | 1,000.00 | $ | 855.70 | 1.27 | % | $ | 5.89 | |||||||||
| Class B | 1,000.00 | 852.30 | 2.02 | 9.35 | |||||||||||||
| Class C | 1,000.00 | 852.00 | 2.02 | 9.35 | |||||||||||||
| Class I | 1,000.00 | 856.70 | 0.97 | 4.50 | |||||||||||||
| Class O | 1,000.00 | 856.30 | 1.27 | 5.89 | |||||||||||||
| Class Q | 1,000.00 | 855.00 | 1.16 | 5.38 | |||||||||||||
| Hypothetical (5% return before expenses) | |||||||||||||||||
| Class A | $ | 1,000.00 | $ | 1,018.65 | 1.27 | % | $ | 6.41 | |||||||||
| Class B | 1,000.00 | 1,014.90 | 2.02 | 10.18 | |||||||||||||
| Class C | 1,000.00 | 1,014.90 | 2.02 | 10.18 | |||||||||||||
| Class I | 1,000.00 | 1,020.15 | 0.97 | 4.90 | |||||||||||||
| Class O | 1,000.00 | 1,018.65 | 1.27 | 6.41 | |||||||||||||
| Class Q | 1,000.00 | 1,019.20 | 1.16 | 5.86 | |||||||||||||
ING Fundamental Research Fund | |||||||||||||||||
| Actual Fund Return | |||||||||||||||||
| Class A | $ | 1,000.00 | $ | 978.80 | 1.25 | % | $ | 6.18 | |||||||||
| Class B | 1,000.00 | 975.20 | 2.00 | 9.88 | |||||||||||||
| Class C | 1,000.00 | 975.20 | 2.00 | 9.88 | |||||||||||||
| Class I | 1,000.00 | 980.40 | 1.00 | 4.95 | |||||||||||||
| Hypothetical (5% return before expenses) | |||||||||||||||||
| Class A | $ | 1,000.00 | $ | 1,018.75 | 1.25 | % | $ | 6.31 | |||||||||
| Class B | 1,000.00 | 1,015.00 | 2.00 | 10.08 | |||||||||||||
| Class C | 1,000.00 | 1,015.00 | 2.00 | 10.08 | |||||||||||||
| Class I | 1,000.00 | 1,020.00 | 1.00 | 5.05 | |||||||||||||
| * | Expenses are equal to each Fund’s respective annualized expense ratios multiplied by the average account value over the period, multiplied by 183/366 to reflect the most recent fiscal half-year. |
15
Table of Contents
| Beginning | Ending | Expenses Paid | |||||||||||||||
| Account | Account | Annualized | During the | ||||||||||||||
| Value | Value | Expense | Period Ended | ||||||||||||||
| ING LargeCap Growth Fund | June 1, 2007 | November 30, 2007 | Ratio | November 30, 2007* | |||||||||||||
| Actual Fund Return | |||||||||||||||||
| Class A | $ | 1,000.00 | $ | 1,054.60 | 1.45 | % | $ | 7.45 | |||||||||
| Class B | 1,000.00 | 1,051.20 | 2.10 | 10.77 | |||||||||||||
| Class C | 1,000.00 | 1,051.40 | 2.10 | 10.77 | |||||||||||||
| Class I | 1,000.00 | 1,056.70 | 0.99 | 5.09 | |||||||||||||
| Class Q | 1,000.00 | 1,055.60 | 1.23 | 6.32 | |||||||||||||
| Hypothetical (5% return before expenses) | |||||||||||||||||
| Class A | $ | 1,000.00 | $ | 1,017.75 | 1.45 | % | $ | 7.31 | |||||||||
| Class B | 1,000.00 | 1,014.50 | 2.10 | 10.58 | |||||||||||||
| Class C | 1,000.00 | 1,014.50 | 2.10 | 10.58 | |||||||||||||
| Class I | 1,000.00 | 1,020.05 | 0.99 | 5.00 | |||||||||||||
| Class Q | 1,000.00 | 1,018.85 | 1.23 | 6.21 | |||||||||||||
ING MidCap Opportunities Fund | |||||||||||||||||
| Actual Fund Return | |||||||||||||||||
| Class A | $ | 1,000.00 | $ | 1,039.10 | 1.25 | % | $ | 6.37 | |||||||||
| Class B | 1,000.00 | 1,035.70 | 2.00 | 10.18 | |||||||||||||
| Class C | 1,000.00 | 1,035.30 | 2.00 | 10.18 | |||||||||||||
| Class I | 1,000.00 | 1,041.60 | 0.80 | 4.08 | |||||||||||||
| Class Q | 1,000.00 | 1,040.20 | 1.05 | 5.36 | |||||||||||||
| Hypothetical (5% return before expenses) | |||||||||||||||||
| Class A | $ | 1,000.00 | $ | 1,018.75 | 1.25 | % | $ | 6.31 | |||||||||
| Class B | 1,000.00 | 1,015.00 | 2.00 | 10.08 | |||||||||||||
| Class C | 1,000.00 | 1,015.00 | 2.00 | 10.08 | |||||||||||||
| Class I | 1,000.00 | 1,021.00 | 0.80 | 4.04 | |||||||||||||
| Class Q | 1,000.00 | 1,019.75 | 1.05 | 5.30 | |||||||||||||
ING Opportunistic LargeCap Fund | |||||||||||||||||
| Actual Fund Return | |||||||||||||||||
| Class A | $ | 1,000.00 | $ | 989.30 | 1.25 | % | $ | 6.22 | |||||||||
| Class B | 1,000.00 | 984.30 | 2.00 | 9.92 | |||||||||||||
| Class C | 1,000.00 | 985.00 | 2.00 | 9.93 | |||||||||||||
| Class I | 1,000.00 | 989.30 | 1.00 | 4.97 | |||||||||||||
| Hypothetical (5% return before expenses) | |||||||||||||||||
| Class A | $ | 1,000.00 | $ | 1,018.75 | 1.25 | % | $ | 6.31 | |||||||||
| Class B | 1,000.00 | 1,015.00 | 2.00 | 10.08 | |||||||||||||
| Class C | 1,000.00 | 1,015.00 | 2.00 | 10.08 | |||||||||||||
| Class I | 1,000.00 | 1,020.00 | 1.00 | 5.05 | |||||||||||||
| * | Expenses are equal to each Fund’s respective annualized expense ratios multiplied by the average account value over the period, multiplied by 183/366 to reflect the most recent fiscal half-year. |
16
Table of Contents
| Beginning | Ending | Expenses Paid | |||||||||||||||
| Account | Account | Annualized | During the | ||||||||||||||
| Value | Value | Expense | Period Ended | ||||||||||||||
| ING SmallCap Opportunities Fund | June 1, 2007 | November 30, 2007 | Ratio | November 30, 2007* | |||||||||||||
| Actual Fund Return | |||||||||||||||||
| Class A | $ | 1,000.00 | $ | 971.70 | 1.50 | % | $ | 7.39 | |||||||||
| Class B | 1,000.00 | 968.00 | 2.25 | 11.07 | |||||||||||||
| Class C | 1,000.00 | 968.00 | 2.25 | 11.07 | |||||||||||||
| Class I | 1,000.00 | 973.80 | 1.07 | 5.28 | |||||||||||||
| Class Q | 1,000.00 | 972.60 | 1.32 | 6.51 | |||||||||||||
| Hypothetical (5% return before expenses) | |||||||||||||||||
| Class A | $ | 1,000.00 | $ | 1,017.50 | 1.50 | % | $ | 7.57 | |||||||||
| Class B | 1,000.00 | 1,013.75 | 2.25 | 11.33 | |||||||||||||
| Class C | 1,000.00 | 1,013.75 | 2.25 | 11.33 | |||||||||||||
| Class I | 1,000.00 | 1,019.65 | 1.07 | 5.40 | |||||||||||||
| Class Q | 1,000.00 | 1,018.40 | 1.32 | 6.66 | |||||||||||||
ING Financial Services Fund | |||||||||||||||||
| Actual Fund Return | |||||||||||||||||
| Class A | $ | 1,000.00 | $ | 865.80 | 1.27 | % | $ | 5.92 | |||||||||
| Class B | 1,000.00 | 862.50 | 2.02 | 9.41 | |||||||||||||
| Class C | 1,000.00 | 862.70 | 2.02 | 9.41 | |||||||||||||
| Class O | 1,000.00 | 865.80 | 1.27 | 5.92 | |||||||||||||
| Hypothetical (5% return before expenses) | |||||||||||||||||
| Class A | $ | 1,000.00 | $ | 1,018.65 | 1.27 | % | $ | 6.41 | |||||||||
| Class B | 1,000.00 | 1,014.90 | 2.02 | 10.18 | |||||||||||||
| Class C | 1,000.00 | 1,014.90 | 2.02 | 10.18 | |||||||||||||
| Class O | 1,000.00 | 1,018.65 | 1.27 | 6.41 | |||||||||||||
ING LargeCap Value Fund | |||||||||||||||||
| Actual Fund Return | |||||||||||||||||
| Class A | $ | 1,000.00 | $ | 827.60 | 1.45 | % | $ | 6.63 | |||||||||
| Class B | 1,000.00 | 824.60 | 2.20 | 10.04 | |||||||||||||
| Class C | 1,000.00 | 825.20 | 2.20 | 10.04 | |||||||||||||
| Class I | 1,000.00 | 828.90 | 1.11 | 5.08 | |||||||||||||
| Hypothetical (5% return before expenses) | |||||||||||||||||
| Class A | $ | 1,000.00 | $ | 1,017.75 | 1.45 | % | $ | 7.31 | |||||||||
| Class B | 1,000.00 | 1,014.00 | 2.20 | 11.08 | |||||||||||||
| Class C | 1,000.00 | 1,014.00 | 2.20 | 11.08 | |||||||||||||
| Class I | 1,000.00 | 1,019.45 | 1.11 | 5.60 | |||||||||||||
| * | Expenses are equal to each Fund’s respective annualized expense ratios multiplied by the average account value over the period, multiplied by 183/366 to reflect the most recent fiscal half-year. |
17
Table of Contents
| Expenses | |||||||||||||||||
| Ending | Paid | ||||||||||||||||
| Beginning | Account | During the | |||||||||||||||
| Account | Value | Annualized | Period Ended | ||||||||||||||
| Value | November 30, | Expense | November 30, | ||||||||||||||
| ING SmallCap Value Choice Fund | June 1, 2007 | 2007 | Ratio | 2007* | |||||||||||||
| Actual Fund Return | |||||||||||||||||
| Class A | $ | 1,000.00 | $ | 855.20 | 1.49 | % | $ | 6.91 | |||||||||
| Class B | 1,000.00 | 851.90 | 2.24 | 10.37 | |||||||||||||
| Class C | 1,000.00 | 852.00 | 2.24 | 10.37 | |||||||||||||
| Class I | 1,000.00 | 856.80 | 1.18 | 5.48 | |||||||||||||
| Hypothetical (5% return before expenses) | |||||||||||||||||
| Class A | $ | 1,000.00 | $ | 1,017.55 | 1.49 | % | $ | 7.52 | |||||||||
| Class B | 1,000.00 | 1,013.80 | 2.24 | 11.28 | |||||||||||||
| Class C | 1,000.00 | 1,013.80 | 2.24 | 11.28 | |||||||||||||
| Class I | 1,000.00 | 1,019.10 | 1.18 | 5.96 | |||||||||||||
ING Value Choice Fund | |||||||||||||||||
| Actual Fund Return | |||||||||||||||||
| Class A | $ | 1,000.00 | $ | 1,014.40 | 1.46 | % | $ | 7.35 | |||||||||
| Class B | 1,000.00 | 1,011.30 | 2.21 | 11.11 | |||||||||||||
| Class C | 1,000.00 | 1,010.70 | 2.21 | 11.11 | |||||||||||||
| Class I | 1,000.00 | 1,016.70 | 1.17 | 5.90 | |||||||||||||
| Hypothetical (5% return before expenses) | |||||||||||||||||
| Class A | $ | 1,000.00 | $ | 1,017.70 | 1.46 | % | $ | 7.36 | |||||||||
| Class B | 1,000.00 | 1,013.95 | 2.21 | 11.13 | |||||||||||||
| Class C | 1,000.00 | 1,013.95 | 2.21 | 11.13 | |||||||||||||
| Class I | 1,000.00 | 1,019.15 | 1.17 | 5.91 | |||||||||||||
| Effective September 28, 2007, the contractual obligations for ING Value Choice Fund has changed. If this change had been in place during the entire six-month period, hypothetical ending account balances, annualized expense ratio and expenses paid would have been as follows: | |||||||||||||||||
| Annualized | Expenses | |||||||||||||||
| Ending | Expense | Paid | ||||||||||||||
| Beginning | Account | Ratio | During the | |||||||||||||
| Account | Value | (adjusted for | Period Ended | |||||||||||||
| Value | November 30, | contractual | November 30, | |||||||||||||
| ING Value Choice Fund | June 1, 2007 | 2007 | changes) | 2007** | ||||||||||||
| Hypothetical (5% return before expenses) | ||||||||||||||||
| Class A | $ | 1,000.00 | $ | 1,018.00 | 1.40 | % | $ | 7.06 | ||||||||
| Class B | 1,000.00 | 1,014.25 | 2.15 | 10.83 | ||||||||||||
| Class C | 1,000.00 | 1,014.25 | 2.15 | 10.83 | ||||||||||||
| Class I | 1,000.00 | 1,019.25 | 1.15 | 5.81 | ||||||||||||
| * | Expenses are equal to each Fund’s respective annualized expense ratios multiplied by the average account value over the period, multiplied by 183/366 to reflect the most recent fiscal half-year. |
| ** | Expenses are equal to each Fund’s respective annualized expense ratios, adjusted for contractual changes, multiplied by the average account value over the period, multiplied by 183/366 to reflect the most recent fiscal half-year. |
18
Table of Contents
| ING | ING | ING | ING | |||||||||||||||
| Real | Fundamental | LargeCap | MidCap | |||||||||||||||
| Estate | Research | Growth | Opportunities | |||||||||||||||
| Fund | Fund | Fund | Fund | |||||||||||||||
ASSETS: | ||||||||||||||||||
| Investments in securities at value+* | $ | 270,200,874 | $ | 34,105,152 | $ | 176,294,041 | $ | 273,577,572 | ||||||||||
| Short-term investments in affiliates at amortized cost | — | 1,100,000 | — | 3,900,000 | ||||||||||||||
| Short-term investments at amortized cost | 2,764,171 | 106,000 | 17,197,932 | 39,263,510 | ||||||||||||||
| Cash | 302,658 | 3,179 | 440,511 | 831 | ||||||||||||||
| Cash collateral for futures | — | 28,350 | — | — | ||||||||||||||
| Foreign currencies at value** | — | — | — | 133,164 | ||||||||||||||
| Receivables: | ||||||||||||||||||
| Investment securities sold | — | 108,143 | 4,098,597 | 12,569,196 | ||||||||||||||
| Fund shares sold | 164,161 | 493 | 173,247 | 70,260 | ||||||||||||||
| Dividends and interest | 244,872 | 50,801 | 190,444 | 222,344 | ||||||||||||||
| Variation margin receivable | — | 1,845 | — | — | ||||||||||||||
| Prepaid expenses | 44,175 | 33,655 | 29,728 | 28,030 | ||||||||||||||
| Reimbursement due from manager | — | 26,015 | — | 57,549 | ||||||||||||||
| Total assets | 273,720,911 | 35,563,633 | 198,424,500 | 329,822,456 | ||||||||||||||
LIABILITIES: | ||||||||||||||||||
| Payable for investment securities purchased | — | 403,458 | 5,482,803 | 9,447,629 | ||||||||||||||
| Payable for fund shares redeemed | 425,200 | 80,575 | 345,749 | 748,963 | ||||||||||||||
| Payable upon receipt of securities loaned | — | — | 13,281,107 | 38,324,510 | ||||||||||||||
| Payable to affiliates | 219,561 | 42,320 | 235,861 | 405,417 | ||||||||||||||
| Payable to custodian due to foreign currency overdraft*** | — | 127 | 463 | — | ||||||||||||||
| Payable for trustee fees | 2,263 | 1,156 | 9,852 | 12,408 | ||||||||||||||
| Other accrued expenses and liabilities | 78,696 | 35,125 | 135,340 | 365,922 | ||||||||||||||
| Total liabilities | 725,720 | 562,761 | 19,491,175 | 49,304,849 | ||||||||||||||
NET ASSETS | $ | 272,995,191 | $ | 35,000,872 | $ | 178,933,325 | $ | 280,517,607 | ||||||||||
NET ASSETS WERE COMPRISED OF: | ||||||||||||||||||
| Paid-in capital | $ | 188,116,294 | $ | 67,774,463 | $ | 450,158,442 | $ | 312,081,936 | ||||||||||
| Undistributed net investment income (distributions in excess of net investment income/accumulated net investment loss) | (2,376,673 | ) | (16,376 | ) | 263,596 | (1,650,286 | ) | |||||||||||
| Accumulated net realized gain (loss) on investments, foreign currency related transactions, and futures | 20,695,958 | (35,306,695 | ) | (309,404,258 | ) | (51,078,296 | ) | |||||||||||
| Net unrealized appreciation on investments, foreign currency related transactions, and futures | 66,559,612 | 2,549,480 | 37,915,545 | 21,164,253 | ||||||||||||||
NET ASSETS | $ | 272,995,191 | $ | 35,000,872 | $ | 178,933,325 | $ | 280,517,607 | ||||||||||
| + Including securities loaned at value | $ | — | $ | — | $ | 13,099,090 | $ | 37,273,859 | ||||||||||
| * Cost of investments in securities | $ | 203,641,262 | $ | 31,557,965 | $ | 138,378,445 | $ | 252,413,276 | ||||||||||
| ** Cost of foreign currencies | $ | — | $ | — | $ | — | $ | 133,207 | ||||||||||
| *** Cost of foreign currency overdraft | $ | — | $ | 129 | $ | 412 | $ | — | ||||||||||
19
Table of Contents
| ING | ING | ING | ING | |||||||||||||
| Real | Fundamental | LargeCap | MidCap | |||||||||||||
| Estate | Research | Growth | Opportunities | |||||||||||||
| Fund | Fund | Fund | Fund | |||||||||||||
Class A: | ||||||||||||||||
| Net assets | $ | 107,733,149 | $ | 15,027,896 | $ | 74,344,636 | $ | 118,071,815 | ||||||||
| Shares authorized | unlimited | unlimited | unlimited | unlimited | ||||||||||||
| Par value | $ | 0.01 | $ | 0.01 | $ | 0.01 | $ | 0.01 | ||||||||
| Shares outstanding | 6,607,825 | 1,302,823 | 3,259,121 | 6,353,185 | ||||||||||||
| Net asset value and redemption price per share | $ | 16.30 | $ | 11.53 | $ | 22.81 | $ | 18.58 | ||||||||
Maximum offering price per share (5.75%)(1) | $ | 17.29 | $ | 12.23 | $ | 24.20 | $ | 19.71 | ||||||||
Class B: | ||||||||||||||||
| Net assets | $ | 3,803,729 | $ | 12,503,942 | $ | 54,449,725 | $ | 74,936,324 | ||||||||
| Shares authorized | unlimited | unlimited | unlimited | unlimited | ||||||||||||
| Par value | $ | 0.01 | $ | 0.01 | $ | 0.01 | $ | 0.01 | ||||||||
| Shares outstanding | 232,713 | 1,097,425 | 2,502,599 | 4,308,473 | ||||||||||||
Net asset value and redemption price per share (2) | $ | 16.35 | $ | 11.39 | $ | 21.76 | $ | 17.39 | ||||||||
| Maximum offering price per share | $ | 16.35 | $ | 11.39 | $ | 21.76 | $ | 17.39 | ||||||||
Class C: | ||||||||||||||||
| Net assets | $ | 3,196,176 | $ | 7,465,683 | $ | 33,357,835 | $ | 77,503,003 | ||||||||
| Shares authorized | unlimited | unlimited | unlimited | unlimited | ||||||||||||
| Par value | $ | 0.01 | $ | 0.01 | $ | 0.01 | $ | 0.01 | ||||||||
| Shares outstanding | 188,917 | 653,458 | 1,537,890 | 4,478,650 | ||||||||||||
Net asset value and redemption price per share (2) | $ | 16.92 | $ | 11.42 | $ | 21.69 | $ | 17.30 | ||||||||
| Maximum offering price per share | $ | 16.92 | $ | 11.42 | $ | 21.69 | $ | 17.30 | ||||||||
Class I: | ||||||||||||||||
| Net assets | $ | 121,951,601 | $ | 3,351 | $ | 15,739,331 | $ | 4,307,776 | ||||||||
| Shares authorized | unlimited | unlimited | unlimited | unlimited | ||||||||||||
| Par value | $ | 0.01 | $ | 0.01 | $ | 0.01 | $ | 0.01 | ||||||||
| Shares outstanding | 7,081,266 | 292 | 660,177 | 223,377 | ||||||||||||
| Net asset value and redemption price per share | $ | 17.22 | $ | 11.48 | $ | 23.84 | $ | 19.28 | ||||||||
| Maximum offering price per share | $ | 17.22 | $ | 11.48 | $ | 23.84 | $ | 19.28 | ||||||||
Class O: | ||||||||||||||||
| Net assets | $ | 36,309,645 | n/a | n/a | n/a | |||||||||||
| Shares authorized | unlimited | n/a | n/a | n/a | ||||||||||||
| Par value | $ | 0.01 | n/a | n/a | n/a | |||||||||||
| Shares outstanding | 2,229,629 | n/a | n/a | n/a | ||||||||||||
| Net asset value and redemption price per share | $ | 16.29 | n/a | n/a | n/a | |||||||||||
| Maximum offering price per share | $ | 16.29 | n/a | n/a | n/a | |||||||||||
Class Q: | ||||||||||||||||
| Net assets | $ | 891 | n/a | $ | 1,041,798 | $ | 5,698,689 | |||||||||
| Shares authorized | unlimited | n/a | unlimited | unlimited | ||||||||||||
| Par value | $ | 0.01 | n/a | $ | 0.01 | $ | 0.01 | |||||||||
| Shares outstanding | 55 | n/a | 44,258 | 301,919 | ||||||||||||
| Net asset value and redemption price per share | $ | 16.30 | n/a | $ | 23.54 | $ | 18.87 | |||||||||
| Maximum offering price per share | $ | 16.30 | n/a | $ | 23.54 | $ | 18.87 | |||||||||
| (1) | Maximum offering price is computed at 100/94.25 of net asset value. On purchases of $100,000 or more, the offering price is reduced. |
| (2) | Redemption price per share may be reduced for any applicable contingent deferred sales charges. |
20
Table of Contents
| ING | ING | ING | ING | |||||||||||||||
| Opportunistic | SmallCap | Financial | LargeCap | |||||||||||||||
| LargeCap | Opportunities | Services | Value | |||||||||||||||
| Fund | Fund | Fund | Fund | |||||||||||||||
ASSETS: | ||||||||||||||||||
| Investments in securities at value+* | $ | 9,523,679 | $ | 132,089,005 | $ | 241,026,785 | $ | 72,740,103 | ||||||||||
| Short-term investments in affiliates at amortized cost | 15,000 | 2,275,000 | 750,000 | — | ||||||||||||||
| Short-term investments at amortized cost | 106,000 | 36,873,571 | 655,000 | 11,184,426 | ||||||||||||||
| Cash | 72 | 81 | 784 | 418,043 | ||||||||||||||
| Foreign currencies at value** | — | — | 21,011 | — | ||||||||||||||
| Receivables: | ||||||||||||||||||
| Investment securities sold | — | 2,322,450 | 3,884,767 | 251,680 | ||||||||||||||
| Fund shares sold | 499,806 | 81,121 | 576,298 | 400,727 | ||||||||||||||
| Dividends and interest | 10,582 | 97,215 | 624,637 | 150,796 | ||||||||||||||
| Prepaid expenses | 32,540 | 24,745 | 29,593 | 15,298 | ||||||||||||||
| Reimbursement due from manager | 5,682 | 3,193 | — | 1,284 | ||||||||||||||
| Total assets | 10,193,361 | 173,766,381 | 247,568,875 | 85,162,357 | ||||||||||||||
LIABILITIES: | ||||||||||||||||||
| Payable for investment securities purchased | 49,043 | 957,565 | — | 720,485 | ||||||||||||||
| Payable for fund shares redeemed | — | 250,510 | 670,680 | 224,592 | ||||||||||||||
| Payable upon receipt of securities loaned | — | 36,570,571 | — | 10,514,627 | ||||||||||||||
| Payable to affiliates | 8,655 | 178,673 | 214,659 | 91,071 | ||||||||||||||
| Payable for trustee fees | 855 | 8,184 | 5,500 | 160 | ||||||||||||||
| Other accrued expenses and liabilities | 22,065 | 195,116 | 162,183 | 38,650 | ||||||||||||||
| Total liabilities | 80,618 | 38,160,619 | 1,053,022 | 11,589,585 | ||||||||||||||
NET ASSETS | $ | 10,112,743 | $ | 135,605,762 | $ | 246,515,853 | $ | 73,572,772 | ||||||||||
NET ASSETS WERE COMPRISED OF: | ||||||||||||||||||
| Paid-in capital | $ | 9,025,386 | $ | 345,405,479 | $ | 188,574,348 | $ | 74,162,836 | ||||||||||
| Undistributed net investment income (accumulated net investment loss) | 5,148 | (303,233 | ) | 2,686,895 | 419,467 | |||||||||||||
| Accumulated net realized gain (loss) on investments and foreign currency related transactions | 501,678 | (217,641,672 | ) | 28,573,430 | 12,486,510 | |||||||||||||
| Net unrealized appreciation or depreciation on investments and foreign currency related transactions | 580,531 | 8,145,188 | 26,681,180 | (13,496,041 | ) | |||||||||||||
NET ASSETS | $ | 10,112,743 | $ | 135,605,762 | $ | 246,515,853 | $ | 73,572,772 | ||||||||||
| + Including securities loaned at value | $ | — | $ | 35,492,494 | $ | — | $ | 10,528,207 | ||||||||||
| * Cost of investments in securities | $ | 8,943,148 | $ | 123,943,817 | $ | 214,345,553 | $ | 86,236,144 | ||||||||||
| ** Cost of foreign currencies | $ | — | $ | — | $ | 21,063 | $ | — | ||||||||||
21
Table of Contents
| ING | ING | ING | ING | |||||||||||||
| Opportunistic | SmallCap | Financial | LargeCap | |||||||||||||
| LargeCap | Opportunities | Services | Value | |||||||||||||
| Fund | Fund | Fund | Fund | |||||||||||||
Class A: | ||||||||||||||||
| Net assets | $ | 9,020,774 | $ | 79,768,105 | $ | 203,100,009 | $ | 44,700,029 | ||||||||
| Shares authorized | unlimited | unlimited | unlimited | unlimited | ||||||||||||
| Par value | $ | 0.01 | $ | 0.01 | $ | 0.01 | $ | 0.01 | ||||||||
| Shares outstanding | 750,137 | 2,367,627 | 9,430,219 | 4,329,763 | ||||||||||||
| Net asset value and redemption price per share | $ | 12.03 | $ | 33.69 | $ | 21.54 | $ | 10.32 | ||||||||
Maximum offering price per share (5.75%)(1) | $ | 12.76 | $ | 35.75 | $ | 22.85 | $ | 10.95 | ||||||||
Class B: | ||||||||||||||||
| Net assets | $ | 505,190 | $ | 20,006,038 | $ | 21,472,979 | $ | 9,158,258 | ||||||||
| Shares authorized | unlimited | unlimited | unlimited | unlimited | ||||||||||||
| Par value | $ | 0.01 | $ | 0.01 | $ | 0.01 | $ | 0.01 | ||||||||
| Shares outstanding | 42,446 | 660,858 | 1,015,843 | 897,475 | ||||||||||||
Net asset value and redemption price per share (2) | $ | 11.90 | $ | 30.27 | $ | 21.14 | $ | 10.20 | ||||||||
| Maximum offering price per share | $ | 11.90 | $ | 30.27 | $ | 21.14 | $ | 10.20 | ||||||||
Class C: | ||||||||||||||||
| Net assets | $ | 560,690 | $ | 31,547,298 | $ | 1,778,514 | $ | 17,324,046 | ||||||||
| Shares authorized | unlimited | unlimited | unlimited | unlimited | ||||||||||||
| Par value | $ | 0.01 | $ | 0.01 | $ | 0.01 | $ | 0.01 | ||||||||
| Shares outstanding | 47,438 | 1,044,330 | 86,043 | 1,699,084 | ||||||||||||
Net asset value and redemption price per share (2) | $ | 11.82 | $ | 30.21 | $ | 20.67 | $ | 10.20 | ||||||||
| Maximum offering price per share | $ | 11.82 | $ | 30.21 | $ | 20.67 | $ | 10.20 | ||||||||
Class I: | ||||||||||||||||
| Net assets | $ | 26,089 | $ | 4,142,892 | n/a | $ | 2,390,439 | |||||||||
| Shares authorized | unlimited | unlimited | n/a | unlimited | ||||||||||||
| Par value | $ | 0.01 | $ | 0.01 | n/a | $ | 0.01 | |||||||||
| Shares outstanding | 2,161 | 119,790 | n/a | 230,521 | ||||||||||||
| Net asset value and redemption price per share | $ | 12.07 | $ | 34.58 | n/a | $ | 10.37 | |||||||||
| Maximum offering price per share | $ | 12.07 | $ | 34.58 | n/a | $ | 10.37 | |||||||||
Class O: | ||||||||||||||||
| Net assets | n/a | n/a | $ | 20,164,351 | n/a | |||||||||||
| Shares authorized | n/a | n/a | unlimited | n/a | ||||||||||||
| Par value | n/a | n/a | $ | 0.01 | n/a | |||||||||||
| Shares outstanding | n/a | n/a | 941,788 | n/a | ||||||||||||
| Net asset value and redemption price per share | n/a | n/a | $ | 21.41 | n/a | |||||||||||
| Maximum offering price per share | n/a | n/a | $ | 21.41 | n/a | |||||||||||
Class Q: | ||||||||||||||||
| Net assets | n/a | $ | 141,429 | n/a | n/a | |||||||||||
| Shares authorized | n/a | unlimited | n/a | n/a | ||||||||||||
| Par value | n/a | $ | 0.01 | n/a | n/a | |||||||||||
| Shares outstanding | n/a | 4,149 | n/a | n/a | ||||||||||||
| Net asset value and redemption price per share | n/a | $ | 34.09 | n/a | n/a | |||||||||||
| Maximum offering price per share | n/a | $ | 34.09 | n/a | n/a | |||||||||||
| (1) | Maximum offering price is computed at 100/94.25 of net asset value. On purchases of $100,000 or more, the offering price is reduced. |
| (2) | Redemption price per share may be reduced for any applicable contingent deferred sales charges. |
22
Table of Contents
| ING | ING | |||||||||
| SmallCap | Value | |||||||||
| Value Choice | Choice | |||||||||
| Fund | Fund | |||||||||
ASSETS: | ||||||||||
| Investments in securities at value+* | $ | 77,611,328 | $ | 329,318,776 | ||||||
| Short-term investments at amortized cost | 1,272,618 | 98,434,220 | ||||||||
| Cash | 861,962 | 99,975 | ||||||||
| Receivables: | ||||||||||
| Investment securities sold | 332,073 | 308,589 | ||||||||
| Fund shares sold | 143,928 | 618,399 | ||||||||
| Dividends and interest | 53,237 | 820,996 | ||||||||
| Prepaid expenses | 14,049 | 32,445 | ||||||||
| Reimbursement due from manager | 35,496 | 158,841 | ||||||||
| Total assets | 80,324,691 | 429,792,241 | ||||||||
LIABILITIES: | ||||||||||
| Payable for investment securities purchased | 194,005 | 2,228,256 | ||||||||
| Payable for fund shares redeemed | 452,375 | 1,055,133 | ||||||||
| Payable upon receipt of securities loaned | — | 88,309,259 | ||||||||
| Payable to affiliates | 136,808 | 399,216 | ||||||||
| Payable for trustee fees | 624 | 5,387 | ||||||||
| Other accrued expenses and liabilities | 13,383 | 68,559 | ||||||||
| Total liabilities | 797,195 | 92,065,810 | ||||||||
NET ASSETS | $ | 79,527,496 | $ | 337,726,431 | ||||||
NET ASSETS WERE COMPRISED OF: | ||||||||||
| Paid-in capital | $ | 79,321,576 | $ | 306,728,634 | ||||||
| Undistributed net investment income | 180,704 | 687,742 | ||||||||
| Accumulated net realized gain on investments | 1,103,998 | 10,607,182 | ||||||||
| Net unrealized appreciation or depreciation on investments | (1,078,782 | ) | 19,702,873 | |||||||
NET ASSETS | $ | 79,527,496 | $ | 337,726,431 | ||||||
| + Including securities loaned at value | $ | — | $ | 85,383,162 | ||||||
| * Cost of investments in securities | $ | 78,690,110 | $ | 309,615,903 | ||||||
23
Table of Contents
| ING | ING | |||||||
| SmallCap | Value | |||||||
| Value Choice | Choice | |||||||
| Fund | Fund | |||||||
Class A: | ||||||||
| Net assets | $ | 53,047,304 | $ | 212,987,739 | ||||
| Shares authorized | unlimited | unlimited | ||||||
| Par value | $ | 0.01 | $ | 0.01 | ||||
| Shares outstanding | 4,319,443 | 13,112,430 | ||||||
| Net asset value and redemption price per share | $ | 12.28 | $ | 16.24 | ||||
Maximum offering price per share (5.75%)(1) | $ | 13.03 | $ | 17.23 | ||||
Class B: | ||||||||
| Net assets | $ | 3,139,181 | $ | 39,740,007 | ||||
| Shares authorized | unlimited | unlimited | ||||||
| Par value | $ | 0.01 | $ | 0.01 | ||||
| Shares outstanding | 259,924 | 2,473,563 | ||||||
Net asset value and redemption price per share(2) | $ | 12.08 | $ | 16.07 | ||||
| Maximum offering price per share | $ | 12.08 | $ | 16.07 | ||||
Class C: | ||||||||
| Net assets | $ | 13,361,824 | $ | 84,516,512 | ||||
| Shares authorized | unlimited | unlimited | ||||||
| Par value | $ | 0.01 | $ | 0.01 | ||||
| Shares outstanding | 1,104,871 | 5,265,918 | ||||||
Net asset value and redemption price per share(2) | $ | 12.09 | $ | 16.05 | ||||
| Maximum offering price per share | $ | 12.09 | $ | 16.05 | ||||
Class I: | ||||||||
| Net assets | $ | 9,979,187 | $ | 482,173 | ||||
| Shares authorized | unlimited | unlimited | ||||||
| Par value | $ | 0.01 | $ | 0.01 | ||||
| Shares outstanding | 809,362 | 29,426 | ||||||
| Net asset value and redemption price per share | $ | 12.33 | $ | 16.39 | ||||
| Maximum offering price per share | $ | 12.33 | $ | 16.39 | ||||
| (1) | Maximum offering price is computed at 100/94.25 of net asset value. On purchases of $100,000 or more, the offering price is reduced. |
| (2) | Redemption price per share may be reduced for any applicable contingent deferred sales charges. |
24
Table of Contents
| ING | ING | ING | ING | ||||||||||||||
| Real | Fundamental | LargeCap | MidCap | ||||||||||||||
| Estate | Research | Growth | Opportunities | ||||||||||||||
| Fund | Fund | Fund | Fund | ||||||||||||||
INVESTMENT INCOME: | |||||||||||||||||
| Dividends, net of foreign taxes withheld* | $ | 3,263,665 | $ | 271,860 | $ | 2,043,034 | $ | 492,313 | |||||||||
Interest(1) | 87,149 | 28,694 | 51,837 | 200,967 | |||||||||||||
| Securities lending income | — | — | 34,988 | 36,066 | |||||||||||||
| Total investment income | 3,350,814 | 300,554 | 2,129,859 | 729,346 | |||||||||||||
EXPENSES: | |||||||||||||||||
| Investment management fees | 1,112,939 | 129,188 | 896,657 | 1,431,494 | |||||||||||||
| Distribution and service fees: | |||||||||||||||||
| Class A | 160,535 | 17,646 | 127,919 | 175,306 | |||||||||||||
| Class B | 23,877 | 74,309 | 291,087 | 402,668 | |||||||||||||
| Class C | 19,381 | 39,651 | 166,959 | 395,734 | |||||||||||||
| Class O | 53,167 | — | — | — | |||||||||||||
| Class Q | 2 | — | 1,305 | 6,920 | |||||||||||||
| Transfer agent fees: | |||||||||||||||||
| Class A | 68,559 | 10,481 | 57,026 | 126,111 | |||||||||||||
| Class B | 2,532 | 11,086 | 45,516 | 86,819 | |||||||||||||
| Class C | 2,074 | 5,903 | 26,072 | 85,377 | |||||||||||||
| Class I | 39,064 | 2 | 16,861 | 372 | |||||||||||||
| Class O | 22,956 | — | — | — | |||||||||||||
| Class Q | — | — | 210 | 489 | |||||||||||||
| Administrative service fees | 158,991 | 18,455 | 119,552 | 256,885 | |||||||||||||
| Shareholder reporting expense | 47,316 | 16,563 | 36,616 | 52,861 | |||||||||||||
| Registration fees | 39,304 | 26,929 | 29,296 | 29,720 | |||||||||||||
| Professional fees | 46,862 | 10,774 | 20,437 | 24,154 | |||||||||||||
| Custody and accounting expense | 21,960 | 11,388 | 20,177 | 15,875 | |||||||||||||
| Trustee fees | 5,490 | 366 | 4,758 | 5,320 | |||||||||||||
| Offering expense | — | 1,777 | — | — | |||||||||||||
| Interest expense | 4,469 | — | — | 857 | |||||||||||||
| Miscellaneous expense | 13,994 | 5,780 | 8,669 | 9,163 | |||||||||||||
| Total expenses | 1,843,472 | 380,298 | 1,869,117 | 3,106,125 | |||||||||||||
| Net waived and reimbursed fees | — | (63,368 | ) | — | (726,493 | ) | |||||||||||
| Brokerage commission recapture | — | — | (2,855 | ) | — | ||||||||||||
| Net expenses | 1,843,472 | 316,930 | 1,866,262 | 2,379,632 | |||||||||||||
| Net investment income (loss) | 1,507,342 | (16,376 | ) | 263,597 | (1,650,286 | ) | |||||||||||
REALIZED AND UNREALIZED GAIN (LOSS) ON INVESTMENTS, FOREIGN CURRENCY RELATED TRANSACTIONS, AND FUTURES: | |||||||||||||||||
| Net realized gain (loss) on: | |||||||||||||||||
| Investments | 6,969,368 | 1,188,304 | 25,236,803 | 33,975,445 | |||||||||||||
| Foreign currency related transactions | — | 315 | 12,416 | (319 | ) | ||||||||||||
| Futures | — | (79,637 | ) | — | — | ||||||||||||
| Net realized gain on investments, foreign currency related transactions, and futures | 6,969,368 | 1,108,982 | 25,249,219 | 33,975,126 | |||||||||||||
| Net change in unrealized appreciation or depreciation on: | |||||||||||||||||
| Investments | (62,179,732 | ) | (2,013,045 | ) | (12,195,596 | ) | (21,932,298 | ) | |||||||||
| Foreign currency related transactions | — | 2 | 164 | (43 | ) | ||||||||||||
| Futures | — | 2,326 | — | — | |||||||||||||
| Net change in unrealized appreciation or depreciation on investments, foreign currency related transactions, and futures | (62,179,732 | ) | (2,010,717 | ) | (12,195,432 | ) | (21,932,341 | ) | |||||||||
| Net realized and unrealized gain (loss) on investments, foreign currency related transactions, and futures | (55,210,364 | ) | (901,735 | ) | 13,053,787 | 12,042,785 | |||||||||||
Increase (decrease) in net assets resulting from operations | $ | (53,703,022 | ) | $ | (918,111 | ) | $ | 13,317,384 | $ | 10,392,499 | |||||||
| * Foreign taxes withheld | $ | 4,360 | $ | 5,182 | $ | 15,644 | $ | — | |||||||||
| (1) Affiliated income | $ | — | $ | 23,547 | $ | — | $ | 178,944 | |||||||||
25
Table of Contents
| ING | ING | ING | ING | ||||||||||||||
| Opportunistic | SmallCap | Financial | LargeCap | ||||||||||||||
| LargeCap | Opportunities | Services | Value | ||||||||||||||
| Fund | Fund | Fund | Fund | ||||||||||||||
INVESTMENT INCOME: | |||||||||||||||||
| Dividends, net of foreign taxes withheld* | $ | 59,174 | $ | 762,330 | $ | 3,246,495 | $ | 975,794 | |||||||||
Interest(1) | 3,349 | 121,615 | 158,723 | 50,497 | |||||||||||||
| Securities lending income | — | 95,370 | — | 26,056 | |||||||||||||
| Total investment income | 62,523 | 979,315 | 3,405,218 | 1,052,347 | |||||||||||||
EXPENSES: | |||||||||||||||||
| Investment management fees | 30,541 | 698,560 | 1,027,268 | 419,645 | |||||||||||||
| Distribution and service fees: | |||||||||||||||||
| Class A | 9,985 | 125,624 | 393,205 | 76,844 | |||||||||||||
| Class B | 2,036 | 113,823 | 132,705 | 55,472 | |||||||||||||
| Class C | 1,527 | 166,732 | 6,040 | 98,747 | |||||||||||||
| Class O | — | — | 26,780 | — | |||||||||||||
| Class Q | — | 180 | — | — | |||||||||||||
| Transfer agent fees: | |||||||||||||||||
| Class A | 3,741 | 81,235 | 184,862 | 32,672 | |||||||||||||
| Class B | 191 | 22,150 | 21,986 | 5,845 | |||||||||||||
| Class C | 144 | 32,481 | 977 | 10,362 | |||||||||||||
| Class I | 11 | 123 | — | 564 | |||||||||||||
| Class O | — | — | 17,484 | — | |||||||||||||
| Class Q | — | 4 | — | — | |||||||||||||
| Administrative service fees | 4,363 | 132,954 | 4,026 | 47,898 | |||||||||||||
| Shareholder reporting expense | 1,837 | 38,613 | 57,818 | 8,466 | |||||||||||||
| Registration fees | 26,544 | 29,051 | 29,144 | 31,811 | |||||||||||||
| Professional fees | 4,625 | 15,165 | 21,960 | 16,204 | |||||||||||||
| Custody and accounting expense | 3,820 | 12,810 | 18,325 | 10,170 | |||||||||||||
| Trustee fees | 356 | 2,745 | 3,975 | 819 | |||||||||||||
| Interest expense | — | — | — | 7,893 | |||||||||||||
| Miscellaneous expense | 1,971 | 5,928 | 10,487 | 2,485 | |||||||||||||
| Total expenses | 91,692 | 1,478,178 | 1,957,042 | 825,897 | |||||||||||||
| Net waived and reimbursed fees | (34,317 | ) | (193,045 | ) | (114,506 | ) | (13,839 | ) | |||||||||
| Brokerage commission recapture | — | — | — | (9,242 | ) | ||||||||||||
| Net expenses | 57,375 | 1,285,133 | 1,842,536 | 802,816 | |||||||||||||
| Net investment income (loss) | 5,148 | (305,818 | ) | 1,562,682 | 249,531 | ||||||||||||
REALIZED AND UNREALIZED GAIN (LOSS) ON INVESTMENTS AND FOREIGN CURRENCY RELATED TRANSACTIONS: | |||||||||||||||||
| Net realized gain (loss) on: | |||||||||||||||||
| Investments | (36,903 | ) | 11,559,440 | 4,505,340 | 6,212,633 | ||||||||||||
| Foreign currency related transactions | — | — | (7,491 | ) | — | ||||||||||||
| Net realized gain (loss) on investments and foreign currency related transactions | (36,903 | ) | 11,559,440 | 4,497,849 | 6,212,633 | ||||||||||||
| Net change in unrealized appreciation or depreciation on: | |||||||||||||||||
| Investments | (17,893 | ) | (15,519,306 | ) | (46,929,421 | ) | (23,848,605 | ) | |||||||||
| Foreign currency related transactions | — | — | (52 | ) | — | ||||||||||||
| Net change in unrealized appreciation or depreciation on investments and foreign currency related transaction | (17,893 | ) | (15,519,306 | ) | (46,929,473 | ) | (23,848,605 | ) | |||||||||
| Net realized and unrealized loss on investments and foreign currency related transactions | (54,796 | ) | (3,959,866 | ) | (42,431,624 | ) | (17,635,972 | ) | |||||||||
Decrease in net assets resulting from operations | $ | (49,648 | ) | $ | (4,265,684 | ) | $ | (40,868,942 | ) | $ | (17,386,441 | ) | |||||
| * Foreign taxes withheld | $ | 704 | $ | — | $ | — | $ | 4,621 | |||||||||
| (1) Affiliated income | $ | 1,365 | $ | 113,203 | $ | 142,633 | $ | — | |||||||||
26
Table of Contents
| ING | ING | ||||||||
| SmallCap | Value | ||||||||
| Value Choice | Choice | ||||||||
| Fund | Fund | ||||||||
INVESTMENT INCOME: | |||||||||
| Dividends, net of foreign taxes withheld* | $ | 833,785 | $ | 1,764,338 | |||||
| Interest | 54,553 | 1,403,886 | |||||||
| Securities lending income | 22,076 | 142,637 | |||||||
| Total investment income | 910,414 | 3,310,861 | |||||||
EXPENSES: | |||||||||
| Investment management fees | 457,520 | 1,661,478 | |||||||
| Distribution and service fees: | |||||||||
| Class A | 81,696 | 268,719 | |||||||
| Class B | 19,621 | 209,552 | |||||||
| Class C | 75,808 | 434,855 | |||||||
| Transfer agent fees: | |||||||||
| Class A | 36,315 | 184,972 | |||||||
| Class B | 2,179 | 36,134 | |||||||
| Class C | 8,435 | 74,854 | |||||||
| Class I | 2,314 | 294 | |||||||
| Administrative service fees | 47,042 | 172,192 | |||||||
| Shareholder reporting expense | 18,551 | 61,756 | |||||||
| Registration fees | 30,941 | 46,668 | |||||||
| Professional fees | 88,247 | 28,096 | |||||||
| Custody and accounting expense | 28,210 | 19,522 | |||||||
| Trustee fees | 1,536 | 2,562 | |||||||
| Interest expense | — | 1,927 | |||||||
| Miscellaneous expense | 3,881 | 10,183 | |||||||
| Total expenses | 902,296 | 3,213,764 | |||||||
| Net waived and reimbursed fees | (137,865 | ) | (204,838 | ) | |||||
| Brokerage commission recapture | (4,760 | ) | (6,890 | ) | |||||
| Net expenses | 759,671 | 3,002,036 | |||||||
| Net investment income | 150,743 | 308,825 | |||||||
REALIZED AND UNREALIZED GAIN (LOSS) ON INVESTMENTS: | |||||||||
| Net realized gain (loss) on investments | (2,085,300 | ) | 17,983,407 | ||||||
| Net change in unrealized appreciation or depreciation on investments | (13,001,437 | ) | (14,202,774 | ) | |||||
| Net realized and unrealized gain (loss) on investments | (15,086,737 | ) | 3,780,633 | ||||||
Increase (decrease) in net assets resulting from operations | $ | (14,935,994 | ) | $ | 4,089,458 | ||||
| * Foreign taxes withheld | $ | 95 | $ | 84,567 | |||||
27
Table of Contents
| ING Fundamental | |||||||||||||||||
| ING Real Estate Fund | Research Fund | ||||||||||||||||
| Six Months | Six Months | ||||||||||||||||
| Ended | Year Ended | Ended | Year Ended | ||||||||||||||
| November 30, | May 31, | November 30, | May 31, | ||||||||||||||
| 2007 | 2007 | 2007 | 2007 | ||||||||||||||
FROM OPERATIONS: | |||||||||||||||||
| Net investment income (loss) | $ | 1,507,342 | $ | 3,263,203 | $ | (16,376 | ) | $ | (3,261 | ) | |||||||
| Net realized gain on investments, foreign currency related transactions, and futures | 6,969,368 | 32,120,633 | 1,108,982 | 2,884,769 | |||||||||||||
| Net change in unrealized appreciation or depreciation on investments, foreign currency related transactions, and futures | (62,179,732 | ) | 47,237,269 | (2,010,717 | ) | 1,634,596 | |||||||||||
| Increase (decrease) in net assets resulting from operations | (53,703,022 | ) | 82,621,105 | (918,111 | ) | 4,516,104 | |||||||||||
FROM DISTRIBUTIONS TO SHAREHOLDERS: | |||||||||||||||||
| Net investment income: | |||||||||||||||||
| Class A | (1,580,290 | ) | (1,408,372 | ) | — | (73,260 | ) | ||||||||||
| Class B | (36,246 | ) | (6,972 | ) | — | (658 | ) | ||||||||||
| Class C | (26,533 | ) | (6,134 | ) | — | (1,359 | ) | ||||||||||
| Class I | (1,812,829 | ) | (1,803,689 | ) | — | (30 | ) | ||||||||||
| Class O | (505,025 | ) | (454,763 | ) | — | — | |||||||||||
| Class Q | (11 | ) | (7 | ) | — | — | |||||||||||
| Net realized gains: | |||||||||||||||||
| Class A | — | (11,843,789 | ) | — | (79,072 | ) | |||||||||||
| Class B | — | (489,173 | ) | — | (852 | ) | |||||||||||
| Class C | — | (318,162 | ) | — | (1,814 | ) | |||||||||||
| Class I | — | (13,166,210 | ) | — | (26 | ) | |||||||||||
| Class O | — | (3,388,566 | ) | — | — | ||||||||||||
| Class Q | — | (3 | ) | — | — | ||||||||||||
| Total distributions | (3,960,934 | ) | (32,885,840 | ) | — | (157,071 | ) | ||||||||||
FROM CAPITAL SHARE TRANSACTIONS: | |||||||||||||||||
| Net proceeds from sale of shares | 22,494,993 | 156,847,828 | 4,861,093 | 2,878,799 | |||||||||||||
| Proceeds issued in merger | — | — | — | 34,984,449 | |||||||||||||
| Dividends reinvested | 3,821,170 | 30,270,929 | — | 7,399 | |||||||||||||
| 26,316,163 | 187,118,757 | 4,861,093 | 37,870,647 | ||||||||||||||
| Cost of shares redeemed | (93,573,405 | ) | (123,578,433 | ) | (8,625,047 | ) | (7,783,893 | ) | |||||||||
| Net increase (decrease) in net assets resulting from capital share transactions | (67,257,242 | ) | 63,540,324 | (3,763,954 | ) | 30,086,754 | |||||||||||
| Net increase (decrease) in net assets | (124,921,198 | ) | 113,275,589 | (4,682,065 | ) | 34,445,787 | |||||||||||
NET ASSETS: | |||||||||||||||||
| Beginning of period | 397,916,389 | 284,640,800 | 39,682,937 | 5,237,150 | |||||||||||||
| End of period | $ | 272,995,191 | $ | 397,916,389 | $ | 35,000,872 | $ | 39,682,937 | |||||||||
| Undistributed net investment income (distribution in excess of net investment income/accumulated net investment loss) at end of period | $ | (2,376,673 | ) | $ | 76,919 | $ | (16,376 | ) | $ | — | |||||||
28
Table of Contents
| ING MidCap | |||||||||||||||||
| ING LargeCap Growth Fund | Opportunities Fund | ||||||||||||||||
| Six Months | Six Months | ||||||||||||||||
| Ended | Year Ended | Ended | Year Ended | ||||||||||||||
| November 30, | May 31, | November 30, | May 31, | ||||||||||||||
| 2007 | 2007 | 2007 | 2007 | ||||||||||||||
FROM OPERATIONS: | |||||||||||||||||
| Net investment income (loss) | $ | 263,597 | $ | (1,884,820 | ) | $ | (1,650,286 | ) | $ | (3,204,027 | ) | ||||||
| Net realized gain on investments and foreign currency related transactions | 25,249,219 | 20,070,483 | 33,975,126 | 43,650,986 | |||||||||||||
| Net change in unrealized appreciation or depreciation on investments and foreign currency related transactions | (12,195,432 | ) | 19,040,624 | (21,932,341 | ) | 5,999,067 | |||||||||||
| Increase in net assets resulting from operations | 13,317,384 | 37,226,287 | 10,392,499 | 46,446,026 | |||||||||||||
FROM DISTRIBUTIONS TO SHAREHOLDERS: | |||||||||||||||||
| Net realized gains: | |||||||||||||||||
| Class A | — | — | — | (681,679 | ) | ||||||||||||
| Class B | — | — | — | (570,827 | ) | ||||||||||||
| Class C | — | — | — | (514,628 | ) | ||||||||||||
| Class I | — | — | — | (19,779 | ) | ||||||||||||
| Class Q | — | — | — | (28,620 | ) | ||||||||||||
| Total distributions | — | — | — | (1,815,533 | ) | ||||||||||||
FROM CAPITAL SHARE TRANSACTIONS: | |||||||||||||||||
| Net proceeds from sale of shares | 17,972,062 | 32,611,853 | 12,477,791 | 14,674,114 | |||||||||||||
| Dividends reinvested | — | — | — | 1,215,823 | |||||||||||||
| 17,972,062 | 32,611,853 | 12,477,791 | 15,889,937 | ||||||||||||||
| Cost of shares redeemed | (105,220,807 | ) | (105,751,377 | ) | (36,156,778 | ) | (95,593,704 | ) | |||||||||
| Net decrease in net assets resulting from capital share transactions | (87,248,745 | ) | (73,139,524 | ) | (23,678,987 | ) | (79,703,767 | ) | |||||||||
| Net decrease in net assets | (73,931,361 | ) | (35,913,237 | ) | (13,286,488 | ) | (35,073,274 | ) | |||||||||
NET ASSETS: | |||||||||||||||||
| Beginning of period | 252,864,686 | 288,777,923 | 293,804,095 | 328,877,369 | |||||||||||||
| End of period | $ | 178,933,325 | $ | 252,864,686 | $ | 280,517,607 | $ | 293,804,095 | |||||||||
| Undistributed net investment income (accumulated net investment loss) at end of period | $ | 263,596 | $ | (1 | ) | $ | (1,650,286 | ) | $ | — | |||||||
29
Table of Contents
| ING Opportunistic | ING SmallCap | ||||||||||||||||
| LargeCap Fund | Opportunities Fund | ||||||||||||||||
| Six Months | Six Months | ||||||||||||||||
| Ended | Year Ended | Ended | Year Ended | ||||||||||||||
| November 30, | May 31, | November 30, | May 31, | ||||||||||||||
| 2007 | 2007 | 2007 | 2007 | ||||||||||||||
FROM OPERATIONS: | |||||||||||||||||
| Net investment income (loss) | $ | 5,148 | $ | (5,353 | ) | $ | (305,818 | ) | $ | (1,731,705 | ) | ||||||
| Net realized gain (loss) on investments | (36,903 | ) | 717,871 | 11,559,440 | 26,070,360 | ||||||||||||
| Net change in unrealized appreciation or depreciation on investments | (17,893 | ) | 445,782 | (15,519,306 | ) | 128,132 | |||||||||||
| Increase (decrease) in net assets resulting from operations | (49,648 | ) | 1,158,300 | (4,265,684 | ) | 24,466,787 | |||||||||||
FROM DISTRIBUTIONS TO SHAREHOLDERS: | |||||||||||||||||
| Net investment income: | |||||||||||||||||
| Class A | — | (34,636 | ) | — | — | ||||||||||||
| Class B | — | (321 | ) | — | — | ||||||||||||
| Class C | — | (653 | ) | — | — | ||||||||||||
| Total distributions | — | (35,610 | ) | — | — | ||||||||||||
FROM CAPITAL SHARE TRANSACTIONS: | |||||||||||||||||
| Net proceeds from sale of shares | 4,151,463 | 1,028,111 | 5,426,837 | 14,245,885 | |||||||||||||
| Dividends reinvested | — | 865 | — | — | |||||||||||||
| 4,151,463 | 1,028,976 | 5,426,837 | 14,245,885 | ||||||||||||||
| Cost of shares redeemed | (1,100,537 | ) | (105,592 | ) | (18,497,720 | ) | (47,862,221 | ) | |||||||||
| Net increase (decrease) in net assets resulting from capital share transactions | 3,050,926 | 923,384 | (13,070,883 | ) | (33,616,336 | ) | |||||||||||
| Net increase (decrease) in net assets | 3,001,278 | 2,046,074 | (17,336,567 | ) | (9,149,549 | ) | |||||||||||
NET ASSETS: | |||||||||||||||||
| Beginning of period | 7,111,465 | 5,065,391 | 152,942,329 | 162,091,878 | |||||||||||||
| End of period | $ | 10,112,743 | $ | 7,111,465 | $ | 135,605,762 | $ | 152,942,329 | |||||||||
| Undistributed net investment income (accumulated net investment loss) at end of period | $ | 5,148 | $ | — | $ | (303,233 | ) | $ | 2,585 | ||||||||
30
Table of Contents
| ING Financial Services Fund | ING LargeCap Value Fund | ||||||||||||||||
| Six Months | Six Months | ||||||||||||||||
| Ended | Year Ended | Ended | Year Ended | ||||||||||||||
| November 30, | May 31, | November 30, | May 31, | ||||||||||||||
| 2007 | 2007 | 2007 | 2007 | ||||||||||||||
FROM OPERATIONS: | |||||||||||||||||
| Net investment income | $ | 1,562,682 | $ | 2,647,687 | $ | 249,531 | $ | 376,017 | |||||||||
| Net realized gain on investments and foreign currency related transactions | 4,497,849 | 38,786,220 | 6,212,633 | 9,329,718 | |||||||||||||
| Net change in unrealized appreciation or depreciation on investments and foreign currency related transactions | (46,929,473 | ) | 10,062,771 | (23,848,605 | ) | 10,408,017 | |||||||||||
| Increase (decrease) in net assets resulting from operations | (40,868,942 | ) | 51,496,678 | (17,386,441 | ) | 20,113,752 | |||||||||||
FROM DISTRIBUTIONS TO SHAREHOLDERS: | |||||||||||||||||
| Net investment income: | |||||||||||||||||
| Class A | — | (2,504,781 | ) | — | (367,115 | ) | |||||||||||
| Class C | — | (11,459 | ) | — | — | ||||||||||||
| Class I | — | — | — | (52,044 | ) | ||||||||||||
| Class O | — | (161,940 | ) | — | — | ||||||||||||
| Net realized gains: | |||||||||||||||||
| Class A | — | (22,831,059 | ) | — | (3,273,593 | ) | |||||||||||
| Class B | — | (3,767,940 | ) | — | (481,495 | ) | |||||||||||
| Class C | — | (172,101 | ) | — | (738,646 | ) | |||||||||||
| Class I | — | — | — | (351,057 | ) | ||||||||||||
| Class O | — | (1,354,093 | ) | — | — | ||||||||||||
| Total distributions | — | (30,803,373 | ) | — | (5,263,950 | ) | |||||||||||
FROM CAPITAL SHARE TRANSACTIONS: | |||||||||||||||||
| Net proceeds from sale of shares | 14,199,532 | 63,360,097 | 16,260,049 | 83,836,650 | |||||||||||||
| Dividends reinvested | — | 23,433,985 | — | 3,549,152 | |||||||||||||
| 14,199,532 | 86,794,082 | 16,260,049 | 87,385,802 | ||||||||||||||
| Cost of shares redeemed | (39,235,593 | ) | (85,156,659 | ) | (32,517,128 | ) | (47,050,351 | ) | |||||||||
| Net increase (decrease) in net assets resulting from capital share transactions | (25,036,061 | ) | 1,637,423 | (16,257,079 | ) | 40,335,451 | |||||||||||
| Net increase (decrease) in net assets | (65,905,003 | ) | 22,330,728 | (33,643,520 | ) | 55,185,253 | |||||||||||
NET ASSETS: | |||||||||||||||||
| Beginning of period | 312,420,856 | 290,090,128 | 107,216,292 | 52,031,039 | |||||||||||||
| End of period | $ | 246,515,853 | $ | 312,420,856 | $ | 73,572,772 | $ | 107,216,292 | |||||||||
| Undistributed net investment income at end of period | $ | 2,686,895 | $ | 1,124,213 | $ | 419,467 | $ | 169,936 | |||||||||
31
Table of Contents
| ING SmallCap | |||||||||||||||||
| Value Choice Fund | ING Value Choice Fund | ||||||||||||||||
| Six Months | Six Months | ||||||||||||||||
| Ended | Year Ended | Ended | Year Ended | ||||||||||||||
| November 30, | May 31, | November 30, | May 31, | ||||||||||||||
| 2007 | 2007 | 2007 | 2007 | ||||||||||||||
FROM OPERATIONS: | |||||||||||||||||
| Net investment income | $ | 150,743 | $ | 121,225 | $ | 308,825 | $ | 1,025,706 | |||||||||
| Net realized gain (loss) on investments | (2,085,300 | ) | 3,540,899 | 17,983,407 | 6,924,276 | ||||||||||||
| Net change in unrealized appreciation or depreciation on investments | (13,001,437 | ) | 9,734,101 | (14,202,774 | ) | 30,437,603 | |||||||||||
| Increase (decrease) in net assets resulting from operations | (14,935,994 | ) | 13,396,225 | 4,089,458 | 38,387,585 | ||||||||||||
FROM DISTRIBUTIONS TO SHAREHOLDERS: | |||||||||||||||||
| Net investment income: | |||||||||||||||||
| Class A | — | (61,882 | ) | — | (813,911 | ) | |||||||||||
| Class I | — | (22,100 | ) | — | (53 | ) | |||||||||||
| Net realized gains: | |||||||||||||||||
| Class A | — | (1,006,775 | ) | — | (5,302,465 | ) | |||||||||||
| Class B | — | (81,228 | ) | — | (432,560 | ) | |||||||||||
| Class C | — | (268,036 | ) | — | (1,716,040 | ) | |||||||||||
| Class I | — | (201,970 | ) | — | (656 | ) | |||||||||||
| Total distributions | — | (1,641,991 | ) | — | (8,265,685 | ) | |||||||||||
FROM CAPITAL SHARE TRANSACTIONS: | |||||||||||||||||
| Net proceeds from sale of shares | 12,831,359 | 75,038,918 | 42,489,764 | 166,823,089 | |||||||||||||
| Proceeds issued in merger | — | — | — | 120,894,408 | |||||||||||||
| Dividends reinvested | — | 1,323,435 | — | 6,729,481 | |||||||||||||
| 12,831,359 | 76,362,353 | 42,489,764 | 294,446,978 | ||||||||||||||
| Cost of shares redeemed | (21,349,174 | ) | (18,585,458 | ) | (59,364,161 | ) | (42,081,510 | ) | |||||||||
| Net increase (decrease) in net assets resulting from capital share transactions | (8,517,815 | ) | 57,776,895 | (16,874,397 | ) | 252,365,468 | |||||||||||
| Net increase (decrease) in net assets | (23,453,809 | ) | 69,531,129 | (12,784,939 | ) | 282,487,368 | |||||||||||
NET ASSETS: | |||||||||||||||||
| Beginning of period | 102,981,305 | 33,450,176 | 350,511,370 | 68,024,002 | |||||||||||||
| End of period | $ | 79,527,496 | $ | 102,981,305 | $ | 337,726,431 | $ | 350,511,370 | |||||||||
| Undistributed net investment income at end of period | $ | 180,704 | $ | 29,961 | $ | 687,742 | $ | 378,917 | |||||||||
32
Table of Contents
Selected data for a share of beneficial interest outstanding throughout each period.
| Class A | ||||||||||||||||||||||||||
| Six Months | December 20, | |||||||||||||||||||||||||
| Ended | Year Ended May 31, | 2002(1) to | ||||||||||||||||||||||||
| November 30, | May 31, | |||||||||||||||||||||||||
| 2007 | 2007 | 2006 | 2005 | 2004 | 2003 | |||||||||||||||||||||
Per Share Operating Performance: | ||||||||||||||||||||||||||
| Net asset value, beginning of period | $ | 19.27 | 16.42 | 14.82 | 12.76 | 11.06 | 10.06 | |||||||||||||||||||
| Income (loss) from investment operations: | ||||||||||||||||||||||||||
| Net investment income | $ | 0.07 | * | 0.14 | * | 0.20 | † | 0.47 | * | 0.57 | 0.16 | |||||||||||||||
| Net realized and unrealized gain (loss) on investments | $ | (2.83 | ) | 4.41 | 3.02 | 3.04 | 2.29 | 1.04 | ||||||||||||||||||
| Total from investment operations | $ | (2.76 | ) | 4.55 | 3.22 | 3.51 | 2.86 | 1.20 | ||||||||||||||||||
| Less distributions from: | ||||||||||||||||||||||||||
| Net investment income | $ | 0.21 | 0.16 | 0.49 | 0.50 | 0.65 | 0.20 | |||||||||||||||||||
| Net realized gains from investments | $ | — | 1.54 | 1.13 | 0.95 | 0.51 | — | |||||||||||||||||||
| Total distributions | $ | 0.21 | 1.70 | 1.62 | 1.45 | 1.16 | 0.20 | |||||||||||||||||||
| Net asset value, end of period | $ | 16.30 | 19.27 | 16.42 | 14.82 | 12.76 | 11.06 | |||||||||||||||||||
| Total Return(2) | % | (14.43 | ) | 28.13 | 22.63 | 28.51 | 26.79 | 12.06 | ||||||||||||||||||
Ratios and Supplemental Data: | ||||||||||||||||||||||||||
| Net assets, end of period (000’s) | $ | 107,733 | 165,377 | 102,853 | 57,799 | 16,569 | 982 | |||||||||||||||||||
| Ratios to average net assets: | ||||||||||||||||||||||||||
| Gross expenses prior to expense reimbursement/recoupment and brokerage commission recapture(3) | % | 1.27 | 1.22 | 1.20 | 1.15 | 1.37 | 1.53 | |||||||||||||||||||
| Net expenses after expense reimbursement/recoupment and prior to brokerage commission recapture(3)(4) | % | 1.27 | 1.22 | 1.20 | 1.23 | 1.31 | 1.45 | |||||||||||||||||||
| Net expenses after expense reimbursement/recoupment and brokerage commission recapture(3)(4) | % | 1.27 | 1.20 | 1.16 | 1.15 | 1.27 | 1.45 | |||||||||||||||||||
| Net investment income after expense reimbursement/recoupment and brokerage commission recapture(3)(4) | % | 0.84 | 0.74 | 1.36 | † | 3.34 | 4.84 | 0.01 | ||||||||||||||||||
| Portfolio turnover rate | % | 37 | 57 | 51 | 91 | 132 | 62 | |||||||||||||||||||
(1) Commencement of operations.
(2) Total return is calculated assuming reinvestment of all dividends and capital gain distributions at net asset value and excluding the deduction of sales charges. Total return for periods less than one year is not annualized.
(3) Annualized for periods less than one year.
(4) The Investment Adviser has agreed to limit expenses, (excluding interest, taxes, brokerage and extraordinary expenses) subject to possible recoupment by the Investment Adviser within three years of being incurred.
* Calculated using average number of shares outstanding throughout the period.
† Effective June 1, 2005, the Fund adopted a policy to reduce cost of investments for financial statement purposes by the distributions received in excess of income from Real Estate Investment Trusts. The effect of this change for the twelve months ended May 31, 2006 was to decrease the net investment income per share by $0.25, increase net realized and unrealized gain on investments per share by $0.25 and decrease the ratio of net investment income to average net assets from 2.91% to 1.36%.
33
Table of Contents
Selected data for a share of beneficial interest outstanding throughout each period.
| Class B | ||||||||||||||||||||||||||
| Six Months | November 20, | |||||||||||||||||||||||||
| Ended | Year Ended May 31, | 2002(1) to | ||||||||||||||||||||||||
| November 30, | May 31, | |||||||||||||||||||||||||
| 2007 | 2007 | 2006 | 2005 | 2004 | 2003 | |||||||||||||||||||||
Per Share Operating Performance: | ||||||||||||||||||||||||||
| Net asset value, beginning of period | $ | 19.32 | 16.45 | 14.85 | 12.78 | 11.10 | 10.00 | |||||||||||||||||||
| Income (loss) from investment operations: | ||||||||||||||||||||||||||
| Net investment income (loss) | $ | 0.01 | * | (0.00 | )* | 0.08 | † | 0.37 | ** | 0.45 | 0.12 | |||||||||||||||
| Net realized and unrealized gain (loss) on investments | $ | (2.85 | ) | 4.43 | 3.02 | 3.05 | 2.32 | 1.15 | ||||||||||||||||||
| Total from investment operations | $ | (2.84 | ) | 4.43 | 3.10 | 3.42 | 2.77 | 1.27 | ||||||||||||||||||
| Less distributions from: | ||||||||||||||||||||||||||
| Net investment income | $ | 0.13 | 0.02 | 0.37 | 0.40 | 0.58 | 0.17 | |||||||||||||||||||
| Net realized gains from investments | $ | — | 1.54 | 1.13 | 0.95 | 0.51 | — | |||||||||||||||||||
| Total distributions | $ | 0.13 | 1.56 | 1.50 | 1.35 | 1.09 | 0.17 | |||||||||||||||||||
| Net asset value, end of period | $ | 16.35 | 19.32 | 16.45 | 14.85 | 12.78 | 11.10 | |||||||||||||||||||
| Total Return(2) | % | (14.77 | ) | 27.24 | 21.70 | 27.62 | 25.81 | 12.77 | ||||||||||||||||||
Ratios and Supplemental Data: | ||||||||||||||||||||||||||
| Net assets, end of period (000’s) | $ | 3,804 | 6,331 | 5,037 | 3,484 | 1,990 | 149 | |||||||||||||||||||
| Ratios to average net assets: | ||||||||||||||||||||||||||
| Gross expenses prior to expense reimbursement/recoupment and brokerage commission recapture(3) | % | 2.02 | 1.97 | 1.95 | 1.90 | 2.12 | 2.30 | |||||||||||||||||||
| Net expenses after expense reimbursement/recoupment and prior to brokerage commission recapture(3)(4) | % | 2.02 | 1.97 | 1.95 | 1.98 | 2.06 | 2.20 | |||||||||||||||||||
| Net expenses after expense reimbursement/recoupment and brokerage commission recapture(3)(4) | % | 2.02 | 1.95 | 1.91 | 1.90 | 2.02 | 2.20 | |||||||||||||||||||
| Net investment income (loss) after expense reimbursement/recoupment and brokerage commission recapture(3)(4) | % | 0.08 | (0.00 | )* | 0.61 | † | 2.64 | 3.28 | 1.91 | |||||||||||||||||
| Portfolio turnover rate | % | 37 | 57 | 51 | 91 | 132 | 62 | |||||||||||||||||||
(1) Commencement of operations.
(2) Total return is calculated assuming reinvestment of all dividends and capital gain distributions at net asset value and excluding the deduction of sales charges. Total return for periods less than one year is not annualized.
(3) Annualized for periods less than one year.
(4) The Investment Adviser has agreed to limit expenses, (excluding interest, taxes, brokerage and extraordinary expenses) subject to possible recoupment by the Investment Adviser within three years of being incurred.
* Amount is more than $(0.005).
** Calculated using average number of shares outstanding throughout the period.
† Effective June 1, 2005, the Fund adopted a policy to reduce cost of investments for financial statement purposes by the distributions received in excess of income from Real Estate Investment Trusts. The effect of this change for the twelve months ended May 31, 2006 was to decrease the net investment income per share by $0.25, increase net realized and unrealized gain on investments per share by $0.25 and decrease the ratio of net investment income to average net assets from 2.16% to 0.61%.
34
Table of Contents
Selected data for a share of beneficial interest outstanding throughout each period.
| Class C | ||||||||||||||||||||||||||
| Six Months | January 17, | |||||||||||||||||||||||||
| Ended | Year Ended May 31, | 2003(1) to | ||||||||||||||||||||||||
| November 30, | May 31, | |||||||||||||||||||||||||
| 2007 | 2007 | 2006 | 2005 | 2004 | 2003 | |||||||||||||||||||||
Per Share Operating Performance: | ||||||||||||||||||||||||||
| Net asset value, beginning of period | $ | 19.99 | 16.98 | 15.28 | 13.11 | 11.37 | 9.96 | |||||||||||||||||||
| Income (loss) from investment operations: | ||||||||||||||||||||||||||
| Net investment income (loss) | $ | 0.01 | * | (0.01 | )* | 0.11 | † | 0.38 | * | 0.43 | (0.01 | )* | ||||||||||||||
| Net realized and unrealized gain (loss) on investments | $ | (2.96 | ) | 4.58 | 3.09 | 3.13 | 2.40 | 1.50 | ||||||||||||||||||
| Total from investment operations | $ | (2.95 | ) | 4.57 | 3.20 | 3.51 | 2.83 | 1.49 | ||||||||||||||||||
| Less distributions from: | ||||||||||||||||||||||||||
| Net investment income | $ | 0.12 | 0.02 | 0.37 | 0.39 | 0.58 | 0.08 | |||||||||||||||||||
| Net realized gains from investments | $ | — | 1.54 | 1.13 | 0.95 | 0.51 | — | |||||||||||||||||||
| Total distributions | $ | 0.12 | 1.56 | 1.50 | 1.34 | 1.09 | 0.08 | |||||||||||||||||||
| Net asset value, end of period | $ | 16.92 | 19.99 | 16.98 | 15.28 | 13.11 | 11.37 | |||||||||||||||||||
| Total Return(2) | % | (14.80 | ) | 27.21 | 21.69 | 27.57 | 25.75 | 15.03 | ||||||||||||||||||
Ratios and Supplemental Data: | ||||||||||||||||||||||||||
| Net assets, end of period (000’s) | $ | 3,196 | 4,942 | 3,124 | 2,720 | 2,708 | 157 | |||||||||||||||||||
| Ratios to average net assets: | ||||||||||||||||||||||||||
| Gross expenses prior to expense reimbursement/recoupment and brokerage commission recapture(3) | % | 2.02 | 1.97 | 1.95 | 1.90 | 2.12 | 2.30 | |||||||||||||||||||
| Net expenses after expense reimbursement/recoupment and prior to brokerage commission recapture(3)(4) | % | 2.02 | 1.97 | 1.95 | 1.98 | 2.06 | 2.20 | |||||||||||||||||||
| Net expenses after expense reimbursement/recoupment and brokerage commission recapture(3)(4) | % | 2.02 | 1.95 | 1.91 | 1.90 | 2.02 | 2.20 | |||||||||||||||||||
| Net investment income (loss) after expense reimbursement/recoupment and brokerage commission recapture(3)(4) | % | 0.07 | (0.02 | ) | 0.61 | † | 2.65 | 3.54 | (1.62 | ) | ||||||||||||||||
| Portfolio turnover rate | % | 37 | 57 | 51 | 91 | 132 | 62 | |||||||||||||||||||
(1) Commencement of operations.
(2) Total return is calculated assuming reinvestment of all dividends and capital gain distributions at net asset value and excluding the deduction of sales charges. Total return for periods less than one year is not annualized.
(3) Annualized for periods less than one year.
(4) The Investment Adviser has agreed to limit expenses, (excluding interest, taxes, brokerage and extraordinary expenses) subject to possible recoupment by the Investment Adviser within three years of being incurred.
* Calculated using average number of shares outstanding throughout the period.
† Effective June 1, 2005, the Fund adopted a policy to reduce cost of investments for financial statement purposes by the distributions received in excess of income from Real Estate Investment Trusts. The effect of this change for the twelve months ended May 31, 2006 was to decrease the net investment income per share by $0.26, increase net realized and unrealized gain on investments per share by $0.26 and decrease the ratio of net investment income to average net assets from 2.16% to 0.61%.
35
Table of Contents
Selected data for a share of beneficial interest outstanding throughout each period.
| Class I | ||||||||||||||||||||||||||
| Six Months | November 1, | |||||||||||||||||||||||||
| Ended | Year Ended May 31, | 2002 to | ||||||||||||||||||||||||
| November 30, | May 31, | |||||||||||||||||||||||||
| 2007 | 2007 | 2006 | 2005 | 2004 | 2003(1) | |||||||||||||||||||||
Per Share Operating Performance: | ||||||||||||||||||||||||||
| Net asset value, beginning of period | $ | 20.35 | 17.25 | 15.49 | 13.28 | 11.45 | 9.98 | |||||||||||||||||||
| Income (loss) from investment operations: | ||||||||||||||||||||||||||
| Net investment income | $ | 0.10 | * | 0.21 | * | 0.28 | *† | 0.54 | * | 0.58 | 0.20 | |||||||||||||||
| Net realized and unrealized gain (loss) on investments | $ | (3.00 | ) | 4.64 | 3.14 | 3.15 | 2.43 | 1.47 | ||||||||||||||||||
| Total from investment operations | $ | (2.90 | ) | 4.85 | 3.42 | 3.69 | 3.01 | 1.67 | ||||||||||||||||||
| Less distributions from: | ||||||||||||||||||||||||||
| Net investment income | $ | 0.23 | 0.21 | 0.53 | 0.53 | 0.67 | 0.20 | |||||||||||||||||||
| Net realized gains from investments | $ | — | 1.54 | 1.13 | 0.95 | 0.51 | — | |||||||||||||||||||
| Total distributions | $ | 0.23 | 1.75 | 1.66 | 1.48 | 1.18 | 0.20 | |||||||||||||||||||
| Net asset value, end of period | $ | 17.22 | 20.35 | 17.25 | 15.49 | 13.28 | 11.45 | |||||||||||||||||||
| Total Return(2) | % | (14.33 | ) | 28.55 | 22.98 | 28.82 | 27.24 | 16.95 | ||||||||||||||||||
Ratios and Supplemental Data: | ||||||||||||||||||||||||||
| Net assets, end of period (000’s) | $ | 121,952 | 168,125 | 144,907 | 146,499 | 161,904 | 125,645 | |||||||||||||||||||
| Ratios to average net assets: | ||||||||||||||||||||||||||
| Gross expenses prior to expense reimbursement/recoupment and brokerage commission recapture(3) | % | 0.97 | 0.90 | 0.92 | 0.90 | 1.06 | 1.19 | |||||||||||||||||||
| Net expenses after expense reimbursement/recoupment and prior to brokerage commission recapture(3)(4) | % | 0.97 | 0.90 | 0.92 | 0.98 | 0.96 | 1.00 | |||||||||||||||||||
| Net expenses after expense reimbursement/recoupment and brokerage commission recapture(3)(4) | % | 0.97 | 0.87 | 0.88 | 0.90 | 0.96 | 1.00 | |||||||||||||||||||
| Net investment income after expense reimbursement/recoupment and brokerage commission recapture(3)(4) | % | 1.14 | 1.07 | 1.68 | † | 3.70 | 4.69 | 4.26 | ||||||||||||||||||
| Portfolio turnover rate | % | 37 | 57 | 51 | 91 | 132 | 62 | |||||||||||||||||||
(1) On November 4, 2002, pursuant to an Agreement and Plan of Reorganization dated August 20, 2002, all of the assets and liabilities of the CRA Realty Shares Portfolio were transferred to the newly created ING Real Estate Fund in exchange for shares of the ING Real Estate Fund. The financial highlight information presented for periods prior to November 4, 2002 reflects the activity of the CRA Realty Shares Portfolio. The ING Real Estate Fund has adopted a fiscal year end of May 31.
(2) Total return is calculated assuming reinvestment of all dividends and capital gain distributions at net asset value and excluding the deduction of sales charges. Total return for periods less than one year is not annualized.
(3) Annualized for periods less than one year.
(4) The Investment Adviser has agreed to limit expenses, (excluding interest, taxes, brokerage and extraordinary expenses) subject to possible recoupment by the Investment Adviser within three years of being incurred.
* Calculated using average number of shares outstanding throughout the period.
† Effective June 1, 2005, the Fund adopted a policy to reduce cost of investments for financial statement purposes by the distributions received in excess of income from Real Estate Investment Trusts. The effect of this change for the twelve months ended May 31, 2006 was to decrease the net investment income per share by $0.26, increase net realized and unrealized gain on investments per share by $0.26 and decrease the ratio of net investment income to average net assets from 3.23% to 1.68%.
36
Table of Contents
Selected data for a share of beneficial interest outstanding throughout each period.
| Class O | Class Q | |||||||||||||||||||||||||
| Six Months | Year | Year | September 15, | Six Months | December 20, | |||||||||||||||||||||
| Ended | Ended | Ended | 2004(1) to | Ended | 2006(1) to | |||||||||||||||||||||
| November 30, | May 31, | May 31, | May 31, | November 30, | May 31, | |||||||||||||||||||||
| 2007 | 2007 | 2006 | 2005 | 2007 | 2007 | |||||||||||||||||||||
Per Share Operating Performance: | ||||||||||||||||||||||||||
| Net asset value, beginning of period | $ | 19.24 | 16.40 | 14.81 | 13.52 | 19.28 | 18.84 | |||||||||||||||||||
| Income (loss) from investment operations: | ||||||||||||||||||||||||||
| Net investment income (loss) | $ | 0.07 | * | 0.14 | * | 0.21 | † | 0.39 | 0.08 | (0.08 | ) | |||||||||||||||
| Net realized and unrealized gain (loss) on investments | $ | (2.82 | ) | 4.41 | 3.00 | 2.23 | (2.86 | ) | 0.71 | |||||||||||||||||
| Total from investment operations | $ | (2.75 | ) | 4.55 | 3.21 | 2.62 | (2.78 | ) | 0.63 | |||||||||||||||||
| Less distributions from: | ||||||||||||||||||||||||||
| Net investment income | $ | 0.20 | 0.17 | 0.49 | 0.38 | 0.20 | 0.14 | |||||||||||||||||||
| Net realized gains from investments | $ | — | 1.54 | 1.13 | 0.95 | — | 0.05 | |||||||||||||||||||
| Total distributions | $ | 0.20 | 1.71 | 1.62 | 1.33 | 0.20 | 0.19 | |||||||||||||||||||
| Net asset value, end of period | $ | 16.29 | 19.24 | 16.40 | 14.81 | 16.30 | 19.28 | |||||||||||||||||||
| Total Return(2) | % | (14.37 | ) | 28.15 | 22.60 | 20.12 | (14.50 | ) | 3.35 | |||||||||||||||||
Ratios and Supplemental Data: | ||||||||||||||||||||||||||
| Net assets, end of period (000’s) | $ | 36,310 | 53,140 | 28,720 | 12,305 | 1 | 1 | |||||||||||||||||||
| Ratios to average net assets: | ||||||||||||||||||||||||||
| Gross expenses prior to expense reimbursement/recoupment and brokerage commission recapture(3) | % | 1.27 | 1.22 | 1.16 | 1.15 | 1.16 | 1.45 | |||||||||||||||||||
| Net expenses after expense reimbursement/recoupment and prior to brokerage commission recapture(3)(4) | % | 1.27 | 1.22 | 1.16 | 1.23 | 1.16 | 1.45 | |||||||||||||||||||
| Net expenses after expense reimbursement/recoupment and brokerage commission recapture (3)(4) | % | 1.27 | 1.20 | 1.13 | 1.15 | 1.16 | 1.43 | |||||||||||||||||||
| Net investment income (loss) after expense reimbursement/recoupment and brokerage commission recapture (3)(4) | % | 0.83 | 0.73 | 1.36 | † | 3.32 | 0.89 | (1.35 | ) | |||||||||||||||||
| Portfolio turnover rate | % | 37 | 57 | 51 | 91 | 37 | 57 | |||||||||||||||||||
(1) Commencement of operations.
(2) Total return is calculated assuming reinvestment of all dividends and capital gain distributions at net asset value and excluding the deduction of sales charges. Total return for periods less than one year is not annualized.
(3) Annualized for periods less than one year.
(4) The Investment Adviser has agreed to limit expenses, (excluding interest, taxes, brokerage and extraordinary expenses) subject to possible recoupment by the Investment Adviser within three years of being incurred.
* Calculated using average number of shares outstanding throughout the period.
† Effective June 1, 2005, the Fund adopted a policy to reduce cost of investments for financial statement purposes by the distributions received in excess of income from Real Estate Investment Trusts. The effect of this change for the twelve months ended May 31, 2006 was to decrease the net investment income per share by $0.25, increase net realized and unrealized gain on investments per share by $0.25 and decrease the ratio of net investment income to average net assets from 2.91% to 1.36%.
37
Table of Contents
Selected data for a share of beneficial interest outstanding throughout each period.
| Class A | ||||||||||||||
| Six Months | Year | |||||||||||||
| Ended | Ended | December 28, | ||||||||||||
| November 30, | May 31, | 2005(1) to | ||||||||||||
| 2007 | 2007 | May 31, 2006 | ||||||||||||
Per Share Operating Performance: | ||||||||||||||
| Net asset value, beginning of period | $ | 11.78 | 10.16 | 10.00 | ||||||||||
| Income (loss) from investment operations: | ||||||||||||||
| Net investment income | $ | 0.02 | 0.06 | * | 0.01 | |||||||||
| Net realized and unrealized gain (loss) on investments | $ | (0.27 | ) | 1.86 | 0.15 | |||||||||
| Total from investment operations | $ | (0.25 | ) | 1.92 | 0.16 | |||||||||
| Less distributions from: | ||||||||||||||
| Net investment income | $ | — | 0.14 | — | ||||||||||
| Net realized gains on investments | $ | — | 0.16 | — | ||||||||||
| Total distributions | $ | — | 0.30 | — | ||||||||||
| Net asset value, end of period | $ | 11.53 | 11.78 | 10.16 | ||||||||||
| Total Return(2) | % | (2.12 | ) | 19.12 | 1.60 | |||||||||
Ratios and Supplemental Data: | ||||||||||||||
| Net assets, end of period (000’s) | $ | 15,028 | 12,298 | 5,136 | ||||||||||
| Ratios to average net assets: | ||||||||||||||
| Gross expenses prior to expense reimbursement(3) | % | 1.60 | 2.57 | 3.74 | ||||||||||
| Net expenses after expense reimbursement(3)(4) | % | 1.25 | 1.25 | 1.25 | ||||||||||
| Net investment income after expense reimbursement (3)(4) | % | 0.37 | 0.56 | 0.32 | ||||||||||
| Portfolio turnover rate | % | 65 | 413 | 54 | ||||||||||
| Class B | ||||||||||||||
| Six Months | Year | |||||||||||||
| Ended | Ended | February 6, | ||||||||||||
| November 30, | May 31, | 2006(1) to | ||||||||||||
| 2007 | 2007 | May 31, 2006 | ||||||||||||
Per Share Operating Performance: | ||||||||||||||
| Net asset value, beginning of period | $ | 11.68 | 10.12 | 10.15 | ||||||||||
| Income (loss) from investment operations: | ||||||||||||||
| Net investment loss | $ | (0.03 | ) | (0.07 | )* | (0.02 | )* | |||||||
| Net realized and unrealized gain (loss) on investments | $ | (0.26 | ) | 1.91 | (0.01 | ) | ||||||||
| Total from investment operations | $ | (0.29 | ) | 1.84 | (0.03 | ) | ||||||||
| Less distributions from: | ||||||||||||||
| Net investment income | $ | — | 0.12 | — | ||||||||||
| Net realized gains on investments | $ | — | 0.16 | — | ||||||||||
| Total distributions | $ | — | 0.28 | — | ||||||||||
| Net asset value, end of period | $ | 11.39 | 11.68 | 10.12 | ||||||||||
| Total Return(2) | % | (2.48 | ) | 18.34 | (0.30 | ) | ||||||||
Ratios and Supplemental Data: | ||||||||||||||
| Net assets, end of period (000’s) | $ | 12,504 | 18,759 | 25 | ||||||||||
| Ratios to average net assets: | ||||||||||||||
| Gross expenses prior to expense reimbursement(3) | % | 2.35 | 3.32 | 4.49 | ||||||||||
| Net expenses after expense reimbursement(3)(4) | % | 2.00 | 2.00 | 2.00 | ||||||||||
| Net investment loss after expense reimbursement(3)(4) | % | (0.38 | ) | (0.62 | ) | (0.42 | ) | |||||||
| Portfolio turnover rate | % | 65 | 413 | 54 | ||||||||||
(1) Commencement of operations.
(2) Total return is calculated assuming reinvestment of all dividends and capital gain distributions at net asset value and excluding the deduction of sales charges. Total return for periods less than one year is not annualized.
(3) Annualized for periods less than one year.
(4) The Investment Adviser has agreed to limit expenses (excluding interest, taxes, brokerage and extraordinary expenses) subject to possible recoupment by the Investment Adviser within three years of being incurred.
* Calculated using average number of shares outstanding throughout the period.
38
Table of Contents
Selected data for a share of beneficial interest outstanding throughout each period.
| Class C | ||||||||||||||
| Six Months | Year | |||||||||||||
| Ended | Ended | April 17, | ||||||||||||
| November 30, | May 31, | 2006(1) to | ||||||||||||
| 2007 | 2007 | May 31, 2006 | ||||||||||||
Per Share Operating Performance: | ||||||||||||||
| Net asset value, beginning of period | $ | 11.71 | 10.12 | 10.31 | ||||||||||
| Income (loss) from investment operations: | ||||||||||||||
| Net investment loss | $ | (0.02 | ) | (0.07 | )* | (0.02 | )* | |||||||
| Net realized and unrealized gain (loss) on investments | $ | (0.27 | ) | 1.94 | (0.17 | ) | ||||||||
| Total from investment operations | $ | (0.29 | ) | 1.87 | (0.19 | ) | ||||||||
| Less distributions from: | ||||||||||||||
| Net investment income | $ | — | 0.12 | — | ||||||||||
| Net realized gains on investments | $ | — | 0.16 | — | ||||||||||
| Total distributions | $ | — | 0.28 | — | ||||||||||
| Net asset value, end of period | $ | 11.42 | 11.71 | 10.12 | ||||||||||
| Total Return(2) | % | (2.48 | ) | 18.60 | (1.84 | ) | ||||||||
Ratios and Supplemental Data: | ||||||||||||||
| Net assets, end of period (000’s) | $ | 7,466 | 8,622 | 77 | ||||||||||
| Ratios to average net assets: | ||||||||||||||
| Gross expenses prior to expense reimbursement(3) | % | 2.35 | 3.32 | 4.49 | ||||||||||
| Net expenses after expense reimbursement(3)(4) | % | 2.00 | 2.00 | 2.00 | ||||||||||
| Net investment loss after expense reimbursement(3)(4) | % | (0.36 | ) | (0.60 | ) | (0.42 | ) | |||||||
| Portfolio turnover rate | % | 65 | 413 | 54 | ||||||||||
| Class I | ||||||||||
| Six Months | July 18, | |||||||||
| Ended | 2006(1) to | |||||||||
| November 30, | May 31, | |||||||||
| 2007 | 2007 | |||||||||
Per Share Operating Performance: | ||||||||||
| Net asset value, beginning of period | $ | 11.71 | 9.77 | |||||||
| Income (loss) from investment operations: | ||||||||||
| Net investment income (loss) | $ | 0.04 | (0.05 | )* | ||||||
| Net realized and unrealized gain (loss) on investments | $ | (0.27 | ) | 2.33 | ||||||
| Total from investment operations | $ | (0.23 | ) | 2.28 | ||||||
| Less distributions from: | ||||||||||
| Net investment income | $ | — | 0.18 | |||||||
| Net realized gains on investments | $ | — | 0.16 | |||||||
| Total distributions | $ | — | 0.34 | |||||||
| Net asset value, end of period | $ | 11.48 | 11.71 | |||||||
| Total Return(2) | % | (1.96 | ) | 23.56 | ||||||
Ratios and Supplemental Data: | ||||||||||
| Net assets, end of period (000’s) | $ | 3 | 3 | |||||||
| Ratios to average net assets: | ||||||||||
| Gross expenses prior to expense reimbursement(3) | % | 1.34 | 2.17 | |||||||
| Net expenses after expense reimbursement(3)(4) | % | 1.00 | 0.83 | |||||||
| Net investment income (loss) after expense reimbursement(3)(4) | % | 0.62 | (0.49 | ) | ||||||
| Portfolio turnover rate | % | 65 | 413 | |||||||
(1) Commencement of operations.
(2) Total return is calculated assuming reinvestment of all dividends and capital gain distributions at net asset value and excluding the deduction of sales charges. Total return for periods less than one year is not annualized.
(3) Annualized for periods less than one year.
(4) The Investment Adviser has agreed to limit expenses (excluding interest, taxes, brokerage and extraordinary expenses) subject to possible recoupment by the Investment Adviser within three years of being incurred.
* Calculated using average number of shares outstanding throughout the period.
39
Table of Contents
Selected data for a share of beneficial interest outstanding throughout each period.
| Class A | ||||||||||||||||||||||||||
| Six Months | ||||||||||||||||||||||||||
| Ended | Year Ended May 31, | |||||||||||||||||||||||||
| November 30, | ||||||||||||||||||||||||||
| 2007 | 2007 | 2006 | 2005 | 2004 | 2003 | |||||||||||||||||||||
Per Share Operating Performance: | ||||||||||||||||||||||||||
| Net asset value, beginning of period | $ | 21.63 | 18.64 | 17.88 | 18.11 | 14.33 | 16.59 | |||||||||||||||||||
| Income (loss) from investment operations: | ||||||||||||||||||||||||||
| Net investment income (loss) | $ | 0.07 | (0.11 | )* | (0.10 | )* | (0.07 | ) | (0.10 | ) | (0.15 | ) | ||||||||||||||
| Net realized and unrealized gain (loss) on investments | $ | 1.11 | 3.10 | 0.86 | 0.37 | 3.88 | (2.11 | ) | ||||||||||||||||||
| Total from investment operations | $ | 1.18 | 2.99 | 0.76 | 0.30 | 3.78 | (2.26 | ) | ||||||||||||||||||
| Less distributions from: | ||||||||||||||||||||||||||
| Net investment income | $ | — | — | — | 0.38 | — | — | |||||||||||||||||||
| Return of capital | $ | — | — | — | 0.15 | — | — | |||||||||||||||||||
| Total distributions | $ | — | — | — | 0.53 | — | — | |||||||||||||||||||
| Net asset value, end of period | $ | 22.81 | 21.63 | 18.64 | 17.88 | 18.11 | 14.33 | |||||||||||||||||||
| Total Return(1) | % | 5.46 | 16.04 | 4.25 | 1.65 | 26.38 | (13.62 | ) | ||||||||||||||||||
Ratios and Supplemental Data: | ||||||||||||||||||||||||||
| Net assets, end of period (000’s) | $ | 74,345 | 73,556 | 95,300 | 111,208 | 109,858 | 40,941 | |||||||||||||||||||
| Ratios to average net assets: | ||||||||||||||||||||||||||
| Gross expenses prior to expense reimbursement/recoupment and brokerage commission recapture(2) | % | 1.45 | 1.48 | 1.43 | 1.40 | 1.61 | 1.76 | |||||||||||||||||||
| Net expenses after expense reimbursement/ recoupment and prior to brokerage commission recapture (2)(3) | % | 1.45 | 1.45 | 1.45 | 1.45 | 1.45 | 1.60 | |||||||||||||||||||
| Net expenses after expense reimbursement/ recoupment and brokerage commission recapture(2)(3) | % | 1.45 | 1.44 | 1.44 | 1.43 | 1.42 | 1.60 | |||||||||||||||||||
| Net investment income (loss) after expense reimbursement/ recoupment and brokerage commission recapture(2)(3) | % | 0.65 | (0.57 | ) | (0.55 | ) | (0.49 | ) | (0.82 | ) | (0.96 | ) | ||||||||||||||
| Portfolio turnover rate | % | 49 | 84 | 99 | 81 | 142 | 291 | |||||||||||||||||||
| Class B | ||||||||||||||||||||||||||
| Six Months | ||||||||||||||||||||||||||
| Ended | Year Ended May 31, | |||||||||||||||||||||||||
| November 30, | ||||||||||||||||||||||||||
| 2007 | 2007 | 2006 | 2005 | 2004 | 2003 | |||||||||||||||||||||
Per Share Operating Performance: | ||||||||||||||||||||||||||
| Net asset value, beginning of period | $ | 20.70 | 17.95 | 17.33 | 17.57 | 13.99 | 16.30 | |||||||||||||||||||
| Income (loss) from investment operations: | ||||||||||||||||||||||||||
| Net investment loss | $ | (0.01 | ) | (0.23 | )* | (0.22 | )* | (0.24 | ) | (0.21 | ) | (0.24 | ) | |||||||||||||
| Net realized and unrealized gain (loss) on investments | $ | 1.07 | 2.98 | 0.84 | 0.41 | 3.79 | (2.07 | ) | ||||||||||||||||||
| Total from investment operations | $ | 1.06 | 2.75 | 0.62 | 0.17 | 3.58 | (2.31 | ) | ||||||||||||||||||
| Less distributions from: | ||||||||||||||||||||||||||
| Net investment income | $ | — | — | — | 0.26 | — | — | |||||||||||||||||||
| Return of capital | $ | — | — | — | 0.15 | — | — | |||||||||||||||||||
| Total distributions | $ | — | — | — | 0.41 | — | — | |||||||||||||||||||
| Net asset value, end of period | $ | 21.76 | 20.70 | 17.95 | 17.33 | 17.57 | 13.99 | |||||||||||||||||||
| Total Return(1) | % | 5.12 | 15.32 | 3.58 | 0.97 | 25.59 | (14.17 | ) | ||||||||||||||||||
Ratios and Supplemental Data: | ||||||||||||||||||||||||||
| Net assets, end of period (000’s) | $ | 54,450 | 64,120 | 83,019 | 106,162 | 119,658 | 72,575 | |||||||||||||||||||
| Ratios to average net assets: | ||||||||||||||||||||||||||
| Gross expenses prior to expense reimbursement/ recoupment and brokerage commission recapture(2) | % | 2.10 | 2.13 | 2.08 | 2.05 | 2.26 | 2.41 | |||||||||||||||||||
| Net expenses after expense reimbursement/ recoupment and prior to brokerage commission recapture (2)(3) | % | 2.10 | 2.10 | 2.10 | 2.10 | 2.09 | 2.25 | |||||||||||||||||||
| Net expenses after expense reimbursement/ recoupment and brokerage commission recapture(2)(3) | % | 2.10 | 2.09 | 2.09 | 2.08 | 2.07 | 2.25 | |||||||||||||||||||
| Net investment loss after expense reimbursement/recoupment and brokerage commission recapture(2)(3) | % | (0.10 | ) | (1.22 | ) | (1.20 | ) | (1.13 | ) | (1.47 | ) | (1.61 | ) | |||||||||||||
| Portfolio turnover rate | % | 49 | 84 | 99 | 81 | 142 | 291 | |||||||||||||||||||
(1) Total return is calculated assuming reinvestment of all dividends and capital gain distributions at net asset value and excluding the deduction of sales charges. Total return for periods less than one year is not annualized.
(2) Annualized for periods less than one year.
(3) The Investment Adviser has agreed to limit expenses, (excluding interest, taxes, brokerage and extraordinary expenses) subject to possible recoupment by the Investment Adviser within three years of being incurred.
* Calculated using average number of shares outstanding throughout the period.
40
Table of Contents
Selected data for a share of beneficial interest outstanding throughout each period.
| Class C | ||||||||||||||||||||||||||
| Six Months | ||||||||||||||||||||||||||
| Ended | Year Ended May 31, | |||||||||||||||||||||||||
| November 30, | ||||||||||||||||||||||||||
| 2007 | 2007 | 2006 | 2005 | 2004 | 2003 | |||||||||||||||||||||
Per Share Operating Performance: | ||||||||||||||||||||||||||
| Net asset value, beginning of period | $ | 20.63 | 17.90 | 17.27 | 17.52 | 13.95 | 16.25 | |||||||||||||||||||
| Income (loss) from investment operations: | ||||||||||||||||||||||||||
| Net investment loss | $ | (0.00 | )** | (0.22 | )* | (0.22 | )* | (0.19 | ) | (0.22 | ) | (0.25 | ) | |||||||||||||
| Net realized and unrealized gain (loss) on investments | $ | 1.06 | 2.95 | 0.85 | 0.36 | 3.79 | (2.05 | ) | ||||||||||||||||||
| Total from investment operations | $ | 1.06 | 2.73 | 0.63 | 0.17 | 3.57 | (2.30 | ) | ||||||||||||||||||
| Less distributions from: | ||||||||||||||||||||||||||
| Net investment income | $ | — | — | — | 0.27 | — | — | |||||||||||||||||||
| Return of capital | $ | — | — | — | 0.15 | — | — | |||||||||||||||||||
| Total distributions | $ | — | — | — | 0.42 | — | — | |||||||||||||||||||
| Net asset value, end of period | $ | 21.69 | 20.63 | 17.90 | 17.27 | 17.52 | 13.95 | |||||||||||||||||||
| Total Return(1) | % | 5.14 | 15.25 | 3.65 | 0.92 | 25.59 | (14.15 | ) | ||||||||||||||||||
Ratios and Supplemental Data: | ||||||||||||||||||||||||||
| Net assets, end of period (000’s) | $ | 33,358 | 34,843 | 43,089 | 52,355 | 53,976 | 31,516 | |||||||||||||||||||
| Ratios to average net assets: | ||||||||||||||||||||||||||
| Gross expenses prior to expense reimbursement and brokerage commission recapture(2) | % | 2.10 | 2.13 | 2.08 | 2.05 | 2.26 | 2.41 | |||||||||||||||||||
| Net expenses after expense reimbursement and prior to brokerage commission recapture(2)(3) | % | 2.10 | 2.10 | 2.10 | 2.10 | 2.09 | 2.25 | |||||||||||||||||||
| Net expenses after expense reimbursement and brokerage commission recapture(2)(3) | % | 2.10 | 2.09 | 2.09 | 2.08 | 2.07 | 2.25 | |||||||||||||||||||
| Net investment loss after expense reimbursement and brokerage commission recapture(2)(3) | % | (0.02 | ) | (1.22 | ) | (1.20 | ) | (1.13 | ) | (1.47 | ) | (1.61 | ) | |||||||||||||
| Portfolio turnover rate | % | 49 | 84 | 99 | 81 | 142 | 291 | |||||||||||||||||||
| Class I | ||||||||||||||||||||||||||
| Six Months | ||||||||||||||||||||||||||
| Ended | Year Ended May 31, | |||||||||||||||||||||||||
| November 30, | ||||||||||||||||||||||||||
| 2007 | 2007 | 2006 | 2005 | 2004 | 2003 | |||||||||||||||||||||
Per Share Operating Performance: | ||||||||||||||||||||||||||
| Net asset value, beginning of period | $ | 22.56 | 19.35 | 18.47 | 18.69 | 14.71 | 16.93 | |||||||||||||||||||
| Income (loss) from investment operations: | ||||||||||||||||||||||||||
| Net investment income (loss) | $ | 0.02 | * | (0.01 | ) | (0.01 | )* | 0.02 | (0.05 | ) | (0.06 | ) | ||||||||||||||
| Net realized and unrealized gain (loss) on investments | $ | 1.26 | 3.22 | 0.89 | 0.37 | 4.03 | (2.16 | ) | ||||||||||||||||||
| Total from investment operations | $ | 1.28 | 3.21 | 0.88 | 0.39 | 3.98 | (2.22 | ) | ||||||||||||||||||
| Less distributions from: | ||||||||||||||||||||||||||
| Net investment income | $ | — | — | — | 0.46 | — | — | |||||||||||||||||||
| Return of capital | $ | — | — | — | 0.15 | — | — | |||||||||||||||||||
| Total distribution | $ | — | — | — | 0.61 | — | — | |||||||||||||||||||
| Net asset value, end of period | $ | 23.84 | 22.56 | 19.35 | 18.47 | 18.69 | 14.71 | |||||||||||||||||||
| Total Return(1) | % | 5.67 | 16.59 | 4.76 | 2.07 | 27.06 | (13.11 | ) | ||||||||||||||||||
Ratios and Supplemental Data: | ||||||||||||||||||||||||||
| Net assets, end of period (000’s) | $ | 15,739 | 79,265 | 66,319 | 38,841 | 36,504 | 22,156 | |||||||||||||||||||
| Ratios to average net assets: | ||||||||||||||||||||||||||
| Gross expenses prior to expense reimbursement and brokerage commission recapture(2) | % | 1.00 | 1.01 | 0.97 | 0.94 | 1.10 | 1.21 | |||||||||||||||||||
| Net expenses after expense reimbursement and prior to brokerage commission recapture(2)(3) | % | 1.00 | 0.98 | 0.98 | 0.99 | 0.94 | 1.05 | |||||||||||||||||||
| Net expenses after expense reimbursement and brokerage commission recapture(2)(3) | % | 0.99 | 0.96 | 0.98 | 0.97 | 0.91 | 1.05 | |||||||||||||||||||
| Net investment income (loss) after expense reimbursement and brokerage commission recapture (2)(3) | % | 0.14 | (0.09 | ) | (0.05 | ) | (0.02 | ) | (0.31 | ) | (0.42 | ) | ||||||||||||||
| Portfolio turnover rate | % | 49 | 84 | 99 | 81 | 142 | 291 | |||||||||||||||||||
(1) Total return is calculated assuming reinvestment of all dividends and capital gain distributions at net asset value and excluding the deduction of sales charges. Total return for periods less than one year is not annualized.
(2) Annualized for periods less than one year.
(3) The Investment Adviser has agreed to limit expenses, (excluding interest, taxes, brokerage and extraordinary expenses) subject to possible recoupment by the Investment Adviser within three years of being incurred.
* Calculated using average number of shares outstanding throughout the period
** Amount is more than $(0.005).
41
Table of Contents
Selected data for a share of beneficial interest outstanding throughout each period.
| Class Q | ||||||||||||||||||||||||||
| Six Months | ||||||||||||||||||||||||||
| Ended | Year Ended May 31, | |||||||||||||||||||||||||
| November 30, | ||||||||||||||||||||||||||
| 2007 | 2007 | 2006 | 2005 | 2004 | 2003 | |||||||||||||||||||||
Per Share Operating Performance: | ||||||||||||||||||||||||||
| Net asset value, beginning of period | $ | 22.30 | 19.17 | 18.35 | 18.58 | 14.66 | 16.92 | |||||||||||||||||||
| Income (loss) from investment operations: | ||||||||||||||||||||||||||
| Net investment income (loss) | $ | 0.10 | (0.07 | ) | (0.07 | )* | (0.06 | ) | (0.11 | ) | (0.15 | ) | ||||||||||||||
| Net realized and unrealized gain (loss) on investments | $ | 1.14 | 3.20 | 0.89 | 0.40 | 4.03 | (2.11 | ) | ||||||||||||||||||
| Total from investment operations | $ | 1.24 | 3.13 | 0.82 | 0.34 | 3.92 | (2.26 | ) | ||||||||||||||||||
| Less distributions from: | ||||||||||||||||||||||||||
| Net investment income | $ | — | — | — | 0.42 | — | — | |||||||||||||||||||
| Return of capital | $ | — | — | — | 0.15 | — | — | |||||||||||||||||||
| Total distributions | $ | — | — | — | 0.57 | — | — | |||||||||||||||||||
| Net asset value, end of period | $ | 23.54 | 22.30 | 19.17 | 18.35 | 18.58 | 14.66 | |||||||||||||||||||
| Total Return(1) | % | 5.56 | 16.33 | 4.47 | 1.81 | 26.74 | (13.36 | ) | ||||||||||||||||||
Ratios and Supplemental Data: | ||||||||||||||||||||||||||
| Net assets, end of period (000’s) | $ | 1,042 | 1,081 | 1,051 | 2,037 | 6,035 | 6,178 | |||||||||||||||||||
| Ratios to average net assets: | ||||||||||||||||||||||||||
| Gross expenses prior to expense reimbursement and brokerage commission recapture(2) | % | 1.24 | 1.26 | 1.22 | 1.19 | 1.32 | 1.47 | |||||||||||||||||||
| Net expenses after expense reimbursement and prior to brokerage commission recapture(2)(3) | % | 1.24 | 1.23 | 1.24 | 1.24 | 1.17 | 1.31 | |||||||||||||||||||
| Net expenses after expense reimbursement and brokerage commission recapture(2)(3) | % | 1.23 | 1.22 | 1.23 | 1.22 | 1.14 | 1.31 | |||||||||||||||||||
| Net investment income (loss) after expense reimbursement and brokerage commission recapture(2)(3) | % | 0.85 | (0.34 | ) | (0.36 | ) | (0.27 | ) | (0.53 | ) | (0.66 | ) | ||||||||||||||
| Portfolio turnover rate | % | 49 | 84 | 99 | 81 | 142 | 291 | |||||||||||||||||||
(1) Total return is calculated assuming reinvestment of all dividends and capital gain distributions at net asset value and excluding the deduction of sales charges. Total return for periods less than one year is not annualized
(2) Annualized for periods less than one year.
(3) The Investment Adviser has agreed to limit expenses, (excluding interest, taxes, brokerage and extraordinary expenses) subject to possible recoupment by the Investment Adviser within three years of being incurred.
* Calculated using average number of shares outstanding throughout the period.
42
Table of Contents
Selected data for a share of beneficial interest outstanding throughout each period.
| Class A | ||||||||||||||||||||||||||
| Six Months | ||||||||||||||||||||||||||
| Ended | Year Ended May 31, | |||||||||||||||||||||||||
| November 30, | ||||||||||||||||||||||||||
| 2007 | 2007 | 2006 | 2005 | 2004 | 2003 | |||||||||||||||||||||
Per Share Operating Performance: | ||||||||||||||||||||||||||
| Net asset value, beginning of period | $ | 17.88 | 15.18 | 13.01 | 12.06 | 10.12 | 11.11 | |||||||||||||||||||
| Income (loss) from investment operations: | ||||||||||||||||||||||||||
| Net investment loss | $ | (0.07 | ) | (0.11 | ) | (0.13 | )* | (0.16 | ) | (0.06 | ) | (0.12 | ) | |||||||||||||
| Net realized and unrealized gain (loss) on investments | $ | 0.77 | 2.90 | 2.30 | 1.10 | 2.00 | (0.87 | ) | ||||||||||||||||||
| Total from investment operations | $ | 0.70 | 2.79 | 2.17 | 0.94 | 1.94 | (0.99 | ) | ||||||||||||||||||
| Less distributions from: | ||||||||||||||||||||||||||
| Net realized gains on investments | $ | — | 0.09 | — | — | — | — | |||||||||||||||||||
| Total distributions | $ | — | 0.09 | — | — | — | — | |||||||||||||||||||
| Payment by affiliate | $ | — | — | — | 0.01 | — | — | |||||||||||||||||||
| Net asset value, end of period | $ | 18.58 | 17.88 | 15.18 | 13.01 | 12.06 | 10.12 | |||||||||||||||||||
| Total Return(1) | % | 3.91 | 18.49 | 16.68 | 7.88 | † | 19.17 | (8.91 | ) | |||||||||||||||||
Ratios and Supplemental Data: | ||||||||||||||||||||||||||
| Net assets, end of period (000’s) | $ | 118,072 | 117,178 | 122,820 | 118,668 | 133,363 | 44,010 | |||||||||||||||||||
| Ratios to average net assets: | ||||||||||||||||||||||||||
| Gross expenses prior to expense reimbursement/recoupment(2) | % | 1.79 | 1.84 | 1.82 | 1.71 | 1.70 | 1.83 | |||||||||||||||||||
| Net expenses after expense reimbursement/recoupment(2)(3)(4) | % | 1.25 | 1.25 | 1.39 | 1.64 | 1.59 | 1.50 | |||||||||||||||||||
| Net investment loss after expense reimbursement/recoupment(2)(3)(4) | % | (0.74 | ) | (0.66 | ) | (0.90 | ) | (1.15 | ) | (1.06 | ) | (1.15 | ) | |||||||||||||
| Portfolio turnover rate | % | 91 | 167 | 103 | 50 | 115 | 345 | |||||||||||||||||||
| Class B | ||||||||||||||||||||||||||
| Six Months | ||||||||||||||||||||||||||
| Ended | Year Ended May 31, | |||||||||||||||||||||||||
| November 30, | ||||||||||||||||||||||||||
| 2007 | 2007 | 2006 | 2005 | 2004 | 2003 | |||||||||||||||||||||
Per Share Operating Performance: | ||||||||||||||||||||||||||
| Net asset value, beginning of period | $ | 16.79 | 14.37 | 12.41 | 11.59 | 9.80 | 10.83 | |||||||||||||||||||
| Income (loss) from investment operations: | ||||||||||||||||||||||||||
| Net investment loss | $ | (0.13 | )* | (0.21 | )* | (0.23 | )* | (0.27 | ) | (0.06 | ) | (0.20 | ) | |||||||||||||
| Net realized and unrealized gain (loss) on investments | $ | 0.73 | 2.72 | 2.19 | 1.08 | 1.85 | (0.83 | ) | ||||||||||||||||||
| Total from investment operations | $ | 0.60 | 2.51 | 1.96 | 0.81 | 1.79 | (1.03 | ) | ||||||||||||||||||
| Less distributions from: | ||||||||||||||||||||||||||
| Net realized gains on investments | $ | — | 0.09 | — | — | — | — | |||||||||||||||||||
| Total distributions | $ | — | 0.09 | — | — | — | — | |||||||||||||||||||
| Payment by affiliate | $ | — | — | — | 0.01 | — | — | |||||||||||||||||||
| Net asset value, end of period | $ | 17.39 | 16.79 | 14.37 | 12.41 | 11.59 | 9.80 | |||||||||||||||||||
| Total Return(1) | % | 3.57 | 17.58 | 15.79 | 7.08 | † | 18.27 | (9.51 | ) | |||||||||||||||||
Ratios and Supplemental Data: | ||||||||||||||||||||||||||
| Net assets, end of period (000’s) | $ | 74,936 | 86,240 | 107,722 | 139,100 | 191,288 | 43,183 | |||||||||||||||||||
| Ratios to average net assets: | ||||||||||||||||||||||||||
| Gross expenses prior to expense reimbursement/recoupment(2) | % | 2.49 | 2.54 | 2.52 | 2.41 | 2.40 | 2.53 | |||||||||||||||||||
| Net expenses after expense reimbursement/recoupment(2)(3) | % | 2.00 | 2.00 | 2.15 | 2.37 | 2.29 | 2.20 | |||||||||||||||||||
| Net investment loss after expense reimbursement/recoupment(2)(3) | % | (1.50 | ) | (1.41 | ) | (1.66 | ) | (1.87 | ) | (1.69 | ) | (1.85 | ) | |||||||||||||
| Portfolio turnover rate | % | 91 | 167 | 103 | 50 | 115 | 345 | |||||||||||||||||||
(1) Total return is calculated assuming reinvestment of all dividends and capital gain distributions at net asset value and excluding the deduction of sales charges. Total return for periods less than one year not annualized.
(2) Annualized for periods less than one year.
(3) The Investment Adviser has agreed to limit expenses, (excluding interest, taxes, brokerage and extraordinary expenses) subject to possible recoupment by the Investment Adviser within three years of being incurred.
(4) ING Funds Distributor, LLC has contractually agreed to waive 0.05% of the Distribution Fee for Class A shares of MidCap Opportunities.
* Calculated using average number of shares outstanding throughout the period.
† In 2005, the Sub-Adviser fully reimbursed the Fund for a loss on an investment transaction, which otherwise would have had a 0.08% impact on the Fund’s total return. Excluding the reimbursement, total return would have been 7.80% and 7.00% for Class A and Class B, respectively.
43
Table of Contents
Selected data for a share of beneficial interest outstanding throughout each period.
| Class C | ||||||||||||||||||||||||||
| Six Months | ||||||||||||||||||||||||||
| Ended | Year Ended May 31, | |||||||||||||||||||||||||
| November 30, | ||||||||||||||||||||||||||
| 2007 | 2007 | 2006 | 2005 | 2004 | 2003 | |||||||||||||||||||||
Per Share Operating Performance: | ||||||||||||||||||||||||||
| Net asset value, beginning of period | $ | 16.71 | 14.30 | 12.35 | 11.53 | 9.75 | 10.77 | |||||||||||||||||||
| Income (loss) from investment operations: | ||||||||||||||||||||||||||
| Net investment loss | $ | (0.13 | ) | (0.20 | )* | (0.23 | )* | (0.26 | ) | (0.12 | ) | (0.19 | ) | |||||||||||||
| Net realized and unrealized gain (loss) on investments | $ | 0.72 | 2.70 | 2.18 | 1.07 | 1.90 | (0.83 | ) | ||||||||||||||||||
| Total from investment operations | $ | 0.59 | 2.50 | 1.95 | 0.81 | 1.78 | (1.02 | ) | ||||||||||||||||||
| Less distributions from: | ||||||||||||||||||||||||||
| Net realized gains on investments | $ | — | 0.09 | — | — | — | — | |||||||||||||||||||
| Total distributions | $ | — | 0.09 | — | — | — | — | |||||||||||||||||||
| Payment by affiliate | $ | — | — | — | 0.01 | — | — | |||||||||||||||||||
| Net asset value, end of period | $ | 17.30 | 16.71 | 14.30 | 12.35 | 11.53 | 9.75 | |||||||||||||||||||
| Total Return(1) | % | 3.53 | 17.60 | 15.79 | 7.11 | † | 18.26 | (9.47 | ) | |||||||||||||||||
Ratios and Supplemental Data: | ||||||||||||||||||||||||||
| Net assets, end of period (000’s) | $ | 77,503 | 80,703 | 90,156 | 101,261 | 131,461 | 67,730 | |||||||||||||||||||
| Ratios to average net assets: | ||||||||||||||||||||||||||
| Gross expenses prior to expense reimbursement (2) | % | 2.49 | 2.54 | 2.52 | 2.41 | 2.40 | 2.53 | |||||||||||||||||||
| Net expenses after expense reimbursement(2)(3) | % | 2.00 | 2.00 | 2.15 | 2.37 | 2.29 | 2.20 | |||||||||||||||||||
| Net investment loss after expense reimbursement (2)(3) | % | (1.49 | ) | (1.41 | ) | (1.66 | ) | (1.88 | ) | (1.80 | ) | (1.85 | ) | |||||||||||||
| Portfolio turnover rate | % | 91 | 167 | 103 | 50 | 115 | 345 | |||||||||||||||||||
| Class I | ||||||||||||||||||||||||||
| Six Months | ||||||||||||||||||||||||||
| Ended | Year Ended May 31, | |||||||||||||||||||||||||
| November 30, | ||||||||||||||||||||||||||
| 2007 | 2007 | 2006 | 2005 | 2004 | 2003 | |||||||||||||||||||||
Per Share Operating Performance: | ||||||||||||||||||||||||||
| Net asset value, beginning of period | $ | 18.51 | 15.64 | 13.35 | 12.33 | 10.33 | 11.29 | |||||||||||||||||||
| Income (loss) from investment operations: | ||||||||||||||||||||||||||
| Net investment loss | $ | (0.03 | ) | (0.03 | ) | (0.07 | ) | (0.09 | ) | (0.09 | )* | (0.11 | ) | |||||||||||||
| Net realized and unrealized gain (loss) on investments | $ | 0.80 | 2.99 | 2.36 | 1.10 | 2.09 | (0.85 | ) | ||||||||||||||||||
| Total from investment operations | $ | 0.77 | 2.96 | 2.29 | 1.01 | 2.00 | (0.96 | ) | ||||||||||||||||||
| Less distributions from: | ||||||||||||||||||||||||||
| Net realized gains on investments | $ | — | 0.09 | — | — | — | — | |||||||||||||||||||
| Total distributions | $ | — | 0.09 | — | — | — | — | |||||||||||||||||||
| Payment by affiliate | $ | — | — | — | 0.01 | — | — | |||||||||||||||||||
| Net asset value, end of period | $ | 19.28 | 18.51 | 15.64 | 13.35 | 12.33 | 10.33 | |||||||||||||||||||
| Total Return(1) | % | 4.16 | 19.03 | 17.15 | 8.27 | † | 19.36 | (8.50 | ) | |||||||||||||||||
Ratios and Supplemental Data: | ||||||||||||||||||||||||||
| Net assets, end of period (000’s) | $ | 4,308 | 4,253 | 3,376 | 3,000 | 2,614 | 10,844 | |||||||||||||||||||
| Ratios to average net assets: | ||||||||||||||||||||||||||
| Gross expenses prior to expense reimbursement(2) | % | 1.29 | 1.33 | 1.34 | 1.27 | 1.31 | 1.41 | |||||||||||||||||||
| Net expenses after expense reimbursement(2)(3) | % | 0.80 | 0.79 | 0.97 | 1.22 | 1.17 | 1.09 | |||||||||||||||||||
| Net investment loss after expense reimbursement (2)(3) | % | (0.29 | ) | (0.20 | ) | (0.48 | ) | (0.72 | ) | (0.81 | ) | (0.71 | ) | |||||||||||||
| Portfolio turnover rate | % | 91 | 167 | 103 | 50 | 115 | 345 | |||||||||||||||||||
(1) Total return is calculated assuming reinvestment of all dividends and capital gain distributions at net asset value and excluding the deduction of sales charges. Total return for periods less than one year is not annualized.
(2) Annualized for periods less than one year.
(3) The Investment Adviser has agreed to limit expenses, (excluding interest, taxes, brokerage and extraordinary expenses) subject to possible recoupment by the Investment Adviser within three years of being incurred.
* Calculated using average number of shares outstanding throughout the period.
† In 2005, the Sub-Adviser fully reimbursed the Fund for a loss on an investment transaction, which otherwise would have had a 0.08% impact on the Fund’s total return. Excluding the reimbursement, total return would have been 7.03% and 8.19% for Class C and Class I, respectively.
44
Table of Contents
Selected data for a share of beneficial interest outstanding throughout each period.
| Class Q | ||||||||||||||||||||||||||
| Six Months | ||||||||||||||||||||||||||
| Ended | Year Ended May 31, | |||||||||||||||||||||||||
| November 30, | ||||||||||||||||||||||||||
| 2007 | 2007 | 2006 | 2005 | 2004 | 2003 | |||||||||||||||||||||
Per Share Operating Performance: | ||||||||||||||||||||||||||
| Net asset value, beginning of period | $ | 18.14 | 15.36 | 13.15 | 12.17 | 10.19 | 11.16 | |||||||||||||||||||
| Income (loss) from investment operations: | ||||||||||||||||||||||||||
| Net investment loss | $ | (0.05 | ) | (0.07 | ) | (0.11 | ) | (0.13 | ) | (0.10 | )* | (0.09 | ) | |||||||||||||
| Net realized and unrealized gain (loss) on investments | $ | 0.78 | 2.94 | 2.32 | 1.10 | 2.08 | (0.88 | ) | ||||||||||||||||||
| Total from investment operations | $ | 0.73 | 2.87 | 2.21 | 0.97 | 1.98 | (0.97 | ) | ||||||||||||||||||
| Less distributions from: | ||||||||||||||||||||||||||
| Net realized gains on investments | $ | — | 0.09 | — | — | — | — | |||||||||||||||||||
| Total distributions | $ | — | 0.09 | — | — | — | — | |||||||||||||||||||
| Payment by affiliate | $ | — | — | — | 0.01 | — | — | |||||||||||||||||||
| Net asset value, end of period | $ | 18.87 | 18.14 | 15.36 | 13.15 | 12.17 | 10.19 | |||||||||||||||||||
| Total Return(1) | % | 4.02 | 18.79 | 16.81 | 8.05 | † | 19.43 | (8.69 | ) | |||||||||||||||||
Ratios and Supplemental Data: | ||||||||||||||||||||||||||
| Net assets, end of period (000’s) | $ | 5,699 | 5,429 | 4,805 | 4,753 | 4,898 | 4,886 | |||||||||||||||||||
| Ratios to average net assets: | ||||||||||||||||||||||||||
| Gross expenses prior to expense reimbursement(2) | % | 1.54 | 1.58 | 1.60 | 1.52 | 1.56 | 1.66 | |||||||||||||||||||
| Net expenses after expense reimbursement(2)(3) | % | 1.05 | 1.04 | 1.22 | 1.47 | 1.45 | 1.33 | |||||||||||||||||||
| Net investment loss after expense reimbursement (2)(3) | % | (0.54 | ) | (0.45 | ) | (0.73 | ) | (0.98 | ) | (1.00 | ) | (0.98 | ) | |||||||||||||
| Portfolio turnover rate | % | 91 | 167 | 103 | 50 | 115 | 345 | |||||||||||||||||||
(1) Total return is calculated assuming reinvestment of all dividends and capital gain distributions at net asset value and excluding the deduction of sales charges. Total return for periods less than one year is not annualized.
(2) Annualized for periods less than one year.
(3) The Investment Adviser has agreed to limit expenses, (excluding interest, taxes, brokerage and extraordinary expenses) subject to possible recoupment by the Investment Adviser within three years of being incurred.
* Calculated using average number of shares outstanding throughout the period.
† In 2005, the Sub-Adviser fully reimbursed the Fund for a loss on an investment transaction, which otherwise would have had a 0.08% impact on the Fund’s total return. Excluding the reimbursement, total return would have been 7.97% for Class Q.
45
Table of Contents
Selected data for a share of beneficial interest outstanding throughout each period.
| Class A | ||||||||||||||
| Six Months | ||||||||||||||
| Ended | Year Ended | December 28, | ||||||||||||
| November 30, | May 31, | 2005(1) to | ||||||||||||
| 2007 | 2007 | May 31, 2006 | ||||||||||||
Per Share Operating Performance: | ||||||||||||||
| Net asset value, beginning of period | $ | 12.16 | 10.02 | 10.00 | ||||||||||
| Income (loss) from investment operations: | ||||||||||||||
| Net investment income (loss) | $ | 0.01 | (0.01 | )* | 0.06 | |||||||||
| Net realized and unrealized gain (loss) on investments | $ | (0.14 | ) | 2.22 | (0.04 | ) | ||||||||
| Total from investment operations | $ | (0.13 | ) | 2.21 | 0.02 | |||||||||
| Less distributions from: | ||||||||||||||
| Net investment income | $ | — | 0.07 | — | ||||||||||
| Total distributions | $ | — | 0.07 | — | ||||||||||
| Net asset value, end of period | $ | 12.03 | 12.16 | 10.02 | ||||||||||
| Total Return(2) | % | (1.07 | ) | 22.11 | 0.20 | |||||||||
Ratios and Supplemental Data: | ||||||||||||||
| Net assets, end of period (000’s) | $ | 9,021 | 6,716 | 5,021 | ||||||||||
| Ratios to average net assets: | ||||||||||||||
| Gross expenses prior to expense reimbursement(3) | % | 2.04 | 3.97 | 3.74 | ||||||||||
| Net expenses after expense reimbursement(3)(4) | % | 1.25 | 1.25 | 1.25 | ||||||||||
| Net investment income (loss) after expense reimbursement(3)(4) | % | 0.14 | (0.08 | ) | 1.32 | |||||||||
| Portfolio turnover rate | % | 258 | 240 | 51 | ||||||||||
| Class B | ||||||||||||||
| Six Months | ||||||||||||||
| Ended | Year Ended | April 5, | ||||||||||||
| November 30, | May 31, | 2006(1) to | ||||||||||||
| 2007 | 2007 | May 31, 2006 | ||||||||||||
Per Share Operating Performance: | ||||||||||||||
| Net asset value, beginning of period | $ | 12.09 | 10.01 | 10.65 | ||||||||||
| Income (loss) from investment operations: | ||||||||||||||
| Net investment loss | $ | (0.03 | )* | (0.08 | )* | (0.01 | ) | |||||||
| Net realized and unrealized gain (loss) on investments | $ | (0.16 | ) | 2.21 | (0.63 | ) | ||||||||
| Total from investment operations | $ | (0.19 | ) | 2.13 | (0.64 | ) | ||||||||
| Less distributions from: | ||||||||||||||
| Net investment income | $ | — | 0.05 | — | ||||||||||
| Total distributions | $ | — | 0.05 | — | ||||||||||
| Net asset value, end of period | $ | 11.90 | 12.09 | 10.01 | ||||||||||
| Total Return(2) | % | (1.57 | ) | 21.35 | (6.10 | ) | ||||||||
Ratios and Supplemental Data: | ||||||||||||||
| Net assets, end of period (000’s) | $ | 505 | 257 | 35 | ||||||||||
| Ratios to average net assets: | ||||||||||||||
| Gross expenses prior to expense reimbursement(3) | % | 2.79 | 4.72 | 4.49 | ||||||||||
| Net expenses after expense reimbursement(3)(4) | % | 2.00 | 2.00 | 2.00 | ||||||||||
| Net investment loss after expense reimbursement(3)(4) | % | (0.45 | ) | (0.70 | ) | (0.81 | ) | |||||||
| Portfolio turnover rate | % | 258 | 240 | 51 | ||||||||||
(1) Commencement of operations.
(2) Total return is calculated assuming reinvestment of all dividends and capital gain distributions at net asset value and excluding the deduction of sales charges. Total return for periods less than one year is not annualized.
(3) Annualized for periods less than one year.
(4) The Investment Adviser has agreed to limit expenses (excluding interest, taxes, brokerage and extraordinary expenses) subject to possible recoupment by the Investment Adviser within three years of being incurred.
* Calculated using average shares outstanding throughout the period.
46
Table of Contents
Selected data for a share of beneficial interest outstanding throughout each period.
| Class C | ||||||||||||||
| Six Months | ||||||||||||||
| Ended | Year Ended | April 27, | ||||||||||||
| November 30, | May 31, | 2006(1) to | ||||||||||||
| 2007 | 2007 | May 31, 2006 | ||||||||||||
Per Share Operating Performance: | ||||||||||||||
| Net asset value, beginning of period | $ | 12.00 | 10.01 | 10.48 | ||||||||||
| Income (loss) from investment operations: | ||||||||||||||
| Net investment income (loss) | $ | 0.01 | (0.08 | )* | (0.01 | ) | ||||||||
| Net realized and unrealized gain (loss) on investments | $ | (0.19 | ) | 2.16 | (0.46 | ) | ||||||||
| Total from investment operations | $ | (0.18 | ) | 2.08 | (0.47 | ) | ||||||||
| Less distributions from: | ||||||||||||||
| Net investment income | $ | — | 0.09 | — | ||||||||||
| Total distributions | $ | — | 0.09 | — | ||||||||||
| Net asset value, end of period | $ | 11.82 | 12.00 | 10.01 | ||||||||||
| Total Return(2) | % | (1.50 | ) | 20.89 | (4.58 | ) | ||||||||
Ratios and Supplemental Data: | ||||||||||||||
| Net assets, end of period (000’s) | $ | 561 | 112 | 10 | ||||||||||
| Ratios to average net assets: | ||||||||||||||
| Gross expenses prior to expense reimbursement(3) | % | 2.79 | 4.72 | 4.54 | ||||||||||
| Net expenses after expense reimbursement(3)(4) | % | 2.00 | 2.00 | 2.00 | ||||||||||
| Net investment income (loss) after expense reimbursement(3)(4) | % | 0.18 | (0.75 | ) | (0.74 | ) | ||||||||
| Portfolio turnover rate | % | 258 | 240 | 51 | ||||||||||
| Class I | ||||||||||
| Six Months | ||||||||||
| Ended | December 20, | |||||||||
| November 30, | 2006(1) to | |||||||||
| 2007 | May 31, 2007 | |||||||||
Per Share Operating Performance: | ||||||||||
| Net asset value, beginning of period | $ | 12.20 | 10.99 | |||||||
| Income (loss) from investment operations: | ||||||||||
| Net investment income | $ | 0.02 | 0.02 | * | ||||||
| Net realized and unrealized gain (loss) on investments | $ | (0.15 | ) | 1.19 | ||||||
| Total from investment operations | $ | (0.13 | ) | 1.21 | ||||||
| Net asset value, end of period | $ | 12.07 | 12.20 | |||||||
| Total Return(2) | % | (1.07 | ) | 11.01 | ||||||
Ratios and Supplemental Data: | ||||||||||
| Net assets, end of period (000’s) | $ | 26 | 26 | |||||||
| Ratios to average net assets: | ||||||||||
| Gross expenses prior to expense reimbursement(3) | % | 1.79 | 3.72 | |||||||
| Net expenses after expense reimbursement(3)(4) | % | 1.00 | 1.00 | |||||||
| Net investment income after expense reimbursement (3)(4) | % | 0.30 | 0.43 | |||||||
| Portfolio turnover rate | % | 258 | 240 | |||||||
(1) Commencement of operations.
(2) Total return is calculated assuming reinvestment of all dividends and capital gain distributions at net asset value and excluding the deduction of sales charges. Total return for periods less than one year is not annualized.
(3) Annualized for periods less than one year.
(4) The Investment Adviser has agreed to limit expenses (excluding interest, taxes, brokerage and extraordinary expenses) subject to possible recoupment by the Investment Adviser within three years of being incurred.
* Calculated using average shares outstanding throughout the period.
47
Table of Contents
Selected data for a share of beneficial interest outstanding throughout each period.
| Class A | ||||||||||||||||||||||||||
| Six Months | ||||||||||||||||||||||||||
| Ended | Year Ended May 31, | |||||||||||||||||||||||||
| November 30, | ||||||||||||||||||||||||||
| 2007 | 2007 | 2006 | 2005 | 2004 | 2003 | |||||||||||||||||||||
Per Share Operating Performance: | ||||||||||||||||||||||||||
| Net asset value, beginning of period | $ | 34.67 | 29.23 | 24.37 | 22.53 | 18.16 | 24.04 | |||||||||||||||||||
| Income (loss) from investment operations: | ||||||||||||||||||||||||||
| Net investment loss | $ | (0.03 | ) | (0.26 | )* | (0.31 | )* | (0.31 | )* | (0.37 | ) | (0.35 | ) | |||||||||||||
| Net realized and unrealized gain (loss) on investments | $ | (0.95 | ) | 5.70 | 5.17 | 2.15 | 4.74 | (5.53 | ) | |||||||||||||||||
| Total from investment operations | $ | (0.98 | ) | 5.44 | 4.86 | 1.84 | 4.37 | (5.88 | ) | |||||||||||||||||
| Net asset value, end of period | $ | 33.69 | 34.67 | 29.23 | 24.37 | 22.53 | 18.16 | |||||||||||||||||||
| Total Return(1) | % | (2.83 | ) | 18.61 | 19.94 | 8.17 | 24.06 | † | (24.46 | ) | ||||||||||||||||
Ratios and Supplemental Data: | ||||||||||||||||||||||||||
| Net assets, end of period (000’s) | $ | 79,768 | 88,436 | 89,328 | 93,821 | 105,890 | 118,570 | |||||||||||||||||||
| Ratios to average net assets: | ||||||||||||||||||||||||||
| Gross expenses prior to expense reimbursement (2) | % | 1.79 | 1.83 | 1.85 | 1.74 | 1.74 | 1.88 | |||||||||||||||||||
| Net expenses after expense reimbursement (2)(3)(4) | % | 1.50 | 1.50 | 1.50 | 1.63 | 1.74 | 1.88 | |||||||||||||||||||
| Net investment loss after expense reimbursement(2)(3)(4) | % | (0.15 | ) | (0.86 | ) | (1.13 | ) | (1.36 | ) | (1.52 | ) | (1.80 | ) | |||||||||||||
| Portfolio turnover rate | % | 57 | 78 | 87 | 62 | 60 | 357 | |||||||||||||||||||
| Class B | ||||||||||||||||||||||||||
| Six Months | ||||||||||||||||||||||||||
| Ended | Year Ended May 31, | |||||||||||||||||||||||||
| November 30, | ||||||||||||||||||||||||||
| 2007 | 2007 | 2006 | 2005 | 2004 | 2003 | |||||||||||||||||||||
Per Share Operating Performance: | ||||||||||||||||||||||||||
| Net asset value, beginning of period | $ | 31.27 | 26.57 | 22.32 | 20.78 | 16.87 | 22.48 | |||||||||||||||||||
| Income (loss) from investment operations: | ||||||||||||||||||||||||||
| Net investment loss | $ | (0.14 | )* | (0.44 | )* | (0.47 | )* | (0.44 | )* | (0.50 | ) | (0.48 | ) | |||||||||||||
| Net realized and unrealized gain (loss) on investments | $ | (0.86 | ) | 5.14 | 4.72 | 1.98 | 4.41 | (5.13 | ) | |||||||||||||||||
| Total from investment operations | $ | (1.00 | ) | 4.70 | 4.25 | 1.54 | 3.91 | (5.61 | ) | |||||||||||||||||
| Net asset value, end of period | $ | 30.27 | 31.27 | 26.57 | 22.32 | 20.78 | 16.87 | |||||||||||||||||||
| Total Return(1) | % | (3.20 | ) | 17.69 | 19.04 | 7.41 | 23.18 | † | (24.96 | ) | ||||||||||||||||
Ratios and Supplemental Data: | ||||||||||||||||||||||||||
| Net assets, end of period (000’s) | $ | 20,006 | 25,219 | 30,678 | 43,929 | 77,751 | 85,465 | |||||||||||||||||||
| Ratios to average net assets: | ||||||||||||||||||||||||||
| Gross expenses prior to expense reimbursement (2)(3) | % | 2.49 | 2.53 | 2.55 | 2.44 | 2.44 | 2.58 | |||||||||||||||||||
| Net expenses after expense reimbursement (2)(3)(4) | % | 2.25 | 2.25 | 2.25 | 2.35 | 2.44 | 2.58 | |||||||||||||||||||
| Net investment loss after expense reimbursement(2)(3)(4) | % | (0.88 | ) | (1.61 | ) | (1.88 | ) | (2.10 | ) | (2.07 | ) | (2.50 | ) | |||||||||||||
| Portfolio turnover rate | % | 57 | 78 | 87 | 62 | 60 | 357 | |||||||||||||||||||
(1) Total return is calculated assuming reinvestment of all dividends and capital gain distributions at net asset value and excluding the deduction of sales charges. Total return for periods less than one year is not annualized.
(2) Annualized for periods less than one year.
(3) ING Funds Distributor, LLC has contractually agreed to waive 0.05% of the Distribution Fee for Class A shares of SmallCap Opportunities.
(4) The Investment Adviser has agreed to limit expenses, (excluding interest, taxes, brokerage and extraordinary expenses) subject to possible recoupment by the Investment Adviser within three years of being incurred.
* Calculated using average number of shares outstanding throughout the period.
† In 2004, the Sub-Adviser fully reimbursed the Fund for a loss on an investment transaction, which otherwise would have had a 0.11% and 0.06% impact on Class A and Class B total returns, respectively. Excluding the reimbursements, the total returns would have been 23.95% and 23.12%, for Class A and Class B, respectively.
48
Table of Contents
Selected data for a share of beneficial interest outstanding throughout each period.
| Class C | ||||||||||||||||||||||||||
| Six Months | ||||||||||||||||||||||||||
| Ended | Year Ended May 31, | |||||||||||||||||||||||||
| November 30, | ||||||||||||||||||||||||||
| 2007 | 2007 | 2006 | 2005 | 2004 | 2003 | |||||||||||||||||||||
Per Share Operating Performance: | ||||||||||||||||||||||||||
| Net asset value, beginning of period | $ | 31.21 | 26.51 | 22.27 | 20.73 | 16.83 | 22.44 | |||||||||||||||||||
| Income (loss) from investment operations: | ||||||||||||||||||||||||||
| Net investment loss | $ | (0.14 | ) | (0.44 | )* | (0.47 | )* | (0.44 | )* | (0.49 | ) | (0.49 | ) | |||||||||||||
| Net realized and unrealized gain (loss) on investments | $ | (0.86 | ) | 5.14 | 4.71 | 1.98 | 4.39 | (5.12 | ) | |||||||||||||||||
| Total from investment operations | $ | (1.00 | ) | 4.70 | 4.24 | 1.54 | 3.90 | (5.61 | ) | |||||||||||||||||
| Net asset value, end of period | $ | 30.21 | 31.21 | 26.51 | 22.27 | 20.73 | 16.83 | |||||||||||||||||||
| Total Return(1) | % | (3.20 | ) | 17.73 | 19.04 | 7.43 | 23.17 | † | (25.00 | ) | ||||||||||||||||
Ratios and Supplemental Data: | ||||||||||||||||||||||||||
| Net assets, end of period (000’s) | $ | 31,547 | 34,951 | 39,174 | 43,603 | 57,140 | 63,406 | |||||||||||||||||||
| Ratios to average net assets: | ||||||||||||||||||||||||||
| Gross expenses prior to expense reimbursement(2) | % | 2.49 | 2.53 | 2.55 | 2.44 | 2.44 | 2.58 | |||||||||||||||||||
| Net expenses after expense reimbursement(2)(3) | % | 2.25 | 2.25 | 2.25 | 2.35 | 2.44 | 2.58 | |||||||||||||||||||
| Net investment loss after expense reimbursement (2)(3) | % | (0.90 | ) | (1.61 | ) | (1.88 | ) | (2.09 | ) | (2.06 | ) | (2.50 | ) | |||||||||||||
| Portfolio turnover rate | % | 57 | 78 | 87 | 62 | 60 | 357 | |||||||||||||||||||
| Class I | ||||||||||||||||||||||||||
| Six Months | ||||||||||||||||||||||||||
| Ended | Year Ended May 31, | |||||||||||||||||||||||||
| November 30, | ||||||||||||||||||||||||||
| 2007 | 2007 | 2006 | 2005 | 2004 | 2003 | |||||||||||||||||||||
Per Share Operating Performance: | ||||||||||||||||||||||||||
| Net asset value, beginning of period | $ | 35.51 | 29.82 | 24.73 | 22.76 | 18.27 | 24.07 | |||||||||||||||||||
| Income (loss) from investment operations: | ||||||||||||||||||||||||||
| Net investment income (loss) | $ | 0.05 | (0.13 | )* | (0.18 | )* | (0.21 | ) | (0.23 | ) | (0.23 | ) | ||||||||||||||
| Net realized and unrealized gain (loss) on investments | $ | (0.98 | ) | 5.82 | 5.27 | 2.18 | 4.72 | (5.57 | ) | |||||||||||||||||
| Total from investment operations | $ | (0.93 | ) | 5.69 | 5.09 | 1.97 | 4.49 | (5.80 | ) | |||||||||||||||||
| Net asset value, end of period | $ | 34.58 | 35.51 | 29.82 | 24.73 | 22.76 | 18.27 | |||||||||||||||||||
| Total Return(1) | % | (2.62 | ) | 19.08 | 20.58 | 8.66 | 24.58 | † | (24.10 | ) | ||||||||||||||||
Ratios and Supplemental Data: | ||||||||||||||||||||||||||
| Net assets, end of period (000’s) | $ | 4,143 | 4,186 | 2,727 | 13,359 | 11,526 | 8,510 | |||||||||||||||||||
| Ratios to average net assets: | ||||||||||||||||||||||||||
| Gross expenses prior to expense reimbursement(2) | % | 1.30 | 1.34 | 1.34 | 1.28 | 1.31 | 1.46 | |||||||||||||||||||
| Net expenses after expense reimbursement(2)(3) | % | 1.07 | 1.06 | 1.04 | 1.17 | 1.31 | 1.46 | |||||||||||||||||||
| Net investment income (loss) after expense reimbursement(2)(3) | % | 0.29 | (0.42 | ) | (0.65 | ) | (0.91 | ) | (1.09 | ) | (1.37 | ) | ||||||||||||||
| Portfolio turnover rate | % | 57 | 78 | 87 | 62 | 60 | 357 | |||||||||||||||||||
(1) Total return is calculated assuming reinvestment of all dividends and capital gain distributions at net asset value and excluding the deduction of sales charges. Total return for periods less than one year is not annualized.
(2) Annualized for periods less than one year.
(3) The Investment Adviser has agreed to limit expenses, (excluding interest, taxes, brokerage and extraordinary expenses) subject to possible recoupment by the Investment Adviser within three years of being incurred.
* Calculated using average number of shares outstanding throughout the period.
† In 2004, the Sub-Adviser fully reimbursed the Fund for a loss on an investment transaction, which otherwise would have had a 0.06% impact on Class C and Class I total returns. Excluding the reimbursements, the total returns would have been 23.11% and 24.52% for Class C and Class I, respectively.
49
Table of Contents
Selected data for a share of beneficial interest outstanding throughout each period.
| Class Q | ||||||||||||||||||||||||||
| Six Months | ||||||||||||||||||||||||||
| Ended | Year Ended May 31, | |||||||||||||||||||||||||
| November 30, | ||||||||||||||||||||||||||
| 2007 | 2007 | 2006 | 2005 | 2004 | 2003 | |||||||||||||||||||||
Per Share Operating Performance: | ||||||||||||||||||||||||||
| Net asset value, beginning of period | $ | 35.05 | 29.50 | 24.54 | 22.64 | 18.22 | 24.07 | |||||||||||||||||||
| Income (loss) from investment operations: | ||||||||||||||||||||||||||
| Net investment income (loss) | $ | 0.01 | (0.21 | )* | (0.26 | )* | (0.27 | )* | (0.29 | )* | (0.53 | ) | ||||||||||||||
| Net realized and unrealized gain (loss) on investments | $ | (0.97 | ) | 5.76 | 5.22 | 2.17 | 4.71 | (5.32 | ) | |||||||||||||||||
| Total from investment operations | $ | (0.96 | ) | 5.55 | 4.96 | 1.90 | 4.42 | (5.85 | ) | |||||||||||||||||
| Net asset value, end of period | $ | 34.09 | 35.05 | 29.50 | 24.54 | 22.64 | 18.22 | |||||||||||||||||||
| Total Return(1) | % | (2.74 | ) | 18.81 | 20.21 | 8.39 | 24.26 | † | (24.30 | ) | ||||||||||||||||
Ratios and Supplemental Data: | ||||||||||||||||||||||||||
| Net assets, end of period (000’s) | $ | 141 | 150 | 186 | 243 | 463 | 906 | |||||||||||||||||||
| Ratios to average net assets: | ||||||||||||||||||||||||||
| Gross expenses prior to expense reimbursement(2) | % | 1.55 | 1.59 | 1.59 | 1.56 | 1.57 | 1.70 | |||||||||||||||||||
| Net expenses after expense reimbursement(2)(3) | % | 1.32 | 1.31 | 1.30 | 1.45 | 1.57 | 1.70 | |||||||||||||||||||
| Net investment income (loss) after expense reimbursement(2)(3) | % | 0.05 | (0.67 | ) | (0.93 | ) | (1.19 | ) | (1.36 | ) | (1.62 | ) | ||||||||||||||
| Portfolio turnover rate | % | 57 | 78 | 87 | 62 | 60 | 357 | |||||||||||||||||||
(1) Total return is calculated assuming reinvestment of all dividends and capital gain distributions at net asset value and excluding the deduction of sales charges. Total return for periods less than one year is not annualized.
(2) Annualized for periods less than one year.
(3) The Investment Adviser has agreed to limit expenses, (excluding interest, taxes, brokerage and extraordinary expenses) subject to possible recoupment by the Investment Adviser within three years of being incurred.
* Calculated using average number of shares outstanding throughout the period.
† In 2004, the Sub-Adviser fully reimbursed the Fund for a loss on an investment transaction, which otherwise would have had a 0.11% impact on Class Q total returns. Excluding the reimbursements, the total returns would have been 24.15%.
50
Table of Contents
Selected data for a share of beneficial interest outstanding throughout each period.
| Class A | ||||||||||||||||||||||||||
| Six Months | ||||||||||||||||||||||||||
| Ended | Year Ended May 31, | |||||||||||||||||||||||||
| November 30, | ||||||||||||||||||||||||||
| 2007 | 2007 | 2006 | 2005 | 2004 | 2003 | |||||||||||||||||||||
Per Share Operating Performance: | ||||||||||||||||||||||||||
| Net asset value, beginning of period | $ | 24.88 | 23.23 | 22.21 | 22.03 | 19.24 | 22.11 | |||||||||||||||||||
| Income (loss) from investment operations: | ||||||||||||||||||||||||||
| Net investment income | $ | 0.15 | 0.24 | 0.23 | 0.16 | 0.09 | 0.12 | |||||||||||||||||||
| Net realized and unrealized gain (loss) on investments | $ | (3.49 | ) | 4.02 | 3.00 | 1.58 | 3.60 | (1.78 | ) | |||||||||||||||||
| Total from investment operations | $ | (3.34 | ) | 4.26 | 3.23 | 1.74 | 3.69 | (1.66 | ) | |||||||||||||||||
| Less distributions from: | ||||||||||||||||||||||||||
| Net investment income | $ | — | 0.26 | 0.22 | 0.08 | 0.08 | 0.09 | |||||||||||||||||||
| Net realized gains from investments | $ | — | 2.35 | 1.99 | 1.48 | 0.82 | 1.12 | |||||||||||||||||||
| Total distributions | $ | — | 2.61 | 2.21 | 1.56 | 0.90 | 1.21 | |||||||||||||||||||
| Net asset value, end of period | $ | 21.54 | 24.88 | 23.23 | 22.21 | 22.03 | 19.24 | |||||||||||||||||||
| Total Return(1) | % | (13.42 | ) | 18.80 | 14.71 | 7.97 | 19.57 | (6.98 | ) | |||||||||||||||||
Ratios and Supplemental Data: | ||||||||||||||||||||||||||
| Net assets, end of period (millions) | $ | 203 | 255 | 215 | 183 | 193 | 182 | |||||||||||||||||||
| Ratios to average net assets: | ||||||||||||||||||||||||||
| Gross expenses prior to expense reimbursement(2) | % | 1.37 | 1.32 | 1.29 | 1.27 | 1.41 | 1.52 | |||||||||||||||||||
| Net expenses after expense reimbursement(2)(3) | % | 1.27 | 1.22 | 1.19 | 1.17 | 1.41 | 1.52 | |||||||||||||||||||
| Net investment income after expense reimbursement (2)(3) | % | 1.22 | 0.99 | 0.99 | 0.69 | 0.40 | 0.54 | |||||||||||||||||||
| Portfolio turnover rate | % | 20 | 36 | 26 | 27 | 35 | 19 | |||||||||||||||||||
| Class B | ||||||||||||||||||||||||||
| Six Months | ||||||||||||||||||||||||||
| Ended | Year Ended May 31, | |||||||||||||||||||||||||
| November 30, | ||||||||||||||||||||||||||
| 2007 | 2007 | 2006 | 2005 | 2004 | 2003 | |||||||||||||||||||||
Per Share Operating Performance: | ||||||||||||||||||||||||||
| Net asset value, beginning of period | $ | 24.51 | 22.86 | 21.87 | 21.79 | 19.12 | 22.03 | |||||||||||||||||||
| Income (loss) from investment operations: | ||||||||||||||||||||||||||
| Net investment income (loss) | $ | 0.05 | * | 0.05 | * | 0.05 | * | (0.01 | ) | (0.08 | ) | (0.07 | ) | |||||||||||||
| Net realized and unrealized gain (loss) on investments | $ | (3.42 | ) | 3.95 | 2.95 | 1.57 | 3.57 | (1.72 | ) | |||||||||||||||||
| Total from investment operations | $ | (3.37 | ) | 4.00 | 3.00 | 1.56 | 3.49 | (1.79 | ) | |||||||||||||||||
| Less distributions from: | ||||||||||||||||||||||||||
| Net investment income | $ | — | — | 0.02 | — | — | — | |||||||||||||||||||
| Net realized gains from investments | $ | — | 2.35 | 1.99 | 1.48 | 0.82 | 1.12 | |||||||||||||||||||
| Total distributions | $ | — | 2.35 | 2.01 | 1.48 | 0.82 | 1.12 | |||||||||||||||||||
| Net asset value, end of period | $ | 21.14 | 24.51 | 22.86 | 21.87 | 21.79 | 19.12 | |||||||||||||||||||
| Total Return(1) | % | (13.75 | ) | 17.89 | 13.81 | 7.21 | 18.60 | (7.66 | ) | |||||||||||||||||
Ratios and Supplemental Data: | ||||||||||||||||||||||||||
| Net assets, end of period (millions) | $ | 21 | 33 | 64 | 107 | 127 | 127 | |||||||||||||||||||
| Ratios to average net assets: | ||||||||||||||||||||||||||
| Expenses(2) | % | 2.02 | 1.97 | 1.94 | 1.92 | 2.16 | 2.27 | |||||||||||||||||||
| Net investment income (loss)(2) | % | 0.43 | 0.20 | 0.21 | (0.06 | ) | (0.36 | ) | (0.21 | ) | ||||||||||||||||
| Portfolio turnover rate | % | 20 | 36 | 26 | 27 | 35 | 19 | |||||||||||||||||||
(1) Total return is calculated assuming reinvestment of all dividends and capital gain distributions at net asset value and excluding the deduction of sales charges. Total return for periods less than one year is not annualized.
(2) Annualized for periods less than one year.
(3) ING Funds Distributor, LLC has contractually agreed to waive 0.10% of the Distribution Fee for Class A shares of Financial Services.
* Calculated using average number of shares outstanding throughout the period.
51
Table of Contents
Selected data for a share of beneficial interest outstanding throughout each period.
| Class C | ||||||||||||||||||
| Six Months | Year Ended | August 24, | ||||||||||||||||
| Ended | May 31, | 2004(1) to | ||||||||||||||||
| November 30, | May 31, | |||||||||||||||||
| 2007 | 2007 | 2006 | 2005 | |||||||||||||||
Per Share Operating Performance: | ||||||||||||||||||
| Net asset value, beginning of period | $ | 23.96 | 22.53 | 21.78 | 21.78 | |||||||||||||
| Income (loss) from investment operations: | ||||||||||||||||||
| Net investment income | $ | 0.06 | * | 0.06 | * | 0.08 | * | 0.09 | ||||||||||
| Net realized and unrealized gain (loss) on investments | $ | (3.35 | ) | 3.88 | 2.93 | 1.49 | ||||||||||||
| Total from investment operations | $ | (3.29 | ) | 3.94 | 3.01 | 1.58 | ||||||||||||
| Less distributions from: | ||||||||||||||||||
| Net investment income | $ | — | 0.16 | 0.27 | 0.10 | |||||||||||||
| Net realized gains from investments | $ | — | 2.35 | 1.99 | 1.48 | |||||||||||||
| Total distributions | $ | — | 2.51 | 2.26 | 1.58 | |||||||||||||
| Net asset value, end of period | $ | 20.67 | 23.96 | 22.53 | 21.78 | |||||||||||||
| Total Return(2) | % | (13.73 | ) | 17.90 | 13.97 | 7.29 | ||||||||||||
Ratios and Supplemental Data: | ||||||||||||||||||
| Net assets, end of period (000’s) | $ | 1,779 | 1,256 | 1,311 | 13 | |||||||||||||
| Ratios to average net assets: | ||||||||||||||||||
| Expenses(3) | % | 2.02 | 1.97 | 1.94 | 1.92 | |||||||||||||
| Net investment income(3) | % | 0.55 | 0.24 | 0.35 | 0.12 | |||||||||||||
| Portfolio turnover rate | % | 20 | 36 | 26 | 27 | |||||||||||||
| Class O | ||||||||||||||||||
| Six Months | Year Ended | September 15, | ||||||||||||||||
| Ended | May 31, | 2004(1) to | ||||||||||||||||
| November 30, | May 31, | |||||||||||||||||
| 2007 | 2007 | 2006 | 2005 | |||||||||||||||
Per Share Operating Performance: | ||||||||||||||||||
| Net asset value, beginning of period | $ | 24.73 | 23.13 | 22.15 | 22.67 | |||||||||||||
| Income (loss) from investment operations: | ||||||||||||||||||
| Net investment income | $ | 0.14 | 0.25 | * | 0.22 | 0.17 | ||||||||||||
| Net realized and unrealized gain (loss) on investments | $ | (3.46 | ) | 3.98 | 3.00 | 0.92 | ||||||||||||
| Total from investment operations | $ | (3.32 | ) | 4.23 | 3.22 | 1.09 | ||||||||||||
| Less distributions from: | ||||||||||||||||||
| Net investment income | $ | — | 0.28 | 0.25 | 0.13 | |||||||||||||
| Net realized gains from investments | $ | — | 2.35 | 1.99 | 1.48 | |||||||||||||
| Total distributions | $ | — | 2.63 | 2.24 | 1.61 | |||||||||||||
| Net asset value, end of period | $ | 21.41 | 24.73 | 23.13 | 22.15 | |||||||||||||
| Total Return(2) | % | (13.42 | ) | 18.77 | 14.68 | 4.90 | ||||||||||||
Ratios and Supplemental Data: | ||||||||||||||||||
| Net assets, end of period (000’s) | $ | 20,164 | 23,459 | 9,659 | 3,658 | |||||||||||||
| Ratios to average net assets: | ||||||||||||||||||
| Expenses(3) | % | 1.27 | 1.22 | 1.19 | 1.17 | |||||||||||||
| Net investment income(3) | % | 1.24 | 1.03 | 1.03 | 0.80 | |||||||||||||
| Portfolio turnover rate | % | 20 | 36 | 26 | 27 | |||||||||||||
(1) Commencement of operations.
(2) Total return is calculated assuming reinvestment of all dividends and capital gain distributions at net asset value and excluding the deduction of sales charges. Total returns for periods less than one year are not annualized.
(3) Annualized for periods less than one year.
* Calculated using average number of shares outstanding throughout the period.
52
Table of Contents
Selected data for a share of beneficial interest outstanding throughout each period.
| Class A | ||||||||||||||||||||||
| Six Months | February 2, | |||||||||||||||||||||
| Ended | Year Ended May 31, | 2004(1) to | ||||||||||||||||||||
| November 30, | May 31, | |||||||||||||||||||||
| 2007 | 2007 | 2006 | 2005 | 2004 | ||||||||||||||||||
Per Share Operating Performance: | ||||||||||||||||||||||
| Net asset value, beginning of period | $ | 12.47 | 10.31 | 10.23 | 9.65 | 10.00 | ||||||||||||||||
| Income (loss) from investment operations: | ||||||||||||||||||||||
| Net investment income | $ | 0.04 | ** | 0.07 | ** | 0.10 | 0.05 | 0.01 | ||||||||||||||
| Net realized and unrealized gain (loss) on investments | $ | (2.19 | ) | 2.70 | 0.64 | 0.69 | (0.36 | ) | ||||||||||||||
| Total from investment operations | $ | (2.15 | ) | 2.77 | 0.74 | 0.74 | (0.35 | ) | ||||||||||||||
| Less distributions from: | ||||||||||||||||||||||
| Net investment income | $ | — | 0.06 | 0.09 | 0.08 | — | ||||||||||||||||
| Net realized gains on investments | $ | — | 0.55 | 0.57 | 0.08 | — | ||||||||||||||||
| Total distributions | $ | — | 0.61 | 0.66 | 0.16 | — | ||||||||||||||||
| Net asset value, end of period | $ | 10.32 | 12.47 | 10.31 | 10.23 | 9.65 | ||||||||||||||||
| Total Return(2) | % | (17.24 | ) | 27.32 | 7.65 | 7.64 | (3.50 | ) | ||||||||||||||
Ratios and Supplemental Data: | ||||||||||||||||||||||
| Net assets, end of period (000’s) | $ | 44,700 | 70,598 | 29,839 | 22,079 | 4,729 | ||||||||||||||||
| Ratios to average net assets: | ||||||||||||||||||||||
| Gross expenses prior to expense reimbursement and brokerage commission recapture(3) | % | 1.50 | 1.45 | 1.50 | 1.94 | 4.05 | ||||||||||||||||
| Net expenses after expense reimbursement and prior to brokerage commission recapture(3)(4) | % | 1.47 | 1.45 | 1.45 | 1.45 | 1.35 | ||||||||||||||||
| Net expense after expense reimbursement and brokerage commission recapture | % | 1.45 | 1.45 | 1.45 | 1.45 | 1.35 | ||||||||||||||||
| Net investment income after expense reimbursement and brokerage commission recapture(3)(4) | % | 0.74 | 0.62 | 1.06 | 0.93 | 0.72 | ||||||||||||||||
| Portfolio turnover rate | % | 22 | 43 | 34 | 47 | 4 | ||||||||||||||||
| Class B | ||||||||||||||||||||||
| Six Months | February 2, | |||||||||||||||||||||
| Ended | Year Ended May 31, | 2004(1) to | ||||||||||||||||||||
| November 30, | May 31, | |||||||||||||||||||||
| 2007 | 2007 | 2006 | 2005 | 2004 | ||||||||||||||||||
Per Share Operating Performance: | ||||||||||||||||||||||
| Net asset value, beginning of period | $ | 12.37 | 10.25 | 10.17 | 9.63 | 10.00 | ||||||||||||||||
| Income (loss) from investment operations: | ||||||||||||||||||||||
| Net investment income (loss) | $ | 0.00 | * | (0.02 | ) | 0.03 | (0.00 | )* | (0.00 | )* | ||||||||||||
| Net realized and unrealized gain (loss) on investments | $ | (2.17 | ) | 2.69 | 0.63 | 0.65 | (0.37 | ) | ||||||||||||||
| Total from investment operations | $ | (2.17 | ) | 2.67 | 0.66 | 0.65 | (0.37 | ) | ||||||||||||||
| Less distributions from: | ||||||||||||||||||||||
| Net investment income | $ | — | — | 0.01 | 0.03 | — | ||||||||||||||||
| Net realized gains on investments | $ | — | 0.55 | 0.57 | 0.08 | — | ||||||||||||||||
| Total distributions | $ | — | 0.55 | 0.58 | 0.11 | — | ||||||||||||||||
| Net asset value, end of period | $ | 10.20 | 12.37 | 10.25 | 10.17 | 9.63 | ||||||||||||||||
| Total Return(2) | % | (17.54 | ) | 26.42 | 6.81 | 6.78 | (3.70 | ) | ||||||||||||||
Ratios and Supplemental Data: | ||||||||||||||||||||||
| Net assets, end of period (000’s) | $ | 9,158 | 12,381 | 7,645 | 8,447 | 2,601 | ||||||||||||||||
| Ratios to average net assets: | ||||||||||||||||||||||
| Gross expenses prior to expense reimbursement and brokerage commission recapture(3) | % | 2.25 | 2.20 | 2.25 | 2.69 | 4.80 | ||||||||||||||||
| Net expenses after expense reimbursement and prior to brokerage commission recapture(3)(4) | % | 2.22 | 2.20 | 2.20 | 2.20 | 2.10 | ||||||||||||||||
| Net expense after expense reimbursement and brokerage commission recapture | % | 2.20 | 2.20 | 2.20 | 2.20 | 2.10 | ||||||||||||||||
| Net investment income (loss) after expense reimbursement and brokerage commission recapture(3)(4) | % | 0.01 | (0.13 | ) | 0.29 | 0.17 | (0.07 | ) | ||||||||||||||
| Portfolio turnover rate | % | 22 | 43 | 34 | 47 | 4 | ||||||||||||||||
(1) Commencement of operations.
(2) Total return is calculated assuming reinvestment of all dividends and capital gain distributions at net asset value and excluding the deduction of sales charges. Total return for periods less than one year is not annualized.
(3) Annualized for periods less than one year.
(4) The Investment Adviser has agreed to limit expenses (excluding interest, taxes, brokerage and extraordinary expenses) subject to possible recoupment by the Investment Adviser within three years of being incurred.
* Amount is less than $0.005 or more than $(0.005).
** Calculated using average number of shares outstanding throughout the period.
53
Table of Contents
Selected data for a share of beneficial interest outstanding throughout each period.
| Class C | ||||||||||||||||||||||
| Six Months | February 3, | |||||||||||||||||||||
| Ended | Year Ended May 31, | 2004(1) to | ||||||||||||||||||||
| November 30, | May 31, | |||||||||||||||||||||
| 2007 | 2007 | 2006 | 2005 | 2004 | ||||||||||||||||||
Per Share Operating Performance: | ||||||||||||||||||||||
| Net asset value, beginning of period | $ | 12.36 | 10.24 | 10.17 | 9.63 | 9.96 | ||||||||||||||||
| Income (loss) from investment operations: | ||||||||||||||||||||||
| Net investment income (loss) | $ | 0.00 | * | (0.03 | ) | 0.03 | 0.00 | * | (0.00 | )* | ||||||||||||
| Net realized and unrealized gain (loss) on investments | $ | (2.16 | ) | 2.70 | 0.62 | 0.65 | (0.33 | ) | ||||||||||||||
| Total from investment operations | $ | (2.16 | ) | 2.67 | 0.65 | 0.65 | (0.33 | ) | ||||||||||||||
| Less distributions from: | ||||||||||||||||||||||
| Net investment income | $ | — | — | 0.01 | 0.03 | — | ||||||||||||||||
| Net realized gains on investments | $ | — | 0.55 | 0.57 | 0.08 | — | ||||||||||||||||
| Total distributions | $ | — | 0.55 | 0.58 | 0.11 | — | ||||||||||||||||
| Net asset value, end of period | $ | 10.20 | 12.36 | 10.24 | 10.17 | 9.63 | ||||||||||||||||
| Total Return(2) | % | (17.48 | ) | 26.45 | 6.79 | 6.76 | (3.31 | ) | ||||||||||||||
Ratios and Supplemental Data: | ||||||||||||||||||||||
| Net assets, end of period (000’s) | $ | 17,324 | 20,418 | 11,566 | 11,358 | 3,793 | ||||||||||||||||
| Ratios to average net assets: | ||||||||||||||||||||||
| Gross expenses prior to expense reimbursement and brokerage commission recapture(3) | % | 2.25 | 2.20 | 2.25 | 2.69 | 4.81 | ||||||||||||||||
| Net expenses after expense reimbursement and prior to brokerage commission recapture(3)(4) | % | 2.22 | 2.20 | 2.20 | 2.20 | 2.11 | ||||||||||||||||
| Net expense after expense reimbursement and brokerage commission recapture(3)(4) | % | 2.20 | 2.20 | 2.20 | 2.20 | 2.11 | ||||||||||||||||
| Net investment income (loss) after expense reimbursement and brokerage commission recapture(3)(4) | % | 0.02 | (0.13 | ) | 0.29 | 0.17 | (0.03 | ) | ||||||||||||||
| Portfolio turnover rate | % | 22 | 43 | 34 | 47 | 4 | ||||||||||||||||
| Class I | ||||||||||||||||||
| Six Months | Year Ended | August 2, | ||||||||||||||||
| Ended | May 31, | 2004(1) to | ||||||||||||||||
| November 30, | May 31, | |||||||||||||||||
| 2007 | 2007 | 2006 | 2005 | |||||||||||||||
Per Share Operating Performance: | ||||||||||||||||||
| Net asset value, beginning of period | $ | 12.51 | 10.32 | 10.24 | 9.72 | |||||||||||||
| Income (loss) from investment operations: | ||||||||||||||||||
| Net investment income | $ | 0.06 | ** | 0.10 | ** | 0.14 | 0.10 | |||||||||||
| Net realized and unrealized gain (loss) on investments | $ | (2.20 | ) | 2.72 | 0.63 | 0.59 | ||||||||||||
| Total from investment operations | $ | (2.14 | ) | 2.82 | 0.77 | 0.69 | ||||||||||||
| Less distributions from: | ||||||||||||||||||
| Net investment income | $ | — | 0.08 | 0.12 | 0.09 | |||||||||||||
| Net realized gains on investments | $ | — | 0.55 | 0.57 | 0.08 | |||||||||||||
| Total distributions | $ | — | 0.63 | 0.69 | 0.17 | |||||||||||||
| Net asset value, end of period | $ | 10.37 | 12.51 | 10.32 | 10.24 | |||||||||||||
| Total Return(2) | % | (17.11 | ) | 27.80 | 7.94 | 7.13 | ||||||||||||
Ratios and Supplemental Data: | ||||||||||||||||||
| Net assets, end of period (000’s) | $ | 2,390 | 3,819 | 2,981 | 2,764 | |||||||||||||
| Ratios to average net assets: | ||||||||||||||||||
| Gross expenses prior to expense reimbursement and brokerage commission recapture(3) | % | 1.16 | 1.13 | 1.23 | 1.65 | |||||||||||||
| Net expenses after expense reimbursement and prior to brokerage commission recapture(3)(4) | % | 1.13 | 1.13 | 1.18 | 1.16 | |||||||||||||
| Net expense after expense reimbursement and brokerage commission recapture(3)(4) | % | 1.11 | 1.13 | 1.18 | 1.16 | |||||||||||||
| Net investment income after expense reimbursement and brokerage commission recapture(3)(4) | % | 1.11 | 0.90 | 1.31 | 1.22 | |||||||||||||
| Portfolio turnover rate | % | 22 | 43 | 34 | 47 | |||||||||||||
(1) Commencement of operations.
(2) Total return is calculated assuming reinvestment of all dividends and capital gain distributions at net asset value and excluding the deduction of sales charges. Total return for periods less than one year is not annualized.
(3) Annualized for periods less than one year.
(4) The Investment Adviser has agreed to limit expenses (excluding interest, taxes, brokerage and extraordinary expenses) subject to possible recoupment by the Investment Adviser within three years of being incurred.
* Amount is less than $0.005 or more than $(0.005).
** Calculated using average number of shares outstanding throughout the period.
54
Table of Contents
Selected data for a share of beneficial interest outstanding throughout each period.
| Class A | ||||||||||||||||||
| Six Months | Year Ended | February 1, | ||||||||||||||||
| Ended | May 31, | 2005(1) to | ||||||||||||||||
| November 30, | May 31, | |||||||||||||||||
| 2007 | 2007 | 2006 | 2005 | |||||||||||||||
Per Share Operating Performance: | ||||||||||||||||||
| Net asset value, beginning of period | $ | 14.36 | 12.48 | 9.57 | 10.00 | |||||||||||||
| Income (loss) from investment operations: | ||||||||||||||||||
| Net investment income (loss) | $ | 0.03 | 0.05 | ** | (0.00 | )* | ** (0.00 | )* | ||||||||||
| Net realized and unrealized gain (loss) on investments | $ | (2.11 | ) | 2.15 | 3.04 | (0.43 | ) | |||||||||||
| Total from investment operations | $ | (2.08 | ) | 2.20 | 3.04 | (0.43 | ) | |||||||||||
| Less distributions from: | ||||||||||||||||||
| Net investment income | $ | — | 0.02 | 0.05 | — | |||||||||||||
| Net realized gains from investments | $ | — | 0.30 | 0.08 | — | |||||||||||||
| Total distributions | $ | — | 0.32 | 0.13 | — | |||||||||||||
| Net asset value, end of period | $ | 12.28 | 14.36 | 12.48 | 9.57 | |||||||||||||
| Total Return(2) | % | (14.48 | ) | 17.82 | 31.90 | (4.30 | ) | |||||||||||
Ratios and Supplemental Data: | ||||||||||||||||||
| Net assets, end of period (000’s) | $ | 53,047 | 72,290 | 21,127 | 3,976 | |||||||||||||
| Ratios to average net assets: | ||||||||||||||||||
| Gross expenses prior to expense reimbursement and brokerage commission recapture(3) | % | 1.80 | 1.65 | 2.14 | 4.73 | |||||||||||||
| Net expenses after expense reimbursement and prior to brokerage commission recapture(3)(4) | % | 1.50 | 1.50 | 1.54 | 1.50 | |||||||||||||
| Net expenses after expense reimbursement and brokerage commission recapture(3)(4) | % | 1.49 | 1.47 | 1.50 | 1.50 | |||||||||||||
| Net investment income (loss) after expense reimbursement(3)(4) | % | 0.44 | 0.42 | (0.01 | ) | (0.18 | ) | |||||||||||
| Portfolio turnover rate | % | 39 | 28 | 36 | 14 | |||||||||||||
| Class B | ||||||||||||||||||
| Six Months | Year Ended | February 1, | ||||||||||||||||
| Ended | May 31, | 2005(1) to | ||||||||||||||||
| November 30, | May 31, | |||||||||||||||||
| 2007 | 2007 | 2006 | 2005 | |||||||||||||||
Per Share Operating Performance: | ||||||||||||||||||
| Net asset value, beginning of period | $ | 14.18 | 12.41 | 9.55 | 10.00 | |||||||||||||
| Income (loss) from investment operations: | ||||||||||||||||||
| Net investment loss | $ | (0.02 | ) | (0.08 | )** | (0.08 | ) | (0.01 | ) | |||||||||
| Net realized and unrealized gain (loss) on investments | $ | (2.08 | ) | 2.15 | 3.02 | (0.44 | ) | |||||||||||
| Total from investment operations | $ | (2.10 | ) | 2.07 | 2.94 | (0.45 | ) | |||||||||||
| Less distributions from: | ||||||||||||||||||
| Net investment income | $ | — | — | (0.00 | )* | — | ||||||||||||
| Net realized gains from investments | $ | — | 0.30 | 0.08 | — | |||||||||||||
| Total distributions | $ | — | 0.30 | 0.08 | — | |||||||||||||
| Net asset value, end of period | $ | 12.08 | 14.18 | 12.41 | 9.55 | |||||||||||||
| Total Return(2) | % | (14.81 | ) | 16.86 | 30.91 | (4.50 | ) | |||||||||||
Ratios and Supplemental Data: | ||||||||||||||||||
| Net assets, end of period (000’s) | $ | 3,139 | 4,497 | 2,187 | 591 | |||||||||||||
| Ratios to average net assets: | ||||||||||||||||||
| Gross expenses prior to expense reimbursement and brokerage commission recapture(3) | % | 2.55 | 2.40 | 2.87 | 5.48 | |||||||||||||
| Net expenses after expense reimbursement and prior to brokerage commission recapture(3)(4) | % | 2.25 | 2.25 | 2.29 | 2.25 | |||||||||||||
| Net expenses after expense reimbursement and brokerage commission recapture(3)(4) | % | 2.24 | 2.22 | 2.25 | 2.25 | |||||||||||||
| Net investment loss after expense reimbursement(3)(4) | % | (0.31 | ) | (0.69 | ) | (0.75 | ) | (0.93 | ) | |||||||||
| Portfolio turnover rate | % | 39 | 28 | 36 | 14 | |||||||||||||
(1) Commencement of operations.
(2) Total return is calculated assuming reinvestment of all dividends and capital gain distributions at net asset value and excluding the deduction of sales charges. Total return for periods less than one year is not annualized.
(3) Annualized for periods less than one year.
(4) The Investment Adviser has agreed to limit expenses (excluding interest, taxes, brokerage and extraordinary expenses) subject to possible recoupment by the Investment Adviser within three years of being incurred.
* Amount is less than $0.005 or more than $(0.005).
** Calculated using average number of shares outstanding throughout the period.
55
Table of Contents
Selected data for a share of beneficial interest outstanding throughout each period.
| Class C | ||||||||||||||||||
| Six Months | Year Ended | February 2, | ||||||||||||||||
| Ended | May 31, | 2005(1) to | ||||||||||||||||
| November 30, | May 31, | |||||||||||||||||
| 2007 | 2007 | 2006 | 2005 | |||||||||||||||
Per Share Operating Performance: | ||||||||||||||||||
| Net asset value, beginning of period | $ | 14.19 | 12.42 | 9.56 | 10.05 | |||||||||||||
| Income (loss) from investment operations: | ||||||||||||||||||
| Net investment loss | $ | (0.02 | ) | (0.06 | )** | (0.08 | ) | (0.01 | ) | |||||||||
| Net realized and unrealized gain (loss) on investments | $ | (2.08 | ) | 2.13 | 3.03 | (0.48 | ) | |||||||||||
| Total from investment operations | $ | (2.10 | ) | 2.07 | 2.95 | (0.49 | ) | |||||||||||
| Less distributions from: | ||||||||||||||||||
| Net investment income | $ | — | — | 0.01 | — | |||||||||||||
| Net realized gains from investments | $ | — | 0.30 | 0.08 | — | |||||||||||||
| Total distributions | $ | — | 0.30 | 0.09 | — | |||||||||||||
| Net asset value, end of period | $ | 12.09 | 14.19 | 12.42 | 9.56 | |||||||||||||
| Total Return(2) | % | (14.80 | ) | 16.85 | 30.97 | (4.88 | ) | |||||||||||
Ratios and Supplemental Data: | ||||||||||||||||||
| Net assets, end of period (000’s) | $ | 13,362 | 16,264 | 6,803 | 1,517 | |||||||||||||
| Ratios to average net assets: | ||||||||||||||||||
| Gross expenses prior to expense reimbursement and brokerage commission recapture(3) | % | 2.55 | 2.40 | 2.87 | 5.48 | |||||||||||||
| Net expenses after expense reimbursement and prior to brokerage commission recapture(3)(4) | % | 2.25 | 2.25 | 2.29 | 2.25 | |||||||||||||
| Net expenses after expense reimbursement and brokerage commission recapture(3)(4) | % | 2.24 | 2.22 | 2.25 | 2.25 | |||||||||||||
| Net investment loss after expense reimbursement(3)(4) | % | (0.32 | ) | (0.58 | ) | (0.75 | ) | (0.91 | ) | |||||||||
| Portfolio turnover rate | % | 39 | 28 | 36 | 14 | |||||||||||||
| Class I | ||||||||||||||
| Six Months | Year | June 9, | ||||||||||||
| Ended | Ended | 2005(1) to | ||||||||||||
| November 30, | May 31, | May 31, | ||||||||||||
| 2007 | 2007 | 2006 | ||||||||||||
Per Share Operating Performance: | ||||||||||||||
| Net asset value, beginning of period | $ | 14.39 | 12.50 | 9.80 | ||||||||||
| Income (loss) from investment operations: | ||||||||||||||
| Net investment income | $ | 0.05 | ** | 0.05 | 0.05 | ** | ||||||||
| Net realized and unrealized gain (loss) on investments | $ | (2.11 | ) | 2.17 | 2.80 | |||||||||
| Total from investment operations | $ | (2.06 | ) | 2.22 | 2.85 | |||||||||
| Less distributions from: | ||||||||||||||
| Net investment income | $ | — | 0.03 | 0.07 | ||||||||||
| Net realized gains from investments | $ | — | 0.30 | 0.08 | ||||||||||
| Total distributions | $ | — | 0.33 | 0.15 | ||||||||||
| Net asset value, end of period | $ | 12.33 | 14.39 | 12.50 | ||||||||||
| Total Return(2) | % | (14.32 | ) | 18.00 | 29.26 | |||||||||
Ratios and Supplemental Data: | ||||||||||||||
| Net assets, end of period (000’s) | $ | 9,979 | 9,930 | 3,333 | ||||||||||
| Ratios to average net assets: | ||||||||||||||
| Gross expenses prior to expense reimbursement and brokerage commission recapture(3) | % | 1.49 | 1.34 | 1.75 | ||||||||||
| Net expenses after expense reimbursement and prior to brokerage commission recapture(3)(4) | % | 1.19 | 1.19 | 1.15 | ||||||||||
| Net expenses after expense reimbursement and brokerage commission recapture(3)(4) | % | 1.18 | 1.16 | 1.11 | ||||||||||
| Net investment income after expense reimbursement (3)(4) | % | 0.74 | 0.40 | 0.42 | ||||||||||
| Portfolio turnover rate | % | 39 | 28 | 36 | ||||||||||
(1) Commencement of operations.
(2) Total return is calculated assuming reinvestment of all dividends and capital gain distributions at net asset value and excluding the deduction of sales charges. Total return for periods less than one year is not annualized.
(3) Annualized for periods less than one year.
(4) The Investment Adviser has agreed to limit expenses (excluding interest, taxes, brokerage and extraordinary expenses) subject to possible recoupment by the Investment Adviser within three years of being incurred.
** Calculated using average number of shares outstanding throughout the period.
56
Table of Contents
Selected data for a share of beneficial interest outstanding throughout each period.
| Class A | ||||||||||||||||||
| Six Months | Year Ended | February 1, | ||||||||||||||||
| Ended | May 31, | 2005(1) to | ||||||||||||||||
| November 30, | May 31, | |||||||||||||||||
| 2007 | 2007 | 2006 | 2005 | |||||||||||||||
Per Share Operating Performance: | ||||||||||||||||||
| Net asset value, beginning of period | $ | 16.01 | 13.43 | 9.97 | 10.00 | |||||||||||||
| Income (loss) from investment operations: | ||||||||||||||||||
| Net investment income | $ | 0.04 | 0.13 | ** | 0.10 | ** | 0.00 | * | ||||||||||
| Net realized and unrealized gain (loss) on investments | $ | 0.19 | 3.13 | 3.51 | (0.03 | ) | ||||||||||||
| Total from investment operations | $ | 0.23 | 3.26 | 3.61 | (0.03 | ) | ||||||||||||
| Less distributions from: | ||||||||||||||||||
| Net investment income | $ | — | 0.09 | 0.04 | — | |||||||||||||
| Net realized gains from investments | $ | — | 0.59 | 0.11 | — | |||||||||||||
| Total distributions | $ | — | 0.68 | 0.15 | — | |||||||||||||
| Net asset value, end of period | $ | 16.24 | 16.01 | 13.43 | 9.97 | |||||||||||||
| Total Return(2) | % | 1.44 | 24.60 | 36.48 | (0.30 | ) | ||||||||||||
Ratios and Supplemental Data: | ||||||||||||||||||
| Net assets, end of period (000’s) | $ | 212,988 | 216,598 | 39,931 | 3,598 | |||||||||||||
| Ratios to average net assets: | ||||||||||||||||||
| Gross expenses prior to expense reimbursement and brokerage commission recapture(3) | % | 1.59 | 1.59 | 1.86 | 4.95 | |||||||||||||
| Net expenses after expense reimbursement and prior to brokerage commission recapture(3)(4) | % | 1.47 | 1.50 | 1.51 | 1.50 | |||||||||||||
| Net expenses after expense reimbursement and brokerage commission recapture(3)(4) | % | 1.46 | 1.49 | 1.50 | 1.50 | |||||||||||||
| Net investment income after expense reimbursement and brokerage commission recapture(3)(4) | % | 0.46 | 0.90 | 0.84 | 0.23 | |||||||||||||
| Portfolio turnover rate | % | 37 | 35 | 27 | 10 | |||||||||||||
| Class B | ||||||||||||||||||
| Six Months | Year Ended | February 1, | ||||||||||||||||
| Ended | May 31, | 2005(1) to | ||||||||||||||||
| November 30, | May 31, | |||||||||||||||||
| 2007 | 2007 | 2006 | 2005 | |||||||||||||||
Per Share Operating Performance: | ||||||||||||||||||
| Net asset value, beginning of period | $ | 15.89 | 13.35 | 9.95 | 10.00 | |||||||||||||
| Income (loss) from investment operations: | ||||||||||||||||||
| Net investment income (loss) | $ | (0.02 | ) | 0.03 | ** | 0.00 | * ** | (0.01 | ) | |||||||||
| Net realized and unrealized gain (loss) on investments | $ | 0.20 | 3.10 | 3.52 | (0.04 | ) | ||||||||||||
| Total from investment operations | $ | 0.18 | 3.13 | 3.52 | (0.05 | ) | ||||||||||||
| Less distributions from: | ||||||||||||||||||
| Net investment income | $ | — | — | 0.01 | — | |||||||||||||
| Net realized gains from investments | $ | — | 0.59 | 0.11 | — | |||||||||||||
| Total distributions | $ | — | 0.59 | 0.12 | — | |||||||||||||
| Net asset value, end of period | $ | 16.07 | 15.89 | 13.35 | 9.95 | |||||||||||||
| Total Return(2) | % | 1.13 | 23.69 | 35.54 | (0.50 | ) | ||||||||||||
Ratios and Supplemental Data: | ||||||||||||||||||
| Net assets, end of period (000’s) | $ | 39,740 | 45,163 | 6,538 | 1,107 | |||||||||||||
| Ratios to average net assets: | ||||||||||||||||||
| Gross expenses prior to expense reimbursement and brokerage commission recapture | % | 2.34 | 2.34 | 2.61 | 5.70 | |||||||||||||
| Net expenses after expense reimbursement and prior to brokerage commission recapture(3)(4) | % | 2.22 | 2.25 | 2.26 | 2.25 | |||||||||||||
| Net expenses after expense reimbursement and brokerage commission recapture(3)(4) | % | 2.21 | 2.24 | 2.25 | 2.25 | |||||||||||||
| Net investment income (loss) after expense reimbursement and brokerage commission recapture(3)(4) | % | (0.29 | ) | 0.18 | 0.05 | (0.48 | ) | |||||||||||
| Portfolio turnover rate | % | 37 | 35 | 27 | 10 | |||||||||||||
(1) Commencement of operations.
(2) Total return is calculated assuming reinvestment of all dividends and capital gain distributions at net asset value and excluding the deduction of sales charges. Total return for periods less than one year is not annualized.
(3) Annualized for periods less than one year.
(4) The Investment Adviser has agreed to limit expenses (excluding interest, taxes, brokerage and extraordinary expenses) subject to possible recoupment by the Investment Adviser within three years of being incurred.
* Amount is less than $0.005.
** Calculated using average number of shares outstanding throughout the period.
57
Table of Contents
| Class C | ||||||||||||||||||
| Six Months | Year Ended | February 7, | ||||||||||||||||
| Ended | May 31, | 2005(1) to | ||||||||||||||||
| November 30, | May 31, | |||||||||||||||||
| 2007 | 2007 | 2006 | 2005 | |||||||||||||||
Per Share Operating Performance: | ||||||||||||||||||
| Net asset value, beginning of period | $ | 15.88 | 13.34 | 9.94 | 9.94 | |||||||||||||
| Income (loss) from investment operations: | ||||||||||||||||||
| Net investment income (loss) | $ | (0.02 | ) | 0.02 | ** | 0.01 | ** | (0.00 | )* | |||||||||
| Net realized and unrealized gain on investments | $ | 0.19 | 3.11 | 3.51 | 0.00 | * | ||||||||||||
| Total from investment operations | $ | 0.17 | 3.13 | 3.52 | 0.00 | * | ||||||||||||
| Less distributions from: | ||||||||||||||||||
| Net investment income | $ | — | — | 0.01 | — | |||||||||||||
| Net realized gains from investments | $ | — | 0.59 | 0.11 | — | |||||||||||||
| Total distributions | $ | — | 0.59 | 0.12 | — | |||||||||||||
| Net asset value, end of period | $ | 16.05 | 15.88 | 13.34 | 9.94 | |||||||||||||
| Total Return(2) | % | 1.07 | 23.71 | 35.62 | 0.00 | * | ||||||||||||
Ratios and Supplemental Data: | ||||||||||||||||||
| Net assets, end of period (000’s) | $ | 84,517 | 87,992 | 21,549 | 2,012 | |||||||||||||
| Ratios to average net assets: | ||||||||||||||||||
| Gross expenses prior to expense reimbursement and brokerage commission recapture(3) | % | 2.34 | 2.34 | 2.61 | 5.70 | |||||||||||||
| Net expenses after expense reimbursement and prior to brokerage commission recapture(3)(4) | % | 2.22 | 2.25 | 2.26 | 5.70 | |||||||||||||
| Net expenses after expense reimbursement and brokerage commission recapture(3)(4) | % | 2.21 | 2.24 | 2.25 | 2.25 | |||||||||||||
| Net investment income (loss) after expense reimbursement and brokerage commission recapture(3)(4) | % | (0.29 | ) | 0.15 | 0.05 | (0.42 | ) | |||||||||||
| Portfolio turnover rate | % | 37 | 35 | 27 | 10 | |||||||||||||
| Class I | ||||||||||||||
| Six Months | Year | September 15, | ||||||||||||
| Ended | Ended | 2005(1) to | ||||||||||||
| November 30, | May 31, | May 31, | ||||||||||||
| 2007 | 2007 | 2006 | ||||||||||||
Per Share Operating Performance: | ||||||||||||||
| Net asset value, beginning of period | $ | 16.12 | 13.43 | 11.18 | ||||||||||
| Income from investment operations: | ||||||||||||||
| Net investment income | $ | 0.08 | 0.30 | ** | 0.14 | ** | ||||||||
| Net realized and unrealized gain on investments | $ | 0.19 | 3.02 | 2.28 | ||||||||||
| Total from investment operations | $ | 0.27 | 3.32 | 2.42 | ||||||||||
| Less distributions from: | ||||||||||||||
| Net investment income | $ | — | 0.04 | 0.06 | ||||||||||
| Net realized gains from investments | $ | — | 0.59 | 0.11 | ||||||||||
| Total distributions | $ | — | 0.63 | 0.17 | ||||||||||
| Net asset value, end of period | $ | 16.39 | 16.12 | 13.43 | ||||||||||
| Total Return(2) | % | 1.67 | 24.99 | 21.87 | ||||||||||
Ratios and Supplemental Data: | ||||||||||||||
| Net assets, end of period (000’s) | $ | 482 | 758 | 6 | ||||||||||
| Ratios to average net assets: | ||||||||||||||
| Gross expenses prior to expense reimbursement and brokerage commission recapture | % | 1.27 | 1.27 | 2.11 | ||||||||||
| Net expenses after expense reimbursement and prior to brokerage commission recapture(3)(4) | % | 1.18 | 1.18 | 1.63 | ||||||||||
| Net expenses after expense reimbursement and brokerage commission recapture(3)(4) | % | 1.17 | 1.17 | 1.61 | ||||||||||
| Net investment income after expense reimbursement and brokerage commission recapture(3)(4) | % | 0.74 | 2.00 | 1.58 | ||||||||||
| Portfolio turnover rate | % | 37 | 35 | 27 | ||||||||||
(1) Commencement of operations.
(2) Total return is calculated assuming reinvestment of all dividends and capital gain distributions at net asset value and excluding the deduction of sales charges. Total return for periods less than one year is not annualized.
(3) Annualized for periods less than one year.
(4) The Investment Adviser has agreed to limit expenses (excluding interest, taxes, brokerage and extraordinary expenses) subject to possible recoupment by the Investment Adviser within three years of being incurred.
* Amount is less than $0.005 or 0.005% or more than $(0.005).
** Calculated using average number of shares outstanding throughout the period.
58
Table of Contents
NOTE 1 — ORGANIZATION
Organization. The ING Funds included in this report are comprised of ING Equity Trust (“IET”), organized as an open-end investment management company registered under the Investment Company Act of 1940, as amended (“1940 Act”).
IET is a Massachusetts business trust organized on June 12, 1998 with twenty-four separate active series. Ten of which are discussed in this report: ING Real Estate Fund (“Real Estate”), ING Fundamental Research Fund (“Fundamental Research”), ING LargeCap Growth Fund (“LargeCap Growth”), ING MidCap Opportunities Fund (“MidCap Opportunities”), ING Opportunistic LargeCap Fund (“Opportunistic LargeCap”), ING SmallCap Opportunities Fund (“SmallCap Opportunities”), ING Financial Services Fund (“Financial Services”), ING LargeCap Value Fund (“LargeCap Value”), ING SmallCap Value Choice Fund (“SmallCap Value Choice”) and ING Value Choice Fund (“Value Choice”), (each, the “Fund” and collectively, the “Funds”). The investment objective of each Fund is described in the Fund’s prospectus.
Each Fund offers at least three of the following classes of shares: Class A, Class B, Class C, Class I, Class O and Class Q. The separate classes of shares differ principally in the applicable sales charges (if any), distribution fees (if any), shareholder servicing fees (if any) and transfer agency fees. Shareholders of each class also bear certain expenses that pertain to that particular class. All shareholders bear the common expenses of the Fund and earn income and realized gains/losses from the Fund pro rata based on the average daily net assets of each class, without distinction between share classes. Common expenses of the Funds (including custodial asset-based fees, legal and audit fees, printing and mailing expenses, transfer agency out-of-pocket expenses, and fees and expenses of the independent trustees) are allocated to each Fund in proportion to its relative daily net assets. Expenses directly attributable to a particular fund (including advisory, administration, custodial transaction-based, registration, other professional, distribution and/or service fees, certain taxes, and offering costs) are charged directly to that Fund. Differences in per share dividend rates generally result from differences in separate class expenses, including distribution, and shareholder servicing fees. Class B shares, along with their pro rata reinvested dividend shares, automatically convert to Class A shares approximately eight years after purchase.
NOTE 2 — SIGNIFICANT ACCOUNTING POLICIES
The following significant accounting policies are consistently followed by the Funds in the preparation of their financial statements. Such policies are in conformity with U.S. generally accepted accounting principles for investment companies.
| A. | Security Valuation. Investments in equity securities traded on a national securities exchange are valued at the last reported sale price. Securities reported by NASDAQ will be valued at the NASDAQ official closing prices. Securities traded on an exchange or NASDAQ for which there has been no sale and securities traded in the over-the-counter-market are valued at the mean between the last reported bid and ask prices. All investments quoted in foreign currencies will be valued daily in U.S. dollars on the basis of the foreign currency exchange rates prevailing at that time. Debt securities are valued at prices obtained from independent services or from one or more dealers making markets in the securities and may be adjusted based on the Funds’ valuation procedures. U.S. government obligations are valued by using market quotations or independent pricing services that use prices provided by market-makers or estimates of market values obtained from yield data relating to instruments or securities with similar characteristics. |
| Securities and assets for which market quotations are not readily available (which may include certain restricted securities which are subject to limitations as to their sale) are valued at their fair values as determined in good faith by or under the supervision of the Funds’ Board of Trustees (“Board”), in accordance with methods that are specifically authorized by the Board. Securities traded on exchanges, including foreign exchanges, which close earlier than the time that a Fund calculates its net asset value (“NAV”) may also be valued at their fair values as determined in good faith by or under the supervision of a Fund’s Board, in accordance with methods that are specifically authorized by the Board. The valuation techniques applied in any specific instance are likely to vary from case to case. With respect to a restricted security, for example, consideration is generally given to the cost of the investment, the market value of any unrestricted securities of the same class at the time of |
59
Table of Contents
| valuation, the potential expiration of restrictions on the security, the existence of any registration rights, the costs to the Funds related to registration of the security, as well as factors relevant to the issuer itself. Consideration may also be given to the price and extent of any public trading in similar securities of the issuer or comparable companies’ securities. | |
| The value of a foreign security traded on an exchange outside the United States is generally based on the price of a foreign security on the principal foreign exchange where it trades as of the time a Fund determines its NAV or if the foreign exchange closes prior to the time the Fund determines its NAV, the most recent closing price of the foreign security on its principal exchange. | |
| Trading in certain non-U.S. securities may not take place on all days on which the New York Stock Exchange (“NYSE”) is open. Further, trading takes place in various foreign markets on days on which the NYSE is not open. Consequently, the calculation of a Fund’s NAV may not take place contemporaneously with the determination of the prices of securities held by a Fund in foreign securities markets. Further, the value of a Fund’s assets may be significantly affected by foreign trading on days when a shareholder cannot purchase or redeem shares of the Fund. In calculating a Fund’s NAV, foreign securities in foreign currency are converted to U.S. dollar equivalents. | |
| If an event occurs after the time at which the market for foreign securities held by a Fund closes but before the time that the Fund’s NAV is calculated, such event may cause the closing price on the foreign exchange to not represent a readily available reliable market value quotation for such securities at the time a Fund determines its NAV. In such a case, a Fund will use the a value of such securities as determined under the Fund’s valuation procedures. Events after the close of trading on a foreign market that could require the Fund to fair value some or all of its foreign securities include, among others, securities trading in the U.S. and other markets, corporate announcements, natural and other disasters, and political and other events. Among other elements of analysis in the determination of a security’s fair value, the Board has authorized the use of one or more independent research services to assist with such determinations. An independent research service may use statistical analyses and quantitative models to help determine fair value as of the time a Fund calculates its NAV. There can be no assurance that such models accurately reflect the behavior of the applicable markets or the effect of the behavior of such markets on the fair value of securities, or that such markets will continue to behave in a fashion that is consistent with such models. Unlike the closing price of a security on an exchange, fair value determinations employ elements of judgment. Consequently, the fair value assigned to a security may not represent the actual value that the Fund could obtain if it were to sell the security at the time of the close of the NYSE. Pursuant to procedures adopted by the Board, a Fund is not obligated to use the fair valuations suggested by any research service, and valuation recommendations provided by such research services may be overridden if other events have occurred or if other fair valuations are determined in good faith to be more accurate. Unless an event is such that it causes a Fund to determine that the closing prices for one or more securities do not represent readily available reliable market value quotations at the time a Fund determines its NAV, events that occur between the time of the close of the foreign market on which they are traded and the close of regular trading on the NYSE will not be reflected in a Fund’s NAV. Investments in securities maturing in 60 days or less from the date of acquisition are valued at amortized cost, which, when combined with accrued interest, approximates market value. | |
| B. | Security Transactions and Revenue Recognition. Securities transactions are accounted for on the trade date. Realized gains and losses are reported on the basis of identified cost of securities sold. Interest income is recorded on an accrual basis. Dividend income is recorded on the ex-dividend date, or for certain foreign securities, when the information becomes available to the Funds. Premium amortization and discount accretion are determined by the effective yield method and included in interest income. |
| Real Estate estimates components of distributions from real estate investment trusts |
60
Table of Contents
| (“REITs”). Distributions received in excess of income are recorded as a reduction of cost of the related investments. If the Fund no longer owns the applicable securities, any distributions received in excess of income are recorded as realized gains. | |
| C. | Foreign Currency Translation. The books and records of the Funds are maintained in U.S. dollars. |
| Any foreign currency amounts are translated into U.S. dollars on the following basis: |
| (1) | Market value of investment securities, other assets and liabilities — at the exchange rates prevailing at the end of the day. | |
| (2) | Purchases and sales of investment securities, income and expenses — at the rates of exchange prevailing on the respective dates of such transactions. |
| Although the net assets and the market values are presented at the foreign exchange rates at the end of the day, the Funds do not isolate the portion of the results of operations resulting from changes in foreign exchange rates on investments from the fluctuations arising from changes in market prices of securities held. Such fluctuations are included with the net realized and unrealized gains or losses from investments. For securities which are subject to foreign withholding tax upon disposition, liabilities are recorded on the Statement of Assets and Liabilities for the estimated tax withholding based on the securities’ current market value. Upon disposition, realized gains or losses on such securities are recorded net of foreign withholding tax. | |
| Reported net realized foreign exchange gains or losses arise from sales of foreign currencies, currency gains or losses realized between the trade and settlement dates on securities transactions, the difference between the amounts of dividends, interest, and foreign withholding tax reclaims recorded on the Fund’s books, and the U.S. dollar equivalent of the amounts actually received or paid. Net unrealized foreign exchange gains and losses arise from changes in the value of assets and liabilities other than investments in securities at fiscal year end, resulting from changes in the exchange rate. Foreign security and currency transactions may involve certain considerations and risks not typically associated with investing in U.S. companies and the U.S. government securities. These risks include but are not limited to revaluation of currencies and future adverse political and economic developments which could cause securities and their markets to be less liquid and prices more volatile than those of comparable U.S. companies and U.S. government securities. The foregoing risks are even greater with respect to securities of issuers in emerging markets. | |
| D. | Foreign Currency Transactions and Futures Contracts. Certain Funds may enter into foreign currency exchange transactions to convert to and from different foreign currencies and to and from the U.S. dollar in connection with the planned purchases or sales of securities. The Funds either enter into these transactions on a spot basis at the spot rate prevailing in the foreign currency exchange market or use forward foreign currency contracts to purchase or sell foreign currencies. When the contract is fulfilled or closed, gains or losses are realized. Until then, the gain or loss is included in unrealized appreciation or depreciation. Risks may arise upon entering into forward contracts from the potential inability of counterparties to meet the terms of their forward contracts and from unanticipated movements in the value of foreign currencies relative to the U.S. dollar. |
| Each Fund may enter into futures contracts involving foreign currency, interest rates, securities and security indices. Certain Funds intend to limit their use of futures contracts and futures options to “bona fide hedging” transactions, as such term is defined in applicable regulations, interpretations and practice. A futures contract obligates the seller of the contract to deliver and the purchaser of the contract to take delivery of the type of foreign currency, financial instrument or security called for in the contract at a specified future time for a specified price. Upon entering into such a contract, a Fund is required to deposit and maintain as collateral such initial margin as required by the exchange on which the contract is traded. Pursuant to the contract, a Fund agrees to receive from or pay to the broker an amount |
61
Table of Contents
| equal to the daily fluctuations in the value of the contract. Such receipts or payments are known as variation margins and are recorded as unrealized gains or losses by the Fund. When the contract is closed, the Fund records a realized gain or loss equal to the difference between the value of the contract at the time it was opened and the value at the time it was closed. | |
| E. | Distributions to Shareholders. The Funds record distributions to their shareholders on the ex-dividend date. Each Fund pays dividends, if any, as follows: |
Annually | Quarterly | |
| Fundamental Research LargeCap Growth MidCap Opportunities Opportunistic LargeCap SmallCap Opportunities Financial Services LargeCap Value SmallCap Value Choice Value Choice | Real Estate |
| Each Fund distributes capital gains, to the extent available, annually. The Funds may make distributions on a more frequent basis to comply with the distribution requirements of the Internal Revenue Code. The characteristics of income and gains to be distributed are determined in accordance with income tax regulations, which may differ from U.S. generally accepted accounting principles for investment companies. | |
| F. | Federal Income Taxes. It is the policy of the Funds to comply with subchapter M of the Internal Revenue Code and related excise tax provisions applicable to regulated investment companies and to distribute substantially all of their net investment income and any net realized capital gains to their shareholders. Therefore, no federal income tax provision is required. No capital gain distributions shall be made until any capital loss carryforwards have been fully utilized or expired. |
| The Funds may utilize equalization accounting for tax purposes, whereby a portion of redemption payments are treated as distributions of income or gain for income tax purposes. | |
| G. | Use of Estimates. The preparation of financial statements in conformity with U.S. generally accepted accounting principles requires management to make estimates and assumptions that affect the reported amounts of assets and liabilities and disclosure of contingent assets and liabilities at the date of the financial statements and the reported amounts of increases and decreases in net assets from operations during the reporting period. Actual results could differ from those estimates. |
| H. | Repurchase Agreements. Each Fund may invest in repurchase agreements only with government securities dealers recognized by the Board of Governors of the Federal Reserve System. Under such agreements, the seller of the security agrees to repurchase it at a mutually agreed upon time and price. The resale price is in excess of the purchase price and reflects an agreed upon interest rate for the period of time the agreement is outstanding. The period of the repurchase agreements is usually short, from overnight to one week, while the underlying securities generally have longer maturities. Each Fund will receive as collateral securities acceptable to it whose market value is equal to at least 100% of the carrying amount of the repurchase agreements, plus accrued interest, being invested by the Fund. The underlying collateral is valued daily on a mark to market basis to assure that the value, including accrued interest is at least equal to the repurchase price. There would be potential loss to a Fund in the event the Fund is delayed or prevented from exercising its right to dispose of the collateral, and it might incur disposition costs in liquidating the collateral. |
| I. | Options Contracts. Each Fund, may purchase put and call options. Each Fund may write (sell) put options. Each Fund, except Financial Services may write covered call options. The Funds may engage in option transactions as a hedge against adverse movements in the value of portfolio holdings or to increase market exposure. Option contracts are valued daily and unrealized gains or losses are recorded based upon the last sales price on the principal exchange on which the options are traded. The Funds will realize a gain or loss upon the expiration or closing of the option contract. When an option is exercised, the proceeds on sales of the underlying security for a written call option, the purchase cost of the security for a written put option, or the cost of the security for a purchased put or call option is |
62
Table of Contents
| adjusted by the amount of premium received or paid. Realized and unrealized gains or losses on option contracts are reflected in the accompanying financial statements. The risk in writing a covered call option is that the Funds give up the opportunity for profit if the market price of the security increases and the option is exercised. The risk in writing a put option is that the Funds may incur a loss if the market price of the security decreases and the option is exercised. The risk in buying an option is that the Funds pay a premium whether or not the option is exercised. Risks may also arise from an illiquid secondary market or from the inability of counterparties to meet the terms of the contract. | |
| J. | Securities Lending. Each Fund has the option to temporarily loan securities representing up to 30% of its total assets to brokers, dealers or other financial institutions in exchange for a negotiated lender’s fee. The borrower is required to fully collateralize the loans with cash or U.S. government securities. Generally, in the event of counterparty default, the Fund has the right to use collateral to offset losses incurred. There would be potential loss to the Fund in the event the Fund is delayed or prevented from exercising its right to dispose of the collateral. The Fund bears the risk of loss with respect to the investment of collateral. Engaging in securities lending could have a leveraging effect, which may intensify the credit, market and other risks associated with investing in a Fund. |
| K. | Organization Expenses and Offering Costs. Costs incurred with the organization of the Funds are expensed as incurred. Costs incurred with the offering of shares of the Funds are deferred and amortized over a period of twelve months. |
| L. | Illiquid and Restricted Securities. Each Fund may not invest more than 15% of its net assets in illiquid securities. Illiquid securities are not readily marketable. Disposing of illiquid investments may involve time-consuming negotiation and legal expenses, and it may be difficult or impossible for the Funds to sell them promptly at an acceptable price. Each Fund also may invest in restricted securities, which include those sold under Rule 144A of the Securities Act of 1933 (“1933 Act”) or securities offered pursuant to Section 4(2) of the 1933 Act, and/or are subject to legal or contractual restrictions on resale and generally may not be publicly sold without registration under the 1933 Act. Certain restricted securities may be considered liquid pursuant to procedures adopted by the Board or may be deemed to be illiquid because they may not be readily marketable. Illiquid and restricted securities are valued using market quotations when readily available. In the absence of market quotations, the illiquid and restricted securities are valued based upon their fair value determined under procedures approved by the Board. |
| M. | When-Issued and Delayed-Delivery Transactions. Each Fund may purchase or sell securities on a when-issued basis. Each Fund, except Financial Services, may enter into forward commitments. The price of the underlying securities and date when the securities will be delivered and paid for are fixed at the time the transaction is negotiated. The market value of such is identified in each Fund’s Portfolio of Investments. Losses may arise due to changes in the market value of the securities or from the inability of counterparties to meet the terms of the contract. In connection with such purchases, the Funds are required to segregate liquid assets with the Funds’ custodian sufficient to cover the purchase price. |
| N. | Mortgage Dollar Roll Transactions. In connection with a Fund’s ability to purchase or sell securities on a when-issued basis, the Funds may engage in dollar roll transactions with respect to mortgage-backed securities issued by Government National Mortgage Association, Federal National Mortgage Association and Federal Home Loan Mortgage Corp. In a dollar roll transaction, a Fund sells a mortgage-backed security to a financial institution, such as a bank or broker/ dealer, and simultaneously agrees to repurchase a substantially similar (i.e., same type, coupon, and maturity) security from the institution on a delayed delivery basis at an agreed upon price. The mortgage-backed securities that are repurchased will bear the same interest rate as those sold, but generally will be collateralized by different pools of mortgages with different prepayment histories. The Funds account for dollar roll transactions as purchases and sales. |
| O. | Indemnifications. In the normal course of business, the Fund may enter into contracts that |
63
Table of Contents
| provide certain indemnifications. The Funds’ maximum exposure under these arrangements is dependent on future claims that may be made against the Funds and, therefore, cannot be estimated; however, based on experience, the risk of loss from such claims is considered remote. |
NOTE 3 — INVESTMENT TRANSACTIONS
For the six months ended November 30, 2007, the cost of purchases and proceeds from the sales of securities, excluding short-term securities, were as follows:
| Non U.S. Government | ||||||||
| Purchases | Sales | |||||||
| Real Estate | $ | 117,498,007 | $ | 182,790,297 | ||||
| Fundamental Research | 23,463,226 | 26,946,237 | ||||||
| LargeCap Growth | 116,758,817 | 204,882,884 | ||||||
| MidCap Opportunities | 253,563,208 | 280,323,802 | ||||||
| Opportunistic LargeCap | 24,720,581 | 22,126,729 | ||||||
| SmallCap Opportunities | 80,712,850 | 93,785,536 | ||||||
| Financial Services | 52,835,937 | 70,703,211 | ||||||
| LargeCap Value | 20,435,109 | 34,128,101 | ||||||
| SmallCap Value Choice | 34,956,541 | 39,416,248 | ||||||
| Value Choice | 162,526,475 | 118,198,145 | ||||||
NOTE 4 — INVESTMENT MANAGEMENT AND ADMINISTRATIVE FEES
The Funds entered into investment management agreements (“Management Agreements”) with ING Investments, LLC (“ING Investments” or the “Investment Adviser”). The Investment Management Agreements compensate the Investment Adviser with a fee, computed daily and payable monthly, based on the average daily net assets of each Fund, at the following annual rates:
| As a Percent of Average Net Assets | ||
| Real Estate | 0.70% | |
| Fundamental Research | 0.70% on first $500 million; 0.65% on next $500 million; and 0.60% in excess of $1 billion | |
| LargeCap Growth | 0.75% on first $500 million; 0.675% on next $500 million; and 0.65% in excess of $1 billion | |
| MidCap Opportunities | 1.00% on first $500 million; and 0.90% thereafter | |
| Opportunistic LargeCap | 0.70% on first $500 million; 0.65% on next $500 million; and 0.60% in excess of $1 billion | |
| SmallCap Opportunities | 1.00% on first $100 million; 0.90% on next $150 million; 0.80% on next $250 million; and 0.75% in excess of $500 million | |
| Financial Services | 1.00% on first $30 million; 0.75% on next $95 million; and 0.70% in excess of $125 million | |
| LargeCap Value | 0.90% on first $50 million; 0.85% on next $450 million; and 0.80% in excess of $500 million | |
| SmallCap Value Choice | 1.00% of the Fund’s average daily net assets managed by NWQ and Kayne; and 0.75% of the Fund’s average daily net assets managed by ING IM. | |
| Value Choice | 0.90% |
| (1) | Effective September 28, 2007, the management fee for Value Choice has been lowered from 1.00% to 0.90% |
ING Investment Management Co. (“ING IM”), a registered investment adviser, serves as Sub-Adviser to, Fundamental Research, MidCap Opportunities, Opportunistic LargeCap, SmallCap Opportunities and Financial Services pursuant to sub-advisory agreements between the Investment Adviser and ING IM.
ING Clarion Real Estate Securities L.P. (“INGCRES”), a registered investment adviser, is the Sub-Adviser to Real Estate pursuant to a sub-advisory agreement between the Investment Adviser and INGCRES.
Brandes Investment Partners, L.P. (“Brandes”), a registered investment adviser, serves as Sub-Adviser to LargeCap Value pursuant to a sub-advisory agreement between the Investment Adviser and Brandes.
Wellington Management Company, LLP (“Wellington Management”), a registered investment adviser, serves as the Sub-Adviser to LargeCap Growth pursuant to a sub-advisory agreement between the Investment Adviser and Wellington Management.
NWQ Investment Management Company, LLC (“NWQ”), a registered investment adviser, serves as one of the Sub-Advisers to SmallCap Value Choice pursuant to a sub-advisory agreement between the Investment Adviser and NWQ. Effective March 29, 2007, Kayne Anderson Rudnick Investment Management, LLC (“Kayne”) serves as the second Sub-Adviser to SmallCap Value Choice pursuant to a sub-advisory agreement between the Investment Adviser and Kayne. Effective March 29, 2007, ING IM serves as the third Sub-Adviser to SmallCap Value Choice pursuant to a sub-advisory agreement between the Investment Adviser and ING IM.
Tradewinds Global Investors, LLC (“Tradewinds”), a registered investment adviser, serves as Sub-Adviser to Value Choice pursuant to a sub-advisory agreement between the Investment Adviser and Tradewinds.
64
Table of Contents
ING Funds Services, LLC (the “Administrator” or “IFS”), serves as administrator to each Fund except Financial Services. The Funds pay the Administrator a fee calculated at an annual rate of 0.10% of each Fund’s average daily net assets.
Financial Services has entered into Shareholder Service Agreements with IFS whereby IFS will act as Shareholder Service Agent for the Fund. The agreement provides that IFS will be compensated for incoming and outgoing shareholder telephone calls and letters, and all reasonable out-of-pocket expenses incurred in connection with the performance of such services.
MidCap Opportunities, SmallCap Opportunities and Financial Services also pay IFS an annual shareholder account servicing fee of $5.00, payable semi-annually, for each account of beneficial owners of shares. For the six months ended November 30, 2007, MidCap Opportunities, SmallCap Opportunities and Financial Services paid $113,738, $60,893 and $4,026, respectively, in shareholder servicing fees.
The Investment Adviser, ING IM, INGCRES, IFS and the ING Funds Distributor, LLC (“IFD” or the Distributor”) are indirect, wholly-owned subsidiaries of ING Groep N.V. (“ING Groep”). ING Groep is one of the largest financial services organizations in the world, and offers an array of banking, insurance and asset management services to both individuals and investors.
Certain ING Funds sub-advised by ING IM are permitted to invest end-of-day cash balances into ING Institutional Prime Money Market Fund. Investment management fees paid by the Funds will be reduced by an amount equal to the management fees paid indirectly to ING Institutional Prime Money Market Fund with respect to assets invested by the Funds. For the six months ended November 30, 2007, Fundamental Research, MidCap Opportunities, Opportunistic LargeCap, SmallCap Opportunities and Financial Services waived $351, $2,690, $20, $1,634 and $2,163, respectively, of such management fees. These fees are not subject to recoupment.
NOTE 5 — DISTRIBUTION AND SERVICE FEES
Each share class of the Funds (except Class I) has adopted a Plan pursuant to Rule 12b-1 under the 1940 Act (the “12b-1 Plans”), whereby the Distributor is reimbursed or compensated (depending on the class of shares) by the Funds for expenses incurred in the distribution of each Fund’s shares (“Distribution Fees”). Pursuant to the 12b-1 Plans, the Distributor is entitled to a payment each month to reimburse or compensate expenses incurred in the distribution and promotion of each Fund’s shares, including expenses incurred in printing prospectuses and reports used for sales purposes, expenses incurred in preparing and printing sales literature and other such distribution related expenses, including any distribution or shareholder servicing fees (“Service Fees”) paid to securities dealers who have executed a distribution agreement with the Distributor. Under the 12b-1 Plans, each class of shares of the Fund pays the Distributor a combined Distribution and/or Service Fee based on average daily net assets at the following rates:
| Classes B | ||||||||||||||||
| Class A | and C | Class O | Class Q | |||||||||||||
| Real Estate | 0.25 | % | 1.00 | % | 0.25 | % | 0.25 | % | ||||||||
| Fundamental Research | 0.25 | % | 1.00 | % | n/a | n/a | ||||||||||
| LargeCap Growth | 0.35 | % | 1.00 | % | n/a | 0.25 | % | |||||||||
MidCap Opportunities(1) | 0.30 | % | 1.00 | % | n/a | 0.25 | % | |||||||||
| Opportunistic LargeCap | 0.25 | % | 1.00 | % | n/a | n/a | ||||||||||
SmallCap Opportunities(1) | 0.30 | % | 1.00 | % | n/a | 0.25 | % | |||||||||
Financial Services(1) | 0.35 | % | 1.00 | % | 0.25 | % | n/a | |||||||||
| LargeCap Value | 0.25 | % | 1.00 | % | n/a | n/a | ||||||||||
| SmallCap Value Choice | 0.25 | % | 1.00 | % | n/a | n/a | ||||||||||
| Value Choice | 0.25 | % | 1.00 | % | n/a | n/a | ||||||||||
| (1) | ING Funds Distributor, LLC has contractually agreed to waive 0.10% of the Distribution Fee for Class A shares of Financial Services through October 1, 2008. Effective January 1, 2005, ING Funds Distributor, LLC has also contractually agreed to waive 0.05% of the Distribution Fee for Class A shares of MidCap Opportunities and SmallCap Opportunities. The fee waiver is for the period beginning January 1, 2007 through December 31, 2007. |
Presently, the Funds’ class-specific expenses include certain transfer agent fees and distribution fees incurred in connection with Class A, Class B, and Class C shares and service fees in connection with Class B and Class C shares. For the six months ended November 30, 2007, the Distributor retained the following amounts in sales charges:
| Class A | Class C | |||||||
| Initial Sales Charges: | Shares | Shares | ||||||
| Real Estate | $ | 2,597 | N/A | |||||
| Fundamental Research | 398 | N/A | ||||||
| LargeCap Growth | 7,272 | N/A | ||||||
| MidCap Opportunities | 4,820 | N/A | ||||||
| Opportunistic LargeCap | — | N/A | ||||||
| SmallCap Opportunities | 2,749 | N/A | ||||||
| Financial Services | 6,162 | N/A | ||||||
| LargeCap Value | 13,370 | N/A | ||||||
| SmallCap Value Choice | 6,891 | N/A | ||||||
| Value Choice | — | N/A | ||||||
65
Table of Contents
| Contingent Deferred | Class A | Class C | ||||||
| Sales Charges: | Shares | Shares | ||||||
| Real Estate | $ | — | $ | 784 | ||||
| Fundamental Research | — | — | ||||||
| LargeCap Growth | 417 | 69 | ||||||
| MidCap Opportunities | 29 | 177 | ||||||
| Opportunistic LargeCap | — | — | ||||||
| SmallCap Opportunities | — | (39 | ) | |||||
| Financial Services | 13,990 | 276 | ||||||
| LargeCap Value | 11,471 | 1,407 | ||||||
| SmallCap Value Choice | — | 1,681 | ||||||
| Value Choice | 5,835 | 2,271 | ||||||
NOTE 6 — OTHER TRANSACTIONS WITH AFFILIATES AND RELATED PARTIES
The Investment Adviser may direct the Funds’ portfolio managers to use their best efforts (subject to obtaining best execution of each transaction) to allocate a Fund’s equity security transactions through certain designated broker-dealers. The designated broker-dealer, in turn, will reimburse a portion of the brokerage commissions to pay certain expenses of that Fund. Any amounts credited to the Funds are reflected as brokerage commission recapture in the Statements of Operations.
At November 30, 2007, the Funds had the following amounts recorded in payable to affiliates on the accompanying Statements of Assets and Liabilities (see Notes 4 and 5):
| Accrued | ||||||||||||||||
| Accrued | Shareholder | |||||||||||||||
| Investment | Accrued | Service and | ||||||||||||||
| Management | Administrative | Distribution | ||||||||||||||
| Portfolio | Fees | Fees | Fees | Total | ||||||||||||
| Real Estate | $ | 160,500 | $ | 22,928 | $ | 36,133 | $ | 219,561 | ||||||||
| Fundamental Research | 19,987 | 2,866 | 19,467 | 42,320 | ||||||||||||
| LargeCap Growth | 126,227 | 16,356 | 93,278 | 235,861 | ||||||||||||
| MidCap Opportunities | 230,818 | 23,126 | 151,473 | 405,417 | ||||||||||||
| Opportunistic LargeCap | 5,366 | 767 | 2,522 | 8,655 | ||||||||||||
| SmallCap Opportunities | 108,491 | 11,164 | 59,018 | 178,673 | ||||||||||||
| Financial Services | 150,686 | — | 63,973 | 214,659 | ||||||||||||
| LargeCap Value | 53,783 | 6,086 | 31,202 | 91,071 | ||||||||||||
| SmallCap Value Choice | 104,680 | 6,783 | 25,345 | 136,808 | ||||||||||||
| Value Choice | 252,369 | 28,041 | 118,806 | 399,216 | ||||||||||||
At November 30, 2007, the following indirect, wholly-owned subsidiaries of ING Groep owned more than 5% of the following Funds:
ING Life Insurance and Annuity Company (“ILIAC”) — Real Estate (30.44)%; Fundamental Research (10.61)%; SmallCap Value Choice (11.40)%; and Opportunistic LargeCap (62.18)%.
ING National Trust — Real Estate (17.47)%.
NOTE 7 — EXPENSE LIMITATIONS
For the following Funds, the Investment Adviser has agreed to limit expenses, excluding interest expenses, taxes, brokerage and extraordinary expenses (and acquired fund fees and expenses) to the levels listed below:
| Class A | Class B | Class C | Class I | Class O | Class Q | |||||||||||||||||||
| Real Estate | 1.45 | % | 2.20 | % | 2.20 | % | 1.00 | % | 1.45 | % | 1.45 | % | ||||||||||||
| Fundamental Research | 1.25 | % | 2.00 | % | 2.00 | % | 1.00 | % | n/a | n/a | ||||||||||||||
| LargeCap Growth | 1.45 | % | 2.10 | % | 2.10 | % | 1.10 | % | n/a | 1.35 | % | |||||||||||||
MidCap Opportunities(1) | 1.75 | % | 2.45 | % | 2.45 | % | 1.45 | % | n/a | 1.60 | % | |||||||||||||
| Opportunistic LargeCap | 1.25 | % | 2.00 | % | 2.00 | % | 1.00 | % | n/a | n/a | ||||||||||||||
| LargeCap Value | 1.45 | % | 2.20 | % | 2.20 | % | 1.20 | % | n/a | n/a | ||||||||||||||
| SmallCap Value Choice | 1.50 | % | 2.25 | % | 2.25 | % | 1.25 | % | n/a | n/a | ||||||||||||||
Value Choice(2) | 1.40 | % | 2.15 | % | 2.15 | % | 1.15 | % | n/a | n/a | ||||||||||||||
| (1) | Effective January 1, 2006, pursuant to a side agreement, ING Investments has lowered the expense limits for MidCap Opportunities and has implemented expense limits for SmallCap Opportunities through at least December 31, 2007. The expense limits for the Funds are as follows: |
| Class A | Class B | Class C | Class I | Class Q | ||||||||||||||||
| MidCap Opportunities | 1.25 | % | 2.00 | % | 2.00 | % | 1.00 | % | 1.25 | % | ||||||||||
| SmallCap Opportunities | 1.50 | % | 2.25 | % | 2.25 | % | 1.25 | % | 1.50 | % | ||||||||||
| If, after December 31, 2007, ING Investments elects not to renew the side agreement, the expense limits for MidCap Opportunities will revert to the limits listed in the table above. For SmallCap Opportunities, the Fund will no longer have an expense limitation. There is no guarantee that this side agreement will continue after that date. The side agreement will only renew if ING Investments elects to renew it. Any fees waived pursuant to the side agreement shall not be eligible for recoupment. |
| (2) | Prior to September 28, 2007, the expense limits for Value Choice were 1.50%, 2.25%, 2.25% and 1.25% for Class A, Class B, Class C and Class I, respectively. |
The Investment Adviser may at a later date recoup from a Fund management fees waived and certain other expenses assumed by the Investment Adviser during the previous 36 months, but only if, after such recoupment, a Fund’s expense ratio does not exceed the percentage described above. Some of the fees waived are not eligible for recoupment. Waived and reimbursed fees net of any recoupment by the Investment Adviser of such waived and reimbursed fees are reflected on the accompanying Statement of Operations for each Fund. Amounts payable by the Investment Adviser are reflected on the accompanying Statement of Assets and Liabilities for each Fund.
At November 30, 2007, the cumulative amounts of waived or reimbursed fees that are subject to possible recoupment by the Investment Adviser, and the related expiration dates are as follows:
66
Table of Contents
| November 30, | ||||||||||||||||
| 2008 | 2009 | 2010 | Total | |||||||||||||
| Fundamental Research | $ | — | $ | 169,946 | $ | 132,234 | $ | 302,180 | ||||||||
| LargeCap Growth | — | — | 80,629 | 80,629 | ||||||||||||
| Opportunistic LargeCap | — | 164,407 | 76,989 | 241,396 | ||||||||||||
| LargeCap Value | 65,917 | 12,843 | 15,135 | 93,895 | ||||||||||||
| SmallCap Value Choice | 108,508 | 63,738 | 199,734 | 371,980 | ||||||||||||
| Value Choice | 114,069 | 66,178 | 271,792 | 452,039 | ||||||||||||
The expense limitation agreements are contractual and shall renew automatically for one-year terms unless ING Investments provides written notice of the termination of the expense limitation agreement within 90 days of the end of the then current term.
NOTE 8 — LINE OF CREDIT
All of the Funds included in this report, in addition to certain other funds managed by the Investment Adviser, have entered into an unsecured committed revolving line of credit agreement (the “Credit Agreement”) with The Bank of New York Mellon Corporation for an aggregate amount of $125,000,000. The proceeds may be used to: (1) temporarily finance the purchase and sale of securities; (2) finance the redemption of shares of an investor in the Funds; and (3) enable the Funds to meet other emergency expenses as defined in the Credit Agreement. The Funds to which the line of credit is available pay a commitment fee equal to 0.09% per annum on the daily unused portion of the committed line amount payable quarterly in arrears.
The following Funds utilized the line of credit during the six months ended November 30, 2007:
| Approximate | Approximate | |||||||||||
| Average | Weighted | |||||||||||
| Daily | Average | |||||||||||
| Balance For | Interest Rate | |||||||||||
| Days | Days | For Days | ||||||||||
| Fund | Utilized | Utilized | Utilized | |||||||||
| Real Estate | 6 | $ | 4,740,000 | 5.75 | % | |||||||
| MidCap Opportunities | 4 | $ | 1,425,000 | 5.50 | % | |||||||
| LargeCap Value | 20 | $ | 2,712,500 | 5.32 | % | |||||||
| Value Choice | 17 | $ | 785,294 | 5.28 | % | |||||||
NOTE 9 — CAPITAL SHARES
Transactions in capital shares and dollars were as follows:
| Class A | Class B | |||||||||||||||
| Six Months | Year | Six Months | Year | |||||||||||||
| Ended | Ended | Ended | Ended | |||||||||||||
| November 30, | May 31, | November 30, | May 31, | |||||||||||||
| 2007 | 2007 | 2007 | 2007 | |||||||||||||
Real Estate (Number of Shares) | ||||||||||||||||
| Shares sold | 262,850 | 3,223,010 | 6,054 | 74,104 | ||||||||||||
| Dividends reinvested | 87,251 | 696,070 | 1,811 | 23,757 | ||||||||||||
| Shares redeemed | (2,323,565 | ) | (1,602,228 | ) | (102,920 | ) | (76,239 | ) | ||||||||
| Net increase (decrease) in shares outstanding | (1,973,464 | ) | 2,316,852 | (95,055 | ) | 21,622 | ||||||||||
Real Estate ($) | ||||||||||||||||
| Shares sold | $ | 4,505,063 | $ | 62,045,801 | $ | 106,452 | $ | 1,412,883 | ||||||||
| Dividends reinvested | 1,560,550 | 13,127,728 | 32,505 | 449,040 | ||||||||||||
| Shares redeemed | (40,226,640 | ) | (30,457,524 | ) | (1,752,819 | ) | (1,462,600 | ) | ||||||||
| Net increase (decrease) | $ | (34,161,027 | ) | $ | 44,716,005 | $ | (1,613,862 | ) | $ | 399,323 | ||||||
67
Table of Contents
| Class C | Class I | |||||||||||||||
| Six Months | Year | Six Months | Year | |||||||||||||
| Ended | Ended | Ended | Ended | |||||||||||||
| November 30, | May 31, | November 30, | May 31, | |||||||||||||
| 2007 | 2007 | 2007 | 2007 | |||||||||||||
Real Estate (Number of Shares) | ||||||||||||||||
| Shares sold | 15,701 | 114,358 | 657,997 | 2,318,757 | ||||||||||||
| Dividends reinvested | 1,128 | 14,522 | 91,827 | 642,352 | ||||||||||||
| Shares redeemed | (75,167 | ) | (65,626 | ) | (1,930,478 | ) | (3,101,509 | ) | ||||||||
| Net increase (decrease) in shares outstanding | (58,338 | ) | 63,254 | (1,180,654 | ) | (140,400 | ) | |||||||||
Real Estate ($) | ||||||||||||||||
| Shares sold | $ | 276,919 | $ | 2,288,038 | $ | 12,092,858 | $ | 47,677,356 | ||||||||
| Dividends reinvested | 20,986 | 284,029 | 1,733,392 | 12,761,645 | ||||||||||||
| Shares redeemed | (1,331,221 | ) | (1,318,987 | ) | (35,143,674 | ) | (63,308,854 | ) | ||||||||
| Net increase (decrease) | $ | (1,033,316 | ) | $ | 1,253,080 | $ | (21,317,424 | ) | $ | (2,869,853 | ) | |||||
| Class O | Class Q | |||||||||||||||
| Six Months | Year | Six Months | December 20, | |||||||||||||
| Ended | Ended | Ended | 2006(1) to | |||||||||||||
| November 30, | May 31, | November 30, | May 31, | |||||||||||||
| 2007 | 2007 | 2007 | 2007 | |||||||||||||
Real Estate (Number of Shares) | ||||||||||||||||
| Shares sold | 318,665 | 2,245,758 | — | 55 | ||||||||||||
| Dividends reinvested | 26,514 | 193,500 | — | — | ||||||||||||
| Shares redeemed | (877,005 | ) | (1,428,905 | ) | — | — | ||||||||||
| Net increase (decrease) in shares outstanding | (531,826 | ) | 1,010,353 | — | 55 | |||||||||||
Real Estate ($) | ||||||||||||||||
| Shares sold | $ | 5,513,701 | $ | 43,422,740 | $ | — | $ | 1,010 | ||||||||
| Dividends reinvested | 473,737 | 3,648,487 | — | — | ||||||||||||
| Shares redeemed | (15,119,051 | ) | (27,030,468 | ) | — | — | ||||||||||
| Net increase (decrease) | $ | (9,131,613 | ) | $ | 20,040,759 | $ | — | $ | 1,010 | |||||||
| Class A | Class B | |||||||||||||||
| Six Months | Year | Six Months | Year | |||||||||||||
| Ended | Ended | Ended | Ended | |||||||||||||
| November 30, | May 31, | November 30, | May 31, | |||||||||||||
| 2007 | 2007 | 2007 | 2007 | |||||||||||||
Fundamental Research (Number of Shares) | ||||||||||||||||
| Shares sold | 380,150 | 234,079 | 7,943 | 8,586 | ||||||||||||
| Shares issued from merger | — | 560,516 | — | 1,941,926 | ||||||||||||
| Dividends reinvested | — | 260 | — | 139 | ||||||||||||
| Shares redeemed | (120,937 | ) | (256,801 | ) | (516,207 | ) | (347,392 | ) | ||||||||
| Net increase (decrease) in shares outstanding | 259,213 | 538,054 | (508,264 | ) | 1,603,259 | |||||||||||
Fundamental Research ($) | ||||||||||||||||
| Shares sold | $ | 4,434,283 | $ | 2,610,888 | $ | 90,954 | $ | 92,641 | ||||||||
| Shares issued from merger | — | 5,962,002 | — | 20,513,179 | ||||||||||||
| Dividends reinvested | — | 2,837 | — | 1,510 | ||||||||||||
| Shares redeemed | (1,411,847 | ) | (2,912,080 | ) | (5,936,993 | ) | (3,853,979 | ) | ||||||||
| Net increase (decrease) | $ | 3,022,436 | $ | 5,663,647 | $ | (5,846,039 | ) | $ | 16,753,351 | |||||||
| (1) | Commencement of operations. |
68
Table of Contents
| Class C | Class I | |||||||||||||||
| Six Months | Year | Six Months | July 18, | |||||||||||||
| Ended | Ended | Ended | 2006(1) to | |||||||||||||
| November 30, | May 31, | November 30, | May 31, | |||||||||||||
| 2007 | 2007 | 2007 | 2007 | |||||||||||||
Fundamental Research (Number of Shares) | ||||||||||||||||
| Shares sold | 28,739 | 16,166 | 13 | 180 | ||||||||||||
| Shares issued from merger | — | 803,331 | — | 94 | ||||||||||||
| Dividends reinvested | — | 261 | — | 5 | ||||||||||||
| Shares redeemed | (111,299 | ) | (91,328 | ) | — | — | ||||||||||
| Net increase (decrease) in shares outstanding | (82,560 | ) | 728,430 | 13 | 279 | |||||||||||
Fundamental Research ($) | ||||||||||||||||
| Shares sold | $ | 335,706 | $ | 173,508 | $ | 150 | $ | 1,762 | ||||||||
| Shares issued from merger | — | 8,508,265 | — | 1,003 | ||||||||||||
| Dividends reinvested | — | 2,996 | — | 56 | ||||||||||||
| Shares redeemed | (1,276,207 | ) | (1,017,834 | ) | — | — | ||||||||||
| Net increase (decrease) | $ | (940,501 | ) | $ | 7,666,935 | $ | 150 | $ | 2,821 | |||||||
| Class A | Class B | |||||||||||||||
| Six Months | Year | Six Months | Year | |||||||||||||
| Ended | Ended | Ended | Ended | |||||||||||||
| November 30, | May 31, | November 30, | May 31, | |||||||||||||
| 2007 | 2007 | 2007 | 2007 | |||||||||||||
LargeCap Growth (Number of Shares) | ||||||||||||||||
| Shares sold | 419,024 | 723,334 | 60,963 | 118,506 | ||||||||||||
| Shares redeemed | (561,281 | ) | (2,434,945 | ) | (656,557 | ) | (1,644,132 | ) | ||||||||
| Net decrease in shares outstanding | (142,257 | ) | (1,711,611 | ) | (595,594 | ) | (1,525,626 | ) | ||||||||
LargeCap Growth ($) | ||||||||||||||||
| Shares sold | $ | 9,300,182 | $ | 14,010,050 | $ | 1,297,596 | $ | 2,176,900 | ||||||||
| Shares redeemed | (12,248,793 | ) | (46,921,853 | ) | (13,839,399 | ) | (30,706,442 | ) | ||||||||
| Net decrease | $ | (2,948,611 | ) | $ | (32,911,803 | ) | $ | (12,541,803 | ) | $ | (28,529,542 | ) | ||||
| Class C | Class I | |||||||||||||||
| Six Months | Year | Six Months | Year | |||||||||||||
| Ended | Ended | Ended | Ended | |||||||||||||
| November 30, | May 31, | November 30, | May 31, | |||||||||||||
| 2007 | 2007 | 2007 | 2007 | |||||||||||||
LargeCap Growth (Number of Shares) | ||||||||||||||||
| Shares sold | 77,824 | 123,561 | 244,009 | 685,577 | ||||||||||||
| Shares redeemed | (228,726 | ) | (842,107 | ) | (3,097,136 | ) | (598,961 | ) | ||||||||
| Net increase (decrease) in shares outstanding | (150,902 | ) | (718,546 | ) | (2,853,127 | ) | 86,616 | |||||||||
LargeCap Growth ($) | ||||||||||||||||
| Shares sold | $ | 1,669,048 | $ | 2,262,797 | $ | 5,681,424 | $ | 14,107,211 | ||||||||
| Shares redeemed | (4,767,059 | ) | (15,708,757 | ) | (74,243,795 | ) | (12,221,535 | ) | ||||||||
| Net increase (decrease) | $ | (3,098,011 | ) | $ | (13,445,960 | ) | $ | (68,562,371 | ) | $ | 1,885,676 | |||||
| (1) | Commencement of operations. |
69
Table of Contents
| Class Q | ||||||||||||||||
| Six Months | Year | |||||||||||||||
| Ended | Ended | |||||||||||||||
| November 30, | May 31, | |||||||||||||||
| 2007 | 2007 | |||||||||||||||
LargeCap Growth (Number of Shares) | ||||||||||||||||
| Shares sold | 1,070 | 2,896 | ||||||||||||||
| Shares redeemed | (5,293 | ) | (9,248 | ) | ||||||||||||
| Net decrease in shares outstanding | (4,223 | ) | (6,352 | ) | ||||||||||||
LargeCap Growth ($) | ||||||||||||||||
| Shares sold | $ | 23,812 | $ | 54,895 | ||||||||||||
| Shares redeemed | (121,761 | ) | (192,790 | ) | ||||||||||||
| Net decrease | $ | (97,949 | ) | $ | (137,895 | ) | ||||||||||
| Class A | Class B | |||||||||||||||
| Six Months | Year | Six Months | Year | |||||||||||||
| Ended | Ended | Ended | Ended | |||||||||||||
| November 30, | May 31, | November 30, | May 31, | |||||||||||||
| 2007 | 2007 | 2007 | 2007 | |||||||||||||
MidCap Opportunities (Number of Shares) | ||||||||||||||||
| Shares sold | 529,675 | 671,215 | 56,587 | 115,781 | ||||||||||||
| Dividends reinvested | — | 30,308 | — | 29,286 | ||||||||||||
| Shares redeemed | (730,350 | ) | (2,241,102 | ) | (883,098 | ) | (2,507,576 | ) | ||||||||
| Net decrease in shares outstanding | (200,675 | ) | (1,539,579 | ) | (826,511 | ) | (2,362,509 | ) | ||||||||
MidCap Opportunities ($) | ||||||||||||||||
| Shares sold | $ | 9,775,944 | $ | 10,379,661 | $ | 974,209 | $ | 1,691,228 | ||||||||
| Dividends reinvested | — | 476,439 | — | 434,020 | ||||||||||||
| Shares redeemed | (13,268,767 | ) | (34,682,810 | ) | (15,146,805 | ) | (36,529,289 | ) | ||||||||
| Net decrease | $ | (3,492,823 | ) | $ | (23,826,710 | ) | $ | (14,172,596 | ) | $ | (34,404,041 | ) | ||||
| Class C | Class I | |||||||||||||||
| Six Months | Year | Six Months | Year | |||||||||||||
| Ended | Ended | Ended | Ended | |||||||||||||
| November 30, | May 31, | November 30, | May 31, | |||||||||||||
| 2007 | 2007 | 2007 | 2007 | |||||||||||||
MidCap Opportunities (Number of Shares) | ||||||||||||||||
| Shares sold | 67,893 | 72,198 | 23,286 | 94,480 | ||||||||||||
| Dividends reinvested | — | 17,449 | — | 1,218 | ||||||||||||
| Shares redeemed | (418,476 | ) | (1,566,343 | ) | (29,627 | ) | (81,842 | ) | ||||||||
| Net increase (decrease) in shares outstanding | (350,583 | ) | (1,476,696 | ) | (6,341 | ) | 13,856 | |||||||||
MidCap Opportunities ($) | ||||||||||||||||
| Shares sold | $ | 1,166,418 | $ | 1,060,445 | $ | 453,391 | $ | 1,530,683 | ||||||||
| Dividends reinvested | — | 257,194 | — | 19,778 | ||||||||||||
| Shares redeemed | (7,113,343 | ) | (22,794,402 | ) | (574,274 | ) | (1,329,502 | ) | ||||||||
| Net increase (decrease) | $ | (5,946,925 | ) | $ | (21,476,763 | ) | $ | (120,883 | ) | $ | 220,959 | |||||
70
Table of Contents
| Class Q | ||||||||||||||||
| Six Months | Year | |||||||||||||||
| Ended | Ended | |||||||||||||||
| November 30, | May 31, | |||||||||||||||
| 2007 | 2007 | |||||||||||||||
MidCap Opportunities (Number of Shares) | ||||||||||||||||
| Shares sold | 5,586 | 782 | ||||||||||||||
| Dividends reinvested | — | 1,782 | ||||||||||||||
| Shares redeemed | (2,928 | ) | (16,010 | ) | ||||||||||||
| Net increase (decrease) in shares outstanding | 2,658 | (13,446 | ) | |||||||||||||
MidCap Opportunities ($) | ||||||||||||||||
| Shares sold | $ | 107,829 | $ | 12,097 | ||||||||||||
| Dividends reinvested | — | 28,392 | ||||||||||||||
| Shares redeemed | (53,589 | ) | (257,701 | ) | ||||||||||||
| Net increase (decrease) | $ | 54,240 | $ | (217,212 | ) | |||||||||||
| Class A | Class B | |||||||||||||||
| Six Months | Year | Six Months | Year | |||||||||||||
| Ended | Ended | Ended | Ended | |||||||||||||
| November 30, | May 31, | November 30, | May 31, | |||||||||||||
| 2007 | 2007 | 2007 | 2007 | |||||||||||||
Opportunistic LargeCap (Number of Shares) | ||||||||||||||||
| Shares sold | 277,502 | 55,634 | 24,410 | 18,167 | ||||||||||||
| Dividends reinvested | — | 17 | — | 11 | ||||||||||||
| Shares redeemed | (79,534 | ) | (4,443 | ) | (3,224 | ) | (380 | ) | ||||||||
| Net increase in shares outstanding | 197,968 | 51,208 | 21,186 | 17,798 | ||||||||||||
Opportunistic LargeCap ($) | ||||||||||||||||
| Shares sold | $ | 3,323,973 | $ | 648,391 | $ | 285,364 | $ | 206,099 | ||||||||
| Dividends reinvested | — | 186 | — | 116 | ||||||||||||
| Shares redeemed | (966,164 | ) | (47,910 | ) | (37,771 | ) | (4,316 | ) | ||||||||
| Net increase | $ | 2,357,809 | $ | 600,667 | $ | 247,593 | $ | 201,899 | ||||||||
| Class C | Class I | |||||||||||||||
| Six Months | Year | Six Months | December 20, | |||||||||||||
| Ended | Ended | Ended | 2006(1) to | |||||||||||||
| November 30, | May 31, | November 30, | May 31, | |||||||||||||
| 2007 | 2007 | 2007 | 2007 | |||||||||||||
Opportunistic LargeCap (Number of Shares) | ||||||||||||||||
| Shares sold | 46,554 | 13,163 | — | 2,161 | ||||||||||||
| Dividends reinvested | — | 52 | — | — | ||||||||||||
| Shares redeemed | (8,477 | ) | (4,869 | ) | — | — | ||||||||||
| Net increase in shares outstanding | 38,077 | 8,346 | — | 2,161 | ||||||||||||
Opportunistic LargeCap ($) | ||||||||||||||||
| Shares sold | $ | 542,126 | $ | 148,827 | $ | — | $ | 24,794 | ||||||||
| Dividends reinvested | — | 563 | — | — | ||||||||||||
| Shares redeemed | (96,602 | ) | (53,366 | ) | — | — | ||||||||||
| Net increase | $ | 445,524 | $ | 96,024 | $ | — | $ | 24,794 | ||||||||
| (1) | Commencement of operations. |
71
Table of Contents
| Class A | Class B | |||||||||||||||
| Six Months | Year | Six Months | Year | |||||||||||||
| Ended | Ended | Ended | Ended | |||||||||||||
| November 30, | May 31, | November 30, | May 31, | |||||||||||||
| 2007 | 2007 | 2007 | 2007 | |||||||||||||
SmallCap Opportunities (Number of Shares) | ||||||||||||||||
| Shares sold | 123,815 | 367,632 | 12,652 | 27,235 | ||||||||||||
| Shares redeemed | (307,305 | ) | (872,079 | ) | (158,158 | ) | (375,323 | ) | ||||||||
| Net decrease in shares outstanding | (183,490 | ) | (504,447 | ) | (145,506 | ) | (348,088 | ) | ||||||||
SmallCap Opportunities ($) | ||||||||||||||||
| Shares sold | $ | 4,269,305 | $ | 11,237,459 | $ | 392,436 | $ | 755,509 | ||||||||
| Shares redeemed | (10,576,635 | ) | (26,367,422 | ) | (4,895,814 | ) | (10,250,444 | ) | ||||||||
| Net decrease | $ | (6,307,330 | ) | $ | (15,129,963 | ) | $ | (4,503,378 | ) | $ | (9,494,935 | ) | ||||
| Class C | Class I | |||||||||||||||
| Six Months | Year | Six Months | Year | |||||||||||||
| Ended | Ended | Ended | Ended | |||||||||||||
| November 30, | May 31, | November 30, | May 31, | |||||||||||||
| 2007 | 2007 | 2007 | 2007 | |||||||||||||
SmallCap Opportunities (Number of Shares) | ||||||||||||||||
| Shares sold | 11,099 | 14,310 | 11,770 | 59,121 | ||||||||||||
| Shares redeemed | (86,793 | ) | (371,735 | ) | (9,862 | ) | (32,707 | ) | ||||||||
| Net increase (decrease) in shares outstanding | (75,694 | ) | (357,425 | ) | 1,908 | 26,414 | ||||||||||
SmallCap Opportunities ($) | ||||||||||||||||
| Shares sold | $ | 343,918 | $ | 387,389 | $ | 421,178 | $ | 1,864,607 | ||||||||
| Shares redeemed | (2,666,516 | ) | (10,148,107 | ) | (354,067 | ) | (1,028,775 | ) | ||||||||
| Net increase (decrease) | $ | (2,322,598 | ) | $ | (9,760,718 | ) | $ | 67,111 | $ | 835,832 | ||||||
| Class Q | ||||||||||||||||
| Six Months | Year | |||||||||||||||
| Ended | Ended | |||||||||||||||
| November 30, | May 31, | |||||||||||||||
| 2007 | 2007 | |||||||||||||||
SmallCap Opportunities (Number of Shares) | ||||||||||||||||
| Shares sold | — | 27 | ||||||||||||||
| Shares redeemed | (132 | ) | (2,036 | ) | ||||||||||||
| Net decrease in shares outstanding | (132 | ) | (2,009 | ) | ||||||||||||
SmallCap Opportunities ($) | ||||||||||||||||
| Shares sold | $ | — | $ | 921 | ||||||||||||
| Shares redeemed | (4,688 | ) | (67,473 | ) | ||||||||||||
| Net decrease | $ | (4,688 | ) | $ | (66,552 | ) | ||||||||||
72
Table of Contents
| Class A | Class B | |||||||||||||||
| Six Months | Six Months | |||||||||||||||
| Ended | Year Ended | Ended | Year Ended | |||||||||||||
| November 30, | May 31, | November 30, | May 31, | |||||||||||||
| 2007 | 2007 | 2007 | 2007 | |||||||||||||
Financial Services (Number of Shares) | ||||||||||||||||
| Shares sold | 266,983 | 1,713,834 | 32,729 | 100,184 | ||||||||||||
| Dividends reinvested | — | 787,598 | — | 128,322 | ||||||||||||
| Shares redeemed | (1,075,796 | ) | (1,534,106 | ) | (363,739 | ) | (1,669,741 | ) | ||||||||
| Net increase (decrease) in shares outstanding | (808,813 | ) | 967,326 | (331,010 | ) | (1,441,235 | ) | |||||||||
Financial Services ($) | ||||||||||||||||
| Shares sold | $ | 6,047,786 | $ | 41,313,894 | $ | 716,605 | $ | 2,382,661 | ||||||||
| Dividends reinvested | — | 18,792,081 | — | 3,027,109 | ||||||||||||
| Shares redeemed | (24,252,020 | ) | (37,123,257 | ) | (8,116,964 | ) | (39,488,815 | ) | ||||||||
| Net increase (decrease) | $ | (18,204,234 | ) | $ | 22,982,718 | $ | (7,400,359 | ) | $ | (34,079,045 | ) | |||||
| Class C | Class O | |||||||||||||||
| Six Months | Six Months | |||||||||||||||
| Ended | Year Ended | Ended | Year Ended | |||||||||||||
| November 30, | May 31, | November 30, | May 31, | |||||||||||||
| 2007 | 2007 | 2007 | 2007 | |||||||||||||
Financial Services (Number of Shares) | ||||||||||||||||
| Shares sold | 43,052 | 29,910 | 289,575 | 785,354 | ||||||||||||
| Dividends reinvested | — | 7,373 | — | 60,884 | ||||||||||||
| Shares redeemed | (9,451 | ) | (43,052 | ) | (296,219 | ) | (315,333 | ) | ||||||||
| Net increase (decrease) in shares outstanding | 33,601 | (5,769 | ) | (6,644 | ) | 530,905 | ||||||||||
Financial Services ($) | ||||||||||||||||
| Shares sold | $ | 903,012 | $ | 700,932 | $ | 6,532,129 | $ | 18,962,610 | ||||||||
| Dividends reinvested | — | 170,027 | — | 1,444,768 | ||||||||||||
| Shares redeemed | (205,980 | ) | (979,254 | ) | (6,660,629 | ) | (7,565,333 | ) | ||||||||
| Net increase (decrease) | $ | 697,032 | $ | (108,295 | ) | $ | (128,500 | ) | $ | 12,842,045 | ||||||
| Class A | Class B | |||||||||||||||
| Six Months | Six Months | |||||||||||||||
| Ended | Year Ended | Ended | Year Ended | |||||||||||||
| November 30, | May 31, | November 30, | May 31, | |||||||||||||
| 2007 | 2007 | 2007 | 2007 | |||||||||||||
LargeCap Value (Number of Shares) | ||||||||||||||||
| Shares sold | 1,077,670 | 5,756,297 | 66,081 | 489,852 | ||||||||||||
| Dividends reinvested | — | 186,412 | — | 35,531 | ||||||||||||
| Shares redeemed | (2,407,859 | ) | (3,176,836 | ) | (169,197 | ) | (270,308 | ) | ||||||||
| Net increase (decrease) in shares outstanding | (1,330,189 | ) | 2,765,873 | (103,116 | ) | 255,075 | ||||||||||
LargeCap Value ($) | ||||||||||||||||
| Shares sold | $ | 12,505,107 | $ | 66,369,473 | $ | 771,251 | $ | 5,608,611 | ||||||||
| Dividends reinvested | — | 2,158,711 | — | 409,674 | ||||||||||||
| Shares redeemed | (27,481,054 | ) | (37,189,846 | ) | (1,918,745 | ) | (3,112,544 | ) | ||||||||
| Net increase (decrease) | $ | (14,975,947 | ) | $ | 31,338,338 | $ | (1,147,494 | ) | $ | 2,905,741 | ||||||
73
Table of Contents
| Class C | Class I | |||||||||||||||
| Six Months | Year | Six Months | Year | |||||||||||||
| Ended | Ended | Ended | Ended | |||||||||||||
| November 30, | May 31, | November 30, | May 31, | |||||||||||||
| 2007 | 2007 | 2007 | 2007 | |||||||||||||
LargeCap Value (Number of Shares) | ||||||||||||||||
| Shares sold | 256,828 | 679,531 | — | 351,142 | ||||||||||||
| Dividends reinvested | — | 50,145 | — | 34,750 | ||||||||||||
| Shares redeemed | (209,634 | ) | (206,919 | ) | (74,837 | ) | (369,539 | ) | ||||||||
| Net increase (decrease) in shares outstanding | 47,194 | 522,757 | (74,837 | ) | 16,353 | |||||||||||
LargeCap Value ($) | ||||||||||||||||
| Shares sold | $ | 2,983,691 | $ | 7,846,566 | $ | — | $ | 4,012,000 | ||||||||
| Dividends reinvested | — | 577,666 | — | 403,101 | ||||||||||||
| Shares redeemed | (2,324,722 | ) | (2,363,569 | ) | (792,607 | ) | (4,384,392 | ) | ||||||||
| Net increase (decrease) | $ | 658,969 | $ | 6,060,663 | $ | (792,607 | ) | $ | 30,709 | |||||||
| Class A | Class B | |||||||||||||||
| Six Months | Year | Six Months | Year | |||||||||||||
| Ended | Ended | Ended | Ended | |||||||||||||
| November 30, | May 31, | November 30, | May 31, | |||||||||||||
| 2007 | 2007 | 2007 | 2007 | |||||||||||||
SmallCap Value Choice (Number of Shares) | ||||||||||||||||
| Shares sold | 587,526 | 4,325,398 | 22,060 | 176,697 | ||||||||||||
| Dividends reinvested | — | 66,321 | — | 5,413 | ||||||||||||
| Shares redeemed | (1,302,418 | ) | (1,050,481 | ) | (79,335 | ) | (41,168 | ) | ||||||||
| Net increase (decrease) in shares outstanding | (714,892 | ) | 3,341,238 | (57,275 | ) | 140,942 | ||||||||||
SmallCap Value Choice ($) | ||||||||||||||||
| Shares sold | $ | 8,023,522 | $ | 56,208,126 | $ | 290,596 | $ | 2,232,398 | ||||||||
| Dividends reinvested | — | 868,818 | — | 70,365 | ||||||||||||
| Shares redeemed | (16,928,861 | ) | (13,778,960 | ) | (1,022,062 | ) | (523,315 | ) | ||||||||
| Net increase (decrease) | $ | (8,905,339 | ) | $ | 43,297,984 | $ | (731,466 | ) | $ | 1,779,448 | ||||||
| Class C | Class I | |||||||||||||||
| Six Months | Year | Six Months | Year | |||||||||||||
| Ended | Ended | Ended | Ended | |||||||||||||
| November 30, | May 31, | November 30, | May 31, | |||||||||||||
| 2007 | 2007 | 2007 | 2007 | |||||||||||||
SmallCap Value Choice (Number of Shares) | ||||||||||||||||
| Shares sold | 127,982 | 704,194 | 208,208 | 612,833 | ||||||||||||
| Dividends reinvested | — | 14,300 | — | 15,107 | ||||||||||||
| Shares redeemed | (169,066 | ) | (120,465 | ) | (88,751 | ) | (204,734 | ) | ||||||||
| Net increase (decrease) in shares outstanding | (41,084 | ) | 598,029 | 119,457 | 423,206 | |||||||||||
SmallCap Value Choice ($) | ||||||||||||||||
| Shares sold | $ | 1,715,870 | $ | 9,005,124 | $ | 2,801,371 | $ | 7,593,270 | ||||||||
| Dividends reinvested | — | 185,897 | — | 198,355 | ||||||||||||
| Shares redeemed | (2,199,537 | ) | (1,569,159 | ) | (1,198,714 | ) | (2,714,024 | ) | ||||||||
| Net increase (decrease) | $ | (483,667 | ) | $ | 7,621,862 | $ | 1,602,657 | $ | 5,077,601 | |||||||
74
Table of Contents
| Class A | Class B | |||||||||||||||
| Six Months | Year | Six Months | Year | |||||||||||||
| Ended | Ended | Ended | Ended | |||||||||||||
| November 30, | May 31, | November 30, | May 31, | |||||||||||||
| 2007 | 2007 | 2007 | 2007 | |||||||||||||
Value Choice (Number of Shares) | ||||||||||||||||
| Shares sold | 2,109,000 | 9,285,605 | 72,623 | 421,557 | ||||||||||||
| Shares issued from merger | — | 3,279,640 | — | 2,087,296 | ||||||||||||
| Dividends reinvested | — | 331,991 | — | 21,657 | ||||||||||||
| Shares redeemed | (2,527,536 | ) | (2,340,211 | ) | (440,965 | ) | (178,211 | ) | ||||||||
| Net increase (decrease) in shares outstanding | (418,536 | ) | 10,557,025 | (368,342 | ) | 2,352,299 | ||||||||||
Value Choice ($) | ||||||||||||||||
| Shares sold | $ | 33,700,985 | $ | 133,614,986 | $ | 1,144,073 | $ | 5,996,679 | ||||||||
| Shares issued from merger | — | 51,976,387 | — | 32,842,795 | ||||||||||||
| Dividends reinvested | — | 5,073,381 | — | 329,278 | ||||||||||||
| Shares redeemed | (40,027,204 | ) | (34,763,155 | ) | (6,986,505 | ) | (2,655,094 | ) | ||||||||
| Net increase (decrease) | $ | (6,326,219 | ) | $ | 155,901,599 | $ | (5,842,432 | ) | $ | 36,513,658 | ||||||
| Class C | Class I | |||||||||||||||
| Six Months | Year | Six Months | Year | |||||||||||||
| Ended | Ended | Ended | Ended | |||||||||||||
| November 30, | May 31, | November 30, | May 31, | |||||||||||||
| 2007 | 2007 | 2007 | 2007 | |||||||||||||
Value Choice (Number of Shares) | ||||||||||||||||
| Shares sold | 483,486 | 1,907,670 | 354 | 733 | ||||||||||||
| Shares issued from merger | — | 2,248,538 | — | 45,769 | ||||||||||||
| Dividends reinvested | — | 87,238 | — | 46 | ||||||||||||
| Shares redeemed | (759,987 | ) | (316,307 | ) | (17,945 | ) | — | |||||||||
| Net increase (decrease) in shares outstanding | (276,501 | ) | 3,927,139 | (17,591 | ) | 46,548 | ||||||||||
Value Choice ($) | ||||||||||||||||
| Shares sold | $ | 7,638,982 | $ | 27,200,961 | $ | 5,724 | $ | 10,463 | ||||||||
| Shares issued from merger | — | 35,344,608 | — | 730,618 | ||||||||||||
| Dividends reinvested | — | 1,326,113 | — | 709 | ||||||||||||
| Shares redeemed | (12,060,940 | ) | (4,663,261 | ) | (289,512 | ) | — | |||||||||
| Net increase (decrease) | $ | (4,421,958 | ) | $ | 59,208,421 | $ | (283,788 | ) | $ | 741,790 | ||||||
NOTE 10 — SECURITIES LENDING
Under an agreement with The Bank of New York Mellon Corporation (“BNY”), the Funds except, Financial Services, can lend their securities to approved brokers, dealers and other financial institutions. Loans are collateralized by cash and U.S. Government securities. The collateral must be in an amount equal to at least 105% of the market value of non-U.S. securities loaned and 102% of the market value of U.S. securities loaned. The cash collateral received is invested in approved investments as defined in the Securities Lending Agreement with BNY (the “Agreement”). The collateral received is reflected in the Portfolio of Investments as collateral for securities loaned. Generally, in the event of counterparty default, the Funds have the right to use the collateral to offset losses incurred. The Agreement contains certain guarantees by BNY in the event of counterparty default and/or a borrower’s failure to return a loaned security; however, there would be a potential loss to the Funds in the event the Funds are delayed or prevented from exercising their right to dispose of the collateral. The Funds bear the risk of loss with respect to the investment of collateral. Engaging in securities lending could have a leveraging effect, which may intensify the credit, market and other risks associated with investing in a Fund. At November 30, 2007, the Funds had securities on loan with the following market values:
| Value of | ||||||||
| Securities | Value of | |||||||
| Fund Name | Loaned | Collateral | ||||||
| LargeCap Growth | $ | 13,099,090 | $ | 13,281,107 | ||||
| MidCap Opportunities | 37,273,859 | 38,324,510 | ||||||
| SmallCap Opportunities | 35,492,494 | 36,570,571 | ||||||
| LargeCap Value | 10,528,207 | 10,514,627 | ||||||
| Value Choice | 85,383,162 | 88,309,259 | ||||||
75
Table of Contents
NOTE 11 — REORGANIZATIONS
On March 4, 2007, Fundamental Research and on May 28, 2007, Value Choice, each as listed below (“Acquiring Fund”), acquired the assets and certain liabilities of ING Disciplined LargeCap Fund, and ING MidCap Value Fund and ING SmallCap Value Fund, respectively, also listed below (“Acquired Fund”), in tax-free reorganizations in exchange for shares of the Acquiring Fund, pursuant to the plans of reorganization approved by the Acquired Fund’s shareholders. The number and value of shares issued by the Acquiring Funds are presented in Note 9 — Capital Shares. Net assets and unrealized appreciation as of the reorganization dates were as follows:
| Acquired | Acquired Fund | |||||||||||||||||||||||
| Capital Loss | Unrealized | |||||||||||||||||||||||
| Acquiring | Acquired | Total Net Assets of | Total Net Assets of | Carryforward | Appreciation/ | Conversion | ||||||||||||||||||
| Fund | Fund | Acquired Fund (000’s) | Acquiring Fund (000’s) | (000’s) | (Depreciation) (000’s) | Ratio | ||||||||||||||||||
| Fundamental Research | ING Disciplined LargeCap Fund | $ | 34,984 | $ | 5,686 | $ | 39,222 | $ | 2,927 | 1.02 | ||||||||||||||
| Value Choice | ING MidCap Value Fund | 74,983 | 226,833 | 2,482 | (567 | ) | 0.65 | |||||||||||||||||
| Value Choice | ING SmallCap Value Fund | 45,911 | 226,833 | 5,768 | (2,863 | ) | 0.72 | |||||||||||||||||
The net assets of Fundamental Research and Value Choice after the acquisition were $40,670,457 and $347,727,168, respectively.
NOTE 12 — FEDERAL INCOME TAXES
The amount of distributions from net investment income and net realized capital gains are determined in accordance with federal income tax regulations, which may differ from U.S. generally accepted accounting principles for investment companies. These book/tax differences may be either temporary or permanent. Permanent differences are reclassified within the capital accounts based on their federal tax-basis treatment; temporary differences are not reclassified. Key differences include the treatment of short-term capital gains, foreign currency transactions, and wash sale deferrals. Distributions in excess of net investment income and/or net realized capital gains for tax purposes are reported as distributions of paid-in capital.
Dividends paid by the Funds from net investment income and distributions of net realized short-term capital gains are, for federal income tax purposes, taxable as ordinary income to shareholders.
The tax composition of dividends and distributions to shareholders was as follows:
| Six Months Ended | ||||||||||||
| November 30, 2007 | Year Ended May 31, 2007 | |||||||||||
| Long-Term | ||||||||||||
| Ordinary | Capital | |||||||||||
| Ordinary Income | Income | Gains | ||||||||||
Real Estate(1) | $ | 3,960,934 | $ | 8,847,739 | $ | 23,739,362 | ||||||
| Fundamental Research | — | 154,382 | 2,689 | |||||||||
| MidCap Opportunities | — | — | 1,815,533 | |||||||||
| Opportunistic LargeCap | — | 35,610 | — | |||||||||
| Financial Services | — | 5,412,872 | 25,390,501 | |||||||||
| LargeCap Value | — | 1,679,830 | 3,584,120 | |||||||||
| SmallCap Value Choice | — | 1,251,568 | 390,423 | |||||||||
| Value Choice | — | 5,763,247 | 2,502,438 | |||||||||
(1) Composition of dividends and distributions presented herein is based on the Fund’s tax year-ends of December 31, 2007 and 2006.
76
Table of Contents
The tax-basis components of distributable earnings and the expiration dates of the capital loss carryforwards which may be used to offset future realized capital gains for federal income tax purposes as of May 31, 2007 were:
| Undistributed | Undistributed | |||||||||||||||||||
| Ordinary | Long Term | Unrealized | Capital Loss | Expiration | ||||||||||||||||
| Income | Capital Gains | Appreciation | Carryforwards | Dates | ||||||||||||||||
Real Estate(1) | $ | — | $ | 162,665 | $ | 136,813,420 | $ | — | — | |||||||||||
| Fundamental Research | 168,930 | 1,873,438 | 4,409,847 | (7,404,640 | ) | 2009 | ||||||||||||||
| (24,371,998 | ) | 2010 | ||||||||||||||||||
| (6,531,057 | ) | 2011 | ||||||||||||||||||
| $ | (38,307,695 | ) | ||||||||||||||||||
| LargeCap Growth | — | — | 48,972,842 | (77,605,587 | ) | 2009 | ||||||||||||||
| (137,806,249 | ) | 2010 | ||||||||||||||||||
| (117,098,211 | ) | 2011 | ||||||||||||||||||
| (1,005,295 | ) | 2013 | ||||||||||||||||||
| $ | (333,515,342 | ) | ||||||||||||||||||
| MidCap Opportunities | — | 19,083,679 | 43,096,594 | (33,413,565 | ) | 2008 | ||||||||||||||
| (39,681,893 | ) | 2009 | ||||||||||||||||||
| (21,217,297 | ) | 2010 | ||||||||||||||||||
| (9,824,346 | ) | 2011 | ||||||||||||||||||
| $ | (104,137,101 | )* | ||||||||||||||||||
| Opportunistic LargeCap | 292,010 | 246,632 | 598,363 | — | — | |||||||||||||||
| SmallCap Opportunities | — | — | 23,563,548 | (61,778,082 | ) | 2010 | ||||||||||||||
| (167,319,500 | ) | 2011 | ||||||||||||||||||
| $ | (229,097,582 | )* | ||||||||||||||||||
| Financial Services | 2,688,470 | 22,675,943 | 73,446,034 | — | — | |||||||||||||||
| LargeCap Value | 1,738,507 | 4,705,306 | 10,352,564 | — | — | |||||||||||||||
| SmallCap Value Choice | 1,419,923 | 1,840,703 | 11,881,288 | — | — | |||||||||||||||
| Value Choice | 1,258,059 | — | 33,858,054 | (8,207,774 | )* | 2014 | ||||||||||||||
(1) As of the Fund’s tax year ended December 31, 2006.
* Utilization of these capital losses is subject to annual limitations under Section 382 of the Internal Revenue Code.
NOTE 13 — ILLIQUID SECURITIES
Pursuant to guidelines adopted by the Funds’ Board, the following security has been deemed to be illiquid. The Funds may invest up to 15% of its net assets in illiquid securities. Fair value for this security was determined by ING Funds Valuation Committee appointed by the Funds’ Board.
| Initial | Percent | |||||||||||||||||||||
| Acquisition | of Net | |||||||||||||||||||||
| Fund | Security | Shares | Date | Cost | Value | Assets | ||||||||||||||||
| SmallCap Value Choice | PetroHawk Energy Corp. | 3,000 | 03/30/07 | $ | 44,081 | $ | 48,900 | 0.0 | % | |||||||||||||
NOTE 14 — CONCENTRATION OF RISKS
Concentration (Real Estate and Financial Services). Each Fund concentrates (for purposes of the 1940 Act) its assets in securities related to a particular industry, which means that at least 25% of its assets will be invested in that particular industry at all times. As a result, each Fund may be subject to greater market fluctuation than a fund which has securities representing a broader range of investment alternatives.
Non-Diversified (Real Estate and Opportunistic LargeCap). The Funds are each classified as non-diversified investment companies under the 1940 Act, which means that each Fund is not limited by the 1940 Act in the proportion of assets that they may invest in the obligations of a single issuer. Declines in
77
Table of Contents
the value of that single company can significantly impact the value of a Fund. The investment of a large percentage of a Fund’s assets in the securities of a small number of issuers may cause the Fund’s share price to fluctuate more than that of a diversified investment company. Conversely, even though classified as nondiversified, a Fund may actually maintain a portfolio that is diversified with a large number of issuers. In such an event, a Fund would benefit less from appreciation in a single corporate issuer than if it had greater exposure to that issuer.
Foreign Securities (Fundamental Research, LargeCap Growth, MidCap Opportunities, Opportunistic LargeCap, SmallCap Value Choice and Value Choice) There are certain risks in owning foreign securities, including those resulting from: fluctuations in currency exchange rates; devaluation of currencies; political or economic developments and the possible imposition of currency exchange blockages or other foreign governmental laws or restrictions; reduced availability of public information concerning issuers; accounting, auditing and financial reporting standards or other regulatory practices and requirements that are not uniform when compared to those applicable to domestic companies; settlement and clearance procedures in some countries that may not be reliable and can result in delays in settlement; higher transaction and custody expenses than for domestic securities; and limitations on foreign ownership of equity securities. Also, securities of many foreign companies may be less liquid and the prices more volatile than those of domestic companies.
Emerging Markets Investments (Value Choice). Because of less developed markets and economies and, in some countries, less mature governments and governmental institutions, the risks of investing in foreign securities can be intensified in the case of investments in issuers domiciled or doing substantial business in emerging market countries. These risks include: high concentration of market capitalization and trading volume in a small number of issuers representing a limited number of industries, as well as a high concentration of investors and financial intermediaries; political and social uncertainties; overdependence on exports, especially with respect to primary commodities, making these economies vulnerable to changes in commodity prices; overburdened infrastructure and obsolete or unseasoned financial systems; environmental problems; less well-developed legal systems; and less reliable custodial services and settlement practices.
NOTE 15 — SUBSEQUENT EVENT
Dividends: Subsequent to November 30, 2007, the following Funds declared dividends and distributions of:
| PER SHARE AMOUNTS | ||||||||||||||||||||
| Net Investment | Short-Term | Long-Term | ||||||||||||||||||
| Income | Capital Gains | Capital Gains | Payable Date | Record Date | ||||||||||||||||
Real Estate | ||||||||||||||||||||
| Class A | $ | — | $ | — | $ | 1.5193 | December 20, 2007 | December 17, 2007 | ||||||||||||
| Class B | $ | — | $ | — | $ | 1.5193 | December 20, 2007 | December 17, 2007 | ||||||||||||
| Class C | $ | — | $ | — | $ | 1.5193 | December 20, 2007 | December 17, 2007 | ||||||||||||
| Class I | $ | — | $ | — | $ | 1.5193 | December 20, 2007 | December 17, 2007 | ||||||||||||
| Class O | $ | — | $ | — | $ | 1.5193 | December 20, 2007 | December 17, 2007 | ||||||||||||
| Class Q | $ | — | $ | — | $ | 1.5193 | December 20, 2007 | December 17, 2007 | ||||||||||||
| Class A | $ | 0.1616 | $ | — | $ | — | January 3, 2008 | December 28, 2007 | ||||||||||||
| Class B | $ | 0.1304 | $ | — | $ | — | January 3, 2008 | December 28, 2007 | ||||||||||||
| Class C | $ | 0.1295 | $ | — | $ | — | January 3, 2008 | December 28, 2007 | ||||||||||||
| Class I | $ | 0.1764 | $ | — | $ | — | January 3, 2008 | December 28, 2007 | ||||||||||||
| Class O | $ | 0.1616 | $ | — | $ | — | January 3, 2008 | December 28, 2007 | ||||||||||||
| Class Q | $ | 0.1604 | $ | — | $ | — | January 3, 2008 | December 28, 2007 | ||||||||||||
| Class W | $ | 0.1806 | $ | — | $ | — | January 3, 2008 | December 28, 2007 | ||||||||||||
78
Table of Contents
| PER SHARE AMOUNTS | ||||||||||||||||||||
| Net Investment | Short-Term | Long-Term | ||||||||||||||||||
| Income | Capital Gains | Capital Gains | Payable Date | Record Date | ||||||||||||||||
Fundamental Research | ||||||||||||||||||||
| Class A | $ | — | $ | 0.0564 | $ | 0.6221 | December 20, 2007 | December 17, 2007 | ||||||||||||
| Class B | $ | — | $ | 0.0564 | $ | 0.6221 | December 20, 2007 | December 17, 2007 | ||||||||||||
| Class C | $ | — | $ | 0.0564 | $ | 0.6221 | December 20, 2007 | December 17, 2007 | ||||||||||||
| Class I | $ | — | $ | 0.0564 | $ | 0.6221 | December 20, 2007 | December 17, 2007 | ||||||||||||
MidCap Opportunities | ||||||||||||||||||||
| Class A | $ | — | $ | 0.5184 | $ | 1.9771 | December 20, 2007 | December 17, 2007 | ||||||||||||
| Class B | $ | — | $ | 0.5184 | $ | 1.9771 | December 20, 2007 | December 17, 2007 | ||||||||||||
| Class C | $ | — | $ | 0.5184 | $ | 1.9771 | December 20, 2007 | December 17, 2007 | ||||||||||||
| Class I | $ | — | $ | 0.5184 | $ | 1.9771 | December 20, 2007 | December 17, 2007 | ||||||||||||
| Class Q | $ | — | $ | 0.5184 | $ | 1.9771 | December 20, 2007 | December 17, 2007 | ||||||||||||
Financial Services | ||||||||||||||||||||
| Class A | $ | 0.2814 | $ | 0.1377 | $ | 2.7244 | December 20, 2007 | December 17, 2007 | ||||||||||||
| Class B | $ | 0.0211 | $ | 0.1377 | $ | 2.7244 | December 20, 2007 | December 17, 2007 | ||||||||||||
| Class C | $ | 0.2032 | $ | 0.1377 | $ | 2.7244 | December 20, 2007 | December 17, 2007 | ||||||||||||
| Class O | $ | 0.2941 | $ | 0.1377 | $ | 2.7244 | December 20, 2007 | December 17, 2007 | ||||||||||||
LargeCap Value | ||||||||||||||||||||
| Class A | $ | 0.0899 | $ | 0.4225 | $ | 1.3163 | December 20, 2007 | December 17, 2007 | ||||||||||||
| Class B | $ | 0.0028 | $ | 0.4225 | $ | 1.3163 | December 20, 2007 | December 17, 2007 | ||||||||||||
| Class C | $ | 0.0163 | $ | 0.4225 | $ | 1.3163 | December 20, 2007 | December 17, 2007 | ||||||||||||
| Class I | $ | 0.1383 | $ | 0.4225 | $ | 1.3163 | December 20, 2007 | December 17, 2007 | ||||||||||||
SmallCap Value Choice | ||||||||||||||||||||
| Class A | $ | 0.0426 | $ | 0.2173 | $ | 0.2871 | December 20, 2007 | December 17, 2007 | ||||||||||||
| Class B | $ | — | $ | 0.2173 | $ | 0.2871 | December 20, 2007 | December 17, 2007 | ||||||||||||
| Class C | $ | — | $ | 0.2173 | $ | 0.2871 | December 20, 2007 | December 17, 2007 | ||||||||||||
| Class I | $ | 0.0735 | $ | 0.2173 | $ | 0.2871 | December 20, 2007 | December 17, 2007 | ||||||||||||
Value Choice | ||||||||||||||||||||
| Class A | $ | 0.0530 | $ | 0.2012 | $ | 0.7607 | December 20, 2007 | December 17, 2007 | ||||||||||||
| Class B | $ | — | $ | 0.2012 | $ | 0.7607 | December 20, 2007 | December 17, 2007 | ||||||||||||
| Class C | $ | — | $ | 0.2012 | $ | 0.7607 | December 20, 2007 | December 17, 2007 | ||||||||||||
| Class I | $ | 0.0775 | $ | 0.2012 | $ | 0.7607 | December 20, 2007 | December 17, 2007 | ||||||||||||
Effective on or about December 17, 2007, the Board approved to change the name of “SmallCap Value Choice” to “ING SmallCap Value Multi-Manager Fund.”
NOTE 16 — OTHER ACCOUNTING PRONOUNCEMENTS
In June 2006, the Financial Accounting Standards Board (“FASB”) issued FASB Interpretation No. 48 (“FIN 48”), “Accounting for Uncertainty in Income Taxes.” This standard defines the threshold for recognizing the benefits of tax-return positions in the financial statements as “more-likely-than-not” to be sustained upon challenge by the taxing authority and requires measurement of a tax position meeting the more-likely-than-not criterion, based on the largest benefit that is more than 50 percent likely to be realized. FIN 48 was effective for fiscal years beginning after December 15, 2006, with early application permitted if no interim financial statements have been issued. However, acknowledging the unique issues that FIN 48 presents for investment companies that calculate NAVs, the SEC has indicated that they would not object if a fund implements FIN 48 in its NAV calculation as late as its last NAV calculation in the first required financial statement reporting period for its fiscal year beginning after December 15, 2006. For May year-end funds, the current NAV and this semi-annual report are required to reflect the effects of FIN 48. At adoption, companies must adjust their financial statements to reflect only those tax positions that are more likely-than-not to be sustained as of the adoption date. Management of the Funds has analyzed the tax positions of the Funds. Upon adoption of FIN 48, we identified no uncertain tax positions that have not met the more likely-than-not standard.
79
Table of Contents
On September 15, 2006, the FASB issued Statement of Financial Accounting Standards No. 157 (“SFAS No. 157”), “Fair Value Measurements.” The new accounting statement defines fair value, establishes a framework for measuring fair value in generally accepted accounting principles (“GAAP”), and expands disclosures about fair value measurements. SFAS No. 157 defines fair value as the price that would be received to sell an asset or paid to transfer a liability in an orderly transaction between market participants at the measurement date (an exit price). SFAS No. 157 also stipulates that, as a market-based measurement, fair value measurement should be determined based on the assumptions that market participants would use in pricing the asset or liability, and establishes a fair value hierarchy that distinguishes between (a) market participant assumptions developed based on market data obtained from sources independent of the reporting entity (observable inputs) and (b) the reporting entity’s own assumptions about market participant assumptions developed based on the best information available in the circumstances (unobservable inputs). SFAS No. 157 is effective for financial statements issued for fiscal years beginning after November 15, 2007. As of November 30, 2007, management of the Funds is currently assessing the impact, if any, that will result from adopting SFAS No. 157.
NOTE 17 — INFORMATION REGARDING TRADING OF ING’S U.S. MUTUAL FUNDS
As discussed in earlier supplements that were previously filed with the SEC, ING Investments, the adviser to the ING Funds, has reported to the Boards of Directors/ Trustees (the “Boards”) of the ING Funds that, like many U.S. financial services companies, ING Investments and certain of its U.S. affiliates have received informal and formal requests for information since September 2003 from various governmental and self-regulatory agencies in connection with investigations related to mutual funds and variable insurance products. ING Investments has advised the Boards that it and its affiliates have cooperated fully with each request.
In addition to responding to regulatory and governmental requests, ING Investments reported that management of U.S. affiliates of ING Groep N.V., including ING Investments (collectively, “ING”), on their own initiative, have conducted, through independent special counsel and a national accounting firm, an extensive internal review of trading in ING insurance, retirement, and mutual fund products. The goal of this review was to identify any instances of inappropriate trading in those products by third parties or by ING investment professionals and other ING personnel. ING’s internal review related to mutual fund trading is now substantially completed. ING has reported that, of the millions of customer relationships that ING maintains, the internal review identified several isolated arrangements allowing third parties to engage in frequent trading of mutual funds within ING’s variable insurance and mutual fund products, and identified other circumstances where frequent trading occurred, despite measures taken by ING intended to combat market timing. ING further reported that each of these arrangements has been terminated and fully disclosed to regulators. The results of the internal review were also reported to the independent members of the Boards.
ING Investments has advised the Boards that most of the identified arrangements were initiated prior to ING’s acquisition of the businesses in question in the U.S. ING Investments further reported that the companies in question did not receive special benefits in return for any of these arrangements, which have all been terminated.
Based on the internal review, ING Investments has advised the Boards that the identified arrangements do not represent a systemic problem in any of the companies that were involved.
Despite the extensive internal review conducted through independent special counsel and a national accounting firm, there can be no assurance that the instances of inappropriate trading reported to the Boards are the only instances of such trading respecting the ING Funds.
ING Investments reported to the Boards that ING is committed to conducting its business with the highest standards of ethical conduct with zero tolerance for noncompliance. Accordingly, ING Investments advised the Boards that ING management was disappointed that its voluntary internal review identified these situations. Viewed in the context of the breadth and magnitude of its U.S. business as a whole, ING management does not believe that ING’s acquired companies had systemic ethical or compliance issues in these areas. Nonetheless, ING Investments reported that given ING’s refusal to tolerate any lapses, it has
80
Table of Contents
taken the steps noted below, and will continue to seek opportunities to further strengthen the internal controls of its affiliates.
| • | ING has agreed with the ING Funds to indemnify and hold harmless the ING Funds from all damages resulting from wrongful conduct by ING or its employees or from ING’s internal investigation, any investigations conducted by any governmental or self-regulatory agencies, litigation or other formal proceedings, including any proceedings by the SEC. ING Investments reported to the Boards that ING management believes that the total amount of any indemnification obligations will not be material to ING or its U.S. business. |
| • | ING updated its Code of Conduct for employees reinforcing its employees’ obligation to conduct personal trading activity consistent with the law, disclosed limits, and other requirements. |
Other Regulatory Matters
The New York Attorney General and other federal and state regulators are also conducting broad inquiries and investigations involving the insurance industry. These initiatives currently focus on, among other things, compensation and other sales incentives; potential conflicts of interest; potential anti-competitive activity; reinsurance; marketing practices (including suitability); specific product types (including group annuities and indexed annuities); fund selection for investment products and brokerage sales; and disclosure. It is likely that the scope of these industry investigations will further broaden before they conclude. ING has received formal and informal requests in connection with such investigations, and is cooperating fully with each request. In connection with one such investigation, affiliates of ING Investments were named in a petition for relief and cease and desist order filed by the New Hampshire Bureau of Securities Regulation concerning their administration of the New Hampshire state employees deferred compensation plan.
Other federal and state regulators could initiate similar actions in this or other areas of ING’s businesses. These regulatory initiatives may result in new legislation and regulation that could significantly affect the financial services industry, including businesses in which ING is engaged. In light of these and other developments, ING continuously reviews whether modifications to its business practices are appropriate. At this time, in light of the current regulatory factors, ING U.S. is actively engaged in reviewing whether any modifications in our practices are appropriate for the future.
There can be no assurance that these matters, or the adverse publicity associated with them, will not result in increased fund redemptions, reduced sale of fund shares, or other adverse consequences to ING Funds.
81
Table of Contents
| Shares | Value | |||||||||
| COMMON STOCK: 1.0% | ||||||||||
| Lodging: 0.5% | ||||||||||
| 25,400 | Starwood Hotels & Resorts Worldwide, Inc. | $ | 1,363,472 | |||||||
| 1,363,472 | ||||||||||
| Real Estate: 0.5% | ||||||||||
| 69,019 | @ | DuPont Fabros Technology, Inc. | 1,294,106 | |||||||
| 1,294,106 | ||||||||||
| Total Common Stock (Cost $2,852,056) | 2,657,578 | |||||||||
| REAL ESTATE INVESTMENT TRUSTS: 98.0% | ||||||||||
| Apartments: 12.9% | ||||||||||
| 98,200 | AvalonBay Communities, Inc. | 9,765,008 | ||||||||
| 97,700 | BRE Properties, Inc. | 4,352,535 | ||||||||
| 69,700 | Camden Property Trust | 3,666,917 | ||||||||
| 132,100 | Equity Residential | 4,915,441 | ||||||||
| 41,110 | Essex Property Trust, Inc. | 4,264,751 | ||||||||
| 98,000 | Home Properties, Inc. | 4,428,620 | ||||||||
| 103,800 | Post Properties, Inc. | 3,768,978 | ||||||||
| 35,162,250 | ||||||||||
| Diversified: 5.7% | ||||||||||
| 76,700 | Digital Realty Trust, Inc. | 2,926,872 | ||||||||
| 140,900 | Vornado Realty Trust | 12,681,000 | ||||||||
| 15,607,872 | ||||||||||
| Health Care: 10.5% | ||||||||||
| 231,600 | HCP, Inc. | 7,747,020 | ||||||||
| 234,500 | Nationwide Health Properties, Inc. | 7,335,160 | ||||||||
| 159,500 | Omega Healthcare Investors, Inc. | 2,579,115 | ||||||||
| 255,225 | Ventas, Inc. | 11,127,810 | ||||||||
| 28,789,105 | ||||||||||
| Hotels: 6.2% | ||||||||||
| 57,700 | FelCor Lodging Trust, Inc. | 1,010,327 | ||||||||
| 551,438 | Host Hotels & Resorts, Inc. | 10,582,095 | ||||||||
| 73,200 | LaSalle Hotel Properties | 2,723,040 | ||||||||
| 149,300 | Strategic Hotel Capital, Inc. | 2,733,683 | ||||||||
| 17,049,145 | ||||||||||
| Office Property: 16.3% | ||||||||||
| 120,100 | BioMed Realty Trust, Inc. | 2,711,858 | ||||||||
| 166,600 | Boston Properties, Inc. | 16,396,772 | ||||||||
| 111,050 | Corporate Office Properties Trust SBI MD | 4,011,126 | ||||||||
| 149,000 | Douglas Emmett, Inc. | 3,577,490 | ||||||||
| 111,600 | Highwoods Properties, Inc. | 3,541,068 | ||||||||
| 75,700 | Kilroy Realty Corp. | 4,230,873 | ||||||||
| 95,300 | SL Green Realty Corp. | 9,901,670 | ||||||||
| 44,370,857 | ||||||||||
| Regional Malls: 18.9% | ||||||||||
| 242,900 | General Growth Properties, Inc. | 11,280,276 | ||||||||
| 112,000 | Macerich Co. | 8,696,800 | ||||||||
| 257,900 | Simon Property Group, Inc. | 25,390,255 | ||||||||
| 114,900 | Taubman Centers, Inc. | 6,150,597 | ||||||||
| 51,517,928 | ||||||||||
| Shopping Centers: 15.1% | ||||||||||
| 132,350 | Acadia Realty Trust | 3,492,717 | ||||||||
| 141,800 | Equity One, Inc. | 3,356,406 | ||||||||
| 145,800 | Federal Realty Investment Trust | 12,129,102 | ||||||||
| 160,123 | Kimco Realty Corp. | 6,323,257 | ||||||||
| 170,700 | Regency Centers Corp. | 11,341,308 | ||||||||
| 110,500 | Tanger Factory Outlet Centers, Inc. | 4,653,155 | ||||||||
| 41,295,945 | ||||||||||
| Storage: 2.8% | ||||||||||
| 93,000 | Extra Space Storage, Inc. | 1,326,180 | ||||||||
| 80,902 | Public Storage, Inc. | 6,256,961 | ||||||||
| 7,583,141 | ||||||||||
| Warehouse/ Industrial: 9.6% | ||||||||||
| 121,925 | AMB Property Corp. | 7,456,933 | ||||||||
| 286,000 | Prologis | 18,710,120 | ||||||||
| 26,167,053 | ||||||||||
| Total Real Estate Investment Trusts (Cost $200,789,206) | 267,543,296 | |||||||||
| Total Long-Term Investments (Cost $203,641,262) | 270,200,874 | |||||||||
| Principal | ||||||||||
| Amount | Value | |||||||||
| SHORT-TERM INVESTMENTS: 1.0% | ||||||||||
| U.S. Government Agency Obligations: 1.0% | ||||||||||
| $ | 2,765,000 | Z | Freddie Mac, 3.600%, due 12/03/07 | $ | 2,764,171 | |||||
| Total Short-Term Investments (Cost $2,764,171) | 2,764,171 | |||||||||
Total Investments in Securities (Cost $206,405,433) | 100.0 | % | $ | 272,965,045 | ||||||||
Other Assets and Liabilities-Net | 0.0 | 30,146 | ||||||||||
Net Assets | 100.0 | % | $ | 272,995,191 | ||||||||
| @ | Non-income producing security | |
| Z | Indicates Zero Coupon Bond; rate shown reflects current effective yield. | |
| * | Cost for federal income tax purposes is $210,630,337. | |
Net unrealized appreciation consists of: |
| Gross Unrealized Appreciation | $ | 66,764,886 | ||
| Gross Unrealized Depreciation | (4,430,178 | ) | ||
| Net Unrealized Appreciation | $ | 62,334,708 | ||
82
Table of Contents
| Shares | Value | |||||||||
| COMMON STOCK: 97.4% | ||||||||||
| Aerospace/ Defense: 0.7% | ||||||||||
| 4,900 | @ | BE Aerospace, Inc. | $ | 230,300 | ||||||
| 230,300 | ||||||||||
| Agriculture: 2.5% | ||||||||||
| 11,460 | Altria Group, Inc. | 888,838 | ||||||||
| 888,838 | ||||||||||
| Apparel: 0.5% | ||||||||||
| 2,800 | Nike, Inc. | 183,820 | ||||||||
| 183,820 | ||||||||||
| Banks: 4.3% | ||||||||||
| 14,330 | Bank of America Corp. | 661,043 | ||||||||
| 5,400 | State Street Corp. | 431,406 | ||||||||
| 12,800 | US Bancorp | 423,552 | ||||||||
| 1,516,001 | ||||||||||
| Beverages: 2.1% | ||||||||||
| 5,900 | Coca-Cola Co. | 366,390 | ||||||||
| 5,000 | PepsiCo, Inc. | 385,900 | ||||||||
| 752,290 | ||||||||||
| Chemicals: 1.3% | ||||||||||
| 4,500 | Air Products & Chemicals, Inc. | 445,680 | ||||||||
| 445,680 | ||||||||||
| Computers: 4.2% | ||||||||||
| 2,500 | @ | Apple, Inc. | 455,550 | |||||||
| 17,000 | @ | Dell, Inc. | 417,180 | |||||||
| 6,507 | Hewlett-Packard Co. | 332,898 | ||||||||
| 10,800 | Seagate Technology, Inc. | 278,532 | ||||||||
| 12,700 | Seagate Technology, Inc. — Escrow | — | ||||||||
| 1,484,160 | ||||||||||
| Cosmetics/ Personal Care: 1.6% | ||||||||||
| 7,695 | Procter & Gamble Co. | 569,430 | ||||||||
| 569,430 | ||||||||||
| Diversified Financial Services: 8.5% | ||||||||||
| 34,700 | @@ | Amvescap PLC | 448,423 | |||||||
| 17,650 | Citigroup, Inc. | 587,745 | ||||||||
| 15,380 | JPMorgan Chase & Co. | 701,636 | ||||||||
| 7,100 | @@ | Lazard Ltd. | 345,486 | |||||||
| 14,200 | Lehman Brothers Holdings, Inc. | 889,346 | ||||||||
| 2,972,636 | ||||||||||
| Electric: 3.9% | ||||||||||
| 3,900 | Exelon Corp. | 316,173 | ||||||||
| 6,785 | @ | Mirant Corp. | 261,833 | |||||||
| 6,900 | @ | NRG Energy, Inc. | 292,491 | |||||||
| 8,500 | NSTAR | 297,500 | ||||||||
| 3,900 | PG&E Corp. | 180,453 | ||||||||
| 1,348,450 | ||||||||||
| Environmental Control: 1.2% | ||||||||||
| 12,300 | Waste Management, Inc. | 422,136 | ||||||||
| 422,136 | ||||||||||
| Food: 1.6% | ||||||||||
| 16,167 | Kraft Foods, Inc. | 558,570 | ||||||||
| 558,570 | ||||||||||
| Healthcare — Products: 3.5% | ||||||||||
| 11,040 | Johnson & Johnson | 747,850 | ||||||||
| 12,400 | @ | St. Jude Medical, Inc. | 492,900 | |||||||
| 1,240,750 | ||||||||||
| Healthcare — Services: 1.2% | ||||||||||
| 4,700 | @,W | Covance, Inc. | 410,451 | |||||||
| 410,451 | ||||||||||
| Household Products/ Wares: 0.5% | ||||||||||
| 2,600 | Kimberly-Clark Corp. | 181,506 | ||||||||
| 181,506 | ||||||||||
| Housewares: 0.7% | ||||||||||
| 4,700 | Toro Co. | 261,555 | ||||||||
| 261,555 | ||||||||||
| Insurance: 5.4% | ||||||||||
| 4,000 | American International Group, Inc. | 232,520 | ||||||||
| 6,500 | Assurant, Inc. | 425,295 | ||||||||
| 11,400 | MBIA, Inc. | 416,214 | ||||||||
| 7,900 | Principal Financial Group, Inc. | 517,371 | ||||||||
| 6,900 | Protective Life Corp. | 285,522 | ||||||||
| 1,876,922 | ||||||||||
| Internet: 3.0% | ||||||||||
| 2,500 | @,@@, # | Alibaba.com Ltd. | 12,828 | |||||||
| 1,500 | @ | Google, Inc. — Class A | 1,039,500 | |||||||
| 1,052,328 | ||||||||||
| Investment Companies: 0.9% | ||||||||||
| 16,900 | KKR Private Equity Investors LP | 302,510 | ||||||||
| 302,510 | ||||||||||
| Iron/ Steel: 1.3% | ||||||||||
| 4,700 | Allegheny Technologies, Inc. | 459,425 | ||||||||
| 459,425 | ||||||||||
| Media: 2.4% | ||||||||||
| 23,480 | News Corp. — Class A | 494,724 | ||||||||
| 10,100 | Time Warner, Inc. | 174,326 | ||||||||
| 5,200 | Walt Disney Co. | 172,380 | ||||||||
| 841,430 | ||||||||||
| Metal Fabricate/ Hardware: 1.2% | ||||||||||
| 2,800 | Precision Castparts Corp. | 412,552 | ||||||||
| 412,552 | ||||||||||
| Mining: 1.1% | ||||||||||
| 10,300 | Alcoa, Inc. | 374,611 | ||||||||
| 374,611 | ||||||||||
| Miscellaneous Manufacturing: 5.0% | ||||||||||
| 10,200 | Cooper Industries Ltd. | 512,244 | ||||||||
| 20,160 | General Electric Co. | 771,926 | ||||||||
| 7,400 | Roper Industries, Inc. | 469,530 | ||||||||
| 1,753,700 | ||||||||||
| Oil & Gas: 9.2% | ||||||||||
| 20,270 | S | ExxonMobil Corp. | 1,807,273 | |||||||
| 7,800 | Hess Corp. | 555,516 | ||||||||
| 1,284 | @ | Transocean, Inc. | 176,280 | |||||||
| 11,100 | XTO Energy, Inc. | 686,202 | ||||||||
| 3,225,271 | ||||||||||
| Pharmaceuticals: 5.4% | ||||||||||
| 6,800 | Abbott Laboratories | 391,068 | ||||||||
| 9,000 | @ | Hospira, Inc. | 389,700 | |||||||
| 13,800 | Merck & Co., Inc. | 819,168 | ||||||||
| 10,700 | Omnicare, Inc. | 272,636 | ||||||||
| 1,872,572 | ||||||||||
83
Table of Contents
| Shares | Value | |||||||||
| Retail: 5.6% | ||||||||||
| 9,600 | @ | Aeropostale, Inc. | $ | 245,280 | ||||||
| 9,200 | CVS Caremark Corp. | 368,828 | ||||||||
| 7,700 | Home Depot, Inc. | 219,912 | ||||||||
| 5,900 | @ | Kohl’s Corp. | 290,752 | |||||||
| 10,700 | Liz Claiborne, Inc. | 268,463 | ||||||||
| 3,600 | McDonald’s Corp. | 210,492 | ||||||||
| 2,800 | Target Corp. | 168,168 | ||||||||
| 4,100 | Wal-Mart Stores, Inc. | 196,390 | ||||||||
| 1,968,285 | ||||||||||
| Semiconductors: 5.2% | ||||||||||
| 35,800 | Intel Corp. | 933,664 | ||||||||
| 19,400 | Maxim Integrated Products | 449,886 | ||||||||
| 42,501 | @@ | Taiwan Semiconductor Manufacturing Co., Ltd. ADR | 421,610 | |||||||
| 1,805,160 | ||||||||||
| Software: 6.2% | ||||||||||
| 7,200 | @ | Adobe Systems, Inc. | 303,408 | |||||||
| 36,160 | Microsoft Corp. | 1,214,975 | ||||||||
| 31,900 | @ | Oracle Corp. | 643,742 | |||||||
| 2,162,125 | ||||||||||
| Telecommunications: 7.2% | ||||||||||
| 25,500 | @ | Arris Group, Inc. | 265,965 | |||||||
| 25,200 | AT&T, Inc. | 962,892 | ||||||||
| 13,700 | @ | Cisco Systems, Inc. | 383,874 | |||||||
| 13,990 | Qualcomm, Inc. | 570,512 | ||||||||
| 12,800 | @ | Qwest Communications International, Inc. | 84,864 | |||||||
| 6,100 | Verizon Communications, Inc. | 263,581 | ||||||||
| 2,531,688 | ||||||||||
| Total Common Stock (Cost $31,557,965) | 34,105,152 | |||||||||
| SHORT-TERM INVESTMENTS: 3.5% | ||||||||||
| Mutual Fund: 3.2% | ||||||||||
| 1,100,000 | ** | ING Institutional Prime Money Market Fund | 1,100,000 | |||||||
| Total Mutual Fund (Cost $1,100,000) | 1,100,000 | |||||||||
| Repurchase Agreement: 0.3% | ||||||||||
| $ | 106,000 | Morgan Stanley Repurchase Agreement dated 11/30/07, 4.500%, due 12/03/07, $106,040 to be received upon repurchase (Collateralized by $195,000 Resolution Funding Corp., Discount Note, Market Value $110,220, due 07/15/20) | $ | 106,000 | ||||||
| Total Repurchase Agreement (Cost $106,000) | 106,000 | |||||||||
| Total Short-Term Investments (Cost $1,206,000) | 1,206,000 | |||||||||
Total Investments in Securities (Cost $32,763,965) | 100.9 | % | $ | 35,311,152 | ||||||||
Other Assets and Liabilities-Net | (0.9 | ) | (310,280 | ) | ||||||||
Net Assets | 100.0 | % | $ | 35,000,872 | ||||||||
| @ | Non-income producing security | |
| @@ | Foreign Issuer | |
| ADR | American Depositary Receipt | |
| # | Securities with purchases pursuant to Rule 144A or section 4(2), under the Securities Act of 1933 and may not be resold subject to that rule except to qualified institutional buyers. Unless otherwise footnoted, these securities have been determined to be liquid under the guidelines established by the Funds’ Board of Directors/Trustees. | |
| W | When-issued or delayed delivery security | |
| S | All or a portion of this security is segregated for certain derivatives, when-issued or delayed delivery securities and forward currency exchange contracts. | |
| ** | Investment in affiliate | |
| * | Cost for federal income tax purposes is $32,901,770. Net unrealized appreciation consists of: |
| Gross Unrealized Appreciation | $ | 3,747,786 | ||
| Gross Unrealized Depreciation | (1,338,404 | ) | ||
| Net Unrealized Appreciation | $ | 2,409,382 | ||
ING Fundamental Research Fund Open Futures Contracts on November 30, 2007
| Number | Notional | Unrealized | ||||||||||||||
| Contract Description | of Contracts | Market Value ($) | Expiration Date | Appreciation/(Depreciation) | ||||||||||||
Long Contracts | ||||||||||||||||
| S&P 500 E-Mini | 3 | 222,555 | 12/21/07 | $ | 2,293 | |||||||||||
84
Table of Contents
| Shares | Value | |||||||||
| COMMON STOCK: 98.5% | ||||||||||
| Advertising: 1.5% | ||||||||||
| 47,670 | @,@@, L | Focus Media Holding Ltd. ADR | $ | 2,690,495 | ||||||
| 2,690,495 | ||||||||||
| Aerospace/ Defense: 6.2% | ||||||||||
| 30,540 | Boeing Co. | 2,826,172 | ||||||||
| 58,630 | General Dynamics Corp. | 5,205,171 | ||||||||
| 27,470 | Lockheed Martin Corp. | 3,040,105 | ||||||||
| 11,071,448 | ||||||||||
| Apparel: 1.8% | ||||||||||
| 49,910 | Nike, Inc. | 3,276,592 | ||||||||
| 3,276,592 | ||||||||||
| Banks: 0.8% | ||||||||||
| 51,380 | @@ | Banco Itau Holding Financeira SA ADR | 1,415,005 | |||||||
| 1,415,005 | ||||||||||
| Beverages: 0.5% | ||||||||||
| 12,610 | PepsiCo, Inc. | 973,240 | ||||||||
| 973,240 | ||||||||||
| Biotechnology: 0.7% | ||||||||||
| 17,150 | @ | Genentech, Inc. | 1,307,688 | |||||||
| 1,307,688 | ||||||||||
| Chemicals: 3.9% | ||||||||||
| 44,820 | @@,L | Agrium, Inc. | 2,592,389 | |||||||
| 27,660 | Monsanto Co. | 2,748,574 | ||||||||
| 14,110 | @@ | Potash Corp. of Saskatchewan | 1,691,648 | |||||||
| 7,032,611 | ||||||||||
| Commercial Services: 7.3% | ||||||||||
| 73,350 | @@ | Accenture Ltd. | 2,534,976 | |||||||
| 45,940 | @ | Apollo Group, Inc. — Class A | 3,515,329 | |||||||
| 31,740 | Manpower, Inc. | 1,939,314 | ||||||||
| 27,040 | McKesson Corp. | 1,804,379 | ||||||||
| 144,270 | Western Union Co. | 3,260,502 | ||||||||
| 13,054,500 | ||||||||||
| Computers: 6.9% | ||||||||||
| 22,610 | @ | Apple, Inc. | 4,119,994 | |||||||
| 92,450 | @ | Cadence Design Systems, Inc. | 1,534,670 | |||||||
| 30,240 | @ | Cognizant Technology Solutions Corp. | 940,464 | |||||||
| 65,120 | Hewlett-Packard Co. | 3,331,539 | ||||||||
| 7,170 | International Business Machines Corp. | 754,141 | ||||||||
| 65,150 | @ | Network Appliance, Inc. | 1,609,857 | |||||||
| 12,290,665 | ||||||||||
| Cosmetics/ Personal Care: 0.6% | ||||||||||
| 14,220 | Procter & Gamble Co. | 1,052,280 | ||||||||
| 1,052,280 | ||||||||||
| Diversified Financial Services: 6.2% | ||||||||||
| 3,890 | CME Group, Inc. | 2,561,954 | ||||||||
| 14,170 | Franklin Resources, Inc. | 1,745,461 | ||||||||
| 12,240 | Goldman Sachs Group, Inc. | 2,774,074 | ||||||||
| 77,100 | @,@@, L | Invesco PLC ADR | 2,023,875 | |||||||
| 72,100 | @,@@ | MF Global Ltd. | 2,078,643 | |||||||
| 11,184,007 | ||||||||||
| Electrical Components & Equipment: 0.8% | ||||||||||
| 30,769 | @@ | Gamesa Corp. Tecnologica SA | 1,395,195 | |||||||
| 1,395,195 | ||||||||||
| Energy — Alternate Sources: 1.9% | ||||||||||
| 7,800 | @ | Sunpower Corp. | 970,632 | |||||||
| 30,710 | @,@@, L | Suntech Power Holdings Co., Ltd. ADR | 2,431,311 | |||||||
| 3,401,943 | ||||||||||
| Engineering & Construction: 4.9% | ||||||||||
| 102,410 | @@ | ABB Ltd. ADR | 3,008,806 | |||||||
| 23,580 | Fluor Corp. | 3,470,269 | ||||||||
| 15,100 | @,@@ | Foster Wheeler Ltd. | 2,249,900 | |||||||
| 8,728,975 | ||||||||||
| Entertainment: 0.3% | ||||||||||
| 12,500 | International Game Technology | 545,750 | ||||||||
| 545,750 | ||||||||||
| Food: 1.0% | ||||||||||
| 3,800 | @@ | Nestle SA | 1,827,060 | |||||||
| 1,827,060 | ||||||||||
| Healthcare — Products: 1.0% | ||||||||||
| 26,420 | @ | Hologic, Inc. | 1,754,024 | |||||||
| 1,754,024 | ||||||||||
| Insurance: 0.7% | ||||||||||
| 24,370 | AON Corp. | 1,217,769 | ||||||||
| 1,217,769 | ||||||||||
| Internet: 6.5% | ||||||||||
| 9,240 | @ | Google, Inc. — Class A | 6,403,320 | |||||||
| 50,500 | @ | McAfee, Inc. | 1,966,975 | |||||||
| 97,900 | @ | Symantec Corp. | 1,742,620 | |||||||
| 37,230 | @ | VeriSign, Inc. | 1,522,707 | |||||||
| 11,635,622 | ||||||||||
| Machinery — Diversified: 0.7% | ||||||||||
| 7,510 | Deere & Co. | 1,290,218 | ||||||||
| 1,290,218 | ||||||||||
| Media: 0.9% | ||||||||||
| 38,900 | @ | Viacom — Class B | 1,634,578 | |||||||
| 1,634,578 | ||||||||||
| Mining: 4.5% | ||||||||||
| 37,460 | @@ | Cameco Corp. | 1,549,720 | |||||||
| 65,990 | @@ | Cia Vale do Rio Doce ADR | 2,281,934 | |||||||
| 21,750 | Freeport-McMoRan Copper & Gold, Inc. | 2,151,728 | ||||||||
| 41,880 | @@ | Vedanta Resources PLC | 1,982,435 | |||||||
| 7,965,817 | ||||||||||
| Miscellaneous Manufacturing: 4.3% | ||||||||||
| 40,640 | Danaher Corp. | 3,528,365 | ||||||||
| 16,620 | Parker Hannifin Corp. | 1,320,127 | ||||||||
| 18,770 | @@,L | Siemens AG ADR | 2,848,723 | |||||||
| 7,697,215 | ||||||||||
| Oil & Gas: 5.3% | ||||||||||
| 20,510 | ConocoPhillips | 1,641,620 | ||||||||
| 5,770 | Diamond Offshore Drilling | 671,801 | ||||||||
| 34,020 | L | EOG Resources, Inc. | 2,816,176 | |||||||
| 22,555 | @ | Transocean, Inc. | 3,096,590 | |||||||
| 18,640 | @ | Ultra Petroleum Corp. | 1,209,736 | |||||||
| 9,435,923 | ||||||||||
85
Table of Contents
| Shares | Value | |||||||||
| Oil & Gas Services: 0.6% | ||||||||||
| 28,770 | Halliburton Co. | $ | 1,053,270 | |||||||
| 1,053,270 | ||||||||||
| Pharmaceuticals: 8.4% | ||||||||||
| 48,100 | Abbott Laboratories | 2,766,231 | ||||||||
| 62,820 | @,@@ | Elan Corp. PLC ADR | 1,446,745 | |||||||
| 22,360 | @ | Gilead Sciences, Inc. | 1,040,634 | |||||||
| 59,940 | Merck & Co., Inc. | 3,558,038 | ||||||||
| 134,660 | Schering-Plough Corp. | 4,214,853 | ||||||||
| 43,630 | @@ | Teva Pharmaceutical Industries Ltd. ADR | 1,947,207 | |||||||
| 14,973,708 | ||||||||||
| Retail: 1.0% | ||||||||||
| 37,110 | @ | Kohl’s Corp. | 1,828,781 | |||||||
| 1,828,781 | ||||||||||
| Semiconductors: 3.6% | ||||||||||
| 106,360 | Altera Corp. | 1,997,441 | ||||||||
| 103,320 | Intel Corp. | 2,694,586 | ||||||||
| 58,260 | Linear Technology Corp. | 1,774,600 | ||||||||
| 6,466,627 | ||||||||||
| Software: 8.8% | ||||||||||
| 34,700 | @ | Autodesk, Inc. | 1,634,023 | |||||||
| 45,440 | Automatic Data Processing, Inc. | 2,047,526 | ||||||||
| 55,880 | @ | Electronic Arts, Inc. | 3,139,897 | |||||||
| 150,250 | Microsoft Corp. | 5,048,400 | ||||||||
| 192,850 | @ | Oracle Corp. | 3,891,713 | |||||||
| 15,761,559 | ||||||||||
| Telecommunications: 6.9% | ||||||||||
| 20,390 | @@ | America Movil SA de CV ADR | 1,257,247 | |||||||
| 42,550 | AT&T, Inc. | 1,625,836 | ||||||||
| 82,720 | @ | Cisco Systems, Inc. | 2,317,814 | |||||||
| 62,310 | @,L | MetroPCS Communications, Inc. | 1,065,501 | |||||||
| 23,760 | @,L | NII Holdings, Inc. | 1,310,602 | |||||||
| 39,980 | @@ | Nokia OYJ ADR | 1,572,413 | |||||||
| 78,030 | Qualcomm, Inc. | 3,182,063 | ||||||||
| 12,331,476 | ||||||||||
| Total Common Stock (Cost $138,378,445) | 176,294,041 | |||||||||
| SHORT-TERM INVESTMENTS: 9.6% | ||||||||||
| U.S. Government Agency Obligations: 2.2% | ||||||||||
| $ | 3,918,000 | Z | Freddie Mac, 3.600%, due 12/03/07 | $ | 3,916,825 | |||||
| Total U.S. Government Agency Obligations (Cost $3,916,825) | 3,916,825 | |||||||||
| Securities Lending CollateralCC: 7.4% | ||||||||||
| 13,281,107 | Bank of New York Mellon Corp. Institutional Cash Reserves | 13,281,107 | ||||||||
| Total Securities Lending Collateral (Cost $13,281,107) | 13,281,107 | |||||||||
| Total Short-Term Investments (Cost $17,197,932) | 17,197,932 | |||||||||
Total Investments in Securities (Cost $155,576,377)* | 108.1 | % | $ | 193,491,973 | ||||||||
Other Assets and Liabilities-Net | (8.1 | ) | (14,558,648 | ) | ||||||||
Net Assets | 100.0 | % | $ | 178,933,325 | ||||||||
| @ | Non-income producing security | |
| @@ | Foreign Issuer | |
| ADR | American Depositary Receipt | |
| cc | Securities purchased with cash collateral for securities loaned. | |
| L | Loaned security, a portion or all of the security is on loan at November 30, 2007. | |
| Z | Indicates Zero Coupon Bond; rate shown reflects current effective yield. | |
| * | Cost for federal income tax purposes is $156,852,533. | |
| Net unrealized appreciation consists of: |
| Gross Unrealized Appreciation | $ | 39,873,832 | ||
| Gross Unrealized Depreciation | (3,234,392 | ) | ||
| Net Unrealized Appreciation | $ | 36,639,440 | ||
86
Table of Contents
| Shares | Value | |||||||||
| COMMON STOCK: 96.7% | ||||||||||
| Aerospace/ Defense: 2.2% | ||||||||||
| 32,500 | L-3 Communications Holdings, Inc. | $ | 3,596,125 | |||||||
| 104,600 | @,L | Orbital Sciences Corp. | 2,516,675 | |||||||
| 6,112,800 | ||||||||||
| Agriculture: 1.8% | ||||||||||
| 56,700 | Loews Corp. | 5,043,465 | ||||||||
| 5,043,465 | ||||||||||
| Apparel: 2.0% | ||||||||||
| 148,473 | @,@@, L | Gildan Activewear, Inc. | 5,662,760 | |||||||
| 5,662,760 | ||||||||||
| Chemicals: 4.1% | ||||||||||
| 103,100 | Ecolab, Inc. | 4,938,490 | ||||||||
| 69,100 | @,L | Mosaic Co. | 4,778,265 | |||||||
| 38,600 | @ | Zoltek Cos., Inc. | 1,645,132 | |||||||
| 11,361,887 | ||||||||||
| Commercial Services: 7.8% | ||||||||||
| 62,200 | @ | Apollo Group, Inc. — Class A | 4,759,544 | |||||||
| 177,600 | @ | Corrections Corp. of America | 5,418,576 | |||||||
| 55,300 | @ | FTI Consulting, Inc. | 3,152,100 | |||||||
| 70,500 | McKesson Corp. | 4,704,465 | ||||||||
| 82,000 | Watson Wyatt Worldwide, Inc. | 3,776,100 | ||||||||
| 21,810,785 | ||||||||||
| Computers: 6.0% | ||||||||||
| 126,100 | @,@@, L | Logitech International | 4,291,183 | |||||||
| 52,300 | @,L | Micros Systems, Inc. | 3,772,922 | |||||||
| 48,700 | @ | Network Appliance, Inc. | 1,203,377 | |||||||
| 171,800 | Seagate Technology, Inc. | 4,430,722 | ||||||||
| 131,500 | @ | Synopsys, Inc. | 3,236,215 | |||||||
| 16,934,419 | ||||||||||
| Cosmetics/ Personal Care: 0.8% | ||||||||||
| 32,800 | @,L | Chattem, Inc. | 2,325,848 | |||||||
| 2,325,848 | ||||||||||
| Diversified Financial Services: 6.6% | ||||||||||
| 17,900 | @ | GFI Group, Inc. | 1,743,102 | |||||||
| 57,100 | L | Greenhill & Co., Inc. | 4,127,759 | |||||||
| 163,600 | @,@@, L | Invesco PLC ADR | 4,294,500 | |||||||
| 87,000 | @,L | Investment Technology Group, Inc. | 3,974,160 | |||||||
| 37,897 | @ | Nasdaq Stock Market, Inc. | 1,643,214 | |||||||
| 82,213 | Raymond James Financial, Inc. | 2,670,278 | ||||||||
| 18,453,013 | ||||||||||
| Electric: 2.6% | ||||||||||
| 172,500 | @ | NRG Energy, Inc. | 7,312,275 | |||||||
| 7,312,275 | ||||||||||
| Electrical Components & Equipment: 0.9% | ||||||||||
| 59,000 | W | Ametek, Inc. | 2,596,000 | |||||||
| 2,596,000 | ||||||||||
| Electronics: 3.7% | ||||||||||
| 56,885 | @ | Dolby Laboratories, Inc. | 2,857,902 | |||||||
| 41,300 | @@,L | Garmin Ltd. | 4,433,555 | |||||||
| 40,400 | @ | Waters Corp. | 3,152,816 | |||||||
| 10,444,273 | ||||||||||
| Engineering & Construction: 2.0% | ||||||||||
| 14,900 | @,@@ | Foster Wheeler Ltd. | 2,220,100 | |||||||
| 65,600 | @ | McDermott International, Inc. | 3,430,880 | |||||||
| 5,650,980 | ||||||||||
| Environmental Control: 2.3% | ||||||||||
| 106,900 | Republic Services, Inc. | 3,545,873 | ||||||||
| 87,300 | Waste Management, Inc. | 2,996,136 | ||||||||
| 6,542,009 | ||||||||||
| Food: 1.5% | ||||||||||
| 67,600 | WM Wrigley Jr. Co. | 4,326,400 | ||||||||
| 4,326,400 | ||||||||||
| Healthcare — Products: 9.2% | ||||||||||
| 114,435 | @,L | Hologic, Inc. | 7,597,340 | |||||||
| 6,628 | @ | Intuitive Surgical, Inc. | 2,171,863 | |||||||
| 71,700 | @,L | Kinetic Concepts, Inc. | 4,204,488 | |||||||
| 117,700 | @ | Respironics, Inc. | 5,797,902 | |||||||
| 149,500 | @ | St. Jude Medical, Inc. | 5,942,625 | |||||||
| 25,714,218 | ||||||||||
| Healthcare — Services: 1.6% | ||||||||||
| 71,000 | @ | DaVita, Inc. | 4,399,160 | |||||||
| 4,399,160 | ||||||||||
| Household Products/ Wares: 2.3% | ||||||||||
| 77,649 | @ | Fossil, Inc. | 3,365,308 | |||||||
| 90,100 | Tupperware Corp. | 3,142,688 | ||||||||
| 6,507,996 | ||||||||||
| Insurance: 2.4% | ||||||||||
| 31,900 | Assurant, Inc. | 2,087,217 | ||||||||
| 71,400 | Principal Financial Group, Inc. | 4,675,986 | ||||||||
| 6,763,203 | ||||||||||
| Internet: 1.4% | ||||||||||
| 103,100 | @ | McAfee, Inc. | 4,015,745 | |||||||
| 4,015,745 | ||||||||||
| Miscellaneous Manufacturing: 3.3% | ||||||||||
| 78,900 | ITT Corp. | 5,084,316 | ||||||||
| 63,344 | Roper Industries, Inc. | 4,019,177 | ||||||||
| 9,103,493 | ||||||||||
| Oil & Gas: 5.0% | ||||||||||
| 89,600 | Hess Corp. | 6,381,312 | ||||||||
| 28,600 | Murphy Oil Corp. | 2,045,472 | ||||||||
| 54,700 | @ | Southwestern Energy Co. | 2,722,419 | |||||||
| 47,700 | XTO Energy, Inc. | 2,948,814 | ||||||||
| 14,098,017 | ||||||||||
| Oil & Gas Services: 4.4% | ||||||||||
| 36,142 | @ | Cameron International Corp. | 3,369,519 | |||||||
| 27,929 | @,L | Exterran Holdings, Inc. | 2,235,437 | |||||||
| 62,200 | @ | National Oilwell Varco, Inc. | 4,238,930 | |||||||
| 39,200 | @ | Weatherford International Ltd. | 2,454,704 | |||||||
| 12,298,590 | ||||||||||
| Packaging & Containers: 2.3% | ||||||||||
| 142,400 | @ | Pactiv Corp. | 3,616,960 | |||||||
| 50,500 | Silgan Holdings, Inc. | 2,708,315 | ||||||||
| 6,325,275 | ||||||||||
| Pharmaceuticals: 1.8% | ||||||||||
| 26,400 | @ | Express Scripts, Inc. | 1,788,600 | |||||||
| 74,100 | @ | Hospira, Inc. | 3,208,530 | |||||||
| 4,997,130 | ||||||||||
87
Table of Contents
| Shares | Value | |||||||||
| Retail: 5.2% | ||||||||||
| 60,100 | @ | Copart, Inc. | $ | 2,245,336 | ||||||
| 68,475 | @ | GameStop Corp. | 3,933,889 | |||||||
| 55,000 | Phillips-Van Heusen | 2,333,100 | ||||||||
| 211,200 | TJX Cos., Inc. | 6,196,608 | ||||||||
| 14,708,933 | ||||||||||
| Semiconductors: 3.1% | ||||||||||
| 154,200 | @ | Broadcom Corp. | 4,123,308 | |||||||
| 71,700 | @ | Nvidia Corp. | 2,261,418 | |||||||
| 252,000 | @,L | ON Semiconductor Corp. | 2,315,880 | |||||||
| 8,700,606 | ||||||||||
| Software: 8.9% | ||||||||||
| 201,200 | @ | Activision, Inc. | 4,456,580 | |||||||
| 74,000 | @ | Ansys, Inc. | 2,875,640 | |||||||
| 36,300 | Dun & Bradstreet Corp. | 3,239,049 | ||||||||
| 118,000 | @ | Fiserv, Inc. | 6,056,940 | |||||||
| 156,400 | @ | Intuit, Inc. | 4,585,648 | |||||||
| 95,700 | @ | Mantech International Corp. | 3,702,633 | |||||||
| 24,916,490 | ||||||||||
| Telecommunications: 1.5% | ||||||||||
| 77,300 | NTELOS Holdings Corp. | 2,050,769 | ||||||||
| 60,200 | @ | SBA Communications Corp. | 2,253,888 | |||||||
| 4,304,657 | ||||||||||
| Total Common Stock (Cost $250,674,985) | 271,430,427 | |||||||||
| EXCHANGE-TRADED FUNDS: 0.8% | ||||||||||
| Exchange-Traded Funds: 0.8% | ||||||||||
| 18,876 | L | iShares Russell Midcap Growth Index Fund | 2,147,145 | |||||||
| Total Exchange-Traded Funds (Cost $1,738,291) | 2,147,145 | |||||||||
| Total Long-Term Investments (Cost $252,413,276) | 273,577,572 | |||||||||
| SHORT-TERM INVESTMENTS: 15.4% | ||||||||||
| Mutual Fund: 1.4% | ||||||||||
| 3,900,000 | ** | ING Institutional Prime Money Market Fund | 3,900,000 | |||||||
| Total Mutual Fund (Cost $3,900,000) | 3,900,000 | |||||||||
| Repurchase Agreement: 0.3% | ||||||||||
| $ | 939,000 | Morgan Stanley Repurchase Agreement dated 11/30/07, 4.500%, due 12/03/07, $939,352 to be received upon repurchase (Collateralized by $940,000 Federal Home Loan Mortgage Corp., 5.500%, Market Value plus accrued interest $960,686, due 01/18/08) | $ | 939,000 | ||||||
| Total Repurchase Agreement (Cost $939,000) | 939,000 | |||||||||
| Securities Lending CollateralCC: 13.7% | ||||||||||
| 38,324,510 | Bank of New York Mellon Corp. Institutional Cash Reserves | 38,324,510 | ||||||||
| Total Securities Lending Collateral (Cost $38,324,510) | 38,324,510 | |||||||||
| Total Short-Term Investments (Cost $43,163,510) | 43,163,510 | |||||||||
Total Investments in Securities (Cost $295,576,786)* | 112.9 | % | $ | 316,741,082 |
Other Assets and Liabilities-Net | (12.9 | ) | (36,223,475 | ) | ||||||||
Net Assets | 100.0 | % | $ | 280,517,607 | ||||||||
| @ | Non-income producing security | |
| @@ | Foreign Issuer | |
| ADR | American Depositary Receipt | |
| cc | Securities purchased with cash collateral for securities loaned. | |
| W | When-issued or delayed delivery security | |
| L | Loaned security, a portion or all of the security is on loan at November 30, 2007. | |
| ** | Investment in affiliate | |
| * | Cost for federal income tax purposes is $295,602,802. | |
| Net unrealized appreciation consists of: |
| Gross Unrealized Appreciation | $ | 27,457,037 | ||
| Gross Unrealized Depreciation | (6,318,757 | ) | ||
| Net Unrealized Appreciation | $ | 21,138,280 | ||
88
Table of Contents
| Shares | Value | |||||||||
| COMMON STOCK: 91.8% | ||||||||||
| Aerospace/ Defense: 6.6% | ||||||||||
| 600 | Goodrich Corp. | $ | 42,774 | |||||||
| 1,300 | L-3 Communications Holdings, Inc. | 143,845 | ||||||||
| 3,100 | Lockheed Martin Corp. | 343,077 | ||||||||
| 1,700 | Northrop Grumman Corp. | 133,943 | ||||||||
| 663,639 | ||||||||||
| Apparel: 2.5% | ||||||||||
| 3,800 | Nike, Inc. | 249,470 | ||||||||
| 249,470 | ||||||||||
| Auto Parts & Equipment: 1.3% | ||||||||||
| 1,550 | @@ | Magna International, Inc. | 130,619 | |||||||
| 130,619 | ||||||||||
| Banks: 0.5% | ||||||||||
| 320 | @@ | Uniao de Bancos Brasileiros SA GDR | 47,910 | |||||||
| 47,910 | ||||||||||
| Beverages: 4.3% | ||||||||||
| 3,600 | Anheuser-Busch Cos., Inc. | 189,792 | ||||||||
| 2,290 | Pepsi Bottling Group, Inc. | 97,714 | ||||||||
| 2,900 | PepsiAmericas, Inc. | 98,165 | ||||||||
| 700 | PepsiCo, Inc. | 54,026 | ||||||||
| 439,697 | ||||||||||
| Biotechnology: 2.5% | ||||||||||
| 2,600 | @ | Invitrogen Corp. | 252,226 | |||||||
| 252,226 | ||||||||||
| Chemicals: 8.1% | ||||||||||
| 1,300 | CF Industries Holdings, Inc. | 118,274 | ||||||||
| 3,800 | @ | Mosaic Co. | 262,770 | |||||||
| 2,000 | @@ | Potash Corp. of Saskatchewan | 239,780 | |||||||
| 3,700 | Sigma-Aldrich Corp. | 194,805 | ||||||||
| 815,629 | ||||||||||
| Commercial Services: 1.8% | ||||||||||
| 1,640 | @ | ITT Educational Services, Inc. | 185,550 | |||||||
| 185,550 | ||||||||||
| Computers: 7.0% | ||||||||||
| 1,730 | @ | Apple, Inc. | 315,241 | |||||||
| 10,690 | @ | Dell, Inc. | 262,333 | |||||||
| 5,000 | Seagate Technology, Inc. | 128,950 | ||||||||
| 706,524 | ||||||||||
| Cosmetics/ Personal Care: 0.9% | ||||||||||
| 1,200 | Colgate-Palmolive Co. | 96,096 | ||||||||
| 96,096 | ||||||||||
| Diversified Financial Services: 1.5% | ||||||||||
| 1,200 | First Marblehead Corp. | 36,012 | ||||||||
| 500 | Goldman Sachs Group, Inc. | 113,320 | ||||||||
| 149,332 | ||||||||||
| Electric: 0.6% | ||||||||||
| 600 | Constellation Energy Group, Inc. | 60,126 | ||||||||
| 60,126 | ||||||||||
| Electronics: 1.0% | ||||||||||
| 2,700 | @@ | Tyco Electronics Ltd. | 100,953 | |||||||
| 100,953 | ||||||||||
| Food: 0.6% | ||||||||||
| 1,070 | General Mills, Inc. | 64,361 | ||||||||
| 64,361 | ||||||||||
| Gas: 0.5% | ||||||||||
| 800 | Energen Corp. | 50,992 | ||||||||
| 50,992 | ||||||||||
| Healthcare — Services: 8.3% | ||||||||||
| 5,730 | Aetna, Inc. | 320,192 | ||||||||
| 2,300 | @ | Coventry Health Care, Inc. | 133,124 | |||||||
| 4,950 | @ | Humana, Inc. | 381,299 | |||||||
| 834,615 | ||||||||||
| Household Products/ Wares: 0.9% | ||||||||||
| 1,300 | Kimberly-Clark Corp. | 90,753 | ||||||||
| 90,753 | ||||||||||
| Insurance: 1.4% | ||||||||||
| 1,330 | @@ | Axis Capital Holdings Ltd. | 50,726 | |||||||
| 400 | @@ | Everest Re Group Ltd. | 41,972 | |||||||
| 140 | Metlife, Inc. | 9,183 | ||||||||
| 400 | @@ | RenaissanceRe Holdings Ltd. | 23,644 | |||||||
| 400 | Travelers Cos., Inc. | 21,244 | ||||||||
| 146,769 | ||||||||||
| Internet: 4.2% | ||||||||||
| 3,560 | @ | Amazon.com, Inc. | 322,394 | |||||||
| 3,250 | @ | Expedia, Inc. | 105,950 | |||||||
| 428,344 | ||||||||||
| Machinery — Diversified: 1.1% | ||||||||||
| 1,600 | @ | AGCO Corp. | 110,304 | |||||||
| 110,304 | ||||||||||
| Media: 0.7% | ||||||||||
| 2,100 | Walt Disney Co. | 69,615 | ||||||||
| 69,615 | ||||||||||
| Miscellaneous Manufacturing: 2.4% | ||||||||||
| 990 | Eaton Corp. | 88,417 | ||||||||
| 1,900 | Parker Hannifin Corp. | 150,917 | ||||||||
| 239,334 | ||||||||||
| Oil & Gas: 7.0% | ||||||||||
| 2,150 | Chevron Corp. | 188,706 | ||||||||
| 400 | @@ | Encana Corp. | 26,100 | |||||||
| 2,700 | ExxonMobil Corp. | 240,732 | ||||||||
| 4,100 | @@ | Petro-Canada | 198,317 | |||||||
| 419 | @ | Transocean, Inc. | 57,525 | |||||||
| 711,380 | ||||||||||
| Pharmaceuticals: 3.8% | ||||||||||
| 4,300 | @ | Express Scripts, Inc. | 291,325 | |||||||
| 2,300 | @@ | Herbalife Ltd. | 96,301 | |||||||
| 387,626 | ||||||||||
| Savings & Loans: 0.5% | ||||||||||
| 3,300 | Hudson City Bancorp., Inc. | 50,226 | ||||||||
| 50,226 | ||||||||||
| Semiconductors: 5.1% | ||||||||||
| 10,600 | Intel Corp. | 276,448 | ||||||||
| 7,600 | @ | Nvidia Corp. | 239,704 | |||||||
| 516,152 | ||||||||||
| Software: 7.4% | ||||||||||
| 6,200 | @ | BMC Software, Inc. | 205,096 | |||||||
| 7,200 | CA, Inc. | 176,328 | ||||||||
| 10,900 | Microsoft Corp. | 366,237 | ||||||||
| 747,661 | ||||||||||
89
Table of Contents
| Shares | Value | |||||||||
| Telecommunications: 7.2% | ||||||||||
| 1,100 | @@ | China Mobile Ltd. ADR | $ | 100,826 | ||||||
| 4,400 | Harris Corp. | 276,188 | ||||||||
| 6,000 | @@ | Nokia OYJ ADR | 235,980 | |||||||
| 800 | Telephone & Data Systems, Inc. | 49,800 | ||||||||
| 2,320 | @@ | Turkcell Iletisim Hizmet AS ADR | 63,429 | |||||||
| 726,223 | ||||||||||
| Transportation: 2.1% | ||||||||||
| 1,100 | @@ | Canadian Pacific Railway Ltd. | 73,612 | |||||||
| 1,100 | Union Pacific Corp. | 138,754 | ||||||||
| 212,366 | ||||||||||
| Total Common Stock (Cost $8,705,967) | 9,284,492 | |||||||||
| EXCHANGE-TRADED FUNDS: 2.4% | ||||||||||
| Exchange-Traded Funds: 2.4% | ||||||||||
| 3,900 | iShares Russell 1000 Growth | 239,187 | ||||||||
| Total Exchange-Traded Funds (Cost $237,181) | 239,187 | |||||||||
| Total Long-Term Investments (Cost $8,943,148) | 9,523,679 | |||||||||
| SHORT-TERM INVESTMENTS: 1.2% | ||||||||||
| Mutual Fund: 0.2% | ||||||||||
| 15,000 | ** | ING Institutional Prime Money Market Fund | 15,000 | |||||||
| Total Mutual Fund (Cost $15,000) | 15,000 | |||||||||
| Repurchase Agreement: 1.0% | ||||||||||
| $ | 106,000 | Morgan Stanley Repurchase Agreement dated 11/30/07, 4.500%, due 12/03/07, $106,040 to be received upon repurchase (Collateralized by $195,000 Resolution Funding Corp., Discount Note, Market Value $110,220, due 07/15/20) | $ | 106,000 | ||||||
| Total Repurchase Agreement (Cost $106,000) | 106,000 | |||||||||
| Total Short-Term Investments (Cost $121,000) | 121,000 | |||||||||
Total Investments in Securities (Cost $9,064,148) | 95.4 | % | $ | 9,644,679 | ||||||||
Other Assets and Liabilities-Net | 4.6 | 468,064 | ||||||||||
Net Assets | 100.0 | % | $ | 10,112,743 | ||||||||
| @ | Non-income producing security | |
| @@ | Foreign Issuer | |
| ADR | American Depositary Receipt | |
| GDR | Global Depositary Receipt | |
| ** | Investment in affiliate | |
| * | Cost for federal income tax purposes is $9,083,084. | |
| Net unrealized appreciation consists of: |
| Gross Unrealized Appreciation | $ | 747,161 | ||
| Gross Unrealized Depreciation | (185,566 | ) | ||
| Net Unrealized Appreciation | $ | 561,595 | ||
90
Table of Contents
| Shares | Value | |||||||||
| COMMON STOCK: 94.7% | ||||||||||
| Aerospace/ Defense: 2.7% | ||||||||||
| 23,600 | DRS Technologies, Inc. | $ | 1,397,356 | |||||||
| 33,900 | @ | Moog, Inc. | 1,528,212 | |||||||
| 13,900 | @ | Teledyne Technologies, Inc. | 753,658 | |||||||
| 3,679,226 | ||||||||||
| Apparel: 1.3% | ||||||||||
| 2,200 | @,L | Deckers Outdoor Corp. | 317,174 | |||||||
| 30,800 | @,@@, L | Gildan Activewear, Inc. | 1,174,712 | |||||||
| 14,300 | @,L | Steven Madden Ltd. | 325,039 | |||||||
| 1,816,925 | ||||||||||
| Banks: 1.4% | ||||||||||
| 76,600 | Bank Mutual Corp. | 775,192 | ||||||||
| 30,268 | @ | Signature Bank | 1,121,429 | |||||||
| 1,896,621 | ||||||||||
| Biotechnology: 2.4% | ||||||||||
| 13,900 | @,L | Alexion Pharmaceuticals, Inc. | 1,010,808 | |||||||
| 121,800 | @,L | Human Genome Sciences, Inc. | 1,267,938 | |||||||
| 24,700 | @,L | Integra LifeSciences Holdings Corp. | 1,023,815 | |||||||
| 3,302,561 | ||||||||||
| Chemicals: 2.6% | ||||||||||
| 31,000 | L | Albemarle Corp. | 1,368,340 | |||||||
| 17,600 | Minerals Technologies, Inc. | 1,177,440 | ||||||||
| 34,400 | UAP Holding Corp. | 1,028,904 | ||||||||
| 3,574,684 | ||||||||||
| Commercial Services: 7.1% | ||||||||||
| 12,700 | @ | Advisory Board Co. | 825,627 | |||||||
| 26,500 | Arbitron, Inc. | 1,056,025 | ||||||||
| 43,400 | @ | Corrections Corp. of America | 1,324,134 | |||||||
| 77,657 | Diamond Management & Technology Consultants, Inc. | 576,992 | ||||||||
| 34,200 | @ | FTI Consulting, Inc. | 1,949,400 | |||||||
| 41,600 | @,L | Geo Group, Inc. | 1,059,136 | |||||||
| 18,600 | @,L | Kenexa Corp. | 360,282 | |||||||
| 4,700 | @,L | Resources Connection, Inc. | 96,914 | |||||||
| 23,400 | Sotheby’s | 876,330 | ||||||||
| 33,400 | @,L | Vistaprint Ltd. | 1,482,960 | |||||||
| 9,607,800 | ||||||||||
| Computers: 5.5% | ||||||||||
| 35,900 | @ | Ansoft Corp. | 1,041,459 | |||||||
| 21,700 | @,L | CACI International, Inc. | 984,963 | |||||||
| 23,800 | @ | Electronics for Imaging | 545,972 | |||||||
| 27,700 | @,@@, L | Logitech International | 942,631 | |||||||
| 67,100 | @,L | Mentor Graphics Corp. | 730,719 | |||||||
| 12,265 | @ | Micros Systems, Inc. | 884,797 | |||||||
| 66,700 | @,@@, L | Ness Technologies, Inc. | 627,647 | |||||||
| 24,500 | @ | Riverbed Technolgoy, Inc. | 692,860 | |||||||
| 31,500 | @ | Super Micro Computer, Inc. | 260,190 | |||||||
| 54,483 | @,@@ | Xyratex Ltd. | 803,079 | |||||||
| 7,514,317 | ||||||||||
| Cosmetics/ Personal Care: 0.4% | ||||||||||
| 37,600 | @ | Physicians Formula Holdings, Inc. | 487,672 | |||||||
| 487,672 | ||||||||||
| Distribution/ Wholesale: 1.0% | ||||||||||
| 38,000 | @,L | Brightpoint, Inc. | 631,180 | |||||||
| 19,200 | @ | LKQ Corp. | 762,432 | |||||||
| 1,393,612 | ||||||||||
| Diversified Financial Services: 3.9% | ||||||||||
| 20,383 | @,L | Cowen Group, Inc. | 218,710 | |||||||
| 8,900 | @,L | GFI Group, Inc. | 866,682 | |||||||
| 14,300 | Greenhill & Co., Inc. | 1,033,747 | ||||||||
| 29,500 | @ | Investment Technology Group, Inc. | 1,347,560 | |||||||
| 17,311 | @,L | Piper Jaffray Cos. | 801,846 | |||||||
| 28,607 | Waddell & Reed Financial, Inc. | 977,787 | ||||||||
| 5,246,332 | ||||||||||
| Electrical Components & Equipment: 0.4% | ||||||||||
| 22,700 | @,L | Greatbatch, Inc. | 467,166 | |||||||
| 467,166 | ||||||||||
| Electronics: 3.0% | ||||||||||
| 11,300 | @,L | Benchmark Electronics, Inc. | 202,835 | |||||||
| 22,600 | @,L | Cymer, Inc. | 928,182 | |||||||
| 35,100 | Keithley Instruments, Inc. | 333,450 | ||||||||
| 24,400 | @ | Thomas & Betts Corp. | 1,326,384 | |||||||
| 5,578 | @ | Trimble Navigation Ltd. | 206,776 | |||||||
| 15,800 | @ | Varian, Inc. | 1,106,790 | |||||||
| 4,104,417 | ||||||||||
| Energy — Alternate Sources: 0.4% | ||||||||||
| 16,500 | @,L | Comverge, Inc. | 519,420 | |||||||
| 519,420 | ||||||||||
| Engineering & Construction: 0.4% | ||||||||||
| 22,300 | @ | EMCOR Group, Inc. | 594,072 | |||||||
| 594,072 | ||||||||||
| Entertainment: 1.0% | ||||||||||
| 55,000 | @,L | Macrovision Corp. | 1,370,600 | |||||||
| 1,370,600 | ||||||||||
| Environmental Control: 1.4% | ||||||||||
| 21,700 | @ | Energy Solutions, Inc. | 516,894 | |||||||
| 43,800 | @ | Waste Connections, Inc. | 1,394,154 | |||||||
| 1,911,048 | ||||||||||
| Gas: 1.2% | ||||||||||
| 39,700 | L | Piedmont Natural Gas Co. | 1,033,788 | |||||||
| 20,700 | Southwest Gas Corp. | 598,644 | ||||||||
| 1,632,432 | ||||||||||
| Hand/ Machine Tools: 0.3% | ||||||||||
| 9,200 | L | Franklin Electric Co., Inc. | 358,432 | |||||||
| 358,432 | ||||||||||
| Healthcare — Products: 6.3% | ||||||||||
| 51,500 | @,L | Accuray, Inc. | 855,415 | |||||||
| 18,800 | L | Cooper Cos., Inc. | 808,964 | |||||||
| 25,700 | @ | Hologic, Inc. | 1,706,223 | |||||||
| 50,900 | @,L | Luminex Corp. | 814,909 | |||||||
| 27,500 | Meridian Bioscience, Inc. | 848,375 | ||||||||
| 53,500 | @,L | Micrus Endovascular Corp. | 979,585 | |||||||
| 65,200 | @,L | Natus Medical, Inc. | 1,099,924 | |||||||
| 71,500 | @,L | Spectranetics Corp. | 1,084,655 | |||||||
| 21,100 | @,L | Volcano Corp. | 308,271 | |||||||
| 8,506,321 | ||||||||||
| Healthcare — Services: 4.7% | ||||||||||
| 17,200 | @,L | Amedisys, Inc. | 733,752 | |||||||
| 17,600 | @,L | Healthways, Inc. | 1,027,312 | |||||||
| 27,600 | @ | Magellan Health Services, Inc. | 1,254,420 | |||||||
| 6,804 | @ | Pediatrix Medical Group, Inc. | 439,947 | |||||||
| 43,600 | @ | Psychiatric Solutions, Inc. | 1,592,708 | |||||||
| 26,400 | Universal Health Services, Inc. | 1,345,080 | ||||||||
| 6,393,219 | ||||||||||
91
Table of Contents
| Shares | Value | |||||||||
| Housewares: 1.1% | ||||||||||
| 26,000 | Toro Co. | $ | 1,446,900 | |||||||
| 1,446,900 | ||||||||||
| Insurance: 1.0% | ||||||||||
| 26,200 | @@ | Aspen Insurance Holdings Ltd. | 754,560 | |||||||
| 15,200 | @@ | Platinum Underwriters Holdings Ltd. | 552,064 | |||||||
| 1,306,624 | ||||||||||
| Internet: 2.1% | ||||||||||
| 8,100 | @,L | Priceline.com, Inc. | 921,780 | |||||||
| 87,100 | @,L | Trizetto Group | 1,343,953 | |||||||
| 23,200 | @ | Valueclick, Inc. | 548,448 | |||||||
| 2,814,181 | ||||||||||
| Leisure Time: 1.0% | ||||||||||
| 25,272 | @,L | Life Time Fitness, Inc. | 1,372,775 | |||||||
| 1,372,775 | ||||||||||
| Lodging: 0.4% | ||||||||||
| 54,000 | @ | Red Lion Hotels Corp. | 518,400 | |||||||
| 518,400 | ||||||||||
| Machinery — Diversified: 3.1% | ||||||||||
| 31,773 | @,L | Intermec, Inc. | 682,166 | |||||||
| 12,300 | @,L | Middleby Corp. | 933,447 | |||||||
| 26,500 | L | Nordson Corp. | 1,399,200 | |||||||
| 34,200 | Wabtec Corp. | 1,160,748 | ||||||||
| 4,175,561 | ||||||||||
| Mining: 0.9% | ||||||||||
| 106,800 | @,L | Coeur d’Alene Mines Corp. | 445,356 | |||||||
| 10,900 | @,L | RTI International Metals, Inc. | 800,496 | |||||||
| 1,245,852 | ||||||||||
| Miscellaneous Manufacturing: 1.3% | ||||||||||
| 23,300 | Barnes Group, Inc. | 721,368 | ||||||||
| 34,100 | @,L | EnPro Industries, Inc. | 1,043,460 | |||||||
| 1,764,828 | ||||||||||
| Oil & Gas: 4.5% | ||||||||||
| 29,700 | @,L | Carrizo Oil & Gas, Inc. | 1,438,965 | |||||||
| 75,200 | @,L | EXCO Resources, Inc. | 1,051,296 | |||||||
| 108,200 | @,L | McMoRan Exploration Co. | 1,272,432 | |||||||
| 63,400 | @,L | Parallel Petroleum Corp. | 1,214,110 | |||||||
| 86,700 | @ | Petroquest Energy, Inc. | 1,152,243 | |||||||
| 6,129,046 | ||||||||||
| Oil & Gas Services: 0.7% | ||||||||||
| 14,200 | @,L | Allis-Chalmers Energy, Inc. | 215,130 | |||||||
| 13,100 | @ | Dril-Quip, Inc. | 739,102 | |||||||
| 954,232 | ||||||||||
| Packaging & Containers: 1.1% | ||||||||||
| 25,200 | Greif, Inc. | 1,488,564 | ||||||||
| 1,488,564 | ||||||||||
| Pharmaceuticals: 4.9% | ||||||||||
| 129,200 | @,L | Akorn, Inc. | 987,088 | |||||||
| 51,600 | @,L | BioMarin Pharmaceuticals, Inc. | 1,419,000 | |||||||
| 31,600 | @,@@, L | Cardiome Pharma Corp. | 315,052 | |||||||
| 24,600 | @,L | Cubist Pharmaceuticals, Inc. | 522,504 | |||||||
| 41,409 | @,L | MannKind Corp. | 389,245 | |||||||
| 92,187 | @,L | Salix Pharmaceuticals Ltd. | 1,047,244 | |||||||
| 52,700 | @,L | Sciele Pharma, Inc. | 1,176,264 | |||||||
| 19,100 | @,L | USANA Health Sciences, Inc. | 796,088 | |||||||
| 6,652,485 | ||||||||||
| Retail: 5.5% | ||||||||||
| 17,500 | L | Cash America International, Inc. | 629,650 | |||||||
| 5,800 | @ | Chipotle Mexican Grill, Inc. | 670,016 | |||||||
| 38,800 | @,L | JOS A Bank Clothiers, Inc. | 1,004,532 | |||||||
| 24,200 | Longs Drug Stores Corp. | 1,280,664 | ||||||||
| 41,300 | @ | Morton’s Restaurant Group, Inc. | 474,124 | |||||||
| 37,100 | @,L | Pantry, Inc. | 1,068,109 | |||||||
| 24,500 | Phillips-Van Heusen | 1,039,290 | ||||||||
| 53,700 | @,L | Sonic Corp. | 1,310,280 | |||||||
| 7,476,665 | ||||||||||
| Savings & Loans: 0.6% | ||||||||||
| 59,900 | L | NewAlliance Bancshares, Inc. | 772,710 | |||||||
| 772,710 | ||||||||||
| Semiconductors: 8.0% | ||||||||||
| 141,300 | @,L | Entegris, Inc. | 1,223,658 | |||||||
| 24,800 | @ | Fairchild Semiconductor International, Inc. | 393,328 | |||||||
| 38,600 | @ | Formfactor, Inc. | 1,464,484 | |||||||
| 79,400 | @ | Integrated Device Technology, Inc. | 963,122 | |||||||
| 65,200 | L | Micrel, Inc. | 581,584 | |||||||
| 31,100 | @,L | MKS Instruments, Inc. | 565,087 | |||||||
| 106,200 | @,L | ON Semiconductor Corp. | 975,978 | |||||||
| 70,100 | @ | QLogic Corp. | 947,752 | |||||||
| 97,100 | @,L | Semtech Corp. | 1,481,746 | |||||||
| 69,700 | @,L | Teradyne, Inc. | 759,033 | |||||||
| 59,900 | @,@@ | Verigy Ltd. | 1,517,268 | |||||||
| 10,873,040 | ||||||||||
| �� | Software: 4.6% | |||||||||
| 33,900 | @ | Ansys, Inc. | 1,317,354 | |||||||
| 30,200 | Blackbaud, Inc. | 859,492 | ||||||||
| 34,500 | @ | EPIQ Systems, Inc. | 600,990 | |||||||
| 26,312 | @ | MSCI, Inc. — Class A | 727,527 | |||||||
| 17,000 | @ | SPSS, Inc. | 614,380 | |||||||
| 58,600 | @ | THQ, Inc. | 1,432,770 | |||||||
| 20,800 | @,L | Ultimate Software Group, Inc. | 679,536 | |||||||
| 6,232,049 | ||||||||||
| Telecommunications: 4.3% | ||||||||||
| 73,000 | L | Alaska Communications Systems Group, Inc. | 1,095,000 | |||||||
| 13,200 | @,L | Anixter International, Inc. | 851,400 | |||||||
| 46,000 | @,L | Aruba Networks, Inc. | 641,240 | |||||||
| 13,900 | @,L | CommScope, Inc. | 562,950 | |||||||
| 95,100 | @ | Ixia | 982,383 | |||||||
| 34,294 | @,L | RCN Corp. | 497,949 | |||||||
| 33,600 | @ | SBA Communications Corp. | 1,257,984 | |||||||
| 5,888,906 | ||||||||||
| Transportation: 2.2% | ||||||||||
| 18,300 | @,L | American Commercial Lines, Inc. | 318,237 | |||||||
| 33,100 | @,L | Genesee & Wyoming, Inc. | 867,220 | |||||||
| 25,000 | @ | HUB Group, Inc. | 652,000 | |||||||
| 26,100 | Knight Transportation, Inc. | 396,720 | ||||||||
| 22,100 | @,L | PHI, Inc. | 704,769 | |||||||
| 2,938,946 | ||||||||||
| Total Common Stock (Cost $120,491,026) | 128,428,641 | |||||||||
| REAL ESTATE INVESTMENT TRUSTS: 2.4% | ||||||||||
| Diversified: 1.1% | ||||||||||
| 38,101 | Digital Realty Trust, Inc. | 1,453,934 | ||||||||
| 1,453,934 | ||||||||||
92
Table of Contents
| Shares | Value | |||||||||
| Health Care: 0.9% | ||||||||||
| 38,200 | L | Nationwide Health Properties, Inc. | $ | 1,194,896 | ||||||
| 1,194,896 | ||||||||||
| Mortgage: 0.4% | ||||||||||
| 35,000 | Annaly Capital Management, Inc. | 602,350 | ||||||||
| 602,350 | ||||||||||
| Total Real Estate Investment Trusts (Cost $3,055,505) | 3,251,180 | |||||||||
| EXCHANGE-TRADED FUNDS: 0.3% | ||||||||||
| Exchange-Traded Funds: 0.3% | ||||||||||
| 4,901 | L | iShares Russell 2000 Growth Index Fund | 409,184 | |||||||
| Total Exchange-Traded Funds (Cost $397,286) | 409,184 | |||||||||
| Total Long-Term Investments (Cost $123,943,817) | 132,089,005 | |||||||||
| SHORT-TERM INVESTMENTS: 28.9% | ||||||||||
| Mutual Fund: 1.7% | ||||||||||
| 2,275,000 | ** | ING Institutional Prime Money Market Fund | 2,275,000 | |||||||
| Total Mutual Fund (Cost $2,275,000) | 2,275,000 | |||||||||
| Repurchase Agreement: 0.2% | ||||||||||
| $ | 303,000 | Goldman Sachs Repurchase Agreement dated 11/30/07, 4.510%, due 12/03/07, $303,114 to be received upon repurchase (Collateralized by $219,000 U.S. Treasury Bond, 7.625%, Market Value plus accrued interest $309,386, due 02/15/25) | $ | 303,000 | ||||||
| Total Repurchase Agreement (Cost $303,000) | 303,000 | |||||||||
| Securities Lending CollateralCC: 27.0% | ||||||||||
| 36,570,571 | Bank of New York Mellon Corp. Institutional Cash Reserves | 36,570,571 | ||||||||
| Total Securities Lending Collateral (Cost $36,570,571) | 36,570,571 | |||||||||
| Total Short-Term Investments (Cost $39,148,571) | 39,148,571 | |||||||||
Total Investments in Securities (Cost $163,092,388)* | 126.3 | % | $ | 171,237,576 | ||||||||
Other Assets and Liabilities-Net | (26.3 | ) | (35,631,814 | ) | ||||||||
Net Assets | 100.0 | % | $ | 135,605,762 | ||||||||
| @ | Non-income producing security | |
| @@ | Foreign Issuer | |
| cc | Securities purchased with cash collateral for securities loaned. | |
| L | Loaned security, a portion or all of the security is on loan at November 30, 2007. | |
| ** | Investment in affiliate | |
| * | Cost for federal income tax purposes is $163,332,784. | |
| Net unrealized appreciation consists of: |
| Gross Unrealized Appreciation | $ | 15,274,817 | ||
| Gross Unrealized Depreciation | (7,370,025 | ) | ||
| Net Unrealized Appreciation | $ | 7,904,792 | ||
93
Table of Contents
| Shares | Value | |||||||||
| COMMON STOCK: 94.2% | ||||||||||
| Banks: 32.1% | ||||||||||
| 94,700 | Associated Banc-Corp. | $ | 2,576,787 | |||||||
| 266,107 | Bank of America Corp. | 12,275,516 | ||||||||
| 101,735 | Bank of New York Mellon Corp. | 4,879,211 | ||||||||
| 84,500 | Cullen/ Frost Bankers, Inc. | 4,445,545 | ||||||||
| 223,900 | People’s United Financial, Inc. | 3,799,583 | ||||||||
| 97,700 | PNC Financial Services Group, Inc. | 7,152,617 | ||||||||
| 149,800 | Prosperity Bancshares, Inc. | 4,814,572 | ||||||||
| 87,500 | State Street Corp. | 6,990,375 | ||||||||
| 333,719 | US Bancorp. | 11,042,762 | ||||||||
| 188,387 | Wachovia Corp. | 8,100,641 | ||||||||
| 399,490 | Wells Fargo & Co. | 12,955,459 | ||||||||
| 79,033,068 | ||||||||||
| Diversified Financial Services: 28.4% | ||||||||||
| 46,091 | @ | Affiliated Managers Group, Inc. | 5,726,807 | |||||||
| 96,808 | American Express Co. | 5,709,736 | ||||||||
| 246,500 | @@ | Amvescap PLC | 3,185,480 | |||||||
| 274,900 | Citigroup, Inc. | 9,154,170 | ||||||||
| 23,800 | @@ | Deutsche Boerse AG | 4,432,677 | |||||||
| 98 | @ | E*Trade Financial Corp. | 451 | |||||||
| 100,326 | Fannie Mae | 3,854,525 | ||||||||
| 64,517 | Freddie Mac | 2,262,611 | ||||||||
| 21,773 | Goldman Sachs Group, Inc. | 4,934,633 | ||||||||
| 314,198 | JPMorgan Chase & Co. | 14,333,713 | ||||||||
| 66,000 | @@ | Lazard Ltd. | 3,211,560 | |||||||
| 58,932 | Lehman Brothers Holdings, Inc. | 3,690,911 | ||||||||
| 72,454 | Merrill Lynch & Co., Inc. | 4,342,893 | ||||||||
| 38,265 | Morgan Stanley | 2,017,331 | ||||||||
| 171,400 | @ | TD Ameritrade Holding Corp. | 3,203,466 | |||||||
| 70,060,964 | ||||||||||
| Insurance: 32.3% | ||||||||||
| 108,045 | @@ | ACE Ltd. | 6,464,332 | |||||||
| 82,300 | Aflac, Inc. | 5,155,272 | ||||||||
| 207,571 | American International Group, Inc. | 12,066,102 | ||||||||
| 51,900 | Assurant, Inc. | 3,395,817 | ||||||||
| 51,336 | Hartford Financial Services Group, Inc. | 4,893,348 | ||||||||
| 87,615 | Lincoln National Corp. | 5,394,456 | ||||||||
| 86,500 | MBIA, Inc. | 3,158,115 | ||||||||
| 87,800 | Metlife, Inc. | 5,758,802 | ||||||||
| 103,500 | Principal Financial Group, Inc. | 6,778,215 | ||||||||
| 165,300 | Protective Life Corp. | 6,840,114 | ||||||||
| 37,488 | Prudential Financial, Inc. | 3,529,120 | ||||||||
| 76,000 | Stancorp Financial Group, Inc. | 3,958,840 | ||||||||
| 77,805 | Travelers Cos., Inc. | 4,132,224 | ||||||||
| 80,400 | @@ | Willis Group Holdings Ltd. | 3,211,176 | |||||||
| 161,000 | WR Berkley Corp. | 4,923,380 | ||||||||
| 79,659,313 | ||||||||||
| Software: 1.4% | ||||||||||
| 65,600 | @ | Fiserv, Inc. | 3,367,248 | |||||||
| 3,367,248 | ||||||||||
| Total Common Stock (Cost $203,735,720) | 232,120,593 | |||||||||
| REAL ESTATE INVESTMENT TRUSTS: 3.6% | ||||||||||
| Apartments: 0.8% | ||||||||||
| 43,000 | Home Properties, Inc. | 1,943,170 | ||||||||
| 1,943,170 | ||||||||||
| Diversified: 1.4% | ||||||||||
| 38,500 | Digital Realty Trust, Inc. | 1,469,160 | ||||||||
| 62,100 | Liberty Property Trust | 1,944,351 | ||||||||
| 3,413,511 | ||||||||||
| Office Property: 0.6% | ||||||||||
| 68,600 | Douglas Emmett, Inc. | 1,647,086 | ||||||||
| 1,647,086 | ||||||||||
| Regional Malls: 0.8% | ||||||||||
| 24,500 | Macerich Co. | 1,902,425 | ||||||||
| 1,902,425 | ||||||||||
| Total Real Estate Investment Trusts (Cost $10,609,833) | 8,906,192 | |||||||||
| Total Long-Term Investments (Cost $214,345,553) | 241,026,785 | |||||||||
| SHORT-TERM INVESTMENTS: 0.5% | ||||||||||
| Mutual Fund: 0.3% | ||||||||||
| 750,000 | ** | ING Institutional Prime Money Market Fund | 750,000 | |||||||
| Total Mutual Fund (Cost $750,000) | 750,000 | |||||||||
| Principal | ||||||||||
| Amount | Value | |||||||||
| Repurchase Agreement: 0.2% | ||||||||||
| $ | 655,000 | Goldman Sachs Repurchase Agreement dated 11/30/07, 4.510%, due 12/03/07, $655,246 to be received upon repurchase (Collateralized by $473,000 U.S. Treasury Bond, 7.625%, Market Value plus accrued interest $668,217, due 02/15/25) | $ | 655,000 | ||||||
| Total Repurchase Agreement (Cost $655,000) | 655,000 | |||||||||
| Total Short-Term Investments (Cost $1,405,000) | 1,405,000 | |||||||||
Total Investments in Securities (Cost $215,750,553)* | 98.3 | % | $ | 242,431,785 | ||||||||
Other Assets and Liabilities-Net | 1.7 | 4,084,068 | ||||||||||
Net Assets | 100.0 | % | $ | 246,515,853 | ||||||||
| @ | Non-income producing security | |
| @@ | Foreign Issuer | |
| ** | Investment in affiliate | |
| * | Cost for federal income tax purposes is $215,916,693. | |
| Net unrealized appreciation consists of: |
| Gross Unrealized Appreciation | $ | 45,107,685 | ||
| Gross Unrealized Depreciation | (18,592,593 | ) | ||
| Net Unrealized Appreciation | $ | 26,515,092 | ||
94
Table of Contents
| Shares | Value | |||||||||
| COMMON STOCK: 98.9% | ||||||||||
| Auto Manufacturers: 6.7% | ||||||||||
| 361,124 | @,L | Ford Motor Co. | $ | 2,712,040 | ||||||
| 74,500 | L | General Motors Corp. | 2,222,335 | |||||||
| 4,934,375 | ||||||||||
| Auto Parts & Equipment: 0.1% | ||||||||||
| 330,390 | @ | Delphi Corp. | 75,990 | |||||||
| 75,990 | ||||||||||
| Banks: 5.0% | ||||||||||
| 66,540 | Fifth Third Bancorp. | 1,990,211 | ||||||||
| 28,156 | National City Corp. | 556,363 | ||||||||
| 114,460 | @@,L | Popular, Inc. | 1,099,961 | |||||||
| 3,646,535 | ||||||||||
| Biotechnology: 3.9% | ||||||||||
| 51,510 | @ | Amgen, Inc. | 2,845,928 | |||||||
| 2,845,928 | ||||||||||
| Chemicals: 2.6% | ||||||||||
| 45,456 | Dow Chemical Co. | 1,906,425 | ||||||||
| 1,906,425 | ||||||||||
| Commercial Services: 3.7% | ||||||||||
| 136,640 | H&R Block, Inc. | 2,689,075 | ||||||||
| 2,689,075 | ||||||||||
| Computers: 4.9% | ||||||||||
| 42,160 | @ | Dell, Inc. | 1,034,606 | |||||||
| 89,190 | Electronic Data Systems Corp. | 1,806,989 | ||||||||
| 160,620 | @ | Unisys Corp. | 796,675 | |||||||
| 3,638,270 | ||||||||||
| Diversified Financial Services: 5.6% | ||||||||||
| 40,830 | Citigroup, Inc. | 1,359,639 | ||||||||
| 137,267 | L | Countrywide Financial Corp. | 1,485,229 | |||||||
| 36,140 | Freddie Mac | 1,267,430 | ||||||||
| 4,112,298 | ||||||||||
| Electronics: 2.5% | ||||||||||
| 90,928 | @,@@ | Flextronics International Ltd. | 1,087,499 | |||||||
| 432,890 | @ | Sanmina-SCI Corp. | 766,215 | |||||||
| 1,853,714 | ||||||||||
| Food: 11.5% | ||||||||||
| 31,688 | Kraft Foods, Inc. | 1,094,820 | ||||||||
| 76,210 | Safeway, Inc. | 2,652,108 | ||||||||
| 186,593 | Sara Lee Corp. | 3,140,360 | ||||||||
| 37,610 | Supervalu, Inc. | 1,574,731 | ||||||||
| 8,462,019 | ||||||||||
| Healthcare — Products: 6.4% | ||||||||||
| 224,951 | @ | Boston Scientific Corp. | 2,841,131 | |||||||
| 27,200 | Johnson & Johnson | 1,842,528 | ||||||||
| 4,683,659 | ||||||||||
| Healthcare — Services: 2.0% | ||||||||||
| 271,110 | @,L | Tenet Healthcare Corp. | 1,493,816 | |||||||
| 1,493,816 | ||||||||||
| Home Builders: 1.2% | ||||||||||
| 30,570 | D.R. Horton, Inc. | 365,923 | ||||||||
| 17,590 | L | Lennar Corp. | 278,626 | |||||||
| 20,990 | Pulte Homes, Inc. | 214,518 | ||||||||
| 859,067 | ||||||||||
| Home Furnishings: 3.1% | ||||||||||
| 27,860 | Whirlpool Corp. | 2,255,546 | ||||||||
| 2,255,546 | ||||||||||
| Insurance: 5.2% | ||||||||||
| 77,440 | @,L | Conseco, Inc. | 994,330 | |||||||
| 75,000 | Marsh & McLennan Cos., Inc. | 1,884,000 | ||||||||
| 63,480 | Old Republic International Corp. | 952,835 | ||||||||
| 3,831,165 | ||||||||||
| Media: 4.2% | ||||||||||
| 64,200 | Gannett Co., Inc. | 2,359,350 | ||||||||
| 53,620 | McClatchy Co. | 724,406 | ||||||||
| 3,083,756 | ||||||||||
| Miscellaneous Manufacturing: 1.4% | ||||||||||
| 44,105 | L | Eastman Kodak Co. | 1,035,585 | |||||||
| 1,035,585 | ||||||||||
| Office/ Business Equipment: 2.6% | ||||||||||
| 114,290 | @ | Xerox Corp. | 1,929,215 | |||||||
| 1,929,215 | ||||||||||
| Pharmaceuticals: 8.2% | ||||||||||
| 42,980 | Bristol-Myers Squibb Co. | 1,273,497 | ||||||||
| 122,090 | Pfizer, Inc. | 2,900,858 | ||||||||
| 38,325 | Wyeth | 1,881,758 | ||||||||
| 6,056,113 | ||||||||||
| Retail: 2.2% | ||||||||||
| 56,260 | Home Depot, Inc. | 1,606,786 | ||||||||
| 1,606,786 | ||||||||||
| Savings & Loans: 1.4% | ||||||||||
| 52,210 | L | Washington Mutual, Inc. | 1,018,095 | |||||||
| 1,018,095 | ||||||||||
| Semiconductors: 4.8% | ||||||||||
| 44,450 | Intel Corp. | 1,159,256 | ||||||||
| 289,000 | @,L | Micron Technology, Inc. | 2,404,480 | |||||||
| 3,563,736 | ||||||||||
| Software: 2.1% | ||||||||||
| 46,200 | Microsoft Corp. | 1,552,320 | ||||||||
| 1,552,320 | ||||||||||
| Telecommunications: 7.6% | ||||||||||
| 238,619 | @@ | Alcatel SA ADR | 1,932,814 | |||||||
| 29,142 | AT&T, Inc. | 1,113,516 | ||||||||
| 85,100 | Motorola, Inc. | 1,359,047 | ||||||||
| 27,800 | Verizon Communications, Inc. | 1,201,238 | ||||||||
| 5,606,615 | ||||||||||
| Total Common Stock (Cost $86,236,144) | 72,740,103 | |||||||||
| Principal | ||||||||||
| Amount | Value | |||||||||
| SHORT-TERM INVESTMENTS: 15.2% | ||||||||||
| U.S. Government Agency Obligations: 0.9% | ||||||||||
| $ | 670,000 | Z | Freddie Mac, 3.600%, due 12/03/07 | $ | 669,799 | |||||
| Total U.S. Government Agency Obligations (Cost $669,799) | 669,799 | |||||||||
95
Table of Contents
| Principal | ||||||||||
| Amount | Value | |||||||||
| Securities Lending CollateralCC: 14.3% | ||||||||||
| $ | 10,514,627 | Bank of New York Mellon Corp. Institutional Cash Reserves | $ | 10,514,627 | ||||||
| Total Securities Lending Collateral (Cost $10,514,627) | 10,514,627 | |||||||||
| Total Short-Term Investments (Cost $11,184,426) | 11,184,426 | |||||||||
Total Investments in Securities (Cost $97,420,570)* | 114.1 | % | $ | 83,924,529 | ||||||||
Other Assets and Liabilities-Net | (14.1 | ) | (10,351,757 | ) | ||||||||
Net Assets | 100.0 | % | $ | 73,572,772 | ||||||||
| @ | Non-income producing security | |
| @@ | Foreign Issuer | |
| ADR | American Depositary Receipt | |
| cc | Securities purchased with cash collateral for securities loaned. | |
| L | Loaned security, a portion or all of the security is on loan at November 30, 2007. | |
| Z | Indicates Zero Coupon Bond; rate shown reflects current effective yield. | |
| * | Cost for federal income tax purposes is the same as for financial statement purposes. | |
| Net unrealized depreciation consists of: |
| Gross Unrealized Appreciation | $ | 3,996,740 | ||
| Gross Unrealized Depreciation | (17,492,781 | ) | ||
| Net Unrealized Depreciation | $ | (13,496,041 | ) | |
96
Table of Contents
| Shares | Value | |||||||||
| COMMON STOCK: 95.2% | ||||||||||
| Aerospace/ Defense: 0.1% | ||||||||||
| 800 | @ | Esterline Technologies Corp. | $ | 41,776 | ||||||
| 41,776 | ||||||||||
| Agriculture: 0.1% | ||||||||||
| 1,890 | Universal Corp. | 101,455 | ||||||||
| 101,455 | ||||||||||
| Airlines: 0.2% | ||||||||||
| 3,000 | @ | JetBlue Airways Corp. | 21,000 | |||||||
| 2,500 | @ | Republic Airways Holdings, Inc. | 50,200 | |||||||
| 2,200 | Skywest, Inc. | 57,882 | ||||||||
| 129,082 | ||||||||||
| Apparel: 0.4% | ||||||||||
| 9,800 | Cherokee, Inc. | 308,798 | ||||||||
| 1,000 | @ | Perry Ellis International, Inc. | 16,120 | |||||||
| 324,918 | ||||||||||
| Auto Parts & Equipment: 0.1% | ||||||||||
| 950 | American Axle & Manufacturing Holdings, Inc. | 21,964 | ||||||||
| 2,100 | @ | Commercial Vehicle Group, Inc. | 27,993 | |||||||
| 810 | @ | Lear Corp. | 23,846 | |||||||
| 1,700 | Superior Industries International | 31,484 | ||||||||
| 105,287 | ||||||||||
| Banks: 3.3% | ||||||||||
| 4,500 | @@ | Banco Latinoamericano de Exportaciones SA | 80,370 | |||||||
| 65,186 | @ | Bancorp, Inc. | 1,053,406 | |||||||
| 1,300 | Capitol Bancorp., Ltd. | 26,052 | ||||||||
| 16,500 | Cathay General Bancorp | 478,170 | ||||||||
| 870 | Central Pacific Financial Corp. | 17,583 | ||||||||
| 800 | Chemical Financial Corp. | 20,080 | ||||||||
| 3,790 | Citizens Banking Corp. | 53,894 | ||||||||
| 5,250 | Community Bank System, Inc. | 105,893 | ||||||||
| 23,400 | Corus Bankshares, Inc. | 222,066 | ||||||||
| 6,300 | @@ | First Bancorp. | 41,202 | |||||||
| 2,170 | First Community Bancorp., Inc. | 97,628 | ||||||||
| 2,000 | First State Bancorp. | 29,240 | ||||||||
| 3,000 | Irwin Financial Corp. | 24,390 | ||||||||
| 2,200 | Macatawa Bank Corp. | 21,956 | ||||||||
| 3,002 | MainSource Financial Group, Inc. | 45,210 | ||||||||
| 740 | Provident Bankshares Corp. | 17,353 | ||||||||
| 3,100 | Renasant Corp. | 60,481 | ||||||||
| 1,030 | Sterling Financial Corp. | 18,468 | ||||||||
| 5,700 | Susquehanna Bancshares, Inc. | 113,373 | ||||||||
| 1,500 | Umpqua Holdings Corp. | 24,210 | ||||||||
| 900 | WesBanco, Inc. | 21,582 | ||||||||
| 500 | Wintrust Financial Corp. | 17,660 | ||||||||
| 2,590,267 | ||||||||||
| Biotechnology: 0.1% | ||||||||||
| 1,800 | @ | Applera Corp. — Celera Genomics Group | 27,216 | |||||||
| 300 | @ | Bio-Rad Laboratories, Inc. | 30,273 | |||||||
| 700 | @ | Martek Biosciences Corp. | 18,102 | |||||||
| 75,591 | ||||||||||
| Building Materials: 1.6% | ||||||||||
| 88,200 | Gibraltar Industries, Inc. | 1,233,036 | ||||||||
| 1,500 | @ | NCI Building Systems, Inc. | 51,495 | |||||||
| 1,284,531 | ||||||||||
| Chemicals: 0.8% | ||||||||||
| 12,900 | Balchem Corp. | 275,802 | ||||||||
| 610 | CF Industries Holdings, Inc. | 55,498 | ||||||||
| 1,010 | HB Fuller Co. | 25,543 | ||||||||
| 480 | Minerals Technologies, Inc. | 32,112 | ||||||||
| 1,760 | @ | OM Group, Inc. | 99,070 | |||||||
| 600 | @ | Rockwood Holdings, Inc. | 20,208 | |||||||
| 2,700 | Sensient Technologies Corp. | 74,709 | ||||||||
| 1,600 | Spartech Corp. | 21,856 | ||||||||
| 604,798 | ||||||||||
| Commercial Services: 2.7% | ||||||||||
| 22,095 | ABM Industries, Inc. | 450,738 | ||||||||
| 2,490 | @ | Albany Molecular Research, Inc. | 32,893 | |||||||
| 3,100 | @ | Healthspring, Inc. | 58,590 | |||||||
| 16,400 | Jackson Hewitt Tax Service, Inc. | 528,900 | ||||||||
| 2,300 | Kelly Services, Inc. | 43,815 | ||||||||
| 7,300 | Landauer, Inc. | 366,533 | ||||||||
| 16,600 | McGrath Rentcorp | 441,394 | ||||||||
| 4,110 | @ | MPS Group, Inc. | 45,621 | |||||||
| 800 | @ | Pharmanet Development Group | 31,600 | |||||||
| 966 | @ | PHH Corp. | 21,407 | |||||||
| 1,320 | @ | Rent-A-Center, Inc. | 18,691 | |||||||
| 1,300 | @ | SAIC, Inc. | 25,922 | |||||||
| 5,010 | @ | Spherion Corp. | 38,978 | |||||||
| 2,105,082 | ||||||||||
| Computers: 2.4% | ||||||||||
| 3,700 | Agilysys, Inc. | 51,393 | ||||||||
| 500 | @ | CACI International, Inc. | 22,695 | |||||||
| 9,280 | @ | Ciber, Inc. | 63,290 | |||||||
| 6,930 | Computer Services, Inc. | 232,155 | ||||||||
| 3,800 | @,@@ | Ness Technologies, Inc. | 35,758 | |||||||
| 1,490 | @ | Perot Systems Corp. | 19,594 | |||||||
| 283,200 | @ | Quantum Corp. | 897,744 | |||||||
| 7,550 | @ | Silicon Storage Technology, Inc. | 21,442 | |||||||
| 15,000 | Syntel, Inc. | 540,450 | ||||||||
| 1,884,521 | ||||||||||
| Cosmetics/ Personal Care: 0.6% | ||||||||||
| 6,800 | @ | Chattem, Inc. | 482,188 | |||||||
| 482,188 | ||||||||||
| Distribution/ Wholesale: 0.6% | ||||||||||
| 11,100 | Owens & Minor, Inc. | 435,897 | ||||||||
| 435,897 | ||||||||||
| Diversified Financial Services: 1.0% | ||||||||||
| 8,700 | Financial Federal Corp. | 192,183 | ||||||||
| 2,480 | Friedman Billings Ramsey Group, Inc. | 7,415 | ||||||||
| 11,480 | National Financial Partners Corp. | 521,192 | ||||||||
| 4,050 | @ | Ocwen Financial Corp. | 22,680 | |||||||
| 1,300 | SWS Group, Inc. | 17,628 | ||||||||
| 761,098 | ||||||||||
| Electric: 0.8% | ||||||||||
| 500 | Allete, Inc. | 20,480 | ||||||||
| 6,640 | @ | Aquila, Inc. | 26,294 | |||||||
| 1,300 | Avista Corp. | 27,794 | ||||||||
| 1,450 | Black Hills Corp. | 60,407 | ||||||||
| 790 | CH Energy Group, Inc. | 35,013 | ||||||||
| 3,100 | Cleco Corp. | 86,614 | ||||||||
| 1,100 | @ | El Paso Electric Co. | 28,281 | |||||||
| 3,650 | Empire District Electric Co. | 84,096 | ||||||||
| 650 | Idacorp, Inc. | 22,854 | ||||||||
| 750 | NorthWestern Corp. | 20,888 | ||||||||
| 4,500 | PNM Resources, Inc. | 99,810 | ||||||||
| 750 | Unisource Energy Corp. | 23,198 | ||||||||
| 4,900 | Westar Energy, Inc. | 126,959 | ||||||||
| 662,688 | ||||||||||
| Electrical Components & Equipment: 3.0% | ||||||||||
| 24,000 | Belden Cdt, Inc. | 1,105,200 | ||||||||
| 2,590 | @ | EnerSys | 60,269 | |||||||
97
Table of Contents
| Shares | Value | |||||||||
| Electrical Components & Equipment (continued) | ||||||||||
| 16,600 | @ | General Cable Corp. | $ | 1,234,708 | ||||||
| 900 | @ | Superior Essex, Inc. | 21,834 | |||||||
| 2,422,011 | ||||||||||
| Electronics: 1.8% | ||||||||||
| 5,600 | @ | Benchmark Electronics, Inc. | 100,520 | |||||||
| 500 | Brady Corp. | 20,015 | ||||||||
| 990 | @ | Coherent, Inc. | 28,482 | |||||||
| 113,000 | Keithley Instruments, Inc. | 1,073,500 | ||||||||
| 10,250 | @ | Kemet Corp. | 63,550 | |||||||
| 1,800 | Methode Electronics, Inc. | 21,690 | ||||||||
| 3,300 | Watts Water Technologies, Inc. | 96,558 | ||||||||
| 1,404,315 | ||||||||||
| Engineering & Construction: 0.0% | ||||||||||
| 930 | @ | EMCOR Group, Inc. | 24,775 | |||||||
| 24,775 | ||||||||||
| Food: 4.4% | ||||||||||
| 1,450 | @ | Chiquita Brands International, Inc. | 27,826 | |||||||
| 177,800 | Del Monte Foods Co. | 1,564,640 | ||||||||
| 2,000 | @@ | Fresh Del Monte Produce, Inc. | 61,840 | |||||||
| 550 | @ | Hain Celestial Group, Inc. | 18,194 | |||||||
| 950 | Imperial Sugar Co. | 21,679 | ||||||||
| 807 | Nash Finch Co. | 28,802 | ||||||||
| 1,350 | @ | Performance Food Group Co. | 37,382 | |||||||
| 53,598 | @ | Smithfield Foods, Inc. | 1,610,620 | |||||||
| 1,840 | @ | TreeHouse Foods, Inc. | 43,369 | |||||||
| 5,650 | @ | Winn-Dixie Stores, Inc. | 106,842 | |||||||
| 3,521,194 | ||||||||||
| Forest Products & Paper: 10.4% | ||||||||||
| 58,200 | @@ | AbitibiBowater, Inc. | 1,307,172 | |||||||
| 42,600 | @ | Buckeye Technologies, Inc. | 608,328 | |||||||
| 114,800 | Glatfelter | 1,725,444 | ||||||||
| 91,500 | @ | Jefferson Smurfit Corp. | 1,007,415 | |||||||
| 5,520 | @ | Mercer International, Inc. | 43,718 | |||||||
| 1,800 | Rock-Tenn Co. | 47,484 | ||||||||
| 102,400 | @@ | Sappi Ltd. ADR | 1,393,664 | |||||||
| 1,350 | Schweitzer-Mauduit International, Inc. | 36,045 | ||||||||
| 225,400 | Wausau Paper Corp. | 2,125,511 | ||||||||
| 8,294,781 | ||||||||||
| Gas: 0.3% | ||||||||||
| 650 | Laclede Group, Inc. | 22,367 | ||||||||
| 470 | New Jersey Resources Corp. | 23,712 | ||||||||
| 720 | Nicor, Inc. | 30,341 | ||||||||
| 750 | Piedmont Natural Gas Co. | 19,530 | ||||||||
| 930 | Southwest Gas Corp. | 26,896 | ||||||||
| 3,500 | WGL Holdings, Inc. | 115,640 | ||||||||
| 238,486 | ||||||||||
| Hand/ Machine Tools: 4.1% | ||||||||||
| 2,000 | Hardinge, Inc. | 31,540 | ||||||||
| 15,200 | Kennametal, Inc. | 1,186,360 | ||||||||
| 29,390 | Lincoln Electric Holdings, Inc. | 2,050,541 | ||||||||
| 3,268,441 | ||||||||||
| Healthcare — Products: 0.4% | ||||||||||
| 3,950 | @ | Conmed Corp. | 98,276 | |||||||
| 600 | Datascope Corp. | 21,954 | ||||||||
| 500 | @ | Inverness Medical Innovations, Inc. | 29,340 | |||||||
| 6,430 | Young Innovations, Inc. | 149,498 | ||||||||
| 299,068 | ||||||||||
| Healthcare — Services: 3.0% | ||||||||||
| 1,600 | @ | AMERIGROUP Corp. | 54,992 | |||||||
| 2,800 | @ | Amsurg Corp. | 72,408 | |||||||
| 1,420 | @ | Apria Healthcare Group, Inc. | 30,771 | |||||||
| 55,800 | @ | Community Health Systems, Inc. | 1,864,836 | |||||||
| 1,100 | @ | Gentiva Health Services, Inc. | 19,866 | |||||||
| 4,000 | @ | Kindred Healthcare, Inc. | 98,280 | |||||||
| 480 | @ | Magellan Health Services, Inc. | 21,816 | |||||||
| 1,200 | @ | Medcath Corp. | 30,504 | |||||||
| 3,100 | @ | RehabCare Group, Inc. | 71,610 | |||||||
| 4,320 | @ | Res-Care, Inc. | 98,410 | |||||||
| 2,363,493 | ||||||||||
| Holding Companies — Diversified: 0.1% | ||||||||||
| 3,350 | Compass Diversified Trust | 49,882 | ||||||||
| 49,882 | ||||||||||
| Home Builders: 0.0% | ||||||||||
| 3,250 | Monaco Coach Corp. | 29,348 | ||||||||
| 29,348 | ||||||||||
| Home Furnishings: 2.1% | ||||||||||
| 64,900 | Hooker Furniture Corp. | 1,091,618 | ||||||||
| 1,950 | Kimball International, Inc. | 26,013 | ||||||||
| 17,400 | Tempur-Pedic International, Inc. | 516,606 | ||||||||
| 1,634,237 | ||||||||||
| Household Products/ Wares: 5.7% | ||||||||||
| 4,750 | American Greetings Corp. | 110,485 | ||||||||
| 36,331 | @ | Fossil, Inc. | 1,574,586 | |||||||
| 2,050 | @ | Helen of Troy Ltd. | 37,167 | |||||||
| 3,800 | @ | Prestige Brands Holdings, Inc. | 31,882 | |||||||
| 70,600 | WD-40 Co. | 2,800,702 | ||||||||
| 4,554,822 | ||||||||||
| Insurance: 1.7% | ||||||||||
| 2,340 | American Equity Investment Life Holding Co. | 21,083 | ||||||||
| 1,600 | @,@@ | Argo Group International Holdings Ltd. | 63,216 | |||||||
| 1,650 | @@ | Aspen Insurance Holdings Ltd. | 47,520 | |||||||
| 2,950 | @@ | Assured Guaranty Ltd. | 66,582 | |||||||
| 1,350 | @ | CNA Surety Corp. | 27,851 | |||||||
| 600 | Commerce Group, Inc. | 21,570 | ||||||||
| 590 | Delphi Financial Group | 22,680 | ||||||||
| 1,000 | EMC Insurance Group, Inc. | 24,350 | ||||||||
| 650 | FBL Financial Group, Inc. | 24,096 | ||||||||
| 1,070 | Infinity Property & Casualty Corp. | 41,826 | ||||||||
| 4,050 | @@ | IPC Holdings Ltd. | 119,718 | |||||||
| 880 | Landamerica Financial Group, Inc. | 23,162 | ||||||||
| 700 | @@ | Max Re Capital Ltd. | 19,817 | |||||||
| 860 | NYMAGIC, Inc. | 19,161 | ||||||||
| 700 | Odyssey Re Holdings Corp. | 26,978 | ||||||||
| 6,250 | Phoenix Cos., Inc. | 75,125 | ||||||||
| 2,050 | @@ | Platinum Underwriters Holdings Ltd. | 74,456 | |||||||
| 68,200 | @ | PMA Capital Corp. | 596,068 | |||||||
| 3,300 | @,@@ | Primus Guaranty Ltd. | 21,087 | |||||||
| 690 | Safety Insurance Group, Inc. | 25,192 | ||||||||
| 1,580 | @ | SeaBright Insurance Holdings, Inc. | 24,506 | |||||||
| 1,386,044 | ||||||||||
| Internet: 0.2% | ||||||||||
| 2,680 | @ | Avocent Corp. | 66,732 | |||||||
| 2,405 | @ | CMGI, Inc. | 24,940 | |||||||
| 3,650 | @ | Secure Computing Corp. | 33,106 | |||||||
| 2,800 | @ | TIBCO Software, Inc. | 21,924 | |||||||
| 2,300 | @ | Vignette Corp. | 35,374 | |||||||
| 182,076 | ||||||||||
98
Table of Contents
| Shares | Value | |||||||||
| Investment Companies: 1.8% | ||||||||||
| 4,700 | Apollo Investment Corp. | $ | 83,237 | |||||||
| 40,550 | Ares Capital Corp. | 610,683 | ||||||||
| 200 | Capital Southwest Corp. | 24,048 | ||||||||
| 5,500 | Hercules Technology Growth Capital, Inc. | 64,955 | ||||||||
| 46,690 | MCG Capital Corp. | 527,597 | ||||||||
| 3,600 | MVC Capital, Inc. | 57,852 | ||||||||
| 2,828 | Patriot Capital Funding, Inc. | 30,316 | ||||||||
| 4,100 | Prospect Capital Corp. | 57,482 | ||||||||
| 1,456,170 | ||||||||||
| Iron/ Steel: 0.1% | ||||||||||
| 1,020 | Olympic Steel, Inc. | 26,663 | ||||||||
| 420 | Schnitzer Steel Industries, Inc. | 26,216 | ||||||||
| 52,879 | ||||||||||
| Machinery — Diversified: 6.3% | ||||||||||
| 49,250 | Albany International Corp. | 1,904,498 | ||||||||
| 2,100 | @ | Gerber Scientific, Inc. | 19,950 | |||||||
| 39,250 | @ | Kadant, Inc. | 1,156,305 | |||||||
| 270 | Nacco Industries, Inc. | 27,378 | ||||||||
| 79,350 | Sauer-Danfoss, Inc. | 1,928,205 | ||||||||
| 5,036,336 | ||||||||||
| Media: 0.3% | ||||||||||
| 4,440 | Belo Corp. | 73,526 | ||||||||
| 5,670 | @ | Cox Radio, Inc. | 66,793 | |||||||
| 1,680 | Lee Enterprises, Inc. | 23,520 | ||||||||
| 1,040 | Media General, Inc. | 25,761 | ||||||||
| 750 | @ | Scholastic Corp. | 26,430 | |||||||
| 216,030 | ||||||||||
| Metal Fabricate/ Hardware: 1.4% | ||||||||||
| 4,900 | Mueller Water Products, Inc. | 51,303 | ||||||||
| 470 | Quanex Corp. | 23,519 | ||||||||
| 27,100 | @ | RBC Bearings, Inc. | 996,738 | |||||||
| 1,430 | Worthington Industries | 30,302 | ||||||||
| 1,101,862 | ||||||||||
| Mining: 1.7% | ||||||||||
| 22,400 | @ | Century Aluminum Co. | 1,284,416 | |||||||
| 3,710 | @ | USEC, Inc. | 30,459 | |||||||
| 1,314,875 | ||||||||||
| Miscellaneous Manufacturing: 4.8% | ||||||||||
| 16,800 | Acuity Brands, Inc. | 663,432 | ||||||||
| 780 | Aptargroup, Inc. | 32,924 | ||||||||
| 17,200 | Clarcor, Inc. | 612,492 | ||||||||
| 144,771 | @ | Griffon Corp. | 1,870,441 | |||||||
| 13,060 | Matthews International Corp. — Class A | 576,468 | ||||||||
| 5,400 | Tredegar Corp. | 78,084 | ||||||||
| 3,833,841 | ||||||||||
| Office/ Business Equipment: 0.1% | ||||||||||
| 8,750 | IKON Office Solutions, Inc. | 110,513 | ||||||||
| 110,513 | ||||||||||
| Oil & Gas: 8.0% | ||||||||||
| 53,800 | @ | Approach Resources, Inc. | 694,020 | |||||||
| 37,650 | @ | Bill Barrett Corp. | 1,453,290 | |||||||
| 4,500 | @ | Bronco Drilling Co., Inc. | 64,620 | |||||||
| 11,400 | Crosstex Energy, Inc. | 409,260 | ||||||||
| 20,800 | @ | Denbury Resources, Inc. | 1,109,056 | |||||||
| 600 | @ | Encore Acquisition Co. | 19,530 | |||||||
| 3,000 | @,I | PetroHawk Energy Corp. | 48,900 | |||||||
| 7,650 | Range Resources Corp. | 311,202 | ||||||||
| 4,150 | @ | Rosetta Resources, Inc. | 75,945 | |||||||
| 2,500 | @ | Swift Energy Co. | 101,275 | |||||||
| 152,700 | @ | Warren Resources, Inc. | 1,948,452 | |||||||
| 2,300 | @ | Whiting Petroleum Corp. | 121,256 | |||||||
| 6,356,806 | ||||||||||
| Oil & Gas Services: 1.7% | ||||||||||
| 49,400 | @@ | Acergy SA ADR | 1,048,268 | |||||||
| 1,300 | @ | Allis-Chalmers Energy, Inc. | 19,695 | |||||||
| 788 | @ | Exterran Holdings, Inc. | 63,072 | |||||||
| 2,500 | @ | Hercules Offshore, Inc. | 62,525 | |||||||
| 700 | @ | Hornbeck Offshore Services, Inc. | 28,819 | |||||||
| 1,830 | @ | Oil States International, Inc. | 58,029 | |||||||
| 2,090 | @ | Trico Marine Services, Inc. | 73,923 | |||||||
| 1,750 | @ | Union Drilling, Inc. | 22,225 | |||||||
| 1,376,556 | ||||||||||
| Pharmaceuticals: 0.0% | ||||||||||
| 1,000 | @ | Alpharma, Inc. | 21,000 | |||||||
| 21,000 | ||||||||||
| Real Estate: 0.0% | ||||||||||
| 500 | @ | Avatar Holdings, Inc. | 21,780 | |||||||
| 21,780 | ||||||||||
| Retail: 8.2% | ||||||||||
| 2,580 | Asbury Automotive Group, Inc. | 43,189 | ||||||||
| 59,680 | Bob Evans Farms, Inc. | 1,840,531 | ||||||||
| 63,190 | Casey’s General Stores, Inc. | 1,832,510 | ||||||||
| 3,750 | @ | Charming Shoppes, Inc. | 20,738 | |||||||
| 1,100 | @ | Collective Brands, Inc. | 16,863 | |||||||
| 104,066 | @ | Golfsmith International Holdings, Inc. | 416,264 | |||||||
| 750 | Group 1 Automotive, Inc. | 20,160 | ||||||||
| 1,150 | @ | Insight Enterprises, Inc. | 22,782 | |||||||
| 4,140 | O’Charleys, Inc. | 61,727 | ||||||||
| 97,400 | @ | Pacific Sunwear of California | 1,595,412 | |||||||
| 820 | Regis Corp. | 24,100 | ||||||||
| 3,600 | @ | Rush Enterprises, Inc. — Class A | 56,736 | |||||||
| 2,010 | Sonic Automotive, Inc. | 46,451 | ||||||||
| 1,910 | @ | West Marine, Inc. | 16,865 | |||||||
| 14,800 | World Fuel Services Corp. | 468,272 | ||||||||
| 1,000 | @ | Zale Corp. | 17,890 | |||||||
| 6,500,490 | ||||||||||
| Savings & Loans: 0.1% | ||||||||||
| 1,650 | First Place Financial Corp. | 23,826 | ||||||||
| 590 | @ | FirstFed Financial Corp. | 20,662 | |||||||
| 1,770 | Provident Financial Services, Inc. | 26,302 | ||||||||
| 3,280 | United Community Financial Corp. | 18,598 | ||||||||
| 89,388 | ||||||||||
| Semiconductors: 3.2% | ||||||||||
| 15,100 | @ | Applied Micro Circuits Corp. | 37,901 | |||||||
| 4,350 | @ | Axcelis Technologies, Inc. | 20,619 | |||||||
| 7,200 | @ | Brooks Automation, Inc. | 96,696 | |||||||
| 1,500 | @ | DSP Group, Inc. | 20,295 | |||||||
| 12,350 | @ | Entegris, Inc. | 106,951 | |||||||
| 2,300 | @ | Exar Corp. | 21,137 | |||||||
| 98,600 | @ | Mattson Technology, Inc. | 812,464 | |||||||
| 5,800 | @ | MKS Instruments, Inc. | 105,386 | |||||||
| 3,850 | @ | Photronics, Inc. | 39,617 | |||||||
| 34,130 | @ | Standard Microsystems Corp. | 1,203,765 | |||||||
| 4,300 | @ | Zoran Corp. | 93,826 | |||||||
| 2,558,657 | ||||||||||
| Software: 0.5% | ||||||||||
| 15,200 | @ | American Reprographics Co. | 235,296 | |||||||
| 710 | @ | Avid Technology, Inc. | 18,836 | |||||||
| 1,660 | @ | Sybase, Inc. | 42,562 | |||||||
| 2,880 | @ | SYNNEX Corp. | 59,501 | |||||||
| 356,195 | ||||||||||
99
Table of Contents
| Shares | Value | |||||||||
| Telecommunications: 2.2% | ||||||||||
| 6,600 | @ | 3Com Corp. | $ | 28,446 | ||||||
| 2,550 | @ | Andrew Corp. | 37,383 | |||||||
| 460 | Black Box Corp. | 16,928 | ||||||||
| 36,550 | @ | CommScope, Inc. | 1,480,275 | |||||||
| 2,400 | IDT Corp. | 19,464 | ||||||||
| 1,700 | @ | Oplink Communications, Inc. | 27,455 | |||||||
| 18,400 | @ | RF Micro Devices, Inc. | 106,352 | |||||||
| 1,780 | @ | USA Mobility, Inc. | 23,478 | |||||||
| 1,739,781 | ||||||||||
| Textiles: 0.0% | ||||||||||
| 800 | Unifirst Corp. | 29,896 | ||||||||
| 29,896 | ||||||||||
| Toys/ Games/ Hobbies: 0.1% | ||||||||||
| 4,050 | @ | Jakks Pacific, Inc. | 102,222 | |||||||
| 102,222 | ||||||||||
| Transportation: 2.7% | ||||||||||
| 720 | Arkansas Best Corp. | 16,416 | ||||||||
| 1,230 | @ | Gulfmark Offshore, Inc. | 54,661 | |||||||
| 13,030 | Landstar System, Inc. | 518,333 | ||||||||
| 145,425 | @ | Marten Transport Ltd. | 1,593,858 | |||||||
| 2,183,268 | ||||||||||
| Total Common Stock (Cost $75,799,291) | 75,720,697 | |||||||||
| REAL ESTATE INVESTMENT TRUSTS: 2.4% | ||||||||||
| Diversified: 0.8% | ||||||||||
| 10,790 | Entertainment Properties Trust | 574,999 | ||||||||
| 1,300 | Lexington Corporate Properties Trust | 22,997 | ||||||||
| 597,996 | ||||||||||
| Health Care: 0.1% | ||||||||||
| 3,100 | LTC Properties, Inc. | 72,974 | ||||||||
| 72,974 | ||||||||||
| Hotels: 0.2% | ||||||||||
| 8,100 | Ashford Hospitality Trust, Inc. | 62,694 | ||||||||
| 1,390 | DiamondRock Hospitality Co. | 24,075 | ||||||||
| 4,150 | Hersha Hospitality Trust | 42,247 | ||||||||
| 1,000 | Sunstone Hotel Investors, Inc. | 23,200 | ||||||||
| 152,216 | ||||||||||
| Mortgage: 1.1% | ||||||||||
| 194,450 | Alesco Financial, Inc. | 723,354 | ||||||||
| 3,900 | Gramercy Capital Corp. | 92,742 | ||||||||
| 1,250 | Newcastle Investment Corp. | 16,263 | ||||||||
| 6,290 | Northstar Realty Finance Corp. | 57,679 | ||||||||
| 890,038 | ||||||||||
| Office Property: 0.1% | ||||||||||
| 3,450 | BioMed Realty Trust, Inc. | 77,901 | ||||||||
| 77,901 | ||||||||||
| Single Tenant: 0.1% | ||||||||||
| 1,430 | National Retail Properties, Inc. | 35,021 | ||||||||
| 740 | Realty Income Corp. | 21,090 | ||||||||
| 56,111 | ||||||||||
| Storage: 0.0% | ||||||||||
| 500 | Sovran Self Storage, Inc. | 21,855 | ||||||||
| 21,855 | ||||||||||
| Total Real Estate Investment Trusts (Cost $2,868,997) | 1,869,091 | |||||||||
| EXCHANGE-TRADED FUNDS: 0.0% | ||||||||||
| Exchange-Traded Funds: 0.0% | ||||||||||
| 300 | iShares Russell 2000 Value Index Fund | 21,540 | ||||||||
| Total Exchange-Traded Funds (Cost $21,822) | 21,540 | |||||||||
| Total Long-Term Investments (Cost $78,690,110) | 77,611,328 | |||||||||
| SHORT-TERM INVESTMENTS: 1.6% | ||||||||||
| U.S. Government Agency Obligations: 1.6% | ||||||||||
| $ | 1,273,000 | Z | Freddie Mac, 3.600%, due 12/03/07 | $ | 1,272,618 | |||||
| Total Short-Term Investments (Cost $1,272,618) | 1,272,618 | |||||||||
Total Investments in Securities (Cost $79,962,728)* | 99.2 | % | $ | 78,883,946 | ||||||||
Other Assets and Liabilities-Net | 0.8 | 643,550 | ||||||||||
Net Assets | 100.0 | % | $ | 79,527,496 | ||||||||
| @ | Non-income producing security | |
| @@ | Foreign Issuer | |
| ADR | American Depositary Receipt | |
| I | Illiquid security | |
| Z | Indicates Zero Coupon Bond; rate shown reflects current effective yield. | |
| * | Cost for federal income tax purposes is $80,466,455. | |
| Net unrealized depreciation consists of: |
| Gross Unrealized Appreciation | $ | 9,172,451 | ||
| Gross Unrealized Depreciation | (10,754,960 | ) | ||
| Net Unrealized Depreciation | $ | (1,582,509 | ) | |
100
Table of Contents
| Shares | Value | |||||||||
| COMMON STOCK: 77.1% | ||||||||||
| Biotechnology: 2.1% | ||||||||||
| 130,900 | @,L | Amgen, Inc. | $ | 7,232,225 | ||||||
| 7,232,225 | ||||||||||
| Coal: 3.2% | ||||||||||
| 88,100 | Arch Coal, Inc. | 3,335,466 | ||||||||
| 12,420 | @,L | Patriot Coal Corp. | 419,920 | |||||||
| 124,200 | L | Peabody Energy Corp. | 6,910,488 | |||||||
| 10,665,874 | ||||||||||
| Commercial Services: 1.5% | ||||||||||
| 101,800 | @@,L | Toppan Printing Co., Ltd. ADR | 4,997,077 | |||||||
| 4,997,077 | ||||||||||
| Computers: 1.0% | ||||||||||
| 168,900 | Electronic Data Systems Corp. | 3,421,914 | ||||||||
| 3,421,914 | ||||||||||
| Cosmetics/ Personal Care: 2.1% | ||||||||||
| 23,100 | @@ | Kao Corp. ADR | 6,997,161 | |||||||
| 6,997,161 | ||||||||||
| Distribution/ Wholesale: 1.2% | ||||||||||
| 105,801 | @ | Tech Data Corp. | 3,979,176 | |||||||
| 3,979,176 | ||||||||||
| Electric: 9.2% | ||||||||||
| 244,200 | @@,L | Centrais Eletricas Brasileiras SA ADR | 3,373,525 | |||||||
| 68,000 | DTE Energy Co. | 3,335,400 | ||||||||
| 239,000 | L | Idacorp, Inc. | 8,403,240 | |||||||
| 6,300 | @@,L | Korea Electric Power Corp. ADR | 132,804 | |||||||
| 162,000 | L | Mirant Corp. — W/ I | — | |||||||
| 421,000 | L | PNM Resources, Inc. | 9,337,780 | |||||||
| 235,000 | Puget Energy, Inc. | 6,596,450 | ||||||||
| 31,179,199 | ||||||||||
| Electronics: 1.2% | ||||||||||
| 243,100 | @@,#,L | Samsung SDI Co., Ltd. GDR | 4,176,361 | |||||||
| 4,176,361 | ||||||||||
| Environmental Control: 2.6% | ||||||||||
| 756,800 | @,L | Allied Waste Industries, Inc. | 8,635,088 | |||||||
| 8,635,088 | ||||||||||
| Food: 7.0% | ||||||||||
| 325,650 | @,L | Smithfield Foods, Inc. | 9,785,783 | |||||||
| 933,600 | Tyson Foods, Inc. | 13,919,976 | ||||||||
| 23,705,759 | ||||||||||
| Forest Products & Paper: 2.1% | ||||||||||
| 151,206 | @@,L | AbitibiBowater, Inc. | 3,396,087 | |||||||
| 326,200 | @,@@ | Domtar Corp. | 2,479,120 | |||||||
| 129,200 | Wausau Paper Corp. | 1,218,356 | ||||||||
| 7,093,563 | ||||||||||
| Healthcare — Services: 1.6% | ||||||||||
| 251,500 | @,L | Apria Healthcare Group, Inc. | 5,450,005 | |||||||
| 5,450,005 | ||||||||||
| Home Builders: 1.2% | ||||||||||
| 1,326,692 | L | Levitt Corp. | 2,295,177 | |||||||
| 138,000 | @@ | Sekisui House Ltd. ADR | 1,761,625 | |||||||
| 4,056,802 | ||||||||||
| Leisure Time: 1.0% | ||||||||||
| 1,084,500 | @@,L | Sega Sammy Holding ADR | 3,451,204 | |||||||
| 3,451,204 | ||||||||||
| Machinery — Diversified: 2.7% | ||||||||||
| 90,800 | @ | AGCO Corp. | 6,259,752 | |||||||
| 35,300 | Alamo Group, Inc. | 653,050 | ||||||||
| 96,226 | @ | Tecumseh Products Co. | 2,037,104 | |||||||
| 8,949,906 | ||||||||||
| Media: 0.5% | ||||||||||
| 49,600 | @,L | Scholastic Corp. | 1,747,904 | |||||||
| 1,747,904 | ||||||||||
| Mining: 23.6% | ||||||||||
| 65,100 | @@,L | Alumina Ltd. ADR | 1,488,837 | |||||||
| 386,750 | @@,L | Anglogold Ashanti Ltd. ADR | 18,861,798 | |||||||
| 494,300 | @,@@, L | Apex Silver Mines Ltd. | 8,427,815 | |||||||
| 79,100 | @,@@, L | Banro Corp. | 934,171 | |||||||
| 77,495 | @@ | Barrick Gold Corp. | 3,139,322 | |||||||
| 595,500 | @,@@ | Crystallex International Corp. | 1,375,605 | |||||||
| 79,600 | @,@@ | Eldorado Gold Corp. | 463,272 | |||||||
| 282,500 | @@ | Gold Fields Ltd. ADR | 4,647,125 | |||||||
| 318,200 | @,L | Gold Reserve, Inc. | 1,524,178 | |||||||
| 215,500 | @,@@, L | Ivanhoe Mines Ltd. | 2,426,530 | |||||||
| 505,955 | @,@@, L | Kinross Gold Corp. | 8,778,319 | |||||||
| 220,100 | @,@@, L | Lihir Gold Ltd. ADR | 7,382,154 | |||||||
| 324,500 | Newmont Mining Corp. | 16,124,405 | ||||||||
| 172,500 | @,@@, L | Novagold Resources, Inc. | 1,695,675 | |||||||
| 2,175,100 | @,@@, L | Orezone Resources, Inc. | 2,544,867 | |||||||
| 79,814,073 | ||||||||||
| Oil & Gas: 1.5% | ||||||||||
| 99,200 | @,L | Delta Petroleum Corp. | 1,524,704 | |||||||
| 63,200 | @@ | Nexen, Inc. | 1,794,880 | |||||||
| 144,200 | @,L | Warren Resources, Inc. | 1,839,992 | |||||||
| 5,159,576 | ||||||||||
| Oil & Gas Services: 2.4% | ||||||||||
| 262,700 | L | BJ Services Co. | 6,457,166 | |||||||
| 19,500 | @@ | Technip SA ADR | 1,595,160 | |||||||
| 8,052,326 | ||||||||||
| Retail: 1.0% | ||||||||||
| 73,800 | Wal-Mart Stores, Inc. | 3,535,020 | ||||||||
| 3,535,020 | ||||||||||
| Semiconductors: 0.6% | ||||||||||
| 394,400 | @,L | Axcelis Technologies, Inc. | 1,869,456 | |||||||
| 1,869,456 | ||||||||||
| Telecommunications: 6.0% | ||||||||||
| 306,000 | @@ | Chunghwa Telecom Co., Ltd. ADR | 6,098,580 | |||||||
| 62,300 | @@,L | KT Corp. ADR | 1,633,506 | |||||||
| 444,200 | @@,L | Nippon Telegraph & Telephone Corp. ADR | 10,038,920 | |||||||
| 157,300 | Sprint Nextel Corp. | 2,441,296 | ||||||||
| 20,212,302 | ||||||||||
101
Table of Contents
| Shares | Value | |||||||||
| Transportation: 1.4% | ||||||||||
| 83,600 | CSX Corp. | $ | 3,511,200 | |||||||
| 13,460 | @@,L | Stolt-Nielsen SA ADR | 337,289 | |||||||
| 5,700 | Union Pacific Corp. | 718,998 | ||||||||
| 4,567,487 | ||||||||||
| Water: 0.4% | ||||||||||
| 27,900 | @@,L | Cia de Saneamento Basico do Estado de Sao Paulo ADR | 1,380,771 | |||||||
| 1,380,771 | ||||||||||
| Total Common Stock (Cost $240,764,619) | 260,330,229 | |||||||||
| PREFERRED STOCK: 2.3% | ||||||||||
| Telecommunications: 2.3% | ||||||||||
| 8,500 | P | Lucent Technologies Capital Trust I | 7,882,688 | |||||||
| Total Preferred Stock (Cost $8,191,875) | 7,882,688 | |||||||||
| CONVERTIBLE BONDS: 18.1% | ||||||||||
| Aerospace/ Defense: 0.8% | ||||||||||
| $ | 1,635,000 | C,L | EDO Corp., 4.000%, due 11/15/25 | $ | 2,728,406 | |||||
| 2,728,406 | ||||||||||
| Airlines: 2.0% | ||||||||||
| 7,085,000 | C,L | JetBlue Airways Corp., 3.500%, due 07/15/33 | 6,916,731 | |||||||
| 6,916,731 | ||||||||||
| Computers: 0.6% | ||||||||||
| 2,210,000 | C,L | Hutchinson Technology, Inc., 3.250%, due 01/15/26 | 2,151,988 | |||||||
| 2,151,988 | ||||||||||
| Electronics: 0.2% | ||||||||||
| 696,000 | C | FEI Co., 5.500%, due 08/15/08 | 661,200 | |||||||
| 661,200 | ||||||||||
| Environmental Control: 1.9% | ||||||||||
| 6,936,000 | C,L | Allied Waste North America, Inc., 4.250%, due 04/15/34 | 6,467,820 | |||||||
| 6,467,820 | ||||||||||
| Healthcare — Services: 1.5% | ||||||||||
| 4,940,000 | C,L | Apria Healthcare Group, 3.375%, due 09/01/33 | 4,958,525 | |||||||
| 4,958,525 | ||||||||||
| Machinery — Diversified: 1.3% | ||||||||||
| 4,131,000 | +,C,L | Albany International Corp., 2.250%, due 03/15/26 | 4,229,111 | |||||||
| 4,229,111 | ||||||||||
| Mining: 3.2% | ||||||||||
| 379,000 | @@,C | Apex Silver Mines Ltd., 2.875%, due 03/15/24 | 313,149 | |||||||
| 9,647,000 | C,L | Coeur d’Alene Mines Corp., 1.250%, due 01/15/24 | 8,670,241 | |||||||
| 1,817,000 | @@,C, L | Gold Reserve, Inc., 5.500%, due 06/15/22 | 1,737,506 | |||||||
| 10,720,896 | ||||||||||
| Oil & Gas: 2.1% | ||||||||||
| 7,236,000 | Nabors Industries, Inc., 0.940%, due 05/15/11 | 6,937,515 | ||||||||
| 6,937,515 | ||||||||||
| Pharmaceuticals: 1.9% | ||||||||||
| 8,530,000 | C | Omnicare, Inc., 3.250%, due 12/15/35 | 6,450,813 | |||||||
| 6,450,813 | ||||||||||
| Semiconductors: 1.5% | ||||||||||
| 845,000 | L | Credence Systems Corp., 1.500%, due 05/15/08 | 819,650 | |||||||
| 4,935,000 | L | Credence Systems Corp., 3.500%, due 05/15/10 | 4,318,125 | |||||||
| 5,137,775 | ||||||||||
| Telecommunications: 1.1% | ||||||||||
| 2,143,000 | C | Adaptec, Inc., 0.750%, due 12/22/23 | 2,014,420 | |||||||
| 1,931,000 | @@,C, L | AudioCodes Ltd., 2.000%, due 11/09/24 | 1,730,659 | |||||||
| 3,745,079 | ||||||||||
| Total Convertible Bonds (Cost $60,659,409) | 61,105,859 | |||||||||
| Total Long-Term Investments (Cost $309,615,903) | 329,318,776 | |||||||||
| SHORT-TERM INVESTMENTS: 29.2% | ||||||||||
| U.S. Government Agency Obligations: 3.0% | ||||||||||
| 10,128,000 | Z | Freddie Mac, 3.600%, due 12/03/07 | 10,124,961 | |||||||
| Total U.S. Government Agency Obligations (Cost $10,124,961) | 10,124,961 | |||||||||
102
Table of Contents
| Principal | ||||||||||
| Amount | Value | |||||||||
| Securities Lending CollateralCC: 26.2% | ||||||||||
| $ | 88,309,259 | Bank of New York Mellon Corp. Institutional Cash Reserves | $ | 88,309,259 | ||||||
| Total Securities Lending Collateral (Cost $88,309,259) | 88,309,259 | |||||||||
| Total Short-Term Investments (Cost $98,434,220) | 98,434,220 | |||||||||
Total Investments in Securities (Cost $408,050,123)* | 126.7 | % | $ | 427,752,996 | ||||||||
Other Assets and Liabilities-Net | (26.7 | ) | (90,026,565 | ) | ||||||||
Net Assets | 100.0 | % | $ | 337,726,431 | ||||||||
| @ | Non-income producing security | |
| @@ | Foreign Issuer | |
| ADR | American Depositary Receipt | |
| GDR | Global Depositary Receipt | |
| + | Step-up basis bonds. Interest rates shown reflect current and next coupon rates. | |
| # | Securities with purchases pursuant to Rule144A or section 4(2), under the Securities Act of 1933 and may not be resold subject to that rule except to qualified institutional buyers. Unless otherwise footnoted, these securities have been determined to be liquid under the guidelines established by the Funds’ Board of Directors/Trustees. | |
| C | Bond may be called prior to maturity date. | |
| P | Preferred Stock may be called prior to convertible date. | |
| cc | Securities purchased with cash collateral for securities loaned. | |
| L | Loaned security, a portion or all of the security is on loan at November 30, 2007. | |
| Z | Indicates Zero Coupon Bond; rate shown reflects current effective yield. | |
| * | Cost for federal income tax purposes is $408,266,739. | |
| Net unrealized appreciation consists of: |
| Gross Unrealized Appreciation | $ | 36,768,934 | ||
| Gross Unrealized Depreciation | (17,282,677 | ) | ||
| Net Unrealized Appreciation | $ | 19,486,257 | ||
103
Table of Contents
SHAREHOLDER MEETING INFORMATION (UNAUDITED)
A special meeting of shareholders of ING Equity Trust was held on August 7, 2007, at the offices of ING Funds, 7337 East Doubletree Ranch Road, Scottsdale, AZ 85258.
A brief description of the matter voted upon as well as the results are outlined below:
Matter:
| 1 | To approve the appointment of ING Investment Management Co. (“ING IM”) as an additional sub-adviser to the Fund and the implementation of an additional sub-advisory agreement for the Fund between ING Investment, LLC, the Fund’s investment adviser, and ING IM. |
| Shares | ||||||||||||||||||||||||
| Voted | ||||||||||||||||||||||||
| Shares | Against or | Shares | Broker | Total Shares | ||||||||||||||||||||
| Proposal | Voted For | Withheld | Abstained | Non-Vote | Voted | |||||||||||||||||||
| ING SmallCap Value Choice Fund | 1 | 3,893,518 | 76,145 | 35,797 | — | 4,005,460 | ||||||||||||||||||
A special meeting of shareholders of ING Equity Trust was held on October 25, 2007, at the offices of ING Funds, 7337 East Doubletree Ranch Road, Scottsdale, AZ 85258.
A brief description of the matters voted upon as well as the results are outlined below:
Matter:
| 2 | To approve a “Manager-of-Managers” arrangement for certain Funds to permit the Funds’ investment adviser, subject to prior approval by the Board, to enter into and materially amend agreements with unaffiliated sub-advisers without obtaining the approval of the Funds’ shareholders. |
Result:
| Shares | ||||||||||||||||||||||||
| Voted | ||||||||||||||||||||||||
| Shares | Against or | Shares | Broker | Total Shares | ||||||||||||||||||||
| Proposal | Voted For | Withheld | Abstained | Non-Vote | Voted | |||||||||||||||||||
| ING Fundamental Research Fund | 2 | 1,268,668 | 102,079 | 37,727 | 650,358 | 2,058,832 | ||||||||||||||||||
| * | The Shareholder Meeting for ING Fundamental Research Fund was adjourned to November 21, 2007. |
Matter:
| 2 | To approve a “Manager-of-Managers” arrangement for certain Funds to permit the Funds’ investment adviser, subject to prior approval by the Board, to enter into and materially amend agreements with unaffiliated sub-advisers without obtaining the approval of the Funds’ shareholders. |
Result:
| Shares | ||||||||||||||||||||||||
| Voted | ||||||||||||||||||||||||
| Shares | Against or | Shares | Broker | Total Shares | ||||||||||||||||||||
| Proposal | Voted For | Withheld | Abstained | Non-Vote | Voted | |||||||||||||||||||
| ING SmallCap Opportunities Fund | 2 | 1,154,120 | 165,204 | 63,912 | 1,089,496 | 2,472,732 | ||||||||||||||||||
| * | The Shareholder Meeting for ING SmallCap Opportunities Fund was adjourned to November 21, 2007. |
104
Table of Contents
Matter:
| 2 | To approve a “Manager-of-Managers” arrangement for certain Funds to permit the Funds’ investment adviser, subject to prior approval by the Board, to enter into and materially amend agreements with unaffiliated sub-advisers without obtaining the approval of the Funds’ shareholders. |
| Shares | ||||||||||||||||||||||||
| Voted | ||||||||||||||||||||||||
| Shares | Against or | Shares | Broker | Total Shares | ||||||||||||||||||||
| Proposal | Voted For | Withheld | Abstained | Non-Vote | Voted | |||||||||||||||||||
| ING Value Choice Fund | 2 | 6,840,403 | 862,479 | 325,634 | 5,727,750 | 13,756,265 | ||||||||||||||||||
| * | The Shareholder Meeting for ING Value Choice Fund was adjourned to November 21, 2007. |
Matters:
| 2 | To approve a “Manager-of-Managers” arrangement for certain Funds to permit the Funds’ investment adviser, subject to prior approval by the Board, to enter into and materially amend agreements with unaffiliated sub-advisers without obtaining the approval of the Funds’ shareholders. | |
| 3 | To approve the conversion of certain Funds’ investment objectives from fundamental to non-fundamental. |
Results:
| Shares | ||||||||||||||||||||||||
| Voted | ||||||||||||||||||||||||
| Shares | Against or | Shares | Broker | Total Shares | ||||||||||||||||||||
| Proposal | Voted For | Withheld | Abstained | Non-Vote | Voted | |||||||||||||||||||
| ING Financial Services Fund | 2 | 4,351,393 | 725,630 | 189,004 | 3,683,209 | 8,949,236 | ||||||||||||||||||
| ING Financial Services Fund | 3 | 4,267,300 | 719,011 | 279,717 | 3,683,209 | 8,949,236 | ||||||||||||||||||
| * | The Shareholder Meeting for ING Financial Services Fund was adjourned to November 21, 2007. |
Matters:
| 2 | To approve a “Manager-of-Managers” arrangement for certain Funds to permit the Funds’ investment adviser, subject to prior approval by the Board, to enter into and materially amend agreements with unaffiliated sub-advisers without obtaining the approval of the Funds’ shareholders. | |
| 3 | To approve the conversion of certain Funds’ investment objectives from fundamental to non-fundamental. |
Results:
| Shares | ||||||||||||||||||||||||
| Voted | ||||||||||||||||||||||||
| Shares | Against or | Shares | Broker | Total Shares | ||||||||||||||||||||
| Proposal | Voted For | Withheld | Abstained | Non-Vote | Voted | |||||||||||||||||||
| ING LargeCap Growth Fund | 2 | 3,310,816 | 351,769 | 1,039,217 | 2,604,293 | 7,306,096 | ||||||||||||||||||
| ING LargeCap Growth Fund | 3 | 3,284,918 | 1,264,899 | 151,986 | 2,604,293 | 7,306,096 | ||||||||||||||||||
| * | The Shareholder Meeting for ING LargeCap Growth Fund was adjourned to November 21, 2007. |
Matters:
| 2 | To approve a “Manager-of-Managers” arrangement for certain Funds to permit the Funds’ investment adviser, subject to prior approval by the Board, to enter into and materially amend agreements with unaffiliated sub-advisers without obtaining the approval of the Funds’ shareholders. | |
| 3 | To approve the conversion of certain Funds’ investment objectives from fundamental to non-fundamental. |
105
Table of Contents
Results:
| Shares | ||||||||||||||||||||||||
| Voted | ||||||||||||||||||||||||
| Shares | Against or | Shares | Broker | Total Shares | ||||||||||||||||||||
| Proposal | Voted For | Withheld | Abstained | Non-Vote | Voted | |||||||||||||||||||
| ING MidCap Opportunities Fund | 2 | 4,777,018 | 576,575 | 182,155 | 3,323,042 | 8,858,790 | ||||||||||||||||||
| ING MidCap Opportunities Fund | 3 | 4,764,475 | 542,128 | 229,146 | 3,323,042 | 8,858,790 | ||||||||||||||||||
| * | The Shareholder Meeting for ING MidCap Opportunities Fund was adjourned to November 21, 2007. |
Matters:
| 2 | To approve a “Manager-of-Managers” arrangement for certain Funds to permit the Funds’ investment adviser, subject to prior approval by the Board, to enter into and materially amend agreements with unaffiliated sub-advisers without obtaining the approval 2 of the Funds’ shareholders. | |
| 3 | To approve the conversion of certain Funds’ investment objectives from fundamental to non-fundamental. |
Results:
| Shares | ||||||||||||||||||||||||
| Voted | ||||||||||||||||||||||||
| Shares | Against or | Shares | Broker | Total Shares | ||||||||||||||||||||
| Proposal | Voted For | Withheld | Abstained | Non-Vote | Voted | |||||||||||||||||||
| ING Real Estate Fund | 2 | 2,995,234 | 1,516,255 | 207,376 | 1,169,743 | 5,888,608 | ||||||||||||||||||
| ING Real Estate Fund | 3 | 3,032,597 | 1,469,668 | 216,600 | 1,169,743 | 5,888,608 | ||||||||||||||||||
| * | The Shareholder Meeting for ING Real Estate Fund was adjourned to November 21, 2007. |
Matters:
| 1 | To approve the election of eleven nominees to the Boards of Directors/ Trustees of the Funds. | |
| 6 | To amend ING Equity Trust’s Declaration of Trust to permit certain Fund reorganizations without obtaining shareholder approval but subject to approval by the Board. |
Results:
| ING Equity Trust Registrant |
| Shares | ||||||||||||||||||||||||
| Voted | ||||||||||||||||||||||||
| Shares Voted | Against or | Shares | Broker | Total Shares | ||||||||||||||||||||
| Proposal | For | Withheld | Abstained | Non-Vote | Voted | |||||||||||||||||||
| Colleen D. Baldwin | 1 | 142,838,245 | �� | 3,375,162 | 0 | 0 | 146,213,407 | |||||||||||||||||
| John V. Boyer | 1 | 142,839,786 | 3,373,621 | 0 | 0 | 146,213,407 | ||||||||||||||||||
| Patricia W. Chadwick | 1 | 142,879,042 | 3,334,365 | 0 | 0 | 146,213,407 | ||||||||||||||||||
| Robert W. Crispin | 1 | 142,786,154 | 3,427,254 | 0 | 0 | 146,213,407 | ||||||||||||||||||
| Peter S. Drotch | 1 | 142,818,018 | 3,395,389 | 0 | 0 | 146,213,407 | ||||||||||||||||||
| J. Michael Earley | 1 | 142,874,616 | 3,338,792 | 0 | 0 | 146,213,407 | ||||||||||||||||||
| Patrick W. Kenny | 1 | 142,859,525 | 3,353,882 | 0 | 0 | 146,213,407 | ||||||||||||||||||
| Shaun P. Mathews | 1 | 142,849,295 | 3,364,112 | 0 | 0 | 146,213,407 | ||||||||||||||||||
| Sheryl K. Pressler | 1 | 142,823,139 | 3,390,268 | 0 | 0 | 146,213,407 | ||||||||||||||||||
| David W.C. Putnam | 1 | 142,802,259 | 3,411,148 | 0 | 0 | 146,213,407 | ||||||||||||||||||
| Roger B. Vincent | 1 | 142,871,116 | 3,342,291 | 0 | 0 | 146,213,407 | ||||||||||||||||||
| ING Equity Trust Registrant | 6 | 65,255,655 | 9,875,266 | 4,136,288 | 66,946,198 | 146,213,407 | ||||||||||||||||||
| * | The Shareholder Meeting for ING Equity Trust Registrant was adjourned to November 21, 2007. |
106
Table of Contents
A special meeting of shareholders of ING Equity Trust was held on November 21, 2007, at the offices of ING Funds, 7337 East Doubletree Ranch Road, Scottsdale, AZ 85258.
A brief description of the matters voted upon as well as the results are outlined below:
Matter:
| 2 | To approve a “Manager-of-Managers” arrangement for certain Funds to permit the Funds’ investment adviser, subject to prior approval by the Board, to enter into and materially amend agreements with unaffiliated sub-advisers without obtaining the approval of the Funds’ shareholders. |
Result:
| Shares | ||||||||||||||||||||||||
| Voted | ||||||||||||||||||||||||
| Shares | Against or | Shares | Broker | Total Shares | ||||||||||||||||||||
| Proposal | Voted For | Withheld | Abstained | Non-Vote | Voted | |||||||||||||||||||
| ING Fundamental Research Fund | 2 | 1,443,305 | 113,432 | 40,108 | 522,567 | 2,119,413 | ||||||||||||||||||
Matter:
| 2 | To approve a “Manager-of-Managers” arrangement for certain Funds to permit the Funds’ investment adviser, subject to prior approval by the Board, to enter into and materially amend agreements with unaffiliated sub-advisers without obtaining the approval of the Funds’ shareholders. |
Result:
| Shares | ||||||||||||||||||||||||
| Voted | ||||||||||||||||||||||||
| Shares | Against or | Shares | Broker | Total Shares | ||||||||||||||||||||
| Proposal | Voted For | Withheld | Abstained | Non-Vote | Voted | |||||||||||||||||||
| ING SmallCap Opportunities Fund | 2 | 1,549,022 | 202,430 | 77,556 | 593,449 | 2,422,457 | ||||||||||||||||||
| * | The Shareholder Meeting for ING SmallCap Opportunities Fund was adjourned to December 17, 2007. |
Matter:
| 2 | To approve a “Manager-of-Managers” arrangement for certain Funds to permit the Funds’ investment adviser, subject to prior approval by the Board, to enter into and materially amend agreements with unaffiliated sub-advisers without obtaining the approval of the Funds’ shareholders. |
Result:
| Shares | ||||||||||||||||||||||||
| Voted | ||||||||||||||||||||||||
| Shares | Against or | Shares | Broker | Total Shares | ||||||||||||||||||||
| Proposal | Voted For | Withheld | Abstained | Non-Vote | Voted | |||||||||||||||||||
| ING Value Choice Fund | 2 | 7,784,617 | 974,083 | 370,128 | 4,342,949 | 13,471,777 | ||||||||||||||||||
| * | The Shareholder Meeting for ING Value Choice Fund was adjourned to December 17, 2007. |
Matters:
| 2 | To approve a “Manager-of-Managers” arrangement for certain Funds to permit the Funds’ investment adviser, subject to prior approval by the Board, to enter into and materially amend agreements with unaffiliated sub-advisers without obtaining the approval of the Funds’ shareholders. | |
| 3 | To approve the conversion of certain Funds’ investment objectives from fundamental to non-fundamental. |
107
Table of Contents
Results:
| Shares | ||||||||||||||||||||||||
| Voted | ||||||||||||||||||||||||
| Shares | Against or | Shares | Broker | Total Shares | ||||||||||||||||||||
| Proposal | Voted For | Withheld | Abstained | Non-Vote | Voted | |||||||||||||||||||
| ING Financial Services Fund | 2 | 5,009,683 | 850,934 | 229,618 | 2,546,973 | 8,637,208 | ||||||||||||||||||
| ING Financial Services Fund | 3 | 4,922,158 | 848,077 | 320,000 | 2,546,973 | 8,637,208 | ||||||||||||||||||
| * | The Shareholder Meeting for ING Financial Services Fund was adjourned to December 17, 2007. |
Matters:
| 2 | To approve a “Manager-of-Managers” arrangement for certain Funds to permit the Funds’ investment adviser, subject to prior approval by the Board, to enter into and materially amend agreements with unaffiliated sub-advisers without obtaining the approval of the Funds’ shareholders. | |
| 3 | To approve the conversion of certain Funds’ investment objectives from fundamental to non-fundamental. |
Results:
| Shares | ||||||||||||||||||||||||
| Voted | ||||||||||||||||||||||||
| Shares | Against or | Shares | Broker | Total Shares | ||||||||||||||||||||
| Proposal | Voted For | Withheld | Abstained | Non-Vote | Voted | |||||||||||||||||||
| ING LargeCap Growth Fund | 2 | 5,090,772 | 433,801 | 1,182,972 | 1,740,115 | 8,447,660 | ||||||||||||||||||
| ING LargeCap Growth Fund | 3 | 5,064,558 | 1,342,472 | 300,515 | 1,740,115 | 8,447,660 | ||||||||||||||||||
| * | The Shareholder Meeting for ING LargeCap Growth Fund was adjourned to December 17, 2007. |
Matters:
| 2 | To approve a “Manager-of-Managers” arrangement for certain Funds to permit the Funds’ investment adviser, subject to prior approval by the Board, to enter into and materially amend agreements with unaffiliated sub-advisers without obtaining the approval of the Funds’ shareholders. | |
| 3 | To approve the conversion of certain Funds’ investment objectives from fundamental to non-fundamental. |
Results:
| Shares | ||||||||||||||||||||||||
| Voted | ||||||||||||||||||||||||
| Shares | Against or | Shares | Broker | Total Shares | ||||||||||||||||||||
| Proposal | Voted For | Withheld | Abstained | Non-Vote | Voted | |||||||||||||||||||
| ING MidCap Opportunities Fund | 2 | 5,731,422 | 653,748 | 236,237 | 2,638,491 | 9,259,899 | ||||||||||||||||||
| ING MidCap Opportunities Fund | 3 | 5,720,977 | 614,518 | 285,913 | 2,638,491 | 9,259,899 | ||||||||||||||||||
| * | The Shareholder Meeting for ING MidCap Opportunities Fund was adjourned to December 17, 2007. |
Matters:
| 2 | To approve a “Manager-of-Managers” arrangement for certain Funds to permit the Funds’ investment adviser, subject to prior approval by the Board, to enter into and materially amend agreements with unaffiliated sub-advisers without obtaining the approval of the Funds’ shareholders. | |
| 3 | To approve the conversion of certain Funds’ investment objectives from fundamental to non-fundamental. |
108
Table of Contents
Results:
| Shares | ||||||||||||||||||||||||
| Voted | ||||||||||||||||||||||||
| Shares | Against or | Shares | Broker | Total Shares | ||||||||||||||||||||
| Proposal | Voted For | Withheld | Abstained | Non-Vote | Voted | |||||||||||||||||||
| ING Real Estate Fund | 2 | 5,180,936 | 1,564,685 | 265,515 | 1,128,923 | 8,140,060 | ||||||||||||||||||
| ING Real Estate Fund | 3 | 5,201,517 | 1,515,693 | 293,927 | 1,128,923 | 8,140,060 | ||||||||||||||||||
| * | The Shareholder Meeting for ING Real Estate Fund was adjourned to December 17, 2007. |
Matters:
| 1 | To approve the election of eleven nominees to the Boards of Directors/ Trustees of the Funds. | |
| 6 | To amend ING Equity Trust’s Declaration of Trust to permit certain Fund reorganizations without obtaining shareholder approval but subject to approval by the Board. |
Results:
ING Equity Trust Registrant
| Shares | ||||||||||||||||||||||||
| Voted | ||||||||||||||||||||||||
| Shares | Against or | Shares | Broker | Total Shares | ||||||||||||||||||||
| Proposal | Voted For | Withheld | Abstained | Non-Vote | Voted | |||||||||||||||||||
| Colleen D. Baldwin | 1 | 145,594,807 | 4,063,187 | 0 | 0 | 149,657,995 | ||||||||||||||||||
| John V. Boyer | 1 | 145,598,175 | 4,059,820 | 0 | 0 | 149,657,995 | ||||||||||||||||||
| Patricia W. Chadwick | 1 | 145,638,822 | 4,019,173 | 0 | 0 | 149,657,995 | ||||||||||||||||||
| Robert W. Crispin | 1 | 145,549,893 | 4,108,101 | 0 | 0 | 149,657,995 | ||||||||||||||||||
| Peter S. Drotch | 1 | 145,578,905 | 4,079,090 | 0 | 0 | 149,657,995 | ||||||||||||||||||
| J. Michael Earley | 1 | 145,638,445 | 4,019,550 | 0 | 0 | 149,657,995 | ||||||||||||||||||
| Patrick W. Kenny | 1 | 145,623,559 | 4,034,435 | 0 | 0 | 149,657,995 | ||||||||||||||||||
| Shaun P. Mathews | 1 | 145,610,088 | 4,047,907 | 0 | 0 | 149,657,995 | ||||||||||||||||||
| Sheryl K. Pressler | 1 | 145,572,261 | 4,085,734 | 0 | 0 | 149,657,995 | ||||||||||||||||||
| David W.C. Putnam | 1 | 145,565,970 | 4,092,024 | 0 | 0 | 149,657,995 | ||||||||||||||||||
| Roger B. Vincent | 1 | 145,638,762 | 4,019,232 | 0 | 0 | 149,657,995 | ||||||||||||||||||
| ING Equity Trust Registrant | 6 | 79,506,308 | 10,668,337 | 4,710,838 | 54,772,512 | 149,657,995 | ||||||||||||||||||
| * | The Shareholder Meeting for ING Equity Trust Registrant was adjourned to December 17, 2007. |
109
Table of Contents
BOARD CONSIDERATION AND APPROVAL/
Section 15(c) of the Investment Company Act of 1940 (the “1940 Act”) provides that, after an initial period, the Funds’ existing investment advisory and sub-advisory contracts will remain in effect only if the Boards of Directors/ Trustees (the “Board”) of ING Investment Funds, Inc. and ING Equity Trust, including a majority of Board members who have no direct or indirect interest in the advisory and sub-advisory contracts, and who are not “interested persons” of the Funds, as such term is defined under the 1940 Act (the “Independent Directors/ Trustees”), annually review and approve them. Thus, at a meeting held on November 30, 2007, the Board, including a majority of the Independent Directors/ Trustees, considered whether to renew the investment advisory contracts (the “Advisory Contracts”) between ING Investments, LLC (the “Adviser”) and the Funds and the sub-advisory contracts (“Sub-Advisory Contracts”) with one or more sub-advisers to each Fund (the “Sub-Advisers”).
The Independent Directors/ Trustees also held separate meetings on October 10 and November 28, 2007 to consider the renewal of the Advisory Contracts and Sub-Advisory Contracts. As a result, subsequent references herein to factors considered and determinations made by the Independent Directors/ Trustees include, as applicable, factors considered and determinations made on those earlier dates by the Independent Directors/ Trustees.
At its November 30, 2007 meeting, the Board voted to renew the Advisory and Sub-Advisory Contracts for the Funds. In reaching these decisions, the Board took into account information furnished to it throughout the year at regular meetings of the Board and the Board’s committees, as well as information prepared specifically in connection with the annual renewal process. Determinations by the Independent Directors/ Trustees also took into account various factors that they believed, in light of the legal advice furnished to them by Kirkpatrick & Lockhart Preston Gates Ellis LLP (“K&L Gates”), their independent legal counsel, and their own business judgment, to be relevant. Further, while the Advisory Contracts and Sub-Advisory Contracts for all the Funds were considered at the same Board meeting, the Directors/ Trustees considered each Fund’s advisory and sub-advisory relationships separately.
Provided below is an overview of the Board’s contract approval process in general, as well as a discussion of certain specific factors that the Board considered at its renewal meeting. While the Board gave its attention to the information furnished, at its request, that was most relevant to its considerations, discussed below are a number of the primary factors relevant to the Board’s consideration as to whether to renew the Advisory and Sub-Advisory Contracts for the one-year period ending November 30, 2008. Each Board member may have accorded different weight to the various factors in reaching his or her conclusions with respect to each Fund’s advisory and sub-advisory arrangements.
Overview of the Contract Renewal and Approval Process
Several years ago, the Independent Directors/ Trustees instituted a revised process by which they seek and consider relevant information when they decide whether to approve new or existing advisory and sub-advisory arrangements for the investment companies in the ING Funds complex under their jurisdiction, including the Funds’ existing Advisory and Sub-Advisory Contracts. Among other actions, the Independent Directors/ Trustees: retained the services of independent consultants with experience in the mutual fund industry to assist the Independent Directors/ Trustees in working with the personnel employed by the Adviser or its affiliates who administer the Funds (“Management”) to identify the types of information presented to the Board to inform its deliberations with respect to advisory and sub-advisory relationships and to help evaluate that information; established a specific format in which certain requested information is provided to the Board; and determined the process for reviewing such information in connection with Advisory and Sub-Advisory Contract renewals and approvals. The end result was an enhanced process which is currently employed by the Independent Directors/ Trustees to review and analyze information in connection with their annual renewal of the Funds’ Advisory and Sub-Advisory Contracts, as well as their review and approval of new advisory relationships.
Since the current renewal and approval process was first implemented, the Board’s membership has changed substantially through periodic retirements of
110
Table of Contents
some Directors/ Trustees and the appointment and election of new Directors/ Trustees. In addition, throughout this period the Independent Directors/ Trustees have reviewed and refined the renewal and approval process at least annually. The Board also established a Contracts Committee and two Investment Review Committees, including the Domestic Equity Funds Investment Review Committee (the “DE IRC”). Among other matters, the Contracts Committee provides oversight with respect to the contracts renewal process, and each Fund is assigned to the DE IRC, which provides oversight regarding, among other matters, investment performance.
The type and format of the information provided to the Board or to legal counsel for the Independent Directors/ Trustees in connection with the contract approval and renewal process has been codified in the Funds’ 15(c) Methodology Guide. This Guide was developed under the direction of the Independent Directors/ Trustees and sets out a blueprint pursuant to which the Independent Directors/ Trustees request certain information that they deem important to facilitate an informed review in connection with initial and annual approvals of Advisory and Sub-Advisory Contracts.
Management provides certain of the information requested by the 15(c) Methodology Guide in Fund Analysis and Comparison Tables (“FACT sheets”) prior to the Independent Directors/ Trustees’ review of Advisory and Sub-Advisory Contracts. The Independent Directors/ Trustees previously retained an independent firm to verify and test the accuracy of certain FACT sheet data for a representative sample of Funds in the ING Funds complex. In 2007, the Contracts Committee employed the services of an independent consultant to assist in its review and analysis of, among other matters, the 15(c) Methodology Guide, the content and format of the FACT sheets, and proposed selected peer groups of investment companies (“SPGs”) to be used by each Fund for certain comparison purposes during the renewal process.
As part of an ongoing process, the Contracts Committee recommends or considers recommendations from Management for refinements to the 15(c) Methodology Guide and other aspects of the review process, and the Board’s Investment Review Committees review benchmarks used to assess the performance of each Fund in the ING Funds complex. The DE IRC may apply a heightened level of scrutiny in cases where performance has lagged a Fund’s relevant benchmark and/or SPG.
The Board employed its process for reviewing contracts when considering the renewals of the Advisory and Sub-Advisory Contracts that would be effective through November 30, 2008. Set forth below is a discussion of many of the Board’s primary considerations and conclusions resulting from this process are discussed below.
Nature, Extent and Quality of Service
In determining whether to approve the Advisory Contracts and Sub-Advisory Contracts for the Funds for the year ending November 30, 2008, the Independent Directors/ Trustees received and evaluated such information as they deemed necessary regarding the nature, extent and quality of services provided to the Funds by the Adviser and Sub-Advisers. This included information regarding the Adviser and Sub-Advisers to the Funds provided throughout the year at regular meetings of the Board and its committees, as well as information furnished in connection with the contract renewal meetings.
The materials requested by and provided to the Board and/or to K&L Gates prior to the November 30, 2007 Board meeting included, among other information, the following items: (1) FACT sheets for each Fund that provided information regarding the performance and expenses of the Fund and other similarly managed funds in an SPG, as well as information regarding the Fund’s investment portfolio, objectives and strategies; (2) the 15(c) Methodology Guide, which describes how the FACT sheets were prepared, including the manner in which benchmarks and SPGs were selected and how profitability was determined; (3) responses from the Adviser and Sub-Advisers to a series of questions posed by K&L Gates on behalf of the Directors/ Trustees; (4) copies of each form of Advisory Contract and Sub-Advisory Contract; (5) copies of the Forms ADV for the Adviser and each Sub-Adviser to the Funds; (6) financial statements for the Adviser and each Sub-Adviser; (7) drafts of narrative summaries addressing key factors the Board customarily considers in evaluating the renewals of Advisory Contracts and Sub-Advisory Contracts, including a written analysis for each Fund of how performance, fees and expenses compare to its SPG and/or designated benchmarks; (8) independent analyses of Fund performance by the Funds’ Chief Investment Risk Officer; (9) information regarding net
111
Table of Contents
asset flows into and out of the Funds; and (10) other information relevant to the Board’s evaluations.
For each Fund, of its Class A shares were used for purposes of certain comparisons to the funds in its SPG. Class A shares generally were selected so that the Fund class with the longest performance history was compared to the analogous class of shares for each SPG fund. The mutual funds included in a Fund’s SPG were selected based upon criteria designed to mirror the Fund class being compared to the SPG.
In arriving at its conclusions with respect to the Advisory Contracts, the Board was mindful of the “manager-of-managers” platform of the ING Funds that has been developed by Management. The Board also considered the techniques that the Adviser has developed, at the Board’s direction, to screen and perform due diligence on Sub-Advisers that are recommended to the Board to manage the Funds’ portfolios. The Board noted the resources that the Adviser has committed to the Board and to its Investment Review Committees to assist the Board and its committees with their assessment of the investment performance of the Funds in the ING Funds complex on an ongoing basis throughout the year. This includes the appointment of a Chief Investment Risk Officer and his staff, who report directly to the Board and who have developed attribution analyses and other metrics used by the DE IRC to analyze the key factors underlying investment performance for the Funds.
The Board also noted the techniques used by the Adviser to monitor the performance of Sub-Advisers and the proactive approach that the Adviser, working in cooperation with the DE IRC, has taken to advocate or recommend, when it believed appropriate, changes designed to assist in improving the Funds’ performance. Such changes could include, for example, changes in personnel who are responsible for managing a Fund’s portfolio and/or changing the Sub-Adviser to a Fund.
In considering the Funds’ Advisory Contracts, the Board also considered the extent of benefits provided to the Funds’ shareholders, beyond advisory services, from being part of the ING family of Funds. This includes, in most cases, the right to exchange or transfer investments, without a sales charge, between the same class of shares of such Funds or among Funds available on a product platform, and the wide range of Funds available for exchange or transfer.
The Board also took into account the Adviser’s efforts in recent years to reduce the expenses of the ING Funds through renegotiated arrangements with the ING Funds’ service providers. In addition, the Board considered the efforts of the Adviser and the expenses that it incurred in recent years to help make the ING Funds complex more efficient by combinations of similar funds.
Further, the Board received periodic reports showing that the investment policies and restrictions for each Fund were consistently complied with and other periodic reports covering matters such as compliance by Adviser and Sub-Adviser personnel with codes of ethics. The Board considered reports from the Funds’ Chief Compliance Officer (“CCO”) evaluating whether the regulatory compliance systems and procedures of the Adviser and each Sub-Adviser are reasonably designed to assure compliance with the federal securities laws, including those related to, among others, late trading and market timing, best execution, fair value pricing, proxy voting and trade allocation practices. The Board also took into account the CCO’s annual and periodic reports and recommendations with respect to service provider compliance programs. In this regard, the Board also considered the policies and procedures developed by the CCO in consultation with the Board’s Compliance Committee that guide the CCO’s compliance oversight function.
The Board reviewed the level of staffing, quality and experience of each Fund’s portfolio management team. The Board took into account the respective resources and reputations of the Adviser and the Sub-Advisers, and evaluated the ability of the Adviser and the Sub-Advisers to attract and retain qualified investment advisory personnel. The Board also considered the adequacy of the resources committed to the Funds (and other relevant funds in the ING Funds complex) by the Adviser and the Sub-Advisers, and whether those resources are commensurate with the needs of the Funds and are sufficient to sustain appropriate levels of performance and compliance needs.
Based on their deliberations and the materials presented to them, the Board concluded that the advisory and related services provided by the Adviser and Sub-Advisers are appropriate in light of the Funds’ operations, the competitive landscape of the investment company business, and investor needs, and that the nature and quality of the overall services
112
Table of Contents
provided by the Adviser and Sub-Advisers were appropriate.
Fund Performance
In assessing advisory and sub-advisory relationships, the Board placed emphasis on the net investment returns of each Fund. While the Board considered the performance reports and discussions with portfolio managers at Board and committee meetings during the year, particular attention in assessing performance was given to the FACT sheets furnished in connection with the renewal process. The FACT sheet prepared for each Fund included its investment performance compared to the Fund’s Morningstar category median, Lipper category median, SPG and primary benchmark. The Board’s findings specific to each Fund’s performance are discussed under “Fund-by-Fund Analysis,” below.
Economies of Scale
When evaluating the reasonableness of advisory fee rates, the Board also considered whether economies of scale will be realized by the Adviser as a Fund grows larger and the extent to which any such economies are reflected in contractual fee rates. In this regard, the Board noted any breakpoints in advisory fee schedules that resulted in a lower advisory fee rate because a Fund achieved sufficient asset levels to receive a breakpoint discount. In the case of sub-advisory fees, the Board considered that breakpoints would inure to the benefit of the Adviser, except to the extent that there are corresponding advisory fee breakpoints or waivers. For a Fund that did not have advisory fee breakpoints, but did benefit from waivers or reimbursements of advisory or other fees, the Board also considered the extent to which economies of scale could be realized through such waivers, reimbursements or expense reductions.
In evaluating economies of scale, the Independent Directors/ Trustees also considered prior periodic management reports and industry information on this topic, and the Independent Directors/ Trustees who were Board members at that time also considered a November 2006 evaluation and analysis presented to them by an independent consultant regarding fee breakpoint arrangements and economies of scale.
Information Regarding Services to Other Clients
The Board requested and, if received, considered information regarding the nature of services and fee rates offered by the Adviser and the Sub-Advisers to other clients, including other registered investment companies and institutional accounts. When fee rates offered to other clients differed materially from those charged to the Funds, the Board considered any underlying rationale provided by the Adviser or Sub-Advisers for these differences. For unaffiliated Sub-Advisers, the Board did not view this information as being a key factor in its deliberations because of the arms-length nature of negotiations between the Adviser and unaffiliated Sub-Advisers with respect to sub-advisory fee rates. The Board also noted that the fee rates charged to the Funds and similar institutional clients may differ materially due to the different services and additional regulatory overlay associated with registered investment companies, such as the Funds.
Fee Rates and Profitability
The Board reviewed and considered each contractual investment advisory fee rate, combined with the administrative fee rate, payable by each Fund to the Adviser. The Board also considered the contractual sub-advisory fee rates payable by the Adviser to each Sub-Adviser for sub-advisory services. In addition, the Board considered any existing and proposed fee waivers and expense limitations applicable to the fees payable by the Funds.
The Board considered the fee structures of each Fund as they relate to the services provided under the contracts and the potential fall-out benefits to the Adviser and Sub-Advisers and their respective affiliates from their association with the Funds. For each Fund, the Board determined that the fees payable to the Adviser and Sub-Advisers are reasonable for the services that each performs, which were considered in light of the nature and quality of the services that each has performed and is expected to perform.
For each Fund, the Board considered information on revenues, costs and profits realized by the Adviser, which was prepared by Management in accordance with the allocation methodology (including related assumptions) specified in the 15(c) Methodology Guide. In analyzing the profitability of the Adviser in connection with its services to a Fund, the Board took into account the sub-advisory fee rate payable by the Adviser to the Sub-Adviser to that Fund. The Board also considered information that it requested and was provided by Management with respect to the
113
Table of Contents
profitability of service providers affiliated with the Adviser, as well as information provided by certain Sub-Advisers with respect to their profitability. In the case of non-affiliated Sub-Advisers, the Board gave less weight to profitability considerations, or did not view this data as imperative to its deliberations, given the arm’s-length nature of the relationship between the Adviser and these Sub-Advisers with respect to the negotiation of sub-advisory fee rates.
The Board determined that it had requested and received sufficient information to gain a reasonable understanding regarding the Adviser’s and affiliated Sub-Advisers’ profitability. The Board also recognized that profitability analysis is not an exact science and there is no uniform methodology for determining profitability for this purpose. In this context, the Board realized that Management’s calculations regarding its costs incurred in establishing the infrastructure necessary for the Funds’ operations may not be fully reflected in the expenses allocated to each Fund in determining profitability, and that the information presented may not portray all of the costs borne by Management or capture Management’s entrepreneurial risk associated with offering and managing a mutual fund complex in the current regulatory and market environment.
In their review of advisory fee rates, the Independent Directors/ Trustees, from time to time, have directed the Adviser, and the Adviser has agreed, to implement remedial actions for certain Funds within the ING Funds complex. These remedial actions have included, among others: reductions in expense caps or management fee rates; the addition of further breakpoints to fee schedules; reductions in Rule 12b-1 fees payable by a Fund; the merger of certain Funds with and into comparable Funds; changes to the Sub-Adviser or portfolio manager managing a Fund; and enhancements to the resources available to a Sub-Adviser when managing a Fund. As applicable, the Independent Directors/ Trustees have requested these adjustments primarily on the basis of a Fund’s performance as compared to its peer group or benchmarks, or its management fee rate or overall expense ratio in relation to its peer group.
Based on the information on revenues, costs, and profitability considered by the Board, and after considering the factors described in this section, as well as any remedial actions requested by the Independent Directors/ Trustees and agreed to by the Adviser, the Board concluded that the profits, if any, realized by the Adviser and Sub-Advisers were not excessive. In making its determinations, the Board considered that the Adviser had incentives to negotiate the most favorable fees from unaffiliated Sub-Advisers, and it based its conclusions on the reasonableness of the sub-advisory fees of the Sub-Advisers primarily on the factors described for each Fund below and, in the case of non-affiliated Sub-Advisers, in reliance on the arm’s-length nature of the negotiations between the Adviser and Sub-Advisers with respect to sub-advisory fees.
Fund-by-Fund Analysis
The following paragraphs outline certain of the specific factors that the Board considered, and the conclusions reached, at its November 30, 2007 meeting in relation to renewing each Fund’s current Advisory Contract and its Sub-Advisory Contract for the year ending November 30, 2008. These specific factors are in addition to those considerations discussed above. In each case, the Fund’s performance was compared to its Morningstar category median and its primary benchmark, a broad-based securities market index that appears in the Fund’s prospectus. With respect to Morningstar quintile rankings, the first quintile represents the highest (best) performance and the fifth quintile represents the lowest performance. Each Fund’s management fee and expense ratio were compared to the fees and expense ratios of the funds in its SPG.
ING Financial Services Fund
In considering whether to approve the renewal of the Advisory and Sub-Advisory Contracts for ING Financial Services Fund, the Board considered that, based on performance data for the periods ended June 30, 2007: (1) the Fund outperformed its Morningstar category median for all periods presented with the exception of the year-to-date and ten-year periods, during which it underperformed; (2) the Fund outperformed its primary benchmark for all periods presented; and (3) the Fund is ranked in the third quintile of its Morningstar category for the most recent calendar quarter, one-year, three-year, and five-year periods, and the fourth quintile for the year-to-date period.
In considering the fees payable under the Advisory and Sub-Advisory Contracts for ING Financial Services Fund, the Board took into account the factors described above and also considered: (1) the
114
Table of Contents
economies of scale benefits to the Fund and its shareholders from breakpoint discounts applicable to the Fund’s advisory fees, which result in lower fees at higher asset levels; (2) the pricing structure (including the expense ratio to be borne by shareholders) of the Fund, as compared to its Selected Peer Group, including that: (a) the management fee for the Fund is below the median and the average management fees of the funds in its Selected Peer Group; and (b) the expense ratio for the Fund is below the median and the average expense ratios of the funds in its Selected Peer Group.
After its deliberation, the Board reached the following conclusions: (1) the Fund’s management fee rate is reasonable in the context of all factors considered by the Board; (2) the Fund’s expense ratio is reasonable in the context of all factors considered by the Board; (3) the Fund’s performance is reasonable in the context of all factors considered by the Board; (4) the sub-advisory fee rate payable by the Adviser to the Sub-Adviser is reasonable in the context of all factors considered by the Board. Based on these conclusions and other factors, the Board voted to renew the Advisory and Sub-Advisory Contracts for the Fund for the year ending November 30, 2008. During this renewal process, different Board members may have given different weight to different individual factors and related conclusions.
ING Fundamental Research Fund
In considering whether to approve the renewal of the Advisory and Sub-Advisory Contracts for ING Fundamental Research Fund, the Board considered that, based on performance data for the periods ended June 30, 2007: (1) the Fund outperformed its Morningstar category median for all periods presented, with the exception of the one-year period, during which it underperformed; (2) the Fund outperformed its primary benchmark for all periods presented, with the exception of the one-year period, during which it underperformed; and (3) the Fund is ranked in the second quintile of its Morningstar category for the most recent calendar quarter, and in the third quintile for the year-to-date and one-year periods.
In analyzing this performance data, the Board took into account that the Fund launched in January 2006, and therefore had a limited operating history for purposes of performance comparisons.
In considering the fees payable under the Advisory and Sub-Advisory Contracts for ING Fundamental Research Fund, the Board took into account the factors described above and also considered: (1) the fairness of the compensation under an Advisory Contract with a breakpoint fee schedule where the asset level necessary to achieve a breakpoint discount had not been reached by the Fund; and (2) the pricing structure (including the expense ratio to be borne by shareholders) of the Fund as compared to its Selected Peer Group, including that: (a) the management fee (inclusive of the advisory fee and 0.10% administration fee) for the Fund is below the median and the average management fees of the funds in its Selected Peer Group; and (b) the expense ratio for the Fund is below the median and the average expense ratios of the funds in its Selected Peer Group.
After its deliberation, the Board reached the following conclusions: (1) the Fund’s management fee rate is reasonable in the context of all factors considered by the Board; (2) the Fund’s expense ratio is reasonable in the context of all factors considered by the Board; (3) the Fund was launched in June 2006, and it is reasonable to permit the Fund to establish a longer operating history for purposes of evaluating performance; and (4) the sub-advisory fee rate payable by the Adviser to the Sub-Adviser is reasonable in the context of all factors considered by the Board. Based on these conclusions and other factors, the Board voted to renew the Advisory and Sub-Advisory Contracts for the Fund for the year ending November 30, 2008. During this renewal process, different Board members may have given different weight to different individual factors and related conclusions.
ING LargeCap Growth Fund
In considering whether to approve the renewal of the Advisory and Sub-Advisory Contracts for ING LargeCap Growth Fund, the Board considered that, based on performance data for the periods ended June 30, 2007: (1) the Fund underperformed its Morningstar category median for all periods presented with the exception of the most recent calendar quarter and year-to-date periods, during which it outperformed; (2) the Fund underperformed its primary benchmark for all periods presented, with the exception of the most recent calendar quarter and year-to-date periods, during which it outperformed; and (3) the Fund is ranked in the first (highest) quintile of its Morningstar category for the
115
Table of Contents
most recent calendar quarter, the third quintile for the year-to-date period, the fourth quintile for the one-year and five-year periods, and the fifth (lowest) quintile for the three-year period.
In analyzing this performance data, the Board took into account: (1) Management’s analysis of the negative effect that stock selection had on the Fund’s performance; and (2) that Management would continue to monitor, and the Board or its Investment Review Committee would periodically review, the Fund’s investment performance.
In considering the fees payable under the Advisory and Sub-Advisory Contracts for ING LargeCap Growth Fund, the Board took into account the factors described above and also considered: (1) the fairness of the compensation under an Advisory Contract with a breakpoint fee schedule where the asset level necessary to achieve a breakpoint discount had not been reached by the Fund; (2) the pricing structure (including the expense ratio to be borne by shareholders) of the Fund as compared to its Selected Peer Group, including that: (a) the management fee (inclusive of 0.10% administration fee) for the Fund is above the median and the average management fees of the funds in its Selected Peer Group; and (b) the expense ratio for the Fund is above the median and the average expense ratios of the funds in its Selected Peer Group.
After its deliberation, the Board reached the following conclusions: (1) the Fund’s management fee rate is reasonable in the context of all factors considered by the Board; (2) the Fund’s expense ratio is reasonable in the context of all factors considered by the Board; (3) taking into account that Management will continue to monitor, and the Board or its Investment Review Committee will periodically review, its performance, the Fund’s performance is reasonable in the context of all factors considered by the Board; and (4) the sub-advisory fee rate payable by the Adviser to the Sub-Adviser is reasonable in the context of all factors considered by the Board. Based on these conclusions and other factors, the Board voted to renew the Advisory and Sub-Advisory Contracts for the Fund for the year ending November 30, 2008. During this renewal process, different Board members may have given different weight to different individual factors and related conclusions.
ING LargeCap Value Fund
In considering whether to approve the renewal of the Advisory and Sub-Advisory Contracts for ING LargeCap Value Fund, the Board considered that, based on performance data for the periods ended June 30, 2007: (1) the Fund outperformed its Morningstar category median for all periods presented, with the exception of the three-year period, which it underperformed; (2) the Fund outperformed its primary benchmark for all periods presented, with the exception of the three-year period, which it underperformed; and (3) the Fund is ranked in the first (highest) quintile of its Morningstar category for the most recent calendar quarter and one-year periods, the second quintile for the year-to-date period, and the fourth quintile for the three-year period.
In considering the fees payable under the Advisory and Sub-Advisory Contracts for ING LargeCap Value Fund, the Board took into account the factors described above and also considered: (1) the economies of scale benefits to the Fund and its shareholders from breakpoint discounts applicable to the Fund’s advisory fees, which result in lower fees at higher asset levels; (2) the pricing structure (including the expense ratio to be borne by shareholders) of ING LargeCap Value Fund, as compared to its Selected Peer Group, including that: (a) the management fee (inclusive of 0.10% administration fee) for the Fund is above the median and above the average management fees of the funds in its Selected Peer Group; and (b) the expense ratio for the Fund is above the median and above the average expense ratios of the funds in its Selected Peer Group.
After its deliberation, the Board reached the following conclusions: (1) the Fund’s management fee rate is reasonable in the context of all factors considered by the Board; (2) the Fund’s expense ratio is reasonable in the context of all factors considered by the board; (3) the Fund’s performance is reasonable in the context of all factors considered by the Board; and (4) the sub-advisory fee rate payable by the Adviser to the Sub-Adviser is reasonable in the context of all factors considered by the Board. Based on these conclusions and other factors, the Board voted to renew the Advisory and Sub-Advisory Contracts for the Fund for the year ending November 30, 2008. During this renewal process, different Board members may have given different
116
Table of Contents
weight to different individual factors and related conclusions.
ING MidCap Opportunities Fund
In considering whether to approve the renewal of the Advisory and Sub-Advisory Contracts for ING MidCap Opportunities Fund, the Board considered that, based on performance data for the periods ended June 30, 2007: (1) the Fund underperformed its Morningstar category median for all periods presented, with the exception of the most recent calendar quarter and year-to-date periods, during which it outperformed; (2) the Fund underperformed its primary benchmark for all periods presented, with the exception of the most recent calendar quarter and year-to-date periods, during which it outperformed; and (3) the Fund is ranked in the first (highest) quintile of its Morningstar category for the most recent calendar quarter and year-to-date periods, the third quintile for the one-year and three-year periods, and the fourth quintile for the five-year period.
In analyzing this performance data, the Board took into account: (1) Management’s analysis regarding the reasons for underperformance, including the negative effect of stock selection; and (2) in July 2005 a new portfolio management team assumed responsibility for managing the Fund’s assets.
In considering the fees payable under the Advisory and Sub-Advisory Contracts for ING MidCap Opportunities Fund, the Board took into account the factors described above and also considered: (1) the fairness of the compensation under an Advisory Contract with a breakpoint fee schedule where the asset level necessary to achieve a breakpoint discount had not been reached by the Fund; and (2) the pricing structure (including the expense ratio to be borne by shareholders) of the Fund as compared to its Selected Peer Group, including that: (a) the management fee (inclusive of 0.10% administration fee) for the Fund is above the median and the average management fees of the funds in its Selected Peer Group; and (b) the expense ratio for the Fund is below the median and the average expense ratios of the funds in its Selected Peer Group.
In analyzing this fee data, the Board took into account: (1) the advisory fee waivers that Management had put into place, which lower the effective management fee rate payable by the Fund; (2) advisory fee reductions that Management would put into place, at the Board’s direction, following the 2007 annual contract renewal process; and (3) that the reductions in the Fund’s advisory fees were accompanied by an increase in the Fund’s contractual expense limits.
After its deliberation, the Board reached the following conclusions: (1) the Fund’s management fee rate is reasonable in the context of all factors considered by the Board; (2) the Fund’s expense ratio is reasonable in the context of all factors considered by the Board; (3) the portfolio managers were changed in July 2005 and it is reasonable to permit the Sub-Adviser to continue manage the Fund to appropriately assess the longer-term performance of the portfolio management team; and (4) the sub-advisory fee rate payable by the Adviser to the Sub-Adviser is reasonable in the context of all factors considered by the Board. Based on these conclusions and other factors, the Board voted to renew the Advisory and Sub-Advisory Contracts for the Fund for the year ending November 30, 2008. During this renewal process, different Board members may have given different weight to different individual factors and related conclusions.
ING Opportunistic LargeCap Fund
In considering whether to approve the renewal of the Advisory and Sub-Advisory Contracts for ING Opportunistic LargeCap Fund, the Board considered that, based on performance data for the periods ended June 30, 2007: (1) the Fund outperformed its Morningstar category median for all periods presented, with the exception of the most recent calendar quarter, during which it underperformed; (2) the Fund underperformed its benchmark for the most recent calendar quarter and one-year periods, but outperformed for the year-to-date period; and (3) the Fund is ranked in the second quintile of its Morningstar category for the year-to-date and one-year periods, and in the fifth (lowest) quintile for the most recent calendar quarter.
In analyzing this performance data, the Board took into account that the Fund was launched in December 2005, and therefore had a limited operating history for purposes of performance comparisons.
In considering the fees payable under the Advisory and Sub-Advisory Contracts for ING Opportunistic LargeCap Fund, the Board took into account the factors described above and also considered: (1) the fairness of the compensation under an Advisory Contract with a breakpoint fee schedule where the
117
Table of Contents
asset level necessary to achieve a breakpoint discount had not been reached by the Fund; and (2) the pricing structure (including the expense ratio to be borne by shareholders) of the Fund as compared to its Selected Peer Group, including that: (a) the management fee (inclusive of 0.10% administration fee) for the Fund is below the median and the average management fees of the funds in its Selected Peer Group; and (b) the expense ratio for the Fund is below the median and the average expense ratios of the funds in its Selected Peer Group.
After its deliberation, the Board reached the following conclusions: (1) the Fund’s management fee rate is reasonable in the context of all factors considered by the Board; (2) the Fund’s expense ratio is reasonable in the context of all factors considered by the Board; (3) the Fund was launched in December 2005 and it is reasonable to permit the Sub-Adviser to continue to manage the Fund to appropriately evaluate longer-term performance; and (4) the sub-advisory fee rate payable by the Adviser to the Sub-Adviser is reasonable in the context of all factors considered by the Board. Based on these conclusions and other factors, the Board voted to renew the Advisory and Sub-Advisory Contracts for the Fund for the year ending November 30, 2008. During this renewal process, different Board members may have given different weight to different individual factors and related conclusions.
ING Real Estate Fund
In considering whether to approve the renewal of the Advisory and Sub-Advisory Contracts for ING Real Estate Fund, the Board considered that, based on performance data for the periods ended June 30, 2007: (1) the Fund underperformed its Morningstar category median for all periods presented, with the exception of the three-year period, during which it outperformed; (2) the Fund underperformed its primary benchmark for all periods presented, with the exception of the most recent calendar quarter, during which it outperformed; and (3) the Fund is ranked in the third quintile of its Morningstar category for the three-year period, and the fourth quintile for the most recent calendar quarter, year-to-date, and one-year periods.
In analyzing this performance data, the Board took into account: (1) Management’s analysis of the negative effect that stock selection and the relative out-performance of the international real estate markets had on the Fund’s performance; (2) that Management would continue to monitor, and the Board or its Investment Review Committee would periodically review, the Fund’s investment performance; and (3) Management’s expectation that the Fund’s longer-term performance will improve.
In considering the fees payable under the Advisory and Sub-Advisory Contracts for ING Real Estate Fund, the Board took into account the factors described above and also considered: (1) the fairness of the compensation under an Advisory Contract with level fees that does not include breakpoints; (2) the pricing structure (including the expense ratio to be borne by shareholders) of ING Real Estate Fund, as compared to its Selected Peer Group, including that: (a) the management fee (inclusive of the advisory fee and 0.10% administration fee) for the Fund is below the median and the average management fees of the funds in its Selected Peer Group; and (b) the expense ratio for the Fund is below the median and the average expense ratios of the funds in its Selected Peer Group.
After its deliberation, the Board reached the following conclusions: (1) the Fund’s management fee rate is reasonable in the context of all factors considered by the Board; (2) the Fund’s expense ratio is reasonable in the context of all factors considered by the Board; (3) taking into account that Management will continue to monitor, and the Board or its Investment Review Committee will periodically review, its performance, the Fund’s performance is reasonable in the context of all factors considered by the Board; and (4) the sub-advisory fee rate payable by the Adviser to the Sub-Adviser is reasonable in the context of all factors considered by the Board. Based on these conclusions and other factors, the Board voted to renew the Advisory and Sub-Advisory Contracts for the Fund for the year ending November 30, 2008. During this renewal process, different Board members may have given different weight to different individual factors and related conclusions.
ING SmallCap Opportunities Fund
In considering whether to approve the renewal of the Advisory and Sub-Advisory Contracts for ING SmallCap Opportunities Fund, the Board considered that, based on performance data for the periods ended June 30, 2007: (1) the Fund outperformed its Morningstar category median for the year-to-date, one-year, and
118
Table of Contents
three-year periods, but underperformed for the most recent calendar quarter, five-year, and ten-year periods; (2) the Fund outperformed its primary benchmark for all periods presented, with the exception of the five-year period, during which it underperformed; and (3) the Fund is ranked in the second quintile of its Morningstar category for the year-to-date, one-year, and three-year periods, the third quintile for the most recent calendar quarter, and the fifth (lowest) quintile for the five-year period.
In analyzing this performance data, the Board took into account that in July 2005 a new lead portfolio manager assumed responsibility for managing the Fund’s assets.
In considering the fees payable under the Advisory and Sub-Advisory Contracts for ING SmallCap Opportunities Fund, the Board took into account the factors described above and also considered: (1) the economies of scale benefits to the Fund and its shareholders from breakpoint discounts applicable to the Fund’s advisory fees, which result in lower fees at higher asset levels; (2) the pricing structure (including the expense ratio to be borne by shareholders) of the Fund, as compared to its Selected Peer Group, including that: (a) the management fee (inclusive of the advisory fee and a 0.10% administration fee) for the Fund is above the median and the average management fees of the funds in its Selected Peer Group; and (b) the expense ratio for the Fund is above the median and below the average expense ratios of the funds in its Selected Peer Group.
In analyzing this fee data, the Board took into account: (1) the advisory fee waivers that Management had put into place, which lower the effective management fee rate payable by the Fund; and (2) advisory fee reductions that Management would put into place, at the Board’s direction, following the 2007 annual contract renewal process.
After its deliberation, the Board reached the following conclusions: (1) the Fund’s management fee rate is reasonable in the context of all factors considered by the Board; (2) the Fund’s expense ratio is reasonable in the context of all factors considered by the Board; (3) the Fund’s performance is reasonable in the context of all factors considered by the Board; (4) the sub-advisory fee rate payable by the Adviser to the Sub-Adviser is reasonable in the context of all factors considered by the Board. Based on these conclusions and other factors, the Board voted to renew the Advisory and Sub-Advisory Contracts for the Fund for the year ending November 30, 2008. During this renewal process, different Board members may have given different weight to different individual factors and related conclusions.
ING Smallcap Value Multi-Manager Fund (formerly, ING SmallCap Value Choice Fund)
Approval of New Sub-Advisory Contracts
In March 2007, the Board approved two new Sub-Advisory Contracts for ING SmallCap Value Multi-Manager Fund (formerly, ING SmallCap Value Choice Fund). More particularly, NWQ Investment Management Company, LLC (“NWQ”) has sub-advised the Fund since February 2005. In January 2007, NWQ informed Management that it had reached a limit on the amount of assets that it desires to manage in the small-capitalization value style for the Fund. Due to NWQ’s capacity constraints, Management and the Board needed to determine an appropriate course of action or would have been forced to close the Fund to new investors at an asset level of just over $80 million.
Management recommended, and the Board agreed, that the prudent decision for shareholders was to avoid closing the Fund to new investors, and to add additional Sub-Advisers to two new investment “sleeves” of the Fund to increase capacity for additional inflows. At a meeting of the Board held on March 2, 2007, the Board, including a majority of the Independent Directors/ Trustees, determined to appoint Kayne Anderson Rudnick Investment Management, LLC (“KAR”) and ING Investment Management Co. (“ING IM”) as additional Sub-Advisers to the Fund under additional Sub-Advisory Contracts between the Adviser and KAR and ING IM, respectively. The Sub-Advisory Contracts with KAR and ING IM were approved for initial terms ending November 30, 2008.
Agreement with KAR
At a meeting of the Board held on March 2, 2007, the Board, including a majority of the Independent Directors/ Trustees, determined to appoint KAR as an additional Sub-Adviser to the Fund under an additional Sub-Advisory Agreement between the Adviser and KAR. In determining whether to approve the additional Sub-Advisory Contract for the Fund, the Board received and evaluated such information as it deemed necessary for an informed determination of whether the Sub-Advisory Contract should be
119
Table of Contents
approved for the Fund. The materials provided to the Board in support of the sub-advisory arrangement with KAR included the following: (1) KAR’s presentation before the DE IRC at its March 1, 2007 meeting; (2) memoranda and related materials provided to the Board in advance of its March 2, 2007 meeting that discuss Management’s rationale for recommending that KAR serve as an additional Sub-Adviser to the Fund; (3) responses from KAR to questions posed by K&L Gates, independent legal counsel, on behalf of the Independent Directors/ Trustees; (4) supporting documentation, including a copy of the proposed additional Sub-Advisory Contract with KAR on behalf of the Fund; and (5) other information relevant to the Board’s evaluation.
The Board’s consideration of whether to approve the additional Sub-Advisory Contract with KAR took into account several factors including, but not limited to, the following: (1) the view of the Adviser with respect to the reputation of KAR as a manager to similar accounts and the consistent and solid performance of similar accounts managed by KAR; (2) KAR’s strength and reputation in the industry; (3) the nature and quality of the services to be provided by KAR under the additional Sub-Advisory Contract; (4) the personnel, operations, financial condition, and investment management capabilities, methodologies and resources of KAR and its fit among the stable of managers in the ING Funds line-up; (5) the fairness of the compensation under the Sub-Advisory Contract in light of the services to be provided by and the projected profitability of KAR as one of the Fund’s Sub-Advisers; (6) the costs of the services to be provided by KAR; (7) the higher sub-advisory fee payable by the Adviser to KAR; (8) KAR’s operations and compliance program, including its policies and procedures intended to assure compliance with the federal securities laws; (9) the appropriateness of the selection of KAR in light of the Fund’s investment objective and investor base; and (10) KAR’s Code of Ethics and related procedures for complying with that Code.
After its deliberation, the Board reached the following conclusions: (1) KAR should be appointed to serve as an additional Sub-Adviser to the Fund under the Sub-Advisory Contract between the Adviser and KAR; and (2) the sub-advisory fee rate payable by the Adviser to KAR is reasonable in the context of all factors considered by the Board. Based on these conclusions and other factors, the Board voted to approve the additional Sub-Advisory Contract between the Adviser and KAR for the Fund. During its deliberations, different Board members may have given different weight to different individual factors and related conclusions.
Agreement with ING IM
At a meeting of the Board held on March 2, 2007, the Board, including a majority of the Independent Directors/ Trustees, determined to appoint ING IM as an additional Sub-Adviser to the Fund under an additional Sub-Advisory Contract between the Adviser and ING IM. In determining whether to approve the additional Sub-Advisory Contract for the Fund, the Board received and evaluated such information as it deemed necessary for an informed determination of whether the Sub-Advisory Contract should be approved for the Fund. The materials provided to the Board in support of the sub-advisory arrangement with ING IM included the following: (1) ING IM’s presentation before the DE IRC at its March 1, 2007 meeting; (2) memoranda and related materials provided to the Board in advance of its March 2, 2007 meeting that discuss Management’s rationale for recommending that ING IM serve as an additional Sub-Adviser to the Fund; (3) responses from ING IM to questions posed by K&L Gates, independent legal counsel, on behalf of the Independent Directors/ Trustees; (4) supporting documentation, including a copy of the proposed additional Sub-Advisory Contract with ING IM on behalf of the Fund; and (5) other information relevant to the Board’s evaluation.
The Board’s consideration of whether to approve the additional Sub-Advisory Contract with ING IM took into account several factors including, but not limited to, the following: (1) the view of the Adviser with respect to the reputation of ING IM as a manager to a similar account and the performance of the similar account managed by ING IM; (2) ING IM’s strength and reputation in the industry; (3) the nature and quality of the services to be provided by ING IM under the additional Sub-Advisory Contract; (4) the personnel, operations, financial condition, and investment management capabilities, methodologies and resources of ING IM; (5) the fairness of the compensation under the Sub-Advisory Contract in light of the services to be provided by and the projected profitability of ING IM as one of the Fund’s Sub-Advisers; (6) the costs of the services to be provided by ING IM; (7) the sub-advisory fee payable
120
Table of Contents
by the Adviser to ING IM; (8) ING IM’s operations and compliance program, including its policies and procedures intended to assure compliance with the federal securities laws; (9) the appropriateness of the selection of ING IM in light of the Fund’s investment objective and investor base; and (10) ING IM’s Code of Ethics and related procedures for complying with that Code.
After its deliberation, the Board reached the following conclusions: (1) ING IM should be appointed to serve as an additional Sub-Adviser to the Fund under the ING IM Sub-Advisory Contract; and (2) the sub-advisory fee rate payable by the Adviser to ING IM is reasonable in the context of all factors considered by the Board. Based on these conclusions and other factors, the Board voted to approve the additional Sub-Advisory Contract between the Adviser and ING IM for the Fund. During its deliberations, different Board members may have given different weight to different individual factors and related conclusions.
Renewal of Advisory Contract and Sub-Advisory Contract with NWQ
At its November 2007 meeting, the Board determined to renew the Advisory Contract with the Adviser and Sub-Advisory Contract with NWQ for ING SmallCap Value Multi-Manager Fund. In considering whether to approve the renewal of the Advisory Contract and Sub-Advisory Contracts for the Fund, the Board considered that, based on performance data for the periods ended June 30, 2007: (1) the Fund outperformed its Morningstar category median for all periods presented with the exception of the one-year period, during which it underperformed; (2) the Fund outperformed its primary benchmark for all periods presented with the exception of the one-year period, during which it underperformed; and (3) the Fund is ranked in the second quintile of its Morningstar category median for the most recent calendar quarter and year-to-date periods, and the fourth quintile for the one-year period.
In analyzing this performance data, the Board considered the fact that, effective March 2007, two additional Sub-Advisers were added, each to manage a separate sleeve of the Fund, in order to address the capacity constraints faced by the existing Sub-Adviser, NWQ.
In considering the fees payable under the Advisory and Sub-Advisory Contracts for the Fund, the Board took into account the factors described above and also considered: (1) the fairness of the compensation under an Advisory Contract with level fees that does not include breakpoints; (2) the pricing structure (including the expense ratio to be borne by shareholders) of the Fund, as compared to its Selected Peer Group, including that: (a) the management fee (inclusive of the advisory fee and a 0.10% administration fee) for the Fund is above the median and the average management fees of the funds in its Selected Peer Group; and (b) the expense ratio for the Fund is above the median and below the average expense ratios of the funds in its Selected Peer Group.
After its deliberation, the Board reached the following conclusions: (1) the Fund’s management fee rate is reasonable in the context of all factors considered by the Board; (2) the Fund’s expense ratio is reasonable in the context of all factors considered by the Board; (3) the Fund’s performance is reasonable in the context of all factors considered by the Board; and (4) the sub-advisory fee rates payable by the Adviser to the Sub-Advisers is reasonable in the context of all factors considered by the Board. Based on these conclusions and other factors, the Board voted to renew the Advisory and Sub-Advisory Contracts for the Fund for the year ending November 30, 2008. During this renewal process, different Board members may have given different weight to different individual factors and related conclusions.
ING Value Choice Fund (formerly, ING MidCap Value Choice Fund)
In considering whether to approve the renewal of the Advisory and Sub-Advisory Contracts for ING Value Choice Fund (formerly, ING MidCap Value Choice Fund), the Board considered that, based on performance data for the periods ended June 30, 2007: (1) the Fund outperformed its Morningstar category median for all periods presented; (2) the Fund outperformed its primary benchmark for all periods presented; and (3) the Fund is ranked in the second quintile of its Morningstar category for all periods presented.
In considering the fees payable under the Advisory and Sub-Advisory Contracts for ING Value Choice Fund (formerly, ING MidCap Value Choice Fund), the Board took into account the factors described above and also considered: (1) the fairness of the compensation under an Advisory Contract with level fees that does not include breakpoints; and (2) the pricing structure
121
Table of Contents
(including the expense ratio to be borne by shareholders) of the Fund as compared to its Selected Peer Group, including that: (a) the management fee (inclusive of 0.10% administration fee) for the Fund is above the median and the average management fees of the funds in its Selected Peer Group; and (b) the expense ratio for the Fund is above the median and the average expense ratios of the funds in its Selected Peer Group. The Board also noted certain fee reductions that had been approved by the Board at its September 28, 2007 meeting.
After its deliberation, the Board reached the following conclusions: (1) the Fund’s management fee rate is reasonable in the context of all factors considered by the Board; (2) the Fund’s expense ratio is reasonable in the context of all factors considered by the board; (3) the Fund performance is reasonable in the context of all factors considered by the Board; and (4) the sub-advisory fee rate payable by the Adviser to the Sub-Adviser is reasonable in the context of all factors considered by the Board. Based on these conclusions and other factors, the Board voted to renew the Advisory and Sub-Advisory Contracts for the Fund for the year ending November 30, 2008. During this renewal process, different Board members may have given different weight to different individual factors and related conclusions.
122
Table of Contents
ING Funds Distributor, LLC offers the funds listed below. Before investing in a fund, shareholders should carefully review the fund’s prospectus. Investors may obtain a copy of a prospectus of any ING Fund by calling (800) 992-0180 or by going to www.ingfunds.com.
Domestic Equity and Income Funds
| ING Balanced Fund ING Growth and Income Fund ING Real Estate Fund |
Domestic Equity Growth Funds
| ING 130/30 Fundamental Research Fund ING Fundamental Research Fund ING LargeCap Growth Fund ING MidCap Opportunities Fund ING Opportunistic LargeCap Fund ING Small Company Fund ING SmallCap Opportunities Fund |
Domestic Equity Index Funds
| ING Index Plus LargeCap Equity Fund ING Index Plus LargeCap Equity Fund II ING Index Plus LargeCap Equity Fund III ING Index Plus LargeCap Equity Fund IV ING Index Plus LargeCap Fund ING Index Plus MidCap Fund ING Index Plus SmallCap Fund |
Domestic Equity Value Funds
| ING Financial Services Fund ING LargeCap Value Fund ING SmallCap Value Multi-Manager Fund ING Value Choice Fund |
Fixed-Income Funds
| ING GNMA Income Fund ING High Yield Bond Fund ING Intermediate Bond Fund ING National Tax-Exempt Bond Fund |
Global Equity Funds
| ING Global Equity Dividend Fund ING Global Natural Resources Fund ING Global Real Estate Fund ING Global Science and Technology Fund ING Global Value Choice Fund |
International Equity Funds
| ING Asia-Pacific Real Estate Fund ING Disciplined International SmallCap Fund ING Emerging Countries Fund ING European Real Estate Fund ING Foreign Fund ING Greater China Fund ING Index Plus International Equity Fund ING International Capital Appreciation Fund ING International Equity Fund ING International Equity Dividend Fund ING International Growth Opportunities Fund ING International Real Estate Fund ING International SmallCap Multi-Manager Fund ING International Value Fund ING International Value Choice Fund ING International Value Opportunities Fund ING Russia Fund |
Global and International Fixed-Income Funds
| ING Emerging Markets Fixed Income Fund ING Global Bond Fund |
International Fund-of-Funds
| ING Diversified International Fund |
Loan Participation Fund
| ING Senior Income Fund |
Money Market Funds*
| ING Money Market Fund ING Classic Money Market Fund |
Strategic Allocation Funds
| ING Strategic Allocation Conservative Fund ING Strategic Allocation Growth Fund ING Strategic Allocation Moderate Fund |
| * | An investment in the funds is not insured or guaranteed by the Federal Deposit Insurance Corporation or any other government agency. Although the funds seek to preserve the value of your investment at $1.00 per share, it is possible to lose money by investing in the funds. |
Table of Contents
Administrator
Distributor
Transfer Agent
Custodian
Legal Counsel
For more complete information, or to obtain a prospectus for any ING fund, please call your Investment Professional or ING Funds Distributor, LLC at (800) 992-0180 or log on to www.ingfunds.com. The prospectus should be read carefully before investing. Consider the fund’s investment objectives, risks, charges and expenses carefully before investing. The prospectus contains this information and other information about the fund. Check with your Investment Professional to determine which funds are available for sale within their firm. Not all funds are available for sale at all firms.
 | PRSAR-UDEABCIOQ (1107-012508) |
Table of Contents

 | E-Delivery Sign-up — details inside |

| 1 | ||||
| 2 | ||||
| 4 | ||||
| 12 | ||||
| 15 | ||||
| 19 | ||||
| 23 | ||||
| 26 | ||||
| 32 | ||||
| 56 | ||||
| 73 | ||||
| 125 |
| Go Paperless with E-Delivery! | |
Table of Contents

investment professional to make sure you are invested appropriately. Together, you can select the funds that will help you achieve your financial goals. We thank you for choosing ING Funds and look forward to continuing to serve you.

Shaun P. Mathews
President
ING Funds
December 21, 2007
| The views expressed in the President’s Letter reflect those of the President as of the date of the letter. Any such views are subject to change at any time based upon market or other conditions and ING Funds disclaims any responsibility to update such views. These views may not be relied on as investment advice and because investment decisions for an ING Fund are based on numerous factors, may not be relied on as an indication of investment intent on behalf of any ING Fund. Reference to specific company securities should not be construed as recommendations or investment advice. | ||
1
Table of Contents
2
Table of Contents
| (1) | The MSCI World IndexSM is a free float-adjusted market capitalization index that is designed to measure global developed market equity performance. It includes the reinvestment of dividends net of withholding taxes, but does not reflect fees, brokerage commissions or other expenses of investing. | |
| (2) | The S&P 500® Index is an unmanaged index that measures the performance of securities of approximately 500 of the largest companies in the United States. | |
| (3) | The MSCI Japan® Index is a free float-adjusted market capitalization index that is designed to measure developed market equity performance in Japan. | |
| (4) | The MSCI Europe ex UK® Index is a free float adjusted market capitalization index that is designed to measure developed market equity performance in Europe, excluding the UK. | |
| (5) | The MSCI UK® Index is a free float adjusted market capitalization index that is designed to measure developed market equity performance in the U.K. |
3
Table of Contents
| ING Index Plus LargeCap Equity Fund | Portfolio Managers’ Report | |
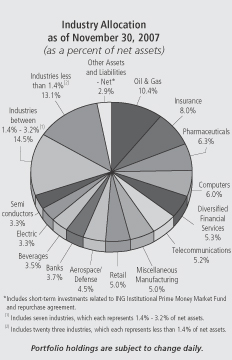
| (1) | The S&P 500® Index is a stock market index comprised of common stocks of 500 of the largest publicly traded companies in the U.S. | |
| (2) | The LB 1-3 Gov Index is an unmanaged index comprised of all publicly issued, non-convertible domestic debt of the U.S. Government, or any agency thereof, or any quasi-federal corporation. The index also includes corporate debt guaranteed by the U.S. Government. |
as of November 30, 2007
(as a percent of net assets)
| ExxonMobil Corp. | 4.3 | % | ||
| Chevron Corp. | 2.4 | % | ||
| General Electric Co. | 2.2 | % | ||
| Merck & Co., Inc. | 2.0 | % | ||
| American International Group, Inc. | 1.9 | % | ||
| Microsoft Corp. | 1.8 | % | ||
| PepsiCo, Inc. | 1.7 | % | ||
| Walt Disney Co. | 1.7 | % | ||
| AT&T, Inc. | 1.6 | % | ||
| JPMorgan Chase & Co. | 1.6 | % |
| * | Excludes short-term investments related to ING Institutional Prime Money Market Fund. |
4
Table of Contents
| Portfolio Managers’ Report | ING Index Plus LargeCap Equity Fund II | |
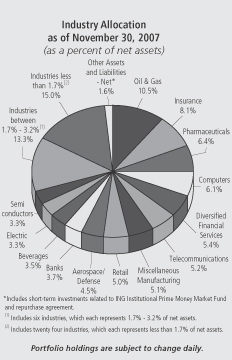
| (1) | The S&P 500® Index is a stock market index comprised of common stocks of 500 of the largest publicly traded companies in the U.S. | |
| (2) | The LB 1-3 Gov Index is an unmanaged index comprised of all publicly issued, non-convertible domestic debt of the U.S. Government, or any agency thereof, or any quasi-federal corporation. The index also includes corporate debt guaranteed by the U.S. Government. |
as of November 30, 2007
(as a percent of net assets)
| ExxonMobil Corp. | 4.3 | % | ||
| Chevron Corp. | 2.5 | % | ||
| General Electric Co. | 2.2 | % | ||
| Merck & Co., Inc. | 2.0 | % | ||
| American International Group, Inc. | 1.9 | % | ||
| Microsoft Corp. | 1.8 | % | ||
| PepsiCo, Inc. | 1.7 | % | ||
| Walt Disney Co. | 1.7 | % | ||
| JPMorgan Chase & Co. | 1.7 | % | ||
| AT&T, Inc. | 1.6 | % |
| * | Excludes short-term investments related to ING Institutional Prime Money Market Fund. |
5
Table of Contents
| ING Index Plus Largecap Equity Fund III | Portfolio Managers’ Report | |
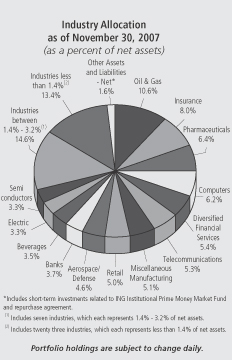
| * | Effective June 6, 2007, the Fund changed its name from “ING Principal Protection Fund III” to ING Index Plus LargeCap Equity Fund III.” Prior to June 6, 2007, the Fund had a different investment objective and different principal investment strategies. | |
| (1) | The S&P 500® Index is a stock market index comprised of common stocks of 500 of the largest publicly traded companies in the U.S. | |
| (2) | The LB 1-3 Gov Index is an unmanaged index comprised of all publicly issued, non-convertible domestic debt of the U.S. Government, or any agency thereof, or any quasi-federal corporation. The index also includes corporate debt guaranteed by the U.S. Government. |
as of November 30, 2007
(as a percent of net assets)
| ExxonMobil Corp. | 4.3 | % | ||
| Chevron Corp. | 2.5 | % | ||
| General Electric Co. | 2.2 | % | ||
| Merck & Co., Inc. | 2.0 | % | ||
| American International Group, Inc. | 1.9 | % | ||
| Microsoft Corp. | 1.8 | % | ||
| PepsiCo, Inc. | 1.7 | % | ||
| AT&T, Inc. | 1.7 | % | ||
| Walt Disney Co. | 1.7 | % | ||
| JPMorgan Chase & Co. | 1.7 | % |
6
Table of Contents
| Portfolio Managers’ Report | ING Index Plus LargeCap Equity Fund IV | |
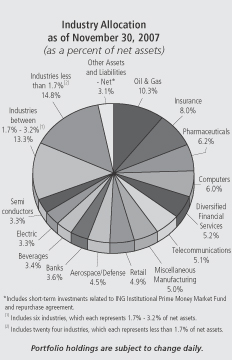
| * | Effective October 9, 2007, the Fund changed its name from “ING Principal Protection Fund IV” to “ING Index Plus LargeCap Equity Fund IV.” Prior to October 9, 2007, the Fund had a different investment objective and different principal investment strategies. | |
| (1) | The S&P 500® Index is a stock market index comprised of common stocks of 500 of the largest publicly traded companies in the U.S. | |
| (2) | The LB 1-3 Gov Index is an unmanaged index comprised of all publicly issued, non-convertible domestic debt of the U.S. Government, or any agency thereof, or any quasi-federal corporation. The index also includes corporate debt guaranteed by the U.S. Government. |
as of November 30, 2007
(as a percent of net assets)
| ExxonMobil Corp. | 4.3 | % | ||
| Chevron Corp. | 2.4 | % | ||
| General Electric Co. | 2.2 | % | ||
| Merck & Co., Inc. | 2.0 | % | ||
| American International Group, Inc. | 1.9 | % | ||
| Microsoft Corp. | 1.8 | % | ||
| PepsiCo, Inc. | 1.7 | % | ||
| Walt Disney Co. | 1.7 | % | ||
| AT&T, Inc. | 1.6 | % | ||
| JPMorgan Chase & Co. | 1.6 | % |
7
Table of Contents
| ING Principal Protection Funds | Portfolio Managers’ Report | |
PPF V(3) | (0.85 | )% | ||
| PPF VI | (0.66 | )% | ||
| PPF VII | (0.38 | )% | ||
| PPF VIII | (0.28 | )% | ||
| PPF IX | (0.37 | )% | ||
| PPF X | (0.09 | )% | ||
| PPF XI | 0.37 | % | ||
| PPF XII | 0.75 | % | ||
S&P500 Index(1) | (2.33 | )% | ||
LB 1-3 Gov Index(2) | 4.98 | % |
| (1) | The S&P 500® Index is a stock market index comprised of common stocks of 500 of the largest publicly traded companies in the U.S. | |
| (2) | The LB 1-3 Gov Index is an unmanaged index comprised of all publicly issued, non-convertible domestic debt of the U.S. Government, or any agency thereof, or any quasi-federal corporation. The index also includes corporate debt guaranteed by the U.S. Government. | |
| (3) | Effective January 23, 2008, PPF V will change its name from “ING Principal Protection Fund V” to “ING Index Plus LargeCap Equity Fund V.” |
8
Table of Contents
| Portfolio Managers’ Report | ING Principal Protection Funds | |
9
Table of Contents
| ING Principal Protection Funds | Portfolio Managers’ Report | |
10
Table of Contents
| Portfolio Managers Report | Portfolio Managers’ Report | |
as of November 30, 2007
(as a percent of net assets)
| Other Assets and | ||||||||||||
| Fixed Income | Common Stock | Liabilities | ||||||||||
| PPF V | 67.5 | % | 33.4 | % | (0.9 | )% | ||||||
| PPF VI | 66.4 | % | 33.1 | % | 0.5 | % | ||||||
| PPF VII | 69.3 | % | 31.0 | % | (0.3 | )% | ||||||
| PPF VIII | 61.5 | % | 38.5 | % | (0.0 | )% | ||||||
| PPF IX | 62.3 | % | 38.0 | % | (0.3 | )% | ||||||
| PPF X | 58.3 | % | 42.8 | % | (1.1 | )% | ||||||
| PPF XI | 62.3 | % | 38.1 | % | (0.4 | )% | ||||||
| PPF XII | 65.4 | % | 34.9 | % | (0.3 | )% | ||||||
11
Table of Contents
| • | During the Guarantee Period, the PPFs’ assets will be allocated between the: |
| • | Equity Component, consisting primarily of common stocks included in the S&P 500® Index and futures contracts on the S&P 500® Index; and the | ||
| • | Fixed Component, consisting primarily of short- to intermediate-duration U.S. government securities. |
12
Table of Contents
13
Table of Contents
14
Table of Contents
| Beginning | Ending | Expenses Paid | ||||||||||||||
| Account | Account | Annualized | During the | |||||||||||||
| Value | Value | Expense | Period Ended | |||||||||||||
| ING Index Plus LargeCap Equity Fund | June 1, 2007 | November 30, 2007 | Ratio | November 30, 2007* | ||||||||||||
Actual Fund Return | ||||||||||||||||
| Class A | $ | 1,000.00 | $ | 961.40 | 1.28 | % | $ | 6.28 | ||||||||
| Class B | 1,000.00 | 957.70 | 2.03 | 9.94 | ||||||||||||
| Class C | 1,000.00 | 957.10 | 2.03 | 9.93 | ||||||||||||
| Class Q | 1,000.00 | 961.70 | 1.26 | 6.18 | ||||||||||||
Hypothetical (5% return before expenses) | ||||||||||||||||
| Class A | $ | 1,000.00 | $ | 1,018.60 | 1.28 | % | $ | 6.46 | ||||||||
| Class B | 1,000.00 | 1,014.85 | 2.03 | 10.23 | ||||||||||||
| Class C | 1,000.00 | 1,014.85 | 2.03 | 10.23 | ||||||||||||
| Class Q | 1,000.00 | 1,018.70 | 1.26 | 6.36 | ||||||||||||
ING Index Plus LargeCap Equity Fund II | ||||||||||||||||
Actual Fund Return | ||||||||||||||||
| Class A | $ | 1,000.00 | $ | 960.10 | 1.19 | % | $ | 5.83 | ||||||||
| Class B | 1,000.00 | 957.20 | 1.94 | 9.49 | ||||||||||||
| Class C | 1,000.00 | 956.50 | 1.94 | 9.49 | ||||||||||||
| * | Expenses are equal to each Fund’s respective annualized expense ratios multiplied by the average account value over the period, multiplied by 183/365 to reflect the most recent fiscal half year. |
15
Table of Contents
| Beginning | Ending | Expenses Paid | ||||||||||||||
| Account | Account | Annualized | During the | |||||||||||||
| Value | Value | Expense | Period Ended | |||||||||||||
| ING Index Plus LargeCap Equity Fund II | June 1, 2007 | November 30, 2007 | Ratio | November 30, 2007* | ||||||||||||
Hypothetical (5% return before expenses) | ||||||||||||||||
| Class A | $ | 1,000.00 | $ | 1,019.05 | 1.19 | % | $ | 6.01 | ||||||||
| Class B | 1,000.00 | 1,015.30 | 1.94 | 9.77 | ||||||||||||
| Class C | 1,000.00 | 1,015.30 | 1.94 | 9.77 | ||||||||||||
ING Index Plus LargeCap Equity Fund III | ||||||||||||||||
Actual Fund Return | ||||||||||||||||
| Class A | $ | 1,000.00 | $ | 960.00 | 1.23 | % | $ | 6.03 | ||||||||
| Class B | 1,000.00 | 956.10 | 1.98 | 9.68 | ||||||||||||
| Class C | 1,000.00 | 956.40 | 1.98 | 9.68 | ||||||||||||
Hypothetical (5% return before expenses) | ||||||||||||||||
| Class A | $ | 1,000.00 | $ | 1,018.85 | 1.23 | % | $ | 6.21 | ||||||||
| Class B | 1,000.00 | 1,015.10 | 1.98 | 9.97 | ||||||||||||
| Class C | 1,000.00 | 1,015.10 | 1.98 | 9.97 | ||||||||||||
ING Index Plus LargeCap Equity Fund IV | ||||||||||||||||
Actual Fund Return | ||||||||||||||||
| Class A | $ | 1,000.00 | $ | 967.20 | 1.51 | % | $ | 7.43 | ||||||||
| Class B | 1,000.00 | 963.20 | 2.26 | 11.09 | ||||||||||||
| Class C | 1,000.00 | 963.00 | 2.26 | 11.09 | ||||||||||||
| Class Q | 1,000.00 | 967.20 | 1.47 | 7.23 | ||||||||||||
Hypothetical (5% return before expenses) | ||||||||||||||||
| Class A | $ | 1,000.00 | $ | 1,017.45 | 1.51 | % | $ | 7.62 | ||||||||
| Class B | 1,000.00 | 1,013.70 | 2.26 | 11.38 | ||||||||||||
| Class C | 1,000.00 | 1,013.70 | 2.26 | 11.38 | ||||||||||||
| Class Q | 1,000.00 | 1,017.65 | 1.47 | 7.41 | ||||||||||||
ING Principal Protection Fund V | ||||||||||||||||
Actual Fund Return | ||||||||||||||||
| Class A | $ | 1,000.00 | $ | 991.50 | 1.55 | % | $ | 7.72 | ||||||||
| Class B | 1,000.00 | 986.70 | 2.30 | 11.42 | ||||||||||||
| Class C | 1,000.00 | 987.70 | 2.30 | 11.43 | ||||||||||||
Hypothetical (5% return before expenses) | ||||||||||||||||
| Class A | $ | 1,000.00 | $ | 1,017.25 | 1.55 | % | $ | 7.82 | ||||||||
| Class B | 1,000.00 | 1,013.50 | 2.30 | 11.58 | ||||||||||||
| Class C | 1,000.00 | 1,013.50 | 2.30 | 11.58 | ||||||||||||
ING Principal Protection Fund VI | ||||||||||||||||
Actual Fund Return | ||||||||||||||||
| Class A | $ | 1,000.00 | $ | 993.40 | 1.68 | % | $ | 8.37 | ||||||||
| Class B | 1,000.00 | 989.60 | 2.43 | 12.09 | ||||||||||||
| Class C | 1,000.00 | 990.60 | 2.43 | 12.09 | ||||||||||||
| * | Expenses are equal to each Fund’s respective annualized expense ratios multiplied by the average account value over the period, multiplied by 1833/365 to reflect the most recent fiscal half year. |
16
Table of Contents
| Beginning | Ending | Expenses Paid | ||||||||||||||
| Account | Account | Annualized | During the | |||||||||||||
| Value | Value | Expense | Period Ended | |||||||||||||
| ING Principal Protection Fund VI | June 1, 2007 | November 30, 2007 | Ratio | November 30, 2007* | ||||||||||||
Hypothetical (5% return before expenses) | ||||||||||||||||
| Class A | $ | 1,000.00 | $ | 1,016.60 | 1.68 | % | $ | 8.47 | ||||||||
| Class B | 1,000.00 | 1,012.85 | 2.43 | 12.23 | ||||||||||||
| Class C | 1,000.00 | 1,012.85 | 2.43 | 12.23 | ||||||||||||
ING Principal Protection Fund VII | ||||||||||||||||
Actual Fund Return | ||||||||||||||||
| Class A | $ | 1,000.00 | $ | 996.20 | 1.75 | % | $ | 8.73 | ||||||||
| Class B | 1,000.00 | 991.50 | 2.50 | 12.45 | ||||||||||||
| Class C | 1,000.00 | 992.50 | 2.50 | 12.45 | ||||||||||||
Hypothetical (5% return before expenses) | ||||||||||||||||
| Class A | $ | 1,000.00 | $ | 1,016.25 | 1.75 | % | $ | 8.82 | ||||||||
| Class B | 1,000.00 | 1,012.50 | 2.50 | 12.58 | ||||||||||||
| Class C | 1,000.00 | 1,012.50 | 2.50 | 12.58 | ||||||||||||
ING Principal Protection Fund VIII | ||||||||||||||||
Actual Fund Return | ||||||||||||||||
| Class A | $ | 1,000.00 | $ | 997.20 | 1.53 | % | $ | 7.64 | ||||||||
| Class B | 1,000.00 | 993.40 | 2.28 | 11.36 | ||||||||||||
| Class C | 1,000.00 | 993.50 | 2.28 | 11.36 | ||||||||||||
Hypothetical (5% return before expenses) | ||||||||||||||||
| Class A | $ | 1,000.00 | $ | 1,017.35 | 1.53 | % | $ | 7.72 | ||||||||
| Class B | 1,000.00 | 1,013.60 | 2.28 | 11.48 | ||||||||||||
| Class C | 1,000.00 | 1,013.60 | 2.28 | 11.48 | ||||||||||||
ING Principal Protection Fund IX | ||||||||||||||||
Actual Fund Return | ||||||||||||||||
| Class A | $ | 1,000.00 | $ | 996.30 | 1.58 | % | $ | 7.89 | ||||||||
| Class B | 1,000.00 | 992.60 | 2.33 | 11.61 | ||||||||||||
| Class C | 1,000.00 | 992.60 | 2.33 | 11.61 | ||||||||||||
Hypothetical (5% return before expenses) | ||||||||||||||||
| Class A | $ | 1,000.00 | $ | 1,017.10 | 1.58 | % | $ | 7.97 | ||||||||
| Class B | 1,000.00 | 1,013.35 | 2.33 | 11.73 | ||||||||||||
| Class C | 1,000.00 | 1,013.35 | 2.33 | 11.73 | ||||||||||||
ING Principal Protection Fund X | ||||||||||||||||
Actual Fund Return | ||||||||||||||||
| Class A | $ | 1,000.00 | $ | 999.10 | 1.59 | % | $ | 7.95 | ||||||||
| Class B | 1,000.00 | 994.40 | 2.34 | 11.67 | ||||||||||||
| Class C | 1,000.00 | 994.40 | 2.34 | 11.67 | ||||||||||||
Hypothetical (5% return before expenses) | ||||||||||||||||
| Class A | $ | 1,000.00 | $ | 1,017.05 | 1.59 | % | $ | 8.02 | ||||||||
| Class B | 1,000.00 | 1,013.30 | 2.34 | 11.78 | ||||||||||||
| Class C | 1,000.00 | 1,013.30 | 2.34 | 11.78 | ||||||||||||
| * | Expenses are equal to each Fund’s respective annualized expense ratios multiplied by the average account value over the period, multiplied by 1833/365 to reflect the most recent fiscal half year. |
17
Table of Contents
| Beginning | Ending | Expenses Paid | ||||||||||||||
| Account | Account | Annualized | During the | |||||||||||||
| Value | Value | Expense | Period Ended | |||||||||||||
| ING Principal Protection Fund XI | June 1, 2007 | November 30, 2007 | Ratio | November 30, 2007* | ||||||||||||
Actual Fund Return | ||||||||||||||||
| Class A | $ | 1,000.00 | $ | 1,003.70 | 1.60 | % | $ | 8.01 | ||||||||
| Class B | 1,000.00 | 1,000.00 | 2.35 | 11.75 | ||||||||||||
| Class C | 1,000.00 | 1,000.00 | 2.35 | 11.75 | ||||||||||||
Hypothetical (5% return before expenses) | ||||||||||||||||
| Class A | $ | 1,000.00 | $ | 1,017.00 | 1.60 | % | $ | 8.07 | ||||||||
| Class B | 1,000.00 | 1,013.25 | 2.35 | 11.83 | ||||||||||||
| Class C | 1,000.00 | 1,013.25 | 2.35 | 11.83 | ||||||||||||
ING Principal Protection Fund XII | ||||||||||||||||
Actual Fund Return | ||||||||||||||||
| Class A | $ | 1,000.00 | $ | 1,007.50 | 1.75 | % | $ | 8.78 | ||||||||
| Class B | 1,000.00 | 1,004.70 | 2.50 | 12.53 | ||||||||||||
| Class C | 1,000.00 | 1,003.80 | 2.50 | 12.52 | ||||||||||||
Hypothetical (5% return before expenses) | ||||||||||||||||
| Class A | $ | 1,000.00 | $ | 1,016.25 | 1.75 | % | $ | 8.82 | ||||||||
| Class B | 1,000.00 | 1,012.50 | 2.50 | 12.58 | ||||||||||||
| Class C | 1,000.00 | 1,012.50 | 2.50 | 12.58 | ||||||||||||
| * | Expenses are equal to each Fund’s respective annualized expense ratios multiplied by the average account value over the period, multiplied by 1833/365 to reflect the most recent fiscal half year. |
18
Table of Contents
| ING | ING | ING | ING | |||||||||||||
| Index Plus | Index Plus | Index Plus | Index Plus | |||||||||||||
| LargeCap Equity | LargeCap Equity | LargeCap Equity | LargeCap Equity | |||||||||||||
| Fund | Fund II | Fund III | Fund IV | |||||||||||||
ASSETS: | ||||||||||||||||
| Investments in securities at value* | $ | 36,635,193 | $ | 56,371,867 | $ | 50,248,192 | $ | 125,333,170 | ||||||||
| Short-term investments in affiliates at amortized cost | 1,000,000 | 1,000,000 | 675,000 | 200,000 | ||||||||||||
| Short-term investments at amortized cost | 130,000 | 150,000 | 383,000 | 218,000 | ||||||||||||
| Cash | 809 | — | 2,143 | 1,868 | ||||||||||||
| Cash collateral for futures | 53,550 | 47,250 | 50,400 | 15,750 | ||||||||||||
| Receivables: | ||||||||||||||||
| Investment securities sold | — | — | — | 5,086,455 | ||||||||||||
| Fund shares sold | 46 | 8,392 | — | — | ||||||||||||
| Dividends and interest | 80,930 | 123,654 | 110,381 | 281,871 | ||||||||||||
| Variation margin receivable | 10,455 | 9,225 | 9,225 | — | ||||||||||||
| Prepaid expenses | 30,940 | 19,200 | 34,419 | 215 | ||||||||||||
| Total assets | 37,941,923 | 57,729,588 | 51,512,760 | 131,137,329 | ||||||||||||
LIABILITIES: | ||||||||||||||||
| Payable for fund shares redeemed | 65,116 | 253,371 | 343,650 | 1,490,324 | ||||||||||||
| Payable for futures variation margin | — | — | — | 1,911 | ||||||||||||
| Payable to affiliates | 45,460 | 69,432 | 62,818 | 164,246 | ||||||||||||
| Payable to custodian due to bank overdraft | — | 15,074 | — | — | ||||||||||||
| Payable for trustee fees | 10,886 | 10,702 | 3,741 | 6,992 | ||||||||||||
| Other accrued expenses and liabilities | 105,422 | 62,010 | 70,487 | 91,724 | ||||||||||||
| Total liabilities | 226,884 | 410,589 | 480,696 | 1,755,197 | ||||||||||||
NET ASSETS | $ | 37,715,039 | $ | 57,318,999 | $ | 51,032,064 | $ | 129,382,132 | ||||||||
NET ASSETS WERE COMPRISED OF: | ||||||||||||||||
| Paid-in capital | $ | 35,805,097 | $ | 74,060,971 | $ | 56,956,694 | $ | 86,324,986 | ||||||||
| Undistributed net investment income | 27,354 | 180,916 | 123,868 | 548,229 | ||||||||||||
| Accumulated net realized gain (loss) on investments and futures | (3,949,746 | ) | (24,460,434 | ) | (13,310,259 | ) | 13,481,913 | |||||||||
| Net unrealized appreciation on investments and futures | 5,832,334 | 7,537,546 | 7,261,761 | 29,027,004 | ||||||||||||
NET ASSETS | $ | 37,715,039 | $ | 57,318,999 | $ | 51,032,064 | $ | 129,382,132 | ||||||||
| * Cost of investments in securities | $ | 30,792,356 | $ | 48,839,011 | $ | 43,002,300 | $ | 96,306,977 | ||||||||
19
Table of Contents
| ING | ING | ING | ING | |||||||||||||
| Index Plus | Index Plus | Index Plus | Index Plus | |||||||||||||
| LargeCap Equity | LargeCap Equity | LargeCap Equity | LargeCap Equity | |||||||||||||
| Fund | Fund II | Fund III | Fund IV | |||||||||||||
Class A: | ||||||||||||||||
| Net assets | $ | 3,505,234 | $ | 5,904,610 | $ | 4,355,934 | $ | 8,125,505 | ||||||||
| Shares authorized | unlimited | unlimited | unlimited | unlimited | ||||||||||||
| Par value | $ | 0.01 | $ | 0.01 | $ | 0.01 | $ | 0.01 | ||||||||
| Shares outstanding | 327,338 | 598,213 | 453,614 | 791,721 | ||||||||||||
| Net asset value and redemption price per share | $ | 10.71 | $ | 9.87 | $ | 9.60 | $ | 10.26 | ||||||||
Maximum offering price per share (3.00%)(1) | $ | 11.04 | $ | 10.18 | $ | 9.90 | $ | 10.58 | ||||||||
Class B: | ||||||||||||||||
| Net assets | $ | 29,145,615 | $ | 43,302,845 | $ | 41,557,798 | $ | 105,580,443 | ||||||||
| Shares authorized | unlimited | unlimited | unlimited | unlimited | ||||||||||||
| Par value | $ | 0.01 | $ | 0.01 | $ | 0.01 | $ | 0.01 | ||||||||
| Shares outstanding | 2,736,377 | 4,406,788 | 4,337,282 | 10,285,823 | ||||||||||||
Net asset value and redemption price per share(2) | $ | 10.65 | $ | 9.83 | $ | 9.58 | $ | 10.26 | ||||||||
| Maximum offering price per share | $ | 10.65 | $ | 9.83 | $ | 9.58 | $ | 10.26 | ||||||||
Class C: | ||||||||||||||||
| Net assets | $ | 5,037,358 | $ | 8,111,544 | $ | 5,118,332 | $ | 15,321,610 | ||||||||
| Shares authorized | unlimited | unlimited | unlimited | unlimited | ||||||||||||
| Par value | $ | 0.01 | $ | 0.01 | $ | 0.01 | $ | 0.01 | ||||||||
| Shares outstanding | 469,875 | 819,938 | 530,328 | 1,482,877 | ||||||||||||
Net asset value and redemption price per share(2) | $ | 10.72 | $ | 9.89 | $ | 9.65 | $ | 10.33 | ||||||||
| Maximum offering price per share | $ | 10.72 | $ | 9.89 | $ | 9.65 | $ | 10.33 | ||||||||
Class Q: | ||||||||||||||||
| Net assets | $ | 26,832 | n/a | n/a | $ | 354,574 | ||||||||||
| Shares authorized | unlimited | n/a | n/a | unlimited | ||||||||||||
| Par value | $ | 0.01 | n/a | n/a | $ | 0.01 | ||||||||||
| Shares outstanding | 2,487 | n/a | n/a | 34,436 | ||||||||||||
| Net asset value and redemption price per share | $ | 10.79 | n/a | n/a | $ | 10.30 | ||||||||||
| Maximum offering price per share | $ | 10.79 | n/a | n/a | $ | 10.30 | ||||||||||
| (1) | Maximum offering price is computed at 100/97.00 of net asset value. On purchases of $50,000 or more, the offering price is reduced. | |
| (2) | Redemption price per share may be reduced for any applicable contingent deferred sales charges. |
20
Table of Contents
| ING | ING | ING | ING | |||||||||||||
| Principal | Principal | Principal | Principal | |||||||||||||
| Protection | Protection | Protection | Protection | |||||||||||||
| Fund V | Fund VI | Fund VII | Fund VIII | |||||||||||||
ASSETS: | ||||||||||||||||
| Investments in securities at value* | $ | 195,832,663 | $ | 198,061,501 | $ | 97,821,230 | $ | 59,329,611 | ||||||||
| Short-term investments in affiliates at amortized cost | 5,475,000 | 325,000 | 190,000 | 250,000 | ||||||||||||
| Short-term investments at amortized cost | 15,901,481 | 236,000 | 108,000 | 150,000 | ||||||||||||
| Cash | 645 | 37,885 | 13,172 | 12,900 | ||||||||||||
| Receivables: | ||||||||||||||||
| Investment securities sold | 37,655 | 1,639,671 | — | 2,213,424 | ||||||||||||
| Dividends and interest | 196,274 | 166,007 | 76,554 | 52,033 | ||||||||||||
| Prepaid expenses | 211 | 173 | 41 | 27 | ||||||||||||
| Total assets | 217,443,929 | 200,466,237 | 98,208,997 | 62,007,995 | ||||||||||||
LIABILITIES: | ||||||||||||||||
| Payable for investment securities purchased | — | — | — | 1,832,588 | ||||||||||||
| Payable for fund shares redeemed | 1,586,531 | 388,833 | 123,853 | 269,160 | ||||||||||||
| Payable to affiliates | 305,050 | 306,733 | 151,446 | 82,805 | ||||||||||||
| Payable for trustee fees | 17,614 | 14,859 | 11,733 | 4,337 | ||||||||||||
| Other accrued expenses and liabilities | 178,361 | 149,927 | 91,457 | 108,792 | ||||||||||||
| Total liabilities | 2,087,556 | 860,352 | 378,489 | 2,297,682 | ||||||||||||
NET ASSETS | $ | 215,356,373 | $ | 199,605,885 | $ | 97,830,508 | $ | 59,710,313 | ||||||||
NET ASSETS WERE COMPRISED OF: | ||||||||||||||||
| Paid-in capital | $ | 201,680,584 | $ | 187,091,355 | $ | 92,949,156 | $ | 55,480,534 | ||||||||
| Undistributed net investment income | 1,184,416 | 839,748 | 46,828 | 439,197 | ||||||||||||
| Accumulated net realized gain on investments | 11,560,185 | 9,953,222 | 4,505,316 | 3,572,315 | ||||||||||||
| Net unrealized appreciation on investments | 931,188 | 1,721,560 | 329,208 | 218,267 | ||||||||||||
NET ASSETS | $ | 215,356,373 | $ | 199,605,885 | $ | 97,830,508 | $ | 59,710,313 | ||||||||
| * Cost of investments in securities | $ | 194,901,475 | $ | 196,339,941 | $ | 97,492,022 | $ | 59,111,344 |
Class A: | ||||||||||||||||
| Net assets | $ | 11,405,640 | $ | 9,088,812 | $ | 4,455,284 | $ | 6,093,618 | ||||||||
| Shares authorized | unlimited | unlimited | unlimited | unlimited | ||||||||||||
| Par value | $ | 0.01 | $ | 0.01 | $ | 0.01 | $ | 0.01 | ||||||||
| Shares outstanding | 1,092,884 | 862,838 | 424,889 | 571,958 | ||||||||||||
| Net asset value and redemption price per share | $ | 10.44 | $ | 10.53 | $ | 10.49 | $ | 10.65 | ||||||||
Maximum offering price per share (5.75%)(1) | $ | 11.08 | $ | 11.17 | $ | 11.13 | $ | 11.30 | ||||||||
Class B: | ||||||||||||||||
| Net assets | $ | 192,748,873 | $ | 177,316,255 | $ | 86,620,881 | $ | 47,936,637 | ||||||||
| Shares authorized | unlimited | unlimited | unlimited | unlimited | ||||||||||||
| Par value | $ | 0.01 | $ | 0.01 | $ | 0.01 | $ | 0.01 | ||||||||
| Shares outstanding | 18,561,216 | 16,917,026 | 8,246,239 | 4,517,468 | ||||||||||||
Net asset value and redemption price per share(2) | $ | 10.38 | $ | 10.48 | $ | 10.50 | $ | 10.61 | ||||||||
| Maximum offering price per share | $ | 10.38 | $ | 10.48 | $ | 10.50 | $ | 10.61 | ||||||||
Class C: | ||||||||||||||||
| Net assets | $ | 11,201,860 | $ | 13,200,818 | $ | 6,754,343 | $ | 5,680,058 | ||||||||
| Shares authorized | unlimited | unlimited | unlimited | unlimited | ||||||||||||
| Par value | $ | 0.01 | $ | 0.01 | $ | 0.01 | $ | 0.01 | ||||||||
| Shares outstanding | 1,073,309 | 1,251,682 | 642,306 | 531,819 | ||||||||||||
Net asset value and redemption price per share(2) | $ | 10.44 | $ | 10.55 | $ | 10.52 | $ | 10.68 | ||||||||
| Maximum offering price per share | $ | 10.44 | $ | 10.55 | $ | 10.52 | $ | 10.68 | ||||||||
| (1) | Maximum offering price is computed at 100/94.25 of net asset value. On purchases of $50,000 or more, the offering price is reduced. | |
| (2) | Redemption price per share may be reduced for any applicable contingent deferred sales charges. |
21
Table of Contents
| ING | ING | ING | ING | |||||||||||||
| Principal | Principal | Principal | Principal | |||||||||||||
| Protection | Protection | Protection | Protection | |||||||||||||
| Fund IX | Fund X | Fund XI | Fund XII | |||||||||||||
ASSETS: | ||||||||||||||||
| Investments in securities at value* | $ | 46,712,800 | $ | 36,314,321 | $ | 25,376,630 | $ | 12,622,616 | ||||||||
| Short-term investments in affiliates at amortized cost | 100,000 | 10,000 | 100,000 | 5,000 | ||||||||||||
| Short-term investments at amortized cost | 194,000 | 105,000 | — | 129,000 | ||||||||||||
| Cash | 608 | 474 | 1,813 | 874 | ||||||||||||
| Receivables: | ||||||||||||||||
| Dividends and interest | 42,925 | 36,930 | 22,921 | 10,507 | ||||||||||||
| Prepaid expenses | 21 | 19 | 17 | 12 | ||||||||||||
| Reimbursement due from manager | — | — | — | 5,395 | ||||||||||||
| Total assets | 47,050,354 | 36,466,744 | 25,501,381 | 12,773,404 | ||||||||||||
LIABILITIES: | ||||||||||||||||
| Payable for fund shares redeemed | 4,755 | 324,704 | 31,488 | 5,213 | ||||||||||||
| Payable to affiliates | 64,736 | 49,514 | 47,021 | 17,249 | ||||||||||||
| Payable for trustee fees | 11,578 | 1,794 | 5,630 | 561 | ||||||||||||
| Other accrued expenses and liabilities | 95,312 | 56,992 | 45,488 | 26,208 | ||||||||||||
| Total liabilities | 176,381 | 433,004 | 129,627 | 49,231 | ||||||||||||
NET ASSETS | $ | 46,873,973 | $ | 36,033,740 | $ | 25,371,754 | $ | 12,724,173 | ||||||||
NET ASSETS WERE COMPRISED OF: | ||||||||||||||||
| Paid-in capital | $ | 43,008,944 | $ | 32,759,945 | $ | 23,295,380 | $ | 11,865,274 | ||||||||
| Undistributed net investment income | 332,626 | 388,856 | 174,691 | 91,052 | ||||||||||||
| Accumulated net realized gain on investments | 3,505,433 | 2,549,268 | 1,681,452 | 529,797 | ||||||||||||
| Net unrealized appreciation on investments | 26,970 | 335,671 | 220,231 | 238,050 | ||||||||||||
NET ASSETS | $ | 46,873,973 | $ | 36,033,740 | $ | 25,371,754 | $ | 12,724,173 | ||||||||
| * Cost of investments in securities | $ | 46,685,830 | $ | 35,978,650 | $ | 25,156,399 | $ | 12,384,566 |
Class A: | ||||||||||||||||
| Net assets | $ | 4,278,703 | $ | 5,082,328 | $ | 3,924,092 | $ | 1,465,066 | ||||||||
| Shares authorized | unlimited | unlimited | unlimited | unlimited | ||||||||||||
| Par value | $ | 0.01 | $ | 0.01 | $ | 0.01 | $ | 0.01 | ||||||||
| Shares outstanding | 399,029 | 474,699 | 363,811 | 136,875 | ||||||||||||
| Net asset value and redemption price per share | $ | 10.72 | $ | 10.71 | $ | 10.79 | $ | 10.70 | ||||||||
Maximum offering price per share (5.75%)(1) | $ | 11.37 | $ | 11.36 | $ | 11.45 | $ | 11.35 | ||||||||
Class B: | ||||||||||||||||
| Net assets | $ | 38,106,482 | $ | 27,446,501 | $ | 17,871,587 | $ | 9,380,704 | ||||||||
| Shares authorized | unlimited | unlimited | unlimited | unlimited | ||||||||||||
| Par value | $ | 0.01 | $ | 0.01 | $ | 0.01 | $ | 0.01 | ||||||||
| Shares outstanding | 3,574,767 | 2,581,475 | 1,671,199 | 883,480 | ||||||||||||
Net asset value and redemption price per share(2) | $ | 10.66 | $ | 10.63 | $ | 10.69 | $ | 10.62 | ||||||||
| Maximum offering price per share | $ | 10.66 | $ | 10.63 | $ | 10.69 | $ | 10.62 | ||||||||
Class C: | ||||||||||||||||
| Net assets | $ | 4,488,788 | $ | 3,504,911 | $ | 3,576,075 | $ | 1,878,403 | ||||||||
| Shares authorized | unlimited | unlimited | unlimited | unlimited | ||||||||||||
| Par value | $ | 0.01 | $ | 0.01 | $ | 0.01 | $ | 0.01 | ||||||||
| Shares outstanding | 418,212 | 328,145 | 333,908 | 176,188 | ||||||||||||
Net asset value and redemption price per share(2) | $ | 10.73 | $ | 10.68 | $ | 10.71 | $ | 10.66 | ||||||||
| Maximum offering price per share | $ | 10.73 | $ | 10.68 | $ | 10.71 | $ | 10.66 | ||||||||
| (1) | Maximum offering price is computed at 100/94.25 of net asset value. On purchases of $50,000 or more, the offering price is reduced. | |
| (2) | Redemption price per share may be reduced for any applicable contingent deferred sales charges. |
22
Table of Contents
| ING | ING | ING | ING | |||||||||||||
| Index Plus | Index Plus | Index Plus | Index Plus | |||||||||||||
| LargeCap | LargeCap | LargeCap | LargeCap | |||||||||||||
| Equity | Equity | Equity | Equity | |||||||||||||
| Fund | Fund II | Fund III | Fund IV | |||||||||||||
INVESTMENT INCOME: | ||||||||||||||||
| Dividends | $ | 409,373 | $ | 637,770 | $ | 588,203 | $ | 1,460,085 | ||||||||
Interest(1) | 22,673 | 34,291 | 155,945 | 1,904,454 | ||||||||||||
| Total investment income | 432,046 | 672,061 | 744,148 | 3,364,539 | ||||||||||||
EXPENSES: | ||||||||||||||||
| Investment management fees | 92,750 | 144,804 | 152,449 | 936,222 | ||||||||||||
| Distribution and service fees: | ||||||||||||||||
| Class A | 4,519 | 8,153 | 6,927 | 14,892 | ||||||||||||
| Class B | 160,183 | 245,778 | 266,359 | 1,086,564 | ||||||||||||
| Class C | 27,695 | 43,397 | 29,418 | 115,500 | ||||||||||||
| Class Q | 39 | — | — | 452 | ||||||||||||
| Transfer agent fees: | ||||||||||||||||
| Class A | 1,882 | 3,888 | 3,684 | 4,587 | ||||||||||||
| Class B | 16,634 | 29,306 | 35,275 | 84,998 | ||||||||||||
| Class C | 2,875 | 5,172 | 3,920 | 8,915 | ||||||||||||
| Class Q | 12 | — | — | 77 | ||||||||||||
| Administrative service fees | 20,611 | 32,178 | 32,348 | 126,342 | ||||||||||||
| Shareholder reporting expense | 12,342 | 14,340 | 25,045 | 35,521 | ||||||||||||
| Registration fees | 42,090 | 30,349 | 9,430 | 101 | ||||||||||||
| Professional fees | 8,371 | 21,450 | 21,410 | 15,211 | ||||||||||||
| Custody and accounting expense | 8,511 | 11,195 | 18,300 | 25,840 | ||||||||||||
| Trustee fees | 1,479 | 2,745 | 4,026 | 5,270 | ||||||||||||
| Insurance expense | — | — | 6,488 | 346,665 | ||||||||||||
| Miscellaneous expense | 4,961 | 7,419 | 4,777 | 8,090 | ||||||||||||
| Interest expense | — | — | 1,725 | 491 | ||||||||||||
| Total expenses | 404,954 | 600,174 | 621,581 | 2,815,738 | ||||||||||||
| Net waived and reimbursed fees | (262 | ) | (413 | ) | (1,301 | ) | (2,373 | ) | ||||||||
| Net expenses | 404,692 | 599,761 | 620,280 | 2,813,365 | ||||||||||||
| Net investment income | 27,354 | 72,300 | 123,868 | 551,174 | ||||||||||||
REALIZED AND UNREALIZED GAIN (LOSS) ON INVESTMENTS AND FUTURES: | ||||||||||||||||
| Net realized gain (loss) on: | ||||||||||||||||
| Investments | 1,441,086 | 872,906 | 2,605,116 | 15,182,677 | ||||||||||||
| Futures | (73,773 | ) | (235,337 | ) | (260,264 | ) | (194,404 | ) | ||||||||
| Net realized gain on investments and futures | 1,367,313 | 637,569 | 2,344,852 | 14,988,273 | ||||||||||||
| Net change in unrealized appreciation or depreciation on: | ||||||||||||||||
| Investments | (3,239,793 | ) | (3,734,356 | ) | (5,797,652 | ) | (20,481,287 | ) | ||||||||
| Futures | (37,810 | ) | (2,031 | ) | 15,869 | 811 | ||||||||||
| Net change in unrealized appreciation or depreciation on investments and futures | (3,277,603 | ) | (3,736,387 | ) | (5,781,783 | ) | (20,480,476 | ) | ||||||||
| Net realized and unrealized loss on investments and futures | (1,910,290 | ) | (3,098,818 | ) | (3,436,931 | ) | (5,492,203 | ) | ||||||||
| Decrease in net assets resulting from operations | $ | (1,882,936 | ) | $ | (3,026,518 | ) | $ | (3,313,063 | ) | $ | (4,941,029 | ) | ||||
(1) Affiliated income | $ | 17,447 | $ | 27,412 | $ | 85,525 | $ | 159,877 | ||||||||
23
Table of Contents
| ING | ING | ING | ING | |||||||||||||
| Principal | Principal | Principal | Principal | |||||||||||||
| Protection | Protection | Protection | Protection | |||||||||||||
| Fund V | Fund VI | Fund VII | Fund VIII | |||||||||||||
INVESTMENT INCOME: | ||||||||||||||||
| Dividends | $ | 941,757 | $ | 853,032 | $ | 399,688 | $ | 281,172 | ||||||||
Interest(1) | 2,311,509 | 2,097,930 | 893,113 | 655,347 | ||||||||||||
| Total investment income | 3,253,266 | 2,950,962 | 1,292,801 | 936,519 | ||||||||||||
EXPENSES: | ||||||||||||||||
| Investment management fees | 805,251 | 837,943 | 412,043 | 210,562 | ||||||||||||
| Distribution and service fees: | ||||||||||||||||
| Class A | 16,283 | 12,217 | 6,180 | 7,982 | ||||||||||||
| Class B | 1,020,332 | 926,971 | 454,141 | 253,727 | ||||||||||||
| Class C | 62,243 | 71,588 | 36,193 | 31,136 | ||||||||||||
| Transfer agent fees: | ||||||||||||||||
| Class A | 5,571 | 5,973 | 1,953 | 2,139 | ||||||||||||
| Class B | 87,338 | 113,375 | 35,832 | 17,000 | ||||||||||||
| Class C | 5,329 | 8,758 | 2,906 | 2,086 | ||||||||||||
| Administrative service fees | 114,769 | 104,741 | 51,505 | 31,679 | ||||||||||||
| Shareholder reporting expense | 23,680 | 30,588 | 9,661 | 8,061 | ||||||||||||
| Registration fees | 101 | 101 | — | — | ||||||||||||
| Professional fees | 28,483 | 22,969 | 15,684 | 10,614 | ||||||||||||
| Custody and accounting expense | 23,503 | 17,212 | 17,355 | 15,372 | ||||||||||||
| Trustee fees | 6,336 | 4,575 | 3,683 | 1,464 | ||||||||||||
| Insurance expense | 378,744 | 345,652 | 169,968 | 104,541 | ||||||||||||
| Miscellaneous expense | 8,041 | 6,951 | 3,822 | 2,398 | ||||||||||||
| Total expenses | 2,586,004 | 2,509,614 | 1,220,926 | 698,761 | ||||||||||||
| Net recouped (waived and reimbursed) fees | (678 | ) | (419 | ) | 47,671 | (138 | ) | |||||||||
| Net expenses | 2,585,326 | 2,509,195 | 1,268,597 | 698,623 | ||||||||||||
| Net investment income | 667,940 | 441,767 | 24,204 | 237,896 | ||||||||||||
REALIZED AND UNREALIZED GAIN (LOSS) ON INVESTMENTS: | ||||||||||||||||
| Net realized gain on investments | 6,862,242 | 5,683,864 | 2,980,908 | 2,326,169 | ||||||||||||
| Net change in unrealized appreciation or depreciation on investments | (10,499,857 | ) | (8,222,086 | ) | (3,803,166 | ) | (2,943,340 | ) | ||||||||
| Net realized and unrealized loss on investments | (3,637,615 | ) | (2,538,222 | ) | (822,258 | ) | (617,171 | ) | ||||||||
| Decrease in net assets resulting from operations | $ | (2,969,675 | ) | $ | (2,096,455 | ) | $ | (798,054 | ) | $ | (379,275 | ) | ||||
(1) Affiliated income | $ | 45,784 | $ | 27,963 | $ | 12,524 | $ | 9,167 | ||||||||
24
Table of Contents
| ING | ING | ING | ING | |||||||||||||
| Principal | Principal | Principal | Principal | |||||||||||||
| Protection | Protection | Protection | Protection | |||||||||||||
| Fund IX | Fund X | Fund XI | Fund XII | |||||||||||||
INVESTMENT INCOME: | ||||||||||||||||
| Dividends | $ | 232,986 | $ | 200,752 | $ | 125,193 | $ | 58,180 | ||||||||
Interest(1) | 501,424 | 436,967 | 270,051 | 151,657 | ||||||||||||
| Total investment income | 734,410 | 637,719 | 395,244 | 209,837 | ||||||||||||
EXPENSES: | ||||||||||||||||
| Investment management fees | 163,476 | 132,178 | 88,796 | 43,282 | ||||||||||||
| Distribution and service fees: | ||||||||||||||||
| Class A | 5,536 | 7,397 | 5,367 | 1,825 | ||||||||||||
| Class B | 197,587 | 143,827 | 93,029 | 48,249 | ||||||||||||
| Class C | 23,332 | 20,188 | 17,955 | 9,535 | ||||||||||||
| Transfer agent fees: | ||||||||||||||||
| Class A | 1,968 | 2,032 | 1,946 | 887 | ||||||||||||
| Class B | 17,562 | 9,889 | 8,436 | 5,871 | ||||||||||||
| Class C | 2,073 | 1,387 | 1,629 | 1,160 | ||||||||||||
| Administrative service fees | 24,306 | 19,360 | 13,245 | 6,508 | ||||||||||||
| Shareholder reporting expense | 3,372 | 3,779 | 2,013 | 2,745 | ||||||||||||
| Professional fees | 7,869 | 9,869 | 4,575 | 5,753 | ||||||||||||
| Custody and accounting expense | 16,557 | 13,725 | 12,627 | 12,789 | ||||||||||||
| Trustee fees | 1,686 | 183 | 183 | 183 | ||||||||||||
| Insurance expense | 80,211 | 63,890 | 43,710 | 21,478 | ||||||||||||
| Miscellaneous expense | 3,626 | 2,449 | 1,994 | 2,337 | ||||||||||||
| Total expenses | 549,161 | 430,153 | 295,505 | 162,602 | ||||||||||||
| Net waived and reimbursed fees | (84 | ) | (48 | ) | (28 | ) | (5,414 | ) | ||||||||
| Net expenses | 549,077 | 430,105 | 295,477 | 157,188 | ||||||||||||
| Net investment income | 185,333 | 207,614 | 99,767 | 52,649 | ||||||||||||
REALIZED AND UNREALIZED GAIN (LOSS) ON INVESTMENTS: | ||||||||||||||||
| Net realized gain on investments | 2,219,374 | 2,083,691 | 1,053,218 | 432,900 | ||||||||||||
| Net change in unrealized appreciation or depreciation on investments | (2,767,025 | ) | (2,490,963 | ) | (1,136,751 | ) | (428,637 | ) | ||||||||
| Net realized and unrealized gain (loss) on investments | (547,651 | ) | (407,272 | ) | (83,533 | ) | 4,263 | |||||||||
| Increase (decrease) in net assets resulting from operations | $ | (362,318 | ) | $ | (199,658 | ) | $ | 16,234 | $ | 56,912 | ||||||
(1) Affiliated income | $ | 5,549 | $ | 3,173 | $ | 1,897 | $ | 1,286 | ||||||||
25
Table of Contents
| ING Index Plus LargeCap | ING Index Plus LargeCap | |||||||||||||||
| Equity Fund | Equity Fund II | |||||||||||||||
| Six Months Ended | Year Ended | Six Months Ended | Year Ended | |||||||||||||
| November 30, | May 31, | November 30, | May 31, | |||||||||||||
| 2007 | 2007 | 2007 | 2007 | |||||||||||||
FROM OPERATIONS: | ||||||||||||||||
| Net investment income | $ | 27,354 | $ | 1,070,038 | $ | 72,300 | $ | 3,609,117 | ||||||||
| Net realized gain on investments and futures | 1,367,313 | 7,495,131 | 637,569 | 6,872,523 | ||||||||||||
| Net change in unrealized appreciation or depreciation on investments and futures | (3,277,603 | ) | 1,814,972 | (3,736,387 | ) | 3,082,413 | ||||||||||
| Increase (decrease) in net assets resulting from operations | (1,882,936 | ) | 10,380,141 | (3,026,518 | ) | 13,564,053 | ||||||||||
FROM DISTRIBUTIONS TO SHAREHOLDERS: | ||||||||||||||||
| Net investment income: | ||||||||||||||||
| Class A | — | (235,424 | ) | — | (487,876 | ) | ||||||||||
| Class B | — | (1,992,729 | ) | — | (4,573,984 | ) | ||||||||||
| Class C | — | (162,195 | ) | — | (490,786 | ) | ||||||||||
| Class Q | — | (2,203 | ) | — | — | |||||||||||
| Total distributions | — | (2,392,551 | ) | — | (5,552,646 | ) | ||||||||||
FROM CAPITAL SHARE TRANSACTIONS: | ||||||||||||||||
| Net proceeds from sale of shares | 30,484 | 236,302 | 29,990 | 1,654,689 | ||||||||||||
| Dividends reinvested | — | 1,859,254 | — | 4,163,136 | ||||||||||||
| 30,484 | 2,095,556 | 29,990 | 5,817,825 | |||||||||||||
| Cost of shares redeemed | (6,553,454 | ) | (121,998,844 | ) | (13,978,700 | ) | (171,223,647 | ) | ||||||||
| Net decrease in net assets resulting from capital share transactions | (6,522,970 | ) | (119,903,288 | ) | (13,948,710 | ) | (165,405,822 | ) | ||||||||
| Net decrease in net assets | (8,405,906 | ) | (111,915,698 | ) | (16,975,228 | ) | (157,394,415 | ) | ||||||||
NET ASSETS: | ||||||||||||||||
| Beginning of period | 46,120,945 | 158,036,643 | 74,294,227 | 231,688,642 | ||||||||||||
| End of period | $ | 37,715,039 | $ | 46,120,945 | $ | 57,318,999 | $ | 74,294,227 | ||||||||
| Undistributed net investment income at end of period | $ | 27,354 | $ | — | $ | 180,916 | $ | 108,616 | ||||||||
26
Table of Contents
| ING Index Plus LargeCap | ING Index Plus LargeCap | |||||||||||||||
| Equity Fund III | Equity Fund IV | |||||||||||||||
| Six Months Ended | Year Ended | Six Months Ended | Year Ended | |||||||||||||
| November 30, | May 31, | November 30, | May 31, | |||||||||||||
| 2007 | 2007 | 2007 | 2007 | |||||||||||||
FROM OPERATIONS: | ||||||||||||||||
| Net investment income | $ | 123,868 | $ | 2,860,191 | $ | 551,174 | $ | 2,086,987 | ||||||||
| Net realized gain on investments and futures | 2,344,852 | 3,056,853 | 14,988,273 | 17,336,115 | ||||||||||||
| Net change in unrealized appreciation or depreciation on investments and futures | (5,781,783 | ) | 4,509,992 | (20,480,476 | ) | 14,864,688 | ||||||||||
| Increase (decrease) in net assets resulting from operations | (3,313,063 | ) | 10,427,036 | (4,941,029 | ) | 34,287,790 | ||||||||||
FROM DISTRIBUTIONS TO SHAREHOLDERS: | ||||||||||||||||
| Net investment income: | ||||||||||||||||
| Class A | — | (471,587 | ) | (90,915 | ) | (253,409 | ) | |||||||||
| Class B | — | (3,526,322 | ) | (357,540 | ) | (1,786,454 | ) | |||||||||
| Class C | — | (279,725 | ) | (3,404 | ) | (163,280 | ) | |||||||||
| Class Q | — | — | (2,988 | ) | (5,349 | ) | ||||||||||
| Net realized gains: | ||||||||||||||||
| Class A | — | — | (593,132 | ) | (435,959 | ) | ||||||||||
| Class B | — | — | (11,696,919 | ) | (6,989,968 | ) | ||||||||||
| Class C | — | — | (1,089,729 | ) | (804,384 | ) | ||||||||||
| Class Q | — | — | (17,688 | ) | (8,686 | ) | ||||||||||
| Total distributions | — | (4,277,634 | ) | (13,852,315 | ) | (10,447,489 | ) | |||||||||
FROM CAPITAL SHARE TRANSACTIONS: | ||||||||||||||||
| Net proceeds from sale of shares | 8,916 | — | 574,897 | — | ||||||||||||
| Dividends reinvested | — | 3,366,603 | 11,368,000 | 8,374,234 | ||||||||||||
| 8,916 | 3,366,603 | 11,942,897 | 8,374,234 | |||||||||||||
| Cost of shares redeemed | (89,305,692 | ) | (46,116,954 | ) | (175,945,842 | ) | (84,002,006 | ) | ||||||||
| Net decrease in net assets resulting from capital share transactions | (89,296,776 | ) | (42,750,351 | ) | (164,002,945 | ) | (75,627,772 | ) | ||||||||
| Net decrease in net assets | (92,609,839 | ) | (36,600,949 | ) | (182,796,289 | ) | (51,787,471 | ) | ||||||||
NET ASSETS: | ||||||||||||||||
| Beginning of period | 143,641,903 | 180,242,852 | 312,178,421 | 363,965,892 | ||||||||||||
| End of period | $ | 51,032,064 | $ | 143,641,903 | $ | 129,382,132 | $ | 312,178,421 | ||||||||
| Undistributed net investment income at end of period | $ | 123,868 | $ | — | $ | 548,229 | $ | 451,902 | ||||||||
27
Table of Contents
| ING Principal Protection Fund V | ING Principal Protection Fund VI | |||||||||||||||
| Six Months Ended | Year Ended | Six Months Ended | Year Ended | |||||||||||||
| November 30, | May 31, | November 30, | May 31, | |||||||||||||
| 2007 | 2007 | 2007 | 2007 | |||||||||||||
FROM OPERATIONS: | ||||||||||||||||
| Net investment income | $ | 667,940 | $ | 1,515,248 | $ | 441,767 | $ | 1,225,710 | ||||||||
| Net realized gain on investments | 6,862,242 | 8,419,217 | 5,683,864 | 6,147,902 | ||||||||||||
| Net change in unrealized appreciation or depreciation on investments | (10,499,857 | ) | 13,456,868 | (8,222,086 | ) | 12,934,658 | ||||||||||
| Increase (decrease) in net assets resulting from operations | (2,969,675 | ) | 23,391,333 | (2,096,455 | ) | 20,308,270 | ||||||||||
FROM DISTRIBUTIONS TO SHAREHOLDERS: | ||||||||||||||||
| Net investment income: | ||||||||||||||||
| Class A | — | (276,476 | ) | — | (176,092 | ) | ||||||||||
| Class B | — | (1,329,057 | ) | — | (1,189,240 | ) | ||||||||||
| Class C | — | (82,810 | ) | — | (68,309 | ) | ||||||||||
| Net realized gains: | ||||||||||||||||
| Class A | — | (308,268 | ) | — | (69,882 | ) | ||||||||||
| Class B | — | (3,638,712 | ) | — | (1,116,676 | ) | ||||||||||
| Class C | — | (282,805 | ) | — | (93,440 | ) | ||||||||||
| Total distributions | — | (5,918,128 | ) | — | (2,713,639 | ) | ||||||||||
FROM CAPITAL SHARE TRANSACTIONS: | ||||||||||||||||
| Dividends reinvested | — | 5,175,015 | — | 2,358,199 | ||||||||||||
| Cost of shares redeemed | (24,692,081 | ) | (74,255,281 | ) | (18,832,496 | ) | (65,962,586 | ) | ||||||||
| Net decrease in net assets resulting from capital share transactions | (24,692,081 | ) | (69,080,266 | ) | (18,832,496 | ) | (63,604,387 | ) | ||||||||
| Net decrease in net assets | (27,661,756 | ) | (51,607,061 | ) | (20,928,951 | ) | (46,009,756 | ) | ||||||||
NET ASSETS: | ||||||||||||||||
| Beginning of period | 243,018,129 | 294,625,190 | 220,534,836 | 266,544,592 | ||||||||||||
| End of period | $ | 215,356,373 | $ | 243,018,129 | $ | 199,605,885 | $ | 220,534,836 | ||||||||
| Undistributed net investment income at end of period | $ | 1,184,416 | $ | 516,476 | $ | 839,748 | $ | 397,981 | ||||||||
28
Table of Contents
| ING Principal Protection | ||||||||||||||||
| ING Principal Protection Fund VII | Fund VIII | |||||||||||||||
| Six Months Ended | Year Ended | Six Months Ended | Year Ended | |||||||||||||
| November 30, | May 31, | November 30, | May 31, | |||||||||||||
| 2007 | 2007 | 2007 | 2007 | |||||||||||||
FROM OPERATIONS: | ||||||||||||||||
| Net investment income | $ | 24,204 | $ | 181,069 | $ | 237,896 | $ | 650,010 | ||||||||
| Net realized gain on investments | 2,980,908 | 2,769,739 | 2,326,169 | 1,914,847 | ||||||||||||
| Net change in unrealized appreciation or depreciation on investments | (3,803,166 | ) | 6,658,057 | (2,943,340 | ) | 4,327,718 | ||||||||||
| Increase (decrease) in net assets resulting from operations | (798,054 | ) | 9,608,865 | (379,275 | ) | 6,892,575 | ||||||||||
FROM DISTRIBUTIONS TO SHAREHOLDERS: | ||||||||||||||||
| Net investment income: | ||||||||||||||||
| Class A | — | (54,947 | ) | — | (140,822 | ) | ||||||||||
| Class B | — | (99,560 | ) | — | (582,505 | ) | ||||||||||
| Class C | — | — | — | (50,936 | ) | |||||||||||
| Net realized gains: | ||||||||||||||||
| Class A | — | — | — | (8,854 | ) | |||||||||||
| Class B | — | — | — | (65,475 | ) | |||||||||||
| Class C | — | — | — | (7,920 | ) | |||||||||||
| Total distributions | — | (154,507 | ) | — | (856,512 | ) | ||||||||||
FROM CAPITAL SHARE TRANSACTIONS: | ||||||||||||||||
| Dividends reinvested | — | 131,960 | — | 694,745 | ||||||||||||
| Cost of shares redeemed | (10,184,658 | ) | (33,821,329 | ) | (7,055,931 | ) | (23,480,449 | ) | ||||||||
| Net decrease in net assets resulting from capital share transactions | (10,184,658 | ) | (33,689,369 | ) | (7,055,931 | ) | (22,785,704 | ) | ||||||||
| Net decrease in net assets | (10,982,712 | ) | (24,235,011 | ) | (7,435,206 | ) | (16,749,641 | ) | ||||||||
NET ASSETS: | ||||||||||||||||
| Beginning of period | 108,813,220 | 133,048,231 | 67,145,519 | 83,895,160 | ||||||||||||
| End of period | $ | 97,830,508 | $ | 108,813,220 | $ | 59,710,313 | $ | 67,145,519 | ||||||||
| Undistributed net investment income at end of period | $ | 46,828 | $ | 22,624 | $ | 439,197 | $ | 201,301 | ||||||||
29
Table of Contents
| ING Principal Protection Fund IX | ING Principal Protection Fund X | |||||||||||||||
| Six Months Ended | Year Ended | Six Months Ended | Year Ended | |||||||||||||
| November 30, | May 31, | November 30, | May 31, | |||||||||||||
| 2007 | 2007 | 2007 | 2007 | |||||||||||||
FROM OPERATIONS: | ||||||||||||||||
| Net investment income | $ | 185,333 | $ | 488,882 | $ | 207,614 | $ | 485,104 | ||||||||
| Net realized gain on investments | 2,219,374 | 1,931,636 | 2,083,691 | 1,091,259 | ||||||||||||
| Net change in unrealized appreciation or depreciation on investments | (2,767,025 | ) | 3,075,935 | (2,490,963 | ) | 3,185,539 | ||||||||||
| Increase (decrease) in net assets resulting from operations | (362,318 | ) | 5,496,453 | (199,658 | ) | 4,761,902 | ||||||||||
FROM DISTRIBUTIONS TO SHAREHOLDERS: | ||||||||||||||||
| Net investment income: | ||||||||||||||||
| Class A | — | (102,958 | ) | — | (132,165 | ) | ||||||||||
| Class B | — | (520,491 | ) | — | (369,123 | ) | ||||||||||
| Class C | — | (46,905 | ) | — | (54,799 | ) | ||||||||||
| Net realized gains: | ||||||||||||||||
| Class A | — | (57,266 | ) | — | (91,200 | ) | ||||||||||
| Class B | — | (477,849 | ) | — | (420,212 | ) | ||||||||||
| Class C | — | (57,462 | ) | — | (69,830 | ) | ||||||||||
| Total distributions | — | (1,262,931 | ) | — | (1,137,329 | ) | ||||||||||
FROM CAPITAL SHARE TRANSACTIONS: | ||||||||||||||||
| Dividends reinvested | — | 1,100,726 | — | 974,726 | ||||||||||||
| Cost of shares redeemed | (3,694,772 | ) | (14,582,928 | ) | (5,653,659 | ) | (12,466,691 | ) | ||||||||
| Net decrease in net assets resulting from capital share transactions | (3,694,772 | ) | (13,482,202 | ) | (5,653,659 | ) | (11,491,965 | ) | ||||||||
| Net decrease in net assets | (4,057,090 | ) | (9,248,680 | ) | (5,853,317 | ) | (7,867,392 | ) | ||||||||
NET ASSETS: | ||||||||||||||||
| Beginning of period | 50,931,063 | 60,179,743 | 41,887,057 | 49,754,449 | ||||||||||||
| End of period | $ | 46,873,973 | $ | 50,931,063 | $ | 36,033,740 | $ | 41,887,057 | ||||||||
| Undistributed net investment income at end of period | $ | 332,626 | $ | 147,293 | $ | 388,856 | $ | 181,242 | ||||||||
30
Table of Contents
| ING Principal Protection | ||||||||||||||||
| ING Principal Protection Fund XI | Fund XII | |||||||||||||||
| Six Months Ended | Year Ended | Six Months Ended | Year Ended | |||||||||||||
| November 30, | May 31, | November 30, | May 31, | |||||||||||||
| 2007 | 2007 | 2007 | 2007 | |||||||||||||
FROM OPERATIONS: | ||||||||||||||||
| Net investment income | $ | 99,767 | $ | 285,481 | $ | 52,649 | $ | 153,237 | ||||||||
| Net realized gain on investments | 1,053,218 | 918,132 | 432,900 | 367,560 | ||||||||||||
| Net change in unrealized appreciation or depreciation on investments | (1,136,751 | ) | 1,828,467 | (428,637 | ) | 895,901 | ||||||||||
| Increase in net assets resulting from operations | 16,234 | 3,032,080 | 56,912 | 1,416,698 | ||||||||||||
FROM DISTRIBUTIONS TO SHAREHOLDERS: | ||||||||||||||||
| Net investment income: | ||||||||||||||||
| Class A | — | (90,085 | ) | — | (44,882 | ) | ||||||||||
| Class B | — | (274,377 | ) | — | (126,917 | ) | ||||||||||
| Class C | — | (51,556 | ) | — | (18,969 | ) | ||||||||||
| Net realized gains: | ||||||||||||||||
| Class A | — | (15,388 | ) | — | — | |||||||||||
| Class B | — | (72,259 | ) | — | — | |||||||||||
| Class C | — | (14,564 | ) | — | — | |||||||||||
| Total distributions | — | (518,229 | ) | — | (190,768 | ) | ||||||||||
FROM CAPITAL SHARE TRANSACTIONS: | ||||||||||||||||
| Dividends reinvested | — | 426,859 | — | 156,915 | ||||||||||||
| Cost of shares redeemed | (2,343,383 | ) | (9,668,525 | ) | (898,944 | ) | (4,391,627 | ) | ||||||||
| Net decrease in net assets resulting from capital share transactions | (2,343,383 | ) | (9,241,666 | ) | (898,944 | ) | (4,234,712 | ) | ||||||||
| Net decrease in net assets | (2,327,149 | ) | (6,727,815 | ) | (842,032 | ) | (3,008,782 | ) | ||||||||
NET ASSETS: | ||||||||||||||||
| Beginning of period | 27,698,903 | 34,426,718 | 13,566,205 | 16,574,987 | ||||||||||||
| End of period | $ | 25,371,754 | $ | 27,698,903 | $ | 12,724,173 | $ | 13,566,205 | ||||||||
| Undistributed net investment income at end of period | $ | 174,691 | $ | 74,924 | $ | 91,052 | $ | 38,403 | ||||||||
31
Table of Contents
| Class A | ||||||||||||||||||||||||||||
| Six Months | ||||||||||||||||||||||||||||
| Ended | ||||||||||||||||||||||||||||
| November 30, | Year Ended May 31, | |||||||||||||||||||||||||||
| 2007 | 2007 | 2006 | 2005 | 2004 | 2003 | |||||||||||||||||||||||
Per Share Operating Performance: | ||||||||||||||||||||||||||||
| Net asset value, beginning of period | $ | 11.14 | 9.82 | 9.85 | 9.95 | 10.25 | 9.85 | |||||||||||||||||||||
| Income (loss) from investment operations: | ||||||||||||||||||||||||||||
| Net investment income | $ | 0.05 | 0.18 | *† | 0.23 | * | 0.22 | * | 0.23 | 0.22 | ||||||||||||||||||
| Net realized and unrealized gain (loss) on investments and futures | $ | (0.48 | ) | 1.43 | (0.01 | ) | (0.08 | ) | (0.33 | ) | 0.42 | |||||||||||||||||
| Total from investment operations | $ | (0.43 | ) | 1.61 | 0.22 | 0.14 | (0.10 | ) | 0.64 | |||||||||||||||||||
| Less distributions from: | ||||||||||||||||||||||||||||
| Net investment income | $ | — | 0.29 | 0.25 | 0.24 | 0.20 | 0.24 | |||||||||||||||||||||
| Total distributions | $ | — | 0.29 | 0.25 | 0.24 | 0.20 | 0.24 | |||||||||||||||||||||
| Net asset value, end of period | $ | 10.71 | 11.14 | 9.82 | 9.85 | 9.95 | 10.25 | |||||||||||||||||||||
Total Return(1) | % | (3.86 | ) | 16.76 | † | 2.22 | 1.42 | (1.01 | ) | 6.60 | ||||||||||||||||||
Ratios and Supplemental Data: | ||||||||||||||||||||||||||||
| Net assets, end of period (000’s) | $ | 3,505 | 3,878 | 12,043 | 18,420 | 28,057 | 51,385 | |||||||||||||||||||||
| Ratios to average net assets: | ||||||||||||||||||||||||||||
Gross expenses prior to expense reimbursement/recoupment(3) | % | 1.28 | 1.64 | 1.63 | 1.57 | 1.67 | 1.78 | |||||||||||||||||||||
Net expenses after expense reimbursement/recoupment(2)(3) | % | 1.28 | *** | 1.64 | *** | 1.63 | 1.69 | 1.74 | 1.75 | |||||||||||||||||||
Net investment income after expense reimbursement/recoupment(2)(3) | % | 0.84 | *** | 1.82 | ***† | 2.33 | 2.22 | 2.03 | 2.21 | |||||||||||||||||||
| Portfolio turnover rate | % | 63 | 172 | 12 | 29 | 29 | 47 | |||||||||||||||||||||
| Class B | ||||||||||||||||||||||||||||
| Six Months | ||||||||||||||||||||||||||||
| Ended | ||||||||||||||||||||||||||||
| November 30, | Year Ended May 31, | |||||||||||||||||||||||||||
| 2007 | 2007 | 2006 | 2005 | 2004 | 2003 | |||||||||||||||||||||||
Per Share Operating Performance: | ||||||||||||||||||||||||||||
| Net asset value, beginning of period | $ | 11.12 | 9.80 | 9.83 | 9.91 | 10.21 | 9.81 | |||||||||||||||||||||
| Income (loss) from investment operations: | ||||||||||||||||||||||||||||
| Net investment income | $ | 0.00 | ** | 0.12 | *† | 0.16 | * | 0.14 | 0.14 | 0.15 | ||||||||||||||||||
| Net realized and unrealized gain (loss) on investments and futures | $ | (0.47 | ) | 1.41 | (0.03 | ) | (0.06 | ) | (0.32 | ) | 0.41 | |||||||||||||||||
| Total from investment operations | $ | (0.47 | ) | 1.53 | 0.13 | 0.08 | (0.18 | ) | 0.56 | |||||||||||||||||||
| Less distributions from: | ||||||||||||||||||||||||||||
| Net investment income | $ | — | 0.21 | 0.16 | 0.16 | 0.12 | 0.16 | |||||||||||||||||||||
| Total distributions | $ | — | 0.21 | 0.16 | 0.16 | 0.12 | 0.16 | |||||||||||||||||||||
| Net asset value, end of period | $ | 10.65 | 11.12 | 9.80 | 9.83 | 9.91 | 10.21 | |||||||||||||||||||||
Total Return(1) | % | (4.23 | ) | 15.86 | † | 1.37 | 0.79 | (1.76 | ) | 5.82 | ||||||||||||||||||
Ratios and Supplemental Data: | ||||||||||||||||||||||||||||
| Net assets, end of period (000’s) | $ | 29,146 | 36,000 | 132,611 | 178,017 | 237,539 | 328,399 | |||||||||||||||||||||
| Ratios to average net assets: | ||||||||||||||||||||||||||||
Gross expenses prior to expense reimbursement/recoupment(3) | % | 2.03 | 2.39 | 2.38 | 2.32 | 2.42 | 2.54 | |||||||||||||||||||||
Net expenses after expense reimbursement/recoupment(2)(3) | % | 2.03 | *** | 2.39 | *** | 2.38 | 2.44 | 2.49 | 2.50 | |||||||||||||||||||
Net investment income after expense reimbursement/recoupment(2)(3) | % | 0.06 | *** | 1.18 | ***† | 1.58 | 1.48 | 1.28 | 1.46 | |||||||||||||||||||
| Portfolio turnover rate | % | 63 | 172 | 12 | 29 | 29 | 47 | |||||||||||||||||||||
| (1) | Total return is calculated assuming reinvestment of all dividends and capital gain distributions at net asset value and excluding the deduction of sales charges. Total return for periods less than one year is not annualized. | |
| (2) | The Investment Adviser has agreed to limit expenses, (excluding interest, taxes, brokerage and extraordinary expenses) subject to possible recoupment by the Investment Adviser within three years of being incurred. This expense limitation agreement terminated on October 11, 2006. | |
| (3) | Annualized for periods less than one year. | |
| * | Calculated using average number of shares outstanding throughout the period. | |
| ** | Amount is less than $0.005. | |
| *** | Impact of waiving the advisory fee for the ING Institutional Prime Money Market Fund holding has less than 0.005% impact on the expense ratio. | |
| † | Includes one-time settlement income representing $0.05 and $0.06 per share for Class A and Class B, respectively, and 0.27% of the fund’s average net assets. |
32
Table of Contents
| Class C | ||||||||||||||||||||||||||||
| Six Months | ||||||||||||||||||||||||||||
| Ended | ||||||||||||||||||||||||||||
| November 30, | Year Ended May 31, | |||||||||||||||||||||||||||
| 2007 | 2007 | 2006 | 2005 | 2004 | 2003 | |||||||||||||||||||||||
Per Share Operating Performance: | ||||||||||||||||||||||||||||
| Net asset value, beginning of period | $ | 11.20 | 9.84 | 9.85 | 9.92 | 10.21 | 9.81 | |||||||||||||||||||||
| Income (loss) from investment operations: | ||||||||||||||||||||||||||||
| Net investment income | $ | 0.00 | ** | 0.09 | *† | 0.16 | * | 0.15 | * | 0.15 | 0.15 | |||||||||||||||||
| Net realized and unrealized gain (loss) on investments and futures | $ | (0.48 | ) | 1.46 | (0.02 | ) | (0.08 | ) | (0.34 | ) | 0.41 | |||||||||||||||||
| Total from investment operations | $ | (0.48 | ) | 1.55 | 0.14 | 0.07 | (0.19 | ) | 0.56 | |||||||||||||||||||
| Less distributions from: | ||||||||||||||||||||||||||||
| Net investment income | $ | — | 0.19 | 0.15 | 0.14 | 0.10 | 0.16 | |||||||||||||||||||||
| Total distributions | $ | — | 0.19 | 0.15 | 0.14 | 0.10 | 0.16 | |||||||||||||||||||||
| Net asset value, end of period | $ | 10.72 | 11.20 | 9.84 | 9.85 | 9.92 | 10.21 | |||||||||||||||||||||
Total Return(1) | % | (4.29 | ) | 15.94 | † | 1.39 | 0.72 | (1.83 | ) | 5.78 | ||||||||||||||||||
Ratios and Supplemental Data: | ||||||||||||||||||||||||||||
| Net assets, end of period (000’s) | $ | 5,037 | 6,184 | 13,294 | 24,476 | 43,529 | 85,451 | |||||||||||||||||||||
| Ratios to average net assets: | ||||||||||||||||||||||||||||
Gross expenses prior to expense reimbursement/recoupment(3) | % | 2.03 | 2.39 | 2.38 | 2.32 | 2.42 | 2.54 | |||||||||||||||||||||
Net expenses after expense reimbursement/recoupment(2)(3) | % | 2.03 | *** | 2.39 | *** | 2.38 | 2.44 | 2.49 | 2.50 | |||||||||||||||||||
Net investment income after expense reimbursement/recoupment(2)(3) | % | 0.07 | *** | 0.89 | ***† | 1.58 | 1.46 | 1.28 | 1.45 | |||||||||||||||||||
| Portfolio turnover rate | % | 63 | 172 | 12 | 29 | 29 | 47 | |||||||||||||||||||||
| Class Q | ||||||||||||||||||||||||||||
| Six Months | ||||||||||||||||||||||||||||
| Ended | ||||||||||||||||||||||||||||
| November 30, | Year Ended May 31, | |||||||||||||||||||||||||||
| 2007 | 2007 | 2006 | 2005 | 2004 | 2003 | |||||||||||||||||||||||
Per Share Operating Performance: | ||||||||||||||||||||||||||||
| Net asset value, beginning of period | $ | 11.22 | 9.89 | 9.88 | 9.97 | 10.27 | 9.87 | |||||||||||||||||||||
| Income (loss) from investment operations: | ||||||||||||||||||||||||||||
| Net investment income | $ | 0.05 | 0.16 | *† | 0.23 | * | 0.22 | * | 0.24 | 0.25 | ||||||||||||||||||
| Net realized and unrealized gain (loss) on investments and futures | $ | (0.48 | ) | 1.47 | (0.01 | ) | (0.07 | ) | (0.34 | ) | 0.40 | |||||||||||||||||
| Total from investment operations | $ | (0.43 | ) | 1.63 | 0.22 | 0.15 | (0.10 | ) | 0.65 | |||||||||||||||||||
| Less distributions from: | ||||||||||||||||||||||||||||
| Net investment income | $ | — | 0.30 | 0.21 | 0.24 | 0.20 | 0.25 | |||||||||||||||||||||
| Total distributions | $ | — | 0.30 | 0.21 | 0.24 | 0.20 | 0.25 | |||||||||||||||||||||
| Net asset value, end of period | $ | 10.79 | 11.22 | 9.89 | 9.88 | 9.97 | 10.27 | |||||||||||||||||||||
Total Return(1) | % | (3.83 | ) | 16.83 | † | 2.25 | 1.53 | (1.01 | ) | 6.68 | ||||||||||||||||||
Ratios and Supplemental Data: | ||||||||||||||||||||||||||||
| Net assets, end of period (000’s) | $ | 27 | 59 | 89 | 335 | 671 | 1,733 | |||||||||||||||||||||
| Ratios to average net assets: | ||||||||||||||||||||||||||||
Gross expenses prior to expense reimbursement/recoupment(3) | % | 1.26 | 1.63 | 1.59 | 1.57 | 1.63 | 1.69 | |||||||||||||||||||||
Net expenses after expense reimbursement/recoupment(2)(3) | % | 1.26 | *** | 1.63 | *** | 1.59 | 1.69 | 1.70 | 1.66 | |||||||||||||||||||
Net investment income after expense reimbursement/recoupment(2)(3) | % | 0.74 | *** | 1.54 | ***† | 2.34 | 2.21 | 2.08 | 2.30 | |||||||||||||||||||
| Portfolio turnover rate | % | 63 | 172 | 12 | 29 | 29 | 47 | |||||||||||||||||||||
| (1) | Total return is calculated assuming reinvestment of all dividends and capital gain distributions at net asset value and excluding the deduction of sales charges. Total return for periods less than one year is not annualized. | |
| (2) | The Investment Adviser has agreed to limit expenses, (excluding interest, taxes, brokerage and extraordinary expenses) subject to possible recoupment by the Investment Adviser within three years of being incurred. This expense limitation agreement terminated on October 11, 2006. | |
| (3) | Annualized for periods less than one year. | |
| * | Calculated using average number of shares outstanding throughout the period. | |
| ** | Amount is less than $0.005. | |
| *** | Impact of waiving the advisory fee for the ING Institutional Prime Money Market Fund holding has less than 0.005% impact on the expense ratio. | |
| † | Includes one-time settlement income representing $0.04 and $0.03 per share for Class C and Class Q, respectively, and 0.27% of the fund’s average net assets. |
33
Table of Contents
| Class A | ||||||||||||||||||||||||||||
| Six Months | ||||||||||||||||||||||||||||
| Ended | ||||||||||||||||||||||||||||
| November 30, | Year Ended May 31, | |||||||||||||||||||||||||||
| 2007 | 2007 | 2006 | 2005 | 2004 | 2003 | |||||||||||||||||||||||
Per Share Operating Performance: | ||||||||||||||||||||||||||||
| Net asset value, beginning of period | $ | 10.28 | 9.52 | 9.65 | 9.77 | 10.15 | 9.83 | |||||||||||||||||||||
| Income (loss) from investment operations: | ||||||||||||||||||||||||||||
| Net investment income | $ | 0.05 | 0.25 | † | 0.26 | * | 0.25 | * | 0.25 | 0.23 | ||||||||||||||||||
| Net realized and unrealized gain (loss) on investments and futures | $ | (0.46 | ) | 0.86 | (0.09 | ) | (0.10 | ) | (0.43 | ) | 0.32 | |||||||||||||||||
| Total from investment operations | $ | (0.41 | ) | 1.11 | 0.17 | 0.15 | (0.18 | ) | 0.55 | |||||||||||||||||||
| Less distributions from: | ||||||||||||||||||||||||||||
| Net investment income | $ | — | 0.35 | 0.30 | 0.27 | 0.20 | 0.23 | |||||||||||||||||||||
| Total distributions | $ | — | 0.35 | 0.30 | 0.27 | 0.20 | 0.23 | |||||||||||||||||||||
| Net asset value, end of period | $ | 9.87 | 10.28 | 9.52 | 9.65 | 9.77 | 10.15 | |||||||||||||||||||||
Total Return(1) | % | (3.99 | ) | 11.93 | † | 1.74 | 1.49 | (1.74 | ) | 5.73 | ||||||||||||||||||
Ratios and Supplemental Data: | ||||||||||||||||||||||||||||
| Net assets, end of period (000’s) | $ | 5,905 | 7,346 | 15,940 | 25,160 | 37,580 | 76,897 | |||||||||||||||||||||
| Ratios to average net assets: | ||||||||||||||||||||||||||||
Gross expenses prior to expense reimbursement/recoupment(3) | % | 1.19 | 1.60 | 1.62 | 1.58 | 1.65 | 1.78 | |||||||||||||||||||||
Net expenses after expense reimbursement/recoupment(2)(3) | % | 1.19 | ** | 1.60 | ** | 1.62 | 1.58 | 1.69 | 1.75 | |||||||||||||||||||
Net investment income after expense reimbursement/recoupment(2)(3) | % | 0.91 | ** | 2.66 | **† | 2.69 | 2.56 | 2.26 | 2.30 | |||||||||||||||||||
| Portfolio turnover rate | % | 61 | 96 | 25 | 24 | 74 | 60 | |||||||||||||||||||||
| Class B | ||||||||||||||||||||||||||||
| Six Months | ||||||||||||||||||||||||||||
| Ended | ||||||||||||||||||||||||||||
| November 30, | Year Ended May 31, | |||||||||||||||||||||||||||
| 2007 | 2007 | 2006 | 2005 | 2004 | 2003 | |||||||||||||||||||||||
Per Share Operating Performance: | ||||||||||||||||||||||||||||
| Net asset value, beginning of period | $ | 10.27 | 9.50 | 9.63 | 9.74 | 10.12 | 9.80 | |||||||||||||||||||||
| Income (loss) from investment operations: | ||||||||||||||||||||||||||||
| Net investment income | $ | 0.01 | 0.20 | *† | 0.19 | * | 0.19 | 0.16 | 0.16 | |||||||||||||||||||
| Net realized and unrealized gain (loss) on investments and futures | $ | (0.45 | ) | 0.83 | (0.10 | ) | (0.12 | ) | (0.41 | ) | 0.32 | |||||||||||||||||
| Total from investment operations | $ | (0.44 | ) | 1.03 | 0.09 | 0.07 | (0.25 | ) | 0.48 | |||||||||||||||||||
| Less distributions from: | ||||||||||||||||||||||||||||
| Net investment income | $ | — | 0.26 | 0.22 | 0.18 | 0.13 | 0.16 | |||||||||||||||||||||
| Total distributions | $ | — | 0.26 | 0.22 | 0.18 | 0.13 | 0.16 | |||||||||||||||||||||
| Net asset value, end of period | $ | 9.83 | 10.27 | 9.50 | 9.63 | 9.74 | 10.12 | |||||||||||||||||||||
Total Return(1) | % | (4.28 | ) | 11.07 | † | 0.90 | 0.76 | (2.47 | ) | 4.98 | ||||||||||||||||||
Ratios and Supplemental Data: | ||||||||||||||||||||||||||||
| Net assets, end of period (000’s) | $ | 43,303 | 57,511 | 189,657 | 249,693 | 328,221 | 442,268 | |||||||||||||||||||||
| Ratios to average net assets: | ||||||||||||||||||||||||||||
Gross expenses prior to expense reimbursement/recoupment(3) | % | 1.94 | 2.35 | 2.37 | 2.33 | 2.40 | 2.53 | |||||||||||||||||||||
Net expenses after expense reimbursement/recoupment(2)(3) | % | 1.94 | ** | 2.35 | ** | 2.37 | 2.33 | 2.44 | 2.50 | |||||||||||||||||||
Net investment income after expense reimbursement/recoupment(2)(3) | % | 0.14 | ** | 2.07 | **† | 1.94 | 1.82 | 1.51 | 1.55 | |||||||||||||||||||
| Portfolio turnover rate | % | 61 | 96 | 25 | 24 | 74 | 60 | |||||||||||||||||||||
| (1) | Total return is calculated assuming reinvestment of all dividends and capital gain distributions at net asset value and excluding the deduction of sales charges. Total return for periods less than one year is not annualized. | |
| (2) | The Investment Adviser has agreed to limit expenses, (excluding interest, taxes, brokerage and extraordinary expenses), subject to possible reimbursement to the Investment Adviser within three years of being incurred. | |
| (3) | Annualized for periods less than one year. | |
| * | Calculated using average number of shares outstanding throughout the period. | |
| ** | Impact of waiving the advisory fee for the ING Institutional Prime Money Market Fund holding has less than 0.005% impact on the expense ratio. | |
| † | Includes one-time settlement income representing $0.05 and $0.07 per share for Class A and Class B, respectively, and 0.29% of the fund’s average net assets. |
34
Table of Contents
| Class C | ||||||||||||||||||||||||||||
| Six Months | ||||||||||||||||||||||||||||
| Ended | ||||||||||||||||||||||||||||
| November 30, | Year Ended May 31, | |||||||||||||||||||||||||||
| 2007 | 2007 | 2006 | 2005 | 2004 | 2003 | |||||||||||||||||||||||
Per Share Operating Performance: | ||||||||||||||||||||||||||||
| Net asset value, beginning of period | $ | 10.34 | 9.54 | 9.65 | 9.75 | 10.12 | 9.80 | |||||||||||||||||||||
| Income (loss) from investment operations: | ||||||||||||||||||||||||||||
| Net investment income | $ | 0.01 | 0.19 | *† | 0.19 | * | 0.17 | * | 0.18 | 0.15 | ||||||||||||||||||
| Net realized and unrealized gain (loss) on investments and futures | $ | (0.46 | ) | 0.85 | (0.10 | ) | (0.10 | ) | (0.43 | ) | 0.33 | |||||||||||||||||
| Total from investment operations | $ | (0.45 | ) | 1.04 | 0.09 | 0.07 | (0.25 | ) | 0.48 | |||||||||||||||||||
| Less distributions from: | ||||||||||||||||||||||||||||
| Net investment income | $ | — | 0.24 | 0.20 | 0.17 | 0.12 | 0.16 | |||||||||||||||||||||
| Total distributions | $ | — | 0.24 | 0.20 | 0.17 | 0.12 | 0.16 | |||||||||||||||||||||
| Net asset value, end of period | $ | 9.89 | 10.34 | 9.54 | 9.65 | 9.75 | 10.12 | |||||||||||||||||||||
Total Return(1) | % | (4.35 | ) | 11.10 | † | 0.92 | 0.75 | (2.52 | ) | 4.99 | ||||||||||||||||||
Ratios and Supplemental Data: | ||||||||||||||||||||||||||||
| Net assets, end of period (000’s) | $ | 8,112 | 9,436 | 26,092 | 45,748 | 71,250 | 139,961 | |||||||||||||||||||||
| Ratios to average net assets: | ||||||||||||||||||||||||||||
Gross expenses prior to expense reimbursement/recoupment(3) | % | 1.94 | 2.35 | 2.37 | 2.33 | 2.40 | 2.53 | |||||||||||||||||||||
Net expenses after expense reimbursement/recoupment(2)(3) | % | 1.94 | ** | 2.35 | ** | 2.37 | 2.33 | 2.44 | 2.50 | |||||||||||||||||||
Net investment income after expense reimbursement/recoupment(2)(3) | % | 0.17 | ** | 2.01 | **† | 1.94 | 1.81 | 1.51 | 1.55 | |||||||||||||||||||
| Portfolio turnover rate | % | 61 | 96 | 25 | 24 | 74 | 60 | |||||||||||||||||||||
| (1) | Total return is calculated assuming reinvestment of all dividends and capital gain distributions at net asset value and excluding the deduction of sales charges. Total return for periods less than one year is not annualized. | |
| (2) | The Investment Adviser has agreed to limit expenses, (excluding interest, taxes, brokerage and extraordinary expenses), subject to possible reimbursement to the Investment Adviser within three years of being incurred. | |
| (3) | Annualized for periods less than one year. | |
| * | Calculated using average number of shares outstanding throughout the period. | |
| ** | Impact of waiving the advisory fee for the ING Institutional Prime Money Market Fund holding has less than 0.005% impact on the expense ratio. | |
| † | Includes one-time settlement income representing $0.06 per share for Class C and 0.29% of the fund’s average net assets. |
35
Table of Contents
| ING Index Plus LargeCap Equity Fund III (Unaudited). | Financial Highlights | |||||||||||||||||||||||||||
| Class A | ||||||||||||||||||||||||||||
| Six Months | ||||||||||||||||||||||||||||
| Ended | Year Ended May 31, | |||||||||||||||||||||||||||
| November 30, | ||||||||||||||||||||||||||||
| 2007 | 2007 | 2006 | 2005 | 2004 | 2003 | |||||||||||||||||||||||
Per Share Operating Performance: | ||||||||||||||||||||||||||||
| Net asset value, beginning of period | $ | 10.00 | 9.67 | 9.82 | 9.90 | 10.27 | 10.01 | |||||||||||||||||||||
| Income (loss) from investment operations: | ||||||||||||||||||||||||||||
| Net investment income | $ | 0.06 | 0.24 | 0.24 | * | 0.24 | * | 0.25 | 0.21 | |||||||||||||||||||
| Net realized and unrealized gain (loss) on investments and futures | $ | (0.46 | ) | 0.47 | (0.11 | ) | (0.06 | ) | (0.42 | ) | 0.22 | |||||||||||||||||
| Total from investment operations | $ | (0.40 | ) | 0.71 | 0.13 | 0.18 | (0.17 | ) | 0.43 | |||||||||||||||||||
| Less distributions from: | ||||||||||||||||||||||||||||
| Net investment income | $ | — | 0.38 | 0.28 | 0.26 | 0.20 | 0.17 | |||||||||||||||||||||
| Total distributions | $ | — | 0.38 | 0.28 | 0.26 | 0.20 | 0.17 | |||||||||||||||||||||
| Net asset value, end of period | $ | 9.60 | 10.00 | 9.67 | 9.82 | 9.90 | 10.27 | |||||||||||||||||||||
Total Return(1) | % | (4.00 | ) | 7.46 | 1.35 | 1.83 | (1.63 | ) | 4.35 | † | ||||||||||||||||||
Ratios and Supplemental Data: | ||||||||||||||||||||||||||||
| Net assets, end of period (000’s) | $ | 4,356 | 10,588 | 12,955 | 19,005 | 29,113 | 49,652 | |||||||||||||||||||||
| Ratios to average net assets: | ||||||||||||||||||||||||||||
Gross expenses prior to expense reimbursement/recoupment(3) | % | 1.24 | 1.65 | 1.65 | 1.59 | 1.66 | 1.77 | |||||||||||||||||||||
Net expenses after expense reimbursement/recoupment(2)(3) | % | 1.23 | + | 1.65 | ** | 1.65 | 1.59 | 1.68 | 1.75 | |||||||||||||||||||
Net investment income after expense reimbursement/recoupment(2)(3) | % | 1.04 | + | 2.46 | ** | 2.47 | 2.44 | 2.26 | 2.08 | |||||||||||||||||||
| Portfolio turnover rate | % | 158 | 18 | 35 | 16 | 27 | 91 | |||||||||||||||||||||
| Class B | ||||||||||||||||||||||||||||
| Six Months | ||||||||||||||||||||||||||||
| Ended | Year Ended May 31, | |||||||||||||||||||||||||||
| November 30, | ||||||||||||||||||||||||||||
| 2007 | 2007 | 2006 | 2005 | 2004 | 2003 | |||||||||||||||||||||||
Per Share Operating Performance: | ||||||||||||||||||||||||||||
| Net asset value, beginning of period | $ | 10.02 | 9.65 | 9.79 | 9.86 | 10.23 | 10.00 | |||||||||||||||||||||
| Income (loss) from investment operations: | ||||||||||||||||||||||||||||
| Net investment income | $ | 0.02 | 0.17 | * | 0.17 | * | 0.18 | 0.16 | 0.13 | |||||||||||||||||||
| Net realized and unrealized gain (loss) on investments and futures | $ | (0.46 | ) | 0.46 | (0.11 | ) | (0.07 | ) | (0.40 | ) | 0.22 | |||||||||||||||||
| Total from investment operations | $ | (0.44 | ) | 0.63 | 0.06 | 0.11 | (0.24 | ) | 0.35 | |||||||||||||||||||
| Less distributions from: | ||||||||||||||||||||||||||||
| Net investment income | $ | — | 0.26 | 0.20 | 0.18 | 0.13 | 0.12 | |||||||||||||||||||||
| Total distributions | $ | — | 0.26 | 0.20 | 0.18 | 0.13 | 0.12 | |||||||||||||||||||||
| Net asset value, end of period | $ | 9.58 | 10.02 | 9.65 | 9.79 | 9.86 | 10.23 | |||||||||||||||||||||
Total Return(1) | % | (4.39 | ) | 6.63 | 0.61 | 1.12 | (2.38 | ) | 3.51 | † | ||||||||||||||||||
Ratios and Supplemental Data: | ||||||||||||||||||||||||||||
| Net assets, end of period (000’s) | $ | 41,558 | 124,512 | 151,765 | 203,705 | 261,098 | 335,942 | |||||||||||||||||||||
| Ratios to average net assets: | ||||||||||||||||||||||||||||
Gross expenses prior to expense reimbursement/recoupment(3) | % | 1.99 | 2.40 | 2.40 | 2.34 | 2.41 | 2.52 | |||||||||||||||||||||
Net expenses after expense reimbursement/recoupment(2)(3) | % | 1.98 | + | 2.40 | ** | 2.40 | 2.34 | 2.43 | 2.50 | |||||||||||||||||||
Net investment income after expense reimbursement/recoupment(2)(3) | % | 0.32 | + | 1.70 | ** | 1.72 | 1.69 | 1.51 | 1.33 | |||||||||||||||||||
| Portfolio turnover rate | % | 158 | 18 | 35 | 16 | 27 | 91 | |||||||||||||||||||||
| (1) | Total return is calculated assuming reinvestment of all dividends and capital gain distributions at net asset value and excluding the deduction of sales charges. Total return for periods less than one year is not annualized. | |
| (2) | The Investment Adviser has agreed to limit expenses, (excluding interest, taxes, brokerage and extraordinary expenses), subject to possible reimbursement to the Investment Adviser within three years of being incurred. | |
| (3) | Annualized for periods less than one year. | |
| * | Calculated using average number of shares outstanding throughout the period. | |
| ** | Impact of waiving the advisory fee for the ING Institutional Prime Money Market Fund holding has less than 0.005% impact on the expense ratio. | |
| + | Impact of waiving the advisory fee for the ING Institutional Prime Money Market Fund holding has more than 0.005% impact on the expense ratio. | |
| † | Represents performance beginning on the first day of the Guarantee Period (June 6, 2002). Total return for year ended May 31, 2003 was 4.35% and 3.51% for Class A and B, respectively. |
36
Table of Contents
| ING Index Plus LargeCap Equity Fund III (Unaudited) (Continued) | Financial Highlights | |||||||||||||||||||||||||||
| Class C | ||||||||||||||||||||||||||||
| Six Months | ||||||||||||||||||||||||||||
| Ended | Year Ended May 31, | |||||||||||||||||||||||||||
| November 30, | ||||||||||||||||||||||||||||
| 2007 | 2007 | 2006 | 2005 | 2004 | 2003 | |||||||||||||||||||||||
Per Share Operating Performance: | ||||||||||||||||||||||||||||
| Net asset value, beginning of period | $ | 10.09 | 9.69 | 9.81 | 9.88 | 10.23 | 10.00 | |||||||||||||||||||||
| Income (loss) from investment operations: | ||||||||||||||||||||||||||||
| Net investment income | $ | 0.02 | 0.17 | * | 0.17 | * | 0.17 | * | 0.19 | 0.13 | ||||||||||||||||||
| Net realized and unrealized gain (loss) on investments and futures | $ | (0.46 | ) | 0.47 | (0.11 | ) | (0.07 | ) | (0.43 | ) | 0.22 | |||||||||||||||||
| Total from investment operations | $ | (0.44 | ) | 0.64 | 0.06 | 0.10 | (0.24 | ) | 0.35 | |||||||||||||||||||
| Less distributions from: | ||||||||||||||||||||||||||||
| Net investment income | $ | — | 0.24 | 0.18 | 0.17 | 0.11 | 0.12 | |||||||||||||||||||||
| Total distributions | $ | — | 0.24 | 0.18 | 0.17 | 0.11 | 0.12 | |||||||||||||||||||||
| Net asset value, end of period | $ | 9.65 | 10.09 | 9.69 | 9.81 | 9.88 | 10.23 | |||||||||||||||||||||
Total Return(1) | % | (4.36 | ) | 6.69 | 0.63 | 1.04 | (2.37 | ) | 3.51 | † | ||||||||||||||||||
Ratios and Supplemental Data: | ||||||||||||||||||||||||||||
| Net assets, end of period (000’s) | $ | 5,118 | 8,543 | 15,523 | 26.637 | 43,018 | 81,800 | |||||||||||||||||||||
| Ratios to average net assets: | ||||||||||||||||||||||||||||
Gross expenses prior to expense reimbursement/recoupment(3) | % | 1.99 | 2.40 | 2.40 | 2.34 | 2.41 | 2.52 | |||||||||||||||||||||
Net expenses after expense reimbursement/recoupment(2)(3) | % | 1.98 | + | 2.40 | ** | 2.40 | 2.34 | 2.43 | 2.50 | |||||||||||||||||||
Net investment income after expense reimbursement/recoupment(2)(3) | % | 0.29 | + | 1.70 | ** | 1.71 | 1.69 | 1.51 | 1.33 | |||||||||||||||||||
| Portfolio turnover rate | % | 158 | 18 | 35 | 16 | 27 | 91 | |||||||||||||||||||||
| (1) | Total return is calculated assuming reinvestment of all dividends and capital gain distributions at net asset value and excluding the deduction of sales charges. Total return for periods less than one year is not annualized. | |
| (2) | The Investment Adviser has agreed to limit expenses, (excluding interest, taxes, brokerage and extraordinary expenses), subject to possible reimbursement to the Investment Adviser within three years of being incurred. | |
| (3) | Annualized for periods less than one year. | |
| * | Calculated using average number of shares outstanding throughout the period. | |
| ** | Impact of waiving the advisory fee for the ING Institutional Prime Money Market Fund holding has less than 0.005% impact on the expense ratio. | |
| + | Impact of waiving the advisory fee for the ING Institutional Prime Money Market Fund holding has more than 0.005% impact on the expense ratio. | |
| † | Represents performance beginning on the first day of the Guarantee Period (June 6, 2002). Total return for year ended May 31, 2003 was 3.51% for Class C. |
37
Table of Contents
| ING Index Plus LargeCap Equity Fund III (Unaudited). | Financial Highlights | |||||||||||||||||||||||||||
| Class A | ||||||||||||||||||||||||||||
| Six Months | July 1, | |||||||||||||||||||||||||||
| Ended | Year Ended May 31, | 2002(1) to | ||||||||||||||||||||||||||
| November 30, | May 31, | |||||||||||||||||||||||||||
| 2007 | 2007 | 2006 | 2005 | 2004 | 2003 | |||||||||||||||||||||||
Per Share Operating Performance: | ||||||||||||||||||||||||||||
| Net asset value, beginning of period | $ | 11.23 | 10.46 | 10.47 | 10.39 | 10.52 | 10.00 | |||||||||||||||||||||
| Income (loss) from investment operations: | ||||||||||||||||||||||||||||
| Net investment income | $ | 0.06 | 0.15 | † | 0.12 | 0.13 | 0.12 | 0.09 | ||||||||||||||||||||
| Net realized and unrealized gain (loss) on investments and futures | $ | (0.41 | ) | 1.05 | 0.12 | 0.15 | (0.08 | ) | 0.47 | |||||||||||||||||||
| Total from investment operations | $ | (0.35 | ) | 1.20 | 0.24 | 0.28 | 0.04 | 0.56 | ||||||||||||||||||||
| Less distributions from: | ||||||||||||||||||||||||||||
| Net investment income | $ | 0.08 | 0.16 | 0.13 | 0.13 | 0.14 | 0.03 | |||||||||||||||||||||
| Net realized gains on investments | $ | 0.54 | 0.27 | 0.12 | 0.07 | 0.03 | 0.01 | |||||||||||||||||||||
| Total distributions | $ | 0.62 | 0.43 | 0.25 | 0.20 | 0.17 | 0.04 | |||||||||||||||||||||
| Net asset value, end of period | $ | 10.26 | 11.23 | 10.46 | 10.47 | 10.39 | 10.52 | |||||||||||||||||||||
Total Return(2) | % | (3.28 | ) | 11.69 | † | 2.22 | 2.79 | 0.36 | 5.50 | * | ||||||||||||||||||
Ratios and Supplemental Data: | ||||||||||||||||||||||||||||
| Net assets, end of period (000’s) | $ | 8,126 | 14,452 | 19,418 | 30,711 | 52,094 | 89,558 | |||||||||||||||||||||
| Ratios to average net assets: | ||||||||||||||||||||||||||||
Gross expenses prior to expense reimbursement/recoupment(3) | % | 1.52 | 1.63 | 1.63 | 1.58 | 1.65 | 1.61 | |||||||||||||||||||||
Net expenses after expense reimbursement/recoupment(3)(4) | % | 1.51+ | 1.63 | ** | 1.63 | 1.58 | 1.65 | 1.61 | ||||||||||||||||||||
Net investment income after expense reimbursement/recoupment(3)(4) | % | 1.18+ | 1.33 | **† | 1.08 | 1.22 | 1.08 | 1.12 | ||||||||||||||||||||
| Portfolio turnover rate | % | 56 | 37 | 60 | 70 | 75 | 31 | |||||||||||||||||||||
| Class B | ||||||||||||||||||||||||||||
| Six Months | July 1, | |||||||||||||||||||||||||||
| Ended | Year Ended May 31, | 2002(1) to | ||||||||||||||||||||||||||
| November 30, | May 31, | |||||||||||||||||||||||||||
| 2007 | 2007 | 2006 | 2005 | 2004 | 2003 | |||||||||||||||||||||||
Per Share Operating Performance: | ||||||||||||||||||||||||||||
| Net asset value, beginning of period | $ | 11.21 | 10.43 | 10.44 | 10.35 | 10.47 | 10.00 | |||||||||||||||||||||
| Income (loss) from investment operations: | ||||||||||||||||||||||||||||
| Net investment income | $ | 0.02 | 0.07 | † | 0.04 | 0.05 | 0.04 | 0.03 | ||||||||||||||||||||
| Net realized and unrealized gain (loss) on investments and futures | $ | (0.41 | ) | 1.05 | 0.11 | 0.16 | (0.07 | ) | 0.46 | |||||||||||||||||||
| Total from investment operations | $ | (0.39 | ) | 1.12 | 0.15 | 0.21 | (0.03 | ) | 0.49 | |||||||||||||||||||
| Less distributions from: | ||||||||||||||||||||||||||||
| Net investment income | $ | 0.02 | 0.07 | 0.04 | 0.05 | 0.06 | 0.01 | |||||||||||||||||||||
| Net realized gains on investments | $ | 0.54 | 0.27 | 0.12 | 0.07 | 0.03 | 0.01 | |||||||||||||||||||||
| Total distributions | $ | 0.56 | 0.34 | 0.16 | 0.12 | 0.09 | 0.02 | |||||||||||||||||||||
| Net asset value, end of period | $ | 10.26 | 11.21 | 10.43 | 10.44 | 10.35 | 10.47 | |||||||||||||||||||||
Total Return(2) | % | (3.68 | ) | 10.91 | † | 1.41 | 2.04 | (0.29 | ) | 4.89 | * | |||||||||||||||||
Ratios and Supplemental Data: | ||||||||||||||||||||||||||||
| Net assets, end of period (000’s) | $ | 105,580 | 268,885 | 305,370 | 394,210 | 487,343 | 603,649 | |||||||||||||||||||||
| Ratios to average net assets: | ||||||||||||||||||||||||||||
Gross expenses prior to expense reimbursement/recoupment(3) | % | 2.27 | 2.38 | 2.38 | 2.33 | 2.40 | 2.36 | |||||||||||||||||||||
Net expenses after expense reimbursement/recoupment(3)(4) | % | 2.26+ | 2.38 | ** | 2.38 | 2.33 | 2.40 | 2.36 | ||||||||||||||||||||
Net investment income after expense reimbursement/recoupment(3)(4) | % | 0.40+ | 0.59 | **† | 0.33 | 0.49 | 0.33 | 0.36 | ||||||||||||||||||||
| Portfolio turnover rate | % | 56 | 37 | 60 | 70 | 75 | 31 | |||||||||||||||||||||
| (1) | Commencement of operations. | |
| (2) | Total return is calculated assuming reinvestment of all dividends and capital gain distributions at net asset value and excluding the deduction of sales charges. Total returns for periods less than one year are not annualized. | |
| (3) | Annualized for periods less than one year. | |
| (4) | The Investment Adviser has agreed to limit expenses, (excluding interest, taxes, brokerage and extraordinary expenses), subject to possible reimbursement to the Investment Adviser within three years of being incurred. | |
| * | Represents performance beginning on the first day of the Guarantee Period (October 8, 2002). Total return from commencement of offering of shares was 5.61% and 4.89% for Class A and B, respectively. | |
| ** | Impact of waiving the advisory fee for the ING Institutional Prime Money Market Fund holding has less than 0.005% impact on the expense ratio. | |
| + | Impact of waiving the advisory fee for the ING Institutional Prime Money Market Fund holding has more than 0.005% impact on the expense ratio. | |
| † | Includes one-time settlement income representing $0.03 per share for Class A and Class B and 0.23% of the fund’s average net assets. |
38
Table of Contents
| ING Index Plus LargeCap Equity Fund IV (Unaudited). (CONTINUED) | Financial Highlights | |||||||||||||||||||||||||||
| Class C | ||||||||||||||||||||||||||||
| Six Months | July 1, | |||||||||||||||||||||||||||
| Ended | Year Ended May 31, | 2002(1) to | ||||||||||||||||||||||||||
| November 30, | May 31, | |||||||||||||||||||||||||||
| 2007 | 2007 | 2006 | 2005 | 2004 | 2003 | |||||||||||||||||||||||
Per Share Operating Performance: | ||||||||||||||||||||||||||||
| Net asset value, beginning of period | $ | 11.27 | 10.47 | 10.46 | 10.36 | 10.47 | 10.00 | |||||||||||||||||||||
| Income (loss) from investment operations: | ||||||||||||||||||||||||||||
| Net investment income | $ | 0.02 | 0.08 | † | 0.05 | 0.06 | 0.05 | 0.03 | ||||||||||||||||||||
| Net realized and unrealized gain (loss) on investments and futures | $ | (0.42 | ) | 1.05 | 0.11 | 0.14 | (0.09 | ) | 0.46 | |||||||||||||||||||
| Total from investment operations | $ | (0.40 | ) | 1.13 | 0.16 | 0.20 | (0.04 | ) | 0.49 | |||||||||||||||||||
| Less distributions from: | ||||||||||||||||||||||||||||
| Net investment income | $ | — | 0.06 | 0.03 | 0.03 | 0.04 | 0.01 | |||||||||||||||||||||
| Net realized gains on investments | $ | 0.54 | 0.27 | 0.12 | 0.07 | 0.03 | 0.01 | |||||||||||||||||||||
| Total distributions | $ | 0.54 | 0.33 | 0.15 | 0.10 | 0.07 | 0.02 | |||||||||||||||||||||
| Net asset value, end of period | $ | 10.33 | 11.27 | 10.47 | 10.46 | 10.36 | 10.47 | |||||||||||||||||||||
Total Return(2) | % | (3.70 | ) | 10.92 | † | 1.48 | 2.00 | (0.37 | ) | 4.90 | †† | |||||||||||||||||
Ratios and Supplemental Data: | ||||||||||||||||||||||||||||
| Net assets, end of period (000’s) | $ | 15,322 | 28,474 | 38,846 | 63,431 | 98,026 | 183,228 | |||||||||||||||||||||
| Ratios to average net assets: | ||||||||||||||||||||||||||||
Gross expenses prior to expense reimbursement/recoupment(3) | % | 2.27 | 2.38 | 2.38 | 2.33 | 2.40 | 2.36 | |||||||||||||||||||||
Net expenses after expense reimbursement/recoupment(3)(4) | % | 2.26+ | 2.38 | ** | 2.38 | 2.33 | 2.40 | 2.36 | ||||||||||||||||||||
Net investment income after expense reimbursement/recoupment(3)(4) | % | 0.42+ | 0.60 | **† | 0.33 | 0.47 | 0.33 | 0.36 | ||||||||||||||||||||
| Portfolio turnover rate | % | 56 | 37 | 60 | 70 | 75 | 31 | |||||||||||||||||||||
| Class Q | ||||||||||||||||||||||||||||
| Six Months | July 1, | |||||||||||||||||||||||||||
| Ended | Year Ended May 31, | 2002(1) to | ||||||||||||||||||||||||||
| November 30, | May 31, | |||||||||||||||||||||||||||
| 2007 | 2007 | 2006 | 2005 | 2004 | 2003 | |||||||||||||||||||||||
Per Share Operating Performance: | ||||||||||||||||||||||||||||
| Net asset value, beginning of period | $ | 11.28 | 10.50 | 10.47 | 10.40 | 10.52 | 10.00 | |||||||||||||||||||||
| Income (loss) from investment operations: | ||||||||||||||||||||||||||||
| Net investment income | $ | 0.07 | 0.15 | † | 0.12 | * | 0.13 | 0.13 | 0.10 | |||||||||||||||||||
| Net realized and unrealized gain (loss) on investments and futures | $ | (0.42 | ) | 1.07 | 0.12 | 0.15 | (0.07 | ) | 0.46 | |||||||||||||||||||
| Total from investment operations | $ | (0.35 | ) | 1.22 | 0.24 | 0.28 | 0.06 | 0.56 | ||||||||||||||||||||
| Less distributions from: | ||||||||||||||||||||||||||||
| Net investment income | $ | 0.09 | 0.17 | 0.09 | 0.14 | 0.15 | 0.03 | |||||||||||||||||||||
| Net realized gains on investments | $ | 0.54 | 0.27 | 0.12 | 0.07 | 0.03 | 0.01 | |||||||||||||||||||||
| Total distributions | $ | 0.63 | 0.44 | 0.21 | 0.21 | 0.18 | 0.04 | |||||||||||||||||||||
| Net asset value, end of period | $ | 10.30 | 11.28 | 10.50 | 10.47 | 10.40 | 10.52 | |||||||||||||||||||||
Total Return(2) | % | (3.28 | ) | 11.84 | † | 2.21 | 2.75 | 0.58 | 5.54 | †† | ||||||||||||||||||
Ratios and Supplemental Data: | ||||||||||||||||||||||||||||
| Net assets, end of period (000’s) | $ | 355 | 367 | 332 | 958 | 950 | 1,473 | |||||||||||||||||||||
| Ratios to average net assets: | ||||||||||||||||||||||||||||
Gross expenses prior to expense reimbursement/recoupment(3) | % | 1.48 | 1.60 | 1.60 | 1.58 | 1.59 | 1.49 | |||||||||||||||||||||
Net expenses after expense reimbursement/recoupment(3)(4) | % | 1.47+ | 1.60 | ** | 1.60 | 1.58 | 1.59 | 1.49 | ||||||||||||||||||||
Net investment income after expense reimbursement/recoupment(3)(4) | % | 1.28+ | 1.35 | **† | 1.08 | 1.23 | 1.14 | 1.24 | ||||||||||||||||||||
| Portfolio turnover rate | % | 56 | 37 | 60 | 70 | 75 | 31 | |||||||||||||||||||||
| (1) | Commencement of operations. | |
| (2) | Total return is calculated assuming reinvestment of all dividends and capital gain distributions at net asset value and excluding the deduction of sales charges. Total returns for periods less than one year are not annualized. | |
| (3) | Annualized for periods less than one year. | |
| (4) | The Investment Adviser has agreed to limit expenses, (excluding interest, taxes, brokerage and extraordinary expenses), subject to possible reimbursement to the Investment Adviser within three years of being incurred. | |
| * | Calculated using average number of shares outstanding throughout the period. | |
| ** | Impact of waiving the advisory fee for the ING Institutional Prime Money Market Fund holding has less than 0.005% impact on the expense ratio. | |
| + | Impact of waiving the advisory fee for the ING Institutional Prime Money Market Fund holding has more than 0.005% impact on the expense ratio. | |
| † | Includes one-time settlement income representing $0.03 and $0.02 per share for Class C and Class Q, respectively, and 0.23% of the fund’s average net assets. | |
| †† | Represents performance beginning on the first day of the Guarantee Period (October 8, 2002). Total return from commencement of offering of shares was 4.90% and 5.64% for Class C and Q, respectively. |
39
Table of Contents
| Ing Principal Protection Fund V (Unaudited) | Financial Highlights | |
| Class A | ||||||||||||||||||||||||||||
| Six Months | November 1, | |||||||||||||||||||||||||||
| Ended | 2002(1) to | |||||||||||||||||||||||||||
| November 30, | Year Ended May 31, | May 31, | ||||||||||||||||||||||||||
| 2007 | 2007 | 2006 | 2005 | 2004 | 2003 | |||||||||||||||||||||||
Per Share Operating Performance: | ||||||||||||||||||||||||||||
| Net asset value, beginning of period | $ | 10.53 | 9.86 | 9.91 | 10.11 | 10.41 | 10.00 | |||||||||||||||||||||
| Income (loss) from investment operations: | ||||||||||||||||||||||||||||
| Net investment income | $ | 0.08 | 0.13 | 0.14 | 0.13 | * | 0.13 | 0.05 | ||||||||||||||||||||
| Net realized and unrealized gain (loss) on investments | $ | (0.17 | ) | 0.85 | 0.01 | 0.16 | (0.22 | ) | 0.36 | |||||||||||||||||||
| Total from investment operations | $ | (0.09 | ) | 0.98 | 0.15 | 0.29 | (0.09 | ) | 0.41 | |||||||||||||||||||
| Less distributions from: | ||||||||||||||||||||||||||||
| Net investment income | $ | — | 0.15 | 0.14 | 0.14 | 0.14 | — | |||||||||||||||||||||
| Net realized gains on investments | $ | — | 0.16 | 0.06 | 0.35 | 0.07 | — | |||||||||||||||||||||
| Total distributions | $ | — | 0.31 | 0.20 | 0.49 | 0.21 | — | |||||||||||||||||||||
| Net asset value, end of period | $ | 10.44 | 10.53 | 9.86 | 9.91 | 10.11 | 10.41 | |||||||||||||||||||||
Total Return(2) | % | (0.85 | ) | 10.05 | 1.53 | 2.89 | (0.89 | ) | 4.10 | † | ||||||||||||||||||
Ratios and Supplemental Data: | ||||||||||||||||||||||||||||
| Net assets, end of period (000’s) | $ | 11,406 | 14,436 | 20,694 | 30,203 | 42,889 | 74,905 | |||||||||||||||||||||
| Ratios to average net assets: | ||||||||||||||||||||||||||||
Expenses(3)(4) | % | 1.55 | ** | 1.64 | ** | 1.63 | 1.59 | 1.67 | 1.56 | |||||||||||||||||||
Net investment income(3)(4) | % | 1.28 | ** | 1.26 | ** | 1.24 | 1.34 | 1.22 | 1.00 | |||||||||||||||||||
| Portfolio turnover rate | % | 25 | 42 | 60 | 80 | 53 | 12 | |||||||||||||||||||||
| Class B | ||||||||||||||||||||||||||||
| Six Months | November 1, | |||||||||||||||||||||||||||
| Ended | 2002(1) to | |||||||||||||||||||||||||||
| November 30, | Year Ended May 31, | May 31, | ||||||||||||||||||||||||||
| 2007 | 2007 | 2006 | 2005 | 2004 | 2003 | |||||||||||||||||||||||
Per Share Operating Performance: | ||||||||||||||||||||||||||||
| Net asset value, beginning of period | $ | 10.52 | 9.85 | 9.89 | 10.09 | 10.38 | 10.00 | |||||||||||||||||||||
| Income (loss) from investment operations: | ||||||||||||||||||||||||||||
| Net investment income | $ | 0.03 | 0.06 | 0.06 | 0.06 | 0.05 | 0.01 | |||||||||||||||||||||
| Net realized and unrealized gain (loss) on investments | $ | (0.17 | ) | 0.83 | 0.02 | 0.15 | (0.21 | ) | 0.37 | |||||||||||||||||||
| Total from investment operations | $ | (0.14 | ) | 0.89 | 0.08 | 0.21 | (0.16 | ) | 0.38 | |||||||||||||||||||
| Less distributions from: | ||||||||||||||||||||||||||||
| Net investment income | $ | — | 0.06 | 0.06 | 0.06 | 0.06 | — | |||||||||||||||||||||
| Net realized gains on investments | $ | — | 0.16 | 0.06 | 0.35 | 0.07 | — | |||||||||||||||||||||
| Total distributions | $ | — | 0.22 | 0.12 | 0.41 | 0.13 | — | |||||||||||||||||||||
| Net asset value, end of period | $ | 10.38 | 10.52 | 9.85 | 9.89 | 10.09 | 10.38 | |||||||||||||||||||||
Total Return(2) | % | (1.33 | ) | 9.14 | 0.82 | 2.10 | (1.54 | ) | 3.90 | † | ||||||||||||||||||
Ratios and Supplemental Data: | ||||||||||||||||||||||||||||
| Net assets, end of period (000’s) | $ | 192,749 | 214,860 | 252,730 | 335,117 | 405,311 | 496,076 | |||||||||||||||||||||
| Ratios to average net assets: | ||||||||||||||||||||||||||||
Expenses(3)(4) | % | 2.30 | ** | 2.39 | ** | 2.38 | 2.34 | 2.42 | 2.31 | |||||||||||||||||||
Net investment income(3)(4) | % | 0.54 | ** | 0.51 | ** | 0.49 | 0.59 | 0.47 | 0.25 | |||||||||||||||||||
| Portfolio turnover rate | % | 25 | 42 | 60 | 80 | 53 | 12 | |||||||||||||||||||||
| (1) | Commencement of operations. | |
| (2) | Total return is calculated assuming reinvestment of all dividends and capital gain distributions at net asset value and excluding the deduction of sales charges. Total returns for periods less than one year are not annualized. | |
| (3) | Annualized for periods less than one year. | |
| (4) | The Investment Adviser has agreed to limit expenses, (excluding interest, taxes, brokerage and extraordinary expenses), subject to possible reimbursement to the Investment Adviser within three years of being incurred. | |
| * | Calculated using average number of shares outstanding throughout the period. | |
| ** | Impact of waiving the advisory fee for the ING Institutional Prime Money Market Fund holding has less than 0.005% impact on the expense ratio. | |
| † | Represents performance beginning on the first day of the Guarantee Period (January 23, 2003). Total return from commencement of offering of shares is 4.10% and 3.80% for Class A and B, respectively. |
Table of Contents
| Ing Principal Protection Fund V (Unaudited) (Continued) | Financial Highlights | |
| Class C | ||||||||||||||||||||||||||||
| Six Months | November 1, | |||||||||||||||||||||||||||
| Ended | 2002(1) to | |||||||||||||||||||||||||||
| November 30, | Year Ended May 31, | May 31, | ||||||||||||||||||||||||||
| 2007 | 2007 | 2006 | 2005 | 2004 | 2003 | |||||||||||||||||||||||
Per Share Operating Performance: | ||||||||||||||||||||||||||||
| Net asset value, beginning of period | $ | 10.57 | 9.88 | 9.91 | 10.10 | 10.38 | 10.00 | |||||||||||||||||||||
| Income (loss) from investment operations: | ||||||||||||||||||||||||||||
| Net investment income | $ | 0.04 | 0.05 | * | 0.05 | * | 0.06 | * | 0.06 | 0.01 | ||||||||||||||||||
| Net realized and unrealized gain (loss) on investments | $ | (0.17 | ) | 0.85 | 0.02 | 0.15 | (0.22 | ) | 0.37 | |||||||||||||||||||
| Total from investment operations | $ | (0.13 | ) | 0.90 | 0.07 | 0.21 | (0.16 | ) | 0.38 | |||||||||||||||||||
| Less distributions from: | ||||||||||||||||||||||||||||
| Net investment income | $ | — | 0.05 | 0.04 | 0.05 | 0.05 | — | |||||||||||||||||||||
| Net realized gains on investments | $ | — | 0.16 | 0.06 | 0.35 | 0.07 | — | |||||||||||||||||||||
| Total distributions | $ | — | 0.21 | 0.10 | 0.40 | 0.12 | — | |||||||||||||||||||||
| Net asset value, end of period | $ | 10.44 | 10.57 | 9.88 | 9.91 | 10.10 | 10.38 | |||||||||||||||||||||
Total Return(2) | % | (1.23 | ) | 9.19 | 0.74 | 2.02 | (1.52 | ) | 3.90 | † | ||||||||||||||||||
Ratios and Supplemental Data: | ||||||||||||||||||||||||||||
| Net assets, end of year (000’s) | $ | 11,202 | 13,723 | 21,201 | 37,116 | 60,980 | 106,754 | |||||||||||||||||||||
| Ratios to average net assets: | ||||||||||||||||||||||||||||
Expenses(3)(4) | % | 2.30 | ** | 2.39 | ** | 2.38 | 2.34 | 2.42 | 2.31 | |||||||||||||||||||
Net investment income(3)(4) | % | 0.53 | ** | 0.51 | ** | 0.49 | 0.59 | 0.47 | 0.25 | |||||||||||||||||||
| Portfolio turnover rate | % | 25 | 42 | 60 | 80 | 53 | 12 | |||||||||||||||||||||
| (1) | Commencement of operations. | |
| (2) | Total return is calculated assuming reinvestment of all dividends and capital gain distributions at net asset value and excluding the deduction of sales charges. Total returns for periods less than one year are not annualized. | |
| (3) | Annualized for periods less than one year. | |
| (4) | The Investment Adviser has agreed to limit expenses, (excluding interest, taxes, brokerage and extraordinary expenses), subject to possible reimbursement to the Investment Adviser within three years of being incurred. | |
| * | Calculated using average number of shares outstanding throughout the period. | |
| ** | Impact of waiving the advisory fee for the ING Institutional Prime Money Market Fund holding has less than 0.005% impact on the expense ratio. | |
| † | Represents performance beginning on the first day of the Guarantee Period (January 23, 2003). Total return from commencement of offering of shares is 3.80% for Class C. |
Table of Contents
Ing Principal Protection Fund VI (Unaudited) | Financial Highlights | |
| Class A | ||||||||||||||||||||||||||||
| Six Months | February 3, | |||||||||||||||||||||||||||
| Ended | 2003(1) to | |||||||||||||||||||||||||||
| November 30, | Year Ended May 31, | May 31, | ||||||||||||||||||||||||||
| 2007 | 2007 | 2006 | 2005 | 2004 | 2003 | |||||||||||||||||||||||
Per Share Operating Performance: | ||||||||||||||||||||||||||||
| Net asset value, beginning of period | $ | 10.60 | 9.85 | 9.87 | 10.08 | 10.31 | 10.00 | |||||||||||||||||||||
| Income (loss) from investment operations: | ||||||||||||||||||||||||||||
| Net investment income | $ | 0.07 | 0.12 | * | 0.14 | 0.13 | * | 0.13 | 0.01 | |||||||||||||||||||
| Net realized and unrealized gain (loss) on investments | $ | (0.14 | ) | 0.83 | (0.02 | ) | 0.14 | (0.23 | ) | 0.30 | ||||||||||||||||||
| Total from investment operations | $ | (0.07 | ) | 0.95 | 0.12 | 0.27 | (0.10 | ) | 0.31 | |||||||||||||||||||
| Less distributions from: | ||||||||||||||||||||||||||||
| Net investment income | $ | — | 0.14 | 0.14 | 0.15 | 0.10 | — | |||||||||||||||||||||
| Net realized gains on investments | $ | — | 0.06 | — | 0.33 | 0.03 | — | |||||||||||||||||||||
| Total distributions | $ | — | 0.20 | 0.14 | 0.48 | 0.13 | — | |||||||||||||||||||||
| Net asset value, end of period | $ | 10.53 | 10.60 | 9.85 | 9.87 | 10.08 | 10.31 | |||||||||||||||||||||
Total Return(2) | % | (0.66 | ) | 9.67 | 1.18 | 2.72 | † | (1.01 | ) | 3.10 | †† | |||||||||||||||||
Ratios and Supplemental Data: | ||||||||||||||||||||||||||||
| Net assets, end of period (000’s) | $ | 9,089 | 10,855 | 15,634 | 24,971 | 43,443 | 63,460 | |||||||||||||||||||||
| Ratios to average net assets: | ||||||||||||||||||||||||||||
Expenses(3)(4) | % | 1.68 | *** | 1.67 | *** | 1.66 | 1.62 | 1.67 | 1.41 | |||||||||||||||||||
Net investment income(3)(4) | % | 1.13 | *** | 1.22 | *** | 1.28 | 1.33 | 1.19 | 0.59 | |||||||||||||||||||
| Portfolio turnover rate | % | 20 | 54 | 42 | 100 | 44 | 3 | |||||||||||||||||||||
| Class B | ||||||||||||||||||||||||||||
| Six Months | February 3, | |||||||||||||||||||||||||||
| Ended | 2003(1) to | |||||||||||||||||||||||||||
| November 30, | Year Ended May 31, | May 31, | ||||||||||||||||||||||||||
| 2007 | 2007 | 2006 | 2005 | 2004 | 2003 | |||||||||||||||||||||||
Per Share Operating Performance: | ||||||||||||||||||||||||||||
| Net asset value, beginning of period | $ | 10.59 | 9.83 | 9.85 | 10.06 | 10.30 | 10.00 | |||||||||||||||||||||
| Income (loss) from investment operations: | ||||||||||||||||||||||||||||
| Net investment income | $ | 0.02 | 0.05 | 0.06 | 0.06 | 0.05 | 0.00 | ** | ||||||||||||||||||||
| Net realized and unrealized gain (loss) on investments | $ | (0.13 | ) | 0.83 | (0.02 | ) | 0.12 | (0.22 | ) | 0.30 | ||||||||||||||||||
| Total from investment operations | $ | (0.11 | ) | 0.88 | 0.04 | 0.18 | (0.17 | ) | 0.30 | |||||||||||||||||||
| Less distributions from: | ||||||||||||||||||||||||||||
| Net investment income | $ | — | 0.06 | 0.06 | 0.06 | 0.04 | — | |||||||||||||||||||||
| Net realized gains on investments | $ | — | 0.06 | — | 0.33 | 0.03 | — | |||||||||||||||||||||
| Total distributions | $ | — | 0.12 | 0.06 | 0.39 | 0.07 | — | |||||||||||||||||||||
| Net asset value, end of period | $ | 10.48 | 10.59 | 9.83 | 9.85 | 10.06 | 10.30 | |||||||||||||||||||||
Total Return(2) | % | (1.04 | ) | 8.94 | 0.40 | 1.85 | (1.70 | ) | 3.10 | †† | ||||||||||||||||||
Ratios and Supplemental Data: | ||||||||||||||||||||||||||||
| Net assets, end of period (000’s) | $ | 177,316 | 194,464 | 229,092 | 304,303 | 372,323 | 444,549 | |||||||||||||||||||||
| Ratios to average net assets: | ||||||||||||||||||||||||||||
Expenses(3)(4) | % | 2.43 | *** | 2.42 | *** | 2.41 | 2.37 | 2.42 | 2.16 | |||||||||||||||||||
Net investment income (loss)(3)(4) | % | 0.39 | *** | 0.47 | *** | 0.53 | 0.59 | 0.44 | (0.16 | ) | ||||||||||||||||||
| Portfolio turnover rate | % | 20 | 54 | 42 | 100 | 44 | 3 | |||||||||||||||||||||
| (1) | Commencement of operations. | |
| (2) | Total return is calculated assuming reinvestment of all dividends and capital gain distributions at net asset value and excluding the deduction of sales charges. Total returns for periods less than one year are not annualized. | |
| (3) | Annualized for periods less than one year. | |
| (4) | The Investment Adviser has agreed to limit expenses, (excluding interest, taxes, brokerage and extraordinary expenses), subject to possible reimbursement to the Investment Adviser within three years of being incurred. | |
| * | Calculated using average number of shares outstanding throughout the period. | |
| ** | Amount is less than $0.005. | |
| *** | Impact of waiving the advisory fee for the ING Institutional Prime Money Market Fund holding has less than 0.005% impact on the expense ratio. | |
| † | In 2005, the Sub-Adviser fully reimbursed the Fund for a loss on an investment transaction, which did not have an impact on total return. | |
| †† | Represents performance beginning on the first day of the Guarantee Period (April 24, 2003). Total return from commencement of offering of shares was 3.10% and 3.00% for Class A and B, respectively. |
Table of Contents
| Ing Principal Protection Fund VI (Unaudited) (Continued) | Financial Highlights | |
| Class C | ||||||||||||||||||||||||||||
| Six Months | February 3, | |||||||||||||||||||||||||||
| Ended | 2003(1) to | |||||||||||||||||||||||||||
| November 30, | Year Ended May 31, | May 31, | ||||||||||||||||||||||||||
| 2007 | 2007 | 2006 | 2005 | 2004 | 2003 | |||||||||||||||||||||||
Per Share Operating Performance: | ||||||||||||||||||||||||||||
| Net asset value, beginning of period | $ | 10.65 | 9.88 | 9.87 | 10.06 | 10.30 | 10.00 | |||||||||||||||||||||
| Income (loss) from investment operations: | ||||||||||||||||||||||||||||
| Net investment income | $ | 0.02 | 0.05 | * | 0.05 | * | 0.06 | * | 0.05 | 0.00 | ** | |||||||||||||||||
| Net realized and unrealized gain (loss) on investments | $ | (0.12 | ) | 0.82 | (0.00) | ** | 0.12 | (0.22 | ) | 0.30 | ||||||||||||||||||
| Total from investment operations | $ | (0.10 | ) | 0.87 | 0.05 | 0.18 | (0.17 | ) | 0.30 | |||||||||||||||||||
| Less distributions from: | ||||||||||||||||||||||||||||
| Net investment income | $ | — | 0.04 | 0.04 | 0.04 | 0.04 | — | |||||||||||||||||||||
| Net realized gains on investments | $ | — | 0.06 | — | 0.33 | 0.03 | — | |||||||||||||||||||||
| Total distributions | $ | — | 0.10 | 0.04 | 0.37 | 0.07 | — | |||||||||||||||||||||
| Net asset value, end of period | $ | 10.55 | 10.65 | 9.88 | 9.87 | 10.06 | 10.30 | |||||||||||||||||||||
Total Return(2) | % | (0.94 | ) | 8.80 | 0.50 | 1.85 | (1.72 | ) | 3.00 | †† | ||||||||||||||||||
Ratios and Supplemental Data: | ||||||||||||||||||||||||||||
| Net assets, end of period (000’s) | $ | 13,201 | 15,216 | 21,819 | 39,288 | 65,269 | 102,047 | |||||||||||||||||||||
| Ratios to average net assets: | ||||||||||||||||||||||||||||
Expenses(3)(4) | % | 2.43 | *** | 2.42 | † | 2.41 | 2.37 | 2,42 | 2.19 | |||||||||||||||||||
Net investment income (loss)(3)(4) | % | 0.38 | *** | 0.47 | † | 0.53 | 0.58 | 0.44 | (0.13 | ) | ||||||||||||||||||
| Portfolio turnover rate | % | 20 | 54 | 42 | 100 | 44 | 3 | |||||||||||||||||||||
| (1) | Commencement of operations. | |
| (2) | Total return is calculated assuming reinvestment of all dividends and capital gain distributions at net asset value and excluding the deduction of sales charges. Total returns for periods less than one year are not annualized. | |
| (3) | Annualized for periods less than one year. | |
| (4) | The Investment Adviser has agreed to limit expenses, (excluding interest, taxes, brokerage and extraordinary expenses), subject to possible reimbursement to the Investment Adviser within three years of being incurred. | |
| * | Calculated using average number of shares outstanding throughout the period. | |
| ** | Amount is less than $0.005 or more than $(0.005). | |
| *** | Impact of waiving the advisory fee for the ING Institutional Prime Money Market Fund holding has less than 0.005% impact on the expense ratio. | |
| † | Impact of waiving the advisory fee for the ING Institutional Prime Money Market Fund holding has less than 0.005% impact on the expense ratio. | |
| †† | Represents performance beginning on the first day of the Guarantee Period (April 24, 2003). Total return from commencement of offering of shares was 3.00% for Class C. |
Table of Contents
| ING Principal Protection Fund VII (Unaudited) | Financial Highlights | |
| Class A | ||||||||||||||||||||||||||||
| Six Months | May 1, | |||||||||||||||||||||||||||
| Ended | 2003(1) to | |||||||||||||||||||||||||||
| November 30, | Year Ended May 31, | May 31, | ||||||||||||||||||||||||||
| 2007 | 2007 | 2006 | 2005 | 2004 | 2003 | |||||||||||||||||||||||
Per Share Operating Performance: | ||||||||||||||||||||||||||||
| Net asset value, beginning of period | $ | 10.53 | 9.71 | 9.85 | 9.88 | 10.00 | 10.00 | |||||||||||||||||||||
| Income (loss) from investment operations: | ||||||||||||||||||||||||||||
| Net investment income | $ | 0.04 | 0.09 | 0.08 | 0.12 | * | 0.13 | 0.00 | ** | |||||||||||||||||||
| Net realized and unrealized gain (loss) on investments | $ | (0.08 | ) | 0.81 | 0.02 | 0.16 | (0.08 | ) | 0.00 | ** | ||||||||||||||||||
| Total from investment operations | $ | (0.04 | ) | 0.90 | 0.10 | 0.28 | 0.05 | 0.00 | ** | |||||||||||||||||||
| Less distributions from: | ||||||||||||||||||||||||||||
| Net investment income | $ | — | 0.08 | 0.10 | 0.16 | 0.17 | — | |||||||||||||||||||||
| Net realized gains on investments | $ | — | — | 0.14 | 0.15 | — | — | |||||||||||||||||||||
| Total distributions | $ | — | 0.08 | 0.24 | 0.31 | 0.17 | — | |||||||||||||||||||||
| Net asset value, end of period | $ | 10.49 | 10.53 | 9.71 | 9.85 | 9.88 | 10.00 | |||||||||||||||||||||
Total Return(2) | % | (0.38 | ) | 9.35 | 1.06 | 2.82 | 0.52 | †† | — | † | ||||||||||||||||||
Ratios and Supplemental Data: | ||||||||||||||||||||||||||||
| Net assets end of period (000’s) | $ | 4,455 | 5,664 | 7,736 | 13,942 | 21,805 | 11,028 | |||||||||||||||||||||
| Ratios to average net assets: | ||||||||||||||||||||||||||||
Gross expenses prior to expense reimbursement/recoupment(3) | % | 1.66 | 1.67 | 1.62 | 1.59 | 1.72 | 0.88 | |||||||||||||||||||||
Net expenses after expense reimbursement/recoupment(3)(4) | % | 1.75 | *** | 1.75 | *** | 1.75 | 1.46 | 0.99 | 0.88 | |||||||||||||||||||
Net investment income after expense reimbursement/recoupment(3)(4) | % | 0.75 | *** | 0.86 | *** | 0.76 | 1.23 | 1.51 | 0.09 | |||||||||||||||||||
| Portfolio turnover rate | % | 20 | 52 | 58 | 49 | 91 | — | |||||||||||||||||||||
| Class B | ||||||||||||||||||||||||||||
| Six Months | May 1, | |||||||||||||||||||||||||||
| Ended | 2003(1) to | |||||||||||||||||||||||||||
| November 30, | Year Ended May 31, | May 31, | ||||||||||||||||||||||||||
| 2007 | 2007 | 2006 | 2005 | 2004 | 2003 | |||||||||||||||||||||||
Per Share Operating Performance: | ||||||||||||||||||||||||||||
| Net asset value, beginning of period | $ | 10.59 | 9.77 | 9.90 | 9.93 | 10.00 | 10.00 | |||||||||||||||||||||
| Income (loss) from investment operations: | ||||||||||||||||||||||||||||
| Net investment income | $ | — | 0.01 | 0.00 | ** | 0.05 | 0.07 | 0.00 | ** | |||||||||||||||||||
| Net realized and unrealized gain (loss) on investments | $ | (0.09 | ) | 0.82 | 0.03 | 0.15 | (0.09 | ) | 0.00 | ** | ||||||||||||||||||
| Total from investment operations | $ | (0.09 | ) | 0.83 | 0.03 | 0.20 | (0.02 | ) | 0.00 | ** | ||||||||||||||||||
| Less distributions from: | ||||||||||||||||||||||||||||
| Net investment income | $ | — | 0.01 | 0.02 | 0.08 | 0.05 | — | |||||||||||||||||||||
| Net realized gains on investments | $ | — | — | 0.14 | 0.15 | — | ||||||||||||||||||||||
| Total distributions | $ | — | 0.01 | 0.16 | 0.23 | 0.05 | — | |||||||||||||||||||||
| Net asset value, end of period | $ | 10.50 | 10.59 | 9.77 | 9.90 | 9.93 | 10.00 | |||||||||||||||||||||
Total Return(2) | % | (0.85 | ) | 8.50 | 0.34 | 2.05 | (0.21) | †† | — | † | ||||||||||||||||||
Ratios and Supplemental Data: | ||||||||||||||||||||||||||||
| Net assets end of period (000’s) | $ | 86,621 | 95,425 | 113,102 | 155,148 | 182,112 | 92,014 | |||||||||||||||||||||
| Ratios to average net assets: | ||||||||||||||||||||||||||||
Gross expenses prior to expense reimbursement/recoupment(3) | % | 2.41 | 2.42 | 2.37 | 2.34 | 2.47 | 1.60 | |||||||||||||||||||||
Net expenses after expense reimbursement/recoupment(3)(4) | % | 2.50 | *** | 2.50 | *** | 2.50 | 2.21 | 1.74 | 1.60 | |||||||||||||||||||
Net investment income (loss) after expense reimbursement/recoupment(3)(4) | % | 0.01 | *** | 0.11 | *** | 0.01 | 0.48 | 0.76 | (0.63 | ) | ||||||||||||||||||
| Portfolio turnover rate | % | 20 | 52 | 58 | 49 | 91 | — | |||||||||||||||||||||
| (1) | Commencement of operations. | |
| (2) | Total return is calculated assuming reinvestment of all dividends and capital gain distributions at net asset value and excluding the deduction of sales charges. Total returns for periods less than one year are not annualized. | |
| (3) | Annualized for periods less than one year. | |
| (4) | The Investment Adviser has agreed to limit expenses, (excluding interest, taxes, brokerage and extraordinary expenses), subject to possible reimbursement to the Investment Adviser within three years of being incurred. | |
| * | Calculated using average number of shares outstanding throughout the period. | |
| ** | Amount is less than $0.005. | |
| *** | Impact of waiving the advisory fee for the ING Institutional Prime Money Market Fund holding has less than 0.005% impact on the expense ratio. | |
| † | As of May 31, 2003, the Fund was in its Offering Period. Total return from commencement of offering of shares was 0.00% for Class A and B. | |
| †† | Represents performance beginning on the first day of Guarantee Period (June 30, 2003). Total return for the year ended May 31, 2004 was 0.69% and (0.02)% for Class A and B, respectively. |
Table of Contents
| ING Principal Protection Fund VII (Unaudited) (Continued) | Financial Highlights | |
| �� | ||||||||||||||||||||||||||||
| Class C | ||||||||||||||||||||||||||||
| Six Months | May 1, | |||||||||||||||||||||||||||
| Ended | 2003(1) to | |||||||||||||||||||||||||||
| November 30, | Year Ended May 31, | May 31, | ||||||||||||||||||||||||||
| 2007 | 2007 | 2006 | 2005 | 2004 | 2003 | |||||||||||||||||||||||
Per Share Operating Performance: | ||||||||||||||||||||||||||||
| Net asset value, beginning of period | $ | 10.60 | 9.77 | 9.89 | 9.90 | 10.00 | 10.00 | |||||||||||||||||||||
| Income (loss) from investment operations: | ||||||||||||||||||||||||||||
| Net investment income | $ | — | 0.01 | 0.01 | 0.04 | * | 0.07 | 0.00 | ** | |||||||||||||||||||
| Net realized and unrealized gain (loss) on investments | $ | (0.08 | ) | 0.82 | 0.02 | 0.16 | (0.09 | ) | 0.00 | ** | ||||||||||||||||||
| Total from investment operations | $ | (0.08 | ) | 0.83 | 0.03 | 0.20 | (0.02 | ) | 0.00 | ** | ||||||||||||||||||
| Less distributions from: | ||||||||||||||||||||||||||||
| Net investment income | $ | — | — | 0.01 | 0.06 | 0.08 | — | |||||||||||||||||||||
| Net realized gains on investments | $ | — | — | 0.14 | 0.15 | — | — | |||||||||||||||||||||
| Total distributions | $ | — | — | 0.15 | 0.21 | 0.08 | — | |||||||||||||||||||||
| Net asset value, end of period | $ | 10.52 | 10.60 | 9.77 | 9.89 | 9.90 | 10.00 | |||||||||||||||||||||
Total Return(2) | % | (0.75 | ) | 8.50 | 0.31 | 2.04 | (0.24) | †† | — | † | ||||||||||||||||||
Ratios and Supplemental Data: | ||||||||||||||||||||||||||||
| Net assets, end of period (000’s) | $ | 6,754 | 7,725 | 12,210 | 24,100 | 44,390 | 19,903 | |||||||||||||||||||||
| Ratios to average net assets: | ||||||||||||||||||||||||||||
Gross expenses prior to expense reimbursement/recoupment(3) | % | 2.41 | 2.42 | 2.37 | 2.34 | 2.47 | 1.60 | |||||||||||||||||||||
Net expenses after expense reimbursement/recoupment(3)(4) | % | 2.50 | *** | 2.50 | *** | 2.50 | 2.21 | 1.74 | 1.60 | |||||||||||||||||||
Net investment income (loss) after expense reimbursement/recoupment(3)(4) | % | 0.01 | *** | 0.11 | *** | 0.01 | 0.49 | 0.76 | (0.64 | ) | ||||||||||||||||||
| Portfolio turnover rate | % | 20 | 52 | 58 | 49 | 91 | — | |||||||||||||||||||||
| (1) | Commencement of operations. | |
| (2) | Total return is calculated assuming reinvestment of all dividends and capital gain distributions at net asset value and excluding the deduction of sales charges. Total returns for periods less than one year are not annualized. | |
| (3) | Annualized for periods less than one year. | |
| (4) | The Investment Adviser has agreed to limit expenses, (excluding interest, taxes, brokerage and extraordinary expenses), subject to possible reimbursement to the Investment Adviser within three years of being incurred. | |
| * | Calculated using average number of shares outstanding throughout the period. | |
| ** | Amount is less than $0.005. | |
| *** | Impact of waiving the advisory fee for the ING Institutional Prime Money Market Fund holding has less than 0.005% impact on the expense ratio. | |
| † | As of May 31, 2003, the Fund was in its Offering Period. Total return from commencement of offering of shares was 0.00% for Class C. | |
| †† | Represents performance beginning on the first day of Guarantee Period (June 30, 2003). Total return for the year ended May 31, 2004 was (0.05)% for Class C. |
Table of Contents
| ING Principal Protection Fund VIII (Unaudited) | Financial Highlights | |
| Class A | ||||||||||||||||||||||||
| Six Months | October 1, | |||||||||||||||||||||||
| Ended | 2003(1) to | |||||||||||||||||||||||
| November 30, | Year Ended May 31, | May 31, | ||||||||||||||||||||||
| 2007 | 2007 | 2006 | 2005 | 2004 | ||||||||||||||||||||
Per Share Operating Performance: | ||||||||||||||||||||||||
| Net asset value, beginning of period | $ | 10.68 | 9.84 | 9.94 | 9.95 | 10.00 | ||||||||||||||||||
| Income (loss) from investment operations: | ||||||||||||||||||||||||
| Net investment income | $ | 0.08 | 0.16 | * | 0.17 | 0.18 | 0.06 | |||||||||||||||||
| Net realized and unrealized gain (loss) on investments | $ | (0.11 | ) | 0.87 | (0.07 | ) | 0.11 | (0.10 | ) | |||||||||||||||
| Total from investment operations | $ | (0.03 | ) | 1.03 | 0.10 | 0.29 | (0.04 | ) | ||||||||||||||||
| Less distributions from: | ||||||||||||||||||||||||
| Net investment income | $ | — | 0.18 | 0.20 | 0.18 | 0.01 | ||||||||||||||||||
| Net realized gains on investments | $ | — | 0.01 | — | 0.12 | — | ||||||||||||||||||
| Total distributions | $ | — | 0.19 | 0.20 | 0.30 | 0.01 | ||||||||||||||||||
| Net asset value, end of period | $ | 10.65 | 10.68 | 9.84 | 9.94 | 9.95 | ||||||||||||||||||
Total Return(2) | % | (0.28 | ) | 10.61 | 0.97 | 2.99 | (0.45) | †† | ||||||||||||||||
Ratios and Supplemental Data: | ||||||||||||||||||||||||
| Net assets, end of period (000’s) | $ | 6,094 | 6,799 | 9,965 | 16,375 | 22,336 | ||||||||||||||||||
| Ratios to average net assets: | ||||||||||||||||||||||||
Gross expenses prior to expense reimbursement(3) | % | 1.53 | 1.51 | 1.48 | 1.44 | 1.54 | ||||||||||||||||||
Net expenses after expense reimbursement(3)(4) | % | 1.53 | ** | 1.51 | ** | 1.48 | 1.44 | 1.51 | ||||||||||||||||
Net investment income after expense reimbursement(3)(4) | % | 1.43 | ** | 1.55 | ** | 1.62 | 1.68 | 0.96 | ||||||||||||||||
| Portfolio turnover rate | % | 59 | 53 | 57 | 77 | 42 | ||||||||||||||||||
| Class B | ||||||||||||||||||||||||
| Six Months | October 1, | |||||||||||||||||||||||
| Ended | 2003(1) to | |||||||||||||||||||||||
| November 30, | Year Ended May 31, | May 31, | ||||||||||||||||||||||
| 2007 | 2007 | 2006 | 2005 | 2004 | ||||||||||||||||||||
Per Share Operating Performance: | ||||||||||||||||||||||||
| Net asset value, beginning of period | $ | 10.68 | 9.83 | 9.93 | 9.91 | 10.00 | ||||||||||||||||||
| Income (loss) from investment operations: | ||||||||||||||||||||||||
| Net investment income | $ | 0.04 | 0.09 | 0.10 | 0.10 | 0.02 | ||||||||||||||||||
| Net realized and unrealized gain (loss) on investments | $ | (0.11 | ) | 0.87 | (0.09 | ) | 0.13 | (0.10 | ) | |||||||||||||||
| Total from investment operations | $ | (0.07 | ) | 0.96 | 0.01 | 0.23 | (0.08 | ) | ||||||||||||||||
| Less distributions from: | ||||||||||||||||||||||||
| Net investment income | $ | — | 0.10 | 0.11 | 0.09 | 0.01 | ||||||||||||||||||
| Net realized gains on investments | $ | — | 0.01 | — | 0.12 | — | ||||||||||||||||||
| Total distributions | $ | — | 0.11 | 0.11 | 0.21 | 0.01 | ||||||||||||||||||
| Net asset value, end of period | $ | 10.61 | 10.68 | 9.83 | 9.93 | 9.91 | ||||||||||||||||||
Total Return(2) | % | (0.66 | ) | 9.86 | 0.13 | 2.34 | (0.85) | †† | ||||||||||||||||
Ratios and Supplemental Data: | ||||||||||||||||||||||||
| Net assets, end of period (000’s) | $ | 47,937 | 53,549 | 64,586 | 87,326 | 105,448 | ||||||||||||||||||
| Ratios to average net assets: | ||||||||||||||||||||||||
Gross expenses prior to expense reimbursement(3) | % | 2.28 | 2.26 | 2.23 | 2.19 | 2.29 | ||||||||||||||||||
Net expenses after expense reimbursement(3)(4) | % | 2.28 | ** | 2.26 | ** | 2.23 | 2.19 | 2.12 | † | |||||||||||||||
Net investment income after expense reimbursement(3)(4) | % | 0.68 | ** | 0.79 | ** | 0.87 | 0.93 | 0.39 | † | |||||||||||||||
| Portfolio turnover rate | % | 59 | 53 | 57 | 77 | 42 | ||||||||||||||||||
| (1) | Commencement of operations. | |
| (2) | Total return is calculated assuming reinvestment of all dividends and capital gain distributions at net asset value and excluding the deduction of sales charges. Total returns for periods less than one year are not annualized. | |
| (3) | Annualized for periods less than one year. | |
| (4) | The Investment Adviser has agreed to limit expenses, (excluding interest, taxes, brokerage and extraordinary expenses), subject to possible reimbursement to the Investment Adviser within three years of being incurred. | |
| * | Calculated using average number of shares outstanding throughout the period. | |
| ** | Impact of waiving the advisory fee for the ING Institutional Prime Money Market Fund holding has less than 0.005% impact on the expense ratio. | |
| † | ING Funds Distributor, LLC voluntarily waived 0.75% of distribution fees on Class B from October 1, 2003 through December 23, 2003. | |
| †† | Represents performance beginning on the first day of the Guarantee Period (December 23, 2003). Total return from commencement of offering of shares was (0.45)% and (0.85)% for Class A and B, respectively. |
46
Table of Contents
| ING Principal Protection Fund VIII (Unaudited) (Continued) | Financial Highlights | |
| Class C | ||||||||||||||||||||||||
| Six Months | October 1, | |||||||||||||||||||||||
| Ended | 2003(1) to | |||||||||||||||||||||||
| November 30, | Year Ended May 31, | May 31, | ||||||||||||||||||||||
| 2007 | 2007 | 2006 | 2005 | 2004 | ||||||||||||||||||||
Per Share Operating Performance: | ||||||||||||||||||||||||
| Net asset value, beginning of period | $ | 10.75 | 9.87 | 9.93 | 9.91 | 10.00 | ||||||||||||||||||
| Income (loss) from investment operations: | ||||||||||||||||||||||||
| Net investment income | $ | 0.05 | 0.08 | * | 0.09 | * | 0.10 | 0.02 | ||||||||||||||||
| Net realized and unrealized gain (loss) on investments | $ | (0.12 | ) | 0.88 | (0.07 | ) | 0.12 | (0.10 | ) | |||||||||||||||
| Total from investment operations | $ | (0.07 | ) | 0.96 | 0.02 | 0.22 | (0.08 | ) | ||||||||||||||||
| Less distributions from: | ||||||||||||||||||||||||
| Net investment income | $ | — | 0.07 | 0.08 | 0.08 | 0.01 | ||||||||||||||||||
| Net realized gains on investments | $ | — | 0.01 | — | 0.12 | — | ||||||||||||||||||
| Total distributions | $ | — | 0.08 | 0.08 | 0.20 | 0.01 | ||||||||||||||||||
| Net asset value, end of period | $ | 10.68 | 10.75 | 9.87 | 9.93 | 9.91 | ||||||||||||||||||
Total Return(2) | % | (0.65 | ) | 9.82 | 0.18 | 2.29 | (0.85) | †† | ||||||||||||||||
Ratios and Supplemental Data: | ||||||||||||||||||||||||
| Net assets, end of period (000’s) | $ | 5,680 | 6,798 | 9,345 | 19,883 | 33,289 | ||||||||||||||||||
| Ratios to average net assets: | ||||||||||||||||||||||||
Gross expenses prior to expense reimbursement(3) | % | 2.28 | 2.26 | 2.23 | 2.19 | 2.29 | ||||||||||||||||||
Net expenses after expense reimbursement(3)(4) | % | 2.28 | ** | 2.26 | ** | 2.23 | 2.19 | 2.12 | † | |||||||||||||||
Net investment income after expense reimbursement(3)(4) | % | 0.67 | ** | 0.79 | ** | 0.87 | 0.92 | 0.39 | † | |||||||||||||||
| Portfolio turnover rate | % | 59 | 53 | 57 | 77 | 42 | ||||||||||||||||||
| (1) | Commencement of operations. | |
| (2) | Total return is calculated assuming reinvestment of all dividends and capital gain distributions at net asset value and excluding the deduction of sales charges. Total returns for periods less than one year are not annualized. | |
| (3) | Annualized for periods less than one year. | |
| (4) | The Investment Adviser has agreed to limit expenses, (excluding interest, taxes, brokerage and extraordinary expenses), subject to possible reimbursement to the Investment Adviser within three years of being incurred. | |
| * | Calculated using average number of shares outstanding throughout the period. | |
| ** | Impact of waiving the advisory fee for the ING Institutional Prime Money Market Fund holding has less than 0.005% impact on the expense ratio. | |
| † | ING Funds Distributor, LLC voluntarily waived 0.75% of distribution fees on Class C from October 1, 2003 through December 23, 2003. | |
| †† | Represents performance beginning on the first day of the Guarantee Period (December 23, 2003). Total return from commencement of offering of shares was (0.85)% for Class C. |
47
Table of Contents
| ING Principal Protection Fund IX (Unaudited) | Financial Highlights | |
| Class A | ||||||||||||||||||||||||
| Six Months | February 2, | |||||||||||||||||||||||
| Ended | 2004(1) to | |||||||||||||||||||||||
| November 30, | Year Ended May 31, | May 31, | ||||||||||||||||||||||
| 2007 | 2007 | 2006 | 2005 | 2004 | ||||||||||||||||||||
Per Share Operating Performance: | ||||||||||||||||||||||||
| Net asset value, beginning of period | $ | 10.76 | 9.95 | 10.08 | 9.92 | 10.00 | ||||||||||||||||||
| Income (loss) from investment operations: | ||||||||||||||||||||||||
| Net investment income | $ | 0.08 | 0.16 | * | 0.18 | * | 0.18 | 0.02 | ||||||||||||||||
| Net realized and unrealized gain (loss) on investments | $ | (0.12 | ) | 0.97 | (0.05 | ) | 0.16 | (0.10 | ) | |||||||||||||||
| Total from investment operations | $ | (0.04 | ) | 1.13 | 0.13 | 0.34 | (0.08 | ) | ||||||||||||||||
| Less distributions from: | ||||||||||||||||||||||||
| Net investment income | $ | — | 0.21 | 0.19 | 0.15 | — | ||||||||||||||||||
| Net realized gains on investments | $ | — | 0.11 | 0.07 | 0.03 | — | ||||||||||||||||||
| Total distributions | $ | — | 0.32 | 0.26 | 0.18 | — | ||||||||||||||||||
| Net asset value, end of period | $ | 10.72 | 10.76 | 9.95 | 10.08 | 9.92 | ||||||||||||||||||
Total Return(2) | % | (0.37 | ) | 11.48 | 1.25 | 3.43 | (0.80) | † | ||||||||||||||||
Ratios and Supplemental Data: | ||||||||||||||||||||||||
| Net assets, end of period (000’s) | $ | 4,279 | 4,694 | 6,311 | 10,035 | 20,081 | ||||||||||||||||||
| Ratios to average net assets: | ||||||||||||||||||||||||
Gross expenses prior to expense reimbursement(3) | % | 1.58 | 1.56 | 1.51 | 1.62 | 1.56 | ||||||||||||||||||
Net expenses after expense reimbursement(3)(4) | % | 1.58 | ** | 1.56 | ** | 1.51 | 1.68 | 1.30 | ||||||||||||||||
Net investment income after expense reimbursement(3)(4) | % | 1.44 | ** | 1.57 | ** | 1.81 | 1.56 | 0.77 | ||||||||||||||||
| Portfolio turnover rate | % | 62 | 57 | 76 | 67 | 4 | ||||||||||||||||||
| Class B | ||||||||||||||||||||||||
| Six Months | February 2, | |||||||||||||||||||||||
| Ended | 2004(1) to | |||||||||||||||||||||||
| November 30, | Year Ended May 31, | May 31, | ||||||||||||||||||||||
| 2007 | 2007 | 2006 | 2005 | 2004 | ||||||||||||||||||||
Per Share Operating Performance: | ||||||||||||||||||||||||
| Net asset value, beginning of period | $ | 10.74 | 9.93 | 10.06 | 9.91 | 10.00 | ||||||||||||||||||
| Income (loss) from investment operations: | ||||||||||||||||||||||||
| Net investment income | $ | 0.04 | 0.10 | 0.12 | 0.09 | 0.01 | ||||||||||||||||||
| Net realized and unrealized gain (loss) on investments | $ | (0.12 | ) | 0.94 | (0.07 | ) | 0.17 | (0.10 | ) | |||||||||||||||
| Total from investment operations | $ | (0.08 | ) | 1.04 | 0.05 | 0.26 | (0.09 | ) | ||||||||||||||||
| Less distributions from: | ||||||||||||||||||||||||
| Net investment income | $ | — | 0.12 | 0.11 | 0.08 | — | ||||||||||||||||||
| Net realized gains on investments | $ | — | 0.11 | 0.07 | 0.03 | — | ||||||||||||||||||
| Total distributions | $ | — | 0.23 | 0.18 | 0.11 | — | ||||||||||||||||||
| Net asset value, end of period | $ | 10.66 | 10.74 | 9.93 | 10.06 | 9.91 | ||||||||||||||||||
Total Return(2) | % | (0.74 | ) | 10.65 | 0.51 | 2.68 | (0.90) | † | ||||||||||||||||
Ratios and Supplemental Data: | ||||||||||||||||||||||||
| Net assets, end of period (000’s) | $ | 38,106 | 41,294 | 47,196 | 58,077 | 66,636 | ||||||||||||||||||
| Ratios to average net assets: | ||||||||||||||||||||||||
Gross expenses prior to expense reimbursement(3) | % | 2.33 | 2.31 | 2.26 | 2.37 | 2.36 | ||||||||||||||||||
Net expenses after expense reimbursement(3)(4) | % | 2.33 | ** | 2.31 | ** | 2.26 | 2.43 | 1.74 | †† | |||||||||||||||
Net investment income after expense reimbursement(3)(4) | % | 0.69 | ** | 0.82 | ** | 1.06 | 0.82 | 0.37 | †† | |||||||||||||||
| Portfolio turnover rate | % | 62 | 57 | 76 | 67 | 4 | ||||||||||||||||||
| (1) | Commencement of operations. | |
| (2) | Total return is calculated assuming reinvestment of all dividends and capital gain distributions at net asset value and excluding the deduction of sales charges. Total returns for periods less than one year are not annualized. | |
| (3) | Annualized for periods less than one year. | |
| (4) | The Investment Adviser has agreed to limit expenses, (excluding interest, taxes, brokerage and extraordinary expenses), subject to possible reimbursement to the Investment Adviser within three years of being incurred. | |
| * | Calculated using average number of shares outstanding throughout the period. | |
| ** | Impact of waiving the advisory fee for the ING Institutional Prime Money Market Fund holding has less than 0.005% impact on the expense ratio. | |
| † | Represents performance beginning on the first day of the Guarantee Period (April 22, 2004). Total return from commencement of offering of shares was (0.50)% and (0.60)% for Class A and B, respectively. | |
| †† | ING Fund Distributor, LLC voluntarily waived 0.75% of distribution fees on Class B from February 2, 2004 through April 22, 2004. |
48
Table of Contents
| ING Principal Protection Fund IX (Unaudited) (Continued) | Financial Highlights | |
| Class C | ||||||||||||||||||||||||
| Six Months | February 2, | |||||||||||||||||||||||
| Ended | 2004(1) to | |||||||||||||||||||||||
| November 30, | Year Ended May 31, | May 31, | ||||||||||||||||||||||
| 2007 | 2007 | 2006 | 2005 | 2004 | ||||||||||||||||||||
Per Share Operating Performance: | ||||||||||||||||||||||||
| Net asset value, beginning of period | $ | 10.81 | 9.97 | 10.06 | 9.91 | 10.00 | ||||||||||||||||||
| Income (loss) from investment operations: | ||||||||||||||||||||||||
| Net investment income | $ | 0.04 | 0.08 | * | 0.11 | * | 0.09 | 0.01 | ||||||||||||||||
| Net realized and unrealized gain (loss) on investments | $ | (0.12 | ) | 0.96 | (0.05 | ) | 0.17 | (0.10 | ) | |||||||||||||||
| Total from investment operations | $ | (0.08 | ) | 1.04 | 0.06 | 0.26 | (0.09 | ) | ||||||||||||||||
| Less distributions from: | ||||||||||||||||||||||||
| Net investment income | $ | — | 0.09 | 0.08 | 0.08 | — | ||||||||||||||||||
| Net realized gains on investments | $ | — | 0.11 | 0.07 | 0.03 | — | ||||||||||||||||||
| Total distributions | $ | — | 0.20 | 0.15 | 0.11 | — | ||||||||||||||||||
| Net asset value, end of period | $ | 10.73 | 10.81 | 9.97 | 10.06 | 9.91 | ||||||||||||||||||
Total Return(2) | % | (0.74 | ) | 10.59 | 0.64 | 2.64 | (0.90) | † | ||||||||||||||||
Ratios and Supplemental Data: | ||||||||||||||||||||||||
| Net assets, end of period (000’s) | $ | 4,489 | 4,943 | 6,673 | 15,054 | 21,753 | ||||||||||||||||||
| Ratios to average net assets: | ||||||||||||||||||||||||
Gross expenses prior to expense reimbursement(3) | % | 2.33 | 2.31 | 2.26 | 2.37 | 2.36 | ||||||||||||||||||
Net expenses after expense reimbursement(3)(4) | % | 2.33 | ** | 2.31 | ** | 2.26 | 2.43 | 1.74 | †† | |||||||||||||||
Net investment income after expense reimbursement(3)(4) | % | 0.69 | ** | 0.82 | ** | 1.06 | 0.81 | 0.37 | †† | |||||||||||||||
| Portfolio turnover rate | % | 62 | 57 | 76 | 67 | 4 | ||||||||||||||||||
| (1) | Commencement of operations. | |
| (2) | Total return is calculated assuming reinvestment of all dividends and capital gain distributions at net asset value and excluding the deduction of sales charges. Total returns for periods less than one year are not annualized. | |
| (3) | Annualized for periods less than one year. | |
| (4) | The Investment Adviser has agreed to limit expenses, (excluding interest, taxes, brokerage and extraordinary expenses), subject to possible reimbursement to the Investment Adviser within three years of being incurred. | |
| * | Per share numbers have been calculated using average number of shares outstanding throughout the period. | |
| ** | Impact of waiving the advisory fee for the ING Institutional Prime Money Market Fund holding has less than 0.005% impact on the expense ratio. | |
| † | Represents performance beginning on the first day of the Guarantee Period (April 22, 2004). Total return from commencement of offering of shares was (0.60)% for Class C. | |
| †† | ING Fund Distributor, LLC voluntarily waived 0.75% of distribution fees on Class C from February 2, 2004 through April 22, 2004. |
49
Table of Contents
ING Principal Protection Fund X (Unaudited) | Financial Highlights | |
| Class A | ||||||||||||||||||||||||
| Six Months | May 3, | |||||||||||||||||||||||
| Ended | 2004(1) to | |||||||||||||||||||||||
| November 30, | Year Ended May 31, | May 31, | ||||||||||||||||||||||
| 2007 | 2007 | 2006 | 2005 | 2004 | ||||||||||||||||||||
Per Share Operating Performance: | ||||||||||||||||||||||||
| Net asset value, beginning of period | $ | 10.72 | 9.89 | 10.25 | 10.00 | 10.00 | ||||||||||||||||||
| Income (loss) from investment operations: | ||||||||||||||||||||||||
| Net investment income | $ | 0.09 | 0.17 | * | 0.17 | 0.10 | 0.00 | ** | ||||||||||||||||
| Net realized and unrealized gain (loss) on investments | $ | (0.10 | ) | 0.98 | (0.09 | ) | 0.26 | 0.00 | ** | |||||||||||||||
| Total from investment operations | $ | (0.01 | ) | 1.15 | 0.08 | 0.36 | 0.00 | ** | ||||||||||||||||
| Less distributions from: | ||||||||||||||||||||||||
| Net investment income | $ | — | 0.19 | 0.15 | 0.07 | — | ||||||||||||||||||
| Net realized gains on investments | $ | — | 0.13 | 0.29 | 0.04 | — | ||||||||||||||||||
| Total distributions | $ | — | 0.32 | 0.44 | 0.11 | — | ||||||||||||||||||
| Net asset value, end of period | $ | 10.71 | 10.72 | 9.89 | 10.25 | 10.00 | ||||||||||||||||||
Total Return(2) | % | (0.09 | ) | 11.84 | 0.72 | 3.62 | †† | — | † | |||||||||||||||
Ratios and Supplemental Data: | ||||||||||||||||||||||||
| Net assets, end of period (000’s) | $ | 5,082 | 6,536 | 8,986 | 14,204 | 5,047 | ||||||||||||||||||
| Ratios to average net assets: | ||||||||||||||||||||||||
Gross expenses prior to expense reimbursement/recoupment(3) | % | 1.59 | 1.54 | 1.51 | 1.68 | 2.27 | ||||||||||||||||||
Net expenses after expense reimbursement/recoupment(3)(4) | % | 1.59 | *** | 1.54 | *** | 1.51 | 1.69 | 0.93 | ||||||||||||||||
Net investment income (loss) after expense reimbursement/recoupment(3)(4) | % | 1.69 | *** | 1.69 | *** | 1.54 | 1.08 | (0.01 | ) | |||||||||||||||
| Portfolio turnover rate | % | 77 | 106 | 57 | 78 | — | ||||||||||||||||||
| Class B | ||||||||||||||||||||||||
| Six Months | May 3, | |||||||||||||||||||||||
| Ended | 2004(1) to | |||||||||||||||||||||||
| November 30, | Year Ended May 31, | May 31, | ||||||||||||||||||||||
| 2007 | 2007 | 2006 | 2005 | 2004 | ||||||||||||||||||||
Per Share Operating Performance: | ||||||||||||||||||||||||
| Net asset value, beginning of period | $ | 10.69 | 9.86 | 10.22 | 10.00 | 10.00 | ||||||||||||||||||
| Income (loss) from investment operations: | ||||||||||||||||||||||||
| Net investment income | $ | 0.05 | 0.11 | 0.09 | 0.04 | 0.00 | ** | |||||||||||||||||
| Net realized and unrealized gain (loss) on investments | $ | (0.11 | ) | 0.97 | (0.09 | ) | 0.26 | 0.00 | ** | |||||||||||||||
| Total from investment operations | $ | (0.06 | ) | 1.08 | 0.00 | 0.30 | 0.00 | ** | ||||||||||||||||
| Less distributions from: | ||||||||||||||||||||||||
| Net investment income | $ | — | 0.12 | 0.07 | 0.04 | — | ||||||||||||||||||
| Net realized gains on investments | $ | — | 0.13 | 0.29 | 0.04 | — | ||||||||||||||||||
| Total distributions | $ | — | 0.25 | 0.36 | 0.08 | — | ||||||||||||||||||
| Net asset value, end of period | $ | 10.63 | 10.69 | 9.86 | 10.22 | 10.00 | ||||||||||||||||||
Total Return(2) | % | (0.56 | ) | 11.06 | (0.08 | ) | 3.00 | †† | — | † | ||||||||||||||
Ratios and Supplemental Data: | ||||||||||||||||||||||||
| Net assets, end of period (000’s) | $ | 27,447 | 30,438 | 34,312 | 42,237 | 12,477 | ||||||||||||||||||
| Ratios to average net assets: | ||||||||||||||||||||||||
Gross expenses prior to expense reimbursement/recoupment(3) | % | 2.34 | 2.29 | 2.26 | 2.43 | 3.02 | ||||||||||||||||||
Net expenses after expense reimbursement/recoupment(3)(4) | % | 2.34 | *** | 2.29 | *** | 2.26 | 2.32 | 1.68 | ||||||||||||||||
Net investment income (loss) after expense reimbursement/recoupment(3)(4) | % | 0.96 | *** | 0.95 | *** | 0.79 | 0.43 | (0.75 | ) | |||||||||||||||
| Portfolio turnover rate | % | 77 | 106 | 57 | 78 | — | ||||||||||||||||||
| (1) | Commencement of operations. | |
| (2) | Total return is calculated assuming reinvestment of all dividends and capital gain distributions at net asset value and excluding the deduction of sales charges. Total returns for periods less than one year are not annualized. | |
| (3) | Annualized for periods less than one year. | |
| (4) | The Investment Adviser has agreed to limit expenses, (excluding interest, taxes, brokerage and extraordinary expenses), subject to possible reimbursement to the Investment Adviser within three years of being incurred. | |
| * | Calculated using average number of shares outstanding throughout the period. | |
| ** | Amount is less than $0.005. | |
| *** | Impact of waiving the advisory fee for the ING Institutional Prime Money Market Fund holding has less than 0.005% impact on the expense ratio. | |
| † | As of May 31, 2004, the Fund was in its Offering Period. Total return calculation will begin on the commencement date of the Guarantee Period (August 17, 2004). Total return from commencement of offering of shares was 0.00% for Class A and B. | |
| †† | Represents performance beginning on the first day of the Guarantee Period (August 17, 2004). Total return for the year ended May 31, 2005 was 3.62% and 3.00% for Class A and B, respectively. |
50
Table of Contents
| ING Principal Protection Fund X (Unaudited) (Continued) | Financial Highlights | |
| Class C | ||||||||||||||||||||||||
| Six Months | May 3, | |||||||||||||||||||||||
| Ended | 2004(1) to | |||||||||||||||||||||||
| November 30, | Year Ended May 31, | May 31, | ||||||||||||||||||||||
| 2007 | 2007 | 2006 | 2005 | 2004 | ||||||||||||||||||||
Per Share Operating Performance: | ||||||||||||||||||||||||
| Net asset value, beginning of period | $ | 10.74 | 9.89 | 10.22 | 10.00 | 10.00 | ||||||||||||||||||
| Income (loss) from investment operations: | ||||||||||||||||||||||||
| Net investment income | $ | 0.05 | 0.10 | * | 0.08 | * | 0.04 | 0.00 | ** | |||||||||||||||
| Net realized and unrealized gain (loss) on investments | $ | (0.11 | ) | 0.99 | (0.08 | ) | 0.26 | 0.00 | ** | |||||||||||||||
| Total from investment operations | $ | (0.06 | ) | 1.09 | 0.00 | 0.30 | 0.00 | ** | ||||||||||||||||
| Less distributions from: | ||||||||||||||||||||||||
| Net investment income | $ | — | 0.11 | 0.04 | 0.04 | — | ||||||||||||||||||
| Net realized gains on investments | $ | — | 0.13 | 0.29 | 0.04 | — | ||||||||||||||||||
| Total distributions | $ | — | 0.24 | 0.33 | 0.08 | — | ||||||||||||||||||
| Net asset value, end of period | $ | 10.68 | 10.74 | 9.89 | 10.22 | 10.00 | ||||||||||||||||||
Total Return(2) | % | (0.56 | ) | 11.10 | (0.07 | ) | 3.02 | †† | — | † | ||||||||||||||
Ratios and Supplemental Data: | ||||||||||||||||||||||||
| Net assets, end of period (000’s) | $ | 3,505 | 4,913 | 6,456 | 12,256 | 1,825 | ||||||||||||||||||
| Ratios to average net assets: | ||||||||||||||||||||||||
Gross expenses prior to expense reimbursement(3) | % | 2.34 | 2.29 | 2.26 | 2.43 | 3.02 | ||||||||||||||||||
Net expenses after expense reimbursement(3)(4) | % | 2.34 | *** | 2.29 | *** | 2.26 | 2.32 | 1.68 | ||||||||||||||||
Net investment income (loss) after expense reimbursement (3)(4) | % | 0.95 | *** | 0.94 | *** | 0.79 | 0.43 | (0.77 | ) | |||||||||||||||
| Portfolio turnover rate | % | 77 | 106 | 57 | 78 | — | ||||||||||||||||||
| (1) | Commencement of operations. | |
| (2) | Total return is calculated assuming reinvestment of all dividends and capital gain distributions at net asset value and excluding the deduction of sales charges. Total returns for periods less than one year are not annualized. | |
| (3) | Annualized for periods less than one year. | |
| (4) | The Investment Adviser has agreed to limit expenses, (excluding interest, taxes, brokerage and extraordinary expenses), subject to possible reimbursement to the Investment Adviser within three years of being incurred. | |
| * | Calculated using average number of shares outstanding throughout the period. | |
| ** | Amount is less than $0.005. | |
| *** | Impact of waiving the advisory fee for the ING Institutional Prime Money Market Fund holding has less than 0.005% impact on the expense ratio. | |
| † | As of May 31, 2004, the Fund was in its Offering Period. Total return calculation will begin on the commencement date of the Guarantee Period (August 17, 2004). Total return from commencement of offering of shares was 0.00% for Class C. | |
| †† | Represents performance beginning on the first day of the Guarantee Period (August 17, 2004). Total return for the year ended May 31, 2005 was 3.02% for Class C. |
51
Table of Contents
| ING Principal Protection Fund XI (Unaudited) | Financial Highlights | |
| Class A | ||||||||||||||||||||
| Six Months | August 16, | |||||||||||||||||||
| Ended | Year Ended | 2004(1) to | ||||||||||||||||||
| November 30, | May 31, | May 31, | ||||||||||||||||||
| 2007 | 2007 | 2006 | 2005 | |||||||||||||||||
Per Share Operating Performance: | ||||||||||||||||||||
| Net asset value, beginning of period | $ | 10.75 | 9.88 | 9.99 | 10.00 | |||||||||||||||
| Income (loss) from investment operations: | ||||||||||||||||||||
| Net investment income | $ | 0.07 | 0.16 | * | 0.18 | 0.08 | ||||||||||||||
| Net realized and unrealized gain (loss) on investments | $ | (0.03 | ) | 0.95 | (0.12 | ) | (0.04 | ) | ||||||||||||
| Total from investment operations | $ | 0.04 | 1.11 | 0.06 | 0.04 | |||||||||||||||
| Less distributions from: | ||||||||||||||||||||
| Net investment income | $ | — | 0.20 | 0.16 | 0.05 | |||||||||||||||
| Net realized gains on investments | $ | — | 0.04 | 0.01 | — | |||||||||||||||
| Total distributions | $ | — | 0.24 | 0.17 | 0.05 | |||||||||||||||
| Net asset value, end of period | $ | 10.79 | 10.75 | 9.88 | 9.99 | |||||||||||||||
Total Return(2) | % | 0.37 | 11.33 | 0.62 | (0.09) | † | ||||||||||||||
Ratios and Supplemental Data: | ||||||||||||||||||||
| Net assets, end of period (000’s) | $ | 3,924 | 4,436 | 6,783 | 8,999 | |||||||||||||||
| Ratios to average net assets: | ||||||||||||||||||||
Expenses(3)(4) | % | 1.60 | ** | 1.59 | ** | 1.59 | 1.75 | |||||||||||||
Net investment income(3)(4) | % | 1.38 | ** | 1.56 | ** | 1.66 | 1.19 | |||||||||||||
| Portfolio turnover rate | % | 50 | 64 | 29 | 28 | |||||||||||||||
| Class B | ||||||||||||||||||||
| Six Months | August 16, | |||||||||||||||||||
| Ended | Year Ended | 2004(1) to | ||||||||||||||||||
| November 30, | May 31, | May 31, | ||||||||||||||||||
| 2007 | 2007 | 2006 | 2005 | |||||||||||||||||
Per Share Operating Performance: | ||||||||||||||||||||
| Net asset value, beginning of period | $ | 10.69 | 9.84 | 9.96 | 10.00 | |||||||||||||||
| Income (loss) from investment operations: | ||||||||||||||||||||
| Net investment income | $ | 0.03 | 0.08 | * | 0.10 | 0.03 | ||||||||||||||
| Net realized and unrealized gain (loss) on investments | $ | (0.03 | ) | 0.94 | (0.13 | ) | (0.04 | ) | ||||||||||||
| Total from investment operations | $ | — | 1.02 | (0.03 | ) | (0.01 | ) | |||||||||||||
| Less distributions from: | ||||||||||||||||||||
| Net investment income | $ | — | 0.13 | 0.08 | 0.03 | |||||||||||||||
| Net realized gains on investments | $ | — | 0.04 | 0.01 | — | |||||||||||||||
| Total distributions | $ | — | 0.17 | 0.09 | 0.03 | |||||||||||||||
| Net asset value, end of period | $ | 10.69 | 10.69 | 9.84 | 9.96 | |||||||||||||||
Total Return(2) | % | 0.00 | 10.40 | (0.27 | ) | (0.36) | † | |||||||||||||
Ratios and Supplemental Data: | ||||||||||||||||||||
| Net assets, end of period (000’s) | $ | 17,872 | 19,606 | 22,907 | 28,380 | |||||||||||||||
| Ratios to average net assets: | ||||||||||||||||||||
Expenses(3)(4) | % | 2.35 | ** | 2.34 | ** | 2.34 | 2.50 | |||||||||||||
Net investment income(3)(4) | % | 0.63 | ** | 0.80 | ** | 0.91 | 0.43 | |||||||||||||
| Portfolio turnover rate | % | 50 | 64 | 29 | 28 | |||||||||||||||
| (1) | Commencement of operations. | |
| (2) | Total return is calculated assuming reinvestment of all dividends and capital gain distributions at net asset value and excluding the deduction of sales charges. Total returns for periods less than one year are not annualized. | |
| (3) | Annualized for periods less than one year. | |
| (4) | The Investment Adviser has agreed to limit expenses, (excluding interest, taxes, brokerage and extraordinary expenses), subject to possible reimbursement to the Investment Adviser within three years of being incurred. | |
| * | Calculated using average number of shares outstanding throughout the period. | |
| ** | Impact of waiving the advisory fee for the ING Institutional Prime Money Market Fund holding has less than 0.005% impact on the expense ratio. | |
| † | Represents performance beginning on the first day of the Guarantee Period (November 18, 2004). Total return from commencement of offering of shares was 0.27% and (0.11)% for Class A and B, respectively. |
52
Table of Contents
| ING Principal Protection Fund XI (Unaudited) (Continued) | Financial Highlights | |
| Class C | ||||||||||||||||||||
| Six Months | August 16, | |||||||||||||||||||
| Ended | 2004(1) to | |||||||||||||||||||
| November 30, | Year Ended May 31, | May 31, | ||||||||||||||||||
| 2007 | 2007 | 2006 | 2005 | |||||||||||||||||
Per Share Operating Performance: | ||||||||||||||||||||
| Net asset value, beginning of period | $ | 10.71 | 9.85 | 9.96 | 10.00 | |||||||||||||||
| Income (loss) from investment operations: | ||||||||||||||||||||
| Net investment income | $ | 0.03 | 0.08 | * | 0.11 | 0.03 | ||||||||||||||
| Net realized and unrealized gain (loss) on investments | $ | (0.03 | ) | 0.94 | (0.13 | ) | (0.04 | ) | ||||||||||||
| Total from investment operations | $ | — | 1.02 | (0.02 | ) | (0.01 | ) | |||||||||||||
| Less distributions from: | ||||||||||||||||||||
| Net investment income | $ | — | 0.12 | 0.08 | 0.03 | |||||||||||||||
| Net realized gains on investments | $ | — | 0.04 | 0.01 | — | |||||||||||||||
| Total distributions | $ | — | 0.16 | 0.09 | 0.03 | |||||||||||||||
| Net asset value, end of period | $ | 10.71 | 10.71 | 9.85 | 9.96 | |||||||||||||||
Total Return(2) | % | 0.00 | 10.40 | (0.20 | ) | (0.36) | † | |||||||||||||
Ratios and Supplemental Data: | ||||||||||||||||||||
| Net assets, end of period (000’s) | $ | 3,576 | 3,658 | 4,737 | 7,143 | |||||||||||||||
| Ratios to average net assets: | ||||||||||||||||||||
Expenses(3)(4) | % | 2.35 | ** | 2.34 | ** | 2.34 | 2.50 | |||||||||||||
Net investment income(3)(4) | % | 0.64 | ** | 0.80 | ** | 0.91 | 0.46 | |||||||||||||
| Portfolio turnover rate | % | 50 | 64 | 29 | 28 | |||||||||||||||
| (1) | Commencement of operations. | |
| (2) | Total return is calculated assuming reinvestment of all dividends and capital gain distributions at net asset value and excluding the deduction of sales charges. Total returns for periods less than one year are not annualized. | |
| (3) | Annualized for periods less than one year. | |
| (4) | The Investment Adviser has agreed to limit expenses, (excluding interest, taxes, brokerage and extraordinary expenses), subject to possible reimbursement to the Investment Adviser within three years of being incurred. | |
| * | Calculated using average number of shares outstanding throughout the period. | |
| ** | Impact of waiving the advisory fee for the ING Institutional Prime Money Market Fund holding has less than 0.005% impact on the expense ratio. | |
| † | Represents performance beginning on the first day of the Guarantee Period (November 18, 2004). Total return from commencement of offering of shares was (0.08)% for Class C. |
53
Table of Contents
| ING Principal Protection Fund XII (Unaudited) | Financial Highlights | |
| Class A | ||||||||||||||||||||
| Six Months | November 15, | |||||||||||||||||||
| Ended | Year Ended | 2004(1) to | ||||||||||||||||||
| November 30, | May 31, | May 31, | ||||||||||||||||||
| 2007 | 2007 | 2006 | 2005 | |||||||||||||||||
Per Share Operating Performance: | ||||||||||||||||||||
| Net asset value, beginning of period | $ | 10.62 | 9.78 | 10.01 | 10.00 | |||||||||||||||
| Income (loss) from investment operations: | ||||||||||||||||||||
| Net investment income | $ | 0.08 | 0.17 | * | 0.16 | * | 0.05 | |||||||||||||
| Net realized and unrealized gain (loss) on investments | $ | 0.00 | ** | 0.87 | (0.21 | ) | (0.04 | ) | ||||||||||||
| Total from investment operations | $ | 0.08 | 1.04 | (0.05 | ) | 0.01 | ||||||||||||||
| Less distributions from: | ||||||||||||||||||||
| Net investment income | $ | — | 0.20 | 0.18 | — | |||||||||||||||
| Total distributions | $ | — | 0.20 | 0.18 | — | |||||||||||||||
| Net asset value, end of period | $ | 10.70 | 10.62 | 9.78 | 10.01 | |||||||||||||||
Total Return(2) | % | 0.75 | 10.66 | (0.51 | ) | 0.00 | † | |||||||||||||
Ratios and Supplemental Data: | ||||||||||||||||||||
| Net assets, end of period (000’s) | $ | 1,465 | 1,472 | 3,051 | 4,734 | |||||||||||||||
| Ratios to average net assets: | ||||||||||||||||||||
Gross expenses prior to expense reimbursement(3) | % | 1.83 | 1.71 | 1.92 | 1.68 | |||||||||||||||
Net expenses after expense reimbursement(3)(4) | % | 1.75 | *** | 1.75 | *** | 1.75 | 1.68 | |||||||||||||
Net investment income after expense reimbursement(3)(4) | % | 1.48 | *** | 1.67 | *** | 1.63 | 1.26 | |||||||||||||
| Portfolio turnover rate | % | 51 | 44 | 97 | 14 | |||||||||||||||
| Class B | ||||||||||||||||||||
| Six Months | November 15, | |||||||||||||||||||
| Ended | Year Ended | 2004(1) to | ||||||||||||||||||
| November 30, | May 31, | May 31, | ||||||||||||||||||
| 2007 | 2007 | 2006 | 2005 | |||||||||||||||||
Per Share Operating Performance: | ||||||||||||||||||||
| Net asset value, beginning of period | $ | 10.57 | 9.75 | 9.97 | 10.00 | |||||||||||||||
| Income (loss) from investment operations: | ||||||||||||||||||||
| Net investment income | $ | 0.04 | 0.10 | 0.09 | 0.02 | |||||||||||||||
| Net realized and unrealized gain (loss) on investments | $ | 0.01 | 0.84 | (0.20 | ) | (0.05 | ) | |||||||||||||
| Total from investment operations | $ | 0.05 | 0.94 | (0.11 | ) | (0.03 | ) | |||||||||||||
| Less distributions from: | ||||||||||||||||||||
| Net investment income | $ | — | 0.12 | 0.11 | — | |||||||||||||||
| Total distributions | $ | — | 0.12 | 0.11 | — | |||||||||||||||
| Net asset value, end of period | $ | 10.62 | 10.57 | 9.75 | 9.97 | |||||||||||||||
Total Return(2) | % | 0.47 | 9.72 | (1.11 | ) | (0.30) | † | |||||||||||||
Ratios and Supplemental Data: | ||||||||||||||||||||
| Net assets, end of period (000’s) | $ | 9,381 | 10,098 | 10,748 | 12,974 | |||||||||||||||
| Ratios to average net assets: | ||||||||||||||||||||
Gross expenses prior to expense reimbursement(3) | % | 2.58 | 2.46 | 2.67 | 2.43 | |||||||||||||||
Net expenses after expense reimbursement(3)(4) | % | 2.50 | *** | 2.50 | *** | 2.50 | 2.43 | |||||||||||||
Net investment income after expense reimbursement(3)(4) | % | 0.72 | *** | 0.90 | *** | 0.89 | 0.49 | |||||||||||||
| Portfolio turnover rate | % | 51 | 44 | 97 | 14 | |||||||||||||||
| (1) | Commencement of operations. | |
| (2) | Total return is calculated assuming reinvestment of all dividends and capital gain distributions at net asset value and excluding the deduction of sales charges. Total returns for periods less than one year are not annualized. | |
| (3) | Annualized for periods less than one year. | |
| (4) | The Investment Adviser has agreed to limit expenses, (excluding interest, taxes, brokerage and extraordinary expenses), subject to possible reimbursement to the Investment Adviser within three year of being incurred. | |
| * | Calculated using the average number of shares outstanding throughout the period. | |
| ** | Amount is less than $0.005. | |
| *** | Impact of waiving the advisory fee for the ING Institutional Prime Money Market Fund holding has less than 0.005% impact on the expense ratio. | |
| † | Represents performance beginning on the first day of the Guarantee period (February 16, 2005). Total return from commencement of offering of shares was 0.10% and (0.30)% for Class A and B, respectively. |
54
Table of Contents
| ING Principal Protection Fund XII (Unaudited) (continued) | Financial Highlights | |
| Class C | ||||||||||||||||||||
| Six Months | November 15, | |||||||||||||||||||
| Ended | Year Ended | 2004(1) to | ||||||||||||||||||
| November 30, | May 31, | May 31, | ||||||||||||||||||
| 2007 | 2007 | 2006 | 2005 | |||||||||||||||||
Per Share Operating Performance: | ||||||||||||||||||||
| Net asset value, beginning of period | $ | 10.62 | 9.75 | 9.97 | 10.00 | |||||||||||||||
| Income (loss) from investment operations: | ||||||||||||||||||||
| Net investment income | $ | 0.04 | 0.09 | * | 0.09 | * | 0.02 | |||||||||||||
| Net realized and unrealized gain (loss) on investments | $ | 0.00 | ** | 0.87 | (0.20 | ) | (0.05 | ) | ||||||||||||
| Total from investment operations | $ | 0.04 | 0.96 | (0.11 | ) | (0.03 | ) | |||||||||||||
| Less distributions from: | ||||||||||||||||||||
| Net investment income | $ | — | 0.09 | 0.11 | — | |||||||||||||||
| Total distributions | $ | — | 0.09 | 0.11 | — | |||||||||||||||
| Net asset value, end of period | $ | 10.66 | 10.62 | 9.75 | 9.97 | |||||||||||||||
Total Return(2) | % | 0.38 | 9.87 | (1.16 | ) | (0.30) | † | |||||||||||||
Ratios and Supplemental Data: | ||||||||||||||||||||
| Net assets, end of period (000’s) | $ | 1,878 | 1,996 | 2,775 | 5,327 | |||||||||||||||
| Ratios to average net assets: | ||||||||||||||||||||
Gross expenses prior to expense reimbursement(3) | % | 2.58 | 2.46 | 2.67 | 2.43 | |||||||||||||||
Net expenses after expense reimbursement(3)(4) | % | 2.50 | *** | 2.50 | *** | 2.50 | 2.43 | |||||||||||||
Net investment income after expense reimbursement(3)(4) | % | 0.72 | *** | 0.91 | *** | 0.89 | 0.52 | |||||||||||||
| Portfolio turnover rate | % | 51 | 44 | 97 | 14 | |||||||||||||||
| (1) | Commencement of operations. | |
| (2) | Total return is calculated assuming reinvestment of all dividends and capital gain distributions at net asset value and excluding the deduction of sales charges. Total returns for periods less than one year are not annualized. | |
| (3) | Annualized for periods less than one year. | |
| (4) | The Investment Adviser has agreed to limit expenses, (excluding interest, taxes, brokerage and extraordinary expenses), subject to possible reimbursement to the Investment Adviser within three year of being incurred. | |
| * | Calculated using the average number of shares outstanding throughout the period. | |
| ** | Amount is less than $0.005. | |
| *** | Impact of waiving the advisory fee for the ING Institutional Prime Money Market Fund holding has less than 0.005% impact on the expense ratio. | |
| † | Represents performance beginning on the first day of the Guarantee period (February 16, 2005). Total return from commencement of offering of shares was (0.30)% for Class C. |
55
Table of Contents
| Commencement | ||||||||||||
| Offering | Guarantee | of Index Plus | ||||||||||
| Period | Period | LargeCap Equity | ||||||||||
| PPF V | 11/01/02 — 01/15/03 | * | 01/23/03 — 01/22/08 | 01/23/08 | ||||||||
| PPF VI | 02/03/03 — 04/15/03 | * | 04/24/03 — 04/23/08 | 04/24/08 | ||||||||
| PPF VII | 05/01/03 — 06/24/03 | * | 06/30/03 — 06/26/08 | 06/27/08 | ||||||||
| PPF VIII | 10/01/03 — 12/15/03 | * | 12/23/03 — 12/22/08 | 12/23/08 | ||||||||
| PPF IX | 02/02/04 — 04/15/04 | * | 04/22/04 — 04/21/09 | 04/22/09 | ||||||||
| PPF X | 05/03/04 — 08/09/04 | * | 08/17/04 — 08/14/09 | 08/15/09 | ||||||||
| PPF XI | 08/16/04 — 11/11/04 | * | 11/18/04 — 11/18/09 | 11/19/09 | ||||||||
| PPF XII | 11/15/04 — 02/09/05 | * | 02/16/05 — 02/16/10 | 02/17/10 | ||||||||
| * | A Quiet Period between the Offering Period and the Guarantee Period where new deposits are not accepted and the assets will remain invested in short term instruments. |
56
Table of Contents
| A. | Security Valuation. Investments in equity securities traded on a national securities exchange are valued at the last reported sale price. Securities reported by NASDAQ will be valued at the NASDAQ official closing prices. Securities traded on an exchange or NASDAQ for which there has been no sale and securities traded in the over-the-counter-market are valued at the mean between the last reported bid and ask prices. All investments quoted in foreign currencies will be valued daily in U.S. dollars on the basis of the foreign currency exchange rates prevailing at that time. Debt securities are valued at prices obtained from independent services or from one or more dealers making markets in the securities and may be adjusted based on the Funds’ valuation procedures. U.S. government obligations are valued by using market quotations or independent pricing services that use prices provided by market-makers or estimates of market values obtained from yield data relating to instruments or securities with similar characteristics. | |
| Securities and assets for which market quotations are not readily available (which may include certain restricted securities which are subject to limitations as to their sale) are valued at their fair values as determined in good faith by or under the supervision of the Funds’ Board of Trustees (“Board”), in accordance with methods that are specifically authorized by the Board. Securities traded on exchanges, including foreign exchanges, which close earlier than the time that a Fund calculates its net asset value (“NAV”) may also be valued at their fair values as determined in good faith by or under the supervision of a Fund’s Board, in accordance with methods that are specifically authorized by the Board. The valuation techniques applied in any specific instance are likely to vary from case to case. With respect to a restricted security, for example, consideration is generally given to the cost of the investment, the market value of any unrestricted securities of the same class at the time of valuation, the potential expiration of restrictions on the security, the existence of any registration rights, the costs to the Funds related to registration of the security, as well as factors relevant to the issuer itself. Consideration may also be given to the price and extent of any public trading in similar securities of the issuer or comparable companies’ securities. | ||
| The value of a foreign security traded on an exchange outside the United States is generally based on the price of a foreign security on the principal foreign exchange where it trades as of the time a Fund determines its NAV or if the foreign exchange closes prior to the time a Fund determines its NAV, the most recent closing price of the foreign security on its principal exchange. Trading in certain non-U.S. securities may not take place on all days on which the New York Stock Exchange (“NYSE”) is open. Further, trading takes place in various foreign markets on days on which the NYSE is not open. Consequently, the calculation of a Fund’s NAV may not take place contemporaneously with the determination of the prices of securities held by a Fund in foreign securities markets. Further, the value of a Fund’s assets may be significantly affected by foreign trading on days when a shareholder cannot purchase or redeem shares of the Fund. In calculating a Fund’s NAV, foreign securities denominated in foreign currency are converted to U.S. dollar equivalents. | ||
| If an event occurs after the time at which the market for foreign securities held by a Fund closes but before the time that the Fund’s NAV is calculated, such event may cause the closing price on the foreign exchange to not represent a readily available reliable market value quotation for such securities at the time the Fund determines its NAV. In such a case, a Fund will use the fair value of such securities as determined under the Fund’s valuation procedures. Events after the close of trading on a foreign market that could require a Fund to fair value some or all of its foreign securities include, among others, securities trading in the U.S. and other markets, corporate announcements, natural and other disasters, and political and other events. Among other elements of analysis in the determination of a security’s fair value, the Board has authorized the use of one or more independent research services to assist with such determinations. An independent research service may use statistical analyses and quantitative models to help determine fair value as of the time a Fund calculates its NAV. There can be no |
57
Table of Contents
POLICIES (continued)
| assurance that such models accurately reflect the behavior of the applicable markets or the effect of the behavior of such markets on the fair value of securities, or that such markets will continue to behave in a fashion that is consistent with such models. Unlike the closing price of a security on an exchange, fair value determinations employ elements of judgment. Consequently, the fair value assigned to a security may not represent the actual value that a Fund could obtain if it were to sell the security at the time of the close of the NYSE. Pursuant to procedures adopted by the Board, a Fund is not obligated to use the fair valuation suggested by any research service, and valuation recommendations provided by such research services may be overridden if other events have occurred or if other fair valuations are determined in good faith to be more accurate. Unless an event is such that it causes a Fund to determine that the closing prices for one or more securities do not represent readily available reliable market value quotations at a time a Fund determines its NAV, events that occur between the time of the close of the foreign market on which they are traded and the close of regular trading on the NYSE will not be reflected in a Fund’s NAV. Investments in securities maturing in 60 days or less from the date of acquisition are valued at amortized cost, which, when combined with accrued interest, approximates market value. | ||
| B. | Security Transactions and Revenue Recognition. Securities transactions are accounted for on the trade date. Realized gains and losses are reported on the basis of identified cost of securities sold. Interest income is recorded on an accrual basis. Dividend income is recorded on the ex-dividend date, or for certain foreign securities, when the information becomes available to the Funds. Premium amortization and discount accretion are determined by the effective yield method. | |
| C. | Foreign Currency Translation. The books and records of the Funds are maintained in U.S. dollars. Any foreign currency amounts are translated into U.S. dollars on the following basis: |
| (1) | Market value of investment securities, other assets and liabilities — at the exchange rates prevailing at the end of the day. | ||
| (2) | Purchases and sales of investment securities, income and expenses — at the exchange rates of exchange prevailing on the respective dates of such transactions. |
| Although the net assets and the market values are presented at the foreign exchange rates at the end of the day, the Funds do not isolate the portion of the results of operations resulting from changes in foreign exchange rates on investments from the fluctuations arising from changes in market prices of securities held. Such fluctuations are included with the net realized and unrealized gains or losses from investments. For securities which are subject to foreign withholding tax upon disposition, liabilities are recorded on the Statements of Assets and Liabilities for the estimated tax withholding based on the securities’ current market value. Upon disposition, realized gains or losses on such securities are recorded net of foreign withholding tax. | ||
| Reported net realized foreign exchange gains or losses arise from sales of foreign currencies, currency gains or losses realized between the trade and settlement dates on securities transactions, the difference between the amounts of dividends, interest, and foreign withholding tax reclaims recorded on a Fund’s books, and the U.S. dollar equivalent of the amounts actually received or paid. Net unrealized foreign exchange gains and losses arise from changes in the value of assets and liabilities other than investments in securities at fiscal year end, resulting from changes in the exchange rate. Foreign security and currency transactions may involve certain considerations and risks not typically associated with investing in U.S. companies and U.S. government securities. These risks include but are not limited to revaluation of currencies and future adverse political and economic developments which could cause securities and their markets to be less liquid and prices more volatile than those of comparable U.S. companies and U.S. government securities. The foregoing risks are even greater with respect to securing of issuers in emerging markets. | ||
| D. | Foreign Currency Transactions and Futures Contracts. The Funds may enter into foreign currency exchange transactions to convert to and from different foreign currencies and to and from the U.S. dollar in connection with the planned purchases or sales of securities. The Funds either enter into these transactions on a spot basis at the |
58
Table of Contents
POLICIES (continued)
| spot rate prevailing in the foreign currency exchange market or use forward foreign currency contracts to purchase or sell foreign currencies. When the contract is fulfilled or closed, gains or losses are realized. Until then, the gain or loss is included in unrealized appreciation or depreciation. Risks may arise upon entering into forward contracts from the potential inability of counterparties to meet the terms of their forward contracts and from unanticipated movements in the value of foreign currencies relative to the U.S. dollar. For the six months ended November 30, 2007, the Funds did not enter into foreign currency exchange transactions. | ||
| Each Fund may enter into futures contracts involving foreign currency, interest rates, securities and security indices. A futures contract obligates the seller of the contract to deliver and the purchaser of the contract to take delivery of the type of foreign currency, financial instrument or security called for in the contract at a specified future time for a specified price. Upon entering into such a contract, a Fund is required to deposit and maintain as collateral such initial margin as required by the exchange on which the contract is traded. Pursuant to the contract, a Fund agrees to receive from or pay to the broker an amount equal to the daily fluctuations in the value of the contract. Such receipts or payments are known as variation margins and are recorded as unrealized gains or losses by a Fund. When the contract is closed, a Fund records a realized gain or loss equal to the difference between the value of the contract at the time it was opened and the value at the time it was closed. | ||
| E. | Distributions to Shareholders. The Funds record distributions to their shareholders on the ex-dividend date. Each Fund pays dividends and capital gains, if any, annually. The Funds may make distributions on a more frequent basis to comply with the distribution requirements of the Internal Revenue Code. The Characteristics of income and gains to be distributed are determined in accordance with income tax regulations, which may differ from U.S. generally accepted accounting principles for investment companies. | |
| F. | Federal Income Taxes. It is the policy of the Funds to comply with the requirements of the subchapter M of the Internal Revenue code and related excise tax provisions applicable to regulated investment companies and to distribute substantially all of their net investment income and any net realized capital gains to their shareholders. Therefore, no federal income tax or provision is required. No capital gain distributions will be made until any capital loss carryforwards have been fully utilized or expired. | |
| G. | Guarantee Fees. Each PPF’s Guarantee is backed by an unconditional, irrevocable guarantee from MBIA Insurance Corporation (“MBIA”), a monoline financial guarantor. Each PPF pays MBIA a guarantee fee of 0.33% of its average daily net assets during the guarantee period. | |
| MBIA Insurance Corporation (“MBIA”), 113 King Street, Armonk, New York 10504 serves as the financial guarantor to the PPF’s pursuant to a written agreement with ING Investments, ING Investment Management Co. and the Trust. Pursuant to the terms of the Financial Guaranty Agreement, MBIA will issue to the Trust, for the benefit of the shareholders of the PPF, the insurance policy to support the PPF’s Payment Undertaking. The insurance policy is unconditional and irrevocable and will remain in place through the Guarantee Maturity Date for a PPF. MBIA and its subsidiaries provide financial guarantees to municipalities and other bond issuers. MBIA also guarantees structured asset-backed and mortgage-backed transactions, selected corporate bonds and obligations of high-quality financial institutions. | ||
| H. | Use of Estimates. The preparation of financial statements in conformity with U.S. generally accepted accounting principles requires management to make estimates and assumptions that affect the reported amounts of assets and liabilities and disclosure of contingent assets and liabilities at the date of the financial statements and the reported amounts of increases and decreases in net assets from operations during the reporting period. Actual results could differ from those estimates. | |
| I. | Repurchase Agreements. Each Fund may invest in repurchase agreements only with government securities dealers recognized by the Board of Governors of the Federal Reserve System. Under such agreements, the seller of the security agrees to repurchase it at a mutually agreed upon time and price. The resale price is in excess of the purchase price and reflects an agreed upon interest |
59
Table of Contents
| rate for the period of time the agreement is outstanding. The period of the repurchase agreements is usually short, from overnight to one week, while the underlying securities generally have longer maturities. Each Fund will receive as collateral securities acceptable to it whose market value is equal to at least 100% of the carrying amount of the repurchase agreements, plus accrued interest, being invested by the Fund. The underlying collateral is valued daily on a mark-to-market basis to assure that the value, including accrued interest is at least equal to the repurchase price. If the seller defaults, a Fund might incur a loss or delay in the realization of proceeds if the value of the security collateralizing the repurchase agreement declines, and it might incur disposition costs in liquidating the collateral. | ||
| J. | Securities Lending. Index Plus LargeCap Equity Funds have the option to temporarily loan up to 30% of its total assets to brokers, dealers or other financial institutions in exchange for a negotiated lender’s fee. The borrower is required to fully collateralize the loans with cash or U.S. government securities. Generally, in the event of counterparty default, each Fund has the right to use collateral to offset losses incurred. There would be potential loss to each Fund in the event the Fund is delayed or prevented from exercising its right to dispose of the collateral. Each Fund bears the risk of loss with respect to the investment of collateral. Engaging in securities lending could have a leveraging effect, which may intensify the credit, market and other risks associated with investing in a Fund. | |
| K. | Illiquid and Restricted Securities. Each Fund may not invest more than 15% of its net assets in illiquid securities. Illiquid securities are not readily marketable. Disposing of illiquid investments may involve time-consuming negotiation and legal expenses, and it may be difficult or impossible for the Funds to sell them promptly at an acceptable price. Each Fund also may invest in restricted securities, which include those sold under Rule 144A of the Securities Act of 1933 (“1933 Act”) or securities offered pursuant to Section 4(2) of the 1933 Act, and/or are subject to legal or contractual restrictions on resale and generally may not be publicly sold without registration under the 1933 Act. Certain restricted securities may be considered liquid pursuant to procedures adopted by the Board or may be deemed to be illiquid because they may not be readily marketable. Illiquid and restricted securities are valued using market quotations when readily available. In the absence of market quotations, the securities are valued based upon their fair value determined under procedures approved by the Board. | |
| L. | Indemnifications. In the normal course of business, the Funds may enter into contracts that provide certain indemnifications. The Funds’ maximum exposure under these arrangements is dependent on future claims that may be made against the Funds and, therefore, cannot be estimated; however, based on experience, the risk of loss from such claims is considered remote. |
| Purchases | Sales | |||||||
| Index Plus LargeCap Equity | $ | 25,402,541 | $ | 31,906,852 | ||||
| Index Plus LargeCap Equity II | 38,628,298 | 53,714,033 | ||||||
| Index Plus LargeCap Equity III | 111,805,874 | 99,942,238 | ||||||
| Index Plus LargeCap Equity IV | 137,390,227 | 164,021,501 | ||||||
| PPF V | 56,503,729 | 89,415,906 | ||||||
| PPF VI | 41,948,416 | 70,141,980 | ||||||
| PPF VII | 20,281,623 | 35,026,465 | ||||||
| PPF VIII | 18,895,793 | 27,957,073 | ||||||
| PPF IX | 14,881,184 | 24,245,023 | ||||||
| PPF X | 29,546,169 | 35,197,675 | ||||||
| PPF XI | 6,710,831 | 11,922,611 | ||||||
| PPF XII | 3,323,513 | 5,790,967 | ||||||
| Purchases | Sales | |||||||
| Index Plus LargeCap Equity III | $ | — | $ | 101,200,000 | ||||
| Index Plus LargeCap Equity IV | — | 144,209,103 | ||||||
| PPF VI | — | 1,635,096 | ||||||
| PPF VII | — | 4,220,053 | ||||||
| PPF VIII | 18,142,211 | 19,327,313 | ||||||
| PPF IX | 15,380,484 | 10,016,764 | ||||||
| PPF XI | 6,632,198 | 3,939,868 | ||||||
| PPF XII | 3,336,941 | 1,817,701 | ||||||
60
Table of Contents
| Amount | ||||
| Waived | ||||
| Index Plus LargeCap Equity | $ | 262 | ||
| Index Plus LargeCap Equity II | 413 | |||
| Index Plus LargeCap Equity III | 1,301 | |||
| Index Plus LargeCap Equity IV | 2,373 | |||
| PPF V | 678 | |||
| PPF VI | 419 | |||
| PPF VII | 187 | |||
| PPF VIII | 138 | |||
| PPF IX | 84 | |||
| PPF X | 48 | |||
| PPF XI | 28 | |||
| PPF XII | 19 | |||
N.V. (“ING Groep”). ING Groep is one of the largest financial services organizations in the world, and offers an array of banking, insurance and asset management services to both individuals and investors.
| Class A | Class B | Class C | Class Q | |||||||||||||
| Index Plus LargeCap Equity | 0.25 | % | 1.00 | % | 1.00 | % | 0.25 | % | ||||||||
| Index Plus LargeCap Equity II | 0.25 | % | 1.00 | % | 1.00 | % | n/a | |||||||||
| Index Plus LargeCap Equity III | 0.25 | % | 1.00 | % | 1.00 | % | n/a | |||||||||
| Index Plus LargeCap Equity IV | 0.25 | % | 1.00 | % | 1.00 | % | 0.25 | % | ||||||||
| PPF V | 0.25 | % | 1.00 | % | 1.00 | % | n/a | |||||||||
| PPF VI | 0.25 | % | 1.00 | % | 1.00 | % | n/a | |||||||||
| PPF VII | 0.25 | % | 1.00 | % | 1.00 | % | n/a | |||||||||
| PPF VIII | 0.25 | % | 1.00 | % | 1.00 | % | n/a | |||||||||
| PPF IX | 0.25 | % | 1.00 | % | 1.00 | % | n/a | |||||||||
| PPF X | 0.25 | % | 1.00 | % | 1.00 | % | n/a | |||||||||
| PPF XI | 0.25 | % | 1.00 | % | 1.00 | % | n/a | |||||||||
| PPF XII | 0.25 | % | 1.00 | % | 1.00 | % | n/a | |||||||||
| Class A | Class B | Class C | ||||||||||
| Shares | Shares | Shares | ||||||||||
Contingent Deferred Sales Charges: | ||||||||||||
| Index Plus LargeCap Equity | $ | 125 | N/A | N/A | ||||||||
| Index Plus LargeCap Equity II | N/A | N/A | N/A | |||||||||
| Index Plus LargeCao Equity III | N/A | N/A | N/A | |||||||||
| Index Plus LargeCap Equity IV | N/A | N/A | $ | 49 | ||||||||
| PPF V | N/A | N/A | N/A | |||||||||
| PPF VI | N/A | N/A | N/A | |||||||||
| PPF VII | N/A | N/A | N/A | |||||||||
| PPF VIII | N/A | N/A | N/A | |||||||||
| PPF IX | N/A | N/A | N/A | |||||||||
| PPF X | N/A | N/A | N/A | |||||||||
| PPF XI | N/A | N/A | N/A | |||||||||
| PPF XII | N/A | N/A | N/A | |||||||||
61
Table of Contents
| Accrued | ||||||||||||||||||||
| Accrued | Shareholder | |||||||||||||||||||
| Investment | Accrued | Service and | ||||||||||||||||||
| Management | Administrative | Distribution | Accrued | |||||||||||||||||
| Portfolio | Fees | Fees | Fees | Waivers | Total | |||||||||||||||
| Index Plus LargeCap Equity | $ | 13,780 | $ | 3,075 | $ | 28,605 | $ | — | $ | 45,460 | ||||||||||
| Index Plus LargeCap Equity II | 21,164 | 4,719 | 43,549 | — | 69,432 | |||||||||||||||
| Index Plus LargeCap Equity III | 18,971 | 4,232 | 39,615 | — | 62,818 | |||||||||||||||
| Index Plus LargeCap Equity IV | 49,121 | 10,939 | 104,186 | — | 164,246 | |||||||||||||||
| PPF V | 115,478 | 17,904 | 171,668 | — | 305,050 | |||||||||||||||
| PPF VI | 131,499 | 16,443 | 158,791 | — | 306,733 | |||||||||||||||
| PPF VII | 64,447 | 8,058 | 77,829 | 1,112 | 151,446 | |||||||||||||||
| PPF VIII | 32,177 | 4,943 | 45,685 | — | 82,805 | |||||||||||||||
| PPF IX | 25,205 | 3,832 | 35,699 | — | 64,736 | |||||||||||||||
| PPF X | 19,862 | 2,981 | 26,671 | — | 49,514 | |||||||||||||||
| PPF XI | 13,644 | 2,087 | 18,372 | 12,918 | 47,021 | |||||||||||||||
| PPF XII | 6,729 | 1,038 | 9,482 | — | 17,249 | |||||||||||||||
| Fund | Expense | Amount | ||||||
| Index Plus LargeCap Equity | Transfer Agent | $ | 12,719 | |||||
| Audit | 18,129 | |||||||
| Legal | 11,779 | |||||||
| Postage | 11,843 | |||||||
| 38,195 | ||||||||
| Index Plus LargeCap Equity II | Audit | 26,567 | ||||||
| PPF VI | Accrued MBIA Fee | 54,261 | ||||||
| PPF VII | Accrued MBIA Fee | 26,592 | ||||||
| PPF IX | Custody | 14,834 | ||||||
| Transfer Agent | 10,326 | |||||||
| Accrued MBIA Fee | 12,647 | |||||||
| Audit | 13,894 | |||||||
| Postage | 21,311 | |||||||
| 13,191 | ||||||||
| PPF XI | Custody | 9,564 | ||||||
| Transfer Agent | 10,105 | |||||||
| Accrued MBIA Fee | 6,887 | |||||||
| PPF XII | Custody | 8,475 | ||||||
| Transfer Agent | 5,214 | |||||||
| Accrued MBIA Fee | 3,425 | |||||||
| Audit | 2,668 | |||||||
| Class A | Class B | Class C | Class Q | |||||||||||||
| Index Plus LargeCap Equity II | 1.75 | % | 2.50 | % | 2.50 | % | n/a | |||||||||
| Index Plus LargeCap Equity III | 1.75 | % | 2.50 | % | 2.50 | % | n/a | |||||||||
| Index Plus LargeCap Equity IV | 1.75 | % | 2.50 | % | 2.50 | % | 1.75 | % | ||||||||
| PPF V | 1.75 | % | 2.50 | % | 2.50 | % | n/a | |||||||||
| PPF VI | 1.75 | % | 2.50 | % | 2.50 | % | 1.75 | % | ||||||||
| PPF VII | 1.75 | % | 2.50 | % | 2.50 | % | n/a | |||||||||
| PPF VIII | 1.75 | % | 2.50 | % | 2.50 | % | n/a | |||||||||
| PPF IX | 1.75 | % | 2.50 | % | 2.50 | % | n/a | |||||||||
| PPF X | 1.75 | % | 2.50 | % | 2.50 | % | n/a | |||||||||
| PPF XI | 1.75 | % | 2.50 | % | 2.50 | % | n/a | |||||||||
| PPF XII | 1.75 | % | 2.50 | % | 2.50 | % | n/a | |||||||||
| November 30, | ||||||||||||||||
| 2008 | 2009 | 2010 | Total | |||||||||||||
| PPF VII | $ | 21,464 | $ | — | $ | — | $ | 21,464 | ||||||||
| PPF XII | 14,917 | 13,229 | 5,393 | 33,539 | ||||||||||||
62
Table of Contents
| Approximate | ||||||||||||
| Weighted | ||||||||||||
| Approximate | Average | |||||||||||
| Average Daily | Interest Rate | |||||||||||
| Days | Balance for | For Days | ||||||||||
| Utilized | Days Utilized | Utilized | ||||||||||
| Index Plus LargeCap Equity III | 9 | $ | 1,214,444 | 5.76 | % | |||||||
| Index Plus LargeCap Equity IV | 4 | $ | 870,000 | 5.15 | % | |||||||
| Class A | Class B | |||||||||||||||
| Six Months | Year | Six Months | Year | |||||||||||||
| Ended | Ended | Ended | Ended | |||||||||||||
| November 30, | May 31, | November 30, | May 31, | |||||||||||||
| 2007 | 2007 | 2007 | 2007 | |||||||||||||
Index Plus LargeCap Equity (Number of Shares) | ||||||||||||||||
| Shares sold | 2,802 | 19,640 | — | — | ||||||||||||
| Dividends reinvested | — | 20,883 | — | 154,567 | ||||||||||||
| Shares redeemed | (23,537 | ) | (919,216 | ) | (502,231 | ) | (10,450,574 | ) | ||||||||
| Net decrease in shares outstanding | (20,735 | ) | (878,693 | ) | (502,231 | ) | (10,296,007 | ) | ||||||||
Index Plus LargeCap Equity ($) | ||||||||||||||||
| Shares sold | $ | 30,484 | $ | 196,898 | $ | — | $ | — | ||||||||
| Dividends reinvested | — | 208,224 | — | 1,538,594 | ||||||||||||
| Shares redeemed | (252,959 | ) | (9,201,387 | ) | (5,374,398 | ) | (104,535,311 | ) | ||||||||
| Net decrease | $ | (222,475 | ) | $ | (8,796,265 | ) | $ | (5,374,398 | ) | $ | (102,996,717 | ) | ||||
| Class C | Class Q | |||||||||||||||
| Six Months | Year | Six Months | Year | |||||||||||||
| Ended | Ended | Ended | Ended | |||||||||||||
| November 30, | May 31, | November 30, | May 31, | |||||||||||||
| 2007 | 2007 | 2007 | 2007 | |||||||||||||
Index Plus LargeCap Equity (Number of Shares) | ||||||||||||||||
| Shares sold | — | 3,689 | — | — | ||||||||||||
| Dividends reinvested | — | 10,909 | — | 204 | ||||||||||||
| Shares redeemed | (82,180 | ) | (813,459 | ) | (2,770 | ) | (3,903 | ) | ||||||||
| Net decrease in shares outstanding | (82,180 | ) | (798,861 | ) | (2,770 | ) | (3,699 | ) | ||||||||
Index Plus LargeCap Equity ($) | ||||||||||||||||
| Shares sold | $ | — | $ | 39,404 | $ | — | $ | — | ||||||||
| Dividends reinvested | — | 110,388 | — | 2,048 | ||||||||||||
| Shares redeemed | (895,479 | ) | (8,223,037 | ) | (30,618 | ) | (39,109 | ) | ||||||||
| Net decrease | $ | (895,479 | ) | $ | (8,073,245 | ) | $ | (30,618 | ) | $ | (37,061 | ) | ||||
63
Table of Contents
| Class A | Class B | Class C | ||||||||||||||||||||||
| Six Months | Year | Six Months | Year | Six Months | Year | |||||||||||||||||||
| Ended | Ended | Ended | Ended | Ended | Ended | |||||||||||||||||||
| November 30, | May 31, | November 30, | May 31, | November 30, | May 31, | |||||||||||||||||||
| 2007 | 2007 | 2007 | 2007 | 2007 | 2007 | |||||||||||||||||||
Index Plus LargeCap Equity Fund II (Number of Shares) | ||||||||||||||||||||||||
| Shares sold | 2,102 | 157,125 | — | — | — | 13,618 | ||||||||||||||||||
| Dividends reinvested | — | 41,773 | — | 358,794 | — | 34,011 | ||||||||||||||||||
| Shares redeemed | (118,545 | ) | (1,159,143 | ) | (1,192,262 | ) | (14,730,188 | ) | (92,547 | ) | (1,869,985 | ) | ||||||||||||
| Net decrease in shares outstanding | (116,443 | ) | (960,245 | ) | (1,192,262 | ) | (14,371,394 | ) | (92,547 | ) | (1,822,356 | ) | ||||||||||||
Index Plus LargeCap Equity Fund II ($) | ||||||||||||||||||||||||
| Shares sold | $ | 29,990 | $ | 1,523,179 | $ | — | $ | — | $ | — | $ | 131,510 | ||||||||||||
| Dividends reinvested | — | 399,399 | — | 3,435,833 | — | 327,904 | ||||||||||||||||||
| Shares redeemed | (1,165,194 | ) | (11,216,527 | ) | (11,883,053 | ) | (141,875,714 | ) | (930,453 | ) | (18,131,406 | ) | ||||||||||||
| Net decrease | $ | (1,135,204 | ) | $ | (9,293,949 | ) | $ | (11,883,053 | ) | $ | (138,439,881 | ) | $ | (930,453 | ) | $ | (17,671,992 | ) | ||||||
| Class A | Class B | Class C | ||||||||||||||||||||||
| Six Months | Year | Six Months | Year | Six Months | Year | |||||||||||||||||||
| Ended | Ended | Ended | Ended | Ended | Ended | |||||||||||||||||||
| November 30, | May 31, | November 30, | May 31, | November 30, | May 31, | |||||||||||||||||||
| 2007 | 2007 | 2007 | 2007 | 2007 | 2007 | |||||||||||||||||||
Index Plus LargeCap Equity Fund III (Number of Shares) | ||||||||||||||||||||||||
| Shares sold | 280 | — | — | — | 502 | — | ||||||||||||||||||
| Dividends reinvested | — | 37,220 | 54 | 286,166 | — | 17,841 | ||||||||||||||||||
| Shares redeemed | (605,083 | ) | (318,154 | ) | (8,087,872 | ) | (3,590,369 | ) | (316,642 | ) | (772,555 | ) | ||||||||||||
| Net decrease in shares outstanding | (604,803 | ) | (280,934 | ) | (8,087,818 | ) | (3,304,203 | ) | (316,140 | ) | (754,714 | ) | ||||||||||||
Index Plus LargeCap Equity Fund III ($) | ||||||||||||||||||||||||
| Shares sold | $ | 3,271 | $ | — | $ | — | $ | — | $ | 5,100 | $ | — | ||||||||||||
| Dividends reinvested | — | 366,354 | 545 | 2,823,281 | — | 176,968 | ||||||||||||||||||
| Shares redeemed | (5,999,686 | ) | (3,135,586 | ) | (80,148,124 | ) | (35,323,126 | ) | (3,156,914 | ) | (7,658,242 | ) | ||||||||||||
| Net decrease | $ | (5,996,415 | ) | $ | (2,769,232 | ) | $ | (80,147,579 | ) | $ | (32,499,845 | ) | $ | (3,151,814 | ) | $ | (7,481,274 | ) | ||||||
| Class A | Class B | |||||||||||||||
| Six Months | Year | Six Months | Year | |||||||||||||
| Ended | Ended | Ended | Ended | |||||||||||||
| November 30, | May 31, | November 30, | May 31, | |||||||||||||
| 2007 | 2007 | 2007 | 2007 | |||||||||||||
Index Plus LargeCap Equity Fund IV (Number of Shares) | ||||||||||||||||
| Shares sold | 31,204 | — | — | — | ||||||||||||
| Dividends reinvested | 52,791 | 50,787 | 933,639 | 659,691 | ||||||||||||
| Shares redeemed | (578,822 | ) | (620,633 | ) | (14,632,269 | ) | (5,943,920 | ) | ||||||||
| Net decrease in shares outstanding | (494,827 | ) | (569,846 | ) | (13,698,630 | ) | (5,284,229 | ) | ||||||||
Index Plus LargeCap Equity Fund IV ($) | ||||||||||||||||
| Shares sold | $ | 340,202 | $ | — | $ | — | $ | — | ||||||||
| Dividends reinvested | 564,861 | 546,976 | 9,988,081 | 7,111,461 | ||||||||||||
| Shares redeemed | (6,278,234 | ) | (6,662,949 | ) | (157,218,765 | ) | (63,867,415 | ) | ||||||||
| Net decrease | $ | (5,373,171 | ) | $ | (6,115,973 | ) | $ | (147,230,684 | ) | $ | (56,755,954 | ) | ||||
64
Table of Contents
| Class C | Class Q | |||||||||||||||
| Six Months | Year | Six Months | Year | |||||||||||||
| Ended | Ended | Ended | Ended | |||||||||||||
| November 30, | May 31, | November 30, | May 31, | |||||||||||||
| 2007 | 2007 | 2007 | 2007 | |||||||||||||
Index Plus LargeCap Equity Fund IV (Number of Shares) | ||||||||||||||||
| Shares sold | 21,729 | — | — | — | ||||||||||||
| Dividends reinvested | 73,691 | 64,738 | 1,927 | 1,298 | ||||||||||||
| Shares redeemed | (1,139,575 | ) | (1,247,427 | ) | — | (442 | ) | |||||||||
| Net increase (decrease) in shares outstanding | (1,044,155 | ) | (1,182,689 | ) | 1,927 | 856 | ||||||||||
Index Plus LargeCap Equity Fund IV ($) | ||||||||||||||||
| Shares sold | $ | 234,695 | $ | — | $ | — | $ | — | ||||||||
| Dividends reinvested | 794,383 | 701,763 | 20,675 | 14,034 | ||||||||||||
| Shares redeemed | (12,448,843 | ) | (13,466,797 | ) | — | (4,845 | ) | |||||||||
| Net increase (decrease) | $ | (11,419,765 | ) | $ | (12,765,034 | ) | $ | 20,675 | $ | 9,189 | ||||||
| Class A | Class B | Class C | ||||||||||||||||||||||
| Six Months | Year | Six Months | Year | Six Months | Year | |||||||||||||||||||
| Ended | Ended | Ended | Ended | Ended | Ended | |||||||||||||||||||
| November 30, | May 31, | November 30, | May 31, | November 30, | May 31, | |||||||||||||||||||
| 2007 | 2007 | 2007 | 2007 | 2007 | 2007 | |||||||||||||||||||
Principal Protection Fund V (Number of Shares) | ||||||||||||||||||||||||
| Dividends reinvested | — | 51,192 | — | 430,963 | — | 27,252 | ||||||||||||||||||
| Shares redeemed | (277,585 | ) | (778,926 | ) | (1,862,152 | ) | (5,678,086 | ) | (224,553 | ) | (874,668 | ) | ||||||||||||
| Net decrease in shares outstanding | (277,585 | ) | (727,734 | ) | (1,862,152 | ) | (5,247,123 | ) | (224,553 | ) | (847,416 | ) | ||||||||||||
Principal Protection Fund V ($) | ||||||||||||||||||||||||
| Dividends reinvested | $ | — | $ | 519,091 | $ | — | $ | 4,377,408 | $ | — | $ | 278,516 | ||||||||||||
| Shares redeemed | (2,907,178 | ) | (7,913,191 | ) | (19,425,997 | ) | (57,448,447 | ) | (2,358,906 | ) | (8,893,643 | ) | ||||||||||||
| Net decrease | $ | (2,907,178 | ) | $ | (7,394,100 | ) | $ | (19,425,997 | ) | $ | (53,071,039 | ) | $ | (2,358,906 | ) | $ | (8,615,127 | ) | ||||||
| Class A | Class B | Class C | ||||||||||||||||||||||
| Six Months | Year | Six Months | Year | Six Months | Year | |||||||||||||||||||
| Ended | Ended | Ended | Ended | Ended | Ended | |||||||||||||||||||
| November 30, | May 31, | November 30, | May 31, | November 30, | May 31, | |||||||||||||||||||
| 2007 | 2007 | 2007 | 2007 | 2007 | 2007 | |||||||||||||||||||
Principal Protection Fund VI (Number of Shares) | ||||||||||||||||||||||||
| Dividends reinvested | — | 21,565 | — | 196,552 | — | 12,146 | ||||||||||||||||||
| Shares redeemed | (161,094 | ) | (584,874 | ) | (1,449,855 | ) | (5,125,388 | ) | (176,633 | ) | (792,890 | ) | ||||||||||||
| Net decrease in shares outstanding | (161,094 | ) | (563,309 | ) | (1,449,855 | ) | (4,928,836 | ) | (176,633 | ) | (780,744 | ) | ||||||||||||
Principal Protection Fund VI ($) | ||||||||||||||||||||||||
| Dividends reinvested | $ | — | $ | 220,396 | $ | — | $ | 2,012,696 | $ | — | $ | 125,107 | ||||||||||||
| Shares redeemed | (1,701,065 | ) | (5,976,290 | ) | (15,260,766 | ) | (51,923,434 | ) | (1,870,665 | ) | (8,062,862 | ) | ||||||||||||
| Net decrease | $ | (1,701,065 | ) | $ | (5,755,894 | ) | $ | (15,260,766 | ) | $ | (49,910,738 | ) | $ | (1,870,665 | ) | $ | (7,937,755 | ) | ||||||
65
Table of Contents
| Class A | Class B | Class C | ||||||||||||||||||||||
| Six Months | Year | Six Months | Year | Six Months | Year | |||||||||||||||||||
| Ended | Ended | Ended | Ended | Ended | Ended | |||||||||||||||||||
| November 30, | May 31, | November 30, | May 31, | November 30, | May 31, | |||||||||||||||||||
| 2007 | 2007 | 2007 | 2007 | 2007 | 2007 | |||||||||||||||||||
Principal Protection Fund VII (Number of Shares) | ||||||||||||||||||||||||
| Dividends reinvested | — | 4,487 | — | 8,417 | — | — | ||||||||||||||||||
| Shares redeemed | (113,160 | ) | (263,200 | ) | (768,639 | ) | (2,575,468 | ) | (86,668 | ) | (521,191 | ) | ||||||||||||
| Net decrease in shares outstanding | (113,160 | ) | (258,713 | ) | (768,639 | ) | (2,567,051 | ) | (86,668 | ) | (521,191 | ) | ||||||||||||
Principal Protection Fund VII ($) | ||||||||||||||||||||||||
| Dividends reinvested | $ | — | $ | 45,585 | $ | — | $ | 86,375 | $ | — | $ | — | ||||||||||||
| Shares redeemed | (1,191,546 | ) | (2,637,519 | ) | (8,084,341 | ) | (25,961,868 | ) | (908,771 | ) | (5,221,942 | ) | ||||||||||||
| Net decrease | $ | (1,191,546 | ) | $ | (2,591,934 | ) | $ | (8,084,341 | ) | $ | (25,875,493 | ) | $ | (908,771 | ) | $ | (5,221,942 | ) | ||||||
| Class A | Class B | Class C | ||||||||||||||||||||||
| Six Months | Year | Six Months | Year | Six Months | Year | |||||||||||||||||||
| Ended | Ended | Ended | Ended | Ended | Ended | |||||||||||||||||||
| November 30, | May 31, | November 30, | May 31, | November 30, | May 31, | |||||||||||||||||||
| 2007 | 2007 | 2007 | 2007 | 2007 | 2007 | |||||||||||||||||||
Principal Protection Fund VIII (Number of Shares) | ||||||||||||||||||||||||
| Dividends reinvested | — | 10,884 | — | 52,831 | — | 3,678 | ||||||||||||||||||
| Shares redeemed | (64,654 | ) | (387,077 | ) | (497,566 | ) | (1,606,149 | ) | (100,689 | ) | (318,046 | ) | ||||||||||||
| Net decrease in shares outstanding | (64,654 | ) | (376,193 | ) | (497,566 | ) | (1,553,318 | ) | (100,689 | ) | (314,368 | ) | ||||||||||||
Principal Protection Fund VIII ($) | ||||||||||||||||||||||||
| Dividends reinvested | $ | — | $ | 111,895 | $ | — | $ | 544,673 | $ | — | $ | 38,177 | ||||||||||||
| Shares redeemed | (689,206 | ) | (3,928,814 | ) | (5,285,630 | ) | (16,341,764 | ) | (1,081,095 | ) | (3,209,871 | ) | ||||||||||||
| Net decrease | $ | (689,206 | ) | $ | (3,816,919 | ) | $ | (5,285,630 | ) | $ | (15,797,091 | ) | $ | (1,081,095 | ) | $ | (3,171,694 | ) | ||||||
| Class A | Class B | Class C | |||||||||||||||||||||||
| Six Months | Year | Six Months | Year | Six Months | Year | ||||||||||||||||||||
| Ended | Ended | Ended | Ended | Ended | Ended | ||||||||||||||||||||
| November 30, | May 31, | November 30, | May 31, | November 30, | May 31, | ||||||||||||||||||||
| 2007 | 2007 | 2007 | 2007 | 2007 | 2007 | ||||||||||||||||||||
Principal Protection Fund IX (Number of Shares) | |||||||||||||||||||||||||
| Dividends reinvested | — | 14,267 | — | 85,378 | — | 6,674 | |||||||||||||||||||
| Shares redeemed | (37,187 | ) | (212,076 | ) | (271,096 | ) | (991,814 | ) | (38,978 | ) | (219,147 | ) | |||||||||||||
| Net decrease in shares outstanding | (37,187 | ) | (197,809 | ) | (271,096 | ) | (906,436 | ) | (38,978 | ) | (212,473 | ) | |||||||||||||
Principal Protection Fund IX ($) | |||||||||||||||||||||||||
| Dividends reinvested | $ | — | $ | 147,526 | $ | — | $ | 883,660 | $ | — | $ | 69,540 | |||||||||||||
| Shares redeemed | (395,183 | ) | (2,176,102 | ) | (2,883,652 | ) | (10,169,261 | ) | (415,937 | ) | (2,237,565 | ) | |||||||||||||
| Net decrease | $ | (395,183 | ) | $ | (2,028,576 | ) | $ | (2,883,652 | ) | $ | (9,285,601 | ) | $ | (415,937 | ) | $ | (2,168,025 | ) | |||||||
66
Table of Contents
| Class A | Class B | Class C | ||||||||||||||||||||||
| Six Months | Year | Six Months | Year | Six Months | Year | |||||||||||||||||||
| Ended | Ended | Ended | Ended | Ended | Ended | |||||||||||||||||||
| November 30, | May 31, | November 30, | May 31, | November 30, | May 31, | |||||||||||||||||||
| 2007 | 2007 | 2007 | 2007 | 2007 | 2007 | |||||||||||||||||||
Principal Protection Fund X (Number of Shares) | ||||||||||||||||||||||||
| Dividends reinvested | — | 20,208 | — | 65,737 | — | 8,646 | ||||||||||||||||||
| Shares redeemed | (134,791 | ) | (319,351 | ) | (265,884 | ) | (697,300 | ) | (129,397 | ) | (203,664 | ) | ||||||||||||
| Net decrease in shares outstanding | (134,791 | ) | (299,143 | ) | (265,884 | ) | (631,563 | ) | (129,397 | ) | (195,018 | ) | ||||||||||||
Principal Protection Fund X ($) | ||||||||||||||||||||||||
| Dividends reinvested | $ | — | $ | 208,148 | $ | — | $ | 677,088 | $ | — | $ | 89,490 | ||||||||||||
| Shares redeemed | (1,444,503 | ) | (3,249,398 | ) | (2,823,274 | ) | (7,137,311 | ) | (1,385,882 | ) | (2,079,982 | ) | ||||||||||||
| Net decrease | $ | (1,444,503 | ) | $ | (3,041,250 | ) | $ | (2,823,274 | ) | $ | (6,460,223 | ) | $ | (1,385,882 | ) | $ | (1,990,492 | ) | ||||||
| Class A | Class B | Class C | ||||||||||||||||||||||
| Six Months | Year | Six Months | Year | Six Months | Year | |||||||||||||||||||
| Ended | Ended | Ended | Ended | Ended | Ended | |||||||||||||||||||
| November 30, | May 31, | November 30, | May 31, | November 30, | May 31, | |||||||||||||||||||
| 2007 | 2007 | 2007 | 2007 | 2007 | 2007 | |||||||||||||||||||
Principal Protection Fund XI (Number of Shares) | ||||||||||||||||||||||||
| Dividends reinvested | — | 9,322 | — | 28,510 | — | 3,466 | ||||||||||||||||||
| Shares redeemed | (48,988 | ) | (283,358 | ) | (163,274 | ) | (520,967 | ) | (7,753 | ) | (142,747 | ) | ||||||||||||
| Net decrease in shares outstanding | (48,988 | ) | (274,036 | ) | (163,274 | ) | (492,457 | ) | (7,753 | ) | (139,281 | ) | ||||||||||||
Principal Protection Fund XI ($) | ||||||||||||||||||||||||
| Dividends reinvested | $ | — | $ | 96,480 | $ | — | $ | 294,506 | $ | — | $ | 35,873 | ||||||||||||
| Shares redeemed | (522,550 | ) | (2,887,005 | ) | (1,737,796 | ) | (5,323,835 | ) | (83,037 | ) | (1,457,685 | ) | ||||||||||||
| Net decrease | $ | (522,550 | ) | $ | (2,790,525 | ) | $ | (1,737,796 | ) | $ | (5,029,329 | ) | $ | (83,037 | ) | $ | (1,421,812 | ) | ||||||
| Class A | Class B | Class C | ||||||||||||||||||||||
| Six Months | Year | Six Months | Year | Six Months | Year | |||||||||||||||||||
| Ended | Ended | Ended | Ended | Ended | Ended | |||||||||||||||||||
| November 30, | May 31, | November 30, | May 31, | November 30, | May 31, | |||||||||||||||||||
| 2007 | 2007 | 2007 | 2007 | 2007 | 2007 | |||||||||||||||||||
Principal Protection Fund XII (Number of Shares) | ||||||||||||||||||||||||
| Dividends reinvested | — | 3,678 | — | 10,961 | — | 676 | ||||||||||||||||||
| Shares redeemed | (1,768 | ) | (176,913 | ) | (71,477 | ) | (158,912 | ) | (11,836 | ) | (97,231 | ) | ||||||||||||
| Net decrease in shares outstanding | (1,768 | ) | (173,235 | ) | (71,477 | ) | (147,951 | ) | (11,836 | ) | (96,555 | ) | ||||||||||||
Principal Protection Fund XII ($) | ||||||||||||||||||||||||
| Dividends reinvested | $ | — | $ | 37,709 | $ | — | $ | 112,246 | $ | — | $ | 6,960 | ||||||||||||
| Shares redeemed | (17,822 | ) | (1,798,646 | ) | (756,201 | ) | (1,617,490 | ) | (124,921 | ) | (975,491 | ) | ||||||||||||
| Net decrease | $ | (17,822 | ) | $ | (1,760,937 | ) | $ | (756,201 | ) | $ | (1,505,244 | ) | $ | (124,921 | ) | $ | (968,531 | ) | ||||||
67
Table of Contents
| Six Months Ended | ||||||||||||||||
| November 30, 2007 | Year Ended May 31, 2007 | |||||||||||||||
| Long-Term | Long-Term | |||||||||||||||
| Ordinary | Capital | Ordinary | Capital | |||||||||||||
| Income | Gains | Income | Gains | |||||||||||||
| Index Plus LargeCap Equity | $ | — | $ | — | $ | 2,392,551 | $ | — | ||||||||
| Index Plus LargeCap Equity II | — | — | 5,552,646 | — | ||||||||||||
| Index Plus LargeCap Equity III | — | — | 4,277,634 | — | ||||||||||||
| Index Plus LargeCap Equity IV | 3,237,265 | 10,615,050 | 2,208,492 | 8,238,997 | ||||||||||||
| PPF V | — | — | 3,303,399 | 2,614,729 | ||||||||||||
| PPF VI | — | — | 2,265,409 | 448,230 | ||||||||||||
| PPF VII | — | — | 154,507 | — | ||||||||||||
| PPF VIII | — | — | 856,512 | — | ||||||||||||
| PPF IX | — | — | 907,282 | 355,649 | ||||||||||||
| PPF X | — | — | 726,811 | 410,518 | ||||||||||||
| PPF XI | — | — | 436,168 | 82,061 | ||||||||||||
| PPF XII | — | — | 190,768 | — | ||||||||||||
| Undistributed | Undistributed | Capital | ||||||||||||||||||
| Ordinary | Long Term | Unrealized | Loss | Expiration | ||||||||||||||||
| Income | Capital Gains | Appreciation | Carryforwards | Dates | ||||||||||||||||
| Index Plus LargeCap Equity | $ | — | $ | — | $ | 8,194,485 | $ | (4,401,607 | ) | 2011 | ||||||||||
| Index Plus LargeCap Equity II | 108,616 | — | 10,013,704 | (23,837,774 | ) | 2011 | ||||||||||||||
| Index Plus LargeCap Equity III | — | — | 11,556,604 | (14,168,171 | ) | 2011 | ||||||||||||||
| Index Plus LargeCap Equity IV | 3,233,959 | 10,612,049 | 48,004,563 | — | — | |||||||||||||||
| PPF V | 2,144,963 | 4,532,398 | 9,968,307 | — | — | |||||||||||||||
| PPF VI | 1,459,889 | 4,155,327 | 8,996,247 | — | — | |||||||||||||||
| PPF VII | 661,517 | 1,306,302 | 3,711,587 | — | — | |||||||||||||||
| PPF VIII | 633,550 | 1,191,546 | 2,783,958 | — | — | |||||||||||||||
| PPF IX | 461,000 | 1,230,196 | 2,537,623 | — | — | |||||||||||||||
| PPF X | 507,482 | 379,835 | 2,586,136 | — | — | |||||||||||||||
| PPF XI | 245,379 | 566,424 | 1,248,337 | — | — | |||||||||||||||
| PPF XII | 38,403 | 190,381 | 573,203 | — | — | |||||||||||||||
68
Table of Contents
| Index Plus LargeCap Equity | $ | 241,820 | ||
| Index Plus LargeCap Equity II | 502,489 | |||
| Index Plus LargeCap Equity IV | 755,691 |
statements as “more-likely-than-not” to be sustained upon challenge by the taxing authority and requires measurement of a tax position meeting the more-likely-than-not criterion, based on the largest benefit that is more than 50 percent likely to be realized. FIN 48 was effective for fiscal years beginning after December 15, 2006, with early application permitted if no interim financial statements have been issued. However, acknowledging the unique issues that FIN 48 presents for investment companies that calculate NAVs, the SEC has indicated that they would not object if a fund implements FIN 48 in its NAV calculation as late as its last NAV calculation in the first required financial statement reporting period for its fiscal year beginning after December 15, 2006. For May year-end funds, the current NAV and this semi-annual report are required to reflect the effects of FIN 48. At adoption, companies must adjust their financial statements to reflect only those tax positions that are more likely-than-not to be sustained as of the adoption date. Management of the Funds has analyzed the tax positions of the Funds. Upon adoption of FIN 48, we identified no uncertain tax positions that have not met the more likely-than-not standard.
69
Table of Contents
| PER SHARE AMOUNTS | ||||||||||||||||||||
| Net Investment | Short-Term | Long-Term | ||||||||||||||||||
| Income | Capital Gains | Capital Gains | Payable Date | Record Date | ||||||||||||||||
Index Plus LargeCap Equity II | ||||||||||||||||||||
| Class A | $ | 0.1363 | $ | — | $ | — | December 20, 2007 | December 17, 2007 | ||||||||||||
| Class B | $ | 0.0184 | $ | — | $ | — | December 20, 2007 | December 17, 2007 | ||||||||||||
| Class C | $ | 0.0462 | $ | — | $ | — | December 20, 2007 | December 17, 2007 | ||||||||||||
Index Plus LargeCap Equity III | ||||||||||||||||||||
| Class A | $ | 0.0695 | $ | — | $ | — | December 20, 2007 | December 17, 2007 | ||||||||||||
| Class B | $ | 0.0121 | $ | — | $ | — | December 20, 2007 | December 17, 2007 | ||||||||||||
| Class C | $ | 0.0198 | $ | — | $ | — | December 20, 2007 | December 17, 2007 | ||||||||||||
Index Plus LargeCap Equity IV | ||||||||||||||||||||
| Class A | $ | 0.0736 | $ | 0.0898 | $ | 1.1496 | December 20, 2007 | December 17, 2007 | ||||||||||||
| Class B | $ | 0.0480 | $ | 0.0898 | $ | 1.1496 | December 20, 2007 | December 17, 2007 | ||||||||||||
| Class C | $ | 0.0518 | $ | 0.0898 | $ | 1.1496 | December 20, 2007 | December 17, 2007 | ||||||||||||
| Class Q | $ | 0.0752 | $ | 0.0898 | $ | 1.1496 | December 20, 2007 | December 17, 2007 | ||||||||||||
PPF V | ||||||||||||||||||||
| Class A | $ | 0.1401 | $ | 0.1305 | $ | 0.4561 | December 20, 2007 | December 17, 2007 | ||||||||||||
| Class B | $ | 0.0606 | $ | 0.1305 | $ | 0.4561 | December 20, 2007 | December 17, 2007 | ||||||||||||
| Class C | $ | 0.0427 | $ | 0.1305 | $ | 0.4561 | December 20, 2007 | December 17, 2007 | ||||||||||||
PPF VI | ||||||||||||||||||||
| Class A | $ | 0.1258 | $ | 0.0901 | $ | 0.4139 | December 20, 2007 | December 17, 2007 | ||||||||||||
| Class B | $ | 0.0445 | $ | 0.0901 | $ | 0.4139 | December 20, 2007 | December 17, 2007 | ||||||||||||
| Class C | $ | 0.0360 | $ | 0.0901 | $ | 0.4139 | December 20, 2007 | December 17, 2007 | ||||||||||||
PPF VII | ||||||||||||||||||||
| Class A | $ | 0.1194 | $ | 0.1058 | $ | 0.3569 | December 20, 2007 | December 17, 2007 | ||||||||||||
| Class B | $ | 0.0408 | $ | 0.1058 | $ | 0.3569 | December 20, 2007 | December 17, 2007 | ||||||||||||
| Class C | $ | 0.0335 | $ | 0.1058 | $ | 0.3569 | December 20, 2007 | December 17, 2007 | ||||||||||||
PPF VIII | ||||||||||||||||||||
| Class A | $ | 0.1661 | $ | 0.1652 | $ | 0.5080 | December 20, 2007 | December 17, 2007 | ||||||||||||
| Class B | $ | 0.0783 | $ | 0.1652 | $ | 0.5080 | December 20, 2007 | December 17, 2007 | ||||||||||||
| Class C | $ | 0.0740 | $ | 0.1652 | $ | 0.5080 | December 20, 2007 | December 17, 2007 | ||||||||||||
PPF IX | ||||||||||||||||||||
| Class A | $ | 0.1614 | $ | 0.1562 | $ | 0.6488 | December 20, 2007 | December 17, 2007 | ||||||||||||
| Class B | $ | 0.0765 | $ | 0.1562 | $ | 0.6488 | December 20, 2007 | December 17, 2007 | ||||||||||||
| Class C | $ | 0.0719 | $ | 0.1562 | $ | 0.6488 | December 20, 2007 | December 17, 2007 | ||||||||||||
PPF X | ||||||||||||||||||||
| Class A | $ | 0.1992 | $ | 0.2419 | $ | 0.6220 | December 20, 2007 | December 17, 2007 | ||||||||||||
| Class B | $ | 0.1191 | $ | 0.2419 | $ | 0.6220 | December 20, 2007 | December 17, 2007 | ||||||||||||
| Class C | $ | 0.0952 | $ | 0.2419 | $ | 0.6220 | December 20, 2007 | December 17, 2007 | ||||||||||||
PPF XI | ||||||||||||||||||||
| Class A | $ | 0.1521 | $ | 0.1447 | $ | 0.5760 | December 20, 2007 | December 17, 2007 | ||||||||||||
| Class B | $ | 0.0666 | $ | 0.1447 | $ | 0.5760 | December 20, 2007 | December 17, 2007 | ||||||||||||
| Class C | $ | 0.0746 | $ | 0.1447 | $ | 0.5760 | December 20, 2007 | December 17, 2007 | ||||||||||||
PPF XII | ||||||||||||||||||||
| Class A | $ | 0.1517 | $ | 0.0713 | $ | 0.4430 | December 20, 2007 | December 17, 2007 | ||||||||||||
| Class B | $ | 0.0677 | $ | 0.0713 | $ | 0.4430 | December 20, 2007 | December 17, 2007 | ||||||||||||
| Class C | $ | 0.0691 | $ | 0.0713 | $ | 0.4430 | December 20, 2007 | December 17, 2007 | ||||||||||||
70
Table of Contents
| • | ING has agreed with the ING Funds to indemnify and hold harmless the ING Funds from all damages resulting from wrongful conduct by ING or its employees or from ING’s internal investigation, any investigations conducted by any governmental or self-regulatory agencies, litigation or other formal proceedings, including any proceedings by the SEC. ING Investments reported to the Boards that ING management believes that the total amount of any indemnification obligations will not be material to ING or its U.S. business. |
| • | ING updated its Code of Conduct for employees reinforcing its employees’ obligation to conduct personal trading activity consistent with the law, disclosed limits, and other requirements. |
71
Table of Contents
72
Table of Contents
| ING Index Plus | PORTFOLIO OF INVESTMENTS | |
| LargeCap Equity Fund | AS OF November 30, 2007 (Unaudited) | |
| Shares | Value | |||||||||
| COMMON STOCK: 97.1% | ||||||||||
| Advertising: 1.1% | ||||||||||
| 8,200 | Omnicom Group | $ | 399,750 | |||||||
| 399,750 | ||||||||||
| Aerospace/Defense: 4.5% | ||||||||||
| 1,200 | Boeing Co. | 111,048 | ||||||||
| 1,500 | General Dynamics Corp. | 133,170 | ||||||||
| 1,900 | L-3 Communications Holdings, Inc. | 210,235 | ||||||||
| 2,800 | Lockheed Martin Corp. | 309,876 | ||||||||
| 3,600 | Northrop Grumman Corp. | 283,644 | ||||||||
| 4,483 | Raytheon Co. | 277,274 | ||||||||
| 5,200 | United Technologies Corp. | 388,804 | ||||||||
| 1,714,051 | ||||||||||
| Agriculture: 1.7% | ||||||||||
| 5,640 | Altria Group, Inc. | 437,438 | ||||||||
| 1,000 | Reynolds American, Inc. | 70,020 | ||||||||
| 2,300 | UST, Inc. | 133,170 | ||||||||
| 640,628 | ||||||||||
| Apparel: 1.4% | ||||||||||
| 8,100 | Nike, Inc. | 531,765 | ||||||||
| 531,765 | ||||||||||
| Auto Manufacturers: 0.3% | ||||||||||
| 2,000 | Paccar, Inc. | 101,220 | ||||||||
| 101,220 | ||||||||||
| Auto Parts & Equipment: 0.1% | ||||||||||
| 600 | Johnson Controls, Inc. | 23,172 | ||||||||
| 23,172 | ||||||||||
| Banks: 3.7% | ||||||||||
| 6,371 | Bank of America Corp. | 293,894 | ||||||||
| 1,800 | Comerica, Inc. | 82,404 | ||||||||
| 600 | Commerce Bancorp., Inc. | 23,892 | ||||||||
| 2,800 | Huntington Bancshares, Inc. | 43,932 | ||||||||
| 6,400 | Regions Financial Corp. | 169,152 | ||||||||
| 9,719 | Wachovia Corp. | 417,917 | ||||||||
| 11,100 | Wells Fargo & Co. | 359,973 | ||||||||
| 1,391,164 | ||||||||||
| Beverages: 3.5% | ||||||||||
| 5,200 | Anheuser-Busch Cos., Inc. | 274,144 | ||||||||
| 4,000 | Coca-Cola Co. | 248,400 | ||||||||
| 3,470 | Pepsi Bottling Group, Inc. | 148,065 | ||||||||
| 8,280 | PepsiCo, Inc. | 639,050 | ||||||||
| 1,309,659 | ||||||||||
| Biotechnology: 0.1% | ||||||||||
| 400 | @ | Genzyme Corp. | 29,972 | |||||||
| 29,972 | ||||||||||
| Chemicals: 1.7% | ||||||||||
| 200 | Air Products & Chemicals, Inc. | 19,808 | ||||||||
| 1,500 | Dow Chemical Co. | 62,910 | ||||||||
| 400 | EI DuPont de Nemours & Co. | 18,460 | ||||||||
| 1,200 | International Flavors & Fragrances, Inc. | 60,168 | ||||||||
| 3,000 | Monsanto Co. | 298,110 | ||||||||
| 3,200 | Sigma-Aldrich Corp. | 168,480 | ||||||||
| 627,936 | ||||||||||
| Shares | Value | |||||||||
| Commercial Services: 0.5% | ||||||||||
| 300 | @ | Apollo Group, Inc. — Class A | $ | 22,956 | ||||||
| 1,680 | McKesson Corp. | 112,106 | ||||||||
| 600 | Robert Half International, Inc. | 16,176 | ||||||||
| 1,500 | Western Union Co. | 33,900 | ||||||||
| 185,138 | ||||||||||
| Computers: 6.0% | ||||||||||
| 300 | @ | Affiliated Computer Services, Inc. | 12,588 | |||||||
| 2,700 | @ | Apple, Inc. | 491,994 | |||||||
| 600 | @ | Cognizant Technology Solutions Corp. | 18,660 | |||||||
| 1,300 | @ | Computer Sciences Corp. | 68,666 | |||||||
| 16,500 | @ | Dell, Inc. | 404,910 | |||||||
| 4,500 | Electronic Data Systems Corp. | 91,170 | ||||||||
| 5,300 | @ | EMC Corp. | 102,131 | |||||||
| 8,667 | Hewlett-Packard Co. | 443,404 | ||||||||
| 4,770 | International Business Machines Corp. | 501,709 | ||||||||
| 1,200 | @ | Lexmark International, Inc. | 41,856 | |||||||
| 2,200 | @ | Sandisk Corp. | 82,368 | |||||||
| 2,259,456 | ||||||||||
| Cosmetics/Personal Care: 1.1% | ||||||||||
| 1,000 | Colgate-Palmolive Co. | 80,080 | ||||||||
| 4,711 | Procter & Gamble Co. | 348,614 | ||||||||
| 428,694 | ||||||||||
| Diversified Financial Services: 5.3% | ||||||||||
| 1,100 | Charles Schwab Corp. | 26,741 | ||||||||
| 6,250 | Citigroup, Inc. | 208,125 | ||||||||
| 1,670 | Discover Financial Services | 29,008 | ||||||||
| 800 | Freddie Mac | 28,056 | ||||||||
| 2,300 | Goldman Sachs Group, Inc. | 521,272 | ||||||||
| 13,400 | JPMorgan Chase & Co. | 611,308 | ||||||||
| 1,000 | Lehman Brothers Holdings, Inc. | 62,630 | ||||||||
| 4,210 | Merrill Lynch & Co., Inc. | 252,347 | ||||||||
| 4,440 | Morgan Stanley | 234,077 | ||||||||
| 1,200 | SLM Corp. | 45,696 | ||||||||
| 2,019,260 | ||||||||||
| Electric: 3.3% | ||||||||||
| 1,700 | Constellation Energy Group, Inc. | 170,357 | ||||||||
| 1,100 | Duke Energy Corp. | 21,769 | ||||||||
| 3,400 | Entergy Corp. | 406,436 | ||||||||
| 1,300 | Exelon Corp. | 105,391 | ||||||||
| 1,700 | FirstEnergy Corp. | 116,552 | ||||||||
| 700 | FPL Group, Inc. | 48,832 | ||||||||
| 3,800 | Public Service Enterprise Group, Inc. | 363,812 | ||||||||
| 1,233,149 | ||||||||||
| Electrical Components & Equipment: 0.1% | ||||||||||
| 400 | Emerson Electric Co. | 22,808 | ||||||||
| 22,808 | ||||||||||
| Electronics: 1.2% | ||||||||||
| 4,500 | Applera Corp. — Applied Biosystems Group | 153,720 | ||||||||
| 600 | @ | Thermo Electron Corp. | 34,584 | |||||||
| 1,900 | @@ | Tyco Electronics Ltd. | 71,041 | |||||||
| 2,500 | @ | Waters Corp. | 195,100 | |||||||
| 454,445 | ||||||||||
| Entertainment: 0.1% | ||||||||||
| 600 | International Game Technology | 26,196 | ||||||||
| 26,196 | ||||||||||
73
Table of Contents
| ING Index Plus | PORTFOLIO OF INVESTMENTS | |
| LargeCap Equity Fund | AS OF November 30, 2007 (Unaudited) (continued) | |
| Shares | Value | |||||||||
| Food: 1.3% | ||||||||||
| 4,700 | General Mills, Inc. | $ | 282,705 | |||||||
| 800 | HJ Heinz Co. | 37,840 | ||||||||
| 4,000 | Kroger Co. | 115,000 | ||||||||
| 1,100 | WM Wrigley Jr. Co. | 70,400 | ||||||||
| 505,945 | ||||||||||
| Forest Products & Paper: 0.3% | ||||||||||
| 3,200 | International Paper Co. | 108,000 | ||||||||
| 108,000 | ||||||||||
| Hand/Machine Tools: 0.6% | ||||||||||
| 1,100 | Black & Decker Corp. | 90,915 | ||||||||
| 1,440 | Snap-On, Inc. | 70,387 | ||||||||
| 1,500 | Stanley Works | 78,225 | ||||||||
| 239,527 | ||||||||||
| Healthcare — Products: 1.1% | ||||||||||
| 2,200 | Baxter International, Inc. | 131,714 | ||||||||
| 3,850 | Johnson & Johnson | 260,799 | ||||||||
| 400 | @ | St. Jude Medical, Inc. | 15,900 | |||||||
| 400 | Stryker Corp. | 29,052 | ||||||||
| 437,465 | ||||||||||
| Healthcare — Services: 2.4% | ||||||||||
| 2,540 | Aetna, Inc. | 141,935 | ||||||||
| 2,535 | @ | Coventry Health Care, Inc. | 146,726 | |||||||
| 2,550 | @ | Humana, Inc. | 196,427 | |||||||
| 5,340 | UnitedHealth Group, Inc. | 293,700 | ||||||||
| 1,460 | @ | WellPoint, Inc. | 122,947 | |||||||
| 901,735 | ||||||||||
| Household Products/Wares: 0.2% | ||||||||||
| 1,000 | Kimberly-Clark Corp. | 69,810 | ||||||||
| 69,810 | ||||||||||
| Insurance: 8.0% | ||||||||||
| 5,500 | @@ | ACE Ltd. | 329,065 | |||||||
| 400 | Aflac, Inc. | 25,056 | ||||||||
| 3,350 | Allstate Corp. | 171,252 | ||||||||
| 12,100 | American International Group, Inc. | 703,373 | ||||||||
| 500 | AON Corp. | 24,985 | ||||||||
| 2,400 | Assurant, Inc. | 157,032 | ||||||||
| 9,480 | Chubb Corp. | 517,134 | ||||||||
| 600 | Cigna Corp. | 32,166 | ||||||||
| 1,500 | Hartford Financial Services Group, Inc. | 142,980 | ||||||||
| 1,310 | Metlife, Inc. | 85,923 | ||||||||
| 2,960 | Prudential Financial, Inc. | 278,654 | ||||||||
| 10,200 | Travelers Cos., Inc. | 541,722 | ||||||||
| 3,009,342 | ||||||||||
| Internet: 1.9% | ||||||||||
| 2,100 | @ | Amazon.com, Inc. | 190,176 | |||||||
| 600 | @ | Expedia, Inc. | 19,560 | |||||||
| 600 | @ | Google, Inc. — Class A | 415,800 | |||||||
| 4,900 | @ | Symantec Corp. | 87,220 | |||||||
| 712,756 | ||||||||||
| Iron/Steel: 0.2% | ||||||||||
| 800 | United States Steel Corp. | 78,160 | ||||||||
| 78,160 | ||||||||||
| Lodging: 0.1% | ||||||||||
| 600 | Harrah’s Entertainment, Inc. | 52,842 | ||||||||
| 52,842 | ||||||||||
| Shares | Value | |||||||||
| Machinery — Construction & Mining: 0.4% | ||||||||||
| 1,900 | Caterpillar, Inc. | $ | 136,610 | |||||||
| 136,610 | ||||||||||
| Machinery — Diversified: 0.6% | ||||||||||
| 1,700 | Cummins, Inc. | 198,730 | ||||||||
| 200 | Deere & Co. | 34,360 | ||||||||
| 233,090 | ||||||||||
| Media: 2.2% | ||||||||||
| 1,600 | Clear Channel Communications, Inc. | 57,440 | ||||||||
| 2,400 | @ | DIRECTV Group, Inc. | 59,688 | |||||||
| 940 | McGraw-Hill Cos., Inc. | 46,135 | ||||||||
| 1,100 | @ | Viacom — Class B | 46,222 | |||||||
| 18,970 | Walt Disney Co. | 628,856 | ||||||||
| 838,341 | ||||||||||
| Mining: 1.2% | ||||||||||
| 4,500 | Freeport-McMoRan Copper & Gold, Inc. | 445,185 | ||||||||
| 445,185 | ||||||||||
| Miscellaneous Manufacturing: 5.0% | ||||||||||
| 1,500 | 3M Co. | 124,890 | ||||||||
| 1,100 | Cooper Industries Ltd. | 55,242 | ||||||||
| 5,100 | Dover Corp. | 236,028 | ||||||||
| 2,380 | Eaton Corp. | 212,558 | ||||||||
| 21,280 | General Electric Co. | 814,808 | ||||||||
| 600 | Honeywell International, Inc. | 33,972 | ||||||||
| 1,200 | Illinois Tool Works, Inc. | 66,600 | ||||||||
| 1,300 | ITT Corp. | 83,772 | ||||||||
| 2,525 | Parker Hannifin Corp. | 200,561 | ||||||||
| 1,400 | @@ | Tyco International Ltd. | 56,182 | |||||||
| 1,884,613 | ||||||||||
| Oil & Gas: 10.4% | ||||||||||
| 10,452 | Chevron Corp. | 917,372 | ||||||||
| 4,917 | ConocoPhillips | 393,557 | ||||||||
| 300 | Devon Energy Corp. | 24,843 | ||||||||
| 18,140 | S | ExxonMobil Corp. | 1,617,362 | |||||||
| 700 | Hess Corp. | 49,854 | ||||||||
| 4,140 | Marathon Oil Corp. | 231,426 | ||||||||
| 1,600 | Murphy Oil Corp. | 114,432 | ||||||||
| 800 | Noble Corp. | 41,704 | ||||||||
| 500 | Noble Energy, Inc. | 36,020 | ||||||||
| 2,840 | Occidental Petroleum Corp. | 198,147 | ||||||||
| 1,119 | @ | Transocean, Inc. | 153,628 | |||||||
| 2,400 | Valero Energy Corp. | 156,168 | ||||||||
| 3,934,513 | ||||||||||
| Oil & Gas Services: 1.3% | ||||||||||
| 5,760 | Halliburton Co. | 210,874 | ||||||||
| 400 | @ | National Oilwell Varco, Inc. | 27,260 | |||||||
| 2,900 | Schlumberger Ltd. | 271,005 | ||||||||
| 509,139 | ||||||||||
| Pharmaceuticals: 6.3% | ||||||||||
| 300 | Allergan, Inc. | 20,112 | ||||||||
| 2,980 | AmerisourceBergen Corp. | 135,203 | ||||||||
| 7,200 | Bristol-Myers Squibb Co. | 213,336 | ||||||||
| 8,000 | Eli Lilly & Co. | 423,600 | ||||||||
| 400 | @ | Express Scripts, Inc. | 27,100 | |||||||
| 2,300 | @ | Gilead Sciences, Inc. | 107,042 | |||||||
| 600 | @ | Medco Health Solutions, Inc. | 59,994 | |||||||
| 12,800 | Merck & Co., Inc. | 759,808 | ||||||||
74
Table of Contents
| ING Index Plus | PORTFOLIO OF INVESTMENTS | |
| LargeCap Equity Fund | AS OF November 30, 2007 (Unaudited) (continued) | |
| Shares | Value | |||||||||
| Pharmaceuticals (continued) | ||||||||||
| 8,034 | Pfizer, Inc. | $ | 190,888 | |||||||
| 12,000 | Schering-Plough Corp. | 375,600 | ||||||||
| 2,600 | @ | Watson Pharmaceuticals, Inc. | 76,206 | |||||||
| 2,388,889 | ||||||||||
| Pipelines: 0.1% | ||||||||||
| 800 | Williams Cos., Inc. | 27,768 | ||||||||
| 27,768 | ||||||||||
| Retail: 5.0% | ||||||||||
| 500 | @ | Autozone, Inc. | 55,815 | |||||||
| 1,500 | Best Buy Co., Inc. | 76,575 | ||||||||
| 2,800 | @ | Big Lots, Inc. | 52,276 | |||||||
| 5,540 | @ | Coach, Inc. | 205,756 | |||||||
| 3,500 | Costco Wholesale Corp. | 235,900 | ||||||||
| 3,000 | CVS Caremark Corp. | 120,270 | ||||||||
| 2,450 | Family Dollar Stores, Inc. | 57,698 | ||||||||
| 5,870 | Gap, Inc. | 119,748 | ||||||||
| 2,600 | Lowe’s Cos., Inc. | 63,466 | ||||||||
| 5,550 | McDonald’s Corp. | 324,509 | ||||||||
| 900 | Polo Ralph Lauren Corp. | 62,082 | ||||||||
| 2,100 | RadioShack Corp. | 38,850 | ||||||||
| 1,200 | @ | Starbucks Corp. | 28,068 | |||||||
| 4,030 | TJX Cos., Inc. | 118,240 | ||||||||
| 5,400 | Wal-Mart Stores, Inc. | 258,660 | ||||||||
| 2,400 | Wendy’s International, Inc. | 67,272 | ||||||||
| 1,885,185 | ||||||||||
| Savings & Loans: 0.8% | ||||||||||
| 13,600 | Hudson City Bancorp., Inc. | 206,992 | ||||||||
| 5,500 | Washington Mutual, Inc. | 107,250 | ||||||||
| 314,242 | ||||||||||
| Semiconductors: 3.3% | ||||||||||
| 2,400 | Applied Materials, Inc. | 45,192 | ||||||||
| 22,300 | Intel Corp. | 581,584 | ||||||||
| 500 | @ | MEMC Electronic Materials, Inc. | 38,790 | |||||||
| 2,700 | @ | Novellus Systems, Inc. | 70,227 | |||||||
| 13,050 | @ | Nvidia Corp. | 411,597 | |||||||
| 2,800 | Texas Instruments, Inc. | 88,396 | ||||||||
| 1,235,786 | ||||||||||
| Software: 3.2% | ||||||||||
| 1,800 | @ | Autodesk, Inc. | 84,762 | |||||||
| 2,910 | @ | BMC Software, Inc. | 96,263 | |||||||
| 5,400 | CA, Inc. | 132,246 | ||||||||
| 20,450 | Microsoft Corp. | 687,120 | ||||||||
| 3,200 | @ | Novell, Inc. | 22,464 | |||||||
| 9,300 | @ | Oracle Corp. | 187,674 | |||||||
| 1,210,529 | ||||||||||
| Telecommunications: 5.2% | ||||||||||
| 1,100 | @ | American Tower Corp. | 50,094 | |||||||
| 16,195 | AT&T, Inc. | 618,811 | ||||||||
| 1,000 | CenturyTel, Inc. | 42,630 | ||||||||
| 14,670 | @ | Cisco Systems, Inc. | 411,053 | |||||||
| 4,500 | Corning, Inc. | 109,305 | ||||||||
| 1,800 | @ | Juniper Networks, Inc. | 53,496 | |||||||
| 9,100 | Qualcomm, Inc. | 371,098 | ||||||||
| 2,900 | Sprint Nextel Corp. | 45,008 | ||||||||
| 5,900 | Verizon Communications, Inc. | 254,939 | ||||||||
| 1,956,434 | ||||||||||
| Shares | Value | |||||||||
| Transportation: 0.3% | ||||||||||
| 700 | CSX Corp. | $ | 29,400 | |||||||
| 800 | Norfolk Southern Corp. | 40,968 | ||||||||
| 400 | Union Pacific Corp. | 50,456 | ||||||||
| 120,824 | ||||||||||
| Total Common Stock (Cost $30,792,356) | 36,635,193 | |||||||||
| SHORT-TERM INVESTMENTS: 3.0% | ||||||||||
| Mutual Fund: 2.7% | ||||||||||
| 1,000,000 | ** | ING Institutional Prime Money Market Fund | 1,000,000 | |||||||
| Total Mutual Fund (Cost $1,000,000) | 1,000,000 | |||||||||
| Principal | ||||||||||||||
| Amount | Value | |||||||||||||
| Repurchase Agreement: 0.3% | ||||||||||||||
| $ | 130,000 | Morgan Stanley Repurchase Agreement dated 11/30/07, 4.500%, due 12/03/07, $130,049 to be received upon repurchase (Collateralized by $235,000 Resolution Funding Corporation, Discount Note, Market Value $132,829, due 07/15/20) | 130,000 | |||||||||||
| Total Repurchase Agreement (Cost $130,000) | 130,000 | |||||||||||||
| Total Short-Term Investments (Cost $1,130,000) | 1,130,000 | |||||||||||||
Total Investments in Securities (Cost $31,922,356)* | 100.1 | % | $ | 37,765,193 | ||||||||||
Other Assets and | ||||||||||||||
Liabilities — Net | (0.1 | ) | (50,154 | ) | ||||||||||
Net Assets | 100.0 | % | $ | 37,715,039 | ||||||||||
| @ | Non-income producing security | |
| @@ | Foreign Issuer | |
| S | All or a portion of this security is segregated for certain derivatives, when-issued or delayed delivery securities and forward currency exchange contracts. | |
| ** | Investment in affiliate | |
| * | Cost for federal income tax purposes is $32,666,568. |
| Net unrealized appreciation consists of: | ||||
| Gross Unrealized Appreciation | $ | 6,067,865 | ||
| Gross Unrealized Depreciation | (969,240 | ) | ||
| Net Unrealized Appreciation | $ | 5,098,625 | ||
| Number | Notional | Unrealized | ||||||||||||||
| of | Market | Expiration | Appreciation/ | |||||||||||||
| Contract Description | Contracts | Value ($) | Date | (Depreciation) | ||||||||||||
| Long Contracts S&P500 E-Mini | 17 | 1,261,145 | 12/21/07 | $ | (10,503 | ) | ||||||||||
| $ | (10,503 | ) | ||||||||||||||
75
Table of Contents
| ING Index Plus | PORTFOLIO OF INVESTMENTS | |
| LargeCap Equity Fund II | AS OF November 30, 2007 (Unaudited) | |
| Shares | Value | |||||||||
| COMMON STOCK: 98.4% | ||||||||||
| Advertising: 1.1% | ||||||||||
| 12,700 | Omnicom Group | $ | 619,125 | |||||||
| 619,125 | ||||||||||
| Aerospace/Defense: 4.5% | ||||||||||
| 1,800 | Boeing Co. | 166,572 | ||||||||
| 2,300 | General Dynamics Corp. | 204,194 | ||||||||
| 3,000 | L-3 Communications Holdings, Inc. | 331,950 | ||||||||
| 4,100 | Lockheed Martin Corp. | 453,747 | ||||||||
| 5,500 | Northrop Grumman Corp. | 433,345 | ||||||||
| 6,581 | Raytheon Co. | 407,035 | ||||||||
| 7,880 | United Technologies Corp. | 589,188 | ||||||||
| 2,586,031 | ||||||||||
| Agriculture: 1.7% | ||||||||||
| 8,570 | Altria Group, Inc. | 664,689 | ||||||||
| 1,530 | Reynolds American, Inc. | 107,131 | ||||||||
| 3,700 | UST, Inc. | 214,230 | ||||||||
| 986,050 | ||||||||||
| Apparel: 1.4% | ||||||||||
| 12,500 | Nike, Inc. | 820,625 | ||||||||
| 820,625 | ||||||||||
| Auto Manufacturers: 0.3% | ||||||||||
| 3,000 | Paccar, Inc. | 151,830 | ||||||||
| 151,830 | ||||||||||
| Auto Parts & Equipment: 0.1% | ||||||||||
| 900 | Johnson Controls, Inc. | 34,758 | ||||||||
| 34,758 | ||||||||||
| Banks: 3.7% | ||||||||||
| 9,761 | Bank of America Corp. | 450,275 | ||||||||
| 2,800 | Comerica, Inc. | 128,184 | ||||||||
| 800 | Commerce Bancorp., Inc. | 31,856 | ||||||||
| 4,100 | Huntington Bancshares, Inc. | 64,329 | ||||||||
| 9,917 | Regions Financial Corp. | 262,106 | ||||||||
| 14,871 | Wachovia Corp. | 639,453 | ||||||||
| 16,650 | Wells Fargo & Co. | 539,960 | ||||||||
| 2,116,163 | ||||||||||
| Beverages: 3.5% | ||||||||||
| 8,000 | Anheuser-Busch Cos., Inc. | 421,760 | ||||||||
| 6,100 | Coca-Cola Co. | 378,810 | ||||||||
| 5,020 | Pepsi Bottling Group, Inc. | 214,203 | ||||||||
| 12,700 | PepsiCo, Inc. | 980,186 | ||||||||
| 1,994,959 | ||||||||||
| Biotechnology: 0.1% | ||||||||||
| 600 | @ | Genzyme Corp. | 44,958 | |||||||
| 44,958 | ||||||||||
| Chemicals: 1.7% | ||||||||||
| 400 | Air Products & Chemicals, Inc. | 39,616 | ||||||||
| 2,500 | Dow Chemical Co. | 104,850 | ||||||||
| 600 | EI DuPont de Nemours & Co. | 27,690 | ||||||||
| 1,630 | International Flavors & Fragrances, Inc. | 81,728 | ||||||||
| 4,600 | Monsanto Co. | 457,102 | ||||||||
| 5,000 | Sigma-Aldrich Corp. | 263,250 | ||||||||
| 974,236 | ||||||||||
| Shares | Value | |||||||||
| Commercial Services: 0.5% | ||||||||||
| 500 | @ | Apollo Group, Inc. — Class A | $ | 38,260 | ||||||
| 2,830 | McKesson Corp. | 188,846 | ||||||||
| 900 | Robert Half International, Inc. | 24,264 | ||||||||
| 2,300 | Western Union Co. | 51,980 | ||||||||
| 303,350 | ||||||||||
| Computers: 6.1% | ||||||||||
| 500 | @ | Affiliated Computer Services, Inc. | 20,980 | |||||||
| 4,200 | @ | Apple, Inc. | 765,324 | |||||||
| 800 | @ | Cognizant Technology Solutions Corp. | 24,880 | |||||||
| 2,300 | @ | Computer Sciences Corp. | 121,486 | |||||||
| 25,400 | @ | Dell, Inc. | 623,316 | |||||||
| 6,800 | Electronic Data Systems Corp. | 137,768 | ||||||||
| 8,400 | @ | EMC Corp. | 161,868 | |||||||
| 13,352 | Hewlett-Packard Co. | 683,088 | ||||||||
| 7,540 | International Business Machines Corp. | 793,057 | ||||||||
| 1,770 | @ | Lexmark International, Inc. | 61,738 | |||||||
| 3,400 | @ | Sandisk Corp. | 127,296 | |||||||
| 3,520,801 | ||||||||||
| Cosmetics/Personal Care: 1.1% | ||||||||||
| 1,500 | Colgate-Palmolive Co. | 120,120 | ||||||||
| 7,348 | Procter & Gamble Co. | 543,752 | ||||||||
| 663,872 | ||||||||||
| Diversified Financial Services: 5.4% | ||||||||||
| 1,600 | Charles Schwab Corp. | 38,896 | ||||||||
| 9,600 | Citigroup, Inc. | 319,680 | ||||||||
| 2,550 | Discover Financial Services | 44,294 | ||||||||
| 1,200 | Freddie Mac | 42,084 | ||||||||
| 3,500 | Goldman Sachs Group, Inc. | 793,240 | ||||||||
| 20,800 | JPMorgan Chase & Co. | 948,896 | ||||||||
| 1,490 | Lehman Brothers Holdings, Inc. | 93,319 | ||||||||
| 6,460 | Merrill Lynch & Co., Inc. | 387,212 | ||||||||
| 6,400 | Morgan Stanley | 337,408 | ||||||||
| 2,200 | SLM Corp. | 83,776 | ||||||||
| 3,088,805 | ||||||||||
| Electric: 3.3% | ||||||||||
| 2,600 | Constellation Energy Group, Inc. | 260,546 | ||||||||
| 1,600 | Duke Energy Corp. | 31,664 | ||||||||
| 5,200 | Entergy Corp. | 621,608 | ||||||||
| 2,000 | Exelon Corp. | 162,140 | ||||||||
| 2,700 | FirstEnergy Corp. | 185,112 | ||||||||
| 1,100 | FPL Group, Inc. | 76,736 | ||||||||
| 5,800 | Public Service Enterprise Group, Inc. | 555,292 | ||||||||
| 1,893,098 | ||||||||||
| Electrical Components & Equipment: 0.1% | ||||||||||
| 700 | Emerson Electric Co. | 39,914 | ||||||||
| 39,914 | ||||||||||
| Electronics: 1.2% | ||||||||||
| 6,900 | Applera Corp. — Applied Biosystems Group | 235,704 | ||||||||
| 900 | @ | Thermo Electron Corp. | 51,876 | |||||||
| 2,825 | @@ | Tyco Electronics Ltd. | 105,627 | |||||||
| 4,000 | @ | Waters Corp. | 312,160 | |||||||
| 705,367 | ||||||||||
| Entertainment: 0.1% | ||||||||||
| 900 | International Game Technology | 39,294 | ||||||||
| 39,294 | ||||||||||
76
Table of Contents
| ING Index Plus LargeCap Equity Fund II | PORTFOLIO OF INVESTMENTS AS OF November 30, 2007 (Unaudited) (Continued) | |
| Shares | Value | |||||||||
| Food: 1.4% | ||||||||||
| 7,300 | General Mills, Inc. | $ | 439,095 | |||||||
| 1,300 | HJ Heinz Co. | 61,490 | ||||||||
| 6,200 | Kroger Co. | 178,250 | ||||||||
| 1,600 | WM Wrigley Jr. Co. | 102,400 | ||||||||
| 781,235 | ||||||||||
| Forest Products & Paper: 0.3% | ||||||||||
| 4,800 | International Paper Co. | 162,000 | ||||||||
| 162,000 | ||||||||||
| Hand/Machine Tools: 0.7% | ||||||||||
| 1,600 | Black & Decker Corp. | 132,240 | ||||||||
| 2,470 | Snap-On, Inc. | 120,734 | ||||||||
| 2,500 | Stanley Works | 130,375 | ||||||||
| 383,349 | ||||||||||
| Healthcare — Products: 1.2% | ||||||||||
| 3,200 | Baxter International, Inc. | 191,584 | ||||||||
| 5,850 | Johnson & Johnson | 396,279 | ||||||||
| 700 | @ | St. Jude Medical, Inc. | 27,825 | |||||||
| 700 | Stryker Corp. | 50,841 | ||||||||
| 666,529 | ||||||||||
| Healthcare — Services: 2.5% | ||||||||||
| 3,880 | Aetna, Inc. | 216,814 | ||||||||
| 3,990 | @ | Coventry Health Care, Inc. | 230,941 | |||||||
| 4,000 | @ | Humana, Inc. | 308,120 | |||||||
| 8,290 | UnitedHealth Group, Inc. | 455,950 | ||||||||
| 2,380 | @ | WellPoint, Inc. | 200,420 | |||||||
| 1,412,245 | ||||||||||
| Household Products/Wares: 0.2% | ||||||||||
| 1,600 | Kimberly-Clark Corp. | 111,696 | ||||||||
| 111,696 | ||||||||||
| Insurance: 8.1% | ||||||||||
| 8,460 | @@ | ACE Ltd. | 506,162 | |||||||
| 600 | Aflac, Inc. | 37,584 | ||||||||
| 5,070 | Allstate Corp. | 259,178 | ||||||||
| 18,600 | American International Group, Inc. | 1,081,218 | ||||||||
| 700 | AON Corp. | 34,979 | ||||||||
| 3,600 | Assurant, Inc. | 235,548 | ||||||||
| 14,590 | Chubb Corp. | 795,885 | ||||||||
| 900 | Cigna Corp. | 48,249 | ||||||||
| 2,450 | Hartford Financial Services Group, Inc. | 233,534 | ||||||||
| 2,100 | Metlife, Inc. | 137,739 | ||||||||
| 4,500 | Prudential Financial, Inc. | 423,630 | ||||||||
| 15,600 | Travelers Cos., Inc. | 828,516 | ||||||||
| 4,622,222 | ||||||||||
| Internet: 1.9% | ||||||||||
| 3,200 | @ | Amazon.com, Inc. | 289,792 | |||||||
| 900 | @ | Expedia, Inc. | 29,340 | |||||||
| 900 | @ | Google, Inc. — Class A | 623,700 | |||||||
| 7,100 | @ | Symantec Corp. | 126,380 | |||||||
| 1,069,212 | ||||||||||
| Iron/Steel: 0.2% | ||||||||||
| 1,100 | United States Steel Corp. | 107,470 | ||||||||
| 107,470 | ||||||||||
| Shares | Value | |||||||||
| Lodging: 0.1% | ||||||||||
| 950 | Harrah’s Entertainment, Inc. | $ | 83,667 | |||||||
| 83,667 | ||||||||||
| Machinery — Construction & Mining: 0.4% | ||||||||||
| 3,200 | Caterpillar, Inc. | 230,080 | ||||||||
| 230,080 | ||||||||||
| Machinery — Diversified: 0.7% | ||||||||||
| 2,800 | Cummins, Inc. | 327,320 | ||||||||
| 400 | Deere & Co. | 68,720 | ||||||||
| 396,040 | ||||||||||
| Media: 2.3% | ||||||||||
| 2,650 | Clear Channel Communications, Inc. | 95,135 | ||||||||
| 3,700 | @ | DIRECTV Group, Inc. | 92,019 | |||||||
| 1,670 | McGraw-Hill Cos., Inc. | 81,964 | ||||||||
| 1,700 | @ | Viacom — Class B | 71,434 | |||||||
| 28,980 | Walt Disney Co. | 960,687 | ||||||||
| 1,301,239 | ||||||||||
| Mining: 1.2% | ||||||||||
| 6,800 | Freeport-McMoRan Copper & Gold, Inc. | 672,724 | ||||||||
| 672,724 | ||||||||||
| Miscellaneous Manufacturing: 5.1% | ||||||||||
| 2,300 | 3M Co. | 191,498 | ||||||||
| 1,900 | Cooper Industries Ltd. | 95,418 | ||||||||
| 7,800 | Dover Corp. | 360,984 | ||||||||
| 3,950 | Eaton Corp. | 352,775 | ||||||||
| 32,620 | General Electric Co. | 1,249,016 | ||||||||
| 900 | Honeywell International, Inc. | 50,958 | ||||||||
| 2,000 | Illinois Tool Works, Inc. | 111,000 | ||||||||
| 1,900 | ITT Corp. | 122,436 | ||||||||
| 3,775 | Parker Hannifin Corp. | 299,848 | ||||||||
| 2,225 | @@ | Tyco International Ltd. | 89,289 | |||||||
| 2,923,222 | ||||||||||
| Oil & Gas: 10.5% | ||||||||||
| 16,052 | Chevron Corp. | 1,408,884 | ||||||||
| 7,503 | ConocoPhillips | 600,540 | ||||||||
| 500 | Devon Energy Corp. | 41,405 | ||||||||
| 27,730 | S | ExxonMobil Corp. | 2,472,407 | |||||||
| 1,000 | Hess Corp. | 71,220 | ||||||||
| 6,280 | Marathon Oil Corp. | 351,052 | ||||||||
| 2,500 | Murphy Oil Corp. | 178,800 | ||||||||
| 1,400 | Noble Corp. | 72,982 | ||||||||
| 700 | Noble Energy, Inc. | 50,428 | ||||||||
| 4,490 | Occidental Petroleum Corp. | 313,267 | ||||||||
| 1,749 | @ | Transocean, Inc. | 240,120 | |||||||
| 3,650 | Valero Energy Corp. | 237,506 | ||||||||
| 6,038,611 | ||||||||||
| Oil & Gas Services: 1.4% | ||||||||||
| 8,885 | Halliburton Co. | 325,280 | ||||||||
| 800 | @ | National Oilwell Varco, Inc. | 54,520 | |||||||
| 4,500 | Schlumberger Ltd. | 420,525 | ||||||||
| 800,325 | ||||||||||
| Pharmaceuticals: 6.4% | ||||||||||
| 500 | Allergan, Inc. | 33,520 | ||||||||
| 4,700 | AmerisourceBergen Corp. | 213,239 | ||||||||
| 11,100 | Bristol-Myers Squibb Co. | 328,893 | ||||||||
| 12,400 | Eli Lilly & Co. | 656,580 | ||||||||
| 600 | @ | Express Scripts, Inc. | 40,650 | |||||||
77
Table of Contents
| ING Index Plus | PORTFOLIO OF INVESTMENTS | |
| LargeCap Equity Fund II | AS OF November 30, 2007 (Unaudited) (Continued) | |
| Shares | Value | |||||||||
| Pharmaceuticals (continued) | ||||||||||
| 3,500 | @ | Gilead Sciences, Inc. | $ | 162,890 | ||||||
| 900 | @ | Medco Health Solutions, Inc. | 89,991 | |||||||
| 19,610 | Merck & Co., Inc. | 1,164,050 | ||||||||
| 12,496 | Pfizer, Inc. | 296,905 | ||||||||
| 18,450 | Schering-Plough Corp. | 577,485 | ||||||||
| 3,900 | @ | Watson Pharmaceuticals, Inc. | 114,309 | |||||||
| 3,678,512 | ||||||||||
| Pipelines: 0.1% | ||||||||||
| 1,100 | Williams Cos., Inc. | 38,181 | ||||||||
| 38,181 | ||||||||||
| Retail: 5.0% | ||||||||||
| 700 | @ | Autozone, Inc. | 78,141 | |||||||
| 2,500 | Best Buy Co., Inc. | 127,625 | ||||||||
| 4,400 | @ | Big Lots, Inc. | 82,148 | |||||||
| 8,600 | @ | Coach, Inc. | 319,404 | |||||||
| 5,200 | Costco Wholesale Corp. | 350,480 | ||||||||
| 4,700 | CVS Caremark Corp. | 188,423 | ||||||||
| 3,750 | Family Dollar Stores, Inc. | 88,313 | ||||||||
| 9,020 | Gap, Inc. | 184,008 | ||||||||
| 3,900 | Lowe’s Cos., Inc. | 95,199 | ||||||||
| 8,550 | McDonald’s Corp. | 499,919 | ||||||||
| 1,200 | Polo Ralph Lauren Corp. | 82,776 | ||||||||
| 3,200 | RadioShack Corp. | 59,200 | ||||||||
| 1,800 | @ | Starbucks Corp. | 42,102 | |||||||
| 6,160 | TJX Cos., Inc. | 180,734 | ||||||||
| 8,300 | Wal-Mart Stores, Inc. | 397,570 | ||||||||
| 3,600 | Wendy’s International, Inc. | 100,908 | ||||||||
| 2,876,950 | ||||||||||
| Savings & Loans: 0.8% | ||||||||||
| 21,100 | Hudson City Bancorp., Inc. | 321,142 | ||||||||
| 8,480 | Washington Mutual, Inc. | 165,360 | ||||||||
| 486,502 | ||||||||||
| Semiconductors: 3.3% | ||||||||||
| 3,600 | Applied Materials, Inc. | 67,788 | ||||||||
| 34,200 | Intel Corp. | 891,936 | ||||||||
| 700 | @ | MEMC Electronic Materials, Inc. | 54,306 | |||||||
| 4,200 | @ | Novellus Systems, Inc. | 109,242 | |||||||
| 20,000 | @ | Nvidia Corp. | 630,800 | |||||||
| 4,100 | Texas Instruments, Inc. | 129,437 | ||||||||
| 1,883,509 | ||||||||||
| Software: 3.2% | ||||||||||
| 3,000 | @ | Autodesk, Inc. | 141,270 | |||||||
| 4,270 | @ | BMC Software, Inc. | 141,252 | |||||||
| 8,400 | CA, Inc. | 205,716 | ||||||||
| 31,190 | Microsoft Corp. | 1,047,984 | ||||||||
| 4,900 | @ | Novell, Inc. | 34,398 | |||||||
| 14,200 | @ | Oracle Corp. | 286,556 | |||||||
| 1,857,176 | ||||||||||
| Telecommunications: 5.2% | ||||||||||
| 1,800 | @ | American Tower Corp. | 81,972 | |||||||
| 24,665 | AT&T, Inc. | 942,450 | ||||||||
| 1,800 | CenturyTel, Inc. | 76,734 | ||||||||
| 22,560 | @ | Cisco Systems, Inc. | 632,131 | |||||||
| 6,800 | Corning, Inc. | 165,172 | ||||||||
| 2,300 | @ | Juniper Networks, Inc. | 68,356 | |||||||
| 14,100 | Qualcomm, Inc. | 574,998 | ||||||||
| 4,500 | Sprint Nextel Corp. | 69,840 | ||||||||
| 9,100 | Verizon Communications, Inc. | 393,211 | ||||||||
| 3,004,864 | ||||||||||
| Shares | Value | |||||||||
| Transportation: 0.3% | ||||||||||
| 1,100 | CSX Corp. | $ | 46,200 | |||||||
| 1,300 | Norfolk Southern Corp. | 66,573 | ||||||||
| 700 | Union Pacific Corp. | 88,298 | ||||||||
| 201,071 | ||||||||||
| Total Common Stock (Cost $48,839,011) | 56,371,867 | |||||||||
| SHORT-TERM INVESTMENTS: 2.0% | ||||||||||
| Mutual Fund: 1.7% | ||||||||||
| 1,000,000 | ** | ING Institutional Prime Money Market Fund | 1,000,000 | |||||||
| Total Mutual Fund (Cost $1,000,000) | 1,000,000 | |||||||||
| Principal | ||||||||||||||
| Amount | Value | |||||||||||||
| Repurchase Agreement: 0.3% | ||||||||||||||
| $ | 150,000 | Morgan Stanley Repurchase Agreement dated 11/30/07, 4.500%, due 12/03/07, $150,056 to be received upon repurchase (Collateralized by $275,000 Resolution Funding Corporation, Discount Note, Market Value $155,438, due 07/15/20) | 150,000 | |||||||||||
| Total Repurchase Agreement (Cost $150,000) | 150,000 | |||||||||||||
| Total Short-Term Investments (Cost $1,150,000) | 1,150,000 | |||||||||||||
Total Investments in Securities (Cost $49,989,011)* | 100.4 | % | $ | 57,521,867 | ||||||||||
Other Assets and Liabilities — Net | (0.4 | ) | (202,868 | ) | ||||||||||
Net Assets | 100.0 | % | $ | 57,318,999 | ||||||||||
| @ | Non-income producing security | |
| @@ | Foreign Issuer | |
| S | All or a portion of this security is segregated for certain derivatives, when-issued or delayed delivery securities and forward currency exchange contracts. | |
| ** | Investment in affiliate | |
| * | Cost for federal income tax purposes is $51,127,038. |
| Net unrealized appreciation consists of: | ||||
| Gross Unrealized Appreciation | $ | 7,957,559 | ||
| Gross Unrealized Depreciation | (1,562,730 | ) | ||
| Net Unrealized Appreciation | $ | 6,394,829 | ||
| Number | Notional | Unrealized | ||||||||||||||
| of | Market | Expiration | Appreciation/ | |||||||||||||
| Contract Description | Contracts | Value ($) | Date | (Depreciation) | ||||||||||||
| Long Contracts | ||||||||||||||||
| S&P500 | 3 | 1,112,775 | 12/20/07 | $ | 4,690 | |||||||||||
| $ | 4,690 | |||||||||||||||
78
Table of Contents
| ING Index Plus | PORTFOLIO OF INVESTMENTS | |
| LargeCap Equity Fund III | as of November 30, 2007 (Unaudited) | |
| Shares | Value | |||||||||
| COMMON STOCK: 98.4% | ||||||||||
| Advertising: 1.1% | ||||||||||
| 11,100 | Omnicom Group | $ | 541,125 | |||||||
| 541,125 | ||||||||||
| Aerospace/Defense: 4.6% | ||||||||||
| 1,600 | Boeing Co. | 148,064 | ||||||||
| 1,900 | General Dynamics Corp. | 168,682 | ||||||||
| 2,700 | L-3 Communications Holdings, Inc. | 298,755 | ||||||||
| 3,720 | Lockheed Martin Corp. | 411,692 | ||||||||
| 4,900 | Northrop Grumman Corp. | 386,071 | ||||||||
| 6,002 | Raytheon Co. | 371,224 | ||||||||
| 7,260 | United Technologies Corp. | 542,830 | ||||||||
| 2,327,318 | ||||||||||
| Agriculture: 1.7% | ||||||||||
| 7,600 | Altria Group, Inc. | 589,456 | ||||||||
| 1,300 | Reynolds American, Inc. | 91,026 | ||||||||
| 3,100 | UST, Inc. | 179,490 | ||||||||
| 859,972 | ||||||||||
| Apparel: 1.4% | ||||||||||
| 11,100 | Nike, Inc. | 728,715 | ||||||||
| 728,715 | ||||||||||
| Auto Manufacturers: 0.3% | ||||||||||
| 3,050 | Paccar, Inc. | 154,361 | ||||||||
| 154,361 | ||||||||||
| Auto Parts & Equipment: 0.1% | ||||||||||
| 900 | Johnson Controls, Inc. | 34,758 | ||||||||
| 34,758 | ||||||||||
| Banks: 3.7% | ||||||||||
| 8,640 | Bank of America Corp. | 398,563 | ||||||||
| 2,450 | Comerica, Inc. | 112,161 | ||||||||
| 800 | Commerce Bancorp., Inc. | 31,856 | ||||||||
| 3,800 | Huntington Bancshares, Inc. | 59,622 | ||||||||
| 8,877 | Regions Financial Corp. | 234,619 | ||||||||
| 13,461 | Wachovia Corp. | 578,823 | ||||||||
| 14,900 | Wells Fargo & Co. | 483,207 | ||||||||
| 1,898,851 | ||||||||||
| Beverages: 3.5% | ||||||||||
| 7,000 | Anheuser-Busch Cos., Inc. | 369,040 | ||||||||
| 5,400 | Coca-Cola Co. | 335,340 | ||||||||
| 4,400 | Pepsi Bottling Group, Inc. | 187,748 | ||||||||
| 11,300 | PepsiCo, Inc. | 872,134 | ||||||||
| 1,764,262 | ||||||||||
| Biotechnology: 0.1% | ||||||||||
| 500 | @ | Genzyme Corp. | 37,465 | |||||||
| 37,465 | ||||||||||
| Chemicals: 1.7% | ||||||||||
| 300 | Air Products & Chemicals, Inc. | 29,712 | ||||||||
| 2,300 | Dow Chemical Co. | 96,462 | ||||||||
| 600 | EI DuPont de Nemours & Co. | 27,690 | ||||||||
| 1,600 | International Flavors & Fragrances, Inc. | 80,224 | ||||||||
| 4,000 | Monsanto Co. | 397,480 | ||||||||
| 4,600 | Sigma-Aldrich Corp. | 242,190 | ||||||||
| 873,758 | ||||||||||
| Shares | Value | |||||||||
| Commercial Services: 0.5% | ||||||||||
| 500 | @ | Apollo Group, Inc. — Class A | $ | 38,260 | ||||||
| 2,540 | McKesson Corp. | 169,494 | ||||||||
| 900 | Robert Half International, Inc. | 24,264 | ||||||||
| 2,200 | Western Union Co. | 49,720 | ||||||||
| 281,738 | ||||||||||
| Computers: 6.2% | ||||||||||
| 300 | @ | Affiliated Computer Services, Inc. | 12,588 | |||||||
| 3,800 | @ | Apple, Inc. | 692,436 | |||||||
| 800 | @ | Cognizant Technology Solutions Corp. | 24,880 | |||||||
| 1,750 | @ | Computer Sciences Corp. | 92,435 | |||||||
| 22,950 | @ | Dell, Inc. | 563,193 | |||||||
| 6,450 | Electronic Data Systems Corp. | 130,677 | ||||||||
| 7,650 | @ | EMC Corp. | 147,416 | |||||||
| 12,100 | Hewlett-Packard Co. | 619,036 | ||||||||
| 6,650 | International Business Machines Corp. | 699,447 | ||||||||
| 1,680 | @ | Lexmark International, Inc. | 58,598 | |||||||
| 3,300 | @ | Sandisk Corp. | 123,552 | |||||||
| 3,164,258 | ||||||||||
| Cosmetics/Personal Care: 1.2% | ||||||||||
| 1,400 | Colgate-Palmolive Co. | 112,112 | ||||||||
| 6,552 | Procter & Gamble Co. | 484,848 | ||||||||
| 596,960 | ||||||||||
| Diversified Financial Services: 5.4% | ||||||||||
| 1,500 | Charles Schwab Corp. | 36,465 | ||||||||
| 8,500 | Citigroup, Inc. | 283,050 | ||||||||
| 2,500 | Discover Financial Services | 43,425 | ||||||||
| 1,200 | Freddie Mac | 42,084 | ||||||||
| 3,050 | Goldman Sachs Group, Inc. | 691,252 | ||||||||
| 18,700 | JPMorgan Chase & Co. | 853,094 | ||||||||
| 1,320 | Lehman Brothers Holdings, Inc. | 82,672 | ||||||||
| 5,500 | Merrill Lynch & Co., Inc. | 329,670 | ||||||||
| 5,900 | Morgan Stanley | 311,048 | ||||||||
| 1,700 | SLM Corp. | 64,736 | ||||||||
| 2,737,496 | ||||||||||
| Electric: 3.3% | ||||||||||
| 2,400 | Constellation Energy Group, Inc. | 240,504 | ||||||||
| 1,500 | Duke Energy Corp. | 29,685 | ||||||||
| 4,800 | Entergy Corp. | 573,792 | ||||||||
| 1,900 | Exelon Corp. | 154,033 | ||||||||
| 2,300 | FirstEnergy Corp. | 157,688 | ||||||||
| 700 | FPL Group, Inc. | 48,832 | ||||||||
| 5,200 | Public Service Enterprise Group, Inc. | 497,848 | ||||||||
| 1,702,382 | ||||||||||
| Electrical Components & Equipment: 0.1% | ||||||||||
| 600 | Emerson Electric Co. | 34,212 | ||||||||
| 34,212 | ||||||||||
| Electronics: 1.2% | ||||||||||
| 6,200 | Applera Corp. — Applied Biosystems Group | 211,792 | ||||||||
| 800 | @ | Thermo Electron Corp. | 46,112 | |||||||
| 2,175 | @@ | Tyco Electronics Ltd. | 81,323 | |||||||
| 3,500 | @ | Waters Corp. | 273,140 | |||||||
| 612,367 | ||||||||||
| Entertainment: 0.1% | ||||||||||
| 800 | International Game Technology | 34,928 | ||||||||
| 34,928 | ||||||||||
79
Table of Contents
| ING Index Plus | PORTFOLIO OF INVESTMENTS | |
| LargeCap Equity Fund III | as of November 30, 2007 (Unaudited) (Continued) | |
| Shares | Value | |||||||||
| Food: 1.3% | ||||||||||
| 6,550 | General Mills, Inc. | $ | 393,983 | |||||||
| 1,300 | HJ Heinz Co. | 61,490 | ||||||||
| 5,200 | Kroger Co. | 149,500 | ||||||||
| 1,300 | WM Wrigley Jr. Co. | 83,200 | ||||||||
| 688,173 | ||||||||||
| Forest Products & Paper: 0.3% | ||||||||||
| 4,100 | International Paper Co. | 138,375 | ||||||||
| 138,375 | ||||||||||
| Hand/Machine Tools: 0.7% | ||||||||||
| 1,500 | Black & Decker Corp. | 123,975 | ||||||||
| 2,050 | Snap-On, Inc. | 100,204 | ||||||||
| 2,300 | Stanley Works | 119,945 | ||||||||
| 344,124 | ||||||||||
| Healthcare — Products: 1.2% | ||||||||||
| 2,800 | Baxter International, Inc. | 167,636 | ||||||||
| 5,450 | Johnson & Johnson | 369,183 | ||||||||
| 700 | @ | St. Jude Medical, Inc. | 27,825 | |||||||
| 600 | Stryker Corp. | 43,578 | ||||||||
| 608,222 | ||||||||||
| Healthcare — Services: 2.4% | ||||||||||
| 3,480 | Aetna, Inc. | 194,462 | ||||||||
| 3,835 | @ | Coventry Health Care, Inc. | 221,970 | |||||||
| 3,550 | @ | Humana, Inc. | 273,457 | |||||||
| 7,200 | UnitedHealth Group, Inc. | 396,000 | ||||||||
| 1,970 | @ | WellPoint, Inc. | 165,894 | |||||||
| 1,251,783 | ||||||||||
| Household Products/Wares: 0.2% | ||||||||||
| 1,250 | Kimberly-Clark Corp. | 87,263 | ||||||||
| 87,263 | ||||||||||
| Insurance: 8.0% | ||||||||||
| 7,560 | @@ | ACE Ltd. | 452,315 | |||||||
| 500 | Aflac, Inc. | 31,320 | ||||||||
| 4,360 | Allstate Corp. | 222,883 | ||||||||
| 16,550 | American International Group, Inc. | 962,052 | ||||||||
| 700 | AON Corp. | 34,979 | ||||||||
| 3,300 | Assurant, Inc. | 215,919 | ||||||||
| 13,000 | Chubb Corp. | 709,150 | ||||||||
| 760 | Cigna Corp. | 40,744 | ||||||||
| 2,000 | Hartford Financial Services Group, Inc. | 190,640 | ||||||||
| 1,810 | Metlife, Inc. | 118,718 | ||||||||
| 3,960 | Prudential Financial, Inc. | 372,794 | ||||||||
| 13,990 | Travelers Cos., Inc. | 743,009 | ||||||||
| 4,094,523 | ||||||||||
| Internet: 1.9% | ||||||||||
| 2,900 | @ | Amazon.com, Inc. | 262,624 | |||||||
| 880 | @ | Expedia, Inc. | 28,688 | |||||||
| 800 | @ | Google, Inc. — Class A | 554,400 | |||||||
| 6,754 | @ | Symantec Corp. | 120,221 | |||||||
| 965,933 | ||||||||||
| Iron/Steel: 0.2% | ||||||||||
| 1,120 | United States Steel Corp. | 109,424 | ||||||||
| 109,424 | ||||||||||
| Lodging: 0.1% | ||||||||||
| 900 | Harrah’s Entertainment, Inc. | 79,263 | ||||||||
| 79,263 | ||||||||||
| Shares | Value | |||||||||
| Machinery — Construction & Mining: 0.4% | ||||||||||
| 2,800 | Caterpillar, Inc. | $ | 201,320 | |||||||
| 201,320 | ||||||||||
| Machinery — Diversified: 0.6% | ||||||||||
| 2,300 | Cummins, Inc. | 268,870 | ||||||||
| 300 | Deere & Co. | 51,540 | ||||||||
| 320,410 | ||||||||||
| Media: 2.3% | ||||||||||
| 2,100 | Clear Channel Communications, Inc. | 75,390 | ||||||||
| 3,600 | @ | DIRECTV Group, Inc. | 89,532 | |||||||
| 1,610 | McGraw-Hill Cos., Inc. | 79,019 | ||||||||
| 1,600 | @ | Viacom — Class B | 67,232 | |||||||
| 25,850 | Walt Disney Co. | 856,928 | ||||||||
| 1,168,101 | ||||||||||
| Mining: 1.2% | ||||||||||
| 6,100 | Freeport-McMoRan Copper & Gold, Inc. | 603,473 | ||||||||
| 603,473 | ||||||||||
| Miscellaneous Manufacturing: 5.1% | ||||||||||
| 1,900 | 3M Co. | 158,194 | ||||||||
| 1,600 | Cooper Industries Ltd. | 80,352 | ||||||||
| 6,800 | Dover Corp. | 314,704 | ||||||||
| 3,350 | Eaton Corp. | 299,189 | ||||||||
| 29,100 | General Electric Co. | 1,114,233 | ||||||||
| 800 | Honeywell International, Inc. | 45,296 | ||||||||
| 1,900 | Illinois Tool Works, Inc. | 105,450 | ||||||||
| 1,800 | ITT Corp. | 115,992 | ||||||||
| 3,350 | Parker Hannifin Corp. | 266,091 | ||||||||
| 2,175 | @@ | Tyco International Ltd. | 87,283 | |||||||
| 2,586,784 | ||||||||||
| Oil & Gas: 10.6% | ||||||||||
| 14,515 | Chevron Corp. | 1,273,982 | ||||||||
| 6,609 | ConocoPhillips | 528,984 | ||||||||
| 500 | Devon Energy Corp. | 41,405 | ||||||||
| 24,700 | S | ExxonMobil Corp. | 2,202,252 | |||||||
| 1,000 | Hess Corp. | 71,220 | ||||||||
| 5,500 | Marathon Oil Corp. | 307,450 | ||||||||
| 2,200 | Murphy Oil Corp. | 157,344 | ||||||||
| 1,200 | Noble Corp. | 62,556 | ||||||||
| 720 | Noble Energy, Inc. | 51,869 | ||||||||
| 4,060 | Occidental Petroleum Corp. | 283,266 | ||||||||
| 1,539 | @ | Transocean, Inc. | 211,289 | |||||||
| 3,200 | Valero Energy Corp. | 208,224 | ||||||||
| 5,399,841 | ||||||||||
| Oil & Gas Services: 1.3% | ||||||||||
| 7,700 | Halliburton Co. | 281,897 | ||||||||
| 500 | @ | National Oilwell Varco, Inc. | 34,075 | |||||||
| 4,000 | Schlumberger Ltd. | 373,800 | ||||||||
| 689,772 | ||||||||||
| Pharmaceuticals: 6.4% | ||||||||||
| 500 | Allergan, Inc. | 33,520 | ||||||||
| 4,400 | AmerisourceBergen Corp. | 199,628 | ||||||||
| 9,500 | Bristol-Myers Squibb Co. | 281,485 | ||||||||
| 10,900 | Eli Lilly & Co. | 577,155 | ||||||||
| 500 | @ | Express Scripts, Inc. | 33,875 | |||||||
| 2,900 | @ | Gilead Sciences, Inc. | 134,966 | |||||||
| 700 | @ | Medco Health Solutions, Inc. | 69,993 | |||||||
| 17,500 | Merck & Co., Inc. | 1,038,800 | ||||||||
| 11,030 | Pfizer, Inc. | 262,073 | ||||||||
80
Table of Contents
| ING Index Plus | PORTFOLIO OF INVESTMENTS | |
| LargeCap Equity Fund III | as of November 30, 2007 (Unaudited) (continued) | |
| Shares | Value | |||||||||
| Pharmaceuticals (continued) | ||||||||||
| 16,600 | Schering-Plough Corp. | $ | 519,580 | |||||||
| 3,800 | @ | Watson Pharmaceuticals, Inc. | 111,378 | |||||||
| 3,262,453 | ||||||||||
| Pipelines: 0.1% | ||||||||||
| 1,100 | Williams Cos., Inc. | 38,181 | ||||||||
| 38,181 | ||||||||||
| Retail: 5.0% | ||||||||||
| 700 | @ | Autozone, Inc. | 78,141 | |||||||
| 2,000 | Best Buy Co., Inc. | 102,100 | ||||||||
| 4,100 | @ | Big Lots, Inc. | 76,547 | |||||||
| 7,600 | @ | Coach, Inc. | 282,264 | |||||||
| 4,600 | Costco Wholesale Corp. | 310,040 | ||||||||
| 4,400 | CVS Caremark Corp. | 176,396 | ||||||||
| 3,550 | Family Dollar Stores, Inc. | 83,603 | ||||||||
| 7,400 | Gap, Inc. | 150,960 | ||||||||
| 3,700 | Lowe’s Cos., Inc. | 90,317 | ||||||||
| 7,850 | McDonald’s Corp. | 458,990 | ||||||||
| 1,200 | Polo Ralph Lauren Corp. | 82,776 | ||||||||
| 3,000 | RadioShack Corp. | 55,500 | ||||||||
| 1,700 | @ | Starbucks Corp. | 39,763 | |||||||
| 5,600 | TJX Cos., Inc. | 164,304 | ||||||||
| 7,200 | Wal-Mart Stores, Inc. | 344,880 | ||||||||
| 2,900 | Wendy’s International, Inc. | 81,287 | ||||||||
| 2,577,868 | ||||||||||
| Savings & Loans: 0.8% | ||||||||||
| 18,500 | Hudson City Bancorp., Inc. | 281,570 | ||||||||
| 7,153 | Washington Mutual, Inc. | 139,484 | ||||||||
| 421,054 | ||||||||||
| Semiconductors: 3.3% | ||||||||||
| 3,400 | Applied Materials, Inc. | 64,022 | ||||||||
| 30,500 | Intel Corp. | 795,440 | ||||||||
| 700 | @ | MEMC Electronic Materials, Inc. | 54,306 | |||||||
| 3,950 | @ | Novellus Systems, Inc. | 102,740 | |||||||
| 17,800 | @ | Nvidia Corp. | 561,412 | |||||||
| 3,800 | Texas Instruments, Inc. | 119,966 | ||||||||
| 1,697,886 | ||||||||||
| Software: 3.2% | ||||||||||
| 2,800 | @ | Autodesk, Inc. | 131,852 | |||||||
| 3,920 | @ | BMC Software, Inc. | 129,674 | |||||||
| 7,100 | CA, Inc. | 173,879 | ||||||||
| 27,850 | Microsoft Corp. | 935,760 | ||||||||
| 4,600 | @ | Novell, Inc. | 32,292 | |||||||
| 12,400 | @ | Oracle Corp. | 250,232 | |||||||
| 1,653,689 | ||||||||||
| Telecommunications: 5.3% | ||||||||||
| 1,600 | @ | American Tower Corp. | 72,864 | |||||||
| 22,472 | AT&T, Inc. | 858,655 | ||||||||
| 1,300 | CenturyTel, Inc. | 55,419 | ||||||||
| 20,050 | @ | Cisco Systems, Inc. | 561,801 | |||||||
| 6,400 | Corning, Inc. | 155,456 | ||||||||
| 2,600 | @ | Juniper Networks, Inc. | 77,272 | |||||||
| 12,400 | Qualcomm, Inc. | 505,672 | ||||||||
| 4,224 | Sprint Nextel Corp. | 65,556 | ||||||||
| 7,950 | Verizon Communications, Inc. | 343,520 | ||||||||
| 2,696,215 | ||||||||||
| Shares | Value | |||||||||
| Transportation: 0.3% | ||||||||||
| 1,000 | CSX Corp. | $ | 42,000 | |||||||
| 1,200 | Norfolk Southern Corp. | 61,452 | ||||||||
| 600 | Union Pacific Corp. | 75,684 | ||||||||
| 179,136 | ||||||||||
| Total Common Stock (Cost $43,002,300) | 50,248,192 | |||||||||
| SHORT-TERM INVESTMENTS: 2.1% | ||||||||||
| Mutual Fund: 1.3% | ||||||||||
| 675,000 | ** | ING Institutional Prime Money Market Fund | 675,000 | |||||||
| Total Mutual Fund (Cost $675,000) | 675,000 | |||||||||
| Principal | ||||||||||||||
| Amount | Value | |||||||||||||
| Repurchase Agreement: 0.8% | ||||||||||||||
| $ | 383,000 | Morgan Stanley Repurchase Agreement dated 11/30/07, 4.500%, due 12/03/07, $383,144 to be received upon repurchase (Collateralized by $695,000 Resolution Funding Corporation, Discount Note, Market Value $392,835, due 07/15/20) | 383,000 | |||||||||||
| Total Repurchase Agreement (Cost $383,000) | 383,000 | |||||||||||||
| Total Short-Term Investments (Cost $1,058,000) | 1,058,000 | |||||||||||||
Total Investments in Securities (Cost $44,060,300)* | 100.5 | % | $ | 51,306,192 | ||||||||||
Other Assets and Liabilities — Net | (0.5 | ) | (274,128 | ) | ||||||||||
Net Assets | 100.0 | % | $ | 51,032,064 | ||||||||||
| @ | Non-income producing security | |
| @@ | Foreign Issuer | |
| S | All or a portion of this security is segregated for certain derivatives, when-issued or delayed delivery securities and forward currency exchange contracts. | |
| ** | Investment in affiliate | |
| * | Cost for federal income tax purposes is $44,981,781. |
| Net unrealized appreciation consists of: | ||||
| Gross Unrealized Appreciation | $ | 7,598,423 | ||
| Gross Unrealized Depreciation | (1,274,012 | ) | ||
| Net Unrealized Appreciation | $ | 6,324,411 | ||
| Number | Notional | Unrealized | ||||||||||||||
| of | Market | Expiration | Appreciation/ | |||||||||||||
| Contract Description | Contracts | Value ($) | Date | (Depreciation) | ||||||||||||
| Long Contracts | ||||||||||||||||
| S&P500 E-Mini | 15 | 1,112,775 | 12/21/07 | $ | 15,869 | |||||||||||
| $ | 15,869 | |||||||||||||||
81
Table of Contents
| ING Index Plus | PORTFOLIO OF INVESTMENTS | |
| LargeCap Equity Fund IV | AS OF November 30, 2007 (Unaudited) |
| Shares | Value | |||||||||
| COMMON STOCK: 96.9% | ||||||||||
| Advertising: 1.1% | ||||||||||
| 28,200 | Omnicom Group | $ | 1,374,750 | |||||||
| 1,374,750 | ||||||||||
| Aerospace/Defense: 4.5% | ||||||||||
| 4,500 | Boeing Co. | 416,430 | ||||||||
| 5,300 | General Dynamics Corp. | 470,534 | ||||||||
| 6,700 | L-3 Communications Holdings, Inc. | 741,355 | ||||||||
| 9,100 | Lockheed Martin Corp. | 1,007,097 | ||||||||
| 11,653 | Northrop Grumman Corp. | 918,140 | ||||||||
| 14,852 | Raytheon Co. | 918,596 | ||||||||
| 17,720 | United Technologies Corp. | 1,324,924 | ||||||||
| 5,797,076 | ||||||||||
| Agriculture: 1.7% | ||||||||||
| 18,600 | Altria Group, Inc. | 1,442,616 | ||||||||
| 3,340 | Reynolds American, Inc. | 233,867 | ||||||||
| 8,400 | UST, Inc. | 486,360 | ||||||||
| 2,162,843 | ||||||||||
| Apparel: 1.4% | ||||||||||
| 27,860 | Nike, Inc. | 1,829,009 | ||||||||
| 1,829,009 | ||||||||||
| Auto Manufacturers: 0.3% | ||||||||||
| 6,750 | Paccar, Inc. | 341,618 | ||||||||
| 341,618 | ||||||||||
| Auto Parts & Equipment: 0.0% | ||||||||||
| 1,800 | Johnson Controls, Inc. | 69,516 | ||||||||
| 69,516 | ||||||||||
| Banks: 3.6% | ||||||||||
| 21,792 | Bank of America Corp. | 1,005,265 | ||||||||
| 6,250 | Comerica, Inc. | 286,125 | ||||||||
| 1,900 | Commerce Bancorp., Inc. | 75,658 | ||||||||
| 10,500 | Huntington Bancshares, Inc. | 164,745 | ||||||||
| 21,988 | Regions Financial Corp. | 581,143 | ||||||||
| 33,042 | Wachovia Corp. | 1,420,806 | ||||||||
| 36,100 | Wells Fargo & Co. | 1,170,723 | ||||||||
| 4,704,465 | ||||||||||
| Beverages: 3.4% | ||||||||||
| 17,300 | Anheuser-Busch Cos., Inc. | 912,056 | ||||||||
| 13,200 | Coca-Cola Co. | 819,720 | ||||||||
| 11,850 | Pepsi Bottling Group, Inc. | 505,640 | ||||||||
| 28,510 | PepsiCo, Inc. | 2,200,402 | ||||||||
| 4,437,818 | ||||||||||
| Biotechnology: 0.1% | ||||||||||
| 1,200 | @ | Genzyme Corp. | 89,916 | |||||||
| 89,916 | ||||||||||
| Chemicals: 1.7% | ||||||||||
| 1,150 | Air Products & Chemicals, Inc. | 113,896 | ||||||||
| 6,050 | Dow Chemical Co. | 253,737 | ||||||||
| 1,300 | EI DuPont de Nemours & Co. | 59,995 | ||||||||
| 4,200 | International Flavors & Fragrances, Inc. | 210,588 | ||||||||
| 10,100 | Monsanto Co. | 1,003,637 | ||||||||
| 10,900 | Sigma-Aldrich Corp. | 573,885 | ||||||||
| 2,215,738 | ||||||||||
| Shares | Value | |||||||||
| Commercial Services: 0.5% | ||||||||||
| 1,100 | @ | Apollo Group, Inc. — Class A | $ | 84,172 | ||||||
| 6,260 | McKesson Corp. | 417,730 | ||||||||
| 1,700 | Robert Half International, Inc. | 45,832 | ||||||||
| 5,428 | Western Union Co. | 122,673 | ||||||||
| 670,407 | ||||||||||
| Computers: 6.0% | ||||||||||
| 1,100 | @ | Affiliated Computer Services, Inc. | 46,156 | |||||||
| 9,200 | @ | Apple, Inc. | 1,676,424 | |||||||
| 1,900 | @ | Cognizant Technology Solutions Corp. | 59,090 | |||||||
| 5,050 | @ | Computer Sciences Corp. | 266,741 | |||||||
| 56,640 | @ | Dell, Inc. | 1,389,946 | |||||||
| 16,200 | Electronic Data Systems Corp. | 328,212 | ||||||||
| 17,400 | @ | EMC Corp. | 335,298 | |||||||
| 29,050 | Hewlett-Packard Co. | 1,486,198 | ||||||||
| 16,400 | International Business Machines Corp. | 1,724,952 | ||||||||
| 4,550 | @ | Lexmark International, Inc. | 158,704 | |||||||
| 8,700 | @ | Sandisk Corp. | 325,728 | |||||||
| 7,797,449 | ||||||||||
| Cosmetics/Personal Care: 1.2% | ||||||||||
| 3,700 | Colgate-Palmolive Co. | 296,296 | ||||||||
| 16,655 | Procter & Gamble Co. | 1,232,470 | ||||||||
| 1,528,766 | ||||||||||
| Diversified Financial Services: 5.2% | ||||||||||
| 3,250 | Charles Schwab Corp. | 79,008 | ||||||||
| 21,500 | Citigroup, Inc. | 715,950 | ||||||||
| 6,775 | Discover Financial Services | 117,682 | ||||||||
| 2,000 | Freddie Mac | 70,140 | ||||||||
| 7,750 | Goldman Sachs Group, Inc. | 1,756,460 | ||||||||
| 45,000 | JPMorgan Chase & Co. | 2,052,900 | ||||||||
| 3,300 | Lehman Brothers Holdings, Inc. | 206,679 | ||||||||
| 13,700 | Merrill Lynch & Co., Inc. | 821,178 | ||||||||
| 14,550 | Morgan Stanley | 767,076 | ||||||||
| 4,150 | SLM Corp. | 158,032 | ||||||||
| 6,745,105 | ||||||||||
| Electric: 3.3% | ||||||||||
| 6,250 | Constellation Energy Group, Inc. | 626,313 | ||||||||
| 3,500 | Duke Energy Corp. | 69,265 | ||||||||
| 11,800 | Entergy Corp. | 1,410,572 | ||||||||
| 4,800 | Exelon Corp. | 389,136 | ||||||||
| 6,200 | FirstEnergy Corp. | 425,072 | ||||||||
| 2,200 | FPL Group, Inc. | 153,472 | ||||||||
| 13,100 | Public Service Enterprise Group, Inc. | 1,254,194 | ||||||||
| 4,328,024 | ||||||||||
| Electrical Components & Equipment: 0.0% | ||||||||||
| 1,200 | Emerson Electric Co. | 68,424 | ||||||||
| 68,424 | ||||||||||
| Electronics: 1.2% | ||||||||||
| 15,600 | Applera Corp. — Applied Biosystems Group | 532,896 | ||||||||
| 2,000 | @ | Thermo Electron Corp. | 115,280 | |||||||
| 6,100 | @@ | Tyco Electronics Ltd. | 228,079 | |||||||
| 9,000 | @ | Waters Corp. | 702,360 | |||||||
| 1,578,615 | ||||||||||
| Entertainment: 0.1% | ||||||||||
| 1,700 | International Game Technology | 74,222 | ||||||||
| 74,222 | ||||||||||
82
Table of Contents
| ING Index Plus | PORTFOLIO OF INVESTMENTS | |
| LargeCap Equity Fund IV | AS OF November 30, 2007 (Unaudited) (continued) |
| Shares | Value | |||||||||
| Food: 1.4% | ||||||||||
| 15,850 | General Mills, Inc. | $ | 953,378 | |||||||
| 2,950 | HJ Heinz Co. | 139,535 | ||||||||
| 14,500 | Kroger Co. | 416,875 | ||||||||
| 3,900 | WM Wrigley Jr. Co. | 249,600 | ||||||||
| 1,759,388 | ||||||||||
| Forest Products & Paper: 0.3% | ||||||||||
| 10,400 | International Paper Co. | 351,000 | ||||||||
| 351,000 | ||||||||||
| Hand/Machine Tools: 0.7% | ||||||||||
| 3,920 | Black & Decker Corp. | 323,988 | ||||||||
| 5,700 | Snap-On, Inc. | 278,616 | ||||||||
| 6,200 | Stanley Works | 323,330 | ||||||||
| 925,934 | ||||||||||
| Healthcare — Products: 1.2% | ||||||||||
| 6,850 | Baxter International, Inc. | 410,110 | ||||||||
| 13,650 | Johnson & Johnson | 924,651 | ||||||||
| 1,500 | @ | St. Jude Medical, Inc. | 59,625 | |||||||
| 1,500 | Stryker Corp. | 108,945 | ||||||||
| 1,503,331 | ||||||||||
| Healthcare — Services: 2.5% | ||||||||||
| 8,820 | Aetna, Inc. | 492,862 | ||||||||
| 9,480 | @ | Coventry Health Care, Inc. | 548,702 | |||||||
| 9,100 | @ | Humana, Inc. | 700,973 | |||||||
| 17,700 | UnitedHealth Group, Inc. | 973,500 | ||||||||
| 5,630 | @ | WellPoint, Inc. | 474,102 | |||||||
| 3,190,139 | ||||||||||
| Household Products/Wares: 0.2% | ||||||||||
| 3,500 | Kimberly-Clark Corp. | 244,335 | ||||||||
| 244,335 | ||||||||||
| Insurance: 8.0% | ||||||||||
| 19,050 | @@ | ACE Ltd. | 1,139,762 | |||||||
| 1,200 | Aflac, Inc. | 75,168 | ||||||||
| 11,350 | Allstate Corp. | 580,212 | ||||||||
| 41,750 | American International Group, Inc. | 2,426,928 | ||||||||
| 1,750 | AON Corp. | 87,448 | ||||||||
| 8,200 | Assurant, Inc. | 536,526 | ||||||||
| 32,760 | Chubb Corp. | 1,787,058 | ||||||||
| 1,340 | Cigna Corp. | 71,837 | ||||||||
| 5,600 | Hartford Financial Services Group, Inc. | 533,792 | ||||||||
| 4,130 | Metlife, Inc. | 270,887 | ||||||||
| 9,740 | Prudential Financial, Inc. | 916,924 | ||||||||
| 35,230 | Travelers Cos., Inc. | 1,871,065 | ||||||||
| 10,297,607 | ||||||||||
| Internet: 1.9% | ||||||||||
| 7,200 | @ | Amazon.com, Inc. | 652,032 | |||||||
| 2,000 | @ | Expedia, Inc. | 65,200 | |||||||
| 2,000 | @ | Google, Inc. — Class A | 1,386,000 | |||||||
| 17,050 | @ | Symantec Corp. | 303,490 | |||||||
| 2,406,722 | ||||||||||
| Iron/Steel: 0.2% | ||||||||||
| 2,950 | United States Steel Corp. | 288,215 | ||||||||
| 288,215 | ||||||||||
| Lodging: 0.1% | ||||||||||
| 1,700 | Harrah’s Entertainment, Inc. | 149,719 | ||||||||
| 149,719 | ||||||||||
| Shares | Value | |||||||||
| Machinery — Construction & Mining: 0.4% | ||||||||||
| 7,400 | Caterpillar, Inc. | $ | 532,060 | |||||||
| 532,060 | ||||||||||
| Machinery — Diversified: 0.7% | ||||||||||
| 6,200 | Cummins, Inc. | 724,780 | ||||||||
| 800 | Deere & Co. | 137,440 | ||||||||
| 862,220 | ||||||||||
| Media: 2.3% | ||||||||||
| 6,000 | Clear Channel Communications, Inc. | 215,400 | ||||||||
| 8,600 | @ | DIRECTV Group, Inc. | 213,882 | |||||||
| 3,970 | McGraw-Hill Cos., Inc. | 194,848 | ||||||||
| 3,800 | @ | Viacom — Class B | 159,676 | |||||||
| 65,250 | Walt Disney Co. | 2,163,038 | ||||||||
| 2,946,844 | ||||||||||
| Mining: 1.2% | ||||||||||
| 15,340 | Freeport-McMoRan Copper & Gold, Inc. | 1,517,586 | ||||||||
| 1,517,586 | ||||||||||
| Miscellaneous Manufacturing: 5.0% | ||||||||||
| 5,500 | 3M Co. | 457,930 | ||||||||
| 4,200 | Cooper Industries Ltd. | 210,924 | ||||||||
| 17,500 | Dover Corp. | 809,900 | ||||||||
| 8,400 | Eaton Corp. | 750,204 | ||||||||
| 73,250 | General Electric Co. | 2,804,734 | ||||||||
| 2,000 | Honeywell International, Inc. | 113,240 | ||||||||
| 4,000 | Illinois Tool Works, Inc. | 222,000 | ||||||||
| 4,100 | ITT Corp. | 264,204 | ||||||||
| 8,175 | Parker Hannifin Corp. | 649,340 | ||||||||
| 5,400 | @@ | Tyco International Ltd. | 216,702 | |||||||
| 6,499,178 | ||||||||||
| Oil & Gas: 10.3% | ||||||||||
| 36,003 | Chevron Corp. | 3,159,983 | ||||||||
| 16,201 | ConocoPhillips | 1,296,728 | ||||||||
| 1,100 | Devon Energy Corp. | 91,091 | ||||||||
| 61,850 | S | ExxonMobil Corp. | 5,514,546 | |||||||
| 2,100 | Hess Corp. | 149,562 | ||||||||
| 13,500 | Marathon Oil Corp. | 754,650 | ||||||||
| 5,600 | Murphy Oil Corp. | 400,512 | ||||||||
| 3,100 | Noble Corp. | 161,603 | ||||||||
| 1,930 | Noble Energy, Inc. | 139,037 | ||||||||
| 9,480 | Occidental Petroleum Corp. | 661,420 | ||||||||
| 3,927 | @ | Transocean, Inc. | 539,138 | |||||||
| 8,000 | Valero Energy Corp. | 520,560 | ||||||||
| 13,388,830 | ||||||||||
| Oil & Gas Services: 1.3% | ||||||||||
| 18,850 | Halliburton Co. | 690,099 | ||||||||
| 1,600 | @ | National Oilwell Varco, Inc. | 109,040 | |||||||
| 9,500 | Schlumberger Ltd. | 887,775 | ||||||||
| 1,686,914 | ||||||||||
| Pharmaceuticals: 6.2% | ||||||||||
| 1,000 | Allergan, Inc. | 67,040 | ||||||||
| 10,960 | AmerisourceBergen Corp. | 497,255 | ||||||||
| 23,900 | Bristol-Myers Squibb Co. | 708,157 | ||||||||
| 26,200 | Eli Lilly & Co. | 1,387,290 | ||||||||
| 1,420 | @ | Express Scripts, Inc. | 96,205 | |||||||
| 7,200 | @ | Gilead Sciences, Inc. | 335,088 | |||||||
| 2,000 | @ | Medco Health Solutions, Inc. | 199,980 | |||||||
| 44,050 | Merck & Co., Inc. | 2,614,808 | ||||||||
| 26,270 | Pfizer, Inc. | 624,175 | ||||||||
83
Table of Contents
| ING Index Plus | PORTFOLIO OF INVESTMENTS | |
| LargeCap Equity Fund IV | AS OF November 30, 2007 (Unaudited) (continued) |
| Shares | Value | |||||||||
| Pharmaceuticals (continued) | ||||||||||
| 39,900 | Schering-Plough Corp. | $ | 1,248,870 | |||||||
| 10,000 | @ | Watson Pharmaceuticals, Inc. | 293,100 | |||||||
| 8,071,968 | ||||||||||
| Pipelines: 0.1% | ||||||||||
| 2,300 | Williams Cos., Inc. | 79,833 | ||||||||
| 79,833 | ||||||||||
| Retail: 4.9% | ||||||||||
| 1,300 | @ | Autozone, Inc. | 145,119 | |||||||
| 5,550 | Best Buy Co., Inc. | 283,328 | ||||||||
| 10,400 | @ | Big Lots, Inc. | 194,168 | |||||||
| 18,200 | @ | Coach, Inc. | 675,948 | |||||||
| 11,450 | Costco Wholesale Corp. | 771,730 | ||||||||
| 11,198 | CVS Caremark Corp. | 448,928 | ||||||||
| 8,750 | Family Dollar Stores, Inc. | 206,063 | ||||||||
| 18,720 | Gap, Inc. | 381,888 | ||||||||
| 9,280 | Lowe’s Cos., Inc. | 226,525 | ||||||||
| 19,300 | McDonald’s Corp. | 1,128,471 | ||||||||
| 2,900 | Polo Ralph Lauren Corp. | 200,042 | ||||||||
| 7,400 | RadioShack Corp. | 136,900 | ||||||||
| 4,100 | @ | Starbucks Corp. | 95,899 | |||||||
| 14,200 | TJX Cos., Inc. | 416,628 | ||||||||
| 17,400 | Wal-Mart Stores, Inc. | 833,460 | ||||||||
| 8,900 | Wendy’s International, Inc. | 249,467 | ||||||||
| 6,394,564 | ||||||||||
| Savings & Loans: 0.8% | ||||||||||
| 44,500 | Hudson City Bancorp., Inc. | 677,290 | ||||||||
| 18,356 | Washington Mutual, Inc. | 357,942 | ||||||||
| 1,035,232 | ||||||||||
| Semiconductors: 3.3% | ||||||||||
| 8,300 | Applied Materials, Inc. | 156,289 | ||||||||
| 76,800 | Intel Corp. | 2,002,944 | ||||||||
| 1,100 | @ | MEMC Electronic Materials, Inc. | 85,338 | |||||||
| 10,100 | @ | Novellus Systems, Inc. | 262,701 | |||||||
| 44,900 | @ | Nvidia Corp. | 1,416,146 | |||||||
| 9,500 | Texas Instruments, Inc. | 299,915 | ||||||||
| 4,223,333 | ||||||||||
| Software: 3.2% | ||||||||||
| 6,600 | @ | Autodesk, Inc. | 310,794 | |||||||
| 8,760 | @ | BMC Software, Inc. | 289,781 | |||||||
| 18,900 | CA, Inc. | 462,861 | ||||||||
| 70,150 | Microsoft Corp. | 2,357,040 | ||||||||
| 9,100 | @ | Novell, Inc. | 63,882 | |||||||
| 30,560 | @ | Oracle Corp. | 616,701 | |||||||
| 4,101,059 | ||||||||||
| Telecommunications: 5.1% | ||||||||||
| 4,000 | @ | American Tower Corp. | 182,160 | |||||||
| 55,576 | AT&T, Inc. | 2,123,559 | ||||||||
| 3,650 | CenturyTel, Inc. | 155,600 | ||||||||
| 50,600 | @ | Cisco Systems, Inc. | 1,417,812 | |||||||
| 14,200 | Corning, Inc. | 344,918 | ||||||||
| 6,000 | @ | Juniper Networks, Inc. | 178,320 | |||||||
| 29,850 | Qualcomm, Inc. | 1,217,283 | ||||||||
| 7,620 | Sprint Nextel Corp. | 118,262 | ||||||||
| 20,450 | Verizon Communications, Inc. | 883,645 | ||||||||
| 6,621,559 | ||||||||||
| Shares | Value | |||||||||
| Transportation: 0.3% | ||||||||||
| 2,540 | CSX Corp. | $ | 106,680 | |||||||
| 2,850 | Norfolk Southern Corp. | 145,949 | ||||||||
| 1,500 | Union Pacific Corp. | 189,210 | ||||||||
| 441,839 | ||||||||||
| Total Common Stock (Cost $96,306,977) | 125,333,170 | |||||||||
| SHORT-TERM INVESTMENTS: 0.3% | ||||||||||
| Mutual Fund: 0.1% | ||||||||||
| 200,000 | ** | ING Institutional Prime | ||||||||
| Money Market Fund | 200,000 | |||||||||
| Total Mutual Fund (Cost $200,000) | 200,000 | |||||||||
| Principal | ||||||||||||
| Amount | Value | |||||||||||
| Repurchase Agreement: 0.2% | ||||||||||||
| $218,000 | Morgan Stanley Repurchase Agreement dated 11/30/07, 4.500%, due 12/03/07, $218,082 to be received upon repurchase (Collateralized by $395,000 Resolution Funding Corporation, Discount Note, Market Value $223,266, due 07/15/20) | 218,000 | ||||||||||
| Total Repurchase Agreement (Cost $218,000) | 218,000 | |||||||||||
| Total Short-Term Investments (Cost $418,000) | 418,000 | |||||||||||
| Total Investments in Securities (Cost $96,724,977)* | 97.2 | % | $ | 125,751,170 | ||||||||
| Other Assets and Liabilities — Net | 2.8 | 3,630,962 | ||||||||||
| Net Assets | 100.0 | % | $ | 129,382,132 | ||||||||
| @ | Non-income producing security | |
| @@ | Foreign Issuer | |
| S | All or a portion of this security is segregated for certain derivatives, when-issued or delayed delivery securities and forward currency exchange contracts. | |
| ** | Investment in affiliate | |
| * | Cost for federal income tax purposes is $98,442,919. |
| Net unrealized appreciation consists of: | ||||
| Gross Unrealized Appreciation | $ | 29,210,909 | ||
| Gross Unrealized Depreciation | (1,902,658 | ) | ||
| Net Unrealized Appreciation | $ | 27,308,251 | ||
| Number | Notional | Unrealized | ||||||||||||||
| Contract | of | Market | Expiration | Appreciation/ | ||||||||||||
| Description | Contracts | Value ($) | Date | (Depreciation) | ||||||||||||
| Long Contracts | ||||||||||||||||
| S&P 500 | 12 | 4,451,100 | 12/20/07 | $ | 811 | |||||||||||
| $ | 811 | |||||||||||||||
84
Table of Contents
| PORTFOLIO OF INVESTMENTS | ||
| ING Principal Protection Fund V | as of November 30, 2007 (Unaudited) | |
| Shares | Value | |||||||||
| COMMON STOCK: 33.2% | ||||||||||
| Advertising: 0.1% | ||||||||||
| 4,700 | Omnicom Group | $ | 229,125 | |||||||
| 229,125 | ||||||||||
| Aerospace/Defense: 0.9% | ||||||||||
| 3,900 | Boeing Co. | 360,906 | ||||||||
| 2,800 | General Dynamics Corp. | 248,584 | ||||||||
| 1,300 | Goodrich Corp. | 92,677 | ||||||||
| 1,350 | L-3 Communications Holdings, Inc. | 149,378 | ||||||||
| 2,870 | Lockheed Martin Corp. | 317,623 | ||||||||
| 2,917 | Northrop Grumman Corp. | 229,830 | ||||||||
| 1,431 | Raytheon Co. | 88,507 | ||||||||
| 6,300 | United Technologies Corp. | 471,051 | ||||||||
| 1,958,556 | ||||||||||
| Agriculture: 0.6% | ||||||||||
| 11,850 | Altria Group, Inc. | 919,086 | ||||||||
| 2,320 | Archer-Daniels-Midland Co. | 84,332 | ||||||||
| 1,180 | Reynolds American, Inc. | 82,624 | ||||||||
| 2,900 | UST, Inc. | 167,910 | ||||||||
| 1,253,952 | ||||||||||
| Apparel: 0.1% | ||||||||||
| 3,880 | Nike, Inc. | 254,722 | ||||||||
| 400 | VF Corp. | 29,916 | ||||||||
| 284,638 | ||||||||||
| Auto Manufacturers: 0.1% | ||||||||||
| 9,630 | @ | Ford Motor Co. | 72,321 | |||||||
| 2,300 | General Motors Corp. | 68,609 | ||||||||
| 2,350 | Paccar, Inc. | 118,934 | ||||||||
| 259,864 | ||||||||||
| Auto Parts & Equipment: 0.1% | ||||||||||
| 3,450 | Johnson Controls, Inc. | 133,239 | ||||||||
| 133,239 | ||||||||||
| Banks: 1.6% | ||||||||||
| 21,757 | Bank of America Corp. | 1,003,650 | ||||||||
| 2,900 | Bank of New York Mellon Corp. | 139,084 | ||||||||
| 4,163 | BB&T Corp. | 150,201 | ||||||||
| 2,579 | Capital One Financial Corp. | 137,486 | ||||||||
| 1,300 | Comerica, Inc. | 59,514 | ||||||||
| 1,100 | Commerce Bancorp., Inc. | 43,802 | ||||||||
| 2,000 | Fifth Third Bancorp. | 59,820 | ||||||||
| 3,900 | Keycorp. | 102,726 | ||||||||
| 1,598 | Marshall & Ilsley Corp. | 50,289 | ||||||||
| 4,851 | Regions Financial Corp. | 128,212 | ||||||||
| 2,250 | State Street Corp. | 179,753 | ||||||||
| 1,850 | SunTrust Bank | 129,704 | ||||||||
| 12,348 | Wachovia Corp. | 530,964 | ||||||||
| 19,500 | Wells Fargo & Co. | 632,385 | ||||||||
| 1,100 | Zions Bancorp. | 60,027 | ||||||||
| 3,407,617 | ||||||||||
| Beverages: 0.9% | ||||||||||
| 7,900 | Anheuser-Busch Cos., Inc. | 416,488 | ||||||||
| 9,700 | Coca-Cola Co. | 602,370 | ||||||||
| 1,500 | @ | Constellation Brands, Inc. | 35,325 | |||||||
| 3,650 | Pepsi Bottling Group, Inc. | 155,746 | ||||||||
| 9,260 | PepsiCo, Inc. | 714,687 | ||||||||
| 1,924,616 | ||||||||||
| Shares | Value | |||||||||
| Biotechnology: 0.3% | ||||||||||
| 5,400 | @ | Amgen, Inc. | $ | 298,350 | ||||||
| 1,300 | @ | Biogen Idec, Inc. | 96,356 | |||||||
| 2,200 | @ | Celgene Corp. | 135,410 | |||||||
| 1,950 | @ | Genzyme Corp. | 146,114 | |||||||
| 500 | @ | Millipore Corp. | 40,940 | |||||||
| 717,170 | ||||||||||
| Building Materials: 0.0% | ||||||||||
| 2,300 | Masco Corp. | 51,520 | ||||||||
| 51,520 | ||||||||||
| Chemicals: 0.8% | ||||||||||
| 2,000 | Air Products & Chemicals, Inc. | 198,080 | ||||||||
| 4,300 | Dow Chemical Co. | 180,342 | ||||||||
| 2,500 | Ecolab, Inc. | 119,750 | ||||||||
| 4,700 | EI DuPont de Nemours & Co. | 216,905 | ||||||||
| 1,200 | International Flavors & Fragrances, Inc. | 60,168 | ||||||||
| 3,500 | Monsanto Co. | 347,795 | ||||||||
| 1,750 | PPG Industries, Inc. | 120,120 | ||||||||
| 2,000 | Praxair, Inc. | 170,760 | ||||||||
| 750 | Sherwin-Williams Co. | 47,123 | ||||||||
| 3,700 | Sigma-Aldrich Corp. | 194,805 | ||||||||
| 1,655,848 | ||||||||||
| Coal: 0.1% | ||||||||||
| 900 | Consol Energy, Inc. | 53,352 | ||||||||
| 1,200 | Peabody Energy Corp. | 66,768 | ||||||||
| 120,120 | ||||||||||
| Commercial Services: 0.2% | ||||||||||
| 1,000 | @ | Apollo Group, Inc. — Class A | 76,520 | |||||||
| 2,000 | McKesson Corp. | 133,460 | ||||||||
| 1,200 | Moody’s Corp. | 45,192 | ||||||||
| 1,700 | Robert Half International, Inc. | 45,832 | ||||||||
| 2,400 | RR Donnelley & Sons Co. | 87,984 | ||||||||
| 4,190 | Western Union Co. | 94,694 | ||||||||
| 483,682 | ||||||||||
| Computers: 1.6% | ||||||||||
| 500 | @ | Affiliated Computer Services, Inc. | 20,980 | |||||||
| 5,000 | @ | Apple, Inc. | 911,100 | |||||||
| 1,700 | @ | Cognizant Technology Solutions Corp. | 52,870 | |||||||
| 1,000 | @ | Computer Sciences Corp. | 52,820 | |||||||
| 14,630 | @ | Dell, Inc. | 359,020 | |||||||
| 13,400 | @ | EMC Corp. | 258,218 | |||||||
| 15,100 | Hewlett-Packard Co. | 772,516 | ||||||||
| 7,500 | International Business Machines Corp. | 788,850 | ||||||||
| 1,850 | @ | Lexmark International, Inc. | 64,528 | |||||||
| 1,200 | @ | Sandisk Corp. | 44,928 | |||||||
| 3,750 | @ | Sun Microsystems, Inc. | 77,925 | |||||||
| 3,403,755 | ||||||||||
| Cosmetics/Personal Care: 0.8% | ||||||||||
| 1,700 | Avon Products, Inc. | 69,785 | ||||||||
| 3,700 | Colgate-Palmolive Co. | 296,296 | ||||||||
| 17,275 | Procter & Gamble Co. | 1,278,350 | ||||||||
| 1,644,431 | ||||||||||
| Diversified Financial Services: 2.5% | ||||||||||
| 6,000 | American Express Co. | 353,880 | ||||||||
| 1,260 | Ameriprise Financial, Inc. | 73,949 | ||||||||
| 1,140 | Bear Stearns Cos., Inc. | 113,658 | ||||||||
| 4,400 | Charles Schwab Corp. | 106,964 | ||||||||
| 1,650 | CIT Group, Inc. | 43,890 | ||||||||
85
Table of Contents
| PORTFOLIO OF INVESTMENTS | ||
| ING Principal Protection Fund V | as of November 30, 2007 (Unaudited)(Continued) | |
| Shares | Value | |||||||||
| Diversified Financial Services (continued) | ||||||||||
| 26,200 | Citigroup, Inc. | $ | 872,460 | |||||||
| 290 | CME Group, Inc. | 190,994 | ||||||||
| 3,198 | Countrywide Financial Corp. | 34,602 | ||||||||
| 2,875 | Discover Financial Services | 49,939 | ||||||||
| 9,900 | @ | E*Trade Financial Corp. | 45,540 | |||||||
| 5,050 | Fannie Mae | 194,021 | ||||||||
| 1,100 | Federated Investors, Inc. | 44,869 | ||||||||
| 500 | Franklin Resources, Inc. | 61,590 | ||||||||
| 3,600 | Freddie Mac | 126,252 | ||||||||
| 2,900 | Goldman Sachs Group, Inc. | 657,256 | ||||||||
| 400 | @ | IntercontinentalExchange, Inc. | 66,784 | |||||||
| 2,000 | Janus Capital Group, Inc. | 67,140 | ||||||||
| 20,400 | JPMorgan Chase & Co. | 930,648 | ||||||||
| 600 | Legg Mason, Inc. | 45,786 | ||||||||
| 4,260 | Lehman Brothers Holdings, Inc. | 266,804 | ||||||||
| 6,900 | Merrill Lynch & Co., Inc. | 413,586 | ||||||||
| 5,950 | Morgan Stanley | 313,684 | ||||||||
| 1,450 | Nyse Euronext | 125,570 | ||||||||
| 2,000 | SLM Corp. | 76,160 | ||||||||
| 600 | T. Rowe Price Group, Inc. | 36,888 | ||||||||
| 5,312,914 | ||||||||||
| Electric: 1.2% | ||||||||||
| 1,000 | Allegheny Energy, Inc. | 60,750 | ||||||||
| 1,500 | Constellation Energy Group, Inc. | 150,315 | ||||||||
| 5,000 | Dominion Resources, Inc. | 236,150 | ||||||||
| 1,900 | DTE Energy Co. | 93,195 | ||||||||
| 10,400 | Duke Energy Corp. | 205,816 | ||||||||
| 1,120 | Edison International | 62,698 | ||||||||
| 2,900 | Entergy Corp. | 346,666 | ||||||||
| 3,900 | Exelon Corp. | 316,173 | ||||||||
| 3,650 | FirstEnergy Corp. | 250,244 | ||||||||
| 4,400 | FPL Group, Inc. | 306,944 | ||||||||
| 4,300 | PPL Corp. | 219,128 | ||||||||
| 2,650 | Public Service Enterprise Group, Inc. | 253,711 | ||||||||
| 2,501,790 | ||||||||||
| Electrical Components & Equipment: 0.2% | ||||||||||
| 5,700 | Emerson Electric Co. | 325,014 | ||||||||
| 325,014 | ||||||||||
| Electronics: 0.3% | ||||||||||
| 2,050 | @ | Agilent Technologies, Inc. | 77,552 | |||||||
| 2,400 | Applera Corp. — Applied Biosystems Group | 81,984 | ||||||||
| 1,900 | Jabil Circuit, Inc. | 32,205 | ||||||||
| 3,900 | @ | Thermo Electron Corp. | 224,796 | |||||||
| 2,375 | @@ | Tyco Electronics Ltd. | 88,801 | |||||||
| 1,200 | @ | Waters Corp. | 93,648 | |||||||
| 598,986 | ||||||||||
| Engineering & Construction: 0.0% | ||||||||||
| 400 | Fluor Corp. | 58,868 | ||||||||
| 400 | @ | Jacobs Engineering Group, Inc. | 33,508 | |||||||
| 92,376 | ||||||||||
| Entertainment: 0.0% | ||||||||||
| 1,950 | International Game Technology | 85,137 | ||||||||
| 85,137 | ||||||||||
| Environmental Control: 0.0% | ||||||||||
| 3,100 | @ | Allied Waste Industries, Inc. | 35,371 | |||||||
| 35,371 | ||||||||||
| Shares | Value | |||||||||
| Food: 0.5% | ||||||||||
| 3,200 | General Mills, Inc. | $ | 192,480 | |||||||
| 3,250 | HJ Heinz Co. | 153,725 | ||||||||
| 4,500 | Kellogg Co. | 243,180 | ||||||||
| 3,322 | Kraft Foods, Inc. | 114,775 | ||||||||
| 4,900 | Kroger Co. | 140,875 | ||||||||
| 1,250 | Safeway, Inc. | 43,500 | ||||||||
| 2,200 | Sysco Corp. | 71,522 | ||||||||
| 2,100 | WM Wrigley Jr. Co. | 134,400 | ||||||||
| 1,094,457 | ||||||||||
| Forest Products & Paper: 0.0% | ||||||||||
| 2,500 | International Paper Co. | 84,375 | ||||||||
| 84,375 | ||||||||||
| Gas: 0.1% | ||||||||||
| 2,100 | Sempra Energy | 131,502 | ||||||||
| 131,502 | ||||||||||
| Hand/Machine Tools: 0.1% | ||||||||||
| 870 | Black & Decker Corp. | 71,906 | ||||||||
| 1,200 | Snap-On, Inc. | 58,656 | ||||||||
| 1,000 | Stanley Works | 52,150 | ||||||||
| 182,712 | ||||||||||
| Healthcare — Products: 1.0% | ||||||||||
| 4,100 | Baxter International, Inc. | 245,467 | ||||||||
| 3,600 | @ | Boston Scientific Corp. | 45,468 | |||||||
| 2,375 | @@ | Covidien Ltd. | 95,261 | |||||||
| 1,000 | CR Bard, Inc. | 84,530 | ||||||||
| 15,200 | Johnson & Johnson | 1,029,648 | ||||||||
| 6,100 | Medtronic, Inc. | 310,185 | ||||||||
| 2,300 | @ | St. Jude Medical, Inc. | 91,425 | |||||||
| 1,600 | Stryker Corp. | 116,208 | ||||||||
| 500 | @ | Zimmer Holdings, Inc. | 32,365 | |||||||
| 2,050,557 | ||||||||||
| Healthcare — Services: 0.5% | ||||||||||
| 3,210 | Aetna, Inc. | 179,375 | ||||||||
| 1,235 | @ | Coventry Health Care, Inc. | 71,482 | |||||||
| 1,290 | @ | Humana, Inc. | 99,369 | |||||||
| 1,400 | @ | Laboratory Corp. of America Holdings | 101,738 | |||||||
| 8,070 | UnitedHealth Group, Inc. | 443,850 | ||||||||
| 2,880 | @ | WellPoint, Inc. | 242,525 | |||||||
| 1,138,339 | ||||||||||
| Holding Companies — Diversified: 0.0% | ||||||||||
| 900 | Leucadia National Corp. | 42,264 | ||||||||
| 42,264 | ||||||||||
| Home Builders: 0.0% | ||||||||||
| 1,400 | Centex Corp. | 29,204 | ||||||||
| 2,700 | D.R. Horton, Inc. | 32,319 | ||||||||
| 1,500 | KB Home | 31,335 | ||||||||
| 900 | Lennar Corp. | 14,256 | ||||||||
| 107,114 | ||||||||||
| Home Furnishings: 0.0% | ||||||||||
| 400 | Harman International Industries, Inc. | 29,440 | ||||||||
| 400 | Whirlpool Corp. | 32,384 | ||||||||
| 61,824 | ||||||||||
| Household Products/Wares: 0.2% | ||||||||||
| 5,350 | Kimberly-Clark Corp. | 373,484 | ||||||||
| 373,484 | ||||||||||
86
Table of Contents
| PORTFOLIO OF INVESTMENTS | ||
| ING Principal Protection Fund V | as of November 30, 2007 (Unaudited)(Continued) | |
| Shares | Value | |||||||||
| Housewares: 0.0% | ||||||||||
| 2,300 | Newell Rubbermaid, Inc. | $ | 61,594 | |||||||
| 61,594 | ||||||||||
| Insurance: 1.7% | ||||||||||
| 2,960 | @@ | ACE Ltd. | 177,097 | |||||||
| 2,850 | Aflac, Inc. | 178,524 | ||||||||
| 6,310 | Allstate Corp. | 322,567 | ||||||||
| 1,350 | AMBAC Financial Group, Inc. | 36,761 | ||||||||
| 15,000 | American International Group, Inc. | 871,950 | ||||||||
| 2,150 | AON Corp. | 107,436 | ||||||||
| 1,800 | Assurant, Inc. | 117,774 | ||||||||
| 3,280 | Chubb Corp. | 178,924 | ||||||||
| 2,000 | Cigna Corp. | 107,220 | ||||||||
| 1,950 | Hartford Financial Services Group, Inc. | 185,874 | ||||||||
| 800 | Loews Corp. | 38,232 | ||||||||
| 1,400 | Marsh & McLennan Cos., Inc. | 35,168 | ||||||||
| 1,900 | MBIA, Inc. | 69,369 | ||||||||
| 5,020 | Metlife, Inc. | 329,262 | ||||||||
| 3,680 | Progressive Corp. | 67,712 | ||||||||
| 3,800 | Prudential Financial, Inc. | 357,732 | ||||||||
| 1,640 | Safeco Corp. | 94,644 | ||||||||
| 1,050 | Torchmark Corp. | 64,764 | ||||||||
| 5,050 | Travelers Cos., Inc. | 268,206 | ||||||||
| 1,900 | @@ | XL Capital Ltd. | 111,207 | |||||||
| 3,720,423 | ||||||||||
| Internet: 0.7% | ||||||||||
| 1,000 | @ | Akamai Technologies, Inc. | 38,060 | |||||||
| 1,600 | @ | Amazon.com, Inc. | 144,896 | |||||||
| 6,100 | @ | eBay, Inc. | 204,533 | |||||||
| 1,100 | @ | Expedia, Inc. | 35,860 | |||||||
| 1,200 | @ | Google, Inc. — Class A | 831,600 | |||||||
| 1,600 | @ | IAC/InterActiveCorp. | 44,528 | |||||||
| 5,369 | @ | Symantec Corp. | 95,568 | |||||||
| 4,900 | @ | Yahoo!, Inc. | 131,369 | |||||||
| 1,526,414 | ||||||||||
| Investment Companies: 0.0% | ||||||||||
| 900 | American Capital Strategies Ltd. | 33,849 | ||||||||
| 33,849 | ||||||||||
| Iron/Steel: 0.1% | ||||||||||
| 1,640 | Nucor Corp. | 97,104 | ||||||||
| 740 | United States Steel Corp. | 72,298 | ||||||||
| 169,402 | ||||||||||
| Leisure Time: 0.1% | ||||||||||
| 2,200 | Carnival Corp. | 99,264 | ||||||||
| 700 | Harley-Davidson, Inc. | 33,614 | ||||||||
| 132,878 | ||||||||||
| Lodging: 0.1% | ||||||||||
| 1,100 | Harrah’s Entertainment, Inc. | 96,877 | ||||||||
| 2,600 | Marriott International, Inc. | 97,500 | ||||||||
| 2,200 | Starwood Hotels & Resorts Worldwide, Inc. | 118,096 | ||||||||
| 312,473 | ||||||||||
| Machinery — Construction & Mining: 0.1% | ||||||||||
| 3,100 | Caterpillar, Inc. | 222,890 | ||||||||
| 700 | @ | Terex Corp. | 45,115 | |||||||
| 268,005 | ||||||||||
| Shares | Value | |||||||||
| Machinery — Diversified: 0.2% | ||||||||||
| 1,000 | Cummins, Inc. | $ | 116,900 | |||||||
| 1,300 | Deere & Co. | 223,340 | ||||||||
| 800 | Rockwell Automation, Inc. | 54,312 | ||||||||
| 394,552 | ||||||||||
| Media: 0.8% | ||||||||||
| 2,300 | Clear Channel Communications, Inc. | 82,570 | ||||||||
| 9,550 | @ | Comcast Corp. — Class A | 196,157 | |||||||
| 7,000 | @ | DIRECTV Group, Inc. | 174,090 | |||||||
| 800 | EW Scripps Co. | 34,760 | ||||||||
| 1,470 | McGraw-Hill Cos., Inc. | 72,148 | ||||||||
| 700 | Meredith Corp. | 38,535 | ||||||||
| 11,500 | News Corp. — Class A | 242,305 | ||||||||
| 13,600 | Time Warner, Inc. | 234,736 | ||||||||
| 4,900 | @ | Viacom — Class B | 205,898 | |||||||
| 14,000 | Walt Disney Co. | 464,100 | ||||||||
| 1,745,299 | ||||||||||
| Mining: 0.2% | ||||||||||
| 1,000 | Alcoa, Inc. | 36,370 | ||||||||
| 2,864 | Freeport-McMoRan Copper & Gold, Inc. | 283,336 | ||||||||
| 1,500 | Newmont Mining Corp. | 74,535 | ||||||||
| 394,241 | ||||||||||
| Miscellaneous Manufacturing: 1.9% | ||||||||||
| 3,900 | 3M Co. | 324,714 | ||||||||
| 2,000 | Cooper Industries Ltd. | 100,440 | ||||||||
| 3,550 | Danaher Corp. | 308,211 | ||||||||
| 3,700 | Dover Corp. | 171,236 | ||||||||
| 1,600 | Eastman Kodak Co. | 37,568 | ||||||||
| 2,300 | Eaton Corp. | 205,413 | ||||||||
| 52,950 | General Electric Co. | 2,027,456 | ||||||||
| 3,900 | Honeywell International, Inc. | 220,818 | ||||||||
| 3,000 | Illinois Tool Works, Inc. | 166,500 | ||||||||
| 2,400 | ITT Corp. | 154,656 | ||||||||
| 2,000 | Parker Hannifin Corp. | 158,860 | ||||||||
| 500 | Textron, Inc. | 34,525 | ||||||||
| 2,275 | @@ | Tyco International Ltd. | 91,296 | |||||||
| 4,001,693 | ||||||||||
| Oil & Gas: 3.3% | ||||||||||
| 1,300 | Anadarko Petroleum Corp. | 73,580 | ||||||||
| 1,700 | Apache Corp. | 164,543 | ||||||||
| 2,000 | Chesapeake Energy Corp. | 75,700 | ||||||||
| 13,661 | Chevron Corp. | 1,199,026 | ||||||||
| 10,147 | ConocoPhillips | 812,166 | ||||||||
| 3,800 | Devon Energy Corp. | 314,678 | ||||||||
| 1,400 | ENSCO International, Inc. | 75,390 | ||||||||
| 32,650 | ExxonMobil Corp. | 2,911,074 | ||||||||
| 2,000 | Hess Corp. | 142,440 | ||||||||
| 4,340 | Marathon Oil Corp. | 242,606 | ||||||||
| 1,200 | Murphy Oil Corp. | 85,824 | ||||||||
| 2,400 | Noble Corp. | 125,112 | ||||||||
| 1,000 | Noble Energy, Inc. | 72,040 | ||||||||
| 5,300 | Occidental Petroleum Corp. | 369,781 | ||||||||
| 800 | Tesoro Petroleum Corp. | 39,344 | ||||||||
| 1,609 | @ | Transocean, Inc. | 220,900 | |||||||
| 3,500 | Valero Energy Corp. | 227,745 | ||||||||
| 600 | XTO Energy, Inc. | 37,092 | ||||||||
| 7,189,041 | ||||||||||
| Oil & Gas Services: 0.5% | ||||||||||
| 500 | Baker Hughes, Inc. | 40,135 | ||||||||
| 5,400 | Halliburton Co. | 197,694 | ||||||||
| 2,300 | @ | National Oilwell Varco, Inc. | 156,745 | |||||||
87
Table of Contents
| PORTFOLIO OF INVESTMENTS | ||
| ING Principal Protection Fund V | as of November 30, 2007 (Unaudited)(Continued) | |
| Shares | Value | |||||||||
| Oil & Gas Services (continued) | ||||||||||
| 6,100 | Schlumberger Ltd. | $ | 570,045 | |||||||
| 1,500 | Smith International, Inc. | 94,080 | ||||||||
| 1,058,699 | ||||||||||
| Packaging & Containers: 0.1% | ||||||||||
| 2,500 | Ball Corp. | 115,625 | ||||||||
| 1,700 | @ | Pactiv Corp. | 43,180 | |||||||
| 158,805 | ||||||||||
| Pharmaceuticals: 1.9% | ||||||||||
| 4,700 | Abbott Laboratories | 270,297 | ||||||||
| 1,400 | Allergan, Inc. | 93,856 | ||||||||
| 1,500 | AmerisourceBergen Corp. | 68,055 | ||||||||
| 11,800 | Bristol-Myers Squibb Co. | 349,634 | ||||||||
| 1,140 | Cardinal Health, Inc. | 69,027 | ||||||||
| 7,100 | Eli Lilly & Co. | 375,945 | ||||||||
| 1,420 | @ | Express Scripts, Inc. | 96,205 | |||||||
| 950 | @ | Forest Laboratories, Inc. | 36,623 | |||||||
| 4,500 | @ | Gilead Sciences, Inc. | 209,430 | |||||||
| 1,000 | @ | Hospira, Inc. | 43,300 | |||||||
| 2,000 | @ | Medco Health Solutions, Inc. | 199,980 | |||||||
| 12,400 | Merck & Co., Inc. | 736,064 | ||||||||
| 37,190 | Pfizer, Inc. | 883,634 | ||||||||
| 10,200 | Schering-Plough Corp. | 319,260 | ||||||||
| 1,400 | @ | Watson Pharmaceuticals, Inc. | 41,034 | |||||||
| 5,300 | Wyeth | 260,230 | ||||||||
| 4,052,574 | ||||||||||
| Pipelines: 0.1% | ||||||||||
| 1,400 | Questar Corp. | 74,830 | ||||||||
| 4,000 | Spectra Energy Corp. | 98,560 | ||||||||
| 2,850 | Williams Cos., Inc. | 98,924 | ||||||||
| 272,314 | ||||||||||
| Retail: 1.8% | ||||||||||
| 1,000 | Abercrombie & Fitch Co. | 82,040 | ||||||||
| 900 | @ | Autozone, Inc. | 100,467 | |||||||
| 1,000 | @ | Bed Bath & Beyond, Inc. | 31,450 | |||||||
| 3,085 | Best Buy Co., Inc. | 157,489 | ||||||||
| 2,900 | @ | Big Lots, Inc. | 54,143 | |||||||
| 4,320 | @ | Coach, Inc. | 160,445 | |||||||
| 3,700 | Costco Wholesale Corp. | 249,380 | ||||||||
| 9,410 | CVS Caremark Corp. | 377,247 | ||||||||
| 2,200 | Darden Restaurants, Inc. | 87,538 | ||||||||
| 1,950 | Family Dollar Stores, Inc. | 45,923 | ||||||||
| 4,390 | Gap, Inc. | 89,556 | ||||||||
| 6,470 | Home Depot, Inc. | 184,783 | ||||||||
| 750 | JC Penney Co., Inc. | 33,090 | ||||||||
| 1,450 | @ | Kohl’s Corp. | 71,456 | |||||||
| 10,560 | Lowe’s Cos., Inc. | 257,770 | ||||||||
| 7,200 | McDonald’s Corp. | 420,984 | ||||||||
| 1,400 | Nordstrom, Inc. | 46,956 | ||||||||
| 1,200 | Polo Ralph Lauren Corp. | 82,776 | ||||||||
| 1,800 | RadioShack Corp. | 33,300 | ||||||||
| 450 | @ | Sears Holding Corp. | 47,480 | |||||||
| 1,610 | Staples, Inc. | 38,157 | ||||||||
| 4,150 | @ | Starbucks Corp. | 97,069 | |||||||
| 3,650 | Target Corp. | 219,219 | ||||||||
| 4,850 | TJX Cos., Inc. | 142,299 | ||||||||
| 1,300 | Walgreen Co. | 47,567 | ||||||||
| 11,500 | Wal-Mart Stores, Inc. | 550,850 | ||||||||
| 1,600 | Wendy’s International, Inc. | 44,848 | ||||||||
| 2,900 | Yum! Brands, Inc. | 107,735 | ||||||||
| 3,862,017 | ||||||||||
| Shares | Value | |||||||||
| Savings & Loans: 0.2% | ||||||||||
| 13,400 | Hudson City Bancorp., Inc. | $ | 203,948 | |||||||
| 6,962 | Washington Mutual, Inc. | 135,759 | ||||||||
| 339,707 | ||||||||||
| Semiconductors: 0.9% | ||||||||||
| 2,600 | Analog Devices, Inc. | 80,028 | ||||||||
| 10,300 | Applied Materials, Inc. | 193,949 | ||||||||
| 1,200 | @ | Broadcom Corp. | 32,088 | |||||||
| 35,300 | Intel Corp. | 920,624 | ||||||||
| 1,000 | KLA-Tencor Corp. | 48,080 | ||||||||
| 1,200 | @ | MEMC Electronic Materials, Inc. | 93,096 | |||||||
| 2,450 | National Semiconductor Corp. | 56,007 | ||||||||
| 1,650 | @ | Novellus Systems, Inc. | 42,917 | |||||||
| 2,900 | @ | Nvidia Corp. | 91,466 | |||||||
| 2,400 | @ | QLogic Corp. | 32,448 | |||||||
| 7,800 | Texas Instruments, Inc. | 246,246 | ||||||||
| 1,900 | Xilinx, Inc. | 41,610 | ||||||||
| 1,878,559 | ||||||||||
| Software: 1.2% | ||||||||||
| 2,790 | @ | Adobe Systems, Inc. | 117,571 | |||||||
| 1,650 | @ | Autodesk, Inc. | 77,699 | |||||||
| 2,250 | Automatic Data Processing, Inc. | 101,385 | ||||||||
| 2,200 | @ | BMC Software, Inc. | 72,776 | |||||||
| 5,600 | CA, Inc. | 137,144 | ||||||||
| 600 | @ | Electronic Arts, Inc. | 33,714 | |||||||
| 900 | Fidelity National Information Services, Inc. | 38,898 | ||||||||
| 1,050 | @ | Fiserv, Inc. | 53,897 | |||||||
| 44,800 | Microsoft Corp. | 1,505,280 | ||||||||
| 5,200 | @ | Novell, Inc. | 36,504 | |||||||
| 22,840 | @ | Oracle Corp. | 460,911 | |||||||
| 1,400 | Paychex, Inc. | 54,600 | ||||||||
| 2,690,379 | ||||||||||
| Telecommunications: 2.0% | ||||||||||
| 2,300 | @ | American Tower Corp. | 104,742 | |||||||
| 33,948 | AT&T, Inc. | 1,297,153 | ||||||||
| 2,400 | CenturyTel, Inc. | 102,312 | ||||||||
| 900 | @ | Ciena Corp. | 39,582 | |||||||
| 32,800 | @ | Cisco Systems, Inc. | 919,056 | |||||||
| 8,950 | Corning, Inc. | 217,396 | ||||||||
| 685 | Embarq Corp. | 34,901 | ||||||||
| 2,700 | @ | JDS Uniphase Corp. | 36,342 | |||||||
| 2,400 | @ | Juniper Networks, Inc. | 71,328 | |||||||
| 11,080 | Motorola, Inc. | 176,948 | ||||||||
| 11,050 | Qualcomm, Inc. | 450,619 | ||||||||
| 8,900 | @ | Qwest Communications International, Inc. | 59,007 | |||||||
| 11,002 | Sprint Nextel Corp. | 170,751 | ||||||||
| 12,150 | Verizon Communications, Inc. | 525,002 | ||||||||
| 6,800 | Windstream Corp. | 88,060 | ||||||||
| 4,293,199 | ||||||||||
| Toys/Games/Hobbies: 0.0% | ||||||||||
| 1,800 | Hasbro, Inc. | 49,986 | ||||||||
| 49,986 | ||||||||||
| Transportation: 0.5% | ||||||||||
| 400 | Burlington Northern Santa Fe Corp. | 33,408 | ||||||||
| 800 | CH Robinson Worldwide, Inc. | 41,240 | ||||||||
| 4,340 | CSX Corp. | 182,280 | ||||||||
| 800 | Expeditors International Washington, Inc. | 37,536 | ||||||||
88
Table of Contents
| PORTFOLIO OF INVESTMENTS | ||
| ING Principal Protection Fund V | as of November 30, 2007 (Unaudited) (Continued) | |
| Shares | Value | |||||||||
| Transportation (continued) | ||||||||||
| 2,000 | FedEx Corp. | $ | 196,940 | |||||||
| 2,850 | Norfolk Southern Corp. | 145,949 | ||||||||
| 1,950 | Union Pacific Corp. | 245,973 | ||||||||
| 3,500 | United Parcel Service, Inc. — Class B | 257,867 | ||||||||
| 1,141,193 | ||||||||||
| Total Common Stock (Cost $70,492,090) | 71,493,645 | |||||||||
| REAL ESTATE INVESTMENT TRUSTS: 0.2% | ||||||||||
| Hotels: 0.0% | ||||||||||
| 2,300 | Host Hotels & Resorts, Inc. | 44,137 | ||||||||
| 44,137 | ||||||||||
| Regional Malls: 0.1% | ||||||||||
| 700 | General Growth Properties, Inc. | 32,508 | ||||||||
| 400 | Simon Property Group, Inc. | 39,380 | ||||||||
| 71,888 | ||||||||||
| Warehouse/Industrial: 0.1% | ||||||||||
| 2,200 | Prologis | 143,924 | ||||||||
| 143,924 | ||||||||||
| Total Real Estate Investment Trusts (Cost $289,717) | 259,949 | |||||||||
| Principal | ||||||||||
| Amount | Value | |||||||||
| U.S. GOVERNMENT AGENCY OBLIGATIONS: 57.6% | ||||||||||
| Federal National Mortgage Corporation: 57.6% | ||||||||||
| $ | 124,700,000 | Z | 3.500%, due 01/22/08 | 124,079,069 | ||||||
| Total U.S. Government Agency Obligations (Cost $124,119,668) | 124,079,069 | |||||||||
| Total Long-Term Investments (Cost $194,901,475) | 195,832,663 | |||||||||
| Shares | Value | |||||||||
| SHORT-TERM INVESTMENTS: 9.9% | ||||||||||
| Mutual Fund: 2.5% | ||||||||||
| 5,475,000 | ** | ING Institutional Prime Money Market Fund | 5,475,000 | |||||||
| Total Mutual Fund (Cost $5,475,000) | 5,475,000 | |||||||||
| Principal | ||||||||||
| Amount | Value | |||||||||
| U.S. Government Agency Obligations: 7.2% | ||||||||||
| $ | 6,555,000 | Z | Fannie Mae, 4.230%, due 01/22/08 | 6,514,421 | ||||||
| 9,000,000 | Z | Freddie Mac, 4.260%, due 01/18/08 | 8,948,060 | |||||||
| Total U.S. Government Agency Obligations (Cost $15,462,481) | 15,462,481 | |||||||||
| Principal | ||||||||||||||
| Amount | Value | |||||||||||||
| Repurchase Agreement: 0.2% | ||||||||||||||
| $ | 439,000 | Morgan Stanley Repurchase Agreement dated 11/30/07, 4.500%, due 12/03/07, $439,165 to be received upon repurchase (Collateralized by $795,000 Resolution Funding Corporation, Discount Note, Market Value $449,358, due 07/15/20) | $ | 439,000 | ||||||||||
| Total Repurchase Agreement (Cost $439,000) | 439,000 | |||||||||||||
| Total Short-Term Investments (Cost $21,376,481) | 21,376,481 | |||||||||||||
Total Investments in Securities (Cost $216,277,956)* | 100.9 | % | $ | 217,209,144 | ||||||||||
Other Assets and Liabilities — Net | (0.9 | ) | (1,852,771 | ) | ||||||||||
Net Assets | 100.0 | % | $ | 215,356,373 | ||||||||||
| @ | Non-income producing security | |
| @@ | Foreign Issuer | |
| ** | Investment in affiliate | |
| Z | Indicates Zero Coupon Bond; rate shown reflects current effective yield. | |
| * | Cost for federal income tax purposes is $217,900,087. |
| Net unrealized depreciation consists of: | ||||
| Gross Unrealized Appreciation | $ | 2,976,555 | ||
| Gross Unrealized Depreciation | (3,667,498 | ) | ||
| Net Unrealized Depreciation | $ | (690,943 | ) | |
89
Table of Contents
| PORTFOLIO OF INVESTMENTS | ||||
| ING Principal Protection Fund VI | as of November 30, 2007 (Unaudited) | |||
| Shares | Value | |||||||||
| COMMON STOCK: 33.0% | ||||||||||
| Advertising: 0.1% | ||||||||||
| 4,400 | Omnicom Group | $ | 214,500 | |||||||
| 214,500 | ||||||||||
| Aerospace/Defense: 0.9% | ||||||||||
| 3,300 | Boeing Co. | 305,382 | ||||||||
| 2,500 | General Dynamics Corp. | 221,950 | ||||||||
| 1,200 | Goodrich Corp. | 85,548 | ||||||||
| 1,300 | L-3 Communications Holdings, Inc. | 143,845 | ||||||||
| 2,630 | Lockheed Martin Corp. | 291,062 | ||||||||
| 2,727 | Northrop Grumman Corp. | 214,860 | ||||||||
| 1,341 | Raytheon Co. | 82,941 | ||||||||
| 5,850 | United Technologies Corp. | 437,405 | ||||||||
| 1,782,993 | ||||||||||
| Agriculture: 0.6% | ||||||||||
| 10,900 | Altria Group, Inc. | 845,404 | ||||||||
| 2,360 | Archer-Daniels-Midland Co. | 85,786 | ||||||||
| 920 | Reynolds American, Inc. | 64,418 | ||||||||
| 2,800 | UST, Inc. | 162,120 | ||||||||
| 1,157,728 | ||||||||||
| Apparel: 0.1% | ||||||||||
| 3,700 | Nike, Inc. | 242,905 | ||||||||
| 400 | VF Corp. | 29,916 | ||||||||
| 272,821 | ||||||||||
| Auto Manufacturers: 0.1% | ||||||||||
| 9,000 | @ | Ford Motor Co. | 67,590 | |||||||
| 2,200 | General Motors Corp. | 65,626 | ||||||||
| 2,150 | Paccar, Inc. | 108,812 | ||||||||
| 242,028 | ||||||||||
| Auto Parts & Equipment: 0.1% | ||||||||||
| 3,050 | Johnson Controls, Inc. | 117,791 | ||||||||
| 117,791 | ||||||||||
| Banks: 1.6% | ||||||||||
| 20,065 | Bank of America Corp. | 925,598 | ||||||||
| 2,600 | Bank of New York Mellon Corp. | 124,696 | ||||||||
| 3,854 | BB&T Corp. | 139,052 | ||||||||
| 2,342 | Capital One Financial Corp. | 124,852 | ||||||||
| 1,300 | Comerica, Inc. | 59,514 | ||||||||
| 1,000 | Commerce Bancorp., Inc. | 39,820 | ||||||||
| 1,750 | Fifth Third Bancorp. | 52,343 | ||||||||
| 3,400 | Keycorp. | 89,556 | ||||||||
| 1,000 | Marshall & Ilsley Corp. | 31,470 | ||||||||
| 5,414 | Regions Financial Corp. | 143,092 | ||||||||
| 2,100 | State Street Corp. | 167,769 | ||||||||
| 1,700 | SunTrust Bank | 119,187 | ||||||||
| 10,767 | Wachovia Corp. | 462,981 | ||||||||
| 18,000 | Wells Fargo & Co. | 583,740 | ||||||||
| 1,000 | Zions Bancorp. | 54,570 | ||||||||
| 3,118,240 | ||||||||||
| Beverages: 0.9% | ||||||||||
| 7,300 | Anheuser-Busch Cos., Inc. | 384,856 | ||||||||
| 9,150 | Coca-Cola Co. | 568,215 | ||||||||
| 1,400 | @ | Constellation Brands, Inc. | 32,970 | |||||||
| 3,050 | Pepsi Bottling Group, Inc. | 130,144 | ||||||||
| 8,490 | PepsiCo, Inc. | 655,258 | ||||||||
| 1,771,443 | ||||||||||
| Shares | Value | |||||||||
| Biotechnology: 0.3% | ||||||||||
| 5,050 | @ | Amgen, Inc. | $ | 279,013 | ||||||
| 1,300 | @ | Biogen Idec, Inc. | 96,356 | |||||||
| 1,560 | @ | Celgene Corp. | 96,018 | |||||||
| 1,300 | @ | Genzyme Corp. | 97,409 | |||||||
| 400 | @ | Millipore Corp. | 32,752 | |||||||
| 601,548 | ||||||||||
| Building Materials: 0.0% | ||||||||||
| 2,150 | Masco Corp. | 48,160 | ||||||||
| 48,160 | ||||||||||
| Chemicals: 0.8% | ||||||||||
| 2,000 | Air Products & Chemicals, Inc. | 198,080 | ||||||||
| 3,800 | Dow Chemical Co. | 159,372 | ||||||||
| 2,300 | Ecolab, Inc. | 110,170 | ||||||||
| 4,400 | EI DuPont de Nemours & Co. | 203,060 | ||||||||
| 1,100 | International Flavors & Fragrances, Inc. | 55,154 | ||||||||
| 3,180 | Monsanto Co. | 315,997 | ||||||||
| 1,510 | PPG Industries, Inc. | 103,646 | ||||||||
| 1,800 | Praxair, Inc. | 153,684 | ||||||||
| 850 | Sherwin-Williams Co. | 53,406 | ||||||||
| 3,500 | Sigma-Aldrich Corp. | 184,275 | ||||||||
| 1,536,844 | ||||||||||
| Coal: 0.1% | ||||||||||
| 800 | Consol Energy, Inc. | 47,424 | ||||||||
| 1,100 | Peabody Energy Corp. | 61,204 | ||||||||
| 108,628 | ||||||||||
| Commercial Services: 0.2% | ||||||||||
| 1,000 | @ | Apollo Group, Inc. — Class A | 76,520 | |||||||
| 1,810 | McKesson Corp. | 120,781 | ||||||||
| 1,200 | Moody’s Corp. | 45,192 | ||||||||
| 1,500 | Robert Half International, Inc. | 40,440 | ||||||||
| 2,100 | RR Donnelley & Sons Co. | 76,986 | ||||||||
| 3,817 | Western Union Co. | 86,264 | ||||||||
| 446,183 | ||||||||||
| Computers: 1.6% | ||||||||||
| 500 | @ | Affiliated Computer Services, Inc. | 20,980 | |||||||
| 4,500 | @ | Apple, Inc. | 819,990 | |||||||
| 1,600 | @ | Cognizant Technology Solutions Corp. | 49,760 | |||||||
| 1,000 | @ | Computer Sciences Corp. | 52,820 | |||||||
| 13,540 | @ | Dell, Inc. | 332,272 | |||||||
| 12,350 | @ | EMC Corp. | 237,985 | |||||||
| 13,850 | Hewlett-Packard Co. | 708,566 | ||||||||
| 6,950 | International Business Machines Corp. | 731,001 | ||||||||
| 1,750 | @ | Lexmark International, Inc. | 61,040 | |||||||
| 1,100 | @ | Sandisk Corp. | 41,184 | |||||||
| 4,000 | @ | Sun Microsystems, Inc. | 83,120 | |||||||
| 3,138,718 | ||||||||||
| Cosmetics/Personal Care: 0.8% | ||||||||||
| 1,000 | Avon Products, Inc. | 41,050 | ||||||||
| 3,800 | Colgate-Palmolive Co. | 304,304 | ||||||||
| 15,916 | Procter & Gamble Co. | 1,177,784 | ||||||||
| 1,523,138 | ||||||||||
| Diversified Financial Services: 2.5% | ||||||||||
| 5,600 | American Express Co. | 330,288 | ||||||||
| 1,480 | Ameriprise Financial, Inc. | 86,861 | ||||||||
| 1,040 | Bear Stearns Cos., Inc. | 103,688 | ||||||||
| 4,050 | Charles Schwab Corp. | 98,456 | ||||||||
| 1,500 | CIT Group, Inc. | 39,900 | ||||||||
90
Table of Contents
| PORTFOLIO OF INVESTMENTS | ||||
| ING Principal Protection Fund VI | as of November 30, 2007 (Unaudited) (continued) | |||
| Shares | Value | |||||||||
| Diversified Financial Services (continued) | ||||||||||
| 24,100 | Citigroup, Inc. | $ | 802,530 | |||||||
| 350 | CME Group, Inc. | 230,510 | ||||||||
| 2,968 | Countrywide Financial Corp. | 32,114 | ||||||||
| 3,025 | Discover Financial Services | 52,544 | ||||||||
| 9,100 | @ | E*Trade Financial Corp. | 41,860 | |||||||
| 4,450 | Fannie Mae | 170,969 | ||||||||
| 1,000 | Federated Investors, Inc. | 40,790 | ||||||||
| 700 | Franklin Resources, Inc. | 86,226 | ||||||||
| 3,300 | Freddie Mac | 115,731 | ||||||||
| 2,500 | Goldman Sachs Group, Inc. | 566,600 | ||||||||
| 400 | @ | IntercontinentalExchange, Inc. | 66,784 | |||||||
| 1,600 | Janus Capital Group, Inc. | 53,712 | ||||||||
| 18,700 | JPMorgan Chase & Co. | 853,094 | ||||||||
| 600 | Legg Mason, Inc. | 45,786 | ||||||||
| 3,920 | Lehman Brothers Holdings, Inc. | 245,510 | ||||||||
| 6,300 | Merrill Lynch & Co., Inc. | 377,622 | ||||||||
| 5,850 | Morgan Stanley | 308,412 | ||||||||
| 1,290 | Nyse Euronext | 111,714 | ||||||||
| 1,850 | SLM Corp. | 70,448 | ||||||||
| 500 | T. Rowe Price Group, Inc. | 30,740 | ||||||||
| 4,962,889 | ||||||||||
| Electric: 1.1% | ||||||||||
| 1,000 | Allegheny Energy, Inc. | 60,750 | ||||||||
| 1,400 | Constellation Energy Group, Inc. | 140,294 | ||||||||
| 4,500 | Dominion Resources, Inc. | 212,535 | ||||||||
| 1,700 | DTE Energy Co. | 83,385 | ||||||||
| 9,600 | Duke Energy Corp. | 189,984 | ||||||||
| 1,020 | Edison International | 57,100 | ||||||||
| 2,700 | Entergy Corp. | 322,758 | ||||||||
| 3,400 | Exelon Corp. | 275,638 | ||||||||
| 3,300 | FirstEnergy Corp. | 226,248 | ||||||||
| 4,300 | FPL Group, Inc. | 299,968 | ||||||||
| 3,900 | PPL Corp. | 198,744 | ||||||||
| 2,350 | Public Service Enterprise Group, Inc. | 224,989 | ||||||||
| 2,292,393 | ||||||||||
| Electrical Components & Equipment: 0.2% | ||||||||||
| 5,300 | Emerson Electric Co. | 302,206 | ||||||||
| 302,206 | ||||||||||
| Electronics: 0.3% | ||||||||||
| 1,150 | @ | Agilent Technologies, Inc. | 43,505 | |||||||
| 2,200 | Applera Corp. — Applied Biosystems Group | 75,152 | ||||||||
| 1,700 | Jabil Circuit, Inc. | 28,815 | ||||||||
| 3,850 | @ | Thermo Electron Corp. | 221,914 | |||||||
| 2,250 | @@ | Tyco Electronics Ltd. | 84,128 | |||||||
| 1,200 | @ | Waters Corp. | 93,648 | |||||||
| 547,162 | ||||||||||
| Engineering & Construction: 0.0% | ||||||||||
| 400 | Fluor Corp. | 58,868 | ||||||||
| 400 | @ | Jacobs Engineering Group, Inc. | 33,508 | |||||||
| 92,376 | ||||||||||
| Entertainment: 0.0% | ||||||||||
| 1,950 | International Game Technology | 85,137 | ||||||||
| 85,137 | ||||||||||
| Environmental Control: 0.0% | ||||||||||
| 2,900 | @ | Allied Waste Industries, Inc. | 33,089 | |||||||
| 33,089 | ||||||||||
| Shares | Value | |||||||||
| Food: 0.5% | ||||||||||
| 2,950 | General Mills, Inc. | $ | 177,443 | |||||||
| 3,000 | HJ Heinz Co. | 141,900 | ||||||||
| 4,100 | Kellogg Co. | 221,564 | ||||||||
| 3,019 | Kraft Foods, Inc. | 104,306 | ||||||||
| 4,450 | Kroger Co. | 127,938 | ||||||||
| 1,300 | Safeway, Inc. | 45,240 | ||||||||
| 2,100 | Sysco Corp. | 68,271 | ||||||||
| 2,000 | WM Wrigley Jr. Co. | 128,000 | ||||||||
| 1,014,662 | ||||||||||
| Forest Products & Paper: 0.0% | ||||||||||
| 2,600 | International Paper Co. | 87,750 | ||||||||
| 87,750 | ||||||||||
| Gas: 0.1% | ||||||||||
| 2,000 | Sempra Energy | 125,240 | ||||||||
| 125,240 | ||||||||||
| Hand/Machine Tools: 0.1% | ||||||||||
| 900 | Black & Decker Corp. | 74,385 | ||||||||
| 1,000 | Snap-On, Inc. | 48,880 | ||||||||
| 1,000 | Stanley Works | 52,150 | ||||||||
| 175,415 | ||||||||||
| Healthcare — Products: 0.9% | ||||||||||
| 3,250 | Baxter International, Inc. | 194,578 | ||||||||
| 3,200 | @ | Boston Scientific Corp. | 40,416 | |||||||
| 2,250 | @@ | Covidien Ltd. | 90,248 | |||||||
| 900 | CR Bard, Inc. | 76,077 | ||||||||
| 14,050 | Johnson & Johnson | 951,747 | ||||||||
| 5,400 | Medtronic, Inc. | 274,590 | ||||||||
| 2,100 | @ | St. Jude Medical, Inc. | 83,475 | |||||||
| 1,500 | Stryker Corp. | 108,945 | ||||||||
| 400 | @ | Zimmer Holdings, Inc. | 25,892 | |||||||
| 1,845,968 | ||||||||||
| Healthcare — Services: 0.5% | ||||||||||
| 2,960 | Aetna, Inc. | 165,405 | ||||||||
| 1,465 | @ | Coventry Health Care, Inc. | 84,794 | |||||||
| 1,050 | @ | Humana, Inc. | 80,882 | |||||||
| 1,250 | @ | Laboratory Corp. of America Holdings | 90,838 | |||||||
| 7,260 | UnitedHealth Group, Inc. | 399,300 | ||||||||
| 2,540 | @ | WellPoint, Inc. | 213,893 | |||||||
| 1,035,112 | ||||||||||
| Holding Companies — Diversified: 0.0% | ||||||||||
| 800 | Leucadia National Corp. | 37,568 | ||||||||
| 37,568 | ||||||||||
| Home Builders: 0.0% | ||||||||||
| 1,300 | Centex Corp. | 27,118 | ||||||||
| 2,400 | D.R. Horton, Inc. | 28,728 | ||||||||
| 1,300 | KB Home | 27,157 | ||||||||
| 800 | Lennar Corp. | 12,672 | ||||||||
| 95,675 | ||||||||||
| Home Furnishings: 0.0% | ||||||||||
| 400 | Harman International Industries, Inc. | 29,440 | ||||||||
| 400 | Whirlpool Corp. | 32,384 | ||||||||
| 61,824 | ||||||||||
| Household Products/Wares: 0.2% | ||||||||||
| 4,900 | Kimberly-Clark Corp. | 342,069 | ||||||||
| 342,069 | ||||||||||
91
Table of Contents
| PORTFOLIO OF INVESTMENTS | ||||
| ING Principal Protection Fund VI | as of November 30, 2007 (Unaudited) (continued) | |||
| Shares | Value | |||||||||
| Housewares: 0.0% | ||||||||||
| 2,100 | Newell Rubbermaid, Inc. | $ | 56,238 | |||||||
| 56,238 | ||||||||||
| Insurance: 1.7% | ||||||||||
| 2,820 | @@ | ACE Ltd. | 168,721 | |||||||
| 2,150 | Aflac, Inc. | 134,676 | ||||||||
| 5,710 | Allstate Corp. | 291,895 | ||||||||
| 1,000 | AMBAC Financial Group, Inc. | 27,230 | ||||||||
| 13,800 | American International Group, Inc. | 802,194 | ||||||||
| 1,600 | AON Corp. | 79,952 | ||||||||
| 1,700 | Assurant, Inc. | 111,231 | ||||||||
| 2,980 | Chubb Corp. | 162,559 | ||||||||
| 1,960 | Cigna Corp. | 105,076 | ||||||||
| 1,850 | Hartford Financial Services Group, Inc. | 176,342 | ||||||||
| 700 | Loews Corp. | 33,453 | ||||||||
| 1,300 | Marsh & McLennan Cos., Inc. | 32,656 | ||||||||
| 1,750 | MBIA, Inc. | 63,893 | ||||||||
| 4,910 | Metlife, Inc. | 322,047 | ||||||||
| 3,640 | Progressive Corp. | 66,976 | ||||||||
| 3,560 | Prudential Financial, Inc. | 335,138 | ||||||||
| 1,480 | Safeco Corp. | 85,411 | ||||||||
| 1,050 | Torchmark Corp. | 64,764 | ||||||||
| 4,710 | Travelers Cos., Inc. | 250,148 | ||||||||
| 1,700 | @@ | XL Capital Ltd. | 99,501 | |||||||
| 3,413,863 | ||||||||||
| Internet: 0.7% | ||||||||||
| 900 | @ | Akamai Technologies, Inc. | 34,254 | |||||||
| 1,600 | @ | Amazon.com, Inc. | 144,896 | |||||||
| 5,650 | @ | eBay, Inc. | 189,445 | |||||||
| 1,000 | @ | Expedia, Inc. | 32,600 | |||||||
| 1,200 | @ | Google, Inc. — Class A | 831,600 | |||||||
| 1,500 | @ | IAC/InterActiveCorp. | 41,745 | |||||||
| 4,988 | @ | Symantec Corp. | 88,786 | |||||||
| 4,200 | @ | Yahoo!, Inc. | 112,602 | |||||||
| 1,475,928 | ||||||||||
| Investment Companies: 0.0% | ||||||||||
| 800 | American Capital Strategies Ltd. | 30,088 | ||||||||
| 30,088 | ||||||||||
| Iron/Steel: 0.1% | ||||||||||
| 1,320 | Nucor Corp. | 78,157 | ||||||||
| 900 | United States Steel Corp. | 87,930 | ||||||||
| 166,087 | ||||||||||
| Leisure Time: 0.1% | ||||||||||
| 2,150 | Carnival Corp. | 97,008 | ||||||||
| 700 | Harley-Davidson, Inc. | 33,614 | ||||||||
| 130,622 | ||||||||||
| Lodging: 0.1% | ||||||||||
| 1,000 | Harrah’s Entertainment, Inc. | 88,070 | ||||||||
| 2,400 | Marriott International, Inc. | 90,000 | ||||||||
| 2,050 | Starwood Hotels & Resorts Worldwide, Inc. | 110,044 | ||||||||
| 288,114 | ||||||||||
| Machinery — Construction & Mining: 0.1% | ||||||||||
| 2,900 | Caterpillar, Inc. | 208,510 | ||||||||
| 600 | @ | Terex Corp. | 38,670 | |||||||
| 247,180 | ||||||||||
| Shares | Value | |||||||||
| Machinery — Diversified: 0.2% | ||||||||||
| 1,000 | Cummins, Inc. | $ | 116,900 | |||||||
| 1,300 | Deere & Co. | 223,340 | ||||||||
| 710 | Rockwell Automation, Inc. | 48,202 | ||||||||
| 388,442 | ||||||||||
| Media: 0.8% | ||||||||||
| 2,100 | Clear Channel Communications, Inc. | 75,390 | ||||||||
| 8,850 | @ | Comcast Corp. — Class A | 181,779 | |||||||
| 6,500 | @ | DIRECTV Group, Inc. | 161,655 | |||||||
| 700 | EW Scripps Co. | 30,415 | ||||||||
| 1,550 | McGraw-Hill Cos., Inc. | 76,074 | ||||||||
| 600 | Meredith Corp. | 33,030 | ||||||||
| 10,400 | News Corp. — Class A | 219,128 | ||||||||
| 12,500 | Time Warner, Inc. | 215,750 | ||||||||
| 4,500 | @ | Viacom — Class B | 189,090 | |||||||
| 12,900 | Walt Disney Co. | 427,635 | ||||||||
| 1,609,946 | ||||||||||
| Mining: 0.2% | ||||||||||
| 1,000 | Alcoa, Inc. | 36,370 | ||||||||
| 2,631 | Freeport-McMoRan Copper & Gold, Inc. | 260,285 | ||||||||
| 1,400 | Newmont Mining Corp. | 69,566 | ||||||||
| 366,221 | ||||||||||
| Miscellaneous Manufacturing: 1.9% | ||||||||||
| 3,650 | 3M Co. | 303,899 | ||||||||
| 1,900 | Cooper Industries Ltd. | 95,418 | ||||||||
| 3,250 | Danaher Corp. | 282,165 | ||||||||
| 3,500 | Dover Corp. | 161,980 | ||||||||
| 1,400 | Eastman Kodak Co. | 32,872 | ||||||||
| 1,850 | Eaton Corp. | 165,224 | ||||||||
| 48,850 | General Electric Co. | 1,870,467 | ||||||||
| 3,800 | Honeywell International, Inc. | 215,156 | ||||||||
| 2,900 | Illinois Tool Works, Inc. | 160,950 | ||||||||
| 2,200 | ITT Corp. | 141,768 | ||||||||
| 1,800 | Parker Hannifin Corp. | 142,974 | ||||||||
| 1,000 | Textron, Inc. | 69,050 | ||||||||
| 1,950 | @@ | Tyco International Ltd. | 78,254 | |||||||
| 3,720,177 | ||||||||||
| Oil & Gas: 3.3% | ||||||||||
| 1,200 | Anadarko Petroleum Corp. | 67,920 | ||||||||
| 1,600 | Apache Corp. | 154,864 | ||||||||
| 1,700 | Chesapeake Energy Corp. | 64,345 | ||||||||
| 12,593 | Chevron Corp. | 1,105,288 | ||||||||
| 9,264 | ConocoPhillips | 741,491 | ||||||||
| 3,500 | Devon Energy Corp. | 289,835 | ||||||||
| 1,300 | ENSCO International, Inc. | 70,005 | ||||||||
| 30,050 | ExxonMobil Corp. | 2,679,258 | ||||||||
| 1,500 | Hess Corp. | 106,830 | ||||||||
| 3,900 | Marathon Oil Corp. | 218,010 | ||||||||
| 1,100 | Murphy Oil Corp. | 78,672 | ||||||||
| 2,200 | Noble Corp. | 114,686 | ||||||||
| 890 | Noble Energy, Inc. | 64,116 | ||||||||
| 5,200 | Occidental Petroleum Corp. | 362,804 | ||||||||
| 700 | Tesoro Petroleum Corp. | 34,426 | ||||||||
| 1,469 | @ | Transocean, Inc. | 201,679 | |||||||
| 3,450 | Valero Energy Corp. | 224,492 | ||||||||
| 600 | XTO Energy, Inc. | 37,092 | ||||||||
| 6,615,813 | ||||||||||
| Oil & Gas Services: 0.5% | ||||||||||
| 400 | Baker Hughes, Inc. | 32,108 | ||||||||
| 4,550 | Halliburton Co. | 166,576 | ||||||||
| 2,100 | @ | National Oilwell Varco, Inc. | 143,115 | |||||||
92
Table of Contents
| PORTFOLIO OF INVESTMENTS | ||||
| ING Principal Protection Fund VI | as of November 30, 2007 (Unaudited) (continued) | |||
| Shares | Value | |||||||||
| Oil & Gas Services (continued) | ||||||||||
| 5,600 | Schlumberger Ltd. | $ | 523,320 | |||||||
| 1,800 | Smith International, Inc. | 112,896 | ||||||||
| 978,015 | ||||||||||
| Packaging & Containers: 0.1% | ||||||||||
| 1,850 | Ball Corp. | 85,563 | ||||||||
| 1,500 | @ | Pactiv Corp. | 38,100 | |||||||
| 123,663 | ||||||||||
| Pharmaceuticals: 1.8% | ||||||||||
| 4,400 | Abbott Laboratories | 253,044 | ||||||||
| 1,300 | Allergan, Inc. | 87,152 | ||||||||
| 1,380 | AmerisourceBergen Corp. | 62,611 | ||||||||
| 10,600 | Bristol-Myers Squibb Co. | 314,078 | ||||||||
| 1,000 | Cardinal Health, Inc. | 60,550 | ||||||||
| 6,500 | Eli Lilly & Co. | 344,175 | ||||||||
| 1,120 | @ | Express Scripts, Inc. | 75,880 | |||||||
| 900 | @ | Forest Laboratories, Inc. | 34,695 | |||||||
| 4,400 | @ | Gilead Sciences, Inc. | 204,776 | |||||||
| 900 | @ | Hospira, Inc. | 38,970 | |||||||
| 1,600 | @ | Medco Health Solutions, Inc. | 159,984 | |||||||
| 11,250 | Merck & Co., Inc. | 667,800 | ||||||||
| 34,300 | Pfizer, Inc. | 814,968 | ||||||||
| 9,450 | Schering-Plough Corp. | 295,785 | ||||||||
| 1,300 | @ | Watson Pharmaceuticals, Inc. | 38,103 | |||||||
| 4,800 | Wyeth | 235,680 | ||||||||
| 3,688,251 | ||||||||||
| Pipelines: 0.1% | ||||||||||
| 1,400 | Questar Corp. | 74,830 | ||||||||
| 3,700 | Spectra Energy Corp. | 91,168 | ||||||||
| 3,450 | Williams Cos., Inc. | 119,750 | ||||||||
| 285,748 | ||||||||||
| Retail: 1.8% | ||||||||||
| 900 | Abercrombie & Fitch Co. | 73,836 | ||||||||
| 800 | @ | Autozone, Inc. | 89,304 | |||||||
| 1,000 | @ | Bed Bath & Beyond, Inc. | 31,450 | |||||||
| 2,965 | Best Buy Co., Inc. | 151,363 | ||||||||
| 1,900 | @ | Big Lots, Inc. | 35,473 | |||||||
| 3,950 | @ | Coach, Inc. | 146,703 | |||||||
| 3,450 | Costco Wholesale Corp. | 232,530 | ||||||||
| 8,476 | CVS Caremark Corp. | 339,803 | ||||||||
| 1,650 | Darden Restaurants, Inc. | 65,654 | ||||||||
| 1,750 | Family Dollar Stores, Inc. | 41,213 | ||||||||
| 3,050 | Gap, Inc. | 62,220 | ||||||||
| 5,940 | Home Depot, Inc. | 169,646 | ||||||||
| 650 | JC Penney Co., Inc. | 28,678 | ||||||||
| 1,000 | @ | Kohl’s Corp. | 49,280 | |||||||
| 9,700 | Lowe’s Cos., Inc. | 236,777 | ||||||||
| 7,050 | McDonald’s Corp. | 412,214 | ||||||||
| 1,500 | Nordstrom, Inc. | 50,310 | ||||||||
| 1,000 | Polo Ralph Lauren Corp. | 68,980 | ||||||||
| 1,700 | RadioShack Corp. | 31,450 | ||||||||
| 390 | @ | Sears Holding Corp. | 41,149 | |||||||
| 1,650 | Staples, Inc. | 39,105 | ||||||||
| 3,800 | @ | Starbucks Corp. | 88,882 | |||||||
| 3,450 | Target Corp. | 207,207 | ||||||||
| 3,850 | TJX Cos., Inc. | 112,959 | ||||||||
| 1,200 | Walgreen Co. | 43,908 | ||||||||
| 10,650 | Wal-Mart Stores, Inc. | 510,135 | ||||||||
| 1,400 | Wendy’s International, Inc. | 39,242 | ||||||||
| 2,500 | Yum! Brands, Inc. | 92,875 | ||||||||
| 3,492,346 | ||||||||||
| Shares | Value | |||||||||
| Savings & Loans: 0.2% | ||||||||||
| 12,300 | Hudson City Bancorp., Inc. | $ | 187,206 | |||||||
| 6,362 | Washington Mutual, Inc. | 124,059 | ||||||||
| 311,265 | ||||||||||
| Semiconductors: 0.9% | ||||||||||
| 2,350 | Analog Devices, Inc. | 72,333 | ||||||||
| 9,350 | Applied Materials, Inc. | 176,061 | ||||||||
| 2,000 | @ | Broadcom Corp. | 53,480 | |||||||
| 32,130 | Intel Corp. | 837,950 | ||||||||
| 900 | KLA-Tencor Corp. | 43,272 | ||||||||
| 1,100 | @ | MEMC Electronic Materials, Inc. | 85,338 | |||||||
| 2,600 | National Semiconductor Corp. | 59,436 | ||||||||
| 1,500 | @ | Novellus Systems, Inc. | 39,015 | |||||||
| 2,600 | @ | Nvidia Corp. | 82,004 | |||||||
| 2,200 | @ | QLogic Corp. | 29,744 | |||||||
| 7,300 | Texas Instruments, Inc. | 230,461 | ||||||||
| 1,700 | Xilinx, Inc. | 37,230 | ||||||||
| 1,746,324 | ||||||||||
| Software: 1.3% | ||||||||||
| 2,490 | @ | Adobe Systems, Inc. | 104,929 | |||||||
| 1,720 | @ | Autodesk, Inc. | 80,995 | |||||||
| 2,050 | Automatic Data Processing, Inc. | 92,373 | ||||||||
| 2,250 | @ | BMC Software, Inc. | 74,430 | |||||||
| 5,150 | CA, Inc. | 126,124 | ||||||||
| 500 | @ | Electronic Arts, Inc. | 28,095 | |||||||
| 800 | Fidelity National Information Services, Inc. | 34,576 | ||||||||
| 1,000 | @ | Fiserv, Inc. | 51,330 | |||||||
| 1 | @ | Metavante Technologies, inc. | 23 | |||||||
| 41,300 | Microsoft Corp. | 1,387,665 | ||||||||
| 4,700 | @ | Novell, Inc. | 32,994 | |||||||
| 20,920 | @ | Oracle Corp. | 422,166 | |||||||
| 1,450 | Paychex, Inc. | 56,550 | ||||||||
| 2,492,250 | ||||||||||
| Telecommunications: 2.0% | ||||||||||
| 2,100 | @ | American Tower Corp. | 95,634 | |||||||
| 31,052 | AT&T, Inc. | 1,186,497 | ||||||||
| 2,500 | CenturyTel, Inc. | 106,575 | ||||||||
| 800 | @ | Ciena Corp. | 35,184 | |||||||
| 30,250 | @ | Cisco Systems, Inc. | 847,605 | |||||||
| 7,550 | Corning, Inc. | 183,390 | ||||||||
| 675 | Embarq Corp. | 34,391 | ||||||||
| 2,500 | @ | JDS Uniphase Corp. | 33,650 | |||||||
| 2,800 | @ | Juniper Networks, Inc. | 83,216 | |||||||
| 10,190 | Motorola, Inc. | 162,734 | ||||||||
| 10,250 | Qualcomm, Inc. | 417,995 | ||||||||
| 8,300 | @ | Qwest Communications International, Inc. | 55,029 | |||||||
| 9,200 | Sprint Nextel Corp. | 142,784 | ||||||||
| 11,200 | Verizon Communications, Inc. | 483,952 | ||||||||
| 6,300 | Windstream Corp. | 81,585 | ||||||||
| 3,950,221 | ||||||||||
| Toys/Games/Hobbies: 0.0% | ||||||||||
| 1,700 | Hasbro, Inc. | 47,209 | ||||||||
| 47,209 | ||||||||||
| Transportation: 0.5% | ||||||||||
| 400 | Burlington Northern Santa Fe Corp. | 33,408 | ||||||||
| 700 | CH Robinson Worldwide, Inc. | 36,085 | ||||||||
| 3,880 | CSX Corp. | 162,960 | ||||||||
93
Table of Contents
| PORTFOLIO OF INVESTMENTS | ||||
| ING Principal Protection Fund VI | as of November 30, 2007 (Unaudited) (Continued) | |||
| Shares | Value | |||||||||
| Transportation (continued) | ||||||||||
| 700 | Expeditors International Washington, Inc. | $ | 32,844 | |||||||
| 2,000 | FedEx Corp. | 196,940 | ||||||||
| 2,700 | Norfolk Southern Corp. | 138,267 | ||||||||
| 1,750 | Union Pacific Corp. | 220,745 | ||||||||
| 3,100 | United Parcel Service, Inc. — Class B | 228,408 | ||||||||
| 1,049,657 | ||||||||||
| Total Common Stock (Cost $64,008,771) | 65,890,966 | |||||||||
| REAL ESTATE INVESTMENT TRUSTS: 0.1% | ||||||||||
| Hotels: 0.0% | ||||||||||
| 2,100 | Host Hotels & Resorts, Inc. | 40,299 | ||||||||
| 40,299 | ||||||||||
| Regional Malls: 0.0% | ||||||||||
| 600 | General Growth Properties, Inc. | 27,864 | ||||||||
| 400 | Simon Property Group, Inc. | 39,380 | ||||||||
| 67,244 | ||||||||||
| Warehouse/Industrial: 0.1% | ||||||||||
| 2,100 | Prologis | 137,382 | ||||||||
| 137,382 | ||||||||||
| Total Real Estate Investment Trusts (Cost $274,915) | 244,925 | |||||||||
| Principal | ||||||||||
| Amount | Value | |||||||||
| U.S. GOVERNMENT AGENCY OBLIGATIONS: 57.6% | ||||||||||
| Federal National Mortgage Corporation: 32.9% | ||||||||||
| $ | 66,500,000 | Z | 3.590%, due 04/22/08 | 65,584,162 | ||||||
| 65,584,162 | ||||||||||
| Other U.S. Agency Obligations: 24.7% | ||||||||||
| 50,000,000 | Z | Federal Agricultural Mortgage Corp., 3.590%, due 04/22/08 | 49,311,400 | |||||||
| 49,311,400 | ||||||||||
| Total U.S. Government Agency Obligations (Cost $115,037,324) | 114,895,562 | |||||||||
| U.S. TREASURY OBLIGATIONS: 8.5% | ||||||||||
| U.S. Treasury STRIP: 8.5% | ||||||||||
| 17,137,000 | ^^ | 2.940%, due 02/15/08 | 17,030,048 | |||||||
| Total U.S. Treasury Obligations (Cost $17,018,931) | 17,030,048 | |||||||||
| Total Long-Term Investments (Cost $196,339,941) | 198,061,501 | |||||||||
| Shares | Value | |||||||||
| SHORT-TERM INVESTMENTS: 0.3% | ||||||||||
| Mutual Fund: 0.2% | ||||||||||
| 325,000 | ** | ING Institutional Prime Money Market Fund | 325,000 | |||||||
| Total Mutual Fund (Cost $325,000) | 325,000 | |||||||||
| Principal | ||||||||||||||
| Amount | Value | |||||||||||||
| Repurchase Agreement: 0.1% | ||||||||||||||
| $ | 236,000 | Goldman Sachs Repurchase Agreement dated 11/30/07, 4.510%, due 12/03/07, $236,089 to be received upon repurchase (Collateralized by $171,000 U.S. Treasury, 7.625%, Market Value plus accrued interest $241,575, due 02/15/25) | $ | 236,000 | ||||||||||
| Total Repurchase Agreement (Cost $236,000) | 236,000 | |||||||||||||
| Total Short-Term Investments (Cost $561,000) | 561,000 | |||||||||||||
Total Investments in Securities (Cost $196,900,941)* | 99.5 | % | $ | 198,622,501 | ||||||||||
Other Assets and Liabilities — Net | 0.5 | 983,384 | ||||||||||||
Net Assets | 100.0 | % | $ | 199,605,885 | ||||||||||
| @ | Non-income producing security | |
| @@ | Foreign Issuer | |
| STRIP | Separate Trading of Registered Interest and Principal of Securities | |
| ** | Investment in affiliate | |
| ^^ | Principal Only (PO) Security | |
| Z | Indicates Zero Coupon Bond; rate shown reflects current effective yield. | |
| * | Cost for federal income tax purposes is $197,810,791. |
| Net unrealized appreciation consists of: | ||||
| Gross Unrealized Appreciation | $ | 4,264,821 | ||
| Gross Unrealized Depreciation | (3,453,111 | ) | ||
| Net Unrealized Appreciation | $ | 811,710 | ||
94
Table of Contents
| PORTFOLIO OF INVESTMENTS | ||
| ING Principal Protection Fund VII | as of November 30, 2007 (Unaudited) | |
| Shares | Value | |||||||||
| COMMON STOCK: 30.9% | ||||||||||
| Advertising: 0.1% | ||||||||||
| 2,000 | Omnicom Group | $ | 97,500 | |||||||
| 97,500 | ||||||||||
| Aerospace/Defense: 0.9% | ||||||||||
| 1,500 | Boeing Co. | 138,810 | ||||||||
| 1,200 | General Dynamics Corp. | 106,536 | ||||||||
| 500 | Goodrich Corp. | 35,645 | ||||||||
| 550 | L-3 Communications Holdings, Inc. | 60,858 | ||||||||
| 1,270 | Lockheed Martin Corp. | 140,551 | ||||||||
| 1,265 | Northrop Grumman Corp. | 99,669 | ||||||||
| 570 | Raytheon Co. | 35,255 | ||||||||
| 2,850 | United Technologies Corp. | 213,095 | ||||||||
| 830,419 | ||||||||||
| Agriculture: 0.6% | ||||||||||
| 5,050 | Altria Group, Inc. | 391,678 | ||||||||
| 1,350 | Archer-Daniels-Midland Co. | 49,073 | ||||||||
| 440 | Reynolds American, Inc. | 30,809 | ||||||||
| 1,200 | UST, Inc. | 69,480 | ||||||||
| 541,040 | ||||||||||
| Apparel: 0.1% | ||||||||||
| 1,660 | Nike, Inc. | 108,979 | ||||||||
| 200 | VF Corp. | 14,958 | ||||||||
| 123,937 | ||||||||||
| Auto Manufacturers: 0.1% | ||||||||||
| 4,100 | @ | Ford Motor Co. | 30,791 | |||||||
| 1,100 | General Motors Corp. | 32,813 | ||||||||
| 1,050 | Paccar, Inc. | 53,141 | ||||||||
| 116,745 | ||||||||||
| Auto Parts & Equipment: 0.1% | ||||||||||
| 1,500 | Johnson Controls, Inc. | 57,930 | ||||||||
| 57,930 | ||||||||||
| Banks: 1.5% | ||||||||||
| 9,271 | Bank of America Corp. | 427,671 | ||||||||
| 1,200 | Bank of New York Mellon Corp. | 57,552 | ||||||||
| 1,734 | BB&T Corp. | 62,563 | ||||||||
| 1,103 | Capital One Financial Corp. | 58,801 | ||||||||
| 550 | Comerica, Inc. | 25,179 | ||||||||
| 400 | Commerce Bancorp., Inc. | 15,928 | ||||||||
| 500 | Fifth Third Bancorp. | 14,955 | ||||||||
| 1,350 | Keycorp. | 35,559 | ||||||||
| 400 | Marshall & Ilsley Corp. | 12,588 | ||||||||
| 2,117 | Regions Financial Corp. | 55,952 | ||||||||
| 1,000 | State Street Corp. | 79,890 | ||||||||
| 750 | SunTrust Bank | 52,583 | ||||||||
| 5,014 | Wachovia Corp. | 215,602 | ||||||||
| 8,600 | Wells Fargo & Co. | 278,898 | ||||||||
| 400 | Zions Bancorp. | 21,828 | ||||||||
| 1,415,549 | ||||||||||
| Beverages: 0.8% | ||||||||||
| 3,350 | Anheuser-Busch Cos., Inc. | 176,612 | ||||||||
| 4,150 | Coca-Cola Co. | 257,715 | ||||||||
| 600 | @ | Constellation Brands, Inc. | 14,130 | |||||||
| 1,600 | Pepsi Bottling Group, Inc. | 68,272 | ||||||||
| 3,870 | PepsiCo, Inc. | 298,687 | ||||||||
| 815,416 | ||||||||||
| Shares | Value | |||||||||
| Biotechnology: 0.3% | ||||||||||
| 2,400 | @ | Amgen, Inc. | $ | 132,600 | ||||||
| 500 | @ | Biogen Idec, Inc. | 37,060 | |||||||
| 810 | @ | Celgene Corp. | 49,856 | |||||||
| 800 | @ | Genzyme Corp. | 59,944 | |||||||
| 300 | @ | Millipore Corp. | 24,564 | |||||||
| 304,024 | ||||||||||
| Building Materials: 0.0% | ||||||||||
| 950 | Masco Corp. | 21,280 | ||||||||
| 21,280 | ||||||||||
| Chemicals: 0.7% | ||||||||||
| 900 | Air Products & Chemicals, Inc. | 89,136 | ||||||||
| 2,050 | Dow Chemical Co. | 85,977 | ||||||||
| 1,100 | Ecolab, Inc. | 52,690 | ||||||||
| 2,100 | EI DuPont de Nemours & Co. | 96,915 | ||||||||
| 400 | International Flavors & Fragrances, Inc. | 20,056 | ||||||||
| 1,420 | Monsanto Co. | 141,105 | ||||||||
| 700 | PPG Industries, Inc. | 48,048 | ||||||||
| 900 | Praxair, Inc. | 76,842 | ||||||||
| 400 | Sherwin-Williams Co. | 25,132 | ||||||||
| 1,600 | Sigma-Aldrich Corp. | 84,240 | ||||||||
| 720,141 | ||||||||||
| Coal: 0.1% | ||||||||||
| 400 | Consol Energy, Inc. | 23,712 | ||||||||
| 400 | Peabody Energy Corp. | 22,256 | ||||||||
| 45,968 | ||||||||||
| Commercial Services: 0.2% | ||||||||||
| 400 | @ | Apollo Group, Inc. — Class A | 30,608 | |||||||
| 780 | McKesson Corp. | 52,049 | ||||||||
| 500 | Moody’s Corp. | 18,830 | ||||||||
| 700 | Robert Half International, Inc. | 18,872 | ||||||||
| 1,000 | RR Donnelley & Sons Co. | 36,660 | ||||||||
| 2,049 | Western Union Co. | 46,307 | ||||||||
| 203,326 | ||||||||||
| Computers: 1.5% | ||||||||||
| 300 | @ | Affiliated Computer Services, Inc. | 12,588 | |||||||
| 2,100 | @ | Apple, Inc. | 382,662 | |||||||
| 800 | @ | Cognizant Technology Solutions Corp. | 24,880 | |||||||
| 450 | @ | Computer Sciences Corp. | 23,769 | |||||||
| 6,250 | @ | Dell, Inc. | 153,375 | |||||||
| 5,400 | @ | EMC Corp. | 104,058 | |||||||
| 6,300 | Hewlett-Packard Co. | 322,308 | ||||||||
| 3,300 | International Business Machines Corp. | 347,094 | ||||||||
| 750 | @ | Lexmark International, Inc. | 26,160 | |||||||
| 600 | @ | Sandisk Corp. | 22,464 | |||||||
| 1,875 | @ | Sun Microsystems, Inc. | 38,963 | |||||||
| 1,458,321 | ||||||||||
| Cosmetics/Personal Care: 0.7% | ||||||||||
| 400 | Avon Products, Inc. | 16,420 | ||||||||
| 1,750 | Colgate-Palmolive Co. | 140,140 | ||||||||
| 7,283 | Procter & Gamble Co. | 538,942 | ||||||||
| 695,502 | ||||||||||
| Diversified Financial Services: 2.3% | ||||||||||
| 2,500 | American Express Co. | 147,450 | ||||||||
| 640 | Ameriprise Financial, Inc. | 37,562 | ||||||||
| 450 | Bear Stearns Cos., Inc. | 44,865 | ||||||||
| 1,900 | Charles Schwab Corp. | 46,189 | ||||||||
| 700 | CIT Group, Inc. | 18,620 | ||||||||
95
Table of Contents
| PORTFOLIO OF INVESTMENTS | ||
| ING Principal Protection Fund VII | as of November 30, 2007 (Unaudited) (continued) | |
| Shares | Value | |||||||||
| Diversified Financial Services (continued) | ||||||||||
| 11,100 | Citigroup, Inc. | $ | 369,630 | |||||||
| 110 | CME Group, Inc. | 72,446 | ||||||||
| 1,298 | Countrywide Financial Corp. | 14,044 | ||||||||
| 1,400 | Discover Financial Services | 24,318 | ||||||||
| 900 | @ | E*Trade Financial Corp. | 4,140 | |||||||
| 2,050 | Fannie Mae | 78,761 | ||||||||
| 400 | Federated Investors, Inc. | 16,316 | ||||||||
| 350 | Franklin Resources, Inc. | 43,113 | ||||||||
| 1,500 | Freddie Mac | 52,605 | ||||||||
| 1,200 | Goldman Sachs Group, Inc. | 271,968 | ||||||||
| 200 | @ | IntercontinentalExchange, Inc. | 33,392 | |||||||
| 800 | Janus Capital Group, Inc. | 26,856 | ||||||||
| 8,600 | JPMorgan Chase & Co. | 392,332 | ||||||||
| 300 | Legg Mason, Inc. | 22,893 | ||||||||
| 1,820 | Lehman Brothers Holdings, Inc. | 113,987 | ||||||||
| 2,900 | Merrill Lynch & Co., Inc. | 173,826 | ||||||||
| 2,600 | Morgan Stanley | 137,072 | ||||||||
| 580 | Nyse Euronext | 50,228 | ||||||||
| 800 | SLM Corp. | 30,464 | ||||||||
| 300 | T. Rowe Price Group, Inc. | 18,444 | ||||||||
| 2,241,521 | ||||||||||
| Electric: 1.1% | ||||||||||
| 400 | Allegheny Energy, Inc. | 24,300 | ||||||||
| 550 | Constellation Energy Group, Inc. | 55,116 | ||||||||
| 2,100 | Dominion Resources, Inc. | 99,183 | ||||||||
| 800 | DTE Energy Co. | 39,240 | ||||||||
| 4,500 | Duke Energy Corp. | 89,055 | ||||||||
| 420 | Edison International | 23,512 | ||||||||
| 1,200 | Entergy Corp. | 143,448 | ||||||||
| 1,600 | Exelon Corp. | 129,712 | ||||||||
| 1,600 | FirstEnergy Corp. | 109,696 | ||||||||
| 2,000 | FPL Group, Inc. | 139,520 | ||||||||
| 1,800 | PPL Corp. | 91,728 | ||||||||
| 1,150 | Public Service Enterprise Group, Inc. | 110,101 | ||||||||
| 1,054,611 | ||||||||||
| Electrical Components & Equipment: 0.1% | ||||||||||
| 2,400 | Emerson Electric Co. | 136,848 | ||||||||
| 136,848 | ||||||||||
| Electronics: 0.2% | ||||||||||
| 500 | @ | Agilent Technologies, Inc. | 18,915 | |||||||
| 1,000 | Applera Corp. — Applied Biosystems Group | 34,160 | ||||||||
| 800 | Jabil Circuit, Inc. | 13,560 | ||||||||
| 1,600 | @ | Thermo Electron Corp. | 92,224 | |||||||
| 1,200 | @@ | Tyco Electronics Ltd. | 44,868 | |||||||
| 450 | @ | Waters Corp. | 35,118 | |||||||
| 238,845 | ||||||||||
| Engineering & Construction: 0.1% | ||||||||||
| 200 | Fluor Corp. | 29,434 | ||||||||
| 200 | @ | Jacobs Engineering Group, Inc. | 16,754 | |||||||
| 46,188 | ||||||||||
| Entertainment: 0.0% | ||||||||||
| 950 | International Game Technology | 41,477 | ||||||||
| 41,477 | ||||||||||
| Environmental Control: 0.0% | ||||||||||
| 1,300 | @ | Allied Waste Industries, Inc. | 14,833 | |||||||
| 14,833 | ||||||||||
| Shares | Value | |||||||||
| Food: 0.5% | ||||||||||
| 1,500 | General Mills, Inc. | $ | 90,225 | |||||||
| 1,300 | HJ Heinz Co. | 61,490 | ||||||||
| 1,900 | Kellogg Co. | 102,676 | ||||||||
| 1,432 | Kraft Foods, Inc. | 49,476 | ||||||||
| 2,250 | Kroger Co. | 64,688 | ||||||||
| 950 | Safeway, Inc. | 33,060 | ||||||||
| 900 | Sysco Corp. | 29,259 | ||||||||
| 700 | WM Wrigley Jr. Co. | 44,800 | ||||||||
| 475,674 | ||||||||||
| Forest Products & Paper: 0.0% | ||||||||||
| 1,000 | International Paper Co. | 33,750 | ||||||||
| 33,750 | ||||||||||
| Gas: 0.1% | ||||||||||
| 900 | Sempra Energy | 56,358 | ||||||||
| 56,358 | ||||||||||
| Hand/Machine Tools: 0.1% | ||||||||||
| 390 | Black & Decker Corp. | 32,234 | ||||||||
| 600 | Snap-On, Inc. | 29,328 | ||||||||
| 450 | Stanley Works | 23,468 | ||||||||
| 85,030 | ||||||||||
| Healthcare — Products: 0.9% | ||||||||||
| 1,600 | Baxter International, Inc. | 95,792 | ||||||||
| 1,500 | @ | Boston Scientific Corp. | 18,945 | |||||||
| 900 | @@ | Covidien Ltd. | 36,099 | |||||||
| 400 | CR Bard, Inc. | 33,812 | ||||||||
| 6,450 | Johnson & Johnson | 436,923 | ||||||||
| 2,300 | Medtronic, Inc. | 116,955 | ||||||||
| 1,000 | @ | St. Jude Medical, Inc. | 39,750 | |||||||
| 500 | Stryker Corp. | 36,315 | ||||||||
| 400 | @ | Zimmer Holdings, Inc. | 25,892 | |||||||
| 840,483 | ||||||||||
| Healthcare — Services: 0.5% | ||||||||||
| 1,350 | Aetna, Inc. | 75,438 | ||||||||
| 525 | @ | Coventry Health Care, Inc. | 30,387 | |||||||
| 460 | @ | Humana, Inc. | 35,434 | |||||||
| 450 | @ | Laboratory Corp. of America Holdings | 32,702 | |||||||
| 3,230 | UnitedHealth Group, Inc. | 177,650 | ||||||||
| 1,250 | @ | WellPoint, Inc. | 105,263 | |||||||
| 456,874 | ||||||||||
| Holding Companies — Diversified: 0.0% | ||||||||||
| 400 | Leucadia National Corp. | 18,784 | ||||||||
| 18,784 | ||||||||||
| Home Builders: 0.0% | ||||||||||
| 600 | Centex Corp. | 12,516 | ||||||||
| 1,100 | D.R. Horton, Inc. | 13,167 | ||||||||
| 600 | KB Home | 12,534 | ||||||||
| 400 | Lennar Corp. | 6,336 | ||||||||
| 44,553 | ||||||||||
| Home Furnishings: 0.0% | ||||||||||
| 200 | Harman International Industries, Inc. | 14,720 | ||||||||
| 200 | Whirlpool Corp. | 16,192 | ||||||||
| 30,912 | ||||||||||
| Household Products/Wares: 0.2% | ||||||||||
| 2,250 | Kimberly-Clark Corp. | 157,073 | ||||||||
| 157,073 | ||||||||||
96
Table of Contents
| PORTFOLIO OF INVESTMENTS | ||
| ING Principal Protection Fund VII | as of November 30, 2007 (Unaudited) (Continued) | |
| Shares | Value | |||||||||
| Housewares: 0.0% | ||||||||||
| 800 | Newell Rubbermaid, Inc. | $ | 21,424 | |||||||
| 21,424 | ||||||||||
| Insurance: 1.6% | ||||||||||
| 1,230 | @@ | ACE Ltd. | 73,591 | |||||||
| 1,200 | Aflac, Inc. | 75,168 | ||||||||
| 2,700 | Allstate Corp. | 138,024 | ||||||||
| 450 | AMBAC Financial Group, Inc. | 12,254 | ||||||||
| 6,300 | American International Group, Inc. | 366,219 | ||||||||
| 1,000 | AON Corp. | 49,970 | ||||||||
| 800 | Assurant, Inc. | 52,344 | ||||||||
| 1,300 | Chubb Corp. | 70,915 | ||||||||
| 780 | Cigna Corp. | 41,816 | ||||||||
| 850 | Hartford Financial Services Group, Inc. | 81,022 | ||||||||
| 400 | Loews Corp. | 19,116 | ||||||||
| 600 | Marsh & McLennan Cos., Inc. | 15,072 | ||||||||
| 1,200 | MBIA, Inc. | 43,812 | ||||||||
| 2,140 | Metlife, Inc. | 140,363 | ||||||||
| 1,200 | Progressive Corp. | 22,080 | ||||||||
| 1,620 | Prudential Financial, Inc. | 152,507 | ||||||||
| 700 | Safeco Corp. | 40,397 | ||||||||
| 450 | Torchmark Corp. | 27,756 | ||||||||
| 2,120 | Travelers Cos., Inc. | 112,593 | ||||||||
| 800 | @@ | XL Capital Ltd. | 46,824 | |||||||
| 1,581,843 | ||||||||||
| Internet: 0.6% | ||||||||||
| 400 | @ | Akamai Technologies, Inc. | 15,224 | |||||||
| 600 | @ | Amazon.com, Inc. | 54,336 | |||||||
| 2,600 | @ | eBay, Inc. | 87,178 | |||||||
| 400 | @ | Expedia, Inc. | 13,040 | |||||||
| 500 | @ | Google, Inc. — Class A | 346,500 | |||||||
| 700 | @ | IAC/InterActiveCorp. | 19,481 | |||||||
| 2,250 | @ | Symantec Corp. | 40,050 | |||||||
| 2,100 | @ | Yahoo!, Inc. | 56,301 | |||||||
| 632,110 | ||||||||||
| Investment Companies: 0.0% | ||||||||||
| 400 | American Capital Strategies Ltd. | 15,044 | ||||||||
| 15,044 | ||||||||||
| Iron/Steel: 0.1% | ||||||||||
| 760 | Nucor Corp. | 45,000 | ||||||||
| 420 | United States Steel Corp. | 41,034 | ||||||||
| 86,034 | ||||||||||
| Leisure Time: 0.1% | ||||||||||
| 1,050 | Carnival Corp. | 47,376 | ||||||||
| 300 | Harley-Davidson, Inc. | 14,406 | ||||||||
| 61,782 | ||||||||||
| Lodging: 0.1% | ||||||||||
| 400 | Harrah’s Entertainment, Inc. | 35,228 | ||||||||
| 1,100 | Marriott International, Inc. | 41,250 | ||||||||
| 950 | Starwood Hotels & Resorts Worldwide, Inc. | 50,996 | ||||||||
| 127,474 | ||||||||||
| Machinery — Construction & Mining: 0.1% | ||||||||||
| 1,500 | Caterpillar, Inc. | 107,850 | ||||||||
| 200 | @ | Terex Corp. | 12,890 | |||||||
| 120,740 | ||||||||||
| Shares | Value | |||||||||
| Machinery — Diversified: 0.2% | ||||||||||
| 400 | Cummins, Inc. | $ | 46,760 | |||||||
| 500 | Deere & Co. | 85,900 | ||||||||
| 400 | Rockwell Automation, Inc. | 27,156 | ||||||||
| 159,816 | ||||||||||
| Media: 0.8% | ||||||||||
| 1,000 | Clear Channel Communications, Inc. | 35,900 | ||||||||
| 4,100 | @ | Comcast Corp. — Class A | 84,214 | |||||||
| 3,000 | @ | DIRECTV Group, Inc. | 74,610 | |||||||
| 400 | EW Scripps Co. | 17,380 | ||||||||
| 890 | McGraw-Hill Cos., Inc. | 43,681 | ||||||||
| 400 | Meredith Corp. | 22,020 | ||||||||
| 5,250 | News Corp. — Class A | 110,618 | ||||||||
| 5,800 | Time Warner, Inc. | 100,108 | ||||||||
| 2,100 | @ | Viacom — Class B | 88,242 | |||||||
| 6,300 | Walt Disney Co. | 208,845 | ||||||||
| 785,618 | ||||||||||
| Mining: 0.2% | ||||||||||
| 400 | Alcoa, Inc. | 14,548 | ||||||||
| 1,131 | Freeport-McMoRan Copper & Gold, Inc. | 111,890 | ||||||||
| 600 | Newmont Mining Corp. | 29,814 | ||||||||
| 156,252 | ||||||||||
| Miscellaneous Manufacturing: 1.7% | ||||||||||
| 1,650 | 3M Co. | 137,379 | ||||||||
| 900 | Cooper Industries Ltd. | 45,198 | ||||||||
| 1,450 | Danaher Corp. | 125,889 | ||||||||
| 1,600 | Dover Corp. | 74,048 | ||||||||
| 700 | Eastman Kodak Co. | 16,436 | ||||||||
| 900 | Eaton Corp. | 80,379 | ||||||||
| 22,550 | General Electric Co. | 863,440 | ||||||||
| 1,600 | Honeywell International, Inc. | 90,592 | ||||||||
| 1,300 | Illinois Tool Works, Inc. | 72,150 | ||||||||
| 1,000 | ITT Corp. | 64,440 | ||||||||
| 850 | Parker Hannifin Corp. | 67,516 | ||||||||
| 300 | Textron, Inc. | 20,715 | ||||||||
| 1,100 | @@ | Tyco International Ltd. | 44,143 | |||||||
| 1,702,325 | ||||||||||
| Oil & Gas: 3.1% | ||||||||||
| 500 | Anadarko Petroleum Corp. | 28,300 | ||||||||
| 700 | Apache Corp. | 67,753 | ||||||||
| 900 | Chesapeake Energy Corp. | 34,065 | ||||||||
| 5,771 | Chevron Corp. | 506,521 | ||||||||
| 4,332 | ConocoPhillips | 346,733 | ||||||||
| 1,600 | Devon Energy Corp. | 132,496 | ||||||||
| 400 | ENSCO International, Inc. | 21,540 | ||||||||
| 13,800 | ExxonMobil Corp. | 1,230,408 | ||||||||
| 700 | Hess Corp. | 49,854 | ||||||||
| 1,800 | Marathon Oil Corp. | 100,620 | ||||||||
| 400 | Murphy Oil Corp. | 28,608 | ||||||||
| 1,100 | Noble Corp. | 57,343 | ||||||||
| 410 | Noble Energy, Inc. | 29,536 | ||||||||
| 2,400 | Occidental Petroleum Corp. | 167,448 | ||||||||
| 400 | Tesoro Petroleum Corp. | 19,672 | ||||||||
| 630 | @ | Transocean, Inc. | 86,443 | |||||||
| 1,400 | Valero Energy Corp. | 91,098 | ||||||||
| 300 | XTO Energy, Inc. | 18,546 | ||||||||
| 3,016,984 | ||||||||||
| Oil & Gas Services: 0.5% | ||||||||||
| 300 | Baker Hughes, Inc. | 24,081 | ||||||||
| 2,250 | Halliburton Co. | 82,373 | ||||||||
| 1,000 | @ | National Oilwell Varco, Inc. | 68,150 | |||||||
97
Table of Contents
| PORTFOLIO OF INVESTMENTS | ||
| ING Principal Protection Fund VII | as of November 30, 2007 (Unaudited) (Continued) | |
| Shares | Value | |||||||||
| Oil & Gas Services (continued) | ||||||||||
| 2,600 | Schlumberger Ltd. | $ | 242,970 | |||||||
| 600 | Smith International, Inc. | 37,632 | ||||||||
| 455,206 | ||||||||||
| Packaging & Containers: 0.1% | ||||||||||
| 900 | Ball Corp. | 41,625 | ||||||||
| 1,100 | @ | Pactiv Corp. | 27,940 | |||||||
| 69,565 | ||||||||||
| Pharmaceuticals: 1.7% | ||||||||||
| 2,000 | Abbott Laboratories | 115,020 | ||||||||
| 500 | Allergan, Inc. | 33,520 | ||||||||
| 720 | AmerisourceBergen Corp. | 32,666 | ||||||||
| 4,800 | Bristol-Myers Squibb Co. | 142,224 | ||||||||
| 400 | Cardinal Health, Inc. | 24,220 | ||||||||
| 2,800 | Eli Lilly & Co. | 148,260 | ||||||||
| 520 | @ | Express Scripts, Inc. | 35,230 | |||||||
| 450 | @ | Forest Laboratories, Inc. | 17,348 | |||||||
| 2,100 | @ | Gilead Sciences, Inc. | 97,734 | |||||||
| 400 | @ | Hospira, Inc. | 17,320 | |||||||
| 800 | @ | Medco Health Solutions, Inc. | 79,992 | |||||||
| 5,300 | Merck & Co., Inc. | 314,608 | ||||||||
| 15,800 | Pfizer, Inc. | 375,408 | ||||||||
| 4,600 | Schering-Plough Corp. | 143,980 | ||||||||
| 600 | @ | Watson Pharmaceuticals, Inc. | 17,586 | |||||||
| 2,200 | Wyeth | 108,020 | ||||||||
| 1,703,136 | ||||||||||
| Pipelines: 0.1% | ||||||||||
| 800 | Questar Corp. | 42,760 | ||||||||
| 1,700 | Spectra Energy Corp. | 41,888 | ||||||||
| 1,250 | Williams Cos., Inc. | 43,388 | ||||||||
| 128,036 | ||||||||||
| Retail: 1.6% | ||||||||||
| 400 | Abercrombie & Fitch Co. | 32,816 | ||||||||
| 300 | @ | Autozone, Inc. | 33,489 | |||||||
| 400 | @ | Bed Bath & Beyond, Inc. | 12,580 | |||||||
| 1,240 | Best Buy Co., Inc. | 63,302 | ||||||||
| 1,200 | @ | Big Lots, Inc. | 22,404 | |||||||
| 1,810 | @ | Coach, Inc. | 67,223 | |||||||
| 1,400 | Costco Wholesale Corp. | 94,360 | ||||||||
| 3,904 | CVS Caremark Corp. | 156,511 | ||||||||
| 850 | Darden Restaurants, Inc. | 33,822 | ||||||||
| 850 | Family Dollar Stores, Inc. | 20,018 | ||||||||
| 1,400 | Gap, Inc. | 28,560 | ||||||||
| 2,770 | Home Depot, Inc. | 79,111 | ||||||||
| 400 | JC Penney Co., Inc. | 17,648 | ||||||||
| 450 | @ | Kohl’s Corp. | 22,176 | |||||||
| 4,500 | Lowe’s Cos., Inc. | 109,830 | ||||||||
| 3,150 | McDonald’s Corp. | 184,181 | ||||||||
| 700 | Nordstrom, Inc. | 23,478 | ||||||||
| 400 | Polo Ralph Lauren Corp. | 27,592 | ||||||||
| 800 | RadioShack Corp. | 14,800 | ||||||||
| 230 | @ | Sears Holding Corp. | 24,267 | |||||||
| 625 | Staples, Inc. | 14,813 | ||||||||
| 1,750 | @ | Starbucks Corp. | 40,933 | |||||||
| 1,550 | Target Corp. | 93,093 | ||||||||
| 1,800 | TJX Cos., Inc. | 52,812 | ||||||||
| 500 | Walgreen Co. | 18,295 | ||||||||
| 4,850 | Wal-Mart Stores, Inc. | 232,315 | ||||||||
| 700 | Wendy’s International, Inc. | 19,621 | ||||||||
| 1,400 | Yum! Brands, Inc. | 52,010 | ||||||||
| 1,592,060 | ||||||||||
| Shares | Value | |||||||||
| Savings & Loans: 0.1% | ||||||||||
| 5,600 | Hudson City Bancorp., Inc. | $ | 85,232 | |||||||
| 2,891 | Washington Mutual, Inc. | 56,375 | ||||||||
| 141,607 | ||||||||||
| Semiconductors: 0.8% | ||||||||||
| 1,150 | Analog Devices, Inc. | 35,397 | ||||||||
| 4,350 | Applied Materials, Inc. | 81,911 | ||||||||
| 500 | @ | Broadcom Corp. | 13,370 | |||||||
| 14,800 | Intel Corp. | 385,984 | ||||||||
| 400 | KLA-Tencor Corp. | 19,232 | ||||||||
| 500 | @ | MEMC Electronic Materials, Inc. | 38,790 | |||||||
| 1,100 | National Semiconductor Corp. | 25,146 | ||||||||
| 700 | @ | Novellus Systems, Inc. | 18,207 | |||||||
| 1,250 | @ | Nvidia Corp. | 39,425 | |||||||
| 1,100 | @ | QLogic Corp. | 14,872 | |||||||
| 3,300 | Texas Instruments, Inc. | 104,181 | ||||||||
| 800 | Xilinx, Inc. | 17,520 | ||||||||
| 794,035 | ||||||||||
| Software: 1.2% | ||||||||||
| 1,170 | @ | Adobe Systems, Inc. | 49,304 | |||||||
| 580 | @ | Autodesk, Inc. | 27,312 | |||||||
| 1,100 | Automatic Data Processing, Inc. | 49,566 | ||||||||
| 1,050 | @ | BMC Software, Inc. | 34,734 | |||||||
| 2,350 | CA, Inc. | 57,552 | ||||||||
| 300 | @ | Electronic Arts, Inc. | 16,857 | |||||||
| 400 | Fidelity National Information Services, Inc. | 17,288 | ||||||||
| 600 | @ | Fiserv, Inc. | 30,798 | |||||||
| 1 | @ | Metavante Technologies, inc. | 23 | |||||||
| 19,000 | Microsoft Corp. | 638,400 | ||||||||
| 2,200 | @ | Novell, Inc. | 15,444 | |||||||
| 9,680 | @ | Oracle Corp. | 195,342 | |||||||
| 400 | Paychex, Inc. | 15,600 | ||||||||
| 1,148,220 | ||||||||||
| Telecommunications: 1.9% | ||||||||||
| 900 | @ | American Tower Corp. | 40,986 | |||||||
| 14,301 | AT&T, Inc. | 546,441 | ||||||||
| 1,200 | CenturyTel, Inc. | 51,156 | ||||||||
| 400 | @ | Ciena Corp. | 17,592 | |||||||
| 13,900 | @ | Cisco Systems, Inc. | 389,478 | |||||||
| 3,700 | Corning, Inc. | 89,873 | ||||||||
| 348 | Embarq Corp. | 17,731 | ||||||||
| 1,200 | @ | JDS Uniphase Corp. | 16,152 | |||||||
| 1,100 | @ | Juniper Networks, Inc. | 32,692 | |||||||
| 5,220 | Motorola, Inc. | 83,363 | ||||||||
| 4,650 | Qualcomm, Inc. | 189,627 | ||||||||
| 4,100 | @ | Qwest Communications International, Inc. | 27,183 | |||||||
| 4,668 | Sprint Nextel Corp. | 72,447 | ||||||||
| 5,150 | Verizon Communications, Inc. | 222,532 | ||||||||
| 2,900 | Windstream Corp. | 37,555 | ||||||||
| 1,834,808 | ||||||||||
| Toys/Games/Hobbies: 0.0% | ||||||||||
| 800 | Hasbro, Inc. | 22,216 | ||||||||
| 22,216 | ||||||||||
| Transportation: 0.5% | ||||||||||
| 200 | Burlington Northern Santa Fe Corp. | 16,704 | ||||||||
| �� | 400 | CH Robinson Worldwide, Inc. | 20,620 | |||||||
| 1,860 | CSX Corp. | 78,120 | ||||||||
| 400 | Expeditors International Washington, Inc. | 18,768 | ||||||||
| 800 | FedEx Corp. | 78,776 | ||||||||
98
Table of Contents
| PORTFOLIO OF INVESTMENTS | ||
| ING Principal Protection Fund VII | as of November 30, 2007 (Unaudited) (continued) | |
| Shares | Value | |||||||||
| Transportation (continued) | ||||||||||
| 1,250 | Norfolk Southern Corp. | $ | 64,013 | |||||||
| 800 | Union Pacific Corp. | 100,912 | ||||||||
| 1,500 | United Parcel Service, Inc. — Class B | 110,520 | ||||||||
| 488,433 | ||||||||||
| Total Common Stock (Cost $29,641,846) | 30,265,680 | |||||||||
| REAL ESTATE INVESTMENT TRUSTS: 0.1% | ||||||||||
| Hotels: 0.0% | ||||||||||
| 1,000 | Host Hotels & Resorts, Inc. | 19,190 | ||||||||
| 19,190 | ||||||||||
| Regional Malls: 0.0% | ||||||||||
| 400 | General Growth Properties, Inc. | 18,576 | ||||||||
| 200 | Simon Property Group, Inc. | 19,690 | ||||||||
| 38,266 | ||||||||||
| Warehouse/Industrial: 0.1% | ||||||||||
| 900 | Prologis | 58,878 | ||||||||
| 58,878 | ||||||||||
| Total Real Estate Investment Trusts (Cost $131,399) | 116,334 | |||||||||
| Principal | ||||||||||
| Amount | Value | |||||||||
| U.S. GOVERNMENT AGENCY OBLIGATIONS: 59.7% | ||||||||||
| Federal Home Loan Mortgage Corporation: 42.6% | ||||||||||
| $ | 42,500,000 | Z | 3.620%, due 06/26/08 | 41,646,728 | ||||||
| 41,646,728 | ||||||||||
| Federal National Mortgage Corporation: 17.1% | ||||||||||
| 17,000,000 | ^^, Z | 3.510%, due 05/15/08 | 16,727,507 | |||||||
| 16,727,507 | ||||||||||
| Total U.S. Government Agency Obligations (Cost $58,671,353) | 58,374,235 | |||||||||
| U.S. TREASURY OBLIGATIONS: 9.3% | ||||||||||
| U.S. Treasury STRIP: 9.3% | ||||||||||
| 9,200,000 | ^^ | 3.290%, due 05/15/08 | 9,064,981 | |||||||
| Total U.S. Treasury Obligations (Cost $9,047,424) | 9,064,981 | |||||||||
| Total Long-Term Investments (Cost $97,492,022) | 97,821,230 | |||||||||
| Shares | Value | |||||||||
| SHORT-TERM INVESTMENTS: 0.3% | ||||||||||
| Mutual Fund: 0.2% | ||||||||||
| 190,000 | ** | ING Institutional Prime Money Market Fund | 190,000 | |||||||
| Total Mutual Fund (Cost $190,000) | 190,000 | |||||||||
| Principal | ||||||||||||||
| Amount | Value | |||||||||||||
| Repurchase Agreement: 0.1% | ||||||||||||||
| $ | 108,000 | Goldman Sachs Repurchase Agreement dated 11/30/07, 4.510%, due 12/03/07, $108,041 to be received upon repurchase (Collateralized by $78,000 U.S. Treasury, 7.625%, Market Value plus accrued interest $110,192, due 02/15/25) | $ | 108,000 | ||||||||||
| Total Repurchase Agreement (Cost $108,000) | 108,000 | |||||||||||||
| Total Short-Term Investments (Cost $298,000) | 298,000 | |||||||||||||
Total Investments in Securities (Cost $97,790,022)* | 100.3 | % | $ | 98,119,230 | ||||||||||
Other Assets and Liabilities — Net | (0.3 | ) | (288,722 | ) | ||||||||||
Net Assets | 100.0 | % | $ | 97,830,508 | ||||||||||
| @ | Non-income producing security | |
| @@ | Foreign Issuer | |
| STRIP | Separate Trading of Registered Interest and Principal of Securities | |
| ** | Investment in affiliate | |
| ^^ | Principal Only (PO) Security | |
| Z | Indicates Zero Coupon Bond; rate shown reflects current effective yield. | |
| * | Cost for federal income tax purposes is $98,222,100. |
| Net unrealized depreciation consists of: | ||||
| Gross Unrealized Appreciation | $ | 1,744,488 | ||
| Gross Unrealized Depreciation | (1,847,358 | ) | ||
| Net Unrealized Depreciation | $ | (102,870 | ) | |
99
Table of Contents
| PORTFOLIO OF INVESTMENTS | ||
| ING Principal Protection Fund VII | as of November 30, 2007 (Unaudited) | |
| Shares | Value | |||||||||
| COMMON STOCK: 38.4% | ||||||||||
| Advertising: 0.1% | ||||||||||
| 1,440 | Omnicom Group | $ | 70,200 | |||||||
| 70,200 | ||||||||||
| Aerospace/Defense: 1.0% | ||||||||||
| 1,320 | Boeing Co. | 122,153 | ||||||||
| 930 | General Dynamics Corp. | 82,565 | ||||||||
| 300 | Goodrich Corp. | 21,387 | ||||||||
| 350 | L-3 Communications Holdings, Inc. | 38,728 | ||||||||
| 990 | Lockheed Martin Corp. | 109,563 | ||||||||
| 947 | Northrop Grumman Corp. | 74,614 | ||||||||
| 404 | Raytheon Co. | 24,987 | ||||||||
| 2,050 | United Technologies Corp. | 153,279 | ||||||||
| 627,276 | ||||||||||
| Agriculture: 0.7% | ||||||||||
| 3,840 | Altria Group, Inc. | 297,830 | ||||||||
| 900 | Archer-Daniels-Midland Co. | 32,715 | ||||||||
| 340 | Reynolds American, Inc. | 23,807 | ||||||||
| 850 | UST, Inc. | 49,215 | ||||||||
| 403,567 | ||||||||||
| Apparel: 0.1% | ||||||||||
| 1,240 | Nike, Inc. | 81,406 | ||||||||
| 81,406 | ||||||||||
| Auto Manufacturers: 0.1% | ||||||||||
| 3,480 | @ | Ford Motor Co. | 26,135 | |||||||
| 700 | General Motors Corp. | 20,881 | ||||||||
| 762 | Paccar, Inc. | 38,565 | ||||||||
| 85,581 | ||||||||||
| Auto Parts & Equipment: 0.1% | ||||||||||
| 1,260 | Johnson Controls, Inc. | 48,661 | ||||||||
| 48,661 | ||||||||||
| Banks: 1.8% | ||||||||||
| 7,033 | Bank of America Corp. | 324,432 | ||||||||
| 900 | Bank of New York Mellon Corp. | 43,164 | ||||||||
| 1,271 | BB&T Corp. | 45,858 | ||||||||
| 879 | Capital One Financial Corp. | 46,859 | ||||||||
| 440 | Comerica, Inc. | 20,143 | ||||||||
| 400 | Commerce Bancorp., Inc. | 15,928 | ||||||||
| 700 | Fifth Third Bancorp. | 20,937 | ||||||||
| 950 | Keycorp. | 25,023 | ||||||||
| 400 | Marshall & Ilsley Corp. | 12,588 | ||||||||
| 1,901 | Regions Financial Corp. | 50,243 | ||||||||
| 750 | State Street Corp. | 59,918 | ||||||||
| 370 | SunTrust Bank | 25,941 | ||||||||
| 3,869 | Wachovia Corp. | 166,367 | ||||||||
| 6,220 | Wells Fargo & Co. | 201,715 | ||||||||
| 400 | Zions Bancorp. | 21,828 | ||||||||
| 1,080,944 | ||||||||||
| Beverages: 1.0% | ||||||||||
| 2,510 | Anheuser-Busch Cos., Inc. | 132,327 | ||||||||
| 3,040 | Coca-Cola Co. | 188,784 | ||||||||
| 400 | @ | Constellation Brands, Inc. | 9,420 | |||||||
| 1,270 | Pepsi Bottling Group, Inc. | 54,191 | ||||||||
| 3,010 | PepsiCo, Inc. | 232,312 | ||||||||
| 617,034 | ||||||||||
| Shares | Value | |||||||||
| Biotechnology: 0.4% | ||||||||||
| 1,770 | @ | Amgen, Inc. | $ | 97,793 | ||||||
| 350 | @ | Biogen Idec, Inc. | 25,942 | |||||||
| 650 | @ | Celgene Corp. | 40,008 | |||||||
| 450 | @ | Genzyme Corp. | 33,719 | |||||||
| 200 | @ | Millipore Corp. | 16,376 | |||||||
| 213,838 | ||||||||||
| Building Materials: 0.0% | ||||||||||
| 820 | Masco Corp. | 18,368 | ||||||||
| 18,368 | ||||||||||
| Chemicals: 0.9% | ||||||||||
| 650 | Air Products & Chemicals, Inc. | 64,376 | ||||||||
| 1,430 | Dow Chemical Co. | 59,974 | ||||||||
| 800 | Ecolab, Inc. | 38,320 | ||||||||
| 1,500 | EI DuPont de Nemours & Co. | 69,225 | ||||||||
| 370 | International Flavors & Fragrances, Inc. | 18,552 | ||||||||
| 1,300 | Monsanto Co. | 129,181 | ||||||||
| 400 | PPG Industries, Inc. | 27,456 | ||||||||
| 500 | Praxair, Inc. | 42,690 | ||||||||
| 350 | Sherwin-Williams Co. | 21,991 | ||||||||
| 1,200 | Sigma-Aldrich Corp. | 63,180 | ||||||||
| 534,945 | ||||||||||
| Coal: 0.1% | ||||||||||
| 300 | Consol Energy, Inc. | 17,784 | ||||||||
| 300 | Peabody Energy Corp. | 16,692 | ||||||||
| 34,476 | ||||||||||
| Commercial Services: 0.3% | ||||||||||
| 350 | @ | Apollo Group, Inc. — Class A | 26,782 | |||||||
| 790 | McKesson Corp. | 52,717 | ||||||||
| 410 | Moody’s Corp. | 15,441 | ||||||||
| 500 | Robert Half International, Inc. | 13,480 | ||||||||
| 800 | RR Donnelley & Sons Co. | 29,328 | ||||||||
| 1,597 | Western Union Co. | 36,092 | ||||||||
| 173,840 | ||||||||||
| Computers: 1.8% | ||||||||||
| 200 | @ | Affiliated Computer Services, Inc. | 8,392 | |||||||
| 1,500 | @ | Apple, Inc. | 273,330 | |||||||
| 400 | @ | Cognizant Technology Solutions Corp. | 12,440 | |||||||
| 400 | @ | Computer Sciences Corp. | 21,128 | |||||||
| 4,950 | @ | Dell, Inc. | 121,473 | |||||||
| 4,190 | @ | EMC Corp. | 80,741 | |||||||
| 4,760 | Hewlett-Packard Co. | 243,522 | ||||||||
| 2,400 | International Business Machines Corp. | 252,432 | ||||||||
| 380 | @ | Lexmark International, Inc. | 13,254 | |||||||
| 450 | @ | Sandisk Corp. | 16,848 | |||||||
| 1,437 | @ | Sun Microsystems, Inc. | 29,861 | |||||||
| 1,073,421 | ||||||||||
| Cosmetics/Personal Care: 0.9% | ||||||||||
| 400 | Avon Products, Inc. | 16,420 | ||||||||
| 1,290 | Colgate-Palmolive Co. | 103,303 | ||||||||
| 5,579 | Procter & Gamble Co. | 412,846 | ||||||||
| 532,569 | ||||||||||
| Diversified Financial Services: 2.8% | ||||||||||
| 1,980 | American Express Co. | 116,780 | ||||||||
| 396 | Ameriprise Financial, Inc. | 23,241 | ||||||||
| 380 | Bear Stearns Cos., Inc. | 37,886 | ||||||||
| 1,600 | Charles Schwab Corp. | 38,896 | ||||||||
| 400 | CIT Group, Inc. | 10,640 | ||||||||
100
Table of Contents
| PORTFOLIO OF INVESTMENTS | ||
| ING Principal Protection Fund VIII | as of November 30, 2007 (Unaudited) (continued) | |
| Shares | Value | |||||||||
| Diversified Financial Services (continued) | ||||||||||
| 8,490 | Citigroup, Inc. | $ | 282,717 | |||||||
| 80 | CME Group, Inc. | 52,688 | ||||||||
| 1,110 | Countrywide Financial Corp. | 12,010 | ||||||||
| 1,140 | Discover Financial Services | 19,802 | ||||||||
| 900 | @ | E*Trade Financial Corp. | 4,140 | |||||||
| 1,450 | Fannie Mae | 55,709 | ||||||||
| 300 | Federated Investors, Inc. | 12,237 | ||||||||
| 220 | Franklin Resources, Inc. | 27,100 | ||||||||
| 1,150 | Freddie Mac | 40,331 | ||||||||
| 920 | Goldman Sachs Group, Inc. | 208,509 | ||||||||
| 100 | @ | IntercontinentalExchange, Inc. | 16,696 | |||||||
| 450 | Janus Capital Group, Inc. | 15,107 | ||||||||
| 6,450 | JPMorgan Chase & Co. | 294,249 | ||||||||
| 300 | Legg Mason, Inc. | 22,893 | ||||||||
| 1,280 | Lehman Brothers Holdings, Inc. | 80,166 | ||||||||
| 2,130 | Merrill Lynch & Co., Inc. | 127,672 | ||||||||
| 2,080 | Morgan Stanley | 109,658 | ||||||||
| 460 | Nyse Euronext | 39,836 | ||||||||
| 820 | SLM Corp. | 31,226 | ||||||||
| 200 | T. Rowe Price Group, Inc. | 12,296 | ||||||||
| 1,692,485 | ||||||||||
| Electric: 1.3% | ||||||||||
| 400 | Allegheny Energy, Inc. | 24,300 | ||||||||
| 400 | Constellation Energy Group, Inc. | 40,084 | ||||||||
| 1,500 | Dominion Resources, Inc. | 70,845 | ||||||||
| 500 | DTE Energy Co. | 24,525 | ||||||||
| 3,400 | Duke Energy Corp. | 67,286 | ||||||||
| 410 | Edison International | 22,952 | ||||||||
| 900 | Entergy Corp. | 107,586 | ||||||||
| 1,300 | Exelon Corp. | 105,391 | ||||||||
| 1,270 | FirstEnergy Corp. | 87,071 | ||||||||
| 1,300 | FPL Group, Inc. | 90,688 | ||||||||
| 1,300 | PPL Corp. | 66,248 | ||||||||
| 800 | Public Service Enterprise Group, Inc. | 76,592 | ||||||||
| 783,568 | ||||||||||
| Electrical Components & Equipment: 0.2% | ||||||||||
| 1,840 | Emerson Electric Co. | 104,917 | ||||||||
| 104,917 | ||||||||||
| Electronics: 0.3% | ||||||||||
| 350 | @ | Agilent Technologies, Inc. | 13,241 | |||||||
| 800 | Applera Corp. — Applied Biosystems Group | 27,328 | ||||||||
| 500 | Jabil Circuit, Inc. | 8,475 | ||||||||
| 1,320 | @ | Thermo Electron Corp. | 76,085 | |||||||
| 850 | @@ | Tyco Electronics Ltd. | 31,782 | |||||||
| 400 | @ | Waters Corp. | 31,216 | |||||||
| 188,127 | ||||||||||
| Engineering & Construction: 0.1% | ||||||||||
| 100 | Fluor Corp. | 14,717 | ||||||||
| 200 | @ | Jacobs Engineering Group, Inc. | 16,754 | |||||||
| 31,471 | ||||||||||
| Entertainment: 0.0% | ||||||||||
| 650 | International Game Technology | 28,379 | ||||||||
| 28,379 | ||||||||||
| Environmental Control: 0.0% | ||||||||||
| 1,100 | @ | Allied Waste Industries, Inc. | 12,551 | |||||||
| 12,551 | ||||||||||
| Shares | Value | |||||||||
| Food: 0.6% | ||||||||||
| 1,150 | General Mills, Inc. | $ | 69,173 | |||||||
| 1,300 | HJ Heinz Co. | 61,490 | ||||||||
| 1,400 | Kellogg Co. | 75,656 | ||||||||
| 1,080 | Kraft Foods, Inc. | 37,314 | ||||||||
| 1,500 | Kroger Co. | 43,125 | ||||||||
| 400 | Safeway, Inc. | 13,920 | ||||||||
| 700 | Sysco Corp. | 22,757 | ||||||||
| 500 | WM Wrigley Jr. Co. | 32,000 | ||||||||
| 355,435 | ||||||||||
| Forest Products & Paper: 0.0% | ||||||||||
| 900 | International Paper Co. | 30,375 | ||||||||
| 30,375 | ||||||||||
| Gas: 0.1% | ||||||||||
| 700 | Sempra Energy | 43,834 | ||||||||
| 43,834 | ||||||||||
| Hand/Machine Tools: 0.1% | ||||||||||
| 360 | Black & Decker Corp. | 29,754 | ||||||||
| 390 | Snap-On, Inc. | 19,063 | ||||||||
| 380 | Stanley Works | 19,817 | ||||||||
| 68,634 | ||||||||||
| Healthcare — Products: 1.1% | ||||||||||
| 1,310 | Baxter International, Inc. | 78,430 | ||||||||
| 1,300 | @ | Boston Scientific Corp. | 16,419 | |||||||
| 850 | @@ | Covidien Ltd. | 34,094 | |||||||
| 300 | CR Bard, Inc. | 25,359 | ||||||||
| 4,840 | Johnson & Johnson | 327,862 | ||||||||
| 1,900 | Medtronic, Inc. | 96,615 | ||||||||
| 800 | @ | St. Jude Medical, Inc. | 31,800 | |||||||
| 400 | Stryker Corp. | 29,052 | ||||||||
| 150 | @ | Zimmer Holdings, Inc. | 9,710 | |||||||
| 649,341 | ||||||||||
| Healthcare — Services: 0.6% | ||||||||||
| 990 | Aetna, Inc. | 55,321 | ||||||||
| 425 | @ | Coventry Health Care, Inc. | 24,599 | |||||||
| 370 | @ | Humana, Inc. | 28,501 | |||||||
| 400 | @ | Laboratory Corp. of America Holdings | 29,068 | |||||||
| 2,400 | UnitedHealth Group, Inc. | 132,000 | ||||||||
| 990 | @ | WellPoint, Inc. | 83,368 | |||||||
| 352,857 | ||||||||||
| Holding Companies — Diversified: 0.0% | ||||||||||
| 300 | Leucadia National Corp. | 14,088 | ||||||||
| 14,088 | ||||||||||
| Home Builders: 0.1% | ||||||||||
| 400 | Centex Corp. | 8,344 | ||||||||
| 900 | D.R. Horton, Inc. | 10,773 | ||||||||
| 400 | KB Home | 8,356 | ||||||||
| 400 | Lennar Corp. | 6,336 | ||||||||
| 33,809 | ||||||||||
| Home Furnishings: 0.0% | ||||||||||
| 100 | Harman International Industries, Inc. | 7,360 | ||||||||
| 200 | Whirlpool Corp. | 16,192 | ||||||||
| 23,552 | ||||||||||
| Household Products/Wares: 0.2% | ||||||||||
| 1,650 | Kimberly-Clark Corp. | 115,187 | ||||||||
| 115,187 | ||||||||||
101
Table of Contents
| PORTFOLIO OF INVESTMENTS | ||
| ING Principal Protection Fund VIII | as of November 30, 2007 (Unaudited) (continued) | |
| Shares | Value | |||||||||
| Housewares: 0.0% | ||||||||||
| 500 | Newell Rubbermaid, Inc. | $ | 13,390 | |||||||
| 13,390 | ||||||||||
| Insurance: 2.0% | ||||||||||
| 990 | @@ | ACE Ltd. | 59,232 | |||||||
| 970 | Aflac, Inc. | 60,761 | ||||||||
| 2,030 | Allstate Corp. | 103,774 | ||||||||
| 420 | AMBAC Financial Group, Inc. | 11,437 | ||||||||
| 4,720 | American International Group, Inc. | 274,374 | ||||||||
| 650 | AON Corp. | 32,481 | ||||||||
| 500 | Assurant, Inc. | 32,715 | ||||||||
| 1,010 | Chubb Corp. | 55,096 | ||||||||
| 770 | Cigna Corp. | 41,280 | ||||||||
| 650 | Hartford Financial Services Group, Inc. | 61,958 | ||||||||
| 300 | Loews Corp. | 14,337 | ||||||||
| 400 | Marsh & McLennan Cos., Inc. | 10,048 | ||||||||
| 720 | MBIA, Inc. | 26,287 | ||||||||
| 1,520 | Metlife, Inc. | 99,697 | ||||||||
| 990 | Progressive Corp. | 18,216 | ||||||||
| 1,290 | Prudential Financial, Inc. | 121,441 | ||||||||
| 710 | Safeco Corp. | 40,974 | ||||||||
| 380 | Torchmark Corp. | 23,438 | ||||||||
| 1,560 | Travelers Cos., Inc. | 82,852 | ||||||||
| 400 | @@ | XL Capital Ltd. | 23,412 | |||||||
| 1,193,810 | ||||||||||
| Internet: 0.8% | ||||||||||
| 300 | @ | Akamai Technologies, Inc. | 11,418 | |||||||
| 450 | @ | Amazon.com, Inc. | 40,752 | |||||||
| 2,010 | @ | eBay, Inc. | 67,395 | |||||||
| 400 | @ | Expedia, Inc. | 13,040 | |||||||
| 350 | @ | Google, Inc. — Class A | 242,550 | |||||||
| 400 | @ | IAC/InterActiveCorp. | 11,132 | |||||||
| 2,017 | @ | Symantec Corp. | 35,903 | |||||||
| 1,900 | @ | Yahoo!, Inc. | 50,939 | |||||||
| 473,129 | ||||||||||
| Investment Companies: 0.0% | ||||||||||
| 300 | American Capital Strategies Ltd. | 11,283 | ||||||||
| 11,283 | ||||||||||
| Iron/Steel: 0.1% | ||||||||||
| 490 | Nucor Corp. | 29,013 | ||||||||
| 360 | United States Steel Corp. | 35,172 | ||||||||
| 64,185 | ||||||||||
| Leisure Time: 0.1% | ||||||||||
| 1,000 | Carnival Corp. | 45,120 | ||||||||
| 200 | Harley-Davidson, Inc. | 9,604 | ||||||||
| 54,724 | ||||||||||
| Lodging: 0.2% | ||||||||||
| 300 | Harrah’s Entertainment, Inc. | 26,421 | ||||||||
| 700 | Marriott International, Inc. | 26,250 | ||||||||
| 700 | Starwood Hotels & Resorts Worldwide, Inc. | 37,576 | ||||||||
| 90,247 | ||||||||||
| Machinery — Construction & Mining: 0.2% | ||||||||||
| 1,150 | Caterpillar, Inc. | 82,685 | ||||||||
| 300 | @ | Terex Corp. | 19,335 | |||||||
| 102,020 | ||||||||||
| Shares | Value | |||||||||
| Machinery — Diversified: 0.2% | ||||||||||
| 240 | Cummins, Inc. | $ | 28,056 | |||||||
| 350 | Deere & Co. | 60,130 | ||||||||
| 220 | Rockwell Automation, Inc. | 14,936 | ||||||||
| 103,122 | ||||||||||
| Media: 1.0% | ||||||||||
| 900 | Clear Channel Communications, Inc. | 32,310 | ||||||||
| 3,025 | @ | Comcast Corp. — Class A | 62,134 | |||||||
| 2,200 | @ | DIRECTV Group, Inc. | 54,714 | |||||||
| 300 | EW Scripps Co. | 13,035 | ||||||||
| 700 | McGraw-Hill Cos., Inc. | 34,356 | ||||||||
| 300 | Meredith Corp. | 16,515 | ||||||||
| 3,600 | News Corp. — Class A | 75,852 | ||||||||
| 4,300 | Time Warner, Inc. | 74,218 | ||||||||
| 1,500 | @ | Viacom — Class B | 63,030 | |||||||
| 4,490 | Walt Disney Co. | 148,844 | ||||||||
| 575,008 | ||||||||||
| Mining: 0.2% | ||||||||||
| 400 | Alcoa, Inc. | 14,548 | ||||||||
| 898 | Freeport-McMoRan Copper & Gold, Inc. | 88,839 | ||||||||
| 400 | Newmont Mining Corp. | 19,876 | ||||||||
| 123,263 | ||||||||||
| Miscellaneous Manufacturing: 2.1% | ||||||||||
| 1,250 | 3M Co. | 104,075 | ||||||||
| 680 | Cooper Industries Ltd. | 34,150 | ||||||||
| 1,150 | Danaher Corp. | 99,843 | ||||||||
| 1,200 | Dover Corp. | 55,536 | ||||||||
| 450 | Eastman Kodak Co. | 10,566 | ||||||||
| 650 | Eaton Corp. | 58,052 | ||||||||
| 17,050 | General Electric Co. | 652,845 | ||||||||
| 1,230 | Honeywell International, Inc. | 69,643 | ||||||||
| 1,000 | Illinois Tool Works, Inc. | 55,500 | ||||||||
| 790 | ITT Corp. | 50,908 | ||||||||
| 460 | Parker Hannifin Corp. | 36,538 | ||||||||
| 200 | Textron, Inc. | 13,810 | ||||||||
| 850 | @@ | Tyco International Ltd. | 34,111 | |||||||
| 1,275,577 | ||||||||||
| Oil & Gas: 3.9% | ||||||||||
| 320 | Anadarko Petroleum Corp. | 18,112 | ||||||||
| 700 | Apache Corp. | 67,753 | ||||||||
| 500 | Chesapeake Energy Corp. | 18,925 | ||||||||
| 4,571 | Chevron Corp. | 401,197 | ||||||||
| 3,274 | ConocoPhillips | 262,051 | ||||||||
| 1,160 | Devon Energy Corp. | 96,060 | ||||||||
| 400 | ENSCO International, Inc. | 21,540 | ||||||||
| 10,500 | ExxonMobil Corp. | 936,180 | ||||||||
| 700 | Hess Corp. | 49,854 | ||||||||
| 1,300 | Marathon Oil Corp. | 72,670 | ||||||||
| 300 | Murphy Oil Corp. | 21,456 | ||||||||
| 800 | Noble Corp. | 41,704 | ||||||||
| 360 | Noble Energy, Inc. | 25,934 | ||||||||
| 1,860 | Occidental Petroleum Corp. | 129,772 | ||||||||
| 300 | Tesoro Petroleum Corp. | 14,754 | ||||||||
| 454 | @ | Transocean, Inc. | 62,330 | |||||||
| 1,200 | Valero Energy Corp. | 78,084 | ||||||||
| 250 | XTO Energy, Inc. | 15,455 | ||||||||
| 2,333,831 | ||||||||||
| Oil & Gas Services: 0.6% | ||||||||||
| 200 | Baker Hughes, Inc. | 16,054 | ||||||||
| 1,450 | Halliburton Co. | 53,085 | ||||||||
| 900 | @ | National Oilwell Varco, Inc. | 61,335 | |||||||
102
Table of Contents
| PORTFOLIO OF INVESTMENTS | ||
| ING Principal Protection Fund VIII | as of November 30, 2007 (Unaudited) (Continued) | |
| Shares | Value | |||||||||
| Oil & Gas Services (continued) | ||||||||||
| 2,100 | Schlumberger Ltd. | $ | 196,245 | |||||||
| 700 | Smith International, Inc. | 43,904 | ||||||||
| 370,623 | ||||||||||
| Packaging & Containers: 0.1% | ||||||||||
| 630 | Ball Corp. | 29,138 | ||||||||
| 450 | @ | Pactiv Corp. | 11,430 | |||||||
| 40,568 | ||||||||||
| Pharmaceuticals: 2.2% | ||||||||||
| 1,400 | Abbott Laboratories | 80,514 | ||||||||
| 400 | Allergan, Inc. | 26,816 | ||||||||
| 480 | AmerisourceBergen Corp. | 21,778 | ||||||||
| 3,700 | Bristol-Myers Squibb Co. | 109,631 | ||||||||
| 350 | Cardinal Health, Inc. | 21,193 | ||||||||
| 2,200 | Eli Lilly & Co. | 116,490 | ||||||||
| 420 | @ | Express Scripts, Inc. | 28,455 | |||||||
| 270 | @ | Forest Laboratories, Inc. | 10,409 | |||||||
| 1,500 | @ | Gilead Sciences, Inc. | 69,810 | |||||||
| 400 | @ | Hospira, Inc. | 17,320 | |||||||
| 700 | @ | Medco Health Solutions, Inc. | 69,993 | |||||||
| 3,960 | Merck & Co., Inc. | 235,066 | ||||||||
| 11,920 | Pfizer, Inc. | 283,219 | ||||||||
| 3,600 | Schering-Plough Corp. | 112,680 | ||||||||
| 400 | @ | Watson Pharmaceuticals, Inc. | 11,724 | |||||||
| 1,600 | Wyeth | 78,560 | ||||||||
| 1,293,658 | ||||||||||
| Pipelines: 0.2% | ||||||||||
| 400 | Questar Corp. | 21,380 | ||||||||
| 1,300 | Spectra Energy Corp. | 32,032 | ||||||||
| 1,270 | Williams Cos., Inc. | 44,082 | ||||||||
| 97,494 | ||||||||||
| Retail: 2.1% | ||||||||||
| 400 | Abercrombie & Fitch Co. | 32,816 | ||||||||
| 300 | @ | Autozone, Inc. | 33,489 | |||||||
| 400 | @ | Bed Bath & Beyond, Inc. | 12,580 | |||||||
| 1,020 | Best Buy Co., Inc. | 52,071 | ||||||||
| 700 | @ | Big Lots, Inc. | 13,069 | |||||||
| 1,310 | @ | Coach, Inc. | 48,653 | |||||||
| 1,270 | Costco Wholesale Corp. | 85,598 | ||||||||
| 2,786 | CVS Caremark Corp. | 111,691 | ||||||||
| 490 | Darden Restaurants, Inc. | 19,497 | ||||||||
| 650 | Family Dollar Stores, Inc. | 15,308 | ||||||||
| 1,280 | Gap, Inc. | 26,112 | ||||||||
| 2,090 | Home Depot, Inc. | 59,690 | ||||||||
| 350 | JC Penney Co., Inc. | 15,442 | ||||||||
| 350 | @ | Kohl’s Corp. | 17,248 | |||||||
| 3,330 | Lowe’s Cos., Inc. | 81,285 | ||||||||
| 2,410 | McDonald’s Corp. | 140,913 | ||||||||
| 430 | Nordstrom, Inc. | 14,422 | ||||||||
| 400 | Polo Ralph Lauren Corp. | 27,592 | ||||||||
| 500 | RadioShack Corp. | 9,250 | ||||||||
| 100 | @ | Sears Holding Corp. | 10,551 | |||||||
| 410 | Staples, Inc. | 9,717 | ||||||||
| 1,420 | @ | Starbucks Corp. | 33,214 | |||||||
| 1,200 | Target Corp. | 72,072 | ||||||||
| 1,780 | TJX Cos., Inc. | 52,225 | ||||||||
| 400 | Walgreen Co. | 14,636 | ||||||||
| 3,840 | Wal-Mart Stores, Inc. | 183,936 | ||||||||
| 400 | Wendy’s International, Inc. | 11,212 | ||||||||
| 940 | Yum! Brands, Inc. | 34,921 | ||||||||
| 1,239,210 | ||||||||||
| Shares | Value | |||||||||
| Savings & Loans: 0.2% | ||||||||||
| 4,600 | Hudson City Bancorp., Inc. | $ | 70,012 | |||||||
| 2,142 | Washington Mutual, Inc. | 41,769 | ||||||||
| 111,781 | ||||||||||
| Semiconductors: 1.0% | ||||||||||
| 870 | Analog Devices, Inc. | 26,779 | ||||||||
| 3,200 | Applied Materials, Inc. | 60,256 | ||||||||
| 500 | @ | Broadcom Corp. | 13,370 | |||||||
| 11,480 | Intel Corp. | 299,398 | ||||||||
| 400 | KLA-Tencor Corp. | 19,232 | ||||||||
| 400 | @ | MEMC Electronic Materials, Inc. | 31,032 | |||||||
| 990 | National Semiconductor Corp. | 22,631 | ||||||||
| 450 | @ | Novellus Systems, Inc. | 11,705 | |||||||
| 1,100 | @ | Nvidia Corp. | 34,694 | |||||||
| 800 | @ | QLogic Corp. | 10,816 | |||||||
| 2,500 | Texas Instruments, Inc. | 78,925 | ||||||||
| 450 | Xilinx, Inc. | 9,855 | ||||||||
| 618,693 | ||||||||||
| Software: 1.5% | ||||||||||
| 910 | @ | Adobe Systems, Inc. | 38,347 | |||||||
| 480 | @ | Autodesk, Inc. | 22,603 | |||||||
| 910 | Automatic Data Processing, Inc. | 41,005 | ||||||||
| 860 | @ | BMC Software, Inc. | 28,449 | |||||||
| 1,970 | CA, Inc. | 48,245 | ||||||||
| 300 | @ | Electronic Arts, Inc. | 16,857 | |||||||
| 300 | Fidelity National Information Services, Inc. | 12,966 | ||||||||
| 390 | @ | Fiserv, Inc. | 20,019 | |||||||
| 1 | @ | Metavante Technologies, inc. | 23 | |||||||
| 14,550 | Microsoft Corp. | 488,880 | ||||||||
| 1,800 | @ | Novell, Inc. | 12,636 | |||||||
| 7,080 | @ | Oracle Corp. | 142,874 | |||||||
| 370 | Paychex, Inc. | 14,430 | ||||||||
| 887,334 | ||||||||||
| Telecommunications: 2.3% | ||||||||||
| 700 | @ | American Tower Corp. | 31,878 | |||||||
| 10,585 | AT&T, Inc. | 404,453 | ||||||||
| 840 | CenturyTel, Inc. | 35,809 | ||||||||
| 300 | @ | Ciena Corp. | 13,194 | |||||||
| 10,500 | @ | Cisco Systems, Inc. | 294,210 | |||||||
| 3,000 | Corning, Inc. | 72,870 | ||||||||
| 251 | Embarq Corp. | 12,788 | ||||||||
| 900 | @ | JDS Uniphase Corp. | 12,114 | |||||||
| 900 | @ | Juniper Networks, Inc. | 26,748 | |||||||
| 3,870 | Motorola, Inc. | 61,804 | ||||||||
| 3,540 | Qualcomm, Inc. | 144,361 | ||||||||
| 1,800 | @ | Qwest Communications International, Inc. | 11,934 | |||||||
| 3,735 | Sprint Nextel Corp. | 57,967 | ||||||||
| 3,800 | Verizon Communications, Inc. | 164,198 | ||||||||
| 2,200 | Windstream Corp. | 28,490 | ||||||||
| 1,372,818 | ||||||||||
| Toys/Games/Hobbies: 0.0% | ||||||||||
| 500 | Hasbro, Inc. | 13,885 | ||||||||
| 13,885 | ||||||||||
| Transportation: 0.6% | ||||||||||
| 300 | CH Robinson Worldwide, Inc. | 15,465 | ||||||||
| 1,280 | CSX Corp. | 53,760 | ||||||||
| 300 | Expeditors International Washington, Inc. | 14,076 | ||||||||
| 710 | FedEx Corp. | 69,914 | ||||||||
| 830 | Norfolk Southern Corp. | 42,504 | ||||||||
103
Table of Contents
| PORTFOLIO OF INVESTMENTS | ||
| ING Principal Protection Fund VIII | as of November 30, 2007 (Unaudited) (Continued) | |
| Shares | Value | |||||||||
| Transportation (continued) | ||||||||||
| 650 | Union Pacific Corp. | $ | 81,991 | |||||||
| 1,200 | United Parcel Service, Inc. — Class B | 88,399 | ||||||||
| 366,109 | ||||||||||
| Total Common Stock (Cost $22,792,197) | 22,950,498 | |||||||||
| REAL ESTATE INVESTMENT TRUSTS: 0.1% | ||||||||||
| Hotels: 0.0% | ||||||||||
| 800 | Host Hotels & Resorts, Inc. | 15,352 | ||||||||
| 15,352 | ||||||||||
| Regional Malls: 0.0% | ||||||||||
| 300 | General Growth Properties, Inc. | 13,932 | ||||||||
| 100 | Simon Property Group, Inc. | 9,845 | ||||||||
| 23,777 | ||||||||||
| Warehouse/Industrial: 0.1% | ||||||||||
| 700 | Prologis | 45,794 | ||||||||
| 45,794 | ||||||||||
| Total Real Estate Investment Trusts (Cost $94,854) | 84,923 | |||||||||
| Principal | ||||||||||
| Amount | Value | |||||||||
| U.S. GOVERNMENT AGENCY OBLIGATIONS: 51.0% | ||||||||||
| Federal Home Loan Mortgage Corporation: 51.0% | ||||||||||
| $ | 31,600,000 | Z | 3.500%, due 12/22/08 | 30,468,088 | ||||||
| Total U.S. Government Agency Obligations (Cost $30,417,623) | 30,468,088 | |||||||||
| U.S. TREASURY OBLIGATIONS: 9.8% | ||||||||||
| U.S. Treasury STRIP: 9.8% | ||||||||||
| 6,000,000 | ^ | 3.110%, due 11/15/08 | 5,826,102 | |||||||
| Total U.S. Treasury Obligations (Cost $5,806,670) | 5,826,102 | |||||||||
| Total Long-Term Investments (Cost $59,111,344) | 59,329,611 | |||||||||
| Shares | Value | |||||||||
| SHORT-TERM INVESTMENTS: 0.7% | ||||||||||
| Mutual Fund: 0.4% | ||||||||||
| 250,000 | ** | ING Institutional Prime Money Market Fund | 250,000 | |||||||
| Total Mutual Fund (Cost $250,000) | 250,000 | |||||||||
| Principal | ||||||||||||||
| Amount | Value | |||||||||||||
| Repurchase Agreement: 0.3% | ||||||||||||||
| $ | 150,000 | Goldman Sachs Repurchase Agreement dated 11/30/07, 4.510%, due 12/03/07, $150,056 to be received upon repurchase (Collateralized by $109,000 U.S. Treasury, 7.625%, Market Value plus accrued interest $153,987, due 02/15/25) | $ | 150,000 | ||||||||||
| Total Repurchase Agreement (Cost $150,000) | 150,000 | |||||||||||||
| Total Short-Term Investments (Cost $400,000) | 400,000 | |||||||||||||
Total Investments in Securities (Cost $59,511,344)* | 100.0 | % | $ | 59,729,611 | ||||||||||
Other Assets and Liabilities — Net | (0.0 | ) | (19,298 | ) | ||||||||||
Net Assets | 100.0 | % | $ | 59,710,313 | ||||||||||
| @ | Non-income producing security | |
| @@ | Foreign Issuer | |
| STRIP | Separate Trading of Registered Interest and Principal of Securities | |
| ** | Investment in affiliate | |
| ^ | Interest Only (IO) Security | |
| Z | Indicates Zero Coupon Bond; rate shown reflects current effective yield. | |
| * | Cost for federal income tax purposes is $60,059,570. |
| Net unrealized depreciation consists of: | ||||
| Gross Unrealized Appreciation | $ | 785,405 | ||
| Gross Unrealized Depreciation | (1,115,364 | ) | ||
| Net Unrealized Depreciation | $ | (329,959 | ) | |
104
Table of Contents
| PORTFOLIO OF INVESTMENTS | ||
| ING Principal Protection Fund IX | as of November 30, 2007 (Unaudited) | |
| Shares | Value | |||||||||
| COMMON STOCK: 37.8% | ||||||||||
| Advertising: | 0.1% | |||||||||
| 1,300 | Omnicom Group | $ | 63,375 | |||||||
| 63,375 | ||||||||||
| Aerospace/Defense: 1.0% | ||||||||||
| 850 | Boeing Co. | 78,659 | ||||||||
| 650 | General Dynamics Corp. | 57,707 | ||||||||
| 200 | Goodrich Corp. | 14,258 | ||||||||
| 350 | L-3 Communications Holdings, Inc. | 38,728 | ||||||||
| 650 | Lockheed Martin Corp. | 71,936 | ||||||||
| 765 | Northrop Grumman Corp. | 60,274 | ||||||||
| 409 | Raytheon Co. | 25,297 | ||||||||
| 1,600 | United Technologies Corp. | 119,632 | ||||||||
| 466,491 | ||||||||||
| Agriculture: 0.7% | ||||||||||
| 2,950 | Altria Group, Inc. | 228,802 | ||||||||
| 860 | Archer-Daniels-Midland Co. | 31,261 | ||||||||
| 400 | Reynolds American, Inc. | 28,008 | ||||||||
| 700 | UST, Inc. | 40,530 | ||||||||
| 328,601 | ||||||||||
| Apparel: 0.2% | ||||||||||
| 1,100 | Nike, Inc. | 72,215 | ||||||||
| 100 | VF Corp. | 7,479 | ||||||||
| 79,694 | ||||||||||
| Auto Manufacturers: 0.2% | ||||||||||
| 2,600 | @ | Ford Motor Co. | 19,526 | |||||||
| 600 | General Motors Corp. | 17,898 | ||||||||
| 675 | Paccar, Inc. | 34,162 | ||||||||
| 71,586 | ||||||||||
| Auto Parts & Equipment: 0.1% | ||||||||||
| 950 | Johnson Controls, Inc. | 36,689 | ||||||||
| 36,689 | ||||||||||
| Banks: 1.8% | ||||||||||
| 5,272 | Bank of America Corp. | 243,197 | ||||||||
| 700 | Bank of New York Mellon Corp. | 33,572 | ||||||||
| 786 | BB&T Corp. | 28,359 | ||||||||
| 582 | Capital One Financial Corp. | 31,026 | ||||||||
| 350 | Comerica, Inc. | 16,023 | ||||||||
| 300 | Commerce Bancorp., Inc. | 11,946 | ||||||||
| 500 | Fifth Third Bancorp. | 14,955 | ||||||||
| 750 | Keycorp. | 19,755 | ||||||||
| 398 | Marshall & Ilsley Corp. | 12,525 | ||||||||
| 1,358 | Regions Financial Corp. | 35,892 | ||||||||
| 600 | State Street Corp. | 47,934 | ||||||||
| 400 | SunTrust Bank | 28,044 | ||||||||
| 2,923 | Wachovia Corp. | 125,689 | ||||||||
| 4,900 | Wells Fargo & Co. | 158,907 | ||||||||
| 300 | Zions Bancorp. | 16,371 | ||||||||
| 824,195 | ||||||||||
| Beverages: 1.0% | ||||||||||
| 1,900 | Anheuser-Busch Cos., Inc. | 100,168 | ||||||||
| 2,250 | Coca-Cola Co. | 139,725 | ||||||||
| 400 | @ | Constellation Brands, Inc. | 9,420 | |||||||
| 950 | Pepsi Bottling Group, Inc. | 40,537 | ||||||||
| 2,140 | PepsiCo, Inc. | 165,165 | ||||||||
| 455,015 | ||||||||||
| Shares | Value | |||||||||
| Biotechnology: 0.4% | ||||||||||
| 1,300 | @ | Amgen, Inc. | $ | 71,825 | ||||||
| 400 | @ | Biogen Idec, Inc. | 29,648 | |||||||
| 500 | @ | Celgene Corp. | 30,775 | |||||||
| 450 | @ | Genzyme Corp. | 33,719 | |||||||
| 100 | @ | Millipore Corp. | 8,188 | |||||||
| 174,155 | ||||||||||
| Building Materials: 0.0% | ||||||||||
| 700 | Masco Corp. | 15,680 | ||||||||
| 15,680 | ||||||||||
| Chemicals: 0.9% | ||||||||||
| 550 | Air Products & Chemicals, Inc. | 54,472 | ||||||||
| 950 | Dow Chemical Co. | 39,843 | ||||||||
| 600 | Ecolab, Inc. | 28,740 | ||||||||
| 1,200 | EI DuPont de Nemours & Co. | 55,380 | ||||||||
| 200 | International Flavors & Fragrances, Inc. | 10,028 | ||||||||
| 840 | Monsanto Co. | 83,471 | ||||||||
| 430 | PPG Industries, Inc. | 29,515 | ||||||||
| 600 | Praxair, Inc. | 51,228 | ||||||||
| 250 | Sherwin-Williams Co. | 15,708 | ||||||||
| 900 | Sigma-Aldrich Corp. | 47,385 | ||||||||
| 415,770 | ||||||||||
| Coal: 0.1% | ||||||||||
| 300 | Consol Energy, Inc. | 17,784 | ||||||||
| 200 | Peabody Energy Corp. | 11,128 | ||||||||
| 28,912 | ||||||||||
| Commercial Services: 0.3% | ||||||||||
| 300 | @ | Apollo Group, Inc. — Class A | 22,956 | |||||||
| 620 | McKesson Corp. | 41,373 | ||||||||
| 400 | Moody’s Corp. | 15,064 | ||||||||
| 400 | Robert Half International, Inc. | 10,784 | ||||||||
| 600 | RR Donnelley & Sons Co. | 21,996 | ||||||||
| 1,200 | Western Union Co. | 27,120 | ||||||||
| 139,293 | ||||||||||
| Computers: 1.8% | ||||||||||
| 200 | @ | Affiliated Computer Services, Inc. | 8,392 | |||||||
| 1,200 | @ | Apple, Inc. | 218,664 | |||||||
| 500 | @ | Cognizant Technology Solutions Corp. | 15,550 | |||||||
| 350 | @ | Computer Sciences Corp. | 18,487 | |||||||
| 3,720 | @ | Dell, Inc. | 91,289 | |||||||
| 3,050 | @ | EMC Corp. | 58,774 | |||||||
| 3,650 | Hewlett-Packard Co. | 186,734 | ||||||||
| 1,850 | International Business Machines Corp. | 194,583 | ||||||||
| 300 | @ | Lexmark International, Inc. | 10,464 | |||||||
| 400 | @ | Sandisk Corp. | 14,976 | |||||||
| 1,200 | @ | Sun Microsystems, Inc. | 24,936 | |||||||
| 842,849 | ||||||||||
| Cosmetics/Personal Care: 0.9% | ||||||||||
| 300 | Avon Products, Inc. | 12,315 | ||||||||
| 1,000 | Colgate-Palmolive Co. | 80,080 | ||||||||
| 4,243 | Procter & Gamble Co. | 313,982 | ||||||||
| 406,377 | ||||||||||
| Diversified Financial Services: 2.8% | ||||||||||
| 1,350 | American Express Co. | 79,623 | ||||||||
| 430 | Ameriprise Financial, Inc. | 25,237 | ||||||||
| 340 | Bear Stearns Cos., Inc. | 33,898 | ||||||||
| 1,300 | Charles Schwab Corp. | 31,603 | ||||||||
| 450 | CIT Group, Inc. | 11,970 | ||||||||
105
Table of Contents
| PORTFOLIO OF INVESTMENTS | ||
| ING Principal Protection Fund IX | as of November 30, 2007 (Unaudited) (Continued) | |
| Shares | Value | |||||||||
| Diversified Financial Services (continued) | ||||||||||
| 6,600 | Citigroup, Inc. | $ | 219,780 | |||||||
| 70 | CME Group, Inc. | 46,102 | ||||||||
| 770 | Countrywide Financial Corp. | 8,331 | ||||||||
| 1,025 | Discover Financial Services | 17,804 | ||||||||
| 600 | @ | E*Trade Financial Corp. | 2,760 | |||||||
| 1,100 | Fannie Mae | 42,262 | ||||||||
| 300 | Federated Investors, Inc. | 12,237 | ||||||||
| 150 | Franklin Resources, Inc. | 18,477 | ||||||||
| 900 | Freddie Mac | 31,563 | ||||||||
| 700 | Goldman Sachs Group, Inc. | 158,648 | ||||||||
| 100 | @ | IntercontinentalExchange, Inc. | 16,696 | |||||||
| 400 | Janus Capital Group, Inc. | 13,428 | ||||||||
| 4,800 | JPMorgan Chase & Co. | 218,976 | ||||||||
| 200 | Legg Mason, Inc. | 15,262 | ||||||||
| 1,040 | Lehman Brothers Holdings, Inc. | 65,135 | ||||||||
| 1,500 | Merrill Lynch & Co., Inc. | 89,910 | ||||||||
| 1,350 | Morgan Stanley | 71,172 | ||||||||
| 390 | Nyse Euronext | 33,774 | ||||||||
| 600 | SLM Corp. | 22,848 | ||||||||
| 200 | T. Rowe Price Group, Inc. | 12,296 | ||||||||
| 1,299,792 | ||||||||||
| Electric: 1.3% | ||||||||||
| 300 | Allegheny Energy, Inc. | 18,225 | ||||||||
| 450 | Constellation Energy Group, Inc. | 45,095 | ||||||||
| 1,300 | Dominion Resources, Inc. | 61,399 | ||||||||
| 500 | DTE Energy Co. | 24,525 | ||||||||
| 2,600 | Duke Energy Corp. | 51,454 | ||||||||
| 300 | Edison International | 16,794 | ||||||||
| 600 | Entergy Corp. | 71,724 | ||||||||
| 900 | Exelon Corp. | 72,963 | ||||||||
| 820 | FirstEnergy Corp. | 56,219 | ||||||||
| 1,100 | FPL Group, Inc. | 76,736 | ||||||||
| 1,000 | PPL Corp. | 50,960 | ||||||||
| 550 | Public Service Enterprise Group, Inc. | 52,657 | ||||||||
| 598,751 | ||||||||||
| Electrical Components & Equipment: 0.2% | ||||||||||
| 1,300 | Emerson Electric Co. | 74,126 | ||||||||
| 74,126 | ||||||||||
| Electronics: 0.3% | ||||||||||
| 350 | @ | Agilent Technologies, Inc. | 13,241 | |||||||
| 600 | Applera Corp. — Applied Biosystems Group | 20,496 | ||||||||
| 500 | Jabil Circuit, Inc. | 8,475 | ||||||||
| 900 | @ | Thermo Electron Corp. | 51,876 | |||||||
| 575 | @@ | Tyco Electronics Ltd. | 21,499 | |||||||
| 400 | @ | Waters Corp. | 31,216 | |||||||
| 146,803 | ||||||||||
| Engineering & Construction: 0.0% | ||||||||||
| 100 | Fluor Corp. | 14,717 | ||||||||
| 100 | @ | Jacobs Engineering Group, Inc. | 8,377 | |||||||
| 23,094 | ||||||||||
| Entertainment: 0.0% | ||||||||||
| 400 | International Game Technology | 17,464 | ||||||||
| 17,464 | ||||||||||
| Environmental Control: 0.0% | ||||||||||
| 900 | @ | Allied Waste Industries, Inc. | 10,269 | |||||||
| 10,269 | ||||||||||
| Shares | Value | |||||||||
| Food: 0.6% | ||||||||||
| 700 | General Mills, Inc. | $ | 42,105 | |||||||
| 800 | HJ Heinz Co. | 37,840 | ||||||||
| 1,200 | Kellogg Co. | 64,848 | ||||||||
| 795 | Kraft Foods, Inc. | 27,467 | ||||||||
| 1,250 | Kroger Co. | 35,938 | ||||||||
| 400 | Safeway, Inc. | 13,920 | ||||||||
| 600 | Sysco Corp. | 19,506 | ||||||||
| 600 | WM Wrigley Jr. Co. | 38,400 | ||||||||
| 280,024 | ||||||||||
| Forest Products & Paper: 0.0% | ||||||||||
| 600 | International Paper Co. | 20,250 | ||||||||
| 20,250 | ||||||||||
| Gas: 0.1% | ||||||||||
| 600 | Sempra Energy | 37,572 | ||||||||
| 37,572 | ||||||||||
| Hand/Machine Tools: 0.1% | ||||||||||
| 210 | Black & Decker Corp. | 17,357 | ||||||||
| 400 | Snap-On, Inc. | 19,552 | ||||||||
| 400 | Stanley Works | 20,860 | ||||||||
| 57,769 | ||||||||||
| Healthcare — Products: 1.1% | ||||||||||
| 850 | Baxter International, Inc. | 50,890 | ||||||||
| 1,000 | @ | Boston Scientific Corp. | 12,630 | |||||||
| 575 | @@ | Covidien Ltd. | 23,063 | |||||||
| 200 | CR Bard, Inc. | 16,906 | ||||||||
| 3,800 | Johnson & Johnson | 257,412 | ||||||||
| 1,500 | Medtronic, Inc. | 76,275 | ||||||||
| 700 | @ | St. Jude Medical, Inc. | 27,825 | |||||||
| 400 | Stryker Corp. | 29,052 | ||||||||
| 100 | @ | Zimmer Holdings, Inc. | 6,473 | |||||||
| 500,526 | ||||||||||
| Healthcare — Services: 0.6% | ||||||||||
| 770 | Aetna, Inc. | 43,028 | ||||||||
| 350 | @ | Coventry Health Care, Inc. | 20,258 | |||||||
| 310 | @ | Humana, Inc. | 23,879 | |||||||
| 450 | @ | Laboratory Corp. of America Holdings | 32,702 | |||||||
| 1,850 | UnitedHealth Group, Inc. | 101,750 | ||||||||
| 660 | @ | WellPoint, Inc. | 55,579 | |||||||
| 277,196 | ||||||||||
| Holding Companies — Diversified: 0.0% | ||||||||||
| 300 | Leucadia National Corp. | 14,088 | ||||||||
| 14,088 | ||||||||||
| Home Builders: 0.1% | ||||||||||
| 400 | Centex Corp. | 8,344 | ||||||||
| 700 | D.R. Horton, Inc. | 8,379 | ||||||||
| 400 | KB Home | 8,356 | ||||||||
| 300 | Lennar Corp. | 4,752 | ||||||||
| 29,831 | ||||||||||
| Home Furnishings: 0.0% | ||||||||||
| 100 | Harman International Industries, Inc. | 7,360 | ||||||||
| 100 | Whirlpool Corp. | 8,096 | ||||||||
| 15,456 | ||||||||||
| Household Products/Wares: 0.2% | ||||||||||
| 1,350 | Kimberly-Clark Corp. | 94,244 | ||||||||
| 94,244 | ||||||||||
106
Table of Contents
| PORTFOLIO OF INVESTMENTS | ||
| ING Principal Protection Fund IX | as of November 30, 2007 (Unaudited) (Continued) | |
| Shares | Value | |||||||||
| Housewares: 0.0% | ||||||||||
| 500 | Newell Rubbermaid, Inc. | $ | 13,390 | |||||||
| 13,390 | ||||||||||
| Insurance: 2.0% | ||||||||||
| 640 | @@ | ACE Ltd. | 38,291 | |||||||
| 600 | Aflac, Inc. | 37,584 | ||||||||
| 1,460 | Allstate Corp. | 74,635 | ||||||||
| 400 | AMBAC Financial Group, Inc. | 10,892 | ||||||||
| 3,750 | American International Group, Inc. | 217,988 | ||||||||
| 600 | AON Corp. | 29,982 | ||||||||
| 400 | Assurant, Inc. | 26,172 | ||||||||
| 830 | Chubb Corp. | 45,277 | ||||||||
| 600 | Cigna Corp. | 32,166 | ||||||||
| 550 | Hartford Financial Services Group, Inc. | 52,426 | ||||||||
| 200 | Loews Corp. | 9,558 | ||||||||
| 400 | Marsh & McLennan Cos., Inc. | 10,048 | ||||||||
| 550 | MBIA, Inc. | 20,081 | ||||||||
| 1,240 | Metlife, Inc. | 81,332 | ||||||||
| 740 | Progressive Corp. | 13,616 | ||||||||
| 950 | Prudential Financial, Inc. | 89,433 | ||||||||
| 600 | Safeco Corp. | 34,626 | ||||||||
| 400 | Torchmark Corp. | 24,672 | ||||||||
| 1,150 | Travelers Cos., Inc. | 61,077 | ||||||||
| 400 | @@ | XL Capital Ltd. | 23,412 | |||||||
| 933,268 | ||||||||||
| Internet: 0.9% | ||||||||||
| 300 | @ | Akamai Technologies, Inc. | 11,418 | |||||||
| 500 | @ | Amazon.com, Inc. | 45,280 | |||||||
| 1,700 | @ | eBay, Inc. | 57,001 | |||||||
| 300 | @ | Expedia, Inc. | 9,780 | |||||||
| 300 | @ | Google, Inc. — Class A | 207,900 | |||||||
| 400 | @ | IAC/InterActiveCorp. | 11,132 | |||||||
| 1,487 | @ | Symantec Corp. | 26,469 | |||||||
| 1,200 | @ | Yahoo!, Inc. | 32,172 | |||||||
| 401,152 | ||||||||||
| Investment Companies: 0.0% | ||||||||||
| 300 | American Capital Strategies Ltd. | 11,283 | ||||||||
| 11,283 | ||||||||||
| Iron/Steel: 0.1% | ||||||||||
| 400 | Nucor Corp. | 23,684 | ||||||||
| 250 | United States Steel Corp. | 24,425 | ||||||||
| 48,109 | ||||||||||
| Leisure Time: 0.1% | ||||||||||
| 600 | Carnival Corp. | 27,072 | ||||||||
| 200 | Harley-Davidson, Inc. | 9,604 | ||||||||
| 36,676 | ||||||||||
| Lodging: 0.1% | ||||||||||
| 300 | Harrah’s Entertainment, Inc. | 26,421 | ||||||||
| 500 | Marriott International, Inc. | 18,750 | ||||||||
| 450 | Starwood Hotels & Resorts Worldwide, Inc. | 24,156 | ||||||||
| 69,327 | ||||||||||
| Machinery — Construction & Mining: 0.1% | ||||||||||
| 800 | Caterpillar, Inc. | 57,520 | ||||||||
| 200 | @ | Terex Corp. | 12,890 | |||||||
| 70,410 | ||||||||||
| Shares | Value | |||||||||
| Machinery — Diversified: 0.2% | ||||||||||
| 200 | Cummins, Inc. | $ | 23,380 | |||||||
| 400 | Deere & Co. | 68,720 | ||||||||
| 200 | Rockwell Automation, Inc. | 13,578 | ||||||||
| 105,678 | ||||||||||
| Media: 0.9% | ||||||||||
| 600 | Clear Channel Communications, Inc. | 21,540 | ||||||||
| 2,300 | @ | Comcast Corp. — Class A | 47,242 | |||||||
| 1,700 | @ | DIRECTV Group, Inc. | 42,279 | |||||||
| 200 | EW Scripps Co. | 8,690 | ||||||||
| 430 | McGraw-Hill Cos., Inc. | 21,104 | ||||||||
| 200 | Meredith Corp. | 11,010 | ||||||||
| 2,650 | News Corp. — Class A | 55,836 | ||||||||
| 3,200 | Time Warner, Inc. | 55,232 | ||||||||
| 1,200 | @ | Viacom — Class B | 50,424 | |||||||
| 3,550 | Walt Disney Co. | 117,683 | ||||||||
| 431,040 | ||||||||||
| Mining: 0.2% | ||||||||||
| 400 | Alcoa, Inc. | 14,548 | ||||||||
| 624 | Freeport-McMoRan Copper & Gold, Inc. | 61,732 | ||||||||
| 300 | Newmont Mining Corp. | 14,907 | ||||||||
| 91,187 | ||||||||||
| Miscellaneous Manufacturing: 2.1% | ||||||||||
| 950 | 3M Co. | 79,097 | ||||||||
| 500 | Cooper Industries Ltd. | 25,110 | ||||||||
| 850 | Danaher Corp. | 73,797 | ||||||||
| 900 | Dover Corp. | 41,652 | ||||||||
| 450 | Eastman Kodak Co. | 10,566 | ||||||||
| 600 | Eaton Corp. | 53,586 | ||||||||
| 12,900 | General Electric Co. | 493,941 | ||||||||
| 1,000 | Honeywell International, Inc. | 56,620 | ||||||||
| 600 | Illinois Tool Works, Inc. | 33,300 | ||||||||
| 600 | ITT Corp. | 38,664 | ||||||||
| 550 | Parker Hannifin Corp. | 43,687 | ||||||||
| 200 | Textron, Inc. | 13,810 | ||||||||
| 675 | @@ | Tyco International Ltd. | 27,088 | |||||||
| 990,918 | ||||||||||
| Oil & Gas: 3.8% | ||||||||||
| 400 | Anadarko Petroleum Corp. | 22,640 | ||||||||
| 500 | Apache Corp. | 48,395 | ||||||||
| 400 | Chesapeake Energy Corp. | 15,140 | ||||||||
| 3,344 | Chevron Corp. | 293,503 | ||||||||
| 2,499 | ConocoPhillips | 200,020 | ||||||||
| 900 | Devon Energy Corp. | 74,529 | ||||||||
| 400 | ENSCO International, Inc. | 21,540 | ||||||||
| 7,950 | ExxonMobil Corp. | 708,822 | ||||||||
| 400 | Hess Corp. | 28,488 | ||||||||
| 1,100 | Marathon Oil Corp. | 61,490 | ||||||||
| 200 | Murphy Oil Corp. | 14,304 | ||||||||
| 600 | Noble Corp. | 31,278 | ||||||||
| 300 | Noble Energy, Inc. | 21,612 | ||||||||
| 1,300 | Occidental Petroleum Corp. | 90,701 | ||||||||
| 200 | Tesoro Petroleum Corp. | 9,836 | ||||||||
| 420 | @ | Transocean, Inc. | 57,629 | |||||||
| 750 | Valero Energy Corp. | 48,803 | ||||||||
| 200 | XTO Energy, Inc. | 12,364 | ||||||||
| 1,761,094 | ||||||||||
| Oil & Gas Services: 0.6% | ||||||||||
| 200 | Baker Hughes, Inc. | 16,054 | ||||||||
| 1,300 | Halliburton Co. | 47,593 | ||||||||
| 600 | @ | National Oilwell Varco, Inc. | 40,890 | |||||||
107
Table of Contents
| PORTFOLIO OF INVESTMENTS | ||
| ING Principal Protection Fund IX | as of November 30, 2007 (Unaudited) (Continued) | |
| Shares | Value | |||||||||
| Oil & Gas Services (continued) | ||||||||||
| 1,500 | Schlumberger Ltd. | $ | 140,175 | |||||||
| 400 | Smith International, Inc. | 25,088 | ||||||||
| 269,800 | ||||||||||
| Packaging & Containers: 0.1% | ||||||||||
| 600 | Ball Corp. | 27,750 | ||||||||
| 400 | @ | Pactiv Corp. | 10,160 | |||||||
| 37,910 | ||||||||||
| Pharmaceuticals: 2.1% | ||||||||||
| 1,100 | Abbott Laboratories | 63,261 | ||||||||
| 400 | Allergan, Inc. | 26,816 | ||||||||
| 460 | AmerisourceBergen Corp. | 20,870 | ||||||||
| 2,600 | Bristol-Myers Squibb Co. | 77,038 | ||||||||
| 290 | Cardinal Health, Inc. | 17,560 | ||||||||
| 1,700 | Eli Lilly & Co. | 90,015 | ||||||||
| 420 | @ | Express Scripts, Inc. | 28,455 | |||||||
| 300 | @ | Forest Laboratories, Inc. | 11,565 | |||||||
| 1,200 | @ | Gilead Sciences, Inc. | 55,848 | |||||||
| 300 | @ | Hospira, Inc. | 12,990 | |||||||
| 500 | @ | Medco Health Solutions, Inc. | 49,995 | |||||||
| 2,850 | Merck & Co., Inc. | 169,176 | ||||||||
| 9,100 | Pfizer, Inc. | 216,216 | ||||||||
| 2,550 | Schering-Plough Corp. | 79,815 | ||||||||
| 400 | @ | Watson Pharmaceuticals, Inc. | 11,724 | |||||||
| 1,400 | Wyeth | 68,740 | ||||||||
| 1,000,084 | ||||||||||
| Pipelines: 0.2% | ||||||||||
| 500 | Questar Corp. | 26,725 | ||||||||
| 700 | Spectra Energy Corp. | 17,248 | ||||||||
| 1,050 | Williams Cos., Inc. | 36,446 | ||||||||
| 80,419 | ||||||||||
| Retail: 2.0% | ||||||||||
| 200 | Abercrombie & Fitch Co. | 16,408 | ||||||||
| 200 | @ | Autozone, Inc. | 22,326 | |||||||
| 300 | @ | Bed Bath & Beyond, Inc. | 9,435 | |||||||
| 820 | Best Buy Co., Inc. | 41,861 | ||||||||
| 600 | @ | Big Lots, Inc. | 11,202 | |||||||
| 1,280 | @ | Coach, Inc. | 47,539 | |||||||
| 750 | Costco Wholesale Corp. | 50,550 | ||||||||
| 2,186 | CVS Caremark Corp. | 87,637 | ||||||||
| 610 | Darden Restaurants, Inc. | 24,272 | ||||||||
| 500 | Family Dollar Stores, Inc. | 11,775 | ||||||||
| 850 | Gap, Inc. | 17,340 | ||||||||
| 1,610 | Home Depot, Inc. | 45,982 | ||||||||
| 350 | JC Penney Co., Inc. | 15,442 | ||||||||
| 400 | @ | Kohl’s Corp. | 19,712 | |||||||
| 2,400 | Lowe’s Cos., Inc. | 58,584 | ||||||||
| 1,800 | McDonald’s Corp. | 105,246 | ||||||||
| 400 | Nordstrom, Inc. | 13,416 | ||||||||
| 300 | Polo Ralph Lauren Corp. | 20,694 | ||||||||
| 500 | RadioShack Corp. | 9,250 | ||||||||
| 30 | @ | Sears Holding Corp. | 3,165 | |||||||
| 440 | Staples, Inc. | 10,428 | ||||||||
| 1,250 | @ | Starbucks Corp. | 29,238 | |||||||
| 850 | Target Corp. | 51,051 | ||||||||
| 1,250 | TJX Cos., Inc. | 36,675 | ||||||||
| 400 | Walgreen Co. | 14,636 | ||||||||
| 2,850 | Wal-Mart Stores, Inc. | 136,515 | ||||||||
| 400 | Wendy’s International, Inc. | 11,212 | ||||||||
| 800 | Yum! Brands, Inc. | 29,720 | ||||||||
| 951,311 | ||||||||||
| Shares | Value | |||||||||
| Savings & Loans: 0.2% | ||||||||||
| 3,100 | Hudson City Bancorp., Inc. | $ | 47,182 | |||||||
| 1,670 | Washington Mutual, Inc. | 32,565 | ||||||||
| 79,747 | ||||||||||
| Semiconductors: 1.0% | ||||||||||
| 600 | Analog Devices, Inc. | 18,468 | ||||||||
| 2,400 | Applied Materials, Inc. | 45,192 | ||||||||
| 500 | @ | Broadcom Corp. | 13,370 | |||||||
| 8,640 | Intel Corp. | 225,331 | ||||||||
| 300 | KLA-Tencor Corp. | 14,424 | ||||||||
| 400 | @ | MEMC Electronic Materials, Inc. | 31,032 | |||||||
| 400 | National Semiconductor Corp. | 9,144 | ||||||||
| 450 | @ | Novellus Systems, Inc. | 11,705 | |||||||
| 750 | @ | Nvidia Corp. | 23,655 | |||||||
| 600 | @ | QLogic Corp. | 8,112 | |||||||
| 1,900 | Texas Instruments, Inc. | 59,983 | ||||||||
| 400 | Xilinx, Inc. | 8,760 | ||||||||
| 469,176 | ||||||||||
| Software: 1.4% | ||||||||||
| 620 | @ | Adobe Systems, Inc. | 26,127 | |||||||
| 480 | @ | Autodesk, Inc. | 22,603 | |||||||
| 650 | Automatic Data Processing, Inc. | 29,289 | ||||||||
| 590 | @ | BMC Software, Inc. | 19,517 | |||||||
| 1,450 | CA, Inc. | 35,511 | ||||||||
| 200 | @ | Electronic Arts, Inc. | 11,238 | |||||||
| 300 | Fidelity National Information Services, Inc. | 12,966 | ||||||||
| 300 | @ | Fiserv, Inc. | 15,399 | |||||||
| 10,900 | Microsoft Corp. | 366,240 | ||||||||
| 1,500 | @ | Novell, Inc. | 10,530 | |||||||
| 5,310 | @ | Oracle Corp. | 107,156 | |||||||
| 250 | Paychex, Inc. | 9,750 | ||||||||
| 666,326 | ||||||||||
| Telecommunications: 2.2% | ||||||||||
| 600 | @ | American Tower Corp. | 27,324 | |||||||
| 8,242 | AT&T, Inc. | 314,927 | ||||||||
| 700 | CenturyTel, Inc. | 29,841 | ||||||||
| 300 | @ | Ciena Corp. | 13,194 | |||||||
| 8,150 | @ | Cisco Systems, Inc. | 228,363 | |||||||
| 2,050 | Corning, Inc. | 49,795 | ||||||||
| 225 | Embarq Corp. | 11,464 | ||||||||
| 600 | @ | JDS Uniphase Corp. | 8,076 | |||||||
| 900 | @ | Juniper Networks, Inc. | 26,748 | |||||||
| 2,830 | Motorola, Inc. | 45,195 | ||||||||
| 2,600 | Qualcomm, Inc. | 106,028 | ||||||||
| 1,400 | @ | Qwest Communications International, Inc. | 9,282 | |||||||
| 2,409 | Sprint Nextel Corp. | 37,388 | ||||||||
| 2,900 | Verizon Communications, Inc. | 125,309 | ||||||||
| 1,700 | Windstream Corp. | 22,015 | ||||||||
| 1,054,949 | ||||||||||
| Toys/Games/Hobbies: 0.0% | ||||||||||
| 400 | Hasbro, Inc. | 11,108 | ||||||||
| 11,108 | ||||||||||
| Transportation: 0.6% | ||||||||||
| 100 | Burlington Northern Santa Fe Corp. | 8,352 | ||||||||
| 300 | CH Robinson Worldwide, Inc. | 15,465 | ||||||||
| 1,100 | CSX Corp. | 46,200 | ||||||||
| 200 | Expeditors International Washington, Inc. | 9,384 | ||||||||
| 600 | FedEx Corp. | 59,082 | ||||||||
| 650 | Norfolk Southern Corp. | 33,287 | ||||||||
108
Table of Contents
| PORTFOLIO OF INVESTMENTS | ||
| ING Principal Protection Fund IX | as of November 30, 2007 (Unaudited) (Continued) | |
| Shares | Value | |||||||||
| Transportation (continued) | ||||||||||
| 550 | Union Pacific Corp. | $ | 69,377 | |||||||
| 700 | United Parcel Service, Inc. — Class B | 51,562 | ||||||||
| 292,709 | ||||||||||
| Total Common Stock (Cost $17,867,562) | 17,723,008 | |||||||||
| REAL ESTATE INVESTMENT TRUSTS: 0.2% | ||||||||||
| Hotels: 0.0% | ||||||||||
| 700 | Host Hotels & Resorts, Inc. | 13,433 | ||||||||
| 13,433 | ||||||||||
| Regional Malls: 0.1% | ||||||||||
| 200 | General Growth Properties, Inc. | 9,288 | ||||||||
| 100 | Simon Property Group, Inc. | 9,845 | ||||||||
| 19,133 | ||||||||||
| Warehouse/Industrial: 0.1% | ||||||||||
| 600 | Prologis | 39,252 | ||||||||
| 39,252 | ||||||||||
| Total Real Estate Investment Trusts (Cost $77,580) | 71,818 | |||||||||
| Principal | ||||||||||
| Amount | Value | |||||||||
| U.S. GOVERNMENT AGENCY OBLIGATIONS: 48.0% | ||||||||||
| Federal Home Loan Mortgage Corporation: 48.0% | ||||||||||
| $ | 23,600,000 | Z | 3.460%, due 04/21/09 | 22,510,294 | ||||||
| Total U.S. Government Agency Obligations (Cost $22,367,613) | 22,510,294 | |||||||||
| U.S. TREASURY OBLIGATIONS: 13.7% | ||||||||||
| U.S. Treasury STRIP: 13.7% | ||||||||||
| 6,640,000 | ^ | 2.990%, due 02/15/09 | 6,407,680 | |||||||
| Total U.S. Treasury Obligations (Cost $6,373,075) | 6,407,680 | |||||||||
| Total Long-Term Investments (Cost $46,685,830) | 46,712,800 | |||||||||
| Shares | Value | |||||||||
| SHORT-TERM INVESTMENTS: 0.6% | ||||||||||
| Mutual Fund: 0.2% | ||||||||||
| 100,000 | ** | ING Institutional Prime Money Market Fund | 100,000 | |||||||
| Total Mutual Fund (Cost $100,000) | 100,000 | |||||||||
| Principal | ||||||||||||||
| Amount | Value | |||||||||||||
| Repurchase Agreement: 0.4% | ||||||||||||||
| $ | 194,000 | Goldman Sachs Repurchase Agreement dated 11/30/07, 4.510%, due 12/03/07, $194,073 to be received upon repurchase (Collateralized by $141,000 U.S. Treasury, 7.625%, Market Value plus accrued interest $199,194, due 02/15/25) | $ | 194,000 | ||||||||||
| Total Repurchase Agreement (Cost $194,000) | 194,000 | |||||||||||||
| Total Short-Term Investments (Cost $294,000) | 294,000 | |||||||||||||
Total Investments in Securities (Cost $46,979,830)* | 100.3 | % | $ | 47,006,800 | ||||||||||
Other Assets and Liabilities — Net | (0.3 | ) | (132,827 | ) | ||||||||||
Net Assets | 100.0 | % | $ | 46,873,973 | ||||||||||
| @ | Non-income producing security | |
| @@ | Foreign Issuer | |
| STRIP | Separate Trading of Registered Interest and Principal of Securities | |
| ** | Investment in affiliate | |
| ^ | Interest Only (IO) Security | |
| Z | Indicates Zero Coupon Bond; rate shown reflects current effective yield. | |
| * | Cost for federal income tax purposes is $47,328,105. |
| Net unrealized depreciation consists of: | ||||
| Gross Unrealized Appreciation | $ | 659,550 | ||
| Gross Unrealized Depreciation | (980,855 | ) | ||
| Net Unrealized Depreciation | $ | (321,305 | ) | |
109
Table of Contents
| PORTFOLIO OF INVESTMENTS | ||
| ING Principal Protection Fund X | as of November 30, 2007 (Unaudited) | |
| Shares | Value | |||||||||
| COMMON STOCK: 42.6% | ||||||||||
| Advertising: 0.1% | ||||||||||
| 1,014 | Omnicom Group | $ | 49,433 | |||||||
| 49,433 | ||||||||||
| Aerospace/Defense: 1.1% | ||||||||||
| 715 | Boeing Co. | 66,166 | ||||||||
| 498 | General Dynamics Corp. | 44,212 | ||||||||
| 300 | Goodrich Corp. | 21,387 | ||||||||
| 300 | L-3 Communications Holdings, Inc. | 33,195 | ||||||||
| 539 | Lockheed Martin Corp. | 59,651 | ||||||||
| 647 | Northrop Grumman Corp. | 50,977 | ||||||||
| 323 | Raytheon Co. | 19,978 | ||||||||
| 1,398 | United Technologies Corp. | 104,528 | ||||||||
| 400,094 | ||||||||||
| Agriculture: 0.7% | ||||||||||
| 2,476 | Altria Group, Inc. | 192,039 | ||||||||
| 525 | Archer-Daniels-Midland Co. | 19,084 | ||||||||
| 234 | Reynolds American, Inc. | 16,385 | ||||||||
| 500 | UST, Inc. | 28,950 | ||||||||
| 256,458 | ||||||||||
| Apparel: 0.2% | ||||||||||
| 936 | Nike, Inc. | 61,448 | ||||||||
| 100 | VF Corp. | 7,479 | ||||||||
| 68,927 | ||||||||||
| Auto Manufacturers: 0.2% | ||||||||||
| 2,350 | @ | Ford Motor Co. | 17,649 | |||||||
| 600 | General Motors Corp. | 17,898 | ||||||||
| 425 | Paccar, Inc. | 21,509 | ||||||||
| 57,056 | ||||||||||
| Auto Parts & Equipment: 0.1% | ||||||||||
| 840 | Johnson Controls, Inc. | 32,441 | ||||||||
| 32,441 | ||||||||||
| Banks: 2.0% | ||||||||||
| 4,614 | Bank of America Corp. | 212,844 | ||||||||
| 600 | Bank of New York Mellon Corp. | 28,776 | ||||||||
| 856 | BB&T Corp. | 30,884 | ||||||||
| 506 | Capital One Financial Corp. | 26,975 | ||||||||
| 337 | Comerica, Inc. | 15,428 | ||||||||
| 300 | Commerce Bancorp., Inc. | 11,946 | ||||||||
| 500 | Fifth Third Bancorp. | 14,955 | ||||||||
| 752 | Keycorp. | 19,808 | ||||||||
| 300 | Marshall & Ilsley Corp. | 9,441 | ||||||||
| 998 | Regions Financial Corp. | 26,377 | ||||||||
| 502 | State Street Corp. | 40,105 | ||||||||
| 475 | SunTrust Bank | 33,302 | ||||||||
| 2,428 | Wachovia Corp. | 104,404 | ||||||||
| 4,126 | Wells Fargo & Co. | 133,806 | ||||||||
| 300 | Zions Bancorp. | 16,371 | ||||||||
| 725,422 | ||||||||||
| Beverages: 1.1% | ||||||||||
| 1,642 | Anheuser-Busch Cos., Inc. | 86,566 | ||||||||
| 2,202 | Coca-Cola Co. | 136,744 | ||||||||
| 400 | @ | Constellation Brands, Inc. | 9,420 | |||||||
| 659 | Pepsi Bottling Group, Inc. | 28,120 | ||||||||
| 1,915 | PepsiCo, Inc. | 147,800 | ||||||||
| 408,650 | ||||||||||
| Shares | Value | |||||||||
| Biotechnology: 0.5% | ||||||||||
| 1,327 | @ | Amgen, Inc. | $ | 73,317 | ||||||
| 300 | @ | Biogen Idec, Inc. | 22,236 | |||||||
| 450 | @ | Celgene Corp. | 27,698 | |||||||
| 397 | @ | Genzyme Corp. | 29,747 | |||||||
| 100 | @ | Millipore Corp. | 8,188 | |||||||
| 161,186 | ||||||||||
| Building Materials: 0.0% | ||||||||||
| 468 | Masco Corp. | 10,483 | ||||||||
| 10,483 | ||||||||||
| Chemicals: 1.0% | ||||||||||
| 452 | Air Products & Chemicals, Inc. | 44,766 | ||||||||
| 848 | Dow Chemical Co. | 35,565 | ||||||||
| 500 | Ecolab, Inc. | 23,950 | ||||||||
| 1,050 | EI DuPont de Nemours & Co. | 48,458 | ||||||||
| 188 | International Flavors & Fragrances, Inc. | 9,426 | ||||||||
| 688 | Monsanto Co. | 68,367 | ||||||||
| 425 | PPG Industries, Inc. | 29,172 | ||||||||
| 500 | Praxair, Inc. | 42,690 | ||||||||
| 212 | Sherwin-Williams Co. | 13,320 | ||||||||
| 600 | Sigma-Aldrich Corp. | 31,590 | ||||||||
| 347,304 | ||||||||||
| Coal: 0.1% | ||||||||||
| 200 | Consol Energy, Inc. | 11,856 | ||||||||
| 300 | Peabody Energy Corp. | 16,692 | ||||||||
| 28,548 | ||||||||||
| Commercial Services: 0.3% | ||||||||||
| 200 | @ | Apollo Group, Inc. — Class A | 15,304 | |||||||
| 401 | McKesson Corp. | 26,759 | ||||||||
| 444 | Moody’s Corp. | 16,721 | ||||||||
| 400 | Robert Half International, Inc. | 10,784 | ||||||||
| 500 | RR Donnelley & Sons Co. | 18,330 | ||||||||
| 1,019 | Western Union Co. | 23,029 | ||||||||
| 110,927 | ||||||||||
| Computers: 2.0% | ||||||||||
| 200 | @ | Affiliated Computer Services, Inc. | 8,392 | |||||||
| 1,000 | @ | Apple, Inc. | 182,220 | |||||||
| 400 | @ | Cognizant Technology Solutions Corp. | 12,440 | |||||||
| 179 | @ | Computer Sciences Corp. | 9,455 | |||||||
| 3,136 | @ | Dell, Inc. | 76,957 | |||||||
| 2,960 | @ | EMC Corp. | 57,039 | |||||||
| 3,189 | Hewlett-Packard Co. | 163,149 | ||||||||
| 1,538 | International Business Machines Corp. | 161,767 | ||||||||
| 303 | @ | Lexmark International, Inc. | 10,569 | |||||||
| 400 | @ | Sandisk Corp. | 14,976 | |||||||
| 900 | @ | Sun Microsystems, Inc. | 18,702 | |||||||
| 715,666 | ||||||||||
| Cosmetics/Personal Care: 1.0% | ||||||||||
| 300 | Avon Products, Inc. | 12,315 | ||||||||
| 825 | Colgate-Palmolive Co. | 66,066 | ||||||||
| 3,697 | Procter & Gamble Co. | 273,578 | ||||||||
| 351,959 | ||||||||||
| Diversified Financial Services: 3.1% | ||||||||||
| 1,166 | American Express Co. | 68,771 | ||||||||
| 253 | Ameriprise Financial, Inc. | 14,849 | ||||||||
| 299 | Bear Stearns Cos., Inc. | 29,810 | ||||||||
| 1,050 | Charles Schwab Corp. | 25,526 | ||||||||
| 500 | CIT Group, Inc. | 13,300 | ||||||||
110
Table of Contents
| PORTFOLIO OF INVESTMENTS | ||
| ING Principal Protection Fund X | as of November 30, 2007 (Unaudited) (continued) | |
| Shares | Value | |||||||||
| Diversified Financial Services (continued) | ||||||||||
| 5,580 | Citigroup, Inc. | $ | 185,814 | |||||||
| 60 | CME Group, Inc. | 39,516 | ||||||||
| 630 | Countrywide Financial Corp. | 6,817 | ||||||||
| 645 | Discover Financial Services | 11,204 | ||||||||
| 450 | @ | E*Trade Financial Corp. | 2,070 | |||||||
| 1,118 | Fannie Mae | 42,954 | ||||||||
| 200 | Federated Investors, Inc. | 8,158 | ||||||||
| 173 | Franklin Resources, Inc. | 21,310 | ||||||||
| 800 | Freddie Mac | 28,056 | ||||||||
| 580 | Goldman Sachs Group, Inc. | 131,451 | ||||||||
| 100 | @ | IntercontinentalExchange, Inc. | 16,696 | |||||||
| 300 | Janus Capital Group, Inc. | 10,071 | ||||||||
| 4,200 | JPMorgan Chase & Co. | 191,604 | ||||||||
| 100 | Legg Mason, Inc. | 7,631 | ||||||||
| 938 | Lehman Brothers Holdings, Inc. | 58,747 | ||||||||
| 1,453 | Merrill Lynch & Co., Inc. | 87,093 | ||||||||
| 1,290 | Morgan Stanley | 68,009 | ||||||||
| 300 | Nyse Euronext | 25,980 | ||||||||
| 445 | SLM Corp. | 16,946 | ||||||||
| 1,112,383 | ||||||||||
| Electric: 1.4% | ||||||||||
| 200 | Allegheny Energy, Inc. | 12,150 | ||||||||
| 323 | Constellation Energy Group, Inc. | 32,368 | ||||||||
| 1,100 | Dominion Resources, Inc. | 51,953 | ||||||||
| 400 | DTE Energy Co. | 19,620 | ||||||||
| 2,200 | Duke Energy Corp. | 43,538 | ||||||||
| 291 | Edison International | 16,290 | ||||||||
| 550 | Entergy Corp. | 65,747 | ||||||||
| 800 | Exelon Corp. | 64,856 | ||||||||
| 763 | FirstEnergy Corp. | 52,311 | ||||||||
| 900 | FPL Group, Inc. | 62,784 | ||||||||
| 900 | PPL Corp. | 45,864 | ||||||||
| 450 | Public Service Enterprise Group, Inc. | 43,083 | ||||||||
| 510,564 | ||||||||||
| Electrical Components & Equipment: 0.2% | ||||||||||
| 1,208 | Emerson Electric Co. | 68,880 | ||||||||
| 68,880 | ||||||||||
| Electronics: 0.3% | ||||||||||
| 292 | @ | Agilent Technologies, Inc. | 11,046 | |||||||
| 500 | Applera Corp. — Applied Biosystems Group | 17,080 | ||||||||
| 400 | Jabil Circuit, Inc. | 6,780 | ||||||||
| 783 | @ | Thermo Electron Corp. | 45,132 | |||||||
| 475 | @@ | Tyco Electronics Ltd. | 17,760 | |||||||
| 290 | @ | Waters Corp. | 22,632 | |||||||
| 120,430 | ||||||||||
| Engineering & Construction: 0.1% | ||||||||||
| 100 | Fluor Corp. | 14,717 | ||||||||
| 100 | @ | Jacobs Engineering Group, Inc. | 8,377 | |||||||
| 23,094 | ||||||||||
| Entertainment: 0.1% | ||||||||||
| 400 | International Game Technology | 17,464 | ||||||||
| 17,464 | ||||||||||
| Environmental Control: 0.0% | ||||||||||
| 600 | @ | Allied Waste Industries, Inc. | 6,846 | |||||||
| 6,846 | ||||||||||
| Shares | Value | |||||||||
| Food: 0.7% | ||||||||||
| 730 | General Mills, Inc. | $ | 43,910 | |||||||
| 732 | HJ Heinz Co. | 34,624 | ||||||||
| 1,000 | Kellogg Co. | 54,040 | ||||||||
| 636 | Kraft Foods, Inc. | 21,974 | ||||||||
| 1,175 | Kroger Co. | 33,781 | ||||||||
| 300 | Safeway, Inc. | 10,440 | ||||||||
| 500 | Sysco Corp. | 16,255 | ||||||||
| 500 | WM Wrigley Jr. Co. | 32,000 | ||||||||
| 247,024 | ||||||||||
| Forest Products & Paper: 0.1% | ||||||||||
| 600 | International Paper Co. | 20,250 | ||||||||
| 20,250 | ||||||||||
| Gas: 0.1% | ||||||||||
| 500 | Sempra Energy | 31,310 | ||||||||
| 31,310 | ||||||||||
| Hand/Machine Tools: 0.1% | ||||||||||
| 198 | Black & Decker Corp. | 16,365 | ||||||||
| 348 | Snap-On, Inc. | 17,010 | ||||||||
| 185 | Stanley Works | 9,648 | ||||||||
| 43,023 | ||||||||||
| Healthcare — Products: 1.2% | ||||||||||
| 719 | Baxter International, Inc. | 43,047 | ||||||||
| 800 | @ | Boston Scientific Corp. | 10,104 | |||||||
| 475 | @@ | Covidien Ltd. | 19,052 | |||||||
| 200 | CR Bard, Inc. | 16,906 | ||||||||
| 3,202 | Johnson & Johnson | 216,903 | ||||||||
| 1,300 | Medtronic, Inc. | 66,105 | ||||||||
| 500 | @ | St. Jude Medical, Inc. | 19,875 | |||||||
| 300 | Stryker Corp. | 21,789 | ||||||||
| 100 | @ | Zimmer Holdings, Inc. | 6,473 | |||||||
| 420,254 | ||||||||||
| Healthcare — Services: 0.6% | ||||||||||
| 668 | Aetna, Inc. | 37,328 | ||||||||
| 215 | @ | Coventry Health Care, Inc. | 12,444 | |||||||
| 302 | @ | Humana, Inc. | 23,263 | |||||||
| 300 | @ | Laboratory Corp. of America Holdings | 21,801 | |||||||
| 1,548 | UnitedHealth Group, Inc. | 85,140 | ||||||||
| 568 | @ | WellPoint, Inc. | 47,831 | |||||||
| 227,807 | ||||||||||
| Holding Companies — Diversified: 0.0% | ||||||||||
| 200 | Leucadia National Corp. | 9,392 | ||||||||
| 9,392 | ||||||||||
| Home Builders: 0.1% | ||||||||||
| 400 | Centex Corp. | 8,344 | ||||||||
| 500 | D.R. Horton, Inc. | 5,985 | ||||||||
| 300 | KB Home | 6,267 | ||||||||
| 200 | Lennar Corp. | 3,168 | ||||||||
| 23,764 | ||||||||||
| Home Furnishings: 0.0% | ||||||||||
| 100 | Harman International Industries, Inc. | 7,360 | ||||||||
| 70 | Whirlpool Corp. | 5,667 | ||||||||
| 13,027 | ||||||||||
| Household Products/Wares: 0.2% | ||||||||||
| 1,137 | Kimberly-Clark Corp. | 79,374 | ||||||||
| 79,374 | ||||||||||
111
Table of Contents
| PORTFOLIO OF INVESTMENTS | ||
| ING Principal Protection Fund X | as of November 30, 2007 (Unaudited) (continued) | |
| Shares | Value | |||||||||
| Housewares: 0.0% | ||||||||||
| 500 | Newell Rubbermaid, Inc. | $ | 13,390 | |||||||
| 13,390 | ||||||||||
| Insurance: 2.2% | ||||||||||
| 612 | @@ | ACE Ltd. | 36,616 | |||||||
| 486 | Aflac, Inc. | 30,443 | ||||||||
| 1,294 | Allstate Corp. | 66,149 | ||||||||
| 267 | AMBAC Financial Group, Inc. | 7,270 | ||||||||
| 3,199 | American International Group, Inc. | 185,958 | ||||||||
| 450 | AON Corp. | 22,487 | ||||||||
| 400 | Assurant, Inc. | 26,172 | ||||||||
| 692 | Chubb Corp. | 37,749 | ||||||||
| 454 | Cigna Corp. | 24,339 | ||||||||
| 476 | Hartford Financial Services Group, Inc. | 45,372 | ||||||||
| 200 | Loews Corp. | 9,558 | ||||||||
| 400 | Marsh & McLennan Cos., Inc. | 10,048 | ||||||||
| 497 | MBIA, Inc. | 18,145 | ||||||||
| 1,161 | Metlife, Inc. | 76,150 | ||||||||
| 638 | Progressive Corp. | 11,739 | ||||||||
| 773 | Prudential Financial, Inc. | 72,770 | ||||||||
| 418 | Safeco Corp. | 24,123 | ||||||||
| 377 | Torchmark Corp. | 23,253 | ||||||||
| 1,080 | Travelers Cos., Inc. | 57,359 | ||||||||
| 300 | @@ | XL Capital Ltd. | 17,559 | |||||||
| 803,259 | ||||||||||
| Internet: 1.1% | ||||||||||
| 200 | @ | Akamai Technologies, Inc. | 7,612 | |||||||
| 400 | @ | Amazon.com, Inc. | 36,224 | |||||||
| 1,316 | @ | eBay, Inc. | 44,125 | |||||||
| 300 | @ | Expedia, Inc. | 9,780 | |||||||
| 350 | @ | Google, Inc. — Class A | 242,550 | |||||||
| 500 | @ | IAC/InterActiveCorp. | 13,915 | |||||||
| 1,159 | @ | Symantec Corp. | 20,630 | |||||||
| 1,200 | @ | Yahoo!, Inc. | 32,172 | |||||||
| 407,008 | ||||||||||
| Investment Companies: 0.0% | ||||||||||
| 200 | American Capital Strategies Ltd. | 7,522 | ||||||||
| 7,522 | ||||||||||
| Iron/Steel: 0.1% | ||||||||||
| 352 | Nucor Corp. | 20,842 | ||||||||
| 183 | United States Steel Corp. | 17,879 | ||||||||
| 38,721 | ||||||||||
| Leisure Time: 0.1% | ||||||||||
| 457 | Carnival Corp. | 20,620 | ||||||||
| 200 | Harley-Davidson, Inc. | 9,604 | ||||||||
| 30,224 | ||||||||||
| Lodging: 0.2% | ||||||||||
| 200 | Harrah’s Entertainment, Inc. | 17,614 | ||||||||
| 500 | Marriott International, Inc. | 18,750 | ||||||||
| 504 | Starwood Hotels & Resorts Worldwide, Inc. | 27,055 | ||||||||
| 63,419 | ||||||||||
| Machinery — Construction & Mining: 0.2% | ||||||||||
| 750 | Caterpillar, Inc. | 53,925 | ||||||||
| 100 | @ | Terex Corp. | 6,445 | |||||||
| 60,370 | ||||||||||
| Shares | Value | |||||||||
| Machinery — Diversified: 0.2% | ||||||||||
| 212 | Cummins, Inc. | $ | 24,783 | |||||||
| 300 | Deere & Co. | 51,540 | ||||||||
| 166 | Rockwell Automation, Inc. | 11,270 | ||||||||
| 87,593 | ||||||||||
| Media: 1.1% | ||||||||||
| 500 | Clear Channel Communications, Inc. | 17,950 | ||||||||
| 2,100 | @ | Comcast Corp. — Class A | 43,134 | |||||||
| 1,500 | @ | DIRECTV Group, Inc. | 37,305 | |||||||
| 200 | EW Scripps Co. | 8,690 | ||||||||
| 502 | McGraw-Hill Cos., Inc. | 24,638 | ||||||||
| 200 | Meredith Corp. | 11,010 | ||||||||
| 2,400 | News Corp. — Class A | 50,568 | ||||||||
| 2,900 | Time Warner, Inc. | 50,054 | ||||||||
| 1,100 | @ | Viacom — Class B | 46,222 | |||||||
| 3,170 | Walt Disney Co. | 105,086 | ||||||||
| 394,657 | ||||||||||
| Mining: 0.2% | ||||||||||
| 300 | Alcoa, Inc. | 10,911 | ||||||||
| 494 | Freeport-McMoRan Copper & Gold, Inc. | 48,871 | ||||||||
| 400 | Newmont Mining Corp. | 19,876 | ||||||||
| 79,658 | ||||||||||
| Miscellaneous Manufacturing: 2.4% | ||||||||||
| 770 | 3M Co. | 64,110 | ||||||||
| 426 | Cooper Industries Ltd. | 21,394 | ||||||||
| 725 | Danaher Corp. | 62,945 | ||||||||
| 800 | Dover Corp. | 37,024 | ||||||||
| 450 | Eastman Kodak Co. | 10,566 | ||||||||
| 496 | Eaton Corp. | 44,298 | ||||||||
| 11,255 | General Electric Co. | 430,954 | ||||||||
| 759 | Honeywell International, Inc. | 42,975 | ||||||||
| 600 | Illinois Tool Works, Inc. | 33,300 | ||||||||
| 480 | ITT Corp. | 30,931 | ||||||||
| 477 | Parker Hannifin Corp. | 37,888 | ||||||||
| 200 | Textron, Inc. | 13,810 | ||||||||
| 475 | @@ | Tyco International Ltd. | 19,062 | |||||||
| 849,257 | ||||||||||
| Oil & Gas: 4.3% | ||||||||||
| 254 | Anadarko Petroleum Corp. | 14,376 | ||||||||
| 500 | Apache Corp. | 48,395 | ||||||||
| 500 | Chesapeake Energy Corp. | 18,925 | ||||||||
| 2,947 | Chevron Corp. | 258,658 | ||||||||
| 2,151 | ConocoPhillips | 172,166 | ||||||||
| 824 | Devon Energy Corp. | 68,235 | ||||||||
| 300 | ENSCO International, Inc. | 16,155 | ||||||||
| 6,967 | ExxonMobil Corp. | 621,178 | ||||||||
| 500 | Hess Corp. | 35,610 | ||||||||
| 952 | Marathon Oil Corp. | 53,217 | ||||||||
| 200 | Murphy Oil Corp. | 14,304 | ||||||||
| 500 | Noble Corp. | 26,065 | ||||||||
| 260 | Noble Energy, Inc. | 18,730 | ||||||||
| 1,180 | Occidental Petroleum Corp. | 82,329 | ||||||||
| 200 | Tesoro Petroleum Corp. | 9,836 | ||||||||
| 349 | @ | Transocean, Inc. | 47,914 | |||||||
| 678 | Valero Energy Corp. | 44,117 | ||||||||
| 200 | XTO Energy, Inc. | 12,364 | ||||||||
| 1,562,574 | ||||||||||
| Oil & Gas Services: 0.7% | ||||||||||
| 200 | Baker Hughes, Inc. | 16,054 | ||||||||
| 1,100 | Halliburton Co. | 40,271 | ||||||||
| 500 | @ | National Oilwell Varco, Inc. | 34,075 | |||||||
112
Table of Contents
| PORTFOLIO OF INVESTMENTS | ||
| ING Principal Protection Fund X | as of November 30, 2007 (unaudited) (continued) | |
| Shares | Value | |||||||||
| Oil & Gas Services (continued) | ||||||||||
| 1,350 | Schlumberger Ltd. | $ | 126,158 | |||||||
| 500 | Smith International, Inc. | 31,360 | ||||||||
| 247,918 | ||||||||||
| Packaging & Containers: 0.1% | ||||||||||
| 460 | Ball Corp. | 21,275 | ||||||||
| 400 | @ | Pactiv Corp. | 10,160 | |||||||
| 31,435 | ||||||||||
| Pharmaceuticals: 2.5% | ||||||||||
| 1,050 | Abbott Laboratories | 60,386 | ||||||||
| 300 | Allergan, Inc. | 20,112 | ||||||||
| 380 | AmerisourceBergen Corp. | 17,241 | ||||||||
| 2,500 | Bristol-Myers Squibb Co. | 74,075 | ||||||||
| 258 | Cardinal Health, Inc. | 15,622 | ||||||||
| 1,400 | Eli Lilly & Co. | 74,130 | ||||||||
| 320 | @ | Express Scripts, Inc. | 21,680 | |||||||
| 209 | @ | Forest Laboratories, Inc. | 8,057 | |||||||
| 1,048 | @ | Gilead Sciences, Inc. | 48,774 | |||||||
| 300 | @ | Hospira, Inc. | 12,990 | |||||||
| 500 | @ | Medco Health Solutions, Inc. | 49,995 | |||||||
| 2,639 | Merck & Co., Inc. | 156,651 | ||||||||
| 7,806 | Pfizer, Inc. | 185,471 | ||||||||
| 2,150 | Schering-Plough Corp. | 67,295 | ||||||||
| 400 | @ | Watson Pharmaceuticals, Inc. | 11,724 | |||||||
| 1,244 | Wyeth | 61,080 | ||||||||
| 885,283 | ||||||||||
| Pipelines: 0.2% | ||||||||||
| 500 | Questar Corp. | 26,725 | ||||||||
| 800 | Spectra Energy Corp. | 19,712 | ||||||||
| 729 | Williams Cos., Inc. | 25,304 | ||||||||
| 71,741 | ||||||||||
| Retail: 2.2% | ||||||||||
| 200 | Abercrombie & Fitch Co. | 16,408 | ||||||||
| 200 | @ | Autozone, Inc. | 22,326 | |||||||
| 300 | @ | Bed Bath & Beyond, Inc. | 9,435 | |||||||
| 639 | Best Buy Co., Inc. | 32,621 | ||||||||
| 600 | @ | Big Lots, Inc. | 11,202 | |||||||
| 820 | @ | Coach, Inc. | 30,455 | |||||||
| 686 | Costco Wholesale Corp. | 46,236 | ||||||||
| 1,987 | CVS Caremark Corp. | 79,659 | ||||||||
| 491 | Darden Restaurants, Inc. | 19,537 | ||||||||
| 400 | Family Dollar Stores, Inc. | 9,420 | ||||||||
| 768 | Gap, Inc. | 15,667 | ||||||||
| 1,362 | Home Depot, Inc. | 38,899 | ||||||||
| 292 | JC Penney Co., Inc. | 12,883 | ||||||||
| 350 | @ | Kohl’s Corp. | 17,248 | |||||||
| 2,262 | Lowe’s Cos., Inc. | 55,215 | ||||||||
| 1,452 | McDonald’s Corp. | 84,898 | ||||||||
| 448 | Nordstrom, Inc. | 15,026 | ||||||||
| 200 | Polo Ralph Lauren Corp. | 13,796 | ||||||||
| 500 | RadioShack Corp. | 9,250 | ||||||||
| 30 | @ | Sears Holding Corp. | 3,165 | |||||||
| 467 | Staples, Inc. | 11,068 | ||||||||
| 642 | @ | Starbucks Corp. | 15,016 | |||||||
| 801 | Target Corp. | 48,108 | ||||||||
| 830 | TJX Cos., Inc. | 24,352 | ||||||||
| 400 | Walgreen Co. | 14,636 | ||||||||
| 2,360 | Wal-Mart Stores, Inc. | 113,044 | ||||||||
| 400 | Wendy’s International, Inc. | 11,212 | ||||||||
| 592 | Yum! Brands, Inc. | 21,993 | ||||||||
| 802,775 | ||||||||||
| Shares | Value | |||||||||
| Savings & Loans: 0.2% | ||||||||||
| 2,900 | Hudson City Bancorp., Inc. | $ | 44,138 | |||||||
| 1,437 | Washington Mutual, Inc. | 28,022 | ||||||||
| 72,160 | ||||||||||
| Semiconductors: 1.1% | ||||||||||
| 499 | Analog Devices, Inc. | 15,359 | ||||||||
| 2,082 | Applied Materials, Inc. | 39,204 | ||||||||
| 500 | @ | Broadcom Corp. | 13,370 | |||||||
| 7,571 | Intel Corp. | 197,452 | ||||||||
| 200 | KLA-Tencor Corp. | 9,616 | ||||||||
| 300 | @ | MEMC Electronic Materials, Inc. | 23,274 | |||||||
| 507 | National Semiconductor Corp. | 11,590 | ||||||||
| 400 | @ | Novellus Systems, Inc. | 10,404 | |||||||
| 500 | @ | Nvidia Corp. | 15,770 | |||||||
| 500 | @ | QLogic Corp. | 6,760 | |||||||
| 1,600 | Texas Instruments, Inc. | 50,512 | ||||||||
| 500 | Xilinx, Inc. | 10,950 | ||||||||
| 404,261 | ||||||||||
| Software: 1.6% | ||||||||||
| 524 | @ | Adobe Systems, Inc. | 22,081 | |||||||
| 442 | @ | Autodesk, Inc. | 20,814 | |||||||
| 413 | Automatic Data Processing, Inc. | 18,610 | ||||||||
| 464 | @ | BMC Software, Inc. | 15,349 | |||||||
| 1,331 | CA, Inc. | 32,596 | ||||||||
| 200 | @ | Electronic Arts, Inc. | 11,238 | |||||||
| 200 | Fidelity National Information Services, Inc. | 8,644 | ||||||||
| 389 | @ | Fiserv, Inc. | 19,967 | |||||||
| 1 | @ | Metavante Technologies, inc. | 23 | |||||||
| 9,537 | Microsoft Corp. | 320,443 | ||||||||
| 1,200 | @ | Novell, Inc. | 8,424 | |||||||
| 4,886 | @ | Oracle Corp. | 98,599 | |||||||
| 173 | Paychex, Inc. | 6,747 | ||||||||
| 583,535 | ||||||||||
| Telecommunications: 2.5% | ||||||||||
| 500 | @ | American Tower Corp. | 22,770 | |||||||
| 7,237 | AT&T, Inc. | 276,526 | ||||||||
| 480 | CenturyTel, Inc. | 20,462 | ||||||||
| 300 | @ | Ciena Corp. | 13,194 | |||||||
| 6,901 | @ | Cisco Systems, Inc. | 193,366 | |||||||
| 1,846 | Corning, Inc. | 44,839 | ||||||||
| 212 | Embarq Corp. | 10,801 | ||||||||
| 500 | @ | JDS Uniphase Corp. | 6,730 | |||||||
| 600 | @ | Juniper Networks, Inc. | 17,832 | |||||||
| 2,489 | Motorola, Inc. | 39,749 | ||||||||
| 2,324 | Qualcomm, Inc. | 94,773 | ||||||||
| 1,200 | @ | Qwest Communications International, Inc. | 7,956 | |||||||
| 2,240 | Sprint Nextel Corp. | 34,765 | ||||||||
| 2,545 | Verizon Communications, Inc. | 109,969 | ||||||||
| 1,400 | Windstream Corp. | 18,130 | ||||||||
| 911,862 | ||||||||||
| Toys/Games/Hobbies: 0.0% | ||||||||||
| 500 | Hasbro, Inc. | 13,885 | ||||||||
| 13,885 | ||||||||||
| Transportation: 0.7% | ||||||||||
| 100 | Burlington Northern Santa Fe Corp. | 8,352 | ||||||||
| 200 | CH Robinson Worldwide, Inc. | 10,310 | ||||||||
| 860 | CSX Corp. | 36,120 | ||||||||
| 200 | Expeditors International Washington, Inc. | 9,384 | ||||||||
| 485 | FedEx Corp. | 47,758 | ||||||||
113
Table of Contents
| PORTFOLIO OF INVESTMENTS | ||
| ING Principal Protection Fund X | as of November 30, 2007 (unaudited) (continued) | |
| Shares | Value | |||||||||
| Transportation (continued) | ||||||||||
| 475 | Norfolk Southern Corp. | $ | 24,325 | |||||||
| 450 | Union Pacific Corp. | 56,763 | ||||||||
| 700 | United Parcel Service, Inc. — Class B | 51,573 | ||||||||
| 244,585 | ||||||||||
| Total Common Stock (Cost $15,426,141) | 15,366,532 | |||||||||
| REAL ESTATE INVESTMENT TRUSTS: 0.2% | ||||||||||
| Hotels: 0.0% | ||||||||||
| 500 | Host Hotels & Resorts, Inc. | 9,595 | ||||||||
| 9,595 | ||||||||||
| Regional Malls: 0.1% | ||||||||||
| 200 | General Growth Properties, Inc. | 9,288 | ||||||||
| 100 | Simon Property Group, Inc. | 9,845 | ||||||||
| 19,133 | ||||||||||
| Warehouse/Industrial: 0.1% | ||||||||||
| 500 | Prologis | 32,710 | ||||||||
| 32,710 | ||||||||||
| Total Real Estate Investment Trusts (Cost $68,416) | 61,438 | |||||||||
| Principal | ||||||||||
| Amount | Value | |||||||||
| U.S. TREASURY OBLIGATIONS: 58.0% | ||||||||||
| U.S. Treasury STRIP: 58.0% | ||||||||||
| $ | 22,004,000 | ^^ | 3.000%, due 08/15/09 | 20,886,351 | ||||||
| Total U.S. Treasury Obligations (Cost $20,484,093) | 20,886,351 | |||||||||
| Total Long-Term Investments (Cost $35,978,650) | 36,314,321 | |||||||||
| Shares | Value | |||||||||
| SHORT-TERM INVESTMENTS: 0.3% | ||||||||||
| Mutual Fund: 0.0% | ||||||||||
| 10,000 | ** | ING Institutional Prime Money Market Fund | 10,000 | |||||||
| Total Mutual Fund (Cost $10,000) | 10,000 | |||||||||
| Principal | ||||||||||||||
| Amount | Value | |||||||||||||
| Repurchase Agreement: 0.3% | ||||||||||||||
| $ | 105,000 | Goldman Sachs Repurchase Agreement dated 11/30/07, 4.510%, due 12/03/07, $105,039 to be received upon repurchase (Collateralized by $76,000 U.S. Treasury, 7.625%, Market Value plus accrued interest $107,367, due 02/15/25) | $ | 105,000 | ||||||||||
| Total Repurchase Agreement (Cost $105,000) | 105,000 | |||||||||||||
| Total Short-Term Investments (Cost $115,000) | 115,000 | |||||||||||||
Total Investments in Securities (Cost $36,093,650)* | 101.1 | % | $ | 36,429,321 | ||||||||||
Other Assets and Liabilities — Net | (1.1 | ) | (395,581 | ) | ||||||||||
Net Assets | 100.0 | % | $ | 36,033,740 | ||||||||||
| @ | Non-income producing security | |
| @@ | Foreign Issuer | |
| STRIP | Separate Trading of Registered Interest and Principal of Securities | |
| ** | Investment in affiliate | |
| ^^ | Principal Only (PO) Security | |
| * | Cost for federal income tax purposes is $36,485,720. |
| Net unrealized depreciation consists of: | ||||
| Gross Unrealized Appreciation | $ | 778,387 | ||
| Gross Unrealized Depreciation | (834,786 | ) | ||
| Net Unrealized Depreciation | $ | (56,399 | ) | |
114
Table of Contents
| PORTFOLIO OF INVESTMENTS | ||
| ING Principal Protection Fund XI | as of November 30, 2007 (unaudited) | |
| Shares | Value | |||||||||
| COMMON STOCK: 38.0% | ||||||||||
| Advertising: 0.1% | ||||||||||
| 614 | Omnicom Group | $ | 29,933 | |||||||
| 29,933 | ||||||||||
| Aerospace/Defense: 1.0% | ||||||||||
| 449 | Boeing Co. | 41,550 | ||||||||
| 354 | General Dynamics Corp. | 31,428 | ||||||||
| 200 | Goodrich Corp. | 14,258 | ||||||||
| 160 | L-3 Communications Holdings, Inc. | 17,704 | ||||||||
| 376 | Lockheed Martin Corp. | 41,612 | ||||||||
| 474 | Northrop Grumman Corp. | 37,346 | ||||||||
| 242 | Raytheon Co. | 14,968 | ||||||||
| 798 | United Technologies Corp. | 59,666 | ||||||||
| 258,532 | ||||||||||
| Agriculture: 0.7% | ||||||||||
| 1,519 | Altria Group, Inc. | 117,814 | ||||||||
| 432 | Archer-Daniels-Midland Co. | 15,703 | ||||||||
| 166 | Reynolds American, Inc. | 11,623 | ||||||||
| 400 | UST, Inc. | 23,160 | ||||||||
| 168,300 | ||||||||||
| Apparel: 0.2% | ||||||||||
| 456 | Nike, Inc. | 29,936 | ||||||||
| 100 | VF Corp. | 7,479 | ||||||||
| 37,415 | ||||||||||
| Auto Manufacturers: 0.2% | ||||||||||
| 1,333 | @ | Ford Motor Co. | 10,011 | |||||||
| 400 | General Motors Corp. | 11,932 | ||||||||
| 362 | Paccar, Inc. | 18,321 | ||||||||
| 40,264 | ||||||||||
| Auto Parts & Equipment: 0.1% | ||||||||||
| 506 | Johnson Controls, Inc. | 19,542 | ||||||||
| 19,542 | ||||||||||
| Banks: 1.8% | ||||||||||
| 2,921 | Bank of America Corp. | 134,746 | ||||||||
| 400 | Bank of New York Mellon Corp. | 19,184 | ||||||||
| 530 | BB&T Corp. | 19,122 | ||||||||
| 350 | Capital One Financial Corp. | 18,659 | ||||||||
| 153 | Comerica, Inc. | 7,004 | ||||||||
| 200 | Commerce Bancorp., Inc. | 7,964 | ||||||||
| 350 | Fifth Third Bancorp. | 10,469 | ||||||||
| 401 | Keycorp. | 10,562 | ||||||||
| 300 | Marshall & Ilsley Corp. | 9,441 | ||||||||
| 764 | Regions Financial Corp. | 20,193 | ||||||||
| 375 | State Street Corp. | 29,959 | ||||||||
| 311 | SunTrust Bank | 21,804 | ||||||||
| 1,588 | Wachovia Corp. | 68,284 | ||||||||
| 2,458 | Wells Fargo & Co. | 79,713 | ||||||||
| 200 | Zions Bancorp. | 10,914 | ||||||||
| 468,018 | ||||||||||
| Beverages: 1.0% | ||||||||||
| 1,029 | Anheuser-Busch Cos., Inc. | 54,249 | ||||||||
| 1,293 | Coca-Cola Co. | 80,295 | ||||||||
| 200 | @ | Constellation Brands, Inc. | 4,710 | |||||||
| 424 | Pepsi Bottling Group, Inc. | 18,092 | ||||||||
| 1,212 | PepsiCo, Inc. | 93,542 | ||||||||
| 250,888 | ||||||||||
| Shares | Value | |||||||||
| Biotechnology: 0.4% | ||||||||||
| 684 | @ | Amgen, Inc. | $ | 37,791 | ||||||
| 200 | @ | Biogen Idec, Inc. | 14,824 | |||||||
| 250 | @ | Celgene Corp. | 15,388 | |||||||
| 297 | @ | Genzyme Corp. | 22,254 | |||||||
| 100 | @ | Millipore Corp. | 8,188 | |||||||
| 98,445 | ||||||||||
| Building Materials: 0.0% | ||||||||||
| 350 | Masco Corp. | 7,840 | ||||||||
| 7,840 | ||||||||||
| Chemicals: 0.9% | ||||||||||
| 296 | Air Products & Chemicals, Inc. | 29,316 | ||||||||
| 493 | Dow Chemical Co. | 20,676 | ||||||||
| 400 | Ecolab, Inc. | 19,160 | ||||||||
| 550 | EI DuPont de Nemours & Co. | 25,383 | ||||||||
| 146 | International Flavors & Fragrances, Inc. | 7,320 | ||||||||
| 464 | Monsanto Co. | 46,108 | ||||||||
| 222 | PPG Industries, Inc. | 15,238 | ||||||||
| 300 | Praxair, Inc. | 25,614 | ||||||||
| 111 | Sherwin-Williams Co. | 6,974 | ||||||||
| 500 | Sigma-Aldrich Corp. | 26,325 | ||||||||
| 222,114 | ||||||||||
| Coal: 0.1% | ||||||||||
| 150 | Consol Energy, Inc. | 8,892 | ||||||||
| 100 | Peabody Energy Corp. | 5,564 | ||||||||
| 14,456 | ||||||||||
| Commercial Services: 0.3% | ||||||||||
| 100 | @ | Apollo Group, Inc. — Class A | 7,652 | |||||||
| 270 | McKesson Corp. | 18,017 | ||||||||
| 252 | Moody’s Corp. | 9,490 | ||||||||
| 200 | Robert Half International, Inc. | 5,392 | ||||||||
| 300 | RR Donnelley & Sons Co. | 10,998 | ||||||||
| 533 | Western Union Co. | 12,046 | ||||||||
| 63,595 | ||||||||||
| Computers: 1.8% | ||||||||||
| 100 | @ | Affiliated Computer Services, Inc. | 4,196 | |||||||
| 600 | @ | Apple, Inc. | 109,332 | |||||||
| 400 | @ | Cognizant Technology Solutions Corp. | 12,440 | |||||||
| 204 | @ | Computer Sciences Corp. | 10,775 | |||||||
| 1,971 | @ | Dell, Inc. | 48,368 | |||||||
| 1,611 | @ | EMC Corp. | 31,044 | |||||||
| 1,970 | Hewlett-Packard Co. | 100,785 | ||||||||
| 987 | International Business Machines Corp. | 103,813 | ||||||||
| 169 | @ | Lexmark International, Inc. | 5,895 | |||||||
| 300 | @ | Sandisk Corp. | 11,232 | |||||||
| 600 | @ | Sun Microsystems, Inc. | 12,468 | |||||||
| 450,348 | ||||||||||
| Cosmetics/Personal Care: 0.8% | ||||||||||
| 200 | Avon Products, Inc. | 8,210 | ||||||||
| 449 | Colgate-Palmolive Co. | 35,956 | ||||||||
| 2,295 | Procter & Gamble Co. | 169,830 | ||||||||
| 213,996 | ||||||||||
| Diversified Financial Services: 2.8% | ||||||||||
| 735 | American Express Co. | 43,350 | ||||||||
| 217 | Ameriprise Financial, Inc. | 12,736 | ||||||||
| 130 | Bear Stearns Cos., Inc. | 12,961 | ||||||||
| 600 | Charles Schwab Corp. | 14,586 | ||||||||
| 298 | CIT Group, Inc. | 7,927 | ||||||||
| 3,464 | Citigroup, Inc. | 115,351 | ||||||||
115
Table of Contents
| PORTFOLIO OF INVESTMENTS | ||
| ING Principal Protection Fund XI | as of November 30, 2007 (unaudited) (continued) | |
| Shares | Value | |||||||||
| Diversified Financial Services (continued) | ||||||||||
| 40 | CME Group, Inc. | $ | 26,344 | |||||||
| 438 | Countrywide Financial Corp. | 4,739 | ||||||||
| 492 | Discover Financial Services | 8,546 | ||||||||
| 350 | @ | E*Trade Financial Corp. | 1,610 | |||||||
| 641 | Fannie Mae | 24,627 | ||||||||
| 200 | Federated Investors, Inc. | 8,158 | ||||||||
| 63 | Franklin Resources, Inc. | 7,760 | ||||||||
| 450 | Freddie Mac | 15,782 | ||||||||
| 393 | Goldman Sachs Group, Inc. | 89,070 | ||||||||
| 100 | @ | IntercontinentalExchange, Inc. | 16,696 | |||||||
| 250 | Janus Capital Group, Inc. | 8,393 | ||||||||
| 2,600 | JPMorgan Chase & Co. | 118,612 | ||||||||
| 100 | Legg Mason, Inc. | 7,631 | ||||||||
| 504 | Lehman Brothers Holdings, Inc. | 31,566 | ||||||||
| 871 | Merrill Lynch & Co., Inc. | 52,208 | ||||||||
| 785 | Morgan Stanley | 41,385 | ||||||||
| 150 | Nyse Euronext | 12,990 | ||||||||
| 351 | SLM Corp. | 13,366 | ||||||||
| 100 | T. Rowe Price Group, Inc. | 6,148 | ||||||||
| 702,542 | ||||||||||
| Electric: 1.3% | ||||||||||
| 200 | Allegheny Energy, Inc. | 12,150 | ||||||||
| 262 | Constellation Energy Group, Inc. | 26,255 | ||||||||
| 700 | Dominion Resources, Inc. | 33,061 | ||||||||
| 250 | DTE Energy Co. | 12,263 | ||||||||
| 1,400 | Duke Energy Corp. | 27,706 | ||||||||
| 194 | Edison International | 10,860 | ||||||||
| 400 | Entergy Corp. | 47,816 | ||||||||
| 500 | Exelon Corp. | 40,535 | ||||||||
| 463 | FirstEnergy Corp. | 31,743 | ||||||||
| 550 | FPL Group, Inc. | 38,368 | ||||||||
| 500 | PPL Corp. | 25,480 | ||||||||
| 342 | Public Service Enterprise Group, Inc. | 32,743 | ||||||||
| 338,980 | ||||||||||
| Electrical Components & Equipment: 0.2% | ||||||||||
| 654 | Emerson Electric Co. | 37,291 | ||||||||
| 37,291 | ||||||||||
| Electronics: 0.3% | ||||||||||
| 156 | @ | Agilent Technologies, Inc. | 5,901 | |||||||
| 300 | Applera Corp. — Applied Biosystems Group | 10,248 | ||||||||
| 300 | Jabil Circuit, Inc. | 5,085 | ||||||||
| 481 | @ | Thermo Electron Corp. | 27,725 | |||||||
| 350 | @@ | Tyco Electronics Ltd. | 13,087 | |||||||
| 154 | @ | Waters Corp. | 12,018 | |||||||
| 74,064 | ||||||||||
| Engineering & Construction: 0.1% | ||||||||||
| 100 | Fluor Corp. | 14,717 | ||||||||
| 100 | @ | Jacobs Engineering Group, Inc. | 8,377 | |||||||
| 23,094 | ||||||||||
| Entertainment: 0.0% | ||||||||||
| 270 | International Game Technology | 11,788 | ||||||||
| 11,788 | ||||||||||
| Environmental Control: 0.0% | ||||||||||
| 400 | @ | Allied Waste Industries, Inc. | 4,564 | |||||||
| 4,564 | ||||||||||
| Shares | Value | |||||||||
| Food: 0.6% | ||||||||||
| 480 | General Mills, Inc. | $ | 28,872 | |||||||
| 450 | HJ Heinz Co. | 21,285 | ||||||||
| 600 | Kellogg Co. | 32,424 | ||||||||
| 497 | Kraft Foods, Inc. | 17,171 | ||||||||
| 528 | Kroger Co. | 15,180 | ||||||||
| 207 | Safeway, Inc. | 7,204 | ||||||||
| 200 | Sysco Corp. | 6,502 | ||||||||
| 300 | WM Wrigley Jr. Co. | 19,200 | ||||||||
| 147,838 | ||||||||||
| Forest Products & Paper: 0.0% | ||||||||||
| 350 | International Paper Co. | 11,813 | ||||||||
| 11,813 | ||||||||||
| Gas: 0.1% | ||||||||||
| 300 | Sempra Energy | 18,786 | ||||||||
| 18,786 | ||||||||||
| Hand/Machine Tools: 0.1% | ||||||||||
| 162 | Black & Decker Corp. | 13,389 | ||||||||
| 192 | Snap-On, Inc. | 9,385 | ||||||||
| 159 | Stanley Works | 8,292 | ||||||||
| 31,066 | ||||||||||
| Healthcare — Products: 1.0% | ||||||||||
| 482 | Baxter International, Inc. | 28,857 | ||||||||
| 500 | @ | Boston Scientific Corp. | 6,315 | |||||||
| 350 | @@ | Covidien Ltd. | 14,039 | |||||||
| 100 | CR Bard, Inc. | 8,453 | ||||||||
| 2,007 | Johnson & Johnson | 135,954 | ||||||||
| 750 | Medtronic, Inc. | 38,138 | ||||||||
| 300 | @ | St. Jude Medical, Inc. | 11,925 | |||||||
| 200 | Stryker Corp. | 14,526 | ||||||||
| 100 | @ | Zimmer Holdings, Inc. | 6,473 | |||||||
| 264,680 | ||||||||||
| Healthcare — Services: 0.6% | ||||||||||
| 444 | Aetna, Inc. | 24,811 | ||||||||
| 160 | @ | Coventry Health Care, Inc. | 9,261 | |||||||
| 198 | @ | Humana, Inc. | 15,252 | |||||||
| 181 | @ | Laboratory Corp. of America Holdings | 13,153 | |||||||
| 976 | UnitedHealth Group, Inc. | 53,680 | ||||||||
| 406 | @ | WellPoint, Inc. | 34,189 | |||||||
| 150,346 | ||||||||||
| Holding Companies — Diversified: 0.0% | ||||||||||
| 200 | Leucadia National Corp. | 9,392 | ||||||||
| 9,392 | ||||||||||
| Home Builders: 0.1% | ||||||||||
| 300 | Centex Corp. | 6,258 | ||||||||
| 400 | D.R. Horton, Inc. | 4,788 | ||||||||
| 200 | KB Home | 4,178 | ||||||||
| 200 | Lennar Corp. | 3,168 | ||||||||
| 18,392 | ||||||||||
| Home Furnishings: 0.1% | ||||||||||
| 100 | Harman International Industries, Inc. | 7,360 | ||||||||
| 90 | Whirlpool Corp. | 7,286 | ||||||||
| 14,646 | ||||||||||
| Household Products/Wares: 0.2% | ||||||||||
| 714 | Kimberly-Clark Corp. | 49,844 | ||||||||
| 49,844 | ||||||||||
116
Table of Contents
| PORTFOLIO OF INVESTMENTS | ||
| ING Principal Protection Fund XI | as of November 30, 2007 (unaudited) (continued) | |
| Shares | Value | |||||||||
| Housewares: 0.0% | ||||||||||
| 400 | Newell Rubbermaid, Inc. | $ | 10,712 | |||||||
| 10,712 | ||||||||||
| Insurance: 2.0% | ||||||||||
| 465 | @@ | ACE Ltd. | 27,821 | |||||||
| 447 | Aflac, Inc. | 28,000 | ||||||||
| 723 | Allstate Corp. | 36,960 | ||||||||
| 242 | AMBAC Financial Group, Inc. | 6,590 | ||||||||
| 1,942 | American International Group, Inc. | 112,888 | ||||||||
| 320 | AON Corp. | 15,990 | ||||||||
| 200 | Assurant, Inc. | 13,086 | ||||||||
| 440 | Chubb Corp. | 24,002 | ||||||||
| 292 | Cigna Corp. | 15,654 | ||||||||
| 263 | Hartford Financial Services Group, Inc. | 25,069 | ||||||||
| 100 | Loews Corp. | 4,779 | ||||||||
| 300 | Marsh & McLennan Cos., Inc. | 7,536 | ||||||||
| 383 | MBIA, Inc. | 13,983 | ||||||||
| 636 | Metlife, Inc. | 41,715 | ||||||||
| 432 | Progressive Corp. | 7,949 | ||||||||
| 433 | Prudential Financial, Inc. | 40,763 | ||||||||
| 310 | Safeco Corp. | 17,890 | ||||||||
| 252 | Torchmark Corp. | 15,543 | ||||||||
| 650 | Travelers Cos., Inc. | 34,522 | ||||||||
| 300 | @@ | XL Capital Ltd. | 17,559 | |||||||
| 508,299 | ||||||||||
| Internet: 0.9% | ||||||||||
| 250 | @ | Amazon.com, Inc. | 22,640 | |||||||
| 766 | @ | eBay, Inc. | 25,684 | |||||||
| 200 | @ | Expedia, Inc. | 6,520 | |||||||
| 200 | @ | Google, Inc. — Class A | 138,600 | |||||||
| 350 | @ | IAC/InterActiveCorp. | 9,741 | |||||||
| 796 | @ | Symantec Corp. | 14,169 | |||||||
| 700 | @ | Yahoo!, Inc. | 18,767 | |||||||
| 236,121 | ||||||||||
| Investment Companies: 0.0% | ||||||||||
| 150 | American Capital Strategies Ltd. | 5,642 | ||||||||
| 5,642 | ||||||||||
| Iron/Steel: 0.1% | ||||||||||
| 230 | Nucor Corp. | 13,618 | ||||||||
| 136 | United States Steel Corp. | 13,287 | ||||||||
| 26,905 | ||||||||||
| Leisure Time: 0.1% | ||||||||||
| 445 | Carnival Corp. | 20,078 | ||||||||
| 100 | Harley-Davidson, Inc. | 4,802 | ||||||||
| 24,880 | ||||||||||
| Lodging: 0.2% | ||||||||||
| 200 | Harrah’s Entertainment, Inc. | 17,614 | ||||||||
| 400 | Marriott International, Inc. | 15,000 | ||||||||
| 300 | Starwood Hotels & Resorts Worldwide, Inc. | 16,104 | ||||||||
| 48,718 | ||||||||||
| Machinery — Construction & Mining: 0.2% | ||||||||||
| 500 | Caterpillar, Inc. | 35,950 | ||||||||
| 100 | @ | Terex Corp. | 6,445 | |||||||
| 42,395 | ||||||||||
| Machinery — Diversified: 0.2% | ||||||||||
| 108 | Cummins, Inc. | 12,625 | ||||||||
| 150 | Deere & Co. | 25,770 | ||||||||
| 101 | Rockwell Automation, Inc. | 6,857 | ||||||||
| 45,252 | ||||||||||
| Shares | Value | |||||||||
| Media: 0.9% | ||||||||||
| 400 | Clear Channel Communications, Inc. | $ | 14,360 | |||||||
| 1,225 | @ | Comcast Corp. — Class A | 25,162 | |||||||
| 1,050 | @ | DIRECTV Group, Inc. | 26,114 | |||||||
| 100 | Dow Jones & Co., Inc. | 5,975 | ||||||||
| 100 | EW Scripps Co. | 4,345 | ||||||||
| 258 | McGraw-Hill Cos., Inc. | 12,663 | ||||||||
| 100 | Meredith Corp. | 5,505 | ||||||||
| 1,330 | News Corp. — Class A | 28,023 | ||||||||
| 1,800 | Time Warner, Inc. | 31,068 | ||||||||
| 600 | @ | Viacom — Class B | 25,212 | |||||||
| 1,779 | Walt Disney Co. | 58,974 | ||||||||
| 237,401 | ||||||||||
| Mining: 0.2% | ||||||||||
| 200 | Alcoa, Inc. | 7,274 | ||||||||
| 397 | Freeport-McMoRan Copper & Gold, Inc. | 39,275 | ||||||||
| 200 | Newmont Mining Corp. | 9,938 | ||||||||
| 56,487 | ||||||||||
| Miscellaneous Manufacturing: 2.1% | ||||||||||
| 437 | 3M Co. | 36,385 | ||||||||
| 254 | Cooper Industries Ltd. | 12,756 | ||||||||
| 438 | Danaher Corp. | 38,027 | ||||||||
| 500 | Dover Corp. | 23,140 | ||||||||
| 250 | Eastman Kodak Co. | 5,870 | ||||||||
| 289 | Eaton Corp. | 25,811 | ||||||||
| 6,963 | General Electric Co. | 266,613 | ||||||||
| 506 | Honeywell International, Inc. | 28,650 | ||||||||
| 400 | Illinois Tool Works, Inc. | 22,200 | ||||||||
| 336 | ITT Corp. | 21,652 | ||||||||
| 249 | Parker Hannifin Corp. | 19,778 | ||||||||
| 100 | Textron, Inc. | 6,905 | ||||||||
| 350 | @@ | Tyco International Ltd. | 14,046 | |||||||
| 521,833 | ||||||||||
| Oil & Gas: 3.7% | ||||||||||
| 170 | Anadarko Petroleum Corp. | 9,622 | ||||||||
| 300 | Apache Corp. | 29,037 | ||||||||
| 300 | Chesapeake Energy Corp. | 11,355 | ||||||||
| 1,777 | Chevron Corp. | 155,967 | ||||||||
| 1,349 | ConocoPhillips | 107,974 | ||||||||
| 437 | Devon Energy Corp. | 36,188 | ||||||||
| 200 | ENSCO International, Inc. | 10,770 | ||||||||
| 4,198 | ExxonMobil Corp. | 374,294 | ||||||||
| 300 | Hess Corp. | 21,366 | ||||||||
| 494 | Marathon Oil Corp. | 27,615 | ||||||||
| 100 | Murphy Oil Corp. | 7,152 | ||||||||
| 400 | Noble Corp. | 20,852 | ||||||||
| 160 | Noble Energy, Inc. | 11,526 | ||||||||
| 726 | Occidental Petroleum Corp. | 50,653 | ||||||||
| 100 | Tesoro Petroleum Corp. | 4,918 | ||||||||
| 209 | @ | Transocean, Inc. | 28,694 | |||||||
| 482 | Valero Energy Corp. | 31,364 | ||||||||
| 100 | XTO Energy, Inc. | 6,182 | ||||||||
| 945,529 | ||||||||||
| Oil & Gas Services: 0.6% | ||||||||||
| 100 | Baker Hughes, Inc. | 8,027 | ||||||||
| 630 | Halliburton Co. | 23,064 | ||||||||
| 400 | @ | National Oilwell Varco, Inc. | 27,260 | |||||||
| 800 | Schlumberger Ltd. | 74,760 | ||||||||
| 300 | Smith International, Inc. | 18,816 | ||||||||
| 151,927 | ||||||||||
117
Table of Contents
| PORTFOLIO OF INVESTMENTS | ||
| ING Principal Protection Fund XI | as of November 30, 2007 (unaudited) (continued) | |
| Shares | Value | |||||||||
| Packaging & Containers: 0.1% | ||||||||||
| 340 | Ball Corp. | $ | 15,725 | |||||||
| 350 | @ | Pactiv Corp. | 8,890 | |||||||
| 24,615 | ||||||||||
| Pharmaceuticals: 2.1% | ||||||||||
| 650 | Abbott Laboratories | 37,382 | ||||||||
| 200 | Allergan, Inc. | 13,408 | ||||||||
| 176 | AmerisourceBergen Corp. | 7,985 | ||||||||
| 1,450 | Bristol-Myers Squibb Co. | 42,964 | ||||||||
| 133 | Cardinal Health, Inc. | 8,053 | ||||||||
| 850 | Eli Lilly & Co. | 45,008 | ||||||||
| 220 | @ | Express Scripts, Inc. | 14,905 | |||||||
| 148 | @ | Forest Laboratories, Inc. | 5,705 | |||||||
| 652 | @ | Gilead Sciences, Inc. | 30,344 | |||||||
| 200 | @ | Hospira, Inc. | 8,660 | |||||||
| 300 | @ | Medco Health Solutions, Inc. | 29,997 | |||||||
| 1,534 | Merck & Co., Inc. | 91,058 | ||||||||
| 4,904 | Pfizer, Inc. | 116,519 | ||||||||
| 1,400 | Schering-Plough Corp. | 43,820 | ||||||||
| 200 | @ | Watson Pharmaceuticals, Inc. | 5,862 | |||||||
| 754 | Wyeth | 37,021 | ||||||||
| 538,691 | ||||||||||
| Pipelines: 0.2% | ||||||||||
| 300 | Questar Corp. | 16,035 | ||||||||
| 500 | Spectra Energy Corp. | 12,320 | ||||||||
| 437 | Williams Cos., Inc. | 15,168 | ||||||||
| 43,523 | ||||||||||
| Retail: 2.0% | ||||||||||
| 100 | Abercrombie & Fitch Co. | 8,204 | ||||||||
| 150 | @ | Autozone, Inc. | 16,745 | |||||||
| 200 | @ | Bed Bath & Beyond, Inc. | 6,290 | |||||||
| 429 | Best Buy Co., Inc. | 21,900 | ||||||||
| 400 | @ | Big Lots, Inc. | 7,468 | |||||||
| 416 | @ | Coach, Inc. | 15,450 | |||||||
| 474 | Costco Wholesale Corp. | 31,948 | ||||||||
| 1,216 | CVS Caremark Corp. | 48,749 | ||||||||
| 362 | Darden Restaurants, Inc. | 14,404 | ||||||||
| 250 | Family Dollar Stores, Inc. | 5,888 | ||||||||
| 442 | Gap, Inc. | 9,017 | ||||||||
| 823 | Home Depot, Inc. | 23,505 | ||||||||
| 151 | JC Penney Co., Inc. | 6,662 | ||||||||
| 140 | @ | Kohl’s Corp. | 6,899 | |||||||
| 1,356 | Lowe’s Cos., Inc. | 33,100 | ||||||||
| 982 | McDonald’s Corp. | 57,418 | ||||||||
| 224 | Nordstrom, Inc. | 7,513 | ||||||||
| 100 | Polo Ralph Lauren Corp. | 6,898 | ||||||||
| 300 | RadioShack Corp. | 5,550 | ||||||||
| 90 | @ | Sears Holding Corp. | 9,496 | |||||||
| 421 | Staples, Inc. | 9,978 | ||||||||
| 530 | @ | Starbucks Corp. | 12,397 | |||||||
| 445 | Target Corp. | 26,727 | ||||||||
| 545 | TJX Cos., Inc. | 15,990 | ||||||||
| 200 | Walgreen Co. | 7,318 | ||||||||
| 1,461 | Wal-Mart Stores, Inc. | 69,982 | ||||||||
| 300 | Wendy’s International, Inc. | 8,409 | ||||||||
| 414 | Yum! Brands, Inc. | 15,380 | ||||||||
| 509,285 | ||||||||||
| Savings & Loans: 0.2% | ||||||||||
| 1,800 | Hudson City Bancorp., Inc. | 27,396 | ||||||||
| 1,046 | Washington Mutual, Inc. | 20,397 | ||||||||
| 47,793 | ||||||||||
| Shares | Value | |||||||||
| Semiconductors: 1.0% | ||||||||||
| 403 | Analog Devices, Inc. | $ | 12,404 | |||||||
| 1,316 | Applied Materials, Inc. | 24,780 | ||||||||
| 200 | @ | Broadcom Corp. | 5,348 | |||||||
| 4,652 | Intel Corp. | 121,324 | ||||||||
| 200 | KLA-Tencor Corp. | 9,616 | ||||||||
| 200 | @ | MEMC Electronic Materials, Inc. | 15,516 | |||||||
| 220 | National Semiconductor Corp. | 5,029 | ||||||||
| 300 | @ | Novellus Systems, Inc. | 7,803 | |||||||
| 470 | @ | Nvidia Corp. | 14,824 | |||||||
| 400 | @ | QLogic Corp. | 5,408 | |||||||
| 1,000 | Texas Instruments, Inc. | 31,570 | ||||||||
| 350 | Xilinx, Inc. | 7,665 | ||||||||
| 261,287 | ||||||||||
| Software: 1.5% | ||||||||||
| 440 | @ | Adobe Systems, Inc. | 18,542 | |||||||
| 220 | @ | Autodesk, Inc. | 10,360 | |||||||
| 330 | Automatic Data Processing, Inc. | 14,870 | ||||||||
| 423 | @ | BMC Software, Inc. | 13,993 | |||||||
| 796 | CA, Inc. | 19,494 | ||||||||
| 100 | @ | Electronic Arts, Inc. | 5,619 | |||||||
| 200 | Fidelity National Information Services, Inc. | 8,644 | ||||||||
| 267 | @ | Fiserv, Inc. | 13,705 | |||||||
| 1 | @ | Metavante Technologies, inc. | 23 | |||||||
| 5,790 | Microsoft Corp. | 194,544 | ||||||||
| 700 | @ | Novell, Inc. | 4,914 | |||||||
| 2,867 | @ | Oracle Corp. | 57,856 | |||||||
| 118 | Paychex, Inc. | 4,602 | ||||||||
| 367,166 | ||||||||||
| Telecommunications: 2.2% | ||||||||||
| 300 | @ | American Tower Corp. | 13,662 | |||||||
| 4,261 | AT&T, Inc. | 162,813 | ||||||||
| 471 | CenturyTel, Inc. | 20,079 | ||||||||
| 100 | @ | Ciena Corp. | 4,398 | |||||||
| 4,227 | @ | Cisco Systems, Inc. | 118,441 | |||||||
| 1,055 | Corning, Inc. | 25,626 | ||||||||
| 84 | Embarq Corp. | 4,280 | ||||||||
| 400 | @ | JDS Uniphase Corp. | 5,384 | |||||||
| 350 | @ | Juniper Networks, Inc. | 10,402 | |||||||
| 1,406 | Motorola, Inc. | 22,454 | ||||||||
| 1,410 | Qualcomm, Inc. | 57,500 | ||||||||
| 950 | @ | Qwest Communications International, Inc. | 6,299 | |||||||
| 1,494 | Sprint Nextel Corp. | 23,187 | ||||||||
| 1,562 | Verizon Communications, Inc. | 67,494 | ||||||||
| 900 | Windstream Corp. | 11,655 | ||||||||
| 553,674 | ||||||||||
| Toys/Games/Hobbies: 0.0% | ||||||||||
| 300 | Hasbro, Inc. | 8,331 | ||||||||
| 8,331 | ||||||||||
| Transportation: 0.6% | ||||||||||
| 100 | Burlington Northern Santa Fe Corp. | 8,352 | ||||||||
| 100 | CH Robinson Worldwide, Inc. | 5,155 | ||||||||
| 488 | CSX Corp. | 20,496 | ||||||||
| 100 | Expeditors International Washington, Inc. | 4,692 | ||||||||
| 317 | FedEx Corp. | 31,215 | ||||||||
| 410 | Norfolk Southern Corp. | 20,996 | ||||||||
| 280 | Union Pacific Corp. | 35,319 | ||||||||
| 500 | United Parcel Service, Inc. — Class B | 36,833 | ||||||||
| 163,058 | ||||||||||
| Total Common Stock (Cost $9,513,456) | 9,632,336 | |||||||||
118
Table of Contents
| PORTFOLIO OF INVESTMENTS | ||
| ING Principal Protection Fund XI | as of November 30, 2007 (unaudited) (continued) | |
| Shares | Value | |||||||||
| REAL ESTATE INVESTMENT TRUSTS: 0.1% | ||||||||||
| Hotels: 0.0% | ||||||||||
| 300 | Host Hotels & Resorts, Inc. | $ | 5,757 | |||||||
| 5,757 | ||||||||||
| Regional Malls: 0.0% | ||||||||||
| 100 | General Growth Properties, Inc. | 4,644 | ||||||||
| 100 | Simon Property Group, Inc. | 9,845 | ||||||||
| 14,489 | ||||||||||
| Warehouse/Industrial: 0.1% | ||||||||||
| 300 | Prologis | 19,626 | ||||||||
| 19,626 | ||||||||||
| Total Real Estate Investment Trusts (Cost $43,873) | 39,872 | |||||||||
| Principal | ||||||||||
| Amount | Value | |||||||||
| U.S. GOVERNMENT AGENCY OBLIGATIONS: 45.5% | ||||||||||
| Federal National Mortgage Corporation: 45.5% | ||||||||||
| $ | 12,250,000 | ^^, Z | 3.390%, due 09/15/09 | 11,539,280 | ||||||
| Total U.S. Government Agency Obligations (Cost $11,492,251) | 11,539,280 | |||||||||
| U.S. TREASURY OBLIGATIONS: 16.4% | ||||||||||
| U.S. Treasury STRIP: 16.4% | ||||||||||
| 4,415,000 | ^ | 3.000%, due 11/15/09 | 4,165,142 | |||||||
| Total U.S. Treasury Obligations (Cost $4,106,819) | 4,165,142 | |||||||||
| Total Long-Term Investments (Cost $25,156,399) | 25,376,630 | |||||||||
| Shares | Value | |||||||||||||
| SHORT-TERM INVESTMENTS: 0.4% | ||||||||||||||
| Mutual Fund: 0.4% | ||||||||||||||
| 100,000 | * * | ING Institutional Prime Money Market Fund | $ | 100,000 | ||||||||||
| Total Short-Term Investments (Cost $100,000) | 100,000 | |||||||||||||
Total Investments in Securities (Cost $25,256,399)* | 100.4 | % | $ | 25,476,630 | ||||||||||
Other Assets and Liabilities — Net | (0.4 | ) | (104,876 | ) | ||||||||||
Net Assets | 100.0 | % | $ | 25,371,754 | ||||||||||
| @ | Non-income producing security | |
| @@ | Foreign Issuer | |
| STRIP | Separate Trading of Registered Interest and Principal of Securities | |
| ** | Investment in affiliate | |
| ^ | Interest Only (IO) Security | |
| ^^ | Principal Only (PO) Security | |
| Z | Indicates Zero Coupon Bond; rate shown reflects current effective yield. | |
| * | Cost for federal income tax purposes is $25,394,973. |
| Net unrealized appreciation consists of: | ||||
| Gross Unrealized Appreciation | $ | 622,127 | ||
| Gross Unrealized Depreciation | (540,470 | ) | ||
| Net Unrealized Appreciation | $ | 81,657 | ||
119
Table of Contents
| PORTFOLIO OF INVESTMENTS | ||
| ING Principal Protection Fund XII | as of November 30, 2007 (unaudited) | |
| Shares | Value | |||||||||
| COMMON STOCK: 34.8% | ||||||||||
| Advertising: 0.1% | ||||||||||
| 280 | Omnicom Group | $ | 13,650 | |||||||
| 13,650 | ||||||||||
| Aerospace/Defense: 0.9% | ||||||||||
| 209 | Boeing Co. | 19,341 | ||||||||
| 202 | General Dynamics Corp. | 17,934 | ||||||||
| 60 | Goodrich Corp. | 4,277 | ||||||||
| 91 | L-3 Communications Holdings, Inc. | 10,069 | ||||||||
| 169 | Lockheed Martin Corp. | 18,703 | ||||||||
| 235 | Northrop Grumman Corp. | 18,516 | ||||||||
| 95 | Raytheon Co. | 5,876 | ||||||||
| 310 | United Technologies Corp. | 23,179 | ||||||||
| 117,895 | ||||||||||
| Agriculture: 0.6% | ||||||||||
| 711 | Altria Group, Inc. | 55,145 | ||||||||
| 178 | Archer-Daniels-Midland Co. | 6,470 | ||||||||
| 92 | Reynolds American, Inc. | 6,442 | ||||||||
| 180 | UST, Inc. | 10,422 | ||||||||
| 78,479 | ||||||||||
| Apparel: 0.1% | ||||||||||
| 256 | Nike, Inc. | 16,806 | ||||||||
| 16,806 | ||||||||||
| Auto Manufacturers: 0.1% | ||||||||||
| 604 | @ | Ford Motor Co. | 4,536 | |||||||
| 120 | General Motors Corp. | 3,580 | ||||||||
| 147 | Paccar, Inc. | 7,440 | ||||||||
| 15,556 | ||||||||||
| Auto Parts & Equipment: 0.1% | ||||||||||
| 274 | Johnson Controls, Inc. | 10,582 | ||||||||
| 10,582 | ||||||||||
| Banks: 1.6% | ||||||||||
| 1,311 | Bank of America Corp. | 60,476 | ||||||||
| 200 | Bank of New York Mellon Corp. | 9,592 | ||||||||
| 217 | BB&T Corp. | 7,829 | ||||||||
| 144 | Capital One Financial Corp. | 7,677 | ||||||||
| 114 | Comerica, Inc. | 5,219 | ||||||||
| 90 | Commerce Bancorp., Inc. | 3,584 | ||||||||
| 100 | Fifth Third Bancorp. | 2,991 | ||||||||
| 251 | Keycorp. | 6,611 | ||||||||
| 78 | Marshall & Ilsley Corp. | 2,455 | ||||||||
| 298 | Regions Financial Corp. | 7,876 | ||||||||
| 141 | State Street Corp. | 11,264 | ||||||||
| 119 | SunTrust Bank | 8,343 | ||||||||
| 708 | Wachovia Corp. | 30,444 | ||||||||
| 1,094 | Wells Fargo & Co. | 35,478 | ||||||||
| 100 | Zions Bancorp. | 5,457 | ||||||||
| 205,296 | ||||||||||
| Beverages: 0.9% | ||||||||||
| 463 | Anheuser-Busch Cos., Inc. | 24,409 | ||||||||
| 592 | Coca-Cola Co. | 36,763 | ||||||||
| 100 | @ | Constellation Brands, Inc. | 2,355 | |||||||
| 235 | Pepsi Bottling Group, Inc. | 10,027 | ||||||||
| 574 | PepsiCo, Inc. | 44,301 | ||||||||
| 117,855 | ||||||||||
| Shares | Value | |||||||||
| Biotechnology: 0.3% | ||||||||||
| 270 | @ | Amgen, Inc. | $ | 14,918 | ||||||
| 100 | @ | Biogen Idec, Inc. | 7,412 | |||||||
| 170 | @ | Celgene Corp. | 10,464 | |||||||
| 115 | @ | Genzyme Corp. | 8,617 | |||||||
| 41,411 | ||||||||||
| Building Materials: 0.0% | ||||||||||
| 189 | Masco Corp. | 4,234 | ||||||||
| 4,234 | ||||||||||
| Chemicals: 0.9% | ||||||||||
| 130 | Air Products & Chemicals, Inc. | 12,875 | ||||||||
| 207 | Dow Chemical Co. | 8,682 | ||||||||
| 200 | Ecolab, Inc. | 9,580 | ||||||||
| 260 | EI DuPont de Nemours & Co. | 11,999 | ||||||||
| 94 | International Flavors & Fragrances, Inc. | 4,713 | ||||||||
| 282 | Monsanto Co. | 28,022 | ||||||||
| 134 | PPG Industries, Inc. | 9,198 | ||||||||
| 140 | Praxair, Inc. | 11,953 | ||||||||
| 73 | Sherwin-Williams Co. | 4,587 | ||||||||
| 270 | Sigma-Aldrich Corp. | 14,216 | ||||||||
| 115,825 | ||||||||||
| Coal: 0.1% | ||||||||||
| 70 | Consol Energy, Inc. | 4,150 | ||||||||
| 100 | Peabody Energy Corp. | 5,564 | ||||||||
| 9,714 | ||||||||||
| Commercial Services: 0.3% | ||||||||||
| 60 | @ | Apollo Group, Inc. — Class A | 4,591 | |||||||
| 169 | McKesson Corp. | 11,277 | ||||||||
| 114 | Moody’s Corp. | 4,293 | ||||||||
| 100 | Robert Half International, Inc. | 2,696 | ||||||||
| 200 | RR Donnelley & Sons Co. | 7,332 | ||||||||
| 211 | Western Union Co. | 4,769 | ||||||||
| 34,958 | ||||||||||
| Computers: 1.6% | ||||||||||
| 50 | @ | Affiliated Computer Services, Inc. | 2,098 | |||||||
| 290 | @ | Apple, Inc. | 52,844 | |||||||
| 140 | @ | Cognizant Technology Solutions Corp. | 4,354 | |||||||
| 79 | @ | Computer Sciences Corp. | 4,173 | |||||||
| 775 | @ | Dell, Inc. | 19,019 | |||||||
| 785 | @ | EMC Corp. | 15,127 | |||||||
| 796 | Hewlett-Packard Co. | 40,723 | ||||||||
| 427 | International Business Machines Corp. | 44,912 | ||||||||
| 166 | @ | Lexmark International, Inc. | 5,790 | |||||||
| 130 | @ | Sandisk Corp. | 4,867 | |||||||
| 292 | @ | Sun Microsystems, Inc. | 6,068 | |||||||
| 199,975 | ||||||||||
| Cosmetics/Personal Care: 0.7% | ||||||||||
| 80 | Avon Products, Inc. | 3,284 | ||||||||
| 210 | Colgate-Palmolive Co. | 16,817 | ||||||||
| 965 | Procter & Gamble Co. | 71,410 | ||||||||
| 91,511 | ||||||||||
| Diversified Financial Services: 2.6% | ||||||||||
| 280 | American Express Co. | 16,514 | ||||||||
| 144 | Ameriprise Financial, Inc. | 8,451 | ||||||||
| 57 | Bear Stearns Cos., Inc. | 5,683 | ||||||||
| 254 | Charles Schwab Corp. | 6,175 | ||||||||
| 122 | CIT Group, Inc. | 3,245 | ||||||||
| 1,458 | Citigroup, Inc. | 48,551 | ||||||||
120
Table of Contents
| PORTFOLIO OF INVESTMENTS | ||
| ING Principal Protection Fund XII | as of November 30, 2007 (unaudited) (continued) | |
| Shares | Value | |||||||||
| Diversified Financial Services (continued) | ||||||||||
| 30 | CME Group, Inc. | $ | 19,758 | |||||||
| 210 | Countrywide Financial Corp. | 2,272 | ||||||||
| 237 | Discover Financial Services | 4,117 | ||||||||
| 170 | @ | E*Trade Financial Corp. | 782 | |||||||
| 256 | Fannie Mae | 9,836 | ||||||||
| 100 | Federated Investors, Inc. | 4,079 | ||||||||
| 49 | Franklin Resources, Inc. | 6,036 | ||||||||
| 250 | Freddie Mac | 8,768 | ||||||||
| 227 | Goldman Sachs Group, Inc. | 51,447 | ||||||||
| 30 | @ | IntercontinentalExchange, Inc. | 5,009 | |||||||
| 110 | Janus Capital Group, Inc. | 3,693 | ||||||||
| 1,130 | JPMorgan Chase & Co. | 51,551 | ||||||||
| 50 | Legg Mason, Inc. | 3,816 | ||||||||
| 254 | Lehman Brothers Holdings, Inc. | 15,908 | ||||||||
| 335 | Merrill Lynch & Co., Inc. | 20,080 | ||||||||
| 314 | Morgan Stanley | 16,554 | ||||||||
| 110 | Nyse Euronext | 9,526 | ||||||||
| 200 | SLM Corp. | 7,616 | ||||||||
| 329,467 | ||||||||||
| Electric: 1.4% | ||||||||||
| 80 | Allegheny Energy, Inc. | 4,860 | ||||||||
| 119 | Constellation Energy Group, Inc. | 11,925 | ||||||||
| 300 | Dominion Resources, Inc. | 14,169 | ||||||||
| 160 | DTE Energy Co. | 7,848 | ||||||||
| 620 | Duke Energy Corp. | 12,270 | ||||||||
| 96 | Edison International | 5,374 | ||||||||
| 140 | Entergy Corp. | 16,736 | ||||||||
| 290 | Exelon Corp. | 23,510 | ||||||||
| 287 | FirstEnergy Corp. | 19,677 | ||||||||
| 240 | FPL Group, Inc. | 16,742 | ||||||||
| 285 | PG&E Corp. | 13,187 | ||||||||
| 290 | PPL Corp. | 14,778 | ||||||||
| 204 | Public Service Enterprise Group, Inc. | 19,531 | ||||||||
| 180,607 | ||||||||||
| Electrical Components & Equipment: 0.1% | ||||||||||
| 266 | Emerson Electric Co. | 15,167 | ||||||||
| 15,167 | ||||||||||
| Electronics: 0.3% | ||||||||||
| 78 | @ | Agilent Technologies, Inc. | 2,951 | |||||||
| 200 | Applera Corp. — Applied Biosystems Group | 6,832 | ||||||||
| 213 | @ | Thermo Electron Corp. | 12,277 | |||||||
| 155 | @@ | Tyco Electronics Ltd. | 5,795 | |||||||
| 98 | @ | Waters Corp. | 7,648 | |||||||
| 35,503 | ||||||||||
| Engineering & Construction: 0.0% | ||||||||||
| 30 | Fluor Corp. | 4,415 | ||||||||
| 4,415 | ||||||||||
| Entertainment: 0.1% | ||||||||||
| 170 | International Game Technology | 7,422 | ||||||||
| 7,422 | ||||||||||
| Environmental Control: 0.0% | ||||||||||
| 300 | @ | Allied Waste Industries, Inc. | 3,423 | |||||||
| 3,423 | ||||||||||
| Food: 0.6% | ||||||||||
| 224 | General Mills, Inc. | 13,474 | ||||||||
| 229 | HJ Heinz Co. | 10,832 | ||||||||
| 230 | Kellogg Co. | 12,429 | ||||||||
| Shares | Value | |||||||||
| 264 | Kraft Foods, Inc. | $ | 9,121 | |||||||
| 222 | Kroger Co. | 6,383 | ||||||||
| 98 | Safeway, Inc. | 3,410 | ||||||||
| 180 | Sysco Corp. | 5,852 | ||||||||
| 130 | WM Wrigley Jr. Co. | 8,320 | ||||||||
| 69,821 | ||||||||||
| Forest Products & Paper: 0.1% | ||||||||||
| 210 | International Paper Co. | 7,088 | ||||||||
| 7,088 | ||||||||||
| Gas: 0.1% | ||||||||||
| 100 | Sempra Energy | 6,262 | ||||||||
| 6,262 | ||||||||||
| Hand/Machine Tools: 0.1% | ||||||||||
| 77 | Black & Decker Corp. | 6,364 | ||||||||
| 107 | Snap-On, Inc. | 5,230 | ||||||||
| 91 | Stanley Works | 4,746 | ||||||||
| 16,340 | ||||||||||
| Healthcare — Products: 1.0% | ||||||||||
| 204 | Baxter International, Inc. | 12,213 | ||||||||
| 280 | @ | Boston Scientific Corp. | 3,536 | |||||||
| 165 | @@ | Covidien Ltd. | 6,618 | |||||||
| 90 | CR Bard, Inc. | 7,608 | ||||||||
| 871 | Johnson & Johnson | 59,002 | ||||||||
| 270 | Medtronic, Inc. | 13,730 | ||||||||
| 190 | @ | St. Jude Medical, Inc. | 7,553 | |||||||
| 120 | Stryker Corp. | 8,716 | ||||||||
| 60 | @ | Zimmer Holdings, Inc. | 3,884 | |||||||
| 122,860 | ||||||||||
| Healthcare — Services: 0.6% | ||||||||||
| 192 | Aetna, Inc. | 10,729 | ||||||||
| 100 | @ | Coventry Health Care, Inc. | 5,788 | |||||||
| 96 | @ | Humana, Inc. | 7,395 | |||||||
| 42 | @ | Laboratory Corp. of America Holdings | 3,052 | |||||||
| 426 | UnitedHealth Group, Inc. | 23,430 | ||||||||
| 234 | @ | WellPoint, Inc. | 19,705 | |||||||
| 70,099 | ||||||||||
| Holding Companies — Diversified: 0.0% | ||||||||||
| 70 | Leucadia National Corp. | 3,287 | ||||||||
| 3,287 | ||||||||||
| Home Builders: 0.1% | ||||||||||
| 100 | Centex Corp. | 2,086 | ||||||||
| 210 | D.R. Horton, Inc. | 2,514 | ||||||||
| 120 | KB Home | 2,507 | ||||||||
| 170 | Lennar Corp. | 2,693 | ||||||||
| 9,800 | ||||||||||
| Home Furnishings: 0.0% | ||||||||||
| 40 | Harman International Industries, Inc. | 2,944 | ||||||||
| 40 | Whirlpool Corp. | 3,238 | ||||||||
| 6,182 | ||||||||||
| Household Products/Wares: 0.2% | ||||||||||
| 277 | Kimberly-Clark Corp. | 19,337 | ||||||||
| 19,337 | ||||||||||
| Housewares: 0.0% | ||||||||||
| 190 | Newell Rubbermaid, Inc. | 5,088 | ||||||||
| 5,088 | ||||||||||
121
Table of Contents
| PORTFOLIO OF INVESTMENTS | ||
| ING Principal Protection Fund XII | as of November 30, 2007 (unaudited) (continued) | |
| Shares | Value | |||||||||
| Insurance: 1.9% | ||||||||||
| 160 | @@ | ACE Ltd. | $ | 9,573 | ||||||
| 229 | Aflac, Inc. | 14,345 | ||||||||
| 304 | Allstate Corp. | 15,540 | ||||||||
| 82 | AMBAC Financial Group, Inc. | 2,233 | ||||||||
| 794 | American International Group, Inc. | 46,155 | ||||||||
| 170 | AON Corp. | 8,495 | ||||||||
| 140 | Assurant, Inc. | 9,160 | ||||||||
| 232 | Chubb Corp. | 12,656 | ||||||||
| 150 | Cigna Corp. | 8,042 | ||||||||
| 86 | Hartford Financial Services Group, Inc. | 8,198 | ||||||||
| 124 | Lincoln National Corp. | 7,635 | ||||||||
| 60 | Loews Corp. | 2,867 | ||||||||
| 120 | Marsh & McLennan Cos., Inc. | 3,014 | ||||||||
| 163 | MBIA, Inc. | 5,951 | ||||||||
| 228 | Metlife, Inc. | 14,955 | ||||||||
| 294 | Progressive Corp. | 5,410 | ||||||||
| 294 | Prudential Financial, Inc. | 27,677 | ||||||||
| 132 | Safeco Corp. | 7,618 | ||||||||
| 97 | Torchmark Corp. | 5,983 | ||||||||
| 257 | Travelers Cos., Inc. | 13,649 | ||||||||
| 110 | @@ | XL Capital Ltd. | 6,438 | |||||||
| 235,594 | ||||||||||
| Internet: 0.9% | ||||||||||
| 100 | @ | Akamai Technologies, Inc. | 3,806 | |||||||
| 120 | @ | Amazon.com, Inc. | 10,867 | |||||||
| 278 | @ | eBay, Inc. | 9,321 | |||||||
| 90 | @ | Expedia, Inc. | 2,934 | |||||||
| 100 | @ | Google, Inc. — Class A | 69,300 | |||||||
| 110 | @ | IAC/InterActiveCorp. | 3,061 | |||||||
| 244 | @ | Symantec Corp. | 4,343 | |||||||
| 320 | @ | Yahoo!, Inc. | 8,579 | |||||||
| 112,211 | ||||||||||
| Investment Companies: 0.0% | ||||||||||
| 70 | American Capital Strategies Ltd. | 2,633 | ||||||||
| 2,633 | ||||||||||
| Iron/Steel: 0.1% | ||||||||||
| 48 | Nucor Corp. | 2,842 | ||||||||
| 69 | United States Steel Corp. | 6,741 | ||||||||
| 9,583 | ||||||||||
| Leisure Time: 0.1% | ||||||||||
| 219 | Carnival Corp. | 9,881 | ||||||||
| 100 | Harley-Davidson, Inc. | 4,802 | ||||||||
| 14,683 | ||||||||||
| Lodging: 0.2% | ||||||||||
| 80 | Harrah’s Entertainment, Inc. | 7,046 | ||||||||
| 120 | Marriott International, Inc. | 4,500 | ||||||||
| 174 | Starwood Hotels & Resorts Worldwide, Inc. | 9,340 | ||||||||
| 20,886 | ||||||||||
| Machinery — Construction & Mining: 0.2% | ||||||||||
| 260 | Caterpillar, Inc. | 18,694 | ||||||||
| 40 | @ | Terex Corp. | 2,578 | |||||||
| 21,272 | ||||||||||
| Machinery — Diversified: 0.2% | ||||||||||
| 74 | Cummins, Inc. | 8,651 | ||||||||
| 130 | Deere & Co. | 22,334 | ||||||||
| 8 | Rockwell Automation, Inc. | 543 | ||||||||
| 31,528 | ||||||||||
| Shares | Value | |||||||||
| Media: 0.8% | ||||||||||
| 200 | Clear Channel Communications, Inc. | $ | 7,180 | |||||||
| 475 | @ | Comcast Corp. — Class A | 9,757 | |||||||
| 340 | @ | DIRECTV Group, Inc. | 8,456 | |||||||
| 100 | EW Scripps Co. | 4,345 | ||||||||
| 170 | McGraw-Hill Cos., Inc. | 8,344 | ||||||||
| 60 | Meredith Corp. | 3,303 | ||||||||
| 638 | News Corp. — Class A | 13,443 | ||||||||
| 790 | Time Warner, Inc. | 13,635 | ||||||||
| 290 | @ | Viacom — Class B | 12,186 | |||||||
| 776 | Walt Disney Co. | 25,724 | ||||||||
| 106,373 | ||||||||||
| Mining: 0.2% | ||||||||||
| 90 | Alcoa, Inc. | 3,273 | ||||||||
| 203 | Freeport-McMoRan Copper & Gold, Inc. | 20,083 | ||||||||
| 70 | Newmont Mining Corp. | 3,478 | ||||||||
| 26,834 | ||||||||||
| Miscellaneous Manufacturing: 2.0% | ||||||||||
| 217 | 3M Co. | 18,067 | ||||||||
| 160 | Cooper Industries Ltd. | 8,035 | ||||||||
| 267 | Danaher Corp. | 23,181 | ||||||||
| 270 | Dover Corp. | 12,496 | ||||||||
| 130 | Eastman Kodak Co. | 3,052 | ||||||||
| 146 | Eaton Corp. | 13,039 | ||||||||
| 3,029 | General Electric Co. | 115,980 | ||||||||
| 212 | Honeywell International, Inc. | 12,003 | ||||||||
| 190 | Illinois Tool Works, Inc. | 10,545 | ||||||||
| 210 | ITT Corp. | 13,532 | ||||||||
| 132 | Parker Hannifin Corp. | 10,485 | ||||||||
| 50 | Textron, Inc. | 3,453 | ||||||||
| 205 | @@ | Tyco International Ltd. | 8,227 | |||||||
| 252,095 | ||||||||||
| Oil & Gas: 3.3% | ||||||||||
| 106 | Anadarko Petroleum Corp. | 6,000 | ||||||||
| 140 | Apache Corp. | 13,551 | ||||||||
| 150 | Chesapeake Energy Corp. | 5,678 | ||||||||
| 762 | Chevron Corp. | 66,881 | ||||||||
| 546 | ConocoPhillips | 43,702 | ||||||||
| 281 | Devon Energy Corp. | 23,270 | ||||||||
| 120 | ENSCO International, Inc. | 6,462 | ||||||||
| 1,795 | ExxonMobil Corp. | 160,042 | ||||||||
| 140 | Hess Corp. | 9,971 | ||||||||
| 244 | Marathon Oil Corp. | 13,640 | ||||||||
| 10 | Murphy Oil Corp. | 715 | ||||||||
| 140 | Noble Corp. | 7,298 | ||||||||
| 70 | Noble Energy, Inc. | 5,043 | ||||||||
| 260 | Occidental Petroleum Corp. | 18,140 | ||||||||
| 60 | Tesoro Petroleum Corp. | 2,951 | ||||||||
| 112 | @ | Transocean, Inc. | 15,368 | |||||||
| 284 | Valero Energy Corp. | 18,480 | ||||||||
| 50 | XTO Energy, Inc. | 3,091 | ||||||||
| 420,283 | ||||||||||
| Oil & Gas Services: 0.5% | ||||||||||
| 50 | Baker Hughes, Inc. | 4,014 | ||||||||
| 284 | Halliburton Co. | 10,397 | ||||||||
| 160 | @ | National Oilwell Varco, Inc. | 10,904 | |||||||
| 320 | Schlumberger Ltd. | 29,904 | ||||||||
| 120 | Smith International, Inc. | 7,526 | ||||||||
| 62,745 | ||||||||||
122
Table of Contents
| PORTFOLIO OF INVESTMENTS | ||
| ING Principal Protection Fund XII | as of November 30, 2007 (unaudited) (continued) | |
| Shares | Value | |||||||||
| Packaging & Containers: 0.1% | ||||||||||
| 171 | Ball Corp. | $ | 7,909 | |||||||
| 110 | @ | Pactiv Corp. | 2,794 | |||||||
| 10,703 | ||||||||||
| Pharmaceuticals: 1.9% | ||||||||||
| 280 | Abbott Laboratories | 16,103 | ||||||||
| 120 | Allergan, Inc. | 8,045 | ||||||||
| 52 | AmerisourceBergen Corp. | 2,359 | ||||||||
| 650 | Bristol-Myers Squibb Co. | 19,260 | ||||||||
| 84 | Cardinal Health, Inc. | 5,086 | ||||||||
| 370 | Eli Lilly & Co. | 19,592 | ||||||||
| 130 | @ | Express Scripts, Inc. | 8,808 | |||||||
| 85 | @ | Forest Laboratories, Inc. | 3,277 | |||||||
| 286 | @ | Gilead Sciences, Inc. | 13,310 | |||||||
| 70 | @ | Hospira, Inc. | 3,031 | |||||||
| 140 | @ | Medco Health Solutions, Inc. | 13,999 | |||||||
| 695 | Merck & Co., Inc. | 41,255 | ||||||||
| 2,157 | Pfizer, Inc. | 51,250 | ||||||||
| 590 | Schering-Plough Corp. | 18,467 | ||||||||
| 110 | @ | Watson Pharmaceuticals, Inc. | 3,224 | |||||||
| 281 | Wyeth | 13,797 | ||||||||
| 240,863 | ||||||||||
| Pipelines: 0.2% | ||||||||||
| 120 | Questar Corp. | 6,414 | ||||||||
| 260 | Spectra Energy Corp. | 6,406 | ||||||||
| 264 | Williams Cos., Inc. | 9,163 | ||||||||
| 21,983 | ||||||||||
| Retail: 1.8% | ||||||||||
| 80 | Abercrombie & Fitch Co. | 6,563 | ||||||||
| 50 | @ | Autozone, Inc. | 5,582 | |||||||
| 80 | @ | Bed Bath & Beyond, Inc. | 2,516 | |||||||
| 189 | Best Buy Co., Inc. | 9,648 | ||||||||
| 140 | @ | Big Lots, Inc. | 2,614 | |||||||
| 250 | @ | Coach, Inc. | 9,285 | |||||||
| 274 | Costco Wholesale Corp. | 18,468 | ||||||||
| 464 | CVS Caremark Corp. | 18,602 | ||||||||
| 148 | Darden Restaurants, Inc. | 5,889 | ||||||||
| 132 | Family Dollar Stores, Inc. | 3,109 | ||||||||
| 280 | Gap, Inc. | 5,712 | ||||||||
| 342 | Home Depot, Inc. | 9,768 | ||||||||
| 21 | JC Penney Co., Inc. | 927 | ||||||||
| 100 | @ | Kohl’s Corp. | 4,928 | |||||||
| 554 | Lowe’s Cos., Inc. | 13,523 | ||||||||
| 409 | McDonald’s Corp. | 23,914 | ||||||||
| 30 | Nordstrom, Inc. | 1,006 | ||||||||
| 80 | Polo Ralph Lauren Corp. | 5,518 | ||||||||
| 140 | RadioShack Corp. | 2,590 | ||||||||
| 20 | @ | Sears Holding Corp. | 2,110 | |||||||
| 129 | Staples, Inc. | 3,057 | ||||||||
| 214 | @ | Starbucks Corp. | 5,005 | |||||||
| 277 | Target Corp. | 16,637 | ||||||||
| 248 | TJX Cos., Inc. | 7,276 | ||||||||
| 110 | Walgreen Co. | 4,025 | ||||||||
| 691 | Wal-Mart Stores, Inc. | 33,099 | ||||||||
| 100 | Wendy’s International, Inc. | 2,803 | ||||||||
| 254 | Yum! Brands, Inc. | 9,436 | ||||||||
| 233,610 | ||||||||||
| Savings & Loans: 0.1% | ||||||||||
| 770 | Hudson City Bancorp., Inc. | 11,719 | ||||||||
| 357 | Washington Mutual, Inc. | 6,962 | ||||||||
| 18,681 | ||||||||||
| Shares | Value | |||||||||
| Semiconductors: 0.8% | ||||||||||
| 106 | Analog Devices, Inc. | $ | 3,263 | |||||||
| 530 | Applied Materials, Inc. | 9,980 | ||||||||
| 70 | @ | Broadcom Corp. | 1,872 | |||||||
| 2,012 | Intel Corp. | 52,473 | ||||||||
| 80 | KLA-Tencor Corp. | 3,846 | ||||||||
| 100 | @ | MEMC Electronic Materials, Inc. | 7,758 | |||||||
| 153 | National Semiconductor Corp. | 3,498 | ||||||||
| 50 | @ | Novellus Systems, Inc. | 1,301 | |||||||
| 185 | @ | Nvidia Corp. | 5,835 | |||||||
| 200 | @ | QLogic Corp. | 2,704 | |||||||
| 400 | Texas Instruments, Inc. | 12,628 | ||||||||
| 60 | Xilinx, Inc. | 1,314 | ||||||||
| 106,472 | ||||||||||
| Software: 1.3% | ||||||||||
| 180 | @ | Adobe Systems, Inc. | 7,585 | |||||||
| 152 | @ | Autodesk, Inc. | 7,158 | |||||||
| 171 | Automatic Data Processing, Inc. | 7,705 | ||||||||
| 195 | @ | BMC Software, Inc. | 6,451 | |||||||
| 254 | CA, Inc. | 6,220 | ||||||||
| 50 | @ | Electronic Arts, Inc. | 2,810 | |||||||
| 70 | Fidelity National Information Services, Inc. | 3,025 | ||||||||
| 106 | @ | Fiserv, Inc. | 5,441 | |||||||
| 2,521 | Microsoft Corp. | 84,706 | ||||||||
| 300 | @ | Novell, Inc. | 2,106 | |||||||
| 1,222 | @ | Oracle Corp. | 24,660 | |||||||
| 28 | Paychex, Inc. | 1,092 | ||||||||
| 158,959 | ||||||||||
| Telecommunications: 2.0% | ||||||||||
| 160 | @ | American Tower Corp. | 7,286 | |||||||
| 1,905 | AT&T, Inc. | 72,790 | ||||||||
| 237 | CenturyTel, Inc. | 10,103 | ||||||||
| 70 | @ | Ciena Corp. | 3,079 | |||||||
| 1,784 | @ | Cisco Systems, Inc. | 49,988 | |||||||
| 478 | Corning, Inc. | 11,611 | ||||||||
| 32 | Embarq Corp. | 1,630 | ||||||||
| 200 | @ | JDS Uniphase Corp. | 2,692 | |||||||
| 210 | @ | Juniper Networks, Inc. | 6,241 | |||||||
| 593 | Motorola, Inc. | 9,470 | ||||||||
| 622 | Qualcomm, Inc. | 25,365 | ||||||||
| 320 | @ | Qwest Communications International, Inc. | 2,122 | |||||||
| 701 | Sprint Nextel Corp. | 10,880 | ||||||||
| 755 | Verizon Communications, Inc. | 32,624 | ||||||||
| 400 | Windstream Corp. | 5,180 | ||||||||
| 251,061 | ||||||||||
| Toys/Games/Hobbies: 0.0% | ||||||||||
| 140 | Hasbro, Inc. | 3,888 | ||||||||
| 3,888 | ||||||||||
| Transportation: 0.6% | ||||||||||
| 60 | CH Robinson Worldwide, Inc. | 3,093 | ||||||||
| 208 | CSX Corp. | 8,736 | ||||||||
| 100 | Expeditors International Washington, Inc. | 4,692 | ||||||||
| 158 | FedEx Corp. | 15,558 | ||||||||
| 135 | Norfolk Southern Corp. | 6,913 | ||||||||
| 123 | Union Pacific Corp. | 15,515 | ||||||||
| 280 | United Parcel Service, Inc. — Class B | 20,630 | ||||||||
| 75,137 | ||||||||||
| Total Common Stock (Cost $4,310,324) | 4,423,992 | |||||||||
123
Table of Contents
| PORTFOLIO OF INVESTMENTS | ||
| ING Principal Protection Fund XII | as of November 30, 2007 (Unaudited) (continued) | |
| Shares | Value | |||||||||
| REAL ESTATE INVESTMENT TRUSTS: 0.1% | ||||||||||
| Hotels: 0.0% | ||||||||||
| 180 | Host Hotels & Resorts, Inc. | $ | 3,454 | |||||||
| 3,454 | ||||||||||
| Regional Malls: 0.0% | ||||||||||
| 60 | General Growth Properties, Inc. | 2,786 | ||||||||
| 30 | Simon Property Group, Inc. | 2,954 | ||||||||
| 5,740 | ||||||||||
| Warehouse/Industrial: 0.1% | ||||||||||
| 140 | Prologis | 9,159 | ||||||||
| Total Real Estate Investment Trusts (Cost $20,436) | 18,353 | |||||||||
| Principal | ||||||||||
| Amount | Value | |||||||||
| U.S. GOVERNMENT AGENCY OBLIGATIONS: 39.3% | ||||||||||
| Federal National Mortgage Corporation: 39.3% | ||||||||||
| $ | 2,697,000 | ^, Z | 3.330%, due 11/15/09 | 2,529,217 | ||||||
| 2,651,000 | ^, Z | 3.340%, due 01/15/10 | 2,472,853 | |||||||
| Total U.S. Government Agency Obligations (Cost $4,942,252) | 5,002,070 | |||||||||
| U.S. TREASURY OBLIGATIONS: 25.0% | ||||||||||
| U.S. Treasury STRIP: 25.0% | ||||||||||
| 3,400,000 | ^^ | 3.110%, due 02/15/10 | 3,178,201 | |||||||
| Total U.S. Treasury Obligations (Cost $3,111,554) | 3,178,201 | |||||||||
| Total Long-Term Investments (Cost $12,384,566) | 12,622,616 | |||||||||
| Shares | Value | |||||||||
| SHORT-TERM INVESTMENTS: 1.1% | ||||||||||
| Mutual Fund: 0.1% | ||||||||||
| 5,000 | ** | ING Institutional Prime Money Market Fund | 5,000 | |||||||
| Total Mutual Fund (Cost $5,000) | 5,000 | |||||||||
| Principal | ||||||||||||||
| Amount | Value | |||||||||||||
| Repurchase Agreement: 1.0% | ||||||||||||||
| $ | 129,000 | Goldman Sachs Repurchase Agreement dated 11/30/07, 4.510%, due 12/03/07, $129,048 to be received upon repurchase (Collateralized by $94,000 U.S. Treasury, 7.625%, Market Value plus accrued interest $132,796, due 02/15/25) | $ | 129,000 | ||||||||||
| Total Repurchase Agreement (Cost $129,000) | 129,000 | |||||||||||||
| Total Short-Term Investments (Cost $134,000) | 134,000 | |||||||||||||
Total Investments in Securities (Cost $12,518,566)* | 100.3 | % | $ | 12,756,616 | ||||||||||
Other Assets and Liabilities — Net | (0.3 | ) | (32,443 | ) | ||||||||||
Net Assets | 100.0 | % | $ | 12,724,173 | ||||||||||
| @ | Non-income producing security | |
| @@ | Foreign Issuer | |
| STRIP | Separate Trading of Registered Interest and Principal of Securities | |
| ** | Investment in affiliate | |
| ^ | Interest Only (IO) Security | |
| ^^ | Principal Only (PO) Security | |
| Z | Indicates Zero Coupon Bond; rate shown reflects current effective yield. | |
| * | Cost for federal income tax purposes is $12,601,804. |
| Net unrealized appreciation consists of: | ||||
| Gross Unrealized Appreciation | $ | 386,226 | ||
| Gross Unrealized Depreciation | (231,414 | ) | ||
| Net Unrealized Appreciation | $ | 154,812 | ||
124
Table of Contents
125
Table of Contents
126
Table of Contents
127
Table of Contents
128
Table of Contents
129
Table of Contents
130
Table of Contents
131
Table of Contents
132
Table of Contents
133
Table of Contents
134
Table of Contents
135
Table of Contents
136
Table of Contents
137
Table of Contents
138
Table of Contents
ING Investments, LLC
7337 East Doubletree Ranch Road
Scottsdale, Arizona 85258
ING Funds Services, LLC
7337 East Doubletree Ranch Road
Scottsdale, Arizona 85258
DST Systems, Inc.
P.O. Box 419368
Kansas City, Missouri 64141
The Bank of New York Mellon Corporation
One Wall Street,
New York, New York 10286
Dechert LLP
1775 I Street, N.W.
Washington, D.C. 20006
 | ||||
| PRSAR-UDEPPFABCQ | (1107-012808) |
Table of Contents
Item 2. Code of Ethics.
Not required for semi-annual filing.
Item 3. Audit Committee Financial Expert.
Not required for semi-annual filing.
Item 4. Principal Accountant Fees and Services.
Not required for semi-annual filing.
Item 5. Audit Committee Of Listed Registrants.
Not required for semi-annual filing.
Item 6. Schedule of Investments.
Schedule is included as part of the report to shareholders filed under Item 1 of this Form.
Item 7. Disclosure of Proxy Voting Policies and Procedures for Closed-end Management Investment Companies.
Not required for Semi-annual filing.
Item 8. Purchases of Equity Securities by Closed-end Management Investment Company and Affiliated Purchasers.
Not applicable.
Item 9. Submission of Matters to a Vote of Security Holders.
The Board has a Nominating Committee (“Committee”) for the purpose of considering and presenting to the Board candidates it proposes for nomination to fill Trustee vacancies on the Board. The Committee currently consists of four Trustees of the Board, none of whom are considered “interested persons” of the Trust within the meaning of Section 2(a)(19) of the Investment Company Act of 1940. The Committee has adopted a written charter that sets forth the policies and procedures of the Committee. The Committee will accept referrals for potential candidates from Board members, Fund shareholders, legal counsel to the disinterested Trustees or such other sources as the Committee deems appropriate. Shareholders can submit recommendations in writing to the attention of the Chairperson of the Committee at an address to be maintained by Fund management for this purpose. In order for the Committee to consider a potential candidate, the Committee initially must receive at least the following information regarding such person: (1) name; (2) date of birth; (3) education; (4) business, professional or other relevant experience and areas of expertise; (5) current business, professional or other relevant experience and areas of expertise; (6) current business and home addresses and contact information; (7) other board positions or prior experience; and (8) any knowledge and experience relating to investment companies and investment company governance.
Table of Contents
Item 10. Controls and Procedures.
| (a) | Based on our evaluation conducted within 90 days of the filing date, hereof, the design and operation of the registrant’s disclosure controls and procedures are effective to ensure that material information relating to the registrant is made known to the certifying officers by others within the appropriate entities, particularly during the period in which Forms N-CSR are being prepared, and the registrant’s disclosure controls and procedures allow timely preparation and review of the information for the registrant’s Form N-CSR and the officer certifications of such Form N-CSR. | |||
| (b) | There were no significant changes in the registrant’s internal controls that occurred during the second fiscal quarter of the period covered by this report that has materially affected, or is reasonably likely to materially affect, the registrant’s internal control over financial reporting. | |||
Item 11. Exhibits.
| (a)(1) | The Code of Ethics is not required for the semi-annual filing. | |||
| (a)(2) | A separate certification for each principal executive officer and principal financial officer of the registrant as required by Rule 30a-2 under the Act (17 CFR 270.30a-2) is attached hereto as EX-99.CERT. | |||
| (a)(3) | Not required for semi-annual filing. | |||
| (b) | The officer certifications required by Section 906 of the Sarbanes-Oxley Act of 2002 are attached hereto as EX-99.906CERT. | |||
Table of Contents
| (Registrant): ING Equity Trust | ||||
| By | /s/ Shaun P. Mathews | |||
| Shaun P. Mathews | ||||
| President and Chief Executive Officer | ||||
| By | /s/ Shaun P. Mathews | |||
| Shaun P. Mathews | ||||
| President and Chief Executive Officer | ||||
| By | /s/ Todd Modic | |||
| Todd Modic | ||||
| Senior Vice President and Chief Financial Officer | ||||