|
| OMB APPROVAL | ||
|
| OMB Number: | 3235-0570 | |
|
| Expires: | September 30, 2007 | |
| UNITED STATES | Estimated average burden hours per response. . . . . . . . . . . . . . . . .19.3 | ||
| SECURITIES AND EXCHANGE COMMISSION |
| ||
| Washington, D.C. 20549 |
| ||
FORM N-CSR
CERTIFIED SHAREHOLDER REPORT OF REGISTERED
MANAGEMENT INVESTMENT COMPANIES
Investment Company Act file number | 811-8817 | ||||||||
| |||||||||
ING Equity Trust | |||||||||
(Exact name of registrant as specified in charter) | |||||||||
| |||||||||
7337 E. Doubletree Ranch Rd., Scottsdale, AZ |
| 85258 | |||||||
(Address of principal executive offices) |
| (Zip code) | |||||||
| |||||||||
CT Corporation System, 101 Federal Street, Boston, MA 02110 | |||||||||
(Name and address of agent for service) | |||||||||
| |||||||||
Registrant’s telephone number, including area code: | 1-800-992-0180 |
| |||||||
| |||||||||
Date of fiscal year end: | May 31 |
| |||||||
| |||||||||
Date of reporting period: | June 1, 2006 to November 30, 2006 |
| |||||||
ITEM 1. REPORTS TO STOCKHOLDERS.
The following is a copy of the report transmitted to stockholders pursuant to Rule 30e-1 under the Act (17 CFR 270.30e-1):

Funds
Semi-Annual Report
November 30, 2006
Classes A, B, C and Q
Equity Index Fund
n ING Index Plus LargeCap Equity Fund
(formerly, ING Principal Protection Fund)
Principal Protection Funds
n ING Principal Protection Fund II
n ING Principal Protection Fund III
n ING Principal Protection Fund IV
n ING Principal Protection Fund V
n ING Principal Protection Fund VI
n ING Principal Protection Fund VII
n ING Principal Protection Fund VIII
n ING Principal Protection Fund IX
n ING Principal Protection Fund X
n ING Principal Protection Fund XI
n ING Principal Protection Fund XII
This report is submitted for general information to shareholders of the ING Funds. It is not authorized for distribution to prospective shareholders unless accompanied or preceded by a prospectus which includes details regarding the funds' investment objectives, risks, charges, expenses and other information. This information should be read carefully.
 E-Delivery Sign-up – details inside

TABLE OF CONTENTS
| President's Letter | 1 | ||||||
| Market Perspective | 2 | ||||||
| Portfolio Managers' Report | 4 | ||||||
| Investment Strategy and Principal Risks | 20 | ||||||
| Shareholder Expense Examples | 23 | ||||||
| Statements of Assets and Liabilities | 28 | ||||||
| Statements of Operations | 34 | ||||||
| Statements of Changes in Net Assets | 37 | ||||||
| Financial Highlights | 43 | ||||||
| Notes to Financial Statements | 58 | ||||||
| Portfolios of Investments | 74 | ||||||
| Advisory Contract Approval Discussion | 143 | ||||||
 Go Paperless with E-Delivery!
Sign up now for on-line prospectuses, fund reports, and proxy statements. In less than five minutes, you can help reduce paper mail and lower fund costs.
Just go to www.ingfunds.com, click on the E-Delivery icon from the home page, follow the directions and complete the quick 5 Steps to Enroll.
You will be notified by e-mail when these communications become available on the internet. Documents that are not available on the internet will continue to be sent by mail.
(THIS PAGE INTENTIONALLY LEFT BLANK)

PRESIDENT'S LETTER
Dear Shareholder,
In its recent meetings, the Federal Reserve Board (the "Fed") ceased its two-year trend of raising interest rates. That trend — a string of 17 consecutive interest rate hikes — was seen by many analysts as a sign that the Fed was concerned about containing inflation.
Now, the Fed is choosing to neither raise nor lower interest rates, which puts us in the midst of what economists refer to as a "plateau." Historically, there have been six similar plateaus since 1982 and during four of those periods the Standard & Poors 500® Composite Stock Price Index ("S&P 500® Index") rose significantly during plateau periods.
It has been an interesting — if not unpredictable — year for equity investors. In May of 2006, the S&P 500® Index hit a five-year high that surprised many at the time because we were in a climate of slumping housing prices and escalating interest rates. This was followed by a slight correction and market drift for a couple of months. A strong rally has been experienced in the second half of the year driven in part by the dollar decline and the more stable interest rate environment. Many economists believe that these conditions will be positive for the stock market for the next twelve months.
Whatever the future holds, we at ING Funds continue to work hard to provide you, the investor, with an array of investment choices that enable you to build a smart and diversified portfolio. We also continue to expand and improve our customer service department to ensure that your needs are met promptly and that we indeed continue to make attaining your future goals easier.
On behalf of everyone here at ING Funds, I thank you for your continued support.
Sincerely,

Shaun P. Mathews
President
ING Funds
December 18, 2006
The views expressed in the President's Letter reflect those of the President as of the date of the letter. Any such views are subject to change at any time based upon market or other conditions and ING Funds disclaims any responsibility to update such views. These views may not be relied on as investment advice and because investment decisions for an ING Fund are based on numerous factors, may not be relied on as an indication of investment intent on behalf of any ING Fund. Reference to specific company securities should not be construed as recommendations or investment advice.
For more complete information, or to obtain a prospectus on any ING fund, please call your Investment Professional or ING Funds Distributor, LLC at (800) 992-0180 or log on to www.ingfunds.com. The prospectus should be read carefully before investing. Consider the fund's investment objectives, risks, charges and expenses. The prospectus contains this information and other information about the fund. Check with your Investment Professional to determine which funds are available for sale within their firm. Not all funds are available for sale at all firms.
1
MARKET PERSPECTIVE: SIX MONTHS ENDED NOVEMBER 30, 2006
In our report for the last fiscal year, we described how, three weeks before it ended, investors suddenly took fright that inflation fighting central bankers would raise interest rates by too much and strangle global growth. We asked whether the sharp correction was just that, or the start of something big. In the end it proved to be the former, but it was not until nearly mid-October that the May 9, 2006 high was recaptured with most markets adding to their gains from there. For the first six months ended November 30, 2006, global stocks according to the Morgan Stanley Capital International ("MSCI") World IndexSM(1) with net reinvested divi dends rose 10.9%. In currencies the dollar was mixed, gaining 2.8% against the yen, but losing 3.4% against the euro and 5.2% to the pound sterling after these currencies surged in late November.
U.S. equities in the form of the Standard & Poors 500® Composite Stock Price Index ("S&P 500® Index")(2), returned 11.3% including dividends in the six months ended November 30, 2006. Stocks had actually become cheaper in the last 12 months as corporate profits had been rising faster than prices. However, for a time, investors seemed only to have eyes for interest rates. After sixteen consecu tive interest rate increases since June 2004, a barrage of hawkish rhetoric from the Federal Open Market Committee ("FOMC") in May had sent stocks reeling. The problem was that the economy was already cooling, evidenced especially by a slumping housing market that had driven much of the consumer spending in the last few years, spending that was now also under threat from record oil prices. By June 13, 2006, the market had fallen by 7.7% from its highest level. However, the seventeenth interest rate increase on June 29, 2006, was accompanied by balanced language, reviving hopes that the FOMC might at last be finished raising interest rates. A tentative recovery was interrupted when renewed conflict in the Middle East sent the price of a barrel of oil to another all-time peak on July 14, 2006. Nevertheless, peace of sorts ultimately returned and as summer driving demand and the hurricane damage threat subsided, the oil price dropped as much as 27% from its pinnacle and spent much of November below $60 per bar rel. The FOMC refrained from raising interest rates on August 8 and again took no action in September and October, although its members frequently felt the need to remind us that inflation was still uncomfortably elevated. Housing data continued to deteriorate and in October new and existing home prices were falling at the fastest rate in decades, while the stock of unsold homes rose through November. Gross Domestic Product ("GDP") growth in the third calendar quarter slowed to 2.2% and Wal-Mart reported its first decline in same store sales in over ten years. So in the face of all this gloom, why were stocks in a clear up-trend to a six-year high by the last days of November? For one thing, the pull back in oil prices promised to leave more money in the pockets of consumers. Interest rates were now falling fast at the long end, which made stocks look relatively more attractive and raised the present value of future corporate profits. Speaking of which, corporate profits registered their thirteenth straight quarter of double-digit year-over-year growth and for the economy as a whole, reached 12.44% of GDP, the biggest share since the 1950s. Despite the worrying news, equity investors saw this market as a glass that was distinctly half-full.
The main international markets also advanced, based on MSCI indices in local currencies including net dividends. Sustained growth and an end to inflation had pushed Japan to almost a 15-year high in April. As in the U.S., stocks had been falling as our fiscal year started, on U.S. interest rate fears combined with signals from the Bank of Japan, followed by the reality on July 14, that local interest rates would rise for the first time in six years. The economic data were still mostly positive, but getting past their prime. By the end of November, household spending was falling fast and the government lowered its evaluation of the economy for the first time in nearly two years. For the six months, the market rose 3.8%. European ex UK markets had been supported by broadly based mergers and acquisitions amid clear signs of improving growth and employment. But from their May 9 top, events in the U.S. and a 25 basis point increase in euro interest rates as inflation remained stubbornly above 2%, sent stocks down 6.9% by mid-June. From there however, markets turned around smartly, even as the European Central Bank raised rates on two more occasions. Business confidence was strong and unemployment fell to the lowest in five years. Merger and acquisition activity rolled on, heartening investors while suggesting that stocks were not particularly expensive. For the half-year, markets touched January 2001 levels and added 11.8% for the six months. UK equities had been boosted by the large acquisition-prone fin ancial sector, as well as the sizeable energy and vibrant materials sectors. The reversal in the latter two exacerbated the global retrenchment brought on by
2
MARKET PERSPECTIVE: SIX MONTHS ENDED NOVEMBER 30, 2006
interest rate worries after May 9 and UK stocks sank 9.3% by mid-June. As in Japan and the Eurozone, the Bank of England raised rates, twice to 5%, as inflation climbed above target, GDP growth returned to trend, and house prices, an important demand generator, continued their recovery. This re-energized investors and led again by financials, the market surpassed its best levels of 2006, revisited those of December 2000 and finished up 7.7% for the half-year.
(1) The MSCI World® Index is an unmanaged index that measures the performance of over 1,400 securities listed on exchanges in the U.S., Europe, Canada, Australia, New Zealand and the Far East.
(2) The Standard & Poor's 500® Composite Stock Price Index is an unmanaged index that measures the performance of securities of approximately 500 large-capitalization companies whose securities are traded on major U.S. stock markets.
All indices are unmanaged and investors cannot invest directly in an index.
Past performance does not guarantee future results. The performance quoted represents past performance. Investment return and principal value of an investment will fluctuate, and shares, when redeemed, may be worth more or less than their original cost. The Funds' performance is subject to change since the period's end and may be lower or higher than the performance data shown. Please call (800) 992-0180 or log on to www.ingfunds.com to obtain performance data current to the most recent month end.
Market Perspective reflects the views of the ING Chief Investment Risk Officer only through the end of the period, and is subject to change based on market and other conditions.
3
ING INDEX PLUS LARGECAP EQUITY FUND
PORTFOLIO MANAGERS' REPORT
The ING Index Plus LargeCap Equity Fund (the "Fund") seeks to outperform the total return of the Standard & Poor's 500® Composite Stock Price Index ("S&P 500® Index"), while maintaining a risk profile consistent with the index. The Fund is managed by Omar Aguilar, Ph.D. and Vincent Costa, CFA, Portfolio Managers, of ING Investment Management Co. — the Sub-Adviser.(1)
Performance: For the six months ended November 30, 2006, the Fund's Class A shares, excluding sales charges, provided a total return of 6.43% compared to the S&P 500® Index and the Lehman Brothers 1-3 Year Government Index ("LB 1-3 Gov Index"), which returned 11.33% and 3.17%, respectively, for the same period.
Portfolio Specifics: Previously, under the Principal Protection Funds' strategy, the Fund's performance was driven by a combination of returns attributable to both equity and bond portfolios and the impact of the asset allocation between the two components. Between May 31, and October 11, the Fund's Fixed-Income Component underperformed the LB 1-3 Gov. Index. The Fund was overweight agency securities which helped performance over the period. However, the Fixed-Income Component also had a shorter duration than the index, which was the major reason for underperformance. Shorter duration agencies and Treasuries underperformed longer duration issues over the period. The Fund's Equity Component outperformed the S&P 500® Index due mainly to the positive impact of security selection, especially in information technology, health care and energy. This was somewhat offset by security selection in financials, which acted as a drag. Sector allocations had a slight negative impact on the Equity Component, mainly due to our overweight in energy. However, our underweight industrials position helped to partially offset the negative impact of these allocations.
During the period October 12 to November 30, returns attributable to economic sector choices were about even with the index, while returns from stock selection were unfavorable, which together detracted slightly from performance. In terms of our sector decisions, we were slightly underweight industrial stocks, which performed poorly and overweight energy, which benefited the Fund. A positive contribution to performance also came from an underweight allocation to health care. While most other sector positions were either flat or did not add value, an overweight position in financials acted as a slight drag. Unfortunately, security selection in general hurt the Fund. Selection in industrials, financials and telecommunication services particularly offset the gain we made through sector allocation. Turning to the Fund's individual security positions, an overweight in Exxon Mobil, the world's largest publicly traded integrated oil and gas company , was one of the main contributors to performance. Several other overweight energy positions including Halliburton, Chevron Corp and Marathon Oil also helped. By comparison, an underweight position in Apple Computer, a leading personal computer, software, peripherals and portable digital music player manufacturer, hurt the Fund's relative performance. An overweight position in Motorola, a U.S.-based multinational communications company, also detracted from relative performance.
Current Strategy and Outlook: Our research builds structured stock funds with fundamental characteristics that we believe will translate into a performance advantage over the benchmark. We believe our analysis positions the Fund to capitalize on high-quality companies with superior business momentum, earnings growth and attractive valuations. As of November 30, 2006, the Fund was overweight financials and energy and underweight consumer staples and industrials. However, our exposures to economic sectors are a function of individual stock selection and by design quite close to the S&P 500® Index.
(1) Effective October 12, 2006, the Fund changed its name from ING Principal Protection Fund to ING Index Plus LargeCap Equity Fund. Prior to October 12, 2006, the Fund had a different investment objective and different principal investment strategies.
Portfolio holdings and characteristics are subject to change and may not be representative of current holdings and characteristics. The outlook for this Fund may differ from that presented for other ING Funds. Performance for the different classes of shares will vary based on differences in sales charges and fees associated with each class.
Top Ten Holdings*
as of November 30, 2006
(as a percent of net assets)
| ExxonMobil Corp. | 4.6 | % | |||||
| General Electric Co. | 2.8 | % | |||||
| Citigroup, Inc. | 2.7 | % | |||||
| Bank of America Corp. | 2.7 | % | |||||
| JPMorgan Chase & Co. | 2.0 | % | |||||
| Microsoft Corp. | 2.0 | % | |||||
| Cisco Systems, Inc. | 1.9 | % | |||||
| Chevron Corp. | 1.8 | % | |||||
| International Business Machines Corp. | 1.7 | % | |||||
| Procter & Gamble Co. | 1.4 | % | |||||
*Excludes short-term investments related to repurchase agreement.
Portfolio holdings are subject to change daily.
4
PORTFOLIO MANAGERS' REPORT
ING INDEX PLUS LARGECAP EQUITY FUND
| Average Annual Total Returns for the Periods Ended November 30, 2006 | |||||||||||||||
| 1 Year | 5 Year | Since Inception of Guarantee Period October 12, 2001 | |||||||||||||
| Including Sales Charge: | |||||||||||||||
| Class A(1) | 1.48 | % | 1.42 | % | 1.57 | % | |||||||||
| Class B(2) | 1.82 | % | 1.31 | % | 1.98 | % | |||||||||
| Class C(3) | 5.95 | % | 1.89 | % | 2.00 | % | |||||||||
| Class Q | 7.65 | % | 2.70 | % | 2.83 | % | |||||||||
| Excluding Sales Charge: | |||||||||||||||
| Class A | 7.70 | % | 2.64 | % | 2.75 | % | |||||||||
| Class B | 6.82 | % | 1.87 | % | 1.98 | % | |||||||||
| Class C | 6.95 | % | 1.89 | % | 2.00 | % | |||||||||
| Class Q | 7.65 | % | 2.70 | % | 2.83 | % | |||||||||
| S&P 500® Index(4) | 14.23 | % | 6.08 | % | 7.80 | %(6) | |||||||||
| LB 1-3 Gov Index(5) | 4.49 | % | 2.98 | % | 3.02 | %(6) | |||||||||
The table above illustrates the total return of ING Index Plus LargeCap Equity Fund against the indices indicated. An index is unmanaged and has no cash in its portfolio, imposes no sales charges and incurs no operating expenses. An investor cannot invest directly in an index. The Fund's performance is shown both with and without the imposition of sales charges.
The table does not reflect the deduction of taxes that a shareholder will pay on Fund distributions or the redemption of Fund shares.
The performance shown may include the effect of fee waivers and/or expense reimbursements by the Investment Adviser and/or other service providers, which have the effect of increasing total return. Had all fees and expenses been considered, the total returns would have been lower.
Performance data represents past performance and is no assurance of future results. Investment return and principal value of an investment in the Fund will fluctuate. Shares, when sold, may be worth more or less than their original cost. The Fund's current performance may be lower or higher than the performance data shown. Please log on to www.ingfunds.com or call (800) 922-0180 to get performance through the most recent month end.
This report contains statements that may be "forward-looking" statements. Actual results may differ materially from those projected in the "forward-looking" statements.
The views expressed in this report reflect those of the portfolio managers, only through the end of the period as stated on the cover. The portfolio managers' views are subject to change at any time based on market and other conditions.
Fund holdings are subject to change daily.
(1) Reflects deduction of the maximum Class A sales charge of 5.75%.
(2) Reflects deduction of the Class B deferred sales charge of 5% and 2%, respectively, for the 1 year and 5 year returns.
(3) Reflects deduction of the Class C deferred sales charge of 1% for the 1 year return.
(4) The S&P 500® Index is an unmanaged index that measures the performance of securities of approximately 500 large-capitalization companies whose securities are traded on major U.S. stock markets.
(5) The LB 1-3 Gov Index is an unmanaged index comprised of all issued, non-convertible domestic debt of the U.S. Government, or any agency thereof, or any quasi-federal corporation. The index also includes corporate debt guaranteed by the U.S. Government.
(6) Since inception performance for the index is shown from October 1, 2001.
5
ING PRINCIPAL PROTECTION FUNDS
PORTFOLIO MANAGERS' REPORT
During the Guarantee Period, the Principal Protection Funds ("PPF") seek to participate in favorable equity market conditions while preserving at least the principal amount of each PPF Fund, as of the inception of the Guarantee Period. After the five year Guarantee Period, the Index Plus LargeCap Period begins. During this Period, the PPFs will seek to outperform the total return performance of the Standard & Poor's 500® Composite Stock Price Index ("S&P 500® Index"), while maintaining a risk profile consistent with the S&P 500® Index. At the end of the Guarantee Period, the guarantee will no longer apply. Each PPF is managed by the following Portfolio Management Team with ING Investment Management Co. ("ING IM") the Sub-Adviser:
Asset Allocation: Mary Ann Fernandez, CFA, Senior Vice President, ING IM, serves as strategist for the PPFs and is responsible for overseeing overall PPF strategy and the allocation of PPF Assets between the Equity and Fixed components.
Equity Component*: Omar Aguilar, Ph.D., Portfolio Manager and Vincent Costa, Portfolio Manager, co-manage the Equity Component.
Fixed Component: James B. Kauffmann, Portfolio Manager.
Note: The PPFs are closed to new deposits.
Performance: Listed below are the Class A share total returns of each PPF, excluding sales charges, the S&P 500® Index(1) and the Lehman Brothers 1-3 Year Government Index(2) ("LB 1-3 Gov Index") for the six months ended November 30, 2006:
| PPF II | 3.36 | % | |||||
| PPF III | 3.62 | % | |||||
| PPF IV | 5.93 | % | |||||
| PPF V | 5.07 | % | |||||
| PPF VI | 4.87 | % | |||||
| PPF VII | 4.84 | % | |||||
| PPF VIII | 5.59 | % | |||||
| PPF IX | 6.13 | % | |||||
| PPF X | 6.47 | % | |||||
| PPF XI | 6.17 | % | |||||
| PPF XII | 6.03 | % | |||||
| S&P 500 Index(1) | 11.33 | % | |||||
| LB 1-3 Gov Index(2) | 3.17 | % | |||||
* Effective December 31, 2006, Douglas Coté resigned from ING Investment Management Co.
(1) The S&P 500® Index is an unmanaged index that measures the performance of securities of approximately 500 large-capitalization companies whose securities are traded on major U.S. stock markets.
(2) The LB 1-3 Gov Index is an unmanaged index comprised of all publicly issued, non-convertible domestic debt of the U.S. Government, or any agency thereof, or any quasi-federal corporation. The index also includes corporate debt guaranteed by the U.S. Government.
An investor cannot invest directly in an index.
Portfolio Specifics: PPF performance is driven by a combination of returns on the equity portfolio, returns on the bond portfolio, and the asset allocation between the two components. The asset allocation process seeks to participate in rising equity markets and protect principal on the downside. Stocks are more volatile than bonds, an important consideration in the asset allocation process. Other factors, such as the current level of interest rates, time remaining to the maturity date, and the ratio of current assets to the underlying guarantee amount are also important. The PPFs' allocations to equities and fixed income are dependent on these factors and the path they take over the guarantee period. In general, when the time left to maturity is short, or the ratio of assets to the guarantee amount is low, asset allocation will tend to be conservative in o rder to protect principal from losses. All other factors being equal, the PPFs generally buy equities (and sell bonds) when the equity market rises and sell equities (and buys bonds) as the equity market declines. The use of the fixed income component reduces the Funds' ability to participate as fully in upward moving equity markets.
6
PORTFOLIO MANAGERS' REPORT
ING PRINCIPAL PROTECTION FUNDS
Principal Protection Funds ("Funds") II-VII
The Funds' performance is driven by a combination of returns attributable to the equity and bond portfolios and the impact of the asset allocation between the two components. The asset allocation process seeks to participate in rising equity markets while protecting principal on the downside. It is accepted that historically stocks have been more volatile than bonds, and this is an important consideration in the asset allocation process. Other factors, such as the current level of interest rates, time remaining to maturity date, and the ratio of current assets to the underlying guarantee amount are also important. The Funds' allocation to equities and fixed income is dependent on these factors and the path they take over the Guarantee Period. In general, when the time left to maturity is short, or the ratio of assets to the guarantee amount is low, asset allocation will tend to be conservative in order to protect principal. All other factors being equal, the Funds generally buy equities (and sell bonds) when the equity market rises and sell equities (and buy bonds) as the equity market declines. The fixed income allocation reduces the Funds' ability to participate as fully in rising equity markets.
The Funds' Fixed-Income Component underperformed the LB 1-3 Gov. Index. The Funds' were overweight agency securities which helped performance over the period. However, the Fixed-Income Component also had a shorter duration than the index, which was the major reason for underperformance. Shorter duration agencies and treasuries underperformed longer duration issues over the period.
The Funds' Equity Component outperformed the S&P 500® Index due mainly to the positive impact of security selection, especially in information technology, healthcare and energy. This was somewhat offset by security selection in financials and consumer discretionary, which acted as a drag. Examples of stocks that helped included overweight positions in Exxon Mobil Corp. and Cisco Systems, Inc. By comparison, underweight positions in Apple Computer and Time Warner, Inc. hurt performance. Sector allocations had a slight negative impact on the Equity Component, due mainly to our overweight in financials and underweight in telecoms. However, our underweight industrials position helped to partially offset the negative impact of these allocations. Our overall sector exposures are by desig n quite close to the S&P 500® Index so that nearly all of our relative performance is driven by individual stock selection.
Principal Protection Funds ("Funds") VIII-XII
The Funds' performance is driven by a combination of returns attributable to the equity and bond portfolios and the impact of the asset allocation between the two components. The asset allocation process seeks to participate in rising equity markets while protecting principal on the downside. It is accepted that historically stocks have been more volatile than bonds, and this is an important consideration in the asset allocation process. Other factors, such as the current level of interest rates, time remaining to maturity date, and the ratio of current assets to the underlying guarantee amount are also important. The Funds' allocation to equities and fixed income is dependent on these factors and the path they take over the Guarantee Period. In general, when the time left to maturity is short, or the ratio of assets to the guarantee amount is low, asset allocation will tend to be conservative in order to protect principal. All other factors being equal, the Funds generally buy equities (and sells bonds) when the equity market rises and sells equities (and buys bonds) as the equity market declines. The fixed income allocation reduces the Funds' ability to participate as fully in rising equity markets.
The Funds' Fixed-Income Component underperformed the LB 1-3 Gov. Index. The Funds' were overweight agency securities which helped performance over the period. However, the strategy also had a shorter duration than the index, which was the major reason for underperformance. Shorter duration agencies and treasuries underperformed longer duration issues over the period.
The Funds' Equity Component outperformed the S&P 500® Index due mainly to the positive impact of security selection, especially in information technology, healthcare and energy. This was somewhat offset by security selection in financials and consumer discretionary, which acted as a drag. Examples of stocks that helped included overweight positions in Exxon Mobil Corp. and Cisco Systems, Inc. By comparison, underweight positions in Apple Computer and Time Warner hurt performance. Sector allocations had a slight negative impact on the Equity Component, due mainly to our overweight in financials and underweight in telecoms. However, our underweight industrials position helped to partially offset the negative impact of these allocations. Our overall sector exposures are by design quit e close to the S&P 500® Index so that nearly all of our relative performance is driven by individual stock selection.
7
PORTFOLIO MANAGERS' REPORT
ING PRINCIPAL PROTECTION FUNDS
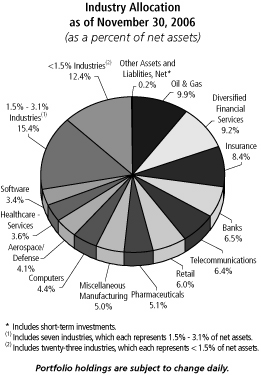
Presented below is the asset allocation for each Fund as of November 30, 2006 as presented in the accompanying Portfolio of Investments as a percentage of net assets.
Asset Allocation
as of November 30, 2006
(as a percent of net assets)
| Fixed Income | Common Stock | Other Assets and Liabilities | |||||||||||||
| PPF II | 83.6 | % | 17.0 | % | (0.6 | )% | |||||||||
| PPF III | 77.6 | % | 22.9 | % | (0.5 | )% | |||||||||
| PPF IV | 48.7 | % | 51.7 | % | (0.4 | )% | |||||||||
| PPF V | 58.8 | % | 41.6 | % | (0.4 | )% | |||||||||
| PPF VI | 61.1 | % | 39.3 | % | (0.4 | )% | |||||||||
| PPF VII | 63.2 | % | 37.3 | % | (0.5 | )% | |||||||||
| PPF VIII | 58.1 | % | 42.6 | % | (0.7 | )% | |||||||||
| PPF IX | 53.3 | % | 47.3 | % | (0.6 | )% | |||||||||
| PPF X | 50.0 | % | 50.3 | % | (0.3 | )% | |||||||||
| PPF XI | 53.6 | % | 46.7 | % | (0.3 | )% | |||||||||
| PPF XII | 58.0 | % | 42.2 | % | (0.2 | )% | |||||||||
Outlook and Current Strategy: A weak housing market, coupled with the lagged effect of 17 rate hikes by the U.S. Federal Reserve Board ("Fed") has slowed the U.S. economy. Going forward, we expect gross domestic product growth to be moderate, with output expanding at a slightly below-trend rate, as residential investment declines, while lower gasoline prices and credit conditions should help mitigate the spillover effects from the weakening housing market. Our view is that the economy is in a mid-cycle slowdown with a low likelihood of recession. Yields have fallen across the curve, and the inversion of the U.S. Treasury yield curve has become much more pronounced between one and three years suggesting growing confidence in eventual Fed easing. There are still some contradicting signals affecting the capital markets. The equities market surpassed a post 9/1 1 high during the period, while at the same time slower growth and lower inflation metrics have sent interest rates to their lowest levels in almost 11 months.
Allocation between equities and fixed income are dependent on our quantitative asset allocation model, which uses the factors mentioned above not on a qualitative evaluation of bonds versus equities.
Portfolio holdings and characteristics are subject to change and may not be representative of current holdings and characteristics. The outlook for this fund may differ from that presented for other ING Funds. Performance for the different classes of shares will vary based on differences in sales charges and fees associated with each class.
8
PORTFOLIO MANAGERS' REPORT
ING PRINCIPAL PROTECTION FUND II
| Average Annual Total Returns for the Periods Ended November 30, 2006 | |||||||||||
| 1 Year | Since Inception of Guarantee Period February 1, 2002 | ||||||||||
| Including Sales Charge: | |||||||||||
| Class A(1) | (1.58 | )% | 0.56 | % | |||||||
| Class B(2) | (1.44 | )% | 0.43 | % | |||||||
| Class C(3) | 2.56 | % | 1.01 | % | |||||||
| Excluding Sales Charge: | |||||||||||
| Class A | 4.40 | % | 1.80 | % | |||||||
| Class B | 3.56 | % | 1.02 | % | |||||||
| Class C | 3.56 | % | 1.01 | % | |||||||
| S&P 500® Index(4) | 14.23 | % | 6.43 | % | |||||||
| LB 1-3 Gov Index(5) | 4.49 | % | 3.02 | % | |||||||
The table above illustrates the total return of ING Principal Protection Fund II against the indices indicated. An index is unmanaged and has no cash in its portfolio, imposes no sales charges and incurs no operating expenses. An investor cannot invest directly in an index. The Fund's performance is shown both with and without the imposition of sales charges.
The table does not reflect the deduction of taxes that a shareholder will pay on Fund distributions or the redemption of Fund shares.
The performance shown may include the effect of fee waivers and/or expense reimbursements by the Investment Adviser and/or other service providers, which have the effect of increasing total return. Had all fees and expenses been considered, the total returns would have been lower.
Performance data represents past performance and is no assurance of future results. Investment return and principal value of an investment in the Fund will fluctuate. Shares, when sold, may be worth more or less than their original cost. The Fund's current performance may be lower or higher than the performance data shown. Please log on to www.ingfunds.com or call (800) 922-0180 to get performance through the most recent month end.
This report contains statements that may be "forward-looking" statements. Actual results may differ materially from those projected in the "forward-looking" statements.
The views expressed in this report reflect those of the portfolio managers, only through the end of the period as stated on the cover. The portfolio managers' views are subject to change at any time based on market and other conditions.
Fund holdings are subject to change daily.
(1) Reflects deduction of the maximum Class A sales charge of 5.75%.
(2) Reflects deduction of the Class B deferred sales charge of 5% and 3%, respectively, for the 1 year and since inception returns.
(3) Reflects deduction of the Class C deferred sales charge of 1% for the 1 year return.
(4) The S&P 500® Index is an unmanaged index that measures the performance of securities of approximately 500 large-capitalization companies whose securities are traded on major U.S. stock markets.
(5) The LB 1-3 Gov Index is an unmanaged index comprised of all publicly issued, non-convertible domestic debt of the U.S. Government, or any agency thereof, or any quasi-federal corporation. The index also includes corporate debt guaranteed by the U.S. Government.
9
PORTFOLIO MANAGERS' REPORT
ING PRINCIPAL PROTECTION FUND III
| Average Annual Total Returns for the Periods Ended November 30, 2006 | |||||||||||
| 1 Year | Since Inception of Guarantee Period June 6, 2002 | ||||||||||
| Including Sales Charge: | |||||||||||
| Class A(1) | (1.60 | )% | 0.76 | % | |||||||
| Class B(2) | (1.37 | )% | 0.69 | % | |||||||
| Class C(3) | 2.74 | % | 1.34 | % | |||||||
| Excluding Sales Charge: | |||||||||||
| Class A | 4.38 | % | 2.10 | % | |||||||
| Class B | 3.63 | % | 1.33 | % | |||||||
| Class C | 3.74 | % | 1.34 | % | |||||||
| S&P 500® Index(4) | 14.23 | % | 8.17 | %(6) | |||||||
| LB 1-3 Gov Index(5) | 4.49 | % | 2.93 | %(6) | |||||||
The table above illustrates the total return of ING Principal Protection Fund III against the indices indicated. An index is unmanaged and has no cash in its portfolio, imposes no sales charges and incurs no operating expense. An investor cannot invest directly in an index. The Fund's performance is shown both with and without the imposition of sales charges.
The table does not reflect the deduction of taxes that a shareholder will pay on Fund distributions or the redemption of Fund shares.
The performance shown may include the effect of fee waivers and/or expense reimbursements by the Investment Adviser and/or other service providers, which have the effect of increasing total return. Had all fees and expenses been considered, the total returns would have been lower.
Performance data represents past performance and is no assurance of future results. Investment return and principal value of an investment in the Fund will fluctuate. Shares, when sold, may be worth more or less than their original cost. The Fund's current performance may be lower or higher than the performance data shown. Please log on to www.ingfunds.com or call (800) 922-0180 to get performance through the most recent month end.
This report contains statements that may be "forward-looking" statements. Actual results may differ materially from those projected in the "forward-looking" statements.
The views expressed in this report reflect those of the portfolio managers, only through the end of the period as stated on the cover. The portfolio managers' views are subject to change at any time based on market and other conditions.
Fund holdings are subject to change daily.
(1) Reflects deduction of the maximum Class A sales charge of 5.75%.
(2) Reflects deduction of the Class B deferred sales charge of 5% and 3%, respectively, for the 1 year and since inception returns.
(3) Reflects deduction of the Class C deferred sales charge of 1% for the 1 year return.
(4) The S&P 500® Index is an unmanaged index that measures the performance of securities of approximately 500 large-capitalization companies whose securities are traded on major U.S. stock markets.
(5) The LB 1-3 Gov Index is an unmanaged index comprised of all publicly issued, non-convertible domestic debt of the U.S. Government, or any agency thereof, or any quasi-federal corporation. The index also includes corporate debt guaranteed by the U.S. Government.
(6) Since inception performance for the index is shown from June 1, 2002.
10
PORTFOLIO MANAGERS' REPORT
ING PRINCIPAL PROTECTION FUND IV
| Average Annual Total Returns for the Periods Ended November 30, 2006 | |||||||||||
| 1 Year | Since Inception of Guarantee Period October 8, 2002 | ||||||||||
| Including Sales Charge: | |||||||||||
| Class A(1) | 0.50 | % | 2.56 | % | |||||||
| Class B(2) | 0.83 | % | 2.60 | % | |||||||
| Class C(3) | 4.78 | % | 3.25 | % | |||||||
| Class Q | 6.61 | % | 4.10 | % | |||||||
| Excluding Sales Charge: | |||||||||||
| Class A | 6.64 | % | 4.04 | % | |||||||
| Class B | 5.83 | % | 3.26 | % | |||||||
| Class C | 5.78 | % | 3.25 | % | |||||||
| Class Q | 6.61 | % | 4.10 | % | |||||||
| S&P 500® Index(4) | 14.23 | % | 15.97 | %(6) | |||||||
| LB 1-3 Gov Index(5) | 4.49 | % | 2.35 | %(6) | |||||||
The table above illustrates the total return of ING Principal Protection Fund IV against the indices indicated. An index is unmanaged and has no cash in its portfolio, imposes no sales charges and incurs no operating expense. An investor cannot invest directly in an index. The Fund's performance is shown both with and without the imposition of sales charges.
The table does not reflect the deduction of taxes that a shareholder will pay on Fund distributions or the redemption of Fund shares.
The performance shown may include the effect of fee waivers and/or expense reimbursements by the Investment Adviser and/or other service providers, which have the effect of increasing total return. Had all fees and expenses been considered, the total returns would have been lower.
Performance data represents past performance and is no assurance of future results. Investment return and principal value of an investment in the Fund will fluctuate. Shares, when sold, may be worth more or less than their original cost. The Fund's current performance may be lower or higher than the performance data shown. Please log on to www.ingfunds.com or call (800) 922-0180 to get performance through the most recent month end.
This report contains statements that may be "forward-looking" statements. Actual results may differ materially from those projected in the "forward-looking" statements.
The views expressed in this report reflect those of the portfolio managers, only through the end of the period as stated on the cover. The portfolio managers' views are subject to change at any time based on market and other conditions.
Fund holdings are subject to change daily.
(1) Reflects deduction of the maximum Class A sales charge of 5.75%.
(2) Reflects deduction of the Class B deferred sales charge of 5% and 3%, respectively, for the 1 year and since inception returns.
(3) Reflects deduction of the Class C deferred sales charge of 1% for the 1 year return.
(4) The S&P 500® Index is an unmanaged index that measures the performance of securities of approximately 500 large-capitalization companies whose securities are traded on major U.S. stock markets.
(5) The LB 1-3 Gov Index is an unmanaged index comprised of all publicly issued, non-convertible domestic debt of the U.S. Government, or any agency thereof, or any quasi-federal corporation. The index also includes corporate debt guaranteed by the U.S. Government.
(6) Since inception performance for the index is shown from October 1, 2002.
11
PORTFOLIO MANAGERS' REPORT
ING PRINCIPAL PROTECTION FUND V
| Average Annual Total Returns for the Periods Ended November 30, 2006 | |||||||||||
| 1 Year | Since Inception of Guarantee Period January 23, 2003 | ||||||||||
| Including Sales Charge: | |||||||||||
| Class A(1) | (0.46 | )% | 1.70 | % | |||||||
| Class B(2) | (0.11 | )% | 1.58 | % | |||||||
| Class C(3) | 3.80 | % | 2.52 | % | |||||||
| Excluding Sales Charge: | |||||||||||
| Class A | 3.46 | % | 3.28 | % | |||||||
| Class B | 2.68 | % | 2.56 | % | |||||||
| Class C | 2.66 | % | 2.52 | % | |||||||
| S&P 500® Index(4) | 14.23 | % | 15.81 | %(6) | |||||||
| LB 1-3 Gov Index(5) | 4.49 | % | 2.31 | %(6) | |||||||
The table above illustrates the total return of ING Principal Protection Fund V against the indices indicated. An index is unmanaged and has no cash in its portfolio, imposes no sales charge and incurs no operating expenses. An investor cannot invest directly in an index. The Fund's performance is shown both with and without the imposition of sales charges.
The table does not reflect the deduction of taxes that a shareholder will pay on Fund distributions or the redemption of Fund shares.
The performance shown may include the effect of fee waivers and/or expense reimbursements by the Investment Adviser and/or other service providers, which have the effect of increasing total return. Had all fees and expenses been considered, the total returns would have been lower.
Performance data represents past performance and is no assurance of future results. Investment return and principal value of an investment in the Fund will fluctuate. Shares, when sold, may be worth more or less than their original cost. The Fund's current performance may be lower or higher than the performance data shown. Please log on to www.ingfunds.com or call (800) 922-0180 to get performance through the most recent month end.
This report contains statements that may be "forward-looking" statements. Actual results may differ materially from those projected in the "forward-looking" statements.
The views expressed in this report reflect those of the portfolio managers, only through the end of the period as stated on the cover. The portfolio managers' views are subject to change at any time based on market and other conditions.
Fund holdings are subject to change daily.
(1) Reflects deduction of the maximum Class A sales charge of 5.75%.
(2) Reflects deduction of the Class B deferred sales charge of 5% and 4%, respectively, for the 1 year and since inception returns.
(3) Reflects deduction of the Class C deferred sales charge of 1% for the 1 year return.
(4) The S&P 500® Index is an unmanaged index that measures the performance of securities of approximately 500 large-capitalization companies whose securities are traded on major U.S. stock markets.
(5) The LB 1-3 Gov Index is an unmanaged index comprised of all publicly issued, non-convertible domestic debt of the U.S. Government, or any agency thereof, or any quasi-federal corporation. The index also includes corporate debt guaranteed by the U.S. Government.
(6) Since inception performance for the index is shown from February 1, 2003.
12
PORTFOLIO MANAGERS' REPORT
ING PRINCIPAL PROTECTION FUND VI
| Average Annual Total Returns for the Periods Ended November 30, 2006 | |||||||||||
| 1 Year | Since Inception of Guarantee Period April 24, 2003 | ||||||||||
| Including Sales Charge: | |||||||||||
| Class A(1) | (0.82 | )% | 1.32 | % | |||||||
| Class B(2) | (0.42 | )% | 1.20 | % | |||||||
| Class C(3) | 3.55 | % | 2.22 | % | |||||||
| Excluding Sales Charge: | |||||||||||
| Class A | 5.26 | % | 3.00 | % | |||||||
| Class B | 4.58 | % | 2.26 | % | |||||||
| Class C | 4.55 | % | 2.22 | % | |||||||
| S&P 500® Index(4) | 14.23 | % | 14.62 | %(6) | |||||||
| LB 1-3 Gov Index(5) | 4.49 | % | 2.23 | %(6) | |||||||
The table above illustrates the total return of ING Principal Protection Fund VI against the indices indicated. An index is unmanaged and has no cash in its portfolio, imposes no sales charges and incurs no operating expense. An investor cannot invest directly in an index. The Fund's performance is shown both with and without the imposition of sales charges.
The table does not reflect the deduction of taxes that a shareholder will pay on Fund distributions or the redemption of Fund shares.
The performance shown may include the effect of fee waivers and/or expense reimbursements by the Investment Adviser and/or other service providers, which have the effect of increasing total return. Had all fees and expenses been considered, the total returns would have been lower.
Performance data represents past performance and is no assurance of future results. Investment return and principal value of an investment in the Fund will fluctuate. Shares, when sold, may be worth more or less than their original cost. The Fund's current performance may be lower or higher than the performance data shown. Please log on to www.ingfunds.com or call (800) 922-0180 to get performance through the most recent month end.
This report contains statements that may be "forward-looking" statements. Actual results may differ materially from those projected in the "forward-looking" statements.
The views expressed in this report reflect those of the portfolio managers, only through the end of the period as stated on the cover. The portfolio managers' views are subject to change at any time based on market and other conditions.
Fund holdings are subject to change daily.
(1) Reflects deduction of the maximum Class A sales charge of 5.75%.
(2) Reflects deduction of the Class B deferred sales charge of 5% and 4%, respectively, for the 1 year and since inception returns.
(3) Reflects deduction of the Class C deferred sales charge of 1% for the 1 year return.
(4) The S&P 500® Index is an unmanaged index that measures the performance of securities of approximately 500 large-capitalization companies whose securities are traded on major U.S. stock markets.
(5) The LB 1-3 Gov Index is an unmanaged index comprised of all publicly issued, non-convertible domestic debt of the U.S. Government, or any agency thereof, or any quasi-federal corporation. The index also includes corporate debt guaranteed by the U.S. Government.
(6) Since inception performance for the index is shown from May 1, 2003.
13
PORTFOLIO MANAGERS' REPORT
ING PRINCIPAL PROTECTION FUND VII
| Average Annual Total Returns for the Periods Ended November 30, 2006 | |||||||||||
| 1 Year | Since Inception of Guarantee Period June 30, 2003 | ||||||||||
| Including Sales Charge: | |||||||||||
| Class A(1) | (0.89 | )% | 0.93 | % | |||||||
| Class B(2) | (0.57 | )% | 0.77 | % | |||||||
| Class C(3) | 3.41 | % | 1.89 | % | |||||||
| Excluding Sales Charge: | |||||||||||
| Class A | 5.20 | % | 2.69 | % | |||||||
| Class B | 4.43 | % | 1.91 | % | |||||||
| Class C | 4.41 | % | 1.89 | % | |||||||
| S&P 500® Index(4) | 14.23 | % | 13.25 | %(6) | |||||||
| LB 1-3 Gov Index(5) | 4.49 | % | 2.17 | %(6) | |||||||
The table above illustrates the total return of ING Principal Protection Fund VII against the indices indicated. An index is unmanaged and has no cash in its portfolio, imposes no sales charges and incurs no operating expenses. An investor cannot invest directly in an index. The Fund's performance is shown both with and without the imposition of sales charges.
The table does not reflect the deduction of taxes that a shareholder will pay on Fund distributions or the redemption of Fund shares.
The performance shown may include the effect of fee waivers and/or expense reimbursements by the Investment Adviser and/or other service providers, which have the effect of increasing total return. Had all fees and expenses been considered, the total returns would have been lower.
Performance data represents past performance and is no assurance of future results. Investment return and principal value of an investment in the Fund will fluctuate. Shares, when sold, may be worth more or less than their original cost. The Fund's current performance may be lower or higher than the performance data shown. Please log on to www.ingfunds.com or call (800) 922-0180 to get performance through the most recent month end.
This report contains statements that may be "forward-looking" statements. Actual results may differ materially from those projected in the "forward-looking" statements.
The views expressed in this report reflect those of the portfolio managers, only through the end of the period as stated on the cover. The portfolio managers' views are subject to change at any time based on market and other conditions.
Fund holdings are subject to change daily.
(1) Reflects deduction of the maximum Class A sales charge of 5.75%.
(2) Reflects deduction of the Class B deferred sales charge of 5% and 4%, respectively, for the 1 year and since inception return.
(3) Reflects deduction of the Class C deferred sales charge of 1% for the 1 year return.
(4) The S&P 500® Index is an unmanaged index that measures the performance of securities of approximately 500 large-capitalization companies whose securities are traded on major U.S. stock markets.
(5) The LB 1-3 Gov Index is an unmanaged index comprised of all publicly issued, non-convertible domestic debt of the U.S. Government, or any agency thereof, or any quasi-federal corporation. The index also includes corporate debt guaranteed by the U.S. Government.
(6) Since inception performance for the index is shown from July 1, 2003.
14
PORTFOLIO MANAGERS' REPORT
ING PRINCIPAL PROTECTION FUND VIII
| Average Annual Total Returns for the Periods Ended November 30, 2006 | |||||||||||
| 1 Year | Since Inception of Guarantee Period December 23, 2003 | ||||||||||
| Including Sales Charge: | |||||||||||
| Class A(1) | (0.30 | )% | 1.02 | % | |||||||
| Class B(2) | 0.11 | % | 1.00 | % | |||||||
| Class C(3) | 4.04 | % | 2.28 | % | |||||||
| Excluding Sales Charge: | |||||||||||
| Class A | 5.77 | % | 3.07 | % | |||||||
| Class B | 5.11 | % | 2.32 | % | |||||||
| Class C | 5.04 | % | 2.28 | % | |||||||
| S&P 500® Index(4) | 14.23 | % | 10.23 | %(6) | |||||||
| LB 1-3 Gov Index(5) | 4.49 | % | 2.35 | %(6) | |||||||
The table above illustrates the total return of ING Principal Protection Fund VIII against the indices indicated. An index is unmanaged and has no cash in its portfolio, imposes no sales charges and incurs no operating expenses. An investor cannot invest directly in an index. The Fund's performance is shown both with and without the imposition of sales charges.
The table does not reflect the deduction of taxes that a shareholder will pay on Fund distributions or the redemption of Fund shares.
The performance shown may include the effect of fee waivers and/or expense reimbursements by the Investment Adviser and/or other service providers, which have the effect of increasing total return. Had all fees and expenses been considered, the total returns would have been lower.
Performance data represents past performance and is no assurance of future results. Investment return and principal value of an investment in the Fund will fluctuate. Shares, when sold, may be worth more or less than their original cost. The Fund's current performance may be lower or higher than the performance data shown. Please log on to www.ingfunds.com or call (800) 922-0180 to get performance through the most recent month end.
This report contains statements that may be "forward-looking" statements. Actual results may differ materially from those projected in the "forward-looking" statements.
The views expressed in this report reflect those of the portfolio managers, only through the end of the period as stated on the cover. The portfolio managers' views are subject to change at any time based on market and other conditions.
Fund holdings are subject to change daily.
(1) Reflects deduction of the maximum Class A sales charge of 5.75%.
(2) Reflects deduction of the Class B deferred sales charge of 5% and 4%, respectively, for the 1 year and since inception returns.
(3) Reflects deduction of the Class C deferred sales charge of 1% for the 1 year return.
(4) The S&P 500® Index is an unmanaged index that measures the performance of securities of approximately 500 large-capitalization companies whose securities are traded on major U.S. stock markets.
(5) The LB 1-3 Gov Index is an unmanaged index comprised of all publicly issued, non-convertible domestic debt of the U.S. Government, or any agency thereof, or any quasi-federal corporation. The index also includes corporate debt guaranteed by the U.S. Government.
(6) Since inception performance for the index is shown from January 1, 2004.
15
PORTFOLIO MANAGERS' REPORT
ING PRINCIPAL PROTECTION FUND IX
| Average Annual Total Returns for the Periods Ended November 30, 2006 | |||||||||||
| 1 Year | Since Inception of Guarantee Period April 22, 2004 | ||||||||||
| Including Sales Charge: | |||||||||||
| Class A(1) | 0.39 | % | 1.48 | % | |||||||
| Class B(2) | 0.65 | % | 1.57 | % | |||||||
| Class C(3) | 4.76 | % | 3.07 | % | |||||||
| Excluding Sales Charge: | |||||||||||
| Class A | 6.51 | % | 3.81 | % | |||||||
| Class B | 5.65 | % | 3.05 | % | |||||||
| Class C | 5.76 | % | 3.07 | % | |||||||
| S&P 500® Index(4) | 14.23 | % | 11.58 | %(6) | |||||||
| LB 1-3 Gov Index(5) | 4.49 | % | 2.63 | %(6) | |||||||
The table above illustrates the total return of ING Principal Protection Fund IX against the indices indicated. An index is unmanaged and has no cash in its portfolio, imposes no sales charges and incurs no operating expenses. An investor cannot invest directly in an index. The Fund's performance is shown both with and without the imposition of sales charges.
The table does not reflect the deduction of taxes that a shareholder will pay on Fund distributions or the redemption of Fund shares.
The performance shown may include the effect of fee waivers and/or expense reimbursements by the Investment Adviser and/or other service providers, which have the effect of increasing total return. Had all fees and expenses been considered, the total returns would have been lower.
Performance data represents past performance and is no assurance of future results. Investment return and principal value of an investment in the Fund will fluctuate. Shares, when sold, may be worth more or less than their original cost. The Fund's current performance may be lower or higher than the performance data shown. Please log on to www.ingfunds.com or call (800) 922-0180 to get performance through the most recent month end.
This report contains statements that may be "forward-looking" statements. Actual results may differ materially from those projected in the "forward-looking" statements.
The views expressed in this report reflect those of the portfolio managers, only through the end of the period as stated on the cover. The portfolio managers' views are subject to change at any time based on market and other conditions.
Fund holdings are subject to change daily.
(1) Reflects deduction of the maximum Class A sales charge of 5.75%.
(2) Reflects deduction of the Class B deferred sales charge of 5% and 4%, respectively, for the 1 year and since inception returns.
(3) Reflects deduction of the Class C deferred sales charge of 1% for the 1 year return.
(4) The S&P 500® Index is an unmanaged index that measures the performance of securities of approximately 500 large-capitalization companies whose securities are traded on major U.S. stock markets.
(5) The LB 1-3 Gov Index is an unmanaged index comprised of all publicly issued, non-convertible domestic debt of the U.S. Government, or any agency thereof, or any quasi-federal corporation. The index also includes corporate debt guaranteed by the U.S. Government.
(6) Since inception performance for the index is shown from May 1, 2004.
16
PORTFOLIO MANAGERS' REPORT
ING PRINCIPAL PROTECTION FUND X
| Average Annual Total Returns for the Periods Ended November 30, 2006 | |||||||||||
| 1 Year | Since Inception of Guarantee Period August 17, 2004 | ||||||||||
| Including Sales Charge: | |||||||||||
| Class A(1) | 0.47 | % | 2.04 | % | |||||||
| Class B(2) | 0.79 | % | 2.23 | % | |||||||
| Class C(3) | 4.78 | % | 3.92 | % | |||||||
| Excluding Sales Charge: | |||||||||||
| Class A | 6.61 | % | 4.72 | % | |||||||
| Class B | 5.79 | % | 3.91 | % | |||||||
| Class C | 5.78 | % | 3.92 | % | |||||||
| S&P 500® Index(4) | 14.23 | % | 13.24 | %(6) | |||||||
| LB 1-3 Gov Index(5) | 4.49 | % | 2.56 | %(6) | |||||||
The table above illustrates the total return of ING Principal Protection Fund X against the indices indicated. An index is unmanaged and has no cash in its portfolio, imposes no sales charges and incurs no operating expenses. An investor cannot invest directly in an index. The Fund's performance is shown both with and without the imposition of sales charges.
The table does not reflect the deduction of taxes that a shareholder will pay on Fund distributions or the redemption of Fund shares.
The performance shown may include the effect of fee waivers and/or expense reimbursements by the Investment Adviser and/or other service providers, which have the effect of increasing total return. Had all fees and expenses been considered, the total returns would have been lower.
Performance data represents past performance and is no assurance of future results. Investment return and principal value of an investment in the Fund will fluctuate. Shares, when sold, may be worth more or less than their original cost. The Fund's current performance may be lower or higher than the performance data shown. Please log on to www.ingfunds.com or call (800) 922-0180 to get performance through the most recent month end.
This report contains statements that may be "forward-looking" statements. Actual results may differ materially from those projected in the "forward-looking" statements.
The views expressed in this report reflect those of the portfolio managers, only through the end of the period as stated on the cover. The portfolio managers' views are subject to change at any time based on market and other conditions.
Fund holdings are subject to change daily.
(1) Reflects deduction of the maximum Class A sales charge of 5.75%.
(2) Reflects deduction of the Class B deferred sales charge of 5% and 4%, respectively, for the 1 year and since inception returns.
(3) Reflects deduction of the Class C deferred sales charge of 1% for the since inception return.
(4) The S&P 500® Index is an unmanaged index that measures the performance of securities of approximately 500 large-capitalization companies whose securities are traded on major U.S. stock markets.
(5) The LB 1-3 Gov Index is an unmanaged index comprised of all publicly issued, non-convertible domestic debt of the U.S. Government, or any agency thereof, or any quasi-federal corporation. The index also includes corporate debt guaranteed by the U.S. Government.
(6) Since inception performance for the index is shown from September 1, 2004.
17
PORTFOLIO MANAGERS' REPORT
ING PRINCIPAL PROTECTION FUND XI
| Average Annual Total Returns for the Periods Ended November 30, 2006 | |||||||||||
| 1 Year | Since Inception of Guarantee Period November 18, 2004 | ||||||||||
| Including Sales Charge: | |||||||||||
| Class A(1) | 0.21 | % | 0.30 | % | |||||||
| Class B(2) | 0.50 | % | 0.55 | % | |||||||
| Class C(3) | 4.58 | % | 2.52 | % | |||||||
| Excluding Sales Charge: | |||||||||||
| Class A | 6.30 | % | 3.26 | % | |||||||
| Class B | 5.50 | % | 2.49 | % | |||||||
| Class C | 5.58 | % | 2.52 | % | |||||||
| S&P 500® Index(4) | 14.23 | % | 11.30 | %(6) | |||||||
| LB 1-3 Gov Index(5) | 4.49 | % | 3.01 | %(6) | |||||||
The table above illustrates the total return of ING Principal Protection Fund XI against the indices indicated. An index is unmanaged and has no cash in its portfolio, imposes no sales charges and incurs no operating expenses. An investor cannot invest directly in an index. The Fund's performance is shown both with and without the imposition of sales charges.
The table does not reflect the deduction of taxes that a shareholder will pay on Fund distributions or the redemption of Fund shares.
The performance shown may include the effect of fee waivers and/or expense reimbursements by the Investment Adviser and/or other service providers, which have the effect of increasing total return. Had all fees and expenses been considered, the total returns would have been lower.
Performance data represents past performance and is no assurance of future results. Investment return and principal value of an investment in the Fund will fluctuate. Shares, when sold, may be worth more or less than their original cost. The Fund's current performance may be lower or higher than the performance data shown. Please log on to www.ingfunds.com or call (800) 922-0180 to get performance through the most recent month end.
This report contains statements that may be "forward-looking" statements. Actual results may differ materially from those projected in the "forward-looking" statements.
The views expressed in this report reflect those of the portfolio managers, only through the end of the period as stated on the cover. The portfolio managers' views are subject to change at any time based on market and other conditions.
Fund holdings are subject to change daily.
(1) Reflects deduction of the maximum Class A sales charge of 5.75%.
(2) Reflects deduction of the Class B deferred sales charge of 5% and 4%, respectively, for the 1 year and since inception returns.
(3) Reflects deduction of the Class C deferred sales charge of 1% for the since inception return.
(4) The S&P 500® Index is an unmanaged index that measures the performance of securities of approximately 500 large-capitalization companies whose securities are traded on major U.S. stock markets.
(5) The LB 1-3 Gov Index is an unmanaged index comprised of all publicly issued, non-convertible domestic debt of the U.S. Government, or any agency thereof, or any quasi-federal corporation. The index also includes corporate debt guaranteed by the U.S. Government.
(6) Since inception performance for the index is shown from December 1, 2004.
18
PORTFOLIO MANAGERS' REPORT
ING PRINCIPAL PROTECTION FUND XII
| Average Annual Total Returns for the Period Ended November 30, 2006 | |||||||||||
| 1 Year | Since Inception of Guarantee Period February 16, 2005 | ||||||||||
| Including Sales Charge: | |||||||||||
| Class A(1) | (0.38 | )% | (0.32 | )% | |||||||
| Class B(2) | 0.00 | % | (0.53 | )% | |||||||
| Class C(3) | 3.95 | % | 2.28 | % | |||||||
| Excluding Sales Charge: | |||||||||||
| Class A | 5.70 | % | 3.04 | % | |||||||
| Class B | 5.00 | % | 2.25 | % | |||||||
| Class C | 4.95 | % | 2.28 | % | |||||||
| S&P 500® Index(4) | 14.23 | % | 11.12 | %(6) | |||||||
| LB 1-3 Gov Index(5) | 4.49 | % | 3.45 | %(6) | |||||||
The table above illustrates the total return of ING Principal Protection Fund XII against the indices indicated. An index is unmanaged and has no cash in its portfolio, imposes no sales charges and incurs no operating expenses. An investor cannot invest directly in an index. The Fund's performance is shown both with and without the imposition of sales charges.
The table does not reflect the deduction of taxes that a shareholder will pay on Fund distributions or the redemption of Fund shares.
The performance shown may include the effect of fee waivers and/or expense reimbursements by the Investment Adviser and/or other service providers, which have the effect of increasing total return. Had all fees and expenses been considered, the total returns would have been lower.
Performance data represents past performance and is no assurance of future results. Investment return and principal value of an investment in the Fund will fluctuate. Shares, when sold, may be worth more or less than their original cost. The Fund's current performance may be lower or higher than the performance data shown. Please log on to www.ingfunds.com or call (800) 922-0180 to get performance through the most recent month end.
This report contains statements that may be "forward-looking" statements. Actual results may differ materially from those projected in the "forward-looking" statements.
The views expressed in this report reflect those of the portfolio managers, only through the end of the period as stated on the cover. The portfolio managers' views are subject to change at any time based on market and other conditions.
Fund holdings are subject to change daily.
(1) Reflects deduction of the maximum Class A sales charge of 5.75%.
(2) Reflects deduction of the Class B deferred sales charge of 5% for the 1 year and since inception returns.
(3) Reflects deduction of the Class C deferred sales charge of 1% for the since inception return.
(4) The S&P 500® Index is an unmanaged index that measures the performance of securities of approximately 500 large-capitalization companies whose securities are traded on major U.S. stock markets.
(5) The LB 1-3 Gov Index is an unmanaged index comprised of all publicly issued, non-convertible domestic debt of the U.S. Government, or any agency thereof, or any quasi-federal corporation. The index also includes corporate debt guaranteed by the U.S. Government.
(6) Since inception performance for the index is shown from March 1, 2005.
19
INVESTMENT STRATEGY AND PRINCIPAL RISKS OF PRINCIPAL PROTECTION FUNDS
What is the Investment Strategy During the Guarantee Period?
The PPFs undertake ("Payment Undertaking") that on the Guarantee Maturity Date specified in the Prospectuses, each shareholder will be entitled to redeem his or her shares for an amount no less than the value of that shareholder's account as of the inception of the Guarantee Period, less certain expenses not covered by the Expense Limitation Agreement ("Guaranteed Amount"), provided that all dividends and distributions received from a PPF have been reinvested and no shares have been redeemed. Note: An investor must act on the Guarantee Maturity Date in order to receive the Guaranteed Amount.
The PPFs do not implement an "investment strategy" in any conventional sense. Rather, the PPFs' asset allocation strategy seeks to optimize the exposure of the PPFs to the Equity Component while protecting the PPFs' assets. Assets allocated to the Equity Component may be reduced or eliminated in order to conserve assets at a level equal to or above the present value of the Payment Undertaking. The PPFs allocate their assets among the following asset classes:
• During the Guarantee Period, the PPFs' assets will be allocated between the:
• Equity Component, consisting primarily of common stocks included in the S&P 500® Index and futures contracts on the S&P 500® Index; and the
• Fixed Component, consisting primarily of short- to intermediate-duration U.S. government securities.
The PPFs' asset allocation strategy is implemented by allocating assets appropriately to the Equity Component and to the Fixed Component to optimize exposure to the Equity Component while controlling the risk that the assets of any Fund would fall below the amount of the Payment Undertaking. Consequently, there can be no assurance as to the percentage of assets, if any, allocated to the Equity Component, or to any investment returns generated by the PPFs.
How Does the Funds' Asset Allocation work?
The Sub-Adviser to the PPFs uses a proprietary computer model to determine on a daily basis the percentage of assets allocated to the Equity Component and to the Fixed Component. The model evaluates a number of factors, including the then current market value of the PPFs, the then prevailing level of interest rates, equity market volatility, the PPFs' total annual expenses, and the Maturity Date. The model determined the initial allocation between the Equity Component and the Fixed Component on the first day of the Guarantee Period and provides direction for any reallocations on a daily basis thereafter.
Equity Component: The PPFs will employ an enhanced index strategy. This means that the PPFs invest at least 80% of the Equity Component's net assets in stocks included in the S&P 500® Index although the weightings of the stocks will vary somewhat from their respective weightings in the index. The Equity Component may also include up to 20% of its assets in S&P 500® Index futures contracts. During the Guarantee Period, the PPFs may use futures for hedging purposes or to maintain liquidity to meet Shareholders Redemptions and minimize trading costs, but may only use futures on the S&P 500® Index and U.S. Treasury securities.
If the Equity Component's market value is $5 million or less, in order to replicate investment in stocks listed on the S&P 500® Index, the Sub-Adviser may invest the entire amount of the Equity Component's assets in S&P 500® Index futures, in exchange traded funds ("ETFs"), or in a combination of S&P 500® Index futures and ETFs, subject to any limitation on the PPFs' investment in such securities (subject to restrictions imposed by the Investment Company Act of 1940, as amended "1940 Act"). ETFs are passively managed investment companies traded on a securities exchange whose goal is to track or replicate a desired index. The Sub-Adviser will not employ an enhanced index strategy when it invests in S&P 500® Index futures and ETFs.
Fixed Component: The Sub-Adviser looks to select investments for the Fixed Component with financial characteristics that will, at any point in time, closely resemble those of a portfolio of zero coupon bonds which mature within three months of the Guarantee Maturity Date. The Fixed Component will consist primarily of securities issued or guaranteed by the U.S. government and its agencies or instrumentalities of a short- to intermediate duration. Duration refers to the sensitivity of fixed-income securities to interest rate changes.
20
INVESTMENT STRATEGY AND PRINCIPAL RISKS OF PRINCIPAL PROTECTION FUNDS (CONTINUED)
Generally, fixed-income securities with shorter durations are less sensitive to changes in interest rates. These U.S. government securities include Separate Trading of Registered Interest and Principal of Securities ("STRIPS"). STRIPS are created by the Federal Reserve Bank by separating the interest and principal components of an outstanding U.S. Treasury or Agency bond and selling them as individual securities. The Fixed Component may also include corporate bonds rated AA- or higher by Standard & Poor's ("S&P") and/or Aa3 or higher by Moody's Investors Service, Inc., futures on U.S. Treasury securities and money market instruments.
What Are the Principal Guarantee Period Risks?
Allocation Risk: If at the inception of, or at any time during, the Guarantee Period interest rates are low, the PPFs' assets may be largely invested in the Fixed Component in order to decrease the likelihood that a payment would be required under the Payment Undertaking. The effect of low interest rates on the PPFs would likely be more pronounced at the inception of the Guarantee Period, as the initial allocation of assets would include more fixed income securities. In addition, if during the Guarantee Period the equity markets experienced a major decline, the PPFs' assets may become largely invested in the Fixed Component. If the value of the Equity Component were to decline by a significant amount, a complete reallocation to the Fixed Component would likely occur. In the event of a reallocation of 100% of the assets to the Fixed Component, the PPFs would not reallocate any assets into the Equity Component prior to the Maturity Date. Use of the Fixed Component reduces the PPFs' ability to participate as fully in upward equity market movements, and therefore represents some loss of opportunity, or opportunity cost, compared to a portfolio that is fully invested in equities.
Opportunity Costs: The PPFs may allocate a substantial portion, and under certain circumstances all, of the PPF's assets to the Fixed Component in order to conserve the PPFs' assets to a level equal to or above the present value of the Payment Undertaking. Initially, if interest rates are low, the allocation to the Fixed Component may be over 70% of the PPFs' assets. If the market value of the Equity Component rises, the percentage of the PPFs' assets allocated to the Equity Component generally will also rise. However, the relative volatility of these two components as well as the past performance of the PPFs will affect these allocations. For example, if the PPFs incur early losses, the PPFs may allocate 100% of the PPFs' assets to the Fixed Component for the entire Guarantee Period, irrespective of the subsequent upward movements in the equity markets and /or the Equity Component. The extent to which the PPFs participate in upward movements in the Equity Component during the Guarantee Period will depend on the performance of the PPFs, the performance and volatility of the Fixed and Equity Components, interest rates, expenses of the PPFs and other factors. The PPFs might capture a material portion, very little or none of any equity market increase. It is possible that on the Maturity Date, an investor could receive only the Guaranteed Amount even though the equity markets, as well as the Equity Component, has had significant positive performance during the Guarantee Period.
Worse Case Scenarios for the PPFs' Equity Participation: The opportunity cost of not allocating assets to the Equity Component will be particularly high if early in the Guarantee period: (a) the PPFs' net asset value ("NAV") decreases; or (b) the value of the Equity Component declines. In either case, all or substantially all of the PPFs' assets could be allocated to the Fixed Component for the remainder of the Guarantee Period.
Investing in Stocks: The risks associated with investing in stocks include sudden and unpredictable drops in the value of the market as a whole and periods of lackluster or negative performance. The performance of the Equity Component also depends significantly on the Sub-Adviser's skill in determining which securities to overweight, underweight or avoid altogether.
Investing in Bonds: The principal risk associated with investing in bonds is that interest rates may rise, which generally causes bond prices to fall. The market value of a zero coupon bond portfolio (which may include STRIPS) generally is more volatile than the market value of a portfolio of fixed income securities with similar maturities that pay interest periodically. With corporate bonds, there is also a risk that the issuer will default on the payment of principal or interest. Federal tax law requires that a holder of a zero coupon security accrue a portion of the discount at which the security was purchased as taxable income each year, even though the holder receives no interest payment on the security during the year. Because the PPFs must distribute substantially all of their net
21
INVESTMENT STRATEGY AND PRINCIPAL RISKS OF PRINCIPAL PROTECTION FUNDS (CONTINUED)
income (including non-cash income attributable to zero coupon securities) to their shareholders each year for income and excise tax purposes, such accrued discount would also be taken into account in determining the amount of taxable distributions to shareholders. In addition, the PPFs may have to dispose of portfolio securities under disadvantageous circumstances to generate cash, or may be required to borrow, to satisfy their distribution requirements.
Use of Futures: While the use of futures contracts by the PPFs can amplify a gain, it can also amplify a loss. Such a loss can be substantially more money than the actual cost of the investment. In addition, while a hedging strategy can guard against potential risks for the PPFs as a whole, it adds to the PPFs' expense and may reduce or eliminate potential gains. There is also a risk that a futures contract intended as a hedge may not perform as expected.
Risks of Using Derivatives: Certain securities in which the PPFs may invest, including futures contracts, are derivative instruments. In general terms, a derivative instrument is a financial contract whose value is derived, at least in part, from the performance of an underlying asset, interest rate, or index. If the issuer of a derivative does not pay the amount due, the PPFs can lose money on the investment. The underlying investment on which the derivative is based, and the derivative itself, might not perform in the manner the Sub-Adviser expected, which could cause the PPFs' share prices to decline. Markets of underlying securities may move in a direction not anticipated by the Sub-Adviser, which may result in the PPFs' realizing a lower return than expected on an investment.
Transaction Costs and Taxes: The asset allocation process results in additional transaction costs such as brokerage commissions. The process can have an adverse effect on the performance of the PPFs during periods of increased equity market volatility. In addition, a high portfolio turnover rate, which may also have an adverse effect on the performance of the PPFs, may increase the PPFs' transaction costs.
The asset allocation process and sale of fixed income securities in connection with the transition period may also result in the realization of additional gains to the PPFs and may therefore also increase the tax liability of shareholders. The PPFs will distribute any net gains and income to shareholders. Such distributions are taxable to shareholders even if the distributions are reinvested in the Funds.
For further information on the PPFs' investment strategies and principal risks, please refer to your Prospectus and Statement of Additional Information.
22
SHAREHOLDER EXPENSE EXAMPLES (UNAUDITED)
As a shareholder of a Fund, you incur two types of costs: (1) transaction costs, including sales charges (loads) on purchase payments; redemption fees; and exchange fees; and (2) ongoing costs, including management fees; distribution and/or service (12b–1) fees; and other Fund expenses. These Examples are intended to help you understand your ongoing costs (in dollars) of investing in a Fund and to compare these costs with the ongoing costs of investing in other mutual funds.
The Examples are based on an investment of $1,000 invested at the beginning of the period and held for the entire period from June 1, 2006 to November 30, 2006.
Actual Expenses
The first section of the table shown, "Actual Fund Return," provides information about actual account values and actual expenses. You may use the information in this section, together with the amount you invested, to estimate the expenses that you paid over the period. Simply divide your account value by $1,000 (for example, an $8,600 account value divided by $1,000 = 8.6), then multiply the result by the number in the first section under the heading entitled "Expenses Paid During the Six Months Ended November 30, 2006" to estimate the expenses you paid on your account during this period.
Hypothetical Example for Comparison Purposes
The second section of the table shown, "Hypothetical (5% return before expenses)," provides information about hypothetical account values and hypothetical expenses based on the Fund's actual expense ratio and an assumed rate of return of 5% per year before expenses, which is not the Fund's actual return. The hypothetical account values and expenses may not be used to estimate the actual ending account balance or expenses you paid for the period. You may use this information to compare the ongoing costs of investing in the Fund and other funds. To do so, compare this 5% hypothetical example with the 5% hypothetical examples that appear in the shareholder reports of the other funds.
Please note that the expenses shown in the table are meant to highlight your ongoing costs only and do not reflect any transactional costs, such as sales charges (loads), redemption fees, or exchange fees. Therefore, the hypothetical lines of the table are useful in comparing ongoing costs only, and will not help you determine the relative total costs of owning different funds. In addition, if these transactional costs were included, your costs would have been higher.
| ING Index Plus LargeCap Equity Fund | Beginning Account Value June 1, 2006 | Ending Account Value November 30, 2006 | Annualized Expense Ratio | Expenses Paid During the Six Months Ended November 30, 2006* | |||||||||||||||
| Actual Fund Return | |||||||||||||||||||
| Class A | $ | 1,000.00 | $ | 1,064.30 | 1.56 | % | $ | 8.07 | |||||||||||
| Class B | 1,000.00 | 1,060.20 | 2.31 | 11.98 | |||||||||||||||
| Class C | 1,000.00 | 1,061.30 | 2.31 | 11.78 | |||||||||||||||
| Class Q | 1,000.00 | 1,064.60 | 1.49 | 7.71 | |||||||||||||||
| Hypothetical (5% return before expenses) | |||||||||||||||||||
| Class A | $ | 1,000.00 | $ | 1,017.25 | 1.56 | % | $ | 7.89 | |||||||||||
| Class B | 1,000.00 | 1,013.44 | 2.31 | 11.71 | |||||||||||||||
| Class C | 1,000.00 | 1,013.64 | 2.31 | 11.51 | |||||||||||||||
| Class Q | 1,000.00 | 1,017.60 | 1.49 | 7.54 | |||||||||||||||
* Expenses are equal to each Fund's respective annualized expense ratios multiplied by the average account value over the period, multiplied by 183/365 to reflect the most recent fiscal half year.
23
SHAREHOLDER EXPENSE EXAMPLES (UNAUDITED) (CONTINUED)
| ING Principal Protection Fund II | Beginning Account Value June 1, 2006 | Ending Account Value November 30, 2006 | Annualized Expense Ratio | Expenses Paid During the Six Months Ended November 30, 2006* | |||||||||||||||
| Actual Fund Return | |||||||||||||||||||
| Class A | $ | 1,000.00 | $ | 1,033.60 | 1.64 | % | $ | 8.36 | |||||||||||
| Class B | 1,000.00 | 1,029.50 | 2.39 | 12.16 | |||||||||||||||
| Class C | 1,000.00 | 1,029.40 | 2.39 | 12.16 | |||||||||||||||
| Hypothetical (5% return before expenses) | |||||||||||||||||||
| Class A | $ | 1,000.00 | $ | 1,016.85 | 1.64 | % | $ | 8.29 | |||||||||||
| Class B | 1,000.00 | 1,013.09 | 2.39 | 12.06 | |||||||||||||||
| Class C | 1,000.00 | 1,013.09 | 2.39 | 12.06 | |||||||||||||||
| ING Principal Protection Fund III | |||||||||||||||||||
| Actual Fund Return | |||||||||||||||||||
| Class A | $ | 1,000.00 | $ | 1,036.20 | 1.65 | % | $ | 8.42 | |||||||||||
| Class B | 1,000.00 | 1,032.10 | 2.40 | 12.23 | |||||||||||||||
| Class C | 1,000.00 | 1,033.00 | 2.40 | 12.23 | |||||||||||||||
| Hypothetical (5% return before expenses) | |||||||||||||||||||
| Class A | $ | 1,000.00 | $ | 1,016.80 | 1.65 | % | $ | 8.34 | |||||||||||
| Class B | 1,000.00 | 1,013.04 | 2.40 | 12.11 | |||||||||||||||
| Class C | 1,000.00 | 1,013.04 | 2.40 | 12.11 | |||||||||||||||
| ING Principal Protection Fund IV | |||||||||||||||||||
| Actual Fund Return | |||||||||||||||||||
| Class A | $ | 1,000.00 | $ | 1,059.30 | 1.63 | % | $ | 8.41 | |||||||||||
| Class B | 1,000.00 | 1,055.60 | 2.38 | 12.26 | |||||||||||||||
| Class C | 1,000.00 | 1,055.40 | 2.38 | 12.26 | |||||||||||||||
| Class Q | 1,000.00 | 1,060.00 | 1.59 | 8.21 | |||||||||||||||
| Hypothetical (5% return before expenses) | |||||||||||||||||||
| Class A | $ | 1,000.00 | $ | 1,016.90 | 1.63 | % | $ | 8.24 | |||||||||||
| Class B | 1,000.00 | 1,013.14 | 2.38 | 12.01 | |||||||||||||||
| Class C | 1,000.00 | 1,013.14 | 2.38 | 12.01 | |||||||||||||||
| Class Q | 1,000.00 | 1,017.10 | 1.59 | 8.04 | |||||||||||||||
* Expenses are equal to each Fund's respective annualized expense ratios multiplied by the average account value over the period, multiplied by 183/365 to reflect the most recent fiscal half-year.
24
SHAREHOLDER EXPENSE EXAMPLES (UNAUDITED) (CONTINUED)
| ING Principal Protection Fund V | Beginning Account Value June 1, 2006 | Ending Account Value November 30, 2006 | Annualized Expense Ratio | Expenses Paid During the Six Months Ended November 30, 2006* | |||||||||||||||
| Actual Fund Return | |||||||||||||||||||
| Class A | $ | 1,000.00 | $ | 1,050.70 | 1.63 | % | $ | 8.38 | |||||||||||
| Class B | 1,000.00 | 1,046.70 | 2.38 | 12.21 | |||||||||||||||
| Class C | 1,000.00 | 1,046.60 | 2.38 | 12.21 | |||||||||||||||
| Hypothetical (5% return before expenses) | |||||||||||||||||||
| Class A | $ | 1,000.00 | $ | 1,016.90 | 1.63 | % | $ | 8.24 | |||||||||||
| Class B | 1,000.00 | 1,013.14 | 2.38 | 12.01 | |||||||||||||||
| Class C | 1,000.00 | 1,013.14 | 2.38 | 12.01 | |||||||||||||||
| ING Principal Protection Fund VI | |||||||||||||||||||
| Actual Fund Return | |||||||||||||||||||
| Class A | $ | 1,000.00 | $ | 1,048.70 | 1.68 | % | $ | 8.63 | |||||||||||
| Class B | 1,000.00 | 1,045.80 | 2.43 | 12.46 | |||||||||||||||
| Class C | 1,000.00 | 1,044.50 | 2.43 | 12.45 | |||||||||||||||
| Hypothetical (5% return before expenses) | |||||||||||||||||||
| Class A | $ | 1,000.00 | $ | 1,016.65 | 1.68 | % | $ | 8.49 | |||||||||||
| Class B | 1,000.00 | 1,012.89 | 2.43 | 12.26 | |||||||||||||||
| Class C | 1,000.00 | 1,012.89 | 2.43 | 12.26 | |||||||||||||||
| ING Principal Protection Fund VII | |||||||||||||||||||
| Actual Fund Return | |||||||||||||||||||
| Class A | $ | 1,000.00 | $ | 1,048.40 | 1.75 | % | $ | 8.99 | |||||||||||
| Class B | 1,000.00 | 1,044.00 | 2.50 | 12.81 | |||||||||||||||
| Class C | 1,000.00 | 1,044.00 | 2.50 | 12.81 | |||||||||||||||
| Hypothetical (5% return before expenses) | |||||||||||||||||||
| Class A | $ | 1,000.00 | $ | 1,016.29 | 1.75 | % | $ | 8.85 | |||||||||||
| Class B | 1,000.00 | 1,012.53 | 2.50 | 12.61 | |||||||||||||||
| Class C | 1,000.00 | 1,012.53 | 2.50 | 12.61 | |||||||||||||||
* Expenses are equal to each Fund's respective annualized expense ratios multiplied by the average account value over the period, multiplied by 183/365 to reflect the most recent fiscal half-year.
25
SHAREHOLDER EXPENSE EXAMPLES (UNAUDITED) (CONTINUED)
| ING Principal Protection Fund VIII | Beginning Account Value June 1, 2006 | Ending Account Value November 30, 2006 | Annualized Expense Ratio | Expenses Paid During the Six Months Ended November 30, 2006* | |||||||||||||||
| Actual Fund Return | |||||||||||||||||||
| Class A | $ | 1,000.00 | $ | 1,055.90 | 1.47 | % | $ | 7.58 | |||||||||||
| Class B | 1,000.00 | 1,052.90 | 2.22 | 11.42 | |||||||||||||||
| Class C | 1,000.00 | 1,051.70 | 2.22 | 11.42 | |||||||||||||||
| Hypothetical (5% return before expenses) | |||||||||||||||||||
| Class A | $ | 1,000.00 | $ | 1,017.70 | 1.47 | % | $ | 7.44 | |||||||||||
| Class B | 1,000.00 | 1,013.94 | 2.22 | 11.21 | |||||||||||||||
| Class C | 1,000.00 | 1,013.94 | 2.22 | 11.21 | |||||||||||||||
| ING Principal Protection Fund IX | |||||||||||||||||||
| Actual Fund Return | |||||||||||||||||||
| Class A | $ | 1,000.00 | $ | 1,061.30 | 1.53 | % | $ | 7.91 | |||||||||||
| Class B | 1,000.00 | 1,057.40 | 2.28 | 11.76 | |||||||||||||||
| Class C | 1,000.00 | 1,057.20 | 2.28 | 11.76 | |||||||||||||||
| Hypothetical (5% return before expenses) | |||||||||||||||||||
| Class A | $ | 1,000.00 | $ | 1,017.40 | 1.53 | % | $ | 7.74 | |||||||||||
| Class B | 1,000.00 | 1,013.64 | 2.28 | 11.51 | |||||||||||||||
| Class C | 1,000.00 | 1,013.64 | 2.28 | 11.51 | |||||||||||||||
| ING Principal Protection Fund X | |||||||||||||||||||
| Actual Fund Return | |||||||||||||||||||
| Class A | $ | 1,000.00 | $ | 1,064.70 | 1.52 | % | $ | 7.87 | |||||||||||
| Class B | 1,000.00 | 1,060.90 | 2.27 | 11.73 | |||||||||||||||
| Class C | 1,000.00 | 1,060.70 | 2.27 | 11.73 | |||||||||||||||
| Hypothetical (5% return before expenses) | |||||||||||||||||||
| Class A | $ | 1,000.00 | $ | 1,017.45 | 1.52 | % | $ | 7.69 | |||||||||||
| Class B | 1,000.00 | 1,013.69 | 2.27 | 11.46 | |||||||||||||||
| Class C | 1,000.00 | 1,013.69 | 2.27 | 11.46 | |||||||||||||||
* Expenses are equal to each Fund's respective annualized expense ratios multiplied by the average account value over the period, multiplied by 183/365 to reflect the most recent fiscal half-year.
26
SHAREHOLDER EXPENSE EXAMPLES (UNAUDITED) (CONTINUED)
| ING Principal Protection Fund XI | Beginning Account Value June 1, 2006 | Ending Account Value November 30, 2006 | Annualized Expense Ratio | Expenses Paid During the Six Months Ended November 30, 2006* | |||||||||||||||
| Class A | $ | 1,000.00 | $ | 1,061.70 | 1.56 | % | $ | 8.06 | |||||||||||
| Class B | 1,000.00 | 1,057.90 | 2.31 | 11.92 | |||||||||||||||
| Class C | 1,000.00 | 1,057.90 | 2.31 | 11.92 | |||||||||||||||
| Hypothetical (5% return before expenses) | |||||||||||||||||||
| Class A | $ | 1,000.00 | $ | 1,017.25 | 1.56 | % | $ | 7.89 | |||||||||||
| Class B | 1,000.00 | 1,013.49 | 2.31 | 11.66 | |||||||||||||||
| Class C | 1,000.00 | 1,013.49 | 2.31 | 11.66 | |||||||||||||||
| ING Principal Protection Fund XII | |||||||||||||||||||
| Actual Fund Return | |||||||||||||||||||
| Class A | $ | 1,000.00 | $ | 1,060.30 | 1.70 | % | $ | 8.78 | |||||||||||
| Class B | 1,000.00 | 1,055.40 | 2.45 | 12.62 | |||||||||||||||
| Class C | 1,000.00 | 1,056.40 | 2.45 | 12.63 | |||||||||||||||
| Hypothetical (5% return before expenses) | |||||||||||||||||||
| Class A | $ | 1,000.00 | $ | 1,016.55 | 1.70 | % | $ | 8.59 | |||||||||||
| Class B | 1,000.00 | 1,012.78 | 2.45 | 12.36 | |||||||||||||||
| Class C | 1,000.00 | 1,012.78 | 2.45 | 12.36 | |||||||||||||||
* Expenses are equal to each Fund's respective annualized expense ratios multiplied by the average account value over the period, multiplied by 183/365 to reflect the most recent fiscal half year.
27
STATEMENTS OF ASSETS AND LIABILITIES AS OF NOVEMBER 30, 2006 (UNAUDITED)
| ING Index Plus LargeCap Equity Fund | ING Principal Protection Fund II | ING Principal Protection Fund III | ING Principal Protection Fund IV | ||||||||||||||||
| ASSETS: | |||||||||||||||||||
| Investments in securities at value* | $ | 55,472,163 | $ | 203,351,195 | $ | 162,114,949 | $ | 333,393,418 | |||||||||||
| Repurchase agreement | 377,000 | 5,303,000 | 1,630,000 | 2,183,000 | |||||||||||||||
| Cash | 5,688 | 14,559 | 566 | 339 | |||||||||||||||
| Cash collateral for futures | 31,500 | — | — | — | |||||||||||||||
| Receivables: | |||||||||||||||||||
| Dividends and interest | 138,525 | 81,672 | 85,905 | 397,957 | |||||||||||||||
| Variation margin receivable | 175 | — | — | — | |||||||||||||||
| Prepaid expenses | 55,033 | 2,954 | 2,223 | 4,689 | |||||||||||||||
| Total assets | 56,080,084 | 208,753,380 | 163,833,643 | 335,979,403 | |||||||||||||||
| LIABILITIES: | |||||||||||||||||||
| Payable for fund shares redeemed | 387,889 | 917,995 | 455,980 | 824,743 | |||||||||||||||
| Payable to affiliates | 70,562 | 319,838 | 248,602 | 514,132 | |||||||||||||||
| Payable for directors fees | 14,639 | 19,336 | 10,174 | 11,751 | |||||||||||||||
| Other accrued expenses and liabilities | 38,511 | 169,718 | 160,612 | 255,404 | |||||||||||||||
| Total liabilities | 511,601 | 1,426,887 | 875,368 | 1,606,030 | |||||||||||||||
| NET ASSETS | $ | 55,568,483 | $ | 207,326,493 | $ | 162,958,275 | $ | 334,373,373 | |||||||||||
| NET ASSETS WERE COMPRISED OF: | |||||||||||||||||||
| Paid-in capital | $ | 55,887,948 | $ | 222,642,387 | $ | 166,372,894 | $ | 277,782,627 | |||||||||||
| Undistributed net investment income | 317,591 | 4,857,625 | 2,943,959 | 2,119,514 | |||||||||||||||
| Accumulated net realized gain (loss) on investments and futures | (7,738,798 | ) | (30,616,184 | ) | (17,417,335 | ) | 7,283,683 | ||||||||||||
| Net unrealized appreciation on investments and futures | 7,101,742 | 10,442,665 | 11,058,757 | 47,187,549 | |||||||||||||||
| NET ASSETS | $ | 55,568,483 | $ | 207,326,493 | $ | 162,958,275 | $ | 334,373,373 | |||||||||||
| * Cost of investments in securities | $ | 48,373,467 | $ | 192,908,530 | $ | 151,056,192 | $ | 286,205,869 | |||||||||||
See Accompanying Notes to Financial Statements
28
STATEMENTS OF ASSETS AND LIABILITIES AS OF NOVEMBER 30, 2006 (UNAUDITED) (CONTINUED)
| ING Index Plus LargeCap Equity Fund | ING Principal Protection Fund II | ING Principal Protection Fund III | ING Principal Protection Fund IV | ||||||||||||||||
| Class A: | |||||||||||||||||||
| Net Assets | $ | 4,652,509 | $ | 14,083,615 | $ | 13,228,329 | $ | 18,343,692 | |||||||||||
| Shares authorized | unlimited | unlimited | unlimited | unlimited | |||||||||||||||
| Par value | $ | 0.01 | $ | 0.01 | $ | 0.01 | $ | 0.01 | |||||||||||
| Shares outstanding | 453,768 | 1,431,869 | 1,319,861 | 1,655,144 | |||||||||||||||
| Net asset value and redemption price per share | $ | 10.25 | $ | 9.84 | $ | 10.02 | $ | 11.08 | |||||||||||
| Maximum offering price per share (5.75%)(1) | $ | 10.57 | (3) | $ | 10.44 | $ | 10.63 | $ | 11.76 | ||||||||||
| Class B: | |||||||||||||||||||
| Net Assets | $ | 43,696,878 | $ | 172,595,387 | $ | 136,972,730 | $ | 282,901,067 | |||||||||||
| Shares authorized | unlimited | unlimited | unlimited | unlimited | |||||||||||||||
| Par value | $ | 0.01 | $ | 0.01 | $ | 0.01 | $ | 0.01 | |||||||||||
| Shares outstanding | 4,263,501 | 17,650,718 | 13,753,187 | 25,688,588 | |||||||||||||||
| Net asset value and redemption price per share(2) | $ | 10.25 | $ | 9.78 | $ | 9.96 | $ | 11.01 | |||||||||||
| Maximum offering price per share | $ | 10.25 | $ | 9.78 | $ | 9.96 | $ | 11.01 | |||||||||||
| Class C: | |||||||||||||||||||
| Net Assets | $ | 7,165,299 | $ | 20,647,491 | $ | 12,757,216 | $ | 32,776,284 | |||||||||||
| Shares authorized | unlimited | unlimited | unlimited | unlimited | |||||||||||||||
| Par value | $ | 0.01 | $ | 0.01 | $ | 0.01 | $ | 0.01 | |||||||||||
| Shares outstanding | 693,857 | 2,101,848 | 1,274,826 | 2,965,455 | |||||||||||||||
| Net asset value and redemption price per share(2) | $ | 10.33 | $ | 9.82 | $ | 10.01 | $ | 11.05 | |||||||||||
| Maximum offering price per share | $ | 10.33 | $ | 9.82 | $ | 10.01 | $ | 11.05 | |||||||||||
| Class Q: | |||||||||||||||||||
| Net Assets | $ | 53,797 | n/a | n/a | $ | 352,330 | |||||||||||||
| Shares authorized | unlimited | n/a | n/a | unlimited | |||||||||||||||
| Par value | $ | 0.01 | n/a | n/a | $ | 0.01 | |||||||||||||
| Shares outstanding | 5,213 | n/a | n/a | 31,653 | |||||||||||||||
| Net asset value and redemption price per share | $ | 10.32 | n/a | n/a | $ | 11.13 | |||||||||||||
| Maximum offering price per share | $ | 10.32 | n/a | n/a | $ | 11.13 | |||||||||||||
(1) Maximum offering price is computed at 100/94.25 of net asset value. On purchases of $50,000 or more, the offering price is reduced.
(2) Redemption price per share may be reduced for any applicable contingent deffered sales charges.
(3) Maximum offering price for ING Index Plus LargeCap Equity Fund is 3.00% and is computed at 100/97.00 of net asset value. On purchases of $50,000 or more, the offering price is reduced.
See Accompanying Notes to Financial Statements
29
STATEMENTS OF ASSETS AND LIABILITIES AS OF NOVEMBER 30, 2006 (UNAUDITED)
| ING Principal Protection Fund V | ING Principal Protection Fund VI | ING Principal Protection Fund VII | ING Principal Protection Fund VIII | ||||||||||||||||
| ASSETS: | |||||||||||||||||||
| Investments in securities at value* | $ | 268,381,063 | $ | 240,439,326 | $ | 118,170,768 | $ | 73,886,655 | |||||||||||
| Repurchase agreement | 2,779,000 | 2,359,000 | 942,000 | 656,000 | |||||||||||||||
| Cash | 777 | 15 | 353 | 439 | |||||||||||||||
| Receivables: | |||||||||||||||||||
| Dividends and interest | 259,289 | 219,434 | 102,063 | 72,270 | |||||||||||||||
| Prepaid expenses | 3,810 | 3,386 | 1,640 | 1,026 | |||||||||||||||
| Reimbursement due from manager | — | — | 65 | — | |||||||||||||||
| Total assets | 271,423,939 | 243,021,161 | 119,216,889 | 74,616,390 | |||||||||||||||
| LIABILITIES: | |||||||||||||||||||
| Payable for fund shares redeemed | 657,007 | 562,382 | 647,040 | 403,868 | |||||||||||||||
| Payable to affiliates | 412,197 | 371,029 | 182,185 | 102,652 | |||||||||||||||
| Payable for directors fees | 16,491 | 13,637 | 8,113 | 3,835 | |||||||||||||||
| Other accrued expenses and liabilities | 208,138 | 211,847 | 100,180 | 110,490 | |||||||||||||||
| Total liabilities | 1,293,833 | 1,158,895 | 937,518 | 620,845 | |||||||||||||||
| NET ASSETS | $ | 270,130,106 | $ | 241,862,266 | $ | 118,279,371 | $ | 73,995,545 | |||||||||||
| NET ASSETS WERE COMPRISED OF: | |||||||||||||||||||
| Paid-in capital | $ | 258,258,997 | $ | 233,780,988 | $ | 116,758,856 | $ | 71,503,192 | |||||||||||
| Undistributed net investment income | 1,571,851 | 1,330,919 | 144,730 | 716,339 | |||||||||||||||
| Accumulated net realized gain (loss) on investments | 2,830,987 | 535,786 | (522,530 | ) | (387,787 | ) | |||||||||||||
| Net unrealized appreciation on investments | 7,468,271 | 6,214,573 | 1,898,315 | 2,163,801 | |||||||||||||||
| NET ASSETS | $ | 270,130,106 | $ | 241,862,266 | $ | 118,279,371 | $ | 73,995,545 | |||||||||||
| * Cost of investments in securities | $ | 260,912,792 | $ | 234,224,753 | $ | 116,272,453 | $ | 71,722,854 | |||||||||||
See Accompanying Notes to Financial Statements
30
STATEMENTS OF ASSETS AND LIABILITIES AS OF NOVEMBER 30, 2006 (UNAUDITED) (CONTINUED)
| ING Principal Protection Fund V | ING Principal Protection Fund VI | ING Principal Protection Fund VII | ING Principal Protection Fund VIII | ||||||||||||||||
| Class A: | |||||||||||||||||||
| Net Assets | $ | 19,997,196 | $ | 14,612,600 | $ | 6,727,973 | $ | 8,129,509 | |||||||||||
| Shares authorized | unlimited | unlimited | unlimited | unlimited | |||||||||||||||
| Par value | $ | 0.01 | $ | 0.01 | $ | 0.01 | $ | 0.01 | |||||||||||
| Shares outstanding | 1,929,736 | 1,413,955 | 661,216 | 782,388 | |||||||||||||||
| Net asset value and redemption price per share | $ | 10.36 | $ | 10.33 | $ | 10.18 | $ | 10.39 | |||||||||||
| Maximum offering price per share (5.75%)(1) | $ | 10.99 | $ | 10.96 | $ | 10.80 | $ | 11.02 | |||||||||||
| Class B: | |||||||||||||||||||
| Net Assets | $ | 231,956,247 | $ | 209,449,512 | $ | 102,387,222 | $ | 58,765,048 | |||||||||||
| Shares authorized | unlimited | unlimited | unlimited | unlimited | |||||||||||||||
| Par value | $ | 0.01 | $ | 0.01 | $ | 0.01 | $ | 0.01 | |||||||||||
| Shares outstanding | 22,508,624 | 20,375,048 | 10,042,535 | 5,680,161 | |||||||||||||||
| Net asset value and redemption price per share(2) | $ | 10.31 | $ | 10.28 | $ | 10.20 | $ | 10.35 | |||||||||||
| Maximum offering price per share | $ | 10.31 | $ | 10.28 | $ | 10.20 | $ | 10.35 | |||||||||||
| Class C: | |||||||||||||||||||
| Net Assets | $ | 18,176,663 | $ | 17,800,154 | $ | 9,164,176 | $ | 7,100,988 | |||||||||||
| Shares authorized | unlimited | unlimited | unlimited | unlimited | |||||||||||||||
| Par value | $ | 0.01 | $ | 0.01 | $ | 0.01 | $ | 0.01 | |||||||||||
| Shares outstanding | 1,757,088 | 1,724,092 | 898,757 | 683,859 | |||||||||||||||
| Net asset value and redemption price per share(2) | $ | 10.34 | $ | 10.32 | $ | 10.20 | $ | 10.38 | |||||||||||
| Maximum offering price per share | $ | 10.34 | $ | 10.32 | $ | 10.20 | $ | 10.38 | |||||||||||
(1) Maximum offering price is computed at 100/94.25 of net asset value. On purchases of $50,000 or more, the offering price is reduced.
(2) Redemption price per share may be reduced for any applicable contingent deffered sales charges.
See Accompanying Notes to Financial Statements
31
STATEMENTS OF ASSETS AND LIABILITIES AS OF NOVEMBER 30, 2006 (UNAUDITED)
| ING Principal Protection Fund IX | ING Principal Protection Fund X | ING Principal Protection Fund XI | ING Principal Protection Fund XII | ||||||||||||||||
| ASSETS: | |||||||||||||||||||
| Investments in securities at value* | $ | 54,457,931 | $ | 45,691,711 | $ | 30,448,800 | $ | 15,350,015 | |||||||||||
| Repurchase agreement | 782,000 | 443,000 | 278,000 | 120,000 | |||||||||||||||
| Cash | 466 | 33 | 472 | 444 | |||||||||||||||
| Receivables: | |||||||||||||||||||
| Dividends and interest | 59,806 | 53,141 | 33,018 | 15,099 | |||||||||||||||
| Prepaid expenses | 743 | 614 | 425 | 212 | |||||||||||||||
| Total assets | 55,300,946 | 46,188,499 | 30,760,715 | 15,485,770 | |||||||||||||||
| LIABILITIES: | |||||||||||||||||||
| Payable for fund shares redeemed | 224,844 | 69,930 | 118,492 | 3,208 | |||||||||||||||
| Payable to affiliates | 76,515 | 62,584 | 54,498 | 20,692 | |||||||||||||||
| Payable for directors fees | 9,877 | 2,921 | 5,934 | 1,017 | |||||||||||||||
| Other accrued expenses and liabilities | 92,022 | 52,237 | 35,036 | 18,033 | |||||||||||||||
| Total liabilities | 403,258 | 187,672 | 213,960 | 42,950 | |||||||||||||||
| NET ASSETS | $ | 54,897,688 | $ | 46,000,827 | $ | 30,546,755 | $ | 15,442,820 | |||||||||||
| NET ASSETS WERE COMPRISED OF: | |||||||||||||||||||
| Paid-in capital | $ | 51,776,746 | $ | 43,395,092 | $ | 29,208,980 | $ | 15,002,711 | |||||||||||
| Undistributed net investment income | 624,330 | 509,946 | 386,781 | 171,881 | |||||||||||||||
| Accumulated net realized gain (loss) on investments | 376,433 | (393,403 | ) | (34,459 | ) | (226,006 | ) | ||||||||||||
| Net unrealized appreciation on investments | 2,120,179 | 2,489,192 | 985,453 | 494,234 | |||||||||||||||
| NET ASSETS | $ | 54,897,688 | $ | 46,000,827 | $ | 30,546,755 | $ | 15,442,820 | |||||||||||
| * Cost of investments in securities | $ | 52,337,752 | $ | 43,202,519 | $ | 29,463,347 | $ | 14,855,781 | |||||||||||
See Accompanying Notes to Financial Statements
32
STATEMENTS OF ASSETS AND LIABILITIES AS OF NOVEMBER 30, 2006 (UNAUDITED) (CONTINUED)
| ING Principal Protection Fund IX | ING Principal Protection Fund X | ING Principal Protection Fund XI | ING Principal Protection Fund XII | ||||||||||||||||
| Class A: | |||||||||||||||||||
| Net Assets | $ | 5,356,790 | $ | 7,257,177 | $ | 4,627,745 | $ | 2,427,860 | |||||||||||
| Shares authorized | unlimited | unlimited | unlimited | unlimited | |||||||||||||||
| Par value | $ | 0.01 | $ | 0.01 | $ | 0.01 | $ | 0.01 | |||||||||||
| Shares outstanding | 507,099 | 689,302 | 441,197 | 234,087 | |||||||||||||||
| Net asset value and redemption price per share | $ | 10.56 | $ | 10.53 | $ | 10.49 | $ | 10.37 | |||||||||||
| Maximum offering price per share (5.75%)(1) | $ | 11.20 | $ | 11.17 | $ | 11.13 | $ | 11.00 | |||||||||||
| Class B: | |||||||||||||||||||
| Net Assets | $ | 44,193,783 | $ | 33,170,167 | $ | 21,544,339 | $ | 10,756,825 | |||||||||||
| Shares authorized | unlimited | unlimited | unlimited | unlimited | |||||||||||||||
| Par value | $ | 0.01 | $ | 0.01 | $ | 0.01 | $ | 0.01 | |||||||||||
| Shares outstanding | 4,209,056 | 3,171,695 | 2,070,176 | 1,045,087 | |||||||||||||||
| Net asset value and redemption price per share(2) | $ | 10.50 | $ | 10.46 | $ | 10.41 | $ | 10.29 | |||||||||||
| Maximum offering price per share | $ | 10.50 | $ | 10.46 | $ | 10.41 | $ | 10.29 | |||||||||||
| Class C: | |||||||||||||||||||
| Net Assets | $ | 5,347,115 | $ | 5,573,483 | $ | 4,374,671 | $ | 2,258,135 | |||||||||||
| Shares authorized | unlimited | unlimited | unlimited | unlimited | |||||||||||||||
| Par value | $ | 0.01 | $ | 0.01 | $ | 0.01 | $ | 0.01 | |||||||||||
| Shares outstanding | 507,406 | 531,193 | 420,034 | 219,227 | |||||||||||||||
| Net asset value and redemption price per share(2) | $ | 10.54 | $ | 10.49 | $ | 10.42 | $ | 10.30 | |||||||||||
| Maximum offering price per share | $ | 10.54 | $ | 10.49 | $ | 10.42 | $ | 10.30 | |||||||||||
(1) Maximum offering price is computed at 100/94.25 of net asset value. On purchases of $50,000 or more, the offering price is reduced.
(2) Redemption price per share may be reduced for any applicable contingent deffered sales charges.
See Accompanying Notes to Financial Statements
33
STATEMENTS OF OPERATIONS FOR THE SIX MONTHS ENDED NOVEMBER 30, 2006 (UNAUDITED)
| ING Index Plus LargeCap Equity Fund | ING Principal Protection Fund II | ING Principal Protection Fund III | ING Principal Protection Fund IV | ||||||||||||||||
| INVESTMENT INCOME: | |||||||||||||||||||
| Dividends | $ | 358,142 | $ | 314,016 | $ | 332,473 | $ | 1,430,722 | |||||||||||
| Interest | 2,080,740 | 4,563,314 | 3,248,483 | 3,410,757 | |||||||||||||||
| Settlement income | 241,820 | 502,489 | — | 755,691 | |||||||||||||||
| Total investment income | 2,680,702 | 5,379,819 | 3,580,956 | 5,597,170 | |||||||||||||||
| EXPENSES: | |||||||||||||||||||
| Investment management fees | 484,654 | 881,499 | 686,126 | 1,391,350 | |||||||||||||||
| Distribution and service fees: | |||||||||||||||||||
| Class A | 11,983 | 18,709 | 16,091 | 22,637 | |||||||||||||||
| Class B | 540,759 | 908,363 | 722,244 | 1,468,156 | |||||||||||||||
| Class C | 54,912 | 118,671 | 71,048 | 178,776 | |||||||||||||||
| Class Q | 98 | — | — | 426 | |||||||||||||||
| Transfer agent fees: | |||||||||||||||||||
| Class A | 4,892 | 6,885 | 6,436 | 7,516 | |||||||||||||||
| Class B | 55,223 | 83,571 | 72,224 | 121,859 | |||||||||||||||
| Class C | 5,601 | 10,918 | 7,105 | 14,839 | |||||||||||||||
| Class Q | 28 | — | — | 86 | |||||||||||||||
| Administrative service fees | 64,399 | 110,186 | 85,765 | 173,917 | |||||||||||||||
| Shareholder reporting expense | 3,660 | 16,864 | 13,145 | 30,052 | |||||||||||||||
| Registration fees | — | 101 | — | 201 | |||||||||||||||
| Professional fees | 15,015 | 18,089 | 17,207 | 31,501 | |||||||||||||||
| Custody and accounting expense | 18,300 | 19,904 | 19,675 | 27,525 | |||||||||||||||
| Trustees fees | 5,175 | 7,320 | 1,648 | 6,061 | |||||||||||||||
| Guarantee fees | 183,721 | 363,619 | 283,027 | 573,932 | |||||||||||||||
| Miscellaneous expense | 3,388 | 11,383 | 7,969 | 15,168 | |||||||||||||||
| Interest expense | 2,700 | — | — | — | |||||||||||||||
| Total expenses | 1,454,508 | 2,576,082 | 2,009,710 | 4,064,002 | |||||||||||||||
| Net investment income | 1,226,194 | 2,803,737 | 1,571,246 | 1,533,168 | |||||||||||||||
| REALIZED AND UNREALIZED GAIN (LOSS) ON INVESTMENTS AND FUTURES: | |||||||||||||||||||
| Net realized gain on: | |||||||||||||||||||
| Investments | 4,939,142 | 1,356,085 | 1,297,777 | 4,502,632 | |||||||||||||||
| Futures | 134,982 | — | — | — | |||||||||||||||
| Net realized gain on investments and futures | 5,074,124 | 1,356,085 | 1,297,777 | 4,502,632 | |||||||||||||||
| Net change in unrealized appreciation or depreciation on: | |||||||||||||||||||
| Investments | (196,269 | ) | 2,251,145 | 2,525,205 | 12,544,757 | ||||||||||||||
| Futures | 3,046 | — | — | — | |||||||||||||||
| Net change in unrealized appreciation or depreciation on investments and futures | (193,223 | ) | 2,251,145 | 2,525,205 | 12,544,757 | ||||||||||||||
| Net realized and unrealized gain on investments and futures | 4,880,901 | 3,607,230 | 3,822,982 | 17,047,389 | |||||||||||||||
| Increase in net assets resulting from operations | $ | 6,107,095 | $ | 6,410,967 | $ | 5,394,228 | $ | 18,580,557 | |||||||||||
See Accompanying Notes to Financial Statements
34
STATEMENTS OF OPERATIONS FOR THE SIX MONTHS ENDED NOVEMBER 30, 2006 (UNAUDITED)
| ING Principal Protection Fund V | ING Principal Protection Fund VI | ING Principal Protection Fund VII | ING Principal Protection Fund VIII | ||||||||||||||||
| INVESTMENT INCOME: | |||||||||||||||||||
| Dividends | $ | 961,938 | $ | 805,040 | $ | 370,870 | $ | 270,137 | |||||||||||
| Interest | 3,179,372 | 2,933,796 | 1,310,095 | 954,567 | |||||||||||||||
| Total investment income | 4,141,310 | 3,738,836 | 1,680,965 | 1,224,704 | |||||||||||||||
| EXPENSES: | |||||||||||||||||||
| Investment management fees | 1,125,287 | 1,013,076 | 499,803 | 250,655 | |||||||||||||||
| Distribution and service fees: | |||||||||||||||||||
| Class A | 24,723 | 18,737 | 8,593 | 11,012 | |||||||||||||||
| Class B | 1,210,509 | 1,092,422 | 537,985 | 306,872 | |||||||||||||||
| Class C | 97,203 | 98,974 | 52,395 | 40,511 | |||||||||||||||
| Transfer agent fees: | |||||||||||||||||||
| Class A | 8,816 | 8,919 | 2,750 | 3,177 | |||||||||||||||
| Class B | 108,035 | 129,855 | 43,138 | 22,126 | |||||||||||||||
| Class C | 8,678 | 11,786 | 4,223 | 2,923 | |||||||||||||||
| Administrative service fees | 140,660 | 126,633 | 62,475 | 39,143 | |||||||||||||||
| Shareholder reporting expense | 11,755 | 44,204 | 12,469 | 5,060 | |||||||||||||||
| Registration fees | 150 | 101 | — | — | |||||||||||||||
| Professional fees | 24,009 | 24,897 | 14,057 | 10,654 | |||||||||||||||
| Custody and accounting expense | 24,209 | 18,230 | 19,215 | 7,930 | |||||||||||||||
| Trustees fees | 8,063 | 2,663 | 4,390 | 2,696 | |||||||||||||||
| Guarantee fees | 464,181 | 417,894 | 206,169 | 129,173 | |||||||||||||||
| Miscellaneous expense | 11,903 | 13,177 | 6,205 | 4,703 | |||||||||||||||
| Interest expense | — | 80 | — | — | |||||||||||||||
| Total expenses | 3,268,181 | 3,021,648 | 1,473,867 | 836,635 | |||||||||||||||
| Net recouped fees | — | — | 62,368 | — | |||||||||||||||
| Net expenses | 3,268,181 | 3,021,648 | 1,536,235 | 836,635 | |||||||||||||||
| Net investment income | 873,129 | 717,188 | 144,730 | 388,069 | |||||||||||||||
| REALIZED AND UNREALIZED GAIN (LOSS) ON INVESTMENTS: | |||||||||||||||||||
| Net realized gain on investments | 2,331,627 | 1,142,151 | 726,739 | 201,381 | |||||||||||||||
| Net change in unrealized appreciation or depreciation on investments | 9,494,094 | 9,205,585 | 4,423,998 | 3,329,912 | |||||||||||||||
| Net realized and unrealized gain on investments | 11,825,721 | 10,347,736 | 5,150,737 | 3,531,293 | |||||||||||||||
| Increase in net assets resulting from operations | $ | 12,698,850 | $ | 11,064,924 | $ | 5,295,467 | $ | 3,919,362 | |||||||||||
See Accompanying Notes to Financial Statements
35
STATEMENTS OF OPERATIONS FOR THE SIX MONTHS ENDED NOVEMBER 30, 2006 (UNAUDITED)
| ING Principal Protection Fund IX | ING Principal Protection Fund X | ING Principal Protection Fund XI | ING Principal Protection Fund XII | ||||||||||||||||
| INVESTMENT INCOME: | |||||||||||||||||||
| Dividends | $ | 219,099 | $ | 196,908 | $ | 121,052 | $ | 55,225 | |||||||||||
| Interest | 701,644 | 564,509 | 413,528 | 224,641 | |||||||||||||||
| Total investment income | 920,743 | 761,417 | 534,580 | 279,866 | |||||||||||||||
| EXPENSES: | |||||||||||||||||||
| Investment management fees | 185,436 | 156,042 | 105,388 | 50,971 | |||||||||||||||
| Distribution and service fees: | |||||||||||||||||||
| Class A | 7,196 | 10,021 | 7,506 | 3,421 | |||||||||||||||
| Class B | 226,001 | 167,335 | 110,308 | 53,401 | |||||||||||||||
| Class C | 29,912 | 29,144 | 22,611 | 12,403 | |||||||||||||||
| Transfer agent fees: | |||||||||||||||||||
| Class A | 1,698 | 2,726 | 1,342 | 889 | |||||||||||||||
| Class B | 13,333 | 11,379 | 4,954 | 3,471 | |||||||||||||||
| Class C | 1,765 | 1,982 | 1,015 | 806 | |||||||||||||||
| Administrative service fees | 28,470 | 23,656 | 16,294 | 7,949 | |||||||||||||||
| Shareholder reporting expense | 5,375 | 5,674 | 5,059 | 707 | |||||||||||||||
| Professional fees | 10,649 | 5,535 | 2,575 | 3,701 | |||||||||||||||
| Custody and accounting expense | 16,653 | 10,225 | 18,627 | 15,637 | |||||||||||||||
| Trustees fees | 2,076 | 1,082 | 1,390 | 250 | |||||||||||||||
| Offering expense | — | — | — | 2,207 | |||||||||||||||
| Insurance expense | — | — | 383 | — | |||||||||||||||
| Guarantee fees | 93,951 | 78,065 | 53,771 | 26,231 | |||||||||||||||
| Miscellaneous expense | 4,964 | 2,937 | 3,276 | 2,435 | |||||||||||||||
| Total expenses | 627,479 | 505,803 | 354,499 | 184,479 | |||||||||||||||
| Net investment income | 293,264 | 255,614 | 180,081 | 95,387 | |||||||||||||||
| REALIZED AND UNREALIZED GAIN (LOSS) ON INVESTMENTS: | |||||||||||||||||||
| Net realized gain (loss) on investments | 431,734 | (346,856 | ) | 154,467 | 45,217 | ||||||||||||||
| Net change in unrealized appreciation or depreciation on investments | 2,402,119 | 2,848,097 | 1,456,938 | 723,448 | |||||||||||||||
| Net realized and unrealized gain on investments | 2,833,853 | 2,501,241 | 1,611,405 | 768,665 | |||||||||||||||
| Increase in net assets resulting from operations | $ | 3,127,117 | $ | 2,756,855 | $ | 1,791,486 | $ | 864,052 | |||||||||||
See Accompanying Notes to Financial Statements
36
STATEMENTS OF CHANGES IN NET ASSETS (UNAUDITED)
| ING Index Plus LargeCap Equity Fund | ING Principal Protection Fund II | ||||||||||||||||||
| Six Months Ended November 30, 2006 | Year Ended May 31, 2006 | Six Months Ended November 30, 2006 | Year Ended May 31, 2006 | ||||||||||||||||
| FROM OPERATIONS: | |||||||||||||||||||
| Net investment income | $ | 1,226,194 | $ | 3,073,658 | $ | 2,803,737 | $ | 5,495,055 | |||||||||||
| Net realized gain on investments and futures | 5,074,124 | 2,154,158 | 1,356,085 | 1,449,024 | |||||||||||||||
| Net change in unrealized appreciation or depreciation on investments and futures | (193,223 | ) | (2,493,923 | ) | 2,251,145 | (4,369,505 | ) | ||||||||||||
| Net increase in net assets resulting from operations | 6,107,095 | 2,733,893 | 6,410,967 | 2,574,574 | |||||||||||||||
| FROM DISTRIBUTIONS TO SHAREHOLDERS: | |||||||||||||||||||
| Net investment income: | |||||||||||||||||||
| Class A | (192,299 | ) | (349,033 | ) | — | (606,451 | ) | ||||||||||||
| Class B | (1,679,250 | ) | (2,492,934 | ) | — | (4,851,955 | ) | ||||||||||||
| Class C | (108,423 | ) | (260,958 | ) | — | (695,042 | ) | ||||||||||||
| Class Q | (1,690 | ) | (2,075 | ) | — | (157 | ) | ||||||||||||
| Total distributions | (1,981,662 | ) | (3,105,000 | ) | — | (6,153,605 | ) | ||||||||||||
| FROM CAPITAL SHARE TRANSACTIONS: | |||||||||||||||||||
| Dividends reinvested | 1,979,796 | 2,420,778 | — | 4,621,927 | |||||||||||||||
| Cost of shares redeemed | (108,573,389 | ) | (65,261,064 | ) | (30,773,116 | ) | (89,960,599 | ) | |||||||||||
| Net decrease in net assets resulting from capital share transactions | (106,593,593 | ) | (62,840,286 | ) | (30,773,116 | ) | (85,338,672 | ) | |||||||||||
| Net decrease in net assets | (102,468,160 | ) | (63,211,393 | ) | (24,362,149 | ) | (88,917,703 | ) | |||||||||||
| NET ASSETS: | |||||||||||||||||||
| Beginning of period | 158,036,643 | 221,248,036 | 231,688,642 | 320,606,345 | |||||||||||||||
| End of period | $ | 55,568,483 | $ | 158,036,643 | $ | 207,326,493 | $ | 231,688,642 | |||||||||||
| Undistributed net investment income at end of period | $ | 317,591 | $ | 1,073,059 | $ | 4,857,625 | $ | 2,053,888 | |||||||||||
See Accompanying Notes to Financial Statements
37
STATEMENTS OF CHANGES IN NET ASSETS (UNAUDITED)
| ING Principal Protection Fund III | ING Principal Protection Fund IV | ||||||||||||||||||
| Six Months Ended November 30, 2006 | Year Ended May 31, 2006 | Six Months Ended November 30, 2006 | Year Ended May 31, 2006 | ||||||||||||||||
| FROM OPERATIONS: | |||||||||||||||||||
| Net investment income | $ | 1,571,246 | $ | 3,787,956 | $ | 1,533,168 | $ | 1,608,803 | |||||||||||
| Net realized gain on investments | 1,297,777 | 2,085,296 | 4,502,632 | 9,615,969 | |||||||||||||||
| Net change in unrealized appreciation or depreciation on investments | 2,525,205 | (4,293,824 | ) | 12,544,757 | (3,897,102 | ) | |||||||||||||
| Net increase in net assets resulting from operations | 5,394,228 | 1,579,428 | 18,580,557 | 7,327,670 | |||||||||||||||
| FROM DISTRIBUTIONS TO SHAREHOLDERS: | |||||||||||||||||||
| Net investment income: | |||||||||||||||||||
| Class A | — | (442,133 | ) | — | (304,273 | ) | |||||||||||||
| Class B | — | (3,553,871 | ) | — | (1,378,985 | ) | |||||||||||||
| Class C | — | (366,846 | ) | — | (139,848 | ) | |||||||||||||
| Class Q | — | (656 | ) | — | (2,643 | ) | |||||||||||||
| Net realized gains: | |||||||||||||||||||
| Class A | — | — | — | (280,125 | ) | ||||||||||||||
| Class B | — | — | — | (3,836,026 | ) | ||||||||||||||
| Class C | — | — | — | (557,469 | ) | ||||||||||||||
| Class Q | — | — | — | (3,603 | ) | ||||||||||||||
| Total distributions | — | (4,363,506 | ) | — | (6,502,972 | ) | |||||||||||||
| FROM CAPITAL SHARE TRANSACTIONS: | |||||||||||||||||||
| Dividends reinvested | — | 3,457,898 | — | 5,249,484 | |||||||||||||||
| Cost of shares redeemed | (22,678,805 | ) | (69,851,899 | ) | (48,173,076 | ) | (131,418,398 | ) | |||||||||||
| Net decrease in net assets resulting from capital share transactions | (22,678,805 | ) | (66,394,001 | ) | (48,173,076 | ) | (126,168,914 | ) | |||||||||||
| Net decrease in net assets | (17,284,577 | ) | (69,178,079 | ) | (29,592,519 | ) | (125,344,216 | ) | |||||||||||
| NET ASSETS: | |||||||||||||||||||
| Beginning of period | 180,242,852 | 249,420,931 | 363,965,892 | 489,310,108 | |||||||||||||||
| End of period | $ | 162,958,275 | $ | 180,242,852 | $ | 334,373,373 | $ | 363,965,892 | |||||||||||
| Undistributed net investment income at end of period | $ | 2,943,959 | $ | 1,372,713 | $ | 2,119,514 | $ | 586,346 | |||||||||||
See Accompanying Notes to Financial Statements
38
STATEMENTS OF CHANGES IN NET ASSETS (UNAUDITED)
| ING Principal Protection Fund V | ING Principal Protection Fund VI | ||||||||||||||||||
| Six Months Ended November 30, 2006 | Year Ended May 31, 2006 | Six Months Ended November 30, 2006 | Year Ended May 31, 2006 | ||||||||||||||||
| FROM OPERATIONS: | |||||||||||||||||||
| Net investment income | $ | 873,129 | $ | 1,924,684 | $ | 717,188 | $ | 1,844,542 | |||||||||||
| Net realized gain on investments | 2,331,627 | 5,247,979 | 1,142,151 | 4,572,364 | |||||||||||||||
| Net change in unrealized appreciation or depreciation on investments | 9,494,094 | (3,656,357 | ) | 9,205,585 | (4,359,199 | ) | |||||||||||||
| Net increase in net assets resulting from operations | 12,698,850 | 3,516,306 | 11,064,924 | 2,057,707 | |||||||||||||||
| FROM DISTRIBUTIONS TO SHAREHOLDERS: | |||||||||||||||||||
| Net investment income: | |||||||||||||||||||
| Class A | — | (331,351 | ) | — | (278,750 | ) | |||||||||||||
| Class B | — | (1,692,973 | ) | — | (1,620,295 | ) | |||||||||||||
| Class C | — | (113,799 | ) | — | (116,796 | ) | |||||||||||||
| Net realized gains: | |||||||||||||||||||
| Class A | — | (154,695 | ) | — | — | ||||||||||||||
| Class B | — | (1,895,967 | ) | — | — | ||||||||||||||
| Class C | — | (183,280 | ) | — | — | ||||||||||||||
| Total distributions | — | (4,372,065 | ) | — | (2,015,841 | ) | |||||||||||||
| FROM CAPITAL SHARE TRANSACTIONS: | |||||||||||||||||||
| Dividends reinvested | — | 3,872,500 | — | 1,753,765 | |||||||||||||||
| Cost of shares redeemed | (37,193,934 | ) | (110,827,280 | ) | (35,747,250 | ) | (104,017,977 | ) | |||||||||||
| Net decrease in net assets resulting from capital share transactions | (37,193,934 | ) | (106,954,780 | ) | (35,747,250 | ) | (102,264,212 | ) | |||||||||||
| Net decrease in net assets | (24,495,084 | ) | (107,810,539 | ) | (24,682,326 | ) | (102,222,346 | ) | |||||||||||
| NET ASSETS: | |||||||||||||||||||
| Beginning of period | 294,625,190 | 402,435,729 | 266,544,592 | 368,766,938 | |||||||||||||||
| End of period | $ | 270,130,106 | $ | 294,625,190 | $ | 241,862,266 | $ | 266,544,592 | |||||||||||
| Undistributed net investment income at end of period | $ | 1,571,851 | $ | 698,722 | $ | 1,330,919 | $ | 613,731 | |||||||||||
See Accompanying Notes to Financial Statements
39
STATEMENTS OF CHANGES IN NET ASSETS (UNAUDITED)
| ING Principal Protection Fund VII | ING Principal Protection Fund VIII | ||||||||||||||||||
| Six Months Ended November 30, 2006 | Year Ended May 31, 2006 | Six Months Ended November 30, 2006 | Year Ended May 31, 2006 | ||||||||||||||||
| FROM OPERATIONS: | |||||||||||||||||||
| Net investment income | $ | 144,730 | $ | 105,689 | $ | 388,069 | $ | 1,009,195 | |||||||||||
| Net realized gain on investments | 726,739 | 1,093,566 | 201,381 | 1,411,290 | |||||||||||||||
| Net change in unrealized appreciation or depreciation on investments | 4,423,998 | (415,096 | ) | 3,329,912 | (1,918,813 | ) | |||||||||||||
| Net increase in net assets resulting from operations | 5,295,467 | 784,159 | 3,919,362 | 501,672 | |||||||||||||||
| FROM DISTRIBUTIONS TO SHAREHOLDERS: | |||||||||||||||||||
| Net investment income: | |||||||||||||||||||
| Class A | — | (112,345 | ) | — | (276,502 | ) | |||||||||||||
| Class B | — | (271,116 | ) | — | (871,171 | ) | |||||||||||||
| Class C | — | (15,429 | ) | — | (104,486 | ) | |||||||||||||
| Net realized gains: | |||||||||||||||||||
| Class A | — | (160,064 | ) | — | — | ||||||||||||||
| Class B | — | (1,930,526 | ) | — | — | ||||||||||||||
| Class C | — | (275,583 | ) | — | — | ||||||||||||||
| Total distributions | — | (2,765,063 | ) | — | (1,252,159 | ) | |||||||||||||
| FROM CAPITAL SHARE TRANSACTIONS: | |||||||||||||||||||
| Dividends reinvested | — | 2,388,926 | — | 1,033,852 | |||||||||||||||
| Cost of shares redeemed | (20,064,327 | ) | (60,550,050 | ) | (13,818,977 | ) | (39,972,547 | ) | |||||||||||
| Net decrease in net assets resulting from capital share transactions | (20,064,327 | ) | (58,161,124 | ) | (13,818,977 | ) | (38,938,695 | ) | |||||||||||
| Net decrease in net assets | (14,768,860 | ) | (60,142,028 | ) | (9,899,615 | ) | (39,689,182 | ) | |||||||||||
| NET ASSETS: | |||||||||||||||||||
| Beginning of period | 133,048,231 | 193,190,259 | 83,895,160 | 123,584,342 | |||||||||||||||
| End of period | $ | 118,279,371 | $ | 133,048,231 | $ | 73,995,545 | $ | 83,895,160 | |||||||||||
| Undistributed net investment income at end of period | $ | 144,730 | $ | — | $ | 716,339 | $ | 328,270 | |||||||||||
See Accompanying Notes to Financial Statements
40
STATEMENTS OF CHANGES IN NET ASSETS (UNAUDITED)
| ING Principal Protection Fund IX | ING Principal Protection Fund X | ||||||||||||||||||
| Six Months Ended November 30, 2006 | Year Ended May 31, 2006 | Six Months Ended November 30, 2006 | Year Ended May 31, 2006 | ||||||||||||||||
| FROM OPERATIONS: | |||||||||||||||||||
| Net investment income | $ | 293,264 | $ | 828,849 | $ | 255,614 | $ | 554,321 | |||||||||||
| Net realized gain (loss) on investments | 431,734 | 919,682 | (346,856 | ) | 911,476 | ||||||||||||||
| Net change in unrealized appreciation or depreciation on investments | 2,402,119 | (1,164,339 | ) | 2,848,097 | (1,307,624 | ) | |||||||||||||
| Net increase in net assets resulting from operations | 3,127,117 | 584,192 | 2,756,855 | 158,173 | |||||||||||||||
| FROM DISTRIBUTIONS TO SHAREHOLDERS: | |||||||||||||||||||
| Net investment income: | |||||||||||||||||||
| Class A | — | (141,810 | ) | — | (177,871 | ) | |||||||||||||
| Class B | — | (579,735 | ) | — | (255,442 | ) | |||||||||||||
| Class C | — | (90,167 | ) | — | (31,658 | ) | |||||||||||||
| Net realized gains: | |||||||||||||||||||
| Class A | — | (55,114 | ) | — | (331,309 | ) | |||||||||||||
| Class B | — | (375,522 | ) | — | (1,060,255 | ) | |||||||||||||
| Class C | — | (78,108 | ) | — | (216,574 | ) | |||||||||||||
| Total distributions | — | (1,320,456 | ) | — | (2,073,109 | ) | |||||||||||||
| FROM CAPITAL SHARE TRANSACTIONS: | |||||||||||||||||||
| Dividends reinvested | — | 1,148,431 | — | 1,773,725 | |||||||||||||||
| Cost of shares redeemed | (8,409,172 | ) | (23,397,901 | ) | (6,510,477 | ) | (18,801,946 | ) | |||||||||||
| Net decrease in net assets resulting from capital share transactions | (8,409,172 | ) | (22,249,470 | ) | (6,510,477 | ) | (17,028,221 | ) | |||||||||||
| Net decrease in net assets | (5,282,055 | ) | (22,985,734 | ) | (3,753,622 | ) | (18,943,157 | ) | |||||||||||
| NET ASSETS: | |||||||||||||||||||
| Beginning of period | 60,179,743 | 83,165,477 | 49,754,449 | 68,697,606 | |||||||||||||||
| End of period | $ | 54,897,688 | $ | 60,179,743 | $ | 46,000,827 | $ | 49,754,449 | |||||||||||
| Undistributed net investment income at end of period | $ | 624,330 | $ | 331,066 | $ | 509,946 | $ | 254,332 | |||||||||||
See Accompanying Notes to Financial Statements
41
STATEMENTS OF CHANGES IN NET ASSETS (UNAUDITED)
| ING Principal Protection Fund XI | ING Principal Protection Fund XII | ||||||||||||||||||
| Six Months Ended November 30, 2006 | Year Ended May 31, 2006 | Six Months Ended November 30, 2006 | Year Ended May 31, 2006 | ||||||||||||||||
| FROM OPERATIONS: | |||||||||||||||||||
| Net investment income | $ | 180,081 | $ | 427,852 | $ | 95,387 | $ | 210,762 | |||||||||||
| Net realized gain (loss) on investments | 154,467 | 6,005 | 45,217 | (146,921 | ) | ||||||||||||||
| Net change in unrealized appreciation or depreciation on investments | 1,456,938 | (420,549 | ) | 723,448 | (238,355 | ) | |||||||||||||
| Net increase (decrease) in net assets resulting from operations | 1,791,486 | 13,308 | 864,052 | (174,514 | ) | ||||||||||||||
| FROM DISTRIBUTIONS TO SHAREHOLDERS: | |||||||||||||||||||
| Net investment income: | |||||||||||||||||||
| Class A | — | (130,773 | ) | — | (66,743 | ) | |||||||||||||
| Class B | — | (214,238 | ) | — | (134,457 | ) | |||||||||||||
| Class C | — | (51,092 | ) | — | (50,434 | ) | |||||||||||||
| Net realized gains: | |||||||||||||||||||
| Class A | — | (8,896 | ) | — | — | ||||||||||||||
| Class B | — | (28,496 | ) | — | — | ||||||||||||||
| Class C | — | (7,043 | ) | — | — | ||||||||||||||
| Total distributions | — | (440,538 | ) | — | (251,634 | ) | |||||||||||||
| FROM CAPITAL SHARE TRANSACTIONS: | |||||||||||||||||||
| Dividends reinvested | — | 359,348 | — | 200,220 | |||||||||||||||
| Cost of shares redeemed | (5,671,449 | ) | (10,026,730 | ) | (1,996,219 | ) | (6,233,475 | ) | |||||||||||
| Net decrease in net assets resulting from capital share transactions | (5,671,449 | ) | (9,667,382 | ) | (1,996,219 | ) | (6,033,255 | ) | |||||||||||
| Net decrease in net assets | (3,879,963 | ) | (10,094,612 | ) | (1,132,167 | ) | (6,459,403 | ) | |||||||||||
| NET ASSETS: | |||||||||||||||||||
| Beginning of period | 34,426,718 | 44,521,330 | 16,574,987 | 23,034,390 | |||||||||||||||
| End of period | $ | 30,546,755 | $ | 34,426,718 | $ | 15,442,820 | $ | 16,574,987 | |||||||||||
| Undistributed net investment income at end of period | $ | 386,781 | $ | 206,700 | $ | 171,881 | $ | 76,494 | |||||||||||
See Accompanying Notes to Financial Statements
42
ING INDEX PLUS LARGECAP EQUITY FUND (UNAUDITED)
FINANCIAL
HIGHLIGHTS
Selected data for a share of beneficial interest outstanding throughout each period.
| Class A | |||||||||||||||||||||||||||
| Six Months Ended November 30, | Year Ended May 31, | July 5, 2001(1) to May 31, | |||||||||||||||||||||||||
| 2006 | 2006 | 2005 | 2004 | 2003 | 2002 | ||||||||||||||||||||||
| Per Share Operating Performance: | |||||||||||||||||||||||||||
| Net asset value, beginning of period | $ | 9.82 | 9.85 | 9.95 | 10.25 | 9.85 | 10.00 | ||||||||||||||||||||
| Income (loss) from investment operations: | |||||||||||||||||||||||||||
| Net investment income | $ | 0.13 | *† | 0.23 | * | 0.22 | * | 0.23 | 0.22 | 0.11 | |||||||||||||||||
| Net realized and unrealized gain (loss) on investments and futures | $ | 0.49 | (0.01 | ) | (0.08 | ) | (0.33 | ) | 0.42 | (0.22 | ) | ||||||||||||||||
| Total from investment operations | $ | 0.62 | 0.22 | 0.14 | (0.10 | ) | 0.64 | (0.11 | ) | ||||||||||||||||||
| Less distributions from: | |||||||||||||||||||||||||||
| Net investment income | $ | 0.19 | 0.25 | 0.24 | 0.20 | 0.24 | 0.04 | ||||||||||||||||||||
| Total distributions | $ | 0.19 | 0.25 | 0.24 | 0.20 | 0.24 | 0.04 | ||||||||||||||||||||
| Net asset value, end of period | $ | 10.25 | 9.82 | 9.85 | 9.95 | 10.25 | 9.85 | ||||||||||||||||||||
| Total Return(2) | % | 6.43 | † | 2.22 | 1.42 | (1.01 | ) | 6.60 | (1.29 | )** | |||||||||||||||||
| Ratios and Supplemental Data: | |||||||||||||||||||||||||||
| Net assets, end of period (000's) | $ | 4,653 | 12,043 | 18,420 | 28,057 | 51,385 | 62,301 | ||||||||||||||||||||
| Ratios to average net assets: | |||||||||||||||||||||||||||
| Net expenses after expense reimbursement/recoupment(3)(4) | % | 1.56 | 1.63 | 1.69 | 1.74 | 1.75 | 1.75 | ||||||||||||||||||||
| Gross expenses prior to expense reimbursement/ recoupment(3) | % | 1.56 | 1.63 | 1.57 | 1.67 | 1.78 | 1.87 | ||||||||||||||||||||
| Net investment income after expense reimbursement/ recoupment(3)(4) | %2.58† | 2.33 | 2.22 | 2.03 | 2.21 | 1.44 | |||||||||||||||||||||
| Portfolio turnover rate | % | 104 | 12 | 29 | 29 | 47 | 125 | ||||||||||||||||||||
| Class B | |||||||||||||||||||||||||||
| Six Months Ended November 30, | Year Ended May 31, | July 5, 2001(1) to May 31, | |||||||||||||||||||||||||
| 2006 | 2006 | 2005 | 2004 | 2003 | 2002 | ||||||||||||||||||||||
| Per Share Operating Performance: | |||||||||||||||||||||||||||
| Net asset value, beginning of period | $ | 9.80 | 9.83 | 9.91 | 10.21 | 9.81 | 10.00 | ||||||||||||||||||||
| Income (loss) from investment operations: | |||||||||||||||||||||||||||
| Net investment income | $ | 0.09 | *† | 0.16 | * | 0.14 | 0.14 | 0.15 | 0.04 | ||||||||||||||||||
| Net realized and unrealized gain (loss) on investments and futures | $ | 0.49 | (0.03 | ) | (0.06 | ) | (0.32 | ) | 0.41 | (0.21 | ) | ||||||||||||||||
| Total from investment operations | $ | 0.58 | 0.13 | 0.08 | (0.18 | ) | 0.56 | (0.17 | ) | ||||||||||||||||||
| Less distributions from: | |||||||||||||||||||||||||||
| Net investment income | $ | 0.13 | 0.16 | 0.16 | 0.12 | 0.16 | 0.02 | ||||||||||||||||||||
| Total distributions | $ | 0.13 | 0.16 | 0.16 | 0.12 | 0.16 | 0.02 | ||||||||||||||||||||
| Net asset value, end of period | $ | 10.25 | 9.80 | 9.83 | 9.91 | 10.21 | 9.81 | ||||||||||||||||||||
| Total Return(2) | % | 6.02 | † | 1.37 | 0.79 | (1.76 | ) | 5.82 | (1.78 | )** | |||||||||||||||||
| Ratios and Supplemental Data: | |||||||||||||||||||||||||||
| Net assets, end of period (000's) | $ | 43,697 | 132,611 | 178,017 | 237,539 | 328,399 | 345,449 | ||||||||||||||||||||
| Ratios to average net assets: | |||||||||||||||||||||||||||
| Net expenses after expense reimbursement/recoupment(3)(4) | % | 2.31 | 2.38 | 2.44 | 2.49 | 2.50 | 2.50 | ||||||||||||||||||||
| Gross expenses prior to expense reimbursement/ recoupment(3) | % | 2.31 | 2.38 | 2.32 | 2.42 | 2.54 | 2.62 | ||||||||||||||||||||
| Net investment income after expense reimbursement/ recoupment(3)(4) | %1.86† | 1.58 | 1.48 | 1.28 | 1.46 | 0.69 | |||||||||||||||||||||
| Portfolio turnover rate | % | 104 | 12 | 29 | 29 | 47 | 125 | ||||||||||||||||||||
(1) Commencement of operations.
(2) Total return is calculated assuming reinvestment of all dividends and capital gain distributions at net asset value and excluding the deduction of sales charges. Total returns for periods less than one year are not annualized.
(3) Annualized for periods less than one year.
(4) The Investment Adviser has agreed to limit expenses, (excluding interest, taxes, brokerage and extraordinary expenses) subject to possible recoupment by ING Investments, LLC within three years. This expense limitation agreement ceased on October 11, 2006.
* Per share data calculated using the average number of shares throughout the period.
** Represents performance beginning on the first day of the Guarantee Period (October 12, 2001). Total return from commencement of offering of shares was (1.11)%, (1.70)%, (1.70)% and (0.81)% for Class A, B, C and Q, respectively.
† Includes one-time settlement income representing $0.04 and $0.05 per share and 0.19% of average net assets for Class A and Class B, respectively.
See Accompanying Notes to Financial Statements
43
ING INDEX PLUS LARGECAP EQUITY FUND (UNAUDITED) (CONTINUED)
FINANCIAL
HIGHLIGHTS
Selected data for a share of beneficial interest outstanding throughout each period.
| Class C | |||||||||||||||||||||||||||
| Six Months Ended November 30, | Year Ended May 31, | July 5, 2001(1) to May 31, | |||||||||||||||||||||||||
| 2006 | 2006 | 2005 | 2004 | 2003 | 2002 | ||||||||||||||||||||||
| Per Share Operating Performance: | |||||||||||||||||||||||||||
| Net asset value, beginning of period | $ | 9.84 | 9.85 | 9.92 | 10.21 | 9.81 | 10.00 | ||||||||||||||||||||
| Income (loss) from investment operations: | |||||||||||||||||||||||||||
| Net investment income | $ | 0.09 | *† | 0.16 | * | 0.15 | * | 0.15 | 0.15 | 0.05 | |||||||||||||||||
| Net realized and unrealized gain (loss) on investments and futures | $ | 0.51 | (0.02 | ) | (0.08 | ) | (0.34 | ) | 0.41 | (0.22 | ) | ||||||||||||||||
| Total from investment operations | $ | 0.60 | 0.14 | 0.07 | (0.19 | ) | 0.56 | (0.17 | ) | ||||||||||||||||||
| Less distributions from: | |||||||||||||||||||||||||||
| Net investment income | $ | 0.11 | 0.15 | 0.14 | 0.10 | 0.16 | 0.02 | ||||||||||||||||||||
| Total distributions | $ | 0.11 | 0.15 | 0.14 | 0.10 | 0.16 | 0.02 | ||||||||||||||||||||
| Net asset value, end of period | $ | 10.33 | 9.84 | 9.85 | 9.92 | 10.21 | 9.81 | ||||||||||||||||||||
| Total Return(2) | % | 6.13 | † | 1.39 | 0.72 | (1.83 | ) | 5.78 | (1.66 | )** | |||||||||||||||||
| Ratios and Supplemental Data: | |||||||||||||||||||||||||||
| Net assets, end of period (000's) | $ | 7,165 | 13,294 | 24,476 | 43,529 | 85,451 | 105,908 | ||||||||||||||||||||
| Ratios to average net assets: | |||||||||||||||||||||||||||
| Net expenses after expense reimbursement/recoupment(3)(4) | % | 2.31 | 2.38 | 2.44 | 2.49 | 2.50 | 2.30 | ||||||||||||||||||||
| Gross expenses prior to expense reimbursement/ recoupment(3) | % | 2.31 | 2.38 | 2.32 | 2.42 | 2.54 | 2.62 | ||||||||||||||||||||
| Net investment income after expense reimbursement/ recoupment(3)(4) | %1.79† | 1.58 | 1.46 | 1.28 | 1.45 | 0.72 | |||||||||||||||||||||
| Portfolio turnover rate | % | 104 | 12 | 29 | 29 | 47 | 125 | ||||||||||||||||||||
| Class Q | |||||||||||||||||||||||||||
| Six Months Ended November 30, | Year Ended May 31, | July 5, 2001(1) to May 31, | |||||||||||||||||||||||||
| 2006 | 2006 | 2005 | 2004 | 2003 | 2002 | ||||||||||||||||||||||
| Per Share Operating Performance: | |||||||||||||||||||||||||||
| Net asset value, beginning of period | $ | 9.89 | 9.88 | 9.97 | 10.27 | 9.87 | 10.00 | ||||||||||||||||||||
| Income (loss) from investment operations: | |||||||||||||||||||||||||||
| Net investment income | $ | 0.13 | *† | 0.23 | * | 0.22 | * | 0.24 | 0.25 | 0.11 | |||||||||||||||||
| Net realized and unrealized gain (loss) on investments and futures | $ | 0.50 | (0.01 | ) | (0.07 | ) | (0.34 | ) | 0.40 | (0.19 | ) | ||||||||||||||||
| Total from investment operations | $ | 0.63 | 0.22 | 0.15 | (0.10 | ) | 0.65 | (0.08 | ) | ||||||||||||||||||
| Less distributions from: | |||||||||||||||||||||||||||
| Net investment income | $ | 0.20 | 0.21 | 0.24 | 0.20 | 0.25 | 0.05 | ||||||||||||||||||||
| Total distributions | $ | 0.20 | 0.21 | 0.24 | 0.20 | 0.25 | 0.05 | ||||||||||||||||||||
| Net asset value, end of period | $ | 10.32 | 9.89 | 9.88 | 9.97 | 10.27 | 9.87 | ||||||||||||||||||||
| Total Return(2) | % | 6.46 | † | 2.25 | 1.53 | (1.01 | ) | 6.68 | (1.13 | )** | |||||||||||||||||
| Ratios and Supplemental Data: | |||||||||||||||||||||||||||
| Net assets, end of period (000's) | $ | 54 | 89 | 335 | 671 | 1,733 | 2,434 | ||||||||||||||||||||
| Ratios to average net assets: | |||||||||||||||||||||||||||
| Net expenses after expense reimbursement/recoupment(3)(4) | % | 1.49 | 1.59 | 1.69 | 1.70 | 1.66 | 1.60 | ||||||||||||||||||||
| Gross expenses prior to expense reimbursement/ recoupment(3) | % | 1.49 | 1.59 | 1.57 | 1.63 | 1.69 | 1.72 | ||||||||||||||||||||
| Net investment income after expense reimbursement/ recoupment(3)(4) | %2.53† | 2.34 | 2.21 | 2.08 | 2.30 | 1.59 | |||||||||||||||||||||
| Portfolio turnover rate | % | 104 | 12 | 29 | 29 | 47 | 125 | ||||||||||||||||||||
(1) Commencement of operations.
(2) Total return is calculated assuming reinvestment of all dividends and capital gain distributions at net asset value and excluding the deduction of sales charges. Total returns for periods less than one year are not annualized.
(3) Annualized for periods less than one year.
(4) The Investment Adviser has agreed to limit expenses, (excluding interest, taxes, brokerage and extraordinary expenses) subject to possible recoupment by ING Investments, LLC within three years.
* Per share data calculated using the average number of shares throughout the period.
** Represents performance beginning on the first day of the Guarantee Period (October 12, 2001). Total return from commencement of offering of shares was (1.11)%, (1.70)%, (1.70)% and (0.81)% for Class A, B, C and Q, respectively.
† Includes one-time settlement income representing $0.03 per share and 0.19% of average net assets for Classes C and Q.
See Accompanying Notes to Financial Statements
44
ING PRINCIPAL PROTECTION FUND II (UNAUDITED)
FINANCIAL HIGHLIGHTS
Selected data for a share of beneficial interest outstanding throughout each period.
| Class A | |||||||||||||||||||||||||||
| Six Months Ended November 30, | Year Ended May 31, | November 5, 2001(1) to May 31, | |||||||||||||||||||||||||
| 2006 | 2006 | 2005 | 2004 | 2003 | 2002 | ||||||||||||||||||||||
| Per Share Operating Performance: | |||||||||||||||||||||||||||
| Net asset value, beginning of period | $ | 9.52 | 9.65 | 9.77 | 10.15 | 9.83 | 10.00 | ||||||||||||||||||||
| Income (loss) from investment operations: | |||||||||||||||||||||||||||
| Net investment income | $ | 0.16 | *†† | 0.26 | * | 0.25 | * | 0.25 | 0.23 | 0.06 | |||||||||||||||||
| Net realized and unrealized gain (loss) on investments | $ | 0.16 | (0.09 | ) | (0.10 | ) | (0.43 | ) | 0.32 | (0.22 | ) | ||||||||||||||||
| Total from investment operations | $ | 0.32 | 0.17 | 0.15 | (0.18 | ) | 0.55 | (0.16 | ) | ||||||||||||||||||
| Less distributions from: | |||||||||||||||||||||||||||
| Net investment income | $ | — | 0.30 | 0.27 | 0.20 | 0.23 | 0.01 | ||||||||||||||||||||
| Total distributions | $ | — | 0.30 | 0.27 | 0.20 | 0.23 | 0.01 | ||||||||||||||||||||
| Net asset value, end of period | $ | 9.84 | 9.52 | 9.65 | 9.77 | 10.15 | 9.83 | ||||||||||||||||||||
| Total Return(2) | % | 3.36 | †† | 1.74 | 1.49 | (1.74 | ) | 5.73 | (1.70 | )† | |||||||||||||||||
| Ratios and Supplemental Data: | |||||||||||||||||||||||||||
| Net assets, end of period (000's) | $ | 14,084 | 15,940 | 25,160 | 37,580 | 76,897 | 98,109 | ||||||||||||||||||||
| Ratios to average net assets: | |||||||||||||||||||||||||||
| Net expenses after expense reimbursement/recoupment(3)(4) | % | 1.64 | 1.62 | 1.58 | 1.69 | 1.75 | 1.61 | ||||||||||||||||||||
| Gross expenses prior to expense reimbursement/ recoupment(3) | % | 1.64 | 1.62 | 1.58 | 1.65 | 1.78 | 1.61 | ||||||||||||||||||||
| Net investment income after expense reimbursement/ recoupment(3)(4) | %3.24†† | 2.69 | 2.56 | 2.26 | 2.30 | 1.36 | |||||||||||||||||||||
| Portfolio turnover rate | % | 4 | 25 | 24 | 74 | 60 | 70 | ||||||||||||||||||||
| Class B | |||||||||||||||||||||||||||
| Six Months Ended November 30, | Year Ended May 31, | November 5, 2001(1) to May 31, | |||||||||||||||||||||||||
| 2006 | 2006 | 2005 | 2004 | 2003 | 2002 | ||||||||||||||||||||||
| Per Share Operating Performance: | |||||||||||||||||||||||||||
| Net asset value, beginning of period | $ | 9.50 | 9.63 | 9.74 | 10.12 | 9.80 | 10.00 | ||||||||||||||||||||
| Income (loss) from investment operations: | |||||||||||||||||||||||||||
| Net investment income | $ | 0.12 | *†† | 0.19 | * | 0.19 | 0.16 | 0.16 | 0.03 | ||||||||||||||||||
| Net realized and unrealized gain (loss) on investments | $ | 0.16 | (0.10 | ) | (0.12 | ) | (0.41 | ) | 0.32 | (0.23 | ) | ||||||||||||||||
| Total from investment operations | $ | 0.28 | 0.09 | 0.07 | (0.25 | ) | 0.48 | (0.20 | ) | ||||||||||||||||||
| Less distributions from: | |||||||||||||||||||||||||||
| Net investment income | $ | — | 0.22 | 0.18 | 0.13 | 0.16 | 0.00 | ** | |||||||||||||||||||
| Total distributions | $ | — | 0.22 | 0.18 | 0.13 | 0.16 | 0.00 | ** | |||||||||||||||||||
| Net asset value, end of period | $ | 9.78 | 9.50 | 9.63 | 9.74 | 10.12 | 9.80 | ||||||||||||||||||||
| Total Return(2) | % | 2.95 | †† | 0.90 | 0.76 | (2.47 | ) | 4.98 | (2.00 | )† | |||||||||||||||||
| Ratios and Supplemental Data: | |||||||||||||||||||||||||||
| Net assets, end of period (000's) | $ | 172,595 | 189,657 | 249,693 | 328,221 | 442,268 | 465,111 | ||||||||||||||||||||
| Ratios to average net assets: | |||||||||||||||||||||||||||
| Net expenses after expense reimbursement/recoupment(3)(4) | % | 2.39 | 2.37 | 2.33 | 2.44 | 2.50 | 2.36 | ||||||||||||||||||||
| Gross expenses prior to expense reimbursement/ recoupment(3) | % | 2.39 | 2.37 | 2.33 | 2.40 | 2.53 | 2.36 | ||||||||||||||||||||
| Net investment income after expense reimbursement/ recoupment(3)(4) | %2.49†† | 1.94 | 1.82 | 1.51 | 1.55 | 0.61 | |||||||||||||||||||||
| Portfolio turnover rate | % | 4 | 25 | 24 | 74 | 60 | 70 | ||||||||||||||||||||
(1) Commencement of operations.
(2) Total return is calculated assuming reinvestment of all dividends and capital gain distributions at net asset value and excluding the deduction of sales charges. Total returns for periods less than one year are not annualized.
(3) Annualized for periods less than one year.
(4) The Investment Adviser has agreed to limit expenses, (excluding interest, taxes, brokerage and extraordinary expenses), subject to possible reimbursement to ING Investments, LLC within three years.
* Per share data calculated using the average number of shares throughout the period.
** Amount represents less than $0.005 per share.
† Represents performance beginning on the first day of the Guarantee Period (February 1, 2002). Total return from commencement of offering of shares was (1.60)%, (1.96)% and (1.97)% for Class A, B and C, respectively.
†† Includes one-time settlement income representing $0.02 per share and 0.23% of average net assets for Classes A and B.
See Accompanying Notes to Financial Statements
45
ING PRINCIPAL PROTECTION FUND II (UNAUDITED) (CONTINUED)
FINANCIAL
HIGHLIGHTS
Selected data for a share of beneficial interest outstanding throughout each period.
| Class C | |||||||||||||||||||||||||||
| Six Months Ended November 30, | Year Ended May 31, | November 5, 2001(1) to May 31, | |||||||||||||||||||||||||
| 2006 | 2006 | 2005 | 2004 | 2003 | 2002 | ||||||||||||||||||||||
| Per Share Operating Performance: | |||||||||||||||||||||||||||
| Net asset value, beginning of period | $ | 9.54 | 9.65 | 9.75 | 10.12 | 9.80 | 10.00 | ||||||||||||||||||||
| Income (loss) from investment operations: | |||||||||||||||||||||||||||
| Net investment income | $ | 0.12 | *†† | 0.19 | * | 0.17 | * | 0.18 | 0.15 | 0.03 | |||||||||||||||||
| Net realized and unrealized gain (loss) on investments | $ | 0.16 | (0.10 | ) | (0.10 | ) | (0.43 | ) | 0.33 | (0.23 | ) | ||||||||||||||||
| Total from investment operations | $ | 0.28 | 0.09 | 0.07 | (0.25 | ) | 0.48 | (0.20 | ) | ||||||||||||||||||
| Less distributions from: | |||||||||||||||||||||||||||
| Net investment income | $ | — | 0.20 | 0.17 | 0.12 | 0.16 | 0.00 | ** | |||||||||||||||||||
| Total distributions | $ | — | 0.20 | 0.17 | 0.12 | 0.16 | 0.00 | ** | |||||||||||||||||||
| Net asset value, end of period | $ | 9.82 | 9.54 | 9.65 | 9.75 | 10.12 | 9.80 | ||||||||||||||||||||
| Total Return(2) | % | 2.94 | †† | 0.92 | 0.75 | (2.52 | ) | 4.99 | (2.00 | )† | |||||||||||||||||
| Ratios and Supplemental Data: | |||||||||||||||||||||||||||
| Net assets, end of period (000's) | $ | 20,647 | 26,092 | 45,748 | 71,250 | 139,961 | 159,563 | ||||||||||||||||||||
| Ratios to average net assets: | |||||||||||||||||||||||||||
| Net expenses after expense reimbursement/recoupment(3)(4) | % | 2.39 | 2.37 | 2.33 | 2.44 | 2.50 | 2.36 | ||||||||||||||||||||
| Gross expenses prior to expense reimbursement/ recoupment(3) | % | 2.39 | 2.37 | 2.33 | 2.40 | 2.53 | 2.36 | ||||||||||||||||||||
| Net investment income after expense reimbursement/ recoupment(3)(4) | %2.50†† | 1.94 | 1.81 | 1.51 | 1.55 | 0.69 | |||||||||||||||||||||
| Portfolio turnover rate | % | 4 | 25 | 24 | 74 | 60 | 70 | ||||||||||||||||||||
(1) Commencement of operations.
(2) Total return is calculated assuming reinvestment of all dividends and capital gain distributions at net asset value and excluding the deduction of sales charges. Total returns for periods less than one year are not annualized.
(3) Annualized for periods less than one year.
(4) The Investment Adviser has agreed to limit expenses, (excluding interest, taxes, brokerage and extraordinary expenses), subject to possible reimbursement to ING Investments, LLC within three years.
* Per share data calculated using the average number of shares throughout the period.
** Amount represents less than $0.005 per share.
† Represents performance beginning on the first day of the Guarantee Period (February 1, 2002). Total return from commencement of offering of shares was (1.60)%, (1.96)% and (1.97)% for Class A, B and C, respectively.
†† Includes one-time settlement income representing $0.03 per share and 0.23% of average net assets for Class C.
See Accompanying Notes to Financial Statements
46
ING PRINCIPAL PROTECTION FUND III (UNAUDITED)
FINANCIAL HIGHLIGHTS
Selected data for a share of beneficial interest outstanding throughout each period.
| Class A | |||||||||||||||||||||||||||
| Six Months Ended November 30, | Year Ended May 31, | March 5, 2001(1) to May 31, | |||||||||||||||||||||||||
| 2006 | 2006 | 2005 | 2004 | 2003 | 2002 | ||||||||||||||||||||||
| Per Share Operating Performance: | |||||||||||||||||||||||||||
| Net asset value, beginning of period | $ | 9.67 | 9.82 | 9.90 | 10.27 | 10.01 | 10.00 | ||||||||||||||||||||
| Income (loss) from investment operations: | |||||||||||||||||||||||||||
| Net investment income | $ | 0.12 | 0.24 | * | 0.24 | * | 0.25 | 0.21 | 0.01 | ||||||||||||||||||
| Net realized and unrealized gain (loss) on investments | $ | 0.23 | (0.11 | ) | (0.06 | ) | (0.42 | ) | 0.22 | 0.00 | ** | ||||||||||||||||
| Total from investment operations | $ | 0.35 | 0.13 | 0.18 | (0.17 | ) | 0.43 | 0.01 | |||||||||||||||||||
| Less distributions from: | |||||||||||||||||||||||||||
| Net investment income | $ | — | 0.28 | 0.26 | 0.20 | 0.17 | — | ||||||||||||||||||||
| Total distributions | $ | — | 0.28 | 0.26 | 0.20 | 0.17 | — | ||||||||||||||||||||
| Net asset value, end of period | $ | 10.02 | 9.67 | 9.82 | 9.90 | 10.27 | 10.01 | ||||||||||||||||||||
| Total Return(2) | % | 3.62 | 1.35 | 1.83 | (1.63 | ) | 4.35 | † | — | *** | |||||||||||||||||
| Ratios and Supplemental Data: | |||||||||||||||||||||||||||
| Net assets, end of period (000's) | $ | 13,228 | 12,955 | 19,005 | 29,113 | 49,652 | 57,749 | ||||||||||||||||||||
| Ratios to average net assets: | |||||||||||||||||||||||||||
| Net expenses after expense reimbursement/ recoupment(3)(4) | %1.65 | 1.65 | 1.59 | 1.68 | 1.75 | 0.97 | |||||||||||||||||||||
| Gross expenses prior to expense reimbursement/ recoupment(3) | % | 1.65 | 1.65 | 1.59 | 1.66 | 1.77 | 0.97 | ||||||||||||||||||||
| Net investment income after expense reimbursement/ recoupment(3)(4) | %2.53 | 2.47 | 2.44 | 2.26 | 2.08 | 0.85 | |||||||||||||||||||||
| Portfolio turnover rate | % | 5 | 35 | 16 | 27 | 91 | — | ||||||||||||||||||||
| Class B | |||||||||||||||||||||||||||
| Six Months Ended November 30, | Year Ended May 31, | March 5, 2001(1) to May 31, | |||||||||||||||||||||||||
| 2006 | 2006 | 2005 | 2004 | 2003 | 2002 | ||||||||||||||||||||||
| Per Share Operating Performance: | |||||||||||||||||||||||||||
| Net asset value, beginning of period | $ | 9.65 | 9.79 | 9.86 | 10.23 | 10.00 | 10.00 | ||||||||||||||||||||
| Income (loss) from investment operations: | |||||||||||||||||||||||||||
| Net investment income | $ | 0.09 | * | 0.17 | * | 0.18 | 0.16 | 0.13 | 0.00 | ** | |||||||||||||||||
| Net realized and unrealized gain (loss) on investments | $ | 0.22 | (0.11 | ) | (0.07 | ) | (0.40 | ) | 0.22 | 0.00 | ** | ||||||||||||||||
| Total from investment operations | $ | 0.31 | 0.06 | 0.11 | (0.24 | ) | 0.35 | 0.00 | ** | ||||||||||||||||||
| Less distributions from: | |||||||||||||||||||||||||||
| Net investment income | $ | — | 0.20 | 0.18 | 0.13 | 0.12 | — | ||||||||||||||||||||
| Total distributions | $ | — | 0.20 | 0.18 | 0.13 | 0.12 | — | ||||||||||||||||||||
| Net asset value, end of period | $ | 9.96 | 9.65 | 9.79 | 9.86 | 10.23 | 10.00 | ||||||||||||||||||||
| Total Return(2) | % | 3.21 | 0.61 | 1.12 | (2.38 | ) | 3.51 | † | — | *** | |||||||||||||||||
| Ratios and Supplemental Data: | |||||||||||||||||||||||||||
| Net assets, end of period (000's) | $ | 136,973 | 151,765 | 203,705 | 261,098 | 335,942 | 347,788 | ||||||||||||||||||||
| Ratios to average net assets: | |||||||||||||||||||||||||||
| Net expenses after expense reimbursement/ recoupment(3)(4) | %2.40 | 2.40 | 2.34 | 2.43 | 2.50 | 1.72 | |||||||||||||||||||||
| Gross expenses prior to expense reimbursement/ recoupment(3) | % | 2.40 | 2.40 | 2.34 | 2.41 | 2.52 | 1.72 | ||||||||||||||||||||
| Net investment income after expense reimbursement/ recoupment(3)(4) | %1.78 | 1.72 | 1.69 | 1.51 | 1.33 | 0.07 | |||||||||||||||||||||
| Portfolio turnover rate | % | 5 | 35 | 16 | 27 | 91 | — | ||||||||||||||||||||
(1) Commencement of operations.
(2) Total return is calculated assuming reinvestment of all dividends and capital gain distributions at net asset value and excluding the deduction of sales charges. Total returns for periods less than one year are not annualized.
(3) Annualized for periods less than one year.
(4) The Investment Adviser has agreed to limit expenses, (excluding interest, taxes, brokerage and extraordinary expenses), subject to possible reimbursement to ING Investments, LLC within three years.
* Per share data calculated using the average number of shares throughout the period.
** Amount represents less than $0.005 per share.
*** As of May 31, 2002, the Fund was in its Offering Period. Total return from commencement of offering of shares was 0.10%, 0.00% and 0.00% for Class A, B and C, respectively.
† Represents performance beginning on the first day of the Guarantee Period (June 6, 2002). Total return for year ended May 31, 2003 was 4.35%, 3.51% and 3 .51% for Class A, B and C, respectively.
See Accompanying Notes to Financial Statements
47
ING PRINCIPAL PROTECTION FUND III (UNAUDITED) (CONTINUED)
FINANCIAL
HIGHLIGHTS
| Class C | |||||||||||||||||||||||||||
| Six Months Ended November 30, | Year Ended May 31, | March 5, 2001(1) to May 31, | |||||||||||||||||||||||||
| 2006 | 2006 | 2005 | 2004 | 2003 | 2002 | ||||||||||||||||||||||
| Per Share Operating Performance: | |||||||||||||||||||||||||||
| Net asset value, beginning of period | $ | 9.69 | 9.81 | 9.88 | 10.23 | 10.00 | 10.00 | ||||||||||||||||||||
| Income (loss) from investment operations: | |||||||||||||||||||||||||||
| Net investment income | $ | 0.09 | * | 0.17 | * | 0.17 | * | 0.19 | 0.13 | 0.00 | ** | ||||||||||||||||
| Net realized and unrealized gain (loss) on investments | $ | 0.23 | (0.11 | ) | (0.07 | ) | (0.43 | ) | 0.22 | 0.00 | ** | ||||||||||||||||
| Total from investment operations | $ | 0.32 | 0.06 | 0.10 | (0.24 | ) | 0.35 | 0.00 | ** | ||||||||||||||||||
| Less distributions from: | |||||||||||||||||||||||||||
| Net investment income | $ | — | 0.18 | 0.17 | 0.11 | 0.12 | — | ||||||||||||||||||||
| Total distributions | $ | — | 0.18 | 0.17 | 0.11 | 0.12 | — | ||||||||||||||||||||
| Net asset value, end of period | $ | 10.01 | 9.69 | 9.81 | 9.88 | 10.23 | 10.00 | ||||||||||||||||||||
| Total Return(2) | % | 3.30 | 0.63 | 1.04 | (2.37 | ) | 3.51 | † | — | *** | |||||||||||||||||
| Ratios and Supplemental Data: | |||||||||||||||||||||||||||
| Net assets, end of period (000's) | $ | 12,757 | 15,523 | 26,637 | 43,018 | 81,800 | 90,826 | ||||||||||||||||||||
| Ratios to average net assets: | |||||||||||||||||||||||||||
| Net expenses after expense reimbursement/recoupment(3)(4) | % | 2.40 | 2.40 | 2.34 | 2.43 | 2.50 | 1.72 | ||||||||||||||||||||
| Gross expenses prior to expense reimbursement/ recoupment(3) | % | 2.40 | 2.40 | 2.34 | 2.41 | 2.52 | 1.72 | ||||||||||||||||||||
| Net investment income after expense reimbursement/ recoupment(3)(4) | %1.77 | 1.71 | 1.69 | 1.51 | 1.33 | 0.06 | |||||||||||||||||||||
| Portfolio turnover rate | % | 5 | 35 | 16 | 27 | 91 | — | ||||||||||||||||||||
(1) Commencement of operations.
(2) Total return is calculated assuming reinvestment of all dividends and capital gain distributions at net asset value and excluding the deduction of sales charges. Total returns for periods less than one year are not annualized.
(3) Annualized for periods less than one year.
(4) The Investment Adviser has agreed to limit expenses, (excluding interest, taxes, brokerage and extraordinary expenses), subject to possible reimbursement to ING Investments, LLC within three years.
* Per share data calculated using the average number of shares throughout the period.
** Amount represents less than $0.005 per share.
*** As of May 31, 2002, the Fund was in its Offering Period. Total return from commencement of offering of shares was 0.10%, 0.00% and 0.00% for Class A, B and C, respectively.
† Represents performance beginning on the first day of the Guarantee Period (June 6, 2002). Total return for year ended May 31, 2003 was 4.35%, 3.51% and 3.51% for Class A, B and C, respectively.
See Accompanying Notes to Financial Statements
48
ING PRINCIPAL PROTECTION FUND IV (UNAUDITED)
FINANCIAL HIGHLIGHTS
Selected data for a share of beneficial interest outstanding throughout each period.
| Class A | Class B | ||||||||||||||||||||||||||||||||||||||||||
| Six Months Ended November 30, | Year Ended May 31, | July 1, 2002(1) to May 31, | Six Months Ended November 30, | Year Ended May 31, | July 1, 2002(1) to May 31, | ||||||||||||||||||||||||||||||||||||||
| 2006 | 2006 | 2005 | 2004 | 2003 | 2006 | 2006 | 2005 | 2004 | 2003 | ||||||||||||||||||||||||||||||||||
| Per Share Operating Performance: | |||||||||||||||||||||||||||||||||||||||||||
| Net asset value, beginning of period | $ | 10.46 | 10.47 | 10.39 | 10.52 | 10.00 | 10.43 | 10.44 | 10.35 | 10.47 | 10.00 | ||||||||||||||||||||||||||||||||
| Income (loss) from investment operations: | |||||||||||||||||||||||||||||||||||||||||||
| Net investment income | $ | 0.09 | † | 0.12 | 0.13 | 0.12 | 0.09 | 0.05 | † | 0.04 | 0.05 | 0.04 | 0.03 | ||||||||||||||||||||||||||||||
| Net realized and unrealized gain (loss) on investments | $ | 0.53 | 0.12 | 0.15 | (0.08 | ) | 0.47 | 0.53 | 0.11 | 0.16 | (0.07 | ) | 0.46 | ||||||||||||||||||||||||||||||
| Total from investment operations | $ | 0.62 | 0.24 | 0.28 | 0.04 | 0.56 | 0.58 | 0.15 | 0.21 | (0.03 | ) | 0.49 | |||||||||||||||||||||||||||||||
| Less distributions from: | |||||||||||||||||||||||||||||||||||||||||||
| Net investment income | $ | — | 0.13 | 0.13 | 0.14 | 0.03 | — | 0.04 | 0.05 | 0.06 | 0.01 | ||||||||||||||||||||||||||||||||
| Net realized gains on investments | $ | — | 0.12 | 0.07 | 0.03 | 0.01 | — | 0.12 | 0.07 | 0.03 | 0.01 | ||||||||||||||||||||||||||||||||
| Total distributions | $ | — | 0.25 | 0.20 | 0.17 | 0.04 | — | 0.16 | 0.12 | 0.09 | 0.02 | ||||||||||||||||||||||||||||||||
| Net asset value, end of period | $ | 11.08 | 10.46 | 10.47 | 10.39 | 10.52 | 11.01 | 10.43 | 10.44 | 10.35 | 10.47 | ||||||||||||||||||||||||||||||||
| Total Return(2) | % | 5.93 | † | 2.22 | 2.79 | 0.36 | 5.50 | ** | 5.56 | † | 1.41 | 2.04 | (0.29 | ) | 4.89 | ** | |||||||||||||||||||||||||||
| Ratios and Supplemental Data: | |||||||||||||||||||||||||||||||||||||||||||
| Net assets, end of period (000's) | $ | 18,344 | 19,418 | 30,711 | 52,094 | 89,558 | 282,901 | 305,370 | 394,210 | 487,343 | 603,649 | ||||||||||||||||||||||||||||||||
| Ratios to average net assets: | |||||||||||||||||||||||||||||||||||||||||||
| Expenses(3) | % | 1.63 | 1.63 | 1.58 | 1.65 | 1.61 | 2.38 | 2.38 | 2.33 | 2.40 | 2.36 | ||||||||||||||||||||||||||||||||
| Net investment income(3) | % | 1.57 | † | 1.08 | 1.22 | 1.08 | 1.12 | 0.84 | † | 0.33 | 0.49 | 0.33 | 0.36 | ||||||||||||||||||||||||||||||
| Portfolio turnover rate | % | 19 | 60 | 70 | 75 | 31 | 19 | 60 | 70 | 75 | 31 | ||||||||||||||||||||||||||||||||
| Class C | Class Q | ||||||||||||||||||||||||||||||||||||||||||
| Six Months Ended November 30, | Year Ended May 31, | July 1, 2002(1) to May 31, | Six Months Ended November 30, | Year Ended May 31, | July 1, 2002(1) to May 31, | ||||||||||||||||||||||||||||||||||||||
| 2006 | 2006 | 2005 | 2004 | 2003 | 2006 | 2006 | 2005 | 2004 | 2003 | ||||||||||||||||||||||||||||||||||
| Per Share Operating Performance: | |||||||||||||||||||||||||||||||||||||||||||
| Net asset value, beginning of period | $ | 10.47 | 10.46 | 10.36 | 10.47 | 10.00 | 10.50 | 10.47 | 10.40 | 10.52 | 10.00 | ||||||||||||||||||||||||||||||||
| Income (loss) from investment operations: | |||||||||||||||||||||||||||||||||||||||||||
| Net investment income | $ | 0.06 | † | 0.05 | 0.06 | 0.05 | 0.03 | 0.09 | † | 0.12 | * | 0.13 | 0.13 | 0.10 | |||||||||||||||||||||||||||||
| Net realized and unrealized gain (loss) on investments | $ | 0.52 | 0.11 | 0.14 | (0.09 | ) | 0.46 | 0.54 | 0.12 | 0.15 | (0.07 | ) | 0.46 | ||||||||||||||||||||||||||||||
| Total from investment operations | $ | 0.58 | 0.16 | 0.20 | (0.04 | ) | 0.49 | 0.63 | 0.24 | 0.28 | 0.06 | 0.56 | |||||||||||||||||||||||||||||||
| Less distributions from: | |||||||||||||||||||||||||||||||||||||||||||
| Net investment income | $ | — | 0.03 | 0.03 | 0.04 | 0.01 | — | 0.09 | 0.14 | 0.15 | 0.03 | ||||||||||||||||||||||||||||||||
| Net realized gains on investments | $ | — | 0.12 | 0.07 | 0.03 | 0.01 | — | 0.12 | 0.07 | 0.03 | 0.01 | ||||||||||||||||||||||||||||||||
| Total distributions | $ | — | 0.15 | 0.10 | 0.07 | 0.02 | — | 0.21 | 0.21 | 0.18 | 0.04 | ||||||||||||||||||||||||||||||||
| Net asset value, end of period | $ | 11.05 | 10.47 | 10.46 | 10.36 | 10.47 | 11.13 | 10.50 | 10.47 | 10.40 | 10.52 | ||||||||||||||||||||||||||||||||
| Total Return(2) | % | 5.54 | † | 1.48 | 2.00 | (0.37 | ) | 4.90 | ** | 6.00 | † | 2.21 | 2.75 | 0.58 | 5.54 | ** | |||||||||||||||||||||||||||
| Ratios and Supplemental Data: | |||||||||||||||||||||||||||||||||||||||||||
| Net assets, end of period (000's) | $ | 32,776 | 38,846 | 63,431 | 98,026 | 183,228 | 352 | 332 | 958 | 950 | 1,473 | ||||||||||||||||||||||||||||||||
| Ratios to average net assets: | |||||||||||||||||||||||||||||||||||||||||||
| Expenses(3) | % | 2.38 | 2.38 | 2.33 | 2.40 | 2.36 | 1.59 | 1.60 | 1.58 | 1.59 | 1.49 | ||||||||||||||||||||||||||||||||
| Net investment income(3) | % | 0.85 | † | 0.33 | 0.47 | 0.33 | 0.36 | 1.62 | † | 1.08 | 1.23 | 1.14 | 1.24 | ||||||||||||||||||||||||||||||
| Portfolio turnover rate | % | 19 | 60 | 70 | 75 | 31 | 19 | 60 | 70 | 75 | 31 | ||||||||||||||||||||||||||||||||
(1) Commencement of operations.
(2) Total return is calculated assuming reinvestment of all dividends and capital gain distributions at net asset value and excluding the deduction of sales charges. Total returns for periods less than one year are not annualized.
(3) Annualized for periods less than one year.
* Per share data calculated using the average number of shares throughout the period.
** Represents performance beginning on the first day of the Guarantee Period (October 8, 2002). Total return from commencement of offering of shares was 5.61%, 4.89%, 4.90% and 5.64% for Class A, B, C and Q, respectively.
† Includes one-time settlement income representing $0.02, $0.02, $0.03 and $0.02 per share and 0.22% of average net assets for Class A, Class B, Class C and Class Q, respectively.
See Accompanying Notes to Financial Statements
49
ING PRINCIPAL PROTECTION FUND V (UNAUDITED)
FINANCIAL HIGHLIGHTS
Selected data for a share of beneficial interest outstanding throughout each period.
| Class A | Class B | ||||||||||||||||||||||||||||||||||||||||||
| Six Months Ended November 30, | Year Ended May 31, | November 1, 2002(1) to May 31, | Six Months Ended November 30, | Year Ended May 31, | November 1, 2002(1) to May 31, | ||||||||||||||||||||||||||||||||||||||
| 2006 | 2006 | 2005 | 2004 | 2003 | 2006 | 2006 | 2005 | 2004 | 2003 | ||||||||||||||||||||||||||||||||||
| Per Share Operating Performance: | |||||||||||||||||||||||||||||||||||||||||||
| Net asset value, beginning of period | $ | 9.86 | 9.91 | 10.11 | 10.41 | 10.00 | 9.85 | 9.89 | 10.09 | 10.38 | 10.00 | ||||||||||||||||||||||||||||||||
| Income (loss) from investment operations: | |||||||||||||||||||||||||||||||||||||||||||
| Net investment income | $ | 0.07 | 0.14 | 0.13 | * | 0.13 | 0.05 | 0.03 | 0.06 | 0.06 | 0.05 | 0.01 | |||||||||||||||||||||||||||||||
| Net realized and unrealized gain (loss) on investments | $ | 0.43 | 0.01 | 0.16 | (0.22 | ) | 0.36 | 0.43 | 0.02 | 0.15 | (0.21 | ) | 0.37 | ||||||||||||||||||||||||||||||
| Total from investment operations | $ | 0.50 | 0.15 | 0.29 | (0.09 | ) | 0.41 | 0.46 | 0.08 | 0.21 | (0.16 | ) | 0.38 | ||||||||||||||||||||||||||||||
| Less distributions from: | |||||||||||||||||||||||||||||||||||||||||||
| Net investment income | $ | — | 0.14 | 0.14 | 0.14 | — | — | 0.06 | 0.06 | 0.06 | — | ||||||||||||||||||||||||||||||||
| Net realized gains on investments | $ | — | 0.06 | 0.35 | 0.07 | — | — | 0.06 | 0.35 | 0.07 | — | ||||||||||||||||||||||||||||||||
| Total distributions | $ | — | 0.20 | 0.49 | 0.21 | — | — | 0.12 | 0.41 | 0.13 | — | ||||||||||||||||||||||||||||||||
| Net asset value, end of period | $ | 10.36 | 9.86 | 9.91 | 10.11 | 10.41 | 10.31 | 9.85 | 9.89 | 10.09 | 10.38 | ||||||||||||||||||||||||||||||||
| Total Return(2) | % | 5.07 | 1.53 | 2.89 | (0.89 | ) | 4.10 | ** | 4.67 | 0.82 | 2.10 | (1.54 | ) | 3.90 | ** | ||||||||||||||||||||||||||||
| Ratios and Supplemental Data: | |||||||||||||||||||||||||||||||||||||||||||
| Net assets, end of period (000's) | $ | 19,997 | 20,694 | 30,203 | 42,889 | 74,905 | 231,956 | 252,730 | 335,117 | 405,311 | 496,076 | ||||||||||||||||||||||||||||||||
| Ratios to average net assets: | |||||||||||||||||||||||||||||||||||||||||||
| Expenses(3) | % | 1.63 | 1.63 | 1.59 | 1.67 | 1.56 | 2.38 | 2.38 | 2.34 | 2.42 | 2.31 | ||||||||||||||||||||||||||||||||
| Net investment income(3) | % | 1.32 | 1.24 | 1.34 | 1.22 | 1.00 | 0.57 | 0.49 | 0.59 | 0.47 | 0.25 | ||||||||||||||||||||||||||||||||
| Portfolio turnover rate | % | 25 | 60 | 80 | 53 | 12 | 25 | 60 | 80 | 53 | 12 | ||||||||||||||||||||||||||||||||
| Class C | |||||||||||||||||||||||
| Six Months Ended November 30, | Year Ended May 31, | November 1, 2002(1) to May 31, | |||||||||||||||||||||
| 2006 | 2006 | 2005 | 2004 | 2003 | |||||||||||||||||||
| Per Share Operating Performance: | |||||||||||||||||||||||
| Net asset value, beginning of period | $ | 9.88 | 9.91 | 10.10 | 10.38 | 10.00 | |||||||||||||||||
| Income (loss) from investment operations: | |||||||||||||||||||||||
| Net investment income | $ | 0.03 | * | 0.05 | * | 0.06 | * | 0.06 | 0.01 | ||||||||||||||
| Net realized and unrealized gain (loss) on investments | $ | 0.43 | 0.02 | 0.15 | (0.22 | ) | 0.37 | ||||||||||||||||
| Total from investment operations | $ | 0.46 | 0.07 | 0.21 | (0.16 | ) | 0.38 | ||||||||||||||||
| Less distributions from: | |||||||||||||||||||||||
| Net investment income | $ | — | 0.04 | 0.05 | 0.05 | — | |||||||||||||||||
| Net realized gains on investments | $ | — | 0.06 | 0.35 | 0.07 | — | |||||||||||||||||
| Total distributions | $ | — | 0.10 | 0.40 | 0.12 | — | |||||||||||||||||
| Net asset value, end of period | $ | 10.34 | 9.88 | 9.91 | 10.10 | 10.38 | |||||||||||||||||
| Total Return(2) | % | 4.66 | 0.74 | 2.02 | (1.52 | ) | 3.90 | ** | |||||||||||||||
| Ratios and Supplemental Data: | |||||||||||||||||||||||
| Net assets, end of period (000's) | $ | 18,177 | 21,201 | 37,116 | 60,980 | 106,754 | |||||||||||||||||
| Ratios to average net assets: | |||||||||||||||||||||||
| Expenses(3) | % | 2.38 | 2.38 | 2.34 | 2.42 | 2.31 | |||||||||||||||||
| Net investment income(3) | % | 0.57 | 0.49 | 0.59 | 0.47 | 0.25 | |||||||||||||||||
| Portfolio turnover rate | % | 25 | 60 | 80 | 53 | 12 | |||||||||||||||||
(1) Commencement of operations.
(2) Total return is calculated assuming reinvestment of all dividends and capital gain distributions at net asset value and excluding the deduction of sales charges. Total returns for periods less than one year are not annualized.
(3) Annualized for periods less than one year.
* Per share data calculated using the average number of shares throughout the period.
** Represents performance beginning on the first day of the Guarantee Period (January 23, 2003). Total return from commencement of offering of shares is 4.10%, 3.80% and 3.80% for Class A, B and C, respectively.
See Accompanying Notes to Financial Statements
50
ING PRINCIPAL PROTECTION FUND VI (UNAUDITED)
FINANCIAL HIGHLIGHTS
Selected data for a share of beneficial interest outstanding throughout each period.
| Class A | Class B | ||||||||||||||||||||||||||||||||||||||||||
| Six Months Ended November 30, | Year Ended May 31, | February 3, 2003(1) to May 31, | Six Months Ended November 30, | Year Ended May 31, | February 3, 2003(1) to May 31, | ||||||||||||||||||||||||||||||||||||||
| 2006 | 2006 | 2005 | 2004 | 2003 | 2006 | 2006 | 2005 | 2004 | 2003 | ||||||||||||||||||||||||||||||||||
| Per Share Operating Performance: | |||||||||||||||||||||||||||||||||||||||||||
| Net asset value, beginning of period | $ | 9.85 | 9.87 | 10.08 | 10.31 | 10.00 | 9.83 | 9.85 | 10.06 | 10.30 | 10.00 | ||||||||||||||||||||||||||||||||
| Income (loss) from investment operations: | |||||||||||||||||||||||||||||||||||||||||||
| Net investment income | $ | 0.07 | 0.14 | 0.13 | * | 0.13 | 0.01 | 0.03 | 0.06 | 0.06 | 0.05 | 0.00 | ** | ||||||||||||||||||||||||||||||
| Net realized and unrealized gain (loss) on investments | $ | 0.41 | (0.02 | ) | 0.14 | (0.23 | ) | 0.30 | 0.42 | (0.02 | ) | 0.12 | (0.22 | ) | 0.30 | ||||||||||||||||||||||||||||
| Total from investment operations | $ | 0.48 | 0.12 | 0.27 | (0.10 | ) | 0.31 | 0.45 | 0.04 | 0.18 | (0.17 | ) | 0.30 | ||||||||||||||||||||||||||||||
| Less distributions from: | |||||||||||||||||||||||||||||||||||||||||||
| Net investment income | $ | — | 0.14 | 0.15 | 0.10 | — | — | 0.06 | 0.06 | 0.04 | — | ||||||||||||||||||||||||||||||||
| Net realized gains on investments | $ | — | — | 0.33 | 0.03 | — | — | — | 0.33 | 0.03 | — | ||||||||||||||||||||||||||||||||
| Total distributions | $ | — | 0.14 | 0.48 | 0.13 | — | — | 0.06 | 0.39 | 0.07 | — | ||||||||||||||||||||||||||||||||
| Net asset value, end of period | $ | 10.33 | 9.85 | 9.87 | 10.08 | 10.31 | 10.28 | 9.83 | 9.85 | 10.06 | 10.30 | ||||||||||||||||||||||||||||||||
| Total Return(2) | % | 4.87 | 1.18 | 2.72 | *** | (1.01 | ) | 3.10 | † | 4.58 | 0.40 | 1.85 | (1.70 | ) | 3.10 | † | |||||||||||||||||||||||||||
| Ratios and Supplemental Data: | |||||||||||||||||||||||||||||||||||||||||||
| Net assets, end of period (000's) | $ | 14,613 | 15,634 | 24,971 | 43,443 | 63,460 | 209,450 | 229,092 | 304,303 | 372,323 | 444,549 | ||||||||||||||||||||||||||||||||
| Ratios to average net assets: | |||||||||||||||||||||||||||||||||||||||||||
| Expenses(3) | % | 1.68 | 1.66 | 1.62 | 1.67 | 1.41 | 2.43 | 2.41 | 2.37 | 2.42 | 2.16 | ||||||||||||||||||||||||||||||||
| Net investment income (loss)(3) | % | 1.27 | 1.28 | 1.33 | 1.19 | 0.59 | 0.52 | 0.53 | 0.59 | 0.44 | (0.16 | ) | |||||||||||||||||||||||||||||||
| Portfolio turnover rate | % | 31 | 42 | 100 | 44 | 3 | 31 | 42 | 100 | 44 | 3 | ||||||||||||||||||||||||||||||||
| Class C | |||||||||||||||||||||||
| Six Months Ended November 30, | Year Ended May 31, | February 3, 2003(1) to May 31, | |||||||||||||||||||||
| 2006 | 2006 | 2005 | 2004 | 2003 | |||||||||||||||||||
| Per Share Operating Performance: | |||||||||||||||||||||||
| Net asset value, beginning of period | $ | 9.88 | 9.87 | 10.06 | 10.30 | 10.00 | |||||||||||||||||
| Income (loss) from investment operations: | |||||||||||||||||||||||
| Net investment income | $ | 0.03 | * | 0.05 | * | 0.06 | * | 0.05 | 0.00 | ** | |||||||||||||
| Net realized and unrealized gain (loss) on investments | $ | 0.41 | (0.00 | )** | 0.12 | (0.22 | ) | 0.30 | |||||||||||||||
| Total from investment operations | $ | 0.44 | 0.05 | 0.18 | (0.17 | ) | 0.30 | ||||||||||||||||
| Less distributions from: | |||||||||||||||||||||||
| Net investment income | $ | — | 0.04 | 0.04 | 0.04 | — | |||||||||||||||||
| Net realized gains on investments | $ | — | — | 0.33 | 0.03 | — | |||||||||||||||||
| Total distributions | $ | — | 0.04 | 0.37 | 0.07 | — | |||||||||||||||||
| Net asset value, end of period | $ | 10.32 | 9.88 | 9.87 | 10.06 | 10.30 | |||||||||||||||||
| Total Return(2) | % | 4.45 | 0.50 | 1.85 | (1.72 | ) | 3.00 | † | |||||||||||||||
| Ratios and Supplemental Data: | |||||||||||||||||||||||
| Net assets, end of period (000's) | $ | 17,800 | 21,819 | 39,288 | 65,269 | 102,047 | |||||||||||||||||
| Ratios to average net assets: | |||||||||||||||||||||||
| Expenses(3) | % | 2.43 | 2.41 | 2.37 | 2.42 | 2.19 | |||||||||||||||||
| Net investment income (loss)(3) | % | 0.52 | 0.53 | 0.58 | 0.44 | (0.13 | ) | ||||||||||||||||
| Portfolio turnover rate | % | 31 | 42 | 100 | 44 | 3 | |||||||||||||||||
(1) Commencement of operations.
(2) Total return is calculated assuming reinvestment of all dividends and capital gain distributions at net asset value and excluding the deduction of sales charges. Total returns for periods less than one year are not annualized.
(3) Annualized for periods less than one year.
* Per share data calculated using the average number of shares throughout the period.
** Amount represents less than $0.005 per share.
*** In 2005, the Sub-Adviser fully reimbursed the Fund for a loss on an investment transaction, which did not have an impact on total return.
† Represents performance beginning on the first day of the Guarantee Period (April 24, 2003). Total return from commencement of offering of shares was 3.10%, 3.00% and 3.00% for Class A, B and C, respectively.
See Accompanying Notes to Financial Statements
51
ING PRINCIPAL PROTECTION FUND VII (UNAUDITED)
FINANCIAL HIGHLIGHTS
Selected data for a share of beneficial interest outstanding throughout each period.
| Class A | |||||||||||||||||||||||
| Six Months Ended November 30, | Year Ended May 31, | May 1, 2003(1) to May 31, | |||||||||||||||||||||
| 2006 | 2006 | 2005 | 2004 | 2003 | |||||||||||||||||||
| Per Share Operating Performance: | |||||||||||||||||||||||
| Net asset value, beginning of period | $ | 9.71 | 9.85 | 9.88 | 10.00 | 10.00 | |||||||||||||||||
| Income (loss) from investment operations: | |||||||||||||||||||||||
| Net investment income | $ | 0.05 | 0.08 | 0.12 | * | 0.13 | 0.00 | ** | |||||||||||||||
| Net realized and unrealized gain (loss) on investments | $ | 0.42 | 0.02 | 0.16 | (0.08 | ) | 0.00 | ** | |||||||||||||||
| Total from investment operations | $ | 0.47 | 0.10 | 0.28 | 0.05 | 0.00 | ** | ||||||||||||||||
| Less distributions from: | |||||||||||||||||||||||
| Net investment income | $ | — | 0.10 | 0.16 | 0.17 | — | |||||||||||||||||
| Net realized gains on investments | $ | — | 0.14 | 0.15 | — | — | |||||||||||||||||
| Total distributions | $ | — | 0.24 | 0.31 | 0.17 | — | |||||||||||||||||
| Net asset value, end of period | $ | 10.18 | 9.71 | 9.85 | 9.88 | 10.00 | |||||||||||||||||
| Total Return(2) | % | 4.84 | 1.06 | 2.82 | 0.52 | † | — | *** | |||||||||||||||
| Ratios and Supplemental Data: | |||||||||||||||||||||||
| Net assets, end of period (000's) | $ | 6,728 | 7,736 | 13,942 | 21,805 | 11,028 | |||||||||||||||||
| Ratios to average net assets: | |||||||||||||||||||||||
| Net expenses after expense reimbursement/recoupment(3)(4) | %1.75 | 1.75 | 1.46 | 0.99 | 0.88 | ||||||||||||||||||
| Gross expenses prior to expense reimbursement/recoupment(3) | % | 1.65 | 1.62 | 1.59 | 1.72 | 0.88 | |||||||||||||||||
| Net investment income (loss) after expense reimbursement/recoupment(3)(4) | %0.94 | 0.76 | 1.23 | 1.51 | 0.09 | ||||||||||||||||||
| Portfolio turnover rate | % | 22 | 58 | 49 | 91 | — | |||||||||||||||||
| Class B | |||||||||||||||||||||||
| Six Months Ended November 30, | Year Ended May 31, | May 1, 2003(1) to May 31, | |||||||||||||||||||||
| 2006 | 2006 | 2005 | 2004 | 2003 | |||||||||||||||||||
| Per Share Operating Performance: | |||||||||||||||||||||||
| Net asset value, beginning of period | 9.77 | 9.90 | 9.93 | 10.00 | 10.00 | ||||||||||||||||||
| Income (loss) from investment operations: | |||||||||||||||||||||||
| Net investment income | 0.01 | 0.00 | ** | 0.05 | 0.07 | 0.00 | ** | ||||||||||||||||
| Net realized and unrealized gain (loss) on investments | 0.42 | 0.03 | 0.15 | (0.09 | ) | 0.00 | ** | ||||||||||||||||
| Total from investment operations | 0.43 | 0.03 | 0.20 | (0.02 | ) | 0.00 | ** | ||||||||||||||||
| Less distributions from: | |||||||||||||||||||||||
| Net investment income | — | 0.02 | 0.08 | 0.05 | — | ||||||||||||||||||
| Net realized gains on investments | — | 0.14 | 0.15 | — | |||||||||||||||||||
| Total distributions | — | 0.16 | 0.23 | 0.05 | — | ||||||||||||||||||
| Net asset value, end of period | 10.20 | 9.77 | 9.90 | 9.93 | 10.00 | ||||||||||||||||||
| Total Return(2) | 4.40 | 0.34 | 2.05 | (0.21 | )† | — | *** | ||||||||||||||||
| Ratios and Supplemental Data: | |||||||||||||||||||||||
| Net assets, end of period (000's) | 102,387 | 113,102 | 155,148 | 182,112 | 92,014 | ||||||||||||||||||
| Ratios to average net assets: | |||||||||||||||||||||||
| Net expenses after expense reimbursement/recoupment(3)(4) | 2.50 | 2.50 | 2.21 | 1.74 | 1.60 | ||||||||||||||||||
| Gross expenses prior to expense reimbursement/recoupment(3) | 2.40 | 2.37 | 2.34 | 2.47 | 1.60 | ||||||||||||||||||
| Net investment income (loss) after expense reimbursement/recoupment(3)(4) | 0.19 | 0.01 | 0.48 | 0.76 | (0.63) | ||||||||||||||||||
| Portfolio turnover rate | 22 | 58 | 49 | 91 | — | ||||||||||||||||||
| Class C | |||||||||||||||||||||||
| Six Months Ended November 30, | Year Ended May 31, | May 1, 2003(1) to May 31, | |||||||||||||||||||||
| 2006 | 2006 | 2005 | 2004 | 2003 | |||||||||||||||||||
| Per Share Operating Performance: | |||||||||||||||||||||||
| Net asset value, beginning of period | $ | 9.77 | 9.89 | 9.90 | 10.00 | 10.00 | |||||||||||||||||
| Income (loss) from investment operations: | |||||||||||||||||||||||
| Net investment income | $ | 0.01 | 0.01 | 0.04 | * | 0.07 | 0.00 | ** | |||||||||||||||
| Net realized and unrealized gain (loss) on investments | $ | 0.42 | 0.02 | 0.16 | (0.09 | ) | 0.00 | ** | |||||||||||||||
| Total from investment operations | $ | 0.43 | 0.03 | 0.20 | (0.02 | ) | 0.00 | ** | |||||||||||||||
| Less distributions from: | |||||||||||||||||||||||
| Net investment income | $ | — | 0.01 | 0.06 | 0.08 | — | |||||||||||||||||
| Net realized gains on investments | $ | — | 0.14 | 0.15 | — | ||||||||||||||||||
| Total distributions | $ | — | 0.15 | 0.21 | 0.08 | — | |||||||||||||||||
| Net asset value, end of period | $ | 10.20 | 9.77 | 9.89 | 9.90 | 10.00 | |||||||||||||||||
| Total Return(2) | % | 4.40 | 0.31 | 2.04 | (0.24 | )† | — | *** | |||||||||||||||
| Ratios and Supplemental Data: | |||||||||||||||||||||||
| Net assets, end of period (000's) | $ | 9,164 | 12,210 | 24,100 | 44,390 | 19,903 | |||||||||||||||||
| Ratios to average net assets: | |||||||||||||||||||||||
| Net expenses after expense reimbursement/recoupment(3)(4) | % | 2.50 | 2.50 | 2.21 | 1.74 | 1.60 | |||||||||||||||||
| Gross expenses prior to expense reimbursement/recoupment(3) | % | 2.40 | 2.37 | 2.34 | 2.47 | 1.60 | |||||||||||||||||
| Net investment income (loss) after expense reimbursement/ recoupment(3)(4) | %0.19 | 0.01 | 0.49 | 0.76 | (0.64) | ||||||||||||||||||
| Portfolio turnover rate | % | 22 | 58 | 49 | 91 | — | |||||||||||||||||
(1) Commencement of operations.
(2) Total return is calculated assuming reinvestment of all dividends and capital gain distributions at net asset value and excluding the deduction of sales charges. Total returns for periods less than one year are not annualized.
(3) Annualized for periods less than one year.
(4) The Investment Adviser has agreed to limit expenses, (excluding interest, taxes, brokerage and extraordinary expenses), subject to possible reimbursement to ING Investments, LLC within three years.
* Per share data calculated using the average number of shares throughout the period.
** Amount represents less than $0.005 per share.
*** As of May 31, 2003, the Fund was in its Offering Period. Total return from commencement of offering of shares was 0.00%, 0.00% and 0.00% for Class A, B and C, respectively.
† Represents performance beginning on the first day of Guarantee Period (June 30, 2003). Total return for the year ended May 31, 2004 was 0.69%, (0.02)% and (0.05)% for Class A, B and C, respectively.
See Accompanying Notes to Financial Statements
52
ING PRINCIPAL PROTECTION FUND VIII (UNAUDITED)
FINANCIAL HIGHLIGHTS
Selected data for a share of beneficial interest outstanding throughout each period.
| Class A | Class B | ||||||||||||||||||||||||||||||||||
| Six Months Ended November 30, | Year Ended May 31, | October 1, 2003(1) to May 31, | Six Months Ended November 30, | Year Ended May 31, | October 1, 2003(1) to May 31, | ||||||||||||||||||||||||||||||
| 2006 | 2006 | 2005 | 2004 | 2006 | 2006 | 2005 | 2004 | ||||||||||||||||||||||||||||
| Per Share Operating Performance: | |||||||||||||||||||||||||||||||||||
| Net asset value, beginning of period | $ | 9.84 | 9.94 | 9.95 | 10.00 | 9.83 | 9.93 | 9.91 | 10.00 | ||||||||||||||||||||||||||
| Income (loss) from investment operations: | |||||||||||||||||||||||||||||||||||
| Net investment income | $ | 0.08 | * | 0.17 | 0.18 | 0.06 | 0.05 | * | 0.10 | 0.10 | 0.02 | ||||||||||||||||||||||||
| Net realized and unrealized gain (loss) on investments | $ | 0.47 | (0.07 | ) | 0.11 | (0.10 | ) | 0.47 | (0.09 | ) | 0.13 | (0.10 | ) | ||||||||||||||||||||||
| Total from investment operations | $ | 0.55 | 0.10 | 0.29 | (0.04 | ) | 0.52 | 0.01 | 0.23 | (0.08 | ) | ||||||||||||||||||||||||
| Less distributions from: | |||||||||||||||||||||||||||||||||||
| Net investment income | $ | — | 0.20 | 0.18 | 0.01 | — | 0.11 | 0.09 | 0.01 | ||||||||||||||||||||||||||
| Net realized gains on investments | $ | — | — | 0.12 | — | — | — | 0.12 | — | ||||||||||||||||||||||||||
| Total distributions | $ | — | 0.20 | 0.30 | 0.01 | — | 0.11 | 0.21 | 0.01 | ||||||||||||||||||||||||||
| Net asset value, end of period | $ | 10.39 | 9.84 | 9.94 | 9.95 | 10.35 | 9.83 | 9.93 | 9.91 | ||||||||||||||||||||||||||
| Total Return(2) | % | 5.59 | 0.97 | 2.99 | (0.45 | )** | 5.29 | 0.13 | 2.34 | (0.85 | )** | ||||||||||||||||||||||||
| Ratios and Supplemental Data: | |||||||||||||||||||||||||||||||||||
| Net assets, end of period (000's) | $ | 8,130 | 9,965 | 16,375 | 22,336 | 58,765 | 64,586 | 87,326 | 105,448 | ||||||||||||||||||||||||||
| Ratios to average net assets: | |||||||||||||||||||||||||||||||||||
| Net expenses after expense reimbursement(3)(4) | %1.47 | 1.48 | 1.44 | 1.51 | 2.22 | 2.23 | 2.19 | 2.12† | |||||||||||||||||||||||||||
| Gross expenses prior to expense reimbursement(3) | % | 1.47 | 1.48 | 1.44 | 1.54 | 2.22 | 2.23 | 2.19 | 2.29 | ||||||||||||||||||||||||||
| Net investment income after expense reimbursement(3)(4) | %1.66 | 1.62 | 1.68 | 0.96 | 0.91 | 0.87 | 0.93 | 0.39† | |||||||||||||||||||||||||||
| Portfolio turnover rate | % | 24 | 57 | 77 | 42 | 24 | 57 | 77 | 42 | ||||||||||||||||||||||||||
| Class C | |||||||||||||||||||
| Six Months Ended November 30, | Year Ended May 31, | October 1, 2003(1) to May 31, | |||||||||||||||||
| 2006 | 2006 | 2005 | 2004 | ||||||||||||||||
| Per Share Operating Performance: | |||||||||||||||||||
| Net asset value, beginning of period | $ | 9.87 | 9.93 | 9.91 | 10.00 | ||||||||||||||
| Income (loss) from investment operations: | |||||||||||||||||||
| Net investment income | $ | 0.05 | * | 0.09 | * | 0.10 | 0.02 | ||||||||||||
| Net realized and unrealized gain (loss) on investments | $ | 0.46 | (0.07 | ) | 0.12 | (0.10 | ) | ||||||||||||
| Total from investment operations | $ | 0.51 | 0.02 | 0.22 | (0.08 | ) | |||||||||||||
| Less distributions from: | |||||||||||||||||||
| Net investment income | $ | — | 0.08 | 0.08 | 0.01 | ||||||||||||||
| Net realized gains on investments | $ | — | — | 0.12 | — | ||||||||||||||
| Total distributions | $ | — | 0.08 | 0.20 | 0.01 | ||||||||||||||
| Net asset value, end of period | $ | 10.38 | 9.87 | 9.93 | 9.91 | ||||||||||||||
| Total Return(2) | % | 5.17 | 0.18 | 2.29 | (0.85 | )** | |||||||||||||
| Ratios and Supplemental Data: | |||||||||||||||||||
| Net assets, end of period (000's) | $ | 7,101 | 9,345 | 19,883 | 33,289 | ||||||||||||||
| Ratios to average net assets: | |||||||||||||||||||
| Net expenses after expense reimbursement(3)(4) | % | 2.22 | 2.23 | 2.19 | 2.12 | † | |||||||||||||
| Gross expenses prior to expense reimbursement(3) | % | 2.22 | 2.23 | 2.19 | 2.29 | ||||||||||||||
| Net investment income after expense reimbursement(3)(4) | % | 0.90 | 0.87 | 0.92 | 0.39 | † | |||||||||||||
| Portfolio turnover rate | % | 24 | 57 | 77 | 42 | ||||||||||||||
(1) Commencement of operations.
(2) Total return is calculated assuming reinvestment of all dividends and capital gain distributions at net asset value and excluding the deduction of sales charges. Total returns for periods less than one year are not annualized.
(3) Annualized for periods less than one year.
(4) The Investment Adviser has agreed to limit expenses, (excluding interest, taxes, brokerage and extraordinary expenses), subject to possible reimbursement to ING Investments, LLC within three years.
† ING Funds Distributor, LLC voluntarily waived 0.75% of distribution fees on Classes B and C from October 1, 2003 through December 23, 2003.
* Per share data calculated using the average number of shares throughout the period.
** Represents performance beginning on the first day of the Guarantee Period (December 23, 2003). Total return from commencement of offering of shares was (0.45)%, (0.85)% and (0.85)% for Class A, B and C, respectively.
See Accompanying Notes to Financial Statements
53
ING PRINCIPAL PROTECTION FUND IX (UNAUDITED)
FINANCIAL HIGHLIGHTS
Selected data for a share of beneficial interest outstanding throughout each period.
| Class A | Class B | ||||||||||||||||||||||||||||||||||
| Six Months Ended November 30, | Year Ended May 31, | February 2, 2004(1) to May 31, | Six Months Ended November 30, | Year Ended May 31, | February 2, 2004(1) to May 31, | ||||||||||||||||||||||||||||||
| 2006 | 2006 | 2005 | 2004 | 2006 | 2006 | 2005 | 2004 | ||||||||||||||||||||||||||||
| Per Share Operating Performance: | |||||||||||||||||||||||||||||||||||
| Net asset value, beginning of period | $ | 9.95 | 10.08 | 9.92 | 10.00 | 9.93 | 10.06 | 9.91 | 10.00 | ||||||||||||||||||||||||||
| Income (loss) from investment operations: | |||||||||||||||||||||||||||||||||||
| Net investment income | $ | 0.09 | * | 0.18 | * | 0.18 | 0.02 | 0.05 | * | 0.12 | 0.09 | 0.01 | |||||||||||||||||||||||
| Net realized and unrealized gain (loss) on investments | $ | 0.52 | (0.05 | ) | 0.16 | (0.10 | ) | 0.52 | (0.07 | ) | 0.17 | (0.10 | ) | ||||||||||||||||||||||
| Total from investment operations | $ | 0.61 | 0.13 | 0.34 | (0.08 | ) | 0.57 | 0.05 | 0.26 | (0.09 | ) | ||||||||||||||||||||||||
| Less distributions from: | |||||||||||||||||||||||||||||||||||
| Net investment income | $ | — | 0.19 | 0.15 | — | — | 0.11 | 0.08 | — | ||||||||||||||||||||||||||
| Net realized gain on investments | $ | — | 0.07 | 0.03 | — | — | 0.07 | 0.03 | — | ||||||||||||||||||||||||||
| Total distributions | $ | — | 0.26 | 0.18 | — | — | 0.18 | 0.11 | — | ||||||||||||||||||||||||||
| Net asset value, end of period | $ | 10.56 | 9.95 | 10.08 | 9.92 | 10.50 | 9.93 | 10.06 | 9.91 | ||||||||||||||||||||||||||
| Total Return(2) | % | 6.13 | 1.25 | 3.43 | (0.80 | )† | 5.74 | 0.51 | 2.68 | (0.90 | )† | ||||||||||||||||||||||||
| Ratios and Supplemental Data: | |||||||||||||||||||||||||||||||||||
| Net assets, end of period (000's) | $ | 5,357 | 6,311 | 10,035 | 20,081 | 44,194 | 47,196 | 58,077 | 66,636 | ||||||||||||||||||||||||||
| Ratios to average net assets: | |||||||||||||||||||||||||||||||||||
| Net expenses after expense reimbursement(3)(4) | %1.53 | 1.51 | 1.68 | 1.30 | 2.28 | 2.26 | 2.43 | 1.74** | |||||||||||||||||||||||||||
| Gross expenses prior to expense reimbursement(3) | % | 1.53 | 1.51 | 1.62 | 1.56 | 2.28 | 2.26 | 2.37 | 2.36 | ||||||||||||||||||||||||||
| Net investment income after expense reimbursement(3)(4) | %1.70 | 1.81 | 1.56 | 0.77 | 0.96 | 1.06 | 0.82 | 0.37** | |||||||||||||||||||||||||||
| Portfolio turnover rate | % | 21 | 76 | 67 | 4 | 21 | 76 | 67 | 4 | ||||||||||||||||||||||||||
| Class C | |||||||||||||||||||
| Six Months Ended November 30, | Year Ended May 31, | February 2, 2004(1) to May 31, | |||||||||||||||||
| 2006 | 2006 | 2005 | 2004 | ||||||||||||||||
| Per Share Operating Performance: | |||||||||||||||||||
| Net asset value, beginning of period | $ | 9.97 | 10.06 | 9.91 | 10.00 | ||||||||||||||
| Income (loss) from investment operations: | |||||||||||||||||||
| Net investment income | $ | 0.05 | * | 0.11 | * | 0.09 | 0.01 | ||||||||||||
| Net realized and unrealized gain (loss) on investments | $ | 0.52 | (0.05 | ) | 0.17 | (0.10 | ) | ||||||||||||
| Total from investment operations | $ | 0.57 | 0.06 | 0.26 | (0.09 | ) | |||||||||||||
| Less distributions from: | |||||||||||||||||||
| Net investment income | $ | — | 0.08 | 0.08 | — | ||||||||||||||
| Net realized gain on investments | $ | — | 0.07 | 0.03 | — | ||||||||||||||
| Total distributions | $ | — | 0.15 | 0.11 | — | ||||||||||||||
| Net asset value, end of period | $ | 10.54 | 9.97 | 10.06 | 9.91 | ||||||||||||||
| Total Return(2) | % | 5.72 | 0.64 | 2.64 | (0.90 | )† | |||||||||||||
| Ratios and Supplemental Data: | |||||||||||||||||||
| Net assets, end of period (000's) | $ | 5,347 | 6,673 | 15,054 | 21,753 | ||||||||||||||
| Ratios to average net assets: | |||||||||||||||||||
| Net expenses after expense reimbursement(3)(4) | % | 2.28 | 2.26 | 2.43 | 1.74 | ** | |||||||||||||
| Gross expenses prior to expense reimbursement(3) | % | 2.28 | 2.26 | 2.37 | 2.36 | ||||||||||||||
| Net investment income after expense reimbursement(3)(4) | % | 0.95 | 1.06 | 0.81 | 0.37 | ** | |||||||||||||
| Portfolio turnover rate | % | 21 | 76 | 67 | 4 | ||||||||||||||
(1) Commencement of operations.
(2) Total return is calculated assuming reinvestment of all dividends and capital gain distributions at net asset value and excluding the deduction of sales charges. Total returns for periods less than one year are not annualized.
(3) Annualized for periods less than one year.
(4) The Investment Adviser has agreed to limit expenses, (excluding interest, taxes, brokerage and extraordinary expenses), subject to possible reimbursement to ING Investments, LLC within three years.
* Per share data calculated using the average number of shares throughout the period.
** ING Fund Distributor, LLC voluntarily waived 0.75% of distribution fees on Class B and Class C of Principal Protection IX from February 2, 2004 through April 22, 2004.
† Represents performance beginning on the first day of the Guarantee Period (April 22, 2004). Total return from commencement of offering of shares was (0.50)%, (0.60)% and (0.60)% for Class A, B and C, respectively.
See Accompanying Notes to Financial Statements
54
ING PRINCIPAL PROTECTION FUND X (UNAUDITED)
FINANCIAL HIGHLIGHTS
Selected data for a share of beneficial interest outstanding throughout each period.
| Class A | Class B | ||||||||||||||||||||||||||||||||||
| Six Months Ended November 30, | Year Ended May 31, | May 3, 2004(1) to May 31, | Six Months Ended November 30, | Year Ended May 31, | May 3, 2004(1) to May 31, | ||||||||||||||||||||||||||||||
| 2006 | 2006 | 2005 | 2004 | 2006 | 2006 | 2005 | 2004 | ||||||||||||||||||||||||||||
| Per Share Operating Performance: | |||||||||||||||||||||||||||||||||||
| Net asset value, beginning of period | $ | 9.89 | 10.25 | 10.00 | 10.00 | 9.86 | 10.22 | 10.00 | 10.00 | ||||||||||||||||||||||||||
| Income (loss) from investment operations: | |||||||||||||||||||||||||||||||||||
| Net investment income | $ | 0.09 | * | 0.17 | 0.10 | 0.00 | ** | 0.05 | * | 0.09 | 0.04 | 0.00 | ** | ||||||||||||||||||||||
| Net realized and unrealized gain (loss) on investments | $ | 0.55 | (0.09 | ) | 0.26 | 0.00 | ** | 0.55 | (0.09 | ) | 0.26 | 0.00 | ** | ||||||||||||||||||||||
| Total from investment operations | $ | 0.64 | 0.08 | 0.36 | 0.00 | ** | 0.60 | 0.00 | 0.30 | 0.00 | ** | ||||||||||||||||||||||||
| Less distributions from: | |||||||||||||||||||||||||||||||||||
| Net investment income | $ | — | 0.15 | 0.07 | — | — | 0.07 | 0.04 | — | ||||||||||||||||||||||||||
| Net realized gains on investments | $ | — | 0.29 | 0.04 | — | — | 0.29 | 0.04 | — | ||||||||||||||||||||||||||
| Total distributions | $ | — | 0.44 | 0.11 | — | — | 0.36 | 0.08 | — | ||||||||||||||||||||||||||
| Net asset value, end of period | $ | 10.53 | 9.89 | 10.25 | 10.00 | 10.46 | 9.86 | 10.22 | 10.00 | ||||||||||||||||||||||||||
| Total Return(2) | % | 6.47 | 0.72 | 3.62 | † | — | *** | 6.09 | (0.08 | ) | 3.00 | † | — | *** | |||||||||||||||||||||
| Ratios and Supplemental Data: | |||||||||||||||||||||||||||||||||||
| Net assets, end of period (000's) | $ | 7,257 | 8,986 | 14,204 | 5,047 | 33,170 | 34,312 | 42,237 | 12,477 | ||||||||||||||||||||||||||
| Ratios to average net assets: | |||||||||||||||||||||||||||||||||||
| Net expenses after expense reimbursement/recoupment(3)(4) | %1.52 | 1.51 | 1.69 | 0.93 | 2.27 | 2.26 | 2.32 | 1.68 | |||||||||||||||||||||||||||
| Gross expenses prior to expense reimbursement/recoupment(3) | %1.52 | 1.51 | 1.68 | 2.27 | 2.27 | 2.26 | 2.43 | 3.02 | |||||||||||||||||||||||||||
| Net investment income (loss) after expense reimbursement/recoupment(3)(4) | %1.69 | 1.54 | 1.08 | (0.01) | 0.96 | 0.79 | 0.43 | (0.75) | |||||||||||||||||||||||||||
| Portfolio turnover rate | % | 70 | 57 | 78 | — | 70 | 57 | 78 | — | ||||||||||||||||||||||||||
| Class C | |||||||||||||||||||
| Six Months Ended November 30, | Year Ended May 31, | May 3, 2004(1) to May 31, | |||||||||||||||||
| 2006 | 2006 | 2005 | 2004 | ||||||||||||||||
| Per Share Operating Performance: | |||||||||||||||||||
| Net asset value, beginning of period | $ | 9.89 | 10.22 | 10.00 | 10.00 | ||||||||||||||
| Income (loss) from investment operations: | |||||||||||||||||||
| Net investment income | $ | 0.05 | * | 0.08 | * | 0.04 | 0.00 | ** | |||||||||||
| Net realized and unrealized gain (loss) on investments | $ | 0.55 | (0.08 | ) | 0.26 | 0.00 | ** | ||||||||||||
| Total from investment operations | $ | 0.60 | 0.00 | 0.30 | 0.00 | ** | |||||||||||||
| Less distributions from: | |||||||||||||||||||
| Net investment income | $ | — | 0.04 | 0.04 | — | ||||||||||||||
| Net realized gains on investments | $ | — | 0.29 | 0.04 | — | ||||||||||||||
| Total distributions | $ | — | 0.33 | 0.08 | — | ||||||||||||||
| Net asset value, end of period | $ | 10.49 | 9.89 | 10.22 | 10.00 | ||||||||||||||
| Total Return(2) | % | 6.07 | (0.07 | ) | 3.02 | † | — | *** | |||||||||||
| Ratios and Supplemental Data: | |||||||||||||||||||
| Net assets, end of period (000's) | $ | 5,573 | 6,456 | 12,256 | 1,825 | ||||||||||||||
| Ratios to average net assets: | |||||||||||||||||||
| Net expenses after expense reimbursement(3)(4) | % | 2.27 | 2.26 | 2.32 | 1.68 | ||||||||||||||
| Gross expenses prior to expense reimbursement(3) | % | 2.27 | 2.26 | 2.43 | 3.02 | ||||||||||||||
| Net investment income (loss) after expense reimbursement(3)(4) | % | 0.95 | 0.79 | 0.43 | (0.77 | ) | |||||||||||||
| Portfolio turnover rate | % | 70 | 57 | 78 | — | ||||||||||||||
(1) Commencement of operations.
(2) Total return is calculated assuming reinvestment of all dividends and capital gain distributions at net asset value and excluding the deduction of sales charges. Total returns for periods less than one year are not annualized.
(3) Annualized for periods less than one year.
(4) The Investment Adviser has agreed to limit expenses, (excluding interest, taxes, brokerage and extraordinary expenses), subject to possible reimbursement to ING Investments, LLC within three years.
* Per share data calculated using the average number of shares throughout the period.
** Amount represents less than $0.005 per share.
*** As of May 31, 2004, the Fund was in its Offering Period. Total return calculation will begin on the commencement date of the Guarantee Period (August 17, 2004). Total return from commencement of offering of shares was 0.00%, 0.00% and 0.00% for Class A, B and C, respectively.
† Represents performance beginning on the first day of the Guarantee Period (August 17, 2004). Total return for the year ended May 31, 2005 was 3.62%, 3.00% and 3.02% for Class A, B and C, respectively.
See Accompanying Notes to Financial Statements
55
ING PRINCIPAL PROTECTION FUND XI (UNAUDITED)
FINANCIAL HIGHLIGHTS
Selected data for a share of beneficial interest outstanding throughout each period.
| Class A | Class B | ||||||||||||||||||||||||||
| Six Months Ended November 30, 2006 | Year Ended May 31, 2006 | August 16, 2004(1) to May 31, 2005 | Six Months Ended November 30, 2006 | Year Ended May 31, 2006 | August 16, 2004(1) to May 31, 2005 | ||||||||||||||||||||||
| Per Share Operating Performance: | |||||||||||||||||||||||||||
| Net asset value, beginning of period | $ | 9.88 | 9.99 | 10.00 | 9.84 | 9.96 | 10.00 | ||||||||||||||||||||
| Income (loss) from investment operations: | |||||||||||||||||||||||||||
| Net investment income | $ | 0.09 | * | 0.18 | 0.08 | 0.05 | * | 0.10 | 0.03 | ||||||||||||||||||
| Net realized and unrealized gain (loss) on investments | $ | 0.52 | (0.12 | ) | (0.04 | ) | 0.52 | (0.13 | ) | (0.04 | ) | ||||||||||||||||
| Total from investment operations | $ | 0.61 | 0.06 | 0.04 | 0.57 | (0.03 | ) | (0.01 | ) | ||||||||||||||||||
| Less distributions from: | |||||||||||||||||||||||||||
| Net investment income | $ | — | 0.16 | 0.05 | — | 0.08 | 0.03 | ||||||||||||||||||||
| Net realized gains on investments | $ | — | 0.01 | — | — | 0.01 | — | ||||||||||||||||||||
| Total distributions | $ | — | 0.17 | — | — | 0.09 | — | ||||||||||||||||||||
| Net asset value, end of period | $ | 10.49 | 9.88 | 9.99 | 10.41 | 9.84 | 9.96 | ||||||||||||||||||||
| Total Return(2) | $ | 6.17 | 0.62 | (0.09 | )** | 5.79 | (0.27 | ) | (0.36 | )** | |||||||||||||||||
| Ratios and Supplemental Data: | |||||||||||||||||||||||||||
| Net assets, end of period (000's) | $ | 4,628 | 6,783 | 8,999 | 21,544 | 22,907 | 28,380 | ||||||||||||||||||||
| Ratios to average net assets: | |||||||||||||||||||||||||||
| Expenses(3) | % | 1.56 | 1.59 | 1.75 | 2.31 | 2.34 | 2.50 | ||||||||||||||||||||
| Net investment income(3) | % | 1.71 | 1.66 | 1.19 | 0.97 | 0.91 | 0.43 | ||||||||||||||||||||
| Portfolio turnover rate | % | 23 | 29 | 28 | 23 | 29 | 28 | ||||||||||||||||||||
| Class C | |||||||||||||||
| Six Months Ended November 30, 2006 | Year Ended May 31, 2006 | August 16, 2004(1) to May 31, 2005 | |||||||||||||
| Per Share Operating Performance: | |||||||||||||||
| Net asset value, beginning of period | $ | 9.85 | 9.96 | 10.00 | |||||||||||
| Income (loss) from investment operations: | |||||||||||||||
| Net investment income | $ | 0.05 | * | 0.11 | 0.03 | ||||||||||
| Net realized and unrealized gain (loss) on investments | $ | 0.52 | (0.13 | ) | (0.04 | ) | |||||||||
| Total from investment operations | $ | 0.57 | (0.02 | ) | (0.01 | ) | |||||||||
| Less distributions from: | |||||||||||||||
| Net investment income | $ | — | 0.08 | 0.03 | |||||||||||
| Net realized gains on investments | $ | — | 0.01 | — | |||||||||||
| Total distributions | $ | — | 0.09 | — | |||||||||||
| Net asset value, end of period | $ | 10.42 | 9.85 | 9.96 | |||||||||||
| Total Return(2) | $ | 5.79 | (0.20 | ) | (0.36 | )** | |||||||||
| Ratios and Supplemental Data: | |||||||||||||||
| Net assets, end of period (000's) | $ | 4,375 | 4,737 | 7,143 | |||||||||||
| Ratios to average net assets: | |||||||||||||||
| Expenses(3) | % | 2.31 | 2.34 | 2.50 | |||||||||||
| Net investment income(3) | % | 0.97 | 0.91 | 0.46 | |||||||||||
| Portfolio turnover rate | % | 23 | 29 | 28 | |||||||||||
(1) Commencement of operations.
(2) Total return is calculated assuming reinvestment of all dividends and capital gain distributions at net asset value and excluding the deduction of sales charges. Total returns for periods less than one year are not annualized.
(3) Annualized for periods less than one year.
* Per share data calculated using the average number of shares throughout the period.
** Represents performance beginning on the first day of the Guarantee Period (November 18, 2004). Total return from commencement of offering of shares was 0.27%, (0.11)% and (0.08)% for Class A, B and C, respectively.
See Accompanying Notes to Financial Statements
56
ING PRINCIPAL PROTECTION FUND XII (UNAUDITED)
FINANCIAL HIGHLIGHTS
Selected data for a share of beneficial interest outstanding throughout each period.
| Class A | Class B | ||||||||||||||||||||||||||
| Six Months Ended November 30, 2006 | Year Ended May 31, 2006 | November 15, 2004(1) to May 31, 2005 | Six Months Ended November 30, 2006 | Year Ended May 31, 2006 | November 15, 2004(1) to May 31, 2005 | ||||||||||||||||||||||
| Per Share Operating Performance: | |||||||||||||||||||||||||||
| Net asset value, beginning of period | $ | 9.78 | 10.01 | 10.00 | 9.75 | 9.97 | 10.00 | ||||||||||||||||||||
| Income (loss) from investment operations: | |||||||||||||||||||||||||||
| Net investment income | $ | 0.09 | * | 0.16 | * | 0.05 | 0.05 | * | 0.09 | 0.02 | |||||||||||||||||
| Net realized and unrealized loss on investments | $ | 0.50 | (0.21 | ) | (0.04 | ) | 0.49 | (0.20 | ) | (0.05 | ) | ||||||||||||||||
| Total from investment operations | $ | 0.59 | (0.05 | ) | 0.01 | 0.54 | (0.11 | ) | (0.03 | ) | |||||||||||||||||
| Less distributions from: | |||||||||||||||||||||||||||
| Net investment income | $ | — | 0.18 | — | — | 0.11 | — | ||||||||||||||||||||
| Total distributions | $ | — | 0.18 | — | — | 0.11 | |||||||||||||||||||||
| Net asset value, end of period | $ | 10.37 | 9.78 | 10.01 | 10.29 | 9.75 | 9.97 | ||||||||||||||||||||
| Total Return(2) | % | 6.03 | (0.51 | ) | 0.00 | ** | 5.54 | (1.11 | ) | (0.30 | )** | ||||||||||||||||
| Ratios and Supplemental Data: | |||||||||||||||||||||||||||
| Net assets, end of period (000's) | $ | 2,428 | 3,051 | 4,734 | 10,757 | 10,748 | 12,974 | ||||||||||||||||||||
| Ratios to average net assets: | |||||||||||||||||||||||||||
| Net expenses after expense reimbursement(3)(4) | % | 1.70 | 1.75 | 1.68 | 2.45 | 2.50 | 2.43 | ||||||||||||||||||||
| Gross expenses prior to expense reimbursement(3) | % | 1.70 | 1.92 | 1.68 | 2.45 | 2.67 | 2.43 | ||||||||||||||||||||
| Net investment income after expense reimbursement(3)(4) | % | 1.82 | 1.63 | 1.26 | 1.07 | 0.89 | 0.49 | ||||||||||||||||||||
| Portfolio turnover rate | % | 16 | 97 | 14 | 16 | 97 | 14 | ||||||||||||||||||||
| Class C | |||||||||||||||
| Six Months Ended November 30, 2006 | Year Ended May 31, 2006 | November 15, 2004(1) to May 31, 2005 | |||||||||||||
| Per Share Operating Performance: | |||||||||||||||
| Net asset value, beginning of period | $ | 9.75 | 9.97 | 10.00 | |||||||||||
| Income (loss) from investment operations: | |||||||||||||||
| Net investment income | $ | 0.05 | * | 0.09 | * | 0.02 | |||||||||
| Net realized and unrealized loss on investments | $ | 0.50 | (0.20 | ) | (0.05 | ) | |||||||||
| Total from investment operations | $ | 0.55 | (0.11 | ) | (0.03 | ) | |||||||||
| Less distributions from: | |||||||||||||||
| Net investment income | $ | — | 0.11 | — | |||||||||||
| Total distributions | $ | — | 0.11 | ||||||||||||
| Net asset value, end of period | $ | 10.30 | 9.75 | 9.97 | |||||||||||
| Total Return(2) | % | 5.64 | (1.16 | ) | (0.30 | )** | |||||||||
| Ratios and Supplemental Data: | |||||||||||||||
| Net assets, end of period (000's) | $ | 2,258 | 2,775 | 5,327 | |||||||||||
| Ratios to average net assets: | |||||||||||||||
| Net expenses after expense reimbursement(3)(4) | % | 2.45 | 2.50 | 2.43 | |||||||||||
| Gross expenses prior to expense reimbursement(3) | % | 2.45 | 2.67 | 2.43 | |||||||||||
| Net investment income after expense reimbursement(3)(4) | % | 1.07 | 0.89 | 0.52 | |||||||||||
| Portfolio turnover rate | % | 16 | 97 | 14 | |||||||||||
(1) Commencement of operations.
(2) Total return is calculated assuming reinvestment of all dividends and capital gain distributions at net asset value and excluding the deduction of sales charges. Total returns for periods less than one year are not annualized.
(3) Annualized for periods less than one year.
(4) The Investment Adviser has agreed to limit expenses, (excluding interest, taxes, brokerage and extraordinary expenses), subject to possible reimbursement to ING Investments, LLC within three years.
* Per share data calculated using the average number of shares throughout the period.
** Represents performance beginning on the first day of the Guarantee Period (February 16, 2005). Total return from commencement of offering of shares was 0.10%, (0.30)% and (0.30)% for Class A, B and C, respectively.
See Accompanying Notes to Financial Statements
57
NOTES TO FINANCIAL STATEMENTS AS OF NOVEMBER 30, 2006 (UNAUDITED)
NOTE 1 — ORGANIZATION
Organization. The ING Principal Protection Funds ("PPFs") and ING Index Plus LargeCap Equity Fund ("Index Plus LargeCap Equity") are part of the ING Equity Trust ("IET"), which is an open-end investment management company registered under the 1940 Act.
IET is a Massachusetts business trust organized on June 12, 1998 with twenty-five separate funds. Twelve of the Funds included in this report are: ING Index Plus LargeCap Equity Fund ("Index Plus LargeCap Equity" formerly ING Principal Protection Fund), ING Principal Protection Fund II ("Principal Protection II" or "PPF II"), ING Principal Protection Fund III ("Principal Protection III" or "PPF III"), ING Principal Protection Fund IV ("Principal Protection IV" or "PPF IV"), ING Principal Protection Fund V ("Principal Protection V" or "PPF V"), ING Principal Protection Fund VI ("Principal Protection VI" or "PPF VI"), ING Principal Protection Fund VII ("Principal Protection VII" or "PPF VII"), ING Principal Protection Fund VIII ("Principal Protection VIII" or "PPF VIII"), ING Principal Protection Fund IX ("Principal Protection IX" or "PPF IX"), ING Principal Protection Fund X ("Principal Protection X" or "PPF X"), ING Principal Protection Fund XI ("Principal Protection XI" or "PPF XI"), and ING Principal Protection Fund XII ("Principal Protection XII" or "PPF XII"), (each a "Fund"; collectively the "Funds").
Each PPF has an Offering Period, a Guarantee Period and an Index Plus LargeCap Period. Shares of each PPF will be offered during the Offering Period but will not be offered during the Guarantee Period, except in connection with reinvestment of dividends. Each PPF will be offered on a continuous basis to existing shareholders during the Index Plus LargeCap Period. During the Guarantee Period, each PPF seeks to participate in favorable equity market conditions while preserving at least the principal amount of the PPF as of the inception of the Guarantee Period. Each PPF guarantees that the amount distributed, if any, to each shareholder at the end of the Guarantee Period will be no less than the value of that shareholder's investment as of the inception of the Guarantee Period provided that all distributions received from the PPF have been reinvested and no shares have been redeemed. During the Index Plus LargeCap Period, which will commence i mmediately following the Guarantee Period, each PPF seeks to outperform the total return performance of the S&P 500® Index, while maintaining a risk profile consistent with the index.
The following table presents the time periods for each PPF's three phases:
| Offering Period | Guarantee Period | Commencement of Index Plus LargeCap Equity | |||||||||||||
| PPF II | 11/05/01 — 01/31/02 | 02/01/02 — 01/31/07 | 02/01/07 | ||||||||||||
| PPF III | 03/01/02 — 05/30/02* | 06/06/02 — 06/05/07 | 06/06/07 | ||||||||||||
| PPF IV | 07/01/02 — 09/30/02* | 10/08/02 — 10/08/07 | 10/09/07 | ||||||||||||
| PPF V | 11/01/02 — 01/15/03* | 01/23/03 — 01/22/08 | 01/23/08 | ||||||||||||
| PPF VI | 02/03/03 — 04/15/03* | 04/24/03 — 04/23/08 | 04/24/08 | ||||||||||||
| PPF VII | 05/01/03 — 06/24/03* | 06/30/03 — 06/26/08 | 06/27/08 | ||||||||||||
| PPF VIII | 10/01/03 — 12/15/03* | 12/23/03 — 12/22/08 | 12/23/08 | ||||||||||||
| PPF IX | 02/02/04 — 04/15/04* | 04/22/04 — 04/21/09 | 04/22/09 | ||||||||||||
| PPF X | 05/03/04 — 08/09/04* | 08/17/04 — 08/14/09 | 08/15/09 | ||||||||||||
| PPF XI | 08/16/04 — 11/11/04* | 11/18/04 — 11/18/09 | 11/19/09 | ||||||||||||
| PPF XII | 11/15/04 — 02/09/05* | 02/16/05 — 02/16/10 | 02/17/10 | ||||||||||||
* A Quiet Period between the Offering Period and the Guarantee Period where new deposits are not accepted and the assets will remain invested in short term instruments.
Each Fund offers at least three of the following classes of shares: Class A, Class B, Class C and Class Q. The separate classes of shares differ principally in the applicable sales charges (if any), distribution fees, shareholder servicing fees and transfer agency fees. Shareholders of each class also bear certain expenses that pertain to that particular class. All shareholders bear the common expenses of the Funds and earn income and realized gains/losses from the Funds pro rata based on the average daily net assets of each class, without distinction between share classes. Differences in per share dividend rates generally result from differences in separate class expenses, including distribution and shareholder servicing fees. Class B shares, along with their pro rata reinvested dividend shares, automatically convert to Class A shares eight years after purchase.
Effective October 12, 2006, the maximum Class A sales charge for Index Plus LargeCap Equity has been reduced to 3.00%. Return calculations with a starting date prior to October 12, 2006 are based on a 5.75% sales charge, while returns with a starting date on or after October 12, 2006 are based on a 3.00% sales charge.
NOTE 2 — SIGNIFICANT ACCOUNTING POLICIES
The following significant accounting policies are consistently followed by the Funds in the preparation of their financial statements. Such policies are in conformity with U.S. generally accepted accounting principles for investment companies.
A. Security Valuation. Investments in equity securities traded on a national securities exchange are valued at the last reported sale price. Securities reported by NASDAQ will be valued at the NASDAQ official closing prices. Securities traded on an exchange or NASDAQ for which there has been no sale and
58
NOTES TO FINANCIAL STATEMENTS AS OF NOVEMBER 30, 2006 (UNAUDITED) (CONTINUED)
NOTE 2 — SIGNIFICANT ACCOUNTING POLICIES (continued)
securities traded in the over-the-counter-market are valued at the mean between the last reported bid and ask prices. All investments quoted in foreign currencies will be valued daily in U.S. dollars on the basis of the foreign currency exchange rates prevailing at that time. Debt securities are valued at prices obtained from independent services or from one or more dealers making markets in the securities and may be adjusted based on the Funds' valuation procedures. U.S. government obligations are valued by using market quotations or independent pricing services that use prices provided by market-makers or estimates of market values obtained from yield data relating to instruments or securities with similar characteristics.
Securities and assets for which market quotations are not readily available (which may include certain restricted securities which are subject to limitations as to their sale) are valued at their fair values as determined in good faith by or under the supervision of the Funds' Board of Trustees ("Board"), in accordance with methods that are specifically authorized by the Board. Securities traded on exchanges, including foreign exchanges, which close earlier than the time that a Fund calculates its net asset value ("NAV") may also be valued at their fair values as determined in good faith by or under the supervision of a Fund's Board, in accordance with methods that are specifically authorized by the Board. The valuation techniques applied in any specific instance are likely to vary from case to case. With respect to a restricted security, for example, consideration is generally given to the cost of the investment, the market value of any unr estricted securities of the same class at the time of valuation, the potential expiration of restrictions on the security, the existence of any registration rights, the costs to the Funds related to registration of the security, as well as factors relevant to the issuer itself. Consideration may also be given to the price and extent of any public trading in similar securities of the issuer or comparable companies' securities.
The value of a foreign security traded on an exchange outside the United States is generally based on the price of a foreign security on the principal foreign exchange where it trades as of the time a Fund determines its NAV or if the foreign exchange closes prior to the time the Fund determines its NAV, the most recent closing price of the foreign security on its principal exchange. Trading in certain non-U.S. securities may not take place on all days on which the New York Stock Exchange ("NYSE") is open. Further, trading takes place in various foreign markets on days on which the NYSE is not open. Consequently, the calculation of a Fund's NAV may not take place contemporaneously with the determination of the prices of securities held by a Fund in foreign securities markets. Further, the value of a Fund's assets may be significantly affected by foreign trading on days w hen a shareholder cannot purchase or redeem shares of the Fund. In calculating a Fund's NAV, foreign securities denominated in foreign currency are converted to U.S. dollar equivalents.
If an event occurs after the time at which the market for foreign securities held by a Fund closes but before the time that the Fund's NAV is calculated, such event may cause the closing price on the foreign exchange to not represent a readily available reliable market value quotation for such securities at the time the Fund determines its NAV. In such a case, a Fund will use the fair value of such securities as determined under the Fund's valuation procedures. Events after the close of trading on a foreign market that could require a Fund to fair value some or all of its foreign securities include, among others, securities trading in the U.S. and other markets, corporate announcements, natural and other disasters, and political and other events. Among other elements of analysis in the determination of a security's fair value, the Board has authorized the use of one or more independent research services to assist with such determinations. An independent research service may use statistical analyses and quantitative models to help determine fair value as of the time a Fund calculates its NAV. There can be no assurance that such models accurately reflect the behavior of the applicable markets or the effect of the behavior of such markets on the fair value of securities, or that such markets will continue to behave in a fashion that is consistent with such models. Unlike the closing price of a security on an exchange, fair value determinations employ elements of judgment. Consequently, the fair value assigned to a security may not represent the actual value that a Fund could obtain if it were to sell the security at the time of the close of the NYSE. Pursuant to procedures adopted by the Board, a Fund is not obligated to use the fair valuations suggested by any research service, and valuation recommendations provided by such research services may be overridden if other events have occurred or if other fair valuations are
59
NOTES TO FINANCIAL STATEMENTS AS OF NOVEMBER 30, 2006 (UNAUDITED) (CONTINUED)
NOTE 2 — SIGNIFICANT ACCOUNTING POLICIES (continued)
determined in good faith to be more accurate. Unless an event is such that it causes a Fund to determine that the closing prices for one or more securities do not represent readily available reliable market value quotations at a time the Fund determines its NAV, events that occur between the time of the close of the foreign market on which they are traded and the close of regular trading on the NYSE will not be reflected in the Fund's NAV. Investments in securities maturing in 60 days or less from the date of acquisition are valued at amortized cost, which, when combined with accrued interest, approximates market value.
B. Security Transactions and Revenue Recognition. Securities transactions are accounted for on the trade date. Realized gains and losses are reported on the basis of identified cost of securities sold. Interest income is recorded on an accrual basis. Dividend income is recorded on the ex-dividend date, or for certain foreign securities, when the information becomes available to the Funds. Premium amortization and discount accretion are determined by the effective yield method.
C. Foreign Currency Translation. The books and records of the Funds are maintained in U.S. dollars. Any foreign currency amounts are translated into U.S. dollars on the following basis:
(1) Market value of investment securities, other assets and liabilities — at the exchange rates prevailing at the end of the day.
(2) Purchases and sales of investment securities, income and expenses — at the exchange rates of exchange prevailing on the respective dates of such transactions.
Although the net assets and the market values are presented at the foreign exchange rates at the end of the day, the Funds do not isolate the portion of the results of operations resulting from changes in foreign exchange rates on investments from the fluctuations arising from changes in market prices of securities held. Such fluctuations are included with the net realized and unrealized gains or losses from investments. For securities which are subject to foreign withholding tax upon disposition, liabilities are recorded on the Statement of Assets and Liabilities for the estimated tax withholding based on the securities' current market value. Upon disposition, realized gains or losses on such securities are recorded net of foreign withholding tax.
Reported net realized foreign exchange gains or losses arise from sales of foreign currencies, currency gains or losses realized between the trade and settlement dates on securities transactions, the difference between the amounts of dividends, interest, and foreign withholding tax reclaims recorded on a Fund's books, and the U.S. dollar equivalent of the amounts actually received or paid. Net unrealized foreign exchange gains and losses arise from changes in the value of assets and liabilities other than investments in securities at fiscal year end, resulting from changes in the exchange rate. Foreign security and currency transactions may involve certain considerations and risks not typically associated with investing in U.S. companies and U.S. government securities. These risks include but are not limited to revaluation of currencies and future adverse political and economic developments which could cause securities and their markets to b e less liquid and prices more volatile than those of comparable U.S. companies and U.S. government securities.
D. Foreign Currency Transactions and Futures Contracts. The Funds may enter into foreign currency exchange transactions to convert to and from different foreign currencies and to and from the U.S. dollar in connection with the planned purchases or sales of securities. The Funds either enter into these transactions on a spot basis at the spot rate prevailing in the foreign currency exchange market or use forward foreign currency contracts to purchase or sell foreign currencies. When the contract is fulfilled or closed, gains or losses are realized. Until then, the gain or loss is included in unrealized appreciation or depreciation. Risks may arise upon entering into forward contracts from the potential inability of counterparties to meet the terms of their forward contracts and from unanticipated movements in the value of foreign currencies relative to the U.S. dollar. For the six months ended November 30, 2006, the Funds did not enter into foreign currency exchange transactions.
Each Fund may enter into futures contracts involving foreign currency, interest rates, securities and security indices. A futures contract obligates the seller of the contract to deliver and the purchaser of the contract to take delivery of the type of foreign currency, financial instrument or security called for in the contract at a specified future time for a specified price. Upon entering into such a contract, a Fund is required to deposit and maintain as collateral such initial margin as required by the exchange on which the contract is
60
NOTES TO FINANCIAL STATEMENTS AS OF NOVEMBER 30, 2006 (UNAUDITED) (CONTINUED)
NOTE 2 — SIGNIFICANT ACCOUNTING POLICIES (continued)
traded. Pursuant to the contract, a Fund agrees to receive from or pay to the broker an amount equal to the daily fluctuations in the value of the contract. Such receipts or payments are known as variation margins and are recorded as unrealized gains or losses by a Fund. When the contract is closed, a Fund records a realized gain or loss equal to the difference between the value of the contract at the time it was opened and the value at the time it was closed.
E. Distributions to Shareholders. The Funds record distributions to their shareholders on the ex-dividend date. Each Fund pays dividends and capital gains, if any, annually. The Funds may make distributions on a more frequent basis to comply with the distribution requirements of the Internal Revenue Code. The characteristics of income and gains to be distributed are determined in accordance with income tax regulations, which may differ from U.S. generally accepted accounting principles for investment companies.
F. Federal Income Taxes. It is the policy of the Funds to comply with the requirements of the subchapter M of the Internal Revenue Code and related excise tax provisions applicable to regulated investment companies and to distribute substantially all of their net investment income and any net realized capital gains to their shareholders. Therefore, no federal income tax or provision is required. No capital gain distributions will be made until any capital loss carryforwards have been fully utilized or expired.
G. Organization Expenses and Offering Costs. Costs incurred with the organization of the Funds were expensed as incurred. Costs incurred with the offering of shares of the Funds are deferred and amortized over a twelve-month period starting on the first day of the Guarantee Period on a straight-line basis.
H. Guarantee Fees. Each PPF's Guarantee is backed by an unconditional, irrevocable guarantee from MBIA Insurance Corporation ("MBIA"), a monoline financial guarantor. Each PPF pays MBIA a guarantee fee of 0.33% of its average daily net assets during the guarantee period.
MBIA Insurance Corporation ("MBIA"), 113 King Street, Armonk, New York 10504 serves as the financial guarantor to the PPFs' pursuant to a written agreement with ING Investments, ING Investment Management Co. and the Trust.
Pursuant to the terms of the Financial Guaranty Agreement, MBIA will issue to the Trust, for the benefit of the shareholders of the PPF, the insurance policy to support the PPF's Payment Undertaking. The insurance policy is unconditional and irrevocable and will remain in place through the Guarantee Maturity Date for a PPF. MBIA is one of the world's premier financial guarantee companies and a leading provider of investment management products and services. MBIA and its subsidiaries provide financial guarantees to municipalities and other bond issuers. MBIA also guarantees structured asset-backed and mortgage-backed transactions, selected corporate bonds and obligations of high-quality financial institutions. Further information about MBIA and its parent company MBIA, Inc. can be found on its website at www.mbia.com.
I. Use of Estimates. The preparation of financial statements in conformity with U.S. generally accepted accounting principles requires management to make estimates and assumptions that affect the reported amounts of assets and liabilities and disclosure of contingent assets and liabilities at the date of the financial statements and the reported amounts of increases and decreases in net assets from operations during the reporting period. Actual results could differ from those estimates.
J. Repurchase Agreements. Each Fund may invest in repurchase agreements only with government securities dealers recognized by the Board of Governors of the Federal Reserve System. Under such agreements, the seller of the security agrees to repurchase it at a mutually agreed upon time and price. The resale price is in excess of the purchase price and reflects an agreed upon interest rate for the period of time the agreement is outstanding. The period of the repurchase agreements is usually short, from overnight to one week, while the underlying securities generally have longer maturities. Each Fund will receive as collateral securities acceptable to it whose market value is equal to at least 100% of the carrying amount of the repurchase agreements, plus accrued interest, being invest ed by the Fund. The underlying collateral is valued daily on a mark-to-market basis to assure that the value, including accrued interest is at least equal to the repurchase price. If the seller defaults, a Fund might incur a loss or delay in the realization of proceeds if the value of the security collateralizing the repurchase agreement declines, and it might incur disposition costs in liquidating the collateral.
61
NOTES TO FINANCIAL STATEMENTS AS OF NOVEMBER 30, 2006 (UNAUDITED) (CONTINUED)
NOTE 2 — SIGNIFICANT ACCOUNTING POLICIES (continued)
K. Illiquid and Restricted Securities. Each Fund may not invest more than 15% of its net assets in illiquid securities. Illiquid securities are not readily marketable. Disposing of illiquid investments may involve time-consuming negotiation and legal expenses, and it may be difficult or impossible for the Funds to sell them promptly at an acceptable price. Each Fund also may invest in restricted securities, which include those sold under Rule 144A of the Securities Act of 1933 ("1933 Act") or securities offered pursuant to Section 4(2) of the 1933 Act, and/or are subject to legal or contractual restrictions on resale and generally may not be publicly sold without registration under the 1933 Act. Certain restricted securities may be considered liquid pursuant to procedures adopted by the Board or may be deemed to be illiquid because they may not be readily marketable. Illiquid and restricted securities are valued using market quotations when readily available. In the absence of market quotations, the securities are valued based upon their fair value determined under procedures approved by the Board.
NOTE 3 — INVESTMENT TRANSACTIONS
For the six months ended November 30, 2006, the cost of purchases and proceeds from the sales of securities, excluding short-term securities, were as follows:
| Purchases | Sales | ||||||||||
| Index Plus LargeCap Equity | $ | 130,185,542 | $ | 108,492,760 | |||||||
| PPF II | 7,758,637 | 14,925,685 | |||||||||
| PPF III | 8,124,000 | 13,417,708 | |||||||||
| PPF IV | 54,582,157 | 82,962,188 | |||||||||
| PPF V | 42,339,030 | 27,049,221 | |||||||||
| PPF VI | 25,641,397 | 43,237,439 | |||||||||
| PPF VII | 11,920,396 | 15,895,892 | |||||||||
| PPF VIII | 8,474,196 | 8,454,464 | |||||||||
| PPF IX | 7,016,732 | 6,712,102 | |||||||||
| PPF X | 29,515,631 | 7,935,812 | |||||||||
| PPF XI | 3,817,413 | 4,016,122 | |||||||||
| PPF XII | 1,869,733 | 2,021,262 | |||||||||
U.S. government securities not included above were as follows:
| Purchases | Sales | ||||||||||
| Index Plus LargeCap Equity | $ | — | $ | 121,972,238 | |||||||
| PPF II | — | 28,188,494 | |||||||||
| PPF III | — | 19,316,787 | |||||||||
| PPF IV | 9,429,000 | 38,373,956 | |||||||||
| PPF V | 27,049,221 | 67,245,889 | |||||||||
| PPF VI | 51,686,377 | 71,634,574 | |||||||||
| PPF VII | 15,882,015 | 32,040,677 | |||||||||
| PPF VIII | 10,196,051 | 24,250,200 | |||||||||
| PPF IX | 5,085,762 | 14,158,999 | |||||||||
| PPF X | 3,611,708 | 32,418,455 | |||||||||
| PPF XI | 3,536,276 | 9,205,877 | |||||||||
| PPF XII | 626,903 | 2,546,529 | |||||||||
NOTE 4 — INVESTMENT MANAGEMENT AND ADMINISTRATIVE FEES
The Funds entered into an investment management agreement ("Management Agreement") with ING Investments, LLC ("ING Investments" or "Investment Adviser"). The Management Agreement compensates the Investment Adviser with a fee, computed daily and payable monthly, based on the average daily net assets of each Fund. The fee for each PPF is 0.25% during its Offering Period and 0.45% during its Index Plus LargeCap Period. For PPF II — PPF VII, the fee during the Guarantee Period is 0.80%. During the Guarantee Period for PPF VIII — PPF XII, the maximum fee is 0.80% on the Equity Component and 0.55% on both the Fixed Component and Exchange Traded Fund/Futures Strategy Component of the average daily net assets. The fee for Index Plus LargeCap Equity is 0.45% of its average daily net assets.
ING Investment Management Co. ("ING IM" or "Sub-Adviser") a registered investment adviser, serves as Sub-Adviser to the Funds.
ING Funds Services, LLC (the "Administrator"), serves as administrator to each Fund. Each Fund compensates the Administrator with a fee calculated at an annual rate of 0.10% of each Fund's average daily net assets.
The Investment Adviser, ING IM, the Administrator and ING Funds Distributor, LLC (the "Distributor") are indirect, wholly-owned subsidiaries of ING Groep N.V. ("ING Groep"). ING Groep is one of the largest financial services organizations in the world, and offers an array of banking, insurance and asset management services to both individuals and investors.
NOTE 5 — DISTRIBUTION AND SERVICE FEES
Each share class of the Funds has adopted a Plan pursuant to Rule 12b-1 under the 1940 Act (the "12b-1 Plans"), whereby the Distributor is compensated by the Funds for expenses incurred in the distribution of each Fund's shares ("Distribution Fees"). Pursuant to the 12b-1 Plans, the Distributor is entitled to a payment each month to compensate expenses incurred in the distribution and promotion of each Fund's shares, including expenses incurred in printing prospectuses and reports used for sales purposes, expenses incurred in preparing and printing sales literature and other such distribution related expenses, including any distribution or shareholder servicing fees ("Service Fees") paid to securities dealers who have executed a distribution agreement
62
NOTES TO FINANCIAL STATEMENTS AS OF NOVEMBER 30, 2006 (UNAUDITED) (CONTINUED)
NOTE 5 — DISTRIBUTION AND SERVICE FEES (continued)
with the Distributor. Under the 12b-1 Plans, each class of shares of the Fund pays the Distributor a combined Distribution and/or Service Fee based on average daily net assets at the following rates:
| Class A | Class B | Class C | Class Q | ||||||||||||||||
| Index Plus LargeCap Equity | 0.25 | % | 1.00 | % | 1.00 | % | 0.25 | % | |||||||||||
| PPF II | 0.25 | % | 1.00 | % | 1.00 | % | N/A | ||||||||||||
| PPF III | 0.25 | % | 1.00 | % | 1.00 | % | N/A | ||||||||||||
| PPF IV | 0.25 | % | 1.00 | % | 1.00 | % | 0.25 | % | |||||||||||
| PPF V | 0.25 | % | 1.00 | % | 1.00 | % | N/A | ||||||||||||
| PPF VI | 0.25 | % | 1.00 | % | 1.00 | % | N/A | ||||||||||||
| PPF VII | 0.25 | % | 1.00 | % | 1.00 | % | N/A | ||||||||||||
| PPF VIII | 0.25 | % | 1.00 | % | 1.00 | % | N/A | ||||||||||||
| PPF IX | 0.25 | % | 1.00 | % | 1.00 | % | N/A | ||||||||||||
| PPF X | 0.25 | % | 1.00 | % | 1.00 | % | N/A | ||||||||||||
| PPF XI | 0.25 | % | 1.00 | % | 1.00 | % | N/A | ||||||||||||
| PPF XII | 0.25 | % | 1.00 | % | 1.00 | % | N/A | ||||||||||||
For the six months ended November 30, 2006, the Distributor retained the following amounts in sales charges:
| Initial Sales Charges: | Class A Shares | Class B Shares | Class C Shares | ||||||||||||
| PPF VIII | $ | 1,409 | N/A | N/A | |||||||||||
| Contingent Deferred Sales Charges: | Class A Shares | Class B Shares | Class C Shares | ||||||||||||
| Index Plus LargeCap Equity | $ | 14 | N/A | N/A | |||||||||||
| PPF II | 2 | N/A | N/A | ||||||||||||
| PPF IV | N/A | N/A | $ | 1 | |||||||||||
| PPF V | 2 | N/A | N/A | ||||||||||||
| PPF VII | 588 | N/A | N/A | ||||||||||||
| PPF XI | 3,006 | N/A | N/A | ||||||||||||
NOTE 6 — OTHER TRANSACTIONS WITH AFFILIATES AND RELATED PARTIES
At November 30, 2006, the Funds had the following amounts recorded in payable to affiliates on the accompanying Statements of Assets and Liabilities (see Notes 4 and 5):
| Accrued Investment Management Fees | Accrued Administrative Fees | Accrued Shareholder Service and Distribution Fees | Accrued Waivers & Reimbursements | Total | |||||||||||||||||||
| Index Plus LargeCap Equity | $ | 21,355 | $ | 4,746 | $ | 44,461 | $ | — | $ | 70,562 | |||||||||||||
| PPF II | 138,447 | 17,306 | 164,085 | — | 319,838 | ||||||||||||||||||
| PPF III | 108,139 | 13,517 | 126,946 | — | 248,602 | ||||||||||||||||||
| PPF IV | 221,408 | 27,676 | 265,048 | — | 514,132 | ||||||||||||||||||
| PPF V | 178,783 | 22,348 | 211,066 | — | 412,197 | ||||||||||||||||||
| PPF VI | 160,040 | 20,005 | 190,984 | — | 371,029 | ||||||||||||||||||
| PPF VII | 78,394 | 9,799 | 93,787 | 205 | 182,185 | ||||||||||||||||||
| PPF VIII | 40,200 | 6,147 | 56,305 | — | 102,652 | ||||||||||||||||||
| PPF IX | 30,123 | 4,520 | 41,872 | — | 76,515 | ||||||||||||||||||
| PPF X | 25,491 | 3,781 | 33,312 | — | 62,584 | ||||||||||||||||||
| PPF XI | 16,771 | 2,523 | 22,287 | 12,917 | 54,498 | ||||||||||||||||||
| PPF XII | 8,281 | 1,265 | 11,146 | — | 20,692 | ||||||||||||||||||
During the year ended May 31, 2005, the Sub-Adviser reimbursed PPF VI $11,250 in connection with loss on an investment transaction.
The Funds have adopted a Retirement Policy covering all independent trustees of each Fund who will have served as an independent trustee for at least five years at the time of retirement. Benefits under this plan are based on an annual rate as defined in the plan agreement.
NOTE 7 — OTHER ACCRUED EXPENSES AND LIABILITIES
At November 30, 2006, the Funds had the following payables included in Other Accrued Expenses and Liabilities on the Statements of Assets and Liabilities that exceeded 5% of total liabilities.
| Payable for MBIA Fees | |||||||
| PPF III | $ | 44,607 | |||||
| PPF IV | 91,331 | ||||||
| PPF V | 73,748 | ||||||
| PPF VI | 66,017 | ||||||
| PPF X | 12,478 | ||||||
| PPF XI | 8,327 | ||||||
| PPF XII | 4,174 | ||||||
| Payable for Custody Fees | |||||||
| PPF XI | $ | 6,200 | |||||
| PPF XII | 2,216 | ||||||
| Payable for Postage Fees | |||||||
| PPF IX | $ | 26,395 | |||||
| PPF XI | 7,244 | ||||||
| Payable for Transfer Agent Fees | |||||||
| PPF XII | $ | 3,970 | |||||
| Payable for Printing Fees | |||||||
| Index Plus LargeCap Equity | $ | 42,282 | |||||
| PPF IX | 23,878 | ||||||
| PPF X | 12,559 | ||||||
| Payable for Audit Fees | |||||||
| PPF XII | $ | 3,326 | |||||
NOTE 8 — EXPENSE LIMITATIONS
ING Investments entered into a written expense limitation agreement ("Expense Limitation Agreement") with each of the Funds whereby, the Investment Adviser has agreed to limit expenses, excluding interest, taxes,
63
NOTES TO FINANCIAL STATEMENTS AS OF NOVEMBER 30, 2006 (UNAUDITED) (CONTINUED)
NOTE 8 — EXPENSE LIMITATIONS (continued)
brokerage and extraordinary expenses to the levels listed below:
| Class A | Class B | Class C | Class Q | ||||||||||||||||
| PPF II | 1.75 | % | 2.50 | % | 2.50 | % | N/A | ||||||||||||
| PPF III | 1.75 | % | 2.50 | % | 2.50 | % | N/A | ||||||||||||
| PPF IV | 1.75 | % | 2.50 | % | 2.50 | % | 1.75 | % | |||||||||||
| PPF V | 1.75 | % | 2.50 | % | 2.50 | % | N/A | ||||||||||||
| PPF VI | 1.75 | % | 2.50 | % | 2.50 | % | N/A | ||||||||||||
| PPF VII(1) | 1.75 | % | 2.50 | % | 2.50 | % | N/A | ||||||||||||
| PPF VIII | 1.75 | % | 2.50 | % | 2.50 | % | N/A | ||||||||||||
| PPF IX | 1.75 | % | 2.50 | % | 2.50 | % | N/A | ||||||||||||
| PPF X | 1.75 | % | 2.50 | % | 2.50 | % | N/A | ||||||||||||
| PPF XI | 1.75 | % | 2.50 | % | 2.50 | % | N/A | ||||||||||||
| PPF XII | 1.75 | % | 2.50 | % | 2.50 | % | N/A | ||||||||||||
(1) The Expense Limitation Agreement for PPF VII was modified May 1, 2004 into a tier structure based on the percentage of assets in the Equity Component. Under this tier structure, the Investment Adviser will limit expenses to a maximum of 1.75%, 2.50% and 2.50% for Classes A, B and C, respectively, excluding expenses such as interest, taxes, brokerage and extraordinary expenses. The actual expense limitation rates from May 31, 2004 to May 31, 2005 were 1.46%, 2.21% and 2.21% for Classes A, B and C, respectively. The actual expense limitation rates from
May 31, 2005 to May 31, 2006 were 1.75%, 2.50% and 2.50% for Classes A, B and C, respectively.
The Investment Adviser may at a later date recoup from a Fund for management fees waived and other expenses assumed by the Investment Adviser during the previous 36 months, but only if, after such reimbursement, that Fund's expense ratio does not exceed the percentage described above. Waived and reimbursed fees net of any recoupment by the Investment Adviser of such waived and reimbursed fees are reflected on the accompanying Statement of Operations for each Fund. Outstanding reimbursement balances due to the Funds, if any, under their respective expense limitation agreements are reflected in Reimbursement Due from Manager on the accompanying Statements of Assets and Liabilities.
As of November 30, 2006, the cumulative amounts of reimbursed fees that are subject to possible recoupment by the Investment Adviser, and the related expiration dates are as follows:
| November 30, | |||||||||||||||||||
| 2007 | 2008 | 2009 | Total | ||||||||||||||||
| PPF VII | $ | 114,876 | $ | 22,717 | $ | — | $ | 137,593 | |||||||||||
| PPF XII | — | 21,171 | 13,229 | 34,400 | |||||||||||||||
The Expense Limitation Agreement is contractual and shall renew automatically for one-year terms unless ING Investments provides written termination of the Expense Limitation Agreement within 90 days of the end of the then current term.
NOTE 9 — LINE OF CREDIT
The Funds, in addition to certain other funds managed by the Investment Adviser, have entered into an unsecured committed revolving line of credit agreement (the "Credit Agreement") with The Bank of New York for an aggregate amount of $125,000,000. The proceeds may be used to: (1) temporarily finance the purchase and sale of securities; (2) finance the redemption of shares of an investor in the Funds; and (3) enable the Funds to meet other emergency expenses as defined in the Credit Agreement. The Funds to which the line of credit is available pay a commitment fee equal to 0.09% per annum on the daily unused portion of the committed line amount payable quarterly in arrears.
The following Funds utilized the line of credit during the six months ended November 30, 2006:
| Fund | Days Utilized | Approximate Average Daily Balance for Days Utilized | Approximate Weighted Average Interest Rate For Days Utilized | ||||||||||||
| Index Plus LargeCap Equity | 7 | $ | 2,327,143 | 6.05 | % | ||||||||||
| PPF VI | 1 | 530,000 | 5.52 | % | |||||||||||
64
NOTES TO FINANCIAL STATEMENTS AS OF NOVEMBER 30, 2006 (UNAUDITED) (CONTINUED)
NOTE 10 — CAPITAL SHARES
Transaction in capital shares and dollars were as follows:
| Class A | Class B | ||||||||||||||||||
| Six Months Ended November 30, 2006 | Year Ended May 31, 2006 | Six Months Ended November 30, 2006 | Year Ended May 31, 2006 | ||||||||||||||||
| Index Plus LargeCap Equity (Number of Shares) | |||||||||||||||||||
| Dividends reinvested | 34,809 | 31,106 | 184,494 | 199,169 | |||||||||||||||
| Shares redeemed | (807,807 | ) | (673,796 | ) | (9,425,611 | ) | (4,782,935 | ) | |||||||||||
| Net decrease in shares outstanding | (772,998 | ) | (642,690 | ) | (9,271,114 | ) | (4,583,766 | ) | |||||||||||
| Index Plus LargeCap Equity ($) | |||||||||||||||||||
| Dividends reinvested | $ | 345,696 | $ | 303,285 | $ | 1,529,381 | $ | 1,943,888 | |||||||||||
| Shares redeemed | (8,035,276 | ) | (6,650,627 | ) | (93,821,307 | ) | (47,005,553 | ) | |||||||||||
| Net decrease | $ | (7,689,580 | ) | $ | (6,347,342 | ) | $ | (92,291,926 | ) | $ | (45,061,665 | ) | |||||||
| Class C | Class Q | ||||||||||||||||||
| Six Months Ended November 30, 2006 | Year Ended May 31, 2006 | Six Months Ended November 30, 2006 | Year Ended May 31, 2006 | ||||||||||||||||
| Index Plus LargeCap Equity (Number of Shares) | |||||||||||||||||||
| Dividends reinvested | 10,191 | 17,514 | 159 | 200 | |||||||||||||||
| Shares redeemed | (667,250 | ) | (1,151,202 | ) | (3,902 | ) | (25,168 | ) | |||||||||||
| Net decrease in shares outstanding | (657,059 | ) | (1,133,688 | ) | (3,743 | ) | (24,968 | ) | |||||||||||
| Index Plus LargeCap Equity ($) | |||||||||||||||||||
| Dividends reinvested | $ | 103,133 | $ | 171,639 | $ | 1,586 | $ | 1,966 | |||||||||||
| Shares redeemed | (6,677,697 | ) | (11,355,140 | ) | (39,109 | ) | (249,744 | ) | |||||||||||
| Net decrease | $ | (6,574,564 | ) | $ | (11,183,501 | ) | $ | (37,523 | ) | $ | (247,778 | ) | |||||||
| Class A | Class B | Class C | |||||||||||||||||||||||||
| Six Months Ended November 30, 2006 | Year Ended May 31, 2006 | Six Months Ended November 30, 2006 | Year Ended May 31, 2006 | Six Months Ended November 30, 2006 | Year Ended May 31, 2006 | ||||||||||||||||||||||
| Principal Protection II (Number of Shares) | |||||||||||||||||||||||||||
| Dividends reinvested | — | 51,981 | — | 388,101 | — | 47,860 | |||||||||||||||||||||
| Shares redeemed | (243,032 | ) | (983,030 | ) | (2,319,726 | ) | (6,349,149 | ) | (632,993 | ) | (2,051,427 | ) | |||||||||||||||
| Net decrease in shares outstanding | (243,032 | ) | (931,049 | ) | (2,319,726 | ) | (5,961,048 | ) | (632,993 | ) | (2,003,567 | ) | |||||||||||||||
| Principal Protection II ($) | |||||||||||||||||||||||||||
| Dividends reinvested | $ | — | $ | 491,739 | $ | — | $ | 3,674,885 | $ | — | $ | 455,147 | |||||||||||||||
| Shares redeemed | (2,341,124 | ) | (9,440,582 | ) | (22,308,403 | ) | (60,794,351 | ) | (6,123,589 | ) | (19,720,368 | ) | |||||||||||||||
| Net decrease | $ | (2,341,124 | ) | $ | (8,948,843 | ) | $ | (22,308,403 | ) | $ | (57,119,466 | ) | $ | (6,123,589 | ) | $ | (19,265,221 | ) | |||||||||
| Class A | Class B | Class C | |||||||||||||||||||||||||
| Six Months Ended November 30, 2006 | Year Ended May 31, 2006 | Six Months Ended November 30, 2006 | Year Ended May 31, 2006 | Six Months Ended November 30, 2006 | Year Ended May 31, 2006 | ||||||||||||||||||||||
| Principal Protection III (Number of Shares) | |||||||||||||||||||||||||||
| Dividends reinvested | — | 40,089 | — | 293,694 | — | 25,229 | |||||||||||||||||||||
| Shares redeemed | (19,490 | ) | (636,574 | ) | (1,976,116 | ) | (5,381,274 | ) | (326,356 | ) | (1,138,454 | ) | |||||||||||||||
| Net decrease in shares outstanding | (19,490 | ) | (596,485 | ) | (1,976,716 | ) | (5,087,580 | ) | (326,356 | ) | (1,113,225 | ) | |||||||||||||||
| Principal Protection III ($) | |||||||||||||||||||||||||||
| Dividends reinvested | $ | — | $ | 386,061 | $ | — | $ | 2,826,711 | $ | — | $ | 244,470 | |||||||||||||||
| Shares redeemed | (183,436 | ) | (6,219,092 | ) | (19,290,871 | ) | (52,423,016 | ) | (3,204,498 | ) | (11,134,704 | ) | |||||||||||||||
| Net decrease | $ | (183,436 | ) | $ | (5,833,031 | ) | $ | (19,290,871 | ) | $ | (49,596,305 | ) | $ | (3,204,498 | ) | $ | (10,890,234 | ) | |||||||||
65
NOTES TO FINANCIAL STATEMENTS AS OF NOVEMBER 30, 2006 (UNAUDITED) (CONTINUED)
NOTE 10 — CAPITAL SHARES (continued)
| Class A | Class B | ||||||||||||||||||
| Six Months Ended November 30, 2006 | Year Ended May 31, 2006 | Six Months Ended November 30, 2006 | Year Ended May 31, 2006 | ||||||||||||||||
| Principal Protection IV (Number of Shares) | |||||||||||||||||||
| Dividends reinvested | — | 45,876 | — | 407,834 | |||||||||||||||
| Shares redeemed | (201,250 | ) | (1,123,796 | ) | (3,580,094 | ) | (8,913,971 | ) | |||||||||||
| Net decrease in shares outstanding | (201,250 | ) | (1,077,920 | ) | (3,580,094 | ) | (8,506,137 | ) | |||||||||||
| Principal Protection IV ($) | |||||||||||||||||||
| Dividends reinvested | $ | — | $ | 479,858 | $ | — | $ | 4,270,017 | |||||||||||
| Shares redeemed | (2,097,380 | ) | (11,831,527 | ) | (38,122,530 | ) | (93,677,960 | ) | |||||||||||
| Net decrease | $ | (2,097,380 | ) | $ | (11,351,669 | ) | $ | (38,122,530 | ) | $ | (89,407,943 | ) | |||||||
| Class C | Class Q | ||||||||||||||||||
| Six Months Ended November 30, 2006 | Year Ended May 31, 2006 | Six Months Ended November 30, 2006 | Year Ended May 31, 2006 | ||||||||||||||||
| Principal Protection IV (Number of Shares) | |||||||||||||||||||
| Dividends reinvested | — | 46,942 | — | 595 | |||||||||||||||
| Shares redeemed | (744,266 | ) | (2,400,736 | ) | — | (60,464 | ) | ||||||||||||
| Net decrease in shares outstanding | (744,266 | ) | (2,353,794 | ) | — | (59,869 | ) | ||||||||||||
| Principal Protection IV ($) | |||||||||||||||||||
| Dividends reinvested | $ | — | $ | 493,363 | $ | — | $ | 6,246 | |||||||||||
| Shares redeemed | (7,953,166 | ) | (25,278,434 | ) | — | (630,477 | ) | ||||||||||||
| Net decrease | $ | (7,953,166 | ) | $ | (24,785,071 | ) | $ | — | $ | (624,231 | ) | ||||||||
| Class A | Class B | Class C | |||||||||||||||||||||||||
| Six Months Ended November 30, 2006 | Year Ended May 31, 2006 | Six Months Ended November 30, 2006 | Year Ended May 31, 2006 | Six Months Ended November 30, 2006 | Year Ended May 31, 2006 | ||||||||||||||||||||||
| Principal Protection V (Number of Shares) | |||||||||||||||||||||||||||
| Dividends reinvested | — | 44,717 | — | 323,489 | — | 23,373 | |||||||||||||||||||||
| Shares redeemed | (168,467 | ) | (995,261 | ) | (3,161,867 | ) | (8,546,359 | ) | (388,190 | ) | (1,624,326 | ) | |||||||||||||||
| Net decrease in shares outstanding | (168,467 | ) | (950,544 | ) | (3,161,867 | ) | (8,222,870 | ) | (388,190 | ) | (1,600,953 | ) | |||||||||||||||
| Principal Protection V ($) | |||||||||||||||||||||||||||
| Dividends reinvested | $ | — | $ | 441,356 | $ | — | $ | 3,199,283 | $ | — | $ | 231,861 | |||||||||||||||
| Shares redeemed | (1,658,412 | ) | (9,902,918 | ) | (31,653,642 | ) | (84,767,488 | ) | (3,881,880 | ) | (16,156,874 | ) | |||||||||||||||
| Net decrease | $ | (1,658,412 | ) | $ | (9,461,562 | ) | $ | (31,653,642 | ) | $ | (81,568,205 | ) | $ | (3,881,880 | ) | $ | (15,925,013 | ) | |||||||||
| Class A | Class B | Class C | |||||||||||||||||||||||||
| Six Months Ended November 30, 2006 | Year Ended May 31, 2006 | Six Months Ended November 30, 2006 | Year Ended May 31, 2006 | Six Months Ended November 30, 2006 | Year Ended May 31, 2006 | ||||||||||||||||||||||
| Principal Protection VI (Number of Shares) | |||||||||||||||||||||||||||
| Dividends reinvested | — | 25,571 | — | 143,057 | — | 8,842 | |||||||||||||||||||||
| Shares redeemed | (173,286 | ) | (969,227 | ) | (2,920,669 | ) | (7,743,763 | ) | (484,967 | ) | (1,779,638 | ) | |||||||||||||||
| Net decrease in shares outstanding | (173,286 | ) | (943,656 | ) | (2,920,669 | ) | (7,600,706 | ) | (484,967 | ) | (1,770,796 | ) | |||||||||||||||
| Principal Protection VI ($) | |||||||||||||||||||||||||||
| Dividends reinvested | $ | — | $ | 252,132 | $ | — | $ | 1,413,830 | $ | — | $ | 87,803 | |||||||||||||||
| Shares redeemed | (1,732,273 | ) | (9,603,783 | ) | (29,150,455 | ) | (76,565,988 | ) | (4,864,522 | ) | (17,641,534 | ) | |||||||||||||||
| Net decrease | $ | (1,732,273 | ) | $ | (9,351,651 | ) | $ | (29,150,455 | ) | $ | (75,152,158 | ) | $ | (4,864,522 | ) | $ | (17,553,731 | ) | |||||||||
66
NOTES TO FINANCIAL STATEMENTS AS OF NOVEMBER 30, 2006 (UNAUDITED) (CONTINUED)
NOTE 10 — CAPITAL SHARES (continued)
| Class A | Class B | Class C | |||||||||||||||||||||||||
| Six Months Ended November 30, 2006 | Year Ended May 31, 2006 | Six Months Ended November 30, 2006 | Year Ended May 31, 2006 | Six Months Ended November 30, 2006 | Year Ended May 31, 2006 | ||||||||||||||||||||||
| Principal Protection VII (Number of Shares) | |||||||||||||||||||||||||||
| Dividends reinvested | — | 23,571 | — | 197,277 | — | 22,688 | |||||||||||||||||||||
| Shares redeemed | (135,546 | ) | (642,056 | ) | (1,539,394 | ) | (4,285,829 | ) | (351,408 | ) | (1,208,528 | ) | |||||||||||||||
| Net decrease in shares outstanding | (135,546 | ) | (618,485 | ) | (1,539,394 | ) | (4,088,552 | ) | (351,408 | ) | (1,185,840 | ) | |||||||||||||||
| Principal Protection VII ($) | |||||||||||||||||||||||||||
| Dividends reinvested | $ | — | $ | 229,345 | $ | — | $ | 1,937,257 | $ | — | $ | 222,324 | |||||||||||||||
| Shares redeemed | (1,326,577 | ) | (6,302,333 | ) | (15,265,072 | ) | (42,315,808 | ) | (3,472,678 | ) | (11,931,909 | ) | |||||||||||||||
| Net decrease | $ | (1,326,577 | ) | $ | (6,072,988 | ) | $ | (15,265,072 | ) | $ | (40,378,551 | ) | $ | (3,472,678 | ) | $ | (11,709,585 | ) | |||||||||
| Class A | Class B | Class C | |||||||||||||||||||||||||
| Six Months Ended November 30, 2006 | Year Ended May 31, 2006 | Six Months Ended November 30, 2006 | Year Ended May 31, 2006 | Six Months Ended November 30, 2006 | Year Ended May 31, 2006 | ||||||||||||||||||||||
| Principal Protection VIII (Number of Shares) | |||||||||||||||||||||||||||
| Dividends reinvested | — | 23,085 | — | 74,009 | — | 7,188 | |||||||||||||||||||||
| Shares redeemed | (230,417 | ) | (657,270 | ) | (888,191 | ) | (2,301,769 | ) | (263,017 | ) | (1,062,504 | ) | |||||||||||||||
| Net decrease in shares outstanding | (230,417 | ) | (634,185 | ) | (888,191 | ) | (2,227,760 | ) | (263,017 | ) | (1,055,316 | ) | |||||||||||||||
| Principal Protection VIII ($) | |||||||||||||||||||||||||||
| Dividends reinvested | $ | — | $ | 228,971 | $ | — | $ | 733,428 | $ | — | $ | 71,453 | |||||||||||||||
| Shares redeemed | (2,299,883 | ) | (6,539,174 | ) | (8,884,307 | ) | (22,860,333 | ) | (2,634,787 | ) | (10,573,040 | ) | |||||||||||||||
| Net decrease | $ | (2,299,883 | ) | $ | (6,310,203 | ) | $ | (8,884,307 | ) | $ | (22,126,905 | ) | $ | (2,634,787 | ) | $ | (10,501,587 | ) | |||||||||
| Class A | Class B | Class C | |||||||||||||||||||||||||
| Six Months Ended November 30, 2006 | Year Ended May 31, 2006 | Six Months Ended November 30, 2006 | Year Ended May 31, 2006 | Six Months Ended November 30, 2006 | Year Ended May 31, 2006 | ||||||||||||||||||||||
| Dividends reinvested | — | 18,092 | — | 85,532 | — | 11,222 | |||||||||||||||||||||
| Shares redeemed | (126,926 | ) | (380,083 | ) | (543,243 | ) | (1,108,578 | ) | (162,257 | ) | (838,141 | ) | |||||||||||||||
| Net decrease in shares outstanding | (126,926 | ) | (361,991 | ) | (543,243 | ) | (1,023,046 | ) | (162,257 | ) | (826,919 | ) | |||||||||||||||
| Principal Protection IX ($) | |||||||||||||||||||||||||||
| Dividends reinvested | $ | — | $ | 180,559 | $ | — | $ | 855,316 | $ | — | $ | 112,556 | |||||||||||||||
| Shares redeemed | (1,290,291 | ) | (3,829,592 | ) | (5,477,022 | ) | (11,133,148 | ) | (1,641,859 | ) | (8,435,161 | ) | |||||||||||||||
| Net decrease | $ | (1,290,291 | ) | $ | (3,649,033 | ) | $ | (5,477,022 | ) | $ | (10,277,832 | ) | $ | (1,641,859 | ) | $ | (8,322,605 | ) | |||||||||
| Class A | Class B | Class C | |||||||||||||||||||||||||
| Six Months Ended November 30, 2006 | Year Ended May 31, 2006 | Six Months Ended November 30, 2006 | Year Ended May 31, 2006 | Six Months Ended November 30, 2006 | Year Ended May 31, 2006 | ||||||||||||||||||||||
| Principal Protection X (Number of Shares) | |||||||||||||||||||||||||||
| Dividends reinvested | — | 47,295 | — | 113,117 | — | 17,685 | |||||||||||||||||||||
| Shares redeemed | (219,331 | ) | (524,488 | ) | (307,227 | ) | (766,980 | ) | (121,367 | ) | (564,447 | ) | |||||||||||||||
| Net decrease in shares outstanding | (219,331 | ) | (477,193 | ) | (307,227 | ) | (653,863 | ) | (121,367 | ) | (546,762 | ) | |||||||||||||||
| Principal Protection X ($) | |||||||||||||||||||||||||||
| Dividends reinvested | $ | — | $ | 470,585 | $ | — | $ | 1,126,641 | $ | — | $ | 176,499 | |||||||||||||||
| Shares redeemed | (2,210,157 | ) | (5,304,227 | ) | (3,083,381 | ) | (7,756,528 | ) | (1,216,939 | ) | (5,741,191 | ) | |||||||||||||||
| Net decrease | $ | (2,210,157 | ) | $ | (4,833,642 | ) | $ | (3,083,381 | ) | $ | (6,629,887 | ) | $ | (1,216,939 | ) | $ | (5,564,692 | ) | |||||||||
67
NOTES TO FINANCIAL STATEMENTS AS OF NOVEMBER 30, 2006 (UNAUDITED) (CONTINUED)
NOTE 10 — CAPITAL SHARES (continued)
| Class A | Class B | Class C | |||||||||||||||||||||||||
| Six Months Ended November 30, 2006 | Year Ended May 31, 2006 | Six Months Ended November 30, 2006 | Year Ended May 31, 2006 | Six Months Ended November 30, 2006 | Year Ended May 31, 2006 | ||||||||||||||||||||||
| Principal Protection XI (Number of Shares) | |||||||||||||||||||||||||||
| Dividends reinvested | — | 12,030 | — | 21,159 | — | 29,698 | |||||||||||||||||||||
| Shares redeemed | (245,638 | ) | (225,598 | ) | (256,754 | ) | (543,755 | ) | (60,908 | ) | (2,372,379 | ) | |||||||||||||||
| Net decrease in shares outstanding | (245,638 | ) | (213,568 | ) | (256,754 | ) | (522,596 | ) | (60,908 | ) | (2,342,681 | ) | |||||||||||||||
| Principal Protection XI ($) | |||||||||||||||||||||||||||
| Dividends reinvested | $ | — | $ | 119,453 | $ | — | $ | 210,197 | $ | — | $ | — | |||||||||||||||
| Shares redeemed | (2,493,197 | ) | (2,250,088 | ) | (2,569,729 | ) | (5,404,263 | ) | (608,523 | ) | (2,342,681 | ) | |||||||||||||||
| Net decrease | $ | (2,493,197 | ) | $ | (2,130,635 | ) | $ | (2,569,729 | ) | $ | (5,194,066 | ) | $ | (608,523 | ) | $ | (2,342,681 | ) | |||||||||
| Class A | Class B | Class C | |||||||||||||||||||||||||
| Six Months Ended November 30, 2006 | Year Ended May 31, 2006 | Six Months Ended November 30, 2006 | Year Ended May 31, 2006 | Six Months Ended November 30, 2006 | Year Ended May 31, 2006 | ||||||||||||||||||||||
| Principal Protection XII (Number of Shares) | |||||||||||||||||||||||||||
| Dividends reinvested | — | 5,714 | — | 12,290 | — | 2,295 | |||||||||||||||||||||
| Shares redeemed | (77,791 | ) | (166,920 | ) | (57,821 | ) | (210,380 | ) | (65,352 | ) | (251,832 | ) | |||||||||||||||
| Net decrease in shares outstanding | (77,791 | ) | (161,206 | ) | (57,821 | ) | (198,090 | ) | (65,352 | ) | (249,537 | ) | |||||||||||||||
| Principal Protection XII ($) | |||||||||||||||||||||||||||
| Dividends reinvested | $ | — | $ | 56,393 | $ | — | $ | 121,177 | $ | — | $ | 22,650 | |||||||||||||||
| Shares redeemed | (777,057 | ) | (1,662,265 | ) | (572,550 | ) | (2,079,467 | ) | (646,612 | ) | (2,491,743 | ) | |||||||||||||||
| Net decrease | $ | (777,057 | ) | $ | (1,605,872 | ) | $ | (572,550 | ) | $ | (1,958,290 | ) | $ | (646,612 | ) | $ | (2,469,093 | ) | |||||||||
NOTE 11 — FEDERAL INCOME TAXES
The amount of distributions from net investment income and net realized capital gains are determined in accordance with federal income tax regulations, which may differ from U.S. generally accepted accounting principles for investment companies. These book/tax differences may be either temporary or permanent. Permanent differences are reclassified within the capital accounts based on their federal tax-basis treatment; temporary differences are not reclassified. Key differences include the treatment of short-term
capital gains, foreign currency transactions, and wash sale deferrals. Distributions in excess of net investment income and/or net realized capital gains for tax purposes are reported as distributions of paid-in capital.
Dividends paid by the Funds from net investment income and distributions of net realized short-term capital gains are, for federal income tax purposes, taxable as ordinary income to shareholders.
The tax composition of dividends and distributions to shareholders was as follows:
| Six Months Ended November 30, 2006 | Year Ended May 31, 2006 | ||||||||||||||
| Ordinary Income | Ordinary Income | Long-Term Capital Gains | |||||||||||||
| Index Plus LargeCap Equity | $ | 1,981,662 | $ | 3,105,000 | $ | — | |||||||||
| PPF II | — | 6,153,605 | — | ||||||||||||
| PPF III | — | 4,363,506 | — | ||||||||||||
| PPF IV | — | 2,031,385 | 4,471,587 | ||||||||||||
| PPF V | — | 4,372,065 | — | ||||||||||||
| PPF VI | — | 2,015,841 | — | ||||||||||||
| PPF VII | — | 1,582,496 | 1,182,567 | ||||||||||||
| PPF VIII | — | 1,252,159 | — | ||||||||||||
| PPF IX | — | 1,320,304 | 152 | ||||||||||||
| PPF X | — | 1,911,672 | 161,437 | ||||||||||||
| PPF XI | — | 439,730 | 808 | ||||||||||||
| PPF XII | — | 251,634 | — | ||||||||||||
68
NOTES TO FINANCIAL STATEMENTS AS OF NOVEMBER 30, 2006 (UNAUDITED) (CONTINUED)
NOTE 11 — FEDERAL INCOME TAXES (continued)
The tax-basis components of distributable earnings and the expiration dates of the capital loss carryforwards which may be used to offset future realized capital gains for federal income tax purposes as of May 31, 2006 were:
| Undistributed Ordinary Income | Undistributed Long Term Capital Gains | Unrealized Appreciation/ Depreciation | Post- October Capital Losses Deferred | Capital Loss Carryforwards | Expiration Dates | ||||||||||||||||||||||
| Index Plus LargeCap Equity | $ | 1,078,559 | $ | — | $ | 5,366,815 | $ | — | $ | (10,884,772 | ) | 2011 | |||||||||||||||
| PPF II | 2,061,895 | — | 5,580,119 | — | (29,360,869 | ) | 2011 | ||||||||||||||||||||
| PPF III | 1,377,677 | — | 6,580,528 | — | (16,762,087 | ) | 2011 | ||||||||||||||||||||
| PPF IV | 587,410 | 4,734,459 | 32,689,383 | — | — | — | |||||||||||||||||||||
| PPF V | 1,947,123 | 1,622,240 | (4,396,411 | ) | — | — | — | ||||||||||||||||||||
| PPF VI | 1,573,668 | — | (4,556,133 | ) | — | — | — | ||||||||||||||||||||
| PPF VII | — | — | (3,354,177 | ) | (420,775 | ) | — | — | |||||||||||||||||||
| PPF VIII | 410,010 | — | (1,837,019 | ) | — | — | — | ||||||||||||||||||||
| PPF IX | 555,589 | 162,272 | (721,828 | ) | — | — | — | ||||||||||||||||||||
| PPF X | 424,844 | 410,391 | (986,355 | ) | — | — | — | ||||||||||||||||||||
| PPF XI | 226,768 | 81,969 | (762,448 | ) | — | — | — | ||||||||||||||||||||
| PPF XII | 76,494 | — | (346,475 | ) | — | $ | (61,895 | ) | 2013 | ||||||||||||||||||
| (92,067 | ) | 2014 | |||||||||||||||||||||||||
| $ | (153,962 | ) | |||||||||||||||||||||||||
NOTE 12 — LITIGATION
Lawsuits were filed by certain shareholders on behalf of Index Plus LargeCap Equity, Principal Protection II, and Principal Protection IV (the "Funds") against ING Investments, LLC, the Funds' Investment Adviser, ING IM, the Funds' Sub-Adviser, ING Funds Distributors, LLC, the Funds' Distributor and certain of the independent trustees of the Funds (collectively, the "Defendants") that allege, among other things, that the Funds' advisory fees, sub-advisory fees and certain 12b-1 fees are excessive. The claims regarding 12b-1 fees and the claims against the Independent Trustees were dismissed. The Funds were named as nominal defendants in each of these suits. The suits sought recovery by the Funds from the Defendants of any fees found to be excessive.
On July 19, 2006, the United States District Court District of Massachusetts approved the terms of a settlement of the matter. Under the terms of the settlement, ING Investments, LLC and ING IM, Defendants, made an aggregate payment of $1.5 million to the Funds on August 21, 2006 as follows:
| Index Plus LargeCap Equity | $ | 241,820 | |||||
| PPF II | 502,489 | ||||||
| PPF IV | 755,691 | ||||||
In addition, under the terms of the settlement, the Defendants have agreed, subject to the approval of the Trustees of the PPFs, to reduce for a period of ten years the advisory fee of the PPFs during the Index Plus LargeCap Period from 0.60% to 0.45% of average daily net assets.
NOTE 13 — OTHER ACCOUNTING PRONOUNCEMENTS
In June 2006, the Financial Accounting Standards Board ("FASB") issued FASB Interpretation 48 ("FIN 48"), "Accounting for Uncertainty in Income Taxes." This standard defines the threshold for recognizing the benefits of tax-return positions in the financial statements as "more-likely-than-not" to be sustained by the taxing authority and requires measurement of a tax position meeting the more-likely-than-not criterion, based on the largest benefit that is more than 50 percent likely to be realized. FIN 48 is effective for the first fiscal year beginning after December 15, 2006, with early application permitted if no interim financial statements have been issued. At adoption, companies must adjust their financial statements to reflect only those tax positions that are more likely-than-not to be sustained as of the adoption date. Management of the Funds has assessed the impact of adopting FIN 48 and currently does not believe there will be a ma terial impact to the Funds.
On September 15, 2006, the FASB issued Statement of Financial Accounting Standard No. 157 ("SFAS No. 157"), Fair Value Measurements. The new accounting statement defines fair value, establishes a framework for measuring fair value in generally accepted accounting principles ("GAAP"), and expands disclosures about fair value measurements. SFAS No. 157 defines fair value as the price that would be received to sell an asset or paid to transfer a liability in an orderly transaction between market participants at the measurement date (an exit price). SFAS No. 157 also stipulates that, as a market-based measurement, fair value measurement should be determined based on
69
NOTES TO FINANCIAL STATEMENTS AS OF NOVEMBER 30, 2006 (UNAUDITED) (CONTINUED)
NOTE 13 — OTHER ACCOUNTING PRONOUNCEMENTS (continued)
the assumptions that market participants would use in pricing the asset or liability, and establishes a fair value hierarchy that distinguishes between (a) market participant assumptions developed based on market data obtained from sources independent of the reporting entity (observable inputs) and (b) the reporting entity's own assumptions about market
participant assumptions developed based on the best information available in the circumstances (unobservable inputs). SFAS No. 157 is effective for financial statements issued for fiscal years beginning after November 15, 2007. As of November 30, 2006, the Funds are currently assessing the impact, if any, that will result from adopting SFAS No. 157.
NOTE 14 — SUBSEQUENT EVENTS
Dividends: Subsequent to November 30, 2006, the following Funds declared dividends and distributions of:
| PER SHARE AMOUNTS | |||||||||||||||||||||||
| Net Investment Income | Short-Term Capital Gains | Long-Term Capital Gains | Payable Date | Record Date | |||||||||||||||||||
| Index Plus LargeCap Equity | |||||||||||||||||||||||
| Class A | $ | 0.0971 | $ | — | $ | — | December 19, 2006 | December 14, 2006 | |||||||||||||||
| Class B | $ | 0.0759 | $ | — | $ | — | December 19, 2006 | December 14, 2006 | |||||||||||||||
| Class C | $ | 0.0792 | $ | — | $ | — | December 19, 2006 | December 14, 2006 | |||||||||||||||
| Class Q | $ | 0.0984 | $ | — | $ | — | December 19, 2006 | December 14, 2006 | |||||||||||||||
| PPF II | |||||||||||||||||||||||
| Class A | $ | 0.3264 | $ | — | $ | — | December 19, 2006 | December 14, 2006 | |||||||||||||||
| Class B | $ | 0.2465 | $ | — | $ | — | December 19, 2006 | December 14, 2006 | |||||||||||||||
| Class C | $ | 0.2259 | $ | — | $ | — | December 19, 2006 | December 14, 2006 | |||||||||||||||
| PPF III | |||||||||||||||||||||||
| Class A | $ | 0.2790 | $ | — | $ | — | December 19, 2006 | December 14, 2006 | |||||||||||||||
| Class B | $ | 0.1925 | $ | — | $ | — | December 19, 2006 | December 14, 2006 | |||||||||||||||
| Class C | $ | 0.1774 | $ | — | $ | — | December 19, 2006 | December 14, 2006 | |||||||||||||||
| PPF IV | |||||||||||||||||||||||
| Class A | $ | 0.1595 | $ | — | $ | 0.2744 | December 19, 2006 | December 14, 2006 | |||||||||||||||
| Class B | $ | 0.0701 | $ | — | $ | 0.2744 | December 19, 2006 | December 14, 2006 | |||||||||||||||
| Class C | $ | 0.0557 | $ | — | $ | 0.2744 | December 19, 2006 | December 14, 2006 | |||||||||||||||
| Class Q | $ | 0.1690 | $ | — | $ | 0.2744 | December 19, 2006 | December 14, 2006 | |||||||||||||||
| PPF V | |||||||||||||||||||||||
| Class A | $ | 0.1461 | $ | 0.0622 | $ | 0.1007 | December 19, 2006 | December 14, 2006 | |||||||||||||||
| Class B | $ | 0.0595 | $ | 0.0622 | $ | 0.1007 | December 19, 2006 | December 14, 2006 | |||||||||||||||
| Class C | $ | 0.0477 | $ | 0.0622 | $ | 0.1007 | December 19, 2006 | December 14, 2006 | |||||||||||||||
| PPF VI | |||||||||||||||||||||||
| Class A | $ | 0.1396 | $ | 0.0360 | $ | 0.0194 | December 19, 2006 | December 14, 2006 | |||||||||||||||
| Class B | $ | 0.0590 | $ | 0.0360 | $ | 0.0194 | December 19, 2006 | December 14, 2006 | |||||||||||||||
| Class C | $ | 0.0405 | $ | 0.0360 | $ | 0.0194 | December 19, 2006 | December 14, 2006 | |||||||||||||||
| PPF VII | |||||||||||||||||||||||
| Class A | $ | 0.0846 | $ | — | $ | — | December 19, 2006 | December 14, 2006 | |||||||||||||||
| Class B | $ | 0.0100 | $ | — | $ | — | December 19, 2006 | December 14, 2006 | |||||||||||||||
| Class C | $ | — | $ | — | $ | — | December 19, 2006 | December 14, 2006 | |||||||||||||||
| PPF VIII | |||||||||||||||||||||||
| Class A | $ | 0.1845 | $ | 0.0116 | $ | — | December 19, 2006 | December 14, 2006 | |||||||||||||||
| Class B | $ | 0.1032 | $ | 0.0116 | $ | — | December 19, 2006 | December 14, 2006 | |||||||||||||||
| Class C | $ | 0.0746 | $ | 0.0116 | $ | — | December 19, 2006 | December 14, 2006 | |||||||||||||||
| PPF IX | |||||||||||||||||||||||
| Class A | $ | 0.2055 | $ | 0.0457 | $ | 0.0686 | December 19, 2006 | December 14, 2006 | |||||||||||||||
| Class B | $ | 0.1245 | $ | 0.0457 | $ | 0.0686 | December 19, 2006 | December 14, 2006 | |||||||||||||||
| Class C | $ | 0.0933 | $ | 0.0457 | $ | 0.0686 | December 19, 2006 | December 14, 2006 | |||||||||||||||
| PPF X | |||||||||||||||||||||||
| Class A | $ | 0.1939 | $ | 0.0393 | $ | 0.0945 | December 19, 2006 | December 14, 2006 | |||||||||||||||
| Class B | $ | 0.1171 | $ | 0.0393 | $ | 0.0945 | December 19, 2006 | December 14, 2006 | |||||||||||||||
| Class C | $ | 0.1050 | $ | 0.0393 | $ | 0.0945 | December 19, 2006 | December 14, 2006 | |||||||||||||||
70
NOTES TO FINANCIAL STATEMENTS AS OF NOVEMBER 30, 2006 (UNAUDITED) (CONTINUED)
NOTE 14 — SUBSEQUENT EVENTS (continued)
| PER SHARE AMOUNTS | |||||||||||||||||||||||
| Net Investment Income | Short-Term Capital Gains | Long-Term Capital Gains | Payable Date | Record Date | |||||||||||||||||||
| PPF XI | |||||||||||||||||||||||
| Class A | $ | 0.2049 | $ | 0.0069 | $ | 0.0281 | December 19, 2006 | December 14, 2006 | |||||||||||||||
| Class B | $ | 0.1329 | $ | 0.0069 | $ | 0.0281 | December 19, 2006 | December 14, 2006 | |||||||||||||||
| Class C | $ | 0.1239 | $ | 0.0069 | $ | 0.0281 | December 19, 2006 | December 14, 2006 | |||||||||||||||
| PPF XII | |||||||||||||||||||||||
| Class A | $ | 0.1958 | $ | — | $ | — | December 19, 2006 | December 14, 2006 | |||||||||||||||
| Class B | $ | 0.1240 | $ | — | $ | — | December 19, 2006 | December 14, 2006 | |||||||||||||||
| Class C | $ | 0.0890 | $ | — | $ | — | December 19, 2006 | December 14, 2006 | |||||||||||||||
Effective, December 15, 2006, Class B shares of Index Plus LargeCap Equity are closed to new investment, except that: (1) Class B shares of Index Plus LargeCap Equity may be purchased through the reinvestment of dividends issued by Class B shares of the Fund; and (2) subject to the terms and conditions of relevant exchange privileges and as permitted under the Prospectus, existing shareholders of the Fund may acquire Class B shares of the Funds through the exchange of other funds in the ING mutual funds complex.
Effective February 1, 2007, PPF II will change its name to ING Index Plus LargeCap Equity Fund II. Effective February 1, 2007, PPF II will also change its investment objective and principal investment strategies.
NOTE 15 — INFORMATION REGARDING TRADING OF ING'S U.S. MUTUAL FUNDS
ING Investments reported to the Boards of Directors/Trustees (the "Boards") of the ING Funds that, like many U.S. financial services companies, ING Investments and certain of its U.S. affiliates have received informal and formal requests for information since September 2003 from various governmental and self-regulatory agencies in connection with investigations related to mutual funds and variable insurance products. ING Investments has advised the Boards that it and its affiliates have cooperated fully with each request.
In addition to responding to regulatory and governmental requests, ING Investments reported that management of U.S. affiliates of ING Groep, including ING Investments (collectively, "ING"), on their own initiative, have conducted, through independent special counsel and a national accounting firm, an extensive internal review of trading in ING insurance, retirement, and mutual fund products. The goal of this review was to identify any instances of inappropriate trading in those products by third parties or by ING investment professionals and other ING personnel. ING's internal review related to mutual fund trading is now substantially completed. ING has reported that, of the millions of customer relationships that ING maintains, the internal review identified several isolated arrangements allowing third parties to engage in frequent trading of mutual funds within ING's variable insurance and mutual fund products, and identified other circums tances where frequent trading occurred, despite measures taken by ING intended to
combat market timing. ING further reported that each of these arrangements has been terminated and fully disclosed to regulators. The results of the internal review were also reported to the independent members of the Boards.
ING Investments has advised the Boards that most of the identified arrangements were initiated prior to ING's acquisition of the businesses in question in the U.S. ING Investments further reported that the companies in question did not receive special benefits in return for any of these arrangements, which have all been terminated.
Based on the internal review, ING Investments has advised the Boards that the identified arrangements do not represent a systemic problem in any of the companies that were involved.
In September 2005, ING Funds Distributor, LLC ("IFD"), the distributor of certain ING Funds, settled an administrative proceeding with the NASD regarding three arrangements, dating from 1995, 1996 and 1998, under which the administrator to the then-Pilgrim Funds, which subsequently became part of the ING Funds, entered into formal and informal arrangements that permitted frequent trading. Under the terms of the Letter of Acceptance, Waiver and Consent ("AWC") with the NASD, under which IFD neither admitted nor denied the allegations or findings, IFD consented to the following sanctions: (i) a censure; (ii) a fine of $1.5 million; (iii) restitution of approximately $1.44 million to certain ING Funds for losses attributable to excessive trading described
71
NOTES TO FINANCIAL STATEMENTS AS OF NOVEMBER 30, 2006 (UNAUDITED) (CONTINUED)
NOTE 15 — INFORMATION REGARDING TRADING OF ING'S U.S. MUTUAL FUNDS (continued)
in the AWC; and (iv) agreement to make certification to the NASD regarding the review and establishment of certain procedures.
In addition to the arrangements discussed above, ING Investments reported to the Boards that, at this time, these instances include the following, in addition to the arrangements subject to the AWC discussed above:
• Aeltus Investment Management, Inc. (a predecessor entity to ING Investment Management Co.) identified two investment professionals who engaged in extensive frequent trading in certain ING Funds. One was subsequently terminated for cause and incurred substantial financial penalties in connection with this conduct and the second has been disciplined.
• ReliaStar Life Insurance Company ("ReliaStar") entered into agreements seven years ago permitting the owner of policies issued by the insurer to engage in frequent trading and to submit orders until 4pm Central Time. In 2001 ReliaStar also entered into a selling agreement with a broker-dealer that engaged in frequent trading. Employees of ING affiliates were terminated and/or disciplined in connection with these matters.
• In 1998, Golden American Life Insurance Company entered into arrangements permitting a broker-dealer to frequently trade up to certain specific limits in a fund available in an ING variable annuity product. No employee responsible for this arrangement remains at the company.
For additional information regarding these matters, you may consult the Form 8-K and Form 8-K/A for each of four life insurance companies, ING USA Annuity and Life Insurance Company, ING Life Insurance and Annuity Company, ING Insurance Company of America, and ReliaStar Life Insurance Company of New York, each filed with the Securities and Exchange Commission (the "SEC") on October 29, 2004 and September 8, 2004. These Forms 8-K and Forms 8-K/A can be accessed through the SEC's Web site at http://www.sec.gov. Despite the extensive internal review conducted through independent special counsel and a national accounting firm, there can be no assurance that the instances of inappropriate trading reported to the Boards are the only instances of such trading respecting the ING Funds.
ING Investments reported to the Boards that ING is committed to conducting its business with the highest standards of ethical conduct with zero tolerance for noncompliance. Accordingly, ING Investments advised the Boards that ING management was disappointed that its voluntary internal review identified these situations. Viewed in the context of the breadth and magnitude of its U.S. business as a whole, ING management does not believe that ING's acquired companies had systemic ethical or compliance issues in these areas. Nonetheless, Investments reported that given ING's refusal to tolerate any lapses, it has taken the steps noted below, and will continue to seek opportunities to further strengthen the internal controls of its affiliates.
• ING has agreed with the ING Funds to indemnify and hold harmless the ING Funds from all damages resulting from wrongful conduct by ING or its employees or from ING's internal investigation, any investigations conducted by any governmental or self-regulatory agencies, litigation or other formal proceedings, including any proceedings by the SEC. ING Investments reported to the Boards that ING management believes that the total amount of any indemnification obligations will not be material to ING or its U.S. business.
• ING updated its Code of Conduct for employees reinforcing its employees' obligation to conduct personal trading activity consistent with the law, disclosed limits, and other requirements.
• The ING Funds, upon a recommendation from ING, updated their respective Codes of Ethics applicable to investment professionals with ING entities and certain other fund personnel, requiring such personnel to pre-clear any purchases or sales of ING Funds that are not systematic in nature (i.e., dividend reinvestment), and imposing minimum holding periods for shares of ING Funds.
• ING instituted excessive trading policies for all customers in its variable insurance and retirement products and for shareholders of the ING Funds sold to the public through financial intermediaries. ING does not make exceptions to these policies.
• ING reorganized and expanded its U.S. Compliance Department, and created an Enterprise Compliance team to enhance controls and consistency in regulatory compliance.
72
NOTES TO FINANCIAL STATEMENTS AS OF NOVEMBER 30, 2006 (UNAUDITED) (CONTINUED)
NOTE 15 — INFORMATION REGARDING TRADING OF ING'S U.S. MUTUAL FUNDS (continued)
Other Regulatory Matters
The New York Attorney General (the "NYAG") and other federal and state regulators are also conducting broad inquiries and investigations involving the insurance industry. These initiatives currently focus on, among other things, compensation and other sales incentives; potential conflicts of interest; potential anti-competitive activity; reinsurance; marketing practices (including suitability); specific product types (including group annuities and indexed annuities); fund selection for investment products and brokerage sales; and disclosure. It is likely that the scope of these industry investigations will further broaden before they conclude. ING has received formal and informal requests in connection with such investigations, and is cooperating fully with each request. In connection with one such investigation, affiliates of ING Investments were named in a petition for relief and cease and desist order filed by the New Hampshire Bureau of Securities Regulation (the "NH Bureau") concerning their administration of the New Hampshire state employees deferred compensation plan.
On October 10, 2006, an affiliate of ING Investments entered into an assurance of discontinuance with the NYAG (the "NYAG Agreement") regarding the endorsement of its products by the New York State United Teachers Union Member Benefits Trust ("NYSUT") and the sale of their products to NYSUT members. Under the terms of the NYAG Agreement, the affiliate of ING Investments, without admitting or denying the NYAG's findings, will distribute $30 million to NYSUT members, and/or former NYSUT members, who participated in the NYSUT-endorsed products at any point between January 1, 2001 and June 30, 2006. The affiliate also agreed with the NYAG's office to develop a one-page disclosure that will further improve transparency and disclosure regarding retirement product fees (the "One-Page Disclosure"). Pursuant to the terms of the NYAG Agreement, the affiliate has agreed for a five year period to provide its retirement product customers with the One-Pag e Disclosure.
In addition, on the same date, these affiliates of ING Investments entered into a consent agreement with the NH Bureau (the "NH Agreement") to resolve this petition for relief and cease and desist order. Under the terms of the NH Agreement, these affiliates of ING Investments, without admitting or denying the NH
Bureau's claims, have agreed to pay $3 million to resolve the matter, and for a five year period to provide their retirement product customers with the One-Page Disclosure described above.
Other federal and state regulators could initiate similar actions in this or other areas of ING's businesses.
These regulatory initiatives may result in new legislation and regulation that could significantly affect the financial services industry, including businesses in which ING is engaged.
In light of these and other developments, ING continuously reviews whether modifications to its business practices are appropriate.
At this time, in light of the current regulatory factors, ING U.S. is actively engaged in reviewing whether any modifications in our practices are appropriate for the future.
There can be no assurance that these matters, or the adverse publicity associated with them, will not result in increased fund redemptions, reduced sale of fund shares, or other adverse consequences to ING Funds.
NOTE 16 — PROXY VOTING INFORMATION
A description of the policies and procedures that the Funds use to determine how to vote proxies related to portfolio securities is available (1) without charge, upon request, by calling Shareholder Services toll-free at 1-800-992-0180; (2) on the Funds' website at www.ingfunds.com and (3) on the SEC's website at www.sec.gov. Information regarding how the Funds voted proxies related to portfolio securities during the most recent 12-month period ended June 30 is available without charge on the Funds' website at www.ingfunds.com and on the SEC's website at www.sec.gov.
NOTE 17 — QUARTERLY PORTFOLIO HOLDINGS
The Funds file their complete schedule of portfolio holdings with the SEC for the first and third quarters of each fiscal year on Form N-Q. The Funds' Forms N-Q are available on the SEC's website at www.sec.gov. The Funds' Forms N-Q may be reviewed and copied at the SEC's Public Reference Room in Washington, DC, and information on the operation of the Public Reference Room may be obtained by calling 1-800-SEC-0330; and is available upon request from the Funds by calling Shareholder Services toll-free at 1-800-992-0180.
73
PORTFOLIO OF INVESTMENTS
ING INDEX PLUS LARGECAP EQUITY FUND AS OF NOVEMBER 30, 2006 (UNAUDITED)
| Shares | Value | ||||||||||||||
| COMMON STOCK: 99.8% | |||||||||||||||
| Advertising: 0.5% | |||||||||||||||
| 2,800 | Omnicom Group | $ | 286,048 | ||||||||||||
| 286,048 | |||||||||||||||
| Aerospace/Defense: 4.1% | |||||||||||||||
| 3,370 | Boeing Co. | 298,346 | |||||||||||||
| 6,000 | General Dynamics Corp. | 449,040 | |||||||||||||
| 5,000 | Lockheed Martin Corp. | 452,250 | |||||||||||||
| 5,600 | Northrop Grumman Corp. | 374,808 | |||||||||||||
| 7,483 | Raytheon Co. | 381,932 | |||||||||||||
| 4,600 | United Technologies Corp. | 296,838 | |||||||||||||
| 2,253,214 | |||||||||||||||
| Agriculture: 1.3% | |||||||||||||||
| 8,440 | Altria Group, Inc. | 710,732 | |||||||||||||
| 710,732 | |||||||||||||||
| Apparel: 0.6% | |||||||||||||||
| 6,640 | @ | Coach, Inc. | 286,914 | ||||||||||||
| 2,150 | Jones Apparel Group, Inc. | 72,240 | |||||||||||||
| 359,154 | |||||||||||||||
| Auto Manufacturers: 0.5% | |||||||||||||||
| 29,430 | Ford Motor Co. | 239,266 | |||||||||||||
| 1,400 | @ | Navistar International Corp. | 44,786 | ||||||||||||
| 284,052 | |||||||||||||||
| Banks: 6.5% | |||||||||||||||
| 28,071 | Bank of America Corp. | 1,511,623 | |||||||||||||
| 3,200 | Comerica, Inc. | 186,400 | |||||||||||||
| 9,130 | National City Corp. | 329,593 | |||||||||||||
| 800 | North Fork Bancorp., Inc. | 22,456 | |||||||||||||
| 10,600 | Regions Financial Corp. | 388,490 | |||||||||||||
| 7,380 | US Bancorp. | 248,263 | |||||||||||||
| 7,919 | Wachovia Corp. | 429,131 | |||||||||||||
| 14,000 | Wells Fargo & Co. | 493,360 | |||||||||||||
| 3,609,316 | |||||||||||||||
| Beverages: 2.4% | |||||||||||||||
| 9,490 | Anheuser-Busch Cos., Inc. | 450,870 | |||||||||||||
| 8,170 | Coca-Cola Co. | 382,601 | |||||||||||||
| 3,070 | Pepsi Bottling Group, Inc. | 96,152 | |||||||||||||
| 6,680 | PepsiCo, Inc. | 413,960 | |||||||||||||
| 1,343,583 | |||||||||||||||
| Biotechnology: 0.6% | |||||||||||||||
| 4,662 | @ | Amgen, Inc. | 331,002 | ||||||||||||
| 331,002 | |||||||||||||||
| Chemicals: 1.5% | |||||||||||||||
| 3,850 | Dow Chemical Co. | 154,039 | |||||||||||||
| 3,900 | EI DuPont de Nemours & Co. | 183,027 | |||||||||||||
| 2,600 | Monsanto Co. | 124,982 | |||||||||||||
| 3,530 | PPG Industries, Inc. | 226,979 | |||||||||||||
| 2,100 | Sherwin-Williams Co. | 131,355 | |||||||||||||
| 820,382 | |||||||||||||||
| Commercial Services: 1.4% | |||||||||||||||
| 2,600 | @ | Apollo Group, Inc. | 100,854 | ||||||||||||
| 3,200 | @ | Convergys Corp. | 77,184 | ||||||||||||
| 5,880 | McKesson Corp. | 290,472 | |||||||||||||
| 4,500 | Moody's Corp. | 312,660 | |||||||||||||
| 781,170 | |||||||||||||||
| Shares | Value | ||||||||||||||
| Computers: 4.4% | |||||||||||||||
| 21,740 | @ | Dell, Inc. | $ | 592,198 | |||||||||||
| 19,767 | Hewlett-Packard Co. | 780,006 | |||||||||||||
| 10,070 | International Business Machines Corp. | 925,634 | |||||||||||||
| 1,920 | @ | Lexmark International, Inc. | 132,442 | ||||||||||||
| 2,430,280 | |||||||||||||||
| Cosmetics/Personal Care: 1.7% | |||||||||||||||
| 3,000 | Estee Lauder Cos., Inc. | 123,870 | |||||||||||||
| 12,811 | Procter & Gamble Co. | 804,403 | |||||||||||||
| 928,273 | |||||||||||||||
| Diversified Financial Services: 9.2% | |||||||||||||||
| 5,130 | American Express Co. | 301,234 | |||||||||||||
| 4,400 | CIT Group, Inc. | 228,844 | |||||||||||||
| 30,650 | Citigroup, Inc. | 1,519,934 | |||||||||||||
| 4,010 | Fannie Mae | 228,690 | |||||||||||||
| 3,700 | Goldman Sachs Group, Inc. | 720,760 | |||||||||||||
| 24,000 | JPMorgan Chase & Co. | 1,110,720 | |||||||||||||
| 3,510 | Merrill Lynch & Co., Inc. | 306,879 | |||||||||||||
| 9,240 | Morgan Stanley | 703,718 | |||||||||||||
| 5,120,779 | |||||||||||||||
| Electric: 2.7% | |||||||||||||||
| 22,400 | @ | AES Corp. | 523,488 | ||||||||||||
| 4,800 | Exelon Corp. | 291,504 | |||||||||||||
| 10,800 | PG&E Corp. | 496,044 | |||||||||||||
| 3,380 | TXU Corp. | 193,978 | |||||||||||||
| 1,505,014 | |||||||||||||||
| Electronics: 0.2% | |||||||||||||||
| 2,350 | @ | Waters Corp. | 117,594 | ||||||||||||
| 117,594 | |||||||||||||||
| Environmental Control: 0.6% | |||||||||||||||
| 9,800 | Waste Management, Inc. | 358,778 | |||||||||||||
| 358,778 | |||||||||||||||
| Food: 0.9% | |||||||||||||||
| 5,300 | Campbell Soup Co. | 201,771 | |||||||||||||
| 5,800 | General Mills, Inc. | 324,510 | |||||||||||||
| 526,281 | |||||||||||||||
| Forest Products & Paper: 0.2% | |||||||||||||||
| 2,600 | Temple-Inland, Inc. | 101,660 | |||||||||||||
| 101,660 | |||||||||||||||
| Hand/Machine Tools: 0.1% | |||||||||||||||
| 1,140 | Snap-On, Inc. | 54,150 | |||||||||||||
| 54,150 | |||||||||||||||
| Healthcare-Products: 1.8% | |||||||||||||||
| 11,650 | Johnson & Johnson | 767,852 | |||||||||||||
| 4,800 | Medtronic, Inc. | 250,224 | |||||||||||||
| 1,018,076 | |||||||||||||||
| Healthcare-Services: 3.6% | |||||||||||||||
| 8,340 | Aetna, Inc. | 344,525 | |||||||||||||
| 3,635 | @ | Coventry Health Care, Inc. | 174,953 | ||||||||||||
| 3,250 | @ | Humana, Inc. | 175,825 | ||||||||||||
| 2,450 | @ | Laboratory Corp. of America Holdings | 173,460 | ||||||||||||
| 12,940 | UnitedHealth Group, Inc. | 635,095 | |||||||||||||
See Accompanying Notes to Financial Statements
74
PORTFOLIO OF INVESTMENTS
ING INDEX PLUS LARGECAP EQUITY FUND AS OF NOVEMBER 30, 2006 (UNAUDITED) (CONTINUED)
| Shares | Value | ||||||||||||||
| Healthcare-Services (continued) | |||||||||||||||
| 6,860 | @ | WellPoint, Inc. | $ | 519,096 | |||||||||||
| 2,022,954 | |||||||||||||||
| Home Furnishings: 0.2% | |||||||||||||||
| 1,200 | Harman International Industries, Inc. | 124,608 | |||||||||||||
| 124,608 | |||||||||||||||
| Insurance: 8.4% | |||||||||||||||
| 7,650 | Allstate Corp. | 485,622 | |||||||||||||
| 2,170 | AMBAC Financial Group, Inc. | 185,839 | |||||||||||||
| 10,300 | American International Group, Inc. | 724,296 | |||||||||||||
| 6,880 | Chubb Corp. | 356,109 | |||||||||||||
| 2,000 | Cigna Corp. | 252,100 | |||||||||||||
| 8,400 | Genworth Financial, Inc. | 275,520 | |||||||||||||
| 4,200 | Hartford Financial Services Group, Inc. | 360,192 | |||||||||||||
| 7,700 | Loews Corp. | 307,384 | |||||||||||||
| 8,810 | Metlife, Inc. | 517,411 | |||||||||||||
| 5,220 | Principal Financial Group | 301,455 | |||||||||||||
| 13,900 | Progressive Corp. | 313,445 | |||||||||||||
| 5,960 | Prudential Financial, Inc. | 485,621 | |||||||||||||
| 2,130 | Safeco Corp. | 129,014 | |||||||||||||
| 4,694,008 | |||||||||||||||
| Internet: 0.9% | |||||||||||||||
| 800 | @ | Google, Inc. | 387,936 | ||||||||||||
| 4,700 | @ | VeriSign, Inc. | 122,717 | ||||||||||||
| 510,653 | |||||||||||||||
| Iron/Steel: 1.0% | |||||||||||||||
| 5,600 | Nucor Corp. | 335,160 | |||||||||||||
| 2,900 | United States Steel Corp. | 216,891 | |||||||||||||
| 552,051 | |||||||||||||||
| Leisure Time: 0.2% | |||||||||||||||
| 3,000 | Sabre Holdings Corp. | 82,290 | |||||||||||||
| 82,290 | |||||||||||||||
| Machinery-Construction & Mining: 0.3% | |||||||||||||||
| 3,000 | Caterpillar, Inc. | 186,090 | |||||||||||||
| 186,090 | |||||||||||||||
| Machinery-Diversified: 0.3% | |||||||||||||||
| 1,200 | Cummins, Inc. | 143,904 | |||||||||||||
| 143,904 | |||||||||||||||
| Media: 3.1% | |||||||||||||||
| 10,105 | CBS Corp. | 300,624 | |||||||||||||
| 7,300 | @ | Comcast Corp. | 295,358 | ||||||||||||
| 4,740 | McGraw-Hill Cos., Inc. | 315,921 | |||||||||||||
| 9,100 | News Corp., Inc. | 187,460 | |||||||||||||
| 18,270 | Walt Disney Co. | 603,824 | |||||||||||||
| 1,703,187 | |||||||||||||||
| Mining: 0.3% | |||||||||||||||
| 1,170 | Phelps Dodge Corp. | 143,910 | |||||||||||||
| 143,910 | |||||||||||||||
| Miscellaneous Manufacturing: 5.0% | |||||||||||||||
| 3,450 | 3M Co. | 281,037 | |||||||||||||
| 5,400 | Eastman Kodak Co. | 140,508 | |||||||||||||
| 3,480 | Eaton Corp. | 268,238 | |||||||||||||
| Shares | Value | ||||||||||||||
| 44,380 | General Electric Co. | $ | 1,565,726 | ||||||||||||
| 2,750 | Parker Hannifin Corp. | 229,570 | |||||||||||||
| 9,200 | @@ | Tyco International Ltd. | 278,668 | ||||||||||||
| 2,763,747 | |||||||||||||||
| Office/Business Equipment: 0.5% | |||||||||||||||
| 16,640 | @ | Xerox Corp. | 274,560 | ||||||||||||
| 274,560 | |||||||||||||||
| Oil & Gas: 9.9% | |||||||||||||||
| 6,600 | Anadarko Petroleum Corp. | 325,776 | |||||||||||||
| 13,652 | Chevron Corp. | 987,313 | |||||||||||||
| 6,117 | ConocoPhillips | 411,674 | |||||||||||||
| 33,040 | S | ExxonMobil Corp. | 2,537,802 | ||||||||||||
| 4,270 | Marathon Oil Corp. | 403,003 | |||||||||||||
| 9,140 | Occidental Petroleum Corp. | 460,108 | |||||||||||||
| 6,800 | Valero Energy Corp. | 374,476 | |||||||||||||
| 5,500,152 | |||||||||||||||
| Oil & Gas Services: 1.3% | |||||||||||||||
| 12,100 | Halliburton Co. | 408,254 | |||||||||||||
| 4,400 | Schlumberger Ltd. | 301,312 | |||||||||||||
| 709,566 | |||||||||||||||
| Packaging & Containers: 0.2% | |||||||||||||||
| 2,900 | @ | Pactiv Corp. | 99,905 | ||||||||||||
| 99,905 | |||||||||||||||
| Pharmaceuticals: 5.1% | |||||||||||||||
| 6,600 | Abbott Laboratories | 307,956 | |||||||||||||
| 3,980 | AmerisourceBergen Corp. | 183,040 | |||||||||||||
| 6,300 | @ | Forest Laboratories, Inc. | 306,810 | ||||||||||||
| 5,580 | @ | King Pharmaceuticals, Inc. | 92,237 | ||||||||||||
| 17,900 | Merck & Co., Inc. | 796,729 | |||||||||||||
| 4,800 | Mylan Laboratories | 97,392 | |||||||||||||
| 28,934 | Pfizer, Inc. | 795,396 | |||||||||||||
| 5,700 | Wyeth | 275,196 | |||||||||||||
| 2,854,756 | |||||||||||||||
| Real Estate Investment Trusts: 0.1% | |||||||||||||||
| 1,690 | Equity Office Properties Trust | 81,458 | |||||||||||||
| 81,458 | |||||||||||||||
| Retail: 6.0% | |||||||||||||||
| 2,100 | @ | Big Lots, Inc. | 46,851 | ||||||||||||
| 2,850 | Family Dollar Stores, Inc. | 79,487 | |||||||||||||
| 7,638 | Federated Department Stores, Inc. | 321,483 | |||||||||||||
| 10,170 | Gap, Inc. | 190,382 | |||||||||||||
| 7,790 | Home Depot, Inc. | 295,786 | |||||||||||||
| 4,200 | @ | Kohl's Corp. | 292,320 | ||||||||||||
| 5,740 | Lowe's Cos., Inc. | 173,118 | |||||||||||||
| 11,550 | McDonald's Corp. | 484,754 | |||||||||||||
| 4,300 | Nordstrom, Inc. | 210,786 | |||||||||||||
| 5,380 | @ | Office Depot, Inc. | 203,687 | ||||||||||||
| 1,400 | OfficeMax, Inc. | 65,898 | |||||||||||||
| 3,000 | @ | Starbucks Corp. | 105,870 | ||||||||||||
| 3,250 | Target Corp. | 188,793 | |||||||||||||
| 8,530 | TJX Cos., Inc. | 233,893 | |||||||||||||
| 9,870 | Wal-Mart Stores, Inc. | 455,007 | |||||||||||||
| 3,348,115 | |||||||||||||||
| Semiconductors: 2.2% | |||||||||||||||
| 10,400 | @ | Advanced Micro Devices, Inc. | 224,328 | ||||||||||||
| 6,850 | @ | Altera Corp. | 136,247 | ||||||||||||
See Accompanying Notes to Financial Statements
75
PORTFOLIO OF INVESTMENTS
ING INDEX PLUS LARGECAP EQUITY FUND AS OF NOVEMBER 30, 2006 (UNAUDITED) (CONTINUED)
| Shares | Value | ||||||||||||||
| Semiconductors (continued) | |||||||||||||||
| 1,669 | @ | Freescale Semiconductor, Inc. | $ | 66,643 | |||||||||||
| 22,080 | Intel Corp. | 471,408 | |||||||||||||
| 9,100 | @ | LSI Logic Corp. | 97,006 | ||||||||||||
| 13,900 | @ | Micron Technology, Inc. | 202,940 | ||||||||||||
| 200 | @ | Teradyne, Inc. | 2,980 | ||||||||||||
| 1,201,552 | |||||||||||||||
| Software: 3.4% | |||||||||||||||
| 3,910 | @ | BMC Software, Inc. | 127,310 | ||||||||||||
| 8,500 | @ | Compuware Corp. | 71,315 | ||||||||||||
| 12,200 | First Data Corp. | 308,050 | |||||||||||||
| 37,150 | Microsoft Corp. | 1,089,610 | |||||||||||||
| 15,410 | @ | Oracle Corp. | 293,252 | ||||||||||||
| 1,889,537 | |||||||||||||||
| Telecommunications: 6.4% | |||||||||||||||
| 16,692 | AT&T, Inc. | 566,026 | |||||||||||||
| 8,250 | @ | Avaya, Inc. | 105,435 | ||||||||||||
| 8,250 | BellSouth Corp. | 367,868 | |||||||||||||
| 480 | CenturyTel, Inc. | 20,424 | |||||||||||||
| 38,770 | @ | Cisco Systems, Inc. | 1,042,138 | ||||||||||||
| 22,710 | Motorola, Inc. | 503,481 | |||||||||||||
| 6,300 | Qualcomm, Inc. | 230,517 | |||||||||||||
| 13,600 | Sprint Nextel Corp. | 265,336 | |||||||||||||
| 13,200 | Verizon Communications, Inc. | 461,208 | |||||||||||||
| 3,562,433 | |||||||||||||||
| Toys/Games/Hobbies: 0.2% | |||||||||||||||
| 3,110 | Hasbro, Inc. | 83,189 | |||||||||||||
| 83,189 | |||||||||||||||
| Total Common Stock (Cost $48,373,467) | 55,472,163 | ||||||||||||||
| Principal Amount | Value | ||||||||||||||
| SHORT-TERM INVESTMENTS: 0.7% | |||||||||||||||
| Repurchase Agreement: 0.7% | |||||||||||||||
| $377,000 | Morgan Stanley Repurchase Agreement dated 11/30/06, 5.290%, due 12/01/06, $377,055 to be received upon repurchase (Collateralized by $390,000 Federal National Mortgage Association, 3.125%-3.750%, Market Value plus accrued interest $389,325, due 04/05/07-11/09/07) | 377,000 | |||||||||||||
| Total Short-Term Investments (Cost $377,000) | 377,000 | ||||||||||||||
| Total Investments in Securities (Cost $48,750,467)* | 100.5 | % | $ | 55,849,163 | |||||||
| Other Assets and Liabilities - Net | (0.5 | ) | (280,680 | ) | |||||||
| Net Assets | 100.0 | % | $ | 55,568,483 | |||||||
@ Non-income producing security
@@ Foreign Issuer
S Segregated securities for certain derivatives, when-issued or delayed-delivery securities and forward foreign currency exchange contracts.
* Cost for federal income tax purposes is $49,872,468
Net unrealized appreciation consists of:
| Gross Unrealized Appreciation | $ | 6,164,611 | |||||
| Gross Unrealized Depreciation | (187,916 | ) | |||||
| Net Unrealized Appreciation | $ | 5,976,695 | |||||
ING Index Plus LargeCap Equity Fund Futures Contracts as of November 30, 2006
| Contract Description | Number of Contracts | Notional Market Value | Expiration Date | Unrealized Appreciation/ (Depreciation) | |||||||||||||||
| Long Contracts | |||||||||||||||||||
| S&P 500 | 1 | $ | 350,725 | 12/14/06 | $ | 3,046 | |||||||||||||
| $ | 3,046 | ||||||||||||||||||
See Accompanying Notes to Financial Statements
76
PORTFOLIO OF INVESTMENTS
ING PRINCIPAL PROTECTION FUND II AS OF NOVEMBER 30, 2006 (UNAUDITED)
| Shares | Value | ||||||||||||||
| COMMON STOCK: 17.0% | |||||||||||||||
| Advertising: 0.0% | |||||||||||||||
| 750 | Omnicom Group | $ | 76,620 | ||||||||||||
| 76,620 | |||||||||||||||
| Aerospace/Defense: 0.4% | |||||||||||||||
| 2,170 | Boeing Co. | 192,110 | |||||||||||||
| 1,500 | General Dynamics Corp. | 112,260 | |||||||||||||
| 300 | Goodrich Corp. | 13,500 | |||||||||||||
| 400 | L-3 Communications Holdings, Inc. | 32,900 | |||||||||||||
| 1,260 | Lockheed Martin Corp. | 113,967 | |||||||||||||
| 1,019 | Northrop Grumman Corp. | 68,202 | |||||||||||||
| 2,081 | Raytheon Co. | 106,214 | |||||||||||||
| 140 | Rockwell Collins, Inc. | 8,446 | |||||||||||||
| 2,680 | United Technologies Corp. | 172,940 | |||||||||||||
| 820,539 | |||||||||||||||
| Agriculture: 0.3% | |||||||||||||||
| 5,620 | Altria Group, Inc. | 473,260 | |||||||||||||
| 1,670 | Archer-Daniels-Midland Co. | 58,617 | |||||||||||||
| 580 | Reynolds American, Inc. | 37,259 | |||||||||||||
| 400 | UST, Inc. | 22,392 | |||||||||||||
| 591,528 | |||||||||||||||
| Airlines: 0.0% | |||||||||||||||
| 2,150 | Southwest Airlines Co. | 33,777 | |||||||||||||
| 33,777 | |||||||||||||||
| Apparel: 0.1% | |||||||||||||||
| 1,800 | @ | Coach, Inc. | 77,778 | ||||||||||||
| 500 | Jones Apparel Group, Inc. | 16,800 | |||||||||||||
| 430 | Liz Claiborne, Inc. | 18,383 | |||||||||||||
| 520 | Nike, Inc. | 51,454 | |||||||||||||
| 50 | VF Corp. | 3,920 | |||||||||||||
| 168,335 | |||||||||||||||
| Auto Manufacturers: 0.1% | |||||||||||||||
| 4,890 | Ford Motor Co. | 39,756 | |||||||||||||
| 600 | General Motors Corp. | 17,538 | |||||||||||||
| 250 | @ | Navistar International Corp. | 7,998 | ||||||||||||
| 900 | Paccar, Inc. | 58,770 | |||||||||||||
| 124,062 | |||||||||||||||
| Auto Parts & Equipment: 0.0% | |||||||||||||||
| 550 | @ | Goodyear Tire & Rubber Co. | 9,268 | ||||||||||||
| 520 | Johnson Controls, Inc. | 42,292 | |||||||||||||
| 51,560 | |||||||||||||||
| Banks: 1.3% | |||||||||||||||
| 16,511 | Bank of America Corp. | 889,117 | |||||||||||||
| 2,250 | Bank of New York Co., Inc. | 79,965 | |||||||||||||
| 1,411 | BB&T Corp. | 60,687 | |||||||||||||
| 790 | Capital One Financial Corp. | 61,525 | |||||||||||||
| 600 | Comerica, Inc. | 34,950 | |||||||||||||
| 200 | Commerce Bancorp., Inc. | 6,952 | |||||||||||||
| 250 | Compass Bancshares, Inc. | 14,285 | |||||||||||||
| 1,400 | Fifth Third Bancorp. | 55,202 | |||||||||||||
| 380 | First Horizon National Corp. | 15,147 | |||||||||||||
| 670 | Huntington Bancshares, Inc. | 16,288 | |||||||||||||
| 1,080 | Keycorp | 38,988 | |||||||||||||
| 250 | M&T Bank Corp. | 29,660 | |||||||||||||
| 660 | Marshall & Ilsley Corp. | 30,221 | |||||||||||||
| 1,150 | Mellon Financial Corp. | 46,265 | |||||||||||||
| 2,190 | National City Corp. | 79,059 | |||||||||||||
| Shares | Value | ||||||||||||||
| 1,200 | North Fork Bancorp., Inc. | $ | 33,684 | ||||||||||||
| 550 | Northern Trust Corp. | 31,328 | |||||||||||||
| 820 | PNC Financial Services Group, Inc. | 57,966 | |||||||||||||
| 2,617 | Regions Financial Corp. | 95,913 | |||||||||||||
| 840 | State Street Corp. | 52,189 | |||||||||||||
| 1,000 | SunTrust Banks, Inc. | 81,650 | |||||||||||||
| 838 | Synovus Financial Corp. | 25,157 | |||||||||||||
| 4,680 | US Bancorp. | 157,435 | |||||||||||||
| 6,971 | Wachovia Corp. | 377,758 | |||||||||||||
| 9,100 | Wells Fargo & Co. | 320,684 | |||||||||||||
| 270 | Zions Bancorp. | 21,125 | |||||||||||||
| 2,713,200 | |||||||||||||||
| Beverages: 0.4% | |||||||||||||||
| 2,750 | Anheuser-Busch Cos., Inc. | 130,653 | |||||||||||||
| 190 | Brown-Forman Corp. | 13,196 | |||||||||||||
| 5,390 | Coca-Cola Co. | 252,414 | |||||||||||||
| 880 | Coca-Cola Enterprises, Inc. | 17,996 | |||||||||||||
| 500 | @ | Constellation Brands, Inc. | 13,990 | ||||||||||||
| 100 | Molson Coors Brewing Co. | 7,108 | |||||||||||||
| 570 | Pepsi Bottling Group, Inc. | 17,852 | |||||||||||||
| 4,410 | PepsiCo, Inc. | 273,288 | |||||||||||||
| 726,497 | |||||||||||||||
| Biotechnology: 0.2% | |||||||||||||||
| 3,118 | @ | Amgen, Inc. | 221,378 | ||||||||||||
| 900 | @ | Biogen Idec, Inc. | 47,034 | ||||||||||||
| 950 | @ | Celgene Corp. | 52,944 | ||||||||||||
| 300 | @ | Genzyme Corp. | 19,320 | ||||||||||||
| 300 | @ | Medimmune, Inc. | 9,807 | ||||||||||||
| 200 | @ | Millipore Corp. | 13,682 | ||||||||||||
| 364,165 | |||||||||||||||
| Building Materials: 0.0% | |||||||||||||||
| 470 | American Standard Cos., Inc. | 21,061 | |||||||||||||
| 1,150 | Masco Corp. | 32,994 | |||||||||||||
| 54,055 | |||||||||||||||
| Chemicals: 0.3% | |||||||||||||||
| 250 | Air Products & Chemicals, Inc. | 17,285 | |||||||||||||
| 200 | Ashland, Inc. | 13,522 | |||||||||||||
| 2,900 | Dow Chemical Co. | 116,029 | |||||||||||||
| 500 | Ecolab, Inc. | 22,175 | |||||||||||||
| 2,800 | EI DuPont de Nemours & Co. | 131,404 | |||||||||||||
| 330 | International Flavors & Fragrances, Inc. | 15,546 | |||||||||||||
| 1,660 | Monsanto Co. | 79,796 | |||||||||||||
| 870 | PPG Industries, Inc. | 55,941 | |||||||||||||
| 1,080 | Praxair, Inc. | 67,392 | |||||||||||||
| 560 | Rohm & Haas Co. | 29,243 | |||||||||||||
| 450 | Sherwin-Williams Co. | 28,148 | |||||||||||||
| 200 | Sigma-Aldrich Corp. | 15,222 | |||||||||||||
| 591,703 | |||||||||||||||
| Coal: 0.0% | |||||||||||||||
| 730 | Peabody Energy Corp. | 33,587 | |||||||||||||
| 33,587 | |||||||||||||||
| Commercial Services: 0.1% | |||||||||||||||
| 400 | @ | Apollo Group, Inc. | 15,516 | ||||||||||||
| 500 | @ | Convergys Corp. | 12,060 | ||||||||||||
| 660 | Equifax, Inc. | 25,073 | |||||||||||||
| 990 | H&R Block, Inc. | 23,760 | |||||||||||||
| 1,430 | McKesson Corp. | 70,642 | |||||||||||||
See Accompanying Notes to Financial Statements
77
PORTFOLIO OF INVESTMENTS
ING PRINCIPAL PROTECTION FUND II AS OF NOVEMBER 30, 2006 (UNAUDITED) (CONTINUED)
| Shares | Value | ||||||||||||||
| Commercial Services (continued) | |||||||||||||||
| 300 | @ | Monster Worldwide, Inc. | $ | 13,095 | |||||||||||
| 900 | Moody's Corp. | 62,532 | |||||||||||||
| 190 | Robert Half International, Inc. | 7,332 | |||||||||||||
| 200 | RR Donnelley & Sons Co. | 7,054 | |||||||||||||
| 1,959 | Western Union Co. | 44,665 | |||||||||||||
| 281,729 | |||||||||||||||
| Computers: 0.8% | |||||||||||||||
| 350 | @ | Affiliated Computer Services, Inc. | 17,693 | ||||||||||||
| 380 | @ | Cognizant Technology Solutions Corp. | 30,993 | ||||||||||||
| 550 | @ | Computer Sciences Corp. | 28,710 | ||||||||||||
| 10,400 | @ | Dell, Inc. | 283,296 | ||||||||||||
| 1,400 | Electronic Data Systems Corp. | 37,996 | |||||||||||||
| 6,350 | @ | EMC Corp. | 83,249 | ||||||||||||
| 12,602 | Hewlett-Packard Co. | 497,275 | |||||||||||||
| 5,540 | International Business Machines Corp. | 509,237 | |||||||||||||
| 470 | @ | Lexmark International, Inc. | 32,421 | ||||||||||||
| 500 | @ | NCR Corp. | 21,455 | ||||||||||||
| 950 | @ | Network Appliance, Inc. | 37,250 | ||||||||||||
| 500 | @ | Sandisk Corp. | 22,200 | ||||||||||||
| 8,900 | @ | Sun Microsystems, Inc. | 48,238 | ||||||||||||
| 900 | @ | Unisys Corp. | 6,489 | ||||||||||||
| 1,656,502 | |||||||||||||||
| Cosmetics/Personal Care: 0.3% | |||||||||||||||
| 1,200 | Avon Products, Inc. | 39,168 | |||||||||||||
| 1,450 | Colgate-Palmolive Co. | 94,323 | |||||||||||||
| 600 | Estee Lauder Cos., Inc. | 24,774 | |||||||||||||
| 8,448 | Procter & Gamble Co. | 530,450 | |||||||||||||
| 688,715 | |||||||||||||||
| Distribution/Wholesale: 0.0% | |||||||||||||||
| 200 | WW Grainger, Inc. | 14,472 | |||||||||||||
| 14,472 | |||||||||||||||
| Diversified Financial Services: 1.5% | |||||||||||||||
| 3,220 | American Express Co. | 189,078 | |||||||||||||
| 664 | Ameriprise Financial, Inc. | 35,922 | |||||||||||||
| 280 | Bear Stearns Cos., Inc. | 42,694 | |||||||||||||
| 2,650 | Charles Schwab Corp. | 48,601 | |||||||||||||
| 100 | Chicago Mercantile Exchange Holdings, Inc. | 53,560 | |||||||||||||
| 950 | CIT Group, Inc. | 49,410 | |||||||||||||
| 18,000 | Citigroup, Inc. | 892,620 | |||||||||||||
| 1,610 | Countrywide Financial Corp. | 63,949 | |||||||||||||
| 1,200 | @ | E*Trade Financial Corp. | 28,884 | ||||||||||||
| 2,580 | Fannie Mae | 147,137 | |||||||||||||
| 200 | Federated Investors, Inc. | 6,636 | |||||||||||||
| 400 | Franklin Resources, Inc. | 42,696 | |||||||||||||
| 1,900 | Freddie Mac | 127,604 | |||||||||||||
| 1,200 | Goldman Sachs Group, Inc. | 233,760 | |||||||||||||
| 600 | Janus Capital Group, Inc. | 12,156 | |||||||||||||
| 12,500 | JPMorgan Chase & Co. | 578,500 | |||||||||||||
| 1,440 | Lehman Brothers Holdings, Inc. | 106,085 | |||||||||||||
| 2,460 | Merrill Lynch & Co., Inc. | 215,078 | |||||||||||||
| 2,900 | Morgan Stanley | 220,864 | |||||||||||||
| 1,110 | SLM Corp. | 50,882 | |||||||||||||
| 600 | T. Rowe Price Group, Inc. | 25,998 | |||||||||||||
| 3,172,114 | |||||||||||||||
| Shares | Value | ||||||||||||||
| Electric: 0.5% | |||||||||||||||
| 2,900 | @ | AES Corp. | $ | 67,773 | |||||||||||
| 450 | @ | Allegheny Energy, Inc. | 19,962 | ||||||||||||
| 700 | Ameren Corp. | 38,297 | |||||||||||||
| 1,300 | American Electric Power Co., Inc. | 53,963 | |||||||||||||
| 700 | Centerpoint Energy, Inc. | 11,445 | |||||||||||||
| 1,050 | @ | CMS Energy Corp. | 17,021 | ||||||||||||
| 500 | Constellation Energy Group, Inc. | 34,305 | |||||||||||||
| 600 | DTE Energy Co. | 28,254 | |||||||||||||
| 1,200 | @ | Dynegy, Inc. | 8,148 | ||||||||||||
| 940 | Edison International | 43,221 | |||||||||||||
| 700 | Entergy Corp. | 63,924 | |||||||||||||
| 2,300 | Exelon Corp. | 139,679 | |||||||||||||
| 1,050 | FirstEnergy Corp. | 62,832 | |||||||||||||
| 1,000 | PG&E Corp. | 45,930 | |||||||||||||
| 300 | Pinnacle West Capital Corp. | 14,802 | |||||||||||||
| 1,120 | PPL Corp. | 40,712 | |||||||||||||
| 300 | Progress Energy, Inc. | 14,331 | |||||||||||||
| 750 | Public Service Enterprise Group, Inc. | 50,415 | |||||||||||||
| 2,600 | Southern Co. | 94,250 | |||||||||||||
| 700 | TECO Energy, Inc. | 11,893 | |||||||||||||
| 1,600 | TXU Corp. | 91,824 | |||||||||||||
| 1,350 | Xcel Energy, Inc. | 30,996 | |||||||||||||
| 983,977 | |||||||||||||||
| Electrical Components & Equipment: 0.1% | |||||||||||||||
| 1,080 | Emerson Electric Co. | 93,636 | |||||||||||||
| 400 | Molex, Inc. | 12,800 | |||||||||||||
| 106,436 | |||||||||||||||
| Electronics: 0.1% | |||||||||||||||
| 1,050 | @ | Agilent Technologies, Inc. | 33,432 | ||||||||||||
| 490 | Applera Corp. - Applied Biosystems Group | 17,856 | |||||||||||||
| 440 | Jabil Circuit, Inc. | 12,478 | |||||||||||||
| 450 | PerkinElmer, Inc. | 9,752 | |||||||||||||
| 700 | Symbol Technologies, Inc. | 10,374 | |||||||||||||
| 1,000 | @ | Thermo Electron Corp. | 43,830 | ||||||||||||
| 300 | @ | Waters Corp. | 15,012 | ||||||||||||
| 142,734 | |||||||||||||||
| Entertainment: 0.0% | |||||||||||||||
| 400 | International Game Technology | 17,512 | |||||||||||||
| 17,512 | |||||||||||||||
| Environmental Control: 0.0% | |||||||||||||||
| 700 | @ | Allied Waste Industries, Inc. | 8,876 | ||||||||||||
| 1,980 | Waste Management, Inc. | 72,488 | |||||||||||||
| 81,364 | |||||||||||||||
| Food: 0.2% | |||||||||||||||
| 1,050 | Campbell Soup Co. | 39,974 | |||||||||||||
| 1,450 | ConAgra Foods, Inc. | 37,265 | |||||||||||||
| 400 | @ | Dean Foods Co. | 17,128 | ||||||||||||
| 1,600 | General Mills, Inc. | 89,520 | |||||||||||||
| 200 | Hershey Co. | 10,594 | |||||||||||||
| 850 | HJ Heinz Co. | 37,783 | |||||||||||||
| 670 | Kellogg Co. | 33,353 | |||||||||||||
| 1,850 | Kroger Co. | 39,701 | |||||||||||||
| 350 | McCormick & Co., Inc. | 13,552 | |||||||||||||
| 1,100 | Safeway, Inc. | 33,891 | |||||||||||||
See Accompanying Notes to Financial Statements
78
PORTFOLIO OF INVESTMENTS
ING PRINCIPAL PROTECTION FUND II AS OF NOVEMBER 30, 2006 (UNAUDITED) (CONTINUED)
| Shares | Value | ||||||||||||||
| Food (continued) | |||||||||||||||
| 808 | Sara Lee Corp. | $ | 13,397 | ||||||||||||
| 528 | Supervalu, Inc. | 18,089 | |||||||||||||
| 400 | Whole Foods Market, Inc. | 19,520 | |||||||||||||
| 403,767 | |||||||||||||||
| Forest Products & Paper: 0.1% | |||||||||||||||
| 1,300 | International Paper Co. | 43,030 | |||||||||||||
| 550 | MeadWestvaco Corp. | 16,225 | |||||||||||||
| 500 | Plum Creek Timber Co., Inc. | 18,630 | |||||||||||||
| 400 | Temple-Inland, Inc. | 15,640 | |||||||||||||
| 300 | Weyerhaeuser Co. | 19,404 | |||||||||||||
| 112,929 | |||||||||||||||
| Gas: 0.0% | |||||||||||||||
| 600 | KeySpan Corp. | 24,618 | |||||||||||||
| 900 | NiSource, Inc. | 22,194 | |||||||||||||
| 910 | Sempra Energy | 49,595 | |||||||||||||
| 96,407 | |||||||||||||||
| Hand/Machine Tools: 0.0% | |||||||||||||||
| 250 | Black & Decker Corp. | 21,470 | |||||||||||||
| 120 | Snap-On, Inc. | 5,700 | |||||||||||||
| 280 | Stanley Works | 14,286 | |||||||||||||
| 41,456 | |||||||||||||||
| Healthcare-Products: 0.5% | |||||||||||||||
| 1,750 | Baxter International, Inc. | 78,295 | |||||||||||||
| 690 | Becton Dickinson & Co. | 49,487 | |||||||||||||
| 3,100 | @ | Boston Scientific Corp. | 49,042 | ||||||||||||
| 300 | CR Bard, Inc. | 24,687 | |||||||||||||
| 7,900 | Johnson & Johnson | 520,689 | |||||||||||||
| 3,100 | Medtronic, Inc. | 161,603 | |||||||||||||
| 400 | @ | Patterson Cos., Inc. | 14,844 | ||||||||||||
| 370 | @ | St. Jude Medical, Inc. | 13,790 | ||||||||||||
| 800 | Stryker Corp. | 41,488 | |||||||||||||
| 700 | @ | Zimmer Holdings, Inc. | 51,072 | ||||||||||||
| 1,004,997 | |||||||||||||||
| Healthcare-Services: 0.4% | |||||||||||||||
| 1,980 | Aetna, Inc. | 81,794 | |||||||||||||
| 590 | @ | Coventry Health Care, Inc. | 28,397 | ||||||||||||
| 700 | @ | Humana, Inc. | 37,870 | ||||||||||||
| 500 | @ | Laboratory Corp. of America Holdings | 35,400 | ||||||||||||
| 200 | Manor Care, Inc. | 9,504 | |||||||||||||
| 400 | Quest Diagnostics | 21,268 | |||||||||||||
| 6,190 | UnitedHealth Group, Inc. | 303,805 | |||||||||||||
| 2,880 | @ | WellPoint, Inc. | 217,930 | ||||||||||||
| 735,968 | |||||||||||||||
| Home Builders: 0.0% | |||||||||||||||
| 200 | Lennar Corp. | 10,500 | |||||||||||||
| 10,500 | |||||||||||||||
| Home Furnishings: 0.0% | |||||||||||||||
| 200 | Harman International Industries, Inc. | 20,768 | |||||||||||||
| 200 | Whirlpool Corp. | 17,060 | |||||||||||||
| 37,828 | |||||||||||||||
| Household Products/Wares: 0.1% | |||||||||||||||
| 100 | Avery Dennison Corp. | 6,747 | |||||||||||||
| 410 | Fortune Brands, Inc. | 33,169 | |||||||||||||
| Shares | Value | ||||||||||||||
| 1,350 | Kimberly-Clark Corp. | $ | 89,735 | ||||||||||||
| 129,651 | |||||||||||||||
| Housewares: 0.0% | |||||||||||||||
| 650 | Newell Rubbermaid, Inc. | 18,519 | |||||||||||||
| 18,519 | |||||||||||||||
| Insurance: 1.0% | |||||||||||||||
| 760 | @@ | ACE Ltd. | 43,198 | ||||||||||||
| 1,350 | Aflac, Inc. | 59,589 | |||||||||||||
| 2,270 | Allstate Corp. | 144,100 | |||||||||||||
| 350 | AMBAC Financial Group, Inc. | 29,974 | |||||||||||||
| 7,050 | American International Group, Inc. | 495,756 | |||||||||||||
| 1,050 | AON Corp. | 37,464 | |||||||||||||
| 1,440 | Chubb Corp. | 74,534 | |||||||||||||
| 400 | Cigna Corp. | 50,420 | |||||||||||||
| 651 | Cincinnati Financial Corp. | 28,826 | |||||||||||||
| 2,100 | Genworth Financial, Inc. | 68,880 | |||||||||||||
| 1,350 | Hartford Financial Services Group, Inc. | 115,776 | |||||||||||||
| 963 | Lincoln National Corp. | 61,237 | |||||||||||||
| 1,670 | Loews Corp. | 66,666 | |||||||||||||
| 600 | Marsh & McLennan Cos., Inc. | 18,852 | |||||||||||||
| 370 | MBIA, Inc. | 25,771 | |||||||||||||
| 2,750 | Metlife, Inc. | 161,508 | |||||||||||||
| 350 | MGIC Investment Corp. | 20,286 | |||||||||||||
| 970 | Principal Financial Group | 56,018 | |||||||||||||
| 2,780 | Progressive Corp. | 62,689 | |||||||||||||
| 1,750 | Prudential Financial, Inc. | 142,590 | |||||||||||||
| 530 | Safeco Corp. | 32,102 | |||||||||||||
| 2,490 | St. Paul Travelers Cos., Inc. | 129,007 | |||||||||||||
| 420 | Torchmark Corp. | 26,552 | |||||||||||||
| 800 | UnumProvident Corp. | 16,384 | |||||||||||||
| 500 | @@ | XL Capital Ltd. | 35,560 | ||||||||||||
| 2,003,739 | |||||||||||||||
| Internet: 0.1% | |||||||||||||||
| 800 | @ | Amazon.com, Inc. | 32,272 | ||||||||||||
| 1,200 | @ | eBay, Inc. | 38,820 | ||||||||||||
| 200 | @ | Google, Inc. | 96,984 | ||||||||||||
| 2,822 | @ | Symantec Corp. | 59,826 | ||||||||||||
| 600 | @ | VeriSign, Inc. | 15,666 | ||||||||||||
| 243,568 | |||||||||||||||
| Iron/Steel: 0.1% | |||||||||||||||
| 1,540 | Nucor Corp. | 92,169 | |||||||||||||
| 550 | United States Steel Corp. | 41,135 | |||||||||||||
| 133,304 | |||||||||||||||
| Leisure Time: 0.1% | |||||||||||||||
| 260 | Brunswick Corp. | 8,416 | |||||||||||||
| 1,150 | Carnival Corp. | 56,339 | |||||||||||||
| 780 | Harley-Davidson, Inc. | 57,541 | |||||||||||||
| 350 | Sabre Holdings Corp. | 9,601 | |||||||||||||
| 131,897 | |||||||||||||||
| Lodging: 0.0% | |||||||||||||||
| 800 | Marriott International, Inc. | 36,120 | |||||||||||||
| 200 | Starwood Hotels & Resorts Worldwide, Inc. | 12,834 | |||||||||||||
| 510 | @ | Wyndham Worldwide Corp. | 16,187 | ||||||||||||
| 65,141 | |||||||||||||||
See Accompanying Notes to Financial Statements
79
PORTFOLIO OF INVESTMENTS
ING PRINCIPAL PROTECTION FUND II AS OF NOVEMBER 30, 2006 (UNAUDITED) (CONTINUED)
| Shares | Value | ||||||||||||||
| Machinery-Construction & Mining: 0.1% | |||||||||||||||
| 1,800 | Caterpillar, Inc. | $ | 111,654 | ||||||||||||
| 111,654 | |||||||||||||||
| Machinery-Diversified: 0.0% | |||||||||||||||
| 250 | Cummins, Inc. | 29,980 | |||||||||||||
| 300 | Deere & Co. | 28,800 | |||||||||||||
| 480 | Rockwell Automation, Inc. | 31,238 | |||||||||||||
| 90,018 | |||||||||||||||
| Media: 0.4% | |||||||||||||||
| 2,875 | CBS Corp. | 85,531 | |||||||||||||
| 1,300 | Clear Channel Communications, Inc. | 45,708 | |||||||||||||
| 5,600 | @ | Comcast Corp. | 226,576 | ||||||||||||
| 200 | EW Scripps Co. | 9,772 | |||||||||||||
| 600 | Gannett Co., Inc. | 35,712 | |||||||||||||
| 1,320 | McGraw-Hill Cos., Inc. | 87,978 | |||||||||||||
| 190 | Meredith Corp. | 10,279 | |||||||||||||
| 6,400 | News Corp., Inc. | 131,840 | |||||||||||||
| 200 | @ | Univision Communications, Inc. | 7,118 | ||||||||||||
| 7,530 | Walt Disney Co. | 248,867 | |||||||||||||
| 889,381 | |||||||||||||||
| Mining: 0.1% | |||||||||||||||
| 600 | Freeport-McMoRan Copper & Gold, Inc. | 37,722 | |||||||||||||
| 490 | Phelps Dodge Corp. | 60,270 | |||||||||||||
| 100 | Vulcan Materials Co. | 8,872 | |||||||||||||
| 106,864 | |||||||||||||||
| Miscellaneous Manufacturing: 0.9% | |||||||||||||||
| 2,070 | 3M Co. | 168,622 | |||||||||||||
| 250 | Cooper Industries Ltd. | 22,860 | |||||||||||||
| 700 | Danaher Corp. | 51,184 | |||||||||||||
| 550 | Dover Corp. | 27,665 | |||||||||||||
| 1,100 | Eastman Kodak Co. | 28,622 | |||||||||||||
| 650 | Eaton Corp. | 50,102 | |||||||||||||
| 27,820 | General Electric Co. | 981,490 | |||||||||||||
| 2,880 | Honeywell International, Inc. | 123,782 | |||||||||||||
| 1,160 | Illinois Tool Works, Inc. | 54,752 | |||||||||||||
| 880 | @@ | Ingersoll-Rand Co. | 34,329 | ||||||||||||
| 560 | ITT Corp. | 30,212 | |||||||||||||
| 500 | Leggett & Platt, Inc. | 11,890 | |||||||||||||
| 500 | Parker Hannifin Corp. | 41,740 | |||||||||||||
| 380 | Textron, Inc. | 37,031 | |||||||||||||
| 5,400 | @@ | Tyco International Ltd. | 163,566 | ||||||||||||
| 1,827,847 | |||||||||||||||
| Office/Business Equipment: 0.0% | |||||||||||||||
| 630 | Pitney Bowes, Inc. | 29,037 | |||||||||||||
| 4,370 | @ | Xerox Corp. | 72,105 | ||||||||||||
| 101,142 | |||||||||||||||
| Oil & Gas: 1.7% | |||||||||||||||
| 1,000 | Anadarko Petroleum Corp. | 49,360 | |||||||||||||
| 280 | Apache Corp. | 19,580 | |||||||||||||
| 8,802 | Chevron Corp. | 636,561 | |||||||||||||
| 4,053 | ConocoPhillips | 272,767 | |||||||||||||
| 1,050 | Devon Energy Corp. | 77,039 | |||||||||||||
| 600 | EOG Resources, Inc. | 42,318 | |||||||||||||
| 23,730 | ExxonMobil Corp. | 1,822,701 | |||||||||||||
| 530 | Hess Corp. | 26,643 | |||||||||||||
| 1,440 | Marathon Oil Corp. | 135,907 | |||||||||||||
| Shares | Value | ||||||||||||||
| 800 | @, @@ | Nabors Industries Ltd. | $ | 27,008 | |||||||||||
| 300 | Noble Corp. | 23,175 | |||||||||||||
| 2,140 | Occidental Petroleum Corp. | 107,728 | |||||||||||||
| 500 | Sunoco, Inc. | 34,080 | |||||||||||||
| 700 | @ | Transocean, Inc. | 54,565 | ||||||||||||
| 1,900 | Valero Energy Corp. | 104,633 | |||||||||||||
| 900 | XTO Energy, Inc. | 45,540 | |||||||||||||
| 3,479,605 | |||||||||||||||
| Oil & Gas Services: 0.2% | |||||||||||||||
| 800 | Baker Hughes, Inc. | 58,744 | |||||||||||||
| 300 | BJ Services Co. | 10,131 | |||||||||||||
| 4,300 | Halliburton Co. | 145,082 | |||||||||||||
| 400 | @ | National Oilwell Varco, Inc. | 26,604 | ||||||||||||
| 2,800 | Schlumberger Ltd. | 191,744 | |||||||||||||
| 300 | @ | Weatherford International Ltd. | 13,473 | ||||||||||||
| 445,778 | |||||||||||||||
| Packaging & Containers: 0.0% | |||||||||||||||
| 400 | Ball Corp. | 17,104 | |||||||||||||
| 300 | Bemis Co. | 10,239 | |||||||||||||
| 400 | @ | Pactiv Corp. | 13,780 | ||||||||||||
| 250 | Sealed Air Corp. | 14,878 | |||||||||||||
| 56,001 | |||||||||||||||
| Pharmaceuticals: 0.9% | |||||||||||||||
| 4,100 | Abbott Laboratories | 191,306 | |||||||||||||
| 300 | Allergan, Inc. | 34,974 | |||||||||||||
| 1,000 | AmerisourceBergen Corp. | 45,990 | |||||||||||||
| 200 | @ | Barr Pharmaceuticals, Inc. | 10,216 | ||||||||||||
| 2,100 | Bristol-Myers Squibb Co. | 52,143 | |||||||||||||
| 1,040 | Cardinal Health, Inc. | 67,205 | |||||||||||||
| 1,180 | Caremark Rx, Inc. | 55,814 | |||||||||||||
| 1,000 | Eli Lilly & Co. | 53,590 | |||||||||||||
| 600 | @ | Express Scripts, Inc. | 40,920 | ||||||||||||
| 1,130 | @ | Forest Laboratories, Inc. | 55,031 | ||||||||||||
| 1,150 | @ | Gilead Sciences, Inc. | 75,808 | ||||||||||||
| 200 | @ | Hospira, Inc. | 6,560 | ||||||||||||
| 1,180 | @ | King Pharmaceuticals, Inc. | 19,505 | ||||||||||||
| 862 | @ | Medco Health Solutions, Inc. | 43,281 | ||||||||||||
| 7,910 | Merck & Co., Inc. | 352,074 | |||||||||||||
| 1,000 | Mylan Laboratories | 20,290 | |||||||||||||
| 19,646 | Pfizer, Inc. | 540,069 | |||||||||||||
| 5,350 | Schering-Plough Corp. | 117,754 | |||||||||||||
| 500 | @ | Watson Pharmaceuticals, Inc. | 12,835 | ||||||||||||
| 3,600 | Wyeth | 173,808 | |||||||||||||
| 1,969,173 | |||||||||||||||
| Pipelines: 0.0% | |||||||||||||||
| 1,600 | El Paso Corp. | 23,360 | |||||||||||||
| 1,400 | Williams Cos., Inc. | 38,864 | |||||||||||||
| 62,224 | |||||||||||||||
| Real Estate: 0.0% | |||||||||||||||
| 500 | @ | CB Richard Ellis Group, Inc. | 16,465 | ||||||||||||
| 602 | @ | Realogy Corp. | 15,706 | ||||||||||||
| 32,171 | |||||||||||||||
| Real Estate Investment Trusts: 0.1% | |||||||||||||||
| 250 | Apartment Investment & Management Co. | 14,410 | |||||||||||||
| 100 | Boston Properties, Inc. | 11,705 | |||||||||||||
| 940 | Equity Office Properties Trust | 45,308 | |||||||||||||
| 300 | Prologis | 19,551 | |||||||||||||
See Accompanying Notes to Financial Statements
80
PORTFOLIO OF INVESTMENTS
ING PRINCIPAL PROTECTION FUND II AS OF NOVEMBER 30, 2006 (UNAUDITED) (CONTINUED)
| Shares | Value | ||||||||||||||
| Real Estate Investment Trusts (continued) | |||||||||||||||
| 200 | Public Storage, Inc. | $ | 19,256 | ||||||||||||
| 100 | Vornado Realty Trust | 12,611 | |||||||||||||
| 122,841 | |||||||||||||||
| Retail: 0.9% | |||||||||||||||
| 200 | @ | Autozone, Inc. | 22,722 | ||||||||||||
| 710 | @ | Bed Bath & Beyond, Inc. | 27,513 | ||||||||||||
| 1,060 | Best Buy Co., Inc. | 58,268 | |||||||||||||
| 500 | @ | Big Lots, Inc. | 11,155 | ||||||||||||
| 650 | Circuit City Stores, Inc. | 16,224 | |||||||||||||
| 1,250 | Costco Wholesale Corp. | 65,325 | |||||||||||||
| 2,000 | CVS Corp. | 57,540 | |||||||||||||
| 600 | Darden Restaurants, Inc. | 24,090 | |||||||||||||
| 700 | Family Dollar Stores, Inc. | 19,523 | |||||||||||||
| 2,520 | Federated Department Stores, Inc. | 106,067 | |||||||||||||
| 2,420 | Gap, Inc. | 45,302 | |||||||||||||
| 2,290 | Home Depot, Inc. | 86,951 | |||||||||||||
| 600 | JC Penney Co., Inc. | 46,404 | |||||||||||||
| 1,500 | @ | Kohl's Corp. | 104,400 | ||||||||||||
| 910 | Limited Brands, Inc. | 28,838 | |||||||||||||
| 4,060 | Lowe's Cos., Inc. | 122,450 | |||||||||||||
| 3,400 | McDonald's Corp. | 142,698 | |||||||||||||
| 1,000 | Nordstrom, Inc. | 49,020 | |||||||||||||
| 1,300 | @ | Office Depot, Inc. | 49,218 | ||||||||||||
| 300 | OfficeMax, Inc. | 14,121 | |||||||||||||
| 400 | RadioShack Corp. | 7,012 | |||||||||||||
| 200 | @ | Sears Holding Corp. | 34,284 | ||||||||||||
| 1,940 | Staples, Inc. | 49,412 | |||||||||||||
| 2,720 | @ | Starbucks Corp. | 95,989 | ||||||||||||
| 2,300 | Target Corp. | 133,607 | |||||||||||||
| 2,110 | TJX Cos., Inc. | 57,856 | |||||||||||||
| 2,710 | Walgreen Co. | 109,728 | |||||||||||||
| 6,550 | Wal-Mart Stores, Inc. | 301,955 | |||||||||||||
| 570 | Wendy's International, Inc. | 18,565 | |||||||||||||
| 700 | Yum! Brands, Inc. | 42,833 | |||||||||||||
| 1,949,070 | |||||||||||||||
| Savings & Loans: 0.1% | |||||||||||||||
| 2,530 | Washington Mutual, Inc. | 110,510 | |||||||||||||
| 110,510 | |||||||||||||||
| Semiconductors: 0.4% | |||||||||||||||
| 2,200 | @ | Advanced Micro Devices, Inc. | 47,454 | ||||||||||||
| 1,580 | @ | Altera Corp. | 31,426 | ||||||||||||
| 1,330 | Analog Devices, Inc. | 43,252 | |||||||||||||
| 4,420 | Applied Materials, Inc. | 79,472 | |||||||||||||
| 1,119 | @ | Freescale Semiconductor, Inc. | 44,682 | ||||||||||||
| 15,570 | Intel Corp. | 332,420 | |||||||||||||
| 500 | KLA-Tencor Corp. | 25,835 | |||||||||||||
| 780 | Linear Technology Corp. | 25,069 | |||||||||||||
| 1,050 | @ | LSI Logic Corp. | 11,193 | ||||||||||||
| 800 | Maxim Integrated Products | 25,184 | |||||||||||||
| 3,300 | @ | Micron Technology, Inc. | 48,180 | ||||||||||||
| 800 | National Semiconductor Corp. | 19,352 | |||||||||||||
| 450 | @ | Novellus Systems, Inc. | 14,049 | ||||||||||||
| 400 | @ | Nvidia Corp. | 14,796 | ||||||||||||
| 500 | @ | QLogic Corp. | 11,125 | ||||||||||||
| 750 | @ | Teradyne, Inc. | 11,175 | ||||||||||||
| 1,700 | Texas Instruments, Inc. | 50,235 | |||||||||||||
| 900 | Xilinx, Inc. | 24,120 | |||||||||||||
| 859,019 | |||||||||||||||
| Shares | Value | ||||||||||||||
| Software: 0.7% | |||||||||||||||
| 1,540 | @ | Adobe Systems, Inc. | $ | 61,800 | |||||||||||
| 820 | @ | Autodesk, Inc. | 33,768 | ||||||||||||
| 1,540 | Automatic Data Processing, Inc. | 74,274 | |||||||||||||
| 920 | @ | BMC Software, Inc. | 29,955 | ||||||||||||
| 1,264 | CA, Inc. | 27,429 | |||||||||||||
| 570 | @ | Citrix Systems, Inc. | 16,382 | ||||||||||||
| 1,400 | @ | Compuware Corp. | 11,746 | ||||||||||||
| 760 | @ | Electronic Arts, Inc. | 42,446 | ||||||||||||
| 500 | Fidelity National Information Services, Inc. | 19,950 | |||||||||||||
| 1,959 | First Data Corp. | 49,465 | |||||||||||||
| 500 | @ | Fiserv, Inc. | 25,555 | ||||||||||||
| 550 | IMS Health, Inc. | 15,109 | |||||||||||||
| 920 | @ | Intuit, Inc. | 28,962 | ||||||||||||
| 23,390 | Microsoft Corp. | 686,029 | |||||||||||||
| 1,500 | @ | Novell, Inc. | 9,420 | ||||||||||||
| 10,850 | @ | Oracle Corp. | 206,476 | ||||||||||||
| 568 | @ | Parametric Technology Corp. | 10,996 | ||||||||||||
| 1,050 | Paychex, Inc. | 41,381 | |||||||||||||
| 1,391,143 | |||||||||||||||
| Telecommunications: 1.2% | |||||||||||||||
| 1,000 | Alltel Corp. | 56,740 | |||||||||||||
| 10,342 | AT&T, Inc. | 350,678 | |||||||||||||
| 2,100 | @ | Avaya, Inc. | 26,838 | ||||||||||||
| 5,150 | BellSouth Corp. | 229,639 | |||||||||||||
| 470 | CenturyTel, Inc. | 19,999 | |||||||||||||
| 27,960 | @ | Cisco Systems, Inc. | 751,565 | ||||||||||||
| 900 | Citizens Communications Co. | 12,753 | |||||||||||||
| 500 | @ | Comverse Technology, Inc. | 9,760 | ||||||||||||
| 4,050 | @ | Corning, Inc. | 87,318 | ||||||||||||
| 401 | Embarq Corp. | 20,631 | |||||||||||||
| 600 | @ | JDS Uniphase Corp. | 11,088 | ||||||||||||
| 1,500 | @ | Juniper Networks, Inc. | 31,935 | ||||||||||||
| 8,840 | Motorola, Inc. | 195,983 | |||||||||||||
| 4,450 | Qualcomm, Inc. | 162,826 | |||||||||||||
| 4,200 | @ | Qwest Communications International, Inc. | 32,298 | ||||||||||||
| 8,423 | Sprint Nextel Corp. | 164,333 | |||||||||||||
| 1,290 | @ | Tellabs, Inc. | 12,952 | ||||||||||||
| 7,760 | Verizon Communications, Inc. | 271,134 | |||||||||||||
| 1,306 | Windstream Corp. | 18,206 | |||||||||||||
| 2,466,676 | |||||||||||||||
| Textiles: 0.0% | |||||||||||||||
| 400 | Cintas Corp. | 16,880 | |||||||||||||
| 16,880 | |||||||||||||||
| Toys/Games/Hobbies: 0.0% | |||||||||||||||
| 600 | Hasbro, Inc. | 16,050 | |||||||||||||
| 1,000 | Mattel, Inc. | 21,950 | |||||||||||||
| 38,000 | |||||||||||||||
| Transportation: 0.2% | |||||||||||||||
| 1,060 | Burlington Northern Santa Fe Corp. | 79,670 | |||||||||||||
| 1,080 | CSX Corp. | 38,729 | |||||||||||||
| 860 | FedEx Corp. | 99,270 | |||||||||||||
| 1,100 | Norfolk Southern Corp. | 54,175 | |||||||||||||
| 200 | Ryder System, Inc. | 10,434 | |||||||||||||
| 700 | Union Pacific Corp. | 63,364 | |||||||||||||
| 345,642 | |||||||||||||||
| Total Common Stock (Cost $24,596,544) | 35,136,493 | ||||||||||||||
See Accompanying Notes to Financial Statements
81
PORTFOLIO OF INVESTMENTS
ING PRINCIPAL PROTECTION FUND II AS OF NOVEMBER 30, 2006 (UNAUDITED) (CONTINUED)
| Principal Amount | Value | ||||||
| U.S. GOVERNMENT AGENCY OBLIGATIONS: 81.1% | |||||||
| Federal National Mortgage Association: 81.1% | |||||||||||||||
| $ | 156,000,000 | 5.250%, due 01/31/07 | $ | 154,650,132 | |||||||||||
| 13,653,000 | 5.290%, due 01/15/07 | 13,564,570 | |||||||||||||
| Total U.S. Government Agency Obligations (Cost $168,311,986) | 168,214,702 | ||||||||||||||
| Total Long-Term Investments (Cost $192,908,530) | 203,351,195 | ||||||||||||||
| SHORT-TERM INVESTMENTS: 2.5% | |||||||||||||||
| Repurchase Agreement: 2.5% | |||||||||||
| 5,303,000 | Goldman Sachs Repurchase Agreement dated 11/30/06, 5.280%, due 12/01/06, $5,303,778 to be received upon repurchase (Collateralized by $5,254,000 Federal National Mortgage Association, 5.250%, Market Value plus accrued interest $5,410,004, due 06/15/08) | 5,303,000 | |||||||||
| Total Short-Term Investments (Cost $5,303,000) | 5,303,000 | ||||||||||
| Total Investments in Securities (Cost $198,211,530)* | 100.6 | % | $ | 208,654,195 | |||||||
| Other Assets and Liabilities - Net | (0.6 | ) | (1,327,702 | ) | |||||||
| Net Assets | 100.0 | % | $ | 207,326,493 | |||||||
@ Non-income producing security
@@ Foreign Issuer
* Cost for federal income tax purposes is $200,476,119.
Net unrealized appreciation consists of:
| Gross Unrealized Appreciation | $ | 8,417,040 | |||||
| Gross Unrealized Depreciation | (238,964 | ) | |||||
| Net Unrealized Appreciation | $ | 8,178,076 | |||||
See Accompanying Notes to Financial Statements
82
PORTFOLIO OF INVESTMENTS
ING PRINCIPAL PROTECTION FUND III AS OF NOVEMBER 30, 2006 (UNAUDITED)
| Shares | Value | ||||||||||||||
| COMMON STOCK: 22.9% | |||||||||||||||
| Advertising: 0.0% | |||||||||||||||
| 850 | Omnicom Group | $ | 86,836 | ||||||||||||
| 86,836 | |||||||||||||||
| Aerospace/Defense: 0.5% | |||||||||||||||
| 2,250 | Boeing Co. | 199,193 | |||||||||||||
| 1,600 | General Dynamics Corp. | 119,744 | |||||||||||||
| 300 | Goodrich Corp. | 13,500 | |||||||||||||
| 450 | L-3 Communications Holdings, Inc. | 37,013 | |||||||||||||
| 1,420 | Lockheed Martin Corp. | 128,439 | |||||||||||||
| 1,027 | Northrop Grumman Corp. | 68,737 | |||||||||||||
| 2,102 | Raytheon Co. | 107,286 | |||||||||||||
| 200 | Rockwell Collins, Inc. | 12,066 | |||||||||||||
| 2,860 | United Technologies Corp. | 184,556 | |||||||||||||
| 870,534 | |||||||||||||||
| Agriculture: 0.4% | |||||||||||||||
| 6,000 | Altria Group, Inc. | 505,260 | |||||||||||||
| 1,800 | Archer-Daniels-Midland Co. | 63,180 | |||||||||||||
| 600 | Reynolds American, Inc. | 38,544 | |||||||||||||
| 400 | UST, Inc. | 22,392 | |||||||||||||
| 629,376 | |||||||||||||||
| Airlines: 0.0% | |||||||||||||||
| 2,300 | Southwest Airlines Co. | 36,133 | |||||||||||||
| 36,133 | |||||||||||||||
| Apparel: 0.1% | |||||||||||||||
| 1,900 | @ | Coach, Inc. | 82,099 | ||||||||||||
| 520 | Jones Apparel Group, Inc. | 17,472 | |||||||||||||
| 320 | Liz Claiborne, Inc. | 13,680 | |||||||||||||
| 540 | Nike, Inc. | 53,433 | |||||||||||||
| 200 | VF Corp. | 15,678 | |||||||||||||
| 182,362 | |||||||||||||||
| Auto Manufacturers: 0.1% | |||||||||||||||
| 5,110 | Ford Motor Co. | 41,544 | |||||||||||||
| 600 | General Motors Corp. | 17,538 | |||||||||||||
| 1,000 | Paccar, Inc. | 65,300 | |||||||||||||
| 124,382 | |||||||||||||||
| Auto Parts & Equipment: 0.0% | |||||||||||||||
| 700 | @ | Goodyear Tire & Rubber Co. | 11,795 | ||||||||||||
| 600 | Johnson Controls, Inc. | 48,798 | |||||||||||||
| 60,593 | |||||||||||||||
| Banks: 1.8% | |||||||||||||||
| 17,540 | Bank of America Corp. | 944,529 | |||||||||||||
| 2,300 | Bank of New York Co., Inc. | 81,742 | |||||||||||||
| 1,544 | BB&T Corp. | 66,407 | |||||||||||||
| 880 | Capital One Financial Corp. | 68,534 | |||||||||||||
| 650 | Comerica, Inc. | 37,863 | |||||||||||||
| 350 | Compass Bancshares, Inc. | 19,999 | |||||||||||||
| 1,500 | Fifth Third Bancorp. | 59,145 | |||||||||||||
| 350 | First Horizon National Corp. | 13,951 | |||||||||||||
| 700 | Huntington Bancshares, Inc. | 17,017 | |||||||||||||
| 1,450 | Keycorp | 52,345 | |||||||||||||
| 250 | M&T Bank Corp. | 29,660 | |||||||||||||
| 650 | Marshall & Ilsley Corp. | 29,764 | |||||||||||||
| 1,350 | Mellon Financial Corp. | 54,311 | |||||||||||||
| 2,290 | National City Corp. | 82,669 | |||||||||||||
| 1,300 | North Fork Bancorp., Inc. | 36,491 | |||||||||||||
| Shares | Value | ||||||||||||||
| 550 | Northern Trust Corp. | $ | 31,328 | ||||||||||||
| 900 | PNC Financial Services Group, Inc. | 63,621 | |||||||||||||
| 2,777 | Regions Financial Corp. | 101,777 | |||||||||||||
| 850 | State Street Corp. | 52,811 | |||||||||||||
| 1,000 | SunTrust Banks, Inc. | 81,650 | |||||||||||||
| 919 | Synovus Financial Corp. | 27,588 | |||||||||||||
| 5,050 | US Bancorp. | 169,882 | |||||||||||||
| 7,361 | Wachovia Corp. | 398,893 | |||||||||||||
| 9,500 | Wells Fargo & Co. | 334,780 | |||||||||||||
| 350 | Zions Bancorp. | 27,384 | |||||||||||||
| 2,884,141 | |||||||||||||||
| Beverages: 0.5% | |||||||||||||||
| 2,950 | Anheuser-Busch Cos., Inc. | 140,155 | |||||||||||||
| 220 | Brown-Forman Corp. | 15,279 | |||||||||||||
| 5,750 | Coca-Cola Co. | 269,273 | |||||||||||||
| 1,200 | Coca-Cola Enterprises, Inc. | 24,540 | |||||||||||||
| 600 | @ | Constellation Brands, Inc. | 16,788 | ||||||||||||
| 700 | Pepsi Bottling Group, Inc. | 21,924 | |||||||||||||
| 4,660 | PepsiCo, Inc. | 288,780 | |||||||||||||
| 776,739 | |||||||||||||||
| Biotechnology: 0.2% | |||||||||||||||
| 3,326 | @ | Amgen, Inc. | 236,146 | ||||||||||||
| 900 | @ | Biogen Idec, Inc. | 47,034 | ||||||||||||
| 1,000 | @ | Celgene Corp. | 55,730 | ||||||||||||
| 250 | @ | Genzyme Corp. | 16,100 | ||||||||||||
| 300 | @ | Medimmune, Inc. | 9,807 | ||||||||||||
| 250 | @ | Millipore Corp. | 17,103 | ||||||||||||
| 381,920 | |||||||||||||||
| Building Materials: 0.0% | |||||||||||||||
| 430 | American Standard Cos., Inc. | 19,268 | |||||||||||||
| 1,350 | Masco Corp. | 38,732 | |||||||||||||
| 58,000 | |||||||||||||||
| Chemicals: 0.4% | |||||||||||||||
| 300 | Air Products & Chemicals, Inc. | 20,742 | |||||||||||||
| 200 | Ashland, Inc. | 13,522 | |||||||||||||
| 3,100 | Dow Chemical Co. | 124,031 | |||||||||||||
| 600 | Ecolab, Inc. | 26,610 | |||||||||||||
| 3,000 | EI DuPont de Nemours & Co. | 140,790 | |||||||||||||
| 200 | International Flavors & Fragrances, Inc. | 9,422 | |||||||||||||
| 1,760 | Monsanto Co. | 84,603 | |||||||||||||
| 810 | PPG Industries, Inc. | 52,083 | |||||||||||||
| 950 | Praxair, Inc. | 59,280 | |||||||||||||
| 600 | Rohm & Haas Co. | 31,332 | |||||||||||||
| 600 | Sherwin-Williams Co. | 37,530 | |||||||||||||
| 200 | Sigma-Aldrich Corp. | 15,222 | |||||||||||||
| 615,167 | |||||||||||||||
| Coal: 0.0% | |||||||||||||||
| 770 | Peabody Energy Corp. | 35,428 | |||||||||||||
| 35,428 | |||||||||||||||
| Commercial Services: 0.2% | |||||||||||||||
| 700 | @ | Apollo Group, Inc. | 27,153 | ||||||||||||
| 500 | @ | Convergys Corp. | 12,060 | ||||||||||||
| 330 | Equifax, Inc. | 12,537 | |||||||||||||
| 1,020 | H&R Block, Inc. | 24,480 | |||||||||||||
| 1,440 | McKesson Corp. | 71,136 | |||||||||||||
| 300 | @ | Monster Worldwide, Inc. | 13,095 | ||||||||||||
See Accompanying Notes to Financial Statements
83
PORTFOLIO OF INVESTMENTS
ING PRINCIPAL PROTECTION FUND III AS OF NOVEMBER 30, 2006 (UNAUDITED) (CONTINUED)
| Shares | Value | ||||||||||||||
| Commercial Services (continued) | |||||||||||||||
| 900 | Moody's Corp. | $ | 62,532 | ||||||||||||
| 550 | Robert Half International, Inc. | 21,225 | |||||||||||||
| 550 | RR Donnelley & Sons Co. | 19,399 | |||||||||||||
| 2,107 | Western Union Co. | 48,040 | |||||||||||||
| 311,657 | |||||||||||||||
| Computers: 1.0% | |||||||||||||||
| 350 | @ | Affiliated Computer Services, Inc. | 17,693 | ||||||||||||
| 410 | @ | Cognizant Technology Solutions Corp. | 33,440 | ||||||||||||
| 450 | @ | Computer Sciences Corp. | 23,490 | ||||||||||||
| 8,650 | @ | Dell, Inc. | 235,626 | ||||||||||||
| 1,450 | Electronic Data Systems Corp. | 39,353 | |||||||||||||
| 6,750 | @ | EMC Corp. | 88,493 | ||||||||||||
| 13,400 | Hewlett-Packard Co. | 528,764 | |||||||||||||
| 5,850 | International Business Machines Corp. | 537,732 | |||||||||||||
| 480 | @ | Lexmark International, Inc. | 33,110 | ||||||||||||
| 550 | @ | NCR Corp. | 23,601 | ||||||||||||
| 950 | @ | Network Appliance, Inc. | 37,250 | ||||||||||||
| 500 | @ | Sandisk Corp. | 22,200 | ||||||||||||
| 9,600 | @ | Sun Microsystems, Inc. | 52,032 | ||||||||||||
| 1,050 | @ | Unisys Corp. | 7,571 | ||||||||||||
| 1,680,355 | |||||||||||||||
| Cosmetics/Personal Care: 0.4% | |||||||||||||||
| 1,300 | Avon Products, Inc. | 42,432 | |||||||||||||
| 1,450 | Colgate-Palmolive Co. | 94,323 | |||||||||||||
| 300 | Estee Lauder Cos., Inc. | 12,387 | |||||||||||||
| 8,952 | Procter & Gamble Co. | 562,096 | |||||||||||||
| 711,238 | |||||||||||||||
| Distribution/Wholesale: 0.0% | |||||||||||||||
| 200 | WW Grainger, Inc. | 14,472 | |||||||||||||
| 14,472 | |||||||||||||||
| Diversified Financial Services: 2.0% | |||||||||||||||
| 3,400 | American Express Co. | 199,648 | |||||||||||||
| 920 | Ameriprise Financial, Inc. | 49,772 | |||||||||||||
| 330 | Bear Stearns Cos., Inc. | 50,318 | |||||||||||||
| 2,850 | Charles Schwab Corp. | 52,269 | |||||||||||||
| 110 | Chicago Mercantile Exchange Holdings, Inc. | 58,916 | |||||||||||||
| 550 | CIT Group, Inc. | 28,606 | |||||||||||||
| 19,100 | Citigroup, Inc. | 947,169 | |||||||||||||
| 1,618 | Countrywide Financial Corp. | 64,267 | |||||||||||||
| 900 | @ | E*Trade Financial Corp. | 21,663 | ||||||||||||
| 2,710 | Fannie Mae | 154,551 | |||||||||||||
| 150 | Federated Investors, Inc. | 4,977 | |||||||||||||
| 450 | Franklin Resources, Inc. | 48,033 | |||||||||||||
| 2,000 | Freddie Mac | 134,320 | |||||||||||||
| 1,250 | Goldman Sachs Group, Inc. | 243,500 | |||||||||||||
| 700 | Janus Capital Group, Inc. | 14,182 | |||||||||||||
| 13,300 | JPMorgan Chase & Co. | 615,524 | |||||||||||||
| 1,520 | Lehman Brothers Holdings, Inc. | 111,978 | |||||||||||||
| 2,600 | Merrill Lynch & Co., Inc. | 227,318 | |||||||||||||
| 3,100 | Morgan Stanley | 236,096 | |||||||||||||
| 1,100 | SLM Corp. | 50,424 | |||||||||||||
| 700 | T. Rowe Price Group, Inc. | 30,331 | |||||||||||||
| 3,343,862 | |||||||||||||||
| Shares | Value | ||||||||||||||
| Electric: 0.7% | |||||||||||||||
| 3,070 | @ | AES Corp. | $ | 71,746 | |||||||||||
| 500 | @ | Allegheny Energy, Inc. | 22,180 | ||||||||||||
| 700 | Ameren Corp. | 38,297 | |||||||||||||
| 1,400 | American Electric Power Co., Inc. | 58,114 | |||||||||||||
| 950 | Centerpoint Energy, Inc. | 15,533 | |||||||||||||
| 1,250 | @ | CMS Energy Corp. | 20,263 | ||||||||||||
| 650 | Constellation Energy Group, Inc. | 44,597 | |||||||||||||
| 600 | DTE Energy Co. | 28,254 | |||||||||||||
| 1,300 | @ | Dynegy, Inc. | 8,827 | ||||||||||||
| 1,190 | Edison International | 54,716 | |||||||||||||
| 700 | Entergy Corp. | 63,924 | |||||||||||||
| 2,500 | Exelon Corp. | 151,825 | |||||||||||||
| 1,200 | FirstEnergy Corp. | 71,808 | |||||||||||||
| 1,120 | PG&E Corp. | 51,442 | |||||||||||||
| 300 | Pinnacle West Capital Corp. | 14,802 | |||||||||||||
| 1,100 | PPL Corp. | 39,985 | |||||||||||||
| 300 | Progress Energy, Inc. | 14,331 | |||||||||||||
| 800 | Public Service Enterprise Group, Inc. | 53,776 | |||||||||||||
| 2,700 | Southern Co. | 97,875 | |||||||||||||
| 700 | TECO Energy, Inc. | 11,893 | |||||||||||||
| 1,700 | TXU Corp. | 97,563 | |||||||||||||
| 1,450 | Xcel Energy, Inc. | 33,292 | |||||||||||||
| 1,065,043 | |||||||||||||||
| Electrical Components & Equipment: 0.1% | |||||||||||||||
| 1,150 | Emerson Electric Co. | 99,705 | |||||||||||||
| 400 | Molex, Inc. | 12,800 | |||||||||||||
| 112,505 | |||||||||||||||
| Electronics: 0.1% | |||||||||||||||
| 1,150 | @ | Agilent Technologies, Inc. | 36,616 | ||||||||||||
| 800 | Applera Corp. - Applied Biosystems Group | 29,152 | |||||||||||||
| 700 | Jabil Circuit, Inc. | 19,852 | |||||||||||||
| 600 | PerkinElmer, Inc. | 13,002 | |||||||||||||
| 700 | Symbol Technologies, Inc. | 10,374 | |||||||||||||
| 1,350 | @ | Thermo Electron Corp. | 59,171 | ||||||||||||
| 450 | @ | Waters Corp. | 22,518 | ||||||||||||
| 190,685 | |||||||||||||||
| Entertainment: 0.0% | |||||||||||||||
| 350 | International Game Technology | 15,323 | |||||||||||||
| 15,323 | |||||||||||||||
| Environmental Control: 0.0% | |||||||||||||||
| 700 | @ | Allied Waste Industries, Inc. | 8,876 | ||||||||||||
| 2,100 | Waste Management, Inc. | 76,881 | |||||||||||||
| 85,757 | |||||||||||||||
| Food: 0.3% | |||||||||||||||
| 900 | Campbell Soup Co. | 34,263 | |||||||||||||
| 1,500 | ConAgra Foods, Inc. | 38,550 | |||||||||||||
| 400 | @ | Dean Foods Co. | 17,128 | ||||||||||||
| 1,750 | General Mills, Inc. | 97,913 | |||||||||||||
| 200 | Hershey Co. | 10,594 | |||||||||||||
| 900 | HJ Heinz Co. | 40,005 | |||||||||||||
| 850 | Kellogg Co. | 42,313 | |||||||||||||
| 1,950 | Kroger Co. | 41,847 | |||||||||||||
| 400 | McCormick & Co., Inc. | 15,488 | |||||||||||||
| 1,400 | Safeway, Inc. | 43,134 | |||||||||||||
See Accompanying Notes to Financial Statements
84
PORTFOLIO OF INVESTMENTS
ING PRINCIPAL PROTECTION FUND III AS OF NOVEMBER 30, 2006 (UNAUDITED) (CONTINUED)
| Shares | Value | ||||||||||||||
| Food (continued) | |||||||||||||||
| 875 | Sara Lee Corp. | $ | 14,508 | ||||||||||||
| 550 | Supervalu, Inc. | 18,843 | |||||||||||||
| 300 | Whole Foods Market, Inc. | 14,640 | |||||||||||||
| 429,226 | |||||||||||||||
| Forest Products & Paper: 0.1% | |||||||||||||||
| 1,400 | International Paper Co. | 46,340 | |||||||||||||
| 650 | MeadWestvaco Corp. | 19,175 | |||||||||||||
| 500 | Plum Creek Timber Co., Inc. | 18,630 | |||||||||||||
| 500 | Temple-Inland, Inc. | 19,550 | |||||||||||||
| 300 | Weyerhaeuser Co. | 19,404 | |||||||||||||
| 123,099 | |||||||||||||||
| Gas: 0.1% | |||||||||||||||
| 600 | KeySpan Corp. | 24,618 | |||||||||||||
| 200 | Nicor, Inc. | 9,910 | |||||||||||||
| 900 | NiSource, Inc. | 22,194 | |||||||||||||
| 950 | Sempra Energy | 51,775 | |||||||||||||
| 108,497 | |||||||||||||||
| Hand/Machine Tools: 0.0% | |||||||||||||||
| 260 | Black & Decker Corp. | 22,329 | |||||||||||||
| 250 | Snap-On, Inc. | 11,875 | |||||||||||||
| 250 | Stanley Works | 12,755 | |||||||||||||
| 46,959 | |||||||||||||||
| Healthcare-Products: 0.6% | |||||||||||||||
| 200 | Bausch & Lomb, Inc. | 9,684 | |||||||||||||
| 1,900 | Baxter International, Inc. | 85,006 | |||||||||||||
| 730 | Becton Dickinson & Co. | 52,356 | |||||||||||||
| 3,300 | @ | Boston Scientific Corp. | 52,206 | ||||||||||||
| 300 | CR Bard, Inc. | 24,687 | |||||||||||||
| 8,350 | Johnson & Johnson | 550,349 | |||||||||||||
| 3,200 | Medtronic, Inc. | 166,816 | |||||||||||||
| 400 | @ | Patterson Cos., Inc. | 14,844 | ||||||||||||
| 400 | @ | St. Jude Medical, Inc. | 14,908 | ||||||||||||
| 800 | Stryker Corp. | 41,488 | |||||||||||||
| 700 | @ | Zimmer Holdings, Inc. | 51,072 | ||||||||||||
| 1,063,416 | |||||||||||||||
| Healthcare-Services: 0.5% | |||||||||||||||
| 2,080 | Aetna, Inc. | 85,925 | |||||||||||||
| 835 | @ | Coventry Health Care, Inc. | 40,189 | ||||||||||||
| 850 | @ | Humana, Inc. | 45,985 | ||||||||||||
| 350 | @ | Laboratory Corp. of America Holdings | 24,780 | ||||||||||||
| 300 | Manor Care, Inc. | 14,256 | |||||||||||||
| 500 | Quest Diagnostics | 26,585 | |||||||||||||
| 6,400 | UnitedHealth Group, Inc. | 314,112 | |||||||||||||
| 2,970 | @ | WellPoint, Inc. | 224,740 | ||||||||||||
| 776,572 | |||||||||||||||
| Home Builders: 0.0% | |||||||||||||||
| 200 | Lennar Corp. | 10,500 | |||||||||||||
| 10,500 | |||||||||||||||
| Home Furnishings: 0.0% | |||||||||||||||
| 300 | Harman International Industries, Inc. | 31,152 | |||||||||||||
| 300 | Whirlpool Corp. | 25,590 | |||||||||||||
| 56,742 | |||||||||||||||
| Shares | Value | ||||||||||||||
| Household Products/Wares: 0.1% | |||||||||||||||
| 300 | Avery Dennison Corp. | $ | 20,241 | ||||||||||||
| 450 | Fortune Brands, Inc. | 36,405 | |||||||||||||
| 1,450 | Kimberly-Clark Corp. | 96,382 | |||||||||||||
| 153,028 | |||||||||||||||
| Housewares: 0.0% | |||||||||||||||
| 700 | Newell Rubbermaid, Inc. | 19,943 | |||||||||||||
| 19,943 | |||||||||||||||
| Insurance: 1.3% | |||||||||||||||
| 860 | @@ | ACE Ltd. | 48,882 | ||||||||||||
| 1,500 | Aflac, Inc. | 66,210 | |||||||||||||
| 2,360 | Allstate Corp. | 149,813 | |||||||||||||
| 400 | AMBAC Financial Group, Inc. | 34,256 | |||||||||||||
| 7,450 | American International Group, Inc. | 523,884 | |||||||||||||
| 900 | AON Corp. | 32,112 | |||||||||||||
| 1,600 | Chubb Corp. | 82,816 | |||||||||||||
| 420 | Cigna Corp. | 52,941 | |||||||||||||
| 705 | Cincinnati Financial Corp. | 31,217 | |||||||||||||
| 2,200 | Genworth Financial, Inc. | 72,160 | |||||||||||||
| 1,500 | Hartford Financial Services Group, Inc. | 128,640 | |||||||||||||
| 1,044 | Lincoln National Corp. | 66,388 | |||||||||||||
| 1,720 | Loews Corp. | 68,662 | |||||||||||||
| 600 | Marsh & McLennan Cos., Inc. | 18,852 | |||||||||||||
| 350 | MBIA, Inc. | 24,378 | |||||||||||||
| 2,910 | Metlife, Inc. | 170,904 | |||||||||||||
| 290 | MGIC Investment Corp. | 16,808 | |||||||||||||
| 1,050 | Principal Financial Group | 60,638 | |||||||||||||
| 2,900 | Progressive Corp. | 65,395 | |||||||||||||
| 1,860 | Prudential Financial, Inc. | 151,553 | |||||||||||||
| 590 | Safeco Corp. | 35,736 | |||||||||||||
| 2,690 | St. Paul Travelers Cos., Inc. | 139,369 | |||||||||||||
| 450 | Torchmark Corp. | 28,449 | |||||||||||||
| 850 | UnumProvident Corp. | 17,408 | |||||||||||||
| 500 | @@ | XL Capital Ltd. | 35,560 | ||||||||||||
| 2,123,031 | |||||||||||||||
| Internet: 0.2% | |||||||||||||||
| 900 | @ | Amazon.com, Inc. | 36,306 | ||||||||||||
| 1,300 | @ | eBay, Inc. | 42,055 | ||||||||||||
| 200 | @ | Google, Inc. | 96,984 | ||||||||||||
| 3,054 | @ | Symantec Corp. | 64,745 | ||||||||||||
| 700 | @ | VeriSign, Inc. | 18,277 | ||||||||||||
| 258,367 | |||||||||||||||
| Iron/Steel: 0.1% | |||||||||||||||
| 1,600 | Nucor Corp. | 95,760 | |||||||||||||
| 620 | United States Steel Corp. | 46,370 | |||||||||||||
| 142,130 | |||||||||||||||
| Leisure Time: 0.1% | |||||||||||||||
| 230 | Brunswick Corp. | 7,445 | |||||||||||||
| 1,300 | Carnival Corp. | 63,687 | |||||||||||||
| 850 | Harley-Davidson, Inc. | 62,705 | |||||||||||||
| 450 | Sabre Holdings Corp. | 12,344 | |||||||||||||
| 146,181 | |||||||||||||||
| Lodging: 0.1% | |||||||||||||||
| 1,160 | Marriott International, Inc. | 52,374 | |||||||||||||
| 300 | Starwood Hotels & Resorts Worldwide, Inc. | 19,251 | |||||||||||||
See Accompanying Notes to Financial Statements
85
PORTFOLIO OF INVESTMENTS
ING PRINCIPAL PROTECTION FUND III AS OF NOVEMBER 30, 2006 (UNAUDITED) (CONTINUED)
| Shares | Value | ||||||||||||||
| Lodging (continued) | |||||||||||||||
| 610 | @ | Wyndham Worldwide Corp. | $ | 19,361 | |||||||||||
| 90,986 | |||||||||||||||
| Machinery-Construction & Mining: 0.1% | |||||||||||||||
| 1,900 | Caterpillar, Inc. | 117,857 | |||||||||||||
| 117,857 | |||||||||||||||
| Machinery-Diversified: 0.1% | |||||||||||||||
| 300 | Cummins, Inc. | 35,976 | |||||||||||||
| 300 | Deere & Co. | 28,800 | |||||||||||||
| 450 | Rockwell Automation, Inc. | 29,286 | |||||||||||||
| 94,062 | |||||||||||||||
| Media: 0.6% | |||||||||||||||
| 3,100 | CBS Corp. | �� | 92,225 | ||||||||||||
| 1,400 | Clear Channel Communications, Inc. | 49,224 | |||||||||||||
| 6,000 | @ | Comcast Corp. | 242,760 | ||||||||||||
| 200 | EW Scripps Co. | 9,772 | |||||||||||||
| 700 | Gannett Co., Inc. | 41,664 | |||||||||||||
| 1,410 | McGraw-Hill Cos., Inc. | 93,977 | |||||||||||||
| 130 | Meredith Corp. | 7,033 | |||||||||||||
| 6,800 | News Corp., Inc. | 140,080 | |||||||||||||
| 200 | @ | Univision Communications, Inc. | 7,118 | ||||||||||||
| 7,950 | Walt Disney Co. | 262,748 | |||||||||||||
| 946,601 | |||||||||||||||
| Mining: 0.1% | |||||||||||||||
| 630 | Freeport-McMoRan Copper & Gold, Inc. | 39,608 | |||||||||||||
| 610 | Phelps Dodge Corp. | 75,030 | |||||||||||||
| 100 | Vulcan Materials Co. | 8,872 | |||||||||||||
| 123,510 | |||||||||||||||
| Miscellaneous Manufacturing: 1.2% | |||||||||||||||
| 2,200 | 3M Co. | 179,212 | |||||||||||||
| 300 | Cooper Industries Ltd. | 27,432 | |||||||||||||
| 850 | Danaher Corp. | 62,152 | |||||||||||||
| 600 | Dover Corp. | 30,180 | |||||||||||||
| 900 | Eastman Kodak Co. | 23,418 | |||||||||||||
| 750 | Eaton Corp. | 57,810 | |||||||||||||
| 29,400 | General Electric Co. | 1,037,232 | |||||||||||||
| 3,050 | Honeywell International, Inc. | 131,089 | |||||||||||||
| 1,100 | Illinois Tool Works, Inc. | 51,920 | |||||||||||||
| 900 | @@ | Ingersoll-Rand Co. | 35,109 | ||||||||||||
| 560 | ITT Corp. | 30,212 | |||||||||||||
| 600 | Leggett & Platt, Inc. | 14,268 | |||||||||||||
| 600 | Parker Hannifin Corp. | 50,088 | |||||||||||||
| 330 | Textron, Inc. | 32,159 | |||||||||||||
| 5,800 | @@ | Tyco International Ltd. | 175,682 | ||||||||||||
| 1,937,963 | |||||||||||||||
| Office/Business Equipment: 0.1% | |||||||||||||||
| 700 | Pitney Bowes, Inc. | 32,263 | |||||||||||||
| 4,650 | @ | Xerox Corp. | 76,725 | ||||||||||||
| 108,988 | |||||||||||||||
| Oil & Gas: 2.3% | |||||||||||||||
| 1,100 | Anadarko Petroleum Corp. | 54,296 | |||||||||||||
| 368 | Apache Corp. | 25,734 | |||||||||||||
| 9,215 | Chevron Corp. | 666,429 | |||||||||||||
| 4,309 | ConocoPhillips | 289,996 | |||||||||||||
| Shares | Value | ||||||||||||||
| 1,200 | Devon Energy Corp. | $ | 88,044 | ||||||||||||
| 600 | EOG Resources, Inc. | 42,318 | |||||||||||||
| 25,200 | ExxonMobil Corp. | 1,935,612 | |||||||||||||
| 560 | Hess Corp. | 28,151 | |||||||||||||
| 1,550 | Marathon Oil Corp. | 146,289 | |||||||||||||
| 700 | @,@@ | Nabors Industries Ltd. | 23,632 | ||||||||||||
| 300 | Noble Corp. | 23,175 | |||||||||||||
| 2,260 | Occidental Petroleum Corp. | 113,768 | |||||||||||||
| 600 | Sunoco, Inc. | 40,896 | |||||||||||||
| 800 | @ | Transocean, Inc. | 62,360 | ||||||||||||
| 2,100 | Valero Energy Corp. | 115,647 | |||||||||||||
| 900 | XTO Energy, Inc. | 45,540 | |||||||||||||
| 3,701,887 | |||||||||||||||
| Oil & Gas Services: 0.3% | |||||||||||||||
| 900 | Baker Hughes, Inc. | 66,087 | |||||||||||||
| 300 | BJ Services Co. | 10,131 | |||||||||||||
| 4,500 | Halliburton Co. | 151,830 | |||||||||||||
| 500 | @ | National Oilwell Varco, Inc. | 33,255 | ||||||||||||
| 3,000 | Schlumberger Ltd. | 205,440 | |||||||||||||
| 400 | @ | Weatherford International Ltd. | 17,964 | ||||||||||||
| 484,707 | |||||||||||||||
| Packaging & Containers: 0.0% | |||||||||||||||
| 290 | Ball Corp. | 12,400 | |||||||||||||
| 300 | Bemis Co. | 10,239 | |||||||||||||
| 600 | @ | Pactiv Corp. | 20,670 | ||||||||||||
| 200 | Sealed Air Corp. | 11,902 | |||||||||||||
| 55,211 | |||||||||||||||
| Pharmaceuticals: 1.3% | |||||||||||||||
| 4,400 | Abbott Laboratories | 205,304 | |||||||||||||
| 150 | Allergan, Inc. | 17,487 | |||||||||||||
| 1,100 | AmerisourceBergen Corp. | 50,589 | |||||||||||||
| 300 | @ | Barr Pharmaceuticals, Inc. | 15,324 | ||||||||||||
| 2,300 | Bristol-Myers Squibb Co. | 57,109 | |||||||||||||
| 1,210 | Cardinal Health, Inc. | 78,190 | |||||||||||||
| 1,350 | Caremark Rx, Inc. | 63,855 | |||||||||||||
| 1,100 | Eli Lilly & Co. | 58,949 | |||||||||||||
| 500 | @ | Express Scripts, Inc. | 34,100 | ||||||||||||
| 1,250 | @ | Forest Laboratories, Inc. | 60,875 | ||||||||||||
| 1,350 | @ | Gilead Sciences, Inc. | 88,992 | ||||||||||||
| 420 | @ | Hospira, Inc. | 13,776 | ||||||||||||
| 1,150 | @ | King Pharmaceuticals, Inc. | 19,010 | ||||||||||||
| 882 | @ | Medco Health Solutions, Inc. | 44,285 | ||||||||||||
| 8,400 | Merck & Co., Inc. | 373,884 | |||||||||||||
| 700 | Mylan Laboratories | 14,203 | |||||||||||||
| 20,730 | Pfizer, Inc. | 569,868 | |||||||||||||
| 5,700 | Schering-Plough Corp. | 125,457 | |||||||||||||
| 350 | @ | Watson Pharmaceuticals, Inc. | 8,985 | ||||||||||||
| 3,850 | Wyeth | 185,878 | |||||||||||||
| 2,086,120 | |||||||||||||||
| Pipelines: 0.0% | |||||||||||||||
| 1,700 | El Paso Corp. | 24,820 | |||||||||||||
| 1,500 | Williams Cos., Inc. | 41,640 | |||||||||||||
| 66,460 | |||||||||||||||
| Real Estate: 0.0% | |||||||||||||||
| 530 | @ | CB Richard Ellis Group, Inc. | 17,453 | ||||||||||||
| 602 | @ | Realogy Corp. | 15,706 | ||||||||||||
| 33,159 | |||||||||||||||
See Accompanying Notes to Financial Statements
86
PORTFOLIO OF INVESTMENTS
ING PRINCIPAL PROTECTION FUND III AS OF NOVEMBER 30, 2006 (UNAUDITED) (CONTINUED)
| Shares | Value | ||||||||||||||
| Real Estate Investment Trusts: 0.1% | |||||||||||||||
| 250 | Apartment Investment & Management Co. | $ | 14,410 | ||||||||||||
| 100 | Boston Properties, Inc. | 11,705 | |||||||||||||
| 980 | Equity Office Properties Trust | 47,236 | |||||||||||||
| 300 | Prologis | 19,551 | |||||||||||||
| 100 | Public Storage, Inc. | 9,628 | |||||||||||||
| 100 | Vornado Realty Trust | 12,611 | |||||||||||||
| 115,141 | |||||||||||||||
| Retail: 1.3% | |||||||||||||||
| 200 | @ | Autozone, Inc. | 22,722 | ||||||||||||
| 900 | @ | Bed Bath & Beyond, Inc. | 34,875 | ||||||||||||
| 1,155 | Best Buy Co., Inc. | 63,490 | |||||||||||||
| 750 | Circuit City Stores, Inc. | 18,720 | |||||||||||||
| 1,350 | Costco Wholesale Corp. | 70,551 | |||||||||||||
| 2,400 | CVS Corp. | 69,048 | |||||||||||||
| 350 | Darden Restaurants, Inc. | 14,053 | |||||||||||||
| 750 | Family Dollar Stores, Inc. | 20,918 | |||||||||||||
| 2,684 | Federated Department Stores, Inc. | 112,970 | |||||||||||||
| 2,150 | Gap, Inc. | 40,248 | |||||||||||||
| 2,400 | Home Depot, Inc. | 91,128 | |||||||||||||
| 600 | JC Penney Co., Inc. | 46,404 | |||||||||||||
| 1,600 | @ | Kohl's Corp. | 111,360 | ||||||||||||
| 940 | Limited Brands, Inc. | 29,789 | |||||||||||||
| 4,360 | Lowe's Cos., Inc. | 131,498 | |||||||||||||
| 3,550 | McDonald's Corp. | 148,994 | |||||||||||||
| 1,100 | Nordstrom, Inc. | 53,922 | |||||||||||||
| 1,460 | @ | Office Depot, Inc. | 55,276 | ||||||||||||
| 300 | OfficeMax, Inc. | 14,121 | |||||||||||||
| 290 | @ | Sears Holding Corp. | 49,712 | ||||||||||||
| 2,025 | Staples, Inc. | 51,577 | |||||||||||||
| 2,900 | @ | Starbucks Corp. | 102,341 | ||||||||||||
| 2,350 | Target Corp. | 136,512 | |||||||||||||
| 2,200 | TJX Cos., Inc. | 60,324 | |||||||||||||
| 2,840 | Walgreen Co. | 114,992 | |||||||||||||
| 7,100 | Wal-Mart Stores, Inc. | 327,310 | |||||||||||||
| 450 | Wendy's International, Inc. | 14,657 | |||||||||||||
| 850 | Yum! Brands, Inc. | 52,012 | |||||||||||||
| 2,059,524 | |||||||||||||||
| Savings & Loans: 0.1% | |||||||||||||||
| 2,753 | Washington Mutual, Inc. | 120,251 | |||||||||||||
| 120,251 | |||||||||||||||
| Semiconductors: 0.6% | |||||||||||||||
| 2,300 | @ | Advanced Micro Devices, Inc. | 49,611 | ||||||||||||
| 1,700 | @ | Altera Corp. | 33,813 | ||||||||||||
| 1,400 | Analog Devices, Inc. | 45,528 | |||||||||||||
| 4,350 | Applied Materials, Inc. | 78,213 | |||||||||||||
| 1,495 | @ | Freescale Semiconductor, Inc. | 59,695 | ||||||||||||
| 16,510 | Intel Corp. | 352,489 | |||||||||||||
| 600 | KLA-Tencor Corp. | 31,002 | |||||||||||||
| 850 | Linear Technology Corp. | 27,319 | |||||||||||||
| 1,200 | @ | LSI Logic Corp. | 12,792 | ||||||||||||
| 850 | Maxim Integrated Products | 26,758 | |||||||||||||
| 3,400 | @ | Micron Technology, Inc. | 49,640 | ||||||||||||
| 1,450 | National Semiconductor Corp. | 35,076 | |||||||||||||
| 450 | @ | Novellus Systems, Inc. | 14,049 | ||||||||||||
| 400 | @ | Nvidia Corp. | 14,796 | ||||||||||||
| 400 | @ | QLogic Corp. | 8,900 | ||||||||||||
| 1,800 | Texas Instruments, Inc. | 53,190 | |||||||||||||
| 900 | Xilinx, Inc. | 24,120 | |||||||||||||
| 916,991 | |||||||||||||||
| Shares | Value | ||||||||||||||
| Software: 0.9% | |||||||||||||||
| 1,700 | @ | Adobe Systems, Inc. | $ | 68,221 | |||||||||||
| 930 | @ | Autodesk, Inc. | 38,297 | ||||||||||||
| 1,600 | Automatic Data Processing, Inc. | 77,168 | |||||||||||||
| 1,020 | @ | BMC Software, Inc. | 33,211 | ||||||||||||
| 1,500 | CA, Inc. | 32,550 | |||||||||||||
| 450 | @ | Citrix Systems, Inc. | 12,933 | ||||||||||||
| 1,650 | @ | Compuware Corp. | 13,844 | ||||||||||||
| 920 | @ | Electronic Arts, Inc. | 51,382 | ||||||||||||
| 500 | Fidelity National Information Services, Inc. | 19,950 | |||||||||||||
| 2,107 | First Data Corp. | 53,202 | |||||||||||||
| 650 | @ | Fiserv, Inc. | 33,222 | ||||||||||||
| 550 | IMS Health, Inc. | 15,109 | |||||||||||||
| 900 | @ | Intuit, Inc. | 28,332 | ||||||||||||
| 24,850 | Microsoft Corp. | 728,851 | |||||||||||||
| 900 | @ | Novell, Inc. | 5,652 | ||||||||||||
| 11,550 | @ | Oracle Corp. | 219,797 | ||||||||||||
| 284 | @ | Parametric Technology Corp. | 5,498 | ||||||||||||
| 950 | Paychex, Inc. | 37,440 | |||||||||||||
| 1,474,659 | |||||||||||||||
| Telecommunications: 1.6% | |||||||||||||||
| 1,100 | Alltel Corp. | 62,414 | |||||||||||||
| 10,956 | AT&T, Inc. | 371,518 | |||||||||||||
| 2,250 | @ | Avaya, Inc. | 28,755 | ||||||||||||
| 5,450 | BellSouth Corp. | 243,016 | |||||||||||||
| 600 | CenturyTel, Inc. | 25,530 | |||||||||||||
| 29,350 | @ | Cisco Systems, Inc. | 788,928 | ||||||||||||
| 1,000 | Citizens Communications Co. | 14,170 | |||||||||||||
| 500 | @ | Comverse Technology, Inc. | 9,760 | ||||||||||||
| 4,300 | @ | Corning, Inc. | 92,708 | ||||||||||||
| 401 | Embarq Corp. | 20,631 | |||||||||||||
| 600 | @ | JDS Uniphase Corp. | 11,088 | ||||||||||||
| 1,600 | @ | Juniper Networks, Inc. | 34,064 | ||||||||||||
| 9,790 | Motorola, Inc. | 217,044 | |||||||||||||
| 4,700 | Qualcomm, Inc. | 171,973 | |||||||||||||
| 4,400 | @ | Qwest Communications International, Inc. | 33,836 | ||||||||||||
| 8,924 | Sprint Nextel Corp. | 174,107 | |||||||||||||
| 1,150 | @ | Tellabs, Inc. | 11,546 | ||||||||||||
| 8,250 | Verizon Communications, Inc. | 288,255 | |||||||||||||
| 1,310 | Windstream Corp. | 18,261 | |||||||||||||
| 2,617,604 | |||||||||||||||
| Textiles: 0.0% | |||||||||||||||
| 450 | Cintas Corp. | 18,990 | |||||||||||||
| 18,990 | |||||||||||||||
| Toys/Games/Hobbies: 0.0% | |||||||||||||||
| 800 | Hasbro, Inc. | 21,400 | |||||||||||||
| 1,300 | Mattel, Inc. | 28,535 | |||||||||||||
| 49,935 | |||||||||||||||
| Transportation: 0.2% | |||||||||||||||
| 1,000 | Burlington Northern Santa Fe Corp. | 75,160 | |||||||||||||
| 1,300 | CSX Corp. | 46,618 | |||||||||||||
| 850 | FedEx Corp. | 98,116 | |||||||||||||
| 1,200 | Norfolk Southern Corp. | 59,100 | |||||||||||||
| 200 | Ryder System, Inc. | 10,434 | |||||||||||||
| 800 | Union Pacific Corp. | 72,394 | |||||||||||||
| 361,822 | |||||||||||||||
| Total Common Stock (Cost $25,950,201) | 37,312,627 | ||||||||||||||
See Accompanying Notes to Financial Statements
87
PORTFOLIO OF INVESTMENTS
ING PRINCIPAL PROTECTION FUND III AS OF NOVEMBER 30, 2006 (UNAUDITED) (CONTINUED)
| Principal Amount | Value | ||||||
| U.S. GOVERNMENT AGENCY OBLIGATIONS: 75.9% | |||||||
| Federal National Mortgage Association: 75.9% | |||||||||||||||
| $ | 127,000,000 | 5.300%, due 06/05/07 | $ | 123,681,744 | |||||||||||
| Total U.S. Government Agency Obligations (Cost $123,985,359) | 123,681,744 | ||||||||||||||
| U.S. TREASURY OBLIGATIONS: 0.7% | |||||||||||||||
| U.S. Treasury Principal Only STRIP: 0.7% | |||||||||||||||
| 1,146,000 | 5.060%, due 05/15/07 | 1,120,578 | |||||||||||||
| Total U.S. Treasury Obligations (Cost $1,120,632) | 1,120,578 | ||||||||||||||
| Total Long-Term Investments (Cost $151,056,192) | 162,114,949 | ||||||||||||||
| SHORT-TERM INVESTMENTS: 1.0% | |||||||||||||||
| Repurchase Agreement: 1.0% | |||||||||||
| 1,630,000 | Morgan Stanley Repurchase Agreement dated 11/30/06, 5.290%, due 12/01/06, $1,630,240 to be received upon repurchase (Collateralized by $1,690,000 Federal National Mortgage Association, 3.750%-5.500%, Market Value plus accrued interest $1,678,640, due 11/09/07-06/19/28) | 1,630,000 | |||||||||
| Total Short-Term Investments (Cost $1,630,000) | 1,630,000 | ||||||||||
| Total Investments in Securities (Cost $152,686,192)* | 100.5 | % | $ | 163,744,949 | |||||||
| Other Assets and Liabilities - Net | (0.5 | ) | (786,674 | ) | |||||||
| Net Assets | 100.0 | % | $ | 162,958,275 | |||||||
@ Non-income producing security
@@ Foreign Issuer
STRIP Separate Trading of Registered Interest and Principal of Securities
* Cost for federal income tax purposes is $154,347,467.
Net unrealized appreciation consists of:
| Gross Unrealized Appreciation | $ | 9,846,381 | |||||
| Gross Unrealized Depreciation | (448,899 | ) | |||||
| Net Unrealized Appreciation | $ | 9,397,482 | |||||
See Accompanying Notes to Financial Statements
88
PORTFOLIO OF INVESTMENTS
ING PRINCIPAL PROTECTION FUND IV AS OF NOVEMBER 30, 2006 (UNAUDITED)
| Shares | Value | ||||||||||||||
| COMMON STOCK: 51.7% | |||||||||||||||
| Advertising: 0.1% | |||||||||||||||
| 3,950 | Omnicom Group | $ | 403,532 | ||||||||||||
| 403,532 | |||||||||||||||
| Aerospace/Defense: 1.2% | |||||||||||||||
| 10,500 | Boeing Co. | 929,565 | |||||||||||||
| 7,300 | General Dynamics Corp. | 546,332 | |||||||||||||
| 1,600 | Goodrich Corp. | 72,000 | |||||||||||||
| 2,200 | L-3 Communications Holdings, Inc. | 180,950 | |||||||||||||
| 6,400 | Lockheed Martin Corp. | 578,880 | |||||||||||||
| 4,753 | Northrop Grumman Corp. | 318,118 | |||||||||||||
| 10,152 | Raytheon Co. | 518,158 | |||||||||||||
| 900 | Rockwell Collins, Inc. | 54,297 | |||||||||||||
| 13,420 | United Technologies Corp. | 865,993 | |||||||||||||
| 4,064,293 | |||||||||||||||
| Agriculture: 0.9% | |||||||||||||||
| 27,700 | Altria Group, Inc. | 2,332,617 | |||||||||||||
| 7,850 | Archer-Daniels-Midland Co. | 275,535 | |||||||||||||
| 2,240 | Reynolds American, Inc. | 143,898 | |||||||||||||
| 2,200 | UST, Inc. | 123,156 | |||||||||||||
| 2,875,206 | |||||||||||||||
| Airlines: 0.0% | |||||||||||||||
| 10,500 | Southwest Airlines Co. | 164,955 | |||||||||||||
| 164,955 | |||||||||||||||
| Apparel: 0.3% | |||||||||||||||
| 8,600 | @ | Coach, Inc. | 371,606 | ||||||||||||
| 2,370 | Jones Apparel Group, Inc. | 79,632 | |||||||||||||
| 2,380 | Liz Claiborne, Inc. | 101,745 | |||||||||||||
| 3,130 | Nike, Inc. | 309,714 | |||||||||||||
| 1,210 | VF Corp. | 94,852 | |||||||||||||
| 957,549 | |||||||||||||||
| Auto Manufacturers: 0.2% | |||||||||||||||
| 22,220 | Ford Motor Co. | 180,649 | |||||||||||||
| 2,800 | General Motors Corp. | 81,844 | |||||||||||||
| 4,500 | Paccar, Inc. | 293,850 | |||||||||||||
| 556,343 | |||||||||||||||
| Auto Parts & Equipment: 0.1% | |||||||||||||||
| 3,100 | @ | Goodyear Tire & Rubber Co. | 52,235 | ||||||||||||
| 2,600 | Johnson Controls, Inc. | 211,458 | |||||||||||||
| 263,693 | |||||||||||||||
| Banks: 4.0% | |||||||||||||||
| 81,692 | Bank of America Corp. | 4,399,114 | |||||||||||||
| 10,150 | Bank of New York Co., Inc. | 360,731 | |||||||||||||
| 6,598 | BB&T Corp. | 283,780 | |||||||||||||
| 4,080 | Capital One Financial Corp. | 317,750 | |||||||||||||
| 2,850 | Comerica, Inc. | 166,013 | |||||||||||||
| 1,000 | Commerce Bancorp., Inc. | 34,760 | |||||||||||||
| 1,800 | Compass Bancshares, Inc. | 102,852 | |||||||||||||
| 6,650 | Fifth Third Bancorp. | 262,210 | |||||||||||||
| 950 | First Horizon National Corp. | 37,867 | |||||||||||||
| 2,900 | Huntington Bancshares, Inc. | 70,499 | |||||||||||||
| 5,400 | Keycorp | 194,940 | |||||||||||||
| 1,200 | M&T Bank Corp. | 142,368 | |||||||||||||
| 3,350 | Marshall & Ilsley Corp. | 153,397 | |||||||||||||
| 5,850 | Mellon Financial Corp. | 235,346 | |||||||||||||
| 9,990 | National City Corp. | 360,639 | |||||||||||||
| Shares | Value | ||||||||||||||
| 6,100 | North Fork Bancorp., Inc. | $ | 171,227 | ||||||||||||
| 2,650 | Northern Trust Corp. | 150,944 | |||||||||||||
| 3,850 | PNC Financial Services Group, Inc. | 272,157 | |||||||||||||
| 13,088 | Regions Financial Corp. | 479,675 | |||||||||||||
| 4,350 | State Street Corp. | 270,266 | |||||||||||||
| 4,800 | SunTrust Banks, Inc. | 391,920 | |||||||||||||
| 3,884 | Synovus Financial Corp. | 116,598 | |||||||||||||
| 23,500 | US Bancorp. | 790,540 | |||||||||||||
| 34,842 | Wachovia Corp. | 1,888,088 | |||||||||||||
| 44,600 | Wells Fargo & Co. | 1,571,704 | |||||||||||||
| 1,250 | Zions Bancorp. | 97,800 | |||||||||||||
| 13,323,185 | |||||||||||||||
| Beverages: 1.1% | |||||||||||||||
| 13,800 | Anheuser-Busch Cos., Inc. | 655,638 | |||||||||||||
| 1,410 | Brown-Forman Corp. | 97,925 | |||||||||||||
| 27,000 | Coca-Cola Co. | 1,264,410 | |||||||||||||
| 4,300 | Coca-Cola Enterprises, Inc. | 87,935 | |||||||||||||
| 2,500 | @ | Constellation Brands, Inc. | 69,950 | ||||||||||||
| 600 | Molson Coors Brewing Co. | 42,648 | |||||||||||||
| 2,150 | Pepsi Bottling Group, Inc. | 67,338 | |||||||||||||
| 21,810 | PepsiCo, Inc. | 1,351,566 | |||||||||||||
| 3,637,410 | |||||||||||||||
| Biotechnology: 0.5% | |||||||||||||||
| 15,550 | @ | Amgen, Inc. | 1,104,050 | ||||||||||||
| 4,400 | @ | Biogen Idec, Inc. | 229,944 | ||||||||||||
| 4,850 | @ | Celgene Corp. | 270,291 | ||||||||||||
| 1,300 | @ | Genzyme Corp. | 83,720 | ||||||||||||
| 1,300 | @ | Medimmune, Inc. | 42,497 | ||||||||||||
| 750 | @ | Millipore Corp. | 51,308 | ||||||||||||
| 1,781,810 | |||||||||||||||
| Building Materials: 0.1% | |||||||||||||||
| 850 | American Standard Cos., Inc. | 38,089 | |||||||||||||
| 5,900 | Masco Corp. | 169,271 | |||||||||||||
| 207,360 | |||||||||||||||
| Chemicals: 0.8% | |||||||||||||||
| 1,150 | Air Products & Chemicals, Inc. | 79,511 | |||||||||||||
| 900 | Ashland, Inc. | 60,849 | |||||||||||||
| 14,350 | Dow Chemical Co. | 574,144 | |||||||||||||
| 2,500 | Ecolab, Inc. | 110,875 | |||||||||||||
| 13,800 | EI DuPont de Nemours & Co. | 647,634 | |||||||||||||
| 1,200 | International Flavors & Fragrances, Inc. | 56,532 | |||||||||||||
| 8,100 | Monsanto Co. | 389,367 | |||||||||||||
| 4,200 | PPG Industries, Inc. | 270,060 | |||||||||||||
| 4,800 | Praxair, Inc. | 299,520 | |||||||||||||
| 2,300 | Rohm & Haas Co. | 120,106 | |||||||||||||
| 2,250 | Sherwin-Williams Co. | 140,738 | |||||||||||||
| 800 | Sigma-Aldrich Corp. | 60,888 | |||||||||||||
| 2,810,224 | |||||||||||||||
| Coal: 0.0% | |||||||||||||||
| 3,610 | Peabody Energy Corp. | 166,096 | |||||||||||||
| 166,096 | |||||||||||||||
| Commercial Services: 0.4% | |||||||||||||||
| 3,200 | @ | Apollo Group, Inc. | 124,128 | ||||||||||||
| 2,300 | @ | Convergys Corp. | 55,476 | ||||||||||||
| 2,560 | Equifax, Inc. | 97,254 | |||||||||||||
| 4,410 | H&R Block, Inc. | 105,840 | |||||||||||||
See Accompanying Notes to Financial Statements
89
PORTFOLIO OF INVESTMENTS
ING PRINCIPAL PROTECTION FUND IV AS OF NOVEMBER 30, 2006 (UNAUDITED) (CONTINUED)
| Shares | Value | ||||||||||||||
| Commercial Services (continued) | |||||||||||||||
| 6,760 | McKesson Corp. | $ | 333,944 | ||||||||||||
| 1,650 | @ | Monster Worldwide, Inc. | 72,023 | ||||||||||||
| 4,300 | Moody's Corp. | 298,764 | |||||||||||||
| 2,300 | Robert Half International, Inc. | 88,757 | |||||||||||||
| 2,500 | RR Donnelley & Sons Co. | 88,175 | |||||||||||||
| 9,028 | Western Union Co. | 205,838 | |||||||||||||
| 1,470,199 | |||||||||||||||
| Computers: 2.4% | |||||||||||||||
| 1,500 | @ | Affiliated Computer Services, Inc. | 75,825 | ||||||||||||
| 1,910 | @ | Cognizant Technology Solutions Corp. | 155,780 | ||||||||||||
| 2,550 | @ | Computer Sciences Corp. | 133,110 | ||||||||||||
| 51,640 | @ | Dell, Inc. | 1,406,674 | ||||||||||||
| 6,850 | Electronic Data Systems Corp. | 185,909 | |||||||||||||
| 27,900 | @ | EMC Corp. | 365,769 | ||||||||||||
| 61,650 | Hewlett-Packard Co. | 2,432,709 | |||||||||||||
| 27,200 | International Business Machines Corp. | 2,500,224 | |||||||||||||
| 2,150 | @ | Lexmark International, Inc. | 148,307 | ||||||||||||
| 2,900 | @ | NCR Corp. | 124,439 | ||||||||||||
| 4,550 | @ | Network Appliance, Inc. | 178,406 | ||||||||||||
| 2,500 | @ | Sandisk Corp. | 111,000 | ||||||||||||
| 45,100 | @ | Sun Microsystems, Inc. | 244,442 | ||||||||||||
| 3,800 | @ | Unisys Corp. | 27,398 | ||||||||||||
| 8,089,992 | |||||||||||||||
| Cosmetics/Personal Care: 1.0% | |||||||||||||||
| 5,900 | Avon Products, Inc. | 192,576 | |||||||||||||
| 6,850 | Colgate-Palmolive Co. | 445,593 | |||||||||||||
| 2,900 | Estee Lauder Cos., Inc. | 119,741 | |||||||||||||
| 42,055 | Procter & Gamble Co. | 2,640,633 | |||||||||||||
| 3,398,543 | |||||||||||||||
| Distribution/Wholesale: 0.0% | |||||||||||||||
| 1,200 | WW Grainger, Inc. | 86,832 | |||||||||||||
| 86,832 | |||||||||||||||
| Diversified Financial Services: 4.7% | |||||||||||||||
| 16,050 | American Express Co. | 942,456 | |||||||||||||
| 3,390 | Ameriprise Financial, Inc. | 183,399 | |||||||||||||
| 1,500 | Bear Stearns Cos., Inc. | 228,720 | |||||||||||||
| 12,350 | Charles Schwab Corp. | 226,499 | |||||||||||||
| 520 | Chicago Mercantile Exchange Holdings, Inc. | 278,512 | |||||||||||||
| 4,500 | CIT Group, Inc. | 234,045 | |||||||||||||
| 89,200 | Citigroup, Inc. | 4,423,428 | |||||||||||||
| 8,008 | Countrywide Financial Corp. | 318,078 | |||||||||||||
| 4,600 | @ | E*Trade Financial Corp. | 110,722 | ||||||||||||
| 12,850 | Fannie Mae | 732,836 | |||||||||||||
| 1,450 | Federated Investors, Inc. | 48,111 | |||||||||||||
| 2,200 | Franklin Resources, Inc. | 234,828 | |||||||||||||
| 9,200 | Freddie Mac | 617,872 | |||||||||||||
| 5,750 | Goldman Sachs Group, Inc. | 1,120,100 | |||||||||||||
| 2,800 | Janus Capital Group, Inc. | 56,728 | |||||||||||||
| 62,100 | JPMorgan Chase & Co. | 2,873,988 | |||||||||||||
| 7,100 | Lehman Brothers Holdings, Inc. | 523,057 | |||||||||||||
| 11,700 | Merrill Lynch & Co., Inc. | 1,022,931 | |||||||||||||
| 14,350 | Morgan Stanley | 1,092,896 | |||||||||||||
| 5,650 | SLM Corp. | 258,996 | |||||||||||||
| 3,600 | T. Rowe Price Group, Inc. | 155,988 | |||||||||||||
| 15,684,190 | |||||||||||||||
| Shares | Value | ||||||||||||||
| Electric: 1.5% | |||||||||||||||
| 14,400 | @ | AES Corp. | $ | 336,528 | |||||||||||
| 2,300 | @ | Allegheny Energy, Inc. | 102,028 | ||||||||||||
| 3,300 | Ameren Corp. | 180,543 | |||||||||||||
| 6,550 | American Electric Power Co., Inc. | 271,891 | |||||||||||||
| 3,800 | Centerpoint Energy, Inc. | 62,130 | |||||||||||||
| 5,350 | @ | CMS Energy Corp. | 86,724 | ||||||||||||
| 2,850 | Constellation Energy Group, Inc. | 195,539 | |||||||||||||
| 2,900 | DTE Energy Co. | 136,561 | |||||||||||||
| 6,500 | @ | Dynegy, Inc. | 44,135 | ||||||||||||
| 5,610 | Edison International | 257,948 | |||||||||||||
| 3,600 | Entergy Corp. | 328,752 | |||||||||||||
| 11,600 | Exelon Corp. | 704,468 | |||||||||||||
| 5,300 | FirstEnergy Corp. | 317,152 | |||||||||||||
| 6,070 | PG&E Corp. | 278,795 | |||||||||||||
| 1,700 | Pinnacle West Capital Corp. | 83,878 | |||||||||||||
| 6,600 | PPL Corp. | 239,910 | |||||||||||||
| 1,400 | Progress Energy, Inc. | 66,878 | |||||||||||||
| 4,000 | Public Service Enterprise Group, Inc. | 268,880 | |||||||||||||
| 11,900 | Southern Co. | 431,375 | |||||||||||||
| 3,400 | TECO Energy, Inc. | 57,766 | |||||||||||||
| 7,940 | TXU Corp. | 455,677 | |||||||||||||
| 6,800 | Xcel Energy, Inc. | 156,128 | |||||||||||||
| 5,063,686 | |||||||||||||||
| Electrical Components & Equipment: 0.2% | |||||||||||||||
| 5,400 | Emerson Electric Co. | 468,180 | |||||||||||||
| 1,800 | Molex, Inc. | 57,600 | |||||||||||||
| 525,780 | |||||||||||||||
| Electronics: 0.3% | |||||||||||||||
| 6,800 | @ | Agilent Technologies, Inc. | 216,512 | ||||||||||||
| 3,700 | Applera Corp. - Applied Biosystems Group | 134,828 | |||||||||||||
| 3,730 | Jabil Circuit, Inc. | 105,783 | |||||||||||||
| 2,900 | PerkinElmer, Inc. | 62,843 | |||||||||||||
| 3,400 | Symbol Technologies, Inc. | 50,388 | |||||||||||||
| 5,400 | @ | Thermo Electron Corp. | 236,682 | ||||||||||||
| 1,650 | @ | Waters Corp. | 82,566 | ||||||||||||
| 889,602 | |||||||||||||||
| Entertainment: 0.0% | |||||||||||||||
| 1,800 | International Game Technology | 78,804 | |||||||||||||
| 78,804 | |||||||||||||||
| Environmental Control: 0.1% | |||||||||||||||
| 3,400 | @ | Allied Waste Industries, Inc. | 43,112 | ||||||||||||
| 9,800 | Waste Management, Inc. | 358,778 | |||||||||||||
| 401,890 | |||||||||||||||
| Food: 0.6% | |||||||||||||||
| 5,200 | Campbell Soup Co. | 197,964 | |||||||||||||
| 6,950 | ConAgra Foods, Inc. | 178,615 | |||||||||||||
| 1,700 | @ | Dean Foods Co. | 72,794 | ||||||||||||
| 7,950 | General Mills, Inc. | 444,803 | |||||||||||||
| 900 | Hershey Co. | 47,673 | |||||||||||||
| 4,050 | HJ Heinz Co. | 180,023 | |||||||||||||
| 3,550 | Kellogg Co. | 176,719 | |||||||||||||
| 9,200 | Kroger Co. | 197,432 | |||||||||||||
| 2,500 | McCormick & Co., Inc. | 96,800 | |||||||||||||
| 5,900 | Safeway, Inc. | 181,779 | |||||||||||||
| 3,751 | Sara Lee Corp. | 62,192 | |||||||||||||
| 2,382 | Supervalu, Inc. | 81,607 | |||||||||||||
See Accompanying Notes to Financial Statements
90
PORTFOLIO OF INVESTMENTS
ING PRINCIPAL PROTECTION FUND IV AS OF NOVEMBER 30, 2006 (UNAUDITED) (CONTINUED)
| Shares | Value | ||||||||||||||
| Food (continued) | |||||||||||||||
| 1,800 | Whole Foods Market, Inc. | $ | 87,840 | ||||||||||||
| 2,006,241 | |||||||||||||||
| Forest Products & Paper: 0.2% | |||||||||||||||
| 6,400 | International Paper Co. | 211,840 | |||||||||||||
| 2,700 | MeadWestvaco Corp. | 79,650 | |||||||||||||
| 2,250 | Plum Creek Timber Co., Inc. | 83,835 | |||||||||||||
| 2,200 | Temple-Inland, Inc. | 86,020 | |||||||||||||
| 1,200 | Weyerhaeuser Co. | 77,616 | |||||||||||||
| 538,961 | |||||||||||||||
| Gas: 0.1% | |||||||||||||||
| 2,800 | KeySpan Corp. | 114,884 | |||||||||||||
| 800 | Nicor, Inc. | 39,640 | |||||||||||||
| 4,400 | NiSource, Inc. | 108,504 | |||||||||||||
| 4,400 | Sempra Energy | 239,800 | |||||||||||||
| 502,828 | |||||||||||||||
| Hand/Machine Tools: 0.1% | |||||||||||||||
| 1,220 | Black & Decker Corp. | 104,774 | |||||||||||||
| 1,300 | Snap-On, Inc. | 61,750 | |||||||||||||
| 1,700 | Stanley Works | 86,734 | |||||||||||||
| 253,258 | |||||||||||||||
| Healthcare-Products: 1.5% | |||||||||||||||
| 700 | Bausch & Lomb, Inc. | 33,894 | |||||||||||||
| 8,050 | Baxter International, Inc. | 360,157 | |||||||||||||
| 3,280 | Becton Dickinson & Co. | 235,242 | |||||||||||||
| 14,400 | @ | Boston Scientific Corp. | 227,808 | ||||||||||||
| 1,200 | CR Bard, Inc. | 98,748 | |||||||||||||
| 38,750 | Johnson & Johnson | 2,554,013 | |||||||||||||
| 15,200 | Medtronic, Inc. | 792,376 | |||||||||||||
| 1,900 | @ | Patterson Cos., Inc. | 70,509 | ||||||||||||
| 1,700 | @ | St. Jude Medical, Inc. | 63,359 | ||||||||||||
| 4,000 | Stryker Corp. | 207,440 | |||||||||||||
| 3,200 | @ | Zimmer Holdings, Inc. | 233,472 | ||||||||||||
| 4,877,018 | |||||||||||||||
| Healthcare-Services: 1.1% | |||||||||||||||
| 9,820 | Aetna, Inc. | 405,664 | |||||||||||||
| 3,580 | @ | Coventry Health Care, Inc. | 172,305 | ||||||||||||
| 3,500 | @ | Humana, Inc. | 189,350 | ||||||||||||
| 2,250 | @ | Laboratory Corp. of America Holdings | 159,300 | ||||||||||||
| 900 | Manor Care, Inc. | 42,768 | |||||||||||||
| 2,100 | Quest Diagnostics | 111,657 | |||||||||||||
| 30,300 | UnitedHealth Group, Inc. | 1,487,124 | |||||||||||||
| 13,930 | @ | WellPoint, Inc. | 1,054,083 | ||||||||||||
| 3,622,251 | |||||||||||||||
| Home Builders: 0.0% | |||||||||||||||
| 700 | Lennar Corp. | 36,750 | |||||||||||||
| 36,750 | |||||||||||||||
| Home Furnishings: 0.1% | |||||||||||||||
| 1,500 | Harman International Industries, Inc. | 155,760 | |||||||||||||
| 1,000 | Whirlpool Corp. | 85,300 | |||||||||||||
| 241,060 | |||||||||||||||
| Household Products/Wares: 0.2% | |||||||||||||||
| 300 | Avery Dennison Corp. | 20,241 | |||||||||||||
| 1,850 | Fortune Brands, Inc. | 149,665 | |||||||||||||
| Shares | Value | ||||||||||||||
| 6,100 | Kimberly-Clark Corp. | $ | 405,467 | ||||||||||||
| 575,373 | |||||||||||||||
| Housewares: 0.0% | |||||||||||||||
| 3,800 | Newell Rubbermaid, Inc. | 108,262 | |||||||||||||
| 108,262 | |||||||||||||||
| Insurance: 2.9% | |||||||||||||||
| 4,050 | @@ | ACE Ltd. | 230,202 | ||||||||||||
| 6,500 | Aflac, Inc. | 286,910 | |||||||||||||
| 11,250 | Allstate Corp. | 714,150 | |||||||||||||
| 1,700 | AMBAC Financial Group, Inc. | 145,588 | |||||||||||||
| 34,450 | American International Group, Inc. | 2,422,524 | |||||||||||||
| 4,350 | AON Corp. | 155,208 | |||||||||||||
| 7,460 | Chubb Corp. | 386,130 | |||||||||||||
| 1,780 | Cigna Corp. | 224,369 | |||||||||||||
| 3,141 | Cincinnati Financial Corp. | 139,083 | |||||||||||||
| 9,500 | Genworth Financial, Inc. | 311,600 | |||||||||||||
| 6,900 | Hartford Financial Services Group, Inc. | 591,744 | |||||||||||||
| 3,496 | Lincoln National Corp. | 222,311 | |||||||||||||
| 8,140 | Loews Corp. | 324,949 | |||||||||||||
| 2,900 | Marsh & McLennan Cos., Inc. | 91,118 | |||||||||||||
| 2,300 | MBIA, Inc. | 160,195 | |||||||||||||
| 13,630 | Metlife, Inc. | 800,490 | |||||||||||||
| 1,120 | MGIC Investment Corp. | 64,915 | |||||||||||||
| 4,600 | Principal Financial Group | 265,650 | |||||||||||||
| 12,800 | Progressive Corp. | 288,640 | |||||||||||||
| 8,640 | Prudential Financial, Inc. | 703,987 | |||||||||||||
| 2,620 | Safeco Corp. | 158,693 | |||||||||||||
| 12,430 | St. Paul Travelers Cos., Inc. | 643,998 | |||||||||||||
| 1,200 | Torchmark Corp. | 75,864 | |||||||||||||
| 3,800 | UnumProvident Corp. | 77,824 | |||||||||||||
| 2,200 | @@ | XL Capital Ltd. | 156,464 | ||||||||||||
| 9,642,606 | |||||||||||||||
| Internet: 0.4% | |||||||||||||||
| 4,000 | @ | Amazon.com, Inc. | 161,360 | ||||||||||||
| 5,750 | @ | eBay, Inc. | 186,013 | ||||||||||||
| 1,100 | @ | Google, Inc. | 533,412 | ||||||||||||
| 14,250 | @ | Symantec Corp. | 302,100 | ||||||||||||
| 3,000 | @ | VeriSign, Inc. | 78,330 | ||||||||||||
| 1,261,215 | |||||||||||||||
| Iron/Steel: 0.2% | |||||||||||||||
| 7,900 | Nucor Corp. | 472,815 | |||||||||||||
| 3,150 | United States Steel Corp. | 235,589 | |||||||||||||
| 708,404 | |||||||||||||||
| Leisure Time: 0.2% | |||||||||||||||
| 1,450 | Brunswick Corp. | 46,937 | |||||||||||||
| 5,450 | Carnival Corp. | 266,996 | |||||||||||||
| 3,800 | Harley-Davidson, Inc. | 280,326 | |||||||||||||
| 2,400 | Sabre Holdings Corp. | 65,832 | |||||||||||||
| 660,091 | |||||||||||||||
| Lodging: 0.1% | |||||||||||||||
| 3,860 | Marriott International, Inc. | 174,279 | |||||||||||||
| 1,200 | Starwood Hotels & Resorts Worldwide, Inc. | 77,004 | |||||||||||||
| 2,680 | @ | Wyndham Worldwide Corp. | 85,063 | ||||||||||||
| 336,346 | |||||||||||||||
See Accompanying Notes to Financial Statements
91
PORTFOLIO OF INVESTMENTS
ING PRINCIPAL PROTECTION FUND IV AS OF NOVEMBER 30, 2006 (UNAUDITED) (CONTINUED)
| Shares | Value | ||||||||||||||
| Machinery-Construction & Mining: 0.2% | |||||||||||||||
| 8,700 | Caterpillar, Inc. | $ | 539,661 | ||||||||||||
| 539,661 | |||||||||||||||
| Machinery-Diversified: 0.1% | |||||||||||||||
| 1,200 | Cummins, Inc. | 143,904 | |||||||||||||
| 1,100 | Deere & Co. | 105,600 | |||||||||||||
| 2,300 | Rockwell Automation, Inc. | 149,684 | |||||||||||||
| 399,188 | |||||||||||||||
| Media: 1.3% | |||||||||||||||
| 14,300 | CBS Corp. | 425,425 | |||||||||||||
| 6,100 | Clear Channel Communications, Inc. | 214,476 | |||||||||||||
| 27,700 | @ | Comcast Corp. | 1,120,742 | ||||||||||||
| 1,100 | EW Scripps Co. | 53,746 | |||||||||||||
| 2,900 | Gannett Co., Inc. | 172,608 | |||||||||||||
| 6,470 | McGraw-Hill Cos., Inc. | 431,226 | |||||||||||||
| 450 | Meredith Corp. | 24,345 | |||||||||||||
| 31,650 | News Corp., Inc. | 651,990 | |||||||||||||
| 1,100 | @ | Univision Communications, Inc. | 39,149 | ||||||||||||
| 37,350 | Walt Disney Co. | 1,234,418 | |||||||||||||
| 4,368,125 | |||||||||||||||
| Mining: 0.2% | |||||||||||||||
| 2,700 | Freeport-McMoRan Copper & Gold, Inc. | 169,749 | |||||||||||||
| 2,650 | Phelps Dodge Corp. | 325,950 | |||||||||||||
| 1,200 | Vulcan Materials Co. | 106,464 | |||||||||||||
| 602,163 | |||||||||||||||
| Miscellaneous Manufacturing: 2.7% | |||||||||||||||
| 10,000 | 3M Co. | 814,600 | |||||||||||||
| 1,600 | Cooper Industries Ltd. | 146,304 | |||||||||||||
| 2,800 | Danaher Corp. | 204,736 | |||||||||||||
| 2,550 | Dover Corp. | 128,265 | |||||||||||||
| 5,300 | Eastman Kodak Co. | 137,906 | |||||||||||||
| 3,100 | Eaton Corp. | 238,948 | |||||||||||||
| 138,050 | General Electric Co. | 4,870,404 | |||||||||||||
| 14,600 | Honeywell International, Inc. | 627,508 | |||||||||||||
| 5,400 | Illinois Tool Works, Inc. | 254,880 | |||||||||||||
| 4,400 | @@ | Ingersoll-Rand Co. | 171,644 | ||||||||||||
| 2,700 | ITT Corp. | 145,665 | |||||||||||||
| 2,500 | Leggett & Platt, Inc. | 59,450 | |||||||||||||
| 2,750 | Parker Hannifin Corp. | 229,570 | |||||||||||||
| 1,930 | Textron, Inc. | 188,079 | |||||||||||||
| 26,700 | @@ | Tyco International Ltd. | 808,743 | ||||||||||||
| 9,026,702 | |||||||||||||||
| Office/Business Equipment: 0.1% | |||||||||||||||
| 3,700 | Pitney Bowes, Inc. | 170,533 | |||||||||||||
| 20,400 | @ | Xerox Corp. | 336,600 | ||||||||||||
| 507,133 | |||||||||||||||
| Oil & Gas: 5.1% | |||||||||||||||
| 5,100 | Anadarko Petroleum Corp. | 251,736 | |||||||||||||
| 1,500 | Apache Corp. | 104,895 | |||||||||||||
| 43,503 | Chevron Corp. | 3,146,137 | |||||||||||||
| 20,001 | ConocoPhillips | 1,346,067 | |||||||||||||
| 5,400 | Devon Energy Corp. | 396,198 | |||||||||||||
| 2,900 | EOG Resources, Inc. | 204,537 | |||||||||||||
| 117,750 | ExxonMobil Corp. | 9,044,378 | |||||||||||||
| 1,080 | Hess Corp. | 54,292 | |||||||||||||
| 7,400 | Marathon Oil Corp. | 698,412 | |||||||||||||
| Shares | Value | ||||||||||||||
| 3,200 | @,@@ | Nabors Industries Ltd. | $ | 108,032 | |||||||||||
| 1,600 | Noble Corp. | 123,600 | |||||||||||||
| 10,480 | Occidental Petroleum Corp. | 527,563 | |||||||||||||
| 2,000 | Sunoco, Inc. | 136,320 | |||||||||||||
| 3,700 | @ | Transocean, Inc. | 288,415 | ||||||||||||
| 9,600 | Valero Energy Corp. | 528,672 | |||||||||||||
| 4,300 | XTO Energy, Inc. | 217,580 | |||||||||||||
| 17,176,834 | |||||||||||||||
| Oil & Gas Services: 0.7% | |||||||||||||||
| 3,700 | Baker Hughes, Inc. | 271,691 | |||||||||||||
| 1,300 | BJ Services Co. | 43,901 | |||||||||||||
| 21,350 | Halliburton Co. | 720,349 | |||||||||||||
| 2,000 | @ | National Oilwell Varco, Inc. | 133,020 | ||||||||||||
| 14,400 | Schlumberger Ltd. | 986,112 | |||||||||||||
| 1,600 | @ | Weatherford International Ltd. | 71,856 | ||||||||||||
| 2,226,929 | |||||||||||||||
| Packaging & Containers: 0.1% | |||||||||||||||
| 2,200 | Ball Corp. | 94,072 | |||||||||||||
| 1,500 | Bemis Co. | 51,195 | |||||||||||||
| 2,700 | @ | Pactiv Corp. | 93,015 | ||||||||||||
| 1,400 | Sealed Air Corp. | 83,314 | |||||||||||||
| 321,596 | |||||||||||||||
| Pharmaceuticals: 2.8% | |||||||||||||||
| 20,200 | Abbott Laboratories | 942,532 | |||||||||||||
| 750 | Allergan, Inc. | 87,435 | |||||||||||||
| 4,160 | AmerisourceBergen Corp. | 191,318 | |||||||||||||
| 1,400 | @ | Barr Pharmaceuticals, Inc. | 71,512 | ||||||||||||
| 10,500 | Bristol-Myers Squibb Co. | 260,715 | |||||||||||||
| 5,460 | Cardinal Health, Inc. | 352,825 | |||||||||||||
| 5,250 | Caremark Rx, Inc. | 248,325 | |||||||||||||
| 4,800 | Eli Lilly & Co. | 257,232 | |||||||||||||
| 2,300 | @ | Express Scripts, Inc. | 156,860 | ||||||||||||
| 5,750 | @ | Forest Laboratories, Inc. | 280,025 | ||||||||||||
| 5,900 | @ | Gilead Sciences, Inc. | 388,928 | ||||||||||||
| 1,940 | @ | Hospira, Inc. | 63,632 | ||||||||||||
| 4,300 | @ | King Pharmaceuticals, Inc. | 71,079 | ||||||||||||
| 3,748 | @ | Medco Health Solutions, Inc. | 188,187 | ||||||||||||
| 39,250 | Merck & Co., Inc. | 1,747,018 | |||||||||||||
| 4,800 | Mylan Laboratories | 97,392 | |||||||||||||
| 96,570 | Pfizer, Inc. | 2,654,709 | |||||||||||||
| 26,700 | Schering-Plough Corp. | 587,667 | |||||||||||||
| 1,700 | @ | Watson Pharmaceuticals, Inc. | 43,639 | ||||||||||||
| 17,850 | Wyeth | 861,798 | |||||||||||||
| 9,552,828 | |||||||||||||||
| Pipelines: 0.1% | |||||||||||||||
| 7,500 | El Paso Corp. | 109,500 | |||||||||||||
| 6,500 | Williams Cos., Inc. | 180,440 | |||||||||||||
| 289,940 | |||||||||||||||
| Real Estate: 0.0% | |||||||||||||||
| 2,500 | @ | CB Richard Ellis Group, Inc. | 82,325 | ||||||||||||
| 2,809 | @ | Realogy Corp. | 73,287 | ||||||||||||
| 155,612 | |||||||||||||||
| Real Estate Investment Trusts: 0.2% | |||||||||||||||
| 1,550 | Apartment Investment & Management Co. | 89,342 | |||||||||||||
| 600 | Boston Properties, Inc. | 70,230 | |||||||||||||
| 4,590 | Equity Office Properties Trust | 221,238 | |||||||||||||
| 1,200 | Prologis | 78,204 | |||||||||||||
See Accompanying Notes to Financial Statements
92
PORTFOLIO OF INVESTMENTS
ING PRINCIPAL PROTECTION FUND IV AS OF NOVEMBER 30, 2006 (UNAUDITED) (CONTINUED)
| Shares | Value | ||||||||||||||
| Real Estate Investment Trusts (continued) | |||||||||||||||
| 1,000 | Public Storage, Inc. | $ | 96,280 | ||||||||||||
| 700 | Vornado Realty Trust | 88,277 | |||||||||||||
| 643,571 | |||||||||||||||
| Retail: 2.8% | |||||||||||||||
| 500 | @ | Autozone, Inc. | 56,805 | ||||||||||||
| 4,150 | @ | Bed Bath & Beyond, Inc. | 160,813 | ||||||||||||
| 5,550 | Best Buy Co., Inc. | 305,084 | |||||||||||||
| 2,500 | @ | Big Lots, Inc. | 55,775 | ||||||||||||
| 2,450 | Circuit City Stores, Inc. | 61,152 | |||||||||||||
| 5,750 | Costco Wholesale Corp. | 300,495 | |||||||||||||
| 10,200 | CVS Corp. | 293,454 | |||||||||||||
| 1,550 | Darden Restaurants, Inc. | 62,233 | |||||||||||||
| 3,250 | Family Dollar Stores, Inc. | 90,643 | |||||||||||||
| 12,534 | Federated Department Stores, Inc. | 527,556 | |||||||||||||
| 11,220 | Gap, Inc. | 210,038 | |||||||||||||
| 11,190 | Home Depot, Inc. | 424,884 | |||||||||||||
| 2,750 | JC Penney Co., Inc. | 212,685 | |||||||||||||
| 7,100 | @ | Kohl's Corp. | 494,160 | ||||||||||||
| 4,200 | Limited Brands, Inc. | 133,098 | |||||||||||||
| 20,280 | Lowe's Cos., Inc. | 611,645 | |||||||||||||
| 16,600 | McDonald's Corp. | 696,702 | |||||||||||||
| 4,800 | Nordstrom, Inc. | 235,296 | |||||||||||||
| 6,350 | @ | Office Depot, Inc. | 240,411 | ||||||||||||
| 1,200 | OfficeMax, Inc. | 56,484 | |||||||||||||
| 990 | @ | Sears Holding Corp. | 169,706 | ||||||||||||
| 8,935 | Staples, Inc. | 227,574 | |||||||||||||
| 13,500 | @ | Starbucks Corp. | 476,415 | ||||||||||||
| 11,350 | Target Corp. | 659,322 | |||||||||||||
| 10,400 | TJX Cos., Inc. | 285,168 | |||||||||||||
| 13,500 | Walgreen Co. | 546,615 | |||||||||||||
| 32,600 | Wal-Mart Stores, Inc. | 1,502,860 | |||||||||||||
| 1,750 | Wendy's International, Inc. | 56,998 | |||||||||||||
| 3,150 | Yum! Brands, Inc. | 192,749 | |||||||||||||
| 9,346,820 | |||||||||||||||
| Savings & Loans: 0.2% | |||||||||||||||
| 12,756 | Washington Mutual, Inc. | 557,182 | |||||||||||||
| 557,182 | |||||||||||||||
| Semiconductors: 1.3% | |||||||||||||||
| 12,200 | @ | Advanced Micro Devices, Inc. | 263,154 | ||||||||||||
| 7,500 | @ | Altera Corp. | 149,175 | ||||||||||||
| 6,000 | Analog Devices, Inc. | 195,120 | |||||||||||||
| 18,700 | Applied Materials, Inc. | 336,226 | |||||||||||||
| 6,590 | @ | Freescale Semiconductor, Inc. | 263,139 | ||||||||||||
| 76,400 | Intel Corp. | 1,631,140 | |||||||||||||
| 2,700 | KLA-Tencor Corp. | 139,509 | |||||||||||||
| 3,800 | Linear Technology Corp. | 122,132 | |||||||||||||
| 9,000 | @ | LSI Logic Corp. | 95,940 | ||||||||||||
| 4,000 | Maxim Integrated Products | 125,920 | |||||||||||||
| 15,100 | @ | Micron Technology, Inc. | 220,460 | ||||||||||||
| 3,650 | National Semiconductor Corp. | 88,294 | |||||||||||||
| 2,300 | @ | Novellus Systems, Inc. | 71,806 | ||||||||||||
| 1,900 | @ | Nvidia Corp. | 70,281 | ||||||||||||
| 3,500 | @ | QLogic Corp. | 77,875 | ||||||||||||
| 3,500 | @ | Teradyne, Inc. | 52,150 | ||||||||||||
| 8,200 | Texas Instruments, Inc. | 242,310 | |||||||||||||
| 4,500 | Xilinx, Inc. | 120,600 | |||||||||||||
| 4,265,231 | |||||||||||||||
| Shares | Value | ||||||||||||||
| Software: 2.0% | |||||||||||||||
| 7,720 | @ | Adobe Systems, Inc. | $ | 309,804 | |||||||||||
| 3,000 | @ | Autodesk, Inc. | 123,540 | ||||||||||||
| 7,750 | Automatic Data Processing, Inc. | 373,783 | |||||||||||||
| 4,260 | @ | BMC Software, Inc. | 138,706 | ||||||||||||
| 6,500 | CA, Inc. | 141,050 | |||||||||||||
| 2,150 | @ | Citrix Systems, Inc. | 61,791 | ||||||||||||
| 8,000 | @ | Compuware Corp. | 67,120 | ||||||||||||
| 3,900 | @ | Electronic Arts, Inc. | 217,815 | ||||||||||||
| 2,200 | Fidelity National Information Services, Inc. | 87,780 | |||||||||||||
| 9,028 | First Data Corp. | 227,957 | |||||||||||||
| 2,350 | @ | Fiserv, Inc. | 120,109 | ||||||||||||
| 3,050 | IMS Health, Inc. | 83,784 | |||||||||||||
| 4,700 | @ | Intuit, Inc. | 147,956 | ||||||||||||
| 114,450 | Microsoft Corp. | 3,356,819 | |||||||||||||
| 5,400 | @ | Novell, Inc. | 33,912 | ||||||||||||
| 53,460 | @ | Oracle Corp. | 1,017,344 | ||||||||||||
| 1,288 | @ | Parametric Technology Corp. | 24,936 | ||||||||||||
| 4,900 | Paychex, Inc. | 193,109 | |||||||||||||
| 6,727,315 | |||||||||||||||
| Telecommunications: 3.6% | |||||||||||||||
| 5,200 | Alltel Corp. | 295,048 | |||||||||||||
| 51,454 | AT&T, Inc. | 1,744,805 | |||||||||||||
| 8,150 | @ | Avaya, Inc. | 104,157 | ||||||||||||
| 24,300 | BellSouth Corp. | 1,083,537 | |||||||||||||
| 2,750 | CenturyTel, Inc. | 117,013 | |||||||||||||
| 137,500 | @ | Cisco Systems, Inc. | 3,696,000 | ||||||||||||
| 4,300 | Citizens Communications Co. | 60,931 | |||||||||||||
| 2,700 | @ | Comverse Technology, Inc. | 52,704 | ||||||||||||
| 20,000 | @ | Corning, Inc. | 431,200 | ||||||||||||
| 1,921 | Embarq Corp. | 98,835 | |||||||||||||
| 2,800 | @ | JDS Uniphase Corp. | 51,744 | ||||||||||||
| 6,900 | @ | Juniper Networks, Inc. | 146,901 | ||||||||||||
| 43,840 | Motorola, Inc. | 971,933 | |||||||||||||
| 21,850 | Qualcomm, Inc. | 799,492 | |||||||||||||
| 19,100 | @ | Qwest Communications International, Inc. | 146,879 | ||||||||||||
| 38,620 | Sprint Nextel Corp. | 753,476 | |||||||||||||
| 6,350 | @ | Tellabs, Inc. | 63,754 | ||||||||||||
| 38,450 | Verizon Communications, Inc. | 1,343,443 | |||||||||||||
| 5,740 | Windstream Corp. | 80,016 | |||||||||||||
| 12,041,868 | |||||||||||||||
| Textiles: 0.0% | |||||||||||||||
| 2,150 | Cintas Corp. | 90,730 | |||||||||||||
| 90,730 | |||||||||||||||
| Toys/Games/Hobbies: 0.1% | |||||||||||||||
| 3,700 | Hasbro, Inc. | 98,975 | |||||||||||||
| 5,350 | Mattel, Inc. | 117,433 | |||||||||||||
| 216,408 | |||||||||||||||
| Transportation: 0.5% | |||||||||||||||
| 4,950 | Burlington Northern Santa Fe Corp. | 372,042 | |||||||||||||
| 5,840 | CSX Corp. | 209,422 | |||||||||||||
| 4,100 | FedEx Corp. | 473,263 | |||||||||||||
| 5,050 | Norfolk Southern Corp. | 248,713 | |||||||||||||
| 800 | Ryder System, Inc. | 41,736 | |||||||||||||
| 3,650 | Union Pacific Corp. | 330,375 | |||||||||||||
| 1,675,551 | |||||||||||||||
| Total Common Stock (Cost $123,286,623) | 173,003,225 | ||||||||||||||
See Accompanying Notes to Financial Statements
93
PORTFOLIO OF INVESTMENTS
ING PRINCIPAL PROTECTION FUND IV AS OF NOVEMBER 30, 2006 (UNAUDITED) (CONTINUED)
| Principal Amount | Value | ||||||
| U.S. GOVERNMENT AGENCY OBLIGATIONS: 45.0% | |||||||
| Federal National Mortgage Association: 45.0% | |||||||||||||||
| $ | 157,000,000 | 5.250%, due 10/05/07 | $ | 150,346,183 | |||||||||||
| Total U.S. Government Agency Obligations (Cost $152,870,046) | 150,346,183 | ||||||||||||||
| U.S. TREASURY OBLIGATIONS: 3.0% | |||||||||||||||
| U.S. Treasury Principal Only STRIP: 3.0% | |||||||||||||||
| 10,398,000 | 5.020%, due 08/15/07 | 10,044,010 | |||||||||||||
| Total U.S. Treasury Obligations (Cost $10,049,200) | 10,044,010 | ||||||||||||||
| Total Long-Term Investments (Cost $286,205,869) | 333,393,418 | ||||||||||||||
| SHORT-TERM INVESTMENTS: 0.7% | |||||||||||||||
| Repurchase Agreement: 0.7% | |||||||||||
| 2,183,000 | Morgan Stanley Repurchase Agreement dated 11/30/06, 5.290%, due 12/01/06, $2,183,321 to be received upon repurchase (Collateralized by $2,325,000 Federal National Mortgage Association, 3.550%-5.500%, Market Value plus accrued interest $2,273,540, due 06/17/10-06/19/28) | 2,183,000 | |||||||||
| Total Short-Term Investments (Cost $2,183,000) | 2,183,000 | ||||||||||
| Total Investments in Securities (Cost $288,388,869)* | 100.4 | % | $ | 335,576,418 | |||||||
| Other Assets and Liabilities - Net | (0.4 | ) | (1,203,045 | ) | |||||||
| Net Assets | 100.0 | % | $ | 334,373,373 | |||||||
@ Non-income producing security
@@ Foreign Issuer
STRIP Separate Trading of Registered Interest and Principal of Securities
* Cost for federal income tax purposes is $290,153,868.
Net unrealized appreciation consists of:
| Gross Unrealized Appreciation | $ | 48,659,074 | |||||
| Gross Unrealized Depreciation | (3,236,524 | ) | |||||
| Net Unrealized Appreciation | $ | 45,422,550 | |||||
See Accompanying Notes to Financial Statements
94
PORTFOLIO OF INVESTMENTS
ING PRINCIPAL PROTECTION FUND V AS OF NOVEMBER 30, 2006 (UNAUDITED)
| Shares | Value | ||||||||||||||
| COMMON STOCK: 41.6% | |||||||||||||||
| Advertising: 0.1% | |||||||||||||||
| 2,350 | Omnicom Group | $ | 240,076 | ||||||||||||
| 240,076 | |||||||||||||||
| Aerospace/Defense: 1.0% | |||||||||||||||
| 6,900 | Boeing Co. | 610,857 | |||||||||||||
| 4,700 | General Dynamics Corp. | 351,748 | |||||||||||||
| 900 | Goodrich Corp. | 40,500 | |||||||||||||
| 1,450 | L-3 Communications Holdings, Inc. | 119,263 | |||||||||||||
| 4,170 | Lockheed Martin Corp. | 377,177 | |||||||||||||
| 2,717 | Northrop Grumman Corp. | 181,849 | |||||||||||||
| 6,631 | Raytheon Co. | 338,446 | |||||||||||||
| 600 | Rockwell Collins, Inc. | 36,198 | |||||||||||||
| 8,800 | United Technologies Corp. | 567,864 | |||||||||||||
| 2,623,902 | |||||||||||||||
| Agriculture: 0.7% | |||||||||||||||
| 18,250 | Altria Group, Inc. | 1,536,833 | |||||||||||||
| 5,720 | Archer-Daniels-Midland Co. | 200,772 | |||||||||||||
| 1,180 | Reynolds American, Inc. | 75,803 | |||||||||||||
| 1,300 | UST, Inc. | 72,774 | |||||||||||||
| 1,886,182 | |||||||||||||||
| Airlines: 0.0% | |||||||||||||||
| 6,800 | Southwest Airlines Co. | 106,828 | |||||||||||||
| 106,828 | |||||||||||||||
| Apparel: 0.2% | |||||||||||||||
| 5,620 | @ | Coach, Inc. | 242,840 | ||||||||||||
| 1,060 | Jones Apparel Group, Inc. | 35,616 | |||||||||||||
| 1,550 | Liz Claiborne, Inc. | 66,263 | |||||||||||||
| 2,040 | Nike, Inc. | 201,858 | |||||||||||||
| 660 | VF Corp. | 51,737 | |||||||||||||
| 598,314 | |||||||||||||||
| Auto Manufacturers: 0.1% | |||||||||||||||
| 14,180 | Ford Motor Co. | 115,283 | |||||||||||||
| 1,800 | General Motors Corp. | 52,614 | |||||||||||||
| 2,900 | Paccar, Inc. | 189,370 | |||||||||||||
| 357,267 | |||||||||||||||
| Auto Parts & Equipment: 0.1% | |||||||||||||||
| 1,600 | @ | Goodyear Tire & Rubber Co. | 26,960 | ||||||||||||
| 1,550 | Johnson Controls, Inc. | 126,062 | |||||||||||||
| 153,022 | |||||||||||||||
| Banks: 3.2% | |||||||||||||||
| 53,257 | Bank of America Corp. | 2,867,889 | |||||||||||||
| 6,450 | Bank of New York Co., Inc. | 229,233 | |||||||||||||
| 4,163 | BB&T Corp. | 179,051 | |||||||||||||
| 2,650 | Capital One Financial Corp. | 206,382 | |||||||||||||
| 1,600 | Comerica, Inc. | 93,200 | |||||||||||||
| 1,100 | Compass Bancshares, Inc. | 62,854 | |||||||||||||
| 4,900 | Fifth Third Bancorp. | 193,207 | |||||||||||||
| 1,100 | First Horizon National Corp. | 43,846 | |||||||||||||
| 1,650 | Huntington Bancshares, Inc. | 40,112 | |||||||||||||
| 3,200 | Keycorp | 115,520 | |||||||||||||
| 650 | M&T Bank Corp. | 77,116 | |||||||||||||
| 1,800 | Marshall & Ilsley Corp. | 82,422 | |||||||||||||
| 3,500 | Mellon Financial Corp. | 140,805 | |||||||||||||
| 7,100 | National City Corp. | 256,310 | |||||||||||||
| 3,600 | North Fork Bancorp., Inc. | 101,052 | |||||||||||||
| Shares | Value | ||||||||||||||
| 1,600 | Northern Trust Corp. | $ | 91,136 | ||||||||||||
| 2,250 | PNC Financial Services Group, Inc. | 159,053 | |||||||||||||
| 8,551 | Regions Financial Corp. | 313,394 | |||||||||||||
| 2,650 | State Street Corp. | 164,645 | |||||||||||||
| 3,150 | SunTrust Banks, Inc. | 257,198 | |||||||||||||
| 2,449 | Synovus Financial Corp. | 73,519 | |||||||||||||
| 15,450 | US Bancorp. | 519,738 | |||||||||||||
| 22,348 | Wachovia Corp. | 1,211,038 | |||||||||||||
| 29,300 | Wells Fargo & Co. | 1,032,532 | |||||||||||||
| 850 | Zions Bancorp. | 66,504 | |||||||||||||
| 8,577,756 | |||||||||||||||
| Beverages: 0.9% | |||||||||||||||
| 9,000 | Anheuser-Busch Cos., Inc. | 427,590 | |||||||||||||
| 680 | Brown-Forman Corp. | 47,226 | |||||||||||||
| 17,800 | Coca-Cola Co. | 833,574 | |||||||||||||
| 2,550 | Coca-Cola Enterprises, Inc. | 52,148 | |||||||||||||
| 1,500 | @ | Constellation Brands, Inc. | 41,970 | ||||||||||||
| 400 | Molson Coors Brewing Co. | 28,432 | |||||||||||||
| 1,750 | Pepsi Bottling Group, Inc. | 54,810 | |||||||||||||
| 14,360 | PepsiCo, Inc. | 889,889 | |||||||||||||
| 2,375,639 | |||||||||||||||
| Biotechnology: 0.4% | |||||||||||||||
| 10,200 | @ | Amgen, Inc. | 724,200 | ||||||||||||
| 2,600 | @ | Biogen Idec, Inc. | 135,876 | ||||||||||||
| 3,100 | @ | Celgene Corp. | 172,763 | ||||||||||||
| 850 | @ | Genzyme Corp. | 54,740 | ||||||||||||
| 800 | @ | Medimmune, Inc. | 26,152 | ||||||||||||
| 450 | @ | Millipore Corp. | 30,785 | ||||||||||||
| 1,144,516 | |||||||||||||||
| Building Materials: 0.1% | |||||||||||||||
| 1,400 | American Standard Cos., Inc. | 62,734 | |||||||||||||
| 3,500 | Masco Corp. | 100,415 | |||||||||||||
| 163,149 | |||||||||||||||
| Chemicals: 0.7% | |||||||||||||||
| 700 | Air Products & Chemicals, Inc. | 48,398 | |||||||||||||
| 600 | Ashland, Inc. | 40,566 | |||||||||||||
| 9,500 | Dow Chemical Co. | 380,095 | |||||||||||||
| 1,600 | Ecolab, Inc. | 70,960 | |||||||||||||
| 9,100 | EI DuPont de Nemours & Co. | 427,063 | |||||||||||||
| 800 | International Flavors & Fragrances, Inc. | 37,688 | |||||||||||||
| 5,300 | Monsanto Co. | 254,771 | |||||||||||||
| 2,750 | PPG Industries, Inc. | 176,825 | |||||||||||||
| 3,150 | Praxair, Inc. | 196,560 | |||||||||||||
| 1,450 | Rohm & Haas Co. | 75,719 | |||||||||||||
| 1,350 | Sherwin-Williams Co. | 84,443 | |||||||||||||
| 500 | Sigma-Aldrich Corp. | 38,055 | |||||||||||||
| 1,831,143 | |||||||||||||||
| Coal: 0.0% | |||||||||||||||
| 2,340 | Peabody Energy Corp. | 107,663 | |||||||||||||
| 107,663 | |||||||||||||||
| Commercial Services: 0.4% | |||||||||||||||
| 1,900 | @ | Apollo Group, Inc. | 73,701 | ||||||||||||
| 1,500 | @ | Convergys Corp. | 36,180 | ||||||||||||
| 1,550 | Equifax, Inc. | 58,885 | |||||||||||||
| 2,600 | H&R Block, Inc. | 62,400 | |||||||||||||
| 4,200 | McKesson Corp. | 207,480 | |||||||||||||
| 950 | @ | Monster Worldwide, Inc. | 41,468 | ||||||||||||
See Accompanying Notes to Financial Statements
95
PORTFOLIO OF INVESTMENTS
ING PRINCIPAL PROTECTION FUND V AS OF NOVEMBER 30, 2006 (UNAUDITED) (CONTINUED)
| Shares | Value | ||||||||||||||
| Commercial Services (continued) | |||||||||||||||
| 2,800 | Moody's Corp. | $ | 194,544 | ||||||||||||
| 1,550 | Robert Half International, Inc. | 59,815 | |||||||||||||
| 1,950 | RR Donnelley & Sons Co. | 68,777 | |||||||||||||
| 5,890 | Western Union Co. | 134,292 | |||||||||||||
| 937,542 | |||||||||||||||
| Computers: 2.0% | |||||||||||||||
| 900 | @ | Affiliated Computer Services, Inc. | 45,495 | ||||||||||||
| 1,240 | @ | Cognizant Technology Solutions Corp. | 101,134 | ||||||||||||
| 1,500 | @ | Computer Sciences Corp. | 78,300 | ||||||||||||
| 33,530 | @ | Dell, Inc. | 913,357 | ||||||||||||
| 4,050 | Electronic Data Systems Corp. | 109,917 | |||||||||||||
| 18,800 | @ | EMC Corp. | 246,468 | ||||||||||||
| 40,600 | Hewlett-Packard Co. | 1,602,076 | |||||||||||||
| 17,900 | International Business Machines Corp. | 1,645,368 | |||||||||||||
| 1,350 | @ | Lexmark International, Inc. | 93,123 | ||||||||||||
| 2,100 | @ | NCR Corp. | 90,111 | ||||||||||||
| 3,240 | @ | Network Appliance, Inc. | 127,040 | ||||||||||||
| 1,500 | @ | Sandisk Corp. | 66,600 | ||||||||||||
| 26,400 | @ | Sun Microsystems, Inc. | 143,088 | ||||||||||||
| 2,000 | @ | Unisys Corp. | 14,420 | ||||||||||||
| 5,276,497 | |||||||||||||||
| Cosmetics/Personal Care: 0.8% | |||||||||||||||
| 3,600 | Avon Products, Inc. | 117,504 | |||||||||||||
| 4,500 | Colgate-Palmolive Co. | 292,725 | |||||||||||||
| 1,500 | Estee Lauder Cos., Inc. | 61,935 | |||||||||||||
| 27,675 | Procter & Gamble Co. | 1,737,713 | |||||||||||||
| 2,209,877 | |||||||||||||||
| Distribution/Wholesale: 0.0% | |||||||||||||||
| 850 | WW Grainger, Inc. | 61,506 | |||||||||||||
| 61,506 | |||||||||||||||
| Diversified Financial Services: 3.8% | |||||||||||||||
| 10,600 | American Express Co. | 622,432 | |||||||||||||
| 1,960 | Ameriprise Financial, Inc. | 106,036 | |||||||||||||
| 940 | Bear Stearns Cos., Inc. | 143,331 | |||||||||||||
| 7,900 | Charles Schwab Corp. | 144,886 | |||||||||||||
| 290 | Chicago Mercantile Exchange Holdings, Inc. | 155,324 | |||||||||||||
| 2,950 | CIT Group, Inc. | 153,430 | |||||||||||||
| 58,100 | Citigroup, Inc. | 2,881,179 | |||||||||||||
| 5,298 | Countrywide Financial Corp. | 210,437 | |||||||||||||
| 3,700 | @ | E*Trade Financial Corp. | 89,059 | ||||||||||||
| 8,450 | Fannie Mae | 481,904 | |||||||||||||
| 800 | Federated Investors, Inc. | 26,544 | |||||||||||||
| 1,500 | Franklin Resources, Inc. | 160,110 | |||||||||||||
| 6,000 | Freddie Mac | 402,960 | |||||||||||||
| 3,800 | Goldman Sachs Group, Inc. | 740,240 | |||||||||||||
| 1,600 | Janus Capital Group, Inc. | 32,416 | |||||||||||||
| 40,800 | JPMorgan Chase & Co. | 1,888,224 | |||||||||||||
| 4,660 | Lehman Brothers Holdings, Inc. | 343,302 | |||||||||||||
| 7,700 | Merrill Lynch & Co., Inc. | 673,211 | |||||||||||||
| 9,350 | Morgan Stanley | 712,096 | |||||||||||||
| 3,200 | SLM Corp. | 146,688 | |||||||||||||
| 2,200 | T. Rowe Price Group, Inc. | 95,326 | |||||||||||||
| 10,209,135 | |||||||||||||||
| Shares | Value | ||||||||||||||
| Electric: 1.2% | |||||||||||||||
| 9,350 | @ | AES Corp. | $ | 218,510 | |||||||||||
| 1,850 | @ | Allegheny Energy, Inc. | 82,066 | ||||||||||||
| 2,200 | Ameren Corp. | 120,362 | |||||||||||||
| 4,500 | American Electric Power Co., Inc. | 186,795 | |||||||||||||
| 2,300 | Centerpoint Energy, Inc. | 37,605 | |||||||||||||
| 2,250 | @ | CMS Energy Corp. | 36,473 | ||||||||||||
| 1,900 | Constellation Energy Group, Inc. | 130,359 | |||||||||||||
| 1,900 | DTE Energy Co. | 89,471 | |||||||||||||
| 4,300 | @ | Dynegy, Inc. | 29,197 | ||||||||||||
| 3,320 | Edison International | 152,654 | |||||||||||||
| 2,400 | Entergy Corp. | 219,168 | |||||||||||||
| 7,600 | Exelon Corp. | 461,548 | |||||||||||||
| 3,650 | FirstEnergy Corp. | 218,416 | |||||||||||||
| 3,550 | PG&E Corp. | 163,052 | |||||||||||||
| 1,100 | Pinnacle West Capital Corp. | 54,274 | |||||||||||||
| 4,300 | PPL Corp. | 156,305 | |||||||||||||
| 900 | Progress Energy, Inc. | 42,993 | |||||||||||||
| 2,550 | Public Service Enterprise Group, Inc. | 171,411 | |||||||||||||
| 8,500 | Southern Co. | 308,125 | |||||||||||||
| 2,200 | TECO Energy, Inc. | 37,378 | |||||||||||||
| 5,260 | TXU Corp. | 301,871 | |||||||||||||
| 4,000 | Xcel Energy, Inc. | 91,840 | |||||||||||||
| 3,309,873 | |||||||||||||||
| Electrical Components & Equipment: 0.1% | |||||||||||||||
| 3,550 | Emerson Electric Co. | 307,785 | |||||||||||||
| 1,100 | Molex, Inc. | 35,200 | |||||||||||||
| 342,985 | |||||||||||||||
| Electronics: 0.2% | |||||||||||||||
| 4,450 | @ | Agilent Technologies, Inc. | 141,688 | ||||||||||||
| 1,250 | Applera Corp. - Applied Biosystems Group | 45,550 | |||||||||||||
| 1,550 | Jabil Circuit, Inc. | 43,958 | |||||||||||||
| 1,500 | PerkinElmer, Inc. | 32,505 | |||||||||||||
| 2,000 | Symbol Technologies, Inc. | 29,640 | |||||||||||||
| 3,200 | @ | Thermo Electron Corp. | 140,256 | ||||||||||||
| 1,100 | @ | Waters Corp. | 55,044 | ||||||||||||
| 488,641 | |||||||||||||||
| Entertainment: 0.0% | |||||||||||||||
| 1,150 | International Game Technology | 50,347 | |||||||||||||
| 50,347 | |||||||||||||||
| Environmental Control: 0.1% | |||||||||||||||
| 2,200 | @ | Allied Waste Industries, Inc. | 27,896 | ||||||||||||
| 6,300 | Waste Management, Inc. | 230,643 | |||||||||||||
| 258,539 | |||||||||||||||
| Food: 0.5% | |||||||||||||||
| 3,450 | Campbell Soup Co. | 131,342 | |||||||||||||
| 4,050 | ConAgra Foods, Inc. | 104,085 | |||||||||||||
| 1,000 | @ | Dean Foods Co. | 42,820 | ||||||||||||
| 5,200 | General Mills, Inc. | 290,940 | |||||||||||||
| 600 | Hershey Co. | 31,782 | |||||||||||||
| 2,550 | HJ Heinz Co. | 113,348 | |||||||||||||
| 2,000 | Kellogg Co. | 99,560 | |||||||||||||
| 6,300 | Kroger Co. | 135,198 | |||||||||||||
| 1,100 | McCormick & Co., Inc. | 42,592 | |||||||||||||
| 3,550 | Safeway, Inc. | 109,376 | |||||||||||||
See Accompanying Notes to Financial Statements
96
PORTFOLIO OF INVESTMENTS
ING PRINCIPAL PROTECTION FUND V AS OF NOVEMBER 30, 2006 (UNAUDITED) (CONTINUED)
| Shares | Value | ||||||||||||||
| Food (continued) | |||||||||||||||
| 2,338 | Sara Lee Corp. | $ | 38,764 | ||||||||||||
| 632 | Supervalu, Inc. | 21,652 | |||||||||||||
| 1,100 | Whole Foods Market, Inc. | 53,680 | |||||||||||||
| 1,215,139 | |||||||||||||||
| Forest Products & Paper: 0.1% | |||||||||||||||
| 4,500 | International Paper Co. | 148,950 | |||||||||||||
| 1,500 | MeadWestvaco Corp. | 44,250 | |||||||||||||
| 1,400 | Plum Creek Timber Co., Inc. | 52,164 | |||||||||||||
| 1,800 | Temple-Inland, Inc. | 70,380 | |||||||||||||
| 700 | Weyerhaeuser Co. | 45,276 | |||||||||||||
| 361,020 | |||||||||||||||
| Gas: 0.1% | |||||||||||||||
| 1,800 | KeySpan Corp. | 73,854 | |||||||||||||
| 400 | Nicor, Inc. | 19,820 | |||||||||||||
| 2,900 | NiSource, Inc. | 71,514 | |||||||||||||
| 2,550 | Sempra Energy | 138,975 | |||||||||||||
| 304,163 | |||||||||||||||
| Hand/Machine Tools: 0.1% | |||||||||||||||
| 670 | Black & Decker Corp. | 57,540 | |||||||||||||
| 900 | Snap-On, Inc. | 42,750 | |||||||||||||
| 500 | Stanley Works | 25,510 | |||||||||||||
| 125,800 | |||||||||||||||
| Healthcare-Products: 1.2% | |||||||||||||||
| 500 | Bausch & Lomb, Inc. | 24,210 | |||||||||||||
| 5,700 | Baxter International, Inc. | 255,018 | |||||||||||||
| 1,920 | Becton Dickinson & Co. | 137,702 | |||||||||||||
| 9,200 | @ | Boston Scientific Corp. | 145,544 | ||||||||||||
| 1,000 | CR Bard, Inc. | 82,290 | |||||||||||||
| 25,500 | Johnson & Johnson | 1,680,705 | |||||||||||||
| 10,000 | Medtronic, Inc. | 521,300 | |||||||||||||
| 1,200 | @ | Patterson Cos., Inc. | 44,532 | ||||||||||||
| 1,150 | @ | St. Jude Medical, Inc. | 42,861 | ||||||||||||
| 2,600 | Stryker Corp. | 134,836 | |||||||||||||
| 1,900 | @ | Zimmer Holdings, Inc. | 138,624 | ||||||||||||
| 3,207,622 | |||||||||||||||
| Healthcare-Services: 0.9% | |||||||||||||||
| 6,410 | Aetna, Inc. | 264,797 | |||||||||||||
| 1,935 | @ | Coventry Health Care, Inc. | 93,132 | ||||||||||||
| 2,390 | @ | Humana, Inc. | 129,299 | ||||||||||||
| 1,500 | @ | Laboratory Corp. of America Holdings | 106,200 | ||||||||||||
| 600 | Manor Care, Inc. | 28,512 | |||||||||||||
| 1,300 | Quest Diagnostics | 69,121 | |||||||||||||
| 19,970 | UnitedHealth Group, Inc. | 980,128 | |||||||||||||
| 9,180 | @ | WellPoint, Inc. | 694,651 | ||||||||||||
| 2,365,840 | |||||||||||||||
| Home Builders: 0.0% | |||||||||||||||
| 500 | Lennar Corp. | 26,250 | |||||||||||||
| 26,250 | |||||||||||||||
| Home Furnishings: 0.1% | |||||||||||||||
| 900 | Harman International Industries, Inc. | 93,456 | |||||||||||||
| 700 | Whirlpool Corp. | 59,710 | |||||||||||||
| 153,166 | |||||||||||||||
| Shares | Value | ||||||||||||||
| Household Products/Wares: 0.1% | |||||||||||||||
| 200 | Avery Dennison Corp. | $ | 13,494 | ||||||||||||
| 1,200 | Fortune Brands, Inc. | 97,080 | |||||||||||||
| 3,950 | Kimberly-Clark Corp. | 262,557 | |||||||||||||
| 373,131 | |||||||||||||||
| Housewares: 0.0% | |||||||||||||||
| 1,950 | Newell Rubbermaid, Inc. | 55,556 | |||||||||||||
| 55,556 | |||||||||||||||
| Insurance: 2.3% | |||||||||||||||
| 2,860 | @@ | ACE Ltd. | 162,562 | ||||||||||||
| 4,050 | Aflac, Inc. | 178,767 | |||||||||||||
| 7,410 | Allstate Corp. | 470,387 | |||||||||||||
| 1,050 | AMBAC Financial Group, Inc. | 89,922 | |||||||||||||
| 22,600 | American International Group, Inc. | 1,589,232 | |||||||||||||
| 2,550 | AON Corp. | 90,984 | |||||||||||||
| 4,880 | Chubb Corp. | 252,589 | |||||||||||||
| 1,300 | Cigna Corp. | 163,865 | |||||||||||||
| 2,084 | Cincinnati Financial Corp. | 92,280 | |||||||||||||
| 6,100 | Genworth Financial, Inc. | 200,080 | |||||||||||||
| 4,450 | Hartford Financial Services Group, Inc. | 381,632 | |||||||||||||
| 2,212 | Lincoln National Corp. | 140,661 | |||||||||||||
| 5,390 | Loews Corp. | 215,169 | |||||||||||||
| 1,900 | Marsh & McLennan Cos., Inc. | 59,698 | |||||||||||||
| 1,200 | MBIA, Inc. | 83,580 | |||||||||||||
| 8,920 | Metlife, Inc. | 523,872 | |||||||||||||
| 650 | MGIC Investment Corp. | 37,674 | |||||||||||||
| 2,900 | Principal Financial Group | 167,475 | |||||||||||||
| 9,080 | Progressive Corp. | 204,754 | |||||||||||||
| 5,700 | Prudential Financial, Inc. | 464,436 | |||||||||||||
| 1,740 | Safeco Corp. | 105,392 | |||||||||||||
| 8,150 | St. Paul Travelers Cos., Inc. | 422,252 | |||||||||||||
| 1,250 | Torchmark Corp. | 79,025 | |||||||||||||
| 3,000 | UnumProvident Corp. | 61,440 | |||||||||||||
| 1,400 | @@ | XL Capital Ltd. | 99,568 | ||||||||||||
| 6,337,296 | |||||||||||||||
| Internet: 0.3% | |||||||||||||||
| 2,400 | @ | Amazon.com, Inc. | 96,816 | ||||||||||||
| 3,700 | @ | eBay, Inc. | 119,695 | ||||||||||||
| 700 | @ | Google, Inc. | 339,444 | ||||||||||||
| 8,369 | @ | Symantec Corp. | 177,423 | ||||||||||||
| 1,900 | @ | VeriSign, Inc. | 49,609 | ||||||||||||
| 782,987 | |||||||||||||||
| Iron/Steel: 0.2% | |||||||||||||||
| 5,140 | Nucor Corp. | 307,629 | |||||||||||||
| 2,040 | United States Steel Corp. | 152,572 | |||||||||||||
| 460,201 | |||||||||||||||
| Leisure Time: 0.2% | |||||||||||||||
| 850 | Brunswick Corp. | 27,515 | |||||||||||||
| 3,500 | Carnival Corp. | 171,465 | |||||||||||||
| 2,550 | Harley-Davidson, Inc. | 188,114 | |||||||||||||
| 1,500 | Sabre Holdings Corp. | 41,145 | |||||||||||||
| 428,239 | |||||||||||||||
| Lodging: 0.1% | |||||||||||||||
| 3,380 | Marriott International, Inc. | 152,607 | |||||||||||||
| 800 | Starwood Hotels & Resorts Worldwide, Inc. | 51,336 | |||||||||||||
See Accompanying Notes to Financial Statements
97
PORTFOLIO OF INVESTMENTS
ING PRINCIPAL PROTECTION FUND V AS OF NOVEMBER 30, 2006 (UNAUDITED) (CONTINUED)
| Shares | Value | ||||||||||||||
| Lodging (continued) | |||||||||||||||
| 1,600 | @ | Wyndham Worldwide Corp. | $ | 50,784 | |||||||||||
| 254,727 | |||||||||||||||
| Machinery-Construction & Mining: 0.1% | |||||||||||||||
| 5,700 | Caterpillar, Inc. | 353,571 | |||||||||||||
| 353,571 | |||||||||||||||
| Machinery-Diversified: 0.1% | |||||||||||||||
| 750 | Cummins, Inc. | 89,940 | |||||||||||||
| 700 | Deere & Co. | 67,200 | |||||||||||||
| 1,600 | Rockwell Automation, Inc. | 104,128 | |||||||||||||
| 261,268 | |||||||||||||||
| Media: 1.1% | |||||||||||||||
| 9,325 | CBS Corp. | 277,419 | |||||||||||||
| 3,900 | Clear Channel Communications, Inc. | 137,124 | |||||||||||||
| 18,200 | @ | Comcast Corp. | 736,372 | ||||||||||||
| 600 | EW Scripps Co. | 29,316 | |||||||||||||
| 1,900 | Gannett Co., Inc. | 113,088 | |||||||||||||
| 4,170 | McGraw-Hill Cos., Inc. | 277,931 | |||||||||||||
| 550 | Meredith Corp. | 29,755 | |||||||||||||
| 20,550 | News Corp., Inc. | 423,330 | |||||||||||||
| 700 | Tribune Co. | 22,260 | |||||||||||||
| 600 | @ | Univision Communications, Inc. | 21,354 | ||||||||||||
| 24,600 | Walt Disney Co. | 813,030 | |||||||||||||
| 2,880,979 | |||||||||||||||
| Mining: 0.1% | |||||||||||||||
| 1,800 | Freeport-McMoRan Copper & Gold, Inc. | 113,166 | |||||||||||||
| 1,740 | Phelps Dodge Corp. | 214,020 | |||||||||||||
| 300 | Vulcan Materials Co. | 26,616 | |||||||||||||
| 353,802 | |||||||||||||||
| Miscellaneous Manufacturing: 2.2% | |||||||||||||||
| 6,600 | 3M Co. | 537,636 | |||||||||||||
| 750 | Cooper Industries Ltd. | 68,580 | |||||||||||||
| 2,250 | Danaher Corp. | 164,520 | |||||||||||||
| 1,550 | Dover Corp. | 77,965 | |||||||||||||
| 3,400 | Eastman Kodak Co. | 88,468 | |||||||||||||
| 2,000 | Eaton Corp. | 154,160 | |||||||||||||
| 89,950 | General Electric Co. | 3,173,436 | |||||||||||||
| 9,600 | Honeywell International, Inc. | 412,608 | |||||||||||||
| 3,800 | Illinois Tool Works, Inc. | 179,360 | |||||||||||||
| 2,600 | @@ | Ingersoll-Rand Co. | 101,426 | ||||||||||||
| 1,600 | ITT Corp. | 86,320 | |||||||||||||
| 1,500 | Leggett & Platt, Inc. | 35,670 | |||||||||||||
| 1,600 | Parker Hannifin Corp. | 133,568 | |||||||||||||
| 1,400 | Textron, Inc. | 136,430 | |||||||||||||
| 17,500 | @@ | Tyco International Ltd. | 530,075 | ||||||||||||
| 5,880,222 | |||||||||||||||
| Office/Business Equipment: 0.1% | |||||||||||||||
| 1,500 | Pitney Bowes, Inc. | 69,135 | |||||||||||||
| 14,450 | @ | Xerox Corp. | 238,425 | ||||||||||||
| 307,560 | |||||||||||||||
| Oil & Gas: 4.1% | |||||||||||||||
| 3,300 | Anadarko Petroleum Corp. | 162,888 | |||||||||||||
| 920 | Apache Corp. | 64,336 | |||||||||||||
| 28,261 | Chevron Corp. | 2,043,836 | |||||||||||||
| 13,147 | ConocoPhillips | 884,793 | |||||||||||||
| Shares | Value | ||||||||||||||
| 3,300 | Devon Energy Corp. | $ | 242,121 | ||||||||||||
| 1,650 | EOG Resources, Inc. | 116,375 | |||||||||||||
| 76,550 | ExxonMobil Corp. | 5,879,806 | |||||||||||||
| 1,500 | Hess Corp. | 75,405 | |||||||||||||
| 4,820 | Marathon Oil Corp. | 454,912 | |||||||||||||
| 1,900 | @,@@ | Nabors Industries Ltd. | 64,144 | ||||||||||||
| 1,000 | Noble Corp. | 77,250 | |||||||||||||
| 6,900 | Occidental Petroleum Corp. | 347,346 | |||||||||||||
| 1,600 | Sunoco, Inc. | 109,056 | |||||||||||||
| 2,400 | @ | Transocean, Inc. | 187,080 | ||||||||||||
| 6,300 | Valero Energy Corp. | 346,941 | |||||||||||||
| 2,600 | XTO Energy, Inc. | 131,560 | |||||||||||||
| 11,187,849 | |||||||||||||||
| Oil & Gas Services: 0.5% | |||||||||||||||
| 2,400 | Baker Hughes, Inc. | 176,232 | |||||||||||||
| 800 | BJ Services Co. | 27,016 | |||||||||||||
| 14,000 | Halliburton Co. | 472,360 | |||||||||||||
| 1,300 | @ | National Oilwell Varco, Inc. | 86,463 | ||||||||||||
| 9,400 | Schlumberger Ltd. | 643,712 | |||||||||||||
| 1,000 | @ | Weatherford International Ltd. | 44,910 | ||||||||||||
| 1,450,693 | |||||||||||||||
| Packaging & Containers: 0.1% | |||||||||||||||
| 1,000 | Ball Corp. | 42,760 | |||||||||||||
| 800 | Bemis Co. | 27,304 | |||||||||||||
| 1,100 | @ | Pactiv Corp. | 37,895 | ||||||||||||
| 800 | Sealed Air Corp. | 47,608 | |||||||||||||
| 155,567 | |||||||||||||||
| Pharmaceuticals: 2.3% | |||||||||||||||
| 13,300 | Abbott Laboratories | 620,578 | |||||||||||||
| 450 | Allergan, Inc. | 52,461 | |||||||||||||
| 3,100 | AmerisourceBergen Corp. | 142,569 | |||||||||||||
| 800 | @ | Barr Pharmaceuticals, Inc. | 40,864 | ||||||||||||
| 6,800 | Bristol-Myers Squibb Co. | 168,844 | |||||||||||||
| 3,240 | Cardinal Health, Inc. | 209,369 | |||||||||||||
| 3,580 | Caremark Rx, Inc. | 169,334 | |||||||||||||
| 3,100 | Eli Lilly & Co. | 166,129 | |||||||||||||
| 1,900 | @ | Express Scripts, Inc. | 129,580 | ||||||||||||
| 3,750 | @ | Forest Laboratories, Inc. | 182,625 | ||||||||||||
| 3,950 | @ | Gilead Sciences, Inc. | 260,384 | ||||||||||||
| 1,270 | @ | Hospira, Inc. | 41,656 | ||||||||||||
| 2,680 | @ | King Pharmaceuticals, Inc. | 44,300 | ||||||||||||
| 2,260 | @ | Medco Health Solutions, Inc. | 113,475 | ||||||||||||
| 25,500 | Merck & Co., Inc. | 1,135,005 | |||||||||||||
| 3,100 | Mylan Laboratories | 62,899 | |||||||||||||
| 63,490 | Pfizer, Inc. | 1,745,340 | |||||||||||||
| 17,400 | Schering-Plough Corp. | 382,974 | |||||||||||||
| 1,150 | @ | Watson Pharmaceuticals, Inc. | 29,521 | ||||||||||||
| 11,700 | Wyeth | 564,876 | |||||||||||||
| 6,262,783 | |||||||||||||||
| Pipelines: 0.1% | |||||||||||||||
| 4,800 | El Paso Corp. | 70,080 | |||||||||||||
| 4,150 | Williams Cos., Inc. | 115,204 | |||||||||||||
| 185,284 | |||||||||||||||
| Real Estate: 0.0% | |||||||||||||||
| 1,620 | @ | CB Richard Ellis Group, Inc. | 53,347 | ||||||||||||
| 1,615 | @ | Realogy Corp. | 42,135 | ||||||||||||
| 95,482 | |||||||||||||||
See Accompanying Notes to Financial Statements
98
PORTFOLIO OF INVESTMENTS
ING PRINCIPAL PROTECTION FUND V AS OF NOVEMBER 30, 2006 (UNAUDITED) (CONTINUED)
| Shares | Value | ||||||||||||||
| Real Estate Investment Trusts: 0.1% | |||||||||||||||
| 950 | Apartment Investment & Management Co. | $ | 54,758 | ||||||||||||
| 300 | Boston Properties, Inc. | 35,115 | |||||||||||||
| 2,940 | Equity Office Properties Trust | 141,708 | |||||||||||||
| 800 | Prologis | 52,136 | |||||||||||||
| 300 | Public Storage, Inc. | 28,884 | |||||||||||||
| 400 | Vornado Realty Trust | 50,444 | |||||||||||||
| 363,045 | |||||||||||||||
| Retail: 2.3% | |||||||||||||||
| 400 | @ | Autozone, Inc. | 45,444 | ||||||||||||
| 2,400 | @ | Bed Bath & Beyond, Inc. | 93,000 | ||||||||||||
| 3,585 | Best Buy Co., Inc. | 197,067 | |||||||||||||
| 1,500 | @ | Big Lots, Inc. | 33,465 | ||||||||||||
| 2,150 | Circuit City Stores, Inc. | 53,664 | |||||||||||||
| 3,700 | Costco Wholesale Corp. | 193,362 | |||||||||||||
| 7,200 | CVS Corp. | 207,144 | |||||||||||||
| 1,900 | Darden Restaurants, Inc. | 76,285 | |||||||||||||
| 2,050 | Family Dollar Stores, Inc. | 57,175 | |||||||||||||
| 8,092 | Federated Department Stores, Inc. | 340,592 | |||||||||||||
| 7,190 | Gap, Inc. | 134,597 | |||||||||||||
| 7,270 | Home Depot, Inc. | 276,042 | |||||||||||||
| 1,850 | JC Penney Co., Inc. | 143,079 | |||||||||||||
| 4,950 | @ | Kohl's Corp. | 344,520 | ||||||||||||
| 2,700 | Limited Brands, Inc. | 85,563 | |||||||||||||
| 13,260 | Lowe's Cos., Inc. | 399,922 | |||||||||||||
| 10,800 | McDonald's Corp. | 453,276 | |||||||||||||
| 3,000 | Nordstrom, Inc. | 147,060 | |||||||||||||
| 3,850 | @ | Office Depot, Inc. | 145,761 | ||||||||||||
| 700 | OfficeMax, Inc. | 32,949 | |||||||||||||
| 1,200 | RadioShack Corp. | 21,036 | |||||||||||||
| 650 | @ | Sears Holding Corp. | 111,423 | ||||||||||||
| 5,710 | Staples, Inc. | 145,434 | |||||||||||||
| 8,850 | @ | Starbucks Corp. | 312,317 | ||||||||||||
| 7,450 | Target Corp. | 432,771 | |||||||||||||
| 6,750 | TJX Cos., Inc. | 185,085 | |||||||||||||
| 8,780 | Walgreen Co. | 355,502 | |||||||||||||
| 21,400 | Wal-Mart Stores, Inc. | 986,540 | |||||||||||||
| 1,570 | Wendy's International, Inc. | 51,135 | |||||||||||||
| 2,050 | Yum! Brands, Inc. | 125,440 | |||||||||||||
| 6,186,650 | |||||||||||||||
| Savings & Loans: 0.1% | |||||||||||||||
| 8,362 | Washington Mutual, Inc. | 365,252 | |||||||||||||
| 365,252 | |||||||||||||||
| Semiconductors: 1.0% | |||||||||||||||
| 6,400 | @ | Advanced Micro Devices, Inc. | 138,048 | ||||||||||||
| 4,750 | @ | Altera Corp. | 94,478 | ||||||||||||
| 3,800 | Analog Devices, Inc. | 123,576 | |||||||||||||
| 12,900 | Applied Materials, Inc. | 231,942 | |||||||||||||
| 3,554 | @ | Freescale Semiconductor, Inc. | 141,911 | ||||||||||||
| 50,300 | Intel Corp. | 1,073,905 | |||||||||||||
| 1,700 | KLA-Tencor Corp. | 87,839 | |||||||||||||
| 2,300 | Linear Technology Corp. | 73,922 | |||||||||||||
| 5,900 | @ | LSI Logic Corp. | 62,894 | ||||||||||||
| 2,400 | Maxim Integrated Products | 75,552 | |||||||||||||
| 10,800 | @ | Micron Technology, Inc. | 157,680 | ||||||||||||
| 2,350 | National Semiconductor Corp. | 56,847 | |||||||||||||
| 1,550 | @ | Novellus Systems, Inc. | 48,391 | ||||||||||||
| 1,200 | @ | Nvidia Corp. | 44,388 | ||||||||||||
| 2,200 | @ | QLogic Corp. | 48,950 | ||||||||||||
| Shares | Value | ||||||||||||||
| 2,300 | @ | Teradyne, Inc. | $ | 34,270 | |||||||||||
| 5,300 | Texas Instruments, Inc. | 156,615 | |||||||||||||
| 2,600 | Xilinx, Inc. | 69,680 | |||||||||||||
| 2,720,888 | |||||||||||||||
| Software: 1.6% | |||||||||||||||
| 4,690 | @ | Adobe Systems, Inc. | 188,210 | ||||||||||||
| 2,550 | @ | Autodesk, Inc. | 105,009 | ||||||||||||
| 4,550 | Automatic Data Processing, Inc. | 219,447 | |||||||||||||
| 2,600 | @ | BMC Software, Inc. | 84,656 | ||||||||||||
| 3,800 | CA, Inc. | 82,460 | |||||||||||||
| 2,150 | @ | Citrix Systems, Inc. | 61,791 | ||||||||||||
| 4,050 | @ | Compuware Corp. | 33,980 | ||||||||||||
| 2,350 | @ | Electronic Arts, Inc. | 131,248 | ||||||||||||
| 1,410 | Fidelity National Information Services, Inc. | 56,259 | |||||||||||||
| 5,890 | First Data Corp. | 148,723 | |||||||||||||
| 1,550 | @ | Fiserv, Inc. | 79,221 | ||||||||||||
| 1,500 | IMS Health, Inc. | 41,205 | |||||||||||||
| 2,700 | @ | Intuit, Inc. | 84,996 | ||||||||||||
| 75,200 | Microsoft Corp. | 2,205,616 | |||||||||||||
| 2,600 | @ | Novell, Inc. | 16,328 | ||||||||||||
| 35,140 | @ | Oracle Corp. | 668,714 | ||||||||||||
| 1,580 | @ | Parametric Technology Corp. | 30,589 | ||||||||||||
| 2,800 | Paychex, Inc. | 110,348 | |||||||||||||
| 4,348,800 | |||||||||||||||
| Telecommunications: 2.9% | |||||||||||||||
| 3,400 | Alltel Corp. | 192,916 | |||||||||||||
| 33,736 | AT&T, Inc. | 1,143,988 | |||||||||||||
| 5,400 | @ | Avaya, Inc. | 69,012 | ||||||||||||
| 15,800 | BellSouth Corp. | 704,522 | |||||||||||||
| 1,500 | CenturyTel, Inc. | 63,825 | |||||||||||||
| 90,400 | @ | Cisco Systems, Inc. | 2,429,952 | ||||||||||||
| 2,600 | Citizens Communications Co. | 36,842 | |||||||||||||
| 1,600 | @ | Comverse Technology, Inc. | 31,232 | ||||||||||||
| 13,550 | @ | Corning, Inc. | 292,138 | ||||||||||||
| 1,185 | Embarq Corp. | 60,968 | |||||||||||||
| 1,800 | @ | JDS Uniphase Corp. | 33,264 | ||||||||||||
| 4,400 | @ | Juniper Networks, Inc. | 93,676 | ||||||||||||
| 28,780 | Motorola, Inc. | 638,053 | |||||||||||||
| 14,350 | Qualcomm, Inc. | 525,067 | |||||||||||||
| 12,200 | @ | Qwest Communications International, Inc. | 93,818 | ||||||||||||
| 26,002 | Sprint Nextel Corp. | 507,299 | |||||||||||||
| 3,100 | @ | Tellabs, Inc. | 31,124 | ||||||||||||
| 25,250 | Verizon Communications, Inc. | 882,235 | |||||||||||||
| 3,723 | Windstream Corp. | 51,899 | |||||||||||||
| 7,881,830 | |||||||||||||||
| Textiles: 0.0% | |||||||||||||||
| 1,500 | Cintas Corp. | 63,300 | |||||||||||||
| 63,300 | |||||||||||||||
| Toys/Games/Hobbies: 0.1% | |||||||||||||||
| 2,150 | Hasbro, Inc. | 57,513 | |||||||||||||
| 3,150 | Mattel, Inc. | 69,143 | |||||||||||||
| 126,656 | |||||||||||||||
| Transportation: 0.4% | |||||||||||||||
| 3,150 | Burlington Northern Santa Fe Corp. | 236,754 | |||||||||||||
| 3,240 | CSX Corp. | 116,186 | |||||||||||||
| 2,700 | FedEx Corp. | 311,661 | |||||||||||||
See Accompanying Notes to Financial Statements
99
PORTFOLIO OF INVESTMENTS
ING PRINCIPAL PROTECTION FUND V AS OF NOVEMBER 30, 2006 (UNAUDITED) (CONTINUED)
| Shares | Value | ||||||||||||||
| Transportation (continued) | |||||||||||||||
| 3,250 | Norfolk Southern Corp. | $ | 160,063 | ||||||||||||
| 500 | Ryder System, Inc. | 26,085 | |||||||||||||
| 2,150 | Union Pacific Corp. | 194,592 | |||||||||||||
| 1,045,341 | |||||||||||||||
| Total Common Stock (Cost $101,838,094) | 112,238,358 | ||||||||||||||
| Principal Amount | Value | ||||||||||||||
| U.S. GOVERNMENT AGENCY OBLIGATIONS: 54.9% | |||||||||||||||
| Federal National Mortgage Association: 54.9% | |||||||||||||||
| $ | 157,000,000 | 5.100%, due 01/22/08 | 148,308,323 | ||||||||||||
| 148,308,323 | |||||||||||||||
| Total U.S. Government Agency Obligations (Cost $151,235,544) | 148,308,323 | ||||||||||||||
| U.S. TREASURY OBLIGATIONS: 2.9% | |||||||||||||||
| U.S. Treasury Principal Only STRIP: 2.9% | |||||||||||||||
| 8,203,000 | 4.910%, due 11/15/07 | 7,834,382 | |||||||||||||
| 7,834,382 | |||||||||||||||
| Total U.S. Treasury Obligations (Cost $7,839,154) | 7,834,382 | ||||||||||||||
| Total Long-Term Investments (Cost $260,912,792) | 268,381,063 | ||||||||||||||
| SHORT-TERM INVESTMENTS: 1.0% | |||||||||||||||
| Repurchase Agreement: 1.0% | |||||||||||||||
| 2,779,000 | Morgan Stanley Repurchase Agreement dated 11/30/06, 5.290%, due 12/01/06, $2,779,408 to be received upon repurchase (Collateralized by $2,915,000 Federal National Mortgage Association, 2.600%-3.550%, Market Value plus accrued interest $2,875,155, due 12/20/07-06/17/10) | 2,779,000 | |||||||||
| Total Short-Term Investments (Cost $2,779,000) | 2,779,000 | ||||||||||
| Total Investments in Securities (Cost $263,691,792)* | 100.4 | % | $ | 271,160,063 | |||||||
| Other Assets and Liabilities - Net | (0.4 | ) | (1,029,957 | ) | |||||||
| Net Assets | 100.0 | % | $ | 270,130,106 | |||||||
@ Non-income producing security
@@ Foreign Issuer
STRIP Separate Trading of Registered Interest and Principal of Securities
* Cost for federal income tax purposes is $265,659,329.
Net unrealized appreciation consists of:
| Gross Unrealized Appreciation | $ | 9,899,661 | |||||
| Gross Unrealized Depreciation | (4,398,927 | ) | |||||
| Net Unrealized Appreciation | $ | 5,500,734 | |||||
See Accompanying Notes to Financial Statements
100
PORTFOLIO OF INVESTMENTS
ING PRINCIPAL PROTECTION FUND VI AS OF NOVEMBER 30, 2006 (UNAUDITED)
| Shares | Value | ||||||||||||||
| COMMON STOCK: 39.3% | |||||||||||||||
| Advertising: 0.1% | |||||||||||||||
| 2,150 | Omnicom Group | $ | 219,644 | ||||||||||||
| 219,644 | |||||||||||||||
| Aerospace/Defense: 0.9% | |||||||||||||||
| 5,800 | Boeing Co. | 513,474 | |||||||||||||
| 4,000 | General Dynamics Corp. | 299,360 | |||||||||||||
| 900 | Goodrich Corp. | 40,500 | |||||||||||||
| 1,200 | L-3 Communications Holdings, Inc. | 98,700 | |||||||||||||
| 3,530 | Lockheed Martin Corp. | 319,289 | |||||||||||||
| 2,527 | Northrop Grumman Corp. | 169,132 | |||||||||||||
| 5,541 | Raytheon Co. | 282,813 | |||||||||||||
| 550 | Rockwell Collins, Inc. | 33,182 | |||||||||||||
| 7,350 | United Technologies Corp. | 474,296 | |||||||||||||
| 2,230,746 | |||||||||||||||
| Agriculture: 0.7% | |||||||||||||||
| 15,300 | Altria Group, Inc. | 1,288,413 | |||||||||||||
| 4,860 | Archer-Daniels-Midland Co. | 170,586 | |||||||||||||
| 1,320 | Reynolds American, Inc. | 84,797 | |||||||||||||
| 1,200 | UST, Inc. | 67,176 | |||||||||||||
| 1,610,972 | |||||||||||||||
| Airlines: 0.0% | |||||||||||||||
| 5,800 | Southwest Airlines Co. | 91,118 | |||||||||||||
| 91,118 | |||||||||||||||
| Apparel: 0.2% | |||||||||||||||
| 4,650 | @ | Coach, Inc. | 200,927 | ||||||||||||
| 950 | Jones Apparel Group, Inc. | 31,920 | |||||||||||||
| 700 | Liz Claiborne, Inc. | 29,925 | |||||||||||||
| 1,650 | Nike, Inc. | 163,268 | |||||||||||||
| 650 | VF Corp. | 50,954 | |||||||||||||
| 476,994 | |||||||||||||||
| Auto Manufacturers: 0.1% | |||||||||||||||
| 16,000 | Ford Motor Co. | 130,080 | |||||||||||||
| 1,500 | General Motors Corp. | 43,845 | |||||||||||||
| 2,500 | Paccar, Inc. | 163,250 | |||||||||||||
| 337,175 | |||||||||||||||
| Auto Parts & Equipment: 0.1% | |||||||||||||||
| 1,450 | @ | Goodyear Tire & Rubber Co. | 24,433 | ||||||||||||
| 1,450 | Johnson Controls, Inc. | 117,929 | |||||||||||||
| 142,362 | |||||||||||||||
| Banks: 3.0% | |||||||||||||||
| 44,565 | Bank of America Corp. | 2,399,825 | |||||||||||||
| 5,550 | Bank of New York Co., Inc. | 197,247 | |||||||||||||
| 3,554 | BB&T Corp. | 152,858 | |||||||||||||
| 2,250 | Capital One Financial Corp. | 175,230 | |||||||||||||
| 1,600 | Comerica, Inc. | 93,200 | |||||||||||||
| 1,000 | Compass Bancshares, Inc. | 57,140 | |||||||||||||
| 4,050 | Fifth Third Bancorp. | 159,692 | |||||||||||||
| 900 | First Horizon National Corp. | 35,874 | |||||||||||||
| 1,600 | Huntington Bancshares, Inc. | 38,896 | |||||||||||||
| 3,000 | Keycorp | 108,300 | |||||||||||||
| 550 | M&T Bank Corp. | 65,252 | |||||||||||||
| 1,800 | Marshall & Ilsley Corp. | 82,422 | |||||||||||||
| 2,600 | Mellon Financial Corp. | 104,598 | |||||||||||||
| 5,460 | National City Corp. | 197,106 | |||||||||||||
| 3,500 | North Fork Bancorp., Inc. | 98,245 | |||||||||||||
| Shares | Value | ||||||||||||||
| 1,500 | Northern Trust Corp. | $ | 85,440 | ||||||||||||
| 2,100 | PNC Financial Services Group, Inc. | 148,449 | |||||||||||||
| 7,214 | Regions Financial Corp. | 264,393 | |||||||||||||
| 2,400 | State Street Corp. | 149,112 | |||||||||||||
| 2,700 | SunTrust Banks, Inc. | 220,455 | |||||||||||||
| 2,089 | Synovus Financial Corp. | 62,712 | |||||||||||||
| 13,000 | US Bancorp. | 437,320 | |||||||||||||
| 18,967 | Wachovia Corp. | 1,027,822 | |||||||||||||
| 24,600 | Wells Fargo & Co. | 866,904 | |||||||||||||
| 750 | Zions Bancorp. | 58,680 | |||||||||||||
| 7,287,172 | |||||||||||||||
| Beverages: 0.8% | |||||||||||||||
| 7,600 | Anheuser-Busch Cos., Inc. | 361,076 | |||||||||||||
| 590 | Brown-Forman Corp. | 40,976 | |||||||||||||
| 14,850 | Coca-Cola Co. | 695,426 | |||||||||||||
| 2,500 | Coca-Cola Enterprises, Inc. | 51,125 | |||||||||||||
| 1,300 | @ | Constellation Brands, Inc. | 36,374 | ||||||||||||
| 300 | Molson Coors Brewing Co. | 21,324 | |||||||||||||
| 1,150 | Pepsi Bottling Group, Inc. | 36,018 | |||||||||||||
| 11,990 | PepsiCo, Inc. | 743,020 | |||||||||||||
| 1,985,339 | |||||||||||||||
| Biotechnology: 0.4% | |||||||||||||||
| 8,550 | @ | Amgen, Inc. | 607,050 | ||||||||||||
| 2,500 | @ | Biogen Idec, Inc. | 130,650 | ||||||||||||
| 2,660 | @ | Celgene Corp. | 148,242 | ||||||||||||
| 700 | @ | Genzyme Corp. | 45,080 | ||||||||||||
| 700 | @ | Medimmune, Inc. | 22,883 | ||||||||||||
| 400 | @ | Millipore Corp. | 27,364 | ||||||||||||
| 981,269 | |||||||||||||||
| Building Materials: 0.1% | |||||||||||||||
| 450 | American Standard Cos., Inc. | 20,165 | |||||||||||||
| 3,250 | Masco Corp. | 93,243 | |||||||||||||
| 113,408 | |||||||||||||||
| Chemicals: 0.7% | |||||||||||||||
| 600 | Air Products & Chemicals, Inc. | 41,484 | |||||||||||||
| 500 | Ashland, Inc. | 33,805 | |||||||||||||
| 7,900 | Dow Chemical Co. | 316,079 | |||||||||||||
| 1,300 | Ecolab, Inc. | 57,655 | |||||||||||||
| 7,600 | EI DuPont de Nemours & Co. | 356,668 | |||||||||||||
| 900 | International Flavors & Fragrances, Inc. | 42,399 | |||||||||||||
| 4,480 | Monsanto Co. | 215,354 | |||||||||||||
| 2,110 | PPG Industries, Inc. | 135,673 | |||||||||||||
| 2,650 | Praxair, Inc. | 165,360 | |||||||||||||
| 1,450 | Rohm & Haas Co. | 75,719 | |||||||||||||
| 1,450 | Sherwin-Williams Co. | 90,698 | |||||||||||||
| 400 | Sigma-Aldrich Corp. | 30,444 | |||||||||||||
| 1,561,338 | |||||||||||||||
| Coal: 0.0% | |||||||||||||||
| 1,980 | Peabody Energy Corp. | 91,100 | |||||||||||||
| 91,100 | |||||||||||||||
| Commercial Services: 0.3% | |||||||||||||||
| 1,700 | @ | Apollo Group, Inc. | 65,943 | ||||||||||||
| 1,400 | @ | Convergys Corp. | 33,768 | ||||||||||||
| 1,500 | Equifax, Inc. | 56,985 | |||||||||||||
| 2,500 | H&R Block, Inc. | 60,000 | |||||||||||||
| 3,710 | McKesson Corp. | 183,274 | |||||||||||||
See Accompanying Notes to Financial Statements
101
PORTFOLIO OF INVESTMENTS
ING PRINCIPAL PROTECTION FUND VI AS OF NOVEMBER 30, 2006 (UNAUDITED) (CONTINUED)
| Shares | Value | ||||||||||||||
| Commercial Services (continued) | |||||||||||||||
| 950 | @ | Monster Worldwide, Inc. | $ | 41,468 | |||||||||||
| 2,300 | Moody's Corp. | 159,804 | |||||||||||||
| 1,050 | Robert Half International, Inc. | 40,520 | |||||||||||||
| 1,650 | RR Donnelley & Sons Co. | 58,196 | |||||||||||||
| 4,917 | Western Union Co. | 112,108 | |||||||||||||
| 812,066 | |||||||||||||||
| Computers: 1.9% | |||||||||||||||
| 800 | @ | Affiliated Computer Services, Inc. | 40,440 | ||||||||||||
| 1,050 | @ | Cognizant Technology Solutions Corp. | 85,638 | ||||||||||||
| 1,300 | @ | Computer Sciences Corp. | 67,860 | ||||||||||||
| 28,340 | @ | Dell, Inc. | 771,982 | ||||||||||||
| 3,850 | Electronic Data Systems Corp. | 104,489 | |||||||||||||
| 16,750 | @ | EMC Corp. | 219,593 | ||||||||||||
| 33,950 | Hewlett-Packard Co. | 1,339,667 | |||||||||||||
| 15,000 | International Business Machines Corp. | 1,378,800 | |||||||||||||
| 1,150 | @ | Lexmark International, Inc. | 79,327 | ||||||||||||
| 1,700 | @ | NCR Corp. | 72,947 | ||||||||||||
| 2,580 | @ | Network Appliance, Inc. | 101,162 | ||||||||||||
| 1,300 | @ | Sandisk Corp. | 57,720 | ||||||||||||
| 25,400 | @ | Sun Microsystems, Inc. | 137,668 | ||||||||||||
| 2,200 | @ | Unisys Corp. | 15,862 | ||||||||||||
| 4,473,155 | |||||||||||||||
| Cosmetics/Personal Care: 0.8% | |||||||||||||||
| 3,400 | Avon Products, Inc. | 110,976 | |||||||||||||
| 3,800 | Colgate-Palmolive Co. | 247,190 | |||||||||||||
| 1,600 | Estee Lauder Cos., Inc. | 66,064 | |||||||||||||
| 23,116 | Procter & Gamble Co. | 1,451,454 | |||||||||||||
| 1,875,684 | |||||||||||||||
| Distribution/Wholesale: 0.0% | |||||||||||||||
| 600 | WW Grainger, Inc. | 43,416 | |||||||||||||
| 43,416 | |||||||||||||||
| Diversified Financial Services: 3.6% | |||||||||||||||
| 8,900 | American Express Co. | 522,608 | |||||||||||||
| 1,980 | Ameriprise Financial, Inc. | 107,118 | |||||||||||||
| 1,040 | Bear Stearns Cos., Inc. | 158,579 | |||||||||||||
| 6,650 | Charles Schwab Corp. | 121,961 | |||||||||||||
| 250 | Chicago Mercantile Exchange Holdings, Inc. | 133,900 | |||||||||||||
| 2,500 | CIT Group, Inc. | 130,025 | |||||||||||||
| 48,700 | Citigroup, Inc. | 2,415,033 | |||||||||||||
| 4,468 | Countrywide Financial Corp. | 177,469 | |||||||||||||
| 2,600 | @ | E*Trade Financial Corp. | 62,582 | ||||||||||||
| 7,050 | Fannie Mae | 402,062 | |||||||||||||
| 700 | Federated Investors, Inc. | 23,226 | |||||||||||||
| 1,200 | Franklin Resources, Inc. | 128,088 | |||||||||||||
| 5,000 | Freddie Mac | 335,800 | |||||||||||||
| 3,200 | Goldman Sachs Group, Inc. | 623,360 | |||||||||||||
| 1,600 | Janus Capital Group, Inc. | 32,416 | |||||||||||||
| 34,200 | JPMorgan Chase & Co. | 1,582,776 | |||||||||||||
| 3,920 | Lehman Brothers Holdings, Inc. | 288,786 | |||||||||||||
| 6,500 | Merrill Lynch & Co., Inc. | 568,295 | |||||||||||||
| 7,850 | Morgan Stanley | 597,856 | |||||||||||||
| 3,050 | SLM Corp. | 139,812 | |||||||||||||
| 2,000 | T. Rowe Price Group, Inc. | 86,660 | |||||||||||||
| 8,638,412 | |||||||||||||||
| Shares | Value | ||||||||||||||
| Electric: 1.2% | |||||||||||||||
| 7,910 | @ | AES Corp. | $ | 184,857 | |||||||||||
| 1,300 | @ | Allegheny Energy, Inc. | 57,668 | ||||||||||||
| 1,800 | Ameren Corp. | 98,478 | |||||||||||||
| 3,750 | American Electric Power Co., Inc. | 155,663 | |||||||||||||
| 2,400 | Centerpoint Energy, Inc. | 39,240 | |||||||||||||
| 2,750 | @ | CMS Energy Corp. | 44,578 | ||||||||||||
| 1,600 | Constellation Energy Group, Inc. | 109,776 | |||||||||||||
| 1,600 | DTE Energy Co. | 75,344 | |||||||||||||
| 3,600 | @ | Dynegy, Inc. | 24,444 | ||||||||||||
| 3,120 | Edison International | 143,458 | |||||||||||||
| 2,000 | Entergy Corp. | 182,640 | |||||||||||||
| 6,400 | Exelon Corp. | 388,672 | |||||||||||||
| 3,100 | FirstEnergy Corp. | 185,504 | |||||||||||||
| 3,100 | PG&E Corp. | 142,383 | |||||||||||||
| 1,000 | Pinnacle West Capital Corp. | 49,340 | |||||||||||||
| 3,600 | PPL Corp. | 130,860 | |||||||||||||
| 800 | Progress Energy, Inc. | 38,216 | |||||||||||||
| 2,350 | Public Service Enterprise Group, Inc. | 157,967 | |||||||||||||
| 7,100 | Southern Co. | 257,375 | |||||||||||||
| 1,900 | TECO Energy, Inc. | 32,281 | |||||||||||||
| 4,400 | TXU Corp. | 252,516 | |||||||||||||
| 3,750 | Xcel Energy, Inc. | 86,100 | |||||||||||||
| 2,837,360 | |||||||||||||||
| Electrical Components & Equipment: 0.1% | |||||||||||||||
| 3,000 | Emerson Electric Co. | 260,100 | |||||||||||||
| 1,100 | Molex, Inc. | 35,200 | |||||||||||||
| 295,300 | |||||||||||||||
| Electronics: 0.2% | |||||||||||||||
| 3,650 | @ | Agilent Technologies, Inc. | 116,216 | ||||||||||||
| 1,700 | Applera Corp. - Applied Biosystems Group | 61,948 | |||||||||||||
| 1,450 | Jabil Circuit, Inc. | 41,122 | |||||||||||||
| 1,500 | PerkinElmer, Inc. | 32,505 | |||||||||||||
| 1,700 | Symbol Technologies, Inc. | 25,194 | |||||||||||||
| 2,950 | @ | Thermo Electron Corp. | 129,299 | ||||||||||||
| 1,000 | @ | Waters Corp. | 50,040 | ||||||||||||
| 456,324 | |||||||||||||||
| Entertainment: 0.0% | |||||||||||||||
| 1,050 | International Game Technology | 45,969 | |||||||||||||
| 45,969 | |||||||||||||||
| Environmental Control: 0.1% | |||||||||||||||
| 1,900 | @ | Allied Waste Industries, Inc. | 24,092 | ||||||||||||
| 5,400 | Waste Management, Inc. | 197,694 | |||||||||||||
| 221,786 | |||||||||||||||
| Food: 0.5% | |||||||||||||||
| 2,850 | Campbell Soup Co. | 108,500 | |||||||||||||
| 4,050 | ConAgra Foods, Inc. | 104,085 | |||||||||||||
| 1,000 | @ | Dean Foods Co. | 42,820 | ||||||||||||
| 4,350 | General Mills, Inc. | 243,383 | |||||||||||||
| 500 | Hershey Co. | 26,485 | |||||||||||||
| 2,200 | HJ Heinz Co. | 97,790 | |||||||||||||
| 1,950 | Kellogg Co. | 97,071 | |||||||||||||
| 5,250 | Kroger Co. | 112,665 | |||||||||||||
| 1,050 | McCormick & Co., Inc. | 40,656 | |||||||||||||
See Accompanying Notes to Financial Statements
102
PORTFOLIO OF INVESTMENTS
ING PRINCIPAL PROTECTION FUND VI AS OF NOVEMBER 30, 2006 (UNAUDITED) (CONTINUED)
| Shares | Value | ||||||||||||||
| Food (continued) | |||||||||||||||
| 3,800 | Safeway, Inc. | $ | 117,078 | ||||||||||||
| 2,025 | Sara Lee Corp. | 33,575 | |||||||||||||
| 531 | Supervalu, Inc. | 18,192 | |||||||||||||
| 1,100 | Whole Foods Market, Inc. | 53,680 | |||||||||||||
| 1,095,980 | |||||||||||||||
| Forest Products & Paper: 0.1% | |||||||||||||||
| 3,600 | International Paper Co. | 119,160 | |||||||||||||
| 1,500 | MeadWestvaco Corp. | 44,250 | |||||||||||||
| 1,200 | Plum Creek Timber Co., Inc. | 44,712 | |||||||||||||
| 1,100 | Temple-Inland, Inc. | 43,010 | |||||||||||||
| 600 | Weyerhaeuser Co. | 38,808 | |||||||||||||
| 289,940 | |||||||||||||||
| Gas: 0.1% | |||||||||||||||
| 1,500 | KeySpan Corp. | 61,545 | |||||||||||||
| 350 | Nicor, Inc. | 17,343 | |||||||||||||
| 2,400 | NiSource, Inc. | 59,184 | |||||||||||||
| 2,450 | Sempra Energy | 133,525 | |||||||||||||
| 271,597 | |||||||||||||||
| Hand/Machine Tools: 0.0% | |||||||||||||||
| 600 | Black & Decker Corp. | 51,528 | |||||||||||||
| 300 | Snap-On, Inc. | 14,250 | |||||||||||||
| 800 | Stanley Works | 40,816 | |||||||||||||
| 106,594 | |||||||||||||||
| Healthcare-Products: 1.1% | |||||||||||||||
| 400 | Bausch & Lomb, Inc. | 19,368 | |||||||||||||
| 4,750 | Baxter International, Inc. | 212,515 | |||||||||||||
| 1,920 | Becton Dickinson & Co. | 137,702 | |||||||||||||
| 7,800 | @ | Boston Scientific Corp. | 123,396 | ||||||||||||
| 650 | CR Bard, Inc. | 53,489 | |||||||||||||
| 21,350 | Johnson & Johnson | 1,407,179 | |||||||||||||
| 8,400 | Medtronic, Inc. | 437,892 | |||||||||||||
| 1,000 | @ | Patterson Cos., Inc. | 37,110 | ||||||||||||
| 900 | @ | St. Jude Medical, Inc. | 33,543 | ||||||||||||
| 2,200 | Stryker Corp. | 114,092 | |||||||||||||
| 1,900 | @ | Zimmer Holdings, Inc. | 138,624 | ||||||||||||
| 2,714,910 | |||||||||||||||
| Healthcare-Services: 0.8% | |||||||||||||||
| 5,360 | Aetna, Inc. | 221,422 | |||||||||||||
| 1,665 | @ | Coventry Health Care, Inc. | 80,136 | ||||||||||||
| 2,050 | @ | Humana, Inc. | 110,905 | ||||||||||||
| 1,050 | @ | Laboratory Corp. of America Holdings | 74,340 | ||||||||||||
| 500 | Manor Care, Inc. | 23,760 | |||||||||||||
| 1,100 | Quest Diagnostics | 58,487 | |||||||||||||
| 16,660 | UnitedHealth Group, Inc. | 817,673 | |||||||||||||
| 7,640 | @ | WellPoint, Inc. | 578,119 | ||||||||||||
| 1,964,842 | |||||||||||||||
| Home Builders: 0.0% | |||||||||||||||
| 400 | Lennar Corp. | 21,000 | |||||||||||||
| 21,000 | |||||||||||||||
| Home Furnishings: 0.1% | |||||||||||||||
| 700 | Harman International Industries, Inc. | 72,688 | |||||||||||||
| 600 | Whirlpool Corp. | 51,180 | |||||||||||||
| 123,868 | |||||||||||||||
| Shares | Value | ||||||||||||||
| Household Products/Wares: 0.1% | |||||||||||||||
| 200 | Avery Dennison Corp. | $ | 13,494 | ||||||||||||
| 950 | Fortune Brands, Inc. | 76,855 | |||||||||||||
| 3,300 | Kimberly-Clark Corp. | 219,351 | |||||||||||||
| 309,700 | |||||||||||||||
| Housewares: 0.0% | |||||||||||||||
| 2,200 | Newell Rubbermaid, Inc. | 62,678 | |||||||||||||
| 62,678 | |||||||||||||||
| Insurance: 2.2% | |||||||||||||||
| 2,320 | @@ | ACE Ltd. | 131,869 | ||||||||||||
| 3,650 | Aflac, Inc. | 161,111 | |||||||||||||
| 6,210 | Allstate Corp. | 394,211 | |||||||||||||
| 1,000 | AMBAC Financial Group, Inc. | 85,640 | |||||||||||||
| 18,900 | American International Group, Inc. | 1,329,048 | |||||||||||||
| 2,600 | AON Corp. | 92,768 | |||||||||||||
| 4,080 | Chubb Corp. | 211,181 | |||||||||||||
| 1,120 | Cigna Corp. | 141,176 | |||||||||||||
| 1,364 | Cincinnati Financial Corp. | 60,398 | |||||||||||||
| 5,700 | Genworth Financial, Inc. | 186,960 | |||||||||||||
| 3,750 | Hartford Financial Services Group, Inc. | 321,600 | |||||||||||||
| 1,882 | Lincoln National Corp. | 119,676 | |||||||||||||
| 4,470 | Loews Corp. | 178,442 | |||||||||||||
| 1,600 | Marsh & McLennan Cos., Inc. | 50,272 | |||||||||||||
| 1,050 | MBIA, Inc. | 73,133 | |||||||||||||
| 7,510 | Metlife, Inc. | 441,062 | |||||||||||||
| 750 | MGIC Investment Corp. | 43,470 | |||||||||||||
| 2,450 | Principal Financial Group | 141,488 | |||||||||||||
| 6,940 | Progressive Corp. | 156,497 | |||||||||||||
| 4,760 | Prudential Financial, Inc. | 387,845 | |||||||||||||
| 1,180 | Safeco Corp. | 71,473 | |||||||||||||
| 6,810 | St. Paul Travelers Cos., Inc. | 352,826 | |||||||||||||
| 750 | Torchmark Corp. | 47,415 | |||||||||||||
| 2,200 | UnumProvident Corp. | 45,056 | |||||||||||||
| 1,200 | @@ | XL Capital Ltd. | 85,344 | ||||||||||||
| 5,309,961 | |||||||||||||||
| Internet: 0.3% | |||||||||||||||
| 2,300 | @ | Amazon.com, Inc. | 92,782 | ||||||||||||
| 3,150 | @ | eBay, Inc. | 101,903 | ||||||||||||
| 600 | @ | Google, Inc. | 290,952 | ||||||||||||
| 8,088 | @ | Symantec Corp. | 171,466 | ||||||||||||
| 1,600 | @ | VeriSign, Inc. | 41,776 | ||||||||||||
| 698,879 | |||||||||||||||
| Iron/Steel: 0.2% | |||||||||||||||
| 4,320 | Nucor Corp. | 258,552 | |||||||||||||
| 1,700 | United States Steel Corp. | 127,143 | |||||||||||||
| 385,695 | |||||||||||||||
| Leisure Time: 0.2% | |||||||||||||||
| 900 | Brunswick Corp. | 29,133 | |||||||||||||
| 3,350 | Carnival Corp. | 164,117 | |||||||||||||
| 1,750 | Harley-Davidson, Inc. | 129,098 | |||||||||||||
| 1,300 | Sabre Holdings Corp. | 35,659 | |||||||||||||
| 358,007 | |||||||||||||||
| Lodging: 0.1% | |||||||||||||||
| 2,400 | Marriott International, Inc. | 108,360 | |||||||||||||
| 650 | Starwood Hotels & Resorts Worldwide, Inc. | 41,711 | |||||||||||||
See Accompanying Notes to Financial Statements
103
PORTFOLIO OF INVESTMENTS
ING PRINCIPAL PROTECTION FUND VI AS OF NOVEMBER 30, 2006 (UNAUDITED) (CONTINUED)
| Shares | Value | ||||||||||||||
| Lodging (continued) | |||||||||||||||
| 1,320 | @ | Wyndham Worldwide Corp. | $ | 41,897 | |||||||||||
| 191,968 | |||||||||||||||
| Machinery-Construction & Mining: 0.1% | |||||||||||||||
| 4,800 | Caterpillar, Inc. | 297,744 | |||||||||||||
| 297,744 | |||||||||||||||
| Machinery-Diversified: 0.1% | |||||||||||||||
| 600 | Cummins, Inc. | 71,952 | |||||||||||||
| 600 | Deere & Co. | 57,600 | |||||||||||||
| 1,110 | Rockwell Automation, Inc. | 72,239 | |||||||||||||
| 201,791 | |||||||||||||||
| Media: 1.0% | |||||||||||||||
| 7,850 | CBS Corp. | 233,538 | |||||||||||||
| 3,300 | Clear Channel Communications, Inc. | 116,028 | |||||||||||||
| 15,300 | @ | Comcast Corp. | 619,038 | ||||||||||||
| 600 | EW Scripps Co. | 29,316 | |||||||||||||
| 1,600 | Gannett Co., Inc. | 95,232 | |||||||||||||
| 3,550 | McGraw-Hill Cos., Inc. | 236,608 | |||||||||||||
| 500 | Meredith Corp. | 27,050 | |||||||||||||
| 17,400 | News Corp., Inc. | 358,440 | |||||||||||||
| 600 | Tribune Co. | 19,080 | |||||||||||||
| 600 | @ | Univision Communications, Inc. | 21,354 | ||||||||||||
| 20,600 | Walt Disney Co. | 680,830 | |||||||||||||
| 2,436,514 | |||||||||||||||
| Mining: 0.1% | |||||||||||||||
| 1,500 | Freeport-McMoRan Copper & Gold, Inc. | 94,305 | |||||||||||||
| 1,490 | Phelps Dodge Corp. | 183,270 | |||||||||||||
| 600 | Vulcan Materials Co. | 53,232 | |||||||||||||
| 330,807 | |||||||||||||||
| Miscellaneous Manufacturing: 2.0% | |||||||||||||||
| 5,450 | 3M Co. | 443,957 | |||||||||||||
| 600 | Cooper Industries Ltd. | 54,864 | |||||||||||||
| 1,550 | Danaher Corp. | 113,336 | |||||||||||||
| 1,450 | Dover Corp. | 72,935 | |||||||||||||
| 2,900 | Eastman Kodak Co. | 75,458 | |||||||||||||
| 1,850 | Eaton Corp. | 142,598 | |||||||||||||
| 75,250 | General Electric Co. | 2,654,820 | |||||||||||||
| 8,100 | Honeywell International, Inc. | 348,138 | |||||||||||||
| 3,100 | Illinois Tool Works, Inc. | 146,320 | |||||||||||||
| 2,500 | @@ | Ingersoll-Rand Co. | 97,525 | ||||||||||||
| 1,200 | ITT Corp. | 64,740 | |||||||||||||
| 1,300 | Leggett & Platt, Inc. | 30,914 | |||||||||||||
| 1,500 | Parker Hannifin Corp. | 125,220 | |||||||||||||
| 850 | Textron, Inc. | 82,833 | |||||||||||||
| 14,700 | @@ | Tyco International Ltd. | 445,263 | ||||||||||||
| 4,898,921 | |||||||||||||||
| Office/Business Equipment: 0.1% | |||||||||||||||
| 1,550 | Pitney Bowes, Inc. | 71,440 | |||||||||||||
| 12,200 | @ | Xerox Corp. | 201,300 | ||||||||||||
| 272,740 | |||||||||||||||
| Oil & Gas: 3.9% | |||||||||||||||
| 3,100 | Anadarko Petroleum Corp. | 153,016 | |||||||||||||
| 850 | Apache Corp. | 59,441 | |||||||||||||
| 23,893 | Chevron Corp. | 1,727,942 | |||||||||||||
| 11,064 | ConocoPhillips | 744,607 | |||||||||||||
| Shares | Value | ||||||||||||||
| 2,900 | Devon Energy Corp. | $ | 212,773 | ||||||||||||
| 1,700 | EOG Resources, Inc. | 119,901 | |||||||||||||
| 64,650 | ExxonMobil Corp. | 4,965,767 | |||||||||||||
| 600 | Hess Corp. | 30,162 | |||||||||||||
| 4,100 | Marathon Oil Corp. | 386,958 | |||||||||||||
| 2,300 | @,@@ | Nabors Industries Ltd. | 77,648 | ||||||||||||
| 900 | Noble Corp. | 69,525 | |||||||||||||
| 5,800 | Occidental Petroleum Corp. | 291,972 | |||||||||||||
| 1,300 | Sunoco, Inc. | 88,608 | |||||||||||||
| 2,000 | @ | Transocean, Inc. | 155,900 | ||||||||||||
| 5,250 | Valero Energy Corp. | 289,118 | |||||||||||||
| 2,500 | XTO Energy, Inc. | 126,500 | |||||||||||||
| 9,499,838 | |||||||||||||||
| Oil & Gas Services: 0.5% | |||||||||||||||
| 2,000 | Baker Hughes, Inc. | 146,860 | |||||||||||||
| 700 | BJ Services Co. | 23,639 | |||||||||||||
| 11,750 | Halliburton Co. | 396,445 | |||||||||||||
| 1,100 | @ | National Oilwell Varco, Inc. | 73,161 | ||||||||||||
| 7,900 | Schlumberger Ltd. | 540,992 | |||||||||||||
| 800 | @ | Weatherford International Ltd. | 35,928 | ||||||||||||
| 1,217,025 | |||||||||||||||
| Packaging & Containers: 0.1% | |||||||||||||||
| 950 | Ball Corp. | 40,622 | |||||||||||||
| 700 | Bemis Co. | 23,891 | |||||||||||||
| 1,500 | @ | Pactiv Corp. | 51,675 | ||||||||||||
| 700 | Sealed Air Corp. | 41,657 | |||||||||||||
| 157,845 | |||||||||||||||
| Pharmaceuticals: 2.2% | |||||||||||||||
| 11,100 | Abbott Laboratories | 517,926 | |||||||||||||
| 450 | Allergan, Inc. | 52,461 | |||||||||||||
| 2,280 | AmerisourceBergen Corp. | 104,857 | |||||||||||||
| 800 | @ | Barr Pharmaceuticals, Inc. | 40,864 | ||||||||||||
| 5,800 | Bristol-Myers Squibb Co. | 144,014 | |||||||||||||
| 3,000 | Cardinal Health, Inc. | 193,860 | |||||||||||||
| 2,860 | Caremark Rx, Inc. | 135,278 | |||||||||||||
| 2,600 | Eli Lilly & Co. | 139,334 | |||||||||||||
| 1,300 | @ | Express Scripts, Inc. | 88,660 | ||||||||||||
| 3,200 | @ | Forest Laboratories, Inc. | 155,840 | ||||||||||||
| 3,300 | @ | Gilead Sciences, Inc. | 217,536 | ||||||||||||
| 1,000 | @ | Hospira, Inc. | 32,800 | ||||||||||||
| 2,950 | @ | King Pharmaceuticals, Inc. | 48,764 | ||||||||||||
| 2,099 | @ | Medco Health Solutions, Inc. | 105,391 | ||||||||||||
| 21,550 | Merck & Co., Inc. | 959,191 | |||||||||||||
| 1,700 | Mylan Laboratories | 34,493 | |||||||||||||
| 53,200 | Pfizer, Inc. | 1,462,468 | |||||||||||||
| 14,650 | Schering-Plough Corp. | 322,447 | |||||||||||||
| 1,050 | @ | Watson Pharmaceuticals, Inc. | 26,954 | ||||||||||||
| 9,800 | Wyeth | 473,144 | |||||||||||||
| 5,256,282 | |||||||||||||||
| Pipelines: 0.1% | |||||||||||||||
| 4,100 | El Paso Corp. | 59,860 | |||||||||||||
| 3,550 | Williams Cos., Inc. | 98,548 | |||||||||||||
| 158,408 | |||||||||||||||
| Real Estate: 0.0% | |||||||||||||||
| 1,370 | @ | CB Richard Ellis Group, Inc. | 45,114 | ||||||||||||
| 1,313 | @ | Realogy Corp. | 34,256 | ||||||||||||
| 79,370 | |||||||||||||||
See Accompanying Notes to Financial Statements
104
PORTFOLIO OF INVESTMENTS
ING PRINCIPAL PROTECTION FUND VI AS OF NOVEMBER 30, 2006 (UNAUDITED) (CONTINUED)
| Shares | Value | ||||||||||||||
| Real Estate Investment Trusts: 0.1% | |||||||||||||||
| 900 | Apartment Investment & Management Co. | $ | 51,876 | ||||||||||||
| 300 | Boston Properties, Inc. | 35,115 | |||||||||||||
| 2,480 | Equity Office Properties Trust | 119,536 | |||||||||||||
| 600 | Prologis | 39,102 | |||||||||||||
| 200 | Public Storage, Inc. | 19,256 | |||||||||||||
| 400 | Vornado Realty Trust | 50,444 | |||||||||||||
| 315,329 | |||||||||||||||
| Retail: 2.1% | |||||||||||||||
| 300 | @ | Autozone, Inc. | 34,083 | ||||||||||||
| 1,950 | @ | Bed Bath & Beyond, Inc. | 75,563 | ||||||||||||
| 2,965 | Best Buy Co., Inc. | 162,986 | |||||||||||||
| 1,300 | @ | Big Lots, Inc. | 29,003 | ||||||||||||
| 1,700 | Circuit City Stores, Inc. | 42,432 | |||||||||||||
| 3,150 | Costco Wholesale Corp. | 164,619 | |||||||||||||
| 5,800 | CVS Corp. | 166,866 | |||||||||||||
| 850 | Darden Restaurants, Inc. | 34,128 | |||||||||||||
| 1,750 | Family Dollar Stores, Inc. | 48,808 | |||||||||||||
| 6,712 | Federated Department Stores, Inc. | 282,508 | |||||||||||||
| 6,050 | Gap, Inc. | 113,256 | |||||||||||||
| 6,140 | Home Depot, Inc. | 233,136 | |||||||||||||
| 1,450 | JC Penney Co., Inc. | 112,143 | |||||||||||||
| 4,100 | @ | Kohl's Corp. | 285,360 | ||||||||||||
| 2,650 | Limited Brands, Inc. | 83,979 | |||||||||||||
| 11,100 | Lowe's Cos., Inc. | 334,776 | |||||||||||||
| 9,150 | McDonald's Corp. | 384,026 | |||||||||||||
| 2,600 | Nordstrom, Inc. | 127,452 | |||||||||||||
| 3,500 | @ | Office Depot, Inc. | 132,510 | ||||||||||||
| 600 | OfficeMax, Inc. | 28,242 | |||||||||||||
| 1,000 | RadioShack Corp. | 17,530 | |||||||||||||
| 590 | @ | Sears Holding Corp. | 101,138 | ||||||||||||
| 4,850 | Staples, Inc. | 123,530 | |||||||||||||
| 7,400 | @ | Starbucks Corp. | 261,146 | ||||||||||||
| 6,250 | Target Corp. | 363,063 | |||||||||||||
| 5,650 | TJX Cos., Inc. | 154,923 | |||||||||||||
| 7,420 | Walgreen Co. | 300,436 | |||||||||||||
| 17,950 | Wal-Mart Stores, Inc. | 827,495 | |||||||||||||
| 1,300 | Wendy's International, Inc. | 42,341 | |||||||||||||
| 1,750 | Yum! Brands, Inc. | 107,083 | |||||||||||||
| 5,174,561 | |||||||||||||||
| Savings & Loans: 0.1% | |||||||||||||||
| 7,062 | Washington Mutual, Inc. | 308,468 | |||||||||||||
| 308,468 | |||||||||||||||
| Semiconductors: 1.0% | |||||||||||||||
| 6,000 | @ | Advanced Micro Devices, Inc. | 129,420 | ||||||||||||
| 4,400 | @ | Altera Corp. | 87,516 | ||||||||||||
| 3,250 | Analog Devices, Inc. | 105,690 | |||||||||||||
| 10,150 | Applied Materials, Inc. | 182,497 | |||||||||||||
| 3,577 | @ | Freescale Semiconductor, Inc. | 142,830 | ||||||||||||
| 42,030 | Intel Corp. | 897,341 | |||||||||||||
| 1,500 | KLA-Tencor Corp. | 77,505 | |||||||||||||
| 2,200 | Linear Technology Corp. | 70,708 | |||||||||||||
| 5,000 | @ | LSI Logic Corp. | 53,300 | ||||||||||||
| 2,200 | Maxim Integrated Products | 69,256 | |||||||||||||
| 8,000 | @ | Micron Technology, Inc. | 116,800 | ||||||||||||
| 2,000 | National Semiconductor Corp. | 48,380 | |||||||||||||
| 900 | @ | Novellus Systems, Inc. | 28,098 | ||||||||||||
| 1,000 | @ | Nvidia Corp. | 36,990 | ||||||||||||
| 1,900 | @ | QLogic Corp. | 42,275 | ||||||||||||
| Shares | Value | ||||||||||||||
| 1,900 | @ | Teradyne, Inc. | $ | 28,310 | |||||||||||
| 4,500 | Texas Instruments, Inc. | 132,975 | |||||||||||||
| 2,500 | Xilinx, Inc. | 67,000 | |||||||||||||
| 2,316,891 | |||||||||||||||
| Software: 1.5% | |||||||||||||||
| 3,890 | @ | Adobe Systems, Inc. | 156,106 | ||||||||||||
| 1,520 | @ | Autodesk, Inc. | 62,594 | ||||||||||||
| 4,050 | Automatic Data Processing, Inc. | 195,332 | |||||||||||||
| 2,450 | @ | BMC Software, Inc. | 79,772 | ||||||||||||
| 3,750 | CA, Inc. | 81,375 | |||||||||||||
| 1,100 | @ | Citrix Systems, Inc. | 31,614 | ||||||||||||
| 3,850 | @ | Compuware Corp. | 32,302 | ||||||||||||
| 2,200 | @ | Electronic Arts, Inc. | 122,870 | ||||||||||||
| 1,200 | Fidelity National Information Services, Inc. | 47,880 | |||||||||||||
| 4,917 | First Data Corp. | 124,154 | |||||||||||||
| 1,600 | @ | Fiserv, Inc. | 81,776 | ||||||||||||
| 1,550 | IMS Health, Inc. | 42,579 | |||||||||||||
| 2,600 | @ | Intuit, Inc. | 81,848 | ||||||||||||
| 63,000 | Microsoft Corp. | 1,847,790 | |||||||||||||
| 2,400 | @ | Novell, Inc. | 15,072 | ||||||||||||
| 29,420 | @ | Oracle Corp. | 559,863 | ||||||||||||
| 672 | @ | Parametric Technology Corp. | 13,010 | ||||||||||||
| 2,750 | Paychex, Inc. | 108,378 | |||||||||||||
| 3,684,315 | |||||||||||||||
| Telecommunications: 2.7% | |||||||||||||||
| 2,800 | Alltel Corp. | 158,872 | |||||||||||||
| 28,362 | AT&T, Inc. | 961,755 | |||||||||||||
| 5,700 | @ | Avaya, Inc. | 72,846 | ||||||||||||
| 13,200 | BellSouth Corp. | 588,588 | |||||||||||||
| 1,300 | CenturyTel, Inc. | 55,315 | |||||||||||||
| 75,650 | @ | Cisco Systems, Inc. | 2,033,437 | ||||||||||||
| 2,500 | Citizens Communications Co. | 35,425 | |||||||||||||
| 1,350 | @ | Comverse Technology, Inc. | 26,352 | ||||||||||||
| 11,350 | @ | Corning, Inc. | 244,706 | ||||||||||||
| 1,275 | Embarq Corp. | 65,599 | |||||||||||||
| 1,500 | @ | JDS Uniphase Corp. | 27,720 | ||||||||||||
| 3,700 | @ | Juniper Networks, Inc. | 78,773 | ||||||||||||
| 24,090 | Motorola, Inc. | 534,075 | |||||||||||||
| 12,050 | Qualcomm, Inc. | 440,910 | |||||||||||||
| 10,400 | @ | Qwest Communications International, Inc. | 79,976 | ||||||||||||
| 21,900 | Sprint Nextel Corp. | 427,269 | |||||||||||||
| 2,700 | @ | Tellabs, Inc. | 27,108 | ||||||||||||
| 21,100 | Verizon Communications, Inc. | 737,234 | |||||||||||||
| 3,123 | Windstream Corp. | 43,535 | |||||||||||||
| 6,639,495 | |||||||||||||||
| Textiles: 0.0% | |||||||||||||||
| 1,350 | Cintas Corp. | 56,970 | |||||||||||||
| 56,970 | |||||||||||||||
| Toys/Games/Hobbies: 0.1% | |||||||||||||||
| 1,700 | Hasbro, Inc. | 45,475 | |||||||||||||
| 3,100 | Mattel, Inc. | 68,045 | |||||||||||||
| 113,520 | |||||||||||||||
| Transportation: 0.4% | |||||||||||||||
| 2,650 | Burlington Northern Santa Fe Corp. | 199,174 | |||||||||||||
| 3,180 | CSX Corp. | 114,035 | |||||||||||||
| 2,200 | FedEx Corp. | 253,946 | |||||||||||||
See Accompanying Notes to Financial Statements
105
PORTFOLIO OF INVESTMENTS
ING PRINCIPAL PROTECTION FUND VI AS OF NOVEMBER 30, 2006 (UNAUDITED) (CONTINUED)
| Shares | Value | ||||||||||||||
| Transportation (continued) | |||||||||||||||
| 2,700 | Norfolk Southern Corp. | $ | 132,975 | ||||||||||||
| 500 | Ryder System, Inc. | 26,085 | |||||||||||||
| 1,750 | Union Pacific Corp. | 158,410 | |||||||||||||
| 884,625 | |||||||||||||||
| Total Common Stock (Cost $85,571,284) | 95,035,187 | ||||||||||||||
| Principal Amount | Value | ||||||||||||||
| U.S. GOVERNMENT AGENCY OBLIGATIONS: 56.8% | |||||||||||||||
| Federal National Mortgage Association: 37.5% | |||||||||||||||
| $ | 97,000,000 | 5.030%, due 04/22/08 | 90,596,836 | ||||||||||||
| 90,596,836 | |||||||||||||||
| Other U.S. Government Agencies: 19.3% | |||||||||||||||
| 50,000,000 | Federal Agricultural Mortgage Corp., 5.030%, due 04/22/08 | 46,699,400 | |||||||||||||
| 46,699,400 | |||||||||||||||
| Total U.S. Government Agency Obligations (Cost $140,556,783) | 137,296,236 | ||||||||||||||
| U.S. TREASURY OBLIGATIONS: 3.3% | |||||||||||||||
| U.S. Treasury Principal Only STRIP: 3.3% | |||||||||||||||
| 8,580,000 | 4.740%, due 02/15/08 | 8,107,903 | |||||||||||||
| 8,107,903 | |||||||||||||||
| Total U.S. Treasury Obligations (Cost $8,096,686) | 8,107,903 | ||||||||||||||
| Total Long-Term Investments (Cost $234,224,753) | 240,439,326 | ||||||||||||||
| SHORT-TERM INVESTMENTS: 1.0% | |||||||||||||||
| Repurchase Agreement: 1.0% | |||||||||||
| 2,359,000 | Morgan Stanley Repurchase Agreement dated 11/30/06, 5.290%, due 12/01/06, $2,359,347 to be received upon repurchase (Collateralized by $2,440,000 Federal National Mortgage Association, 4.000%, Market Value plus accrued interest $2,437,606, due 02/22/08) | 2,359,000 | |||||||||
| Total Short-Term Investments (Cost $2,359,000) | 2,359,000 | ||||||||||
| Total Investments in Securities (Cost $236,583,753)* | 100.4 | % | $ | 242,798,326 | |||||||
| Other Assets and Liabilities - Net | (0.4 | ) | (936,060 | ) | |||||||
| Net Assets | 100.0 | % | $ | 241,862,266 | |||||||
@ Non-income producing security
@@ Foreign Issuer
STRIP Separate Trading of Registered Interest and Principal of Securities
* Cost for federal income tax purposes is $237,835,864.
Net unrealized appreciation consists of:
| Gross Unrealized Appreciation | $ | 9,669,031 | |||||
| Gross Unrealized Depreciation | (4,706,569 | ) | |||||
| Net Unrealized Appreciation | $ | 4,962,462 | |||||
See Accompanying Notes to Financial Statements
106
PORTFOLIO OF INVESTMENTS
ING PRINCIPAL PROTECTION FUND VII AS OF NOVEMBER 30, 2006 (UNAUDITED)
| Shares | Value | ||||||||||||||
| COMMON STOCK: 37.4% | |||||||||||||||
| Advertising: 0.1% | |||||||||||||||
| 1,050 | Omnicom Group | $ | 107,268 | ||||||||||||
| 107,268 | |||||||||||||||
| Aerospace/Defense: 0.9% | |||||||||||||||
| 2,700 | Boeing Co. | 239,031 | |||||||||||||
| 1,900 | General Dynamics Corp. | 142,196 | |||||||||||||
| 400 | Goodrich Corp. | 18,000 | |||||||||||||
| 550 | L-3 Communications Holdings, Inc. | 45,238 | |||||||||||||
| 1,670 | Lockheed Martin Corp. | 151,052 | |||||||||||||
| 1,065 | Northrop Grumman Corp. | 71,280 | |||||||||||||
| 2,570 | Raytheon Co. | 131,173 | |||||||||||||
| 200 | Rockwell Collins, Inc. | 12,066 | |||||||||||||
| 3,450 | United Technologies Corp. | 222,629 | |||||||||||||
| 1,032,665 | |||||||||||||||
| Agriculture: 0.6% | |||||||||||||||
| 7,150 | Altria Group, Inc. | 602,102 | |||||||||||||
| 2,250 | Archer-Daniels-Midland Co. | 78,975 | |||||||||||||
| 540 | Reynolds American, Inc. | 34,690 | |||||||||||||
| 500 | UST, Inc. | 27,990 | |||||||||||||
| 743,757 | |||||||||||||||
| Airlines: 0.0% | |||||||||||||||
| 2,700 | Southwest Airlines Co. | 42,417 | |||||||||||||
| 42,417 | |||||||||||||||
| Apparel: 0.2% | |||||||||||||||
| 1,910 | @ | Coach, Inc. | 82,531 | ||||||||||||
| 500 | Jones Apparel Group, Inc. | 16,800 | |||||||||||||
| 339 | Liz Claiborne, Inc. | 14,492 | |||||||||||||
| 630 | Nike, Inc. | 62,339 | |||||||||||||
| 210 | VF Corp. | 16,462 | |||||||||||||
| 192,624 | |||||||||||||||
| Auto Manufacturers: 0.1% | |||||||||||||||
| 5,550 | Ford Motor Co. | 45,122 | |||||||||||||
| 700 | General Motors Corp. | 20,461 | |||||||||||||
| 1,100 | Paccar, Inc. | 71,830 | |||||||||||||
| 137,413 | |||||||||||||||
| Auto Parts & Equipment: 0.1% | |||||||||||||||
| 500 | @ | Goodyear Tire & Rubber Co. | 8,425 | ||||||||||||
| 700 | Johnson Controls, Inc. | 56,931 | |||||||||||||
| 65,356 | |||||||||||||||
| Banks: 2.8% | |||||||||||||||
| 20,771 | Bank of America Corp. | 1,118,518 | |||||||||||||
| 2,450 | Bank of New York Co., Inc. | 87,073 | |||||||||||||
| 1,834 | BB&T Corp. | 78,880 | |||||||||||||
| 950 | Capital One Financial Corp. | 73,986 | |||||||||||||
| 750 | Comerica, Inc. | 43,688 | |||||||||||||
| 300 | Commerce Bancorp., Inc. | 10,428 | |||||||||||||
| 450 | Compass Bancshares, Inc. | 25,713 | |||||||||||||
| 1,700 | Fifth Third Bancorp. | 67,031 | |||||||||||||
| 250 | First Horizon National Corp. | 9,965 | |||||||||||||
| 750 | Huntington Bancshares, Inc. | 18,233 | |||||||||||||
| 1,150 | Keycorp | 41,515 | |||||||||||||
| 300 | M&T Bank Corp. | 35,592 | |||||||||||||
| 850 | Marshall & Ilsley Corp. | 38,922 | |||||||||||||
| 1,250 | Mellon Financial Corp. | 50,288 | |||||||||||||
| 2,770 | National City Corp. | 99,997 | |||||||||||||
| Shares | Value | ||||||||||||||
| 1,500 | North Fork Bancorp., Inc. | $ | 42,105 | ||||||||||||
| 550 | Northern Trust Corp. | 31,328 | |||||||||||||
| 900 | PNC Financial Services Group, Inc. | 63,621 | |||||||||||||
| 3,317 | Regions Financial Corp. | 121,568 | |||||||||||||
| 1,100 | State Street Corp. | 68,343 | |||||||||||||
| 1,250 | SunTrust Banks, Inc. | 102,063 | |||||||||||||
| 944 | Synovus Financial Corp. | 28,339 | |||||||||||||
| 6,050 | US Bancorp. | 203,522 | |||||||||||||
| 8,714 | Wachovia Corp. | 472,212 | |||||||||||||
| 11,400 | Wells Fargo & Co. | 401,736 | |||||||||||||
| 300 | Zions Bancorp. | 23,472 | |||||||||||||
| 3,358,138 | |||||||||||||||
| Beverages: 0.8% | |||||||||||||||
| 3,550 | Anheuser-Busch Cos., Inc. | 168,661 | |||||||||||||
| 380 | Brown-Forman Corp. | 26,391 | |||||||||||||
| 6,950 | Coca-Cola Co. | 325,469 | |||||||||||||
| 1,350 | Coca-Cola Enterprises, Inc. | 27,608 | |||||||||||||
| 600 | @ | Constellation Brands, Inc. | 16,788 | ||||||||||||
| 200 | Molson Coors Brewing Co. | 14,216 | |||||||||||||
| 600 | Pepsi Bottling Group, Inc. | 18,792 | |||||||||||||
| 5,570 | PepsiCo, Inc. | 345,173 | |||||||||||||
| 943,098 | |||||||||||||||
| Biotechnology: 0.4% | |||||||||||||||
| 4,000 | @ | Amgen, Inc. | 284,000 | ||||||||||||
| 1,200 | @ | Biogen Idec, Inc. | 62,712 | ||||||||||||
| 1,210 | @ | Celgene Corp. | 67,433 | ||||||||||||
| 300 | @ | Genzyme Corp. | 19,320 | ||||||||||||
| 300 | @ | Medimmune, Inc. | 9,807 | ||||||||||||
| 200 | @ | Millipore Corp. | 13,682 | ||||||||||||
| 456,954 | |||||||||||||||
| Building Materials: 0.0% | |||||||||||||||
| 200 | American Standard Cos., Inc. | 8,962 | |||||||||||||
| 1,250 | Masco Corp. | 35,863 | |||||||||||||
| 44,825 | |||||||||||||||
| Chemicals: 0.6% | |||||||||||||||
| 300 | Air Products & Chemicals, Inc. | 20,742 | |||||||||||||
| 200 | Ashland, Inc. | 13,522 | |||||||||||||
| 3,650 | Dow Chemical Co. | 146,037 | |||||||||||||
| 600 | Ecolab, Inc. | 26,610 | |||||||||||||
| 3,500 | EI DuPont de Nemours & Co. | 164,255 | |||||||||||||
| 400 | International Flavors & Fragrances, Inc. | 18,844 | |||||||||||||
| 2,120 | Monsanto Co. | 101,908 | |||||||||||||
| 1,000 | PPG Industries, Inc. | 64,300 | |||||||||||||
| 1,250 | Praxair, Inc. | 78,000 | |||||||||||||
| 600 | Rohm & Haas Co. | 31,332 | |||||||||||||
| 700 | Sherwin-Williams Co. | 43,785 | |||||||||||||
| 200 | Sigma-Aldrich Corp. | 15,222 | |||||||||||||
| 724,557 | |||||||||||||||
| Coal: 0.0% | |||||||||||||||
| 920 | Peabody Energy Corp. | 42,329 | |||||||||||||
| 42,329 | |||||||||||||||
| Commercial Services: 0.3% | |||||||||||||||
| 800 | @ | Apollo Group, Inc. | 31,032 | ||||||||||||
| 600 | @ | Convergys Corp. | 14,472 | ||||||||||||
| 650 | Equifax, Inc. | 24,694 | |||||||||||||
| 1,300 | H&R Block, Inc. | 31,200 | |||||||||||||
See Accompanying Notes to Financial Statements
107
PORTFOLIO OF INVESTMENTS
ING PRINCIPAL PROTECTION FUND VII AS OF NOVEMBER 30, 2006 (UNAUDITED) (CONTINUED)
| Shares | Value | ||||||||||||||
| Commercial Services (continued) | |||||||||||||||
| 1,680 | McKesson Corp. | $ | 82,992 | ||||||||||||
| 450 | @ | Monster Worldwide, Inc. | 19,643 | ||||||||||||
| 1,100 | Moody's Corp. | 76,428 | |||||||||||||
| 500 | Robert Half International, Inc. | 19,295 | |||||||||||||
| 250 | RR Donnelley & Sons Co. | 8,818 | |||||||||||||
| 2,649 | Western Union Co. | 60,397 | |||||||||||||
| 368,971 | |||||||||||||||
| Computers: 1.8% | |||||||||||||||
| 400 | @ | Affiliated Computer Services, Inc. | 20,220 | ||||||||||||
| 480 | @ | Cognizant Technology Solutions Corp. | 39,149 | ||||||||||||
| 650 | @ | Computer Sciences Corp. | 33,930 | ||||||||||||
| 13,150 | @ | Dell, Inc. | 358,206 | ||||||||||||
| 1,950 | Electronic Data Systems Corp. | 52,923 | |||||||||||||
| 7,800 | @ | EMC Corp. | 102,258 | ||||||||||||
| 15,800 | Hewlett-Packard Co. | 623,468 | |||||||||||||
| 7,000 | International Business Machines Corp. | 643,440 | |||||||||||||
| 550 | @ | Lexmark International, Inc. | 37,939 | ||||||||||||
| 700 | @ | NCR Corp. | 30,037 | ||||||||||||
| 1,050 | @ | Network Appliance, Inc. | 41,171 | ||||||||||||
| 700 | @ | Sandisk Corp. | 31,080 | ||||||||||||
| 11,200 | @ | Sun Microsystems, Inc. | 60,704 | ||||||||||||
| 1,200 | @ | Unisys Corp. | 8,652 | ||||||||||||
| 2,083,177 | |||||||||||||||
| Cosmetics/Personal Care: 0.7% | |||||||||||||||
| 1,300 | Avon Products, Inc. | 42,432 | |||||||||||||
| 1,650 | Colgate-Palmolive Co. | 107,333 | |||||||||||||
| 700 | Estee Lauder Cos., Inc. | 28,903 | |||||||||||||
| 10,783 | Procter & Gamble Co. | 677,065 | |||||||||||||
| 855,733 | |||||||||||||||
| Distribution/Wholesale: 0.0% | |||||||||||||||
| 350 | WW Grainger, Inc. | 25,326 | |||||||||||||
| 25,326 | |||||||||||||||
| Diversified Financial Services: 3.4% | |||||||||||||||
| 4,100 | American Express Co. | 240,752 | |||||||||||||
| 740 | Ameriprise Financial, Inc. | 40,034 | |||||||||||||
| 450 | Bear Stearns Cos., Inc. | 68,616 | |||||||||||||
| 3,900 | Charles Schwab Corp. | 71,526 | |||||||||||||
| 110 | Chicago Mercantile Exchange Holdings, Inc. | 58,916 | |||||||||||||
| 1,200 | CIT Group, Inc. | 62,412 | |||||||||||||
| 22,700 | Citigroup, Inc. | 1,125,693 | |||||||||||||
| 2,098 | Countrywide Financial Corp. | 83,333 | |||||||||||||
| 1,400 | @ | E*Trade Financial Corp. | 33,698 | ||||||||||||
| 3,250 | Fannie Mae | 185,348 | |||||||||||||
| 350 | Federated Investors, Inc. | 11,613 | |||||||||||||
| 550 | Franklin Resources, Inc. | 58,707 | |||||||||||||
| 2,300 | Freddie Mac | 154,468 | |||||||||||||
| 1,500 | Goldman Sachs Group, Inc. | 292,200 | |||||||||||||
| 800 | Janus Capital Group, Inc. | 16,208 | |||||||||||||
| 15,900 | JPMorgan Chase & Co. | 735,852 | |||||||||||||
| 1,820 | Lehman Brothers Holdings, Inc. | 134,079 | |||||||||||||
| 3,000 | Merrill Lynch & Co., Inc. | 262,290 | |||||||||||||
| 3,700 | Morgan Stanley | 281,792 | |||||||||||||
| 1,300 | SLM Corp. | 59,592 | |||||||||||||
| 900 | T. Rowe Price Group, Inc. | 38,997 | |||||||||||||
| 4,016,126 | |||||||||||||||
| Shares | Value | ||||||||||||||
| Electric: 1.1% | |||||||||||||||
| 3,720 | @ | AES Corp. | $ | 86,936 | |||||||||||
| 650 | @ | Allegheny Energy, Inc. | 28,834 | ||||||||||||
| 800 | Ameren Corp. | 43,768 | |||||||||||||
| 1,750 | American Electric Power Co., Inc. | 72,643 | |||||||||||||
| 1,150 | Centerpoint Energy, Inc. | 18,803 | |||||||||||||
| 900 | @ | CMS Energy Corp. | 14,589 | ||||||||||||
| 750 | Constellation Energy Group, Inc. | 51,458 | |||||||||||||
| 700 | DTE Energy Co. | 32,963 | |||||||||||||
| 1,700 | @ | Dynegy, Inc. | 11,543 | ||||||||||||
| 1,220 | Edison International | 56,096 | |||||||||||||
| 900 | Entergy Corp. | 82,188 | |||||||||||||
| 3,000 | Exelon Corp. | 182,190 | |||||||||||||
| 1,400 | FirstEnergy Corp. | 83,776 | |||||||||||||
| 1,500 | PG&E Corp. | 68,895 | |||||||||||||
| 400 | Pinnacle West Capital Corp. | 19,736 | |||||||||||||
| 1,700 | PPL Corp. | 61,795 | |||||||||||||
| 300 | Progress Energy, Inc. | 14,331 | |||||||||||||
| 1,050 | Public Service Enterprise Group, Inc. | 70,581 | |||||||||||||
| 3,300 | Southern Co. | 119,625 | |||||||||||||
| 900 | TECO Energy, Inc. | 15,291 | |||||||||||||
| 2,060 | TXU Corp. | 118,223 | |||||||||||||
| 1,900 | Xcel Energy, Inc. | 43,624 | |||||||||||||
| 1,297,888 | |||||||||||||||
| Electrical Components & Equipment: 0.1% | |||||||||||||||
| 1,350 | Emerson Electric Co. | 117,045 | |||||||||||||
| 500 | Molex, Inc. | 16,000 | |||||||||||||
| 133,045 | |||||||||||||||
| Electronics: 0.2% | |||||||||||||||
| 1,200 | @ | Agilent Technologies, Inc. | 38,208 | ||||||||||||
| 700 | Applera Corp. - Applied Biosystems Group | 25,508 | |||||||||||||
| 700 | Jabil Circuit, Inc. | 19,852 | |||||||||||||
| 400 | PerkinElmer, Inc. | 8,668 | |||||||||||||
| 800 | Symbol Technologies, Inc. | 11,856 | |||||||||||||
| 300 | Tektronix, Inc. | 9,168 | |||||||||||||
| 1,400 | @ | Thermo Electron Corp. | 61,362 | ||||||||||||
| 450 | @ | Waters Corp. | 22,518 | ||||||||||||
| 197,140 | |||||||||||||||
| Entertainment: 0.0% | |||||||||||||||
| 450 | International Game Technology | 19,701 | |||||||||||||
| 19,701 | |||||||||||||||
| Environmental Control: 0.1% | |||||||||||||||
| 900 | @ | Allied Waste Industries, Inc. | 11,412 | ||||||||||||
| 2,500 | Waste Management, Inc. | 91,525 | |||||||||||||
| 102,937 | |||||||||||||||
| Food: 0.4% | |||||||||||||||
| 1,350 | Campbell Soup Co. | 51,395 | |||||||||||||
| 1,950 | ConAgra Foods, Inc. | 50,115 | |||||||||||||
| 500 | @ | Dean Foods Co. | 21,410 | ||||||||||||
| 2,000 | General Mills, Inc. | 111,900 | |||||||||||||
| 200 | Hershey Co. | 10,594 | |||||||||||||
| 1,000 | HJ Heinz Co. | 44,450 | |||||||||||||
| 950 | Kellogg Co. | 47,291 | |||||||||||||
| 2,450 | Kroger Co. | 52,577 | |||||||||||||
See Accompanying Notes to Financial Statements
108
PORTFOLIO OF INVESTMENTS
ING PRINCIPAL PROTECTION FUND VII AS OF NOVEMBER 30, 2006 (UNAUDITED) (CONTINUED)
| Shares | Value | ||||||||||||||
| Food (continued) | |||||||||||||||
| 400 | McCormick & Co., Inc. | $ | 15,488 | ||||||||||||
| 1,550 | Safeway, Inc. | 47,756 | |||||||||||||
| 963 | Sara Lee Corp. | 15,967 | |||||||||||||
| 636 | Supervalu, Inc. | 21,789 | |||||||||||||
| 400 | Whole Foods Market, Inc. | 19,520 | |||||||||||||
| 510,252 | |||||||||||||||
| Forest Products & Paper: 0.1% | |||||||||||||||
| 1,600 | International Paper Co. | 52,960 | |||||||||||||
| 500 | MeadWestvaco Corp. | 14,750 | |||||||||||||
| 550 | Plum Creek Timber Co., Inc. | 20,493 | |||||||||||||
| 600 | Temple-Inland, Inc. | 23,460 | |||||||||||||
| 300 | Weyerhaeuser Co. | 19,404 | |||||||||||||
| 131,067 | |||||||||||||||
| Gas: 0.1% | |||||||||||||||
| 700 | KeySpan Corp. | 28,721 | |||||||||||||
| 200 | Nicor, Inc. | 9,910 | |||||||||||||
| 1,100 | NiSource, Inc. | 27,126 | |||||||||||||
| 1,100 | Sempra Energy | 59,950 | |||||||||||||
| 125,707 | |||||||||||||||
| Hand/Machine Tools: 0.0% | |||||||||||||||
| 290 | Black & Decker Corp. | 24,905 | |||||||||||||
| 300 | Snap-On, Inc. | 14,250 | |||||||||||||
| 350 | Stanley Works | 17,857 | |||||||||||||
| 57,012 | |||||||||||||||
| Healthcare-Products: 1.1% | |||||||||||||||
| 200 | Bausch & Lomb, Inc. | 9,684 | |||||||||||||
| 2,200 | Baxter International, Inc. | 98,428 | |||||||||||||
| 790 | Becton Dickinson & Co. | 56,659 | |||||||||||||
| 3,600 | @ | Boston Scientific Corp. | 56,952 | ||||||||||||
| 400 | CR Bard, Inc. | 32,916 | |||||||||||||
| 9,950 | Johnson & Johnson | 655,805 | |||||||||||||
| 3,900 | Medtronic, Inc. | 203,307 | |||||||||||||
| 500 | @ | Patterson Cos., Inc. | 18,555 | ||||||||||||
| 450 | @ | St. Jude Medical, Inc. | 16,772 | ||||||||||||
| 1,000 | Stryker Corp. | 51,860 | |||||||||||||
| 700 | @ | Zimmer Holdings, Inc. | 51,072 | ||||||||||||
| 1,252,010 | |||||||||||||||
| Healthcare-Services: 0.8% | |||||||||||||||
| 2,550 | Aetna, Inc. | 105,341 | |||||||||||||
| 825 | @ | Coventry Health Care, Inc. | 39,707 | ||||||||||||
| 860 | @ | Humana, Inc. | 46,526 | ||||||||||||
| 450 | @ | Laboratory Corp. of America Holdings | 31,860 | ||||||||||||
| 200 | Manor Care, Inc. | 9,504 | |||||||||||||
| 600 | Quest Diagnostics | 31,902 | |||||||||||||
| 7,730 | UnitedHealth Group, Inc. | 379,388 | |||||||||||||
| 3,550 | @ | WellPoint, Inc. | 268,629 | ||||||||||||
| 912,857 | |||||||||||||||
| Home Builders: 0.0% | |||||||||||||||
| 200 | Lennar Corp. | 10,500 | |||||||||||||
| 10,500 | |||||||||||||||
| Home Furnishings: 0.1% | |||||||||||||||
| 400 | Harman International Industries, Inc. | 41,536 | |||||||||||||
| 300 | Whirlpool Corp. | 25,590 | |||||||||||||
| 67,126 | |||||||||||||||
| Shares | Value | ||||||||||||||
| Household Products/Wares: 0.1% | |||||||||||||||
| 100 | Avery Dennison Corp. | $ | 6,747 | ||||||||||||
| 500 | Fortune Brands, Inc. | 40,450 | |||||||||||||
| 1,450 | Kimberly-Clark Corp. | 96,382 | |||||||||||||
| 143,579 | |||||||||||||||
| Housewares: 0.0% | |||||||||||||||
| 1,100 | Newell Rubbermaid, Inc. | 31,339 | |||||||||||||
| 31,339 | |||||||||||||||
| Insurance: 2.1% | |||||||||||||||
| 1,130 | @@ | ACE Ltd. | 64,229 | ||||||||||||
| 1,700 | Aflac, Inc. | 75,038 | |||||||||||||
| 2,900 | Allstate Corp. | 184,092 | |||||||||||||
| 450 | AMBAC Financial Group, Inc. | 38,538 | |||||||||||||
| 8,800 | American International Group, Inc. | 618,816 | |||||||||||||
| 900 | AON Corp. | 32,112 | |||||||||||||
| 1,900 | Chubb Corp. | 98,344 | |||||||||||||
| 560 | Cigna Corp. | 70,588 | |||||||||||||
| 692 | Cincinnati Financial Corp. | 30,642 | |||||||||||||
| 2,400 | Genworth Financial, Inc. | 78,720 | |||||||||||||
| 1,750 | Hartford Financial Services Group, Inc. | 150,080 | |||||||||||||
| 888 | Lincoln National Corp. | 56,468 | |||||||||||||
| 2,050 | Loews Corp. | 81,836 | |||||||||||||
| 800 | Marsh & McLennan Cos., Inc. | 25,136 | |||||||||||||
| 500 | MBIA, Inc. | 34,825 | |||||||||||||
| 3,440 | Metlife, Inc. | 202,031 | |||||||||||||
| 350 | MGIC Investment Corp. | 20,286 | |||||||||||||
| 1,250 | Principal Financial Group | 72,188 | |||||||||||||
| 3,600 | Progressive Corp. | 81,180 | |||||||||||||
| 2,220 | Prudential Financial, Inc. | 180,886 | |||||||||||||
| 600 | Safeco Corp. | 36,342 | |||||||||||||
| 3,220 | St. Paul Travelers Cos., Inc. | 166,828 | |||||||||||||
| 350 | Torchmark Corp. | 22,127 | |||||||||||||
| 1,150 | UnumProvident Corp. | 23,552 | |||||||||||||
| 500 | @@ | XL Capital Ltd. | 35,560 | ||||||||||||
| 2,480,444 | |||||||||||||||
| Internet: 0.3% | |||||||||||||||
| 1,000 | @ | Amazon.com, Inc. | 40,340 | ||||||||||||
| 1,400 | @ | eBay, Inc. | 45,290 | ||||||||||||
| 300 | @ | Google, Inc. | 145,476 | ||||||||||||
| 3,050 | @ | Symantec Corp. | 64,660 | ||||||||||||
| 800 | @ | VeriSign, Inc. | 20,888 | ||||||||||||
| 316,654 | |||||||||||||||
| Iron/Steel: 0.2% | |||||||||||||||
| 2,060 | Nucor Corp. | 123,291 | |||||||||||||
| 820 | United States Steel Corp. | 61,328 | |||||||||||||
| 184,619 | |||||||||||||||
| Leisure Time: 0.1% | |||||||||||||||
| 400 | Brunswick Corp. | 12,948 | |||||||||||||
| 1,550 | Carnival Corp. | 75,935 | |||||||||||||
| 800 | Harley-Davidson, Inc. | 59,016 | |||||||||||||
| 550 | Sabre Holdings Corp. | 15,087 | |||||||||||||
| 162,986 | |||||||||||||||
| Lodging: 0.1% | |||||||||||||||
| 1,180 | Marriott International, Inc. | 53,277 | |||||||||||||
| 350 | Starwood Hotels & Resorts Worldwide, Inc. | 22,460 | |||||||||||||
See Accompanying Notes to Financial Statements
109
PORTFOLIO OF INVESTMENTS
ING PRINCIPAL PROTECTION FUND VII AS OF NOVEMBER 30, 2006 (UNAUDITED) (CONTINUED)
| Shares | Value | ||||||||||||||
| Lodging (continued) | |||||||||||||||
| 630 | @ | Wyndham Worldwide Corp. | $ | 19,996 | |||||||||||
| 95,733 | |||||||||||||||
| Machinery-Construction & Mining: 0.1% | |||||||||||||||
| 2,200 | Caterpillar, Inc. | 136,466 | |||||||||||||
| 136,466 | |||||||||||||||
| Machinery-Diversified: 0.1% | |||||||||||||||
| 350 | Cummins, Inc. | 41,972 | |||||||||||||
| 300 | Deere & Co. | 28,800 | |||||||||||||
| 500 | Rockwell Automation, Inc. | 32,540 | |||||||||||||
| 103,312 | |||||||||||||||
| Media: 1.0% | |||||||||||||||
| 3,625 | CBS Corp. | 107,844 | |||||||||||||
| 1,500 | Clear Channel Communications, Inc. | 52,740 | |||||||||||||
| 7,100 | @ | Comcast Corp. | 287,266 | ||||||||||||
| 400 | EW Scripps Co. | 19,544 | |||||||||||||
| 700 | Gannett Co., Inc. | 41,664 | |||||||||||||
| 1,890 | McGraw-Hill Cos., Inc. | 125,969 | |||||||||||||
| 100 | Meredith Corp. | 5,410 | |||||||||||||
| 8,050 | News Corp., Inc. | 165,830 | |||||||||||||
| 300 | Tribune Co. | 9,540 | |||||||||||||
| 700 | @ | Univision Communications, Inc. | 24,913 | ||||||||||||
| 9,600 | Walt Disney Co. | 317,280 | |||||||||||||
| 1,158,000 | |||||||||||||||
| Mining: 0.1% | |||||||||||||||
| 650 | Freeport-McMoRan Copper & Gold, Inc. | 40,866 | |||||||||||||
| 670 | Phelps Dodge Corp. | 82,410 | |||||||||||||
| 100 | Vulcan Materials Co. | 8,872 | |||||||||||||
| 132,148 | |||||||||||||||
| Miscellaneous Manufacturing: 2.0% | |||||||||||||||
| 2,550 | 3M Co. | 207,723 | |||||||||||||
| 400 | Cooper Industries Ltd. | 36,576 | |||||||||||||
| 850 | Danaher Corp. | 62,152 | |||||||||||||
| 800 | Dover Corp. | 40,240 | |||||||||||||
| 1,100 | Eastman Kodak Co. | 28,622 | |||||||||||||
| 800 | Eaton Corp. | 61,664 | |||||||||||||
| 35,050 | General Electric Co. | 1,236,564 | |||||||||||||
| 3,800 | Honeywell International, Inc. | 163,324 | |||||||||||||
| 1,400 | Illinois Tool Works, Inc. | 66,080 | |||||||||||||
| 1,200 | @@ | Ingersoll-Rand Co. | 46,812 | ||||||||||||
| 500 | ITT Corp. | 26,975 | |||||||||||||
| 700 | Leggett & Platt, Inc. | 16,646 | |||||||||||||
| 700 | Parker Hannifin Corp. | 58,436 | |||||||||||||
| 500 | Textron, Inc. | 48,725 | |||||||||||||
| 6,800 | @@ | Tyco International Ltd. | 205,972 | ||||||||||||
| 2,306,511 | |||||||||||||||
| Office/Business Equipment: 0.1% | |||||||||||||||
| 850 | Pitney Bowes, Inc. | 39,177 | |||||||||||||
| 5,700 | @ | Xerox Corp. | 94,050 | ||||||||||||
| 133,227 | |||||||||||||||
| Oil & Gas: 3.7% | |||||||||||||||
| 1,400 | Anadarko Petroleum Corp. | 69,104 | |||||||||||||
| 400 | Apache Corp. | 27,972 | |||||||||||||
| 11,071 | Chevron Corp. | 800,655 | |||||||||||||
| Shares | Value | ||||||||||||||
| 5,132 | ConocoPhillips | $ | 345,384 | ||||||||||||
| 1,400 | Devon Energy Corp. | 102,718 | |||||||||||||
| 900 | EOG Resources, Inc. | 63,477 | |||||||||||||
| 30,100 | ExxonMobil Corp. | 2,311,981 | |||||||||||||
| 250 | Hess Corp. | 12,568 | |||||||||||||
| 1,900 | Marathon Oil Corp. | 179,322 | |||||||||||||
| 900 | @,@@ | Nabors Industries Ltd. | 30,384 | ||||||||||||
| 400 | Noble Corp. | 30,900 | |||||||||||||
| 2,700 | Occidental Petroleum Corp. | 135,918 | |||||||||||||
| 500 | Sunoco, Inc. | 34,080 | |||||||||||||
| 900 | @ | Transocean, Inc. | �� | 70,155 | |||||||||||
| 2,500 | Valero Energy Corp. | 137,675 | |||||||||||||
| 1,100 | XTO Energy, Inc. | 55,660 | |||||||||||||
| 4,407,953 | |||||||||||||||
| Oil & Gas Services: 0.5% | |||||||||||||||
| 900 | Baker Hughes, Inc. | 66,087 | |||||||||||||
| 400 | BJ Services Co. | 13,508 | |||||||||||||
| 5,450 | Halliburton Co. | 183,883 | |||||||||||||
| 500 | @ | National Oilwell Varco, Inc. | 33,255 | ||||||||||||
| 3,700 | Schlumberger Ltd. | 253,376 | |||||||||||||
| 400 | @ | Weatherford International Ltd. | 17,964 | ||||||||||||
| 568,073 | |||||||||||||||
| Packaging & Containers: 0.1% | |||||||||||||||
| 300 | Ball Corp. | 12,828 | |||||||||||||
| 400 | Bemis Co. | 13,652 | |||||||||||||
| 500 | @ | Pactiv Corp. | 17,225 | ||||||||||||
| 400 | Sealed Air Corp. | 23,804 | |||||||||||||
| 67,509 | |||||||||||||||
| Pharmaceuticals: 2.1% | |||||||||||||||
| 5,200 | Abbott Laboratories | 242,632 | |||||||||||||
| 250 | Allergan, Inc. | 29,145 | |||||||||||||
| 1,120 | AmerisourceBergen Corp. | 51,509 | |||||||||||||
| 400 | @ | Barr Pharmaceuticals, Inc. | 20,432 | ||||||||||||
| 2,700 | Bristol-Myers Squibb Co. | 67,041 | |||||||||||||
| 1,400 | Cardinal Health, Inc. | 90,468 | |||||||||||||
| 1,480 | Caremark Rx, Inc. | 70,004 | |||||||||||||
| 1,200 | Eli Lilly & Co. | 64,308 | |||||||||||||
| 600 | @ | Express Scripts, Inc. | 40,920 | ||||||||||||
| 1,450 | @ | Forest Laboratories, Inc. | 70,615 | ||||||||||||
| 1,550 | @ | Gilead Sciences, Inc. | 102,176 | ||||||||||||
| 170 | @ | Hospira, Inc. | 5,576 | ||||||||||||
| 1,310 | @ | King Pharmaceuticals, Inc. | 21,654 | ||||||||||||
| 891 | @ | Medco Health Solutions, Inc. | 44,737 | ||||||||||||
| 10,000 | Merck & Co., Inc. | 445,100 | |||||||||||||
| 900 | Mylan Laboratories | 18,261 | |||||||||||||
| 24,700 | Pfizer, Inc. | 679,003 | |||||||||||||
| 6,800 | Schering-Plough Corp. | 149,668 | |||||||||||||
| 450 | @ | Watson Pharmaceuticals, Inc. | 11,552 | ||||||||||||
| 4,600 | Wyeth | 222,088 | |||||||||||||
| 2,446,889 | |||||||||||||||
| Pipelines: 0.1% | |||||||||||||||
| 1,900 | El Paso Corp. | 27,740 | |||||||||||||
| 1,650 | Williams Cos., Inc. | 45,804 | |||||||||||||
| 73,544 | |||||||||||||||
| Real Estate: 0.0% | |||||||||||||||
| 630 | @ | CB Richard Ellis Group, Inc. | 20,746 | ||||||||||||
| 702 | @ | Realogy Corp. | 18,315 | ||||||||||||
| 39,061 | |||||||||||||||
See Accompanying Notes to Financial Statements
110
PORTFOLIO OF INVESTMENTS
ING PRINCIPAL PROTECTION FUND VII AS OF NOVEMBER 30, 2006 (UNAUDITED) (CONTINUED)
| Shares | Value | ||||||||||||||
| Real Estate Investment Trusts: 0.1% | |||||||||||||||
| 350 | Apartment Investment & Management Co. | $ | 20,174 | ||||||||||||
| 200 | Boston Properties, Inc. | 23,410 | |||||||||||||
| 1,180 | Equity Office Properties Trust | 56,876 | |||||||||||||
| 300 | Prologis | 19,551 | |||||||||||||
| 200 | Public Storage, Inc. | 19,256 | |||||||||||||
| 200 | Vornado Realty Trust | 25,222 | |||||||||||||
| 164,489 | |||||||||||||||
| Retail: 2.1% | |||||||||||||||
| 300 | @ | Autozone, Inc. | 34,083 | ||||||||||||
| 1,100 | @ | Bed Bath & Beyond, Inc. | 42,625 | ||||||||||||
| 1,440 | Best Buy Co., Inc. | 79,157 | |||||||||||||
| 600 | @ | Big Lots, Inc. | 13,386 | ||||||||||||
| 650 | Circuit City Stores, Inc. | 16,224 | |||||||||||||
| 1,600 | Costco Wholesale Corp. | 83,616 | |||||||||||||
| 2,800 | CVS Corp. | 80,556 | |||||||||||||
| 450 | Darden Restaurants, Inc. | 18,068 | |||||||||||||
| 850 | Family Dollar Stores, Inc. | 23,707 | |||||||||||||
| 3,172 | Federated Department Stores, Inc. | 133,509 | |||||||||||||
| 3,100 | Gap, Inc. | 58,032 | |||||||||||||
| 2,870 | Home Depot, Inc. | 108,974 | |||||||||||||
| 700 | JC Penney Co., Inc. | 54,138 | |||||||||||||
| 1,950 | @ | Kohl's Corp. | 135,720 | ||||||||||||
| 1,000 | Limited Brands, Inc. | 31,690 | |||||||||||||
| 5,200 | Lowe's Cos., Inc. | 156,832 | |||||||||||||
| 4,250 | McDonald's Corp. | 178,373 | |||||||||||||
| 1,200 | Nordstrom, Inc. | 58,824 | |||||||||||||
| 1,450 | @ | Office Depot, Inc. | 54,897 | ||||||||||||
| 300 | OfficeMax, Inc. | 14,121 | |||||||||||||
| 500 | RadioShack Corp. | 8,765 | |||||||||||||
| 330 | @ | Sears Holding Corp. | 56,569 | ||||||||||||
| 2,225 | Staples, Inc. | 56,671 | |||||||||||||
| 3,450 | @ | Starbucks Corp. | 121,751 | ||||||||||||
| 2,950 | Target Corp. | 171,366 | |||||||||||||
| 2,600 | TJX Cos., Inc. | 71,292 | |||||||||||||
| 3,410 | Walgreen Co. | 138,071 | |||||||||||||
| 8,350 | Wal-Mart Stores, Inc. | 384,935 | |||||||||||||
| 600 | Wendy's International, Inc. | 19,542 | |||||||||||||
| 800 | Yum! Brands, Inc. | 48,952 | |||||||||||||
| 2,454,446 | |||||||||||||||
| Savings & Loans: 0.1% | |||||||||||||||
| 3,291 | Washington Mutual, Inc. | 143,751 | |||||||||||||
| 143,751 | |||||||||||||||
| Semiconductors: 0.9% | |||||||||||||||
| 2,500 | @ | Advanced Micro Devices, Inc. | 53,925 | ||||||||||||
| 2,100 | @ | Altera Corp. | 41,769 | ||||||||||||
| 1,150 | Analog Devices, Inc. | 37,398 | |||||||||||||
| 4,650 | Applied Materials, Inc. | 83,607 | |||||||||||||
| 1,394 | @ | Freescale Semiconductor, Inc. | 55,662 | ||||||||||||
| 19,600 | Intel Corp. | 418,460 | |||||||||||||
| 700 | KLA-Tencor Corp. | 36,169 | |||||||||||||
| 1,100 | Linear Technology Corp. | 35,354 | |||||||||||||
| 1,500 | @ | LSI Logic Corp. | 15,990 | ||||||||||||
| 1,150 | Maxim Integrated Products | 36,202 | |||||||||||||
| 3,700 | @ | Micron Technology, Inc. | 54,020 | ||||||||||||
| 1,300 | National Semiconductor Corp. | 31,447 | |||||||||||||
| 700 | @ | Novellus Systems, Inc. | 21,854 | ||||||||||||
| 500 | @ | Nvidia Corp. | 18,495 | ||||||||||||
| 900 | @ | QLogic Corp. | 20,025 | ||||||||||||
| Shares | Value | ||||||||||||||
| 900 | @ | Teradyne, Inc. | $ | 13,410 | |||||||||||
| 2,100 | Texas Instruments, Inc. | 62,055 | |||||||||||||
| 1,200 | Xilinx, Inc. | 32,160 | |||||||||||||
| 1,068,002 | |||||||||||||||
| Software: 1.4% | |||||||||||||||
| 1,870 | @ | Adobe Systems, Inc. | 75,043 | ||||||||||||
| 880 | @ | Autodesk, Inc. | 36,238 | ||||||||||||
| 1,900 | Automatic Data Processing, Inc. | 91,637 | |||||||||||||
| 1,150 | @ | BMC Software, Inc. | 37,444 | ||||||||||||
| 1,350 | CA, Inc. | 29,295 | |||||||||||||
| 600 | @ | Citrix Systems, Inc. | 17,244 | ||||||||||||
| 2,140 | @ | Compuware Corp. | 17,955 | ||||||||||||
| 1,050 | @ | Electronic Arts, Inc. | 58,643 | ||||||||||||
| 550 | Fidelity National Information Services, Inc. | 21,945 | |||||||||||||
| 2,649 | First Data Corp. | 66,887 | |||||||||||||
| 500 | @ | Fiserv, Inc. | 25,555 | ||||||||||||
| 700 | IMS Health, Inc. | 19,229 | |||||||||||||
| 1,300 | @ | Intuit, Inc. | 40,924 | ||||||||||||
| 29,300 | Microsoft Corp. | 859,369 | |||||||||||||
| 1,450 | @ | Novell, Inc. | 9,106 | ||||||||||||
| 13,680 | @ | Oracle Corp. | 260,330 | ||||||||||||
| 296 | @ | Parametric Technology Corp. | 5,731 | ||||||||||||
| 1,000 | Paychex, Inc. | 39,410 | |||||||||||||
| 1,711,985 | |||||||||||||||
| Telecommunications: 2.6% | |||||||||||||||
| 1,300 | Alltel Corp. | 73,762 | |||||||||||||
| 13,186 | AT&T, Inc. | 447,137 | |||||||||||||
| 2,650 | @ | Avaya, Inc. | 33,867 | ||||||||||||
| 6,200 | BellSouth Corp. | 276,458 | |||||||||||||
| 500 | CenturyTel, Inc. | 21,275 | |||||||||||||
| 35,200 | @ | Cisco Systems, Inc. | 946,176 | ||||||||||||
| 1,200 | Citizens Communications Co. | 17,004 | |||||||||||||
| 700 | @ | Comverse Technology, Inc. | 13,664 | ||||||||||||
| 5,300 | @ | Corning, Inc. | 114,268 | ||||||||||||
| 548 | Embarq Corp. | 28,195 | |||||||||||||
| 700 | @ | JDS Uniphase Corp. | 12,936 | ||||||||||||
| 1,700 | @ | Juniper Networks, Inc. | 36,193 | ||||||||||||
| 11,220 | Motorola, Inc. | 248,747 | |||||||||||||
| 5,650 | Qualcomm, Inc. | 206,734 | |||||||||||||
| 4,800 | @ | Qwest Communications International, Inc. | 36,912 | ||||||||||||
| 10,168 | Sprint Nextel Corp. | 198,378 | |||||||||||||
| 1,900 | @ | Tellabs, Inc. | 19,076 | ||||||||||||
| 9,850 | Verizon Communications, Inc. | 344,159 | |||||||||||||
| 1,410 | Windstream Corp. | 19,655 | |||||||||||||
| 3,094,596 | |||||||||||||||
| Textiles: 0.0% | |||||||||||||||
| 650 | Cintas Corp. | 27,430 | |||||||||||||
| 27,430 | |||||||||||||||
| Toys/Games/Hobbies: 0.1% | |||||||||||||||
| 1,000 | Hasbro, Inc. | 26,750 | |||||||||||||
| 1,500 | Mattel, Inc. | 32,925 | |||||||||||||
| 59,675 | |||||||||||||||
| Transportation: 0.4% | |||||||||||||||
| 1,250 | Burlington Northern Santa Fe Corp. | 93,950 | |||||||||||||
| 1,560 | CSX Corp. | 55,942 | |||||||||||||
| 1,000 | FedEx Corp. | 115,430 | |||||||||||||
See Accompanying Notes to Financial Statements
111
PORTFOLIO OF INVESTMENTS
ING PRINCIPAL PROTECTION FUND VII AS OF NOVEMBER 30, 2006 (UNAUDITED) (CONTINUED)
| Shares | Value | ||||||||||||||
| Transportation (continued) | |||||||||||||||
| 1,450 | Norfolk Southern Corp. | $ | 71,413 | ||||||||||||
| 200 | Ryder System, Inc. | 10,434 | |||||||||||||
| 900 | Union Pacific Corp. | 81,444 | |||||||||||||
| 428,613 | |||||||||||||||
| Total Common Stock (Cost $39,870,923) | 44,199,010 | ||||||||||||||
| Principal Amount | Value | ||||||||||||||
| U.S. GOVERNMENT AGENCY OBLIGATIONS: 58.4% | |||||||||||||||
| Federal National Mortgage Association: 58.4% | |||||||||||||||
| $ | 49,500,000 | 4.990%, due 06/26/08 | 45,855,414 | ||||||||||||
| 25,000,000 | 5.010%, due 05/15/08 | 23,275,525 | |||||||||||||
| 69,130,939 | |||||||||||||||
| Total U.S. Government Agency Obligations (Cost $71,575,734) | 69,130,939 | ||||||||||||||
| U.S. TREASURY OBLIGATIONS: 4.1% | |||||||||||||||
| U.S. Treasury Principal Only STRIP: 4.1% | |||||||||||||||
| 5,178,000 | 4.740%, due 05/15/08 | 4,840,819 | |||||||||||||
| 4,840,819 | |||||||||||||||
| Total U.S. Treasury Obligations (Cost $4,825,796) | 4,840,819 | ||||||||||||||
| Total Long-Term Investments (Cost $116,272,453) | 118,170,768 | ||||||||||||||
| SHORT-TERM INVESTMENTS: 0.8% | |||||||||||||||
| Repurchase Agreement: 0.8% | |||||||||||
| 942,000 | Goldman Sachs Repurchase Agreement dated 11/30/06, 5.280%, due 12/01/06, $942,138 to be received upon repurchase (Collateralized by $934,000 Federal National Mortgage Association, 5.250%, Market Value plus accrued interest $961,733, due 06/15/08) | 942,000 | |||||||||
| Total Short-Term Investments (Cost $942,000) | 942,000 | ||||||||||
| Total Investments in Securities (Cost $117,214,453)* | 100.7 | % | $ | 119,112,768 | |||||||
| Other Assets and Liabilities - Net | (0.7 | ) | (833,397 | ) | |||||||
| Net Assets | 100.0 | % | $ | 118,279,371 | |||||||
@ Non-income producing security
@@ Foreign Issuer
STRIP Separate Trading of Registered Interest and Principal of Securities
* Cost for federal income tax purposes is $117,826,498.
Net unrealized appreciation consists of:
| Gross Unrealized Appreciation | $ | 4,363,944 | |||||
| Gross Unrealized Depreciation | (3,077,674 | ) | |||||
| Net Unrealized Appreciation | $ | 1,286,270 | |||||
See Accompanying Notes to Financial Statements
112
PORTFOLIO OF INVESTMENTS
ING PRINCIPAL PROTECTION FUND VIII AS OF NOVEMBER 30, 2006 (UNAUDITED)
| Shares | Value | ||||||||||||||
| COMMON STOCK: 42.6% | |||||||||||||||
| Advertising: 0.1% | |||||||||||||||
| 720 | Omnicom Group | $ | 73,555 | ||||||||||||
| 73,555 | |||||||||||||||
| Aerospace/Defense: 1.0% | |||||||||||||||
| 1,920 | Boeing Co. | 169,978 | |||||||||||||
| 1,330 | General Dynamics Corp. | 99,537 | |||||||||||||
| 350 | Goodrich Corp. | 15,750 | |||||||||||||
| 450 | L-3 Communications Holdings, Inc. | 37,013 | |||||||||||||
| 1,190 | Lockheed Martin Corp. | 107,636 | |||||||||||||
| 847 | Northrop Grumman Corp. | 56,690 | |||||||||||||
| 1,704 | Raytheon Co. | 86,972 | |||||||||||||
| 170 | Rockwell Collins, Inc. | 10,256 | |||||||||||||
| 2,450 | United Technologies Corp. | 158,099 | |||||||||||||
| 741,931 | |||||||||||||||
| Agriculture: 0.7% | |||||||||||||||
| 5,040 | Altria Group, Inc. | 424,418 | |||||||||||||
| 1,600 | Archer-Daniels-Midland Co. | 56,160 | |||||||||||||
| 440 | Reynolds American, Inc. | 28,266 | |||||||||||||
| 350 | UST, Inc. | 19,593 | |||||||||||||
| 528,437 | |||||||||||||||
| Airlines: 0.0% | |||||||||||||||
| 1,950 | Southwest Airlines Co. | 30,635 | |||||||||||||
| 30,635 | |||||||||||||||
| Apparel: 0.2% | |||||||||||||||
| 1,510 | @ | Coach, Inc. | 65,247 | ||||||||||||
| 470 | Jones Apparel Group, Inc. | 15,792 | |||||||||||||
| 210 | Liz Claiborne, Inc. | 8,978 | |||||||||||||
| 620 | Nike, Inc. | 61,349 | |||||||||||||
| 60 | VF Corp. | 4,703 | |||||||||||||
| 156,069 | |||||||||||||||
| Auto Manufacturers: 0.1% | |||||||||||||||
| 3,980 | Ford Motor Co. | 32,357 | |||||||||||||
| 500 | General Motors Corp. | 14,615 | |||||||||||||
| 675 | Paccar, Inc. | 44,078 | |||||||||||||
| 91,050 | |||||||||||||||
| Auto Parts & Equipment: 0.1% | |||||||||||||||
| 400 | @ | Goodyear Tire & Rubber Co. | 6,740 | ||||||||||||
| 520 | Johnson Controls, Inc. | 42,292 | |||||||||||||
| 49,032 | |||||||||||||||
| Banks: 3.3% | |||||||||||||||
| 14,733 | Bank of America Corp. | 793,372 | |||||||||||||
| 1,790 | Bank of New York Co., Inc. | 63,617 | |||||||||||||
| 1,171 | BB&T Corp. | 50,365 | |||||||||||||
| 710 | Capital One Financial Corp. | 55,295 | |||||||||||||
| 540 | Comerica, Inc. | 31,455 | |||||||||||||
| 200 | Commerce Bancorp., Inc. | 6,952 | |||||||||||||
| 300 | Compass Bancshares, Inc. | 17,142 | |||||||||||||
| 1,400 | Fifth Third Bancorp. | 55,202 | |||||||||||||
| 260 | First Horizon National Corp. | 10,364 | |||||||||||||
| 430 | Huntington Bancshares, Inc. | 10,453 | |||||||||||||
| 850 | Keycorp | 30,685 | |||||||||||||
| 200 | M&T Bank Corp. | 23,728 | |||||||||||||
| 620 | Marshall & Ilsley Corp. | 28,390 | |||||||||||||
| 890 | Mellon Financial Corp. | 35,805 | |||||||||||||
| 1,980 | National City Corp. | 71,478 | |||||||||||||
| Shares | Value | ||||||||||||||
| 1,000 | North Fork Bancorp., Inc. | $ | 28,070 | ||||||||||||
| 460 | Northern Trust Corp. | 26,202 | |||||||||||||
| 760 | PNC Financial Services Group, Inc. | 53,724 | |||||||||||||
| 2,401 | Regions Financial Corp. | 87,997 | |||||||||||||
| 850 | State Street Corp. | 52,811 | |||||||||||||
| 870 | SunTrust Banks, Inc. | 71,036 | |||||||||||||
| 738 | Synovus Financial Corp. | 22,155 | |||||||||||||
| 4,290 | US Bancorp. | 144,316 | |||||||||||||
| 6,269 | Wachovia Corp. | 339,717 | |||||||||||||
| 8,120 | Wells Fargo & Co. | 286,149 | |||||||||||||
| 290 | Zions Bancorp. | 22,690 | |||||||||||||
| 2,419,170 | |||||||||||||||
| Beverages: 0.9% | |||||||||||||||
| 2,510 | Anheuser-Busch Cos., Inc. | 119,250 | |||||||||||||
| 270 | Brown-Forman Corp. | 18,752 | |||||||||||||
| 4,940 | Coca-Cola Co. | 231,340 | |||||||||||||
| 840 | Coca-Cola Enterprises, Inc. | 17,178 | |||||||||||||
| 450 | @ | Constellation Brands, Inc. | 12,591 | ||||||||||||
| 100 | Molson Coors Brewing Co. | 7,108 | |||||||||||||
| 470 | Pepsi Bottling Group, Inc. | 14,720 | |||||||||||||
| 4,010 | PepsiCo, Inc. | 248,500 | |||||||||||||
| 669,439 | |||||||||||||||
| Biotechnology: 0.4% | |||||||||||||||
| 2,870 | @ | Amgen, Inc. | 203,770 | ||||||||||||
| 750 | @ | Biogen Idec, Inc. | 39,195 | ||||||||||||
| 850 | @ | Celgene Corp. | 47,371 | ||||||||||||
| 250 | @ | Genzyme Corp. | 16,100 | ||||||||||||
| 200 | @ | Medimmune, Inc. | 6,538 | ||||||||||||
| 150 | @ | Millipore Corp. | 10,262 | ||||||||||||
| 323,236 | |||||||||||||||
| Building Materials: 0.1% | |||||||||||||||
| 120 | American Standard Cos., Inc. | 5,377 | |||||||||||||
| 1,120 | Masco Corp. | 32,133 | |||||||||||||
| 37,510 | |||||||||||||||
| Chemicals: 0.7% | |||||||||||||||
| 250 | Air Products & Chemicals, Inc. | 17,285 | |||||||||||||
| 200 | Ashland, Inc. | 13,522 | |||||||||||||
| 2,630 | Dow Chemical Co. | 105,226 | |||||||||||||
| 400 | Ecolab, Inc. | 17,740 | |||||||||||||
| 2,500 | EI DuPont de Nemours & Co. | 117,325 | |||||||||||||
| 270 | International Flavors & Fragrances, Inc. | 12,720 | |||||||||||||
| 1,500 | Monsanto Co. | 72,105 | |||||||||||||
| 600 | PPG Industries, Inc. | 38,580 | |||||||||||||
| 810 | Praxair, Inc. | 50,544 | |||||||||||||
| 380 | Rohm & Haas Co. | 19,844 | |||||||||||||
| 450 | Sherwin-Williams Co. | 28,148 | |||||||||||||
| 200 | Sigma-Aldrich Corp. | 15,222 | |||||||||||||
| 508,261 | |||||||||||||||
| Coal: 0.0% | |||||||||||||||
| 650 | Peabody Energy Corp. | 29,907 | |||||||||||||
| 29,907 | |||||||||||||||
| Commercial Services: 0.4% | |||||||||||||||
| 450 | @ | Apollo Group, Inc. | 17,456 | ||||||||||||
| 400 | @ | Convergys Corp. | 9,648 | ||||||||||||
| 420 | Equifax, Inc. | 15,956 | |||||||||||||
| 820 | H&R Block, Inc. | 19,680 | |||||||||||||
| 1,190 | McKesson Corp. | 58,786 | |||||||||||||
See Accompanying Notes to Financial Statements
113
PORTFOLIO OF INVESTMENTS
ING PRINCIPAL PROTECTION FUND VIII AS OF NOVEMBER 30, 2006 (UNAUDITED) (CONTINUED)
| Shares | Value | ||||||||||||||
| Commercial Services (continued) | |||||||||||||||
| 350 | @ | Monster Worldwide, Inc. | $ | 15,278 | |||||||||||
| 810 | Moody's Corp. | 56,279 | |||||||||||||
| 450 | Robert Half International, Inc. | 17,366 | |||||||||||||
| 550 | RR Donnelley & Sons Co. | 19,399 | |||||||||||||
| 1,897 | Western Union Co. | 43,252 | |||||||||||||
| 273,100 | |||||||||||||||
| Computers: 2.0% | |||||||||||||||
| 300 | @ | Affiliated Computer Services, Inc. | 15,165 | ||||||||||||
| 340 | @ | Cognizant Technology Solutions Corp. | 27,730 | ||||||||||||
| 400 | @ | Computer Sciences Corp. | 20,880 | ||||||||||||
| 9,350 | @ | Dell, Inc. | 254,694 | ||||||||||||
| 1,250 | Electronic Data Systems Corp. | 33,925 | |||||||||||||
| 5,290 | @ | EMC Corp. | 69,352 | ||||||||||||
| 11,260 | Hewlett-Packard Co. | 444,320 | |||||||||||||
| 5,000 | International Business Machines Corp. | 459,600 | |||||||||||||
| 380 | @ | Lexmark International, Inc. | 26,212 | ||||||||||||
| 450 | @ | NCR Corp. | 19,310 | ||||||||||||
| 810 | @ | Network Appliance, Inc. | 31,760 | ||||||||||||
| 450 | @ | Sandisk Corp. | 19,980 | ||||||||||||
| 7,450 | @ | Sun Microsystems, Inc. | 40,379 | ||||||||||||
| 800 | @ | Unisys Corp. | 5,768 | ||||||||||||
| 1,469,075 | |||||||||||||||
| Cosmetics/Personal Care: 0.8% | |||||||||||||||
| 1,000 | Avon Products, Inc. | 32,640 | |||||||||||||
| 1,290 | Colgate-Palmolive Co. | 83,915 | |||||||||||||
| 450 | Estee Lauder Cos., Inc. | 18,581 | |||||||||||||
| 7,679 | Procter & Gamble Co. | 482,164 | |||||||||||||
| 617,300 | |||||||||||||||
| Distribution/Wholesale: 0.0% | |||||||||||||||
| 150 | WW Grainger, Inc. | 10,854 | |||||||||||||
| 10,854 | |||||||||||||||
| Diversified Financial Services: 3.8% | |||||||||||||||
| 2,880 | American Express Co. | 169,114 | |||||||||||||
| 596 | Ameriprise Financial, Inc. | 32,244 | |||||||||||||
| 280 | Bear Stearns Cos., Inc. | 42,694 | |||||||||||||
| 2,700 | Charles Schwab Corp. | 49,518 | |||||||||||||
| 80 | Chicago Mercantile Exchange Holdings, Inc. | 42,848 | |||||||||||||
| 800 | CIT Group, Inc. | 41,608 | |||||||||||||
| 16,090 | Citigroup, Inc. | 797,903 | |||||||||||||
| 1,510 | Countrywide Financial Corp. | 59,977 | |||||||||||||
| 800 | @ | E*Trade Financial Corp. | 19,256 | ||||||||||||
| 2,350 | Fannie Mae | 134,021 | |||||||||||||
| 120 | Federated Investors, Inc. | 3,982 | |||||||||||||
| 420 | Franklin Resources, Inc. | 44,831 | |||||||||||||
| 1,650 | Freddie Mac | 110,814 | |||||||||||||
| 1,020 | Goldman Sachs Group, Inc. | 198,696 | |||||||||||||
| 450 | Janus Capital Group, Inc. | 9,117 | |||||||||||||
| 11,250 | JPMorgan Chase & Co. | 520,650 | |||||||||||||
| 1,280 | Lehman Brothers Holdings, Inc. | 94,298 | |||||||||||||
| 2,130 | Merrill Lynch & Co., Inc. | 186,226 | |||||||||||||
| 2,580 | Morgan Stanley | 196,493 | |||||||||||||
| 920 | SLM Corp. | 42,173 | |||||||||||||
| 750 | T. Rowe Price Group, Inc. | 32,498 | |||||||||||||
| 2,828,961 | |||||||||||||||
| Shares | Value | ||||||||||||||
| Electric: 1.3% | |||||||||||||||
| 2,600 | @ | AES Corp. | $ | 60,762 | |||||||||||
| 450 | @ | Allegheny Energy, Inc. | 19,962 | ||||||||||||
| 600 | Ameren Corp. | 32,826 | |||||||||||||
| 1,090 | American Electric Power Co., Inc. | 45,246 | |||||||||||||
| 800 | Centerpoint Energy, Inc. | 13,080 | |||||||||||||
| 900 | @ | CMS Energy Corp. | 14,589 | ||||||||||||
| 500 | Constellation Energy Group, Inc. | 34,305 | |||||||||||||
| 500 | DTE Energy Co. | 23,545 | |||||||||||||
| 1,200 | @ | Dynegy, Inc. | 8,148 | ||||||||||||
| 910 | Edison International | 41,842 | |||||||||||||
| 700 | Entergy Corp. | 63,924 | |||||||||||||
| 2,150 | Exelon Corp. | 130,570 | |||||||||||||
| 970 | FirstEnergy Corp. | 58,045 | |||||||||||||
| 1,040 | PG&E Corp. | 47,767 | |||||||||||||
| 350 | Pinnacle West Capital Corp. | 17,269 | |||||||||||||
| 1,230 | PPL Corp. | 44,711 | |||||||||||||
| 300 | Progress Energy, Inc. | 14,331 | |||||||||||||
| 800 | Public Service Enterprise Group, Inc. | 53,776 | |||||||||||||
| 2,350 | Southern Co. | 85,188 | |||||||||||||
| 600 | TECO Energy, Inc. | 10,194 | |||||||||||||
| 1,330 | TXU Corp. | 76,329 | |||||||||||||
| 1,220 | Xcel Energy, Inc. | 28,011 | |||||||||||||
| 924,420 | |||||||||||||||
| Electrical Components & Equipment: 0.1% | |||||||||||||||
| 970 | Emerson Electric Co. | 84,099 | |||||||||||||
| 350 | Molex, Inc. | 11,200 | |||||||||||||
| 95,299 | |||||||||||||||
| Electronics: 0.2% | |||||||||||||||
| 1,250 | @ | Agilent Technologies, Inc. | 39,800 | ||||||||||||
| 450 | Applera Corp. - Applied Biosystems Group | 16,398 | |||||||||||||
| 420 | Jabil Circuit, Inc. | 11,911 | |||||||||||||
| 340 | PerkinElmer, Inc. | 7,368 | |||||||||||||
| 600 | Symbol Technologies, Inc. | 8,892 | |||||||||||||
| 1,120 | @ | Thermo Electron Corp. | 49,090 | ||||||||||||
| 300 | @ | Waters Corp. | 15,012 | ||||||||||||
| 148,471 | |||||||||||||||
| Entertainment: 0.0% | |||||||||||||||
| 350 | International Game Technology | 15,323 | |||||||||||||
| 15,323 | |||||||||||||||
| Environmental Control: 0.1% | |||||||||||||||
| 600 | @ | Allied Waste Industries, Inc. | 7,608 | ||||||||||||
| 1,760 | Waste Management, Inc. | 64,434 | |||||||||||||
| 72,042 | |||||||||||||||
| Food: 0.5% | |||||||||||||||
| 1,000 | Campbell Soup Co. | 38,070 | |||||||||||||
| 1,150 | ConAgra Foods, Inc. | 29,555 | |||||||||||||
| 350 | @ | Dean Foods Co. | 14,987 | ||||||||||||
| 1,350 | General Mills, Inc. | 75,533 | |||||||||||||
| 200 | Hershey Co. | 10,594 | |||||||||||||
| 700 | HJ Heinz Co. | 31,115 | |||||||||||||
| 570 | Kellogg Co. | 28,375 | |||||||||||||
| 1,700 | Kroger Co. | 36,482 | |||||||||||||
| 400 | McCormick & Co., Inc. | 15,488 | |||||||||||||
| 1,300 | Safeway, Inc. | 40,053 | |||||||||||||
| 688 | Sara Lee Corp. | 11,407 | |||||||||||||
See Accompanying Notes to Financial Statements
114
PORTFOLIO OF INVESTMENTS
ING PRINCIPAL PROTECTION FUND VIII AS OF NOVEMBER 30, 2006 (UNAUDITED) (CONTINUED)
| Shares | Value | ||||||||||||||
| Food (continued) | |||||||||||||||
| 165 | Supervalu, Inc. | $ | 5,653 | ||||||||||||
| 350 | Whole Foods Market, Inc. | 17,080 | |||||||||||||
| 354,392 | |||||||||||||||
| Forest Products & Paper: 0.1% | |||||||||||||||
| 1,100 | International Paper Co. | 36,410 | |||||||||||||
| 450 | MeadWestvaco Corp. | 13,275 | |||||||||||||
| 450 | Plum Creek Timber Co., Inc. | 16,767 | |||||||||||||
| 450 | Temple-Inland, Inc. | 17,595 | |||||||||||||
| 300 | Weyerhaeuser Co. | 19,404 | |||||||||||||
| 103,451 | |||||||||||||||
| Gas: 0.1% | |||||||||||||||
| 500 | KeySpan Corp. | 20,515 | |||||||||||||
| 100 | Nicor, Inc. | 4,955 | |||||||||||||
| 800 | NiSource, Inc. | 19,728 | |||||||||||||
| 770 | Sempra Energy | 41,965 | |||||||||||||
| 87,163 | |||||||||||||||
| Hand/Machine Tools: 0.1% | |||||||||||||||
| 260 | Black & Decker Corp. | 22,329 | |||||||||||||
| 90 | Snap-On, Inc. | 4,275 | |||||||||||||
| 280 | Stanley Works | 14,286 | |||||||||||||
| 40,890 | |||||||||||||||
| Healthcare-Products: 1.2% | |||||||||||||||
| 1,610 | Baxter International, Inc. | 72,031 | |||||||||||||
| 630 | Becton Dickinson & Co. | 45,184 | |||||||||||||
| 2,650 | @ | Boston Scientific Corp. | 41,923 | ||||||||||||
| 290 | CR Bard, Inc. | 23,864 | |||||||||||||
| 7,140 | Johnson & Johnson | 470,597 | |||||||||||||
| 2,800 | Medtronic, Inc. | 145,964 | |||||||||||||
| 300 | @ | Patterson Cos., Inc. | 11,133 | ||||||||||||
| 290 | @ | St. Jude Medical, Inc. | 10,808 | ||||||||||||
| 700 | Stryker Corp. | 36,302 | |||||||||||||
| 550 | @ | Zimmer Holdings, Inc. | 40,128 | ||||||||||||
| 897,934 | |||||||||||||||
| Healthcare-Services: 0.9% | |||||||||||||||
| 1,790 | Aetna, Inc. | 73,945 | |||||||||||||
| 625 | @ | Coventry Health Care, Inc. | 30,081 | ||||||||||||
| 670 | @ | Humana, Inc. | 36,247 | ||||||||||||
| 400 | @ | Laboratory Corp. of America Holdings | 28,320 | ||||||||||||
| 200 | Manor Care, Inc. | 9,504 | |||||||||||||
| 430 | Quest Diagnostics | 22,863 | |||||||||||||
| 5,500 | UnitedHealth Group, Inc. | 269,940 | |||||||||||||
| 2,590 | @ | WellPoint, Inc. | 195,985 | ||||||||||||
| 666,885 | |||||||||||||||
| Home Furnishings: 0.1% | |||||||||||||||
| 300 | Harman International Industries, Inc. | 31,152 | |||||||||||||
| 200 | Whirlpool Corp. | 17,060 | |||||||||||||
| 48,212 | |||||||||||||||
| Household Products/Wares: 0.2% | |||||||||||||||
| 50 | Avery Dennison Corp. | 3,374 | |||||||||||||
| 400 | Fortune Brands, Inc. | 32,360 | |||||||||||||
| 1,150 | Kimberly-Clark Corp. | 76,441 | |||||||||||||
| 112,175 | |||||||||||||||
| Shares | Value | ||||||||||||||
| Housewares: 0.0% | |||||||||||||||
| 750 | Newell Rubbermaid, Inc. | $ | 21,368 | ||||||||||||
| 21,368 | |||||||||||||||
| Insurance: 2.4% | |||||||||||||||
| 790 | @@ | ACE Ltd. | 44,904 | ||||||||||||
| 1,170 | Aflac, Inc. | 51,644 | |||||||||||||
| 2,030 | Allstate Corp. | 128,864 | |||||||||||||
| 320 | AMBAC Financial Group, Inc. | 27,405 | |||||||||||||
| 6,320 | American International Group, Inc. | 444,422 | |||||||||||||
| 850 | AON Corp. | 30,328 | |||||||||||||
| 1,410 | Chubb Corp. | 72,982 | |||||||||||||
| 390 | Cigna Corp. | 49,160 | |||||||||||||
| 456 | Cincinnati Financial Corp. | 20,192 | |||||||||||||
| 1,900 | Genworth Financial, Inc. | 62,320 | |||||||||||||
| 1,250 | Hartford Financial Services Group, Inc. | 107,200 | |||||||||||||
| 682 | Lincoln National Corp. | 43,368 | |||||||||||||
| 1,510 | Loews Corp. | 60,279 | |||||||||||||
| 500 | Marsh & McLennan Cos., Inc. | 15,710 | |||||||||||||
| 420 | MBIA, Inc. | 29,253 | |||||||||||||
| 2,420 | Metlife, Inc. | 142,127 | |||||||||||||
| 270 | MGIC Investment Corp. | 15,649 | |||||||||||||
| 860 | Principal Financial Group | 49,665 | |||||||||||||
| 2,290 | Progressive Corp. | 51,640 | |||||||||||||
| 1,590 | Prudential Financial, Inc. | 129,553 | |||||||||||||
| 410 | Safeco Corp. | 24,834 | |||||||||||||
| 2,260 | St. Paul Travelers Cos., Inc. | 117,091 | |||||||||||||
| 280 | Torchmark Corp. | 17,702 | |||||||||||||
| 850 | UnumProvident Corp. | 17,408 | |||||||||||||
| 400 | @@ | XL Capital Ltd. | 28,448 | ||||||||||||
| 1,782,148 | |||||||||||||||
| Internet: 0.3% | |||||||||||||||
| 650 | @ | Amazon.com, Inc. | 26,221 | ||||||||||||
| 1,010 | @ | eBay, Inc. | 32,674 | ||||||||||||
| 250 | @ | Google, Inc. | 121,230 | ||||||||||||
| 2,317 | @ | Symantec Corp. | 49,120 | ||||||||||||
| 600 | @ | VeriSign, Inc. | 15,666 | ||||||||||||
| 244,911 | |||||||||||||||
| Iron/Steel: 0.2% | |||||||||||||||
| 1,400 | Nucor Corp. | 83,790 | |||||||||||||
| 560 | United States Steel Corp. | 41,882 | |||||||||||||
| 125,672 | |||||||||||||||
| Leisure Time: 0.2% | |||||||||||||||
| 270 | Brunswick Corp. | 8,740 | |||||||||||||
| 1,000 | Carnival Corp. | 48,990 | |||||||||||||
| 670 | Harley-Davidson, Inc. | 49,426 | |||||||||||||
| 450 | Sabre Holdings Corp. | 12,344 | |||||||||||||
| 119,500 | |||||||||||||||
| Lodging: 0.1% | |||||||||||||||
| 940 | Marriott International, Inc. | 42,441 | |||||||||||||
| 390 | Starwood Hotels & Resorts Worldwide, Inc. | 25,026 | |||||||||||||
| 466 | @ | Wyndham Worldwide Corp. | 14,791 | ||||||||||||
| 82,258 | |||||||||||||||
| Machinery-Construction & Mining: 0.1% | |||||||||||||||
| 1,550 | Caterpillar, Inc. | 96,147 | |||||||||||||
| 96,147 | |||||||||||||||
See Accompanying Notes to Financial Statements
115
PORTFOLIO OF INVESTMENTS
ING PRINCIPAL PROTECTION FUND VIII AS OF NOVEMBER 30, 2006 (UNAUDITED) (CONTINUED)
| Shares | Value | ||||||||||||||
| Machinery-Diversified: 0.1% | |||||||||||||||
| 220 | Cummins, Inc. | $ | 26,382 | ||||||||||||
| 250 | Deere & Co. | 24,000 | |||||||||||||
| 420 | Rockwell Automation, Inc. | 27,334 | |||||||||||||
| 77,716 | |||||||||||||||
| Media: 1.1% | |||||||||||||||
| 2,600 | CBS Corp. | 77,350 | |||||||||||||
| 1,100 | Clear Channel Communications, Inc. | 38,676 | |||||||||||||
| 5,050 | @ | Comcast Corp. | 204,323 | ||||||||||||
| 200 | EW Scripps Co. | 9,772 | |||||||||||||
| 500 | Gannett Co., Inc. | 29,760 | |||||||||||||
| 1,300 | McGraw-Hill Cos., Inc. | 86,645 | |||||||||||||
| 140 | Meredith Corp. | 7,574 | |||||||||||||
| 5,800 | News Corp., Inc. | 119,480 | |||||||||||||
| 200 | Tribune Co. | 6,360 | |||||||||||||
| 450 | @ | Univision Communications, Inc. | 16,016 | ||||||||||||
| 6,990 | Walt Disney Co. | 231,020 | |||||||||||||
| 826,976 | |||||||||||||||
| Mining: 0.1% | |||||||||||||||
| 490 | Freeport-McMoRan Copper & Gold, Inc. | 30,806 | |||||||||||||
| 460 | Phelps Dodge Corp. | 56,580 | |||||||||||||
| 60 | Vulcan Materials Co. | 5,323 | |||||||||||||
| 92,709 | |||||||||||||||
| Miscellaneous Manufacturing: 2.2% | |||||||||||||||
| 1,850 | 3M Co. | 150,701 | |||||||||||||
| 190 | Cooper Industries Ltd. | 17,374 | |||||||||||||
| 650 | Danaher Corp. | 47,528 | |||||||||||||
| 450 | Dover Corp. | 22,635 | |||||||||||||
| 950 | Eastman Kodak Co. | 24,719 | |||||||||||||
| 650 | Eaton Corp. | 50,102 | |||||||||||||
| 25,050 | General Electric Co. | 883,764 | |||||||||||||
| 2,630 | Honeywell International, Inc. | 113,037 | |||||||||||||
| 960 | Illinois Tool Works, Inc. | 45,312 | |||||||||||||
| 710 | @@ | Ingersoll-Rand Co. | 27,697 | ||||||||||||
| 390 | ITT Corp. | 21,041 | |||||||||||||
| 450 | Leggett & Platt, Inc. | 10,701 | |||||||||||||
| 540 | Parker Hannifin Corp. | 45,079 | |||||||||||||
| 360 | Textron, Inc. | 35,082 | |||||||||||||
| 4,900 | @@ | Tyco International Ltd. | 148,421 | ||||||||||||
| 1,643,193 | |||||||||||||||
| Office/Business Equipment: 0.1% | |||||||||||||||
| 550 | Pitney Bowes, Inc. | 25,350 | |||||||||||||
| 3,710 | @ | Xerox Corp. | 61,215 | ||||||||||||
| 86,565 | |||||||||||||||
| Oil & Gas: 4.2% | |||||||||||||||
| 1,020 | Anadarko Petroleum Corp. | 50,347 | |||||||||||||
| 320 | Apache Corp. | 22,378 | |||||||||||||
| 7,871 | Chevron Corp. | 569,231 | |||||||||||||
| 3,674 | ConocoPhillips | 247,260 | |||||||||||||
| 960 | Devon Energy Corp. | 70,435 | |||||||||||||
| 530 | EOG Resources, Inc. | 37,381 | |||||||||||||
| 21,400 | ExxonMobil Corp. | 1,643,734 | |||||||||||||
| 220 | Hess Corp. | 11,059 | |||||||||||||
| 1,350 | Marathon Oil Corp. | 127,413 | |||||||||||||
| 750 | @,@@ | Nabors Industries Ltd. | 25,320 | ||||||||||||
| 300 | Noble Corp. | 23,175 | |||||||||||||
| 1,760 | Occidental Petroleum Corp. | 88,598 | |||||||||||||
| Shares | Value | ||||||||||||||
| 470 | Sunoco, Inc. | $ | 32,035 | ||||||||||||
| 650 | @ | Transocean, Inc. | 50,668 | ||||||||||||
| 1,800 | Valero Energy Corp. | 99,126 | |||||||||||||
| 750 | XTO Energy, Inc. | 37,950 | |||||||||||||
| 3,136,110 | |||||||||||||||
| Oil & Gas Services: 0.6% | |||||||||||||||
| 750 | Baker Hughes, Inc. | 55,073 | |||||||||||||
| 300 | BJ Services Co. | 10,131 | |||||||||||||
| 3,850 | Halliburton Co. | 129,899 | |||||||||||||
| 400 | @ | National Oilwell Varco, Inc. | 26,604 | ||||||||||||
| 2,600 | Schlumberger Ltd. | 178,048 | |||||||||||||
| 300 | @ | Weatherford International Ltd. | 13,473 | ||||||||||||
| 413,228 | |||||||||||||||
| Packaging & Containers: 0.1% | |||||||||||||||
| 430 | Ball Corp. | 18,387 | |||||||||||||
| 300 | Bemis Co. | 10,239 | |||||||||||||
| 450 | @ | Pactiv Corp. | 15,503 | ||||||||||||
| 290 | Sealed Air Corp. | 17,258 | |||||||||||||
| 61,387 | |||||||||||||||
| Pharmaceuticals: 2.4% | |||||||||||||||
| 3,700 | Abbott Laboratories | 172,642 | |||||||||||||
| 140 | Allergan, Inc. | 16,321 | |||||||||||||
| 780 | AmerisourceBergen Corp. | 35,872 | |||||||||||||
| 250 | @ | Barr Pharmaceuticals, Inc. | 12,770 | ||||||||||||
| 1,900 | Bristol-Myers Squibb Co. | 47,177 | |||||||||||||
| 950 | Cardinal Health, Inc. | 61,389 | |||||||||||||
| 1,020 | Caremark Rx, Inc. | 48,246 | |||||||||||||
| 900 | Eli Lilly & Co. | 48,231 | |||||||||||||
| 490 | @ | Express Scripts, Inc. | 33,418 | ||||||||||||
| 1,070 | @ | Forest Laboratories, Inc. | 52,109 | ||||||||||||
| 1,100 | @ | Gilead Sciences, Inc. | 72,512 | ||||||||||||
| 150 | @ | Hospira, Inc. | 4,920 | ||||||||||||
| 890 | @ | King Pharmaceuticals, Inc. | 14,712 | ||||||||||||
| 670 | @ | Medco Health Solutions, Inc. | 33,641 | ||||||||||||
| 7,160 | Merck & Co., Inc. | 318,692 | |||||||||||||
| 850 | Mylan Laboratories | 17,247 | |||||||||||||
| 17,520 | Pfizer, Inc. | 481,625 | |||||||||||||
| 4,900 | Schering-Plough Corp. | 107,849 | |||||||||||||
| 350 | @ | Watson Pharmaceuticals, Inc. | 8,985 | ||||||||||||
| 3,200 | Wyeth | 154,496 | |||||||||||||
| 1,742,854 | |||||||||||||||
| Pipelines: 0.1% | |||||||||||||||
| 1,400 | El Paso Corp. | 20,440 | |||||||||||||
| 1,170 | Williams Cos., Inc. | 32,479 | |||||||||||||
| 52,919 | |||||||||||||||
| Real Estate: 0.0% | |||||||||||||||
| 450 | @ | CB Richard Ellis Group, Inc. | 14,819 | ||||||||||||
| 502 | @ | Realogy Corp. | 13,097 | ||||||||||||
| 27,916 | |||||||||||||||
| Real Estate Investment Trusts: 0.1% | |||||||||||||||
| 300 | Apartment Investment & Management Co. | 17,292 | |||||||||||||
| 100 | Boston Properties, Inc. | 11,705 | |||||||||||||
| 790 | Equity Office Properties Trust | 38,078 | |||||||||||||
| 200 | Prologis | 13,034 | |||||||||||||
| 100 | Public Storage, Inc. | 9,628 | |||||||||||||
| 100 | Vornado Realty Trust | 12,611 | |||||||||||||
| 102,348 | |||||||||||||||
See Accompanying Notes to Financial Statements
116
PORTFOLIO OF INVESTMENTS
ING PRINCIPAL PROTECTION FUND VIII AS OF NOVEMBER 30, 2006 (UNAUDITED) (CONTINUED)
| Shares | Value | ||||||||||||||
| Retail: 2.4% | |||||||||||||||
| 200 | @ | Autozone, Inc. | $ | 22,722 | |||||||||||
| 690 | @ | Bed Bath & Beyond, Inc. | 26,738 | ||||||||||||
| 1,020 | Best Buy Co., Inc. | 56,069 | |||||||||||||
| 400 | @ | Big Lots, Inc. | 8,924 | ||||||||||||
| 400 | Circuit City Stores, Inc. | 9,984 | |||||||||||||
| 1,270 | Costco Wholesale Corp. | 66,370 | |||||||||||||
| 1,950 | CVS Corp. | 56,102 | |||||||||||||
| 390 | Darden Restaurants, Inc. | 15,659 | |||||||||||||
| 550 | Family Dollar Stores, Inc. | 15,340 | |||||||||||||
| 2,298 | Federated Department Stores, Inc. | 96,723 | |||||||||||||
| 2,180 | Gap, Inc. | 40,810 | |||||||||||||
| 1,990 | Home Depot, Inc. | 75,560 | |||||||||||||
| 550 | JC Penney Co., Inc. | 42,537 | |||||||||||||
| 1,350 | @ | Kohl's Corp. | 93,960 | ||||||||||||
| 770 | Limited Brands, Inc. | 24,401 | |||||||||||||
| 3,630 | Lowe's Cos., Inc. | 109,481 | |||||||||||||
| 3,010 | McDonald's Corp. | 126,330 | |||||||||||||
| 830 | Nordstrom, Inc. | 40,687 | |||||||||||||
| 1,150 | @ | Office Depot, Inc. | 43,539 | ||||||||||||
| 200 | OfficeMax, Inc. | 9,414 | |||||||||||||
| 200 | @ | Sears Holding Corp. | 34,284 | ||||||||||||
| 1,610 | Staples, Inc. | 41,007 | |||||||||||||
| 2,420 | @ | Starbucks Corp. | 85,402 | ||||||||||||
| 2,100 | Target Corp. | 121,989 | |||||||||||||
| 1,880 | TJX Cos., Inc. | 51,550 | |||||||||||||
| 2,450 | Walgreen Co. | 99,201 | |||||||||||||
| 5,940 | Wal-Mart Stores, Inc. | 273,834 | |||||||||||||
| 480 | Wendy's International, Inc. | 15,634 | |||||||||||||
| 720 | Yum! Brands, Inc. | 44,057 | |||||||||||||
| 1,748,308 | |||||||||||||||
| Savings & Loans: 0.1% | |||||||||||||||
| 2,342 | Washington Mutual, Inc. | 102,299 | |||||||||||||
| 102,299 | |||||||||||||||
| Semiconductors: 1.0% | |||||||||||||||
| 1,850 | @ | Advanced Micro Devices, Inc. | 39,905 | ||||||||||||
| 1,320 | @ | Altera Corp. | 26,255 | ||||||||||||
| 1,070 | Analog Devices, Inc. | 34,796 | |||||||||||||
| 3,400 | Applied Materials, Inc. | 61,132 | |||||||||||||
| 975 | @ | Freescale Semiconductor, Inc. | 38,932 | ||||||||||||
| 13,880 | Intel Corp. | 296,338 | |||||||||||||
| 500 | KLA-Tencor Corp. | 25,835 | |||||||||||||
| 680 | Linear Technology Corp. | 21,855 | |||||||||||||
| 1,600 | @ | LSI Logic Corp. | 17,056 | ||||||||||||
| 710 | Maxim Integrated Products | 22,351 | |||||||||||||
| 2,750 | @ | Micron Technology, Inc. | 40,150 | ||||||||||||
| 1,090 | National Semiconductor Corp. | 26,367 | |||||||||||||
| 450 | @ | Novellus Systems, Inc. | 14,049 | ||||||||||||
| 300 | @ | Nvidia Corp. | 11,097 | ||||||||||||
| 550 | @ | QLogic Corp. | 12,238 | ||||||||||||
| 600 | @ | Teradyne, Inc. | 8,940 | ||||||||||||
| 1,460 | Texas Instruments, Inc. | 43,143 | |||||||||||||
| 750 | Xilinx, Inc. | 20,100 | |||||||||||||
| 760,539 | |||||||||||||||
| Software: 1.7% | |||||||||||||||
| 1,310 | @ | Adobe Systems, Inc. | 52,570 | ||||||||||||
| 580 | @ | Autodesk, Inc. | 23,884 | ||||||||||||
| 1,310 | Automatic Data Processing, Inc. | 63,181 | |||||||||||||
| 760 | @ | BMC Software, Inc. | 24,746 | ||||||||||||
| 1,270 | CA, Inc. | 27,559 | |||||||||||||
| Shares | Value | ||||||||||||||
| 440 | @ | Citrix Systems, Inc. | $ | 12,646 | |||||||||||
| 1,320 | @ | Compuware Corp. | 11,075 | ||||||||||||
| 620 | @ | Electronic Arts, Inc. | 34,627 | ||||||||||||
| 400 | Fidelity National Information Services, Inc. | 15,960 | |||||||||||||
| 1,897 | First Data Corp. | 47,899 | |||||||||||||
| 390 | @ | Fiserv, Inc. | 19,933 | ||||||||||||
| 430 | IMS Health, Inc. | 11,812 | |||||||||||||
| 960 | @ | Intuit, Inc. | 30,221 | ||||||||||||
| 20,850 | Microsoft Corp. | 611,531 | |||||||||||||
| 1,130 | @ | Novell, Inc. | 7,096 | ||||||||||||
| 9,680 | @ | Oracle Corp. | 184,210 | ||||||||||||
| 462 | @ | Parametric Technology Corp. | 8,944 | ||||||||||||
| 870 | Paychex, Inc. | 34,287 | |||||||||||||
| 1,222,181 | |||||||||||||||
| Telecommunications: 3.0% | |||||||||||||||
| 950 | Alltel Corp. | 53,903 | |||||||||||||
| 9,322 | AT&T, Inc. | 316,109 | |||||||||||||
| 1,550 | @ | Avaya, Inc. | 19,809 | ||||||||||||
| 4,350 | BellSouth Corp. | 193,967 | |||||||||||||
| 340 | CenturyTel, Inc. | 14,467 | |||||||||||||
| 25,000 | @ | Cisco Systems, Inc. | 672,000 | ||||||||||||
| 750 | Citizens Communications Co. | 10,628 | |||||||||||||
| 390 | @ | Comverse Technology, Inc. | 7,613 | ||||||||||||
| 3,800 | @ | Corning, Inc. | 81,928 | ||||||||||||
| 351 | Embarq Corp. | 18,059 | |||||||||||||
| 500 | @ | JDS Uniphase Corp. | 9,240 | ||||||||||||
| 1,200 | @ | Juniper Networks, Inc. | 25,548 | ||||||||||||
| 7,970 | Motorola, Inc. | 176,695 | |||||||||||||
| 3,940 | Qualcomm, Inc. | 144,165 | |||||||||||||
| 3,500 | @ | Qwest Communications International, Inc. | 26,915 | ||||||||||||
| 6,935 | Sprint Nextel Corp. | 135,302 | |||||||||||||
| 1,290 | @ | Tellabs, Inc. | 12,952 | ||||||||||||
| 7,000 | Verizon Communications, Inc. | 244,580 | |||||||||||||
| 1,061 | Windstream Corp. | 14,790 | |||||||||||||
| 2,178,670 | |||||||||||||||
| Textiles: 0.0% | |||||||||||||||
| 440 | Cintas Corp. | 18,568 | |||||||||||||
| 18,568 | |||||||||||||||
| Toys/Games/Hobbies: 0.1% | |||||||||||||||
| 710 | Hasbro, Inc. | 18,993 | |||||||||||||
| 950 | Mattel, Inc. | 20,853 | |||||||||||||
| 39,846 | |||||||||||||||
| Transportation: 0.4% | |||||||||||||||
| 890 | Burlington Northern Santa Fe Corp. | 66,892 | |||||||||||||
| 1,080 | CSX Corp. | 38,729 | |||||||||||||
| 710 | FedEx Corp. | 81,955 | |||||||||||||
| 930 | Norfolk Southern Corp. | 45,803 | |||||||||||||
| 650 | Union Pacific Corp. | 58,803 | |||||||||||||
| 292,182 | |||||||||||||||
| Total Common Stock (Cost $28,355,933) | 31,522,697 | ||||||||||||||
See Accompanying Notes to Financial Statements
117
PORTFOLIO OF INVESTMENTS
ING PRINCIPAL PROTECTION FUND VIII AS OF NOVEMBER 30, 2006 (UNAUDITED) (CONTINUED)
| Principal Amount | Value | ||||||||||||||
| U.S. GOVERNMENT AGENCY OBLIGATIONS: 54.1% | |||||||||||||||
| Federal Home Loan Mortgage Corporation: 54.1% | |||||||||||||||
| $ | 44,200,000 | 4.930%, due 12/22/08 | $ | 40,025,487 | |||||||||||
| 40,025,487 | |||||||||||||||
| Total U.S. Government Agency Obligations (Cost $41,039,276) | 40,025,487 | ||||||||||||||
| U.S. TREASURY OBLIGATIONS: 3.1% | |||||||||||||||
| U.S. Treasury Principal Only STRIP: 3.1% | |||||||||||||||
| 2,555,000 | 4.620%, due 11/15/08 | 2,338,471 | |||||||||||||
| 2,338,471 | |||||||||||||||
| Total U.S. Treasury Obligations (Cost $2,327,645) | 2,338,471 | ||||||||||||||
| Total Long-Term Investments (Cost $71,722,854) | 73,886,655 | ||||||||||||||
| SHORT-TERM INVESTMENTS: 0.9% | |||||||||||||||
| Repurchase Agreement: 0.9% | |||||||||||
| 656,000 | Goldman Sachs Repurchase Agreement dated 11/30/06, 5.280%, due 12/01/06, $656,096 to be received upon repurchase (Collateralized by $650,000 Federal National Mortgage Association, 5.250%, Market Value plus accrued interest $669,300, due 06/15/08) | 656,000 | |||||||||
| Total Short-Term Investments (Cost $656,000) | 656,000 | ||||||||||
| Total Investments in Securities (Cost $72,378,854)* | 100.7 | % | $ | 74,542,655 | |||||||
| Other Assets and Liabilities - Net | (0.7 | ) | (547,110 | ) | |||||||
| Net Assets | 100.0 | % | $ | 73,995,545 | |||||||
@ Non-income producing security
@@ Foreign Issuer
STRIP Separate Trading of Registered Interest and Principal of Securities
* Cost for federal income tax purposes is $72,918,650.
Net unrealized appreciation consists of:
| Gross Unrealized Appreciation | $ | 3,099,712 | |||||
| Gross Unrealized Depreciation | (1,475,707 | ) | |||||
| Net Unrealized Appreciation | $ | 1,624,005 | |||||
See Accompanying Notes to Financial Statements
118
PORTFOLIO OF INVESTMENTS
ING PRINCIPAL PROTECTION FUND IX AS OF NOVEMBER 30, 2006 (UNAUDITED)
| Shares | Value | ||||||||||||||
| COMMON STOCK: 47.3% | |||||||||||||||
| Advertising: 0.1% | |||||||||||||||
| 600 | Omnicom Group | $ | 61,296 | ||||||||||||
| 61,296 | |||||||||||||||
| Aerospace/Defense: 1.1% | |||||||||||||||
| 1,550 | Boeing Co. | 137,222 | |||||||||||||
| 1,050 | General Dynamics Corp. | 78,582 | |||||||||||||
| 300 | Goodrich Corp. | 13,500 | |||||||||||||
| 350 | L-3 Communications Holdings, Inc. | 28,788 | |||||||||||||
| 950 | Lockheed Martin Corp. | 85,928 | |||||||||||||
| 665 | Northrop Grumman Corp. | 44,508 | |||||||||||||
| 1,509 | Raytheon Co. | 77,019 | |||||||||||||
| 150 | Rockwell Collins, Inc. | 9,050 | |||||||||||||
| 2,000 | United Technologies Corp. | 129,060 | |||||||||||||
| 603,657 | |||||||||||||||
| Agriculture: 0.8% | |||||||||||||||
| 4,150 | Altria Group, Inc. | 349,472 | |||||||||||||
| 1,160 | Archer-Daniels-Midland Co. | 40,716 | |||||||||||||
| 300 | Reynolds American, Inc. | 19,272 | |||||||||||||
| 300 | UST, Inc. | 16,794 | |||||||||||||
| 426,254 | |||||||||||||||
| Airlines: 0.0% | |||||||||||||||
| 1,550 | Southwest Airlines Co. | 24,351 | |||||||||||||
| 24,351 | |||||||||||||||
| Apparel: 0.2% | |||||||||||||||
| 1,180 | @ | Coach, Inc. | 50,988 | ||||||||||||
| 250 | Jones Apparel Group, Inc. | 8,400 | |||||||||||||
| 250 | Liz Claiborne, Inc. | 10,688 | |||||||||||||
| 350 | Nike, Inc. | 34,633 | |||||||||||||
| 120 | VF Corp. | 9,407 | |||||||||||||
| 114,116 | |||||||||||||||
| Auto Manufacturers: 0.2% | |||||||||||||||
| 3,300 | Ford Motor Co. | 26,829 | |||||||||||||
| 400 | General Motors Corp. | 11,692 | |||||||||||||
| 200 | @ | Navistar International Corp. | 6,398 | ||||||||||||
| 650 | Paccar, Inc. | 42,445 | |||||||||||||
| 87,364 | |||||||||||||||
| Auto Parts & Equipment: 0.1% | |||||||||||||||
| 600 | @ | Goodyear Tire & Rubber Co. | 10,110 | ||||||||||||
| 350 | Johnson Controls, Inc. | 28,466 | |||||||||||||
| 38,576 | |||||||||||||||
| Banks: 3.6% | |||||||||||||||
| 12,172 | Bank of America Corp. | 655,462 | |||||||||||||
| 1,500 | Bank of New York Co., Inc. | 53,310 | |||||||||||||
| 986 | BB&T Corp. | 42,408 | |||||||||||||
| 650 | Capital One Financial Corp. | 50,622 | |||||||||||||
| 450 | Comerica, Inc. | 26,213 | |||||||||||||
| 300 | Compass Bancshares, Inc. | 17,142 | |||||||||||||
| 1,000 | Fifth Third Bancorp. | 39,430 | |||||||||||||
| 250 | First Horizon National Corp. | 9,965 | |||||||||||||
| 450 | Huntington Bancshares, Inc. | 10,940 | |||||||||||||
| 750 | Keycorp | 27,075 | |||||||||||||
| 150 | M&T Bank Corp. | 17,796 | |||||||||||||
| 450 | Marshall & Ilsley Corp. | 20,606 | |||||||||||||
| 800 | Mellon Financial Corp. | 32,184 | |||||||||||||
| 1,500 | National City Corp. | 54,150 | |||||||||||||
| Shares | Value | ||||||||||||||
| 900 | North Fork Bancorp., Inc. | $ | 25,263 | ||||||||||||
| 400 | Northern Trust Corp. | 22,784 | |||||||||||||
| 550 | PNC Financial Services Group, Inc. | 38,880 | |||||||||||||
| 1,958 | Regions Financial Corp. | 71,761 | |||||||||||||
| 700 | State Street Corp. | 43,491 | |||||||||||||
| 700 | SunTrust Banks, Inc. | 57,155 | |||||||||||||
| 585 | Synovus Financial Corp. | 17,562 | |||||||||||||
| 3,500 | US Bancorp. | 117,740 | |||||||||||||
| 5,223 | Wachovia Corp. | 283,034 | |||||||||||||
| 6,700 | Wells Fargo & Co. | 236,108 | |||||||||||||
| 200 | Zions Bancorp. | 15,648 | |||||||||||||
| 1,986,729 | |||||||||||||||
| Beverages: 1.0% | |||||||||||||||
| 2,100 | Anheuser-Busch Cos., Inc. | 99,771 | |||||||||||||
| 170 | Brown-Forman Corp. | 11,807 | |||||||||||||
| 4,050 | Coca-Cola Co. | 189,662 | |||||||||||||
| 700 | Coca-Cola Enterprises, Inc. | 14,315 | |||||||||||||
| 400 | @ | Constellation Brands, Inc. | 11,192 | ||||||||||||
| 100 | Molson Coors Brewing Co. | 7,108 | |||||||||||||
| 350 | Pepsi Bottling Group, Inc. | 10,962 | |||||||||||||
| 3,340 | PepsiCo, Inc. | 206,980 | |||||||||||||
| 551,797 | |||||||||||||||
| Biotechnology: 0.5% | |||||||||||||||
| 2,300 | @ | Amgen, Inc. | 163,300 | ||||||||||||
| 600 | @ | Biogen Idec, Inc. | 31,356 | ||||||||||||
| 700 | @ | Celgene Corp. | 39,011 | ||||||||||||
| 250 | @ | Genzyme Corp. | 16,100 | ||||||||||||
| 200 | @ | Medimmune, Inc. | 6,538 | ||||||||||||
| 100 | @ | Millipore Corp. | 6,841 | ||||||||||||
| 263,146 | |||||||||||||||
| Building Materials: 0.1% | |||||||||||||||
| 150 | American Standard Cos., Inc. | 6,722 | |||||||||||||
| 900 | Masco Corp. | 25,821 | |||||||||||||
| 32,543 | |||||||||||||||
| Chemicals: 0.8% | |||||||||||||||
| 150 | Air Products & Chemicals, Inc. | 10,371 | |||||||||||||
| 100 | Ashland, Inc. | 6,761 | |||||||||||||
| 2,150 | Dow Chemical Co. | 86,022 | |||||||||||||
| 100 | Eastman Chemical Co. | 5,938 | |||||||||||||
| 400 | Ecolab, Inc. | 17,740 | |||||||||||||
| 2,100 | EI DuPont de Nemours & Co. | 98,553 | |||||||||||||
| 300 | @ | Hercules, Inc. | 5,589 | ||||||||||||
| 200 | International Flavors & Fragrances, Inc. | 9,422 | |||||||||||||
| 1,240 | Monsanto Co. | 59,607 | |||||||||||||
| 630 | PPG Industries, Inc. | 40,509 | |||||||||||||
| 750 | Praxair, Inc. | 46,800 | |||||||||||||
| 300 | Rohm & Haas Co. | 15,666 | |||||||||||||
| 350 | Sherwin-Williams Co. | 21,893 | |||||||||||||
| 100 | Sigma-Aldrich Corp. | 7,611 | |||||||||||||
| 432,482 | |||||||||||||||
| Coal: 0.0% | |||||||||||||||
| 540 | Peabody Energy Corp. | 24,845 | |||||||||||||
| 24,845 | |||||||||||||||
| Commercial Services: 0.4% | |||||||||||||||
| 500 | @ | Apollo Group, Inc. | 19,395 | ||||||||||||
| 400 | @ | Convergys Corp. | 9,648 | ||||||||||||
| 400 | Equifax, Inc. | 15,196 | |||||||||||||
See Accompanying Notes to Financial Statements
119
PORTFOLIO OF INVESTMENTS
ING PRINCIPAL PROTECTION FUND IX AS OF NOVEMBER 30, 2006 (UNAUDITED) (CONTINUED)
| Shares | Value | ||||||||||||||
| Commercial Services (continued) | |||||||||||||||
| 600 | H&R Block, Inc. | $ | 14,400 | ||||||||||||
| 1,020 | McKesson Corp. | 50,388 | |||||||||||||
| 300 | @ | Monster Worldwide, Inc. | 13,095 | ||||||||||||
| 600 | Moody's Corp. | 41,688 | |||||||||||||
| 100 | Robert Half International, Inc. | 3,859 | |||||||||||||
| 200 | RR Donnelley & Sons Co. | 7,054 | |||||||||||||
| 1,400 | Western Union Co. | 31,920 | |||||||||||||
| 206,643 | |||||||||||||||
| Computers: 2.2% | |||||||||||||||
| 250 | @ | Affiliated Computer Services, Inc. | 12,638 | ||||||||||||
| 280 | @ | Cognizant Technology Solutions Corp. | 22,837 | ||||||||||||
| 450 | @ | Computer Sciences Corp. | 23,490 | ||||||||||||
| 7,720 | @ | Dell, Inc. | 210,293 | ||||||||||||
| 1,000 | Electronic Data Systems Corp. | 27,140 | |||||||||||||
| 4,650 | @ | EMC Corp. | 60,962 | ||||||||||||
| 9,250 | Hewlett-Packard Co. | 365,005 | |||||||||||||
| 4,150 | International Business Machines Corp. | 381,468 | |||||||||||||
| 300 | @ | Lexmark International, Inc. | 20,694 | ||||||||||||
| 450 | @ | NCR Corp. | 19,310 | ||||||||||||
| 710 | @ | Network Appliance, Inc. | 27,839 | ||||||||||||
| 400 | @ | Sandisk Corp. | 17,760 | ||||||||||||
| 6,700 | @ | Sun Microsystems, Inc. | 36,314 | ||||||||||||
| 600 | @ | Unisys Corp. | 4,326 | ||||||||||||
| 1,230,076 | |||||||||||||||
| Cosmetics/Personal Care: 0.9% | |||||||||||||||
| 900 | Avon Products, Inc. | 29,376 | |||||||||||||
| 1,000 | Colgate-Palmolive Co. | 65,050 | |||||||||||||
| 300 | Estee Lauder Cos., Inc. | 12,387 | |||||||||||||
| 6,343 | Procter & Gamble Co. | 398,277 | |||||||||||||
| 505,090 | |||||||||||||||
| Distribution/Wholesale: 0.0% | |||||||||||||||
| 100 | WW Grainger, Inc. | 7,236 | |||||||||||||
| 7,236 | |||||||||||||||
| Diversified Financial Services: 4.3% | |||||||||||||||
| 2,450 | American Express Co. | 143,864 | |||||||||||||
| 530 | Ameriprise Financial, Inc. | 28,673 | |||||||||||||
| 240 | Bear Stearns Cos., Inc. | 36,595 | |||||||||||||
| 2,100 | Charles Schwab Corp. | 38,514 | |||||||||||||
| 70 | Chicago Mercantile Exchange Holdings, Inc. | 37,492 | |||||||||||||
| 650 | CIT Group, Inc. | 33,807 | |||||||||||||
| 13,200 | Citigroup, Inc. | 654,588 | |||||||||||||
| 1,170 | Countrywide Financial Corp. | 46,472 | |||||||||||||
| 700 | @ | E*Trade Financial Corp. | 16,849 | ||||||||||||
| 1,900 | Fannie Mae | 108,357 | |||||||||||||
| 250 | Federated Investors, Inc. | 8,295 | |||||||||||||
| 350 | Franklin Resources, Inc. | 37,359 | |||||||||||||
| 1,400 | Freddie Mac | 94,024 | |||||||||||||
| 900 | Goldman Sachs Group, Inc. | 175,320 | |||||||||||||
| 500 | Janus Capital Group, Inc. | 10,130 | |||||||||||||
| 9,300 | JPMorgan Chase & Co. | 430,404 | |||||||||||||
| 1,040 | Lehman Brothers Holdings, Inc. | 76,617 | |||||||||||||
| 1,800 | Merrill Lynch & Co., Inc. | 157,374 | |||||||||||||
| 2,150 | Morgan Stanley | 163,744 | |||||||||||||
| 800 | SLM Corp. | 36,672 | |||||||||||||
| 500 | T. Rowe Price Group, Inc. | 21,665 | |||||||||||||
| 2,356,815 | |||||||||||||||
| Shares | Value | ||||||||||||||
| Electric: 1.4% | |||||||||||||||
| 2,150 | @ | AES Corp. | $ | 50,246 | |||||||||||
| 400 | @ | Allegheny Energy, Inc. | 17,744 | ||||||||||||
| 500 | Ameren Corp. | 27,355 | |||||||||||||
| 950 | American Electric Power Co., Inc. | 39,435 | |||||||||||||
| 750 | Centerpoint Energy, Inc. | 12,263 | |||||||||||||
| 490 | @ | CMS Energy Corp. | 7,943 | ||||||||||||
| 450 | Constellation Energy Group, Inc. | 30,875 | |||||||||||||
| 400 | DTE Energy Co. | 18,836 | |||||||||||||
| 1,000 | @ | Dynegy, Inc. | 6,790 | ||||||||||||
| 800 | Edison International | 36,784 | |||||||||||||
| 500 | Entergy Corp. | 45,660 | |||||||||||||
| 1,700 | Exelon Corp. | 103,241 | |||||||||||||
| 820 | FirstEnergy Corp. | 49,069 | |||||||||||||
| 850 | PG&E Corp. | 39,041 | |||||||||||||
| 300 | Pinnacle West Capital Corp. | 14,802 | |||||||||||||
| 1,000 | PPL Corp. | 36,350 | |||||||||||||
| 200 | Progress Energy, Inc. | 9,554 | |||||||||||||
| 650 | Public Service Enterprise Group, Inc. | 43,693 | |||||||||||||
| 1,800 | Southern Co. | 65,250 | |||||||||||||
| 500 | TECO Energy, Inc. | 8,495 | |||||||||||||
| 1,180 | TXU Corp. | 67,720 | |||||||||||||
| 1,000 | Xcel Energy, Inc. | 22,960 | |||||||||||||
| 754,106 | |||||||||||||||
| Electrical Components & Equipment: 0.1% | |||||||||||||||
| 800 | Emerson Electric Co. | 69,360 | |||||||||||||
| 300 | Molex, Inc. | 9,600 | |||||||||||||
| 78,960 | |||||||||||||||
| Electronics: 0.2% | |||||||||||||||
| 750 | @ | Agilent Technologies, Inc. | 23,880 | ||||||||||||
| 500 | Applera Corp. - Applied Biosystems Group | 18,220 | |||||||||||||
| 450 | Jabil Circuit, Inc. | 12,762 | |||||||||||||
| 400 | PerkinElmer, Inc. | 8,668 | |||||||||||||
| 500 | Symbol Technologies, Inc. | 7,410 | |||||||||||||
| 200 | Tektronix, Inc. | 6,112 | |||||||||||||
| 800 | @ | Thermo Electron Corp. | 35,064 | ||||||||||||
| 300 | @ | Waters Corp. | 15,012 | ||||||||||||
| 127,128 | |||||||||||||||
| Entertainment: 0.0% | |||||||||||||||
| 300 | International Game Technology | 13,134 | |||||||||||||
| 13,134 | |||||||||||||||
| Environmental Control: 0.1% | |||||||||||||||
| 500 | @ | Allied Waste Industries, Inc. | 6,340 | ||||||||||||
| 1,450 | Waste Management, Inc. | 53,085 | |||||||||||||
| 59,425 | |||||||||||||||
| Food: 0.5% | |||||||||||||||
| 650 | Campbell Soup Co. | 24,746 | |||||||||||||
| 1,000 | ConAgra Foods, Inc. | 25,700 | |||||||||||||
| 300 | @ | Dean Foods Co. | 12,846 | ||||||||||||
| 1,200 | General Mills, Inc. | 67,140 | |||||||||||||
| 100 | Hershey Co. | 5,297 | |||||||||||||
| 800 | HJ Heinz Co. | 35,560 | |||||||||||||
| 450 | Kellogg Co. | 22,401 | |||||||||||||
| 1,450 | Kroger Co. | 31,117 | |||||||||||||
| 200 | McCormick & Co., Inc. | 7,744 | |||||||||||||
| 800 | Safeway, Inc. | 24,648 | |||||||||||||
See Accompanying Notes to Financial Statements
120
PORTFOLIO OF INVESTMENTS
ING PRINCIPAL PROTECTION FUND IX AS OF NOVEMBER 30, 2006 (UNAUDITED) (CONTINUED)
| Shares | Value | ||||||||||||||
| Food (continued) | |||||||||||||||
| 600 | Sara Lee Corp. | $ | 9,948 | ||||||||||||
| 159 | Supervalu, Inc. | 5,447 | |||||||||||||
| 300 | Whole Foods Market, Inc. | 14,640 | |||||||||||||
| 287,234 | |||||||||||||||
| Forest Products & Paper: 0.1% | |||||||||||||||
| 900 | International Paper Co. | 29,790 | |||||||||||||
| 400 | MeadWestvaco Corp. | 11,800 | |||||||||||||
| 350 | Plum Creek Timber Co., Inc. | 13,041 | |||||||||||||
| 300 | Temple-Inland, Inc. | 11,730 | |||||||||||||
| 200 | Weyerhaeuser Co. | 12,936 | |||||||||||||
| 79,297 | |||||||||||||||
| Gas: 0.1% | |||||||||||||||
| 400 | KeySpan Corp. | 16,412 | |||||||||||||
| 100 | Nicor, Inc. | 4,955 | |||||||||||||
| 700 | NiSource, Inc. | 17,262 | |||||||||||||
| 700 | Sempra Energy | 38,150 | |||||||||||||
| 76,779 | |||||||||||||||
| Hand/Machine Tools: 0.0% | |||||||||||||||
| 110 | Black & Decker Corp. | 9,447 | |||||||||||||
| 100 | Snap-On, Inc. | 4,750 | |||||||||||||
| 200 | Stanley Works | 10,204 | |||||||||||||
| 24,401 | |||||||||||||||
| Healthcare-Products: 1.4% | |||||||||||||||
| 100 | Bausch & Lomb, Inc. | 4,842 | |||||||||||||
| 1,350 | Baxter International, Inc. | 60,399 | |||||||||||||
| 480 | Becton Dickinson & Co. | 34,426 | |||||||||||||
| 2,100 | @ | Boston Scientific Corp. | 33,222 | ||||||||||||
| 250 | CR Bard, Inc. | 20,573 | |||||||||||||
| 5,800 | Johnson & Johnson | 382,278 | |||||||||||||
| 2,300 | Medtronic, Inc. | 119,899 | |||||||||||||
| 300 | @ | Patterson Cos., Inc. | 11,133 | ||||||||||||
| 250 | @ | St. Jude Medical, Inc. | 9,318 | ||||||||||||
| 600 | Stryker Corp. | 31,116 | |||||||||||||
| 500 | @ | Zimmer Holdings, Inc. | 36,480 | ||||||||||||
| 743,686 | |||||||||||||||
| Healthcare-Services: 1.0% | |||||||||||||||
| 1,370 | Aetna, Inc. | 56,595 | |||||||||||||
| 550 | @ | Coventry Health Care, Inc. | 26,472 | ||||||||||||
| 610 | @ | Humana, Inc. | 33,001 | ||||||||||||
| 350 | @ | Laboratory Corp. of America Holdings | 24,780 | ||||||||||||
| 100 | Manor Care, Inc. | 4,752 | |||||||||||||
| 400 | Quest Diagnostics | 21,268 | |||||||||||||
| 4,550 | UnitedHealth Group, Inc. | 223,314 | |||||||||||||
| 2,060 | @ | WellPoint, Inc. | 155,880 | ||||||||||||
| 546,062 | |||||||||||||||
| Home Furnishings: 0.1% | |||||||||||||||
| 200 | Harman International Industries, Inc. | 20,768 | |||||||||||||
| 200 | Whirlpool Corp. | 17,060 | |||||||||||||
| 37,828 | |||||||||||||||
| Household Products/Wares: 0.2% | |||||||||||||||
| 100 | Avery Dennison Corp. | 6,747 | |||||||||||||
| 300 | Fortune Brands, Inc. | 24,270 | |||||||||||||
| 950 | Kimberly-Clark Corp. | 63,147 | |||||||||||||
| 94,164 | |||||||||||||||
| Shares | Value | ||||||||||||||
| Housewares: 0.0% | |||||||||||||||
| 600 | Newell Rubbermaid, Inc. | $ | 17,094 | ||||||||||||
| 17,094 | |||||||||||||||
| Insurance: 2.7% | |||||||||||||||
| 640 | @@ | ACE Ltd. | 36,378 | ||||||||||||
| 900 | Aflac, Inc. | 39,726 | |||||||||||||
| 1,660 | Allstate Corp. | 105,377 | |||||||||||||
| 300 | AMBAC Financial Group, Inc. | 25,692 | |||||||||||||
| 5,150 | American International Group, Inc. | 362,148 | |||||||||||||
| 600 | AON Corp. | 21,408 | |||||||||||||
| 1,080 | Chubb Corp. | 55,901 | |||||||||||||
| 300 | Cigna Corp. | 37,815 | |||||||||||||
| 403 | Cincinnati Financial Corp. | 17,845 | |||||||||||||
| 1,500 | Genworth Financial, Inc. | 49,200 | |||||||||||||
| 1,050 | Hartford Financial Services Group, Inc. | 90,048 | |||||||||||||
| 614 | Lincoln National Corp. | 39,044 | |||||||||||||
| 1,190 | Loews Corp. | 47,505 | |||||||||||||
| 400 | Marsh & McLennan Cos., Inc. | 12,568 | |||||||||||||
| 350 | MBIA, Inc. | 24,378 | |||||||||||||
| 2,040 | Metlife, Inc. | 119,809 | |||||||||||||
| 200 | MGIC Investment Corp. | 11,592 | |||||||||||||
| 750 | Principal Financial Group | 43,313 | |||||||||||||
| 1,940 | Progressive Corp. | 43,747 | |||||||||||||
| 1,350 | Prudential Financial, Inc. | 109,998 | |||||||||||||
| 400 | Safeco Corp. | 24,228 | |||||||||||||
| 1,850 | St. Paul Travelers Cos., Inc. | 95,849 | |||||||||||||
| 300 | Torchmark Corp. | 18,966 | |||||||||||||
| 550 | UnumProvident Corp. | 11,264 | |||||||||||||
| 400 | @@ | XL Capital Ltd. | 28,448 | ||||||||||||
| 1,472,247 | |||||||||||||||
| Internet: 0.4% | |||||||||||||||
| 500 | @ | Amazon.com, Inc. | 20,170 | ||||||||||||
| 900 | @ | eBay, Inc. | 29,115 | ||||||||||||
| 200 | @ | Google, Inc. | 96,984 | ||||||||||||
| 1,787 | @ | Symantec Corp. | 37,884 | ||||||||||||
| 500 | @ | VeriSign, Inc. | 13,055 | ||||||||||||
| 197,208 | |||||||||||||||
| Iron/Steel: 0.2% | |||||||||||||||
| 1,200 | Nucor Corp. | 71,820 | |||||||||||||
| 450 | United States Steel Corp. | 33,656 | |||||||||||||
| 105,476 | |||||||||||||||
| Leisure Time: 0.2% | |||||||||||||||
| 250 | Brunswick Corp. | 8,093 | |||||||||||||
| 800 | Carnival Corp. | 39,192 | |||||||||||||
| 500 | Harley-Davidson, Inc. | 36,885 | |||||||||||||
| 300 | Sabre Holdings Corp. | 8,229 | |||||||||||||
| 92,399 | |||||||||||||||
| Lodging: 0.1% | |||||||||||||||
| 740 | Marriott International, Inc. | 33,411 | |||||||||||||
| 150 | Starwood Hotels & Resorts Worldwide, Inc. | 9,626 | |||||||||||||
| 350 | @ | Wyndham Worldwide Corp. | 11,109 | ||||||||||||
| 54,146 | |||||||||||||||
| Machinery-Construction & Mining: 0.2% | |||||||||||||||
| 1,300 | Caterpillar, Inc. | 80,639 | |||||||||||||
| 80,639 | |||||||||||||||
See Accompanying Notes to Financial Statements
121
PORTFOLIO OF INVESTMENTS
ING PRINCIPAL PROTECTION FUND IX AS OF NOVEMBER 30, 2006 (UNAUDITED) (CONTINUED)
| Shares | Value | ||||||||||||||
| Machinery-Diversified: 0.1% | |||||||||||||||
| 150 | Cummins, Inc. | $ | 17,988 | ||||||||||||
| 200 | Deere & Co. | 19,200 | |||||||||||||
| 400 | Rockwell Automation, Inc. | 26,032 | |||||||||||||
| 63,220 | |||||||||||||||
| Media: 1.2% | |||||||||||||||
| 2,125 | CBS Corp. | 63,219 | |||||||||||||
| 900 | Clear Channel Communications, Inc. | 31,644 | |||||||||||||
| 4,100 | @ | Comcast Corp. | 165,886 | ||||||||||||
| 200 | EW Scripps Co. | 9,772 | |||||||||||||
| 500 | Gannett Co., Inc. | 29,760 | |||||||||||||
| 930 | McGraw-Hill Cos., Inc. | 61,985 | |||||||||||||
| 100 | Meredith Corp. | 5,410 | |||||||||||||
| 4,750 | News Corp., Inc. | 97,850 | |||||||||||||
| 200 | Tribune Co. | 6,360 | |||||||||||||
| 200 | @ | Univision Communications, Inc. | 7,118 | ||||||||||||
| 5,750 | Walt Disney Co. | 190,038 | |||||||||||||
| 669,042 | |||||||||||||||
| Mining: 0.2% | |||||||||||||||
| 450 | Freeport-McMoRan Copper & Gold, Inc. | 28,292 | |||||||||||||
| 410 | Phelps Dodge Corp. | 50,430 | |||||||||||||
| 150 | Vulcan Materials Co. | 13,308 | |||||||||||||
| 92,030 | |||||||||||||||
| Miscellaneous Manufacturing: 2.5% | |||||||||||||||
| 1,550 | 3M Co. | 126,263 | |||||||||||||
| 300 | Cooper Industries Ltd. | 27,432 | |||||||||||||
| 550 | Danaher Corp. | 40,216 | |||||||||||||
| 500 | Dover Corp. | 25,150 | |||||||||||||
| 800 | Eastman Kodak Co. | 20,816 | |||||||||||||
| 500 | Eaton Corp. | 38,540 | |||||||||||||
| 20,600 | General Electric Co. | 726,768 | |||||||||||||
| 2,200 | Honeywell International, Inc. | 94,556 | |||||||||||||
| 700 | Illinois Tool Works, Inc. | 33,040 | |||||||||||||
| 550 | @@ | Ingersoll-Rand Co. | 21,456 | ||||||||||||
| 400 | ITT Corp. | 21,580 | |||||||||||||
| 400 | Leggett & Platt, Inc. | 9,512 | |||||||||||||
| 400 | Parker Hannifin Corp. | 33,392 | |||||||||||||
| 250 | Textron, Inc. | 24,363 | |||||||||||||
| 4,000 | @@ | Tyco International Ltd. | 121,160 | ||||||||||||
| 1,364,244 | |||||||||||||||
| Office/Business Equipment: 0.1% | |||||||||||||||
| 450 | Pitney Bowes, Inc. | 20,741 | |||||||||||||
| 3,300 | @ | Xerox Corp. | 54,450 | ||||||||||||
| 75,191 | |||||||||||||||
| Oil & Gas: 4.7% | |||||||||||||||
| 700 | Anadarko Petroleum Corp. | 34,552 | |||||||||||||
| 250 | Apache Corp. | 17,483 | |||||||||||||
| 6,544 | Chevron Corp. | 473,262 | |||||||||||||
| 2,999 | ConocoPhillips | 201,833 | |||||||||||||
| 800 | Devon Energy Corp. | 58,696 | |||||||||||||
| 500 | EOG Resources, Inc. | 35,265 | |||||||||||||
| 17,550 | ExxonMobil Corp. | 1,347,980 | |||||||||||||
| 150 | Hess Corp. | 7,541 | |||||||||||||
| 1,100 | Marathon Oil Corp. | 103,818 | |||||||||||||
| 500 | @,@@ | Nabors Industries Ltd. | 16,880 | ||||||||||||
| 200 | Noble Corp. | 15,450 | |||||||||||||
| 1,600 | Occidental Petroleum Corp. | 80,544 | |||||||||||||
| Shares | Value | ||||||||||||||
| 400 | Sunoco, Inc. | $ | 27,264 | ||||||||||||
| 500 | @ | Transocean, Inc. | 38,975 | ||||||||||||
| 1,450 | Valero Energy Corp. | 79,852 | |||||||||||||
| 600 | XTO Energy, Inc. | 30,360 | |||||||||||||
| 2,569,755 | |||||||||||||||
| Oil & Gas Services: 0.6% | |||||||||||||||
| 600 | Baker Hughes, Inc. | 44,058 | |||||||||||||
| 200 | BJ Services Co. | 6,754 | |||||||||||||
| 3,200 | Halliburton Co. | 107,968 | |||||||||||||
| 300 | @ | National Oilwell Varco, Inc. | 19,953 | ||||||||||||
| 2,100 | Schlumberger Ltd. | 143,808 | |||||||||||||
| 200 | @ | Weatherford International Ltd. | 8,982 | ||||||||||||
| 331,523 | |||||||||||||||
| Packaging & Containers: 0.1% | |||||||||||||||
| 200 | Ball Corp. | 8,552 | |||||||||||||
| 200 | Bemis Co. | 6,826 | |||||||||||||
| 500 | @ | Pactiv Corp. | 17,225 | ||||||||||||
| 200 | Sealed Air Corp. | 11,902 | |||||||||||||
| 44,505 | |||||||||||||||
| Pharmaceuticals: 2.6% | |||||||||||||||
| 3,000 | Abbott Laboratories | 139,980 | |||||||||||||
| 100 | Allergan, Inc. | 11,658 | |||||||||||||
| 660 | AmerisourceBergen Corp. | 30,353 | |||||||||||||
| 200 | @ | Barr Pharmaceuticals, Inc. | 10,216 | ||||||||||||
| 1,600 | Bristol-Myers Squibb Co. | 39,728 | |||||||||||||
| 790 | Cardinal Health, Inc. | 51,050 | |||||||||||||
| 830 | Caremark Rx, Inc. | 39,259 | |||||||||||||
| 800 | Eli Lilly & Co. | 42,872 | |||||||||||||
| 400 | @ | Express Scripts, Inc. | 27,280 | ||||||||||||
| 900 | @ | Forest Laboratories, Inc. | 43,830 | ||||||||||||
| 900 | @ | Gilead Sciences, Inc. | 59,328 | ||||||||||||
| 150 | @ | Hospira, Inc. | 4,920 | ||||||||||||
| 730 | @ | King Pharmaceuticals, Inc. | 12,067 | ||||||||||||
| 600 | @ | Medco Health Solutions, Inc. | 30,126 | ||||||||||||
| 5,850 | Merck & Co., Inc. | 260,384 | |||||||||||||
| 500 | Mylan Laboratories | 10,145 | |||||||||||||
| 14,600 | Pfizer, Inc. | 401,354 | |||||||||||||
| 3,950 | Schering-Plough Corp. | 86,940 | |||||||||||||
| 300 | @ | Watson Pharmaceuticals, Inc. | 7,701 | ||||||||||||
| 2,700 | Wyeth | 130,356 | |||||||||||||
| 1,439,547 | |||||||||||||||
| Pipelines: 0.1% | |||||||||||||||
| 1,100 | El Paso Corp. | 16,060 | |||||||||||||
| 950 | Williams Cos., Inc. | 26,372 | |||||||||||||
| 42,432 | |||||||||||||||
| Real Estate: 0.0% | |||||||||||||||
| 370 | @ | CB Richard Ellis Group, Inc. | 12,184 | ||||||||||||
| 401 | @ | Realogy Corp. | 10,462 | ||||||||||||
| 22,646 | |||||||||||||||
| Real Estate Investment Trusts: 0.2% | |||||||||||||||
| 250 | Apartment Investment & Management Co. | 14,410 | |||||||||||||
| 100 | Boston Properties, Inc. | 11,705 | |||||||||||||
| 700 | Equity Office Properties Trust | 33,740 | |||||||||||||
| 200 | Prologis | 13,034 | |||||||||||||
| 100 | Public Storage, Inc. | 9,628 | |||||||||||||
| 100 | Vornado Realty Trust | 12,611 | |||||||||||||
| 95,128 | |||||||||||||||
See Accompanying Notes to Financial Statements
122
PORTFOLIO OF INVESTMENTS
ING PRINCIPAL PROTECTION FUND IX AS OF NOVEMBER 30, 2006 (UNAUDITED) (CONTINUED)
| Shares | Value | ||||||||||||||
| Retail: 2.6% | |||||||||||||||
| 100 | @ | Autozone, Inc. | $ | 11,361 | |||||||||||
| 450 | @ | Bed Bath & Beyond, Inc. | 17,438 | ||||||||||||
| 820 | Best Buy Co., Inc. | 45,075 | |||||||||||||
| 400 | @ | Big Lots, Inc. | 8,924 | ||||||||||||
| 350 | Circuit City Stores, Inc. | 8,736 | |||||||||||||
| 950 | Costco Wholesale Corp. | 49,647 | |||||||||||||
| 1,600 | CVS Corp. | 46,032 | |||||||||||||
| 310 | Darden Restaurants, Inc. | 12,447 | |||||||||||||
| 500 | Family Dollar Stores, Inc. | 13,945 | |||||||||||||
| 1,866 | Federated Department Stores, Inc. | 78,540 | |||||||||||||
| 1,850 | Gap, Inc. | 34,632 | |||||||||||||
| 1,710 | Home Depot, Inc. | 64,929 | |||||||||||||
| 550 | JC Penney Co., Inc. | 42,537 | |||||||||||||
| 1,100 | @ | Kohl's Corp. | 76,560 | ||||||||||||
| 650 | Limited Brands, Inc. | 20,599 | |||||||||||||
| 3,000 | Lowe's Cos., Inc. | 90,480 | |||||||||||||
| 2,500 | McDonald's Corp. | 104,925 | |||||||||||||
| 800 | Nordstrom, Inc. | 39,216 | |||||||||||||
| 950 | @ | Office Depot, Inc. | 35,967 | ||||||||||||
| 200 | OfficeMax, Inc. | 9,414 | |||||||||||||
| 300 | RadioShack Corp. | 5,259 | |||||||||||||
| 130 | @ | Sears Holding Corp. | 22,285 | ||||||||||||
| 1,340 | Staples, Inc. | 34,130 | |||||||||||||
| 2,050 | @ | Starbucks Corp. | 72,345 | ||||||||||||
| 1,750 | Target Corp. | 101,658 | |||||||||||||
| 1,550 | TJX Cos., Inc. | 42,501 | |||||||||||||
| 2,030 | Walgreen Co. | 82,195 | |||||||||||||
| 4,850 | Wal-Mart Stores, Inc. | 223,585 | |||||||||||||
| 250 | Wendy's International, Inc. | 8,143 | |||||||||||||
| 550 | Yum! Brands, Inc. | 33,655 | |||||||||||||
| 1,437,160 | |||||||||||||||
| Savings & Loans: 0.2% | |||||||||||||||
| 1,970 | Washington Mutual, Inc. | 86,050 | |||||||||||||
| 86,050 | |||||||||||||||
| Semiconductors: 1.1% | |||||||||||||||
| 1,600 | @ | Advanced Micro Devices, Inc. | 34,512 | ||||||||||||
| 1,150 | @ | Altera Corp. | 22,874 | ||||||||||||
| 700 | Analog Devices, Inc. | 22,764 | |||||||||||||
| 2,800 | Applied Materials, Inc. | 50,344 | |||||||||||||
| 1,008 | @ | Freescale Semiconductor, Inc. | 40,249 | ||||||||||||
| 11,440 | Intel Corp. | 244,244 | |||||||||||||
| 400 | KLA-Tencor Corp. | 20,668 | |||||||||||||
| 550 | Linear Technology Corp. | 17,677 | |||||||||||||
| 1,400 | @ | LSI Logic Corp. | 14,924 | ||||||||||||
| 550 | Maxim Integrated Products | 17,314 | |||||||||||||
| 2,450 | @ | Micron Technology, Inc. | 35,770 | ||||||||||||
| 500 | National Semiconductor Corp. | 12,095 | |||||||||||||
| 250 | @ | Novellus Systems, Inc. | 7,805 | ||||||||||||
| 300 | @ | Nvidia Corp. | 11,097 | ||||||||||||
| 500 | @ | QLogic Corp. | 11,125 | ||||||||||||
| 500 | @ | Teradyne, Inc. | 7,450 | ||||||||||||
| 1,250 | Texas Instruments, Inc. | 36,938 | |||||||||||||
| 600 | Xilinx, Inc. | 16,080 | |||||||||||||
| 623,930 | |||||||||||||||
| Software: 1.8% | |||||||||||||||
| 1,020 | @ | Adobe Systems, Inc. | 40,933 | ||||||||||||
| 380 | @ | Autodesk, Inc. | 15,648 | ||||||||||||
| 1,150 | Automatic Data Processing, Inc. | 55,465 | |||||||||||||
| 590 | @ | BMC Software, Inc. | 19,210 | ||||||||||||
| Shares | Value | ||||||||||||||
| 850 | CA, Inc. | $ | 18,445 | ||||||||||||
| 450 | @ | Citrix Systems, Inc. | 12,933 | ||||||||||||
| 1,150 | @ | Compuware Corp. | 9,649 | ||||||||||||
| 650 | @ | Electronic Arts, Inc. | 36,303 | ||||||||||||
| 320 | Fidelity National Information Services, Inc. | 12,768 | |||||||||||||
| 1,400 | First Data Corp. | 35,350 | |||||||||||||
| 400 | @ | Fiserv, Inc. | 20,444 | ||||||||||||
| 450 | IMS Health, Inc. | 12,362 | |||||||||||||
| 600 | @ | Intuit, Inc. | 18,888 | ||||||||||||
| 17,300 | Microsoft Corp. | 507,409 | |||||||||||||
| 900 | @ | Novell, Inc. | 5,652 | ||||||||||||
| 8,010 | @ | Oracle Corp. | 152,430 | ||||||||||||
| 180 | @ | Parametric Technology Corp. | 3,485 | ||||||||||||
| 750 | Paychex, Inc. | 29,558 | |||||||||||||
| 1,006,932 | |||||||||||||||
| Telecommunications: 3.3% | |||||||||||||||
| 800 | Alltel Corp. | 45,392 | |||||||||||||
| 7,805 | AT&T, Inc. | 264,668 | |||||||||||||
| 1,300 | @ | Avaya, Inc. | 16,614 | ||||||||||||
| 3,500 | BellSouth Corp. | 156,065 | |||||||||||||
| 300 | CenturyTel, Inc. | 12,765 | |||||||||||||
| 20,550 | @ | Cisco Systems, Inc. | 552,384 | ||||||||||||
| 600 | Citizens Communications Co. | 8,502 | |||||||||||||
| 400 | @ | Comverse Technology, Inc. | 7,808 | ||||||||||||
| 3,050 | @ | Corning, Inc. | 65,758 | ||||||||||||
| 325 | Embarq Corp. | 16,721 | |||||||||||||
| 400 | @ | JDS Uniphase Corp. | 7,392 | ||||||||||||
| 1,000 | @ | Juniper Networks, Inc. | 21,290 | ||||||||||||
| 6,530 | Motorola, Inc. | 144,770 | |||||||||||||
| 3,300 | Qualcomm, Inc. | 120,747 | |||||||||||||
| 2,800 | @ | Qwest Communications International, Inc. | 21,532 | ||||||||||||
| 6,009 | Sprint Nextel Corp. | 117,236 | |||||||||||||
| 900 | @ | Tellabs, Inc. | 9,036 | ||||||||||||
| 5,700 | Verizon Communications, Inc. | 199,158 | |||||||||||||
| 906 | Windstream Corp. | 12,630 | |||||||||||||
| 1,800,468 | |||||||||||||||
| Textiles: 0.0% | |||||||||||||||
| 200 | Cintas Corp. | 8,440 | |||||||||||||
| 8,440 | |||||||||||||||
| Toys/Games/Hobbies: 0.1% | |||||||||||||||
| 500 | Hasbro, Inc. | 13,375 | |||||||||||||
| 750 | Mattel, Inc. | 16,463 | |||||||||||||
| 29,838 | |||||||||||||||
| Transportation: 0.5% | |||||||||||||||
| 750 | Burlington Northern Santa Fe Corp. | 56,370 | |||||||||||||
| 1,000 | CSX Corp. | 35,860 | |||||||||||||
| 600 | FedEx Corp. | 69,258 | |||||||||||||
| 850 | Norfolk Southern Corp. | 41,863 | |||||||||||||
| 100 | Ryder System, Inc. | 5,217 | |||||||||||||
| 550 | Union Pacific Corp. | 49,786 | |||||||||||||
| 258,354 | |||||||||||||||
| Total Common Stock (Cost $23,223,055) | 25,954,864 | ||||||||||||||
See Accompanying Notes to Financial Statements
123
PORTFOLIO OF INVESTMENTS
ING PRINCIPAL PROTECTION FUND IX AS OF NOVEMBER 30, 2006 (UNAUDITED) (CONTINUED)
| Principal Amount | Value | ||||||||||||||
| U.S. GOVERNMENT AGENCY OBLIGATIONS: 49.9% | |||||||||||||||
| Federal Home Loan Mortgage Corporation: 49.9% | |||||||||||||||
| $ | 30,700,000 | 4.900%, due 04/21/09 | $ | 27,384,247 | |||||||||||
| 27,384,247 | |||||||||||||||
| Total U.S. Government Agency Obligations (Cost $27,995,784) | 27,384,247 | ||||||||||||||
| U.S. TREASURY OBLIGATIONS: 2.0% | |||||||||||||||
| U.S. Treasury Principal Only STRIP: 2.0% | |||||||||||||||
| 1,235,000 | 4.580%, due 02/15/09 | 1,118,820 | |||||||||||||
| 1,118,820 | |||||||||||||||
| Total U.S. Treasury Obligations (Cost $1,118,913) | 1,118,820 | ||||||||||||||
| Total Long-Term Investments (Cost $52,337,752) | 54,457,931 | ||||||||||||||
| SHORT-TERM INVESTMENTS: 1.4% | |||||||||||||||
| Repurchase Agreement: 1.4% | |||||||||||
| 782,000 | Goldman Sachs Repurchase Agreement dated 11/30/06, 5.280%, due 12/01/06, $782,115 to be received upon repurchase (Collateralized by $775,000 Federal National Mortgage Association, 5.250%, Market Value plus accrued interest $798,012, due 06/15/08) | 782,000 | |||||||||
| Total Short-Term Investments (Cost $782,000) | 782,000 | ||||||||||
| Total Investments in Securities (Cost $53,119,752)* | 100.6 | % | $ | 55,239,931 | |||||||
| Other Assets and Liabilities - Net | (0.6 | ) | (342,243 | ) | |||||||
| Net Assets | 100.0 | % | $ | 54,897,688 | |||||||
@ Non-income producing security
@@ Foreign Issuer
STRIP Separate Trading of Registered Interest and Principal of Securities
* Cost for federal income tax purposes is $53,464,462.
Net unrealized appreciation consists of:
| Gross Unrealized Appreciation | $ | 2,745,934 | |||||
| Gross Unrealized Depreciation | (970,465 | ) | |||||
| Net Unrealized Appreciation | $ | 1,775,469 | |||||
See Accompanying Notes to Financial Statements
124
PORTFOLIO OF INVESTMENTS
ING PRINCIPAL PROTECTION FUND X AS OF NOVEMBER 30, 2006 (UNAUDITED)
| Shares | Value | ||||||||||||||
| COMMON STOCK: 50.3% | |||||||||||||||
| Advertising: 0.1% | |||||||||||||||
| 507 | Omnicom Group | $ | 51,795 | ||||||||||||
| 51,795 | |||||||||||||||
| Aerospace/Defense: 1.2% | |||||||||||||||
| 1,415 | Boeing Co. | 125,270 | |||||||||||||
| 998 | General Dynamics Corp. | 74,690 | |||||||||||||
| 250 | Goodrich Corp. | 11,250 | |||||||||||||
| 300 | L-3 Communications Holdings, Inc. | 24,675 | |||||||||||||
| 839 | Lockheed Martin Corp. | 75,888 | |||||||||||||
| 647 | Northrop Grumman Corp. | 43,304 | |||||||||||||
| 1,323 | Raytheon Co. | 67,526 | |||||||||||||
| 149 | Rockwell Collins, Inc. | 8,989 | |||||||||||||
| 1,798 | United Technologies Corp. | 116,025 | |||||||||||||
| 547,617 | |||||||||||||||
| Agriculture: 0.8% | |||||||||||||||
| 3,676 | Altria Group, Inc. | 309,556 | |||||||||||||
| 1,025 | Archer-Daniels-Midland Co. | 35,978 | |||||||||||||
| 334 | Reynolds American, Inc. | 21,456 | |||||||||||||
| 300 | UST, Inc. | 16,794 | |||||||||||||
| 383,784 | |||||||||||||||
| Airlines: 0.0% | |||||||||||||||
| 1,400 | Southwest Airlines Co. | 21,994 | |||||||||||||
| 21,994 | |||||||||||||||
| Apparel: 0.3% | |||||||||||||||
| 1,220 | @ | Coach, Inc. | 52,716 | ||||||||||||
| 303 | Jones Apparel Group, Inc. | 10,181 | |||||||||||||
| 261 | Liz Claiborne, Inc. | 11,158 | |||||||||||||
| 368 | Nike, Inc. | 36,414 | |||||||||||||
| 133 | VF Corp. | 10,426 | |||||||||||||
| 120,895 | |||||||||||||||
| Auto Manufacturers: 0.2% | |||||||||||||||
| 3,950 | Ford Motor Co. | 32,114 | |||||||||||||
| 400 | General Motors Corp. | 11,692 | |||||||||||||
| 550 | Paccar, Inc. | 35,915 | |||||||||||||
| 79,721 | |||||||||||||||
| Auto Parts & Equipment: 0.1% | |||||||||||||||
| 379 | @ | Goodyear Tire & Rubber Co. | 6,386 | ||||||||||||
| 380 | Johnson Controls, Inc. | 30,905 | |||||||||||||
| 37,291 | |||||||||||||||
| Banks: 3.8% | |||||||||||||||
| 10,814 | Bank of America Corp. | 582,334 | |||||||||||||
| 1,228 | Bank of New York Co., Inc. | 43,643 | |||||||||||||
| 856 | BB&T Corp. | 36,817 | |||||||||||||
| 574 | Capital One Financial Corp. | 44,703 | |||||||||||||
| 437 | Comerica, Inc. | 25,455 | |||||||||||||
| 250 | Compass Bancshares, Inc. | 14,285 | |||||||||||||
| 900 | Fifth Third Bancorp. | 35,487 | |||||||||||||
| 120 | First Horizon National Corp. | 4,783 | |||||||||||||
| 398 | Huntington Bancshares, Inc. | 9,675 | |||||||||||||
| 752 | Keycorp | 27,147 | |||||||||||||
| 121 | M&T Bank Corp. | 14,355 | |||||||||||||
| 495 | Marshall & Ilsley Corp. | 22,666 | |||||||||||||
| 778 | Mellon Financial Corp. | 31,299 | |||||||||||||
| 1,378 | National City Corp. | 49,746 | |||||||||||||
| 900 | North Fork Bancorp., Inc. | 25,263 | |||||||||||||
| Shares | Value | ||||||||||||||
| 371 | Northern Trust Corp. | $ | 21,132 | ||||||||||||
| 479 | PNC Financial Services Group, Inc. | 33,861 | |||||||||||||
| 1,598 | Regions Financial Corp. | 58,567 | |||||||||||||
| 602 | State Street Corp. | 37,402 | |||||||||||||
| 675 | SunTrust Banks, Inc. | 55,114 | |||||||||||||
| 532 | Synovus Financial Corp. | 15,971 | |||||||||||||
| 3,118 | US Bancorp. | 104,890 | |||||||||||||
| 4,628 | Wachovia Corp. | 250,791 | |||||||||||||
| 5,926 | Wells Fargo & Co. | 208,832 | |||||||||||||
| 200 | Zions Bancorp. | 15,648 | |||||||||||||
| 1,769,866 | |||||||||||||||
| Beverages: 1.1% | |||||||||||||||
| 1,842 | Anheuser-Busch Cos., Inc. | 87,513 | |||||||||||||
| 113 | Brown-Forman Corp. | 7,848 | |||||||||||||
| 3,602 | Coca-Cola Co. | 168,682 | |||||||||||||
| 662 | Coca-Cola Enterprises, Inc. | 13,538 | |||||||||||||
| 350 | @ | Constellation Brands, Inc. | 9,793 | ||||||||||||
| 100 | Molson Coors Brewing Co. | 7,108 | |||||||||||||
| 359 | Pepsi Bottling Group, Inc. | 11,244 | |||||||||||||
| 2,915 | PepsiCo, Inc. | 180,643 | |||||||||||||
| 486,369 | |||||||||||||||
| Biotechnology: 0.5% | |||||||||||||||
| 2,127 | @ | Amgen, Inc. | 151,017 | ||||||||||||
| 600 | @ | Biogen Idec, Inc. | 31,356 | ||||||||||||
| 650 | @ | Celgene Corp. | 36,225 | ||||||||||||
| 197 | @ | Genzyme Corp. | 12,687 | ||||||||||||
| 200 | @ | Medimmune, Inc. | 6,538 | ||||||||||||
| 97 | @ | Millipore Corp. | 6,636 | ||||||||||||
| 244,459 | |||||||||||||||
| Building Materials: 0.1% | |||||||||||||||
| 121 | American Standard Cos., Inc. | 5,422 | |||||||||||||
| 668 | Masco Corp. | 19,165 | |||||||||||||
| 24,587 | |||||||||||||||
| Chemicals: 0.8% | |||||||||||||||
| 152 | Air Products & Chemicals, Inc. | 10,509 | |||||||||||||
| 100 | Ashland, Inc. | 6,761 | |||||||||||||
| 1,948 | Dow Chemical Co. | 77,939 | |||||||||||||
| 100 | Eastman Chemical Co. | 5,938 | |||||||||||||
| 400 | Ecolab, Inc. | 17,740 | |||||||||||||
| 1,850 | EI DuPont de Nemours & Co. | 86,821 | |||||||||||||
| 188 | International Flavors & Fragrances, Inc. | 8,857 | |||||||||||||
| 1,088 | Monsanto Co. | 52,300 | |||||||||||||
| 525 | PPG Industries, Inc. | 33,758 | |||||||||||||
| 615 | Praxair, Inc. | 38,376 | |||||||||||||
| 301 | Rohm & Haas Co. | 15,718 | |||||||||||||
| 312 | Sherwin-Williams Co. | 19,516 | |||||||||||||
| 100 | Sigma-Aldrich Corp. | 7,611 | |||||||||||||
| 381,844 | |||||||||||||||
| Coal: 0.0% | |||||||||||||||
| 480 | Peabody Energy Corp. | 22,085 | |||||||||||||
| 22,085 | |||||||||||||||
| Commercial Services: 0.4% | |||||||||||||||
| 400 | @ | Apollo Group, Inc. | 15,516 | ||||||||||||
| 300 | @ | Convergys Corp. | 7,236 | ||||||||||||
| 332 | Equifax, Inc. | 12,613 | |||||||||||||
| 606 | H&R Block, Inc. | 14,544 | |||||||||||||
See Accompanying Notes to Financial Statements
125
PORTFOLIO OF INVESTMENTS
ING PRINCIPAL PROTECTION FUND X AS OF NOVEMBER 30, 2006 (UNAUDITED) (CONTINUED)
| Shares | Value | ||||||||||||||
| Commercial Services (continued) | |||||||||||||||
| 901 | McKesson Corp. | $ | 44,509 | ||||||||||||
| 250 | @ | Monster Worldwide, Inc. | 10,913 | ||||||||||||
| 544 | Moody's Corp. | 37,797 | |||||||||||||
| 295 | Robert Half International, Inc. | 11,384 | |||||||||||||
| 129 | RR Donnelley & Sons Co. | 4,550 | |||||||||||||
| 1,219 | Western Union Co. | 27,793 | |||||||||||||
| 186,855 | |||||||||||||||
| Computers: 2.4% | |||||||||||||||
| 250 | @ | Affiliated Computer Services, Inc. | 12,638 | ||||||||||||
| 250 | @ | Cognizant Technology Solutions Corp. | 20,390 | ||||||||||||
| 379 | @ | Computer Sciences Corp. | 19,784 | ||||||||||||
| 6,836 | @ | Dell, Inc. | 186,213 | ||||||||||||
| 950 | Electronic Data Systems Corp. | 25,783 | |||||||||||||
| 3,760 | @ | EMC Corp. | 49,294 | ||||||||||||
| 8,189 | Hewlett-Packard Co. | 323,138 | |||||||||||||
| 3,638 | International Business Machines Corp. | 334,405 | |||||||||||||
| 203 | @ | Lexmark International, Inc. | 14,003 | ||||||||||||
| 396 | @ | NCR Corp. | 16,992 | ||||||||||||
| 584 | @ | Network Appliance, Inc. | 22,899 | ||||||||||||
| 400 | @ | Sandisk Corp. | 17,760 | ||||||||||||
| 6,200 | @ | Sun Microsystems, Inc. | 33,604 | ||||||||||||
| 666 | @ | Unisys Corp. | 4,802 | ||||||||||||
| 1,081,705 | |||||||||||||||
| Cosmetics/Personal Care: 1.0% | |||||||||||||||
| 800 | Avon Products, Inc. | 26,112 | |||||||||||||
| 925 | Colgate-Palmolive Co. | 60,171 | |||||||||||||
| 300 | Estee Lauder Cos., Inc. | 12,387 | |||||||||||||
| 5,597 | Procter & Gamble Co. | 351,436 | |||||||||||||
| 450,106 | |||||||||||||||
| Distribution/Wholesale: 0.0% | |||||||||||||||
| 165 | WW Grainger, Inc. | 11,939 | |||||||||||||
| 11,939 | |||||||||||||||
| Diversified Financial Services: 4.5% | |||||||||||||||
| 2,166 | American Express Co. | 127,188 | |||||||||||||
| 453 | Ameriprise Financial, Inc. | 24,507 | |||||||||||||
| 199 | Bear Stearns Cos., Inc. | 30,344 | |||||||||||||
| 1,950 | Charles Schwab Corp. | 35,763 | |||||||||||||
| 60 | Chicago Mercantile Exchange Holdings, Inc. | 32,136 | |||||||||||||
| 600 | CIT Group, Inc. | 31,206 | |||||||||||||
| 11,880 | Citigroup, Inc. | 589,129 | |||||||||||||
| 1,130 | Countrywide Financial Corp. | 44,884 | |||||||||||||
| 650 | @ | E*Trade Financial Corp. | 15,646 | ||||||||||||
| 1,718 | Fannie Mae | 97,978 | |||||||||||||
| 99 | Federated Investors, Inc. | 3,285 | |||||||||||||
| 273 | Franklin Resources, Inc. | 29,140 | |||||||||||||
| 1,200 | Freddie Mac | 80,592 | |||||||||||||
| 780 | Goldman Sachs Group, Inc. | 151,944 | |||||||||||||
| 400 | Janus Capital Group, Inc. | 8,104 | |||||||||||||
| 8,300 | JPMorgan Chase & Co. | 384,124 | |||||||||||||
| 938 | Lehman Brothers Holdings, Inc. | 69,102 | |||||||||||||
| 1,553 | Merrill Lynch & Co., Inc. | 135,779 | |||||||||||||
| 1,890 | Morgan Stanley | 143,942 | |||||||||||||
| 745 | SLM Corp. | 34,151 | |||||||||||||
| 500 | T. Rowe Price Group, Inc. | 21,665 | |||||||||||||
| 2,090,609 | |||||||||||||||
| Shares | Value | ||||||||||||||
| Electric: 1.5% | |||||||||||||||
| 1,938 | @ | AES Corp. | $ | 45,291 | |||||||||||
| 275 | @ | Allegheny Energy, Inc. | 12,199 | ||||||||||||
| 400 | Ameren Corp. | 21,884 | |||||||||||||
| 907 | American Electric Power Co., Inc. | 37,650 | |||||||||||||
| 700 | Centerpoint Energy, Inc. | 11,445 | |||||||||||||
| 392 | @ | CMS Energy Corp. | 6,354 | ||||||||||||
| 423 | Constellation Energy Group, Inc. | 29,022 | |||||||||||||
| 400 | DTE Energy Co. | 18,836 | |||||||||||||
| 900 | @ | Dynegy, Inc. | 6,111 | ||||||||||||
| 791 | Edison International | 36,370 | |||||||||||||
| 450 | Entergy Corp. | 41,094 | |||||||||||||
| 1,550 | Exelon Corp. | 94,132 | |||||||||||||
| 763 | FirstEnergy Corp. | 45,658 | |||||||||||||
| 754 | PG&E Corp. | 34,631 | |||||||||||||
| 200 | Pinnacle West Capital Corp. | 9,868 | |||||||||||||
| 858 | PPL Corp. | 31,188 | |||||||||||||
| 200 | Progress Energy, Inc. | 9,554 | |||||||||||||
| 550 | Public Service Enterprise Group, Inc. | 36,971 | |||||||||||||
| 1,600 | Southern Co. | 58,000 | |||||||||||||
| 400 | TECO Energy, Inc. | 6,796 | |||||||||||||
| 1,076 | TXU Corp. | 61,752 | |||||||||||||
| 907 | Xcel Energy, Inc. | 20,825 | |||||||||||||
| 675,631 | |||||||||||||||
| Electrical Components & Equipment: 0.2% | |||||||||||||||
| 754 | Emerson Electric Co. | 65,372 | |||||||||||||
| 300 | Molex, Inc. | 9,600 | |||||||||||||
| 74,972 | |||||||||||||||
| Electronics: 0.2% | |||||||||||||||
| 892 | @ | Agilent Technologies, Inc. | 28,401 | ||||||||||||
| 444 | Applera Corp. - Applied Biosystems Group | 16,179 | |||||||||||||
| 424 | Jabil Circuit, Inc. | 12,025 | |||||||||||||
| 284 | PerkinElmer, Inc. | 6,154 | |||||||||||||
| 400 | Symbol Technologies, Inc. | 5,928 | |||||||||||||
| 683 | @ | Thermo Electron Corp. | 29,936 | ||||||||||||
| 290 | @ | Waters Corp. | 14,512 | ||||||||||||
| 113,135 | |||||||||||||||
| Entertainment: 0.0% | |||||||||||||||
| 200 | International Game Technology | 8,756 | |||||||||||||
| 8,756 | |||||||||||||||
| Environmental Control: 0.1% | |||||||||||||||
| 400 | @ | Allied Waste Industries, Inc. | 5,072 | ||||||||||||
| 1,252 | Waste Management, Inc. | 45,836 | |||||||||||||
| 50,908 | |||||||||||||||
| Food: 0.5% | |||||||||||||||
| 700 | Campbell Soup Co. | 26,649 | |||||||||||||
| 971 | ConAgra Foods, Inc. | 24,955 | |||||||||||||
| 300 | @ | Dean Foods Co. | 12,846 | ||||||||||||
| 1,030 | General Mills, Inc. | 57,629 | |||||||||||||
| 100 | Hershey Co. | 5,297 | |||||||||||||
| 532 | HJ Heinz Co. | 23,647 | |||||||||||||
| 429 | Kellogg Co. | 21,356 | |||||||||||||
| 1,175 | Kroger Co. | 25,216 | |||||||||||||
| 291 | McCormick & Co., Inc. | 11,268 | |||||||||||||
| 700 | Safeway, Inc. | 21,567 | |||||||||||||
| 493 | Sara Lee Corp. | 8,174 | |||||||||||||
See Accompanying Notes to Financial Statements
126
PORTFOLIO OF INVESTMENTS
ING PRINCIPAL PROTECTION FUND X AS OF NOVEMBER 30, 2006 (UNAUDITED) (CONTINUED)
| Shares | Value | ||||||||||||||
| Food (continued) | |||||||||||||||
| 116 | Supervalu, Inc. | $ | 3,974 | ||||||||||||
| 200 | Whole Foods Market, Inc. | 9,760 | |||||||||||||
| 252,338 | |||||||||||||||
| Forest Products & Paper: 0.2% | |||||||||||||||
| 900 | International Paper Co. | 29,790 | |||||||||||||
| 425 | MeadWestvaco Corp. | 12,538 | |||||||||||||
| 296 | Plum Creek Timber Co., Inc. | 11,029 | |||||||||||||
| 338 | Temple-Inland, Inc. | 13,216 | |||||||||||||
| 150 | Weyerhaeuser Co. | 9,702 | |||||||||||||
| 76,275 | |||||||||||||||
| Gas: 0.1% | |||||||||||||||
| 400 | KeySpan Corp. | 16,412 | |||||||||||||
| 135 | Nicor, Inc. | 6,689 | |||||||||||||
| 600 | NiSource, Inc. | 14,796 | |||||||||||||
| 565 | Sempra Energy | 30,793 | |||||||||||||
| 68,690 | |||||||||||||||
| Hand/Machine Tools: 0.1% | |||||||||||||||
| 98 | Black & Decker Corp. | 8,416 | |||||||||||||
| 148 | Snap-On, Inc. | 7,030 | |||||||||||||
| 185 | Stanley Works | 9,439 | |||||||||||||
| 24,885 | |||||||||||||||
| Healthcare-Products: 1.4% | |||||||||||||||
| 100 | Bausch & Lomb, Inc. | 4,842 | |||||||||||||
| 1,119 | Baxter International, Inc. | 50,064 | |||||||||||||
| 454 | Becton Dickinson & Co. | 32,561 | |||||||||||||
| 1,950 | @ | Boston Scientific Corp. | 30,849 | ||||||||||||
| 207 | CR Bard, Inc. | 17,034 | |||||||||||||
| 5,202 | Johnson & Johnson | 342,864 | |||||||||||||
| 2,000 | Medtronic, Inc. | 104,260 | |||||||||||||
| 200 | @ | Patterson Cos., Inc. | 7,422 | ||||||||||||
| 238 | @ | St. Jude Medical, Inc. | 8,870 | ||||||||||||
| 500 | Stryker Corp. | 25,930 | |||||||||||||
| 400 | @ | Zimmer Holdings, Inc. | 29,184 | ||||||||||||
| 653,880 | |||||||||||||||
| Healthcare-Services: 1.1% | |||||||||||||||
| 1,168 | Aetna, Inc. | 48,250 | |||||||||||||
| 515 | @ | Coventry Health Care, Inc. | 24,787 | ||||||||||||
| 502 | @ | Humana, Inc. | 27,158 | ||||||||||||
| 300 | @ | Laboratory Corp. of America Holdings | 21,240 | ||||||||||||
| 200 | Manor Care, Inc. | 9,504 | |||||||||||||
| 304 | Quest Diagnostics | 16,164 | |||||||||||||
| 4,048 | UnitedHealth Group, Inc. | 198,676 | |||||||||||||
| 1,868 | @ | WellPoint, Inc. | 141,352 | ||||||||||||
| 487,131 | |||||||||||||||
| Home Builders: 0.0% | |||||||||||||||
| 100 | Lennar Corp. | 5,250 | |||||||||||||
| 5,250 | |||||||||||||||
| Home Furnishings: 0.1% | |||||||||||||||
| 200 | Harman International Industries, Inc. | 20,768 | |||||||||||||
| 170 | Whirlpool Corp. | 14,501 | |||||||||||||
| 35,269 | |||||||||||||||
| Household Products/Wares: 0.2% | |||||||||||||||
| 100 | Avery Dennison Corp. | 6,747 | |||||||||||||
| Shares | Value | ||||||||||||||
| 278 | Fortune Brands, Inc. | $ | 22,490 | ||||||||||||
| 837 | Kimberly-Clark Corp. | 55,635 | |||||||||||||
| 84,872 | |||||||||||||||
| Housewares: 0.0% | |||||||||||||||
| 618 | Newell Rubbermaid, Inc. | 17,607 | |||||||||||||
| 17,607 | |||||||||||||||
| Insurance: 2.8% | |||||||||||||||
| 612 | @@ | ACE Ltd. | 34,786 | ||||||||||||
| 886 | Aflac, Inc. | 39,108 | |||||||||||||
| 1,494 | Allstate Corp. | 94,839 | |||||||||||||
| 267 | AMBAC Financial Group, Inc. | 22,866 | |||||||||||||
| 4,599 | American International Group, Inc. | 323,402 | |||||||||||||
| 550 | AON Corp. | 19,624 | |||||||||||||
| 992 | Chubb Corp. | 51,346 | |||||||||||||
| 218 | Cigna Corp. | 27,479 | |||||||||||||
| 431 | Cincinnati Financial Corp. | 19,085 | |||||||||||||
| 1,400 | Genworth Financial, Inc. | 45,920 | |||||||||||||
| 876 | Hartford Financial Services Group, Inc. | 75,126 | |||||||||||||
| 597 | Lincoln National Corp. | 37,963 | |||||||||||||
| 963 | Loews Corp. | 38,443 | |||||||||||||
| 400 | Marsh & McLennan Cos., Inc. | 12,568 | |||||||||||||
| 197 | MBIA, Inc. | 13,721 | |||||||||||||
| 1,861 | Metlife, Inc. | 109,297 | |||||||||||||
| 187 | MGIC Investment Corp. | 10,839 | |||||||||||||
| 608 | Principal Financial Group | 35,112 | |||||||||||||
| 1,738 | Progressive Corp. | 39,192 | |||||||||||||
| 1,173 | Prudential Financial, Inc. | 95,576 | |||||||||||||
| 318 | Safeco Corp. | 19,261 | |||||||||||||
| 1,680 | St. Paul Travelers Cos., Inc. | 87,041 | |||||||||||||
| 177 | Torchmark Corp. | 11,190 | |||||||||||||
| 710 | UnumProvident Corp. | 14,541 | |||||||||||||
| 300 | @@ | XL Capital Ltd. | 21,336 | ||||||||||||
| 1,299,661 | |||||||||||||||
| Internet: 0.4% | |||||||||||||||
| 600 | @ | Amazon.com, Inc. | 24,204 | ||||||||||||
| 816 | @ | eBay, Inc. | 26,398 | ||||||||||||
| 150 | @ | Google, Inc. | 72,738 | ||||||||||||
| 1,959 | @ | Symantec Corp. | 41,531 | ||||||||||||
| 400 | @ | VeriSign, Inc. | 10,444 | ||||||||||||
| 175,315 | |||||||||||||||
| Iron/Steel: 0.2% | |||||||||||||||
| 1,052 | Nucor Corp. | 62,962 | |||||||||||||
| 383 | United States Steel Corp. | 28,645 | |||||||||||||
| 91,607 | |||||||||||||||
| Leisure Time: 0.2% | |||||||||||||||
| 188 | Brunswick Corp. | 6,086 | |||||||||||||
| 757 | Carnival Corp. | 37,085 | |||||||||||||
| 512 | Harley-Davidson, Inc. | 37,770 | |||||||||||||
| 354 | Sabre Holdings Corp. | 9,710 | |||||||||||||
| 90,651 | |||||||||||||||
| Lodging: 0.1% | |||||||||||||||
| 532 | Marriott International, Inc. | 24,020 | |||||||||||||
| 204 | Starwood Hotels & Resorts Worldwide, Inc. | 13,091 | |||||||||||||
| 329 | @ | Wyndham Worldwide Corp. | 10,442 | ||||||||||||
| 47,553 | |||||||||||||||
See Accompanying Notes to Financial Statements
127
PORTFOLIO OF INVESTMENTS
ING PRINCIPAL PROTECTION FUND X AS OF NOVEMBER 30, 2006 (UNAUDITED) (CONTINUED)
| Shares | Value | ||||||||||||||
| Machinery-Construction & Mining: 0.2% | |||||||||||||||
| 1,150 | Caterpillar, Inc. | $ | 71,335 | ||||||||||||
| 71,335 | |||||||||||||||
| Machinery-Diversified: 0.1% | |||||||||||||||
| 106 | Cummins, Inc. | 12,712 | |||||||||||||
| 200 | Deere & Co. | 19,200 | |||||||||||||
| 266 | Rockwell Automation, Inc. | 17,311 | |||||||||||||
| 49,223 | |||||||||||||||
| Media: 1.3% | |||||||||||||||
| 1,922 | CBS Corp. | 57,180 | |||||||||||||
| 800 | Clear Channel Communications, Inc. | 28,128 | |||||||||||||
| 3,700 | @ | Comcast Corp. | 149,702 | ||||||||||||
| 200 | EW Scripps Co. | 9,772 | |||||||||||||
| 450 | Gannett Co., Inc. | 26,784 | |||||||||||||
| 1,002 | McGraw-Hill Cos., Inc. | 66,783 | |||||||||||||
| 95 | Meredith Corp. | 5,140 | |||||||||||||
| 4,200 | News Corp., Inc. | 86,520 | |||||||||||||
| 150 | @ | Univision Communications, Inc. | 5,339 | ||||||||||||
| 4,970 | Walt Disney Co. | 164,259 | |||||||||||||
| 599,607 | |||||||||||||||
| Mining: 0.2% | |||||||||||||||
| 400 | Freeport-McMoRan Copper & Gold, Inc. | 25,148 | |||||||||||||
| 390 | Phelps Dodge Corp. | 47,970 | |||||||||||||
| 152 | Vulcan Materials Co. | 13,485 | |||||||||||||
| 86,603 | |||||||||||||||
| Miscellaneous Manufacturing: 2.6% | |||||||||||||||
| 1,370 | 3M Co. | 111,600 | |||||||||||||
| 113 | Cooper Industries Ltd. | 10,333 | |||||||||||||
| 425 | Danaher Corp. | 31,076 | |||||||||||||
| 353 | Dover Corp. | 17,756 | |||||||||||||
| 700 | Eastman Kodak Co. | 18,214 | |||||||||||||
| 496 | Eaton Corp. | 38,232 | |||||||||||||
| 18,355 | General Electric Co. | 647,564 | |||||||||||||
| 1,959 | Honeywell International, Inc. | 84,198 | |||||||||||||
| 728 | Illinois Tool Works, Inc. | 34,362 | |||||||||||||
| 528 | @@ | Ingersoll-Rand Co. | 20,597 | ||||||||||||
| 280 | ITT Corp. | 15,106 | |||||||||||||
| 400 | Leggett & Platt, Inc. | 9,512 | |||||||||||||
| 318 | Parker Hannifin Corp. | 26,547 | |||||||||||||
| 237 | Textron, Inc. | 23,096 | |||||||||||||
| 3,500 | @@ | Tyco International Ltd. | 106,015 | ||||||||||||
| 1,194,208 | |||||||||||||||
| Office/Business Equipment: 0.1% | |||||||||||||||
| 359 | Pitney Bowes, Inc. | 16,546 | |||||||||||||
| 2,894 | @ | Xerox Corp. | 47,751 | ||||||||||||
| 64,297 | |||||||||||||||
| Oil & Gas: 5.0% | |||||||||||||||
| 754 | Anadarko Petroleum Corp. | 37,217 | |||||||||||||
| 248 | Apache Corp. | 17,343 | |||||||||||||
| 5,747 | Chevron Corp. | 415,623 | |||||||||||||
| 2,651 | ConocoPhillips | 178,412 | |||||||||||||
| 724 | Devon Energy Corp. | 53,120 | |||||||||||||
| 426 | EOG Resources, Inc. | 30,046 | |||||||||||||
| 15,667 | ExxonMobil Corp. | 1,203,382 | |||||||||||||
| 330 | Hess Corp. | 16,589 | |||||||||||||
| Shares | Value | ||||||||||||||
| 976 | Marathon Oil Corp. | $ | 92,115 | ||||||||||||
| 500 | @,@@ | Nabors Industries Ltd. | 16,880 | ||||||||||||
| 200 | Noble Corp. | 15,450 | |||||||||||||
| 1,380 | Occidental Petroleum Corp. | 69,469 | |||||||||||||
| 374 | Sunoco, Inc. | 25,492 | |||||||||||||
| 500 | @ | Transocean, Inc. | 38,975 | ||||||||||||
| 1,278 | Valero Energy Corp. | 70,379 | |||||||||||||
| 600 | XTO Energy, Inc. | 30,360 | |||||||||||||
| 2,310,852 | |||||||||||||||
| Oil & Gas Services: 0.7% | |||||||||||||||
| 500 | Baker Hughes, Inc. | 36,715 | |||||||||||||
| 200 | BJ Services Co. | 6,754 | |||||||||||||
| 2,800 | Halliburton Co. | 94,472 | |||||||||||||
| 300 | @ | National Oilwell Varco, Inc. | 19,953 | ||||||||||||
| 1,950 | Schlumberger Ltd. | 133,536 | |||||||||||||
| 200 | @ | Weatherford International Ltd. | 8,982 | ||||||||||||
| 300,412 | |||||||||||||||
| Packaging & Containers: 0.1% | |||||||||||||||
| 260 | Ball Corp. | 11,118 | |||||||||||||
| 200 | Bemis Co. | 6,826 | |||||||||||||
| 300 | @ | Pactiv Corp. | 10,335 | ||||||||||||
| 197 | Sealed Air Corp. | 11,723 | |||||||||||||
| 40,002 | |||||||||||||||
| Pharmaceuticals: 2.8% | |||||||||||||||
| 2,750 | Abbott Laboratories | 128,315 | |||||||||||||
| 93 | Allergan, Inc. | 10,842 | |||||||||||||
| 580 | AmerisourceBergen Corp. | 26,674 | |||||||||||||
| 200 | @ | Barr Pharmaceuticals, Inc. | 10,216 | ||||||||||||
| 1,400 | Bristol-Myers Squibb Co. | 34,762 | |||||||||||||
| 758 | Cardinal Health, Inc. | 48,982 | |||||||||||||
| 811 | Caremark Rx, Inc. | 38,360 | |||||||||||||
| 700 | Eli Lilly & Co. | 37,513 | |||||||||||||
| 330 | @ | Express Scripts, Inc. | 22,506 | ||||||||||||
| 809 | @ | Forest Laboratories, Inc. | 39,398 | ||||||||||||
| 824 | @ | Gilead Sciences, Inc. | 54,318 | ||||||||||||
| 115 | @ | Hospira, Inc. | 3,772 | ||||||||||||
| 644 | @ | King Pharmaceuticals, Inc. | 10,645 | ||||||||||||
| 574 | @ | Medco Health Solutions, Inc. | 28,821 | ||||||||||||
| 5,239 | Merck & Co., Inc. | 233,188 | |||||||||||||
| 400 | Mylan Laboratories | 8,116 | |||||||||||||
| 13,006 | Pfizer, Inc. | 357,535 | |||||||||||||
| 3,550 | Schering-Plough Corp. | 78,136 | |||||||||||||
| 250 | @ | Watson Pharmaceuticals, Inc. | 6,418 | ||||||||||||
| 2,344 | Wyeth | 113,168 | |||||||||||||
| 1,291,685 | |||||||||||||||
| Pipelines: 0.1% | |||||||||||||||
| 1,000 | El Paso Corp. | 14,600 | |||||||||||||
| 829 | Williams Cos., Inc. | 23,013 | |||||||||||||
| 37,613 | |||||||||||||||
| Real Estate: 0.0% | |||||||||||||||
| 330 | @ | CB Richard Ellis Group, Inc. | 10,867 | ||||||||||||
| 401 | @ | Realogy Corp. | 10,462 | ||||||||||||
| 21,329 | |||||||||||||||
| Real Estate Investment Trusts: 0.2% | |||||||||||||||
| 200 | Apartment Investment & Management Co. | 11,528 | |||||||||||||
| 100 | Boston Properties, Inc. | 11,705 | |||||||||||||
| 560 | Equity Office Properties Trust | 26,992 | |||||||||||||
See Accompanying Notes to Financial Statements
128
PORTFOLIO OF INVESTMENTS
ING PRINCIPAL PROTECTION FUND X AS OF NOVEMBER 30, 2006 (UNAUDITED) (CONTINUED)
| Shares | Value | ||||||||||||||
| Real Estate Investment Trusts (continued) | |||||||||||||||
| 200 | Prologis | $ | 13,034 | ||||||||||||
| 50 | Public Storage, Inc. | 4,814 | |||||||||||||
| 100 | Vornado Realty Trust | 12,611 | |||||||||||||
| 80,684 | |||||||||||||||
| Retail: 2.7% | |||||||||||||||
| 100 | @ | Autozone, Inc. | 11,361 | ||||||||||||
| 428 | @ | Bed Bath & Beyond, Inc. | 16,585 | ||||||||||||
| 739 | Best Buy Co., Inc. | 40,623 | |||||||||||||
| 300 | @ | Big Lots, Inc. | 6,693 | ||||||||||||
| 393 | Circuit City Stores, Inc. | 9,809 | |||||||||||||
| 786 | Costco Wholesale Corp. | 41,076 | |||||||||||||
| 1,400 | CVS Corp. | 40,278 | |||||||||||||
| 191 | Darden Restaurants, Inc. | 7,669 | |||||||||||||
| 500 | Family Dollar Stores, Inc. | 13,945 | |||||||||||||
| 1,572 | Federated Department Stores, Inc. | 66,165 | |||||||||||||
| 1,568 | Gap, Inc. | 29,353 | |||||||||||||
| 1,462 | Home Depot, Inc. | 55,512 | |||||||||||||
| 492 | JC Penney Co., Inc. | 38,051 | |||||||||||||
| 950 | @ | Kohl's Corp. | 66,120 | ||||||||||||
| 582 | Limited Brands, Inc. | 18,444 | |||||||||||||
| 2,662 | Lowe's Cos., Inc. | 80,286 | |||||||||||||
| 2,252 | McDonald's Corp. | 94,516 | |||||||||||||
| 648 | Nordstrom, Inc. | 31,765 | |||||||||||||
| 812 | @ | Office Depot, Inc. | 30,742 | ||||||||||||
| 200 | OfficeMax, Inc. | 9,414 | |||||||||||||
| 130 | @ | Sears Holding Corp. | 22,285 | ||||||||||||
| 1,167 | Staples, Inc. | 29,723 | |||||||||||||
| 1,842 | @ | Starbucks Corp. | 65,004 | ||||||||||||
| 1,501 | Target Corp. | 87,193 | |||||||||||||
| 1,330 | TJX Cos., Inc. | 36,469 | |||||||||||||
| 1,743 | Walgreen Co. | 70,574 | |||||||||||||
| 4,360 | Wal-Mart Stores, Inc. | 200,996 | |||||||||||||
| 339 | Wendy's International, Inc. | 11,041 | |||||||||||||
| 446 | Yum! Brands, Inc. | 27,291 | |||||||||||||
| 1,258,983 | |||||||||||||||
| Savings & Loans: 0.2% | |||||||||||||||
| 1,737 | Washington Mutual, Inc. | 75,872 | |||||||||||||
| 75,872 | |||||||||||||||
| Semiconductors: 1.2% | |||||||||||||||
| 1,400 | @ | Advanced Micro Devices, Inc. | 30,198 | ||||||||||||
| 1,070 | @ | Altera Corp. | 21,282 | ||||||||||||
| 699 | Analog Devices, Inc. | 22,731 | |||||||||||||
| 2,482 | Applied Materials, Inc. | 44,626 | |||||||||||||
| 897 | @ | Freescale Semiconductor, Inc. | 35,817 | ||||||||||||
| 10,071 | Intel Corp. | 215,016 | |||||||||||||
| 400 | KLA-Tencor Corp. | 20,668 | |||||||||||||
| 503 | Linear Technology Corp. | 16,166 | |||||||||||||
| 650 | @ | LSI Logic Corp. | 6,929 | ||||||||||||
| 612 | Maxim Integrated Products | 19,266 | |||||||||||||
| 2,000 | @ | Micron Technology, Inc. | 29,200 | ||||||||||||
| 507 | National Semiconductor Corp. | 12,264 | |||||||||||||
| 300 | @ | Novellus Systems, Inc. | 9,366 | ||||||||||||
| 300 | @ | Nvidia Corp. | 11,097 | ||||||||||||
| 466 | @ | QLogic Corp. | 10,369 | ||||||||||||
| 500 | @ | Teradyne, Inc. | 7,450 | ||||||||||||
| 1,133 | Texas Instruments, Inc. | 33,480 | |||||||||||||
| 600 | Xilinx, Inc. | 16,080 | |||||||||||||
| 562,005 | |||||||||||||||
| Shares | Value | ||||||||||||||
| Software: 2.0% | |||||||||||||||
| 924 | @ | Adobe Systems, Inc. | $ | 37,080 | |||||||||||
| 342 | @ | Autodesk, Inc. | 14,084 | ||||||||||||
| 1,013 | Automatic Data Processing, Inc. | 48,857 | |||||||||||||
| 664 | @ | BMC Software, Inc. | 21,620 | ||||||||||||
| 931 | CA, Inc. | 20,203 | |||||||||||||
| 396 | @ | Citrix Systems, Inc. | 11,381 | ||||||||||||
| 1,159 | @ | Compuware Corp. | 9,724 | ||||||||||||
| 508 | @ | Electronic Arts, Inc. | 28,372 | ||||||||||||
| 300 | Fidelity National Information Services, Inc. | 11,970 | |||||||||||||
| 1,219 | First Data Corp. | 30,780 | |||||||||||||
| 289 | @ | Fiserv, Inc. | 14,771 | ||||||||||||
| 337 | IMS Health, Inc. | 9,257 | |||||||||||||
| 756 | @ | Intuit, Inc. | 23,799 | ||||||||||||
| 15,337 | Microsoft Corp. | 449,834 | |||||||||||||
| 697 | @ | Novell, Inc. | 4,377 | ||||||||||||
| 7,086 | @ | Oracle Corp. | 134,847 | ||||||||||||
| 308 | @ | Parametric Technology Corp. | 5,963 | ||||||||||||
| 673 | Paychex, Inc. | 26,523 | |||||||||||||
| 903,442 | |||||||||||||||
| Telecommunications: 3.5% | |||||||||||||||
| 700 | Alltel Corp. | 39,718 | |||||||||||||
| 6,884 | AT&T, Inc. | 233,436 | |||||||||||||
| 1,383 | @ | Avaya, Inc. | 17,675 | ||||||||||||
| 3,210 | BellSouth Corp. | 143,134 | |||||||||||||
| 280 | CenturyTel, Inc. | 11,914 | |||||||||||||
| 18,401 | @ | Cisco Systems, Inc. | 494,619 | ||||||||||||
| 600 | Citizens Communications Co. | 8,502 | |||||||||||||
| 400 | @ | Comverse Technology, Inc. | 7,808 | ||||||||||||
| 2,746 | @ | Corning, Inc. | 59,204 | ||||||||||||
| 312 | Embarq Corp. | 16,052 | |||||||||||||
| 400 | @ | JDS Uniphase Corp. | 7,392 | ||||||||||||
| 900 | @ | Juniper Networks, Inc. | 19,161 | ||||||||||||
| 5,789 | Motorola, Inc. | 128,342 | |||||||||||||
| 2,924 | Qualcomm, Inc. | 106,989 | |||||||||||||
| 2,600 | @ | Qwest Communications International, Inc. | 19,994 | ||||||||||||
| 5,140 | Sprint Nextel Corp. | 100,281 | |||||||||||||
| 1,057 | @ | Tellabs, Inc. | 10,612 | ||||||||||||
| 5,045 | Verizon Communications, Inc. | 176,258 | |||||||||||||
| 806 | Windstream Corp. | 11,236 | |||||||||||||
| 1,612,327 | |||||||||||||||
| Textiles: 0.0% | |||||||||||||||
| 211 | Cintas Corp. | 8,904 | |||||||||||||
| 8,904 | |||||||||||||||
| Toys/Games/Hobbies: 0.1% | |||||||||||||||
| 355 | Hasbro, Inc. | 9,496 | |||||||||||||
| 776 | Mattel, Inc. | 17,033 | |||||||||||||
| 26,529 | |||||||||||||||
| Transportation: 0.5% | |||||||||||||||
| 622 | Burlington Northern Santa Fe Corp. | 46,750 | |||||||||||||
| 660 | CSX Corp. | 23,668 | |||||||||||||
| 585 | FedEx Corp. | 67,527 | |||||||||||||
| 775 | Norfolk Southern Corp. | 38,169 | |||||||||||||
| 100 | Ryder System, Inc. | 5,217 | |||||||||||||
| 450 | Union Pacific Corp. | 40,734 | |||||||||||||
| 222,065 | |||||||||||||||
| Total Common Stock (Cost $20,806,309) | 23,145,884 | ||||||||||||||
See Accompanying Notes to Financial Statements
129
PORTFOLIO OF INVESTMENTS
ING PRINCIPAL PROTECTION FUND X AS OF NOVEMBER 30, 2006 (UNAUDITED) (CONTINUED)
| Principal Amount | Value | ||||||||||||||
| U.S. TREASURY OBLIGATIONS: 49.0% | |||||||||||||||
| U.S. Treasury Principal Only STRIP: 49.0% | |||||||||||||||
| $ | 25,444,000 | Discount Note, due 08/15/09 | $ | 22,545,827 | |||||||||||
| 22,545,827 | |||||||||||||||
| Total U.S. Treasury Obligations (Cost $22,396,210) | 22,545,827 | ||||||||||||||
| Total Long-Term Investments (Cost $43,202,519) | 45,691,711 | ||||||||||||||
| SHORT-TERM INVESTMENTS: 1.0% | |||||||||||||||
| Repurchase Agreement: 1.0% | |||||||||||
| 443,000 | Goldman Sachs Repurchase Agreement dated 11/30/06, 5.280%, due 12/01/06, $443,065 to be received upon repurchase (Collateralized by $439,000 Federal National Mortgage Association, 5.250%, Market Value plus accrued interest $452,035, due 06/15/08) | 443,000 | |||||||||
| Total Short-Term Investments (Cost $443,000) | 443,000 | ||||||||||
| Total Investments in Securities (Cost $43,645,519)* | 100.3 | % | $ | 46,134,711 | |||||||
| Other Assets and Liabilities - Net | (0.3 | ) | (133,884 | ) | |||||||
| Net Assets | 100.0 | % | $ | 46,000,827 | |||||||
@ Non-income producing security
@@ Foreign Issuer
STRIP Separate Trading of Registered Interest and Principal of Securities
* Cost for federal income tax purposes is $43,914,645.
Net unrealized appreciation consists of:
| Gross Unrealized Appreciation | $ | 2,554,217 | |||||
| Gross Unrealized Depreciation | (334,151 | ) | |||||
| Net Unrealized Appreciation | $ | 2,220,066 | |||||
See Accompanying Notes to Financial Statements
130
PORTFOLIO OF INVESTMENTS
ING PRINCIPAL PROTECTION FUND XI AS OF NOVEMBER 30, 2006 (UNAUDITED)
| Shares | Value | ||||||||||||||
| COMMON STOCK: 46.9% | |||||||||||||||
| Advertising: 0.1% | |||||||||||||||
| 307 | Omnicom Group | $ | 31,363 | ||||||||||||
| 31,363 | |||||||||||||||
| Aerospace/Defense: 1.1% | |||||||||||||||
| 849 | Boeing Co. | 75,162 | |||||||||||||
| 604 | General Dynamics Corp. | 45,203 | |||||||||||||
| 150 | Goodrich Corp. | 6,750 | |||||||||||||
| 160 | L-3 Communications Holdings, Inc. | 13,160 | |||||||||||||
| 526 | Lockheed Martin Corp. | 47,577 | |||||||||||||
| 374 | Northrop Grumman Corp. | 25,032 | |||||||||||||
| 842 | Raytheon Co. | 42,976 | |||||||||||||
| 55 | Rockwell Collins, Inc. | 3,318 | |||||||||||||
| 1,098 | United Technologies Corp. | 70,854 | |||||||||||||
| 330,032 | |||||||||||||||
| Agriculture: 0.8% | |||||||||||||||
| 2,319 | Altria Group, Inc. | 195,283 | |||||||||||||
| 732 | Archer-Daniels-Midland Co. | 25,693 | |||||||||||||
| 166 | Reynolds American, Inc. | 10,664 | |||||||||||||
| 200 | UST, Inc. | 11,196 | |||||||||||||
| 242,836 | |||||||||||||||
| Airlines: 0.0% | |||||||||||||||
| 850 | Southwest Airlines Co. | 13,354 | |||||||||||||
| 13,354 | |||||||||||||||
| Apparel: 0.3% | |||||||||||||||
| 716 | @ | Coach, Inc. | 30,938 | ||||||||||||
| 162 | Jones Apparel Group, Inc. | 5,443 | |||||||||||||
| 83 | Liz Claiborne, Inc. | 3,548 | |||||||||||||
| 278 | Nike, Inc. | 27,508 | |||||||||||||
| 104 | VF Corp. | 8,153 | |||||||||||||
| 75,590 | |||||||||||||||
| Auto Manufacturers: 0.2% | |||||||||||||||
| 2,433 | Ford Motor Co. | 19,780 | |||||||||||||
| 250 | General Motors Corp. | 7,308 | |||||||||||||
| 120 | @ | Navistar International Corp. | 3,839 | ||||||||||||
| 375 | Paccar, Inc. | 24,488 | |||||||||||||
| 55,415 | |||||||||||||||
| Auto Parts & Equipment: 0.1% | |||||||||||||||
| 323 | @ | Goodyear Tire & Rubber Co. | 5,443 | ||||||||||||
| 202 | Johnson Controls, Inc. | 16,429 | |||||||||||||
| 21,872 | |||||||||||||||
| Banks: 3.6% | |||||||||||||||
| 6,721 | Bank of America Corp. | 361,926 | |||||||||||||
| 827 | Bank of New York Co., Inc. | 29,392 | |||||||||||||
| 530 | BB&T Corp. | 22,795 | |||||||||||||
| 366 | Capital One Financial Corp. | 28,504 | |||||||||||||
| 253 | Comerica, Inc. | 14,737 | |||||||||||||
| 100 | Commerce Bancorp., Inc. | 3,476 | |||||||||||||
| 120 | Compass Bancshares, Inc. | 6,857 | |||||||||||||
| 550 | Fifth Third Bancorp. | 21,687 | |||||||||||||
| 62 | First Horizon National Corp. | 2,471 | |||||||||||||
| 250 | Huntington Bancshares, Inc. | 6,078 | |||||||||||||
| 401 | Keycorp | 14,476 | |||||||||||||
| 107 | M&T Bank Corp. | 12,694 | |||||||||||||
| 298 | Marshall & Ilsley Corp. | 13,645 | |||||||||||||
| 427 | Mellon Financial Corp. | 17,178 | |||||||||||||
| Shares | Value | ||||||||||||||
| 871 | National City Corp. | $ | 31,443 | ||||||||||||
| 500 | North Fork Bancorp., Inc. | 14,035 | |||||||||||||
| 217 | Northern Trust Corp. | 12,360 | |||||||||||||
| 311 | PNC Financial Services Group, Inc. | 21,985 | |||||||||||||
| 1,064 | Regions Financial Corp. | 38,996 | |||||||||||||
| 375 | State Street Corp. | 23,299 | |||||||||||||
| 411 | SunTrust Banks, Inc. | 33,558 | |||||||||||||
| 306 | Synovus Financial Corp. | 9,186 | |||||||||||||
| 1,925 | US Bancorp. | 64,757 | |||||||||||||
| 2,838 | Wachovia Corp. | 153,791 | |||||||||||||
| 3,658 | Wells Fargo & Co. | 128,908 | |||||||||||||
| 126 | Zions Bancorp. | 9,858 | |||||||||||||
| 1,098,092 | |||||||||||||||
| Beverages: 1.0% | |||||||||||||||
| 1,129 | Anheuser-Busch Cos., Inc. | 53,639 | |||||||||||||
| 87 | Brown-Forman Corp. | 6,042 | |||||||||||||
| 2,193 | Coca-Cola Co. | 102,698 | |||||||||||||
| 398 | Coca-Cola Enterprises, Inc. | 8,139 | |||||||||||||
| 250 | @ | Constellation Brands, Inc. | 6,995 | ||||||||||||
| 50 | Molson Coors Brewing Co. | 3,554 | |||||||||||||
| 224 | Pepsi Bottling Group, Inc. | 7,016 | |||||||||||||
| 1,812 | PepsiCo, Inc. | 112,290 | |||||||||||||
| 300,373 | |||||||||||||||
| Biotechnology: 0.5% | |||||||||||||||
| 1,284 | @ | Amgen, Inc. | 91,164 | ||||||||||||
| 400 | @ | Biogen Idec, Inc. | 20,904 | ||||||||||||
| 400 | @ | Celgene Corp. | 22,292 | ||||||||||||
| 97 | @ | Genzyme Corp. | 6,247 | ||||||||||||
| 100 | @ | Medimmune, Inc. | 3,269 | ||||||||||||
| 59 | @ | Millipore Corp. | 4,036 | ||||||||||||
| 147,912 | |||||||||||||||
| Building Materials: 0.1% | |||||||||||||||
| 79 | American Standard Cos., Inc. | 3,540 | |||||||||||||
| 450 | Masco Corp. | 12,911 | |||||||||||||
| 16,451 | |||||||||||||||
| Chemicals: 0.8% | |||||||||||||||
| 96 | Air Products & Chemicals, Inc. | 6,637 | |||||||||||||
| 100 | Ashland, Inc. | 6,761 | |||||||||||||
| 1,193 | Dow Chemical Co. | 47,732 | |||||||||||||
| 50 | Eastman Chemical Co. | 2,969 | |||||||||||||
| 200 | Ecolab, Inc. | 8,870 | |||||||||||||
| 1,150 | EI DuPont de Nemours & Co. | 53,970 | |||||||||||||
| 146 | International Flavors & Fragrances, Inc. | 6,878 | |||||||||||||
| 664 | Monsanto Co. | 31,918 | |||||||||||||
| 322 | PPG Industries, Inc. | 20,705 | |||||||||||||
| 410 | Praxair, Inc. | 25,584 | |||||||||||||
| 207 | Rohm & Haas Co. | 10,810 | |||||||||||||
| 211 | Sherwin-Williams Co. | 13,198 | |||||||||||||
| 100 | Sigma-Aldrich Corp. | 7,611 | |||||||||||||
| 243,643 | |||||||||||||||
| Coal: 0.0% | |||||||||||||||
| 290 | Peabody Energy Corp. | 13,343 | |||||||||||||
| 13,343 | |||||||||||||||
| Commercial Services: 0.4% | |||||||||||||||
| 200 | @ | Apollo Group, Inc. | 7,758 | ||||||||||||
| 200 | @ | Convergys Corp. | 4,824 | ||||||||||||
See Accompanying Notes to Financial Statements
131
PORTFOLIO OF INVESTMENTS
ING PRINCIPAL PROTECTION FUND XI AS OF NOVEMBER 30, 2006 (UNAUDITED) (CONTINUED)
| Shares | Value | ||||||||||||||
| Commercial Services (continued) | |||||||||||||||
| 236 | Equifax, Inc. | $ | 8,966 | ||||||||||||
| 420 | H&R Block, Inc. | 10,080 | |||||||||||||
| 570 | McKesson Corp. | 28,158 | |||||||||||||
| 130 | @ | Monster Worldwide, Inc. | 5,675 | ||||||||||||
| 352 | Moody's Corp. | 24,457 | |||||||||||||
| 201 | Robert Half International, Inc. | 7,757 | |||||||||||||
| 87 | RR Donnelley & Sons Co. | 3,068 | |||||||||||||
| 733 | Western Union Co. | 16,712 | |||||||||||||
| 117,455 | |||||||||||||||
| Computers: 2.2% | |||||||||||||||
| 130 | @ | Affiliated Computer Services, Inc. | 6,572 | ||||||||||||
| 150 | @ | Cognizant Technology Solutions Corp. | 12,234 | ||||||||||||
| 204 | @ | Computer Sciences Corp. | 10,649 | ||||||||||||
| 4,271 | @ | Dell, Inc. | 116,342 | ||||||||||||
| 534 | Electronic Data Systems Corp. | 14,493 | |||||||||||||
| 2,511 | @ | EMC Corp. | 32,919 | ||||||||||||
| 5,070 | Hewlett-Packard Co. | 200,062 | |||||||||||||
| 2,237 | International Business Machines Corp. | 205,625 | |||||||||||||
| 169 | @ | Lexmark International, Inc. | 11,658 | ||||||||||||
| 238 | @ | NCR Corp. | 10,213 | ||||||||||||
| 444 | @ | Network Appliance, Inc. | 17,409 | ||||||||||||
| 200 | @ | Sandisk Corp. | 8,880 | ||||||||||||
| 3,800 | @ | Sun Microsystems, Inc. | 20,596 | ||||||||||||
| 381 | @ | Unisys Corp. | 2,747 | ||||||||||||
| 670,399 | |||||||||||||||
| Cosmetics/Personal Care: 0.9% | |||||||||||||||
| 450 | Avon Products, Inc. | 14,688 | |||||||||||||
| 549 | Colgate-Palmolive Co. | 35,712 | |||||||||||||
| 250 | Estee Lauder Cos., Inc. | 10,323 | |||||||||||||
| 3,495 | Procter & Gamble Co. | 219,451 | |||||||||||||
| 280,174 | |||||||||||||||
| Distribution/Wholesale: 0.0% | |||||||||||||||
| 98 | WW Grainger, Inc. | 7,091 | |||||||||||||
| 7,091 | |||||||||||||||
| Diversified Financial Services: 4.2% | |||||||||||||||
| 1,335 | American Express Co. | 78,391 | |||||||||||||
| 217 | Ameriprise Financial, Inc. | 11,740 | |||||||||||||
| 130 | Bear Stearns Cos., Inc. | 19,822 | |||||||||||||
| 1,200 | Charles Schwab Corp. | 22,008 | |||||||||||||
| 40 | Chicago Mercantile Exchange Holdings, Inc. | 21,424 | |||||||||||||
| 298 | CIT Group, Inc. | 15,499 | |||||||||||||
| 7,364 | Citigroup, Inc. | 365,181 | |||||||||||||
| 638 | Countrywide Financial Corp. | 25,341 | |||||||||||||
| 450 | @ | E*Trade Financial Corp. | 10,832 | ||||||||||||
| 1,041 | Fannie Mae | 59,368 | |||||||||||||
| 57 | Federated Investors, Inc. | 1,891 | |||||||||||||
| 163 | Franklin Resources, Inc. | 17,399 | |||||||||||||
| 750 | Freddie Mac | 50,370 | |||||||||||||
| 493 | Goldman Sachs Group, Inc. | 96,036 | |||||||||||||
| 250 | Janus Capital Group, Inc. | 5,065 | |||||||||||||
| 5,100 | JPMorgan Chase & Co. | 236,028 | |||||||||||||
| 604 | Lehman Brothers Holdings, Inc. | 44,497 | |||||||||||||
| 971 | Merrill Lynch & Co., Inc. | 84,895 | |||||||||||||
| 1,185 | Morgan Stanley | 90,250 | |||||||||||||
| 451 | SLM Corp. | 20,674 | |||||||||||||
| 220 | T. Rowe Price Group, Inc. | 9,533 | |||||||||||||
| 1,286,244 | |||||||||||||||
| Shares | Value | ||||||||||||||
| Electric: 1.4% | |||||||||||||||
| 1,208 | @ | AES Corp. | $ | 28,231 | |||||||||||
| 244 | @ | Allegheny Energy, Inc. | 10,824 | ||||||||||||
| 250 | Ameren Corp. | 13,678 | |||||||||||||
| 559 | American Electric Power Co., Inc. | 23,204 | |||||||||||||
| 420 | Centerpoint Energy, Inc. | 6,867 | |||||||||||||
| 260 | @ | CMS Energy Corp. | 4,215 | ||||||||||||
| 262 | Constellation Energy Group, Inc. | 17,976 | |||||||||||||
| 250 | DTE Energy Co. | 11,773 | |||||||||||||
| 550 | @ | Dynegy, Inc. | 3,735 | ||||||||||||
| 394 | Edison International | 18,116 | |||||||||||||
| 300 | Entergy Corp. | 27,396 | |||||||||||||
| 950 | Exelon Corp. | 57,694 | |||||||||||||
| 463 | FirstEnergy Corp. | 27,706 | |||||||||||||
| 442 | PG&E Corp. | 20,301 | |||||||||||||
| 150 | Pinnacle West Capital Corp. | 7,401 | |||||||||||||
| 556 | PPL Corp. | 20,211 | |||||||||||||
| 100 | Progress Energy, Inc. | 4,777 | |||||||||||||
| 342 | Public Service Enterprise Group, Inc. | 22,989 | |||||||||||||
| 1,050 | Southern Co. | 38,063 | |||||||||||||
| 300 | TECO Energy, Inc. | 5,097 | |||||||||||||
| 668 | TXU Corp. | 38,337 | |||||||||||||
| 510 | Xcel Energy, Inc. | 11,710 | |||||||||||||
| 420,301 | |||||||||||||||
| Electrical Components & Equipment: 0.1% | |||||||||||||||
| 427 | Emerson Electric Co. | 37,021 | |||||||||||||
| 150 | Molex, Inc. | 4,800 | |||||||||||||
| 41,821 | |||||||||||||||
| Electronics: 0.2% | |||||||||||||||
| 556 | @ | Agilent Technologies, Inc. | 17,703 | ||||||||||||
| 278 | Applera Corp. - Applied Biosystems Group | 10,130 | |||||||||||||
| 274 | Jabil Circuit, Inc. | 7,771 | |||||||||||||
| 195 | PerkinElmer, Inc. | 4,226 | |||||||||||||
| 250 | Symbol Technologies, Inc. | 3,705 | |||||||||||||
| 100 | Tektronix, Inc. | 3,056 | |||||||||||||
| 481 | @ | Thermo Electron Corp. | 21,082 | ||||||||||||
| 154 | @ | Waters Corp. | 7,706 | ||||||||||||
| 75,379 | |||||||||||||||
| Entertainment: 0.0% | |||||||||||||||
| 170 | International Game Technology | 7,443 | |||||||||||||
| 7,443 | |||||||||||||||
| Environmental Control: 0.1% | |||||||||||||||
| 300 | @ | Allied Waste Industries, Inc. | 3,804 | ||||||||||||
| 779 | Waste Management, Inc. | 28,519 | |||||||||||||
| 32,323 | |||||||||||||||
| Food: 0.5% | |||||||||||||||
| 416 | Campbell Soup Co. | 15,837 | |||||||||||||
| 549 | ConAgra Foods, Inc. | 14,109 | |||||||||||||
| 150 | @ | Dean Foods Co. | 6,423 | ||||||||||||
| 680 | General Mills, Inc. | 38,046 | |||||||||||||
| 100 | Hershey Co. | 5,297 | |||||||||||||
| 450 | HJ Heinz Co. | 20,003 | |||||||||||||
| 241 | Kellogg Co. | 11,997 | |||||||||||||
| 728 | Kroger Co. | 15,623 | |||||||||||||
| 192 | McCormick & Co., Inc. | 7,434 | |||||||||||||
| 507 | Safeway, Inc. | 15,621 | |||||||||||||
| 313 | Sara Lee Corp. | 5,190 | |||||||||||||
See Accompanying Notes to Financial Statements
132
PORTFOLIO OF INVESTMENTS
ING PRINCIPAL PROTECTION FUND XI AS OF NOVEMBER 30, 2006 (UNAUDITED) (CONTINUED)
| Shares | Value | ||||||||||||||
| Food (continued) | |||||||||||||||
| 61 | Supervalu, Inc. | $ | 2,090 | ||||||||||||
| 150 | Whole Foods Market, Inc. | 7,320 | |||||||||||||
| 164,990 | |||||||||||||||
| Forest Products & Paper: 0.2% | |||||||||||||||
| 550 | International Paper Co. | 18,205 | |||||||||||||
| 222 | MeadWestvaco Corp. | 6,549 | |||||||||||||
| 177 | Plum Creek Timber Co., Inc. | 6,595 | |||||||||||||
| 196 | Temple-Inland, Inc. | 7,664 | |||||||||||||
| 100 | Weyerhaeuser Co. | 6,468 | |||||||||||||
| 45,481 | |||||||||||||||
| Gas: 0.1% | |||||||||||||||
| 250 | KeySpan Corp. | 10,258 | |||||||||||||
| 75 | Nicor, Inc. | 3,716 | |||||||||||||
| 350 | NiSource, Inc. | 8,631 | |||||||||||||
| 317 | Sempra Energy | 17,277 | |||||||||||||
| 39,882 | |||||||||||||||
| Hand/Machine Tools: 0.0% | |||||||||||||||
| 62 | Black & Decker Corp. | 5,325 | |||||||||||||
| 92 | Snap-On, Inc. | 4,370 | |||||||||||||
| 59 | Stanley Works | 3,010 | |||||||||||||
| 12,705 | |||||||||||||||
| Healthcare-Products: 1.3% | |||||||||||||||
| 682 | Baxter International, Inc. | 30,513 | |||||||||||||
| 276 | Becton Dickinson & Co. | 19,795 | |||||||||||||
| 1,200 | @ | Boston Scientific Corp. | 18,984 | ||||||||||||
| 93 | CR Bard, Inc. | 7,653 | |||||||||||||
| 3,207 | Johnson & Johnson | 211,373 | |||||||||||||
| 1,250 | Medtronic, Inc. | 65,163 | |||||||||||||
| 150 | @ | Patterson Cos., Inc. | 5,567 | ||||||||||||
| 146 | @ | St. Jude Medical, Inc. | 5,441 | ||||||||||||
| 350 | Stryker Corp. | 18,151 | |||||||||||||
| 300 | @ | Zimmer Holdings, Inc. | 21,888 | ||||||||||||
| 404,528 | |||||||||||||||
| Healthcare-Services: 1.0% | |||||||||||||||
| 844 | Aetna, Inc. | 34,866 | |||||||||||||
| 260 | @ | Coventry Health Care, Inc. | 12,514 | ||||||||||||
| 298 | @ | Humana, Inc. | 16,122 | ||||||||||||
| 181 | @ | Laboratory Corp. of America Holdings | 12,815 | ||||||||||||
| 100 | Manor Care, Inc. | 4,752 | |||||||||||||
| 212 | Quest Diagnostics | 11,272 | |||||||||||||
| 2,476 | UnitedHealth Group, Inc. | 121,522 | |||||||||||||
| 1,156 | @ | WellPoint, Inc. | 87,475 | ||||||||||||
| 301,338 | |||||||||||||||
| Home Furnishings: 0.1% | |||||||||||||||
| 100 | Harman International Industries, Inc. | 10,384 | |||||||||||||
| 90 | Whirlpool Corp. | 7,677 | |||||||||||||
| 18,061 | |||||||||||||||
| Household Products/Wares: 0.2% | |||||||||||||||
| 50 | Avery Dennison Corp. | 3,374 | |||||||||||||
| 182 | Fortune Brands, Inc. | 14,724 | |||||||||||||
| 514 | Kimberly-Clark Corp. | 34,166 | |||||||||||||
| 52,264 | |||||||||||||||
| Shares | Value | ||||||||||||||
| Housewares: 0.0% | |||||||||||||||
| 358 | Newell Rubbermaid, Inc. | $ | 10,199 | ||||||||||||
| 10,199 | |||||||||||||||
| Insurance: 2.6% | |||||||||||||||
| 365 | @@ | ACE Ltd. | 20,747 | ||||||||||||
| 547 | Aflac, Inc. | 24,145 | |||||||||||||
| 923 | Allstate Corp. | 58,592 | |||||||||||||
| 142 | AMBAC Financial Group, Inc. | 12,161 | |||||||||||||
| 2,842 | American International Group, Inc. | 199,849 | |||||||||||||
| 420 | AON Corp. | 14,986 | |||||||||||||
| 540 | Chubb Corp. | 27,950 | |||||||||||||
| 164 | Cigna Corp. | 20,672 | |||||||||||||
| 197 | Cincinnati Financial Corp. | 8,723 | |||||||||||||
| 850 | Genworth Financial, Inc. | 27,880 | |||||||||||||
| 563 | Hartford Financial Services Group, Inc. | 48,283 | |||||||||||||
| 291 | Lincoln National Corp. | 18,505 | |||||||||||||
| 648 | Loews Corp. | 25,868 | |||||||||||||
| 250 | Marsh & McLennan Cos., Inc. | 7,855 | |||||||||||||
| 183 | MBIA, Inc. | 12,746 | |||||||||||||
| 1,136 | Metlife, Inc. | 66,717 | |||||||||||||
| 105 | MGIC Investment Corp. | 6,086 | |||||||||||||
| 423 | Principal Financial Group | 24,428 | |||||||||||||
| 1,032 | Progressive Corp. | 23,272 | |||||||||||||
| 733 | Prudential Financial, Inc. | 59,725 | |||||||||||||
| 210 | Safeco Corp. | 12,720 | |||||||||||||
| 1,050 | St. Paul Travelers Cos., Inc. | 54,401 | |||||||||||||
| 152 | Torchmark Corp. | 9,609 | |||||||||||||
| 403 | UnumProvident Corp. | 8,253 | |||||||||||||
| 200 | @@ | XL Capital Ltd. | 14,224 | ||||||||||||
| 808,397 | |||||||||||||||
| Internet: 0.4% | |||||||||||||||
| 350 | @ | Amazon.com, Inc. | 14,119 | ||||||||||||
| 466 | @ | eBay, Inc. | 15,075 | ||||||||||||
| 100 | @ | Google, Inc. | 48,492 | ||||||||||||
| 1,196 | @ | Symantec Corp. | 25,355 | ||||||||||||
| 250 | @ | VeriSign, Inc. | 6,528 | ||||||||||||
| 109,569 | |||||||||||||||
| Iron/Steel: 0.2% | |||||||||||||||
| 630 | Nucor Corp. | 37,706 | |||||||||||||
| 236 | United States Steel Corp. | 17,650 | |||||||||||||
| 55,356 | |||||||||||||||
| Leisure Time: 0.2% | |||||||||||||||
| 158 | Brunswick Corp. | 5,114 | |||||||||||||
| 445 | Carnival Corp. | 21,801 | |||||||||||||
| 295 | Harley-Davidson, Inc. | 21,762 | |||||||||||||
| 203 | Sabre Holdings Corp. | 5,568 | |||||||||||||
| 54,245 | |||||||||||||||
| Lodging: 0.1% | |||||||||||||||
| 332 | Marriott International, Inc. | 14,990 | |||||||||||||
| 83 | Starwood Hotels & Resorts Worldwide, Inc. | 5,326 | |||||||||||||
| 225 | @ | Wyndham Worldwide Corp. | 7,142 | ||||||||||||
| 27,458 | |||||||||||||||
| Machinery-Construction & Mining: 0.1% | |||||||||||||||
| 700 | Caterpillar, Inc. | 43,421 | |||||||||||||
| 43,421 | |||||||||||||||
See Accompanying Notes to Financial Statements
133
PORTFOLIO OF INVESTMENTS
ING PRINCIPAL PROTECTION FUND XI AS OF NOVEMBER 30, 2006 (UNAUDITED) (CONTINUED)
| Shares | Value | ||||||||||||||
| Machinery-Diversified: 0.1% | |||||||||||||||
| 104 | Cummins, Inc. | $ | 12,472 | ||||||||||||
| 100 | Deere & Co. | 9,600 | |||||||||||||
| 201 | Rockwell Automation, Inc. | 13,081 | |||||||||||||
| 35,153 | |||||||||||||||
| Media: 1.2% | |||||||||||||||
| 1,151 | CBS Corp. | 34,242 | |||||||||||||
| 500 | Clear Channel Communications, Inc. | 17,580 | |||||||||||||
| 2,350 | @ | Comcast Corp. | 95,081 | ||||||||||||
| 100 | EW Scripps Co. | 4,886 | |||||||||||||
| 250 | Gannett Co., Inc. | 14,880 | |||||||||||||
| 508 | McGraw-Hill Cos., Inc. | 33,858 | |||||||||||||
| 54 | Meredith Corp. | 2,921 | |||||||||||||
| 2,630 | News Corp., Inc. | 54,178 | |||||||||||||
| 100 | Tribune Co. | 3,180 | |||||||||||||
| 200 | @ | Univision Communications, Inc. | 7,118 | ||||||||||||
| 3,079 | Walt Disney Co. | 101,761 | |||||||||||||
| 369,685 | |||||||||||||||
| Mining: 0.2% | |||||||||||||||
| 250 | Freeport-McMoRan Copper & Gold, Inc. | 15,718 | |||||||||||||
| 220 | Phelps Dodge Corp. | 27,060 | |||||||||||||
| 93 | Vulcan Materials Co. | 8,251 | |||||||||||||
| 51,029 | |||||||||||||||
| Miscellaneous Manufacturing: 2.4% | |||||||||||||||
| 837 | 3M Co. | 68,182 | |||||||||||||
| 77 | Cooper Industries Ltd. | 7,041 | |||||||||||||
| 238 | Danaher Corp. | 17,403 | |||||||||||||
| 253 | Dover Corp. | 12,726 | |||||||||||||
| 350 | Eastman Kodak Co. | 9,107 | |||||||||||||
| 289 | Eaton Corp. | 22,276 | |||||||||||||
| 11,363 | General Electric Co. | 400,887 | |||||||||||||
| 1,206 | Honeywell International, Inc. | 51,834 | |||||||||||||
| 418 | Illinois Tool Works, Inc. | 19,730 | |||||||||||||
| 320 | @@ | Ingersoll-Rand Co. | 12,483 | ||||||||||||
| 236 | ITT Corp. | 12,732 | |||||||||||||
| 250 | Leggett & Platt, Inc. | 5,945 | |||||||||||||
| 233 | Parker Hannifin Corp. | 19,451 | |||||||||||||
| 157 | Textron, Inc. | 15,300 | |||||||||||||
| 2,200 | @@ | Tyco International Ltd. | 66,638 | ||||||||||||
| 741,735 | |||||||||||||||
| Office/Business Equipment: 0.1% | |||||||||||||||
| 253 | Pitney Bowes, Inc. | 11,661 | |||||||||||||
| 1,819 | @ | Xerox Corp. | 30,014 | ||||||||||||
| 41,675 | |||||||||||||||
| Oil & Gas: 4.7% | |||||||||||||||
| 470 | Anadarko Petroleum Corp. | 23,199 | |||||||||||||
| 134 | Apache Corp. | 9,371 | |||||||||||||
| 3,577 | Chevron Corp. | 258,689 | |||||||||||||
| 1,649 | ConocoPhillips | 110,978 | |||||||||||||
| 437 | Devon Energy Corp. | 32,063 | |||||||||||||
| 238 | EOG Resources, Inc. | 16,786 | |||||||||||||
| 9,698 | ExxonMobil Corp. | 744,903 | |||||||||||||
| 204 | Hess Corp. | 10,255 | |||||||||||||
| 597 | Marathon Oil Corp. | 56,345 | |||||||||||||
| 300 | @,@@ | Nabors Industries Ltd. | 10,128 | ||||||||||||
| 150 | Noble Corp. | 11,588 | |||||||||||||
| 876 | Occidental Petroleum Corp. | 44,098 | |||||||||||||
| Shares | Value | ||||||||||||||
| 186 | Sunoco, Inc. | $ | 12,678 | ||||||||||||
| 300 | @ | Transocean, Inc. | 23,385 | ||||||||||||
| 782 | Valero Energy Corp. | 43,065 | |||||||||||||
| 300 | XTO Energy, Inc. | 15,180 | |||||||||||||
| 1,422,711 | |||||||||||||||
| Oil & Gas Services: 0.6% | |||||||||||||||
| 350 | Baker Hughes, Inc. | 25,701 | |||||||||||||
| 100 | BJ Services Co. | 3,377 | |||||||||||||
| 1,730 | Halliburton Co. | 58,370 | |||||||||||||
| 150 | @ | National Oilwell Varco, Inc. | 9,977 | ||||||||||||
| 1,200 | Schlumberger Ltd. | 82,176 | |||||||||||||
| 150 | @ | Weatherford International Ltd. | 6,737 | ||||||||||||
| 186,338 | |||||||||||||||
| Packaging & Containers: 0.1% | |||||||||||||||
| 140 | Ball Corp. | 5,986 | |||||||||||||
| 150 | Bemis Co. | 5,120 | |||||||||||||
| 250 | @ | Pactiv Corp. | 8,613 | ||||||||||||
| 116 | Sealed Air Corp. | 6,903 | |||||||||||||
| 26,622 | |||||||||||||||
| Pharmaceuticals: 2.6% | |||||||||||||||
| 1,650 | Abbott Laboratories | 76,989 | |||||||||||||
| 81 | Allergan, Inc. | 9,443 | |||||||||||||
| 376 | AmerisourceBergen Corp. | 17,292 | |||||||||||||
| 150 | @ | Barr Pharmaceuticals, Inc. | 7,662 | ||||||||||||
| 850 | Bristol-Myers Squibb Co. | 21,106 | |||||||||||||
| 433 | Cardinal Health, Inc. | 27,980 | |||||||||||||
| 459 | Caremark Rx, Inc. | 21,711 | |||||||||||||
| 450 | Eli Lilly & Co. | 24,116 | |||||||||||||
| 192 | @ | Express Scripts, Inc. | 13,094 | ||||||||||||
| 448 | @ | Forest Laboratories, Inc. | 21,818 | ||||||||||||
| 526 | @ | Gilead Sciences, Inc. | 34,674 | ||||||||||||
| 162 | @ | Hospira, Inc. | 5,314 | ||||||||||||
| 375 | @ | King Pharmaceuticals, Inc. | 6,199 | ||||||||||||
| 363 | @ | Medco Health Solutions, Inc. | 18,226 | ||||||||||||
| 3,234 | Merck & Co., Inc. | 143,945 | |||||||||||||
| 400 | Mylan Laboratories | 8,116 | |||||||||||||
| 7,904 | Pfizer, Inc. | 217,281 | |||||||||||||
| 2,200 | Schering-Plough Corp. | 48,422 | |||||||||||||
| 90 | @ | Watson Pharmaceuticals, Inc. | 2,310 | ||||||||||||
| 1,454 | Wyeth | 70,199 | |||||||||||||
| 795,897 | |||||||||||||||
| Pipelines: 0.1% | |||||||||||||||
| 600 | El Paso Corp. | 8,760 | |||||||||||||
| 537 | Williams Cos., Inc. | 14,907 | |||||||||||||
| 23,667 | |||||||||||||||
| Real Estate: 0.0% | |||||||||||||||
| 200 | @ | CB Richard Ellis Group, Inc. | 6,586 | ||||||||||||
| 250 | @ | Realogy Corp. | 6,523 | ||||||||||||
| 13,109 | |||||||||||||||
| Real Estate Investment Trusts: 0.2% | |||||||||||||||
| 120 | Apartment Investment & Management Co. | 6,917 | |||||||||||||
| 50 | Boston Properties, Inc. | 5,853 | |||||||||||||
| 370 | Equity Office Properties Trust | 17,834 | |||||||||||||
| 100 | Prologis | 6,517 | |||||||||||||
| 100 | Public Storage, Inc. | 9,628 | |||||||||||||
| 50 | Vornado Realty Trust | 6,306 | |||||||||||||
| 53,055 | |||||||||||||||
See Accompanying Notes to Financial Statements
134
PORTFOLIO OF INVESTMENTS
ING PRINCIPAL PROTECTION FUND XI AS OF NOVEMBER 30, 2006 (UNAUDITED) (CONTINUED)
| Shares | Value | ||||||||||||||
| Retail: 2.6% | |||||||||||||||
| 50 | @ | Autozone, Inc. | $ | 5,681 | |||||||||||
| 245 | @ | Bed Bath & Beyond, Inc. | 9,494 | ||||||||||||
| 429 | Best Buy Co., Inc. | 23,582 | |||||||||||||
| 200 | @ | Big Lots, Inc. | 4,462 | ||||||||||||
| 208 | Circuit City Stores, Inc. | 5,192 | |||||||||||||
| 474 | Costco Wholesale Corp. | 24,771 | |||||||||||||
| 850 | CVS Corp. | 24,455 | |||||||||||||
| 162 | Darden Restaurants, Inc. | 6,504 | |||||||||||||
| 250 | Family Dollar Stores, Inc. | 6,973 | |||||||||||||
| 1,046 | Federated Department Stores, Inc. | 44,026 | |||||||||||||
| 1,042 | Gap, Inc. | 19,506 | |||||||||||||
| 923 | Home Depot, Inc. | 35,046 | |||||||||||||
| 251 | JC Penney Co., Inc. | 19,412 | |||||||||||||
| 640 | @ | Kohl's Corp. | 44,544 | ||||||||||||
| 428 | Limited Brands, Inc. | 13,563 | |||||||||||||
| 1,656 | Lowe's Cos., Inc. | 49,945 | |||||||||||||
| 1,382 | McDonald's Corp. | 58,003 | |||||||||||||
| 424 | Nordstrom, Inc. | 20,784 | |||||||||||||
| 529 | @ | Office Depot, Inc. | 20,028 | ||||||||||||
| 100 | OfficeMax, Inc. | 4,707 | |||||||||||||
| 150 | RadioShack Corp. | 2,630 | |||||||||||||
| 90 | @ | Sears Holding Corp. | 15,428 | ||||||||||||
| 721 | Staples, Inc. | 18,364 | |||||||||||||
| 1,130 | @ | Starbucks Corp. | 39,878 | ||||||||||||
| 945 | Target Corp. | 54,895 | |||||||||||||
| 845 | TJX Cos., Inc. | 23,170 | |||||||||||||
| 1,113 | Walgreen Co. | 45,065 | |||||||||||||
| 2,661 | Wal-Mart Stores, Inc. | 122,672 | |||||||||||||
| 157 | Wendy's International, Inc. | 5,113 | |||||||||||||
| 307 | Yum! Brands, Inc. | 18,785 | |||||||||||||
| 786,678 | |||||||||||||||
| Savings & Loans: 0.2% | |||||||||||||||
| 1,046 | Washington Mutual, Inc. | 45,689 | |||||||||||||
| 45,689 | |||||||||||||||
| Semiconductors: 1.1% | |||||||||||||||
| 900 | @ | Advanced Micro Devices, Inc. | 19,413 | ||||||||||||
| 678 | @ | Altera Corp. | 13,485 | ||||||||||||
| 503 | Analog Devices, Inc. | 16,358 | |||||||||||||
| 1,516 | Applied Materials, Inc. | 27,258 | |||||||||||||
| 538 | @ | Freescale Semiconductor, Inc. | 21,482 | ||||||||||||
| 6,252 | Intel Corp. | 133,480 | |||||||||||||
| 200 | KLA-Tencor Corp. | 10,334 | |||||||||||||
| 357 | Linear Technology Corp. | 11,474 | |||||||||||||
| 750 | @ | LSI Logic Corp. | 7,995 | ||||||||||||
| 350 | Maxim Integrated Products | 11,018 | |||||||||||||
| 1,250 | @ | Micron Technology, Inc. | 18,250 | ||||||||||||
| 320 | National Semiconductor Corp. | 7,741 | |||||||||||||
| 200 | @ | Novellus Systems, Inc. | 6,244 | ||||||||||||
| 180 | @ | Nvidia Corp. | 6,658 | ||||||||||||
| 238 | @ | QLogic Corp. | 5,296 | ||||||||||||
| 300 | @ | Teradyne, Inc. | 4,470 | ||||||||||||
| 657 | Texas Instruments, Inc. | 19,414 | |||||||||||||
| 350 | Xilinx, Inc. | 9,380 | |||||||||||||
| 349,750 | |||||||||||||||
| Software: 1.8% | |||||||||||||||
| 640 | @ | Adobe Systems, Inc. | 25,683 | ||||||||||||
| 220 | @ | Autodesk, Inc. | 9,060 | ||||||||||||
| 630 | Automatic Data Processing, Inc. | 30,385 | |||||||||||||
| 323 | @ | BMC Software, Inc. | 10,517 | ||||||||||||
| Shares | Value | ||||||||||||||
| 496 | CA, Inc. | $ | 10,763 | ||||||||||||
| 230 | @ | Citrix Systems, Inc. | 6,610 | ||||||||||||
| 564 | @ | Compuware Corp. | 4,732 | ||||||||||||
| 361 | @ | Electronic Arts, Inc. | 20,162 | ||||||||||||
| 200 | Fidelity National Information Services, Inc. | 7,980 | |||||||||||||
| 733 | First Data Corp. | 18,508 | |||||||||||||
| 167 | @ | Fiserv, Inc. | 8,535 | ||||||||||||
| 214 | IMS Health, Inc. | 5,879 | |||||||||||||
| 360 | @ | Intuit, Inc. | 11,333 | ||||||||||||
| 9,490 | Microsoft Corp. | 278,315 | |||||||||||||
| 415 | @ | Novell, Inc. | 2,606 | ||||||||||||
| 4,367 | @ | Oracle Corp. | 83,104 | ||||||||||||
| 132 | @ | Parametric Technology Corp. | 2,556 | ||||||||||||
| 318 | Paychex, Inc. | 12,532 | |||||||||||||
| 549,260 | |||||||||||||||
| Telecommunications: 3.3% | |||||||||||||||
| 450 | Alltel Corp. | 25,533 | |||||||||||||
| 4,211 | AT&T, Inc. | 142,795 | |||||||||||||
| 838 | @ | Avaya, Inc. | 10,710 | ||||||||||||
| 2,000 | BellSouth Corp. | 89,180 | |||||||||||||
| 171 | CenturyTel, Inc. | 7,276 | |||||||||||||
| 11,427 | @ | Cisco Systems, Inc. | 307,158 | ||||||||||||
| 400 | Citizens Communications Co. | 5,668 | |||||||||||||
| 208 | @ | Comverse Technology, Inc. | 4,060 | ||||||||||||
| 1,655 | @ | Corning, Inc. | 35,682 | ||||||||||||
| 184 | Embarq Corp. | 9,467 | |||||||||||||
| 250 | @ | JDS Uniphase Corp. | 4,620 | ||||||||||||
| 550 | @ | Juniper Networks, Inc. | 11,710 | ||||||||||||
| 3,606 | Motorola, Inc. | 79,945 | |||||||||||||
| 1,810 | Qualcomm, Inc. | 66,228 | |||||||||||||
| 1,550 | @ | Qwest Communications International, Inc. | 11,920 | ||||||||||||
| 3,294 | Sprint Nextel Corp. | 64,266 | |||||||||||||
| 395 | @ | Tellabs, Inc. | 3,966 | ||||||||||||
| 3,162 | Verizon Communications, Inc. | 110,480 | |||||||||||||
| 453 | Windstream Corp. | 6,315 | |||||||||||||
| 996,979 | |||||||||||||||
| Textiles: 0.0% | |||||||||||||||
| 118 | Cintas Corp. | 4,980 | |||||||||||||
| 4,980 | |||||||||||||||
| Toys/Games/Hobbies: 0.1% | |||||||||||||||
| 224 | Hasbro, Inc. | 5,992 | |||||||||||||
| 464 | Mattel, Inc. | 10,185 | |||||||||||||
| 16,177 | |||||||||||||||
| Transportation: 0.4% | |||||||||||||||
| 376 | Burlington Northern Santa Fe Corp. | 28,260 | |||||||||||||
| 488 | CSX Corp. | 17,500 | |||||||||||||
| 317 | FedEx Corp. | 36,591 | |||||||||||||
| 410 | Norfolk Southern Corp. | 20,193 | |||||||||||||
| 280 | Union Pacific Corp. | 25,346 | |||||||||||||
| 127,890 | |||||||||||||||
| Total Common Stock (Cost $12,838,117) | 14,314,879 | ||||||||||||||
See Accompanying Notes to Financial Statements
135
PORTFOLIO OF INVESTMENTS
ING PRINCIPAL PROTECTION FUND XI AS OF NOVEMBER 30, 2006 (UNAUDITED) (CONTINUED)
| Principal Amount | Value | ||||||||||||||
| U.S. GOVERNMENT AGENCY OBLIGATIONS: 51.0% | |||||||||||||||
| Federal National Mortgage Association: 51.0% | |||||||||||||||
| $ | 17,800,000 | 5.000%, due 09/15/09 | $ | 15,589,703 | |||||||||||
| 15,589,703 | |||||||||||||||
| Total U.S. Government Agency Obligations (Cost $16,084,441) | 15,589,703 | ||||||||||||||
| U.S. TREASURY OBLIGATIONS: 1.8% | |||||||||||||||
| U.S. Treasury Principal Only STRIP: 1.8% | |||||||||||||||
| 620,000 | 4.460%, due 11/15/09 | 544,218 | |||||||||||||
| 544,218 | |||||||||||||||
| Total U.S. Treasury Obligations (Cost $540,789) | 544,218 | ||||||||||||||
| Total Long-Term Investments (Cost $29,463,347) | 30,448,800 | ||||||||||||||
| SHORT-TERM INVESTMENTS: 0.9% | |||||||||||||||
| Repurchase Agreement: 0.9% | |||||||||||
| 278,000 | Morgan Stanley Repurchase Agreement dated 11/30/06, 5.290%, due 12/01/06, $278,041 to be received upon repurchase (Collateralized by $290,000 Federal National Mortgage Association, 4.000%-5.200%, Market Value plus accrued interest $292,226, due 02/22/08-06/02/08) | 278,000 | |||||||||
| Total Short-Term Investments (Cost $278,000) | 278,000 | ||||||||||
| Total Investments in Securities (Cost $29,741,347)* | 100.6 | % | $ | 30,726,800 | |||||||
| Other Assets and Liabilities - Net | (0.6 | ) | (180,045 | ) | |||||||
| Net Assets | 100.0 | % | $ | 30,546,755 | |||||||
@ Non-income producing security
@@ Foreign Issuer
STRIP Separate Trading of Registered Interest and Principal of Securities
* Cost for federal income tax purposes is $29,885,316.
Net unrealized appreciation consists of:
| Gross Unrealized Appreciation | $ | 1,555,767 | |||||
| Gross Unrealized Depreciation | (714,283 | ) | |||||
| Net Unrealized Appreciation | $ | 841,484 | |||||
See Accompanying Notes to Financial Statements
136
PORTFOLIO OF INVESTMENTS
ING PRINCIPAL PROTECTION FUND XII AS OF NOVEMBER 30, 2006 (UNAUDITED)
| Shares | Value | ||||||||||||||
| COMMON STOCK: 42.2% | |||||||||||||||
| Advertising: 0.1% | |||||||||||||||
| 150 | Omnicom Group | $ | 15,324 | ||||||||||||
| 15,324 | |||||||||||||||
| Aerospace/Defense: 1.0% | |||||||||||||||
| 399 | Boeing Co. | 35,323 | |||||||||||||
| 272 | General Dynamics Corp. | 20,356 | |||||||||||||
| 70 | Goodrich Corp. | 3,150 | |||||||||||||
| 81 | L-3 Communications Holdings, Inc. | 6,662 | |||||||||||||
| 239 | Lockheed Martin Corp. | 21,618 | |||||||||||||
| 175 | Northrop Grumman Corp. | 11,713 | |||||||||||||
| 385 | Raytheon Co. | 19,650 | |||||||||||||
| 39 | Rockwell Collins, Inc. | 2,353 | |||||||||||||
| 510 | United Technologies Corp. | 32,910 | |||||||||||||
| 153,735 | |||||||||||||||
| Agriculture: 0.7% | |||||||||||||||
| 1,051 | Altria Group, Inc. | 88,505 | |||||||||||||
| 328 | Archer-Daniels-Midland Co. | 11,513 | |||||||||||||
| 92 | Reynolds American, Inc. | 5,910 | |||||||||||||
| 80 | UST, Inc. | 4,478 | |||||||||||||
| 110,406 | |||||||||||||||
| Airlines: 0.0% | |||||||||||||||
| 400 | Southwest Airlines Co. | 6,284 | |||||||||||||
| 6,284 | |||||||||||||||
| Apparel: 0.2% | |||||||||||||||
| 310 | @ | Coach, Inc. | 13,395 | ||||||||||||
| 82 | Jones Apparel Group, Inc. | 2,755 | |||||||||||||
| 43 | Liz Claiborne, Inc. | 1,838 | |||||||||||||
| 118 | Nike, Inc. | 11,676 | |||||||||||||
| 44 | VF Corp. | 3,449 | |||||||||||||
| 33,113 | |||||||||||||||
| Auto Manufacturers: 0.1% | |||||||||||||||
| 824 | Ford Motor Co. | 6,699 | |||||||||||||
| 100 | General Motors Corp. | 2,923 | |||||||||||||
| 165 | Paccar, Inc. | 10,775 | |||||||||||||
| 20,397 | |||||||||||||||
| Auto Parts & Equipment: 0.1% | |||||||||||||||
| 74 | @ | Goodyear Tire & Rubber Co. | 1,247 | ||||||||||||
| 88 | Johnson Controls, Inc. | 7,157 | |||||||||||||
| 8,404 | |||||||||||||||
| Banks: 3.2% | |||||||||||||||
| 3,061 | Bank of America Corp. | 164,835 | |||||||||||||
| 377 | Bank of New York Co., Inc. | 13,399 | |||||||||||||
| 247 | BB&T Corp. | 10,623 | |||||||||||||
| 156 | Capital One Financial Corp. | 12,149 | |||||||||||||
| 114 | Comerica, Inc. | 6,641 | |||||||||||||
| 40 | Commerce Bancorp., Inc. | 1,390 | |||||||||||||
| 71 | Compass Bancshares, Inc. | 4,057 | |||||||||||||
| 280 | Fifth Third Bancorp. | 11,040 | |||||||||||||
| 32 | First Horizon National Corp. | 1,276 | |||||||||||||
| 107 | Huntington Bancshares, Inc. | 2,601 | |||||||||||||
| 181 | Keycorp | 6,534 | |||||||||||||
| 35 | M&T Bank Corp. | 4,152 | |||||||||||||
| 131 | Marshall & Ilsley Corp. | 5,998 | |||||||||||||
| 208 | Mellon Financial Corp. | 8,368 | |||||||||||||
| 408 | National City Corp. | 14,729 | |||||||||||||
| 240 | North Fork Bancorp., Inc. | 6,737 | |||||||||||||
| Shares | Value | ||||||||||||||
| 81 | Northern Trust Corp. | $ | 4,614 | ||||||||||||
| 152 | PNC Financial Services Group, Inc. | 10,745 | |||||||||||||
| 498 | Regions Financial Corp. | 18,252 | |||||||||||||
| 161 | State Street Corp. | 10,003 | |||||||||||||
| 179 | SunTrust Banks, Inc. | 14,615 | |||||||||||||
| 142 | Synovus Financial Corp. | 4,263 | |||||||||||||
| 887 | US Bancorp. | 29,839 | |||||||||||||
| 1,288 | Wachovia Corp. | 69,797 | |||||||||||||
| 1,684 | Wells Fargo & Co. | 59,344 | |||||||||||||
| 44 | Zions Bancorp. | 3,443 | |||||||||||||
| 499,444 | |||||||||||||||
| Beverages: 0.9% | |||||||||||||||
| 523 | Anheuser-Busch Cos., Inc. | 24,848 | |||||||||||||
| 45 | Brown-Forman Corp. | 3,125 | |||||||||||||
| 1,022 | Coca-Cola Co. | 47,860 | |||||||||||||
| 204 | Coca-Cola Enterprises, Inc. | 4,172 | |||||||||||||
| 90 | @ | Constellation Brands, Inc. | 2,518 | ||||||||||||
| 20 | Molson Coors Brewing Co. | 1,422 | |||||||||||||
| 115 | Pepsi Bottling Group, Inc. | 3,602 | |||||||||||||
| 824 | PepsiCo, Inc. | 51,063 | |||||||||||||
| 138,610 | |||||||||||||||
| Biotechnology: 0.4% | |||||||||||||||
| 590 | @ | Amgen, Inc. | 41,890 | ||||||||||||
| 150 | @ | Biogen Idec, Inc. | 7,839 | ||||||||||||
| 190 | @ | Celgene Corp. | 10,589 | ||||||||||||
| 45 | @ | Genzyme Corp. | 2,898 | ||||||||||||
| 50 | @ | Medimmune, Inc. | 1,635 | ||||||||||||
| 30 | @ | Millipore Corp. | 2,052 | ||||||||||||
| 66,903 | |||||||||||||||
| Building Materials: 0.1% | |||||||||||||||
| 37 | American Standard Cos., Inc. | 1,658 | |||||||||||||
| 179 | Masco Corp. | 5,136 | |||||||||||||
| 6,794 | |||||||||||||||
| Chemicals: 0.7% | |||||||||||||||
| 40 | Air Products & Chemicals, Inc. | 2,766 | |||||||||||||
| 30 | Ashland, Inc. | 2,028 | |||||||||||||
| 547 | Dow Chemical Co. | 21,885 | |||||||||||||
| 90 | Ecolab, Inc. | 3,992 | |||||||||||||
| 520 | EI DuPont de Nemours & Co. | 24,404 | |||||||||||||
| 34 | International Flavors & Fragrances, Inc. | 1,602 | |||||||||||||
| 302 | Monsanto Co. | 14,517 | |||||||||||||
| 154 | PPG Industries, Inc. | 9,902 | |||||||||||||
| 184 | Praxair, Inc. | 11,482 | |||||||||||||
| 86 | Rohm & Haas Co. | 4,491 | |||||||||||||
| 93 | Sherwin-Williams Co. | 5,817 | |||||||||||||
| 30 | Sigma-Aldrich Corp. | 2,283 | |||||||||||||
| 105,169 | |||||||||||||||
| Coal: 0.0% | |||||||||||||||
| 130 | Peabody Energy Corp. | 5,981 | |||||||||||||
| 5,981 | |||||||||||||||
| Commercial Services: 0.4% | |||||||||||||||
| 120 | @ | Apollo Group, Inc. | 4,655 | ||||||||||||
| 90 | @ | Convergys Corp. | 2,171 | ||||||||||||
| 109 | Equifax, Inc. | 4,141 | |||||||||||||
| 140 | H&R Block, Inc. | 3,360 | |||||||||||||
| 259 | McKesson Corp. | 12,795 | |||||||||||||
| 70 | @ | Monster Worldwide, Inc. | 3,056 | ||||||||||||
| 164 | Moody's Corp. | 11,395 | |||||||||||||
| 102 | Robert Half International, Inc. | 3,936 | |||||||||||||
See Accompanying Notes to Financial Statements
137
PORTFOLIO OF INVESTMENTS
ING PRINCIPAL PROTECTION FUND XII AS OF NOVEMBER 30, 2006 (UNAUDITED) (CONTINUED)
| Shares | Value | ||||||||||||||
| Commercial Services (continued) | |||||||||||||||
| 46 | RR Donnelley & Sons Co. | $ | 1,622 | ||||||||||||
| 331 | Western Union Co. | 7,547 | |||||||||||||
| 54,678 | |||||||||||||||
| Computers: 2.0% | |||||||||||||||
| 50 | @ | Affiliated Computer Services, Inc. | 2,528 | ||||||||||||
| 70 | @ | Cognizant Technology Solutions Corp. | 5,709 | ||||||||||||
| 79 | @ | Computer Sciences Corp. | 4,124 | ||||||||||||
| 1,945 | @ | Dell, Inc. | 52,982 | ||||||||||||
| 228 | Electronic Data Systems Corp. | 6,188 | |||||||||||||
| 1,165 | @ | EMC Corp. | 15,273 | ||||||||||||
| 2,336 | Hewlett-Packard Co. | 92,179 | |||||||||||||
| 1,027 | International Business Machines Corp. | 94,402 | |||||||||||||
| 76 | @ | Lexmark International, Inc. | 5,242 | ||||||||||||
| 106 | @ | NCR Corp. | 4,548 | ||||||||||||
| 207 | @ | Network Appliance, Inc. | 8,116 | ||||||||||||
| 100 | @ | Sandisk Corp. | 4,440 | ||||||||||||
| 1,740 | @ | Sun Microsystems, Inc. | 9,431 | ||||||||||||
| 244 | @ | Unisys Corp. | 1,759 | ||||||||||||
| 306,921 | |||||||||||||||
| Cosmetics/Personal Care: 0.8% | |||||||||||||||
| 200 | Avon Products, Inc. | 6,528 | |||||||||||||
| 260 | Colgate-Palmolive Co. | 16,913 | |||||||||||||
| 110 | Estee Lauder Cos., Inc. | 4,542 | |||||||||||||
| 1,595 | Procter & Gamble Co. | 100,150 | |||||||||||||
| 128,133 | |||||||||||||||
| Distribution/Wholesale: 0.0% | |||||||||||||||
| 51 | WW Grainger, Inc. | 3,690 | |||||||||||||
| 3,690 | |||||||||||||||
| Diversified Financial Services: 3.8% | |||||||||||||||
| 610 | American Express Co. | 35,819 | |||||||||||||
| 114 | Ameriprise Financial, Inc. | 6,167 | |||||||||||||
| 57 | Bear Stearns Cos., Inc. | 8,691 | |||||||||||||
| 524 | Charles Schwab Corp. | 9,610 | |||||||||||||
| 20 | Chicago Mercantile Exchange Holdings, Inc. | 10,712 | |||||||||||||
| 172 | CIT Group, Inc. | 8,946 | |||||||||||||
| 3,348 | Citigroup, Inc. | 166,027 | |||||||||||||
| 310 | Countrywide Financial Corp. | 12,313 | |||||||||||||
| 220 | @ | E*Trade Financial Corp. | 5,295 | ||||||||||||
| 486 | Fannie Mae | 27,717 | |||||||||||||
| 29 | Federated Investors, Inc. | 962 | |||||||||||||
| 79 | Franklin Resources, Inc. | 8,432 | |||||||||||||
| 350 | Freddie Mac | 23,506 | |||||||||||||
| 217 | Goldman Sachs Group, Inc. | 42,272 | |||||||||||||
| 120 | Janus Capital Group, Inc. | 2,431 | |||||||||||||
| 2,350 | JPMorgan Chase & Co. | 108,758 | |||||||||||||
| 264 | Lehman Brothers Holdings, Inc. | 19,449 | |||||||||||||
| 445 | Merrill Lynch & Co., Inc. | 38,906 | |||||||||||||
| 544 | Morgan Stanley | 41,431 | |||||||||||||
| 210 | SLM Corp. | 9,626 | |||||||||||||
| 142 | T. Rowe Price Group, Inc. | 6,153 | |||||||||||||
| 593,223 | |||||||||||||||
| Electric: 1.3% | |||||||||||||||
| 544 | @ | AES Corp. | 12,713 | ||||||||||||
| 123 | @ | Allegheny Energy, Inc. | 5,456 | ||||||||||||
| 120 | Ameren Corp. | 6,565 | |||||||||||||
| Shares | Value | ||||||||||||||
| 254 | American Electric Power Co., Inc. | $ | 10,544 | ||||||||||||
| 240 | Centerpoint Energy, Inc. | 3,924 | |||||||||||||
| 130 | @ | CMS Energy Corp. | 2,107 | ||||||||||||
| 109 | Constellation Energy Group, Inc. | 7,478 | |||||||||||||
| 110 | DTE Energy Co. | 5,180 | |||||||||||||
| 250 | @ | Dynegy, Inc. | 1,698 | ||||||||||||
| 196 | Edison International | 9,012 | |||||||||||||
| 140 | Entergy Corp. | 12,785 | |||||||||||||
| 440 | Exelon Corp. | 26,721 | |||||||||||||
| 217 | FirstEnergy Corp. | 12,985 | |||||||||||||
| 225 | PG&E Corp. | 10,334 | |||||||||||||
| 70 | Pinnacle West Capital Corp. | 3,454 | |||||||||||||
| 244 | PPL Corp. | 8,869 | |||||||||||||
| 50 | Progress Energy, Inc. | 2,389 | |||||||||||||
| 164 | Public Service Enterprise Group, Inc. | 11,024 | |||||||||||||
| 490 | Southern Co. | 17,763 | |||||||||||||
| 130 | TECO Energy, Inc. | 2,209 | |||||||||||||
| 302 | TXU Corp. | 17,332 | |||||||||||||
| 289 | Xcel Energy, Inc. | 6,635 | |||||||||||||
| 197,177 | |||||||||||||||
| Electrical Components & Equipment: 0.1% | |||||||||||||||
| 203 | Emerson Electric Co. | 17,600 | |||||||||||||
| 80 | Molex, Inc. | 2,560 | |||||||||||||
| 20,160 | |||||||||||||||
| Electronics: 0.2% | |||||||||||||||
| 258 | @ | Agilent Technologies, Inc. | 8,215 | ||||||||||||
| 141 | Applera Corp. - Applied Biosystems Group | 5,138 | |||||||||||||
| 79 | Jabil Circuit, Inc. | 2,240 | |||||||||||||
| 99 | PerkinElmer, Inc. | 2,145 | |||||||||||||
| 130 | Symbol Technologies, Inc. | 1,927 | |||||||||||||
| 213 | @ | Thermo Electron Corp. | 9,336 | ||||||||||||
| 78 | @ | Waters Corp. | 3,903 | ||||||||||||
| 32,904 | |||||||||||||||
| Entertainment: 0.0% | |||||||||||||||
| 70 | International Game Technology | 3,065 | |||||||||||||
| 3,065 | |||||||||||||||
| Environmental Control: 0.1% | |||||||||||||||
| 130 | @ | Allied Waste Industries, Inc. | 1,648 | ||||||||||||
| 371 | Waste Management, Inc. | 13,582 | |||||||||||||
| 15,230 | |||||||||||||||
| Food: 0.5% | |||||||||||||||
| 197 | Campbell Soup Co. | 7,500 | |||||||||||||
| 290 | ConAgra Foods, Inc. | 7,453 | |||||||||||||
| 80 | @ | Dean Foods Co. | 3,426 | ||||||||||||
| 304 | General Mills, Inc. | 17,009 | |||||||||||||
| 30 | Hershey Co. | 1,589 | |||||||||||||
| 169 | HJ Heinz Co. | 7,512 | |||||||||||||
| 145 | Kellogg Co. | 7,218 | |||||||||||||
| 342 | Kroger Co. | 7,339 | |||||||||||||
| 98 | McCormick & Co., Inc. | 3,795 | |||||||||||||
| 198 | Safeway, Inc. | 6,100 | |||||||||||||
| 136 | Sara Lee Corp. | 2,255 | |||||||||||||
| 88 | Supervalu, Inc. | 3,015 | |||||||||||||
| 60 | Whole Foods Market, Inc. | 2,928 | |||||||||||||
| 77,139 | |||||||||||||||
See Accompanying Notes to Financial Statements
138
PORTFOLIO OF INVESTMENTS
ING PRINCIPAL PROTECTION FUND XII AS OF NOVEMBER 30, 2006 (UNAUDITED) (CONTINUED)
| Shares | Value | ||||||||||||||
| Forest Products & Paper: 0.1% | |||||||||||||||
| 250 | International Paper Co. | $ | 8,275 | ||||||||||||
| 78 | MeadWestvaco Corp. | 2,301 | |||||||||||||
| 85 | Plum Creek Timber Co., Inc. | 3,167 | |||||||||||||
| 80 | Temple-Inland, Inc. | 3,128 | |||||||||||||
| 40 | Weyerhaeuser Co. | 2,587 | |||||||||||||
| 19,458 | |||||||||||||||
| Gas: 0.1% | |||||||||||||||
| 100 | KeySpan Corp. | 4,103 | |||||||||||||
| 38 | Nicor, Inc. | 1,883 | |||||||||||||
| 160 | NiSource, Inc. | 3,946 | |||||||||||||
| 162 | Sempra Energy | 8,829 | |||||||||||||
| 18,761 | |||||||||||||||
| Hand/Machine Tools: 0.1% | |||||||||||||||
| 47 | Black & Decker Corp. | 4,036 | |||||||||||||
| 47 | Snap-On, Inc. | 2,233 | |||||||||||||
| 41 | Stanley Works | 2,092 | |||||||||||||
| 8,361 | |||||||||||||||
| Healthcare-Products: 1.2% | |||||||||||||||
| 30 | Bausch & Lomb, Inc. | 1,453 | |||||||||||||
| 324 | Baxter International, Inc. | 14,496 | |||||||||||||
| 112 | Becton Dickinson & Co. | 8,033 | |||||||||||||
| 530 | @ | Boston Scientific Corp. | 8,385 | ||||||||||||
| 43 | CR Bard, Inc. | 3,538 | |||||||||||||
| 1,471 | Johnson & Johnson | 96,954 | |||||||||||||
| 580 | Medtronic, Inc. | 30,235 | |||||||||||||
| 70 | @ | Patterson Cos., Inc. | 2,598 | ||||||||||||
| 67 | @ | St. Jude Medical, Inc. | 2,497 | ||||||||||||
| 150 | Stryker Corp. | 7,779 | |||||||||||||
| 110 | @ | Zimmer Holdings, Inc. | 8,026 | ||||||||||||
| 183,994 | |||||||||||||||
| Healthcare-Services: 0.9% | |||||||||||||||
| 372 | Aetna, Inc. | 15,367 | |||||||||||||
| 140 | @ | Coventry Health Care, Inc. | 6,738 | ||||||||||||
| 136 | @ | Humana, Inc. | 7,358 | ||||||||||||
| 72 | @ | Laboratory Corp. of America Holdings | 5,098 | ||||||||||||
| 40 | Manor Care, Inc. | 1,901 | |||||||||||||
| 88 | Quest Diagnostics | 4,679 | |||||||||||||
| 1,146 | UnitedHealth Group, Inc. | 56,246 | |||||||||||||
| 524 | @ | WellPoint, Inc. | 39,651 | ||||||||||||
| 137,038 | |||||||||||||||
| Home Builders: 0.0% | |||||||||||||||
| 30 | Lennar Corp. | 1,575 | |||||||||||||
| 1,575 | |||||||||||||||
| Home Furnishings: 0.1% | |||||||||||||||
| 40 | Harman International Industries, Inc. | 4,154 | |||||||||||||
| 40 | Whirlpool Corp. | 3,412 | |||||||||||||
| 7,566 | |||||||||||||||
| Household Products/Wares: 0.1% | |||||||||||||||
| 10 | Avery Dennison Corp. | 675 | |||||||||||||
| 72 | Fortune Brands, Inc. | 5,825 | |||||||||||||
| 227 | Kimberly-Clark Corp. | 15,089 | |||||||||||||
| 21,589 | |||||||||||||||
| Shares | Value | ||||||||||||||
| Housewares: 0.0% | |||||||||||||||
| 122 | Newell Rubbermaid, Inc. | $ | 3,476 | ||||||||||||
| 3,476 | |||||||||||||||
| Insurance: 2.4% | |||||||||||||||
| 140 | @@ | ACE Ltd. | 7,958 | ||||||||||||
| 249 | Aflac, Inc. | 10,991 | |||||||||||||
| 424 | Allstate Corp. | 26,916 | |||||||||||||
| 72 | AMBAC Financial Group, Inc. | 6,166 | |||||||||||||
| 1,304 | American International Group, Inc. | 91,697 | |||||||||||||
| 140 | AON Corp. | 4,995 | |||||||||||||
| 282 | Chubb Corp. | 14,596 | |||||||||||||
| 60 | Cigna Corp. | 7,563 | |||||||||||||
| 100 | Cincinnati Financial Corp. | 4,428 | |||||||||||||
| 390 | Genworth Financial, Inc. | 12,792 | |||||||||||||
| 256 | Hartford Financial Services Group, Inc. | 21,955 | |||||||||||||
| 134 | Lincoln National Corp. | 8,521 | |||||||||||||
| 283 | Loews Corp. | 11,297 | |||||||||||||
| 110 | Marsh & McLennan Cos., Inc. | 3,456 | |||||||||||||
| 63 | MBIA, Inc. | 4,388 | |||||||||||||
| 518 | Metlife, Inc. | 30,422 | |||||||||||||
| 54 | MGIC Investment Corp. | 3,130 | |||||||||||||
| 185 | Principal Financial Group | 10,684 | |||||||||||||
| 474 | Progressive Corp. | 10,689 | |||||||||||||
| 324 | Prudential Financial, Inc. | 26,400 | |||||||||||||
| 92 | Safeco Corp. | 5,572 | |||||||||||||
| 467 | St. Paul Travelers Cos., Inc. | 24,195 | |||||||||||||
| 47 | Torchmark Corp. | 2,971 | |||||||||||||
| 205 | UnumProvident Corp. | 4,198 | |||||||||||||
| 80 | @@ | XL Capital Ltd. | 5,690 | ||||||||||||
| 361,670 | |||||||||||||||
| Internet: 0.3% | |||||||||||||||
| 160 | @ | Amazon.com, Inc. | 6,454 | ||||||||||||
| 218 | @ | eBay, Inc. | 7,052 | ||||||||||||
| 40 | @ | Google, Inc. | 19,397 | ||||||||||||
| 454 | @ | Symantec Corp. | 9,625 | ||||||||||||
| 120 | @ | VeriSign, Inc. | 3,133 | ||||||||||||
| 45,661 | |||||||||||||||
| Iron/Steel: 0.2% | |||||||||||||||
| 298 | Nucor Corp. | 17,835 | |||||||||||||
| 119 | United States Steel Corp. | 8,900 | |||||||||||||
| 26,735 | |||||||||||||||
| Leisure Time: 0.2% | |||||||||||||||
| 80 | Brunswick Corp. | 2,590 | |||||||||||||
| 229 | Carnival Corp. | 11,219 | |||||||||||||
| 121 | Harley-Davidson, Inc. | 8,926 | |||||||||||||
| 89 | Sabre Holdings Corp. | 2,441 | |||||||||||||
| 25,176 | |||||||||||||||
| Lodging: 0.1% | |||||||||||||||
| 168 | Marriott International, Inc. | 7,585 | |||||||||||||
| 44 | Starwood Hotels & Resorts Worldwide, Inc. | 2,823 | |||||||||||||
| 96 | @ | Wyndham Worldwide Corp. | 3,047 | ||||||||||||
| 13,455 | |||||||||||||||
| Machinery-Construction & Mining: 0.1% | |||||||||||||||
| 330 | Caterpillar, Inc. | 20,470 | |||||||||||||
| 20,470 | |||||||||||||||
See Accompanying Notes to Financial Statements
139
PORTFOLIO OF INVESTMENTS
ING PRINCIPAL PROTECTION FUND XII AS OF NOVEMBER 30, 2006 (UNAUDITED) (CONTINUED)
| Shares | Value | ||||||||||||||
| Machinery-Diversified: 0.1% | |||||||||||||||
| 47 | Cummins, Inc. | $ | 5,636 | ||||||||||||
| 40 | Deere & Co. | 3,840 | |||||||||||||
| 98 | Rockwell Automation, Inc. | 6,378 | |||||||||||||
| 15,854 | |||||||||||||||
| Media: 1.1% | |||||||||||||||
| 535 | CBS Corp. | 15,916 | |||||||||||||
| 220 | Clear Channel Communications, Inc. | 7,735 | |||||||||||||
| 1,050 | @ | Comcast Corp. | 42,483 | ||||||||||||
| 50 | EW Scripps Co. | 2,443 | |||||||||||||
| 110 | Gannett Co., Inc. | 6,547 | |||||||||||||
| 1 | @ | Idearc, Inc. | 21 | ||||||||||||
| 240 | McGraw-Hill Cos., Inc. | 15,996 | |||||||||||||
| 27 | Meredith Corp. | 1,461 | |||||||||||||
| 1,198 | News Corp., Inc. | 24,679 | |||||||||||||
| 40 | @ | Univision Communications, Inc. | 1,424 | ||||||||||||
| 1,416 | Walt Disney Co. | 46,799 | |||||||||||||
| 165,504 | |||||||||||||||
| Mining: 0.2% | |||||||||||||||
| 100 | Freeport-McMoRan Copper & Gold, Inc. | 6,287 | |||||||||||||
| 100 | Phelps Dodge Corp. | 12,300 | |||||||||||||
| 43 | Vulcan Materials Co. | 3,815 | |||||||||||||
| 22,402 | |||||||||||||||
| Miscellaneous Manufacturing: 2.2% | |||||||||||||||
| 377 | 3M Co. | 30,710 | |||||||||||||
| 65 | Cooper Industries Ltd. | 5,944 | |||||||||||||
| 107 | Danaher Corp. | 7,824 | |||||||||||||
| 119 | Dover Corp. | 5,986 | |||||||||||||
| 160 | Eastman Kodak Co. | 4,163 | |||||||||||||
| 126 | Eaton Corp. | 9,712 | |||||||||||||
| 5,179 | General Electric Co. | 182,715 | |||||||||||||
| 552 | Honeywell International, Inc. | 23,725 | |||||||||||||
| 206 | Illinois Tool Works, Inc. | 9,723 | |||||||||||||
| 144 | @@ | Ingersoll-Rand Co. | 5,617 | ||||||||||||
| 80 | ITT Corp. | 4,316 | |||||||||||||
| 100 | Leggett & Platt, Inc. | 2,378 | |||||||||||||
| 98 | Parker Hannifin Corp. | 8,181 | |||||||||||||
| 60 | Textron, Inc. | 5,847 | |||||||||||||
| 1,010 | @@ | Tyco International Ltd. | 30,593 | ||||||||||||
| 337,434 | |||||||||||||||
| Office/Business Equipment: 0.1% | |||||||||||||||
| 99 | Pitney Bowes, Inc. | 4,563 | |||||||||||||
| 838 | @ | Xerox Corp. | 13,827 | ||||||||||||
| 18,390 | |||||||||||||||
| Oil & Gas: 4.2% | |||||||||||||||
| 206 | Anadarko Petroleum Corp. | 10,168 | |||||||||||||
| 60 | Apache Corp. | 4,196 | |||||||||||||
| 1,642 | Chevron Corp. | 118,749 | |||||||||||||
| 756 | ConocoPhillips | 50,879 | |||||||||||||
| 201 | Devon Energy Corp. | 14,747 | |||||||||||||
| 96 | EOG Resources, Inc. | 6,771 | |||||||||||||
| 4,435 | ExxonMobil Corp. | 340,652 | |||||||||||||
| 40 | Hess Corp. | 2,011 | |||||||||||||
| 282 | Marathon Oil Corp. | 26,615 | |||||||||||||
| 160 | @,@@ | Nabors Industries Ltd. | 5,402 | ||||||||||||
| 60 | Noble Corp. | 4,635 | |||||||||||||
| 400 | Occidental Petroleum Corp. | 20,136 | |||||||||||||
| Shares | Value | ||||||||||||||
| 66 | Sunoco, Inc. | $ | 4,499 | ||||||||||||
| 140 | @ | Transocean, Inc. | 10,913 | ||||||||||||
| 364 | Valero Energy Corp. | 20,045 | |||||||||||||
| 140 | XTO Energy, Inc. | 7,084 | |||||||||||||
| 647,502 | |||||||||||||||
| Oil & Gas Services: 0.5% | |||||||||||||||
| 140 | Baker Hughes, Inc. | 10,280 | |||||||||||||
| 50 | BJ Services Co. | 1,689 | |||||||||||||
| 804 | Halliburton Co. | 27,127 | |||||||||||||
| 70 | @ | National Oilwell Varco, Inc. | 4,656 | ||||||||||||
| 540 | Schlumberger Ltd. | 36,979 | |||||||||||||
| 60 | @ | Weatherford International Ltd. | 2,695 | ||||||||||||
| 83,426 | |||||||||||||||
| Packaging & Containers: 0.1% | |||||||||||||||
| 71 | Ball Corp. | 3,036 | |||||||||||||
| 60 | Bemis Co. | 2,048 | |||||||||||||
| 100 | @ | Pactiv Corp. | 3,445 | ||||||||||||
| 59 | Sealed Air Corp. | 3,511 | |||||||||||||
| 12,040 | |||||||||||||||
| Pharmaceuticals: 2.4% | |||||||||||||||
| 770 | Abbott Laboratories | 35,928 | |||||||||||||
| 32 | Allergan, Inc. | 3,731 | |||||||||||||
| 182 | AmerisourceBergen Corp. | 8,370 | |||||||||||||
| 60 | @ | Barr Pharmaceuticals, Inc. | 3,065 | ||||||||||||
| 400 | Bristol-Myers Squibb Co. | 9,932 | |||||||||||||
| 204 | Cardinal Health, Inc. | 13,182 | |||||||||||||
| 228 | Caremark Rx, Inc. | 10,784 | |||||||||||||
| 180 | Eli Lilly & Co. | 9,646 | |||||||||||||
| 108 | @ | Express Scripts, Inc. | 7,366 | ||||||||||||
| 215 | @ | Forest Laboratories, Inc. | 10,471 | ||||||||||||
| 233 | @ | Gilead Sciences, Inc. | 15,359 | ||||||||||||
| 33 | @ | Hospira, Inc. | 1,082 | ||||||||||||
| 181 | @ | King Pharmaceuticals, Inc. | 2,992 | ||||||||||||
| 134 | @ | Medco Health Solutions, Inc. | 6,728 | ||||||||||||
| 1,485 | Merck & Co., Inc. | 66,097 | |||||||||||||
| 120 | Mylan Laboratories | 2,435 | |||||||||||||
| 3,657 | Pfizer, Inc. | 100,522 | |||||||||||||
| 1,010 | Schering-Plough Corp. | 22,230 | |||||||||||||
| 70 | @ | Watson Pharmaceuticals, Inc. | 1,797 | ||||||||||||
| 671 | Wyeth | 32,396 | |||||||||||||
| 364,113 | |||||||||||||||
| Pipelines: 0.1% | |||||||||||||||
| 280 | El Paso Corp. | 4,088 | |||||||||||||
| 244 | Williams Cos., Inc. | 6,773 | |||||||||||||
| 10,861 | |||||||||||||||
| Real Estate: 0.0% | |||||||||||||||
| 90 | @ | CB Richard Ellis Group, Inc. | 2,964 | ||||||||||||
| 110 | @ | Realogy Corp. | 2,870 | ||||||||||||
| 5,834 | |||||||||||||||
| Real Estate Investment Trusts: 0.1% | |||||||||||||||
| 60 | Apartment Investment & Management Co. | 3,458 | |||||||||||||
| 20 | Boston Properties, Inc. | 2,341 | |||||||||||||
| 170 | Equity Office Properties Trust | 8,194 | |||||||||||||
| 40 | Prologis | 2,607 | |||||||||||||
| 20 | Public Storage, Inc. | 1,926 | |||||||||||||
| 20 | Vornado Realty Trust | 2,522 | |||||||||||||
| 21,048 | |||||||||||||||
See Accompanying Notes to Financial Statements
140
PORTFOLIO OF INVESTMENTS
ING PRINCIPAL PROTECTION FUND XII AS OF NOVEMBER 30, 2006 (UNAUDITED) (CONTINUED)
| Shares | Value | ||||||||||||||
| Retail: 2.3% | |||||||||||||||
| 20 | @ | Autozone, Inc. | $ | 2,272 | |||||||||||
| 161 | @ | Bed Bath & Beyond, Inc. | 6,239 | ||||||||||||
| 209 | Best Buy Co., Inc. | 11,489 | |||||||||||||
| 90 | @ | Big Lots, Inc. | 2,008 | ||||||||||||
| 111 | Circuit City Stores, Inc. | 2,771 | |||||||||||||
| 214 | Costco Wholesale Corp. | 11,184 | |||||||||||||
| 410 | CVS Corp. | 11,796 | |||||||||||||
| 58 | Darden Restaurants, Inc. | 2,329 | |||||||||||||
| 122 | Family Dollar Stores, Inc. | 3,403 | |||||||||||||
| 458 | Federated Department Stores, Inc. | 19,277 | |||||||||||||
| 410 | Gap, Inc. | 7,675 | |||||||||||||
| 422 | Home Depot, Inc. | 16,023 | |||||||||||||
| 111 | JC Penney Co., Inc. | 8,585 | |||||||||||||
| 280 | @ | Kohl's Corp. | 19,488 | ||||||||||||
| 198 | Limited Brands, Inc. | 6,275 | |||||||||||||
| 764 | Lowe's Cos., Inc. | 23,042 | |||||||||||||
| 629 | McDonald's Corp. | 26,399 | |||||||||||||
| 180 | Nordstrom, Inc. | 8,824 | |||||||||||||
| 238 | @ | Office Depot, Inc. | 9,011 | ||||||||||||
| 60 | OfficeMax, Inc. | 2,824 | |||||||||||||
| 70 | RadioShack Corp. | 1,227 | |||||||||||||
| 40 | @ | Sears Holding Corp. | 6,857 | ||||||||||||
| 329 | Staples, Inc. | 8,380 | |||||||||||||
| 514 | @ | Starbucks Corp. | 18,139 | ||||||||||||
| 437 | Target Corp. | 25,385 | |||||||||||||
| 388 | TJX Cos., Inc. | 10,639 | |||||||||||||
| 506 | Walgreen Co. | 20,488 | |||||||||||||
| 1,231 | Wal-Mart Stores, Inc. | 56,749 | |||||||||||||
| 80 | Wendy's International, Inc. | 2,606 | |||||||||||||
| 117 | Yum! Brands, Inc. | 7,159 | |||||||||||||
| 358,543 | |||||||||||||||
| Savings & Loans: 0.1% | |||||||||||||||
| 487 | Washington Mutual, Inc. | 21,272 | |||||||||||||
| 21,272 | |||||||||||||||
| Semiconductors: 1.0% | |||||||||||||||
| 410 | @ | Advanced Micro Devices, Inc. | 8,844 | ||||||||||||
| 303 | @ | Altera Corp. | 6,027 | ||||||||||||
| 186 | Analog Devices, Inc. | 6,049 | |||||||||||||
| 690 | Applied Materials, Inc. | 12,406 | |||||||||||||
| 207 | @ | Freescale Semiconductor, Inc. | 8,266 | ||||||||||||
| 2,892 | Intel Corp. | 61,744 | |||||||||||||
| 100 | KLA-Tencor Corp. | 5,167 | |||||||||||||
| 152 | Linear Technology Corp. | 4,885 | |||||||||||||
| 280 | @ | LSI Logic Corp. | 2,985 | ||||||||||||
| 136 | Maxim Integrated Products | 4,281 | |||||||||||||
| 550 | @ | Micron Technology, Inc. | 8,030 | ||||||||||||
| 133 | National Semiconductor Corp. | 3,217 | |||||||||||||
| 90 | @ | Novellus Systems, Inc. | 2,810 | ||||||||||||
| 70 | @ | Nvidia Corp. | 2,589 | ||||||||||||
| 120 | @ | QLogic Corp. | 2,670 | ||||||||||||
| 130 | @ | Teradyne, Inc. | 1,937 | ||||||||||||
| 312 | Texas Instruments, Inc. | 9,220 | |||||||||||||
| 170 | Xilinx, Inc. | 4,556 | |||||||||||||
| 155,683 | |||||||||||||||
| Software: 1.6% | |||||||||||||||
| 260 | @ | Adobe Systems, Inc. | 10,434 | ||||||||||||
| 132 | @ | Autodesk, Inc. | 5,436 | ||||||||||||
| 281 | Automatic Data Processing, Inc. | 13,553 | |||||||||||||
| 155 | @ | BMC Software, Inc. | 5,047 | ||||||||||||
| 204 | CA, Inc. | 4,427 | |||||||||||||
| Shares | Value | ||||||||||||||
| 117 | @ | Citrix Systems, Inc. | $ | 3,363 | |||||||||||
| 298 | @ | Compuware Corp. | 2,500 | ||||||||||||
| 129 | @ | Electronic Arts, Inc. | 7,205 | ||||||||||||
| 100 | Fidelity National Information Services, Inc. | 3,990 | |||||||||||||
| 331 | First Data Corp. | 8,358 | |||||||||||||
| 86 | @ | Fiserv, Inc. | 4,395 | ||||||||||||
| 90 | IMS Health, Inc. | 2,472 | |||||||||||||
| 184 | @ | Intuit, Inc. | 5,792 | ||||||||||||
| 4,331 | Microsoft Corp. | 127,028 | |||||||||||||
| 261 | @ | Novell, Inc. | 1,639 | ||||||||||||
| 2,022 | @ | Oracle Corp. | 38,479 | ||||||||||||
| 64 | @ | Parametric Technology Corp. | 1,239 | ||||||||||||
| 148 | Paychex, Inc. | 5,833 | |||||||||||||
| 251,190 | |||||||||||||||
| Telecommunications: 3.0% | |||||||||||||||
| 190 | Alltel Corp. | 10,781 | |||||||||||||
| 1,950 | AT&T, Inc. | 66,125 | |||||||||||||
| 389 | @ | Avaya, Inc. | 4,971 | ||||||||||||
| 910 | BellSouth Corp. | 40,577 | |||||||||||||
| 87 | CenturyTel, Inc. | 3,702 | |||||||||||||
| 5,204 | @ | Cisco Systems, Inc. | 139,884 | ||||||||||||
| 190 | Citizens Communications Co. | 2,692 | |||||||||||||
| 101 | @ | Comverse Technology, Inc. | 1,972 | ||||||||||||
| 778 | @ | Corning, Inc. | 16,774 | ||||||||||||
| 82 | Embarq Corp. | 4,219 | |||||||||||||
| 110 | @ | JDS Uniphase Corp. | 2,033 | ||||||||||||
| 260 | @ | Juniper Networks, Inc. | 5,535 | ||||||||||||
| 1,663 | Motorola, Inc. | 36,869 | |||||||||||||
| 832 | Qualcomm, Inc. | 30,443 | |||||||||||||
| 710 | @ | Qwest Communications International, Inc. | 5,460 | ||||||||||||
| 1,501 | Sprint Nextel Corp. | 29,285 | |||||||||||||
| 301 | @ | Tellabs, Inc. | 3,022 | ||||||||||||
| 1,455 | Verizon Communications, Inc. | 50,838 | |||||||||||||
| 211 | Windstream Corp. | 2,941 | |||||||||||||
| 458,123 | |||||||||||||||
| Textiles: 0.0% | |||||||||||||||
| 61 | Cintas Corp. | 2,574 | |||||||||||||
| 2,574 | |||||||||||||||
| Toys/Games/Hobbies: 0.1% | |||||||||||||||
| 124 | Hasbro, Inc. | 3,317 | |||||||||||||
| 256 | Mattel, Inc. | 5,619 | |||||||||||||
| 8,936 | |||||||||||||||
| Transportation: 0.4% | |||||||||||||||
| 182 | Burlington Northern Santa Fe Corp. | 13,679 | |||||||||||||
| 188 | CSX Corp. | 6,742 | |||||||||||||
| 158 | FedEx Corp. | 18,238 | |||||||||||||
| 185 | Norfolk Southern Corp. | 9,111 | |||||||||||||
| 30 | Ryder System, Inc. | 1,565 | |||||||||||||
| 123 | Union Pacific Corp. | 11,134 | |||||||||||||
| 60,469 | |||||||||||||||
| Total Common Stock (Cost $5,895,132) | 6,519,067 | ||||||||||||||
See Accompanying Notes to Financial Statements
141
PORTFOLIO OF INVESTMENTS
ING PRINCIPAL PROTECTION FUND XII AS OF NOVEMBER 30, 2006 (UNAUDITED) (CONTINUED)
| Principal Amount | Value | ||||||||||||||
| U.S. GOVERNMENT AGENCY OBLIGATIONS: 30.0% | |||||||||||||||
| Federal National Mortgage Association: 30.0% | |||||||||||||||
| $ | 2,697,000 | 4.810%, due 11/15/09 | $ | 2,347,237 | |||||||||||
| 2,651,000 | 4.950%, due 01/15/10 | 2,291,047 | |||||||||||||
| 4,638,284 | |||||||||||||||
| Total U.S. Government Agency Obligations (Cost $4,749,066) | 4,638,284 | ||||||||||||||
| U.S. TREASURY OBLIGATIONS: 27.2% | |||||||||||||||
| U.S. Treasury Principal Only STRIP: 27.2% | |||||||||||||||
| 4,834,000 | 4.690%, due 02/15/10 | 4,192,664 | |||||||||||||
| 4,192,664 | |||||||||||||||
| Total U.S. Treasury Obligations (Cost $4,211,583) | 4,192,664 | ||||||||||||||
| Total Long-Term Investments (Cost $14,855,781) | 15,350,015 | ||||||||||||||
| SHORT-TERM INVESTMENTS: 0.8% | |||||||||||||||
| Repurchase Agreement: 0.8% | |||||||||||
| 120,000 | Goldman Sachs Repurchase Agreement dated 11/30/06, 5.280%, due 12/01/06, $120,018 to be received upon repurchase (Collateralized by $119,000 Federal National Mortgage Association, 5.250%, Market Value plus accr ued interest $122,533, due 06/15/08) | 120,000 | |||||||||
| Total Short-Term Investments (Cost $120,000) | 120,000 | ||||||||||
| Total Investments in Securities (Cost $14,975,781)* | 100.2 | % | $ | 15,470,015 | |||||||
| Other Assets and Liabilities - Net | (0.2 | ) | (27,195 | ) | |||||||
| Net Assets | 100.0 | % | $ | 15,442,820 | |||||||
@ Non-income producing security
@@ Foreign Issuer
STRIP Seperate Trading of Registered Interest and Principal of Securities
* Cost for federal income tax purposes is $15,086,848.
Net unrealized appreciation consists of:
| Gross Unrealized Appreciation | $ | 597,343 | |||||
| Gross Unrealized Depreciation | (214,176 | ) | |||||
| Net Unrealized Appreciation | $ | 383,167 | |||||
See Accompanying Notes to Financial Statements
142
ADVISORY CONTRACT APPROVAL DISCUSSION (UNAUDITED)
Section 15(c) of the Investment Company Act of 1940 (the "1940 Act") provides that, after an initial period, the Principal Protection Funds' existing investment advisory and sub-advisory contracts remain in effect only if the Board of Trustees (the "Board") of ING Equity Trust, including a majority of the Trustees who have no direct or indirect interest in the advisory and sub-advisory contracts, and who are not "interested persons" of the Funds, as such term is defined under the 1940 Act (the "Independent Trustees"), annually review and renew them. In this regard, at a meeting held on November 9, 2006 the Board, including a majority of the Independent Trustees, considered whether to renew the investment advisory contracts (the "Advisory Contracts") between ING Investments, LLC (the "Adviser") and the Funds and the sub-advisory contracts ("Sub-Advisory Contracts") with ING Investment Management Co. ("ING IM" or the "Sub-Adviser").
The Independent Trustees also held separate meetings on October 12, 2006 and November 7, 2006 to consider renewals of the Advisory Contracts and Sub-Advisory Contracts. Thus, references herein to factors considered and determinations made by the Independent Trustees include, as applicable, factors considered and determinations made on those earlier dates.
At the November 9, 2006 meeting, the Board voted to renew the Advisory and Sub-Advisory Contracts for the Funds. In reaching these decisions, the Board took into account information furnished throughout the year at regular Board meetings, as well as information prepared specifically in connection with the annual review process. The Board's determination took into account a number of factors that its members believed, in light of the legal advice furnished to them by Kirkpatrick & Lockhart Preston Gates Ellis LLP ("K&L Gates"), their independent legal counsel, and their own business judgment, to be relevant. Further, while the Advisory Contracts and Sub-Advisory Contracts for all the Funds were considered at the same Board meeting, the Trustees considered each Fund's advisory and sub-advisory relationships separately.
Provided below is an overview of the Board's contract approval process in general, as well as a discussion of certain of the specific factors the Board considered at the November 9, 2006 meeting. While the Board gave its attention to the information furnished, at its request, that was most relevant to its consideration, discussed below are a number of the primary factors relevant to the Board's consideration as to whether to renew the Advisory and Sub-Advisory Contracts for the one-year period ending November 30, 2007. Each Trustee may have accorded different weight to the various factors in reaching his or her conclusions with respect to the Funds' advisory and sub-advisory arrangements.
Overview of the Contract Renewal and Approval Process
In 2003, the Independent Trustees determined to undertake steps to further enhance the process under which the Board determines whether to renew existing advisory and sub-advisory arrangements for the funds in the ING Funds complex, including ING Equity Trust's existing Advisory and Sub-Advisory Contracts, and to approve new advisory and sub-advisory arrangements. Among these measures, the Board: retained the services of an independent consultant with experience in the mutual fund industry to assist the Independent Trustees in working with the personnel employed by the Adviser or its affiliates who administer the Funds ("Management") to identify the types of information presented to the Board to inform its deliberations with respect to advisory and sub-advisory relationships; established the format in which the information requested by the Board is provided to the Board; and determined the process for reviewing such information in connection with the Advisory and Sub-Advisory Contract renewal process. The end result was the implementation of the current process relied upon by the Board to review and analyze information in connection with the annual renewal of the Funds' Advisory and Sub-Advisory Contracts, as well as its review and approval of new advisory relationships.
Since the foregoing approval and renewal process was implemented, the Board regularly has reviewed and refined the process. In addition, the Board established a Contracts Committee and two Investment Review Committees, including the International Equity/Balanced/Fixed-Income Funds Investment Review Committee (the "I/B/F IRC"). The type and format of the information provided to the Board or its counsel to inform its approval and annual review and renewal process has been codified in the Funds' "15(c) Methodology Guide" (the "Methodology Guide"). The Methodology Guide was developed under the direction of the Independent Trustees, and sets out a written blueprint under which the Independent Trustees request certain information necessary to facilitate a thorough and informed review in connection with the annual Advisory and Sub-Advisory Contract renewal process. Management provides Fund-specific information to the Independent Trustees based on t he Methodology Guide through "Fund Analysis and Comparison Tables" or "FACT" sheets prior to the Independent Trustees' review of
143
ADVISORY CONTRACT APPROVAL DISCUSSION (UNAUDITED) (CONTINUED)
Advisory and Sub-Advisory Contracts. In 2005, the Independent Trustees retained an independent firm to verify and test the accuracy of certain of this information for a representative sample of Funds in the ING Funds complex. The Independent Trustees have determined to conduct such testing periodically.
As part of a regular on-going process, the Board's Contracts Committee recommends or considers recommendations from Management for refinements and other changes to the Methodology Guide and other aspects of the review process, and the Board's Investment Review Committees, including the I/B/F IRC, review benchmarks used to assess the performance of each Fund. The I/B/F IRC also meets regularly with the Adviser and periodically with the Sub-Adviser. The I/B/F IRC may apply a heightened level of scrutiny in cases where performance has lagged a Fund's relevant benchmark and/or peer group of investment companies.
The Board employed its process for reviewing contracts when considering the renewals of the Advisory and Sub-Advisory Contracts that would be effective through November 30, 2007. A number of the Board's primary considerations and conclusions resulting from this process are discussed below.
Nature, Extent and Quality of Service
In determining whether to approve the Advisory Contracts and Sub-Advisory Contracts for the Funds for the year ending November 30, 2007, the Independent Trustees received and evaluated such information as they deemed necessary regarding the nature, extent and quality of services provided to the Funds by the Adviser and ING IM. This included information regarding the Adviser and ING IM provided throughout the year at regular Board meetings, as well as information furnished for the November 9, 2006 Board meeting, which was held specifically to consider contract renewals for the period ending November 30, 2007. In addition, the Board's Independent Trustees also held meetings on October 12 and November 7, prior to the November 9, 2006 meeting of the full Board, to consider the annual renewal of the Advisory and Sub-Advisory Contracts.
The materials requested by and provided to the Board and/or to K&L Gates prior to the November 2006 Board meeting included the following items: (1) FACT sheets for each Fund that provided information about the performance and expenses of the Fund, the performance of the Fund's fixed income benchmark (Lehman Brothers 1-3 Government Index) and its equity benchmark (S&P 500® Composite Stock Price Index), and the expenses of other similarly managed funds in a selected peer group ("Selected Peer Group"), as well as information about the Fund's investment portfolio, objectives and strategies; (2) the Methodology Guide, which describes how the FACT sheets were prepared, including the manner in which benchmarks and Selected Peer Groups were selected and how profitability was determined; (3) responses from the Adviser and ING IM to a detailed series of questions posed by K&L Gates; (4) copies of each form of Advisory Contract and Sub-Advisory Contract; (5) copies of the Forms ADV for the Adviser and ING IM; (6) financial statements for the Adviser and ING IM; (7) drafts of narrative summaries addressing key factors the Board customarily considers in evaluating the renewals of Advisory Contracts and Sub-Advisory Contracts, including a written analysis for each Fund of how the Fund's performance compares to its designated benchmarks and its fees compare to the fees of the funds in its Selected Peer Group; and (8) other information relevant to the Board's evaluations.
For each Fund, its Class A shares were used for purposes of certain comparisons to the Fund's fixed income benchmark (Lehman Brothers 1-3 Government Index) and its equity benchmark (S&P 500® Composite Stock Price Index) for all periods presented.
In arriving at its conclusions with respect to the Advisory Contracts, the Board was mindful of the "manager-of-managers" platform of the ING Funds. The Board noted the resources that the Adviser has committed to the Board and the I/B/F IRC to assist the Board and members of the I/B/F IRC with their assessment of the investment performance of the Funds on an ongoing basis throughout the year. This includes the appointment of a Chief Investment Risk Officer and his staff, who report directly to the Board and who have developed attribution analyses and other metrics used by the Investment Review Committees, including the I/B/F IRC, to analyze the key factors underlying investment performance for the Funds.
The Board also noted the techniques used by the Adviser to monitor the performance of ING IM and took note of the pro-active approach that the Adviser, working in cooperation with the I/B/F IRC, has taken to advocate or recommend, when it believed appropriate, changes intended to assist in improving the performance of the Funds.
In considering the Funds' Advisory Contracts, the Board also considered the extent of benefits provided to the Funds' shareholders, beyond advisory services, from being part of the ING family of Funds. This
144
ADVISORY CONTRACT APPROVAL DISCUSSION (UNAUDITED) (CONTINUED)
includes, in most cases, the right to exchange or transfer investments, without a sales charge, between the same class of shares of such Funds or among Funds available on a product platform, and the wide variety in the types of Funds available for exchange or transfer. The Board also took into account the Adviser's extensive efforts in recent years to reduce the expenses of the ING Funds through re-negotiated arrangements with the ING Funds' service providers.
Further, the Board received periodic reports showing that the investment policies and restrictions for each Fund were consistently complied with and other periodic reports covering matters such as compliance by the Adviser's and ING IM's personnel with codes of ethics. The Board considered reports from the Funds' Chief Compliance Officer ("CCO") evaluating the regulatory compliance systems of the Adviser and ING IM and procedures reasonably designed by them to assure compliance with the federal securities laws, including those related to late trading and market timing, best execution, fair value pricing, proxy voting procedures, and trade allocation, among others. The Board considered the implementation by the Adviser and ING IM of enhanced compliance policies and procedures in response to SEC rule changes and other regulatory initiatives. The Board also took into account the CCO's annual and periodic reports with respect to service provider compliance and his recommendations regarding service providers' compliance programs. In this regard, the Board also considered the policies and procedures developed by the CCO in consultation with the Board's Compliance Committee that guide the CCO's compliance oversight function.
The Board reviewed the level of staffing, quality and experience of each Fund's portfolio management team. The Board took into account the respective resources and reputations of the Adviser and ING IM, and evaluated the ability of the Adviser and the Sub-Adviser to attract and retain qualified investment advisory personnel. The Board also considered the adequacy of the resources committed to the Funds (and other relevant funds in the ING Funds complex) by the Adviser and ING IM, and whether those resources are commensurate with the needs of the Funds and are appropriate to attempt to sustain expected levels of performance, compliance, and other needs.
Based on their deliberations and the materials presented to them, the Board concluded that the advisory and related services provided by the Adviser and ING IM are appropriate in light of the Funds' operations, the competitive landscape of the investment company business, and investor needs, and that the nature and quality of the overall services provided by the Adviser and ING IM were appropriate.
Fund Performance
In assessing advisory and sub-advisory relationships, the Board placed emphasis on the investment performance of each Fund, taking into account the importance of such performance to Fund shareholders. While the Board considered the performance reports and discussions with portfolio managers at Board and Committee meetings during the year, particular attention in assessing performance was given to the Fund FACT sheets furnished in advance of the November meeting of the Independent Trustees. The FACT sheet prepared for each Fund included its investment performance compared to the Lehman Brothers 1-3 Government Index and the S&P 500 Composite Stock Price Index. The Board's findings specific to each Fund's performance are discussed under "Fund-by-Fund Analysis," below.
Economies of Scale
In considering the reasonableness of advisory fees, the Board considered whether economies of scale will be realized by the Adviser as a Fund grows larger and the extent to which this is reflected in the level of management fee rates charged. In this regard, the Board noted that the Funds do not have breakpoint discounts on advisory fees, but do benefit from waivers to or reimbursements of advisory or other fees. The Board considered the extent to which economies of scale could effectively be realized through such waivers, reimbursements, or expense reductions.
Information about Services to Other Clients
The Board requested, and if received considered, information about the nature of services and fee rates offered by the Adviser and ING IM to other clients, including other registered investment companies and institutional accounts. When rates offered to other clients differed materially from those charged to the Funds, the Board considered the underlying rationale provided by the Adviser and/or ING IM for these differences. The Board also noted that the fee rates charged to the Funds and similar institutional clients may differ materially due to the different services and additional regulatory overlay associated with registered investment companies, such as the Funds.
145
ADVISORY CONTRACT APPROVAL DISCUSSION (UNAUDITED) (CONTINUED)
Fee Rates and Profitability
The Board reviewed and considered each contractual investment advisory fee rate, combined with the administrative fee rate, payable by each Fund to the Adviser. The Board also considered the contractual sub-advisory fee rates payable by the Adviser to ING IM for sub-advisory services. In addition, the Board reviewed and took into account existing and proposed fee waivers and expense limitations applicable to the fees payable by the Funds.
The Board considered the fee structures of the Funds as they relate to the services provided under the Contracts, and the potential fall-out benefits to the Adviser and ING IM, and their respective affiliates, from their association with the Funds. For each Fund, the Board determined that the fees payable to the Adviser and ING IM are reasonable for the services that each performs, which were considered in light of the nature and quality of the services that each has performed and is expected to perform through the year ending November 30, 2007.
For each Fund, the Board considered information on revenues, costs and profits realized by the Adviser, which was prepared by Management in accordance with the allocation methodology (including assumptions) specified in the Methodology Guide. In analyzing the profitability of the Adviser in connection with its services to a Fund, the Board took into account the sub-advisory fee rate payable by the Adviser to ING IM. The Board also considered information that it requested and was provided by Management with respect to the profitability of service providers affiliated with the Adviser, as well as information provided respect to ING IM's profitability.
The Board determined that it had requested and received sufficient information to gain a reasonable understanding regarding the Adviser's and ING IM's profitability. The Board also recognized that profitability analysis is not an exact science and there is no uniform methodology for determining profitability for this purpose. In this context, the Board realized that Management's calculations regarding its costs incurred in establishing the infrastructure necessary for the Funds' operations may not be fully reflected in the expenses allocated to each Fund in determining profitability, and that the information presented may not portray all of the costs borne by Management nor capture Management's entrepreneurial risk associated with offering and managing a mutual fund complex in today's regulatory environment.
Based on the information on revenues, costs, and profitability considered by the Board, after considering the factors described in this section, as well as any remedial actions requested by the Independent Trustees and agreed to by the Adviser, the Board concluded that the profits, if any, realized by the Adviser and ING IM were not excessive.
Fund-by-Fund Analysis
The following paragraphs outline certain of the specific factors that the Board considered, and the conclusions reached, at its November 2006 meeting in relation to renewing each Fund's current Advisory Contract and its Sub-Advisory Contract for the year ending November 30, 2007. These specific factors are in addition to those considerations discussed above.
In each case, the performance of the Fund's fixed income and equity components was compared to its fixed income and equity benchmarks, respectively. Each Fund's management fees and expense ratios were compared to the fees and expense ratios of the funds in its Selected Peer Group. In analyzing performance data for each Principal Protection Fund, the Board noted the difficulty of identifying a peer group of comparable mutual funds given the unique nature of each Fund, including the interest rate and market environment in place at the time the Fund commenced operations.
ING Index Plus LargeCap Equity Fund (formerly, ING Principal Protection Fund)
In considering whether to approve the renewal of the Advisory and Sub-Advisory Contracts for ING Principal Protection Fund, the Board considered that, based on performance data for the periods ended June 30, 2006: (1) the Fund's fixed income component outperformed its fixed income benchmark for the most recent calendar quarter and year-to-date periods, but underperformed its fixed income benchmark for the one- and three-year periods; and (2) the Fund's equity component underperformed its equity benchmark for all periods presented.
In analyzing the Fund's performance, the Board noted Management's representations that, unlike more conventional mutual funds, during its Guarantee Period the Fund's primary focus is preserving at least the principal amount of the Fund at the inception of the Guarantee Period while at the same time participating in equity markets to the extent consistent with that focus, and this can cause its performance to
146
ADVISORY CONTRACT APPROVAL DISCUSSION (UNAUDITED) (CONTINUED)
differ from the performance it may have attained had the Fund invested solely in equities or solely in fixed income instruments without regard to principal protection. The Board also considered that the extent to which the Fund is able to participate in upward movements of the equity markets is affected by a number of factors, including interest rates and the performance of its equity component.
In considering the fees payable under the Advisory and Sub-Advisory Contracts for ING Principal Protection Fund, the Board considered: (1) the fairness of the compensation under an Advisory Contract with level fees that does not include breakpoints; and (2) the pricing structure (including the expense ratio to be borne by shareholders) of ING Principal Protection Fund, as compared to its Selected Peer Group, including that: (a) the management fee (inclusive of the advisory fee and a 0.10% administration fee) for the Fund is above the median and the average management fees of the funds in its Selected Peer Group; and (b) the expense ratio for the Fund is below the median and the average expense ratios of the funds in its Selected Peer Group.
In analyzing the Fund's management fee and expense ratio, the Board took into account Management's representations that (1) the Fund's expense ratio is more favorable due to the attractive rate that the Adviser was able to negotiate with MBIA for the principal guarantee, reflecting, in part, MBIA's high degree of confidence in the Adviser's ability to manage the Fund in a manner consistent with MBIA's requirements under its guarantee agreement; and (2) in October 2006, in connection with the start of the Fund's Index Plus Large Cap period, the Fund's management fee will be reduced.
After its deliberation, the Board reached the following conclusions: (1) the Fund's management fee rate is reasonable in the context of all factors considered by the Board; (2) the Fund's expense ratio is reasonable in the context of all factors considered by the Board; (3) the Fund's performance is reasonable in the context of all factors considered by the Board; and (4) the sub-advisory fee rate payable by the Adviser to the Sub-Adviser is reasonable in the context of all factors considered by the Board. Based on these conclusions and other factors, the Board voted to renew the Advisory and Sub-Advisory Contracts for the Fund for the year ending November 30, 2007. During this renewal process, different Board members may have given different weight to different individual factors and related conclusions.
ING Principal Protection Fund II
In considering whether to approve the renewal of the Advisory and Sub-Advisory Contracts for ING Principal Protection Fund II, the Board considered that, based on performance data for the periods ended June 30, 2006: (1) the Fund's fixed income component underperformed its fixed income benchmark for the one- and three-year periods, but outperformed for the most recent calendar quarter and year-to-date periods; and (2) the Fund's equity component underperformed its equity benchmark for all periods presented.
In considering the fees payable under the Advisory and Sub-Advisory Contracts for ING Principal Protection Fund II, the Board considered: (1) the fairness of the compensation under an Advisory Contract with level fees that does not include breakpoints; and (2) the pricing structure (including the expense ratio to be borne by shareholders) of ING Principal Protection Fund II, as compared to its Selected Peer Group, including that: (a) the management fee (inclusive of the advisory fee and a 0.10% administration fee) for the Fund is above the median and the average management fees of the funds in its Selected Peer Group; and (b) the expense ratio for the Fund is below the median and the average expense ratios of the funds in its Selected Peer Group. In analyzing the Fund's management fee and expense ratio, the Board took into account Management's representations that: (1) the Fund's expense ratio is more favorable due to the attractive principa l guarantee that the Adviser was able to negotiate with the entity guaranteeing the Fund's Guaranteed Amount; and (2) the Adviser bears the risk of reduced fee revenue resulting from redemptions during the Guarantee Period, a period of time during which there are no sales of Fund shares.
In analyzing the Fund's performance, the Board noted Management's representations that, unlike more conventional mutual funds, during its Guarantee Period the Fund's primary focus is preserving at least the principal amount of the Fund at the inception of the Guarantee Period while at the same time participating in equity markets to the extent consistent with that focus, and this can cause its performance to differ from the performance it may have attained had the Fund invested solely in equities or solely in fixed income instruments without regard to principal protection. The Board also considered
147
ADVISORY CONTRACT APPROVAL DISCUSSION (UNAUDITED) (CONTINUED)
that the extent to which the Fund is able to participate in upward movements of the equity markets is affected by a number of factors, including interest rates and the performance of its equity component. The Board also took into account Management's representations that the Fund's expense ratio is more favorable due to the attractive rate that the Adviser was able to negotiate with MBIA for the principal guarantee, reflecting, in part, MBIA's high degree of confidence in the Adviser's ability to manage the Fund in a manner consistent with MBIA's requirements under its guarantee agreement.
After its deliberation, the Board reached the following conclusions: (1) the Fund's management fee rate is reasonable in the context of all factors considered by the Board; (2) the Fund's expense ratio is reasonable in the context of all factors considered by the Board; (3) the Fund's performance is reasonable in the context of all factors considered by the Board; and (4) the sub-advisory fee rate payable by the Adviser to the Sub-Adviser is reasonable in the context of all factors considered by the Board. Based on these conclusions and other factors, the Board voted to renew the Advisory and Sub-Advisory Contracts for the Fund for the year ending November 30, 2007. During this renewal process, different Board members may have given different weight to different individual factors and related conclusions.
ING Principal Protection Fund III
In considering whether to approve the renewal of the Advisory and Sub-Advisory Contracts for ING Principal Protection Fund III, the Board considered that, based on performance data for the periods ended June 30, 2006: (1) the Fund's fixed income component underperformed its fixed income benchmark for all periods presented; and (2) the Fund's equity component underperformed its equity benchmark for all periods presented.
In considering the fees payable under the Advisory and Sub-Advisory Contracts for ING Principal Protection Fund III, the Board considered: (1) the fairness of the compensation under an Advisory Contract with level fees that does not include breakpoints; and (2) the pricing structure (including the expense ratio to be borne by shareholders) of ING Principal Protection Fund III, as compared to its Selected Peer Group, including that: (a) the management fee (inclusive of the advisory fee and a 0.10% administration fee) for the Fund is above the median and the average management fees of the funds in its Selected Peer Group; and (b) the expense ratio for the Fund is below the median and the average expense ratios of the funds in its Selected Peer Group. In analyzing the Fund's management fee and expense ratio, the Board took into account Management's representations that: (1) the Fund's expense ratio is more favorable due to the attractive principal guarantee that the Adviser was able to negotiate with the entity guaranteeing the Fund's Guaranteed Amount; and (2) the Adviser bears the risk of reduced fee revenue resulting from redemptions during the Guarantee Period, a period of time during which there are no sales of Fund shares.
In analyzing the Fund's performance, the Board noted Management's representations that, unlike more conventional mutual funds, during its Guarantee Period the Fund's primary focus is preserving at least the principal amount of the Fund at the inception of the Guarantee Period while at the same time participating in equity markets to the extent consistent with that focus, and this can cause its performance to differ from the performance it may have attained had the Fund that invested solely in equities or solely in fixed income instruments without regard to principal protection. The Board also considered that the extent to which the Fund is able to participate in upward movements of the equity markets is affected by a number of factors, including interest rates and the performance of its equity component. The Board also took into account Management's representations that the Fund's expense ratio is more favorable due to the attractive rate th at the Adviser was able to negotiate with MBIA for the principal guarantee, reflecting, in part, MBIA's high degree of confidence in the Adviser's ability to manage the Fund in a manner consistent with MBIA's requirements under its guarantee agreement.
After its deliberation, the Board reached the following conclusions: (1) the Fund's management fee rate is reasonable in the context of all factors considered by the Board; (2) the Fund's expense ratio is reasonable in the context of all factors considered by the Board; (3) the Fund's performance is reasonable in the context of all factors considered by the Board; and (4) the sub-advisory fee rate payable by the Adviser to the Sub-Adviser is reasonable in the context of all factors considered by the Board. Based on these conclusions and other factors, the Board voted to renew the Advisory and Sub-Advisory Contracts for the Fund for the year ending November 30, 2007. During this renewal process, different Board members may have given different weight to different individual factors and related conclusions.
148
ADVISORY CONTRACT APPROVAL DISCUSSION (UNAUDITED) (CONTINUED)
ING Principal Protection Fund IV
In considering whether to approve the renewal of the Advisory and Sub-Advisory Contracts for ING Principal Protection Fund IV, the Board considered that, based on performance data for the periods ended June 30, 2006: (1) the Fund's fixed income component underperformed its fixed income benchmark for all periods presented; and (2) the Fund's equity component underperformed its equity benchmark for all periods presented.
In considering the fees payable under the Advisory and Sub-Advisory Contracts for ING Principal Protection Fund IV, the Board considered: (1) the fairness of the compensation under an Advisory Contract with level fees that does not include breakpoints; and (2) the pricing structure (including the expense ratio to be borne by shareholders) of ING Principal Protection Fund IV, as compared to its Selected Peer Group, including that: (a) the management fee (inclusive of the advisory fee and a 0.10% administration fee) for the Fund is above the median and the average management fees of the funds in its Selected Peer Group; and (b) the expense ratio for the Fund is below the median and the average expense ratios of the funds in its Selected Peer Group. In analyzing the Fund's management fee and expense ratio, the Board took into account Management's representations that: (1) the Fund's expense ratio is more favorable due to the attractive principa l guarantee that the Adviser was able to negotiate with the entity guaranteeing the Fund's Guaranteed Amount; and (2) the Adviser bears the risk of reduced fee revenue resulting from redemptions during the Guarantee Period, a period of time during which there are no sales of Fund shares.
In analyzing the Fund's performance, the Board noted Management's representations that, unlike more conventional mutual funds, during its Guarantee Period the Fund's primary focus is preserving at least the principal amount of the Fund at the inception of the Guarantee Period while at the same time participating in equity markets to the extent consistent with that focus, and this can cause its performance to differ from the performance it may have attained had the Fund invested solely in equities or solely in fixed income instruments without regard to principal protection. The Board also considered that the extent to which the Fund is able to participate in upward movements of the equity markets is affected by a number of factors, including interest rates and the performance of its equity component. The Board also took into account Management's representations that the Fund's expense ratio is more favorable due to the attractive rate that the Adviser was able to negotiate with MBIA for the principal guarantee, reflecting, in part, MBIA's high degree of confidence in the Adviser's ability to manage the Fund in a manner consistent with MBIA's requirements under its guarantee agreement.
After its deliberation, the Board reached the following conclusions: (1) the Fund's management fee rate is reasonable in the context of all factors considered by the Board; (2) the Fund's expense ratio is reasonable in the context of all factors considered by the Board; (3) the Fund's performance is reasonable in the context of all factors considered by the Board; and (4) the sub-advisory fee rate payable by the Adviser to the Sub-Adviser is reasonable in the context of all factors considered by the Board. Based on these conclusions and other factors, the Board voted to renew the Advisory and Sub-Advisory Contracts for the Fund for the year ending November 30, 2007. During this renewal process, different Board members may have given different weight to different individual factors and related conclusions.
ING Principal Protection Fund V
In considering whether to approve the renewal of the Advisory and Sub-Advisory Contracts for ING Principal Protection Fund V, the Board considered that, based on performance data for the periods ended June 30, 2006: (1) the Fund's fixed income component underperformed its fixed income benchmark for all periods presented; and (2) the Fund's equity component underperformed its equity benchmark for all periods presented.
In considering the fees payable under the Advisory and Sub-Advisory Contracts for ING Principal Protection Fund V, the Board considered: (1) the fairness of the compensation under an Advisory Contract with level fees that does not include breakpoints; and (2) the pricing structure (including the expense ratio to be borne by shareholders) of ING Principal Protection Fund V, as compared to its Selected Peer Group, including that: (a) the management fee (inclusive of the advisory fee and a 0.10% administration fee) for the Fund is above the median and the average management fees of the funds in its Selected Peer Group; and (b) the expense ratio for the Fund is below the median and the average expense ratios of the funds in its Selected Peer Group. In analyzing the Fund's management fee and expense ratio, the Board took into account Management's representations that: (1) the Fund's expense ratio is more favorable due to the attractive
149
ADVISORY CONTRACT APPROVAL DISCUSSION (UNAUDITED) (CONTINUED)
principal guarantee that the Adviser was able to negotiate with the entity guaranteeing the Fund's Guaranteed Amount; and (2) the Adviser bears the risk of reduced fee revenue resulting from redemptions during the Guarantee Period, a period of time during which there are no sales of Fund shares.
In analyzing the Fund's performance, the Board noted Management's representations that, unlike more conventional mutual funds, during its Guarantee Period the Fund's primary focus is preserving at least the principal amount of the Fund at the inception of the Guarantee Period while at the same time participating in equity markets to the extent consistent with that focus, and this can cause its performance to differ from the performance it may have attained had the Fund invested solely in equities or solely in fixed income instruments without regard to principal protection. The Board also considered that the extent to which the Fund is able to participate in upward movements of the equity markets is affected by a number of factors, including interest rates and the performance of its equity component. The Board also took into account Management's representations that the Fund's expense ratio is more favorable due to the attractive rate that th e Adviser was able to negotiate with MBIA for the principal guarantee, reflecting, in part, MBIA's high degree of confidence in the Adviser's ability to manage the Fund in a manner consistent with MBIA's requirements under its guarantee agreement.
After its deliberation, the Board reached the following conclusions: (1) the Fund's management fee rate is reasonable in the context of all factors considered by the Board; (2) the Fund's expense ratio is reasonable in the context of all factors considered by the Board; (3) the Fund's performance is reasonable in the context of all factors considered by the Board; and (4) the sub-advisory fee rate payable by the Adviser to the Sub-Adviser is reasonable in the context of all factors considered by the Board. Based on these conclusions and other factors, the Board voted to renew the Advisory and Sub-Advisory Contracts for the Fund for the year ending November 30, 2007. During this renewal process, different Board members may have given different weight to different individual factors and related conclusions.
ING Principal Protection Fund VI
In considering whether to approve the renewal of the Advisory and Sub-Advisory Contracts for ING Principal Protection Fund VI, the Board considered that, based on performance data for the periods ended June 30, 2006: (1) the Fund's fixed income component underperformed its fixed income benchmark for all periods presented; and (2) the Fund's equity component underperformed its equity benchmark for all periods presented.
In considering the fees payable under the Advisory and Sub-Advisory Contracts for ING Principal Protection Fund VI, the Board considered: (1) the fairness of the compensation under an Advisory Contract with level fees that does not include breakpoints; and (2) the pricing structure (including the expense ratio to be borne by shareholders) of ING Principal Protection Fund VI, as compared to its Selected Peer Group, including that: (a) the management fee (inclusive of the advisory fee and a 0.10% administration fee) for the Fund is above the median and the average management fees of the funds in its Selected Peer Group; and (b) the expense ratio for the Fund is below the median and the average expense ratios of the funds in its Selected Peer Group. In analyzing the Fund's management fee and expense ratio, the Board took into account Management's representations that: (1) the Fund's expense ratio is more favorable due to the attractive principa l guarantee that the Adviser was able to negotiate with the entity guaranteeing the Fund's Guaranteed Amount; and (2) the Adviser bears the risk of reduced fee revenue resulting from redemptions during the Guarantee Period, a period of time during which there are no sales of Fund shares.
In analyzing the Fund's performance, the Board noted Management's representations that, unlike more conventional mutual funds, during its Guarantee Period the Fund's primary focus is preserving at least the principal amount of the Fund at the inception of the Guarantee Period while at the same time participating in equity markets to the extent consistent with that focus, and this can cause its performance to differ from the performance it may have attained had the Fund invested solely in equities or solely in fixed income instruments without regard to principal protection. The Board also considered that the extent to which the Fund is able to participate in upward movements of the equity markets is affected by a number of factors, including interest rates and the performance of its equity component. The Board also took into account Management's representations that the Fund's expense ratio is more favorable due to the attractive rate that th e Adviser was able to negotiate with MBIA for the principal guarantee, reflecting, in part, MBIA's high degree of confidence in the Adviser's ability to manage the Fund in a manner consistent with MBIA's requirements under its guarantee agreement.
150
ADVISORY CONTRACT APPROVAL DISCUSSION (UNAUDITED) (CONTINUED)
After its deliberation, the Board reached the following conclusions: (1) the Fund's management fee rate is reasonable in the context of all factors considered by the Board; (2) the Fund's expense ratio is reasonable in the context of all factors considered by the Board; (3) the Fund's performance is reasonable in the context of all factors considered by the Board; and (4) the sub-advisory fee rate payable by the Adviser to the Sub-Adviser is reasonable in the context of all factors considered by the Board. Based on these conclusions and other factors, the Board voted to renew the Advisory and Sub-Advisory Contracts for the Fund for the year ending November 30, 2007. During this renewal process, different Board members may have given different weight to different individual factors and related conclusions.
ING Principal Protection Fund VII
In considering whether to approve the renewal of the Advisory and Sub-Advisory Contracts for ING Principal Protection Fund VII, the Board considered that, based on performance data for the periods ended June 30, 2006: (1) the Fund's fixed income component underperformed its fixed income benchmark for all periods presented; and (2) the Fund's equity component underperformed its equity benchmark for all periods presented.
In considering the fees payable under the Advisory and Sub-Advisory Contracts for ING Principal Protection Fund VII, the Board considered: (1) the fairness of the compensation under an Advisory Contract with level fees that does not include breakpoints; and (2) the pricing structure (including the expense ratio to be borne by shareholders) of ING Principal Protection Fund VII, as compared to its Selected Peer Group, including that: (a) the management fee (inclusive of the advisory fee and a 0.10% administration fee) for the Fund is above the median and the average management fees of the funds in its Selected Peer Group; and (b) the expense ratio for the Fund is below the median and the average expense ratios of the funds in its Selected Peer Group. In analyzing the Fund's management fee and expense ratio, the Board took into account Management's representations that: (1) the Fund's expense ratio is more favorable due to the attractive princi pal guarantee that the Adviser was able to negotiate with the entity guaranteeing the Fund's Guaranteed Amount; and (2) the Adviser bears the risk of reduced fee revenue resulting from redemptions during the Guarantee Period, a period of time during which there are no sales of Fund shares.
In analyzing the Fund's performance, the Board noted Management's representations that, unlike more conventional mutual funds, during its Guarantee Period the Fund's primary focus is preserving at least the principal amount of the Fund at the inception of the Guarantee Period while at the same time participating in equity markets to the extent consistent with that focus, and this can cause its performance to differ from the performance it may have attained had the Fund invested solely in equities or solely in fixed income instruments without regard to principal protection. The Board also considered that the extent to which the Fund is able to participate in upward movements of the equity markets is affected by a number of factors, including interest rates and the performance of its equity component. The Board also took into account Management's representations that the Fund's expense ratio is more favorable due to the attractive rate that th e Adviser was able to negotiate with MBIA for the principal guarantee, reflecting, in part, MBIA's high degree of confidence in the Adviser's ability to manage the Fund in a manner consistent with MBIA's requirements under its guarantee agreement.
After its deliberation, the Board reached the following conclusions: (1) the Fund's management fee rate is reasonable in the context of all factors considered by the Board; (2) the Fund's expense ratio is reasonable in the context of all factors considered by the Board; (3) the Fund's performance is reasonable in the context of all factors considered by the Board; and (4) the sub-advisory fee rate payable by the Adviser to the Sub-Adviser is reasonable in the context of all factors considered by the Board. Based on these conclusions and other factors, the Board voted to renew the Advisory and Sub-Advisory Contracts for the Fund for the year ending November 30, 2007. In considering whether to approve the renewal of the Advisory and Sub-Advisory Contracts for ING Principal Protection Fund VIII, the Board considered that, based on performance data for the periods ended June 30, 2006: (1) the Fund's fixed income component underperformed its fixe d income benchmark for all periods presented; and (2) the Fund's equity component underperformed its equity benchmark for all periods presented.
In considering the fees payable under the Advisory and Sub-Advisory Contracts for ING Principal Protection Fund VIII, the Board considered: (1) the fairness of the compensation under an Advisory Contract with level fees that does not include breakpoints; and (2) the pricing structure (including
151
ADVISORY CONTRACT APPROVAL DISCUSSION (UNAUDITED) (CONTINUED)
the expense ratio to be borne by shareholders) of ING Principal Protection Fund VIII, as compared to its Selected Peer Group, including that: (a) the management fee (inclusive of the advisory fee and a 0.10% administration fee) for the Fund is equal to the median and the average management fees of the funds in its Selected Peer Group; and (b) the expense ratio for the Fund is below the median and the average expense ratios of the funds in its Selected Peer Group. In analyzing the Fund's management fee and expense ratio, the Board took into account Management's representations that: (1) the Fund's expense ratio is more favorable due to the attractive principal guarantee that the Adviser was able to negotiate with the entity guaranteeing the Fund's Guaranteed Amount; and (2) the Adviser bears the risk of reduced fee revenue resulting from redemptions during the Guarantee Period, a period of time during which there are no sales of Fund shares.
In analyzing the Fund's performance, the Board noted Management's representations that, unlike more conventional mutual funds, during its Guarantee Period the Fund's primary focus is preserving at least the principal amount of the Fund at the inception of the Guarantee Period while at the same time participating in equity markets to the extent consistent with that focus, and this can cause its performance to differ from the performance it may have attained had the Fund invested solely in equities or solely in fixed income instruments without regard to principal protection. The Board also considered that the extent to which the Fund is able to participate in upward movements of the equity markets is affected by a number of factors, including interest rates and the performance of its equity component. The Board also took into account Management's representations that the Fund's expense ratio is more favorable due to the attractive rate that th e Adviser was able to negotiate with MBIA for the principal guarantee, reflecting, in part, MBIA's high degree of confidence in the Adviser's ability to manage the Fund in a manner consistent with MBIA's requirements under its guarantee agreement.
After its deliberation, the Board reached the following conclusions: (1) the Fund's management fee rate is reasonable in the context of all factors considered by the Board; (2) the Fund's expense ratio is reasonable in the context of all factors considered by the Board; (3) the Fund's performance is reasonable in the context of all factors considered by the Board; and (4) the sub-advisory fee rate payable by the Adviser to the Sub-Adviser is reasonable in the context of all factors considered by the Board. Based on these conclusions and other factors, the Board voted to renew the Advisory and Sub-Advisory Contracts for the Fund for the year ending November 30, 2007. During this renewal process, different Board members may have given different weight to different individual factors and related conclusions. During this renewal process, different Board members may have give n different weight to different individual factors and related conclusions.
ING Principal Protection Fund VIII
In considering whether to approve the renewal of the Advisory and Sub-Advisory Contracts for ING Principal Protection Fund VIII, the Board considered that, based on performance data for the periods ended June 30, 2006: (1) the Fund's fixed income component underperformed its fixed income benchmark for all periods presented; and (2) the Fund's equity component underperformed its equity benchmark for all periods presented.
In considering the fees payable under the Advisory and Sub-Advisory Contracts for ING Principal Protection Fund VIII, the Board considered: (1) the fairness of the compensation under an Advisory Contract with level fees that does not include breakpoints; and (2) the pricing structure (including the expense ratio to be borne by shareholders) of ING Principal Protection Fund VIII, as compared to its Selected Peer Group, including that: (a) the management fee (inclusive of the advisory fee and a 0.10% administration fee) for the Fund is equal to the median and the average management fees of the funds in its Selected Peer Group; and (b) the expense ratio for the Fund is below the median and the average expense ratios of the funds in its Selected Peer Group. In analyzing the Fund's management fee and expense ratio, the Board took into account Management's representations that: (1) the Fund's expense ratio is more favorable due to the attractive p rincipal guarantee that the Adviser was able to negotiate with the entity guaranteeing the Fund's Guaranteed Amount; and (2) the Adviser bears the risk of reduced fee revenue resulting from redemptions during the Guarantee Period, a period of time during which there are no sales of Fund shares.
In analyzing the Fund's performance, the Board noted Management's representations that, unlike more conventional mutual funds, during its Guarantee Period the Fund's primary focus is preserving at least the principal amount of the Fund at the inception of the Guarantee Period while at the same time participating in equity markets to the extent
152
ADVISORY CONTRACT APPROVAL DISCUSSION (UNAUDITED) (CONTINUED)
consistent with that focus, and this can cause its performance to differ from the performance it may have attained had the Fund invested solely in equities or solely in fixed income instruments without regard to principal protection. The Board also considered that the extent to which the Fund is able to participate in upward movements of the equity markets is affected by a number of factors, including interest rates and the performance of its equity component. The Board also took into account Management's representations that the Fund's expense ratio is more favorable due to the attractive rate that the Adviser was able to negotiate with MBIA for the principal guarantee, reflecting, in part, MBIA's high degree of confidence in the Adviser's ability to manage the Fund in a manner consistent with MBIA's requirements under its guarantee agreement.
After its deliberation, the Board reached the following conclusions: (1) the Fund's management fee rate is reasonable in the context of all factors considered by the Board; (2) the Fund's expense ratio is reasonable in the context of all factors considered by the Board; (3) the Fund's performance is reasonable in the context of all factors considered by the Board; and (4) the sub-advisory fee rate payable by the Adviser to the Sub-Adviser is reasonable in the context of all factors considered by the Board. Based on these conclusions and other factors, the Board voted to renew the Advisory and Sub-Advisory Contracts for the Fund for the year ending November 30, 2007. During this renewal process, different Board members may have given different weight to different individual factors and related conclusions.
ING Principal Protection Fund IX
In considering whether to approve the renewal of the Advisory and Sub-Advisory Contracts for ING Principal Protection Fund IX, the Board considered that, based on performance data for the periods ended June 30, 2006: (1) the Fund's fixed income component underperformed its fixed income benchmark for all periods presented; and (2) the Fund's equity component underperformed its equity benchmark for all periods presented.
In considering the fees payable under the Advisory and Sub-Advisory Contracts for ING Principal Protection Fund IX, the Board considered: (1) the fairness of the compensation under an Advisory Contract with level fees that does not include breakpoints; and (2) the pricing structure (including the expense ratio to be borne by shareholders) of ING Principal Protection Fund IX, as compared to its Selected Peer Group, including that: (a) the management fee (inclusive of the advisory fee and a 0.10% administration fee) for the Fund is above the median and equal to the average management fees of the funds in its Selected Peer Group; and (b) the expense ratio for the Fund is below the median and the average expense ratios of the funds in its Selected Peer Group. In analyzing the Fund's management fee and expense ratio, the Board took into account Management's representations th at: (1) the Fund's expense ratio is more favorable due to the attractive principal guarantee that the Adviser was able to negotiate with the entity guaranteeing the Fund's Guaranteed Amount; and (2) the Adviser bears the risk of reduced fee revenue resulting from redemptions during the Guarantee Period, a period of time during which there are no sales of Fund shares.
In analyzing the Fund's performance, the Board noted Management's representations that, unlike more conventional mutual funds, during its Guarantee Period the Fund's primary focus is preserving at least the principal amount of the Fund at the inception of the Guarantee Period while at the same time participating in equity markets to the extent consistent with that focus, and this can cause its performance to differ from the performance it may have attained had the Fund invested solely in equities or solely in fixed income instruments without regard to principal protection. The Board also considered that the extent to which the Fund is able to participate in upward movements of the equity markets is affected by a number of factors, including interest rates and the performance of its equity component. The Board also took into account Management's representations that the Fund's expense ratio is more favorable due to the attractive rate that th e Adviser was able to negotiate with MBIA for the principal guarantee, reflecting, in part, MBIA's high degree of confidence in the Adviser's ability to manage the Fund in a manner consistent with MB IA's requirements under its guarantee agreement.
After its deliberation, the Board reached the following conclusions: (1) the Fund's management fee rate is reasonable in the context of all factors considered by the Board; (2) the Fund's expense ratio is reasonable in the context of all factors considered by the Board; (3) the Fund's performance is reasonable in the context of all factors considered by the Board; and (4) the sub-advisory fee rate payable by the Adviser to the Sub-Adviser is reasonable in the context of all factors considered by the Board. Based on these conclusions and other factors, the Board voted to renew the Advisory and Sub-Advisory Contracts for
153
ADVISORY CONTRACT APPROVAL DISCUSSION (UNAUDITED) (CONTINUED)
the Fund for the year ending November 30, 2007. During this renewal process, different Board members may have given different weight to different individual factors and related conclusions.
ING Principal Protection Fund X
In considering whether to approve the renewal of the Advisory and Sub-Advisory Contracts for ING Principal Protection Fund X, the Board considered that, based on performance data for the periods ended June 30, 2006: (1) the Fund's fixed income component underperformed its fixed income benchmark for all periods presented; and (2) the Fund's equity component underperformed its equity benchmark for all periods presented.
In considering the fees payable under the Advisory and Sub-Advisory Contracts for ING Principal Protection Fund X, the Board considered: (1) the fairness of the compensation under an Advisory Contract with level fees that does not include breakpoints; and (2) the pricing structure (including the expense ratio to be borne by shareholders) of ING Principal Protection Fund X, as compared to its Selected Peer Group, including that: (a) the management fee (inclusive of the advisory fee and a 0.10% administration fee) for the Fund is above the median and equal to the average management fees of the funds in its Selected Peer Group; and (b) the expense ratio for the Fund is below the median and the average expense ratios of the funds in its Selected Peer Group. In analyzing the Fund's management fee and expense ratio, the Board took into account Management's representations that: (1) the Fund's expense ratio is more favorable due to the attractive p rincipal guarantee that the Adviser was able to negotiate with the entity guaranteeing the Fund's Guaranteed Amount; and (2) the Adviser bears the risk of reduced fee revenue resulting from redemptions during the Guarantee Period, a period of time during which there are no sales of Fund shares.
In analyzing the Fund's performance, the Board noted Management's representations that, unlike more conventional mutual funds, during its Guarantee Period the Fund's primary focus is preserving at least the principal amount of the Fund at the inception of the Guarantee Period while at the same time participating in equity markets to the extent consistent with that focus, and this can cause its performance to differ from the performance it may have attained had the Fund invested solely in equities or solely in fixed income instruments without regard to principal protection. The Board also considered that the extent to which the Fund is able to participate in upward movements of the equity markets is affected by a number of factors, including interest rates and the performance of its equity component. The Board also took into account Management's representations that the F und's expense ratio is more favorable due to the attractive rate that the Adviser was able to negotiate with MBIA for the principal guarantee, reflecting, in part, MBIA's high degree of confidence in the Adviser's ability to manage the Fund in a manner consistent with MB IA's requirements under its guarantee agreement.
After its deliberation, the Board reached the following conclusions: (1) the Fund's management fee rate is reasonable in the context of all factors considered by the Board; (2) the Fund's expense ratio is reasonable in the context of all factors considered by the Board; (3) the Fund's performance is reasonable in the context of all factors considered by the Board; and (4) the sub-advisory fee rate payable by the Adviser to the Sub-Adviser is reasonable in the context of all factors considered by the Board. Based on these conclusions and other factors, the Board voted to renew the Advisory and Sub-Advisory Contracts for the Fund for the year ending November 30, 2007. During this renewal process, different Board members may have given different weight to different individual factors and related conclusions.
ING Principal Protection Fund XI
In considering whether to approve the renewal of the Advisory and Sub-Advisory Contracts for ING Principal Protection Fund Xl, the Board considered that, based on performance data for the periods ended June 30, 2006: (1) the Fund's fixed income component underperformed its fixed income benchmark for all periods presented; and (2) the Fund's equity component underperformed its equity benchmark for all periods presented.
In considering the fees payable under the Advisory and Sub-Advisory Contracts for ING Principal Protection Fund Xl, the Board considered: (1) the fairness of the compensation under an Advisory Contract with level fees that does not include breakpoints; and (2) the pricing structure (including the expense ratio to be borne by shareholders) of ING Principal Protection Fund Xl, as compared to its Selected Peer Group, including that: (a) the management fee (inclusive of the advisory fee and a 0.10% administration fee) for the Fund is equal to the median and the average management fees of the funds in its Selected Peer Group; and (b) the expense
154
ADVISORY CONTRACT APPROVAL DISCUSSION (UNAUDITED) (CONTINUED)
ratio for the Fund is below the median and the average expense ratios of the funds in its Selected Peer Group. In analyzing the Fund's management fee and expense ratio, the Board took into account Management's representations that: (1) the Fund's expense ratio is more favorable due to the attractive principal guarantee that the Adviser was able to negotiate with the entity guaranteeing the Fund's Guaranteed Amount; and (2) the Adviser bears the risk of reduced fee revenue resulting from redemptions during the Guarantee Period, a period of time during which there are no sales of Fund shares.
In analyzing the Fund's performance, the Board noted Management's representations that, unlike more conventional mutual funds, during its Guarantee Period the Fund's primary focus is preserving at least the principal amount of the Fund at the inception of the Guarantee Period while at the same time participating in equity markets to the extent consistent with that focus, and this can cause its performance to differ from the performance it may have attained had the Fund invested solely in equities or solely in fixed income instruments without regard to principal protection. The Board also considered that the extent to which the Fund is able to participate in upward movements of the equity markets is affected by a number of factors, including interest rates and the performance of its equity component. The Board also took into account Management's representations that the Fund's expense ratio is more favorable due to the attractive rate that th e Adviser was able to negotiate with MBIA for the principal guarantee, reflecting, in part, MBIA's high degree of confidence in the Adviser's ability to manage the Fund in a manner consistent with MB IA's requirements under its guarantee agreement.
After its deliberation, the Board reached the following conclusions: (1) the Fund's management fee rate is reasonable in the context of all factors considered by the Board; (2) the Fund's expense ratio is reasonable in the context of all factors considered by the Board; (3) the Fund's performance is reasonable in the context of all factors considered by the Board; and (4) the sub-advisory fee rate payable by the Adviser to the Sub-Adviser is reasonable in the context of all factors considered by the Board. Based on these conclusions and other factors, the Board voted to renew the Advisory and Sub-Advisory Contracts for the Fund for the year ending November 30, 2007. During this renewal process, different Board members may have given different weight to different individual factors and related conclusions.
ING Principal Protection Fund XII
In considering whether to approve the renewal of the Advisory and Sub-Advisory Contracts for ING Principal Protection Fund XII, the Board considered that, based on performance data for the periods ended June 30, 2006: (1) the Fund's fixed income component underperformed its fixed income benchmark for all periods presented; and (2) the Fund's equity component underperformed its equity benchmark for all periods presented.
In considering the fees payable under the Advisory and Sub-Advisory Contracts for ING Principal Protection Fund XII, the Board considered: (1) the fairness of the compensation under an Advisory Contract with level fees that does not include breakpoints; and (2) the pricing structure (including the expense ratio to be borne by shareholders) of ING Principal Protection Fund XII, as compared to its Selected Peer Group, including that: (a) the management fee (inclusive of the advisory fee and a 0.10% administration fee) for the Fund is equal to the median and the average management fees of the funds in its Selected Peer Group; and (b) the expense ratio for the Fund is below the median and the average expense ratios of the funds in its Selected Peer Group. In analyzing the Fund's management fee and expense ratio, the Board took into account Management's representations that: (1) the Fund's expense ratio is more favorable due to the attractive pri ncipal guarantee that the Adviser was able to negotiate with the entity guaranteeing the Fund's Guaranteed Amount; and (2) the Adviser bears the risk of reduced fee revenue resulting from redemptions during the Guarantee Period, a period of time during which there are no sales of Fund shares.
In analyzing the Fund's performance, the Board noted Management's representations that, unlike more conventional mutual funds, during its Guarantee Period the Fund's primary focus is preserving at least the principal amount of the Fund at the inception of the Guarantee Period while at the same time participating in equity markets to the extent consistent with that focus, and this can cause its performance to differ from the performance it may have attained had the Fund invested solely in equities or solely in fixed income instruments without regard to principal protection. The Board also considered that the extent to which the Fund is able to participate in upward movements of the equity markets is affected by a number of factors, including interest rates and the performance of its equity component. The Board also took into account
155
ADVISORY CONTRACT APPROVAL DISCUSSION (UNAUDITED) (CONTINUED)
Management's representations that the Fund's expense ratio is more favorable due to the attractive rate that the Adviser was able to negotiate with MBIA for the principal guarantee, reflecting, in part, MBIA's high degree of confidence in the Adviser's ability to manage the Fund in a manner consistent with MBIA's requirements under its guarantee agreement.
After its deliberation, the Board reached the following conclusions: (1) the Fund's management fee rate is reasonable in the context of all factors considered by the Board; (2) the Fund's expense ratio is reasonable in the context of all factors considered by the Board; (3) the Fund's performance is reasonable in the context of all factors considered by the Board; and (4) the sub-advisory fee rate payable by the Adviser to the Sub-Adviser is reasonable in the context of all factors considered by the Board. Based on these conclusions and other factors, the Board voted to renew the Advisory and Sub-Advisory Contracts for the Fund for the year ending November 30, 2007. During this renewal process, different Board members may have given different weight to different individual factors and related conclusions.
156
(THIS PAGE INTENTIONALLY LEFT BLANK)
(THIS PAGE INTENTIONALLY LEFT BLANK)
ING Funds Distributor, LLC offers the funds listed below. Before investing in a fund, shareholders should carefully review the fund's prospectus. Investors may obtain a copy of a prospectus of any ING Fund by calling (800) 992-0180 or by going to www.ingfunds.com.
Domestic Equity and Income Funds
ING Balanced Fund
ING Growth and Income Fund
ING Real Estate Fund
Domestic Equity Growth Funds
ING 130/30 Fundamental Research Fund
ING Disciplined LargeCap Fund
ING Fundamental Research Fund
ING Growth Fund
ING LargeCap Growth Fund
ING MidCap Opportunities Fund
ING Opportunistic LargeCap Fund
ING SmallCap Opportunities Fund
ING Small Company Fund
Domestic Equity Index Funds
ING Index Plus LargeCap Fund
ING Index Plus MidCap Fund
ING Index Plus SmallCap Fund
Domestic Equity Value Funds
ING Financial Services Fund
ING LargeCap Value Fund
ING MagnaCap Fund
ING MidCap Value Fund
ING SmallCap Value Fund
ING SmallCap Value Choice Fund
ING Value Choice Fund
Fixed-Income Funds
ING GNMA Income Fund
ING High Yield Bond Fund
ING Intermediate Bond Fund
ING National Tax-Exempt Bond Fund
Global Equity Funds
ING Global Equity Dividend Fund
ING Global Natural Resources Fund
ING Global Real Estate Fund
ING Global Science and Technology Fund
ING Global Value Choice Fund
International Equity Funds
ING Emerging Countries Fund
ING Foreign Fund
ING Greater China Fund
ING Index Plus International Equity Fund
ING International Fund
ING International Capital Appreciation Fund
ING International Growth Fund
ING International Real Estate Fund
ING International SmallCap Fund
ING International Value Fund
ING International Value Choice Fund
ING Russia Fund
Global and International Fixed-Income Funds
ING Emerging Markets Fixed Income Fund
ING Global Bond Fund
International Fund-of-Funds
ING Diversified International Fund
Loan Participation Fund
ING Senior Income Fund
Money Market Funds*
ING Aeltus Money Market Fund
ING Classic Money Market Fund
Strategic Allocation Funds
ING Strategic Allocation Conservative Fund
ING Strategic Allocation Growth Fund
ING Strategic Allocation Moderate Fund
* An investment in a Fund is not insured or guaranteed by the Federal Deposit Insurance Corporation or any other government agency. Although the Funds seek to preserve the value of your investment at $1.00 per share, it is possible to lose money by investing in the Funds.
Investment Adviser
ING Investments, LLC
7337 East Doubletree Ranch Road
Scottsdale, Arizona 85258
Administrator
ING Funds Services, LLC
7337 East Doubletree Ranch Road
Scottsdale, Arizona 85258
Transfer Agent
DST Systems, Inc.
P.O. Box 419368
Kansas City, Missouri 64141
Custodian
The Bank of New York
One Wall Street,
New York, New York 10286
Legal Counsel
Dechert LLP
1775 I Street, N.W.
Washington, D.C. 20006
For more complete information, or to obtain a prospectus on any ING fund, please call your Investment Professional or ING Funds Distributor, LLC at (800) 992-0180 or log on to www.ingfunds.com. The prospectus should be read carefully before investing. Consider the fund's investment objectives, risks, charges and expenses carefully before investing. The prospectus contains this information and other information about the funds. Check with your Investment Professional to determine which funds are available for sale within their firm. Not all funds are available for sale at all firms.

PRSAR-UDEPPFABCQ (1106-011007)
Table of Contents
OMB APPROVAL
OMB Number: 3235-0570
Expires: September 30, 2007
Estimated average burden hours per response: 19.3
UNITED STATES
SECURITIES AND EXCHANGE COMMISSION
FORM N-CSR
CERTIFIED SHAREHOLDER REPORT OF REGISTERED MANAGEMENT INVESTMENT COMPANIES
Investment Company Act file number: 811-05629
ING Investment Funds, Inc.
7337 E. Doubletree Ranch Rd., Scottsdale, AZ 85258
(Address of principal executive offices) (Zip code)
CT Corporation System, 300 E. Lombard Street, Baltimore, MD 21201
(Name and address of agent for service)
Registrant’s telephone number, including area code: 1-800-992-0180
Date of fiscal year end: May 31
Date of reporting period: June 1, 2006 to November 30, 2006
Item 1. Reports to Stockholders.
The following is a copy of the report transmitted to stockholders pursuant to Rule 30e-1 under the Act (17 CFR 270.30e-1):
Table of Contents

| Funds |
| Semi-Annual Report | |
| November 30, 2006 | |
| Classes A, B, C, I, M, O and Q | |
| Domestic Equity and Income Fund | |
| • ING Real Estate Fund | |
| Domestic Equity Growth Funds | |
| • ING Disciplined LargeCap Fund | |
| • ING Fundamental Research Fund | |
| • ING LargeCap Growth Fund | |
| • ING MidCap Opportunities Fund | |
| • ING Opportunistic LargeCap Fund | |
| • ING SmallCap Opportunities Fund | |
| Domestic Equity Value Funds | |
| • ING Financial Services Fund | |
| • ING LargeCap Value Fund | |
| • ING MagnaCap Fund | |
| • ING MidCap Value Fund | |
| • ING MidCap Value Choice Fund | |
| • ING SmallCap Value Fund | |
| • ING SmallCap Value Choice Fund |
 E-Delivery Sign-up – details inside E-Delivery Sign-up – details inside |
| This report is submitted for general information to shareholders of the ING Funds. It is not authorized for distribution to prospective shareholders unless accompanied or preceded by a prospectus which includes details regarding the funds’ investment objectives, risks, charges, expenses and other information. This information should be read carefully. |

| 1 | ||
| 2 | ||
| 4 | ||
| 32 | ||
| 38 | ||
| 46 | ||
| 50 | ||
| 57 | ||
| 90 | ||
| 114 | ||
| 140 |
| Go Paperless with E-Delivery! | ||
| Sign up now for on-line prospectuses, fund reports, and proxy statements. In less than five minutes, you can help reduce paper mail and lower fund costs. |
Just go to www.ingfunds.com, click on the E-Delivery icon from the home page, follow the directions and complete the quick 5 Steps to Enroll.
You will be notified by e-mail when these communications become available on the internet. Documents that are not available on the internet will continue to be sent by mail.
Table of Contents
Table of Contents

Dear Shareholder,
In its recent meetings, the Federal Reserve Board (the “Fed”) ceased its two-year trend of raising interest rates. That trend — a string of 17 consecutive interest rate hikes — was seen by many analysts as a sign that the Fed was concerned about containing inflation.
Now, the Fed is choosing to neither raise nor lower interest rates, which puts us in the midst of what economists refer to as a “plateau.” Historically, there have been six similar plateaus since 1982 and during four of those periods the Standard & Poors 500® Composite Stock Price Index (“S&P 500® Index”) rose significantly during plateau periods.
It has been an interesting — if not unpredictable — year for equity investors. In May of 2006, the S&P 500® Index hit a five-year high that surprised many at the time because we were in a climate of slumping housing prices and escalating interest rates. This was followed by a slight correction and market drift for a couple of months. A strong rally has been experienced in the second half of the year driven in part by the dollar decline and the more stable interest rate environment. Many economists believe that these conditions will be positive for the stock market for the next twelve months.
Whatever the future holds, we at ING Funds continue to work hard to provide you, the investor, with an array of investment choices that enable you to build a smart and diversified portfolio. We also continue to expand and improve our customer service department to ensure that your needs are met promptly and that we indeed continue to make attaining your future goals easier.
On behalf of everyone here at ING Funds, I thank you for your continued support.
Sincerely,

For more complete information, or to obtain a prospectus on any ING fund, please call your Investment Professional or ING Funds Distributor, LLC at (800) 992-0180 or log on to www.ingfunds.com. The prospectus should be read carefully before investing. Consider the fund’s investment objectives, risks, charges and expenses. The prospectus contains this information and other information about the fund. Check with your Investment Professional to determine which funds are available for sale within their firm. Not all funds are available for sale at all firms.
1
Table of Contents
In our report for the last fiscal year, we described how, three weeks before it ended, investors suddenly took fright that inflation fighting central bankers would raise interest rates by too much and strangle global growth. We asked whether the sharp correction was just that, or the start of something big. In the end it proved to be the former, but it was not until nearly mid-October that the May 9, 2006 high was recaptured, with most markets adding to their gains from there. For the first six months ended November 30, 2006, global stocks according to the Morgan Stanley Capital International (“MSCI”) World IndexSM(1) with net reinvested dividends rose 10.9%. In currencies, the dollar was mixed, gaining 2.8% against the yen, but losing 3.4% against the euro and 5.2% to the pound sterling after these currencies surged in late November.
U.S. equities in the form of the Standard & Poors 500® Composite Stock Price Index (“S&P 500® Index”)(2), returned 11.3% including dividends for the six months ended November 30, 2006. Stocks had actually become cheaper in the last 12 months as corporate profits had been rising faster than prices. However, for a time, investors seemed only to have eyes for interest rates. After sixteen consecutive interest rate increases since June 2004, a barrage of hawkish rhetoric from the Federal Open Market Committee (“FOMC”) in May had sent stocks reeling. The problem was that the economy was already cooling, evidenced especially by a slumping housing market that had driven much of the consumer spending in the last few years, spending that was now also under threat from record oil prices. By June 13, 2006, the market had fallen by 7.7% from its highest level. However, the seventeenth interest rate increase on June 29, 2006, was accompanied by balanced language, reviving hopes that the FOMC might at last be finished raising interest rates. A tentative recovery was interrupted when renewed conflict in the Middle East sent the price of a barrel of oil to another all-time peak on July 14, 2006. Nevertheless, peace of sorts ultimately returned and as summer driving demand and the hurricane damage threat subsided, the oil prices dropped as much as 27% from their pinnacle and spent much of November below $60 per barrel. The FOMC indeed refrained from raising interest rates on August 8 and again took no action in September and October, although its members frequently felt the need to remind us that inflation was still uncomfortably elevated. Housing data continued to deteriorate and in October new and existing home prices were falling at the fastest rate in decades, while the stock of unsold homes rose through November. Gross Domestic Product (“GDP”) growth in the third calendar quarter slowed to 2.2% and Wal-Mart reported its first decline in same store sales in over ten years. So in the face of all this gloom, why were stocks in a clear up-trend to a six-year high by the last days of November? For one thing, the pull back in oil prices promised to leave more money in the pockets of consumers. Interest rates were now falling fast at the long end, which made stocks look relatively more attractive and raised the present value of future corporate profits. Speaking of which, corporate profits registered their thirteenth straight quarter of double-digit year-over-year growth and for the economy as a whole, reached 12.44% of GDP, the biggest share since the 1950s. Despite the worrying news, equity investors saw this market as a glass that was distinctly half-full.
The main international markets also advanced, based on MSCI indices in local currencies including net dividends. Sustained growth and an end to inflation had pushed Japan to almost a 15-year high in April. As in the U.S., stocks had been falling as the fiscal year started, on U.S. interest rate fears combined with signals from the Bank of Japan, followed by the reality on July 14, that local interest rates would rise for the first time in six years. The economic data were still mostly positive, but getting past their prime. By the end of November, household spending was falling fast and the government lowered its evaluation of the economy for the first time in nearly two years. For the six months, the market rose 3.8%. European ex UK markets had been supported by broadly based mergers and acquisitions amid clear signs of improving growth and employment. However, from their May 9 top, events in the U.S. and a 25 basis point increase in euro interest rates as inflation remained stubbornly above 2%, sent stocks down 6.9% by mid-June. From there however, markets turned around smartly, even as the European Central Bank raised rates on two more occasions. Business confidence was strong and unemployment fell to the lowest level in five years. Merger and acquisition activity rolled on, heartening investors while suggesting that stocks were not particularly expensive. For the half-year, markets touched January 2001 levels and added 11.8% for the six months ended November 30, 2006. UK equities had been boosted by the large acquisition-prone financial sector, as well as the sizeable energy and vibrant materials sectors. The
2
Table of Contents
reversal in the latter two exacerbated the global retrenchment brought on by interest rate worries after May 9 and UK stocks sank 9.3% by mid-June. As in Japan and the Eurozone, the Bank of England raised rates, twice to 5%, as inflation climbed above target, GDP growth returned to trend, and housing prices, an important demand generator, continued their recovery. This re-energized investors and led again by financials, the market surpassed its best levels of 2006, revisited those of December 2000 and finished up 7.7% for the half-year.
(2) The Standard & Poor’s 500® Composite Stock Price Index is an unmanaged index that measures the performance of securities of approximately 500 large-capitalization companies whose securities are traded on major U.S. stock markets.
All indices are unmanaged and investors cannot invest directly in an index.
Past performance does not guarantee future results. The performance quoted represents past performance. Investment return and principal value of an investment will fluctuate, and shares, when redeemed, may be worth more or less than their original cost. The Funds’ performance is subject to change since the period’s end and may be lower or higher than the performance data shown. Please call (800) 992-0180 or log on to www.ingfunds.com to obtain performance data current to the most recent month end.
Market Perspective reflects the views of the ING Chief Investment Risk Officer only through the end of the period, and is subject to change based on market and other conditions.
3
Table of Contents
The ING Real Estate Fund (the “Fund”) seeks total return consisting of long-term capital appreciation and current income. The Fund is managed by T. Ritson Ferguson, CFA and Joseph P. Smith, CFA, Portfolio Managers, of ING Clarion Real Estate Securities L.P. — the Sub-Adviser.
Performance: For the six months ended November 30, 2006, the Fund’s Class A shares, excluding sales charges, provided a total return of 27.23% compared to the Morgan Stanley Capital International U.S. REIT Index (“MSCI U.S. REIT® Index”), which returned 28.57%, for the same period.
Portfolio Specifics: During the last six months the Fund underperformed its benchmark due primarily to unfavorable property sector allocation and the drag on performance of our modest cash position. In a market that rose over 28%, our cash position which averaged just over 1.5% accounted for half of the shortfall of our net performance versus the benchmark. An underweight in the health care sector, which rose 34.4% in the period and an overweight in the hotel sector, which rose 19.3%, were main components of the Fund’s negative sector allocation effects. On the positive side, our overweight in the office sector, which was the second best performing sector, up 34.6%, helped
Industry Allocation
performance. Security selection was a slightly positive contributor for the period. Our selections in the office and mall sectors were significantly positive contributors during the period. In the office sector we benefited from the privatization of several large holdings at premium prices including Trizec Hahn and CarrAmerica. In the mall sector, our decision to eliminate our position in Mills Corporation, which fell (31)%, was clearly a good one. Unfortunately, our holdings in the hotel sector hurt relative performance. In particular, our investment in Starwood Lodging, which fell (4.9)% over the last six months despite delivering positive operating growth, hurt the fund’s performance. Our overall performance for the trailing twelve months is in the top quartile relative to the Lipper Median for all real estate funds for the same period.
Current Strategy and Outlook: Overall, 2006 has proven to be yet another good year for real estate stocks. Returns lately have been well above historical averages and have exceeded the returns for the broader equity market for several years. We expect real estate stock returns in 2007 to return to more normal levels. There is still an enormous amount of capital looking to invest in real estate. During the last two years there have been many REIT takeovers by private equity firms, suggesting that REITs are not overvalued relative to private market real estate values.
We are overweight the apartment and office property sectors, which we expect to benefit the most from an environment of positive economic growth and stable to mildly rising interest rates. We have reduced our exposure to the retail and the industrial sectors. REITs still offer an attractive source of high current income relative to other equities. Earnings growth is positive and accelerating. Given our outlook for continued economic growth and historically low interest rates, we look for continued positive returns from an actively managed portfolio of real estate stocks.
Top Ten Holdings
| Simon Property Group, Inc. | 6.5% |
| Boston Properties, Inc. | 5.2% |
| Equity Office Properties Trust | 5.0% |
| Prologis | 4.9% |
| Archstone-Smith Trust | 4.7% |
| Vornado Realty Trust | 4.5% |
| Equity Residential | 4.1% |
| Host Hotels & Resorts, Inc. | 4.1% |
| Public Storage, Inc. | 4.0% |
| AvalonBay Communities, Inc. | 3.8% |
Portfolio holdings are subject to change daily.
4
Table of Contents
| Average Annual Returns for the Periods Ended November 30, 2006 | |||||||||||||||||||||||||||||
| Since Inception | Since Inception | Since Inception | Since Inception | Since Inception | |||||||||||||||||||||||||
| of Class A | of Class B | of Class C | of Class I | of Class O | |||||||||||||||||||||||||
| 1 Year | 5 Year | December 20, 2002 | November 20, 2002 | January 17, 2003 | December 31, 1996 | September 15, 2004 | |||||||||||||||||||||||
| Including Sales Charge: | |||||||||||||||||||||||||||||
Class A(1) | 30.81 | % | — | 28.62 | % | — | — | — | — | ||||||||||||||||||||
Class B(2) | 32.81 | % | — | — | 28.82 | % | — | — | — | ||||||||||||||||||||
Class C(3) | 36.78 | % | — | — | — | 30.90 | % | — | — | ||||||||||||||||||||
| Class I | 39.24 | % | 25.16 | % | — | — | — | 15.66 | % | — | |||||||||||||||||||
| Class O | 38.79 | % | — | — | — | — | — | 32.69 | % | ||||||||||||||||||||
| Excluding Sales Charge: | |||||||||||||||||||||||||||||
| Class A | 38.79 | % | — | 30.56 | % | — | — | — | — | ||||||||||||||||||||
| Class B | 37.81 | % | — | — | 29.05 | % | — | — | — | ||||||||||||||||||||
| Class C | 37.78 | % | — | — | — | 30.90 | % | — | — | ||||||||||||||||||||
| Class I | 39.24 | % | 25.16 | % | — | — | — | 15.66 | % | — | |||||||||||||||||||
| Class O | 38.79 | % | — | — | — | — | — | 32.69 | % | ||||||||||||||||||||
MSCI U.S. REIT® Index(4) | 38.30 | % | 24.29 | % | 29.96 | %(5) | 29.52 | %(6) | 31.66 | %(7) | 14.69 | %(8) | 29.43 | %(9) | |||||||||||||||
The table above illustrates the total return of ING Real Estate Fund against the index indicated. An index is unmanaged and has no cash in its portfolio, imposes no sales charges and incurs no operating expenses. An investor cannot invest directly in an index. The Fund’s performance is shown both with and without the imposition of sales charges.
The table does not reflect the deduction of taxes that a shareholder will pay on Fund distributions or the redemption of Fund shares.
The performance shown may include the effect of fee waivers and/or expense reimbursements by the Investment Adviser and/or other service providers, which have the effect of increasing total return. Had all fees and expenses been considered, the total returns would have been lower.
Performance data represents past performance and is no assurance of future results. Investment return and principal value of an investment in the Fund will fluctuate. Shares, when sold, may be worth more or less than their original cost. The Fund’s current performance may be lower or higher than the performance data shown. Please log on to www.ingfunds.com or call (800) 992-0180 to get performance through the most recent month end.
This report contains statements that may be “forward-looking” statements. Actual results may differ materially from those projected in the “forward-looking” statements.
The views expressed in this report reflect those of the portfolio managers, only through the end of the period as stated on the cover. The portfolio managers’ views are subject to change at any time based on market and other conditions.
Fund holdings are subject to change daily.
(1)Reflects deduction of the maximum Class A sales charge of 5.75%.
(2)Reflects deduction of the Class B deferred sales charge of 5% and 2% for the 1 year and since inception returns, respectively.
(3)Reflects deduction of the Class C deferred sales charge of 1% for the 1 year return.
(4)The MSCI U.S. REIT® Index is a free float-adjusted market capitalization weighted index that is comprised of equity real estate investment trusts that are included in the MSCI U.S. Investable Market 2500 Index (with the exception of specialty REITs that do not generate a majority of their revenue and income from real estate rental and leasing obligations). The index represents approximately 85% of the U.S. REIT market.
(5)Since inception for the index is shown from January 1, 2003.
(6)Since inception for the index is shown from December 1, 2002.
(7)Since inception for the index is shown from February 1, 2003.
(8)Since inception for the index is shown from January 1, 1997.
(9)Since inception for the index is shown from September 1, 2004.
5
Table of Contents
The ING Disciplined LargeCap Fund (the “Fund”) seeks capital appreciation. The Fund is managed by Omar Aguilar, Ph.D. and Vincent Costa(1), Portfolio Managers, of ING Investment Management Co. — the Sub-Adviser.
Performance: For the six months ended November 30, 2006, the Fund’s Class A shares, excluding sales charges, provided a total return of 10.85% compared to Standard & Poor’s 500® Composite Stock Price Index (“S&P 500® Index”), which returned 11.33% for the same period.
Portfolio Specifics: During the period, the Fund’s relative performance benefited from both sector allocations and security selection. An underweight position in industrials and overweight position in consumer staples and consumer discretionary helped. Superior security selection in telecommunication services, information technology and consumer discretionary also benefited the Fund. By contrast, underweight positions in telecommunication services, information technology and utilities acted as a drag during the period. The Fund also gave up some of the gains it accumulated in consumer staples and industrials as security selection in these sectors was unfavorable.
An overweight position in Cisco Systems, Inc. a supplier of data-networking equipment and software, was one of the main contributors to performance. The company introduced a high-end video conferencing product, which many believe will become a
Industry Allocation
billion dollar business in five to seven years. It also acquired some key companies during the period. After the company reported better-than-expected earnings for the first quarter, several analysts upgraded the stock and raised price estimates for the company. Bell South Corp., another overweight position, helped the Fund. The company’s stock moved higher as merger talks with AT&T, Inc. stimulated buyers. The firm’s third-quarter profit rose 30%, which included profits from its stake in Cingular Wireless.
By comparison, an underweight position in Apple Computer, a personal computer, software, peripherals and portable digital music player manufacturer, hurt the Fund’s relative returns. The stock performed well as profits rose 27% due to strong sales of its iPod digital music player and record shipments of its Macintosh computer. Shares also rose in anticipation of the new iPod phone technology.
An underweight position in Verizon Communications, Inc., a telecommunications and internet company, also detracted from relative performance. The company reported a 2.8% rise in its third-quarter profits as it added new wireless customers. Shares rose as the company showed increased faith in its investment in fiber networks. The company believes its overall investment in fiber optics will generate a positive contribution to earnings by financial year 2008.
Current Strategy and Outlook: Our research builds a portfolio with fundamental characteristics that we believe will translate into a performance advantage over the benchmark. The Fund is structured to capitalize on what we believe are high-quality companies with superior business momentum, earnings growth and attractive valuations.
As of November 30, 2006, the Fund was overweight financials, energy and consumer discretionary and underweight consumer staples and information technology. However, our sector exposures are a function of individual stock selection and by design quite close to the S&P 500® Index.
Top Ten Holdings*
| ExxonMobil Corp. | 4.6% |
| General Electric Co. | 2.9% |
| Citigroup, Inc. | 2.8% |
| Bank of America Corp. | 2.8% |
| JPMorgan Chase & Co. | 2.0% |
| Cisco Systems, Inc. | 1.9% |
| Microsoft Corp. | 1.9% |
| Chevron Corp. | 1.8% |
| International Business Machines Corp. | 1.7% |
| Procter & Gamble Co. | 1.5% |
| * | Excludes short-term investments related to securities lending collateral. |
Portfolio holdings and characteristics are subject to change and may not be representative of current holdings and characteristics. The outlook for this Fund may differ from that presented for other ING Funds. Performance for the different classes of shares will vary based on differences in sales charges and fees associated with each class.
6
Table of Contents
| Average Annual Returns for the Periods Ended November 30, 2006 | |||||||||||||
| Since Inception | |||||||||||||
| of Class A, B and C | |||||||||||||
| 1 Year | 5 Year | December 30, 1998 | |||||||||||
Including Sales Charge: | |||||||||||||
Class A(1) | 5.94 | % | 3.80 | % | 1.17 | % | |||||||
Class B(2) | 6.41 | % | 3.94 | % | 1.19 | % | |||||||
Class C(3) | 10.41 | % | 4.28 | % | 1.19 | % | |||||||
Excluding Sales Charge: | |||||||||||||
| Class A | 12.37 | % | 5.04 | % | 1.92 | % | |||||||
| Class B | 11.41 | % | 4.28 | % | 1.19 | % | |||||||
| Class C | 11.41 | % | 4.28 | % | 1.19 | % | |||||||
S&P 500® Index(4) | 14.23 | % | 6.08 | % | 3.28 | %(5) | |||||||
The table above illustrates the total return of ING Disciplined LargeCap Fund against the index indicated. An index is unmanaged and has no cash in its portfolio, imposes no sales charges and incurs no operating expenses. An investor cannot invest directly in an index. The Fund’s performance is shown both with and without the imposition of sales charges.
The table does not reflect the deduction of taxes that a shareholder will pay on Fund distributions or the redemption of Fund shares.
The performance shown may include the effect of fee waivers and/or expense reimbursements by the Investment Adviser and/or other service providers, which have the effect of increasing total return. Had all fees and expenses been considered, the total returns would have been lower.
Performance data represents past performance and is no assurance of future results. Investment return and principal value of an investment in the Fund will fluctuate. Shares, when sold, may be worth more or less than their original cost. The Fund’s current performance may be lower or higher than the performance data shown. Please log on to www.ingfunds.com or call (800) 992-0180 to get performance through the most recent month end.
This report contains statements that may be “forward-looking” statements. Actual results may differ materially from those projected in the “forward-looking” statements.
The views expressed in this report reflect those of the portfolio managers, only through the end of the period as stated on the cover. The portfolio managers’ views are subject to change at any time based on market and other conditions.
Fund holdings are subject to change daily.
(1)Reflects deduction of the maximum Class A sales charge of 5.75%.
(2)Reflects deduction of the Class B deferred sales charge of 5% and 2% for the 1 year and 5 year returns, respectively.
(3)Reflects deduction of the Class C deferred sales charge of 1% for the 1��year return.
(4)The S&P 500® Index is an unmanaged index that measures the performance of securities of approximately 500 large-capitalization companies whose securities are traded on major U.S. stock markets.
(5)Since inception performance for index is shown from January 1, 1999.
Prior to August 1, 2001, the Fund was managed by a different sub-adviser.
7
Table of Contents
The ING Fundamental Research Fund (the “Fund”) seeks to maximize total return. The Fund is managed by Christopher Corapi, Portfolio Manager, of ING Investment Management Co. — the Sub-Adviser.
Performance: For the six months ended November 30, 2006, the Fund’s Class A shares, excluding sales charges, provided a total return of 8.17% compared to Standard & Poor’s 500® Composite Stock Price Index (“S&P 500® Index”), which returned 11.33%, for the same period.
Portfolio Specifics: The Fund benefited from favorable stock selection in telecommunication services and financials. In financials, our position in the insurance industry had the largest positive impact on performance. By contrast, the Fund underperformed its benchmark largely due to weak stock selection in technology and energy. Our energy holdings were hurt by a sharp and unanticipated sell off in crude and natural gas during the third quarter as cooler weather allowed natural gas inventories to build, and the Gulf of Mexico was untouched by severe weather for the first time in several years.
Our decision not to own Sprint Nextel Corp. had a positive impact on relative performance. The stock struggled for the majority of this year due to concerns over the company’s integration with Nextel. In addition, our position in AT&T, Inc. continued to appreciate as the company benefited from improved wireline performance and expectations of margin recovery at Cingular Wireless. Axis Capital Holdings Ltd., a global insurance and reinsurance company, was another position that aided performance. The company reported better-than-expected second-quarter results and was also a beneficiary of the mild hurricane season. We sold out of our position in October as the stock had reached our price target.
Industry Allocation
By comparison, Yahoo!, Inc. and Motorola, Inc. were two technology names that had a negative impact on performance. In the third quarter, Yahoo!, Inc. was hurt by weakness in search and brand advertising and concerns over the delayed launch of Panama, a new search system. Due to a lack of positive catalysts for the stock we decided to replace it with Google, Inc. which we believe to be a better long-term investment in the on-line advertising space. Motorola’s stock declined as mobile phone sales in the third quarter failed to meet the Street’s expectations. We believe that this sell off was an overreaction to a short term inventory issue with one of its customers and should not impact fourth-quarter results. Within energy, our investment in Evergreen Energy, a company with a potentially revolutionary coal cleaning process, underperformed as management failed to deliver on performance milestones that we viewed were well within their reach. We are in the process of eliminating our position.
Current Strategy and Outlook: Currently, the Fund is positioned in companies that we believe have strong or improving competitive positions, robust end markets and/or superior capital allocation opportunities. Furthermore, we believe each stock possesses an attractive valuation and a clear catalyst to improve it. Top holdings include Altria Group, Inc., Motorola, Inc., General Cable Corp., Cooper Industries Ltd., AT&T, Inc. (mentioned above), and St. Jude Medical, Inc.
After years of underperformance, Motorola has managed an impressive turnaround through product innovation, cost cutting and divestures. We expect continued revenue growth going forward due to a solid product
Top Ten Holdings*
| ExxonMobil Corp. | 3.2% |
| Microsoft Corp. | 2.9% |
| Altria Group, Inc. | 2.8% |
| American International Group, Inc. | 2.6% |
| AT&T, Inc. | 2.5% |
| Citigroup, Inc. | 2.5% |
| Bank of America Corp. | 2.4% |
| General Electric Co. | 2.3% |
| Procter & Gamble Co. | 2.2% |
| Motorola, Inc. | 2.1% |
| * | Excludes short-term investments related to repurchase agreement. |
lineup and strong global demand for handsets. In addition, Motorola we believe should benefit from a weak product portfolio offered by its competitors, particularly Nokia, which will not be rectified in time for the holiday season. We believe that there is substantial upside for Altria due to its attractive and stable yield. Additionally, the recent ease in litigation risk should allow the company’s planned break-up to occur sooner than expected. We also continue to favor electrical equipment companies including General Cable Corp. and Cooper Industries Ltd. who are beneficiaries of spending by utility companies on energy infrastructure. Finally, we see significant upside potential in St. Jude Medical as their robust product line should allow them to continue to gain share in the implantable cardioverter defibrillator (“IDC”) market. IDC devices are used to treat patients with irregular heartbeats and heart failure.
8
Table of Contents
| Cumulative Total Returns for the Periods Ended November 30, 2006 | |||||||||||||||||
| Since Inception | Since Inception | Since Inception | Since Inception | ||||||||||||||
| of Class A | of Class B | of Class C | of Class I | ||||||||||||||
| December 28, 2005 | February 6, 2006 | April 17, 2006 | July 18, 2006 | ||||||||||||||
Including Sales Charge: | |||||||||||||||||
Class A(1) | 3.58 | % | — | — | — | ||||||||||||
Class B(2) | — | 2.49 | % | — | — | ||||||||||||
Class C(3) | — | — | 4.92 | % | — | ||||||||||||
| Class I | — | — | — | 12.59 | % | ||||||||||||
Excluding Sales Charge: | |||||||||||||||||
| Class A | 9.90 | % | — | — | — | ||||||||||||
| Class B | — | 7.49 | % | — | — | ||||||||||||
| Class C | — | — | 5.92 | % | — | ||||||||||||
| Class I | — | — | — | 12.59 | % | ||||||||||||
S&P 500® Index(4) | 14.19 | %(5) | 11.25 | %(6) | 8.13 | %(7) | 10.50 | %(8) | |||||||||
The table above illustrates the total return of ING Fundamental Research Fund against the index indicated. An index is unmanaged and has no cash in its portfolio, imposes no sales charges and incurs no operating expenses. An investor cannot invest directly in an index. The Fund’s performance is shown both with and without the imposition of sales charges.
The table does not reflect the deduction of taxes that a shareholder will pay on Fund distributions or the redemption of Fund shares.
The performance shown may include the effect of fee waivers and/or expense reimbursements by the Investment Adviser and/or other service providers, which have the effect of increasing total return. Had all fees and expenses been considered, the total returns would have been lower.
Performance data represents past performance and is no assurance of future results. Investment return and principal value of an investment in the Fund will fluctuate. Shares, when sold, may be worth more or less than their original cost. The Fund’s current performance may be lower or higher than the performance data shown. Please log on to www.ingfunds.com or call (800) 992-0180 to get performance through the most recent month end.
This report contains statements that may be “forward-looking” statements. Actual results may differ materially from those projected in the “forward-looking” statements.
The views expressed in this report reflect those of the portfolio managers, only through the end of the period as stated on the cover. The portfolio managers’ views are subject to change at any time based on market and other conditions.
Fund holdings are subject to change daily.
(1)Reflects deduction of the maximum Class A sales charge of 5.75%.
(2)Reflects deduction of the Class B deferred sales charge of 5% for the since inception return.
(3)Reflects deduction of the Class C deferred sales charge of 1% for the since inception return.
(4)The S&P 500® Index is an unmanaged index that measures the performance of securities of approximately 500 large-capitalization companies whose securities are traded on major U.S. stock markets.
(5)Since inception performance for index is shown from December 28, 2005.
(6)Since inception performance for index is shown from February 1, 2006.
(7)Since inception performance for index is shown from May 1, 2006.
(8)Since inception performance for index is shown from August 1, 2006.
9
Table of Contents
The ING LargeCap Growth Fund (the “Fund”) seeks long-term capital appreciation. The Fund is managed by Andrew J. Schilling and John A. Boselli, Portfolio Managers at Wellington Management Company, LLP — the Sub-Adviser.
Performance: For the six months ended November 30, 2006, the Fund’s Class A shares, excluding sales charges, provided a total return of 6.87% compared to the Russell 1000® Growth Index and the Russell 1000® Index, which returned 9.29% and 11.09%, respectively, for the same period.
Portfolio Specifics: Equity markets posted a strong return for the period. US large cap equities performed well, up 11.1% as measured by the Russell 1000® Index, and, in a change of leadership, outpaced smaller companies as the small cap Russell 2000 rose 9.7%. Value stocks continued to lead their growth oriented peers, with the broad market Russell 3000 Value finishing ahead of the Russell 3000 Growth by nearly four percentage points. Every sector in the Russell 1000® Growth but one finished with positive returns, led by technology which was up by 14.6%, utilities which were up by 12.7%, and financials which were up by 12.1%. The lone negative sector was energy, which fell 0.3% in aggregate.
Poor security selection was the main source of underperformance for the period, focused predominately in the technology, energy, and consumer staples sectors. Allocations to sectors, which are primarily a result of bottom-up stock selection, had a negligible effect. The top three
Industry Allocation
detractors on a relative basis were Marvell Technology Group Ltd., Microsoft Corp., and Commerce Bancorp., Inc. Global semiconductor company Marvell Technology Group Ltd. declined on weak earnings and lowered guidance. We eliminated our position due to decelerating growth and lowered expectations in the disk drive business. Shares in regional bank Commerce Bancorp., Inc. fell when the company warned that earnings would fall short of expectations due to spread compression between long and short rates, which hurt profitability on deposits. Relative performance was also hurt by not holding Microsoft during a period when the software giant benefited from strong revenues and a $40 billion share buyback initiative. Communication equipment company Qualcomm, Inc. was a significant detractor on an absolute basis. The company’s stock underperformed on lower near-term growth prospects and legal uncertainties.
Several stocks served to partially offset this underperformance. Top relative performers included Adobe Systems and Network Appliance, Inc. Stock in graphic design and publishing software company Adobe rose sharply as the November launch of Acrobat 8 signaled the start of a new product cycle. We expect sales to strengthen with the release of Creative Suite 3, which combines Adobe products with those of recently acquired Macromedia. Data management firm Network Appliance benefited from a healthy storage spending environment where sales of the company’s mid-range storage solution remained strong. On an absolute basis, networking systems giant Cisco was the top contributor. The company reported better than expected earnings as enterprise and service provider revenues improved.
Current Strategy and Outlook: Our investment approach is very much a “bottom-up” process; we pick one stock at a time based upon the attractiveness of each company’s valuation and fundamentals. Greater-than-benchmark exposure to financials includes top-10 positions in world
| Medtronic, Inc. | 4.3% |
| Network Appliance, Inc. | 3.6% |
| Boeing Co. | 3.6% |
| UBS AG | 3.5% |
| Cisco Systems, Inc. | 3.4% |
| Franklin Resources, Inc. | 3.4% |
| UnitedHealth Group, Inc. | 3.1% |
| Google, Inc. | 2.9% |
| Adobe Systems, Inc. | 2.8% |
| Schering-Plough Corp. | 2.7% |
| * | Excludes short-term investments related to securities lending collateral. |
class wealth manager UBS and asset manager Franklin Resources. While our relative weight in the sector remains high, exposure was reduced by eliminating Legg Mason and scaling back our position in Countrywide Financial Corp., while establishing a comparatively smaller position in State Street. We are also overweight industrials stocks, driven by positions in Boeing Co., General Dynamics Corp., and Fluor Corp. We have neutralized exposure to the energy sector, eliminating Peabody Energy Corp. and Petro-Canada and reducing a position in Cameco Corp. We are underweight consumer-related sectors broadly as they remain relatively unattractive, in our view. In consumer discretionary, the prospects for retailers are not encouraging given an expected consumer spending slowdown. On the consumer staples side, stocks are relatively expensive given their growth prospects.
10
Table of Contents
| Average Annual Returns for the Periods Ended November 30, 2006 | |||||||||||||||||
| Since Inception | Since Inception | ||||||||||||||||
| of Class A, B, C and Q | of Class I | ||||||||||||||||
| 1 Year | 5 Year | July 21, 1997 | January 8, 2002 | ||||||||||||||
Including Sales Charge: | |||||||||||||||||
Class A(1) | (1.29 | )% | (0.49 | )% | 5.39 | % | — | ||||||||||
Class B(2) | (0.92 | )% | (0.33 | )% | 5.37 | % | — | ||||||||||
Class C(3) | 3.09 | % | 0.06 | % | 5.36 | % | — | ||||||||||
| Class I | 5.23 | % | — | — | 0.36 | % | |||||||||||
| Class Q | 4.96 | % | 0.97 | % | 6.30 | % | — | ||||||||||
Excluding Sales Charge: | |||||||||||||||||
| Class A | 4.73 | % | 0.70 | % | 6.05 | % | — | ||||||||||
| Class B | 4.08 | % | 0.07 | % | 5.37 | % | — | ||||||||||
| Class C | 4.09 | % | 0.06 | % | 5.36 | % | — | ||||||||||
| Class I | 5.23 | % | — | — | 0.36 | % | |||||||||||
| Class Q | 4.96 | % | 0.97 | % | 6.30 | % | — | ||||||||||
Russell 1000® Growth Index(4) | 8.36 | % | 2.58 | % | 2.86 | %(6) | 2.67 | %(7) | |||||||||
Russell 1000® Index(5) | 14.16 | % | 6.78 | % | 6.26 | %(6) | 6.67 | %(7) | |||||||||
The table above illustrates the total return of ING LargeCap Growth Fund against the indices indicated. An index is unmanaged and has no cash in its portfolio, imposes no sales charges and incurs no operating expenses. An investor cannot invest directly in an index. The Fund’s performance is shown both with and without the imposition of sales charges.
The table does not reflect the deduction of taxes that a shareholder will pay on Fund distributions or the redemption of Fund shares.
The performance shown may include the effect of fee waivers and/or expense reimbursements by the Investment Adviser and/or other service providers, which have the effect of increasing total return. Had all fees and expenses been considered, the total returns would have been lower.
Performance data represents past performance and is no assurance of future results. Investment return and principal value of an investment in the Fund will fluctuate. Shares, when sold, may be worth more or less than their original cost. The Fund’s current performance may be lower or higher than the performance data shown. Please log on to www.ingfunds.com or call (800) 992-0180 to get performance through the most recent month end.
This report contains statements that may be “forward-looking” statements. Actual results may differ materially from those projected in the “forward-looking” statements.
The views expressed in this report reflect those of the portfolio managers, only through the end of the period as stated on the cover. The portfolio managers’ views are subject to change at any time based on market and other conditions.
Fund holdings are subject to change daily.
(1)Reflects deduction of the maximum Class A sales charge of 5.75%.
(2)Reflects deduction of the Class B deferred sales charge of 5% and 2% for the 1 year and 5 year returns, respectively.
(3)Reflects deduction of the Class C deferred sales charge of 1% for the 1 year return.
(4)The Russell 1000® Growth Index is an unmanaged index that measures the performance of those Russell 1000® Index companies with higher price-to-book ratios and forecasted growth.
(5)The Russell 1000® Index is an unmanaged, comprehensive large-cap index measuring the performance of the largest 1,000 U.S. incorporated companies.
(6)Since inception performance for index is shown from August 1, 1997.
(7)Since inception performance for index is shown from January 1, 2002.
Prior to October 1, 2000 the Fund was managed by a different sub-adviser.
11
Table of Contents
The ING MidCap Opportunities Fund (the “Fund”) seeks long-term capital appreciation. The Fund is managed by Richard Welsh and Jeff Bianchi, Portfolio Managers of ING Investment Management Co. — the Sub-Adviser.
Performance: For the six months ended November 30, 2006, the Fund’s Class A shares, excluding sales charges, provided a total return of 3.16% compared to the Russell Midcap® Growth Index and the Russell Midcap® Index, which returned 8.43% and 10.08%, respectively, for the same period.
Portfolio Specifics: Unfavorable stock selection in the health care, information technology, and financials sectors acted as the primary drag on relative performance during the period. Turning to the Fund’s individual security selection, a position in Hospira, Inc., a medical supply company, which was spun off by Abbott Laboratories in 2004, hurt the Fund. The company reduced earnings guidance for 2007 due to softer demand for its drug pump and announced the delay of an injectable antibiotic launch. We eliminated the position as a consequence. Citrix Systems, a supplier of access information software and services, also lagged as it reported disappointing third quarter 2006 results due to weak licensing growth in its core presentation products. A
Industry Allocation
position in Investment Technology Group, Inc. (“ITG”), which provides online trading services to institutions and brokerages, also acted as a drag during the period. ITG’s fiscal third quarter earnings missed consensus estimates due to the biggest decline in U.S. share trading in three years. The company also revised expectations lower for its European and Asian operations.
Luxury retailer Coach was the best-performing stock during the period. Coach, Inc.’s fiscal first quarter 2006 sales and earnings benefited from new style introductions, resulting in a positive earnings surprise. In addition, profit expectations were revised higher based on its new style features, accelerated store openings, and the introduction of higher priced items for the holiday season. Veritas DGC, Inc., a seismic data collection company for energy companies, also added to the Fund’s performance. The company agreed to be purchased by France-based Geophysique. Fiscal first quarter earnings results exceeded expectations by a wide margin due to stronger-than-expected demand. Lastly, our position in Adobe Systems benefited from the anticipated launch of a range of new products.
Current Strategy and Outlook: We believe that economic growth will continue, albeit at a moderate pace and that inflation will remain in check. Both will be favorable for equity valuations, in our view. Consistent with an economy transitioning to slower growth, we are focusing intently on companies whose business momentum prospects are both attractive and reasonably certain. We continue our focus on stocks with above average business momentum, market recognition and appropriate valuations.
Top Ten Holdings*
| Coach, Inc. | 4.5% |
| Roper Industries, Inc. | 2.8% |
| Cameron International Corp. | 2.6% |
| Nordstrom, Inc. | 2.3% |
| Gildan Activewear, Inc. | 2.3% |
| Dun & Bradstreet Corp. | 2.2% |
| Harman International Industries, Inc. | 2.1% |
| Adobe Systems, Inc. | 2.1% |
| Akamai Technologies, Inc. | 2.0% |
| NII Holdings, Inc. | 2.0% |
| * | Excludes short-term investments related to repurchase agreement and securities lending collateral. |
12
Table of Contents
| Average Annual Total Returns for the Periods Ended November 30, 2006 | |||||||||||||||||
| Since Inception | Since Inception | ||||||||||||||||
| of Class A, B, C and I | of Class Q | ||||||||||||||||
| 1 Year | 5 Year | August 20, 1998 | April 4, 2000 | ||||||||||||||
Including Sales Charge: | |||||||||||||||||
Class A(1) | 3.30 | % | 4.89 | % | 8.90 | % | — | ||||||||||
Class B(2) | 3.76 | % | 5.08 | % | 8.94 | % | — | ||||||||||
Class C(3) | 7.73 | % | 5.40 | % | 8.90 | % | — | ||||||||||
| Class I | 10.00 | % | 6.57 | % | 10.09 | % | — | ||||||||||
| Class Q | 9.75 | % | 6.34 | % | — | (3.66 | )% | ||||||||||
Excluding Sales Charge: | |||||||||||||||||
| Class A | 9.59 | % | 6.15 | % | 9.68 | % | — | ||||||||||
| Class B | 8.76 | % | 5.41 | % | 8.94 | % | — | ||||||||||
| Class C | 8.73 | % | 5.40 | % | 8.90 | % | — | ||||||||||
| Class I | 10.00 | % | 6.57 | % | 10.09 | % | — | ||||||||||
| Class Q | 9.75 | % | 6.34 | % | — | (3.66 | )% | ||||||||||
Russell Midcap® Growth Index(4) | 12.88 | % | 9.22 | % | 9.86 | %(6) | (2.05 | )%(7) | |||||||||
Russell Midcap® Index(5) | 16.47 | % | 13.77 | % | 13.25 | %(6) | 8.29 | %(7) | |||||||||
The table above illustrates the total return of ING MidCap Opportunities Fund against the indices indicated. An index is unmanaged and has no cash in its portfolio, imposes no sales charges and incurs no operating expenses. An investor cannot invest directly in an index. The Fund’s performance is shown both with and without the imposition of sales charges.
The table does not reflect the deduction of taxes that a shareholder will pay on Fund distributions or the redemption of Fund shares.
The performance shown may include the effect of fee waivers and/or expense reimbursements by the Investment Adviser and/or other service providers, which have the effect of increasing total return. Had all fees and expenses been considered, the total returns would have been lower.
Performance data represents past performance and is no assurance of future results. Investment return and principal value of an investment in the Fund will fluctuate. Shares, when sold, may be worth more or less than their original cost. The Fund’s current performance may be lower or higher than the performance data shown. Please log on to www.ingfunds.com or call (800) 992-0180 to get performance through the most recent month end.
This report contains statements that may be “forward-looking” statements. Actual results may differ materially from those projected in the “forward-looking” statements.
The views expressed in this report reflect those of the portfolio managers, only through the end of the period as stated on the cover. The portfolio managers’ views are subject to change at any time based on market and other conditions.
Fund holdings are subject to change daily.
(1)Reflects deduction of the maximum Class A sales charge of 5.75%.
(2)Reflects deduction of the Class B deferred sales charge of 5% and 2% for the 1 year and 5 year returns, respectively.
(3)Reflects deduction of the Class C deferred sales charge of 1% for the 1 year return.
(4)The Russell Midcap® Growth Index is an unmanaged index that measures the performance of those companies included in the Russell Midcap® Index with relatively higher price-to-book ratios and higher forecasted growth values.
(5)The Russell Midcap® Index is an unmanaged index that measures the performance of the 800 smallest companies in the Russell 1000® Index, which represents approximately 26% of the total market capitalization of the Russell 1000® Index.
(6)Since inception performance for index is shown from September 1, 1998.
(7)Since inception performance for index is shown from April 1, 2000.
13
Table of Contents
The ING Opportunistic LargeCap Fund (the “Fund”) seeks capital appreciation. The Fund is managed by Omar Aguilar, Ph.D., Portfolio Manager, of ING Investment Management Co. — the Sub-Adviser.
Performance: For the six months ended November 30, 2006, the Fund’s Class A shares, excluding sales charges, provided a total return of 8.38% compared to the Russell 1000® Growth Index, which returned 9.29%, for the same period.
Portfolio Specifics: During the period, sector allocation was unfavorable, which hurt the Fund. A significant overweight position in energy acted as the biggest drag from an allocation perspective. Unfavorable weightings in information technology, utilities and industrials also were a drag on the Fund. On a positive note, an overweight position in financials and underweight position in consumer staples benefited the Fund.
Overall, security selection was positive during the period and almost completely offset the unfavorable effects of our sector allocations. Security selection in energy, consumer discretionary, industrials and information technology particularly benefited the Fund during the period. By comparison, selection in financials and health care produced negative relative results.
Industry Allocation
Turning to the portfolio’s individual security positions, an overweight position in BMC Software, Inc. (“BMC”), an independent software vendor, was one of the main contributors to performance during the period. BMC’s share price jumped as the technology sector in general performed well. In November, the company reported higher-than-expected quarterly revenue and reiterated its upward earnings guidance for 2007. Some analysts upgraded BMC to neutral from underperform, boosting the stock further. Analysts noted that the stabilizing of revenue, combined with the company’s cost-cutting measures, lead to less downside risk to earnings estimates.
Continental Airlines, Inc. a U.S. air carrier, helped the Fund as air traffic rose during the period. The company’s stock also gained as the company’s chief executive said he would consider a merger, if necessary, to maintain competitiveness.
By contrast, an underweight position in Microsoft Corp. hurt the Fund as the company’s stock strengthened during the period. In addition, the stock gained in anticipation of future sales of new products including its digital music player Zune, and its new windows platform Vista. Several acquisitions and strategic alliances were also
Top Ten Holdings
| Prudential Financial, Inc. | 2.9% |
| ExxonMobil Corp. | 2.9% |
| BMC Software, Inc. | 2.8% |
| AmerisourceBergen Corp. | 2.7% |
| Raytheon Co. | 2.7% |
| Phillips-Van Heusen | 2.7% |
| General Mills, Inc. | 2.6% |
| Guess ?, Inc. | 2.6% |
| McGraw-Hill Cos., Inc. | 2.5% |
| Chubb Corp. | 2.5% |
Portfolio holdings are subject to change daily.
announced during the period. The company also initiated a large share buyback program.
Another detractor was an overweight position in Biovail Corporation, Canada’s largest publicly traded drug maker. The company reported a third-quarter loss of U.S. $56.5 million, resulting from costs related to the halting of work on a blood-pressure treatment.
Current Strategy and Outlook: Our research builds a portfolio with fundamental characteristics that we believe will translate into a performance advantage over the benchmark. The Fund is structured to capitalize on high-quality companies with superior business momentum, growing earnings and attractive valuations.
As of November 30, 2006, the Fund was overweight consumer discretionary and financials and underweight information technology, health care, and industrials. However, our sector exposures are a function of individual stock selection and by design quite close to the Russell 1000® Growth Index.
14
Table of Contents
| Cumulative Total Returns for the Periods Ended November 30, 2006 | |||||||||||||
| Since Inception | Since Inception | Since Inception | |||||||||||
| of Class A | of Class B | of Class C | |||||||||||
| December 28, 2005 | April 5, 2006 | April 27, 2006 | |||||||||||
Including Sales Charge: | |||||||||||||
Class A(1) | 2.36 | % | — | — | |||||||||
Class B(2) | — | (3.59 | )% | — | |||||||||
Class C(3) | — | — | 1.96 | % | |||||||||
Excluding Sales Charge: | |||||||||||||
| Class A | 8.60 | % | — | — | |||||||||
| Class B | — | 1.41 | % | — | |||||||||
| Class C | — | — | 2.96 | % | |||||||||
Russell 1000® Growth Index(4) | 8.71 | %(5) | 5.44 | %(6) | 5.59 | %(7) | |||||||
The table above illustrates the total return of ING Opportunistic LargeCap Fund against the index indicated. An index is unmanaged and has no cash in its portfolio, imposes no sales charges and incurs no operating expenses. An investor cannot invest directly in an index. The Fund’s performance is shown both with and without the imposition of sales charges.
The table does not reflect the deduction of taxes that a shareholder will pay on Fund distributions or the redemption of Fund shares.
The performance shown may include the effect of fee waivers and/or expense reimbursements by the Investment Adviser and/or other service providers, which have the effect of increasing total return. Had all fees and expenses been considered, the total returns would have been lower.
Performance data represents past performance and is no assurance of future results. Investment return and principal value of an investment in the Fund will fluctuate. Shares, when sold, may be worth more or less than their original cost. The Fund’s current performance may be lower or higher than the performance data shown. Please log on to www.ingfunds.com or call (800) 992-0180 to get performance through the most recent month end.
This report contains statements that may be “forward-looking” statements. Actual results may differ materially from those projected in the “forward-looking” statements.
The views expressed in this report reflect those of the portfolio managers, only through the end of the period as stated on the cover. The portfolio managers’ views are subject to change at any time based on market and other conditions.
Fund holdings are subject to change daily.
(1)Reflects deduction of the maximum Class A sales charge of 5.75%.
(2)Reflects deduction of the Class B deferred sales charge of 5% for the since inception return.
(3)Reflects deduction of the Class C deferred sales charge of 1% for the since inception return.
(4)The Russell 1000® Growth Index is an index that measures the performance of those Russell 1000® Index companies with higher price-to-book ratios and higher forecasted growth values.
(5)Since inception performance for index is shown from January 1, 2006.
(6)Since inception performance for index is shown from April 1, 2006.
(7)Since inception performance for index is shown from May 1, 2006.
15
Table of Contents
The ING SmallCap Opportunities Fund (the “Fund”) seeks capital appreciation. The Fund is managed by Steve Salopek, Portfolio Manager of ING Investment Management Co. — the Sub-Adviser.
Performance: For the six months ended November 30, 2006, the Fund’s Class A shares, excluding sales charges, provided a total return of 5.71% compared to the Russell 2000® Growth Index and the Russell 2000® Index, which returned 7.18% and 9.72%, respectively, for the same period.
Portfolio Specifics: Positive stock selection in the materials and financials sectors contributed most to relative returns. By comparison, stock selection in the health care and technology sectors detracted the most from relative performance versus the benchmarks.
On an individual security basis, Albemarle Corp. and Crocs, Inc. added significantly to the Fund’s performance over the period. Albemarle, a catalyst and specialty chemicals company, has improved its businesses in both of these areas. Crocs, a footwear manufacturer, also beat estimates and raised expectations for the last several quarters.
Industry Allocation
By comparison, Chemed Corp. and HealthExtras, Inc. were two of the largest detractors from performance over the period. Chemed is primarily a hospice provider with meaningful exposure to Medicare reimbursement. The company lowered guidance as a result of Medicare caps on revenue in certain markets and was unable to offset these losses through cost reductions. HealthExtras, Inc. is a mid-market pharmacy benefit management company. The company lowered expectations for the year, as a large contract it was awarded by the state of Maryland has yet to be finalized due to an appeal brought by the previous provider. We continue to own the stock because we believe the delay in the initiation of this contract should not have a significant impact on the company’s valuation.
Current Strategy and Outlook: We remain underweight in sectors heavily reliant on consumer spending, such as retail and consumer durables. Although the impact of rising interest rates and gas prices has been somewhat alleviated, we believe that weakness in the housing market and the absence of mortgage equity withdrawals will continue to be a headwind. Within the capital goods area, we have positioned the Fund away from deeply cyclical companies as we expect some moderation in the rate of economic growth. We are
Top Ten Holdings*
| Ansys, Inc. | 1.4% |
| Valueclick, Inc. | 1.4% |
| NewAlliance Bancshares, Inc. | 1.3% |
| Psychiatric Solutions, Inc. | 1.2% |
| Micros Systems, Inc. | 1.2% |
| UAP Holding Corp. | 1.2% |
| Albemarle Corp. | 1.1% |
| Toro Co. | 1.1% |
| Entegris, Inc. | 1.1% |
| Pediatrix Medical Group, Inc. | 1.1% |
| * | Excludes short-term investments related to repurchase agreement and securities lending collateral. |
likely to increase our weighting in the consumer services sector, especially in companies that show stable growth despite a moderating economy.
16
Table of Contents
| Average Annual Returns for the Periods Ended November 30, 2006 | |||||||||||||||||||||
| Since Inception | Since Inception | ||||||||||||||||||||
| of Class I | of Class Q | ||||||||||||||||||||
| 1 Year | 5 Year | 10 Year | April 1, 1999 | April 4, 2000 | |||||||||||||||||
Including Sales Charge: | |||||||||||||||||||||
Class A(1) | 5.93 | % | 0.11 | % | 6.22 | % | — | — | |||||||||||||
Class B(2) | 6.56 | % | 0.19 | % | 6.10 | % | — | — | |||||||||||||
Class C(3) | 10.59 | % | 0.58 | % | 6.08 | % | — | — | |||||||||||||
| Class I | 12.98 | % | 1.75 | % | — | 5.12 | % | — | |||||||||||||
| Class Q | 12.63 | % | 1.46 | % | — | — | (6.76 | )% | |||||||||||||
Excluding Sales Charge: | |||||||||||||||||||||
| Class A | 12.40 | % | 1.30 | % | 6.85 | % | — | — | |||||||||||||
| Class B | 11.56 | % | 0.58 | % | 6.10 | % | — | — | |||||||||||||
| Class C | 11.59 | % | 0.58 | % | 6.08 | % | — | — | |||||||||||||
| Class I | 12.98 | % | 1.75 | % | — | 5.12 | % | — | |||||||||||||
| Class Q | 12.63 | % | 1.46 | % | — | — | (6.76 | )% | |||||||||||||
Russell 2000® Growth Index(4) | 13.45 | % | 8.28 | % | 5.11 | % | 4.83 | % | (1.52 | )%(6) | |||||||||||
Russell 2000® Index(5) | 17.43 | % | 12.65 | % | 9.68 | % | 10.68 | % | 7.16 | %(6) | |||||||||||
The table above illustrates the total return of ING SmallCap Opportunities Fund against the indices indicated. An index is unmanaged and has no cash in its portfolio, imposes no sales charges and incurs no operating expenses. An investor cannot invest directly in an index. The Fund’s performance is shown both with and without the imposition of sales charges.
The table does not reflect the deduction of taxes that a shareholder will pay on Fund distributions or the redemption of Fund shares.
The performance shown may include the effect of fee waivers and/or expense reimbursements by the Investment Adviser and/or other service providers, which have the effect of increasing total return. Had all fees and expenses been considered, the total returns would have been lower.
Performance data represents past performance and is no assurance of future results. Investment return and principal value of an investment in the Fund will fluctuate. Shares, when sold, may be worth more or less than their original cost. The Fund’s current performance may be lower or higher than the performance data shown. Please log on to www.ingfunds.com or call (800) 992-0180 to get performance through the most recent month end.
This report contains statements that may be “forward-looking” statements. Actual results may differ materially from those projected in the “forward-looking” statements.
The views expressed in this report reflect those of the portfolio managers, only through the end of the period as stated on the cover. The portfolio managers’ views are subject to change at any time based on market and other conditions.
Fund holdings are subject to change daily.
(1)Reflects deduction of the maximum Class A sales charge of 5.75%.
(2)Reflects deduction of the Class B deferred sales charge of 5% and 2% for the 1 year and 5 year returns, respectively.
(3)Reflects deduction of the Class C deferred sales charge of 1% for the 1 year return.
(4)The Russell 2000® Growth Index is an unmanaged index that measures the performance of securities of smaller U.S. companies with greater than average growth orientation.
(5)The Russell 2000® Index is an index that measures the performance of securities of small U.S. companies.
(6)Since inception performance for index is shown from April 1, 2000.
17
Table of Contents
The ING Financial Services Fund (the “Fund”) seeks long-term capital appreciation. The Fund is managed by Robert M. Kloss and Steven L. Rayner, Portfolio Managers, of ING Investment Management Co. — the Sub-Adviser.
Performance: For the six months ended November 30, 2006, the Fund’s Class A shares, excluding sales charges, provided a total return of 10.42% compared to Standard & Poor’s 500 Financials Index (“S&P 500 Financials Index”) and the Standard & Poor’s 500® Composite Stock Price Index (“S&P 500 Index”), which returned 10.62% and 11.33%, respectively, for the same period.
Portfolio Specifics: The U.S. Federal Reserve Board’s (the “Fed”) August decision to pause after raising short term interest rates 17 consecutive times helped the equity markets and financial stocks in particular. A procession of mixed economic results also heightened speculation that the Fed will cut short-term rates some time in 2007. However, the continued deterioration of the housing sector created uncertainty as to when the Fed could possibly cut rates. While the deterioration of this sector has already taken its toll on select areas of the economy, it has yet to spill over more broadly. Gross domestic product growth forecasts have come down, and still imply that the U.S. economy is headed for a soft landing. With the Fed on hold, the yield curve has remained flat or inverted, acting as a headwind for spread-based income.
Turning to the portfolio, over the past six months we have shifted the Fund’s tilt from economically-sensitive stocks to a more defensive stance. The flat yield curve and credit concerns have kept us underweight bank stocks, though we remain alert for opportunities if and when the Fed begins to ease
its monetary policy. Capital markets stocks, including brokers, asset managers, and trust banks, were some of the largest contributors to performance during the period, as strong stock selection outpaced the effect of allocations to these sub-sectors. A relatively benign hurricane season also meant that insurance stocks helped the portfolio. Also, a number of our life insurance stocks produced solid earnings and proved more resilient to spread pressures compared to the banking group. Our underweight banking position continued to be a positive, as the group underperformed financials as a whole during the period.
By comparison, an underweight position in real estate investment trusts (“REITs”) hurt the Fund. As consolidation activity in the richly-valued marketplace continued to attract new money to the sector, our valuation-driven underweight position acted as a drag even though the REIT names we owned performed well. The consumer finance sub-group performed poorly, and though we maintained a neutral weight our individual stock selections were hurt by credit concerns.
On an individual security basis, brokerage holdings Merrill Lynch & Co., Inc., Morgan Stanley, and Goldman Sachs Group, Inc. benefited from supportive capital markets including trading, merger and acquisition, and security issuance activity during the period. Strong equity markets and increased fund flows contributed to performance of asset managers Affiliated Managers Group and Franklin Resources, Inc. Capital markets and transaction flow exposure also aided our positions in JP Morgan Chase and Bank of New York. Strong pricing and a lack of catastrophes proved helpful for property/casualty holdings Axis Capital Holdings, Ltd., Endurance Specialty Holdings Ltd., and St. Paul Travelers Cos., Inc. Positions in commercial banks Wells Fargo & Co., Bank of America Corp., and US Bancorp also helped the Fund, as did a position in “REITs”, KKR Financial and Douglas Emmett.
Top Ten Holdings
| Citigroup, Inc. | 5.7% |
| Bank of America Corp. | 5.6% |
| American International Group, Inc. | 4.7% |
| JPMorgan Chase & Co. | 4.7% |
| Wells Fargo & Co. | 4.6% |
| US Bancorp. | 3.8% |
| Wachovia Corp. | 3.3% |
| Affiliated Managers Group, Inc. | 3.2% |
| Bank of New York Co., Inc. | 3.1% |
| Merrill Lynch & Co., Inc. | 3.1% |
By contrast, a position in Life/ Health insurer Conseco, Inc. acted as a drag on performance as the company did not earn the debt rating upgrade we expected, and its stock declined after a weak quarter. This prompted us to sell the position. Credit card giant Capital One Financial Corp. also fell on concerns surrounding consumer credit and the company’s pending acquisition of North Fork Bank. We continue to like the stock and believe investors will be well-rewarded as North Fork is integrated and the market gains respect for the company’s more stable risk profile. A position in health insurer Aflac also acted as a drag as the company reported weak sales in their key Japanese market.
Current Strategy and Outlook: As the year progressed, we saw an increase in risk levels for many areas in financials, and reacted by positioning the Fund more defensively. This included reducing our overweight position in brokerages, toning down our property and casualty insurance allocation, and eliminating positions in companies with weaker balance sheets.
In the face of the flat yield curve and credit concerns, we remain underweight the banking sector, though recent price underperformance and the possibility of the Fed easing in 2007 make us somewhat more positive on this segment. We have also maintained our REIT underweight, though we continue to scour the group for opportunities that meet our valuation parameters.
18
Table of Contents
| Average Annual Returns for the Periods Ended November 30, 2006 | |||||||||||||||||||||||||
| Since Inception | Since Inception | Since Inception | |||||||||||||||||||||||
| of Class B | of Class C | of Class O | |||||||||||||||||||||||
| 1 Year | 5 Year | 10 Year | October 20, 1997 | August 24, 2004 | September 15, 2004 | ||||||||||||||||||||
Including Sales Charge: | |||||||||||||||||||||||||
Class A(1) | 6.96 | % | 8.97 | % | 12.95 | % | — | — | — | ||||||||||||||||
Class B(2) | 7.65 | % | 9.16 | % | — | 7.15 | % | — | — | ||||||||||||||||
Class C(3) | 11.77 | % | — | — | — | 13.97 | % | — | |||||||||||||||||
| Class O | 13.51 | % | — | — | — | — | 13.74 | % | |||||||||||||||||
Excluding Sales Charge: | |||||||||||||||||||||||||
| Class A | 13.48 | % | 10.27 | % | 13.62 | % | — | — | — | ||||||||||||||||
| Class B | 12.65 | % | 9.44 | % | — | 7.15 | % | — | — | ||||||||||||||||
| Class C | 12.77 | % | — | — | — | 13.97 | % | — | |||||||||||||||||
| Class O | 13.51 | % | — | — | — | — | 13.74 | % | |||||||||||||||||
S&P 500 Financials Index(4) | 15.03 | % | 9.14 | % | 11.13 | % | 9.04 | %(6) | 12.66 | %(7) | 13.62 | %(8) | |||||||||||||
S&P 500® Index (5) | 14.23 | % | 6.08 | % | 8.05 | % | 6.46 | %(6) | 13.24 | %(7) | 13.22 | %(8) | |||||||||||||
The table above illustrates the total return of ING Financial Services Fund against the indices indicated. An index is unmanaged and has no cash in its portfolio, imposes no sales charges and incurs no operating expenses. An investor cannot invest directly in an index. The Fund’s performance is shown both with and without the imposition of sales charges.
The table does not reflect the deduction of taxes that a shareholder will pay on Fund distributions or the redemption of Fund shares.
The performance shown may include the effect of fee waivers and/or expense reimbursements by the Investment Adviser and/or other service providers, which have the effect of increasing total return. Had all fees and expenses been considered, the total returns would have been lower.
Performance data represents past performance and is no assurance of future results. Investment return and principal value of an investment in the Fund will fluctuate. Shares, when sold, may be worth more or less than their original cost. The Fund’s current performance may be lower or higher than the performance data shown. Please log on to www.ingfunds.com or call (800) 992-0180 to get performance through the most recent month end.
This report contains statements that may be “forward-looking” statements. Actual results may differ materially from those projected in the “forward-looking” statements.
The views expressed in this report reflect those of the portfolio managers, only through the end of the period as stated on the cover. The portfolio managers’ views are subject to change at any time based on market and other conditions.
Fund holdings are subject to change daily.
(1)Reflects deduction of the maximum Class A sales charge of 5.75%.
(2)Reflects deduction of the Class B deferred sales charge of 5% and 2% for the 1 year and 5 year returns, respectively.
(3)Reflects deduction of the Class C deferred sales charge of 1% for the 1 year return.
(4)The S&P 500 Financials Index is a capitalization-weighted index of all stocks designed to measure the performance of the financial sector of the S&P 500® Index.
(5)The S&P 500® Index is an unmanaged index that measures the performance of securities of approximately 500 large-capitalization companies whose securities are traded on major U.S. stock markets.
(6)Since inception performance for index is shown from November 1, 1997.
(7)Since inception performance for index is shown from September 1, 2004.
(8)Since inception performance for index is shown from October 1, 2004.
19
Table of Contents
The ING LargeCap Value Fund (the “Fund”) seeks long-term capital appreciation. The Fund is managed by Brandes Investment Partners, L.P. (“Brandes”), the Sub-Adviser. Brandes’ Large Cap Investment Committee is responsible for making the day-to-day investment decisions for the Fund and Glenn R. Carlson, CFA, Chief Executive Officer, Brent V. Woods, CFA, Managing Director, William Pickering, CFA, Director, Amelia Maccoun Morris, CFA, Director and Douglas C. Edman, CFA, Director are five members that comprise Brandes’ Large Cap Investment Committee.
Performance: For the six months ended November 30, 2006, the Fund’s Class A shares, excluding sales charges, provided a total return of 16.29% compared to the Russell 1000® Value Index and the Russell 1000® Index, which returned 12.92% and 11.09%, respectively, for the same period.
Portfolio Specifics: On an absolute basis, gains for the Fund’s holdings in the diversified telecom services and pharmaceuticals industries made positive contributions to returns. Top performers from these industries included BellSouth (diversified telecom services), AT&T, Inc. (diversified telecom services), and Merck (pharmaceuticals). The Fund’s positions in the food & staples retailing, computers & peripherals, and automobiles industries also tended to advance. While most holdings registered gains in the
Industry Allocation
period, select positions declined, such as Micron Technology (semiconductors & semiconductor equipment) and Tenet Healthcare (health care providers & services).
On a relative basis, stock selection in the diversified telecom services, food & staples retailing, and insurance industries and the Fund’s overweight exposure to the computers & peripherals, diversified telecom services, and pharmaceuticals industries, were the main reasons for the Fund’s outperformance relative to the benchmarks. Keep in mind industry allocations are the residual of the manager’s company-by-company analysis. Conversely, stock selection and a lower allocation to the oil, gas, & consumable fuels industry than the indices weighed on relative performance.
Current Strategy and Outlook: During the period, we sold several positions as their market prices advanced toward our estimate of their fair values. We used the proceeds to purchase shares of new holdings at prices that we consider attractive.
As a result of buying and selling, as well as changes in the prices of holdings, many of the Fund’s industry exposures shifted. For example, exposure to the commercial banking industry increased, while exposure to the diversified telecom services and pharmaceuticals industries declined. As of the end of the period, the Fund retains its greatest exposure to the pharmaceuticals industry.
Keep in mind that industry exposures are the direct result of
Top Ten Holdings*
| Lucent Technologies, Inc. | 3.9% |
| Ford Motor Co. | 3.9% |
| Intel Corp. | 3.2% |
| General Motors Corp. | 3.2% |
| Gannett Co., Inc. | 3.2% |
| Dell, Inc. | 3.2% |
| Pfizer, Inc. | 3.1% |
| Eastman Kodak Co. | 3.0% |
| H&R Block, Inc. | 3.0% |
| Boston Scientific Corp. | 2.9% |
| * | Excludes short-term investments related to U.S. government agency obligations. |
purchase and sell decisions made on a bottom-up, company-by-company basis. While we continue to monitor short-term events in U.S. equity markets, our investment philosophy focuses on company-by-company analysis. We take a long-term perspective and believe that none or very little of the short-term “market news” provides useful information to investors. Instead, we remain focused on purchasing large-cap stocks at discounts to our estimates of their intrinsic values. We believe that this approach will provide patient investors with favorable returns over the long term.
20
Table of Contents
| Average Annual Returns for the Periods Ended November 30, 2006 | |||||||||||||||||
| Since Inception | Since Inception | Since Inception | |||||||||||||||
| of Class A and B | of Class C | of Class I | |||||||||||||||
| 1 Year | February 2, 2004 | February 3, 2004 | August 2, 2004 | ||||||||||||||
Including Sales Charge: | |||||||||||||||||
Class A(1) | 18.48 | % | 7.46 | % | — | — | |||||||||||
Class B(2) | 19.77 | % | 7.99 | % | — | — | |||||||||||
Class C(3) | 23.77 | % | — | 9.07 | % | — | |||||||||||
| Class I | 26.10 | % | — | — | 13.64 | % | |||||||||||
Excluding Sales Charge: | |||||||||||||||||
| Class A | 25.69 | % | 9.74 | % | — | — | |||||||||||
| Class B | 24.77 | % | 8.91 | % | — | — | |||||||||||
| Class C | 24.77 | % | — | 9.07 | % | — | |||||||||||
| Class I | 26.10 | % | — | — | 13.64 | % | |||||||||||
Russell 1000® Value Index(4) | 20.30 | % | 14.44 | %(6) | 14.44 | %(6) | 17.44 | %(7) | |||||||||
Russell 1000® Index(5) | 14.16 | % | 10.43 | %(6) | 10.43 | %(6) | 13.85 | %(7) | |||||||||
The table above illustrates the total return of ING LargeCap Value Fund against the indices indicated. An index is unmanaged and has no cash in its portfolio, imposes no sales charges and incurs no operating expenses. An investor cannot invest directly in an index. The Fund’s performance is shown both with and without the imposition of sales charges.
Performance table does not reflect the deduction of taxes that a shareholder will pay on Fund distributions or the redemption of Fund shares.
The performance shown may include the effect of fee waivers and/or expense reimbursements by the Investment Adviser and/or other service providers, which have the effect of increasing total return. Had all fees and expenses been considered, the total returns would have been lower.
Performance data represents past performance and is no assurance of future results. Investment return and principal value of an investment in the Fund will fluctuate. Shares, when sold, may be worth more or less than their original cost. The Fund’s current performance may be lower or higher than the performance data shown. Please log on to www.ingfunds.com or call (800) 992-0180 to get performance through the most recent month end.
This report contains statements that may be “forward-looking” statements. Actual results may differ materially from those projected in the “forward-looking” statements.
The views expressed in this report reflect those of the portfolio managers, only through the end of the period as stated on the cover. The portfolio managers’ views are subject to change at any time based on market and other conditions.
Fund holdings are subject to change daily.
(1)Reflects deduction of the maximum Class A sales charge of 5.75%.
(2)Reflects deduction of the Class B deferred sales charge of 5% and 3% for the 1 year and since inception returns, respectively.
(3)Reflects deduction of the Class C deferred sales charge of 1%.
(4)The Russell 1000® Value Index is an unmanaged index that measures the performance of those Russell 1000 securities with lower price-to-book ratios and lower forecasted growth values.
(5)The Russell 1000® Index measures the performance of the largest 1,000 U.S. incorporated companies.
(6)Since inception performance for the index is shown from February 1, 2004.
(7)Since inception performance for the index is shown from August 1, 2004.
21
Table of Contents
The ING MagnaCap Fund (the “Fund”) seeks growth of capital, with dividend income as a secondary consideration. The Fund is managed by Scott Lewis, Senior Portfolio Manager, of ING Investment Management Co. — the Sub-Adviser.
Performance: For the six months ended November 30, 2006, the Fund’s Class A shares, excluding sales charges, provided a total return of 10.09% compared to the Russell 1000® Value Index and the Standard & Poor’s 500® Composite Stock Price Index (“S&P 500® Index”), which returned 12.92% and 11.33%, respectively, for the same period.
Portfolio Specifics: The Fund benefited from favorable stock selection in telecommunication services and, to a lesser extent, technology. Within the telecom sector, our decision to underweight Sprint Nextel and overweight AT&T, Inc. had a positive impact on relative performance. Sprint Nextel Corp. struggled for much of this year over concerns about the company’s integration with Nextel. Taking advantage of price weakness in September we initiated a position in the company. Over the past three months the stock has performed well due to the company’s successful launch of a faster cellular internet service. Our position in AT&T, Inc. continued to appreciate as the company benefited from improved wireline performance and margin recovery at Cingular Wireless.
By contrast, the Fund’s holdings in the energy sector acted as the biggest drag. A sharp and unanticipated sell off in crude oil and natural gas
Industry Allocation
occurred during the third quarter as cooler weather allowed natural gas inventories to build and the Gulf of Mexico was untouched by severe weather for the first time in several years. Our investment in Evergreen Energy, Inc., a company with a potentially revolutionary coal cleaning process, underperformed as management proved incapable of delivering performance milestones previously thought to be achievable. Other energy holdings that detracted from performance include Peabody Energy Corp. and Weatherford International Ltd.
On an industry level, the Fund was also hurt by its underweight position in real estate investment trusts (“REITs”), a segment that soared over 27% in the past six months. While we continue to believe REITs are generally overvalued, based on their multi-year outperformance and relative yield versus Treasury’s, we identified a few stocks that we believe have reasonable valuations and good prospects for 2007 and increased our position in the industry.
As of the end of the reporting period, we believe the Fund was positioned in companies that have strong or improving competitive positions, robust end markets and/or superior capital allocation opportunities. Furthermore, in our opinion the valuations are attractive and most have clear catalysts that suggest improvement is possible. A few of the Fund’s largest positions include Peabody Coal, Union Pacific Corp., Newfield Exploration Co., Plains Exploration & Production Co., Bank of New York, and Hudson City Bancorp, Inc.
Top Ten Holdings*
| ExxonMobil Corp. | 4.8% |
| Bank of America Corp. | 3.9% |
| Altria Group, Inc. | 3.8% |
| Pfizer, Inc. | 3.3% |
| JPMorgan Chase & Co. | 3.3% |
| AT&T, Inc. | 3.2% |
| Citigroup, Inc. | 2.7% |
| Wells Fargo & Co. | 2.6% |
| Procter & Gamble Co. | 2.5% |
| Newfield Exploration Co. | 2.2% |
| * | Excludes short-term investments related to repurchase agreement and securities lending collateral. |
Current Strategy and Outlook: We believe there is meaningful upside in our holdings of Peabody Coal and Union Pacific Corporation, as both will continue to play important roles in the development of the Powder River Basin in Wyoming. This region contains one of the largest coal deposits in the world, and mining there will continue to expand as underground mines in Appalachia increasingly become cost prohibitive. We also continue to favor independent exploration and production concerns including Plains Exploration and Newfield Exploration who either have high-yielding energy reserves or the ability to discover such in an economic fashion. The Bank of New York, which recently acquired Mellon Financial Corp., is trading at a meaningful discount to competitors Northern Trust Corp. and State Street Corp. We believe that once this transaction is complete, and integration between the two is successful, this valuation gap will close. We believe the combined company will achieve greater synergies than is currently expected. Hudson City Bancorp, Inc., another regional bank holding company, is in our view poised to outperform as the significant excess capital it has put to work could benefit from an expected steepening of the yield curve and a possible U.S. Federal Reserve Board rate hike by mid-2007.
22
Table of Contents
| Average Annual Returns for the Periods Ended November 30, 2006 | |||||||||||||||||||||
| Since Inception | Since Inception | ||||||||||||||||||||
| of Class C | of Class I | ||||||||||||||||||||
| 1 Year | 5 Year | 10 Year | June 1, 1999 | March 4, 2003 | |||||||||||||||||
Including Sales Charge: | |||||||||||||||||||||
Class A(1) | 8.12 | % | 4.74 | % | 5.81 | % | — | — | |||||||||||||
Class B(2) | 8.83 | % | 4.88 | % | 5.67 | % | — | — | |||||||||||||
Class C(3) | 12.82 | % | 5.20 | % | — | 2.03 | % | — | |||||||||||||
| Class I | 15.04 | % | — | — | — | 18.05 | % | ||||||||||||||
Class M(4) | 10.11 | % | 4.73 | % | 5.58 | % | — | — | |||||||||||||
Excluding Sales Charge: | |||||||||||||||||||||
| Class A | 14.72 | % | 5.99 | % | 6.44 | % | — | — | |||||||||||||
| Class B | 13.83 | % | 5.21 | % | 5.67 | % | — | — | |||||||||||||
| Class C | 13.82 | % | 5.20 | % | — | 2.03 | % | — | |||||||||||||
| Class I | 15.04 | % | — | — | — | 18.05 | % | ||||||||||||||
| Class M | 14.10 | % | 5.48 | % | 5.95 | % | — | — | |||||||||||||
Russell 1000® Value Index(5) | 20.30 | % | 10.89 | % | 10.61 | % | 6.64 | % | 20.96 | %(7) | |||||||||||
S&P 500® Index(6) | 14.23 | % | 6.08 | % | 8.05 | % | 2.60 | % | 16.66 | %(7) | |||||||||||
The table above illustrates the total return of ING MagnaCap Fund against the indices indicated. An index is unmanaged and has no cash in its portfolio, imposes no sales charges and incurs no operating expenses. An investor cannot invest directly in an index. The Fund’s performance is shown both with and without the imposition of sales charges.
The table does not reflect the deduction of taxes that a shareholder will pay on Fund distributions or the redemption of Fund shares.
The performance shown may include the effect of fee waivers and/or expense reimbursements by the Investment Adviser and/or other service providers, which have the effect of increasing total return. Had all fees and expenses been considered, the total returns would have been lower.
Performance data represents past performance and is no assurance of future results. Investment return and principal value of an investment in the Fund will fluctuate. Shares, when sold, may be worth more or less than their original cost. The Fund’s current performance may be lower or higher than the performance data shown. Please log on to www.ingfunds.com or call (800) 992-0180 to get performance through the most recent month end.
This report contains statements that may be “forward-looking” statements. Actual results may differ materially from those projected in the “forward-looking” statements.
The views expressed in this report reflect those of the portfolio managers, only through the end of the period as stated on the cover. The portfolio managers’ views are subject to change at any time based on market and other conditions.
Fund holdings are subject to change daily.
(1)Reflects deduction of the maximum Class A sales charge of 5.75%.
(2)Reflects deduction of the Class B deferred sales charge of 5% and 2% for the 1 year and 5 year returns, respectively.
(3)Reflects deduction of the Class C deferred sales charge of 1% for the 1 year return.
(4)Reflects deduction of the maximum Class M sales charge of 3.50%.
(5)The Russell 1000® Value Index is an unmanaged index that measures the performance of those Russell 1000 securities with lower price-to-book ratios and lower forecasted growth values.
(6)The S&P 500® Index is an unmanaged index that measures the performance of securities of approximately 500 large-capitalization companies whose securities are traded on major U.S. stock markets.
(7)Since inception performance for index is shown from March 1, 2003.
23
Table of Contents
ING MidCap Value Fund (the “Fund”) seeks long-term capital appreciation. The Fund is managed by Brandes Investment Partners, L.P. (“Brandes”), the Sub-Adviser. Brandes’ Mid Cap Investment Committee, comprised of Charles H. Brandes, CFA, Chairman, Barbara Kyrillos, Senior Analyst, Kenneth Little, CFA, Director, R. Erickson Cox, CFA, Senior Analyst and Ted Kim, CFA, Senior Analyst, is responsible for making the day-to-day investment decisions for the Fund.
Performance: For the six months ended November 30, 2006, the Fund’s Class A shares, excluding sales charges, provided a total return of 8.12% compared to the Russell Midcap® Value Index and the Russell Midcap® Index, which returned 11.86% and 10.08%, respectively, for the same period.
Portfolio Specifics: Advances among the Fund’s positions in the auto components industry drove positive performance during the period. Top performing positions from this industry included Goodyear Tire & Rubber Co., Lear Corp., and Delphi Financial Group. Securities in the communications equipment, IT services, and food & staples retailing industries also tended to make positive contributions to returns. Holdings from these industries that experienced the greatest share appreciation included UTStarcom, Inc. (communications equipment), BISYS Group, Inc. (IT services), and Safeway, Inc. (food & staples retailing). Outside of these industries, other contributors to the Fund’s return included Deluxe Corporation (commercial services & supplies), Cincinnati Bell, Inc. (diversified telecom services), and Agere Systems (semiconductors & semiconductor equipment).
Industry Allocation
Conversely, declines for positions in the electronic equipment & instruments industry weighed on the period’s results. Share price weakness among holdings within this industry, such as Sanmina, Kemet Corp., and Solectron Corp. were among the most significant detractors to performance. Other stock specific declines, such as W Holding Company, Inc. (thrifts & mortgage finance), Dana Corp. (auto components), and Tenet Healthcare Corp. (health care providers & services), also negatively impacted results.
On a relative basis, the Fund benefited from excess returns attributed to a combination of stock selection and an overweight exposure to the auto components industry, relative to the benchmarks. Relative performance also benefited from the Fund’s larger allocation and stock selection within the communications equipment industry. However, the Fund’s overweighting to the electronic equipment & instruments and food products industries relative to the benchmarks, as well as stock selection within these industries, adversely impacted relative performance. Keep in mind that industry exposures are the result of our individual security selection — not top-down industry forecasts.
Current Strategy and Outlook: During the six-month period ended November 30, 2006, we sold several positions as their market prices advanced toward our estimate of their fair values. We used the proceeds to purchase shares of new holdings at prices that we consider attractive.
Stock-specific purchases and sales, as well as changes in the prices of holdings, shifted the portfolios’ industry exposures modestly during the period. For
Top Ten Holdings*
| Tenet Healthcare Corp. | 4.6% |
| Chemtura Corp. | 4.3% |
| Solectron Corp. | 4.3% |
| ArvinMeritor, Inc. | 4.1% |
| Unisys Corp. | 3.8% |
| Goodyear Tire & Rubber Co. | 3.6% |
| Lear Corp. | 3.4% |
| Sanmina-SCI Corp. | 3.4% |
| Huntsman Corp. | 3.1% |
| Delphi Corp. | 3.0% |
| * | Excludes short-term investments related to securities lending collateral. |
example, exposure to the auto components industry rose as a result of appreciation. Meanwhile, the sale of select holdings within the food & staples retailing, computers & peripherals, and semiconductors & semiconductor equipment industries reduced exposure in these areas. The Fund retains its greatest exposure to the auto components industry as of the end of the period.
Keep in mind that industry exposures are the direct result of purchase and sell decisions made on a bottom-up, company-by-company basis. While we continue to monitor short-term events in U.S. equity markets, our investment philosophy focuses on company-by-company analysis. We take a long-term perspective and believe that none or very little of the short-term “market news” provides useful information to investors. Instead, we remain focused on purchasing mid-cap stocks at discounts to our estimates of their intrinsic values. We believe that this approach will provide patient investors with favorable returns over the long term.
24
Table of Contents
| Average Annual Returns for the Periods Ended November 30, 2006 | |||||||||||||||||||||
| Since Inception | Since Inception | Since Inception | Since Inception | ||||||||||||||||||
| of Class A | of Class B and C | of Class I | of Class Q | ||||||||||||||||||
| 1 Year | February 1, 2002 | February 4, 2002 | March 4, 2002 | April 17, 2002 | |||||||||||||||||
| Including Sales Charge: | |||||||||||||||||||||
Class A(1) | 9.13 | % | 6.06 | % | — | — | — | ||||||||||||||
Class B(2) | 10.03 | % | — | 6.60 | % | — | — | ||||||||||||||
Class C(3) | 13.91 | % | — | 6.93 | % | — | — | ||||||||||||||
| Class I | 16.03 | % | — | — | 7.52 | % | — | ||||||||||||||
| Class Q | 15.79 | % | — | — | — | 6.59 | % | ||||||||||||||
| Excluding Sales Charge: | |||||||||||||||||||||
| Class A | 15.75 | % | 7.37 | % | — | — | — | ||||||||||||||
| Class B | 14.86 | % | — | 6.92 | % | — | — | ||||||||||||||
| Class C | 14.88 | % | — | 6.93 | % | — | — | ||||||||||||||
| Class I | 16.03 | % | — | — | 7.52 | % | — | ||||||||||||||
| Class Q | 15.79 | % | — | — | — | 6.59 | % | ||||||||||||||
Russell Midcap® Value Index(4) | 20.16 | % | 15.99 | % | 15.99 | %(6) | 15.90 | %(7) | 15.28 | %(8) | |||||||||||
Russell Midcap® Index (5) | 16.47 | % | 13.49 | % | 13.49 | %(6) | 14.00 | %(7) | 13.58 | %(8) | |||||||||||
The table above illustrates the total return of ING MidCap Value Fund against the indices indicated. An index is unmanaged and has no cash in its portfolio, imposes no sales charges and incurs no operating expenses. An investor cannot invest directly in an index. The Fund’s performance is shown both with and without the imposition of sales charges.
The table does not reflect the deduction of taxes that a shareholder will pay on Fund distributions or the redemption of Fund shares.
The performance shown may include the effect of fee waivers and/or expense reimbursements by the Investment Adviser and/or other service providers, which have the effect of increasing total return. Had all fees and expenses been considered, the total returns would have been lower.
Performance data represents past performance and is no assurance of future results. Investment return and principal value of an investment in the Fund will fluctuate. Shares, when sold, may be worth more or less than their original cost. The Fund’s current performance may be lower or higher than the performance data shown. Please log on to www.ingfunds.com or call (800) 992-0180 to get performance through the most recent month end.
This report contains statements that may be “forward-looking” statements. Actual results may differ materially from those projected in the “forward-looking” statements.
The views expressed in this report reflect those of the portfolio managers, only through the end of the period as stated on the cover. The portfolio managers’ views are subject to change at any time based on market and other conditions.
Fund holdings are subject to change daily.
(1)Reflects deduction of the maximum Class A sales charge of 5.75%.
(2)Reflects deduction of the Class B deferred sales charge of 5% and 2% for the 1 year and since inception returns, respectively.
(3)Reflects deduction of the Class C deferred sales charge of 1% for the 1 year return.
(4)The Russell Midcap® Value Index is an unmanaged index that measures the performance of those Russell MidCap companies with lower price-to-book ratios and lower forecasted growth values.
(5)The Russell Midcap® Index measures the performance of the 800 smallest companies in the Russell 1000® Index, which represents approximately 26% of the total market capitalization of the Russell 1000® Index.
(6)Since inception performance for index is shown from February 1, 2002.
(7)Since inception performance for index is shown from March 1, 2002.
(8)Since inception performance for index is shown from May 1, 2002.
25
Table of Contents
The ING MidCap Value Choice Fund(1) (the “Fund”) seeks long-term capital appreciation. The Fund is managed by David B. Iben, CFA, Chief Investment Officer and Managing Director of Tradewinds NWQ Global Investors, LLC — the Sub-Adviser.
Performance: For the six months ended November 30, 2006, the Fund’s Class A shares, excluding sales charges, provided a total return of 11.91% compared to the Russell Midcap® Value Index, which returned 11.88% for the same period.
Portfolio Specifics: For the six months ended November 30, 2006, absolute gains were driven primarily by the Fund’s holdings in the materials sectors. Relative returns were enhanced by a combination of the Fund’s heavily overweight position and stock selection within the sector. Mining companies performed particularly well as worldwide demand for commodities continued to increase. Several of our mining investments, including Apex Silver Mines Ltd., Newcrest Mining Ltd. and Ivanhoe Mines Ltd., registered double digit gains. In the producer durables sector, agricultural equipment manufacturer AGCO Corp. was also a top performer. As noted in a previous fund commentary, the agricultural industry lagged the market in 2005 and currently continues to work its way out of a cyclical bottom. Utilities worldwide performed well on receding fears of higher interest rates. The Fund’s holdings in the utilities sector, notably
Industry Allocation
Companhia de Saneamento and Puget Energy, Inc., also contributed to positive performance. In the transportation sector, shipping company Stolt Nielsen SA was first bought in July after the share price significantly declined due to market uncertainty over excess short-term capacity and legal risk from an anti-trust case. With resolution of the anti-trust case and increased demand for its shipping services, the share price rebounded to become another one of the Fund’s top performers over the period. Our significant underweighting in financials, including under exposure to REITS, had a negative impact. Over all, the largest detractors from performance were two Japanese consumer finance companies, Acom Co Ltd. and Promise Co Ltd., which were also added to the Fund in July. Regulatory changes and legal challenges have caused the prices of these stocks to plummet and they are among the market’s worst-performing stocks this year. However, these companies are now trading significantly below book value and we find the risk/reward profile compelling.
Current Strategy and Outlook: Looking ahead, the contrarian side of us worries that “what can’t last forever — won’t.” Corporate profit margins in the world’s largest economies are at all-time highs and economic theory dictates that they must retreat. Three years of rising federal funds rates and the current malaise in the housing market suggests that this inevitability may happen sooner rather than later.
Yet, over the longer-term, the economies of China, India, Brazil and other developing countries, should experience robust and sustainable growth, albeit with periodic downturns. We continue to find value in the securities of companies who meet the consumption needs of these growth markets. We believe the Fund is well positioned in food, agriculture, energy, commodities and materials companies worldwide and should benefit from these ongoing global developments.
Top Ten Holdings*
| Tyson Foods, Inc. | 4.0% |
| Apex Silver Mines Ltd. | 3.4% |
| Anglogold Ashanti Ltd. ADR | 3.1% |
| AGCO Corp. | 2.9% |
| Newcrest Mining Ltd. ADR | 2.6% |
| Lihir Gold Ltd. | 2.5% |
| Puget Energy, Inc. | 2.4% |
| Smithfield Foods, Inc. | 2.2% |
| Bowater, Inc. | 2.0% |
| Alumina Ltd. ADR | 1.9% |
| * | Excludes short-term investments related to U.S. government agency obligations and securities lending collateral. |
Portfolio holdings and characteristics are subject to change and may not be representative of current holdings and characteristics. The outlook for this Fund may differ from that presented for other ING Funds. Performance for the different classes of shares will vary based on differences in sales charges and fees associated with each class.
26
Table of Contents
| Average Annual Returns for the Periods Ended November 30, 2006 | |||||||||||||||||
| Since Inception | Since Inception | Since Inception | |||||||||||||||
| of Class A and B | of Class C | of Class I | |||||||||||||||
| 1 Year | February 1, 2005 | February 7, 2005 | September 15, 2005 | ||||||||||||||
Including Sales Charge: | |||||||||||||||||
Class A(1) | 24.01 | % | 21.86 | % | — | — | |||||||||||
Class B(2) | 25.57 | % | 23.20 | % | — | — | |||||||||||
Class C(3) | 29.64 | % | — | 25.68 | % | — | |||||||||||
| Class I | 32.05 | % | — | — | 29.50 | % | |||||||||||
Excluding Sales Charge: | |||||||||||||||||
| Class A | 31.62 | % | 25.88 | % | — | — | |||||||||||
| Class B | 30.57 | % | 25.03 | % | — | — | |||||||||||
| Class C | 30.64 | % | — | 25.68 | % | — | |||||||||||
| Class I | 32.05 | % | — | — | 29.50 | % | |||||||||||
Russell Midcap® Value Index(4) | 20.16 | % | 18.85 | % | 18.85 | %(6) | 17.41 | %(7) | |||||||||
Russell Midcap® Index(5) | 16.47 | % | 16.90 | % | 16.90 | %(6) | 15.23 | %(7) | |||||||||
The table above illustrates the total return of ING MidCap Value Choice Fund against the indices indicated. An index is unmanaged and has no cash in its portfolio, imposes no sales charges and incurs no operating expenses. An investor cannot invest directly in an index. The Fund’s performance is shown both with and without the imposition of sales charges.
The table does not reflect the deduction of taxes that a shareholder will pay on Fund distributions or the redemption of Fund shares.
The performance shown may include the effect of fee waivers and/or expense reimbursements by the Investment Adviser and/or other service providers, which have the effect of increasing total return. Had all fees and expenses been considered, the total returns would have been lower.
Performance data represents past performance and is no assurance of future results. Investment return and principal value of an investment in the Fund will fluctuate. Shares, when sold, may be worth more or less than their original cost. The Fund’s current performance may be lower or higher than the performance data shown. Please log on to www.ingfunds.com or call (800) 992-0180 to get performance through the most recent month end.
This report contains statements that may be “forward-looking” statements. Actual results may differ materially from those projected in the “forward-looking” statements.
The views expressed in this report reflect those of the portfolio managers, only through the end of the period as stated on the cover. The portfolio managers’ views are subject to change at any time based on market and other conditions.
Fund holdings are subject to change daily.
(1)Reflects deduction of the maximum Class A sales charge of 5.75%.
(2)Reflects deduction of the Class B deferred sales charge of 5% and 4% for the 1 year and since inception returns, respectively.
(3)Reflects deduction of the Class C deferred sales charge of 1% for the since inception return.
(4)The Russell Midcap® Value Index is an unmanaged index that measures the performance of Russell MidCap companies with lower price-to-book ratios and lower forecasted growth values.
(5)The Russell Midcap® Index measures the performance of the 800 smallest companies in the Russell 1000® Index, which represents approximately 26% of the total market capitalization of the Russell 1000® Index.
(6)Since inception performance for index is shown from February 1, 2005.
(7)Since inception performance for index is shown from October 1, 2005.
27
Table of Contents
The ING SmallCap Value Fund (the “Fund”) seeks long-term capital appreciation. The Fund is managed by Brandes Investment Partners, L.P. (“Brandes”), the Sub-Adviser. Brandes’ Small Cap Investment Committee, comprised of William Pickering, CFA, Director, Robert J. Gallagher, CFA, Director, Jeffrey Meyer, CFA, Director, Luiz G. Sauerbronn, Senior Analyst and Richard Birchmeir, CFA, Senior Analyst, is responsible for making the day-to-day investment decisions for the Fund.
Performance: For the six months ended November 30, 2006, the Fund’s Class A shares, excluding sales charges, provided a total return of 3.26% compared to the Russell 2000® Value Index and the Russell 2000® Index, which returned 12.21% and 9.72%, respectively, for the same period.
Portfolio Specifics: Gains for the Fund’s holdings in the auto components and communications equipment industries contributed to the Fund’s positive results for the period. Top performers from these industries included Lear (auto components), Goodyear Tire & Rubber Co. (auto components), and UTStarcom, com. (communications equipment). Positions outside of these industries also made positive contributions to returns, including Agere Systems (semiconductors & semiconductor equipment), K2 (leisure equipment & products), and Innospec (chemicals).
Industry Allocation
Declines for the Fund’s holdings in the food products, automobiles, and machinery industries weighed heaviest on the period’s performance. Positions such as Interstate Bakeries (food products), National R.V. Holdings (automobiles), and Tecumseh Products (machinery) were among the positions in these industries enduring share price declines. Stock-specific declines for positions such as Kemet (electronic equipment & instruments), ESS Technology (semiconductors & semiconductor equipment), and Winn-Dixie Stores (food & staples retailing) also negatively impacted overall Fund performance.
On a relative basis, overweight exposure to the food products and machinery industries, coupled with unfavorable stock selection within these industries, negatively impacted performance relative to the benchmarks. The Fund’s larger allocation to the automobiles industry, relative to the benchmarks, also weighed upon relative returns. However the Fund’s stock selection within the communications equipment industry and overweight exposure to the auto components industry, relative to the benchmarks, proved beneficial to relative results.
Current Strategy and Outlook: During the six-month period ended November 30, 2006, we sold several positions as their market prices advanced toward our estimate of their fair values. We used the
Top Ten Holdings
| ArvinMeritor, Inc. | 4.5% |
| Tecumseh Products Co. | 4.1% |
| Visteon Corp. | 3.8% |
| Superior Industries International | 3.6% |
| Lear Corp. | 3.5% |
| Agere Systems, Inc. | 3.5% |
| American Axle & Manufacturing Holdings, Inc. | 3.3% |
| Adaptec, Inc. | 3.2% |
| Gateway, Inc. | 3.0% |
| Goodyear Tire & Rubber Co. | 2.9% |
Portfolio holdings are subject to change daily.
proceeds to purchase shares of new holdings at prices that we consider attractive.
As a result of buying and selling, as well as changes in the prices of holdings, many of the Fund’s industry exposures shifted. For example, exposure to the chemicals industry decreased as a result of select sales, while new purchases drove up the Fund’s allocation in the machinery industry. Share price appreciation also increased exposure to the auto components industry, which remains the Fund’s greatest industry exposure as of the end of the period.
Keep in mind that industry exposures are the direct result of purchase and sell decisions made on a bottom-up, company-by-company basis. While we continue to monitor short-term events in U.S. equity markets, our investment philosophy focuses on company-by-company analysis. We take a long-term perspective and believe that none or very little of the short-term “market news” provides useful information to investors. Instead, we remain focused on purchasing small-cap stocks at discounts to our estimate of their intrinsic values. We believe that this approach will provide patient investors with favorable returns over the long term.
28
Table of Contents
| Average Annual Returns for the Periods Ended November 30, 2006 | |||||||||||||||||||||||||
| Since Inception | Since Inception | Since Inception | Since Inception | Since Inception | |||||||||||||||||||||
| of Class A | of Class B | of Class C | of Class I | of Class Q | |||||||||||||||||||||
| 1 Year | February 1, 2002 | February 4, 2002 | February 7, 2002 | March 6, 2002 | April 30, 2002 | ||||||||||||||||||||
| Including Sales Charge: | |||||||||||||||||||||||||
Class A(1) | 0.40 | % | 9.39 | % | — | — | — | — | |||||||||||||||||
Class B(2) | 1.75 | % | — | 10.01 | % | — | — | — | |||||||||||||||||
Class C(3) | 4.95 | % | — | — | 10.52 | % | — | — | |||||||||||||||||
| Class I | 6.82 | % | — | — | — | 10.65 | % | — | |||||||||||||||||
| Class Q | 6.68 | % | — | — | — | — | 9.25 | % | |||||||||||||||||
Excluding Sales Charge: | |||||||||||||||||||||||||
| Class A | 6.51 | % | 10.74 | % | — | — | — | — | |||||||||||||||||
| Class B | 5.73 | % | — | 10.30 | % | — | — | — | |||||||||||||||||
| Class C | 5.74 | % | — | — | 10.52 | % | — | — | |||||||||||||||||
| Class I | 6.82 | % | — | — | — | 10.65 | % | — | |||||||||||||||||
| Class Q | 6.68 | % | — | — | — | — | 9.25 | % | |||||||||||||||||
Russell 2000® Value Index(4) | 21.47 | % | 15.42 | % | 15.42 | %(6) | 15.42 | %(6) | 15.56 | %(7) | 13.50 | %(8) | |||||||||||||
Russell 2000® Index(5) | 17.43 | % | 11.97 | % | 11.97 | %(6) | 11.97 | %(6) | 12.85 | %(7) | 11.23 | %(8) | |||||||||||||
The table above illustrates the total return of ING SmallCap Value Fund against the indices indicated. An index is unmanaged and has no cash in its portfolio, imposes no sales charges and incurs no operating expenses. An investor cannot invest directly in an index. The Fund’s performance is shown both with and without the imposition of sales charges.
The table does not reflect the deduction of taxes that a shareholder will pay on Fund distributions or the redemption of Fund shares.
The performance shown may include the effect of fee waivers and/or expense reimbursements by the Investment Adviser and/or other service providers, which have the effect of increasing total return. Had all fees and expenses been considered, the total returns would have been lower.
Performance data represents past performance and is no assurance of future results. Investment return and principal value of an investment in the Fund will fluctuate. Shares, when sold, may be worth more or less than their original cost. The Fund’s current performance may be lower or higher than the performance data shown. Please log on to www.ingfunds.com or call (800) 992-0180 to get performance through the most recent month end.
This report contains statements that may be “forward-looking” statements. Actual results may differ materially from those projected in the “forward-looking” statements.
The views expressed in this report reflect those of the portfolio managers, only through the end of the period as stated on the cover. The portfolio managers’ views are subject to change at any time based on market and other conditions.
Fund holdings are subject to change daily.
(1)Reflects deduction of the maximum Class A sales charge of 5.75%.
(2)Reflects deduction of the Class B deferred sales charge of 5% and 2% for the 1 year and since inception return, respectively.
(3)Reflects deduction of the Class C deferred sales charge of 1% for the 1 year return.
(4)The Russell 2000® Value Index is an unmanaged index that measures the performance of those Russell 2000 companies with lower price-to-book ratios and lower forecasted growth values.
(5)The Russell 2000® Index is an unmanaged index that measures the performance of securities of small U.S. companies.
(6)Since inception performance for index is shown from February 1, 2002.
(7)Since inception performance for index is shown from March 1, 2002.
(8)Since inception performance for index is shown from May 1, 2002.
29
Table of Contents
The ING SmallCap Value Choice Fund (the “Fund”) seeks long-term capital appreciation. The Fund is managed by Phyllis G. Thomas, CFA, Managing Director, of NWQ Investment Management Company, LLC (“NWQ”) — the Sub-Adviser.
Performance: For the six months ended November 30, 2006, the Fund’s Class A shares, excluding sales charges, provided a total return of 6.09% compared to the Russell 2000® Value Index and the Russell 2000® Index, which returned 12.21% and 9.72%, respectively, for the same period.
Portfolio Specifics: The Fund’s performance was positive on an absolute basis but disappointing compared to the Russell 2000® Value benchmark in the last six months.
In the six month period, relative performance was impacted by sector weightings, but was primarily a function of stock selection. The Fund was underweight and had unfavorable stock selection in the financials and technology sectors. Stock selection in the overweighted materials sector hurt performance. On a positive note, overweighted positions in the auto, energy and producer durables sectors and strong stock selection contributed positively to the Fund’s returns. The largest positive contributions were generated by holdings in General Cable Corp., Sauer-Danfoss, Inc., Buckeye Technologies, Inc., and Sappi Ltd. The four largest
Industry Allocation
negative contributors were Gibraltar Industries, Inc., Quantum Corp., Albany International Corp., and Griffon Corp. Gibraltar Industries, Inc.’s stock has declined reflecting exposure to residential housing. The company’s revenues are primarily from the replacement market, however, and it continues to make excellent acquisitions. The stock offers excellent risk/reward. Quantum Corp. stock declined on the company’s acquisition of ADIC. After persistent rumors of a takeover of Quantum Corp., shareholders were disappointed. We are pleased with the selection of ADIC’s CFO as CFO of the combined company, and with the renewed focus on execution of new product strategies and cost cutting. We believe that the stock is undervalued. While Albany International Corp.’s revenues have been under pressure, reflecting a consolidation of paper machines in Europe and North America, the company has been gaining share and has entered the growing Asian market. In the short term, however, some renewed price competition in Europe has depressed the stock. The growth in Asia combined with additional restructuring and cost cutting should improve the earning power of this well managed company. Deeply undervalued, in our opinion, Griffon Corp. stock has suffered from short term execution issues in their specialty chemical operations. These problems are fixable, and we continue to believe that management is working to optimize the value of the company either through a sale of the company, or an IPO or spin off of its aerospace operation.
Top Ten Holdings*
| Griffon Corp. | 4.0% |
| Casey’s General Stores, Inc. | 4.0% |
| Sauer-Danfoss, Inc. | 3.6% |
| Warren Resources, Inc. | 3.2% |
| Sappi Ltd. ADR | 3.1% |
| General Cable Corp. | 3.1% |
| Wausau Paper Corp. | 3.1% |
| Kennametal, Inc. | 3.1% |
| Bowater, Inc. | 2.9% |
| Gibraltar Industries, Inc. | 2.9% |
| * | Excludes short-term investments related to U.S. government |
Portfolio holdings are subject to change daily.
Current Strategy and Outlook: Despite ongoing concerns about tightening monetary policy, there are few signs of any impact on credit availability for corporate borrowers. Global money continues to grow rapidly supporting economic expansion. In this environment, small cap companies can borrow to fund growth. Thus, despite virtual unanimity among stock market strategists that large cap stocks will significantly outperform small, this has not occurred. Recognizing that it will eventually become more difficult for small companies to borrow, NWQ continues to stress test every stock by using conservative growth assumptions and higher discount rates in our valuation work to minimize the Fund’s downside risk. Using these rigorous inputs, we are still finding mispriced stocks to buy.
30
Table of Contents
| Average Annual Returns for the Periods Ended November 30, 2006 | |||||||||||||||||
| Since Inception | Since Inception | Since Inception | |||||||||||||||
| of Class A and B | of Class C | of Class I | |||||||||||||||
| 1 Year | February 1, 2005 | February 2, 2005 | June 9, 2005 | ||||||||||||||
Including Sales Charge: | |||||||||||||||||
Class A(1) | 13.87 | % | 13.59 | % | — | — | |||||||||||
Class B(2) | 15.05 | % | 14.55 | % | — | — | |||||||||||
Class C(3) | 18.91 | % | — | 16.24 | % | — | |||||||||||
| Class I | 21.25 | % | — | — | 23.96 | % | |||||||||||
Excluding Sales Charge: | |||||||||||||||||
| Class A | 20.86 | % | 17.33 | % | — | — | |||||||||||
| Class B | 20.05 | % | 16.49 | % | — | — | |||||||||||
| Class C | 19.91 | % | — | 16.24 | % | — | |||||||||||
| Class I | 21.25 | % | — | — | 23.96 | % | |||||||||||
Russell 2000® Value Index(4) | 21.47 | % | 16.99 | % | 16.99 | %(6) | 20.73 | %(7) | |||||||||
Russell 2000® Index(5) | 17.43 | % | 14.76 | % | 14.76 | %(6) | 18.95 | %(7) | |||||||||
The table above illustrates the total return of ING SmallCap Value Choice Fund against the indices indicated. An index is unmanaged and has no cash in its portfolio, imposes no sales charges and incurs no operating expenses. An investor cannot invest directly in an index. The Fund’s performance is shown both with and without the imposition of sales charges.
The table does not reflect the deduction of taxes that a shareholder will pay on Fund distributions or the redemption of Fund shares.
The performance shown may include the effect of fee waivers and/or expense reimbursements by the Investment Adviser and/or other service providers, which have the effect of increasing total return. Had all fees and expenses been considered, the total returns would have been lower.
Performance data represents past performance and is no assurance of future results. Investment return and principal value of an investment in the Fund will fluctuate. Shares, when sold, may be worth more or less than their original cost. The Fund’s current performance may be lower or higher than the performance data shown. Please log on to www.ingfunds.com or call (800) 992-0180 to get performance through the most recent month end.
This report contains statements that may be “forward-looking” statements. Actual results may differ materially from those projected in the “forward-looking” statements.
The views expressed in this report reflect those of the portfolio managers, only through the end of the period as stated on the cover. The portfolio managers’ views are subject to change at any time based on market and other conditions.
Fund holdings are subject to change daily.
(1)Reflects deduction of the maximum Class A sales charge of 5.75%.
(2)Reflects deduction of the Class B deferred sales charge of 5% and 4% for the 1 year and since inception returns, respectively.
(3)Reflects deduction of the Class C deferred sales charge of 1% for the since inception returns.
(4)The Russell 2000® Value Index measures the performance of those Russell 2000 companies with lower price-to-book ratios and lower forecasted growth values.
(5)The Russell 2000® Index is an unmanaged index that measures the performance of securities of small U.S. companies.
(6)Since inception performance for index is shown from February 1, 2005.
(7)Since inception performance for index is shown from June 1, 2005.
31
Table of Contents
As a shareholder of a Fund, you incur two types of costs: (1) transaction costs, including sales charges (loads) on purchase payments; redemption fees; and exchange fees; and (2) ongoing costs, including management fees; distribution and/or service (12b–1) fees; and other Fund expenses. These Examples are intended to help you understand your ongoing costs (in dollars) of investing in a Fund and to compare these costs with the ongoing costs of investing in other mutual funds.
The Examples are based on an investment of $1,000 invested at the beginning of the period and held for the entire period from June 1, 2006 to November 30, 2006.
Actual Expenses
The first section of the table shown, “Actual Fund Return,” provides information about actual account values and actual expenses. You may use the information in this section, together with the amount you invested, to estimate the expenses that you paid over the period. Simply divide your account value by $1,000 (for example, an $8,600 account value divided by $1,000 = 8.6), then multiply the result by the number in the first section under the heading entitled “Expenses Paid During Period” to estimate the expenses you paid on your account during this period.
Hypothetical Example for Comparison Purposes
The second section of the table shown, “Hypothetical 5% Return,” provides information about hypothetical account values and hypothetical expenses based on the Fund’s actual expense ratio and an assumed rate of return of 5% per year before expenses, which is not the Fund’s actual return. The hypothetical account values and expenses may not be used to estimate the actual ending account balance or expenses you paid for the period. You may use this information to compare the ongoing costs of investing in the Fund and other funds. To do so, compare this 5% hypothetical example with the 5% hypothetical examples that appear in the shareholder reports of the other funds.
Please note that the expenses shown in the table are meant to highlight your ongoing costs only and do not reflect any transactional costs, such as sales charges (loads), redemption fees, or exchange fees. Therefore, the hypothetical lines of the table are useful in comparing ongoing costs only, and will not help you determine the relative total costs of owning different funds. In addition, if these transactional costs were included, your costs would have been higher.
| Beginning | Ending | Expenses Paid | ||||||||||||||
| Account | Account | Annualized | During the | |||||||||||||
| Value | Value | Expense | Six Months Ended | |||||||||||||
| ING Real Estate Fund | June 1, 2006 | November 30, 2006 | Ratio | November 30, 2006* | ||||||||||||
| Actual Fund Return | ||||||||||||||||
| Class A | $ | 1,000.00 | $ | 1,272.30 | 1.18 | % | $ | 6.72 | ||||||||
| Class B | 1,000.00 | 1,268.40 | 1.93 | 10.98 | ||||||||||||
| Class C | 1,000.00 | 1,268.10 | 1.93 | 10.97 | ||||||||||||
| Class I | 1,000.00 | 1,274.10 | 0.89 | 5.07 | ||||||||||||
| Class O | 1,000.00 | 1,272.90 | 1.13 | 6.44 | ||||||||||||
| Hypothetical (5% return before expenses) | ||||||||||||||||
| Class A | $ | 1,000.00 | $ | 1,019.15 | 1.18 | % | $ | 5.97 | ||||||||
| Class B | 1,000.00 | 1,015.39 | 1.93 | 9.75 | ||||||||||||
| Class C | 1,000.00 | 1,015.39 | 1.93 | 9.75 | ||||||||||||
| Class I | 1,000.00 | 1,020.61 | 0.89 | 4.51 | ||||||||||||
| Class O | 1,000.00 | 1,019.40 | 1.13 | 5.72 | ||||||||||||
| * | Expenses are equal to each Fund’s respective annualized expense ratios multiplied by the average account value over the period, multiplied by 183/365 to reflect the most recent fiscal half-year. |
32
Table of Contents
| Beginning | Ending | Expenses Paid | |||||||||||||||
| Account | Account | Annualized | During the | ||||||||||||||
| Value | Value | Expense | Six Months Ended | ||||||||||||||
| ING Disciplined LargeCap Fund | June 1, 2006 | November 30, 2006 | Ratio | November 30, 2006* | |||||||||||||
| Actual Fund Return | |||||||||||||||||
| Class A | $ | 1,000.00 | $ | 1,108.50 | 1.36 | % | $ | 7.19 | |||||||||
| Class B | 1,000.00 | 1,102.70 | 2.11 | 11.12 | |||||||||||||
| Class C | 1,000.00 | 1,103.90 | 2.11 | 11.13 | |||||||||||||
| Hypothetical (5% return before expenses) | |||||||||||||||||
| Class A | $ | 1,000.00 | $ | 1,018.25 | 1.36 | % | $ | 6.88 | |||||||||
| Class B | 1,000.00 | 1,014.49 | 2.11 | 10.66 | |||||||||||||
| Class C | 1,000.00 | 1,014.49 | 2.11 | 10.66 | |||||||||||||
ING Fundamental Research Fund | |||||||||||||||||
| Actual Fund Return | |||||||||||||||||
| Class A | $ | 1,000.00 | $ | 1,081.70 | 1.25 | % | $ | 6.52 | |||||||||
| Class B | 1,000.00 | 1,078.10 | 2.00 | 10.42 | |||||||||||||
| Class C | 1,000.00 | 1,079.10 | 2.00 | 10.42 | |||||||||||||
Class I(a) | 1,000.00 | 1,125.90 | 0.88 | 4.69 | |||||||||||||
| Hypothetical (5% return before expenses) | |||||||||||||||||
| Class A | $ | 1,000.00 | $ | 1,018.80 | 1.25 | % | $ | 6.33 | |||||||||
| Class B | 1,000.00 | 1,015.04 | 2.00 | 10.10 | |||||||||||||
| Class C | 1,000.00 | 1,015.04 | 2.00 | 10.10 | |||||||||||||
| Class I | 1,000.00 | 1,020.66 | 0.88 | 4.46 | |||||||||||||
ING LargeCap Growth Fund | |||||||||||||||||
| Actual Fund Return | |||||||||||||||||
| Class A | $ | 1,000.00 | $ | 1,068.70 | 1.43 | % | $ | 7.42 | |||||||||
| Class B | 1,000.00 | 1,065.70 | 2.08 | 10.77 | |||||||||||||
| Class C | 1,000.00 | 1,065.40 | 2.08 | 10.77 | |||||||||||||
| Class I | 1,000.00 | 1,071.30 | 0.96 | 4.98 | |||||||||||||
| Class Q | 1,000.00 | 1,069.90 | 1.21 | 6.28 | |||||||||||||
| Hypothetical (5% return before expenses) | |||||||||||||||||
| Class A | $ | 1,000.00 | $ | 1,017.90 | 1.43 | % | $ | 7.23 | |||||||||
| Class B | 1,000.00 | 1,014.64 | 2.08 | 10.50 | |||||||||||||
| Class C | 1,000.00 | 1,014.64 | 2.08 | 10.50 | |||||||||||||
| Class I | 1,000.00 | 1,020.26 | 0.96 | 4.86 | |||||||||||||
| Class Q | 1,000.00 | 1,019.00 | 1.21 | 6.12 | |||||||||||||
| * | Expenses are equal to each Fund’s respective annualized expense ratios multiplied by the average account value over the period, multiplied by 183/365 to reflect the most recent fiscal half-year (except “Actual Fund Return” information for ING Fundamental Research Fund, which reflects the 134-day period due to its Class I inception date of July 18, 2006). |
| (a) | Commencement of operations for Class I on July 18, 2006. |
33
Table of Contents
| Beginning | Ending | Expenses Paid | |||||||||||||||
| Account | Account | Annualized | During the | ||||||||||||||
| Value | Value | Expense | Six Months Ended | ||||||||||||||
| ING MidCap Opportunities Fund | June 1, 2006 | November 30, 2006 | Ratio | November 30, 2006* | |||||||||||||
| Actual Fund Return | |||||||||||||||||
| Class A | $ | 1,000.00 | $ | 1,031.60 | 1.25 | % | $ | 6.37 | |||||||||
| Class B | 1,000.00 | 1,027.80 | 2.00 | 10.17 | |||||||||||||
| Class C | 1,000.00 | 1,028.00 | 2.00 | 10.17 | |||||||||||||
| Class I | 1,000.00 | 1,033.90 | 0.79 | 4.03 | |||||||||||||
| Class Q | 1,000.00 | 1,033.20 | 1.04 | 5.30 | |||||||||||||
| Hypothetical (5% return before expenses) | |||||||||||||||||
| Class A | $ | 1,000.00 | $ | 1,018.80 | 1.25 | % | $ | 6.33 | |||||||||
| Class B | 1,000.00 | 1,015.04 | 2.00 | 10.10 | |||||||||||||
| Class C | 1,000.00 | 1,015.04 | 2.00 | 10.10 | |||||||||||||
| Class I | 1,000.00 | 1,021.11 | 0.79 | 4.00 | |||||||||||||
| Class Q | 1,000.00 | 1,019.85 | 1.04 | 5.27 | |||||||||||||
ING Opportunistic LargeCap Fund | |||||||||||||||||
| Actual Fund Return | |||||||||||||||||
| Class A | $ | 1,000.00 | $ | 1,083.80 | 1.25 | % | $ | 6.53 | |||||||||
| Class B | 1,000.00 | 1,078.90 | 2.00 | 10.42 | |||||||||||||
| Class C | 1,000.00 | 1,077.90 | 2.00 | 10.42 | |||||||||||||
| Hypothetical (5% return before expenses) | |||||||||||||||||
| Class A | $ | 1,000.00 | $ | 1,018.80 | 1.25 | % | $ | 6.33 | |||||||||
| Class B | 1,000.00 | 1,015.04 | 2.00 | 10.10 | |||||||||||||
| Class C | 1,000.00 | 1,015.04 | 2.00 | 10.10 | |||||||||||||
ING SmallCap Opportunities Fund | |||||||||||||||||
| Actual Fund Return | |||||||||||||||||
| Class A | $ | 1,000.00 | $ | 1,057.10 | 1.50 | % | $ | 7.74 | |||||||||
| Class B | 1,000.00 | 1,053.10 | 2.25 | 11.58 | |||||||||||||
| Class C | 1,000.00 | 1,053.20 | 2.25 | 11.58 | |||||||||||||
| Class I | 1,000.00 | 1,059.40 | 1.04 | 5.37 | |||||||||||||
| Class Q | 1,000.00 | 1,058.00 | 1.29 | 6.66 | |||||||||||||
| Hypothetical (5% return before expenses) | |||||||||||||||||
| Class A | $ | 1,000.00 | $ | 1,017.60 | 1.50 | % | $ | 7.59 | |||||||||
| Class B | 1,000.00 | 1,013.84 | 2.25 | 11.36 | |||||||||||||
| Class C | 1,000.00 | 1,013.84 | 2.25 | 11.36 | |||||||||||||
| Class I | 1,000.00 | 1,019.90 | 1.04 | 5.27 | |||||||||||||
| Class Q | 1,000.00 | 1,018.65 | 1.29 | 6.53 | |||||||||||||
| * | Expenses are equal to each Fund’s respective annualized expense ratios multiplied by the average account value over the period, multiplied by 183/365 to reflect the most recent fiscal half-year. |
34
Table of Contents
| Beginning | Ending | Expenses Paid | |||||||||||||||
| Account | Account | Annualized | During the | ||||||||||||||
| Value | Value | Expense | Six Months Ended | ||||||||||||||
| ING Financial Services Fund | June 1, 2006 | November 30, 2006 | Ratio | November 30, 2006* | |||||||||||||
| Actual Fund Return | |||||||||||||||||
| Class A | $ | 1,000.00 | $ | 1,104.20 | 1.20 | % | $ | 6.33 | |||||||||
| Class B | 1,000.00 | 1,100.20 | 1.95 | 10.27 | |||||||||||||
| Class C | 1,000.00 | 1,100.30 | 1.95 | 10.27 | |||||||||||||
| Class O | 1,000.00 | 1,104.60 | 1.19 | 6.28 | |||||||||||||
| Hypothetical (5% return before expenses) | |||||||||||||||||
| Class A | $ | 1,000.00 | $ | 1,019.05 | 1.20 | % | $ | 6.07 | |||||||||
| Class B | 1,000.00 | 1,015.29 | 1.95 | 9.85 | |||||||||||||
| Class C | 1,000.00 | 1,015.29 | 1.95 | 9.85 | |||||||||||||
| Class O | 1,000.00 | 1,019.10 | 1.19 | 6.02 | |||||||||||||
ING LargeCap Value Fund | |||||||||||||||||
| Actual Fund Return | |||||||||||||||||
| Class A | $ | 1,000.00 | $ | 1,162.90 | 1.45 | % | $ | 7.86 | |||||||||
| Class B | 1,000.00 | 1,159.00 | 2.20 | 11.91 | |||||||||||||
| Class C | 1,000.00 | 1,159.20 | 2.20 | 11.91 | |||||||||||||
| Class I | 1,000.00 | 1,164.70 | 1.13 | 6.13 | |||||||||||||
| Hypothetical (5% return before expenses) | |||||||||||||||||
| Class A | $ | 1,000.00 | $ | 1,017.80 | 1.45 | % | $ | 7.33 | |||||||||
| Class B | 1,000.00 | 1,014.04 | 2.20 | 11.11 | |||||||||||||
| Class C | 1,000.00 | 1,014.04 | 2.20 | 11.11 | |||||||||||||
| Class I | 1,000.00 | 1,019.40 | 1.13 | 5.72 | |||||||||||||
ING MagnaCap Fund | |||||||||||||||||
| Actual Fund Return | |||||||||||||||||
| Class A | $ | 1,000.00 | $ | 1,100.90 | 1.11 | % | $ | 5.85 | |||||||||
| Class B | 1,000.00 | 1,095.50 | 1.91 | 10.03 | |||||||||||||
| Class C | 1,000.00 | 1,095.40 | 1.91 | 10.03 | |||||||||||||
| Class I | 1,000.00 | 1,101.50 | 0.84 | 4.43 | |||||||||||||
| Class M | 1,000.00 | 1,097.20 | 1.66 | 8.73 | |||||||||||||
| Hypothetical (5% return before expenses) | |||||||||||||||||
| Class A | $ | 1,000.00 | $ | 1,019.50 | 1.11 | % | $ | 5.62 | |||||||||
| Class B | 1,000.00 | 1,015.49 | 1.91 | 9.65 | |||||||||||||
| Class C | 1,000.00 | 1,015.49 | 1.91 | 9.65 | |||||||||||||
| Class I | 1,000.00 | 1,020.86 | 0.84 | 4.26 | |||||||||||||
| Class M | 1,000.00 | 1,016.75 | 1.66 | 8.39 | |||||||||||||
| * | Expenses are equal to each Fund’s respective annualized expense ratios multiplied by the average account value over the period, multiplied by 183/365 to reflect the most recent fiscal half-year. |
35
Table of Contents
| Beginning | Ending | Expenses Paid | |||||||||||||||
| Account | Account | Annualized | During the Six | ||||||||||||||
| Value | Value | Expense | Months Ended | ||||||||||||||
| ING MidCap Value Fund | June 1, 2006 | November 30, 2006 | Ratio | November 30, 2006* | |||||||||||||
| Actual Fund Return | |||||||||||||||||
| Class A | $ | 1,000.00 | $ | 1,081.20 | 1.49 | % | $ | 7.77 | |||||||||
| Class B | 1,000.00 | 1,076.40 | 2.24 | 11.66 | |||||||||||||
| Class C | 1,000.00 | 1,076.40 | 2.24 | 11.66 | |||||||||||||
| Class I | 1,000.00 | 1,082.80 | 1.24 | 6.47 | |||||||||||||
| Class Q | 1,000.00 | 1,081.30 | 1.49 | 7.77 | |||||||||||||
| Hypothetical (5% return before expenses) | |||||||||||||||||
| Class A | $ | 1,000.00 | $ | 1,017.60 | 1.49 | % | $ | 7.54 | |||||||||
| Class B | 1,000.00 | 1,013.84 | 2.24 | 11.31 | |||||||||||||
| Class C | 1,000.00 | 1,013.84 | 2.24 | 11.31 | |||||||||||||
| Class I | 1,000.00 | 1,019.00 | 1.24 | 6.28 | |||||||||||||
| Class Q | 1,000.00 | 1,017.75 | 1.49 | 7.54 | |||||||||||||
ING MidCap Value Choice Fund | |||||||||||||||||
| Actual Fund Return | |||||||||||||||||
| Class A | $ | 1,000.00 | $ | 1,119.10 | 1.47 | % | $ | 7.81 | |||||||||
| Class B | 1,000.00 | 1,115.40 | 2.22 | 11.77 | |||||||||||||
| Class C | 1,000.00 | 1,115.40 | 2.22 | 11.77 | |||||||||||||
| Class I | 1,000.00 | 1,121.40 | 1.16 | 6.17 | |||||||||||||
| Hypothetical (5% return before expenses) | |||||||||||||||||
| Class A | $ | 1,000.00 | $ | 1,017.70 | 1.47 | % | $ | 7.44 | |||||||||
| Class B | 1,000.00 | 1,013.94 | 2.22 | 11.21 | |||||||||||||
| Class C | 1,000.00 | 1,013.94 | 2.22 | 11.21 | |||||||||||||
| Class I | 1,000.00 | 1,019.25 | 1.16 | 5.87 | |||||||||||||
ING SmallCap Value Fund | |||||||||||||||||
| Actual Fund Return | |||||||||||||||||
| Class A | $ | 1,000.00 | $ | 1,032.60 | 1.71 | % | $ | 8.71 | |||||||||
| Class B | 1,000.00 | 1,028.80 | 2.46 | 12.51 | |||||||||||||
| Class C | 1,000.00 | 1,027.90 | 2.46 | 12.51 | |||||||||||||
| Class I | 1,000.00 | 1,034.00 | 1.39 | 7.09 | |||||||||||||
| Class Q | 1,000.00 | 1,032.90 | 1.64 | 8.36 | |||||||||||||
| Hypothetical (5% return before expenses) | |||||||||||||||||
| Class A | $ | 1,000.00 | $ | 1,016.50 | 1.71 | % | $ | 8.64 | |||||||||
| Class B | 1,000.00 | 1,012.73 | 2.46 | 12.41 | |||||||||||||
| Class C | 1,000.00 | 1,012.73 | 2.46 | 12.41 | |||||||||||||
| Class I | 1,000.00 | 1,018.00 | 1.39 | 7.03 | |||||||||||||
| Class Q | 1,000.00 | 1,016.85 | 1.64 | 8.29 | |||||||||||||
| * | Expenses are equal to each Fund’s respective annualized expense ratios multiplied by the average account value over the period, multiplied by 183/365 to reflect the most recent fiscal half-year. |
36
Table of Contents
| Beginning | Ending | Expenses Paid | ||||||||||||||
| Account | Account | Annualized | During the Six | |||||||||||||
| Value | Value | Expense | Months Ended | |||||||||||||
| ING SmallCap Value Choice Fund | June 1, 2006 | November 30, 2006 | Ratio | November 30, 2006* | ||||||||||||
| Actual Fund Return | ||||||||||||||||
| Class A | $ | 1,000.00 | $ | 1,060.90 | 1.46 | % | $ | 7.54 | ||||||||
| Class B | 1,000.00 | 1,057.20 | 2.21 | 11.40 | ||||||||||||
| Class C | 1,000.00 | 1,056.40 | 2.21 | 11.39 | ||||||||||||
| Class I | 1,000.00 | 1,062.40 | 1.15 | 5.95 | ||||||||||||
| Hypothetical (5% return before expenses) | ||||||||||||||||
| Class A | $ | 1,000.00 | $ | 1,017.75 | 1.46 | % | $ | 7.38 | ||||||||
| Class B | 1,000.00 | 1,013.99 | 2.21 | 11.16 | ||||||||||||
| Class C | 1,000.00 | 1,013.99 | 2.21 | 11.16 | ||||||||||||
| Class I | 1,000.00 | 1,019.30 | 1.15 | 5.82 | ||||||||||||
| * | Expenses are equal to each Fund’s respective annualized expense ratios multiplied by the average account value over the period, multiplied by 183/365 to reflect the most recent fiscal half-year. |
37
Table of Contents
| ING | ING | ING | ING | |||||||||||||||
| Real | Disciplined | Fundamental | LargeCap | |||||||||||||||
| Estate | LargeCap | Research | Growth | |||||||||||||||
| Fund | Fund | Fund | Fund | |||||||||||||||
ASSETS: | ||||||||||||||||||
| Investments in securities at value+* | $ | 394,790,856 | $ | 37,926,100 | $ | 5,465,553 | $ | 269,661,525 | ||||||||||
| Short-term investments at amortized cost | 4,050,440 | 2,647,498 | — | 51,974,303 | ||||||||||||||
| Repurchase agreement | — | 246,000 | 203,000 | — | ||||||||||||||
| Cash | 476,443 | 997 | 391 | 371,851 | ||||||||||||||
| Cash collateral for futures | — | 9,450 | 3,150 | — | ||||||||||||||
| Foreign currencies at value** | — | — | — | 513 | ||||||||||||||
| Receivables: | ||||||||||||||||||
| Investment securities sold | — | — | 148,521 | 4,527,775 | ||||||||||||||
| Fund shares sold | 578,238 | 3,777 | 7,025 | 255,420 | ||||||||||||||
| Dividends and interest | 274,838 | 97,298 | 8,064 | 164,486 | ||||||||||||||
| Variation margin receivable | — | 105 | 3 | — | ||||||||||||||
| Prepaid expenses | 58,925 | 32,109 | 46,794 | 35,436 | ||||||||||||||
| Reimbursement due from manager | 27 | 4,465 | 27,478 | 12,806 | ||||||||||||||
| Total assets | 400,229,767 | 40,967,799 | 5,909,979 | 327,004,115 | ||||||||||||||
LIABILITIES: | ||||||||||||||||||
| Payable for investment securities purchased | — | — | 95,949 | 4,366,189 | ||||||||||||||
| Payable for fund shares redeemed | 27,119 | 36,822 | — | 610,699 | ||||||||||||||
| Payable upon receipt of securities loaned | — | 2,647,498 | — | 51,726,337 | ||||||||||||||
| Payable to affiliates | 294,052 | 52,856 | 5,008 | 305,977 | ||||||||||||||
| Payable for trustee fees | 2,957 | 1,420 | 399 | 9,153 | ||||||||||||||
| Other accrued expenses and liabilities | 66,006 | 66,844 | 22,212 | 113,001 | ||||||||||||||
| Total liabilities | 390,134 | 2,805,440 | 123,568 | 57,131,356 | ||||||||||||||
NET ASSETS | $ | 399,839,633 | $ | 38,162,359 | $ | 5,786,411 | $ | 269,872,759 | ||||||||||
NET ASSETS WERE COMPRISED OF: | ||||||||||||||||||
| Paid-in capital | 229,699,206 | 74,268,286 | 5,271,342 | 576,604,058 | ||||||||||||||
| Undistributed net investment income (distributions in excess of net investment income or accumulated net investment loss) | (1,164,122 | ) | (29,716 | ) | 25,842 | (1,141,726 | ) | |||||||||||
| Accumulated net realized gain (loss) on investments, foreign currency related transactions, and futures | 24,918,325 | (40,458,638 | ) | 44,774 | (344,735,777 | ) | ||||||||||||
| Net unrealized appreciation on investments, foreign currency related transactions, and futures | 146,386,224 | 4,382,427 | 444,453 | 39,146,204 | ||||||||||||||
NET ASSETS | $ | 399,839,633 | $ | 38,162,359 | $ | 5,786,411 | $ | 269,872,759 | ||||||||||
| + Including securities loaned at value | $ | — | $ | 2,575,625 | $ | — | $ | 50,606,694 | ||||||||||
| * Cost of investments in securities | $ | 248,404,632 | $ | 33,545,638 | $ | 5,025,841 | $ | 230,515,339 | ||||||||||
| ** Cost of foreign currencies | $ | — | $ | — | $ | — | $ | 495 | ||||||||||
38
Table of Contents
| ING | ING | ING | ING | |||||||||||||
| Real | Disciplined | Fundamental | LargeCap | |||||||||||||
| Estate | LargeCap | Research | Growth | |||||||||||||
| Fund | Fund | Fund | Fund | |||||||||||||
Class A: | ||||||||||||||||
| Net assets | $ | 159,624,596 | $ | 5,635,045 | $ | 5,603,248 | $ | 85,825,816 | ||||||||
| Shares authorized | unlimited | unlimited | unlimited | unlimited | ||||||||||||
| Par value | $ | 0.01 | $ | 0.01 | $ | 0.01 | $ | 0.01 | ||||||||
| Shares outstanding | 7,732,300 | 492,742 | 509,810 | 4,308,744 | ||||||||||||
| Net asset value and redemption price per share | $ | 20.64 | $ | 11.44 | $ | 10.99 | $ | 19.92 | ||||||||
Maximum offering price per share (5.75%)(1) | $ | 21.90 | $ | 12.14 | $ | 11.66 | $ | 21.14 | ||||||||
Class B: | ||||||||||||||||
| Net assets | $ | 6,600,587 | $ | 23,478,353 | $ | 59,952 | $ | 74,357,451 | ||||||||
| Shares authorized | unlimited | unlimited | unlimited | unlimited | ||||||||||||
| Par value | $ | 0.01 | $ | 0.01 | $ | 0.01 | $ | 0.01 | ||||||||
| Shares outstanding | 319,059 | 2,165,101 | 5,494 | 3,887,885 | ||||||||||||
Net asset value and redemption price per share(2) | $ | 20.69 | $ | 10.84 | $ | 10.91 | $ | 19.13 | ||||||||
| Maximum offering price per share | $ | 20.69 | $ | 10.84 | $ | 10.91 | $ | 19.13 | ||||||||
Class C: | ||||||||||||||||
| Net assets | $ | 4,407,836 | $ | 9,048,961 | $ | 121,396 | $ | 40,047,342 | ||||||||
| Shares authorized | unlimited | unlimited | unlimited | unlimited | ||||||||||||
| Par value | $ | 0.01 | $ | 0.01 | $ | 0.01 | $ | 0.01 | ||||||||
| Shares outstanding | 206,388 | 834,536 | 11,118 | 2,100,436 | ||||||||||||
Net asset value and redemption price per share(2) | $ | 21.36 | $ | 10.84 | $ | 10.92 | $ | 19.07 | ||||||||
| Maximum offering price per share | $ | 21.36 | $ | 10.84 | $ | 10.92 | $ | 19.07 | ||||||||
Class I: | ||||||||||||||||
| Net assets | $ | 184,267,571 | n/a | $ | 1,815 | $ | 68,496,147 | |||||||||
| Shares authorized | unlimited | n/a | unlimited | unlimited | ||||||||||||
| Par value | $ | 0.01 | n/a | $ | 0.01 | $ | 0.01 | |||||||||
| Shares outstanding | 8,491,016 | n/a | 165 | 3,303,875 | ||||||||||||
| Net asset value and redemption price per share | $ | 21.70 | n/a | $ | 11.00 | $ | 20.73 | |||||||||
| Maximum offering price per share | $ | 21.70 | n/a | $ | 11.00 | $ | 20.73 | |||||||||
Class O: | ||||||||||||||||
| Net assets | $ | 44,939,043 | n/a | n/a | n/a | |||||||||||
| Shares authorized | unlimited | n/a | n/a | n/a | ||||||||||||
| Par value | $ | 0.01 | n/a | n/a | n/a | |||||||||||
| Shares outstanding | 2,178,907 | n/a | n/a | n/a | ||||||||||||
| Net asset value and redemption price per share | $ | 20.62 | n/a | n/a | n/a | |||||||||||
| Maximum offering price per share | $ | 20.62 | n/a | n/a | n/a | |||||||||||
Class Q: | ||||||||||||||||
| Net assets | n/a | n/a | n/a | $ | 1,146,003 | |||||||||||
| Shares authorized | n/a | n/a | n/a | unlimited | ||||||||||||
| Par value | n/a | n/a | n/a | $ | 0.01 | |||||||||||
| Shares outstanding | n/a | n/a | n/a | 55,868 | ||||||||||||
| Net asset value and redemption price per share | n/a | n/a | n/a | $ | 20.51 | |||||||||||
| Maximum offering price per share | n/a | n/a | n/a | $ | 20.51 | |||||||||||
| (1) | Maximum offering price is computed at 100/94.25 of net asset value. On purchases of $50,000 or more, the offering price is reduced. |
| (2) | Redemption price per share may be reduced for any applicable contingent deferred sales charges. |
39
Table of Contents
| ING | ING | ING | ING | |||||||||||||||
| MidCap | Opportunistic | SmallCap | Financial | |||||||||||||||
| Opportunities | LargeCap | Opportunities | Services | |||||||||||||||
| Fund | Fund | Fund | Fund | |||||||||||||||
ASSETS: | ||||||||||||||||||
| Investments in securities at value+* | $ | 289,001,980 | $ | 5,457,498 | $ | 143,262,561 | $ | 298,324,383 | ||||||||||
| Short-term investments at amortized cost | 73,372,935 | — | 40,639,690 | — | ||||||||||||||
| Short-term investment in affiliate at amortized cost | — | — | — | 5,000,000 | ||||||||||||||
| Repurchase agreement | 11,122,000 | — | 7,059,000 | 4,288,000 | ||||||||||||||
| Cash | 346 | 62,573 | 539 | 179 | ||||||||||||||
| Receivables: | ||||||||||||||||||
| Investment securities sold | 5,235,941 | 48,100 | 1,618,346 | — | ||||||||||||||
| Fund shares sold | 38,901 | — | 52,211 | 59,317 | ||||||||||||||
| Dividends and interest | 151,564 | 10,787 | 52,689 | 702,558 | ||||||||||||||
| Prepaid expenses | 35,523 | 46,361 | 28,492 | 35,451 | ||||||||||||||
| Reimbursement due from manager | 75,623 | 22,478 | 28,667 | — | ||||||||||||||
| Total assets | 379,034,813 | 5,647,797 | 192,742,195 | 308,409,888 | ||||||||||||||
LIABILITIES: | ||||||||||||||||||
| Payable for investment securities purchased | 7,440,786 | 79,279 | 2,023,733 | — | ||||||||||||||
| Payable for fund shares redeemed | 724,843 | — | 429,148 | 504,789 | ||||||||||||||
| Payable upon receipt of securities loaned | 73,372,935 | — | 40,639,690 | — | ||||||||||||||
| Payable to affiliates | 434,523 | 4,808 | 199,574 | 279,032 | ||||||||||||||
| Payable for trustee fees | 9,709 | 390 | 7,776 | 8,623 | ||||||||||||||
| Other accrued expenses and liabilities | 330,073 | 17,713 | 210,530 | 143,066 | ||||||||||||||
| Total liabilities | 82,312,869 | 102,190 | 43,510,451 | 935,510 | ||||||||||||||
NET ASSETS | $ | 296,721,944 | $ | 5,545,607 | $ | 149,231,744 | $ | 307,474,378 | ||||||||||
NET ASSETS WERE COMPRISED OF: | ||||||||||||||||||
| Paid-in capital | 379,008,675 | 5,108,502 | 373,504,290 | 200,269,810 | ||||||||||||||
| Undistributed net investment income (accumulated net investment loss) | (1,628,552 | ) | 34,574 | (857,760 | ) | 2,613,922 | ||||||||||||
| Accumulated net realized gain (loss) on investments | (117,180,429 | ) | (201,934 | ) | (242,774,464 | ) | 28,296,251 | |||||||||||
| Net unrealized appreciation on investments | 36,522,250 | 604,465 | 19,359,678 | 76,294,395 | ||||||||||||||
NET ASSETS | $ | 296,721,944 | $ | 5,545,607 | $ | 149,231,744 | $ | 307,474,378 | ||||||||||
| + Including securities loaned at value | $ | 71,753,965 | $ | — | $ | 39,717,713 | $ | — | ||||||||||
| * Cost of investments in securities | $ | 252,479,730 | $ | 4,853,033 | $ | 123,902,883 | $ | 222,029,988 | ||||||||||
40
Table of Contents
| ING | ING | ING | ING | |||||||||||||
| MidCap | Opportunistic | SmallCap | Financial | |||||||||||||
| Opportunities | LargeCap | Opportunities | Services | |||||||||||||
| Fund | Fund | Fund | Fund | |||||||||||||
Class A: | ||||||||||||||||
| Net assets | $ | 114,733,594 | $ | 5,456,793 | $ | 83,757,205 | $ | 249,113,285 | ||||||||
| Shares authorized | unlimited | unlimited | unlimited | unlimited | ||||||||||||
| Par value | $ | 0.01 | $ | 0.01 | $ | 0.01 | $ | 0.01 | ||||||||
| Shares outstanding | 7,327,341 | 502,697 | 2,710,563 | 9,711,326 | ||||||||||||
| Net asset value and redemption price per share | $ | 15.66 | $ | 10.86 | $ | 30.90 | $ | 25.65 | ||||||||
Maximum offering price per share (5.75%)(1) | $ | 16.62 | $ | 11.52 | $ | 32.79 | $ | 27.21 | ||||||||
Class B: | ||||||||||||||||
| Net assets | $ | 91,788,662 | $ | 67,326 | $ | 26,571,147 | $ | 42,351,001 | ||||||||
| Shares authorized | unlimited | unlimited | unlimited | unlimited | ||||||||||||
| Par value | $ | 0.01 | $ | 0.01 | $ | 0.01 | $ | 0.01 | ||||||||
| Shares outstanding | 6,215,015 | 6,236 | 949,586 | 1,684,058 | ||||||||||||
Net asset value and redemption price per share (2) | $ | 14.77 | $ | 10.80 | $ | 27.98 | $ | 25.15 | ||||||||
| Maximum offering price per share | $ | 14.77 | $ | 10.80 | $ | 27.98 | $ | 25.15 | ||||||||
Class C: | ||||||||||||||||
| Net assets | $ | 81,911,478 | $ | 21,488 | $ | 35,761,162 | $ | 1,814,389 | ||||||||
| Shares authorized | unlimited | unlimited | unlimited | unlimited | ||||||||||||
| Par value | $ | 0.01 | $ | 0.01 | $ | 0.01 | $ | 0.01 | ||||||||
| Shares outstanding | 5,573,712 | 1,991 | 1,280,919 | 73,205 | ||||||||||||
Net asset value and redemption price per share (2) | $ | 14.70 | $ | 10.79 | $ | 27.92 | $ | 24.79 | ||||||||
| Maximum offering price per share | $ | 14.70 | $ | 10.79 | $ | 27.92 | $ | 24.79 | ||||||||
Class I: | ||||||||||||||||
| Net assets | $ | 3,425,421 | n/a | $ | 2,958,044 | n/a | ||||||||||
| Shares authorized | unlimited | n/a | unlimited | n/a | ||||||||||||
| Par value | $ | 0.01 | n/a | $ | 0.01 | n/a | ||||||||||
| Shares outstanding | 211,805 | n/a | 93,649 | n/a | ||||||||||||
| Net asset value and redemption price per share | $ | 16.17 | n/a | $ | 31.59 | n/a | ||||||||||
| Maximum offering price per share | $ | 16.17 | n/a | $ | 31.59 | n/a | ||||||||||
Class O: | ||||||||||||||||
| Net assets | n/a | n/a | n/a | $ | 14,195,703 | |||||||||||
| Shares authorized | n/a | n/a | n/a | unlimited | ||||||||||||
| Par value | n/a | n/a | n/a | $ | 0.01 | |||||||||||
| Shares outstanding | n/a | n/a | n/a | 555,659 | ||||||||||||
| Net asset value and redemption price per share | n/a | n/a | n/a | $ | 25.55 | |||||||||||
| Maximum offering price per share | n/a | n/a | n/a | $ | 25.55 | |||||||||||
Class Q: | ||||||||||||||||
| Net assets | $ | 4,862,789 | n/a | $ | 184,186 | n/a | ||||||||||
| Shares authorized | unlimited | n/a | unlimited | n/a | ||||||||||||
| Par value | $ | 0.01 | n/a | $ | 0.01 | n/a | ||||||||||
| Shares outstanding | 306,413 | n/a | 5,901 | n/a | ||||||||||||
| Net asset value and redemption price per share | $ | 15.87 | n/a | $ | 31.21 | n/a | ||||||||||
| Maximum offering price per share | $ | 15.87 | n/a | $ | 31.21 | n/a | ||||||||||
| (1) | Maximum offering price is computed at 100/94.25 of net asset value. On purchases of $50,000 or more, the offering price is reduced. |
| (2) | Redemption price per share may be reduced for any applicable contingent deferred sales charges. |
41
Table of Contents
| ING | ||||||||||||||||||
| ING | ING | MidCap | ||||||||||||||||
| LargeCap | ING | MidCap | Value | |||||||||||||||
| Value | MagnaCap | Value | Choice | |||||||||||||||
| Fund | Fund | Fund | Fund | |||||||||||||||
ASSETS: | ||||||||||||||||||
| Investments in securities at value+* | $ | 99,302,384 | $ | 354,917,201 | $ | 82,160,437 | $ | 128,922,240 | ||||||||||
| Short-term investments at amortized cost | 9,826,640 | 63,985,533 | 26,484,414 | 59,515,424 | ||||||||||||||
| Repurchase agreement | — | 12,109,000 | — | — | ||||||||||||||
| Cash | 1,091,062 | 311 | 440,999 | 3,750,903 | ||||||||||||||
| Receivables: | ||||||||||||||||||
| Investment securities sold | — | 7,598,693 | — | 259,708 | ||||||||||||||
| Fund shares sold | 1,158,200 | 68,400 | 726 | 1,687,998 | ||||||||||||||
| Dividends and interest | 206,146 | 830,635 | 119,102 | 265,189 | ||||||||||||||
| Prepaid expenses | 27,480 | 35,506 | 21,226 | 24,358 | ||||||||||||||
| Reimbursement due from manager | — | — | — | 9,048 | ||||||||||||||
| Total assets | 111,611,912 | 439,545,279 | 109,226,904 | 194,434,868 | ||||||||||||||
LIABILITIES: | ||||||||||||||||||
| Payable for investment securities purchased | 1,140,387 | 7,252,965 | — | — | ||||||||||||||
| Payable for fund shares redeemed | 369,269 | 459,898 | 407,711 | 180,852 | ||||||||||||||
| Payable upon receipt of securities loaned | — | 63,985,533 | 24,719,658 | 25,802,088 | ||||||||||||||
| Payable to affiliates | 122,615 | 300,988 | 121,364 | 203,428 | ||||||||||||||
| Payable for trustee fees | 214 | 32,056 | 4,281 | 386 | ||||||||||||||
| Other accrued expenses and liabilities | 37,424 | 182,700 | 106,832 | 34,590 | ||||||||||||||
| Total liabilities | 1,669,909 | 72,214,140 | 25,359,846 | 26,221,344 | ||||||||||||||
NET ASSETS | $ | 109,942,003 | $ | 367,331,139 | $ | 83,867,058 | $ | 168,213,524 | ||||||||||
NET ASSETS WERE COMPRISED OF: | ||||||||||||||||||
| Paid-in capital | 97,262,590 | 333,190,944 | 91,585,784 | 144,831,211 | ||||||||||||||
| Undistributed net investment income (accumulated net investment loss) | 384,271 | 2,199,894 | (248,684 | ) | 487,641 | |||||||||||||
| Accumulated net realized gain (loss) on investments | 5,324,815 | (28,442,387 | ) | 4,440,528 | 3,931,362 | |||||||||||||
| Net unrealized appreciation or depreciation on investments | 6,970,327 | 60,382,688 | (11,910,570 | ) | 18,963,310 | |||||||||||||
NET ASSETS | $ | 109,942,003 | $ | 367,331,139 | $ | 83,867,058 | $ | 168,213,524 | ||||||||||
| + Including securities loaned at value | $ | — | $ | 62,192,955 | $ | 23,764,412 | $ | 25,237,604 | ||||||||||
| * Cost of investments in securities | $ | 92,332,057 | $ | 294,534,513 | $ | 94,071,007 | $ | 109,958,930 | ||||||||||
42
Table of Contents
| ING | ||||||||||||||||
| ING | ING | MidCap | ||||||||||||||
| LargeCap | ING | MidCap | Value | |||||||||||||
| Value | MagnaCap | Value | Choice | |||||||||||||
| Fund | Fund | Fund | Fund | |||||||||||||
Class A: | ||||||||||||||||
| Net assets | $ | 76,146,380 | $ | 328,786,614 | $ | 35,857,103 | $ | 119,980,369 | ||||||||
| Shares authorized | unlimited | 80,000,000 | unlimited | unlimited | ||||||||||||
| Par value | $ | 0.01 | $ | 0.01 | $ | 0.01 | $ | 0.01 | ||||||||
| Shares outstanding | 6,349,541 | 24,747,551 | 3,323,026 | 7,982,653 | ||||||||||||
| Net asset value and redemption price per share | $ | 11.99 | $ | 13.29 | $ | 10.79 | $ | 15.03 | ||||||||
Maximum offering price per share (5.75%)(1) | $ | 12.72 | $ | 14.10 | $ | 11.45 | $ | 15.95 | ||||||||
Class B: | ||||||||||||||||
| Net assets | $ | 10,381,150 | $ | 25,664,731 | $ | 22,947,095 | $ | 9,971,446 | ||||||||
| Shares authorized | unlimited | 80,000,000 | unlimited | unlimited | ||||||||||||
| Par value | $ | 0.01 | $ | 0.01 | $ | 0.01 | $ | 0.01 | ||||||||
| Shares outstanding | 873,582 | 1,997,156 | 2,201,785 | 669,640 | ||||||||||||
Net asset value and redemption price per share (2) | $ | 11.88 | $ | 12.85 | $ | 10.42 | $ | 14.89 | ||||||||
| Maximum offering price per share | $ | 11.88 | $ | 12.85 | $ | 10.42 | $ | 14.89 | ||||||||
Class C: | ||||||||||||||||
| Net assets | $ | 15,717,841 | $ | 6,410,744 | $ | 24,191,263 | $ | 38,248,890 | ||||||||
| Shares authorized | unlimited | 20,000,000 | unlimited | unlimited | ||||||||||||
| Par value | $ | 0.01 | $ | 0.01 | $ | 0.01 | $ | 0.01 | ||||||||
| Shares outstanding | 1,324,076 | 498,411 | 2,321,861 | 2,571,161 | ||||||||||||
Net asset value and redemption price per share (2) | $ | 11.87 | $ | 12.86 | $ | 10.42 | $ | 14.88 | ||||||||
| Maximum offering price per share | $ | 11.87 | $ | 12.86 | $ | 10.42 | $ | 14.88 | ||||||||
Class I: | ||||||||||||||||
| Net assets | $ | 7,696,632 | $ | 2,993,031 | $ | 855,847 | $ | 12,819 | ||||||||
| Shares authorized | unlimited | 50,000,000 | unlimited | unlimited | ||||||||||||
| Par value | $ | 0.01 | $ | 0.01 | $ | 0.01 | $ | 0.01 | ||||||||
| Shares outstanding | 640,147 | 226,392 | 77,871 | 851 | ||||||||||||
| Net asset value and redemption price per share | $ | 12.02 | $ | 13.22 | $ | 10.99 | $ | 15.06 | ||||||||
| Maximum offering price per share | $ | 12.02 | $ | 13.22 | $ | 10.99 | $ | 15.06 | ||||||||
Class M: | ||||||||||||||||
| Net assets | n/a | $ | 3,476,019 | n/a | n/a | |||||||||||
| Shares authorized | n/a | 5,000,000 | n/a | n/a | ||||||||||||
| Par value | n/a | $ | 0.01 | n/a | n/a | |||||||||||
| Shares outstanding | n/a | 263,570 | n/a | n/a | ||||||||||||
| Net asset value and redemption price per share | n/a | $ | 13.19 | n/a | n/a | |||||||||||
Maximum offering price per share (3.50%)(3) | n/a | $ | 13.67 | n/a | n/a | |||||||||||
Class Q: | ||||||||||||||||
| Net assets | n/a | n/a | $ | 15,750 | n/a | |||||||||||
| Shares authorized | n/a | n/a | unlimited | n/a | ||||||||||||
| Par value | n/a | n/a | $ | 0.01 | n/a | |||||||||||
| Shares outstanding | n/a | n/a | 1,463 | n/a | ||||||||||||
| Net asset value and redemption price per share | n/a | n/a | $ | 10.77 | n/a | |||||||||||
| Maximum offering price per share | n/a | n/a | $ | 10.77 | n/a | |||||||||||
| (1) | Maximum offering price is computed at 100/94.25 of net asset value. On purchases of $50,000 or more, the offering price is reduced. |
| (2) | Redemption price per share may be reduced for any applicable contingent deffered sales charges. |
| (3) | Maximum offering price is computed at 100/96.50 of net asset value. On purchases of $50,000 or more, the offering price is reduced. |
43
Table of Contents
| ING | ||||||||||
| ING | SmallCap | |||||||||
| SmallCap | Value | |||||||||
| Value | Choice | |||||||||
| Fund | Fund | |||||||||
ASSETS: | ||||||||||
| Investments in securities at value* | $ | 55,526,274 | $ | 63,563,609 | ||||||
| Short-term investments at amortized cost | 218,970 | 4,021,443 | ||||||||
| Cash | 327,666 | 465,804 | ||||||||
| Receivables: | ||||||||||
| Investment securities sold | 1,527,135 | — | ||||||||
| Fund shares sold | 521 | 549,287 | ||||||||
| Dividends and interest | 67,245 | 29,023 | ||||||||
| Prepaid expenses | 24,778 | 19,995 | ||||||||
| Reimbursement due from manager | — | 11,235 | ||||||||
| Total assets | 57,692,589 | 68,660,396 | ||||||||
| LIABILITIES: | ||||||||||
| Payable for investment securities purchased | — | 750,588 | ||||||||
| Payable for fund shares redeemed | 177,015 | 130,856 | ||||||||
| Payable to affiliates | 83,226 | 78,329 | ||||||||
| Payable for trustee fees | 5,117 | 869 | ||||||||
| Other accrued expenses and liabilities | 67,816 | 18,444 | ||||||||
| Total liabilities | 333,174 | 979,086 | ||||||||
NET ASSETS | $ | 57,359,415 | $ | 67,681,310 | ||||||
NET ASSETS WERE COMPRISED OF: | ||||||||||
| Paid-in capital | 71,038,556 | 60,148,390 | ||||||||
| Undistributed net investment income (accumulated net investment loss) | (184,097 | ) | 57,072 | |||||||
| Accumulated net realized gain (loss) on investments | (4,266,194 | ) | 1,582,515 | |||||||
| Net unrealized appreciation or depreciation on investments | (9,228,850 | ) | 5,893,333 | |||||||
NET ASSETS | $ | 57,359,415 | $ | 67,681,310 | ||||||
| * Cost of investments in securities | $ | 64,755,124 | $ | 57,670,276 | ||||||
44
Table of Contents
| ING | ||||||||
| ING | SmallCap | |||||||
| SmallCap | Value | |||||||
| Value | Choice | |||||||
| Fund | Fund | |||||||
Class A: | ||||||||
| Net assets | $ | 27,388,437 | $ | 43,630,087 | ||||
| Shares authorized | unlimited | unlimited | ||||||
| Par value | $ | 0.01 | $ | 0.01 | ||||
| Shares outstanding | 2,540,891 | 3,295,345 | ||||||
| Net asset value and redemption price per share | $ | 10.78 | $ | 13.24 | ||||
Maximum offering price per share (5.75%)(1) | $ | 11.44 | $ | 14.05 | ||||
Class B: | ||||||||
| Net assets | $ | 12,881,507 | $ | 3,510,989 | ||||
| Shares authorized | unlimited | unlimited | ||||||
| Par value | $ | 0.01 | $ | 0.01 | ||||
| Shares outstanding | 1,245,086 | 267,587 | ||||||
Net asset value and redemption price per share(2) | $ | 10.35 | $ | 13.12 | ||||
| Maximum offering price per share | $ | 10.35 | $ | 13.12 | ||||
Class C: | ||||||||
| Net assets | $ | 17,040,128 | $ | 11,482,022 | ||||
| Shares authorized | unlimited | unlimited | ||||||
| Par value | $ | 0.01 | $ | 0.01 | ||||
| Shares outstanding | 1,649,582 | 874,870 | ||||||
Net asset value and redemption price per share(2) | $ | 10.33 | $ | 13.12 | ||||
| Maximum offering price per share | $ | 10.33 | $ | 13.12 | ||||
Class I: | ||||||||
| Net assets | $ | 44,998 | $ | 9,058,212 | ||||
| Shares authorized | unlimited | unlimited | ||||||
| Par value | $ | 0.01 | $ | 0.01 | ||||
| Shares outstanding | 4,110 | 682,087 | ||||||
| Net asset value and redemption price per share | $ | 10.95 | $ | 13.28 | ||||
| Maximum offering price per share | $ | 10.95 | $ | 13.28 | ||||
Class Q: | ||||||||
| Net assets | $ | 4,345 | n/a | |||||
| Shares authorized | unlimited | n/a | ||||||
| Par value | $ | 0.01 | n/a | |||||
| Shares outstanding | 395 | n/a | ||||||
| Net asset value and redemption price per share | $ | 11.00 | n/a | |||||
| Maximum offering price per share | $ | 11.00 | n/a | |||||
| (1) | Maximum offering price is computed at 100/94.25 of net asset value. On purchases of $50,000 or more, the offering price is reduced. |
| (2) | Redemption price per share may be reduced for any applicable contingent deffered sales charges. |
45
Table of Contents
| ING | ING | ING | |||||||||||||||
| ING | Disciplined | Fundamental | LargeCap | ||||||||||||||
| Real Estate | LargeCap | Research | Growth | ||||||||||||||
| Fund | Fund | Fund | Fund | ||||||||||||||
INVESTMENT INCOME: | |||||||||||||||||
| Dividends, net of foreign taxes withheld* | $ | 3,340,659 | $ | 341,275 | $ | 41,421 | $ | 950,078 | |||||||||
| Interest | 133,322 | 7,632 | 7,487 | 52,228 | |||||||||||||
| Securities lending income | — | 290 | — | 28,352 | |||||||||||||
| Total investment income | 3,473,981 | 349,197 | 48,908 | 1,030,658 | |||||||||||||
EXPENSES: | |||||||||||||||||
| Investment management fees | 1,163,903 | 132,151 | 18,841 | 1,015,565 | |||||||||||||
| Distribution and service fees: | |||||||||||||||||
| Class A | 160,168 | 7,764 | 6,544 | 151,597 | |||||||||||||
| Class B | 28,516 | 116,721 | 213 | 385,093 | |||||||||||||
| Class C | 18,645 | 46,187 | 523 | 202,345 | |||||||||||||
| Class O | 43,062 | — | — | — | |||||||||||||
| Class Q | — | — | — | 1,361 | |||||||||||||
| Transfer agent fees: | |||||||||||||||||
| Class A | 43,684 | 2,860 | 3,141 | 63,796 | |||||||||||||
| Class B | 1,959 | 12,898 | 25 | 56,733 | |||||||||||||
| Class C | 1,279 | 5,104 | 62 | 29,800 | |||||||||||||
| Class I | 31,175 | — | — | 8,367 | |||||||||||||
| Class O | 3,554 | — | — | — | |||||||||||||
| Class Q | — | — | — | 117 | |||||||||||||
| Administrative and shareholder servicing fees | 166,270 | 32,684 | 2,691 | 135,407 | |||||||||||||
| Shareholder reporting expense | 38,125 | 11,895 | 1,076 | 45,912 | |||||||||||||
| Registration fees | 39,879 | 23,230 | 12,371 | 28,270 | |||||||||||||
| Professional fees | 21,348 | 5,588 | 5,676 | 27,525 | |||||||||||||
| Custody and accounting expense | 22,178 | 7,320 | 7,515 | 20,147 | |||||||||||||
| Trustee fees | 5,815 | 524 | 269 | 6,832 | |||||||||||||
| Offering expense | — | — | 88,923 | — | |||||||||||||
| Insurance expense | — | — | — | 2,795 | |||||||||||||
| Miscellaneous expense | 8,901 | 1,986 | 1,960 | 7,582 | |||||||||||||
| Interest Expense | — | — | — | 1,126 | |||||||||||||
| Total expenses | 1,798,461 | 406,912 | 149,830 | 2,190,370 | |||||||||||||
| Net waived and reimbursed fees | — | (27,999 | ) | (115,617 | ) | — | |||||||||||
| Brokerage commission recapture | (42,415 | ) | — | — | (24,072 | ) | |||||||||||
| �� | |||||||||||||||||
| Net expenses | 1,756,046 | 378,913 | 34,213 | 2,166,298 | |||||||||||||
| Net investment income (loss) | 1,717,935 | (29,716 | ) | 14,695 | (1,135,640 | ) | |||||||||||
REALIZED AND UNREALIZED GAIN (LOSS) ON INVESTMENTS, FOREIGN CURRENCY RELATED TRANSACTIONS, AND FUTURES: | |||||||||||||||||
| Net realized gain (loss) on: | |||||||||||||||||
| Investments | 14,707,998 | 1,697,778 | (40,644 | ) | 9,945,584 | ||||||||||||
| Foreign currency related transactions | — | — | — | 21,767 | |||||||||||||
| Futures | — | 23,710 | 15,078 | — | |||||||||||||
| Net realized gain (loss) on investments, foreign currency related transactions, and futures | 14,707,998 | 1,721,488 | (25,566 | ) | 9,967,351 | ||||||||||||
| Net change in unrealized appreciation or depreciation on: | |||||||||||||||||
| Investments | 64,884,149 | 2,021,182 | 441,008 | 8,075,833 | |||||||||||||
| Foreign currency related transactions | — | — | — | 18 | |||||||||||||
| Futures | — | 7,750 | 4,741 | — | |||||||||||||
| Net change in unrealized appreciation or depreciation on investments, foreign currency related transactions, and futures | 64,884,149 | 2,028,932 | 445,749 | 8,075,851 | |||||||||||||
| Net realized and unrealized gain on investments, foreign currency related transactions, and futures | 79,592,147 | 3,750,420 | 420,183 | 18,043,202 | |||||||||||||
Increase in net assets resulting from operations | $ | 81,310,082 | $ | 3,720,704 | $ | 434,878 | $ | 16,907,562 | |||||||||
| * Foreign taxes withheld | $ | — | $ | — | $ | 191 | $ | 28,431 | |||||||||
46
Table of Contents
| ING | ING | ING | ING | ||||||||||||||
| MidCap | Opportunistic | SmallCap | Financial | ||||||||||||||
| Opportunities | LargeCap | Opportunities | Services | ||||||||||||||
| Fund | Fund | Fund | Fund | ||||||||||||||
INVESTMENT INCOME: | |||||||||||||||||
| Dividends, net of foreign taxes withheld* | $ | 635,296 | $ | 32,562 | $ | 288,689 | $ | 3,232,671 | |||||||||
Interest(1) | 242,862 | 168 | 131,715 | 146,661 | |||||||||||||
| Securities lending income | 43,688 | — | 68,645 | — | |||||||||||||
| Total investment income | 921,846 | 32,730 | 489,049 | 3,379,332 | |||||||||||||
EXPENSES: | |||||||||||||||||
| Investment management fees | 1,512,368 | 18,226 | 723,679 | 1,101,820 | |||||||||||||
| Distribution and service fees: | |||||||||||||||||
| Class A | 172,693 | 6,435 | 125,157 | 407,154 | |||||||||||||
| Class B | 479,980 | 232 | 137,025 | 249,397 | |||||||||||||
| Class C | 416,366 | 68 | 179,209 | 7,504 | |||||||||||||
| Class O | — | — | — | 13,835 | |||||||||||||
| Class Q | 5,839 | — | 223 | — | |||||||||||||
| Transfer agent fees: | |||||||||||||||||
| Class A | 124,413 | 3,089 | 101,622 | 135,922 | |||||||||||||
| Class B | 103,620 | 27 | 33,423 | 29,320 | |||||||||||||
| Class C | 89,963 | 8 | 43,659 | 873 | |||||||||||||
| Class I | 184 | — | 546 | — | |||||||||||||
| Class O | — | — | — | 5,884 | |||||||||||||
| Class Q | 252 | — | 35 | — | |||||||||||||
| Administrative and shareholder servicing fees | 285,420 | 2,604 | 140,273 | — | |||||||||||||
| Shareholder reporting expense | 85,455 | 1,042 | 48,014 | 41,214 | |||||||||||||
| Registration fees | 29,792 | 12,471 | 29,674 | 28,249 | |||||||||||||
| Professional fees | 39,498 | 5,619 | 17,021 | 27,220 | |||||||||||||
| Custody and accounting expense | 22,875 | 1,781 | 15,210 | 21,300 | |||||||||||||
| Trustee fees | 8,700 | 260 | 3,421 | 3,660 | |||||||||||||
| Offering expense | — | 89,352 | — | — | |||||||||||||
| Miscellaneous expense | 13,248 | 1,763 | 8,681 | 11,965 | |||||||||||||
| Total expenses | 3,390,666 | 142,977 | 1,606,872 | 2,085,317 | |||||||||||||
| Net waived and reimbursed fees | (840,268 | ) | (110,197 | ) | (260,063 | ) | (116,592 | ) | |||||||||
| Net expenses | 2,550,398 | 32,780 | 1,346,809 | 1,968,725 | |||||||||||||
| Net investment income (loss) | (1,628,552 | ) | (50 | ) | (857,760 | ) | 1,410,607 | ||||||||||
REALIZED AND UNREALIZED GAIN (LOSS) ON INVESTMENTS AND FOREIGN CURRENCY RELATED TRANSACTIONS: | |||||||||||||||||
| Net realized gain (loss) on investments | 9,708,446 | (28,983 | ) | 12,515,763 | 14,930,306 | ||||||||||||
| Net change in unrealized appreciation or depreciation on: | |||||||||||||||||
| Investments | (575,277 | ) | 451,825 | (4,176,685 | ) | 12,746,513 | |||||||||||
| Foreign currency related transactions | — | (2 | ) | 1 | — | ||||||||||||
| Net change in unrealized appreciation or depreciation on investments and foreign currency related transactions | (575,277 | ) | 451,823 | (4,176,684 | ) | 12,746,513 | |||||||||||
| Net realized and unrealized gain on investments and foreign currency related transactions | 9,133,169 | 422,840 | 8,339,079 | 27,676,819 | |||||||||||||
Increase in net assets resulting from operations | $ | 7,504,617 | $ | 422,790 | $ | 7,481,319 | $ | 29,087,426 | |||||||||
| * Foreign taxes withheld | $ | — | $ | 56 | $ | — | $ | — | |||||||||
| (1) Affiliated income | $ | — | $ | — | $ | — | $ | 17,827 | |||||||||
47
Table of Contents
| ING | |||||||||||||||||
| ING | ING | MidCap | |||||||||||||||
| LargeCap | ING | MidCap | Value | ||||||||||||||
| Value | MagnaCap | Value | Choice | ||||||||||||||
| Fund | Fund | Fund | Fund | ||||||||||||||
INVESTMENT INCOME: | |||||||||||||||||
| Dividends, net of foreign taxes withheld* | $ | 671,130 | $ | 4,380,918 | $ | 436,234 | $ | 487,312 | |||||||||
| Interest | 108,535 | 185,260 | 37,563 | 707,409 | |||||||||||||
| Securities lending income | — | 54,554 | 106,372 | 30,084 | |||||||||||||
| Total investment income | 779,665 | 4,620,732 | 580,169 | 1,224,805 | |||||||||||||
EXPENSES: | |||||||||||||||||
| Investment management fees | 326,123 | 1,314,588 | 417,660 | 523,101 | |||||||||||||
| Distribution and service fees: | |||||||||||||||||
| Class A | 58,902 | 478,860 | 48,408 | 85,682 | |||||||||||||
| Class B | 44,102 | 132,756 | 116,564 | 39,268 | |||||||||||||
| Class C | 65,315 | 32,364 | 120,375 | 141,057 | |||||||||||||
| Class M | — | 12,851 | — | — | |||||||||||||
| Class Q | — | — | 18 | — | |||||||||||||
| Transfer agent fees: | |||||||||||||||||
| Class A | 20,027 | 141,668 | 30,642 | 34,797 | |||||||||||||
| Class B | 3,748 | 11,733 | 18,330 | 3,960 | |||||||||||||
| Class C | 5,552 | 2,848 | 18,929 | 14,254 | |||||||||||||
| Class I | 287 | 162 | 703 | 2 | |||||||||||||
| Class M | — | 1,349 | — | — | |||||||||||||
| Class Q | — | — | 9 | — | |||||||||||||
| Administrative service fees | 36,892 | — | 43,621 | 52,310 | |||||||||||||
| Shareholder reporting expense | 7,686 | 56,128 | 1,504 | 8,879 | |||||||||||||
| Registration fees | 26,830 | 42,973 | — | 26,457 | |||||||||||||
| Professional fees | 5,124 | 21,200 | 3,570 | 6,514 | |||||||||||||
| Custody and accounting expense | 6,575 | 23,620 | 6,552 | 11,120 | |||||||||||||
| Trustee fees | 549 | 7,035 | 3,141 | 707 | |||||||||||||
| Insurance expense | — | 3,239 | — | — | |||||||||||||
| Miscellaneous expense | 3,885 | 8,288 | 409 | 3,172 | |||||||||||||
| Interest Expense | — | — | 170 | — | |||||||||||||
| Total expenses | 611,597 | 2,291,662 | 830,605 | 951,280 | |||||||||||||
| Net waived and reimbursed fees | (2,644 | ) | (159,624 | ) | — | (31,729 | ) | ||||||||||
| Brokerage commission recapture | (481 | ) | — | (7,085 | ) | (15,212 | ) | ||||||||||
| Net expenses | 608,472 | 2,132,038 | 823,520 | 904,339 | |||||||||||||
| Net investment income (loss) | 171,193 | 2,488,694 | (243,351 | ) | 320,466 | ||||||||||||
REALIZED AND UNREALIZED GAIN (LOSS) ON INVESTMENTS AND FOREIGN CURRENCY RELATED TRANSACTIONS: | |||||||||||||||||
| Net realized gain (loss) on investments | 3,535,865 | 8,431,891 | (2,701,676 | ) | 2,530,834 | ||||||||||||
| Net change in unrealized appreciation or depreciation on: | |||||||||||||||||
| Investments | 7,025,780 | 23,227,438 | 9,022,658 | 12,064,726 | |||||||||||||
| Foreign currency related transactions | — | (1 | ) | — | — | ||||||||||||
| Net change in unrealized appreciation or depreciation on investments and foreign currency related transactions | 7,025,780 | 23,227,437 | 9,022,658 | 12,064,726 | |||||||||||||
| Net realized and unrealized gain on investments and foreign currency related transactions | 10,561,645 | 31,659,328 | 6,320,982 | 14,595,560 | |||||||||||||
Increase in net assets resulting from operations | $ | 10,732,838 | $ | 34,148,022 | $ | 6,077,631 | $ | 14,916,026 | |||||||||
| * Foreign taxes withheld | $ | 759 | $ | 32,726 | $ | 5,620 | $ | 12,313 | |||||||||
48
Table of Contents
| ING | |||||||||
| ING | SmallCap | ||||||||
| SmallCap | Value | ||||||||
| Value | Choice | ||||||||
| Fund | Fund | ||||||||
INVESTMENT INCOME: | |||||||||
| Dividends, net of foreign taxes withheld* | $ | 298,336 | $ | 342,252 | |||||
| Interest | 18,681 | 87,825 | |||||||
| Securities lending income | 149,326 | — | |||||||
| Total investment income | 466,343 | 430,077 | |||||||
EXPENSES: | |||||||||
| Investment management fees | 301,429 | 236,233 | |||||||
| Distribution and service fees: | |||||||||
| Class A | 36,563 | 36,339 | |||||||
| Class B | 69,121 | 13,671 | |||||||
| Class C | 91,276 | 43,100 | |||||||
| Class Q | 41 | — | |||||||
| Transfer agent fees: | |||||||||
| Class A | 24,877 | 15,844 | |||||||
| Class B | 11,759 | 1,490 | |||||||
| Class C | 15,513 | 4,698 | |||||||
| Class I | 29 | 1,637 | |||||||
| Class Q | 17 | — | |||||||
| Administrative service fees | 30,705 | 23,623 | |||||||
| Shareholder reporting expense | 15,870 | 4,964 | |||||||
| Registration fees | 30,244 | 23,813 | |||||||
| Professional fees | 7,950 | 4,634 | |||||||
| Custody and accounting expense | 5,731 | 8,128 | |||||||
| Trustee fees | 2,745 | 679 | |||||||
| Miscellaneous expense | 4,905 | 2,234 | |||||||
| Interest Expense | 108 | — | |||||||
| Total expenses | 648,883 | 421,087 | |||||||
| Net waived and reimbursed fees | — | (34,749 | ) | ||||||
| Brokerage commission recapture | (3,776 | ) | (10,442 | ) | |||||
| Net expenses | 645,107 | 375,896 | |||||||
| Net investment income (loss) | (178,764 | ) | 54,181 | ||||||
REALIZED AND UNREALIZED GAIN (LOSS) ON INVESTMENTS: | |||||||||
| Net realized gain (loss) on investments | (2,696,781 | ) | 386,280 | ||||||
| Net change in unrealized appreciation or depreciation on investments | 4,083,426 | 3,704,779 | |||||||
| Net realized and unrealized gain on investments | 1,386,645 | 4,091,059 | |||||||
Increase in net assets resulting from operations | $ | 1,207,881 | $ | 4,145,240 | |||||
| * Foreign taxes withheld | $ | 2,061 | $ | — | |||||
49
Table of Contents
| ING Disciplined | |||||||||||||||||
| ING Real Estate Fund | LargeCap Fund | ||||||||||||||||
| Six Months | Six Months | ||||||||||||||||
| Ended | Year Ended | Ended | Year Ended | ||||||||||||||
| November 30, | May 31, | November 30, | May 31, | ||||||||||||||
| 2006 | 2006 | 2006 | 2006 | ||||||||||||||
FROM OPERATIONS: | |||||||||||||||||
| Net investment income (loss) | $ | 1,717,935 | $ | 4,054,361 | $ | (29,716 | ) | $ | (68,813 | ) | |||||||
| Net realized gain on investments and futures | 14,707,998 | 21,963,828 | 1,721,488 | 3,482,071 | |||||||||||||
| Net change in unrealized appreciation or depreciation on investments and futures | 64,884,149 | 25,113,333 | 2,028,932 | (624,407 | ) | ||||||||||||
| Net increase in net assets resulting from operations | 81,310,082 | 51,131,522 | 3,720,704 | 2,788,851 | |||||||||||||
FROM DISTRIBUTIONS TO SHAREHOLDERS: | |||||||||||||||||
| Net investment income: | |||||||||||||||||
| Class A | (1,490,716 | ) | (2,566,941 | ) | — | (20,068 | ) | ||||||||||
| Class B | (46,973 | ) | (105,254 | ) | — | — | |||||||||||
| Class C | (28,782 | ) | (62,864 | ) | — | — | |||||||||||
| Class I | (2,007,083 | ) | (4,784,572 | ) | — | — | |||||||||||
| Class O | (403,689 | ) | (599,987 | ) | — | — | |||||||||||
| Net realized gains: | |||||||||||||||||
| Class A | — | (5,812,816 | ) | — | — | ||||||||||||
| Class B | — | (302,426 | ) | — | — | ||||||||||||
| Class C | — | (179,433 | ) | — | — | ||||||||||||
| Class I | — | (10,452,149 | ) | — | — | ||||||||||||
| Class O | — | (1,290,330 | ) | — | — | ||||||||||||
| Total distributions | (3,977,243 | ) | (26,156,772 | ) | — | (20,068 | ) | ||||||||||
FROM CAPITAL SHARE TRANSACTIONS: | |||||||||||||||||
| Net proceeds from sale of shares | 62,690,215 | 115,308,881 | 2,181,823 | 4,211,548 | |||||||||||||
| Dividends reinvested | 3,552,595 | 23,193,708 | — | 14,496 | |||||||||||||
| 66,242,810 | 138,502,589 | 2,181,823 | 4,226,044 | ||||||||||||||
| Cost of shares redeemed | (28,376,816 | ) | (101,643,495 | ) | (6,142,058 | ) | (14,571,436 | ) | |||||||||
| Net increase (decrease) in net assets resulting from capital share transactions | 37,865,994 | 36,859,094 | (3,960,235 | ) | (10,345,392 | ) | |||||||||||
| Net increase (decrease) in net assets | 115,198,833 | 61,833,844 | (239,531 | ) | (7,576,609 | ) | |||||||||||
NET ASSETS: | |||||||||||||||||
| Beginning of period | 284,640,800 | 222,806,956 | 38,401,890 | 45,978,499 | |||||||||||||
| End of period | $ | 399,839,633 | $ | 284,640,800 | $ | 38,162,359 | $ | 38,401,890 | |||||||||
| Undistributed net investment income (distributions in excess of net investment income or accumulated net investment loss) at end of period | $ | (1,164,122 | ) | $ | 1,095,186 | $ | (29,716 | ) | $ | — | |||||||
50
Table of Contents
| ING Fundamental | ||||||||||||||||
| Research Fund | ING LargeCap Growth Fund | |||||||||||||||
| Six Months | December 28, | Six Months | ||||||||||||||
| Ended | 2005(1) | Ended | Year Ended | |||||||||||||
| November 30, | to May 31, | November 30, | May 31, | |||||||||||||
| 2006 | 2006 | 2006 | 2006 | |||||||||||||
FROM OPERATIONS: | ||||||||||||||||
| Net investment income (loss) | $ | 14,695 | $ | 6,990 | $ | (1,135,640 | ) | $ | (2,410,086 | ) | ||||||
| Net realized gain (loss) on investments, foreign currency related transactions, and futures | (25,566 | ) | 70,340 | 9,967,351 | 36,220,023 | |||||||||||
| Net change in unrealized appreciation or depreciation on investments, foreign currency related transactions, and futures | 445,749 | (1,296 | ) | 8,075,851 | (20,867,738 | ) | ||||||||||
| Net increase in net assets resulting from operations | 434,878 | 76,034 | 16,907,562 | 12,942,199 | ||||||||||||
FROM CAPITAL SHARE TRANSACTIONS: | ||||||||||||||||
| Net proceeds from sale of shares | 186,010 | 5,165,971 | 13,771,882 | 80,221,412 | ||||||||||||
| Cost of shares redeemed | (71,627 | ) | (4,855 | ) | (49,584,608 | ) | (114,987,759 | ) | ||||||||
| Net increase (decrease) in net assets resulting from capital share transactions | 114,383 | 5,161,116 | (35,812,726 | ) | (34,766,347 | ) | ||||||||||
| Net increase (decrease) in net assets | 549,261 | 5,237,150 | (18,905,164 | ) | (21,824,148 | ) | ||||||||||
NET ASSETS: | ||||||||||||||||
| Beginning of period | 5,237,150 | — | 288,777,923 | 310,602,071 | ||||||||||||
| End of period | $ | 5,786,411 | $ | 5,237,150 | $ | 269,872,759 | $ | 288,777,923 | ||||||||
| Undistributed net investment income (accumulated net investment loss) at end of period | $ | 25,842 | $ | 11,147 | $ | (1,141,726 | ) | $ | (6,086 | ) | ||||||
| (1) | Commencement of operations |
51
Table of Contents
| ING Opportunistic | ||||||||||||||||
| ING MidCap Opportunities Fund | LargeCap Fund | |||||||||||||||
| Six Months | Six Months | December 28, | ||||||||||||||
| Ended | Year Ended | Ended | 2005(1) | |||||||||||||
| November 30, | May 31, | November 30, | to May 31, | |||||||||||||
| 2006 | 2006 | 2006 | 2006 | |||||||||||||
FROM OPERATIONS: | ||||||||||||||||
| Net investment income (loss) | $ | (1,628,552 | ) | $ | (4,908,287 | ) | $ | (50 | ) | $ | 28,546 | |||||
| Net realized gain (loss) on investments | 9,708,446 | 98,754,455 | (28,983 | ) | (172,951 | ) | ||||||||||
| Net change in unrealized appreciation or depreciation on investments and foreign currency transactions | (575,277 | ) | (39,232,338 | ) | 451,823 | 152,642 | ||||||||||
| Net increase in net assets resulting from operations | 7,504,617 | 54,613,830 | 422,790 | 8,237 | ||||||||||||
FROM CAPITAL SHARE TRANSACTIONS: | ||||||||||||||||
| Net proceeds from sale of shares | 6,945,388 | 27,209,447 | 74,311 | 5,057,154 | ||||||||||||
| Cost of shares redeemed | (46,605,430 | ) | (119,727,888 | ) | (16,885 | ) | — | |||||||||
| Net increase (decrease) in net assets resulting from capital share transactions | (39,660,042 | ) | (92,518,441 | ) | 57,426 | 5,057,154 | ||||||||||
| Net increase (decrease) in net assets | (32,155,425 | ) | (37,904,611 | ) | 480,216 | 5,065,391 | ||||||||||
NET ASSETS: | ||||||||||||||||
| Beginning of period | 328,877,369 | 366,781,980 | 5,065,391 | — | ||||||||||||
| End of period | $ | 296,721,944 | $ | 328,877,369 | $ | 5,545,607 | $ | 5,065,391 | ||||||||
| Undistributed net investment income (accumulated net investment loss) at end of period | $ | (1,628,552 | ) | $ | — | $ | 34,574 | $ | 34,624 | |||||||
| (1) | Commencement of operations |
52
Table of Contents
| ING SmallCap | |||||||||||||||||
| Opportunities Fund | ING Financial Services Fund | ||||||||||||||||
| Six Months | Six Months | ||||||||||||||||
| Ended | Year Ended | Ended | Year Ended | ||||||||||||||
| November 30, | May 31, | November 30, | May 31, | ||||||||||||||
| 2006 | 2006 | 2006 | 2006 | ||||||||||||||
FROM OPERATIONS: | |||||||||||||||||
| Net investment income (loss) | $ | (857,760 | ) | $ | (2,652,118 | ) | $ | 1,410,607 | $ | 2,194,203 | |||||||
| Net realized gain on investments | 12,515,763 | 64,527,257 | 14,930,306 | 23,899,698 | |||||||||||||
| Net change in unrealized appreciation or depreciation on investments and foreign currency related transactions | (4,176,684 | ) | (28,193,494 | ) | 12,746,513 | 13,832,355 | |||||||||||
| Net increase in net assets resulting from operations | 7,481,319 | 33,681,645 | 29,087,426 | 39,926,256 | |||||||||||||
FROM DISTRIBUTIONS TO SHAREHOLDERS: | |||||||||||||||||
| Net investment income: | |||||||||||||||||
| Class A | — | — | — | (1,740,903 | ) | ||||||||||||
| Class B | — | — | — | (73,306 | ) | ||||||||||||
| Class C | — | — | — | (2,732 | ) | ||||||||||||
| Class O | — | — | — | (58,021 | ) | ||||||||||||
| Net realized gains: | |||||||||||||||||
| Class A | — | — | — | (15,589,580 | ) | ||||||||||||
| Class B | — | — | — | (8,219,594 | ) | ||||||||||||
| Class C | — | — | — | (19,903 | ) | ||||||||||||
| Class O | — | — | — | (461,154 | ) | ||||||||||||
| Total distributions | — | — | — | (26,165,193 | ) | ||||||||||||
FROM CAPITAL SHARE TRANSACTIONS: | |||||||||||||||||
| Net proceeds from sale of shares | 4,517,786 | 29,308,006 | 34,874,358 | 61,106,269 | |||||||||||||
| Dividends reinvested | — | — | — | 19,452,946 | |||||||||||||
| 4,517,786 | 29,308,006 | 34,874,358 | 80,559,215 | ||||||||||||||
| Cost of shares redeemed | (24,859,239 | ) | (95,852,416 | ) | (46,577,534 | ) | (97,577,296 | ) | |||||||||
| Net decrease in net assets resulting from capital share transactions | (20,341,453 | ) | (66,544,410 | ) | (11,703,176 | ) | (17,018,081 | ) | |||||||||
| Net increase (decrease) in net assets | (12,860,134 | ) | (32,862,765 | ) | 17,384,250 | (3,257,018 | ) | ||||||||||
NET ASSETS: | |||||||||||||||||
| Beginning of period | 162,091,878 | 194,954,643 | 290,090,128 | 293,347,146 | |||||||||||||
| End of period | $ | 149,231,744 | $ | 162,091,878 | $ | 307,474,378 | $ | 290,090,128 | |||||||||
| Undistributed net investment income (accumulated net investment loss) at end of period | $ | (857,760 | ) | $ | — | $ | 2,613,922 | $ | 1,203,315 | ||||||||
53
Table of Contents
| ING LargeCap Value Fund | ING MagnaCap Fund | ||||||||||||||||
| Six Months | Six Months | ||||||||||||||||
| Ended | Year Ended | Ended | Year Ended | ||||||||||||||
| November 30, | May 31, | November 30, | May 31, | ||||||||||||||
| 2006 | 2006 | 2006 | 2006 | ||||||||||||||
FROM OPERATIONS: | |||||||||||||||||
| Net investment income | $ | 171,193 | $ | 364,436 | $ | 2,488,694 | $ | 3,326,910 | |||||||||
| Net realized gain on investments | 3,535,865 | 2,657,085 | 8,431,891 | 49,585,253 | |||||||||||||
| Net change in unrealized appreciation or depreciation on investments and foreign currency related transactions | 7,025,780 | 258,554 | 23,227,437 | (8,969,892 | ) | ||||||||||||
| Net increase in net assets resulting from operations | 10,732,838 | 3,280,075 | 34,148,022 | 43,942,271 | |||||||||||||
FROM DISTRIBUTIONS TO SHAREHOLDERS: | |||||||||||||||||
| Net investment income: | |||||||||||||||||
| Class A | — | (217,524 | ) | (1,255,160 | ) | (3,246,856 | ) | ||||||||||
| Class B | — | (4,140 | ) | — | (76,481 | ) | |||||||||||
| Class C | — | (15,696 | ) | — | (12,808 | ) | |||||||||||
| Class I | — | (31,556 | ) | (15,644 | ) | (33,945 | ) | ||||||||||
| Class M | — | — | (2,298 | ) | (20,123 | ) | |||||||||||
| Net realized gains: | |||||||||||||||||
| Class A | — | (1,407,656 | ) | — | — | ||||||||||||
| Class B | — | (456,950 | ) | — | — | ||||||||||||
| Class C | — | (667,380 | ) | — | — | ||||||||||||
| Class I | — | (154,947 | ) | — | — | ||||||||||||
| Total distributions | — | (2,955,849 | ) | (1,273,102 | ) | (3,390,213 | ) | ||||||||||
FROM CAPITAL SHARE TRANSACTIONS: | |||||||||||||||||
| Net proceeds from sale of shares | 57,430,594 | 20,646,122 | 7,764,231 | 16,026,134 | |||||||||||||
| Proceeds issued in merger | — | — | — | 31,483,153 | |||||||||||||
| Dividends reinvested | — | 2,113,921 | 1,128,805 | 2,971,606 | |||||||||||||
| 57,430,594 | 22,760,043 | 8,893,036 | 50,480,893 | ||||||||||||||
| Cost of shares redeemed | (10,252,468 | ) | (15,701,185 | ) | (33,833,788 | ) | (75,383,445 | ) | |||||||||
| Net increase (decrease) in net assets resulting from capital share transactions | 47,178,126 | 7,058,858 | (24,940,752 | ) | (24,902,552 | ) | |||||||||||
| Net increase in net assets | 57,910,964 | 7,383,084 | 7,934,168 | 15,649,506 | |||||||||||||
NET ASSETS: | |||||||||||||||||
| Beginning of period | 52,031,039 | 44,647,955 | 359,396,971 | 343,747,465 | |||||||||||||
| End of period | $ | 109,942,003 | $ | 52,031,039 | $ | 367,331,139 | $ | 359,396,971 | |||||||||
| Undistributed net investment income at end of period | $ | 384,271 | $ | 213,078 | $ | 2,199,894 | $ | 984,302 | |||||||||
54
Table of Contents
| ING MidCap Value Fund | ING MidCap Value Choice Fund | ||||||||||||||||
| Six Months | Six Months | ||||||||||||||||
| Ended | Year Ended | Ended | Year Ended | ||||||||||||||
| November 30, | May 31, | November 30, | May 31, | ||||||||||||||
| 2006 | 2006 | 2006 | 2006 | ||||||||||||||
FROM OPERATIONS: | |||||||||||||||||
| Net investment income (loss) | $ | (243,351 | ) | $ | (1,339,358 | ) | $ | 320,466 | $ | 169,520 | |||||||
| Net realized gain (loss) on investments | (2,701,676 | ) | 15,293,985 | 2,530,834 | 1,729,370 | ||||||||||||
| Net change in unrealized appreciation or depreciation on investments | 9,022,658 | (6,506,322 | ) | 12,064,726 | 6,938,428 | ||||||||||||
| Net increase in net assets resulting from operations | 6,077,631 | 7,448,305 | 14,916,026 | 8,837,318 | |||||||||||||
FROM DISTRIBUTIONS TO SHAREHOLDERS: | |||||||||||||||||
| Net investment income: | |||||||||||||||||
| Class A | — | — | — | (57,665 | ) | ||||||||||||
| Class B | — | — | — | (1,537 | ) | ||||||||||||
| Class C | — | — | — | (8,035 | ) | ||||||||||||
| Class I | — | — | — | (11,138 | ) | ||||||||||||
| Net realized gains: | |||||||||||||||||
| Class A | — | (8,934,857 | ) | — | (165,586 | ) | |||||||||||
| Class B | — | (5,142,799 | ) | — | (35,054 | ) | |||||||||||
| Class C | — | (5,332,449 | ) | — | (102,919 | ) | |||||||||||
| Class I | — | (222,814 | ) | — | (23,003 | ) | |||||||||||
| Class M | — | (2,154 | ) | — | — | ||||||||||||
| Total distributions | — | (19,635,073 | ) | — | (404,937 | ) | |||||||||||
FROM CAPITAL SHARE TRANSACTIONS: | |||||||||||||||||
| Net proceeds from sale of shares | 1,189,376 | 4,584,580 | 95,725,468 | 59,815,178 | |||||||||||||
| Dividends reinvested | — | 15,883,657 | — | 286,053 | |||||||||||||
| 1,189,376 | 20,468,237 | 95,725,468 | 60,101,231 | ||||||||||||||
| Cost of shares redeemed | (20,009,820 | ) | (65,362,602 | ) | (10,451,972 | ) | (7,225,859 | ) | |||||||||
| Net increase (decrease) in net assets resulting from capital share transactions | (18,820,444 | ) | (44,894,365 | ) | 85,273,496 | 52,875,372 | |||||||||||
| Net increase (decrease) in net assets | (12,742,813 | ) | (57,081,133 | ) | 100,189,522 | 61,307,753 | |||||||||||
NET ASSETS: | |||||||||||||||||
| Beginning of period | 96,609,871 | 153,691,004 | 68,024,002 | 6,716,249 | |||||||||||||
| End of period | $ | 83,867,058 | $ | 96,609,871 | $ | 168,213,524 | $ | 68,024,002 | |||||||||
| Undistributed net investment income (accumulated net investment loss) at end of period | $ | (248,684 | ) | $ | (5,333 | ) | $ | 487,641 | $ | 167,175 | |||||||
55
Table of Contents
| ING SmallCap Value | |||||||||||||||||
| ING SmallCap Value Fund | Choice Fund | ||||||||||||||||
| Six Months | Six Months | ||||||||||||||||
| Ended | Year Ended | Ended | Year Ended | ||||||||||||||
| November 30, | May 31, | November 30, | May 31, | ||||||||||||||
| 2006 | 2006 | 2006 | 2006 | ||||||||||||||
FROM OPERATIONS: | |||||||||||||||||
| Net investment income (loss) | $ | (178,764 | ) | $ | (556,600 | ) | $ | 54,181 | $ | (35,021 | ) | ||||||
| Net realized gain (loss) on investments | (2,696,781 | ) | 4,953,324 | 386,280 | 1,378,067 | ||||||||||||
| Net change in unrealized appreciation or depreciation on investments | 4,083,426 | 3,335,087 | 3,704,779 | 2,321,540 | |||||||||||||
| Net increase in net assets resulting from operations | 1,207,881 | 7,731,811 | 4,145,240 | 3,664,586 | |||||||||||||
FROM DISTRIBUTIONS TO SHAREHOLDERS: | |||||||||||||||||
| Net investment income: | |||||||||||||||||
| Class A | — | — | — | (46,978 | ) | ||||||||||||
| Class B | — | — | — | (264 | ) | ||||||||||||
| Class C | — | — | — | (3,505 | ) | ||||||||||||
| Class I | — | — | — | (3,927 | ) | ||||||||||||
| Net realized gains: | |||||||||||||||||
| Class A | — | (13,147,307 | ) | — | (78,955 | ) | |||||||||||
| Class B | — | (5,008,132 | ) | — | (8,444 | ) | |||||||||||
| Class C | — | (7,840,098 | ) | — | (27,492 | ) | |||||||||||
| Class I | — | (114,787 | ) | — | (4,501 | ) | |||||||||||
| Class Q | — | (15,523 | ) | — | — | ||||||||||||
| Return of capital: | |||||||||||||||||
| Class A | — | (76,567 | ) | — | — | ||||||||||||
| Class B | — | (29,167 | ) | — | — | ||||||||||||
| Class C | — | (45,660 | ) | — | — | ||||||||||||
| Class I | — | (669 | ) | — | — | ||||||||||||
| Class O | — | (90 | ) | — | — | ||||||||||||
| �� | |||||||||||||||||
| Total distributions | — | (26,278,000 | ) | — | (174,066 | ) | |||||||||||
FROM CAPITAL SHARE TRANSACTIONS: | |||||||||||||||||
| Net proceeds from sale of shares | 247,469 | 5,673,303 | 36,609,237 | 28,818,198 | |||||||||||||
| Dividends reinvested | — | 21,203,110 | — | 129,190 | |||||||||||||
| 247,469 | 26,876,413 | 36,609,237 | 28,947,388 | ||||||||||||||
| Cost of shares redeemed | (14,493,400 | ) | (85,016,873 | ) | (6,523,343 | ) | (5,071,697 | ) | |||||||||
| Net increase (decrease) in net assets resulting from capital share transactions | (14,245,931 | ) | (58,140,460 | ) | 30,085,894 | 23,875,691 | |||||||||||
| Net increase (decrease) in net assets | (13,038,050 | ) | (76,686,649 | ) | 34,231,134 | 27,366,211 | |||||||||||
NET ASSETS: | |||||||||||||||||
| Beginning of period | 70,397,465 | 147,084,114 | 33,450,176 | 6,083,965 | |||||||||||||
| End of period | $ | 57,359,415 | $ | 70,397,465 | $ | 67,681,310 | $ | 33,450,176 | |||||||||
| Undistributed net investment income (accumulated net investment loss) at end of period | $ | (184,097 | ) | $ | (5,333 | ) | $ | 57,072 | $ | 2,891 | |||||||
56
Table of Contents
Selected data for a share of beneficial interest outstanding throughout each period.
| Class A | ||||||||||||||||||||||
| Six Months | December 20, | |||||||||||||||||||||
| Ended | Year Ended May 31, | 2002(1) to | ||||||||||||||||||||
| November 30, | May 31, | |||||||||||||||||||||
| 2006 | 2006 | 2005 | 2004 | 2003 | ||||||||||||||||||
Per Share Operating Performance: | ||||||||||||||||||||||
| Net asset value, beginning of period | $ | 16.42 | 14.82 | 12.76 | 11.06 | 10.06 | ||||||||||||||||
| Income from investment operations: | ||||||||||||||||||||||
| Net investment income | $ | 0.08 | * | 0.20 | † | 0.47 | * | 0.57 | 0.16 | |||||||||||||
| Net realized and unrealized gain on investments | $ | 4.36 | 3.02 | 3.04 | 2.29 | 1.04 | ||||||||||||||||
| Total from investment operations | $ | 4.44 | 3.22 | 3.51 | 2.86 | 1.20 | ||||||||||||||||
| Less distributions from: | ||||||||||||||||||||||
| Net investment income | $ | 0.22 | 0.49 | 0.50 | 0.65 | 0.20 | ||||||||||||||||
| Net realized gain from investments | $ | — | 1.13 | 0.95 | 0.51 | — | ||||||||||||||||
| Total distributions | $ | 0.22 | 1.62 | 1.45 | 1.16 | 0.20 | ||||||||||||||||
| Net asset value, end of period | $ | 20.64 | 16.42 | 14.82 | 12.76 | 11.06 | ||||||||||||||||
| Total Return(2) | % | 27.23 | 22.63 | 28.51 | 26.79 | 12.06 | ||||||||||||||||
Ratios and Supplemental Data: | ||||||||||||||||||||||
| Net assets, end of period (000’s) | $ | 159,625 | 102,853 | 57,799 | 16,569 | 982 | ||||||||||||||||
| Ratios to average net assets: | ||||||||||||||||||||||
| Net expenses after expense reimbursement/recoupment and brokerage commission recapture(3)(4) | % | 1.18 | 1.16 | 1.15 | 1.27 | 1.45 | ||||||||||||||||
| Net expenses after expense reimbursement/recoupment and prior to brokerage commission recapture(3)(4) | % | 1.20 | 1.20 | 1.23 | 1.31 | 1.45 | ||||||||||||||||
| Gross expenses prior to expense reimbursement/recoupment and brokerage commission recapture(3) | % | 1.20 | 1.20 | 1.15 | 1.37 | 1.53 | ||||||||||||||||
| Net investment income after expense reimbursement/recoupment and brokerage commission recapture(3)(4) | % | 0.91 | 1.36 | † | 3.34 | 4.84 | 0.01 | |||||||||||||||
| Portfolio turnover rate | % | 17 | 51 | 91 | 132 | 62 | ||||||||||||||||
(1) Commencement of operations.
(2) Total return is calculated assuming reinvestment of all dividends and capital gain distributions at net asset value and excluding the deduction of sales charges. Total return for less than one year is not annualized.
(3) Annualized for periods less than one year.
(4) The Investment Adviser has agreed to limit expenses, (excluding interest, taxes, brokerage and extraordinary expenses) subject to possible recoupment by ING Investments, LLC within three years of being incurred.
* Per share data calculated using average number of shares outstanding throughout the period.
† Effective June 1, 2005, the Fund adopted a policy to reduce cost of investments for financial statement purposes by the distributions received in excess of income from Real Estate Investment Trusts. The effect of this change for the twelve months ended May 31, 2006 was to decrease the net investment income per share by $0.25, increase net realized and unrealized gain on investments per share by $0.25 and decrease the ratio of net investment income to average net assets from 2.91% to 1.36% and 2.16% to 0.61% on Class A and Class B, respectively.
57
Table of Contents
| Class B | ||||||||||||||||||||||
| Six Months | November 20, | |||||||||||||||||||||
| Ended | Year Ended May 31, | 2002(1) to | ||||||||||||||||||||
| November 30, | May 31, | |||||||||||||||||||||
| 2006 | 2006 | 2005 | 2004 | 2003 | ||||||||||||||||||
Per Share Operating Performance: | ||||||||||||||||||||||
| Net asset value, beginning of period | $ | 16.45 | 14.85 | 12.78 | 11.10 | 10.00 | ||||||||||||||||
| Income from investment operations: | ||||||||||||||||||||||
| Net investment income | $ | 0.02 | 0.08† | 0.37 | * | 0.45 | 0.12 | |||||||||||||||
| Net realized and unrealized gain on investments | $ | 4.37 | 3.02 | 3.05 | 2.32 | 1.15 | ||||||||||||||||
| Total from investment operations | $ | 4.39 | 3.10 | 3.42 | 2.77 | 1.27 | ||||||||||||||||
| Less distributions from: | ||||||||||||||||||||||
| Net investment income | $ | 0.15 | 0.37 | 0.40 | 0.58 | 0.17 | ||||||||||||||||
| Net realized gain from investments | $ | — | 1.13 | 0.95 | 0.51 | — | ||||||||||||||||
| Total distributions | $ | 0.15 | 1.50 | 1.35 | 1.09 | 0.17 | ||||||||||||||||
| Net asset value, end of period | $ | 20.69 | 16.45 | 14.85 | 12.78 | 11.10 | ||||||||||||||||
| Total Return(2) | % | 26.84 | 21.70 | 27.62 | 25.81 | 12.77 | ||||||||||||||||
Ratios and Supplemental Data: | ||||||||||||||||||||||
| Net assets, end of period (000’s) | $ | 6,601 | 5,037 | 3,484 | 1,990 | 149 | ||||||||||||||||
| Ratios to average net assets: | ||||||||||||||||||||||
| Net expenses after expense reimbursement/recoupment and brokerage commission recapture(3)(4) | % | 1.93 | 1.91 | 1.90 | 2.02 | 2.20 | ||||||||||||||||
| Net expenses after expense reimbursement/recoupment and prior to brokerage commission recapture(3)(4) | % | 1.95 | 1.95 | 1.98 | 2.06 | 2.20 | ||||||||||||||||
| Gross expenses prior to expense reimbursement/recoupment and brokerage commission recapture(3) | % | 1.95 | 1.95 | 1.90 | 2.12 | 2.30 | ||||||||||||||||
| Net investment income after expense reimbursement/recoupment and brokerage commission recapture(3)(4) | % | 0.17 | 0.61 | † | 2.64 | 3.28 | 1.91 | |||||||||||||||
| Portfolio turnover rate | % | 17 | 51 | 91 | 132 | 62 | ||||||||||||||||
(1) Commencement of operations.
(2) Total return is calculated assuming reinvestment of all dividends and capital gain distributions at net asset value and excluding the deduction of sales charges. Total return for less than one year is not annualized.
(3) Annualized for periods less than one year.
(4) The Investment Adviser has agreed to limit expenses, (excluding interest, taxes, brokerage and extraordinary expenses) subject to possible recoupment by ING Investments, LLC within three years of being incurred.
* Per share data calculated using average number of shares outstanding throughout the period.
† Effective June 1, 2005, the Fund adopted a policy to reduce cost of investments for financial statement purposes by the distributions received in excess of income from Real Estate Investment Trusts. The effect of this change for the twelve months ended May 31, 2006 was to decrease the net investment income per share by $0.25, increase net realized and unrealized gain on investments per share by $0.25 and decrease the ratio of net investment income to average net assets from 2.91% to 1.36% and 2.16% to 0.61% on Class A and Class B, respectively.
58
Table of Contents
Selected data for a share of beneficial interest outstanding throughout each period.
| Class C | ||||||||||||||||||||||
| Six Months | January 17, | |||||||||||||||||||||
| Ended | Year Ended May 31, | 2003(1) to | ||||||||||||||||||||
| November 30, | May 31, | |||||||||||||||||||||
| 2006 | 2006 | 2005 | 2004 | 2003 | ||||||||||||||||||
Per Share Operating Performance: | ||||||||||||||||||||||
| Net asset value, beginning of period | $ | 16.98 | 15.28 | 13.11 | 11.37 | 9.96 | ||||||||||||||||
| Income (loss) from investment operations: | ||||||||||||||||||||||
| Net investment income (loss) | $ | 0.02 | 0.11 | † | 0.38 | * | 0.43 | (0.01 | )* | |||||||||||||
| Net realized and unrealized gain on investments | $ | 4.51 | 3.09 | 3.13 | 2.40 | 1.50 | ||||||||||||||||
| Total from investment operations | $ | 4.53 | 3.20 | 3.51 | 2.83 | 1.49 | ||||||||||||||||
| Less distributions from: | ||||||||||||||||||||||
| Net investment income | $ | 0.15 | 0.37 | 0.39 | 0.58 | 0.08 | ||||||||||||||||
| Net realized gain from investments | $ | — | 1.13 | 0.95 | 0.51 | — | ||||||||||||||||
| Total distributions | $ | 0.15 | 1.50 | 1.34 | 1.09 | 0.08 | ||||||||||||||||
| Net asset value, end of period | $ | 21.36 | 16.98 | 15.28 | 13.11 | 11.37 | ||||||||||||||||
| Total Return(2) | % | 26.81 | 21.69 | 27.57 | 25.75 | 15.03 | ||||||||||||||||
Ratios and Supplemental Data: | ||||||||||||||||||||||
| Net assets, end of period (000’s) | $ | 4,408 | 3,124 | 2,720 | 2,708 | 157 | ||||||||||||||||
| Ratios to average net assets: | ||||||||||||||||||||||
| Net expenses after expense reimbursement/ recoupment and brokerage commission recapture(3)(4) | % | 1.93 | 1.91 | 1.90 | 2.02 | 2.20 | ||||||||||||||||
| Net expenses after expense reimbursement/ recoupment and prior to brokerage commission recapture (3)(4) | % | 1.95 | 1.95 | 1.98 | 2.06 | 2.20 | ||||||||||||||||
| Gross expenses prior to expense reimbursement and brokerage commission recapture(3) | % | 1.95 | 1.95 | 1.90 | 2.12 | 2.30 | ||||||||||||||||
| Net investment income (loss) after expense reimbursement/recoupment and brokerage commission recapture(3)(4) | % | 0.17 | 0.61 | † | 2.65 | 3.54 | (1.62 | ) | ||||||||||||||
| Portfolio turnover rate | % | 17 | 51 | 91 | 132 | 62 | ||||||||||||||||
(1) Commencement of operations.
(2) Total return is calculated assuming reinvestment of all dividends and capital gain distributions at net asset value and excluding the deduction of sales charges. Total return for less than one year is not annualized.
(3) Annualized for periods less than one year.
(4) The Investment Adviser has agreed to limit expenses, (excluding interest, taxes, brokerage and extraordinary expenses) subject to possible recoupment by ING Investments, LLC within three years of being incurred.
* Per share data calculated using average number of shares outstanding throughout the period.
† Effective June 1, 2005, the Fund adopted a policy to reduce cost of investments for financial statement purposes by the distributions received in excess of income from Real Estate Investment Trusts. The effect of this change for the twelve months ended May 31, 2006 was to decrease the net investment income per share by $0.26, increase net realized and unrealized gain on investments per share by $0.26 and decrease the ratio of net investment income to average net assets from 2.16% to 0.61% on Class C.
59
Table of Contents
Selected data for a share of beneficial interest outstanding throughout each period.
| Class I | ||||||||||||||||||||||||||
| Six Months | Period | |||||||||||||||||||||||||
| Ended | Year Ended May 31, | Ended | Year Ended | |||||||||||||||||||||||
| November 30, | May 31, | October 31, | ||||||||||||||||||||||||
| 2006 | 2006 | 2005 | 2004 | 2003(1) | 2002 | |||||||||||||||||||||
Per Share Operating Performance: | ||||||||||||||||||||||||||
| Net asset value, beginning of period | $ | 17.25 | 15.49 | 13.28 | 11.45 | 9.98 | 9.77 | |||||||||||||||||||
| Income from investment operations: | ||||||||||||||||||||||||||
| Net investment income | $ | 0.12 | 0.28 | *† | 0.54 | * | 0.58 | 0.20 | 0.60 | |||||||||||||||||
| Net realized and unrealized gain on investments | $ | 4.57 | 3.14 | 3.15 | 2.43 | 1.47 | 0.23 | |||||||||||||||||||
| Total from investment operations | $ | 4.69 | 3.42 | 3.69 | 3.01 | 1.67 | 0.83 | |||||||||||||||||||
| Less distributions from: | ||||||||||||||||||||||||||
| Net investment income | $ | 0.24 | 0.53 | 0.53 | 0.67 | 0.20 | 0.62 | |||||||||||||||||||
| Net realized gain from investments | $ | — | 1.13 | 0.95 | 0.51 | — | — | |||||||||||||||||||
| Total distributions | $ | 0.24 | 1.66 | 1.48 | 1.18 | 0.20 | 0.62 | |||||||||||||||||||
| Net asset value, end of period | $ | 21.70 | 17.25 | 15.49 | 13.28 | 11.45 | 9.98 | |||||||||||||||||||
| Total Return(2) | % | 27.41 | 22.98 | 28.82 | 27.24 | 16.95 | 8.06 | |||||||||||||||||||
Ratios and Supplemental Data: | ||||||||||||||||||||||||||
| Net assets, end of period (000’s) | $ | 184,268 | 144,907 | 146,499 | 161,904 | 125,645 | 97,331 | |||||||||||||||||||
| Ratios to average net assets: | ||||||||||||||||||||||||||
| Net expenses after expense reimbursement/ recoupment and brokerage commission recapture(3)(4) | % | 0.89 | 0.88 | 0.90 | 0.96 | 1.00 | 0.98 | |||||||||||||||||||
| Net expenses after expense reimbursement/ recoupment and prior to brokerage commission recapture(3)(4) | % | 0.92 | 0.92 | 0.98 | 0.96 | 1.00 | 0.98 | |||||||||||||||||||
| Gross expenses prior to expense reimbursement/ recoupment and brokerage commission recapture(3) | % | 0.92 | 0.92 | 0.90 | 1.06 | 1.19 | 0.98 | |||||||||||||||||||
| Net investment income after expense reimbursement(3)(4) | % | 1.20 | 1.68 | † | 3.70 | 4.69 | 4.26 | 4.29 | ||||||||||||||||||
| Portfolio turnover rate | % | 17 | 51 | 91 | 132 | 62 | 106 | |||||||||||||||||||
(1) On November 4, 2002, pursuant to an Agreement and Plan of Reorganization dated August 20, 2002, all of the assets and liabilities of the CRA Realty Shares Portfolio were transferred to the newly created ING Real Estate Fund in exchange for shares of the ING Real Estate Fund. The financial highlight information presented for periods prior to November 4, 2002 reflects the activity of the CRA Realty Shares Portfolio. The ING Real Estate Fund has adopted a fiscal year end of May 31.
(2) Total return is calculated assuming reinvestment of all dividends and capital gain distributions at net asset value and excluding the deduction of sales charges. Total return for less than one year is not annualized.
(3) Annualized for periods less than one year.
(4) The Investment Adviser has agreed to limit expenses, (excluding interest, taxes, brokerage and extraordinary expenses) subject to possible recoupment by ING Investments, LLC within three years of being incurred.
* Per share data calculated using average number of shares outstanding throughout the period.
† Effective June 1, 2005, the Fund adopted a policy to reduce cost of investments for financial statement purposes by the distributions received in excess of income from Real Estate Investment Trusts. The effect of this change for the twelve months ended May 31, 2006 was to decrease the net investment income per share by $0.26, increase net realized and unrealized gain on investments per share by $0.26 and decrease the ratio of net investment income to average net assets from 3.23% to 1.68% on Class I.
60
Table of Contents
Selected data for a share of beneficial interest outstanding throughout each period.
| Class O | ||||||||||||||
| Six Months | Year | September 15, | ||||||||||||
| Ended | Ended | 2004(1) to | ||||||||||||
| November 30, | May 31, | May 31, | ||||||||||||
| 2006 | 2006 | 2005 | ||||||||||||
Per Share Operating Performance: | ||||||||||||||
| Net asset value, beginning of period | $ | 16.40 | 14.81 | 13.52 | ||||||||||
| Income from investment operations: | ||||||||||||||
| Net investment income | $ | 0.09 | * | 0.21 | † | 0.39 | ||||||||
| Net realized and unrealized gain on investments | $ | 4.35 | 3.00 | 2.23 | ||||||||||
| Total from investment operations | $ | 4.44 | 3.21 | 2.62 | ||||||||||
| Less distributions from: | ||||||||||||||
| Net investment income | $ | 0.22 | 0.49 | 0.38 | ||||||||||
| Net realized gain from investments | $ | — | 1.13 | 0.95 | ||||||||||
| Total distributions | $ | 0.22 | 1.62 | 1.33 | ||||||||||
| Net asset value, end of period | $ | 20.62 | 16.40 | 14.81 | ||||||||||
| Total Return(2) | % | 27.29 | 22.60 | 20.12 | ||||||||||
Ratios and Supplemental Data: | ||||||||||||||
| Net assets, end of period (000’s) | $ | 44,939 | 28,720 | 12,305 | ||||||||||
| Ratios to average net assets: | ||||||||||||||
| Net expenses after expense reimbursement/recoupment and brokerage commission recapture(3)(4) | % | 1.13 | 1.13 | 1.15 | ||||||||||
| Net expenses after expense reimbursement/recoupment and prior to brokerage commission recapture(3)(4) | % | 1.15 | 1.16 | 1.23 | ||||||||||
| Gross expenses prior to expense reimbursement and brokerage commission recapture(3) | % | 1.15 | 1.16 | 1.15 | ||||||||||
| Net investment income after expense reimbursement/recoupment and brokerage commission recapture (3)(4) | % | 0.96 | 1.36 | † | 3.32 | |||||||||
| Portfolio turnover rate | % | 17 | 51 | 91 | ||||||||||
(1) Commencement of operations.
(2) Total return is calculated assuming reinvestment of all dividends and capital gain distributions at net asset value and excluding the deduction of sales charges. Total return for less than one year is not annualized.
(3) Annualized for periods less than one year.
(4) The Investment Adviser has agreed to limit expenses, (excluding interest, taxes, brokerage and extraordinary expenses) subject to possible recoupment by ING Investments, LLC within three years of being incurred.
* Per share data calculated using average number of shares outstanding throughout the period.
† Effective June 1, 2005, the Fund adopted a policy to reduce cost of investments for financial statement purposes by the distributions received in excess of income from Real Estate Investment Trusts. The effect of this change for the twelve months ended May 31, 2006 was to decrease the net investment income per share by $0.25, increase net realized and unrealized gain on investments per share by $0.25 and decrease the ratio of net investment income to average net assets from 2.91% to 1.36% on Class O.
61
Table of Contents
Selected data for a share of beneficial interest outstanding throughout each period.
| Class A | ||||||||||||||||||||||||||
| Six Months | ||||||||||||||||||||||||||
| Ended | Year Ended May 31, | |||||||||||||||||||||||||
| November 30, | ||||||||||||||||||||||||||
| 2006 | 2006 | 2005 | 2004 | 2003 | 2002 | |||||||||||||||||||||
Per Share Operating Performance: | ||||||||||||||||||||||||||
| Net asset value, beginning of period | $ | 10.32 | 9.68 | 8.82 | 7.61 | 8.43 | 9.87 | |||||||||||||||||||
| Income (loss) from investment operations: | ||||||||||||||||||||||||||
| Net investment income | $ | 0.03 | 0.05 | 0.06 | 0.01 | 0.03 | 0.03 | |||||||||||||||||||
| Net realized and unrealized gain (loss) on investments | $ | 1.09 | 0.63 | 0.80 | 1.20 | (0.85 | ) | (1.47 | ) | |||||||||||||||||
| Total from investment operations | $ | 1.12 | 0.68 | 0.86 | 1.21 | (0.82 | ) | (1.44 | ) | |||||||||||||||||
| Less distributions from: | ||||||||||||||||||||||||||
| Net investments income | $ | — | 0.04 | — | — | — | — | |||||||||||||||||||
| Total distributions | $ | — | 0.04 | — | — | — | — | |||||||||||||||||||
| Net asset value, end of period | $ | 11.44 | 10.32 | 9.68 | 8.82 | 7.61 | 8.43 | |||||||||||||||||||
| Total Return(1) | % | 10.85 | 7.02 | 9.75 | 15.90 | (9.73 | ) | (14.59 | ) | |||||||||||||||||
Ratios and Supplemental Data: | ||||||||||||||||||||||||||
| Net assets, end of period (000’s) | $ | 5,635 | 4,977 | 5,173 | 5,362 | 7,205 | 9,883 | |||||||||||||||||||
| Ratios to average net assets: | ||||||||||||||||||||||||||
| Net expenses after expense reimbursement(2)(3) | % | 1.36 | 1.36 | 1.40 | 1.53 | 1.54 | 1.33 | |||||||||||||||||||
| Gross expenses prior to expense reimbursement(3)(4) | % | 1.55 | 1.50 | 1.42 | 1.53 | 1.54 | 1.33 | |||||||||||||||||||
| Net investment income (loss) after expense reimbursement(2)(3) | % | 0.51 | 0.51 | 0.60 | 0.11 | 0.32 | 0.12 | |||||||||||||||||||
| Portfolio turnover rate | % | 56 | 173 | 154 | 200 | 106 | 149 | |||||||||||||||||||
| Class B | ||||||||||||||||||||||||||
| Six Months | ||||||||||||||||||||||||||
| Ended | Year Ended May 31, | |||||||||||||||||||||||||
| November 30, | ||||||||||||||||||||||||||
| 2006 | 2006 | 2005 | 2004 | 2003 | 2002 | |||||||||||||||||||||
Per Share Operating Performance: | ||||||||||||||||||||||||||
| Net asset value, beginning of period | $ | 9.83 | 9.25 | 8.49 | 7.37 | 8.23 | 9.70 | |||||||||||||||||||
| Income (loss) from investment operations: | ||||||||||||||||||||||||||
| Net investment loss | $ | (0.01 | ) | (0.03 | ) | (0.01 | ) | (0.05 | ) | (0.03 | ) | (0.07 | ) | |||||||||||||
| Net realized and unrealized gain (loss) on investments | $ | 1.02 | 0.61 | 0.77 | 1.17 | (0.83 | ) | (1.40 | ) | |||||||||||||||||
| Total from investment operations | $ | 1.01 | 0.58 | 0.76 | 1.12 | (0.86 | ) | (1.47 | ) | |||||||||||||||||
| Net asset value, end of period | $ | 10.84 | 9.83 | 9.25 | 8.49 | 7.37 | 8.23 | |||||||||||||||||||
| Total Return(1) | % | 10.27 | 6.27 | 8.95 | 15.20 | (10.45 | ) | (15.15 | ) | |||||||||||||||||
Ratios and Supplemental Data: | ||||||||||||||||||||||||||
| Net assets, end of period (000’s) | $ | 23,478 | 23,954 | 28,635 | 32,848 | 34,358 | 53,185 | |||||||||||||||||||
| Ratios to average net assets: | ||||||||||||||||||||||||||
| Net expenses after expense reimbursement(2)(3) | % | 2.11 | 2.11 | 2.12 | 2.23 | 2.24 | 2.03 | |||||||||||||||||||
| Gross expenses prior to expense reimbursement(3) | % | 2.25 | 2.20 | 2.12 | 2.23 | 2.24 | 2.03 | |||||||||||||||||||
| Net investment loss after expense reimbursement(2)(3) | % | (0.26 | ) | (0.25 | ) | (0.11 | ) | (0.59 | ) | (0.43 | ) | (0.58 | ) | |||||||||||||
| Portfolio turnover rate | % | 56 | 173 | 154 | 200 | 106 | 149 | |||||||||||||||||||
(1) Total return is calculated assuming reinvestment of all dividends and capital gain distributions at net asset value and excluding the deduction of sales charges. Total return for less than one year is not annualized.
(2) The Investment Adviser has agreed to limit expenses, (excluding interest, taxes, brokerage and extraordinary expenses) subject to possible recoupment by ING Investments, LLC within three years of being incurred.
(3) Annualized for periods less than one year.
(4) ING Funds Distributor, LLC has contractually agreed to waive 0.05% of the Distribution Fee for Class A shares of Disciplined LargeCap.
62
Table of Contents
Selected data for a share of beneficial interest outstanding throughout each period.
| Class C | ||||||||||||||||||||||||||
| Six Months | ||||||||||||||||||||||||||
| Ended | Year Ended May 31, | |||||||||||||||||||||||||
| November 30, | ||||||||||||||||||||||||||
| 2006 | 2006 | 2005 | 2004 | 2003 | 2002 | |||||||||||||||||||||
Per Share Operating Performance: | ||||||||||||||||||||||||||
| Net asset value, beginning of period | $ | 9.82 | 9.25 | 8.49 | 7.37 | 8.23 | 9.70 | |||||||||||||||||||
| Income (loss) from investment operations: | ||||||||||||||||||||||||||
| Net investment loss | $ | (0.01 | ) | (0.03 | ) | (0.01 | ) | (0.06 | ) | (0.04 | ) | (0.09 | ) | |||||||||||||
| Net realized and unrealized gain (loss) on investments | $ | 1.03 | 0.60 | 0.77 | 1.18 | (0.82 | ) | (1.38 | ) | |||||||||||||||||
| Total from investment operations | $ | 1.02 | 0.57 | 0.76 | 1.12 | (0.86 | ) | (1.47 | ) | |||||||||||||||||
| Net asset value, end of period | $ | 10.84 | 9.82 | 9.25 | 8.49 | 7.37 | 8.23 | |||||||||||||||||||
| Total Return(1) | % | 10.39 | 6.16 | 8.95 | 15.20 | (10.45 | ) | (15.15 | ) | |||||||||||||||||
Ratios and Supplemental Data: | ||||||||||||||||||||||||||
| Net assets, end of period (000’s) | $ | 9,049 | 9,471 | 12,170 | 15,233 | 21,478 | 36,486 | |||||||||||||||||||
| Ratios to average net assets: | ||||||||||||||||||||||||||
| Net expenses after expense reimbursement(2)(3) | % | 2.11 | 2.11 | 2.12 | 2.23 | 2.24 | 2.03 | |||||||||||||||||||
| Gross expenses prior to expense reimbursement(3) | % | 2.25 | 2.20 | 2.12 | 2.23 | 2.24 | 2.03 | |||||||||||||||||||
| Net investment loss after expense reimbursement(2)(3) | % | (0.26 | ) | (0.25 | ) | (0.11 | ) | (0.59 | ) | (0.43 | ) | (0.58 | ) | |||||||||||||
| Portfolio turnover rate | % | 56 | 173 | 154 | 200 | 106 | 149 | |||||||||||||||||||
(1) Total return is calculated assuming reinvestment of all dividends and capital gain distributions at net asset value and excluding the deduction of sales charges. Total return for less than one year is not annualized.
(2) The Investment Adviser has agreed to limit expenses, (excluding interest, taxes, brokerage and extraordinary expenses) subject to possible recoupment by ING Investments, LLC within three years of being incurred.
(3) Annualized for periods less than one year.
63
Table of Contents
Selected data for a share of beneficial interest outstanding throughout each period.
| Class A | Class B | Class C | Class I | |||||||||||||||||||||||||||
| Six Months | Six Months | Six Months | July 18, | |||||||||||||||||||||||||||
| Ended | December 28, | Ended | February 6, | Ended | April 17, | 2006(1) to | ||||||||||||||||||||||||
| November 30, | 2005(1) to | November 30, | 2006(1) to | November 30, | 2006(1) to | November 30, | ||||||||||||||||||||||||
| 2006 | May 31, 2006 | 2006 | May 31, 2006 | 2006 | May 31, 2006 | 2006 | ||||||||||||||||||||||||
Per Share Operating Performance: | ||||||||||||||||||||||||||||||
| Net asset value, beginning of period | $ | 10.16 | 10.00 | 10.12 | 10.15 | 10.12 | 10.31 | 9.77 | ||||||||||||||||||||||
| Income (loss) from investment operations: | ||||||||||||||||||||||||||||||
| Net investment income (loss) | $ | 0.03 | 0.01 | (0.01 | )* | (0.02 | )* | (0.01 | )* | (0.02 | )* | 0.04 | * | |||||||||||||||||
| Net realized and unrealized gain (loss) on investments | $ | 0.80 | 0.15 | 0.80 | (0.01 | )* | 0.81 | (0.17 | ) | 1.19 | ||||||||||||||||||||
| Total from investment operations | $ | 0.83 | 0.16 | 0.79 | (0.03 | ) | 0.80 | (0.19 | ) | 1.23 | ||||||||||||||||||||
| Net asset value, end of period | $ | 10.99 | 10.16 | 10.91 | 10.12 | 10.92 | 10.12 | 11.00 | ||||||||||||||||||||||
| Total Return(2) | % | 8.17 | 1.60 | 7.81 | (0.30 | ) | 7.91 | (1.84 | ) | 12.59 | ||||||||||||||||||||
Ratios and Supplemental Data: | ||||||||||||||||||||||||||||||
| Net assets, end of period (000’s) | $ | 5,603 | 5,136 | 60 | 25 | 121 | 77 | 2 | ||||||||||||||||||||||
| Ratios to average net assets: | ||||||||||||||||||||||||||||||
| Net expenses after expense reimbursement(3)(4) | % | 1.25 | 1.25 | 2.00 | 2.00 | 2.00 | 2.00 | 0.88 | ||||||||||||||||||||||
| Gross expenses prior to expense reimbursement(3) | % | 5.55 | 3.74 | 6.30 | 4.49 | 6.30 | 4.49 | 5.18 | ||||||||||||||||||||||
| Net investment income (loss) after expense reimbursement(3)(4) | % | 0.57 | 0.32 | (0.25 | ) | (0.42 | ) | (0.24 | ) | (0.42 | ) | 0.99 | ||||||||||||||||||
| Portfolio turnover rate | % | 116 | 54 | 116 | 54 | 116 | 54 | 116 | ||||||||||||||||||||||
(1) Commencement of operations.
(2) Total return is calculated assuming reinvestment of all dividends and capital gain distributions at net asset value and excluding the deduction of sales charges. Total return for less than one year is not annualized.
(3) Annualized for periods less than one year.
(4) The Investment Adviser has agreed to limit expenses (excluding interest, taxes, brokerage and extraordinary expenses) subject to possible recoupment by ING Investment, LLC within three years of being incurred.
* Per share data calculated using average number of shares outstanding throughout the period.
64
Table of Contents
Selected data for a share of beneficial interest outstanding throughout each period.
| Class A | ||||||||||||||||||||||||||
| Six Months | ||||||||||||||||||||||||||
| Ended | Year Ended May 31, | |||||||||||||||||||||||||
| November 30, | ||||||||||||||||||||||||||
| 2006 | 2006 | 2005 | 2004 | 2003 | 2002 | |||||||||||||||||||||
Per Share Operating Performance: | ||||||||||||||||||||||||||
| Net asset value, beginning of period | $ | 18.64 | 17.88 | 18.11 | 14.33 | 16.59 | 24.40 | |||||||||||||||||||
| Income (loss) from investment operations: | ||||||||||||||||||||||||||
| Net investment loss | $ | (0.07 | ) | (0.10 | )** | (0.07 | ) | (0.10 | ) | (0.15 | ) | (0.18 | ) | |||||||||||||
| Net realized and unrealized gain (loss) on investments | $ | 1.35 | 0.86 | 0.37 | 3.88 | (2.11 | ) | (7.63 | ) | |||||||||||||||||
| Total from investment operations | $ | 1.28 | 0.76 | 0.30 | 3.78 | (2.26 | ) | (7.81 | ) | |||||||||||||||||
| Less distributions from: | ||||||||||||||||||||||||||
| Net investment income | $ | — | — | 0.38 | — | — | 0.00 | * | ||||||||||||||||||
| Return of capital | $ | — | — | 0.15 | — | — | — | |||||||||||||||||||
| Total distributions | $ | — | — | 0.53 | — | — | 0.00 | * | ||||||||||||||||||
| Net asset value, end of period | $ | 19.92 | 18.64 | 17.88 | 18.11 | 14.33 | 16.59 | |||||||||||||||||||
| Total Return(1) | % | 6.87 | 4.25 | 1.65 | 26.38 | (13.62 | ) | (31.99 | ) | |||||||||||||||||
Ratios and Supplemental Data: | ||||||||||||||||||||||||||
| Net assets, end of period (000’s) | $ | 85,826 | 95,300 | 111,208 | 109,858 | 40,941 | 65,642 | |||||||||||||||||||
| Ratios to average net assets: | ||||||||||||||||||||||||||
| Net expenses after expense reimbursement/ recoupment and brokerage commission recapture(2)(3) | % | 1.43 | 1.44 | 1.43 | 1.42 | 1.60 | 1.58 | |||||||||||||||||||
| Net expenses after expense reimbursement/ recoupment and prior to brokerage commission recapture (2)(3) | % | 1.45 | 1.45 | 1.45 | 1.45 | 1.60 | 1.58 | |||||||||||||||||||
| Gross expenses prior to expense reimbursement and brokerage commission recapture(3) | % | 1.45 | 1.43 | 1.40 | 1.61 | 1.76 | 1.58 | |||||||||||||||||||
| Net investment loss after expense reimbursement/ recoupment and brokerage commission recapture(2)(3) | % | (0.67 | ) | (0.55 | ) | (0.49 | ) | (0.82 | ) | (0.96 | ) | (1.12 | ) | |||||||||||||
| Portfolio turnover rate | % | 42 | 99 | 81 | 142 | 291 | 536 | |||||||||||||||||||
| Class B | ||||||||||||||||||||||||||
| Six Months | ||||||||||||||||||||||||||
| Ended | Year Ended May 31, | |||||||||||||||||||||||||
| November 30, | ||||||||||||||||||||||||||
| 2006 | 2006 | 2005 | 2004 | 2003 | 2002 | |||||||||||||||||||||
Per Share Operating Performance: | ||||||||||||||||||||||||||
| Net asset value, beginning of period | $ | 17.95 | 17.33 | 17.57 | 13.99 | 16.30 | 24.14 | |||||||||||||||||||
| Income (loss) from investment operations: | ||||||||||||||||||||||||||
| Net investment loss | $ | (0.13 | ) | (0.22 | )** | (0.24 | ) | (0.21 | ) | (0.24 | ) | (0.43 | ) | |||||||||||||
| Net realized and unrealized gain (loss) on investments | $ | 1.31 | 0.84 | 0.41 | 3.79 | (2.07 | ) | (7.41 | ) | |||||||||||||||||
| Total from investment operations | $ | 1.18 | 0.62 | 0.17 | 3.58 | (2.31 | ) | (7.84 | ) | |||||||||||||||||
| Less distributions from: | ||||||||||||||||||||||||||
| Net investment income | $ | — | — | 0.26 | — | — | — | |||||||||||||||||||
| Return of capital | $ | — | — | 0.15 | — | — | — | |||||||||||||||||||
| Total distributions | $ | — | — | 0.41 | — | — | — | |||||||||||||||||||
| Net asset value, end of period | $ | 19.13 | 17.95 | 17.33 | 17.57 | 13.99 | 16.30 | |||||||||||||||||||
| Total Return(1) | % | 6.57 | 3.58 | 0.97 | 25.59 | (14.17 | ) | (32.48 | ) | |||||||||||||||||
Ratios and Supplemental Data: | ||||||||||||||||||||||||||
| Net assets, end of period (000’s) | $ | 74,357 | 83,019 | 106,162 | 119,658 | 72,575 | 116,738 | |||||||||||||||||||
| Ratios to average net assets: | ||||||||||||||||||||||||||
| Net expenses after expense reimbursement/ recoupment and brokerage commission recapture(2)(3) | % | 2.08 | 2.09 | 2.08 | 2.07 | 2.25 | 2.23 | |||||||||||||||||||
| Net expenses after expense reimbursement/ recoupment and prior to brokerage commission recapture(2)(3) | % | 2.10 | 2.10 | 2.10 | 2.09 | 2.25 | 2.23 | |||||||||||||||||||
| Gross expenses prior to expense reimbursement/ recoupment and brokerage commission recapture(3) | % | 2.10 | 2.08 | 2.05 | 2.26 | 2.41 | 2.23 | |||||||||||||||||||
| Net investment loss after expense reimbursement and brokerage commission recapture(2)(3) | % | (1.32 | ) | (1.20 | ) | (1.13 | ) | (1.47 | ) | (1.61 | ) | (1.77 | ) | |||||||||||||
| Portfolio turnover rate | % | 42 | 99 | 81 | 142 | 291 | 536 | |||||||||||||||||||
(1) Total return is calculated assuming reinvestment of all dividends and capital gain distributions at net asset value and excluding the deduction of sales charges. Total return for less than one year is not annualized.
(2) The Investment Adviser has agreed to limit expenses, (excluding interest, taxes, brokerage and extraordinary expenses) subject to possible recoupment by ING Investments, LLC within three years of being incurred.
(3) Annualized for periods less than one year.
* Amount represents less than $0.005 per share.
** Per share data calculated using average number of shares outstanding throughout the period.
65
Table of Contents
Selected data for a share of beneficial interest outstanding throughout each period.
| Class C | ||||||||||||||||||||||||||
| Six Months | ||||||||||||||||||||||||||
| Ended | Year Ended May 31, | |||||||||||||||||||||||||
| November 30, | ||||||||||||||||||||||||||
| 2006 | 2006 | 2005 | 2004 | 2003 | 2002 | |||||||||||||||||||||
Per Share Operating Performance: | ||||||||||||||||||||||||||
| Net asset value, beginning of period | $ | 17.90 | 17.27 | 17.52 | 13.95 | 16.25 | 24.07 | |||||||||||||||||||
| Income (loss) from investment operations: | ||||||||||||||||||||||||||
| Net investment loss | $ | (0.13 | ) | (0.22 | )* | (0.19 | ) | (0.22 | ) | (0.25 | ) | (0.48 | ) | |||||||||||||
| Net realized and unrealized gain (loss) on investments | $ | 1.30 | 0.85 | 0.36 | 3.79 | (2.05 | ) | (7.34 | ) | |||||||||||||||||
| Total from investment operations | $ | 1.17 | 0.63 | 0.17 | 3.57 | (2.30 | ) | (7.82 | ) | |||||||||||||||||
| Less distributions from: | ||||||||||||||||||||||||||
| Net investment income | $ | — | — | 0.27 | — | — | — | |||||||||||||||||||
| Return of capital | $ | — | — | 0.15 | — | — | — | |||||||||||||||||||
| Total distributions | $ | — | — | 0.42 | — | — | — | |||||||||||||||||||
| Net asset value, end of period | $ | 19.07 | 17.90 | 17.27 | 17.52 | 13.95 | 16.25 | |||||||||||||||||||
| Total Return(2) | % | 6.54 | 3.65 | 0.92 | 25.59 | (14.15 | ) | (32.49 | ) | |||||||||||||||||
Ratios and Supplemental Data: | ||||||||||||||||||||||||||
| Net assets, end of period (000’s) | $ | 40,047 | 43,089 | 52,355 | 53,976 | 31,516 | 54,048 | |||||||||||||||||||
| Ratios to average net assets: | ||||||||||||||||||||||||||
| Net expenses after expense reimbursement and brokerage commission recapture(3)(4) | % | 2.08 | 2.09 | 2.08 | 2.07 | 2.25 | 2.23 | |||||||||||||||||||
| Net expenses after expense reimbursement and prior to brokerage commission recapture (3)(4) | % | 2.10 | 2.10 | 2.10 | 2.09 | 2.25 | 2.23 | |||||||||||||||||||
| Gross expenses prior to expense reimbursement and brokerage commission recapture(3) | % | 2.10 | 2.08 | 2.05 | 2.26 | 2.41 | 2.23 | |||||||||||||||||||
| Net investment loss after expense reimbursement and brokerage commission recapture(3)(4) | % | (1.32 | ) | (1.20 | ) | (1.13 | ) | (1.47 | ) | (1.61 | ) | (1.77 | ) | |||||||||||||
| Portfolio turnover rate | % | 42 | 99 | 81 | 142 | 291 | 536 | |||||||||||||||||||
| Class I | ||||||||||||||||||||||||||
| Six Months | January 8, | |||||||||||||||||||||||||
| Ended | Year Ended May 31, | 2002(1) to | ||||||||||||||||||||||||
| November 30, | May 31, | |||||||||||||||||||||||||
| 2006 | 2006 | 2005 | 2004 | 2003 | 2002 | |||||||||||||||||||||
Per Share Operating Performance: | ||||||||||||||||||||||||||
| Net asset value, beginning of period | $ | 19.35 | 18.47 | 18.69 | 14.71 | 16.93 | 21.04 | |||||||||||||||||||
| Income (loss) from investment operations: | ||||||||||||||||||||||||||
| Net investment income (loss) | $ | (0.02 | ) | (0.01 | )* | 0.02 | (0.05 | ) | (0.06 | ) | (0.02 | ) | ||||||||||||||
| Net realized and unrealized gain (loss) on investments | $ | 1.40 | 0.89 | 0.37 | 4.03 | (2.16 | ) | (4.09 | ) | |||||||||||||||||
| Total from investment operations | $ | 1.38 | 0.88 | 0.39 | 3.98 | (2.22 | ) | (4.11 | ) | |||||||||||||||||
| Less distributions from: | ||||||||||||||||||||||||||
| Net investment income | $ | — | — | 0.46 | — | — | — | |||||||||||||||||||
| Return of capital | $ | — | — | 0.15 | — | — | — | |||||||||||||||||||
| Total distribution | $ | — | — | 0.61 | — | — | — | |||||||||||||||||||
| Net asset value, end of period | $ | 20.73 | 19.35 | 18.47 | 18.69 | 14.71 | 16.93 | |||||||||||||||||||
| Total Return(2) | % | 7.13 | 4.76 | 2.07 | 27.06 | (13.11 | ) | (19.53 | ) | |||||||||||||||||
Ratios and Supplemental Data: | ||||||||||||||||||||||||||
| Net assets, end of period (000’s) | $ | 68,496 | 66,319 | 38,841 | 36,504 | 22,156 | 26,106 | |||||||||||||||||||
| Ratios to average net assets: | ||||||||||||||||||||||||||
| Net expenses after expense reimbursement and brokerage commission recapture(3)(4) | % | 0.96 | 0.98 | 0.97 | 0.91 | 1.05 | 0.96 | |||||||||||||||||||
| Net expenses after expense reimbursement and prior to brokerage commission recapture (3)(4) | % | 0.98 | 0.98 | 0.99 | 0.94 | 1.05 | 0.96 | |||||||||||||||||||
| Gross expenses prior to expense reimbursement and brokerage commission recapture(3) | % | 0.98 | 0.97 | 0.94 | 1.10 | 1.21 | 0.96 | |||||||||||||||||||
| Net investment loss after expense reimbursement and brokerage commission recapture(3)(4) | % | (0.20 | ) | (0.05 | ) | (0.02 | ) | (0.31 | ) | (0.42 | ) | (0.43 | ) | |||||||||||||
| Portfolio turnover rate | % | 42 | 99 | 81 | 142 | 291 | 536 | |||||||||||||||||||
(1) Commencement of operations
(2) Total return is calculated assuming reinvestment of all dividends and capital gain distributions at net asset value and excluding the deduction of sales charges. Total return for less than one year is not annualized.
(3) Annualized for periods less than one year.
(4) The Investment Adviser has agreed to limit expenses, (excluding interest, taxes, brokerage and extraordinary expenses) subject to possible recoupment by ING Investments, LLC within three years of being incurred.
* Per share data calculated using average number of shares outstanding throughout the period
66
Table of Contents
Selected data for a share of beneficial interest outstanding throughout each period.
| Class Q | ||||||||||||||||||||||||||
| Six Months | ||||||||||||||||||||||||||
| Ended | Year Ended May 31, | |||||||||||||||||||||||||
| November 30, | ||||||||||||||||||||||||||
| 2006 | 2006 | 2005 | 2004 | 2003 | 2002 | |||||||||||||||||||||
Per Share Operating Performance: | ||||||||||||||||||||||||||
| Net asset value, beginning of period | $ | 19.17 | 18.35 | 18.58 | 14.66 | 16.92 | 24.81 | |||||||||||||||||||
| Income (loss) from investment operations: | ||||||||||||||||||||||||||
| Net investment loss | $ | (0.04 | ) | (0.07 | )* | (0.06 | ) | (0.11 | ) | (0.15 | ) | (0.44 | ) | |||||||||||||
| Net realized and unrealized gain (loss) on investments | $ | 1.38 | 0.89 | 0.40 | 4.03 | (2.11 | ) | (7.44 | ) | |||||||||||||||||
| Total from investment operations | $ | 1.34 | 0.82 | 0.34 | 3.92 | (2.26 | ) | (7.88 | ) | |||||||||||||||||
| Less distributions from: | ||||||||||||||||||||||||||
| Net investment income | $ | — | — | 0.42 | — | — | 0.01 | |||||||||||||||||||
| Return of capital | $ | — | — | 0.15 | — | — | — | |||||||||||||||||||
| Total distributions | $ | — | — | 0.57 | — | — | 0.01 | |||||||||||||||||||
| Net asset value, end of period | $ | 20.51 | 19.17 | 18.35 | 18.58 | 14.66 | 16.92 | |||||||||||||||||||
| Total Return(1) | % | 6.99 | 4.47 | 1.81 | 26.74 | (13.36 | ) | (31.77 | ) | |||||||||||||||||
Ratios and Supplemental Data: | ||||||||||||||||||||||||||
| Net assets, end of period (000’s) | $ | 1,146 | 1,051 | 2,037 | 6,035 | 6,178 | 16,840 | |||||||||||||||||||
| Ratios to average net assets: | ||||||||||||||||||||||||||
| Net expenses after expense reimbursement and brokerage commission recapture(2)(3) | % | 1.21 | 1.23 | 1.22 | 1.14 | 1.31 | 1.21 | |||||||||||||||||||
| Net expenses after expense reimbursement and prior to brokerage commission recapture (2)(3) | % | 1.23 | 1.24 | 1.24 | 1.17 | 1.31 | 1.21 | |||||||||||||||||||
| Gross expenses prior to expense reimbursement and brokerage commission recapture(3) | % | 1.23 | 1.22 | 1.19 | 1.32 | 1.47 | 1.21 | |||||||||||||||||||
| Net investment loss after expense reimbursement and brokerage commission recapture(2)(3) | % | (0.45 | ) | (0.36 | ) | (0.27 | ) | (0.53 | ) | (0.66 | ) | (0.76 | ) | |||||||||||||
| Portfolio turnover rate | % | 42 | 99 | 81 | 142 | 291 | 536 | |||||||||||||||||||
(1) Total return is calculated assuming reinvestment of all dividends and capital gain distributions at net asset value and excluding the deduction of sales charges. Total return for less than one year is not annualized.
(2) The Investment Adviser has agreed to limit expenses, (excluding interest, taxes, brokerage and extraordinary expenses) subject to possible recoupment by ING Investments, LLC within three years of being incurred.
(3) Annualized for periods less than one year.
* Per share data calculated using average number of shares outstanding throughout the period.
67
Table of Contents
Selected data for a share of beneficial interest outstanding throughout each period.
| Class A | ||||||||||||||||||||||||||
| Six Months | ||||||||||||||||||||||||||
| Ended | Year Ended May 31, | |||||||||||||||||||||||||
| November 30, | ||||||||||||||||||||||||||
| 2006 | 2006 | 2005 | 2004 | 2003 | 2002 | |||||||||||||||||||||
Per Share Operating Performance: | ||||||||||||||||||||||||||
| Net asset value, beginning of period | $ | 15.18 | 13.01 | 12.06 | 10.12 | 11.11 | 14.58 | |||||||||||||||||||
| Income (loss) from investment operations: | ||||||||||||||||||||||||||
| Net investment loss | $ | (0.05 | ) | (0.13 | )* | (0.16 | ) | (0.06 | ) | (0.12 | ) | (0.17 | )* | |||||||||||||
| Net realized and unrealized gain (loss) on investments | $ | 0.53 | 2.30 | 1.10 | 2.00 | (0.87 | ) | (3.30 | ) | |||||||||||||||||
| Total from investment operations | $ | 0.48 | 2.17 | 0.94 | 1.94 | (0.99 | ) | (3.47 | ) | |||||||||||||||||
| Payment by affiliate | $ | — | — | 0.01 | — | — | — | |||||||||||||||||||
| Net asset value, end of period | $ | 15.66 | 15.18 | 13.01 | 12.06 | 10.12 | 11.11 | |||||||||||||||||||
| Total Return(1) | % | 3.16 | 16.68 | 7.88 | † | 19.17 | (8.91 | ) | (23.80 | ) | ||||||||||||||||
Ratios and Supplemental Data: | ||||||||||||||||||||||||||
| Net assets, end of period (000’s) | $ | 114,734 | 122,820 | 118,668 | 133,363 | 44,010 | 68,106 | |||||||||||||||||||
| Ratios to average net assets: | ||||||||||||||||||||||||||
| Net expenses after expense reimbursement/recoupment(2)(3) | % | 1.25 | 1.39 | 1.64 | 1.59 | 1.50 | 1.77 | |||||||||||||||||||
| Gross expenses prior to expense reimbursement/recoupment(3)(4) | % | 1.84 | 1.82 | 1.71 | 1.70 | 1.83 | 1.99 | |||||||||||||||||||
| Net investment loss after expense reimbursement/recoupment(2)(3) | % | (0.64 | ) | (0.90 | ) | (1.15 | ) | (1.06 | ) | (1.15 | ) | (1.45 | ) | |||||||||||||
| Portfolio turnover rate | % | 86 | 103 | 50 | 115 | 345 | 399 | |||||||||||||||||||
| Class B | ||||||||||||||||||||||||||
| Six Months | ||||||||||||||||||||||||||
| Ended | Year Ended May 31, | |||||||||||||||||||||||||
| November 30, | ||||||||||||||||||||||||||
| 2006 | 2006 | 2005 | 2004 | 2003 | 2002 | |||||||||||||||||||||
Per Share Operating Performance: | ||||||||||||||||||||||||||
| Net asset value, beginning of period | $ | 14.37 | 12.41 | 11.59 | 9.80 | 10.83 | 14.30 | |||||||||||||||||||
| Income (loss) from investment operations: | ||||||||||||||||||||||||||
| Net investment loss | $ | (0.11 | ) | (0.23 | )* | (0.27 | ) | (0.06 | ) | (0.20 | ) | (0.25 | )* | |||||||||||||
| Net realized and unrealized gain (loss) on investments | $ | 0.51 | 2.19 | 1.08 | 1.85 | (0.83 | ) | (3.22 | ) | |||||||||||||||||
| Total from investment operations | $ | 0.40 | 1.96 | 0.81 | 1.79 | (1.03 | ) | (3.47 | ) | |||||||||||||||||
| Payment by affiliate | $ | — | — | 0.01 | — | — | — | |||||||||||||||||||
| Net asset value, end of period | $ | 14.77 | 14.37 | 12.41 | 11.59 | 9.80 | 10.83 | |||||||||||||||||||
| Total Return(1) | % | 2.78 | 15.79 | 7.08 | † | 18.27 | (9.51 | ) | (24.27 | ) | ||||||||||||||||
Ratios and Supplemental Data: | ||||||||||||||||||||||||||
| Net assets, end of period (000’s) | $ | 91,789 | 107,722 | 139,100 | 191,288 | 43,183 | 69,621 | |||||||||||||||||||
| Ratios to average net assets: | ||||||||||||||||||||||||||
| Net expenses after expense reimbursement/recoupment(2)(3) | % | 2.00 | 2.15 | 2.37 | 2.29 | 2.20 | 2.47 | |||||||||||||||||||
| Gross expenses prior to expense reimbursement/recoupment(3) | % | 2.54 | 2.52 | 2.41 | 2.40 | 2.53 | 2.69 | |||||||||||||||||||
| Net investment loss after expense reimbursement/recoupment(2)(3) | % | (1.39 | ) | (1.66 | ) | (1.87 | ) | (1.69 | ) | (1.85 | ) | (2.15 | ) | |||||||||||||
| Portfolio turnover rate | % | 86 | 103 | 50 | 115 | 345 | 399 | |||||||||||||||||||
(1) Total return is calculated assuming reinvestment of all dividends and capital gain distributions at net asset value and excluding the deduction of sales charges. Total return for less than one year is not annualized.
(2) The Investment Adviser has agreed to limit expenses, (excluding interest, taxes, brokerage and extraordinary expenses) subject to possible recoupment by ING Investments, LLC within three years of being incurred.
(3) Annualized for periods less than one year.
(4) ING Funds Distributor, LLC has contractually agreed to waive 0.05% of the Distribution Fee for Class A shares of MidCap Opportunities.
* Per share data calculated using average number of shares outstanding throughout the period.
† In 2005, the Sub-Adviser fully reimbursed the Fund for a loss on an investment transaction, which otherwise would have had a 0.08% impact on the Fund’s total return. Excluding the reimbursement, total return would have been 7.80% and 7.00% for Class A and Class B, respectively.
68
Table of Contents
Selected data for a share of beneficial interest outstanding throughout each period.
| Class C | ||||||||||||||||||||||||||
| Six Months | ||||||||||||||||||||||||||
| Ended | Year Ended May 31, | |||||||||||||||||||||||||
| November 30, | ||||||||||||||||||||||||||
| 2006 | 2006 | 2005 | 2004 | 2003 | 2002 | |||||||||||||||||||||
Per Share Operating Performance: | ||||||||||||||||||||||||||
| Net asset value, beginning of period | $ | 14.30 | 12.35 | 11.53 | 9.75 | 10.77 | 14.24 | |||||||||||||||||||
| Income (loss) from investment operations: | ||||||||||||||||||||||||||
| Net investment loss | $ | (0.10 | ) | (0.23 | )* | (0.26 | ) | (0.12 | ) | (0.19 | ) | (0.25 | )* | |||||||||||||
| Net realized and unrealized gain (loss) on investments | $ | 0.50 | 2.18 | 1.07 | 1.90 | (0.83 | ) | (3.22 | ) | |||||||||||||||||
| Total from investment operations | $ | 0.40 | 1.95 | 0.81 | 1.78 | (1.02 | ) | (3.47 | ) | |||||||||||||||||
| Payment by affiliate | $ | — | — | 0.01 | — | — | — | |||||||||||||||||||
| Net asset value, end of period | $ | 14.70 | 14.30 | 12.35 | 11.53 | 9.75 | 10.77 | |||||||||||||||||||
| Total Return(1) | % | 2.80 | 15.79 | 7.11 | † | 18.26 | (9.47 | ) | (24.37 | ) | ||||||||||||||||
Ratios and Supplemental Data: | ||||||||||||||||||||||||||
| Net assets, end of period (000’s) | $ | 81,911 | 90,156 | 101,261 | 131,461 | 67,730 | 100,888 | |||||||||||||||||||
| Ratios to average net assets: | ||||||||||||||||||||||||||
| Net expenses after expense reimbursement(2)(3) | % | 2.00 | 2.15 | 2.37 | 2.29 | 2.20 | 2.47 | |||||||||||||||||||
| Gross expenses prior to expense reimbursement(3) | % | 2.54 | 2.52 | 2.41 | 2.40 | 2.53 | 2.69 | |||||||||||||||||||
| Net investment loss after expense reimbursement(2)(3) | % | (1.39 | ) | (1.66 | ) | (1.88 | ) | (1.80 | ) | (1.85 | ) | (2.15 | ) | |||||||||||||
| Portfolio turnover rate | % | 86 | 103 | 50 | 115 | 345 | 399 | |||||||||||||||||||
| Class I | ||||||||||||||||||||||||||
| Six Months | ||||||||||||||||||||||||||
| Ended | Year Ended May 31, | |||||||||||||||||||||||||
| November 30, | ||||||||||||||||||||||||||
| 2006 | 2006 | 2005 | 2004 | 2003 | 2002 | |||||||||||||||||||||
Per Share Operating Performance: | ||||||||||||||||||||||||||
| Net asset value, beginning of period | $ | 15.64 | 13.35 | 12.33 | 10.33 | 11.29 | 14.73 | |||||||||||||||||||
| Income (loss) from investment operations: | ||||||||||||||||||||||||||
| Net investment loss | $ | (0.01 | ) | (0.07 | ) | (0.09 | ) | (0.09 | )* | (0.11 | ) | (0.11 | )* | |||||||||||||
| Net realized and unrealized gain (loss) on investments | $ | 0.54 | 2.36 | 1.10 | 2.09 | (0.85 | ) | (3.33 | ) | |||||||||||||||||
| Total from investment operations | $ | 0.53 | 2.29 | 1.01 | 2.00 | (0.96 | ) | (3.44 | ) | |||||||||||||||||
| Payment by affiliate | $ | — | — | 0.01 | — | — | — | |||||||||||||||||||
| Net asset value, end of period | $ | 16.17 | 15.64 | 13.35 | 12.33 | 10.33 | 11.29 | |||||||||||||||||||
| Total Return(1) | % | 3.39 | 17.15 | 8.27 | † | 19.36 | (8.50 | ) | (23.35 | ) | ||||||||||||||||
Ratios and Supplemental Data: | ||||||||||||||||||||||||||
| Net assets, end of period (000’s) | $ | 3,425 | 3,376 | 3,000 | 2,614 | 10,844 | 39,874 | |||||||||||||||||||
| Ratios to average net assets: | ||||||||||||||||||||||||||
| Net expenses after expense reimbursement(2)(3) | % | 0.79 | 0.97 | 1.22 | 1.17 | 1.09 | 1.26 | |||||||||||||||||||
| Gross expenses prior to expense reimbursement(3) | % | 1.33 | 1.34 | 1.27 | 1.31 | 1.41 | 1.50 | |||||||||||||||||||
| Net investment loss after expense reimbursement (2)(3) | % | (0.19 | ) | (0.48 | ) | (0.72 | ) | (0.81 | ) | (0.71 | ) | (0.95 | ) | |||||||||||||
| Portfolio turnover rate | % | 86 | 103 | 50 | 115 | 345 | 399 | |||||||||||||||||||
(1) Total return is calculated assuming reinvestment of all dividends and capital gain distributions at net asset value and excluding the deduction of sales charges. Total return for less than one year is not annualized.
(2) The Investment Adviser has agreed to limit expenses, (excluding interest, taxes, brokerage and extraordinary (expenses) subject to possible recoupment by ING Investments, LLC within three years of being incurred.
(3) Annualized for periods less than one year.
* Per share data calculated using average number of shares outstanding throughout the period.
† In 2005, the Sub-Adviser fully reimbursed the Fund for a loss on an investment transaction, which otherwise would have had a 0.08% impact on the Fund’s total return. Excluding the reimbursement, total return would have been 7.03% and 8.19% for Class C and Class I, respectively.
69
Table of Contents
Selected data for a share of beneficial interest outstanding throughout each period.
| Class Q | ||||||||||||||||||||||||||
| Six Months | ||||||||||||||||||||||||||
| Ended | Year Ended May 31, | |||||||||||||||||||||||||
| November 30, | ||||||||||||||||||||||||||
| 2006 | 2006 | 2005 | 2004 | 2003 | 2002 | |||||||||||||||||||||
Per Share Operating Performance: | ||||||||||||||||||||||||||
| Net asset value, beginning of period | $ | 15.36 | 13.15 | 12.17 | 10.19 | 11.16 | 14.63 | |||||||||||||||||||
| Income (loss) from investment operations: | ||||||||||||||||||||||||||
| Net investment loss | $ | (0.03 | ) | (0.11 | ) | (0.13 | ) | (0.10 | )* | (0.09 | ) | (0.17 | )* | |||||||||||||
| Net realized and unrealized gain (loss) on investments | $ | 0.54 | 2.32 | 1.10 | 2.08 | (0.88 | ) | (3.30 | ) | |||||||||||||||||
| Total from investment operations | $ | 0.51 | 2.21 | 0.97 | 1.98 | (0.97 | ) | (3.47 | ) | |||||||||||||||||
| Payment by affiliate | $ | — | — | 0.01 | — | — | — | |||||||||||||||||||
| Net asset value, end of period | $ | 15.87 | 15.36 | 13.15 | 12.17 | 10.19 | 11.16 | |||||||||||||||||||
| Total Return(1) | % | 3.32 | 16.81 | 8.05 | † | 19.43 | (8.69 | ) | (23.72 | ) | ||||||||||||||||
Ratios and Supplemental Data: | ||||||||||||||||||||||||||
| Net assets, end of period (000’s) | $ | 4,863 | 4,805 | 4,753 | 4,898 | 4,886 | 6,563 | |||||||||||||||||||
| Ratios to average net assets: | ||||||||||||||||||||||||||
| Net expenses after expense reimbursement(2)(3) | % | 1.04 | 1.22 | 1.47 | 1.45 | 1.33 | 1.63 | |||||||||||||||||||
| Gross expenses prior to expense reimbursement(3) | % | 1.58 | 1.60 | 1.52 | 1.56 | 1.66 | 1.69 | |||||||||||||||||||
| Net investment loss after expense reimbursement (2)(3) | % | (0.43 | ) | (0.73 | ) | (0.98 | ) | (1.00 | ) | (0.98 | ) | (1.35 | ) | |||||||||||||
| Portfolio turnover rate | % | 86 | 103 | 50 | 115 | 345 | 399 | |||||||||||||||||||
(1) Total return is calculated assuming reinvestment of all dividends and capital gain distributions at net asset value and excluding the deduction of sales charges. Total return for less than one year is not annualized.
(2) The Investment Adviser has agreed to limit expenses, (excluding interest, taxes, brokerage and extraordinary expenses) subject to possible recoupment by ING Investments, LLC within three years of being incurred.
(3) Annualized for periods less than one year.
* Per share data calculated using average number of shares outstanding throughout the period.
† In 2005, the Sub-Adviser fully reimbursed the Fund for a loss on an investment transaction, which otherwise would have had a 0.08% impact on the Fund’s total return. Excluding the reimbursement, total return would have been 7.97% for Class Q.
70
Table of Contents
Selected data for a share of beneficial interest outstanding throughout each period.
| Class A | Class B | Class C | ||||||||||||||||||||||||
| Six Months | Six Months | Six Months | ||||||||||||||||||||||||
| Ended | December 28, | Ended | April 5, | Ended | April 27, | |||||||||||||||||||||
| November 30, | 2005(1) to | November 30, | 2006(1) to | November 30, | 2006(1) to | |||||||||||||||||||||
| 2006 | May 31, 2006 | 2006 | May 31, 2006 | 2006 | May 31, 2006 | |||||||||||||||||||||
Per Share Operating Performance: | ||||||||||||||||||||||||||
| Net asset value, beginning of period | $ | 10.02 | 10.00 | 10.01 | 10.65 | 10.01 | 10.48 | |||||||||||||||||||
| Income (loss) from investment operations: | ||||||||||||||||||||||||||
| Net investment income (loss) | $ | 0.00 | * | 0.06 | (0.03 | )** | (0.01 | ) | (0.03 | )** | (0.01 | ) | ||||||||||||||
| Net realized and unrealized loss on investments | $ | 0.84 | (0.04 | ) | 0.82 | (0.63 | ) | 0.81 | (0.46 | ) | ||||||||||||||||
| Total from investment operations | $ | 0.84 | 0.02 | 0.79 | (0.64 | ) | 0.78 | (0.47 | ) | |||||||||||||||||
| Net asset value, end of period | $ | 10.86 | 10.02 | 10.80 | 10.01 | 10.79 | 10.01 | |||||||||||||||||||
| Total Return(2) | % | 8.38 | 0.20 | 7.89 | (6.10 | ) | 7.79 | (4.58 | ) | |||||||||||||||||
Ratios and Supplemental Data: | ||||||||||||||||||||||||||
| Net assets, end of period (000’s) | $ | 5,457 | 5,021 | 67 | 35 | 21 | 10 | |||||||||||||||||||
| Ratios to average net assets: | ||||||||||||||||||||||||||
| Net expenses after expense reimbursement (3)(4) | % | 1.25 | 1.25 | 2.00 | 2.00 | 2.00 | 2.00 | |||||||||||||||||||
| Gross expenses prior to expense reimbursement (3) | % | 5.48 | 3.74 | 6.23 | 4.49 | 6.23 | 4.54 | |||||||||||||||||||
| Net investment income (loss) after expense reimbursement(3)(4) | % | 0.01 | 1.32 | (0.64 | ) | (0.81 | ) | (0.65 | ) | (0.74 | ) | |||||||||||||||
| Portfolio turnover rate | % | 87 | 51 | 87 | 51 | 87 | 51 | |||||||||||||||||||
(1) Commencement of operations.
(2) Total return is calculated assuming reinvestment of all dividends and capital gain distributions at net asset value and excluding the deduction of sales charges. Total return for less than one year is not annualized.
(3) Annualized for periods less than one year.
(4) The Investment Adviser has agreed to limit expenses (excluding interest, taxes, brokerage and extraordinary expenses) subject to possible recoupment by ING Investment, LLC within three years of being incurred.
* Amount represents less than $0.005 per share.
** Per share data calculated using average shares outstanding throughout the period.
71
Table of Contents
Selected data for a share of beneficial interest outstanding throughout each period.
| Class A | ||||||||||||||||||||||||||
| Six Months | ||||||||||||||||||||||||||
| Ended | Year Ended May 31, | |||||||||||||||||||||||||
| November 30, | ||||||||||||||||||||||||||
| 2006 | 2006 | 2005 | 2004 | 2003 | 2002 | |||||||||||||||||||||
Per Share Operating Performance: | ||||||||||||||||||||||||||
| Net asset value, beginning of period | $ | 29.23 | 24.37 | 22.53 | 18.16 | 24.04 | 38.78 | |||||||||||||||||||
| Income (loss) from investment operations: | ||||||||||||||||||||||||||
| Net investment loss | $ | (0.13 | ) | (0.31 | )* | (0.31 | )* | (0.37 | ) | (0.35 | ) | (0.51 | )* | |||||||||||||
| Net realized and unrealized gain (loss) on investments | $ | 1.80 | 5.17 | 2.15 | 4.74 | (5.53 | ) | (13.24 | ) | |||||||||||||||||
| Total from investment operations | $ | 1.67 | 4.86 | 1.84 | 4.37 | (5.88 | ) | (13.75 | ) | |||||||||||||||||
| Less distributions from: | ||||||||||||||||||||||||||
| Net realized gain from investments | $ | — | — | — | — | — | 0.99 | |||||||||||||||||||
| Total distributions | $ | — | — | — | — | — | 0.99 | |||||||||||||||||||
| Net asset value, end of period | $ | 30.90 | 29.23 | 24.37 | 22.53 | 18.16 | 24.04 | |||||||||||||||||||
| Total Return(1) | % | 5.71 | 19.94 | 8.17 | 24.06 | † | (24.46 | ) | (35.86 | ) | ||||||||||||||||
Ratios and Supplemental Data: | ||||||||||||||||||||||||||
| Net assets, end of period (000’s) | $ | 83,757 | 89,328 | 93,821 | 105,890 | 118,570 | 183,810 | |||||||||||||||||||
| Ratios to average net assets: | ||||||||||||||||||||||||||
| Net expenses after expense reimbursement(2) | % | 1.50 | 1.50 | 1.63 | 1.74 | 1.88 | 1.81 | |||||||||||||||||||
| Gross expenses prior to expense reimbursement (2)(3) | % | 1.86 | 1.85 | 1.74 | 1.74 | 1.88 | 1.81 | |||||||||||||||||||
| Net investment loss after expense reimbursement(2) | % | (0.83 | ) | (1.13 | ) | (1.36 | ) | (1.52 | ) | (1.80 | ) | (1.70 | ) | |||||||||||||
| Portfolio turnover rate | % | 36 | 87 | 62 | 60 | 357 | 427 | |||||||||||||||||||
| Class B | ||||||||||||||||||||||||||
| Six Months | ||||||||||||||||||||||||||
| Ended | Year Ended May 31, | |||||||||||||||||||||||||
| November 30, | ||||||||||||||||||||||||||
| 2006 | 2006 | 2005 | 2004 | 2003 | 2002 | |||||||||||||||||||||
Per Share Operating Performance: | ||||||||||||||||||||||||||
| Net asset value, beginning of period | $ | 26.57 | 22.32 | 20.78 | 16.87 | 22.48 | 36.60 | |||||||||||||||||||
| Income (loss) from investment operations: | ||||||||||||||||||||||||||
| Net investment loss | $ | (0.21 | )* | (0.47 | )* | (0.44 | )* | (0.50 | ) | (0.48 | ) | (0.68 | )* | |||||||||||||
| Net realized and unrealized gain (loss) on investments | $ | 1.62 | 4.72 | 1.98 | 4.41 | (5.13 | ) | (12.45 | ) | |||||||||||||||||
| Total from investment operations | $ | 1.41 | 4.25 | 1.54 | 3.91 | (5.61 | ) | (13.13 | ) | |||||||||||||||||
| Less distributions from: | ||||||||||||||||||||||||||
| Net realized gain from investments | $ | — | — | — | — | — | 0.99 | |||||||||||||||||||
| Total distributions | $ | — | — | — | — | — | 0.99 | |||||||||||||||||||
| Net asset value, end of period | $ | 27.98 | 26.57 | 22.32 | 20.78 | 16.87 | 22.48 | |||||||||||||||||||
| Total Return(1) | % | 5.31 | 19.04 | 7.41 | 23.18 | † | (24.96 | ) | (36.31 | ) | ||||||||||||||||
Ratios and Supplemental Data: | ||||||||||||||||||||||||||
| Net assets, end of period (000’s) | $ | 26,571 | 30,678 | 43,929 | 77,751 | 85,465 | 154,899 | |||||||||||||||||||
| Ratios to average net assets: | ||||||||||||||||||||||||||
| Net expenses after expense reimbursement(2) | % | 2.25 | 2.25 | 2.35 | 2.44 | 2.58 | 2.51 | |||||||||||||||||||
| Gross expenses prior to expense reimbursement (2) | % | 2.56 | 2.55 | 2.44 | 2.44 | 2.58 | 2.51 | |||||||||||||||||||
| Net investment loss after expense reimbursement(2) | % | (1.58 | ) | (1.88 | ) | (2.10 | ) | (2.07 | ) | (2.50 | ) | (2.40 | ) | |||||||||||||
| Portfolio turnover rate | % | 36 | 87 | 62 | 60 | 357 | 427 | |||||||||||||||||||
(1) Total return is calculated assuming reinvestment of all dividends and capital gain distributions at net asset value and excluding the deduction of sales charges. Total return for less than one year is not annualized.
(2) Annualized for periods less than one year.
(3) ING Funds Distributor, LLC has contractually agreed to waive 0.05% of the Distribution Fee for Class A shares of SmallCap Opportunities.
* Per share data calculated using average number of shares outstanding throughout the period.
† In 2004, the Sub-Adviser fully reimbursed the Fund for a loss on an investment transaction, which otherwise would have had a 0.11% and 0.06% impact on Class A and Class B total returns, respectively. Excluding the reimbursements, the total returns would have been 23.95% and 23.12%, for Class A and Class B, respectively.
72
Table of Contents
Selected data for a share of beneficial interest outstanding throughout each period.
| Class C | ||||||||||||||||||||||||||
| Six Months | ||||||||||||||||||||||||||
| Ended | Year Ended May 31, | |||||||||||||||||||||||||
| November 30, | ||||||||||||||||||||||||||
| 2006 | 2006 | 2005 | 2004 | 2003 | 2002 | |||||||||||||||||||||
Per Share Operating Performance: | ||||||||||||||||||||||||||
| Net asset value, beginning of period | $ | 26.51 | 22.27 | 20.73 | 16.83 | 22.44 | 36.53 | |||||||||||||||||||
| Income (loss) from investment operations: | ||||||||||||||||||||||||||
| Net investment loss | $ | (0.21 | )* | (0.47 | )* | (0.44 | )* | (0.49 | ) | (0.49 | ) | (0.67 | )* | |||||||||||||
| Net realized and unrealized gain (loss) on investments | $ | 1.62 | 4.71 | 1.98 | 4.39 | (5.12 | ) | (12.43 | ) | |||||||||||||||||
| Total from investment operations | $ | 1.41 | 4.24 | 1.54 | 3.90 | (5.61 | ) | (13.10 | ) | |||||||||||||||||
| Less distributions from: | ||||||||||||||||||||||||||
| Net realized gain from investments | $ | — | — | — | — | — | 0.99 | |||||||||||||||||||
| Total distributions | $ | — | — | — | — | — | 0.99 | |||||||||||||||||||
| Net asset value, end of period | $ | 27.92 | 26.51 | 22.27 | 20.73 | 16.83 | 22.44 | |||||||||||||||||||
| Total Return(1) | % | 5.32 | 19.04 | 7.43 | 23.17 | † | (25.00 | ) | (36.30 | ) | ||||||||||||||||
Ratios and Supplemental Data: | ||||||||||||||||||||||||||
| Net assets, end of period (000’s) | $ | 35,761 | 39,174 | 43,603 | 57,140 | 63,406 | 119,498 | |||||||||||||||||||
| Ratios to average net assets: | ||||||||||||||||||||||||||
| Net expenses after expense reimbursement(2) | % | 2.25 | 2.25 | 2.35 | 2.44 | 2.58 | 2.51 | |||||||||||||||||||
| Gross expenses prior to expense reimbursement(2) | % | 2.56 | 2.55 | 2.44 | 2.44 | 2.58 | 2.51 | |||||||||||||||||||
| Net investment loss after expense reimbursement(2) | % | (1.60 | ) | (1.88 | ) | (2.09 | ) | (2.06 | ) | (2.50 | ) | (2.40 | ) | |||||||||||||
| Portfolio turnover rate | % | 36 | 87 | 62 | 60 | 357 | 427 | |||||||||||||||||||
| Class I | ||||||||||||||||||||||||||
| Six Months | ||||||||||||||||||||||||||
| Ended | Year Ended May 31, | |||||||||||||||||||||||||
| November 30, | ||||||||||||||||||||||||||
| 2006 | 2006 | 2005 | 2004 | 2003 | 2002 | |||||||||||||||||||||
Per Share Operating Performance: | ||||||||||||||||||||||||||
| Net asset value, beginning of period | $ | 29.82 | 24.73 | 22.76 | 18.27 | 24.07 | 39.02 | |||||||||||||||||||
| Income (loss) from investment operations: | ||||||||||||||||||||||||||
| Net investment loss | $ | (0.06 | )* | (0.18 | )* | (0.21 | ) | (0.23 | ) | (0.23 | ) | (0.36 | )* | |||||||||||||
| Net realized and unrealized gain (loss) on investments | $ | 1.83 | 5.27 | 2.18 | 4.72 | (5.57 | ) | (13.60 | ) | |||||||||||||||||
| Total from investment operations | $ | 1.77 | 5.09 | 1.97 | 4.49 | (5.80 | ) | (13.96 | ) | |||||||||||||||||
| Less distributions from: | ||||||||||||||||||||||||||
| Net realized gain from investments | $ | — | — | — | — | — | 0.99 | |||||||||||||||||||
| Total distributions | $ | — | — | — | — | — | 0.99 | |||||||||||||||||||
| Net asset value, end of period | $ | 31.59 | 29.82 | 24.73 | 22.76 | 18.27 | 24.07 | |||||||||||||||||||
| Total Return(1) | % | 5.94 | 20.58 | 8.66 | 24.58 | † | (24.10 | ) | (36.17 | ) | ||||||||||||||||
Ratios and Supplemental Data: | ||||||||||||||||||||||||||
| Net assets, end of period (000’s) | $ | 2,958 | 2,727 | 13,359 | 11,526 | 8,510 | 10,700 | |||||||||||||||||||
| Ratios to average net assets: | ||||||||||||||||||||||||||
| Net expenses after expense reimbursement(2) | % | 1.04 | 1.04 | 1.17 | 1.31 | 1.46 | 1.41 | |||||||||||||||||||
| Gross expenses prior to expense reimbursement(2) | % | 1.35 | 1.34 | 1.28 | 1.31 | 1.46 | 1.41 | |||||||||||||||||||
| Net investment loss after expense reimbursement (2) | % | (0.38 | ) | (0.65 | ) | (0.91 | ) | (1.09 | ) | (1.37 | ) | (1.34 | ) | |||||||||||||
| Portfolio turnover rate | % | 36 | 87 | 62 | 60 | 357 | 423 | |||||||||||||||||||
(1) Total return is calculated assuming reinvestment of all dividends and capital gain distributions at net asset value and excluding the deduction of sales charges. Total return for less than one year is not annualized.
(2) Annualized for periods less than one year.
* Per share data calculated using average number of shares outstanding throughout the period.
† In 2004, the Sub-Adviser fully reimbursed the Fund for a loss on an investment transaction, which otherwise would have had a 0.06% impact on Class C and Class I total returns. Excluding the reimbursements, the total returns would have been 23.11% and 24.52% for Class C and Class I, respectively.
73
Table of Contents
Selected data for a share of beneficial interest outstanding throughout each period.
| Class Q | ||||||||||||||||||||||||||
| Six Months | ||||||||||||||||||||||||||
| Ended | Year Ended May 31, | |||||||||||||||||||||||||
| November 30, | ||||||||||||||||||||||||||
| 2006 | 2006 | 2005 | 2004 | 2003 | 2002 | |||||||||||||||||||||
Per Share Operating Performance: | ||||||||||||||||||||||||||
| Net asset value, beginning of period | $ | 29.50 | 24.54 | 22.64 | 18.22 | 24.07 | 38.81 | |||||||||||||||||||
| Income (loss) from investment operations: | ||||||||||||||||||||||||||
| Net investment loss | $ | (0.10 | ) | (0.26 | )* | (0.27 | )* | (0.29 | )* | (0.53 | ) | (0.51 | )* | |||||||||||||
| Net realized and unrealized gain (loss) on investments | $ | 1.81 | 5.22 | 2.17 | 4.13 | (5.32 | ) | (13.24 | ) | |||||||||||||||||
| Total from investment operations | $ | 1.71 | 4.96 | 1.90 | 4.42 | (5.85 | ) | (13.75 | ) | |||||||||||||||||
| Less distributions from: | ||||||||||||||||||||||||||
| Net realized gain from investments | $ | — | — | — | — | — | 0.99 | |||||||||||||||||||
| Total distributions | $ | — | — | — | — | — | 0.99 | |||||||||||||||||||
| Net asset value, end of period | $ | 31.21 | 29.50 | 24.54 | 22.64 | 18.22 | 24.07 | |||||||||||||||||||
| Total Return(1) | % | 5.80 | 20.21 | 8.39 | 24.26 | † | (24.30 | ) | (35.83 | ) | ||||||||||||||||
Ratios and Supplemental Data: | ||||||||||||||||||||||||||
| Net assets, end of period (000’s) | $ | 184 | 186 | 243 | 463 | 906 | 3,651 | |||||||||||||||||||
| Ratios to average net assets: | ||||||||||||||||||||||||||
| Net expenses after expense reimbursement(2)(3) | % | 1.29 | 1.30 | 1.45 | 1.57 | 1.70 | 1.66 | |||||||||||||||||||
| Gross expenses prior to expense reimbursement(3) | % | 1.60 | 1.59 | 1.56 | 1.57 | 1.70 | 1.66 | |||||||||||||||||||
| Net investment loss after expense reimbursement(2)(3) | % | (0.63 | ) | (0.93 | ) | (1.19 | ) | (1.36 | ) | (1.62 | ) | (1.62 | ) | |||||||||||||
| Portfolio turnover rate | % | 36 | 87 | 62 | 60 | 357 | 423 | |||||||||||||||||||
(1) Total return is calculated assuming reinvestment of all dividends and capital gain distributions at net asset value and excluding the deduction of sales charges. Total return for less than one year is not annualized.
(2) The Investment Adviser has agreed to limit expenses (excluding interest, taxes, brokerage and extraordinary expenses) subject to possible recoupment by ING Investment, LLC within three years of being incurred.
(3) Annualized for periods less than one year.
** Per share data calculated using average number of shares outstanding throughout the period.
† In 2004, the Sub-Adviser fully reimbursed the Fund for a loss on an investment transaction, which otherwise would have had a 0.11% impact on Class Q total returns. Excluding the reimbursements, the total returns would have been 24.15%.
74
Table of Contents
Selected data for a share of beneficial interest outstanding throughout each period.
| Class A | ||||||||||||||||||||||||||
| Six Months | ||||||||||||||||||||||||||
| Ended | Year Ended May 31, | |||||||||||||||||||||||||
| November 30, | ||||||||||||||||||||||||||
| 2006 | 2006 | 2005 | 2004 | 2003 | 2002 | |||||||||||||||||||||
Per Share Operating Performance: | ||||||||||||||||||||||||||
| Net asset value, beginning of period | $ | 23.23 | 22.21 | 22.03 | 19.24 | 22.11 | 23.36 | |||||||||||||||||||
| Income (loss) from investment operations: | ||||||||||||||||||||||||||
| Net investment income | $ | 0.13 | 0.23 | 0.16 | 0.09 | 0.12 | 0.14 | |||||||||||||||||||
| Net realized and unrealized gain (loss) on investments | $ | 2.29 | 3.00 | 1.58 | 3.60 | (1.78 | ) | 1.29 | ||||||||||||||||||
| Total from investment operations | $ | 2.42 | 3.23 | 1.74 | 3.69 | (1.66 | ) | 1.43 | ||||||||||||||||||
| Less distributions from: | ||||||||||||||||||||||||||
| Net investment income | $ | — | 0.22 | 0.08 | 0.08 | 0.09 | 0.33 | |||||||||||||||||||
| Net realized gain from investments | $ | — | 1.99 | 1.48 | 0.82 | 1.12 | 2.35 | |||||||||||||||||||
| Total distributions | $ | — | 2.21 | 1.56 | 0.90 | 1.21 | 2.68 | |||||||||||||||||||
| Net asset value, end of period | $ | 25.65 | 23.23 | 22.21 | 22.03 | 19.24 | 22.11 | |||||||||||||||||||
| Total Return(1) | % | 10.42 | 14.71 | 7.97 | 19.57 | (6.98 | ) | 7.05 | ||||||||||||||||||
Ratios and Supplemental Data: | ||||||||||||||||||||||||||
| Net assets, end of period (millions) | $ | 249 | 215 | 183 | 193 | 182 | 231 | |||||||||||||||||||
| Ratios to average net assets: | ||||||||||||||||||||||||||
| Net expenses after expense reimbursement(2)(3) | % | 1.20 | 1.19 | 1.17 | 1.41 | 1.52 | 1.48 | |||||||||||||||||||
| Gross expenses prior to expense reimbursement(3) | % | 1.30 | 1.29 | 1.27 | 1.41 | 1.52 | 1.48 | |||||||||||||||||||
| Net investment income after expense reimbursement(2) (3) | % | 1.10 | 0.99 | 0.69 | 0.40 | 0.54 | 0.54 | |||||||||||||||||||
| Portfolio turnover rate | % | 17 | 26 | 27 | 35 | 19 | 43 | |||||||||||||||||||
| Class B | ||||||||||||||||||||||||||
| Six Months | ||||||||||||||||||||||||||
| Ended | Year Ended May 31, | |||||||||||||||||||||||||
| November 30, | ||||||||||||||||||||||||||
| 2006 | 2006 | 2005 | 2004 | 2003 | 2002 | |||||||||||||||||||||
Per Share Operating Performance: | ||||||||||||||||||||||||||
| Net asset value, beginning of period | $ | 22.86 | 21.87 | 21.79 | 19.12 | 22.03 | 23.28 | |||||||||||||||||||
| Income (loss) from investment operations: | ||||||||||||||||||||||||||
| Net investment income (loss) | $ | 0.03 | * | 0.05 | * | (0.01 | ) | (0.08 | ) | (0.07 | ) | (0.04 | ) | |||||||||||||
| Net realized and unrealized gain (loss) on investments | $ | 2.26 | 2.95 | 1.57 | 3.57 | (1.72 | ) | 1.29 | ||||||||||||||||||
| Total from investment operations | $ | 2.29 | 3.00 | 1.56 | 3.49 | (1.79 | ) | 1.25 | ||||||||||||||||||
| Less distributions from: | ||||||||||||||||||||||||||
| Net investment income | $ | — | 0.02 | — | — | — | 0.15 | |||||||||||||||||||
| Net realized gain from investments | $ | — | 1.99 | 1.48 | 0.82 | 1.12 | 2.35 | |||||||||||||||||||
| Total distributions | $ | — | 2.01 | 1.48 | 0.82 | 1.12 | 2.50 | |||||||||||||||||||
| Net asset value, end of period | $ | 25.15 | 22.86 | 21.87 | 21.79 | 19.12 | 22.03 | |||||||||||||||||||
| Total Return(1) | % | 10.02 | 13.81 | 7.21 | 18.60 | (7.66 | ) | 6.22 | ||||||||||||||||||
Ratios and Supplemental Data: | ||||||||||||||||||||||||||
| Net assets, end of period (millions) | $ | 42 | 64 | 107 | 127 | 127 | 171 | |||||||||||||||||||
| Ratios to average net assets: | ||||||||||||||||||||||||||
| Expenses(3) | % | 1.95 | 1.94 | 1.92 | 2.16 | 2.27 | 2.23 | |||||||||||||||||||
| Net investment income (loss) after expense reimbursement(3) | % | 0.27 | 0.21 | (0.06 | ) | (0.36 | ) | (0.21 | ) | (0.21 | ) | |||||||||||||||
| Portfolio turnover rate | % | 17 | 26 | 27 | 35 | 19 | 43 | |||||||||||||||||||
(1) Total return is calculated assuming reinvestment of all dividends and capital gain distributions at net asset value and excluding the deduction of sales charges. Total return for less than one year is not annualized.
(2) ING Funds Distributor, LLC has contractually agreed to waive 0.10% of the Distribution Fee for Class A shares of Financial Services.
(3) Annualized for periods less than one year.
* Per share data calculated using average number of shares outstanding throughout the period.
75
Table of Contents
Selected data for a share of beneficial interest outstanding throughout each period.
| Class C | Class O | |||||||||||||||||||||||||
| Six Months | August 24, | Six Months | September 15, | |||||||||||||||||||||||
| Ended | Year Ended | 2004(1) to | Ended | Year Ended | 2004(1) to | |||||||||||||||||||||
| November 30, | May 31, | May 31, | November 30, | May 31, | May 31, | |||||||||||||||||||||
| 2006 | 2006 | 2005 | 2006 | 2006 | 2005 | |||||||||||||||||||||
Per Share Operating Performance: | ||||||||||||||||||||||||||
| Net asset value, beginning of period | $ | 22.53 | 21.78 | 21.78 | 23.13 | 22.15 | 22.67 | |||||||||||||||||||
| Income from investment operations: | ||||||||||||||||||||||||||
| Net investment income | $ | 0.05 | * | 0.08 | * | 0.09 | 0.14 | * | 0.22 | 0.17 | ||||||||||||||||
| Net realized and unrealized gain on investments | $ | 2.21 | 2.93 | 1.49 | 2.28 | 3.00 | 0.92 | |||||||||||||||||||
| Total from investment operations | $ | 2.26 | 3.01 | 1.58 | 2.42 | 3.22 | 1.09 | |||||||||||||||||||
| Less distributions from: | ||||||||||||||||||||||||||
| Net investment income | $ | — | 0.27 | 0.10 | — | 0.25 | 0.13 | |||||||||||||||||||
| Net realized gain from investments | $ | — | 1.99 | 1.48 | — | 1.99 | 1.48 | |||||||||||||||||||
| Total distributions | $ | — | 2.26 | 1.58 | — | 2.24 | 1.61 | |||||||||||||||||||
| Net asset value, end of period | $ | 24.79 | 22.53 | 21.78 | 25.55 | 23.13 | 22.15 | |||||||||||||||||||
| Total Return(2) | % | 10.03 | 13.97 | 7.29 | 10.46 | 14.68 | 4.90 | |||||||||||||||||||
Ratios and Supplemental Data: | ||||||||||||||||||||||||||
| Net assets, end of period (000’s) | $ | 1,814 | 1,311 | 13 | 14,196 | 9,659 | 3,658 | |||||||||||||||||||
| Ratios to average net assets: | ||||||||||||||||||||||||||
| Expenses(3) | % | 1.95 | 1.94 | 1.92 | 1.19 | 1.19 | 1.17 | |||||||||||||||||||
| Net investment income after expense reimbursement(3) | % | 0.39 | 0.35 | 0.12 | 1.16 | 1.03 | 0.80 | |||||||||||||||||||
| Portfolio turnover rate | % | 17 | 26 | 27 | 17 | 26 | 27 | |||||||||||||||||||
(1) Commencement of operations.
(2) Total return is calculated assuming reinvestment of all dividends and capital gain distributions at net asset value and excluding the deduction of sales charges. Total returns for periods less than one year are not annualized.
(3) Annualized for periods less than one year.
* Per share data calculated using average number of shares outstanding throughout the period.
76
Table of Contents
Selected data for a share of beneficial interest outstanding throughout each period.
| Class A | Class B | |||||||||||||||||||||||||||||||||
| Six Months | Year Ended | February 2, | Six Months | Year Ended | February 2, | |||||||||||||||||||||||||||||
| Ended | May 31, | 2004(1) to | Ended | May 31, | 2004(1) to | |||||||||||||||||||||||||||||
| November 30, | May 31, | November 30, | May 31, | |||||||||||||||||||||||||||||||
| 2006 | 2006 | 2005 | 2004 | 2006 | 2006 | 2005 | 2004 | |||||||||||||||||||||||||||
Per Share Operating Performance: | ||||||||||||||||||||||||||||||||||
| Net asset value, beginning of period | $ | 10.31 | 10.23 | 9.65 | 10.00 | 10.25 | 10.17 | 9.63 | 10.00 | |||||||||||||||||||||||||
| Income (loss) from investment operations: | ||||||||||||||||||||||||||||||||||
| Net investment income (loss) | $ | 0.04 | ** | 0.10 | 0.05 | 0.01 | (0.01 | ) | 0.03 | (0.00 | )* | (0.00 | )* | |||||||||||||||||||||
| Net realized and unrealized income (loss) on investments | $ | 1.64 | 0.64 | 0.69 | (0.36 | ) | 1.64 | 0.63 | 0.65 | (0.37 | ) | |||||||||||||||||||||||
| Total from investment operations | $ | 1.68 | 0.74 | 0.74 | (0.35 | ) | 1.63 | 0.66 | 0.65 | (0.37 | ) | |||||||||||||||||||||||
| Less distributions from: | ||||||||||||||||||||||||||||||||||
| Net investment income | $ | — | 0.09 | 0.08 | — | — | 0.01 | 0.03 | — | |||||||||||||||||||||||||
| Net realized gains on investments | $ | — | 0.57 | 0.08 | — | — | 0.57 | 0.08 | — | |||||||||||||||||||||||||
| Total distributions | $ | — | 0.66 | 0.16 | — | — | 0.58 | 0.11 | — | |||||||||||||||||||||||||
| Net asset value, end of period | $ | 11.99 | 10.31 | 10.23 | 9.65 | 11.88 | 10.25 | 10.17 | 9.63 | |||||||||||||||||||||||||
| Total Return(2) | % | 16.29 | 7.65 | 7.64 | (3.50 | ) | 15.90 | 6.81 | 6.78 | (3.70 | ) | |||||||||||||||||||||||
Ratios and Supplemental Data: | ||||||||||||||||||||||||||||||||||
| Net assets, end of period (000’s) | $ | 76,146 | 29,839 | 22,079 | 4,729 | 10,381 | 7,645 | 8,447 | 2,601 | |||||||||||||||||||||||||
| Ratios to average net assets: | ||||||||||||||||||||||||||||||||||
| Net expenses after expense reimbursement(3)(4) | % | 1.45 | 1.45 | 1.45 | 1.35 | 2.20 | 2.20 | 2.20 | 2.10 | |||||||||||||||||||||||||
| Gross expenses prior to expense reimbursement(3) | % | 1.45 | 1.50 | 1.94 | 4.05 | 2.20 | 2.25 | 2.69 | 4.80 | |||||||||||||||||||||||||
| Net investment income (loss) after expense reimbursement(3)(4) | % | 0.67 | 1.06 | 0.93 | 0.72 | (0.10 | ) | 0.29 | 0.17 | (0.07 | ) | |||||||||||||||||||||||
| Portfolio turnover rate | % | 24 | 34 | 47 | 4 | 24 | 34 | 47 | 4 | |||||||||||||||||||||||||
| Class C | ||||||||||||||||||
| Six Months | Year Ended | February 3, | ||||||||||||||||
| Ended | May 31, | 2004(1) to | ||||||||||||||||
| November 30, | May 31, | |||||||||||||||||
| 2006 | 2006 | 2005 | 2004 | |||||||||||||||
Per Share Operating Performance: | ||||||||||||||||||
| Net asset value, beginning of period | $ | 10.24 | 10.17 | 9.63 | 9.96 | |||||||||||||
| Income (loss) from investment operations: | ||||||||||||||||||
| Net investment income (loss) | $ | (0.01 | ) | 0.03 | 0.00 | * | (0.00 | )* | ||||||||||
| Net realized and unrealized income (loss) on investments | $ | 1.64 | 0.62 | 0.65 | (0.33 | ) | ||||||||||||
| Total from investment operations | $ | 1.63 | 0.65 | 0.65 | (0.33 | ) | ||||||||||||
| Less distributions from: | ||||||||||||||||||
| Net investment income | $ | — | 0.01 | 0.03 | — | |||||||||||||
| Net realized gains on investments | $ | — | 0.57 | 0.08 | — | |||||||||||||
| Total distributions | $ | — | 0.58 | 0.11 | — | |||||||||||||
| Net asset value, end of period | $ | 11.87 | 10.24 | 10.17 | 9.63 | |||||||||||||
| Total Return(2) | % | 15.92 | 6.79 | 6.76 | (3.31 | ) | ||||||||||||
Ratios and Supplemental Data: | ||||||||||||||||||
| Net assets, end of period (000’s) | $ | 15,718 | 11,566 | 11,358 | 3,793 | |||||||||||||
| Ratios to average net assets: | ||||||||||||||||||
| Net expenses after expense reimbursement(3)(4) | % | 2.20 | 2.20 | 2.20 | 2.11 | |||||||||||||
| Gross expenses prior to expense reimbursement(3) | % | 2.20 | 2.25 | 2.69 | 4.81 | |||||||||||||
| Net investment income (loss) after expense reimbursement(3)(4) | % | (0.10 | ) | 0.29 | 0.17 | (0.03 | ) | |||||||||||
| Portfolio turnover rate | % | 24 | 34 | 47 | 4 | |||||||||||||
(1) Commencement of operations.
(2) Total return is calculated assuming reinvestment of all dividends and capital gain distributions at net asset value and excluding the deduction of sales charges. Total return for less than one year is not annualized.
(3) Annualized for periods less than one year.
(4) The Investment Adviser has agreed to limit expenses (excluding interest, taxes, brokerage and extraordinary expenses) subject to possible recoupment by ING Investments, LLC within three years of being incurred.
* Amount is less than $0.005 or $(0.005) per share.
** Per share data calculated using average number of shares outstanding throughout the period.
77
Table of Contents
Selected data for a share of beneficial interest outstanding throughout each period.
| Class I | ||||||||||||||
| Six Months | Year | August 2, | ||||||||||||
| Ended | Ended | 2004(1) to | ||||||||||||
| November 30, | May 31, | May 31, | ||||||||||||
| 2006 | 2006 | 2005 | ||||||||||||
Per Share Operating Performance: | ||||||||||||||
| Net asset value, beginning of period | $ | 10.32 | 10.24 | 9.72 | ||||||||||
| Income from investment operations: | ||||||||||||||
| Net investment income | $ | 0.06 | * | 0.14 | 0.10 | |||||||||
| Net realized and unrealized gain on investments | $ | 1.64 | 0.63 | 0.59 | ||||||||||
| Total from investment operations | $ | 1.70 | 0.77 | 0.69 | ||||||||||
| Less distributions from: | ||||||||||||||
| Net investment income | $ | — | 0.12 | 0.09 | ||||||||||
| Net realized gains on investments | $ | — | 0.57 | 0.08 | ||||||||||
| Total distributions | $ | — | 0.69 | 0.17 | ||||||||||
| Net asset value, end of period | $ | 12.02 | 10.32 | 10.24 | ||||||||||
| Total Return(2) | % | 16.47 | 7.94 | 7.13 | ||||||||||
Ratios and Supplemental Data: | ||||||||||||||
| Net assets, end of period (000’s) | $ | 7,697 | 2,981 | 2,764 | ||||||||||
| Ratios to average net assets: | ||||||||||||||
| Net expenses after expense reimbursement(3)(4) | % | 1.13 | 1.18 | 1.16 | ||||||||||
| Gross expenses prior to expense reimbursement(3) | % | 1.13 | 1.23 | 1.65 | ||||||||||
| Net investment income after expense reimbursement(3)(4) | % | 0.99 | 1.31 | 1.22 | ||||||||||
| Portfolio turnover rate | % | 24 | 34 | 47 | ||||||||||
(1) Commencement of operations.
(2) Total return is calculated assuming reinvestment of all dividends and capital gain distributions at net asset value and excluding the deduction of sales charges. Total returns for periods less than one year are not annualized.
(3) Annualized for periods less than one year.
(4) The Investment Adviser has agreed to limit expenses, (excluding interest, taxes, brokerage and extraordinary expenses), subject to possible reimbursement to ING Investments, LLC within three years of being incurred.
* Per share data calculated using average number of shares outstanding throughout the period.
78
Table of Contents
Selected data for a share of beneficial interest outstanding throughout each period.
| Class A | ||||||||||||||||||||||||||
| Six Months | ||||||||||||||||||||||||||
| Ended | Year Ended May 31, | |||||||||||||||||||||||||
| November 30, | ||||||||||||||||||||||||||
| 2006 | 2006 | 2005 | 2004 | 2003 | 2002 | |||||||||||||||||||||
Per Share Operating Performance: | ||||||||||||||||||||||||||
| Net asset value, beginning of period | $ | 12.12 | 10.81 | 10.28 | 8.82 | 10.11 | 13.54 | |||||||||||||||||||
| Income (loss) from investment operations: | ||||||||||||||||||||||||||
| Net investment income | $ | 0.09 | 0.12 | 0.12 | 0.09 | 0.06 | 0.07 | |||||||||||||||||||
| Net realized and unrealized gain (loss) on investments | $ | 1.13 | 1.31 | 0.54 | 1.46 | (1.32 | ) | (1.53 | ) | |||||||||||||||||
| Total from investment operations | $ | 1.22 | 1.43 | 0.66 | 1.55 | (1.26 | ) | (1.46 | ) | |||||||||||||||||
| Less distributions from: | ||||||||||||||||||||||||||
| Net investment income | $ | 0.05 | 0.12 | 0.13 | 0.09 | 0.03 | 0.07 | |||||||||||||||||||
| Net realized gain from investments | $ | — | — | — | — | — | 1.90 | |||||||||||||||||||
| Total distributions | $ | 0.05 | 0.12 | 0.13 | 0.09 | 0.03 | 1.97 | |||||||||||||||||||
| Net asset value, end of period | $ | 13.29 | 12.12 | 10.81 | 10.28 | 8.82 | 10.11 | |||||||||||||||||||
| Total Return(1) | % | 10.09 | 13.32 | 6.48 | 17.64 | (12.46 | ) | (10.96 | ) | |||||||||||||||||
Ratios and Supplemental Data: | ||||||||||||||||||||||||||
| Net assets, end of period (000’s) | $ | 328,787 | 317,309 | 293,793 | 311,087 | 156,902 | 211,602 | |||||||||||||||||||
| Ratios to average net assets: | ||||||||||||||||||||||||||
| Net expenses after expense reimbursements (2)(3) | % | 1.11 | 1.09 | 1.15 | 1.35 | 1.45 | 1.34 | |||||||||||||||||||
| Gross expenses prior to expense reimbursements(3) | % | 1.21 | 1.19 | — | — | — | — | |||||||||||||||||||
| Net investment income after expense reimbursement(2)(3) | % | 1.47 | 1.03 | 1.12 | 1.10 | 0.73 | 0.59 | |||||||||||||||||||
| Portfolio turnover rate | % | 42 | 80 | 50 | 28 | 110 | 75 | |||||||||||||||||||
| Class B | ||||||||||||||||||||||||||
| Six Months | ||||||||||||||||||||||||||
| Ended | Year Ended May 31, | |||||||||||||||||||||||||
| November 30, | ||||||||||||||||||||||||||
| 2006 | 2006 | 2005 | 2004 | 2003 | 2002 | |||||||||||||||||||||
Per Share Operating Performance: | ||||||||||||||||||||||||||
| Net asset value, beginning of period | $ | 11.73 | 10.46 | 9.91 | 8.48 | 9.75 | 13.14 | |||||||||||||||||||
| Income (loss) from investment operations: | ||||||||||||||||||||||||||
| Net investment income (loss) | $ | 0.04 | ** | 0.04 | 0.06 | 0.04 | 0.00 | * | (0.02 | ) | ||||||||||||||||
| Net realized and unrealized gain (loss) on investments | $ | 1.08 | 1.25 | 0.51 | 1.39 | (1.27 | ) | (1.47 | ) | |||||||||||||||||
| Total from investment operations | $ | 1.12 | 1.29 | 0.57 | 1.43 | (1.27 | ) | (1.49 | ) | |||||||||||||||||
| Less distributions from: | ||||||||||||||||||||||||||
| Net investment income | $ | — | 0.02 | 0.02 | — | — | — | |||||||||||||||||||
| Net realized gain from investments | $ | — | — | — | — | — | 1.90 | |||||||||||||||||||
| Total distributions | $ | — | 0.02 | 0.02 | — | — | 1.90 | |||||||||||||||||||
| Net asset value, end of period | $ | 12.85 | 11.73 | 10.46 | 9.91 | 8.48 | 9.75 | |||||||||||||||||||
| Total Return(1) | % | 9.55 | 12.38 | 5.77 | 16.86 | (13.03 | ) | (11.61 | ) | |||||||||||||||||
Ratios and Supplemental Data: | ||||||||||||||||||||||||||
| Net assets, end of period (000’s) | $ | 25,665 | 29,186 | 36,962 | 52,812 | 50,677 | 79,685 | |||||||||||||||||||
| Ratios to average net assets: | ||||||||||||||||||||||||||
| Expenses(3) | % | 1.91 | 1.89 | 1.85 | 2.05 | 2.15 | 2.04 | |||||||||||||||||||
| Net investment income (loss) after expense reimbursement(2)(3) | % | 0.64 | 0.22 | 0.43 | 0.35 | 0.03 | (0.11 | ) | ||||||||||||||||||
| Portfolio turnover rate | % | 42 | 80 | 50 | 28 | 110 | 75 | |||||||||||||||||||
(1) Total return is calculated assuming reinvestment of all dividends and capital gain distributions at net asset value and excluding the deduction of sales charges. Total return for less than one year is not annualized.
(2) The Investment Adviser has agreed to limit expenses, (excluding interest, taxes, brokerage and extraordinary expenses) subject to possible recoupment by ING Investments, LLC within three years of being incurred.
(3) Annualized for periods less than one year.
* Amount represents less than $0.005 per share.
** Per share data calculated using average number of shares outstanding throughout the period.
79
Table of Contents
Selected data for a share of beneficial interest outstanding throughout each period.
| Class C | ||||||||||||||||||||||||||
| Six Months | ||||||||||||||||||||||||||
| Ended | Year Ended May 31, | |||||||||||||||||||||||||
| November 30, | ||||||||||||||||||||||||||
| 2006 | 2006 | 2005 | 2004 | 2003 | 2002 | |||||||||||||||||||||
Per Share Operating Performance: | ||||||||||||||||||||||||||
| Net asset value, beginning of period | $ | 11.74 | 10.46 | 9.91 | 8.48 | 9.76 | 13.14 | |||||||||||||||||||
| Income (loss) from investment operations: | ||||||||||||||||||||||||||
| Net investment income (loss) | $ | 0.04 | ** | 0.03 | 0.08 | 0.03 | 0.00 | * | (0.01 | ) | ||||||||||||||||
| Net realized and unrealized gain (loss) on investments | $ | 1.08 | 1.27 | 0.49 | 1.40 | (1.28 | ) | (1.47 | ) | |||||||||||||||||
| Total from investment operations | $ | 1.12 | 1.30 | 0.57 | 1.43 | (1.28 | ) | (1.48 | ) | |||||||||||||||||
| Less distributions from: | ||||||||||||||||||||||||||
| Net investment income | $ | — | 0.02 | 0.02 | — | — | — | |||||||||||||||||||
| Net realized gain from investments | $ | — | — | — | — | — | 1.90 | |||||||||||||||||||
| Total distributions | $ | — | 0.02 | 0.02 | — | — | 1.90 | |||||||||||||||||||
| Net asset value, end of period | $ | 12.86 | 11.74 | 10.46 | 9.91 | 8.48 | 9.76 | |||||||||||||||||||
| Total Return(2) | % | 9.54 | 12.45 | 5.77 | 16.86 | (13.11 | ) | (11.53 | ) | |||||||||||||||||
Ratios and Supplemental Data: | ||||||||||||||||||||||||||
| Net assets, end of period (000’s) | $ | 6,411 | 6,657 | 6,490 | 11,502 | 8,291 | 9,693 | |||||||||||||||||||
| Ratios to average net assets: | ||||||||||||||||||||||||||
| Expenses(3) | % | 1.91 | 1.89 | 1.85 | 2.05 | 2.15 | 2.04 | |||||||||||||||||||
| Net investment income (loss) after expense reimbursement(2)(3) | % | 0.65 | 0.22 | 0.43 | 0.36 | 0.03 | (0.11 | ) | ||||||||||||||||||
| Portfolio turnover rate | % | 42 | 80 | 50 | 28 | 110 | 75 | |||||||||||||||||||
| Class I | ||||||||||||||||||||||
| Six Months | March 5, | |||||||||||||||||||||
| Ended | Year Ended May 31, | 2003(1) to | ||||||||||||||||||||
| November 30, | May 31, | |||||||||||||||||||||
| 2006 | 2006 | 2005 | 2004 | 2003 | ||||||||||||||||||
Per Share Operating Performance: | ||||||||||||||||||||||
| Net asset value, beginning of period | $ | 12.07 | 10.76 | 10.27 | 8.82 | 7.55 | ||||||||||||||||
| Income from investment operations: | ||||||||||||||||||||||
| Net investment income | $ | 0.11 | 0.15 | 0.16 | 0.15 | 0.01 | ||||||||||||||||
| Net realized and unrealized gain on investments | $ | 1.11 | 1.31 | 0.53 | 1.44 | 1.26 | ||||||||||||||||
| Total from investment operations | $ | 1.22 | 1.46 | 0.69 | 1.59 | 1.27 | ||||||||||||||||
| Less distributions from: | ||||||||||||||||||||||
| Net investment income | $ | 0.07 | 0.15 | 0.20 | 0.14 | — | ||||||||||||||||
| Total distributions | $ | 0.07 | 0.15 | 0.20 | 0.14 | — | ||||||||||||||||
| Net asset value, end of period | $ | 13.22 | 12.07 | 10.76 | 10.27 | 8.82 | ||||||||||||||||
| Total Return(2) | % | 10.15 | 13.65 | 6.79 | 18.26 | 16.82 | ||||||||||||||||
Ratios and Supplemental Data: | ||||||||||||||||||||||
| Net assets, end of period (000’s) | $ | 2,993 | 2,713 | 2,454 | 8 | 7 | ||||||||||||||||
| Ratios to average net assets: | ||||||||||||||||||||||
| Expenses(3) | % | 0.84 | 0.82 | 0.80 | 0.88 | 0.92 | ||||||||||||||||
| Net investment income after expense reimbursement (2)(3) | % | 1.75 | 1.28 | 1.47 | 1.55 | 2.06 | ||||||||||||||||
| Portfolio turnover rate | % | 42 | 80 | 50 | 28 | 110 | ||||||||||||||||
(1) Commencement of operations.
(2) Total return is calculated assuming reinvestment of all dividends and capital gain distributions at net asset value and excluding the deduction of sales charges. Total return for less than one year is not annualized.
(3) Annualized for periods less than one year.
* Amount represents less than $0.005 per share.
** Per share data calculated using average number of shares outstanding throughout the period.
80
Table of Contents
Selected data for a share of beneficial interest outstanding throughout each period.
| Class M | ||||||||||||||||||||||||||
| Six Months | ||||||||||||||||||||||||||
| Ended | Year Ended May 31, | |||||||||||||||||||||||||
| November 30, | ||||||||||||||||||||||||||
| 2006 | 2006 | 2005 | 2004 | 2003 | 2002 | |||||||||||||||||||||
Per Share Operating Performance: | ||||||||||||||||||||||||||
| Net asset value, beginning of period | $ | 12.03 | 10.73 | 10.16 | 8.68 | 9.96 | 13.36 | |||||||||||||||||||
| Income (loss) from investment operations: | ||||||||||||||||||||||||||
| Net investment income | $ | 0.06 | 0.07 | 0.09 | 0.08 | 0.03 | 0.02 | |||||||||||||||||||
| Net realized and unrealized gain (loss) on investments | $ | 1.11 | 1.29 | 0.52 | 1.41 | (1.31 | ) | (1.50 | ) | |||||||||||||||||
| Total from investment operations | $ | 1.17 | 1.36 | 0.61 | 1.49 | (1.28 | ) | (1.48 | ) | |||||||||||||||||
| Less distributions from: | ||||||||||||||||||||||||||
| Net investment income | $ | 0.01 | 0.06 | 0.04 | 0.01 | — | 0.02 | |||||||||||||||||||
| Net realized gain from investments | $ | — | — | — | — | — | 1.90 | |||||||||||||||||||
| Total distributions | $ | 0.01 | 0.06 | 0.04 | 0.01 | — | 1.92 | |||||||||||||||||||
| Net asset value, end of period | $ | 13.19 | 12.03 | 10.73 | 10.16 | 8.68 | 9.96 | |||||||||||||||||||
| Total Return(1) | % | 9.72 | 12.73 | 6.01 | 17.13 | (12.85 | ) | (11.30 | ) | |||||||||||||||||
Ratios and Supplemental Data: | ||||||||||||||||||||||||||
| Net assets, end of period (000’s) | $ | 3,476 | 3,533 | 4,048 | 5,270 | 7,445 | 12,074 | |||||||||||||||||||
| Ratios to average net assets: | ||||||||||||||||||||||||||
| Expenses(2) | % | 1.66 | 1.59 | 1.60 | 1.80 | 1.90 | 1.79 | |||||||||||||||||||
| Net investment income(2) | % | 0.92 | 0.52 | 0.67 | 0.55 | 0.28 | 0.14 | |||||||||||||||||||
| Portfolio turnover rate | % | 42 | 80 | 50 | 28 | 110 | 75 | |||||||||||||||||||
(1) Total return is calculated assuming reinvestment of all dividends and capital gain distributions at net asset value and excluding the deduction of sales charges. Total return for less than one year is not annualized.
(2) Annualized for periods less than one year.
81
Table of Contents
Selected data for a share of beneficial interest outstanding throughout each period.
| Class A | ||||||||||||||||||||||||||
| Six Months | February 1, | |||||||||||||||||||||||||
| Ended | Year Ended May 31, | 2002(1) to | ||||||||||||||||||||||||
| November 30, | May 31, | |||||||||||||||||||||||||
| 2006 | 2006 | 2005 | 2004 | 2003 | 2002 | |||||||||||||||||||||
Per Share Operating Performance: | ||||||||||||||||||||||||||
| Net asset value, beginning of period | $ | 9.98 | 11.02 | 11.53 | 8.36 | 10.28 | 10.00 | |||||||||||||||||||
| Income (loss) from investment operations: | ||||||||||||||||||||||||||
| Net investment income (loss) | $ | (0.01 | ) | (0.07 | )** | (0.04 | ) | (0.02 | ) | 0.00 | * | 0.00 | * | |||||||||||||
| Net realized and unrealized gain (loss) on investments | $ | 0.82 | 0.78 | 0.41 | 3.19 | (1.77 | ) | 0.28 | ||||||||||||||||||
| Total from investment operations | $ | 0.81 | 0.71 | 0.37 | 3.17 | (1.77 | ) | 0.28 | ||||||||||||||||||
| Less distributions from: | ||||||||||||||||||||||||||
| Net investment income | $ | — | — | — | — | 0.04 | — | |||||||||||||||||||
| Net realized gain from investments | $ | — | 1.75 | 0.88 | — | 0.11 | — | |||||||||||||||||||
| Total distributions | $ | — | 1.75 | 0.88 | — | 0.15 | — | |||||||||||||||||||
| Net asset value, end of period | $ | 10.79 | 9.98 | 11.02 | 11.53 | 8.36 | 10.28 | |||||||||||||||||||
| Total Return(2) | % | 8.12 | 7.35 | 3.13 | 37.92 | (16.94 | ) | 2.80 | ||||||||||||||||||
Ratios and Supplemental Data: | ||||||||||||||||||||||||||
| Net assets, end of period (000’s) | $ | 35,857 | 43,356 | 71,136 | 58,631 | 15,026 | 25,325 | |||||||||||||||||||
| Ratios to average net assets: | ||||||||||||||||||||||||||
| Net expenses after expense reimbursement/ recoupment and brokerage commission recapture(3)(4) | % | 1.49 | 1.63 | 1.63 | 1.75 | 1.75 | 1.61 | |||||||||||||||||||
| Net expenses after expense reimbursement/ recoupment and prior to brokerage commission recapture(3)(4) | % | 1.50 | 1.63 | 1.63 | 1.75 | 1.75 | 1.61 | |||||||||||||||||||
| Gross expenses prior to expense reimbursement/ recoupment and brokerage commission recapture(3) | % | 1.50 | 1.63 | 1.53 | 1.62 | 2.17 | 3.05 | |||||||||||||||||||
| Net investment income (loss) after expense reimbursement/ recoupment and brokerage commission recapture(3)(4) | % | (0.16 | ) | (0.67 | ) | (0.35 | ) | (0.18 | ) | (0.10 | ) | 0.04 | ||||||||||||||
| Portfolio turnover rate | % | 15 | 42 | 79 | 70 | 72 | 13 | |||||||||||||||||||
| Class B | ||||||||||||||||||||||||||
| Six Months | February 4, | |||||||||||||||||||||||||
| Ended | Year Ended May 31, | 2002(1) to | ||||||||||||||||||||||||
| November 30, | May 31, | |||||||||||||||||||||||||
| 2006 | 2006 | 2005 | 2004 | 2003 | 2002 | |||||||||||||||||||||
Per Share Operating Performance: | ||||||||||||||||||||||||||
| Net asset value, beginning of period | $ | 9.68 | 10.81 | 11.41 | 8.34 | 10.27 | 9.87 | |||||||||||||||||||
| Income (loss) from investment operations: | ||||||||||||||||||||||||||
| Net investment loss | $ | (0.05 | ) | (0.15 | )** | (0.12 | ) | (0.07 | ) | (0.06 | ) | (0.01 | ) | |||||||||||||
| Net realized and unrealized gain (loss) on investments | $ | 0.79 | 0.77 | 0.40 | 3.14 | (1.75 | ) | 0.41 | ||||||||||||||||||
| Total from investment operations | $ | 0.74 | 0.62 | 0.28 | 3.07 | (1.81 | ) | 0.40 | ||||||||||||||||||
| Less distributions from: | ||||||||||||||||||||||||||
| Net investment income | $ | — | — | — | — | 0.01 | — | |||||||||||||||||||
| Net realized gain from investments | $ | — | 1.75 | 0.88 | — | 0.11 | — | |||||||||||||||||||
| Total distributions | $ | — | 1.75 | 0.88 | — | 0.12 | — | |||||||||||||||||||
| Net asset value, end of period | $ | 10.42 | 9.68 | 10.81 | 11.41 | 8.34 | 10.27 | |||||||||||||||||||
| Total Return(2) | % | 7.64 | 6.60 | 2.35 | 36.81 | (17.40 | ) | 4.05 | ||||||||||||||||||
Ratios and Supplemental Data: | ||||||||||||||||||||||||||
| Net assets, end of period (000’s) | $ | 22,947 | 25,825 | 38,071 | 34,856 | 12,205 | 11,656 | |||||||||||||||||||
| Ratios to average net assets: | ||||||||||||||||||||||||||
| Net expenses after expense reimbursement/ recoupment and brokerage commission recapture(3)(4) | % | 2.24 | 2.38 | 2.38 | 2.50 | 2.50 | 2.36 | |||||||||||||||||||
| Net expenses after expense reimbursement/ recoupment and prior to brokerage commission recapture(3)(4) | % | 2.25 | 2.38 | 2.38 | 2.50 | 2.50 | 2.36 | |||||||||||||||||||
| Gross expenses prior to expense reimbursement/ recoupment and brokerage commission recapture(3) | % | 2.25 | 2.38 | 2.28 | 2.37 | 2.92 | 3.80 | |||||||||||||||||||
| Net investment loss after expense reimbursement/ recoupment and brokerage commission recapture(3)(4) | % | (0.90 | ) | (1.42 | ) | (1.09 | ) | (0.95 | ) | (0.82 | ) | (0.71 | ) | |||||||||||||
| Portfolio turnover rate | % | 15 | 42 | 79 | 70 | 72 | 13 | |||||||||||||||||||
(1) Commencement of operations.
(2) Total return is calculated assuming reinvestment of all dividends and capital gain distributions at net asset value and excluding the deduction of sales charges. Total return for less than one year is not annualized.
(3) Annualized for periods less than one year.
(4) The Investment Adviser has agreed to limit expenses, (excluding interest, taxes, brokerage and extraordinary expenses) subject to possible recoupment by ING Investments, LLC within three years of being incurred.
* Amount represents less than $0.005 per share.
** Per share data calculated using average number of shares outstanding throughout the period.
82
Table of Contents
Selected data for a share of beneficial interest outstanding throughout each period.
| Class C | ||||||||||||||||||||||||||
| Six Months | February 4, | |||||||||||||||||||||||||
| Ended | Year Ended May 31, | 2002(1) to | ||||||||||||||||||||||||
| November 30, | May 31, | |||||||||||||||||||||||||
| 2006 | 2006 | 2005 | 2004 | 2003 | 2002 | |||||||||||||||||||||
Per Share Operating Performance: | ||||||||||||||||||||||||||
| Net asset value, beginning of period | $ | 9.68 | 10.81 | 11.40 | 8.34 | 10.26 | 9.87 | |||||||||||||||||||
| Income (loss) from investment operations: | ||||||||||||||||||||||||||
| Net investment loss | $ | (0.05 | ) | (0.15 | )* | (0.12 | ) | (0.07 | ) | (0.05 | ) | (0.01 | ) | |||||||||||||
| Net realized and unrealized gain (loss) on investments | $ | 0.79 | 0.77 | 0.41 | 3.13 | (1.75 | ) | 0.40 | ||||||||||||||||||
| Total from investment operations | $ | 0.74 | 0.62 | 0.29 | 3.06 | (1.80 | ) | 0.39 | ||||||||||||||||||
| Less distributions from: | ||||||||||||||||||||||||||
| Net investment income | $ | — | — | — | — | 0.01 | — | |||||||||||||||||||
| Net realized gain from investments | $ | — | 1.75 | 0.88 | — | 0.11 | — | |||||||||||||||||||
| Total distributions | $ | — | 1.75 | 0.88 | — | 0.12 | — | |||||||||||||||||||
| Net asset value, end of period | $ | 10.42 | 9.68 | 10.81 | 11.40 | 8.34 | 10.26 | |||||||||||||||||||
| Total Return(2) | % | 7.64 | 6.62 | 2.44 | 36.69 | (17.32 | ) | 3.95 | ||||||||||||||||||
Ratios and Supplemental Data: | ||||||||||||||||||||||||||
| Net assets, end of period (000’s) | $ | 24,191 | 25,996 | 42,426 | 31,982 | 12,034 | 9,731 | |||||||||||||||||||
| Ratios to average net assets: | ||||||||||||||||||||||||||
| Net expenses after expense reimbursement/ recoupment and brokerage commission recapture(3)(4) | % | 2.24 | 2.38 | 2.38 | 2.50 | 2.50 | 2.36 | |||||||||||||||||||
| Net expenses after expense reimbursement/ recoupment and prior to brokerage commission recapture(3)(4) | % | 2.25 | 2.38 | 2.38 | 2.50 | 2.50 | 2.36 | |||||||||||||||||||
| Gross expenses prior to expense reimbursement/ recoupment and brokerage commission recapture(3) | % | 2.25 | 2.38 | 2.28 | 2.37 | 2.92 | 3.80 | |||||||||||||||||||
| Net investment loss after expense reimbursement/ recoupment and brokerage commission recapture(3)(4) | % | (0.90 | ) | (1.42 | ) | (1.09 | ) | (0.94 | ) | (0.81 | ) | (0.71 | ) | |||||||||||||
| Portfolio turnover rate | % | 15 | 42 | 79 | 70 | 72 | 13 | |||||||||||||||||||
| Class I | ||||||||||||||||||||||||||
| Six Months | March 4, | |||||||||||||||||||||||||
| Ended | Year Ended May 31, | 2002(1) to | ||||||||||||||||||||||||
| November 30, | May 31, | |||||||||||||||||||||||||
| 2006 | 2006 | 2005 | 2004 | 2003 | 2002 | |||||||||||||||||||||
Per Share Operating Performance: | ||||||||||||||||||||||||||
| Net asset value, beginning of period | $ | 10.15 | 11.16 | 11.61 | 8.39 | 10.30 | 10.20 | |||||||||||||||||||
| Income (loss) from investment operations: | ||||||||||||||||||||||||||
| Net investment income (loss) | $ | 0.01 | (0.05 | ) | (0.01 | ) | 0.01 | * | 0.01 | 0.01 | ||||||||||||||||
| Net realized and unrealized gain (loss) on investments | $ | 0.83 | 0.79 | 0.44 | 3.21 | (1.74 | ) | 0.09 | ||||||||||||||||||
| Total from investment operations | $ | 0.84 | 0.74 | 0.43 | 3.22 | (1.73 | ) | 0.10 | ||||||||||||||||||
| Less distributions from: | ||||||||||||||||||||||||||
| Net investment income | $ | — | — | — | — | 0.07 | — | |||||||||||||||||||
| Net realized gain from investments | $ | — | 1.75 | 0.88 | — | 0.11 | — | |||||||||||||||||||
| Total distributions | $ | — | 1.75 | 0.88 | — | 0.18 | — | |||||||||||||||||||
| Net asset value, end of period | $ | 10.99 | 10.15 | 11.16 | 11.61 | 8.39 | 10.30 | |||||||||||||||||||
| Total Return(2) | % | 8.28 | 7.55 | 3.64 | 38.38 | (16.35 | ) | 0.98 | ||||||||||||||||||
Ratios and Supplemental Data: | ||||||||||||||||||||||||||
| Net assets, end of period (000’s) | $ | 856 | 1,418 | 2,037 | 2,157 | 197 | 71 | |||||||||||||||||||
| Ratios to average net assets: | ||||||||||||||||||||||||||
| Net expenses after expense reimbursement/ recoupment and brokerage commission recapture(3)(4) | % | 1.24 | 1.38 | 1.36 | 1.46 | 1.28 | 1.24 | |||||||||||||||||||
| Net expenses after expense reimbursement/ recoupment and prior to brokerage commission recapture(3)(4) | % | 1.25 | 1.38 | 1.36 | 1.46 | 1.28 | 1.24 | |||||||||||||||||||
| Gross expenses prior to expense reimbursement/ recoupment and brokerage commission recapture(3) | % | 1.25 | 1.38 | 1.26 | 1.34 | 1.70 | 2.60 | |||||||||||||||||||
| Net investment income (loss) after expense reimbursement/ recoupment and brokerage commission recapture(3)(4) | % | 0.15 | (0.42 | ) | (0.05 | ) | 0.22 | 0.46 | 0.38 | |||||||||||||||||
| Portfolio turnover rate | % | 15 | 42 | 79 | 70 | 72 | 133 | |||||||||||||||||||
(1) Commencement of operations.
(2) Total return is calculated assuming reinvestment of all dividends and capital gain distributions at net asset value and excluding the deduction of sales charges. Total return for less than one year is not annualized.
(3) Annualized for periods less than one year.
(4) The Investment Adviser has agreed to limit expenses, (excluding interest, taxes, brokerage and extraordinary expenses) subject to possible recoupment by ING Investments, LLC within three years of being incurred.
* Per share data calculated using average number of shares outstanding throughout the period.
83
Table of Contents
Selected data for a share of beneficial interest outstanding throughout each period.
| Class Q | ||||||||||||||||||||||||||
| Six Months | April 17, | |||||||||||||||||||||||||
| Ended | Year Ended May 31, | 2002(1) to | ||||||||||||||||||||||||
| November 30, | May 31, | |||||||||||||||||||||||||
| 2006 | 2006 | 2005 | 2004 | 2003 | 2002 | |||||||||||||||||||||
Per Share Operating Performance: | ||||||||||||||||||||||||||
| Net asset value, beginning of period | $ | 9.96 | 11.00 | 11.54 | 8.36 | 10.28 | 10.52 | |||||||||||||||||||
| Income (loss) from investment operations: | ||||||||||||||||||||||||||
| Net investment income (loss) | $ | (0.01 | ) | (0.07 | ) | (0.07 | ) | (0.02 | )** | 0.00 | * | 0.00 | * | |||||||||||||
| Net realized and unrealized gain (loss) on investments | $ | 0.82 | 0.78 | 0.41 | 3.20 | (1.75 | ) | (0.24 | ) | |||||||||||||||||
| Total from investment operations | $ | 0.81 | 0.71 | 0.34 | 3.18 | (1.75 | ) | (0.24 | ) | |||||||||||||||||
| Less distributions from: | ||||||||||||||||||||||||||
| Net investment income | $ | — | — | — | — | 0.06 | — | |||||||||||||||||||
| Net realized gain from investments | $ | — | 1.75 | 0.88 | — | 0.11 | — | |||||||||||||||||||
| Total distributions | $ | — | 1.75 | 0.88 | — | 0.17 | — | |||||||||||||||||||
| Net asset value, end of period | $ | 10.77 | 9.96 | 11.00 | 11.54 | 8.36 | 10.28 | |||||||||||||||||||
| Total Return(2) | % | 8.13 | 7.37 | 2.85 | 38.04 | (16.62 | ) | (2.28 | ) | |||||||||||||||||
Ratios and Supplemental Data: | ||||||||||||||||||||||||||
| Net assets, end of period (000’s) | $ | 16 | 15 | 20 | 20 | 14 | 11 | |||||||||||||||||||
| Ratios to average net assets: | ||||||||||||||||||||||||||
| Net expenses after expense reimbursement/ recoupment and brokerage commission recapture(3)(4) | % | 1.49 | 1.61 | 1.63 | 1.67 | 1.54 | 1.52 | |||||||||||||||||||
| Net expenses after expense reimbursement/ recoupment and prior to brokerage commission recapture (3)(4) | % | 1.50 | 1.61 | 1.63 | 1.67 | 1.54 | 1.52 | |||||||||||||||||||
| Gross expenses prior to expense reimbursement/ recoupment and brokerage commission recapture(3) | % | 1.50 | 1.61 | 1.53 | 1.54 | 1.96 | 2.28 | |||||||||||||||||||
| Net investment income (loss) after expense reimbursement/ recoupment and brokerage commission recapture(3)(4) | % | (0.11 | ) | (0.63 | ) | (0.65 | ) | (0.16 | ) | 0.14 | 0.43 | |||||||||||||||
| Portfolio turnover rate | % | 15 | 42 | 79 | 70 | 72 | 13 | |||||||||||||||||||
(1) Commencement of operations.
(2) Total return is calculated assuming reinvestment of all dividends and capital gain distributions at net asset value and excluding the deduction of sales charges. Total return for less than one year is not annualized.
(3) Annualized for periods less than one year.
(4) The Investment Adviser has agreed to limit expenses, (excluding interest, taxes, brokerage and extraordinary expenses) subject to possible recoupment by ING Investments, LLC within three years of being incurred.
* Amount represents less than $0.005 per share.
** Per share data calculated using average number of shares outstanding throughout the period.
84
Table of Contents
Selected data for a share of beneficial interest outstanding throughout each period.
| Class A | Class B | |||||||||||||||||||||||||
| Six Months | Year | February 1, | Six Months | Year | February 1, | |||||||||||||||||||||
| Ended | Ended | 2005(1) to | Ended | Ended | 2005(1) to | |||||||||||||||||||||
| November 30, | May 31, | May 31, | November 30, | May 31, | May 31, | |||||||||||||||||||||
| 2006 | 2006 | 2005 | 2006 | 2006 | 2005 | |||||||||||||||||||||
Per Share Operating Performance: | ||||||||||||||||||||||||||
| Net asset value, beginning of period | $ | 13.43 | 9.97 | 10.00 | 13.35 | 9.95 | 10.00 | |||||||||||||||||||
| Income (loss) from investment operations: | ||||||||||||||||||||||||||
| Net investment income (loss) | $ | 0.06 | ** | 0.10 | ** | 0.00 | * | 0.01 | ** | 0.00 | ** | (0.01 | ) | |||||||||||||
| Net realized and unrealized income (loss) on investments | $ | 1.54 | 3.51 | (0.03 | ) | 1.53 | 3.52 | (0.04 | ) | |||||||||||||||||
| Total from investment operations | $ | 1.60 | 3.61 | (0.03 | ) | 1.54 | 3.52 | (0.05 | ) | |||||||||||||||||
| Less distributions from: | ||||||||||||||||||||||||||
| Net investment income | $ | — | 0.04 | — | — | 0.01 | — | |||||||||||||||||||
| Net realized gain from investments | $ | — | 0.11 | — | — | 0.11 | — | |||||||||||||||||||
| Total distributions | $ | — | 0.15 | — | — | 0.12 | — | |||||||||||||||||||
| Net asset value, end of period | $ | 15.03 | 13.43 | 9.97 | 14.89 | 13.35 | 9.95 | |||||||||||||||||||
| Total Return(2) | % | 11.91 | 36.48 | (0.30 | ) | 11.54 | 35.54 | (0.50 | ) | |||||||||||||||||
Ratios and Supplemental Data: | ||||||||||||||||||||||||||
| Net assets, end of period (000’s) | $ | 119,980 | 39,931 | 3,598 | 9,971 | 6,538 | 1,107 | |||||||||||||||||||
| Ratios to average net assets: | ||||||||||||||||||||||||||
| Net expenses after expense reimbursement and brokerage commission recapture(3)(4) | % | 1.47 | 1.50 | 1.50 | 2.22 | 2.25 | 2.25 | |||||||||||||||||||
| Net expenses after expense reimbursement and prior to brokerage commission recapture(3)(4) | % | 1.50 | 1.51 | 1.50 | 2.25 | 2.26 | 2.25 | |||||||||||||||||||
| Gross expenses prior to expense reimbursement and brokerage commission recapture(3) | % | 1.56 | 1.86 | 4.95 | 2.31 | 2.61 | 5.70 | |||||||||||||||||||
| Net investment income (loss) after expense reimbursement and brokerage commission recapture(3)(4) | % | 0.89 | 0.84 | 0.23 | 0.08 | 0.05 | (0.48 | ) | ||||||||||||||||||
| Portfolio turnover rate | % | 17 | 27 | 10 | 17 | 27 | 10 | |||||||||||||||||||
| Class C | Class I | |||||||||||||||||||||
| Six Months | Year | February 7, | Six Months | September 16, | ||||||||||||||||||
| Ended | Ended | 2005(1) to | Ended | 2005(1) to | ||||||||||||||||||
| November 30, | May 31, | May 31, | November 30, | May 31, | ||||||||||||||||||
| 2006 | 2006 | 2005 | 2006 | 2006 | ||||||||||||||||||
Per Share Operating Performance: | ||||||||||||||||||||||
| Net asset value, beginning of period | $ | 13.34 | 9.94 | 9.94 | 13.43 | 11.18 | ||||||||||||||||
| Income (loss) from investment operations: | ||||||||||||||||||||||
| Net investment income (loss) | $ | 0.01 | ** | 0.01 | ** | (0.00 | )* | 0.08 | ** | 0.14 | ** | |||||||||||
| Net realized and unrealized income on investments | $ | 1.53 | 3.51 | 0.00 | * | 1.55 | 2.28 | |||||||||||||||
| Total from investment operations | $ | 1.54 | 3.52 | 0.00 | * | 1.63 | 2.42 | |||||||||||||||
| Less distributions from: | ||||||||||||||||||||||
| Net investment income | $ | — | 0.01 | — | — | 0.06 | ||||||||||||||||
| Net realized gain from investments | $ | — | 0.11 | — | — | 0.11 | ||||||||||||||||
| Total distributions | $ | — | 0.12 | — | — | 0.17 | ||||||||||||||||
| Net asset value, end of period | $ | 14.88 | 13.34 | 9.94 | 15.06 | 13.43 | ||||||||||||||||
| Total Return(2) | % | 11.54 | 35.62 | 0.00 | * | 12.14 | 21.87 | |||||||||||||||
Ratios and Supplemental Data: | ||||||||||||||||||||||
| Net assets, end of period (000’s) | $ | 38,249 | 21,549 | 2,012 | 13 | 6 | ||||||||||||||||
| Ratios to average net assets: | ||||||||||||||||||||||
| Net expenses after expense reimbursement and brokerage commission recapture(3)(4) | % | 2.22 | 2.25 | 2.25 | 1.16 | 1.61 | ||||||||||||||||
| Net expenses after expense reimbursement and prior to brokerage commission recapture(3)(4) | % | 2.25 | 2.26 | 5.70 | 1.19 | 1.63 | ||||||||||||||||
| Gross expenses prior to expense reimbursement and brokerage commission recapture (3) | % | 2.31 | 2.61 | 5.70 | 1.25 | 2.11 | ||||||||||||||||
| Net investment income (loss) after expense reimbursement and brokerage commission recapture (3)(4) | % | 0.10 | 0.05 | (0.42 | ) | 1.14 | 1.58 | |||||||||||||||
| Portfolio turnover rate | % | 17 | 27 | 10 | 17 | 27 | ||||||||||||||||
(1) Commencement of operations.
(2) Total return is calculated assuming reinvestment of all dividends and capital gain distributions at net asset value and excluding the deduction of sales charges. Total return for less than one year is not annualized.
(3) Annualized for periods less than one year.
(4) The Investment Adviser has agreed to limit expenses (excluding interest, taxes, brokerage and extraordinary expenses) subject to possible recoupment by ING Investments, LLC within three years of being incurred.
* Amount is less than $0.005 or $(0.005) per share or 0.005%.
** Per share data calculated using average number of shares outstanding throughout the period.
85
Table of Contents
Selected data for a share of beneficial interest outstanding throughout each period.
| Class A | ||||||||||||||||||||||||||
| Six Months | February 1, | |||||||||||||||||||||||||
| Ended | Year Ended May 31, | 2002(1) to | ||||||||||||||||||||||||
| November 30, | May 31, | |||||||||||||||||||||||||
| 2006 | 2006 | 2005 | 2004 | 2003 | 2002 | |||||||||||||||||||||
Per Share Operating Performance: | ||||||||||||||||||||||||||
| Net asset value, beginning of period | $ | 10.44 | 12.89 | 13.53 | 9.44 | 10.62 | 10.00 | |||||||||||||||||||
| Income (loss) from investment operations: | ||||||||||||||||||||||||||
| Net investment loss | $ | (0.01 | ) | (0.03 | ) | (0.02 | ) | (0.05 | ) | (0.05 | ) | (0.01 | ) | |||||||||||||
| Net realized and unrealized gain (loss) on investments | $ | 0.35 | 0.78 | 0.27 | 4.88 | (1.00 | ) | 0.63 | ||||||||||||||||||
| Total from investment operations | $ | 0.34 | 0.75 | 0.25 | 4.83 | (1.05 | ) | 0.62 | ||||||||||||||||||
| Less distributions from: | ||||||||||||||||||||||||||
| Net investment income | $ | — | — | — | — | 0.04 | — | |||||||||||||||||||
| Net realized gain from investments | $ | — | 3.18 | 0.89 | 0.74 | 0.09 | — | |||||||||||||||||||
| Return of capital | $ | — | 0.02 | — | — | — | — | |||||||||||||||||||
| Total distributions | $ | — | 3.20 | 0.89 | 0.74 | 0.13 | — | |||||||||||||||||||
| Net asset value, end of period | $ | 10.78 | 10.44 | 12.89 | 13.53 | 9.44 | 10.62 | |||||||||||||||||||
| Total Return(2) | % | 3.26 | 6.51 | 1.67 | 52.83 | (9.83 | ) | 6.20 | ||||||||||||||||||
Ratios and Supplemental Data: | ||||||||||||||||||||||||||
| Net assets, end of period (000’s) | $ | 27,388 | 33,543 | 79,748 | 45,609 | 12,280 | 18,435 | |||||||||||||||||||
| Ratios to average net assets: | ||||||||||||||||||||||||||
| Net expenses after expense reimbursement/recoupment and brokerage commission recapture(3)(4) | % | 1.71 | 1.62 | 1.66 | 1.75 | 1.75 | 1.62 | |||||||||||||||||||
| Net expenses after expense reimbursement/recoupment and prior to brokerage commission recapture(3)(4) | % | 1.72 | 1.62 | 1.66 | 1.75 | 1.75 | 1.62 | |||||||||||||||||||
| Gross expenses prior to expense reimbursement and brokerage commission recapture(3) | % | 1.72 | 1.62 | 1.53 | 1.66 | 2.17 | 3.65 | |||||||||||||||||||
| Net investment loss after expense reimbursement/recoupment and brokerage commission recapture(3)(4) | % | (0.19 | ) | (0.14 | ) | (0.20 | ) | (0.67 | ) | (0.54 | ) | (0.39 | ) | |||||||||||||
| Portfolio turnover rate | % | 7 | 28 | 76 | 57 | 54 | 12 | |||||||||||||||||||
| Class B | ||||||||||||||||||||||||||
| Six Months | February 4, | |||||||||||||||||||||||||
| Ended | Year Ended May 31, | 2002(1) to | ||||||||||||||||||||||||
| November 30, | May 31, | |||||||||||||||||||||||||
| 2006 | 2006 | 2005 | 2004 | 2003 | 2002 | |||||||||||||||||||||
Per Share Operating Performance: | ||||||||||||||||||||||||||
| Net asset value, beginning of period | $ | 10.06 | 12.61 | 13.36 | 9.39 | 10.60 | 9.85 | |||||||||||||||||||
| Income (loss) from investment operations: | ||||||||||||||||||||||||||
| Net investment loss | $ | (0.05 | ) | (0.12 | ) | (0.12 | ) | (0.13 | ) | (0.11 | ) | (0.02 | ) | |||||||||||||
| Net realized and unrealized gain (loss) on investments | $ | 0.34 | 0.77 | 0.26 | 4.84 | (1.01 | ) | 0.77 | ||||||||||||||||||
| Total from investment operations | $ | 0.29 | 0.65 | 0.14 | 4.71 | (1.12 | ) | 0.75 | ||||||||||||||||||
| Less distributions from: | ||||||||||||||||||||||||||
| Net realized gain from investments | $ | — | 3.18 | 0.89 | 0.74 | 0.09 | — | |||||||||||||||||||
| Return of capital | $ | — | 0.02 | — | — | — | — | |||||||||||||||||||
| Total distributions | $ | — | 3.20 | 0.89 | 0.74 | 0.09 | — | |||||||||||||||||||
| Net asset value, end of period | $ | 10.35 | 10.06 | 12.61 | 13.36 | 9.39 | 10.60 | |||||||||||||||||||
| Total Return(2) | % | 2.88 | 5.79 | 0.84 | 51.80 | (10.53 | ) | 7.61 | ||||||||||||||||||
Ratios and Supplemental Data: | ||||||||||||||||||||||||||
| Net assets, end of period (000’s) | $ | 12,882 | 15,953 | 24,540 | 19,815 | 8,233 | 7,889 | |||||||||||||||||||
| Ratios to average net assets: | ||||||||||||||||||||||||||
| Net expenses after expense reimbursement/recoupment and brokerage commission recapture(3)(4) | % | 2.46 | 2.37 | 2.41 | 2.50 | 2.50 | 2.37 | |||||||||||||||||||
| Net expenses after expense reimbursement/recoupment and prior to brokerage commission recapture(3)(4) | % | 2.47 | 2.37 | 2.41 | 2.50 | 2.50 | 2.37 | |||||||||||||||||||
| Gross expenses prior to expense reimbursement and brokerage commission recapture(3) | % | 2.47 | 2.37 | 2.28 | 2.41 | 2.92 | 4.40 | |||||||||||||||||||
| Net investment loss after expense reimbursement/recoupment and brokerage commission recapture(3)(4) | % | (0.94 | ) | (0.89 | ) | (0.97 | ) | (1.37 | ) | (1.29 | ) | (1.14 | ) | |||||||||||||
| Portfolio turnover rate | % | 7 | 28 | 76 | 57 | 54 | 12 | |||||||||||||||||||
(1) Commencement of operations.
(2) Total return is calculated assuming reinvestment of all dividends and capital gain distributions at net asset value and excluding the deduction of sales charges. Total return for less than one year is not annualized.
(3) Annualized for periods less than one year.
(4) The Investment Adviser has agreed to limit expenses, (excluding interest, taxes, brokerage and extraordinary expenses) subject to possible recoupment by ING Investments, LLC within three years of being incurred.
86
Table of Contents
Selected data for a share of beneficial interest outstanding throughout each period.
| Class C | ||||||||||||||||||||||||||
| Six Months | February 7, | |||||||||||||||||||||||||
| Ended | Year Ended May 31, | 2002(1) to | ||||||||||||||||||||||||
| November 30, | May 31, | |||||||||||||||||||||||||
| 2006 | 2006 | 2005 | 2004 | 2003 | 2002 | |||||||||||||||||||||
Per Share Operating Performance: | ||||||||||||||||||||||||||
| Net asset value, beginning of period | $ | 10.05 | 12.60 | 13.35 | 9.38 | 10.60 | 9.76 | |||||||||||||||||||
| Income (loss) from investment operations: | ||||||||||||||||||||||||||
| Net investment loss | $ | (0.05 | ) | (0.11 | )** | (0.11 | ) | (0.12 | ) | (0.10 | ) | (0.01 | ) | |||||||||||||
| Net realized and unrealized gain (loss) on investments | $ | 0.33 | 0.76 | 0.25 | 4.83 | (1.02 | ) | 0.85 | ||||||||||||||||||
| Total from investment operations | $ | 0.28 | 0.65 | 0.14 | 4.71 | (1.12 | ) | 0.84 | ||||||||||||||||||
| Less distributions from: | ||||||||||||||||||||||||||
| Net investment income | $ | — | — | — | — | 0.01 | — | |||||||||||||||||||
| Net realized gain from investments | $ | — | 3.18 | 0.89 | 0.74 | 0.09 | — | |||||||||||||||||||
| Return of capital | $ | — | 0.02 | — | — | — | — | |||||||||||||||||||
| Total distributions | $ | — | 3.20 | 0.89 | 0.74 | 0.10 | — | |||||||||||||||||||
| Net asset value, end of period | $ | 10.33 | 10.05 | 12.60 | 13.35 | 9.38 | 10.60 | |||||||||||||||||||
| Total Return(2) | % | 2.79 | 5.82 | 0.84 | 51.86 | (10.55 | ) | 8.61 | ||||||||||||||||||
Ratios and Supplemental Data: | ||||||||||||||||||||||||||
| Net assets, end of period (000’s) | $ | 17,040 | 20,802 | 42,276 | 28,906 | 11,241 | 8,468 | |||||||||||||||||||
| Ratios to average net assets: | ||||||||||||||||||||||||||
| Net expenses after expense reimbursement/recoupment and brokerage commission recapture(3)(4) | % | 2.46 | 2.37 | 2.41 | 2.50 | 2.50 | 2.37 | |||||||||||||||||||
| Net expenses after expense reimbursement/recoupment and prior to brokerage commission recapture(3)(4) | % | 2.47 | 2.37 | 2.41 | 2.50 | 2.50 | 2.37 | |||||||||||||||||||
| Gross expenses prior to expense reimbursement and brokerage commission recapture(3) | % | 2.47 | 2.37 | 2.28 | 2.41 | 2.92 | 4.40 | |||||||||||||||||||
| Net investment loss after expense reimbursement/recoupment and brokerage commission recapture(3)(4) | % | (0.94 | ) | (0.89 | ) | (0.96 | ) | (1.35 | ) | (1.28 | ) | (1.14 | ) | |||||||||||||
| Portfolio turnover rate | % | 7 | 28 | 76 | 57 | 54 | 12 | |||||||||||||||||||
| Class I | ||||||||||||||||||||||||||
| Six Months | March 7, | |||||||||||||||||||||||||
| Ended | Year Ended May 31, | 2002(1) to | ||||||||||||||||||||||||
| November 30, | May 31, | |||||||||||||||||||||||||
| 2006 | 2006 | 2005 | 2004 | 2003 | 2002 | |||||||||||||||||||||
Per Share Operating Performance: | ||||||||||||||||||||||||||
| Net asset value, beginning of period | $ | 10.59 | 12.99 | 13.60 | 9.44 | 10.63 | 10.32 | |||||||||||||||||||
| Income (loss) from investment operations: | ||||||||||||||||||||||||||
| Net investment income (loss) | $ | 0.01 | 0.01 | ** | 0.01 | (0.04 | ) | (0.05 | ) | 0.00 | * | |||||||||||||||
| Net realized and unrealized gain (loss) on investments | $ | 0.35 | 0.79 | 0.27 | 4.94 | (0.97 | ) | 0.31 | ||||||||||||||||||
| Total from investment operations | $ | 0.36 | 0.80 | 0.28 | 4.90 | (1.02 | ) | 0.31 | ||||||||||||||||||
| Less distributions from: | ||||||||||||||||||||||||||
| Net investment income | $ | — | — | — | — | 0.08 | — | |||||||||||||||||||
| Net realized gain from investments | $ | — | 3.18 | 0.89 | 0.74 | 0.09 | — | |||||||||||||||||||
| Return of capital | $ | — | 0.02 | — | — | — | — | |||||||||||||||||||
| Total distributions | $ | — | 3.20 | 0.89 | 0.74 | 0.17 | — | |||||||||||||||||||
| Net asset value, end of period | $ | 10.95 | 10.59 | 12.99 | 13.60 | 9.44 | 10.63 | |||||||||||||||||||
| Total Return(2) | % | 3.40 | 6.89 | 1.89 | 53.60 | (9.49 | ) | 3.00 | ||||||||||||||||||
Ratios and Supplemental Data: | ||||||||||||||||||||||||||
| Net assets, end of period (000’s) | $ | 45 | 64 | 456 | 481 | 222 | 26 | |||||||||||||||||||
| Ratios to average net assets: | ||||||||||||||||||||||||||
| Net expenses after expense reimbursement/recoupment and brokerage commission recapture(3)(4) | % | 1.39 | 1.37 | 1.35 | 1.43 | 1.32 | 1.23 | |||||||||||||||||||
| Net expenses after expense reimbursement/recoupment and prior to brokerage commission recapture(3)(4) | % | 1.40 | 1.37 | 1.35 | 1.43 | 1.32 | 1.23 | |||||||||||||||||||
| Gross expenses prior to expense reimbursement/recoupment and brokerage commission recapture(3) | % | 1.40 | 1.37 | 1.22 | 1.35 | 1.73 | 2.78 | |||||||||||||||||||
| Net investment income (loss) after expense reimbursement/recoupment and brokerage commission recapture(3)(4) | % | 0.12 | 0.10 | 0.08 | (0.37 | ) | (0.13 | ) | 0.17 | |||||||||||||||||
| Portfolio turnover rate | % | 7 | 28 | 76 | 57 | 54 | 12 | |||||||||||||||||||
(1) Commencement of operations.
(2) Total return is calculated assuming reinvestment of all dividends and capital gain distributions at net asset value and excluding the deduction of sales charges. Total return for less than one year is not annualized.
(3) Annualized for periods less than one year.
(4) The Investment Adviser has agreed to limit expenses, (excluding interest, taxes, brokerage and extraordinary expenses) subject to possible recoupment by ING Investments, LLC within three years of being incurred.
* Amount represents less than $0.005 per share.
** Per share data calculated using average number of shares outstanding throughout the period.
87
Table of Contents
Selected data for a share of beneficial interest outstanding throughout each period.
| Class Q | ||||||||||||||||||||||||||
| Six Months | April 30, | |||||||||||||||||||||||||
| Ended | Year Ended May 31, | 2002(1) to | ||||||||||||||||||||||||
| November 30, | May 31, | |||||||||||||||||||||||||
| 2006 | 2006 | 2005 | 2004 | 2003 | 2002 | |||||||||||||||||||||
Per Share Operating Performance: | ||||||||||||||||||||||||||
| Net asset value, beginning of period | $ | 10.65 | 13.07 | 13.71 | 9.53 | 10.63 | 11.01 | |||||||||||||||||||
| Income (loss) from investment operations: | ||||||||||||||||||||||||||
| Net investment income (loss) | $ | (0.01 | )** | (0.02 | ) | (0.02 | ) | (0.01 | ) | 0.33 | 0.00 | * | ||||||||||||||
| Net realized and unrealized gain (loss) on investments | $ | 0.36 | 0.80 | 0.27 | 4.93 | (1.34 | ) | (0.38 | ) | |||||||||||||||||
| Total from investment operations | $ | 0.35 | 0.78 | 0.25 | 4.92 | (1.01 | ) | (0.38 | ) | |||||||||||||||||
| Less distributions from: | ||||||||||||||||||||||||||
| Net realized gain from investments | $ | — | 3.18 | 0.89 | 0.74 | 0.09 | — | |||||||||||||||||||
| Return of capital | $ | — | 0.02 | — | — | — | — | |||||||||||||||||||
| Total distributions | $ | — | 3.20 | 0.89 | 0.74 | 0.09 | — | |||||||||||||||||||
| Net asset value, end of period | $ | 11.00 | 10.65 | 13.07 | 13.71 | 9.53 | 10.63 | |||||||||||||||||||
| Total Return(2) | % | 3.29 | 6.69 | 1.65 | 53.29 | (9.47 | ) | (3.45 | ) | |||||||||||||||||
Ratios and Supplemental Data: | ||||||||||||||||||||||||||
| Net assets, end of period (000’s) | $ | 4 | 36 | 64 | 58 | 1 | 8 | |||||||||||||||||||
| Ratios to average net assets: | ||||||||||||||||||||||||||
| Net expenses after expense reimbursement/recoupment and brokerage commission recapture(3)(4) | % | 1.64 | 1.62 | 1.60 | 1.52 | 1.35 | 1.42 | |||||||||||||||||||
| Net expense after expense reimbursement/recoupment and prior to brokerage commission recapture(3)(4) | % | 1.65 | 1.62 | 1.60 | 1.52 | 1.35 | 1.42 | |||||||||||||||||||
| Gross expenses prior to expense reimbursement/recoupment(3) | % | 1.65 | 1.62 | 1.47 | 1.52 | 1.73 | 2.42 | |||||||||||||||||||
| Net investment income (loss) after expense reimbursement/recoupment(3)(4) | % | (0.21 | ) | (0.13 | ) | (0.16 | ) | (1.03 | ) | (0.32 | ) | 0.00 | ||||||||||||||
| Portfolio turnover rate | % | 7 | 28 | 76 | 57 | 54 | 12 | |||||||||||||||||||
(1) Commencement of operations.
(2) Total return is calculated assuming reinvestment of all dividends and capital gain distributions at net asset value and excluding the deduction of sales charges. Total return for less than one year is not annualized.
(3) Annualized for periods less than one year.
(4) The Investment Adviser has agreed to limit expenses, (excluding interest, taxes, brokerage and extraordinary expenses) subject to possible recoupment by ING Investments, LLC within three years of being incurred.
* Amount represents less than $0.005 per share.
** Per share data calculated using average number of shares outstanding throughout the period.
88
Table of Contents
Selected data for a share of beneficial interest outstanding throughout each period.
| Class A | Class B | |||||||||||||||||||||||||
| Six Months | Year | February 1, | Six Months | Year | February 1, | |||||||||||||||||||||
| Ended | Ended | 2005(1) to | Ended | Ended | 2005(1) to | |||||||||||||||||||||
| November 30, | May 31, | May 31, | November 30, | May 31, | May 31, | |||||||||||||||||||||
| 2006 | 2006 | 2005 | 2006 | 2006 | 2005 | |||||||||||||||||||||
Per Share Operating Performance: | ||||||||||||||||||||||||||
| Net asset value, beginning of period | $ | 12.48 | 9.57 | 10.00 | 12.41 | 9.55 | 10.00 | |||||||||||||||||||
| Income (loss) from investment operations: | ||||||||||||||||||||||||||
| Net investment loss | $ | 0.02 | ** | (0.00 | )* ** | (0.00 | )* | (0.02 | ) | (0.08 | ) | (0.01 | ) | |||||||||||||
| Net realized and unrealized gain (loss) on investments | $ | 0.74 | 3.04 | (0.43 | ) | 0.73 | 3.02 | (0.44 | ) | |||||||||||||||||
| Total from investment operations | $ | 0.76 | 3.04 | (0.43 | ) | 0.71 | 2.94 | (0.45 | ) | |||||||||||||||||
| Less distributions from: | ||||||||||||||||||||||||||
| Net investment income | $ | — | 0.05 | — | — | (0.00 | )* | — | ||||||||||||||||||
| Net realized gain from investments | $ | — | 0.08 | — | — | 0.08 | — | |||||||||||||||||||
| Total distributions | $ | — | 0.13 | — | — | 0.08 | — | |||||||||||||||||||
| Net asset value, end of period | $ | 13.24 | 12.48 | 9.57 | 13.12 | 12.41 | 9.55 | |||||||||||||||||||
| Total Return(2) | % | 6.09 | 31.90 | (4.30 | ) | 5.72 | 30.91 | (4.50 | ) | |||||||||||||||||
Ratios and Supplemental Data: | ||||||||||||||||||||||||||
| Net assets, end of period (000’s) | $ | 43,630 | 21,127 | 3,976 | 3,511 | 2,187 | 591 | |||||||||||||||||||
| Ratios to average net assets: | ||||||||||||||||||||||||||
| Net expenses after expense reimbursement and brokerage commission recapture(3)(4) | % | 1.46 | 1.50 | 1.50 | 2.21 | 2.25 | 2.25 | |||||||||||||||||||
| Net expenses after expense reimbursement and prior to brokerage commission recapture (3)(4) | % | 1.50 | 1.54 | 1.50 | 2.25 | 2.29 | 2.25 | |||||||||||||||||||
| Gross expenses prior to expense reimbursement and brokerage commission recapture(3) | % | 1.65 | 2.14 | 4.73 | 2.40 | 2.87 | 5.48 | |||||||||||||||||||
| Net investment loss after expense reimbursement(3)(4) | % | 0.35 | (0.01 | ) | (0.18 | ) | (0.36 | ) | (0.75 | ) | (0.93 | ) | ||||||||||||||
| Portfolio turnover rate | % | 6 | 36 | 14 | 6 | 36 | 14 | |||||||||||||||||||
| Class C | Class I | |||||||||||||||||||||
| Six Months | Year | February 2, | Six Months | June 9, | ||||||||||||||||||
| Ended | Ended | 2005(1) to | Ended | 2005(1) to | ||||||||||||||||||
| November 30, | May 31, | May 31, | November 30, | May 31, | ||||||||||||||||||
| 2006 | 2006 | 2005 | 2006 | 2006 | ||||||||||||||||||
Per Share Operating Performance: | ||||||||||||||||||||||
| Net asset value, beginning of period | $ | 12.42 | 9.56 | 10.05 | 12.50 | 9.80 | ||||||||||||||||
| Income (loss) from investment operations: | ||||||||||||||||||||||
| Net investment income (loss) | $ | (0.02 | ) | (0.08 | ) | (0.01 | ) | 0.04 | ** | 0.05 | ** | |||||||||||
| Net realized and unrealized gain (loss) on investments | $ | 0.72 | 3.03 | (0.48 | ) | 0.74 | 2.80 | |||||||||||||||
| Total from investment operations | $ | 0.70 | 2.95 | (0.49 | ) | 0.78 | 2.65 | |||||||||||||||
| Less distributions from: | ||||||||||||||||||||||
| Net investment income | $ | — | 0.01 | — | — | 0.07 | ||||||||||||||||
| Net realized gain from investments | $ | — | 0.08 | — | — | 0.08 | ||||||||||||||||
| Total distributions | $ | — | 0.09 | — | — | 0.15 | ||||||||||||||||
| Net asset value, end of period | $ | 13.12 | 12.42 | 9.56 | 13.28 | 12.50 | ||||||||||||||||
| Total Return(2) | % | 5.64 | 30.97 | (4.88 | ) | 6.24 | 29.26 | |||||||||||||||
Ratios and Supplemental Data: | ||||||||||||||||||||||
| Net assets, end of period (000’s) | $ | 11,482 | 6,803 | 1,517 | 9,058 | 3,333 | ||||||||||||||||
| Ratios to average net assets: | ||||||||||||||||||||||
| Net expenses after expense reimbursement and brokerage commission recapture(3)(4) | % | 2.21 | 2.25 | 2.25 | 1.15 | 1.11 | ||||||||||||||||
| Net expenses after expense reimbursement and prior to brokerage commission recapture (3)(4) | % | 2.25 | 2.29 | 2.25 | 1.19 | 1.15 | ||||||||||||||||
| Gross expenses prior to expense reimbursement and brokerage commission recapture(3) | % | 2.40 | 2.87 | 5.48 | 1.34 | 1.75 | ||||||||||||||||
| Net investment income (loss) after expense reimbursement(3)(4) | % | (0.36 | ) | (0.75 | ) | (0.91 | ) | 0.70 | 0.42 | |||||||||||||
| Portfolio turnover rate | % | 6 | 36 | 14 | 6 | 36 | ||||||||||||||||
(1) Commencement of operations.
(2) Total return is calculated assuming reinvestment of all dividends and capital gain distributions at net asset value and excluding the deduction of sales charges. Total return for less than one year is not annualized.
(3) Annualized for periods less than one year.
(4) The Investment Adviser has agreed to limit expenses (excluding interest, taxes, brokerage and extraordinary expenses) subject to possible recoupment by ING Investments, LLC within three years of being incurred.
* Amount is less than $0.005 per share.
** Per share data calculated using average number of shares outstanding throughout the period.
89
Table of Contents
NOTE 1 — ORGANIZATION
Organization. The ING Funds included in this report are comprised of ING Equity Trust (“IET”) and ING Investment Funds, Inc. (“IIF”), both organized as open-end investment management companies registered under the Investment Company Act of 1940, as amended (“1940 Act”).
IET is a Massachusetts business trust organized on June 12, 1998 with twenty-seven separate series. Thirteen of which are discussed in this report: ING Real Estate Fund (“Real Estate”), ING Disciplined LargeCap Fund (“Disciplined LargeCap”), ING Fundamental Research Fund (“Fundamental Research”), ING LargeCap Growth Fund (“LargeCap Growth”), ING MidCap Opportunities Fund (“MidCap Opportunities”), ING Opportunistic LargeCap Fund (“Opportunistic LargeCap”), ING SmallCap Opportunities Fund (“SmallCap Opportunities”), ING Financial Services Fund (“Financial Services”), ING LargeCap Value Fund (“LargeCap Value”), ING MidCap Value Fund (“MidCap Value”), ING MidCap Value Choice Fund (“MidCap Value Choice”), ING SmallCap Value Fund (“SmallCap Value”) and ING SmallCap Value Choice Fund (“SmallCap Value Choice”). IIF is a Maryland Corporation organized on July 7, 1969 with one Series, ING MagnaCap Fund (“MagnaCap”), collectively (the “Funds”). The investment objective of each Fund is described in the Fund’s prospectus.
Each Fund offers at least three of the following classes of shares: Class A, Class B, Class C, Class I, Class M, Class O and Class Q. The separate classes of shares differ principally in the applicable sales charges (if any), distribution fees (if any), shareholder servicing fees (if any) and transfer agency fees. Shareholders of each class also bear certain expenses that pertain to that particular class. All shareholders bear the common expenses of the Fund and earn income and realized gains/losses from the Fund pro rata based on the average daily net assets of each class, without distinction between share classes. Differences in per share dividend rates generally results from differences in separate class expenses, including distribution, and shareholder servicing fees. Class B shares, along with their pro rata reinvested dividend shares, automatically convert to Class A shares approximately eight years after purchase.
MidCap Value and SmallCap Value are each closed to new investments except for shares purchased: (1) through the reinvestment of dividends and distributions; (2) by 401(k), 403(b) and 457 plans that have selected MidCap Value and SmallCap Value as an investment option prior to December 31, 2004; (3) by shareholders participating in mutual fund wrap fee programs who were invested in MidCap Value and SmallCap Value prior to December 31, 2004; (4) by new 401(k), 403(b) and 457 plans and new shareholders participating in mutual fund wrap fee programs subject to approval by the Adviser and Sub-Adviser based on their assessment of a Fund’s ability to invest the monies consistent with the Fund’s objectives in light of market conditions, the size of the purchase, and other relevant factors relating to MidCap Value and SmallCap Value; and (5) by employees of the Adviser or Sub-Adviser and their affiliates. Proof of eligibility may be required. Employees of the Adviser or Sub-Adviser and their affiliates must identify themselves as such at the time of purchase. Failure to do so may result in a rejection of the purchase. MidCap Value and SmallCap Value may reopen in the future.
NOTE 2 — SIGNIFICANT ACCOUNTING POLICIES
The following significant accounting policies are consistently followed by the Funds in the preparation of their financial statements. Such policies are in conformity with U.S. generally accepted accounting principles for investment companies.
| A. | Security Valuation. Investments in equity securities traded on a national securities exchange are valued at the last reported sale price. Securities reported by NASDAQ will be valued at the NASDAQ official closing prices. Securities traded on an exchange or NASDAQ for which there has been no sale and securities traded in the over-the-counter-market are valued at the mean between the last reported bid and ask prices. All investments quoted in foreign currencies will be valued daily in U.S. dollars on the basis of the foreign currency exchange rates prevailing at that time. Debt securities are valued at prices obtained from independent services or from one or more dealers making markets in the securities and may be adjusted based on the Funds’ valuation procedures. U.S. government obligations are valued by using market quotations or independent pricing services that use prices provided by market-makers or estimates of market values obtained from yield data relating |
90
Table of Contents
| to instruments or securities with similar characteristics. | |
| Securities and assets for which market quotations are not readily available (which may include certain restricted securities which are subject to limitations as to their sale) are valued at their fair values as determined in good faith by or under the supervision of the Funds’ Board of Trustees (“Board”), in accordance with methods that are specifically authorized by the Board. Securities traded on exchanges, including foreign exchanges, which close earlier than the time that a Fund calculates its net asset value (“NAV”) may also be valued at their fair values as determined in good faith by or under the supervision of a Fund’s Board, in accordance with methods that are specifically authorized by the Board. The valuation techniques applied in any specific instance are likely to vary from case to case. With respect to a restricted security, for example, consideration is generally given to the cost of the investment, the market value of any unrestricted securities of the same class at the time of valuation, the potential expiration of restrictions on the security, the existence of any registration rights, the costs to the Funds related to registration of the security, as well as factors relevant to the issuer itself. Consideration may also be given to the price and extent of any public trading in similar securities of the issuer or comparable companies’ securities. | |
| The value of a foreign security traded on an exchange outside the United States is generally based on the price of a foreign security on the principal foreign exchange where it trades as of the time a Fund determines its NAV or if the foreign exchange closes prior to the time the Fund determines its NAV, the most recent closing price of the foreign security on its principal exchange. | |
| Trading in certain non-U.S. securities may not take place on all days on which the New York Stock Exchange (“NYSE”) is open. Further, trading takes place in various foreign markets on days on which the NYSE is not open. Consequently, the calculation of a Fund’s NAV may not take place contemporaneously with the determination of the prices of securities held by a Fund in foreign securities markets. Further, the value of a Fund’s assets may be significantly affected by foreign trading on days when a shareholder cannot purchase or redeem shares of the Fund. In calculating a Fund’s NAV, foreign securities in foreign currency are converted to U.S. dollar equivalents. | |
| If an event occurs after the time at which the market for foreign securities held by a Fund closes but before the time that the Fund’s NAV is calculated, such event may cause the closing price on the foreign exchange to not represent a readily available reliable market value quotation for such securities at the time a Fund determines its NAV. In such a case, a Fund will use the a value of such securities as determined under the Fund’s valuation procedures. Events after the close of trading on a foreign market that could require the Fund to fair value some or all of its foreign securities include, among others, securities trading in the U.S. and other markets, corporate announcements, natural and other disasters, and political and other events. Among other elements of analysis in the determination of a security’s fair value, the Board has authorized the use of one or more independent research services to assist with such determinations. An independent research service may use statistical analyses and quantitative models to help determine fair value as of the time a Fund calculates its NAV. There can be no assurance that such models accurately reflect the behavior of the applicable markets or the effect of the behavior of such markets on the fair value of securities, or that such markets will continue to behave in a fashion that is consistent with such models. Unlike the closing price of a security on an exchange, fair value determinations employ elements of judgment. Consequently, the fair value assigned to a security may not represent the actual value that the Fund could obtain if it were to sell the security at the time of the close of the NYSE. Pursuant to procedures adopted by the Board, a Fund is not obligated to use the fair valuations suggested by any research service, and valuation recommendations provided by such research services may be overridden if other events have occurred or if other fair valuations are determined in good faith to be more accurate. Unless an event is such that it causes the Fund to determine that the closing prices for one or more securities do not represent readily available reliable market value quotations at the |
91
Table of Contents
| time the Fund determines its NAV, events that occur between the time of the close of the foreign market on which they are traded and the close of regular trading on the NYSE will not be reflected in the Fund’s NAV. Investments in securities maturing in 60 days or less from the date of acquisition are valued at amortized cost, which, when combined with accrued interest, approximates market value. | |
| B. | Security Transactions and Revenue Recognition. Securities transactions are accounted for on the trade date. Realized gains and losses are reported on the basis of identified cost of securities sold. Interest income is recorded on an accrual basis. Dividend income is recorded on the ex-dividend date, or for certain foreign securities, when the information becomes available to the Funds. Premium amortization and discount accretion are determined by the effective yield method and included in interest income. |
| Real Estate estimates components of distributions from real estate investment trusts (“REITs”). Distributions received in excess of income are recorded as a reduction of cost of the related investments. If the Fund no longer owns the applicable securities, any distributions received in excess of income are recorded as realized gains. | |
| C. | Foreign Currency Translation. The books and records of the Funds are maintained in U.S. dollars. |
| Any foreign currency amounts are translated into U.S. dollars on the following basis: |
| (1) | Market value of investment securities, other assets and liabilities — at the exchange rates prevailing at the end of the day. | |
| (2) | Purchases and sales of investment securities, income and expenses — at the rates of exchange prevailing on the respective dates of such transactions. |
| Although the net assets and the market values are presented at the foreign exchange rates at the end of the day, the Funds do not isolate the portion of the results of operations resulting from changes in foreign exchange rates on investments from the fluctuations arising from changes in market prices of securities held. Such fluctuations are included with the net realized and unrealized gains or losses from investments. For securities which are subject to foreign withholding tax upon disposition, liabilities are recorded on the Statement of Assets and Liabilities for the estimated tax withholding based on the securities’ current market value. Upon disposition, realized gains or losses on such securities are recorded net of foreign withholding tax. | |
| Reported net realized foreign exchange gains or losses arise from sales of foreign currencies, currency gains or losses realized between the trade and settlement dates on securities transactions, the difference between the amounts of dividends, interest, and foreign withholding tax reclaims recorded on the Fund’s books, and the U.S. dollar equivalent of the amounts actually received or paid. Net unrealized foreign exchange gains and losses arise from changes in the value of assets and liabilities other than investments in securities at fiscal year end, resulting from changes in the exchange rate. Foreign security and currency transactions may involve certain considerations and risks not typically associated with investing in U.S. companies and the U.S. government securities. These risks include but are not limited to revaluation of currencies and future adverse political and economic developments which could cause securities and their markets to be less liquid and prices more volatile than those of comparable U.S. companies and the U.S. government securities. | |
| D. | Foreign Currency Transactions and Futures Contracts. Certain Funds may enter into foreign currency exchange transactions to convert to and from different foreign currencies and to and from the U.S. dollar in connection with the planned purchases or sales of securities. The Funds either enter into these transactions on a spot basis at the spot rate prevailing in the foreign currency exchange market or use forward foreign currency contracts to purchase or sell foreign currencies. When the contract is fulfilled or closed, gains or losses are realized. Until then, the gain or loss is included in unrealized appreciation or depreciation. Risks may arise upon entering into forward contracts from the potential inability of counterparties to |
92
Table of Contents
| meet the terms of their forward contracts and from unanticipated movements in the value of foreign currencies relative to the U.S. dollar. | |
| Each Fund may enter into futures contracts involving foreign currency, interest rates, securities and security indices. A futures contract obligates the seller of the contract to deliver and the purchaser of the contract to take delivery of the type of foreign currency, financial instrument or security called for in the contract at a specified future time for a specified price. Upon entering into such a contract, a Fund is required to deposit and maintain as collateral such initial margin as required by the exchange on which the contract is traded. Pursuant to the contract, a Fund agrees to receive from or pay to the broker an amount equal to the daily fluctuations in the value of the contract. Such receipts or payments are known as variation margins and are recorded as unrealized gains or losses by the Fund. When the contract is closed, the Fund records a realized gain or loss equal to the difference between the value of the contract at the time it was opened and the value at the time it was closed. | |
| E. | Distributions to Shareholders. The Funds record distributions to their shareholders on the ex-dividend date. Each Fund pays dividends, if any, as follows: |
Annually | Semi-Annually | |
| Disciplined LargeCap Fundamental Research LargeCap Growth MidCap Opportunities Opportunistic LargeCap SmallCap Opportunities Financial Services LargeCap Value MidCap Value MidCap Value Choice SmallCap Value SmallCap Value Choice | MagnaCap Quarterly Real Estate |
| Each Fund distributes capital gains, to the extent available, annually. The Funds may make distributions on a more frequent basis to comply with the distribution requirements of the Internal Revenue Code. The characteristics of income and gains to be distributed are determined in accordance with income tax regulations, which may differ from U.S. generally accepted accounting principles for investment companies. | |
| F. | Federal Income Taxes. It is the policy of the Funds to comply with subchapter M of the Internal Revenue Code and related excise tax provisions applicable to regulated investment companies and to distribute substantially all of their net investment income and any net realized capital gains to their shareholders. Therefore, no federal income tax provision is required. No capital gain distributions shall be made until any capital loss carryforwards have been fully utilized or expired. |
| The Funds may utilize equalization accounting for tax purposes, whereby a portion of redemption payments are treated as distributions of income or gain for income tax purposes. | |
| G. | Use of Estimates. The preparation of financial statements in conformity with U.S. generally accepted accounting principles requires management to make estimates and assumptions that affect the reported amounts of assets and liabilities and disclosure of contingent assets and liabilities at the date of the financial statements and the reported amounts of increases and decreases in net assets from operations during the reporting period. Actual results could differ from those estimates. |
| H. | Repurchase Agreements. Each Fund may invest in repurchase agreements only with government securities dealers recognized by the Board of Governors of the Federal Reserve System. Under such agreements, the seller of the security agrees to repurchase it at a mutually agreed upon time and price. The resale price is in excess of the purchase price and reflects an agreed upon interest rate for the period of time the agreement is outstanding. The period of the repurchase agreements is usually short, from overnight to one week, while the underlying securities generally have longer maturities. Each Fund will receive as collateral securities acceptable to it whose market value is equal to at least 100% of the carrying amount of the repurchase agreements, plus accrued interest, being invested by the Fund. The underlying collateral is valued daily on a mark to market basis to assure that the value, including accrued interest is at least equal to the repurchase price. There would be potential loss to a Fund in the event the Fund is delayed or prevented from exercising its right to dispose of the collateral, |
93
Table of Contents
| and it might incur disposition costs in liquidating the collateral. | |
| I. | Options Contracts. Each Fund, except MagnaCap, may purchase put and call options. Each Fund may write (sell) put options. Each Fund, except Financial Services and MagnaCap, may write covered call options. The Funds may engage in option transactions as a hedge against adverse movements in the value of portfolio holdings or to increase market exposure. Option contracts are valued daily and unrealized gains or losses are recorded based upon the last sales price on the principal exchange on which the options are traded. The Funds will realize a gain or loss upon the expiration or closing of the option contract. When an option is exercised, the proceeds on sales of the underlying security for a written call option, the purchase cost of the security for a written put option, or the cost of the security for a purchased put or call option is adjusted by the amount of premium received or paid. Realized and unrealized gains or losses on option contracts are reflected in the accompanying financial statements. The risk in writing a call option is that the Funds give up the opportunity for profit if the market price of the security increases and the option is exercised. The risk in writing a put option is that the Funds may incur a loss if the market price of the security decreases and the option is exercised. The risk in buying an option is that the Funds pay a premium whether or not the option is exercised. Risks may also arise from an illiquid secondary market or from the inability of counterparties to meet the terms of the contract. |
| J. | Securities Lending. Each Fund has the option to temporarily loan up to 30% of its total assets to brokers, dealers or other financial institutions in exchange for a negotiated lender’s fee. The borrower is required to fully collateralize the loans with cash or U.S. government securities. Generally, in the event of counterparty default, the Fund has the right to use collateral to offset losses incurred. There would be potential loss to the Fund in the event the Fund is delayed or prevented from exercising its right to dispose of the collateral. The Fund bears the risk of loss with respect to the investment of collateral. Engaging in securities lending could have a leveraging effect, which may intensify the credit, market and other risks associated with investing in a Fund. |
| K. | Organization Expenses and Offering Costs. Costs incurred with the organization of the Funds are expensed as incurred. Costs incurred with the offering of shares of the Funds are deferred and amortized over a period of twelve months. |
| L. | Illiquid and Restricted Securities. Each Fund, except MagnaCap, may not invest more than 15% of its net assets in illiquid securities. Illiquid securities are not readily marketable. Disposing of illiquid investments may involve time-consuming negotiation and legal expenses, and it may be difficult or impossible for the Funds to sell them promptly at an acceptable price. Each Fund also may invest in restricted securities, which include those sold under Rule 144A of the Securities Act of 1933 (“1933 Act”) or securities offered pursuant to Section 4(2) of the 1933 Act, and/or are subject to legal or contractual restrictions on resale and generally may not be publicly sold without registration under the 1933 Act. Certain restricted securities may be considered liquid pursuant to procedures adopted by the Board or may be deemed to be illiquid because they may not be readily marketable. Illiquid and restricted securities are valued using market quotations when readily available. In the absence of market quotations, the illiquid and restricted securities are valued based upon their fair value determined under procedures approved by the Board. |
| M. | Delayed Delivery Transactions. Each Fund may purchase or sell securities on a when-issued basis. Each Fund, except MagnaCap and Financial Services, may enter into forward commitments. The price of the underlying securities and date when the securities will be delivered and paid for are fixed at the time the transaction is negotiated. The market value of such is identified in each Fund’s Portfolio of Investments. Losses may arise due to changes in the market value of the securities or from the inability of counterparties to meet the terms of the contract. In connection with such purchases, the Funds are required to segregate liquid assets with the Funds’ custodian sufficient to cover the purchase price. |
| N. | Mortgage Dollar Roll Transactions. In connection with a Fund’s ability to purchase or sell securities |
94
Table of Contents
| on a when-issued basis, the Funds may engage in dollar roll transactions with respect to mortgage-backed securities issued by Government National Mortgage Association, Federal National Mortgage Association and Federal Home Loan Mortgage Corp. In a dollar roll transaction, a Fund sells a mortgage-backed security to a financial institution, such as a bank or broker/ dealer, and simultaneously agrees to repurchase a substantially similar (i.e., same type, coupon, and maturity) security from the institution on a delayed delivery basis at an agreed upon price. The mortgage-backed securities that are repurchased will bear the same interest rate as those sold, but generally will be collateralized by different pools of mortgages with different prepayment histories. The Funds account for dollar roll transactions as purchases and sales. |
NOTE 3 — INVESTMENT TRANSACTIONS
For the six months ended November 30, 2006, the cost of purchases and proceeds from the sales of securities, excluding short-term securities, were as follows:
| Purchases | Sales | |||||||
| Real Estate | $ | 92,284,946 | $ | 55,796,568 | ||||
| Disciplined LargeCap | 20,961,835 | 25,035,124 | ||||||
| Fundamental Research | 5,962,738 | 5,825,345 | ||||||
| LargeCap Growth | 113,622,597 | 149,299,744 | ||||||
| MidCap Opportunities | 253,763,145 | 287,312,893 | ||||||
| Opportunistic LargeCap | 4,542,018 | 4,426,134 | ||||||
| SmallCap Opportunities | 53,307,974 | 76,052,870 | ||||||
| Financial Services | 48,298,175 | 63,558,675 | ||||||
| LargeCap Value | 54,523,886 | 16,632,859 | ||||||
| MagnaCap | 147,645,965 | 179,263,385 | ||||||
| MidCap Value | 13,194,467 | 33,342,762 | ||||||
| MidCap Value Choice | 65,840,206 | 14,677,070 | ||||||
| SmallCap Value | 4,250,359 | 20,498,315 | ||||||
| SmallCap Value Choice | 31,220,164 | 2,758,035 | ||||||
NOTE 4 — INVESTMENT MANAGEMENT AND ADMINISTRATIVE FEES
The Funds entered into investment management agreements (“Management Agreements”) with ING Investments, LLC (“ING Investments” or the “Investment Adviser”). The Investment Management Agreements compensate the Investment Adviser with a fee, computed daily and payable monthly, based on the average daily net assets of each Fund, at the following annual rates:
| As a Percent of Average Net Assets | ||
| Real Estate | 0.70% | |
| Disciplined LargeCap | 0.70% | |
| Fundamental Research | 0.70% on first $500 million; 0.65% on next $500 million; and 0.60% thereafter | |
| LargeCap Growth | 0.75% on first $500 million; 0.675% on next $500 million; and 0.65% in excess of $1 billion | |
| MidCap Opportunities | 1.00% on first $500 million; and 0.90% thereafter | |
| Opportunistic LargeCap | 0.70% on first $500 million; 0.65% on next $500 million; and 0.60% thereafter | |
| SmallCap Opportunities | 1.00% on first $100 million; 0.90% on next $150 million; 0.80% on next $250 million; and 0.75% in excess of $500 million | |
| Financial Services | 1.00% on first $30 million; 0.75% on next $95 million; and 0.70% in excess of $125 million | |
| LargeCap Value | 0.90% on first $50 million; 0.85% on next $450 million; and 0.80% thereafter | |
| MagnaCap | 1.00% on first $30 million; 0.75% on next $220 million; 0.625% on next $200 million; and 0.50% in excess of $450 million | |
| MidCap Value | 1.00% on first $50 million; and 0.90% thereafter | |
| MidCap Value Choice | 1.00% | |
| SmallCap Value | 1.00% on first $50 million; and 0.90% thereafter | |
| SmallCap Value Choice | 1.00% |
ING Investment Management Co. (“ING IM”), a registered investment adviser, serves as Sub-Adviser to, Disciplined LargeCap, Fundamental Research, MidCap Opportunities, Opportunistic LargeCap, SmallCap Opportunities, Financial Services and MagnaCap pursuant to sub-Advisory agreements between the Investment Adviser and ING IM.
ING Clarion Real Estate Securities L.P. (“INGCRES”), a registered investment adviser, is the Sub-Adviser to Real Estate pursuant to a sub-Advisory agreement between the Investment Adviser and INGCRES.
Brandes Investment Partners, L.P. (“Brandes”), a registered investment adviser, serves as Sub-Adviser to LargeCap Value, MidCap Value and SmallCap Value pursuant to a sub-advisory agreement between the Investment Adviser and Brandes.
Wellington Management Company, LLP (“Wellington Management”), a registered investment adviser, serves as the Sub-Adviser to LargeCap Growth pursuant to a sub-Advisory agreement between the Investment Adviser and Wellington Management.
NWQ Investment Management Company, LLC (“NWQ”), a registered investment adviser, serves as a Sub-Adviser to SmallCap Value Choice pursuant to a
95
Table of Contents
sub-advisory agreement between the Investment Adviser and NWQ.
Tradewinds NWQ Global Investors, LLC (“Tradewinds”), a registered investment adviser, serves as Sub-Adviser to MidCap Value Choice, pursuant to a sub-advisory agreement between the Investment Adviser and Tradewinds.
ING Funds Services, LLC (the “Administrator” or “IFS”), serves as administrator to each Fund except Financial Services and MagnaCap. The Funds pay the Administrator a fee calculated at an annual rate of 0.10% of each Funds’ average daily net assets.
Financial Services and MagnaCap have entered into Shareholder Service Agreements with IFS whereby IFS will act as Shareholder Service Agent for the Funds. The agreement provides that IFS will be compensated for incoming and outgoing shareholder telephone calls and letters, and all reasonable out-of-pocket expenses incurred in connection with the performance of such services.
Disciplined LargeCap, MidCap Opportunities and SmallCap Opportunities also pay IFS an annual shareholder account servicing fee of $5.00, payable semi-annually, for each account of beneficial owners of shares.
The Investment Adviser, ING IM, INGCRES, IFS and the Distributor are indirect, wholly-owned subsidiaries of ING Groep N.V. (“ING Groep”). ING Groep is one of the largest financial services organizations in the world, and offers an array of banking, insurance and asset management services to both individuals and investors.
Effective November 1, 2006, all ING Funds sub-advised by ING IM will be permitted to invest end-of-day cash balances into affiliated ING money market funds, including ING Institutional Prime Money Market Fund. The investment management fee equivalent to 0.08% will be waived at the investment level of the ING Funds using ING Prime Institutional Money Market Fund. As of November 30, 2006, Financial Services has waived $263.
NOTE 5 — DISTRIBUTION AND SERVICE FEES
Each share class of the Funds (except Class I) has adopted a Plan pursuant to Rule 12b-1 under the 1940 Act (the “12b-1 Plans”), whereby ING Funds Distributor, LLC (the “Distributor”) is reimbursed or compensated (depending on the class of shares) by the Funds for expenses incurred in the distribution of each Fund’s shares (“Distribution Fees”). Pursuant to the 12b-1 Plans, the Distributor is entitled to a payment each month to reimburse or compensate expenses incurred in the distribution and promotion of each Fund’s shares, including expenses incurred in printing prospectuses and reports used for sales purposes, expenses incurred in preparing and printing sales literature and other such distribution related expenses, including any distribution or shareholder servicing fees (“Service Fees”) paid to securities dealers who have executed a distribution agreement with the Distributor. Under the 12b-1 Plans, each class of shares of the Fund pays the Distributor a combined Distribution and/or Service Fee based on average daily net assets at the following rates:
| Classes B | ||||||||||||||||||||
| Class A | and C | Class M | Class O | Class Q | ||||||||||||||||
| Real Estate | 0.25 | % | 1.00 | % | N/A | 0.25 | % | 0.25 | % | |||||||||||
Disciplined LargeCap(1) | 0.30 | % | 1.00 | % | N/A | N/A | N/A | |||||||||||||
| Fundamental Research | 0.25 | % | 1.00 | % | N/A | N/A | N/A | |||||||||||||
| LargeCap Growth | 0.35 | % | 1.00 | % | N/A | N/A | 0.25 | % | ||||||||||||
MidCap Opportunities(1) | 0.30 | % | 1.00 | % | N/A | N/A | 0.25 | % | ||||||||||||
| Opportunistic LargeCap | 0.25 | % | 1.00 | % | N/A | N/A | N/A | |||||||||||||
SmallCap Opportunities(1) | 0.30 | % | 1.00 | % | N/A | N/A | 0.25 | % | ||||||||||||
Financial Services(1) | 0.35 | % | 1.00 | % | N/A | 0.25 | % | N/A | ||||||||||||
| LargeCap Value | 0.25 | % | 1.00 | % | N/A | N/A | N/A | |||||||||||||
MagnaCap(2) | 0.30 | % | 1.00 | % | 0.75 | % | N/A | N/A | ||||||||||||
| MidCap Value | 0.25 | % | 1.00 | % | N/A | N/A | 0.25 | % | ||||||||||||
| MidCap Value Choice | 0.25 | % | 1.00 | % | N/A | N/A | N/A | |||||||||||||
| SmallCap Value | 0.25 | % | 1.00 | % | N/A | N/A | 0.25 | % | ||||||||||||
| SmallCap Value Choice | 0.25 | % | 1.00 | % | N/A | N/A | N/A | |||||||||||||
| (1) | ING Funds Distributor, LLC has contractually agreed to waive 0.10% of the Distribution Fee for Class A shares of Financial Services through October 1, 2007. Effective January 1, 2005, ING Funds Distributor, LLC has also contractually agreed to waive 0.05% of the Distribution Fee for Class A shares of Disciplined LargeCap, MidCap Opportunities and SmallCap Opportunities. The fee waiver is for the period beginning January 1, 2006 through December 31, 2007. |
| (2) | MagnaCap Class A paid only 0.19% in Distribution Fees under its 12b-1 reimbursement plan. |
Presently, the Funds’ class-specific expenses include certain transfer agent fees and distribution fees incurred in connection with Class A, Class B, and Class C shares and service fees in connection with Class B, Class C and Class M shares. For the six months
96
Table of Contents
ended November 30, 2006, the Distributor retained the following amounts in sales charges:
| Class A | Class B | Class C | Class M | |||||||||||||
| Initial Sales Charges: | Shares | Shares | Shares | Shares | ||||||||||||
| Real Estate | $ | 8,182 | N/A | N/A | N/A | |||||||||||
| Disciplined LargeCap | 958 | N/A | N/A | N/A | ||||||||||||
| Fundamental Research | 16 | N/A | N/A | N/A | ||||||||||||
| LargeCap Growth | 15,137 | N/A | N/A | N/A | ||||||||||||
| MidCap Opportunities | 2,165 | N/A | N/A | N/A | ||||||||||||
| SmallCap Opportunities | 1,242 | N/A | N/A | N/A | ||||||||||||
| Financial Services | 8,978 | N/A | N/A | N/A | ||||||||||||
| LargeCap Value | 18,503 | N/A | N/A | N/A | ||||||||||||
| MagnaCap | 2,670 | N/A | N/A | $ | 87 | |||||||||||
| MidCap Value | 30 | N/A | N/A | N/A | ||||||||||||
| MidCap Value Choice | 29,259 | N/A | N/A | N/A | ||||||||||||
| SmallCap Value Choice | 10,412 | N/A | N/A | N/A | ||||||||||||
| Class A | Class B | Class C | Class M | |||||||||||||
| Contingent Deferred Sales Charges: | Shares | Shares | Shares | Shares | ||||||||||||
| Real Estate | $ | — | N/A | $ | 663 | N/A | ||||||||||
| Disciplined LargeCap | — | N/A | 86 | N/A | ||||||||||||
| LargeCap Growth | 9,651 | N/A | 1,519 | N/A | ||||||||||||
| MidCap Opportunities | — | N/A | 268 | N/A | ||||||||||||
| SmallCap Opportunities | 107 | N/A | 522 | N/A | ||||||||||||
| Financial Services | 31 | N/A | 750 | N/A | ||||||||||||
| LargeCap Value | 7,320 | N/A | 326 | N/A | ||||||||||||
| MagnaCap | — | N/A | 131 | N/A | ||||||||||||
| MidCap Value | 5,293 | N/A | 222 | N/A | ||||||||||||
| MidCap Value Choice | — | N/A | 3,505 | N/A | ||||||||||||
| SmallCap Value | 4,225 | N/A | — | N/A | ||||||||||||
| SmallCap Value Choice | — | N/A | 2,033 | N/A | ||||||||||||
NOTE 6 — OTHER TRANSACTIONS WITH AFFILIATES AND RELATED PARTIES
The Investment Adviser may direct the Funds’ portfolio managers to use their best efforts (subject to obtaining best execution of each transaction) to allocate a Fund’s equity security transactions through certain designated broker-dealers. The designated broker-dealer, in turn, will reimburse a portion of the brokerage commissions to pay certain expenses of that Portfolio. Any amounts credited to the Funds are reflected as brokerage commission recapture in the Statements of Operations.
At November 30, 2006, the Funds had the following amounts recorded in payable to affiliates on the accompanying Statements of Assets and Liabilities (see Notes 4 and 5):
| Accrued | ||||||||||||||||||||
| Accrued | Shareholder | |||||||||||||||||||
| Investment | Accrued | Service and | Accrued | |||||||||||||||||
| Management | Administrative | Distribution | Waivers & | |||||||||||||||||
| Fees | Fees | Fees | Reimbursements | Total | ||||||||||||||||
| Real Estate | $ | 215,542 | $ | 30,791 | $ | 47,719 | $ | — | $ | 294,052 | ||||||||||
| Disciplined LargeCap | 21,887 | 3,127 | 27,842 | — | 52,856 | |||||||||||||||
| Fundamental Research | 3,269 | 467 | 1,272 | — | 5,008 | |||||||||||||||
| LargeCap Growth | 165,254 | 22,034 | 118,689 | — | 305,977 | |||||||||||||||
| MidCap Opportunities | 243,173 | 24,317 | 167,033 | — | 434,523 | |||||||||||||||
| Opportunistic LargeCap | 3,171 | 453 | 1,184 | — | 4,808 | |||||||||||||||
| SmallCap Opportunities | 118,710 | 12,277 | 68,587 | — | 199,574 | |||||||||||||||
| Financial Services | 188,227 | — | 90,805 | — | 279,032 | |||||||||||||||
| LargeCap Value | 77,062 | 8,824 | 36,392 | 337 | 122,615 | |||||||||||||||
| MagnaCap | 219,098 | — | 81,890 | — | 300,988 | |||||||||||||||
| MidCap Value | 67,565 | 7,050 | 46,749 | — | 121,364 | |||||||||||||||
| MidCap Value Choice | 129,823 | 12,982 | 60,623 | — | 203,428 | |||||||||||||||
| SmallCap Value | 47,458 | 4,816 | 30,952 | — | 83,226 | |||||||||||||||
| SmallCap Value Choice | 53,001 | 5,300 | 20,028 | — | 78,329 | |||||||||||||||
At November 30, 2006, the following indirect, wholly-owned subsidiaries of ING Groep owned more than 5% of the following Funds:
ING Life Insurance and Annuity Company — Real Estate (31.33)%; Fundamental Research (95.07)%; and Opportunistic LargeCap (97.86)%.
ING National Trust — Real Estate (13.50)%; and LargeCap Growth (24.85)%.
ING USA Annuity and Life Insurance Company — Fundamental Research (30.00)%.
NOTE 7 — OTHER ACCRUED EXPENSES AND LIABILITIES
At November 30, 2006, the Funds had following payables included in Other Accrued Expenses and Liabilities on the Statements of Assets and Liabilities that exceeded 5% of total liabilities:
| Accrued Transfer | ||||
| Agent Fees | ||||
| SmallCap Opportunities | $ | 75,135 | ||
| Accrued Postage | ||||
| Fees | ||||
| SmallCap Value | $ | 16,986 | ||
| Accrued Printing | ||||
| Fees | ||||
| Real Estate | $ | 27,908 | ||
97
Table of Contents
NOTE 8 — EXPENSE LIMITATIONS
For the following Funds, the Investment Adviser has agreed to limit expenses, excluding interest, taxes, brokerage and extraordinary expenses to the levels listed below:
| Class A | Class B | Class C | Class I | Class O | Class Q | |||||||||||||||||||
| Real Estate | 1.45 | % | 2.20 | % | 2.20 | % | 1.00 | % | 1.45 | % | 1.45 | % | ||||||||||||
| Fundamental Research | 1.25 | % | 2.00 | % | 2.00 | % | 1.00 | % | N/A | N/A | ||||||||||||||
| LargeCap Growth | 1.45 | % | 2.10 | % | 2.10 | % | 1.10 | % | N/A | 1.35 | % | |||||||||||||
MidCap Opportunities(1)(2) | 1.75 | % | 2.45 | % | 2.45 | % | 1.45 | % | N/A | 1.60 | % | |||||||||||||
| Opportunistic LargeCap | 1.25 | % | 2.00 | % | 2.00 | % | 1.00 | % | N/A | N/A | ||||||||||||||
| LargeCap Value | 1.45 | % | 2.20 | % | 2.20 | % | 1.20 | % | N/A | N/A | ||||||||||||||
| MidCap Value | 1.75 | % | 2.50 | % | 2.50 | % | 1.50 | % | N/A | 1.75 | % | |||||||||||||
| MidCap Value Choice | 1.50 | % | 2.25 | % | 2.25 | % | 1.25 | % | N/A | N/A | ||||||||||||||
| SmallCap Value | 1.75 | % | 2.50 | % | 2.50 | % | 1.50 | % | N/A | 1.75 | % | |||||||||||||
| SmallCap Value Choice | 1.50 | % | 2.25 | % | 2.25 | % | 1.25 | % | N/A | N/A | ||||||||||||||
| (1) | Effective January 1, 2006, pursuant to a side agreement, ING Investments has lowered the expense limits for Disciplined LargeCap, MidCap Opportunities and SmallCap Opportunities through at least December 31, 2007. The expense limits for the Funds are as follows: |
| Class A | Class B | Class C | Class I | Class Q | ||||||||||||||||
| Disciplined LargeCap | 1.36 | % | 2.11 | % | 2.11 | % | N/A | N/A | ||||||||||||
| MidCap Opportunities | 1.25 | % | 2.00 | % | 2.00 | % | 1.00 | % | 1.25 | % | ||||||||||
| SmallCap Opportunities | 1.50 | % | 2.25 | % | 2.25 | % | 1.25 | % | 1.50 | % | ||||||||||
| If, after December 31, 2007, ING Investments elects not to renew the side agreement, the expense limits will revert to the limits listed in the table above. For Disciplined LargeCap and SmallCap Opportunities, the Funds will no longer have an expense limitation. There is no guarantee that this side agreement will continue after that date. The side agreement will only renew if ING Investments elects to renew it. Any fees waived pursuant to the side agreement shall not be eligible for recoupment. |
| (2) | Effective January 1, 2005 through December 31, 2005, pursuant to a side agreement, ING Investments lowered the expense limits for Disciplined Large Cap, MidCap Opportunities and SmallCap Opportunities, as follows: |
| Class A | Class B | Class C | Class I | Class Q | ||||||||||||||||
| Disciplined Large Cap | 1.36 | % | 2.11 | % | 2.11 | % | 1.11 | % | N/A | |||||||||||
| MidCap Opportunities | 1.50 | % | 2.25 | % | 2.25 | % | 1.25 | % | 1.50 | % | ||||||||||
| SmallCap Opportunities | 1.50 | % | 2.25 | % | 2.25 | % | 1.25 | % | 1.50 | % | ||||||||||
The Investment Adviser may at a later date recoup from a Fund management fees waived and certain other expenses assumed by the Investment Adviser during the previous 36 months, but only if, after such recoupment, a Fund’s expense ratio does not exceed the percentage described above. Some of the fees waived are not eligible for recoupment. Waived and reimbursed fees net of any recoupment by the Investment Adviser of such waived and reimbursed fees are reflected on the accompanying Statements of Operations for each Fund. Amounts payable by the Investment Adviser are reflected on the accompanying Statements of Assets and Liabilities for each Fund.
As of November 30, 2006, the cumulative amounts of waived or reimbursed fees that are subject to possible recoupment by the Investment Adviser, and the related expiration dates are as follows:
| November 30, | ||||||||||||||||
| 2007 | 2008 | 2009 | Total | |||||||||||||
| Disciplined LargeCap | $ | — | $ | 28,822 | $ | 38,833 | $ | 67,655 | ||||||||
| Fundamental Research | — | — | 169,946 | 169,946 | ||||||||||||
| LargeCap Growth | 82,149 | — | — | 82,149 | ||||||||||||
| Opportunistic LargeCap | — | — | 164,407 | 164,407 | ||||||||||||
| LargeCap Value | 145,120 | 65,917 | 15,487 | 226,524 | ||||||||||||
| MidCap Value Choice | — | 114,069 | 66,178 | 180,247 | ||||||||||||
| SmallCap Value Choice | — | 108,508 | 63,738 | 172,246 | ||||||||||||
The expense limitation agreements are contractual and shall renew automatically for one-year terms unless ING Investments provides written notice of the termination of the expense limitation agreement within 90 days of the end of the then current term.
NOTE 9 — LINE OF CREDIT
All of the Funds included in this report, in addition to certain other funds managed by the Investment Adviser, have entered into an unsecured committed revolving line of credit agreement (the “Credit Agreement”) with The Bank of New York for an aggregate amount of $125,000,000. The proceeds may be used to: (1) temporarily finance the purchase and sale of securities; (2) finance the redemption of shares of an investor in the Funds; and (3) enable the Funds to meet other emergency expenses as defined in the Credit Agreement. The Funds to which the line of credit is available pay a commitment fee equal to 0.09% per annum on the daily unused portion of the committed line amount payable quarterly in arrears. The following Funds utilized the line of credit during the six months ended November 30, 2006:
| Approximate | ||||||||||||
| Approximate | Weighted | |||||||||||
| Average Daily | Average | |||||||||||
| Balance | Interest Rate | |||||||||||
| Days | For Days | For Days | ||||||||||
| Fund | Utilized | Utilized | Utilized | |||||||||
| LargeCap Growth | 5 | $ | 1,500,000 | 5.48 | % | |||||||
| MidCap Value | 1 | $ | 1,020,000 | 6.09 | % | |||||||
| SmallCap Value | 2 | $ | 325,000 | 6.09 | % | |||||||
98
Table of Contents
NOTE 10 — CAPITAL SHARES
| Class A | Class B | Class C | ||||||||||||||||||||||
| Six Months | Year | Six Months | Year | Six Months | Year | |||||||||||||||||||
| Ended | Ended | Ended | Ended | Ended | Ended | |||||||||||||||||||
| November 30, | May 31, | November 30, | May 31, | November 30, | May 31, | |||||||||||||||||||
| 2006 | 2006 | 2006 | 2006 | 2006 | 2006 | |||||||||||||||||||
| Real Estate (Number of Shares) | ||||||||||||||||||||||||
| Shares sold | 1,646,591 | 2,875,437 | 44,353 | 126,848 | 34,791 | 76,070 | ||||||||||||||||||
| Dividends reinvested | 81,760 | 529,472 | 2,315 | 23,838 | 1,273 | 13,589 | ||||||||||||||||||
| Shares redeemed | (260,488 | ) | (1,039,591 | ) | (33,755 | ) | (79,077 | ) | (13,677 | ) | (83,667 | ) | ||||||||||||
| Net increase in shares outstanding | 1,467,863 | 2,365,318 | 12,913 | 71,609 | 22,387 | 5,992 | ||||||||||||||||||
| Real Estate ($) | ||||||||||||||||||||||||
| Shares sold | $ | 30,245,809 | $ | 46,599,231 | $ | 823,754 | $ | 2,047,010 | $ | 659,388 | $ | 1,300,645 | ||||||||||||
| Dividends reinvested | 1,474,117 | 8,265,193 | 41,798 | 372,014 | 23,745 | 218,707 | ||||||||||||||||||
| Shares redeemed | (4,763,160 | ) | (16,705,118 | ) | (619,434 | ) | (1,283,419 | ) | (260,424 | ) | (1,400,270 | ) | ||||||||||||
| Net increase | $ | 26,956,766 | $ | 38,159,306 | $ | 246,118 | $ | 1,135,605 | $ | 422,709 | $ | 119,082 | ||||||||||||
| Class I | Class O | |||||||||||||||||||||||
| Six Months | Year | Six Months | Year | |||||||||||||||||||||
| Ended | Ended | Ended | Ended | |||||||||||||||||||||
| November 30, | May 31, | November 30, | May 31, | |||||||||||||||||||||
| 2006 | 2006 | 2006 | 2006 | |||||||||||||||||||||
| Real Estate (Number of Shares) | ||||||||||||||||||||||||
| Shares sold | 777,132 | 2,306,972 | 854,572 | 1,642,568 | ||||||||||||||||||||
| Dividends reinvested | 86,606 | 767,164 | 20,808 | 114,187 | ||||||||||||||||||||
| Shares redeemed | (775,042 | ) | (4,127,596 | ) | (447,575 | ) | (836,522 | ) | ||||||||||||||||
| Net increase (decrease) in shares outstanding | 88,696 | (1,053,460 | ) | 427,805 | 920,233 | |||||||||||||||||||
| Real Estate ($) | ||||||||||||||||||||||||
| Shares sold | $ | 15,119,228 | $ | 38,620,833 | $ | 15,842,036 | $ | 26,741,162 | ||||||||||||||||
| Dividends reinvested | 1,638,158 | 12,555,053 | 374,777 | 1,782,741 | ||||||||||||||||||||
| Shares redeemed | (14,642,561 | ) | (68,813,973 | ) | (8,091,237 | ) | (13,440,715 | ) | ||||||||||||||||
| Net increase (decrease) | $ | 2,114,825 | $ | (17,638,087 | ) | $ | 8,125,576 | $ | 15,083,188 | |||||||||||||||
| Class A | Class B | Class C | ||||||||||||||||||||||
| Six Months | Year | Six Months | Year | Six Months | Year | |||||||||||||||||||
| Ended | Ended | Ended | Ended | Ended | Ended | |||||||||||||||||||
| November 30, | May 31, | November 30, | May 31, | November 30, | May 31, | |||||||||||||||||||
| 2006 | 2006 | 2006 | 2006 | 2006 | 2006 | |||||||||||||||||||
| Disciplined LargeCap (Number of Shares) | ||||||||||||||||||||||||
| Shares sold | 99,160 | 126,622 | 93,868 | 258,014 | 17,111 | 41,656 | ||||||||||||||||||
| Dividends reinvested | — | 1,407 | — | — | — | — | ||||||||||||||||||
| Shares redeemed | (88,539 | ) | (180,288 | ) | (366,590 | ) | (916,501 | ) | (146,515 | ) | (393,833 | ) | ||||||||||||
| Net increase (decrease) in shares outstanding | 10,621 | (52,259 | ) | (272,722 | ) | (658,487 | ) | (129,404 | ) | (352,177 | ) | |||||||||||||
| Disciplined LargeCap ($) | ||||||||||||||||||||||||
| Shares sold | $ | 1,063,167 | $ | 1,291,168 | $ | 947,034 | $ | 2,515,392 | $ | 171,622 | $ | 404,988 | ||||||||||||
| Dividends reinvested | — | 14,496 | — | — | — | — | ||||||||||||||||||
| Shares redeemed | (942,372 | ) | (1,835,392 | ) | (3,708,299 | ) | (8,889,697 | ) | (1,491,387 | ) | (3,846,320 | ) | ||||||||||||
| Net increase (decrease) | $ | 120,795 | $ | (529,728 | ) | $ | (2,761,265 | ) | $ | (6,374,305 | ) | $ | (1,319,765 | ) | $ | (3,441,332 | ) | |||||||
99
Table of Contents
| Class A | Class B | |||||||||||||||||||||||
| Six Months | December 28, | Six Months | February 6, | |||||||||||||||||||||
| Ended | 2005(1) to | Ended | 2006(1) to | |||||||||||||||||||||
| November 30, | May 31, | November 30, | May 31, | |||||||||||||||||||||
| 2006 | 2006 | 2006 | 2006 | |||||||||||||||||||||
| Fundamental Research (Number of Shares) | ||||||||||||||||||||||||
| Shares sold | 8,683 | 506,018 | 3,063 | 2,430 | ||||||||||||||||||||
| Shares redeemed | (4,429 | ) | (462 | ) | 1 | — | ||||||||||||||||||
| Net increase in shares outstanding | 4,254 | 505,556 | 3,064 | 2,430 | ||||||||||||||||||||
| Fundamental Research ($) | ||||||||||||||||||||||||
| Shares sold | $ | 93,459 | $ | 5,061,622 | $ | 31,218 | $ | 24,839 | ||||||||||||||||
| Shares redeemed | (46,306 | ) | (4,855 | ) | 6 | — | ||||||||||||||||||
| Net increase | $ | 47,153 | $ | 5,056,767 | $ | 31,224 | $ | 24,839 | ||||||||||||||||
| Class C | Class I | |||||||||||||||||||||||
| Six Months | April 17, | July 18, | ||||||||||||||||||||||
| Ended | 2006(1) to | 2006(1) to | ||||||||||||||||||||||
| November 30, | May 31, | May 31, | ||||||||||||||||||||||
| 2006 | 2006 | 2006 | ||||||||||||||||||||||
| Fundamental Research (Number of Shares) | ||||||||||||||||||||||||
| Shares sold | 5,905 | 7,588 | 165 | |||||||||||||||||||||
| Shares redeemed | (2,375 | ) | — | — | ||||||||||||||||||||
| Net increase in shares outstanding | 3,530 | 7,588 | 165 | |||||||||||||||||||||
| Fundamental Research ($) | ||||||||||||||||||||||||
| Shares sold | $ | 59,721 | $ | 79,510 | $ | 1,612 | ||||||||||||||||||
| Shares redeemed | (25,327 | ) | — | — | ||||||||||||||||||||
| Net increase | $ | 34,394 | $ | 79,510 | $ | 1,612 | ||||||||||||||||||
| Class A | Class B | Class C | ||||||||||||||||||||||
| Six Months | Year | Six Months | Year | Six Months | Year | |||||||||||||||||||
| Ended | Ended | Ended | Ended | Ended | Ended | |||||||||||||||||||
| November 30, | May 31, | November 30, | May 31, | November 30, | May 31, | |||||||||||||||||||
| 2006 | 2006 | 2006 | 2006 | 2006 | 2006 | |||||||||||||||||||
| LargeCap Growth (Number of Shares) | ||||||||||||||||||||||||
| Shares sold | 440,080 | 1,327,040 | 79,170 | 484,520 | 84,558 | 453,259 | ||||||||||||||||||
| Shares redeemed | (1,244,325 | ) | (2,435,369 | ) | (815,104 | ) | (1,986,634 | ) | (391,460 | ) | (1,076,747 | ) | ||||||||||||
| Net decrease in shares outstanding | (804,245 | ) | (1,108,329 | ) | (735,934 | ) | (1,502,114 | ) | (306,902 | ) | (623,488 | ) | ||||||||||||
| LargeCap Growth ($) | ||||||||||||||||||||||||
| Shares sold | $ | 8,280,527 | $ | 25,113,421 | $ | 1,420,796 | $ | 8,879,172 | $ | 1,509,532 | $ | 8,273,495 | ||||||||||||
| Shares redeemed | (22,975,007 | ) | (46,082,519 | ) | (14,692,318 | ) | (36,333,053 | ) | (6,982,948 | ) | (19,684,677 | ) | ||||||||||||
| Net decrease | $ | (14,694,480 | ) | $ | (20,969,098 | ) | $ | (13,271,522 | ) | $ | (27,453,881 | ) | $ | (5,473,416 | ) | $ | (11,411,182 | ) | ||||||
| (1) | Commencement of operations. |
100
Table of Contents
| Class I | Class Q | |||||||||||||||||||||||
| Six Months | Year | Six Months | Year | |||||||||||||||||||||
| Ended | Ended | Ended | Ended | |||||||||||||||||||||
| November 30, | May 31, | November 30, | May 31, | |||||||||||||||||||||
| 2006 | 2006 | 2006 | 2006 | |||||||||||||||||||||
| LargeCap Growth (Number of Shares) | ||||||||||||||||||||||||
| Shares sold | 128,475 | 1,902,655 | 2,710 | 11,078 | ||||||||||||||||||||
| Shares redeemed | (251,288 | ) | (578,511 | ) | (1,675 | ) | (67,254 | ) | ||||||||||||||||
| Net increase (decrease) in shares outstanding | (122,813 | ) | 1,324,144 | 1,035 | (56,176 | ) | ||||||||||||||||||
| LargeCap Growth ($) | ||||||||||||||||||||||||
| Shares sold | $ | 2,510,027 | $ | 37,746,164 | $ | 51,000 | $ | 209,160 | ||||||||||||||||
| Shares redeemed | (4,901,027 | ) | (11,583,527 | ) | (33,308 | ) | (1,303,983 | ) | ||||||||||||||||
| Net increase (decrease) | $ | (2,391,000 | ) | $ | 26,162,637 | $ | 17,692 | $ | (1,094,823 | ) | ||||||||||||||
| Class A | Class B | Class C | ||||||||||||||||||||||
| Six Months | Year | Six Months | Year | Six Months | Year | |||||||||||||||||||
| Ended | Ended | Ended | Ended | Ended | Ended | |||||||||||||||||||
| November 30, | May 31, | November 30, | May 31, | November 30, | May 31, | |||||||||||||||||||
| 2006 | 2006 | 2006 | 2006 | 2006 | 2006 | |||||||||||||||||||
| MidCap Opportunities (Number of Shares) | ||||||||||||||||||||||||
| Shares sold | 362,717 | 1,481,144 | 56,849 | 236,873 | 24,339 | 107,712 | ||||||||||||||||||
| Shares redeemed | (1,128,815 | ) | (2,507,765 | ) | (1,339,327 | ) | (3,946,282 | ) | (756,556 | ) | (2,000,599 | ) | ||||||||||||
| Net decrease in shares outstanding | (766,098 | ) | (1,026,621 | ) | (1,282,478 | ) | (3,709,409 | ) | (732,217 | ) | (1,892,887 | ) | ||||||||||||
| MidCap Opportunities ($) | ||||||||||||||||||||||||
| Shares sold | $ | 5,410,693 | $ | 21,483,242 | $ | 794,305 | $ | 3,332,518 | $ | 340,193 | $ | 1,499,594 | ||||||||||||
| Shares redeemed | (16,696,786 | ) | (36,384,965 | ) | (18,788,222 | ) | (54,239,246 | ) | (10,554,049 | ) | (27,369,385 | ) | ||||||||||||
| Net decrease | $ | (11,286,093 | ) | $ | (14,901,723 | ) | $ | (17,993,917 | ) | $ | (50,906,728 | ) | $ | (10,213,856 | ) | $ | (25,869,791 | ) | ||||||
| Class I | Class Q | |||||||||||||||||||||||
| Six Months | Year | Six Months | Year | |||||||||||||||||||||
| Ended | Ended | Ended | Ended | |||||||||||||||||||||
| November 30, | May 31, | November 30, | May 31, | |||||||||||||||||||||
| 2006 | 2006 | 2006 | 2006 | |||||||||||||||||||||
| MidCap Opportunities (Number of Shares) | ||||||||||||||||||||||||
| Shares sold | 25,795 | 57,290 | 430 | 1,762 | ||||||||||||||||||||
| Shares redeemed | (29,852 | ) | (66,102 | ) | (6,724 | ) | (50,497 | ) | ||||||||||||||||
| Net decrease in shares outstanding | (4,057 | ) | (8,812 | ) | (6,294 | ) | (48,735 | ) | ||||||||||||||||
| MidCap Opportunities ($) | ||||||||||||||||||||||||
| Shares sold | $ | 393,756 | $ | 868,307 | $ | 6,441 | $ | 25,786 | ||||||||||||||||
| Shares redeemed | (464,469 | ) | (1,012,855 | ) | (101,904 | ) | (721,437 | ) | ||||||||||||||||
| Net decrease | $ | (70,713 | ) | $ | (144,548 | ) | $ | (95,463 | ) | $ | (695,651 | ) | ||||||||||||
| Class A | Class B | Class C | ||||||||||||||||||||||
| Six Months | December 28, | Six Months | April 5, | Six Months | April 27, | |||||||||||||||||||
| Ended | 2005(1) to | Ended | 2006(1) to | Ended | 2006(1) to | |||||||||||||||||||
| November 30, | May 31, | November 30, | May 31, | November 30, | May 31, | |||||||||||||||||||
| 2006 | 2006 | 2006 | 2006 | 2006 | 2006 | |||||||||||||||||||
| Opportunistic LargeCap (Number of Shares) | ||||||||||||||||||||||||
| Shares sold | 3,425 | 500,961 | 2,774 | 3,462 | 976 | 1,015 | ||||||||||||||||||
| Shares redeemed | (1,689 | ) | — | — | — | — | — | |||||||||||||||||
| Net increase in shares outstanding | 1,736 | 500,961 | 2,774 | 3,462 | 976 | 1,015 | ||||||||||||||||||
| Opportunistic LargeCap ($) | ||||||||||||||||||||||||
| Shares sold | $ | 35,609 | $ | 5,010,020 | $ | 28,537 | $ | 36,494 | $ | 10,165 | $ | 10,640 | ||||||||||||
| Shares redeemed | (16,885 | ) | — | — | — | — | — | |||||||||||||||||
| Net increase | $ | 18,724 | $ | 5,010,020 | $ | 28,537 | $ | 36,494 | $ | 10,165 | $ | 10,640 | ||||||||||||
| (1) | Commencement of operations. |
101
Table of Contents
| Class A | Class B | Class C | ||||||||||||||||||||||
| Six Months | Year | Six Months | Year | Six Months | Year | |||||||||||||||||||
| Ended | Ended | Ended | Ended | Ended | Ended | |||||||||||||||||||
| November 30, | May 31, | November 30, | May 31, | November 30, | May 31, | |||||||||||||||||||
| 2006 | 2006 | 2006 | 2006 | 2006 | 2006 | |||||||||||||||||||
| SmallCap Opportunities (Number of Shares) | ||||||||||||||||||||||||
| Shares sold | 120,942 | 839,289 | 12,886 | 61,586 | 8,472 | 67,942 | ||||||||||||||||||
| Shares redeemed | (465,943 | ) | (1,632,957 | ) | (217,752 | ) | (875,233 | ) | (205,002 | ) | (548,247 | ) | ||||||||||||
| Net decrease in shares outstanding | (345,001 | ) | (793,668 | ) | (204,866 | ) | (813,647 | ) | (196,530 | ) | (480,305 | ) | ||||||||||||
| SmallCap Opportunities ($) | ||||||||||||||||||||||||
| Shares sold | $ | 3,500,744 | $ | 23,105,401 | $ | 337,242 | $ | 1,593,581 | $ | 218,703 | $ | 1,699,261 | ||||||||||||
| Shares redeemed | (13,396,341 | ) | (44,909,311 | ) | (5,701,209 | ) | (21,758,557 | ) | (5,343,896 | ) | (13,653,058 | ) | ||||||||||||
| Net decrease | $ | (9,895,597 | ) | $ | (21,803,910 | ) | $ | (5,363,967 | ) | $ | (20,164,976 | ) | $ | (5,125,193 | ) | $ | (11,953,797 | ) | ||||||
| Class I | Class Q | |||||||||||||||||||||||
| Six Months | Year | Six Months | Year | |||||||||||||||||||||
| Ended | Ended | Ended | Ended | |||||||||||||||||||||
| November 30, | May 31, | November 30, | May 31, | |||||||||||||||||||||
| 2006 | 2006 | 2006 | 2006 | |||||||||||||||||||||
| SmallCap Opportunities (Number of Shares) | ||||||||||||||||||||||||
| Shares sold | 15,778 | 106,241 | — | 114 | ||||||||||||||||||||
| Shares redeemed | (13,597 | ) | (554,865 | ) | (389 | ) | (3,708 | ) | ||||||||||||||||
| Net increase (decrease) in shares outstanding | 2,181 | (448,624 | ) | (389 | ) | (3,594 | ) | |||||||||||||||||
| SmallCap Opportunities ($) | ||||||||||||||||||||||||
| Shares sold | $ | 461,097 | $ | 2,906,925 | $ | — | $ | 2,838 | ||||||||||||||||
| Shares redeemed | (406,472 | ) | (15,427,027 | ) | (11,321 | ) | (104,463 | ) | ||||||||||||||||
| Net increase (decrease) | $ | 54,625 | $ | (12,520,102 | ) | $ | (11,321 | ) | $ | (101,625 | ) | |||||||||||||
| Class A | Class B | |||||||||||||||
| Six Months | Year | Six Months | Year | |||||||||||||
| Ended | Ended | Ended | Ended | |||||||||||||
| November 30, | May 31, | November 30, | May 31, | |||||||||||||
| 2006 | 2006 | 2006 | 2006 | |||||||||||||
| Financial Services (Number of Shares) | ||||||||||||||||
| Shares sold | 1,149,644 | 1,961,853 | 45,004 | 181,408 | ||||||||||||
| Dividends reinvested | — | 541,022 | — | 292,888 | ||||||||||||
| Shares redeemed | (710,024 | ) | (1,461,651 | ) | (1,149,034 | ) | (2,573,322 | ) | ||||||||
| Net increase (decrease) in shares outstanding | 439,620 | 1,041,224 | (1,104,030 | ) | (2,099,026 | ) | ||||||||||
Financial Services ($) | ||||||||||||||||
| Shares sold | $ | 27,643,460 | $ | 46,128,839 | $ | 1,069,904 | $ | 4,148,782 | ||||||||
| Dividends reinvested | — | 12,344,913 | — | 6,601,698 | ||||||||||||
| Shares redeemed | (17,193,703 | ) | (34,102,203 | ) | (27,017,613 | ) | (59,363,972 | ) | ||||||||
| Net increase (decrease) | $ | 10,449,757 | $ | 24,371,549 | $ | (25,947,709 | ) | $ | (48,613,492 | ) | ||||||
102
Table of Contents
| Class C | Class O | |||||||||||||||
| Six Months | Year | Six Months | Year | |||||||||||||
| Ended | Ended | Ended | Ended | |||||||||||||
| November 30, | May 31, | November 30, | May 31, | |||||||||||||
| 2006 | 2006 | 2006 | 2006 | |||||||||||||
| Financial Services (Number of Shares) | ||||||||||||||||
| Shares sold | 22,499 | 59,345 | 229,329 | 405,456 | ||||||||||||
| Dividends reinvested | — | 771 | — | 21,511 | ||||||||||||
| Shares redeemed | (7,505 | ) | (2,510 | ) | (91,197 | ) | (174,554 | ) | ||||||||
| Net increase in shares outstanding | 14,994 | 57,606 | 138,132 | 252,413 | ||||||||||||
| Financial Services ($) | ||||||||||||||||
| Shares sold | $ | 529,200 | $ | 1,366,554 | $ | 5,631,794 | $ | 9,462,094 | ||||||||
| Dividends reinvested | — | 17,119 | — | 489,216 | ||||||||||||
| Shares redeemed | (172,767 | ) | (58,484 | ) | (2,193,451 | ) | (4,052,637 | ) | ||||||||
| Net increase | $ | 356,433 | $ | 1,325,189 | $ | 3,438,343 | $ | 5,898,673 | ||||||||
| Class A | Class B | |||||||||||||||
| Six Months | Year | Six Months | Year | |||||||||||||
| Ended | Ended | Ended | Ended | |||||||||||||
| November 30, | May 31, | November 30, | May 31, | |||||||||||||
| 2006 | 2006 | 2006 | 2006 | |||||||||||||
| LargeCap Value (Number of Shares) | ||||||||||||||||
| Shares sold | 4,178,199 | 1,499,753 | 220,777 | 181,524 | ||||||||||||
| Dividends reinvested | — | 105,458 | — | 39,675 | ||||||||||||
| Shares redeemed | (722,737 | ) | (868,471 | ) | (92,711 | ) | (305,974 | ) | ||||||||
| Net increase (decrease) in shares outstanding | 3,455,462 | 736,740 | 128,066 | (84,775 | ) | |||||||||||
| LargeCap Value ($) | ||||||||||||||||
| Shares sold | $ | 47,733,397 | $ | 15,356,145 | $ | 2,459,026 | $ | 1,875,799 | ||||||||
| Dividends reinvested | — | 1,025,750 | — | 384,809 | ||||||||||||
| Shares redeemed | (8,239,439 | ) | (8,812,594 | ) | (1,025,561 | ) | (3,103,224 | ) | ||||||||
| Net increase (decrease) | $ | 39,493,958 | $ | 7,569,301 | $ | 1,433,465 | $ | (842,616 | ) | |||||||
| Class C | Class I | |||||||||||||||
| Six Months | Year | Six Months | Year | |||||||||||||
| Ended | Ended | Ended | Ended | |||||||||||||
| November 30, | May 31, | November 30, | May 31, | |||||||||||||
| 2006 | 2006 | 2006 | 2006 | |||||||||||||
| LargeCap Value (Number of Shares) | ||||||||||||||||
| Shares sold | 283,542 | 331,556 | 351,142 | 263 | ||||||||||||
| Dividends reinvested | — | 53,355 | — | 19,188 | ||||||||||||
| Shares redeemed | (88,599 | ) | (372,445 | ) | — | (388 | ) | |||||||||
| Net increase in shares outstanding | 194,943 | 12,466 | 351,142 | 19,063 | ||||||||||||
| LargeCap Value ($) | ||||||||||||||||
| Shares sold | $ | 3,226,171 | $ | 3,410,728 | $ | 4,012,000 | $ | 3,450 | ||||||||
| Dividends reinvested | — | 516,859 | — | 186,503 | ||||||||||||
| Shares redeemed | (987,468 | ) | (3,781,589 | ) | — | (3,778 | ) | |||||||||
| Net increase | $ | 2,238,703 | $ | 145,998 | $ | 4,012,000 | $ | 186,175 | ||||||||
103
Table of Contents
| Class A | Class B | Class C | ||||||||||||||||||||||
| Six Months | Year | Six Months | Year | Six Months | Year | |||||||||||||||||||
| Ended | Ended | Ended | Ended | Ended | Ended | |||||||||||||||||||
| November 30, | May 31, | November 30, | May 31, | November 30, | May 31, | |||||||||||||||||||
| 2006 | 2006 | 2006 | 2006 | 2006 | 2006 | |||||||||||||||||||
MagnaCap (Number of Shares) | ||||||||||||||||||||||||
| Shares sold | 531,610 | 1,105,157 | 61,933 | 147,873 | 11,955 | 42,365 | ||||||||||||||||||
| Shares issued from merger | — | 2,217,193 | — | 370,650 | — | 66,493 | ||||||||||||||||||
| Dividends reinvested | 90,760 | 248,548 | — | 4,892 | — | 933 | ||||||||||||||||||
| Shares redeemed | (2,045,875 | ) | (4,574,625 | ) | (553,430 | ) | (1,570,097 | ) | (80,624 | ) | (163,090 | ) | ||||||||||||
| Net decrease in shares outstanding | (1,423,505 | ) | (1,003,727 | ) | (491,497 | ) | (1,046,682 | ) | (68,669 | ) | (53,299 | ) | ||||||||||||
MagnaCap ($) | ||||||||||||||||||||||||
| Shares sold | $ | 6,613,519 | $ | 12,967,828 | $ | 740,819 | $ | 1,676,585 | $ | 143,294 | $ | 488,219 | ||||||||||||
| Shares issued from merger | — | 26,189,242 | — | 4,248,959 | — | 762,914 | ||||||||||||||||||
| Dividends reinvested | 1,110,863 | 2,853,761 | — | 54,664 | — | 10,482 | ||||||||||||||||||
| Shares redeemed | (25,571,315 | ) | (53,591,229 | ) | (6,652,867 | ) | (17,715,296 | ) | (977,293 | ) | (1,858,048 | ) | ||||||||||||
| Net decrease | $ | (17,846,933 | ) | $ | (11,580,398 | ) | $ | (5,912,048 | ) | $ | (11,735,088 | ) | $ | (833,999 | ) | $ | (596,433 | ) | ||||||
| Class I | Class M | |||||||||||||||||||||||
| Six Months | Year | Six Months | Year | |||||||||||||||||||||
| Ended | Ended | Ended | Ended | |||||||||||||||||||||
| November 30, | May 31, | November 30, | May 31, | |||||||||||||||||||||
| 2006 | 2006 | 2006 | 2006 | |||||||||||||||||||||
MagnaCap (Number of Shares) | ||||||||||||||||||||||||
| Shares sold | 19,841 | 73,155 | 1,410 | 2,197 | ||||||||||||||||||||
| Shares issued from merger | — | 24,033 | — | — | ||||||||||||||||||||
| Dividends reinvested | 1,285 | 2,984 | 189 | 1,637 | ||||||||||||||||||||
| Shares redeemed | (19,498 | ) | (103,450 | ) | (31,597 | ) | (87,539 | ) | ||||||||||||||||
| Net increase (decrease) in shares outstanding | 1,628 | (3,278 | ) | (29,998 | ) | (83,705 | ) | |||||||||||||||||
MagnaCap ($) | ||||||||||||||||||||||||
| Shares sold | $ | 248,942 | $ | 868,524 | $ | 17,657 | $ | 24,978 | ||||||||||||||||
| Shares issued from merger | — | 282,038 | — | — | ||||||||||||||||||||
| Dividends reinvested | 15,644 | 33,945 | 2,298 | 18,754 | ||||||||||||||||||||
| Shares redeemed | (244,594 | ) | (1,222,554 | ) | (387,719 | ) | (996,318 | ) | ||||||||||||||||
| Net increase (decrease) | $ | 19,992 | $ | (38,047 | ) | $ | (367,764 | ) | $ | (952,586 | ) | |||||||||||||
| Class A | Class B | Class C | ||||||||||||||||||||||
| Six Months | Year | Six Months | Year | Six Months | Year | |||||||||||||||||||
| Ended | Ended | Ended | Ended | Ended | Ended | |||||||||||||||||||
| November 30, | May 31, | November 30, | May 31, | November 30, | May 31, | |||||||||||||||||||
| 2006 | 2006 | 2006 | 2006 | 2006 | 2006 | |||||||||||||||||||
MidCap Value (Number of Shares) | ||||||||||||||||||||||||
| Shares sold | 115,715 | 255,023 | 1,463 | 73,607 | 149 | 114,576 | ||||||||||||||||||
| Dividends reinvested | — | 821,647 | — | 444,000 | — | 420,010 | ||||||||||||||||||
| Shares redeemed | (1,135,431 | ) | (3,187,072 | ) | (467,851 | ) | (1,369,866 | ) | (365,021 | ) | (1,771,928 | ) | ||||||||||||
| Net decrease in shares outstanding | (1,019,716 | ) | (2,110,402 | ) | (466,388 | ) | (852,259 | ) | (364,872 | ) | (1,237,342 | ) | ||||||||||||
MidCap Value ($) | ||||||||||||||||||||||||
| Shares sold | $ | 1,125,938 | $ | 2,562,557 | $ | 19,347 | $ | 693,274 | $ | 1,430 | $ | 1,075,454 | ||||||||||||
| Dividends reinvested | — | 7,739,914 | — | 4,071,484 | — | 3,847,296 | ||||||||||||||||||
| Shares redeemed | (11,390,494 | ) | (32,744,727 | ) | (4,475,412 | ) | (13,647,439 | ) | (3,474,933 | ) | (17,986,630 | ) | ||||||||||||
| Net decrease | $ | (10,264,556 | ) | $ | (22,442,256 | ) | $ | (4,456,065 | ) | $ | (8,882,681 | ) | $ | (3,473,503 | ) | $ | (13,063,880 | ) | ||||||
104
Table of Contents
| Class I | Class Q | |||||||||||||||||||||||
| Six Months | Year | Six Months | Year | |||||||||||||||||||||
| Ended | Ended | Ended | Ended | |||||||||||||||||||||
| November 30, | May 31, | November 30, | May 31, | |||||||||||||||||||||
| 2006 | 2006 | 2006 | 2006 | |||||||||||||||||||||
MidCap Value (Number of Shares) | ||||||||||||||||||||||||
| Shares sold | 4,438 | 23,705 | — | — | ||||||||||||||||||||
| Dividends reinvested | — | 23,283 | — | 229 | ||||||||||||||||||||
| Shares redeemed | (66,233 | ) | (89,960 | ) | — | (608 | ) | |||||||||||||||||
| Net decrease in shares outstanding | (61,795 | ) | (42,972 | ) | — | (379 | ) | |||||||||||||||||
MidCap Value ($) | ||||||||||||||||||||||||
| Shares sold | $ | 42,661 | $ | 253,290 | $ | — | $ | — | ||||||||||||||||
| Dividends reinvested | — | 222,814 | — | 2,154 | ||||||||||||||||||||
| Shares redeemed | (668,981 | ) | (976,700 | ) | — | (7,106 | ) | |||||||||||||||||
| Net decrease | $ | (626,320 | ) | $ | (500,596 | ) | $ | — | $ | (4,952 | ) | |||||||||||||
| Class A | Class B | |||||||||||||||||||||||
| Six Months | Year | Six Months | Year | |||||||||||||||||||||
| Ended | Ended | Ended | Ended | |||||||||||||||||||||
| November 30, | May 31, | November 30, | May 31, | |||||||||||||||||||||
| 2006 | 2006 | 2006 | 2006 | |||||||||||||||||||||
MidCap Value Choice (Number of Shares) | ||||||||||||||||||||||||
| Shares sold | 5,619,807 | 2,860,002 | 234,669 | 420,438 | ||||||||||||||||||||
| Dividends reinvested | — | 11,460 | — | 2,093 | ||||||||||||||||||||
| Shares redeemed | (611,095 | ) | (258,442 | ) | (54,635 | ) | (44,180 | ) | ||||||||||||||||
| Net increase in shares outstanding | 5,008,712 | 2,613,020 | 180,034 | 378,351 | ||||||||||||||||||||
MidCap Value Choice ($) | ||||||||||||||||||||||||
| Shares sold | $ | 78,294,199 | $ | 35,010,086 | $ | 3,189,587 | $ | 5,015,913 | ||||||||||||||||
| Dividends reinvested | — | 133,846 | — | 24,402 | ||||||||||||||||||||
| Shares redeemed | (8,508,547 | ) | (3,158,512 | ) | (741,753 | ) | (524,954 | ) | ||||||||||||||||
| Net increase | $ | 69,785,652 | $ | 31,985,420 | $ | 2,447,834 | $ | 4,515,361 | ||||||||||||||||
| Class C | Class I | |||||||||||||||||||||||
| Six Months | Year | Six Months | Year | |||||||||||||||||||||
| Ended | Ended | Ended | Ended | |||||||||||||||||||||
| November 30, | May 31, | November 30, | May 31, | |||||||||||||||||||||
| 2006 | 2006 | 2006 | 2006 | |||||||||||||||||||||
MidCap Value Choice (Number of Shares) | ||||||||||||||||||||||||
| Shares sold | 1,045,201 | 1,472,161 | 382 | 201,993 | ||||||||||||||||||||
| Dividends reinvested | — | 8,037 | — | 2,923 | ||||||||||||||||||||
| Shares redeemed | (89,320 | ) | (67,363 | ) | — | (204,447 | ) | |||||||||||||||||
| Net increase (decrease) in shares outstanding | 955,881 | 1,412,835 | 382 | 469 | ||||||||||||||||||||
MidCap Value Choice ($) | ||||||||||||||||||||||||
| Shares sold | $ | 14,236,532 | $ | 17,506,653 | $ | 5,150 | $ | 2,282,526 | ||||||||||||||||
| Dividends reinvested | — | 93,663 | — | 34,142 | ||||||||||||||||||||
| Shares redeemed | (1,201,672 | ) | (820,376 | ) | — | (2,722,017 | ) | |||||||||||||||||
| Net increase (decrease) | $ | 13,034,860 | $ | 16,779,940 | $ | 5,150 | $ | (405,349 | ) | |||||||||||||||
105
Table of Contents
| Class A | Class B | Class C | ||||||||||||||||||||||
| Six Months | Year | Six Months | Year | Six Months | Year | |||||||||||||||||||
| Ended | Ended | Ended | Ended | Ended | Ended | |||||||||||||||||||
| November 30, | May 31, | November 30, | May 31, | November 30, | May 31, | |||||||||||||||||||
| 2006 | 2006 | 2006 | 2006 | 2006 | 2006 | |||||||||||||||||||
SmallCap Value (Number of Shares) | ||||||||||||||||||||||||
| Shares sold | 23,978 | 297,657 | 6 | 34,802 | 542 | 190,450 | ||||||||||||||||||
| Dividends reinvested | — | 1,128,334 | — | 433,514 | — | 545,442 | ||||||||||||||||||
| Shares redeemed | (694,512 | ) | (4,402,929 | ) | (340,161 | ) | (828,792 | ) | (421,264 | ) | (2,021,135 | ) | ||||||||||||
| Net decrease in shares outstanding | (670,534 | ) | (2,976,938 | ) | (340,155 | ) | (360,476 | ) | (420,722 | ) | (1,285,243 | ) | ||||||||||||
SmallCap Value ($) | ||||||||||||||||||||||||
| Shares sold | $ | 241,922 | $ | 3,407,425 | $ | 60 | $ | 349,467 | $ | 5,487 | $ | 1,896,406 | ||||||||||||
| Dividends reinvested | — | 11,475,313 | — | 4,261,442 | — | 5,350,792 | ||||||||||||||||||
| Shares redeemed | (7,031,511 | ) | (52,203,312 | ) | (3,306,545 | ) | (9,443,727 | ) | (4,102,591 | ) | (22,925,321 | ) | ||||||||||||
| Net decrease | $ | (6,789,589 | ) | $ | (37,320,574 | ) | $ | (3,306,485 | ) | $ | (4,832,818 | ) | $ | (4,097,104 | ) | $ | (15,678,123 | ) | ||||||
| Class I | Class Q | |||||||||||||||||||||||
| Six Months | Year | Six Months | Year | |||||||||||||||||||||
| Ended | Ended | Ended | Ended | |||||||||||||||||||||
| November 30, | May 31, | November 30, | May 31, | |||||||||||||||||||||
| 2006 | 2006 | 2006 | 2006 | |||||||||||||||||||||
SmallCap Value (Number of Shares) | ||||||||||||||||||||||||
| Shares sold | — | 1,417 | — | — | ||||||||||||||||||||
| Dividends reinvested | — | 9,704 | — | 1,508 | ||||||||||||||||||||
| Shares redeemed | (1,910 | ) | (40,181 | ) | (2,995 | ) | (2,990 | ) | ||||||||||||||||
| Net decrease in shares outstanding | (1,910 | ) | (29,060 | ) | (2,995 | ) | (1,482 | ) | ||||||||||||||||
SmallCap Value ($) | ||||||||||||||||||||||||
| Shares sold | $ | — | $ | 20,005 | $ | — | $ | — | ||||||||||||||||
| Dividends reinvested | — | 99,950 | — | 15,613 | ||||||||||||||||||||
| Shares redeemed | (18,854 | ) | (413,389 | ) | (33,899 | ) | (31,124 | ) | ||||||||||||||||
| Net decrease | $ | (18,854 | ) | $ | (293,434 | ) | $ | (33,899 | ) | $ | (15,511 | ) | ||||||||||||
| Class A | Class B | |||||||||||||||||||||||
| Six Months | Year | Six Months | Year | |||||||||||||||||||||
| Ended | Ended | Ended | Ended | |||||||||||||||||||||
| November 30, | May 31, | November 30, | May 31, | |||||||||||||||||||||
| 2006 | 2006 | 2006 | 2006 | |||||||||||||||||||||
SmallCap Value Choice (Number of Shares) | ||||||||||||||||||||||||
| Shares sold | 1,967,508 | 1,594,368 | 112,521 | 159,358 | ||||||||||||||||||||
| Dividends reinvested | — | 8,438 | — | 651 | ||||||||||||||||||||
| Shares redeemed | (365,260 | ) | (325,253 | ) | (21,191 | ) | (45,639 | ) | ||||||||||||||||
| Net increase in shares outstanding | 1,602,248 | 1,277,553 | 91,330 | 114,370 | ||||||||||||||||||||
SmallCap Value Choice ($) | ||||||||||||||||||||||||
| Shares sold | $ | 24,449,707 | $ | 18,511,677 | $ | 1,376,617 | $ | 1,864,751 | ||||||||||||||||
| Dividends reinvested | — | 94,088 | — | 7,241 | ||||||||||||||||||||
| Shares redeemed | (4,550,307 | ) | (3,730,931 | ) | (259,245 | ) | (535,586 | ) | ||||||||||||||||
| Net increase | $ | 19,899,400 | $ | 14,874,834 | $ | 1,117,372 | $ | 1,336,406 | ||||||||||||||||
106
Table of Contents
| Class C | Class I | |||||||||||||||||||||||
| Six Months | Year | Six Months | June 9, | |||||||||||||||||||||
| Ended | Ended | Ended | 2005(1) to | |||||||||||||||||||||
| November 30, | May 31, | November 30, | May 31, | |||||||||||||||||||||
| 2006 | 2006 | 2006 | 2006 | |||||||||||||||||||||
SmallCap Value Choice (Number of Shares) | ||||||||||||||||||||||||
| Shares sold | 371,460 | 445,462 | 506,464 | 276,205 | ||||||||||||||||||||
| Dividends reinvested | — | 2,067 | — | 434 | ||||||||||||||||||||
| Shares redeemed | (44,516 | ) | (58,238 | ) | (91,076 | ) | (9,940 | ) | ||||||||||||||||
| Net increase in shares outstanding | 326,944 | 389,291 | 415,388 | 266,699 | ||||||||||||||||||||
SmallCap Value Choice ($) | ||||||||||||||||||||||||
| Shares sold | $ | 4,596,100 | $ | 5,127,341 | $ | 6,186,813 | $ | 3,314,429 | ||||||||||||||||
| Dividends reinvested | — | 23,027 | — | 4,834 | ||||||||||||||||||||
| Shares redeemed | (547,977 | ) | (678,850 | ) | (1,165,814 | ) | (126,330 | ) | ||||||||||||||||
| Net increase | $ | 4,048,123 | $ | 4,471,518 | $ | 5,020,999 | $ | 3,192,933 | ||||||||||||||||
| (1) | Commencement of operations. |
NOTE 11 — SECURITIES LENDING
Under an agreement with The Bank of New York (“BNY”), the Funds except, Financial Services, can lend their securities to approved brokers, dealers and other financial institutions. Loans are collateralized by cash and U.S. Government securities. The collateral must be in an amount equal to at least 105% of the market value of non-U.S. securities loaned and 102% of the market value of U.S. securities loaned. The cash collateral received is invested in approved investments as defined in the Securities Lending Agreement with BNY (the “Agreement”). The collateral received is reflected in the Portfolio of Investments as collateral for securities loaned. Generally, in the event of counterparty default, the Funds have the right to use the collateral to offset losses incurred. The Agreement contains certain guarantees by BNY in the event of counterparty default and/or a borrower’s failure to return a loaned security; however, there would be a potential loss to the Funds in the event the Funds are delayed or prevented from exercising their right to dispose of the collateral. The Funds bear the risk of loss with respect to the investment of collateral. Engaging in securities lending could have a leveraging effect, which may intensify the credit, market and other risks associated with investing in a Fund. At November 30, 2006, the Funds had securities on loan with the following market values:
| Value of | ||||||||
| Securities | Value of | |||||||
| Loaned | Collateral | |||||||
| Disciplined LargeCap | $ | 2,575,625 | $ | 2,647,498 | ||||
| LargeCap Growth | 50,606,694 | 51,726,337 | ||||||
| MidCap Opportunities | 71,753,965 | 73,372,935 | ||||||
| SmallCap Opportunities | 39,717,713 | 40,639,690 | ||||||
| MagnaCap | 62,192,955 | 63,985,533 | ||||||
| MidCap Value | 23,764,412 | 24,719,658 | ||||||
| MidCap Value Choice | 25,237,604 | 25,802,088 | ||||||
NOTE 12 — REORGANIZATIONS
On December 3, 2005, MagnaCap as listed below (“Acquiring Fund”), acquired the assets and certain liabilities of ING Value Opportunity Fund, also listed below (“Acquired Fund”), in a tax-free reorganization in exchange for shares of the Acquiring Fund, pursuant to a plan or reorganization approved by the Acquired Fund’s shareholders. The number and value of shares issued by the Acquiring Fund are presented in Note 10 — Capital Share Transactions. Net assets and unrealized appreciation as of the reorganization date were as follows:
| Acquired Fund | ||||||||||||||||||
| Acquiring | Acquired | Total Net Assets of | Total Net Assets of | Unrealized | Conversion | |||||||||||||
| Fund | Fund | Acquired Fund (000’s) | Acquiring Fund (000’s) | Appreciation (000’s) | Ratio | |||||||||||||
| MagnaCap | ING Value Opportunity Fund | $ | 31,483 | $ | 347,924 | $ | 3,594 | 0.95 | ||||||||||
The net assets of MagnaCap after the acquisition were $379,406,835.
107
Table of Contents
NOTE 13 — FEDERAL INCOME TAXES
The amount of distributions from net investment income and net realized capital gains are determined in accordance with federal income tax regulations, which may differ from U.S. generally accepted accounting principles for investment companies. These book/tax differences may be either temporary or permanent. Permanent differences are reclassified within the capital accounts based on their federal tax-basis treatment; temporary differences are not reclassified. Key differences include the treatment of short-term capital gains, foreign currency transactions, and wash sale deferrals. Distributions in excess of net investment income and/or net realized capital gains for tax purposes are reported as distributions of paid-in capital.
Dividends paid by the Funds from net investment income and distributions of net realized short-term capital gains are, for federal income tax purposes, taxable as ordinary income to shareholders.
The tax composition of dividends and distributions to shareholders was as follows:
| Six Months | ||||||||||||||||
| Ended | ||||||||||||||||
| November 30, | ||||||||||||||||
| 2006 | Year Ended May 31, 2006 | |||||||||||||||
| Ordinary | Ordinary | Long-Term | Return of | |||||||||||||
| Income | Income | Capital Gains | Capital | |||||||||||||
Real Estate(1) | $ | 3,977,243 | $ | 10,931,855 | $ | 15,299,144 | $ | — | ||||||||
| Disciplined LargeCap | — | 20,068 | — | — | ||||||||||||
| LargeCap Growth | — | — | — | — | ||||||||||||
| Financial Services | — | 6,839,942 | 19,325,251 | — | ||||||||||||
| LargeCap Value | — | 2,304,244 | 651,605 | — | ||||||||||||
| MagnaCap | 1,273,102 | 3,390,213 | — | — | ||||||||||||
| MidCap Value | — | 10,441,461 | 9,193,612 | — | ||||||||||||
| MidCap Value Choice | — | 404,937 | — | — | ||||||||||||
| SmallCap Value | — | 18,265,818 | 7,860,029 | 152,153 | ||||||||||||
| SmallCap Value Choice | — | 174,066 | — | — | ||||||||||||
(1) Composition of dividends and distributions presented herein is based on the Fund’s tax year-end of December 31, 2005.
The tax-basis components of distributable earnings and the expiration dates of the capital loss carryforwards which may be used to offset future realized capital gains for federal income tax purposes as of May 31, 2006 were:
| Post-October | Post-October | |||||||||||||||||||||||||||
| Undistributed | Undistributed | Unrealized | Capital | Currency | ||||||||||||||||||||||||
| Ordinary | Long Term | Appreciation/ | Losses | Losses | Capital Loss | Expiration | ||||||||||||||||||||||
| Income | Capital Gains | Depreciation | Deferred | Deferred | Carryforwards | Dates | ||||||||||||||||||||||
Real Estate(1) | — | 1,660,007 | 1,684,827 | — | — | — | — | |||||||||||||||||||||
| Disciplined LargeCap | — | — | 1,885,302 | — | — | $ | (327,924 | ) | 2009 | |||||||||||||||||||
| (10,480,954 | ) | 2010 | ||||||||||||||||||||||||||
| (24,371,998 | ) | 2011 | ||||||||||||||||||||||||||
| (6,531,057 | ) | 2012 | ||||||||||||||||||||||||||
| $ | (41,711,933 | ) | ||||||||||||||||||||||||||
| Fundamental Research | 90,044 | — | (9,853 | ) | — | — | — | — | ||||||||||||||||||||
| LargeCap Growth | — | — | 29,744,140 | — | (6,086 | ) | $ | (97,467,160 | ) | 2009 | ||||||||||||||||||
| (137,806,249 | ) | 2010 | ||||||||||||||||||||||||||
| (117,098,211 | ) | 2011 | ||||||||||||||||||||||||||
| (1,005,295 | ) | 2013 | ||||||||||||||||||||||||||
| $ | (353,376,915 | )* | ||||||||||||||||||||||||||
| MidCap Opportunities | — | 1,813,813 | 37,063,870 | — | — | $ | (50,084,771 | ) | 2008 | |||||||||||||||||||
| (47,542,617 | ) | 2009 | ||||||||||||||||||||||||||
| (21,217,297 | ) | 2010 | ||||||||||||||||||||||||||
| (9,824,346 | ) | 2011 | ||||||||||||||||||||||||||
| $ | (128,669,031 | )* | ||||||||||||||||||||||||||
| Opportunistic LargeCap | 34,624 | — | 150,695 | (171,004 | ) | — | — | — | ||||||||||||||||||||
| SmallCap Opportunities | — | — | 23,430,402 | — | — | $ | (87,864,767 | ) | 2010 | |||||||||||||||||||
| (167,319,500 | ) | 2011 | ||||||||||||||||||||||||||
| $ | (255,184,267 | )* | ||||||||||||||||||||||||||
108
Table of Contents
| Post-October | Post-October | |||||||||||||||||||||||||||
| Undistributed | Undistributed | Unrealized | Capital | Currency | ||||||||||||||||||||||||
| Ordinary | Long Term | Appreciation/ | Losses | Losses | Capital Loss | Expiration | ||||||||||||||||||||||
| Income | Capital Gains | Depreciation | Deferred | Deferred | Carryforwards | Dates | ||||||||||||||||||||||
| Financial Services | 2,081,368 | 12,652,657 | 63,383,117 | — | — | — | — | |||||||||||||||||||||
| LargeCap Value | 880,560 | 1,121,468 | (55,453 | ) | — | — | — | — | ||||||||||||||||||||
| MagnaCap | 984,302 | — | 37,017,109 | — | — | $ | (24,685,569 | ) | 2010 | |||||||||||||||||||
| (12,050,567 | ) | 2012 | ||||||||||||||||||||||||||
| $ | (36,736,136 | )* | ||||||||||||||||||||||||||
| MidCap Value | 1,407,884 | 5,734,320 | (20,933,228 | ) | — | — | — | — | ||||||||||||||||||||
| MidCap Value Choice | 1,515,462 | 91,368 | 6,859,457 | — | — | — | — | |||||||||||||||||||||
| SmallCap Value | — | — | (13,635,978 | ) | (1,245,709 | ) | — | — | — | |||||||||||||||||||
| SmallCap Value Choice | 1,149,049 | 87,770 | 2,150,861 | — | — | — | — | |||||||||||||||||||||
(1) As of the Fund’s tax year ended December 31, 2005.
* Utilization of these capital losses is subject to annual limitations under Section 382 of the Internal Revenue Code.
NOTE 14 — ILLIQUID SECURITIES
Pursuant to guidelines adopted by the Funds’ Board, the following securities have been deemed to be illiquid. The Funds may invest up to 15% of its net assets in illiquid securities. Fair value for these securities was determined by ING Funds Valuation Committee appointed by the Funds’ Board.
NOTE 15 — CONCENTRATION OF RISKS
Concentration (Real Estate and Financial Services). Each Fund concentrates (for purposes of the 1940 Act) its assets in securities related to a particular industry, which means that at least 25% of its assets will be invested in that particular industry at all times. As a result, each Fund may be subject to greater market fluctuation than a fund which has securities representing a broader range of investment alternatives.
Non-Diversified (Real Estate and Opportunistic LargeCap). The Funds are each classified as non-diversified investment companies under the 1940 Act, which means that each Fund is not limited by the 1940 Act in the proportion of assets that they may invest in the obligations of a single issuer. Declines in the value of that single company can significantly impact the value of a Fund. The investment of a large percentage of a Fund’s assets in the securities of a small number of issuers may cause the Funds’ share price to fluctuate more than that of a diversified investment company. Conversely, even though classified as nondiversified, a Fund may actually maintain a portfolio that is diversified with a large number of issuers. In such an event, a Fund would benefit less from appreciation in a single corporate issuer than if it had greater exposure to that issuer.
NOTE 16 — SUBSEQUENT EVENT
Dividends: Subsequent to November 30, 2006, the following Funds declared dividends and distributions of:
| PER SHARE AMOUNTS | ||||||||||||||||||||
| Net Investment | Short-Term | Long-Term | Payable | Record | ||||||||||||||||
| Income | Capital Gains | Capital Gains | Date | Date | ||||||||||||||||
Real Estate | ||||||||||||||||||||
| Class A | $ | — | $ | 0.0623 | $ | 1.2372 | December 19, 2006 | December 14, 2006 | ||||||||||||
| Class B | $ | — | $ | 0.0623 | $ | 1.2372 | December 19, 2006 | December 14, 2006 | ||||||||||||
| Class C | $ | — | $ | 0.0623 | $ | 1.2372 | December 19, 2006 | December 14, 2006 | ||||||||||||
| Class I | $ | — | $ | 0.0623 | $ | 1.2372 | December 19, 2006 | December 14, 2006 | ||||||||||||
| Class O | $ | — | $ | 0.0623 | $ | 1.2372 | December 19, 2006 | December 14, 2006 | ||||||||||||
| Class A | $ | 0.0872 | $ | — | $ | — | January 3, 2007 | December 28, 2006 | ||||||||||||
| Class B | $ | 0.0520 | $ | — | $ | — | January 3, 2007 | December 28, 2006 | ||||||||||||
| Class C | $ | 0.0517 | $ | — | $ | — | January 3, 2007 | December 28, 2006 | ||||||||||||
| Class I | $ | 0.0993 | $ | — | $ | — | January 3, 2007 | December 28, 2006 | ||||||||||||
| Class Q | $ | 0.1009 | $ | — | $ | — | January 3, 2007 | December 28, 2006 | ||||||||||||
| Class O | $ | 0.0904 | $ | — | $ | — | January 3, 2007 | December 28, 2006 | ||||||||||||
Fundamental Research | ||||||||||||||||||||
| Class A | $ | 0.1437 | $ | 0.1500 | $ | 0.0051 | December 19, 2006 | December 14, 2006 | ||||||||||||
| Class B | $ | 0.1197 | $ | 0.1500 | $ | 0.0051 | December 19, 2006 | December 14, 2006 | ||||||||||||
| Class C | $ | 0.1162 | $ | 0.1500 | $ | 0.0051 | December 19, 2006 | December 14, 2006 | ||||||||||||
| Class I | $ | 0.1810 | $ | 0.1500 | $ | 0.0051 | December 19, 2006 | December 14, 2006 | ||||||||||||
109
Table of Contents
| PER SHARE AMOUNTS | ||||||||||||||||||||
| Net Investment | Short-Term | Long-Term | Payable | Record | ||||||||||||||||
| Income | Capital Gains | Capital Gains | Date | Date | ||||||||||||||||
MidCap Opportunities | ||||||||||||||||||||
| Class A | $ | — | $ | — | $ | 0.0936 | December 19, 2006 | December 14, 2006 | ||||||||||||
| Class B | $ | — | $ | — | $ | 0.0936 | December 19, 2006 | December 14, 2006 | ||||||||||||
| Class C | $ | — | $ | — | $ | 0.0936 | December 19, 2006 | December 14, 2006 | ||||||||||||
| Class I | $ | — | $ | — | $ | 0.0936 | December 19, 2006 | December 14, 2006 | ||||||||||||
| Class Q | $ | — | $ | — | $ | 0.0936 | December 19, 2006 | December 14, 2006 | ||||||||||||
Opportunistic LargeCap | ||||||||||||||||||||
| Class A | $ | 0.0689 | $ | — | $ | — | December 19, 2006 | December 14, 2006 | ||||||||||||
| Class B | $ | 0.0514 | $ | — | $ | — | December 19, 2006 | December 14, 2006 | ||||||||||||
| Class C | $ | 0.0918 | $ | — | $ | — | December 19, 2006 | December 14, 2006 | ||||||||||||
| Class I | $ | 0.0120 | $ | — | $ | — | December 19, 2006 | December 14, 2006 | ||||||||||||
Financial Services | ||||||||||||||||||||
| Class A | $ | 0.2576 | $ | 0.2284 | $ | 2.1206 | December 19, 2006 | December 14, 2006 | ||||||||||||
| Class B | $ | — | $ | 0.2284 | $ | 2.1206 | December 19, 2006 | December 14, 2006 | ||||||||||||
| Class C | $ | 0.1564 | $ | 0.2284 | $ | 2.1206 | December 19, 2006 | December 14, 2006 | ||||||||||||
| Class O | $ | 0.2805 | $ | 0.2284 | $ | 2.1206 | December 19, 2006 | December 14, 2006 | ||||||||||||
LargeCap Value | ||||||||||||||||||||
| Class A | $ | 0.0615 | $ | 0.1427 | $ | 0.4057 | December 19, 2006 | December 14, 2006 | ||||||||||||
| Class B | $ | — | $ | 0.1427 | $ | 0.4057 | December 19, 2006 | December 14, 2006 | ||||||||||||
| Class C | $ | — | $ | 0.1427 | $ | 0.4057 | December 19, 2006 | December 14, 2006 | ||||||||||||
| Class I | $ | 0.0813 | $ | 0.1427 | $ | 0.4057 | December 19, 2006 | December 14, 2006 | ||||||||||||
MagnaCap | ||||||||||||||||||||
| Class A | $ | 0.0986 | $ | — | $ | — | December 19, 2006 | December 14, 2006 | ||||||||||||
| Class B | $ | 0.0546 | $ | — | $ | — | December 19, 2006 | December 14, 2006 | ||||||||||||
| Class C | $ | 0.0540 | $ | — | $ | — | December 19, 2006 | December 14, 2006 | ||||||||||||
| Class I | $ | 0.1135 | $ | — | $ | — | December 19, 2006 | December 14, 2006 | ||||||||||||
| Class M | $ | 0.0691 | $ | — | $ | — | December 19, 2006 | December 14, 2006 | ||||||||||||
MidCap Value | ||||||||||||||||||||
| Class A | $ | — | $ | 0.1800 | $ | 0.7330 | December 19, 2006 | December 14, 2006 | ||||||||||||
| Class B | $ | — | $ | 0.1800 | $ | 0.7330 | December 19, 2006 | December 14, 2006 | ||||||||||||
| Class C | $ | — | $ | 0.1800 | $ | 0.7330 | December 19, 2006 | December 14, 2006 | ||||||||||||
| Class I | $ | — | $ | 0.1800 | $ | 0.7330 | December 19, 2006 | December 14, 2006 | ||||||||||||
| Class Q | $ | — | $ | 0.1800 | $ | 0.7330 | December 19, 2006 | December 14, 2006 | ||||||||||||
MidCap Value Choice | ||||||||||||||||||||
| Class A | $ | 0.0663 | $ | 0.2346 | $ | 0.0835 | December 19, 2006 | December 14, 2006 | ||||||||||||
| Class B | $ | — | $ | 0.2346 | $ | 0.0835 | December 19, 2006 | December 14, 2006 | ||||||||||||
| Class C | $ | — | $ | 0.2346 | $ | 0.0835 | December 19, 2006 | December 14, 2006 | ||||||||||||
| Class I | $ | — | $ | 0.2346 | $ | 0.0835 | December 19, 2006 | December 14, 2006 | ||||||||||||
SmallCap Value Choice | ||||||||||||||||||||
| Class A | $ | 0.0182 | $ | 0.2219 | $ | 0.0742 | December 19, 2006 | December 14, 2006 | ||||||||||||
| Class B | $ | — | $ | 0.2219 | $ | 0.0742 | December 19, 2006 | December 14, 2006 | ||||||||||||
| Class C | $ | — | $ | 0.2219 | $ | 0.0742 | December 19, 2006 | December 14, 2006 | ||||||||||||
| Class I | $ | 0.0324 | $ | 0.2219 | $ | 0.0742 | December 19, 2006 | December 14, 2006 | ||||||||||||
On November 9, 2006, the Board of IET approved a proposal to reorganize each “Disappearing Fund” into the following “Surviving Fund” (each a “Reorganization,” and collectively, the “Reorganizations”):
| Disappearing Fund | Surviving Fund | |
| ING MidCap Value Fund | ING Value Choice Fund | |
| ING SmallCap Value Fund |
The proposed Reorganizations are subject to the approval by shareholders of each Disappearing Fund. If shareholder approval is obtained, it is expected that each Reorganization will take place during the first quarter of 2007. Shareholders will be notified if a Reorganization is not approved.
NOTE 17 — OTHER ACCOUNTING PRONOUNCEMENTS
In June 2006, the Financial Accounting Standards Board (“FASB”) issued FASB Interpretation 48 (“FIN 48”), “Accounting for Uncertainty in Income Taxes.” This standard defines the threshold for recognizing the benefits of tax-return positions in the financial statements as “more-likely-than-not” to be sustained upon challenge by the taxing authority and requires measurement of a tax position meeting the more-likely-than-not criterion, based on the largest benefit that is more than 50 percent likely to be realized. FIN 48 is as of the first fiscal year beginning after December 15, 2006, with early application permitted if no interim financial statements have been issued. At adoption, companies must adjust their financial statements to reflect only those tax positions
110
Table of Contents
that are more likely than-not to be sustained as of the adoption date. Management of the Funds has assessed the impact of adopting FIN 48 and currently does not believe there will be a material impact to the Funds.
On September 15, 2006, the FASB issued Statement of Financial Accounting Standard No. 157 (“SFAS No. 157”), Fair Value Measurements. The new accounting statement defines fair value, establishes a framework for measuring fair value in generally accepted accounting principles (“GAAP”), and expands disclosures about fair value measurements. SFAS No. 157 defines fair value as the price that would be received upon sale of an asset or paid to transfer a liability in an orderly transaction between market participants at the measurement date (an exit price). SFAS No. 157 also stipulates that, as a market-based measurement, fair value measurement should be determined based on the assumptions that market participants would use in pricing the asset or liability, and establishes a fair value hierarchy that distinguishes between (a) market participant assumptions developed based on market data obtained from sources independent of the reporting entity (observable inputs) and (b) the reporting entity’s own assumptions about market participant assumptions developed based on the best information available in the circumstances (unobservable inputs). SFAS No. 157 is effective for financial statements issued for fiscal years beginning after November 15, 2007. As of November 30 2006, the Funds are assessing the impact, if any, that will result from adopting SFAS No. 157.
NOTE 18 — INFORMATION REGARDING TRADING OF ING’S U.S. MUTUAL FUNDS
ING Investments reported to the Boards of Directors/ Trustees (the “Boards”) of the ING Funds that, like many U.S. financial services companies, ING Investments and certain of its U.S. affiliates have received informal and formal requests for information since September 2003 from various governmental and self-regulatory agencies in connection with investigations related to mutual funds and variable insurance products. ING Investments has advised the Boards that it and its affiliates have cooperated fully with each request.
In addition to responding to regulatory and governmental requests, ING Investments reported that management of U.S. affiliates of ING Groep, including ING Investments (collectively, “ING”), on their own initiative, have conducted, through independent special counsel and a national accounting firm, an extensive internal review of trading in ING insurance, retirement, and mutual fund products. The goal of this review was to identify any instances of inappropriate trading in those products by third parties or by ING investment professionals and other ING personnel. ING’s internal review related to mutual fund trading is now substantially completed. ING has reported that, of the millions of customer relationships that ING maintains, the internal review identified several isolated arrangements allowing third parties to engage in frequent trading of mutual funds within ING’s variable insurance and mutual fund products, and identified other circumstances where frequent trading occurred, despite measures taken by ING intended to combat market timing. ING further reported that each of these arrangements has been terminated and fully disclosed to regulators. The results of the internal review were also reported to the independent members of the Boards.
ING Investments has advised the Boards that most of the identified arrangements were initiated prior to ING’s acquisition of the businesses in question in the U.S. ING Investments further reported that the companies in question did not receive special benefits in return for any of these arrangements, which have all been terminated.
Based on the internal review, ING Investments has advised the Boards that the identified arrangements do not represent a systemic problem in any of the companies that were involved.
In September 2005, ING Funds Distributor, LLC (“IFD”), the distributor of certain ING Funds, settled an administrative proceeding with the NASD regarding three arrangements, dating from 1995, 1996 and 1998, under which the administrator to the then-Pilgrim Funds, which subsequently became part of the ING Funds, entered into formal and informal arrangements that permitted frequent trading. Under the terms of the Letter of Acceptance, Waiver and Consent (“AWC”) with the NASD, under which IFD neither admitted nor denied the allegations or findings, IFD consented to the following sanctions: (i) a censure; (ii) a fine of $1.5 million; (iii) restitution of approximately $1.44 million to certain ING Funds
111
Table of Contents
for losses attributable to excessive trading described in the AWC; and (iv) agreement to make certification to NASD regarding the review and establishment of certain procedures.
In addition to the arrangements discussed above, ING Investments reported to the Boards that, at this time, these instances include the following, in addition to the arrangements subject to the AWC discussed above:
| • | Aeltus Investment Management, Inc. (a predecessor entity to ING Investment Management Co.) identified two investment professionals who engaged in extensive frequent trading in certain ING Funds. One was subsequently terminated for cause and incurred substantial financial penalties in connection with this conduct and the second has been disciplined. |
| • | ReliaStar Life Insurance Company (“ReliaStar”) entered into agreements seven years ago permitting the owner of policies issued by the insurer to engage in frequent trading and to submit orders until 4pm Central Time. In 2001 ReliaStar also entered into a selling agreement with a broker-dealer that engaged in frequent trading. Employees of ING affiliates were terminated and/or disciplined in connection with these matters. |
| • | In 1998, Golden American Life Insurance Company entered into arrangements permitting a broker-dealer to frequently trade up to certain specific limits in a fund available in an ING variable annuity product. No employee responsible for this arrangement remains at the company. |
For additional information regarding these matters and the AWC, you may consult the Form 8-K and Form 8-K/ A for each of four life insurance companies, ING USA Annuity and Life Insurance Company, ING Life Insurance and Annuity Company, ING Insurance Company of America, and ReliaStar Life Insurance Company of New York, each filed with the Securities and Exchange Commission (the “SEC”) on October 29, 2004 and September 8, 2004. These Forms 8-K and Forms 8-K/ A can be accessed through the SEC’s Web site at http://www.sec.gov. Despite the extensive internal review conducted through independent special counsel and a national accounting firm, there can be no assurance that the instances of inappropriate trading reported to the Boards are the only instances of such trading respecting the ING Funds.
ING Investments reported to the Boards that ING is committed to conducting its business with the highest standards of ethical conduct with zero tolerance for noncompliance. Accordingly, ING Investments advised the Boards that ING management was disappointed that its voluntary internal review identified these situations. Viewed in the context of the breadth and magnitude of its U.S. business as a whole, ING management does not believe that ING’s acquired companies had systemic ethical or compliance issues in these areas. Nonetheless, Investments reported that given ING’s refusal to tolerate any lapses, it has taken the steps noted below, and will continue to seek opportunities to further strengthen the internal controls of its affiliates.
| • | ING has agreed with the ING Funds to indemnify and hold harmless the ING Funds from all damages resulting from wrongful conduct by ING or its employees or from ING’s internal investigation, any investigations conducted by any governmental or self-regulatory agencies, litigation or other formal proceedings, including any proceedings by the Securities and Exchange Commission. ING Investments reported to the Boards that ING management believes that the total amount of any indemnification obligations will not be material to ING or its U.S. business. |
| • | ING updated its Code of Conduct for employees reinforcing its employees’ obligation to conduct personal trading activity consistent with the law, disclosed limits, and other requirements. |
| • | The ING Funds, upon a recommendation from ING, updated their respective Codes of Ethics applicable to investment professionals with ING entities and certain other fund personnel, requiring such personnel to pre-clear any purchases or sales of ING Funds that are not systematic in nature (i.e., dividend reinvestment), and imposing minimum holding periods for shares of ING Funds. |
| • | ING instituted excessive trading policies for all customers in its variable insurance and retirement products and for shareholders of the ING Funds sold to the public through financial intermediaries. ING does not make exceptions to these policies. |
| • | ING reorganized and expanded its U.S. Compliance Department, and created an Enterprise Compliance |
112
Table of Contents
| team to enhance controls and consistency in regulatory compliance. |
Other Regulatory Matters
The New York Attorney General (the “NYAG”) and other federal and state regulators are also conducting broad inquiries and investigations involving the insurance industry. These initiatives currently focus on, among other things, compensation and other sales incentives; potential conflicts of interest; potential anti-competitive activity; reinsurance; marketing practices (including suitability); specific product types (including group annuities and indexed annuities); fund selection for investment products and brokerage sales; and disclosure. It is likely that the scope of these industry investigations will further broaden before they conclude. ING has received formal and informal requests in connection with such investigations, and is cooperating fully with each request. In connection with one such investigation, affiliates of ING Investments were named in a petition for relief and cease and desist order filed by the New Hampshire Bureau of Securities Regulation (the “NH Bureau”) concerning their administration of the New Hampshire state employees deferred compensation plan.
On October 10, 2006, an affiliate of ING Investments entered into an assurance of discontinuance with the NYAG (the “NYAG Agreement”) regarding the endorsement of its products by the New York State United Teachers Union Member Benefits Trust (“NYSUT”) and the sale of their products to NYSUT members. Under the terms of the NYAG Agreement, the affiliate of ING Investments, without admitting or denying the NYAG’s findings, will distribute $30 million to NYSUT members, and/or former NYSUT members, who participated in the NYSUT-endorsed products at any point between January 1, 2001 and June 30, 2006. The affiliate also agreed with the NYAG’s office to develop a one-page disclosure that will further improve transparency and disclosure regarding retirement product fees (the “One-Page Disclosure”). Pursuant to the terms of the NYAG Agreement, the affiliate has agreed for a five year period to provide its retirement product customers with the One-Page Disclosure.
In addition, on the same date, these affiliates of ING Investments entered into a consent agreement with the NH Bureau (the “NH Agreement”) to resolve this petition for relief and cease and desist order. Under the terms of the NH Agreement, these affiliates of ING Investments, without admitting or denying the NH Bureau’s claims, have agreed to pay $3 million to resolve the matter, and for a five year period to provide their retirement product customers with the One-Page Disclosure described above. Other federal and state regulators could initiate similar actions in this or other areas of ING’s businesses.
In light of these and other developments, ING continuously reviews whether modifications to its business practices are appropriate.
At this time, in light of the current regulatory factors, ING U.S. is actively engaged in reviewing whether any modifications in our practices are appropriate for the future.
There can be no assurance that these matters, or the adverse publicity associated with them, will not result in increased fund redemptions, reduced sale of fund shares, or other adverse consequences to ING Funds.
NOTE 19 — PROXY VOTING INFORMATION
A description of the policies and procedures that the Funds use to determine how to vote proxies related to portfolio securities is available (1) without charge, upon request, by calling Shareholder Services toll-free at 1-800-992-0180; (2) on the Funds’ website at www.ingfunds.com and (3) on the SEC’s website at www.sec.gov. Information regarding how the Funds voted proxies related to portfolio securities during the most recent 12-month period ended June 30 is available without charge on the Funds’ website at www.ingfunds.com and on the SEC’s website at www.sec.gov.
NOTE 20 — QUARTERLY PORTFOLIO HOLDINGS
The Funds file their complete schedule of portfolio holdings with the SEC for the first and third quarters of each fiscal year on Form N-Q. The Funds’ Forms N-Q are available on the SEC’s website at www.sec.gov. The Funds’ Forms N-Q may be reviewed and copied at the SEC’s Public Reference Room in Washington, DC, and information on the operation of the Public Reference Room may be obtained by calling 1-800-SEC-0330; and is available upon request from the Funds by calling Shareholder Services toll-free at 1-800-992-0180.
113
Table of Contents
| Shares | Value | |||||||||
| REAL ESTATE INVESTMENT TRUSTS: 98.8% | ||||||||||
| Apartments: 21.2% | ||||||||||
| 315,900 | Archstone-Smith Trust | $ | 18,947,682 | |||||||
| 114,700 | AvalonBay Communities, Inc. | 15,264,276 | ||||||||
| 136,600 | BRE Properties, Inc. | 8,829,824 | ||||||||
| 126,800 | Camden Property Trust | 10,109,764 | ||||||||
| 309,700 | Equity Residential | 16,494,622 | ||||||||
| 29,500 | GMH Communities Trust | 366,095 | ||||||||
| 63,200 | Home Properties, Inc. | 3,906,392 | ||||||||
| 57,700 | Post Properties, Inc. | 2,760,368 | ||||||||
| 240,500 | United Dominion Realty Trust, Inc. | 8,075,990 | ||||||||
| 84,755,013 | ||||||||||
| Diversified: 7.8% | ||||||||||
| 158,400 | Crescent Real Estate EQT Co. | 3,402,432 | ||||||||
| 116,500 | Liberty Property Trust | 5,965,965 | ||||||||
| 142,300 | Vornado Realty Trust | 17,945,453 | ||||||||
| 86,100 | Washington Real Estate Investment Trust | 3,691,107 | ||||||||
| 31,004,957 | ||||||||||
| Health Care: 6.1% | ||||||||||
| 205,100 | Health Care Property Investors, Inc. | 7,438,977 | ||||||||
| 197,100 | Nationwide Health Properties, Inc. | 5,832,189 | ||||||||
| 228,800 | Omega Healthcare Investors, Inc. | 4,054,336 | ||||||||
| 179,600 | Ventas, Inc. | 6,995,420 | ||||||||
| 24,320,922 | ||||||||||
| Hotels: 7.0% | ||||||||||
| 644,338 | Host Hotels & Resorts, Inc. | 16,250,204 | ||||||||
| 88,700 | LaSalle Hotel Properties | 3,911,670 | ||||||||
| 179,000 | Strategic Hotel Capital, Inc. | 3,893,250 | ||||||||
| 135,800 | Sunstone Hotel Investors, Inc. | 3,786,104 | ||||||||
| 27,841,228 | ||||||||||
| Office Property: 21.8% | ||||||||||
| 163,300 | BioMed Realty Trust, Inc. | 4,931,660 | ||||||||
| 176,600 | Boston Properties, Inc. | 20,671,030 | ||||||||
| 117,450 | Corporate Office Properties Trust SBI MD | 5,838,440 | ||||||||
| 139,200 | Douglas Emmett, Inc. | 3,660,960 | ||||||||
| 414,500 | Equity Office Properties Trust | 19,978,900 | ||||||||
| 200,100 | Highwoods Properties, Inc. | 8,164,080 | ||||||||
| 49,700 | Kilroy Realty Corp. | 4,065,460 | ||||||||
| 176,000 | Maguire Properties, Inc. | 7,541,600 | ||||||||
| 92,600 | SL Green Realty Corp. | 12,523,224 | ||||||||
| 87,375,354 | ||||||||||
| Regional Malls: 12.5% | ||||||||||
| 113,000 | General Growth Properties, Inc. | 6,208,220 | ||||||||
| 140,100 | Macerich Co. | 11,974,347 | ||||||||
| 253,000 | Simon Property Group, Inc. | 25,800,940 | ||||||||
| 121,100 | Taubman Centers, Inc. | 5,989,606 | ||||||||
| 49,973,113 | ||||||||||
| Shopping Centers: 10.4% | ||||||||||
| 147,950 | Acadia Realty Trust | 3,843,741 | ||||||||
| 154,600 | Developers Diversified Realty Corp. | 10,014,988 | ||||||||
| 140,300 | Federal Realty Investment Trust | 11,950,754 | ||||||||
| 165,623 | Kimco Realty Corp. | 7,681,595 | ||||||||
| 103,900 | Regency Centers Corp. | 8,206,022 | ||||||||
| 41,697,100 | ||||||||||
| Storage: 4.6% | ||||||||||
| 117,300 | Extra Space Storage, Inc. | 2,160,666 | ||||||||
| 167,302 | Public Storage, Inc. | 16,107,837 | ||||||||
| 18,268,503 | ||||||||||
| Warehouse/ Industrial: 7.4% | ||||||||||
| 160,400 | AMB Property Corp. | 9,827,708 | ||||||||
| 302,700 | Prologis | 19,726,958 | ||||||||
| 29,554,666 | ||||||||||
| Total Real Estate Investment Trusts (Cost $248,404,632) | 394,790,856 | |||||||||
| Principal | ||||||||||
| Amount | Value | |||||||||
| SHORT-TERM INVESTMENTS: 1.0% | ||||||||||
| U.S. Government Agency Obligations: 1.0% | ||||||||||
| $4,051,000 | Federal Home Loan Bank, 4.980%, due 12/01/06 | $ | 4,050,440 | |||||||
| Total Short-Term Investments (Cost $4,050,440) | 4,050,440 | |||||||||
Total Investments in Securities (Cost $252,455,072)* | 99.8 | % | $ | 398,841,296 | ||||||||
Other Assets and Liabilities-Net | �� | 0.2 | 998,337 | |||||||||
Net Assets | 100.0 | % | $ | 399,839,633 | ||||||||
| * | Cost for federal income tax purposes is $250,388,539. Net unrealized appreciation consists of: |
| Gross Unrealized Appreciation | $ | 148,508,255 | ||
| Gross Unrealized Depreciation | (55,498 | ) | ||
| Net Unrealized Appreciation | $ | 148,452,757 | ||
114
Table of Contents
| Shares | Value | |||||||||
| COMMON STOCK: 99.3% | ||||||||||
| Advertising: 0.5% | ||||||||||
| 1,900 | Omnicom Group | $ | 194,104 | |||||||
| 194,104 | ||||||||||
| Aerospace/Defense: 4.0% | ||||||||||
| 2,350 | Boeing Co. | 208,046 | ||||||||
| 4,100 | General Dynamics Corp. | 306,844 | ||||||||
| 3,300 | Lockheed Martin Corp. | 298,485 | ||||||||
| 3,900 | Northrop Grumman Corp. | 261,027 | ||||||||
| 5,081 | Raytheon Co. | 259,334 | ||||||||
| 2,940 | United Technologies Corp. | 189,718 | ||||||||
| 1,523,454 | ||||||||||
| Agriculture: 1.3% | ||||||||||
| 5,960 | Altria Group, Inc. | 501,892 | ||||||||
| 501,892 | ||||||||||
| Apparel: 0.6% | ||||||||||
| 4,350 | @ | Coach, Inc. | 187,964 | |||||||
| 1,700 | Jones Apparel Group, Inc. | 57,120 | ||||||||
| 245,084 | ||||||||||
| Auto Manufacturers: 0.5% | ||||||||||
| 21,800 | L | Ford Motor Co. | 177,234 | |||||||
| 900 | @,L | Navistar International Corp. | 28,791 | |||||||
| 206,025 | ||||||||||
| Banks: 6.3% | ||||||||||
| 19,530 | Bank of America Corp. | 1,051,691 | ||||||||
| 2,200 | Comerica, Inc. | 128,150 | ||||||||
| 6,350 | L | National City Corp. | 229,235 | |||||||
| 5,900 | Regions Financial Corp. | 216,235 | ||||||||
| 5,250 | US Bancorp. | 176,610 | ||||||||
| 5,240 | Wachovia Corp. | 283,956 | ||||||||
| 9,200 | Wells Fargo & Co. | 324,208 | ||||||||
| 2,410,085 | ||||||||||
| Beverages: 2.5% | ||||||||||
| 6,700 | Anheuser-Busch Cos., Inc. | 318,317 | ||||||||
| 5,680 | Coca-Cola Co. | 265,994 | ||||||||
| 2,100 | Pepsi Bottling Group, Inc. | 65,772 | ||||||||
| 4,790 | PepsiCo, Inc. | 296,836 | ||||||||
| 946,919 | ||||||||||
| Biotechnology: 0.6% | ||||||||||
| 3,290 | @ | Amgen, Inc. | 233,590 | |||||||
| 233,590 | ||||||||||
| Chemicals: 1.5% | ||||||||||
| 2,700 | Dow Chemical Co. | 108,027 | ||||||||
| 2,850 | EI DuPont de Nemours & Co. | 133,751 | ||||||||
| 1,600 | Monsanto Co. | 76,912 | ||||||||
| 2,550 | PPG Industries, Inc. | 163,965 | ||||||||
| 1,400 | Sherwin-Williams Co. | 87,570 | ||||||||
| 570,225 | ||||||||||
| Commercial Services: 1.4% | ||||||||||
| 2,000 | @,L | Apollo Group, Inc. | 77,580 | |||||||
| 2,100 | @ | Convergys Corp. | 50,652 | |||||||
| 4,090 | McKesson Corp. | 202,046 | ||||||||
| 2,900 | Moody’s Corp. | 201,492 | ||||||||
| 531,770 | ||||||||||
| Computers: 4.3% | ||||||||||
| 14,300 | @ | Dell, Inc. | 389,532 | |||||||
| 13,607 | Hewlett-Packard Co. | 536,932 | ||||||||
| 6,990 | International Business Machines Corp. | 642,521 | ||||||||
| 1,300 | @,L | Lexmark International, Inc. | 89,674 | |||||||
| 12,700 | @,X | Seagate Technology, Inc. | — | |||||||
| 1,658,659 | ||||||||||
| Cosmetics/Personal Care: 1.7% | ||||||||||
| 1,900 | Estee Lauder Cos., Inc. | 78,451 | ||||||||
| 9,090 | Procter & Gamble Co. | 570,761 | ||||||||
| 649,212 | ||||||||||
| Diversified Financial Services: 9.3% | ||||||||||
| 3,290 | American Express Co. | 193,189 | ||||||||
| 2,900 | CIT Group, Inc. | 150,829 | ||||||||
| 21,250 | Citigroup, Inc. | 1,053,788 | ||||||||
| 2,650 | Fannie Mae | 151,130 | ||||||||
| 2,560 | Goldman Sachs Group, Inc. | 498,688 | ||||||||
| 16,680 | JPMorgan Chase & Co. | 771,950 | ||||||||
| 2,540 | Merrill Lynch & Co., Inc. | 222,072 | ||||||||
| 6,450 | Morgan Stanley | 491,232 | ||||||||
| 3,532,878 | ||||||||||
| Electric: 2.7% | ||||||||||
| 14,100 | @ | AES Corp. | 329,517 | |||||||
| 544 | @ | Dynegy, Inc. | — | |||||||
| 3,300 | Exelon Corp. | 200,409 | ||||||||
| 7,700 | PG&E Corp. | 353,661 | ||||||||
| 2,300 | TXU Corp. | 131,997 | ||||||||
| 1,015,584 | ||||||||||
| Electronics: 0.2% | ||||||||||
| 1,600 | @ | Waters Corp. | 80,064 | |||||||
| 80,064 | ||||||||||
| Environmental Control: 0.6% | ||||||||||
| 6,400 | Waste Management, Inc. | 234,304 | ||||||||
| 234,304 | ||||||||||
| Food: 0.9% | ||||||||||
| 3,450 | L | Campbell Soup Co. | 131,342 | |||||||
| 4,004 | General Mills, Inc. | 224,024 | ||||||||
| 355,366 | ||||||||||
| Forest Products & Paper: 0.2% | ||||||||||
| 1,800 | Temple-Inland, Inc. | 70,380 | ||||||||
| 70,380 | ||||||||||
| Hand/Machine Tools: 0.1% | ||||||||||
| 900 | Snap-On, Inc. | 42,750 | ||||||||
| 42,750 | ||||||||||
| Healthcare — Products: 1.8% | ||||||||||
| 8,040 | Johnson & Johnson | 529,916 | ||||||||
| 3,200 | Medtronic, Inc. | 166,816 | ||||||||
| 696,732 | ||||||||||
| Healthcare — Services: 3.8% | ||||||||||
| 6,130 | Aetna, Inc. | 253,230 | ||||||||
| 2,310 | @ | Coventry Health Care, Inc. | 111,180 | |||||||
| 2,460 | @ | Humana, Inc. | 133,086 | |||||||
| 1,900 | @,L | Laboratory Corp. of America Holdings | 134,520 | |||||||
| 8,980 | UnitedHealth Group, Inc. | 440,738 | ||||||||
| 4,790 | @ | WellPoint, Inc. | 362,459 | |||||||
| 1,435,213 | ||||||||||
| Home Furnishings: 0.2% | ||||||||||
| 800 | Harman International Industries, Inc. | 83,072 | ||||||||
| 83,072 | ||||||||||
| Insurance: 8.6% | ||||||||||
| 5,100 | Allstate Corp. | 323,748 | ||||||||
| 1,600 | AMBAC Financial Group, Inc. | 137,024 | ||||||||
115
Table of Contents
| Shares | Value | |||||||||
| Insurance: (continued) | ||||||||||
| 7,100 | American International Group, Inc. | $ | 499,272 | |||||||
| 4,570 | Chubb Corp. | 236,543 | ||||||||
| 1,500 | Cigna Corp. | 189,075 | ||||||||
| 6,100 | Genworth Financial, Inc. | 200,080 | ||||||||
| 3,083 | Hartford Financial Services Group, Inc. | 264,398 | ||||||||
| 5,600 | Loews Corp. | 223,552 | ||||||||
| 6,050 | Metlife, Inc. | 355,317 | ||||||||
| 3,500 | Principal Financial Group | 202,125 | ||||||||
| 9,200 | Progressive Corp. | 207,460 | ||||||||
| 3,931 | Prudential Financial, Inc. | 320,298 | ||||||||
| 1,700 | L | Safeco Corp. | 102,969 | |||||||
| 3,261,861 | ||||||||||
| Internet: 0.9% | ||||||||||
| 500 | @ | Google, Inc. | 242,460 | |||||||
| 3,100 | @ | VeriSign, Inc. | 80,941 | |||||||
| 323,401 | ||||||||||
| Iron/Steel: 1.0% | ||||||||||
| 3,770 | L | Nucor Corp. | 225,635 | |||||||
| 1,900 | United States Steel Corp. | 142,101 | ||||||||
| 367,736 | ||||||||||
| Leisure Time: 0.1% | ||||||||||
| 2,000 | Sabre Holdings Corp. | 54,860 | ||||||||
| 54,860 | ||||||||||
| Machinery — Construction & Mining: 0.3% | ||||||||||
| 2,000 | Caterpillar, Inc. | 124,060 | ||||||||
| 124,060 | ||||||||||
| Machinery — Diversified: 0.3% | ||||||||||
| 800 | Cummins, Inc. | 95,936 | ||||||||
| 95,936 | ||||||||||
| Media: 3.1% | ||||||||||
| 7,500 | CBS Corp. | 223,125 | ||||||||
| 5,300 | @,L | Comcast Corp. | 214,438 | |||||||
| 3,490 | McGraw-Hill Cos., Inc. | 232,609 | ||||||||
| 5,980 | News Corp., Inc. | 123,188 | ||||||||
| 12,050 | Walt Disney Co. | 398,253 | ||||||||
| 1,191,613 | ||||||||||
| Mining: 0.3% | ||||||||||
| 780 | L | Phelps Dodge Corp. | 95,940 | |||||||
| 95,940 | ||||||||||
| Miscellaneous Manufacturing: 4.9% | ||||||||||
| 2,160 | 3M Co. | 175,954 | ||||||||
| 3,600 | L | Eastman Kodak Co. | 93,672 | |||||||
| 2,200 | Eaton Corp. | 169,576 | ||||||||
| 31,010 | General Electric Co. | 1,094,033 | ||||||||
| 1,800 | Parker Hannifin Corp. | 150,264 | ||||||||
| 6,000 | @@ | Tyco International Ltd. | 181,740 | |||||||
| 1,865,239 | ||||||||||
| Office/Business Equipment: 0.5% | ||||||||||
| 11,000 | @ | Xerox Corp. | 181,500 | |||||||
| 181,500 | ||||||||||
| Oil & Gas: 9.8% | ||||||||||
| 4,400 | Anadarko Petroleum Corp. | 217,184 | ||||||||
| 9,548 | Chevron Corp. | 690,511 | ||||||||
| 4,036 | ConocoPhillips | 271,623 | ||||||||
| 22,770 | S | ExxonMobil Corp. | 1,748,964 | |||||||
| 2,800 | Marathon Oil Corp. | 264,264 | ||||||||
| 6,000 | Occidental Petroleum Corp. | 302,040 | ||||||||
| 4,770 | Valero Energy Corp. | 262,684 | ||||||||
| 3,757,270 | ||||||||||
| Oil & Gas Services: 1.2% | ||||||||||
| 8,000 | Halliburton Co. | 269,920 | ||||||||
| 2,850 | Schlumberger Ltd. | 195,168 | ||||||||
| 465,088 | ||||||||||
| Packaging & Containers: 0.0% | ||||||||||
| 400 | @ | Pactiv Corp. | 13,780 | |||||||
| 13,780 | ||||||||||
| Pharmaceuticals: 5.2% | ||||||||||
| 4,190 | Abbott Laboratories | 195,505 | ||||||||
| 3,050 | AmerisourceBergen Corp. | 140,270 | ||||||||
| 4,100 | @ | Forest Laboratories, Inc. | 199,670 | |||||||
| 3,690 | @,L | King Pharmaceuticals, Inc. | 60,996 | |||||||
| 12,700 | Merck & Co., Inc. | 565,277 | ||||||||
| 3,100 | Mylan Laboratories | 62,899 | ||||||||
| 20,660 | Pfizer, Inc. | 567,943 | ||||||||
| 4,050 | Wyeth | 195,534 | ||||||||
| 1,988,094 | ||||||||||
| Real Estate Investment Trusts: 0.1% | ||||||||||
| 1,130 | Equity Office Properties Trust | 54,466 | ||||||||
| 54,466 | ||||||||||
| Retail: 6.1% | ||||||||||
| 1,600 | @ | Big Lots, Inc. | 35,696 | |||||||
| 2,400 | Family Dollar Stores, Inc. | 66,936 | ||||||||
| 5,000 | Federated Department Stores, Inc. | 210,450 | ||||||||
| 6,700 | Gap, Inc. | 125,424 | ||||||||
| 5,200 | Home Depot, Inc. | 197,444 | ||||||||
| 3,100 | @ | Kohl’s Corp. | 215,760 | |||||||
| 3,920 | L | Lowe’s Cos., Inc. | 118,227 | |||||||
| 8,090 | McDonald’s Corp. | 339,537 | ||||||||
| 3,100 | Nordstrom, Inc. | 151,962 | ||||||||
| 3,550 | @ | Office Depot, Inc. | 134,403 | |||||||
| 1,000 | L | OfficeMax, Inc. | 47,070 | |||||||
| 1,960 | @,L | Starbucks Corp. | 69,168 | |||||||
| 2,340 | Target Corp. | 135,931 | ||||||||
| 5,700 | TJX Cos., Inc. | 156,294 | ||||||||
| 7,030 | Wal-Mart Stores, Inc. | 324,083 | ||||||||
| 2,328,385 | ||||||||||
| Semiconductors: 2.0% | ||||||||||
| 7,100 | @,L | Advanced Micro Devices, Inc. | 153,147 | |||||||
| 4,500 | @ | Altera Corp. | 89,505 | |||||||
| 1,550 | @ | Freescale Semiconductor, Inc. | 61,892 | |||||||
| 11,700 | Intel Corp. | 249,795 | ||||||||
| 5,950 | @ | LSI Logic Corp. | 63,427 | |||||||
| 9,200 | @,L | Micron Technology, Inc. | 134,320 | |||||||
| 752,086 | ||||||||||
| Software: 3.3% | ||||||||||
| 2,540 | @ | BMC Software, Inc. | 82,702 | |||||||
| 5,400 | @ | Compuware Corp. | 45,306 | |||||||
| 8,000 | First Data Corp. | 202,000 | ||||||||
| 24,560 | Microsoft Corp. | 720,345 | ||||||||
| 10,150 | @ | Oracle Corp. | 193,155 | |||||||
| 1,243,508 | ||||||||||
| Telecommunications: 6.4% | ||||||||||
| 11,680 | L | AT&T, Inc. | 396,069 | |||||||
| 5,900 | @,L | Avaya, Inc. | 75,402 | |||||||
| 5,400 | BellSouth Corp. | 240,786 | ||||||||
| 27,030 | @ | Cisco Systems, Inc. | 726,566 | |||||||
| 16,800 | Motorola, Inc. | 372,456 | ||||||||
| 4,190 | Qualcomm, Inc. | 153,312 | ||||||||
116
Table of Contents
| Shares | Value | |||||||||
| Telecommunications (continued) | ||||||||||
| 9,000 | Sprint Nextel Corp. | $ | 175,590 | |||||||
| 8,700 | Verizon Communications, Inc. | 303,978 | ||||||||
| 2,444,159 | ||||||||||
| Toys/Games/Hobbies: 0.2% | ||||||||||
| 2,500 | Hasbro, Inc. | 66,871 | ||||||||
| 66,871 | ||||||||||
| Total Common Stock (Cost $33,545,638) | 37,893,215 | |||||||||
| WARRANTS: 0.1% | ||||||||||
| Aerospace/ Defense: 0.1% | ||||||||||
| 1,993 | Raytheon Co. | 32,885 | ||||||||
| 32,885 | ||||||||||
| Total Warrants (Cost $—) | 32,885 | |||||||||
| Total Long-Term Investments (Cost $33,545,638) | 37,926,100 | |||||||||
| Principal | ||||||||||
| Amount | Value | |||||||||
| SHORT-TERM INVESTMENTS: 7.6% | ||||||||||
| Repurchase Agreement: 0.7% | ||||||||||
| $ | 246,000 | Goldman Sachs Repurchase Agreement dated 11/30/06, 5.280%, due 12/01/06, $246,036 to be received upon repurchase (Collateralized by $244,000 Federal National Mortgage Association, 5.250%, Market Value plus accrued interest $251,245, due 06/15/08) | $ | 246,000 | ||||||
| Total Repurchase Agreement (Cost $246,000) | 246,000 | |||||||||
| Securities Lending CollateralCC: 6.9% | ||||||||||
| 2,647,498 | The Bank of New York Institutional Cash Reserves Fund | 2,647,498 | ||||||||
| Total Securities Lending Collateral (Cost $2,647,498) | 2,647,498 | |||||||||
| Total Short-Term Investments (Cost $2,893,498) | 2,893,498 | |||||||||
Total Investments in Securities (Cost $36,439,136)* | 107.0 | % | $ | 40,819,598 | ||||||||
Other Assets and Liabilities-Net | (7.0 | ) | (2,657,239 | ) | ||||||||
Net Assets | 100.0 | % | $ | 38,162,359 | ||||||||
| @ | Non-income producing security | |
| @@ | Foreign Issuer | |
| cc | Securities purchased with cash collateral for securities loaned. | |
| S | Segregated securities for certain derivatives, when-issued or delayed-delivery securities and forward foreign currency exchange contracts. | |
| L | Loaned Security, a portion or all of the security is on loan at November 30, 2006. | |
| X | Fair value determined by ING Funds Valuation Committee appointed by the Funds’ Board of Directors/Trustees. | |
| * | Cost for federal income tax purposes is $36,811,491. Net unrealized appreciation consists of: |
| Gross Unrealized Appreciation | $ | 4,394,514 | ||
| Gross Unrealized Depreciation | (386,407 | ) | ||
| Net Unrealized Appreciation | $ | 4,008,107 | ||
ING Disciplined Large Cap Fund Futures Contracts as of November 30, 2006
| Unrealized | ||||||||||||||||
| Number of | Notional | Expiration | Appreciation/ | |||||||||||||
| Contract Description | Contracts | Market Value | Date | (Depreciation) | ||||||||||||
| Long Contracts | ||||||||||||||||
| S&P 500 E-Mini | 3 | 210,435 | 12/15/2006 | $ | 1,965 | |||||||||||
| $ | 1,965 | |||||||||||||||
117
Table of Contents
| Shares | Value | |||||||||
| COMMON STOCK: 94.5% | ||||||||||
| Aerospace/ Defense: 1.0% | ||||||||||
| 900 | United Technologies Corp. | $ | 58,077 | |||||||
| 58,077 | ||||||||||
| Agriculture: 2.8% | ||||||||||
| 1,900 | Altria Group, Inc. | 159,999 | ||||||||
| 159,999 | ||||||||||
| Banks: 6.7% | ||||||||||
| 2,600 | Bank of America Corp. | 140,010 | ||||||||
| 1,600 | Bank of New York Co., Inc. | 56,864 | ||||||||
| 900 | Capital One Financial Corp. | 70,092 | ||||||||
| 2,500 | US Bancorp. | 84,100 | ||||||||
| 1,100 | Wells Fargo & Co. | 38,764 | ||||||||
| 389,830 | ||||||||||
| Beverages: 1.2% | ||||||||||
| 1,100 | PepsiCo, Inc. | 68,167 | ||||||||
| 68,167 | ||||||||||
| Biotechnology: 0.7% | ||||||||||
| 600 | @ | Genzyme Corp. | 38,640 | |||||||
| 38,640 | ||||||||||
| Chemicals: 1.0% | ||||||||||
| 800 | Air Products & Chemicals, Inc. | 55,312 | ||||||||
| 55,312 | ||||||||||
| Computers: 3.6% | ||||||||||
| 2,100 | Hewlett-Packard Co. | 82,866 | ||||||||
| 600 | International Business Machines Corp. | 55,152 | ||||||||
| 2,800 | @@ | Seagate Technology, Inc. | 72,128 | |||||||
| 210,146 | ||||||||||
| Cosmetics/ Personal Care: 2.2% | ||||||||||
| 2,005 | Procter & Gamble Co. | 125,894 | ||||||||
| 125,894 | ||||||||||
| Diversified Financial Services: 7.2% | ||||||||||
| 2,900 | S | Citigroup, Inc. | 143,811 | |||||||
| 1,900 | Countrywide Financial Corp. | 75,468 | ||||||||
| 1,646 | @ | E*Trade Financial Corp. | 39,619 | |||||||
| 700 | @ | Investment Technology Group, Inc. | 26,250 | |||||||
| 1,200 | JPMorgan Chase & Co. | 55,536 | ||||||||
| 900 | Merrill Lynch & Co., Inc. | 78,687 | ||||||||
| 419,371 | ||||||||||
| Electric: 1.0% | ||||||||||
| 1,885 | @ | Mirant Corp. | 57,342 | |||||||
| 57,342 | ||||||||||
| Electrical Components & Equipment: 1.3% | ||||||||||
| 1,800 | @ | General Cable Corp. | 76,500 | |||||||
| 76,500 | ||||||||||
| Electronics: 1.9% | ||||||||||
| 6,100 | @,@@ | Flextronics International Ltd. | 68,625 | |||||||
| 800 | @ | Thomas & Betts Corp. | 41,496 | |||||||
| 110,121 | ||||||||||
| Engineering & Construction: 0.8% | ||||||||||
| 2,900 | @@ | ABB Ltd. ADR | 47,212 | |||||||
| 47,212 | ||||||||||
| Entertainment: 0.5% | ||||||||||
| 700 | International Game Technology | 30,646 | ||||||||
| 30,646 | ||||||||||
| Healthcare — Products: 3.1% | ||||||||||
| 1,500 | Johnson & Johnson | 98,865 | ||||||||
| 2,100 | @ | St. Jude Medical, Inc. | 78,267 | |||||||
| 177,132 | ||||||||||
| Healthcare — Services: 1.2% | ||||||||||
| 1,700 | Aetna, Inc. | 70,227 | ||||||||
| 70,227 | ||||||||||
| Household Products/ Wares: 1.0% | ||||||||||
| 900 | Clorox Co. | 57,600 | ||||||||
| 57,600 | ||||||||||
| Insurance: 5.8% | ||||||||||
| 2,100 | American International Group, Inc. | 147,672 | ||||||||
| 1,600 | AON Corp. | 57,088 | ||||||||
| 1,000 | Metlife, Inc. | 58,730 | ||||||||
| 1,400 | St. Paul Travelers Cos., Inc. | 72,534 | ||||||||
| 336,024 | ||||||||||
| Internet: 1.7% | ||||||||||
| 200 | @ | Google, Inc. | 96,984 | |||||||
| 96,984 | ||||||||||
| Investment Companies: 4.7% | ||||||||||
| 5,200 | @ | KKR Private Equity Investors LP | 113,360 | |||||||
| 720 | SPDR Trust Series 1 | 101,182 | ||||||||
| 1,500 | Utilities Select Sector SPDR Fund | 55,110 | ||||||||
| 269,652 | ||||||||||
| Iron/ Steel: 1.2% | ||||||||||
| 800 | Allegheny Technologies, Inc. | 71,720 | ||||||||
| 71,720 | ||||||||||
| Media: 2.5% | ||||||||||
| 3,900 | News Corp., Inc. | 80,340 | ||||||||
| 1,900 | Walt Disney Co. | 62,795 | ||||||||
| 143,135 | ||||||||||
| Metal Fabricate/ Hardware: 1.0% | ||||||||||
| 800 | Precision Castparts Corp. | 60,368 | ||||||||
| 60,368 | ||||||||||
| Mining: 1.5% | ||||||||||
| 700 | Freeport-McMoRan Copper & Gold, Inc. | 44,009 | ||||||||
| 200 | @@ | Rio Tinto PLC ADR | 42,918 | |||||||
| 86,927 | ||||||||||
| Miscellaneous Manufacturing: 5.9% | ||||||||||
| 900 | Cooper Industries Ltd. | 82,296 | ||||||||
| 1,200 | Dover Corp. | 60,360 | ||||||||
| 3,850 | General Electric Co. | 135,828 | ||||||||
| 1,200 | Roper Industries, Inc. | 61,572 | ||||||||
| 340,056 | ||||||||||
| Oil & Gas: 5.8% | ||||||||||
| 600 | Chevron Corp. | 43,392 | ||||||||
| 2,400 | ExxonMobil Corp. | 184,344 | ||||||||
| 800 | @ | Newfield Exploration Co. | 39,816 | |||||||
| 900 | Rowan Cos., Inc. | 32,418 | ||||||||
| 900 | @ | Southwestern Energy Co. | 37,917 | |||||||
| 337,887 | ||||||||||
| Oil & Gas Services: 1.8% | ||||||||||
| 900 | Schlumberger Ltd. | 61,632 | ||||||||
| 1,000 | @ | Weatherford International Ltd. | 44,910 | |||||||
| 106,542 | ||||||||||
118
Table of Contents
| Shares | Value | |||||||||
| Pharmaceuticals: 4.8% | ||||||||||
| 1,200 | Abbott Laboratories | $ | 55,992 | |||||||
| 1,400 | @ | Medco Health Solutions, Inc. | 70,294 | |||||||
| 3,500 | Pfizer, Inc. | 96,215 | ||||||||
| 1,100 | Wyeth | 53,108 | ||||||||
| 275,609 | ||||||||||
| Retail: 4.7% | ||||||||||
| 2,400 | CVS Corp. | 69,048 | ||||||||
| 1,100 | Home Depot, Inc. | 41,767 | ||||||||
| 3,400 | Staples, Inc. | 86,598 | ||||||||
| 1,500 | @ | Urban Outfitters, Inc. | 33,420 | |||||||
| 900 | Wal-Mart Stores, Inc. | 41,490 | ||||||||
| 272,323 | ||||||||||
| Semiconductors: 5.2% | ||||||||||
| 5,800 | Intel Corp. | 123,830 | ||||||||
| 900 | Maxim Integrated Products | 28,332 | ||||||||
| 1,900 | @ | QLogic Corp. | 42,275 | |||||||
| 9,819 | @@ | Taiwan Semiconductor Manufacturing Co., Ltd. ADR | 105,554 | |||||||
| 299,991 | ||||||||||
| Software: 3.9% | ||||||||||
| 1,000 | @@ | Infosys Technologies Ltd. ADR | 53,530 | |||||||
| 5,800 | Microsoft Corp. | 170,114 | ||||||||
| 223,644 | ||||||||||
| Telecommunications: 6.8% | ||||||||||
| 10,900 | @ | 3Com Corp. | 45,671 | |||||||
| 4,300 | AT&T, Inc. | 145,813 | ||||||||
| 5,600 | Motorola, Inc. | 124,152 | ||||||||
| 2,100 | Qualcomm, Inc. | 76,839 | ||||||||
| 392,475 | ||||||||||
| Total Common Stock (Cost $5,025,841) | 5,465,553 | |||||||||
| Principal | ||||||||||
| Amount | Value | |||||||||
| SHORT-TERM INVESTMENTS: 3.5% | ||||||||||
| Repurchase Agreement: 3.5% | ||||||||||
| $ | 203,000 | Morgan Stanley Repurchase Agreement dated 11/30/06, 5.290%, due 12/01/06, $203,030 to be received upon repurchase (Collateralized by $220,000 Federal Home Loan Mortgage Corporation, Discount Note, Market Value $211,222, due 09/18/07) | $ | 203,000 | ||||||
| Total Short-Term Investments (Cost $203,000) | 203,000 | |||||||||
Total Investments in Securities (Cost $5,228,841)* | 98.0 | % | $ | 5,668,553 | ||||||||
Other Assets and Liabilities-Net | 2.0 | 117,858 | ||||||||||
Net Assets | 100.0 | % | $ | 5,786,411 | ||||||||
| @ | Non-income producing security | |
| @@ | Foreign Issuer | |
| ADR | American Depositary Receipt | |
| S | Segregated securities for certain derivatives, when-issued or delayed-delivery securities and forward foreign currency exchange contracts. | |
| * | Cost for federal income tax purposes is $5,266,616. Net unrealized appreciation consists of: |
| Gross Unrealized Appreciation | $ | 450,146 | ||
| Gross Unrealized Depreciation | (48,209 | ) | ||
| Net Unrealized Appreciation | $ | 401,937 | ||
ING Fundamental Research Fund Futures Contracts as of November 30, 2006
| Unrealized | ||||||||||||||||
| Number of | Notional | Expiration | Appreciation/ | |||||||||||||
| Contract Description | Contracts | Market Value | Date | (Depreciation) | ||||||||||||
| Long Contracts | ||||||||||||||||
| S&P 500 E-Mini | 2 | $ | 140,290 | 12/15/2006 | $ | 4,741 | ||||||||||
| $ | 4,741 | |||||||||||||||
119
Table of Contents
| Shares | Value | |||||||||
| COMMON STOCK: 99.9% | ||||||||||
| Aerospace/ Defense: 6.0% | ||||||||||
| 108,280 | Boeing Co. | $ | 9,586,028 | |||||||
| 90,010 | General Dynamics Corp. | 6,736,348 | ||||||||
| 16,322,376 | ||||||||||
| Banks: 3.1% | ||||||||||
| 153,780 | L | Commerce Bancorp., Inc. | 5,345,393 | |||||||
| 49,680 | State Street Corp. | 3,086,618 | ||||||||
| 8,432,011 | ||||||||||
| Beverages: 0.7% | ||||||||||
| 29,030 | PepsiCo, Inc. | 1,798,989 | ||||||||
| 1,798,989 | ||||||||||
| Biotechnology: 1.1% | ||||||||||
| 15,690 | @ | Amgen, Inc. | 1,113,990 | |||||||
| 39,330 | @,L | Vertex Pharmaceuticals, Inc. | 1,742,319 | |||||||
| 2,856,309 | ||||||||||
| Chemicals: 1.2% | ||||||||||
| 37,850 | Monsanto Co. | 1,819,450 | ||||||||
| 9,780 | @@ | Potash Corp. of Saskatchewan | 1,376,437 | |||||||
| 3,195,887 | ||||||||||
| Commercial Services: 8.1% | ||||||||||
| 87,980 | @@ | Accenture Ltd. | 2,964,926 | |||||||
| 33,580 | @ | Alliance Data Systems Corp. | 2,172,962 | |||||||
| 19,010 | Corporate Executive Board Co. | 1,798,726 | ||||||||
| 77,910 | L | Equifax, Inc. | 2,959,801 | |||||||
| 28,600 | Manpower, Inc. | 2,030,600 | ||||||||
| 87,670 | @ | Monster Worldwide, Inc. | 3,826,796 | |||||||
| 50,070 | Moody’s Corp. | 3,478,864 | ||||||||
| 116,610 | Western Union Co. | 2,658,708 | ||||||||
| 21,891,383 | ||||||||||
| Computers: 5.5% | ||||||||||
| 76,580 | Hewlett-Packard Co. | 3,021,847 | ||||||||
| 246,970 | @,L | Network Appliance, Inc. | 9,683,694 | |||||||
| 50,590 | @,L | Sandisk Corp. | 2,246,196 | |||||||
| 14,951,737 | ||||||||||
| Diversified Financial Services: 12.0% | ||||||||||
| 46,850 | @@ | Amvescap PLC ADR | 1,013,366 | |||||||
| 6,400 | Chicago Mercantile Exchange Holdings, Inc. | 3,427,840 | ||||||||
| 40,400 | L | Countrywide Financial Corp. | 1,604,688 | |||||||
| 10,730 | L | First Marblehead Corp. | 803,033 | |||||||
| 84,860 | Franklin Resources, Inc. | 9,057,956 | ||||||||
| 7,500 | Goldman Sachs Group, Inc. | 1,461,000 | ||||||||
| 139,140 | @,L | Nasdaq Stock Market, Inc. | 5,586,471 | |||||||
| 156,940 | @@,L | UBS AG | 9,450,927 | |||||||
| 32,405,281 | ||||||||||
| Electric: 1.8% | ||||||||||
| 84,070 | TXU Corp. | 4,824,777 | ||||||||
| 4,824,777 | ||||||||||
| Engineering & Construction: 2.4% | ||||||||||
| 74,560 | Fluor Corp. | 6,492,685 | ||||||||
| 6,492,685 | ||||||||||
| Entertainment: 0.6% | ||||||||||
| 38,150 | International Game Technology | 1,670,207 | ||||||||
| 1,670,207 | ||||||||||
| Food: 0.3% | ||||||||||
| 15,140 | L | Whole Foods Market, Inc. | 738,832 | |||||||
| 738,832 | ||||||||||
| Healthcare — Products: 4.4% | ||||||||||
| 222,500 | Medtronic, Inc. | 11,598,925 | ||||||||
| 7,440 | @ | St. Jude Medical, Inc. | 277,289 | |||||||
| 11,876,214 | ||||||||||
| Healthcare — Services: 3.1% | ||||||||||
| 172,740 | UnitedHealth Group, Inc. | 8,478,079 | ||||||||
| 8,478,079 | ||||||||||
| Internet: 4.8% | ||||||||||
| 100,930 | @,L | eBay, Inc. | 3,265,086 | |||||||
| 16,160 | @ | Google, Inc. | 7,836,307 | |||||||
| 87,940 | @,L | Symantec Corp. | 1,864,328 | |||||||
| 12,965,721 | ||||||||||
| Leisure Time: 0.8% | ||||||||||
| 31,060 | L | Harley-Davidson, Inc. | 2,291,296 | |||||||
| 2,291,296 | ||||||||||
| Lodging: 0.6% | ||||||||||
| 25,400 | Starwood Hotels & Resorts Worldwide, Inc. | 1,629,918 | ||||||||
| 1,629,918 | ||||||||||
| Machinery — Construction & Mining: 0.8% | ||||||||||
| 50,100 | Joy Global, Inc. | 2,199,390 | ||||||||
| 2,199,390 | ||||||||||
| Media: 2.8% | ||||||||||
| 35,770 | @ | CBS Corp. | 1,341,733 | |||||||
| 153,656 | Walt Disney Co. | 5,078,331 | ||||||||
| 77,280 | @,L | XM Satellite Radio Holdings, Inc. | 1,115,923 | |||||||
| 7,535,987 | ||||||||||
| Mining: 3.3% | ||||||||||
| 148,400 | @@,L | Cameco Corp. | 5,642,168 | |||||||
| 56,480 | @@,L | Cia Vale do Rio Doce | 1,567,885 | |||||||
| 26,600 | Freeport-McMoRan Copper & Gold, Inc. | 1,672,342 | ||||||||
| 8,882,395 | ||||||||||
| Miscellaneous Manufacturing: 4.3% | ||||||||||
| 84,000 | L | Danaher Corp. | 6,142,080 | |||||||
| 146,980 | General Electric Co. | 5,185,454 | ||||||||
| 5,380 | Roper Industries, Inc. | 276,048 | ||||||||
| 11,603,582 | ||||||||||
| Oil & Gas: 0.6% | ||||||||||
| 12,200 | L | Murphy Oil Corp. | 662,216 | |||||||
| 16,580 | Occidental Petroleum Corp. | 834,637 | ||||||||
| 1,496,853 | ||||||||||
| Oil & Gas Services: 1.7% | ||||||||||
| 135,740 | Halliburton Co. | 4,579,868 | ||||||||
| 4,579,868 | ||||||||||
| Pharmaceuticals: 9.2% | ||||||||||
| 4,400 | Abbott Laboratories | 205,304 | ||||||||
| 95,440 | @@,L | AstraZeneca PLC ADR | 5,525,022 | |||||||
| 26,290 | @@ | Eisai Co., Ltd. | 1,398,993 | |||||||
| 102,940 | @,@@, L | Elan Corp. PLC ADR | 1,489,542 | |||||||
| 17,990 | @ | Gilead Sciences, Inc. | 1,185,901 | |||||||
| 143,390 | @@ | Sanofi-Aventis ADR | 6,310,594 | |||||||
| 331,050 | Schering-Plough Corp. | 7,286,411 | ||||||||
| 74,670 | @@ | Shionogi & Co., Ltd. | 1,444,966 | |||||||
| 24,846,733 | ||||||||||
120
Table of Contents
| Shares | Value | |||||||||
| Retail: 0.9% | ||||||||||
| 51,900 | Wal-Mart Stores, Inc. | $ | 2,392,590 | |||||||
| 2,392,590 | ||||||||||
| Semiconductors: 1.8% | ||||||||||
| 66,700 | @ | Altera Corp. | 1,326,663 | |||||||
| 109,970 | L | Linear Technology Corp. | 3,534,436 | |||||||
| 4,861,099 | ||||||||||
| Software: 8.1% | ||||||||||
| 190,590 | @ | Adobe Systems, Inc. | 7,648,377 | |||||||
| 170,150 | @ | Autodesk, Inc. | 7,006,777 | |||||||
| 46,680 | Automatic Data Processing, Inc. | 2,251,376 | ||||||||
| 254,260 | @ | Oracle Corp. | 4,838,568 | |||||||
| 21,745,098 | ||||||||||
| Telecommunications: 7.6% | ||||||||||
| 32,470 | @@,L | America Movil SA de CV | 1,443,941 | |||||||
| 71,640 | @,L | American Tower Corp. | 2,713,007 | |||||||
| 55,150 | L | AT&T, Inc. | 1,870,137 | |||||||
| 341,490 | @ | Cisco Systems, Inc. | 9,179,251 | |||||||
| 242,960 | Motorola, Inc. | 5,386,423 | ||||||||
| 20,592,759 | ||||||||||
| Transportation: 2.3% | ||||||||||
| 78,330 | United Parcel Service, Inc. | 6,103,469 | ||||||||
| 6,103,469 | ||||||||||
| Total Common Stock (Cost $230,515,339) | 269,661,525 | |||||||||
| SHORT-TERM INVESTMENTS: 19.3% | ||||||||||
| U.S. Government Agency Obligations: 0.1% | ||||||||||
| $ | 248,000 | Federal Home Loan Bank, 4.980%, due 12/01/06 | $ | 247,966 | ||||||
| Total U.S. Government Agency Obligations (Cost $247,966) | 247,966 | |||||||||
| Securities Lending CollateralCC: 19.2% | ||||||||||
| 51,726,337 | The Bank of New York Institutional Cash Reserves Fund | 51,726,337 | ||||||||
| Total Securities Lending Collateral (Cost $51,726,337) | 51,726,337 | |||||||||
| Total Short-Term Investments (Cost $51,974,303) | 51,974,303 | |||||||||
Total Investments in Securities (Cost $282,489,642)* | 119.2 | % | $ | 321,635,828 | ||||||||
Other Assets and Liabilities-Net | (19.2 | ) | (51,763,069 | ) | ||||||||
Net Assets | 100.0 | % | $ | 269,872,759 | ||||||||
| @ | Non-income producing security | |
| @@ | Foreign Issuer | |
| ADR | American Depositary Receipt | |
| cc | Securities purchased with cash collateral for securities loaned. | |
| L | Loaned Security, a portion or all of the security is on loan at November 30, 2006. | |
| * | Cost for federal income tax purposes is $284,105,594. Net unrealized appreciation consists of: |
| Gross Unrealized Appreciation | $ | 40,331,001 | ||
| Gross Unrealized Depreciation | (2,800,767 | ) | ||
| Net Unrealized Appreciation | $ | 37,530,234 | ||
121
Table of Contents
| Shares | Value | |||||||||
| COMMON STOCK: 97.4% | ||||||||||
| Advertising: 1.0% | ||||||||||
| 30,100 | Omnicom Group | $ | 3,075,016 | |||||||
| 3,075,016 | ||||||||||
| Aerospace/ Defense: 2.6% | ||||||||||
| 60,300 | L-3 Communications Holdings, Inc. | 4,959,675 | ||||||||
| 156,800 | @,L | Orbital Sciences Corp. | 2,841,216 | |||||||
| 7,800,891 | ||||||||||
| Agriculture: 1.2% | ||||||||||
| 55,800 | Loews Corp. | 3,480,246 | ||||||||
| 3,480,246 | ||||||||||
| Apparel: 8.3% | ||||||||||
| 305,600 | @,L | Coach, Inc. | 13,204,976 | |||||||
| 121,700 | @,@@, L | Gildan Activewear, Inc. | 6,711,755 | |||||||
| 96,100 | Phillips-Van Heusen | 4,740,613 | ||||||||
| 24,657,344 | ||||||||||
| Biotechnology: 0.9% | ||||||||||
| 49,200 | @,L | Celgene Corp. | 2,741,916 | |||||||
| 2,741,916 | ||||||||||
| Chemicals: 0.2% | ||||||||||
| 16,119 | L | Ecolab, Inc. | 714,878 | |||||||
| 714,878 | ||||||||||
| Commercial Services: 4.6% | ||||||||||
| 66,800 | @ | Corrections Corp. of America | 3,036,060 | |||||||
| 115,600 | @ | Gartner, Inc. | 2,228,768 | |||||||
| 84,500 | McKesson Corp. | 4,174,300 | ||||||||
| 92,100 | Watson Wyatt Worldwide, Inc. | 4,273,440 | ||||||||
| 13,712,568 | ||||||||||
| Computers: 1.7% | ||||||||||
| 85,400 | @,L | CACI International, Inc. | 5,110,336 | |||||||
| 5,110,336 | ||||||||||
| Diversified Financial Services: 3.9% | ||||||||||
| 163,500 | Charles Schwab Corp. | 2,998,590 | ||||||||
| 216,300 | @ | E*Trade Financial Corp. | 5,206,341 | |||||||
| 26,700 | @,L | GFI Group, Inc. | 1,510,152 | |||||||
| 52,200 | @ | Investment Technology Group, Inc. | 1,957,500 | |||||||
| 11,672,583 | ||||||||||
| Electrical Components & Equipment: 2.7% | ||||||||||
| 151,800 | Ametek, Inc. | 4,950,198 | ||||||||
| 72,200 | @ | General Cable Corp. | 3,068,500 | |||||||
| 8,018,698 | ||||||||||
| Electronics: 2.5% | ||||||||||
| 159,500 | @ | Dolby Laboratories, Inc. | 4,552,130 | |||||||
| 56,200 | @ | Itron, Inc. | 2,697,038 | |||||||
| 7,249,168 | ||||||||||
| Engineering & Construction: 1.8% | ||||||||||
| 99,900 | @ | McDermott International, Inc. | 5,202,792 | |||||||
| 5,202,792 | ||||||||||
| Entertainment: 3.9% | ||||||||||
| 128,000 | L | International Game Technology | 5,603,840 | |||||||
| 181,200 | Regal Entertainment Group | 3,770,772 | ||||||||
| 87,300 | Warner Music Group Corp. | 2,219,166 | ||||||||
| 11,593,778 | ||||||||||
| Food: 1.7% | ||||||||||
| 149,000 | Supervalu, Inc. | 5,104,740 | ||||||||
| 5,104,740 | ||||||||||
| Healthcare — Products: 4.1% | ||||||||||
| 89,913 | @ | Gen-Probe, Inc. | 4,382,360 | |||||||
| 116,000 | @,L | Hologic, Inc. | 5,803,480 | |||||||
| 50,700 | @ | Respironics, Inc. | 1,828,242 | |||||||
| 12,014,082 | ||||||||||
| Healthcare — Services: 2.4% | ||||||||||
| 72,620 | @ | Coventry Health Care, Inc. | 3,495,201 | |||||||
| 49,300 | @,L | Laboratory Corp. of America Holdings | 3,490,440 | |||||||
| 6,985,641 | ||||||||||
| Home Furnishings: 2.2% | ||||||||||
| 61,300 | Harman International Industries, Inc. | 6,365,392 | ||||||||
| 6,365,392 | ||||||||||
| Insurance: 2.6% | ||||||||||
| 35,300 | AMBAC Financial Group, Inc. | 3,023,092 | ||||||||
| 93,600 | @,L | ProAssurance Corp. | 4,795,128 | |||||||
| 7,818,220 | ||||||||||
| Internet: 6.0% | ||||||||||
| 123,200 | @,L | Akamai Technologies, Inc. | 6,020,784 | |||||||
| 89,600 | @,L | Digital River, Inc. | 5,278,336 | |||||||
| 47,400 | @,L | Nutri/ System, Inc. | 3,272,970 | |||||||
| 127,700 | @ | VeriSign, Inc. | 3,334,247 | |||||||
| 17,906,337 | ||||||||||
| Investment Companies: 1.3% | ||||||||||
| 36,329 | iShares Russell Midcap Growth Index Fund | 3,787,298 | ||||||||
| 3,787,298 | ||||||||||
| Iron/ Steel: 1.5% | ||||||||||
| 49,300 | L | Allegheny Technologies, Inc. | 4,419,745 | |||||||
| 4,419,745 | ||||||||||
| Metal Fabricate/ Hardware: 1.3% | ||||||||||
| 50,100 | Precision Castparts Corp. | 3,780,546 | ||||||||
| 3,780,546 | ||||||||||
| Miscellaneous Manufacturing: 4.5% | ||||||||||
| 90,600 | ITT Corp. | 4,887,870 | ||||||||
| 162,600 | L | Roper Industries, Inc. | 8,343,006 | |||||||
| 13,230,876 | ||||||||||
| Oil & Gas: 2.2% | ||||||||||
| 95,600 | @ | Newfield Exploration Co. | 4,758,012 | |||||||
| 41,300 | @,L | Southwestern Energy Co. | 1,739,969 | |||||||
| 6,497,981 | ||||||||||
| Oil & Gas Services: 3.9% | ||||||||||
| 143,800 | @,L | Cameron International Corp. | 7,811,216 | |||||||
| 58,300 | @,L | National Oilwell Varco, Inc. | 3,877,533 | |||||||
| 11,688,749 | ||||||||||
122
Table of Contents
| Shares | Value | |||||||||
| Pharmaceuticals: 2.0% | ||||||||||
| 19,700 | Allergan, Inc. | $ | 2,296,626 | |||||||
| 74,200 | @ | Medco Health Solutions, Inc. | 3,725,582 | |||||||
| 6,022,208 | ||||||||||
| Retail: 7.5% | ||||||||||
| 95,900 | @,L | Chipotle Mexican Grill, Inc. | 5,557,405 | |||||||
| 128,200 | L | Circuit City Stores, Inc. | 3,199,872 | |||||||
| 142,000 | Nordstrom, Inc. | 6,960,840 | ||||||||
| 92,105 | @ | Office Depot, Inc. | 3,487,095 | |||||||
| 62,800 | @,L | Pantry, Inc. | 3,078,456 | |||||||
| 22,283,668 | ||||||||||
| Semiconductors: 3.9% | ||||||||||
| 159,700 | @,@@, L | ASML Holding NV | 3,976,530 | |||||||
| 139,400 | @ | Integrated Device Technology, Inc. | 2,300,100 | |||||||
| 141,800 | @,L | Nvidia Corp. | 5,245,182 | |||||||
| 11,521,812 | ||||||||||
| Software: 10.3% | ||||||||||
| 151,900 | @ | Adobe Systems, Inc. | 6,095,747 | |||||||
| 85,600 | @ | Ansys, Inc. | 4,018,920 | |||||||
| 57,900 | @ | Commvault Systems, Inc. | 1,155,684 | |||||||
| 78,400 | @ | Dun & Bradstreet Corp. | 6,446,048 | |||||||
| 46,900 | @ | Electronic Arts, Inc. | 2,619,365 | |||||||
| 64,300 | @ | Fiserv, Inc. | 3,286,373 | |||||||
| 230,700 | @,L | Informatica Corp. | 2,779,935 | |||||||
| 134,800 | @ | Intuit, Inc. | 4,243,504 | |||||||
| 30,645,576 | ||||||||||
| Telecommunications: 4.2% | ||||||||||
| 251,900 | @,L | Arris Group, Inc. | 3,005,167 | |||||||
| 90,000 | @,L | NII Holdings, Inc. | 5,843,700 | |||||||
| 121,600 | @,L | Polycom, Inc. | 3,506,944 | |||||||
| 12,355,811 | ||||||||||
| Toys/ Games/ Hobbies: 0.5% | ||||||||||
| 70,300 | Mattel, Inc. | 1,543,084 | ||||||||
| 1,543,084 | ||||||||||
| Total Common Stock (Cost $252,479,730) | 289,001,980 | |||||||||
| Principal | ||||||||||
| Amount | Value | |||||||||
| SHORT-TERM INVESTMENTS: 28.5% | ||||||||||
| Repurchase Agreement: 3.8% | ||||||||||
| $11,122,000 | Goldman Sachs Repurchase Agreement dated 11/30/06, 5.280%, due 12/01/06, $11,123,631 to be received upon repurchase (Collateralized by $11,487,000 various U.S. Government Agency Obligations, Discount Note-4.250%, Market Value plus accrued interest $11,345,295, due 05/30/07-09/14/07) | $ | 11,122,000 | |||||||
| Total Repurchase Agreement (Cost $11,122,000) | 11,122,000 | |||||||||
| Securities Lending CollateralCC: 24.7% | ||||||||||
| 73,372,935 | The Bank of New York Institutional Cash Reserves Fund | 73,372,935 | ||||||||
| Total Securities Lending Collateral (Cost $73,372,935) | 73,372,935 | |||||||||
| Total Short-Term Investments (Cost $84,494,935) | 84,494,935 | |||||||||
Total Investments in Securities (Cost $336,974,665)* | 125.9 | % | $ | 373,496,915 | ||||||||
Other Assets and Liabilities-Net | (25.9 | ) | (76,774,971 | ) | ||||||||
Net Assets | 100.0 | % | $ | 296,721,944 | ||||||||
| @ | Non-income producing security | |
| @@ | Foreign Issuer | |
| cc | Securities purchased with cash collateral for securities loaned. | |
| L | Loaned Security, a portion or all of the security is on loan at November 30, 2006. | |
| * | Cost for federal income tax purposes is the same as for financial statement purposes. | |
| Net unrealized appreciation consists of: |
| Gross Unrealized Appreciation | $ | 39,480,398 | ||
| Gross Unrealized Depreciation | (2,958,148 | ) | ||
| Net Unrealized Appreciation | $ | 36,522,250 | ||
123
Table of Contents
| Shares | Value | |||||||||
| COMMON STOCK: 98.4% | ||||||||||
| Aerospace/ Defense: 5.1% | ||||||||||
| 1,500 | Lockheed Martin Corp. | $ | 135,675 | |||||||
| 2,900 | Raytheon Co. | 148,016 | ||||||||
| 283,691 | ||||||||||
| Airlines: 2.1% | ||||||||||
| 2,879 | @ | Continental Airlines, Inc. | 117,003 | |||||||
| 117,003 | ||||||||||
| Apparel: 5.2% | ||||||||||
| 2,300 | @ | Guess ?, Inc. | 142,968 | |||||||
| 3,000 | Phillips-Van Heusen | 147,990 | ||||||||
| 290,958 | ||||||||||
| Banks: 0.5% | ||||||||||
| 700 | @@ | Banco Bradesco SA ADR | 26,397 | |||||||
| 26,397 | ||||||||||
| Commercial Services: 2.5% | ||||||||||
| 3,400 | @@ | Accenture Ltd. | 114,580 | |||||||
| 600 | Equifax, Inc. | 22,794 | ||||||||
| 137,374 | ||||||||||
| Computers: 4.2% | ||||||||||
| 2,400 | Hewlett-Packard Co. | 94,704 | ||||||||
| 1,500 | International Business Machines Corp. | 137,880 | ||||||||
| 232,584 | ||||||||||
| Diversified Financial Services: 1.2% | ||||||||||
| 3,700 | Charles Schwab Corp. | 67,858 | ||||||||
| 67,858 | ||||||||||
| Electronics: 1.1% | ||||||||||
| 1,600 | Applera Corp. — Applied Biosystems Group | 58,304 | ||||||||
| 58,304 | ||||||||||
| Food: 4.8% | ||||||||||
| 3,100 | Campbell Soup Co. | 118,017 | ||||||||
| 2,600 | General Mills, Inc. | 145,470 | ||||||||
| 263,487 | ||||||||||
| Healthcare — Services: 4.9% | ||||||||||
| 3,300 | Aetna, Inc. | 136,323 | ||||||||
| 2,100 | @ | WellCare Health Plans, Inc. | 135,597 | |||||||
| 271,920 | ||||||||||
| Insurance: 15.8% | ||||||||||
| 3,700 | @@ | Axis Capital Holdings Ltd. | 126,651 | |||||||
| 2,700 | Chubb Corp. | 139,752 | ||||||||
| 1,200 | Hartford Financial Services Group, Inc. | 102,912 | ||||||||
| 1,900 | Metlife, Inc. | 111,587 | ||||||||
| 2,000 | Prudential Financial, Inc. | 162,960 | ||||||||
| 1,800 | Safeco Corp. | 109,026 | ||||||||
| 3,450 | WR Berkley Corp. | 121,130 | ||||||||
| 874,018 | ||||||||||
| Iron/ Steel: 3.5% | ||||||||||
| 2,943 | Chaparral Steel Co. | 136,850 | ||||||||
| 1,000 | Nucor Corp. | 59,850 | ||||||||
| 196,700 | ||||||||||
| Machinery — Diversified: 1.7% | ||||||||||
| 800 | Cummins, Inc. | 95,936 | ||||||||
| 95,936 | ||||||||||
| Media: 2.5% | ||||||||||
| 2,100 | McGraw-Hill Cos., Inc. | 139,965 | ||||||||
| 139,965 | ||||||||||
| Oil & Gas: 5.0% | ||||||||||
| 1,600 | Chevron Corp. | 115,712 | ||||||||
| 2,100 | ExxonMobil Corp. | 161,301 | ||||||||
| 277,013 | ||||||||||
| Pharmaceuticals: 5.6% | ||||||||||
| 3,300 | AmerisourceBergen Corp. | 151,767 | ||||||||
| 1,200 | @@ | AstraZeneca PLC ADR | 69,468 | |||||||
| 3,400 | @ | King Pharmaceuticals, Inc. | 56,202 | |||||||
| 800 | Merck & Co., Inc. | 35,608 | ||||||||
| 313,045 | ||||||||||
| Retail: 20.4% | ||||||||||
| 2,700 | American Eagle Outfitters | 121,986 | ||||||||
| 2,500 | @ | AnnTaylor Stores Corp. | 86,250 | |||||||
| 1,400 | Darden Restaurants, Inc. | 56,210 | ||||||||
| 3,500 | @ | Dollar Tree Stores, Inc. | 105,035 | |||||||
| 2,800 | Gap, Inc. | 52,416 | ||||||||
| 1,800 | JC Penney Co., Inc. | 139,212 | ||||||||
| 2,000 | @ | Kohl’s Corp. | 139,200 | |||||||
| 3,300 | McDonald’s Corp. | 138,501 | ||||||||
| 2,300 | Nordstrom, Inc. | 112,746 | ||||||||
| 3,400 | @ | Office Depot, Inc. | 128,724 | |||||||
| 1,900 | TJX Cos., Inc. | 52,098 | ||||||||
| 1,132,378 | ||||||||||
| Semiconductors: 4.7% | ||||||||||
| 800 | @,@@ | ASML Holding NV | 19,920 | |||||||
| 7,800 | @,@@ | Infineon Technologies AG ADR | 100,854 | |||||||
| 12,900 | @ | LSI Logic Corp. | 137,514 | |||||||
| 258,288 | ||||||||||
| Software: 4.5% | ||||||||||
| 6,800 | @ | BEA Systems, Inc. | 93,636 | |||||||
| 4,700 | @ | BMC Software, Inc. | 153,032 | |||||||
| 246,668 | ||||||||||
| Telecommunications: 3.1% | ||||||||||
| 1,000 | @@ | China Mobile Ltd. ADR | 42,200 | |||||||
| 4,900 | @ | Cisco Systems, Inc. | 131,711 | |||||||
| 173,911 | ||||||||||
Total Investments in Securities (Cost $4,853,033)* | 98.4 | % | $ | 5,457,498 | ||||||||
Other Assets and Liabilities-Net | 1.6 | 88,109 | ||||||||||
Net Assets | 100.0 | % | $ | 5,545,607 | ||||||||
| @ | Non-income producing security | |
| @@ | Foreign Issuer | |
| ADR | American Depositary Receipt | |
| * | Cost for federal income tax purposes is the same as for financial statement purposes. | |
| Net unrealized appreciation consists of: |
| Gross Unrealized Appreciation | $ | 641,109 | ||
| Gross Unrealized Depreciation | (36,644 | ) | ||
| Net Unrealized Appreciation | $ | 604,465 | ||
124
Table of Contents
| Shares | Value | |||||||||
| COMMON STOCK: 96.0% | ||||||||||
| Advertising: 0.6% | ||||||||||
| 60,300 | @,L | Gaiam, Inc. | $ | 824,904 | ||||||
| 824,904 | ||||||||||
| Aerospace/ Defense: 2.0% | ||||||||||
| 21,900 | DRS Technologies, Inc. | 1,088,211 | ||||||||
| 20,000 | @ | Esterline Technologies Corp. | 778,800 | |||||||
| 30,800 | @ | Moog, Inc. | 1,126,664 | |||||||
| 2,993,675 | ||||||||||
| Apparel: 2.9% | ||||||||||
| 50,600 | @ | Carter’s, Inc. | 1,394,536 | |||||||
| 25,400 | @,@@, L | Gildan Activewear, Inc. | 1,400,810 | |||||||
| 24,500 | Phillips-Van Heusen | 1,208,585 | ||||||||
| 10,525 | @ | Steven Madden Ltd. | 387,004 | |||||||
| 4,390,935 | ||||||||||
| Banks: 1.5% | ||||||||||
| 38,043 | Boston Private Financial Holdings, Inc. | 1,032,867 | ||||||||
| 9,700 | @,L | SVB Financial Group | 460,556 | |||||||
| 21,300 | Whitney Holding Corp. | 686,499 | ||||||||
| 2,179,922 | ||||||||||
| Biotechnology: 2.9% | ||||||||||
| 24,500 | @,L | Alexion Pharmaceuticals, Inc. | 1,060,360 | |||||||
| 77,400 | @,L | Human Genome Sciences, Inc. | 969,048 | |||||||
| 39,800 | @,L | ICos. Corp. | 1,285,142 | |||||||
| 23,100 | @ | Integra LifeSciences Holdings Corp. | 956,571 | |||||||
| 4,271,121 | ||||||||||
| Chemicals: 2.5% | ||||||||||
| 23,800 | Albemarle Corp. | 1,659,812 | ||||||||
| 8,000 | MacDermid, Inc. | 261,200 | ||||||||
| 72,700 | UAP Holding Corp. | 1,745,527 | ||||||||
| 3,666,539 | ||||||||||
| Commercial Services: 5.5% | ||||||||||
| 22,700 | @,L | Advisory Board Co. | 1,259,169 | |||||||
| 30,500 | Arbitron, Inc. | 1,345,355 | ||||||||
| 59,628 | Diamond Management & Technology Consultants, Inc. | 664,852 | ||||||||
| 35,600 | @,L | FTI Consulting, Inc. | 956,928 | |||||||
| 30,000 | @ | Geo Group, Inc. | 1,126,800 | |||||||
| 40,350 | L | Healthcare Services Group | 1,008,750 | |||||||
| 19,900 | @,L | Huron Consulting Group, Inc. | 818,686 | |||||||
| 13,832 | @ | Kendle International, Inc. | 484,535 | |||||||
| 31,200 | @,L | Navigant Consulting, Inc. | 594,360 | |||||||
| 8,259,435 | ||||||||||
| Computers: 4.4% | ||||||||||
| 6,400 | @ | CACI International, Inc. | 382,976 | |||||||
| 43,800 | @ | Electronics for Imaging | 1,073,100 | |||||||
| 29,500 | @,L | Komag, Inc. | 1,164,660 | |||||||
| 17,300 | @,L | Kronos, Inc. | 609,998 | |||||||
| 35,065 | @,L | Micros Systems, Inc. | 1,785,510 | |||||||
| 69,900 | @,L | Palm, Inc. | 979,299 | |||||||
| 20,700 | @,L | SRA International, Inc. | 604,026 | |||||||
| 6,599,569 | ||||||||||
| Cosmetics/ Personal Care: 0.3% | ||||||||||
| 25,600 | @,L | Physicians Formula Holdings, Inc. | 468,480 | |||||||
| 468,480 | ||||||||||
| Distribution/ Wholesale: 2.0% | ||||||||||
| 64,000 | @,L | Brightpoint, Inc. | 883,840 | |||||||
| 34,288 | @ | Nuco2, Inc. | 856,171 | |||||||
| 30,550 | L | Pool Corp. | 1,251,634 | |||||||
| 2,991,645 | ||||||||||
| Diversified Financial Services: 2.6% | ||||||||||
| 29,544 | @,L | CompuCredit Corp. | 1,112,627 | |||||||
| 10,900 | @ | GFI Group, Inc. | 616,504 | |||||||
| 14,600 | International Securities Exchange, Inc. | 776,428 | ||||||||
| 20,400 | @ | Investment Technology Group, Inc. | 765,000 | |||||||
| 11,600 | Nuveen Investments, Inc. | 575,592 | ||||||||
| 3,846,151 | ||||||||||
| Electronics: 3.5% | ||||||||||
| 10,000 | @,L | Cymer, Inc. | 472,500 | |||||||
| 22,100 | @,L | Itron, Inc. | 1,060,579 | |||||||
| 59,600 | Keithley Instruments, Inc. | 749,768 | ||||||||
| 27,818 | @,L | Measurement Specialties, Inc. | 672,639 | |||||||
| 28,100 | @ | Thomas & Betts Corp. | 1,457,547 | |||||||
| 20,000 | @ | Varian, Inc. | 881,600 | |||||||
| 5,294,633 | ||||||||||
| Engineering & Construction: 0.8% | ||||||||||
| 18,900 | @ | EMCOR Group, Inc. | 1,127,763 | |||||||
| 1,127,763 | ||||||||||
| Entertainment: 0.5% | ||||||||||
| 29,600 | @ | Macrovision Corp. | 818,440 | |||||||
| 818,440 | ||||||||||
| Healthcare — Products: 3.9% | ||||||||||
| 34,900 | @,L | Arthrocare Corp. | 1,454,283 | |||||||
| 35,400 | @ | DJO, Inc. | 1,505,208 | |||||||
| 14,400 | @ | Haemonetics Corp. | 652,032 | |||||||
| 12,600 | @,L | Hologic, Inc. | 630,378 | |||||||
| 22,101 | @,L | Kyphon, Inc. | 746,351 | |||||||
| 43,191 | @,L | PSS World Medical, Inc. | 904,420 | |||||||
| 5,892,672 | ||||||||||
| Healthcare — Services: 4.4% | ||||||||||
| 25,200 | @,L | Amedisys, Inc. | 987,084 | |||||||
| 14,400 | @,L | Healthways, Inc. | 661,968 | |||||||
| 26,200 | @,L | Magellan Health Services, Inc. | 1,152,276 | |||||||
| 32,700 | @ | Pediatrix Medical Group, Inc. | 1,574,505 | |||||||
| 49,500 | @,L | Psychiatric Solutions, Inc. | 1,801,305 | |||||||
| 6,300 | @,L | WellCare Health Plans, Inc. | 406,791 | |||||||
| 6,583,929 | ||||||||||
| Housewares: 1.1% | ||||||||||
| 36,900 | Toro Co. | 1,656,810 | ||||||||
| 1,656,810 | ||||||||||
| Insurance: 1.4% | ||||||||||
| 47,300 | @@ | Aspen Insurance Holdings Ltd. | 1,274,735 | |||||||
| 15,353 | @ | ProAssurance Corp. | 786,534 | |||||||
| 2,061,269 | ||||||||||
| Internet: 5.5% | ||||||||||
| 61,000 | @,L | 24/7 Real Media, Inc. | 531,920 | |||||||
| 39,000 | @ | aQuantive, Inc. | 932,100 | |||||||
| 7,609 | @,L | Digital Insight Corp. | 290,359 | |||||||
| 7,300 | @ | F5 Networks, Inc. | 546,113 | |||||||
| 16,000 | @,L | Nutri/ System, Inc. | 1,104,800 | |||||||
| 102,100 | @,L | Sapient Corp. | 557,466 | |||||||
| 31,430 | @,L | Trizetto Group | 543,425 | |||||||
| 84,800 | @,L | Valueclick, Inc. | 2,108,976 | |||||||
125
Table of Contents
| Shares | Value | |||||||||
| Internet (continued) | ||||||||||
| 43,600 | @,L | WebEx Communications, Inc. | $ | 1,565,240 | ||||||
| 8,180,399 | ||||||||||
| Iron/ Steel: 1.0% | ||||||||||
| 2,600 | Allegheny Technologies, Inc. | 233,090 | ||||||||
| 27,200 | L | Cleveland-Cliffs, Inc. | 1,306,688 | |||||||
| 1,539,778 | ||||||||||
| Leisure Time: 1.0% | ||||||||||
| 30,800 | @,L | Life Time Fitness, Inc. | 1,518,748 | |||||||
| 1,518,748 | ||||||||||
| Lodging: 0.7% | ||||||||||
| 88,400 | @ | Red Lion Hotels Corp. | 1,087,320 | |||||||
| 1,087,320 | ||||||||||
| Machinery — Diversified: 2.1% | ||||||||||
| 5,000 | @ | Middleby Corp. | 507,500 | |||||||
| 24,000 | Nordson Corp. | 1,158,960 | ||||||||
| 44,400 | Wabtec Corp. | 1,458,540 | ||||||||
| 3,125,000 | ||||||||||
| Metal Fabricate/ Hardware: 0.5% | ||||||||||
| 11,400 | @ | NS Group, Inc. | 754,110 | |||||||
| 754,110 | ||||||||||
| Mining: 0.4% | ||||||||||
| 98,000 | @,L | Coeur d’Alene Mines Corp. | 534,100 | |||||||
| 534,100 | ||||||||||
| Oil & Gas: 4.9% | ||||||||||
| 45,400 | @,L | Carrizo Oil & Gas, Inc. | 1,511,820 | |||||||
| 68,500 | @ | EXCO Resources, Inc. | 1,005,580 | |||||||
| 82,900 | @,L | McMoRan Exploration Co. | 1,302,359 | |||||||
| 71,400 | @,L | Parallel Petroleum Corp. | 1,410,150 | |||||||
| 50,700 | @ | Petroquest Energy, Inc. | 635,778 | |||||||
| 34,800 | @ | Southwestern Energy Co. | 1,466,124 | |||||||
| 7,331,811 | ||||||||||
| Oil & Gas Services: 2.9% | ||||||||||
| 36,000 | @,L | Dresser-Rand Group, Inc. | 871,560 | |||||||
| 20,500 | @ | FMC Technologies, Inc. | 1,230,205 | |||||||
| 18,700 | @,L | Oil States International, Inc. | 650,947 | |||||||
| 47,800 | @ | Superior Energy Services | 1,556,846 | |||||||
| 4,309,558 | ||||||||||
| Packaging & Containers: 1.0% | ||||||||||
| 15,500 | Greif, Inc. | 1,536,825 | ||||||||
| 1,536,825 | ||||||||||
| Pharmaceuticals: 4.7% | ||||||||||
| 60,600 | @,L | Alkermes, Inc. | 919,908 | |||||||
| 72,600 | @ | BioMarin Pharmaceuticals, Inc. | 1,242,186 | |||||||
| 54,200 | @,L | Cubist Pharmaceuticals, Inc. | 1,103,512 | |||||||
| 54,300 | @ | HealthExtras, Inc. | 1,160,934 | |||||||
| 46,800 | @,L | Sciele Pharma, Inc. | 1,058,148 | |||||||
| 20,000 | @ | Theravance, Inc. | 625,800 | |||||||
| 16,000 | @,L | United Therapeutics Corp. | 931,520 | |||||||
| 7,042,008 | ||||||||||
| Real Estate Investment Trusts: 1.9% | ||||||||||
| 22,600 | L | Digital Realty Trust, Inc. | 823,544 | |||||||
| 28,000 | L | Nationwide Health Properties, Inc. | 828,520 | |||||||
| 63,700 | L | Omega Healthcare Investors, Inc. | 1,128,764 | |||||||
| 2,780,828 | ||||||||||
| Retail: 5.8% | ||||||||||
| 56,100 | Casey’s General Stores, Inc. | 1,396,329 | ||||||||
| 19,391 | L | Cash America International, Inc. | 855,919 | |||||||
| 7,500 | @ | Childrens Place Retail Stores, Inc. | 483,900 | |||||||
| 30,600 | @,L | JOS A Bank Clothiers, Inc. | 917,694 | |||||||
| 63,100 | @ | Morton’s Restaurant Group, Inc. | 1,028,530 | |||||||
| 19,200 | Ruby Tuesday, Inc. | 518,208 | ||||||||
| 45,000 | @,L | Sonic Corp. | 1,056,600 | |||||||
| 24,000 | @,L | Tractor Supply Co. | 1,142,400 | |||||||
| 29,500 | @ | Tween Brands, Inc. | 1,236,640 | |||||||
| 8,636,220 | ||||||||||
| Savings & Loans: 1.6% | ||||||||||
| 24,161 | Flagstar Bancorp., Inc. | 363,623 | ||||||||
| 119,308 | NewAlliance Bancshares, Inc. | 1,950,686 | ||||||||
| 2,314,309 | ||||||||||
| Semiconductors: 7.9% | ||||||||||
| 36,000 | @ | Actel Corp. | 671,760 | |||||||
| 123,700 | @ | Axcelis Technologies, Inc. | 790,443 | |||||||
| 149,600 | @,L | Entegris, Inc. | 1,594,736 | |||||||
| 64,900 | @ | Fairchild Semiconductor International, Inc. | 1,059,168 | |||||||
| 33,600 | @,L | Formfactor, Inc. | 1,255,296 | |||||||
| 23,000 | @ | Integrated Device Technology, Inc. | 379,500 | |||||||
| 68,200 | @ | Micrel, Inc. | 787,710 | |||||||
| 55,900 | @,L | Microsemi Corp. | 1,154,335 | |||||||
| 85,000 | @ | Semtech Corp. | 1,115,200 | |||||||
| 34,700 | @,L | Tessera Technologies, Inc. | 1,314,089 | |||||||
| 15,000 | @,L | Varian Semiconductor Equipment Associates, Inc. | 595,950 | |||||||
| 60,100 | @,@@, | Verigy Ltd. | 1,072,184 | |||||||
| L | 11,790,371 | |||||||||
| Software: 4.5% | ||||||||||
| 20,900 | @ | Activision, Inc. | 356,345 | |||||||
| 45,400 | @ | Ansys, Inc. | 2,131,530 | |||||||
| 27,400 | Blackbaud, Inc. | 706,646 | ||||||||
| 118,700 | @,L | Informatica Corp. | 1,430,335 | |||||||
| 22,100 | @ | Progress Software Corp. | 599,131 | |||||||
| 44,000 | @,L | THQ, Inc. | 1,432,200 | |||||||
| 6,656,187 | ||||||||||
| Storage/ Warehousing: 1.0% | ||||||||||
| 54,400 | @,L | Mobile Mini, Inc. | 1,493,824 | |||||||
| 1,493,824 | ||||||||||
| Telecommunications: 3.4% | ||||||||||
| 37,900 | L | Adtran, Inc. | 825,841 | |||||||
| 101,200 | @ | Arris Group, Inc. | 1,207,316 | |||||||
| 80,645 | @,L | Powerwave Technologies, Inc. | 516,934 | |||||||
| 37,200 | @ | RCN Corp. | 1,118,232 | |||||||
| 50,600 | @,L | SBA Communications Corp. | 1,435,522 | |||||||
| 5,103,845 | ||||||||||
| Transportation: 2.4% | ||||||||||
| 16,200 | L | Forward Air Corp. | 539,460 | |||||||
| 52,500 | @,L | HUB Group, Inc. | 1,498,350 | |||||||
| 52,500 | Knight Transportation, Inc. | 925,050 | ||||||||
| 18,800 | @,L | PHI, Inc. | 636,568 | |||||||
| 3,599,428 | ||||||||||
| Total Common Stock (Cost $123,902,883) | 143,262,561 | |||||||||
126
Table of Contents
| Principal | ||||||||||
| Amount | Value | |||||||||
| SHORT-TERM INVESTMENTS: 32.0% | ||||||||||
| Repurchase Agreement: 4.7% | ||||||||||
| $ | 7,059,000 | Goldman Sachs Repurchase Agreement dated 11/30/06, 5.280%, due 12/01/06, $7,060,035 to be received upon repurchase (Collateralized by $6,993,000 Federal National Mortgage Association, 5.250%, Market Value plus accrued interest $7,200,640, due 06/15/08) | $ | 7,059,000 | ||||||
| Total Repurchase Agreement (Cost $7,059,000) | 7,059,000 | |||||||||
| Securities Lending CollateralCC: 27.3% | ||||||||||
| 40,639,690 | The Bank of New York Institutional Cash Reserves Fund | 40,639,690 | ||||||||
| Total Securities Lending Collateral (Cost $40,639,690) | 40,639,690 | |||||||||
| Total Short-Term Investments (Cost $47,698,690) | 47,698,690 | |||||||||
Total Investments in Securities (Cost $171,601,573)* | 128.0 | % | $ | 190,961,251 | ||||||||
Other Assets and Liabilities-Net | (28.0 | ) | (41,729,507 | ) | ||||||||
Net Assets | 100.0 | % | $ | 149,231,744 | ||||||||
| @ | Non-income producing security | |
| @@ | Foreign Issuer | |
| cc | Securities purchased with cash collateral for securities loaned. | |
| L | Loaned Security, a portion or all of the security is on loan at November 30, 2006. | |
| * | Cost for federal income tax purposes is $171,668,498. Net unrealized appreciation consists of: |
| Gross Unrealized Appreciation | $ | 22,453,367 | ||
| Gross Unrealized Depreciation | (3,160,614 | ) | ||
| Net Unrealized Appreciation | $ | 19,292,753 | ||
127
Table of Contents
| Shares | Value | |||||||||
| COMMON STOCK: 97.0% | ||||||||||
| Banks: 28.5% | ||||||||||
| 118,900 | Associated Banc-Corp. | $ | 3,952,236 | |||||||
| 320,107 | Bank of America Corp. | 17,237,762 | ||||||||
| 267,939 | Bank of New York Co., Inc. | 9,522,552 | ||||||||
| 104,466 | Capital One Financial Corp. | 8,135,812 | ||||||||
| 45,700 | PNC Financial Services Group, Inc. | 3,230,533 | ||||||||
| 162,000 | Prosperity Bancshares, Inc. | 5,493,420 | ||||||||
| 347,319 | US Bancorp | 11,683,811 | ||||||||
| 188,387 | Wachovia Corp. | 10,208,692 | ||||||||
| 399,490 | Wells Fargo & Co. | 14,078,028 | ||||||||
| 52,586 | Zions Bancorp | 4,114,329 | ||||||||
| 87,657,175 | ||||||||||
| Commercial Services: 0.8% | ||||||||||
| 109,334 | Western Union Co. | 2,492,815 | ||||||||
| 2,492,815 | ||||||||||
| Diversified Financial Services: 33.3% | ||||||||||
| 97,791 | @ | Affiliated Managers Group, Inc. | 9,985,439 | |||||||
| 96,808 | American Express Co. | 5,684,566 | ||||||||
| 60,600 | CIT Group, Inc. | 3,151,806 | ||||||||
| 352,800 | Citigroup, Inc. | 17,495,352 | ||||||||
| 181,174 | Countrywide Financial Corp. | 7,196,231 | ||||||||
| 105,998 | @ | E*Trade Financial Corp. | 2,551,372 | |||||||
| 73,926 | Fannie Mae | 4,216,000 | ||||||||
| 50,480 | Franklin Resources, Inc. | 5,388,235 | ||||||||
| 78,417 | Freddie Mac | 5,266,486 | ||||||||
| 25,573 | Goldman Sachs Group, Inc. | 4,981,620 | ||||||||
| 314,198 | JPMorgan Chase & Co. | 14,541,083 | ||||||||
| 41,732 | Lehman Brothers Holdings, Inc. | 3,074,396 | ||||||||
| 108,554 | Merrill Lynch & Co., Inc. | 9,490,876 | ||||||||
| 60,965 | Morgan Stanley | 4,643,094 | ||||||||
| 271,400 | @ | TD Ameritrade Holding Corp. | 4,765,784 | |||||||
| 102,432,340 | ||||||||||
| Home Builders: 1.3% | ||||||||||
| 151,680 | D.R. Horton, Inc. | 4,040,755 | ||||||||
| 4,040,755 | ||||||||||
| Insurance: 29.3% | ||||||||||
| 108,045 | @@ | ACE Ltd. | 6,141,278 | |||||||
| 121,200 | Aflac, Inc. | 5,349,768 | ||||||||
| 207,571 | American International Group, Inc. | 14,596,393 | ||||||||
| 132,600 | AON Corp. | 4,731,168 | ||||||||
| 129,400 | @@ | Axis Capital Holdings Ltd. | 4,429,362 | |||||||
| 153,400 | @@ | Endurance Specialty Holdings Ltd. | 5,757,102 | |||||||
| 124,099 | Genworth Financial, Inc. | 4,070,447 | ||||||||
| 51,336 | Hartford Financial Services Group, Inc. | 4,402,575 | ||||||||
| 57,915 | Lincoln National Corp. | 3,682,815 | ||||||||
| 145,500 | Metlife, Inc. | 8,545,215 | ||||||||
| 74,650 | PMI Group, Inc. | 3,233,092 | ||||||||
| 66,700 | Protective Life Corp. | 3,149,574 | ||||||||
| 72,188 | Prudential Financial, Inc. | 5,881,878 | ||||||||
| 161,300 | @@ | Security Capital Assurance Ltd. | 4,084,116 | |||||||
| 159,305 | St. Paul Travelers Cos., Inc. | 8,253,592 | ||||||||
| 82,700 | Stancorp Financial Group, Inc. | 3,755,407 | ||||||||
| 90,063,782 | ||||||||||
| Internet: 1.3% | ||||||||||
| 93,100 | @ | Checkfree Corp. | 3,892,511 | |||||||
| 3,892,511 | ||||||||||
| Real Estate Investment Trusts: 1.6% | ||||||||||
| 68,600 | @ | Douglas Emmett, Inc. | 1,804,180 | |||||||
| 62,100 | Liberty Property Trust | 3,180,141 | ||||||||
| 4,984,321 | ||||||||||
| Software: 0.9% | ||||||||||
| 109,334 | First Data Corp. | 2,760,684 | ||||||||
| 2,760,684 | ||||||||||
| Total Common Stock (Cost $222,029,988) | 298,324,383 | |||||||||
| Principal | ||||||||||
| Amount | Value | |||||||||
| SHORT-TERM INVESTMENTS: 3.0% | ||||||||||
| Money Market: 1.6% | ||||||||||
| $ | 5,000,000 | ** | ING Institutional Prime Money Market Fund | $ | 5,000,000 | |||||
| Total Money Market (Cost $5,000,000) | 5,000,000 | |||||||||
| Repurchase Agreement: 1.4% | ||||||||||
| 4,288,000 | Goldman Sachs Repurchase Agreement dated 11/30/06, 5.280%, due 12/01/06, $4,288,629 to be received upon repurchase (Collateralized by $4,248,000 Federal National Mortgage Association, 5.250%, Market Value plus accrued interest $4,374,134, due 06/15/08) | 4,288,000 | ||||||||
| Total Repurchase Agreement (Cost $4,288,000) | 4,288,000 | |||||||||
| Total Short-Term Investments (Cost $9,288,000) | 9,288,000 | |||||||||
Total Investments in Securities (Cost $231,317,988)* | 100.0 | % | $ | 307,612,383 | ||||||||
Other Assets and Liabilities-Net | (0.0 | ) | (138,005 | ) | ||||||||
Net Assets | 100.0 | % | $ | 307,474,378 | ||||||||
| @ | Non-income producing security | |
| @@ | Foreign Issuer | |
| ** | Investment in affiliated company | |
| * | Cost for federal income tax purposes is $231,482,753. Net unrealized appreciation consists of: |
| Gross Unrealized Appreciation | $ | 77,789,326 | ||
| Gross Unrealized Depreciation | (1,659,696 | ) | ||
| Net Unrealized Appreciation | $ | 76,129,630 | ||
128
Table of Contents
| Shares | Value | |||||||||
| COMMON STOCK: 90.3% | ||||||||||
| Agriculture: 1.5% | ||||||||||
| 19,530 | Altria Group, Inc. | $ | 1,644,621 | |||||||
| 1,644,621 | ||||||||||
| Auto Manufacturers: 7.1% | ||||||||||
| 525,230 | Ford Motor Co. | 4,270,120 | ||||||||
| 120,760 | General Motors Corp. | 3,529,815 | ||||||||
| 7,799,935 | ||||||||||
| Auto Parts & Equipment: 0.7% | ||||||||||
| 330,390 | @ | Delphi Corp. | 816,063 | |||||||
| 816,063 | ||||||||||
| Banks: 4.2% | ||||||||||
| 66,540 | Fifth Third Bancorp. | 2,623,672 | ||||||||
| 114,460 | @@ | Popular, Inc. | 2,025,942 | |||||||
| 4,649,614 | ||||||||||
| Commercial Services: 3.0% | ||||||||||
| 136,640 | H&R Block, Inc. | 3,279,360 | ||||||||
| 3,279,360 | ||||||||||
| Computers: 8.5% | ||||||||||
| 128,000 | @ | Dell, Inc. | 3,486,720 | |||||||
| 79,990 | Electronic Data Systems Corp. | 2,170,929 | ||||||||
| 27,720 | International Business Machines Corp. | 2,548,022 | ||||||||
| 160,620 | @ | Unisys Corp. | 1,158,070 | |||||||
| 9,363,741 | ||||||||||
| Diversified Financial Services: 1.8% | ||||||||||
| 40,830 | Citigroup, Inc. | 2,024,760 | ||||||||
| 2,024,760 | ||||||||||
| Food: 9.9% | ||||||||||
| 118,900 | Kroger Co. | 2,551,594 | ||||||||
| 86,860 | Safeway, Inc. | 2,676,157 | ||||||||
| 186,593 | Sara Lee Corp. | 3,093,712 | ||||||||
| 74,830 | Supervalu, Inc. | 2,563,676 | ||||||||
| 10,885,139 | ||||||||||
| Healthcare — Products: 2.9% | ||||||||||
| 202,241 | @ | Boston Scientific Corp. | 3,199,453 | |||||||
| 3,199,453 | ||||||||||
| Healthcare — Services: 1.5% | ||||||||||
| 225,570 | @ | Tenet Healthcare Corp. | 1,599,291 | |||||||
| 1,599,291 | ||||||||||
| Home Furnishings: 2.4% | ||||||||||
| 31,210 | Whirlpool Corp. | 2,662,213 | ||||||||
| 2,662,213 | ||||||||||
| Insurance: 5.0% | ||||||||||
| 77,440 | @ | Conseco, Inc. | 1,540,282 | |||||||
| 23,610 | Loews Corp. | 942,511 | ||||||||
| 67,210 | Marsh & McLennan Cos., Inc. | 2,111,738 | ||||||||
| 16,740 | Nationwide Financial Services | 870,480 | ||||||||
| 5,465,011 | ||||||||||
| Media: 5.1% | ||||||||||
| 58,640 | Gannett Co., Inc. | 3,490,253 | ||||||||
| 4,435 | @ | Idearc, Inc. | 122,140 | |||||||
| 64,130 | Tribune Co. | 2,039,334 | ||||||||
| 5,651,727 | ||||||||||
| Miscellaneous Manufacturing: 3.0% | ||||||||||
| 126,990 | Eastman Kodak Co. | 3,304,280 | ||||||||
| 3,304,280 | ||||||||||
| Office/ Business Equipment: 2.2% | ||||||||||
| 143,550 | @ | Xerox Corp. | 2,368,575 | |||||||
| 2,368,575 | ||||||||||
| Pharmaceuticals: 12.3% | ||||||||||
| 110,340 | Bristol-Myers Squibb Co. | 2,739,742 | ||||||||
| 55,960 | Merck & Co., Inc. | 2,490,780 | ||||||||
| 122,090 | Pfizer, Inc. | 3,356,254 | ||||||||
| 125,010 | Schering-Plough Corp. | 2,751,470 | ||||||||
| 45,410 | Wyeth | 2,192,395 | ||||||||
| 13,530,641 | ||||||||||
| Pipelines: 2.2% | ||||||||||
| 161,640 | El Paso Corp. | 2,359,944 | ||||||||
| 2,359,944 | ||||||||||
| Semiconductors: 5.8% | ||||||||||
| 165,900 | Intel Corp. | 3,541,965 | ||||||||
| 193,800 | @ | Micron Technology, Inc. | 2,829,480 | |||||||
| 6,371,445 | ||||||||||
| Software: 2.3% | ||||||||||
| 86,310 | Microsoft Corp. | 2,531,472 | ||||||||
| 2,531,472 | ||||||||||
| Telecommunications: 8.9% | ||||||||||
| 21,260 | AT&T, Inc. | 720,927 | ||||||||
| 36,930 | BellSouth Corp. | 1,646,709 | ||||||||
| 1,697,230 | @ | Lucent Technologies, Inc. | 4,327,937 | |||||||
| 88,710 | Verizon Communications, Inc. | 3,099,526 | ||||||||
| 9,795,099 | ||||||||||
| Total Common Stock (Cost $92,332,057) | 99,302,384 | |||||||||
| Principal | ||||||||||
| Amount | Value | |||||||||
| SHORT-TERM INVESTMENTS: 9.0% | ||||||||||
| U.S. Government Agency Obligations: 9.0% | ||||||||||
| $ | 9,828,000 | Federal Home Loan Bank, 4.980%, due 12/01/06 | $ | 9,826,640 | ||||||
| Total Short-Term Investments (Cost $9,826,640) | 9,826,640 | |||||||||
Total Investments in Securities (Cost $102,158,697)* | 99.3 | % | $ | 109,129,024 | ||||||||
Other Assets and Liabilities-Net | 0.7 | 812,979 | ||||||||||
Net Assets | 100.0 | % | $ | 109,942,003 | ||||||||
| @ | Non-income producing security | |
| @@ | Foreign Issuer | |
| * | Cost for federal income tax purposes is the same as for financial statement purposes. Net unrealized appreciation consists of: |
| Gross Unrealized Appreciation | $ | 9,432,048 | ||
| Gross Unrealized Depreciation | (2,461,721 | ) | ||
| Net Unrealized Appreciation | $ | 6,970,327 | ||
129
Table of Contents
| Shares | Value | |||||||||
| COMMON STOCK: 96.6% | ||||||||||
| Aerospace/ Defense: 1.7% | ||||||||||
| 21,200 | Boeing Co. | $ | 1,876,836 | |||||||
| 69,000 | United Technologies Corp. | 4,452,570 | ||||||||
| 6,329,406 | ||||||||||
| Agriculture: 4.9% | ||||||||||
| 166,700 | Altria Group, Inc. | 14,037,807 | ||||||||
| 64,400 | Loews Corp. | 4,016,628 | ||||||||
| 18,054,435 | ||||||||||
| Banks: 9.3% | ||||||||||
| 268,300 | Bank of America Corp. | 14,447,955 | ||||||||
| 184,300 | Bank of New York Co., Inc. | 6,550,022 | ||||||||
| 46,766 | L | Capital One Financial Corp. | 3,642,136 | |||||||
| 270,400 | Wells Fargo & Co. | 9,528,896 | ||||||||
| 34,169,009 | ||||||||||
| Beverages: 1.9% | ||||||||||
| 78,000 | Coca-Cola Co. | 3,652,740 | ||||||||
| 45,100 | Molson Coors Brewing Co. | 3,205,708 | ||||||||
| 6,858,448 | ||||||||||
| Building Materials: 1.0% | ||||||||||
| 236,900 | @,L | Goodman Global, Inc. | 3,792,769 | |||||||
| 3,792,769 | ||||||||||
| Chemicals: 2.1% | ||||||||||
| 56,800 | Air Products & Chemicals, Inc. | 3,927,152 | ||||||||
| 55,300 | Ashland, Inc. | 3,738,833 | ||||||||
| 7,665,985 | ||||||||||
| Coal: 0.8% | ||||||||||
| 65,400 | L | Peabody Energy Corp. | 3,009,054 | |||||||
| 3,009,054 | ||||||||||
| Computers: 2.1% | ||||||||||
| 102,700 | Hewlett-Packard Co. | 4,052,542 | ||||||||
| 148,900 | @@,L | Seagate Technology, Inc. | 3,835,664 | |||||||
| 7,888,206 | ||||||||||
| Cosmetics/ Personal Care: 2.5% | ||||||||||
| 145,900 | Procter & Gamble Co. | 9,161,061 | ||||||||
| 9,161,061 | ||||||||||
| Diversified Financial Services: 13.3% | ||||||||||
| 38,400 | @,L | Affiliated Managers Group, Inc. | 3,921,024 | |||||||
| 201,500 | Citigroup, Inc. | 9,992,385 | ||||||||
| 132,000 | L | Countrywide Financial Corp. | 5,243,040 | |||||||
| 153,804 | @ | E*Trade Financial Corp. | 3,702,062 | |||||||
| 29,600 | Freddie Mac | 1,987,936 | ||||||||
| 263,300 | JPMorgan Chase & Co. | 12,185,524 | ||||||||
| 82,300 | Merrill Lynch & Co., Inc. | 7,195,489 | ||||||||
| 59,600 | Morgan Stanley | 4,539,136 | ||||||||
| 48,766,596 | ||||||||||
| Electric: 3.6% | ||||||||||
| 32,113 | @ | Dynegy, Inc. | — | |||||||
| 257,800 | @,L | Mirant Corp. | 7,842,276 | |||||||
| 114,600 | L | PG&E Corp. | 5,263,578 | |||||||
| 13,105,854 | ||||||||||
| Electrical Components & Equipment: 1.0% | ||||||||||
| 85,000 | @,L | General Cable Corp. | 3,612,500 | |||||||
| 3,612,500 | ||||||||||
| Electronics: 1.4% | ||||||||||
| 475,000 | @,@@, | Flextronics International Ltd. | 5,343,750 | |||||||
| L | 5,343,750 | |||||||||
| Energy — Alternate Sources: 0.0% | ||||||||||
| 2,037 | @,L | Evergreen Energy, Inc. | 17,926 | |||||||
| 17,926 | ||||||||||
| Engineering & Construction: 1.1% | ||||||||||
| 255,000 | @@,L | ABB Ltd. ADR | 4,151,400 | |||||||
| 4,151,400 | ||||||||||
| Entertainment: 1.2% | ||||||||||
| 208,100 | Regal Entertainment Group | 4,330,561 | ||||||||
| 4,330,561 | ||||||||||
| Food: 0.9% | ||||||||||
| 131,634 | @,L | Smithfield Foods, Inc. | 3,472,505 | |||||||
| 3,472,505 | ||||||||||
| Gas: 1.2% | ||||||||||
| 81,800 | L | Sempra Energy | 4,458,100 | |||||||
| 4,458,100 | ||||||||||
| Healthcare — Products: 0.8% | ||||||||||
| 79,400 | @ | St. Jude Medical, Inc. | 2,959,238 | |||||||
| 2,959,238 | ||||||||||
| Healthcare — Services: 1.0% | ||||||||||
| 89,000 | Aetna, Inc. | 3,676,590 | ||||||||
| 3,676,590 | ||||||||||
| Insurance: 8.1% | ||||||||||
| 103,000 | American International Group, Inc. | 7,242,960 | ||||||||
| 227,800 | @,L | Conseco, Inc. | 4,530,942 | |||||||
| 88,600 | Genworth Financial, Inc. | 2,906,080 | ||||||||
| 114,400 | Metlife, Inc. | 6,718,712 | ||||||||
| 39,300 | Protective Life Corp. | 1,855,746 | ||||||||
| 83,400 | St. Paul Travelers Cos., Inc. | 4,320,954 | ||||||||
| 45,090 | Stancorp Financial Group, Inc. | 2,047,537 | ||||||||
| 29,622,931 | ||||||||||
| Iron/ Steel: 0.5% | ||||||||||
| 21,000 | L | Allegheny Technologies, Inc. | 1,882,650 | |||||||
| 1,882,650 | ||||||||||
| Lodging: 0.9% | ||||||||||
| 77,800 | L | Boyd Gaming Corp. | 3,294,830 | |||||||
| 3,294,830 | ||||||||||
| Media: 1.6% | ||||||||||
| 104,600 | Time Warner, Inc. | 2,106,644 | ||||||||
| 110,300 | Walt Disney Co. | 3,645,415 | ||||||||
| 5,752,059 | ||||||||||
| Mining: 0.8% | ||||||||||
| 49,400 | Freeport-McMoRan Copper & Gold, Inc. | 3,105,778 | ||||||||
| 3,105,778 | ||||||||||
| Miscellaneous Manufacturing: 1.9% | ||||||||||
| 81,600 | Dover Corp. | 4,104,480 | ||||||||
| 80,300 | General Electric Co. | 2,832,984 | ||||||||
| 6,937,464 | ||||||||||
| Oil & Gas: 12.1% | ||||||||||
| 40,900 | Chevron Corp. | 2,957,888 | ||||||||
| 55,900 | ConocoPhillips | 3,762,070 | ||||||||
| 227,600 | ExxonMobil Corp. | 17,481,956 | ||||||||
130
Table of Contents
| Shares | Value | |||||||||
| Oil & Gas (continued) | ||||||||||
| 159,400 | @ | Newfield Exploration Co. | $ | 7,933,338 | ||||||
| 135,600 | @ | Plains Exploration & Production Co. | 6,384,048 | |||||||
| 160,400 | L | Rowan Cos., Inc. | 5,777,608 | |||||||
| 44,296,908 | ||||||||||
| Oil & Gas Services: 1.2% | ||||||||||
| 96,800 | @ | Weatherford International Ltd. | 4,347,288 | |||||||
| 4,347,288 | ||||||||||
| Pharmaceuticals: 5.3% | ||||||||||
| 74,128 | @ | Medco Health Solutions, Inc. | 3,721,967 | |||||||
| 445,200 | Pfizer, Inc. | 12,238,548 | ||||||||
| 75,300 | Wyeth | 3,635,484 | ||||||||
| 19,595,999 | ||||||||||
| Real Estate Investment Trusts: 2.0% | ||||||||||
| 75,600 | L | KKR Financial Corp. | 2,023,056 | |||||||
| 66,700 | Liberty Property Trust | 3,415,707 | ||||||||
| 66,000 | Sunstone Hotel Investors, Inc. | 1,840,080 | ||||||||
| 7,278,843 | ||||||||||
| Retail: 1.0% | ||||||||||
| 87,400 | McDonald’s Corp. | 3,668,178 | ||||||||
| 3,668,178 | ||||||||||
| Savings & Loans: 1.4% | ||||||||||
| 376,700 | L | Hudson City Bancorp., Inc. | 4,998,809 | |||||||
| 4,998,809 | ||||||||||
| Semiconductors: 1.1% | ||||||||||
| 362,696 | @@ | Taiwan Semiconductor Manufacturing Co., Ltd. ADR | 3,898,982 | |||||||
| 3,898,982 | ||||||||||
| Telecommunications: 6.2% | ||||||||||
| 341,300 | L | AT&T, Inc. | 11,573,483 | |||||||
| 208,800 | Motorola, Inc. | 4,629,096 | ||||||||
| 337,200 | @,L | Qwest Communications International, Inc. | 2,593,068 | |||||||
| 198,600 | Sprint Nextel Corp. | 3,874,686 | ||||||||
| 22,670,333 | ||||||||||
| Transportation: 0.7% | ||||||||||
| 30,300 | Union Pacific Corp. | 2,742,756 | ||||||||
| 2,742,756 | ||||||||||
| Total Common Stock (Cost $294,534,513) | 354,917,201 | |||||||||
| Principal | ||||||||||
| Amount | Value | |||||||||
| SHORT-TERM INVESTMENTS: 20.7% | ||||||||||
| Repurchase Agreement: 3.3% | ||||||||||
| $ | 12,109,000 | Goldman Sachs Repurchase Agreement dated 11/30/06, 5.280%, due 12/01/06, $12,110,776 to be received upon repurchase (Collateralized by $12,676,000 Federal National Mortgage Association, Discount Note, Market Value $12,351,494, due 05/30/07) | $ | 12,109,000 | ||||||
| Total Repurchase Agreement (Cost $12,109,000) | 12,109,000 | |||||||||
| Securities Lending CollateralCC: 17.4% | ||||||||||
| 63,985,533 | The Bank of New York Institutional Cash Reserves Fund | 63,985,533 | ||||||||
| Total Securities Lending Collateral (Cost $63,985,533) | 63,985,533 | |||||||||
| Total Short-Term Investments (Cost $76,094,533) | 76,094,533 | |||||||||
Total Investments in Securities (Cost $370,629,046)* | 117.3 | % | $ | 431,011,734 | ||||||||
Other Assets and Liabilities-Net | (17.3 | ) | (63,680,595 | ) | ||||||||
Net Assets | 100.0 | % | $ | 367,331,139 | ||||||||
| @ | Non-income producing security | |
| @@ | Foreign Issuer | |
| ADR | American Depositary Receipt | |
| cc | Securities purchased with cash collateral for securities loaned. | |
| L | Loaned Security, a portion or all of the security is on loan at November 30, 2006. | |
| * | Cost for federal income tax purposes is $370,821,789. Net unrealized appreciation consists of: | |
| Gross Unrealized Appreciation | $ | 62,409,006 | ||
| Gross Unrealized Depreciation | (2,219,061 | ) | ||
| Net Unrealized Appreciation | $ | 60,189,945 | ||
131
Table of Contents
| Shares | Value | |||||||||
| COMMON STOCK: 97.7% | ||||||||||
| Auto Parts & Equipment: 21.8% | ||||||||||
| 99,060 | American Axle & Manufacturing Holdings, Inc. | $ | 1,812,798 | |||||||
| 196,910 | L | ArvinMeritor, Inc. | 3,408,512 | |||||||
| 133,700 | Cooper Tire & Rubber Co. | 1,768,851 | ||||||||
| 381,310 | @,L | Dana Corp. | 625,348 | |||||||
| 1,010,570 | @,L | Delphi Corp. | 2,496,108 | |||||||
| 177,155 | @,L | Goodyear Tire & Rubber Co. | 2,985,062 | |||||||
| 93,400 | L | Lear Corp. | 2,890,730 | |||||||
| 284,915 | @,L | Visteon Corp. | 2,290,717 | |||||||
| 18,278,126 | ||||||||||
| Banks: 4.3% | ||||||||||
| 22,000 | @@,L | First Bancorp | 220,440 | |||||||
| 75,300 | @@,L | Popular, Inc. | 1,332,810 | |||||||
| 337,900 | @@ | W Holding Co., Inc. | 2,074,706 | |||||||
| 3,627,956 | ||||||||||
| Chemicals: 7.3% | ||||||||||
| 372,160 | Chemtura Corp. | 3,602,509 | ||||||||
| 147,430 | @,L | Huntsman Corp. | 2,566,756 | |||||||
| 6,169,265 | ||||||||||
| Commercial Services: 2.2% | ||||||||||
| 73,550 | L | Deluxe Corp. | 1,810,801 | |||||||
| 1,810,801 | ||||||||||
| Computers: 9.1% | ||||||||||
| 181,487 | @ | BISYS Group, Inc. | 2,176,029 | |||||||
| 705,400 | @,L | Gateway, Inc. | 1,340,260 | |||||||
| 33,980 | @ | Synopsys, Inc. | 868,189 | |||||||
| 445,730 | @ | Unisys Corp. | 3,213,713 | |||||||
| 7,598,191 | ||||||||||
| Electric: 1.7% | ||||||||||
| 206,859 | @ | Dynegy, Inc. | 1,395,617 | |||||||
| 162,000 | L,X | Mirant Corp. | — | |||||||
| 1,395,617 | ||||||||||
| Electronics: 9.6% | ||||||||||
| 219,680 | @,L | Kemet Corp. | 1,614,648 | |||||||
| 774,810 | @ | Sanmina-SCI Corp. | 2,866,797 | |||||||
| 1,081,072 | @ | Solectron Corp. | 3,599,970 | |||||||
| 8,081,415 | ||||||||||
| Food: 12.2% | ||||||||||
| 170,530 | Del Monte Foods Co. | 1,925,284 | ||||||||
| 91,741 | L | Pilgrim’s Pride Corp. | 2,341,230 | |||||||
| 59,980 | L | Safeway, Inc. | 1,847,984 | |||||||
| 48,173 | Supervalu, Inc. | 1,650,407 | ||||||||
| 153,400 | Tyson Foods, Inc. | 2,437,526 | ||||||||
| 10,202,431 | ||||||||||
| Healthcare — Services: 4.6% | ||||||||||
| 549,240 | @,L | Tenet Healthcare Corp. | 3,894,112 | |||||||
| 3,894,112 | ||||||||||
| Home Furnishings: 1.4% | ||||||||||
| 13,904 | Whirlpool Corp. | 1,186,011 | ||||||||
| 1,186,011 | ||||||||||
| Household Products/ Wares: 2.5% | ||||||||||
| 89,670 | L | American Greetings Corp. | 2,135,043 | |||||||
| 2,135,043 | ||||||||||
| Insurance: 2.6% | ||||||||||
| 60,000 | @,L | Conseco, Inc. | 1,193,400 | |||||||
| 63,070 | Phoenix Cos., Inc. | 1,018,581 | ||||||||
| 2,211,981 | ||||||||||
| Machinery — Diversified: 2.7% | ||||||||||
| 83,220 | Briggs & Stratton Corp. | 2,254,430 | ||||||||
| 2,254,430 | ||||||||||
| Media: 5.1% | ||||||||||
| 56,730 | McClatchy Co. | 2,363,939 | ||||||||
| 78,140 | L | New York Times Co. | 1,886,300 | |||||||
| 4,250,239 | ||||||||||
| Semiconductors: 2.9% | ||||||||||
| 134,129 | @,L | Agere Systems, Inc. | 2,403,592 | |||||||
| 2,403,592 | ||||||||||
| Telecommunications: 7.7% | ||||||||||
| 488,610 | @,L | 3Com Corp. | 2,047,276 | |||||||
| 460,580 | @ | Cincinnati Bell, Inc. | 2,081,822 | |||||||
| 266,100 | @,L | Utstarcom, Inc. | 2,362,965 | |||||||
| 6,492,063 | ||||||||||
| Total Common Stock (Cost $93,568,597) | 81,991,273 | |||||||||
| WARRANTS: 0.2% | ||||||||||
| Electric: 0.2% | ||||||||||
| 14,097 | Mirant Corp. | 169,164 | ||||||||
| 169,164 | ||||||||||
| Total Warrants (Cost $502,410) | 169,164 | |||||||||
| Total Long-Term Investments (Cost $94,071,007) | 82,160,437 | |||||||||
132
Table of Contents
| Principal | ||||||||||
| Amount | Value | |||||||||
| SHORT-TERM INVESTMENTS: 31.6% | ||||||||||
| U.S. Government Agency Obligations: 2.1% | ||||||||||
| $ | 1,765,000 | Federal Home Loan Bank, 4.980%, due 12/01/06 | $ | 1,764,756 | ||||||
| Total U.S. Government Agency Obligations (Cost $1,764,756) | 1,764,756 | |||||||||
| Securities Lending CollateralCC: 29.5% | ||||||||||
| 24,719,658 | The Bank of New York Institutional Cash Reserves Fund | 24,719,658 | ||||||||
| Total Securities Lending Collateral (Cost $24,719,658) | 24,719,658 | |||||||||
| Total Short-Term Investments (Cost $26,484,414) | 26,484,414 | |||||||||
Total Investments in Securities (Cost $120,555,421)* | 129.5 | % | $ | 108,644,851 | ||||||||
Other Assets and Liabilities-Net | (29.5 | ) | (24,777,793 | ) | ||||||||
Net Assets | 100.0 | % | $ | 83,867,058 | ||||||||
| @ | Non-income producing security | |
| @@ | Foreign Issuer | |
| cc | Securities purchased with cash collateral for securities loaned. | |
| L | Loaned Security, a portion or all of the security is on loan at November 30, 2006. | |
| X | Fair value determined by ING Funds Valuation Committee appointed by the Funds’ Board of Directors/Trustees. | |
| * | Cost for federal income tax purposes is the same as for financial statement purposes. Net unrealized depreciation consists of: |
| Gross Unrealized Appreciation | $ | 5,652,833 | ||
| Gross Unrealized Depreciation | (17,563,403 | ) | ||
| Net Unrealized Depreciation | $ | (11,910,570 | ) | |
133
Table of Contents
| Shares | Value | |||||||||
| COMMON STOCK: 67.5% | ||||||||||
| Aerospace/ Defense: 0.2% | ||||||||||
| 16,000 | @ | Orbital Sciences Corp. | $ | 289,920 | ||||||
| 289,920 | ||||||||||
| Agriculture: 0.0% | ||||||||||
| 600 | Archer-Daniels-Midland Co. | 21,060 | ||||||||
| 21,060 | ||||||||||
| Auto Parts & Equipment: 1.0% | ||||||||||
| 20,800 | @@ | Magna International, Inc. | 1,598,688 | |||||||
| 1,598,688 | ||||||||||
| Chemicals: 2.0% | ||||||||||
| 24,600 | Aceto Corp. | 209,100 | ||||||||
| 119,800 | @ | Mosaic Co. | 2,551,740 | |||||||
| 26,600 | Sensient Technologies Corp. | 633,878 | ||||||||
| 3,394,718 | ||||||||||
| Coal: 0.9% | ||||||||||
| 34,100 | Peabody Energy Corp. | 1,568,941 | ||||||||
| 1,568,941 | ||||||||||
| Commercial Services: 0.9% | ||||||||||
| 29,200 | @@,L | Toppan Printing Co., Ltd. ADR | 1,569,132 | |||||||
| 1,569,132 | ||||||||||
| Cosmetics/ Personal Care: 1.0% | ||||||||||
| 5,900 | @@ | Kao Corp. ADR | 1,591,630 | |||||||
| 1,591,630 | ||||||||||
| Distribution/ Wholesale: 1.0% | ||||||||||
| 8,800 | L | CDW Corp. | 620,400 | |||||||
| 25,400 | @ | Tech Data Corp. | 1,062,228 | |||||||
| 1,682,628 | ||||||||||
| Diversified Financial Services: 2.1% | ||||||||||
| 151,900 | @@ | Acom Co., Ltd. ADR | 1,434,878 | |||||||
| 123,900 | @@ | Promise Co., Ltd. ADR | 2,131,861 | |||||||
| 3,566,739 | ||||||||||
| Electric: 9.0% | ||||||||||
| 18,700 | Alliant Energy Corp. | 727,430 | ||||||||
| 15,000 | Ameren Corp. | 820,650 | ||||||||
| 19,100 | American Electric Power Co., Inc. | 792,841 | ||||||||
| 150,000 | @@,L | Centrais Eletricas Brasileiras SA ADR | 1,594,080 | |||||||
| 45,600 | L | DTE Energy Co. | 2,147,304 | |||||||
| 24,500 | @@ | Energias de Portugal SA ADR | 1,160,810 | |||||||
| 24,600 | Idacorp, Inc. | 983,754 | ||||||||
| 6,300 | @@ | Korea Electric Power Corp. ADR | 135,387 | |||||||
| 15,400 | @,L | NRG Energy, Inc. | 876,568 | |||||||
| 61,600 | PNM Resources, Inc. | 1,891,120 | ||||||||
| 1,100 | L | Progress Energy, Inc. | 52,547 | |||||||
| 160,500 | Puget Energy, Inc. | 3,986,820 | ||||||||
| 15,169,311 | ||||||||||
| Electronics: 1.1% | ||||||||||
| 12,900 | @ | OSI Systems, Inc. | 244,971 | |||||||
| 88,100 | @,@@, #,L | Samsung SDI Co., Ltd. GDR | 1,571,264 | |||||||
| 1,816,235 | ||||||||||
| Engineering & Construction: 0.9% | ||||||||||
| 48,800 | @ | Shaw Group, Inc. | 1,458,632 | |||||||
| 1,458,632 | ||||||||||
| Environmental Control: 1.4% | ||||||||||
| 185,000 | @,L | Allied Waste Industries, Inc. | 2,345,800 | |||||||
| 2,345,800 | ||||||||||
| Food: 9.0% | ||||||||||
| 27,200 | Kroger Co. | 583,712 | ||||||||
| 108,500 | Sara Lee Corp. | 1,798,930 | ||||||||
| 143,200 | @ | Smithfield Foods, Inc. | 3,777,616 | |||||||
| 65,611 | Supervalu, Inc. | 2,247,833 | ||||||||
| 426,100 | Tyson Foods, Inc. | 6,770,729 | ||||||||
| 15,178,820 | ||||||||||
| Forest Products & Paper: 5.4% | ||||||||||
| 153,400 | Bowater, Inc. | 3,344,120 | ||||||||
| 61,300 | @,L | Buckeye Technologies, Inc. | 719,662 | |||||||
| 350,400 | @,@@, L | Domtar, Inc. | 2,515,872 | |||||||
| 170,800 | Wausau Paper Corp. | 2,555,168 | ||||||||
| 9,134,822 | ||||||||||
| Healthcare — Services: 0.7% | ||||||||||
| 50,200 | @,L | Apria Healthcare Group, Inc. | 1,253,494 | |||||||
| 1,253,494 | ||||||||||
| Home Builders: 0.3% | ||||||||||
| 29,400 | Levitt Corp. | 366,324 | ||||||||
| 11,100 | @@ | Sekisui House Ltd. ADR | 168,053 | |||||||
| 534,377 | ||||||||||
| Insurance: 0.1% | ||||||||||
| 4,200 | AON Corp. | 149,856 | ||||||||
| 149,856 | ||||||||||
| Machinery — Diversified: 3.8% | ||||||||||
| 158,700 | @,L | AGCO Corp. | 4,956,201 | |||||||
| 2,700 | Alamo Group, Inc. | 62,208 | ||||||||
| 3,800 | @@,L | CNH Global NV | 109,440 | |||||||
| 15,700 | Lindsay Manufacturing Co. | 540,865 | ||||||||
| 700 | @@ | Metso Oyj | 32,424 | |||||||
| 37,600 | @,L | Tecumseh Products Co. | 609,496 | |||||||
| 6,310,634 | ||||||||||
| Media: 1.1% | ||||||||||
| 54,900 | @,L | Scholastic Corp. | 1,829,268 | |||||||
| 1,829,268 | ||||||||||
| Mining: 18.7% | ||||||||||
| 158,400 | @@ | Alumina Ltd. ADR | 3,169,584 | |||||||
| 109,050 | @@,L | Anglogold Ashanti Ltd. ADR | 5,258,391 | |||||||
| 326,800 | @,L | Apex Silver Mines Ltd. | 5,725,536 | |||||||
| 12,200 | @,@@, L | Banro Corp. | 153,720 | |||||||
| 77,495 | @@ | Barrick Gold Corp. | 2,436,443 | |||||||
| 508,200 | @,@@, L | Bema Gold Corp. | 2,759,526 | |||||||
| 64,100 | @,@@ | Crystallex International Corp. | 238,452 | |||||||
| 79,600 | @,@@, L | Eldorado Gold Corp. | 445,760 | |||||||
| 84,700 | @,@@ | Entree Gold, Inc. | 127,897 | |||||||
| 14,400 | @,@@ | Gammon Lake Resources, Inc. | 218,736 | |||||||
| 11,600 | @@,L, X | Impala Platinum Holdings Ltd. ADR | 289,420 | |||||||
| 215,500 | @,@@, L | Ivanhoe Mines Ltd. | 1,991,220 | |||||||
| 174,000 | @,@@ | Lihir Gold Ltd. | 4,247,340 | |||||||
| 215,200 | @@ | Newcrest Mining Ltd. ADR | 4,398,451 | |||||||
| 47,800 | @,@@ | Orezone Resources, Inc. | 72,178 | |||||||
| 31,532,654 | ||||||||||
134
Table of Contents
| Shares | Value | |||||||||
| Oil & Gas: 0.1% | ||||||||||
| 2,500 | @@ | Nexen, Inc. | $ | 137,025 | ||||||
| 137,025 | ||||||||||
| Oil & Gas Services: 1.2% | ||||||||||
| 29,400 | @@,L | Technip SA | 2,073,876 | |||||||
| 2,073,876 | ||||||||||
| �� | Telecommunications: 0.6% | |||||||||
| 40,500 | @@ | KT Corp. ADR | 1,028,700 | |||||||
| 1,028,700 | ||||||||||
| Transportation: 4.5% | ||||||||||
| 83,600 | CSX Corp. | 2,997,896 | ||||||||
| 34,100 | L | Genco Shipping & Trading Ltd. | 809,875 | |||||||
| 59,500 | @@ | Navios Maritime Holdings, Inc. | 314,160 | |||||||
| 82,500 | @@ | Stolt-Nielsen SA ADR | 2,532,747 | |||||||
| 7,769 | @@,L | TNT NV ADR | 326,065 | |||||||
| 5,700 | Union Pacific Corp. | 515,964 | ||||||||
| 7,496,707 | ||||||||||
| Water: 0.5% | ||||||||||
| 27,900 | @@,L | Cia de Saneamento Basico do Estado de Sao Paulo | 837,000 | |||||||
| 837,000 | ||||||||||
| Total Common Stock (Cost $95,194,910) | 113,570,667 | |||||||||
| Principal | ||||||||||
| Amount | Value | |||||||||
| CONVERTIBLE BONDS: 9.1% | ||||||||||
| Aerospace/ Defense: 2.2% | ||||||||||
| $ | 3,820,000 | C | EDO Corp., 4.000%, due 11/15/25 | $ | 3,624,225 | |||||
| 3,624,225 | ||||||||||
| Airlines: 1.0% | ||||||||||
| 1,820,000 | C,L | JetBlue Airways Corp., 3.500%, due 07/15/33 | 1,747,200 | |||||||
| 1,747,200 | ||||||||||
| Computers: 0.2% | ||||||||||
| 290,000 | C | Quantum Corp., 4.375%, due 08/01/10 | 262,813 | |||||||
| 262,813 | ||||||||||
| Electrical Components & Equipment: 1.3% | ||||||||||
| 2,639,100 | C | GrafTech International Ltd., 1.625%, due 01/15/24 | 2,187,154 | |||||||
| 2,187,154 | ||||||||||
| Electronics: 0.4% | ||||||||||
| 172,000 | C | FEI Co., 5.500%, due 08/15/08 | 171,785 | |||||||
| 488,000 | C | SCI Systems, Inc., 3.000%, due 03/15/07 | 485,560 | |||||||
| 657,345 | ||||||||||
| Environmental Control: 0.6% | ||||||||||
| 1,141,000 | C | Allied Waste North America, Inc., 4.250%, due 04/15/34 | 1,091,081 | |||||||
| 1,091,081 | ||||||||||
| Media: 1.2% | ||||||||||
| 2,022,000 | C | EchoStar Communications Corp., 5.750%, due 05/15/08 | 2,062,440 | |||||||
| 2,062,440 | ||||||||||
| Mining: 0.7% | ||||||||||
| 379,000 | @@,C | Apex Silver Mines Ltd., 2.875%, due 03/15/24 | 335,415 | |||||||
| 862,000 | C | Coeur d’Alene Mines Corp., 1.250%, due 01/15/24 | 860,923 | |||||||
| 1,196,338 | ||||||||||
| Semiconductors: 1.2% | ||||||||||
| 655,000 | C | Axcelis Technologies, Inc., 4.250%, due 01/15/07 | 654,383 | |||||||
| 845,000 | Credence Systems Corp., 1.500%, due 05/15/08 | 774,231 | ||||||||
| 180,000 | C | International Rectifier Corp., 4.250%, due 07/15/07 | 179,325 | |||||||
| 356,000 | C | Triquint Semiconductor, Inc., 4.000%, due 03/01/07 | 355,110 | |||||||
| 1,963,049 | ||||||||||
| Telecommunications: 0.3% | ||||||||||
| 617,000 | C,L | Adaptec, Inc., 0.750%, due 12/22/23 | 559,928 | |||||||
| 559,928 | ||||||||||
| Total Convertible Bonds (Cost $14,764,020) | 15,351,573 | |||||||||
| Total Long-Term Investments (Cost $109,958,930) | 128,922,240 | |||||||||
135
Table of Contents
| Principal | ||||||||||
| Amount | Value | |||||||||
| SHORT-TERM INVESTMENTS: 35.4% | ||||||||||
| U.S. Government Agency Obligations: 20.1% | ||||||||||
| $ | 33,718,000 | Federal Home Loan Bank, 4.980%, due 12/01/06 | $ | 33,713,336 | ||||||
| Total U.S. Government Agency Obligations (Cost $33,713,336) | 33,713,336 | |||||||||
| Securities Lending CollateralCC: 15.3% | ||||||||||
| 25,802,088 | The Bank of New York Institutional Cash Reserves Fund | 25,802,088 | ||||||||
| Total Securities Lending Collateral (Cost $25,802,088) | 25,802,088 | |||||||||
| Total Short-Term Investments (Cost $59,515,424) | 59,515,424 | |||||||||
Total Investments in Securities (Cost $169,474,354)* | 112.0 | % | $ | 188,437,664 | ||||||||
Other Assets and Liabilities-Net | (12.0 | ) | (20,224,140 | ) | ||||||||
Net Assets | 100.0 | % | $ | 168,213,524 | ||||||||
| @ | Non-income producing security | |
| @@ | Foreign Issuer | |
| ADR | American Depositary Receipt | |
| GDR | Global Depositary Receipt | |
| # | Securities with purchases pursuant to Rule 144A, under the Securities Act of 1933 and may not be resold subject to that rule except to qualified institutional buyers. These securities have been determined to be liquid under the guidelines established by the Funds’ Board of Directors/Trustees. | |
| C | Bond may be called prior to maturity date. | |
| cc | Securities purchased with cash collateral for securities loaned. | |
| L | Loaned Security, a portion or all of the security is on loan at November 30, 2006. | |
| X | Fair value determined by ING Funds Valuation Committee appointed by the Funds’ Board of Directors/Trustees. | |
| * | Cost for federal income tax purposes is $169,564,708. Net unrealized appreciation consists of: |
| Gross Unrealized Appreciation | $ | 19,900,633 | ||
| Gross Unrealized Depreciation | (1,027,677 | ) | ||
| Net Unrealized Appreciation | $ | 18,872,956 | ||
136
Table of Contents
| Shares | Value | |||||||||
| COMMON STOCK: 96.8% | ||||||||||
| Auto Manufacturers: 1.7% | ||||||||||
| 64,600 | Wabash National Corp. | $ | 949,620 | |||||||
| 949,620 | ||||||||||
| Auto Parts & Equipment: 25.1% | ||||||||||
| 104,470 | American Axle & Manufacturing Holdings, Inc. | 1,911,801 | ||||||||
| 149,467 | ArvinMeritor, Inc. | 2,587,274 | ||||||||
| 120,270 | Cooper Tire & Rubber Co. | 1,591,172 | ||||||||
| 261,100 | @ | Dana Corp. | 428,204 | |||||||
| 98,169 | @ | Goodyear Tire & Rubber Co. | 1,654,148 | |||||||
| 65,390 | Lear Corp. | 2,023,821 | ||||||||
| 104,090 | Superior Industries International | 2,053,696 | ||||||||
| 269,850 | @ | Visteon Corp. | 2,169,594 | |||||||
| 14,419,710 | ||||||||||
| Banks: 3.0% | ||||||||||
| 105,590 | @@ | First Bancorp | 1,058,012 | |||||||
| 106,080 | @@ | W Holding Co., Inc. | 651,331 | |||||||
| 1,709,343 | ||||||||||
| Chemicals: 3.2% | ||||||||||
| 15,200 | Chemtura Corp. | 147,136 | ||||||||
| 49,330 | Sensient Technologies Corp. | 1,175,534 | ||||||||
| 143,620 | Wellman, Inc. | 505,542 | ||||||||
| 1,828,212 | ||||||||||
| Commercial Services: 1.7% | ||||||||||
| 33,440 | Kelly Services, Inc. | 974,442 | ||||||||
| 974,442 | ||||||||||
| Computers: 3.0% | ||||||||||
| 907,960 | @ | Gateway, Inc. | 1,725,124 | |||||||
| 1,725,124 | ||||||||||
| Diversified Financial Services: 0.9% | ||||||||||
| 127,250 | @@ | Doral Financial Corp. | 515,363 | |||||||
| 515,363 | ||||||||||
| Electronics: 6.0% | ||||||||||
| 223,780 | @ | Kemet Corp. | 1,644,783 | |||||||
| 207,150 | @ | Sanmina-SCI Corp. | 766,455 | |||||||
| 145,390 | @ | Stoneridge, Inc. | 1,052,624 | |||||||
| 3,463,862 | ||||||||||
| Food: 5.8% | ||||||||||
| 111,400 | Chiquita Brands International, Inc. | 1,593,020 | ||||||||
| 101,610 | Del Monte Foods Co. | 1,147,177 | ||||||||
| 212,460 | @ | Interstate Bakeries | 594,888 | |||||||
| 3,335,085 | ||||||||||
| Hand/ Machine Tools: 1.6% | ||||||||||
| 57,120 | LS Starrett Co. | 891,643 | ||||||||
| 891,643 | ||||||||||
| Home Builders: 3.9% | ||||||||||
| 143,729 | Coachmen Industries, Inc. | 1,575,270 | ||||||||
| 200,900 | @ | National RV Holdings, Inc. | 683,060 | |||||||
| 2,258,330 | ||||||||||
| Home Furnishings: 2.8% | ||||||||||
| 49,290 | La-Z-Boy, Inc. | 580,636 | ||||||||
| 11,968 | Whirlpool Corp. | 1,020,870 | ||||||||
| 1,601,506 | ||||||||||
| Household Products/ Wares: 2.6% | ||||||||||
| 61,700 | American Greetings Corp. | 1,469,077 | ||||||||
| 1,469,077 | ||||||||||
| Insurance: 7.5% | ||||||||||
| 24,213 | Kansas City Life Insurance Co. | 1,247,938 | ||||||||
| 109,428 | @ | KMG America Corp. | 919,195 | |||||||
| 76,310 | Phoenix Cos., Inc. | 1,232,407 | ||||||||
| 105,107 | @ | PMA Capital Corp. | 932,299 | |||||||
| 4,331,839 | ||||||||||
| Leisure Time: 2.0% | ||||||||||
| 84,346 | @ | K2, Inc. | 1,140,358 | |||||||
| 1,140,358 | ||||||||||
| Machinery — Diversified: 5.6% | ||||||||||
| 31,166 | Briggs & Stratton Corp. | 844,287 | ||||||||
| 147,256 | @ | Tecumseh Products Co. | 2,341,370 | |||||||
| 3,185,657 | ||||||||||
| Retail: 4.5% | ||||||||||
| 44,600 | @ | Cost Plus, Inc. | 480,342 | |||||||
| 12,631 | @ | Jo-Ann Stores, Inc. | 249,210 | |||||||
| 151,210 | Pier 1 Imports, Inc. | 1,005,547 | ||||||||
| 87,060 | @ | Sharper Image Corp. | 843,611 | |||||||
| 2,578,710 | ||||||||||
| Semiconductors: 4.1% | ||||||||||
| 110,610 | @ | Agere Systems, Inc. | 1,982,131 | |||||||
| 324,700 | @ | ESS Technology | 386,393 | |||||||
| 2,368,524 | ||||||||||
| Software: 2.1% | ||||||||||
| 231,600 | @ | Borland Software Corp. | 1,225,164 | |||||||
| 1,225,164 | ||||||||||
| Telecommunications: 9.7% | ||||||||||
| 283,410 | @ | 3Com Corp. | 1,187,488 | |||||||
| 426,016 | @ | Adaptec, Inc. | 1,857,430 | |||||||
| 197,293 | @ | Cincinnati Bell, Inc. | 891,764 | |||||||
| 182,210 | @ | Utstarcom, Inc. | 1,618,023 | |||||||
| 5,554,705 | ||||||||||
| Total Common Stock (Cost $64,755,124) | 55,526,274 | |||||||||
| Principal | ||||||||||
| Amount | Value | |||||||||
| SHORT-TERM INVESTMENTS: 0.4% | ||||||||||
| U.S. Government Agency Obligations: 0.4% | ||||||||||
| $ | 219,000 | Federal Home Loan Bank, 4.980%, due 12/01/06 | $ | 218,970 | ||||||
| Total Short-Term Investments (Cost $218,970) | 218,970 | |||||||||
Total Investments in Securities (Cost $64,974,094)* | 97.2 | % | $ | 55,745,244 | ||||||||
Other Assets and Liabilities-Net | 2.8 | 1,614,171 | ||||||||||
Net Assets | 100.0 | % | $ | 57,359,415 | ||||||||
| @ | Non-income producing security | |
| @@ | Foreign Issuer | |
| * | Cost for federal income tax purposes is $65,297,796. Net unrealized depreciation consists of: |
| Gross Unrealized Appreciation | $ | 5,633,283 | ||
| Gross Unrealized Depreciation | (15,185,835 | ) | ||
| Net Unrealized Depreciation | $ | (9,552,552 | ) | |
137
Table of Contents
| Shares | Value | |||||||||
| COMMON STOCK: 93.9% | ||||||||||
| Auto Parts & Equipment: 0.9% | ||||||||||
| 26,400 | @ | Commercial Vehicle Group, Inc. | $ | 617,760 | ||||||
| 617,760 | ||||||||||
| Banks: 2.0% | ||||||||||
| 50,786 | @ | Bancorp, Inc. | 1,361,573 | |||||||
| 1,361,573 | ||||||||||
| Computers: 1.0% | ||||||||||
| 283,200 | @ | Quantum Corp. | 668,352 | |||||||
| 668,352 | ||||||||||
| Diversified Financial Services: 1.4% | ||||||||||
| 20,200 | IndyMac Bancorp., Inc. | 928,190 | ||||||||
| 928,190 | ||||||||||
| Electrical Components & Equipment: 3.1% | ||||||||||
| 49,000 | @ | General Cable Corp. | 2,082,500 | |||||||
| 2,082,500 | ||||||||||
| Electronics: 2.1% | ||||||||||
| 114,600 | Keithley Instruments, Inc. | 1,441,668 | ||||||||
| 1,441,668 | ||||||||||
| Environmental Control: 1.7% | ||||||||||
| 22,200 | @ | Aleris International, Inc. | 1,156,842 | |||||||
| 1,156,842 | ||||||||||
| Food: 4.4% | ||||||||||
| 170,800 | Del Monte Foods Co. | 1,928,332 | ||||||||
| 54,854 | Premium Standard Farms, Inc. | 1,041,677 | ||||||||
| 2,970,009 | ||||||||||
| Forest Products & Paper: 14.2% | ||||||||||
| 90,500 | Bowater, Inc. | 1,972,900 | ||||||||
| 137,000 | @ | Buckeye Technologies, Inc. | 1,608,380 | |||||||
| 86,500 | Glatfelter | 1,281,930 | ||||||||
| 53,800 | @ | Jefferson Smurfit Corp. US | 577,274 | |||||||
| 131,500 | @@ | Sappi Ltd. ADR | 2,121,096 | |||||||
| 139,200 | Wausau Paper Corp. | 2,082,432 | ||||||||
| 9,644,012 | ||||||||||
| Hand/ Machine Tools: 5.7% | ||||||||||
| 34,000 | Kennametal, Inc. | 2,076,024 | ||||||||
| 29,000 | Lincoln Electric Holdings, Inc. | 1,764,650 | ||||||||
| 3,840,674 | ||||||||||
| Home Furnishings: 1.9% | ||||||||||
| 88,000 | Hooker Furniture Corp. | 1,307,680 | ||||||||
| 1,307,680 | ||||||||||
| Household Products/ Wares: 4.0% | ||||||||||
| 83,631 | @ | Fossil, Inc. | 1,757,924 | |||||||
| 30,400 | WD-40 Co. | 988,000 | ||||||||
| 2,745,924 | ||||||||||
| Insurance: 1.4% | ||||||||||
| 68,200 | @ | PMA Capital Corp. | 604,934 | |||||||
| 140,200 | @,@@ | Quanta Capital Holdings Ltd. | 318,254 | |||||||
| 923,188 | ||||||||||
| Iron/ Steel: 2.9% | ||||||||||
| 89,000 | Gibraltar Industries, Inc. | 1,949,990 | ||||||||
| 1,949,990 | ||||||||||
| Machinery — Diversified: 7.6% | ||||||||||
| 46,800 | Albany International Corp. | 1,460,160 | ||||||||
| 53,650 | @ | Kadant, Inc. | 1,268,286 | |||||||
| 78,200 | Sauer-Danfoss, Inc. | 2,420,290 | ||||||||
| 5,148,736 | ||||||||||
| Metal Fabricate/ Hardware: 0.8% | ||||||||||
| 19,600 | @ | RBC Bearings, Inc. | 569,576 | |||||||
| 569,576 | ||||||||||
| Mining: 2.7% | ||||||||||
| 43,800 | @ | Century Aluminum Co. | 1,868,070 | |||||||
| 1,868,070 | ||||||||||
| Miscellaneous Manufacturing: 4.0% | ||||||||||
| 114,421 | @ | Griffon Corp. | 2,727,797 | |||||||
| 2,727,797 | ||||||||||
| Oil & Gas: 8.8% | ||||||||||
| 21,600 | @ | Bill Barrett Corp. | 680,400 | |||||||
| 33,500 | @ | Denbury Resources, Inc. | 983,225 | |||||||
| 57,650 | @ | Quest Resource Corp. | 649,716 | |||||||
| 46,700 | Range Resources Corp. | 1,451,903 | ||||||||
| 162,100 | @ | Warren Resources, Inc. | 2,167,277 | |||||||
| 5,932,521 | ||||||||||
| Oil & Gas Services: 2.9% | ||||||||||
| 98,400 | @,@@ | Acergy SA ADR | 1,938,480 | |||||||
| 1,938,480 | ||||||||||
| Real Estate Investment Trusts: 6.9% | ||||||||||
| 82,650 | Alesco Financial, Inc. | 834,765 | ||||||||
| 110,100 | Anthracite Capital, Inc. | 1,394,967 | ||||||||
| 65,600 | HomeBanc Corp. | 276,176 | ||||||||
| 149,100 | New York Mortgage Trust, Inc. | 457,737 | ||||||||
| 51,850 | RAIT Investment Trust | 1,728,161 | ||||||||
| 4,691,806 | ||||||||||
| Retail: 4.0% | ||||||||||
| 107,700 | Casey’s General Stores, Inc. | 2,680,653 | ||||||||
| 2,680,653 | ||||||||||
| Savings & Loans: 1.5% | ||||||||||
| 51,000 | @ | Franklin Bank Corp. | 1,000,620 | |||||||
| 1,000,620 | ||||||||||
| Semiconductors: 1.4% | ||||||||||
| 98,600 | @ | Mattson Technology, Inc. | 937,686 | |||||||
| 937,686 | ||||||||||
| Telecommunications: 4.0% | ||||||||||
| 118,200 | @ | Aeroflex, Inc. | 1,425,492 | |||||||
| 41,650 | @ | CommScope, Inc. | 1,256,581 | |||||||
| 2,682,073 | ||||||||||
| Transportation: 2.6% | ||||||||||
| 95,425 | @ | Marten Transport Ltd. | 1,747,229 | |||||||
| 1,747,229 | ||||||||||
| Total Common Stock (Cost $57,670,276) | 63,563,609 | |||||||||
138
Table of Contents
| Principal | ||||||||||
| Amount | Value | |||||||||
| SHORT-TERM INVESTMENTS: 6.0% | ||||||||||
| U.S. Government Agency Obligations: 6.0% | ||||||||||
| $ | 4,022,000 | Federal Home Loan Bank, 4.980%, due 12/01/06 | $ | 4,021,443 | ||||||
| Total Short-Term Investments (Cost $4,021,443) | 4,021,443 | |||||||||
Total Investments in Securities (Cost $61,691,719)* | 99.9 | % | $ | 67,585,052 | ||||||||
Other Assets and Liabilities-Net | 0.1 | 96,258 | ||||||||||
Net Assets | 100.0 | % | $ | 67,681,310 | ||||||||
| @ | Non-income producing security | |
| @@ | Foreign Issuer | |
| ADR | American Depositary Receipt | |
| * | Cost for federal income tax purposes is $61,735,909. Net unrealized appreciation consists of: |
| Gross Unrealized Appreciation | $ | 7,704,318 | ||
| Gross Unrealized Depreciation | (1,855,175 | ) | ||
| Net Unrealized Appreciation | $ | 5,849,143 | ||
139
Table of Contents
BOARD CONSIDERATION AND RE-APPROVAL OF INVESTMENT ADVISORY AND SUB-ADVISORY CONTRACTS
Section 15(c) of the Investment Company Act of 1940 (the “1940 Act”) provides that, after an initial period, the Funds’ existing investment advisory and sub-advisory contracts remain in effect only if the Boards of Directors/Trustees (the “Board”) of ING Equity Trust and ING Investment Fund, Inc., including a majority of the Directors/Trustees who have no direct or indirect interest in the advisory and sub-advisory contracts, and who are not “interested persons” of the Funds, as such term is defined under the 1940 Act (the “Independent Directors/Trustees”), annually review and renew them. In this regard, at a meeting held on November 9, 2006 the Board, including a majority of the Independent Directors/Trustees, considered whether to renew the investment advisory contracts (the “Advisory Contracts”) between ING Investments, LLC (the “Adviser”) and the Funds and the sub-advisory contracts (“Sub-Advisory Contracts”) with the sub-adviser to each Fund (the “Sub-Advisers”).
The Independent Directors/Trustees also held separate meetings on October 12, 2006 and November 7, 2006 to consider renewals of the Advisory Contracts and Sub-Advisory Contracts. Thus, references herein to factors considered and determinations made by the Independent Directors/Trustees include, as applicable, factors considered and determinations made on those earlier dates.
At the November 9, 2006 meeting, the Board voted to renew the Advisory and Sub-Advisory Contracts for the Funds. In reaching these decisions, the Board took into account information furnished throughout the year at regular Board meetings, as well as information prepared specifically in connection with the annual review process. The Board’s determination took into account a number of factors that its members believed, in light of the legal advice furnished to them by Kirkpatrick & Lockhart Preston Gates Ellis LLP (“K&L Gates”), their independent legal counsel, and their own business judgment, to be relevant. Further, while the Advisory Contracts and Sub-Advisory Contracts for all the Funds were considered at the same Board meeting, the Directors/Trustees considered each Fund’s advisory and sub-advisory relationships separately.
Provided below is an overview of the Board’s contract approval process in general, as well as a discussion of certain of the specific factors the Board considered at the November 9, 2006 meeting. While the Board gave its attention to the information furnished, at its request, that was most relevant to its consideration, discussed below are a number of the primary factors relevant to the Board’s consideration as to whether to renew the Advisory and Sub-Advisory Contracts for the one-year period ending November 30, 2007. Each Director/Trustee may have accorded different weight to the various factors in reaching his or her conclusions with respect to the Funds’ advisory and sub-advisory arrangements.
Overview of the Contract Renewal and Approval Process
In 2003, the Independent Directors/Trustees determined to undertake steps to further enhance the process under which the Board determines whether to renew existing advisory and sub-advisory arrangements for the funds in the ING Funds complex, including ING Equity Trust’s and ING Investment Fund, Inc.’s existing Advisory and Sub-Advisory Contracts, and to approve new advisory and sub-advisory arrangements. Among these measures, the Board: retained the services of an independent consultant with experience in the mutual fund industry to assist the Independent Directors/Trustees in working with the personnel employed by the Adviser or its affiliates who administer the Funds (“Management”) to identify the types of information presented to the Board to inform its deliberations with respect to advisory and sub-advisory relationships; established the format in which the information requested by the Board is provided to the Board; and determined the process for reviewing such information in connection with the Advisory and Sub-Advisory Contract renewal process. The end result was the implementation of the current process relied upon by the Board to review and analyze information in connection with the annual renewal of the Funds’ Advisory and Sub-Advisory Contracts, as well as its review and approval of new advisory relationships.
Since the foregoing approval and renewal process was implemented, the Board regularly has reviewed and refined the process. In addition, the Board established a Contracts Committee and two Investment Review Committees, including the Domestic Equity Funds Investment Review Committee (the “DE IRC”). The type and format of the information provided to the Board or its counsel to inform its approval and annual review and renewal process has been codified in the Funds’ “15(c) Methodology Guide” (the
140
Table of Contents
“Methodology Guide”). The Methodology Guide was developed under the direction of the Independent Directors/Trustees, and sets out a written blueprint under which the Independent Directors/Trustees request certain information necessary to facilitate a thorough and informed review in connection with the annual Advisory and Sub-Advisory Contract renewal process. Management provides Fund-specific information to the Independent Directors/Trustees based on the Methodology Guide through “Fund Analysis and Comparison Tables” or “FACT” sheets prior to the Independent Directors/Trustees’ review of Advisory and Sub-Advisory Contracts. In 2005, the Independent Directors/Trustees retained an independent firm to verify and test the accuracy of certain of this information for a representative sample of Funds in the ING Funds complex. The Independent Directors/Trustees have determined to conduct such testing periodically.
As part of a regular on-going process, the Board’s Contracts Committee recommends or considers recommendations from Management for refinements and other changes to the Methodology Guide and other aspects of the review process, and the Board’s Investment Review Committees, including the DE IRC, review benchmarks used to assess the performance of each Fund. The DE IRC also meets regularly with the Adviser and periodically with the Funds’ Sub-Advisers. The DE IRC may apply a heightened level of scrutiny in cases where performance has lagged a Fund’s relevant benchmark and/or peer group of investment companies.
The Board employed its process for reviewing contracts when considering the renewals of the Advisory and Sub-Advisory Contracts that would be effective through November 30, 2007. A number of the Board’s primary considerations and conclusions resulting from this process are discussed below.
Nature, Extent and Quality of Service
In determining whether to approve the Advisory Contracts and Sub-Advisory Contracts for the Funds for the year ending November 30, 2007, the Independent Directors/Trustees received and evaluated such information as they deemed necessary regarding the nature, extent and quality of services provided to the Funds by the Adviser and Sub-Advisers. This included information regarding the Adviser and Sub-Advisers to the Funds provided throughout the year at regular Board meetings, as well as information furnished for the November 9, 2006 Board meeting, which was held specifically to consider contract renewals for the period ending November 30, 2007. In addition, the Board’s Independent Directors/Trustees also held meetings on October 12 and November 7, prior to the November 9, 2006 meeting of the full Board, to consider the annual renewal of the Advisory and Sub-Advisory Contracts.
The materials requested by and provided to the Board and/or to K&L Gates prior to the November 2006 Board meeting included the following items: (1) FACT sheets for each Fund that provided information about the performance and expenses of the Fund and other similarly managed funds in a selected peer group (“Selected Peer Group”), as well as information about the Fund’s investment portfolio, objectives and strategies; (2) the Methodology Guide, which describes how the FACT sheets were prepared, including the manner in which benchmarks and Selected Peer Groups were selected and how profitability was determined; (3) responses from the Advisers and Sub-Advisers to a detailed series of questions posed by K&L Gates; (4) copies of each form of Advisory Contract and Sub-Advisory Contract; (5) copies of the Forms ADV for the Adviser and each Sub-Adviser to the Funds; (6) financial statements for the Adviser and each Sub-Adviser; (7) drafts of narrative summaries addressing key factors the Board customarily considers in evaluating the renewals of Advisory Contracts and Sub-Advisory Contracts, including a written analysis for each Fund of how performance and fees compare to its Selected Peer Group and/or designated benchmarks; and (8) other information relevant to the Board’s evaluations.
For each Fund, its Class A shares were used for purposes of certain comparisons to the funds in its Selected Peer Group. Class A shares were selected, as general matter, so that the Fund class with the longest performance history was compared to the analogous class of shares for each fund in the Selected Peer Group. The mutual funds chosen for inclusion in a Fund’s Selected Peer Group were selected based upon criteria designed to mirror the Fund class being compared to the Selected Peer Group.
In arriving at its conclusions with respect to the Advisory Contracts, the Board was mindful of the “manager-of-managers” platform of the ING Funds. The Board also considered the techniques that the Adviser developed, at the Board’s direction, to screen and perform due diligence on Sub-Advisers that are
141
Table of Contents
recommended to the Board to manage the Funds’ portfolios. The Board noted the resources that the Adviser has committed to the Board and the DE IRC to assist the Board and members of the DE IRC with their assessment of the investment performance of the Funds on an ongoing basis throughout the year. This includes the appointment of a Chief Investment Risk Officer and his staff, who report directly to the Board and who have developed attribution analyses and other metrics used by the Investment Review Committees, including the DE IRC, to analyze the key factors underlying investment performance for the Funds.
The Board also noted the techniques used by the Adviser to monitor the performance of the Sub-Advisers and took note of the pro-active approach that the Adviser, working in cooperation with the Board’s Investment Review Committees, including the DE IRC, has taken to advocate or recommend, when it believed appropriate, changes intended to assist in improving the performance of the Funds. These changes have historically included modifications in personnel responsible for managing a Fund and/or changing the Sub-Adviser to a Fund.
In considering the Funds’ Advisory Contracts, the Board also considered the extent of benefits provided to the Funds’ shareholders, beyond advisory services, from being part of the ING family of Funds. This includes, in most cases, the right to exchange or transfer investments, without a sales charge, between the same class of shares of such Funds or among Funds available on a product platform, and the wide variety in the types of Funds available for exchange or transfer.
The Board also took into account the Adviser’s extensive efforts in recent years to reduce the expenses of the ING Funds through re-negotiated arrangements with the ING Funds’ service providers. In addition, the Board considered the extensive efforts of the Adviser and expense it incurred in recent years to help make the ING Funds complex more efficient by reducing the number of funds through combinations of similar funds.
Further, the Board received periodic reports showing that the investment policies and restrictions for each Fund were consistently complied with and other periodic reports covering matters such as compliance by Adviser and Sub-Adviser personnel with codes of ethics. The Board considered reports from the Funds’ Chief Compliance Officer (“CCO”) evaluating the regulatory compliance systems of the Adviser and each Sub-Adviser and procedures reasonably designed by them to assure compliance with the federal securities laws, including those related to late trading and market timing, best execution, fair value pricing, proxy voting procedures, and trade allocation, among others. The Board considered the implementation by the Adviser and certain Sub-Advisers of enhanced compliance policies and procedures in response to SEC rule changes and other regulatory initiatives. The Board also took into account the CCO’s annual and periodic reports with respect to service provider compliance and his recommendations regarding service providers’ compliance programs. In this regard, the Board also considered the policies and procedures developed by the CCO in consultation with the Board’s Compliance Committee that guide the CCO’s compliance oversight function.
The Board reviewed the level of staffing, quality and experience of each Fund’s portfolio management team. The Board took into account the respective resources and reputations of the Adviser and the Sub-Advisers, and evaluated the ability of the Adviser and the Sub-Advisers to attract and retain qualified investment advisory personnel. The Board also considered the adequacy of the resources committed to the Funds (and other relevant funds in the ING Funds complex) by the Adviser and the Sub-Advisers, and whether those resources are commensurate with the needs of the Funds and are appropriate to attempt to sustain expected levels of performance, compliance, and other needs.
Based on their deliberations and the materials presented to them, the Board concluded that the advisory and related services provided by the Adviser and Sub-Advisers are appropriate in light of the Funds’ operations, the competitive landscape of the investment company business, and investor needs, and that the nature and quality of the overall services provided by the Adviser and Sub-Advisers were appropriate.
Fund Performance
In assessing advisory and sub-advisory relationships, the Board placed emphasis on the investment performance of each Fund, taking into account the importance of such performance to Fund shareholders. While the Board considered the performance reports and discussions with portfolio managers at Board and Committee meetings during
142
Table of Contents
the year, particular attention in assessing performance was given to the Fund FACT sheets furnished in advance of the November meeting of the Independent Directors/Trustees. The FACT sheet prepared for each Fund included its investment performance compared to the Morningstar category median, Lipper category median, Selected Peer Group and Fund’s primary benchmark. The Board’s findings specific to each Fund’s performance are discussed under “Fund-by-Fund Analysis,” below.
Economies of Scale
In considering the reasonableness of advisory fees, the Board also considered whether economies of scale will be realized by the Adviser as a Fund grows larger and the extent to which this is reflected in the level of management fee rates charged. In this regard, the Board noted any breakpoints in advisory fee schedules that resulted in a lower advisory fee because a Fund achieved sufficient asset levels to receive a breakpoint discount. In the case of sub-advisory fees, the Board considered that breakpoints would inure to the benefit of the Adviser, except to the extent that these savings are passed through in the form of breakpoints on advisory fees that resulted in savings to the Fund. For a Fund that did not have breakpoint discounts on advisory fees, but did benefit from waivers to or reimbursements of advisory or other fees, the Board also considered the extent to which economies of scale could effectively be realized through such waivers, reimbursements, or expense reductions.
In evaluating economies of scale, the Independent Directors/Trustees considered a management report presented to them and also considered an evaluation and analysis presented to them on November 8, 2006 by an independent consultant regarding fee breakpoint arrangements.
Information about Services to Other Clients
The Board requested, and if received considered, information about the nature of services and fee rates offered by the Adviser and the Sub-Advisers to other clients, including other registered investment companies and institutional accounts. When rates offered to other clients differed materially from those charged to the Funds, the Board considered the underlying rationale provided by the Adviser and/or Sub-Advisers for these differences. For the unaffiliated Sub-Advisers, the Board did not view this information as imperative to its deliberations because of the arms-length nature of the negotiations between the Adviser and unaffiliated Sub-Advisers with respect to sub-advisory fees. The Board also noted that the fee rates charged to the Funds and similar institutional clients may differ materially due to the different services and additional regulatory overlay associated with registered investment companies, such as the Funds.
Fee Rates and Profitability
The Board reviewed and considered each contractual investment advisory fee rate, combined with the administrative fee rate, payable by each Fund to the Adviser. The Board also considered the contractual sub-advisory fee rates payable by the Adviser to each Sub-Adviser for sub-advisory services. In addition, the Board reviewed and took into account existing and proposed fee waivers and expense limitations applicable to the fees payable by the Funds.
The Board considered the fee structures of the Funds as they relate to the services provided under the Contracts, and the potential fall-out benefits to the Adviser and Sub-Advisers, and their respective affiliates, from their association with the Funds. For each Fund, the Board determined that the fees payable to the Adviser and Sub-Advisers are reasonable for the services that each performs, which were considered in light of the nature and quality of the services that each has performed and is expected to perform through the year ending November 30, 2007.
For each Fund, the Board considered information on revenues, costs and profits realized by the Adviser, which was prepared by Management in accordance with the allocation methodology (including assumptions) specified in the Methodology Guide. In analyzing the profitability of the Adviser in connection with its services to a Fund, the Board took into account the sub-advisory fee rate payable by the Adviser to the Sub-Adviser to that Fund. The Board also considered information that it requested and was provided by Management with respect to the profitability of service providers affiliated with the Adviser, as well as information provided by certain Sub-Advisers with respect to their profitability. In the case of non-affiliated Sub-Advisers, the Board gave less weight to profitability considerations, or did not view this data as imperative to its deliberations, given the arms-length nature of the relationship between
143
Table of Contents
the Adviser and these Sub-Advisers with respect to the negotiation of sub-advisory fees.
The Board determined that it had requested and received sufficient information to gain a reasonable understanding regarding the Adviser’s and affiliated Sub-Advisers’ profitability. The Board also recognized that profitability analysis is not an exact science and there is no uniform methodology for determining profitability for this purpose. In this context, the Board realized that Management’s calculations regarding its costs incurred in establishing the infrastructure necessary for the Funds’ operations may not be fully reflected in the expenses allocated to each Fund in determining profitability, and that the information presented may not portray all of the costs borne by Management nor capture Management’s entrepreneurial risk associated with offering and managing a mutual fund complex in today’s regulatory environment.
In their review of advisory fee rates, the Independent Directors/Trustees have, from time to time, requested the Adviser, and the Adviser has agreed, to implement remedial actions for certain Funds. These remedial actions have included, among others: reductions in expense caps; the merger of certain Funds with and into comparable Funds; and changes to the portfolio manager managing a Fund. The Independent Directors/Trustees have requested these adjustments primarily on the basis of: (a) a Fund’s performance, as compared to its Selected Peer Group; (b) the performance of a Fund, as compared to its benchmarks; or (c) a Fund’s expenses in relation to its Selected Peer Group.
Based on the information on revenues, costs, and profitability considered by the Board, after considering the factors described in this section, as well as any remedial actions requested by the Independent Directors/Trustees and agreed to by the Adviser, the Board concluded that the profits, if any, realized by the Adviser and Sub-Advisers were not excessive. In making its determinations, the Board considered that the Adviser had incentives to negotiate the most favorable fees from unaffiliated Sub-Advisers, and it based its conclusions on the reasonableness of the sub-advisory fees of the Sub-Advisers primarily on the factors described for each Fund below and, in the case of non-affiliated Sub-Advisers, in reliance on the arms-length nature of the negotiations between the Adviser and Sub-Advisers with respect to sub-advisory fees.
Fund-by-Fund Analysis
The following paragraphs outline certain of the specific factors that the Board considered, and the conclusions reached, at its November 2006 meeting in relation to renewing each Fund’s current Advisory Contract and its Sub-Advisory Contract for the year ending November 30, 2007. These specific factors are in addition to those considerations discussed above. In each case, the Fund’s performance was compared to its Morningstar category median and its primary benchmark, a broad-based securities market index that appears in the Fund’s prospectus. Each Fund’s management fee and expense ratio were compared to the fees and expense ratios of the funds in its Selected Peer Group.
ING Real Estate Fund
In considering whether to approve the renewal of the Advisory and Sub-Advisory Contracts for ING Real Estate Fund, the Board considered that, based on performance data for the periods ended June 30, 2006: (1) the Fund outperformed its Morningstar category median for all periods presented; (2) the Fund outperformed its primary benchmark for all periods presented; and (3) the Fund is ranked in the first (highest) quintile of its Morningstar category for the year-to-date period, in the second quintile for the most recent calendar quarter and one-year periods, and in the third quintile for the three-year period.
In considering the fees payable under the Advisory and Sub-Advisory Contracts for the Fund, the Board took into account the factors described above and also considered: (1) the fairness of the compensation under an Advisory Contract with level fees that does not include breakpoints; (2) the pricing structure (including the expense ratio to be borne by shareholders) of the Fund, as compared to its Selected Peer Group, including that: (a) the management fee (inclusive of an advisory fee and a 0.10% administration fee) for the Fund is below the median and the average management fees of the funds in its Selected Peer Group; and (b) the expense ratio for the Fund is below the median and the average expense ratios of the funds in the Selected Peer Group.
After its deliberation, the Board reached the following conclusions: (1) the Fund’s management fee rate is reasonable in the context of all factors considered by the Board; (2) the Fund’s expense ratio is reasonable in the context of all factors considered by the Board; (3) the Fund’s performance is
144
Table of Contents
reasonable in the context of all factors considered by the Board; and (4) the sub-advisory fee rate payable by the Adviser to the Sub-Adviser is reasonable in the context of all factors considered by the Board. Based on these conclusions and other factors, the Board voted to renew the Advisory and Sub-Advisory Contracts for the Fund for the year ending November 30, 2007. During this renewal process, different Board members may have given different weight to different individual factors and related conclusions.
ING Disciplined LargeCap Fund
In considering whether to approve the renewal of the Advisory and Sub-Advisory Contracts for ING Disciplined LargeCap Fund, the Board considered that, based on performance data for the periods ended June 30, 2006: (1) the Fund underperformed its Morningstar category median and its primary benchmark for all periods presented; and (2) the Fund is ranked in the third quintile of its Morningstar category for the most recent calendar quarter and three-year periods, and in the fourth quintile for the year-to-date, one- and five-year periods. In analyzing this performance data, the Board also took into account: (1) Management’s representations that in December 2005, there was a change in portfolio manager; and (2) that the Board approved, at its May 25, 2006 meeting, the merger of ING Disciplined LargeCap Fund with and into ING Fundamental Research Fund and that this merger is expected to occur in January 2007 if approved by the Fund’s shareholders. In considering the fees payable under the Advisory and Sub-Advisory Contracts for the Fund, the Board took into account the factors described above and also considered: (1) the fairness of the compensation under an Advisory Contract with level fees that does not include breakpoints; (2) the pricing structure (including the expense ratio to be borne by shareholders) of the Fund, as compared to its Selected Peer Group, including Management’s analysis that: (a) the management fee (inclusive of the advisory fee and a 0.10% administration fee) for the Fund is above the median but below the average management fees of the funds in its Selected Peer Group; and (b) the expense ratio for the Fund is below the median and average expense ratios of the funds in its Selected Peer Group.
After its deliberation, the Board reached the following conclusions: (1) the Fund’s management fee rate is reasonable in the context of all factors considered by the Board; (2) the Fund’s expense ratio is reasonable in the context of all factors considered by the Board; (3) the Portfolio’s performance is reasonable in the context of all factors considered by the Board; and (4) the sub-advisory fee rate payable by the Adviser to the Sub-Adviser is reasonable in the context of all factors considered by the Board. Based on these conclusions and other factors, the Board voted to renew the Advisory and Sub-Advisory Contracts for the Fund for the year ending November 30, 2007. During this renewal process, different Board members may have given different weight to different individual factors and related conclusions.
ING Fundamental Research Fund
In considering whether to approve the renewal of the Advisory and Sub-Advisory Contracts for ING Fundamental Research Fund, the Board considered that, based on performance data for the periods ended June 30, 2006: (1) the Fund underperformed its Morningstar category median and its primary benchmark for the most recent calendar quarter and year-to-date periods; and (2) the Fund is ranked in the fourth quintile of its Morningstar category for the year-to-date period and in the fifth (lowest) quintile for the most recent calendar quarter.
In analyzing this performance data, the Board took into account: (1) Management’s analysis of underperformance during certain periods, including its representations that stock selection in certain sectors had a negative effect on performance; and (2) the Fund commenced operations on January 2006, and therefore had a limited operating history for purposes of analyzing Fund performance.
In considering the fees payable under the Advisory and Sub-Advisory Contracts for ING Fundamental Research Fund, the Board took into account the factors described above and also considered: (1) the fairness of the compensation under an Advisory Contract with a breakpoint fee schedule where the asset level necessary to achieve a breakpoint discount had not been reached by the Fund; and (2) the pricing structure (including the expense ratio to be borne by shareholders) of the Fund, as compared to its Selected Peer Group, including that: (a) the management fee (inclusive of an advisory fee and a 0.10% administration fee) for the Fund is below the median and the average management fees of the funds in its Selected Peer Group; and (b) the expense ratio for the
145
Table of Contents
Fund is below the median and average expense ratios of the funds in its Selected Peer Group.
After its deliberation, the Board reached the following conclusions: (1) the Fund’s management fee rate is reasonable in the context of all factors considered by the Board; (2) the Fund’s expense ratio is reasonable in the context of all factors considered by the Board; (3) the sub-advisory fee rate payable by the Adviser to the Sub-Adviser is reasonable in the context of all factors considered by the Board; and (4) the Fund commenced operations on January 2006, and it is reasonable to permit the Fund to establish a longer operating history for purposes of evaluating performance. Based on these conclusions and other factors, the Board voted to renew the Advisory and Sub-Advisory Contracts for the Fund for the year ending November 30, 2007. During this renewal process, different Board members may have given different weight to different individual factors and related conclusions.
ING LargeCap Growth Fund
In considering whether to approve the renewal of the Advisory and Sub-Advisory Contracts for ING LargeCap Growth Fund, the Board considered that, based on performance data for the periods ended June 30, 2006: (1) the Fund underperformed its Morningstar category median and its primary benchmark for the most recent calendar quarter, year-to-date, one- and five-year periods, but outperformed both for the three-year period; and (2) the Fund is ranked in the third quintile of its Morningstar category for the three-year period, in the fourth quintile for the most recent calendar quarter and year-to-date periods, and in the fifth (lowest) quintile for the one- and five-year periods.
In analyzing this performance data, the Board also took into account: (1) Management’s analysis regarding the Sub-Adviser’s rationale for its underperformance, including its representations that the Fund’s underperformance for the most recent periods can be attributed primarily to poor sector allocation and stock selection in the technology sector; and (2) Management’s representations that it will continue to monitor the Fund.
In considering the fees payable under the Advisory and Sub-Advisory Contracts for ING LargeCap Growth Fund, the Board took into account the factors described above and also considered: (1) the fairness of the compensation under an Advisory Contract with a breakpoint fee schedule where the asset level necessary to achieve a breakpoint discount had not been reached by the Fund; (2) the pricing structure (including the expense ratio to be borne by shareholders) of ING LargeCap Growth Fund, as compared to its Selected Peer Group, including that: (a) the management fee (inclusive of a 0.10% administration fee) for the Fund is above the median and the average management fees of the funds in its Selected Peer Group; and (b) the expense ratio for the Fund is above the median and the average expense ratios of the funds in its Selected Peer Group.
After its deliberation, the Board reached the following conclusions: (1) the Fund’s management fee rate is reasonable in the context of all factors considered by the Board; (2) the Fund’s expense ratio is reasonable in the context of all factors considered by the Board; (3) the sub-advisory fee rate payable by the Adviser to the Sub-Adviser is reasonable in the context of all factors considered by the Board; and (4) the Fund’s performance is reasonable in the context of all factors considered by the Board. Based on these conclusions and other factors, the Board voted to renew the Advisory and Sub-Advisory Contracts for the Fund for the year ending November 30, 2007. During this renewal process, different Board members may have given different weight to different individual factors and related conclusions.
ING MidCap Opportunities Fund
In considering whether to approve the renewal of the Advisory and Sub-Advisory Contracts for ING MidCap Opportunities Fund, the Board considered that, based on performance data for the periods ended June 30, 2006: (1) the Fund outperformed its Morningstar category median and its primary benchmark for the year-to-date and one-year periods, but underperformed for the most recent calendar quarter, three- and five-year periods; and (2) the Fund is ranked in the second quintile of its Morningstar category for the year-to-date and one-year periods, in the third quintile for the most recent calendar quarter and three-year periods, and in the fourth quintile for the five-year period. In analyzing this performance data, the Board also took into consideration Management’s representations that in July 2005 there was a change in portfolio managers, and the performance has improved since this change was implemented.
146
Table of Contents
In considering the fees payable under the Advisory and Sub-Advisory Contracts for the Fund, the Board took into account the factors described above and also considered: (1) the fairness of the compensation under an Advisory Contract with a breakpoint fee schedule where the asset level necessary to achieve a breakpoint discount had not been reached by the Fund; (2) the pricing structure (including the expense ratio to be borne by shareholders) of the Fund, as compared to its Selected Peer Group, including that: (a) the management fee (inclusive of the advisory fee and a 0.10% administration fee) for the Fund is above the median and the average management fees of the funds in its Selected Peer Group; and (b) the expense ratio for the Fund is below the median and the average expense ratios of the funds in its Selected Peer Group. In analyzing this fee data, the Board took into account that: (1) in January 2005, at the direction of the Board following the 2004 contract renewal process, Management reduced the expense limit for the Fund; and (2) in January 2006, at the direction of the Board following the 2005 contract renewal process, Management further reduced the expense limit for the Fund.
After its deliberation, the Board reached the following conclusions: (1) the Fund’s management fee rate is reasonable in the context of all factors considered by the Board; (2) the Fund’s expense ratio is reasonable in the context of all factors considered by the Board; (3) the Fund’s more recent performance has improved, and it is reasonable to permit the Sub-Adviser to continue to manage the Fund to appropriately assess longer-term performance; and (4) the sub-advisory fee rate payable by the Adviser to the Sub-Adviser is reasonable in the context of all factors considered by the Board. Based on these conclusions and other factors, the Board voted to renew the Advisory and Sub-Advisory Contracts for the Fund for the year ending November 30, 2007. During this renewal process, different Board members may have given different weight to different individual factors and related conclusions.
ING Opportunistic LargeCap Fund
In considering whether to approve the renewal of the Advisory and Sub-Advisory Contracts for ING Opportunistic LargeCap Fund, the Board considered that based on performance data for the periods ended June 30, 2006: (1) the Fund outperformed its Morningstar category median and its primary benchmark for the most recent calendar quarter and year-to-date periods; and (2) the Fund is ranked in the first (highest) quintile of its Morningstar category for the year-to-date period and in the second quintile for the most recent calendar quarter.
In considering the fees payable under the Advisory and Sub-Advisory Contracts for ING Opportunistic LargeCap Fund, the Board took into account the factors described above and also considered: (1) the fairness of the compensation under an Advisory Contract with a breakpoint fee schedule where the asset level necessary to achieve a breakpoint discount had not been reached by the Fund; and (2) the pricing structure (including the expense ratio to be borne by shareholders) of the Fund, as compared to its Selected Peer Group, including that: (a) the management fee for the Fund (inclusive of the advisory fee and a 0.10% administration fee) is equal to the median and below the average management fees of the funds in its Selected Peer Group; and (b) the expense ratio for the Fund is below the median and the average expense ratios of the funds in its Selected Peer Group.
After its deliberation, the Board reached the following conclusions: (1) the Fund’s management fee rate is reasonable in the context of all factors considered by the Board; (2) the Fund’s expense ratio is reasonable in the context of all factors considered by the Board; (3) the Fund’s performance is reasonable in the context of all factors considered by the Board; and (4) the sub-advisory fee rate payable by the Adviser to the Sub-Adviser is reasonable in the context of all factors considered by the Board. Based on these conclusions and other factors, the Board voted to renew the Advisory and Sub-Advisory Contracts for the Fund for the year ending November 30, 2007. During this renewal process, different Board members may have given different weight to different individual factors and related conclusions.
ING SmallCap Opportunities Fund
In considering whether to approve the renewal of the Advisory and Sub-Advisory Contracts for ING SmallCap Opportunities Fund, the Board considered that, based on performance data for the periods ended June 30, 2006: (1) the Fund outperformed its Morningstar category median for the most recent calendar quarter, year-to-date, one- and three-year periods, but underperformed for the five- and ten-year periods; (2) the Fund outperformed its primary benchmark for the most recent calendar quarter and
147
Table of Contents
ten-year periods, but underperformed for the year-to-date, one-, three- and five-year periods; and (3) the Fund is ranked in the second quintile of its Morningstar category for the year-to-date and one-year periods, in the third quintile for the most recent calendar quarter and three-year periods, in the fourth quintile for the ten-year period, and in the fifth (lowest) quintile for the five-year period.
In analyzing this performance data, the Board took into account Management’s representations that in July 2005 a new portfolio manager assumed responsibility for the Fund to address the Board’s concerns regarding prior underperformance. The Board also noted Management’s assertion that the Fund’s performance has been reasonable for the year-to-date and one-year periods since this change was implemented.
In considering the fees payable under the Advisory and Sub-Advisory Contracts for ING SmallCap Opportunities Fund, the Board took into account the factors described above and also considered: (1) the economies of scale benefits to the Fund and its shareholders from breakpoint discounts applicable to the Fund’s advisory fees, which result in lower fees at higher asset levels; (2) the pricing structure (including the expense ratio to be borne by shareholders) of the Fund, as compared to its Selected Peer Group, including that: (a) the management fee (inclusive of the advisory fee and a 0.10% administration fee) for the Fund is above the median and the average management fees of the funds in its Selected Peer Group; and (b) the expense ratio for the Fund is below the median and average expense ratios of the funds in its Selected Peer Group.
After its deliberation, the Board reached the following conclusions: (1) the Fund’s management fee rate is reasonable in the context of all factors considered by the Board; (2) the Fund’s expense ratio is reasonable in the context of all factors considered by the Board; (3) a change in portfolio manager was implemented in July 2005, and it is reasonable to permit the Sub-Adviser to continue to manage the Fund to assess longer-term performance; and (4) the sub-advisory fee rate payable by the Adviser to the Sub-Adviser is reasonable in the context of all factors considered by the Board. Based on these conclusions and other factors, the Board voted to renew the Advisory and Sub-Advisory Contracts for the Fund for the year ending November 30, 2007. During this renewal process, different Board members may have given different weight to different individual factors and related conclusions.
ING Financial Services Fund
In considering whether to approve the renewal of the Advisory and Sub-Advisory Contracts for ING Financial Services Fund, the Board considered that, based on performance data for the periods ended June 30, 2006: (1) the Fund outperformed its Morningstar category median for the three-, five-, and ten-year periods and was equal to the performance of the Morningstar category median for the most recent calendar quarter; (2) the Fund underperformed its Morningstar category median for the one-year and year-to-date periods; (3) the Fund outperformed its primary benchmark for the three-, five-, and ten-year periods, except it underperformed for the most recent calendar quarter, year-to-date, and one-year periods; and (4) the Fund is ranked in the first (highest) quintile of its Morningstar category for the ten-year period, in the second quintile for the five-year period, in the third quintile for the most recent calendar quarter, one- and three-year periods, and in the fourth quintile for the year-to-date period.
In considering the fees payable under the Advisory and Sub-Advisory Contracts for ING Financial Services Fund, the Board took into account the factors described above and also considered: (1) the economies of scale benefits to the Fund and its shareholders from breakpoint discounts applicable to the Fund’s advisory fees, which result in lower fees at higher asset levels; (2) the pricing structure (including the expense ratio to be borne by shareholders) of the Fund, as compared to its Selected Peer Group, including that: (a) the management fee for the Fund is below the median and the average management fees of the funds in its Selected Peer Group; and (b) the expense ratio for the Fund is below the median and the average expense ratios of the funds in its Selected Peer Group.
After its deliberation, the Board reached the following conclusions: (1) the Fund’s management fee rate is reasonable in the context of all factors considered by the Board; (2) the Fund’s expense ratio is reasonable in the context of all factors considered by the Board; (3) the Fund’s performance is reasonable in the context of all factors considered by the Board; and (4) the sub-advisory fee rate payable by the Adviser to the Sub-Adviser is reasonable in the context of all factors considered by the Board. Based
148
Table of Contents
on these conclusions and other factors, the Board voted to renew the Advisory and Sub-Advisory Contracts for the Fund for the year ending November 30, 2007. During this renewal process, different Board members may have given different weight to different individual factors and related conclusions.
ING LargeCap Value Fund
In considering whether to approve the renewal of the Advisory and Sub-Advisory Contracts for ING LargeCap Value Fund, the Board considered that, based on performance data for the periods ended June 30, 2006: (1) the Fund outperformed its Morningstar category median and primary benchmark for the most recent calendar quarter and year-to-date periods, but underperformed both performance measures for the one-year period; and (2) the Fund is ranked in the first (highest) quintile of its Morningstar category for the most recent calendar quarter and year-to-date periods, and is in the fourth quintile for the one-year periods.
In considering the fees payable under the Advisory and Sub-Advisory Contracts for ING LargeCap Value Fund, the Board took into account the factors described above and also considered: (1) the economies of scale benefits to the Fund and its shareholders from breakpoint discounts applicable to the Fund’s advisory fees, which result in lower fees at higher asset levels; (2) the pricing structure (including the expense ratio to be borne by shareholders) of ING LargeCap Value Fund, as compared to its Selected Peer Group, including that: (a) the management fee (inclusive of the advisory fee and a 0.10% administration fee) for the Fund is above the median and the average management fees of the funds in its Selected Peer Group; and (b) the expense ratio for the Fund is equal to the median and above the average expense ratios of the funds in its Selected Peer Group.
After its deliberation, the Board reached the following conclusions: (1) the Fund’s management fee rate is reasonable in the context of all factors considered by the Board; (2) the Fund’s expense ratio is reasonable in the context of all factors considered by the Board; (3) the Fund’s performance is reasonable in the context of all factors considered by the Board; and (4) the sub-advisory fee rate payable by the Adviser to the Sub-Adviser is reasonable in the context of all factors considered by the Board. Based on these conclusions and other factors, the Board voted to renew the Advisory and Sub-Advisory Contracts for the Fund for the year ending November 30, 2007. During this renewal process, different Board members may have given different weight to different individual factors and related conclusions.
ING MagnaCap Fund
In considering whether to approve the renewal of the Advisory and Sub-Advisory Contracts for ING MagnaCap Fund, the Board considered that, based on performance data for the periods ended June 30, 2006: (1) the Fund outperformed its Morningstar category median for the most recent calendar quarter and one-year periods, but underperformed for the year-to-date, three-, five-, and ten-year periods; (2) the Fund outperformed its primary benchmark for one-year period, but underperformed for all other periods presented; and (3) the Fund is ranked in the second quintile of its Morningstar category for the one-year period, in the third quintile for the most recent calendar quarter and three-year periods, in the fourth quintile for the year-to-date and ten-year periods, and in the fifth (lowest) quintile for the five-year period. In analyzing this performance data, the Board took into account that, to address the Board’s concerns about long-term performance, in April 2005 a new portfolio manager assumed responsibility for the day-to-day management of the Fund.
In considering the fees payable under the Advisory and Sub-Advisory Contracts for ING MagnaCap Fund, the Board took into account the factors described above and also considered: (1) the economies of scale benefits to the Fund and its shareholders from breakpoint discounts applicable to the Fund’s advisory fee, which result in lower fees at higher asset levels; (2) the pricing structure (including the expense ratio to be borne by shareholders) of ING MagnaCap Fund, as compared to its Selected Peer Group, including that: (a) the management fee for the Fund is below the median and the average management fees of the funds in its Selected Peer Group; and (b) the expense ratio for the Fund is below the median and the average expense ratios of the funds in its Selected Peer Group.
After its deliberation, the Board reached the following conclusions: (1) the Fund’s management fee rate is reasonable in the context of all factors considered by the Board; (2) the Fund’s expense ratio is reasonable in the context of all factors considered
149
Table of Contents
by the Board; (3) a change in portfolio manager was implemented in April 2005, and it is reasonable to permit the Sub-Adviser to continue to manage the Fund to assess longer-term performance; and (4) the sub-advisory fee rate payable by the Adviser to the Sub-Adviser is reasonable in the context of all factors considered by the Board. Based on these conclusions and other factors, the Board voted to renew the Advisory and Sub-Advisory Contracts for the Fund for the year ending November 30, 2007. During this renewal process, different Board members may have given different weight to different individual factors and related conclusions.
ING MidCap Value Fund
In considering whether to approve the renewal of the Advisory and Sub-Advisory Contracts for ING MidCap Value Fund, the Board considered that, based on performance data for the periods ended June 30, 2006: (1) the Fund outperformed its Morningstar category median for the most recent calendar quarter and year-to-date periods, except it underperformed for the one- and three-year periods; (2) the Fund underperformed its primary benchmark for all periods presented, except it outperformed for the most recent calendar quarter; and (3) the Fund is ranked in the first (highest) quintile of its Morningstar category for the most recent calendar quarter, in the second quintile for the year-to-date period, and in the fifth (lowest) quintile for the one- and three-year periods.
In analyzing this performance data, the Board also took into account: (1) Management’s analysis regarding the reasons for underperformance, including the negative effect of sector allocation; (2) Management’s representations that it was exploring alternatives for improving the Fund’s performance; and (3) Management would continue to monitor, and the Board or the DE IRC would review, the Portfolio’s investment performance.
In considering the fees payable under the Advisory and Sub-Advisory Contracts for ING MidCap Value Fund, the Board took into account the factors described above and also considered: (1) the economies of scale benefits to the Fund and its shareholders from breakpoint discounts applicable to the Fund’s advisory fee, which result in lower fees at higher asset levels; (2) the pricing structure (including the expense ratio to be borne by shareholders) of ING MidCap Value Fund, as compared to its Selected Peer Group, including that: (a) the management fee (inclusive of the advisory fee and a 0.10% administration fee) for the Fund is above the median and the average management fees of the funds in its Selected Peer Group; and (b) the expense ratio for the Fund is above the median and the average expense ratios of the funds in its Selected Peer Group.
After its deliberation, the Board reached the following conclusions: (1) the Fund’s management fee rate is reasonable in the context of all factors considered by the Board; (2) the Fund’s expense ratio is reasonable in the context of all factors considered by the Board; (3) taking into account Management’s representations that it will continue to monitor, and was taking steps to improve, the Fund’s performance, such performance is reasonable in the context of all factors considered by the Board; and (4) the sub-advisory fee rate payable by the Adviser to the Sub-Adviser is reasonable in the context of all factors considered by the Board. Based on these conclusions and other factors, the Board voted to renew the Advisory and Sub-Advisory Contracts for the Fund for the year ending November 30, 2007. During this renewal process, different Board members may have given different weight to different individual factors and related conclusions.
ING MidCap Value Choice Fund
In considering whether to approve the renewal of the Advisory and Sub-Advisory Contracts for ING MidCap Value Choice Fund, the Board considered that, based on performance data for the periods ended June 30, 2006: (1) the Fund outperformed its Morningstar category median and primary benchmark for all periods presented; and (2) the Fund is ranked in the first (highest) quintile of its Morningstar category for all periods presented.
In considering the fees payable under the Advisory and Sub-Advisory Contracts for ING MidCap Value Choice Fund, the Board took into account the factors described above and also considered: (1) the fairness of the compensation under an Advisory Contract with level fees that does not include breakpoints; (2) the pricing structure (including the expense ratio to be borne by shareholders) of ING MidCap Value Choice Fund, as compared to its Selected Peer Group, including that: (a) the management fee (inclusive of the advisory fee and a 0.10% administration fee) for the Fund is above the median and the average management fees of the funds in its Selected Peer Group; and (b) the expense ratio for the Fund is equal
150
Table of Contents
to the median and the average expense ratios of the funds in its Selected Peer Group.
After its deliberation, the Board reached the following conclusions: (1) the Fund’s management fee rate is reasonable in the context of all factors considered by the Board; (2) the Fund’s expense ratio is reasonable in the context of all factors considered by the Board; (3) the Fund’s performance is reasonable in the context of all factors considered by the Board; and (4) the sub-advisory fee rate payable by the Adviser to the Sub-Adviser is reasonable in the context of all factors considered by the Board. Based on these conclusions and other factors, the Board voted to renew the Advisory and Sub-Advisory Contracts for the Fund for the year ending November 30, 2007. During this renewal process, different Board members may have given different weight to different individual factors and related conclusions.
ING SmallCap Value Fund
In considering whether to approve the renewal of the Advisory and Sub-Advisory Contracts for ING SmallCap Value Fund, the Board considered that, based on performance data for the periods ended June 30, 2006: (1) the Fund underperformed its Morningstar category median for all periods presented, except it outperformed for the most recent calendar quarter; (2) the Fund underperformed its benchmark for all periods presented; and (3) the Fund is ranked in the third quintile of its Morningstar category for the most recent calendar quarter and in the fifth (lowest) quintile for the year-to-date, one-year, and three-year periods.
In analyzing this performance data, the Board also took into account: (1) Management’s analysis regarding the reasons for underperformance, including the negative effect of sector allocation; (2) Management’s representations that it was exploring alternatives for improving the Fund’s performance; and (3) Management would continue to monitor, and the Board or the DE IRC would review, the Portfolio’s investment performance.
In considering the fees payable under the Advisory and Sub-Advisory Contracts for ING SmallCap Value Fund, the Board took into account the factors described above and also considered: (1) the fairness of the compensation under an Advisory Contract with level fees that does not include breakpoints; (2) the pricing structure (including the expense ratio to be borne by shareholders) of ING SmallCap Value Fund, as compared to its Selected Peer Group, including that: (a) the management fee (inclusive of the advisory fee and a 0.10% administration fee) for the Fund is above the median and the average management fees of the funds in its Selected Peer Group; and (b) the expense ratio for the Fund is above the median and the average expense ratios of the funds in its Selected Peer Group.
After its deliberation, the Board reached the following conclusions: (1) the Fund’s management fee rate is reasonable in the context of all factors considered by the Board; (2) the Fund’s expense ratio is reasonable in the context of all factors considered by the Board; (3) taking into account Management’s representations that it will continue to monitor, and was taking steps to improve, the Fund’s performance, such performance is reasonable in the context of all factors considered by the Board; and (4) the sub-advisory fee rate payable by the Adviser to the Sub-Adviser is reasonable in the context of all factors considered by the Board. Based on these conclusions and other factors, the Board voted to renew the Advisory and Sub-Advisory Contracts for the Fund for the year ending November 30, 2007. During this renewal process, different Board members may have given different weight to different individual factors and related conclusions.
ING SmallCap Value Choice Fund
In considering whether to approve the renewal of the Advisory and Sub-Advisory Contracts for ING SmallCap Value Choice Fund, the Board considered that, based on performance data for the periods ended June 30, 2006: (1) the Fund outperformed its Morningstar category median and primary benchmark for all periods presented; and (2) the Fund is ranked in the first (highest) quintile of its Morningstar category for all periods presented.
In considering the fees payable under the Advisory and Sub-Advisory Contracts for ING SmallCap Value Choice Fund, the Board took into account the factors described above and also considered: (1) the fairness of the compensation under an Advisory Contract with level fees that does not include breakpoints; (2) the pricing structure (including the expense ratio to be borne by shareholders) of ING SmallCap Value Choice Fund, as compared to its Selected Peer Group, including that: (a) the management fee (inclusive of the advisory fee and a 0.10% administration fee) for
151
Table of Contents
the Fund is above the median and the average management fees of the funds in its Selected Peer Group; and (b) the expense ratio for the Fund is above the median but below the average expense ratios of the funds in its Selected Peer Group.
After its deliberation, the Board reached the following conclusions: (1) the Fund’s management fee rate is reasonable in the context of all factors considered by the Board; (2) the Fund’s expense ratio is reasonable in the context of all factors considered by the Board; (3) the Fund’s performance is reasonable in the context of all factors considered by the Board; and (4) the sub-advisory fee rate payable by the Adviser to the Sub-Adviser is reasonable in the context of all factors considered by the Board. Based on these conclusions and other factors, the Board voted to renew the Advisory and Sub-Advisory Contracts for the Fund for the year ending November 30, 2007. During this renewal process, different Board members may have given different weight to different individual factors and related conclusions.
152
Table of Contents
ING Funds Distributor, LLC offers the funds listed below. Before investing in a fund, shareholders should carefully review the fund’s prospectus. Investors may obtain a copy of a prospectus of any ING Fund by calling (800) 992-0180 or by going to www.ingfunds.com.
Domestic Equity and Income Funds
| ING Balanced Fund ING Growth and Income Fund ING Real Estate Fund |
Domestic Equity Growth Funds
| ING 130/30 Fundamental Research Fund ING Disciplined LargeCap Fund ING Fundamental Research Fund ING Growth Fund ING LargeCap Growth Fund ING MidCap Opportunities Fund ING Opportunistic LargeCap Fund ING SmallCap Opportunities Fund ING Small Company Fund |
Domestic Equity Index Funds
| ING Index Plus LargeCap Fund ING Index Plus MidCap Fund ING Index Plus SmallCap Fund |
Domestic Equity Value Funds
| ING Financial Services Fund ING LargeCap Value Fund ING MagnaCap Fund ING MidCap Value Fund ING SmallCap Value Fund ING SmallCap Value Choice Fund ING Value Choice Fund |
Fixed-Income Funds
| ING GNMA Income Fund ING High Yield Bond Fund ING Intermediate Bond Fund ING National Tax-Exempt Bond Fund |
Global Equity Funds
| ING Global Equity Dividend Fund ING Global Natural Resources Fund ING Global Real Estate Fund ING Global Science and Technology Fund ING Global Value Choice Fund |
International Equity Funds
| ING Emerging Countries Fund ING Foreign Fund ING Greater China Fund ING Index Plus International Equity Fund ING International Fund ING International Capital Appreciation Fund ING International Growth Fund ING International Real Estate Fund ING International SmallCap Fund ING International Value Fund ING International Value Choice Fund ING Russia Fund |
Global and International Fixed-Income Funds
| ING Emerging Markets Fixed Income Fund ING Global Bond Fund |
International Fund-of-Funds
| ING Diversified International Fund |
Loan Participation Fund
| ING Senior Income Fund |
Money Market Funds*
| ING Aeltus Money Market Fund ING Classic Money Market Fund |
Strategic Allocation Funds
| ING Strategic Allocation Conservative Fund ING Strategic Allocation Growth Fund ING Strategic Allocation Moderate Fund |
| * | An investment in the Funds is not insured or guaranteed by the Federal Deposit Insurance Corporation or any other government agency. Although the Funds seek to preserve the value of your investment at $1.00 per share, it is possible to lose money by investing in the Funds. |
Table of Contents
Administrator
Distributor
Transfer Agent
Custodian
Legal Counsel
For more complete information, or to obtain a prospectus on any ING fund, please call your Investment Professional or ING Funds Distributor, LLC at (800) 992-0180 or log on to www.ingfunds.com. The prospectus should be read carefully before investing. Consider the fund’s investment objectives, risks, charges and expenses carefully before investing. The prospectus contains this information and other information about the fund. Check with your Investment Professional to determine which funds are available for sale within their firm. Not all funds are available for sale at all firms.
 | PRSAR-UDEABCIMOQ (1106-011807) |
Table of Contents
Item 2. Code of Ethics.
Not required for semi-annual filing.
Item 3. Audit Committee Financial Expert.
Not required for semi-annual filing.
Item 4. Principal Accountant Fees and Services.
Not required for semi-annual filing.
Item 5. Audit Committee Of Listed Registrants.
Not required for semi-annual filing.
Item 6. Schedule of Investments.
Schedule is included as part of the report to shareholders filed under Item 1 of this Form.
Item 7. Disclosure of Proxy Voting Policies and Procedures for Closed-end Management Investment Companies.
Not required for Semi-annual filing.
Item 8. Purchases of Equity Securities by Closed-end Management Investment Company and Affiliated Purchasers.
Not applicable.
Item 9. Submission of Matters to a Vote of Security Holders.
The Board has a Nominating Committee (“Committee”) for the purpose of considering and presenting to the Board candidates it proposes for nomination to fill Trustee vacancies on the Board. The Committee currently consists of four Trustees of the Board, none of whom are considered “interested persons” of the Trust within the meaning of Section 2(a)(19) of the Investment Company Act of 1940. The Committee has adopted a written charter that sets forth the policies and procedures of the Committee. The Committee will accept referrals for potential candidates from Board members, Fund shareholders, legal counsel to the disinterested Trustees or such other sources as the Committee deems appropriate. Shareholders can submit recommendations in writing to the attention of the Chairperson of the Committee at an address to be maintained by Fund management for this purpose. In order for the Committee to consider a potential candidate, the Committee initially must receive at least the following information regarding such person: (1) name; (2) date of birth; (3) education; (4) business, professional or other relevant experience and areas of expertise; (5) current business, professional or other relevant experience and areas of expertise; (6) current business and home addresses and contact information; (7) other board positions or prior experience; and (8) any knowledge and experience relating to investment companies and investment company governance.
Table of Contents
Item 10. Controls and Procedures.
| (a) | Based on our evaluation conducted within 90 days of the filing date, hereof, the design and operation of the registrant’s disclosure controls and procedures are effective to ensure that material information relating to the registrant is made known to the certifying officers by others within the appropriate entities, particularly during the period in which Forms N-CSR are being prepared, and the registrant’s disclosure controls and procedures allow timely preparation and review of the information for the registrant’s Form N-CSR and the officer certifications of such Form N-CSR. | |||
| (b) | There were no significant changes in the registrant’s internal controls that occurred during the second fiscal quarter of the period covered by this report that has materially affected, or is reasonably likely to materially affect, the registrant’s internal control over financial reporting. | |||
Item 11. Exhibits.
| (a)(1) | The Code of Ethics is not required for the semi-annual filing. | |||
| (a)(2) | A separate certification for each principal executive officer and principal financial officer of the registrant as required by Rule 30a-2 under the Act (17 CFR 270.30a-2) is attached hereto as EX-99.CERT. | |||
| (a)(3) | Not required for semi-annual filing. | |||
| (b) | The officer certifications required by Section 906 of the Sarbanes-Oxley Act of 2002 are attached hereto as EX-99.906CERT. | |||
Table of Contents
SIGNATURES
Pursuant to the requirements of the Securities Exchange Act of 1934 and the Investment Company Act of 1940, the registrant has duly caused this report to be signed on its behalf by the undersigned, thereunto duly authorized.
(Registrant): ING Investment Funds, Inc.
| By | /s/ Shaun P. Mathews | |||
| Shaun P. Mathews President and Chief Executive Officer | ||||
| Date: | February 6, 2007 | |||
Pursuant to the requirements of the Securities Exchange Act of 1934 and the Investment Company Act of 1940, this report has been signed below by the following persons on behalf of the registrant and in the capacities and on the dates indicated.
| By | /s/ Shaun P. Mathews | |||
| Shaun P. Mathews President and Chief Executive Officer | ||||
| Date: | February 6, 2007 | |||
| By | /s/ Todd Modic | |||
| Todd Modic Senior Vice President and Chief Financial Officer | ||||
| Date: | February 6, 2007 | |||
Table of Contents
EX-99.CERT
CERTIFICATION
I, Shaun P. Mathews, certify that:
| 1. | I have reviewed this report on Form N-CSR of ING Investment Funds, Inc.; | |||
| 2. | Based on my knowledge, this report does not contain any untrue statement of a material fact or omit to state a material fact necessary to make the statements made, in light of the circumstances under which such statements were made, not misleading with respect to the period covered by this report; | |||
| 3. | Based on my knowledge, the financial statements, and other financial information included in this report, fairly present in all material respects the financial condition, results of operations, changes in net assets, and cash flows (if the financial statements are required to include a statement of cash flows) of the registrant as of, and for, the periods presented in this report; | |||
| 4. | The registrant’s other certifying officer(s) and I are responsible for establishing and maintaining disclosure controls and procedures (as defined in Rule 30a-3(c) under the Investment Company of 1940) and internal control over financial reporting (as defined in Rule 30a-3(d) under the Investment Company Act of 1940) for the registrant and have: | |||
| a) | Designed such disclosure controls and procedures, or caused such disclosure controls and procedures to be designed under our supervision, to ensure that material information relating to the registrant, including its consolidated subsidiaries, is made known to us by others within those entities, particularly during the period in which this report is being prepared; | |||
| b) | Designed such internal control over financial reporting, or caused such internal control over financial reporting to be designed under our supervision, to provide reasonable assurance regarding the reliability of financial reporting and the preparation of financial statements for external purposes in accordance with generally accepted accounting principles; | |||
| c) | Evaluated the effectiveness of the registrant’s disclosure controls and procedures and presented in this report our conclusions about the effectiveness of the disclosure controls and procedures, as of a date within 90 days prior to the filing date of this report based on such evaluation; and | |||
| d) | Disclosed in this report any change in the registrant’s internal control over financial reporting that occurred during the second fiscal quarter of the period covered by this report that has materially affected, or is reasonably likely to materially affect, the registrant’s internal control over financial reporting; and | |||
| 5. | The registrant’s other certifying officer(s) and I have disclosed to the registrant’s auditors and the audit committee of the registrant’s board of directors (or persons performing the equivalent functions): | |||
| a) | All significant deficiencies and material weaknesses in the design or operation of internal control over financial reporting which are reasonably likely to adversely affect the registrant’s ability to record, process, summarize, and report financial information; and | |||
| b) | Any fraud, whether or not material, that involves management or other employees who have a significant role in the registrant’s internal control over financial reporting. | |||
| Date: | February 6, 2007 | /s/ Shaun P. Mathews | ||
| Shaun P. Mathews | ||||
| President and Chief Executive Officer |
Table of Contents
EXHIBIT-99.CERT
CERTIFICATION
I, Todd Modic, certify that:
| 1. | I have reviewed this report on Form N-CSR of ING Investment Funds, Inc.; | |||
| 2. | Based on my knowledge, this report does not contain any untrue statement of a material fact or omit to state a material fact necessary to make the statements made, in light of the circumstances under which such statements were made, not misleading with respect to the period covered by this report; | |||
| 3. | Based on my knowledge, the financial statements, and other financial information included in this report, fairly present in all material respects the financial condition, results of operations, changes in net assets, and cash flows (if the financial statements are required to include a statement of cash flows) of the registrant as of, and for, the periods presented in this report; | |||
| 4. | The registrant’s other certifying officer(s) and I are responsible for establishing and maintaining disclosure controls and procedures (as defined in Rule 30a-3(c) under the Investment Company Act of 1940) and internal control over financial reporting (as defined in Rule 30a-3(d) under the Investment Company Act of 1940) for the registrant and have: | |||
| a) | Designed such disclosure controls and procedures, or caused such disclosure controls and procedures to be designed under our supervision, to ensure that material information relating to the registrant, including its consolidated subsidiaries, is made known to us by others within those entities, particularly during the period in which this report is being prepared; | |||
| b) | Designed such internal control over financial reporting, or caused such internal control over financial reporting to be designed under our supervision, to provide reasonable assurance regarding the reliability of financial reporting and the preparation of financial statements for external purposes in accordance with generally accepted accounting principles; | |||
| c) | Evaluated the effectiveness of the registrant’s disclosure controls and procedures and presented in this report our conclusions about the effectiveness of the disclosure controls and procedures, as of a date within 90 days prior to the filing date of this report based on such evaluation; and | |||
| d) | Disclosed in this report any change in the registrant’s internal control over financial reporting that occurred during the second fiscal quarter of the period covered by this report that has materially affected, or is reasonably likely to materially affect, the registrant’s internal control over financial reporting; and | |||
| 5. | The registrant’s other certifying officer(s) and I have disclosed to the registrant’s auditors and the audit committee of the registrant’s board of directors (or persons performing the equivalent functions): | |||
| a) | All significant deficiencies and material weaknesses in the design or operation of internal control over financial reporting which are reasonably likely to adversely affect the registrant’s ability to record, process, summarize, and report financial information; and | |||
| b) | Any fraud, whether or not material, that involves management or other employees who have a significant role in the registrant’s internal control over financial reporting. | |||
| Date: | February 6, 2007 | /s/ Todd Modic | ||
| Todd Modic Senior Vice President and Chief Financial Officer |
Table of Contents
EXHIBIT 99.906 CERT
Certification
Pursuant to Section 906
Name of Registrant: ING Investment Funds, Inc.
Date of Form N-CSR: November 30, 2006
The undersigned, the principal executive officer of the above named registrant (the “Fund”), hereby certifies that, with respect to the Form N-CSR referred to above, to the best of his knowledge and belief, after reasonable inquiry:
1. such Form N-CSR fully complies with the requirements of section 13(a) or 15(d) of the Securities Exchange Act of 1934; and
2. the information contained in such Form N-CSR fairly presents, in all material respects, the financial condition and results of operations of the Fund.
A signed original of this written statement required by Section 906 has been provided to ING Investment Funds, Inc. and will be retained by ING Investment Funds, Inc. and furnished to the Securities and Exchange Commission or its staff upon request.
IN WITNESS WHEREOF, the undersigned has executed this Certification below, as of this 6th day of February, 2007.
| /s/ Shaun P. Mathews _______________________________________ Shaun P. Mathews President and Chief Executive Officer |
Table of Contents
EXHIBIT-99.906CERT
Certification
Pursuant to Section 906
of the
Sarbanes-Oxley Act of 2002
Name of Registrant: ING Investment Funds, Inc.
Date of Form N-CSR: November 30, 2006
The undersigned, the principal financial officer of the above named registrant (the “Fund”), hereby certifies that, with respect to the Form N-CSR referred to above, to the best of his knowledge and belief, after reasonable inquiry:
1. such Form N-CSR fully complies with the requirements of section 13(a) or 15(d) of the Securities Exchange Act of 1934; and
2. the information contained in such Form N-CSR fairly presents, in all material respects, the financial condition and results of operations of the Fund.
A signed original of this written statement required by Section 906 has been provided to ING Investment Funds, Inc. and will be retained by ING Investment Funds, Inc. and furnished to the Securities and Exchange Commission or its staff upon request.
IN WITNESS WHEREOF, the undersigned has executed this Certification below, as of this 6th day of February, 2007.
| /s/ Todd Modic | ||
| Todd Modic Senior Vice President and Chief Financial Officer |
ITEM 2. CODE OF ETHICS.
Not required for semi-annual filing.
ITEM 3. AUDIT COMMITTEE FINANCIAL EXPERT.
Not required for semi-annual filing.
ITEM 4. PRINCIPAL ACCOUNTANT FEES AND SERVICES.
Not required for semi-annual filing.
ITEM 5. AUDIT COMMITTEE OF LISTED REGISTRANTS.
Not required for semi-annual filing.
ITEM 6. SCHEDULE OF INVESTMENTS.
Schedule is included as part of the report to shareholders filed under Item 1 of
this Form.
ITEM 7. DISCLOSURE OF PROXY VOTING POLICIES AND PROCEDURES FOR CLOSED-END MANAGEMENT INVESTMENT COMPANIES.
Not required for semi-annual filing.
ITEM 8. PURCHASES OF EQUITY SECURITIES BY CLOSED-END MANAGEMENT INVESTMENT COMPANY AND AFFILIATED PURCHASERS.
Not applicable.
ITEM 9. SUBMISSION OF MATTERS TO A VOTE OF SECURITY HOLDERS.
The Board has a Nominating Committee (“Committee”) for the purpose of considering and presenting to the Board candidates it proposes for nomination to fill Trustee vacancies on the Board. The Committee currently consists of four Trustees of the Board, none of whom are considered “interested persons” of the Trust within the meaning of Section 2(a)(19) of the Investment Company Act of 1940. The Committee has adopted a written charter that sets forth the policies and procedures of the Committee. The Committee will accept referrals for potential candidates from Board members, Fund shareholders, legal counsel to the disinterested Trustees or such other sources as the Committee deems appropriate. Shareholders can submit recommendations in writing to the attention of the Chairperson of the Committee at an address to be maintained by Fund management for this purpose. In order for the Committee to consider a potential candidate, the Committee initially must receive at least the following information regarding such person: (1) name; (2) date of birth; (3) education; (4) business, professional or other relevant experience and areas of expertise; (5) current business, professional or other relevant experience and areas of expertise; (6) current business and home addresses and contact information; (7) other board positions or prior experience; and (8) any knowledge and experience relating to investment companies and investment company governance.
earlier than the 90th day prior to such meeting and not later than the close of business on the later of the 60th day prior to such meeting or the 10th day following the day on which public announcement of the date of the meeting is first made, by either disclosure in a press release or in a document publicly filed by the Fund with the Securities and Exchange Commission.
ITEM 10. CONTROLS AND PROCEDURES.
(a) Based on our evaluation conducted within 90 days of the filing date, hereof, the design and operation of the registrant’s disclosure controls and procedures are effective to ensure that material information relating to the registrant is made known to the certifying officers by others within the appropriate entities, particularly during the period in which Forms N-CSR are being prepared, and the registrant’s disclosure controls and procedures allow timely preparation and review of the information for the registrant’s Form N-CSR and the officer certifications of such Form N-CSR.
(b) There were no significant changes in the registrant’s internal controls that occurred during the second fiscal quarter of the period covered by this report that has materially affected, or is reasonably likely to materially affect, the registrant’s internal control over financial reporting.
ITEM 11. EXHIBITS.
(a)(1) The Code of Ethics is not required for the semi-annual filing.
(a)(2) A separate certification for each principal executive officer and principal financial officer of the registrant as required by Rule 30a-2 under the Act (17 CFR 270.30a-2) is attached hereto as EX-99.CERT.
(a)(3) Not required for semi-annual filing.
(b) The officer certifications required by Section 906 of the Sarbanes-Oxley Act of 2002 are attached hereto as EX-99.906CERT
SIGNATURES
Pursuant to the requirements of the Securities Exchange Act of 1934 and the Investment Company Act of 1940, the registrant has duly caused this report to be signed on its behalf by the undersigned, thereunto duly authorized.
(Registrant): ING Equity Trust
By | /s/ | Shaun P. Mathews |
| |
|
| Shaun P. Mathews | ||
|
| President and Chief Executive Officer | ||
|
| |||
|
| |||
Date: | February 6, 2007 |
| ||
Pursuant to the requirements of the Securities Exchange Act of 1934 and the Investment Company Act of 1940, this report has been signed below by the following persons on behalf of the registrant and in the capacities and on the dates indicated.
By | /s/ | Shaun P. Mathews |
| |||
|
| Shaun P. Mathews | ||||
|
| President and Chief Executive Officer | ||||
|
| |||||
Date: | February 6, 2007 |
| ||||
|
| |||||
|
| |||||
By | /s/ | Todd Modic |
| |||
|
| Todd Modic | ||||
|
| Senior Vice President and Chief Financial Officer | ||||
|
| |||||
|
| |||||
Date: | February 6, 2007 |
| ||||