|
| OMB APPROVAL | ||
|
| OMB Number: | 3235-0570 | |
|
| Expires: | October 31, 2006 | |
| UNITED STATES | Estimated average burden hours per response. . . . . . . . . . . . . . . . .19.3 | ||
| SECURITIES AND EXCHANGE COMMISSION |
| ||
| Washington, D.C. 20549 |
| ||
FORM N-CSR
CERTIFIED SHAREHOLDER REPORT OF REGISTERED
MANAGEMENT INVESTMENT COMPANIES
Investment Company Act file number | 811-8817 | ||||||||
| |||||||||
ING Equity Trust | |||||||||
(Exact name of registrant as specified in charter) | |||||||||
| |||||||||
7337 E. Doubletree Ranch Rd., Scottsdale, AZ |
| 85258 | |||||||
(Address of principal executive offices) |
| (Zip code) | |||||||
| |||||||||
CT Corporation System, | |||||||||
(Name and address of agent for service) | |||||||||
| |||||||||
Registrant’s telephone number, including area code: | 1-800-992-0180 |
| |||||||
| |||||||||
Date of fiscal year end: | May 31 |
| |||||||
| |||||||||
Date of reporting period: | June 1, 2004 to November 30, 2004 |
| |||||||
ITEM 1. REPORTS TO STOCKHOLDERS.
The following is a copy of the report transmitted to stockholders pursuant to Rule 30e-1 under the Act (17 CFR 270.30e-1):

| Funds |
| Semi-Annual Report |
|
|
| November 30, 2004 |
|
|
| Classes A, B, C and Q |
| Principal Protection Funds |
|
|
| • ING Principal Protection Fund |
| • ING Principal Protection Fund II |
| • ING Principal Protection Fund III |
| • ING Principal Protection Fund IV |
| • ING Principal Protection Fund V |
| • ING Principal Protection Fund VI |
| • ING Principal Protection Fund VII |
| • ING Principal Protection Fund VIII |
| • ING Principal Protection Fund IX |
| • ING Principal Protection Fund X |
| • ING Principal Protection Fund XI |
| • ING Principal Protection Fund XII |
|
This report is submitted for general information to shareholders of the ING Funds. It is not authorized for distribution to prospective shareholders unless accompanied or preceded by a prospectus which includes details regarding the funds’ investment objectives, risks, charges, expenses and other information. This information should be read carefully.
|
TABLE OF CONTENTS
|
| |
Go Paperless with E-Delivery! | ||
|
| |
Sign up now for on-line prospectuses, fund reports, and proxy statements. In less than five minutes, you can help reduce paper mail and lower fund costs.
Just go to www.ingfunds.com, click on the E-Delivery icon from the home page, follow the directions and complete the quick 5 Steps to Enroll.
You will be notified by e-mail when these communications become available on the internet. Documents that are not available on the internet will continue to be sent by mail.
(THIS PAGE INTENTIONALLY LEFT BLANK)

JAMES M. HENNESSY
Dear Shareholder:
The past year has brought about numerous changes in the mutual funds industry, including requests for additional disclosures. I would like to draw your attention to some additional information you will now see in the reports due, in part, to these new requirements:
• You will see a new section entitled “Shareholder Expense Examples”. These examples are intended to illustrate for you the ongoing costs of investing in a mutual fund and to provide a method to compare those costs with the ongoing costs of investing in other mutual funds.
• In addition to the normal performance tables included in the Portfolio Managers’ Reports, there are now additional graphical or tabular presentations, which illustrate the current holdings of the funds as of the period-end.
• Each fund now also files its complete schedule of portfolio holdings with the Securities Exchange Commission (“SEC”) for the first and third quarters of each fiscal year on Form N-Q. These Forms are available for shareholders to view on the SEC’s website at www.sec.gov.
We welcome these changes and believe that they will provide valuable information to our shareholders. We hope you will find these additional disclosures beneficial and easy to understand.
On behalf of ING Funds, I thank you for your continued support and confidence and look forward to serving you in 2005 and beyond.
Sincerely, |
|
|
|
James M. Hennessy |
President |
ING Funds |
January 25, 2005 |

1
MARKET PERSPECTIVE: SIX MONTHS ENDED NOVEMBER 30, 2004
Two months prior to the start of our fiscal year, the economic outlook had changed radically. On April 2, 2004, a very bullish U.S. employment report had sparked a few days of euphoria that vanished as it became clear that as the job market tightens, inflation picks up and rising interest rates cannot be far away. This was followed up with another strong report in May and by mid-month major stock and bond markets had negative returns for 2004. Markets were off their lows as we started our half year and in this period, as we shall see below, sentiment would undergo two more major reversals, accompanied by record-breaking market movements.
Global equities added 9.0% from the end of May through November according to the Morgan Stanley Capital International (“MSCI”) World Index(1) in dollars including net dividends, just under half due to dollar weakness. Among currencies, the euro, yen and pound all gained on the dollar, although the pendulum swung back and forth. Ultimately, the dollar succumbed to record U.S. trade deficits, and latterly, to fears that non-U.S. investors might diversify out of U.S. financial assets. By the end of November 2004, the euro had gained 8.9% and a new all time record against the dollar. The yen rose 6.2% to a level not seen since early 2000, while the pound stood 4.2% higher at a remarkable 12-year peak. On a trade-weighted basis, the dollar plummeted to 9-year lows.
Investment grade U.S. fixed income classes initially bore the brunt of fears of a new cycle of rising interest rates from multi-decade low levels, as evidence mounted that inflation was on the rise. In the six months ended November 30, 2004, the Federal Open Market Committee (FOMC) would increase the Federal Reserves Funds rate four times to 2.0%, even as the economy clearly decelerated again. During this time, the total return of the Lehman Brothers Aggregate Bond Index(2) of investment grade bonds was 3.8%. High yield bonds fared comparatively well, the Lehman Brothers U.S. Corporate High Yield Bond Index(3) returning 9.6% for the six months. In a similar vein there was a notable flattening of the yield curve, as short-term interest rates marched up in anticipation of continued monetary tightening, while bond yields ignored this and fell in the face of mostly tame economic data. For the six months, the yield on 10-year Treasury Notes fell by 30 basis points to 4.4%, but the yield on 13-week Treasury Bills rose 113 basis points to 2.2%.
The U.S. equities market in the form of the Standard & Poor’s (“S&P”) 500 Index(4) rose 5.7% including dividends in the six months ended November 30, 2004. At that point the market was trading at a price to earnings (“P/E”) level of just under 16 times 2005 estimated earnings. As mentioned above, strong monthly employment reports from April 2004 set the tone. After an initial scare about the rise in interest rates that this implied, investors regained their nerve and as the Federal Reserve embarked on its tightening cycle at the end of June the market was challenging its best levels of 2004. And yet in the week before the increase the wind seemed to shift again with some unexpectedly downbeat economic releases. From July through October 2004, the employment reports were neutral to shockingly weak, while oil prices continued their rise, peaking on Friday, October 22 at 41% above end of May 2004 levels. This effective deflationary “tax” on worldwide consumers troubled equity markets, and the S&P 500 Index reached its lowest point of 2004 on August 12. From there, however, oil prices retreated by 13% and that, combined with a clear election result, perceived to be business and shareholder friendly, plus a new, powerful employment report, caused sentiment to shift yet again. By the end of November, the S&P 500 Index had breached levels not seen since before September 11, 2001, bolstered by an upward revision to third quarter gross domestic product (“GDP”) growth to 3.9%.
In international equities markets, for the six months ended November 30, 2004, Japan rose 4.8% in dollars, according to the MSCI Japan Index(5) with net dividends, but fell 2.6% in yen. At that point, stocks were trading at nearly 16 times 2005 estimated earnings. Initially encouraged by surprisingly strong, export led, 6.1% first quarter GDP growth, investors became disillusioned by a likely slow down in China, rising oil prices and a slumping dollar. By the third quarter, GDP growth had fallen to a depressingly flat 0.1%.
Meanwhile, European excluding (“ex”) UK markets gained 15.5% in dollars, about five-eighths due to dollar weakness, according to the MSCI Europe ex UK Index(6) with net dividends. In local currency terms, the region’s markets reached a 28-month high during November 2004, and were then trading on average at just over 13 times 2005 estimated earnings. Growth in this region is held back by weak domestic demand, restrained by 8.9% unemployment in inflexible labor
2
markets. This region’s main attraction is its relative cheapness; the concern is the fragility of this picture, given its export dependency.
The UK market rose 12.1% in dollars between May and November 2004, based on the MSCI UK Index(7) with net dividends. In pounds, the market rose 7.5%, attaining the highest mark since mid-2002, and traded at about 16 1/2 times 2005 estimated earnings. Unlike Continental Europe, the UK economy strains at full employment, with over-committed, property owning consumers, enriched (at least in their own minds), by a housing price bubble. The Bank of England has been trying, with five interest rate increases since November 2003, to cool demand and by the end of November seemed to be succeeding.
(1) The MSCI World Index measures the performance of over 1,400 securities listed on exchanges in the United States, Europe, Canada, Australia, New Zealand and the Far East.
(2) The Lehman Brothers Aggregate Bond Index is composed of securities from the Lehman Brothers Government/Corporate Bond Index, Mortgage-Backed Securities Index, and the Asset-Backed Securities Index. Total return comprises price appreciation/depreciation and income as a percentage of the original investment.
(3) The Lehman Brothers U.S. Corporate High Yield Bond Index is generally representative of corporate bonds rated below investment-grade.
(4) The Standard & Poor’s 500 Index is a capitalization-weighted index of 500 stocks designed to measure performance of the broad domestic economy through changes in the aggregate market value of 500 stocks representing all major industries.
(5) The MSCI Japan Index is a free float-adjusted market capitalization index that is designed to measure developed market equity performance in Japan.
(6) The MSCI Europe ex UK Index is a free float-adjusted market capitalization index that is designed to measure developed market equity performance in Europe, excluding the UK.
(7) The MSCI UK Index is a free float-adjusted market capitalization index that is designed to measure developed market equity performance in the UK.
All indices are unmanaged and investors cannot invest directly in an index.
Past performance does not guarantee future results. The performance quoted represents past performance. Investment return and principal value of an investment will fluctuate, and shares, when redeemed, may be worth more or less than their original cost. The Funds’ performance is subject to change since the period’s end and may be lower or higher than the performance data shown. Please call (800) 992-0180 or log on to www.ingfunds.com to obtain performance data current to the most recent month end.
Market Perspective reflects the views of the Chief Investment Risk Officer only through the end of the period, and is subject to change based on market and other conditions.
3
ING PRINCIPAL PROTECTION FUNDS
During the Guarantee Period, the Funds seek to participate in favorable equity market conditions while preserving at least the principal amount of the Fund as of the inception of the Guarantee Period. After the five year Guarantee Period, the Index Plus LargeCap Period begins. During this Period, the Fund will seek to outperform the total return performance of the Standard & Poor’s (“S&P”) 500 Index while maintaining a risk profile consistent with the Index. At the end of the Guarantee Period, the guarantee will no longer apply. The Funds are managed by the following Portfolio Management Team with ING Investment Management Co. (formerly, Aeltus Investment Management, Inc.), the Sub-Adviser:
Asset Allocation: Mary Ann Fernandez, Senior Vice President, serves as strategist for the Funds and is responsible for overseeing overall Fund strategy and the allocation of Fund Assets between the Equity and Fixed components.
Equity Component: Hugh T.M. Whelan, Portfolio Manager and Douglas K. Coté, Portfolio Manager, co-manage the Equity Component.
Fixed Component: The Fixed Component is managed by a team of fixed-income specialists led by James B. Kauffmann, Portfolio Manager.
Note: The Funds are closed to new deposits.
Performance: Listed below are the Class A share total returns of each Principal Protection Fund (“PPF”), excluding sales charges, the S&P 500 Index(1) and the Lehman Brothers Aggregate Bond (“LBAB”) Index(2) for the six months ended November 30, 2004:
PPF |
| 1.01 | % |
PPF II |
| 1.07 | % |
PPF III |
| 1.20 | % |
PPF IV |
| 1.94 | % |
PPF V |
| 1.95 | % |
PPF VI |
| 1.73 | % |
PPF VII |
| 2.09 | % |
PPF VIII |
| 2.08 | % |
PPF IX |
| 2.43 | % |
S&P 500 Index(1) |
| 5.67 | % |
LBAB Index(2) |
| 3.82 | % |
For the periods ended November 30, 2004 for those PPFs with less than six months of performance since the inception of the Guarantee Period:
PPF X from 08/17/04 |
| 2.46 | % |
S&P 500 Index(1) from 09/01/04 |
| 6.78 | % |
LBAB Index(2) from 09/01/04 |
| 0.31 | % |
|
|
|
|
PPF XI from 11/18/04 |
| (1.60 | )% |
S&P 500 Index(1) from 11/01/04 |
| 4.05 | % |
LBAB Index(2) from 11/01/04 |
| (0.80 | )% |
|
|
|
|
PPF XII(3) |
| — |
|
(1) The S&P 500 Index is an unmanaged index that measures the performance of securities of approximately 500 large- capitalization companies whose securities are traded on major U.S. stock markets.
(2) The Lehman Brothers Aggregate Bond Index is a widely recognized, unmanaged index of publicly issued investment grade U.S. Government, mortgage-backed, asset-backed and corporate debt securities.
(3) Since PPF XII had not entered the Guarantee Period as of November 30, 2004, performance information is not presented. The Guarantee Period for PPF XII begins February 16, 2005.
An investor cannot invest directly in an index.
Portfolio Specifics: Fund performance is driven by a combination of returns on the equity portfolio, returns on the bond portfolio, and the asset allocation between the two components. The asset allocation process seeks to participate in rising equity markets and protect principal on the downside. Stocks are more volatile than bonds — an important consideration in the asset allocation process. Other factors, such as the current level of interest rates, time remaining to the maturity date, and the ratio of current assets to the underlying guarantee amount are also important. The Fund’s allocation to equities and fixed income is dependent on these factors and the path they take over the guarantee period. In general, when the time left to maturity is short, or the ratio of assets to the guarantee amount is low, asset allocation will tend to be conservative in order to protect principal from losses. All other factors being equal, the Funds generally buy equities (and sell bonds) when the equity market rises and sell equities (and buy bonds) as the equity market declines. The use of fixed income reduces the Fund’s ability to participate as fully in upward moving equity markets.
The Fund’s fixed income component underperformed the LBAB Index. The Fund is comprised of short to intermediate duration Treasury and agency securities. In general, long duration credit, agency, and Treasury issues outperformed shorter duration securities in the
4
Index. The mortgage-backed sector also outperformed short- and intermediate-term Treasuries and agencies as the market moved away from AAA-rated Treasuries and agencies towards lower quality issues over the six-month period.
The Fund’s equity component outperformed the S&P 500 Index due to security selection, especially in the health care and information technology sectors. Stock selection in financials and consumer staples detracted modestly from results. The largest contribution to performance was Microsoft Corp. Other positive contributors to performance came from overweight positions in ChevronTexaco Corp. and Apple Computer, Inc. Among the most disappointing performers were Gap, Inc. and Motorola, Inc. Individual security selection was helped by the effectiveness of most of our model’s factors that have been historically successful at identifying outperforming stocks, especially price momentum and analyst estimate revision. Only long-term price reversal detracted from performance modestly. Asset allocation had a neutral impact on performance over the period.
Asset Allocation
as of November 30, 2004
(as a percent of net assets)
|
| Fixed |
| Common |
| Other Assets |
|
|
|
|
|
|
|
|
|
PPF |
| 85.9 | % | 14.5 | % | (0.4 | )% |
PPF II |
| 91.3 | % | 9.1 | % | (0.4 | )% |
PPF III |
| 85.3 | % | 15.1 | % | (0.4 | )% |
PPF IV |
| 65.0 | % | 35.2 | % | (0.2 | )% |
PPF V |
| 70.0 | % | 30.3 | % | (0.3 | )% |
PPF VI |
| 69.6 | % | 30.6 | % | (0.2 | )% |
PPF VII |
| 73.3 | % | 26.9 | % | (0.2 | )% |
PPF VIII |
| 69.5 | % | 30.8 | % | (0.3 | )% |
PPF IX |
| 67.8 | % | 32.4 | % | (0.2 | )% |
PPF X |
| 64.8 | % | 35.4 | % | (0.2 | )% |
PPF XI |
| 68.6 | % | 31.4 | % | — | % |
PPF XII* |
| 60.3 | % | — | % | 39.7 | % |
Portfolio holdings are subject to change daily.
* As of November 30, 2004, the Fund was in its Offering Period.
Current Strategy and Outlook: The near-term outlook is positive with third calendar quarter 2004 earnings hitting 17% and the non-farm payroll report almost double expectations. The Federal Reserve (“Fed”) signaled its intentions to continue with its “measured” increase in rates, and in November 2004 lifted the Fed funds rate to 2.00%*, still considered to be accommodative, triggering a bond market rally. Robust corporate profits, strong jobs numbers, and an inflation-fighting Federal Reserve bode well for equities. Despite Federal Reserve increases to the Fed funds rate, longer term fixed income issues have shown resilience through this period. Looking to 2005, however, we do project rising longer-term rates for the bond market. The allocation decision between equities and fixed income is dependent on our quantitative asset allocation model, which uses the factors mentioned above, not on a qualitative evaluation of the bond versus the equity markets.
* Subsequent to the preparation of this report, the Fed raised rates 25 basis points on December 14 to 2.25%.
5
Average Annual Total Returns for the Periods Ended November 30, 2004
|
| 1 Year |
| Since Inception |
|
Including Sales Charge: |
|
|
|
|
|
Class A(1) |
| (4.42 | )% | (0.27 | )% |
Class B(2) |
| (4.27 | )% | (0.36 | )% |
Class C(3) |
| (0.37 | )% | 0.91 | % |
Class Q |
| 1.42 | % | 1.74 | % |
Excluding Sales Charge: |
|
|
|
|
|
Class A |
| 1.42 | % | 1.63 | % |
Class B |
| 0.69 | % | 0.89 | % |
Class C |
| 0.62 | % | 0.91 | % |
Class Q |
| 1.42 | % | 1.74 | % |
S&P 500 Index(4) |
| 12.85 | % | 5.65 | %(6) |
Lehman Brothers Aggregate Bond Index(5) |
| 4.44 | % | 5.57 | %(6) |
Based on a $10,000 initial investment, the graph and table above illustrate the total return of ING Principal Protection Fund against the S&P 500 Index and the Lehman Brothers Aggregate Bond Index. The Indices are unmanaged and have no cash in their portfolios, impose no sales charges and incur no operating expenses. An investor cannot invest directly in an index. The Fund’s performance is shown both with and without the imposition of sales charges.
The performance graph and table do not reflect the deduction of taxes that a shareholder will pay on Fund distributions or the redemption of Fund shares.
Total returns reflect the fact that the Investment Manager has waived certain fees and expenses otherwise payable by the Fund. Total returns would have been lower had there been no waiver to the Fund.
Performance data represents past performance and is no assurance of future results. Investment return and principal value of an investment in the Fund will fluctuate. Shares, when sold, may be worth more or less than their original cost. The Fund’s current performance may be lower or higher than the performance data shown. Please log on to www.ingfunds.com or call (800) 922-0180 to get performance through the most recent month end.
This report contains statements that may be “forward-looking” statements. Actual results may differ materially from those projected in the “forward-looking” statements.
The views expressed in this report reflect those of the portfolio managers, only through the end of the period as stated on the cover. The portfolio managers’ views are subject to change at any time based on market and other conditions.
Fund holdings are subject to change daily.
(1)Reflects deduction of the maximum Class A sales charge of 5.75%.
(2)Reflects deduction of the Class B deferred sales charge of 5% and 3%, respectively, for the 1 year and since inception returns.
(3)Reflects deduction of the Class C deferred sales charge of 1% for the 1 year return.
(4)The S&P 500 Index is an unmanaged index that measures the performance of securities of approximately 500 large-capitalization companies whose securities are traded on major U.S. stock markets.
(5)The Lehman Brothers Aggregate Bond Index is a widely recognized, unmanaged index of publicly issued investment grade U.S. Government, mortgage-backed, asset-backed and corporate debt securities.
(6)Since inception performance for the index is shown from October 1, 2001.
6
ING PRINCIPAL PROTECTION FUND II
PORTFOLIO MANAGERS’ REPORT
Average Annual Total Returns for the Periods Ended November 30, 2004
|
| 1 Year |
| Since Inception |
|
Including Sales Charge: |
|
|
|
|
|
Class A(1) |
| (4.55 | )% | (0.97 | )% |
Class B(2) |
| (4.48 | )% | (1.02 | )% |
Class C(3) |
| (0.45 | )% | 0.37 | % |
Class Q |
| 1.23 | % | 1.22 | % |
Excluding Sales Charge: |
|
|
|
|
|
Class A |
| 1.27 | % | 1.12 | % |
Class B |
| 0.45 | % | 0.35 | % |
Class C |
| 0.54 | % | 0.37 | % |
Class Q |
| 1.23 | % | 1.22 | % |
S&P 500 Index(4) |
| 12.85 | % | 3.12 | % |
Lehman Brothers Aggregate Bond Index(5) |
| 4.44 | % | 5.93 | % |
Based on a $10,000 initial investment, the graph and table above illustrate the total return of ING Principal Protection Fund II against the S&P 500 Index and the Lehman Brothers Aggregate Bond Index. The Indices are unmanaged and have no cash in their portfolios, impose no sales charges and incur no operating expenses. An investor cannot invest directly in an index. The Fund’s performance is shown both with and without the imposition of sales charges.
The performance graph and table do not reflect the deduction of taxes that a shareholder will pay on Fund distributions or the redemption of Fund shares.
Total returns reflect the fact that the Investment Manager has waived certain fees and expenses otherwise payable by the Fund. Total returns would have been lower had there been no waiver to the Fund.
Performance data represents past performance and is no assurance of future results. Investment return and principal value of an investment in the Fund will fluctuate. Shares, when sold, may be worth more or less than their original cost. The Fund’s current performance may be lower or higher than the performance data shown. Please log on to www.ingfunds.com or call (800) 922-0180 to get performance through the most recent month end.
This report contains statements that may be “forward-looking” statements. Actual results may differ materially from those projected in the “forward-looking” statements.
The views expressed in this report reflect those of the portfolio managers, only through the end of the period as stated on the cover. The portfolio managers’ views are subject to change at any time based on market and other conditions.
Fund holdings are subject to change daily.
(1)Reflects deduction of the maximum Class A sales charge of 5.75%.
(2)Reflects deduction of the Class B deferred sales charge of 5% and 4%, respectively, for the 1 year and since inception returns.
(3)Reflects deduction of the Class C deferred sales charge of 1% for the 1 year return.
(4)The S&P 500 Index is an unmanaged index that measures the performance of securities of approximately 500 large-capitalization companies whose securities are traded on major U.S. stock markets.
(5)The Lehman Brothers Aggregate Bond Index is a widely recognized, unmanaged index of publicly issued investment grade U.S. Government, mortgage-backed, asset-backed and corporate debt securities.
7
ING PRINCIPAL PROTECTION FUND III
PORTFOLIO MANAGERS’ REPORT
Average Annual Total Returns for the Periods Ended November 30, 2004
|
| 1 Year |
| Since Inception |
|
Including Sales Charge: |
|
|
|
|
|
Class A(1) |
| (4.33 | )% | (0.85 | )% |
Class B(2) |
| (4.23 | )% | (0.82 | )% |
Class C(3) |
| (0.26 | )% | 0.76 | % |
Class Q |
| 1.47 | % | 1.61 | % |
Excluding Sales Charge: |
|
|
|
|
|
Class A |
| 1.51 | % | 1.54 | % |
Class B |
| 0.71 | % | 0.75 | % |
Class C |
| 0.73 | % | 0.76 | % |
Class Q |
| 1.47 | % | 1.61 | % |
S&P 500 Index(4) |
| 12.85 | % | 5.74 | %(6) |
Lehman Brothers Aggregate Bond Index(5) |
| 4.44 | % | 5.87 | %(6) |
Based on a $10,000 initial investment, the graph and table above illustrate the total return of ING Principal Protection Fund III against the S&P 500 Index and the Lehman Brothers Aggregate Bond Index. The Indices are unmanaged and have no cash in their portfolios, impose no sales charges and incur no operating expenses. An investor cannot invest directly in an index. The Fund’s performance is shown both with and without the imposition of sales charges.
The performance graph and table do not reflect the deduction of taxes that a shareholder will pay on Fund distributions or the redemption of Fund shares.
Total returns reflect the fact that the Investment Manager has waived certain fees and expenses otherwise payable by the Fund. Total returns would have been lower had there been no waiver to the Fund.
Performance data represents past performance and is no assurance of future results. Investment return and principal value of an investment in the Fund will fluctuate. Shares, when sold, may be worth more or less than their original cost. The Fund’s current performance may be lower or higher than the performance data shown. Please log on to www.ingfunds.com or call (800) 922-0180 to get performance through the most recent month end.
This report contains statements that may be “forward-looking” statements. Actual results may differ materially from those projected in the “forward-looking” statements.
The views expressed in this report reflect those of the portfolio managers, only through the end of the period as stated on the cover. The portfolio managers’ views are subject to change at any time based on market and other conditions.
Fund holdings are subject to change daily.
(1)Reflects deduction of the maximum Class A sales charge of 5.75%.
(2)Reflects deduction of the Class B deferred sales charge of 5% and 4%, respectively, for the 1 year and since inception returns.
(3)Reflects deduction of the Class C deferred sales charge of 1% for the 1 year return.
(4)The S&P 500 Index is an unmanaged index that measures the performance of securities of approximately 500 large-capitalization companies whose securities are traded on major U.S. stock markets.
(5)The Lehman Brothers Aggregate Bond Index is a widely recognized, unmanaged index of publicly issued investment grade U.S. Government, mortgage-backed, asset-backed and corporate debt securities.
(6)Since inception performance for the index is shown from June 1, 2002.
8
ING PRINCIPAL PROTECTION FUND IV
PORTFOLIO MANAGERS’ REPORT
Average Annual Total Returns for the Periods Ended November 30, 2004
|
| 1 Year |
| Since Inception |
|
Including Sales Charge: |
|
|
|
|
|
Class A(1) |
| (2.70 | )% | 0.80 | % |
Class B(2) |
| (2.56 | )% | 1.03 | % |
Class C(3) |
| 1.50 | % | 2.84 | % |
Class Q |
| 3.29 | % | 3.72 | % |
Excluding Sales Charge: |
|
|
|
|
|
Class A |
| 3.23 | % | 3.62 | % |
Class B |
| 2.44 | % | 2.85 | % |
Class C |
| 2.50 | % | 2.84 | % |
Class Q |
| 3.29 | % | 3.72 | % |
S&P 500 Index(4) |
| 12.85 | % | 20.45 | %(6) |
Lehman Brothers Aggregate Bond Index(5) |
| 4.44 | % | 4.20 | %(6) |
Based on a $10,000 initial investment, the graph and table above illustrate the total return of ING Principal Protection Fund IV against the S&P 500 Index and the Lehman Brothers Aggregate Bond Index. The Indices are unmanaged and have no cash in their portfolios, impose no sales charges and incur no operating expenses. An investor cannot invest directly in an index. The Fund’s performance is shown both with and without the imposition of sales charges.
The performance graph and table do not reflect the deduction of taxes that a shareholder will pay on Fund distributions or the redemption of Fund shares.
Total returns reflect the fact that the Investment Manager has waived certain fees and expenses otherwise payable by the Fund. Total returns would have been lower had there been no waiver to the Fund.
Performance data represents past performance and is no assurance of future results. Investment return and principal value of an investment in the Fund will fluctuate. Shares, when sold, may be worth more or less than their original cost. The Fund’s current performance may be lower or higher than the performance data shown. Please log on to www.ingfunds.com or call (800) 922-0180 to get performance through the most recent month end.
This report contains statements that may be “forward-looking” statements. Actual results may differ materially from those projected in the “forward-looking” statements.
The views expressed in this report reflect those of the portfolio managers, only through the end of the period as stated on the cover. The portfolio managers’ views are subject to change at any time based on market and other conditions.
Fund holdings are subject to change daily.
(1)Reflects deduction of the maximum Class A sales charge of 5.75%.
(2)Reflects deduction of the Class B deferred sales charge of 5% and 4%, respectively, for the 1 year and since inception returns.
(3)Reflects deduction of the Class C deferred sales charge of 1% for the 1 year return.
(4)The S&P 500 Index is an unmanaged index that measures the performance of securities of approximately 500 large-capitalization companies whose securities are traded on major U.S. stock markets.
(5)The Lehman Brothers Aggregate Bond Index is a widely recognized, unmanaged index of publicly issued investment grade U.S. Government, mortgage-backed, asset-backed and corporate debt securities.
(6)Since inception performance for the index is shown from October 1, 2002.
9
ING PRINCIPAL PROTECTION FUND V
PORTFOLIO MANAGERS’ REPORT
Average Annual Total Returns for the Periods Ended November 30, 2004
|
| 1 Year |
| Since Inception |
|
Including Sales Charge: |
|
|
|
|
|
Class A(1) |
| (3.04 | )% | (0.46 | )% |
Class B(2) |
| (2.81 | )% | (0.54 | )% |
Class C(3) |
| 1.13 | % | 2.07 | % |
Excluding Sales Charge: |
|
|
|
|
|
Class A |
| 2.87 | % | 2.76 | % |
Class B |
| 2.09 | % | 2.10 | % |
Class C |
| 2.11 | % | 2.07 | % |
S&P 500 Index(4) |
| 12.85 | % | 20.95 | %(6) |
Lehman Brothers Aggregate Bond Index(5) |
| 4.44 | % | 4.04 | %(6) |
Based on a $10,000 initial investment, the graph and table above illustrate the total return of ING Principal Protection Fund V against the S&P 500 Index and the Lehman Brothers Aggregate Bond Index. The Indices are unmanaged and have no cash in their portfolios, impose no sales charges and incur no operating expenses. An investor cannot invest directly in an index. The Fund’s performance is shown both with and without the imposition of sales charges.
The performance graph and table do not reflect the deduction of taxes that a shareholder will pay on Fund distributions or the redemption of Fund shares.
Total returns reflect the fact that the Investment Manager has waived certain fees and expenses otherwise payable by the Fund. Total returns would have been lower had there been no waiver to the Fund.
Performance data represents past performance and is no assurance of future results. Investment return and principal value of an investment in the Fund will fluctuate. Shares, when sold, may be worth more or less than their original cost. The Fund’s current performance may be lower or higher than the performance data shown. Please log on to www.ingfunds.com or call (800) 922-0180 to get performance through the most recent month end.
This report contains statements that may be “forward-looking” statements. Actual results may differ materially from those projected in the “forward-looking” statements.
The views expressed in this report reflect those of the portfolio managers, only through the end of the period as stated on the cover. The portfolio managers’ views are subject to change at any time based on market and other conditions.
Fund holdings are subject to change daily.
(1)Reflects deduction of the maximum Class A sales charge of 5.75%.
(2)Reflects deduction of the Class B deferred sales charge of 5% for the 1 year and since inception returns.
(3)Reflects deduction of the Class C deferred sales charge of 1% for the 1 year return.
(4)The S&P 500 Index is an unmanaged index that measures the performance of securities of approximately 500 large-capitalization companies whose securities are traded on major U.S. stock markets.
(5)The Lehman Brothers Aggregate Bond Index is a widely recognized, unmanaged index of publicly issued investment grade U.S. Government, mortgage-backed, asset-backed and corporate debt securities.
(6)Since inception performance for the index is shown from February 1, 2003.
10
ING PRINCIPAL PROTECTION FUND VI
PORTFOLIO MANAGERS’ REPORT
Average Annual Total Returns for the Periods Ended November 30, 2004
|
| 1 Year |
| Since Inception |
|
Including Sales Charge: |
|
|
|
|
|
Class A(1) |
| (3.35 | )% | (1.34 | )% |
Class B(2) |
| (3.14 | )% | (1.43 | )% |
Class C(3) |
| 0.87 | % | 1.61 | % |
Class Q |
| 2.58 | % | 2.41 | % |
Excluding Sales Charge: |
|
|
|
|
|
Class A |
| 2.54 | % | 2.36 | % |
Class B |
| 1.75 | % | 1.62 | % |
Class C |
| 1.85 | % | 1.61 | % |
Class Q |
| 2.58 | % | 2.41 | % |
S&P 500 Index(4) |
| 12.85 | % | 18.96 | %(6) |
Lehman Brothers Aggregate Bond Index(5) |
| 4.44 | % | 3.31 | %(6) |
Based on a $10,000 initial investment, the graph and table above illustrate the total return of ING Principal Protection Fund VI against the S&P 500 Index and the Lehman Brothers Aggregate Bond Index. The Indices are unmanaged and have no cash in their portfolios, impose no sales charges and incur no operating expenses. An investor cannot invest directly in an index. The Fund’s performance is shown both with and without the imposition of sales charges.
The performance graph and table do not reflect the deduction of taxes that a shareholder will pay on Fund distributions or the redemption of Fund shares.
Total returns reflect the fact that the Investment Manager has waived certain fees and expenses otherwise payable by the Fund. Total returns would have been lower had there been no waiver to the Fund.
Performance data represents past performance and is no assurance of future results. Investment return and principal value of an investment in the Fund will fluctuate. Shares, when sold, may be worth more or less than their original cost. The Fund’s current performance may be lower or higher than the performance data shown. Please log on to www.ingfunds.com or call (800) 922-0180 to get performance through the most recent month end.
This report contains statements that may be “forward-looking” statements. Actual results may differ materially from those projected in the “forward-looking” statements.
The views expressed in this report reflect those of the portfolio managers, only through the end of the period as stated on the cover. The portfolio managers’ views are subject to change at any time based on market and other conditions.
Fund holdings are subject to change daily.
(1)Reflects deduction of the maximum Class A sales charge of 5.75%.
(2)Reflects deduction of the Class B deferred sales charge of 5% for the 1 year and since inception returns.
(3)Reflects deduction of the Class C deferred sales charge of 1% for the 1 year return.
(4)The S&P 500 Index is an unmanaged index that measures the performance of securities of approximately 500 large-capitalization companies whose securities are traded on major U.S. stock markets.
(5)The Lehman Brothers Aggregate Bond Index is a widely recognized, unmanaged index of publicly issued investment grade U.S. Government, mortgage-backed, asset-backed and corporate debt securities.
(6)Since inception performance for the index is shown from May 1, 2003.
11
ING PRINCIPAL PROTECTION FUND VII
PORTFOLIO MANAGERS’ REPORT
Average Annual Total Returns for the Period Ended November 30, 2004
|
| 1 Year |
| Since Inception |
|
Including Sales Charge: |
|
|
|
|
|
Class A(1) |
| (2.70 | )% | (2.32 | )% |
Class B(2) |
| (2.43 | )% | (2.41 | )% |
Class C(3) |
| 1.56 | % | 1.04 | % |
Excluding Sales Charge: |
|
|
|
|
|
Class A |
| 3.24 | % | 1.84 | % |
Class B |
| 2.57 | % | 1.07 | % |
Class C |
| 2.56 | % | 1.04 | % |
S&P 500 Index(4) |
| 12.85 | % | 16.04 | %(6) |
Lehman Brothers Aggregate Bond Index(5) |
| 4.44 | % | 2.50 | %(6) |
Based on a $10,000 initial investment, the graph and table above illustrate the total return of ING Principal Protection Fund VII against the S&P 500 Index and the Lehman Brothers Aggregate Bond Index. The Indices are unmanaged and have no cash in their portfolios, impose no sales charges and incur no operating expenses. An investor cannot invest directly in an index. The Fund’s performance is shown both with and without the imposition of sales charges.
The performance graph and table do not reflect the deduction of taxes that a shareholder will pay on Fund distributions or the redemption of Fund shares.
Total returns reflect the fact that the Investment Manager has waived certain fees and expenses otherwise payable by the Fund. Total returns would have been lower had there been no waiver to the Fund.
Performance data represents past performance and is no assurance of future results. Investment return and principal value of an investment in the Fund will fluctuate. Shares, when sold, may be worth more or less than their original cost. The Fund’s current performance may be lower or higher than the performance data shown. Please log on to www.ingfunds.com or call (800) 922-0180 to get performance through the most recent month end.
This report contains statements that may be “forward-looking” statements. Actual results may differ materially from those projected in the “forward-looking” statements.
The views expressed in this report reflect those of the portfolio managers, only through the end of the period as stated on the cover. The portfolio managers’ views are subject to change at any time based on market and other conditions.
Fund holdings are subject to change daily.
(1)Reflects deduction of the maximum Class A sales charge of 5.75%.
(2)Reflects deduction of the Class B deferred sales charge of 5% for the 1 year and since inception return.
(3)Reflects deduction of the Class C deferred sales charge of 1% for the since inception return.
(4)The S&P 500 Index is an unmanaged index that measures the performance of securities of approximately 500 large-capitalization companies whose securities are traded on major U.S. stock markets.
(5)The Lehman Brothers Aggregate Bond Index is a widely recognized, unmanaged index of publicly issued investment grade U.S. Government, mortgage-backed, asset-backed and corporate debt securities.
(6)Since inception performance for the index is shown from July 1, 2003.
12
ING PRINCIPAL PROTECTION FUND VIII
PORTFOLIO MANAGERS’ REPORT
Cumulative Total Returns for the Period Ended November 30, 2004
|
| Since Inception |
|
Including Sales Charge: |
|
|
|
Class A(1) |
| (4.22 | )% |
Class B(2) |
| (4.10 | )% |
Class C(3) |
| (0.08 | )% |
Excluding Sales Charge: |
|
|
|
Class A |
| 1.62 | % |
Class B |
| 0.85 | % |
Class C |
| 0.91 | % |
S&P 500 Index(4) |
| 7.22 | %(6) |
Lehman Brothers Aggregate Bond Index(5) |
| 3.39 | %(6) |
Based on a $10,000 initial investment, the graph and table above illustrate the total return of ING Principal Protection Fund VIII against the S&P 500 Index and the Lehman Brothers Aggregate Bond Index. The Indices are unmanaged and have no cash in their portfolios, impose no sales charges and incur no operating expenses. An investor cannot invest directly in an index. The Fund’s performance is shown both with and without the imposition of sales charges.
The performance graph and table do not reflect the deduction of taxes that a shareholder will pay on Fund distributions or the redemption of Fund shares.
Total returns reflect the fact that the Investment Manager has waived certain fees and expenses otherwise payable by the Fund. Total returns would have been lower had there been no waiver to the Fund.
Performance data represents past performance and is no assurance of future results. Investment return and principal value of an investment in the Fund will fluctuate. Shares, when sold, may be worth more or less than their original cost. The Fund’s current performance may be lower or higher than the performance data shown. Please log on to www.ingfunds.com or call (800) 922-0180 to get performance through the most recent month end.
This report contains statements that may be “forward-looking” statements. Actual results may differ materially from those projected in the “forward-looking” statements.
The views expressed in this report reflect those of the portfolio managers, only through the end of the period as stated on the cover. The portfolio managers’ views are subject to change at any time based on market and other conditions.
Fund holdings are subject to change daily.
(1)Reflects deduction of the maximum Class A sales charge of 5.75%.
(2)Reflects deduction of the Class B deferred sales charge of 5% for the since inception return.
(3)Reflects deduction of the Class C deferred sales charge of 1% for the since inception return.
(4)The S&P 500 Index is an unmanaged index that measures the performance of securities of approximately 500 large-capitalization companies whose securities are traded on major U.S. stock markets.
(5)The Lehman Brothers Aggregate Bond Index is a widely recognized, unmanaged index of publicly issued investment grade U.S. Government, mortgage-backed, asset-backed and corporate debt securities.
(6)Since inception performance for the index is shown from January 1, 2004.
13
ING PRINCIPAL PROTECTION FUND IX
PORTFOLIO MANAGERS’ REPORT

Cumulative Total Returns for the Period Ended November 30, 2004
|
| Since Inception |
|
Including Sales Charge: |
|
|
|
Class A(1) |
| (4.23 | )% |
Class B(2) |
| (3.90 | )% |
Class C(3) |
| 0.07 | % |
Excluding Sales Charge: |
|
|
|
Class A |
| 1.61 | % |
Class B |
| 1.10 | % |
Class C |
| 1.07 | % |
S&P 500 Index(4) |
| 7.13 | %(6) |
Lehman Brothers Aggregate Bond Index(5) |
| 3.40 | %(6) |
Based on a $10,000 initial investment, the graph and table above illustrate the total return of ING Principal Protection Fund IX against the S&P 500 Index and the Lehman Brothers Aggregate Bond Index. The Indices are unmanaged and have no cash in their portfolios, impose no sales charges and incur no operating expenses. An investor cannot invest directly in an index. The Fund’s performance is shown both with and without the imposition of sales charges.
The performance graph and table do not reflect the deduction of taxes that a shareholder will pay on Fund distributions or the redemption of Fund shares.
Total returns reflect the fact that the Investment Manager has waived certain fees and expenses otherwise payable by the Fund. Total returns would have been lower had there been no waiver to the Fund.
Performance data represents past performance and is no assurance of future results. Investment return and principal value of an investment in the Fund will fluctuate. Shares, when sold, may be worth more or less than their original cost. The Fund’s current performance may be lower or higher than the performance data shown. Please log on to www.ingfunds.com or call (800) 922-0180 to get performance through the most recent month end.
This report contains statements that may be “forward-looking” statements. Actual results may differ materially from those projected in the “forward-looking” statements.
The views expressed in this report reflect those of the portfolio managers, only through the end of the period as stated on the cover. The portfolio managers’ views are subject to change at any time based on market and other conditions.
Fund holdings are subject to change daily.
(1)Reflects deduction of the maximum Class A sales charge of 5.75%.
(2)Reflects deduction of the Class B deferred sales charge of 5% for the since inception return.
(3)Reflects deduction of the Class C deferred sales charge of 1% for the since inception return.
(4)The S&P 500 Index is an unmanaged index that measures the performance of securities of approximately 500 large-capitalization companies whose securities are traded on major U.S. stock markets.
(5)The Lehman Brothers Aggregate Bond Index is a widely recognized, unmanaged index of publicly issued investment grade U.S. Government, mortgage-backed, asset-backed and corporate debt securities.
(6)Since inception performance for the index is shown from May 1, 2004.
14
ING PRINCIPAL PROTECTION FUND X
PORTFOLIO MANAGERS’ REPORT
Cumulative Total Returns for the Period Ended November 30, 2004
|
| Since Inception |
|
Including Sales Charge: |
|
|
|
Class A(1) |
| (3.43 | )% |
Class B(2) |
| (2.80 | )% |
Class C(3) |
| 1.22 | % |
Excluding Sales Charge: |
|
|
|
Class A |
| 2.46 | % |
Class B |
| 2.20 | % |
Class C |
| 2.22 | % |
S&P 500 Index(4) |
| 6.78 | %(6) |
Lehman Brothers Aggregate Bond Index(5) |
| 0.31 | %(6) |
Based on a $10,000 initial investment, the graph and table above illustrate the total return of ING Principal Protection Fund IX against the S&P 500 Index and the Lehman Brothers Aggregate Bond Index. The Indices are unmanaged and have no cash in their portfolios, impose no sales charges and incur no operating expenses. An investor cannot invest directly in an index. The Fund’s performance is shown both with and without the imposition of sales charges.
The performance graph and table do not reflect the deduction of taxes that a shareholder will pay on Fund distributions or the redemption of Fund shares.
Total returns reflect the fact that the Investment Manager has waived certain fees and expenses otherwise payable by the Fund. Total returns would have been lower had there been no waiver to the Fund.
Performance data represents past performance and is no assurance of future results. Investment return and principal value of an investment in the Fund will fluctuate. Shares, when sold, may be worth more or less than their original cost. The Fund’s current performance may be lower or higher than the performance data shown. Please log on to www.ingfunds.com or call (800) 922-0180 to get performance through the most recent month end.
This report contains statements that may be “forward-looking” statements. Actual results may differ materially from those projected in the “forward-looking” statements.
The views expressed in this report reflect those of the portfolio managers, only through the end of the period as stated on the cover. The portfolio managers’ views are subject to change at any time based on market and other conditions.
Fund holdings are subject to change daily.
(1)Reflects deduction of the maximum Class A sales charge of 5.75%.
(2)Reflects deduction of the Class B deferred sales charge of 5% for the since inception return.
(3)Reflects deduction of the Class C deferred sales charge of 1% for the since inception return.
(4)The S&P 500 Index is an unmanaged index that measures the performance of securities of approximately 500 large-capitalization companies whose securities are traded on major U.S. stock markets.
(5)The Lehman Brothers Aggregate Bond Index is a widely recognized, unmanaged index of publicly issued investment grade U.S. Government, mortgage-backed, asset-backed and corporate debt securities.
(6)Since inception performance for the index is shown from May 1, 2004.
15
ING PRINCIPAL PROTECTION FUNDS
INVESTMENT STRATEGY AND PRINCIPAL RISKS
What is the Investment Strategy During the Guarantee Period?
The Funds undertake (the “Payment Undertaking”) that on the Guarantee Maturity Date specified in the Prospectus, each shareholder will be entitled to redeem his or her shares for an amount no less than the value of that shareholder’s account as of the inception of the Guarantee Period, less certain expenses not covered by the Expense Limitation Agreement (“Guaranteed Amount”), provided that all dividends and distributions received from the Fund have been reinvested and no shares have been redeemed. Note: An investor must act on the Guarantee Maturity Date in order to receive the Guaranteed Amount.
As you know, the Funds do not implement an “investment strategy” in any conventional sense. Rather, the Funds’ asset allocation strategy seeks to optimize the exposure of the series to the Equity Component while protecting the Funds’ assets. Assets allocated to the Equity Component may be reduced or eliminated in order to conserve assets at a level equal to or above the present value of the Payment Undertaking. The Funds allocate their assets among the following asset classes during the Guarantee Period:
• During the Guarantee Period, the Funds’ assets will be allocated between the:
• Equity Component, consisting primarily of common stocks included in the S&P 500 Index and futures contracts on the S&P 500 Index; and the
• Fixed Component, consisting primarily of short- to intermediate-duration U.S. Government securities.
The Funds’ asset allocation strategy is implemented by allocating assets appropriately to the Equity Component and to the Fixed Component to optimize exposure to the Equity Component while controlling the risk that payment by MBIA under the Guarantee will be required. Consequently, there can be no assurance as to the percentage of assets, if any, allocated to the Equity Component, or to any investment returns generated by the Funds.
How Does the Funds’ Asset Allocation work?
The Funds use a proprietary computer model to determine on a daily basis the percentage of assets allocated to the Equity Component and to the Fixed Component. The model evaluates a number of factors, including the then current market value of the Funds, the then prevailing level of interest rates, equity market volatility, the Funds’ total annual expenses, and the Maturity Date. The model determined the initial allocation between the Equity Component and the Fixed Component on the first day of the Guarantee Period and provides direction for any reallocations on a daily basis thereafter.
Equity Component: The Funds will employ an enhanced index strategy. This strategy means that the Funds invest at least 80% of the Equity Component’s net assets in stocks included in the S&P 500 Index although the weightings of the stocks will vary somewhat from their respective weightings in the Index. The Equity Component may also include up to 20% of its assets in S&P 500 Index futures contracts. The Funds may use futures for hedging purposes, but may only use futures on the S&P 500 Index and U.S. Treasury securities.
If the Equity Component’s market value is $5 million or less, in order to replicate investment in stocks listed on the S&P 500 Index, the Portfolio Manager may invest the entire amount of the Equity Component’s assets in S&P 500 Index futures, in exchange traded funds (ETFs), or in a combination of S&P 500 Index futures and ETFs, subject to any limitation on the Funds’ investment in such securities. ETFs are passively managed investment companies traded on a securities exchange whose goal is to track or replicate a desired index. The Funds’ Portfolio Manager will not employ an enhanced index strategy when it invests in S&P 500 Index futures and ETFs.
Fixed Component: The Funds look to select investments for the Fixed Component with financial characteristics that will, at any point in time, closely resemble those of a portfolio of zero coupon bonds which mature within three months of the Guarantee Maturity Date. The Fixed Component will consist primarily of securities issued or guaranteed by the U.S. Government and its agencies or instrumentalities of a short- to intermediate duration. Duration refers to the sensitivity of fixed income securities to interest rate changes. Generally, fixed income securities with shorter durations are less sensitive to changes in interest rates. These U.S. Government securities include STRIPS (Separate Trading of Registered Interest and Principal of Securities). STRIPS are created by the Federal Reserve Bank by separating the interest and principal components of an outstanding U.S. Treasury or Agency bond and selling them as individual securities. The Fixed Component may also include corporate bonds rated AA- or higher by S&P and/or Aa3 or higher by Moody’s Investors Service, Inc., futures on U.S. Treasury securities and money market instruments.
What Are the Principal Guarantee Period Risks?
Allocation Risk: If at the inception of, or at any time during, the Guarantee Period interest rates are low, the Funds’ assets may be largely invested in the Fixed Component in order to decrease the likelihood that a payment would be required under the Payment Undertaking. The effect of low interest rates on the Funds would likely be more pronounced at the inception of the Guarantee Period, as the initial allocation of assets would include more fixed income securities. In addition, if during the Guarantee Period the equity markets experienced a major decline, the Funds’ assets may become largely invested in the Fixed Component. If the
16
value of the Equity Component were to decline by a significant amount, a complete reallocation to the Fixed Component would likely occur. In the event of a reallocation of 100% of the assets to the Fixed Component, the Funds would not reallocate any assets into the Equity Component prior to the Maturity Date. Use of the Fixed Component reduces the Funds’ ability to participate as fully in upward equity market movements, and therefore represents some loss of opportunity, or opportunity cost, compared to a portfolio that is fully invested in equities.
Opportunity Costs: The Funds may allocate a substantial portion, and under certain circumstances all, of the Fund’s assets to the Fixed Component in order to conserve the Funds’ assets to a level equal to or above the present value of the Payment Undertaking. Initially, if interest rates are low, the allocation to the Fixed Component may be over 70% of the Funds’ assets. If the market value of the Equity Component rises, the percentage of the Funds’ assets allocated to the Equity Component generally will also rise. However, the relative volatility of these two Components as well as the past performance of the Funds will affect these allocations. For example, if the Funds incur early losses, the Funds may allocate 100% of the Funds’ assets to the Fixed Component for the entire Guarantee Period, irrespective of the subsequent upward movements in the equity markets and/or the Equity Component. The extent to which the Funds participate in upward movements in the Equity Component during the Guarantee Period will depend on the performance of the Funds, the performance and volatility of the Fixed and Equity Components, interest rates, expenses of the Fund and other factors. The Funds might capture a material portion, very little or none of any equity market increase. It is possible that on the Maturity Date, an investor could receive only the Guaranteed Amount even though the equity markets, as well as the Equity Component, has had significant positive performance during the Guarantee Period.
Worse Case Scenarios for the Funds’ Equity Participation: The opportunity cost of not allocating assets to the Equity Component will be particularly high if early in the Guarantee period: (a) the Fund’s NAVs decrease; or (b) the value of the Equity Component declines. In either case, all or substantially all of the Funds’ assets could be allocated to the Fixed Component for the remainder of the Guarantee Period.
Investing in Stocks: The risks associated with investing in stocks include sudden and unpredictable drops in the value of the market as a whole and periods of lackluster or negative performance. The performance of the Equity Component also depends significantly on the Portfolio Manager’s skill in determining which securities to overweight, underweight or avoid altogether.
Investing in Bonds: The principal risk associated with investing in bonds is that interest rates may rise, which generally causes bond prices to fall. The market value of a zero coupon bond portfolio (which may include STRIPS) generally is more volatile than the market value of a portfolio of fixed income securities with similar maturities that pay interest periodically. With corporate bonds, there is also a risk that the issuer will default on the payment of principal or interest. Federal tax law requires that a holder of a zero coupon security accrue a portion of the discount at which the security was purchased as taxable income each year, even though the holder receives no interest payment on the security during the year. Because the Funds must distribute substantially all of their net income (including non-cash income attributable to zero coupon securities) to their shareholders each year for income and excise tax purposes, such accrued discount would also be taken into account in determining the amount of taxable distributions to shareholders. In addition, the Funds may have to dispose of portfolio securities under disadvantageous circumstances to generate cash, or may be required to borrow, to satisfy their distribution requirements.
Use of Futures: While the use of futures contracts by the Funds can amplify a gain, it can also amplify a loss. Such a loss can be substantially more money than the actual cost of the investment. In addition, while a hedging strategy can guard against potential risks for the Funds as a whole, it adds to the Funds’ expense and may reduce or eliminate potential gains. There is also a risk that a futures contract intended as a hedge may not perform as expected.
Transaction Costs and Taxes: The asset allocation process results in additional transaction costs such as brokerage commissions. The process can have an adverse effect on the performance of the Funds during periods of increased equity market volatility. In addition, a high portfolio turnover rate, which may also have an adverse effect on the performance of the Funds, may increase the Funds’ transaction costs.
The asset allocation process and sale of fixed-income securities in connection with the transition period may also result in the realization of additional gains to the Funds and may therefore also increase the tax liability of shareholders. The Funds will distribute any net gains and income to shareholders. Such distributions are taxable to shareholders even if the distributions are reinvested in the Funds.
For further information on the Funds’ Investment Strategy and Risks, please refer to your Prospectus and Statement of Additional Information.
17
SHAREHOLDER EXPENSE EXAMPLES (UNAUDITED)
As a shareholder of a Fund, you incur two types of costs: (1) transaction costs, including sales charges (loads) on purchase payments, reinvested dividends, or other distributions; redemption fees; and exchange fees; and (2) ongoing costs, including management fees; distribution [and/or service] (12b–1) fees; and other Fund expenses. These Examples are intended to help you understand your ongoing costs (in dollars) of investing in a Fund and to compare these costs with the ongoing costs of investing in other mutual funds.
The Examples are based on an investment of $1,000 invested at the beginning of the period and held for the entire period from June 1, 2004 to November 30, 2004.
Actual Expenses
The first section of the table shown, “Actual Fund Return,” provides information about actual account values and actual expenses. You may use the information in this section, together with the amount you invested, to estimate the expenses that you paid over the period. Simply divide your account value by $1,000 (for example, an $8,600 account value divided by $1,000 = 8.6), then multiply the result by the number in the first section under the heading entitled “Expenses Paid During Period” to estimate the expenses you paid on your account during this period.
Hypothetical Example for Comparison Purposes
The second section of the table shown, “Hypothetical 5% Return,” provides information about hypothetical account values and hypothetical expenses based on the Fund’s actual expense ratio and an assumed rate of return of 5% per year before expenses, which is not the Fund’s actual return. The hypothetical account values and expenses may not be used to estimate the actual ending account balance or expenses you paid for the period. You may use this information to compare the ongoing costs of investing in the Fund and other funds. To do so, compare this 5% hypothetical example with the 5% hypothetical examples that appear in the shareholder reports of the other funds.
Please note that the expenses shown in the table are meant to highlight your ongoing costs only and do not reflect any transactional costs, such as sales charges (loads), redemption fees, or exchange fees. Therefore, the hypothetical lines of the table are useful in comparing ongoing costs only, and will not help you determine the relative total costs of owning different funds. In addition, if these transactional costs were included, your costs would have been higher.
ING Principal Protection Fund |
| Beginning |
| Ending |
| Annualized |
| Expenses Paid |
| |||
Actual Fund Return |
|
|
|
|
|
|
|
|
| |||
Class A |
| $ | 1,000.00 |
| $ | 1,010.10 |
| 1.74 | % | $ | 8.77 |
|
Class B |
| 1,000.00 |
| 1,006.90 |
| 2.49 |
| 12.53 |
| |||
Class C |
| 1,000.00 |
| 1,007.20 |
| 2.49 |
| 12.53 |
| |||
Class Q |
| 1,000.00 |
| 1,011.10 |
| 1.74 |
| 8.77 |
| |||
Hypothetical (5% return before expenses) |
|
|
|
|
|
|
|
|
| |||
Class A |
| $ | 1,000.00 |
| $ | 1,016.34 |
| 1.74 | % | $ | 8.80 |
|
Class B |
| 1,000.00 |
| 1,012.58 |
| 2.49 |
| 12.56 |
| |||
Class C |
| 1,000.00 |
| 1,012.58 |
| 2.49 |
| 12.56 |
| |||
Class Q |
| 1,000.00 |
| 1,016.34 |
| 1.74 |
| 8.80 |
| |||
* Expenses are equal to each Fund’s respective annualized expense ratios multiplied by the average account value over the period, multiplied by 183/365 (to reflect the one-half year period).
18
ING Principal Protection Fund II | �� | Beginning |
| Ending |
| Annualized |
| Expenses Paid |
| |||
Actual Fund Return |
|
|
|
|
|
|
|
|
| |||
Class A |
| $ | 1,000.00 |
| $ | 1,010.70 |
| 1.60 | % | $ | 8.06 |
|
Class B |
| 1,000.00 |
| 1,006.60 |
| 2.35 |
| 11.82 |
| |||
Class C |
| 1,000.00 |
| 1,007.50 |
| 2.35 |
| 11.83 |
| |||
Class Q |
| 1,000.00 |
| 1,010.20 |
| 1.59 |
| 8.01 |
| |||
Hypothetical (5% return before expenses) |
|
|
|
|
|
|
|
|
| |||
Class A |
| $ | 1,000.00 |
| $ | 1,017.05 |
| 1.60 | % | $ | 8.09 |
|
Class B |
| 1,000.00 |
| 1,013.29 |
| 2.35 |
| 11.86 |
| |||
Class C |
| 1,000.00 |
| 1,013.29 |
| 2.35 |
| 11.86 |
| |||
Class Q |
| 1,000.00 |
| 1,017.10 |
| 1.59 |
| 8.04 |
| |||
ING Principal Protection Fund III |
| Beginning |
| Ending |
| Annualized |
| Expenses Paid |
| |||
Actual Fund Return |
|
|
|
|
|
|
|
|
| |||
Class A |
| $ | 1,000.00 |
| $ | 1,012.00 |
| 1.59 | % | $ | 8.02 |
|
Class B |
| 1,000.00 |
| 1,008.10 |
| 2.34 |
| 11.78 |
| |||
Class C |
| 1,000.00 |
| 1,008.30 |
| 2.34 |
| 11.78 |
| |||
Class Q |
| 1,000.00 |
| 1,012.70 |
| 1.59 |
| 8.02 |
| |||
Hypothetical (5% return before expenses) |
|
|
|
|
|
|
|
|
| |||
Class A |
| $ | 1,000.00 |
| $ | 1,017.10 |
| 1.59 | % | $ | 8.04 |
|
Class B |
| 1,000.00 |
| 1,013.34 |
| 2.34 |
| 11.81 |
| |||
Class C |
| 1,000.00 |
| 1,013.34 |
| 2.34 |
| 11.81 |
| |||
Class Q |
| 1,000.00 |
| 1,017.10 |
| 1.59 |
| 8.04 |
| |||
ING Principal Protection Fund IV |
| Beginning |
| Ending |
| Annualized |
| Expenses Paid |
| |||
Actual Fund Return |
|
|
|
|
|
|
|
|
| |||
Class A |
| $ | 1,000.00 |
| $ | 1,019.40 |
| 1.57 | % | $ | 7.95 |
|
Class B |
| 1,000.00 |
| 1,015.50 |
| 2.32 |
| 11.72 |
| |||
Class C |
| 1,000.00 |
| 1,016.10 |
| 2.32 |
| 11.73 |
| |||
Class Q |
| 1,000.00 |
| 1,019.00 |
| 1.57 |
| 7.95 |
| |||
Hypothetical (5% return before expenses) |
|
|
|
|
|
|
|
|
| |||
Class A |
| $ | 1,000.00 |
| $ | 1,017.20 |
| 1.57 | % | $ | 7.94 |
|
Class B |
| 1,000.00 |
| 1,013.44 |
| 2.32 |
| 11.71 |
| |||
Class C |
| 1,000.00 |
| 1,013.44 |
| 2.32 |
| 11.71 |
| |||
Class Q |
| 1,000.00 |
| 1,017.20 |
| 1.57 |
| 7.94 |
| |||
* Expenses are equal to each Fund’s respective annualized expense ratios multiplied by the average account value over the period, multiplied by 183/365 (to reflect the one-half year period).
19
ING Principal Protection Fund V |
| Beginning |
| Ending |
| Annualized |
| Expenses Paid |
| |||
Actual Fund Return |
|
|
|
|
|
|
|
|
| |||
Class A |
| $ | 1,000.00 |
| $ | 1,019.50 |
| 1.56 | % | $ | 7.90 |
|
Class B |
| 1,000.00 |
| 1,015.90 |
| 2.31 |
| 11.67 |
| |||
Class C |
| 1,000.00 |
| 1,015.10 |
| 2.31 |
| 11.67 |
| |||
Hypothetical (5% return before expenses) |
|
|
|
|
|
|
|
|
| |||
Class A |
| $ | 1,000.00 |
| $ | 1,017.25 |
| 1.56 | % | $ | 7.89 |
|
Class B |
| 1,000.00 |
| 1,013.49 |
| 2.31 |
| 11.66 |
| |||
Class C |
| 1,000.00 |
| 1,013.49 |
| 2.31 |
| 11.66 |
| |||
ING Principal Protection Fund VI |
| Beginning |
| Ending |
| Annualized |
| Expenses Paid |
| |||
Actual Fund Return |
|
|
|
|
|
|
|
|
| |||
Class A |
| $ | 1,000.00 |
| $ | 1,017.30 |
| 1.58 | % | $ | 7.99 |
|
Class B |
| 1,000.00 |
| 1,012.50 |
| 2.33 |
| 11.75 |
| |||
Class C |
| 1,000.00 |
| 1,013.50 |
| 2.33 |
| 11.76 |
| |||
Class Q |
| 1,000.00 |
| 1,016.70 |
| 1.58 |
| 7.99 |
| |||
Hypothetical (5% return before expenses) |
|
|
|
|
|
|
|
|
| |||
Class A |
| $ | 1,000.00 |
| $ | 1,017.15 |
| 1.58 | % | $ | 7.99 |
|
Class B |
| 1,000.00 |
| 1,013.39 |
| 2.33 |
| 11.76 |
| |||
Class C |
| 1,000.00 |
| 1,013.39 |
| 2.33 |
| 11.76 |
| |||
Class Q |
| 1,000.00 |
| 1,017.15 |
| 1.58 |
| 7.99 |
| |||
ING Principal Protection Fund VII |
| Beginning |
| Ending |
| Annualized |
| Expenses Paid |
| |||
Actual Fund Return |
|
|
|
|
|
|
|
|
| |||
Class A |
| $ | 1,000.00 |
| $ | 1,020.90 |
| 1.35 | % | $ | 6.84 |
|
Class B |
| 1,000.00 |
| 1,017.40 |
| 2.10 |
| 10.62 |
| |||
Class C |
| 1,000.00 |
| 1,017.30 |
| 2.10 |
| 10.62 |
| |||
Hypothetical (5% return before expenses) |
|
|
|
|
|
|
|
|
| |||
Class A |
| $ | 1,000.00 |
| $ | 1,018.30 |
| 1.35 | % | $ | 6.83 |
|
Class B |
| 1,000.00 |
| 1,014.54 |
| 2.10 |
| 10.61 |
| |||
Class C |
| 1,000.00 |
| 1,014.54 |
| 2.10 |
| 10.61 |
| |||
* Expenses are equal to each Fund’s respective annualized expense ratios multiplied by the average account value over the period, multiplied by 183/365 (to reflect the one-half year period).
20
ING Principal Protection Fund VIII |
| Beginning |
| Ending |
| Annualized |
| Expenses Paid |
| |||
Actual Fund Return |
|
|
|
|
|
|
|
|
| |||
Class A |
| $ | 1,000.00 |
| $ | 1,020.80 |
| 1.51 | % | $ | 7.65 |
|
Class B |
| 1,000.00 |
| 1,017.10 |
| 2.26 |
| 11.43 |
| |||
Class C |
| 1,000.00 |
| 1,017.70 |
| 2.26 |
| 11.43 |
| |||
Hypothetical (5% return before expenses) |
|
|
|
|
|
|
|
|
| |||
Class A |
| $ | 1,000.00 |
| $ | 1,017.50 |
| 1.51 | % | $ | 7.64 |
|
Class B |
| 1,000.00 |
| 1,013.74 |
| 2.26 |
| 11.41 |
| |||
Class C |
| 1,000.00 |
| 1,013.74 |
| 2.26 |
| 11.41 |
| |||
ING Principal Protection Fund IX |
| Beginning |
| Ending |
| Annualized |
| Expenses Paid |
| |||
Actual Fund Return |
|
|
|
|
|
|
|
|
| |||
Class A |
| $ | 1,000.00 |
| $ | 1,024.30 |
| 1.75 | % | $ | 8.88 |
|
Class B |
| 1,000.00 |
| 1,020.20 |
| 2.50 |
| 12.66 |
| |||
Class C |
| 1,000.00 |
| 1,019.90 |
| 2.50 |
| 12.66 |
| |||
Hypothetical (5% return before expenses) |
|
|
|
|
|
|
|
|
| |||
Class A |
| $ | 1,000.00 |
| $ | 1,016.29 |
| 1.75 | % | $ | 8.85 |
|
Class B |
| 1,000.00 |
| 1,012.53 |
| 2.50 |
| 12.61 |
| |||
Class C |
| 1,000.00 |
| 1,012.53 |
| 2.50 |
| 12.61 |
| |||
ING Principal Protection Fund X |
| Beginning |
| Ending |
| Annualized |
| Expenses Paid |
| |||
Actual Fund Return |
|
|
|
|
|
|
|
|
| |||
Class A |
| $ | 1,000.00 |
| $ | 1,024.60 |
| 1.72 | % | $ | 8.73 |
|
Class B |
| 1,000.00 |
| 1,022.00 |
| 2.22 |
| 11.25 |
| |||
Class C |
| 1,000.00 |
| 1,022.20 |
| 2.28 |
| 11.56 |
| |||
Hypothetical (5% return before expenses) |
|
|
|
|
|
|
|
|
| |||
Class A |
| $ | 1,000.00 |
| $ | 1,016.44 |
| 1.72 | % | $ | 8.69 |
|
Class B |
| 1,000.00 |
| 1,013.94 |
| 2.22 |
| 11.21 |
| |||
Class C |
| 1,000.00 |
| 1,013.64 |
| 2.28 |
| 11.51 |
| |||
* Expenses are equal to each Fund’s respective annualized expense ratios multiplied by the average account value over the period, multiplied by 183/365 (to reflect the one-half year period).
21
ING Principal Protection Fund XI |
| Beginning |
| Ending |
| Annualized |
| Expenses Paid |
| |||
Actual Fund Return |
|
|
|
|
|
|
|
|
| |||
Class A |
| $ | 1,000.00 |
| $ | 984.00 |
| 1.24 | % | $ | 6.17 |
|
Class B |
| 1,000.00 |
| 985.00 |
| 1.99 |
| 9.90 |
| |||
Class C |
| 1,000.00 |
| 985.00 |
| 1.99 |
| 9.90 |
| |||
Hypothetical (5% return before expenses) |
|
|
|
|
|
|
|
|
| |||
Class A |
| $ | 1,000.00 |
| $ | 1,018.85 |
| 1.24 | % | $ | 6.28 |
|
Class B |
| 1,000.00 |
| 1,015.14 |
| 1.99 |
| 10.05 |
| |||
Class C |
| 1,000.00 |
| 1,014.84 |
| 1.99 |
| 10.05 |
| |||
ING Principal Protection Fund XII |
| Beginning |
| Ending |
| Annualized |
| Expenses Paid |
| |||
Actual Fund Return |
|
|
|
|
|
|
|
|
| |||
Class A |
| $ | 1,000.00 |
| $ | 1,000.00 |
| 1.25 | % | $ | 6.27 |
|
Class B |
| 1,000.00 |
| 1,000.00 |
| 1.90 |
| 9.53 |
| |||
Class C |
| 1,000.00 |
| 1,000.00 |
| 1.90 |
| 9.53 |
| |||
Hypothetical (5% return before expenses) |
|
|
|
|
|
|
|
|
| |||
Class A |
| $ | 1,000.00 |
| $ | 1,019.00 |
| 1.25 | % | $ | 6.33 |
|
Class B |
| 1,000.00 |
| 1,015.09 |
| 1.90 |
| 9.60 |
| |||
Class C |
| 1,000.00 |
| 1,015.09 |
| 1.90 |
| 9.60 |
| |||
* Expenses are equal to each Fund’s respective annualized expense ratios multiplied by the average account value over the period, multiplied by 183/365 (to reflect the one-half year period).
22
STATEMENTS OF ASSETS AND LIABILITIES AS OF NOVEMBER 30, 2004 (UNAUDITED)
|
| ING |
| ING |
| ING |
| ING |
| ||||
ASSETS: |
|
|
|
|
|
|
|
|
| ||||
Investments in securities at value* |
| $ | 265,532,116 |
| $ | 379,175,499 |
| $ | 293,751,388 |
| $ | 566,110,089 |
|
Repurchase agreement |
| 1,193,000 |
| 2,521,000 |
| 2,477,000 |
| 4,428,000 |
| ||||
Cash |
| 861 |
| 893 |
| 238 |
| 263 |
| ||||
Dividends and interest receivable |
| 185,135 |
| 166,839 |
| 180,714 |
| 992,492 |
| ||||
Prepaid expenses |
| 2,535 |
| 3,605 |
| 2,524 |
| 4,783 |
| ||||
Total assets |
| 266,913,647 |
| 381,867,836 |
| 296,411,864 |
| 571,535,627 |
| ||||
|
|
|
|
|
|
|
|
|
| ||||
LIABILITIES: |
|
|
|
|
|
|
|
|
| ||||
Payable for fund shares redeemed |
| 306,263 |
| 675,288 |
| 625,720 |
| 793,137 |
| ||||
Payable to affiliates |
| 527,006 |
| 583,368 |
| 451,793 |
| 874,371 |
| ||||
Payable for trustee fees |
| 27,672 |
| 52,389 |
| 33,480 |
| 40,841 |
| ||||
Other accrued expenses and liabilities |
| 377,008 |
| 465,037 |
| 281,673 |
| 433,280 |
| ||||
Total liabilities |
| 1,237,949 |
| 1,776,082 |
| 1,392,666 |
| 2,141,629 |
| ||||
NET ASSETS |
| $ | 265,675,698 |
| $ | 380,091,754 |
| $ | 295,019,198 |
| $ | 569,393,998 |
|
|
|
|
|
|
|
|
|
|
| ||||
NET ASSETS WERE COMPRISED OF: |
|
|
|
|
|
|
|
|
| ||||
Paid-in capital |
| $ | 269,940,515 |
| $ | 398,608,503 |
| $ | 301,676,840 |
| $ | 532,882,539 |
|
Accumulated net investment loss |
| (821,077 | ) | (626,916 | ) | (443,909 | ) | (73,163 | ) | ||||
Accumulated net realized loss on investments |
| (16,578,655 | ) | (34,388,224 | ) | (21,693,184 | ) | (2,643,334 | ) | ||||
Net unrealized appreciation or depreciation on investments |
| 13,134,915 |
| 16,498,391 |
| 15,479,451 |
| 39,227,956 |
| ||||
NET ASSETS |
| $ | 265,675,698 |
| $ | 380,091,754 |
| $ | 295,019,198 |
| $ | 569,393,998 |
|
* Cost of investments in securities |
| $ | 252,397,201 |
| $ | 362,677,108 |
| $ | 278,271,937 |
| $ | 526,882,133 |
|
See Accompanying Notes to Financial Statements
23
STATEMENTS OF ASSETS AND LIABILITIES AS OF NOVEMBER 30, 2004 (UNAUDITED)
|
| ING |
| ING |
| ING |
| ING |
| ||||
Class A: |
|
|
|
|
|
|
|
|
| ||||
Net assets |
| $ | 23,410,232 |
| $ | 31,765,257 |
| $ | 23,987,323 |
| $ | 42,136,427 |
|
Shares authorized |
| unlimited |
| unlimited |
| unlimited |
| unlimited |
| ||||
Par value |
| $ | 0.01 |
| $ | 0.01 |
| $ | 0.01 |
| $ | 0.01 |
|
Shares outstanding |
| 2,385,922 |
| 3,305,374 |
| 2,458,025 |
| 4,043,621 |
| ||||
Net asset value and redemption price per share |
| $ | 9.81 |
| $ | 9.61 |
| $ | 9.76 |
| $ | 10.42 |
|
Maximum offering price per share (5.75%)(1) |
| $ | 10.40 |
| $ | 10.20 |
| $ | 10.36 |
| $ | 11.06 |
|
|
|
|
|
|
|
|
|
|
| ||||
Class B: |
|
|
|
|
|
|
|
|
| ||||
Net assets |
| $ | 208,609,127 |
| $ | 290,065,637 |
| $ | 234,603,957 |
| $ | 446,470,906 |
|
Shares authorized |
| unlimited |
| unlimited |
| unlimited |
| unlimited |
| ||||
Par value |
| $ | 0.01 |
| $ | 0.01 |
| $ | 0.01 |
| $ | 0.01 |
|
Shares outstanding |
| 21,243,292 |
| 30,152,326 |
| 24,027,584 |
| 42,838,315 |
| ||||
Net asset value and redemption price per share(2) |
| $ | 9.82 |
| $ | 9.62 |
| $ | 9.76 |
| $ | 10.42 |
|
Maximum offering price per share |
| $ | 9.82 |
| $ | 9.62 |
| $ | 9.76 |
| $ | 10.42 |
|
|
|
|
|
|
|
|
|
|
| ||||
Class C: |
|
|
|
|
|
|
|
|
| ||||
Net assets |
| $ | 33,087,909 |
| $ | 58,229,789 |
| $ | 35,833,339 |
| $ | 79,827,829 |
|
Shares authorized |
| unlimited |
| unlimited |
| unlimited |
| unlimited |
| ||||
Par value |
| $ | 0.01 |
| $ | 0.01 |
| $ | 0.01 |
| $ | 0.01 |
|
Shares outstanding |
| 3,360,304 |
| 6,036,910 |
| 3,659,587 |
| 7,640,811 |
| ||||
Net asset value and redemption price per share(2) |
| $ | 9.85 |
| $ | 9.65 |
| $ | 9.79 |
| $ | 10.45 |
|
Maximum offering price per share |
| $ | 9.85 |
| $ | 9.65 |
| $ | 9.79 |
| $ | 10.45 |
|
|
|
|
|
|
|
|
|
|
| ||||
Class Q: |
|
|
|
|
|
|
|
|
| ||||
Net assets |
| $ | 568,430 |
| $ | 31,071 |
| $ | 594,579 |
| $ | 958,836 |
|
Shares authorized |
| unlimited |
| unlimited |
| unlimited |
| unlimited |
| ||||
Par value |
| $ | 0.01 |
| $ | 0.01 |
| $ | 0.01 |
| $ | 0.01 |
|
Shares outstanding |
| 57,792 |
| 3,230 |
| 60,999 |
| 92,028 |
| ||||
Net asset value and redemption price per share(2) |
| $ | 9.84 |
| $ | 9.62 |
| $ | 9.75 |
| $ | 10.42 |
|
Maximum offering price per share |
| $ | 9.84 |
| $ | 9.62 |
| $ | 9.75 |
| $ | 10.42 |
|
(1) Maximum offering price is computed at 100/94.25 of net asset value. On purchases of $50,000 or more, the offering price is reduced.
(2) Redemption price per share may be reduced for any applicable contingent deferred sales charges.
See Accompanying Notes to Financial Statements
24
STATEMENTS OF ASSETS AND LIABILITIES AS OF NOVEMBER 30, 2004 (UNAUDITED)
|
| ING |
| ING |
| ING |
| ING |
| ||||
ASSETS: |
|
|
|
|
|
|
|
|
| ||||
Investments in securities at value* |
| $ | 460,295,352 |
| $ | 429,712,482 |
| $ | 220,724,569 |
| $ | 146,735,455 |
|
Repurchase agreement |
| 3,496,000 |
| 2,923,000 |
| 1,267,000 |
| 1,139,000 |
| ||||
Cash |
| 686 |
| 761 |
| 570 |
| 911 |
| ||||
|
|
|
|
|
|
|
|
|
| ||||
Receivables: |
|
|
|
|
|
|
|
|
| ||||
Investment securities sold |
| — |
| 14,572,902 |
| — |
| 4,596,495 |
| ||||
Dividends and interest |
| 696,596 |
| 585,202 |
| 293,656 |
| 204,803 |
| ||||
Prepaid expenses |
| 3,528 |
| 3,460 |
| 1,759 |
| 2,265 |
| ||||
Reimbursement due from manager |
| — |
| — |
| 35,740 |
| — |
| ||||
Total assets |
| 464,492,162 |
| 447,797,807 |
| 222,323,294 |
| 152,678,929 |
| ||||
|
|
|
|
|
|
|
|
|
| ||||
LIABILITIES: |
|
|
|
|
|
|
|
|
| ||||
Payable for investment securities purchased |
| — |
| 14,694,308 |
| — |
| 4,739,430 |
| ||||
Payable for fund shares redeemed |
| 1,040,254 |
| 361,477 |
| 173,388 |
| 62,646 |
| ||||
Payable to affiliates |
| 710,643 |
| 662,531 |
| 339,706 |
| 199,940 |
| ||||
Payable for trustee fees |
| 14,445 |
| 12,433 |
| 17,824 |
| 8,680 |
| ||||
Other accrued expenses and liabilities |
| 332,751 |
| 303,642 |
| 230,047 |
| 193,085 |
| ||||
Total liabilities |
| 2,098,093 |
| 16,034,391 |
| 760,965 |
| 5,203,781 |
| ||||
NET ASSETS |
| $ | 462,394,069 |
| $ | 431,763,416 |
| $ | 221,562,329 |
| $ | 147,475,148 |
|
|
|
|
|
|
|
|
|
|
| ||||
NET ASSETS WERE COMPRISED OF: |
|
|
|
|
|
|
|
|
| ||||
Paid-in capital |
| $ | 464,795,019 |
| $ | 436,768,051 |
| $ | 224,194,175 |
| $ | 148,717,830 |
|
Undistributed net investment income (accumulated net investment loss) |
| (143,628 | ) | (139,834 | ) | (76,846 | ) | (162,887 | ) | ||||
Accumulated net realized loss on investments |
| (3,675,706 | ) | (3,512,914 | ) | (342,524 | ) | (1,659,944 | ) | ||||
Net unrealized appreciation or depreciation on investments |
| 1,418,384 |
| (1,351,887 | ) | (2,212,476 | ) | 580,149 |
| ||||
NET ASSETS |
| $ | 462,394,069 |
| $ | 431,763,416 |
| $ | 221,562,329 |
| $ | 147,475,148 |
|
* Cost of investments in securities |
| $ | 458,876,968 |
| $ | 431,064,369 |
| $ | 222,937,045 |
| $ | 146,155,306 |
|
See Accompanying Notes to Financial Statements
25
STATEMENTS OF ASSETS AND LIABILITIES AS OF NOVEMBER 30, 2004 (UNAUDITED)
(CONTINUED)
|
| ING |
| ING |
| ING |
| ING |
| ||||
Class A: |
|
|
|
|
|
|
|
|
| ||||
Net assets |
| $ | 35,893,378 |
| $ | 36,599,355 |
| $ | 17,477,963 |
| $ | 19,330,641 |
|
Shares authorized |
| unlimited |
| unlimited |
| unlimited |
| unlimited |
| ||||
Par value |
| $ | 0.01 |
| $ | 0.01 |
| $ | 0.01 |
| $ | 0.01 |
|
Shares outstanding |
| 3,655,750 |
| 3,738,460 |
| 1,786,935 |
| 1,957,047 |
| ||||
Net asset value and redemption price per share |
| $ | 9.82 |
| $ | 9.79 |
| $ | 9.78 |
| $ | 9.88 |
|
Maximum offering price per share (5.75%)(1) |
| $ | 10.42 |
| $ | 10.39 |
| $ | 10.38 |
| $ | 10.48 |
|
|
|
|
|
|
|
|
|
|
| ||||
Class B: |
|
|
|
|
|
|
|
|
| ||||
Net assets |
| $ | 378,149,278 |
| $ | 343,558,602 |
| $ | 170,879,437 |
| $ | 98,401,496 |
|
Shares authorized |
| unlimited |
| unlimited |
| unlimited |
| unlimited |
| ||||
Par value |
| $ | 0.01 |
| $ | 0.01 |
| $ | 0.01 |
| $ | 0.01 |
|
Shares outstanding |
| 38,445,718 |
| 35,044,796 |
| 17,319,144 |
| 9,946,220 |
| ||||
Net asset value and redemption price per share (2) |
| $ | 9.84 |
| $ | 9.80 |
| $ | 9.87 |
| $ | 9.89 |
|
Maximum offering price per share |
| $ | 9.84 |
| $ | 9.80 |
| $ | 9.87 |
| $ | 9.89 |
|
|
|
|
|
|
|
|
|
|
| ||||
Class C: |
|
|
|
|
|
|
|
|
| ||||
Net assets |
| $ | 48,351,413 |
| $ | 51,319,127 |
| $ | 33,204,929 |
| $ | 29,743,011 |
|
Shares authorized |
| unlimited |
| unlimited |
| unlimited |
| unlimited |
| ||||
Par value |
| $ | 0.01 |
| $ | 0.01 |
| $ | 0.01 |
| $ | 0.01 |
|
Shares outstanding |
| 4,905,675 |
| 5,222,554 |
| 3,367,531 |
| 3,005,533 |
| ||||
Net asset value and redemption price per share (2) |
| $ | 9.86 |
| $ | 9.83 |
| $ | 9.86 |
| $ | 9.90 |
|
Maximum offering price per share |
| $ | 9.86 |
| $ | 9.83 |
| $ | 9.86 |
| $ | 9.90 |
|
|
|
|
|
|
|
|
|
|
| ||||
Class Q: |
|
|
|
|
|
|
|
|
| ||||
Net assets |
| n/a |
| $ | 286,332 |
| n/a |
| n/a |
| |||
Shares authorized |
| n/a |
| unlimited |
| n/a |
| n/a |
| ||||
Par value |
| n/a |
| $ | 0.01 |
| n/a |
| n/a |
| |||
Shares outstanding |
| n/a |
| 29,236 |
| n/a |
| n/a |
| ||||
Net asset value and redemption price per share |
| n/a |
| $ | 9.79 |
| n/a |
| n/a |
| |||
Maximum offering price per share |
| n/a |
| $ | 9.79 |
| n/a |
| n/a |
| |||
(1) Maximum offering price is computed at 100/94.25 of net asset value. On purchases of $50,000 or more, the offering price is reduced.
(2) Redemption price per share may be reduced for any applicable contingent deferred sales charges.
See Accompanying Notes to Financial Statements
26
STATEMENTS OF ASSETS AND LIABILITIES AS OF NOVEMBER 30, 2004 (UNAUDITED)
|
| ING |
| ING |
| ING |
| ING |
| ||||
ASSETS: |
|
|
|
|
|
|
|
|
| ||||
Investments in securities at value* |
| $ | 98,314,511 |
| $ | 73,419,767 |
| $ | 45,981,578 |
| $ | — |
|
Short-term investments** |
| — |
| — |
| — |
| 872,509 |
| ||||
Repurchase agreement |
| 521,000 |
| 378,000 |
| 661,000 |
| 198,000 |
| ||||
Cash |
| 108 |
| 571 |
| 294 |
| 58,151 |
| ||||
|
|
|
|
|
|
|
|
|
| ||||
Receivables: |
|
|
|
|
|
|
|
|
| ||||
Investment securities sold |
| — |
| 15 |
| — |
| — |
| ||||
Fund shares sold |
| 2,362 |
| — |
| — |
| 647,985 |
| ||||
Dividends and interest |
| 164,595 |
| 128,384 |
| 6,856 |
| 16 |
| ||||
Prepaid expenses |
| 57,565 |
| 87,951 |
| 170,902 |
| — |
| ||||
Total assets |
| 99,060,141 |
| 74,014,688 |
| 46,820,630 |
| 1,776,661 |
| ||||
|
|
|
|
|
|
|
|
|
| ||||
LIABILITIES: |
|
|
|
|
|
|
|
|
| ||||
Payable for fund shares redeemed |
| 8,041 |
| 89,582 |
| — |
| — |
| ||||
Payable to affiliates |
| 144,920 |
| 105,896 |
| 49,159 |
| 553 |
| ||||
Payable for trustee fees |
| 7,657 |
| 3,470 |
| 1,023 |
| 3 |
| ||||
Other accrued expenses and liabilities |
| 226,494 |
| 140,564 |
| 125,922 |
| 61 |
| ||||
Total liabilities |
| 387,112 |
| 339,512 |
| 176,104 |
| 617 |
| ||||
NET ASSETS |
| $ | 98,673,029 |
| $ | 73,675,176 |
| $ | 46,644,526 |
| $ | 1,776,044 |
|
|
|
|
|
|
|
|
|
|
| ||||
NET ASSETS WERE COMPRISED OF: |
|
|
|
|
|
|
|
|
| ||||
Paid-in capital |
| $ | 98,498,316 |
| $ | 72,562,918 |
| $ | 47,348,328 |
| $ | 1,776,434 |
|
Accumulated net investment loss |
| (144,687 | ) | (165,783 | ) | (115,720 | ) | (337 | ) | ||||
Accumulated net realized gain (loss) on investments |
| (672,997 | ) | 46,571 |
| — |
| — |
| ||||
Net unrealized appreciation or depreciation on investments |
| 992,397 |
| 1,231,470 |
| (588,082 | ) | (53 | ) | ||||
NET ASSETS |
| $ | 98,673,029 |
| $ | 73,675,176 |
| $ | 46,644,526 |
| $ | 1,776,044 |
|
* Cost of investments in securities |
| $ | 97,322,114 |
| $ | 72,188,297 |
| $ | 46,569,660 |
| $ | — |
|
** Cost of short-term investments |
| $ | — |
| $ | — |
| $ | — |
| $ | 872,562 |
|
See Accompanying Notes to Financial Statements
27
STATEMENTS OF ASSETS AND LIABILITIES AS OF NOVEMBER 30, 2004 (UNAUDITED)
(CONTINUED)
|
| ING |
| ING |
| ING |
| ING |
| ||||
Class A: |
|
|
|
|
|
|
|
|
| ||||
Net assets |
| $ | 17,307,578 |
| $ | 15,825,647 |
| $ | 9,723,332 |
| $ | 129,261 |
|
Shares authorized |
| unlimited |
| unlimited |
| unlimited |
| unlimited |
| ||||
Par value |
| $ | 0.01 |
| $ | 0.01 |
| $ | 0.01 |
| $ | 0.01 |
|
Shares outstanding |
| 1,732,670 |
| 1,559,372 |
| 986,668 |
| 12,927 |
| ||||
Net asset value and redemption price per share |
| $ | 9.99 |
| $ | 10.15 |
| $ | 9.85 |
| $ | 10.00 |
|
Maximum offering price per share (5.75%)(1) |
| $ | 10.60 |
| $ | 10.77 |
| $ | 10.45 |
| $ | 10.61 |
|
|
|
|
|
|
|
|
|
|
| ||||
Class B: |
|
|
|
|
|
|
|
|
| ||||
Net assets |
| $ | 62,144,816 |
| $ | 44,242,318 |
| $ | 29,336,919 |
| $ | 1,460,598 |
|
Shares authorized |
| unlimited |
| unlimited |
| unlimited |
| unlimited |
| ||||
Par value |
| $ | 0.01 |
| $ | 0.01 |
| $ | 0.01 |
| $ | 0.01 |
|
Shares outstanding |
| 6,213,864 |
| 4,358,278 |
| 2,977,763 |
| 146,094 |
| ||||
Net asset value and redemption price per share(2) |
| $ | 10.00 |
| $ | 10.15 |
| $ | 9.85 |
| $ | 10.00 |
|
Maximum offering price per share |
| $ | 10.00 |
| $ | 10.15 |
| $ | 9.85 |
| $ | 10.00 |
|
|
|
|
|
|
|
|
|
|
| ||||
Class C: |
|
|
|
|
|
|
|
|
| ||||
Net assets |
| $ | 19,220,635 |
| $ | 13,607,211 |
| $ | 7,584,275 |
| $ | 186,185 |
|
Shares authorized |
| unlimited |
| unlimited |
| unlimited |
| unlimited |
| ||||
Par value |
| $ | 0.01 |
| $ | 0.01 |
| $ | 0.01 |
| $ | 0.01 |
|
Shares outstanding |
| 1,921,120 |
| 1,340,621 |
| 770,050 |
| 18,622 |
| ||||
Net asset value and redemption price per share(2) |
| $ | 10.00 |
| $ | 10.15 |
| $ | 9.85 |
| $ | 10.00 |
|
Maximum offering price per share |
| $ | 10.00 |
| $ | 10.15 |
| $ | 9.85 |
| $ | 10.00 |
|
(1) Maximum offering price is computed at 100/94.25 of net asset value. On purchases of $50,000 or more, the offering price is reduced.
(2) Redemption price per share may be reduced for any applicable contingent deferred sales charges.
See Accompanying Notes to Financial Statements
28
STATEMENTS OF OPERATIONS FOR THE SIX MONTHS ENDED NOVEMBER 30, 2004 (UNAUDITED)
|
| ING |
| ING |
| ING |
| ING |
| ||||
INVESTMENT INCOME: |
|
|
|
|
|
|
|
|
| ||||
Dividends |
| $ | 441,425 |
| $ | 397,451 |
| $ | 452,704 |
| $ | 2,348,888 |
|
Interest |
| 5,198,194 |
| 8,043,534 |
| 5,873,389 |
| 6,448,829 |
| ||||
Total investment income |
| 5,639,619 |
| 8,440,985 |
| 6,326,093 |
| 8,797,717 |
| ||||
|
|
|
|
|
|
|
|
|
| ||||
EXPENSES: |
|
|
|
|
|
|
|
|
| ||||
Investment management fees |
| 1,151,429 |
| 1,639,999 |
| 1,258,465 |
| 2,419,628 |
| ||||
|
|
|
|
|
|
|
|
|
| ||||
Distribution and service fees: |
|
|
|
|
|
|
|
|
| ||||
Class A |
| 31,915 |
| 43,247 |
| 33,295 |
| 59,931 |
| ||||
Class B |
| 1,118,167 |
| 1,553,979 |
| 1,239,274 |
| 2,337,581 |
| ||||
Class C |
| 190,331 |
| 322,859 |
| 197,657 |
| 442,474 |
| ||||
Class Q |
| 783 |
| 44 |
| 743 |
| 1,190 |
| ||||
|
|
|
|
|
|
|
|
|
| ||||
Transfer agent fees: |
|
|
|
|
|
|
|
|
| ||||
Class A |
| 4,790 |
| 8,790 |
| 6,728 |
| 8,408 |
| ||||
Class B |
| 41,850 |
| 77,013 |
| 62,300 |
| 81,993 |
| ||||
Class C |
| 7,150 |
| 15,995 |
| 9,975 |
| 15,567 |
| ||||
Class Q |
| 106 |
| 9 |
| 137 |
| 149 |
| ||||
Administrative service fees |
| 143,927 |
| 204,998 |
| 157,307 |
| 302,451 |
| ||||
Shareholder reporting expense |
| 30,983 |
| 45,225 |
| 31,380 |
| 47,667 |
| ||||
Registration fees |
| 3,292 |
| 1,964 |
| 2,106 |
| 8,228 |
| ||||
Professional fees |
| 10,776 |
| 20,385 |
| 16,617 |
| 27,401 |
| ||||
Custody and accounting expense |
| 23,830 |
| 31,110 |
| 24,790 |
| 42,973 |
| ||||
Trustee fees |
| 7,618 |
| 20,117 |
| 12,201 |
| 12,763 |
| ||||
Guarantee fees |
| 474,965 |
| 676,500 |
| 519,117 |
| 998,097 |
| ||||
Miscellaneous expense |
| 13,401 |
| 17,072 |
| 12,309 |
| 21,260 |
| ||||
Total expenses |
| 3,255,313 |
| 4,679,306 |
| 3,584,401 |
| 6,827,761 |
| ||||
Net recouped fees |
| 230,000 |
| — |
| — |
| — |
| ||||
Net expenses |
| 3,485,313 |
| 4,679,306 |
| 3,584,401 |
| 6,827,761 |
| ||||
Net investment income |
| 2,154,306 |
| 3,761,679 |
| 2,741,692 |
| 1,969,956 |
| ||||
|
|
|
|
|
|
|
|
|
| ||||
REALIZED AND UNREALIZED GAIN (LOSS) ON INVESTMENTS: |
|
|
|
|
|
|
|
|
| ||||
Net realized gain on investments |
| 1,008,113 |
| 558,526 |
| 1,809,702 |
| 1,830,703 |
| ||||
Net change in unrealized appreciation or depreciation on investments |
| (1,198,015 | ) | (1,404,138 | ) | (1,740,052 | ) | 5,418,427 |
| ||||
Net realized and unrealized gain (loss) on investments |
| (189,902 | ) | (845,612 | ) | 69,650 |
| 7,249,130 |
| ||||
Increase in net assets resulting from operations |
| $ | 1,964,404 |
| $ | 2,916,067 |
| $ | 2,811,342 |
| $ | 9,219,086 |
|
See Accompanying Notes to Financial Statements
29
|
| ING |
| ING |
| ING |
| ING |
| ||||
INVESTMENT INCOME: |
|
|
|
|
|
|
|
|
| ||||
Dividends |
| $ | 1,659,104 |
| $ | 1,410,618 |
| $ | 676,186 |
| $ | 488,435 |
|
Interest |
| 5,732,985 |
| 5,542,544 |
| 2,584,922 |
| 2,004,867 |
| ||||
Total investment income |
| 7,392,089 |
| 6,953,162 |
| 3,261,108 |
| 2,493,302 |
| ||||
|
|
|
|
|
|
|
|
|
| ||||
EXPENSES: |
|
|
|
|
|
|
|
|
| ||||
Investment management fees |
| 1,950,382 |
| 1,831,451 |
| 937,270 |
| 481,226 |
| ||||
|
|
|
|
|
|
|
|
|
| ||||
Distribution and service fees: |
|
|
|
|
|
|
|
|
| ||||
Class A |
| 49,931 |
| 50,334 |
| 24,738 |
| 26,037 |
| ||||
Class B |
| 1,962,011 |
| 1,794,595 |
| 884,405 |
| 516,036 |
| ||||
Class C |
| 276,244 |
| 291,959 |
| 188,233 |
| 161,773 |
| ||||
Class Q |
| — |
| 357 |
| — |
| — |
| ||||
|
|
|
|
|
|
|
|
|
| ||||
Transfer agent fees: |
|
|
|
|
|
|
|
|
| ||||
Class A |
| 6,941 |
| 9,802 |
| 3,942 |
| 3,282 |
| ||||
Class S |
| — |
| — |
| — |
| — |
| ||||
Class B |
| 68,077 |
| 87,329 |
| 35,198 |
| 16,267 |
| ||||
Class C |
| 9,605 |
| 14,331 |
| 7,562 |
| 5,137 |
| ||||
Class Q |
| — |
| 68 |
| — |
| — |
| ||||
Administrative service fees |
| 243,795 |
| 228,929 |
| 117,158 |
| 78,195 |
| ||||
Shareholder reporting expense |
| 37,110 |
| 34,770 |
| 25,268 |
| 6,657 |
| ||||
Registration fees |
| 2,858 |
| 14,136 |
| 10,935 |
| 9,031 |
| ||||
Professional fees |
| 25,437 |
| 23,081 |
| 12,024 |
| 6,172 |
| ||||
Custody and accounting expense |
| 27,630 |
| 31,750 |
| 21,594 |
| 19,620 |
| ||||
Trustee fees |
| 9,787 |
| 8,565 |
| 6,734 |
| 2,254 |
| ||||
Guarantee fees |
| 804,533 |
| 755,474 |
| 386,624 |
| 258,046 |
| ||||
Organization and offering expense |
| — |
| — |
| 18,782 |
| 97,307 |
| ||||
Miscellaneous expense |
| 16,046 |
| 14,425 |
| 8,573 |
| 2,828 |
| ||||
Total expenses |
| 5,490,387 |
| 5,191,356 |
| 2,689,040 |
| 1,689,868 |
| ||||
Net waived and reimbursed fees |
| — |
| — |
| (312,215 | ) | — |
| ||||
Net expenses |
| 5,490,387 |
| 5,191,356 |
| 2,376,825 |
| 1,689,868 |
| ||||
Net investment income |
| 1,901,702 |
| 1,761,806 |
| 884,283 |
| 803,434 |
| ||||
|
|
|
|
|
|
|
|
|
| ||||
REALIZED AND UNREALIZED GAIN (LOSS) ON INVESTMENTS: |
|
|
|
|
|
|
|
|
| ||||
Net realized gain (loss) on investments |
| 1,486,481 |
| 586,961 |
| 1,816,915 |
| (674,887 | ) | ||||
Net change in unrealized appreciation or depreciation on investments |
| 4,028,577 |
| 3,711,608 |
| 1,368,968 |
| 2,633,360 |
| ||||
Net realized and unrealized gain on investments |
| 5,515,058 |
| 4,298,569 |
| 3,185,883 |
| 1,958,473 |
| ||||
Increase in net assets resulting from operations |
| $ | 7,416,760 |
| $ | 6,060,375 |
| $ | 4,070,166 |
| $ | 2,761,907 |
|
See Accompanying Notes to Financial Statements
30
|
| ING |
| ING |
| ING |
| ING |
| ||||
INVESTMENT INCOME: |
|
|
|
|
|
|
|
|
| ||||
Dividends |
| $ | 384,784 |
| $ | 207,293 |
| $ | 6,819 |
| $ | 4 |
|
Interest |
| 1,397,623 |
| 612,259 |
| 135,371 |
| 276 |
| ||||
Total investment income |
| 1,782,407 |
| 819,552 |
| 142,190 |
| 280 |
| ||||
|
|
|
|
|
|
|
|
|
| ||||
EXPENSES: |
|
|
|
|
|
|
|
|
| ||||
Investment management fees |
| 329,376 |
| 159,103 |
| 23,236 |
| 256 |
| ||||
|
|
|
|
|
|
|
|
|
| ||||
Distribution and service fees: |
|
|
|
|
|
|
|
|
| ||||
Class A |
| 23,579 |
| 16,425 |
| 3,588 |
| 5 |
| ||||
Class B |
| 327,614 |
| 188,728 |
| 44,463 |
| 240 |
| ||||
Class C |
| 104,501 |
| 54,114 |
| 10,061 |
| 24 |
| ||||
|
|
|
|
|
|
|
|
|
| ||||
Transfer agent fees: |
|
|
|
|
|
|
|
|
| ||||
Class A |
| 5,920 |
| 4,740 |
| 1,062 |
| 1 |
| ||||
Class B |
| 20,542 |
| 13,488 |
| 3,290 |
| 18 |
| ||||
Class C |
| 6,563 |
| 3,853 |
| 745 |
| 2 |
| ||||
Administrative service fees |
| 52,642 |
| 30,854 |
| 6,888 |
| 28 |
| ||||
Shareholder reporting expense |
| 21,453 |
| 19,908 |
| 4,546 |
| 19 |
| ||||
Registration fees |
| 33,048 |
| 9,245 |
| 433 |
| 1 |
| ||||
Professional fees |
| 22,863 |
| 14,749 |
| 3,444 |
| 13 |
| ||||
Custody and accounting expense |
| 11,401 |
| 7,162 |
| 1,605 |
| 7 |
| ||||
Trustee fees |
| 6,035 |
| 3,458 |
| 1,023 |
| 3 |
| ||||
Guarantee fees |
| 173,722 |
| 70,952 |
| 5,095 |
|
|
| ||||
Organization and offering expense |
| 87,739 |
| 101,164 |
| 16,233 |
| — |
| ||||
Miscellaneous expense |
| 3,617 |
| 2,031 |
| 433 |
| — |
| ||||
Total expenses |
| 1,230,615 |
| 699,974 |
| 126,145 |
| 617 |
| ||||
Net recouped (waived and reimbursed) fees |
| 13,000 |
| (45,548 | ) | — |
| — |
| ||||
Net expenses |
| 1,243,615 |
| 654,426 |
| 126,145 |
| 617 |
| ||||
Net investment income (loss) |
| 538,792 |
| 165,126 |
| 16,045 |
| (337 | ) | ||||
|
|
|
|
|
|
|
|
|
| ||||
REALIZED AND UNREALIZED GAIN (LOSS) ON INVESTMENTS: |
|
|
|
|
|
|
|
|
| ||||
Net realized gain (loss) on investments |
| (356,232 | ) | 268,966 |
| — |
| — |
| ||||
Net change in unrealized appreciation or depreciation on investments |
| 1,989,194 |
| 1,230,712 |
| (588,082 | ) | (53 | ) | ||||
Net realized and unrealized gain (loss) on investments |
| 1,632,962 |
| 1,499,678 |
| (588,082 | ) | (53 | ) | ||||
Increase (decrease) in net assets resulting from operations |
| $ | 2,171,754 |
| $ | 1,664,804 |
| $ | (572,037 | ) | $ | (390 | ) |
See Accompanying Notes to Financial Statements
31
STATEMENTS OF CHANGES IN NET ASSETS (UNAUDITED)
|
| ING Principal |
| ING Principal |
| ING Principal |
| ||||||||||||
|
| Six Months |
| Year Ended |
| Six Months |
| Year Ended |
| Six Months |
| Year Ended |
| ||||||
FROM OPERATIONS: |
|
|
|
|
|
|
|
|
|
|
|
|
| ||||||
Net investment income |
| $ | 2,154,306 |
| $ | 5,268,801 |
| $ | 3,761,679 |
| $ | 8,790,620 |
| $ | 2,741,692 |
| $ | 6,428,702 |
|
Net realized gain on investments |
| 1,008,113 |
| 12,838,793 |
| 558,526 |
| 18,834,971 |
| 1,809,702 |
| 8,922,253 |
| ||||||
Net change in unrealized appreciation or depreciation on investments |
| (1,198,015 | ) | (24,692,215 | ) | (1,404,138 | ) | (40,945,613 | ) | (1,740,052 | ) | (24,725,472 | ) | ||||||
Net increase (decrease) in net assets resulting from operations |
| 1,964,404 |
| (6,584,621 | ) | 2,916,067 |
| (13,320,022 | ) | 2,811,342 |
| (9,374,517 | ) | ||||||
|
|
|
|
|
|
|
|
|
|
|
|
|
| ||||||
FROM DISTRIBUTIONS TO SHAREHOLDERS: |
|
|
|
|
|
|
|
|
|
|
|
|
| ||||||
|
|
|
|
|
|
|
|
|
|
|
|
|
| ||||||
Net investment income: |
|
|
|
|
|
|
|
|
|
|
|
|
| ||||||
Class A |
| (564,345 | ) | (745,132 | ) | (866,398 | ) | (1,197,538 | ) | (626,977 | ) | (832,606 | ) | ||||||
Class B |
| (3,355,370 | ) | (3,485,693 | ) | (5,524,028 | ) | (5,262,708 | ) | (4,298,535 | ) | (3,887,884 | ) | ||||||
Class C |
| (477,836 | ) | (690,305 | ) | (1,035,340 | ) | (1,303,518 | ) | (636,967 | ) | (676,217 | ) | ||||||
Class Q |
| (13,669 | ) | (20,464 | ) | (820 | ) | (1,033 | ) | (15,845 | ) | (12,938 | ) | ||||||
Total distributions |
| (4,411,220 | ) | (4,941,594 | ) | (7,426,586 | ) | (7,764,797 | ) | (5,578,324 | ) | (5,409,645 | ) | ||||||
|
|
|
|
|
|
|
|
|
|
|
|
|
| ||||||
FROM CAPITAL SHARE TRANSACTIONS: |
|
|
|
|
|
|
|
|
|
|
|
|
| ||||||
Dividends reinvested |
| 3,465,396 |
| 3,885,287 |
| 5,578,636 |
| 5,723,908 |
| 4,415,080 |
| 4,189,718 |
| ||||||
Cost of shares redeemed |
| (45,139,034 | ) | (149,531,466 | ) | (58,073,994 | ) | (206,725,364 | ) | (40,446,327 | ) | (123,579,930 | ) | ||||||
Net decrease in net assets resulting from capital share transactions |
| (41,673,638 | ) | (145,646,179 | ) | (52,495,358 | ) | (201,001,456 | ) | (36,031,247 | ) | (119,390,212 | ) | ||||||
Net decrease in net assets |
| (44,120,454 | ) | (157,172,394 | ) | (57,005,877 | ) | (222,086,275 | ) | (38,798,229 | ) | (134,174,374 | ) | ||||||
|
|
|
|
|
|
|
|
|
|
|
|
|
| ||||||
NET ASSETS: |
|
|
|
|
|
|
|
|
|
|
|
|
| ||||||
Beginning of period |
| 309,796,152 |
| 466,968,546 |
| 437,097,631 |
| 659,183,906 |
| 333,817,427 |
| 467,991,801 |
| ||||||
End of period |
| $ | 265,675,698 |
| $ | 309,796,152 |
| $ | 380,091,754 |
| $ | 437,097,631 |
| $ | 295,019,198 |
| $ | 333,817,427 |
|
Undistributed net investment income (accumulated net investment loss) at end of period |
| $ | (821,077 | ) | $ | 1,435,837 |
| $ | (626,916 | ) | $ | 3,037,991 |
| $ | (443,909 | ) | $ | 2,392,723 |
|
See Accompanying Notes to Financial Statements
32
|
| ING Principal |
| ING Principal |
| ING Principal |
| ||||||||||||
|
| Six Months |
| Year Ended |
| Six Months |
| Year Ended |
| Six Months |
| Year Ended |
| ||||||
FROM OPERATIONS: |
|
|
|
|
|
|
|
|
|
|
|
|
| ||||||
Net investment income |
| $ | 1,969,956 |
| $ | 3,011,173 |
| $ | 1,901,702 |
| $ | 3,240,676 |
| $ | 1,761,806 |
| $ | 2,869,402 |
|
Net realized gain on investments |
| 1,830,703 |
| 2,049,301 |
| 1,486,481 |
| 16,807,982 |
| 586,961 |
| 11,213,182 |
| ||||||
Net change in unrealized appreciation or depreciation on investments |
| 5,418,427 |
| (6,751,561 | ) | 4,028,577 |
| (28,351,175 | ) | 3,711,608 |
| (22,877,710 | ) | ||||||
Net increase (decrease) in net assets resulting from operations |
| 9,219,086 |
| (1,691,087 | ) | 7,416,760 |
| (8,302,517 | ) | 6,060,375 |
| (8,795,126 | ) | ||||||
|
|
|
|
|
|
|
|
|
|
|
|
|
| ||||||
FROM DISTRIBUTIONS TO SHAREHOLDERS: |
|
|
|
|
|
|
|
|
|
|
|
|
| ||||||
|
|
|
|
|
|
|
|
|
|
|
|
|
| ||||||
Net investment income: |
|
|
|
|
|
|
|
|
|
|
|
|
| ||||||
Class A |
| (506,742 | ) | (919,743 | ) | (496,879 | ) | (842,738 | ) | (511,388 | ) | (547,735 | ) | ||||||
Class B |
| (1,908,318 | ) | (3,228,097 | ) | (2,350,735 | ) | (2,665,614 | ) | (2,107,697 | ) | (1,560,667 | ) | ||||||
Class C |
| (236,264 | ) | (575,221 | ) | (218,543 | ) | (462,165 | ) | (215,982 | ) | (321,198 | ) | ||||||
Class Q |
| (11,929 | ) | (15,495 | ) | — |
| — |
| (4,049 | ) | (3,278 | ) | ||||||
|
|
|
|
|
|
|
|
|
|
|
|
|
| ||||||
Net realized gains: |
|
|
|
|
|
|
|
|
|
|
|
|
| ||||||
Class A |
| (188,414 | ) | (192,145 | ) | (1,227,769 | ) | (442,254 | ) | (1,182,133 | ) | (151,157 | ) | ||||||
Class B |
| (1,998,186 | ) | (1,520,921 | ) | (12,976,224 | ) | (3,193,257 | ) | (11,096,003 | ) | (1,115,952 | ) | ||||||
Class C |
| (359,397 | ) | (391,698 | ) | (1,686,942 | ) | (638,079 | ) | (1,690,563 | ) | (243,823 | ) | ||||||
Class Q |
| (4,227 | ) | (2,962 | ) | — |
| — |
| (9,107 | ) | (799 | ) | ||||||
Total distributions |
| (5,213,477 | ) | (6,846,282 | ) | (18,957,092 | ) | (8,244,107 | ) | (16,816,922 | ) | (3,944,609 | ) | ||||||
|
|
|
|
|
|
|
|
|
|
|
|
|
| ||||||
FROM CAPITAL SHARE TRANSACTIONS: |
|
|
|
|
|
|
|
|
|
|
|
|
| ||||||
Dividends reinvested |
| 4,213,070 |
| 5,413,299 |
| 16,739,395 |
| 7,188,304 |
| 14,393,055 |
| 3,346,598 |
| ||||||
Cost of shares redeemed |
| (77,237,278 | ) | (236,370,783 | ) | (51,984,786 | ) | (159,341,091 | ) | (53,210,027 | ) | (119,629,889 | ) | ||||||
Net decrease in net assets resulting from capital share transactions |
| (73,024,208 | ) | (230,957,484 | ) | (35,245,391 | ) | (152,152,787 | ) | (38,816,972 | ) | (116,283,291 | ) | ||||||
Net decrease in net assets |
| (69,018,599 | ) | (239,494,853 | ) | (46,785,723 | ) | (168,699,411 | ) | (49,573,519 | ) | (129,023,026 | ) | ||||||
|
|
|
|
|
|
|
|
|
|
|
|
|
| ||||||
NET ASSETS: |
|
|
|
|
|
|
|
|
|
|
|
|
| ||||||
Beginning of period |
| 638,412,597 |
| 877,907,450 |
| 509,179,792 |
| 677,879,203 |
| 481,336,935 |
| 610,359,961 |
| ||||||
End of period |
| $ | 569,393,998 |
| $ | 638,412,597 |
| $ | 462,394,069 |
| $ | 509,179,792 |
| $ | 431,763,416 |
| $ | 481,336,935 |
|
Undistributed net investment income (accumulated net investment loss) at end of period |
| $ | (73,163 | ) | $ | 620,134 |
| $ | (143,628 | ) | $ | 1,020,827 |
| $ | (139,834 | ) | $ | 937,476 |
|
See Accompanying Notes to Financial Statements
33
|
| ING Principal |
| ING Principal |
| ING Principal |
| ||||||||||||
|
| Six Months |
| Year Ended |
| Six Months |
| Year Ended |
| Six Months |
| Year Ended |
| ||||||
FROM OPERATIONS: |
|
|
|
|
|
|
|
|
|
|
|
|
| ||||||
Net investment income |
| $ | 884,283 |
| $ | 2,283,738 |
| $ | 803,434 |
| $ | 447,810 |
| $ | 538,792 |
| $ | 99,904 |
|
Net realized gain (loss) on investments |
| 1,816,915 |
| 1,190,476 |
| (674,887 | ) | 552,844 |
| (356,232 | ) | (28,231 | ) | ||||||
Net change in unrealized appreciation or depreciation on investments |
| 1,368,968 |
| (3,578,229 | ) | 2,633,360 |
| (2,053,211 | ) | 1,989,194 |
| (996,797 | ) | ||||||
Net increase (decrease) in net assets resulting from operations |
| 4,070,166 |
| (104,015 | ) | 2,761,907 |
| (1,052,557 | ) | 2,171,754 |
| (925,124 | ) | ||||||
|
|
|
|
|
|
|
|
|
|
|
|
|
| ||||||
FROM DISTRIBUTIONS TO SHAREHOLDERS: |
|
|
|
|
|
|
|
|
|
|
|
|
| ||||||
|
|
|
|
|
|
|
|
|
|
|
|
|
| ||||||
Net investment income: |
|
|
|
|
|
|
|
|
|
|
|
|
| ||||||
Class A |
| (279,134 | ) | (504,097 | ) | (335,824 | ) | (18,697 | ) | (245,556 | ) | — |
| ||||||
Class B |
| (1,424,159 | ) | (977,463 | ) | (856,452 | ) | (80,749 | ) | (506,813 | ) | — |
| ||||||
Class C |
| (204,609 | ) | (425,072 | ) | (248,056 | ) | (26,745 | ) | (151,384 | ) | — |
| ||||||
|
|
|
|
|
|
|
|
|
|
|
|
|
| ||||||
Net realized gains: |
|
|
|
|
|
|
|
|
|
|
|
|
| ||||||
Class A |
| (268,658 | ) | — |
| (199,695 | ) | — |
| (50,450 | ) | — |
| ||||||
Class B |
| (2,577,457 | ) | — |
| (1,026,758 | ) | — |
| (181,711 | ) | — |
| ||||||
Class C |
| (507,137 | ) | — |
| (312,466 | ) | — |
| (56,624 | ) | — |
| ||||||
Total distributions |
| (5,261,154 | ) | (1,906,632 | ) | (2,979,251 | ) | (126,191 | ) | (1,192,538 | ) | — |
| ||||||
|
|
|
|
|
|
|
|
|
|
|
|
|
| ||||||
FROM CAPITAL SHARE TRANSACTIONS: |
|
|
|
|
|
|
|
|
|
|
|
|
| ||||||
Net proceeds from sale of shares |
| — |
| 178,689,762 |
| — |
| 175,816,255 |
| — |
| 110,468,680 |
| ||||||
Dividends reinvested |
| 4,485,076 |
| 1,581,185 |
| 2,340,510 |
| 99,974 |
| 955,712 |
| — |
| ||||||
|
| 4,485,076 |
| 180,270,947 |
| 2,340,510 |
| 175,916,229 |
| 955,712 |
| 110,468,680 |
| ||||||
Cost of shares redeemed |
| (30,038,631 | ) | (52,898,713 | ) | (15,721,464 | ) | (13,664,035 | ) | (11,732,364 | ) | (1,073,091 | ) | ||||||
Net increase (decrease) in net assets resulting from capital share transactions |
| (25,553,555 | ) | 127,372,234 |
| (13,380,954 | ) | 162,252,194 |
| (10,776,652 | ) | 109,395,589 |
| ||||||
Net increase (decrease) in net assets |
| (26,744,543 | ) | 125,361,587 |
| (13,598,298 | ) | 161,073,446 |
| (9,797,436 | ) | 108,470,465 |
| ||||||
|
|
|
|
|
|
|
|
|
|
|
|
|
| ||||||
NET ASSETS: |
|
|
|
|
|
|
|
|
|
|
|
|
| ||||||
Beginning of period |
| 248,306,872 |
| 122,945,285 |
| 161,073,446 |
| — |
| 108,470,465 |
| — |
| ||||||
End of period |
| $ | 221,562,329 |
| $ | 248,306,872 |
| $ | 147,475,148 |
| $ | 161,073,446 |
| $ | 98,673,029 |
| $ | 108,470,465 |
|
Undistributed net investment income (accumulated net investment loss) at end of period |
| $ | (76,846 | ) | $ | 946,773 |
| $ | (162,887 | ) | $ | 474,011 |
| $ | (144,687 | ) | $ | 220,274 |
|
See Accompanying Notes to Financial Statements
34
|
| ING Principal |
| ING Principal |
| ING Principal |
| ||||||
|
| Six Months |
| Year Ended |
| Period |
| Period |
| ||||
FROM OPERATIONS: |
|
|
|
|
|
|
|
|
| ||||
Net investment income (loss) |
| $ | 165,126 |
| $ | (4,182 | ) | $ | 16,045 |
| $ | (337 | ) |
Net realized gain on investments |
| 268,966 |
| — |
| — |
| — |
| ||||
Net change in unrealized appreciation or depreciation on investments |
| 1,230,712 |
| 758 |
| (588,082 | ) | (53 | ) | ||||
Net increase (decrease) in net assets resulting from operations |
| 1,664,804 |
| (3,424 | ) | (572,037 | ) | (390 | ) | ||||
|
|
|
|
|
|
|
|
|
| ||||
FROM DISTRIBUTIONS TO SHAREHOLDERS: |
|
|
|
|
|
|
|
|
| ||||
|
|
|
|
|
|
|
|
|
| ||||
Net investment income: |
|
|
|
|
|
|
|
|
| ||||
Class A |
| (102,080 | ) | — |
| (35,729 | ) | — |
| ||||
Class B |
| (174,940 | ) | — |
| (74,764 | ) | — |
| ||||
Class C |
| (56,252 | ) | — |
| (21,272 | ) | — |
| ||||
|
|
|
|
|
|
|
|
|
| ||||
Net realized gains: |
|
|
|
|
|
|
|
|
| ||||
Class A |
| (47,638 | ) | — |
| — |
| — |
| ||||
Class B |
| (133,701 | ) | — |
| — |
| — |
| ||||
Class C |
| (41,056 | ) | — |
| — |
| — |
| ||||
Total distributions |
| (555,667 | ) | — |
| (131,765 | ) | — |
| ||||
|
|
|
|
|
|
|
|
|
| ||||
FROM CAPITAL SHARE TRANSACTIONS: |
|
|
|
|
|
|
|
|
| ||||
Net proceeds from sale of shares |
| 54,811,621 |
| 19,576,040 |
| 47,835,655 |
| 1,776,434 |
| ||||
Dividends reinvested |
| 462,384 |
| — |
| 110,271 |
| — |
| ||||
|
| 55,274,005 |
| 19,576,040 |
| 47,945,926 |
| 1,776,434 |
| ||||
Cost of shares redeemed |
| (2,057,322 | ) | (223,260 | ) | (597,598 | ) | — |
| ||||
Net increase in net assets resulting from capital share transactions |
| 53,216,683 |
| 19,352,780 |
| 47,348,328 |
| 1,776,434 |
| ||||
Net increase in net assets |
| 54,325,820 |
| 19,349,356 |
| 46,644,526 |
| 1,776,044 |
| ||||
|
|
|
|
|
|
|
|
|
| ||||
NET ASSETS: |
|
|
|
|
|
|
|
|
| ||||
Beginning of period |
| 19,349,356 |
| — |
| — |
| — |
| ||||
End of period |
| $ | 73,675,176 |
| $ | 19,349,356 |
| $ | 46,644,526 |
| $ | 1,776,044 |
|
Undistributed net investment income (accumulated net investment loss) at end of period |
| $ | (165,783 | ) | $ | 2,363 |
| $ | (115,720 | ) | $ | (337 | ) |
(1) Fund commenced operations on September 16, 2004.
(2) Fund commenced operations on November 15, 2004.
See Accompanying Notes to Financial Statements
35
ING PRINCIPAL PROTECTION FUND (UNAUDITED)
Selected data for a share of beneficial interest outstanding throughout each period.
|
| Class A |
| Class B |
| |||||||||||||||
|
| Six Months |
| Year Ended |
| July 5, |
| Six Months |
| Year Ended |
| July 5, |
| |||||||
|
| 2004 |
| 2004 |
| 2003 |
| 2002 |
| 2004 |
| 2004 |
| 2003 |
| 2002 |
| |||
|
|
|
|
|
|
|
|
|
|
|
|
|
|
|
|
|
| |||
Per Share Operating Performance: |
|
|
|
|
|
|
|
|
|
|
|
|
|
|
|
|
| |||
Net asset value, beginning of period | $ |
| 9.95 |
| 10.25 |
| 9.85 |
| 10.00 |
| 9.91 |
| 10.21 |
| 9.81 |
| 10.00 |
| ||
|
|
|
|
|
|
|
|
|
|
|
|
|
|
|
|
|
| |||
Income (loss) from investment operations: |
|
|
|
|
|
|
|
|
|
|
|
|
|
|
|
|
| |||
Net investment income | $ |
| 0.14 |
| 0.23 |
| 0.22 |
| 0.11 |
| 0.08 |
| 0.14 |
| 0.15 |
| 0.04 |
| ||
Net realized and unrealized gain (loss) on investments | $ |
| (0.04 | ) | (0.33 | ) | 0.42 |
| (0.22 | ) | (0.01 | ) | (0.32 | ) | 0.41 |
| (0.21 | ) | ||
Total from investment operations | $ |
| 0.10 |
| (0.10 | ) | 0.64 |
| (0.11 | ) | 0.07 |
| (0.18 | ) | 0.56 |
| (0.17 | ) | ||
|
|
|
|
|
|
|
|
|
|
|
|
|
|
|
|
|
| |||
Less distributions from: |
|
|
|
|
|
|
|
|
|
|
|
|
|
|
|
|
| |||
Net investment income | $ |
| 0.24 |
| 0.20 |
| 0.24 |
| 0.04 |
| 0.16 |
| 0.12 |
| 0.16 |
| 0.02 |
| ||
Total distributions | $ |
| 0.24 |
| 0.20 |
| 0.24 |
| 0.04 |
| 0.16 |
| 0.12 |
| 0.16 |
| 0.02 |
| ||
Net asset value, end of period | $ |
| 9.81 |
| 9.95 |
| 10.25 |
| 9.85 |
| 9.82 |
| 9.91 |
| 10.21 |
| 9.81 |
| ||
|
|
|
|
|
|
|
|
|
|
|
|
|
|
|
|
|
| |||
Total Return(2): | % |
| 1.01 |
| (1.01 | ) | 6.60 |
| (1.29 | )* | 0.69 |
| (1.76 | ) | 5.82 |
| (1.78 | )* | ||
|
|
|
|
|
|
|
|
|
|
|
|
|
|
|
|
|
| |||
Ratios and Supplemental Data: |
|
|
|
|
|
|
|
|
|
|
|
|
|
|
|
|
| |||
Net assets, end of period (000’s) | $ |
| 23,410 |
| 28,057 |
| 51,385 |
| 62,301 |
| 208,609 |
| 237,539 |
| 328,399 |
| 345,449 |
| ||
|
|
|
|
|
|
|
|
|
|
|
|
|
|
|
|
|
| |||
Ratios to average net assets: |
|
|
|
|
|
|
|
|
|
|
|
|
|
|
|
|
| |||
Net expenses after expense reimbursement/ | % |
| 1.74 |
| 1.74 |
| 1.75 |
| 1.75 |
| 2.49 |
| 2.49 |
| 2.50 |
| 2.50 |
| ||
Gross expenses prior to expense reimbursement/ | % |
| 1.58 |
| 1.67 |
| 1.78 |
| 1.87 |
| 2.33 |
| 2.42 |
| 2.54 |
| 2.62 |
| ||
Net investment income after expense reimbursement/ | % |
| 2.18 |
| 2.03 |
| 2.21 |
| 1.44 |
| 1.43 |
| 1.28 |
| 1.46 |
| 0.69 |
| ||
Portfolio turnover rate | % |
| 4 |
| 29 |
| 47 |
| 125 |
| 4 |
| 29 |
| 47 |
| 125 |
| ||
|
| Class C |
| Class Q |
| ||||||||||||||
|
| Six Months |
| Year Ended |
| July 5, |
| Six Months |
| Year Ended |
| July 5, |
| ||||||
|
| 2004 |
| 2004 |
| 2003 |
| 2002 |
| 2004 |
| 2004 |
| 2003 |
| 2002 |
| ||
|
|
|
|
|
|
|
|
|
|
|
|
|
|
|
|
|
| ||
Per Share Operating Performance: |
|
|
|
|
|
|
|
|
|
|
|
|
|
|
|
|
| ||
Net asset value, beginning of period | $ |
| 9.92 |
| 10.21 |
| 9.81 |
| 10.00 |
| 9.97 |
| 10.27 |
| 9.87 |
| 10.00 |
| |
|
|
|
|
|
|
|
|
|
|
|
|
|
|
|
|
|
| ||
Income (loss) from investment operations: |
|
|
|
|
|
|
|
|
|
|
|
|
|
|
|
|
| ||
Net investment income | $ |
| 0.10 |
| 0.15 |
| 0.15 |
| 0.05 |
| 0.17 |
| 0.24 |
| 0.25 |
| 0.11 |
| |
Net realized and unrealized gain (loss) on investments | $ |
| (0.03 | ) | (0.34 | ) | 0.41 |
| (0.22 | ) | (0.06 | ) | (0.34 | ) | 0.40 |
| (0.19 | ) | |
Total from investment operations | $ |
| 0.07 |
| (0.19 | ) | 0.56 |
| (0.17 | ) | 0.11 |
| (0.10 | ) | 0.65 |
| (0.08 | ) | |
|
|
|
|
|
|
|
|
|
|
|
|
|
|
|
|
|
| ||
Less distributions from: |
|
|
|
|
|
|
|
|
|
|
|
|
|
|
|
|
| ||
Net investment income | $ |
| 0.14 |
| 0.10 |
| 0.16 |
| 0.02 |
| 0.24 |
| 0.20 |
| 0.25 |
| 0.05 |
| |
Total distributions | $ |
| 0.14 |
| 0.10 |
| 0.16 |
| 0.02 |
| 0.24 |
| 0.20 |
| 0.25 |
| 0.05 |
| |
Net asset value, end of period | $ |
| 9.85 |
| 9.92 |
| 10.21 |
| 9.81 |
| 9.84 |
| 9.97 |
| 10.27 |
| 9.87 |
| |
|
|
|
|
|
|
|
|
|
|
|
|
|
|
|
|
|
| ||
Total Return(2): | % |
| 0.72 |
| (1.83 | ) | 5.78 |
| (1.66 | )* | 1.11 |
| (1.01 | ) | 6.68 |
| (1.13 | )* | |
|
|
|
|
|
|
|
|
|
|
|
|
|
|
|
|
|
| ||
Ratios and Supplemental Data: |
|
|
|
|
|
|
|
|
|
|
|
|
|
|
|
|
| ||
Net assets, end of period (000’s) | $ |
| 33,088 |
| 43,529 |
| 85,451 |
| 105,908 |
| 568 |
| 671 |
| 1,733 |
| 2,434 |
| |
|
|
|
|
|
|
|
|
|
|
|
|
|
|
|
|
|
| ||
Ratios to average net assets: |
|
|
|
|
|
|
|
|
|
|
|
|
|
|
|
|
| ||
Net expenses after expense reimbursement/ | % |
| 2.49 |
| 2.49 |
| 2.50 |
| 2.30 |
| 1.74 |
| 1.70 |
| 1.66 |
| 1.60 |
| |
Gross expenses prior to expense reimbursement/ | % |
| 2.33 |
| 2.42 |
| 2.54 |
| 2.62 |
| 1.58 |
| 1.63 |
| 1.69 |
| 1.72 |
| |
Net investment income after expense reimbursement/ | % |
| 1.42 |
| 1.28 |
| 1.45 |
| 0.72 |
| 2.18 |
| 2.08 |
| 2.30 |
| 1.59 |
| |
Portfolio turnover rate | % |
| 4 |
| 29 |
| 47 |
| 125 |
| 4 |
| 29 |
| 47 |
| 125 |
| |
(1) Commencement of operations.
(2) Total return is calculated assuming reinvestment of all dividends and capital gain distributions at net asset value and excluding the deduction of sales charges. Total returns for periods less than one year are not annualized.
(3) Annualized for periods less than one year.
(4) The Investment Manager has agreed to limit expenses, (excluding interest, taxes, brokerage and extraordinary expenses) subject to possible recoupment by ING Investments, LLC within three years.
* Represents performance beginning on the first day of the Guarantee Period (October 12, 2001). Total return from commencement of offering of shares was (1.11)%, (1.70)%, (1.70)% and (0.81)% for Class A, B, C and Q, respectively.
See Accompanying Notes to Financial Statements
36
ING PRINCIPAL PROTECTION FUND II (UNAUDITED)
FINANCIAL HIGHLIGHTS
Selected data for a share of beneficial interest outstanding throughout each period.
|
| Class A |
| Class B |
| |||||||||||||||
|
| Six Months |
| Year Ended |
| November 5, |
| Six Months |
| Year Ended |
| November 5, |
| |||||||
|
| 2004 |
| 2004 |
| 2003 |
| 2002 |
| 2004 |
| 2004 |
| 2003 |
| 2002 |
| |||
|
|
|
|
|
|
|
|
|
|
|
|
|
|
|
|
|
| |||
Per Share Operating Performance: |
|
|
|
|
|
|
|
|
|
|
|
|
|
|
|
|
| |||
Net asset value, beginning of period | $ |
| 9.77 |
| 10.15 |
| 9.83 |
| 10.00 |
| 9.74 |
| 10.12 |
| 9.80 |
| 10.00 |
| ||
|
|
|
|
|
|
|
|
|
|
|
|
|
|
|
|
|
| |||
Income (loss) from investment operations: |
|
|
|
|
|
|
|
|
|
|
|
|
|
|
|
|
| |||
Net investment income | $ |
| 0.17 |
| 0.25 |
| 0.23 |
| 0.06 |
| 0.09 |
| 0.16 |
| 0.16 |
| 0.03 |
| ||
Net realized and unrealized gain (loss) on investments | $ |
| (0.06 | ) | (0.43 | ) | 0.32 |
| (0.22 | ) | (0.03 | ) | (0.41 | ) | 0.32 |
| (0.23 | ) | ||
Total from investment operations | $ |
| 0.11 |
| (0.18 | ) | 0.55 |
| (0.16 | ) | 0.06 |
| (0.25 | ) | 0.48 |
| (0.20 | ) | ||
|
|
|
|
|
|
|
|
|
|
|
|
|
|
|
|
|
| |||
Less distributions from: |
|
|
|
|
|
|
|
|
|
|
|
|
|
|
|
|
| |||
Net investment income | $ |
| 0.27 |
| 0.20 |
| 0.23 |
| 0.01 |
| 0.18 |
| 0.13 |
| 0.16 |
| 0.00 | * | ||
Total distributions | $ |
| 0.27 |
| 0.20 |
| 0.23 |
| 0.01 |
| 0.18 |
| 0.13 |
| 0.16 |
| 0.00 | * | ||
Net asset value, end of period | $ |
| 9.61 |
| 9.77 |
| 10.15 |
| 9.83 |
| 9.62 |
| 9.74 |
| 10.12 |
| 9.80 |
| ||
|
|
|
|
|
|
|
|
|
|
|
|
|
|
|
|
|
| |||
Total Return(2): | % |
| 1.07 |
| (1.74 | ) | 5.73 |
| (1.70 | )** | 0.66 |
| (2.47 | ) | 4.98 |
| (2.00 | )** | ||
|
|
|
|
|
|
|
|
|
|
|
|
|
|
|
|
|
| |||
Ratios and Supplemental Data: |
|
|
|
|
|
|
|
|
|
|
|
|
|
|
|
|
| |||
Net assets, end of period (000’s) | $ |
| 31,765 |
| 37,580 |
| 76,897 |
| 98,109 |
| 290,066 |
| 328,221 |
| 442,268 |
| 465,111 |
| ||
|
|
|
|
|
|
|
|
|
|
|
|
|
|
|
|
|
| |||
Ratios to average net assets: |
|
|
|
|
|
|
|
|
|
|
|
|
|
|
|
|
| |||
Net expenses after expense reimbursement/ | % |
| 1.60 |
| 1.69 |
| 1.75 |
| 1.61 |
| 2.35 |
| 2.44 |
| 2.50 |
| 2.36 |
| ||
Gross expenses prior to expense reimbursement/ | % |
| 1.60 |
| 1.65 |
| 1.78 |
| 1.61 |
| 2.35 |
| 2.40 |
| 2.53 |
| 2.36 |
| ||
Net investment income after expense reimbursement/ | % |
| 2.52 |
| 2.26 |
| 2.30 |
| 1.36 |
| 1.77 |
| 1.51 |
| 1.55 |
| 0.61 |
| ||
Portfolio turnover rate | % |
| 3 |
| 74 |
| 60 |
| 70 |
| 3 |
| 74 |
| 60 |
| 70 |
| ||
|
| Class C |
| Class Q |
| ||||||||||||||
|
| Six Months |
| Year Ended |
| November 5, |
| Six Months |
| Year Ended |
| November 5, |
| ||||||
|
| 2004 |
| 2004 |
| 2003 |
| 2002 |
| 2004 |
| 2004 |
| 2003 |
| 2002 |
| ||
|
|
|
|
|
|
|
|
|
|
|
|
|
|
|
|
|
| ||
Per Share Operating Performance: |
|
|
|
|
|
|
|
|
|
|
|
|
|
|
|
|
| ||
Net asset value, beginning of period | $ |
| 9.75 |
| 10.12 |
| 9.80 |
| 10.00 |
| 9.78 |
| 10.16 |
| 9.83 |
| 10.00 |
| |
|
|
|
|
|
|
|
|
|
|
|
|
|
|
|
|
|
| ||
Income (loss) from investment operations: |
|
|
|
|
|
|
|
|
|
|
|
|
|
|
|
|
| ||
Net investment income | $ |
| 0.12 |
| 0.18 |
| 0.15 |
| 0.03 |
| 0.24 |
| 0.24 |
| 0.31 |
| 0.07 |
| |
Net realized and unrealized gain (loss) on investments | $ |
| (0.05 | ) | (0.43 | ) | 0.33 |
| (0.23 | ) | (0.14 | ) | (0.40 | ) | 0.26 |
| (0.23 | ) | |
Total from investment operations | $ |
| 0.07 |
| (0.25 | ) | 0.48 |
| (0.20 | ) | 0.10 |
| (0.16 | ) | 0.57 |
| (0.16 | ) | |
|
|
|
|
|
|
|
|
|
|
|
|
|
|
|
|
|
| ||
Less distributions from: |
|
|
|
|
|
|
|
|
|
|
|
|
|
|
|
|
| ||
Net investment income | $ |
| 0.17 |
| 0.12 |
| 0.16 |
| 0.00 | * | 0.26 |
| 0.22 |
| 0.24 |
| 0.01 |
| |
Total distributions | $ |
| 0.17 |
| 0.12 |
| 0.16 |
| 0.00 | * | 0.26 |
| 0.22 |
| 0.24 |
| 0.01 |
| |
Net asset value, end of period | $ |
| 9.65 |
| 9.75 |
| 10.12 |
| 9.80 |
| 9.62 |
| 9.78 |
| 10.16 |
| 9.83 |
| |
|
|
|
|
|
|
|
|
|
|
|
|
|
|
|
|
|
| ||
Total Return(2): | % |
| 0.75 |
| (2.52 | ) | 4.99 |
| (2.00 | )** | 1.02 |
| (1.56 | ) | 5.87 |
| (1.70 | )** | |
|
|
|
|
|
|
|
|
|
|
|
|
|
|
|
|
|
| ||
Ratios and Supplemental Data: |
|
|
|
|
|
|
|
|
|
|
|
|
|
|
|
|
| ||
Net assets, end of period (000’s) | $ |
| 58,230 |
| 71,250 |
| 139,961 |
| 159,563 |
| 31 |
| 47 |
| 58 |
| 81 |
| |
|
|
|
|
|
|
|
|
|
|
|
|
|
|
|
|
|
| ||
Ratios to average net assets: |
|
|
|
|
|
|
|
|
|
|
|
|
|
|
|
|
| ||
Net expenses after expense reimbursement/ | % |
| 2.35 |
| 2.44 |
| 2.50 |
| 2.36 |
| 1.60 |
| 1.63 |
| 1.61 |
| 1.45 |
| |
Gross expenses prior to expense reimbursement/ | % |
| 2.35 |
| 2.40 |
| 2.53 |
| 2.36 |
| 1.60 |
| 1.59 |
| 1.64 |
| 1.45 |
| |
Net investment income after expense reimbursement/ | % |
| 1.77 |
| 1.51 |
| 1.55 |
| 0.69 |
| 2.50 |
| 2.33 |
| 2.42 |
| 1.52 |
| |
Portfolio turnover rate | % |
| 3 |
| 74 |
| 60 |
| 70 |
| 3 |
| 74 |
| 60 |
| 70 |
| |
(1) Commencement of operations.
(2) Total return is calculated assuming reinvestment of all dividends and capital gain distributions at net asset value and excluding the deduction of sales charges. Total returns for periods less than one year are not annualized.
(3) Annualized for periods less than one year.
(4) The Investment Manager has agreed to limit expenses, (excluding interest, taxes, brokerage and extraordinary expenses), subject to possible reimbursement to ING Investments, LLC within three years.
* Amount represents less than $0.01 per share.
** Represents performance beginning on the first day of the Guarantee Period (February 1, 2002). Total return from commencement of offering of shares was (1.60)%, (1.96)%, (1.97)% and (1.60)% for Class A, B, C and Q, respectively.
See Accompanying Notes to Financial Statements
37
ING PRINCIPAL PROTECTION FUND III (UNAUDITED)
FINANCIAL HIGHLIGHTS
Selected data for a share of beneficial interest outstanding throughout each period.
|
| Class A |
| Class B |
| ||||||||||||||
|
| Six Months |
| Year Ended |
| March 5, |
| Six Months |
| Year Ended |
| March 5, |
| ||||||
|
| 2004 |
| 2004 |
| 2003 |
| 2002 |
| 2004 |
| 2004 |
| 2003 |
| 2002 |
| ||
|
|
|
|
|
|
|
|
|
|
|
|
|
|
|
|
|
| ||
Per Share Operating Performance: |
|
|
|
|
|
|
|
|
|
|
|
|
|
|
|
|
| ||
Net asset value, beginning of period | $ |
| 9.90 |
| 10.27 |
| 10.01 |
| 10.00 |
| 9.86 |
| 10.23 |
| 10.00 |
| 10.00 |
| |
|
|
|
|
|
|
|
|
|
|
|
|
|
|
|
|
|
| ||
Income (loss) from investment operations: |
|
|
|
|
|
|
|
|
|
|
|
|
|
|
|
|
| ||
Net investment income | $ |
| 0.16 |
| 0.25 |
| 0.21 |
| 0.01 |
| 0.09 |
| 0.16 |
| 0.13 |
| 0.00 | * | |
Net realized and unrealized gain (loss) on investments | $ |
| (0.04 | ) | (0.42 | ) | 0.22 |
| 0.00 | * | (0.01 | ) | (0.40 | ) | 0.22 |
| 0.00 | * | |
Total from investment operations | $ |
| 0.12 |
| (0.17 | ) | 0.43 |
| 0.01 |
| 0.08 |
| (0.24 | ) | 0.35 |
| 0.00 | * | |
|
|
|
|
|
|
|
|
|
|
|
|
|
|
|
|
|
| ||
Less distributions from: |
|
|
|
|
|
|
|
|
|
|
|
|
|
|
|
|
| ||
Net investment income | $ |
| 0.26 |
| 0.20 |
| 0.17 |
| — |
| 0.18 |
| 0.13 |
| 0.12 |
| — |
| |
Total distributions | $ |
| 0.26 |
| 0.20 |
| 0.17 |
| — |
| 0.18 |
| 0.13 |
| 0.12 |
| — |
| |
Net asset value, end of period | $ |
| 9.76 |
| 9.90 |
| 10.27 |
| 10.01 |
| 9.76 |
| 9.86 |
| 10.23 |
| 10.00 |
| |
|
|
|
|
|
|
|
|
|
|
|
|
|
|
|
|
|
| ||
Total Return(2): | % |
| 1.20 |
| (1.63 | ) | 4.35 | *** | — | ** | 0.81 |
| (2.38 | ) | 3.51 | *** | — | ** | |
|
|
|
|
|
|
|
|
|
|
|
|
|
|
|
|
|
| ||
Ratios and Supplemental Data: |
|
|
|
|
|
|
|
|
|
|
|
|
|
|
|
|
| ||
Net assets, end of period (000’s) | $ |
| 23,987 |
| 29,113 |
| 49,652 |
| 57,749 |
| 234,604 |
| 261,098 |
| 335,942 |
| 347,788 |
| |
|
|
|
|
|
|
|
|
|
|
|
|
|
|
|
|
|
| ||
Ratios to average net assets: |
|
|
|
|
|
|
|
|
|
|
|
|
|
|
|
|
| ||
Net expenses after expense reimbursement/ | % |
| 1.59 |
| 1.68 |
| 1.75 |
| 0.97 |
| 2.34 |
| 2.43 |
| 2.50 |
| 1.72 |
| |
Gross expenses prior to expense reimbursement/ | % |
| 1.59 |
| 1.66 |
| 1.77 |
| 0.97 |
| 2.34 |
| 2.41 |
| 2.52 |
| 1.72 |
| |
Net investment income after expense reimbursement/ | % |
| 2.42 |
| 2.26 |
| 2.08 |
| 0.85 |
| 1.68 |
| 1.51 |
| 1.33 |
| 0.07 |
| |
Portfolio turnover rate | % |
| 10 |
| 27 |
| 91 |
| — |
| 10 |
| 27 |
| 91 |
| — |
| |
|
| Class C |
| Class Q |
| ||||||||||||||
|
| Six Months |
| Year Ended |
| March 5, |
| Six Months |
| Year Ended |
| March 5, |
| ||||||
|
| 2004 |
| 2004 |
| 2003 |
| 2002 |
| 2004 |
| 2004 |
| 2003 |
| 2002 |
| ||
|
|
|
|
|
|
|
|
|
|
|
|
|
|
|
|
|
| ||
Per Share Operating Performance: |
|
|
|
|
|
|
|
|
|
|
|
|
|
|
|
|
| ||
Net asset value, beginning of period | $ |
| 9.88 |
| 10.23 |
| 10.00 |
| 10.00 |
| 9.89 |
| 10.28 |
| 10.02 |
| 10.00 |
| |
|
|
|
|
|
|
|
|
|
|
|
|
|
|
|
|
|
| ||
Income (loss) from investment operations: |
|
|
|
|
|
|
|
|
|
|
|
|
|
|
|
|
| ||
Net investment income | $ |
| 0.10 |
| 0.19 |
| 0.13 |
| 0.00 | * | 0.13 |
| 0.23 |
| 0.22 |
| 0.01 |
| |
Net realized and unrealized gain (loss) on investments | $ |
| (0.02 | ) | (0.43 | ) | 0.22 |
| 0.00 | * | 0.00 | * | (0.40 | ) | 0.22 |
| 0.01 |
| |
Total from investment operations | $ |
| 0.08 |
| (0.24 | ) | 0.35 |
| 0.00 | * | 0.13 |
| (0.17 | ) | 0.44 |
| 0.02 |
| |
|
|
|
|
|
|
|
|
|
|
|
|
|
|
|
|
|
| ||
Less distributions from: |
|
|
|
|
|
|
|
|
|
|
|
|
|
|
|
|
| ||
Net investment income | $ |
| 0.17 |
| 0.11 |
| 0.12 |
| — |
| 0.27 |
| 0.22 |
| 0.18 |
| — |
| |
Total distributions | $ |
| 0.17 |
| 0.11 |
| 0.12 |
| — |
| 0.27 |
| 0.22 |
| 0.18 |
| — |
| |
Net asset value, end of period | $ |
| 9.79 |
| 9.88 |
| 10.23 |
| 10.00 |
| 9.75 |
| 9.89 |
| 10.28 |
| 10.02 |
| |
|
|
|
|
|
|
|
|
|
|
|
|
|
|
|
|
|
| ||
Total Return(2): | % |
| 0.83 |
| (2.37 | ) | 3.51 | *** | — | ** | 1.27 |
| (1.64 | ) | 4.45 | *** | — | ** | |
|
|
|
|
|
|
|
|
|
|
|
|
|
|
|
|
|
| ||
Ratios and Supplemental Data: |
|
|
|
|
|
|
|
|
|
|
|
|
|
|
|
|
| ||
Net assets, end of period (000’s) | $ |
| 35,833 |
| 43,018 |
| 81,800 |
| 90,826 |
| 595 |
| 588 |
| 599 |
| 574 |
| |
|
|
|
|
|
|
|
|
|
|
|
|
|
|
|
|
|
| ||
Ratios to average net assets: |
|
|
|
|
|
|
|
|
|
|
|
|
|
|
|
|
| ||
Net expenses after expense reimbursement/ | % |
| 2.34 |
| 2.43 |
| 2.50 |
| 1.72 |
| 1.59 |
| 1.62 |
| 1.62 |
| 0.80 |
| |
Gross expenses prior to expense reimbursement/ | % |
| 2.34 |
| 2.41 |
| 2.52 |
| 1.72 |
| 1.59 |
| 1.60 |
| 1.63 |
| 0.80 |
| |
Net investment income after expense reimbursement/ | % |
| 1.68 |
| 1.51 |
| 1.33 |
| 0.06 |
| 2.44 |
| 2.32 |
| 2.22 |
| 1.02 |
| |
Portfolio turnover rate | % |
| 10 |
| 27 |
| 91 |
| — |
| 10 |
| 27 |
| 91 |
| — |
| |
(1) Commencement of operations.
(2) Total return is calculated assuming reinvestment of all dividends and capital gain distributions at net asset value and excluding the deduction of sales charges. Total returns for periods less than one year are not annualized.
(3) Annualized for periods less than one year.
(4) The Investment Manager has agreed to limit expenses, (excluding interest, taxes, brokerage and extraordinary expenses), subject to possible reimbursement to ING Investments, LLC within three years.
* Amount represents less than $0.01 per share.
** As of May 31, 2002, the Fund was in its Offering Period. Total return from commencement of offering of shares was 0.10%, 0.00%, 0.00% and 0.20% for Class A, B, C and Q, respectively.
*** Represents performance beginning on the first day of the Guarantee Period (June 6, 2002). Total return for year ended May 31, 2003 was 4.35%, 3.51%, 3.51% and 4.45% for Class A, B, C and Q, respectively.
See Accompanying Notes to Financial Statements
38
ING PRINCIPAL PROTECTION FUND IV (UNAUDITED)
FINANCIAL HIGHLIGHTS
Selected data for a share of beneficial interest outstanding throughout each period.
|
| Class A |
| Class B |
| |||||||||||
|
| Six Months |
| Year |
| July 1, |
| Six Months |
| Year |
| July 1, |
| |||
|
|
|
|
|
|
|
|
|
|
|
|
|
| |||
Per Share Operating Performance: |
|
|
|
|
|
|
|
|
|
|
|
|
| |||
Net asset value, beginning of period | $ |
| 10.39 |
| 10.52 |
| 10.00 |
| 10.35 |
| 10.47 |
| 10.00 |
| ||
|
|
|
|
|
|
|
|
|
|
|
|
|
| |||
Income (loss) from investment operations: |
|
|
|
|
|
|
|
|
|
|
|
|
| |||
Net investment income | $ |
| 0.09 |
| 0.12 |
| 0.09 |
| 0.03 |
| 0.04 |
| 0.03 |
| ||
Net realized and unrealized gain (loss) on investments | $ |
| 0.12 |
| (0.08 | ) | 0.47 |
| 0.13 |
| (0.07 | ) | 0.46 |
| ||
Total from investment operations | $ |
| 0.21 |
| 0.04 |
| 0.56 |
| 0.16 |
| (0.03 | ) | 0.49 |
| ||
|
|
|
|
|
|
|
|
|
|
|
|
|
| |||
Less distributions from: |
|
|
|
|
|
|
|
|
|
|
|
|
| |||
Net investment income | $ |
| 0.13 |
| 0.14 |
| 0.03 |
| 0.04 |
| 0.06 |
| 0.01 |
| ||
Net realized gains on investments | $ |
| 0.05 |
| 0.03 |
| 0.01 |
| 0.05 |
| 0.03 |
| 0.01 |
| ||
Total distributions | $ |
| 0.18 |
| 0.17 |
| 0.04 |
| 0.08 |
| 0.09 |
| 0.02 |
| ||
Net asset value, end of period | $ |
| 10.42 |
| 10.39 |
| 10.52 |
| 10.45 |
| 10.35 |
| 10.47 |
| ||
|
|
|
|
|
|
|
|
|
|
|
|
|
| |||
Total Return(2): | % |
| 1.94 |
| 0.36 |
| 5.50 | * | 1.55 |
| (0.29 | ) | 4.89 | * | ||
|
|
|
|
|
|
|
|
|
|
|
|
|
| |||
Ratios and Supplemental Data: |
|
|
|
|
|
|
|
|
|
|
|
|
| |||
Net assets, end of period (000’s) | $ |
| 42,136 |
| 52,094 |
| 89,558 |
| 446,471 |
| 487,343 |
| 603,649 |
| ||
|
|
|
|
|
|
|
|
|
|
|
|
|
| |||
Ratios to average net assets: |
|
|
|
|
|
|
|
|
|
|
|
|
| |||
Expenses(3) | % |
| 1.57 |
| 1.65 |
| 1.61 |
| 2.32 |
| 2.40 |
| 2.36 |
| ||
Net investment income(3) | % |
| 1.33 |
| 1.08 |
| 1.12 |
| 0.59 |
| 0.33 |
| 0.36 |
| ||
Portfolio turnover rate | % |
| 40 |
| 75 |
| 31 |
| 40 |
| 75 |
| 31 |
| ||
|
| Class C |
| Class Q |
| ||||||||||
|
| Six Months |
| Year |
| July 1, |
| Six Months |
| Year |
| July 1, |
| ||
|
|
|
|
|
|
|
|
|
|
|
|
|
| ||
Per Share Operating Performance: |
|
|
|
|
|
|
|
|
|
|
|
|
| ||
Net asset value, beginning of period | $ |
| 10.36 |
| 10.47 |
| 10.00 |
| 10.40 |
| 10.52 |
| 10.00 |
| |
|
|
|
|
|
|
|
|
|
|
|
|
|
| ||
Income (loss) from investment operations: |
|
|
|
|
|
|
|
|
|
|
|
|
| ||
Net investment income | $ |
| 0.04 |
| 0.05 |
| 0.03 |
| 0.07 |
| 0.13 |
| 0.10 |
| |
Net realized and unrealized gain (loss) on investments | $ |
| 0.13 |
| (0.09 | ) | 0.46 |
| 0.13 |
| (0.07 | ) | 0.46 |
| |
Total from investment operations | $ |
| 0.17 |
| (0.04 | ) | 0.49 |
| 0.20 |
| 0.06 |
| 0.56 |
| |
|
|
|
|
|
|
|
|
|
|
|
|
|
| ||
Less distributions from: |
|
|
|
|
|
|
|
|
|
|
|
|
| ||
Net investment income | $ |
| 0.03 |
| 0.04 |
| 0.01 |
| 0.13 |
| 0.15 |
| 0.03 |
| |
Net realized gains on investments | $ |
| 0.05 |
| 0.03 |
| 0.01 |
| 0.05 |
| 0.03 |
| 0.01 |
| |
Total distributions | $ |
| 0.08 |
| 0.07 |
| 0.02 |
| 0.18 |
| 0.18 |
| 0.04 |
| |
Net asset value, end of period | $ |
| 10.45 |
| 10.36 |
| 10.47 |
| 10.42 |
| 10.40 |
| 10.52 |
| |
|
|
|
|
|
|
|
|
|
|
|
|
|
| ||
Total Return(2): | % |
| 1.61 |
| (0.37 | ) | 4.90 | * | 1.90 |
| 0.58 |
| 5.54 | * | |
|
|
|
|
|
|
|
|
|
|
|
|
|
| ||
Ratios and Supplemental Data: |
|
|
|
|
|
|
|
|
|
|
|
|
| ||
Net assets, end of period (000’s) | $ |
| 79,828 |
| 98,026 |
| 183,228 |
| 959 |
| 950 |
| 1,473 |
| |
|
|
|
|
|
|
|
|
|
|
|
|
|
| ||
Ratios to average net assets: |
|
|
|
|
|
|
|
|
|
|
|
|
| ||
Expenses(3) | % |
| 2.32 |
| 2.40 |
| 2.36 |
| 1.57 |
| 1.59 |
| 1.49 |
| |
Net investment income(3) | % |
| 0.58 |
| 0.33 |
| 0.36 |
| 1.36 |
| 1.14 |
| 1.24 |
| |
Portfolio turnover rate | % |
| 40 |
| 75 |
| 31 |
| 40 |
| 75 |
| 31 |
| |
(1) Commencement of operations.
(2) Total return is calculated assuming reinvestment of all dividends and capital gain distributions at net asset value and excluding the deduction of sales charges. Total returns for periods less than one year are not annualized.
(3) Annualized for periods less than one year.
* Represents performance beginning on the first day of the Guarantee Period (October 8, 2002). Total return from commencement of offering of shares was 5.61%, 4.89%, 4.90% and 5.64% for Class A, B, C and Q, respectively.
See Accompanying Notes to Financial Statements
39
ING PRINCIPAL PROTECTION FUND V (UNAUDITED)
FINANCIAL HIGHLIGHTS
Selected data for a share of beneficial interest outstanding throughout each period.
|
| Class A |
| Class B |
| ||||||||||
|
| Six Months |
| Year |
| November 1, |
| Six Months |
| Year |
| November 1, |
| ||
|
|
|
|
|
|
|
|
|
|
|
|
|
| ||
Per Share Operating Performance: |
|
|
|
|
|
|
|
|
|
|
|
|
| ||
Net asset value, beginning of period | $ |
| 10.11 |
| 10.41 |
| 10.00 |
| 10.09 |
| 10.38 |
| 10.00 |
| |
|
|
|
|
|
|
|
|
|
|
|
|
|
| ||
Income (loss) from investment operations: |
|
|
|
|
|
|
|
|
|
|
|
|
| ||
Net investment income | $ |
| 0.10 |
| 0.13 |
| 0.05 |
| 0.04 |
| 0.05 |
| 0.01 |
| |
Net realized and unrealized gain (loss) on investments | $ |
| 0.10 |
| (0.22 | ) | 0.36 |
| 0.12 |
| (0.21 | ) | 0.37 |
| |
Total from investment operations | $ |
| 0.20 |
| (0.09 | ) | 0.41 |
| 0.16 |
| (0.16 | ) | 0.38 |
| |
|
|
|
|
|
|
|
|
|
|
|
|
|
| ||
Less distributions from: |
|
|
|
|
|
|
|
|
|
|
|
|
| ||
Net investment income | $ |
| 0.14 |
| 0.14 |
| — |
| 0.06 |
| 0.06 |
| — |
| |
Net realized gains on investments | $ |
| 0.35 |
| 0.07 |
| — |
| 0.35 |
| 0.07 |
| — |
| |
Total distributions | $ |
| 0.49 |
| 0.21 |
| — |
| 0.41 |
| 0.13 |
| — |
| |
Net asset value, end of period | $ |
| 9.82 |
| 10.11 |
| 10.41 |
| 9.84 |
| 10.09 |
| 10.38 |
| |
|
|
|
|
|
|
|
|
|
|
|
|
|
| ||
Total Return(2): | % |
| 1.95 |
| (0.89 | ) | 4.10 | * | 1.59 |
| (1.54 | ) | 3.90 | * | |
|
|
|
|
|
|
|
|
|
|
|
|
|
| ||
Ratios and Supplemental Data: |
|
|
|
|
|
|
|
|
|
|
|
|
| ||
Net assets, end of period (000’s) | $ |
| 35,893 |
| 42,889 |
| 74,905 |
| 378,149 |
| 405,311 |
| 496,076 |
| |
|
|
|
|
|
|
|
|
|
|
|
|
|
| ||
Ratios to average net assets: |
|
|
|
|
|
|
|
|
|
|
|
|
| ||
Expenses(3) | % |
| 1.56 |
| 1.67 |
| 1.56 |
| 2.31 |
| 2.42 |
| 2.31 |
| |
Net investment income(3) | % |
| 1.46 |
| 1.22 |
| 1.00 |
| 0.72 |
| 0.47 |
| 0.25 |
| |
Portfolio turnover rate | % |
| 45 |
| 53 |
| 12 |
| 45 |
| 53 |
| 12 |
| |
|
| Class C |
| ||||||
|
| Six Months |
| Year |
| November 1, |
| ||
|
|
|
|
|
|
|
| ||
Per Share Operating Performance: |
|
|
|
|
|
|
| ||
Net asset value, beginning of period | $ |
| 10.10 |
| 10.38 |
| 10.00 |
| |
|
|
|
|
|
|
|
| ||
Income (loss) from investment operations: |
|
|
|
|
|
|
| ||
Net investment income | $ |
| 0.05 |
| 0.06 |
| 0.01 |
| |
Net realized and unrealized gain (loss) on investments | $ |
| 0.10 |
| (0.22 | ) | 0.37 |
| |
Total from investment operations | $ |
| 0.15 |
| (0.16 | ) | 0.38 |
| |
|
|
|
|
|
|
|
| ||
Less distributions from: |
|
|
|
|
|
|
| ||
Net investment income | $ |
| 0.04 |
| 0.05 |
| — |
| |
Net realized gains on investments | $ |
| 0.35 |
| 0.07 |
| — |
| |
Total distributions | $ |
| 0.39 |
| 0.12 |
| — |
| |
Net asset value, end of period | $ |
| 9.86 |
| 10.10 |
| 10.38 |
| |
|
|
|
|
|
|
|
| ||
Total Return(2): | % |
| 1.51 |
| (1.52 | ) | 3.90 | * | |
|
|
|
|
|
|
|
| ||
Ratios and Supplemental Data: |
|
|
|
|
|
|
| ||
Net assets, end of period (000’s) | $ |
| 48,351 |
| 60,980 |
| 106,754 |
| |
|
|
|
|
|
|
|
| ||
Ratios to average net assets: |
|
|
|
|
|
|
| ||
Expenses(3) | % |
| 2.31 |
| 2.42 |
| 2.31 |
| |
Net investment income(3) | % |
| 0.70 |
| 0.47 |
| 0.25 |
| |
Portfolio turnover rate | % |
| 45 |
| 53 |
| 12 |
| |
(1) Commencement of operations.
(2) Total return is calculated assuming reinvestment of all dividends and capital gain distributions at net asset value and excluding the deduction of sales charges. Total returns for periods less than one year are not annualized.
(3) Annualized for periods less than one year.
* Represents performance beginning on the first day of the Guarantee Period (January 23, 2003). Total return from commencement of offering of shares is 4.10%, 3.80% and 3.80% for Class A, B and C, respectively.
See Accompanying Notes to Financial Statements
40
ING PRINCIPAL PROTECTION FUND VI (UNAUDITED)
FINANCIAL HIGHLIGHTS
Selected data for a share of beneficial interest outstanding throughout each period.
|
| Class A |
| Class B |
| ||||||||||
|
| Six Months |
| Year |
| February 3, |
| Six Months |
| Year |
| February 3, |
| ||
|
|
|
|
|
|
|
|
|
|
|
|
|
| ||
Per Share Operating Performance: |
|
|
|
|
|
|
|
|
|
|
|
|
| ||
Net asset value, beginning of period | $ |
| 10.08 |
| 10.31 |
| 10.00 |
| 10.06 |
| 10.30 |
| 10.00 |
| |
|
|
|
|
|
|
|
|
|
|
|
|
|
| ||
Income (loss) from investment operations: |
|
|
|
|
|
|
|
|
|
|
|
|
| ||
Net investment income | $ |
| 0.09 |
| 0.13 |
| 0.01 |
| 0.04 |
| 0.05 |
| 0.00 | * | |
Net realized and unrealized gain (loss) on investments | $ |
| 0.09 |
| (0.23 | ) | 0.30 |
| 0.09 |
| (0.22 | ) | 0.30 |
| |
Total from investment operations | $ |
| 0.18 |
| (0.10 | ) | 0.31 |
| 0.13 |
| (0.17 | ) | 0.30 |
| |
|
|
|
|
|
|
|
|
|
|
|
|
|
| ||
Less distributions from: |
|
|
|
|
|
|
|
|
|
|
|
|
| ||
Net investment income | $ |
| 0.14 |
| 0.10 |
| — |
| 0.06 |
| 0.04 |
| — |
| |
Net realized gains on investments | $ |
| 0.33 |
| 0.03 |
| — |
| 0.33 |
| 0.03 |
| — |
| |
Total distributions | $ |
| 0.47 |
| 0.13 |
| — |
| 0.39 |
| 0.07 |
| — |
| |
Net asset value, end of period | $ |
| 9.79 |
| 10.08 |
| 10.31 |
| 9.80 |
| 10.06 |
| 10.30 |
| |
|
|
|
|
|
|
|
|
|
|
|
|
|
| ||
Total Return(2): | % |
| 1.73 |
| (1.01 | ) | 3.10 | ** | 1.25 |
| (1.70 | ) | 3.10 | ** | |
|
|
|
|
|
|
|
|
|
|
|
|
|
| ||
Ratios and Supplemental Data: |
|
|
|
|
|
|
|
|
|
|
|
|
| ||
Net assets, end of period (000’s) | $ |
| 36,599 |
| 43,443 |
| 63,460 |
| 343,559 |
| 372,323 |
| 444,549 |
| |
|
|
|
|
|
|
|
|
|
|
|
|
|
| ||
Ratios to average net assets: |
|
|
|
|
|
|
|
|
|
|
|
|
| ||
Expenses(3) | % |
| 1.58 |
| 1.67 |
| 1.41 |
| 2.33 |
| 2.42 |
| 2.16 |
| |
Net investment income (loss)(3) | % |
| 1.45 |
| 1.19 |
| 0.59 |
| 0.71 |
| 0.44 |
| (0.16 | ) | |
Portfolio turnover rate | % |
| 54 |
| 44 |
| 3 |
| 54 |
| 44 |
| 3 |
| |
|
| Class C |
| Class Q |
| ||||||||||
|
| Six Months |
| Year |
| February 3, |
| Six Months |
| Year |
| February 3, |
| ||
|
|
|
|
|
|
|
|
|
|
|
|
|
| ||
Per Share Operating Performance: |
|
|
|
|
|
|
|
|
|
|
|
|
| ||
Net asset value, beginning of period | $ |
| 10.06 |
| 10.30 |
| 10.00 |
| 10.09 |
| 10.33 |
| 10.00 |
| |
|
|
|
|
|
|
|
|
|
|
|
|
|
| ||
Income (loss) from investment operations: |
|
|
|
|
|
|
|
|
|
|
|
|
| ||
Net investment income | $ |
| 0.05 |
| 0.05 |
| 0.00 | * | 0.08 |
| 0.13 |
| 0.01 |
| |
Net realized and unrealized gain (loss) on investments | $ |
| 0.09 |
| (0.22 | ) | 0.30 |
| 0.10 |
| (0.23 | ) | 0.32 |
| |
Total from investment operations | $ |
| 0.14 |
| (0.17 | ) | 0.30 |
| 0.18 |
| (0.10 | ) | 0.33 |
| |
|
|
|
|
|
|
|
|
|
|
|
|
|
| ||
Less distributions from: |
|
|
|
|
|
|
|
|
|
|
|
|
| ||
Net investment income | $ |
| 0.04 |
| 0.04 |
| — |
| 0.15 |
| 0.11 |
| — |
| |
Net realized gains on investments | $ |
| 0.33 |
| 0.03 |
| — |
| 0.33 |
| 0.03 |
| — |
| |
Total distributions | $ |
| 0.37 |
| 0.07 |
| — |
| 0.48 |
| 0.14 |
| — |
| |
Net asset value, end of period | $ |
| 9.83 |
| 10.06 |
| 10.30 |
| 9.79 |
| 10.09 |
| 10.33 |
| |
|
|
|
|
|
|
|
|
|
|
|
|
|
| ||
Total Return(2): | % |
| 1.35 |
| (1.72 | ) | 3.00 | ** | 1.67 |
| (0.98 | ) | 3.20 | ** | |
|
|
|
|
|
|
|
|
|
|
|
|
|
| ||
Ratios and Supplemental Data: |
|
|
|
|
|
|
|
|
|
|
|
|
| ||
Net assets, end of period (000’s) | $ |
| 51,319 |
| 65,269 |
| 102,047 |
| 286 |
| 302 |
| 304 |
| |
|
|
|
|
|
|
|
|
|
|
|
|
|
| ||
Ratios to average net assets: |
|
|
|
|
|
|
|
|
|
|
|
|
| ||
Expenses(3) | % |
| 2.33 |
| 2.42 |
| 2.19 |
| 1.58 |
| 1.61 |
| 1.35 |
| |
Net investment income (loss)(3) | % |
| 0.69 |
| 0.44 |
| (0.13 | ) | 1.46 |
| 1.24 |
| 0.81 |
| |
Portfolio turnover rate | % |
| 54 |
| 44 |
| 3 |
| 54 |
| 44 |
| 3 |
| |
(1) Commencement of operations.
(2) Total return is calculated assuming reinvestment of all dividends and capital gain distributions at net asset value and excluding the deduction of sales charges. Total returns for periods less than one year are not annualized.
(3) Annualized for periods less than one year.
* Amount represents less than $0.01 per share.
** Represents performance beginning on the first day of the Guarantee Period (April 24, 2003). Total return from commencement of offering of shares was 3.10%, 3.00%, 3.00% and 3.30% for Class A, B, C and Q, respectively.
See Accompanying Notes to Financial Statements
41
ING PRINCIPAL PROTECTION FUND VII (UNAUDITED)
FINANCIAL HIGHLIGHTS
Selected data for a share of beneficial interest outstanding throughout each period.
|
| Class A |
| Class B |
| ||||||||||
|
| Six Months |
| Year |
| May 1, |
| Six Months |
| Year |
| May 1, |
| ||
|
|
|
|
|
|
|
|
|
|
|
|
|
| ||
Per Share Operating Performance: |
|
|
|
|
|
|
|
|
|
|
|
|
| ||
Net asset value, beginning of period | $ |
| 9.88 |
| 10.00 |
| 10.00 |
| 9.93 |
| 10.00 |
| 10.00 |
| |
|
|
|
|
|
|
|
|
|
|
|
|
|
| ||
Income (loss) from investment operations: |
|
|
|
|
|
|
|
|
|
|
|
|
| ||
Net investment income | $ |
| 0.09 |
| 0.13 |
| 0.00 | * | 0.04 |
| 0.07 |
| 0.00 | * | |
Net realized and unrealized gain (loss) on investments | $ |
| 0.12 |
| (0.08 | ) | 0.00 | * | 0.13 |
| (0.09 | ) | 0.00 | * | |
Total from investment operations | $ |
| 0.21 |
| 0.05 |
| 0.00 | * | 0.17 |
| (0.02 | ) | 0.00 | * | |
|
|
|
|
|
|
|
|
|
|
|
|
|
| ||
Less distributions from: |
|
|
|
|
|
|
|
|
|
|
|
|
| ||
Net investment income | $ |
| 0.16 |
| 0.17 |
| — |
| 0.08 |
| 0.05 |
| — |
| |
Net realized gains on investments | $ |
| 0.15 |
| — |
| — |
| 0.15 |
|
|
| — |
| |
Total distributions | $ |
| 0.31 |
| 0.17 |
| — |
| 0.23 |
| 0.05 |
| — |
| |
Net asset value, end of period | $ |
| 9.78 |
| 9.88 |
| 10.00 |
| 9.87 |
| 9.93 |
| 10.00 |
| |
|
|
|
|
|
|
|
|
|
|
|
|
|
| ||
Total Return(2): | % |
| 2.09 |
| 0.52 | *** | — | ** | 1.74 |
| (0.21 | )*** | — | ** | |
|
|
|
|
|
|
|
|
|
|
|
|
|
| ||
Ratios and Supplemental Data: |
|
|
|
|
|
|
|
|
|
|
|
|
| ||
Net assets, end of period (000’s) | $ |
| 17,478 |
| 21,805 |
| 11,028 |
| 170,879 |
| 182,112 |
| 92,014 |
| |
|
|
|
|
|
|
|
|
|
|
|
|
|
| ||
Ratios to average net assets: |
|
|
|
|
|
|
|
|
|
|
|
|
| ||
Net expenses after expense reimbursement(3)(4) | % |
| 1.35 |
| 0.99 |
| 0.88 |
| 2.10 |
| 1.74 |
| 1.60 |
| |
Gross expenses prior to expense reimbursement (3) | % |
| 1.61 |
| 1.72 |
| 0.88 |
| 2.36 |
| 2.47 |
| 1.60 |
| |
Net investment income (loss) after expense reimbursement(3)(4) | % |
| 1.44 |
| 1.51 |
| 0.09 |
| 0.70 |
| 0.76 |
| (0.63 | ) | |
Portfolio turnover rate | % |
| 19 |
| 91 |
| — |
| 19 |
| 91 |
| — |
| |
|
| Class C |
| ||||||
|
| Six Months |
| Year |
| May 1, |
| ||
|
|
|
|
|
|
|
| ||
Per Share Operating Performance: |
|
|
|
|
|
|
| ||
Net asset value, beginning of period | $ |
| 9.90 |
| 10.00 |
| 10.00 |
| |
|
|
|
|
|
|
|
| ||
Income (loss) from investment operations: |
|
|
|
|
|
|
| ||
Net investment income | $ |
| 0.05 |
| 0.07 |
| 0.00 | * | |
Net realized and unrealized gain (loss) on investments | $ |
| 0.12 |
| (0.09 | ) | 0.00 | * | |
Total from investment operations | $ |
| 0.17 |
| (0.02 | ) | 0.00 | * | |
|
|
|
|
|
|
|
| ||
Less distributions from: |
|
|
|
|
|
|
| ||
Net investment income | $ |
| 0.06 |
| 0.08 |
| — |
| |
Net realized gains on investments | $ |
| 0.15 |
|
|
| — |
| |
Total distributions | $ |
| 0.21 |
| 0.08 |
| — |
| |
Net asset value, end of period | $ |
| 9.86 |
| 9.90 |
| 10.00 |
| |
|
|
|
|
|
|
|
| ||
Total Return(2): | % |
| 1.73 |
| (0.24 | )*** | — | ** | |
|
|
|
|
|
|
|
| ||
Ratios and Supplemental Data: |
|
|
|
|
|
|
| ||
Net assets, end of period (000’s) | $ |
| 33,205 |
| 44,390 |
| 19,903 |
| |
|
|
|
|
|
|
|
| ||
Ratios to average net assets: |
|
|
|
|
|
|
| ||
Net expenses after expense reimbursement(3)(4) | % |
| 2.10 |
| 1.74 |
| 1.60 |
| |
Gross expenses prior to expense reimbursement(3) | % |
| 2.36 |
| 2.47 |
| 1.60 |
| |
Net investment income (loss) after expense reimbursement(3)(4) | % |
| 0.68 |
| 0.76 |
| (0.64 | ) | |
Portfolio turnover rate | % |
| 19 |
| 91 |
| — |
| |
(1) Commencement of operations.
(2) Total return is calculated assuming reinvestment of all dividends and capital gain distributions at net asset value and excluding the deduction of sales charges. Total returns for periods less than one year are not annualized.
(3) Annualized for periods less than one year.
(4) The Investment Manager has agreed to limit expenses, (excluding interest, taxes, brokerage and extraordinary expenses), subject to possible reimbursement to ING Investments, LLC within three years.
* Amount represents less than $0.01 per share.
** As of May 31, 2003, the Fund was in its Offering Period. Total return from commencement of offering of shares was 0.00%, 0.00% and 0.00% for Class A, B and C, respectively.
*** Represents performance beginning on the first day of Guarantee Period (June 30, 2003). Total return for the year ended May 31, 2004 was 0.69%, (0.02)% and (0.05)% for Class A, B and C, respectively.
See Accompanying Notes to Financial Statements
42
ING PRINCIPAL PROTECTION FUND VIII (UNAUDITED)
FINANCIAL HIGHLIGHTS
Selected data for a share of beneficial interest outstanding throughout each period.
|
| Class A |
| Class B |
| Class C |
| ||||||||
|
| Six Months |
| October 1, |
| Six Months |
| October 1, |
| Six Months |
| October 1, |
| ||
|
|
|
|
|
|
|
|
|
|
|
|
|
| ||
Per Share Operating Performance: |
|
|
|
|
|
|
|
|
|
|
|
|
| ||
Net asset value, beginning of period | $ |
| 9.95 |
| 10.00 |
| 9.91 |
| 10.00 |
| 9.91 |
| 10.00 |
| |
|
|
|
|
|
|
|
|
|
|
|
|
|
| ||
Income (loss) from investment operations: |
|
|
|
|
|
|
|
|
|
|
|
|
| ||
Net investment income | $ |
| 0.10 |
| 0.06 |
| 0.05 |
| 0.02 |
| 0.05 |
| 0.02 |
| |
Net realized and unrealized loss on investments | $ |
| 0.11 |
| (0.10 | ) | 0.72 |
| (0.10 | ) | 0.12 |
| (0.10 | ) | |
Total from investment operations | $ |
| 0.21 |
| (0.04 | ) | 0.17 |
| (0.08 | ) | 0.17 |
| (0.08 | ) | |
|
|
|
|
|
|
|
|
|
|
|
|
|
| ||
Less distributions from: |
|
|
|
|
|
|
|
|
|
|
|
|
| ||
Net investment income | $ |
| 0.18 |
| 0.01 |
| 0.09 |
| 0.01 |
| 0.09 |
| 0.01 |
| |
Net realized gains on investments | $ |
| 0.10 |
|
|
| 0.10 |
|
|
| 0.10 |
|
|
| |
Total distributions | $ |
| 0.28 |
|
|
| 0.19 |
|
|
| 0.19 |
|
|
| |
Net asset value, end of period | $ |
| 9.88 |
| 9.95 |
| 9.89 |
| 9.91 |
| 9.89 |
| 9.91 |
| |
|
|
|
|
|
|
|
|
|
|
|
|
|
| ||
Total Return(2): | % |
| 2.08 |
| (0.45 | )* | 1.71 |
| (0.85 | )* | 1.77 |
| (0.85 | )* | |
|
|
|
|
|
|
|
|
|
|
|
|
|
| ||
Ratios and Supplemental Data: |
|
|
|
|
|
|
|
|
|
|
|
|
| ||
Net assets, end of period (000’s) | $ |
| 19,331 |
| 22,336 |
| 98,401 |
| 105,448 |
| 29,743 |
| 33,289 |
| |
|
|
|
|
|
|
|
|
|
|
|
|
|
| ||
Ratios to average net assets: |
|
|
|
|
|
|
|
|
|
|
|
|
| ||
Net expenses after expense reimbursement(3)(4) | % |
| 1.51 |
| 1.51 |
| 2.26 |
| 2.12 | (5) | 2.26 |
| 2.12 | (5) | |
Gross expenses prior to expense reimbursement(3) | % |
| 1.51 |
| 1.54 |
| 2.26 |
| 2.29 |
| 2.26 |
| 2.29 |
| |
Net investment income after expense reimbursement(3)(4) | % |
| 1.67 |
| 0.96 |
| 0.93 |
| 0.39 | (5) | 0.93 |
| 0.39 | (5) | |
Portfolio turnover rate | % |
| 47 |
| 42 |
| 47 |
| 42 |
| 47 |
| 42 |
| |
(1) Commencement of operations.
(2) Total return is calculated assuming reinvestment of all dividends and capital gain distributions at net asset value and excluding the deduction of sales charges. Total returns for periods less than one year are not annualized.
(3) Annualized for periods less than one year.
(4) The Investment Manager has agreed to limit expenses, (excluding interest, taxes, brokerage and extraordinary expenses), subject to possible reimbursement to ING Investments, LLC within three years.
(5) ING Funds Distributor, LLC voluntarily waived 0.75% of distribution fees on Classes B and C from October 1, 2003 through December 23, 2003.
* Represents performance beginning on the first day of the Guarantee Period (December 23, 2003). Total return from commencement of offering of shares was (0.45)%, (0.85)% and (0.85)% for Class A, B and C, respectively.
See Accompanying Notes to Financial Statements
43
ING PRINCIPAL PROTECTION FUND IX (UNAUDITED)
FINANCIAL HIGHLIGHTS
Selected data for a share of beneficial interest outstanding throughout each period.
|
| Class A |
| Class B |
| Class C |
| ||||||
|
| Six Months |
| February 2, |
| Six Months |
| February 2, |
| Six Months |
| February 2, |
|
|
|
|
|
|
|
|
|
|
|
|
|
|
|
Per Share Operating Performance: |
|
|
|
|
|
|
|
|
|
|
|
|
|
Net asset value, beginning of period | $ | 9.92 |
| 10.00 |
| 9.91 |
| 10.00 |
| 9.91 |
| 10.00 |
|
|
|
|
|
|
|
|
|
|
|
|
|
|
|
Income (loss) from investment operations: |
|
|
|
|
|
|
|
|
|
|
|
|
|
Net investment income | $ | 0.10 |
| 0.02 |
| 0.05 |
| 0.01 |
| 0.05 |
| 0.01 |
|
Net realized and unrealized loss on investments | $ | 0.15 |
| (0.10 | ) | 0.15 |
| (0.10 | ) | 0.15 |
| (0.10 | ) |
Total from investment operations | $ | 0.24 |
| (0.08 | ) | 0.20 |
| (0.09 | ) | 0.20 |
| (0.09 | ) |
|
|
|
|
|
|
|
|
|
|
|
|
|
|
Less distributions from: |
|
|
|
|
|
|
|
|
|
|
|
|
|
Net investment income | $ | 0.14 |
| — |
| 0.08 |
| — |
| 0.08 |
| — |
|
Net realized gain on investments | $ | 0.03 |
|
|
| 0.03 |
|
|
| 0.03 |
|
|
|
Total distributions | $ | 0.17 |
|
|
| 0.11 |
|
|
| 0.11 |
|
|
|
Net asset value, end of period | $ | 9.99 |
| 9.92 |
| 10.00 |
| 9.91 |
| 10.00 |
| 9.91 |
|
|
|
|
|
|
|
|
|
|
|
|
|
|
|
Total Return(2): | % | 2.43 |
| (0.80 | )* | 2.02 |
| (0.90 | )* | 1.99 |
| (0.90 | )* |
|
|
|
|
|
|
|
|
|
|
|
|
|
|
Ratios and Supplemental Data: |
|
|
|
|
|
|
|
|
|
|
|
|
|
Net assets, end of period (000’s) | $ | 17,308 |
| 20,081 |
| 62,145 |
| 66,636 |
| 19,221 |
| 21,753 |
|
|
|
|
|
|
|
|
|
|
|
|
|
|
|
Ratios to average net assets: |
|
|
|
|
|
|
|
|
|
|
|
|
|
Net expenses after expense | % | 1.75 |
| 1.30 |
| 2.50 |
| 1.74 | (5) | 2.50 |
| 1.74 | (5) |
Gross expenses prior to expense reimbursement(3) | % | 1.72 |
| 1.56 |
| 2.47 |
| 2.36 |
| 2.47 |
| 2.36 |
|
Net investment income after expense reimbursement (3)(4) | % | 1.63 |
| 0.77 |
| 0.89 |
| 0.37 | (5) | 0.89 |
| 0.37 | (5) |
Portfolio turnover rate | % | 42 |
| 4 |
| 42 |
| 4 |
| 42 |
| 4 |
|
(1) Commencement of operations.
(2) Total return is calculated assuming reinvestment of all dividends and capital gain distributions at net asset value and excluding the deduction of sales charges. Total returns for periods less than one year are not annualized.
(3) Annualized for periods less than one year.
(4) The Investment Manager has agreed to limit expenses, (excluding interest, taxes, brokerage and extraordinary expenses), subject to possible reimbursement to ING Investments, LLC within three years.
(5) ING Fund Distributor, LLC voluntarily waived 0.75% of distribution fees on Class B and Class C of Principal Protection IX from February 2, 2004 through April 22, 2004.
* Represents performance beginning on the first day of the Guarantee Period (April 22, 2004). Total return from commencement of offering of shares was (0.50)%, (0.60)% and (0.60)% for Class A, B and C, respectively.
See Accompanying Notes to Financial Statements
44
ING PRINCIPAL PROTECTION FUND X (UNAUDITED)
FINANCIAL HIGHLIGHTS
Selected data for a share of beneficial interest outstanding throughout each period.
|
| Class A |
| Class B |
| Class C |
| ||||||
|
| Six Months |
| May 3, |
| Six Months |
| May 3, |
| Six Months |
| May 3, |
|
|
|
|
|
|
|
|
|
|
|
|
|
|
|
Per Share Operating Performance: |
|
|
|
|
|
|
|
|
|
|
|
|
|
Net asset value, beginning of period | $ | 10.00 |
| 10.00 |
| 10.00 |
| 10.00 |
| 10.00 |
| 10.00 |
|
|
|
|
|
|
|
|
|
|
|
|
|
|
|
Income (loss) from investment operations: |
|
|
|
|
|
|
|
|
|
|
|
|
|
Net investment income | $ | 0.04 |
| 0.00 | * | 0.02 |
| 0.00 | * | 0.02 |
| 0.00 | * |
Net realized and unrealized gain (loss) on investments | $ | 0.21 |
| 0.00 | * | 0.20 |
| 0.00 | * | 0.21 |
| 0.00 | * |
Total from investment operations | $ | 0.25 |
| 0.00 | * | 0.22 |
| 0.00 | * | 0.22 |
| 0.00 | * |
|
|
|
|
|
|
|
|
|
|
|
|
|
|
Less distributions from: |
|
|
|
|
|
|
|
|
|
|
|
|
|
Net investment income | $ | 0.07 |
| — |
| 0.04 |
| — |
| 0.04 |
| — |
|
Net realized gains on investments | $ | 0.03 |
|
|
| 0.03 |
|
|
| 0.03 |
|
|
|
Total distributions | $ | 0.10 |
|
|
| 0.07 |
|
|
| 0.07 |
|
|
|
Net asset value, end of period | $ | 10.15 |
| 10.00 |
| 10.15 |
| 10.00 |
| 10.15 |
| 10.00 |
|
|
|
|
|
|
|
|
|
|
|
|
|
|
|
Total Return(2): | % | 2.46 | *** | — | ** | 2.20 | *** | — | ** | 2.22 | *** | — | ** |
|
|
|
|
|
|
|
|
|
|
|
|
|
|
Ratios and Supplemental Data: |
|
|
|
|
|
|
|
|
|
|
|
|
|
Net assets, end of period (000’s) | $ | 15,826 |
| 5,047 |
| 44,242 |
| 12,477 |
| 13,607 |
| 1,825 |
|
|
|
|
|
|
|
|
|
|
|
|
|
|
|
Ratios to average net assets: |
|
|
|
|
|
|
|
|
|
|
|
|
|
Net expenses after expense reimbursement(3)(4) | % | 1.72 |
| 0.93 |
| 2.22 |
| 1.68 |
| 2.28 |
| 1.68 |
|
Gross expenses prior to expense reimbursement(3) | % | 1.87 |
| 2.27 |
| 2.36 |
| 3.02 |
| 2.44 |
| 3.02 |
|
Net investment loss after expense reimbursement(3)(4) | % | 0.95 |
| (0.01 | ) | 0.42 |
| (0.75 | ) | 0.44 |
| (0.77 | ) |
Portfolio turnover rate | % | 38 |
| — |
| 38 |
| — |
| 38 |
| — |
|
(1) Commencement of operations.
(2) Total return is calculated assuming reinvestment of all dividends and capital gain distributions at net asset value and excluding the deduction of sales charges. Total returns for periods less than one year are not annualized.
(3) Annualized for periods less than one year.
(4) The Investment Manager has agreed to limit expenses, (excluding interest, taxes, brokerage and extraordinary expenses), subject to possible reimbursement to ING Investments, LLC within three years.
* Amount represents less than $0.01 per share.
** As of May 31, 2004, the Fund was in its Offering Period. Total return calculation will begin on the commencement date of the Guarantee Period (August 17, 2004). Total return from commencement of offering of shares was 0.00%, 0.00% and 0.00% for Class A, B and C, respectively.
*** Represents performance beginning on the first day of the Guarantee Period (August 17, 2004). Total return for the six months ended November 30, 2004 was 2.46%, 2.20% and 2.22% for Class A, B and C, respectively.
See Accompanying Notes to Financial Statements
45
ING PRINCIPAL PROTECTION FUND XI (UNAUDITED)
FINANCIAL HIGHLIGHTS
Selected data for a share of beneficial interest outstanding throughout each period.
|
| Class A |
| Class B |
| Class C |
|
|
| August 16, |
| August 16, |
| August 16, |
|
|
|
|
|
|
|
|
|
Per Share Operating Performance: |
|
|
|
|
|
|
|
Net asset value, beginning of period | $ | 10.00 |
| 10.00 |
| 10.00 |
|
|
|
|
|
|
|
|
|
Income (loss) from investment operations: |
|
|
|
|
|
|
|
Net investment income | $ | 0.01 |
| 0.00 | * | 0.00 | * |
Net realized and unrealized gain (loss) on investments | $ | (0.12 | ) | (0.12 | ) | (0.12 | ) |
Total from investment operations | $ | (0.11 | ) | (0.12 | ) | (0.12 | ) |
|
|
|
|
|
|
|
|
Less distributions from: |
|
|
|
|
|
|
|
Net investment income | $ | 0.04 |
| 0.03 |
| 0.03 |
|
Net asset value, end of period | $ | 9.85 |
| 9.85 |
| 9.85 |
|
|
|
|
|
|
|
|
|
Total Return(2): | % | (1.60 | )** | (1.50 | )** | (1.50 | )** |
|
|
|
|
|
|
|
|
Ratios and Supplemental Data: |
|
|
|
|
|
|
|
Net assets, end of period (000’s) | $ | 9,723 |
| 29,337 |
| 7,584 |
|
|
|
|
|
|
|
|
|
Ratios to average net assets: |
|
|
|
|
|
|
|
Expenses(3) | % | 1.24 |
| 1.99 |
| 1.99 |
|
Net investment loss(3) | % | 0.83 |
| 0.07 |
| 0.08 |
|
Portfolio turnover rate | % | 0 |
| 0 |
| 0 |
|
(1) Commencement of operations.
(2) Total return is calculated assuming reinvestment of all dividends and capital gain distributions at net asset value and excluding the deduction of sales charges. Total returns for periods less than one year are not annualized.
(3) Annualized for periods less than one year.
* Amount represents less than $0.01 per share.
** Represents performance beginning on the first day of the Guarantee Period (November 18, 2004). Total return from commencement of offering of shares was (1.50)%, (1.50)% and (1.50)% for Class A, B and C, respectively.
See Accompanying Notes to Financial Statements
46
ING PRINCIPAL PROTECTION FUND XII (UNAUDITED)
FINANCIAL HIGHLIGHTS
Selected data for a share of beneficial interest outstanding throughout each period.
|
| Class A |
| Class B |
| Class C |
|
|
| November 15, |
| November 15, |
| November 15, |
|
|
|
|
|
|
|
|
|
Per Share Operating Performance: |
|
|
|
|
|
|
|
Net asset value, beginning of period | $ | 10.00 |
| 10.00 |
| 10.00 |
|
|
|
|
|
|
|
|
|
Income (loss) from investment operations: |
|
|
|
|
|
|
|
Net investment income | $ | 0.00 | * | 0.00 | * | 0.00 | * |
Net realized and unrealized gain (loss) on investments | $ | 0.00 | * | 0.00 | * | 0.00 | * |
Total from investment operations | $ | 0.00 | * | 0.00 | * | 0.00 | * |
|
|
|
|
|
|
|
|
Less distributions from: |
|
|
|
|
|
|
|
Net investment income | $ | — |
| — |
| — |
|
Net asset value, end of period | $ | 10.00 |
| 10.00 |
| 10.00 |
|
|
|
|
|
|
|
|
|
Total Return(2): | % | — | ** | — | ** | — | ** |
|
|
|
|
|
|
|
|
Ratios and Supplemental Data: |
|
|
|
|
|
|
|
Net assets, end of period (000’s) | $ | 129 |
| 1,461 |
| 186 |
|
|
|
|
|
|
|
|
|
Ratios to average net assets: |
|
|
|
|
|
|
|
Expenses(3) | % | 1.25 |
| 1.90 |
| 1.90 |
|
Net investment loss(3) | % | (0.39 | ) | (1.08 | ) | (0.85 | ) |
Portfolio turnover rate | % | — |
| — |
| — |
|
(1) Commencement of operations.
(2) Total return is calculated assuming reinvestment of all dividends and capital gain distributions at net asset value and excluding the deduction of sales charges. Total returns for periods less than one year are not annualized.
(3) Annualized for periods less than one year.
* Amount represents less than $0.01 per share.
** As of November 30, 2004, the Fund was in its Offering Period. Total return calculation will begin on the commencement date of the Guarantee Period (February 16, 2005). Total return from commencement of offering of shares was 0.00%, 0.00% and 0.00% for Class A, B and C, respectively.
See Accompanying Notes to Financial Statements
47
NOTES TO FINANCIAL STATEMENTS AS OF NOVEMBER 30, 2004 (UNAUDITED)
NOTE 1 — ORGANIZATION
Organization. The ING Principal Protection Funds are part of the ING Equity Trust (“IET”), which is an open-end investment management company registered under the Investment Company Act of 1940 (“the 1940 Act”), as amended.
IET is a Massachusetts business trust organized on June 12, 1998 with twenty-three separate funds. Twelve of the Funds included in this report are: ING Principal Protection Fund (“Principal Protection” or “PPF”), ING Principal Protection Fund II (“Principal Protection II” or “PPF II”), ING Principal Protection Fund III (“Principal Protection III” or “PPF III”), ING Principal Protection Fund IV (“Principal Protection IV” or “PPF IV”), ING Principal Protection Fund V (“Principal Protection V” or “PPF V”), ING Principal Protection Fund VI (“Principal Protection VI” or “PPF VI”), ING Principal Protection Fund VII (“Principal Protection VII” or “PPF VII”), ING Principal Protection VIII (“Principal Protection VIII” or “PPF VIII”), ING Principal Protection IX (“Principal Protection IX” or “PPF IX”), ING Principal Protection X (“Principal Protection X” or “PPF X”), ING Principal Protection XI (“Principal Protection XI” or “PPFXI”), and ING Principal Protection XII (“Principal Protection XII” or “PPFXII”), (each a “Fund”; collectively the “Funds”).
Each Fund has an Offering Period, a Guarantee Period and an Index Plus LargeCap Period. Shares of each Fund will be offered during the Offering Period but will not be offered during the Guarantee Period, except in connection with reinvestment of dividends. Each Fund will be offered on a continuous basis to existing shareholders during the Index Plus LargeCap Period. During the Guarantee Period, each Fund seeks to participate in favorable equity market conditions while preserving at least the principal amount of the Fund as of the inception of the Guarantee Period. Each Fund guarantees that the amount distributed, if any, to each shareholder at the end of the Guarantee Period will be no less than the value of that shareholder’s investment as of the inception of the Guarantee Period provided that all distributions received from the Fund have been reinvested and no shares have been redeemed. Each Fund’s Guarantee is backed by an unconditional, irrevocable guarantee from MBIA Insurance Corporation (“MBIA”), a monoline financial guarantor. Each Fund pays MBIA a guarantee fee of 0.33% of its average daily net assets during the guarantee period. During the Index Plus LargeCap Period, which will commence immediately following the Guarantee Period, the Fund seeks to outperform the total return performance of the S&P 500 Index, while maintaining a risk profile consistent with the Index.
The following table presents the time periods for each Fund’s three phases:
|
| Offering |
| Guarantee |
| Commencement |
|
|
|
|
|
|
|
|
|
PPF |
| 07/05/01 – 10/11/01 |
| 10/12/01 – 10/11/06 |
| 10/12/06 |
|
PPF II |
| 11/05/01 –01/31/02 |
| 02/01/02 – 01/31/07 |
| 02/01/07 |
|
PPF III |
| 03/01/02 – 05/30/02* |
| 06/06/02 – 06/05/07 |
| 06/06/07 |
|
PPF IV |
| 07/01/02 – 09/30/02* |
| 10/08/02 – 10/08/07 |
| 10/09/07 |
|
PPF V |
| 11/01/02 – 01/15/03* |
| 01/23/03 – 01/22/08 |
| 01/23/08 |
|
PPF VI |
| 02/03/03 – 04/15/03* |
| 04/24/03 – 04/23/08 |
| 04/24/08 |
|
PPF VII |
| 05/01/03 – 06/24/03* |
| 06/30/03 – 06/26/08 |
| 06/27/08 |
|
PPF VIII |
| 10/01/03 – 12/15/03* |
| 12/23/03 – 12/22/08 |
| 12/23/08 |
|
PPF IX |
| 02/02/04 – 04/15/04* |
| 04/22/04 – 04/21/09 |
| 04/22/09 |
|
PPF X |
| 05/03/04 – 08/09/04* |
| 08/17/04 – 08/14/09 |
| 08/15/09 |
|
PPF XI |
| 08/16/04 – 11/11/04* |
| 11/18/04 – 11/18/09 |
| 11/19/09 |
|
PPF XII |
| 11/15/04 – 02/09/05* |
| 02/16/05 – 02/16/10 |
| 02/17/10 |
|
* A Quiet Period between the Offering Period and the Guarantee Period where new deposits are not accepted and the assets will remain invested in short term instruments.
Each Fund offers at least three of the following classes of shares: Class A, Class B, Class C and Class Q. The separate classes of shares differ principally in the applicable sales charges (if any), distribution fees, shareholder servicing fees and transfer agency fees. Shareholders of each class also bear certain expenses that pertain to that particular class. All shareholders bear the common expenses of the Funds and earn income and realized gains/losses from the Funds pro rata based on the average daily net assets of each class, without distinction between share classes. No class has preferential dividend rights. Differences in per share dividend rates generally result from the relative weighting of pro rata income and realized gain allocations and from differences in separate class expenses, including distribution and shareholder servicing fees. Class B shares, along with their pro rata reinvested dividend shares, automatically convert to Class A shares approximately eight years after purchase.
NOTE 2 — SIGNIFICANT ACCOUNTING POLICIES
The following significant accounting policies are consistently followed by the Funds in the preparation of their financial statements. Such policies are in conformity with accounting principles generally accepted in the United States of America for investment companies.
A. Security Valuation. Investments in equity securities traded on a national securities exchange are valued at the last reported sale
48
price. Securities reported by NASDAQ will be valued at the NASDAQ official closing prices. Securities traded on an exchange or NASDAQ for which there has been no sale and securities traded in the over-the-counter-market are valued at the mean between the last reported bid and ask prices. All investments quoted in foreign currencies will be valued daily in U.S. dollars on the basis of the foreign currency exchange rates prevailing at that time. Debt securities are valued at prices obtained from independent services or from one or more dealers making markets in the securities and may be adjusted based on the Fund’s valuation procedures. U.S. Government obligations are valued by using market quotations or independent pricing services that use prices provided by market-makers or estimates of market values obtained from yield data relating to instruments or securities with similar characteristics.
Securities and assets for which market quotations are not readily available (which may include certain restricted securities which are subject to limitations as to their sale) are valued at their fair values as determined in good faith by or under the supervision of the Funds’ Board of Trustees (“Board”), in accordance with methods that are specifically authorized by the Board. Securities traded on exchanges, including foreign exchanges, which close earlier than the time that a Fund calculates its net asset value may also be valued at their fair values as determined in good faith by or under the supervision of a Fund’s Board, in accordance with methods that are specifically authorized by the Board. If a significant event which is likely to impact the value of one or more foreign securities held by a Fund occurs after the time at which the foreign market for such security(ies) closes but before the time that the Fund’s net asset value is calculated on any business day, such event may be taken into account in determining the fair value of such security(ies) at the time the Fund calculates its net asset value. For these purposes, significant events after the close of trading on a foreign market may include, among others, securities trading in the U.S. and other markets, corporate announcements, natural and other disasters, and political and other events. Among other elements of analysis, the Board has authorized the use of one or more research services to assist with the determination of the fair value of foreign securities. Research services use statistical analyses and quantitative models to help determine fair value as of the time a Fund calculates its net asset value. Unlike the closing price of a security on an exchange, fair value determinations employ elements of judgment, and the fair value assigned to a security may not represent the actual value that a Fund could obtain if it were to sell the security at the time of the close of the NYSE. Investments in securities maturing in 60 days or less from the date of acquisition are valued at amortized cost, which, when combined with accrued interest, approximates market value.
B. Security Transactions and Revenue Recognition. Securities transactions are accounted for on the trade date. Realized gains and losses are reported on the basis of identified cost of securities sold. Interest income is recorded on an accrual basis. Dividend income is recorded on the ex-dividend date, or for certain foreign securities, when the information becomes available to the Funds. Premium amortization and discount accretion are determined by the effective yield method.
C. Foreign Currency Translation. The books and records of the Funds are maintained in U.S. dollars. Any foreign currency amounts are translated into U.S. dollars on the following basis:
(1) Market value of investment securities, other assets and liabilities — at the exchange rates prevailing at the end of the day.
(2) Purchases and sales of investment securities, income and expenses — at the rates of exchange prevailing on the respective dates of such transactions.
Although the net assets and the market values are presented at the foreign exchange rates at the end of the day, the Funds do not isolate the portion of the results of operations resulting from changes in foreign exchange rates on investments from the fluctuations arising from changes in market prices of securities held. Such fluctuations are included with the net realized and unrealized gains or losses from investments.
49
For securities which are subject to foreign withholding tax upon disposition, liabilities are recorded on the Statement of Assets and Liabilities for the estimated tax withholding based on the securities’ current market value. Upon disposition, realized gains or losses on such securities are recorded net of foreign withholding tax.
Reported net realized foreign exchange gains or losses arise from sales of foreign currencies, currency gains or losses realized between the trade and settlement dates on securities transactions, the difference between the amounts of dividends, interest, and foreign withholding taxes recorded on the Fund’s books, and the U.S. dollar equivalent of the amounts actually received or paid. Net unrealized foreign exchange gains and losses arise from changes in the value of assets and liabilities other than investments in securities at fiscal year end, resulting from changes in the exchange rate. Foreign security and currency transactions may involve certain considerations and risks not typically associated with investing in U.S. companies and U.S. Government securities. These risks include but are not limited to revaluation of currencies and future adverse political and economic developments which could cause securities and their markets to be less liquid and prices more volatile than those of comparable U.S. companies and U.S. Government securities.
D. Foreign Currency Transactions and Futures Contracts. The Funds may enter into foreign currency exchange transactions to convert to and from different foreign currencies and to and from the U.S. dollar in connection with the planned purchases or sales of securities. The Funds either enter into these transactions on a spot basis at the spot rate prevailing in the foreign currency exchange market or use forward foreign currency contracts to purchase or sell foreign currencies. When the contract is fulfilled or closed, gains or losses are realized. Until then, the gain or loss is included in unrealized appreciation or depreciation. Risks may arise upon entering into forward contracts from the potential inability of counterparties to meet the terms of their forward contracts and from unanticipated movements in the value of foreign currencies relative to the U.S. dollar.
Each Fund may enter into futures contracts involving foreign currency, interest rates, securities and security indices. A futures contract obligates the seller of the contract to deliver and the purchaser of the contract to take delivery of the type of foreign currency, financial instrument or security called for in the contract at a specified future time for a specified price. Upon entering into such a contract, a Fund is required to deposit and maintain as collateral such initial margin as required by the exchange on which the contract is traded. Pursuant to the contract, a Fund agrees to receive from or pay to the broker an amount equal to the daily fluctuations in the value of the contract. Such receipts or payments are known as variation margins and are recorded as unrealized gains or losses by the Fund. When the contract is closed, the Fund records a realized gain or loss equal to the difference between the value of the contract at the time it was opened and the value at the time it was closed.
E. Distributions to Shareholders. The Funds record distributions to their shareholders on ex-dividend date. Each Fund pays dividends and capital gains, if any, annually. The Funds may make distributions on a more frequent basis to comply with the distribution requirements of the Internal Revenue Code. The characteristics of income and gains to be distributed are determined in accordance with income tax regulations, which may differ from accounting principles generally accepted in the United States of America for investment companies.
F. Federal Income Taxes. It is the policy of the Funds to comply with the requirements of the subchapter M of the Internal Revenue Code and related excise tax provisions applicable to regulated investment companies and to distribute substantially all of their net investment income and any net realized capital gains to their shareholders. Therefore, no federal income tax or provision is required. No capital gain distributions shall be made until any capital loss carryforwards have been fully utilized or expired.
G. Organization Expenses and Offering Costs. Costs incurred with the organization of the Funds were expensed as incurred. Costs incurred with the offering of shares of the Funds are deferred and amortized over a twelve-month period starting on the first day of the Guarantee Period on a straight-line basis.
50
H. Use of Estimates. Management of the Funds has made certain estimates and assumptions relating to the reporting of assets, liabilities, income, and expenses to prepare these financial statements in conformity with accounting principles generally accepted in the United States of America for investment companies. Actual results could differ from these estimates.
I. Repurchase Agreements. Each Fund may invest in repurchase agreements only with government securities dealers recognized by the Board of Governors of the Federal Reserve System. Under such agreements, the seller of the security agrees to repurchase it at a mutually agreed upon time and price. The resale price is in excess of the purchase price and reflects an agreed upon interest rate for the period of time the agreement is outstanding. The period of the repurchase agreements is usually short, from overnight to one week, while the underlying securities generally have longer maturities. Each Fund will receive as collateral securities acceptable to it whose market value is equal to at least 100% of the carrying amount of the repurchase agreements, plus accrued interest, being invested by the Fund. The underlying collateral is valued daily on a mark-to-market basis to assure that the value, including accrued interest is at least equal to the repurchase price. If the seller defaults, a Fund might incur a loss or delay in the realization of proceeds if the value of the security collateralizing the repurchase agreement declines, and it might incur disposition costs in liquidating the collateral.
J. Illiquid and Restricted Securities. Each Fund may not invest more than 15% of its net assets in illiquid securities. Illiquid securities are not readily marketable. Disposing of illiquid investments may involve time-consuming negotiation and legal expenses, and it may be difficult or impossible for the Funds to sell them promptly at an acceptable price. Each Fund also may invest in restricted securities, which include those sold under Rule 144A of the Securities Act of 1933 (“1933 Act”) or securities offered pursuant to Section 4(2) of the 1933 Act, and/or are subject to legal or contractual restrictions on resale and generally may not be publicly sold without registration under the 1933 Act. Certain restricted securities may be considered liquid pursuant to procedures adopted by the Board or may be deemed to be illiquid because they may not be readily marketable. Illiquid and restricted securities are valued using market quotations when readily available. In the absence of market quotations, the securities are valued based upon their fair value determined under procedures approved by the Board.
NOTE 3 — INVESTMENT TRANSACTIONS
For the six months ended November 30, 2004, the cost of purchases and proceeds from the sales of securities, excluding short-term securities, were as follows:
|
| Purchases |
| Sales |
| ||
PPF |
| $ | 11,901,780 |
| $ | 11,127,797 |
|
PPF II |
| 10,731,648 |
| 9,871,933 |
| ||
PPF III |
| 22,016,701 |
| 11,688,494 |
| ||
PPF IV |
| 141,986,403 |
| 158,690,513 |
| ||
PPF V |
| 100,149,715 |
| 206,560,516 |
| ||
PPF VI |
| 120,186,582 |
| 168,738,767 |
| ||
PPF VII |
| 27,838,163 |
| 34,746,788 |
| ||
PPF VIII |
| 42,775,139 |
| 47,097,869 |
| ||
PPF IX |
| 25,537,723 |
| 31,083,643 |
| ||
PPF X |
| 33,726,073 |
| 9,510,804 |
| ||
PPF XI |
| 14,731,325 |
| — |
| ||
U.S. Government securities not included above were as follows:
|
| Purchases |
| Sales |
| ||
PPF |
| $ | — |
| $ | 49,968,223 |
|
PPF II |
| — |
| 65,587,300 |
| ||
PPF III |
| 8,100,145 |
| 63,937,423 |
| ||
PPF IV |
| 99,364,104 |
| 167,217,516 |
| ||
PPF V |
| 119,299,640 |
| 71,778,624 |
| ||
PPF VI |
| 123,810,199 |
| 136,904,935 |
| ||
PPF VII |
| 15,945,400 |
| 42,217,980 |
| ||
PPF VIII |
| 29,663,485 |
| 42,977,891 |
| ||
PPF IX |
| 18,796,493 |
| 25,760,171 |
| ||
PPF X |
| 54,406,130 |
| 7,191,652 |
| ||
PPF XI |
| 31,798,160 |
| — |
| ||
|
|
|
|
|
| ||
NOTE 4 — INVESTMENT MANAGEMENT AND ADMINISTRATIVE FEES
The Funds entered into an Investment Management Agreement with ING Investments, LLC (the “Investment Manager”). The Investment Management Agreements compensate the Investment Manager with a fee, computed daily and payable monthly, based on the average daily net assets of each Fund. The fee for each Fund is 0.25% during its Offering Period and 0.60% during its Index Plus LargeCap Period. For PPF – PPF VII, the fee during the Guarantee Period is 0.80%. During the Guarantee Period for PPF VIII – PPF XII, the maximum fee is 0.80% on the Equity Component and 0.55% on both the Fixed Component and Exchange Traded Fund (“ETF”) Strategy Component of the average daily net assets.
51
From June 30, 2003 through April 30, 2004, the Investment Manager waived 0.80% of its fees for PPF VII. Beginning May 1, 2004, the Investment Manager began receiving a portion of its Investment Management fees.
ING Investment Management Co. (formerly, Aeltus Investment Management, Inc.,) a registered investment advisor, serves as Sub-Adviser to the Funds.
ING Funds Services, LLC (the “Administrator”), serves as administrator to each Fund. The Funds compensate the Administrator with a fee calculated at an annual rate of 0.10% of each Fund’s average daily net assets.
The Investment Manager, Sub-Adviser, Administrator and Distributor are indirect wholly-owned subsidiaries of ING Groep N.V., a global financial institution active in the fields of banking, insurance and asset management.
NOTE 5 — DISTRIBUTION AND SERVICE FEES
Each share class of the Funds has adopted a Plan pursuant to Rule 12b-1 under the 1940 Act (the “12b-1 Plans”), whereby ING Funds Distributor, LLC (the “Distributor”) is reimbursed or compensated (depending on the class of shares) by the Funds for expenses incurred in the distribution of each Fund’s shares (“Distribution Fees”). Pursuant to the 12b-1 Plans, the Distributor is entitled to a payment each month to compensate or reimburse expenses incurred in the distribution and promotion of each Fund’s shares, including expenses incurred in printing prospectuses and reports used for sales purposes, expenses incurred in preparing and printing sales literature and other such distribution related expenses, including any distribution or shareholder servicing fees (“Service Fees”) paid to securities dealers who have executed a distribution agreement with the Distributor. Under the 12b-1 Plans, each class of shares of the Fund pays the Distributor a combined Distribution and Service Fee based on average daily net assets at the following rates:
|
| Class A |
| Class B |
| Class C |
| Class Q |
|
PPF |
| 0.25 | % | 1.00 | % | 1.00 | % | 0.25 | % |
PPF II |
| 0.25 | % | 1.00 | % | 1.00 | % | 0.25 | % |
PPF III |
| 0.25 | % | 1.00 | % | 1.00 | % | 0.25 | % |
PPF IV |
| 0.25 | % | 1.00 | % | 1.00 | % | 0.25 | % |
PPF V |
| 0.25 | % | 1.00 | % | 1.00 | % | N/A |
|
PPF VI |
| 0.25 | % | 1.00 | % | 1.00 | % | 0.25 | % |
PPF VII |
| 0.25 | % | 1.00 | % | 1.00 | % | N/A |
|
PPF VIII |
| 0.25 | % | 1.00 | % | 1.00 | % | N/A |
|
PPF IX |
| 0.25 | % | 1.00 | % | 1.00 | % | N/A |
|
PPF X |
| 0.25 | % | 1.00 | % | 1.00 | % | N/A |
|
PPF XI |
| 0.25 | % | 1.00 | % | 1.00 | % | N/A |
|
PPF XII |
| 0.25 | % | 1.00 | % | 1.00 | % | N/A |
|
From October 1, 2003 through December 23, 2003, the Distributor voluntarily waived 0.75% of Distribution and Service fees on Class B and Class C of Principal Protection VIII. From February 2, 2004 through April 22, 2004, the Distributor voluntarily waived 0.75% of Distribution and Service fees on Class B and Class C of Principal Protection IX.
For the six months ended November 30, 2004, the Distributor retained the following amounts in sales charges:
|
| Class A |
| Class B |
| Class C |
| Class Q |
| ||
Initial Sales Charges |
| $ | 117,201 |
| N/A |
| N/A |
| N/A |
| |
Contingent Deferred Sales Charges |
| $ | 995 |
| — |
| $ | 252 |
| N/A |
|
NOTE 6 — OTHER TRANSACTIONS WITH AFFILIATES AND RELATED PARTIES
At November 30, 2004, the Funds had the following amounts recorded in payable to affiliates on the accompanying Statements of Assets and Liabilities (see Notes 4 and 5):
|
| Accrued |
| Payable to |
| Accrued |
| Accrued |
| Total |
| |||||
PPF |
| $ | 177,660 |
| $ | 120,003 |
| $ | 22,206 |
| $ | 207,137 |
| $ | 527,006 |
|
PPF II |
| 254,036 |
| — |
| 31,751 |
| 297,581 |
| 583,368 |
| |||||
PPF III |
| 196,718 |
| — |
| 24,588 |
| 230,487 |
| 451,793 |
| |||||
PPF IV |
| 379,621 |
| — |
| 47,449 |
| 447,301 |
| 874,371 |
| |||||
PPF V |
| 308,847 |
| — |
| 38,603 |
| 363,193 |
| 710,643 |
| |||||
PPF VI |
| 288,699 |
| — |
| 36,085 |
| 337,747 |
| 662,531 |
| |||||
PPF VII |
| 147,697 |
| — |
| 18,461 |
| 173,548 |
| 339,706 |
| |||||
PPF VIII |
| 76,071 |
| — |
| 12,355 |
| 111,514 |
| 199,940 |
| |||||
PPF IX |
| 52,106 |
| 12,546 |
| 8,293 |
| 71,975 |
| 144,920 |
| |||||
PPF X |
| 38,681 |
| 10,000 |
| 6,092 |
| 51,123 |
| 105,896 |
| |||||
PPF XI |
| 15,066 |
| — |
| 3,620 |
| 30,473 |
| 49,159 |
| |||||
PPF XII |
| 256 |
| — |
| 28 |
| 269 |
| 553 |
| |||||
The Funds have adopted a Retirement Policy covering all independent trustees of the Fund who will have served as an independent trustee for at least five years at the time of retirement. Benefits under this
52
plan are based on an annual rate as defined in the plan agreement.
NOTE 7 — OTHER ACCRUED EXPENSES AND LIABILITIES
At November 30, 2004, the Funds had the following payables included in Other Accrued Expenses and Liabilities on the Statements of Assets and Liabilities that exceeded 5% of total liabilities.
|
| Payable For |
|
|
| Payable For |
| ||
|
|
|
|
|
|
|
| ||
PPF |
| $ | 73,286 |
| PPF |
| $ | 116,123 |
|
PPF II |
| 104,789 |
| PPF III |
| 66,960 |
| ||
PPF III |
| 81,147 |
| PPF IV |
| 108,550 |
| ||
PPF IV |
| 156,599 |
| PPF VII |
| 44,911 |
| ||
PPF V |
| 127,401 |
| PPF IX |
| 39,500 |
| ||
PPF VII |
| 60,926 |
|
|
|
|
| ||
PPF IX |
| 27,371 |
|
|
|
|
| ||
PPF X |
| 20,106 |
|
|
|
|
| ||
|
| Payable for |
|
|
| Payable for |
| ||
PPF IX |
| $ | 86,692 |
| PPF IX |
| $ | 27,623 |
|
PPF X |
| 71,569 |
|
|
|
|
| ||
PPF XI |
| 109,007 |
|
|
|
|
| ||
|
| Payable for |
|
|
|
|
| |
PPF |
| $ | 129,852 |
|
|
|
|
|
PPF II |
| 119,876 |
|
|
|
|
| |
PPF III |
| 72,675 |
|
|
|
|
| |
PPF VII |
| 63,974 |
|
|
|
|
| |
PPF IX |
| 31,165 |
|
|
|
|
| |
NOTE 8 — EXPENSE LIMITATIONS
ING Investments entered into a written Expense Limitation Agreement with each of the Funds whereby, the Investment Manager has agreed to limit expenses, excluding interest, taxes, brokerage and extraordinary expenses to the levels listed below:
|
| Class A |
| Class B |
| Class C |
| Class Q |
|
PPF |
| 1.75 | % | 2.50 | % | 2.50 | % | 1.75 | % |
PPF II |
| 1.75 | % | 2.50 | % | 2.50 | % | 1.75 | % |
PPF III |
| 1.75 | % | 2.50 | % | 2.50 | % | 1.75 | % |
PPF IV |
| 1.75 | % | 2.50 | % | 2.50 | % | 1.75 | % |
PPF V |
| 1.75 | % | 2.50 | % | 2.50 | % | N/A |
|
PPF VI |
| 1.75 | % | 2.50 | % | 2.50 | % | 1.75 | % |
PPF VII(1) |
| 1.75 | % | 2.50 | % | 2.50 | % | N/A |
|
PPF VIII |
| 1.75 | % | 2.50 | % | 2.50 | % | N/A |
|
PPF IX |
| 1.75 | % | 2.50 | % | 2.50 | % | N/A |
|
PPF X |
| 1.75 | % | 2.50 | % | 2.50 | % | N/A |
|
PPF XI |
| 1.75 | % | 2.50 | % | 2.50 | % | N/A |
|
PPF XII |
| 1.75 | % | 2.50 | % | 2.50 | % | N/A |
|
(1) The Expense Limitation Agreement for PPF VII was modified May 1, 2004 into a tier structure based on the percentage of assets in the Equity Component. Under this tier structure, the Investment Manager will limit expenses to a maximum of 1.75%, 2.50% and 2.50% for Classes A, B and C, respectively, excluding expenses such as interest, taxes, brokerage and extraordinary expenses. The actual expense limitation rates from May 31, 2004 to November 30, 2004 were 1.35%, 2.10% and 2.10% for Classes A, B and C, respectively.
The Investment Manager may at a later date recoup from a Fund for management fees waived and other expenses assumed by the Investment Manager during the previous 36 months, but only if, after such reimbursement, that Fund’s expense ratio does not exceed the percentage described above. Waived and reimbursed fees net of any recoupment by the Investment Manager of such waived and reimbursed fees are reflected on the accompanying Statement of Operations for each Fund. Outstanding reimbursement balances due to the Funds, if any, under their respective expense limitation agreements are reflected in Reimbursement Due from Manager on the accompanying Statements of Assets and Liabilities.
As of November 30, 2004, the cumulative amounts of reimbursed fees that are subject to possible recoupment by the Investment Manager, and the related expiration dates are as follows:.
|
| November 30, |
|
|
| |||||||
|
| 2005 |
| 2006 |
| 2007 |
| Total |
| |||
PPF |
| $ | 274,859 |
| — |
| $ | — |
| $ | 274,859 |
|
PPF VII |
| — |
| — |
| 312,215 |
| 312,215 |
| |||
PPF IX |
| — |
| — |
| 48,423 |
| 48,423 |
| |||
The Expense Limitation Agreements are contractual and shall renew automatically for one-year terms unless ING Investments provides written termination of the Expense Limitation Agreement within 90 days of the end of the then current term.
NOTE 9 — LINE OF CREDIT
The Funds, in addition to certain other funds managed by the Investment Manager, have entered into an unsecured committed revolving line of credit agreement (the “Credit Agreement”) with The Bank of New York for an aggregate amount of $125,000,000. The proceeds may be used to: (1) temporarily finance the purchase and sale of securities; (2) finance the redemption of shares of an investor in the Funds; and (3) enable the Funds to meet other emergency expenses as defined in the Credit Agreement. The Funds to which the line of credit is available pay a commitment fee equal to 0.09% per annum on the daily unused portion of the committed line amount payable quarterly in arrears. At November 30, 2004, the Funds did not have any loans outstanding under the line of credit.
53
NOTE 10 — CAPITAL SHARES
Transactions in capital shares and dollars were as follows:
|
| Class A Shares |
| Class B Shares |
| Class C Shares |
| Class Q Shares |
| ||||||||||||||||
|
| Six Months |
| Year Ended |
| Six Months |
| Year Ended |
| Six Months |
| Year Ended |
| Six Months |
| Year Ended |
| ||||||||
|
|
|
|
|
|
|
|
|
|
|
|
|
|
|
|
|
| ||||||||
Principal Protection Fund |
|
|
|
|
|
|
|
|
|
|
|
|
|
|
|
|
| ||||||||
Dividends reinvested |
| 49,672 |
| 62,521 |
| 269,163 |
| 279,376 |
| 31,671 |
| 46,877 |
| 1,262 |
| 1,657 |
| ||||||||
Shares redeemed |
| (483,691 | ) | (2,255,672 | ) | (2,987,620 | ) | (8,475,812 | ) | (1,057,688 | ) | (4,032,857 | ) | (10,717 | ) | (103,130 | ) | ||||||||
Net decrease in shares outstanding |
| (434,019 | ) | (2,193,151 | ) | (2,718,457 | ) | (8,196,436 | ) | (1,026,017 | ) | (3,985,980 | ) | (9,455 | ) | (101,473 | ) | ||||||||
|
|
|
|
|
|
|
|
|
|
|
|
|
|
|
|
|
| ||||||||
Principal Protection Fund ($) |
|
|
|
|
|
|
|
|
|
|
|
|
|
|
|
|
| ||||||||
Dividends reinvested |
| $ | 488,774 |
| $ | 49,672 |
| $ | 2,651,252 |
| $ | 2,779,804 |
| $ | 312,912 |
| $ | 466,898 |
| $ | 12,458 |
| $ | 16,522 |
|
Shares redeemed |
| (4,833,454 | ) | (22,766,805 | ) | (29,678,740 | ) | (85,181,330 | ) | (10,519,489 | ) | (40,540,710 | ) | (107,351 | ) | (1,042,621 | ) | ||||||||
Net decrease |
| $ | (4,344,680 | ) | $ | (22,717,133 | ) | $ | (27,027,488 | ) | $ | (82,401,526 | ) | $ | (10,206,577 | ) | $ | (40,073,812 | ) | $ | (94,893 | ) | $ | (1,026,099 | ) |
|
| Class A Shares |
| Class B Shares |
| Class C Shares |
| Class Q Shares |
| ||||||||||||||||
|
| Six Months |
| Year Ended |
| Six Months |
| Year Ended |
| Six Months |
| Year Ended |
| Six Months |
| Year Ended |
| ||||||||
|
|
|
|
|
|
|
|
|
|
|
|
|
|
|
|
|
| ||||||||
Principal Protection Fund II |
|
|
|
|
|
|
|
|
|
|
|
|
|
|
|
|
| ||||||||
Dividends reinvested |
| 70,514 |
| 97,596 |
| 435,167 |
| 403,691 |
| 71,657 |
| 82,101 |
| 85 |
| 105 |
| ||||||||
Shares redeemed |
| (610,589 | ) | (3,829,487 | ) | (3,982,284 | ) | (10,422,755 | ) | (1,339,550 | ) | (6,613,575 | ) | (1,613 | ) | (1,025 | ) | ||||||||
Net decrease in shares outstanding |
| (540,075 | ) | (3,731,891 | ) | (3,547,117 | ) | (10,019,064 | ) | (1,267,893 | ) | (6,531,474 | ) | (1,528 | ) | (920 | ) | ||||||||
|
|
|
|
|
|
|
|
|
|
|
|
|
|
|
|
|
| ||||||||
Principal Protection Fund II ($) |
|
|
|
|
|
|
|
|
|
|
|
|
|
|
|
|
| ||||||||
Dividends reinvested |
| $ | 680,470 |
| $ | 956,440 |
| $ | 4,203,704 |
| $ | 3,960,223 |
| $ | 693,642 |
| $ | 806,212 |
| $ | 820 |
| $ | 1,033 |
|
Shares redeemed |
| (5,992,309 | ) | (38,008,278 | ) | (38,938,411 | ) | (103,152,786 | ) | (13,127,434 | ) | (65,553,861 | ) | (15,840 | ) | (10,439 | ) | ||||||||
Net decrease |
| $ | (5,311,839 | ) | $ | (37,051,838 | ) | $ | (34,734,707 | ) | $ | (99,192,563 | ) | $ | (12,433,792 | ) | $ | (64,747,649 | ) | $ | (15,020 | ) | $ | (9,406 | ) |
|
| Class A Shares |
| Class B Shares |
| Class C Shares |
| Class Q Shares |
| ||||||||||||||||
|
| Six Months |
| Year Ended |
| Six Months |
| Year Ended |
| Six Months |
| Year Ended |
| Six Months |
| Year Ended |
| ||||||||
|
|
|
|
|
|
|
|
|
|
|
|
|
|
|
|
|
| ||||||||
Principal Protection Fund III |
|
|
|
|
|
|
|
|
|
|
|
|
|
|
|
|
| ||||||||
Dividends reinvested |
| 54,990 |
| 70,392 |
| 350,147 |
| 309,859 |
| 43,326 |
| 40,366 |
| 1,522 |
| 1,226 |
| ||||||||
Shares redeemed |
| (538,781 | ) | (1,964,837 | ) | (2,802,322 | ) | (6,666,799 | ) | (737,913 | ) | (3,681,856 | ) | — |
| — |
| ||||||||
Net decrease in shares outstanding |
| (483,791 | ) | (1,894,445 | ) | (2,452,175 | ) | (6,356,940 | ) | (694,587 | ) | (3,641,490 | ) | 1,522 |
| 1,226 |
| ||||||||
Principal Protection Fund III ($) |
|
|
|
|
|
|
|
|
|
|
|
|
|
|
|
|
| ||||||||
Dividends reinvested |
| $ | 538,903 |
| $ | 698,989 |
| $ | 3,434,937 |
| $ | 3,076,937 |
| $ | 426,334 |
| $ | 401,636 |
| $ | 14,906 |
| $ | 12,156 |
|
Shares redeemed |
| (5,370,069 | ) | (19,781,296 | ) | (27,758,364 | ) | (66,780,710 | ) | (7,317,894 | ) | (37,017,924 | ) | — |
| — |
| ||||||||
Net decrease |
| $ | (4,831,166 | ) | $ | (19,082,307 | ) | $ | (24,323,427 | ) | $ | (63,703,773 | ) | $ | (6,891,560 | ) | $ | (36,616,288 | ) | $ | 14,906 |
| $ | 12,156 |
|
|
| Class A Shares |
| Class B Shares |
| Class C Shares |
| Class Q Shares |
| ||||||||||||||||
|
| Six Months |
| Year Ended |
| Six Months |
| Year Ended |
| Six Months |
| Year Ended |
| Six Months |
| Year Ended |
| ||||||||
|
|
|
|
|
|
|
|
|
|
|
|
|
|
|
|
|
| ||||||||
Principal Protection Fund IV |
|
|
|
|
|
|
|
|
|
|
|
|
|
|
|
|
| ||||||||
Dividends reinvested |
| 54,624 |
| 85,420 |
| 307,311 |
| 379,544 |
| 38,575 |
| 60,931 |
| 1,520 |
| 1,695 |
| ||||||||
Shares redeemed |
| (1,023,772 | ) | (3,588,838 | ) | (4,540,793 | ) | (10,943,351 | ) | (1,855,555 | ) | (8,099,131 | ) | (866 | ) | (50,269 | ) | ||||||||
Net increase (decrease) in shares outstanding |
| (969,148 | ) | (3,503,418 | ) | (4,233,482 | ) | (10,563,807 | ) | (1,816,980 | ) | (8,038,200 | ) | 654 |
| (48,574 | ) | ||||||||
|
|
|
|
|
|
|
|
|
|
|
|
|
|
|
|
|
| ||||||||
Principal Protection Fund IV ($) |
|
|
|
|
|
|
|
|
|
|
|
|
|
|
|
|
| ||||||||
Dividends reinvested |
| $ | 571,505 |
| $ | 876,255 |
| $ | 3,220,622 |
| $ | 3,894,121 |
| $ | 405,028 |
| $ | 625,532 |
| $ | 15,915 |
| $ | 17,391 |
|
Shares redeemed |
| (10,720,913 | ) | (37,594,082 | ) | (47,207,441 | ) | (113,922,982 | ) | (19,299,924 | ) | (84,331,915 | ) | (9,000 | ) | (521,804 | ) | ||||||||
Net increase (decrease) |
| $ | (10,149,408 | ) | $ | (36,717,827 | ) | $ | (43,986,819 | ) | $ | (110,028,861 | ) | $ | (18,894,896 | ) | $ | (83,706,383 | ) | $ | 6,915 |
| $ | (504,413 | ) |
54
|
| Class A Shares |
| Class B Shares |
| Class C Shares |
| Class Q Shares |
| ||||||||||||||||
|
| Six Months |
| Year Ended |
| Six Months |
| Year Ended |
| Six Months |
| Year Ended |
| Six Months |
| Year Ended |
| ||||||||
|
|
|
|
|
|
|
|
|
|
|
|
|
|
|
|
|
| ||||||||
Principal Protection Fund V |
|
|
|
|
|
|
|
|
|
|
|
|
|
|
|
|
| ||||||||
Dividends reinvested |
| 160,677 |
| 112,825 |
| 1,385,762 |
| 520,030 |
| 146,148 |
| 81,204 |
| — |
| — |
| ||||||||
Shares redeemed |
| (745,539 | ) | (3,066,422 | ) | (3,099,337 | ) | (8,170,839 | ) | (1,281,051 | ) | (4,329,176 | ) | — |
| (13,824 | ) | ||||||||
Net increase (decrease) in shares outstanding |
| (584,862 | ) | (2,953,597 | ) | (1,713,575 | ) | (7,650,809 | ) | (1,134,903 | ) | (4,247,972 | ) | — |
| (13,824 | ) | ||||||||
|
|
|
|
|
|
|
|
|
|
|
|
|
|
|
|
|
| ||||||||
Principal Protection Fund V ($) |
|
|
|
|
|
|
|
|
|
|
|
|
|
|
|
|
| ||||||||
Dividends reinvested |
| $ | 1,585,875 |
| $ | 1,133,886 |
| $ | 13,705,190 |
| $ | 5,236,695 |
| $ | 1,448,330 |
| $ | 817,723 |
| $ | — |
| $ | — |
|
Shares redeemed |
| (7,600,704 | ) | (31,425,959 | ) | (31,399,544 | ) | (83,486,312 | ) | (12,984,538 | ) | (44,284,992 | ) | — |
| (143,828 | ) | ||||||||
Net increase (decrease) |
| $ | (6,014,829 | ) | $ | (30,292,073 | ) | $ | (17,694,354 | ) | $ | (78,249,617 | ) | $ | (11,536,208 | ) | $ | (43,467,269 | ) | $ | — |
| $ | (143,828 | ) |
|
| Class A Shares |
| Class B Shares |
| Class C Shares |
| Class Q Shares |
| ||||||||||||||||
|
| Six Months |
| Year Ended |
| Six Months |
| Year Ended |
| Six Months |
| Year Ended |
| Six Months |
| Year Ended |
| ||||||||
|
|
|
|
|
|
|
|
|
|
|
|
|
|
|
|
|
| ||||||||
Principal Protection Fund VI |
|
|
|
|
|
|
|
|
|
|
|
|
|
|
|
|
| ||||||||
Dividends reinvested |
| 146,847 |
| 59,009 |
| 1,171,582 |
| 232,991 |
| 138,182 |
| 40,979 |
| 1,334 |
| 406 |
| ||||||||
Shares redeemed |
| (716,574 | ) | (1,903,216 | ) | (3,145,014 | ) | (6,380,073 | ) | (1,403,283 | ) | (3,461,259 | ) | (1,978 | ) | — |
| ||||||||
Net increase (decrease) in shares outstanding |
| (569,727 | ) | (1,844,207 | ) | (1,973,432 | ) | (6,147,082 | ) | (1,265,101 | ) | (3,420,280 | ) | (644 | ) | 406 |
| ||||||||
|
|
|
|
|
|
|
|
|
|
|
|
|
|
|
|
|
| ||||||||
Principal Protection Fund VI ($) |
|
|
|
|
|
|
|
|
|
|
|
|
|
|
|
|
| ||||||||
Dividends reinvested |
| $ | 1,447,922 |
| $ | 591,859 |
| $ | 11,563,979 |
| $ | 2,339,231 |
| $ | 1,367,998 |
| $ | 411,432 |
| $ | 13,156 |
| $ | 4,099 |
|
Shares redeemed |
| (7,263,882 | ) | (19,429,994 | ) | (31,757,749 | ) | (64,953,503 | ) | (14,168,396 | ) | (35,246,415 | ) | (20,000 | ) | — |
| ||||||||
Net increase (decrease) |
| $ | (5,815,960 | ) | $ | (18,838,135 | ) | $ | (20,193,770 | ) | $ | (62,614,272 | ) | $ | (12,800,398 | ) | $ | (34,834,983 | ) | $ | (6,844 | ) | $ | 4,099 |
|
|
| Class A Shares |
| Class B Shares |
| Class C Shares |
| ||||||||||||
|
| Six Months |
| Year Ended |
| Six Months |
| Year Ended |
| Six Months |
| Year Ended |
| ||||||
|
|
|
|
|
|
|
|
|
|
|
|
|
| ||||||
Principal Protection Fund VII |
|
|
|
|
|
|
|
|
|
|
|
|
| ||||||
Shares sold |
| — |
| 2,083,874 |
| — |
| 11,662,174 |
| — |
| 4,123,160 |
| ||||||
Dividends reinvested |
| 47,944 |
| 44,585 |
| 353,912 |
| 86,623 |
| 49,842 |
| 29,507 |
| ||||||
Shares redeemed |
| (468,273 | ) | (1,023,987 | ) | (1,378,124 | ) | (2,609,291 | ) | (1,166,076 | ) | (1,659,767 | ) | ||||||
Net increase in shares outstanding |
| (420,329 | ) | 1,104,472 |
| (1,024,212 | ) | 9,139,506 |
| (1,116,234 | ) | 2,492,900 |
| ||||||
|
|
|
|
|
|
|
|
|
|
|
|
|
| ||||||
Principal Protection Fund VII ($) |
|
|
|
|
|
|
|
|
|
|
|
|
| ||||||
Shares sold |
| $ | — |
| $ | 20,838,011 |
| $ | — |
| $ | 116,620,846 |
| $ | — |
| $ | 41,230,905 |
|
Dividends reinvested |
| 472,258 |
| 436,037 |
| 3,517,887 |
| 854,800 |
| 494,931 |
| 290,348 |
| ||||||
Shares redeemed |
| (4,658,472 | ) | (10,221,967 | ) | (13,776,526 | ) | (26,156,354 | ) | (11,603,633 | ) | (16,520,392 | ) | ||||||
Net increase |
| $ | (4,186,214 | ) | $ | 11,052,081 |
| $ | (10,258,639 | ) | $ | 91,319,292 |
| $ | (11,108,702 | ) | $ | 25,000,861 |
|
55
|
| Class A Shares |
| Class B Shares |
| Class C Shares |
| ||||||||||||
|
| Six Months |
| October 1, |
| Six Months |
| October 1, |
| Six Months |
| October 1, |
| ||||||
|
|
|
|
|
|
|
|
|
|
|
|
|
| ||||||
Principal Protection Fund VIII |
|
|
|
|
|
|
|
|
|
|
|
|
| ||||||
Shares sold |
| — |
| 2,708,122 |
| — |
| 11,208,345 |
| — |
| 3,668,221 |
| ||||||
Dividends reinvested |
| 42,409 |
| 1,516 |
| 158,647 |
| 6,815 |
| 33,549 |
| 1,616 |
| ||||||
Shares redeemed |
| (331,065 | ) | (463,935 | ) | (849,809 | ) | (577,778 | ) | (386,617 | ) | (311,236 | ) | ||||||
Net increase in shares outstanding |
| (288,656 | ) | 2,245,703 |
| (691,162 | ) | 10,637,382 |
| (353,068 | ) | 3,358,601 |
| ||||||
|
|
|
|
|
|
|
|
|
|
|
|
|
| ||||||
Principal Protection Fund VIII ($) |
|
|
|
|
|
|
|
|
|
|
|
|
| ||||||
Shares sold |
| $ | — |
| $ | 27,077,722 |
| $ | — |
| $ | 112,063,568 |
| $ | — |
| $ | 36,674,965 |
|
Dividends reinvested |
| 422,391 |
| 15,221 |
| 1,583,297 |
| 68,535 |
| 334,822 |
| 16,218 |
| ||||||
Shares redeemed |
| (3,323,514 | ) | (4,696,020 | ) | (8,516,814 | ) | (5,829,267 | ) | (3,881,136 | ) | (3,138,748 | ) | ||||||
Net increase |
| $ | (2,901,123 | ) | $ | 22,396,923 |
| $ | (6,933,517 | ) | $ | 106,302,836 |
| $ | (3,546,314 | ) | $ | 33,552,435 |
|
|
| Class A Shares |
| Class B Shares |
| Class C Shares |
| ||||||||||||
|
| Six Months |
| February 2, |
| Six Months |
| February 2, |
| Six Months |
| February 2, |
| ||||||
|
|
|
|
|
|
|
|
|
|
|
|
|
| ||||||
Principal Protection Fund IX |
|
|
|
|
|
|
|
|
|
|
|
|
| ||||||
Shares sold |
| — |
| 2,043,715 |
| — |
| 6,785,067 |
| — |
| 2,218,307 |
| ||||||
Dividends reinvested |
| 20,485 |
| — |
| 60,706 |
| — |
| 13,569 |
| — |
| ||||||
Shares redeemed |
| (311,573 | ) | (19,733 | ) | (568,073 | ) | (59,012 | ) | (286,562 | ) | (24,194 | ) | ||||||
Net increase in shares outstanding |
| (291,088 | ) | 2,023,982 |
| (507,367 | ) | 6,726,055 |
| (272,993 | ) | 2,194,113 |
| ||||||
|
|
|
|
|
|
|
|
|
|
|
|
|
| ||||||
Principal Protection Fund IX ($) |
|
|
|
|
|
|
|
|
|
|
|
|
| ||||||
Shares sold |
| $ | — |
| $ | 20,437,156 |
| $ | — |
| $ | 67,850,682 |
| $ | — |
| $ | 22,183,082 |
|
Dividends reinvested |
| 206,282 |
| — |
| 612,520 |
| — |
| 136,910 |
| — |
| ||||||
Shares redeemed |
| (3,126,006 | ) | (197,373 | ) | (5,730,514 | ) | (587,944 | ) | (2,875,844 | ) | (239,965 | ) | ||||||
Net increase |
| $ | (2,919,724 | ) | $ | 20,239,783 |
| $ | (5,117,994 | ) | $ | 67,262,738 |
| $ | (2,738,934 | ) | $ | 21,943,117 |
|
|
| Class A Shares |
| Class B Shares |
| Class C Shares |
| ||||||||||||
|
| Six Months |
| May 3, |
| Six Months |
| May 3, |
| Six Months |
| May 3, |
| ||||||
|
|
|
|
|
|
|
|
|
|
|
|
|
| ||||||
Principal Protection Fund X |
|
|
|
|
|
|
|
|
|
|
|
|
| ||||||
Shares sold |
| 1,089,013 |
| 460,824 |
| 3,209,038 |
| 1,216,466 |
| 1,183,012 |
| 185,618 |
| ||||||
Dividends reinvested |
| 13,562 |
| — |
| 26,227 |
| — |
| 5,366 |
| — |
| ||||||
Shares redeemed |
| (47,870 | ) | (28 | ) | (125,044 | ) | (298 | ) | (30,310 | ) | — |
| ||||||
Net increase in shares outstanding |
| 1,054,705 |
| 460,796 |
| 3,110,221 |
| 1,216,168 |
| 1,158,068 |
| 185,618 |
| ||||||
|
|
|
|
|
|
|
|
|
|
|
|
|
| ||||||
Principal Protection Fund X ($) |
|
|
|
|
|
|
|
|
|
|
|
|
| ||||||
Shares sold |
| $ | 10,890,199 |
| $ | 4,608,253 |
| $ | 32,090,469 |
| $ | 12,164,658 |
| $ | 11,830,953 |
| $ | 1,856,179 |
|
Dividends reinvested |
| 138,874 |
| — |
| 268,560 |
| — |
| 54,950 |
| — |
| ||||||
Shares redeemed |
| (484,685 | ) | (285 | ) | (1,268,490 | ) | (2,981 | ) | (304,147 | ) | — |
| ||||||
Net increase |
| $ | 10,544,388 |
| $ | 4,607,968 |
| $ | 31,090,539 |
| $ | 12,161,677 |
| $ | 11,581,756 |
| $ | 1,856,179 |
|
(1) Commencement of operations.
56
|
| Class A Shares |
| Class B Shares |
| Class C Shares |
| |||
|
| August 16, |
| August 16, |
| August 16, |
| |||
|
|
|
|
|
|
|
| |||
Principal Protection Fund XI |
|
|
|
|
|
|
| |||
Shares sold |
| 1,017,250 |
| 2,997,223 |
| 768,805 |
| |||
Dividends reinvested |
| 3,170 |
| 6,646 |
| 1,245 |
| |||
Shares redeemed |
| (33,752 | ) | (26,106 | ) | — |
| |||
Net increase in shares outstanding |
| 986,668 |
| 2,977,763 |
| 770,050 |
| |||
|
|
|
|
|
|
|
| |||
Principal Protection Fund XI ($) |
|
|
|
|
|
|
| |||
Shares sold |
| $ | 10,175,414 |
| $ | 29,972,215 |
| $ | 7,688,026 |
|
Dividends reinvested |
| 31,603 |
| 66,257 |
| 12,411 |
| |||
Shares redeemed |
| (337,181 | ) | (260,417 | ) | — |
| |||
Net increase |
| $ | 9,869,836 |
| $ | 29,778,055 |
| $ | 7,700,437 |
|
|
| Class A Shares |
| Class B Shares |
| Class C Shares |
| |||
|
| November 15, |
| November 15, |
| November 15, |
| |||
|
|
|
|
|
|
|
| |||
Principal Protection Fund XII |
|
|
|
|
|
|
| |||
Shares sold |
| 12,927 |
| 146,094 |
| 18,622 |
| |||
Dividends reinvested |
| — |
| — |
| — |
| |||
Shares redeemed |
| — |
| — |
| — |
| |||
Net increase in shares outstanding |
| 12,927 |
| 146,094 |
| 18,622 |
| |||
|
|
|
|
|
|
|
| |||
Principal Protection Fund XII ($) |
|
|
|
|
|
|
| |||
Shares sold |
| $ | 129,273 |
| $ | 1,460,944 |
| $ | 186,217 |
|
Dividends reinvested |
| — |
| — |
| — |
| |||
Shares redeemed |
| — |
| — |
| — |
| |||
Net increase |
| $ | 129,273 |
| $ | 1,460,944 |
| $ | 186,217 |
|
(1) Commencement of operations.
NOTE 11 — FEDERAL INCOME TAXES
The amount of distributions from net investment income and net realized capital gains are determined in accordance with federal income tax regulations, which may differ from accounting principles generally accepted in the United States of America for investment companies. These book/tax differences may be either temporary or permanent. Permanent differences are reclassified within the capital accounts based on their federal tax-basis treatment; temporary differences are not reclassified. Key differences include the treatment of short-term capital gains, foreign currency transactions, organizational and offering expenses, and wash sale deferrals. Distributions in excess of net investment income and/or net realized capital gains for tax purposes are reported as distributions of paid-in capital.
Dividends paid by the Funds from net investment income and distributions of net realized short-term capital gains are, for federal income tax purposes, taxable as ordinary income to shareholders.
The tax composition of dividends and distributions to shareholders were as follows:
|
| Six Months Ended |
| ||||
|
| Ordinary |
| Long-term |
| ||
PPF |
| $ | 4,411,200 |
| $ | — |
|
PPF II |
| 7,426,586 |
| — |
| ||
PPF III |
| 5,578,324 |
| — |
| ||
PPF IV |
| 2,663,253 |
| 2,550,224 |
| ||
PPF V |
| 3,066,157 |
| 15,890,935 |
| ||
PPF VI |
| 2,839,116 |
| 13,977,806 |
| ||
PPF VII |
| 1,907,902 |
| 3,353,252 |
| ||
PPF VIII |
| 1,440,332 |
| 1,538,919 |
| ||
PPF IX |
| 903,753 |
| 288,785 |
| ||
PPF X |
| 333,272 |
| 222,395 |
| ||
PPF XI |
| 131,765 |
| — |
| ||
57
|
| Year Ended May 31, 2004 |
| ||||
|
| Ordinary |
| Long-term |
| ||
Principal Protection |
| $ | 4,941,594 |
| $ | — |
|
Principal Protection II |
| 7,764,797 |
| — |
| ||
Principal Protection III |
| 5,409,645 |
| — |
| ||
Principal Protection IV |
| 6,816,803 |
| 29,479 |
| ||
Principal Protection V |
| 8,244,107 |
| — |
| ||
Principal Protection VI |
| 3,944,609 |
| — |
| ||
Principal Protection VII |
| 1,906,632 |
| — |
| ||
Principal Protection VIII |
| 126,191 |
| — |
| ||
The tax-basis components of distributable earnings and the expiration dates of the capital loss carryforwards which may be used to offset future realized capital gains for federal income tax purposes were as follows at May 31, 2004:
|
| Undistributed |
| Undistributed |
| Appreciation |
| Post-October |
| Unrealized |
| Capital |
| |||||
Principal Protection |
| $ | 1,573,337 |
| $ | — |
| $ | 10,757,549 |
| $ | — |
| $ | (14,011,387 | ) | 2011 |
|
Principal Protection II |
| 3,073,676 |
| — |
| 14,730,582 |
| — |
| (31,774,803 | ) | 2011 |
| |||||
Principal Protection III |
| 2,408,613 |
| — |
| 14,040,216 |
| — |
| (20,323,598 | ) | 2011 |
| |||||
Principal Protection IV |
| 1,281,396 |
| 1,584,238 |
| 29,643,246 |
| — |
| — |
| — |
| |||||
Principal Protection V |
| 9,186,833 |
| 4,437,054 |
| (4,482,834 | ) | — |
| — |
| — |
| |||||
Principal Protection VI |
| 11,066,732 |
| 1,319,197 |
| (6,631,429 | ) | — |
| — |
| — |
| |||||
Principal Protection VII |
| 2,340,463 |
| 2,752 |
| (3,784,073 | ) | — |
| — |
| — |
| |||||
Principal Protection VIII |
| 1,325,297 |
| 796 |
| (2,342,164 | ) | — |
| — |
| — |
| |||||
Principal Protection IX |
| 220,274 |
| — |
| (1,014,929 | ) | (9,848 | ) | — |
| — |
| |||||
Principal Protection X |
| 2,363 |
| — |
| 758 |
| — |
| — |
| — |
| |||||
NOTE 12 — LITIGATION
Lawsuits have been filed by certain shareholders on behalf of Principal Protection, Principal Protection II, and Principal Protection IV (the “Funds”) against ING Investments, LLC, the Funds’ Investment Manager, ING IM, the Funds’ Sub-Adviser, ING Funds Distributors, LLC, the Funds’ Distributor and certain of the independent trustees of the Funds (collectively, the “Defendants”) that allege, among other things, that the Funds’ advisory fees, sub-advisory fees and certain 12b-1 fees are excessive. The Funds are named as nominal defendants in each of these suits. The suits seek recovery by the Funds from the Defendants of any fees found to be excessive. The Defendants have advised the Funds that they believe the lawsuits are without merit, and they intend to vigorously defend themselves against the allegations.
NOTE 13 — INFORMATION REGARDING TRADING OF ING’S U.S. MUTUAL FUNDS
ING Investments, LLC (“Investments”), the adviser to the ING Funds, has reported to the Boards of Directors/Trustees (the “Board”) of the ING Funds that, like many U.S. financial services companies, Investments and certain of its U.S. affiliates have received informal and formal requests for information since September 2003 from various governmental and self-regulatory agencies in connection with investigations related to mutual funds and variable insurance products. Investments has advised the Board that it and its affiliates have cooperated fully with each request.
In addition to responding to regulatory and governmental requests, Investments reported that management of U.S. affiliates of ING Groep N.V., including Investments (collectively, “ING”), on their own initiative, have conducted, through independent special counsel and a national accounting firm, an extensive internal review of trading in ING insurance, retirement, and mutual fund products. The goal of this review was to identify any instances of inappropriate trading in those products by third parties or by ING investment professionals and other ING personnel. ING’s internal review related to mutual fund trading is now substantially completed. ING has reported that, of the millions of customer relationships that ING maintains, the internal review identified several isolated arrangements allowing third parties to engage in frequent trading of mutual funds within ING’s variable insurance and mutual fund products, and identified other circumstances where frequent trading occurred, despite measures taken by ING intended to combat market timing. ING further reported that each of these arrangements has been terminated and fully disclosed to regulators. The results of the internal review were also reported to the independent members of the Board.
Investments has advised the Board that most of the identified arrangements were initiated prior to ING’s acquisition of the businesses in question in the
58
U.S. Investments further reported that the companies in question did not receive special benefits in return for any of these arrangements, which have all been terminated. Based on the internal review, Investments has advised the Board that the identified arrangements do not represent a systemic problem in any of the companies that were involved.
More specifically, Investments reported to the Board that, at this time, these instances include the following:
• ING has identified three arrangements, dating from 1995, 1996 and 1998, under which the administrator to the then-Pilgrim Funds, which subsequently became part of the ING Funds, entered formal and informal arrangements that permitted frequent trading. ING Funds Distributor, LLC (“IFD”) has received a notice from the staff of the NASD informing IFD that it has made a preliminary determination to recommend that disciplinary action be brought against IFD and one of its registered persons for violations of the NASD Conduct Rules and certain provisions of the federal securities laws in connection with these arrangements.
• Aeltus Investment Management, Inc. (a predecessor entity to ING Investment Management Co.) has identified two investment professionals who engaged in extensive frequent trading in certain ING Funds. One was subsequently terminated for cause and incurred substantial financial penalties in connection with this conduct and the second has been disciplined.
• ReliaStar Life Insurance Company (“ReliaStar”) entered into agreements seven years ago permitting the owner of policies issued by the insurer to engage in frequent trading and to submit orders until 4pm Central Time. In 2001 ReliaStar also entered into a selling agreement with a broker-dealer that engaged in frequent trading. Employees of ING affiliates were terminated and/or disciplined in connection with these matters.
• In 1998, Golden American Life Insurance Company entered into arrangements permitting a broker-dealer to frequently trade up to certain specific limits in a fund available in an ING variable annuity product. No employee responsible for this arrangement remains at the company.
For additional information regarding these matters, you may consult the Form 8-K for each of four life insurance companies, ING USA Annuity and Life Insurance Company, ING Life Insurance and Annuity Company, ING Insurance Company of America, and ReliaStar Life Insurance Company of New York, each filed with the Securities and Exchange Commission (the “SEC”) on September 9, 2004. These Forms 8-K can be accessed through the SEC’s Web site at http://www.sec.gov. Despite the extensive internal review conducted through independent special counsel and a national accounting firm, there can be no assurance that the instances of inappropriate trading reported to the Board are the only instances of such trading respecting the ING Funds. Investments reported to the Board that ING is committed to conducting its business with the highest standards of ethical conduct with zero tolerance for noncompliance.
Accordingly, Investments advised the Board that ING management was disappointed that its voluntary internal review identified these situations. Viewed in the context of the breadth and magnitude of its U.S. business as a whole, ING management does not believe that ING’s acquired companies had systemic ethical or compliance issues in these areas. Nonetheless, Investments reported that given ING’s refusal to tolerate any lapses, it has taken the steps noted below, and will continue to seek opportunities to further strengthen the internal controls of its affiliates.
• ING has agreed with the ING Funds to indemnify and hold harmless the ING Funds from all damages resulting from wrongful conduct by ING or its employees or from ING’s internal investigation, any investigations conducted by any governmental or self-regulatory agencies, litigation or other formal proceedings, including any proceedings by the Securities and Exchange Commission. Investments reported to the Board that ING management believes that the total amount of any indemnification obligations will not be material to ING or its U.S. business.
• ING updated its Code of Conduct for employees reinforcing its employees’ obligation to conduct personal trading activity consistent with the law, disclosed limits, and other requirements.
• The ING Funds, upon a recommendation from ING, updated their respective Codes of Ethics applicable to investment professionals with ING entities and certain other fund personnel, requiring such personnel to pre-clear any purchases or sales of ING Funds that are not systematic in nature (i.e., dividend reinvestment), and imposing minimum holding periods for shares of ING Funds.
• ING instituted excessive trading policies for all customers in its variable insurance and retirement products and for shareholders of the ING Funds sold to the public through financial intermediaries. ING does not make exceptions to these policies.
• ING reorganized and expanded its U.S. Compliance Department, and created an Enterprise Compliance team to enhance controls and consistency in regulatory compliance.
59
ING PRINCIPAL PROTECTION FUND I
AS OF NOVEMBER 30, 2004 (UNAUDITED)
Shares |
|
|
|
|
| Value |
| |
COMMON STOCK: 14.5% |
|
|
| |||||
|
|
|
| Advertising: 0.0% |
|
|
| |
1,550 |
| @ |
| Interpublic Group of Cos., Inc. |
| $ | 19,236 |
|
650 |
|
|
| Omnicom Group, Inc. |
| 52,650 |
| |
|
|
|
|
|
| 71,886 |
| |
|
|
|
| Aerospace/ Defense: 0.3% |
|
|
| |
4,870 |
|
|
| Boeing Co. |
| 260,885 |
| |
1,150 |
|
|
| General Dynamics Corp. |
| 124,614 |
| |
630 |
|
|
| Goodrich Corp. |
| 20,003 |
| |
1,550 |
|
|
| Lockheed Martin Corp. |
| 94,302 |
| |
1,100 |
|
|
| Northrop Grumman Corp. |
| 61,963 |
| |
2,650 |
|
|
| Raytheon Co. |
| 106,901 |
| |
610 |
|
|
| Rockwell Collins, Inc. |
| 24,315 |
| |
1,800 |
|
|
| United Technologies Corp. |
| 175,644 |
| |
|
|
|
|
|
| 868,627 |
| |
|
|
|
| Agriculture: 0.2% |
|
|
| |
7,090 |
|
|
| Altria Group, Inc. |
| 407,604 |
| |
2,170 |
|
|
| Archer-Daniels-Midland Co. |
| 46,004 |
| |
900 |
|
|
| Monsanto Co. |
| 41,418 |
| |
500 |
|
|
| Reynolds American, Inc. |
| 37,815 |
| |
1,050 |
|
|
| UST, Inc. |
| 46,232 |
| |
|
|
|
|
|
| 579,073 |
| |
|
|
|
| Apparel: 0.1% |
|
|
| |
900 |
| @ |
| Coach, Inc. |
| 44,856 |
| |
700 |
|
|
| Jones Apparel Group, Inc. |
| 24,871 |
| |
610 |
|
|
| Liz Claiborne, Inc. |
| 25,053 |
| |
1,470 |
|
|
| Nike, Inc. |
| 124,449 |
| |
260 |
|
|
| Reebok Intl. Ltd. |
| 10,109 |
| |
650 |
|
|
| VF Corp. |
| 35,094 |
| |
|
|
|
|
|
| 264,432 |
| |
|
|
|
| Auto Manufacturers: 0.1% |
|
|
| |
10,580 |
|
|
| Ford Motor Co. |
| 150,024 |
| |
1,950 |
|
|
| General Motors Corp. |
| 75,251 |
| |
900 |
|
|
| PACCAR, Inc. |
| 70,290 |
| |
|
|
|
|
|
| 295,565 |
| |
|
|
|
| Auto Parts and Equipment: 0.0% |
|
|
| |
600 |
|
|
| Dana Corp. |
| 9,810 |
| |
630 |
|
|
| Johnson Controls, Inc. |
| 38,682 |
| |
|
|
|
|
|
| 48,492 |
| |
|
|
|
| Banks: 1.0% |
|
|
| |
1,290 |
|
|
| AmSouth Bancorporation |
| 33,450 |
| |
13,788 |
|
|
| Bank of America Corp. |
| 637,970 |
| |
1,900 |
|
|
| BB&T Corp. |
| 80,655 |
| |
800 |
|
|
| Comerica, Inc. |
| 49,200 |
| |
750 |
|
|
| Fifth Third Bancorp |
| 37,770 |
| |
430 |
|
|
| First Horizon National Corp. |
| 18,791 |
| |
980 |
|
|
| Huntington Bancshares, Inc. |
| 23,775 |
| |
1,580 |
|
|
| KeyCorp |
| 52,598 |
| |
400 |
|
|
| M & T Bank Corp. |
| 42,164 |
| |
750 |
|
|
| Marshall & Ilsley Corp. |
| 31,268 |
| |
1,300 |
|
|
| Mellon Financial Corp. |
| 37,986 |
| |
3,140 |
|
|
| National City Corp. |
| 116,431 |
| |
600 |
|
|
| North Fork Bancorporation, Inc. |
| 17,280 |
| |
750 |
|
|
| Northern Trust Corp. |
| 35,280 |
| |
940 |
|
|
| PNC Financial Services Group, Inc. |
| 51,136 |
| |
1,606 |
|
|
| Regions Financial Corp. |
| 56,194 |
| |
440 |
|
|
| State Street Corp. |
| 19,606 |
| |
1,220 |
|
|
| SunTrust Banks, Inc. |
| 86,986 |
| |
400 |
|
|
| Synovus Financial Corp. |
| 10,800 |
| |
1,050 |
|
|
| The Bank of New York Co., Inc. |
| 34,556 |
| |
6,330 |
|
|
| U.S. Bancorp |
| 187,558 |
| |
7,389 |
|
|
| Wachovia Corp. |
| 382,381 |
| |
5,800 |
|
|
| Wells Fargo & Co. |
| 358,266 |
| |
340 |
|
|
| Zions Bancorporation |
| 22,610 |
| |
|
|
|
|
|
| 2,424,711 |
| |
|
|
|
| Beverages: 0.3% |
|
|
| |
150 |
|
|
| Adolph Coors Co. |
| 11,235 |
| |
2,790 |
|
|
| Anheuser-Busch Cos., Inc. |
| 139,751 |
| |
380 |
|
|
| Brown-Forman Corp. |
| 18,248 |
| |
8,370 |
|
|
| Coca-Cola Co. |
| 329,025 |
| |
1,600 |
|
|
| Coca-Cola Enterprises, Inc. |
| 33,280 |
| |
1,070 |
|
|
| Pepsi Bottling Group, Inc. |
| 29,981 |
| |
5,830 |
|
|
| PepsiCo, Inc. |
| 290,975 |
| |
|
|
|
|
|
| 852,495 |
| |
|
|
|
| Biotechnology: 0.2% |
|
|
| |
4,362 |
| @ |
| Amgen, Inc. |
| 261,894 |
| |
1,150 |
| @ |
| Biogen Idec, Inc. |
| 67,482 |
| |
800 |
| @ |
| Genzyme Corp. |
| 44,808 |
| |
800 |
| @ |
| MedImmune, Inc. |
| 21,280 |
| |
200 |
| @ |
| Millipore Corp. |
| 9,744 |
| |
|
|
|
|
|
| 405,208 |
| |
|
|
|
| Building Materials: 0.0% |
|
|
| |
670 |
| @ |
| American Standard Cos., Inc. |
| 26,090 |
| |
1,400 |
|
|
| Masco Corp. |
| 49,377 |
| |
450 |
|
|
| Vulcan Materials Co. |
| 23,333 |
| |
|
|
|
|
|
| 98,800 |
| |
|
|
|
| Chemicals: 0.2% |
|
|
| |
750 |
|
|
| Air Products & Chemicals, Inc. |
| 42,938 |
| |
250 |
|
|
| Ashland, Inc. |
| 14,788 |
| |
3,350 |
|
|
| Dow Chemical Co. |
| 169,074 |
| |
3,450 |
|
|
| E.I. du Pont de Nemours & Co. |
| 156,353 |
| |
300 |
|
|
| Eastman Chemical Co. |
| 16,314 |
| |
350 |
|
|
| Ecolab, Inc. |
| 12,243 |
| |
650 |
|
|
| Engelhard Corp. |
| 19,429 |
| |
340 |
|
|
| International Flavors & Fragrances, Inc. |
| 13,770 |
| |
1,080 |
|
|
| PPG Industries, Inc. |
| 72,868 |
| |
1,320 |
|
|
| Praxair, Inc. |
| 59,268 |
| |
690 |
|
|
| Rohm & Haas Co. |
| 30,422 |
| |
650 |
|
|
| Sherwin-Williams Co. |
| 28,990 |
| |
300 |
|
|
| Sigma-Aldrich Corp. |
| 17,919 |
| |
|
|
|
|
|
| 654,376 |
| |
|
|
|
| Commercial Services: 0.1% |
|
|
| |
570 |
| @ |
| Apollo Group, Inc. |
| 45,429 |
| |
3,600 |
|
|
| Cendant Corp. |
| 81,613 |
| |
150 |
|
|
| Deluxe Corp. |
| 5,931 |
| |
410 |
|
|
| Equifax, Inc. |
| 11,324 |
| |
730 |
|
|
| H&R Block, Inc. |
| 34,821 |
| |
1,000 |
|
|
| McKesson Corp. |
| 29,550 |
| |
500 |
|
|
| Moody’s Corp. |
| 40,375 |
| |
1,650 |
|
|
| Paychex, Inc. |
| 54,714 |
| |
800 |
|
|
| R.R. Donnelley & Sons Co. |
| 27,760 |
| |
880 |
|
|
| Robert Half Intl., Inc. |
| 23,786 |
| |
|
|
|
|
|
| 355,303 |
| |
|
|
|
| Computers: 0.7% |
|
|
| |
450 |
| @ |
| Affiliated Computer Services, Inc. |
| 26,631 |
| |
2,200 |
| @ |
| Apple Computer, Inc. |
| 147,510 |
| |
650 |
| @ |
| Computer Sciences Corp. |
| 35,165 |
| |
11,350 |
| @ |
| Dell, Inc. |
| 459,902 |
| |
1,800 |
|
|
| Electronic Data Systems Corp. |
| 40,410 |
| |
8,150 |
| @ |
| EMC Corp. |
| 109,373 |
| |
1,200 |
| @ |
| Gateway, Inc. |
| 8,172 |
| |
10,267 |
|
|
| Hewlett-Packard Co. |
| 205,340 |
| |
7,620 |
|
|
| International Business Machines Corp. |
| 718,109 |
| |
420 |
| @ |
| Lexmark Intl., Inc. |
| 35,658 |
| |
See Accompanying Notes to Financial Statements
60
Shares |
|
|
|
|
| Value |
| |
|
|
|
| Computers (continued) |
|
|
| |
300 |
| @ |
| NCR Corp. |
| $ | 17,919 |
|
1,200 |
| @ |
| Network Appliance, Inc. |
| 36,192 |
| |
19,500 |
| @ |
| Sun Microsystems, Inc. |
| 108,225 |
| |
1,030 |
| @ |
| Sungard Data Systems, Inc. |
| 27,305 |
| |
1,200 |
| @ |
| Unisys Corp. |
| 13,788 |
| |
|
|
|
|
|
| 1,989,699 |
| |
|
|
|
| Cosmetics/ Personal Care: 0.5% |
|
|
| |
405 |
|
|
| Alberto-Culver Co. |
| 18,752 |
| |
1,550 |
|
|
| Avon Products, Inc. |
| 58,187 |
| |
1,750 |
|
|
| Colgate-Palmolive Co. |
| 80,483 |
| |
5,750 |
|
|
| Gillette Co. |
| 250,068 |
| |
2,270 |
|
|
| Kimberly-Clark Corp. |
| 144,395 |
| |
14,530 |
|
|
| Procter & Gamble Co. |
| 777,063 |
| |
|
|
|
|
|
| 1,328,948 |
| |
|
|
|
| Distribution/ Wholesale: 0.0% |
|
|
| |
550 |
|
|
| Genuine Parts Co. |
| 23,876 |
| |
550 |
|
|
| W.W. Grainger, Inc. |
| 34,023 |
| |
|
|
|
|
|
| 57,899 |
| |
|
|
|
| Diversified Financial Services: 1.1% |
|
|
| |
4,180 |
|
|
| American Express Co. |
| 232,867 |
| |
350 |
|
|
| Bear Stearns Cos., Inc. |
| 34,153 |
| |
790 |
|
|
| Capital One Financial Corp. |
| 62,078 |
| |
950 |
|
|
| CIT Group, Inc. |
| 40,613 |
| |
17,550 |
|
|
| Citigroup, Inc. |
| 785,362 |
| |
3,200 |
|
|
| Countrywide Financial Corp. |
| 106,272 |
| |
1,350 |
| @ |
| E*TRADE Financial Corp. |
| 18,711 |
| |
3,360 |
|
|
| Fannie Mae |
| 230,831 |
| |
350 |
|
|
| Federated Investors, Inc. |
| 10,297 |
| |
850 |
|
|
| Franklin Resources, Inc. |
| 55,786 |
| |
2,280 |
|
|
| Freddie Mac |
| 155,633 |
| |
1,650 |
|
|
| Goldman Sachs Group, Inc. |
| 172,854 |
| |
4,895 |
|
|
| J.P. Morgan Chase & Co. |
| 184,296 |
| |
850 |
|
|
| Janus Capital Group, Inc. |
| 14,068 |
| |
950 |
|
|
| Lehman Brothers Holdings, Inc. |
| 79,591 |
| |
4,205 |
|
|
| MBNA Corp. |
| 111,685 |
| |
3,210 |
|
|
| Merrill Lynch & Co., Inc. |
| 178,829 |
| |
1,490 |
|
|
| Morgan Stanley |
| 75,618 |
| |
900 |
| @ |
| Providian Financial Corp. |
| 14,445 |
| |
1,410 |
|
|
| SLM Corp. |
| 72,150 |
| |
|
|
|
|
|
| 2,636,139 |
| |
|
|
|
| Electric: 0.4% |
|
|
| |
2,100 |
| @ |
| AES Corp. |
| 25,704 |
| |
250 |
|
|
| Ameren Corp. |
| 12,105 |
| |
1,530 |
|
|
| American Electric Power Co., Inc. |
| 52,280 |
| |
550 |
|
|
| Cinergy Corp. |
| 22,765 |
| |
850 |
|
|
| Consolidated Edison, Inc. |
| 37,273 |
| |
700 |
|
|
| Constellation Energy Group, Inc. |
| 30,590 |
| |
450 |
|
|
| Dominion Resources, Inc. |
| 29,462 |
| |
600 |
|
|
| DTE Energy Co. |
| 26,328 |
| |
4,350 |
|
|
| Duke Energy Corp. |
| 109,967 |
| |
1,390 |
|
|
| Edison Intl |
| 44,341 |
| |
750 |
|
|
| Entergy Corp. |
| 48,615 |
| |
2,340 |
|
|
| Exelon Corp. |
| 97,600 |
| |
1,100 |
|
|
| FirstEnergy Corp. |
| 46,453 |
| |
600 |
|
|
| FPL Group, Inc. |
| 42,198 |
| |
1,480 |
| @ |
| PG&E Corp. |
| 49,225 |
| |
300 |
|
|
| Pinnacle West Capital Corp. |
| 13,260 |
| |
1,030 |
|
|
| PPL Corp. |
| 53,509 |
| |
800 |
|
|
| Public Service Enterprise Group, Inc. |
| 35,192 |
| |
2,490 |
|
|
| Southern Co. |
| 81,647 |
| |
1,400 |
|
|
| TXU Corp. |
| 87,948 |
| |
1,850 |
|
|
| Xcel Energy, Inc. |
| 33,411 |
| |
|
|
|
|
|
| 979,873 |
| |
|
|
|
| Electrical Components and Equipment: 0.0% |
|
|
| |
1,910 |
|
|
| Emerson Electric Co. |
| 127,626 |
| |
|
|
|
|
|
| 127,626 |
| |
|
|
|
| Electronics: 0.1% |
|
|
| |
1,550 |
| @ |
| Agilent Technologies, Inc. |
| 35,479 |
| |
730 |
|
|
| Applera Corp. — Applied Biosystems Group |
| 14,965 |
| |
400 |
| @ |
| Fisher Scientific Intl |
| 22,616 |
| |
580 |
| @ |
| Jabil Circuit, Inc. |
| 14,535 |
| |
400 |
|
|
| Parker Hannifin Corp. |
| 29,919 |
| |
650 |
|
|
| PerkinElmer, Inc. |
| 13,865 |
| |
750 |
| @ |
| Sanmina-SCI Corp. |
| 6,623 |
| |
2,650 |
| @ |
| Solectron Corp. |
| 16,563 |
| |
250 |
|
|
| Tektronix, Inc. |
| 7,843 |
| |
800 |
| @ |
| Thermo Electron Corp. |
| 24,199 |
| |
450 |
| @ |
| Waters Corp. |
| 20,997 |
| |
|
|
|
|
|
| 207,604 |
| |
|
|
|
| Engineering and Construction: 0.0% |
|
|
| |
300 |
|
|
| Fluor Corp. |
| 15,570 |
| |
|
|
|
|
|
| 15,570 |
| |
|
|
|
| Entertainment: 0.0% |
|
|
| |
1,030 |
|
|
| International Game Technology |
| 36,411 |
| |
|
|
|
|
|
| 36,411 |
| |
|
|
|
| Environmental Control: 0.0% |
|
|
| |
1,840 |
|
|
| Waste Management, Inc. |
| 54,850 |
| |
|
|
|
|
|
| 54,850 |
| |
|
|
|
| Food: 0.2% |
|
|
| |
1,300 |
|
|
| Albertson’s, Inc. |
| 32,890 |
| |
550 |
|
|
| Campbell Soup Co. |
| 15,692 |
| |
1,750 |
|
|
| ConAgra Foods, Inc. |
| 47,338 |
| |
1,250 |
|
|
| General Mills, Inc. |
| 56,863 |
| |
1,170 |
|
|
| H.J. Heinz Co. |
| 43,477 |
| |
900 |
|
|
| Hershey Foods Corp. |
| 46,620 |
| |
1,260 |
|
|
| Kellogg Co. |
| 55,062 |
| |
1,000 |
| @ |
| Kroger Co. |
| 16,180 |
| |
500 |
|
|
| McCormick & Co., Inc. |
| 18,225 |
| |
2,540 |
|
|
| Sara Lee Corp. |
| 59,639 |
| |
530 |
|
|
| SUPERVALU, Inc. |
| 16,743 |
| |
1,000 |
|
|
| Wm. Wrigley Jr. Co. |
| 68,799 |
| |
|
|
|
|
|
| 477,528 |
| |
|
|
|
| Forest Products and Paper: 0.1% |
|
|
| |
900 |
|
|
| Georgia-Pacific Corp. |
| 32,949 |
| |
1,780 |
|
|
| International Paper Co. |
| 73,906 |
| |
550 |
|
|
| Louisiana-Pacific Corp. |
| 13,459 |
| |
700 |
|
|
| MeadWestvaco Corp. |
| 23,555 |
| |
600 |
|
|
| Plum Creek Timber Co., Inc. |
| 22,200 |
| |
200 |
|
|
| Temple-Inland, Inc. |
| 11,918 |
| |
1,200 |
|
|
| Weyerhaeuser Co. |
| 79,199 |
| |
|
|
|
|
|
| 257,186 |
| |
|
|
|
| Gas: 0.0% |
|
|
| |
660 |
|
|
| KeySpan Corp. |
| 26,083 |
| |
990 |
|
|
| Sempra Energy |
| 36,610 |
| |
|
|
|
|
|
| 62,693 |
| |
See Accompanying Notes to Financial Statements
61
Shares |
|
|
|
|
| Value |
| |
|
|
|
| Hand/ Machine Tools: 0.0% |
|
|
| |
410 |
|
|
| Black & Decker Corp. |
| $ | 34,477 |
|
140 |
|
|
| Snap-On, Inc. |
| 4,425 |
| |
410 |
|
|
| Stanley Works |
| 19,172 |
| |
|
|
|
|
|
| 58,074 |
| |
|
|
|
| Healthcare — Products: 0.6% |
|
|
| |
200 |
|
|
| Bausch & Lomb, Inc. |
| 11,776 |
| |
2,150 |
|
|
| Baxter Intl., Inc. |
| 68,048 |
| |
1,080 |
|
|
| Becton Dickinson & Co. |
| 59,162 |
| |
800 |
|
|
| Biomet, Inc. |
| 38,296 |
| |
2,770 |
| @ |
| Boston Scientific Corp. |
| 96,424 |
| |
540 |
|
|
| C.R. Bard, Inc. |
| 32,351 |
| |
1,070 |
|
|
| Guidant Corp. |
| 69,368 |
| |
13,600 |
|
|
| Johnson & Johnson |
| 820,351 |
| |
4,050 |
|
|
| Medtronic, Inc. |
| 194,603 |
| |
1,220 |
| @ |
| St. Jude Medical, Inc. |
| 46,531 |
| |
550 |
|
|
| Stryker Corp. |
| 24,195 |
| |
850 |
| @ |
| Zimmer Holdings, Inc. |
| 69,360 |
| |
|
|
|
|
|
| 1,530,465 |
| |
|
|
|
| Healthcare — Services: 0.3% |
|
|
| |
910 |
|
|
| Aetna, Inc. |
| 107,844 |
| |
750 |
| @ |
| Humana, Inc. |
| 18,615 |
| |
450 |
| @ |
| Laboratory Corp. Of America Holdings |
| 21,578 |
| |
350 |
|
|
| Manor Care, Inc. |
| 12,058 |
| |
150 |
|
|
| Quest Diagnostics, Inc. |
| 14,063 |
| |
3,810 |
|
|
| UnitedHealth Group, Inc. |
| 315,658 |
| |
930 |
| @ |
| WellPoint Health Networks, Inc. |
| 116,342 |
| |
810 |
| @ |
| WellPoint, Inc. |
| 82,077 |
| |
|
|
|
|
|
| 688,235 |
| |
|
|
|
| Home Builders: 0.0% |
|
|
| |
460 |
|
|
| Centex Corp. |
| 24,136 |
| |
|
|
|
|
|
| 24,136 |
| |
|
|
|
| Home Furnishings: 0.0% |
|
|
| |
640 |
|
|
| Leggett & Platt, Inc. |
| 19,104 |
| |
370 |
|
|
| Whirlpool Corp. |
| 23,884 |
| |
|
|
|
|
|
| 42,988 |
| |
|
|
|
| Household Products/ Wares: 0.0% |
|
|
| |
350 |
|
|
| Avery Dennison Corp. |
| 20,531 |
| |
970 |
|
|
| Clorox Co. |
| 53,467 |
| |
630 |
|
|
| Fortune Brands, Inc. |
| 49,442 |
| |
|
|
|
|
|
| 123,440 |
| |
|
|
|
| Housewares: 0.0% |
|
|
| |
950 |
|
|
| Newell Rubbermaid, Inc. |
| 21,926 |
| |
|
|
|
|
|
| 21,926 |
| |
|
|
|
| Insurance: 0.9% |
|
|
| |
1,540 |
| @@ |
| ACE Ltd. |
| 62,247 |
| |
1,720 |
|
|
| AFLAC, Inc. |
| 64,706 |
| |
3,250 |
|
|
| Allstate Corp. |
| 164,125 |
| |
370 |
|
|
| AMBAC Financial Group, Inc. |
| 30,092 |
| |
14,900 |
|
|
| American International Group, Inc. |
| 943,916 |
| |
1,000 |
|
|
| AON Corp. |
| 21,120 |
| |
1,120 |
|
|
| Chubb Corp. |
| 85,355 |
| |
820 |
|
|
| CIGNA Corp. |
| 57,416 |
| |
609 |
|
|
| Cincinnati Financial Corp. |
| 27,283 |
| |
950 |
|
|
| Hartford Financial Services Group, Inc. |
| 60,800 |
| |
510 |
|
|
| Jefferson-Pilot Corp. |
| 25,087 |
| |
850 |
|
|
| Lincoln National Corp. |
| 39,117 |
| |
900 |
|
|
| Loews Corp. |
| 62,919 |
| |
1,770 |
|
|
| Marsh & McLennan Cos., Inc. |
| 50,604 |
| |
520 |
|
|
| MBIA, Inc. |
| 31,179 |
| |
3,400 |
|
|
| MetLife, Inc. |
| 132,600 |
| |
300 |
|
|
| MGIC Investment Corp. |
| 20,400 |
| |
1,070 |
|
|
| Principal Financial Group |
| 40,318 |
| |
660 |
|
|
| Progressive Corp. |
| 60,053 |
| |
3,020 |
|
|
| Prudential Financial, Inc. |
| 147,829 |
| |
630 |
|
|
| Safeco Corp. |
| 30,536 |
| |
480 |
|
|
| Torchmark Corp. |
| 26,357 |
| |
1,100 |
|
|
| UnumProvident Corp. |
| 17,127 |
| |
450 |
| @@ |
| XL Capital Ltd. |
| 33,912 |
| |
|
|
|
|
|
| 2,235,098 |
| |
|
|
|
| Internet: 0.2% |
|
|
| |
2,150 |
| @ |
| eBay, Inc. |
| 241,767 |
| |
1,750 |
| @ |
| Symantec Corp. |
| 111,668 |
| |
4,450 |
| @ |
| Yahoo!, Inc. |
| 167,409 |
| |
|
|
|
|
|
| 520,844 |
| |
|
|
|
| Iron/ Steel: 0.0% |
|
|
| |
500 |
|
|
| Nucor Corp. |
| 26,450 |
| |
750 |
|
|
| United States Steel Corp. |
| 39,270 |
| |
|
|
|
|
|
| 65,720 |
| |
|
|
|
| Leisure Time: 0.1% |
|
|
| |
340 |
|
|
| Brunswick Corp. |
| 16,599 |
| |
2,100 |
|
|
| Carnival Corp. |
| 111,321 |
| |
1,000 |
|
|
| Harley-Davidson, Inc. |
| 57,820 |
| |
500 |
|
|
| Sabre Holdings Corp. |
| 11,540 |
| |
|
|
|
|
|
| 197,280 |
| |
|
|
|
| Lodging: 0.0% |
|
|
| |
330 |
|
|
| Harrah’s Entertainment, Inc. |
| 20,262 |
| |
1,230 |
|
|
| Hilton Hotels Corp. |
| 25,412 |
| |
800 |
|
|
| Marriott Intl., Inc. |
| 45,479 |
| |
650 |
|
|
| Starwood Hotels & Resorts Worldwide, Inc. |
| 33,989 |
| |
|
|
|
|
|
| 125,142 |
| |
|
|
|
| Machinery — Construction and Mining: 0.0% |
|
|
| |
450 |
|
|
| Caterpillar, Inc. |
| 41,198 |
| |
|
|
|
|
|
| 41,198 |
| |
|
|
|
| Machinery — Diversified: 0.0% |
|
|
| |
880 |
|
|
| Deere & Co. |
| 63,122 |
| |
790 |
|
|
| Rockwell Automation, Inc. |
| 37,367 |
| |
|
|
|
|
|
| 100,489 |
| |
|
|
|
| Media: 0.4% |
|
|
| |
750 |
|
|
| Clear Channel Communications, Inc. |
| 25,260 |
| |
7,550 |
| @ |
| Comcast Corp. |
| 226,802 |
| |
910 |
|
|
| Gannett Co., Inc. |
| 75,066 |
| |
260 |
|
|
| Knight-Ridder, Inc. |
| 17,703 |
| |
860 |
|
|
| McGraw-Hill Cos., Inc. |
| 75,448 |
| |
220 |
|
|
| Meredith Corp. |
| 11,598 |
| |
500 |
|
|
| New York Times Co. |
| 20,500 |
| |
15,100 |
| @ |
| Time Warner, Inc. |
| 267,422 |
| |
420 |
|
|
| Tribune Co. |
| 18,215 |
| |
400 |
| @ |
| Univision Communications, Inc. |
| 12,040 |
| |
2,360 |
|
|
| Viacom, Inc. |
| 81,892 |
| |
7,070 |
|
|
| Walt Disney Co. |
| 190,042 |
| |
|
|
|
|
|
| 1,021,988 |
| |
|
|
|
| Mining: 0.0% |
|
|
| |
470 |
|
|
| Phelps Dodge Corp. |
| 45,651 |
| |
|
|
|
|
|
| 45,651 |
| |
See Accompanying Notes to Financial Statements
62
Shares |
|
|
|
|
| Value |
| |
|
|
|
| Miscellaneous Manufacturing: 0.8% |
|
|
| |
2,650 |
|
|
| 3M Co. |
| $ | 210,914 |
|
260 |
|
|
| Cooper Industries Ltd. |
| 17,241 |
| |
1,000 |
|
|
| Danaher Corp. |
| 56,880 |
| |
750 |
|
|
| Dover Corp. |
| 30,338 |
| |
960 |
|
|
| Eastman Kodak Co. |
| 31,402 |
| |
480 |
|
|
| Eaton Corp. |
| 32,352 |
| |
35,780 |
|
|
| General Electric Co. |
| 1,265,180 |
| |
2,820 |
|
|
| Honeywell International, Inc. |
| 99,631 |
| |
1,050 |
|
|
| Illinois Tool Works, Inc. |
| 98,942 |
| |
570 |
| @@ |
| Ingersoll-Rand Co. |
| 42,419 |
| |
250 |
|
|
| ITT Industries, Inc. |
| 21,280 |
| |
400 |
|
|
| Pall Corp. |
| 10,836 |
| |
520 |
|
|
| Textron, Inc. |
| 37,762 |
| |
6,800 |
| @@ |
| Tyco Intl. Ltd. |
| 230,995 |
| |
|
|
|
|
|
| 2,186,172 |
| |
|
|
|
| Office/ Business Equipment: 0.0% |
|
|
| |
720 |
|
|
| Pitney Bowes, Inc. |
| 31,514 |
| |
2,640 |
| @ |
| Xerox Corp. |
| 40,445 |
| |
|
|
|
|
|
| 71,959 |
| |
|
|
|
| Oil and Gas: 1.2% |
|
|
| |
280 |
|
|
| Amerada Hess Corp. |
| 24,878 |
| |
1,050 |
|
|
| Anadarko Petroleum Corp. |
| 73,080 |
| |
1,094 |
|
|
| Apache Corp. |
| 59,142 |
| |
2,120 |
|
|
| Burlington Resources, Inc. |
| 98,389 |
| |
11,150 |
|
|
| ChevronTexaco Corp. |
| 608,789 |
| |
2,866 |
|
|
| ConocoPhillips |
| 260,776 |
| |
2,640 |
|
|
| Devon Energy Corp. |
| 109,349 |
| |
400 |
|
|
| EOG Resources, Inc. |
| 30,028 |
| |
27,290 |
|
|
| Exxon Mobil Corp. |
| 1,398,612 |
| |
500 |
|
|
| Kerr-McGee Corp. |
| 31,115 |
| |
1,370 |
|
|
| Marathon Oil Corp. |
| 54,033 |
| |
180 |
| @,@@ |
| Nabors Industries Ltd. |
| 9,360 |
| |
450 |
| @ |
| Noble Corp. |
| 21,803 |
| |
1,370 |
|
|
| Occidental Petroleum Corp. |
| 82,488 |
| |
400 |
|
|
| Sunoco, Inc. |
| 33,024 |
| |
950 |
| @ |
| Transocean, Inc. |
| 38,257 |
| |
1,000 |
|
|
| Unocal Corp. |
| 46,040 |
| |
1,200 |
|
|
| Valero Energy Corp. |
| 56,148 |
| |
|
|
|
|
|
| 3,035,311 |
| |
|
|
|
| Oil and Gas Services: 0.0% |
|
|
| |
1,100 |
|
|
| Baker Hughes, Inc. |
| 48,763 |
| |
500 |
|
|
| BJ Services Co. |
| 25,335 |
| |
1,350 |
|
|
| Halliburton Co. |
| 55,823 |
| |
|
|
|
|
|
| 129,921 |
| |
|
|
|
| Packaging and Containers: 0.0% |
|
|
| |
540 |
|
|
| Ball Corp. |
| 24,153 |
| |
340 |
|
|
| Bemis Co. |
| 9,466 |
| |
880 |
| @ |
| Pactiv Corp. |
| 21,868 |
| |
250 |
| @ |
| Sealed Air Corp. |
| 12,853 |
| |
|
|
|
|
|
| 68,340 |
| |
|
|
|
| Pharmaceuticals: 0.8% |
|
|
| |
5,250 |
|
|
| Abbott Laboratories |
| 220,290 |
| |
450 |
|
|
| Allergan, Inc. |
| 33,075 |
| |
350 |
|
|
| AmerisourceBergen Corp. |
| 20,629 |
| |
6,500 |
|
|
| Bristol-Myers Squibb Co. |
| 152,750 |
| |
1,500 |
|
|
| Cardinal Health, Inc. |
| 78,420 |
| |
2,600 |
| @ |
| Caremark Rx, Inc. |
| 92,976 |
| |
1,550 |
|
|
| Eli Lilly & Co. |
| 82,662 |
| |
250 |
| @ |
| Express Scripts, Inc. |
| 17,990 |
| |
1,210 |
| @ |
| Forest Laboratories, Inc. |
| 47,154 |
| |
1,500 |
| @ |
| Gilead Sciences, Inc. |
| 51,690 |
| |
550 |
| @ |
| Hospira, Inc. |
| 17,727 |
| |
980 |
| @ |
| King Pharmaceuticals, Inc. |
| 12,201 |
| |
949 |
| @ |
| Medco Health Solutions, Inc. |
| 35,796 |
| |
7,600 |
|
|
| Merck & Co., Inc. |
| 212,952 |
| |
25,634 |
|
|
| Pfizer, Inc. |
| 711,855 |
| |
4,900 |
|
|
| Schering-Plough Corp. |
| 87,465 |
| |
4,600 |
|
|
| Wyeth |
| 183,402 |
| |
|
|
|
|
|
| 2,059,034 |
| |
|
|
|
| Pipelines: 0.0% |
|
|
| |
1,850 |
|
|
| El Paso Corp. |
| 19,314 |
| |
150 |
|
|
| Kinder Morgan, Inc. |
| 10,395 |
| |
1,750 |
|
|
| Williams Cos., Inc. |
| 29,173 |
| |
|
|
|
|
|
| 58,882 |
| |
|
|
|
| Real Estate Investment Trusts: 0.0% |
|
|
| |
550 |
|
|
| Equity Office Properties Trust |
| 15,098 |
| |
600 |
|
|
| ProLogis |
| 24,138 |
| |
710 |
|
|
| Simon Property Group, Inc. |
| 44,076 |
| |
|
|
|
|
|
| 83,312 |
| |
|
|
|
| Retail: 1.3% |
|
|
| |
1,000 |
| @ |
| Bed Bath & Beyond, Inc. |
| 39,928 |
| |
1,100 |
|
|
| Best Buy Co., Inc. |
| 62,018 |
| |
950 |
|
|
| Circuit City Stores, Inc. |
| 14,811 |
| |
2,650 |
|
|
| Costco Wholesale Corp. |
| 128,790 |
| |
1,310 |
|
|
| CVS Corp. |
| 59,435 |
| |
600 |
|
|
| Darden Restaurants, Inc. |
| 16,356 |
| |
770 |
|
|
| Federated Department Stores, Inc. |
| 42,196 |
| |
4,020 |
|
|
| Gap, Inc. |
| 87,837 |
| |
12,550 |
|
|
| Home Depot, Inc. |
| 523,962 |
| |
1,600 |
|
|
| J.C. Penney Co., Inc. Holding Co. |
| 61,760 |
| |
450 |
| @ |
| Kohl’s Corp. |
| 20,772 |
| |
2,130 |
|
|
| Limited Brands, Inc. |
| 52,057 |
| |
2,670 |
|
|
| Lowe’s Cos., Inc. |
| 147,731 |
| |
950 |
|
|
| May Department Stores Co. |
| 26,714 |
| |
4,250 |
|
|
| McDonald’s Corp. |
| 130,645 |
| |
450 |
|
|
| Nordstrom, Inc. |
| 19,688 |
| |
1,730 |
| @ |
| Office Depot, Inc. |
| 28,372 |
| |
890 |
|
|
| RadioShack Corp. |
| 28,097 |
| |
2,220 |
|
|
| Staples, Inc. |
| 70,840 |
| |
1,350 |
| @ |
| Starbucks Corp. |
| 75,951 |
| |
3,050 |
|
|
| Target Corp. |
| 156,221 |
| |
1,630 |
|
|
| TJX Cos., Inc. |
| 38,370 |
| |
950 |
| @ |
| Toys R US, Inc. |
| 18,373 |
| |
14,270 |
|
|
| Wal-Mart Stores, Inc. |
| 742,895 |
| |
4,700 |
|
|
| Walgreen Co. |
| 179,446 |
| |
510 |
|
|
| Wendy’s Intl., Inc. |
| 18,192 |
| |
970 |
|
|
| Yum! Brands, Inc. |
| 44,038 |
| |
|
|
|
|
|
| 2,835,495 |
| |
|
|
|
| Savings and Loans: 0.1% |
|
|
| |
500 |
|
|
| Golden West Financial Corp. |
| 59,620 |
| |
450 |
|
|
| Sovereign Bancorp, Inc. |
| 9,833 |
| |
3,120 |
|
|
| Washington Mutual, Inc. |
| 127,015 |
| |
|
|
|
|
|
| 196,468 |
| |
|
|
|
| Semiconductors: 0.3% |
|
|
| |
1,800 |
| @ |
| Altera Corp. |
| 40,824 |
| |
1,240 |
|
|
| Analog Devices, Inc. |
| 45,818 |
| |
5,740 |
| @ |
| Applied Materials, Inc. |
| 95,514 |
| |
21,850 |
|
|
| Intel Corp. |
| 488,347 |
| |
650 |
| @ |
| KLA-Tencor Corp. |
| 29,289 |
| |
1,050 |
|
|
| Linear Technology Corp. |
| 40,068 |
| |
450 |
|
|
| Maxim Integrated Products, Inc. |
| 18,432 |
| |
1,300 |
| @ |
| National Semiconductor Corp. |
| 20,098 |
| |
2,350 |
|
|
| Texas Instruments, Inc. |
| 56,823 |
| |
|
|
|
|
|
| 835,213 |
| |
|
|
|
| Software: 0.7% |
|
|
| |
810 |
|
|
| Adobe Systems, Inc. |
| 49,054 |
| |
560 |
|
|
| Autodesk, Inc. |
| 36,630 |
| |
See Accompanying Notes to Financial Statements
63
Shares |
|
|
|
|
| Value |
| |
|
|
|
| Software (continued) |
|
|
| |
1,920 |
|
|
| Automatic Data Processing, Inc. |
| $ | 87,418 |
|
1,210 |
| @ |
| BMC Software, Inc. |
| 22,482 |
| |
850 |
| @ |
| Citrix Systems, Inc. |
| 20,069 |
| |
1,980 |
|
|
| Computer Associates Intl., Inc. |
| 60,449 |
| |
1,900 |
| @ |
| Compuware Corp. |
| 10,963 |
| |
400 |
| @ |
| Electronic Arts, Inc. |
| 19,560 |
| |
2,824 |
|
|
| First Data Corp. |
| 116,037 |
| |
760 |
| @ |
| Fiserv, Inc. |
| 29,268 |
| |
1,250 |
|
|
| IMS Health, Inc. |
| 28,213 |
| |
650 |
| @ |
| Intuit, Inc. |
| 27,196 |
| |
36,850 |
|
|
| Microsoft Corp. |
| 987,948 |
| |
2,100 |
| @ |
| Novell, Inc. |
| 12,810 |
| |
30,130 |
| @ |
| Oracle Corp. |
| 381,445 |
| |
1,000 |
| @ |
| PeopleSoft, Inc. |
| 23,610 |
| |
2,650 |
| @ |
| Siebel Systems, Inc. |
| 26,712 |
| |
1,380 |
| @ |
| Veritas Software Corp. |
| 30,222 |
| |
|
|
|
|
|
| 1,970,086 |
| |
|
|
|
| Telecommunications: 1.0% |
|
|
| |
1,480 |
|
|
| Alltel Corp. |
| 83,901 |
| |
1,038 |
|
|
| AT&T Corp. |
| 18,995 |
| |
1,350 |
| @ |
| Avaya, Inc. |
| 22,167 |
| |
6,300 |
|
|
| BellSouth Corp. |
| 168,966 |
| |
680 |
|
|
| CenturyTel, Inc. |
| 22,386 |
| |
23,320 |
| @ |
| Cisco Systems, Inc. |
| 436,317 |
| |
800 |
|
|
| Citizens Communications Co. |
| 11,440 |
| |
710 |
| @ |
| Comverse Technology, Inc. |
| 15,102 |
| |
4,700 |
| @ |
| Corning, Inc. |
| 59,126 |
| |
14,100 |
| @ |
| Lucent Technologies, Inc. |
| 55,413 |
| |
10,750 |
|
|
| Motorola, Inc. |
| 207,045 |
| |
3,750 |
| @ |
| Nextel Communications, Inc. |
| 106,725 |
| |
5,400 |
|
|
| Qualcomm, Inc. |
| 224,748 |
| |
6,350 |
| @ |
| Qwest Communications Intl., Inc. |
| 25,400 |
| |
11,400 |
|
|
| SBC Communications, Inc. |
| 286,938 |
| |
770 |
|
|
| Scientific-Atlanta, Inc. |
| 22,807 |
| |
4,950 |
|
|
| Sprint Corp. |
| 112,910 |
| |
1,720 |
| @ |
| Tellabs, Inc. |
| 14,706 |
| |
9,490 |
|
|
| Verizon Communications, Inc. |
| 391,273 |
| |
|
|
|
|
|
| 2,286,365 |
| |
|
|
|
| Textiles: 0.0% |
|
|
| |
550 |
|
|
| Cintas Corp. |
| 24,596 |
| |
|
|
|
|
|
| 24,596 |
| |
|
|
|
| Toys/ Games/ Hobbies: 0.0% |
|
|
| |
920 |
|
|
| Hasbro, Inc. |
| 17,508 |
| |
1,400 |
|
|
| Mattel, Inc. |
| 26,530 |
| |
|
|
|
|
|
| 44,038 | �� | |
|
|
|
| Transportation: 0.2% |
|
|
| |
1,210 |
|
|
| Burlington Northern Santa Fe Corp. |
| 54,498 |
| |
750 |
|
|
| CSX Corp. |
| 28,598 |
| |
1,400 |
|
|
| FedEx Corp. |
| 133,042 |
| |
1,800 |
|
|
| Norfolk Southern Corp. |
| 61,794 |
| |
270 |
|
|
| Ryder System, Inc. |
| 14,483 |
| |
350 |
|
|
| Union Pacific Corp. |
| 22,204 |
| |
3,880 |
|
|
| United Parcel Service, Inc. |
| 326,502 |
| |
|
|
|
|
|
| 641,121 |
| |
|
|
|
| Total Common Stock |
| 38,519,981 |
| |
Principal |
|
|
|
|
| Value |
| |||||||
|
|
|
|
|
|
|
| |||||||
U.S. GOVERNMENT AGENCY OBLIGATIONS: 72.6% |
|
|
| |||||||||||
|
|
|
| Federal National Mortgage Association: 72.6% |
|
|
| |||||||
$ | 5,000,000 |
|
|
| 3.320%, due 07/24/06, STRIP |
| $ | 4,738,175 |
| |||||
200,000,000 |
|
|
| 3.390%, due 10/11/06 |
| 187,956,200 |
| |||||||
|
|
|
|
|
|
|
| |||||||
|
|
|
| Total U.S. Government Agency Obligations (Cost $188,720,865) |
| 192,694,375 |
| |||||||
|
|
|
|
|
|
|
| |||||||
U.S. TREASURY OBLIGATIONS: 12.9% |
|
|
| |||||||||||
|
|
|
| U.S. Treasury STRIP: 12.9% |
|
|
| |||||||
16,863,000 |
|
|
| 2.880%, due 05/15/06 |
| 16,180,200 |
| |||||||
19,394,000 |
|
|
| 3.090%, due 02/15/07 |
| 18,137,560 |
| |||||||
|
|
|
|
|
|
|
| |||||||
|
|
|
| Total U.S. Treasury Obligations |
| 34,317,760 |
| |||||||
|
|
|
|
|
|
|
| |||||||
|
|
|
| Total Long-Term Investments |
| 265,532,116 |
| |||||||
|
|
|
|
|
|
|
| |||||||
SHORT-TERM INVESTMENTS: 0.4% |
|
|
| |||||||||||
|
|
|
| Repurchase Agreement: 0.4% |
|
|
| |||||||
1,193,000 |
|
|
| Goldman Sachs Repurchase Agreement dated 11/30/04, 2.060% due 12/01/04, $1,193,068 to be received upon repurchase (Collateralized by $1,151,000 Federal Home Loan Mortgage Corporation, 5.500%, Market Value plus accrued interest $1,217,902, due 07/15/06) |
| 1,193,000 |
| |||||||
|
|
|
|
|
|
|
| |||||||
|
|
|
| Total Short-Term Investments |
| 1,193,000 |
| |||||||
|
|
|
|
|
|
|
| |||||||
|
| Total Investments In Securities |
| 100.4 | % | $ | 266,725,116 |
| ||||||
|
| Other Assets and Liabilities-Net |
| (0.4 | ) | (1,049,418 | ) | |||||||
|
|
|
|
|
|
|
| |||||||
|
| Net Assets |
| 100.0 | % | $ | 265,675,698 |
| ||||||
@ |
| Non-income producing security |
@@ |
| Foreign issuer |
STRIP |
| Separate Trading of Registered Interest and Principal of Securities |
* |
| Cost for federal income tax purposes is $256,854,085. Net unrealized appreciation consists of: |
Gross Unrealized Appreciation |
| $ | 10,354,760 |
| |
Gross Unrealized Depreciation |
| (483,729 | ) | ||
Net Unrealized Appreciation |
| $ | 9,871,031 |
| |
See Accompanying Notes to Financial Statements
64
ING PRINCIPAL PROTECTION FUND II
PORTFOLIO OF INVESTMENTS
AS OF NOVEMBER 30, 2004 (UNAUDITED)
Shares |
|
|
|
|
| Value |
| |
COMMON STOCK: 9.1% |
|
|
| |||||
|
|
|
| Advertising: 0.0% |
|
|
| |
450 |
| @ |
| Interpublic Group of Cos., Inc. |
| $ | 5,585 |
|
550 |
|
|
| Omnicom Group, Inc. |
| 44,550 |
| |
|
|
|
|
|
| 50,135 |
| |
|
|
|
| Aerospace/Defense: 0.2% |
|
|
| |
4,370 |
|
|
| Boeing Co. |
| 234,101 |
| |
1,000 |
|
|
| General Dynamics Corp. |
| 108,360 |
| |
330 |
|
|
| Goodrich Corp. |
| 10,478 |
| |
1,360 |
|
|
| Lockheed Martin Corp. |
| 82,742 |
| |
1,100 |
|
|
| Northrop Grumman Corp. |
| 61,963 |
| |
2,400 |
|
|
| Raytheon Co. |
| 96,816 |
| |
540 |
|
|
| Rockwell Collins, Inc. |
| 21,524 |
| |
1,590 |
|
|
| United Technologies Corp. |
| 155,152 |
| |
|
|
|
|
|
| 771,136 |
| |
|
|
|
| Agriculture: 0.1% |
|
|
| |
6,370 |
|
|
| Altria Group, Inc. |
| 366,211 |
| |
1,950 |
|
|
| Archer-Daniels-Midland Co. |
| 41,340 |
| |
850 |
|
|
| Monsanto Co. |
| 39,117 |
| |
450 |
|
|
| Reynolds American, Inc. |
| 34,034 |
| |
900 |
|
|
| UST, Inc. |
| 39,627 |
| |
|
|
|
|
|
| 520,329 |
| |
|
|
|
| Apparel: 0.1% |
|
|
| |
800 |
| @ |
| Coach, Inc. |
| 39,872 |
| |
600 |
|
|
| Jones Apparel Group, Inc. |
| 21,318 |
| |
530 |
|
|
| Liz Claiborne, Inc. |
| 21,767 |
| |
1,330 |
|
|
| Nike, Inc. |
| 112,597 |
| |
250 |
|
|
| Reebok Intl. Ltd. |
| 9,720 |
| |
550 |
|
|
| VF Corp. |
| 29,695 |
| |
|
|
|
|
|
| 234,969 |
| |
|
|
|
| Auto Manufacturers: 0.1% |
|
|
| |
9,490 |
|
|
| Ford Motor Co. |
| 134,568 |
| |
1,750 |
|
|
| General Motors Corp. |
| 67,533 |
| |
840 |
|
|
| PACCAR, Inc. |
| 65,604 |
| |
|
|
|
|
|
| 267,705 |
| |
|
|
|
| Auto Parts and Equipment: 0.0% |
|
|
| |
550 |
|
|
| Dana Corp. |
| 8,993 |
| |
570 |
|
|
| Johnson Controls, Inc. |
| 34,998 |
| |
|
|
|
|
|
| 43,991 |
| |
|
|
|
| Banks: 0.6% |
|
|
| |
1,100 |
|
|
| AmSouth Bancorporation |
| 28,523 |
| |
12,288 |
|
|
| Bank of America Corp. |
| 568,566 |
| |
1,700 |
|
|
| BB&T Corp. |
| 72,165 |
| |
750 |
|
|
| Comerica, Inc. |
| 46,125 |
| |
700 |
|
|
| Fifth Third Bancorp |
| 35,252 |
| |
480 |
|
|
| First Horizon National Corp. |
| 20,976 |
| |
870 |
|
|
| Huntington Bancshares, Inc. |
| 21,106 |
| |
1,730 |
|
|
| KeyCorp |
| 57,592 |
| |
350 |
|
|
| M & T Bank Corp. |
| 36,894 |
| |
860 |
|
|
| Marshall & Ilsley Corp. |
| 35,853 |
| |
1,200 |
|
|
| Mellon Financial Corp. |
| 35,064 |
| |
2,800 |
|
|
| National City Corp. |
| 103,824 |
| |
600 |
|
|
| North Fork Bancorporation, Inc. |
| 17,280 |
| |
650 |
|
|
| Northern Trust Corp. |
| 30,576 |
| |
820 |
|
|
| PNC Financial Services Group, Inc. |
| 44,608 |
| |
1,414 |
|
|
| Regions Financial Corp. |
| 49,476 |
| |
390 |
|
|
| State Street Corp. |
| 17,378 |
| |
1,100 |
|
|
| SunTrust Banks, Inc. |
| 78,430 |
| |
400 |
|
|
| Synovus Financial Corp. |
| 10,800 |
| |
950 |
|
|
| The Bank of New York Co., Inc. |
| 31,265 |
| |
5,680 |
|
|
| U.S. Bancorp |
| 168,298 |
| |
6,620 |
|
|
| Wachovia Corp. |
| 342,585 |
| |
5,200 |
|
|
| Wells Fargo & Co. |
| 321,204 |
| |
120 |
|
|
| Zions Bancorporation |
| 7,980 |
| |
|
|
|
|
|
| 2,181,820 |
| |
|
|
|
| Beverages: 0.2% |
|
|
| |
150 |
|
|
| Adolph Coors Co. |
| 11,235 |
| |
2,500 |
|
|
| Anheuser-Busch Cos., Inc. |
| 125,225 |
| |
340 |
|
|
| Brown-Forman Corp. |
| 16,327 |
| |
7,490 |
|
|
| Coca-Cola Co. |
| 294,433 |
| |
1,430 |
|
|
| Coca-Cola Enterprises, Inc. |
| 29,744 |
| |
1,120 |
|
|
| Pepsi Bottling Group, Inc. |
| 31,382 |
| |
5,240 |
|
|
| PepsiCo, Inc. |
| 261,528 |
| |
|
|
|
|
|
| 769,874 |
| |
|
|
|
| Biotechnology: 0.1% |
|
|
| |
3,918 |
| @ |
| Amgen, Inc. |
| 235,237 |
| |
1,000 |
| @ |
| Biogen Idec, Inc. |
| 58,680 |
| |
700 |
| @ |
| Genzyme Corp. |
| 39,207 |
| |
700 |
| @ |
| MedImmune, Inc. |
| 18,620 |
| |
200 |
| @ |
| Millipore Corp. |
| 9,744 |
| |
|
|
|
|
|
| 361,488 |
| |
|
|
|
| Building Materials: 0.0% |
|
|
| |
920 |
| @ |
| American Standard Cos., Inc. |
| 35,825 |
| |
1,300 |
|
|
| Masco Corp. |
| 45,851 |
| |
400 |
|
|
| Vulcan Materials Co. |
| 20,740 |
| |
|
|
|
|
|
| 102,416 |
| |
|
|
|
| Chemicals: 0.2% |
|
|
| |
700 |
|
|
| Air Products & Chemicals, Inc. |
| 40,075 |
| |
250 |
|
|
| Ashland, Inc. |
| 14,788 |
| |
3,000 |
|
|
| Dow Chemical Co. |
| 151,409 |
| |
3,100 |
|
|
| E.I. du Pont de Nemours & Co. |
| 140,492 |
| |
250 |
|
|
| Eastman Chemical Co. |
| 13,595 |
| |
330 |
|
|
| Ecolab, Inc. |
| 11,543 |
| |
550 |
|
|
| Engelhard Corp. |
| 16,440 |
| |
430 |
|
|
| International Flavors & Fragrances, Inc. |
| 17,415 |
| |
970 |
|
|
| PPG Industries, Inc. |
| 65,446 |
| |
980 |
|
|
| Praxair, Inc. |
| 44,002 |
| |
610 |
|
|
| Rohm & Haas Co. |
| 26,895 |
| |
650 |
|
|
| Sherwin-Williams Co. |
| 28,990 |
| |
250 |
|
|
| Sigma-Aldrich Corp. |
| 14,933 |
| |
|
|
|
|
|
| 586,023 |
| |
|
|
|
| Commercial Services: 0.1% |
|
|
| |
500 |
| @ |
| Apollo Group, Inc. |
| 39,850 |
| |
3,250 |
|
|
| Cendant Corp. |
| 73,677 |
| |
120 |
|
|
| Deluxe Corp. |
| 4,745 |
| |
560 |
|
|
| Equifax, Inc. |
| 15,467 |
| |
670 |
|
|
| H&R Block, Inc. |
| 31,959 |
| |
900 |
|
|
| McKesson Corp. |
| 26,595 |
| |
450 |
|
|
| Moody’s Corp. |
| 36,338 |
| |
1,150 |
|
|
| Paychex, Inc. |
| 38,134 |
| |
400 |
|
|
| R.R. Donnelley & Sons Co. |
| 13,880 |
| |
790 |
|
|
| Robert Half Intl., Inc. |
| 21,354 |
| |
|
|
|
|
|
| 301,999 |
| |
|
|
|
| Computers: 0.5% |
|
|
| |
400 |
| @ |
| Affiliated Computer Services, Inc. |
| 23,672 |
| |
1,950 |
| @ |
| Apple Computer, Inc. |
| 130,748 |
| |
600 |
| @ |
| Computer Sciences Corp. |
| 32,460 |
| |
10,230 |
| @ |
| Dell, Inc. |
| 414,519 |
| |
1,600 |
|
|
| Electronic Data Systems Corp. |
| 35,920 |
| |
7,300 |
| @ |
| EMC Corp. |
| 97,966 |
| |
1,050 |
| @ |
| Gateway, Inc. |
| 7,151 |
| |
9,302 |
|
|
| Hewlett-Packard Co. |
| 186,040 |
| |
6,890 |
|
|
| International Business Machines Corp. |
| 649,313 |
| |
370 |
| @ |
| Lexmark Intl., Inc. |
| 31,413 |
| |
See Accompanying Notes to Financial Statements
65
Shares |
|
|
|
|
| Value |
| |
|
|
|
| Computers (continued) |
|
|
| |
450 |
| @ |
| NCR Corp. |
| $ | 26,879 |
|
1,050 |
| @ |
| Network Appliance, Inc. |
| 31,668 |
| |
17,550 |
| @ |
| Sun Microsystems, Inc. |
| 97,403 |
| |
940 |
| @ |
| Sungard Data Systems, Inc. |
| 24,919 |
| |
1,100 |
| @ |
| Unisys Corp. |
| 12,639 |
| |
|
|
|
|
|
| 1,802,710 |
| |
|
|
|
| Cosmetics/Personal Care: 0.3% |
|
|
| |
375 |
|
|
| Alberto-Culver Co. |
| 17,363 |
| |
1,400 |
|
|
| Avon Products, Inc. |
| 52,556 |
| |
1,550 |
|
|
| Colgate-Palmolive Co. |
| 71,285 |
| |
5,170 |
|
|
| Gillette Co. |
| 224,843 |
| |
2,050 |
|
|
| Kimberly-Clark Corp. |
| 130,401 |
| |
13,110 |
|
|
| Procter & Gamble Co. |
| 701,122 |
| |
|
|
|
|
|
| 1,197,570 |
| |
|
|
|
| Distribution/Wholesale: 0.0% |
|
|
| |
500 |
|
|
| Genuine Parts Co. |
| 21,705 |
| |
500 |
|
|
| W.W. Grainger, Inc. |
| 30,930 |
| |
|
|
|
|
|
| 52,635 |
| |
|
|
|
| Diversified Financial Services: 0.7% |
|
|
| |
3,920 |
|
|
| American Express Co. |
| 218,382 |
| |
330 |
|
|
| Bear Stearns Cos., Inc. |
| 32,201 |
| |
690 |
|
|
| Capital One Financial Corp. |
| 54,220 |
| |
900 |
|
|
| CIT Group, Inc. |
| 38,475 |
| |
15,750 |
|
|
| Citigroup, Inc. |
| 704,812 |
| |
2,860 |
|
|
| Countrywide Financial Corp. |
| 94,981 |
| |
1,200 |
| @ |
| E*TRADE Financial Corp. |
| 16,632 |
| |
2,980 |
|
|
| Fannie Mae |
| 204,725 |
| |
300 |
|
|
| Federated Investors, Inc. |
| 8,826 |
| |
750 |
|
|
| Franklin Resources, Inc. |
| 49,223 |
| |
2,040 |
|
|
| Freddie Mac |
| 139,250 |
| |
1,500 |
|
|
| Goldman Sachs Group, Inc. |
| 157,140 |
| |
4,394 |
|
|
| J.P. Morgan Chase & Co. |
| 165,434 |
| |
750 |
|
|
| Janus Capital Group, Inc. |
| 12,413 |
| |
840 |
|
|
| Lehman Brothers Holdings, Inc. |
| 70,375 |
| |
3,775 |
|
|
| MBNA Corp. |
| 100,264 |
| |
2,860 |
|
|
| Merrill Lynch & Co., Inc. |
| 159,331 |
| |
1,350 |
|
|
| Morgan Stanley |
| 68,513 |
| |
900 |
| @ |
| Providian Financial Corp. |
| 14,445 |
| |
1,410 |
|
|
| SLM Corp. |
| 72,150 |
| |
|
|
|
|
|
| 2,381,792 |
| |
|
|
|
| Electric: 0.2% |
|
|
| |
1,900 |
| @ |
| AES Corp. |
| 23,256 |
| |
250 |
|
|
| Ameren Corp. |
| 12,105 |
| |
1,400 |
|
|
| American Electric Power Co., Inc. |
| 47,838 |
| |
250 |
|
|
| Cinergy Corp. |
| 10,348 |
| |
750 |
|
|
| Consolidated Edison, Inc. |
| 32,888 |
| |
700 |
|
|
| Constellation Energy Group, Inc. |
| 30,590 |
| |
400 |
|
|
| Dominion Resources, Inc. |
| 26,188 |
| |
550 |
|
|
| DTE Energy Co. |
| 24,134 |
| |
3,900 |
|
|
| Duke Energy Corp. |
| 98,591 |
| |
1,240 |
|
|
| Edison Intl. |
| 39,556 |
| |
700 |
|
|
| Entergy Corp. |
| 45,374 |
| |
2,000 |
|
|
| Exelon Corp. |
| 83,420 |
| |
1,000 |
|
|
| FirstEnergy Corp. |
| 42,230 |
| |
680 |
|
|
| FPL Group, Inc. |
| 47,824 |
| |
1,300 |
| @ |
| PG&E Corp. |
| 43,238 |
| |
250 |
|
|
| Pinnacle West Capital Corp. |
| 11,050 |
| |
810 |
|
|
| PPL Corp. |
| 42,080 |
| |
750 |
|
|
| Public Service Enterprise Group, Inc. |
| 32,993 |
| |
2,260 |
|
|
| Southern Co. |
| 74,105 |
| |
1,250 |
|
|
| TXU Corp. |
| 78,525 |
| |
1,650 |
|
|
| Xcel Energy, Inc. |
| 29,799 |
| |
|
|
|
|
|
| 876,132 |
| |
|
|
|
| Electrical Components and Equipment: 0.0% |
|
|
| |
1,730 |
|
|
| Emerson Electric Co. |
| 115,599 |
| |
|
|
|
|
|
| 115,599 |
| |
|
|
|
| Electronics: 0.1% |
|
|
| |
1,400 |
| @ |
| Agilent Technologies, Inc. |
| 32,045 |
| |
590 |
|
|
| Applera Corp. — Applied Biosystems Group |
| 12,095 |
| |
350 |
| @ |
| Fisher Scientific Intl. |
| 19,789 |
| |
540 |
| @ |
| Jabil Circuit, Inc. |
| 13,532 |
| |
400 |
|
|
| Parker Hannifin Corp. |
| 29,920 |
| |
550 |
|
|
| PerkinElmer, Inc. |
| 11,732 |
| |
700 |
| @ |
| Sanmina-SCI Corp. |
| 6,181 |
| |
2,350 |
| @ |
| Solectron Corp. |
| 14,688 |
| |
350 |
|
|
| Tektronix, Inc. |
| 10,980 |
| |
700 |
| @ |
| Thermo Electron Corp. |
| 21,175 |
| |
400 |
| @ |
| Waters Corp. |
| 18,664 |
| |
|
|
|
|
|
| 190,801 |
| |
|
|
|
| Engineering and Construction: 0.0% |
|
|
| |
300 |
|
|
| Fluor Corp. |
| 15,570 |
| |
|
|
|
|
|
| 15,570 |
| |
|
|
|
| Entertainment: 0.0% |
|
|
| |
1,080 |
|
|
| International Game Technology |
| 38,178 |
| |
|
|
|
|
|
| 38,178 |
| |
|
|
|
| Environmental Control: 0.0% |
|
|
| |
1,880 |
|
|
| Waste Management, Inc. |
| 56,043 |
| |
|
|
|
|
|
| 56,043 |
| |
|
|
|
| Food: 0.1% |
|
|
| |
1,150 |
|
|
| Albertson’s, Inc. |
| 29,095 |
| |
500 |
|
|
| Campbell Soup Co. |
| 14,265 |
| |
1,550 |
|
|
| ConAgra Foods, Inc. |
| 41,928 |
| |
1,150 |
|
|
| General Mills, Inc. |
| 52,313 |
| |
1,050 |
|
|
| H.J. Heinz Co. |
| 39,018 |
| |
800 |
|
|
| Hershey Foods Corp. |
| 41,440 |
| |
1,120 |
|
|
| Kellogg Co. |
| 48,944 |
| |
900 |
| @ |
| Kroger Co. |
| 14,562 |
| |
450 |
|
|
| McCormick & Co., Inc. |
| 16,403 |
| |
2,220 |
|
|
| Sara Lee Corp. |
| 52,126 |
| |
510 |
|
|
| SUPERVALU, Inc. |
| 16,111 |
| |
900 |
|
|
| Wm. Wrigley Jr. Co. |
| 61,919 |
| |
|
|
|
|
|
| 428,124 |
| |
|
|
|
| Forest Products and Paper: 0.1% |
|
|
| |
800 |
|
|
| Georgia-Pacific Corp. |
| 29,288 |
| |
1,590 |
|
|
| International Paper Co. |
| 66,017 |
| |
500 |
|
|
| Louisiana-Pacific Corp. |
| 12,235 |
| |
600 |
|
|
| MeadWestvaco Corp. |
| 20,190 |
| |
600 |
|
|
| Plum Creek Timber Co., Inc. |
| 22,200 |
| |
250 |
|
|
| Temple-Inland, Inc. |
| 14,898 |
| |
1,050 |
|
|
| Weyerhaeuser Co. |
| 69,299 |
| |
|
|
|
|
|
| 234,127 |
| |
|
|
|
| Gas: 0.0% |
|
|
| |
570 |
|
|
| KeySpan Corp. |
| 22,526 |
| |
860 |
|
|
| Sempra Energy |
| 31,803 |
| |
|
|
|
|
|
| 54,329 |
| |
See Accompanying Notes to Financial Statements
66
Shares |
|
|
|
|
| Value |
| |
|
|
|
| Hand/Machine Tools: 0.0% |
|
|
| |
400 |
|
|
| Black & Decker Corp. |
| $ | 33,636 |
|
120 |
|
|
| Snap-On, Inc. |
| 3,793 |
| |
380 |
|
|
| Stanley Works |
| 17,769 |
| |
|
|
|
|
|
| 55,198 |
| |
|
|
|
| Healthcare — Products: 0.4% |
|
|
| |
150 |
|
|
| Bausch & Lomb, Inc. |
| 8,832 |
| |
1,900 |
|
|
| Baxter Intl., Inc. |
| 60,135 |
| |
1,010 |
|
|
| Becton Dickinson & Co. |
| 55,328 |
| |
750 |
|
|
| Biomet, Inc. |
| 35,903 |
| |
2,480 |
| @ |
| Boston Scientific Corp. |
| 86,329 |
| |
400 |
|
|
| C.R. Bard, Inc. |
| 23,964 |
| |
990 |
|
|
| Guidant Corp. |
| 64,182 |
| |
12,200 |
|
|
| Johnson & Johnson |
| 735,903 |
| |
3,600 |
|
|
| Medtronic, Inc. |
| 172,980 |
| |
1,020 |
| @ |
| St. Jude Medical, Inc. |
| 38,903 |
| |
500 |
|
|
| Stryker Corp. |
| 21,995 |
| |
750 |
| @ |
| Zimmer Holdings, Inc. |
| 61,200 |
| |
|
|
|
|
|
| 1,365,654 |
| |
|
|
|
| Healthcare — Services: 0.2% |
|
|
| |
810 |
|
|
| Aetna, Inc. |
| 95,993 |
| |
750 |
| @ |
| Humana, Inc. |
| 18,615 |
| |
400 |
| @ |
| Laboratory Corp. Of America Holdings |
| 19,180 |
| |
300 |
|
|
| Manor Care, Inc. |
| 10,335 |
| |
100 |
|
|
| Quest Diagnostics, Inc. |
| 9,375 |
| |
3,430 |
|
|
| UnitedHealth Group, Inc. |
| 284,176 |
| |
760 |
| @ |
| WellPoint Health Networks, Inc. |
| 95,076 |
| |
700 |
| @ |
| WellPoint, Inc. |
| 70,931 |
| |
|
|
|
|
|
| 603,681 |
| |
|
|
|
| Home Builders: 0.0% |
|
|
| |
390 |
|
|
| Centex Corp. |
| 20,463 |
| |
|
|
|
|
|
| 20,463 |
| |
|
|
|
| Home Furnishings: 0.0% |
|
|
| |
650 |
|
|
| Leggett & Platt, Inc. |
| 19,403 |
| |
300 |
|
|
| Whirlpool Corp. |
| 19,365 |
| |
|
|
|
|
|
| 38,768 |
| |
|
|
|
| Household Products/Wares: 0.0% |
|
|
| |
300 |
|
|
| Avery Dennison Corp. |
| 17,598 |
| |
870 |
|
|
| Clorox Co. |
| 47,954 |
| |
510 |
|
|
| Fortune Brands, Inc. |
| 40,025 |
| |
|
|
|
|
|
| 105,577 |
| |
|
|
|
| Housewares: 0.0% |
|
|
| |
850 |
|
|
| Newell Rubbermaid, Inc. |
| 19,618 |
| |
|
|
|
|
|
| 19,618 |
| |
|
|
|
| Insurance: 0.5% |
|
|
| |
1,370 |
| @@ |
| ACE Ltd. |
| 55,375 |
| |
1,550 |
|
|
| AFLAC, Inc. |
| 58,311 |
| |
2,900 |
|
|
| Allstate Corp. |
| 146,450 |
| |
300 |
|
|
| AMBAC Financial Group, Inc. |
| 24,399 |
| |
13,450 |
|
|
| American International Group, Inc. |
| 852,058 |
| |
1,000 |
|
|
| AON Corp. |
| 21,120 |
| |
1,010 |
|
|
| Chubb Corp. |
| 76,972 |
| |
740 |
|
|
| CIGNA Corp. |
| 51,815 |
| |
525 |
|
|
| Cincinnati Financial Corp. |
| 23,520 |
| |
850 |
|
|
| Hartford Financial Services Group, Inc. |
| 54,400 |
| |
460 |
|
|
| Jefferson-Pilot Corp. |
| 22,627 |
| |
750 |
|
|
| Lincoln National Corp. |
| 34,515 |
| |
800 |
|
|
| Loews Corp. |
| 55,928 |
| |
1,560 |
|
|
| Marsh & McLennan Cos., Inc. |
| 44,600 |
| |
470 |
|
|
| MBIA, Inc. |
| 28,181 |
| |
3,100 |
|
|
| MetLife, Inc. |
| 120,900 |
| |
450 |
|
|
| MGIC Investment Corp. |
| 30,600 |
| |
970 |
|
|
| Principal Financial Group |
| 36,550 |
| |
590 |
|
|
| Progressive Corp. |
| 53,684 |
| |
2,700 |
|
|
| Prudential Financial, Inc. |
| 132,165 |
| |
580 |
|
|
| Safeco Corp. |
| 28,113 |
| |
520 |
|
|
| Torchmark Corp. |
| 28,553 |
| |
1,000 |
|
|
| UnumProvident Corp. |
| 15,570 |
| |
550 |
| @@ |
| XL Capital Ltd. |
| 41,448 |
| |
|
|
|
|
|
| 2,037,854 |
| |
|
|
|
| Internet: 0.1% |
|
|
| |
2,050 |
| @ |
| eBay, Inc. |
| 230,522 |
| |
1,550 |
| @ |
| Symantec Corp. |
| 98,906 |
| |
3,950 |
| @ |
| Yahoo!, Inc. |
| 148,599 |
| |
|
|
|
|
|
| 478,027 |
| |
|
|
|
| Iron/Steel: 0.0% |
|
|
| |
500 |
|
|
| Nucor Corp. |
| 26,450 |
| |
400 |
|
|
| United States Steel Corp. |
| 20,944 |
| |
|
|
|
|
|
| 47,394 |
| |
|
|
|
| Leisure Time: 0.0% |
|
|
| |
360 |
|
|
| Brunswick Corp. |
| 17,575 |
| |
1,900 |
|
|
| Carnival Corp. |
| 100,719 |
| |
930 |
|
|
| Harley-Davidson, Inc. |
| 53,773 |
| |
450 |
|
|
| Sabre Holdings Corp. |
| 10,386 |
| |
|
|
|
|
|
| 182,453 |
| |
|
|
|
| Lodging: 0.0% |
|
|
| |
320 |
|
|
| Harrah’s Entertainment, Inc. |
| 19,648 |
| |
1,100 |
|
|
| Hilton Hotels Corp. |
| 22,726 |
| |
700 |
|
|
| Marriott Intl., Inc. |
| 39,795 |
| |
600 |
|
|
| Starwood Hotels & Resorts Worldwide, Inc. |
| 31,374 |
| |
|
|
|
|
|
| 113,543 |
| |
|
|
|
| Machinery — Construction and Mining: 0.0% |
|
|
| |
400 |
|
|
| Caterpillar, Inc. |
| 36,620 |
| |
|
|
|
|
|
| 36,620 |
| |
|
|
|
| Machinery — Diversified: 0.0% |
|
|
| |
150 |
|
|
| Cummins, Inc. |
| 11,943 |
| |
780 |
|
|
| Deere & Co. |
| 55,949 |
| |
780 |
|
|
| Rockwell Automation, Inc. |
| 36,894 |
| |
|
|
|
|
|
| 104,786 |
| |
|
|
|
| Media: 0.2% |
|
|
| |
700 |
|
|
| Clear Channel Communications, Inc. |
| 23,576 |
| |
6,800 |
| @ |
| Comcast Corp. |
| 204,272 |
| |
790 |
|
|
| Gannett Co., Inc. |
| 65,167 |
| |
200 |
|
|
| Knight-Ridder, Inc. |
| 13,618 |
| |
760 |
|
|
| McGraw-Hill Cos., Inc. |
| 66,675 |
| |
190 |
|
|
| Meredith Corp. |
| 10,017 |
| |
450 |
|
|
| New York Times Co. |
| 18,450 |
| |
13,500 |
| @ |
| Time Warner, Inc. |
| 239,085 |
| |
390 |
|
|
| Tribune Co. |
| 16,914 |
| |
400 |
| @ |
| Univision Communications, Inc. |
| 12,040 |
| |
2,100 |
|
|
| Viacom, Inc. |
| 72,870 |
| |
6,180 |
|
|
| Walt Disney Co. |
| 166,118 |
| |
|
|
|
|
|
| 908,802 |
| |
|
|
|
| Mining: 0.0% |
|
|
| |
440 |
|
|
| Phelps Dodge Corp. |
| 42,737 |
| |
|
|
|
|
|
| 42,737 |
| |
See Accompanying Notes to Financial Statements
67
Shares |
|
|
|
|
| Value |
| |
|
|
|
| Miscellaneous Manufacturing: 0.5% |
|
|
| |
2,370 |
|
|
| 3M Co. |
| $ | 188,628 |
|
250 |
|
|
| Cooper Industries Ltd. |
| 16,578 |
| |
900 |
|
|
| Danaher Corp. |
| 51,192 |
| |
650 |
|
|
| Dover Corp. |
| 26,293 |
| |
850 |
|
|
| Eastman Kodak Co. |
| 27,804 |
| |
450 |
|
|
| Eaton Corp. |
| 30,330 |
| |
32,020 |
|
|
| General Electric Co. |
| 1,132,226 |
| |
2,580 |
|
|
| Honeywell International, Inc. |
| 91,151 |
| |
880 |
|
|
| Illinois Tool Works, Inc. |
| 82,922 |
| |
490 |
| @@ |
| Ingersoll-Rand Co. |
| 36,466 |
| |
230 |
|
|
| ITT Industries, Inc. |
| 19,578 |
| |
350 |
|
|
| Pall Corp. |
| 9,482 |
| |
530 |
|
|
| Textron, Inc. |
| 38,489 |
| |
6,150 |
| @@ |
| Tyco Intl. Ltd. |
| 208,915 |
| |
|
|
|
|
|
| 1,960,054 |
| |
|
|
|
| Office/Business Equipment: 0.0% |
|
|
| |
680 |
|
|
| Pitney Bowes, Inc. |
| 29,764 |
| |
2,820 |
| @ |
| Xerox Corp. |
| 43,202 |
| |
|
|
|
|
|
| 72,966 |
| |
|
|
|
| Oil and Gas: 0.8% |
|
|
| |
260 |
|
|
| Amerada Hess Corp. |
| 23,101 |
| |
950 |
|
|
| Anadarko Petroleum Corp. |
| 66,120 |
| |
980 |
|
|
| Apache Corp. |
| 52,979 |
| |
1,930 |
|
|
| Burlington Resources, Inc. |
| 89,571 |
| |
10,050 |
|
|
| ChevronTexaco Corp. |
| 548,729 |
| |
2,576 |
|
|
| ConocoPhillips |
| 234,389 |
| |
2,400 |
|
|
| Devon Energy Corp. |
| 99,408 |
| |
350 |
|
|
| EOG Resources, Inc. |
| 26,275 |
| |
24,580 |
|
|
| Exxon Mobil Corp. |
| 1,259,724 |
| |
500 |
|
|
| Kerr-McGee Corp. |
| 31,115 |
| |
990 |
|
|
| Marathon Oil Corp. |
| 39,046 |
| |
140 |
| @,@@ |
| Nabors Industries Ltd. |
| 7,280 |
| |
450 |
| @ |
| Noble Corp. |
| 21,803 |
| |
1,220 |
|
|
| Occidental Petroleum Corp. |
| 73,456 |
| |
350 |
|
|
| Sunoco, Inc. |
| 28,896 |
| |
850 |
| @ |
| Transocean, Inc. |
| 34,230 |
| |
820 |
|
|
| Unocal Corp. |
| 37,753 |
| |
1,300 |
|
|
| Valero Energy Corp. |
| 60,827 |
| |
|
|
|
|
|
| 2,734,702 |
| |
|
|
|
| Oil and Gas Services: 0.0% |
|
|
| |
1,000 |
|
|
| Baker Hughes, Inc. |
| 44,330 |
| |
450 |
|
|
| BJ Services Co. |
| 22,802 |
| |
1,250 |
|
|
| Halliburton Co. |
| 51,687 |
| |
|
|
|
|
|
| 118,819 |
| |
|
|
|
| Packaging and Containers: 0.0% |
|
|
| |
300 |
|
|
| Ball Corp. |
| 13,419 |
| |
280 |
|
|
| Bemis Co. |
| 7,795 |
| |
610 |
| @ |
| Pactiv Corp. |
| 15,159 |
| |
450 |
| @ |
| Sealed Air Corp. |
| 23,134 |
| |
|
|
|
|
|
| 59,507 |
| |
|
|
|
| Pharmaceuticals: 0.5% |
|
|
| |
4,700 |
|
|
| Abbott Laboratories |
| 197,212 |
| |
400 |
|
|
| Allergan, Inc. |
| 29,400 |
| |
300 |
|
|
| AmerisourceBergen Corp. |
| 17,682 |
| |
5,800 |
|
|
| Bristol-Myers Squibb Co. |
| 136,300 |
| |
1,350 |
|
|
| Cardinal Health, Inc. |
| 70,578 |
| |
2,350 |
| @ |
| Caremark Rx, Inc. |
| 84,036 |
| |
1,400 |
|
|
| Eli Lilly & Co. |
| 74,662 |
| |
250 |
| @ |
| Express Scripts, Inc. |
| 17,990 |
| |
1,080 |
| @ |
| Forest Laboratories, Inc. |
| 42,088 |
| |
1,300 |
| @ |
| Gilead Sciences, Inc. |
| 44,798 |
| |
500 |
| @ |
| Hospira, Inc. |
| 16,115 |
| |
890 |
| @ |
| King Pharmaceuticals, Inc. |
| 11,081 |
| |
862 |
| @ |
| Medco Health Solutions, Inc. |
| 32,515 |
| |
6,860 |
|
|
| Merck & Co., Inc. |
| 192,217 |
| |
23,046 |
|
|
| Pfizer, Inc. |
| 639,986 |
| |
4,400 |
|
|
| Schering-Plough Corp. |
| 78,540 |
| |
3,950 |
|
|
| Wyeth |
| 157,487 |
| |
|
|
|
|
|
| 1,842,687 |
| |
|
|
|
| Pipelines: 0.0% |
|
|
| |
1,650 |
|
|
| El Paso Corp. |
| 17,226 |
| |
150 |
|
|
| Kinder Morgan, Inc. |
| 10,395 |
| |
1,600 |
|
|
| Williams Cos., Inc. |
| 26,672 |
| |
|
|
|
|
|
| 54,293 |
| |
|
|
|
| Real Estate Investment Trusts: 0.0% |
|
|
| |
500 |
|
|
| Equity Office Properties Trust |
| 13,725 |
| |
550 |
|
|
| ProLogis |
| 22,127 |
| |
640 |
|
|
| Simon Property Group, Inc. |
| 39,731 |
| |
|
|
|
|
|
| 75,583 |
| |
|
|
|
| Retail: 0.8% |
|
|
| |
910 |
| @ |
| Bed Bath & Beyond, Inc. |
| 36,334 |
| |
950 |
|
|
| Best Buy Co., Inc. |
| 53,561 |
| |
850 |
|
|
| Circuit City Stores, Inc. |
| 13,252 |
| |
2,400 |
|
|
| Costco Wholesale Corp. |
| 116,640 |
| |
1,200 |
|
|
| CVS Corp. |
| 54,444 |
| |
550 |
|
|
| Darden Restaurants, Inc. |
| 14,993 |
| |
680 |
|
|
| Federated Department Stores, Inc. |
| 37,264 |
| |
3,620 |
|
|
| Gap, Inc. |
| 79,097 |
| |
11,300 |
|
|
| Home Depot, Inc. |
| 471,775 |
| |
1,450 | �� |
|
| J.C. Penney Co., Inc. Holding Co. |
| 55,970 |
| |
400 |
| @ |
| Kohl’s Corp. |
| 18,464 |
| |
1,910 |
|
|
| Limited Brands, Inc. |
| 46,680 |
| |
2,430 |
|
|
| Lowe’s Cos., Inc. |
| 134,452 |
| |
850 |
|
|
| May Department Stores Co. |
| 23,902 |
| |
3,850 |
|
|
| McDonald’s Corp. |
| 118,349 |
| |
400 |
|
|
| Nordstrom, Inc. |
| 17,500 |
| |
1,450 |
| @ |
| Office Depot, Inc. |
| 23,780 |
| |
800 |
|
|
| RadioShack Corp. |
| 25,256 |
| |
2,020 |
|
|
| Staples, Inc. |
| 64,458 |
| |
1,210 |
| @ |
| Starbucks Corp. |
| 68,075 |
| |
2,750 |
|
|
| Target Corp. |
| 140,855 |
| |
1,460 |
|
|
| TJX Cos., Inc. |
| 34,368 |
| |
650 |
| @ |
| Toys R US, Inc. |
| 12,571 |
| |
13,050 |
|
|
| Wal-Mart Stores, Inc. |
| 679,382 |
| |
4,250 |
|
|
| Walgreen Co. |
| 162,265 |
| |
470 |
|
|
| Wendy’s Intl., Inc. |
| 16,765 |
| |
850 |
|
|
| Yum! Brands, Inc. |
| 38,590 |
| |
|
|
|
|
|
| 2,559,042 |
| |
|
|
|
| Savings and Loans: 0.0% |
|
|
| |
460 |
|
|
| Golden West Financial Corp. |
| 54,850 |
| |
400 |
|
|
| Sovereign Bancorp, Inc. |
| 8,740 |
| |
2,770 |
|
|
| Washington Mutual, Inc. |
| 112,767 |
| |
|
|
|
|
|
| 176,357 |
| |
|
|
|
| Semiconductors: 0.2% |
|
|
| |
1,630 |
| @ |
| Altera Corp. |
| 36,968 |
| |
1,130 |
|
|
| Analog Devices, Inc. |
| 41,754 |
| |
5,120 |
| @ |
| Applied Materials, Inc. |
| 85,197 |
| |
19,810 |
|
|
| Intel Corp. |
| 442,753 |
| |
600 |
| @ |
| KLA-Tencor Corp. |
| 27,036 |
| |
930 |
|
|
| Linear Technology Corp. |
| 35,489 |
| |
400 |
|
|
| Maxim Integrated Products, Inc. |
| 16,384 |
| |
1,200 |
| @ |
| National Semiconductor Corp. |
| 18,552 |
| |
2,100 |
|
|
| Texas Instruments, Inc. |
| 50,778 |
| |
|
|
|
|
|
| 754,911 |
| |
|
|
|
| Software: 0.5% |
|
|
| |
730 |
|
|
| Adobe Systems, Inc. |
| 44,209 |
| |
560 |
|
|
| Autodesk, Inc. |
| 36,630 |
| |
See Accompanying Notes to Financial Statements
68
Shares |
|
|
|
|
| Value |
| |
|
|
|
| Software (continued) |
|
|
| |
1,890 |
|
|
| Automatic Data Processing, Inc. |
| $ | 86,052 |
|
1,120 |
| @ |
| BMC Software, Inc. |
| 20,810 |
| |
670 |
| @ |
| Citrix Systems, Inc. |
| 15,819 |
| |
1,770 |
|
|
| Computer Associates Intl., Inc. |
| 54,038 |
| |
1,700 |
| @ |
| Compuware Corp. |
| 9,809 |
| |
360 |
| @ |
| Electronic Arts, Inc. |
| 17,604 |
| |
2,609 |
|
|
| First Data Corp. |
| 107,204 |
| |
600 |
| @ |
| Fiserv, Inc. |
| 23,106 |
| |
650 |
|
|
| IMS Health, Inc. |
| 14,671 |
| |
560 |
| @ |
| Intuit, Inc. |
| 23,430 |
| |
33,140 |
|
|
| Microsoft Corp. |
| 888,482 |
| |
1,900 |
| @ |
| Novell, Inc. |
| 11,590 |
| |
27,050 |
| @ |
| Oracle Corp. |
| 342,453 |
| |
900 |
| @ |
| PeopleSoft, Inc. |
| 21,249 |
| |
2,340 |
| @ |
| Siebel Systems, Inc. |
| 23,587 |
| |
1,230 |
| @ |
| Veritas Software Corp. |
| 26,937 |
| |
|
|
|
|
|
| 1,767,680 |
| |
|
|
|
| Telecommunications: 0.5% |
|
|
| |
1,360 |
|
|
| Alltel Corp. |
| 77,098 |
| |
942 |
|
|
| AT&T Corp. |
| 17,239 |
| |
1,200 |
| @ |
| Avaya, Inc. |
| 19,704 |
| |
5,660 |
|
|
| BellSouth Corp. |
| 151,801 |
| |
570 |
|
|
| CenturyTel, Inc. |
| 18,764 |
| |
20,910 |
| @ |
| Cisco Systems, Inc. |
| 391,227 |
| |
950 |
|
|
| Citizens Communications Co. |
| 13,585 |
| |
800 |
| @ |
| Comverse Technology, Inc. |
| 17,016 |
| |
4,400 |
| @ |
| Corning, Inc. |
| 55,352 |
| |
12,700 |
| @ |
| Lucent Technologies, Inc. |
| 49,911 |
| |
9,650 |
|
|
| Motorola, Inc. |
| 185,859 |
| |
3,350 |
| @ |
| Nextel Communications, Inc. |
| 95,341 |
| |
4,800 |
|
|
| Qualcomm, Inc. |
| 199,776 |
| |
5,750 |
| @ |
| Qwest Communications Intl., Inc. |
| 23,000 |
| |
10,230 |
|
|
| SBC Communications, Inc. |
| 257,489 |
| |
620 |
|
|
| Scientific-Atlanta, Inc. |
| 18,364 |
| |
4,450 |
|
|
| Sprint Corp. |
| 101,505 |
| |
1,590 |
| @ |
| Tellabs, Inc. |
| 13,595 |
| |
8,510 |
|
|
| Verizon Communications, Inc. |
| 350,867 |
| |
|
|
|
|
|
| 2,057,493 |
| |
|
|
|
| Textiles: 0.0% |
|
|
| |
500 |
|
|
| Cintas Corp. |
| 22,360 |
| |
|
|
|
|
|
| 22,360 |
| |
|
|
|
| Toys/Games/Hobbies: 0.0% |
|
|
| |
800 |
|
|
| Hasbro, Inc. |
| 15,224 |
| |
1,300 |
|
|
| Mattel, Inc. |
| 24,635 |
| |
|
|
|
|
|
| 39,859 |
| |
|
|
|
| Transportation: 0.2% |
|
|
| |
1,060 |
|
|
| Burlington Northern Santa Fe Corp. |
| 47,742 |
| |
700 |
|
|
| CSX Corp. |
| 26,691 |
| |
1,260 |
|
|
| FedEx Corp. |
| 119,738 |
| |
1,650 |
|
|
| Norfolk Southern Corp. |
| 56,645 |
| |
310 |
|
|
| Ryder System, Inc. |
| 16,628 |
| |
300 |
|
|
| Union Pacific Corp. |
| 19,032 |
| |
3,480 |
|
|
| United Parcel Service, Inc. |
| 292,842 |
| |
|
|
|
|
|
| 579,318 |
| |
|
|
|
| Total Common Stock |
| 34,672,301 |
| |
Principal |
|
|
|
|
|
|
| ||
Amount |
|
|
|
|
| Value |
| ||
U.S. GOVERNMENT AGENCY OBLIGATIONS: 78.8% |
|
|
| ||||||
|
|
|
| Federal Home Loan Mortgage Corporation: 4.9% |
|
|
| ||
$ | 20,000,000 |
|
|
| 3.390%, due 01/26/07 |
| $ | 18,619,900 |
|
|
|
|
|
|
| 18,619,900 |
| ||
|
|
|
| Federal National Mortgage Association: 72.9% |
|
|
| ||
13,653,000 |
|
|
| 3.520%, due 01/15/07 STRIP |
| 12,686,204 |
| ||
285,000,000 |
|
|
| 3.510%, due 01/31/07 |
| 264,466,889 |
| ||
|
|
|
|
|
| 277,153,093 |
| ||
|
|
|
| Other: 1.0% |
|
|
| ||
4,000,000 |
|
|
| Financing Corp. FICO STRIP, 3.340%, due 12/06/06 |
| 3,743,824 |
| ||
|
|
|
|
|
| 3,743,824 |
| ||
|
|
|
| Total U.S. Government Agency Obligations |
| 299,516,817 |
| ||
U.S. TREASURY OBLIGATIONS: 10.4% |
|
|
| ||||||
|
|
|
| U.S. Treasury STRIP: 10.4% |
|
|
| ||
41,907,000 |
|
|
| 3.020%, due 11/15/06 |
| 39,536,405 |
| ||
|
|
|
| Total U.S. Treasury Obligations |
| 39,536,405 |
| ||
OTHER BONDS: 1.4% |
|
|
|
|
| ||||
|
|
|
| Sovereign: 1.4% |
|
|
| ||
5,827,000 |
|
|
| Israel Trust, 3.480%, due 11/15/06 |
| 5,449,976 |
| ||
|
|
|
| Total Other Bonds |
| 5,449,976 |
| ||
|
|
|
| Total Long-Term Investments |
| 379,175,499 |
| ||
See Accompanying Notes to Financial Statements
69
Principal |
|
|
|
|
|
|
| |||||
Amount |
|
|
|
|
| Value |
| |||||
SHORT-TERM INVESTMENTS: 0.7% |
|
|
| |||||||||
|
|
|
| Repurchase Agreement: 0.7% |
|
|
| |||||
$ | 2,521,000 |
|
|
| Goldman Sachs Repurchase Agreement 11/30/04, 2.060%, due 12/01/04, $2,521,144 to be received upon repurchase (Collateralized by $2,431,000 Federal Home Loan Mortgage Corporation, 5.500%, Market Value plus accrued interest $2,572,302, due 07/15/06) |
| $ | 2,521,000 |
| |||
|
|
|
| Total Short-Term Investments |
| 2,521,000 |
| |||||
|
|
|
|
|
|
|
| |||||
|
|
|
|
|
|
|
| |||||
Total Investments In Securities |
| 100.4 | % | $ | 381,696,499 |
| ||||||
Other Assets and Liabilities-Net |
| (0.4 | ) | (1,604,745 | ) | |||||||
|
|
|
|
|
|
|
|
|
| |||
Net Assets |
| 100.0 | % | $ | 380,091,754 |
| ||||||
@ |
| Non-income producing security |
@@ |
| Foreign issuer |
STRIP |
| Separate Trading of Registered Interest and Principal of Securities |
* |
| Cost for federal income tax purposes is $368,234,705. Net unrealized appreciation consists of: |
Gross Unrealized Appreciation |
| $ | 13,826,010 |
|
Gross Unrealized Depreciation |
| (364,216 | ) | |
|
|
|
| |
Net Unrealized Appreciation |
| $ | 13,461,794 |
|
See Accompanying Notes to Financial Statements
70
ING PRINCIPAL PROTECTION FUND III
PORTFOLIO OF INVESTMENTS
AS OF NOVEMBER 30, 2004 (UNAUDITED)
Shares |
|
|
|
|
| Value |
| |
COMMON STOCK: 15.1% |
|
|
| |||||
|
|
|
| Advertising: 0.0% |
|
|
| |
1,450 |
| @ |
| Interpublic Group of Cos., Inc. |
| $ | 17,995 |
|
700 |
|
|
| Omnicom Group, Inc. |
| 56,700 |
| |
|
|
|
|
|
| 74,695 |
| |
|
|
|
| Aerospace/Defense: 0.3% |
|
|
| |
5,600 |
|
|
| Boeing Co. |
| 299,992 |
| |
1,350 |
|
|
| General Dynamics Corp. |
| 146,286 |
| |
450 |
|
|
| Goodrich Corp. |
| 14,288 |
| |
1,800 |
|
|
| Lockheed Martin Corp. |
| 109,512 |
| |
1,500 |
|
|
| Northrop Grumman Corp. |
| 84,495 |
| |
3,200 |
|
|
| Raytheon Co. |
| 129,088 |
| |
300 |
|
|
| Rockwell Collins, Inc. |
| 11,958 |
| |
2,080 |
|
|
| United Technologies Corp. |
| 202,966 |
| |
|
|
|
|
|
| 998,585 |
| |
|
|
|
| Agriculture: 0.2% |
|
|
| |
8,150 |
|
|
| Altria Group, Inc. |
| 468,543 |
| |
2,000 |
|
|
| Archer-Daniels-Midland Co. |
| 42,400 |
| |
900 |
|
|
| Monsanto Co. |
| 41,418 |
| |
500 |
|
|
| Reynolds American, Inc. |
| 37,815 |
| |
950 |
|
|
| UST, Inc. |
| 41,829 |
| |
|
|
|
|
|
| 632,005 |
| |
|
|
|
| Apparel: 0.1% |
|
|
| |
1,300 |
| @ |
| Coach, Inc. |
| 64,792 |
| |
620 |
|
|
| Jones Apparel Group, Inc. |
| 22,029 |
| |
370 |
|
|
| Liz Claiborne, Inc. |
| 15,196 |
| |
1,900 |
|
|
| Nike, Inc. |
| 160,853 |
| |
250 |
|
|
| Reebok Intl. Ltd. |
| 9,720 |
| |
550 |
|
|
| VF Corp. |
| 29,695 |
| |
|
|
|
|
|
| 302,285 |
| |
|
|
|
| Auto Manufacturers: 0.1% |
|
|
| |
13,060 |
|
|
| Ford Motor Co. |
| 185,191 |
| |
2,400 |
|
|
| General Motors Corp. |
| 92,616 |
| |
1,160 |
|
|
| PACCAR, Inc. |
| 90,596 |
| |
|
|
|
|
|
| 368,403 |
| |
|
|
|
| Auto Parts and Equipment: 0.0% |
|
|
| |
650 |
|
|
| Dana Corp. |
| 10,628 |
| |
600 |
|
|
| Johnson Controls, Inc. |
| 36,840 |
| |
|
|
|
|
|
| 47,468 |
| |
|
|
|
| Banks: 1.0% |
|
|
| |
1,250 |
|
|
| AmSouth Bancorporation |
| 32,413 |
| |
16,196 |
|
|
| Bank of America Corp. |
| 749,388 |
| |
2,350 |
|
|
| BB&T Corp. |
| 99,758 |
| |
900 |
|
|
| Comerica, Inc. |
| 55,350 |
| |
750 |
|
|
| Fifth Third Bancorp |
| 37,770 |
| |
450 |
|
|
| First Horizon National Corp. |
| 19,665 |
| |
650 |
|
|
| Huntington Bancshares, Inc. |
| 15,769 |
| |
2,350 |
|
|
| KeyCorp |
| 78,232 |
| |
350 |
|
|
| M & T Bank Corp. |
| 36,894 |
| |
750 |
|
|
| Marshall & Ilsley Corp. |
| 31,268 |
| |
1,400 |
|
|
| Mellon Financial Corp. |
| 40,908 |
| |
3,750 |
|
|
| National City Corp. |
| 139,049 |
| |
600 |
|
|
| North Fork Bancorporation, Inc. |
| 17,280 |
| |
700 |
|
|
| Northern Trust Corp. |
| 32,928 |
| |
1,150 |
|
|
| PNC Financial Services Group, Inc. |
| 62,560 |
| |
1,493 |
|
|
| Regions Financial Corp. |
| 52,240 |
| |
550 |
|
|
| State Street Corp. |
| 24,508 |
| |
1,500 |
|
|
| SunTrust Banks, Inc. |
| 106,950 |
| |
400 |
|
|
| Synovus Financial Corp. |
| 10,800 |
| |
1,000 |
|
|
| The Bank of New York Co., Inc. |
| 32,910 |
| |
7,750 |
|
|
| U.S. Bancorp |
| 229,632 |
| |
8,634 |
|
|
| Wachovia Corp. |
| 446,809 |
| |
6,700 |
|
|
| Wells Fargo & Co. |
| 413,858 |
| |
250 |
|
|
| Zions Bancorporation |
| 16,625 |
| |
|
|
|
|
|
| 2,783,564 |
| |
|
|
|
| Beverages: 0.3% |
|
|
| |
3,300 |
|
|
| Anheuser-Busch Cos., Inc. |
| 165,297 |
| |
400 |
|
|
| Brown-Forman Corp. |
| 19,208 |
| |
9,500 |
|
|
| Coca-Cola Co. |
| 373,445 |
| |
1,400 |
|
|
| Coca-Cola Enterprises, Inc. |
| 29,120 |
| |
800 |
|
|
| Pepsi Bottling Group, Inc. |
| 22,416 |
| |
6,600 |
|
|
| PepsiCo, Inc. |
| 329,406 |
| |
|
|
|
|
|
| 938,892 |
| |
|
|
|
| Biotechnology: 0.2% |
|
|
| |
4,926 |
| @ |
| Amgen, Inc. |
| 295,757 |
| |
1,400 |
| @ |
| Biogen Idec, Inc. |
| 82,152 |
| |
950 |
| @ |
| Genzyme Corp. |
| 53,210 |
| |
750 |
| @ |
| MedImmune, Inc. |
| 19,950 |
| |
250 |
| @ |
| Millipore Corp. |
| 12,180 |
| |
|
|
|
|
|
| 463,249 |
| |
|
|
|
| Building Materials: 0.0% |
|
|
| |
900 |
| @ |
| American Standard Cos., Inc. |
| 35,046 |
| |
1,700 |
|
|
| Masco Corp. |
| 59,959 |
| |
500 |
|
|
| Vulcan Materials Co. |
| 25,925 |
| |
|
|
|
|
|
| 120,930 |
| |
|
|
|
| Chemicals: 0.3% |
|
|
| |
1,000 |
|
|
| Air Products & Chemicals, Inc. |
| 57,250 |
| |
150 |
|
|
| Ashland, Inc. |
| 8,873 |
| |
3,950 |
|
|
| Dow Chemical Co. |
| 199,356 |
| |
4,100 |
|
|
| E.I. du Pont de Nemours & Co. |
| 185,811 |
| |
350 |
|
|
| Eastman Chemical Co. |
| 19,033 |
| |
350 |
|
|
| Ecolab, Inc. |
| 12,243 |
| |
640 |
|
|
| Engelhard Corp. |
| 19,130 |
| |
300 |
|
|
| International Flavors & Fragrances, Inc. |
| 12,150 |
| |
1,250 |
|
|
| PPG Industries, Inc. |
| 84,338 |
| |
1,450 |
|
|
| Praxair, Inc. |
| 65,105 |
| |
900 |
|
|
| Rohm & Haas Co. |
| 39,681 |
| |
1,000 |
|
|
| Sherwin-Williams Co. |
| 44,600 |
| |
250 |
|
|
| Sigma-Aldrich Corp. |
| 14,933 |
| |
|
|
|
|
|
| 762,503 |
| |
|
|
|
| Commercial Services: 0.1% |
|
|
| |
800 |
| @ |
| Apollo Group, Inc. |
| 63,759 |
| |
4,350 |
|
|
| Cendant Corp. |
| 98,614 |
| |
60 |
|
|
| Deluxe Corp. |
| 2,372 |
| |
600 |
|
|
| Equifax, Inc. |
| 16,572 |
| |
1,210 |
|
|
| H&R Block, Inc. |
| 57,717 |
| |
950 |
|
|
| McKesson Corp. |
| 28,073 |
| |
450 |
|
|
| Moody’s Corp. |
| 36,338 |
| |
1,150 |
|
|
| Paychex, Inc. |
| 38,134 |
| |
650 |
|
|
| R.R. Donnelley & Sons Co. |
| 22,555 |
| |
650 |
|
|
| Robert Half Intl., Inc. |
| 17,570 |
| |
|
|
|
|
|
| 381,704 |
| |
|
|
|
| Computers: 0.8% |
|
|
| |
450 |
| @ |
| Affiliated Computer Services, Inc. |
| 26,631 |
| |
2,800 |
| @ |
| Apple Computer, Inc. |
| 187,740 |
| |
600 |
| @ |
| Computer Sciences Corp. |
| 32,460 |
| |
13,150 |
| @ |
| Dell, Inc. |
| 532,837 |
| |
1,650 |
|
|
| Electronic Data Systems Corp. |
| 37,043 |
| |
10,000 |
| @ |
| EMC Corp. |
| 134,200 |
| |
1,300 |
| @ |
| Gateway, Inc. |
| 8,853 |
| |
12,500 |
|
|
| Hewlett-Packard Co. |
| 250,000 |
| |
9,000 |
|
|
| International Business Machines Corp. |
| 848,159 |
| |
480 |
| @ |
| Lexmark Intl., Inc. |
| 40,752 |
| |
300 |
| @ |
| NCR Corp. |
| 17,919 |
| |
See Accompanying Notes to Financial Statements
71
Shares |
|
|
|
|
| Value |
| |
|
|
|
| Computers (continued) |
|
|
| |
1,150 |
| @ |
| Network Appliance, Inc. |
| $ | 34,684 |
|
23,800 |
| @ |
| Sun Microsystems, Inc. |
| 132,090 |
| |
1,200 |
| @ |
| Sungard Data Systems, Inc. |
| 31,812 |
| |
1,250 |
| @ |
| Unisys Corp. |
| 14,363 |
| |
|
|
|
|
|
| 2,329,543 |
| |
|
|
|
| Cosmetics/Personal Care: 0.5% |
|
|
| |
375 |
|
|
| Alberto-Culver Co. |
| 17,363 |
| |
1,950 |
|
|
| Avon Products, Inc. |
| 73,203 |
| |
2,200 |
|
|
| Colgate-Palmolive Co. |
| 101,178 |
| |
7,000 |
|
|
| Gillette Co. |
| 304,430 |
| |
2,600 |
|
|
| Kimberly-Clark Corp. |
| 165,386 |
| |
16,900 |
|
|
| Procter & Gamble Co. |
| 903,812 |
| |
|
|
|
|
|
| 1,565,372 |
| |
|
|
|
| Distribution/Wholesale: 0.0% |
|
|
| |
650 |
|
|
| Genuine Parts Co. |
| 28,217 |
| |
500 |
|
|
| W.W. Grainger, Inc. |
| 30,930 |
| |
|
|
|
|
|
| 59,147 |
| |
|
|
|
| Diversified Financial Services: 1.2% |
|
|
| |
5,250 |
|
|
| American Express Co. |
| 292,477 |
| |
400 |
|
|
| Bear Stearns Cos., Inc. |
| 39,032 |
| |
980 |
|
|
| Capital One Financial Corp. |
| 77,008 |
| |
1,150 |
|
|
| CIT Group, Inc. |
| 49,163 |
| |
20,600 |
|
|
| Citigroup, Inc. |
| 921,849 |
| |
3,998 |
|
|
| Countrywide Financial Corp. |
| 132,774 |
| |
1,150 |
| @ |
| E*TRADE Financial Corp. |
| 15,939 |
| |
4,010 |
|
|
| Fannie Mae |
| 275,486 |
| |
150 |
|
|
| Federated Investors, Inc. |
| 4,413 |
| |
1,050 |
|
|
| Franklin Resources, Inc. |
| 68,912 |
| |
2,830 |
|
|
| Freddie Mac |
| 193,176 |
| |
2,000 |
|
|
| Goldman Sachs Group, Inc. |
| 209,520 |
| |
5,892 |
|
|
| J.P. Morgan Chase & Co. |
| 221,834 |
| |
400 |
|
|
| Janus Capital Group, Inc. |
| 6,620 |
| |
1,150 |
|
|
| Lehman Brothers Holdings, Inc. |
| 96,347 |
| |
5,225 |
|
|
| MBNA Corp. |
| 138,776 |
| |
3,900 |
|
|
| Merrill Lynch & Co., Inc. |
| 217,269 |
| |
1,800 |
|
|
| Morgan Stanley |
| 91,350 |
| |
1,350 |
| @ |
| Providian Financial Corp. |
| 21,668 |
| |
1,800 |
|
|
| SLM Corp. |
| 92,106 |
| |
|
|
|
|
|
| 3,165,719 |
| |
|
|
|
| Electric: 0.4% |
|
|
| |
3,370 |
| @ |
| AES Corp. |
| 41,249 |
| |
250 |
|
|
| Ameren Corp. |
| 12,105 |
| |
1,300 |
|
|
| American Electric Power Co., Inc. |
| 44,421 |
| |
600 |
|
|
| Cinergy Corp. |
| 24,834 |
| |
750 |
|
|
| Consolidated Edison, Inc. |
| 32,888 |
| |
650 |
|
|
| Constellation Energy Group, Inc. |
| 28,405 |
| |
500 |
|
|
| Dominion Resources, Inc. |
| 32,735 |
| |
550 |
|
|
| DTE Energy Co. |
| 24,134 |
| |
5,150 |
|
|
| Duke Energy Corp. |
| 130,191 |
| |
1,690 |
|
|
| Edison Intl |
| 53,911 |
| |
950 |
|
|
| Entergy Corp. |
| 61,579 |
| |
2,700 |
|
|
| Exelon Corp. |
| 112,617 |
| |
1,050 |
|
|
| FirstEnergy Corp. |
| 44,342 |
| |
600 |
|
|
| FPL Group, Inc. |
| 42,198 |
| |
1,320 |
| @ |
| PG&E Corp. |
| 43,903 |
| |
400 |
|
|
| Pinnacle West Capital Corp. |
| 17,680 |
| |
950 |
|
|
| PPL Corp. |
| 49,353 |
| |
1,000 |
|
|
| Public Service Enterprise Group, Inc. |
| 43,990 |
| |
3,000 |
|
|
| Southern Co. |
| 98,370 |
| |
1,600 |
|
|
| TXU Corp. |
| 100,512 |
| |
1,250 |
|
|
| Xcel Energy, Inc. |
| 22,575 |
| |
|
|
|
|
|
| 1,061,992 |
| |
|
|
|
| Electrical Components and Equipment: 0.1% |
|
|
| |
2,300 |
|
|
| Emerson Electric Co. |
| 153,686 |
| |
|
|
|
|
|
| 153,686 |
| |
|
|
|
| Electronics: 0.1% |
|
|
| |
1,850 |
| @ |
| Agilent Technologies, Inc. |
| 42,346 |
| |
1,000 |
|
|
| Applera Corp.— Applied Biosystems Group |
| 20,500 |
| |
500 |
| @ |
| Fisher Scientific Intl |
| 28,270 |
| |
900 |
| @ |
| Jabil Circuit, Inc. |
| 22,554 |
| |
400 |
|
|
| Parker Hannifin Corp. |
| 29,920 |
| |
700 |
|
|
| PerkinElmer, Inc. |
| 14,931 |
| |
1,500 |
| @ |
| Sanmina-SCI Corp. |
| 13,245 |
| |
2,950 |
| @ |
| Solectron Corp. |
| 18,438 |
| |
200 |
|
|
| Tektronix, Inc. |
| 6,274 |
| |
500 |
| @ |
| Thermo Electron Corp. |
| 15,125 |
| |
550 |
| @ |
| Waters Corp. |
| 25,663 |
| |
|
|
|
|
|
| 237,266 |
| |
|
|
|
| Engineering and Construction: 0.0% |
|
|
| |
300 |
|
|
| Fluor Corp. |
| 15,570 |
| |
|
|
|
|
|
| 15,570 |
| |
|
|
|
| Entertainment: 0.0% |
|
|
| |
1,100 |
|
|
| International Game Technology |
| 38,885 |
| |
|
|
|
|
|
| 38,885 |
| |
|
|
|
| Environmental Control: 0.0% |
|
|
| |
2,450 |
|
|
| Waste Management, Inc. |
| 73,035 |
| |
|
|
|
|
|
| 73,035 |
| |
|
|
|
| Food: 0.2% |
|
|
| |
1,550 |
|
|
| Albertson’s, Inc. |
| 39,215 |
| |
650 |
|
|
| Campbell Soup Co. |
| 18,545 |
| |
1,700 |
|
|
| ConAgra Foods, Inc. |
| 45,985 |
| |
1,600 |
|
|
| General Mills, Inc. |
| 72,784 |
| |
1,100 |
|
|
| H.J. Heinz Co. |
| 40,876 |
| |
800 |
|
|
| Hershey Foods Corp. |
| 41,440 |
| |
1,700 |
|
|
| Kellogg Co. |
| 74,290 |
| |
1,150 |
| @ |
| Kroger Co. |
| 18,607 |
| |
500 |
|
|
| McCormick & Co., Inc. |
| 18,225 |
| |
3,350 |
|
|
| Sara Lee Corp. |
| 78,658 |
| |
950 |
|
|
| SUPERVALU, Inc. |
| 30,011 |
| |
1,300 |
|
|
| Wm. Wrigley Jr. Co. |
| 89,439 |
| |
|
|
|
|
|
| 568,075 |
| |
|
|
|
| Forest Products and Paper: 0.1% |
|
|
| |
1,140 |
|
|
| Georgia-Pacific Corp. |
| 41,735 |
| |
2,050 |
|
|
| International Paper Co. |
| 85,116 |
| |
520 |
|
|
| Louisiana-Pacific Corp. |
| 12,724 |
| |
800 |
|
|
| MeadWestvaco Corp. |
| 26,920 |
| |
600 |
|
|
| Plum Creek Timber Co., Inc. |
| 22,200 |
| |
300 |
|
|
| Temple-Inland, Inc. |
| 17,877 |
| |
1,500 |
|
|
| Weyerhaeuser Co. |
| 99,001 |
| |
|
|
|
|
|
| 305,573 |
| |
|
|
|
| Gas: 0.0% |
|
|
| |
500 |
|
|
| KeySpan Corp. |
| 19,760 |
| |
950 |
|
|
| Sempra Energy |
| 35,131 |
| |
|
|
|
|
|
| 54,891 |
| |
See Accompanying Notes to Financial Statements
72
Shares |
|
|
|
|
| Value |
| |
|
|
|
| Hand/Machine Tools: 0.0% |
|
|
| |
420 |
|
|
| Black & Decker Corp. |
| $ | 35,317 |
|
250 |
|
|
| Snap-On, Inc. |
| 7,903 |
| |
350 |
|
|
| Stanley Works |
| 16,366 |
| |
|
|
|
|
|
| 59,586 |
| |
|
|
|
| Healthcare — Products: 0.6% |
|
|
| |
250 |
|
|
| Bausch & Lomb, Inc. |
| 14,720 |
| |
2,550 |
|
|
| Baxter Intl., Inc. |
| 80,708 |
| |
1,280 |
|
|
| Becton Dickinson & Co. |
| 70,118 |
| |
750 |
|
|
| Biomet, Inc. |
| 35,903 |
| |
3,550 |
| @ |
| Boston Scientific Corp. |
| 123,576 |
| |
400 |
|
|
| C.R. Bard, Inc. |
| 23,964 |
| |
1,330 |
|
|
| Guidant Corp. |
| 86,224 |
| |
15,950 |
|
|
| Johnson & Johnson |
| 962,103 |
| |
4,700 |
|
|
| Medtronic, Inc. |
| 225,835 |
| |
1,600 |
| @ |
| St. Jude Medical, Inc. |
| 61,024 |
| |
500 |
|
|
| Stryker Corp. |
| 21,995 |
| |
1,050 |
| @ |
| Zimmer Holdings, Inc. |
| 85,680 |
| |
|
|
|
|
|
| 1,791,850 |
| |
|
|
|
| Healthcare — Services: 0.3% |
|
|
| |
1,080 |
|
|
| Aetna, Inc. |
| 127,991 |
| |
900 |
| @ |
| Humana, Inc. |
| 22,338 |
| |
450 |
| @ |
| Laboratory Corp. Of America Holdings |
| 21,578 |
| |
400 |
|
|
| Manor Care, Inc. |
| 13,780 |
| |
150 |
|
|
| Quest Diagnostics, Inc. |
| 14,063 |
| |
4,450 |
|
|
| UnitedHealth Group, Inc. |
| 368,682 |
| |
1,120 |
| @ |
| WellPoint Health Networks, Inc. |
| 140,112 |
| |
980 |
| @ |
| WellPoint, Inc. |
| 99,303 |
| |
|
|
|
|
|
| 807,847 |
| |
|
|
|
| Home Builders: 0.0% |
|
|
| |
490 |
|
|
| Centex Corp. |
| 25,710 |
| |
|
|
|
|
|
| 25,710 |
| |
|
|
|
| Home Furnishings: 0.0% |
|
|
| |
550 |
|
|
| Leggett & Platt, Inc. |
| 16,418 |
| |
300 |
|
|
| Whirlpool Corp. |
| 19,365 |
| |
|
|
|
|
|
| 35,783 |
| |
|
|
|
| Household Products/Wares: 0.0% |
|
|
| |
400 |
|
|
| Avery Dennison Corp. |
| 23,464 |
| |
1,210 |
|
|
| Clorox Co. |
| 66,695 |
| |
550 |
|
|
| Fortune Brands, Inc. |
| 43,164 |
| |
|
|
|
|
|
| 133,323 |
| |
|
|
|
| Housewares: 0.0% |
|
|
| |
900 |
|
|
| Newell Rubbermaid, Inc. |
| 20,772 |
| |
|
|
|
|
|
| 20,772 |
| |
|
|
|
| Insurance: 0.9% |
|
|
| |
1,200 |
| @@ |
| ACE Ltd. |
| 48,504 |
| |
2,100 |
|
|
| AFLAC, Inc. |
| 79,002 |
| |
3,850 |
|
|
| Allstate Corp. |
| 194,424 |
| |
400 |
|
|
| AMBAC Financial Group, Inc. |
| 32,532 |
| |
17,650 |
|
|
| American International Group, Inc. |
| 1,118,127 |
| |
1,000 |
|
|
| AON Corp. |
| 21,120 |
| |
1,350 |
|
|
| Chubb Corp. |
| 102,883 |
| |
770 |
|
|
| CIGNA Corp. |
| 53,915 |
| |
577 |
|
|
| Cincinnati Financial Corp. |
| 25,850 |
| |
1,250 |
|
|
| Hartford Financial Services Group, Inc. |
| 80,000 |
| |
450 |
|
|
| Jefferson-Pilot Corp. |
| 22,136 |
| |
950 |
|
|
| Lincoln National Corp. |
| 43,719 |
| |
850 |
|
|
| Loews Corp. |
| 59,424 |
| |
1,650 |
|
|
| Marsh & McLennan Cos., Inc. |
| 47,174 |
| |
450 |
|
|
| MBIA, Inc. |
| 26,982 |
| |
4,150 |
|
|
| MetLife, Inc. |
| 161,849 |
| |
400 |
|
|
| MGIC Investment Corp. |
| 27,200 |
| |
1,000 |
|
|
| Principal Financial Group |
| 37,680 |
| |
850 |
|
|
| Progressive Corp. |
| 77,342 |
| |
3,700 |
|
|
| Prudential Financial, Inc. |
| 181,114 |
| |
700 |
|
|
| Safeco Corp. |
| 33,929 |
| |
350 |
|
|
| Torchmark Corp. |
| 19,219 |
| |
1,050 |
|
|
| UnumProvident Corp. |
| 16,349 |
| |
400 |
| @@ |
| XL Capital Ltd. |
| 30,144 |
| |
|
|
|
|
|
| 2,540,618 |
| |
|
|
|
| Internet: 0.2% |
|
|
| |
2,600 |
| @ |
| eBay, Inc. |
| 292,370 |
| |
2,150 |
| @ |
| Symantec Corp. |
| 137,192 |
| |
5,650 |
| @ |
| Yahoo!, Inc. |
| 212,553 |
| |
|
|
|
|
|
| 642,115 |
| |
|
|
|
| Iron/Steel: 0.0% |
|
|
| |
600 |
|
|
| Nucor Corp. |
| 31,740 |
| |
850 |
|
|
| United States Steel Corp. |
| 44,506 |
| |
|
|
|
|
|
| 76,246 |
| |
|
|
|
| Leisure Time: 0.1% |
|
|
| |
330 |
|
|
| Brunswick Corp. |
| 16,111 |
| |
2,650 |
|
|
| Carnival Corp. |
| 140,476 |
| |
1,250 |
|
|
| Harley-Davidson, Inc. |
| 72,275 |
| |
550 |
|
|
| Sabre Holdings Corp. |
| 12,694 |
| |
|
|
|
|
|
| 241,556 |
| |
|
|
|
| Lodging: 0.0% |
|
|
| |
450 |
|
|
| Harrah’s Entertainment, Inc. |
| 27,630 |
| |
1,400 |
|
|
| Hilton Hotels Corp. |
| 28,924 |
| |
700 |
|
|
| Marriott Intl., Inc. |
| 39,795 |
| |
600 |
|
|
| Starwood Hotels & Resorts Worldwide, Inc. |
| 31,374 |
| |
|
|
|
|
|
| 127,723 |
| |
|
|
|
| Machinery — Construction and Mining: 0.0% |
|
|
| |
450 |
|
|
| Caterpillar, Inc. |
| 41,198 |
| |
|
|
|
|
|
| 41,198 |
| |
|
|
|
| Machinery — Diversified: 0.0% |
|
|
| |
200 |
|
|
| Cummins, Inc. |
| 15,924 |
| |
1,050 |
|
|
| Deere & Co. |
| 75,317 |
| |
600 |
|
|
| Rockwell Automation, Inc. |
| 28,380 |
| |
|
|
|
|
|
| 119,621 |
| |
|
|
|
| Media: 0.4% |
|
|
| |
900 |
|
|
| Clear Channel Communications, Inc. |
| 30,312 |
| |
9,300 |
| @ |
| Comcast Corp. |
| 279,372 |
| |
1,100 |
|
|
| Gannett Co., Inc. |
| 90,739 |
| |
100 |
|
|
| Knight-Ridder, Inc. |
| 6,809 |
| |
1,050 |
|
|
| McGraw-Hill Cos., Inc. |
| 92,117 |
| |
230 |
|
|
| Meredith Corp. |
| 12,126 |
| |
450 |
|
|
| New York Times Co. |
| 18,450 |
| |
17,850 |
| @ |
| Time Warner, Inc. |
| 316,123 |
| |
400 |
|
|
| Tribune Co. |
| 17,348 |
| |
400 |
| @ |
| Univision Communications, Inc. |
| 12,040 |
| |
2,900 |
|
|
| Viacom, Inc. |
| 100,630 |
| |
8,500 |
|
|
| Walt Disney Co. |
| 228,480 |
| |
|
|
|
|
|
| 1,204,546 |
| |
|
|
|
| Mining: 0.0% |
|
|
| |
550 |
|
|
| Phelps Dodge Corp. |
| 53,422 |
| |
|
|
|
|
|
| 53,422 |
| |
See Accompanying Notes to Financial Statements
73
Shares |
|
|
|
|
| Value |
| |
|
|
|
| Miscellaneous Manufacturing: 0.9% |
|
|
| |
3,150 |
|
|
| 3M Co. |
| $ | 250,708 |
|
300 |
|
|
| Cooper Industries Ltd. |
| 19,893 |
| |
1,000 |
|
|
| Danaher Corp. |
| 56,880 |
| |
800 |
|
|
| Dover Corp. |
| 32,360 |
| |
1,110 |
|
|
| Eastman Kodak Co. |
| 36,308 |
| |
550 |
|
|
| Eaton Corp. |
| 37,070 |
| |
41,400 |
|
|
| General Electric Co. |
| 1,463,903 |
| |
3,600 |
|
|
| Honeywell International, Inc. |
| 127,188 |
| |
1,250 |
|
|
| Illinois Tool Works, Inc. |
| 117,788 |
| |
550 |
| @@ |
| Ingersoll-Rand Co. |
| 40,931 |
| |
330 |
|
|
| ITT Industries, Inc. |
| 28,090 |
| |
400 |
|
|
| Pall Corp. |
| 10,836 |
| |
530 |
|
|
| Textron, Inc. |
| 38,489 |
| |
8,300 |
| @@ |
| Tyco Intl. Ltd. |
| 281,950 |
| |
|
|
|
|
|
| 2,542,394 |
| |
|
|
|
| Office/Business Equipment: 0.0% |
|
|
| |
850 |
|
|
| Pitney Bowes, Inc. |
| 37,205 |
| |
3,600 |
| @ |
| Xerox Corp. |
| 55,152 |
| |
|
|
|
|
|
| 92,357 |
| |
|
|
|
| Oil and Gas: 1.3% |
|
|
| |
320 |
|
|
| Amerada Hess Corp. |
| 28,432 |
| |
1,300 |
|
|
| Anadarko Petroleum Corp. |
| 90,480 |
| |
1,318 |
|
|
| Apache Corp. |
| 71,251 |
| |
2,750 |
|
|
| Burlington Resources, Inc. |
| 127,628 |
| |
13,200 |
|
|
| ChevronTexaco Corp. |
| 720,720 |
| |
3,368 |
|
|
| ConocoPhillips |
| 306,454 |
| |
2,900 |
|
|
| Devon Energy Corp. |
| 120,118 |
| |
400 |
|
|
| EOG Resources, Inc. |
| 30,028 |
| |
31,500 |
|
|
| Exxon Mobil Corp. |
| 1,614,374 |
| |
450 |
|
|
| Kerr-McGee Corp. |
| 28,004 |
| |
1,300 |
|
|
| Marathon Oil Corp. |
| 51,272 |
| |
150 |
| @,@@ |
| Nabors Industries Ltd. |
| 7,800 |
| |
400 |
| @ |
| Noble Corp. |
| 19,380 |
| |
1,630 |
|
|
| Occidental Petroleum Corp. |
| 98,142 |
| |
450 |
|
|
| Sunoco, Inc. |
| 37,152 |
| |
1,100 |
| @ |
| Transocean, Inc. |
| 44,297 |
| |
1,150 |
|
|
| Unocal Corp. |
| 52,946 |
| |
1,800 |
|
|
| Valero Energy Corp. |
| 84,222 |
| |
|
|
|
|
|
| 3,532,700 |
| |
|
|
|
| Oil and Gas Services: 0.0% |
|
|
| |
1,050 |
|
|
| Baker Hughes, Inc. |
| 46,547 |
| |
550 |
|
|
| BJ Services Co. |
| 27,869 |
| |
1,600 |
|
|
| Halliburton Co. |
| 66,159 |
| |
|
|
|
|
|
| 140,575 |
| |
|
|
|
| Packaging and Containers: 0.0% |
|
|
| |
340 |
|
|
| Ball Corp. |
| 15,208 |
| |
500 |
|
|
| Bemis Co. |
| 13,920 |
| |
800 |
| @ |
| Pactiv Corp. |
| 19,880 |
| |
300 |
| @ |
| Sealed Air Corp. |
| 15,423 |
| |
|
|
|
|
|
| 64,431 |
| |
|
|
|
| Pharmaceuticals: 0.8% |
|
|
| |
6,100 |
|
|
| Abbott Laboratories |
| 255,955 |
| |
400 |
|
|
| Allergan, Inc. |
| 29,400 |
| |
400 |
|
|
| AmerisourceBergen Corp. |
| 23,576 |
| |
8,050 |
|
|
| Bristol-Myers Squibb Co. |
| 189,175 |
| |
1,750 |
|
|
| Cardinal Health, Inc. |
| 91,490 |
| |
3,200 |
| @ |
| Caremark Rx, Inc. |
| 114,432 |
| |
1,800 |
|
|
| Eli Lilly & Co. |
| 95,994 |
| |
300 |
| @ |
| Express Scripts, Inc. |
| 21,588 |
| |
1,550 |
| @ |
| Forest Laboratories, Inc. |
| 60,404 |
| |
1,400 |
| @ |
| Gilead Sciences, Inc. |
| 48,244 |
| |
650 |
| @ |
| Hospira, Inc. |
| 20,950 |
| |
650 |
| @ |
| King Pharmaceuticals, Inc. |
| 8,093 |
| |
1,182 |
| @ |
| Medco Health Solutions, Inc. |
| 44,585 |
| |
9,100 |
|
|
| Merck & Co., Inc. |
| 254,981 |
| |
29,630 |
|
|
| Pfizer, Inc. |
| 822,824 |
| |
6,150 |
|
|
| Schering-Plough Corp. |
| 109,778 |
| |
5,550 |
|
|
| Wyeth |
| 221,279 |
| |
|
|
|
|
|
| 2,412,748 |
| |
|
|
|
| Pipelines: 0.0% |
|
|
| |
1,750 |
|
|
| El Paso Corp. |
| 18,270 |
| |
150 |
|
|
| Kinder Morgan, Inc. |
| 10,395 |
| |
1,800 |
|
|
| Williams Cos., Inc. |
| 30,006 |
| |
|
|
|
|
|
| 58,671 |
| |
|
|
|
| Real Estate Investment Trusts: 0.0% |
|
|
| |
500 |
|
|
| Equity Office Properties Trust |
| 13,725 |
| |
550 |
|
|
| ProLogis |
| 22,127 |
| |
650 |
|
|
| Simon Property Group, Inc. |
| 40,352 |
| |
|
|
|
|
|
| 76,204 |
| |
|
|
|
| Retail: 1.2% |
|
|
| |
900 |
| @ |
| Bed Bath & Beyond, Inc. |
| 35,935 |
| |
1,350 |
|
|
| Best Buy Co., Inc. |
| 76,113 |
| |
850 |
|
|
| Circuit City Stores, Inc. |
| 13,252 |
| |
3,300 |
|
|
| Costco Wholesale Corp. |
| 160,380 |
| |
1,650 |
|
|
| CVS Corp. |
| 74,861 |
| |
850 |
|
|
| Darden Restaurants, Inc. |
| 23,171 |
| |
700 |
|
|
| Federated Department Stores, Inc. |
| 38,360 |
| |
5,000 |
|
|
| Gap, Inc. |
| 109,250 |
| |
14,790 |
|
|
| Home Depot, Inc. |
| 617,482 |
| |
2,000 |
|
|
| J.C. Penney Co., Inc. Holding Co. |
| 77,200 |
| |
550 |
| @ |
| Kohl’s Corp. |
| 25,388 |
| |
2,690 |
|
|
| Limited Brands, Inc. |
| 65,744 |
| |
3,230 |
|
|
| Lowe’s Cos., Inc. |
| 178,716 |
| |
1,000 |
|
|
| May Department Stores Co. |
| 28,120 |
| |
5,200 |
|
|
| McDonald’s Corp. |
| 159,848 |
| |
400 |
|
|
| Nordstrom, Inc. |
| 17,500 |
| |
1,510 |
| @ |
| Office Depot, Inc. |
| 24,764 |
| |
790 |
|
|
| RadioShack Corp. |
| 24,940 |
| |
2,800 |
|
|
| Staples, Inc. |
| 89,348 |
| |
1,600 |
| @ |
| Starbucks Corp. |
| 90,016 |
| |
3,750 |
|
|
| Target Corp. |
| 192,075 |
| |
1,600 |
|
|
| TJX Cos., Inc. |
| 37,664 |
| |
750 |
| @ |
| Toys R US, Inc. |
| 14,505 |
| |
16,600 |
|
|
| Wal-Mart Stores, Inc. |
| 864,195 |
| |
5,800 |
|
|
| Walgreen Co. |
| 221,443 |
| |
650 |
|
|
| Wendy’s Intl., Inc. |
| 23,186 |
| |
1,100 |
|
|
| Yum! Brands, Inc. |
| 49,940 |
| |
|
|
|
|
|
| 3,333,396 |
| |
|
|
|
| Savings and Loans: 0.1% |
|
|
| |
520 |
|
|
| Golden West Financial Corp. |
| 62,005 |
| |
550 |
|
|
| Sovereign Bancorp, Inc. |
| 12,018 |
| |
3,650 |
|
|
| Washington Mutual, Inc. |
| 148,591 |
| |
|
|
|
|
|
| 222,614 |
| |
|
|
|
| Semiconductors: 0.3% |
|
|
| |
1,500 |
| @ |
| Altera Corp. |
| 34,020 |
| |
1,600 |
|
|
| Analog Devices, Inc. |
| 59,120 |
| |
7,050 |
| @ |
| Applied Materials, Inc. |
| 117,312 |
| |
25,600 |
|
|
| Intel Corp. |
| 572,160 |
| |
600 |
| @ |
| KLA-Tencor Corp. |
| 27,036 |
| |
950 |
|
|
| Linear Technology Corp. |
| 36,252 |
| |
450 |
|
|
| Maxim Integrated Products, Inc. |
| 18,432 |
| |
1,250 |
| @ |
| National Semiconductor Corp. |
| 19,325 |
| |
2,200 |
|
|
| Texas Instruments, Inc. |
| 53,196 |
| |
|
|
|
|
|
| 936,853 |
| |
|
|
|
| Software: 0.8% |
|
|
| |
900 |
|
|
| Adobe Systems, Inc. |
| 54,504 |
| |
600 |
|
|
| Autodesk, Inc. |
| 39,246 |
| |
See Accompanying Notes to Financial Statements
74
Shares |
|
|
|
|
| Value |
| |
|
|
|
| Software (continued) |
|
|
| |
2,400 |
|
|
| Automatic Data Processing, Inc. |
| $ | 109,272 |
|
1,180 |
| @ |
| BMC Software, Inc. |
| 21,924 |
| |
450 |
| @ |
| Citrix Systems, Inc. |
| 10,625 |
| |
2,450 |
|
|
| Computer Associates Intl., Inc. |
| 74,799 |
| |
1,950 |
| @ |
| Compuware Corp. |
| 11,252 |
| |
520 |
| @ |
| Electronic Arts, Inc. |
| 25,428 |
| |
3,557 |
|
|
| First Data Corp. |
| 146,157 |
| |
750 |
| @ |
| Fiserv, Inc. |
| 28,883 |
| |
1,150 |
|
|
| IMS Health, Inc. |
| 25,956 |
| |
750 |
| @ |
| Intuit, Inc. |
| 31,380 |
| |
42,550 |
|
|
| Microsoft Corp. |
| 1,140,765 |
| |
1,000 |
| @ |
| Novell, Inc. |
| 6,100 |
| |
34,500 |
| @ |
| Oracle Corp. |
| 436,769 |
| |
1,300 |
| @ |
| PeopleSoft, Inc. |
| 30,693 |
| |
1,800 |
| @ |
| Siebel Systems, Inc. |
| 18,144 |
| |
1,650 |
| @ |
| Veritas Software Corp. |
| 36,135 |
| |
|
|
|
|
|
| 2,248,032 |
| |
|
|
|
| Telecommunications: 1.0% |
|
|
| |
1,700 |
|
|
| Alltel Corp. |
| 96,373 |
| |
1,240 |
|
|
| AT&T Corp. |
| 22,692 |
| |
1,450 |
| @ |
| Avaya, Inc. |
| 23,809 |
| |
7,550 |
|
|
| BellSouth Corp. |
| 202,491 |
| |
400 |
|
|
| CenturyTel, Inc. |
| 13,168 |
| |
26,550 |
| @ |
| Cisco Systems, Inc. |
| 496,750 |
| |
1,300 |
|
|
| Citizens Communications Co. |
| 18,590 |
| |
600 |
| @ |
| Comverse Technology, Inc. |
| 12,762 |
| |
5,950 |
| @ |
| Corning, Inc. |
| 74,851 |
| |
17,500 |
| @ |
| Lucent Technologies, Inc. |
| 68,775 |
| |
13,250 |
|
|
| Motorola, Inc. |
| 255,195 |
| |
4,650 |
| @ |
| Nextel Communications, Inc. |
| 132,339 |
| |
6,400 |
|
|
| Qualcomm, Inc. |
| 266,368 |
| |
6,000 |
| @ |
| Qwest Communications Intl., Inc. |
| 24,000 |
| |
12,950 |
|
|
| SBC Communications, Inc. |
| 325,951 |
| |
850 |
|
|
| Scientific-Atlanta, Inc. |
| 25,177 |
| |
6,100 |
|
|
| Sprint Corp. |
| 139,141 |
| |
1,450 |
| @ |
| Tellabs, Inc. |
| 12,398 |
| |
10,950 |
|
|
| Verizon Communications, Inc. |
| 451,468 |
| |
|
|
|
|
|
| 2,662,298 |
| |
|
|
|
| Textiles: 0.0% |
|
|
| |
550 |
|
|
| Cintas Corp. |
| 24,596 |
| |
|
|
|
|
|
| 24,596 |
| |
|
|
|
| Toys/Games/Hobbies: 0.0% |
|
|
| |
500 |
|
|
| Hasbro, Inc. |
| 9,515 |
| |
1,700 |
|
|
| Mattel, Inc. |
| 32,215 |
| |
|
|
|
|
|
| 41,730 |
| |
|
|
|
| Transportation: 0.2% |
|
|
| |
1,550 |
|
|
| Burlington Northern Santa Fe Corp. |
| 69,812 |
| |
700 |
|
|
| CSX Corp. |
| 26,691 |
| |
1,650 |
|
|
| FedEx Corp. |
| 156,800 |
| |
1,700 |
|
|
| Norfolk Southern Corp. |
| 58,361 |
| |
350 |
|
|
| Ryder System, Inc. |
| 18,774 |
| |
300 |
|
|
| Union Pacific Corp. |
| 19,032 |
| |
4,400 |
|
|
| United Parcel Service, Inc. |
| 370,260 |
| |
|
|
|
|
|
| 719,730 |
| |
|
|
|
| Total Common Stock |
| 44,534,282 |
| |
Principal |
|
|
|
|
|
|
| ||
Amount |
|
|
|
|
| Value |
| ||
U.S. GOVERNMENT AGENCY OBLIGATIONS: 54.9% |
|
|
| ||||||
|
|
|
| Federal National Mortgage Association: 54.9% |
|
|
| ||
$ | 177,000,000 |
|
|
| 3.640%, due 06/05/07 |
| $ | 161,813,401 |
|
|
|
|
| Total U.S. Government Agency Obligations |
| 161,813,401 |
| ||
U.S. TREASURY OBLIGATIONS: 29.6% |
|
|
| ||||||
|
|
|
| U.S. Treasury STRIP: 29.6% |
|
|
| ||
15,800,000 |
|
|
| 3.140%, due 05/15/07 |
| 14,636,298 |
| ||
78,591,000 |
|
|
| 3.190%, due 05/15/07 |
| 72,767,407 |
| ||
|
|
|
| Total U.S. Treasury Obligations |
| 87,403,705 |
| ||
|
|
|
| Total Long-Term Investments |
| 293,751,388 |
| ||
SHORT-TERM INVESTMENTS: 0.8% |
|
|
| ||||||
|
|
|
| Repurchase Agreement: 0.8% |
|
|
| ||
2,477,000 |
|
|
| Goldman Sachs Repurchase Agreement dated 11/30/04, 2.060%, due 12/01/04, $2,477,141 to be received upon repurchase (Collateralized by $2,388,000.00 Federal Home Loan Mortgage Corporation, 5.500%, Market Value plus accrued interest $2,526,802, due 07/15/06) |
| 2,477,000 |
| ||
|
|
|
| Total Short-Term Investments |
| 2,477,000 |
| ||
|
|
|
|
|
| |
Total Investments In Securities |
| 100.4 | % | $ | 296,228,388 |
|
Other Assets and Liabilities-Net |
| (0.4 | ) | (1,209,190 | ) | |
|
|
|
|
|
| |
Net Assets |
| 100.0 | % | $ | 295,019,198 |
|
@ |
| Non-income producing security |
@@ |
| Foreign issuer |
STRIP |
| Separate Trading of Registered Interest and Principal of Securities |
* |
| Cost for federal income tax purposes is $283,343,588. Net unrealized appreciation consists of: |
Gross Unrealized Appreciation |
| $ | 13,325,275 |
|
Gross Unrealized Depreciation |
| (440,475 | ) | |
|
|
|
| |
Net Unrealized Appreciation |
| $ | 12,884,800 |
|
See Accompanying Notes to Financial Statements
75
ING PRINCIPAL PROTECTION FUND IV
PORTFOLIO OF INVESTMENTS
AS OF NOVEMBER 30, 2004 (UNAUDITED)
Shares |
|
|
|
|
| Value |
| |
COMMON STOCK: 35.2% |
|
|
| |||||
|
|
|
| Advertising: 0.1% |
|
|
| |
6,750 |
| @ |
| Interpublic Group of Cos., Inc. |
| $ | 83,768 |
|
2,900 |
|
|
| Omnicom Group, Inc. |
| 234,900 |
| |
|
|
|
|
|
| 318,668 |
| |
|
|
|
| Aerospace/Defense: 0.8% |
|
|
| |
25,050 |
|
|
| Boeing Co. |
| 1,341,928 |
| |
6,100 |
|
|
| General Dynamics Corp. |
| 660,996 |
| |
2,900 |
|
|
| Goodrich Corp. |
| 92,075 |
| |
8,300 |
|
|
| Lockheed Martin Corp. |
| 504,972 |
| |
5,950 |
|
|
| Northrop Grumman Corp. |
| 335,164 |
| |
14,550 |
|
|
| Raytheon Co. |
| 586,947 |
| |
2,800 |
|
|
| Rockwell Collins, Inc. |
| 111,608 |
| |
9,460 |
|
|
| United Technologies Corp. |
| 923,107 |
| |
|
|
|
|
|
| 4,556,797 |
| |
|
|
|
| Agriculture: 0.5% |
|
|
| |
36,150 |
|
|
| Altria Group, Inc. |
| 2,078,263 |
| |
11,100 |
|
|
| Archer-Daniels-Midland Co. |
| 235,320 |
| |
4,250 |
|
|
| Monsanto Co. |
| 195,585 |
| |
2,750 |
|
|
| Reynolds American, Inc. |
| 207,983 |
| |
5,600 |
|
|
| UST, Inc. |
| 246,568 |
| |
|
|
|
|
|
| 2,963,719 |
| |
|
|
|
| Apparel: 0.2% |
|
|
| |
5,800 |
| @ |
| Coach, Inc. |
| 289,072 |
| |
3,170 |
|
|
| Jones Apparel Group, Inc. |
| 112,630 |
| |
2,780 |
|
|
| Liz Claiborne, Inc. |
| 114,175 |
| |
8,400 |
|
|
| Nike, Inc. |
| 711,144 |
| |
700 |
|
|
| Reebok Intl. Ltd. |
| 27,216 |
| |
2,600 |
|
|
| VF Corp. |
| 140,374 |
| |
|
|
|
|
|
| 1,394,611 |
| |
|
|
|
| Auto Manufacturers: 0.3% |
|
|
| |
57,120 |
|
|
| Ford Motor Co. |
| 809,961 |
| |
10,150 |
|
|
| General Motors Corp. |
| 391,689 |
| |
5,095 |
|
|
| PACCAR, Inc. |
| 397,920 |
| |
|
|
|
|
|
| 1,599,570 |
| |
|
|
|
| Auto Parts and Equipment: 0.1% |
|
|
| |
3,650 |
|
|
| Dana Corp. |
| 59,678 |
| |
5,650 |
| @ |
| Goodyear Tire & Rubber Co. |
| 71,303 |
| |
2,800 |
|
|
| Johnson Controls, Inc. |
| 171,920 |
| |
|
|
|
|
|
| 302,901 |
| |
|
|
|
| Banks: 2.2% |
|
|
| |
5,650 |
|
|
| AmSouth Bancorporation |
| 146,505 |
| |
71,844 |
|
|
| Bank of America Corp. |
| 3,324,221 |
| |
10,400 |
|
|
| BB&T Corp. |
| 441,480 |
| |
3,450 |
|
|
| Comerica, Inc. |
| 212,175 |
| |
4,000 |
|
|
| Fifth Third Bancorp |
| 201,440 |
| |
2,250 |
|
|
| First Horizon National Corp. |
| 98,325 |
| |
4,300 |
|
|
| Huntington Bancshares, Inc. |
| 104,318 |
| |
9,200 |
|
|
| KeyCorp |
| 306,268 |
| |
1,800 |
|
|
| M & T Bank Corp. |
| 189,738 |
| |
3,150 |
|
|
| Marshall & Ilsley Corp. |
| 131,324 |
| |
7,300 |
|
|
| Mellon Financial Corp. |
| 213,306 |
| |
16,550 |
|
|
| National City Corp. |
| 613,674 |
| |
3,225 |
|
|
| North Fork Bancorporation, Inc. |
| 92,880 |
| |
4,000 |
|
|
| Northern Trust Corp. |
| 188,160 |
| |
4,250 |
|
|
| PNC Financial Services Group, Inc. |
| 231,200 |
| |
6,747 |
|
|
| Regions Financial Corp. |
| 236,078 |
| |
2,000 |
|
|
| State Street Corp. |
| 89,120 |
| |
6,650 |
|
|
| SunTrust Banks, Inc. |
| 474,145 |
| |
2,150 |
|
|
| Synovus Financial Corp. |
| 58,050 |
| |
4,800 |
|
|
| The Bank of New York Co., Inc. |
| 157,968 |
| |
32,750 |
|
|
| U.S. Bancorp |
| 970,383 |
| |
38,289 |
|
|
| Wachovia Corp. |
| 1,981,455 |
| |
29,800 |
|
|
| Wells Fargo & Co. |
| 1,840,745 |
| |
1,450 |
|
|
| Zions Bancorporation |
| 96,425 |
| |
|
|
|
|
|
| 12,399,383 |
| |
|
|
|
| Beverages: 0.8% |
|
|
| |
800 |
|
|
| Adolph Coors Co. |
| 59,920 |
| |
15,100 |
|
|
| Anheuser-Busch Cos., Inc. |
| 756,359 |
| |
1,800 |
|
|
| Brown-Forman Corp. |
| 86,436 |
| |
42,650 |
|
|
| Coca-Cola Co. |
| 1,676,571 |
| |
7,950 |
|
|
| Coca-Cola Enterprises, Inc. |
| 165,360 |
| |
4,650 |
|
|
| Pepsi Bottling Group, Inc. |
| 130,293 |
| |
29,950 |
|
|
| PepsiCo, Inc. |
| 1,494,805 |
| |
|
|
|
|
|
| 4,369,744 |
| |
|
|
|
| Biotechnology: 0.4% |
|
|
| |
22,150 |
| @ |
| Amgen, Inc. |
| 1,329,886 |
| |
5,700 |
| @ |
| Biogen Idec, Inc. |
| 334,476 |
| |
4,150 |
| @ |
| Genzyme Corp. |
| 232,442 |
| |
4,100 |
| @ |
| MedImmune, Inc. |
| 109,060 |
| |
50 |
| @ |
| Millipore Corp. |
| 2,436 |
| |
|
|
|
|
|
| 2,008,300 |
| |
|
|
|
| Building Materials: 0.1% |
|
|
| |
3,050 |
| @ |
| American Standard Cos., Inc. |
| 118,767 |
| |
8,500 |
|
|
| Masco Corp. |
| 299,795 |
| |
1,800 |
|
|
| Vulcan Materials Co. |
| 93,330 |
| |
|
|
|
|
|
| 511,892 |
| |
|
|
|
| Chemicals: 0.6% |
|
|
| |
3,950 |
|
|
| Air Products & Chemicals, Inc. |
| 226,138 |
| |
1,600 |
|
|
| Ashland, Inc. |
| 94,640 |
| |
18,800 |
|
|
| Dow Chemical Co. |
| 948,835 |
| |
19,750 |
|
|
| E.I. du Pont de Nemours & Co. |
| 895,070 |
| |
1,800 |
|
|
| Eastman Chemical Co. |
| 97,884 |
| |
1,900 |
|
|
| Ecolab, Inc. |
| 66,462 |
| |
2,950 |
|
|
| Engelhard Corp. |
| 88,176 |
| |
1,200 |
|
|
| International Flavors & Fragrances, Inc. |
| 48,600 |
| |
4,600 |
|
|
| PPG Industries, Inc. |
| 310,362 |
| |
5,300 |
|
|
| Praxair, Inc. |
| 237,970 |
| |
4,100 |
|
|
| Rohm & Haas Co. |
| 180,769 |
| |
4,350 |
|
|
| Sherwin-Williams Co. |
| 194,010 |
| |
1,200 |
|
|
| Sigma-Aldrich Corp. |
| 71,676 |
| |
|
|
|
|
|
| 3,460,592 |
| |
|
|
|
| Commercial Services: 0.3% |
|
|
| |
3,250 |
| @ |
| Apollo Group, Inc. |
| 259,025 |
| |
19,550 |
|
|
| Cendant Corp. |
| 443,198 |
| |
820 |
|
|
| Deluxe Corp. |
| 32,423 |
| |
2,300 |
|
|
| Equifax, Inc. |
| 63,526 |
| |
3,180 |
|
|
| H&R Block, Inc. |
| 151,686 |
| |
5,850 |
|
|
| McKesson Corp. |
| 172,868 |
| |
2,200 |
|
|
| Moody’s Corp. |
| 177,650 |
| |
5,450 |
|
|
| Paychex, Inc. |
| 180,722 |
| |
3,000 |
|
|
| R.R. Donnelley & Sons Co. |
| 104,100 |
| |
2,300 |
|
|
| Robert Half Intl., Inc. |
| 62,169 |
| |
|
|
|
|
|
| 1,647,367 |
| |
|
|
|
| Computers: 1.8% |
|
|
| |
2,300 |
| @ |
| Affiliated Computer Services, Inc. |
| 136,114 |
| |
12,600 |
| @ |
| Apple Computer, Inc. |
| 844,830 |
| |
2,750 |
| @ |
| Computer Sciences Corp. |
| 148,775 |
| |
59,100 |
| @ |
| Dell, Inc. |
| 2,394,731 |
| |
9,150 |
|
|
| Electronic Data Systems Corp. |
| 205,418 |
| |
45,400 |
| @ |
| EMC Corp. |
| 609,268 |
| |
7,100 |
| @ |
| Gateway, Inc. |
| 48,351 |
| |
55,700 |
|
|
| Hewlett-Packard Co. |
| 1,114,000 |
| |
See Accompanying Notes to Financial Statements
76
Shares |
|
|
|
|
| Value |
| |
|
|
|
| Computers (continued) |
|
|
| |
39,900 |
|
|
| International Business Machines Corp. |
| $ | 3,760,175 |
|
2,450 |
| @ |
| Lexmark Intl., Inc. |
| 208,005 |
| |
1,750 |
| @ |
| NCR Corp. |
| 104,528 |
| |
5,750 |
| @ |
| Network Appliance, Inc. |
| 173,420 |
| |
98,200 |
| @ |
| Sun Microsystems, Inc. |
| 545,010 |
| |
4,800 |
| @ |
| Sungard Data Systems, Inc. |
| 127,248 |
| |
5,300 |
| @ |
| Unisys Corp. |
| 60,897 |
| |
|
|
|
|
|
| 10,480,770 |
| |
|
|
|
| Cosmetics/Personal Care: 1.2% |
|
|
| |
1,575 |
|
|
| Alberto-Culver Co. |
| 72,923 |
| |
7,150 |
|
|
| Avon Products, Inc. |
| 268,411 |
| |
9,950 |
|
|
| Colgate-Palmolive Co. |
| 457,601 |
| |
30,150 |
|
|
| Gillette Co. |
| 1,311,223 |
| |
12,250 |
|
|
| Kimberly-Clark Corp. |
| 779,223 |
| |
76,400 |
|
|
| Procter & Gamble Co. |
| 4,085,871 |
| |
|
|
|
|
|
| 6,975,252 |
| |
|
|
|
| Distribution/Wholesale: 0.0% |
|
|
| |
2,500 |
|
|
| Genuine Parts Co. |
| 108,525 |
| |
2,500 |
|
|
| W.W. Grainger, Inc. |
| 154,650 |
| |
|
|
|
|
|
| 263,175 |
| |
|
|
|
| Diversified Financial Services: 2.5% |
|
|
| |
23,450 |
|
|
| American Express Co. |
| 1,306,399 |
| |
1,500 |
|
|
| Bear Stearns Cos., Inc. |
| 146,370 |
| |
3,630 |
|
|
| Capital One Financial Corp. |
| 285,245 |
| |
4,400 |
|
|
| CIT Group, Inc. |
| 188,100 |
| |
91,600 |
|
|
| Citigroup, Inc. |
| 4,099,099 |
| |
18,248 |
|
|
| Countrywide Financial Corp. |
| 606,016 |
| |
5,050 |
| @ |
| E*TRADE Financial Corp. |
| 69,993 |
| |
17,900 |
|
|
| Fannie Mae |
| 1,229,729 |
| |
1,850 |
|
|
| Federated Investors, Inc. |
| 54,427 |
| |
4,400 |
|
|
| Franklin Resources, Inc. |
| 288,772 |
| |
12,750 |
|
|
| Freddie Mac |
| 870,315 |
| |
9,050 |
|
|
| Goldman Sachs Group, Inc. |
| 948,078 |
| |
26,450 |
|
|
| J.P. Morgan Chase & Co. |
| 995,843 |
| |
4,700 |
|
|
| Janus Capital Group, Inc. |
| 77,785 |
| |
4,850 |
|
|
| Lehman Brothers Holdings, Inc. |
| 406,333 |
| |
24,000 |
|
|
| MBNA Corp. |
| 637,440 |
| |
17,550 |
|
|
| Merrill Lynch & Co., Inc. |
| 977,711 |
| |
7,700 |
|
|
| Morgan Stanley |
| 390,775 |
| |
6,590 |
| @ |
| Providian Financial Corp. |
| 105,770 |
| |
6,750 |
|
|
| SLM Corp. |
| 345,398 |
| |
900 |
|
|
| T. Rowe Price Group, Inc. |
| 53,244 |
| |
|
|
|
|
|
| 14,082,842 |
| |
|
|
|
| Electric: 0.9% |
|
|
| |
16,200 |
| @ |
| AES Corp. |
| 198,288 |
| |
1,250 |
|
|
| Ameren Corp. |
| 60,525 |
| |
6,550 |
|
|
| American Electric Power Co., Inc. |
| 223,814 |
| |
1,300 |
|
|
| Cinergy Corp. |
| 53,807 |
| |
4,450 |
|
|
| Consolidated Edison, Inc. |
| 195,133 |
| |
3,250 |
|
|
| Constellation Energy Group, Inc. |
| 142,025 |
| |
2,300 |
|
|
| Dominion Resources, Inc. |
| 150,581 |
| |
3,200 |
|
|
| DTE Energy Co. |
| 140,416 |
| |
22,750 |
|
|
| Duke Energy Corp. |
| 575,119 |
| |
7,910 |
|
|
| Edison Intl |
| 252,329 |
| |
4,050 |
|
|
| Entergy Corp. |
| 262,521 |
| |
12,300 |
|
|
| Exelon Corp. |
| 513,032 |
| |
5,250 |
|
|
| FirstEnergy Corp. |
| 221,708 |
| |
3,250 |
|
|
| FPL Group, Inc. |
| 228,573 |
| |
7,070 |
| @ |
| PG&E Corp. |
| 235,148 |
| |
1,950 |
|
|
| Pinnacle West Capital Corp. |
| 86,190 |
| |
4,550 |
|
|
| PPL Corp. |
| 236,373 |
| |
4,300 |
|
|
| Public Service Enterprise Group, Inc. |
| 189,157 |
| |
13,000 |
|
|
| Southern Co. |
| 426,270 |
| |
4,100 |
|
|
| TECO Energy, Inc. |
| 61,336 |
| |
7,500 |
|
|
| TXU Corp. |
| 471,150 |
| |
6,050 |
|
|
| Xcel Energy, Inc. |
| 109,263 |
| |
|
|
|
|
|
| 5,032,758 |
| |
|
|
|
| Electrical Components and Equipment: 0.1% |
|
|
| |
10,850 |
|
|
| Emerson Electric Co. |
| 724,997 |
| |
|
|
|
|
|
| 724,997 |
| |
|
|
|
| Electronics: 0.2% |
|
|
| |
7,800 |
| @ |
| Agilent Technologies, Inc. |
| 178,541 |
| |
4,400 |
|
|
| Applera Corp. — Applied Biosystems Group |
| 90,200 |
| |
2,200 |
| @ |
| Fisher Scientific Intl. |
| 124,388 |
| |
5,030 |
| @ |
| Jabil Circuit, Inc. |
| 126,052 |
| |
1,800 |
|
|
| Parker Hannifin Corp. |
| 134,640 |
| |
3,500 |
|
|
| PerkinElmer, Inc. |
| 74,655 |
| |
7,200 |
| @ |
| Sanmina-SCI Corp. |
| 63,576 |
| |
14,400 |
| @ |
| Solectron Corp. |
| 90,000 |
| |
1,050 |
|
|
| Tektronix, Inc. |
| 32,939 |
| |
2,950 |
| @ |
| Thermo Electron Corp. |
| 89,238 |
| |
3,050 |
| @ |
| Waters Corp. |
| 142,313 |
| |
|
|
|
|
|
| 1,146,542 |
| |
|
|
|
| Engineering and Construction: 0.0% |
|
|
| |
1,600 |
|
|
| Fluor Corp. |
| 83,040 |
| |
|
|
|
|
|
| 83,040 |
| |
|
|
|
| Entertainment: 0.0% |
|
|
| |
5,550 |
|
|
| International Game Technology |
| 196,193 |
| |
|
|
|
|
|
| 196,193 |
| |
|
|
|
| Environmental Control: 0.0% |
|
|
| |
9,000 |
|
|
| Waste Management, Inc. |
| 268,290 |
| |
|
|
|
|
|
| 268,290 |
| |
|
|
|
| Food: 0.4% |
|
|
| |
6,850 |
|
|
| Albertson’s, Inc. |
| 173,305 |
| |
2,850 |
|
|
| Campbell Soup Co. |
| 81,311 |
| |
8,150 |
|
|
| ConAgra Foods, Inc. |
| 220,458 |
| |
6,800 |
|
|
| General Mills, Inc. |
| 309,332 |
| |
5,350 |
|
|
| H.J. Heinz Co. |
| 198,806 |
| |
4,350 |
|
|
| Hershey Foods Corp. |
| 225,330 |
| |
6,250 |
|
|
| Kellogg Co. |
| 273,125 |
| |
5,100 |
| @ |
| Kroger Co. |
| 82,518 |
| |
2,900 |
|
|
| McCormick & Co., Inc. |
| 105,705 |
| |
3,100 |
| @ |
| Safeway, Inc. |
| 59,768 |
| |
14,250 |
|
|
| Sara Lee Corp. |
| 334,590 |
| |
3,600 |
|
|
| SUPERVALU, Inc. |
| 113,724 |
| |
5,100 |
|
|
| Wm. Wrigley Jr. Co. |
| 350,879 |
| |
|
|
|
|
|
| 2,528,851 |
| |
|
|
|
| Forest Products and Paper: 0.2% |
|
|
| |
4,700 |
|
|
| Georgia-Pacific Corp. |
| 172,067 |
| |
8,000 |
|
|
| International Paper Co. |
| 332,160 |
| |
2,500 |
|
|
| Louisiana-Pacific Corp. |
| 61,175 |
| |
4,350 |
|
|
| MeadWestvaco Corp. |
| 146,378 |
| |
3,250 |
|
|
| Plum Creek Timber Co., Inc. |
| 120,250 |
| |
1,100 |
|
|
| Temple-Inland, Inc. |
| 65,549 |
| |
6,250 |
|
|
| Weyerhaeuser Co. |
| 412,500 |
| |
|
|
|
|
|
| 1,310,079 |
| |
See Accompanying Notes to Financial Statements
77
Shares |
|
|
|
|
| Value |
| |
|
|
|
| Gas: 0.1% |
|
|
| |
3,000 |
|
|
| KeySpan Corp. |
| $ | 118,560 |
|
4,500 |
|
|
| Sempra Energy |
| 166,410 |
| |
|
|
|
|
|
| 284,970 |
| |
|
|
|
| Hand/Machine Tools: 0.0% |
|
|
| |
1,950 |
|
|
| Black & Decker Corp. |
| 163,976 |
| |
400 |
|
|
| Snap-On, Inc. |
| 12,644 |
| |
1,800 |
|
|
| Stanley Works |
| 84,168 |
| |
|
|
|
|
|
| 260,788 |
| |
|
|
|
| Healthcare — Products: 1.4% |
|
|
| |
1,150 |
|
|
| Bausch & Lomb, Inc. |
| 67,712 |
| |
10,900 |
|
|
| Baxter Intl., Inc. |
| 344,985 |
| |
6,220 |
|
|
| Becton Dickinson & Co. |
| 340,732 |
| |
4,200 |
|
|
| Biomet, Inc. |
| 201,054 |
| |
15,500 |
| @ |
| Boston Scientific Corp. |
| 539,555 |
| |
2,400 |
|
|
| C.R. Bard, Inc. |
| 143,784 |
| |
5,670 |
|
|
| Guidant Corp. |
| 367,586 |
| |
70,750 |
|
|
| Johnson & Johnson |
| 4,267,639 |
| |
21,200 |
|
|
| Medtronic, Inc. |
| 1,018,660 |
| |
7,200 |
| @ |
| St. Jude Medical, Inc. |
| 274,608 |
| |
2,750 |
|
|
| Stryker Corp. |
| 120,973 |
| |
3,850 |
| @ |
| Zimmer Holdings, Inc. |
| 314,160 |
| |
|
|
|
|
|
| 8,001,448 |
| |
|
|
|
| Healthcare — Services: 0.6% |
|
|
| |
4,500 |
|
|
| Aetna, Inc. |
| 533,295 |
| |
4,200 |
| @ |
| Humana, Inc. |
| 104,244 |
| |
2,150 |
| @ |
| Laboratory Corp. Of America Holdings |
| 103,093 |
| |
1,700 |
|
|
| Manor Care, Inc. |
| 58,565 |
| |
700 |
|
|
| Quest Diagnostics, Inc. |
| 65,625 |
| |
19,800 |
|
|
| UnitedHealth Group, Inc. |
| 1,640,429 |
| |
4,970 |
| @ |
| WellPoint Health Networks, Inc. |
| 621,747 |
| |
4,090 |
| @ |
| WellPoint, Inc. |
| 414,440 |
| |
|
|
|
|
|
| 3,541,438 |
| |
|
|
|
| Home Builders: 0.0% |
|
|
| |
2,220 |
|
|
| Centex Corp. |
| 116,483 |
| |
|
|
|
|
|
| 116,483 |
| |
|
|
|
| Home Furnishings: 0.0% |
|
|
| |
3,800 |
|
|
| Leggett & Platt, Inc. |
| 113,430 |
| |
1,250 |
|
|
| Whirlpool Corp. |
| 80,688 |
| |
|
|
|
|
|
| 194,118 |
| |
|
|
|
| Household Products/Wares: 0.1% |
|
|
| |
2,100 |
|
|
| Avery Dennison Corp. |
| 123,186 |
| |
4,960 |
|
|
| Clorox Co. |
| 273,395 |
| |
2,750 |
|
|
| Fortune Brands, Inc. |
| 215,820 |
| |
|
|
|
|
|
| 612,401 |
| |
|
|
|
| Housewares: 0.0% |
|
|
| |
5,000 |
|
|
| Newell Rubbermaid, Inc. |
| 115,400 |
| |
|
|
|
|
|
| 115,400 |
| |
|
|
|
| Insurance: 2.0% |
|
|
| |
5,750 |
| @@ |
| ACE Ltd. |
| 232,415 |
| |
8,800 |
|
|
| AFLAC, Inc. |
| 331,056 |
| |
17,350 |
|
|
| Allstate Corp. |
| 876,174 |
| |
1,800 |
|
|
| AMBAC Financial Group, Inc. |
| 146,394 |
| |
78,300 |
|
|
| American International Group, Inc. |
| 4,960,304 |
| |
5,250 |
|
|
| AON Corp. |
| 110,880 |
| |
6,000 |
|
|
| Chubb Corp. |
| 457,260 |
| |
4,270 |
|
|
| CIGNA Corp. |
| 298,985 |
| |
2,992 |
|
|
| Cincinnati Financial Corp. |
| 134,042 |
| |
4,450 |
|
|
| Hartford Financial Services Group, Inc. |
| 284,800 |
| |
2,250 |
|
|
| Jefferson-Pilot Corp. |
| 110,678 |
| |
4,500 |
|
|
| Lincoln National Corp. |
| 207,090 |
| |
4,400 |
|
|
| Loews Corp. |
| 307,604 |
| |
9,050 |
|
|
| Marsh & McLennan Cos., Inc. |
| 258,740 |
| |
2,700 |
|
|
| MBIA, Inc. |
| 161,892 |
| |
18,650 |
|
|
| MetLife, Inc. |
| 727,350 |
| |
1,850 |
|
|
| MGIC Investment Corp. |
| 125,800 |
| |
4,850 |
|
|
| Principal Financial Group |
| 182,748 |
| |
3,500 |
|
|
| Progressive Corp. |
| 318,465 |
| |
15,450 |
|
|
| Prudential Financial, Inc. |
| 756,278 |
| |
4,100 |
|
|
| Safeco Corp. |
| 198,727 |
| |
2,100 |
|
|
| Torchmark Corp. |
| 115,311 |
| |
5,000 |
|
|
| UnumProvident Corp. |
| 77,850 |
| |
2,450 |
| @@ |
| XL Capital Ltd. |
| 184,632 |
| |
|
|
|
|
|
| 11,565,475 |
| |
|
|
|
| Internet: 0.5% |
|
|
| |
11,700 |
| @ |
| eBay, Inc. |
| 1,315,665 |
| |
9,700 |
| @ |
| Symantec Corp. |
| 618,957 |
| |
25,150 |
| @ |
| Yahoo!, Inc. |
| 946,143 |
| |
|
|
|
|
|
| 2,880,765 |
| |
|
|
|
| Iron/Steel: 0.1% |
|
|
| |
3,100 |
|
|
| Nucor Corp. |
| 163,990 |
| |
2,750 |
|
|
| United States Steel Corp. |
| 143,990 |
| |
|
|
|
|
|
| 307,980 |
| |
|
|
|
| Leisure Time: 0.2% |
|
|
| |
1,450 |
|
|
| Brunswick Corp. |
| 70,789 |
| |
11,900 |
|
|
| Carnival Corp. |
| 630,819 |
| |
4,400 |
|
|
| Harley-Davidson, Inc. |
| 254,408 |
| |
3,400 |
|
|
| Sabre Holdings Corp. |
| 78,472 |
| |
|
|
|
|
|
| 1,034,488 |
| |
|
|
|
| Lodging: 0.1% |
|
|
| |
1,430 |
|
|
| Harrah’s Entertainment, Inc. |
| 87,802 |
| |
5,600 |
|
|
| Hilton Hotels Corp. |
| 115,696 |
| |
3,800 |
|
|
| Marriott Intl., Inc. |
| 216,030 |
| |
3,500 |
|
|
| Starwood Hotels & Resorts Worldwide, Inc. |
| 183,015 |
| |
|
|
|
|
|
| 602,543 |
| |
|
|
|
| Machinery — Construction and Mining: 0.0% |
|
|
| |
2,350 |
|
|
| Caterpillar, Inc. |
| 215,143 |
| |
|
|
|
|
|
| 215,143 |
| |
|
|
|
| Machinery — Diversified: 0.1% |
|
|
| |
1,200 |
|
|
| Cummins, Inc. |
| 95,544 |
| |
3,950 |
|
|
| Deere & Co. |
| 283,334 |
| |
3,750 |
|
|
| Rockwell Automation, Inc. |
| 177,375 |
| |
|
|
|
|
|
| 556,253 |
| |
|
|
|
| Media: 1.0% |
|
|
| |
4,050 |
|
|
| Clear Channel Communications, Inc. |
| 136,404 |
| |
41,500 |
| @ |
| Comcast Corp. |
| 1,246,659 |
| |
4,750 |
|
|
| Gannett Co., Inc. |
| 391,828 |
| |
1,150 |
|
|
| Knight-Ridder, Inc. |
| 78,304 |
| |
4,650 |
|
|
| McGraw-Hill Cos., Inc. |
| 407,945 |
| |
1,050 |
|
|
| Meredith Corp. |
| 55,356 |
| |
2,200 |
|
|
| New York Times Co. |
| 90,200 |
| |
80,500 |
| @ |
| Time Warner, Inc. |
| 1,425,654 |
| |
2,250 |
|
|
| Tribune Co. |
| 97,583 |
| |
2,200 |
| @ |
| Univision Communications, Inc. |
| 66,220 |
| |
See Accompanying Notes to Financial Statements
78
Shares |
|
|
|
|
| Value |
| |
|
|
|
| Media (continued) |
|
|
| |
12,300 |
|
|
| Viacom, Inc. |
| $ | 426,810 |
|
38,250 |
|
|
| Walt Disney Co. |
| 1,028,160 |
| |
|
|
|
|
|
| 5,451,123 |
| |
|
|
|
| Mining: 0.0% |
|
|
| |
2,450 |
|
|
| Phelps Dodge Corp. |
| 237,969 |
| |
|
|
|
|
|
| 237,969 |
| |
|
|
|
| Miscellaneous Manufacturing: 2.0% |
|
|
| |
14,450 |
|
|
| 3M Co. |
| 1,150,075 |
| |
1,700 |
|
|
| Cooper Industries Ltd. |
| 112,727 |
| |
4,950 |
|
|
| Danaher Corp. |
| 281,556 |
| |
3,150 |
|
|
| Dover Corp. |
| 127,418 |
| |
5,970 |
|
|
| Eastman Kodak Co. |
| 195,279 |
| |
2,200 |
|
|
| Eaton Corp. |
| 148,280 |
| |
186,750 |
|
|
| General Electric Co. |
| 6,603,479 |
| |
15,850 |
|
|
| Honeywell Intl., Inc. |
| 559,980 |
| |
5,550 |
|
|
| Illinois Tool Works, Inc. |
| 522,977 |
| |
2,600 |
| @@ |
| Ingersoll-Rand Co. |
| 193,492 |
| |
1,350 |
|
|
| ITT Industries, Inc. |
| 114,912 |
| |
1,800 |
|
|
| Pall Corp. |
| 48,762 |
| |
1,930 |
|
|
| Textron, Inc. |
| 140,157 |
| |
35,450 |
| @@ |
| Tyco Intl. Ltd. |
| 1,204,236 |
| |
|
|
|
|
|
| 11,403,330 |
| |
|
|
|
| Office/Business Equipment: 0.1% |
|
|
| |
4,400 |
|
|
| Pitney Bowes, Inc. |
| 192,588 |
| |
12,800 |
| @ |
| Xerox Corp. |
| 196,096 |
| |
|
|
|
|
|
| 388,684 |
| |
|
|
|
| Oil and Gas: 2.8% |
|
|
| |
1,560 |
|
|
| Amerada Hess Corp. |
| 138,606 |
| |
5,400 |
|
|
| Anadarko Petroleum Corp. |
| 375,840 |
| |
4,600 |
|
|
| Apache Corp. |
| 248,676 |
| |
11,500 |
|
|
| Burlington Resources, Inc. |
| 533,715 |
| |
58,650 |
|
|
| ChevronTexaco Corp. |
| 3,202,289 |
| |
14,950 |
|
|
| ConocoPhillips |
| 1,360,300 |
| |
14,400 |
|
|
| Devon Energy Corp. |
| 596,447 |
| |
1,700 |
|
|
| EOG Resources, Inc. |
| 127,619 |
| |
141,550 |
|
|
| Exxon Mobil Corp. |
| 7,254,437 |
| |
2,150 |
|
|
| Kerr-McGee Corp. |
| 133,795 |
| |
5,000 |
|
|
| Marathon Oil Corp. |
| 197,200 |
| |
850 |
| @,@@ |
| Nabors Industries Ltd. |
| 44,200 |
| |
1,850 |
| @ |
| Noble Corp. |
| 89,633 |
| |
6,890 |
|
|
| Occidental Petroleum Corp. |
| 414,847 |
| |
1,800 |
|
|
| Sunoco, Inc. |
| 148,608 |
| |
4,950 |
| @ |
| Transocean, Inc. |
| 199,337 |
| |
6,200 |
|
|
| Unocal Corp. |
| 285,448 |
| |
6,200 |
|
|
| Valero Energy Corp. |
| 290,098 |
| |
|
|
|
|
|
| 15,641,095 |
| |
|
|
|
| Oil and Gas Services: 0.1% |
|
|
| |
4,600 |
|
|
| Baker Hughes, Inc. |
| 203,918 |
| |
2,750 |
|
|
| BJ Services Co. |
| 139,343 |
| |
7,200 |
|
|
| Halliburton Co. |
| 297,720 |
| |
|
|
|
|
|
| 640,981 |
| |
|
|
|
| Packaging and Containers: 0.1% |
|
|
| |
2,600 |
|
|
| Ball Corp. |
| 116,298 |
| |
1,400 |
|
|
| Bemis Co. |
| 38,976 |
| |
2,550 |
| @ |
| Pactiv Corp. |
| 63,368 |
| |
1,400 |
| @ |
| Sealed Air Corp. |
| 71,974 |
| |
|
|
|
|
|
| 290,616 |
| |
|
|
|
| Pharmaceuticals: 1.9% |
|
|
| |
29,000 |
|
|
| Abbott Laboratories |
| 1,216,839 |
| |
2,250 |
|
|
| Allergan, Inc. |
| 165,375 |
| |
2,050 |
|
|
| AmerisourceBergen Corp. |
| 120,827 |
| |
36,500 |
|
|
| Bristol-Myers Squibb Co. |
| 857,750 |
| |
6,700 |
|
|
| Cardinal Health, Inc. |
| 350,276 |
| |
13,600 |
| @ |
| Caremark Rx, Inc. |
| 486,336 |
| |
8,000 |
|
|
| Eli Lilly & Co. |
| 426,640 |
| |
1,400 |
| @ |
| Express Scripts, Inc. |
| 100,744 |
| |
6,050 |
| @ |
| Forest Laboratories, Inc. |
| 235,769 |
| |
6,800 |
| @ |
| Gilead Sciences, Inc. |
| 234,328 |
| |
3,200 |
| @ |
| Hospira, Inc. |
| 103,136 |
| |
5,700 |
| @ |
| King Pharmaceuticals, Inc. |
| 70,965 |
| |
4,948 |
| @ |
| Medco Health Solutions, Inc. |
| 186,639 |
| |
41,000 |
|
|
| Merck & Co., Inc. |
| 1,148,819 |
| |
133,070 |
|
|
| Pfizer, Inc. |
| 3,695,353 |
| |
27,550 |
|
|
| Schering-Plough Corp. |
| 491,768 |
| |
25,050 |
|
|
| Wyeth |
| 998,744 |
| |
|
|
|
|
|
| 10,890,308 |
| |
|
|
|
| Pipelines: 0.1% |
|
|
| |
12,850 |
| @ |
| Dynegy, Inc. |
| 72,603 |
| |
9,500 |
|
|
| El Paso Corp. |
| 99,180 |
| |
750 |
|
|
| Kinder Morgan, Inc. |
| 51,975 |
| |
9,000 |
|
|
| Williams Cos., Inc. |
| 150,030 |
| |
|
|
|
|
|
| 373,788 |
| |
|
|
|
| Real Estate Investment Trusts: 0.1% |
|
|
| |
2,900 |
|
|
| Equity Office Properties Trust |
| 79,605 |
| |
2,750 |
|
|
| ProLogis |
| 110,633 |
| |
3,700 |
|
|
| Simon Property Group, Inc. |
| 229,696 |
| |
|
|
|
|
|
| 419,934 |
| |
|
|
|
| Retail: 2.6% |
|
|
| |
5,550 |
| @ |
| Bed Bath & Beyond, Inc. |
| 221,600 |
| |
5,000 |
|
|
| Best Buy Co., Inc. |
| 281,900 |
| |
5,950 |
|
|
| Circuit City Stores, Inc. |
| 92,761 |
| |
14,550 |
|
|
| Costco Wholesale Corp. |
| 707,130 |
| |
6,350 |
|
|
| CVS Corp. |
| 288,100 |
| |
3,950 |
|
|
| Darden Restaurants, Inc. |
| 107,677 |
| |
2,650 |
|
|
| Federated Department Stores, Inc. |
| 145,220 |
| |
20,670 |
|
|
| Gap, Inc. |
| 451,640 |
| |
65,640 |
|
|
| Home Depot, Inc. |
| 2,740,469 |
| |
8,850 |
|
|
| J.C. Penney Co., Inc. Holding Co. |
| 341,610 |
| |
2,350 |
| @ |
| Kohl’s Corp. |
| 108,476 |
| |
11,550 |
|
|
| Limited Brands, Inc. |
| 282,282 |
| |
14,590 |
|
|
| Lowe’s Cos., Inc. |
| 807,265 |
| |
4,250 |
|
|
| May Department Stores Co. |
| 119,510 |
| |
23,100 |
|
|
| McDonald’s Corp. |
| 710,094 |
| |
2,350 |
|
|
| Nordstrom, Inc. |
| 102,813 |
| |
5,500 |
| @ |
| Office Depot, Inc. |
| 90,200 |
| |
3,840 |
|
|
| RadioShack Corp. |
| 121,229 |
| |
11,620 |
|
|
| Staples, Inc. |
| 370,794 |
| |
7,050 |
| @ |
| Starbucks Corp. |
| 396,633 |
| |
16,900 |
|
|
| Target Corp. |
| 865,618 |
| |
7,800 |
|
|
| TJX Cos., Inc. |
| 183,612 |
| |
3,950 |
| @ |
| Toys R US, Inc. |
| 76,393 |
| |
75,100 |
|
|
| Wal-Mart Stores, Inc. |
| 3,909,705 |
| |
25,900 |
|
|
| Walgreen Co. |
| 988,861 |
| |
3,450 |
|
|
| Wendy’s Intl., Inc. |
| 123,062 |
| |
4,250 |
|
|
| Yum! Brands, Inc. |
| 192,950 |
| |
|
|
|
|
|
| 14,827,604 |
| |
|
|
|
| Savings and Loans: 0.2% |
|
|
| |
2,700 |
|
|
| Golden West Financial Corp. |
| 321,948 |
| |
5,500 |
|
|
| Sovereign Bancorp, Inc. |
| 120,175 |
| |
14,150 |
|
|
| Washington Mutual, Inc. |
| 576,047 |
| |
|
|
|
|
|
| 1,018,170 |
| |
|
|
|
| Semiconductors: 0.8% |
|
|
| |
2,450 |
| @ |
| Advanced Micro Devices, Inc. |
| 52,136 |
| |
5,600 |
| @ |
| Altera Corp. |
| 127,008 |
| |
6,600 |
|
|
| Analog Devices, Inc. |
| 243,870 |
| |
27,500 |
| @ |
| Applied Materials, Inc. |
| 457,600 |
| |
113,600 |
|
|
| Intel Corp. |
| 2,538,960 |
| |
See Accompanying Notes to Financial Statements
79
Shares |
|
|
|
|
| Value |
| |
|
|
|
| Semiconductors (continued) |
|
|
| |
3,300 |
| @ |
| KLA-Tencor Corp. |
| $ | 148,698 |
|
5,300 |
|
|
| Linear Technology Corp. |
| 202,248 |
| |
2,050 |
|
|
| Maxim Integrated Products, Inc. |
| 83,968 |
| |
6,850 |
| @ |
| National Semiconductor Corp. |
| 105,901 |
| |
1,800 |
| @ |
| Qlogic Corp. |
| 61,902 |
| |
12,000 |
|
|
| Texas Instruments, Inc. |
| 290,160 |
| |
|
|
|
|
|
| 4,312,451 |
| |
|
|
|
| Software: 1.8% |
|
|
| |
3,550 |
|
|
| Adobe Systems, Inc. |
| 214,988 |
| |
3,300 |
|
|
| Autodesk, Inc. |
| 215,853 |
| |
9,650 |
|
|
| Automatic Data Processing, Inc. |
| 439,365 |
| |
5,280 |
| @ |
| BMC Software, Inc. |
| 98,102 |
| |
2,650 |
| @ |
| Citrix Systems, Inc. |
| 62,567 |
| |
8,850 |
|
|
| Computer Associates Intl., Inc. |
| 270,191 |
| |
10,700 |
| @ |
| Compuware Corp. |
| 61,739 |
| |
2,200 |
| @ |
| Electronic Arts, Inc. |
| 107,580 |
| |
16,128 |
|
|
| First Data Corp. |
| 662,699 |
| |
2,750 |
| @ |
| Fiserv, Inc. |
| 105,903 |
| |
6,550 |
|
|
| IMS Health, Inc. |
| 147,834 |
| |
3,450 |
| @ |
| Intuit, Inc. |
| 144,348 |
| |
191,000 |
|
|
| Microsoft Corp. |
| 5,120,709 |
| |
7,200 |
| @ |
| Novell, Inc. |
| 43,920 |
| |
154,750 |
| @ |
| Oracle Corp. |
| 1,959,134 |
| |
7,300 |
| @ |
| PeopleSoft, Inc. |
| 172,353 |
| |
8,350 |
| @ |
| Siebel Systems, Inc. |
| 84,168 |
| |
6,500 |
| @ |
| Veritas Software Corp. |
| 142,350 |
| |
|
|
|
|
|
| 10,053,803 |
| |
|
|
|
| Telecommunications: 2.1% |
|
|
| |
6,600 |
|
|
| Alltel Corp. |
| 374,154 |
| |
5,540 |
|
|
| AT&T Corp. |
| 101,382 |
| |
8,050 |
| @ |
| Avaya, Inc. |
| 132,181 |
| |
34,350 |
|
|
| BellSouth Corp. |
| 921,267 |
| |
3,250 |
|
|
| CenturyTel, Inc. |
| 106,990 |
| |
119,050 |
| @ |
| Cisco Systems, Inc. |
| 2,227,425 |
| |
5,600 |
|
|
| Citizens Communications Co. |
| 80,080 |
| |
4,800 |
| @ |
| Comverse Technology, Inc. |
| 102,096 |
| |
20,600 |
| @ |
| Corning, Inc. |
| 259,148 |
| |
72,550 |
| @ |
| Lucent Technologies, Inc. |
| 285,122 |
| |
59,050 |
|
|
| Motorola, Inc. |
| 1,137,303 |
| |
18,350 |
| @ |
| Nextel Communications, Inc. |
| 522,241 |
| |
30,150 |
|
|
| Qualcomm, Inc. |
| 1,254,843 |
| |
28,750 |
| @ |
| Qwest Communications Intl., Inc. |
| 115,000 |
| |
58,900 |
|
|
| SBC Communications, Inc. |
| 1,482,512 |
| |
3,850 |
|
|
| Scientific-Atlanta, Inc. |
| 114,037 |
| |
25,900 |
|
|
| Sprint Corp. |
| 590,779 |
| |
8,450 |
| @ |
| Tellabs, Inc. |
| 72,248 |
| |
48,750 |
|
|
| Verizon Communications, Inc. |
| 2,009,962 |
| |
|
|
|
|
|
| 11,888,770 |
| |
|
|
|
| Textiles: 0.0% |
|
|
| |
3,700 |
|
|
| Cintas Corp. |
| 165,464 |
| |
|
|
|
|
|
| 165,464 |
| |
|
|
|
| Toys/Games/Hobbies: 0.0% |
|
|
| |
4,900 |
|
|
| Hasbro, Inc. |
| 93,247 |
| |
7,350 |
|
|
| Mattel, Inc. |
| 139,283 |
| |
|
|
|
|
|
| 232,530 |
| |
|
|
|
| Transportation: 0.6% |
|
|
| |
5,700 |
|
|
| Burlington Northern Santa Fe Corp. |
| 256,728 |
| |
3,950 |
|
|
| CSX Corp. |
| 150,614 |
| |
7,450 |
|
|
| FedEx Corp. |
| 707,973 |
| |
8,050 |
|
|
| Norfolk Southern Corp. |
| 276,357 |
| |
1,200 |
|
|
| Ryder System, Inc. |
| 64,368 |
| |
1,750 |
|
|
| Union Pacific Corp. |
| 111,020 |
| |
19,950 |
|
|
| United Parcel Service, Inc. |
| 1,678,792 |
| |
|
|
|
|
|
| 3,245,852 |
| |
|
|
|
| Total Common Stock |
| 200,398,498 |
| |
Principal |
|
|
|
|
|
|
| ||
Amount |
|
|
|
|
| Value |
| ||
U.S. GOVERNMENT AGENCY OBLIGATIONS: 59.4% |
|
|
| ||||||
|
|
|
| Federal Home Loan Bank: 55.4% |
|
|
| ||
$ | 350,000,000 |
|
|
| 3.670%, due 10/05/07 |
| $ | 315,893,900 |
|
|
|
|
|
|
| 315,893,900 |
| ||
|
|
|
| Federal National Mortgage Association: 4.0% |
|
|
| ||
25,000,000 |
|
|
| 3.740%, due 10/05/07 |
| 22,521,700 |
| ||
|
|
|
|
|
| 22,521,700 |
| ||
|
|
|
| Total U.S. Government Agency Obligations |
| 338,415,600 |
| ||
U.S. TREASURY OBLIGATIONS: 4.8% |
|
|
| ||||||
|
|
|
| U.S. Treasury STRIP: 4.8% |
|
|
| ||
29,760,000 |
|
|
| 3.240%, due 08/15/07 |
| 27,295,991 |
| ||
|
|
|
| Total U.S. Treasury Obligations |
| 27,295,991 |
| ||
|
|
|
| Total Long-Term Investments |
| 566,110,089 |
| ||
SHORT-TERM INVESTMENTS: 0.8% |
|
|
| ||||||
|
|
|
| Repurchase Agreement: 0.8% |
|
|
| ||
4,428,000 |
|
|
| Goldman Sachs Repurchase Agreement dated 11/30/04, 2.060%, due 12/01/04, $4,428,253 to be received upon repurchase (Collateralized by $4,525,000 Federal Home Loan Bank, 3.200%, Market Value plus accrued interest $4,516,940, due 11/29/06) |
| 4,428,000 |
| ||
|
|
|
| Total Short-Term Investments |
| 4,428,000 |
| ||
|
|
|
|
|
| |
Total Investments In Securities |
| 100.2 | % | $ | 570,538,089 |
|
Other Assets and Liabilities-Net |
| (0.2 | ) | (1,144,091 | ) | |
|
|
|
|
|
| |
Net Assets |
| 100.0 | % | $ | 569,393,998 |
|
@ |
| Non-income producing security |
@@ |
| Foreign issuer |
STRIP |
| Separate Trading of Registered Interest and Principal of Securities |
* |
| Cost for federal income tax purposes is $535,435,198. Net unrealized appreciation consists of: |
Gross Unrealized Appreciation |
| $ | 41,028,474 |
|
Gross Unrealized Depreciation |
| (5,925,583 | ) | |
Net Unrealized Appreciation |
| $ | 35,102,891 |
|
See Accompanying Notes to Financial Statements
80
ING PRINCIPAL PROTECTION FUND V
PORTFOLIO OF INVESTMENTS
AS OF NOVEMBER 30, 2004 (UNAUDITED)
Shares |
|
|
|
|
| Value |
| |
COMMON STOCK: 30.3% |
|
|
| |||||
|
|
|
| Advertising: 0.0% |
|
|
| |
1,950 |
| @ |
| Interpublic Group of Cos., Inc. |
| $ | 24,200 |
|
2,050 |
|
|
| Omnicom Group, Inc. |
| 166,050 |
| |
|
|
|
|
|
| 190,250 |
| |
|
|
|
| Aerospace/ Defense: 0.7% |
|
|
| |
18,500 |
|
|
| Boeing Co. |
| 991,045 |
| |
4,300 |
|
|
| General Dynamics Corp. |
| 465,948 |
| |
2,100 |
|
|
| Goodrich Corp. |
| 66,675 |
| |
5,800 |
|
|
| Lockheed Martin Corp. |
| 352,872 |
| |
3,850 |
|
|
| Northrop Grumman Corp. |
| 216,871 |
| |
10,200 |
|
|
| Raytheon Co. |
| 411,468 |
| |
2,000 |
|
|
| Rockwell Collins, Inc. |
| 79,720 |
| |
6,600 |
|
|
| United Technologies Corp. |
| 644,028 |
| |
|
|
|
|
|
| 3,228,627 |
| |
|
|
|
| Agriculture: 0.4% |
|
|
| |
25,350 |
|
|
| Altria Group, Inc. |
| 1,457,371 |
| |
8,100 |
|
|
| Archer-Daniels-Midland Co. |
| 171,720 |
| |
3,600 |
|
|
| Monsanto Co. |
| 165,672 |
| |
1,550 |
|
|
| Reynolds American, Inc. |
| 117,227 |
| |
3,600 |
|
|
| UST, Inc. |
| 158,508 |
| |
|
|
|
|
|
| 2,070,498 |
| |
|
|
|
| Apparel: 0.2% |
|
|
| |
3,350 |
| @ |
| Coach, Inc. |
| 166,964 |
| |
1,260 |
|
|
| Jones Apparel Group, Inc. |
| 44,768 |
| |
1,750 |
|
|
| Liz Claiborne, Inc. |
| 71,873 |
| |
5,900 |
|
|
| Nike, Inc. |
| 499,493 |
| |
500 |
|
|
| Reebok Intl. Ltd. |
| 19,440 |
| |
1,900 |
|
|
| VF Corp. |
| 102,581 |
| |
|
|
|
|
|
| 905,119 |
| |
|
|
|
| Auto Manufacturers: 0.2% |
|
|
| |
40,030 |
|
|
| Ford Motor Co. |
| 567,625 |
| |
7,100 |
|
|
| General Motors Corp. |
| 273,989 |
| |
3,275 |
|
|
| PACCAR, Inc. |
| 255,778 |
| |
|
|
|
|
|
| 1,097,392 |
| |
|
|
|
| Auto Parts and Equipment: 0.0% |
|
|
| |
1,300 |
|
|
| Dana Corp. |
| 21,255 |
| |
4,150 |
| @ |
| Goodyear Tire & Rubber Co. |
| 52,373 |
| |
2,450 |
|
|
| Johnson Controls, Inc. |
| 150,430 |
| |
|
|
|
|
|
| 224,058 |
| |
|
|
|
| Banks: 1.9% |
|
|
| |
4,350 |
|
|
| AmSouth Bancorporation |
| 112,796 |
| |
50,404 |
|
|
| Bank of America Corp. |
| 2,332,192 |
| |
7,300 |
|
|
| BB&T Corp. |
| 309,885 |
| |
2,500 |
|
|
| Comerica, Inc. |
| 153,750 |
| |
2,450 |
|
|
| Fifth Third Bancorp |
| 123,382 |
| |
1,450 |
|
|
| First Horizon National Corp. |
| 63,365 |
| |
2,900 |
|
|
| Huntington Bancshares, Inc. |
| 70,354 |
| |
7,000 |
|
|
| KeyCorp |
| 233,030 |
| |
1,250 |
|
|
| M & T Bank Corp. |
| 131,763 |
| |
2,250 |
|
|
| Marshall & Ilsley Corp. |
| 93,803 |
| |
4,350 |
|
|
| Mellon Financial Corp. |
| 127,107 |
| |
11,600 |
|
|
| National City Corp. |
| 430,128 |
| |
1,875 |
|
|
| North Fork Bancorporation, Inc. |
| 54,000 |
| |
2,450 |
|
|
| Northern Trust Corp. |
| 115,248 |
| |
3,000 |
|
|
| PNC Financial Services Group, Inc. |
| 163,200 |
| |
4,856 |
|
|
| Regions Financial Corp. |
| 169,911 |
| |
1,400 |
|
|
| State Street Corp. |
| 62,384 |
| |
4,650 |
|
|
| SunTrust Banks, Inc. |
| 331,545 |
| |
1,400 |
|
|
| Synovus Financial Corp. |
| 37,800 |
| |
3,400 |
|
|
| The Bank of New York Co., Inc. |
| 111,894 |
| |
24,700 |
|
|
| U.S. Bancorp |
| 731,861 |
| |
26,899 |
|
|
| Wachovia Corp. |
| 1,392,022 |
| |
20,950 |
|
|
| Wells Fargo & Co. |
| 1,294,082 |
| |
1,050 |
|
|
| Zions Bancorporation |
| 69,825 |
| |
|
|
|
|
|
| 8,715,327 |
| |
|
|
|
| Beverages: 0.7% |
|
|
| |
550 |
|
|
| Adolph Coors Co. |
| 41,195 |
| |
10,600 |
|
|
| Anheuser-Busch Cos., Inc. |
| 530,954 |
| |
1,900 |
|
|
| Brown-Forman Corp. |
| 91,238 |
| |
29,900 |
|
|
| Coca-Cola Co. |
| 1,175,369 |
| |
4,850 |
|
|
| Coca-Cola Enterprises, Inc. |
| 100,880 |
| |
2,650 |
|
|
| Pepsi Bottling Group, Inc. |
| 74,253 |
| |
21,000 |
|
|
| PepsiCo, Inc. |
| 1,048,110 |
| |
|
|
|
|
|
| 3,061,999 |
| |
|
|
|
| Biotechnology: 0.3% |
|
|
| |
15,550 |
| @ |
| Amgen, Inc. |
| 933,622 |
| |
4,150 |
| @ |
| Biogen Idec, Inc. |
| 243,522 |
| |
2,900 |
| @ |
| Genzyme Corp. |
| 162,429 |
| |
2,500 |
| @ |
| MedImmune, Inc. |
| 66,500 |
| |
450 |
| @ |
| Millipore Corp. |
| 21,924 |
| |
|
|
|
|
|
| 1,427,997 |
| |
|
|
|
| Building Materials: 0.1% |
|
|
| |
2,350 |
| @ |
| American Standard Cos., Inc. |
| 91,509 |
| |
6,200 |
|
|
| Masco Corp. |
| 218,674 |
| |
1,300 |
|
|
| Vulcan Materials Co. |
| 67,405 |
| |
|
|
|
|
|
| 377,588 |
| |
|
|
|
| Chemicals: 0.5% |
|
|
| |
2,950 |
|
|
| Air Products & Chemicals, Inc. |
| 168,888 |
| |
1,100 |
|
|
| Ashland, Inc. |
| 65,065 |
| |
13,150 |
|
|
| Dow Chemical Co. |
| 663,680 |
| |
13,850 |
|
|
| E.I. du Pont de Nemours & Co. |
| 627,681 |
| |
1,100 |
|
|
| Eastman Chemical Co. |
| 59,818 |
| |
1,150 |
|
|
| Ecolab, Inc. |
| 40,227 |
| |
1,750 |
|
|
| Engelhard Corp. |
| 52,308 |
| |
1,000 |
|
|
| International Flavors & Fragrances, Inc. |
| 40,500 |
| |
3,900 |
|
|
| PPG Industries, Inc. |
| 263,133 |
| |
3,450 |
|
|
| Praxair, Inc. |
| 154,905 |
| |
2,750 |
|
|
| Rohm & Haas Co. |
| 121,248 |
| |
2,550 |
|
|
| Sherwin-Williams Co. |
| 113,730 |
| |
700 |
|
|
| Sigma-Aldrich Corp. |
| 41,811 |
| |
|
|
|
|
|
| 2,412,994 |
| |
|
|
|
| Commercial Services: 0.3% |
|
|
| |
2,300 |
| @ |
| Apollo Group, Inc. |
| 183,310 |
| |
13,200 |
|
|
| Cendant Corp. |
| 299,244 |
| |
250 |
|
|
| Deluxe Corp. |
| 9,885 |
| |
2,150 |
|
|
| Equifax, Inc. |
| 59,383 |
| |
3,000 |
|
|
| H&R Block, Inc. |
| 143,100 |
| |
3,900 |
|
|
| McKesson Corp. |
| 115,245 |
| |
1,500 |
|
|
| Moody’s Corp. |
| 121,125 |
| |
3,950 |
|
|
| Paychex, Inc. |
| 130,982 |
| |
2,950 |
|
|
| R.R. Donnelley & Sons Co. |
| 102,365 |
| |
2,350 |
|
|
| Robert Half Intl., Inc. |
| 63,521 |
| |
|
|
|
|
|
| 1,228,160 |
| |
|
|
|
| Computers: 1.6% |
|
|
| |
1,700 |
| @ |
| Affiliated Computer Services, Inc. |
| 100,606 |
| |
8,800 |
| @ |
| Apple Computer, Inc. |
| 590,040 |
| |
1,900 |
| @ |
| Computer Sciences Corp. |
| 102,790 |
| |
41,600 |
| @ |
| Dell, Inc. |
| 1,685,631 |
| |
6,600 |
|
|
| Electronic Data Systems Corp. |
| 148,170 |
| |
31,800 |
| @ |
| EMC Corp. |
| 426,756 |
| |
4,100 |
| @ |
| Gateway, Inc. |
| 27,921 |
| |
39,050 |
|
|
| Hewlett-Packard Co. |
| 781,000 |
| |
28,050 |
|
|
| International Business Machines Corp. |
| 2,643,431 |
| |
See Accompanying Notes to Financial Statements
81
Shares |
|
|
|
|
| Value |
| |
|
|
|
| Computers (continued) |
|
|
| |
1,600 |
| @ |
| Lexmark Intl., Inc. |
| $ | 135,840 |
|
1,150 |
| @ |
| NCR Corp. |
| 68,690 |
| |
4,450 |
| @ |
| Network Appliance, Inc. |
| 134,212 |
| |
68,850 |
| @ |
| Sun Microsystems, Inc. |
| 382,118 |
| |
2,850 |
| @ |
| Sungard Data Systems, Inc. |
| 75,554 |
| |
3,300 |
| @ |
| Unisys Corp. |
| 37,917 |
| |
|
|
|
|
|
| 7,340,676 |
| |
|
|
|
| Cosmetics/ Personal Care: 1.1% |
|
|
| |
1,200 |
|
|
| Alberto-Culver Co. |
| 55,560 |
| |
5,900 |
|
|
| Avon Products, Inc. |
| 221,486 |
| |
7,000 |
|
|
| Colgate-Palmolive Co. |
| 321,930 |
| |
21,150 |
|
|
| Gillette Co. |
| 919,814 |
| |
8,600 |
|
|
| Kimberly-Clark Corp. |
| 547,046 |
| |
53,600 |
|
|
| Procter & Gamble Co. |
| 2,866,528 |
| |
|
|
|
|
|
| 4,932,364 |
| |
|
|
|
| Distribution/ Wholesale: 0.0% |
|
|
| |
2,400 |
|
|
| Genuine Parts Co. |
| 104,184 |
| |
1,350 |
|
|
| W.W. Grainger, Inc. |
| 83,511 |
| |
|
|
|
|
|
| 187,695 |
| |
|
|
|
| Diversified Financial Services: 2.2% |
|
|
| |
16,450 |
|
|
| American Express Co. |
| 916,429 |
| |
1,350 |
|
|
| Bear Stearns Cos., Inc. |
| 131,733 |
| |
2,500 |
|
|
| Capital One Financial Corp. |
| 196,450 |
| |
3,100 |
|
|
| CIT Group, Inc. |
| 132,525 |
| |
64,300 |
|
|
| Citigroup, Inc. |
| 2,877,424 |
| |
12,798 |
|
|
| Countrywide Financial Corp. |
| 425,022 |
| |
6,250 |
| @ |
| E*TRADE Financial Corp. |
| 86,625 |
| |
12,550 |
|
|
| Fannie Mae |
| 862,184 |
| |
1,350 |
|
|
| Federated Investors, Inc. |
| 39,717 |
| |
2,700 |
|
|
| Franklin Resources, Inc. |
| 177,201 |
| |
8,900 |
|
|
| Freddie Mac |
| 607,514 |
| |
6,350 |
|
|
| Goldman Sachs Group, Inc. |
| 665,226 |
| |
18,536 |
|
|
| J.P. Morgan Chase & Co. |
| 697,880 |
| |
3,300 |
|
|
| Janus Capital Group, Inc. |
| 54,615 |
| |
3,050 |
|
|
| Lehman Brothers Holdings, Inc. |
| 255,529 |
| |
16,800 |
|
|
| MBNA Corp. |
| 446,208 |
| |
12,300 |
|
|
| Merrill Lynch & Co., Inc. |
| 685,233 |
| |
5,450 |
|
|
| Morgan Stanley |
| 276,588 |
| |
4,350 |
| @ |
| Providian Financial Corp. |
| 69,818 |
| |
4,700 |
|
|
| SLM Corp. |
| 240,499 |
| |
650 |
|
|
| T. Rowe Price Group, Inc. |
| 38,454 |
| |
|
|
|
|
|
| 9,882,874 |
| |
|
|
|
| Electric: 0.7% |
|
|
| |
7,800 |
| @ |
| AES Corp. |
| 95,472 |
| |
900 |
|
|
| Ameren Corp. |
| 43,578 |
| |
5,050 |
|
|
| American Electric Power Co., Inc. |
| 172,559 |
| |
900 |
|
|
| Cinergy Corp. |
| 37,251 |
| |
2,550 |
|
|
| Consolidated Edison, Inc. |
| 111,818 |
| |
2,150 |
|
|
| Constellation Energy Group, Inc. |
| 93,955 |
| |
1,650 |
|
|
| Dominion Resources, Inc. |
| 108,026 |
| |
2,400 |
|
|
| DTE Energy Co. |
| 105,312 |
| |
16,000 |
|
|
| Duke Energy Corp. |
| 404,479 |
| |
5,520 |
|
|
| Edison Intl |
| 176,088 |
| |
2,850 |
|
|
| Entergy Corp. |
| 184,737 |
| |
8,600 |
|
|
| Exelon Corp. |
| 358,705 |
| |
3,500 |
|
|
| FirstEnergy Corp. |
| 147,805 |
| |
2,300 |
|
|
| FPL Group, Inc. |
| 161,759 |
| |
4,300 |
| @ |
| PG&E Corp. |
| 143,018 |
| |
1,000 |
|
|
| Pinnacle West Capital Corp. |
| 44,200 |
| |
2,700 |
|
|
| PPL Corp. |
| 140,265 |
| |
3,050 |
|
|
| Public Service Enterprise Group, Inc. |
| 134,170 |
| |
9,100 |
|
|
| Southern Co. |
| 298,389 |
| |
2,950 |
|
|
| TECO Energy, Inc. |
| 44,132 |
| |
4,950 |
|
|
| TXU Corp. |
| 310,959 |
| |
4,400 |
|
|
| Xcel Energy, Inc. |
| 79,464 |
| |
|
|
|
|
|
| 3,396,141 |
| |
|
|
|
| Electrical Components and Equipment: 0.1% |
|
|
| |
7,050 |
|
|
| Emerson Electric Co. |
| 471,081 |
| |
|
|
|
|
|
| 471,081 |
| |
|
|
|
| Electronics: 0.2% |
|
|
| |
5,900 |
| @ |
| Agilent Technologies, Inc. |
| 135,050 |
| |
1,550 |
|
|
| Applera Corp. — Applied Biosystems Group |
| 31,775 |
| |
1,600 |
| @ |
| Fisher Scientific Intl |
| 90,464 |
| |
1,950 |
| @ |
| Jabil Circuit, Inc. |
| 48,867 |
| |
1,350 |
|
|
| Parker Hannifin Corp. |
| 100,980 |
| |
2,300 |
|
|
| PerkinElmer, Inc. |
| 49,059 |
| |
6,050 |
| @ |
| Sanmina-SCI Corp. |
| 53,422 |
| |
9,450 |
| @ |
| Solectron Corp. |
| 59,063 |
| |
750 |
|
|
| Tektronix, Inc. |
| 23,528 |
| |
2,700 |
| @ |
| Thermo Electron Corp. |
| 81,675 |
| |
2,000 |
| @ |
| Waters Corp. |
| 93,320 |
| |
|
|
|
|
|
| 767,203 |
| |
|
|
|
| Engineering and Construction: 0.0% |
|
|
| |
1,150 |
|
|
| Fluor Corp. |
| 59,685 |
| |
|
|
|
|
|
| 59,685 |
| |
|
|
|
| Entertainment: 0.0% |
|
|
| |
3,800 |
|
|
| International Game Technology |
| 134,330 |
| |
|
|
|
|
|
| 134,330 |
| |
|
|
|
| Environmental Control: 0.0% |
|
|
| |
7,250 |
|
|
| Waste Management, Inc. |
| 216,123 |
| |
|
|
|
|
|
| 216,123 |
| |
|
|
|
| Food: 0.4% |
|
|
| |
4,800 |
|
|
| Albertson’s, Inc. |
| 121,440 |
| |
2,000 |
|
|
| Campbell Soup Co. |
| 57,060 |
| |
5,750 |
|
|
| ConAgra Foods, Inc. |
| 155,538 |
| |
4,150 |
|
|
| General Mills, Inc. |
| 188,784 |
| |
3,850 |
|
|
| H.J. Heinz Co. |
| 143,066 |
| |
2,800 |
|
|
| Hershey Foods Corp. |
| 145,040 |
| |
5,150 |
|
|
| Kellogg Co. |
| 225,055 |
| |
3,800 |
| @ |
| Kroger Co. |
| 61,484 |
| |
1,300 |
|
|
| McCormick & Co., Inc. |
| 47,385 |
| |
2,200 |
| @ |
| Safeway, Inc. |
| 42,416 |
| |
10,050 |
|
|
| Sara Lee Corp. |
| 235,974 |
| |
2,450 |
|
|
| SUPERVALU, Inc. |
| 77,396 |
| |
3,700 |
|
|
| Wm. Wrigley Jr. Co. |
| 254,559 |
| |
|
|
|
|
|
| 1,755,197 |
| |
|
|
|
| Forest Products and Paper: 0.2% |
|
|
| |
3,800 |
|
|
| Georgia-Pacific Corp. |
| 139,118 |
| |
6,200 |
|
|
| International Paper Co. |
| 257,424 |
| |
1,750 |
|
|
| Louisiana-Pacific Corp. |
| 42,823 |
| |
3,000 |
|
|
| MeadWestvaco Corp. |
| 100,950 |
| |
2,100 |
|
|
| Plum Creek Timber Co., Inc. |
| 77,700 |
| |
750 |
|
|
| Temple-Inland, Inc. |
| 44,693 |
| |
4,350 |
|
|
| Weyerhaeuser Co. |
| 287,099 |
| |
|
|
|
|
|
| 949,807 |
| |
|
|
|
| Gas: 0.0% |
|
|
| |
1,750 |
|
|
| KeySpan Corp. |
| 69,160 |
| |
950 |
|
|
| Nicor, Inc. |
| 35,055 |
| |
3,250 |
|
|
| Sempra Energy |
| 120,185 |
| |
|
|
|
|
|
| 224,400 |
| |
See Accompanying Notes to Financial Statements
82
Shares |
|
|
|
|
| Value |
| |
|
|
|
| Hand/ Machine Tools: 0.0% |
|
|
| |
1,380 |
|
|
| Black & Decker Corp. |
| $ | 116,044 |
|
300 |
|
|
| Snap-On, Inc. |
| 9,483 |
| |
1,400 |
|
|
| Stanley Works |
| 65,464 |
| |
|
|
|
|
|
| 190,991 |
| |
|
|
|
| Healthcare — Products: 1.2% |
|
|
| |
750 |
|
|
| Bausch & Lomb, Inc. |
| 44,160 |
| |
6,700 |
|
|
| Baxter Intl., Inc. |
| 212,055 |
| |
4,500 |
|
|
| Becton Dickinson & Co. |
| 246,510 |
| |
3,200 |
|
|
| Biomet, Inc. |
| 153,184 |
| |
10,870 |
| @ |
| Boston Scientific Corp. |
| 378,385 |
| |
1,200 |
|
|
| C.R. Bard, Inc. |
| 71,892 |
| |
3,950 |
|
|
| Guidant Corp. |
| 256,079 |
| |
49,650 |
|
|
| Johnson & Johnson |
| 2,994,887 |
| |
14,900 |
|
|
| Medtronic, Inc. |
| 715,945 |
| |
5,400 |
| @ |
| St. Jude Medical, Inc. |
| 205,956 |
| |
1,650 |
|
|
| Stryker Corp. |
| 72,584 |
| |
2,700 |
| @ |
| Zimmer Holdings, Inc. |
| 220,320 |
| |
|
|
|
|
|
| 5,571,957 |
| |
|
|
|
| Healthcare — Services: 0.5% |
|
|
| |
3,150 |
|
|
| Aetna, Inc. |
| 373,307 |
| |
3,050 |
| @ |
| Humana, Inc. |
| 75,701 |
| |
1,500 |
| @ |
| Laboratory Corp. Of America Holdings |
| 71,925 |
| |
1,200 |
|
|
| Manor Care, Inc. |
| 41,340 |
| |
550 |
|
|
| Quest Diagnostics, Inc. |
| 51,563 |
| |
13,900 |
|
|
| UnitedHealth Group, Inc. |
| 1,151,614 |
| |
3,480 |
| @ |
| WellPoint Health Networks, Inc. |
| 435,348 |
| |
3,110 |
| @ |
| WellPoint, Inc. |
| 315,136 |
| |
|
|
|
|
|
| 2,515,934 |
| |
|
|
|
| Home Builders: 0.0% |
|
|
| |
1,460 |
|
|
| Centex Corp. |
| 76,606 |
| |
|
|
|
|
|
| 76,606 |
| |
|
|
|
| Home Furnishings: 0.0% |
|
|
| |
1,800 |
|
|
| Leggett & Platt, Inc. |
| 53,730 |
| |
1,100 |
|
|
| Whirlpool Corp. |
| 71,005 |
| |
|
|
|
|
|
| 124,735 |
| |
|
|
|
| Household Products/ Wares: 0.1% |
|
|
| |
1,550 |
|
|
| Avery Dennison Corp. |
| 90,923 |
| |
2,900 |
|
|
| Clorox Co. |
| 159,848 |
| |
1,500 |
|
|
| Fortune Brands, Inc. |
| 117,720 |
| |
|
|
|
|
|
| 368,491 |
| |
|
|
|
| Housewares: 0.0% |
|
|
| |
3,650 |
|
|
| Newell Rubbermaid, Inc. |
| 84,242 |
| |
|
|
|
|
|
| 84,242 |
| |
|
|
|
| Insurance: 1.7% |
|
|
| |
4,250 |
| @@ |
| ACE Ltd. |
| 171,785 |
| |
5,350 |
|
|
| AFLAC, Inc. |
| 201,267 |
| |
12,150 |
|
|
| Allstate Corp. |
| 613,574 |
| |
1,350 |
|
|
| AMBAC Financial Group, Inc. |
| 109,796 |
| |
55,000 |
|
|
| American International Group, Inc. |
| 3,484,249 |
| |
5,250 |
|
|
| AON Corp. |
| 110,880 |
| |
4,200 |
|
|
| Chubb Corp. |
| 320,082 |
| |
2,970 |
|
|
| CIGNA Corp. |
| 207,959 |
| |
1,890 |
|
|
| Cincinnati Financial Corp. |
| 84,672 |
| |
3,200 |
|
|
| Hartford Financial Services Group, Inc. |
| 204,800 |
| |
1,350 |
|
|
| Jefferson-Pilot Corp. |
| 66,407 |
| |
2,550 |
|
|
| Lincoln National Corp. |
| 117,351 |
| |
2,800 |
|
|
| Loews Corp. |
| 195,748 |
| |
6,400 |
|
|
| Marsh & McLennan Cos., Inc. |
| 182,976 |
| |
2,050 |
|
|
| MBIA, Inc. |
| 122,918 |
| |
13,050 |
|
|
| MetLife, Inc. |
| 508,950 |
| |
1,000 |
|
|
| MGIC Investment Corp. |
| 68,000 |
| |
3,400 |
|
|
| Principal Financial Group |
| 128,112 |
| |
2,450 |
|
|
| Progressive Corp. |
| 222,926 |
| |
11,550 |
|
|
| Prudential Financial, Inc. |
| 565,372 |
| |
2,850 |
|
|
| Safeco Corp. |
| 138,140 |
| |
1,000 |
|
|
| Torchmark Corp. |
| 54,910 |
| |
3,600 |
|
|
| UnumProvident Corp. |
| 56,052 |
| |
1,500 |
| @@ |
| XL Capital Ltd. |
| 113,040 |
| |
|
|
|
|
|
| 8,049,966 |
| |
|
|
|
| Internet: 0.4% |
|
|
| |
8,100 |
| @ |
| eBay, Inc. |
| 910,845 |
| |
6,800 |
| @ |
| Symantec Corp. |
| 433,908 |
| |
17,600 |
| @ |
| Yahoo!, Inc. |
| 662,112 |
| |
|
|
|
|
|
| 2,006,865 |
| |
|
|
|
| Iron/ Steel: 0.1% |
|
|
| |
1,800 |
|
|
| Nucor Corp. |
| 95,220 |
| |
2,700 |
|
|
| United States Steel Corp. |
| 141,372 |
| |
|
|
|
|
|
| 236,592 |
| |
|
|
|
| Leisure Time: 0.2% |
|
|
| |
1,050 |
|
|
| Brunswick Corp. |
| 51,261 |
| |
8,300 |
|
|
| Carnival Corp. |
| 439,983 |
| |
3,350 |
|
|
| Harley-Davidson, Inc. |
| 193,697 |
| |
2,400 |
|
|
| Sabre Holdings Corp. |
| 55,392 |
| |
|
|
|
|
|
| 740,333 |
| |
|
|
|
| Lodging: 0.1% |
|
|
| |
1,250 |
|
|
| Harrah’s Entertainment, Inc. |
| 76,750 |
| |
3,450 |
|
|
| Hilton Hotels Corp. |
| 71,277 |
| |
2,300 |
|
|
| Marriott Intl., Inc. |
| 130,755 |
| |
2,300 |
|
|
| Starwood Hotels & Resorts Worldwide, Inc. |
| 120,267 |
| |
|
|
|
|
|
| 399,049 |
| |
|
|
|
| Machinery — Construction and Mining: 0.0% |
|
|
| |
1,700 |
|
|
| Caterpillar, Inc. |
| 155,635 |
| |
|
|
|
|
|
| 155,635 |
| |
|
|
|
| Machinery — Diversified: 0.1% |
|
|
| |
800 |
|
|
| Cummins, Inc. |
| 63,696 |
| |
2,750 |
|
|
| Deere & Co. |
| 197,258 |
| |
2,650 |
|
|
| Rockwell Automation, Inc. |
| 125,345 |
| |
|
|
|
|
|
| 386,299 |
| |
|
|
|
| Media: 0.8% |
|
|
| |
2,850 |
|
|
| Clear Channel Communications, Inc. |
| 95,988 |
| |
29,100 |
| @ |
| Comcast Corp. |
| 874,164 |
| |
3,250 |
|
|
| Gannett Co., Inc. |
| 268,093 |
| |
800 |
|
|
| Knight-Ridder, Inc. |
| 54,472 |
| |
3,100 |
|
|
| McGraw-Hill Cos., Inc. |
| 271,963 |
| |
750 |
|
|
| Meredith Corp. |
| 39,540 |
| |
1,550 |
|
|
| New York Times Co. |
| 63,550 |
| |
56,500 |
| @ |
| Time Warner, Inc. |
| 1,000,615 |
| |
1,400 |
|
|
| Tribune Co. |
| 60,718 |
| |
1,400 |
| @ |
| Univision Communications, Inc. |
| 42,140 |
| |
8,600 |
|
|
| Viacom, Inc. |
| 298,420 |
| |
26,800 |
|
|
| Walt Disney Co. |
| 720,384 |
| |
|
|
|
|
|
| 3,790,047 |
| |
|
|
|
| Mining: 0.0% |
|
|
| |
1,500 |
|
|
| Phelps Dodge Corp. |
| 145,695 |
| |
|
|
|
|
|
| 145,695 |
| |
See Accompanying Notes to Financial Statements
83
Shares |
|
|
|
|
| Value |
| |
|
|
|
| Miscellaneous Manufacturing: 1.8% |
|
|
| |
10,100 |
|
|
| 3M Co. |
| $ | 803,859 |
|
1,500 |
|
|
| Cooper Industries Ltd. |
| 99,465 |
| |
3,900 |
|
|
| Danaher Corp. |
| 221,832 |
| |
2,050 |
|
|
| Dover Corp. |
| 82,923 |
| |
4,560 |
|
|
| Eastman Kodak Co. |
| 149,158 |
| |
1,650 |
|
|
| Eaton Corp. |
| 111,210 |
| |
131,100 |
|
|
| General Electric Co. |
| 4,635,695 |
| |
11,100 |
|
|
| Honeywell Intl., Inc. |
| 392,163 |
| |
3,900 |
|
|
| Illinois Tool Works, Inc. |
| 367,497 |
| |
1,850 |
| @@ |
| Ingersoll-Rand Co. |
| 137,677 |
| |
1,000 |
|
|
| ITT Industries, Inc. |
| 85,120 |
| |
1,200 |
|
|
| Pall Corp. |
| 32,508 |
| |
1,750 |
|
|
| Textron, Inc. |
| 127,085 |
| |
26,350 |
| @@ |
| Tyco Intl. Ltd. |
| 895,109 |
| |
|
|
|
|
|
| 8,141,301 |
| |
|
|
|
| Office/ Business Equipment: 0.1% |
|
|
| |
2,550 |
|
|
| Pitney Bowes, Inc. |
| 111,614 |
| |
9,950 |
| @ |
| Xerox Corp. |
| 152,434 |
| |
|
|
|
|
|
| 264,048 |
| |
|
|
|
| Oil and Gas: 2.5% |
|
|
| |
1,100 |
|
|
| Amerada Hess Corp. |
| 97,735 |
| |
3,800 |
|
|
| Anadarko Petroleum Corp. |
| 264,480 |
| |
3,120 |
|
|
| Apache Corp. |
| 168,667 |
| |
7,700 |
|
|
| Burlington Resources, Inc. |
| 357,357 |
| |
41,150 |
|
|
| ChevronTexaco Corp. |
| 2,246,789 |
| |
10,500 |
|
|
| ConocoPhillips |
| 955,394 |
| |
10,100 |
|
|
| Devon Energy Corp. |
| 418,341 |
| |
1,050 |
|
|
| EOG Resources, Inc. |
| 78,824 |
| |
99,350 |
|
|
| Exxon Mobil Corp. |
| 5,091,687 |
| |
1,500 |
|
|
| Kerr-McGee Corp. |
| 93,345 |
| |
4,470 |
|
|
| Marathon Oil Corp. |
| 176,297 |
| |
700 |
| @,@@ |
| Nabors Industries Ltd. |
| 36,400 |
| |
1,850 |
| @ |
| Noble Corp. |
| 89,633 |
| |
4,150 |
|
|
| Occidental Petroleum Corp. |
| 249,872 |
| |
1,300 |
|
|
| Sunoco, Inc. |
| 107,328 |
| |
3,450 |
| @ |
| Transocean, Inc. |
| 138,932 |
| |
3,400 |
|
|
| Unocal Corp. |
| 156,536 |
| |
4,150 |
|
|
| Valero Energy Corp. |
| 194,179 |
| |
|
|
|
|
|
| 10,921,796 |
| |
|
|
|
| Oil and Gas Services: 0.1% |
|
|
| |
3,200 |
|
|
| Baker Hughes, Inc. |
| 141,856 |
| |
1,800 |
|
|
| BJ Services Co. |
| 91,206 |
| |
5,050 |
|
|
| Halliburton Co. |
| 208,818 |
| |
|
|
|
|
|
| 441,880 |
| |
|
|
|
| Packaging and Containers: 0.0% |
|
|
| |
1,200 |
|
|
| Ball Corp. |
| 53,676 |
| |
1,000 |
|
|
| Bemis Co. |
| 27,840 |
| |
2,340 |
| @ |
| Pactiv Corp. |
| 58,149 |
| |
1,000 |
| @ |
| Sealed Air Corp. |
| 51,410 |
| |
|
|
|
|
|
| 191,075 |
| |
|
|
|
| Pharmaceuticals: 1.6% |
|
|
| |
20,300 |
|
|
| Abbott Laboratories |
| 851,787 |
| |
1,650 |
|
|
| Allergan, Inc. |
| 121,275 |
| |
1,350 |
|
|
| AmerisourceBergen Corp. |
| 79,569 |
| |
25,600 |
|
|
| Bristol-Myers Squibb Co. |
| 601,600 |
| |
4,700 |
|
|
| Cardinal Health, Inc. |
| 245,716 |
| |
9,600 |
| @ |
| Caremark Rx, Inc. |
| 343,296 |
| |
5,650 |
|
|
| Eli Lilly & Co. |
| 301,315 |
| |
900 |
| @ |
| Express Scripts, Inc. |
| 64,764 |
| |
4,050 |
| @ |
| Forest Laboratories, Inc. |
| 157,829 |
| |
4,800 |
| @ |
| Gilead Sciences, Inc. |
| 165,408 |
| |
2,400 |
| @ |
| Hospira, Inc. |
| 77,352 |
| |
2,530 |
| @ |
| King Pharmaceuticals, Inc. |
| 31,499 |
| |
3,460 |
| @ |
| Medco Health Solutions, Inc. |
| 130,511 |
| |
28,750 |
|
|
| Merck & Co., Inc. |
| 805,575 |
| |
93,290 |
|
|
| Pfizer, Inc. |
| 2,590,662 |
| |
19,300 |
|
|
| Schering-Plough Corp. |
| 344,505 |
| |
17,550 |
|
|
| Wyeth |
| 699,719 |
| |
|
|
|
|
|
| 7,612,382 |
| |
|
|
|
| Pipelines: 0.1% |
|
|
| |
8,500 |
| @ |
| Dynegy, Inc. |
| 48,025 |
| |
5,850 |
|
|
| El Paso Corp. |
| 61,074 |
| |
550 |
|
|
| Kinder Morgan, Inc. |
| 38,115 |
| |
6,150 |
|
|
| Williams Cos., Inc. |
| 102,521 |
| |
|
|
|
|
|
| 249,735 |
| |
|
|
|
| Real Estate Investment Trusts: 0.1% |
|
|
| |
2,100 |
|
|
| Equity Office Properties Trust |
| 57,645 |
| |
1,950 |
|
|
| ProLogis |
| 78,449 |
| |
2,700 |
|
|
| Simon Property Group, Inc. |
| 167,616 |
| |
|
|
|
|
|
| 303,710 |
| |
|
|
|
| Retail: 2.3% |
|
|
| |
3,100 |
| @ |
| Bed Bath & Beyond, Inc. |
| 123,777 |
| |
3,450 |
|
|
| Best Buy Co., Inc. |
| 194,511 |
| |
3,750 |
|
|
| Circuit City Stores, Inc. |
| 58,463 |
| |
10,200 |
|
|
| Costco Wholesale Corp. |
| 495,720 |
| |
4,300 |
|
|
| CVS Corp. |
| 195,091 |
| |
2,800 |
|
|
| Darden Restaurants, Inc. |
| 76,328 |
| |
2,250 |
|
|
| Federated Department Stores, Inc. |
| 123,300 |
| |
14,940 |
|
|
| Gap, Inc. |
| 326,439 |
| |
46,050 |
|
|
| Home Depot, Inc. |
| 1,922,587 |
| |
6,300 |
|
|
| J.C. Penney Co., Inc. Holding Co. |
| 243,180 |
| |
1,650 |
| @ |
| Kohl’s Corp. |
| 76,164 |
| |
8,100 |
|
|
| Limited Brands, Inc. |
| 197,964 |
| |
10,230 |
|
|
| Lowe’s Cos., Inc. |
| 566,026 |
| |
2,950 |
|
|
| May Department Stores Co. |
| 82,954 |
| |
16,200 |
|
|
| McDonald’s Corp. |
| 497,988 |
| |
2,000 |
|
|
| Nordstrom, Inc. |
| 87,500 |
| |
5,750 |
| @ |
| Office Depot, Inc. |
| 94,300 |
| |
1,550 |
|
|
| RadioShack Corp. |
| 48,934 |
| |
7,090 |
|
|
| Staples, Inc. |
| 226,242 |
| |
4,950 |
| @ |
| Starbucks Corp. |
| 278,487 |
| |
11,850 |
|
|
| Target Corp. |
| 606,957 |
| |
5,600 |
|
|
| TJX Cos., Inc. |
| 131,824 |
| |
2,200 |
| @ |
| Toys R US, Inc. |
| 42,548 |
| |
52,700 |
|
|
| Wal-Mart Stores, Inc. |
| 2,743,561 |
| |
18,150 |
|
|
| Walgreen Co. |
| 692,967 |
| |
2,020 |
|
|
| Wendy’s Intl., Inc. |
| 72,053 |
| |
3,150 |
|
|
| Yum! Brands, Inc. |
| 143,010 |
| |
|
|
|
|
|
| 10,348,875 |
| |
|
|
|
| Savings and Loans: 0.2% |
|
|
| |
1,900 |
|
|
| Golden West Financial Corp. |
| 226,556 |
| |
1,700 |
|
|
| Sovereign Bancorp, Inc. |
| 37,145 |
| |
11,350 |
|
|
| Washington Mutual, Inc. |
| 462,059 |
| |
|
|
|
|
|
| 725,760 |
| |
|
|
|
| Semiconductors: 0.7% |
|
|
| |
1,700 |
| @ |
| Advanced Micro Devices, Inc. |
| 36,176 |
| |
5,550 |
| @ |
| Altera Corp. |
| 125,874 |
| |
4,650 |
|
|
| Analog Devices, Inc. |
| 171,818 |
| |
21,750 |
| @ |
| Applied Materials, Inc. |
| 361,920 |
| |
79,750 |
|
|
| Intel Corp. |
| 1,782,412 |
| |
2,100 |
| @ |
| KLA-Tencor Corp. |
| 94,626 |
| |
3,350 |
|
|
| Linear Technology Corp. |
| 127,836 |
| |
1,450 |
|
|
| Maxim Integrated Products, Inc. |
| 59,392 |
| |
4,800 |
| @ |
| National Semiconductor Corp. |
| 74,208 |
| |
1,300 |
| @ |
| Qlogic Corp. |
| 44,707 |
| |
7,250 |
|
|
| Texas Instruments, Inc. |
| 175,305 |
| |
|
|
|
|
|
| 3,054,274 |
| |
See Accompanying Notes to Financial Statements
84
Shares |
|
|
|
|
| Value |
| |
|
|
|
| Software: 1.5% |
|
|
| |
2,500 |
|
|
| Adobe Systems, Inc. |
| $ | 151,400 |
|
1,900 |
|
|
| Autodesk, Inc. |
| 124,279 |
| |
7,550 |
|
|
| Automatic Data Processing, Inc. |
| 343,752 |
| |
3,750 |
| @ |
| BMC Software, Inc. |
| 69,675 |
| |
1,550 |
| @ |
| Citrix Systems, Inc. |
| 36,596 |
| |
6,250 |
|
|
| Computer Associates Intl., Inc. |
| 190,813 |
| |
7,350 |
| @ |
| Compuware Corp. |
| 42,410 |
| |
1,550 |
| @ |
| Electronic Arts, Inc. |
| 75,795 |
| |
11,290 |
|
|
| First Data Corp. |
| 463,905 |
| |
1,950 |
| @ |
| Fiserv, Inc. |
| 75,095 |
| |
2,300 |
|
|
| IMS Health, Inc. |
| 51,911 |
| |
2,450 |
| @ |
| Intuit, Inc. |
| 102,508 |
| |
133,900 |
|
|
| Microsoft Corp. |
| 3,589,858 |
| |
4,700 |
| @ |
| Novell, Inc. |
| 28,670 |
| |
108,500 |
| @ |
| Oracle Corp. |
| 1,373,609 |
| |
4,800 |
| @ |
| PeopleSoft, Inc. |
| 113,328 |
| |
8,950 |
| @ |
| Siebel Systems, Inc. |
| 90,216 |
| |
4,250 |
| @ |
| Veritas Software Corp. |
| 93,075 |
| |
|
|
|
|
|
| 7,016,895 |
| |
|
|
|
| Telecommunications: 1.8% |
|
|
| |
4,700 |
|
|
| Alltel Corp. |
| 266,443 |
| |
3,900 |
|
|
| AT&T Corp. |
| 71,370 |
| |
5,750 |
| @ |
| Avaya, Inc. |
| 94,415 |
| |
24,050 |
|
|
| BellSouth Corp. |
| 645,021 |
| |
2,100 |
|
|
| CenturyTel, Inc. |
| 69,132 |
| |
83,450 |
| @ |
| Cisco Systems, Inc. |
| 1,561,349 |
| |
4,800 |
|
|
| Citizens Communications Co. |
| 68,640 |
| |
3,000 |
| @ |
| Comverse Technology, Inc. |
| 63,810 |
| |
15,100 |
| @ |
| Corning, Inc. |
| 189,958 |
| |
46,450 |
| @ |
| Lucent Technologies, Inc. |
| 182,549 |
| |
41,400 |
|
|
| Motorola, Inc. |
| 797,364 |
| |
13,900 |
| @ |
| Nextel Communications, Inc. |
| 395,594 |
| |
21,150 |
|
|
| Qualcomm, Inc. |
| 880,263 |
| |
24,400 |
| @ |
| Qwest Communications Intl., Inc. |
| 97,600 |
| |
41,350 |
|
|
| SBC Communications, Inc. |
| 1,040,780 |
| |
2,650 |
|
|
| Scientific-Atlanta, Inc. |
| 78,493 |
| |
18,200 |
|
|
| Sprint Corp. |
| 415,142 |
| |
5,500 |
| @ |
| Tellabs, Inc. |
| 47,025 |
| |
34,200 |
|
|
| Verizon Communications, Inc. |
| 1,410,065 |
| |
|
|
|
|
|
| 8,375,013 |
| |
|
|
|
| Textiles: 0.0% |
|
|
| |
1,800 |
|
|
| Cintas Corp. |
| 80,496 |
| |
|
|
|
|
|
| 80,496 |
| |
|
|
|
| Toys/ Games/ Hobbies: 0.0% |
|
|
| |
3,450 |
|
|
| Hasbro, Inc. |
| 65,654 |
| |
5,550 |
|
|
| Mattel, Inc. |
| 105,172 |
| |
|
|
|
|
|
| 170,826 |
| |
|
|
|
| Transportation: 0.5% |
|
|
| |
3,800 |
|
|
| Burlington Northern Santa Fe Corp. |
| 171,152 |
| |
2,500 |
|
|
| CSX Corp. |
| 95,325 |
| |
5,200 |
|
|
| FedEx Corp. |
| 494,156 |
| |
6,450 |
|
|
| Norfolk Southern Corp. |
| 221,429 |
| |
500 |
|
|
| Ryder System, Inc. |
| 26,820 |
| |
1,100 |
|
|
| Union Pacific Corp. |
| 69,784 |
| |
14,000 |
|
|
| United Parcel Service, Inc. |
| 1,178,100 |
| |
|
|
|
|
|
| 2,256,766 |
| |
|
|
|
| Total Common Stock |
| 140,255,854 |
| |
Principal |
|
|
|
|
|
|
| ||
Amount |
|
|
|
|
| Value |
| ||
U.S. GOVERNMENT AGENCY OBLIGATIONS: 59.6% |
|
|
| ||||||
|
|
|
| Federal National Mortgage Association: 59.6% |
|
|
| ||
$ | 310,000,000 |
|
|
| 3.820%, due 01/22/08 |
| $ | 275,531,720 |
|
|
|
|
| Total U.S. Government Agency Obligations |
| 275,531,720 |
| ||
U.S. TREASURY OBLIGATIONS: 9.6% |
|
|
| ||||||
|
|
|
| U.S. Treasury STRIP: 9.6% |
|
|
| ||
49,000,000 |
|
|
| 3.300%, due 11/15/07 |
| 44,507,778 |
| ||
|
|
|
| Total U.S. Treasury Obligations |
| 44,507,778 |
| ||
|
|
|
| Total Long-Term Investments |
| 460,295,352 |
| ||
SHORT-TERM INVESTMENTS: 0.8% |
|
|
| ||||||
|
|
|
| Repurchase Agreement: 0.8% |
|
|
| ||
3,496,000 |
|
|
| Goldman Sachs Repurchase Agreement 11/30/04, 2.060%, due 12/01/04, $3,496,200 to be received upon repurchase (Collateralized by $3,371,000 Federal Home Loan Mortgage Corporation, 5.500%, Market Value plus accrued interest $3,566,939, due 07/15/06) |
| 3,496,000 |
| ||
|
|
|
| Total Short-Term Investments |
| 3,496,000 |
| ||
|
|
|
|
|
| |
Total Investments In Securities |
| 100.3 | % | $ | 463,791,352 |
|
Other Assets and Liabilities-Net |
| (0.3 | ) | (1,397,283 | ) | |
Net Assets |
| 100.0 | % | $ | 462,394,069 |
|
@ |
| Non-income producing security |
@@ |
| Foreign issuer |
STRIP |
| Separate Trading of Registered Interest and Principal of Securities |
* |
| Cost for federal income tax purposes is $465,673,342. Net unrealized appreciation consists of: |
|
|
|
| |
Gross Unrealized Appreciation |
| $ | 6,137,981 |
|
Gross Unrealized Depreciation |
| (8,019,971 | ) | |
Net Unrealized Appreciation |
| $ | (1,881,990 | ) |
See Accompanying Notes to Financial Statements
85
ING PRINCIPAL PROTECTION FUND VI
PORTFOLIO OF INVESTMENTS
AS OF NOVEMBER 30, 2004 (UNAUDITED)
Shares |
|
|
|
|
| Value |
| |
COMMON STOCK: 30.6% |
|
|
| |||||
|
|
|
| Advertising: 0.0% |
|
|
| |
1,350 |
| @ |
| Interpublic Group of Cos., Inc. |
| $ | 16,754 |
|
1,850 |
|
|
| Omnicom Group, Inc. |
| 149,850 |
| |
|
|
|
|
|
| 166,604 |
| |
|
|
|
| Aerospace/Defense: 0.7% |
|
|
| |
16,950 |
|
|
| Boeing Co. |
| 908,012 |
| |
4,150 |
|
|
| General Dynamics Corp. |
| 449,694 |
| |
900 |
|
|
| Goodrich Corp. |
| 28,575 |
| |
4,850 |
|
|
| Lockheed Martin Corp. |
| 295,074 |
| |
4,200 |
|
|
| Northrop Grumman Corp. |
| 236,586 |
| |
8,550 |
|
|
| Raytheon Co. |
| 344,907 |
| |
1,650 |
|
|
| Rockwell Collins, Inc. |
| 65,769 |
| |
6,100 |
|
|
| United Technologies Corp. |
| 595,238 |
| |
|
|
|
|
|
| 2,923,855 |
| |
|
|
|
| Agriculture: 0.5% |
|
|
| |
24,550 |
|
|
| Altria Group, Inc. |
| 1,411,379 |
| |
6,850 |
|
|
| Archer-Daniels-Midland Co. |
| 145,220 |
| |
2,550 |
|
|
| Monsanto Co. |
| 117,351 |
| |
1,650 |
|
|
| Reynolds American, Inc. |
| 124,790 |
| |
3,300 |
|
|
| UST, Inc. |
| 145,299 |
| |
|
|
|
|
|
| 1,944,039 |
| |
|
|
|
| Apparel: 0.2% |
|
|
| |
4,050 |
| @ |
| Coach, Inc. |
| 201,852 |
| |
1,050 |
|
|
| Jones Apparel Group, Inc. |
| 37,307 |
| |
1,600 |
|
|
| Liz Claiborne, Inc. |
| 65,712 |
| |
4,950 |
|
|
| Nike, Inc. |
| 419,067 |
| |
500 |
|
|
| Reebok Intl. Ltd. |
| 19,440 |
| |
1,600 |
|
|
| VF Corp. |
| 86,384 |
| |
|
|
|
|
|
| 829,762 |
| |
|
|
|
| Auto Manufacturers: 0.2% |
|
|
| |
33,600 |
|
|
| Ford Motor Co. |
| 476,447 |
| |
5,950 |
|
|
| General Motors Corp. |
| 229,611 |
| |
3,675 |
|
|
| PACCAR, Inc. |
| 287,018 |
| |
|
|
|
|
|
| 993,076 |
| |
|
|
|
| Auto Parts and Equipment: 0.0% |
|
|
| |
1,100 |
|
|
| Dana Corp. |
| 17,985 |
| |
3,450 |
| @ |
| Goodyear Tire & Rubber Co. |
| 43,539 |
| |
1,650 |
|
|
| Johnson Controls, Inc. |
| 101,310 |
| |
|
|
|
|
|
| 162,834 |
| |
|
|
|
| Banks: 2.0% |
|
|
| |
2,950 |
|
|
| AmSouth Bancorporation |
| 76,494 |
| |
48,704 |
|
|
| Bank of America Corp. |
| 2,253,533 |
| |
6,100 |
|
|
| BB&T Corp. |
| 258,945 |
| |
3,600 |
|
|
| Comerica, Inc. |
| 221,400 |
| |
2,000 |
|
|
| Fifth Third Bancorp |
| 100,720 |
| |
1,200 |
|
|
| First Horizon National Corp. |
| 52,440 |
| |
2,600 |
|
|
| Huntington Bancshares, Inc. |
| 63,076 |
| |
6,050 |
|
|
| KeyCorp |
| 201,405 |
| |
1,200 |
|
|
| M & T Bank Corp. |
| 126,492 |
| |
2,300 |
|
|
| Marshall & Ilsley Corp. |
| 95,887 |
| |
4,350 |
|
|
| Mellon Financial Corp. |
| 127,107 |
| |
9,750 |
|
|
| National City Corp. |
| 361,530 |
| |
5,475 |
|
|
| North Fork Bancorporation, Inc. |
| 157,680 |
| |
2,300 |
|
|
| Northern Trust Corp. |
| 108,192 |
| |
2,550 |
|
|
| PNC Financial Services Group, Inc. |
| 138,720 |
| |
5,647 |
|
|
| Regions Financial Corp. |
| 197,589 |
| |
4,100 |
|
|
| State Street Corp. |
| 182,696 |
| |
3,900 |
|
|
| SunTrust Banks, Inc. |
| 278,070 |
| |
1,150 |
|
|
| Synovus Financial Corp. |
| 31,050 |
| |
2,800 |
|
|
| The Bank of New York Co., Inc. |
| 92,148 |
| |
22,450 |
|
|
| U.S. Bancorp |
| 665,194 |
| |
22,581 |
|
|
| Wachovia Corp. |
| 1,168,566 |
| |
20,200 |
|
|
| Wells Fargo & Co. |
| 1,247,753 |
| |
850 |
|
|
| Zions Bancorporation |
| 56,525 |
| |
|
|
|
|
|
| 8,263,212 |
| |
|
|
|
| Beverages: 0.7% |
|
|
| |
350 |
|
|
| Adolph Coors Co. |
| 26,215 |
| |
8,900 |
|
|
| Anheuser-Busch Cos., Inc. |
| 445,801 |
| |
1,000 |
|
|
| Brown-Forman Corp. |
| 48,020 |
| |
29,100 |
|
|
| Coca-Cola Co. |
| 1,143,921 |
| |
4,500 |
|
|
| Coca-Cola Enterprises, Inc. |
| 93,600 |
| |
2,750 |
|
|
| Pepsi Bottling Group, Inc. |
| 77,055 |
| |
27,350 |
|
|
| PepsiCo, Inc. |
| 1,365,039 |
| |
|
|
|
|
|
| 3,199,651 |
| |
|
|
|
| Biotechnology: 0.3% |
|
|
| |
15,250 |
| @ |
| Amgen, Inc. |
| 915,610 |
| |
3,750 |
| @ |
| Biogen Idec, Inc. |
| 220,050 |
| |
2,450 |
| @ |
| Genzyme Corp. |
| 137,225 |
| |
1,150 |
| @ |
| MedImmune, Inc. |
| 30,590 |
| |
400 |
| @ |
| Millipore Corp. |
| 19,488 |
| |
|
|
|
|
|
| 1,322,963 |
| |
|
|
|
| Building Materials: 0.1% |
|
|
| |
2,000 |
| @ |
| American Standard Cos., Inc. |
| 77,880 |
| |
5,150 |
|
|
| Masco Corp. |
| 181,641 |
| |
1,100 |
|
|
| Vulcan Materials Co. |
| 57,035 |
| |
|
|
|
|
|
| 316,556 |
| |
|
|
|
| Chemicals: 0.5% |
|
|
| |
2,550 |
|
|
| Air Products & Chemicals, Inc. |
| 145,988 |
| |
800 |
|
|
| Ashland, Inc. |
| 47,320 |
| |
11,050 |
|
|
| Dow Chemical Co. |
| 557,693 |
| |
11,600 |
|
|
| E.I. du Pont de Nemours & Co. |
| 525,711 |
| |
1,050 |
|
|
| Eastman Chemical Co. |
| 57,099 |
| |
950 |
|
|
| Ecolab, Inc. |
| 33,231 |
| |
1,750 |
|
|
| Engelhard Corp. |
| 52,308 |
| |
1,000 |
|
|
| International Flavors & Fragrances, Inc. |
| 40,500 |
| |
3,250 |
|
|
| PPG Industries, Inc. |
| 219,278 |
| |
4,000 |
|
|
| Praxair, Inc. |
| 179,600 |
| |
2,200 |
|
|
| Rohm & Haas Co. |
| 96,998 |
| |
2,550 |
|
|
| Sherwin-Williams Co. |
| 113,730 |
| |
700 |
|
|
| Sigma-Aldrich Corp. |
| 41,811 |
| |
|
|
|
|
|
| 2,111,267 |
| |
|
|
|
| Commercial Services: 0.2% |
|
|
| |
1,750 |
| @ |
| Apollo Group, Inc. |
| 139,475 |
| |
11,500 |
|
|
| Cendant Corp. |
| 260,704 |
| |
300 |
|
|
| Deluxe Corp. |
| 11,862 |
| |
1,900 |
|
|
| Equifax, Inc. |
| 52,478 |
| |
3,300 |
|
|
| H&R Block, Inc. |
| 157,410 |
| |
3,600 |
|
|
| McKesson Corp. |
| 106,380 |
| |
1,250 |
|
|
| Moody’s Corp. |
| 100,938 |
| |
3,500 |
|
|
| Paychex, Inc. |
| 116,060 |
| |
2,050 |
|
|
| R.R. Donnelley & Sons Co. |
| 71,135 |
| |
2,050 |
|
|
| Robert Half Intl., Inc. |
| 55,412 |
| |
|
|
|
|
|
| 1,071,854 |
| |
|
|
|
| Computers: 1.7% |
|
|
| |
1,450 |
| @ |
| Affiliated Computer Services, Inc. |
| 85,811 |
| |
7,400 |
| @ |
| Apple Computer, Inc. |
| 496,170 |
| |
1,750 |
| @ |
| Computer Sciences Corp. |
| 94,675 |
| |
40,500 |
| @ |
| Dell, Inc. |
| 1,641,060 |
| |
5,600 |
|
|
| Electronic Data Systems Corp. |
| 125,720 |
| |
26,700 |
| @ |
| EMC Corp. |
| 358,314 |
| |
3,700 |
| @ |
| Gateway, Inc. |
| 25,197 |
| |
35,950 |
|
|
| Hewlett-Packard Co. |
| 719,000 |
| |
34,200 |
|
|
| International Business Machines Corp. |
| 3,223,007 |
| |
See Accompanying Notes to Financial Statements
86
Shares |
|
|
|
|
| Value |
| |
|
|
|
| Computers (continued) |
|
|
| |
1,150 |
| @ |
| Lexmark Intl., Inc. |
| $ | 97,635 |
|
1,100 |
| @ |
| NCR Corp. |
| 65,703 |
| |
4,050 |
| @ |
| Network Appliance, Inc. |
| 122,148 |
| |
61,200 |
| @ |
| Sun Microsystems, Inc. |
| 339,660 |
| |
2,400 |
| @ |
| Sungard Data Systems, Inc. |
| 63,624 |
| |
3,200 |
| @ |
| Unisys Corp. |
| 36,768 |
| |
|
|
|
|
|
| 7,494,492 |
| |
|
|
|
| Cosmetics/Personal Care: 1.0% |
|
|
| |
900 |
|
|
| Alberto-Culver Co. |
| 41,670 |
| |
5,100 |
|
|
| Avon Products, Inc. |
| 191,454 |
| |
5,850 |
|
|
| Colgate-Palmolive Co. |
| 269,042 |
| |
20,300 |
|
|
| Gillette Co. |
| 882,847 |
| |
7,200 |
|
|
| Kimberly-Clark Corp. |
| 457,992 |
| |
45,000 |
|
|
| Procter & Gamble Co. |
| 2,406,599 |
| |
|
|
|
|
|
| 4,249,604 |
| |
|
|
|
| Distribution/Wholesale: 0.1% |
|
|
| |
2,900 |
|
|
| Genuine Parts Co. |
| 125,889 |
| |
1,600 |
|
|
| W.W. Grainger, Inc. |
| 98,976 |
| |
|
|
|
|
|
| 224,865 |
| |
|
|
|
| Diversified Financial Services: 2.2% |
|
|
| |
15,200 |
|
|
| American Express Co. |
| 846,791 |
| |
900 |
|
|
| Bear Stearns Cos., Inc. |
| 87,822 |
| |
4,000 |
|
|
| Capital One Financial Corp. |
| 314,320 |
| |
6,750 |
|
|
| Charles Schwab Corp. |
| 72,765 |
| |
4,350 |
|
|
| CIT Group, Inc. |
| 185,963 |
| |
62,150 |
|
|
| Citigroup, Inc. |
| 2,781,212 |
| |
10,698 |
|
|
| Countrywide Financial Corp. |
| 355,281 |
| |
3,350 |
| @ |
| E*TRADE Financial Corp. |
| 46,431 |
| |
11,650 |
|
|
| Fannie Mae |
| 800,354 |
| |
1,000 |
|
|
| Federated Investors, Inc. |
| 29,420 |
| |
2,250 |
|
|
| Franklin Resources, Inc. |
| 147,668 |
| |
7,500 |
|
|
| Freddie Mac |
| 511,950 |
| |
5,900 |
|
|
| Goldman Sachs Group, Inc. |
| 618,083 |
| |
15,548 |
|
|
| J.P. Morgan Chase & Co. |
| 585,382 |
| |
1,100 |
|
|
| Janus Capital Group, Inc. |
| 18,205 |
| |
4,400 |
|
|
| Lehman Brothers Holdings, Inc. |
| 368,632 |
| |
14,100 |
|
|
| MBNA Corp. |
| 374,496 |
| |
10,350 |
|
|
| Merrill Lynch & Co., Inc. |
| 576,599 |
| |
4,850 |
|
|
| Morgan Stanley |
| 246,138 |
| |
2,400 |
| @ |
| Providian Financial Corp. |
| 38,520 |
| |
5,200 |
|
|
| SLM Corp. |
| 266,084 |
| |
|
|
|
|
|
| 9,272,116 |
| |
|
|
|
| Electric: 0.8% |
|
|
| |
7,960 |
| @ |
| AES Corp. |
| 97,430 |
| |
750 |
|
|
| Ameren Corp. |
| 36,315 |
| |
3,550 |
|
|
| American Electric Power Co., Inc. |
| 121,304 |
| |
2,200 |
|
|
| Cinergy Corp. |
| 91,058 |
| |
2,650 |
|
|
| Consolidated Edison, Inc. |
| 116,203 |
| |
2,100 |
|
|
| Constellation Energy Group, Inc. |
| 91,770 |
| |
3,950 |
|
|
| Dominion Resources, Inc. |
| 258,607 |
| |
1,750 |
|
|
| DTE Energy Co. |
| 76,790 |
| |
19,000 |
|
|
| Duke Energy Corp. |
| 480,319 |
| |
4,620 |
|
|
| Edison Intl. |
| 147,378 |
| |
2,400 |
|
|
| Entergy Corp. |
| 155,568 |
| |
7,250 |
|
|
| Exelon Corp. |
| 302,397 |
| |
3,150 |
|
|
| FirstEnergy Corp. |
| 133,025 |
| |
2,000 |
|
|
| FPL Group, Inc. |
| 140,660 |
| |
4,300 |
| @ |
| PG&E Corp. |
| 143,018 |
| |
750 |
|
|
| Pinnacle West Capital Corp. |
| 33,150 |
| |
2,250 |
|
|
| PPL Corp. |
| 116,888 |
| |
1,200 |
|
|
| Progress Energy, Inc. |
| 52,692 |
| |
2,550 |
|
|
| Public Service Enterprise Group, Inc. |
| 112,175 |
| |
8,000 |
|
|
| Southern Co. |
| 262,320 |
| |
2,500 |
|
|
| TECO Energy, Inc. |
| 37,400 |
| |
4,400 |
|
|
| TXU Corp. |
| 276,407 |
| |
3,750 |
|
|
| Xcel Energy, Inc. |
| 67,725 |
| |
|
|
|
|
|
| 3,350,599 |
| |
|
|
|
| Electrical Components and Equipment: 0.1% |
|
|
| |
5,850 |
|
|
| Emerson Electric Co. |
| 390,897 |
| |
|
|
|
|
|
| 390,897 |
| |
|
|
|
| Electronics: 0.1% |
|
|
| |
5,050 |
| @ |
| Agilent Technologies, Inc. |
| 115,594 |
| |
2,100 |
|
|
| Applera Corp. — Applied Biosystems Group |
| 43,050 |
| |
1,300 |
| @ |
| Fisher Scientific Intl. |
| 73,502 |
| |
1,650 |
| @ |
| Jabil Circuit, Inc. |
| 41,349 |
| |
1,150 |
|
|
| Parker Hannifin Corp. |
| 86,020 |
| |
1,700 |
|
|
| PerkinElmer, Inc. |
| 36,261 |
| |
5,500 |
| @ |
| Sanmina-SCI Corp. |
| 48,565 |
| |
6,950 |
| @ |
| Solectron Corp. |
| 43,438 |
| |
700 |
|
|
| Tektronix, Inc. |
| 21,959 |
| |
2,550 |
| @ |
| Thermo Electron Corp. |
| 77,138 |
| |
1,100 |
| @ |
| Waters Corp. |
| 51,326 |
| |
|
|
|
|
|
| 638,202 |
| |
|
|
|
| Engineering and Construction: 0.0% |
|
|
| |
1,000 |
|
|
| Fluor Corp. |
| 51,900 |
| |
|
|
|
|
|
| 51,900 |
| |
|
|
|
| Entertainment: 0.0% |
|
|
| |
3,050 |
|
|
| International Game Technology |
| 107,818 |
| |
|
|
|
|
|
| 107,818 |
| |
|
|
|
| Environmental Control: 0.0% |
|
|
| |
5,650 |
|
|
| Waste Management, Inc. |
| 168,427 |
| |
|
|
|
|
|
| 168,427 |
| |
|
|
|
| Food: 0.4% |
|
|
| |
4,050 |
|
|
| Albertson’s, Inc. |
| 102,465 |
| |
5,100 |
|
|
| Campbell Soup Co. |
| 145,503 |
| |
5,250 |
|
|
| ConAgra Foods, Inc. |
| 142,013 |
| |
3,700 |
|
|
| General Mills, Inc. |
| 168,313 |
| |
3,500 |
|
|
| H.J. Heinz Co. |
| 130,060 |
| |
2,650 |
|
|
| Hershey Foods Corp. |
| 137,270 |
| |
5,000 |
|
|
| Kellogg Co. |
| 218,500 |
| |
3,050 |
| @ |
| Kroger Co. |
| 49,349 |
| |
1,150 |
|
|
| McCormick & Co., Inc. |
| 41,918 |
| |
1,800 |
| @ |
| Safeway, Inc. |
| 34,704 |
| |
9,400 |
|
|
| Sara Lee Corp. |
| 220,712 |
| |
2,300 |
|
|
| SUPERVALU, Inc. |
| 72,657 |
| |
3,300 |
|
|
| Wm. Wrigley Jr. Co. |
| 227,039 |
| |
|
|
|
|
|
| 1,690,503 |
| |
|
|
|
| Forest Products and Paper: 0.2% |
|
|
| |
2,350 |
|
|
| Georgia-Pacific Corp. |
| 86,034 |
| |
4,950 |
|
|
| International Paper Co. |
| 205,524 |
| |
1,500 |
|
|
| Louisiana-Pacific Corp. |
| 36,705 |
| |
1,900 |
|
|
| MeadWestvaco Corp. |
| 63,935 |
| |
2,000 |
|
|
| Plum Creek Timber Co., Inc. |
| 74,000 |
| |
600 |
|
|
| Temple-Inland, Inc. |
| 35,754 |
| |
3,650 |
|
|
| Weyerhaeuser Co. |
| 240,900 |
| |
|
|
|
|
|
| 742,852 |
| |
|
|
|
| Gas: 0.1% |
|
|
| |
1,700 |
|
|
| KeySpan Corp. |
| 67,184 |
| |
800 |
|
|
| Nicor, Inc. |
| 29,520 |
| |
3,350 |
|
|
| Sempra Energy |
| 123,883 |
| |
|
|
|
|
|
| 220,587 |
| |
See Accompanying Notes to Financial Statements
87
Shares |
|
|
|
|
| Value |
| |
|
|
|
| Hand/Machine Tools: 0.0% |
|
|
| |
1,300 |
|
|
| Black & Decker Corp. |
| $ | 109,317 |
|
300 |
|
|
| Snap-On, Inc. |
| 9,483 |
| |
900 |
|
|
| Stanley Works |
| 42,084 |
| |
|
|
|
|
|
| 160,884 |
| |
|
|
|
| Healthcare — Products: 1.4% |
|
|
| |
550 |
|
|
| Bausch & Lomb, Inc. |
| 32,384 |
| |
7,350 |
|
|
| Baxter Intl., Inc. |
| 232,628 |
| |
4,950 |
|
|
| Becton Dickinson & Co. |
| 271,161 |
| |
2,200 |
|
|
| Biomet, Inc. |
| 105,314 |
| |
9,150 |
| @ |
| Boston Scientific Corp. |
| 318,511 |
| |
1,150 |
|
|
| C.R. Bard, Inc. |
| 68,897 |
| |
3,350 |
|
|
| Guidant Corp. |
| 217,181 |
| |
60,600 |
|
|
| Johnson & Johnson |
| 3,655,391 |
| |
14,450 |
|
|
| Medtronic, Inc. |
| 694,322 |
| |
3,800 |
| @ |
| St. Jude Medical, Inc. |
| 144,932 |
| |
1,400 |
|
|
| Stryker Corp. |
| 61,586 |
| |
2,950 |
| @ |
| Zimmer Holdings, Inc. |
| 240,720 |
| |
|
|
|
|
|
| 6,043,027 |
| |
|
|
|
| Healthcare — Services: 0.5% |
|
|
| |
3,150 |
|
|
| Aetna, Inc. |
| 373,306 |
| |
2,550 |
| @ |
| Humana, Inc. |
| 63,291 |
| |
1,250 |
| @ |
| Laboratory Corp. Of America Holdings |
| 59,938 |
| |
850 |
|
|
| Manor Care, Inc. |
| 29,283 |
| |
450 |
|
|
| Quest Diagnostics, Inc. |
| 42,188 |
| |
13,600 |
|
|
| UnitedHealth Group, Inc. |
| 1,126,759 |
| |
2,950 |
| @ |
| WellPoint Health Networks, Inc. |
| 369,045 |
| |
2,600 |
| @ |
| WellPoint, Inc. |
| 263,458 |
| |
|
|
|
|
|
| 2,327,268 |
| |
|
|
|
| Home Builders: 0.0% |
|
|
| |
1,400 |
|
|
| Centex Corp. |
| 73,458 |
| |
|
|
|
|
|
| 73,458 |
| |
|
|
|
| Home Furnishings: 0.0% |
|
|
| |
1,800 |
|
|
| Leggett & Platt, Inc. |
| 53,730 |
| |
900 |
|
|
| Whirlpool Corp. |
| 58,095 |
| |
|
|
|
|
|
| 111,825 |
| |
|
|
|
| Household Products/Wares: 0.1% |
|
|
| |
1,350 |
|
|
| Avery Dennison Corp. |
| 79,191 |
| |
2,450 |
|
|
| Clorox Co. |
| 135,044 |
| |
1,300 |
|
|
| Fortune Brands, Inc. |
| 102,024 |
| |
|
|
|
|
|
| 316,259 |
| |
|
|
|
| Housewares: 0.0% |
|
|
| |
3,100 |
|
|
| Newell Rubbermaid, Inc. |
| 71,548 |
| |
|
|
|
|
|
| 71,548 |
| |
|
|
|
| Insurance: 1.7% |
|
|
| |
3,300 |
| @@ |
| ACE Ltd. |
| 133,386 |
| |
5,900 |
|
|
| AFLAC, Inc. |
| 221,958 |
| |
10,200 |
|
|
| Allstate Corp. |
| 515,099 |
| |
1,100 |
|
|
| AMBAC Financial Group, Inc. |
| 89,463 |
| |
46,150 |
|
|
| American International Group, Inc. |
| 2,923,602 |
| |
4,450 |
|
|
| AON Corp. |
| 93,984 |
| |
3,550 |
|
|
| Chubb Corp. |
| 270,546 |
| |
2,850 |
|
|
| CIGNA Corp. |
| 199,557 |
| |
1,680 |
|
|
| Cincinnati Financial Corp. |
| 75,264 |
| |
3,500 |
|
|
| Hartford Financial Services Group, Inc. |
| 224,000 |
| |
1,150 |
|
|
| Jefferson-Pilot Corp. |
| 56,569 |
| |
2,600 |
|
|
| Lincoln National Corp. |
| 119,652 |
| |
3,900 |
|
|
| Loews Corp. |
| 272,649 |
| |
5,350 |
|
|
| Marsh & McLennan Cos., Inc. |
| 152,957 |
| |
1,650 |
|
|
| MBIA, Inc. |
| 98,934 |
| |
12,200 |
|
|
| MetLife, Inc. |
| 475,799 |
| |
850 |
|
|
| MGIC Investment Corp. |
| 57,800 |
| |
2,800 |
|
|
| Principal Financial Group |
| 105,504 |
| |
2,050 |
|
|
| Progressive Corp. |
| 186,530 |
| |
10,450 |
|
|
| Prudential Financial, Inc. |
| 511,527 |
| |
2,750 |
|
|
| Safeco Corp. |
| 133,293 |
| |
3,200 |
|
|
| St. Paul Travelers Cos., Inc. |
| 116,736 |
| |
1,000 |
|
|
| Torchmark Corp. |
| 54,910 |
| |
3,000 |
|
|
| UnumProvident Corp. |
| 46,710 |
| |
1,250 |
| @@ |
| XL Capital Ltd. |
| 94,200 |
| |
|
|
|
|
|
| 7,230,629 |
| |
|
|
|
| Internet: 0.4% |
|
|
| |
7,900 |
| @ |
| eBay, Inc. |
| 888,355 |
| |
5,700 |
| @ |
| Symantec Corp. |
| 363,717 |
| |
16,450 |
| @ |
| Yahoo!, Inc. |
| 618,849 |
| |
|
|
|
|
|
| 1,870,921 |
| |
|
|
|
| Iron/Steel: 0.0% |
|
|
| |
1,600 |
|
|
| Nucor Corp. |
| 84,640 |
| |
1,650 |
|
|
| United States Steel Corp. |
| 86,394 |
| |
|
|
|
|
|
| 171,034 |
| |
|
|
|
| Leisure Time: 0.1% |
|
|
| |
1,000 |
|
|
| Brunswick Corp. |
| 48,820 |
| |
7,000 |
|
|
| Carnival Corp. |
| 371,070 |
| |
2,650 |
|
|
| Harley-Davidson, Inc. |
| 153,223 |
| |
2,200 |
|
|
| Sabre Holdings Corp. |
| 50,776 |
| |
|
|
|
|
|
| 623,889 |
| |
|
|
|
| Lodging: 0.1% |
|
|
| |
1,000 |
|
|
| Harrah’s Entertainment, Inc. |
| 61,400 |
| |
3,250 |
|
|
| Hilton Hotels Corp. |
| 67,145 |
| |
3,750 |
|
|
| Marriott Intl., Inc. |
| 213,187 |
| |
2,050 |
|
|
| Starwood Hotels & Resorts Worldwide, Inc. |
| 107,195 |
| |
|
|
|
|
|
| 448,927 |
| |
|
|
|
| Machinery — Construction and Mining: 0.0% |
|
|
| |
1,450 |
|
|
| Caterpillar, Inc. |
| 132,748 |
| |
|
|
|
|
|
| 132,748 |
| |
|
|
|
| Machinery — Diversified: 0.1% |
|
|
| |
500 |
|
|
| Cummins, Inc. |
| 39,810 |
| |
2,300 |
|
|
| Deere & Co. |
| 164,979 |
| |
1,700 |
|
|
| Rockwell Automation, Inc. |
| 80,410 |
| |
|
|
|
|
|
| 285,199 |
| |
|
|
|
| Media: 0.8% |
|
|
| |
2,400 |
|
|
| Clear Channel Communications, Inc. |
| 80,832 |
| |
26,650 |
| @ |
| Comcast Corp. |
| 800,565 |
| |
2,950 |
|
|
| Gannett Co., Inc. |
| 243,346 |
| |
850 |
|
|
| Knight-Ridder, Inc. |
| 57,877 |
| |
2,600 |
|
|
| McGraw-Hill Cos., Inc. |
| 228,098 |
| |
600 |
|
|
| Meredith Corp. |
| 31,632 |
| |
1,350 |
|
|
| New York Times Co. |
| 55,350 |
| |
54,550 |
| @ |
| Time Warner, Inc. |
| 966,080 |
| |
1,150 |
|
|
| Tribune Co. |
| 49,876 |
| |
1,150 |
| @ |
| Univision Communications, Inc. |
| 34,615 |
| |
7,250 |
|
|
| Viacom, Inc. |
| 251,575 |
| |
24,550 |
|
|
| Walt Disney Co. |
| 659,904 |
| |
|
|
|
|
|
| 3,459,750 |
| |
|
|
|
| Mining: 0.0% |
|
|
| |
1,250 |
|
|
| Phelps Dodge Corp. |
| 121,413 |
| |
|
|
|
|
|
| 121,413 |
| |
See Accompanying Notes to Financial Statements
88
Shares |
|
|
|
|
| Value |
| |
|
|
|
| Miscellaneous Manufacturing: 1.8% |
|
|
| |
9,350 |
|
|
| 3M Co. |
| $ | 744,167 |
|
800 |
|
|
| Cooper Industries Ltd. |
| 53,048 |
| |
3,250 |
|
|
| Danaher Corp. |
| 184,860 |
| |
2,000 |
|
|
| Dover Corp. |
| 80,900 |
| |
4,050 |
|
|
| Eastman Kodak Co. |
| 132,476 |
| |
1,450 |
|
|
| Eaton Corp. |
| 97,730 |
| |
126,650 |
|
|
| General Electric Co. |
| 4,478,343 |
| |
9,300 |
|
|
| Honeywell Intl., Inc. |
| 328,569 |
| |
3,250 |
|
|
| Illinois Tool Works, Inc. |
| 306,248 |
| |
1,700 |
| @@ |
| Ingersoll-Rand Co. |
| 126,514 |
| |
1,000 |
|
|
| ITT Industries, Inc. |
| 85,120 |
| |
1,100 |
|
|
| Pall Corp. |
| 29,799 |
| |
1,400 |
|
|
| Textron, Inc. |
| 101,668 |
| |
24,100 |
| @@ |
| Tyco Intl. Ltd. |
| 818,676 |
| |
|
|
|
|
|
| 7,568,118 |
| |
|
|
|
| Office/Business Equipment: 0.1% |
|
|
| |
2,400 |
|
|
| Pitney Bowes, Inc. |
| 105,048 |
| |
9,200 |
| @ |
| Xerox Corp. |
| 140,944 |
| |
|
|
|
|
|
| 245,992 |
| |
|
|
|
| Oil and Gas: 2.5% |
|
|
| |
1,050 |
|
|
| Amerada Hess Corp. |
| 93,293 |
| |
4,000 |
|
|
| Anadarko Petroleum Corp. |
| 278,400 |
| |
3,000 |
|
|
| Apache Corp. |
| 162,180 |
| |
6,750 |
|
|
| Burlington Resources, Inc. |
| 313,268 |
| |
34,550 |
|
|
| ChevronTexaco Corp. |
| 1,886,429 |
| |
8,050 |
|
|
| ConocoPhillips |
| 732,469 |
| |
8,500 |
|
|
| Devon Energy Corp. |
| 352,069 |
| |
1,050 |
|
|
| EOG Resources, Inc. |
| 78,824 |
| |
103,550 |
|
|
| Exxon Mobil Corp. |
| 5,306,937 |
| |
1,300 |
|
|
| Kerr-McGee Corp. |
| 80,899 |
| |
2,900 |
|
|
| Marathon Oil Corp. |
| 114,376 |
| |
700 |
| @,@@ |
| Nabors Industries Ltd. |
| 36,400 |
| |
1,100 |
| @ |
| Noble Corp. |
| 53,295 |
| |
4,550 |
|
|
| Occidental Petroleum Corp. |
| 273,956 |
| |
1,100 |
|
|
| Sunoco, Inc. |
| 90,816 |
| |
2,900 |
| @ |
| Transocean, Inc. |
| 116,783 |
| |
4,200 |
|
|
| Unocal Corp. |
| 193,368 |
| |
4,450 |
|
|
| Valero Energy Corp. |
| 208,216 |
| |
|
|
|
|
|
| 10,371,978 |
| |
|
|
|
| Oil and Gas Services: 0.1% |
|
|
| |
4,050 |
|
|
| Baker Hughes, Inc. |
| 179,536 |
| |
1,450 |
|
|
| BJ Services Co. |
| 73,472 |
| |
2,050 |
|
|
| Halliburton Co. |
| 84,768 |
| |
|
|
|
|
|
| 337,776 |
| |
|
|
|
| Packaging and Containers: 0.0% |
|
|
| |
1,200 |
|
|
| Ball Corp. |
| 53,676 |
| |
1,000 |
|
|
| Bemis Co. |
| 27,840 |
| |
1,500 |
| @ |
| Pactiv Corp. |
| 37,275 |
| |
800 |
| @ |
| Sealed Air Corp. |
| 41,128 |
| |
|
|
|
|
|
| 159,919 |
| |
|
|
|
| Pharmaceuticals: 1.7% |
|
|
| |
18,600 |
|
|
| Abbott Laboratories |
| 780,455 |
| |
1,350 |
|
|
| Allergan, Inc. |
| 99,225 |
| |
1,300 |
|
|
| AmerisourceBergen Corp. |
| 76,622 |
| |
23,600 |
|
|
| Bristol-Myers Squibb Co. |
| 554,600 |
| |
5,100 |
|
|
| Cardinal Health, Inc. |
| 266,628 |
| |
9,450 |
| @ |
| Caremark Rx, Inc. |
| 337,932 |
| |
13,450 |
|
|
| Eli Lilly & Co. |
| 717,288 |
| |
700 |
| @ |
| Express Scripts, Inc. |
| 50,372 |
| |
3,350 |
| @ |
| Forest Laboratories, Inc. |
| 130,550 |
| |
4,100 |
| @ |
| Gilead Sciences, Inc. |
| 141,286 |
| |
2,050 |
| @ |
| Hospira, Inc. |
| 66,072 |
| |
950 |
| @ |
| King Pharmaceuticals, Inc. |
| 11,828 |
| |
2,899 |
| @ |
| Medco Health Solutions, Inc. |
| 109,350 |
| |
26,600 |
|
|
| Merck & Co., Inc. |
| 745,331 |
| |
90,350 |
|
|
| Pfizer, Inc. |
| 2,509,019 |
| |
16,200 |
|
|
| Schering-Plough Corp. |
| 289,170 |
| |
16,050 |
|
|
| Wyeth |
| 639,914 |
| |
|
|
|
|
|
| 7,525,642 |
| |
|
|
|
| Pipelines: 0.0% |
|
|
| |
6,800 |
| @ |
| Dynegy, Inc. |
| 38,420 |
| |
4,850 |
|
|
| El Paso Corp. |
| 50,634 |
| |
450 |
|
|
| Kinder Morgan, Inc. |
| 31,185 |
| |
4,150 |
|
|
| Williams Cos., Inc. |
| 69,181 |
| |
|
|
|
|
|
| 189,420 |
| |
|
|
|
| Real Estate Investment Trusts: 0.1% |
|
|
| |
1,800 |
|
|
| Equity Office Properties Trust |
| 49,410 |
| |
1,650 |
|
|
| ProLogis |
| 66,380 |
| |
2,300 |
|
|
| Simon Property Group, Inc. |
| 142,784 |
| |
|
|
|
|
|
| 258,574 |
| |
|
|
|
| Retail: 2.4% |
|
|
| |
2,750 |
| @ |
| Bed Bath & Beyond, Inc. |
| 109,802 |
| |
3,650 |
|
|
| Best Buy Co., Inc. |
| 205,787 |
| |
3,200 |
|
|
| Circuit City Stores, Inc. |
| 49,888 |
| |
8,550 |
|
|
| Costco Wholesale Corp. |
| 415,530 |
| |
4,000 |
|
|
| CVS Corp. |
| 181,480 |
| |
2,600 |
|
|
| Darden Restaurants, Inc. |
| 70,876 |
| |
1,600 |
|
|
| Federated Department Stores, Inc. |
| 87,680 |
| |
12,700 |
|
|
| Gap, Inc. |
| 277,495 |
| |
44,800 |
|
|
| Home Depot, Inc. |
| 1,870,400 |
| |
5,300 |
|
|
| J.C. Penney Co., Inc. Holding Co. |
| 204,580 |
| |
4,100 |
| @ |
| Kohl’s Corp. |
| 189,256 |
| |
5,650 |
|
|
| Limited Brands, Inc. |
| 138,086 |
| |
8,600 |
|
|
| Lowe’s Cos., Inc. |
| 475,838 |
| |
2,750 |
|
|
| May Department Stores Co. |
| 77,330 |
| |
20,450 |
|
|
| McDonald’s Corp. |
| 628,633 |
| |
1,200 |
|
|
| Nordstrom, Inc. |
| 52,500 |
| |
4,600 |
| @ |
| Office Depot, Inc. |
| 75,440 |
| |
1,350 |
|
|
| RadioShack Corp. |
| 42,620 |
| |
7,300 |
|
|
| Staples, Inc. |
| 232,943 |
| |
6,550 |
| @ |
| Starbucks Corp. |
| 368,503 |
| |
10,900 |
|
|
| Target Corp. |
| 558,298 |
| |
5,050 |
|
|
| TJX Cos., Inc. |
| 118,877 |
| |
2,450 |
| @ |
| Toys R US, Inc. |
| 47,383 |
| |
50,950 |
|
|
| Wal-Mart Stores, Inc. |
| 2,652,456 |
| |
15,250 |
|
|
| Walgreen Co. |
| 582,245 |
| |
1,800 |
|
|
| Wendy’s Intl., Inc. |
| 64,206 |
| |
2,700 |
|
|
| Yum! Brands, Inc. |
| 122,580 |
| |
|
|
|
|
|
| 9,900,712 |
| |
|
|
|
| Savings and Loans: 0.1% |
|
|
| |
1,500 |
|
|
| Golden West Financial Corp. |
| 178,860 |
| |
1,450 |
|
|
| Sovereign Bancorp, Inc. |
| 31,683 |
| |
9,500 |
|
|
| Washington Mutual, Inc. |
| 386,745 |
| |
|
|
|
|
|
| 597,288 |
| |
|
|
|
| Semiconductors: 0.6% |
|
|
| |
3,400 |
| @ |
| Altera Corp. |
| 77,112 |
| |
3,900 |
|
|
| Analog Devices, Inc. |
| 144,105 |
| |
18,250 |
| @ |
| Applied Materials, Inc. |
| 303,680 |
| |
76,950 |
|
|
| Intel Corp. |
| 1,719,833 |
| |
1,750 |
| @ |
| KLA-Tencor Corp. |
| 78,855 |
| |
3,000 |
|
|
| Linear Technology Corp. |
| 114,480 |
| |
1,200 |
|
|
| Maxim Integrated Products, Inc. |
| 49,152 |
| |
3,400 |
| @ |
| National Semiconductor Corp. |
| 52,564 |
| |
1,100 |
| @ |
| Qlogic Corp. |
| 37,829 |
| |
8,350 |
|
|
| Texas Instruments, Inc. |
| 201,903 |
| |
|
|
|
|
|
| 2,779,513 |
| |
See Accompanying Notes to Financial Statements
89
Shares |
|
|
|
|
| Value |
| |
|
|
|
| Software: 1.5% |
|
|
| |
2,100 |
|
|
| Adobe Systems, Inc. |
| $ | 127,176 |
|
1,800 |
|
|
| Autodesk, Inc. |
| 117,738 |
| |
6,350 |
|
|
| Automatic Data Processing, Inc. |
| 289,116 |
| |
3,450 |
| @ |
| BMC Software, Inc. |
| 64,101 |
| |
1,300 |
| @ |
| Citrix Systems, Inc. |
| 30,693 |
| |
5,750 |
|
|
| Computer Associates Intl., Inc. |
| 175,548 |
| |
5,350 |
| @ |
| Compuware Corp. |
| 30,870 |
| |
1,300 |
| @ |
| Electronic Arts, Inc. |
| 63,570 |
| |
9,467 |
|
|
| First Data Corp. |
| 388,998 |
| |
2,000 |
| @ |
| Fiserv, Inc. |
| 77,020 |
| |
1,950 |
|
|
| IMS Health, Inc. |
| 44,012 |
| |
1,900 |
| @ |
| Intuit, Inc. |
| 79,496 |
| |
130,400 |
|
|
| Microsoft Corp. |
| 3,496,023 |
| |
3,500 |
| @ |
| Novell, Inc. |
| 21,350 |
| |
104,900 |
| @ |
| Oracle Corp. |
| 1,328,033 |
| |
3,250 |
| @ |
| PeopleSoft, Inc. |
| 76,733 |
| |
4,950 |
| @ |
| Siebel Systems, Inc. |
| 49,896 |
| |
3,850 |
| @ |
| Veritas Software Corp. |
| 84,315 |
| |
|
|
|
|
|
| 6,544,688 |
| |
|
|
|
| Telecommunications: 1.9% |
|
|
| |
5,050 |
|
|
| Alltel Corp. |
| 286,285 |
| |
3,300 |
|
|
| AT&T Corp. |
| 60,390 |
| |
6,600 |
| @ |
| Avaya, Inc. |
| 108,372 |
| |
20,200 |
|
|
| BellSouth Corp. |
| 541,764 |
| |
1,500 |
|
|
| CenturyTel, Inc. |
| 49,380 |
| |
80,900 |
| @ |
| Cisco Systems, Inc. |
| 1,513,638 |
| |
3,600 |
|
|
| Citizens Communications Co. |
| 51,480 |
| |
2,850 |
| @ |
| Comverse Technology, Inc. |
| 60,620 |
| |
16,550 |
| @ |
| Corning, Inc. |
| 208,199 |
| |
52,550 |
| @ |
| Lucent Technologies, Inc. |
| 206,522 |
| |
38,300 |
|
|
| Motorola, Inc. |
| 737,658 |
| |
12,050 |
| @ |
| Nextel Communications, Inc. |
| 342,943 |
| |
19,600 |
|
|
| Qualcomm, Inc. |
| 815,752 |
| |
19,800 |
| @ |
| Qwest Communications Intl., Inc. |
| 79,200 |
| |
39,950 |
|
|
| SBC Communications, Inc. |
| 1,005,541 |
| |
2,250 |
|
|
| Scientific-Atlanta, Inc. |
| 66,645 |
| |
17,600 |
|
|
| Sprint Corp. |
| 401,456 |
| |
4,000 |
| @ |
| Tellabs, Inc. |
| 34,200 |
| |
33,150 |
|
|
| Verizon Communications, Inc. |
| 1,366,774 |
| |
|
|
|
|
|
| 7,936,819 |
| |
|
|
|
| Textiles: 0.0% |
|
|
| |
1,550 |
|
|
| Cintas Corp. |
| 69,316 |
| |
|
|
|
|
|
| 69,316 |
| |
|
|
|
| Toys/Games/Hobbies: 0.0% |
|
|
| |
2,100 |
|
|
| Hasbro, Inc. |
| 39,963 |
| |
4,400 |
|
|
| Mattel, Inc. |
| 83,380 |
| |
|
|
|
|
|
| 123,343 |
| |
|
|
|
| Transportation: 0.5% |
|
|
| |
3,350 |
|
|
| Burlington Northern Santa Fe Corp. |
| 150,884 |
| |
2,100 |
|
|
| CSX Corp. |
| 80,073 |
| |
4,350 |
|
|
| FedEx Corp. |
| 413,381 |
| |
5,500 |
|
|
| Norfolk Southern Corp. |
| 188,815 |
| |
1,000 |
|
|
| Ryder System, Inc. |
| 53,640 |
| |
950 |
|
|
| Union Pacific Corp. |
| 60,268 |
| |
13,550 |
|
|
| United Parcel Service, Inc. |
| 1,140,232 |
| |
|
|
|
|
|
| 2,087,293 |
| |
|
|
|
| Total Common Stock |
| 132,053,705 |
| |
Principal |
|
|
|
|
| Value |
| ||
U.S. GOVERNMENT AGENCY OBLIGATIONS: 64.3% |
|
|
| ||||||
|
|
|
| Federal National Mortgage Association: 50.8% |
|
|
| ||
$ | 250,000,000 |
|
|
| 3.900%, due 04/22/08 |
| $ | 219,596,249 |
|
|
|
|
|
|
| 219,596,249 |
| ||
|
|
|
| Other: 13.5% |
|
|
| ||
16,301,000 |
|
|
| FICO STRIP, 3.680%, due 04/06/08 |
| 14,444,414 |
| ||
50,000,000 |
|
|
| Federal Agriculture Mortgage Corp., 3.900%, due 04/22/08 |
| 43,919,250 |
| ||
|
|
|
|
|
| 58,363,664 |
| ||
|
|
|
| Total U.S. Government Agency Obligations |
| 277,959,913 |
| ||
U.S. TREASURY OBLIGATIONS: 4.6% |
|
|
| ||||||
|
|
|
| U.S. Treasury STRIP: 4.6% |
|
|
| ||
21,878,000 |
|
|
| 3.320%, due 02/15/08 |
| 19,698,864 |
| ||
|
|
|
| Total U.S. Treasury Obligations (Cost $19,934,974) |
| 19,698,864 |
| ||
|
|
|
| Total Long-Term Investments (Cost $431,064,369) |
| 429,712,482 |
| ||
SHORT-TERM INVESTMENTS: 0.7% |
|
|
| ||||||
|
|
|
| Repurchase Agreement: 0.7% |
|
|
| ||
2,923,000 |
|
|
| Goldman Sachs Repurchase Agreement 11/30/04, 2.060%, due 12/01/04, $2,923,167 to be received upon repurchase (Collateralized by $2,818,000 Federal Home Loan Mortgage Corporation, 5.500%, Market Value plus accrued interest $2,981,796, due 07/15/06) |
| 2,923,000 |
| ||
|
|
|
| Total Short-Term Investments |
| 2,923,000 |
| ||
Total Investments In Securities |
| 100.2 | % | $ | 432,635,482 |
|
Other Assets and |
| (0.2 | ) | (872,066 | ) | |
Net Assets |
| 100.0 | % | $ | 431,763,416 |
|
@ |
| Non-income producing security |
@@ |
| Foreign issuer |
STRIP |
| Separate Trading of Registered Interest and Principal of Securities |
* |
| Cost for federal income tax purposes is $437,992,154. Net unrealized appreciation consists of: |
Gross Unrealized Appreciation |
| $ | 3,564,090 |
|
Gross Unrealized Depreciation |
| (8,920,762 | ) | |
Net Unrealized Appreciation |
| $ | (5,356,672 | ) |
See Accompanying Notes to Financial Statements
90
ING PRINCIPAL PROTECTION FUND VII
PORTFOLIO OF INVESTMENTS
AS OF NOVEMBER 30, 2004 (UNAUDITED)
Shares |
|
|
|
|
| Value |
| |
COMMON STOCK: 26.9% |
|
|
| |||||
|
|
|
| Advertising: 0.0% |
|
|
| |
2,100 |
| @ |
| Interpublic Group of Cos., Inc. |
| $ | 26,061 |
|
1,000 |
|
|
| Omnicom Group, Inc. |
| 81,000 |
| |
|
|
|
|
|
| 107,061 |
| |
|
|
|
| Aerospace/ Defense: 0.6% |
|
|
| |
7,450 |
|
|
| Boeing Co. |
| 399,096 |
| |
1,800 |
|
|
| General Dynamics Corp. |
| 195,048 |
| |
450 |
|
|
| Goodrich Corp. |
| 14,288 |
| |
2,250 |
|
|
| Lockheed Martin Corp. |
| 136,890 |
| |
2,000 |
|
|
| Northrop Grumman Corp. |
| 112,660 |
| |
4,300 |
|
|
| Raytheon Co. |
| 173,462 |
| |
800 |
|
|
| Rockwell Collins, Inc. |
| 31,888 |
| |
2,800 |
|
|
| United Technologies Corp. |
| 273,224 |
| |
|
|
|
|
|
| 1,336,556 |
| |
|
|
|
| Agriculture: 0.4% |
|
|
| |
10,750 |
|
|
| Altria Group, Inc. |
| 618,017 |
| |
2,850 |
|
|
| Archer-Daniels-Midland Co. |
| 60,420 |
| |
1,150 |
|
|
| Monsanto Co. |
| 52,923 |
| |
800 |
|
|
| Reynolds American, Inc. |
| 60,504 |
| |
1,550 |
|
|
| UST, Inc. |
| 68,247 |
| |
|
|
|
|
|
| 860,111 |
| |
|
|
|
| Apparel: 0.2% |
|
|
| |
1,700 |
| @ |
| Coach, Inc. |
| 84,728 |
| |
500 |
|
|
| Jones Apparel Group, Inc. |
| 17,765 |
| |
450 |
|
|
| Liz Claiborne, Inc. |
| 18,482 |
| |
2,450 |
|
|
| Nike, Inc. |
| 207,417 |
| |
200 |
|
|
| Reebok Intl. Ltd. |
| 7,776 |
| |
800 |
|
|
| VF Corp. |
| 43,192 |
| |
|
|
|
|
|
| 379,360 |
| |
|
|
|
| Auto Manufacturers: 0.2% |
|
|
| |
16,900 |
|
|
| Ford Motor Co. |
| 239,642 |
| |
3,000 |
|
|
| General Motors Corp. |
| 115,770 |
| |
1,600 |
|
|
| PACCAR, Inc. |
| 124,960 |
| |
|
|
|
|
|
| 480,372 |
| |
|
|
|
| Auto Parts and Equipment: 0.0% |
|
|
| |
550 |
|
|
| Dana Corp. |
| 8,993 |
| |
1,000 |
|
|
| Johnson Controls, Inc. |
| 61,400 |
| |
|
|
|
|
|
| 70,393 |
| |
|
|
|
| Banks: 1.7% |
|
|
| |
1,750 |
|
|
| AmSouth Bancorporation |
| 45,378 |
| |
21,406 |
|
|
| Bank of America Corp. |
| 990,455 |
| |
3,100 |
|
|
| BB&T Corp. |
| 131,595 |
| |
1,200 |
|
|
| Comerica, Inc. |
| 73,800 |
| |
1,050 |
|
|
| Fifth Third Bancorp |
| 52,878 |
| |
700 |
|
|
| First Horizon National Corp. |
| 30,590 |
| |
1,300 |
|
|
| Huntington Bancshares, Inc. |
| 31,538 |
| |
3,100 |
|
|
| KeyCorp |
| 103,199 |
| |
500 |
|
|
| M & T Bank Corp. |
| 52,705 |
| |
1,050 |
|
|
| Marshall & Ilsley Corp. |
| 43,775 |
| |
2,100 |
|
|
| Mellon Financial Corp. |
| 61,362 |
| |
4,950 |
|
|
| National City Corp. |
| 183,546 |
| |
825 |
|
|
| North Fork Bancorporation, Inc. |
| 23,760 |
| |
1,000 |
|
|
| Northern Trust Corp. |
| 47,040 |
| |
1,250 |
|
|
| PNC Financial Services Group, Inc. |
| 68,000 |
| |
2,110 |
|
|
| Regions Financial Corp. |
| 73,829 |
| |
600 |
|
|
| State Street Corp. |
| 26,736 |
| |
1,950 |
|
|
| SunTrust Banks, Inc. |
| 139,035 |
| |
550 |
|
|
| Synovus Financial Corp. |
| 14,850 |
| |
1,450 |
|
|
| The Bank of New York Co., Inc. |
| 47,720 |
| |
10,200 |
|
|
| U.S. Bancorp |
| 302,226 |
| |
11,324 |
|
|
| Wachovia Corp. |
| 586,016 |
| |
8,900 |
|
|
| Wells Fargo & Co. |
| 549,752 |
| |
400 |
|
|
| Zions Bancorporation |
| 26,600 |
| |
|
|
|
|
|
| 3,706,385 |
| |
|
|
|
| Beverages: 0.6% |
|
|
| |
250 |
|
|
| Adolph Coors Co. |
| 18,725 |
| |
4,350 |
|
|
| Anheuser-Busch Cos., Inc. |
| 217,892 |
| |
600 |
|
|
| Brown-Forman Corp. |
| 28,812 |
| |
12,700 |
|
|
| Coca-Cola Co. |
| 499,236 |
| |
1,950 |
|
|
| Coca-Cola Enterprises, Inc. |
| 40,560 |
| |
1,400 |
|
|
| Pepsi Bottling Group, Inc. |
| 39,228 |
| |
8,850 |
|
|
| PepsiCo, Inc. |
| 441,704 |
| |
|
|
|
|
|
| 1,286,157 |
| |
|
|
|
| Biotechnology: 0.3% |
|
|
| |
6,600 |
| @ |
| Amgen, Inc. |
| 396,264 |
| |
1,850 |
| @ |
| Biogen Idec, Inc. |
| 108,558 |
| |
1,250 |
| @ |
| Genzyme Corp. |
| 70,013 |
| |
1,050 |
| @ |
| MedImmune, Inc. |
| 27,930 |
| |
|
|
|
|
|
| 602,765 |
| |
|
|
|
| Building Materials: 0.1% |
|
|
| |
950 |
| @ |
| American Standard Cos., Inc. |
| 36,993 |
| |
2,650 |
|
|
| Masco Corp. |
| 93,466 |
| |
500 |
|
|
| Vulcan Materials Co. |
| 25,925 |
| |
|
|
|
|
|
| 156,384 |
| |
|
|
|
| Chemicals: 0.5% |
|
|
| |
1,300 |
|
|
| Air Products & Chemicals, Inc. |
| 74,425 |
| |
500 |
|
|
| Ashland, Inc. |
| 29,575 |
| |
5,500 |
|
|
| Dow Chemical Co. |
| 277,585 |
| |
5,950 |
|
|
| E.I. du Pont de Nemours & Co. |
| 269,654 |
| |
500 |
|
|
| Eastman Chemical Co. |
| 27,190 |
| |
500 |
|
|
| Ecolab, Inc. |
| 17,490 |
| |
900 |
|
|
| Engelhard Corp. |
| 26,901 |
| |
400 |
|
|
| International Flavors & Fragrances, Inc. |
| 16,200 |
| |
1,650 |
|
|
| PPG Industries, Inc. |
| 111,326 |
| |
1,500 |
|
|
| Praxair, Inc. |
| 67,350 |
| |
1,300 |
|
|
| Rohm & Haas Co. |
| 57,317 |
| |
1,150 |
|
|
| Sherwin-Williams Co. |
| 51,290 |
| |
400 |
|
|
| Sigma-Aldrich Corp. |
| 23,892 |
| |
|
|
|
|
|
| 1,050,195 |
| |
|
|
|
| Commercial Services: 0.2% |
|
|
| |
900 |
| @ |
| Apollo Group, Inc. |
| 71,730 |
| |
5,600 |
|
|
| Cendant Corp. |
| 126,952 |
| |
300 |
|
|
| Deluxe Corp. |
| 11,862 |
| |
700 |
|
|
| Equifax, Inc. |
| 19,334 |
| |
1,050 |
|
|
| H&R Block, Inc. |
| 50,085 |
| |
1,600 |
|
|
| McKesson Corp. |
| 47,280 |
| |
850 |
|
|
| Moody’s Corp. |
| 68,638 |
| |
1,700 |
|
|
| Paychex, Inc. |
| 56,372 |
| |
950 |
|
|
| R.R. Donnelley & Sons Co. |
| 32,965 |
| |
1,200 |
|
|
| Robert Half Intl., Inc. |
| 32,436 |
| |
|
|
|
|
|
| 517,654 |
| |
|
|
|
| Computers: 1.4% |
|
|
| |
600 |
| @ |
| Affiliated Computer Services, Inc. |
| 35,508 |
| |
3,700 |
| @ |
| Apple Computer, Inc. |
| 248,085 |
| |
800 |
| @ |
| Computer Sciences Corp. |
| 43,280 |
| |
17,600 |
| @ |
| Dell, Inc. |
| 713,151 |
| |
2,400 |
|
|
| Electronic Data Systems Corp. |
| 53,880 |
| |
13,250 |
| @ |
| EMC Corp. |
| 177,815 |
| |
1,100 |
| @ |
| Gateway, Inc. |
| 7,491 |
| |
16,650 |
|
|
| Hewlett-Packard Co. |
| 333,000 |
| |
11,900 |
|
|
| International Business Machines Corp. |
| 1,121,455 |
| |
550 |
| @ |
| Lexmark Intl., Inc. |
| 46,695 |
| |
550 |
| @ |
| NCR Corp. |
| 32,852 |
| |
2,150 |
| @ |
| Network Appliance, Inc. |
| 64,844 |
| |
See Accompanying Notes to Financial Statements
91
Shares |
|
|
|
|
| Value |
| |
|
|
|
| Computers (continued) |
|
|
| |
31,750 |
| @ |
| Sun Microsystems, Inc. |
| $ | 176,213 |
|
1,850 |
| @ |
| Sungard Data Systems, Inc. |
| 49,044 |
| |
1,600 |
| @ |
| Unisys Corp. |
| 18,384 |
| |
|
|
|
|
|
| 3,121,697 |
| |
|
|
|
| Cosmetics/ Personal Care: 0.9% |
|
|
| |
450 |
|
|
| Alberto-Culver Co. |
| 20,835 |
| |
2,600 |
|
|
| Avon Products, Inc. |
| 97,604 |
| |
2,650 |
|
|
| Colgate-Palmolive Co. |
| 121,874 |
| |
9,300 |
|
|
| Gillette Co. |
| 404,457 |
| |
3,650 |
|
|
| Kimberly-Clark Corp. |
| 232,177 |
| |
22,750 |
|
|
| Procter & Gamble Co. |
| 1,216,669 |
| |
|
|
|
|
|
| 2,093,616 |
| |
|
|
|
| Distribution/ Wholesale: 0.0% |
|
|
| |
1,000 |
|
|
| Genuine Parts Co. |
| 43,410 |
| |
800 |
|
|
| W.W. Grainger, Inc. |
| 49,488 |
| |
|
|
|
|
|
| 92,898 |
| |
|
|
|
| Diversified Financial Services: 1.9% |
|
|
| |
6,900 |
|
|
| American Express Co. |
| 384,398 |
| |
450 |
|
|
| Bear Stearns Cos., Inc. |
| 43,911 |
| |
1,200 |
|
|
| Capital One Financial Corp. |
| 94,296 |
| |
1,300 |
|
|
| CIT Group, Inc. |
| 55,575 |
| |
27,300 |
|
|
| Citigroup, Inc. |
| 1,221,674 |
| |
5,248 |
|
|
| Countrywide Financial Corp. |
| 174,286 |
| |
2,400 |
| @ |
| E*TRADE Financial Corp. |
| 33,264 |
| |
5,250 |
|
|
| Fannie Mae |
| 360,674 |
| |
600 |
|
|
| Federated Investors, Inc. |
| 17,652 |
| |
1,150 |
|
|
| Franklin Resources, Inc. |
| 75,475 |
| |
3,750 |
|
|
| Freddie Mac |
| 255,975 |
| |
2,650 |
|
|
| Goldman Sachs Group, Inc. |
| 277,614 |
| |
7,844 |
|
|
| J.P. Morgan Chase & Co. |
| 295,327 |
| |
1,550 |
|
|
| Janus Capital Group, Inc. |
| 25,653 |
| |
1,500 |
|
|
| Lehman Brothers Holdings, Inc. |
| 125,670 |
| |
6,950 |
|
|
| MBNA Corp. |
| 184,592 |
| |
5,200 |
|
|
| Merrill Lynch & Co., Inc. |
| 289,692 |
| |
2,400 |
|
|
| Morgan Stanley |
| 121,800 |
| |
2,200 |
| @ |
| Providian Financial Corp. |
| 35,310 |
| |
2,450 |
|
|
| SLM Corp. |
| 125,367 |
| |
|
|
|
|
|
| 4,198,205 |
| |
|
|
|
| Electric: 0.7% |
|
|
| |
3,320 |
| @ |
| AES Corp. |
| 40,637 |
| |
350 |
|
|
| Ameren Corp. |
| 16,947 |
| |
2,000 |
|
|
| American Electric Power Co., Inc. |
| 68,340 |
| |
850 |
|
|
| Cinergy Corp. |
| 35,182 |
| |
1,350 |
|
|
| Consolidated Edison, Inc. |
| 59,198 |
| |
700 |
|
|
| Constellation Energy Group, Inc. |
| 30,590 |
| |
700 |
|
|
| Dominion Resources, Inc. |
| 45,829 |
| |
950 |
|
|
| DTE Energy Co. |
| 41,686 |
| |
6,800 |
|
|
| Duke Energy Corp. |
| 171,903 |
| |
2,370 |
|
|
| Edison Intl |
| 75,603 |
| |
1,200 |
|
|
| Entergy Corp. |
| 77,784 |
| |
3,650 |
|
|
| Exelon Corp. |
| 152,241 |
| |
1,450 |
|
|
| FirstEnergy Corp. |
| 61,234 |
| |
900 |
|
|
| FPL Group, Inc. |
| 63,297 |
| |
1,750 |
| @ |
| PG&E Corp. |
| 58,205 |
| |
600 |
|
|
| Pinnacle West Capital Corp. |
| 26,520 |
| |
1,150 |
|
|
| PPL Corp. |
| 59,743 |
| |
1,300 |
|
|
| Public Service Enterprise Group, Inc. |
| 57,187 |
| |
4,050 |
|
|
| Southern Co. |
| 132,800 |
| |
1,150 |
|
|
| TECO Energy, Inc. |
| 17,204 |
| |
2,200 |
|
|
| TXU Corp. |
| 138,203 |
| |
1,800 |
|
|
| Xcel Energy, Inc. |
| 32,508 |
| |
|
|
|
|
|
| 1,462,841 |
| |
|
|
|
| Electrical Components and Equipment: 0.1% |
|
|
| |
3,000 |
|
|
| Emerson Electric Co. |
| 200,460 |
| |
|
|
|
|
|
| 200,460 |
| |
|
|
|
| Electronics: 0.1% |
|
|
| |
2,500 |
| @ |
| Agilent Technologies, Inc. |
| 57,224 |
| |
1,400 |
|
|
| Applera Corp. — Applied Biosystems Group |
| 28,700 |
| |
650 |
| @ |
| Fisher Scientific Intl |
| 36,751 |
| |
800 |
| @ |
| Jabil Circuit, Inc. |
| 20,048 |
| |
550 |
|
|
| Parker Hannifin Corp. |
| 41,140 |
| |
900 |
|
|
| PerkinElmer, Inc. |
| 19,197 |
| |
2,350 |
| @ |
| Sanmina-SCI Corp. |
| 20,751 |
| |
1,750 |
| @ |
| Solectron Corp. |
| 10,938 |
| |
300 |
|
|
| Tektronix, Inc. |
| 9,411 |
| |
900 |
| @ |
| Thermo Electron Corp. |
| 27,225 |
| |
800 |
| @ |
| Waters Corp. |
| 37,328 |
| |
|
|
|
|
|
| 308,713 |
| |
|
|
|
| Engineering and Construction: 0.0% |
|
|
| |
400 |
|
|
| Fluor Corp. |
| 20,760 |
| |
|
|
|
|
|
| 20,760 |
| |
|
|
|
| Entertainment: 0.0% |
|
|
| |
1,500 |
|
|
| International Game Technology |
| 53,025 |
| |
|
|
|
|
|
| 53,025 |
| |
|
|
|
| Environmental Control: 0.0% |
|
|
| |
2,600 |
|
|
| Waste Management, Inc. |
| 77,506 |
| |
|
|
|
|
|
| 77,506 |
| |
|
|
|
| Food: 0.3% |
|
|
| |
2,050 |
|
|
| Albertson’s, Inc. |
| 51,865 |
| |
850 |
|
|
| Campbell Soup Co. |
| 24,251 |
| |
2,350 |
|
|
| ConAgra Foods, Inc. |
| 63,568 |
| |
1,950 |
|
|
| General Mills, Inc. |
| 88,706 |
| |
1,550 |
|
|
| H.J. Heinz Co. |
| 57,598 |
| |
1,150 |
|
|
| Hershey Foods Corp. |
| 59,570 |
| |
2,050 |
|
|
| Kellogg Co. |
| 89,585 |
| |
1,550 |
| @ |
| Kroger Co. |
| 25,079 |
| |
900 |
|
|
| McCormick & Co., Inc. |
| 32,805 |
| |
900 |
| @ |
| Safeway, Inc. |
| 17,352 |
| |
4,000 |
|
|
| Sara Lee Corp. |
| 93,920 |
| |
1,200 |
|
|
| SUPERVALU, Inc. |
| 37,908 |
| |
1,650 |
|
|
| Wm. Wrigley Jr. Co. |
| 113,519 |
| |
|
|
|
|
|
| 755,726 |
| |
|
|
|
| Forest Products and Paper: 0.2% |
|
|
| |
1,200 |
|
|
| Georgia-Pacific Corp. |
| 43,932 |
| |
2,850 |
|
|
| International Paper Co. |
| 118,332 |
| |
700 |
|
|
| Louisiana-Pacific Corp. |
| 17,129 |
| |
1,200 |
|
|
| MeadWestvaco Corp. |
| 40,380 |
| |
850 |
|
|
| Plum Creek Timber Co., Inc. |
| 31,450 |
| |
350 |
|
|
| Temple-Inland, Inc. |
| 20,857 |
| |
1,850 |
|
|
| Weyerhaeuser Co. |
| 122,100 |
| |
|
|
|
|
|
| 394,180 |
| |
|
|
|
| Gas: 0.0% |
|
|
| |
900 |
|
|
| KeySpan Corp. |
| 35,568 |
| |
1,300 |
|
|
| Sempra Energy |
| 48,074 |
| |
|
|
|
|
|
| 83,642 |
| |
|
|
|
| Hand/ Machine Tools: 0.0% |
|
|
| |
600 |
|
|
| Black & Decker Corp. |
| 50,454 |
| |
100 |
|
|
| Snap-On, Inc. |
| 3,161 |
| |
450 |
|
|
| Stanley Works |
| 21,042 |
| |
|
|
|
|
|
| 74,657 |
| |
See Accompanying Notes to Financial Statements
92
Shares |
|
|
|
|
| Value |
| |
|
|
|
| Healthcare — Products: 1.1% |
|
|
| |
300 |
|
|
| Bausch & Lomb, Inc. |
| $ | 17,664 |
|
2,850 |
|
|
| Baxter Intl., Inc. |
| 90,203 |
| |
1,850 |
|
|
| Becton Dickinson & Co. |
| 101,343 |
| |
1,100 |
|
|
| Biomet, Inc. |
| 52,657 |
| |
4,550 |
| @ |
| Boston Scientific Corp. |
| 158,386 |
| |
500 |
|
|
| C.R. Bard, Inc. |
| 29,955 |
| |
1,450 |
|
|
| Guidant Corp. |
| 94,004 |
| |
21,100 |
|
|
| Johnson & Johnson |
| 1,272,751 |
| |
6,600 |
|
|
| Medtronic, Inc. |
| 317,130 |
| |
2,300 |
| @ |
| St. Jude Medical, Inc. |
| 87,722 |
| |
700 |
|
|
| Stryker Corp. |
| 30,793 |
| |
1,150 |
| @ |
| Zimmer Holdings, Inc. |
| 93,840 |
| |
|
|
|
|
|
| 2,346,448 |
| |
|
|
|
| Healthcare — Services: 0.5% |
|
|
| |
1,500 |
|
|
| Aetna, Inc. |
| 177,765 |
| |
1,350 |
| @ |
| Humana, Inc. |
| 33,507 |
| |
650 |
| @ |
| Laboratory Corp. Of America Holdings |
| 31,168 |
| |
300 |
|
|
| Manor Care, Inc. |
| 10,335 |
| |
200 |
|
|
| Quest Diagnostics, Inc. |
| 18,750 |
| |
5,900 |
|
|
| UnitedHealth Group, Inc. |
| 488,815 |
| |
1,450 |
| @ |
| WellPoint Health Networks, Inc. |
| 181,395 |
| |
1,300 |
| @ |
| WellPoint, Inc. |
| 131,729 |
| |
|
|
|
|
|
| 1,073,464 |
| |
|
|
|
| Home Builders: 0.0% |
|
|
| |
650 |
|
|
| Centex Corp. |
| 34,106 |
| |
|
|
|
|
|
| 34,106 |
| |
|
|
|
| Home Furnishings: 0.0% |
|
|
| |
1,200 |
|
|
| Leggett & Platt, Inc. |
| 35,820 |
| |
300 |
|
|
| Whirlpool Corp. |
| 19,365 |
| |
|
|
|
|
|
| 55,185 |
| |
|
|
|
| Household Products/ Wares: 0.1% |
|
|
| |
650 |
|
|
| Avery Dennison Corp. |
| 38,129 |
| |
1,600 |
|
|
| Clorox Co. |
| 88,192 |
| |
700 |
|
|
| Fortune Brands, Inc. |
| 54,936 |
| |
|
|
|
|
|
| 181,257 |
| |
|
|
|
| Housewares: 0.0% |
|
|
| |
1,300 |
|
|
| Newell Rubbermaid, Inc. |
| 30,004 |
| |
|
|
|
|
|
| 30,004 |
| |
|
|
|
| Insurance: 1.6% |
|
|
| |
2,100 |
| @@ |
| ACE Ltd. |
| 84,882 |
| |
2,300 |
|
|
| AFLAC, Inc. |
| 86,526 |
| |
5,150 |
|
|
| Allstate Corp. |
| 260,074 |
| |
550 |
|
|
| AMBAC Financial Group, Inc. |
| 44,732 |
| |
23,350 |
|
|
| American International Group, Inc. |
| 1,479,222 |
| |
2,250 |
|
|
| AON Corp. |
| 47,520 |
| |
1,800 |
|
|
| Chubb Corp. |
| 137,178 |
| |
1,250 |
|
|
| CIGNA Corp. |
| 87,525 |
| |
945 |
|
|
| Cincinnati Financial Corp. |
| 42,336 |
| |
1,650 |
|
|
| Hartford Financial Services Group, Inc. |
| 105,600 |
| |
700 |
|
|
| Jefferson-Pilot Corp. |
| 34,433 |
| |
1,350 |
|
|
| Lincoln National Corp. |
| 62,127 |
| |
1,200 |
|
|
| Loews Corp. |
| 83,892 |
| |
2,350 |
|
|
| Marsh & McLennan Cos., Inc. |
| 67,187 |
| |
850 |
|
|
| MBIA, Inc. |
| 50,966 |
| |
5,500 |
|
|
| MetLife, Inc. |
| 214,500 |
| |
650 |
|
|
| MGIC Investment Corp. |
| 44,200 |
| |
1,450 |
|
|
| Principal Financial Group |
| 54,636 |
| |
1,050 |
|
|
| Progressive Corp. |
| 95,540 |
| |
4,900 |
|
|
| Prudential Financial, Inc. |
| 239,854 |
| |
1,200 |
|
|
| Safeco Corp. |
| 58,164 |
| |
700 |
|
|
| Torchmark Corp. |
| 38,437 |
| |
1,450 |
|
|
| UnumProvident Corp. |
| 22,577 |
| |
600 |
| @@ |
| XL Capital Ltd. |
| 45,216 |
| |
|
|
|
|
|
| 3,487,324 |
| |
|
|
|
| Internet: 0.4% |
|
|
| |
3,450 |
| @ |
| eBay, Inc. |
| 387,953 |
| |
3,000 |
| @ |
| Symantec Corp. |
| 191,430 |
| |
7,550 |
| @ |
| Yahoo!, Inc. |
| 284,031 |
| |
|
|
|
|
|
| 863,414 |
| |
|
|
|
| Iron/ Steel: 0.0% |
|
|
| |
1,000 |
|
|
| Nucor Corp. |
| 52,900 |
| |
800 |
|
|
| United States Steel Corp. |
| 41,888 |
| |
|
|
|
|
|
| 94,788 |
| |
|
|
|
| Leisure Time: 0.1% |
|
|
| |
850 |
|
|
| Brunswick Corp. |
| 41,497 |
| |
3,500 |
|
|
| Carnival Corp. |
| 185,535 |
| |
1,350 |
|
|
| Harley-Davidson, Inc. |
| 78,057 |
| |
550 |
|
|
| Sabre Holdings Corp. |
| 12,694 |
| |
|
|
|
|
|
| 317,783 |
| |
|
|
|
| Lodging: 0.1% |
|
|
| |
500 |
|
|
| Harrah’s Entertainment, Inc. |
| 30,700 |
| |
1,700 |
|
|
| Hilton Hotels Corp. |
| 35,122 |
| |
950 |
|
|
| Marriott Intl., Inc. |
| 54,007 |
| |
950 |
|
|
| Starwood Hotels & Resorts Worldwide, Inc. |
| 49,676 |
| |
|
|
|
|
|
| 169,505 |
| |
|
|
|
| Machinery — Construction and Mining: 0.0% |
|
|
| |
600 |
|
|
| Caterpillar, Inc. |
| 54,930 |
| |
|
|
|
|
|
| 54,930 |
| |
|
|
|
| Machinery — Diversified: 0.1% |
|
|
| |
250 |
|
|
| Cummins, Inc. |
| 19,905 |
| |
1,150 |
|
|
| Deere & Co. |
| 82,490 |
| |
1,050 |
|
|
| Rockwell Automation, Inc. |
| 49,665 |
| |
|
|
|
|
|
| 152,060 |
| |
|
|
|
| Media: 0.7% |
|
|
| |
1,200 |
|
|
| Clear Channel Communications, Inc. |
| 40,416 |
| |
12,250 |
| @ |
| Comcast Corp. |
| 367,990 |
| |
1,450 |
|
|
| Gannett Co., Inc. |
| 119,611 |
| |
400 |
|
|
| Knight-Ridder, Inc. |
| 27,236 |
| |
1,350 |
|
|
| McGraw-Hill Cos., Inc. |
| 118,436 |
| |
300 |
|
|
| Meredith Corp. |
| 15,816 |
| |
650 |
|
|
| New York Times Co. |
| 26,650 |
| |
24,950 |
| @ |
| Time Warner, Inc. |
| 441,864 |
| |
600 |
|
|
| Tribune Co. |
| 26,022 |
| |
550 |
| @ |
| Univision Communications, Inc. |
| 16,555 |
| |
3,650 |
|
|
| Viacom, Inc. |
| 126,655 |
| |
11,300 |
|
|
| Walt Disney Co. |
| 303,744 |
| |
|
|
|
|
|
| 1,630,995 |
| |
|
|
|
| Mining: 0.0% |
|
|
| |
650 |
|
|
| Phelps Dodge Corp. |
| 63,135 |
| |
|
|
|
|
|
| 63,135 |
| |
|
|
|
| Miscellaneous Manufacturing: 1.6% |
|
|
| |
4,300 |
|
|
| 3M Co. |
| 342,237 |
| |
500 |
|
|
| Cooper Industries Ltd. |
| 33,155 |
| |
1,550 |
|
|
| Danaher Corp. |
| 88,164 |
| |
1,250 |
|
|
| Dover Corp. |
| 50,563 |
| |
1,700 |
|
|
| Eastman Kodak Co. |
| 55,607 |
| |
700 |
|
|
| Eaton Corp. |
| 47,180 |
| |
55,650 |
|
|
| General Electric Co. |
| 1,967,783 |
| |
4,650 |
|
|
| Honeywell Intl., Inc. |
| 164,285 |
| |
See Accompanying Notes to Financial Statements
93
Shares |
|
|
|
|
| Value |
| |
|
|
|
| Miscellaneous Manufacturing (continued) |
|
|
| |
1,650 |
|
|
| Illinois Tool Works, Inc. |
| $ | 155,480 |
|
750 |
| @@ |
| Ingersoll-Rand Co. |
| 55,815 |
| |
450 |
|
|
| ITT Industries, Inc. |
| 38,304 |
| |
600 |
|
|
| Pall Corp. |
| 16,254 |
| |
700 |
|
|
| Textron, Inc. |
| 50,834 |
| |
11,100 |
| @@ |
| Tyco Intl. Ltd. |
| 377,066 |
| |
|
|
|
|
|
| 3,442,727 |
| |
|
|
|
| Office/ Business Equipment: 0.1% |
|
|
| |
1,200 |
|
|
| Pitney Bowes, Inc. |
| 52,524 |
| |
4,250 |
| @ |
| Xerox Corp. |
| 65,110 |
| |
|
|
|
|
|
| 117,634 |
| |
|
|
|
| Oil and Gas: 2.2% |
|
|
| |
450 |
|
|
| Amerada Hess Corp. |
| 39,983 |
| |
1,600 |
|
|
| Anadarko Petroleum Corp. |
| 111,360 |
| |
1,600 |
|
|
| Apache Corp. |
| 86,496 |
| |
3,100 |
|
|
| Burlington Resources, Inc. |
| 143,871 |
| |
17,500 |
|
|
| ChevronTexaco Corp. |
| 955,499 |
| |
4,450 |
|
|
| ConocoPhillips |
| 404,905 |
| |
4,200 |
|
|
| Devon Energy Corp. |
| 173,964 |
| |
500 |
|
|
| EOG Resources, Inc. |
| 37,535 |
| |
42,200 |
|
|
| Exxon Mobil Corp. |
| 2,162,749 |
| |
600 |
|
|
| Kerr-McGee Corp. |
| 37,338 |
| |
1,450 |
|
|
| Marathon Oil Corp. |
| 57,188 |
| |
250 |
| @,@@ |
| Nabors Industries Ltd. |
| 13,000 |
| |
850 |
| @ |
| Noble Corp. |
| 41,183 |
| |
2,050 |
|
|
| Occidental Petroleum Corp. |
| 123,431 |
| |
600 |
|
|
| Sunoco, Inc. |
| 49,536 |
| |
1,450 |
| @ |
| Transocean, Inc. |
| 58,392 |
| |
1,900 |
|
|
| Unocal Corp. |
| 87,476 |
| |
2,100 |
|
|
| Valero Energy Corp. |
| 98,259 |
| |
|
|
|
|
|
| 4,682,165 |
| |
|
|
|
| Oil and Gas Services: 0.1% |
|
|
| |
1,500 |
|
|
| Baker Hughes, Inc. |
| 66,495 |
| |
900 |
|
|
| BJ Services Co. |
| 45,603 |
| |
2,150 |
|
|
| Halliburton Co. |
| 88,903 |
| |
|
|
|
|
|
| 201,001 |
| |
|
|
|
| Packaging and Containers: 0.0% |
|
|
| |
800 |
|
|
| Ball Corp. |
| 35,784 |
| |
400 |
|
|
| Bemis Co. |
| 11,136 |
| |
800 |
| @ |
| Pactiv Corp. |
| 19,880 |
| |
400 |
| @ |
| Sealed Air Corp. |
| 20,564 |
| |
|
|
|
|
|
| 87,364 |
| |
|
|
|
| Pharmaceuticals: 1.5% |
|
|
| |
8,600 |
|
|
| Abbott Laboratories |
| 360,855 |
| |
650 |
|
|
| Allergan, Inc. |
| 47,775 |
| |
650 |
|
|
| AmerisourceBergen Corp. |
| 38,311 |
| |
10,750 |
|
|
| Bristol-Myers Squibb Co. |
| 252,625 |
| |
2,000 |
|
|
| Cardinal Health, Inc. |
| 104,560 |
| |
4,050 |
| @ |
| Caremark Rx, Inc. |
| 144,828 |
| |
2,400 |
|
|
| Eli Lilly & Co. |
| 127,992 |
| |
500 |
| @ |
| Express Scripts, Inc. |
| 35,980 |
| |
1,650 |
| @ |
| Forest Laboratories, Inc. |
| 64,301 |
| |
2,000 |
| @ |
| Gilead Sciences, Inc. |
| 68,920 |
| |
1,000 |
| @ |
| Hospira, Inc. |
| 32,230 |
| |
1,000 |
| @ |
| King Pharmaceuticals, Inc. |
| 12,450 |
| |
1,491 |
| @ |
| Medco Health Solutions, Inc. |
| 56,241 |
| |
12,300 |
|
|
| Merck & Co., Inc. |
| 344,645 |
| |
39,650 |
|
|
| Pfizer, Inc. |
| 1,101,080 |
| |
8,100 |
|
|
| Schering-Plough Corp. |
| 144,585 |
| |
7,350 |
|
|
| Wyeth |
| 293,045 |
| |
|
|
|
|
|
| 3,230,423 |
| |
|
|
|
| Pipelines: 0.0% |
|
|
| |
3,850 |
| @ |
| Dynegy, Inc. |
| 21,753 |
| |
2,500 |
|
|
| El Paso Corp. |
| 26,100 |
| |
250 |
|
|
| Kinder Morgan, Inc. |
| 17,325 |
| |
2,450 |
|
|
| Williams Cos., Inc. |
| 40,841 |
| |
|
|
|
|
|
| 106,019 |
| |
|
|
|
| Real Estate Investment Trusts: 0.1% |
|
|
| |
750 |
|
|
| Equity Office Properties Trust |
| 20,588 |
| |
800 |
|
|
| ProLogis |
| 32,184 |
| |
950 |
|
|
| Simon Property Group, Inc. |
| 58,976 |
| |
|
|
|
|
|
| 111,748 |
| |
|
|
|
| Retail: 2.1% |
|
|
| |
1,700 |
| @ |
| Bed Bath & Beyond, Inc. |
| 67,878 |
| |
1,700 |
|
|
| Best Buy Co., Inc. |
| 95,846 |
| |
1,650 |
|
|
| Circuit City Stores, Inc. |
| 25,724 |
| |
4,300 |
|
|
| Costco Wholesale Corp. |
| 208,980 |
| |
1,750 |
|
|
| CVS Corp. |
| 79,398 |
| |
1,250 |
|
|
| Darden Restaurants, Inc. |
| 34,075 |
| |
750 |
|
|
| Federated Department Stores, Inc. |
| 41,100 |
| |
6,850 |
|
|
| Gap, Inc. |
| 149,673 |
| |
19,550 |
|
|
| Home Depot, Inc. |
| 816,212 |
| |
2,400 |
|
|
| J.C. Penney Co., Inc. Holding Co. |
| 92,640 |
| |
700 |
| @ |
| Kohl’s Corp. |
| 32,312 |
| |
3,450 |
|
|
| Limited Brands, Inc. |
| 84,318 |
| |
4,300 |
|
|
| Lowe’s Cos., Inc. |
| 237,918 |
| |
1,800 |
|
|
| May Department Stores Co. |
| 50,616 |
| |
6,950 |
|
|
| McDonald’s Corp. |
| 213,643 |
| |
600 |
|
|
| Nordstrom, Inc. |
| 26,250 |
| |
2,050 |
| @ |
| Office Depot, Inc. |
| 33,620 |
| |
1,150 |
|
|
| RadioShack Corp. |
| 36,306 |
| |
3,050 |
|
|
| Staples, Inc. |
| 97,326 |
| |
2,100 |
| @ |
| Starbucks Corp. |
| 118,146 |
| |
4,950 |
|
|
| Target Corp. |
| 253,538 |
| |
2,600 |
|
|
| TJX Cos., Inc. |
| 61,204 |
| |
1,200 |
| @ |
| Toys R US, Inc. |
| 23,208 |
| |
22,400 |
|
|
| Wal-Mart Stores, Inc. |
| 1,166,143 |
| |
7,500 |
|
|
| Walgreen Co. |
| 286,349 |
| |
850 |
|
|
| Wendy’s Intl., Inc. |
| 30,320 |
| |
1,250 |
|
|
| Yum! Brands, Inc. |
| 56,750 |
| |
|
|
|
|
|
| 4,419,493 |
| |
|
|
|
| Savings and Loans: 0.1% |
|
|
| |
800 |
|
|
| Golden West Financial Corp. |
| 95,392 |
| |
750 |
|
|
| Sovereign Bancorp, Inc. |
| 16,388 |
| |
4,850 |
|
|
| Washington Mutual, Inc. |
| 197,443 |
| |
|
|
|
|
|
| 309,223 |
| |
|
|
|
| Semiconductors: 0.6% |
|
|
| |
1,600 |
| @ |
| Altera Corp. |
| 36,288 |
| |
1,950 |
|
|
| Analog Devices, Inc. |
| 72,053 |
| |
9,150 |
| @ |
| Applied Materials, Inc. |
| 152,256 |
| |
33,850 |
|
|
| Intel Corp. |
| 756,547 |
| |
900 |
| @ |
| KLA-Tencor Corp. |
| 40,554 |
| |
1,350 |
|
|
| Linear Technology Corp. |
| 51,516 |
| |
600 |
|
|
| Maxim Integrated Products, Inc. |
| 24,576 |
| |
1,600 |
| @ |
| National Semiconductor Corp. |
| 24,736 |
| |
500 |
| @ |
| Qlogic Corp. |
| 17,195 |
| |
3,100 |
|
|
| Texas Instruments, Inc. |
| 74,958 |
| |
|
|
|
|
|
| 1,250,679 |
| |
|
|
|
| Software: 1.4% |
|
|
| |
1,200 |
|
|
| Adobe Systems, Inc. |
| 72,672 |
| |
800 |
|
|
| Autodesk, Inc. |
| 52,328 |
| |
3,200 |
|
|
| Automatic Data Processing, Inc. |
| 145,696 |
| |
1,550 |
| @ |
| BMC Software, Inc. |
| 28,799 |
| |
800 |
| @ |
| Citrix Systems, Inc. |
| 18,888 |
| |
See Accompanying Notes to Financial Statements
94
Shares |
|
|
|
|
| Value |
| |
|
|
|
| Software (continued) |
|
|
| |
2,550 |
|
|
| Computer Associates Intl., Inc. |
| $ | 77,852 |
|
2,200 |
| @ |
| Compuware Corp. |
| 12,694 |
| |
650 |
| @ |
| Electronic Arts, Inc. |
| 31,785 |
| |
4,749 |
|
|
| First Data Corp. |
| 195,136 |
| |
1,000 |
| @ |
| Fiserv, Inc. |
| 38,510 |
| |
1,600 |
|
|
| IMS Health, Inc. |
| 36,112 |
| |
1,100 |
| @ |
| Intuit, Inc. |
| 46,024 |
| |
56,900 |
|
|
| Microsoft Corp. |
| 1,525,488 |
| |
1,950 |
| @ |
| Novell, Inc. |
| 11,895 |
| |
46,100 |
| @ |
| Oracle Corp. |
| 583,625 |
| |
2,250 |
| @ |
| PeopleSoft, Inc. |
| 53,123 |
| |
2,350 |
| @ |
| Siebel Systems, Inc. |
| 23,688 |
| |
2,500 |
| @ |
| Veritas Software Corp. |
| 54,750 |
| |
|
|
|
|
|
| 3,009,065 |
| |
|
|
|
| Telecommunications: 1.6% |
|
|
| |
2,000 |
|
|
| Alltel Corp. |
| 113,380 |
| |
1,650 |
|
|
| AT&T Corp. |
| 30,195 |
| |
1,950 |
| @ |
| Avaya, Inc. |
| 32,019 |
| |
10,000 |
|
|
| BellSouth Corp. |
| 268,200 |
| |
600 |
|
|
| CenturyTel, Inc. |
| 19,752 |
| |
35,500 |
| @ |
| Cisco Systems, Inc. |
| 664,204 |
| |
1,950 |
|
|
| Citizens Communications Co. |
| 27,885 |
| |
1,500 |
| @ |
| Comverse Technology, Inc. |
| 31,905 |
| |
6,750 |
| @ |
| Corning, Inc. |
| 84,915 |
| |
23,250 |
| @ |
| Lucent Technologies, Inc. |
| 91,373 |
| |
17,450 |
|
|
| Motorola, Inc. |
| 336,087 |
| |
6,050 |
| @ |
| Nextel Communications, Inc. |
| 172,183 |
| |
8,900 |
|
|
| Qualcomm, Inc. |
| 370,418 |
| |
8,500 |
| @ |
| Qwest Communications Intl., Inc. |
| 34,000 |
| |
17,300 |
|
|
| SBC Communications, Inc. |
| 435,441 |
| |
1,200 |
|
|
| Scientific-Atlanta, Inc. |
| 35,544 |
| |
7,700 |
|
|
| Sprint Corp. |
| 175,637 |
| |
2,700 |
| @ |
| Tellabs, Inc. |
| 23,085 |
| |
14,550 |
|
|
| Verizon Communications, Inc. |
| 599,896 |
| |
|
|
|
|
|
| 3,546,119 |
| |
|
|
|
| Textiles: 0.0% |
|
|
| |
750 |
|
|
| Cintas Corp. |
| 33,540 |
| |
|
|
|
|
|
| 33,540 |
| |
|
|
|
| Toys/ Games/ Hobbies: 0.0% |
|
|
| |
1,000 |
|
|
| Hasbro, Inc. |
| 19,030 |
| |
2,250 |
|
|
| Mattel, Inc. |
| 42,638 |
| |
|
|
|
|
|
| 61,668 |
| |
|
|
|
| Transportation: 0.4% |
|
|
| |
1,600 |
|
|
| Burlington Northern Santa Fe Corp. |
| 72,064 |
| |
1,000 |
|
|
| CSX Corp. |
| 38,130 |
| |
2,200 |
|
|
| FedEx Corp. |
| 209,066 |
| |
3,000 |
|
|
| Norfolk Southern Corp. |
| 102,990 |
| |
400 |
|
|
| Ryder System, Inc. |
| 21,456 |
| |
450 |
|
|
| Union Pacific Corp. |
| 28,548 |
| |
5,900 |
|
|
| United Parcel Service, Inc. |
| 496,485 |
| |
|
|
|
|
|
| 968,739 |
| |
|
|
|
| Total Common Stock |
| 59,623,324 |
| |
Principal |
|
|
|
|
| Value |
| ||
U.S. GOVERNMENT AGENCY OBLIGATIONS: 59.5% |
|
|
| ||||||
|
|
|
| Federal Home Loan Mortgage Corporation: 28.9% |
|
|
| ||
$ | 73,000,000 |
|
|
| 3.880%, due 06/26/08 |
| $ | 63,996,107 |
|
|
|
|
|
|
| 63,996,107 |
| ||
|
|
|
| Federal National Mortgage Association: 30.6% |
|
|
| ||
5,430,000 |
|
|
| 4.040%, due 05/15/08 STRIP |
| 4,756,729 |
| ||
72,000,000 |
|
|
| 4.070%, due 05/15/08 STRIP |
| 63,009,144 |
| ||
|
|
|
| Total U.S. Government Agency Obligations |
| 131,761,980 |
| ||
U.S. TREASURY OBLIGATIONS: 13.2% |
|
|
| ||||||
|
|
|
| U.S. Treasury STRIP: 13.2% |
|
|
| ||
32,942,000 |
|
|
| 3.410%, due 05/15/08 |
| 29,339,265 |
| ||
|
|
|
| Total U.S. Treasury Obligations |
| 29,339,265 |
| ||
|
|
|
| Total Long-Term Investments |
| 220,724,569 |
| ||
SHORT-TERM INVESTMENTS: 0.6% |
|
|
| ||||||
|
|
|
| Repurchase Agreement: 0.6% |
|
|
| ||
1,267,000 |
|
|
| Goldman Sachs Repurchase Agreement dated 11/30/04, 2.060%, due 12/01/04, $1,267,073 to be received upon repurchase (Collateralized by $1,222,000 Federal Home Loan Mortgage Corporation, 5.500%, Market Value plus accrued interest $1,293,029, due 07/15/06) |
| 1,267,000 |
| ||
|
|
|
| Total Short-Term Investments |
| 1,267,000 |
| ||
Total Investments In Securities |
| 100.2 | % | $ | 221,991,569 |
|
Other Assets and |
| (0.2 | ) | (429,240 | ) | |
Net Assets |
| 100.0 | % | $ | 221,562,329 |
|
@ |
| Non-income producing security |
@@ |
| Foreign issuer |
STRIP |
| Separate Trading of Registered Interest and Principal of Securities |
* |
| Cost for federal income tax purposes is $224,802,893. Net unrealized depreciation consists of: |
|
|
|
| ||
Gross Unrealized Appreciation |
| $ | 4,764,461 |
| |
Gross Unrealized Depreciation |
| (7,575,785 | ) | ||
Net Unrealized Depreciation |
| $ | (2,811,324 | ) | |
See Accompanying Notes to Financial Statements
95
ING PRINCIPAL PROTECTION FUND VIII
PORTFOLIO OF INVESTMENTS
AS OF NOVEMBER 30, 2004 (UNAUDITED)
Shares |
|
|
|
|
| Value |
| |
COMMON STOCK: 30.8% |
|
|
| |||||
|
|
|
| Advertising: 0.0% |
|
|
| |
480 |
| @ |
| Interpublic Group of Cos., Inc. |
| $ | 5,957 |
|
670 |
|
|
| Omnicom Group, Inc. |
| 54,270 |
| |
|
|
|
|
|
| 60,227 |
| |
|
|
|
| Aerospace/Defense: 0.7% |
|
|
| |
5,820 |
|
|
| Boeing Co. |
| 311,778 |
| |
1,440 |
|
|
| General Dynamics Corp. |
| 156,038 |
| |
360 |
|
|
| Goodrich Corp. |
| 11,430 |
| |
1,730 |
|
|
| Lockheed Martin Corp. |
| 105,253 |
| |
1,200 |
|
|
| Northrop Grumman Corp. |
| 67,596 |
| |
3,000 |
|
|
| Raytheon Co. |
| 121,020 |
| |
520 |
|
|
| Rockwell Collins, Inc. |
| 20,727 |
| |
1,950 |
|
|
| United Technologies Corp. |
| 190,281 |
| |
|
|
|
|
|
| 984,123 |
| |
|
|
|
| Agriculture: 0.5% |
|
|
| |
8,390 |
|
|
| Altria Group, Inc. |
| 482,341 |
| |
2,430 |
|
|
| Archer-Daniels-Midland Co. |
| 51,516 |
| |
900 |
|
|
| Monsanto Co. |
| 41,418 |
| |
570 |
|
|
| Reynolds American, Inc. |
| 43,109 |
| |
1,200 |
|
|
| UST, Inc. |
| 52,836 |
| |
|
|
|
|
|
| 671,220 |
| |
|
|
|
| Apparel: 0.2% |
|
|
| |
1,400 |
| @ |
| Coach, Inc. |
| 69,776 |
| |
520 |
|
|
| Jones Apparel Group, Inc. |
| 18,476 |
| |
330 |
|
|
| Liz Claiborne, Inc. |
| 13,553 |
| |
1,720 |
|
|
| Nike, Inc. |
| 145,615 |
| |
160 |
|
|
| Reebok Intl. Ltd. |
| 6,221 |
| |
500 |
|
|
| VF Corp. |
| 26,995 |
| |
|
|
|
|
|
| 280,636 |
| |
|
|
|
| Auto Manufacturers: 0.2% |
|
|
| |
11,780 |
|
|
| Ford Motor Co. |
| 167,040 |
| |
2,070 |
|
|
| General Motors Corp. |
| 79,881 |
| |
1,275 |
|
|
| PACCAR, Inc. |
| 99,578 |
| |
|
|
|
|
|
| 346,499 |
| |
|
|
|
| Auto Parts and Equipment: 0.0% |
|
|
| |
380 |
|
|
| Dana Corp. |
| 6,213 |
| |
650 |
| @ |
| Goodyear Tire & Rubber Co. |
| 8,203 |
| |
670 |
|
|
| Johnson Controls, Inc. |
| 41,138 |
| |
|
|
|
|
|
| 55,554 |
| |
|
|
|
| Banks: 2.0% |
|
|
| |
1,280 |
|
|
| AmSouth Bancorporation |
| 33,190 |
| |
16,680 |
|
|
| Bank of America Corp. |
| 771,783 |
| |
2,300 |
|
|
| BB&T Corp. |
| 97,635 |
| |
1,240 |
|
|
| Comerica, Inc. |
| 76,260 |
| |
700 |
|
|
| Fifth Third Bancorp |
| 35,252 |
| |
310 |
|
|
| First Horizon National Corp. |
| 13,547 |
| |
580 |
|
|
| Huntington Bancshares, Inc. |
| 14,071 |
| |
2,050 |
|
|
| KeyCorp |
| 68,245 |
| |
400 |
|
|
| M & T Bank Corp. |
| 42,164 |
| |
770 |
|
|
| Marshall & Ilsley Corp. |
| 32,101 |
| |
1,240 |
|
|
| Mellon Financial Corp. |
| 36,233 |
| |
3,410 |
|
|
| National City Corp. |
| 126,443 |
| |
1,885 |
|
|
| North Fork Bancorporation, Inc. |
| 54,288 |
| |
360 |
|
|
| Northern Trust Corp. |
| 16,934 |
| |
910 |
|
|
| PNC Financial Services Group, Inc. |
| 49,504 |
| |
1,918 |
|
|
| Regions Financial Corp. |
| 67,111 |
| |
1,400 |
|
|
| State Street Corp. |
| 62,384 |
| |
1,370 |
|
|
| SunTrust Banks, Inc. |
| 97,681 |
| |
400 |
|
|
| Synovus Financial Corp. |
| 10,800 |
| |
990 |
|
|
| The Bank of New York Co., Inc. |
| 32,581 |
| |
7,690 |
|
|
| U.S. Bancorp |
| 227,855 |
| |
7,873 |
|
|
| Wachovia Corp. |
| 407,428 |
| |
6,910 |
|
|
| Wells Fargo & Co. |
| 426,830 |
| |
290 |
|
|
| Zions Bancorporation |
| 19,285 |
| |
|
|
|
|
|
| 2,819,605 |
| |
|
|
|
| Beverages: 0.7% |
|
|
| |
3,110 |
|
|
| Anheuser-Busch Cos., Inc. |
| 155,780 |
| |
400 |
|
|
| Brown-Forman Corp. |
| 19,208 |
| |
9,990 |
|
|
| Coca-Cola Co. |
| 392,707 |
| |
1,640 |
|
|
| Coca-Cola Enterprises, Inc. |
| 34,112 |
| |
720 |
|
|
| Pepsi Bottling Group, Inc. |
| 20,174 |
| |
9,380 |
|
|
| PepsiCo, Inc. |
| 468,156 |
| |
|
|
|
|
|
| 1,090,137 |
| |
|
|
|
| Biotechnology: 0.3% |
|
|
| |
5,220 |
| @ |
| Amgen, Inc. |
| 313,408 |
| |
1,150 |
| @ |
| Biogen Idec, Inc. |
| 67,482 |
| |
850 |
| @ |
| Genzyme Corp. |
| 47,609 |
| |
750 |
| @ |
| MedImmune, Inc. |
| 19,950 |
| |
150 |
| @ |
| Millipore Corp. |
| 7,308 |
| |
|
|
|
|
|
| 455,757 |
| |
|
|
|
| Building Materials: 0.1% |
|
|
| |
690 |
| @ |
| American Standard Cos., Inc. |
| 26,869 |
| |
1,820 |
|
|
| Masco Corp. |
| 64,191 |
| |
310 |
|
|
| Vulcan Materials Co. |
| 16,074 |
| |
|
|
|
|
|
| 107,134 |
| |
|
|
|
| Chemicals: 0.5% |
|
|
| |
900 |
|
|
| Air Products & Chemicals, Inc. |
| 51,525 |
| |
150 |
|
|
| Ashland, Inc. |
| 8,873 |
| |
4,080 |
|
|
| Dow Chemical Co. |
| 205,917 |
| |
4,050 |
|
|
| E.I. du Pont de Nemours & Co. |
| 183,545 |
| |
350 |
|
|
| Eastman Chemical Co. |
| 19,033 |
| |
320 |
|
|
| Ecolab, Inc. |
| 11,194 |
| |
510 |
|
|
| Engelhard Corp. |
| 15,244 |
| |
270 |
|
|
| International Flavors & Fragrances, Inc. |
| 10,935 |
| |
1,300 |
|
|
| PPG Industries, Inc. |
| 87,711 |
| |
1,210 |
|
|
| Praxair, Inc. |
| 54,329 |
| |
730 |
|
|
| Rohm & Haas Co. |
| 32,186 |
| |
750 |
|
|
| Sherwin-Williams Co. |
| 33,450 |
| |
270 |
|
|
| Sigma-Aldrich Corp. |
| 16,127 |
| |
|
|
|
|
|
| 730,069 |
| |
|
|
|
| Commercial Services: 0.3% |
|
|
| |
730 |
| @ |
| Apollo Group, Inc. |
| 58,181 |
| |
4,030 |
|
|
| Cendant Corp. |
| 91,359 |
| |
190 |
|
|
| Deluxe Corp. |
| 7,513 |
| |
520 |
|
|
| Equifax, Inc. |
| 14,362 |
| |
860 |
|
|
| H&R Block, Inc. |
| 41,022 |
| |
850 |
|
|
| McKesson Corp. |
| 25,118 |
| |
630 |
|
|
| Moody’s Corp. |
| 50,873 |
| |
1,620 |
|
|
| Paychex, Inc. |
| 53,719 |
| |
900 |
|
|
| R.R. Donnelley & Sons Co. |
| 31,230 |
| |
600 |
|
|
| Robert Half Intl., Inc. |
| 16,218 |
| |
|
|
|
|
|
| 389,595 |
| |
|
|
|
| Computers: 1.8% |
|
|
| |
500 |
| @ |
| Affiliated Computer Services, Inc. |
| 29,590 |
| |
2,760 |
| @ |
| Apple Computer, Inc. |
| 185,058 |
| |
600 |
| @ |
| Computer Sciences Corp. |
| 32,460 |
| |
13,880 |
| @ |
| Dell, Inc. |
| 562,417 |
| |
2,050 |
|
|
| Electronic Data Systems Corp. |
| 46,023 |
| |
9,340 |
| @ |
| EMC Corp. |
| 125,343 |
| |
710 |
| @ |
| Gateway, Inc. |
| 4,835 |
| |
12,310 |
|
|
| Hewlett-Packard Co. |
| 246,200 |
| |
11,750 |
|
|
| International Business Machines Corp. |
| 1,107,319 |
| |
430 |
| @ |
| Lexmark Intl., Inc. |
| 36,507 |
| |
350 |
| @ |
| NCR Corp. |
| 20,906 |
| |
1,190 |
| @ |
| Network Appliance, Inc. |
| 35,890 |
| |
See Accompanying Notes to Financial Statements
96
Shares |
|
|
|
|
| Value |
| |
|
|
|
| Computers (continued) |
|
|
| |
23,550 |
| @ |
| Sun Microsystems, Inc. |
| $ | 130,703 |
|
1,090 |
| @ |
| Sungard Data Systems, Inc. |
| 28,896 |
| |
1,200 |
| @ |
| Unisys Corp. |
| 13,788 |
| |
|
|
|
|
|
| 2,605,935 |
| |
|
|
|
| Cosmetics/Personal Care: 1.0% |
|
|
| |
510 |
|
|
| Alberto-Culver Co. |
| 23,613 |
| |
1,600 |
|
|
| Avon Products, Inc. |
| 60,064 |
| |
2,040 |
|
|
| Colgate-Palmolive Co. |
| 93,820 |
| |
6,980 |
|
|
| Gillette Co. |
| 303,560 |
| |
2,500 |
|
|
| Kimberly-Clark Corp. |
| 159,025 |
| |
15,730 |
|
|
| Procter & Gamble Co. |
| 841,240 |
| |
|
|
|
|
|
| 1,481,322 |
| |
|
|
|
| Distribution/Wholesale: 0.0% |
|
|
| |
1,000 |
|
|
| Genuine Parts Co. |
| 43,410 |
| |
450 |
|
|
| W.W. Grainger, Inc. |
| 27,837 |
| |
|
|
|
|
|
| 71,247 |
| |
|
|
|
| Diversified Financial Services: 2.3% |
|
|
| |
5,230 |
|
|
| American Express Co. |
| 291,363 |
| |
380 |
|
|
| Bear Stearns Cos., Inc. |
| 37,080 |
| |
1,360 |
|
|
| Capital One Financial Corp. |
| 106,869 |
| |
2,300 |
|
|
| Charles Schwab Corp. |
| 24,794 |
| |
1,500 |
|
|
| CIT Group, Inc. |
| 64,125 |
| |
21,290 |
|
|
| Citigroup, Inc. |
| 952,728 |
| |
3,760 |
|
|
| Countrywide Financial Corp. |
| 124,870 |
| |
1,050 |
| @ |
| E*TRADE Financial Corp. |
| 14,553 |
| |
4,000 |
|
|
| Fannie Mae |
| 274,800 |
| |
120 |
|
|
| Federated Investors, Inc. |
| 3,530 |
| |
770 |
|
|
| Franklin Resources, Inc. |
| 50,535 |
| |
2,600 |
|
|
| Freddie Mac |
| 177,476 |
| |
2,020 |
|
|
| Goldman Sachs Group, Inc. |
| 211,615 |
| |
5,461 |
|
|
| J.P. Morgan Chase & Co. |
| 205,607 |
| |
250 |
|
|
| Janus Capital Group, Inc. |
| 4,138 |
| |
1,530 |
|
|
| Lehman Brothers Holdings, Inc. |
| 128,183 |
| |
4,960 |
|
|
| MBNA Corp. |
| 131,738 |
| |
3,630 |
|
|
| Merrill Lynch & Co., Inc. |
| 202,227 |
| |
1,780 |
|
|
| Morgan Stanley |
| 90,335 |
| |
780 |
| @ |
| Providian Financial Corp. |
| 12,519 |
| |
1,520 |
|
|
| SLM Corp. |
| 77,778 |
| |
200 |
|
|
| T. Rowe Price Group, Inc. |
| 11,832 |
| |
|
|
|
|
|
| 3,198,695 |
| |
|
|
|
| Electric: 0.8% |
|
|
| |
3,150 |
| @ |
| AES Corp. |
| 38,556 |
| |
500 |
| @ |
| Allegheny Energy, Inc. |
| 9,570 |
| |
250 |
|
|
| Ameren Corp. |
| 12,105 |
| |
1,690 |
|
|
| American Electric Power Co., Inc. |
| 57,747 |
| |
500 |
|
|
| Cinergy Corp. |
| 20,695 |
| |
850 |
|
|
| Consolidated Edison, Inc. |
| 37,273 |
| |
950 |
|
|
| Constellation Energy Group, Inc. |
| 41,515 |
| |
1,350 |
|
|
| Dominion Resources, Inc. |
| 88,385 |
| |
600 |
|
|
| DTE Energy Co. |
| 26,328 |
| |
6,510 |
|
|
| Duke Energy Corp. |
| 164,573 |
| |
1,910 |
|
|
| Edison Intl. |
| 60,929 |
| |
850 |
|
|
| Entergy Corp. |
| 55,097 |
| |
2,530 |
|
|
| Exelon Corp. |
| 105,526 |
| |
1,120 |
|
|
| FirstEnergy Corp. |
| 47,298 |
| |
540 |
|
|
| FPL Group, Inc. |
| 37,978 |
| |
1,440 |
| @ |
| PG&E Corp. |
| 47,894 |
| |
240 |
|
|
| Pinnacle West Capital Corp. |
| 10,608 |
| |
790 |
|
|
| PPL Corp. |
| 41,041 |
| |
400 |
|
|
| Progress Energy, Inc. |
| 17,564 |
| |
900 |
|
|
| Public Service Enterprise Group, Inc. |
| 39,591 |
| |
3,090 |
|
|
| Southern Co. |
| 101,321 |
| |
900 |
|
|
| TECO Energy, Inc. |
| 13,464 |
| |
1,570 |
|
|
| TXU Corp. |
| 98,627 |
| |
1,320 |
|
|
| Xcel Energy, Inc. |
| 23,839 |
| |
|
|
|
|
|
| 1,197,524 |
| |
|
|
|
| Electrical Components and Equipment: 0.1% |
|
|
| |
2,070 |
|
|
| Emerson Electric Co. |
| 138,317 |
| |
|
|
|
|
|
| 138,317 |
| |
|
|
|
| Electronics: 0.1% |
|
|
| |
1,600 |
| @ |
| Agilent Technologies, Inc. |
| 36,623 |
| |
600 |
|
|
| Applera Corp. — Applied Biosystems Group |
| 12,300 |
| |
450 |
| @ |
| Fisher Scientific Intl. |
| 25,443 |
| |
570 |
| @ |
| Jabil Circuit, Inc. |
| 14,284 |
| |
340 |
|
|
| Parker Hannifin Corp. |
| 25,432 |
| |
390 |
|
|
| PerkinElmer, Inc. |
| 8,319 |
| |
1,640 |
| @ |
| Sanmina-SCI Corp. |
| 14,481 |
| |
3,270 |
| @ |
| Solectron Corp. |
| 20,438 |
| |
250 |
|
|
| Tektronix, Inc. |
| 7,843 |
| |
670 |
| @ |
| Thermo Electron Corp. |
| 20,268 |
| |
350 |
| @ |
| Waters Corp. |
| 16,331 |
| |
|
|
|
|
|
| 201,762 |
| |
|
|
|
| Engineering and Construction: 0.0% |
|
|
| |
350 |
|
|
| Fluor Corp. |
| 18,165 |
| |
|
|
|
|
|
| 18,165 |
| |
|
|
|
| Entertainment: 0.0% |
|
|
| |
1,210 |
|
|
| International Game Technology |
| 42,774 |
| |
|
|
|
|
|
| 42,774 |
| |
|
|
|
| Environmental Control: 0.0% |
|
|
| |
2,010 |
|
|
| Waste Management, Inc. |
| 59,918 |
| |
|
|
|
|
|
| 59,918 |
| |
|
|
|
| Food: 0.4% |
|
|
| |
1,400 |
|
|
| Albertson’s, Inc. |
| 35,420 |
| |
1,750 |
|
|
| Campbell Soup Co. |
| 49,928 |
| |
1,950 |
|
|
| ConAgra Foods, Inc. |
| 52,748 |
| |
1,250 |
|
|
| General Mills, Inc. |
| 56,863 |
| |
1,150 |
|
|
| H.J. Heinz Co. |
| 42,734 |
| |
850 |
|
|
| Hershey Foods Corp. |
| 44,030 |
| |
1,420 |
|
|
| Kellogg Co. |
| 62,054 |
| |
1,100 |
| @ |
| Kroger Co. |
| 17,798 |
| |
550 |
|
|
| McCormick & Co., Inc. |
| 20,048 |
| |
650 |
| @ |
| Safeway, Inc. |
| 12,532 |
| |
2,750 |
|
|
| Sara Lee Corp. |
| 64,569 |
| |
770 |
|
|
| SUPERVALU, Inc. |
| 24,324 |
| |
1,260 |
|
|
| Wm. Wrigley Jr. Co. |
| 86,687 |
| |
|
|
|
|
|
| 569,735 |
| |
|
|
|
| Forest Products and Paper: 0.2% |
|
|
| |
1,100 |
|
|
| Georgia-Pacific Corp. |
| 40,271 |
| |
2,060 |
|
|
| International Paper Co. |
| 85,531 |
| |
510 |
|
|
| Louisiana-Pacific Corp. |
| 12,480 |
| |
650 |
|
|
| MeadWestvaco Corp. |
| 21,873 |
| |
550 |
|
|
| Plum Creek Timber Co., Inc. |
| 20,350 |
| |
250 |
|
|
| Temple-Inland, Inc. |
| 14,898 |
| |
1,300 |
|
|
| Weyerhaeuser Co. |
| 85,799 |
| |
|
|
|
|
|
| 281,202 |
| |
|
|
|
| Gas: 0.0% |
|
|
| |
430 |
|
|
| KeySpan Corp. |
| 16,994 |
| |
300 |
|
|
| Nicor, Inc. |
| 11,070 |
| |
1,150 |
|
|
| Sempra Energy |
| 42,527 |
| |
|
|
|
|
|
| 70,591 |
| |
See Accompanying Notes to Financial Statements
97
Shares |
|
|
|
|
| Value |
| |
|
|
|
| Hand/Machine Tools: 0.0% |
|
|
| |
410 |
|
|
| Black & Decker Corp. |
| $ | 34,477 |
|
90 |
|
|
| Snap-On, Inc. |
| 2,845 |
| |
280 |
|
|
| Stanley Works |
| 13,093 |
| |
|
|
|
|
|
| 50,415 |
| |
|
|
|
| Healthcare — Products: 1.4% |
|
|
| |
260 |
|
|
| Bausch & Lomb, Inc. |
| 15,309 |
| |
2,510 |
|
|
| Baxter Intl., Inc. |
| 79,442 |
| |
1,700 |
|
|
| Becton Dickinson & Co. |
| 93,126 |
| |
750 |
|
|
| Biomet, Inc. |
| 35,903 |
| |
3,210 |
| @ |
| Boston Scientific Corp. |
| 111,740 |
| |
340 |
|
|
| C.R. Bard, Inc. |
| 20,369 |
| |
1,170 |
|
|
| Guidant Corp. |
| 75,851 |
| |
20,790 |
|
|
| Johnson & Johnson |
| 1,254,052 |
| |
4,970 |
|
|
| Medtronic, Inc. |
| 238,808 |
| |
1,340 |
| @ |
| St. Jude Medical, Inc. |
| 51,108 |
| |
500 |
|
|
| Stryker Corp. |
| 21,995 |
| |
910 |
| @ |
| Zimmer Holdings, Inc. |
| 74,256 |
| |
|
|
|
|
|
| 2,071,959 |
| |
|
|
|
| Healthcare — Services: 0.5% |
|
|
| |
970 |
|
|
| Aetna, Inc. |
| 114,955 |
| |
740 |
| @ |
| Humana, Inc. |
| 18,367 |
| |
450 |
| @ |
| Laboratory Corp. Of America Holdings |
| 21,578 |
| |
390 |
|
|
| Manor Care, Inc. |
| 13,436 |
| |
140 |
|
|
| Quest Diagnostics, Inc. |
| 13,125 |
| |
4,670 |
|
|
| UnitedHealth Group, Inc. |
| 386,909 |
| |
1,020 |
| @ |
| WellPoint Health Networks, Inc. |
| 127,601 |
| |
920 |
| @ |
| WellPoint, Inc. |
| 93,224 |
| |
|
|
|
|
|
| 789,195 |
| |
|
|
|
| Home Builders: 0.0% |
|
|
| |
460 |
|
|
| Centex Corp. |
| 24,136 |
| |
|
|
|
|
|
| 24,136 |
| |
|
|
|
| Home Furnishings: 0.0% |
|
|
| |
510 |
|
|
| Leggett & Platt, Inc. |
| 15,224 |
| |
290 |
|
|
| Whirlpool Corp. |
| 18,719 |
| |
|
|
|
|
|
| 33,943 |
| |
|
|
|
| Household Products/Wares: 0.1% |
|
|
| |
350 |
|
|
| Avery Dennison Corp. |
| 20,531 |
| |
860 |
|
|
| Clorox Co. |
| 47,403 |
| |
500 |
|
|
| Fortune Brands, Inc. |
| 39,240 |
| |
|
|
|
|
|
| 107,174 |
| |
|
|
|
| Housewares: 0.0% |
|
|
| |
1,100 |
|
|
| Newell Rubbermaid, Inc. |
| 25,388 |
| |
|
|
|
|
|
| 25,388 |
| |
|
|
|
| Insurance: 1.6% |
|
|
| |
1,140 |
| @@ |
| ACE Ltd. |
| 46,079 |
| |
2,020 |
|
|
| AFLAC, Inc. |
| 75,992 |
| |
3,590 |
|
|
| Allstate Corp. |
| 181,295 |
| |
370 |
|
|
| AMBAC Financial Group, Inc. |
| 30,092 |
| |
14,520 |
|
|
| American International Group, Inc. |
| 919,842 |
| |
1,540 |
|
|
| AON Corp. |
| 32,525 |
| |
1,260 |
|
|
| Chubb Corp. |
| 96,025 |
| |
890 |
|
|
| CIGNA Corp. |
| 62,318 |
| |
482 |
|
|
| Cincinnati Financial Corp. |
| 21,594 |
| |
1,200 |
|
|
| Hartford Financial Services Group, Inc. |
| 76,800 |
| |
360 |
|
|
| Jefferson-Pilot Corp. |
| 17,708 |
| |
710 |
|
|
| Lincoln National Corp. |
| 32,674 |
| |
1,350 |
|
|
| Loews Corp. |
| 94,379 |
| |
2,200 |
|
|
| Marsh & McLennan Cos., Inc. |
| 62,898 |
| |
570 |
|
|
| MBIA, Inc. |
| 34,177 |
| |
3,840 |
|
|
| MetLife, Inc. |
| 149,760 |
| |
270 |
|
|
| MGIC Investment Corp. |
| 18,360 |
| |
960 |
|
|
| Principal Financial Group |
| 36,173 |
| |
730 |
|
|
| Progressive Corp. |
| 66,423 |
| |
3,400 |
|
|
| Prudential Financial, Inc. |
| 166,430 |
| |
720 |
|
|
| Safeco Corp. |
| 34,898 |
| |
1,100 |
|
|
| St. Paul Travelers Cos., Inc. |
| 40,128 |
| |
330 |
|
|
| Torchmark Corp. |
| 18,120 |
| |
900 |
|
|
| UnumProvident Corp. |
| 14,013 |
| |
420 |
| @@ |
| XL Capital Ltd. |
| 31,651 |
| |
|
|
|
|
|
| 2,360,354 |
| |
|
|
|
| Internet: 0.4% |
|
|
| |
2,730 |
| @ |
| eBay, Inc. |
| 306,989 |
| |
2,000 |
| @ |
| Symantec Corp. |
| 127,620 |
| |
5,650 |
| @ |
| Yahoo!, Inc. |
| 212,553 |
| |
|
|
|
|
|
| 647,162 |
| |
|
|
|
| Iron/Steel: 0.0% |
|
|
| |
400 |
|
|
| Allegheny Technologies, Inc. |
| 8,800 |
| |
400 |
|
|
| Nucor Corp. |
| 21,160 |
| |
750 |
|
|
| United States Steel Corp. |
| 39,270 |
| |
|
|
|
|
|
| 69,230 |
| |
|
|
|
| Leisure Time: 0.1% |
|
|
| |
320 |
|
|
| Brunswick Corp. |
| 15,622 |
| |
2,450 |
|
|
| Carnival Corp. |
| 129,875 |
| |
1,020 |
|
|
| Harley-Davidson, Inc. |
| 58,976 |
| |
650 |
|
|
| Sabre Holdings Corp. |
| 15,002 |
| |
|
|
|
|
|
| 219,475 |
| |
|
|
|
| Lodging: 0.1% |
|
|
| |
320 |
|
|
| Harrah’s Entertainment, Inc. |
| 19,648 |
| |
1,270 |
|
|
| Hilton Hotels Corp. |
| 26,238 |
| |
1,270 |
|
|
| Marriott Intl., Inc. |
| 72,199 |
| |
740 |
|
|
| Starwood Hotels & Resorts Worldwide, Inc. |
| 38,695 |
| |
|
|
|
|
|
| 156,780 |
| |
|
|
|
| Machinery — Construction and Mining: 0.0% |
|
|
| |
500 |
|
|
| Caterpillar, Inc. |
| 45,775 |
| |
|
|
|
|
|
| 45,775 |
| |
|
|
|
| Machinery — Diversified: 0.1% |
|
|
| |
250 |
|
|
| Cummins, Inc. |
| 19,905 |
| |
810 |
|
|
| Deere & Co. |
| 58,101 |
| |
520 |
|
|
| Rockwell Automation, Inc. |
| 24,596 |
| |
|
|
|
|
|
| 102,602 |
| |
|
|
|
| Media: 0.8% |
|
|
| |
850 |
|
|
| Clear Channel Communications, Inc. |
| 28,628 |
| |
9,150 |
| @ |
| Comcast Corp. |
| 274,866 |
| |
990 |
|
|
| Gannett Co., Inc. |
| 81,665 |
| |
110 |
|
|
| Knight-Ridder, Inc. |
| 7,490 |
| |
950 |
|
|
| McGraw-Hill Cos., Inc. |
| 83,344 |
| |
140 |
|
|
| Meredith Corp. |
| 7,381 |
| |
490 |
|
|
| New York Times Co. |
| 20,090 |
| |
18,720 |
| @ |
| Time Warner, Inc. |
| 331,531 |
| |
370 |
|
|
| Tribune Co. |
| 16,047 |
| |
400 |
| @ |
| Univision Communications, Inc. |
| 12,040 |
| |
2,500 |
|
|
| Viacom, Inc. |
| 86,750 |
| |
7,890 |
|
|
| Walt Disney Co. |
| 212,083 |
| |
|
|
|
|
|
| 1,161,915 |
| |
|
|
|
| Mining: 0.0% |
|
|
| |
420 |
|
|
| Phelps Dodge Corp. |
| 40,795 |
| |
|
|
|
|
|
| 40,795 |
| |
See Accompanying Notes to Financial Statements
98
Shares |
|
|
|
|
| Value |
| |
|
|
|
| Miscellaneous Manufacturing: 1.8% |
|
|
| |
3,200 |
|
|
| 3M Co. |
| $ | 254,688 |
|
390 |
|
|
| Cooper Industries Ltd. |
| 25,861 |
| |
1,050 |
|
|
| Danaher Corp. |
| 59,724 |
| |
600 |
|
|
| Dover Corp. |
| 24,270 |
| |
1,870 |
|
|
| Eastman Kodak Co. |
| 61,168 |
| |
600 |
|
|
| Eaton Corp. |
| 40,440 |
| |
43,450 |
|
|
| General Electric Co. |
| 1,536,392 |
| |
3,280 |
|
|
| Honeywell Intl., Inc. |
| 115,882 |
| |
1,130 |
|
|
| Illinois Tool Works, Inc. |
| 106,480 |
| |
530 |
| @@ |
| Ingersoll-Rand Co. |
| 39,443 |
| |
320 |
|
|
| ITT Industries, Inc. |
| 27,238 |
| |
410 |
|
|
| Pall Corp. |
| 11,107 |
| |
510 |
|
|
| Textron, Inc. |
| 37,036 |
| |
8,260 |
| @@ |
| Tyco Intl. Ltd. |
| 280,592 |
| |
|
|
|
|
|
| 2,620,321 |
| |
|
|
|
| Office/Business Equipment: 0.1% |
|
|
| |
900 |
|
|
| Pitney Bowes, Inc. |
| 39,393 |
| |
2,610 |
| @ |
| Xerox Corp. |
| 39,985 |
| |
|
|
|
|
|
| 79,378 |
| |
|
|
|
| Oil and Gas: 2.5% |
|
|
| |
290 |
|
|
| Amerada Hess Corp. |
| 25,767 |
| |
1,360 |
|
|
| Anadarko Petroleum Corp. |
| 94,656 |
| |
1,320 |
|
|
| Apache Corp. |
| 71,359 |
| |
2,390 |
|
|
| Burlington Resources, Inc. |
| 110,920 |
| |
11,640 |
|
|
| ChevronTexaco Corp. |
| 635,544 |
| |
2,780 |
|
|
| ConocoPhillips |
| 252,952 |
| |
2,960 |
|
|
| Devon Energy Corp. |
| 122,603 |
| |
390 |
|
|
| EOG Resources, Inc. |
| 29,277 |
| |
35,500 |
|
|
| Exxon Mobil Corp. |
| 1,819,375 |
| |
520 |
|
|
| Kerr-McGee Corp. |
| 32,360 |
| |
1,300 |
|
|
| Marathon Oil Corp. |
| 51,272 |
| |
200 |
| @,@@ |
| Nabors Industries Ltd. |
| 10,400 |
| |
350 |
| @ |
| Noble Corp. |
| 16,958 |
| |
1,330 |
|
|
| Occidental Petroleum Corp. |
| 80,079 |
| |
560 |
|
|
| Sunoco, Inc. |
| 46,234 |
| |
1,000 |
| @ |
| Transocean, Inc. |
| 40,270 |
| |
1,420 |
|
|
| Unocal Corp. |
| 65,377 |
| |
1,800 |
|
|
| Valero Energy Corp. |
| 84,222 |
| |
|
|
|
|
|
| 3,589,625 |
| |
|
|
|
| Oil and Gas Services: 0.1% |
|
|
| |
1,400 |
|
|
| Baker Hughes, Inc. |
| 62,062 |
| |
620 |
|
|
| BJ Services Co. |
| 31,415 |
| |
700 |
|
|
| Halliburton Co. |
| 28,945 |
| |
|
|
|
|
|
| 122,422 |
| |
|
|
|
| Packaging and Containers: 0.0% |
|
|
| |
580 |
|
|
| Ball Corp. |
| 25,943 |
| |
320 |
|
|
| Bemis Co. |
| 8,909 |
| |
580 |
| @ |
| Pactiv Corp. |
| 14,413 |
| |
290 |
| @ |
| Sealed Air Corp. |
| 14,909 |
| |
|
|
|
|
|
| 64,174 |
| |
|
|
|
| Pharmaceuticals: 1.7% |
|
|
| |
6,400 |
|
|
| Abbott Laboratories |
| 268,544 |
| |
490 |
|
|
| Allergan, Inc. |
| 36,015 |
| |
550 |
|
|
| AmerisourceBergen Corp. |
| 32,417 |
| |
7,520 |
|
|
| Bristol-Myers Squibb Co. |
| 176,720 |
| |
1,750 |
|
|
| Cardinal Health, Inc. |
| 91,490 |
| |
2,800 |
| @ |
| Caremark Rx, Inc. |
| 100,128 |
| |
4,610 |
|
|
| Eli Lilly & Co. |
| 245,851 |
| |
320 |
| @ |
| Express Scripts, Inc. |
| 23,027 |
| |
1,270 |
| @ |
| Forest Laboratories, Inc. |
| 49,492 |
| |
1,500 |
| @ |
| Gilead Sciences, Inc. |
| 51,690 |
| |
400 |
| @ |
| Hospira, Inc. |
| 12,892 |
| |
700 |
| @ |
| King Pharmaceuticals, Inc. |
| 8,715 |
| |
1,020 |
| @ |
| Medco Health Solutions, Inc. |
| 38,474 |
| |
9,110 |
|
|
| Merck & Co., Inc. |
| 255,262 |
| |
30,970 |
|
|
| Pfizer, Inc. |
| 860,037 |
| |
5,700 |
|
|
| Schering-Plough Corp. |
| 101,745 |
| |
5,150 |
|
|
| Wyeth |
| 205,331 |
| |
|
|
|
|
|
| 2,557,830 |
| |
|
|
|
| Pipelines: 0.0% |
|
|
| |
2,500 |
| @ |
| Dynegy, Inc. |
| 14,125 |
| |
1,700 |
|
|
| El Paso Corp. |
| 17,748 |
| |
140 |
|
|
| Kinder Morgan, Inc. |
| 9,702 |
| |
1,670 |
|
|
| Williams Cos., Inc. |
| 27,839 |
| |
|
|
|
|
|
| 69,414 |
| |
|
|
|
| Real Estate Investment Trusts: 0.1% |
|
|
| |
650 |
|
|
| Equity Office Properties Trust |
| 17,843 |
| |
500 |
|
|
| ProLogis |
| 20,115 |
| |
810 |
|
|
| Simon Property Group, Inc. |
| 50,284 |
| |
|
|
|
|
|
| 88,242 |
| |
|
|
|
| Retail: 2.4% |
|
|
| |
1,040 |
| @ |
| Bed Bath & Beyond, Inc. |
| 41,525 |
| |
1,110 |
|
|
| Best Buy Co., Inc. |
| 62,582 |
| |
1,050 |
|
|
| Circuit City Stores, Inc. |
| 16,370 |
| |
3,020 |
|
|
| Costco Wholesale Corp. |
| 146,772 |
| |
1,380 |
|
|
| CVS Corp. |
| 62,611 |
| |
450 |
|
|
| Darden Restaurants, Inc. |
| 12,267 |
| |
650 |
|
|
| Federated Department Stores, Inc. |
| 35,620 |
| |
4,580 |
|
|
| Gap, Inc. |
| 100,073 |
| |
15,350 |
|
|
| Home Depot, Inc. |
| 640,863 |
| |
2,100 |
|
|
| J.C. Penney Co., Inc. Holding Co. |
| 81,060 |
| |
1,400 |
| @ |
| Kohl’s Corp. |
| 64,624 |
| |
2,220 |
|
|
| Limited Brands, Inc. |
| 54,257 |
| |
2,990 |
|
|
| Lowe’s Cos., Inc. |
| 165,437 |
| |
860 |
|
|
| May Department Stores Co. |
| 24,183 |
| |
7,010 |
|
|
| McDonald’s Corp. |
| 215,487 |
| |
390 |
|
|
| Nordstrom, Inc. |
| 17,063 |
| |
1,700 |
| @ |
| Office Depot, Inc. |
| 27,880 |
| |
700 |
|
|
| RadioShack Corp. |
| 22,099 |
| |
2,830 |
|
|
| Staples, Inc. |
| 90,305 |
| |
2,260 |
| @ |
| Starbucks Corp. |
| 127,148 |
| |
3,500 |
|
|
| Target Corp. |
| 179,270 |
| |
1,680 |
|
|
| TJX Cos., Inc. |
| 39,547 |
| |
900 |
| @ |
| Toys R US, Inc. |
| 17,406 |
| |
17,490 |
|
|
| Wal-Mart Stores, Inc. |
| 910,528 |
| |
5,320 |
|
|
| Walgreen Co. |
| 203,118 |
| |
480 |
|
|
| Wendy’s Intl., Inc. |
| 17,122 |
| |
1,020 |
|
|
| Yum! Brands, Inc. |
| 46,308 |
| |
|
|
|
|
|
| 3,421,525 |
| |
|
|
|
| Savings and Loans: 0.2% |
|
|
| |
610 |
|
|
| Golden West Financial Corp. |
| 72,736 |
| |
950 |
|
|
| Sovereign Bancorp, Inc. |
| 20,758 |
| |
3,310 |
|
|
| Washington Mutual, Inc. |
| 134,750 |
| |
|
|
|
|
|
| 228,244 |
| |
|
|
|
| Semiconductors: 0.7% |
|
|
| |
1,120 |
| @ |
| Altera Corp. |
| 25,402 |
| |
1,370 |
|
|
| Analog Devices, Inc. |
| 50,622 |
| |
6,400 |
| @ |
| Applied Materials, Inc. |
| 106,495 |
| |
26,390 |
|
|
| Intel Corp. |
| 589,816 |
| |
650 |
| @ |
| KLA-Tencor Corp. |
| 29,289 |
| |
1,030 |
|
|
| Linear Technology Corp. |
| 39,305 |
| |
410 |
|
|
| Maxim Integrated Products, Inc. |
| 16,794 |
| |
1,190 |
| @ |
| National Semiconductor Corp. |
| 18,397 |
| |
400 |
| @ |
| Qlogic Corp. |
| 13,756 |
| |
2,860 |
|
|
| Texas Instruments, Inc. |
| 69,155 |
| |
|
|
|
|
|
| 959,031 |
| |
|
|
|
| Software: 1.5% |
|
|
| |
860 |
|
|
| Adobe Systems, Inc. |
| 52,082 |
| |
830 |
|
|
| Autodesk, Inc. |
| 54,290 |
| |
See Accompanying Notes to Financial Statements
99
Shares |
|
|
|
|
| Value |
| |
|
|
|
| Software (continued) |
|
|
| |
2,210 |
|
|
| Automatic Data Processing, Inc. |
| $ | 100,621 |
|
1,110 |
| @ |
| BMC Software, Inc. |
| 20,624 |
| |
540 |
| @ |
| Citrix Systems, Inc. |
| 12,749 |
| |
1,970 |
|
|
| Computer Associates Intl., Inc. |
| 60,144 |
| |
1,640 |
| @ |
| Compuware Corp. |
| 9,463 |
| |
470 |
| @ |
| Electronic Arts, Inc. |
| 22,983 |
| |
3,347 |
|
|
| First Data Corp. |
| 137,528 |
| |
740 |
| @ |
| Fiserv, Inc. |
| 28,497 |
| |
680 |
|
|
| IMS Health, Inc. |
| 15,348 |
| |
530 |
| @ |
| Intuit, Inc. |
| 22,175 |
| |
44,700 |
|
|
| Microsoft Corp. |
| 1,198,408 |
| |
1,630 |
| @ |
| Novell, Inc. |
| 9,943 |
| |
35,970 |
| @ |
| Oracle Corp. |
| 455,380 |
| |
1,040 |
| @ |
| PeopleSoft, Inc. |
| 24,554 |
| |
1,570 |
| @ |
| Siebel Systems, Inc. |
| 15,826 |
| |
1,290 |
| @ |
| Veritas Software Corp. |
| 28,251 |
| |
|
|
|
|
|
| 2,268,866 |
| |
|
|
|
| Telecommunications: 1.9% |
|
|
| |
1,710 |
|
|
| Alltel Corp. |
| 96,940 |
| |
1,170 |
|
|
| AT&T Corp. |
| 21,411 |
| |
2,350 |
| @ |
| Avaya, Inc. |
| 38,587 |
| |
7,060 |
|
|
| BellSouth Corp. |
| 189,349 |
| |
390 |
|
|
| CenturyTel, Inc. |
| 12,839 |
| |
27,750 |
| @ |
| Cisco Systems, Inc. |
| 519,202 |
| |
800 |
|
|
| Citizens Communications Co. |
| 11,440 |
| |
540 |
| @ |
| Comverse Technology, Inc. |
| 11,486 |
| |
4,600 |
| @ |
| Corning, Inc. |
| 57,868 |
| |
16,000 |
| @ |
| Lucent Technologies, Inc. |
| 62,880 |
| |
13,130 |
|
|
| Motorola, Inc. |
| 252,884 |
| |
4,220 |
| @ |
| Nextel Communications, Inc. |
| 120,101 |
| |
6,690 |
|
|
| Qualcomm, Inc. |
| 278,438 |
| |
6,250 |
| @ |
| Qwest Communications Intl., Inc. |
| 25,000 |
| |
13,710 |
|
|
| SBC Communications, Inc. |
| 345,080 |
| |
710 |
|
|
| Scientific-Atlanta, Inc. |
| 21,030 |
| |
5,350 |
|
|
| Sprint Corp. |
| 122,034 |
| |
1,990 |
| @ |
| Tellabs, Inc. |
| 17,015 |
| |
11,350 |
|
|
| Verizon Communications, Inc. |
| 467,960 |
| |
|
|
|
|
|
| 2,671,544 |
| |
|
|
|
| Textiles: 0.0% |
|
|
| |
490 |
|
|
| Cintas Corp. |
| 21,913 |
| |
|
|
|
|
|
| 21,913 |
| |
|
|
|
| Toys/Games/Hobbies: 0.0% |
|
|
| |
760 |
|
|
| Hasbro, Inc. |
| 14,463 |
| |
1,150 |
|
|
| Mattel, Inc. |
| 21,792 |
| |
|
|
|
|
|
| 36,255 |
| |
|
|
|
| Transportation: 0.5% |
|
|
| |
1,190 |
|
|
| Burlington Northern Santa Fe Corp. |
| 53,598 |
| |
750 |
|
|
| CSX Corp. |
| 28,598 |
| |
1,510 |
|
|
| FedEx Corp. |
| 143,495 |
| |
1,880 |
|
|
| Norfolk Southern Corp. |
| 64,540 |
| |
270 |
|
|
| Ryder System, Inc. |
| 14,483 |
| |
350 |
|
|
| Union Pacific Corp. |
| 22,204 |
| |
4,630 |
|
|
| United Parcel Service, Inc. |
| 389,614 |
| |
|
|
|
|
|
| 716,532 |
| |
|
|
|
| Total Common Stock |
| 45,349,357 |
| |
Principal |
|
|
|
|
| Value |
| ||
U.S. GOVERNMENT AGENCY OBLIGATIONS: 58.0% |
|
|
| ||||||
|
|
|
| Federal Home Loan Mortgage Corporation: 58.0% |
|
|
| ||
$ | 100,000,000 |
|
|
| 3.880%, due 12/22/08 |
| $ | 85,671,001 |
|
|
|
|
| Total U.S. Government Agency Obligations (Cost $86,388,978) |
| 85,671,001 |
| ||
U.S. TREASURY OBLIGATIONS: 10.7% |
|
|
| ||||||
|
|
|
| U.S. Treasury STRIP: 10.7% |
|
|
| ||
18,048,000 |
|
|
| 3.560%, due 11/15/08 |
| 15,715,097 |
| ||
|
|
|
| Total U.S. Treasury Obligations |
| 15,715,097 |
| ||
|
|
|
| Total Long-Term Investments |
| 146,735,455 |
| ||
SHORT-TERM INVESTMENTS: 0.8% |
|
|
| ||||||
|
|
|
| Repurchase Agreement: 0.8% |
|
|
| ||
1,139,000 |
|
|
| Goldman Sachs Repurchase Agreement dated 11/30/04, 2.060%, due 12/01/04, $1,139,065 to be received upon repurchase (Collateralized by $1,098,000 Federal Home Loan Mortgage Corporation, 5.500%, Market Value plus accrued interest $1,161,821, due 07/15/06) |
| 1,139,000 |
| ||
|
|
|
| Total Short-Term Investments |
| 1,139,000 |
| ||
Total Investments In Securities |
| 100.3 | % | $ | 147,874,455 |
|
Other Assets and |
| (0.3 | ) | (399,307 | ) | |
Net Assets |
| 100.0 | % | $ | 147,475,148 |
|
@ |
| Non-income producing security |
@@ |
| Foreign issuer |
STRIP |
| Separate Trading of Registered Interest and Principal of Securities |
* |
| Cost for federal income tax purposes is $149,253,759. Net unrealized appreciation consists of: |
|
|
|
| ||
Gross Unrealized Appreciation |
| $ | 456,190 |
| |
Gross Unrealized Depreciation |
| (1,835,494 | ) | ||
Net Unrealized Appreciation |
| $ | (1,379,304 | ) | |
See Accompanying Notes to Financial Statements
100
ING PRINCIPAL PROTECTION FUND IX
PORTFOLIO OF INVESTMENTS
AS OF NOVEMBER 30, 2004 (UNAUDITED)
Shares |
|
|
|
|
| Value |
| |
COMMON STOCK: 32.4% |
|
|
| |||||
|
|
|
| Advertising: 0.1% |
|
|
| |
1,000 |
| @ |
| Interpublic Group of Cos., Inc. |
| $ | 12,410 |
|
600 |
|
|
| Omnicom Group, Inc. |
| 48,600 |
| |
|
|
|
|
|
| 61,010 |
| |
|
|
|
| Aerospace/Defense: 0.7% |
|
|
| |
4,100 |
|
|
| Boeing Co. |
| 219,637 |
| |
1,000 |
|
|
| General Dynamics Corp. |
| 108,360 |
| |
400 |
|
|
| Goodrich Corp. |
| 12,700 |
| |
1,200 |
|
|
| Lockheed Martin Corp. |
| 73,008 |
| |
1,150 |
|
|
| Northrop Grumman Corp. |
| 64,780 |
| |
2,100 |
|
|
| Raytheon Co. |
| 84,714 |
| |
500 |
|
|
| Rockwell Collins, Inc. |
| 19,930 |
| |
1,450 |
|
|
| United Technologies Corp. |
| 141,491 |
| |
|
|
|
|
|
| 724,620 |
| |
|
|
|
| Agriculture: 0.5% |
|
|
| |
5,900 |
|
|
| Altria Group, Inc. |
| 339,190 |
| |
1,750 |
|
|
| Archer-Daniels-Midland Co. |
| 37,100 |
| |
700 |
|
|
| Monsanto Co. |
| 32,214 |
| |
450 |
|
|
| Reynolds American, Inc. |
| 34,034 |
| |
650 |
|
|
| UST, Inc. |
| 28,620 |
| |
|
|
|
|
|
| 471,158 |
| |
|
|
|
| Apparel: 0.2% |
|
|
| |
700 |
| @ |
| Coach, Inc. |
| 34,888 |
| |
450 |
|
|
| Jones Apparel Group, Inc. |
| 15,989 |
| |
450 |
|
|
| Liz Claiborne, Inc. |
| 18,482 |
| |
1,200 |
|
|
| Nike, Inc. |
| 101,591 |
| |
100 |
|
|
| Reebok Intl. Ltd. |
| 3,888 |
| |
450 |
|
|
| VF Corp. |
| 24,296 |
| |
|
|
|
|
|
| 199,134 |
| |
|
|
|
| Auto Manufacturers: 0.3% |
|
|
| |
8,500 |
|
|
| Ford Motor Co. |
| 120,530 |
| |
1,650 |
|
|
| General Motors Corp. |
| 63,674 |
| |
800 |
|
|
| PACCAR, Inc. |
| 62,480 |
| |
|
|
|
|
|
| 246,684 |
| |
|
|
|
| Auto Parts and Equipment: 0.1% |
|
|
| |
600 |
|
|
| Dana Corp. |
| 9,810 |
| |
800 |
| @ |
| Goodyear Tire & Rubber Co. |
| 10,096 |
| |
550 |
|
|
| Johnson Controls, Inc. |
| 33,770 |
| |
|
|
|
|
|
| 53,676 |
| |
|
|
|
| Banks: 2.1% |
|
|
| |
900 |
|
|
| AmSouth Bancorporation |
| 23,337 |
| |
11,750 |
|
|
| Bank of America Corp. |
| 543,672 |
| |
1,750 |
|
|
| BB&T Corp. |
| 74,288 |
| |
750 |
|
|
| Comerica, Inc. |
| 46,125 |
| |
600 |
|
|
| Fifth Third Bancorp |
| 30,216 |
| |
250 |
|
|
| First Horizon National Corp. |
| 10,925 |
| |
600 |
|
|
| Huntington Bancshares, Inc. |
| 14,556 |
| |
1,350 |
|
|
| KeyCorp |
| 44,942 |
| |
400 |
|
|
| M & T Bank Corp. |
| 42,164 |
| |
550 |
|
|
| Marshall & Ilsley Corp. |
| 22,930 |
| |
1,050 |
|
|
| Mellon Financial Corp. |
| 30,681 |
| |
2,450 |
|
|
| National City Corp. |
| 90,846 |
| |
525 |
|
|
| North Fork Bancorporation, Inc. |
| 15,120 |
| |
600 |
|
|
| Northern Trust Corp. |
| 28,224 |
| |
850 |
|
|
| PNC Financial Services Group, Inc. |
| 46,240 |
| |
1,387 |
|
|
| Regions Financial Corp. |
| 48,531 |
| |
350 |
|
|
| State Street Corp. |
| 15,596 |
| |
1,100 |
|
|
| SunTrust Banks, Inc. |
| 78,430 |
| |
350 |
|
|
| Synovus Financial Corp. |
| 9,450 |
| |
850 |
|
|
| The Bank of New York Co., Inc. |
| 27,974 |
| |
5,450 |
|
|
| U.S. Bancorp |
| 161,483 |
| |
6,251 |
|
|
| Wachovia Corp. |
| 323,488 |
| |
4,900 |
|
|
| Wells Fargo & Co. |
| 302,672 |
| |
200 |
|
|
| Zions Bancorporation |
| 13,300 |
| |
|
|
|
|
|
| 2,045,190 |
| |
|
|
|
| Beverages: 0.7% |
|
|
| |
100 |
|
|
| Adolph Coors Co. |
| 7,490 |
| |
2,250 |
|
|
| Anheuser-Busch Cos., Inc. |
| 112,703 |
| |
300 |
|
|
| Brown-Forman Corp. |
| 14,406 |
| |
6,850 |
|
|
| Coca-Cola Co. |
| 269,273 |
| |
1,200 |
|
|
| Coca-Cola Enterprises, Inc. |
| 24,960 |
| |
650 |
|
|
| Pepsi Bottling Group, Inc. |
| 18,213 |
| |
4,900 |
|
|
| PepsiCo, Inc. |
| 244,559 |
| |
|
|
|
|
|
| 691,604 |
| |
|
|
|
| Biotechnology: 0.3% |
|
|
| |
3,600 |
| @ |
| Amgen, Inc. |
| 216,144 |
| |
1,050 |
| @ |
| Biogen Idec, Inc. |
| 61,614 |
| |
700 |
| @ |
| Genzyme Corp. |
| 39,207 |
| |
650 |
| @ |
| MedImmune, Inc. |
| 17,290 |
| |
100 |
| @ |
| Millipore Corp. |
| 4,872 |
| |
|
|
|
|
|
| 339,127 |
| |
|
|
|
| Building Materials: 0.1% |
|
|
| |
650 |
| @ |
| American Standard Cos., Inc. |
| 25,311 |
| |
1,200 |
|
|
| Masco Corp. |
| 42,324 |
| |
250 |
|
|
| Vulcan Materials Co. |
| 12,963 |
| |
|
|
|
|
|
| 80,598 |
| |
|
|
|
| Chemicals: 0.5% |
|
|
| |
550 |
|
|
| Air Products & Chemicals, Inc. |
| 31,488 |
| |
200 |
|
|
| Ashland, Inc. |
| 11,830 |
| |
2,750 |
|
|
| Dow Chemical Co. |
| 138,792 |
| |
3,000 |
|
|
| E.I. du Pont de Nemours & Co. |
| 135,959 |
| |
300 |
|
|
| Eastman Chemical Co. |
| 16,314 |
| |
300 |
|
|
| Ecolab, Inc. |
| 10,494 |
| |
450 |
|
|
| Engelhard Corp. |
| 13,451 |
| |
200 |
|
|
| International Flavors & Fragrances, Inc. |
| 8,100 |
| |
850 |
|
|
| PPG Industries, Inc. |
| 57,350 |
| |
850 |
|
|
| Praxair, Inc. |
| 38,165 |
| |
600 |
|
|
| Rohm & Haas Co. |
| 26,454 |
| |
650 |
|
|
| Sherwin-Williams Co. |
| 28,990 |
| |
200 |
|
|
| Sigma-Aldrich Corp. |
| 11,946 |
| |
|
|
|
|
|
| 529,333 |
| |
|
|
|
| Commercial Services: 0.3% |
|
|
| |
550 |
| @ |
| Apollo Group, Inc. |
| 43,835 |
| |
2,650 |
|
|
| Cendant Corp. |
| 60,075 |
| |
100 |
|
|
| Deluxe Corp. |
| 3,954 |
| |
300 |
|
|
| Equifax, Inc. |
| 8,286 |
| |
600 |
|
|
| H&R Block, Inc. |
| 28,620 |
| |
850 |
|
|
| McKesson Corp. |
| 25,118 |
| |
350 |
|
|
| Moody’s Corp. |
| 28,263 |
| |
1,000 |
|
|
| Paychex, Inc. |
| 33,160 |
| |
700 |
|
|
| R.R. Donnelley & Sons Co. |
| 24,290 |
| |
500 |
|
|
| Robert Half Intl., Inc. |
| 13,515 |
| |
|
|
|
|
|
| 269,116 |
| |
|
|
|
| Computers: 1.7% |
|
|
| |
350 |
| @ |
| Affiliated Computer Services, Inc. |
| 20,713 |
| |
1,850 |
| @ |
| Apple Computer, Inc. |
| 124,043 |
| |
400 |
| @ |
| Computer Sciences Corp. |
| 21,640 |
| |
9,550 |
| @ |
| Dell, Inc. |
| 386,965 |
| |
1,400 |
|
|
| Electronic Data Systems Corp. |
| 31,430 |
| |
6,550 |
| @ |
| EMC Corp. |
| 87,901 |
| |
1,000 |
| @ |
| Gateway, Inc. |
| 6,810 |
| |
8,650 |
|
|
| Hewlett-Packard Co. |
| 173,000 |
| |
6,400 |
|
|
| International Business Machines Corp. |
| 603,135 |
| |
300 |
| @ |
| Lexmark Intl., Inc. |
| 25,470 |
| |
250 |
| @ |
| NCR Corp. |
| 14,933 |
| |
See Accompanying Notes to Financial Statements
101
Shares |
|
|
|
|
| Value |
| |
|
|
|
| Computers (continued) |
|
|
| |
800 |
| @ |
| Network Appliance, Inc. |
| $ | 24,128 |
|
15,350 |
| @ |
| Sun Microsystems, Inc. |
| 85,193 |
| |
700 |
| @ |
| Sungard Data Systems, Inc. |
| 18,557 |
| |
800 |
| @ |
| Unisys Corp. |
| 9,192 |
| |
|
|
|
|
|
| 1,633,110 |
| |
|
|
|
| Cosmetics/Personal Care: 1.1% |
|
|
| |
400 |
|
|
| Alberto-Culver Co. |
| 18,520 |
| |
1,450 |
|
|
| Avon Products, Inc. |
| 54,433 |
| |
1,450 |
|
|
| Colgate-Palmolive Co. |
| 66,686 |
| |
4,950 |
|
|
| Gillette Co. |
| 215,275 |
| |
1,850 |
|
|
| Kimberly-Clark Corp. |
| 117,679 |
| |
12,200 |
|
|
| Procter & Gamble Co. |
| 652,455 |
| |
|
|
|
|
|
| 1,125,048 |
| |
|
|
|
| Distribution/Wholesale: 0.0% |
|
|
| |
400 |
|
|
| Genuine Parts Co. |
| 17,364 |
| |
350 |
|
|
| W.W. Grainger, Inc. |
| 21,651 |
| |
|
|
|
|
|
| 39,015 |
| |
|
|
|
| Diversified Financial Services: 2.2% |
|
|
| |
3,650 |
|
|
| American Express Co. |
| 203,341 |
| |
300 |
|
|
| Bear Stearns Cos., Inc. |
| 29,274 |
| |
600 |
|
|
| Capital One Financial Corp. |
| 47,148 |
| |
850 |
|
|
| CIT Group, Inc. |
| 36,338 |
| |
14,700 |
|
|
| Citigroup, Inc. |
| 657,824 |
| |
2,650 |
|
|
| Countrywide Financial Corp. |
| 88,007 |
| |
850 |
| @ |
| E*TRADE Financial Corp. |
| 11,781 |
| |
2,800 |
|
|
| Fannie Mae |
| 192,359 |
| |
100 |
|
|
| Federated Investors, Inc. |
| 2,942 |
| |
650 |
|
|
| Franklin Resources, Inc. |
| 42,660 |
| |
1,900 |
|
|
| Freddie Mac |
| 129,694 |
| |
1,350 |
|
|
| Goldman Sachs Group, Inc. |
| 141,426 |
| |
4,048 |
|
|
| J.P. Morgan Chase & Co. |
| 152,407 |
| |
200 |
|
|
| Janus Capital Group, Inc. |
| 3,310 |
| |
750 |
|
|
| Lehman Brothers Holdings, Inc. |
| 62,835 |
| |
4,000 |
|
|
| MBNA Corp. |
| 106,240 |
| |
2,700 |
|
|
| Merrill Lynch & Co., Inc. |
| 150,417 |
| |
1,250 |
|
|
| Morgan Stanley |
| 63,438 |
| |
600 |
| @ |
| Providian Financial Corp. |
| 9,630 |
| |
1,200 |
|
|
| SLM Corp. |
| 61,404 |
| |
|
|
|
|
|
| 2,192,475 |
| |
|
|
|
| Electric: 0.8% |
|
|
| |
2,400 |
| @ |
| AES Corp. |
| 29,376 |
| |
400 |
| @ |
| Allegheny Energy, Inc. |
| 7,656 |
| |
200 |
|
|
| Ameren Corp. |
| 9,684 |
| |
1,050 |
|
|
| American Electric Power Co., Inc. |
| 35,879 |
| |
400 |
|
|
| Cinergy Corp. |
| 16,556 |
| |
500 |
|
|
| Consolidated Edison, Inc. |
| 21,925 |
| |
450 |
|
|
| Constellation Energy Group, Inc. |
| 19,665 |
| |
400 |
|
|
| Dominion Resources, Inc. |
| 26,188 |
| |
500 |
|
|
| DTE Energy Co. |
| 21,940 |
| |
3,700 |
|
|
| Duke Energy Corp. |
| 93,535 |
| |
1,100 |
|
|
| Edison Intl. |
| 35,090 |
| |
650 |
|
|
| Entergy Corp. |
| 42,133 |
| |
1,800 |
|
|
| Exelon Corp. |
| 75,078 |
| |
850 |
|
|
| FirstEnergy Corp. |
| 35,896 |
| |
400 |
|
|
| FPL Group, Inc. |
| 28,132 |
| |
1,050 |
| @ |
| PG&E Corp. |
| 34,923 |
| |
300 |
|
|
| Pinnacle West Capital Corp. |
| 13,260 |
| |
650 |
|
|
| PPL Corp. |
| 33,768 |
| |
700 |
|
|
| Public Service Enterprise Group, Inc. |
| 30,793 |
| |
1,950 |
|
|
| Southern Co. |
| 63,941 |
| |
700 |
|
|
| TECO Energy, Inc. |
| 10,472 |
| |
1,250 |
|
|
| TXU Corp. |
| 78,524 |
| |
1,300 |
|
|
| Xcel Energy, Inc. |
| 23,478 |
| |
|
|
|
|
|
| 787,892 |
| |
|
|
|
| Electrical Components and Equipment: 0.1% |
|
|
| |
1,650 |
|
|
| Emerson Electric Co. |
| 110,253 |
| |
|
|
|
|
|
| 110,253 |
| |
|
|
|
| Electronics: 0.1% |
|
|
| |
1,150 |
| @ |
| Agilent Technologies, Inc. |
| 26,324 |
| |
700 |
|
|
| Applera Corp. — Applied Biosystems Group |
| 14,350 |
| |
250 |
| @ |
| Fisher Scientific Intl. |
| 14,135 |
| |
450 |
| @ |
| Jabil Circuit, Inc. |
| 11,277 |
| |
250 |
|
|
| Parker Hannifin Corp. |
| 18,700 |
| |
500 |
|
|
| PerkinElmer, Inc. |
| 10,665 |
| |
2,100 |
| @ |
| Solectron Corp. |
| 13,125 |
| |
300 |
|
|
| Tektronix, Inc. |
| 9,411 |
| |
500 |
| @ |
| Thermo Electron Corp. |
| 15,125 |
| |
300 |
| @ |
| Waters Corp. |
| 13,998 |
| |
|
|
|
|
|
| 147,110 |
| |
|
|
|
| Engineering and Construction: 0.0% |
|
|
| |
250 |
|
|
| Fluor Corp. |
| 12,975 |
| |
|
|
|
|
|
| 12,975 |
| |
|
|
|
| Entertainment: 0.0% |
|
|
| |
800 |
|
|
| International Game Technology |
| 28,280 |
| |
|
|
|
|
|
| 28,280 |
| |
|
|
|
| Environmental Control: 0.1% |
|
|
| |
1,850 |
|
|
| Waste Management, Inc. |
| 55,149 |
| |
|
|
|
|
|
| 55,149 |
| |
|
|
|
| Food: 0.4% |
|
|
| |
800 |
|
|
| Albertson’s, Inc. |
| 20,240 |
| |
450 |
|
|
| Campbell Soup Co. |
| 12,839 |
| |
1,150 |
|
|
| ConAgra Foods, Inc. |
| 31,108 |
| |
1,200 |
|
|
| General Mills, Inc. |
| 54,588 |
| |
1,000 |
|
|
| H.J. Heinz Co. |
| 37,160 |
| |
550 |
|
|
| Hershey Foods Corp. |
| 28,490 |
| |
1,300 |
|
|
| Kellogg Co. |
| 56,809 |
| |
900 |
| @ |
| Kroger Co. |
| 14,562 |
| |
400 |
|
|
| McCormick & Co., Inc. |
| 14,580 |
| |
500 |
| @ |
| Safeway, Inc. |
| 9,640 |
| |
2,150 |
|
|
| Sara Lee Corp. |
| 50,482 |
| |
550 |
|
|
| SUPERVALU, Inc. |
| 17,375 |
| |
800 |
|
|
| Wm. Wrigley Jr. Co. |
| 55,040 |
| |
|
|
|
|
|
| 402,913 |
| |
|
|
|
| Forest Products and Paper: 0.2% |
|
|
| |
950 |
|
|
| Georgia-Pacific Corp. |
| 34,780 |
| |
1,650 |
|
|
| International Paper Co. |
| 68,507 |
| |
430 |
|
|
| Louisiana-Pacific Corp. |
| 10,522 |
| |
550 |
|
|
| MeadWestvaco Corp. |
| 18,508 |
| |
450 |
|
|
| Plum Creek Timber Co., Inc. |
| 16,650 |
| |
200 |
|
|
| Temple-Inland, Inc. |
| 11,918 |
| |
1,000 |
|
|
| Weyerhaeuser Co. |
| 66,000 |
| |
|
|
|
|
|
| 226,885 |
| |
|
|
|
| Gas: 0.1% |
|
|
| |
400 |
|
|
| KeySpan Corp. |
| 15,808 |
| |
100 |
|
|
| Nicor, Inc. |
| 3,690 |
| |
950 |
|
|
| Sempra Energy |
| 35,131 |
| |
|
|
|
|
|
| 54,629 |
| |
See Accompanying Notes to Financial Statements
102
Shares |
|
|
|
|
| Value |
| |
|
|
|
| Hand/Machine Tools: 0.0% |
|
|
| |
300 |
|
|
| Black & Decker Corp. |
| $ | 25,227 |
|
100 |
|
|
| Snap-On, Inc. |
| 3,161 |
| |
300 |
|
|
| Stanley Works |
| 14,028 |
| |
|
|
|
|
|
| 42,416 |
| |
|
|
|
| Healthcare — Products: 1.3% |
|
|
| |
200 |
|
|
| Bausch & Lomb, Inc. |
| 11,776 |
| |
1,600 |
|
|
| Baxter Intl., Inc. |
| 50,640 |
| |
900 |
|
|
| Becton Dickinson & Co. |
| 49,302 |
| |
550 |
|
|
| Biomet, Inc. |
| 26,329 |
| |
2,250 |
| @ |
| Boston Scientific Corp. |
| 78,322 |
| |
250 |
|
|
| C.R. Bard, Inc. |
| 14,978 |
| |
800 |
|
|
| Guidant Corp. |
| 51,864 |
| |
11,350 |
|
|
| Johnson & Johnson |
| 684,631 |
| |
3,450 |
|
|
| Medtronic, Inc. |
| 165,772 |
| |
1,200 |
| @ |
| St. Jude Medical, Inc. |
| 45,768 |
| |
400 |
|
|
| Stryker Corp. |
| 17,596 |
| |
650 |
| @ |
| Zimmer Holdings, Inc. |
| 53,040 |
| |
|
|
|
|
|
| 1,250,018 |
| |
|
|
|
| Healthcare — Services: 0.6% |
|
|
| |
650 |
|
|
| Aetna, Inc. |
| 77,032 |
| |
600 |
| @ |
| Anthem, Inc. |
| 60,798 |
| |
0 |
|
|
| HCA, Inc. |
| 0 |
| |
600 |
| @ |
| Humana, Inc. |
| 14,892 |
| |
350 |
| @ |
| Laboratory Corp. Of America Holdings |
| 16,783 |
| |
300 |
|
|
| Manor Care, Inc. |
| 10,335 |
| |
100 |
|
|
| Quest Diagnostics, Inc. |
| 9,375 |
| |
3,250 |
|
|
| UnitedHealth Group, Inc. |
| 269,262 |
| |
750 |
| @ |
| WellPoint Health Networks, Inc. |
| 93,825 |
| |
|
|
|
|
|
| 552,302 |
| |
|
|
|
| Home Builders: 0.0% |
|
|
| |
400 |
|
|
| Centex Corp. |
| 20,988 |
| |
|
|
|
|
|
| 20,988 |
| |
|
|
|
| Home Furnishings: 0.0% |
|
|
| |
600 |
|
|
| Leggett & Platt, Inc. |
| 17,910 |
| |
200 |
|
|
| Whirlpool Corp. |
| 12,910 |
| |
|
|
|
|
|
| 30,820 |
| |
|
|
|
| Household Products/Wares: 0.1% |
|
|
| |
350 |
|
|
| Avery Dennison Corp. |
| 20,531 |
| |
900 |
|
|
| Clorox Co. |
| 49,608 |
| |
400 |
|
|
| Fortune Brands, Inc. |
| 31,392 |
| |
|
|
|
|
|
| 101,531 |
| |
|
|
|
| Housewares: 0.0% |
|
|
| |
800 |
|
|
| Newell Rubbermaid, Inc. |
| 18,464 |
| |
|
|
|
|
|
| 18,464 |
| |
|
|
|
| Insurance: 1.8% |
|
|
| |
950 |
| @@ |
| ACE Ltd. |
| 38,399 |
| |
1,300 |
|
|
| AFLAC, Inc. |
| 48,906 |
| |
2,650 |
|
|
| Allstate Corp. |
| 133,824 |
| |
300 |
|
|
| AMBAC Financial Group, Inc. |
| 24,399 |
| |
12,550 |
|
|
| American International Group, Inc. |
| 795,042 |
| |
800 |
|
|
| AON Corp. |
| 16,896 |
| |
850 |
|
|
| Chubb Corp. |
| 64,779 |
| |
600 |
|
|
| CIGNA Corp. |
| 42,012 |
| |
375 |
|
|
| Cincinnati Financial Corp. |
| 16,800 |
| |
900 |
|
|
| Hartford Financial Services Group, Inc. |
| 57,600 |
| |
400 |
|
|
| Jefferson-Pilot Corp. |
| 19,676 |
| |
500 |
|
|
| Lincoln National Corp. |
| 23,010 |
| |
700 |
|
|
| Loews Corp. |
| 48,937 |
| |
1,300 |
|
|
| Marsh & McLennan Cos., Inc. |
| 37,167 |
| |
350 |
|
|
| MBIA, Inc. |
| 20,986 |
| |
3,100 |
|
|
| MetLife, Inc. |
| 120,899 |
| |
250 |
|
|
| MGIC Investment Corp. |
| 17,000 |
| |
850 |
|
|
| Principal Financial Group |
| 32,028 |
| |
550 |
|
|
| Progressive Corp. |
| 50,045 |
| |
2,400 |
|
|
| Prudential Financial, Inc. |
| 117,480 |
| |
650 |
|
|
| Safeco Corp. |
| 31,506 |
| |
300 |
|
|
| Torchmark Corp. |
| 16,473 |
| |
750 |
|
|
| UnumProvident Corp. |
| 11,678 |
| |
400 |
| @@ |
| XL Capital Ltd. |
| 30,144 |
| |
|
|
|
|
|
| 1,815,686 |
| |
|
|
|
| Internet: 0.5% |
|
|
| |
1,900 |
| @ |
| eBay, Inc. |
| 213,655 |
| |
1,500 |
| @ |
| Symantec Corp. |
| 95,715 |
| |
3,850 |
| @ |
| Yahoo!, Inc. |
| 144,837 |
| |
|
|
|
|
|
| 454,207 |
| |
|
|
|
| Iron/Steel: 0.1% |
|
|
| |
400 |
|
|
| Nucor Corp. |
| 21,160 |
| |
600 |
|
|
| United States Steel Corp. |
| 31,416 |
| |
|
|
|
|
|
| 52,576 |
| |
|
|
|
| Leisure Time: 0.2% |
|
|
| |
250 |
|
|
| Brunswick Corp. |
| 12,205 |
| |
1,750 |
|
|
| Carnival Corp. |
| 92,768 |
| |
900 |
|
|
| Harley-Davidson, Inc. |
| 52,038 |
| |
500 |
|
|
| Sabre Holdings Corp. |
| 11,540 |
| |
|
|
|
|
|
| 168,551 |
| |
|
|
|
| Lodging: 0.1% |
|
|
| |
250 |
|
|
| Harrah’s Entertainment, Inc. |
| 15,350 |
| |
1,150 |
|
|
| Hilton Hotels Corp. |
| 23,759 |
| |
500 |
|
|
| Marriott Intl., Inc. |
| 28,425 |
| |
500 |
|
|
| Starwood Hotels & Resorts Worldwide, Inc. |
| 26,145 |
| |
|
|
|
|
|
| 93,679 |
| |
|
|
|
| Machinery — Construction and Mining: 0.0% |
|
|
| |
350 |
|
|
| Caterpillar, Inc. |
| 32,043 |
| |
|
|
|
|
|
| 32,043 |
| |
|
|
|
| Machinery — Diversified: 0.1% |
|
|
| |
200 |
|
|
| Cummins, Inc. |
| 15,924 |
| |
700 |
|
|
| Deere & Co. |
| 50,211 |
| |
450 |
|
|
| Rockwell Automation, Inc. |
| 21,285 |
| |
|
|
|
|
|
| 87,420 |
| |
|
|
|
| Media: 0.9% |
|
|
| |
650 |
|
|
| Clear Channel Communications, Inc. |
| 21,892 |
| |
6,450 |
| @ |
| Comcast Corp. |
| 193,758 |
| |
850 |
|
|
| Gannett Co., Inc. |
| 70,117 |
| |
100 |
|
|
| Knight-Ridder, Inc. |
| 6,809 |
| |
800 |
|
|
| McGraw-Hill Cos., Inc. |
| 70,184 |
| |
100 |
|
|
| Meredith Corp. |
| 5,272 |
| |
300 |
|
|
| New York Times Co. |
| 12,300 |
| |
13,150 |
| @ |
| Time Warner, Inc. |
| 232,886 |
| |
350 |
|
|
| Tribune Co. |
| 15,180 |
| |
350 |
| @ |
| Univision Communications, Inc. |
| 10,535 |
| |
2,000 |
|
|
| Viacom, Inc. |
| 69,400 |
| |
5,950 |
|
|
| Walt Disney Co. |
| 159,936 |
| |
|
|
|
|
|
| 868,269 |
| |
|
|
|
| Metal Fabricate/Hardware: 0.0% |
|
|
| |
300 |
|
|
| Worthington Industries, Inc. |
| 6,453 |
| |
|
|
|
|
|
| 6,453 |
| |
See Accompanying Notes to Financial Statements
103
Shares |
|
|
|
|
| Value |
| |
|
|
|
| Mining: 0.0% |
|
|
| |
400 |
|
|
| Phelps Dodge Corp. |
| $ | 38,852 |
|
|
|
|
|
|
| 38,852 |
| |
|
|
|
| Miscellaneous Manufacturing: 1.8% |
|
|
| |
2,250 |
|
|
| 3M Co. |
| 179,078 |
| |
300 |
|
|
| Cooper Industries Ltd. |
| 19,893 |
| |
950 |
|
|
| Danaher Corp. |
| 54,036 |
| |
500 |
|
|
| Dover Corp. |
| 20,225 |
| |
850 |
|
|
| Eastman Kodak Co. |
| 27,804 |
| |
350 |
|
|
| Eaton Corp. |
| 23,590 |
| |
30,050 |
|
|
| General Electric Co. |
| 1,062,567 |
| |
2,150 |
|
|
| Honeywell International, Inc. |
| 75,960 |
| |
800 |
|
|
| Illinois Tool Works, Inc. |
| 75,384 |
| |
500 |
| @@ |
| Ingersoll-Rand Co. |
| 37,210 |
| |
200 |
|
|
| ITT Industries, Inc. |
| 17,024 |
| |
300 |
|
|
| Pall Corp. |
| 8,127 |
| |
350 |
|
|
| Textron, Inc. |
| 25,417 |
| |
5,800 |
| @@ |
| Tyco Intl. Ltd. |
| 197,025 |
| |
|
|
|
|
|
| 1,823,340 |
| |
|
|
|
| Office/Business Equipment: 0.1% |
|
|
| |
550 |
|
|
| Pitney Bowes, Inc. |
| 24,074 |
| |
2,100 |
| @ |
| Xerox Corp. |
| 32,172 |
| |
|
|
|
|
|
| 56,246 |
| |
|
|
|
| Oil and Gas: 2.7% |
|
|
| |
200 |
|
|
| Amerada Hess Corp. |
| 17,770 |
| |
900 |
|
|
| Anadarko Petroleum Corp. |
| 62,640 |
| |
850 |
|
|
| Apache Corp. |
| 45,951 |
| |
1,900 |
|
|
| Burlington Resources, Inc. |
| 88,179 |
| |
9,600 |
|
|
| ChevronTexaco Corp. |
| 524,159 |
| |
2,450 |
|
|
| ConocoPhillips |
| 222,926 |
| |
2,400 |
|
|
| Devon Energy Corp. |
| 99,408 |
| |
300 |
|
|
| EOG Resources, Inc. |
| 22,521 |
| |
22,800 |
|
|
| Exxon Mobil Corp. |
| 1,168,499 |
| |
300 |
|
|
| Kerr-McGee Corp. |
| 18,669 |
| |
700 |
|
|
| Marathon Oil Corp. |
| 27,608 |
| |
100 |
| @,@@ |
| Nabors Industries Ltd. |
| 5,200 |
| |
300 |
| @ |
| Noble Corp. |
| 14,535 |
| |
1,000 |
|
|
| Occidental Petroleum Corp. |
| 60,210 |
| |
350 |
|
|
| Sunoco, Inc. |
| 28,896 |
| |
800 |
| @ |
| Transocean, Inc. |
| 32,216 |
| |
950 |
|
|
| Unocal Corp. |
| 43,738 |
| |
1,250 |
|
|
| Valero Energy Corp. |
| 58,488 |
| |
|
|
|
|
|
| 2,541,613 |
| |
|
|
|
| Oil and Gas Services: 0.1% |
|
|
| |
900 |
|
|
| Baker Hughes, Inc. |
| 39,897 |
| |
300 |
|
|
| BJ Services Co. |
| 15,201 |
| |
1,200 |
|
|
| Halliburton Co. |
| 49,620 |
| |
|
|
|
|
|
| 104,718 |
| |
|
|
|
| Packaging and Containers: 0.0% |
|
|
| |
400 |
|
|
| Ball Corp. |
| 17,892 |
| |
200 |
|
|
| Bemis Co. |
| 5,568 |
| |
400 |
| @ |
| Pactiv Corp. |
| 9,940 |
| |
200 |
| @ |
| Sealed Air Corp. |
| 10,282 |
| |
|
|
|
|
|
| 43,682 |
| |
|
|
|
| Pharmaceuticals: 1.7% |
|
|
| |
4,400 |
|
|
| Abbott Laboratories |
| 184,623 |
| |
400 |
|
|
| Allergan, Inc. |
| 29,400 |
| |
350 |
|
|
| AmerisourceBergen Corp. |
| 20,629 |
| |
5,600 |
|
|
| Bristol-Myers Squibb Co. |
| 131,600 |
| |
1,150 |
|
|
| Cardinal Health, Inc. |
| 60,122 |
| |
2,200 |
| @ |
| Caremark Rx, Inc. |
| 78,672 |
| |
1,300 |
|
|
| Eli Lilly & Co. |
| 69,329 |
| |
200 |
| @ |
| Express Scripts, Inc. |
| 14,392 |
| |
1,000 |
| @ |
| Forest Laboratories, Inc. |
| 38,970 |
| |
1,200 |
| @ |
| Gilead Sciences, Inc. |
| 41,352 |
| |
350 |
| @ |
| Hospira, Inc. |
| 11,281 |
| |
600 |
| @ |
| King Pharmaceuticals, Inc. |
| 7,470 |
| |
800 |
| @ |
| Medco Health Solutions, Inc. |
| 30,176 |
| |
6,350 |
|
|
| Merck & Co., Inc. |
| 177,927 |
| |
21,450 |
|
|
| Pfizer, Inc. |
| 595,666 |
| |
4,000 |
|
|
| Schering-Plough Corp. |
| 71,400 |
| |
3,850 |
|
|
| Wyeth |
| 153,500 |
| |
|
|
|
|
|
| 1,716,509 |
| |
|
|
|
| Pipelines: 0.1% |
|
|
| |
1,300 |
| @ |
| Dynegy, Inc. |
| 7,345 |
| |
1,800 |
|
|
| El Paso Corp. |
| 18,792 |
| |
100 |
|
|
| Kinder Morgan, Inc. |
| 6,930 |
| |
1,350 |
|
|
| Williams Cos., Inc. |
| 22,505 |
| |
|
|
|
|
|
| 55,572 |
| |
|
|
|
| Real Estate Investment Trusts: 0.1% |
|
|
| |
450 |
|
|
| Equity Office Properties Trust |
| 12,353 |
| |
400 |
|
|
| ProLogis |
| 16,092 |
| |
550 |
|
|
| Simon Property Group, Inc. |
| 34,144 |
| |
|
|
|
|
|
| 62,589 |
| |
|
|
|
| Retail: 2.5% |
|
|
| |
650 |
| @ |
| Bed Bath & Beyond, Inc. |
| 25,953 |
| |
1,050 |
|
|
| Best Buy Co., Inc. |
| 59,199 |
| |
750 |
|
|
| Circuit City Stores, Inc. |
| 11,693 |
| |
2,450 |
|
|
| Costco Wholesale Corp. |
| 119,070 |
| |
1,200 |
|
|
| CVS Corp. |
| 54,444 |
| |
600 |
|
|
| Darden Restaurants, Inc. |
| 16,356 |
| |
350 |
|
|
| Dillard’s, Inc. |
| 8,813 |
| |
450 |
|
|
| Federated Department Stores, Inc. |
| 24,660 |
| |
3,250 |
|
|
| Gap, Inc. |
| 71,013 |
| |
10,750 |
|
|
| Home Depot, Inc. |
| 448,812 |
| |
1,450 |
|
|
| J.C. Penney Co., Inc. Holding Co. |
| 55,970 |
| |
400 |
| @ |
| Kohl’s Corp. |
| 18,464 |
| |
1,950 |
|
|
| Limited Brands, Inc. |
| 47,658 |
| |
2,250 |
|
|
| Lowe’s Cos., Inc. |
| 124,493 |
| |
850 |
|
|
| May Department Stores Co. |
| 23,902 |
| |
3,850 |
|
|
| McDonald’s Corp. |
| 118,349 |
| |
350 |
|
|
| Nordstrom, Inc. |
| 15,313 |
| |
800 |
| @ |
| Office Depot, Inc. |
| 13,120 |
| |
300 |
|
|
| RadioShack Corp. |
| 9,471 |
| |
1,700 |
|
|
| Staples, Inc. |
| 54,247 |
| |
1,150 |
| @ |
| Starbucks Corp. |
| 64,699 |
| |
2,550 |
|
|
| Target Corp. |
| 130,610 |
| |
1,050 |
|
|
| TJX Cos., Inc. |
| 24,717 |
| |
1,000 |
| @ |
| Toys R US, Inc. |
| 19,340 |
| |
12,000 |
|
|
| Wal-Mart Stores, Inc. |
| 624,719 |
| |
4,000 |
|
|
| Walgreen Co. |
| 152,719 |
| |
450 |
|
|
| Wendy’s Intl., Inc. |
| 16,052 |
| |
650 |
|
|
| Yum! Brands, Inc. |
| 29,510 |
| |
|
|
|
|
|
| 2,383,366 |
| |
|
|
|
| Savings and Loans: 0.2% |
|
|
| |
400 |
|
|
| Golden West Financial Corp. |
| 47,696 |
| |
750 |
|
|
| Sovereign Bancorp, Inc. |
| 16,388 |
| |
2,700 |
|
|
| Washington Mutual, Inc. |
| 109,917 |
| |
|
|
|
|
|
| 174,001 |
| |
|
|
|
| Semiconductors: 0.7% |
|
|
| |
950 |
| @ |
| Altera Corp. |
| 21,546 |
| |
1,100 |
|
|
| Analog Devices, Inc. |
| 40,645 |
| |
4,600 |
| @ |
| Applied Materials, Inc. |
| 76,544 |
| |
18,600 |
|
|
| Intel Corp. |
| 415,710 |
| |
450 |
| @ |
| KLA-Tencor Corp. |
| 20,277 |
| |
800 |
|
|
| Linear Technology Corp. |
| 30,528 |
| |
350 |
|
|
| Maxim Integrated Products, Inc. |
| 14,336 |
| |
1,000 |
| @ |
| National Semiconductor Corp. |
| 15,460 |
| |
See Accompanying Notes to Financial Statements
104
Shares |
|
|
|
|
| Value |
| |
|
|
|
| Semiconductors (continued) |
|
|
| |
350 |
| @ |
| Qlogic Corp. |
| $ | 12,037 |
|
1,750 |
|
|
| Texas Instruments, Inc. |
| 42,315 |
| |
|
|
|
|
|
| 689,398 |
| |
|
|
|
| Software: 1.6% |
|
|
| |
550 |
|
|
| Adobe Systems, Inc. |
| 33,308 |
| |
450 |
|
|
| Autodesk, Inc. |
| 29,435 |
| |
1,600 |
|
|
| Automatic Data Processing, Inc. |
| 72,847 |
| |
1,000 |
| @ |
| BMC Software, Inc. |
| 18,580 |
| |
450 |
| @ |
| Citrix Systems, Inc. |
| 10,625 |
| |
1,750 |
|
|
| Computer Associates Intl., Inc. |
| 53,428 |
| |
1,450 |
| @ |
| Compuware Corp. |
| 8,367 |
| |
350 |
| @ |
| Electronic Arts, Inc. |
| 17,115 |
| |
2,700 |
|
|
| First Data Corp. |
| 110,942 |
| |
500 |
| @ |
| Fiserv, Inc. |
| 19,255 |
| |
550 |
|
|
| IMS Health, Inc. |
| 12,414 |
| |
550 |
| @ |
| Intuit, Inc. |
| 23,012 |
| |
30,750 |
|
|
| Microsoft Corp. |
| 824,407 |
| |
1,100 |
| @ |
| Novell, Inc. |
| 6,710 |
| |
24,950 |
| @ |
| Oracle Corp. |
| 315,866 |
| |
1,150 |
| @ |
| PeopleSoft, Inc. |
| 27,152 |
| |
1,250 |
| @ |
| Siebel Systems, Inc. |
| 12,600 |
| |
1,050 |
| @ |
| Veritas Software Corp. |
| 22,995 |
| |
|
|
|
|
|
| 1,619,058 |
| |
|
|
|
| Telecommunications: 1.9% |
|
|
| |
1,300 |
|
|
| Alltel Corp. |
| 73,697 |
| |
900 |
|
|
| AT&T Corp. |
| 16,470 |
| |
1,900 |
| @ |
| Avaya, Inc. |
| 31,198 |
| |
5,300 |
|
|
| BellSouth Corp. |
| 142,146 |
| |
300 |
|
|
| CenturyTel, Inc. |
| 9,876 |
| |
19,250 |
| @ |
| Cisco Systems, Inc. |
| 360,167 |
| |
650 |
|
|
| Citizens Communications Co. |
| 9,295 |
| |
700 |
| @ |
| Comverse Technology, Inc. |
| 14,889 |
| |
3,500 |
| @ |
| Corning, Inc. |
| 44,030 |
| |
10,650 |
| @ |
| Lucent Technologies, Inc. |
| 41,855 |
| |
9,150 |
|
|
| Motorola, Inc. |
| 176,229 |
| |
3,000 |
| @ |
| Nextel Communications, Inc. |
| 85,380 |
| |
4,750 |
|
|
| Qualcomm, Inc. |
| 197,695 |
| |
4,900 |
| @ |
| Qwest Communications Intl., Inc. |
| 19,600 |
| |
9,650 |
|
|
| SBC Communications, Inc. |
| 242,890 |
| |
600 |
|
|
| Scientific-Atlanta, Inc. |
| 17,772 |
| |
4,250 |
|
|
| Sprint Corp. |
| 96,943 |
| |
1,100 |
| @ |
| Tellabs, Inc. |
| 9,405 |
| |
7,950 |
|
|
| Verizon Communications, Inc. |
| 327,778 |
| |
|
|
|
|
|
| 1,917,315 |
| |
|
|
|
| Textiles: 0.0% |
|
|
| |
500 |
|
|
| Cintas Corp. |
| 22,360 |
| |
|
|
|
|
|
| 22,360 |
| |
|
|
|
| Toys/Games/Hobbies: 0.0% |
|
|
| |
700 |
|
|
| Hasbro, Inc. |
| 13,321 |
| |
900 |
|
|
| Mattel, Inc. |
| 17,055 |
| |
|
|
|
|
|
| 30,376 |
| |
|
|
|
| Transportation: 0.5% |
|
|
| |
850 |
|
|
| Burlington Northern Santa Fe Corp. |
| 38,284 |
| |
600 |
|
|
| CSX Corp. |
| 22,878 |
| |
1,250 |
|
|
| FedEx Corp. |
| 118,788 |
| |
1,400 |
|
|
| Norfolk Southern Corp. |
| 48,062 |
| |
200 |
|
|
| Ryder System, Inc. |
| 10,728 |
| |
250 |
|
|
| Union Pacific Corp. |
| 15,860 |
| |
3,250 |
|
|
| United Parcel Service, Inc. |
| 273,487 |
| |
|
|
|
|
|
| 528,087 |
| |
|
|
|
| Total Common Stock |
| 31,929,489 |
| |
Principal |
|
|
|
|
|
|
| |||||
Amount |
|
|
|
|
| Value |
| |||||
U.S. GOVERNMENT AGENCY OBLIGATIONS: 51.3% |
|
|
| |||||||||
|
|
|
| Federal Home Loan Mortgage Corporation: 51.3% |
|
|
| |||||
$ | 60,000,000 |
|
|
| 3.970%, due 04/21/09 |
| $ | 50,581,201 |
| |||
|
|
|
| Total U.S. Government Agency Obligations |
| 50,581,201 |
| |||||
|
|
|
|
|
|
|
| |||||
U.S. TREASURY OBLIGATIONS: 16.0% |
|
|
| |||||||||
|
|
|
| U.S. Treasury STRIP: 16.0% |
|
|
| |||||
18,370,000 |
|
|
| 3.640%, due 02/15/09 |
| 15,803,821 |
| |||||
|
|
|
| Total U.S. Treasury Obligations |
| 15,803,821 |
| |||||
|
|
|
| Total Long-Term Investments |
| 98,314,511 |
| |||||
|
|
|
|
|
|
|
| |||||
SHORT-TERM INVESTMENTS: 0.5% |
|
|
| |||||||||
|
|
|
| Repurchase Agreement: 0.5% |
|
|
| |||||
521,000 |
|
|
| Morgan Stanley Repurchase Agreement dated 11/30/04, 2.070%, due 12/01/04, $521,030 to be received upon repurchased (Collateralized by $535,000 Federal National Mortgage Association, 2.350%-6.250% Market Value plus accrued interest $537,688 due 05/03/06-06/28/19) |
| 521,000 |
| |||||
|
|
|
| Total Short-Term Investments |
| 521,000 |
| |||||
|
|
|
|
|
|
|
| |||||
Total Investments In Securities |
| 100.2 | % | $ | 98,835,511 |
| ||||||
Other Assets and Liabilities-Net |
| (0.2 | ) | (162,482 | ) | |||||||
Net Assets |
| 100.0 | % | $ | 98,673,029 |
| ||||||
@ |
| Non-income producing security |
@@ |
| Foreign issuer |
STRIP |
| Separate Trading of Registered Interest and Principal of Securities |
* |
| Cost for federal income tax purposes is $98,705,601. Net unrealized appreciation consists of: |
Gross Unrealized Appreciation |
| $ | 1,087,726 |
|
Gross Unrealized Depreciation |
| (957,816 | ) | |
Net Unrealized Appreciation |
| $ | 129,910 |
|
See Accompanying Notes to Financial Statements
105
ING PRINCIPAL PROTECTION FUND X
PORTFOLIO OF INVESTMENTS
AS OF NOVEMBER 30, 2004 (UNAUDITED)
Shares |
|
|
|
|
| Value |
| |
COMMON STOCK: 35.4% |
|
|
| |||||
|
|
|
| Advertising: 0.0% |
|
|
| |
331 |
| @ |
| Interpublic Group of Cos., Inc. |
| $ | 4,108 |
|
357 |
|
|
| Omnicom Group, Inc. |
| 28,917 |
| |
|
|
|
|
|
| 33,025 |
| |
|
|
|
| Aerospace/Defense: 0.8% |
|
|
| |
3,415 |
|
|
| Boeing Co. |
| 182,942 |
| |
799 |
|
|
| General Dynamics Corp. |
| 86,580 |
| |
313 |
|
|
| Goodrich Corp. |
| 9,938 |
| |
1,049 |
|
|
| Lockheed Martin Corp. |
| 63,821 |
| |
877 |
|
|
| Northrop Grumman Corp. |
| 49,401 |
| |
1,881 |
|
|
| Raytheon Co. |
| 75,880 |
| |
419 |
|
|
| Rockwell Collins, Inc. |
| 16,701 |
| |
1,199 |
|
|
| United Technologies Corp. |
| 116,998 |
| |
|
|
|
|
|
| 602,261 |
| |
|
|
|
| Agriculture: 0.5% |
|
|
| |
4,676 |
|
|
| Altria Group, Inc. |
| 268,823 |
| |
1,495 |
|
|
| Archer-Daniels-Midland Co. |
| 31,694 |
| |
654 |
|
|
| Monsanto Co. |
| 30,097 |
| |
367 |
|
|
| Reynolds American, Inc. |
| 27,756 |
| |
622 |
|
|
| UST, Inc. |
| 27,387 |
| |
|
|
|
|
|
| 385,757 |
| |
|
|
|
| Apparel: 0.2% |
|
|
| |
600 |
| @ |
| Coach, Inc. |
| 29,904 |
| |
353 |
|
|
| Jones Apparel Group, Inc. |
| 12,542 |
| |
261 |
|
|
| Liz Claiborne, Inc. |
| 10,719 |
| |
1,108 |
|
|
| Nike, Inc. |
| 93,803 |
| |
142 |
|
|
| Reebok Intl. Ltd. |
| 5,521 |
| |
413 |
|
|
| VF Corp. |
| 22,298 |
| |
|
|
|
|
|
| 174,787 |
| |
|
|
|
| Auto Manufacturers: 0.3% |
|
|
| |
7,350 |
|
|
| Ford Motor Co. |
| 104,223 |
| |
1,325 |
|
|
| General Motors Corp. |
| 51,132 |
| |
581 |
|
|
| PACCAR, Inc. |
| 45,376 |
| |
|
|
|
|
|
| 200,731 |
| |
|
|
|
| Auto Parts and Equipment: 0.1% |
|
|
| |
210 |
|
|
| Cooper Tire & Rubber Co. |
| 4,288 |
| |
395 |
|
|
| Dana Corp. |
| 6,458 |
| |
429 |
| @ |
| Goodyear Tire & Rubber Co. |
| 5,414 |
| |
430 |
|
|
| Johnson Controls, Inc. |
| 26,402 |
| |
247 |
|
|
| Visteon Corp. |
| 2,090 |
| |
|
|
|
|
|
| 44,652 |
| |
|
|
|
| Banks: 2.2% |
|
|
| |
850 |
|
|
| AmSouth Bancorporation |
| 22,041 |
| |
9,312 |
|
|
| Bank of America Corp. |
| 430,865 |
| |
1,135 |
|
|
| BB&T Corp. |
| 48,181 |
| |
537 |
|
|
| Comerica, Inc. |
| 33,026 |
| |
550 |
|
|
| Fifth Third Bancorp |
| 27,698 |
| |
270 |
|
|
| First Horizon National Corp. |
| 11,799 |
| |
498 |
|
|
| Huntington Bancshares, Inc. |
| 12,081 |
| |
1,252 |
|
|
| KeyCorp |
| 41,679 |
| |
271 |
|
|
| M & T Bank Corp. |
| 28,566 |
| |
545 |
|
|
| Marshall & Ilsley Corp. |
| 22,721 |
| |
1,028 |
|
|
| Mellon Financial Corp. |
| 30,038 |
| |
1,868 |
|
|
| National City Corp. |
| 69,265 |
| |
406 |
|
|
| North Fork Bancorporation, Inc. |
| 11,693 |
| |
521 |
|
|
| Northern Trust Corp. |
| 24,508 |
| |
629 |
|
|
| PNC Financial Services Group, Inc. |
| 34,218 |
| |
866 |
|
|
| Regions Financial Corp. |
| 30,301 |
| |
252 |
|
|
| State Street Corp. |
| 11,229 |
| |
875 |
|
|
| SunTrust Banks, Inc. |
| 62,388 |
| |
263 |
|
|
| Synovus Financial Corp. |
| 7,101 |
| |
628 |
|
|
| The Bank of New York Co., Inc. |
| 20,667 |
| |
4,568 |
|
|
| U.S. Bancorp |
| 135,350 |
| |
4,985 |
|
|
| Wachovia Corp. |
| 257,974 |
| |
3,863 |
|
|
| Wells Fargo & Co. |
| 238,618 |
| |
199 |
|
|
| Zions Bancorporation |
| 13,234 |
| |
|
|
|
|
|
| 1,625,241 |
| |
|
|
|
| Beverages: 0.8% |
|
|
| |
107 |
|
|
| Adolph Coors Co. |
| 8,014 |
| |
1,942 |
|
|
| Anheuser-Busch Cos., Inc. |
| 97,275 |
| |
313 |
|
|
| Brown-Forman Corp. |
| 15,030 |
| |
5,542 |
|
|
| Coca-Cola Co. |
| 217,856 |
| |
1,162 |
|
|
| Coca-Cola Enterprises, Inc. |
| 24,170 |
| |
609 |
|
|
| Pepsi Bottling Group, Inc. |
| 17,064 |
| |
4,045 |
|
|
| PepsiCo, Inc. |
| 201,886 |
| |
|
|
|
|
|
| 581,295 |
| |
|
|
|
| Biotechnology: 0.4% |
|
|
| |
3,027 |
| @ |
| Amgen, Inc. |
| 181,740 |
| |
801 |
| @ |
| Biogen Idec, Inc. |
| 47,003 |
| |
557 |
| @ |
| Genzyme Corp. |
| 31,198 |
| |
550 |
| @ |
| MedImmune, Inc. |
| 14,630 |
| |
97 |
| @ |
| Millipore Corp. |
| 4,726 |
| |
|
|
|
|
|
| 279,297 |
| |
|
|
|
| Building Materials: 0.1% |
|
|
| |
471 |
| @ |
| American Standard Cos., Inc. |
| 18,341 |
| |
1,118 |
|
|
| Masco Corp. |
| 39,432 |
| |
252 |
|
|
| Vulcan Materials Co. |
| 13,066 |
| |
|
|
|
|
|
| 70,839 |
| |
|
|
|
| Chemicals: 0.6% |
|
|
| |
552 |
|
|
| Air Products & Chemicals, Inc. |
| 31,602 |
| |
142 |
|
|
| Ashland, Inc. |
| 8,399 |
| |
2,398 |
|
|
| Dow Chemical Co. |
| 121,027 |
| |
2,561 |
|
|
| E.I. du Pont de Nemours & Co. |
| 116,065 |
| |
161 |
|
|
| Eastman Chemical Co. |
| 8,755 |
| |
273 |
|
|
| Ecolab, Inc. |
| 9,550 |
| |
344 |
|
|
| Engelhard Corp. |
| 10,282 |
| |
188 |
|
|
| International Flavors & Fragrances, Inc. |
| 7,614 |
| |
635 |
|
|
| PPG Industries, Inc. |
| 42,843 |
| |
715 |
|
|
| Praxair, Inc. |
| 32,104 |
| |
551 |
|
|
| Rohm & Haas Co. |
| 24,294 |
| |
512 |
|
|
| Sherwin-Williams Co. |
| 22,835 |
| |
169 |
|
|
| Sigma-Aldrich Corp. |
| 10,094 |
| |
|
|
|
|
|
| 445,464 |
| |
|
|
|
| Commercial Services: 0.3% |
|
|
| |
394 |
| @ |
| Apollo Group, Inc. |
| 31,402 |
| |
2,545 |
|
|
| Cendant Corp. |
| 57,695 |
| |
110 |
|
|
| Deluxe Corp. |
| 4,349 |
| |
292 |
|
|
| Equifax, Inc. |
| 8,065 |
| |
578 |
|
|
| H&R Block, Inc. |
| 27,571 |
| |
711 |
|
|
| McKesson Corp. |
| 21,010 |
| |
347 |
|
|
| Moody’s Corp. |
| 28,020 |
| |
873 |
|
|
| Paychex, Inc. |
| 28,949 |
| |
479 |
|
|
| R.R. Donnelley & Sons Co. |
| 16,621 |
| |
495 |
|
|
| Robert Half Intl., Inc. |
| 13,380 |
| |
|
|
|
|
|
| 237,062 |
| |
|
|
|
| Computers: 1.8% |
|
|
| |
331 |
| @ |
| Affiliated Computer Services, Inc. |
| 19,589 |
| |
1,645 |
| @ |
| Apple Computer, Inc. |
| 110,297 |
| |
429 |
| @ |
| Computer Sciences Corp. |
| 23,209 |
| |
7,686 |
| @ |
| Dell, Inc. |
| 311,436 |
| |
1,250 |
|
|
| Electronic Data Systems Corp. |
| 28,063 |
| |
5,860 |
| @ |
| EMC Corp. |
| 78,641 |
| |
231 |
| @ |
| Gateway, Inc. |
| 1,573 |
| |
7,189 |
|
|
| Hewlett-Packard Co. |
| 143,780 |
| |
5,198 |
|
|
| International Business Machines Corp. |
| 489,859 |
| |
303 |
| @ |
| Lexmark Intl., Inc. |
| 25,725 |
| |
See Accompanying Notes to Financial Statements
106
Shares |
|
|
|
|
| Value |
| |
|
|
|
| Computers (continued) |
|
|
| |
223 |
| @ |
| NCR Corp. |
| $ | 13,320 |
|
824 |
| @ |
| Network Appliance, Inc. |
| 24,852 |
| |
11,562 |
| @ |
| Sun Microsystems, Inc. |
| 64,169 |
| |
714 |
| @ |
| Sungard Data Systems, Inc. |
| 18,928 |
| |
716 |
| @ |
| Unisys Corp. |
| 8,227 |
| |
|
|
|
|
|
| 1,361,668 |
| |
|
|
|
| Cosmetics/Personal Care: 1.2% |
|
|
| |
343 |
|
|
| Alberto-Culver Co. |
| 15,881 |
| |
963 |
|
|
| Avon Products, Inc. |
| 36,151 |
| |
1,275 |
|
|
| Colgate-Palmolive Co. |
| 58,637 |
| |
3,881 |
|
|
| Gillette Co. |
| 168,785 |
| |
1,597 |
|
|
| Kimberly-Clark Corp. |
| 101,585 |
| |
9,916 |
|
|
| Procter & Gamble Co. |
| 530,308 |
| |
|
|
|
|
|
| 911,347 |
| |
|
|
|
| Distribution/Wholesale: 0.0% |
|
|
| |
378 |
|
|
| Genuine Parts Co. |
| 16,409 |
| |
285 |
|
|
| W.W. Grainger, Inc. |
| 17,630 |
| |
|
|
|
|
|
| 34,039 |
| |
|
|
|
| Diversified Financial Services: 2.6% |
|
|
| |
3,016 |
|
|
| American Express Co. |
| 168,020 |
| |
249 |
|
|
| Bear Stearns Cos., Inc. |
| 24,297 |
| |
594 |
|
|
| Capital One Financial Corp. |
| 46,677 |
| |
600 |
|
|
| CIT Group, Inc. |
| 25,650 |
| |
11,850 |
|
|
| Citigroup, Inc. |
| 530,287 |
| |
2,330 |
|
|
| Countrywide Financial Corp. |
| 77,379 |
| |
838 |
| @ |
| E*TRADE Financial Corp. |
| 11,615 |
| |
2,318 |
|
|
| Fannie Mae |
| 159,246 |
| |
99 |
|
|
| Federated Investors, Inc. |
| 2,913 |
| |
573 |
|
|
| Franklin Resources, Inc. |
| 37,606 |
| |
1,644 |
|
|
| Freddie Mac |
| 112,219 |
| |
1,180 |
|
|
| Goldman Sachs Group, Inc. |
| 123,617 |
| |
3,424 |
|
|
| J.P. Morgan Chase & Co. |
| 128,913 |
| |
544 |
|
|
| Janus Capital Group, Inc. |
| 9,003 |
| |
629 |
|
|
| Lehman Brothers Holdings, Inc. |
| 52,698 |
| |
3,112 |
|
|
| MBNA Corp. |
| 82,655 |
| |
2,253 |
|
|
| Merrill Lynch & Co., Inc. |
| 125,515 |
| |
890 |
|
|
| Morgan Stanley |
| 45,168 |
| |
561 |
| @ |
| Providian Financial Corp. |
| 9,004 |
| |
845 |
|
|
| SLM Corp. |
| 43,239 |
| |
|
|
|
|
|
| 1,815,721 |
| |
|
|
|
| Electric: 0.8% |
|
|
| |
1,708 |
| @ |
| AES Corp. |
| 20,906 |
| |
325 |
| @ |
| Allegheny Energy, Inc. |
| 6,221 |
| |
186 |
|
|
| Ameren Corp. |
| 9,006 |
| |
757 |
|
|
| American Electric Power Co., Inc. |
| 25,867 |
| |
167 |
|
|
| Cinergy Corp. |
| 6,912 |
| |
262 |
| @ |
| CMS Energy Corp. |
| 2,672 |
| |
578 |
|
|
| Consolidated Edison, Inc. |
| 25,345 |
| |
423 |
|
|
| Constellation Energy Group, Inc. |
| 18,485 |
| |
300 |
|
|
| Dominion Resources, Inc. |
| 19,641 |
| |
415 |
|
|
| DTE Energy Co. |
| 18,210 |
| |
2,945 |
|
|
| Duke Energy Corp. |
| 74,450 |
| |
791 |
|
|
| Edison Intl. |
| 25,233 |
| |
550 |
|
|
| Entergy Corp. |
| 35,651 |
| |
1,526 |
|
|
| Exelon Corp. |
| 63,649 |
| |
783 |
|
|
| FirstEnergy Corp. |
| 33,066 |
| |
352 |
|
|
| FPL Group, Inc. |
| 24,756 |
| |
1,004 |
| @ |
| PG&E Corp. |
| 33,393 |
| |
223 |
|
|
| Pinnacle West Capital Corp. |
| 9,857 |
| |
504 |
|
|
| PPL Corp. |
| 26,183 |
| |
550 |
|
|
| Public Service Enterprise Group, Inc. |
| 24,195 |
| |
1,492 |
|
|
| Southern Co. |
| 48,923 |
| |
146 |
|
|
| TECO Energy, Inc. |
| 2,184 |
| |
833 |
|
|
| TXU Corp. |
| 52,329 |
| |
957 |
|
|
| Xcel Energy, Inc. |
| 17,283 |
| |
|
|
|
|
|
| 624,417 |
| |
|
|
|
| Electrical Components and Equipment: 0.1% |
|
|
| |
1,354 |
|
|
| Emerson Electric Co. |
| 90,474 |
| |
|
|
|
|
|
| 90,474 |
| |
|
|
|
| Electronics: 0.2% |
|
|
| |
1,142 |
| @ |
| Agilent Technologies, Inc. |
| 26,141 |
| |
494 |
|
|
| Applera Corp. — Applied Biosystems Group |
| 10,127 |
| |
290 |
| @ |
| Fisher Scientific Intl. |
| 16,397 |
| |
474 |
| @ |
| Jabil Circuit, Inc. |
| 11,878 |
| |
288 |
|
|
| Parker Hannifin Corp. |
| 21,542 |
| |
284 |
|
|
| PerkinElmer, Inc. |
| 6,058 |
| |
1,082 |
| @ |
| Sanmina-SCI Corp. |
| 9,554 |
| |
745 |
| @ |
| Solectron Corp. |
| 4,656 |
| |
171 |
|
|
| Tektronix, Inc. |
| 5,364 |
| |
383 |
| @ |
| Thermo Electron Corp. |
| 11,586 |
| |
290 |
| @ |
| Waters Corp. |
| 13,531 |
| |
|
|
|
|
|
| 136,834 |
| |
|
|
|
| Engineering and Construction: 0.0% |
|
|
| |
88 |
|
|
| Fluor Corp. |
| 4,567 |
| |
|
|
|
|
|
| 4,567 |
| |
|
|
|
| Entertainment: 0.0% |
|
|
| |
876 |
|
|
| International Game Technology |
| 30,967 |
| |
|
|
|
|
|
| 30,967 |
| |
|
|
|
| Environmental Control: 0.1% |
|
|
| |
1,352 |
|
|
| Waste Management, Inc. |
| 40,303 |
| |
|
|
|
|
|
| 40,303 |
| |
|
|
|
| Food: 0.4% |
|
|
| |
878 |
|
|
| Albertson’s, Inc. |
| 22,213 |
| |
350 |
|
|
| Campbell Soup Co. |
| 9,986 |
| |
1,021 |
|
|
| ConAgra Foods, Inc. |
| 27,618 |
| |
730 |
|
|
| General Mills, Inc. |
| 33,208 |
| |
832 |
|
|
| H.J. Heinz Co. |
| 30,917 |
| |
589 |
|
|
| Hershey Foods Corp. |
| 30,510 |
| |
979 |
|
|
| Kellogg Co. |
| 42,782 |
| |
675 |
| @ |
| Kroger Co. |
| 10,922 |
| |
291 |
|
|
| McCormick & Co., Inc. |
| 10,607 |
| |
400 |
| @ |
| Safeway, Inc. |
| 7,712 |
| |
1,862 |
|
|
| Sara Lee Corp. |
| 43,720 |
| |
457 |
|
|
| SUPERVALU, Inc. |
| 14,437 |
| |
583 |
|
|
| Wm. Wrigley Jr. Co. |
| 40,110 |
| |
|
|
|
|
|
| 324,742 |
| |
|
|
|
| Forest Products and Paper: 0.2% |
|
|
| |
533 |
|
|
| Georgia-Pacific Corp. |
| 19,513 |
| |
1,133 |
|
|
| International Paper Co. |
| 47,042 |
| |
344 |
|
|
| Louisiana-Pacific Corp. |
| 8,418 |
| |
475 |
|
|
| MeadWestvaco Corp. |
| 15,984 |
| |
446 |
|
|
| Plum Creek Timber Co., Inc. |
| 16,502 |
| |
194 |
|
|
| Temple-Inland, Inc. |
| 11,560 |
| |
824 |
|
|
| Weyerhaeuser Co. |
| 54,384 |
| |
|
|
|
|
|
| 173,403 |
| |
|
|
|
| Gas: 0.1% |
|
|
| |
381 |
|
|
| KeySpan Corp. |
| 15,057 |
| |
135 |
|
|
| Nicor, Inc. |
| 4,982 |
| |
47 |
|
|
| Peoples Energy Corp. |
| 2,097 |
| |
715 |
|
|
| Sempra Energy |
| 26,440 |
| |
|
|
|
|
|
| 48,576 |
| |
See Accompanying Notes to Financial Statements
107
Shares |
|
|
|
|
| Value |
| |
|
|
|
| Hand/Machine Tools: 0.1% |
|
|
| |
298 |
|
|
| Black & Decker Corp. |
| $ | 25,059 |
|
148 |
|
|
| Snap-On, Inc. |
| 4,678 |
| |
285 |
|
|
| Stanley Works |
| 13,327 |
| |
|
|
|
|
|
| 43,064 |
| |
|
|
|
| Healthcare — Products: 1.4% |
|
|
| |
153 |
|
|
| Bausch & Lomb, Inc. |
| 9,009 |
| |
1,219 |
|
|
| Baxter Intl., Inc. |
| 38,581 |
| |
814 |
|
|
| Becton Dickinson & Co. |
| 44,591 |
| |
572 |
|
|
| Biomet, Inc. |
| 27,382 |
| |
1,751 |
| @ |
| Boston Scientific Corp. |
| 60,952 |
| |
307 |
|
|
| C.R. Bard, Inc. |
| 18,392 |
| |
749 |
|
|
| Guidant Corp. |
| 48,558 |
| |
9,152 |
|
|
| Johnson & Johnson |
| 552,049 |
| |
2,900 |
|
|
| Medtronic, Inc. |
| 139,345 |
| |
788 |
| @ |
| St. Jude Medical, Inc. |
| 30,054 |
| |
350 |
|
|
| Stryker Corp. |
| 15,397 |
| |
509 |
| @ |
| Zimmer Holdings, Inc. |
| 41,534 |
| |
|
|
|
|
|
| 1,025,844 |
| |
|
|
|
| Healthcare — Services: 0.6% |
|
|
| |
537 |
|
|
| Aetna, Inc. |
| 63,640 |
| |
542 |
| @ |
| Humana, Inc. |
| 13,452 |
| |
300 |
| @ |
| Laboratory Corp. Of America Holdings |
| 14,385 |
| |
231 |
|
|
| Manor Care, Inc. |
| 7,958 |
| |
102 |
|
|
| Quest Diagnostics, Inc. |
| 9,563 |
| |
2,554 |
|
|
| UnitedHealth Group, Inc. |
| 211,599 |
| |
650 |
| @ |
| WellPoint Health Networks, Inc. |
| 81,315 |
| |
594 |
| @ |
| WellPoint, Inc. |
| 60,190 |
| |
|
|
|
|
|
| 462,102 |
| |
|
|
|
| Home Builders: 0.0% |
|
|
| |
262 |
|
|
| Centex Corp. |
| 13,747 |
| |
|
|
|
|
|
| 13,747 |
| |
|
|
|
| Home Furnishings: 0.0% |
|
|
| |
449 |
|
|
| Leggett & Platt, Inc. |
| 13,403 |
| |
155 |
|
|
| Whirlpool Corp. |
| 10,005 |
| |
|
|
|
|
|
| 23,408 |
| |
|
|
|
| Household Products/ Wares: 0.1% |
|
|
| |
273 |
|
|
| Avery Dennison Corp. |
| 16,014 |
| |
550 |
|
|
| Clorox Co. |
| 30,316 |
| |
338 |
|
|
| Fortune Brands, Inc. |
| 26,526 |
| |
|
|
|
|
|
| 72,856 |
| |
|
|
|
| Housewares: 0.0% |
|
|
| |
668 |
|
|
| Newell Rubbermaid, Inc. |
| 15,417 |
| |
|
|
|
|
|
| 15,417 |
| |
|
|
|
| Insurance: 2.0% |
|
|
| |
732 |
| @@ |
| ACE Ltd. |
| 29,587 |
| |
986 |
|
|
| AFLAC, Inc. |
| 37,093 |
| |
2,214 |
|
|
| Allstate Corp. |
| 111,807 |
| |
267 |
|
|
| AMBAC Financial Group, Inc. |
| 21,715 |
| |
10,149 |
|
|
| American International Group, Inc. |
| 642,940 |
| |
756 |
|
|
| AON Corp. |
| 15,967 |
| |
786 |
|
|
| Chubb Corp. |
| 59,901 |
| |
468 |
|
|
| CIGNA Corp. |
| 32,769 |
| |
411 |
|
|
| Cincinnati Financial Corp. |
| 18,413 |
| |
676 |
|
|
| Hartford Financial Services Group, Inc. |
| 43,264 |
| |
341 |
|
|
| Jefferson-Pilot Corp. |
| 16,774 |
| |
440 |
|
|
| Lincoln National Corp. |
| 20,249 |
| |
581 |
|
|
| Loews Corp. |
| 40,618 |
| |
1,232 |
|
|
| Marsh & McLennan Cos., Inc. |
| 35,223 |
| |
347 |
|
|
| MBIA, Inc. |
| 20,806 |
| |
2,391 |
|
|
| MetLife, Inc. |
| 93,249 |
| |
187 |
|
|
| MGIC Investment Corp. |
| 12,716 |
| |
658 |
|
|
| Principal Financial Group |
| 24,793 |
| |
442 |
|
|
| Progressive Corp. |
| 40,218 |
| |
2,013 |
|
|
| Prudential Financial, Inc. |
| 98,536 |
| |
368 |
|
|
| Safeco Corp. |
| 17,837 |
| |
277 |
|
|
| Torchmark Corp. |
| 15,210 |
| |
760 |
|
|
| UnumProvident Corp. |
| 11,833 |
| |
302 |
| @@ |
| XL Capital Ltd. |
| 22,759 |
| |
|
|
|
|
|
| 1,484,277 |
| |
|
|
|
| Internet: 0.5% |
|
|
| |
1,583 |
| @ |
| eBay, Inc. |
| 178,008 |
| |
1,244 |
| @ |
| Symantec Corp. |
| 79,380 |
| |
3,249 |
| @ |
| Yahoo!, Inc. |
| 122,227 |
| |
|
|
|
|
|
| 379,615 |
| |
|
|
|
| Iron/Steel: 0.1% |
|
|
| |
121 |
|
|
| Allegheny Technologies, Inc. |
| 2,662 |
| |
346 |
|
|
| Nucor Corp. |
| 18,304 |
| |
343 |
|
|
| United States Steel Corp. |
| 17,959 |
| |
|
|
|
|
|
| 38,925 |
| |
|
|
|
| Leisure Time: 0.2% |
|
|
| |
188 |
|
|
| Brunswick Corp. |
| 9,178 |
| |
1,507 |
|
|
| Carnival Corp. |
| 79,886 |
| |
562 |
|
|
| Harley-Davidson, Inc. |
| 32,495 |
| |
404 |
|
|
| Sabre Holdings Corp. |
| 9,324 |
| |
|
|
|
|
|
| 130,883 |
| |
|
|
|
| Lodging: 0.1% |
|
|
| |
264 |
|
|
| Harrah’s Entertainment, Inc. |
| 16,210 |
| |
847 |
|
|
| Hilton Hotels Corp. |
| 17,499 |
| |
516 |
|
|
| Marriott Intl., Inc. |
| 29,334 |
| |
454 |
|
|
| Starwood Hotels & Resorts Worldwide, Inc. |
| 23,740 |
| |
|
|
|
|
|
| 86,783 |
| |
|
|
|
| Machinery — Construction and Mining: 0.0% |
|
|
| |
312 |
|
|
| Caterpillar, Inc. |
| 28,564 |
| |
|
|
|
|
|
| 28,564 |
| |
|
|
|
| Machinery — Diversified: 0.1% |
|
|
| |
106 |
|
|
| Cummins, Inc. |
| 8,440 |
| |
631 |
|
|
| Deere & Co. |
| 45,261 |
| |
446 |
|
|
| Rockwell Automation, Inc. |
| 21,096 |
| |
|
|
|
|
|
| 74,797 |
| |
|
|
|
| Media: 1.0% |
|
|
| |
550 |
|
|
| Clear Channel Communications, Inc. |
| 18,524 |
| |
5,364 |
| @ |
| Comcast Corp. |
| 161,135 |
| |
629 |
|
|
| Gannett Co., Inc. |
| 51,886 |
| |
74 |
|
|
| Knight-Ridder, Inc. |
| 5,039 |
| |
606 |
|
|
| McGraw-Hill Cos., Inc. |
| 53,164 |
| |
95 |
|
|
| Meredith Corp. |
| 5,008 |
| |
339 |
|
|
| New York Times Co. |
| 13,899 |
| |
10,457 |
| @ |
| Time Warner, Inc. |
| 185,193 |
| |
286 |
|
|
| Tribune Co. |
| 12,404 |
| |
300 |
| @ |
| Univision Communications, Inc. |
| 9,030 |
| |
1,595 |
|
|
| Viacom, Inc. |
| 55,347 |
| |
4,920 |
|
|
| Walt Disney Co. |
| 132,250 |
| |
|
|
|
|
|
| 702,879 |
| |
|
|
|
| Metal Fabricate/ Hardware: 0.0% |
|
|
| |
241 |
|
|
| Worthington Industries, Inc. |
| 5,184 |
| |
|
|
|
|
|
| 5,184 |
| |
See Accompanying Notes to Financial Statements
108
Shares |
|
|
|
|
| Value |
| |
|
|
|
| Mining: 0.0% |
|
|
| |
254 |
|
|
| Phelps Dodge Corp. |
| $ | 24,671 |
|
|
|
|
|
|
| 24,671 |
| |
|
|
|
| Miscellaneous Manufacturing: 2.0% |
|
|
| |
1,840 |
|
|
| 3M Co. |
| 146,446 |
| |
213 |
|
|
| Cooper Industries Ltd. |
| 14,124 |
| |
72 |
|
|
| Crane Co. |
| 2,179 |
| |
725 |
|
|
| Danaher Corp. |
| 41,238 |
| |
503 |
|
|
| Dover Corp. |
| 20,346 |
| |
657 |
|
|
| Eastman Kodak Co. |
| 21,490 |
| |
346 |
|
|
| Eaton Corp. |
| 23,320 |
| |
24,205 |
|
|
| General Electric Co. |
| 855,890 |
| |
2,059 |
|
|
| Honeywell Intl., Inc. |
| 72,744 |
| |
714 |
|
|
| Illinois Tool Works, Inc. |
| 67,280 |
| |
304 |
| @@ |
| Ingersoll-Rand Co. |
| 22,624 |
| |
215 |
|
|
| ITT Industries, Inc. |
| 18,301 |
| |
308 |
|
|
| Pall Corp. |
| 8,344 |
| |
337 |
|
|
| Textron, Inc. |
| 24,473 |
| |
4,619 |
| @@ |
| Tyco Intl. Ltd. |
| 156,907 |
| |
|
|
|
|
|
| 1,495,706 |
| |
|
|
|
| Office/Business Equipment: 0.1% |
|
|
| |
559 |
|
|
| Pitney Bowes, Inc. |
| 24,467 |
| |
1,794 |
| @ |
| Xerox Corp. |
| 27,485 |
| |
|
|
|
|
|
| 51,952 |
| |
|
|
|
| Oil and Gas: 2.9% |
|
|
| |
210 |
|
|
| Amerada Hess Corp. |
| 18,659 |
| |
677 |
|
|
| Anadarko Petroleum Corp. |
| 47,119 |
| |
608 |
|
|
| Apache Corp. |
| 32,868 |
| |
1,465 |
|
|
| Burlington Resources, Inc. |
| 67,991 |
| |
7,622 |
|
|
| ChevronTexaco Corp. |
| 416,160 |
| |
1,943 |
|
|
| ConocoPhillips |
| 176,794 |
| |
1,824 |
|
|
| Devon Energy Corp. |
| 75,550 |
| |
288 |
|
|
| EOG Resources, Inc. |
| 21,620 |
| |
18,327 |
|
|
| Exxon Mobil Corp. |
| 939,258 |
| |
365 |
|
|
| Kerr-McGee Corp. |
| 22,714 |
| |
826 |
|
|
| Marathon Oil Corp. |
| 32,577 |
| |
130 |
| @,@@ |
| Nabors Industries Ltd. |
| 6,760 |
| |
325 |
| @ |
| Noble Corp. |
| 15,746 |
| |
890 |
|
|
| Occidental Petroleum Corp. |
| 53,587 |
| |
262 |
|
|
| Sunoco, Inc. |
| 21,631 |
| |
650 |
| @ |
| Transocean, Inc. |
| 26,176 |
| |
648 |
|
|
| Unocal Corp. |
| 29,834 |
| |
764 |
|
|
| Valero Energy Corp. |
| 35,748 |
| |
|
|
|
|
|
| 2,040,792 |
| |
|
|
|
| Oil and Gas Services: 0.1% |
|
|
| |
613 |
|
|
| Baker Hughes, Inc. |
| 27,174 |
| |
362 |
|
|
| BJ Services Co. |
| 18,343 |
| |
950 |
|
|
| Halliburton Co. |
| 39,282 |
| |
|
|
|
|
|
| 84,799 |
| |
|
|
|
| Packaging and Containers: 0.1% |
|
|
| |
260 |
|
|
| Ball Corp. |
| 11,629 |
| |
275 |
|
|
| Bemis Co. |
| 7,656 |
| |
401 |
| @ |
| Pactiv Corp. |
| 9,965 |
| |
197 |
| @ |
| Sealed Air Corp. |
| 10,128 |
| |
|
|
|
|
|
| 39,378 |
| |
|
|
|
| Pharmaceuticals: 1.9% |
|
|
| |
3,717 |
|
|
| Abbott Laboratories |
| 155,965 |
| |
293 |
|
|
| Allergan, Inc. |
| 21,536 |
| |
275 |
|
|
| AmerisourceBergen Corp. |
| 16,209 |
| |
4,720 |
|
|
| Bristol-Myers Squibb Co. |
| 110,920 |
| |
898 |
|
|
| Cardinal Health, Inc. |
| 46,947 |
| |
1,791 |
| @ |
| Caremark Rx, Inc. |
| 64,046 |
| |
1,025 |
|
|
| Eli Lilly & Co. |
| 54,663 |
| |
190 |
| @ |
| Express Scripts, Inc. |
| 13,672 |
| |
859 |
| @ |
| Forest Laboratories, Inc. |
| 33,475 |
| |
1,024 |
| @ |
| Gilead Sciences, Inc. |
| 35,287 |
| |
335 |
| @ |
| Hospira, Inc. |
| 10,797 |
| |
574 |
| @ |
| King Pharmaceuticals, Inc. |
| 7,146 |
| |
624 |
| @ |
| Medco Health Solutions, Inc. |
| 23,537 |
| |
5,299 |
|
|
| Merck & Co., Inc. |
| 148,478 |
| |
17,356 |
|
|
| Pfizer, Inc. |
| 481,977 |
| |
3,550 |
|
|
| Schering-Plough Corp. |
| 63,368 |
| |
3,234 |
|
|
| Wyeth |
| 128,940 |
| |
|
|
|
|
|
| 1,416,963 |
| |
|
|
|
| Pipelines: 0.1% |
|
|
| |
1,140 |
| @ |
| Dynegy, Inc. |
| 6,441 |
| |
1,250 |
|
|
| El Paso Corp. |
| 13,050 |
| |
77 |
|
|
| Kinder Morgan, Inc. |
| 5,336 |
| |
1,229 |
|
|
| Williams Cos., Inc. |
| 20,488 |
| |
|
|
|
|
|
| 45,315 |
| |
|
|
|
| Real Estate Investment Trusts: 0.1% |
|
|
| |
400 |
|
|
| Equity Office Properties Trust |
| 10,980 |
| |
414 |
|
|
| ProLogis |
| 16,655 |
| |
496 |
|
|
| Simon Property Group, Inc. |
| 30,792 |
| |
|
|
|
|
|
| 58,427 |
| |
|
|
|
| Retail: 2.7% |
|
|
| |
678 |
| @ |
| Bed Bath & Beyond, Inc. |
| 27,071 |
| |
763 |
|
|
| Best Buy Co., Inc. |
| 43,018 |
| |
643 |
|
|
| Circuit City Stores, Inc. |
| 10,024 |
| |
1,886 |
|
|
| Costco Wholesale Corp. |
| 91,660 |
| |
806 |
|
|
| CVS Corp. |
| 36,568 |
| |
361 |
|
|
| Darden Restaurants, Inc. |
| 9,841 |
| |
204 |
|
|
| Dillard’s, Inc. |
| 5,137 |
| |
419 |
|
|
| Federated Department Stores, Inc. |
| 22,961 |
| |
2,568 |
|
|
| Gap, Inc. |
| 56,111 |
| |
8,502 |
|
|
| Home Depot, Inc. |
| 354,959 |
| |
1,192 |
|
|
| J.C. Penney Co., Inc. Holding Co. |
| 46,011 |
| |
321 |
| @ |
| Kohl’s Corp. |
| 14,817 |
| |
1,482 |
|
|
| Limited Brands, Inc. |
| 36,220 |
| |
1,881 |
|
|
| Lowe’s Cos., Inc. |
| 104,076 |
| |
633 |
|
|
| May Department Stores Co. |
| 17,800 |
| |
2,982 |
|
|
| McDonald’s Corp. |
| 91,667 |
| |
299 |
|
|
| Nordstrom, Inc. |
| 13,081 |
| |
762 |
| @ |
| Office Depot, Inc. |
| 12,497 |
| |
297 |
|
|
| RadioShack Corp. |
| 9,376 |
| |
1,525 |
|
|
| Staples, Inc. |
| 48,663 |
| |
896 |
| @ |
| Starbucks Corp. |
| 50,409 |
| |
2,151 |
|
|
| Target Corp. |
| 110,174 |
| |
1,180 |
|
|
| TJX Cos., Inc. |
| 27,777 |
| |
465 |
| @ |
| Toys R US, Inc. |
| 8,993 |
| |
9,720 |
|
|
| Wal-Mart Stores, Inc. |
| 506,022 |
| |
3,353 |
|
|
| Walgreen Co. |
| 128,018 |
| |
389 |
|
|
| Wendy’s Intl., Inc. |
| 13,876 |
| |
546 |
|
|
| Yum! Brands, Inc. |
| 24,788 |
| |
|
|
|
|
|
| 1,921,615 |
| |
|
|
|
| Savings and Loans: 0.2% |
|
|
| |
361 |
|
|
| Golden West Financial Corp. |
| 43,046 |
| |
304 |
|
|
| Sovereign Bancorp, Inc. |
| 6,642 |
| |
2,081 |
|
|
| Washington Mutual, Inc. |
| 84,718 |
| |
|
|
|
|
|
| 134,406 |
| |
|
|
|
| Semiconductors: 0.7% |
|
|
| |
690 |
| @ |
| Altera Corp. |
| 15,649 |
| |
849 |
|
|
| Analog Devices, Inc. |
| 31,371 |
| |
3,482 |
| @ |
| Applied Materials, Inc. |
| 57,940 |
| |
14,711 |
|
|
| Intel Corp. |
| 328,791 |
| |
433 |
| @ |
| KLA-Tencor Corp. |
| 19,511 |
| |
723 |
|
|
| Linear Technology Corp. |
| 27,590 |
| |
262 |
|
|
| Maxim Integrated Products, Inc. |
| 10,732 |
| |
807 |
| @ |
| National Semiconductor Corp. |
| 12,476 |
| |
See Accompanying Notes to Financial Statements
109
Shares |
|
|
|
|
| Value |
| |
|
|
|
| Semiconductors (continued) |
|
|
| |
83 |
| @ |
| Qlogic Corp. |
| $ | 2,854 |
|
1,333 |
|
|
| Texas Instruments, Inc. |
| 32,232 |
| |
|
|
|
|
|
| 539,146 |
| |
|
|
|
| Software: 1.8% |
|
|
| |
527 |
|
|
| Adobe Systems, Inc. |
| 31,915 |
| |
336 |
|
|
| Autodesk, Inc. |
| 21,978 |
| |
1,413 |
|
|
| Automatic Data Processing, Inc. |
| 64,334 |
| |
714 |
| @ |
| BMC Software, Inc. |
| 13,266 |
| |
446 |
| @ |
| Citrix Systems, Inc. |
| 10,530 |
| |
1,131 |
|
|
| Computer Associates Intl., Inc. |
| 34,529 |
| |
1,259 |
| @ |
| Compuware Corp. |
| 7,264 |
| |
278 |
| @ |
| Electronic Arts, Inc. |
| 13,594 |
| |
2,069 |
|
|
| First Data Corp. |
| 85,015 |
| |
489 |
| @ |
| Fiserv, Inc. |
| 18,831 |
| |
687 |
|
|
| IMS Health, Inc. |
| 15,506 |
| |
428 |
| @ |
| Intuit, Inc. |
| 17,908 |
| |
24,887 |
|
|
| Microsoft Corp. |
| 667,221 |
| |
747 |
| @ |
| Novell, Inc. |
| 4,557 |
| |
20,196 |
| @ |
| Oracle Corp. |
| 255,682 |
| |
721 |
| @ |
| Parametric Technology Corp. |
| 4,218 |
| |
858 |
| @ |
| PeopleSoft, Inc. |
| 20,257 |
| |
1,317 |
| @ |
| Siebel Systems, Inc. |
| 13,275 |
| |
953 |
| @ |
| Veritas Software Corp. |
| 20,871 |
| |
|
|
|
|
|
| 1,320,751 |
| |
|
|
|
| Telecommunications: 2.1% |
|
|
| |
847 |
|
|
| Alltel Corp. |
| 48,016 |
| |
737 |
|
|
| AT&T Corp. |
| 13,487 |
| |
1,083 |
| @ |
| Avaya, Inc. |
| 17,783 |
| |
4,446 |
|
|
| BellSouth Corp. |
| 119,242 |
| |
330 |
|
|
| CenturyTel, Inc. |
| 10,864 |
| |
15,501 |
| @ |
| Cisco Systems, Inc. |
| 290,023 |
| |
836 |
|
|
| Citizens Communications Co. |
| 11,955 |
| |
450 |
| @ |
| Comverse Technology, Inc. |
| 9,572 |
| |
3,046 |
| @ |
| Corning, Inc. |
| 38,319 |
| |
9,765 |
| @ |
| Lucent Technologies, Inc. |
| 38,376 |
| |
7,609 |
|
|
| Motorola, Inc. |
| 146,549 |
| |
2,333 |
| @ |
| Nextel Communications, Inc. |
| 66,397 |
| |
3,894 |
|
|
| Qualcomm, Inc. |
| 162,068 |
| |
3,750 |
| @ |
| Qwest Communications Intl., Inc. |
| 15,000 |
| |
7,593 |
|
|
| SBC Communications, Inc. |
| 191,116 |
| |
315 |
|
|
| Scientific-Atlanta, Inc. |
| 9,330 |
| |
3,350 |
|
|
| Sprint Corp. |
| 76,414 |
| |
1,157 |
| @ |
| Tellabs, Inc. |
| 9,892 |
| |
6,295 |
|
|
| Verizon Communications, Inc. |
| 259,543 |
| |
|
|
|
|
|
| 1,533,946 |
| |
|
|
|
| Textiles: 0.0% |
|
|
| |
411 |
|
|
| Cintas Corp. |
| 18,380 |
| |
|
|
|
|
|
| 18,380 |
| |
|
|
|
| Toys/ Games/ Hobbies: 0.0% |
|
|
| |
545 |
|
|
| Hasbro, Inc. |
| 10,371 |
| |
976 |
|
|
| Mattel, Inc. |
| 18,496 |
| |
|
|
|
|
|
| 28,867 |
| |
|
|
|
| Transportation: 0.6% |
|
|
| |
872 |
|
|
| Burlington Northern Santa Fe Corp. |
| 39,275 |
| |
510 |
|
|
| CSX Corp. |
| 19,446 |
| |
935 |
|
|
| FedEx Corp. |
| 88,853 |
| |
1,175 |
|
|
| Norfolk Southern Corp. |
| 40,338 |
| |
165 |
|
|
| Ryder System, Inc. |
| 8,851 |
| |
250 |
|
|
| Union Pacific Corp. |
| 15,860 |
| |
2,562 |
|
|
| United Parcel Service, Inc. |
| 215,592 |
| |
|
|
|
|
|
| 428,215 |
| |
|
|
|
| Total Common Stock |
| 26,049,143 |
| |
Principal |
|
|
|
|
| Value |
| |||||
U.S. TREASURY OBLIGATIONS: 64.3% |
|
|
| |||||||||
|
|
|
| U.S. Treasury STRIP: 64.3% |
|
|
| |||||
$ | 56,290,000 |
|
|
| 3.700%, due 08/15/09 |
| $ | 47,370,624 |
| |||
|
|
|
| Total U.S. Treasury Obligations |
| 47,370,624 |
| |||||
|
|
|
| Total Long-Term Investments |
| 73,419,767 |
| |||||
|
|
|
|
|
|
|
| |||||
SHORT-TERM INVESTMENTS: 0.5% |
|
|
| |||||||||
|
|
|
| Repurchase Agreement: 0.5% |
|
|
| |||||
378,000 |
|
|
| Morgan Stanley Repurchase Agreement dated 11/30/04, 2.071%, due 12/01/04, $3,378,022 to be received upon repurchase (Collateralized by $1,085,000 Federal National Mortgage Association, 4.625%, Market Value plus accrued interest $1,067,342, due 05/01/13) |
| 378,000 |
| |||||
|
|
|
| Total Short-Term Investments |
| 378,000 |
| |||||
|
|
|
|
|
|
|
| |||||
Total Investments In |
| 100.2 | % | $ | 73,797,767 |
| ||||||
Other Assets and |
| (0.2 | ) | (122,591 | ) | |||||||
Net Assets |
| 100.0 | % | $ | 73,675,176 |
| ||||||
@ |
| Non-income producing security |
@@ |
| Foreign issuer |
STRIP |
| Separate Trading of Registered Interest and Principal of Securities |
* |
| Cost for federal income tax purposes is $72,687,152. Net unrealized appreciation consists of: |
|
|
|
| ||
Gross Unrealized Appreciation |
| $ | 1,798,180 |
| |
Gross Unrealized Depreciation |
| (687,565 | ) | ||
Net Unrealized Appreciation |
| $ | 1,110,615 |
| |
See Accompanying Notes to Financial Statements
110
ING PRINCIPAL PROTECTION FUND XI
PORTFOLIO OF INVESTMENTS
AS OF NOVEMBER 30, 2004 (UNAUDITED)
Shares |
|
|
|
|
| Value |
| |
COMMON STOCK: 31.4% |
|
|
| |||||
|
|
|
| Advertising: 0.0% |
|
|
| |
233 |
| @ |
| Interpublic Group of Cos., Inc. |
| $ | 2,892 |
|
237 |
|
|
| Omnicom Group, Inc. |
| 19,197 |
| |
|
|
|
|
|
| 22,089 |
| |
|
|
|
| Aerospace/Defense: 0.7% |
|
|
| |
1,849 |
|
|
| Boeing Co. |
| 99,051 |
| |
447 |
|
|
| General Dynamics Corp. |
| 48,437 |
| |
137 |
|
|
| Goodrich Corp. |
| 4,350 |
| |
586 |
|
|
| Lockheed Martin Corp. |
| 35,652 |
| |
452 |
|
|
| Northrop Grumman Corp. |
| 25,461 |
| |
989 |
|
|
| Raytheon Co. |
| 39,896 |
| |
215 |
|
|
| Rockwell Collins, Inc. |
| 8,570 |
| |
669 |
|
|
| United Technologies Corp. |
| 65,281 |
| |
|
|
|
|
|
| 326,698 |
| |
|
|
|
| Agriculture: 0.5% |
|
|
| |
2,519 |
|
|
| Altria Group, Inc. |
| 144,818 |
| |
822 |
|
|
| Archer-Daniels-Midland Co. |
| 17,427 |
| |
367 |
|
|
| Monsanto Co. |
| 16,889 |
| |
188 |
|
|
| Reynolds American, Inc. |
| 14,218 |
| |
377 |
|
|
| UST, Inc. |
| 16,599 |
| |
|
|
|
|
|
| 209,951 |
| |
|
|
|
| Apparel: 0.2% |
|
|
| |
393 |
| @ |
| Coach, Inc. |
| 19,587 |
| |
162 |
|
|
| Jones Apparel Group, Inc. |
| 5,756 |
| |
183 |
|
|
| Liz Claiborne, Inc. |
| 7,516 |
| |
588 |
|
|
| Nike, Inc. |
| 49,781 |
| |
72 |
|
|
| Reebok Intl. Ltd. |
| 2,799 |
| |
264 |
|
|
| VF Corp. |
| 14,253 |
| |
|
|
|
|
|
| 99,692 |
| |
|
|
|
| Auto Manufacturers: 0.2% |
|
|
| |
4,043 |
|
|
| Ford Motor Co. |
| 57,330 |
| |
748 |
|
|
| General Motors Corp. |
| 28,865 |
| |
372 |
| @ |
| PACCAR, Inc. |
| 29,053 |
| |
|
|
|
|
|
| 115,248 |
| |
|
|
|
| Auto Parts and Equipment: 0.0% |
|
|
| |
171 |
|
|
| Dana Corp. |
| 2,796 |
| |
323 |
| @ |
| Goodyear Tire & Rubber Co. |
| 4,076 |
| |
252 |
|
|
| Johnson Controls, Inc. |
| 15,473 |
| |
|
|
|
|
|
| 22,345 |
| |
|
|
|
| Banks: 2.0% |
|
|
| |
432 |
|
|
| AmSouth Bancorporation |
| 11,202 |
| |
5,295 |
|
|
| Bank of America Corp. |
| 245,000 |
| |
732 |
|
|
| BB&T Corp. |
| 31,073 |
| |
303 |
|
|
| Comerica, Inc. |
| 18,635 |
| |
294 |
|
|
| Fifth Third Bancorp |
| 14,806 |
| |
162 |
|
|
| First Horizon National Corp. |
| 7,079 |
| |
290 |
|
|
| Huntington Bancshares, Inc. |
| 7,035 |
| |
731 |
|
|
| KeyCorp |
| 24,335 |
| |
147 |
|
|
| M & T Bank Corp. |
| 15,495 |
| |
298 |
|
|
| Marshall & Ilsley Corp. |
| 12,424 |
| |
567 |
|
|
| Mellon Financial Corp. |
| 16,568 |
| |
1,151 |
|
|
| National City Corp. |
| 42,679 |
| |
249 |
|
|
| North Fork Bancorporation, Inc. |
| 7,171 |
| |
277 |
|
|
| Northern Trust Corp. |
| 13,030 |
| |
361 |
|
|
| PNC Financial Services Group, Inc. |
| 19,638 |
| |
599 |
|
|
| Regions Financial Corp. |
| 20,959 |
| |
175 |
|
|
| State Street Corp |
| 7,798 |
| |
471 |
|
|
| SunTrust Banks, Inc. |
| 33,582 |
| |
164 |
|
|
| Synovus Financial Corp. |
| 4,428 |
| |
397 |
|
|
| The Bank of New York Co., Inc. |
| 13,065 |
| |
2,455 |
|
|
| U.S. Bancorp |
| 72,742 |
| |
2,797 |
|
|
| Wachovia Corp. |
| 144,745 |
| |
2,179 |
|
|
| Wells Fargo & Co. |
| 134,597 |
| |
126 |
|
|
| Zions Bancorporation |
| 8,379 |
| |
|
|
|
|
|
| 926,465 |
| |
|
|
|
| Beverages: 0.7% |
|
|
| |
1,029 |
|
|
| Anheuser-Busch Cos., Inc. |
| 51,543 |
| |
147 |
|
|
| Brown-Forman Corp. |
| 7,059 |
| |
3,133 |
|
|
| Coca-Cola Co. |
| 123,158 |
| |
598 |
|
|
| Coca-Cola Enterprises, Inc. |
| 12,438 |
| |
344 |
|
|
| Pepsi Bottling Group, Inc. |
| 9,639 |
| |
2,212 |
|
|
| PepsiCo, Inc. |
| 110,401 |
| |
|
|
|
|
|
| 314,238 |
| |
|
|
|
| Biotechnology: 0.3% |
|
|
| |
1,634 |
| @ |
| Amgen, Inc. |
| 98,106 |
| |
447 |
| @ |
| Biogen Idec, Inc. |
| 26,230 |
| |
307 |
| @ |
| Genzyme Corp. |
| 17,195 |
| |
130 |
| @ |
| MedImmune, Inc. |
| 3,458 |
| |
59 |
| @ |
| Millipore Corp. |
| 2,874 |
| |
|
|
|
|
|
| 147,863 |
| |
|
|
|
| Building Materials: 0.1% |
|
|
| |
289 |
| @ |
| American Standard Cos., Inc. |
| 11,254 |
| |
550 |
|
|
| Masco Corp. |
| 19,398 |
| |
143 |
|
|
| Vulcan Materials Co. |
| 7,415 |
| |
|
|
|
|
|
| 38,067 |
| |
|
|
|
| Chemicals: 0.5% |
|
|
| |
296 |
|
|
| Air Products & Chemicals, Inc. |
| 16,946 |
| |
90 |
|
|
| Ashland, Inc. |
| 5,324 |
| |
1,293 |
|
|
| Dow Chemical Co. |
| 65,257 |
| |
1,356 |
|
|
| E.I. du Pont de Nemours & Co. |
| 61,453 |
| |
118 |
|
|
| Eastman Chemical Co. |
| 6,417 |
| |
138 |
|
|
| Ecolab, Inc. |
| 4,827 |
| |
147 |
|
|
| Engelhard Corp. |
| 4,394 |
| |
146 |
|
|
| International Flavors & Fragrances, Inc. |
| 5,913 |
| |
382 |
|
|
| PPG Industries, Inc. |
| 25,774 |
| |
440 |
|
|
| Praxair, Inc. |
| 19,756 |
| |
307 |
|
|
| Rohm & Haas Co. |
| 13,536 |
| |
321 |
|
|
| Sherwin-Williams Co. |
| 14,317 |
| |
102 |
|
|
| Sigma-Aldrich Corp. |
| 6,092 |
| |
|
|
|
|
|
| 250,006 |
| |
|
|
|
| Commercial Services: 0.3% |
|
|
| |
244 |
| @ |
| Apollo Group, Inc. |
| 19,447 |
| |
1,378 |
|
|
| Cendant Corp. |
| 31,238 |
| |
71 |
|
|
| Deluxe Corp. |
| 2,807 |
| |
156 |
|
|
| Equifax, Inc. |
| 4,309 |
| |
305 |
|
|
| H&R Block, Inc. |
| 14,549 |
| |
390 |
|
|
| McKesson Corp. |
| 11,525 |
| |
191 |
|
|
| Moody’s Corp. |
| 15,423 |
| |
468 |
|
|
| Paychex, Inc. |
| 15,519 |
| |
287 |
|
|
| R.R. Donnelley & Sons Co. |
| 9,959 |
| |
201 |
|
|
| Robert Half Intl., Inc. |
| 5,433 |
| |
|
|
|
|
|
| 130,209 |
| |
|
|
|
| Computers: 1.6% |
|
|
| |
166 |
| @ |
| Affiliated Computer Services, Inc. |
| 9,824 |
| |
879 |
| @ |
| Apple Computer, Inc. |
| 58,937 |
| |
234 |
| @ |
| Computer Sciences Corp. |
| 12,659 |
| |
4,381 |
| @ |
| Dell, Inc. |
| 177,518 |
| |
684 |
|
|
| Electronic Data Systems Corp. |
| 15,356 |
| |
2,941 |
| @ |
| EMC Corp. |
| 39,468 |
| |
484 |
| @ |
| Gateway, Inc. |
| 3,296 |
| |
3,790 |
|
|
| Hewlett-Packard Co. |
| 75,800 |
| |
2,927 |
|
|
| International Business Machines Corp. |
| 275,841 |
| |
169 |
| @ |
| Lexmark Intl., Inc. |
| 14,348 |
| |
124 |
| @ |
| NCR Corp. |
| 7,407 |
| |
384 |
| @ |
| Network Appliance, Inc. |
| 11,581 |
| |
See Accompanying Notes to Financial Statements
111
Shares |
|
|
|
|
| Value |
| |
|
|
|
| Computers (continued) |
|
|
| |
6,759 |
| @ |
| Sun Microsystems, Inc. |
| $ | 37,512 |
|
377 |
| @ |
| Sungard Data Systems, Inc. |
| 9,994 |
| |
381 |
| @ |
| Unisys Corp. |
| 4,378 |
| |
|
|
|
|
|
| 753,919 |
| |
|
|
|
| Cosmetics/Personal Care: 1.1% |
|
|
| |
123 |
|
|
| Alberto-Culver Co. |
| 5,695 |
| |
617 |
|
|
| Avon Products, Inc. |
| 23,162 |
| |
669 |
|
|
| Colgate-Palmolive Co. |
| 30,767 |
| |
2,199 |
|
|
| Gillette Co. |
| 95,635 |
| |
884 |
|
|
| Kimberly-Clark Corp. |
| 56,231 |
| |
5,617 |
|
|
| Procter & Gamble Co. |
| 300,397 |
| |
|
|
|
|
|
| 511,887 |
| |
|
|
|
| Distribution/Wholesale: 0.0% |
|
|
| |
228 |
|
|
| Genuine Parts Co. |
| 9,897 |
| |
198 |
|
|
| W.W. Grainger, Inc. |
| 12,249 |
| |
|
|
|
|
|
| 22,146 |
| |
|
|
|
| Diversified Financial Services: 2.2% |
|
|
| |
1,645 |
|
|
| American Express Co. |
| 91,643 |
| |
130 |
|
|
| Bear Stearns Cos., Inc. |
| 12,685 |
| |
306 |
|
|
| Capital One Financial Corp. |
| 24,045 |
| |
378 |
|
|
| CIT Group, Inc. |
| 16,160 |
| |
6,724 |
|
|
| Citigroup, Inc. |
| 300,898 |
| |
1,168 |
|
|
| Countrywide Financial Corp. |
| 38,789 |
| |
494 |
| @ |
| E*TRADE Financial Corp. |
| 6,847 |
| |
1,271 |
|
|
| Fannie Mae |
| 87,318 |
| |
57 |
|
|
| Federated Investors, Inc. |
| 1,677 |
| |
313 |
|
|
| Franklin Resources, Inc. |
| 20,542 |
| |
887 |
|
|
| Freddie Mac |
| 60,547 |
| |
623 |
|
|
| Goldman Sachs Group, Inc. |
| 65,265 |
| |
1,867 |
|
|
| J.P. Morgan Chase & Co. |
| 70,293 |
| |
345 |
|
|
| Janus Capital Group, Inc. |
| 5,710 |
| |
357 |
|
|
| Lehman Brothers Holdings, Inc. |
| 29,909 |
| |
1,647 |
|
|
| MBNA Corp. |
| 43,744 |
| |
1,211 |
|
|
| Merrill Lynch & Co., Inc. |
| 67,465 |
| |
565 |
|
|
| Morgan Stanley |
| 28,674 |
| |
352 |
| @ |
| Providian Financial Corp. |
| 5,650 |
| |
551 |
|
|
| SLM Corp. |
| 28,195 |
| |
|
|
|
|
|
| 1,006,056 |
| |
|
|
|
| Electric: 0.8% |
|
|
| |
808 |
| @ |
| AES Corp. |
| 9,890 |
| |
144 |
| @ |
| Allegheny Energy, Inc. |
| 2,756 |
| |
106 |
|
|
| Ameren Corp. |
| 5,133 |
| |
539 |
|
|
| American Electric Power Co., Inc. |
| 18,418 |
| |
96 |
|
|
| Cinergy Corp. |
| 3,973 |
| |
317 |
|
|
| Consolidated Edison, Inc. |
| 13,900 |
| |
232 |
|
|
| Constellation Energy Group, Inc. |
| 10,138 |
| |
171 |
|
|
| Dominion Resources, Inc. |
| 11,195 |
| |
224 |
|
|
| DTE Energy Co. |
| 9,829 |
| |
1,680 |
|
|
| Duke Energy Corp. |
| 42,469 |
| |
544 |
|
|
| Edison Intl. |
| 17,354 |
| |
301 |
|
|
| Entergy Corp. |
| 19,511 |
| |
863 |
|
|
| Exelon Corp. |
| 35,995 |
| |
433 |
|
|
| FirstEnergy Corp. |
| 18,286 |
| |
236 |
|
|
| FPL Group, Inc. |
| 16,598 |
| |
502 |
| @ |
| PG&E Corp. |
| 16,697 |
| |
127 |
|
|
| Pinnacle West Capital Corp. |
| 5,613 |
| |
328 |
|
|
| PPL Corp. |
| 17,040 |
| |
322 |
|
|
| Public Service Enterprise Group, Inc. |
| 14,165 |
| |
954 |
|
|
| Southern Co. |
| 31,282 |
| |
285 |
|
|
| TECO Energy, Inc. |
| 4,264 |
| |
534 |
|
|
| TXU Corp. |
| 33,546 |
| |
550 |
|
|
| Xcel Energy, Inc. |
| 9,933 |
| |
|
|
|
|
|
| 367,985 |
| |
|
|
|
| Electrical Components and Equipment: 0.1% |
|
|
| |
737 |
|
|
| Emerson Electric Co. |
| 49,246 |
| |
|
|
|
|
|
| 49,246 |
| |
|
|
|
| Electronics: 0.2% |
|
|
| |
606 |
| @ |
| Agilent Technologies, Inc. |
| 13,872 |
| |
278 |
|
|
| Applera Corp. — Applied Biosystems Group |
| 5,699 |
| |
159 |
| @ |
| Fisher Scientific Intl. |
| 8,990 |
| |
274 |
| @ |
| Jabil Circuit, Inc. |
| 6,866 |
| |
153 |
|
|
| Parker Hannifin Corp. |
| 11,444 |
| |
195 |
|
|
| PerkinElmer, Inc. |
| 4,159 |
| |
249 |
| @ |
| Sanmina-SCI Corp. |
| 2,199 |
| |
461 |
| @ |
| Solectron Corp. |
| 2,881 |
| |
130 |
|
|
| Tektronix, Inc. |
| 4,078 |
| |
321 |
| @ |
| Thermo Electron Corp. |
| 9,710 |
| |
154 |
| @ |
| Waters Corp. |
| 7,186 |
| |
|
|
|
|
|
| 77,084 |
| |
|
|
|
| Engineering and Construction: 0.0% |
|
|
| |
122 |
|
|
| Fluor Corp. |
| 6,332 |
| |
|
|
|
|
|
| 6,332 |
| |
|
|
|
| Entertainment: 0.0% |
|
|
| |
441 |
|
|
| International Game Technology |
| 15,589 |
| |
|
|
|
|
|
| 15,589 |
| |
|
|
|
| Environmental Control: 0.0% |
|
|
| |
769 |
|
|
| Waste Management, Inc. |
| 22,924 |
| |
|
|
|
|
|
| 22,924 |
| |
|
|
|
| Food: 0.4% |
|
|
| |
495 |
|
|
| Albertson’s, Inc. |
| 12,524 |
| |
206 |
|
|
| Campbell Soup Co. |
| 5,877 |
| |
669 |
|
|
| ConAgra Foods, Inc. |
| 18,096 |
| |
500 |
|
|
| General Mills, Inc. |
| 22,745 |
| |
450 |
|
|
| H.J. Heinz Co. |
| 16,722 |
| |
327 |
|
|
| Hershey Foods Corp. |
| 16,939 |
| |
541 |
|
|
| Kellogg Co. |
| 23,642 |
| |
378 |
| @ |
| Kroger Co. |
| 6,116 |
| |
192 |
|
|
| McCormick & Co., Inc. |
| 6,998 |
| |
227 |
| @ |
| Safeway, Inc. |
| 4,377 |
| |
1,047 |
|
|
| Sara Lee Corp. |
| 24,584 |
| |
300 |
|
|
| SUPERVALU, Inc. |
| 9,477 |
| |
393 |
|
|
| Wm. Wrigley Jr. Co. |
| 27,037 |
| |
|
|
|
|
|
| 195,134 |
| |
|
|
|
| Forest Products and Paper: 0.2% |
|
|
| |
341 |
|
|
| Georgia-Pacific Corp. |
| 12,484 |
| |
664 |
|
|
| International Paper Co. |
| 27,569 |
| |
203 |
|
|
| Louisiana-Pacific Corp. |
| 4,967 |
| |
272 |
|
|
| MeadWestvaco Corp. |
| 9,153 |
| |
227 |
|
|
| Plum Creek Timber Co., Inc. |
| 8,399 |
| |
98 |
|
|
| Temple-Inland, Inc. |
| 5,840 |
| |
430 |
|
|
| Weyerhaeuser Co. |
| 28,380 |
| |
|
|
|
|
|
| 96,792 |
| |
|
|
|
| Gas: 0.1% |
|
|
| |
212 |
|
|
| KeySpan Corp. |
| 8,378 |
| |
75 |
|
|
| Nicor, Inc. |
| 2,768 |
| |
417 |
|
|
| Sempra Energy |
| 15,420 |
| |
|
|
|
|
|
| 26,566 |
| |
|
|
|
| Hand/Machine Tools: 0.1% |
|
|
| |
172 |
|
|
| Black & Decker Corp. |
| 14,463 |
| |
92 |
|
|
| Snap-On, Inc. |
| 2,908 |
| |
159 |
|
|
| Stanley Works |
| 7,435 |
| |
|
|
|
|
|
| 24,806 |
| |
See Accompanying Notes to Financial Statements
112
Shares |
|
|
|
|
| Value |
| |
|
|
|
| Healthcare — Products: 1.3% |
|
|
| |
70 |
|
|
| Bausch & Lomb, Inc. |
| $ | 4,122 |
|
802 |
|
|
| Baxter Intl., Inc. |
| 25,383 |
| |
456 |
|
|
| Becton Dickinson & Co. |
| 24,980 |
| |
330 |
|
|
| Biomet, Inc. |
| 15,797 |
| |
1,086 |
| @ |
| Boston Scientific Corp. |
| 37,804 |
| |
143 |
|
|
| C.R. Bard, Inc. |
| 8,567 |
| |
415 |
|
|
| Guidant Corp. |
| 26,904 |
| |
5,217 |
|
|
| Johnson & Johnson |
| 314,689 |
| |
1,572 |
|
|
| Medtronic, Inc. |
| 75,535 |
| |
446 |
| @ |
| St. Jude Medical, Inc. |
| 17,010 |
| |
206 |
|
|
| Stryker Corp. |
| 9,062 |
| |
321 |
| @ |
| Zimmer Holdings, Inc. |
| 26,194 |
| |
|
|
|
|
|
| 586,047 |
| |
|
|
|
| Healthcare — Services: 0.6% |
|
|
| |
331 |
|
|
| Aetna, Inc. |
| 39,227 |
| |
308 |
| @ |
| Humana, Inc. |
| 7,645 |
| |
181 |
| @ |
| Laboratory Corp. Of America Holdings |
| 8,679 |
| |
125 |
|
|
| Manor Care, Inc. |
| 4,306 |
| |
56 |
|
|
| Quest Diagnostics, Inc. |
| 5,250 |
| |
1,453 |
|
|
| UnitedHealth Group, Inc. |
| 120,381 |
| |
344 |
| @ |
| WellPoint Health Networks, Inc. |
| 43,034 |
| |
299 |
| @ |
| WellPoint, Inc. |
| 30,298 |
| |
|
|
|
|
|
| 258,820 |
| |
|
|
|
| Home Builders: 0.0% |
|
|
| |
153 |
|
|
| Centex Corp. |
| 8,028 |
| |
|
|
|
|
|
| 8,028 |
| |
|
|
|
| Home Furnishings: 0.0% |
|
|
| |
241 |
|
|
| Leggett & Platt, Inc. |
| 7,194 |
| |
85 |
|
|
| Whirlpool Corp. |
| 5,487 |
| |
|
|
|
|
|
| 12,681 |
| |
|
|
|
| Household Products/Wares: 0.1% |
|
|
| |
147 |
|
|
| Avery Dennison Corp. |
| 8,623 |
| |
366 |
|
|
| Clorox Co. |
| 20,174 |
| |
182 |
|
|
| Fortune Brands, Inc. |
| 14,283 |
| |
|
|
|
|
|
| 43,080 |
| |
|
|
|
| Housewares: 0.0% |
|
|
| |
358 |
|
|
| Newell Rubbermaid, Inc. |
| 8,263 |
| |
|
|
|
|
|
| 8,263 |
| |
|
|
|
| Insurance: 1.8% |
|
|
| |
495 |
| @@ |
| ACE Ltd. |
| 20,008 |
| |
647 |
|
|
| AFLAC, Inc. |
| 24,340 |
| |
1,213 |
|
|
| Allstate Corp. |
| 61,257 |
| |
142 |
|
|
| AMBAC Financial Group, Inc. |
| 11,549 |
| |
5,732 |
|
|
| American International Group, Inc. |
| 363,122 |
| |
553 |
|
|
| AON Corp. |
| 11,679 |
| |
425 |
|
|
| Chubb Corp. |
| 32,389 |
| |
314 |
|
|
| CIGNA Corp. |
| 21,986 |
| |
226 |
|
|
| Cincinnati Financial Corp. |
| 10,125 |
| |
383 |
|
|
| Hartford Financial Services Group, Inc. |
| 24,512 |
| |
171 |
|
|
| Jefferson-Pilot Corp. |
| 8,411 |
| |
288 |
|
|
| Lincoln National Corp. |
| 13,254 |
| |
316 |
|
|
| Loews Corp. |
| 22,092 |
| |
669 |
|
|
| Marsh & McLennan Cos., Inc. |
| 19,127 |
| |
183 |
|
|
| MBIA, Inc. |
| 10,973 |
| |
1,296 |
|
|
| MetLife, Inc. |
| 50,544 |
| |
125 |
|
|
| MGIC Investment Corp. |
| 8,500 |
| |
403 |
|
|
| Principal Financial Group |
| 15,185 |
| |
258 |
|
|
| Progressive Corp. |
| 23,475 |
| |
1,133 |
|
|
| Prudential Financial, Inc. |
| 55,460 |
| |
300 |
|
|
| Safeco Corp. |
| 14,541 |
| |
152 |
|
|
| Torchmark Corp. |
| 8,346 |
| |
403 |
|
|
| UnumProvident Corp. |
| 6,275 |
| |
171 |
| @@ |
| XL Capital Ltd. |
| 12,887 |
| |
|
|
|
|
|
| 850,037 |
| |
|
|
|
| Internet: 0.4% |
|
|
| |
843 |
| @ |
| eBay, Inc. |
| 94,796 |
| |
669 |
| @ |
| Symantec Corp. |
| 42,689 |
| |
1,765 |
| @ |
| Yahoo!, Inc. |
| 66,399 |
| |
|
|
|
|
|
| 203,884 |
| |
|
|
|
| Iron/Steel: 0.1% |
|
|
| |
143 |
|
|
| Allegheny Technologies Inc |
| 3,146 |
| |
205 |
|
|
| Nucor Corp. |
| 10,845 |
| |
276 |
|
|
| United States Steel Corp. |
| 14,451 |
| |
|
|
|
|
|
| 28,442 |
| |
|
|
|
| Leisure Time: 0.2% |
|
|
| |
158 |
|
|
| Brunswick Corp. |
| 7,714 |
| |
825 |
|
|
| Carnival Corp. |
| 43,733 |
| |
395 |
|
|
| Harley-Davidson, Inc. |
| 22,839 |
| |
253 |
|
|
| Sabre Holdings Corp. |
| 5,839 |
| |
|
|
|
|
|
| 80,125 |
| |
|
|
|
| Lodging: 0.1% |
|
|
| |
141 |
|
|
| Harrah’s Entertainment, Inc. |
| 8,657 |
| |
486 |
|
|
| Hilton Hotels Corp. |
| 10,041 |
| |
301 |
|
|
| Marriott Intl., Inc. |
| 17,112 |
| |
283 |
|
|
| Starwood Hotels & Resorts Worldwide, Inc. |
| 14,798 |
| |
|
|
|
|
|
| 50,608 |
| |
|
|
|
| Machinery — Construction and Mining: 0.0% |
|
|
| |
174 |
|
|
| Caterpillar, Inc. |
| 15,930 |
| |
|
|
|
|
|
| 15,930 |
| |
|
|
|
| Machinery — Diversified: 0.1% |
|
|
| |
54 |
| �� |
| Cummins, Inc. |
| 4,299 |
| |
309 |
|
|
| Deere & Co. |
| 22,165 |
| |
251 |
|
|
| Rockwell Automation, Inc. |
| 11,872 |
| |
|
|
|
|
|
| 38,336 |
| |
|
|
|
| Media: 0.8% |
|
|
| |
295 |
|
|
| Clear Channel Communications, Inc. |
| 9,936 |
| |
2,910 |
| @ |
| Comcast Corp. |
| 87,416 |
| |
350 |
|
|
| Gannett Co., Inc. |
| 28,872 |
| |
102 |
|
|
| Knight-Ridder, Inc. |
| 6,945 |
| |
334 |
|
|
| McGraw-Hill Cos., Inc. |
| 29,302 |
| |
54 |
|
|
| Meredith Corp. |
| 2,847 |
| |
207 |
|
|
| New York Times Co. |
| 8,487 |
| |
5,969 |
| @ |
| Time Warner, Inc. |
| 105,711 |
| |
168 |
|
|
| Tribune Co. |
| 7,286 |
| |
169 |
| @ |
| Univision Communications, Inc. |
| 5,087 |
| |
902 |
|
|
| Viacom, Inc. |
| 31,299 |
| |
2,669 |
|
|
| Walt Disney Co. |
| 71,743 |
| |
|
|
|
|
|
| 394,931 |
| |
|
|
|
| Mining: 0.0% |
|
|
| |
169 |
|
|
| Phelps Dodge Corp. |
| 16,415 |
| |
|
|
|
|
|
| 16,415 |
| |
|
|
|
| Miscellaneous Manufacturing: 1.8% |
|
|
| |
1,017 |
|
|
| 3M Co. |
| 80,943 |
| |
127 |
|
|
| Cooper Industries Ltd. |
| 8,421 |
| |
388 |
|
|
| Danaher Corp. |
| 22,069 |
| |
273 |
|
|
| Dover Corp. |
| 11,043 |
| |
477 |
|
|
| Eastman Kodak Co. |
| 15,603 |
| |
189 |
|
|
| Eaton Corp. |
| 12,739 |
| |
13,613 |
|
|
| General Electric Co. |
| 481,356 |
| |
1,106 |
|
|
| Honeywell Intl., Inc. |
| 39,075 |
| |
389 |
|
|
| Illinois Tool Works, Inc. |
| 36,655 |
| |
See Accompanying Notes to Financial Statements
113
Shares |
|
|
|
|
| Value |
| |
|
|
|
| Miscellaneous Manufacturing (continued) |
|
|
| |
230 |
| @@ |
| Ingersoll-Rand Co. |
| $ | 17,117 |
|
118 |
|
|
| ITT Industries, Inc. |
| 10,044 |
| |
160 |
|
|
| Pall Corp. |
| 4,334 |
| |
177 |
|
|
| Textron, Inc. |
| 12,854 |
| |
2,573 |
| @@ |
| Tyco Intl. Ltd. |
| 87,405 |
| |
|
|
|
|
|
| 839,658 |
| |
|
|
|
| Office/Business Equipment: 0.1% |
|
|
| |
293 |
|
|
| Pitney Bowes, Inc. |
| 12,825 |
| |
1,069 |
| @ |
| Xerox Corp. |
| 16,377 |
| |
|
|
|
|
|
| 29,202 |
| |
|
|
|
| Oil and Gas: 2.5% |
|
|
| |
98 |
|
|
| Amerada Hess Corp. |
| 8,707 |
| |
390 |
|
|
| Anadarko Petroleum Corp. |
| 27,144 |
| |
394 |
|
|
| Apache Corp. |
| 21,300 |
| |
793 |
|
|
| Burlington Resources, Inc. |
| 36,803 |
| |
4,262 |
|
|
| ChevronTexaco Corp. |
| 232,705 |
| |
1,092 |
|
|
| ConocoPhillips |
| 99,361 |
| |
987 |
|
|
| Devon Energy Corp. |
| 40,882 |
| |
134 |
|
|
| EOG Resources, Inc. |
| 10,059 |
| |
10,318 |
|
|
| Exxon Mobil Corp. |
| 528,797 |
| |
177 |
|
|
| Kerr-McGee Corp. |
| 11,015 |
| |
417 |
|
|
| Marathon Oil Corp. |
| 16,446 |
| |
74 |
| @,@@ |
| Nabors Industries Ltd. |
| 3,848 |
| |
144 |
| @ |
| Noble Corp. |
| 6,977 |
| |
453 |
|
|
| Occidental Petroleum Corp. |
| 27,275 |
| |
143 |
|
|
| Sunoco, Inc. |
| 11,806 |
| |
388 |
| @ |
| Transocean, Inc. |
| 15,625 |
| |
406 |
|
|
| Unocal Corp. |
| 18,692 |
| |
506 |
|
|
| Valero Energy Corp. |
| 23,676 |
| |
|
|
|
|
|
| 1,141,118 |
| |
|
|
|
| Oil and Gas Services: 0.1% |
|
|
| |
400 |
|
|
| Baker Hughes, Inc. |
| 17,732 |
| |
194 |
|
|
| BJ Services Co. |
| 9,830 |
| |
515 |
|
|
| Halliburton Co. |
| 21,295 |
| |
|
|
|
|
|
| 48,857 |
| |
|
|
|
| Packaging and Containers: 0.0% |
|
|
| |
140 |
|
|
| Ball Corp. |
| 6,262 |
| |
162 |
|
|
| Bemis Co. |
| 4,510 |
| |
178 |
| @ |
| Pactiv Corp. |
| 4,423 |
| |
116 |
| @ |
| Sealed Air Corp. |
| 5,964 |
| |
|
|
|
|
|
| 21,159 |
| |
|
|
|
| Pharmaceuticals: 1.7% |
|
|
| |
2,046 |
|
|
| Abbott Laboratories |
| 85,850 |
| |
181 |
|
|
| Allergan, Inc. |
| 13,304 |
| |
198 |
|
|
| AmerisourceBergen Corp. |
| 11,670 |
| |
2,510 |
|
|
| Bristol-Myers Squibb Co. |
| 58,985 |
| |
553 |
|
|
| Cardinal Health, Inc. |
| 28,911 |
| |
999 |
| @ |
| Caremark Rx, Inc. |
| 35,724 |
| |
599 |
|
|
| Eli Lilly & Co. |
| 31,945 |
| |
96 |
| @ |
| Express Scripts, Inc. |
| 6,908 |
| |
488 |
| @ |
| Forest Laboratories, Inc. |
| 19,017 |
| |
576 |
| @ |
| Gilead Sciences, Inc. |
| 19,849 |
| |
222 |
| @ |
| Hospira, Inc. |
| 7,155 |
| |
375 |
| @ |
| King Pharmaceuticals, Inc. |
| 4,669 |
| |
363 |
| @ |
| Medco Health Solutions, Inc. |
| 13,692 |
| |
2,904 |
|
|
| Merck & Co., Inc. |
| 81,370 |
| |
9,574 |
|
|
| Pfizer, Inc. |
| 265,870 |
| |
1,950 |
|
|
| Schering-Plough Corp. |
| 34,808 |
| |
1,754 |
|
|
| Wyeth |
| 69,932 |
| |
|
|
|
|
|
| 789,659 |
| |
|
|
|
| Pipelines: 0.1% |
|
|
| |
944 |
| @ |
| Dynegy, Inc. |
| 5,334 |
| |
686 |
|
|
| El Paso Corp. |
| 7,162 |
| |
62 |
|
|
| Kinder Morgan, Inc. |
| 4,297 |
| |
637 |
|
|
| Williams Cos., Inc. |
| 10,618 |
| |
|
|
|
|
|
| 27,411 |
| |
|
|
|
| Real Estate Investment Trusts: 0.1% |
|
|
| |
204 |
|
|
| Equity Office Properties Trust |
| 5,600 |
| |
253 |
|
|
| ProLogis |
| 10,178 |
| |
286 |
|
|
| Simon Property Group, Inc. |
| 17,755 |
| |
|
|
|
|
|
| 33,533 |
| |
|
|
|
| Retail: 2.4% |
|
|
| |
395 |
| @ |
| Bed Bath & Beyond, Inc. |
| 15,772 |
| |
416 |
|
|
| Best Buy Co., Inc. |
| 23,454 |
| |
438 |
|
|
| Circuit City Stores, Inc. |
| 6,828 |
| |
1,034 |
|
|
| Costco Wholesale Corp. |
| 50,252 |
| |
521 |
|
|
| CVS Corp. |
| 23,638 |
| |
212 |
|
|
| Darden Restaurants, Inc. |
| 5,779 |
| |
225 |
|
|
| Federated Department Stores, Inc. |
| 12,330 |
| |
1,582 |
|
|
| Gap, Inc. |
| 34,567 |
| |
4,903 |
|
|
| Home Depot, Inc. |
| 204,700 |
| |
651 |
|
|
| J.C. Penney Co., Inc. Holding Co. |
| 25,129 |
| |
182 |
| @ |
| Kohl’s Corp. |
| 8,401 |
| |
848 |
| @ |
| Limited Brands, Inc. |
| 20,725 |
| |
1,008 |
|
|
| Lowe’s Cos., Inc. |
| 55,773 |
| |
369 |
|
|
| May Department Stores Co. |
| 10,376 |
| |
1,632 |
|
|
| McDonald’s Corp. |
| 50,168 |
| |
187 |
|
|
| Nordstrom, Inc. |
| 8,181 |
| |
429 |
| @ |
| Office Depot, Inc. |
| 7,036 |
| |
215 |
|
|
| RadioShack Corp. |
| 6,788 |
| |
854 |
|
|
| Staples, Inc. |
| 27,251 |
| |
510 |
| @ |
| Starbucks Corp. |
| 28,693 |
| |
1,195 |
|
|
| Target Corp. |
| 61,208 |
| |
645 |
|
|
| TJX Cos., Inc. |
| 15,183 |
| |
385 |
| @ |
| Toys R US, Inc. |
| 7,446 |
| |
5,571 |
|
|
| Wal-Mart Stores, Inc. |
| 290,025 |
| |
1,803 |
|
|
| Walgreen Co. |
| 68,839 |
| |
157 |
|
|
| Wendy’s Intl., Inc. |
| 5,600 |
| |
387 |
|
|
| Yum! Brands, Inc. |
| 17,570 |
| |
|
|
|
|
|
| 1,091,712 |
| |
|
|
|
| Savings and Loans: 0.2% |
|
|
| |
199 |
|
|
| Golden West Financial Corp. |
| 23,729 |
| |
178 |
|
|
| Sovereign Bancorp, Inc. |
| 3,889 |
| |
1,117 |
|
|
| Washington Mutual, Inc. |
| 45,473 |
| |
|
|
|
|
|
| 73,091 |
| |
|
|
|
| Semiconductors: 0.7% |
|
|
| |
478 |
| @ |
| Altera Corp. |
| 10,841 |
| |
483 |
|
|
| Analog Devices, Inc. |
| 17,847 |
| |
2,126 |
| @ |
| Applied Materials, Inc. |
| 35,377 |
| |
8,162 |
|
|
| Intel Corp. |
| 182,421 |
| |
241 |
| @ |
| KLA-Tencor Corp. |
| 10,859 |
| |
397 |
|
|
| Linear Technology Corp. |
| 15,150 |
| |
170 |
|
|
| Maxim Integrated Products, Inc. |
| 6,963 |
| |
420 |
|
|
| National Semiconductor Corp. |
| 6,493 |
| |
119 |
| @ |
| Qlogic Corp. |
| 4,092 |
| |
877 |
|
|
| Texas Instruments, Inc. |
| 21,206 |
| |
|
|
|
|
|
| 311,249 |
| |
|
|
|
| Software: 1.6% |
|
|
| |
315 |
|
|
| Adobe Systems, Inc. |
| 19,076 |
| |
240 |
|
|
| Autodesk, Inc. |
| 15,698 |
| |
750 |
|
|
| Automatic Data Processing, Inc. |
| 34,148 |
| |
543 |
| @ |
| BMC Software, Inc. |
| 10,089 |
| |
230 |
| @ |
| Citrix Systems, Inc. |
| 5,430 |
| |
756 |
|
|
| Computer Associates Intl., Inc. |
| 23,081 |
| |
764 |
| @ |
| Compuware Corp. |
| 4,408 |
| |
151 |
| @ |
| Electronic Arts, Inc. |
| 7,384 |
| |
1,123 |
|
|
| First Data Corp. |
| 46,144 |
| |
267 |
| @ |
| Fiserv, Inc. |
| 10,282 |
| |
314 |
|
|
| IMS Health, Inc. |
| 7,087 |
| |
See Accompanying Notes to Financial Statements
114
Shares |
|
|
|
|
| Value |
| |
|
|
|
| Software (continued) |
|
|
| |
260 |
| @ |
| Intuit, Inc. |
| $ | 10,878 |
|
14,090 |
|
|
| Microsoft Corp. |
| 377,754 |
| |
415 |
| @ |
| Novell, Inc. |
| 2,532 |
| |
11,197 |
| @ |
| Oracle Corp. |
| 141,754 |
| |
497 |
| @ |
| PeopleSoft, Inc. |
| 11,734 |
| |
753 |
| @ |
| Siebel Systems, Inc. |
| 7,590 |
| |
552 |
| @ |
| Veritas Software Corp. |
| 12,089 |
| |
|
|
|
|
|
| 747,158 |
| |
|
|
|
| Telecommunications: 1.8% |
|
|
| |
532 |
|
|
| Alltel Corp. |
| 30,159 |
| |
396 |
|
|
| AT&T Corp. |
| 7,247 |
| |
588 |
| @ |
| Avaya, Inc. |
| 9,655 |
| |
2,385 |
|
|
| BellSouth Corp. |
| 63,966 |
| |
171 |
|
|
| CenturyTel, Inc. |
| 5,629 |
| |
8,707 |
| @ |
| Cisco Systems, Inc. |
| 162,909 |
| |
398 |
|
|
| Citizens Communications Co. |
| 5,691 |
| |
258 |
| @ |
| Comverse Technology, Inc. |
| 5,488 |
| |
1,785 |
| @ |
| Corning, Inc. |
| 22,455 |
| |
5,383 |
| @ |
| Lucent Technologies, Inc. |
| 21,155 |
| |
4,116 |
|
|
| Motorola, Inc. |
| 79,274 |
| |
1,406 |
| @ |
| Nextel Communications, Inc. |
| 40,015 |
| |
2,050 |
|
|
| QUALCOMM, Inc. |
| 85,321 |
| |
2,244 |
| @ |
| Qwest Communications Intl., Inc. |
| 8,976 |
| |
4,278 |
|
|
| SBC Communications, Inc. |
| 107,677 |
| |
187 |
|
|
| Scientific-Atlanta, Inc. |
| 5,539 |
| |
1,854 |
|
|
| Sprint Corp. |
| 42,290 |
| |
495 |
| @ |
| Tellabs, Inc. |
| 4,232 |
| |
3,632 |
|
|
| Verizon Communications, Inc. |
| 149,747 |
| |
|
|
|
|
|
| 857,425 |
| |
|
|
|
| Textiles: 0.0% |
|
|
| |
218 |
|
|
| Cintas Corp. |
| 9,749 |
| |
|
|
|
|
|
| 9,749 |
| |
|
|
|
| Toys/Games/Hobbies: 0.0% |
|
|
| |
224 |
|
|
| Hasbro, Inc. |
| 4,263 |
| |
524 |
|
|
| Mattel, Inc. |
| 9,930 |
| |
|
|
|
|
|
| 14,193 |
| |
|
|
|
| Transportation: 0.5% |
|
|
| |
476 |
|
|
| Burlington Northern Santa Fe Corp. |
| 21,439 |
| |
264 |
|
|
| CSX Corp. |
| 10,066 |
| |
527 |
|
|
| FedEx Corp. |
| 50,081 |
| |
680 |
|
|
| Norfolk Southern Corp. |
| 23,344 |
| |
78 |
|
|
| Ryder System, Inc. |
| 4,184 |
| |
134 |
|
|
| Union Pacific Corp. |
| 8,501 |
| |
1,446 |
|
|
| United Parcel Service, Inc. |
| 121,681 |
| |
|
|
|
|
|
| 239,296 |
| |
|
|
|
|
|
|
|
| |
|
|
|
| Total Common Stock |
| 14,649,434 |
| |
Principal |
|
|
|
|
| Value |
| ||
U.S. GOVERNMENT AGENCY OBLIGATIONS: 35.0% |
|
|
| ||||||
|
|
|
| Federal National Mortgage Association: 35.0% |
|
|
| ||
$ | 20,000,000 |
|
|
| 4.630%, due 09/15/09 |
| $ | 16,322,520 |
|
|
|
|
|
|
|
|
| ||
|
|
|
| Total U.S. Government Agency Obligations (Cost $16,691,499) |
| 16,322,520 |
| ||
|
|
|
|
|
|
|
| ||
U.S. TREASURY OBLIGATIONS: 32.2% |
|
|
| ||||||
|
|
|
| U.S. Treasury STRIP: 32.2% |
|
|
| ||
18,000,000 |
|
|
| 3.700%, due 11/15/09 |
| 15,009,624 |
| ||
|
|
|
| Total U.S. Treasury Obligations (Cost $15,146,835) |
| 15,009,624 |
| ||
|
|
|
| Total Long-Term Investment |
| 45,981,578 |
| ||
|
|
|
|
|
|
|
| ||
SHORT-TERM INVESTMENTS: 1.4% |
|
|
| ||||||
|
|
|
| Repurchase Agreement: 1.4% |
|
|
| ||
661,000 |
|
|
| Morgan Stanley Repurchase Agreement 11/30/04, 2.070%, due 12/01/04, $661,038 to be received upon repurchase (Collateralized by $715,000 Federal Home Loan Mortgage Corporation, 3.500%, Market Value plus accrued interest $721,107, due 09/15/07) |
| 661,000 |
| ||
|
|
|
| Total Short-Term Investments (Cost $661,000) |
| 661,000 |
| ||
Total Investments In Securities |
| 100.0 | % | $ | 46,642,578 |
|
Other Assets and |
| 0.0 |
| 1,948 |
| |
Net Assets |
| 100.0 | % | $ | 46,644,526 |
|
@ |
| Non-income producing security |
@@ |
| Foreign issuer |
STRIP |
| Separate Trading of Registered Interest and Principal of Securities |
* |
| Cost for federal income tax purposes is the same as for financial statement purposes. Net unrealized depreciation consists of: |
Gross Unrealized Appreciation |
| $ | 136,117 |
|
Gross Unrealized Depreciation |
| (724,199 | ) | |
Net Unrealized Depreciation |
| $ | (588,082 | ) |
See Accompanying Notes to Financial Statements
115
ING PRINCIPAL PROTECTION FUND XII
PORTFOLIO OF INVESTMENTS
AS OF NOVEMBER 30, 2004 (UNAUDITED)
Principal |
|
|
|
|
| Value |
| ||
SHORT-TERM INVESTMENTS: 60.3% |
|
|
| ||||||
|
|
|
| Federal Home Loan Bank: 11.2% |
|
|
| ||
$ | 100,000 |
|
|
| 2.220%, due 01/28/05 |
| $ | 99,638 |
|
100,000 |
|
|
| 2.280%, due 02/09/05 |
| 99,552 |
| ||
|
|
|
|
|
| 199,190 |
| ||
|
|
|
| Federal Home Loan Mortgage Corporation: 9.8% |
|
|
| ||
175,000 |
|
|
| 2.210%, due 01/18/05 |
| 174,476 |
| ||
|
|
|
|
|
| 174,476 |
| ||
|
|
|
| Federal National Mortgage Association: 16.9% |
|
|
| ||
300,000 |
|
|
| 2.240%, due 01/12/05 |
| 299,201 |
| ||
|
|
|
|
|
| 299,201 |
| ||
|
|
|
| Other: 11.3% |
|
|
| ||
100,000 |
|
|
| Federal Farm Credit Discount Notes, 1.970%, due 12/17/04 |
| 99,907 |
| ||
100,000 |
|
|
| Federal Farm Credit Discount Notes, 2.180%, due 01/13/05 |
| 99,735 |
| ||
|
|
|
|
|
| 199,642 |
| ||
|
|
|
|
|
|
|
| ||
|
|
|
| Total U.S. Government Agency Obligations |
| 872,509 |
| ||
|
|
|
| Repurchase Agreement: 11.1% |
|
|
| ||
198,000 |
|
|
| Morgan Stanley Repurchase Agreement 11/30/04, 2.071%, due 12/01/04, $198,011 to be received upon repurchase (Collateralized by $205,000 Federal National Mortgage Association, 1.750%-5.000%, Market Value plus accrued interest $206,605, due 05/23/05-03/21/07) |
| 198,000 |
| ||
|
|
|
|
|
|
|
| ||
|
|
|
| Total Repurchase Agreement |
| 198,000 |
| ||
|
|
|
|
|
|
|
| ||
|
|
|
| Total Short-Term Investments |
| 1,070,509 |
| ||
|
| Total Investments In Securities |
| 60.3 | % | $ | 1,070,509 |
|
|
| Other Assets and |
| 39.7 |
| 705,535 |
| |
|
| Net Assets |
| 100.0 | % | $ | 1,776,044 |
|
* |
| Cost for federal income tax purposes is the same as for financial statement purposes. Net unrealized depreciation consists of: |
Gross Unrealized Appreciation |
| $ | — |
|
Gross Unrealized Depreciation |
| (53 | ) | |
Net Unrealized Depreciation |
| $ | (53 | ) |
See Accompanying Notes to Financial Statements
116
ING Funds Distributor, LLC offers the funds listed below. Before investing in a fund, shareholders should carefully review the fund’s prospectus. Investors may obtain a copy of a prospectus of any ING Fund by calling (800) 992-0180.
Domestic Equity and Income Funds
ING Balanced Fund
ING Convertible Fund
ING Equity and Bond Fund
ING Equity Income Fund
ING Real Estate Fund
Domestic Equity Growth Funds
ING Disciplined LargeCap Fund
ING Growth Fund
ING LargeCap Growth Fund
ING MidCap Opportunities Fund
ING SmallCap Opportunities Fund
ING Small Company Fund
Domestic Equity Index Funds
ING Index Plus LargeCap Fund
ING Index Plus MidCap Fund
ING Index Plus SmallCap Fund
Domestic Equity Value Funds
ING Financial Services Fund
ING LargeCap Value Fund
ING MagnaCap Fund
ING MidCap Value Fund
ING SmallCap Value Fund
ING Value Opportunity Fund
Fixed Income Funds
ING GNMA Income Fund
ING Government Fund
ING High Yield Bond Fund
ING Intermediate Bond Fund
ING National Tax Exempt Bond Fund
Global Equity Funds
ING Global Equity Dividend Fund
ING Global Real Estate Fund
ING Global Science and Technology Fund
ING Worldwide Growth Fund
International Equity Funds
ING Emerging Countries Fund
ING Foreign Fund
ING International Fund
ING International Growth Fund
ING International SmallCap Growth Fund
ING International Value Fund
ING Precious Metals Fund
ING Russia Fund
Loan Participation Fund
ING Senior Income Fund
Money Market Funds*
ING Aeltus Money Market Fund
ING Classic Money Market Fund
ING Lexington Money Market Trust
ING Money Market Fund
Strategic Allocation Funds
ING Strategic Allocation Balanced Fund
ING Strategic Allocation Growth Fund
ING Strategic Allocation Income Fund
* |
| An investment in the Fund is not insured or guaranteed by the Federal Deposit Insurance Corporation or any other government agency. Although the Fund seeks to preserve the value of your investment at $1.00 per share, it is possible to lose money by investing in the Fund. |
PROXY VOTING INFORMATION
A description of the policies and procedures that the Registrant uses to determine how to vote proxies related to portfolio securities is available (1) without charge, upon request, by calling Shareholder Services toll-free at 800-992-0180; (2) on the Registrant’s website at www.ingfunds.com and (3) on the SEC’s website at www.sec.gov.
Information regarding how the Registrant voted proxies related to portfolio securities during the most recent 12-month period ended June 30 is available without charge on the Registrant’s website at www.ingfunds.com and on the SEC website at www.sec.gov.
QUARTERLY PORTFOLIO HOLDINGS
The Registrant files its complete schedule of portfolio holdings with the Commission for the first and third quarters of each fiscal year on Form N-Q. The Registrant’s Forms N-Q are available on the SEC’s website at www.sec.gov. The Registrant’s Forms N-Q may be reviewed and copied at the Commissions Public Reference Room in Washington, DC, and information on the operation of the Public Reference Room may be obtained by calling 1-800-SEC-0330; and is available upon request from the Registrant by calling Shareholder Services toll-free at 800-992-0180.
Investment Manager
ING Investments, LLC
7337 E. Doubletree Ranch Road
Scottsdale, Arizona 85258
Administrator
ING Funds Services, LLC
7337 E. Doubletree Ranch Road
Scottsdale, Arizona 85258
Distributor
ING Funds Distributor, LLC
7337 E. Doubletree Ranch Road
Scottsdale, Arizona 85258
1-800-992-0180
Transfer Agent
DST Systems, Inc.
P.O. Box 419368
Kansas City, Missouri 64141
Custodian
The Bank of New York
100 Colonial Center Parkway, Suite 300
Lake Mary, FL 32746
Legal Counsel
Dechert LLP
1775 I Street, N.W.
Washington, D.C. 20006
For more complete information, or to obtain a prospectus on any ING fund, please call your Investment Professional or ING Funds Distributor, LLC at (800) 992-0180 or log on to www.ingfunds.com. The prospectus should be read carefully before investing. Consider the fund’s investment objectives, risks, charges and expenses carefully before investing. The prospectus contains this information and other information about the fund. Information regarding how the Funds voted proxies related to portfolio securities during the most recent 12-month period ended June 30 is available without charge on the Funds’ website at www.ingfunds.com and on the SEC’s website www.sec.gov.
| PRSAR-UFPPFABCQ (1104-012805) |

Funds
Semi-Annual Report
November 30, 2004
Classes A, B, C, M and O
Domestic Equity Growth Funds Domestic Equity and Income Funds
n ING Disciplined LargeCap Fund n ING Convertible Fund
n ING LargeCap Growth Fund n ING Equity and Bond Fund
n ING MidCap Opportunities Fund n ING Real Estate Fund
n ING SmallCap Opportunities Fund
Domestic Equity Value Funds
n ING Financial Services Fund
n ING LargeCap Value Fund
n ING MagnaCap Fund
n ING MidCap Value Fund
n ING SmallCap Value Fund
This report is submitted for general information to shareholders of the ING Funds. It is not authorized for distribution to prospective shareholders unless accompanied or preceded by a prospectus which includes details regarding the funds' investment objectives, risks, charges, expenses and other information. This information should be read carefully.
 E-Delivery Sign-up – details inside

TABLE OF CONTENTS
 Go Paperless with E-Delivery!
Sign up now for on-line prospectuses, fund reports, and proxy statements. In less than five minutes, you can help reduce paper mail and lower fund costs.
Just go to www.ingfunds.com, click on the E-Delivery icon from the home page, follow the directions and complete the quick 5 Steps to Enroll.
You will be notified by e-mail when these communications become available on the internet. Documents that are not available on the internet will continue to be sent by mail.
(THIS PAGE INTENTIONALLY LEFT BLANK)
Dear Shareholder:
The past year has brought about numerous changes in the mutual funds industry, including requests for additional disclosures. I would like to draw your attention to some additional information you will now see in the reports due, in part, to these new requirements:
• You will see a new section entitled "Shareholder Expense Examples". These examples are intended to illustrate for you the ongoing costs of investing in a mutual fund and to provide a method to compare those costs with the ongoing costs of investing in other mutual funds.
• In addition to the normal performance tables included in the Portfolio Managers' Reports, there are now additional graphical or tabular presentations, which illustrate the current holdings of the funds as of the period-end.
• Each fund now also files its complete schedule of portfolio holdings with the Securities Exchange Commission ("SEC") for the first and third quarters of each fiscal year on
Form N-Q. These Forms are available for shareholders to view on the SEC's website at www.sec.gov.
We welcome these changes and believe that they will provide valuable information to our shareholders. We hope you will find these additional disclosures beneficial and easy to understand.
On behalf of ING Funds, I thank you for your continued support and confidence and look forward to serving you in 2005 and beyond.
Sincerely,

James M. Hennessy
President
ING Funds
January 25, 2005

JAMES M. HENNESSY
1
MARKET PERSPECTIVE: SIX MONTHS ENDED NOVEMBER 30, 2004
Two months prior to the start of our fiscal year, the economic outlook had changed radically. On April 2, 2004, a very bullish U.S. employment report had sparked a few days of euphoria that vanished as it became clear that as the job market tightens, inflation picks up and rising interest rates cannot be far away. This was followed up with another strong report in May and by mid-month major stock and bond markets had negative returns for 2004. Markets were off their lows as we started our half year and in this period, as we shall see below, sentiment would undergo two more major reversals, accompanied by record-breaking market movements.
Global equities added 9.0% from the end of May through November according to the Morgan Stanley Capital International ("MSCI") World Index(1) in dollars including net dividends, just under half due to dollar weakness. Among currencies, the euro, yen and pound all gained on the dollar, although the pendulum swung back and forth. Ultimately, the dollar succumbed to record U.S. trade deficits, and latterly, to fears that non-U.S. investors might diversify out of U.S. financial assets. By the end of November 2004, the euro had gained 8.9% and a new all tim e record against the dollar. The yen rose 6.2% to a level not seen since early 2000, while the pound stood 4.2% higher at a remarkable 12-year peak. On a trade-weighted basis, the dollar plumbed 9-year lows.
Investment grade U.S. fixed income classes initially bore the brunt of fears of a new cycle of rising interest rates from multi-decade low levels, as evidence mounted that inflation was on the rise. In the six months ended November 30, 2004, the Federal Open Market Committee (FOMC) would increase the Federal Reserves Funds rate four times to 2.0%, even as the economy clearly decelerated again. During this time, the total return of the Lehman Brothers Aggregate Bond Index(2) of investment grade bonds was 3.8%. High yield bonds fared comparatively well, the Lehman Brothers U.S. Corporate High Yield Bond Index(3) returning 9.6% for the six months. In a similar vein there was a notable flattening of the yield curve, as short-term interest rates marched up in anticipation of continued monetary tightening, while bond yields ignored this and fell in the face of mostly tame economic data. For the six months, the yield on 10-year Treasury Notes fell by 30 basis points to 4.4%, but the yield on 13-week Treasury Bills rose 113 basis points to 2.2%.
The U.S. equities market in the form of the Standard & Poor's ("S&P") 500 Index(4) rose 5.7% including dividends in the six months ended November 30, 2004. At that point the market was trading at a price to earnings ("P/E") level of just under 16 times 2005 estimated earnings. As mentioned above, strong monthly employment reports from April 2004 set the tone. After an initial scare about the rise in interest rates that this implied, investors regained their nerve and as the Federal Reserve embarked on its tightening cycle at the end of June the market was challenging its best levels of 2004. And yet in the week before the increase the wind seemed to shift again with some unexpectedly downbeat economic releases. From July through October 2004, the employment reports were neutral to shockingly weak, while oil prices continued their rise, peaking on Friday, October 22 at 41% above end of May 2004 levels. This effective deflationary "tax" on worldwide consumers troubled equity markets, and the S&P 500 Index reached its lowest point of 2004 on August 12. From there, however, oil prices retreated by 13% and that, combined with a clear election result, perceived to be business and shareholder friendly, plus a new, powerful employment report, caused sentiment to shift yet again. By the end of November, the S&P 500 Index had breached levels not seen since before September 11, 2001, bolstered by an upward revision to third quarter gross domestic product ("GDP") growth to 3.9%.
In international equities markets, for the six months ended November 30, 2004, Japan rose 4.8% in dollars, according to the MSCI Japan Index(5) with net dividends, but fell 2.6% in yen. At that point, stocks were trading at nearly 16 times 2005 estimated earnings. Initially encouraged by surprisingly strong, export led, 6.1% first quarter GDP growth, investors became disillusioned by a likely slow down in China, rising oil prices and a slumping dollar. By the third quarter, GDP growth had fallen to a depressingly flat 0.1%.
Meanwhile, European excluding ("ex") UK markets gained 15.5% in dollars, about five-eighths due to dollar weakness, according to the MSCI Europe ex UK Index(6) with net dividends. In local currency terms, the region's markets reached a 28-month high during November 2004, and were then trading on average at just over 13 times 2005 estimated earnings. Growth in this region is held back by weak domestic demand, restrained by 8.9% unemployment in infl exible labor markets. This region's main attraction is its relative
2
MARKET PERSPECTIVE: SIX MONTHS ENDED NOVEMBER 30, 2004
cheapness; the concern is the fragility of this picture, given its export dependency.
The UK market rose 12.1% in dollars between May and November 2004, based on the MSCI UK Index(7) with net dividends. In pounds, the market rose 7.5%, attaining the highest mark since mid-2002, and traded at about 161/2 times 2005 esti mated earnings. Unlike Continental Europe, the UK economy strains at full employment, with over-committed, property owning consumers, enriched (at least in their own minds), by a housing price bubble. The Bank of England has been trying, with five interest rate increases since November 2003, to cool demand and by the end of November seemed to be succeeding.
(1) The MSCI World Index measures the performance of over 1,400 securities listed on exchanges in the United States, Europe, Canada, Australia, New Zealand and the Far East.
(2) The Lehman Brothers Aggregate Bond Index is composed of securities from the Lehman Brothers Government/Corporate Bond Index, Mortgage-Backed Securities Index, and the Asset-Backed Securities Index. Total return comprises price appreciation/depreciation and income as a percentage of the original investment.
(3) The Lehman Brothers U.S. Corporate High Yield Bond Index is generally representative of corporate bonds rated below investment-grade.
(4) The Standard & Poor's 500 Index is a capitalization-weighted index of 500 stocks designed to measure performance of the broad domestic economy through changes in the aggregate market value of 500 stocks representing all major industries.
(5) The MSCI Japan Index is a free float-adjusted market capitalization index that is designed to measure developed market equity performance in Japan.
(6) The MSCI Europe ex UK Index is a free float-adjusted market capitalization index that is designed to measure developed market equity performance in Europe, excluding the UK.
(7) The MSCI UK Index is a free float-adjusted market capitalization index that is designed to measure developed market equity performance in the UK.
All indices are unmanaged and investors cannot invest directly in an index.
Past performance does not guarantee future results. The performance quoted represents past performance. Investment return and principal value of an investment will fluctuate, and shares, when redeemed, may be worth more or less than their original cost. The Funds' performance is subject to change since the period's end and may be lower or higher than the performance data shown. Please call (800) 992-0180 or log on to www.ingfunds.com to obtain performance data current to the most recent month end.
Market Perspective reflects the views of the Chief Investment Risk Officer only through the end of the period, and is subject to change based on market and other conditions.
3
The ING Disciplined LargeCap Fund (the "Fund") seeks capital appreciation. The Fund is managed by a team of investment professionals led by Hugh T.M. Whelan Sr., CFA, ING Investment Management Co. - the Sub-Adviser.
Performance: For the six months ended November 30, 2004, the Fund's Class A shares, excluding sales charges, provided a total return of 7.37% compared to the Standard & Poor's ("S&P") 500 Index(4), which returned 5.67% for the same period.
Portfolio Specifics: Performance benefited from good stock selection. Sector allocation, market timing, and other macro themes played no significant role in the Fund's outperformance of its benchmark.
Relative performance during the first five months of this period was positive, but somewhat restrained. The market headed down going into August weighed by oil's ascent and the beginning of a season full of large events, such as the Olympics and the Democratic and Republican conventions, which were perceived to be prime targets for terrorists. As each potential disaster passed without incident, the market slowly drifted up, until by the end of October it was roughly back to where it had started. Throughout this period, we incrementally added value, especially in the information technology and health care sectors. Stock selection in these sectors was helped by our model's earnings quality and valuation factors. Price momentum and other market recognition factors were detrimental to security selection in these sectors. Security selection during this time was weakest in the financials sector where historically successful factors, such as earnings momentum and earnings surprise, failed to provide positive guidance.
A market catalyst emerged after the election. In November, the S&P 500 Index returned a robust 4.1%, and we generated as much outperformance in November as we did in the preceding five months. The markets seemed to ease its concern over macro fears and concentrate more on individual stock stories. Like the first five months of the reporting period, stock selection within the health care and information technology sectors was particularly successful. However, this time the factors that proved to be the strong indicators of performance were market recognition factors, such as price momentum and analyst estimate revision. Factors that tended not to work as well were those that monitor management behavior, such as capital expenditures intensity. Stock selection in November was weakest in the industrial sector.
For the full six-month performance period, roughly half our outperformance came in November and the other half was spread out over the preceding five months. We had strong stock selection in the health care and information technology sector and weak stock selection in the financial and industrial sectors.
Current Strategy and Outlook: Our strategy going forward is to continue our focus on bottom-up stock selection using the criteria of positive business momentum, valuation, and market recognition. The Fund is overweight in the consumer discretionary and energy sectors and underweight in the industrials and financials sectors. However, our overall sector exposures are a result of our bottom-up stock picking and are by design quite close to the S&P 500 Index so that nearly all of our relative performance is driven by individual stock selection.
The outlook for equities is positive with third calendar quarter earnings hitting seventeen percent and the non-farm payroll report almost double expectations. The Federal Reserve signaled its intentions to continue with its "measured" increase in rates and in November lifted the fed funds rate to 2.00%, still considered to be accommodative. Robust corporate profits, strong jobs numbers and inflation fighting Federal Reserve all bode well for equities.

Top Ten Holdings
as of November 30, 2004
(as a percent of net assets)*
| Exxon Mobil Corp. | 3.7 | % | |||||
| General Electric Co. | 3.1 | % | |||||
| Microsoft Corp. | 2.6 | % | |||||
| Johnson & Johnson | 2.5 | % | |||||
| American International Group, Inc. | 2.5 | % | |||||
| International Business Machines Corp. | 2.4 | % | |||||
| Procter & Gamble Co. | 2.1 | % | |||||
| Citigroup, Inc. | 2.0 | % | |||||
| Wal-Mart Stores, Inc. | 2.0 | % | |||||
| Pfizer, Inc. | 1.9 | % | |||||
Portfolio holdings are subject to change daily.
* Excludes short-term securities related to securities lending.
4
PORTFOLIO MANAGERS' REPORT
ING DISCIPLINED LARGECAP FUND
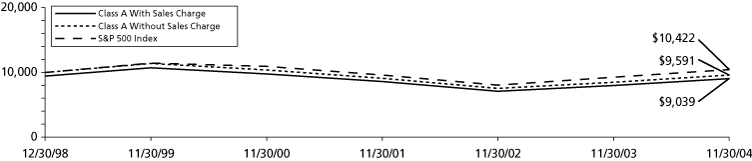
Average Annual Total Returns for the Periods Ended November 30, 2004
| 1 Year | 5 Year | Since Inception December 30, 1998 | |||||||||||||
| Including Sales Charge: | |||||||||||||||
| Class A(1) | 6.89 | % | (4.45 | )% | (1.69 | )% | |||||||||
| Class B(2) | 7.52 | % | (4.40 | )% | (1.57 | )% | |||||||||
| Class C(3) | 11.52 | % | (4.01 | )% | (1.40 | )% | |||||||||
| Excluding Sales Charge: | |||||||||||||||
| Class A | 13.41 | % | (3.31 | )% | (0.70 | )% | |||||||||
| Class B | 12.52 | % | (4.01 | )% | (1.40 | )% | |||||||||
| Class C | 12.52 | % | (4.01 | )% | (1.40 | )% | |||||||||
| S&P 500 Index(4) | 12.85 | % | (1.84 | )% | 0.70 | %(5) | |||||||||
Based on a $10,000 initial investment, the graph and table above illustrate the total return of ING Disciplined LargeCap Fund against the S&P 500 Index. The Index is unmanaged and has no cash in its portfolio, imposes no sales charges and incurs no operating expenses. An investor cannot invest directly in an index. The Fund's performance is shown both with and without the imposition of sales charges.
The performance graph and table do not reflect the deduction of taxes that a shareholder will pay on Fund distributions or the redemption of Fund shares.
Total returns reflect the fact that the Investment Manager has waived certain fees and expenses otherwise payable by the Fund. Total returns would have been lower had there been no waiver to the Fund.
Performance data represents past performance and is no assurance of future results. Investment return and principal value of an investment in the Fund will fluctuate. Shares, when sold, may be worth more or less than their original cost. The Fund's current performance may be lower or higher than the performance data shown. Please log on to www.ingfunds.com or call (800) 922-0180 to get performance through the most recent month end.
This report contains statements that may be "forward-looking" statements. Actual results may differ materially from those projected in the "forward-looking" statements.
The views expressed in this report reflect those of the portfolio managers, only through the end of the period as stated on the cover. The portfolio managers' views are subject to change at any time based on market and other conditions.
Fund holdings are subject to change daily.
(1) Reflects deduction of the maximum Class A sales charge of 5.75%.
(2) Reflects deduction of the Class B deferred sales charge of 5%, 2% and 1%, respectively, for the 1 year, 5 year and since inception returns.
(3) Reflects deduction of the Class C deferred sales charge of 1% for the 1 year return.
(4) The S&P 500 Index is a capitalization-weighted index of 500 stocks chosen for market size, liquidity, and industry group representation.
(5) Since inception performance for index is shown from
January 1, 1999.
5
ING LARGECAP GROWTH FUND
PORTFOLIO MANAGERS' REPORT
The ING LargeCap Growth Fund (the "Fund") seeks long-term capital appreciation by investing primarily in equity securities of large U.S. companies. The Fund is managed by Andrew J. Shilling, CFA, Senior Vice President, Partner and Equity Portfolio Manager, Wellington Management Company, LLP - the Sub-Adviser.
Performance: For the six months ended November 30, 2004, the Fund's Class A shares, excluding sales charges, provided a total return of 0.34% compared to the Russell 1000 Growth Index(4) and the Standard & Poor's ("S&P") 500 Index(5), which returned 0.81% and 5.67%, respectively, for the same period.
Portfolio Specifics: The summer of 2004 weakness in equities was a result of investor focus on several concerns: a softening economy, uncertainty over presidential elections, continued violence in Iraq, and worries of potential terrorist strikes during the political conventions or the Olympics. By fall, many of these worries had been mitigated and America remained free of terrorist attacks. The economy seemed to be moving forward despite record high oil prices. Equity markets generally rallied beginning in September, resulting in positive performance for the six month period.
In this volatile environment, the Fund maintained its focus on stock selection. Wireless handheld device maker Research In Motion Ltd., the top positive contributor to absolute Fund returns, benefited from the introduction of an appealing new messaging and communication device and a software agreement with cell phone giant Nokia Corp. Internet media company Yahoo!, Inc. also boosted results on favorable trends for online advertising and paid search, while online auctioneer eBay, Inc., a consumer discretionary stock, rose on strong international growth and accelerating PayPal metrics.
Unfavorable performance from Apollo Group, Inc. and a handful of health care stocks contributed to the Fund's relative underperformance during the period. Post-secondary educator Apollo Group, Inc., the bottom contributor on a relative basis, declined on negative news flow for the industry and questions regarding its recruitment practices. In the health care sector, pharmaceuticals were generally weak during the period. Of our holdings, Eli Lilly & Co. and AstraZeneca PLC were particularly weak. AstraZeneca PLC's weakness was driven mainly by FDA concerns about negative side effects of Exanta, a blood thinning drug in the company's product pipeline. Drug distributor Cardinal Health, Inc., which was held during the period, was hurt by an investigation of accounting practices.
Current Strategy and Outlook: Though we believe that the economy will exhibit moderate growth over the intermediate term, we are somewhat challenged to aptly forecast the near-term macroeconomic environment. On the one hand, gross domestic product (GDP) rose at a 3.9% annualized rate in the third calendar quarter of 2004, manufacturing indicators continue to show strength, and interest rates are relatively low. On the other hand, employment growth remains somewhat sluggish, the Federal Reserve continues to raise short-term interest rates, and oil prices remain high. Elevated energy prices, particularly if they persist or rise in the coming months, could serve to restrain corporate spending and/or curtail consumer consumption. In this uncertain environment, we continue to emphasize competitiv ely-advantaged, share-gaining industry leaders that should perform well in most economic scenarios. Our strategy is to build a diversified portfolio on a stock-by-stock basis, identifying companies with sustainable strong revenue and cash flow growth.
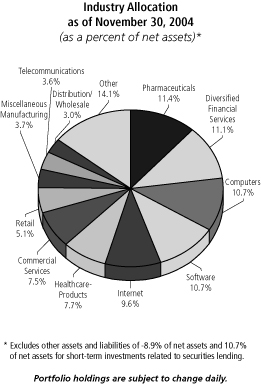
Top Ten Holdings
as of November 30, 2004
(as a percent of net assets)*
| Research In Motion Ltd. | 5.6 | % | |||||
| Apollo Group, Inc. | 5.1 | % | |||||
| Yahoo!, Inc. | 5.1 | % | |||||
| Countrywide Financial Corp. | 4.9 | % | |||||
| Guidant Corp. | 4.6 | % | |||||
| eBay, Inc. | 4.5 | % | |||||
| Dell, Inc. | 4.1 | % | |||||
| Electronic Arts, Inc. | 3.7 | % | |||||
| AstraZeneca PLC ADR | 3.4 | % | |||||
| First Data Corp. | 3.3 | % | |||||
Portfolio holdings are subject to change daily.
* Excludes short-term securities related to securities lending.
6
PORTFOLIO MANAGERS' REPORT
ING LARGECAP GROWTH FUND
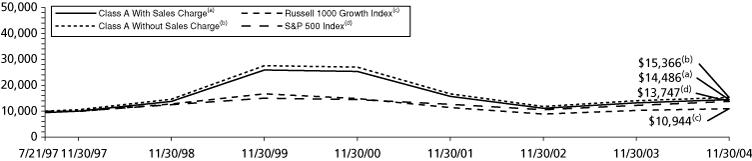
Average Annual Total Returns for the Periods Ended November 30, 2004
| 1 Year | 5 Year | Since Inception July 21, 1997 | |||||||||||||
| Including Sales Charge: | |||||||||||||||
| Class A(1) | 3.05 | % | (12.05 | )% | 5.16 | % | |||||||||
| Class B(2) | 3.64 | % | (11.93 | )% | 5.32 | % | |||||||||
| Class C(3) | 7.54 | % | (11.59 | )% | 5.31 | % | |||||||||
| Excluding Sales Charge: | |||||||||||||||
| Class A | 9.34 | % | (11.00 | )% | 6.00 | % | |||||||||
| Class B | 8.64 | % | (11.58 | )% | 5.32 | % | |||||||||
| Class C | 8.54 | % | (11.59 | )% | 5.31 | % | |||||||||
| Russell 1000 Growth Index(4) | 5.83 | % | (8.19 | )% | 1.24 | %(6) | |||||||||
| S&P 500 Index(5) | 12.85 | % | (1.84 | )% | 4.44 | %(6) | |||||||||
Based on a $10,000 initial investment, the graph and table above illustrate the total return of ING LargeCap Growth Fund against the Russell 1000 Growth Index and the S&P 500 Index. The Indices are unmanaged and have no cash in their portfolios, impose no sales charges and incur no operating expenses. An investor cannot invest directly in an index. The Fund's performance is shown both with and without the imposition of sales charges.
The performance graph and table do not reflect the deduction of taxes that a shareholder will pay on Fund distributions or the redemption of Fund shares.
Total returns reflect the fact that the Investment Manager has waived certain fees and expenses otherwise payable by the Fund, subject to possible later recoupment during a three-year period. Total returns would have been lower had there been no waiver to the Fund.
Performance data represents past performance and is no assurance of future results. Investment return and principal value of an investment in the Fund will fluctuate. Shares, when sold, may be worth more or less than their original cost. The Fund's current performance may be lower or higher than the performance data shown. Please log on to www.ingfunds.com or call (800) 922-0180 to get performance through the most recent month end.
This report contains statements that may be "forward-looking" statements. Actual results may differ materially from those projected in the "forward-looking" statements.
The views expressed in this report reflect those of the portfolio managers, only through the end of the period as stated on the cover. The portfolio managers' views are subject to change at any time based on market and other conditions.
Fund holdings are subject to change daily.
(1) Reflects deduction of the maximum Class A sales charge of 5.75%.
(2) Reflects deduction of the Class B deferred sales charge of 5% and 2%, respectively, for the 1 year and 5 year returns.
(3) Reflects deduction of the Class C deferred sales charge of 1% for the 1 year return.
(4) The Russell 1000 Growth Index is an index that measures the performance of those Russell 1000 Index companies with higher price-to-book ratios and higher forecasted growth values.
(5) The S&P 500 Index is a capitalization-weighted index of 500 stocks chosen for market size, liquidity, and industry group representation.
(6) Since inception performance for index is shown from August 1, 1997.
7
ING MIDCAP OPPORTUNITIES FUND
PORTFOLIO MANAGERS' REPORT
The ING MidCap Opportunities Fund (the "Fund") seeks long-term capital appreciation. The Fund is managed by a team of investment professionals led by Matthew Price, CFA and David Campbell, ING Investment Management Co. - the Sub-Adviser.
Performance: For the six months ended November 30, 2004, the Fund's Class A shares, excluding sales charges, provided a total return of 4.98% compared to the Russell MidCap Growth Index(4) and the Russell MidCap Index(5), which returned 5.68% and 11.09%, respectively, for the same period.
Portfolio Specifics: The Fund slightly underperformed the Russell MidCap Growth Index as unfavorable sector allocation was offset by good stock selection. A substantial overweight in the energy sector combined with strong stock selection was a major positive factor, as was the industrial sector where superior stock selection more than offset unfavorable sector allocation. With energy prices likely to settle for a period around the $40 price level, we believe that share prices remain attractive in that sector. The health care sector hurt performance most as asset allocation and poor stock selection united to negatively impact results. Stocks that contributed to performance during the past six months were Harman Intl. Industries, Inc., CACI Intl., Inc., and Adobe Systems, Inc., while Omnicare, Inc., Broadcom Corp., and NBTY, Inc., which were all previously held, performed poorly and detracted from results.
Energy represents the most heavily overweighted sector relative to the Russell MidCap Growth Index, while technology remains as the most underweighted. This is an indication as to where the Fund's managers believe the best earnings growth will be found in 2005. The latter sector was reduced sharply during the past six months as profits were taken in successful investments, while several unsuccessful technology positions were sold. The exposure to health care remains above the benchmark as we believe that following a period of difficult earnings comparisons and potential "headline risk" from new product failures, the sector offers above- average potential. Overall, we believe that the Fund is well positioned for the 2005 investment environment we see ahead.
Current Strategy and Outlook: The stock market seems poised to end 2004 on a positive note. The favorable presidential election outcome (from the market's perspective) and the outlook for stable to declining energy prices over the next few months have enabled investors to focus on the more traditional economic and market metrics: valuation, interest rates, corporate profits and inflation. Given our positive economic outlook for the remainder of 2004 and into 2005, we believe that the market is reasonably valued and able to provide positive returns during the coming year. However, our stock selection process is primarily based on a combination of positive earnings growth, relative price strength and reasonable valuation and, as such, is not dependent upon our market or economic outlook.
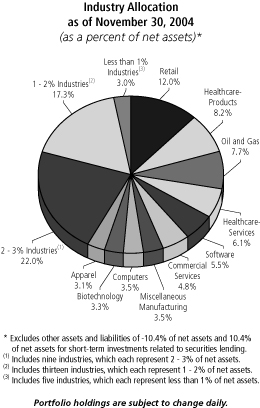
Top Ten Holdings
as of November 30, 2004
(as a percent of net assets)*
| Adobe Systems, Inc. | 2.1 | % | |||||
| Harman Intl. Industries, Inc. | 2.1 | % | |||||
| Coach, Inc. | 2.1 | % | |||||
| Mohawk Industries, Inc. | 2.0 | % | |||||
| Avid Technology, Inc. | 2.0 | % | |||||
| Rockwell Automation, Inc. | 1.8 | % | |||||
| Chesapeake Energy Corp. | 1.8 | % | |||||
| St. Jude Medical, Inc. | 1.8 | % | |||||
| CACI Intl., Inc. | 1.7 | % | |||||
| Sonic Corp. | 1.7 | % | |||||
Portfolio holdings are subject to change daily.
* Excludes short-term securities related to securities lending.
8
PORTFOLIO MANAGERS' REPORT
ING MIDCAP OPPORTUNITIES FUND
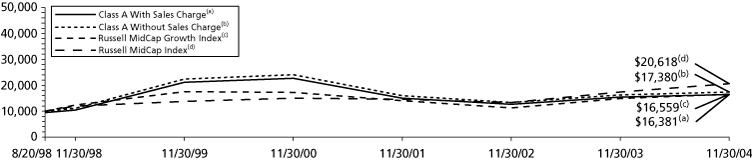
Average Annual Total Returns for the Periods Ended November 30, 2004
| 1 Year | 5 Year | Since Inception August 20, 1998 | |||||||||||||
| Including Sales Charge: | |||||||||||||||
| Class A(1) | 0.35 | % | (6.11 | )% | 8.17 | % | |||||||||
| Class B(2) | 0.67 | % | (5.97 | )% | 8.49 | % | |||||||||
| Class C(3) | 4.70 | % | (5.65 | )% | 8.42 | % | |||||||||
| Excluding Sales Charge: | |||||||||||||||
| Class A | 6.48 | % | (4.99 | )% | 9.19 | % | |||||||||
| Class B | 5.67 | % | (5.64 | )% | 8.49 | % | |||||||||
| Class C | 5.70 | % | (5.65 | )% | 8.42 | % | |||||||||
| Russell MidCap Growth Index(4) | 11.40 | % | (1.15 | )% | 8.40 | %(6) | |||||||||
| Russell MidCap Index(5) | 18.76 | % | 8.51 | % | 12.27 | %(6) | |||||||||
Based on a $10,000 initial investment, the graph and table above illustrate the total return of ING MidCap Opportunities Fund against the Russell MidCap Growth Index and the Russell MidCap Index. The Indices are unmanaged and have no cash in their portfolios, impose no sales charges and incur no operating expenses. An investor cannot invest directly in an index. The Fund's performance is shown both with and without the imposition of sales charges.
The performance graph and table do not reflect the deduction of taxes that a shareholder will pay on Fund distributions or the redemption of Fund shares.
Total returns reflect the fact that the Investment Manager has waived certain fees and expenses otherwise payable by the Fund, subject to possible later recoupment during a three-year period. Total returns would have been lower had there been no waiver to the Fund.
Performance data represents past performance and is no assurance of future results. Investment return and principal value of an investment in the Fund will fluctuate. Shares, when sold, may be worth more or less than their original cost. The Fund's current performance may be lower or higher than the performance data shown. Please log on to www.ingfunds.com or call (800) 922-0180 to get performance through the most recent month end.
This report contains statements that may be "forward-looking" statements. Actual results may differ materially from those projected in the "forward-looking" statements.
The views expressed in this report reflect those of the portfolio managers, only through the end of the period as stated on the cover. The portfolio managers' views are subject to change at any time based on market and other conditions.
Fund holdings are subject to change daily.
(1) Reflects deduction of the maximum Class A sales charge of 5.75%.
(2) Reflects deduction of the Class B deferred sales charge of 5%, 2% and 1%, respectively, for the 1 year, 5 year and since inception returns.
(3) Reflects deduction of the Class C deferred sales charge of 1% for the 1 year return.
(4) The Russell MidCap Growth Index consists of those companies included in the Russell MidCap Index with relatively higher price-to-book ratios and higher forecasted growth values with greater than average growth orientation.
(5) The Russell MidCap Index measures the performance of the 800 smallest companies in the Russell 1000 Index.
(6) Since inception performance for index is shown from September 1, 1998.
9
ING SMALLCAP OPPORTUNITIES FUND
PORTFOLIO MANAGERS' REPORT
The ING SmallCap Opportunities Fund (the "Fund") seeks capital appreciation. The Fund is managed by a team of investment professionals led by Matthew Price, CFA and David Campbell, ING Investment Management Co. - the Sub-Adviser.
Performance: For the six months ended November 30, 2004, the Fund's Class A shares, excluding sales charges, provided a total return of 7.81% compared to the Russell 2000 Growth Index(4) and the Russell 2000 Index(5), which returned 7.88% and 12.18%, respectively, for the same period.
Portfolio Specifics: Strong stock selection was able to overcome disappointing results from our sector allocation, providing a return for the six months ended November 30, 2004 that was in line with the Fund's benchmark. The divergence in performance among sectors was very wide during this period. Compared to the benchmark technology experienced very positive results, but these gains were more than offset by disappointing performance in the health care sector. Strong contributors in technology included Cognizant Technology Solutions, Micros Systems, Inc., and Silicon Image, Inc. However, the problems among several small health care-related companies, including previously held Ligand Pharmaceuticals, Martek Biosciences Corp., and Accredo Health, Inc. had a severely negative impact. The energy sector contributed to the favorable results due to a combination of good sector weighting decisions and strong stock selection, including Southwestern Energy Co. Favorable stock selections in the consumer discretionary sector, such as Penn National Gaming, Inc. and Dick's Sporting Goods, Inc., also helped performance. Lack of exposure to the strongly performing materials sector detracted from performance.
The sector weightings remained relatively unchanged during the June to November 2004 period. The consumer discretionary sector is the Fund's largest position and represents a substantial overweighting versus the benchmark. As is often the case in small-cap growth portfolios, consumer discretionary, technology, and health care remain the three largest sectors, representing about 70% of the entire Fund versus about 65% of the benchmark. There is a high level of industry diversification within these sectors, but they remain the growth areas of the economy. On the other hand, industrials are the most heavily underweighted sector in the Fund, where a lack of earnings growth and relative price strength has made security selection challenging.
Current Strategy and Outlook: The stock market seems poised to end 2004 on a positive note. The favorable presidential election outcome (from the market's perspective) and the outlook for stable to declining energy prices over the next few months have enabled investors to focus on the more traditional economic and market metrics: valuation, interest rates, corporate profits, and inflation. Given our positive economic outlook, we believe that the market is reasonably valued and able to provide positive returns during the coming year.

Top Ten Holdings
as of November 30, 2004
(as a percent of net assets)*
| Southwestern Energy Co. | 3.0 | % | |||||
| Shuffle Master, Inc. | 2.8 | % | |||||
| Cognizant Technology Solutions Corp. | 2.6 | % | |||||
| Ishares Russell 2000 Growth Index Fund | 2.6 | % | |||||
| Avid Technology, Inc. | 2.5 | % | |||||
| Amsurg Corp. | 2.4 | % | |||||
| SCP Pool Corp. | 2.4 | % | |||||
| Station Casinos, Inc. | 2.3 | % | |||||
| Inamed Corp. | 2.3 | % | |||||
| Pediatrix Medical Group, Inc. | 2.2 | % | |||||
Portfolio holdings are subject to change daily.
* Excludes short-term securities related to securities lending.
10
PORTFOLIO MANAGERS' REPORT
ING SMALLCAP OPPORTUNITIES FUND
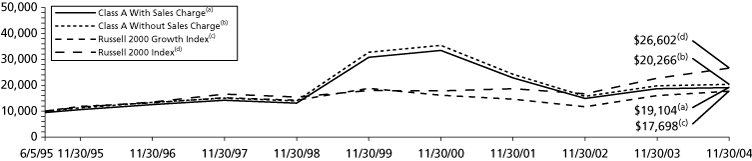
Average Annual Total Returns for the Periods Ended November 30, 2004
| 1 Year | 5 Year | Since Inception of Class A, B and C June 5, 1995 | |||||||||||||
| Including Sales Charge: | |||||||||||||||
| Class A(1) | (3.28 | )% | (10.16 | )% | 7.05 | % | |||||||||
| Class B(2) | (3.04 | )% | (10.00 | )% | 6.98 | % | |||||||||
| Class C(3) | 0.92 | % | (9.72 | )% | 6.96 | % | |||||||||
| Excluding Sales Charge: | |||||||||||||||
| Class A | 2.62 | % | (9.09 | )% | 7.72 | % | |||||||||
| Class B | 1.96 | % | (9.71 | )% | 6.98 | % | |||||||||
| Class C | 1.92 | % | (9.72 | )% | 6.96 | % | |||||||||
| Russell 2000 Growth Index(4) | 10.83 | % | (1.09 | )% | 6.19 | %(6) | |||||||||
| Russell 2000 Index(5) | 17.26 | % | 8.29 | % | 10.85 | %(6) | |||||||||
Based on a $10,000 initial investment, the graph and table above illustrate the total return of ING SmallCap Opportunities Fund against the Russell 2000 Growth Index and the Russell 2000 Index. The Indices are unmanaged and have no cash in their portfolios, impose no sales charges and incur no operating expenses. An investor cannot invest directly in an index. The Fund's performance is shown both with and without the imposition of sales charges.
The performance graph and table do not reflect the deduction of taxes that a shareholder will pay on Fund distributions or the redemption of Fund shares.
Total returns reflect the fact that the Investment Manager has waived certain fees and expenses otherwise payable by the Fund. Total returns would have been lower had there been no waiver to the Fund.
Performance data represents past performance and is no assurance of future results. Investment return and principal value of an investment in the Fund will fluctuate. Shares, when sold, may be worth more or less than their original cost. The Fund's current performance may be lower or higher than the performance data shown. Please log on to www.ingfunds.com or call (800) 922-0180 to get performance through the most recent month end.
This report contains statements that may be "forward-looking" statements. Actual results may differ materially from those projected in the "forward-looking" statements.
The views expressed in this report reflect those of the portfolio managers, only through the end of the period as stated on the cover. The portfolio managers' views are subject to change at any time based on market and other conditions.
Fund holdings are subject to change daily.
(1) Reflects deduction of the maximum Class A sales charge of 5.75%.
(2) Reflects deduction of the Class B deferred sales charge of 5% and 2%, respectively, for the 1 year and 5 year returns.
(3) Reflects deduction of the Class C deferred sales charge of 1% for the 1 year return.
(4) The Russell 2000 Growth Index measures the performance of those Russell 2000 Index companies with higher price-to-book ratios and higher forecasted growth values.
(5) The Russell 2000 Index consists of the smallest 2,000 companies in the Russell 3000 Index. The Russell 3000 Index is an unmanaged Index that measures the performance of 3000 U.S. companies based on total market capitalization.
(6) Since inception performance for index is shown from
June 1, 1995.
11
PORTFOLIO MANAGERS' REPORT
The ING Financial Services Fund (the "Fund") seeks long-term capital appreciation. The Fund is managed by a team of investment professionals led by Steven L. Rayner, CFA, CPA, Vice President and Portfolio Manager and Robert M. Kloss, Vice President and Portfolio Manager, ING Investment Management Co. - the Sub-Adviser.
Performance: For the six months ended November 30, 2004, the Fund's Class A shares, excluding sales charges, provided a total return of 6.70% compared to the Standard & Poor's ("S&P") Financials Index(3) and the S&P 500 Index(4), which returned 4.36% and 5.67%, respectively, for the same period.
Portfolio Specifics: We continued to bias our positioning of the portfolio toward "offensive" holdings during this period, favoring stocks that we believed would benefit on a relative basis from a strengthening economy and would tend to be less vulnerable to a higher interest rate environment that often follows more robust economic growth.
This proved to be an effective strategy overall, though we had to work through a challenging summer and early fall period characterized by oil-price-induced questions about the sustainability of the economic recovery. The Fund was able to outperform its benchmark for the period, and at the time of this writing, we remain committed to our offensive stance, as the domestic economy moves forward and the Federal Reserve ("Fed") continues its measured pace of interest rate increases.
Stock selection rather than allocation to financial industry groups was the source of most of the relative gain, and we were able to add value through stock selection in each of the three main groups: banks, diversified financials, and Insurance. AIG was a benefit to performance and Bank of America a detractor because we were under- and over-weight, respectively, in these stocks. Among the specific stocks that were significant contributors to performance during the six months ended November 30, 2004 were: asset managers Affiliated Managers Group, Franklin Resources, and T. Rowe Price; subprime home equity lender Accredited Home Lenders; banks Prosperity Bancshares and Bank of America; and internet broker E*Trade Financial.
Conversely, our holdings of multiline insurers American Intl. Group and Hartford Financial Services Group suffered due to their involvement in the insurance brokerage scandal, though we continue to hold stakes in both firms as of this writing, believing further downside to be limited.
Current Strategy and Outlook: In our last commentary six months ago, we expressed our conviction that higher interest rates were coming. So far, the Fed has done its part to increase short-term rates, boosting Fed funds from 1.00% in May to 2.25% in December 2004. However, while long-term rates have gyrated a bit during the period, they generally remained in the 4% range.
This flatter yield curve could be a potential negative for interest-spread-driven financials such as banks. As such, we are maintaining our underweight position in the banking sub-sector. But we must point out that the prospect of higher rates is not an automatic negative for financial stocks - there are many companies in our universe that will actually benefit from moderately higher rates. Further, higher rates do not occur in a vacuum; they are typically a result of strong economic growth, which would benefit the earnings of a substantial portion of our universe. That said, we do not foresee the kind of precipitous rise in interest rates that would likely be a major negative for the market as a whole including most of the financial universe.
We have, therefore, maintained our offensive bias in the portfolio, though we are cognizant of the need to maintain valuation discipline in the face of rising equity prices.
We continue to focus on finding what we believe to be the best relative values among companies leveraged to an economic recovery, as opposed to those whose earnings outlook might prove disappointing in a higher rate environment.
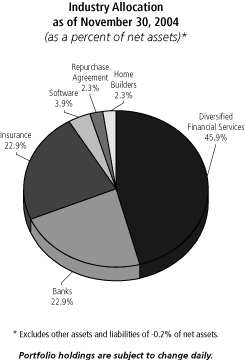
Top Ten Holdings
as of November 30, 2004
(as a percent of net assets)*
| Citigroup, Inc. | 5.8 | % | |||||
| Wells Fargo & Co. | 4.4 | % | |||||
| American International Group, Inc. | 3.7 | % | |||||
| Affiliated Managers Group | 3.5 | % | |||||
| JPMorgan Chase & Co. | 3.2 | % | |||||
| Goldman Sachs Group, Inc. | 3.2 | % | |||||
| Freddie Mac | 3.0 | % | |||||
| Morgan Stanley | 2.9 | % | |||||
| Hartford Financial Services Group, Inc. | 2.8 | % | |||||
| U.S. Bancorp | 2.7 | % | |||||
Portfolio holdings are subject to change daily.
12
PORTFOLIO MANAGERS' REPORT
ING FINANCIAL SERVICES FUND
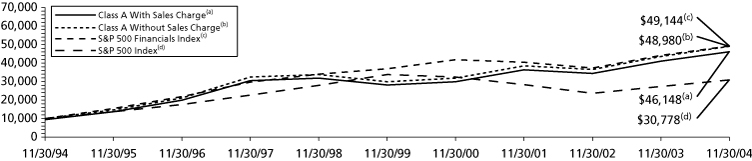
Average Annual Total Returns for the Periods Ended November 30, 2004
| 1 Year | 5 Year | 10 Year | Since Inception of Class B October 20, 1997 | Since Inception of Class C August 25, 2004 | Since Inception of Class O September 15, 2004 | ||||||||||||||||||||||
| Including Sales Charge: | |||||||||||||||||||||||||||
| Class A(1) | 6.31 | % | 9.05 | % | 13.19 | % | - | - | - | ||||||||||||||||||
| Class B(2) | 6.98 | % | 9.24 | % | - | 2.16 | % | - | - | ||||||||||||||||||
| Class C | - | - | - | - | 4.55 | % | - | ||||||||||||||||||||
| Class O | - | - | - | - | - | 3.72 | % | ||||||||||||||||||||
| Excluding Sales Charge: | |||||||||||||||||||||||||||
| Class A | 12.80 | % | 10.35 | % | 17.12 | % | - | - | - | ||||||||||||||||||
| Class B | 11.98 | % | 9.52 | % | - | 5.73 | % | - | - | ||||||||||||||||||
| Class C | - | - | - | - | 5.53 | % | - | ||||||||||||||||||||
| Class O | - | - | - | - | - | 3.72 | % | ||||||||||||||||||||
| S&P 500 Financials Index(3) | 11.44 | % | 5.92 | % | 17.25 | % | 7.97 | %(5) | 2.60 | %(6) | 3.48 | %(7) | |||||||||||||||
| S&P 500 Index(4) | 12.85 | % | (1.84 | )% | 11.90 | % | 5.15 | %(5) | 6.78 | %(6) | 5.63 | %(7) | |||||||||||||||
Based on a $10,000 initial investment, the graph and table above illustrate the total return of ING Financial Services Fund against the S&P 500 Financials Index and the S&P 500 Index. The Indices are unmanaged and have no cash in their portfolios, impose no sales charges and incur no operating expenses. An investor cannot invest directly in an index. The Fund's performance is shown both with and without the imposition of sales charges.
The performance graph and table do not reflect the deduction of taxes that a shareholder will pay on Fund distributions or the redemption of Fund shares.
Total returns reflect the fact that the Investment Manager has waived certain fees and expenses otherwise payable by the Fund. Total returns would have been lower had there been no waiver to the Fund.
Performance data represents past performance and is no assurance of future results. Investment return and principal value of an investment in the Fund will fluctuate. Shares, when sold, may be worth more or less than their original cost. The Fund's current performance may be lower or higher than the performance data shown. Please log on to www.ingfunds.com or call (800) 922-0180 to get performance through the most recent month end.
This report contains statements that may be "forward-looking" statements. Actual results may differ materially from those projected in the "forward-looking" statements.
The views expressed in this report reflect those of the portfolio managers, only through the end of the period as stated on the cover. The portfolio managers' views are subject to change at any time based on market and other conditions.
Fund holdings are subject to change daily.
(1) Reflects deduction of the maximum Class A sales charge of 5.75%.
(2) Reflects deduction of the Class B deferred sales charge of 5%, 2% and 1%, respectively, for the 1 year, 5 year and since inception returns.
(3) The S&P 500 Financials Index is a capitalization-weighted index of all stocks designed to measure the performance of the financial sector of the S&P 500 Index.
(4) The S&P 500 Index is a capitalization-weighted index of 500 stocks chosen for market size, liquidity, and industry group representation.
(5) Since inception performance for index is shown from November 1, 1997.
(6) Since inception performance for index is shown from September 1, 2004.
(7) Since inception performance for index is shown from October 1, 2004.
13
ING LARGECAP VALUE FUND
PORTFOLIO MANAGERS' REPORT
The ING LargeCap Value Fund (the "Fund") seeks long-term capital appreciation. The Fund is managed by Brandes Investment Partners, L.P. - the Sub-Adviser. Brandes' Large Cap Investment Committee is responsible for making the day-to-day investment decisions for the Fund.
Performance: For the six months ended November 30, 2004, the Fund's Class A shares, excluding sales charges, provided a total return of 7.05% compared to the Russell 1000 Value Index(4) and the Russell 1000 Index(5), which returned 11.01% and 5.92%, respectively, for the same period.
Portfolio Specifics: While energy prices increased substantially during the period ended November 30, 2004, U.S. economic output continued to expand. In October, as the price of crude oil reached $55 a barrel, the Commerce Department reported that gross domestic product grew at an annualized 3.7% in the third calendar quarter of 2004.
The Federal Reserve raised U.S. interest rates four times, bringing the federal funds rate to 2.0%. In a November statement, the central bank noted that "output appears to be growing at a moderate pace despite the rise in energy prices, and labor market conditions have improved."
In this environment, U.S. stocks tended to post advances. The Dow Jones Industrial Average(7) gained 3.48%, while the S&P 500 Index(8) climbed 5.67%.
Additionally, the large-cap Russell 1000 Index gained 5.92%, while the small-cap Russell 2000 Index(9) climbed 12.18%, suggesting that returns for large caps trailed returns for small caps during the period. Among large caps, less-expensive "value" stocks tended to outperform their "growth" counterparts. While the Russell 1000 Value Index advanced 11.01%, for example, the Russell 1000 Growth Index(10) gained only 0.81%.
The Fund underperformed the Russell 1000 Value Index, but outperformed the Russell 1000 Index. For the Fund, a majority of holdings posted advances. Gains for positions in industries such as diversified telecom services, oil and gas, and tobacco made the most substantial contributions to returns. Strong performers in these industries included Sprint Corp., El Paso Corp. and Altria Group, Inc.
Returns for holdings in pharmaceuticals were mixed during the period, with Wyeth and Schering-Plough Corp. advancing, while positions such as Merck & Co., Inc. and Pfizer Inc. declined. On a stock-by-stock basis, declines for positions in Merck & Co., Inc., Micron Technology, Inc. and Safeway, Inc. were the most significant detractors from the Fund's performance.
Current Strategy and Outlook: During the period, we sold several positions as their market prices advanced toward our estimate of their fair values. We used the proceeds to purchase shares of new holdings at prices that we consider attractive.
As a result of this buying and selling, many of the Fund's industry exposures shifted. For example, exposure to the insurance industry increased, while exposure to the diversified telecom services industry declined. Keep in mind that the Fund's industry exposures are not the product of top-down forecasts or industry-level analysis, but merely stem from our company-by-company search for compelling investment opportunities.
Overall, we offer no predictions regarding the short-term direction of the stock market, or regarding large-cap U.S. stocks in particular. Instead, we remain focused on purchasing large-cap stocks at discounts to their intrinsic values and holding them until the broader market recognizes their true worth. We believe that this approach will provide patient investors with favorable returns over the long term.

Top Ten Holdings
as of November 30, 2004
(as a percent of net assets)*
| Merck & Co, Inc. | 4.0 | % | |||||
| Schering-Plough Corp. | 4.0 | % | |||||
| Safeway, Inc. | 4.0 | % | |||||
| BellSouth Corp. | 3.9 | % | |||||
| Kroger Co. | 3.8 | % | |||||
| Pfizer, Inc. | 3.6 | % | |||||
| Bristol-Myers Squibb Co. | 3.5 | % | |||||
| Ford Motor Co. | 3.5 | % | |||||
| Albertson's, Inc. | 3.5 | % | |||||
| SBC Communications, Inc. | 3.5 | % | |||||
Portfolio holdings are subject to change daily.
14
PORTFOLIO MANAGERS' REPORT
ING LARGECAP VALUE FUND
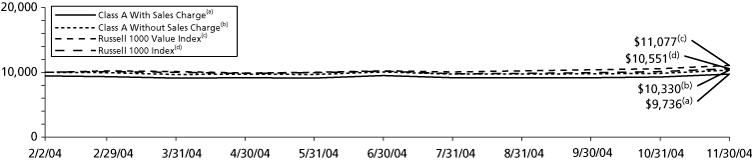
Average Annual Total Returns for the Periods Ended November 30, 2004
| Since Inception of Class A and Class B February 2, 2004 | Since Inception of Class C February 3, 2004 | ||||||||||||||||||
| Including Sales Charge: | |||||||||||||||||||
| Class A(1) | (2.64 | )% | - | ||||||||||||||||
| Class B(2) | (2.38 | )% | - | ||||||||||||||||
| Class C(3) | - | 2.02 | % | ||||||||||||||||
| Excluding Sales Charge: | |||||||||||||||||||
| Class A | 3.30 | % | - | ||||||||||||||||
| Class B | 2.62 | % | - | ||||||||||||||||
| Class C | - | 3.02 | % | ||||||||||||||||
| Russell 1000 Value Index(4) | 10.77 | %(6) | 10.77 | %(6) | |||||||||||||||
| Russell 1000 Index(5) | 5.51 | %(6) | 5.51 | %(6) | |||||||||||||||
Based on a $10,000 initial investment, the graph and table above illustrate the total return of ING LargeCap Value Fund against the Russell 1000 Value Index and the Russell 1000 Index. The Indices have no cash in their portfolios, imposes no sales charges and incur no operating expenses. An investor cannot invest directly in an index. The Fund's performance is shown both with and without the imposition of sales charges.
Performance graph and table do not reflect the deduction of taxes that a shareholder will pay on Fund distributions or the redemption of Fund shares.
Total returns reflect the fact that the Investment Manager has waived certain fees and expenses otherwise payable by the Fund, subject to possible later recoupment during a three-year period. Total returns would have been lower had there been no waiver to the Fund.
Performance data represents past performance and is no assurance of future results. Investment return and principal value of an investment in the Fund will fluctuate. Shares, when sold, may be worth more or less than their original cost. The Fund's current performance may be lower or higher than the performance data shown. Please log on to www.ingfunds.com or call (800) 922-0180 to get performance through the most recent month end.
This report contains statements that may be "forward-looking" statements. Actual results may differ materially from those projected in the "forward-looking" statements.
The views expressed in this report reflect those of the portfolio managers, only through the end of the period as stated on the cover. The portfolio managers' views are subject to change at any time based on market and other conditions.
Fund holdings are subject to change daily.
(1) Reflects deduction of the maximum Class A sales charge of 5.75%.
(2) Reflects deduction of the Class B deferred sales charge of 5%.
(3) Reflects deduction of the Class C deferred sales charge of 1%.
(4) The Russell 1000 Value Index measures the performance of those Russell 1000 securities with lower price-to-book ratios and lower forecasted growth values.
(5) The Russell 1000 Index measures the performance of the 1,000 largest companies in the Russell 3000 Index, which represents approximately 92% of the total market capitalization of the Russell 3000 Index.
(6) Since inception performance for the index is shown from February 1, 2004.
(7) The Dow Jones Industrial Average is an unmanaged U.S. stock index based on the stock prices of 30 large and actively traded U.S. companies.
(8) The S&P 500 Index is an unmanaged index that measures the performance of securities of approximately 500 large, capitalization companies whose securities are traded on major U.S. stock markets.
(9) The Russell 2000 Index measures the performance of the 2,000 smallest companies in the Russell 3000 Index. The Russell 3000 Index is an unmanaged index that measures the performance of 3,000 U.S. companies based on total market capitalization.
(10) The Russell 1000 Growth Index measures the performance of the 1,000 largest companies in the Russell 3000 Index with higher price-to-book ratios and higher forecasted growth.
15
ING MAGNACAP FUND
PORTFOLIO MANAGERS' REPORT
The ING MagnaCap Fund (the "Fund") seeks growth of capital, with dividend income as a secondary consideration. The Fund is managed by a team of investment professionals led by William F. Coughlin, CFA, ING Investment Management Co. - the Sub-Adviser.
Performance: For the six months ended November 30, 2004, the Fund's Class A shares, excluding sales charges, provided a total return of 7.19% compared to the Russell 1000 Value Index(5) and the Russell 1000 Index(6), which returned 11.01% and 5.92%, respectively, for the same period.
Portfolio Specifics: A combination of sector allocation and disappointing stock selection caused the Fund to underperform its Russell 1000 Value Index benchmark during the past six months. With respect to the Fund's sector allocation, an overweighted position in the poorly performing health care sector had a negative impact on performance as Merck & Co., which was previously held, and Pfizer, Inc. were two of the Fund's worst performing positions. Partially offsetting this weakness, however, was an important overweighting of the energy sector where Apache Corp., Halliburton Co., and ChevronTexaco Corp. made positive contributions. Overall, our holdings in the financial services sector had the most impact on relative results as American Intl. Group, Washington Mutual, Inc. and Morgan Stanley all declined during the period.
There were no major sector changes over the last six months. The largest sector exposure in the Fund remains financial services at approximately 34% of total assets. While this appears to be a relatively high level for a single sector, the Russell 1000 Value Index has a weighting of nearly 33%, so the Fund is relatively in line with its benchmark. Consumer staples continues to the most heavily overweighted sector relative to the benchmark, while technology is the most underweighted. Overall, the Fund's sector weightings have remained sensitive to the weightings of the underlying benchmark as a means of controlling the overall risk and volatility of the Fund's returns.
Current Strategy and Outlook: The stock market seems poised to end 2004 on a positive note. The favorable presidential election outcome (from the market's perspective) and the outlook for stable to declining energy prices over the next few months have enabled investors to focus on the more traditional economic and market metrics: valuation, interest rates, corporate profits, and inflation. Given our positive economic outlook, we believe that the market is reasonably valued and able to provide positive returns during the coming year.

Top Ten Holdings
as of November 30, 2004
(as a percent of net assets)*
| ChevronTexaco Corp. | 3.8 | % | |||||
| Bank of America Corp. | 3.7 | % | |||||
| General Dynamics Corp. | 3.6 | % | |||||
| Altria Group, Inc. | 3.6 | % | |||||
| Exxon Mobil Corp. | 3.4 | % | |||||
| Wells Fargo & Co. | 3.3 | % | |||||
| Nestle SA ADR | 3.1 | % | |||||
| BP PLC ADR | 3.0 | % | |||||
| Fannie Mae | 3.0 | % | |||||
| Merrill Lynch & Co, Inc. | 3.0 | % | |||||
Portfolio holdings are subject to change daily.
16
PORTFOLIO MANAGERS' REPORT
ING MAGNACAP FUND
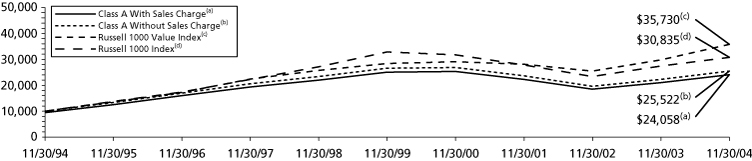
Average Annual Total Returns for the Periods Ended November 30, 2004
| 1 Year | 5 Year | 10 Year | Since Inception of Class B and M July 17, 1995 | Since Inception of Class C June 1, 1999 | |||||||||||||||||||
| Including Sales Charge: | |||||||||||||||||||||||
| Class A(1) | 7.66 | % | (2.03 | )% | 9.08 | % | - | - | |||||||||||||||
| Class B(2) | 8.40 | % | (1.84 | )% | - | 7.39 | % | - | |||||||||||||||
| Class C(3) | 12.39 | % | (1.55 | )% | - | - | (0.86 | )% | |||||||||||||||
| Class M(4) | 9.69 | % | (1.97 | )% | - | 7.27 | % | - | |||||||||||||||
| Excluding Sales Charge: | |||||||||||||||||||||||
| Class A | 14.23 | % | (0.86 | )% | 9.73 | % | - | - | |||||||||||||||
| Class B | 13.40 | % | (1.55 | )% | - | 7.39 | % | - | |||||||||||||||
| Class C | 13.39 | % | (1.55 | )% | - | - | (0.86 | )% | |||||||||||||||
| Class M | 13.67 | % | (1.27 | )% | - | 7.68 | % | - | |||||||||||||||
| Russell 1000 Value Index(5) | 19.67 | % | 4.68 | % | 13.58 | % | 11.92 | %(7) | 3.75 | % | |||||||||||||
| Russell 1000 Index(6) | 12.66 | % | (1.30 | )% | 11.92 | % | 10.02 | %(7) | 0.11 | % | |||||||||||||
Based on a $10,000 initial investment, the graph and table above illustrate the total return of ING MagnaCap Fund against the Russell 1000 Value Index and the Russell 1000 Index. The Indices are unmanaged and have no cash in their portfolios, impose no sales charges and incur no operating expenses. An investor cannot invest directly in an index. The Fund's performance is shown both with and without the imposition of sales charges.
The performance graph and table do not reflect the deduction of taxes that a shareholder will pay on Fund distributions or the redemption of Fund shares.
Total returns reflect the fact that the Investment Manager has waived certain fees and expenses otherwise payable by the Fund. Total returns would have been lower had there been no waiver to the Fund.
Performance data represents past performance and is no assurance of future results. Investment return and principal value of an investment in the Fund will fluctuate. Shares, when sold, may be worth more or less than their original cost. The Fund's current performance may be lower or higher than the performance data shown. Please log on to www.ingfunds.com or call (800) 922-0180 to get performance through the most recent month end.
This report contains statements that may be "forward-looking" statements. Actual results may differ materially from those projected in the "forward-looking" statements.
The views expressed in this report reflect those of the portfolio managers, only through the end of the period as stated on the cover. The portfolio managers' views are subject to change at any time based on market and other conditions.
Fund holdings are subject to change daily.
(1) Reflects deduction of the maximum Class A sales charge of 5.75%.
(2) Reflects deduction of the Class B deferred sales charge of 5% and 2%, respectively, for the 1 year and 5 year returns.
(3) Reflects deduction of the Class C deferred sales charge of 1% for the 1 year return.
(4) Reflects deduction of the maximum Class M sales charge of 3.50%.
(5) The Russell 1000 Value Index measures the performance of those Russell 1000 securities with lower price-to-book ratios and lower forecasted growth values.
(6) The Russell 1000 Index measures the performance of the 1,000 largest companies in the Russell 3000 Index, which represents approximately 92% of the total market capitalization of the Russell 3000 Index.
(7) Since inception performance for index is shown from August 1, 1995.
17
ING MIDCAP VALUE FUND
PORTFOLIO MANAGERS' REPORT
The ING MidCap Value Fund (the "Fund") seeks long-term capital appreciation. The Fund is managed by Brandes Investment Partners, L.P. - the Sub-Adviser. Brandes' Mid Cap Investment Committee is responsible for making the day-to-day investment decisions for the Fund.
Performance: For the six months ended November 30, 2004, the Fund's Class A shares, excluding sales charges, provided a total return of 5.85% compared to the Russell MidCap Value Index(4) and the Russell MidCap Index(5), which returned 15.09% and 11.09%, respectively, for the same period.
Portfolio Specifics: While energy prices increased substantially during the period, U.S. economic output continued to expand. In October, as the price of crude oil reached $55 a barrel, the Commerce Department reported that gross domestic product grew at an annualized 3.7% in the third quarter of 2004.
The Federal Reserve raised U.S. interest rates four times, bringing the federal funds rate to 2.0% as of period end. In a November statement, the central bank noted that "output appears to be growing at a moderate pace despite the rise in energy prices, and labor market conditions have improved."
In this environment, U.S. stocks tended to post advances. The Dow Jones Industrial Average(7) gained 3.48%, while the S&P 500 Index(8) climbed 5.67%.
Additionally, the large-cap Russell 1000 Index(9) gained 5.92% while the Russell Midcap Index climbed 11.09%, suggesting that returns for large caps trailed returns for mid caps during the period. Among mid caps, less-expensive "value" stocks tended to outperform their "growth" counterparts. While the Russell Midcap Value Index advanced 15.09%, for example, the Russell Midcap Growth Index(10) gained only 5.68%.
For the Fund, a majority of holdings posted advances; however, the Fund still underperformed its benchmarks. Gains for positions in the oil and gas, tobacco, and chemicals industries made the most substantial contributions to returns. Strong performers in these industries included El Paso Corp., Loews Corp. - Carolina Group, and RPM International, which was sold during the period.
Returns for positions in the auto components industry were mixed, with Goodyear Tire & Rubber Co. advancing while Visteon Corp. declined. On a stock-by-stock basis, declines for positions in Tommy Hilfiger Corp. and Winn-Dixie Stores, Inc. were the most significant detractors from the Fund's performance.
Current Strategy and Outlook: During the six-month period ended November 30, 2004, we sold several positions as their market prices advanced toward our estimate of their fair values. We used the proceeds to purchase shares of new holdings at prices that we consider attractive.
As a result of this buying and selling, many of the Fund's industry exposures shifted. For example, exposure to the health care providers & services industry increased, while exposure to the chemicals industry declined. Keep in mind that the Fund's industry exposures are not the product of top-down forecasts or industry-level analysis, but merely stem from our company-by-company search for compelling investment opportunities.
Overall, we offer no predictions regarding the short-term direction of the stock market, or regarding mid-cap U.S. stocks in particular. Instead, we remain focused on purchasing mid-cap stocks at discounts to their intrinsic values and holding them until the broader market recognizes their true worth. We believe that this approach will provide patient investors with favorable returns over the long term.
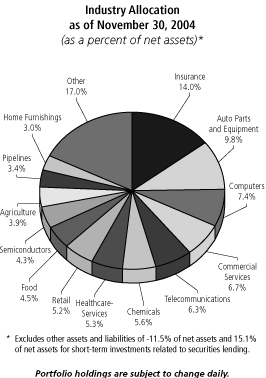
Top Ten Industries
as of November 30, 2004
(as a percent of net assets)*
| Agere Systems, Inc. | 4.2 | % | |||||
| Goodyear Tire & Rubber Co. | 4.1 | % | |||||
| UnumProvident Corp. | 4.0 | % | |||||
| Unisys Corp. | 4.0 | % | |||||
| El Paso Corp. | 3.4 | % | |||||
| Synopsys, Inc. | 3.4 | % | |||||
| Tenet Healthcare Corp. | 3.3 | % | |||||
| Visteon Corp. | 3.2 | % | |||||
| Loews Corp. | 3.2 | % | |||||
| 3Com Corp. | 3.1 | % | |||||
Portfolio holdings are subject to change daily.
* Excludes short-term securities related to securities lending.
18
PORTFOLIO MANAGERS' REPORT
ING MIDCAP VALUE FUND
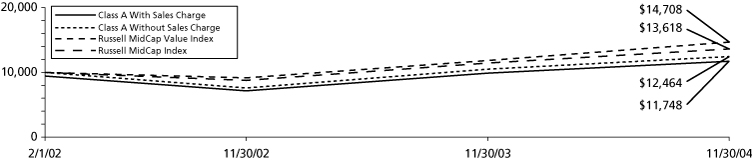
Average Annual Total Returns for the Periods Ended November 30, 2004
| 1 Year | Since Inception of Class A February 1, 2002 | Since Inception of Class B and C February 4, 2002 | |||||||||||||
| Including Sales Charge: | |||||||||||||||
| Class A(1) | 11.78 | % | 5.86 | % | - | ||||||||||
| Class B(2) | 12.75 | % | - | 7.00 | % | ||||||||||
| Class C(3) | 16.65 | % | - | 7.89 | % | ||||||||||
| Excluding Sales Charge: | |||||||||||||||
| Class A | 18.60 | % | 8.09 | % | - | ||||||||||
| Class B | 17.75 | % | - | 7.93 | % | ||||||||||
| Class C | 17.65 | % | - | 7.89 | % | ||||||||||
| Russell MidCap Value Index(4) | 24.23 | % | 14.59 | % | 14.59 | %(6) | |||||||||
| Russell MidCap Index(5) | 18.76 | % | 11.51 | % | 11.51 | %(6) | |||||||||
Based on a $10,000 initial investment, the graph and table above illustrate the total return of ING MidCap Value Fund against the Russell MidCap Value Index and the Russell MidCap Index. The Indices are unmanaged and have no cash in their portfolios, imposes no sales charges and incur no operating expenses. An investor cannot invest directly in an index. The Fund's performance is shown both with and without the imposition of sales charges.
The performance graph and table do not reflect the deduction of taxes that a shareholder will pay on Fund distributions or the redemption of Fund shares.
Total returns reflect the fact that the Investment Manager has waived certain fees and expenses otherwise payable by the Fund, subject to possible later recoupment during a three-year period. Total returns would have been lower had there been no waiver to the Fund.
Performance data represents past performance and is no assurance of future results. Investment return and principal value of an investment in the Fund will fluctuate. Shares, when sold, may be worth more or less than their original cost. The Fund's current performance may be lower or higher than the performance data shown. Please log on to www.ingfunds.com or call (800) 922-0180 to get performance through the most recent month end.
This report contains statements that may be "forward-looking" statements. Actual results may differ materially from those projected in the "forward-looking" statements.
The views expressed in this report reflect those of the portfolio managers, only through the end of the period as stated on the cover. The portfolio managers' views are subject to change at any time based on market and other conditions.
Fund holdings are subject to change daily.
(1) Reflects deduction of the maximum Class A sales charge of 5.75%.
(2) Reflects deduction of the Class B deferred sales charge of 5% and 3%, respectively for the 1 year and since inception returns.
(3) Reflects deduction of the Class C deferred sales charge of 1% for the 1 year return.
(4) The Russell Midcap Value Index is an unmanaged index that measures the performance of Russell Midcap companies with lower price-to-book ratios and lower forecasted growth values.
(5) The Russell MidCap Index measures the performance of the 800 smallest companies in the Russell 1000 Index.
(6) Since inception performance for index is shown from February 1, 2002.
(7) The Dow Jones Industrial Average is an unmanaged U.S. stock index based on the stock prices of 30 large and actively traded U.S. companies.
(8) The S&P 500 Index is an unmanaged index that measures the performance of securities of approximately 500 large, capitalization companies whose securities are traded on major U.S. stock markets.
(9) The Russell 1000 Index measures the performance of the 1000 largest in the Russell 3000 Index. The Russell 3000 Index is an unmanaged index that measures the performance of 3,000 U.S. companies based on total market capitalization.
(10) The Russell MidCap Growth Index consists of those companies included in the Russell MidCap Index with relatively higher price-to-book ratios and higher forecasted growth values with greater than average growth orientation.
19
ING SMALLCAP VALUE FUND
PORTFOLIO MANAGERS' REPORT
The ING SmallCap Value Fund (the "Fund") seeks long-term capital appreciation. The Fund is managed by Brandes Investment Partners, L.P. - the Sub-Adviser. Brandes' Small Cap Investment Committee is responsible for making the day-to-day investment decisions for the Fund.
Performance: For the six months ended November 30, 2004, the Fund's Class A shares, excluding sales charges, provided a total return of 6.56% compared to the Russell 2000 Value Index(4) and the Russell 2000 Index(5), which returned 16.35% and 12.18%, respectively, for the same period.
Portfolio Specifics: While energy prices increased substantially during the period, U.S. economic output continued to expand. In October, as the price of crude oil reached $55 a barrel, the Commerce Department reported that gross domestic product grew at an annualized 3.7% in the third calendar quarter of 2004.
The Federal Reserve raised U.S. interest rates four times, bringing the federal funds rate to 2.0% as of period end. In a November statement, the central bank noted that "output appears to be growing at a moderate pace despite the rise in energy prices, and labor market conditions have improved."
In this environment, U.S. stocks tended to post advances. The Dow Jones Industrial Average(7) gained 3.48%, while the S&P 500 Index(8) climbed 5.67%.
Additionally, the large-cap Russell 1000 Index(9) gained 5.92%, while the small-cap Russell 2000 Index climbed 12.18%, suggesting that returns for large caps trailed returns for small caps during the period. Among small caps, less-expensive "value" stocks tended to outperform their "growth" counterparts. While the Russell 2000 Value Index advanced 16.35%, for example, the Russell 2000 Growth Index(10) gained only 7.88%.
For the Fund, a majority of holdings posted advances; however, the Fund still underperformed its benchmarks. Gains for positions in industries such as household durables, computers and peripherals, and chemicals made the most substantial contributions to returns. Strong performers in these industries included American Greetings Corp., Gateway, Inc., and PolyOne Corp.
Holdings in food & staples retailing and in speciality retail declined. On a stock-by-stock basis, declines for positions in Winn-Dixie Stores, Inc., Tommy Hilfiger Corp., and Interstate Bakeries Corp. - which was sold during the period - were the most significant detractors from the Fund's performance.
Current Strategy and Outlook: During the six-month period ended November 30, 2004, we sold several positions as their market prices advanced toward our estimate of their fair values. We used the proceeds to purchase shares of new holdings at prices that we consider attractive.
As a result of this buying and selling, many of the Fund's industry exposures shifted. For example, exposure to the textiles, apparel & luxury goods industry increased, while exposure to the machinery industry declined. Keep in mind that the Fund's industry exposures are not the product of top-down forecasts or industry-level analysis, but merely stem from our company-by-company search for compelling investment opportunities.
Overall, we offer no predictions regarding the short-term direction of the stock market, or regarding small-cap U.S. stocks in particular. Instead, we remain focused on purchasing small-cap stocks at discounts to their intrinsic values and holding them until the broader market recognizes their true worth. We believe that this approach will provide patient investors with favorable returns over the long term.
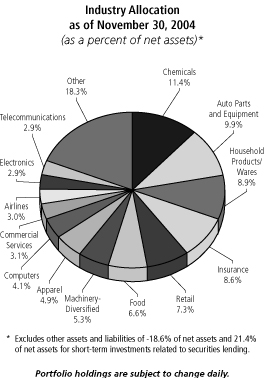
Top Ten Holdings
as of November 30, 2004
(as a percent of net assets)*
| Visteon Corp. | 3.4 | % | |||||
| Winn-Dixie Stores, Inc. | 3.3 | % | |||||
| Playtex Products, Inc. | 3.3 | % | |||||
| Payless Shoesource, Inc. | 3.1 | % | |||||
| Wellman, Inc. | 3.0 | % | |||||
| Delta Air Lines, Inc. | 3.0 | % | |||||
| Cincinnati Bell, Inc. | 2.9 | % | |||||
| Kemet Corp. | 2.9 | % | |||||
| Dillard's, Inc. | 2.9 | % | |||||
| Sensient Technologies Corp. | 2.8 | % | |||||
Portfolio holdings are subject to change daily.
* Excludes short-term securities related to securities lending.
20
ING SMALLCAP VALUE FUND
PORTFOLIO MANAGERS' REPORT
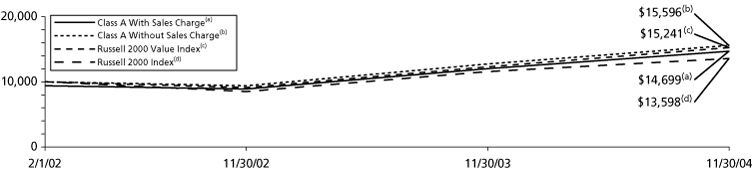
Average Annual Total Returns for the Periods Ended November 30, 2004
| 1 Year | Since Inception of Class A February 1, 2002 | Since Inception of Class B February 4, 2002 | Since Inception of Class C February 7, 2002 | ||||||||||||||||
| Including Sales Charge: | |||||||||||||||||||
| Class A(1) | 14.97 | % | 14.58 | % | - | - | |||||||||||||
| Class B(2) | 16.07 | % | - | 16.02 | % | - | |||||||||||||
| Class C(3) | 20.09 | % | - | - | 17.27 | % | |||||||||||||
| Excluding Sales Charge: | |||||||||||||||||||
| Class A | 21.98 | % | 17.00 | % | - | - | |||||||||||||
| Class B | 21.07 | % | - | 16.83 | % | - | |||||||||||||
| Class C | 21.09 | % | - | - | 17.27 | % | |||||||||||||
| Russell 2000 Value Index(4) | 23.71 | % | 16.04 | % | 16.04 | %(6) | 16.04 | %(6) | |||||||||||
| Russell 2000 Index(5) | 17.26 | % | 11.46 | % | 11.46 | %(6) | 11.46 | %(6) | |||||||||||
Based on a $10,000 initial investment, the graph and table above illustrate the total return of ING SmallCap Value Fund against the Russell 2000 Value Index and Russell 2000 Index. The Indices are unmanaged and have no cash in their portfolios, impose no sales charges and incur no operating expenses. An investor cannot invest directly in an index. The Fund's performance is shown both with and without the imposition of sales charges.
The performance graph and table do not reflect the deduction of taxes that a shareholder will pay on Fund distributions or the redemption of Fund shares.
Total returns reflect the fact that the Investment Manager has waived certain fees and expenses otherwise payable by the Fund, subject to possible later recoupment during a three-year period. Total returns would have been lower had there been no waiver to the Fund.
Performance data represents past performance and is no assurance of future results. Investment return and principal value of an investment in the Fund will fluctuate. Shares, when sold, may be worth more or less than their original cost. The Fund's current performance may be lower or higher than the performance data shown. Please log on to www.ingfunds.com or call (800) 922-0180 to get performance through the most recent month end.
This report contains statements that may be "forward-looking" statements. Actual results may differ materially from those projected in the "forward-looking" statements.
The views expressed in this report reflect those of the portfolio managers, only through the end of the period as stated on the cover. The portfolio managers' views are subject to change at any time based on market and other conditions.
Fund holdings are subject to change daily.
(1) Reflects deduction of the maximum Class A sales charge of 5.75%.
(2) Reflects deduction of the Class B deferred sales charge of 5% and 3%, respectively, for the 1 year and since inception return.
(3) Reflects deduction of the Class C deferred sales charge of 1% for the 1 year return.
(4) The Russell 2000 Value Index measures the performance of those Russell 2000 securities with lower price-to-book ratios and lower forecasted growth values.
(5) The Russell 2000 Index consists of the smallest 2,000 companies in the Russell 3000 Index. The Russell 3000 Index is an unmanaged index that measures the performance of 3000 U.S. companies based on total market capitalization.
(6) Since inception performance for index is shown from February 1, 2002.
(7) The Dow Jones Industrial Average is an unmanaged U.S. stock index based on the stock prices of 30 large and actively traded U.S. companies.
(8) The S&P 500 Index is an unmanaged index that measures the performance of securities of approximately 500 large, capitalization companies whose securities are traded on major U.S. stock markets.
(9) The Russell 1000 Index measures the performance of the 1,000 largest in the Russell 3000 Index. The Russell 3000 Index is an unmanaged index that measures the performance of 3,000 U.S. companies based on total market capitalization.
(10) The Russell 2000 Growth Index measures the performance of those Russell 2000 Index companies with higher price-to-book ratios and higher forecasted growth values.
21
PORTFOLIO MANAGERS' REPORT
The ING Convertible Fund (the "Fund") seeks maximum total return, consisting of capital appreciation and current income. The Fund is managed by a team of investment professionals led by Anuradha Sahai, ING Investment Management Co. - the Sub-Adviser.
Performance: For the six months ended November 30, 2004, the Fund's Class A shares, excluding sales charges, provided a total return of 3.89% compared to the Merrill Lynch All Convertibles Excluding Mandatory All Qualities ("ML Convertible") Index(4) and the First Boston Convertible Index(5), which returned 4.13% and 3 .79%, respectively, for the same period.
Portfolio Specifics: The Fund slightly underperformed its benchmark index (the "ML Convertible Index") and comparable mutual funds for the six months ended November 30, 2004. The Fund was relatively defensively positioned versus its peer group, as well as the Index at the beginning of the six-month period. The barbell approach adopted earlier in the year, with heavier weights in more defensive bond-like higher income names, along with some equity sensitive names having good fundamentals, helped the Fund participate more during the rallies.
The technology sector was the driver of the majority of the gains in the convertible market due to its heavy weight in the ML Convertible Index. The Fund lagged due to underweighting in this sector versus the benchmark. Slight overweighting and security selection aided the Fund in beating the benchmark handily in the energy sector, which was a strong performing sector in the Fund. Security selection was the major driver of performance in the consumer discretionary, transportation, and health care sectors as well. An overweight sensitivity in the materials sector also benefited performance. This was offset by significant underperformance in telecommunications, due to pronounced underperformance of Primus Telecommunications Group, Inc. (3.750%, due 09/15/10), which the Fund has since sold. The Fund also underperformed in the industrial sector due to a couple of names not meeting third-quarter earnings expectations. We believe the inv estment thesis for these companies remains intact and that the market has overreacted. Financials were affected negatively due to overexposure to insurers, which were first affected by hurricanes and then by the announcement of investigations into their sales practices.
Current Strategy and Outlook: With the continued redemption of higher interest bond-like convertibles, as well as the continued new issuance of more equity-like convertibles, the convertible market has taken on more equity sensitivity than witnessed in the last couple of years. U.S. economic indicators continue to improve, but we believe that equity market val uations will improve more modestly going into 2005. A weak dollar, combined with relatively high oil prices, could still act as a damper to economic growth going forward. Inflationary fears, along with geopolitical concerns, decrease the visibility for the financial markets going into next year.
As the equity markets have rallied and with spreads tight, the Fund has since shifted from the barbell approach to a more middle of the road stance with most of its weighting in total return convertibles with neither a pure bond-like tilt, nor a pure equity tilt.
In these volatile times, we believe convertible securities are attractive relative to comparable asset classes due to their bond floor downside protection, while providing equity-like upside participation. Despite the fear of higher rates, strong balance sheets and lower default risk should keep bond floors from dropping much. We continue to look for companies across the spectrum that will benefit from a gradually recovering economy as we expect the market will reward companies that typically profit in the recovery part of the cycle. A bottom-up approach, which relies on fundamental analysis and careful security selection within our broader top-down sector positioning strategy, continues to be the foundation for our investment decisions.
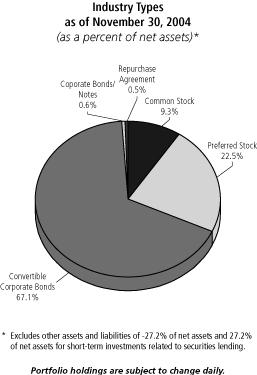
Top Ten Industries
as of November 30, 2004
(as a percent of net assets)*
| Electronics | 3.6 | % | |||||
| Pharmaceuticals | 9.6 | % | |||||
| Mining | 4.3 | % | |||||
| Telecommunications | 6.3 | % | |||||
| Miscellaneous Manufacturing | 3.3 | % | |||||
| Insurance | 9.8 | % | |||||
| Media | 6.0 | % | |||||
| Healthcare-Services | 3.5 | % | |||||
| Diversified Financial Services | 5.7 | % | |||||
| Oil and Gas | 4.7 | % | |||||
Portfolio holdings are subject to change daily.
* Excludes short-term securities related to securities lending.
22
ING CONVERTIBLE FUND
PORTFOLIO MANAGERS' REPORT
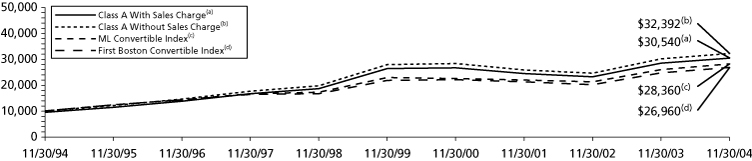
Average Annual Total Returns for the Periods Ended November 30, 2004
| 1 Year | 5 Year | 10 Year | Since Inception of Class B May 31, 1995 | ||||||||||||||||
| Including Sales Charge: | |||||||||||||||||||
| Class A(1) | 0.71 | % | 1.71 | % | 11.75 | % | - | ||||||||||||
| Class B(2) | 1.09 | % | 1.99 | % | - | 11.69 | % | ||||||||||||
| Class C(3) | 5.15 | % | 2.30 | % | 11.72 | % | - | ||||||||||||
| Excluding Sales Charge: | |||||||||||||||||||
| Class A | 6.85 | % | 2.92 | % | 12.42 | % | - | ||||||||||||
| Class B | 6.09 | % | 2.29 | % | - | 11.69 | % | ||||||||||||
| Class C | 6.15 | % | 2.30 | % | 11.72 | % | - | ||||||||||||
| ML Convertible Index(4) | 8.86 | % | 4.31 | % | 10.99 | % | 10.34 | %(6) | |||||||||||
| First Boston Convertible Index(5) | 8.63 | % | 4.31 | % | 10.43 | % | 9.66 | %(6) | |||||||||||
Based on a $10,000 initial investment, the graph and table above illustrate the total return of ING Convertible Fund against the ML Convertible Index and the First Boston Convertible Index. The Indicies are unmanaged and have no cash in their portfolios, impose no sales charges and incur no operating expenses. An investor cannot invest directly in an index. The Fund's performance is shown both with and without the imposition of sales charges.
The performance graph and table do not reflect the deduction of taxes that a shareholder will pay on Fund distributions or the redemption of Fund shares.
Total returns reflect the fact that the Investment Manager has waived certain fees and expenses otherwise payable by the Fund. Total returns would have been lower had there been no waiver to the Fund.
Performance data represents past performance and is no assurance of future results. Investment return and principal value of an investment in the Fund will fluctuate. Shares, when sold, may be worth more or less than their original cost. The Fund's current performance may be lower or higher than the performance data shown. Please log on to www.ingfunds.com or call (800) 922-0180 to get performance through the most recent month end.
This report contains statements that may be "forward-looking" statements. Actual results may differ materially from those projected in the "forward-looking" statements.
The views expressed in this report reflect those of the portfolio managers, only through the end of the period as stated on the cover. The portfolio managers' views are subject to change at any time based on market and other conditions.
Fund holdings are subject to change daily.
(1) Reflects deduction of the maximum Class A sales charge of 5.75%.
(2) Reflects deduction of the Class B deferred sales charge of 5% and 2%, respectively, for the 1 year and 5 year returns.
(3) Reflects deduction of the Class C deferred sales charge of 1% for the 1 year return.
(4) The Merrill Lynch All Convertibles Excluding Mandatory All Quantities Index ("ML Convertible Index") is a market capitalization-weighted index including all non-mandatory domestic corporate convertible securities with at least on overall par of $50 million market value.
(5) The First Boston Convertible Index is an index representing the universe of convertible securities.
(6) Since inception performance for index is shown from June 1, 1995.
23
ING EQUITY AND BOND FUND
PORTFOLIO MANAGERS' REPORT
The ING Equity and Bond Fund (the "Fund") seeks a balance of long-term capital appreciation and current income. The equity portion of the Fund is managed by a team of investment professionals led by James A. Vail, CFA. The bond portion of the Fund is managed by a team of investment professionals led by James B. Kauffmann. Both are with ING Investment Management Co. - the Sub-Adviser.
Performance: For the six months ended November 30, 2004, the Fund's Class A shares, excluding sales charges, provided a total return of 3.12% compared to the Standard & Poor's ("S&P") 500 Index(4), the Lehman Brothers Aggregate Bond Index(5), and a Composite Index (60% S&P 500 Index / 40% Lehman Brothers Aggregate Bond Index), which returned 5.67%, 3.82% and 4.98%, respectively, for the same period.
Portfolio Specifics: Stock selection was the primary reason for the underperformance of the equity portion of the Fund for the six months ended November 30, 2004. Despite being underweight information technology, individual stocks, such as previously held NVIDIA Corp. and Corning, Inc., the Fund encountered company-specific disappointments and negatively impacted performance. Likewise in health care, individual disappointments in biotech and generic pharmaceuticals, specifically Chiron Corp. because of flu vaccine problems and Barr Pharmaceuticals, Inc. and Par Pharmaceuticals, Inc., which was held during the period, due to drug delays, hurt performance.
Performance was aided by our overweight in industrials where demand for a broad array of industrial and heavy duty truck components propelled sales and earnings ahead of expectations. Parker Hannifin Corp., Rockwell Automation, Inc., and Paccar, Inc. all contributed positively to results. The second best supporter of performance was our significant underweight in the consumer staples sector.
Our continuing exposure to emerging markets debt and crossover high yield issues contributed to the outperformance of the fixed income portion of the Fund. The Fund was well positioned for a rising rate environment in which yields of shorter maturities rise more than those of longer maturities. Our underweight in five- and ten-year maturities was particularly beneficial. Overweights in the outperforming securitized sectors -mortgage-backed securities, asset-backed securities, and commercial mortgage-backed securities - also helped. Our underweight in agencies held back performance somewhat.
Overall, our underweight in stocks in favor of cash and bonds detracted from performance.
Current Strategy and Outlook: With domestic gross domestic product and corporate profit growth expected to slow in the quarters ahead, we believe equity returns could also moderate as we go forward. The Fund is positioned for such an environment by stressing later cycle names in the industrial sector that benefit from late cycle corporate spending, such as General Electric Co. and United Technologies Corp. Additionally, we will be seeking individual companies whose particular fundamentals warrant inclusion in the Fund. These would include specialty and discount retailers within the consumer discretionary sector that would benefit from individual company- specific; for example, content providers to a new generation of video games appear ready to outperform. Finally, the Fund will likely maint ain its energy exposure since we continue to believe higher relative prices are here to stay and the sector remains attractive.
While the bond market has renewed its focus on the improving economic releases, we do not believe that the yields on shorter maturity Treasuries fully reflect the future pace of economic activity and the rise in a number of inflation measures. Some projections place a neutral overnight rate around 4% or 5%, indicating that monetary policy is still highly accommodative. Tactically, the Fund is short duration in the anticipation of improving domestic economic fundamentals and the potential for increasing inflation and enduring dollar weakness. The Fund is neutral home mortgages, overweight asset-backed and commercial mortgage-backed securities, and underweight the intermediate and front-end of the yield curve, which appear most vulnerable in a tightening cycle. We are also underweight agencies, which had witnessed some regulatory criticism. While stretched valuations in investment-grade credit still warran t caution, credit continues to post positive excess returns. Exposures to emerging markets debt and crossover high yield remain intact.
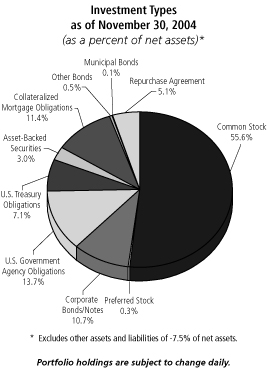
Top Ten Industries
as of November 30, 2004
(as a percent of net assets)*
| Diversified Financial Services | 9.2 | % | |||||
| Whole Loan Collaterized Mortgage Obligation | 7.1 | % | |||||
| Banks | 6.7 | % | |||||
| U.S. Treasury Notes | 4.9 | % | |||||
| Federal Home Loan Mortgage Corporation | 4.6 | % | |||||
| Miscelaneous Manufacturing | 4.6 | % | |||||
| Oil and Gas | 4.3 | % | |||||
| Federal National Mortgage Association | 3.9 | % | |||||
| Chemicals | 3.3 | % | |||||
| Retail | 3.0 | % | |||||
Portfolio holdings are subject to change daily.
24
ING EQUITY AND BOND FUND
PORTFOLIO MANAGERS' REPORT

Average Annual Total Returns for the Periods Ended November 30, 2004
| 1 Year | 5 Year | 10 Year | Since Inception of Class B May 31, 1995 | ||||||||||||||||
| Including Sales Charge: | |||||||||||||||||||
| Class A(1) | 0.44 | % | (0.69 | )% | 8.28 | % | - | ||||||||||||
| Class B(2) | 0.80 | % | (0.51 | )% | - | 7.49 | % | ||||||||||||
| Class C(3) | 4.94 | % | (0.15 | )% | 8.22 | % | - | ||||||||||||
| Excluding Sales Charge: | |||||||||||||||||||
| Class A | 6.56 | % | 0.49 | % | 8.92 | % | - | ||||||||||||
| Class B | 5.80 | % | (0.18 | )% | - | 7.49 | % | ||||||||||||
| Class C | 5.94 | % | (0.15 | )% | 8.22 | % | - | ||||||||||||
| S&P 500 Index(4) | 12.85 | % | (1.84 | )% | 11.90 | % | 10.50 | %(7) | |||||||||||
| Lehman Brothers Aggregate Bond Index(5) | 4.44 | % | 7.41 | % | 7.70 | % | 6.90 | %(7) | |||||||||||
| Composite Index (60% S&P 500 Index/40% Lehman Brothers Aggregate Bond Index) | 9.50 | % | 2.16 | % | 10.55 | % | 9.41 | %(7) | |||||||||||
| S&P Barra Value Index(6) | 18.99 | % | 2.58 | % | 12.02 | % | 10.58 | %(7) | |||||||||||
Based on a $10,000 initial investment, the graph and table above illustrate the total return of ING Equity and Bond Fund against the S&P 500 Index, Lehman Brothers Aggregate Bond Index, Composite Index and the S&P Barra Value Index. The Indices are unmanaged and have no cash in their portfolios, impose no sales charges and incur no operating expenses. An investor cannot invest directly in an index. The Fund's performance is shown both with and without the imposition of sales charges.
The performance graph and table do not reflect the deduction of taxes that a shareholder will pay on Fund distributions or the redemption of Fund shares.
Total returns reflect the fact that the Investment Manager has waived certain fees and expenses otherwise payable by the Fund, subject to possible later recoupment during a three-year period. Total returns would have been lower had there been no waiver to the Fund.
Performance data represents past performance and is no assurance of future results. Investment return and principal value of an investment in the Fund will fluctuate. Shares, when sold, may be worth more or less than their original cost. The Fund's current performance may be lower or higher than the performance data shown. Please log on to www.ingfunds.com or call (800) 922-0180 to get performance through the most recent month end.
This report contains statements that may be "forward-looking" statements. Actual results may differ materially from those projected in the "forward-looking" statements.
The views expressed in this report reflect those of the portfolio managers, only through the end of the period as stated on the cover. The portfolio managers' views are subject to change at any time based on market and other conditions.
Fund holdings are subject to change daily.
(1) Reflects deduction of the maximum Class A sales charge of 5.75%.
(2) Reflects deduction of the Class B deferred sales charge of 5% and 2%, respectively, for the 1 year and 5 year returns.
(3) Reflects deduction of the Class C deferred sales charge of 1% for the 1 year return.
(4) The S&P 500 Index is a capitalization-weighted index of 500 stocks chosen for market size, liquidity, and industry group representation.
(5) The Lehman Brothers Aggregate Bond Index is a widely recognized index of publicly issued fixed rate U.S. government, investment grade mortgage-backed and corporate debt securities.
(6) The S&P Barra Value Index is a capitalization-weighted index of all the stocks in the S&P 500 Index that have low price-to-book ratios.
(7) Since inception performance for index is shown from June 1, 1995.
25
ING REAL ESTATE FUND
PORTFOLIO MANAGERS' REPORT
The ING Real Estate Fund (the "Fund") seeks total return. The Fund is managed by T. Ritson Ferguson, Chief Investment Officer and Kenneth D. Campbell, Managing Director, ING Clarion Real Estate Securities L.P. - the Sub-Adviser.
Performance: For the six months ended November 30, 2004, the Fund's Class A shares, excluding sales charges, provided a total return of 21.49% compared to the Dow Jones Wilshire ("DJW") Real Estate Securities Index(4), which returned 23.01% for the same period.
Portfolio Specifics: Real estate stocks have continued to deliver good returns to investors. The Fund returned 21.49% and 30.54% net of expenses in the last six and 12 months respectively, which trailed the DJW Real Estate Securities Index return o f 23.00% and 31.79% for the same time periods. Real estate investment trusts ("REITs") have outperformed other stocks and bonds in the last year. Over the last six months, the Standard & Poor's ("S&P") 500 Index(9) gained 5.67% and the Lehman Brothers Aggregate Bond Index(10) rose 3.82%. For the year ended November 30, 2004, the S&P 500 Index is up 12.85% and the Lehman Bond Aggregate Bond Index is up 4.44%.
The best returns by sector in the last six months were from the retail (malls and shopping centers), industrial and hotel sectors. Our decision to increase the Fund's weighting to hotels, apartments and industrial in the spring of 2004 when evidence of economic growth was becoming more evident has aided performance. We are now overweight in the mall, hotel and apartment sectors reflecting a more positive view of the economy and accelerating earnings growth prospects for these more economically sensitive property types. We have decreased our exposure to the more bond-like health care sector and remain underweight the office sector.
Real estate stocks have rebounded sharply since April's double-digit decline. The market has adjusted to an expectation of measured increases in short-term interest rates over time as the Federal Reserve reacts appropriately to an improving U.S. economy. Importantly, investors have also realized that REITs can prosper in an environment of slowly rising rates if the economic setting is conducive to better real estate fundamentals and improved earnings prospects for the owners of real estate assets.
The Fund's underperformance for the year as a whole traced to the third quarter when we lost nearly 1% alone from the General Growth Properties, Inc. acquisition of Rouse Co. for a 33% premium. We owned the acquirer but not the acquiree.
Current Strategy and Outlook: With growing evidence that the U.S. economic recovery is gaining strength, the outlook for real estate fundamentals appears to be improving. We look for the earnings growth rate for REITs to nearly double from 4% in 2004 to almost 8% in 2005. Positive earnings growth is expected in every property sector next year. The improving ear nings outlook should help offset the impact of higher interest rates on REIT stock prices.
REIT valuations are above long-term averages reflecting optimism for the sector. At month end, REIT valuations were roughly 12% higher than our estimate of Net Asset Value (NAV). Prices represented a 14.2 multiple of forward cash earnings before depreciation (FFO), which is about 15% above the 12.2 long-term multiple. The average REIT dividend yield is now 4.79%, down almost 90 basis points from 6 months ago. During the same period, the yield on the 10-year Treasury bond has decreased approximately 30 basis points. The average REIT dividend now represents a 43 basis point spread over the yield on the 10-year Treasury bond. The current "spread" is a little below the average spread over the last 20 years which has been approximately 60 basis points. However, it is not unprecedented for REITs to trade at yields less than the 10-year Treasury yield.
Momentum for REITs may continue as funds flows remain strong. According to data from AMG Data Services, dedicated REIT mutual funds have attracted $5.7 billion of new investment this year including $1.75 billion thus far in the fourth calendar quarter of 2004. The positive funds flows to REITs reflects a widespread desire for investors (both institutions and individuals) to increase their allocation to real estate.
REITs offer an attractive source of high current income and as long as new stock issuance remains disciplined, stock prices should improve with earnings growth. For now, we expect REITs, which offer relatively high yields and solid earnings prospects, to retain their appeal to investors, given the alternatives. We believe that REIT investors can still expect reasonable return.

Top Ten Holdings
as of November 30, 2004
(as a percent of net assets)*
| Simon Property Group, Inc. | 5.4 | % | |||||
| Starwood Hotels & Resorts Worldwide, Inc. | 5.1 | % | |||||
| Archstone-Smith Trust | 5.0 | % | |||||
| ProLogis | 5.0 | % | |||||
| Boston Properties, Inc. | 5.0 | % | |||||
| Mills Corp. | 4.8 | % | |||||
| United Dominion Realty Trust, Inc. | 4.0 | % | |||||
| Regency Centers Corp. | 3.5 | % | |||||
| SL Green Realty Corp. | 3.5 | % | |||||
| Vornado Realty Trust | 3.5 | % | |||||
Portfolio holdings are subject to change daily.
* Excludes short-term securities related to securities lending.
26
ING REAL ESTATE FUND
PORTFOLIO MANAGERS' REPORT
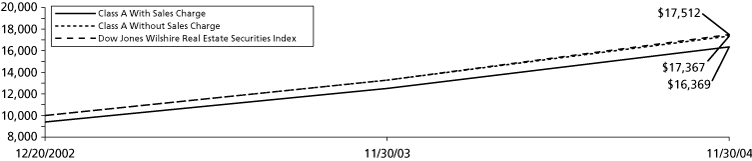
Average Annual Total Returns for the Periods Ended November 30, 2004
| 1 Year | Since Inception of Class A December 20, 2002 | Since Inception of Class B November 20, 2002 | Since Inception of Class C January 17, 2003 | Since Inception of Class O September 15, 2004 | |||||||||||||||||||
| Including Sales Charge: | |||||||||||||||||||||||
| Class A(1) | 23.03 | % | 28.78 | % | - | - | - | ||||||||||||||||
| Class B(2) | 24.66 | % | - | 29.48 | % | - | - | ||||||||||||||||
| Class C(3) | 28.51 | %* | - | - | 34.64 | % | - | ||||||||||||||||
| Class O | - | - | - | - | 13.12 | % | |||||||||||||||||
| Excluding Sales Charge: | |||||||||||||||||||||||
| Class A | 30.54 | %* | 32.75 | % | - | - | - | ||||||||||||||||
| Class B | 29.66 | %* | - | 30.60 | % | - | - | ||||||||||||||||
| Class C | 29.51 | %* | - | - | 34.64 | % | - | ||||||||||||||||
| Class O | - | - | - | - | 13.12 | % | |||||||||||||||||
| Dow Jones Wilshire Real Estate Securities Index(4) | 31.82 | % | 33.95 | %(5) | 33.30 | %(6) | 37.96 | %(7) | 10.37 | %(8) | |||||||||||||
Based on a $10,000 initial investment, the graph and table above illustrate the total return of ING Real Estate Fund against the Dow Jones Wilshire Real Estate Securities Index. The Index is unmanaged and has no cash in its portfolio, imposes no sales charges and incurs no operating expenses. An investor cannot invest directly in an index. The Fund's performance is shown both with and without the imposition of sales charges.
The performance graph and table do not reflect the deduction of taxes that a shareholder will pay on Fund distributions or the redemption of Fund shares.
Total returns reflect the fact that the Investment Manager has waived certain fees and expenses otherwise payable by the Fund, subject to possible later recoupment during a three-year period. Total returns would have been lower had there been no waiver to the Fund.
Performance data represents past performance and is no assurance of future results. Investment return and principal value of an investment in the Fund will fluctuate. Shares, when sold, may be worth more or less than their original cost. The Fund's current performance may be lower or higher than the performance data shown. Please log on to www.ingfunds.com or call (800) 922-0180 to get performance through the most recent month end.
* Performance was attributed to highly favorable conditions. Please be advised that such conditions may not continue to exist and such performance may not be repeated in the future.
This report contains statements that may be "forward-looking" statements. Actual results may differ materially from those projected in the "forward-looking" statements.
The views expressed in this report reflect those of the portfolio managers, only through the end of the period as stated on the cover. The portfolio managers' views are subject to change at any time based on market and other conditions.
Fund holdings are subject to change daily.
(1) Reflects deduction of the maximum Class A sales charge of 5.75%.
(2) Reflects deduction of the Class B deferred sales charge of 5% and 4%, respectively, for the 1 year and since inception returns.
(3) Reflects deduction of the Class C deferred sales charge of 1% for the 1 year return.
(4) The Dow Jones Wilshire Real Estate Securities Index measures the performance of publicly traded real estate securities, such as Real Estate Investment Trusts (REITs) and Real Estate Operating Companies (REOCs). The Index is capitalization-weighted.
(5) Since inception for the index is shown from January 1, 2003.
(6) Since inception for the index is shown from December 1, 2002.
(7) Since inception for the index is shown from February 1, 2003.
(8) Since inception for the index is shown from October 1, 2004.
(9) The S&P 500 Index is a capitalization-weighted index of 500 stocks chosen for market size, liquidity, and industry group representation.
(10) The Lehman Brothers Aggregated Bond Index is a widely recognized index of publicly issued fixed rate U.S. government investment grade mortgage-backed and corporate debt securities.
27
SHAREHOLDER EXPENSE EXAMPLES (UNAUDITED)
As a shareholder of a Fund, you incur two types of costs: (1) transaction costs, including sales charges (loads) on purchase payments, reinvested dividends, or other distributions; redemption fees; and exchange fees; and (2) ongoing costs, including management fees; distribution [and/or service] (12b–1) fees; and other Fund expenses. These Examples are intended to help you understand your ongoing costs (in dollars) of investing in a Fund and to compare these costs with the ongoing costs of investing in other mutual funds.
The Examples are based on an investment of $1,000 invested at the beginning of the period and held for the entire period from June 1, 2004 to November 30, 2004.
Actual Expenses
The first section of the table shown, "Actual Fund Return," provides information about actual account values and actual expenses. You may use the information in this section, together with the amount you invested, to estimate the expenses that you paid over the period. Simply divide your account value by $1,000 (for example, an $8,600 account value divided by $1,000 = 8.6), then multiply the result by the number in the first section under the heading entitled "Expenses Paid During Period" to estimate the expenses you paid on your account during this period.
Hypothetical Example for Comparison Purposes
The second section of the table shown, "Hypothetical 5% Return," provides information about hypothetical account values and hypothetical expenses based on the Fund's actual expense ratio and an assumed rate of return of 5% per year before expenses, which is not the Fund's actual return. The hypothetical account values and expenses may not be used to estimate the actual ending account balance or expenses you paid for the period. You may use this information to compare the ongoing costs of investing in the Fund and other funds. To do so, compare this 5% hypothetical example with the 5% hypothetical examples that appear in the shareholder reports of the other funds.
Please note that the expenses shown in the table are meant to highlight your ongoing costs only and do not reflect any transactional costs, such as sales charges (loads), redemption fees, or exchange fees. Therefore, the hypothetical lines of the table are useful in comparing ongoing costs only, and will not help you determine the relative total costs of owning different funds. In addition, if these transactional costs were included, your costs would have been higher.
| ING Disciplined LargeCap Fund | Beginning Account Value June 1, 2004 | Ending Account Value November 30, 2004 | Annualized Expense Ratio | Expenses Paid During the Six Months Ended November 30, 2004* | |||||||||||||||
| Actual Fund Return | |||||||||||||||||||
| Class A | $ | 1,000.00 | $ | 1,073.70 | 1.36 | % | $ | 7.07 | |||||||||||
| Class B | 1,000.00 | 1,069.50 | 2.06 | 10.69 | |||||||||||||||
| Class C | 1,000.00 | 1,069.50 | 2.06 | 10.69 | |||||||||||||||
| Hypothetical (5% return before expenses) | |||||||||||||||||||
| Class A | $ | 1,000.00 | $ | 1,018.15 | 1.36 | % | $ | 6.88 | |||||||||||
| Class B | 1,000.00 | 1,014.74 | 2.06 | 10.40 | |||||||||||||||
| Class C | 1,000.00 | 1,014.64 | 2.06 | 10.40 | |||||||||||||||
* Expenses are equal to each Fund's respective annualized expense ratios multiplied by the average account value over the period, multiplied by 183/365 (to reflect the one-half year period).
28
SHAREHOLDER EXPENSE EXAMPLES (UNAUDITED) (CONTINUED)
| ING LargeCap Growth Fund | Beginning Account Value June 1, 2004 | Ending Account Value November 30, 2004 | Annualized Expense Ratio | Expenses Paid During the Six Months Ended November 30, 2004* | |||||||||||||||
| Actual Fund Return | |||||||||||||||||||
| Class A | $ | 1,000.00 | $ | 1,003.40 | 1.45 | % | $ | 7.28 | |||||||||||
| Class B | 1,000.00 | 1,000.40 | 2.10 | 10.53 | |||||||||||||||
| Class C | 1,000.00 | 999.90 | 2.10 | 10.53 | |||||||||||||||
| Hypothetical (5% return before expenses) | |||||||||||||||||||
| Class A | $ | 1,000.00 | $ | 1,018.90 | 1.45 | % | $ | 7.33 | |||||||||||
| Class B | 1,000.00 | 1,015.14 | 2.10 | 10.61 | |||||||||||||||
| Class C | 1,000.00 | 1,015.14 | 2.10 | 10.61 | |||||||||||||||
| ING MidCap Opportunities Fund | Beginning Account Value June 1, 2004 | Ending Account Value November 30, 2004 | Annualized Expense Ratio | Expenses Paid During the Six Months Ended November 30, 2004* | |||||||||||||||
| Actual Fund Return | |||||||||||||||||||
| Class A | $ | 1,000.00 | $ | 1,049.80 | 1.75 | % | $ | 8.99 | |||||||||||
| Class B | 1,000.00 | 1,045.70 | 2.45 | 12.56 | |||||||||||||||
| Class C | 1,000.00 | 1,046.00 | 2.45 | 12.57 | |||||||||||||||
| Hypothetical (5% return before expenses) | |||||||||||||||||||
| Class A | $ | 1,000.00 | $ | 1,016.34 | 1.75 | % | $ | 8.85 | |||||||||||
| Class B | 1,000.00 | 1,012.84 | 2.45 | 12.36 | |||||||||||||||
| Class C | 1,000.00 | 1,012.78 | 2.45 | 12.36 | |||||||||||||||
| ING SmallCap Opportunities Fund | Beginning Account Value June 1, 2004 | Ending Account Value November 30, 2004 | Annualized Expense Ratio | Expenses Paid During the Six Months Ended November 30, 2004* | |||||||||||||||
| Actual Fund Return | |||||||||||||||||||
| Class A | $ | 1,000.00 | $ | 1,078.10 | 1.72 | % | $ | 8.96 | |||||||||||
| Class B | 1,000.00 | 1,074.60 | 2.42 | 12.59 | |||||||||||||||
| Class C | 1,000.00 | 1,074.80 | 2.42 | 12.59 | |||||||||||||||
| Hypothetical (5% return before expenses) | |||||||||||||||||||
| Class A | $ | 1,000.00 | $ | 1,016.44 | 1.72 | % | $ | 8.69 | |||||||||||
| Class B | 1,000.00 | 1,013.09 | 2.42 | 12.21 | |||||||||||||||
| Class C | 1,000.00 | 1,012.99 | 2.42 | 12.21 | |||||||||||||||
* Expenses are equal to each Fund's respective annualized expense ratios multiplied by the average account value over the period, multiplied by 183/365 (to reflect the one-half year period).
29
SHAREHOLDER EXPENSE EXAMPLES (UNAUDITED) (CONTINUED)
| ING Financial Services Fund | Beginning Account Value June 1, 2004 | Ending Account Value November 30, 2004 | Annualized Expense Ratio | Expenses Paid During the Six Months Ended November 30, 2004* | |||||||||||||||
| Actual Fund Return | |||||||||||||||||||
| Class A | $ | 1,000.00 | $ | 1,067.00 | 1.17 | % | $ | 6.06 | |||||||||||
| Class B | 1,000.00 | 1,063.70 | 1.92 | 9.93 | |||||||||||||||
| Class C | 1,000.00 | 1,055.30 | 1.92 | 9.89 | |||||||||||||||
| Class O | 1,000.00 | 1,037.20 | 1.13 | 5.77 | |||||||||||||||
| Hypothetical (5% return before expenses) | |||||||||||||||||||
| Class A | $ | 1,000.00 | $ | 1,019.20 | 1.17 | % | $ | 5.92 | |||||||||||
| Class B | 1,000.00 | 1,015.44 | 1.92 | 9.70 | |||||||||||||||
| Class C | 1,000.00 | 1,016.39 | 1.92 | 9.70 | |||||||||||||||
| Class O | 1,000.00 | 1,019.40 | 1.13 | 5.72 | |||||||||||||||
| ING LargeCap Value Fund | Beginning Account Value June 1, 2004 | Ending Account Value November 30, 2004 | Annualized Expense Ratio | Expenses Paid During the Six Months Ended November 30, 2004* | |||||||||||||||
| Actual Fund Return | |||||||||||||||||||
| Class A | $ | 1,000.00 | $ | 1,070.50 | 1.45 | % | $ | 7.53 | |||||||||||
| Class B | 1,000.00 | 1,065.70 | 2.20 | 11.39 | |||||||||||||||
| Class C | 1,000.00 | 1,065.50 | 2.20 | 11.39 | |||||||||||||||
| Hypothetical (5% return before expenses) | |||||||||||||||||||
| Class A | $ | 1,000.00 | $ | 1,017.90 | 1.45 | % | $ | 7.33 | |||||||||||
| Class B | 1,000.00 | 1,014.04 | 2.20 | 11.11 | |||||||||||||||
| Class C | 1,000.00 | 1,014.04 | 2.20 | 11.11 | |||||||||||||||
| ING MagnaCap Fund | Beginning Account Value June 1, 2004 | Ending Account Value November 30, 2004 | Annualized Expense Ratio | Expenses Paid During the Six Months Ended November 30, 2004* | |||||||||||||||
| Actual Fund Return | |||||||||||||||||||
| Class A | $ | 1,000.00 | $ | 1,071.90 | 1.16 | % | $ | 6.02 | |||||||||||
| Class B | 1,000.00 | 1,067.60 | 1.86 | 9.64 | |||||||||||||||
| Class C | 1,000.00 | 1,068.70 | 1.86 | 9.65 | |||||||||||||||
| Class M | 1,000.00 | 1,069.60 | 1.61 | 8.35 | |||||||||||||||
| Hypothetical (5% return before expenses) | |||||||||||||||||||
| Class A | $ | 1,000.00 | $ | 1,019.25 | 1.16 | % | $ | 5.87 | |||||||||||
| Class B | 1,000.00 | 1,015.74 | 1.86 | 9.40 | |||||||||||||||
| Class C | 1,000.00 | 1,015.74 | 1.86 | 9.40 | |||||||||||||||
| Class M | 1,000.00 | 1,017.00 | 1.61 | 8.14 | |||||||||||||||
* Expenses are equal to each Fund's respective annualized expense ratios multiplied by the average account value over the period, multiplied by 183/365 (to reflect the one-half year period).
30
SHAREHOLDER EXPENSE EXAMPLES (UNAUDITED) (CONTINUED)
| ING MidCap Value Fund | Beginning Account Value June 1, 2004 | Ending Account Value November 30, 2004 | Annualized Expense Ratio | Expenses Paid During the Six Months Ended November 30, 2004* | |||||||||||||||
| Actual Fund Return | |||||||||||||||||||
| Class A | $ | 1,000.00 | $ | 1,058.50 | 1.68 | % | $ | 8.67 | |||||||||||
| Class B | 1,000.00 | 1,054.70 | 2.43 | 12.52 | |||||||||||||||
| Class C | 1,000.00 | 1,054.70 | 2.43 | 12.52 | |||||||||||||||
| Hypothetical (5% return before expenses) | |||||||||||||||||||
| Class A | $ | 1,000.00 | $ | 1,016.65 | 1.68 | % | $ | 8.49 | |||||||||||
| Class B | 1,000.00 | 1,012.89 | 2.43 | 12.26 | |||||||||||||||
| Class C | 1,000.00 | 1,012.89 | 2.43 | 12.26 | |||||||||||||||
| ING SmallCap Value Fund | Beginning Account Value June 1, 2004 | Ending Account Value November 30, 2004 | Annualized Expense Ratio | Expenses Paid During the Six Months Ended November 30, 2004* | |||||||||||||||
| Actual Fund Return | |||||||||||||||||||
| Class A | $ | 1,000.00 | $ | 1,065.60 | 1.72 | % | $ | 8.91 | |||||||||||
| Class B | 1,000.00 | 1,061.20 | 2.47 | 12.76 | |||||||||||||||
| Class C | 1,000.00 | 1,061.30 | 2.47 | 12.76 | |||||||||||||||
| Hypothetical (5% return before expenses) | |||||||||||||||||||
| Class A | $ | 1,000.00 | $ | 1,016.44 | 1.72 | % | $ | 8.69 | |||||||||||
| Class B | 1,000.00 | 1,012.68 | 2.47 | 12.46 | |||||||||||||||
| Class C | 1,000.00 | 1,012.68 | 2.47 | 12.46 | |||||||||||||||
| ING Convertible Fund | Beginning Account Value June 1, 2004 | Ending Account Value November 30, 2004 | Annualized Expense Ratio | Expenses Paid During the Six Months Ended November 30, 2004* | |||||||||||||||
| Actual Fund Return | |||||||||||||||||||
| Class A | $ | 1,000.00 | $ | 1,038.90 | 1.41 | % | $ | 7.21 | |||||||||||
| Class B | 1,000.00 | 1,035.20 | 2.06 | 10.51 | |||||||||||||||
| Class C | 1,000.00 | 1,035.60 | 2.06 | 10.51 | |||||||||||||||
| Hypothetical (5% return before expenses) | |||||||||||||||||||
| Class A | $ | 1,000.00 | $ | 1,018.00 | 1.41 | % | $ | 7.13 | |||||||||||
| Class B | 1,000.00 | 1,014.74 | 2.06 | 10.40 | |||||||||||||||
| Class C | 1,000.00 | 1,014.74 | 2.06 | 10.40 | |||||||||||||||
* Expenses are equal to each Fund's respective annualized expense ratios multiplied by the average account value over the period, multiplied by 183/365 (to reflect the one-half year period).
31
SHAREHOLDER EXPENSE EXAMPLES (UNAUDITED) (CONTINUED)
| ING Equity and Bond Fund | Beginning Account Value June 1, 2004 | Ending Account Value November 30, 2004 | Annualized Expense Ratio | Expenses Paid During the Six Months Ended November 30, 2004* | |||||||||||||||
| Actual Fund Return | |||||||||||||||||||
| Class A | $ | 1,000.00 | $ | 1,031.20 | 1.60 | % | $ | 8.15 | |||||||||||
| Class B | 1,000.00 | 1,028.40 | 2.25 | 11.44 | |||||||||||||||
| Class C | 1,000.00 | 1,028.50 | 2.25 | 11.44 | |||||||||||||||
| Hypothetical (5% return before expenses) | |||||||||||||||||||
| Class A | $ | 1,000.00 | $ | 1,017.05 | 1.60 | % | $ | 8.09 | |||||||||||
| Class B | 1,000.00 | 1,013.79 | 2.25 | 11.36 | |||||||||||||||
| Class C | 1,000.00 | 1,013.79 | 2.25 | 11.36 | |||||||||||||||
| ING Real Estate Fund | Beginning Account Value June 1, 2004 | Ending Account Value November 30, 2004 | Annualized Expense Ratio | Expenses Paid During the Six Months Ended November 30, 2004* | |||||||||||||||
| Actual Fund Return | |||||||||||||||||||
| Class A | $ | 1,000.00 | $ | 1,214.90 | 1.24 | % | $ | 6.89 | |||||||||||
| Class B | 1,000.00 | 1,211.90 | 1.99 | 11.03 | |||||||||||||||
| Class C | 1,000.00 | 1,211.00 | 1.99 | 11.03 | |||||||||||||||
| Hypothetical (5% return before expenses) | |||||||||||||||||||
| Class A | $ | 1,000.00 | $ | 1,019.45 | 1.24 | % | $ | 6.28 | |||||||||||
| Class B | 1,000.00 | 1,015.64 | 1.99 | 10.05 | |||||||||||||||
| Class C | 1,000.00 | 1,015.64 | 1.99 | 10.05 | |||||||||||||||
* Expenses are equal to each Fund's respective annualized expense ratios multiplied by the average account value over the period, multiplied by 183/365 (to reflect the one-half year period).
32
STATEMENTS OF ASSETS AND LIABILITIES AS OF NOVEMBER 30, 2004 (UNAUDITED)
| ING Disciplined LargeCap Fund | ING LargeCap Growth Fund | ING MidCap Opportunities Fund | ING SmallCap Opportunities Fund | ||||||||||||||||
| ASSETS: | |||||||||||||||||||
| Investments in securities at value+* | $ | 49,434,365 | $ | 315,413,674 | $ | 413,429,678 | $ | 228,793,610 | |||||||||||
| Short-term investments at amortized cost | 379,129 | 34,202,610 | 43,961,923 | 39,670,466 | |||||||||||||||
| Repurchase agreement | 902,000 | - | 9,091,000 | 1,592,000 | |||||||||||||||
| Cash | 316 | 7,328,269 | 659 | 209 | |||||||||||||||
| Cash collateral for futures | 48,000 | - | - | - | |||||||||||||||
| Receivables: | |||||||||||||||||||
| Investment securities sold | - | 640,838 | 4,048,270 | 2,647,490 | |||||||||||||||
| Fund shares sold | 2,737 | 400,360 | 50,220 | 13,201 | |||||||||||||||
| Dividends and interest | 242,755 | 1,054,628 | 59,492 | 32,236 | |||||||||||||||
| Prepaid expenses | 23,848 | 33,613 | 30,104 | 19,893 | |||||||||||||||
| Total assets | 51,033,150 | 359,073,992 | 470,671,346 | 272,769,105 | |||||||||||||||
| LIABILITIES: | |||||||||||||||||||
| Payable for investment securities purchased | - | 2,565,568 | 2,150,005 | - | |||||||||||||||
| Payable for fund shares redeemed | 62,059 | 268,303 | 475,779 | 265,376 | |||||||||||||||
| Payable for futures variation margin | 1,425 | - | - | - | |||||||||||||||
| Payable upon receipt of securities loaned | 379,129 | 34,202,610 | 43,961,923 | 39,670,466 | |||||||||||||||
| Payable to affiliates | 71,831 | 443,812 | 728,712 | 317,098 | |||||||||||||||
| Payable for trustee | 5,808 | 11,700 | 20,795 | 11,821 | |||||||||||||||
| Other accrued expenses and liabilities | 138,504 | 425,136 | 680,681 | 254,695 | |||||||||||||||
| Total liabilities | 658,756 | 37,917,129 | 48,017,895 | 40,519,456 | |||||||||||||||
| NET ASSETS | $ | 50,374,394 | $ | 321,156,863 | $ | 422,653,451 | $ | 232,249,649 | |||||||||||
| NET ASSETS WERE COMPRISED OF: | |||||||||||||||||||
| Paid-in capital | $ | 92,502,045 | $ | 665,445,578 | $ | 588,588,790 | $ | 504,183,821 | |||||||||||
| Undistributed net investment income (accumulated net investment loss or distributions in excess) | 112,247 | (9,331,502 | ) | (3,768,195 | ) | (2,050,927 | ) | ||||||||||||
| Accumulated net realized loss on investments and futures | (46,642,783 | ) | (391,028,796 | ) | (255,561,411 | ) | (346,789,092 | ) | |||||||||||
| Net unrealized appreciation on investments and futures | 4,402,885 | 56,071,583 | 93,394,267 | 76,905,847 | |||||||||||||||
| NET ASSETS | $ | 50,374,394 | $ | 321,156,863 | $ | 422,653,451 | $ | 232,249,649 | |||||||||||
| + Including securities loaned at value | $ | 369,244 | $ | 33,248,005 | $ | 42,247,835 | $ | 38,383,888 | |||||||||||
| * Cost of investments in securities | $ | 45,032,128 | $ | 259,342,091 | $ | 320,035,411 | $ | 151,887,763 | |||||||||||
See Accompanying Notes to Financial Statements
33
STATEMENTS OF ASSETS AND LIABILITIES AS OF NOVEMBER 30, 2004 (UNAUDITED) (CONTINUED)
| ING Disciplined LargeCap Fund | ING LargeCap Growth Fund | ING MidCap Opportunities Fund | ING SmallCap Opportunities Fund | ||||||||||||||||
| Class A: | |||||||||||||||||||
| Net Assets | $ | 5,087,825 | $ | 110,029,149 | $ | 127,958,230 | $ | 105,312,124 | |||||||||||
| Shares authorized | unlimited | unlimited | unlimited | unlimited | |||||||||||||||
| Par value | $ | 0.01 | $ | 0.00 | $ | 0.01 | $ | 0.01 | |||||||||||
| Shares outstanding | 536,986 | 6,233,223 | 10,104,307 | 4,335,379 | |||||||||||||||
| Net asset value and redemption price per share | $ | 9.47 | $ | 17.65 | $ | 12.66 | $ | 24.29 | |||||||||||
| Maximum offering price per share (5.75%)(1) | $ | 10.05 | $ | 18.73 | $ | 13.43 | $ | 25.77 | |||||||||||
| Class B: | |||||||||||||||||||
| Net Assets | $ | 31,295,544 | $ | 115,070,783 | $ | 168,987,832 | $ | 60,704,615 | |||||||||||
| Shares authorized | unlimited | unlimited | unlimited | unlimited | |||||||||||||||
| Par value | $ | 0.01 | $ | 0.00 | $ | 0.01 | $ | 0.01 | |||||||||||
| Shares outstanding | 3,445,103 | 6,701,823 | 13,937,341 | 2,718,854 | |||||||||||||||
| Net asset value and redemption price per share(2) | $ | 9.08 | $ | 17.17 | $ | 12.12 | $ | 22.33 | |||||||||||
| Maximum offering price per share | $ | 9.08 | $ | 17.17 | $ | 12.12 | $ | 22.33 | |||||||||||
| Class C: | |||||||||||||||||||
| Net Assets | $ | 13,986,491 | $ | 52,989,337 | $ | 117,912,829 | $ | 53,120,315 | |||||||||||
| Shares authorized | unlimited | unlimited | unlimited | unlimited | |||||||||||||||
| Par value | $ | 0.01 | $ | 0.00 | $ | 0.01 | $ | 0.01 | |||||||||||
| Shares outstanding | 1,539,823 | 3,096,325 | 9,773,132 | 2,384,367 | |||||||||||||||
| Net asset value and redemption price per share(2) | $ | 9.08 | $ | 17.11 | $ | 12.06 | $ | 22.28 | |||||||||||
| Maximum offering price per share | $ | 9.08 | $ | 17.11 | $ | 12.06 | $ | 22.28 | |||||||||||
| Class I: | |||||||||||||||||||
| Net Assets | $ | 4,534 | $ | 37,838,639 | $ | 2,985,670 | $ | 12,792,928 | |||||||||||
| Shares authorized | unlimited | unlimited | unlimited | unlimited | |||||||||||||||
| Par value | $ | 0.01 | $ | 0.00 | $ | 0.01 | $ | 0.01 | |||||||||||
| Shares outstanding | 469 | 2,078,840 | 230,208 | 520,134 | |||||||||||||||
| Net asset value and redemption price per share | $ | 9.67 | $ | 18.20 | $ | 12.97 | $ | 24.60 | |||||||||||
| Maximum offering price per share | $ | 9.67 | $ | 18.20 | $ | 12.97 | $ | 24.60 | |||||||||||
| Class Q: | |||||||||||||||||||
| Net Assets | n/a | $ | 5,228,955 | $ | 4,808,890 | $ | 319,667 | ||||||||||||
| Shares authorized | n/a | unlimited | unlimited | unlimited | |||||||||||||||
| Par value | n/a | $ | 0.00 | $ | 0.01 | $ | 0.01 | ||||||||||||
| Shares outstanding | n/a | 288,779 | 375,977 | 13,082 | |||||||||||||||
| Net asset value and redemption price per share | n/a | $ | 18.11 | $ | 12.79 | $ | 24.44 | ||||||||||||
| Maximum offering price per share | n/a | $ | 18.11 | $ | 12.79 | $ | 24.44 | ||||||||||||
(1) Maximum offering price is computed at 100/94.25 of net asset value. On purchases of $50,000 or more, the offering price is reduced.
(2) Redemption price per share may be reduced for any applicable contingent deferred sales charges.
See Accompanying Notes to Financial Statements
34
STATEMENTS OF ASSETS AND LIABILITIES AS OF NOVEMBER 30, 2004 (UNAUDITED)
| ING Financial Services Fund | ING LargeCap Value Fund | ING MagnaCap Fund | ING MidCap Value Fund | ||||||||||||||||
| ASSETS: | |||||||||||||||||||
| Investments in securities at value+* | $ | 308,720,509 | $ | 31,797,838 | $ | 376,239,011 | $ | 161,733,891 | |||||||||||
| Short-term investments at amortized cost | - | - | - | 25,264,576 | |||||||||||||||
| Repurchase agreement | 7,334,000 | - | 2,837,000 | - | |||||||||||||||
| Cash | 677 | 2,240,220 | 158 | 8,031,901 | |||||||||||||||
| Receivables: | |||||||||||||||||||
| Fund shares sold | 48,090 | 224,487 | 677 | 1,666,826 | |||||||||||||||
| Dividends and interest | 405,213 | 48,249 | 942,827 | 242,279 | |||||||||||||||
| Prepaid expenses | 31,394 | 47,773 | 30,747 | 18,480 | |||||||||||||||
| Reimbursement due from manager | - | 27,466 | - | - | |||||||||||||||
| Total assets | 316,539,883 | 34,386,033 | 380,050,420 | 196,957,953 | |||||||||||||||
| LIABILITIES: | |||||||||||||||||||
| Payable for investment securities purchased | 120,917 | 1,581,306 | - | 3,452,746 | |||||||||||||||
| Payable for fund shares redeemed | 320,935 | 484 | 185,500 | 156,178 | |||||||||||||||
| Payable upon receipt of securities loaned | - | - | - | 25,264,576 | |||||||||||||||
| Payable to affiliates | 334,011 | 40,871 | 357,735 | 250,102 | |||||||||||||||
| Payable for trustee fees | 21,026 | 1,157 | 58,030 | 1,754 | |||||||||||||||
| Other accrued expenses and liabilities | 429,722 | 77,179 | 487,410 | 61,487 | |||||||||||||||
| Total liabilities | 1,226,611 | 1,700,997 | 1,088,675 | 29,186,843 | |||||||||||||||
| NET ASSETS | $ | 315,313,272 | $ | 32,685,036 | $ | 378,961,745 | $ | 167,771,110 | |||||||||||
| NET ASSETS WERE COMPRISED OF: | |||||||||||||||||||
| Paid-in capital | $ | 254,309,232 | $ | 31,290,950 | $ | 377,253,427 | $ | 163,835,217 | |||||||||||
| Undistributed net investment income (accumulated net investment loss) | 148,366 | (37,850 | ) | (274,550 | ) | (471,989 | ) | ||||||||||||
| Accumulated net realized gain (loss) on investments | 837,466 | 356,858 | (71,632,059 | ) | 3,160,044 | ||||||||||||||
| Net unrealized appreciation on investments | 60,018,208 | 1,075,078 | 73,614,927 | 1,247,838 | |||||||||||||||
| NET ASSETS | $ | 315,313,272 | $ | 32,685,036 | $ | 378,961,745 | $ | 167,771,110 | |||||||||||
| + Including securities loaned at value | $ | - | $ | - | $ | - | $ | 23,864,087 | |||||||||||
| * Cost of investments in securities | $ | 248,702,301 | $ | 30,722,760 | $ | 302,128,558 | $ | 160,486,053 | |||||||||||
See Accompanying Notes to Financial Statements
35
STATEMENTS OF ASSETS AND LIABILITIES AS OF NOVEMBER 30, 2004 (UNAUDITED) (CONTINUED)
| ING Financial Services Fund | ING LargeCap Value Fund | ING MagnaCap Fund | ING MidCap Value Fund | ||||||||||||||||
| Class A: | |||||||||||||||||||
| Net Assets | $ | 193,057,028 | $ | 14,422,617 | $ | 315,708,153 | $ | 76,288,758 | |||||||||||
| Shares authorized | unlimited | unlimited | 80,000,000 | unlimited | |||||||||||||||
| Par value | $ | 0.00 | $ | 0.00 | $ | 0.00 | $ | 0.001 | |||||||||||
| Shares outstanding | 8,798,157 | 1,415,224 | 28,996,894 | 6,745,688 | |||||||||||||||
| Net asset value and redemption price per share | $ | 21.94 | $ | 10.19 | $ | 10.89 | $ | 11.31 | |||||||||||
| Maximum offering price per share (5.75%)(1) | $ | 23.28 | $ | 10.81 | $ | 11.55 | $ | 12.00 | |||||||||||
| Class B: | |||||||||||||||||||
| Net Assets | $ | 121,424,457 | $ | 6,789,543 | $ | 46,213,724 | $ | 43,156,840 | |||||||||||
| Shares authorized | unlimited | unlimited | 80,000,000 | unlimited | |||||||||||||||
| Par value | $ | 0.00 | $ | 0.00 | $ | 0.00 | $ | 0.001 | |||||||||||
| Shares outstanding | 5,599,238 | 668,022 | 4,376,450 | 3,875,209 | |||||||||||||||
| Net asset value and redemption price per share(2) | $ | 21.69 | $ | 10.16 | $ | 10.56 | $ | 11.14 | |||||||||||
| Maximum offering price per share | $ | 21.69 | $ | 10.16 | $ | 10.56 | $ | 11.14 | |||||||||||
| Class C: | |||||||||||||||||||
| Net Assets | $ | 2,682 | $ | 8,807,918 | $ | 9,970,068 | $ | 46,159,703 | |||||||||||
| Shares authorized | unlimited | unlimited | 20,000,000 | unlimited | |||||||||||||||
| Par value | $ | 0.00 | $ | 0.00 | $ | 0.00 | $ | 0.001 | |||||||||||
| Shares outstanding | 124 | 866,836 | 943,545 | 4,145,661 | |||||||||||||||
| Net asset value and redemption price per share(2) | $ | 21.59 | $ | 10.16 | $ | 10.57 | $ | 11.13 | |||||||||||
| Maximum offering price per share | $ | 21.59 | $ | 10.16 | $ | 10.57 | $ | 11.13 | |||||||||||
| Class I: | |||||||||||||||||||
| Net Assets | n/a | $ | 2,664,958 | $ | 2,271,718 | $ | 2,145,009 | ||||||||||||
| Shares authorized | n/a | unlimited | 50,000,000 | unlimited | |||||||||||||||
| Par value | n/a | $ | 0.00 | $ | 0.00 | $ | 0.001 | ||||||||||||
| Shares outstanding | n/a | 261,620 | 209,911 | 187,674 | |||||||||||||||
| Net asset value and redemption price per share | n/a | $ | 10.19 | $ | 10.82 | $ | 11.43 | ||||||||||||
| Maximum offering price per share | n/a | $ | 10.19 | $ | 10.82 | $ | 11.43 | ||||||||||||
| Class M: | |||||||||||||||||||
| Net Assets | n/a | n/a | $ | 4,798,082 | n/a | ||||||||||||||
| Shares authorized | n/a | n/a | 5,000,000 | n/a | |||||||||||||||
| Par value | n/a | n/a | $ | 0.00 | n/a | ||||||||||||||
| Shares outstanding | n/a | n/a | 443,215 | n/a | |||||||||||||||
| Net asset value and redemption price per share | n/a | n/a | $ | 10.83 | n/a | ||||||||||||||
| Maximum offering price per share | n/a | n/a | $ | 10.83 | n/a | ||||||||||||||
| Class O: | |||||||||||||||||||
| Net Assets | $ | 829,105 | n/a | n/a | n/a | ||||||||||||||
| Shares authorized | unlimited | n/a | n/a | n/a | |||||||||||||||
| Par value | $ | 0.00 | n/a | n/a | n/a | ||||||||||||||
| Shares outstanding | 37,857 | n/a | n/a | n/a | |||||||||||||||
| Net asset value and redemption price per share | $ | 21.90 | n/a | n/a | n/a | ||||||||||||||
| Maximum offering price per share | $ | 21.90 | n/a | n/a | n/a | ||||||||||||||
| Class Q: | |||||||||||||||||||
| Net Assets | n/a | n/a | n/a | $ | 20,800 | ||||||||||||||
| Shares authorized | n/a | n/a | n/a | unlimited | |||||||||||||||
| Par value | n/a | n/a | n/a | $ | 0.001 | ||||||||||||||
| Shares outstanding | n/a | n/a | n/a | 1,842 | |||||||||||||||
| Net asset value and redemption price per share | n/a | n/a | n/a | $ | 11.29 | ||||||||||||||
| Maximum offering price per share | n/a | n/a | n/a | $ | 11.29 | ||||||||||||||
(1) Maximum offering price is computed at 100/94.25 of net asset value. On purchases of $50,000 or more, the offering price is reduced.
(2) Redemption price per share may be reduced for any applicable contingent deferred sales charges.
See Accompanying Notes to Financial Statements
36
STATEMENTS OF ASSETS AND LIABILITIES AS OF NOVEMBER 30, 2004 (UNAUDITED)
| ING SmallCap Value Fund | ING Convertible Fund | ING Equity and Bond Fund | ING Real Estate Fund | ||||||||||||||||
| ASSETS: | |||||||||||||||||||
| Investments in securities at value+* | $ | 154,497,494 | $ | 197,410,504 | $ | 65,854,178 | $ | 240,281,035 | |||||||||||
| Short-term investments at amortized cost | 34,093,573 | 53,943,311 | - | 9,043,070 | |||||||||||||||
| Repurchase agreement | - | 1,065,000 | 3,292,000 | - | |||||||||||||||
| Cash | 4,310,357 | - | 7,046 | 4,772,647 | |||||||||||||||
| Cash collateral for futures | - | - | 7,131 | - | |||||||||||||||
| Foreign currencies at value*** | - | 388 | - | - | |||||||||||||||
| Receivables: | |||||||||||||||||||
| Investment securities sold | 104,555 | - | 682,795 | 371,916 | |||||||||||||||
| Fund shares sold | 1,545,438 | 59,740 | 744 | 18,500 | |||||||||||||||
| Dividends and interest | 208,077 | 861,652 | 333,554 | 185,499 | |||||||||||||||
| Prepaid expenses | 17,221 | 23,646 | 19,070 | 39,188 | |||||||||||||||
| Total assets | 194,776,715 | 253,364,241 | 70,196,518 | 254,711,855 | |||||||||||||||
| LIABILITIES: | |||||||||||||||||||
| Payable for investment securities purchased | 1,217,883 | - | 5,648,348 | 929,811 | |||||||||||||||
| Payable for fund shares redeemed | 99,170 | 495,859 | 32,672 | - | |||||||||||||||
| Payable for futures variation margin | - | - | 3,141 | - | |||||||||||||||
| Payable upon receipt of securities loaned | 34,093,573 | 53,943,311 | - | 9,043,070 | |||||||||||||||
| Payable to affiliates | 272,212 | 267,805 | 89,731 | 224,171 | |||||||||||||||
| Payable to custodian | - | 4,971 | - | - | |||||||||||||||
| Payable for trustee fees | 3,265 | 14,974 | 4,344 | 5,041 | |||||||||||||||
| Other accrued expenses and liabilities | 62,234 | 217,945 | 121,592 | 139,662 | |||||||||||||||
| Total liabilities | 35,748,337 | 54,944,865 | 5,899,828 | 10,341,755 | |||||||||||||||
| NET ASSETS | $ | 159,028,378 | $ | 198,419,376 | $ | 64,296,690 | $ | 244,370,100 | |||||||||||
| NET ASSETS WERE COMPRISED OF: | |||||||||||||||||||
| Paid-in capital | $ | 146,347,901 | $ | 258,623,990 | $ | 75,549,304 | $ | 180,992,251 | |||||||||||
| Undistributed net investment income (accumulated net investment loss) | (419,868 | ) | 789,019 | 140,828 | 2,242,494 | ||||||||||||||
| Accumulated net realized gain (loss) on investments, foreign currencies and futures | 2,209,370 | (80,098,377 | ) | (14,866,452 | ) | 2,958,782 | |||||||||||||
| Net unrealized appreciation on investments, foreign currencies and futures | 10,890,975 | 19,104,744 | 3,473,010 | 58,176,573 | |||||||||||||||
| NET ASSETS | $ | 159,028,378 | $ | 198,419,376 | $ | 64,296,690 | $ | 244,370,100 | |||||||||||
| + Including securities loaned at value | $ | 31,965,747 | $ | 52,558,629 | $ | - | $ | 8,856,992 | |||||||||||
| * Cost of investments in securities | $ | 143,606,519 | $ | 178,306,148 | $ | 62,388,209 | $ | 182,104,462 | |||||||||||
See Accompanying Notes to Financial Statements
37
STATEMENTS OF ASSETS AND LIABILITIES AS OF NOVEMBER 30, 2004 (UNAUDITED) (CONTINUED)
| ING SmallCap Value Fund | ING Convertible Fund | ING Equity and Bond Fund | ING Real Estate Fund | ||||||||||||||||
| Class A: | |||||||||||||||||||
| Net Assets | $ | 88,102,947 | $ | 60,615,668 | $ | 34,189,443 | $ | 38,487,554 | |||||||||||
| Shares authorized | unlimited | unlimited | unlimited | unlimited | |||||||||||||||
| Par value | $ | 0.00 | $ | 0.00 | $ | 0.00 | $ | 0.00 | |||||||||||
| Shares outstanding | 6,520,546 | 3,271,384 | 2,674,821 | 2,698,366 | |||||||||||||||
| Net asset value and redemption price per share | $ | 13.51 | $ | 18.53 | $ | 12.78 | $ | 14.26 | |||||||||||
| Maximum offering price per share (5.75%)(1) | $ | 14.33 | $ | 19.66 | $ | 13.56 | $ | 15.13 | |||||||||||
| Class B: | |||||||||||||||||||
| Net Assets | $ | 26,109,462 | $ | 66,597,556 | $ | 17,407,222 | $ | 3,088,890 | |||||||||||
| Shares authorized | unlimited | unlimited | unlimited | unlimited | |||||||||||||||
| Par value | $ | 0.00 | $ | 0.00 | $ | 0.00 | $ | 0.00 | |||||||||||
| Shares outstanding | 1,966,957 | 3,264,430 | 1,262,835 | 216,073 | |||||||||||||||
| Net asset value and redemption price per share(2) | $ | 13.27 | $ | 20.40 | $ | 13.78 | $ | 14.30 | |||||||||||
| Maximum offering price per share | $ | 13.27 | $ | 20.40 | $ | 13.78 | $ | 14.30 | |||||||||||
| Class C: | |||||||||||||||||||
| Net Assets | $ | 44,235,075 | $ | 68,400,264 | $ | 12,409,157 | $ | 3,476,512 | |||||||||||
| Shares authorized | unlimited | unlimited | unlimited | unlimited | |||||||||||||||
| Par value | $ | 0.00 | $ | 0.00 | $ | 0.00 | $ | 0.00 | |||||||||||
| Shares outstanding | 3,335,852 | 3,600,076 | 1,017,491 | 236,663 | |||||||||||||||
| Net asset value and redemption price per share(2) | $ | 13.26 | $ | 19.00 | $ | 12.20 | $ | 14.69 | |||||||||||
| Maximum offering price per share | $ | 13.26 | $ | 19.00 | $ | 12.20 | $ | 14.69 | |||||||||||
| Class I: | |||||||||||||||||||
| Net Assets | $ | 514,154 | n/a | n/a | $ | 195,284,167 | |||||||||||||
| Shares authorized | unlimited | n/a | n/a | unlimited | |||||||||||||||
| Par value | $ | 0.00 | n/a | n/a | $ | 0.00 | |||||||||||||
| Shares outstanding | 37,796 | n/a | n/a | 13,112,275 | |||||||||||||||
| Net asset value and redemption price per share | $ | 13.60 | n/a | n/a | $ | 14.89 | |||||||||||||
| Maximum offering price per share | $ | 13.60 | n/a | n/a | $ | 14.89 | |||||||||||||
| Class O: | |||||||||||||||||||
| Net Assets | n/a | n/a | n/a | $ | 4,032,977 | ||||||||||||||
| Shares authorized | n/a | n/a | n/a | unlimited | |||||||||||||||
| Par value | n/a | n/a | n/a | $ | 0.00 | ||||||||||||||
| Shares outstanding | n/a | n/a | n/a | 283,008 | |||||||||||||||
| Net asset value and redemption price per share | n/a | n/a | n/a | $ | 14.25 | ||||||||||||||
| Maximum offering price per share | n/a | n/a | n/a | $ | 14.25 | ||||||||||||||
| Class Q: | |||||||||||||||||||
| Net Assets | $ | 66,740 | $ | 2,805,888 | $ | 290,868 | n/a | ||||||||||||
| Shares authorized | unlimited | unlimited | unlimited | n/a | |||||||||||||||
| Par value | $ | 0.00 | $ | 0.00 | $ | 0.00 | n/a | ||||||||||||
| Shares outstanding | 4,872 | 156,101 | 22,915 | n/a | |||||||||||||||
| Net asset value and redemption price per share | $ | 13.70 | $ | 17.97 | $ | 12.69 | n/a | ||||||||||||
| Maximum offering price per share | $ | 13.70 | $ | 17.97 | $ | 12.69 | n/a | ||||||||||||
(1) Maximum offering price is computed at 100/94.25 of net asset value. On purchases of $50,000 or more, the offering price is reduced.
(2) Redemption price per share may be reduced for any applicable contingent deferred sales charges.
See Accompanying Notes to Financial Statements
38
STATEMENTS OF OPERATIONS FOR THE SIX MONTHS ENDED NOVEMBER 30, 2004 (UNAUDITED)
| ING Disciplined LargeCap Fund | ING LargeCap Growth Fund | ING MidCap Opportunities Fund | ING SmallCap Opportunities Fund | ||||||||||||||||
| INVESTMENT INCOME: | |||||||||||||||||||
| Dividends, net of foreign taxes withheld* | $ | 691,060 | $ | 1,805,856 | $ | 807,753 | $ | 227,471 | |||||||||||
| Interest | 4,425 | 280 | 72,014 | 25,401 | |||||||||||||||
| Securities lending income | 684 | 10,762 | 33,398 | 45,707 | |||||||||||||||
| Other | 8,641 | - | - | - | |||||||||||||||
| Total investment income | 704,810 | 1,816,898 | 913,165 | 298,579 | |||||||||||||||
| EXPENSES: | |||||||||||||||||||
| Investment management fees | 234,184 | 1,172,003 | 2,110,695 | 1,086,573 | |||||||||||||||
| Distribution and service fees: | |||||||||||||||||||
| Class A | 7,838 | 184,836 | 185,922 | 152,861 | |||||||||||||||
| Class B | 158,729 | 567,446 | 859,197 | 321,149 | |||||||||||||||
| Class C | 71,301 | 257,635 | 595,408 | 261,952 | |||||||||||||||
| Class Q | - | 6,963 | 5,760 | 447 | |||||||||||||||
| Transfer agent fees: | |||||||||||||||||||
| Class A | 2,409 | 74,221 | 87,048 | 79,035 | |||||||||||||||
| Class B | 12,043 | 80,355 | 116,212 | 49,945 | |||||||||||||||
| Class C | 6,603 | 36,613 | 87,126 | 40,772 | |||||||||||||||
| Class I | 261 | 5,320 | 32 | 668 | |||||||||||||||
| Class Q | - | 743 | 55 | 20 | |||||||||||||||
| Administrative service fees | 33,455 | 156,265 | 367,700 | 242,224 | |||||||||||||||
| Shareholder reporting expense | 8,105 | 27,414 | 45,600 | 42,520 | |||||||||||||||
| Registration fees | 21,390 | 38,825 | 51,208 | 24,604 | |||||||||||||||
| Professional fees | 5,475 | 12,977 | 12,282 | 12,849 | |||||||||||||||
| Custody and accounting expense | 6,797 | 15,298 | 10,755 | 16,480 | |||||||||||||||
| Trustee fees | 1,983 | 4,657 | 6,341 | 8,281 | |||||||||||||||
| Miscellaneous expense | 21,990 | 6,733 | 15,019 | 9,126 | |||||||||||||||
| Total expenses | 592,563 | 2,648,304 | 4,556,360 | 2,349,506 | |||||||||||||||
| Less: | |||||||||||||||||||
| Net recouped fees | - | (55,000 | ) | (125,000 | ) | - | |||||||||||||
| Brokerage commission recapture | - | 32,660 | - | - | |||||||||||||||
| Net expenses | 592,563 | 2,670,644 | 4,681,360 | 2,349,506 | |||||||||||||||
| Net investment income (loss) | 112,247 | (853,746 | ) | (3,768,195 | ) | (2,050,927 | ) | ||||||||||||
| REALIZED AND UNREALIZED GAIN (LOSS) ON INVESTMENTS AND FUTURES: | |||||||||||||||||||
| Net realized gain (loss) on: | |||||||||||||||||||
| Investments | 4,559,066 | (3,952,007 | ) | 2,749,837 | 2,980,721 | ||||||||||||||
| Futures | (12,554 | ) | - | - | - | ||||||||||||||
| Net realized gain (loss) on investments and futures | 4,546,512 | (3,952,007 | ) | 2,749,837 | 2,980,721 | ||||||||||||||
| Net change in unrealized appreciation or depreciation on: | |||||||||||||||||||
| Investments | (1,107,879 | ) | 4,474,101 | 18,335,010 | 14,797,287 | ||||||||||||||
| Futures | (1,077 | ) | - | - | - | ||||||||||||||
| Net change in unrealized appreciation or depreciation on investments and futures | (1,108,956 | ) | 4,474,101 | 18,335,010 | 14,797,287 | ||||||||||||||
| Net realized and unrealized gain on investments investments and futures | 3,437,556 | 522,094 | 21,084,847 | 17,778,008 | |||||||||||||||
| Increase (decrease) in net assets resulting from operations | $ | 3,549,803 | $ | (331,652 | ) | $ | 17,316,652 | $ | 15,727,081 | ||||||||||
| * Foreign taxes | $ | - | $ | 656 | $ | - | $ | - | |||||||||||
See Accompanying Notes to Financial Statements
39
STATEMENTS OF OPERATIONS FOR THE SIX MONTHS ENDED NOVEMBER 30, 2004 (UNAUDITED)
| ING Financial Services Fund | ING LargeCap Value Fund | ING MagnaCap Fund | ING MidCap Value Fund | ||||||||||||||||
| INVESTMENT INCOME: | |||||||||||||||||||
| Dividends, net of foreign taxes withheld* | $ | 2,750,505 | $ | 246,685 | $ | 4,540,680 | $ | 951,578 | |||||||||||
| Interest | 58,755 | - | 25,519 | 150 | |||||||||||||||
| Securities lending income | - | - | 4,382 | 91,306 | |||||||||||||||
| Total investment income | 2,809,260 | 246,685 | 4,570,581 | 1,043,034 | |||||||||||||||
| EXPENSES: | |||||||||||||||||||
| Investment management fees | 1,166,681 | 99,146 | 1,368,733 | 676,353 | |||||||||||||||
| Distribution and service fees: | |||||||||||||||||||
| Class A | 239,023 | 11,578 | 465,906 | 84,150 | |||||||||||||||
| Class B | 611,318 | 23,788 | 243,240 | 192,338 | |||||||||||||||
| Class C | 7 | 31,717 | 54,872 | 184,336 | |||||||||||||||
| Class M | - | - | 18,272 | - | |||||||||||||||
| Class O | 196 | - | - | - | |||||||||||||||
| Class Q | - | - | - | 24 | |||||||||||||||
| Transfer agent fees: | |||||||||||||||||||
| Class A | 85,841 | 7,493 | 98,014 | 34,814 | |||||||||||||||
| Class B | 54,934 | 3,980 | 15,523 | 19,788 | |||||||||||||||
| Class C | - | 5,176 | 3,493 | 19,006 | |||||||||||||||
| Class I | - | 956 | 14 | 853 | |||||||||||||||
| Class M | - | - | 1,553 | - | |||||||||||||||
| Class O | 49 | - | - | - | |||||||||||||||
| Class Q | - | 28 | - | 10 | |||||||||||||||
| Administrative service fees | - | 11,016 | - | 72,364 | |||||||||||||||
| Shareholder reporting expense | 54,082 | 4,626 | 23,547 | 9,876 | |||||||||||||||
| Registration fees | 26,064 | 36,481 | 40,639 | 23,930 | |||||||||||||||
| Professional fees | 14,436 | 3,254 | 16,285 | 12,414 | |||||||||||||||
| Custody and accounting expense | 14,334 | 2,314 | 19,905 | 5,604 | |||||||||||||||
| Trustee fees | 9,671 | 1,102 | 9,006 | 1,614 | |||||||||||||||
| Offering expense | - | 50,137 | - | - | |||||||||||||||
| Miscellaneous expense | 13,490 | 625 | 16,565 | 2,202 | |||||||||||||||
| Total expenses | 2,290,126 | 293,417 | 2,395,567 | 1,339,676 | |||||||||||||||
| Less: | |||||||||||||||||||
| Net waived and reimbursed (recouped) fees | - | 96,134 | - | (153,977 | ) | ||||||||||||||
| Net expenses | 2,290,126 | 197,283 | 2,395,567 | 1,493,653 | |||||||||||||||
| Net investment income (loss) | 519,134 | 49,402 | 2,175,014 | (450,619 | ) | ||||||||||||||
| REALIZED AND UNREALIZED GAIN (LOSS) ON INVESTMENTS: | |||||||||||||||||||
| Net realized gain (loss) on investments | 3,685,735 | 599,544 | (1,812,694 | ) | 8,657,798 | ||||||||||||||
| Net change in unrealized appreciation or depreciation on investments | 15,534,797 | 1,182,223 | 25,384,178 | (426,989 | ) | ||||||||||||||
| Net realized and unrealized gain on investments | 19,220,532 | 1,781,767 | 23,571,484 | 8,230,809 | |||||||||||||||
| Increase in net assets resulting from operations | $ | 19,739,666 | $ | 1,831,169 | $ | 25,746,498 | $ | 7,780,190 | |||||||||||
| * Foreign taxes | $ | - | $ | - | $ | 42,112 | $ | - | |||||||||||
See Accompanying Notes to Financial Statements
40
STATEMENTS OF OPERATIONS FOR THE SIX MONTHS ENDED NOVEMBER 30, 2004 (UNAUDITED)
| ING SmallCap Value Fund | ING Convertible Fund | ING Equity and Bond Fund | ING Real Estate Fund | ||||||||||||||||
| INVESTMENT INCOME: | |||||||||||||||||||
| Dividends, net of foreign taxes withheld* | $ | 771,846 | $ | 1,330,249 | $ | 357,175 | $ | 4,680,768 | |||||||||||
| Interest | - | 1,955,962 | 611,485 | - | |||||||||||||||
| Securities lending income | 134,338 | 69,737 | - | 5,047 | |||||||||||||||
| Total investment income | 906,184 | 3,355,948 | 968,660 | 4,685,815 | |||||||||||||||
| EXPENSES: | |||||||||||||||||||
| Investment management fees | 592,957 | 760,810 | 248,784 | 724,287 | |||||||||||||||
| Distribution and service fees: | |||||||||||||||||||
| Class A | 85,829 | 106,825 | 61,183 | 31,007 | |||||||||||||||
| Class B | 110,437 | 348,467 | 91,076 | 12,180 | |||||||||||||||
| Class C | 174,573 | 345,930 | 64,299 | 14,983 | |||||||||||||||
| Class O | - | - | - | 883 | |||||||||||||||
| Class Q | 75 | 3,691 | 382 | - | |||||||||||||||
| Transfer agent fees: | |||||||||||||||||||
| Class A | 39,421 | 25,663 | 19,709 | 2,174 | |||||||||||||||
| Class B | 12,621 | 29,576 | 10,263 | 221 | |||||||||||||||
| Class C | 20,054 | 29,415 | 7,192 | 295 | |||||||||||||||
| Class I | 162 | - | - | 12,266 | |||||||||||||||
| Class O | - | - | - | 159 | |||||||||||||||
| Class Q | 18 | 418 | 143 | - | |||||||||||||||
| Administrative service fees | 63,098 | 101,440 | 33,171 | 103,469 | |||||||||||||||
| Shareholder reporting expense | 8,607 | 57,030 | 17,751 | 12,301 | |||||||||||||||
| Registration fees | 22,427 | 26,150 | 23,127 | 30,867 | |||||||||||||||
| Professional fees | 4,338 | 12,613 | 7,402 | 13,014 | |||||||||||||||
| Custody and accounting expense | 2,910 | 15,718 | 20,156 | 7,850 | |||||||||||||||
| Trustee fees | 1,917 | 5,555 | 2,652 | 2,897 | |||||||||||||||
| Miscellaneous expense | 2,034 | 7,643 | 3,534 | 27,839 | |||||||||||||||
| Total expenses | 1,141,478 | 1,876,944 | 610,824 | 996,692 | |||||||||||||||
| Less: | |||||||||||||||||||
| Net recouped fees | (163,241 | ) | - | (20,000 | ) | (115,001 | ) | ||||||||||||
| Brokerage commission recapture | - | - | - | 72,658 | |||||||||||||||
| Net expenses | 1,304,719 | 1,876,944 | 630,824 | 1,039,035 | |||||||||||||||
| Net investment income/(loss) | (398,535 | ) | 1,479,004 | 337,836 | 3,646,780 | ||||||||||||||
| REALIZED AND UNREALIZED GAIN (LOSS) ON INVESTMENTS, FOREIGN CURRENCIES AND FUTURES: | |||||||||||||||||||
| Net realized gain (loss) on: | |||||||||||||||||||
| Investments | 5,255,247 | 1,064,427 | 707,649 | 9,073,434 | |||||||||||||||
| Foreign currencies | - | 14,642 | - | - | |||||||||||||||
| Futures | - | - | (19,674 | ) | - | ||||||||||||||
| Net realized gain on investments, foreign currencies and futures | 5,255,247 | 1,079,069 | 687,975 | 9,073,434 | |||||||||||||||
| Net change in unrealized appreciation or depreciation on: | |||||||||||||||||||
| Investments | 5,652,992 | 4,393,868 | 837,028 | 28,898,993 | |||||||||||||||
| Foreign currencies | - | 388 | - | - | |||||||||||||||
| Futures | - | - | 35,819 | - | |||||||||||||||
| Net change in unrealized appreciation or depreciation on investments, foreign currencies and futures | 5,652,992 | 4,394,256 | 872,847 | 28,898,993 | |||||||||||||||
| Net realized and unrealized gain on investments, foreign currencies and futures | 10,908,239 | 5,473,325 | 1,560,822 | 37,972,427 | |||||||||||||||
| Increase in net assets resulting from operations | $ | 10,509,704 | $ | 6,952,329 | $ | 1,898,658 | $ | 41,619,207 | |||||||||||
| * Foreign taxes | $ | - | $ | - | $ | 558 | $ | - | |||||||||||
See Accompanying Notes to Financial Statements
41
STATEMENTS OF CHANGES IN NET ASSETS (UNAUDITED)
| ING Disciplined LargeCap Fund | ING LargeCap Growth Fund | ||||||||||||||||||
| Six Months Ended November 30, 2004 | Year Ended May 31, 2004 | Six Months Ended November 30, 2004 | Year Ended May 31, 2004 | ||||||||||||||||
| FROM OPERATIONS: | |||||||||||||||||||
| Net investment income (loss) | $ | 112,247 | $ | (196,511 | ) | $ | (853,746 | ) | $ | (2,863,179 | ) | ||||||||
| Net realized gain (loss) on investments and futures | 4,546,512 | 8,281,222 | (3,952,007 | ) | 39,816,143 | ||||||||||||||
| Net change in unrealized appreciation or depreciation on invesments and futures | (1,108,956 | ) | 4,006,258 | 4,474,101 | 18,934,271 | ||||||||||||||
| Net increase (decrease) in net assets resulting from operations | 3,549,803 | 12,090,969 | (331,652 | ) | 55,887,235 | ||||||||||||||
| FROM DISTRIBUTIONS TO SHAREHOLDERS: | |||||||||||||||||||
| Net investment income: | |||||||||||||||||||
| Class A | - | - | (3,156,967 | ) | - | ||||||||||||||
| Class B | - | - | (2,693,358 | ) | - | ||||||||||||||
| Class C | - | - | (1,248,300 | ) | - | ||||||||||||||
| Class I | - | - | (1,216,755 | ) | - | ||||||||||||||
| Class Q | - | - | (162,376 | ) | - | ||||||||||||||
| Total distributions | - | - | (8,477,756 | ) | - | ||||||||||||||
| FROM CAPITAL SHARE TRANSACTIONS: | |||||||||||||||||||
| Net proceeds from sale of shares | 2,070,186 | 4,879,672 | 61,314,036 | 167,009,595 | |||||||||||||||
| Dividends reinvested | - | - | 6,728,584 | - | |||||||||||||||
| 2,070,186 | 4,879,672 | 68,042,620 | 167,009,595 | ||||||||||||||||
| Cost of shares redeemed | (31,450,468 | ) | (23,356,188 | ) | (64,106,366 | ) | (70,231,343 | ) | |||||||||||
| Net increase (decrease) in net assets resulting from capital share transactions | (29,380,282 | ) | (18,476,516 | ) | 3,936,254 | 96,778,252 | |||||||||||||
| Net increase (decrease) in net assets | (25,830,479 | ) | (6,385,547 | ) | (4,873,154 | ) | 152,665,487 | ||||||||||||
| NET ASSETS: | |||||||||||||||||||
| Beginning of period | 76,204,873 | 82,590,420 | 326,030,017 | 173,364,530 | |||||||||||||||
| End of period | $ | 50,374,394 | $ | 76,204,873 | $ | 321,156,863 | $ | 326,030,017 | |||||||||||
| Undistributed net investment income (accumulated net investment loss) at end of period | $ | 112,247 | $ | - | $ | (9,331,502 | ) | $ | - | ||||||||||
See Accompanying Notes to Financial Statements
42
STATEMENTS OF CHANGES IN NET ASSETS (UNAUDITED)
| ING MidCap Opportunities Fund | ING SmallCap Opportunities Fund | ||||||||||||||||||
| Six Months Ended November 30, 2004 | Year Ended May 31, 2004 | Six Months Ended November 30, 2004 | Year Ended May 31, 2004 | ||||||||||||||||
| FROM OPERATIONS: | |||||||||||||||||||
| Net investment loss | $ | (3,768,195 | ) | $ | (3,189,037 | ) | $ | (2,050,927 | ) | $ | (5,073,085 | ) | |||||||
| Net realized gain on investments | 2,749,837 | 36,005,578 | 2,980,721 | 43,684,508 | |||||||||||||||
| Net change in unrealized appreciation or depreciation on investments | 18,335,010 | (14,157,412 | ) | 14,797,287 | 20,950,754 | ||||||||||||||
| Net increase in net assets resulting from operations | 17,316,652 | 18,659,129 | 15,727,081 | 59,562,177 | |||||||||||||||
| FROM CAPITAL SHARE TRANSACTIONS: | |||||||||||||||||||
| Net proceeds from sale of shares | 12,197,998 | 28,495,626 | 18,636,682 | 55,115,680 | |||||||||||||||
| Dividends reinvested | - | 373,162,486 | - | - | |||||||||||||||
| 12,197,998 | 401,658,112 | 18,636,682 | 55,115,680 | ||||||||||||||||
| Cost of shares redeemed | (70,485,126 | ) | (127,345,757 | ) | (54,883,976 | ) | (140,542,492 | ) | |||||||||||
| Net increase (decrease) in net assets resulting from capital share transactions | (58,287,128 | ) | 274,312,355 | (36,247,294 | ) | (85,426,812 | ) | ||||||||||||
| Net increase (decrease) in net assets | (40,970,476 | ) | 292,971,484 | (20,520,213 | ) | (25,864,635 | ) | ||||||||||||
| NET ASSETS: | |||||||||||||||||||
| Beginning of period | 463,623,927 | 170,652,443 | 252,769,862 | 278,634,497 | |||||||||||||||
| End of period | $ | 422,653,451 | $ | 463,623,927 | $ | 232,249,649 | $ | 252,769,862 | |||||||||||
| Accumualted net investment loss at end of period | $ | (3,768,195 | ) | $ | - | $ | (2,050,927 | ) | $ | - | |||||||||
See Accompanying Notes to Financial Statements
43
STATEMENTS OF CHANGES IN NET ASSETS (UNAUDITED)
| ING Financial Services Fund | ING LargeCap Value Fund | ||||||||||||||||||
| Six Months Ended November 30, 2004 | Year Ended May 31, 2004 | Six Months Ended November 30, 2004 | February 2, 2004(1) to May 31, 2004 | ||||||||||||||||
| FROM OPERATIONS: | |||||||||||||||||||
| Net investment income | $ | 519,134 | $ | 291,940 | $ | 49,402 | $ | 5,355 | |||||||||||
| Net realized gain on investments | 3,685,735 | 30,704,885 | 599,544 | 8,982 | |||||||||||||||
| Net change in unrealized appreciation or depreciation on investments | 15,534,797 | 25,739,724 | 1,182,223 | (107,145 | ) | ||||||||||||||
| Net increase in net assets resulting from operations | 19,739,666 | 56,736,549 | 1,831,169 | (92,808 | ) | ||||||||||||||
| FROM DISTRIBUTIONS TO SHAREHOLDERS: | |||||||||||||||||||
| Net investment income: | |||||||||||||||||||
| Class A | (653,510 | ) | (697,897 | ) | (82,342 | ) | - | ||||||||||||
| Class B | - | - | (14,178 | ) | - | ||||||||||||||
| Class C | (11 | ) | - | (17,275 | ) | - | |||||||||||||
| Class I | - | - | (18,995 | ) | - | ||||||||||||||
| Class O | (4,300 | ) | - | ||||||||||||||||
| Net realized gains: | |||||||||||||||||||
| Class A | (12,401,564 | ) | (7,418,743 | ) | (110,882 | ) | - | ||||||||||||
| Class B | (7,842,026 | ) | (5,117,566 | ) | (52,095 | ) | - | ||||||||||||
| Class C | (171 | ) | - | (67,763 | ) | - | |||||||||||||
| Class I | - | - | (20,928 | ) | - | ||||||||||||||
| Class O | (47,206 | ) | - | - | - | ||||||||||||||
| Total distributions | (20,948,788 | ) | (13,234,206 | ) | (384,458 | ) | - | ||||||||||||
| FROM CAPITAL SHARE TRANSACTIONS: | |||||||||||||||||||
| Net proceeds from sale of shares | 9,523,610 | 17,608,115 | 21,137,141 | 11,680,876 | |||||||||||||||
| Dividends reinvested | 15,284,143 | 9,519,235 | 261,534 | - | |||||||||||||||
| 24,807,753 | 27,127,350 | 21,398,675 | 11,680,876 | ||||||||||||||||
| Cost of shares redeemed | (29,041,606 | ) | (58,848,107 | ) | (1,284,059 | ) | (464,359 | ) | |||||||||||
| Net increase (decrease) in net assets resulting from capital share transactions | (4,233,853 | ) | (31,720,757 | ) | 20,114,616 | 11,216,517 | |||||||||||||
| Net increase (decrease) in net assets | (5,442,975 | ) | 11,781,586 | 21,561,327 | 11,123,709 | ||||||||||||||
| NET ASSETS: | |||||||||||||||||||
| Beginning of period | 320,756,247 | 308,974,661 | 11,123,709 | - | |||||||||||||||
| End of period | $ | 315,313,272 | $ | 320,756,247 | $ | 32,685,036 | $ | 11,123,709 | |||||||||||
| Undistributed net investment income (accumulated net investment loss) at end of period | $ | 148,366 | $ | 287,053 | $ | (37,850 | ) | $ | 45,538 | ||||||||||
(1) Commencement of operations
See Accompanying Notes to Financial Statements
44
STATEMENTS OF CHANGES IN NET ASSETS (UNAUDITED)
| ING MagnaCap Fund | ING MidCap Value Fund | ||||||||||||||||||
| Six Months Ended November 30, 2004 | Year Ended May 31, 2004 | Six Months Ended November 30, 2004 | Year Ended May 31, 2004 | ||||||||||||||||
| FROM OPERATIONS: | |||||||||||||||||||
| Net investment income (loss) | $ | 2,175,014 | $ | 2,960,215 | $ | (450,619 | ) | $ | (455,900 | ) | |||||||||
| Net realized gain (loss) on investments | (1,812,694 | ) | 5,922,962 | 8,657,798 | 9,538,762 | ||||||||||||||
| Net change in unrealized appreciation or depreciation on invesments | 25,384,178 | 38,819,962 | (426,989 | ) | 9,173,938 | ||||||||||||||
| Net increase in net assets resulting from operations | 25,746,498 | 47,703,139 | 7,780,190 | 18,256,800 | |||||||||||||||
| FROM DISTRIBUTIONS TO SHAREHOLDERS: | |||||||||||||||||||
| Net investment income: | |||||||||||||||||||
| Class A | (3,660,545 | ) | (2,197,417 | ) | - | - | |||||||||||||
| Class B | (93,647 | ) | - | - | - | ||||||||||||||
| Class C | (21,507 | ) | - | - | - | ||||||||||||||
| Class I | (21,582 | ) | (112 | ) | - | - | |||||||||||||
| Class M | (16,713 | ) | (4,890 | ) | - | - | |||||||||||||
| Class O | - | (42,794 | ) | - | - | ||||||||||||||
| Net realized gains: | |||||||||||||||||||
| Class A | - | - | (5,379,868 | ) | - | ||||||||||||||
| Class B | - | - | (3,140,896 | ) | - | ||||||||||||||
| Class C | - | - | (3,310,535 | ) | - | ||||||||||||||
| Class I | - | - | (154,805 | ) | - | ||||||||||||||
| Class Q | (1,507 | ) | - | ||||||||||||||||
| Total distributions | (3,813,994 | ) | (2,245,213 | ) | (11,987,611 | ) | - | ||||||||||||
| FROM CAPITAL SHARE TRANSACTIONS: | |||||||||||||||||||
| Net proceeds from sale of shares | 14,321,548 | 35,810,247 | 68,181,104 | 90,677,565 | |||||||||||||||
| Net proceeds from shares issued in merger | - | 147,505,028 | - | - | |||||||||||||||
| Dividends reinvested | 3,316,498 | 1,940,774 | 9,165,841 | - | |||||||||||||||
| 17,638,046 | 185,256,049 | 77,346,945 | 90,677,565 | ||||||||||||||||
| Cost of shares redeemed | (41,295,845 | ) | (80,780,723 | ) | (33,014,389 | ) | (20,765,261 | ) | |||||||||||
| Net increase (decrease) in net assets resulting from capital share transactions | (23,657,799 | ) | 104,475,326 | 44,332,556 | 69,912,304 | ||||||||||||||
| Net increase (decrease) in net assets | (1,725,295 | ) | 149,933,252 | 40,125,135 | 88,169,104 | ||||||||||||||
| NET ASSETS: | |||||||||||||||||||
| Beginning of period | 380,687,040 | 230,753,788 | 127,645,975 | 39,476,871 | |||||||||||||||
| End of period | $ | 378,961,745 | $ | 380,687,040 | $ | 167,771,110 | $ | 127,645,975 | |||||||||||
| Undistributed net investment income (accumulated net investment loss) at end of period | $ | (274,550 | ) | $ | 1,364,430 | $ | (471,989 | ) | $ | (21,333 | ) | ||||||||
See Accompanying Notes to Financial Statements
45
STATEMENTS OF CHANGES IN NET ASSETS (UNAUDITED)
| ING SmallCap Value Fund | ING Convertible Fund | ||||||||||||||||||
| Six Months Ended November 30, 2004 | Year Ended May 31, 2004 | Six Months Ended November 30, 2004 | Year Ended May 31, 2004 | ||||||||||||||||
| FROM OPERATIONS: | |||||||||||||||||||
| Net investment income (loss) | $ | (398,535 | ) | $ | (576,767 | ) | $ | 1,479,004 | $ | 3,558,967 | |||||||||
| Net realized gain on investments and foreign currencies | 5,255,247 | 10,868,528 | 1,079,069 | 18,580,712 | |||||||||||||||
| Net change in unrealized appreciation or depreciation on investments and foreign currencies | 5,652,992 | 8,636,660 | 4,394,256 | 5,044,475 | |||||||||||||||
| Net increase in net assets resulting from operations | 10,509,704 | 18,928,421 | 6,952,329 | 27,184,154 | |||||||||||||||
| FROM DISTRIBUTIONS TO SHAREHOLDERS: | |||||||||||||||||||
| Net investment income: | |||||||||||||||||||
| Class A | - | - | (931,468 | ) | (1,433,574 | ) | |||||||||||||
| Class B | - | - | (720,738 | ) | (1,224,775 | ) | |||||||||||||
| Class C | - | - | (801,156 | ) | (1,281,578 | ) | |||||||||||||
| Class Q | - | - | (49,687 | ) | (99,026 | ) | |||||||||||||
| Net realized gains: | |||||||||||||||||||
| Class A | (5,340,181 | ) | (1,073,901 | ) | - | - | |||||||||||||
| Class B | (1,592,895 | ) | (775,481 | ) | - | - | |||||||||||||
| Class C | (2,730,797 | ) | (949,961 | ) | - | - | |||||||||||||
| Class I | (31,243 | ) | (22,291 | ) | - | - | |||||||||||||
| Class Q | (4,047 | ) | (49 | ) | - | - | |||||||||||||
| Total distributions | (9,699,163 | ) | (2,821,683 | ) | (2,503,049 | ) | (4,038,953 | ) | |||||||||||
| FROM CAPITAL SHARE TRANSACTIONS: | |||||||||||||||||||
| Net proceeds from sale of shares | 79,263,566 | 57,600,625 | 11,627,954 | 47,499,407 | |||||||||||||||
| Dividends reinvested | 7,367,984 | 2,135,022 | 1,611,454 | 2,581,510 | |||||||||||||||
| 86,631,550 | 59,735,647 | 13,239,408 | 50,080,917 | ||||||||||||||||
| Cost of shares redeemed | (23,281,611 | ) | (12,951,477 | ) | (32,350,100 | ) | (53,959,375 | ) | |||||||||||
| Net increase (decrease) in net assets resulting from capital share transactions | 63,349,939 | 46,784,170 | (19,110,692 | ) | (3,878,458 | ) | |||||||||||||
| Net increase (decrease) in net assets | 64,160,480 | 62,890,908 | (14,661,412 | ) | 19,266,743 | ||||||||||||||
| NET ASSETS: | |||||||||||||||||||
| Beginning of period | 94,867,898 | 31,976,990 | 213,080,788 | 193,814,045 | |||||||||||||||
| End of period | $ | 159,028,378 | $ | 94,867,898 | $ | 198,419,376 | $ | 213,080,788 | |||||||||||
| Undistributed net investment income (accumulated net investment loss) at end of period | $ | (419,868 | ) | $ | (21,333 | ) | $ | 789,019 | $ | 1,813,063 | |||||||||
See Accompanying Notes to Financial Statements
46
STATEMENTS OF CHANGES IN NET ASSETS (UNAUDITED)
| ING Equity and Bond Fund | ING Real Estate Fund | ||||||||||||||||||
| Six Months Ended November 30, 2004 | Year Ended May 31, 2004 | Six Months Ended November 30, 2004 | Year Ended May 13, 2004 | ||||||||||||||||
| FROM OPERATIONS: | |||||||||||||||||||
| Net investment income | $ | 337,836 | $ | 692,027 | $ | 3,646,780 | $ | 7,739,664 | |||||||||||
| Net realized gain (loss) on investments and futures | 687,975 | (791,892 | ) | 9,073,434 | 18,787,767 | ||||||||||||||
| Net change in unrealized appreciation or depreciation on investments and futures | 872,847 | 6,008,996 | 28,898,993 | 10,691,837 | |||||||||||||||
| Net increase in net assets resulting from operations | 1,898,658 | 5,909,131 | 41,619,207 | 37,219,268 | |||||||||||||||
| FROM DISTRIBUTIONS TO SHAREHOLDERS: | |||||||||||||||||||
| Net investment income: | |||||||||||||||||||
| Class A | (217,758 | ) | (789,960 | ) | (409,850 | ) | (327,077 | ) | |||||||||||
| Class B | (42,676 | ) | (315,822 | ) | (33,431 | ) | (35,510 | ) | |||||||||||
| Class C | (42,964 | ) | (249,621 | ) | (42,116 | ) | (77,403 | ) | |||||||||||
| Class I | - | - | (3,183,919 | ) | (8,236,929 | ) | |||||||||||||
| Class Q | (2,104 | ) | (6,646 | ) | - | - | |||||||||||||
| Class O | - | - | (6,743 | ) | - | ||||||||||||||
| Net realized gains: | |||||||||||||||||||
| Class A | - | - | (2,268,169 | ) | (242,273 | ) | |||||||||||||
| Class B | - | - | (184,964 | ) | (30,332 | ) | |||||||||||||
| Class C | - | - | (206,851 | ) | (87,401 | ) | |||||||||||||
| Class I | - | - | - | (6,232,489 | ) | ||||||||||||||
| Class T | - | - | (11,900,609 | ) | - | ||||||||||||||
| Class O | - | - | (199,400 | ) | - | ||||||||||||||
| Total distributions | (305,502 | ) | (1,362,049 | ) | (18,436,052 | ) | (15,269,414 | ) | |||||||||||
| FROM CAPITAL SHARE TRANSACTIONS: | |||||||||||||||||||
| Net proceeds from sale of shares | 2,894,753 | 18,750,762 | 38,765,916 | 73,899,420 | |||||||||||||||
| Dividends reinvested | 232,892 | 1,011,337 | 12,832,345 | 9,979,129 | |||||||||||||||
| 3,127,645 | 19,762,099 | 51,598,261 | 83,878,549 | ||||||||||||||||
| Cost of shares redeemed | (9,905,097 | ) | (27,110,551 | ) | (13,582,137 | ) | (49,590,718 | ) | |||||||||||
| Net increase (decrease) in net assets resulting from capital share transactions | (6,777,452 | ) | (7,348,452 | ) | 38,016,124 | 34,287,831 | |||||||||||||
| Net increase (decrease) in net assets | (5,184,296 | ) | (2,801,370 | ) | 61,199,279 | 56,237,685 | |||||||||||||
| NET ASSETS: | |||||||||||||||||||
| Beginning of period | 69,480,986 | 72,282,356 | 183,170,821 | 126,933,136 | |||||||||||||||
| End of period | $ | 64,296,690 | $ | 69,480,986 | $ | 244,370,100 | $ | 183,170,821 | |||||||||||
| Undistributed net investment income at end of period | $ | 140,828 | $ | 108,494 | $ | 2,242,494 | $ | 2,271,773 | |||||||||||
See Accompanying Notes to Financial Statements
47
ING DISCIPLINED LARGECAP FUND (UNAUDITED)
Selected data for a share of beneficial interest outstanding throughout each period.
| Class A | |||||||||||||||||||||||||||||||
| Six Months Ended | Seven Months Ended | Year Ended | December 30, 1998(2) to | ||||||||||||||||||||||||||||
| November 30, | Year Ended May 31, | May 31, | October 31, | October 31, | |||||||||||||||||||||||||||
| 2004 | 2004 | 2003 | 2002 | 2001(1) | 2000 | 1999 | |||||||||||||||||||||||||
| Per Share Operating Performance: | |||||||||||||||||||||||||||||||
| Net asset value, beginning of period | $ | 8.82 | 7.61 | 8.43 | 9.87 | 11.17 | 11.14 | 10.00 | |||||||||||||||||||||||
| Income (loss) from investment operations: | |||||||||||||||||||||||||||||||
| Net investment income (loss) | $ | 0.04 | 0.01 | 0.03 | 0.03 | �� | (0.01 | ) | - | 0.01 | |||||||||||||||||||||
| Net realized and unrealized gain (loss) on investments | $ | 0.61 | 1.20 | (0.85 | ) | (1.47 | ) | (1.29 | ) | 0.18 | 1.13 | ||||||||||||||||||||
| Total from investment operations | $ | 0.65 | 1.21 | (0.82 | ) | (1.44 | ) | (1.30 | ) | 0.18 | 1.14 | ||||||||||||||||||||
| Less distributions from: | |||||||||||||||||||||||||||||||
| Net realized gain from investments | $ | - | - | - | - | - | 0.15 | - | |||||||||||||||||||||||
| Total distributions | $ | - | - | - | - | - | 0.15 | - | |||||||||||||||||||||||
| Net asset value, end of period | $ | 9.47 | 8.82 | 7.61 | 8.43 | 9.87 | 11.17 | 11.14 | |||||||||||||||||||||||
| Total Return(3) | % | 7.37 | 15.90 | (9.73 | ) | (14.59 | ) | (11.64 | ) | 1.55 | 11.40 | ||||||||||||||||||||
| Ratios and Supplemental Data: | |||||||||||||||||||||||||||||||
| Net assets, end of period (000's) | $ | 5,088 | 5,362 | 7,205 | 9,883 | 12,748 | 23,571 | 27,091 | |||||||||||||||||||||||
| Ratios to average net assets: | |||||||||||||||||||||||||||||||
| Net expenses after expense reimbursement(4) | % | 1.36 | 1.53 | 1.54 | 1.33 | 1.45 | 1.37 | 1.29 | (5) | ||||||||||||||||||||||
| Gross expenses prior to expense | |||||||||||||||||||||||||||||||
| reimbursement(4) | % | 1.36 | 1.53 | 1.54 | 1.33 | 1.45 | 1.37 | 1.56 | |||||||||||||||||||||||
| Net investment income (loss) after expense reimbursement(4) | % | 0.89 | 0.11 | 0.32 | 0.12 | (0.13 | ) | 0.01 | 0.23 | (5) | |||||||||||||||||||||
| Portfolio turnover rate | % | 79 | 200 | 106 | 149 | 26 | 57 | 26 | |||||||||||||||||||||||
| Class B | |||||||||||||||||||||||||||||||
| Six Months Ended | Seven Months Ended | Year Ended | December 30, 1998(2) to | ||||||||||||||||||||||||||||
| November 30, | Year Ended May 31, | May 31, | October 31, | October 31, | |||||||||||||||||||||||||||
| 2004 | 2004 | 2003 | 2002 | 2001(1) | 2000 | 1999 | |||||||||||||||||||||||||
| Per Share Operating Performance: | |||||||||||||||||||||||||||||||
| Net asset value, beginning of period | $ | 8.49 | 7.37 | 8.23 | 9.70 | 11.04 | 11.09 | 10.00 | |||||||||||||||||||||||
| Income (loss) from investment operations: | |||||||||||||||||||||||||||||||
| Net investment income (loss) | $ | 0.01 | (0.05 | ) | (0.03 | ) | (0.07 | ) | (0.05 | ) | (0.08 | ) | (0.02 | ) | |||||||||||||||||
| Net realized and unrealized gain (loss) on investments | $ | 0.58 | 1.17 | (0.83 | ) | (1.40 | ) | (1.29 | ) | 0.18 | 1.11 | ||||||||||||||||||||
| Total from investment operations | $ | 0.59 | 1.12 | (0.86 | ) | (1.47 | ) | (1.34 | ) | 0.10 | 1.09 | ||||||||||||||||||||
| Less distributions from: | |||||||||||||||||||||||||||||||
| Net realized gain from investments | $ | - | - | - | - | - | 0.15 | - | |||||||||||||||||||||||
| Total distributions | $ | - | - | - | - | - | 0.15 | - | |||||||||||||||||||||||
| Net asset value, end of period | $ | 9.08 | 8.49 | 7.37 | 8.23 | 9.70 | 11.04 | 11.09 | |||||||||||||||||||||||
| Total Return(3) | % | 6.95 | 15.20 | (10.45 | ) | (15.15 | ) | (12.14 | ) | 0.83 | 10.90 | ||||||||||||||||||||
| Ratios and Supplemental Data: | |||||||||||||||||||||||||||||||
| Net assets, end of period (000's) | $ | 31,296 | 32,848 | 34,358 | 53,185 | 76,726 | 94,028 | 99,249 | |||||||||||||||||||||||
| Ratios to average net assets: | |||||||||||||||||||||||||||||||
| Net expenses after expense reimbursement(4) | % | 2.06 | 2.23 | 2.24 | 2.03 | 2.15 | 2.07 | 1.99 | (5) | ||||||||||||||||||||||
| Gross expenses prior to expense | |||||||||||||||||||||||||||||||
| reimbursement(4) | % | 2.06 | 2.23 | 2.24 | 2.03 | 2.15 | 2.07 | 2.29 | |||||||||||||||||||||||
| Net investment income (loss) after expense reimbursement(4) | % | 0.21 | (0.59 | ) | (0.43 | ) | (0.58 | ) | (0.83 | ) | (0.70 | ) | (0.49 | )(5) | |||||||||||||||||
| Portfolio turnover rate | % | 79 | 200 | 106 | 149 | 26 | 57 | 26 | |||||||||||||||||||||||
(1) The Fund changed its fiscal year end to May 31.
(2) Commencement of operations.
(3) Total return is calculated assuming reinvestment of all dividends and capital gain distributions at net asset value and excluding the deduction of sales charges. Total return for less than one year is not annualized.
(4) Annualized for periods less than one year.
(5) Expenses calculated net of taxes and advisor reimbursement.
See Accompanying Notes to Financial Statements
48
ING DISCIPLINED LARGECAP FUND (UNAUDITED) (CONTINUED)
FINANCIAL HIGHLIGHTS
Selected data for a share of beneficial interest outstanding throughout each period.
| Class C | |||||||||||||||||||||||||||||||
| Six Months Ended | Seven Months Ended | Year Ended | December 30, 1998(2) to | ||||||||||||||||||||||||||||
| November 30, | Year Ended May 31, | May 31, | October 31, | October 31, | |||||||||||||||||||||||||||
| 2004 | 2004 | 2003 | 2002 | 2001(1) | 2000 | 1999 | |||||||||||||||||||||||||
| Per Share Operating Performance: | |||||||||||||||||||||||||||||||
| Net asset value, beginning of period | $ | 8.49 | 7.37 | 8.23 | 9.70 | 11.05 | 11.09 | 10.00 | |||||||||||||||||||||||
| Income (loss) from investment operations: | |||||||||||||||||||||||||||||||
| Net investment income (loss) | $ | 0.01 | (0.06 | ) | (0.04 | ) | (0.09 | ) | (0.05 | ) | (0.08 | ) | (0.02 | ) | |||||||||||||||||
| Net realized and unrealized gain (loss) on investments | $ | 0.58 | 1.18 | (0.82 | ) | (1.38 | ) | (1.30 | ) | 0.19 | 1.11 | ||||||||||||||||||||
| Total from investment operations | $ | 0.59 | 1.12 | (0.86 | ) | (1.47 | ) | (1.35 | ) | 0.11 | 1.09 | ||||||||||||||||||||
| Less distributions from: | |||||||||||||||||||||||||||||||
| Net realized gain from investments | $ | - | - | - | - | - | 0.15 | - | |||||||||||||||||||||||
| Total distributions | $ | - | - | - | - | - | 0.15 | - | |||||||||||||||||||||||
| Net asset value, end of period | $ | 9.08 | 8.49 | 7.37 | 8.23 | 9.70 | 11.05 | 11.09 | |||||||||||||||||||||||
| Total Return(3) | % | 6.95 | 15.20 | (10.45 | ) | (15.15 | ) | (12.12 | ) | 0.92 | 10.90 | ||||||||||||||||||||
| Ratios and Supplemental Data: | |||||||||||||||||||||||||||||||
| Net assets, end of period (000's) | $ | 13,986 | 15,233 | 21,478 | 36,486 | 66,252 | 88,449 | 75,941 | |||||||||||||||||||||||
| Ratios to average net assets: | |||||||||||||||||||||||||||||||
| Net expenses after expense reimbursement(4) | % | 2.06 | 2.23 | 2.24 | 2.03 | 2.15 | 2.07 | 1.99 | (5) | ||||||||||||||||||||||
| Gross expenses prior to expense | |||||||||||||||||||||||||||||||
| reimbursement(4) | % | 2.06 | 2.23 | 2.24 | 2.03 | 2.15 | 2.07 | 2.27 | |||||||||||||||||||||||
| Net investment income (loss) after expense reimbursement(4) | % | 0.19 | (0.59 | ) | (0.43 | ) | (0.58 | ) | (0.83 | ) | (0.70 | ) | (0.49 | )(5) | |||||||||||||||||
| Portfolio turnover rate | % | 79 | 200 | 106 | 149 | 26 | 57 | 26 | |||||||||||||||||||||||
(1) The Fund changed its fiscal year end to May 31.
(2) Commencement of operations.
(3) Total return is calculated assuming reinvestment of all dividends and capital gain distributions at net asset value and excluding the deduction of sales charges. Total return for less than one year is not annualized.
(4) Annualized for periods less than one year.
(5) Expenses calculated net of taxes and advisor reimbursement.
See Accompanying Notes to Financial Statements
49
ING LARGECAP GROWTH FUND (UNAUDITED)
FINANCIAL HIGHLIGHTS
Selected data for a share of beneficial interest outstanding throughout each period.
| Class A | |||||||||||||||||||||||||||||||
| Six Months Ended | Eleven Months Ended | Year Ended | Three Months Ended | ||||||||||||||||||||||||||||
| November 30, | Year Ended May 31, | May 31, | June 30, | June 30, | |||||||||||||||||||||||||||
| 2004 | 2004 | 2003 | 2002 | 2001(1) | 2000 | 1999(2) | |||||||||||||||||||||||||
| Per Share Operating Performance: | |||||||||||||||||||||||||||||||
| Net asset value, beginning of period | $ | 18.11 | 14.33 | 16.59 | 24.40 | 43.12 | 28.09 | 24.94 | |||||||||||||||||||||||
| Income (loss) from investment operations: | |||||||||||||||||||||||||||||||
| Net investment loss | $ | - | (0.10 | ) | (0.15 | ) | (0.18 | ) | (0.20 | ) | (0.22 | ) | (0.02 | ) | |||||||||||||||||
| Net realized and unrealized gain (loss) on investments | $ | 0.07 | 3.88 | (2.11 | ) | (7.63 | ) | (18.05 | ) | 15.63 | 3.17 | ||||||||||||||||||||
| Total from investment operations | $ | 0.07 | 3.78 | (2.26 | ) | (7.81 | ) | (18.25 | ) | 15.41 | 3.15 | ||||||||||||||||||||
| Less distributions from: | |||||||||||||||||||||||||||||||
| Net investment income | $ | 0.53 | - | - | 0.00 | * | - | - | - | ||||||||||||||||||||||
| Net realized gain from investments | $ | - | - | - | - | 0.47 | 0.38 | - | |||||||||||||||||||||||
| Total distributions | $ | 0.53 | - | - | 0.00 | * | 0.47 | 0.38 | - | ||||||||||||||||||||||
| Net asset value, end of period | $ | 17.65 | 18.11 | 14.33 | 16.59 | 24.40 | 43.12 | 28.09 | |||||||||||||||||||||||
| Total Return(3) | % | 0.34 | 26.38 | (13.62 | ) | (31.99 | ) | (42.67 | ) | 55.35 | 12.63 | ||||||||||||||||||||
| Ratios and Supplemental Data: | |||||||||||||||||||||||||||||||
| Net assets, end of period (000's) | $ | 110,029 | 109,858 | 40,941 | 65,642 | 161,824 | 186,261 | 30,108 | |||||||||||||||||||||||
| Ratios to average net assets: | |||||||||||||||||||||||||||||||
| Net expenses after expense reimbursement/ recoupment and brokerage commission recapture(4)(5) | % | 1.42 | 1.42 | 1.60 | 1.58 | 1.47 | 1.36 | 1.43 | |||||||||||||||||||||||
| Net expenses after expense reimbursement/recoupment(4)(5) | % | 1.45 | 1.45 | 1.60 | 1.58 | 1.47 | 1.36 | 1.43 | |||||||||||||||||||||||
| Gross expenses prior to expense reimbursement and brokerage commission recapture(4) | % | 1.41 | 1.61 | 1.76 | 1.58 | 1.47 | 1.36 | 1.45 | |||||||||||||||||||||||
| Net investment loss after expense reimbursement/recoupment and brokerage commission | % | (0.26 | ) | (0.82 | ) | (0.96 | ) | (1.12 | ) | (0.78 | ) | (0.87 | ) | (0.56 | ) | ||||||||||||||||
| recapture(4)(5) | |||||||||||||||||||||||||||||||
| Portfolio turnover rate | % | 40 | 142 | 291 | 536 | 331 | 139 | 27 | |||||||||||||||||||||||
| Class B | |||||||||||||||||||||||||||||||
| Six Months Ended | Eleven Months Ended | Year Ended | Three Months Ended | ||||||||||||||||||||||||||||
| November 30, | Year Ended May 31, | May 31, | June 30, | June 30, | |||||||||||||||||||||||||||
| 2004 | 2004 | 2003 | 2002 | 2001(1) | 2000 | 1999(2) | |||||||||||||||||||||||||
| Per Share Operating Performance: | |||||||||||||||||||||||||||||||
| Net asset value, beginning of period | $ | 17.57 | 13.99 | 16.30 | 24.14 | 42.94 | 28.15 | 25.04 | |||||||||||||||||||||||
| Income (loss) from investment operations: | |||||||||||||||||||||||||||||||
| Net investment loss | $ | (0.07 | ) | (0.21 | ) | (0.24 | ) | (0.43 | ) | (0.41 | ) | (0.39 | ) | (0.05 | ) | ||||||||||||||||
| Net realized and unrealized gain (loss) on investments | $ | 0.08 | 3.79 | (2.07 | ) | (7.41 | ) | (17.92 | ) | 15.56 | 3.16 | ||||||||||||||||||||
| Total from investment operations | $ | 0.01 | 3.58 | (2.31 | ) | (7.84 | ) | (18.33 | ) | 15.17 | 3.11 | ||||||||||||||||||||
| Less distributions from: | |||||||||||||||||||||||||||||||
| Net investment income | $ | 0.41 | - | - | - | - | - | - | |||||||||||||||||||||||
| Net realized gain from investments | $ | - | - | - | - | 0.47 | 0.38 | - | |||||||||||||||||||||||
| Total distributions | $ | 0.41 | - | - | - | 0.47 | 0.38 | - | |||||||||||||||||||||||
| Net asset value, end of period | $ | 17.17 | 17.57 | 13.99 | 16.30 | 24.14 | 42.94 | 28.15 | |||||||||||||||||||||||
| Total Return(3) | % | 0.04 | 25.59 | (14.17 | ) | (32.48 | ) | (43.04 | ) | 55.37 | 12.42 | ||||||||||||||||||||
| Ratios and Supplemental Data: | |||||||||||||||||||||||||||||||
| Net assets, end of period (000's) | $ | 115,071 | 119,658 | 72,575 | 116,738 | 224,572 | 333,256 | 49,057 | |||||||||||||||||||||||
| Ratios to average net assets: | |||||||||||||||||||||||||||||||
| Net expenses after expense reimbursement/ recoupment and brokerage commission recapture(4)(5) | % | 2.07 | 2.07 | 2.25 | 2.23 | 2.12 | 2.01 | 2.08 | |||||||||||||||||||||||
| Net expenses after expense reimbursement/recoupment(4)(5) | % | 2.10 | 2.09 | 2.25 | 2.23 | 2.12 | 2.01 | 2.10 | |||||||||||||||||||||||
| Gross expenses prior to expense reimbursement/ recoupment and brokerage commission recapture(4) | % | 2.06 | 2.26 | 2.41 | 2.23 | 2.12 | 2.01 | 2.10 | |||||||||||||||||||||||
| Net investment loss after expense reimbursement and brokerage commission recapture(4)(5) | % | (0.92 | ) | (1.47 | ) | (1.61 | ) | (1.77 | ) | (1.43 | ) | (1.52 | ) | (1.21 | ) | ||||||||||||||||
| Portfolio turnover rate | % | 40 | 142 | 291 | 536 | 331 | 139 | 27 | |||||||||||||||||||||||
(1) The Fund changed its fiscal year end to May 31.
(2) Effective May 24, 1999, ING investments, LLC became the Investment Adviser of the Fund, concurrently Nicholas-Applegate Capital Management was appointed as Sub-Adviser and the Fund changed its year end to June 30. The Fund was directly managed by ING Investments, LLC from October 1, 2000 to June 2, 2003. Effective June&nb sp;2, 2003, Wellington Capital Management was appointed as Sub-Adviser to the Fund.
(3) Total return is calculated assuming reinvestment of all dividends and capital gain distributions at net asset value and excluding the deduction of sales charges. Total return for less than one year is not annualized.
(4) Annualized for periods less than one year.
(5) The Investment Adviser has agreed to limit expenses, (excluding interest, taxes, brokerage and extraordinary expenses) subject to possible recoupment by ING Investments, LLC within three years.
* Amount represents less than $0.01 per share.
See Accompanying Notes to Financial Statements
50
ING LARGECAP GROWTH FUND (UNAUDITED) (CONTINUED)
FINANCIAL HIGHLIGHTS
Selected data for a share of beneficial interest outstanding throughout each period.
| Class C | |||||||||||||||||||||||||||||||
| Six Months Ended | Eleven Months Ended | Year Ended | Three Months Ended | ||||||||||||||||||||||||||||
| November 30, | Year Ended May 31, | May 31, | June 30, | June 30, | |||||||||||||||||||||||||||
| 2004 | 2004 | 2003 | 2002 | 2001(1) | 2000 | 1999(2) | |||||||||||||||||||||||||
| Per Share Operating Performance: | |||||||||||||||||||||||||||||||
| Net asset value, beginning of period | $ | 17.52 | 13.95 | 16.25 | 24.07 | 42.82 | 28.07 | 24.97 | |||||||||||||||||||||||
| Income (loss) from investment operations: | |||||||||||||||||||||||||||||||
| Net investment loss | $ | (0.07 | ) | (0.22 | ) | (0.25 | ) | (0.48 | ) | (0.39 | ) | (0.35 | ) | (0.06 | ) | ||||||||||||||||
| Net realized and unrealized gain (loss) on investments | $ | 0.07 | 3.79 | (2.05 | ) | (7.34 | ) | (17.89 | ) | 15.48 | 3.16 | ||||||||||||||||||||
| Total from investment operations | $ | 0.00 | * | 3.57 | (2.30 | ) | (7.82 | ) | (18.28 | ) | 15.13 | 3.10 | |||||||||||||||||||
| Less distributions from: | |||||||||||||||||||||||||||||||
| Net investment income | $ | 0.41 | - | - | - | - | - | - | |||||||||||||||||||||||
| Net realized gain from investments | $ | - | - | - | - | 0.47 | 0.38 | - | |||||||||||||||||||||||
| Total distributions | $ | 0.41 | - | - | - | 0.47 | 0.38 | - | |||||||||||||||||||||||
| Net asset value, end of period | $ | 17.11 | 17.52 | 13.95 | 16.25 | 24.07 | 42.82 | 28.07 | |||||||||||||||||||||||
| Total Return(3) | % | (0.01 | ) | 25.59 | (14.15 | ) | (32.49 | ) | (43.04 | ) | 54.38 | 12.41 | |||||||||||||||||||
| Ratios and Supplemental Data: | |||||||||||||||||||||||||||||||
| Net assets, end of period (000's) | $ | 52,989 | 53,976 | 31,516 | 54,048 | 117,222 | 152,682 | 17,755 | |||||||||||||||||||||||
| Ratios to average net assets: | |||||||||||||||||||||||||||||||
| Net expenses after expense reimbursement and brokerage commission recapture(4)(5) | % | 2.07 | 2.07 | 2.25 | 2.23 | 2.12 | 2.01 | 2.08 | |||||||||||||||||||||||
| Net expenses after expense reimbursement(4)(5) | % | 2.10 | 2.09 | 2.25 | 2.23 | 2.12 | 2.01 | 2.08 | |||||||||||||||||||||||
| Gross expenses prior to expense reimbursement and brokerage commission recapture(4) | % | 2.06 | 2.26 | 2.41 | 2.23 | 2.12 | 2.01 | 2.10 | |||||||||||||||||||||||
| Net investment loss after expense reimbursement | |||||||||||||||||||||||||||||||
| and brokerage commission recapture(4)(5) | % | (0.91 | ) | (1.47 | ) | (1.61 | ) | (1.77 | ) | (1.43 | ) | (1.52 | ) | (1.21 | ) | ||||||||||||||||
| Portfolio turnover rate | % | 40 | 142 | 291 | 536 | 331 | 139 | 27 | |||||||||||||||||||||||
(1) The Fund changed its fiscal year end to May 31.
(2) Effective May 24, 1999, ING investments, LLC became the Investment Adviser of the Fund, concurrently Nicholas-Applegate Capital Management was appointed as Sub-Adviser and the Fund changed its year end to June 30. The Fund was directly managed by ING Investments, LLC from October 1, 2000 to June 2, 2003. Effective June 2, 2003, Wellington Capital Management was appointed as Sub-Adviser to the Fund.
(3) Total return is calculated assuming reinvestment of all dividends and capital gain distributions at net asset value and excluding the deduction of sales charges. Total return for less than one year is not annualized.
(4) Annualized for periods less than one year.
(5) The Investment Adviser has agreed to limit expenses, (excluding interest, taxes, brokerage and extraordinary expenses) subject to possible recoupment by ING Investments, LLC within three years.
* Amount represents less than $0.01 per share.
See Accompanying Notes to Financial Statements
51
ING MIDCAP OPPORTUNITIES FUND (UNAUDITED)
FINANCIAL HIGHLIGHTS
Selected data for a share of beneficial interest outstanding throughout each period.
| Class A | |||||||||||||||||||||||||||||||
| Six Months Ended | Five Months Ended | ||||||||||||||||||||||||||||||
| November 30, | Year Ended May 31, | May 31, | Year Ended December 31, | ||||||||||||||||||||||||||||
| 2004 | 2004 | 2003 | 2002 | 2001(1) | 2000 | 1999 | |||||||||||||||||||||||||
| Per Share Operating Performance: | |||||||||||||||||||||||||||||||
| Net asset value, beginning of period | $ | 12.06 | 10.12 | 11.11 | 14.58 | 19.12 | 21.29 | 12.96 | |||||||||||||||||||||||
| Income (loss) from investment operations: | |||||||||||||||||||||||||||||||
| Net investment loss | $ | (0.08 | ) | (0.06 | ) | (0.12 | ) | (0.17 | )* | (0.11 | ) | (0.15 | ) | (0.09 | ) | ||||||||||||||||
| Net realized and unrealized gain (loss) | |||||||||||||||||||||||||||||||
| on investments | $ | 0.68 | 2.00 | (0.87 | ) | (3.30 | ) | (4.43 | ) | 0.16 | 12.01 | ||||||||||||||||||||
| Total from investment operations | $ | 0.60 | 1.94 | (0.99 | ) | (3.47 | ) | (4.54 | ) | 0.01 | 11.92 | ||||||||||||||||||||
| Less distributions from: | |||||||||||||||||||||||||||||||
| Net realized gain from investments | $ | - | - | - | - | - | 2.18 | 3.59 | |||||||||||||||||||||||
| Total distributions | $ | - | - | - | - | - | 2.18 | 3.59 | |||||||||||||||||||||||
| Net asset value, end of period | $ | 12.66 | 12.06 | 10.12 | 11.11 | 14.58 | 19.12 | 21.29 | |||||||||||||||||||||||
| Total Return(2) | % | 4.98 | 19.17 | (8.91 | ) | (23.80 | ) | (23.74 | ) | (0.35 | ) | 103.24 | |||||||||||||||||||
| Ratios and Supplemental Data: | |||||||||||||||||||||||||||||||
| Net assets, end of period (000's) | $ | 127,958 | 133,363 | 44,010 | 68,106 | 24,265 | 25,742 | 6,291 | |||||||||||||||||||||||
| Ratios to average net assets: | |||||||||||||||||||||||||||||||
| Net expenses after expense reimbursement/recoupment(3)(4) | % | 1.75 | 1.59 | 1.50 | 1.77 | 2.06 | 1.66 | 1.74 | |||||||||||||||||||||||
| Gross expenses prior to expense | |||||||||||||||||||||||||||||||
| reimbursement/recoupment(3) | % | 1.68 | 1.70 | 1.83 | 1.99 | 2.06 | 1.66 | 1.74 | |||||||||||||||||||||||
| Net investment loss after expense reimbursement/recoupment(3)(4) | % | (1.31 | ) | (1.06 | ) | (1.15 | ) | (1.45 | ) | (1.52 | ) | (0.96 | ) | (1.34 | ) | ||||||||||||||||
| Portfolio turnover rate | % | 25 | 115 | 345 | 399 | 182 | 188 | 201 | |||||||||||||||||||||||
| Class B | |||||||||||||||||||||||||||||||
| Six Months Ended | Five Months Ended | ||||||||||||||||||||||||||||||
| November 30, | Year Ended May 31, | May 31, | Year Ended December 31, | ||||||||||||||||||||||||||||
| 2004 | 2004 | 2003 | 2002 | 2001(1) | 2000 | 1999 | |||||||||||||||||||||||||
| Per Share Operating Performance: | |||||||||||||||||||||||||||||||
| Net asset value, beginning of period | $ | 11.59 | 9.80 | 10.83 | 14.30 | 18.79 | 21.12 | 12.97 | |||||||||||||||||||||||
| Income (loss) from investment operations: | |||||||||||||||||||||||||||||||
| Net investment loss | $ | (0.13 | ) | (0.06 | ) | (0.20 | ) | (0.25 | )* | (0.14 | ) | (0.24 | ) | (0.07 | ) | ||||||||||||||||
| Net realized and unrealized gain (loss) | |||||||||||||||||||||||||||||||
| on investments | $ | 0.66 | 1.85 | (0.83 | ) | (3.22 | ) | (4.35 | ) | 0.09 | 11.81 | ||||||||||||||||||||
| Total from investment operations | $ | 0.53 | 1.79 | (1.03 | ) | (3.47 | ) | (4.49 | ) | (0.15 | ) | 11.74 | |||||||||||||||||||
| Less distributions from: | |||||||||||||||||||||||||||||||
| Net realized gain from investments | $ | - | - | - | - | - | 2.18 | 3.59 | |||||||||||||||||||||||
| Total distributions | $ | - | - | - | - | - | 2.18 | 3.59 | |||||||||||||||||||||||
| Net asset value, end of period | $ | 12.12 | 11.59 | 9.80 | 10.83 | 14.30 | 18.79 | 21.12 | |||||||||||||||||||||||
| Total Return(2) | % | 4.57 | 18.27 | (9.51 | ) | (24.27 | ) | (23.90 | ) | (1.13 | ) | 101.73 | |||||||||||||||||||
| Ratios and Supplemental Data: | |||||||||||||||||||||||||||||||
| Net assets, end of period (000's) | $ | 168,988 | 191,288 | 43,183 | 69,621 | 28,448 | 35,551 | 8,252 | |||||||||||||||||||||||
| Ratios to average net assets: | |||||||||||||||||||||||||||||||
| Net expenses after expense reimbursement/recoupment(3)(4) | % | 2.45 | 2.29 | 2.20 | 2.47 | 2.76 | 2.36 | 2.40 | |||||||||||||||||||||||
| Gross expenses prior to expense | |||||||||||||||||||||||||||||||
| reimbursement/recoupment(3) | % | 2.38 | 2.40 | 2.53 | 2.69 | 2.76 | 2.36 | 2.40 | |||||||||||||||||||||||
| Net investment loss after expense reimbursement/recoupment(3)(4) | % | (2.00 | ) | (1.69 | ) | (1.85 | ) | (2.15 | ) | (2.22 | ) | (1.66 | ) | (2.00 | ) | ||||||||||||||||
| Portfolio turnover rate | % | 25 | 115 | 345 | 399 | 182 | 188 | 201 | |||||||||||||||||||||||
(1) The Fund changed its fiscal year end to May 31.
(2) Total return is calculated assuming reinvestment of all dividends and capital gain distributions at net asset value and excluding the deduction of sales charges. Total return for less than one year is not annualized.
(3) Annualized for periods less than one year.
(4) The Investment Adviser has agreed to limit expenses, (excluding interest, taxes, brokerage and extraordinary expenses) subject to possible recoupment by ING Investments, LLC within three years.
* Per share data calculated using weighted average number of shares outstanding throughout the period.
See Accompanying Notes to Financial Statements
52
ING MIDCAP OPPORTUNITIES FUND (UNAUDITED) (CONTINUED)
FINANCIAL HIGHLIGHTS
Selected data for a share of beneficial interest outstanding throughout each period.
| Class C | |||||||||||||||||||||||||||||||
| Six Months Ended | Five Months Ended | ||||||||||||||||||||||||||||||
| November 30, | Year Ended May 31, | May 31, | Year Ended December 31, | ||||||||||||||||||||||||||||
| 2004 | 2004 | 2003 | 2002 | 2001(1) | 2000 | 1999 | |||||||||||||||||||||||||
| Per Share Operating Performance: | |||||||||||||||||||||||||||||||
| Net asset value, beginning of period | $ | 11.53 | 9.75 | 10.77 | 14.24 | 18.72 | 21.03 | 12.96 | |||||||||||||||||||||||
| Income (loss) from investment operations: | |||||||||||||||||||||||||||||||
| Net investment loss | $ | (0.13 | ) | (0.12 | ) | (0.19 | ) | (0.25 | )* | (0.14 | ) | (0.24 | ) | (0.07 | ) | ||||||||||||||||
| Net realized and unrealized gain (loss) | |||||||||||||||||||||||||||||||
| on investments | $ | 0.66 | 1.90 | (0.83 | ) | (3.22 | ) | (4.34 | ) | 0.11 | 11.73 | ||||||||||||||||||||
| Total from investment operations | $ | 0.53 | 1.78 | (1.02 | ) | (3.47 | ) | (4.48 | ) | (0.13 | ) | 11.66 | |||||||||||||||||||
| Less distributions from: | |||||||||||||||||||||||||||||||
| Net realized gain from investments | $ | - | - | - | - | - | 2.18 | 3.59 | |||||||||||||||||||||||
| Total distributions | $ | - | - | - | - | - | 2.18 | 3.59 | |||||||||||||||||||||||
| Net asset value, end of period | $ | 12.06 | 11.53 | 9.75 | 10.77 | 14.24 | 18.72 | 21.03 | |||||||||||||||||||||||
| Total Return(2) | % | 4.60 | 18.26 | (9.47 | ) | (24.37 | ) | (23.93 | ) | (1.03 | ) | 101.16 | |||||||||||||||||||
| Ratios and Supplemental Data: | |||||||||||||||||||||||||||||||
| Net assets, end of period (000's) | $ | 117,913 | 131,461 | 67,730 | 100,888 | 18,901 | 25,939 | 4,560 | |||||||||||||||||||||||
| Ratios to average net assets: | |||||||||||||||||||||||||||||||
| Net expenses after expense reimbursement(3)(4) | % | 2.45 | 2.29 | 2.20 | 2.47 | 2.76 | 2.36 | 2.36 | |||||||||||||||||||||||
| Gross expenses prior to expense | |||||||||||||||||||||||||||||||
| reimbursement(3) | % | 2.38 | 2.40 | 2.53 | 2.69 | 2.76 | 2.36 | 2.36 | |||||||||||||||||||||||
| Net investment loss after expense reimbursement(3)(4) | % | (2.01 | ) | (1.80 | ) | (1.85 | ) | (2.15 | ) | (2.22 | ) | (1.66 | ) | (1.98 | ) | ||||||||||||||||
| Portfolio turnover rate | % | 25 | 115 | 345 | 399 | 182 | 188 | 201 | |||||||||||||||||||||||
(1) The Fund changed its fiscal year end to May 31.
(2) Total return is calculated assuming reinvestment of all dividends and capital gain distributions at net asset value and excluding the deduction of sales charges. Total return for less than one year is not annualized.
(3) Annualized for periods less than one year.
(4) The Investment Adviser has aggreed to limit expenses, (excluding interest, taxes, brokerage and extraordinary (expenses) subject to possible recoupment by ING Investments, LLC within three years.
* Per share data calculated using weighted average number of shares outstanding throughout the period.
See Accompanying Notes to Financial Statements
53
ING SMALLCAP OPPORTUNITIES FUND (UNAUDITED)
FINANCIAL HIGHLIGHTS
Selected data for a share of beneficial interest outstanding throughout each period.
| Class A | |||||||||||||||||||||||||||||||
| Six Months Ended | Five Months Ended | ||||||||||||||||||||||||||||||
| November 30, | Year Ended May 31, | May 31, | Year Ended December 31, | ||||||||||||||||||||||||||||
| 2004 | 2004 | 2003 | 2002 | 2001(1) | 2000 | 1999 | |||||||||||||||||||||||||
| Per Share Operating Performance: | |||||||||||||||||||||||||||||||
| Net asset value, beginning of period | $ | 22.53 | 18.16 | 24.04 | 38.78 | 47.17 | 59.35 | 29.00 | |||||||||||||||||||||||
| Income (loss) from investment operations: | |||||||||||||||||||||||||||||||
| Net investment loss | $ | (0.17 | ) | (0.37 | ) | (0.35 | ) | (0.51 | )* | (0.23 | ) | (0.54 | ) | (0.32 | ) | ||||||||||||||||
| Net realized and unrealized gain (loss) | |||||||||||||||||||||||||||||||
| on investments | $ | 1.93 | 4.74 | (5.53 | ) | (13.24 | ) | (8.16 | ) | (2.74 | ) | 38.23 | |||||||||||||||||||
| Total from investment operations | $ | 1.76 | 4.37 | (5.88 | ) | (13.75 | ) | (8.39 | ) | (3.28 | ) | 37.91 | |||||||||||||||||||
| Less distributions from: | |||||||||||||||||||||||||||||||
| Net realized gain from investments | $ | - | - | - | 0.99 | - | 8.90 | 7.56 | |||||||||||||||||||||||
| Total distributions | $ | - | - | - | 0.99 | - | 8.90 | 7.56 | |||||||||||||||||||||||
| Net asset value, end of period | $ | 24.29 | 22.53 | 18.16 | 24.04 | 38.78 | 47.17 | 59.35 | |||||||||||||||||||||||
| Total Return(2) | % | 7.81 | 24.06 | † | (24.46 | ) | (35.86 | ) | (17.79 | ) | (6.04 | ) | 146.94 | ||||||||||||||||||
| Ratios and Supplemental Data: | |||||||||||||||||||||||||||||||
| Net assets, end of period (000's) | $ | 105,312 | 105,890 | 118,570 | 183,810 | 159,641 | 177,286 | 123,377 | |||||||||||||||||||||||
| Ratios to average net assets: | |||||||||||||||||||||||||||||||
| Expenses(3) | % | 1.72 | 1.74 | 1.88 | 1.81 | 1.69 | 1.45 | 1.43 | |||||||||||||||||||||||
| Net investment loss(3) | % | (1.45 | ) | (1.52 | ) | (1.80 | ) | (1.70 | ) | (1.41 | ) | (1.05 | ) | (1.21 | ) | ||||||||||||||||
| Portfolio turnover rate | % | 34 | 60 | 357 | 427 | 104 | 134 | 223 | |||||||||||||||||||||||
| Class B | |||||||||||||||||||||||||||||||
| Six Months Ended | Five Months Ended | ||||||||||||||||||||||||||||||
| November 30, | Year Ended May 31, | May 31, | Year Ended December 31, | ||||||||||||||||||||||||||||
| 2004 | 2004 | 2003 | 2002 | 2001(1) | 2000 | 1999 | |||||||||||||||||||||||||
| Per Share Operating Performance: | |||||||||||||||||||||||||||||||
| Net asset value, beginning of period | $ | 20.78 | 16.87 | 22.48 | 36.60 | 44.64 | 57.06 | 28.26 | |||||||||||||||||||||||
| Income (loss) from investment operations: | |||||||||||||||||||||||||||||||
| Net investment loss | $ | (0.25 | ) | (0.50 | ) | (0.48 | ) | (0.68 | )* | (0.33 | ) | (0.96 | ) | (0.60 | ) | ||||||||||||||||
| Net realized and unrealized gain (loss) | |||||||||||||||||||||||||||||||
| on investments | $ | 1.80 | 4.41 | (5.13 | ) | (12.45 | ) | (7.71 | ) | (2.56 | ) | 36.96 | |||||||||||||||||||
| Total from investment operations | $ | 1.55 | 3.91 | (5.61 | ) | (13.13 | ) | (8.04 | ) | (3.52 | ) | 36.36 | |||||||||||||||||||
| Less distributions from: | |||||||||||||||||||||||||||||||
| Net realized gain from investments | $ | - | - | - | 0.99 | - | 8.90 | 7.56 | |||||||||||||||||||||||
| Total distributions | $ | - | - | - | 0.99 | - | 8.90 | 7.56 | |||||||||||||||||||||||
| Net asset value, end of period | $ | 22.33 | 20.78 | 16.87 | 22.48 | 36.60 | 44.64 | 57.06 | |||||||||||||||||||||||
| Total Return(2) | % | 7.46 | 23.18 | † | (24.96 | ) | (36.31 | ) | (18.01 | ) | (6.71 | ) | 145.24 | ||||||||||||||||||
| Ratios and Supplemental Data: | |||||||||||||||||||||||||||||||
| Net assets, end of period (000's) | $ | 60,705 | 77,751 | 85,465 | 154,899 | 206,968 | 266,348 | 264,677 | |||||||||||||||||||||||
| Ratios to average net assets: | |||||||||||||||||||||||||||||||
| Expenses(3) | % | 2.42 | 2.44 | 2.58 | 2.51 | 2.39 | 2.15 | 2.15 | |||||||||||||||||||||||
| Net investment loss(3) | % | (2.14 | ) | (2.07 | ) | (2.50 | ) | (2.40 | ) | (2.11 | ) | (1.75 | ) | (1.93 | ) | ||||||||||||||||
| Portfolio turnover rate | % | 34 | 60 | 357 | 427 | 104 | 134 | 223 | |||||||||||||||||||||||
(1) The Fund changed its fiscal year-end to May 31.
(2) Total return is calculated assuming reinvestment of all dividends and capital gain distributions at net asset value and excluding the deduction of sales charges. Total return for less than one year is not annualized.
(3) Annualized for periods less than one year.
* Per share data calculated using weighted average number of shares outstanding throughout the period.
† Total return without the effect of reimbursement by affiliate for investment transaction losses would have been 23.95% and 23.12%, for Class A and Class B, respectively.
See Accompanying Notes to Financial Statements
54
ING SMALLCAP OPPORTUNITIES FUND (UNAUDITED) (CONTINUED)
FINANCIAL HIGHLIGHTS
Selected data for a share of beneficial interest outstanding throughout each period.
| Class C | |||||||||||||||||||||||||||||||
| Six Months Ended | Five Months Ended | ||||||||||||||||||||||||||||||
| November 30, | Year Ended May 31, | May 31, | Year Ended December 31, | ||||||||||||||||||||||||||||
| 2004 | 2004 | 2003 | 2002 | 2001(1) | 2000 | 1999 | |||||||||||||||||||||||||
| Per Share Operating Performance: | |||||||||||||||||||||||||||||||
| Net asset value, beginning of period | $ | 20.73 | 16.83 | 22.44 | 36.53 | 44.54 | 56.98 | 28.24 | |||||||||||||||||||||||
| Income (loss) from investment operations: | |||||||||||||||||||||||||||||||
| Net investment loss | $ | (0.23 | ) | (0.49 | ) | (0.49 | ) | (0.67 | )* | (0.33 | ) | (0.97 | ) | (0.53 | ) | ||||||||||||||||
| Net realized and unrealized gain (loss) | |||||||||||||||||||||||||||||||
| on investments | $ | 1.78 | 4.39 | (5.12 | ) | (12.43 | ) | (7.68 | ) | (2.57 | ) | 36.83 | |||||||||||||||||||
| Total from investment operations | $ | 1.55 | 3.90 | (5.61 | ) | (13.10 | ) | (8.01 | ) | (3.54 | ) | 36.30 | |||||||||||||||||||
| Less distributions from: | |||||||||||||||||||||||||||||||
| Net realized gain from investments | $ | - | - | - | 0.99 | - | 8.90 | 7.56 | |||||||||||||||||||||||
| Total distributions | $ | - | - | - | 0.99 | - | 8.90 | 7.56 | |||||||||||||||||||||||
| Net asset value, end of period | $ | 22.28 | 20.73 | 16.83 | 22.44 | 36.53 | 44.54 | 56.98 | |||||||||||||||||||||||
| Total Return(2) | % | 7.48 | 23.17 | † | (25.00 | ) | (36.30 | ) | (17.98 | ) | (6.76 | ) | 145.12 | ||||||||||||||||||
| Ratios and Supplemental Data: | |||||||||||||||||||||||||||||||
| Net assets, end of period (000's) | $ | 53,120 | 57,140 | 63,406 | 119,498 | 78,658 | 104,094 | 72,581 | |||||||||||||||||||||||
| Ratios to average net assets: | |||||||||||||||||||||||||||||||
| Net expenses(3) | % | 2.42 | 2.44 | 2.58 | 2.51 | 2.39 | 2.15 | 2.18 | |||||||||||||||||||||||
| Net investment loss(3) | % | (2.15 | ) | (2.06 | ) | (2.50 | ) | (2.40 | ) | (2.11 | ) | (1.75 | ) | (1.96 | ) | ||||||||||||||||
| Portfolio turnover rate | % | 34 | 60 | 357 | 427 | 104 | 134 | 223 | |||||||||||||||||||||||
(1) The Fund changed its fiscal year-end to May 31.
(2) Total return is calculated assuming reinvestment of all dividends and capital gain distributions at net asset value and excluding the deduction of sales charges. Total return for less than one year is not annualized.
(3) Annualized for periods less than one year.
* Per share data calculated using weighted average number of shares outstanding throughout the period.
† Total return without the effect of reimbursement by affiliate for investment transaction losses would have been 23.11% for Class C.
See Accompanying Notes to Financial Statements
55
ING FINANCIAL SERVICES FUND (UNAUDITED)
FINANCIAL HIGHLIGHTS
Selected data for a share of beneficial interest outstanding throughout each period.
| Class A | |||||||||||||||||||||||||||||||
| Six Months Ended | Eleven Months Ended | ||||||||||||||||||||||||||||||
| November 30, | Year Ended May 31, | May 31, | Year Ended June 30, | ||||||||||||||||||||||||||||
| 2004 | 2004 | 2003 | 2002 | 2001(1) | 2000 | 1999 | |||||||||||||||||||||||||
| Per Share Operating Performance: | |||||||||||||||||||||||||||||||
| Net asset value, beginning of period | $ | 22.03 | 19.24 | �� | 22.11 | 23.36 | 16.42 | 24.38 | 27.52 | ||||||||||||||||||||||
| Income (loss) from investment operations: | |||||||||||||||||||||||||||||||
| Net investment income | $ | 0.07 | 0.09 | 0.12 | 0.14 | 0.31 | 0.32 | 0.29 | |||||||||||||||||||||||
| Net realized and unrealized gain (loss) | |||||||||||||||||||||||||||||||
| on investments | $ | 1.40 | 3.60 | (1.78 | ) | 1.29 | 7.11 | (5.30 | ) | (2.70 | ) | ||||||||||||||||||||
| Total from investment operations | $ | 1.47 | 3.69 | (1.66 | ) | 1.43 | 7.42 | (4.98 | ) | (2.41 | ) | ||||||||||||||||||||
| Less distributions from: | |||||||||||||||||||||||||||||||
| Net investment income | $ | 0.08 | 0.08 | 0.09 | 0.33 | 0.33 | 0.25 | 0.18 | |||||||||||||||||||||||
| Net realized gain from investments | $ | 1.48 | 0.82 | 1.12 | 2.35 | 0.15 | 2.73 | 0.55 | |||||||||||||||||||||||
| Total distributions | $ | 1.56 | 0.90 | 1.21 | 2.68 | 0.48 | 2.98 | 0.73 | |||||||||||||||||||||||
| Net asset value, end of period | $ | 21.94 | 22.03 | 19.24 | 22.11 | 23.36 | 16.42 | 24.38 | |||||||||||||||||||||||
| Total Return(2) | % | 6.70 | 19.57 | (6.98 | ) | 7.05 | 46.01 | (22.44 | ) | (8.61 | ) | ||||||||||||||||||||
| Ratios and Supplemental Data: | |||||||||||||||||||||||||||||||
| Net assets, end of period (millions) | $ | 193 | 193 | 182 | 231 | 252 | 210 | 403 | |||||||||||||||||||||||
| Ratios to average net assets: | |||||||||||||||||||||||||||||||
| Expenses(3) | % | 1.17 | 1.41 | 1.52 | 1.48 | 1.42 | 1.41 | 1.39 | |||||||||||||||||||||||
| Net investment income(3) | % | 0.62 | 0.40 | 0.54 | 0.54 | 1.48 | 1.46 | 1.09 | |||||||||||||||||||||||
| Portfolio turnover rate | % | 12 | 35 | 19 | 43 | 39 | 10 | 29 | |||||||||||||||||||||||
| Class B | |||||||||||||||||||||||||||||||
| Six Months Ended | Eleven Months Ended | ||||||||||||||||||||||||||||||
| November 30, | Year Ended May 31, | May 31, | Year Ended June 30, | ||||||||||||||||||||||||||||
| 2004 | 2004 | 2003 | 2002 | 2001(1) | 2000 | 1999 | |||||||||||||||||||||||||
| Per Share Operating Performance: | |||||||||||||||||||||||||||||||
| Net asset value, beginning of period | $ | 21.79 | 19.12 | 22.03 | 23.28 | 16.35 | 24.21 | 27.40 | |||||||||||||||||||||||
| Income (loss) from investment operations: | |||||||||||||||||||||||||||||||
| Net investment income (loss) | $ | (0.01 | ) | (0.08 | ) | (0.07 | ) | (0.04 | ) | 0.15 | 0.22 | 0.08 | |||||||||||||||||||
| Net realized and unrealized gain (loss) | |||||||||||||||||||||||||||||||
| on investments | $ | 1.39 | 3.57 | (1.72 | ) | 1.29 | 7.12 | (5.32 | ) | (2.66 | ) | ||||||||||||||||||||
| Total from investment operations | $ | 1.38 | 3.49 | (1.79 | ) | 1.25 | 7.27 | (5.10 | ) | (2.58 | ) | ||||||||||||||||||||
| Less distributions from: | |||||||||||||||||||||||||||||||
| Net investment income | $ | - | - | - | 0.15 | 0.19 | 0.03 | 0.06 | |||||||||||||||||||||||
| Net realized gain from investments | $ | 1.48 | 0.82 | 1.12 | 2.35 | 0.15 | 2.73 | 0.55 | |||||||||||||||||||||||
| Total distributions | $ | 1.48 | 0.82 | 1.12 | 2.50 | 0.34 | 2.76 | 0.61 | |||||||||||||||||||||||
| Net asset value, end of period | $ | 21.69 | 21.79 | 19.12 | 22.03 | 23.28 | 16.35 | 24.21 | |||||||||||||||||||||||
| Total Return(2) | % | 6.37 | 18.60 | (7.66 | ) | 6.22 | 45.01 | (23.00 | ) | (9.31 | ) | ||||||||||||||||||||
| Ratios and Supplemental Data: | |||||||||||||||||||||||||||||||
| Net assets, end of period (millions) | $ | 121 | 127 | 127 | 171 | 183 | 148 | 343 | |||||||||||||||||||||||
| Ratios to average net assets: | |||||||||||||||||||||||||||||||
| Expenses(3) | % | 1.92 | 2.16 | 2.27 | 2.23 | 2.17 | 2.16 | 2.14 | |||||||||||||||||||||||
| Net investment income (loss)(3) | % | (0.13 | ) | (0.36 | ) | (0.21 | ) | (0.21 | ) | 0.73 | 0.71 | 0.34 | |||||||||||||||||||
| Portfolio turnover rate | % | 12 | 35 | 19 | 43 | 39 | 10 | 29 | |||||||||||||||||||||||
(1) The Fund changed its fiscal year end to May 31.
(2) Total return is calculated assuming reinvestment of all dividends and capital gain distributions at net asset value and excluding the deduction of sales charges. Total return for less than one year is not annualized.
(3) Annualized for periods less than one year.
See Accompanying Notes to Financial Statements
56
ING FINANCIAL SERVICES FUND (UNAUDITED) (CONTINUED)
FINANCIAL HIGHLIGHTS
Selected data for a share of beneficial interest outstanding throughout each period.
| Class C | Class O | ||||||||||
| August 25, 2004(1) to November 30, 2004 | September 15, 2004(1) to November 30, 2004 | ||||||||||
| Per Share Operating Performance: | |||||||||||
| Net asset value, beginning of period | $ | 21.78 | 22.67 | ||||||||
| Income (loss) from investment operations: | |||||||||||
| Net investment loss | $ | (0.09 | ) | (0.10 | ) | ||||||
| Net realized and unrealized gain on investments | $ | 1.48 | 0.94 | ||||||||
| Total from investment operations | $ | 1.39 | 0.84 | ||||||||
| Less distributions from: | |||||||||||
| Net investment income | $ | 0.10 | 0.13 | ||||||||
| Net realized gain from investments | $ | 1.48 | 1.48 | ||||||||
| Total distributions | $ | 1.58 | 1.61 | ||||||||
| Net asset value, end of period | $ | 21.59 | 21.90 | ||||||||
| Total Return(2) | % | 5.53 | 3.72 | ||||||||
| Ratios and Supplemental Data: | |||||||||||
| Net assets, end of period (000's) | $ | 3 | 829 | ||||||||
| Ratios to average net assets: | |||||||||||
| Expenses(3)(4) | % | 1.92 | 1.13 | ||||||||
| Net investment income after expense reimbursement(3)(4) | % | 0.00 | * | 0.81 | |||||||
| Portfolio turnover rate | % | 12 | 12 | ||||||||
(1) Commencement of operations.
(2) Total return is calculated assuming reinvestment of all dividends and capital gain distributions at net asset value and excluding the deduction of sales charges. Total returns for periods less than one year are not annualized.
(3) Annualized for periods less than one year.
(4) The Investment Manager has agreed to limit expenses, (excluding interest, taxes, brokerage and extraordinary expenses), subject to possible reimbursement to ING Investments, LLC within three years.
* Amount represents less than $0.01 per share or 0.01%.
See Accompanying Notes to Financial Statements
57
ING LARGECAP VALUE FUND (UNAUDITED)
FINANCIAL HIGHLIGHTS
Selected data for a share of beneficial interest outstanding throughout each period.
| Class A | Class B | ||||||||||||||||||
| Six Months Ended November 30, 2004 | February 2, 2004(1) to May 31, 2004 | Six Months Ended November 30, 2004 | February 2, 2004(1) to May 31, 2004 | ||||||||||||||||
| Per Share Operating Performance: | |||||||||||||||||||
| Net asset value, beginning of period | $ | 9.65 | 10.00 | 9.63 | 10.00 | ||||||||||||||
| Income (loss) from investment operations: | |||||||||||||||||||
| Net investment income (loss) | $ | - | 0.01 | (0.02 | ) | (0.00 | )* | ||||||||||||
| Net realized and unrealized income (loss) | |||||||||||||||||||
| on investments | $ | 0.68 | (0.36 | ) | 0.65 | (0.37 | ) | ||||||||||||
| Total from investment operations | $ | 0.68 | (0.35 | ) | 0.63 | (0.37 | ) | ||||||||||||
| Less distributions from: | |||||||||||||||||||
| Net investment income | $ | 0.06 | - | 0.02 | - | ||||||||||||||
| Net realized gains on investments | $ | 0.08 | - | 0.08 | - | ||||||||||||||
| Total distributions | $ | 0.14 | - | 0.10 | - | ||||||||||||||
| Net asset value, end of period | $ | 10.19 | 9.65 | 10.16 | 9.63 | ||||||||||||||
| Total Return(2) | % | 7.05 | (3.50 | ) | 6.57 | (3.70 | ) | ||||||||||||
| Ratios and Supplemental Data: | |||||||||||||||||||
| Net assets, end of period (000's) | $ | 14,423 | 4,729 | 6,790 | 2,601 | ||||||||||||||
| Ratios to average net assets: | |||||||||||||||||||
| Net expenses after expense reimbursement(3)(4) | % | 1.45 | 1.35 | 2.20 | 2.10 | ||||||||||||||
| Gross expenses prior to expense | |||||||||||||||||||
| reimbursement(4) | % | 2.32 | 4.05 | 3.07 | 4.80 | ||||||||||||||
| Net investment income (loss) after expense reimbursement(3)(4) | % | 0.80 | 0.72 | 0.05 | (0.07) | ||||||||||||||
| Portfolio turnover rate | % | 21 | 4 | 21 | 4 | ||||||||||||||
| Class C | |||||||||||
| Six Months Ended November 30, 2004 | February 3, 2004(1) to May 31, 2004 | ||||||||||
| Per Share Operating Performance: | |||||||||||
| Net asset value, beginning of period | $ | 9.63 | 9.96 | ||||||||
| Income (loss) from investment operations: | |||||||||||
| Net investment loss | $ | (0.02 | ) | (0.00 | )* | ||||||
| Net realized and unrealized income (loss) | |||||||||||
| on investments | $ | 0.65 | (0.33 | ) | |||||||
| Total from investment operations | $ | 0.63 | (0.33 | ) | |||||||
| Less distributions from: | |||||||||||
| Net investment income | $ | 0.02 | - | ||||||||
| Net realized gains on investments | $ | 0.08 | - | ||||||||
| Total distributions | $ | 0.10 | - | ||||||||
| Net asset value, end of period | $ | 10.16 | 9.63 | ||||||||
| Total Return(2) | % | 6.55 | (3.31 | ) | |||||||
| Ratios and Supplemental Data: | |||||||||||
| Net assets, end of period (000's) | $ | 8,808 | 3,793 | ||||||||
| Ratios to average net assets: | |||||||||||
| Net expenses after expense reimbursement(3)(4) | % | 2.20 | 2.11 | ||||||||
| Gross expenses prior to expense | |||||||||||
| reimbursement(4) | % | 3.07 | 4.81 | ||||||||
| Net investment income (loss) after expense reimbursement(3)(4) | % | 0.05 | (0.03 | ) | |||||||
| Portfolio turnover rate | % | 21 | 4 | ||||||||
(1) Commencement of operations.
(2) Total return is calculated assuming reinvestment of all dividends and capital gain distributions at net asset value and excluding the deduction of sales charges. Total return for less than one year is not annualized.
(3) Annualized for periods less than one year.
(4) The Investment Adviser has agreed to limit expenses (excluding interest, taxes, brokerage and extraordinary expenses) subject to possible recoupment by ING Investments, LLC within three years.
* Amount is less than $0.01 per share.
See Accompanying Notes to Financial Statements
58
ING MAGNACAP FUND (UNAUDITED)
FINANCIAL HIGHLIGHTS
Selected data for a share of beneficial interest outstanding throughout each period.
| Class A | |||||||||||||||||||||||||||||||
| Six Months Ended | Eleven Months Ended | ||||||||||||||||||||||||||||||
| November 30, | Year Ended May 31, | May 31, | Year Ended June 30, | ||||||||||||||||||||||||||||
| 2004 | 2004 | 2003 | 2002 | 2001(1) | 2000 | 1999 | |||||||||||||||||||||||||
| Per Share Operating Performance: | |||||||||||||||||||||||||||||||
| Net asset value, beginning of period | $ | 10.28 | 8.82 | 10.11 | 13.54 | 15.84 | 17.69 | 17.07 | |||||||||||||||||||||||
| Income (loss) from investment operations: | |||||||||||||||||||||||||||||||
| Net investment income | $ | 0.15 | 0.09 | 0.06 | 0.07 | 0.05 | 0.07 | 0.07 | |||||||||||||||||||||||
| Net realized and unrealized gain (loss) | |||||||||||||||||||||||||||||||
| on investments | $ | 0.66 | 1.46 | (1.32 | ) | (1.53 | ) | (0.38 | ) | (0.08 | ) | 2.37 | |||||||||||||||||||
| Total from investment operations | $ | 0.81 | 1.55 | (1.26 | ) | (1.46 | ) | (0.33 | ) | (0.01 | ) | 2.44 | |||||||||||||||||||
| Less distributions from: | |||||||||||||||||||||||||||||||
| Net investment income | $ | 0.20 | 0.09 | 0.03 | 0.07 | 0.09 | 0.05 | 0.04 | |||||||||||||||||||||||
| Net realized gain from investments | $ | - | - | - | 1.90 | 1.88 | 1.79 | 1.78 | |||||||||||||||||||||||
| Total distributions | $ | 0.20 | 0.09 | 0.03 | 1.97 | 1.97 | 1.84 | 1.82 | |||||||||||||||||||||||
| Net asset value, end of period | $ | 10.89 | 10.28 | 8.82 | 10.11 | 13.54 | 15.84 | 17.69 | |||||||||||||||||||||||
| Total Return(2) | % | 7.19 | 17.64 | (12.46 | ) | (10.96 | ) | (2.77 | ) | (0.36 | ) | 15.93 | |||||||||||||||||||
| Ratios and Supplemental Data: | |||||||||||||||||||||||||||||||
| Net assets, end of period (000's) | $ | 315,708 | 311,087 | 156,902 | 211,602 | 277,722 | 303,864 | 368,508 | |||||||||||||||||||||||
| Ratios to average net assets: | |||||||||||||||||||||||||||||||
| Expenses(3) | % | 1.16 | 1.35 | 1.45 | 1.34 | 1.31 | 1.29 | 1.35 | |||||||||||||||||||||||
| Net investment income(3) | % | 1.27 | 1.10 | 0.73 | 0.59 | 0.33 | 0.41 | 0.41 | |||||||||||||||||||||||
| Portfolio turnover rate | % | 10 | 28 | 110 | 75 | 92 | 26 | 48 | |||||||||||||||||||||||
| Class B | |||||||||||||||||||||||||||||||
| Six Months Ended | Eleven Months Ended | ||||||||||||||||||||||||||||||
| November 30, | Year Ended May 31, | May 31, | Year Ended June 30, | ||||||||||||||||||||||||||||
| 2004 | 2004 | 2003 | 2002 | 2001(1) | 2000 | 1999 | |||||||||||||||||||||||||
| Per Share Operating Performance: | |||||||||||||||||||||||||||||||
| Net asset value, beginning of period | $ | 9.91 | 8.48 | 9.75 | 13.14 | 15.44 | 17.36 | 16.86 | |||||||||||||||||||||||
| Income (loss) from investment operations: | |||||||||||||||||||||||||||||||
| Net investment income (loss) | $ | 0.04 | 0.04 | 0.00 | * | (0.02 | ) | (0.01 | ) | (0.05 | ) | (0.04 | ) | ||||||||||||||||||
| Net realized and unrealized gain (loss) | |||||||||||||||||||||||||||||||
| on investments | $ | 0.63 | 1.39 | (1.27 | ) | (1.47 | ) | (0.41 | ) | (0.08 | ) | 2.32 | |||||||||||||||||||
| Total from investment operations | $ | 0.67 | 1.43 | (1.27 | ) | (1.49 | ) | (0.42 | ) | (0.13 | ) | 2.28 | |||||||||||||||||||
| Less distributions from: | |||||||||||||||||||||||||||||||
| Net investment income | $ | 0.02 | - | - | - | - | - | - | |||||||||||||||||||||||
| Net realized gain from investments | $ | - | - | - | 1.90 | 1.88 | 1.79 | 1.78 | |||||||||||||||||||||||
| Total distributions | $ | 0.02 | - | - | 1.90 | 1.88 | 1.79 | 1.78 | |||||||||||||||||||||||
| Net asset value, end of period | $ | 10.56 | 9.91 | 8.48 | 9.75 | 13.14 | 15.44 | 17.36 | |||||||||||||||||||||||
| Total Return(2) | % | 6.76 | 16.86 | (13.03 | ) | (11.61 | ) | (3.40 | ) | (1.11 | ) | 15.12 | |||||||||||||||||||
| Ratios and Supplemental Data: | |||||||||||||||||||||||||||||||
| Net assets, end of period (000's) | $ | 46,214 | 52,812 | 50,677 | 79,685 | 112,286 | 87,167 | 116,227 | |||||||||||||||||||||||
| Ratios to average net assets: | |||||||||||||||||||||||||||||||
| Expenses(3) | % | 1.86 | 2.05 | 2.15 | 2.04 | 2.01 | 1.99 | 2.05 | |||||||||||||||||||||||
| Net investment income (loss)(3) | % | 0.56 | 0.35 | 0.03 | (0.11 | ) | (0.37 | ) | (0.29 | ) | (0.29 | ) | |||||||||||||||||||
| Portfolio turnover rate | % | 10 | 28 | 110 | 75 | 92 | 26 | 48 | |||||||||||||||||||||||
(1) The Fund changed its fiscal year end to May 31.
(2) Total return is calculated assuming reinvestment of all dividends and capital gain distributions at net asset value and
excluding the deduction of sales charges. Total return for less than one year is not annualized.
(3) Annualized for periods less than one year.
* Amount represents less than $0.01 per share.
See Accompanying Notes to Financial Statements
59
ING MAGNACAP FUND (UNAUDITED) (CONTINUED)
FINANCIAL HIGHLIGHTS
Selected data for a share of beneficial interest outstanding throughout each period.
| Class C | |||||||||||||||||||||||||||||||
| Six Months Ended November 30, | Year Ended May 31, | Eleven Months Ended May 31, | Year Ended June 30, | June 1, 1999(2) to June 30, | |||||||||||||||||||||||||||
| 2004 | 2004 | 2003 | 2002 | 2001(1) | 2000 | 1999 | |||||||||||||||||||||||||
| Per Share Operating Performance: | |||||||||||||||||||||||||||||||
| Net asset value, beginning of period | $ | 9.91 | 8.48 | 9.76 | 13.14 | 15.44 | 17.37 | 16.69 | |||||||||||||||||||||||
| Income (loss) from investment operations: | |||||||||||||||||||||||||||||||
| Net investment income (loss) | $ | 0.04 | 0.03 | 0.00 | * | (0.01 | ) | (0.01 | ) | (0.10 | ) | - | |||||||||||||||||||
| Net realized and unrealized gain (loss) | |||||||||||||||||||||||||||||||
| on investments | $ | 0.64 | 1.40 | (1.28 | ) | (1.47 | ) | (0.41 | ) | (0.04 | ) | 0.68 | |||||||||||||||||||
| Total from investment operations | $ | 0.68 | 1.43 | (1.28 | ) | (1.48 | ) | (0.42 | ) | (0.14 | ) | 0.68 | |||||||||||||||||||
| Less distributions from: | |||||||||||||||||||||||||||||||
| Net investment income | $ | 0.02 | - | - | - | - | - | - | |||||||||||||||||||||||
| Net realized gain from investments | $ | - | - | - | 1.90 | 1.88 | 1.79 | - | |||||||||||||||||||||||
| Total distributions | �� | $ | 0.02 | - | - | 1.90 | 1.88 | 1.79 | - | ||||||||||||||||||||||
| Net asset value, end of period | $ | 10.57 | 9.91 | 8.48 | 9.76 | 13.14 | 15.44 | 17.37 | |||||||||||||||||||||||
| Total Return(3) | % | 6.87 | 16.86 | (13.11 | ) | (11.53 | ) | (3.41 | ) | (1.17 | ) | 4.07 | |||||||||||||||||||
| Ratios and Supplemental Data: | |||||||||||||||||||||||||||||||
| Net assets, end of period (000's) | $ | 9,970 | 11,502 | 8,291 | 9,693 | 10,887 | 3,660 | 601 | |||||||||||||||||||||||
| Ratios to average net assets: | |||||||||||||||||||||||||||||||
| Expenses(4) | % | 1.86 | 2.05 | 2.15 | 2.04 | 2.01 | 1.99 | 1.12 | |||||||||||||||||||||||
| Net investment income (loss)(4) | % | 0.56 | 0.36 | 0.03 | (0.11 | ) | (0.37 | ) | (0.29 | ) | 0.42 | ||||||||||||||||||||
| Portfolio turnover rate | % | 10 | 28 | 110 | 75 | 92 | 26 | 48 | |||||||||||||||||||||||
| Class M | |||||||||||||||||||||||||||||||
| Six Months Ended | Eleven Months Ended | ||||||||||||||||||||||||||||||
| November 30, | Year Ended May 31, | May 31, | Year Ended June 30, | ||||||||||||||||||||||||||||
| 2004 | 2004 | 2003 | 2002 | 2001(1) | 2000 | 1999 | |||||||||||||||||||||||||
| Per Share Operating Performance: | |||||||||||||||||||||||||||||||
| Net asset value, beginning of period | $ | 10.16 | 8.68 | 9.96 | 13.36 | 15.64 | 17.51 | 16.95 | |||||||||||||||||||||||
| Income (loss) from investment operations: | |||||||||||||||||||||||||||||||
| Net investment income (loss) | $ | 0.05 | 0.08 | 0.03 | 0.02 | - | (0.01 | ) | (0.01 | ) | |||||||||||||||||||||
| Net realized and unrealized gain (loss) | |||||||||||||||||||||||||||||||
| on investments | $ | 0.66 | 1.41 | (1.31 | ) | (1.50 | ) | (0.39 | ) | (0.06 | ) | 2.35 | |||||||||||||||||||
| Total from investment operations | $ | 0.71 | 1.49 | (1.28 | ) | (1.48 | ) | (0.39 | ) | (0.07 | ) | 2.34 | |||||||||||||||||||
| Less distributions from: | |||||||||||||||||||||||||||||||
| Net investment income | $ | 0.04 | 0.01 | - | 0.02 | 0.01 | 0.01 | - | |||||||||||||||||||||||
| Net realized gain from investments | $ | - | - | - | 1.90 | 1.88 | 1.79 | 1.78 | |||||||||||||||||||||||
| Total distributions | $ | 0.04 | 0.01 | - | 1.92 | 1.89 | 1.80 | 1.78 | |||||||||||||||||||||||
| Net asset value, end of period | $ | 10.83 | 10.16 | 8.68 | 9.96 | 13.36 | 15.64 | 17.51 | |||||||||||||||||||||||
| Total Return(3) | % | 6.96 | 17.13 | (12.85 | ) | (11.30 | ) | (3.21 | ) | (0.71 | ) | 15.41 | |||||||||||||||||||
| Ratios and Supplemental Data: | |||||||||||||||||||||||||||||||
| Net assets, end of period (000's) | $ | 4,798 | 5,270 | 7,445 | 12,074 | 17,440 | 13,050 | 16,351 | |||||||||||||||||||||||
| Ratios to average net assets: | |||||||||||||||||||||||||||||||
| Expenses(4) | % | 1.61 | 1.80 | 1.90 | 1.79 | 1.76 | 1.74 | 1.80 | |||||||||||||||||||||||
| Net investment income (loss)(4) | % | 0.82 | 0.55 | 0.28 | 0.14 | (0.12 | ) | (0.04 | ) | (0.04 | ) | ||||||||||||||||||||
| Portfolio turnover rate | % | 10 | 28 | 110 | 75 | 92 | 26 | 48 | |||||||||||||||||||||||
(1) The Fund changed its fiscal year end to May 31.
(2) Commencement of operations.
(3) Total return is calculated assuming reinvestment of all dividends and capital gain distributions at net asset value and
excluding the deduction of sales charges. Total return for less than one year is not annualized.
(4) Annualized for periods less than one year.
* Amount represents less than $0.01 per share.
See Accompanying Notes to Financial Statements
60
ING MIDCAP VALUE FUND (UNAUDITED)
FINANCIAL HIGHLIGHTS
Selected data for a share of beneficial interest outstanding throughout each period.
| Class A | |||||||||||||||||||
| Six Months Ended November 30, | Year Ended May 31, | February 1, 2002(1) to May 31 | |||||||||||||||||
| 2004 | 2004 | 2003 | 2002 | ||||||||||||||||
| Per Share Operating Performance: | |||||||||||||||||||
| Net asset value, beginning of period | $ | 11.53 | 8.36 | 10.28 | 10.00 | ||||||||||||||
| Income (loss) from investment operations: | |||||||||||||||||||
| Net investment income (loss) | $ | (0.01 | ) | (0.02 | ) | 0.00 | * | 0.00 | * | ||||||||||
| Net realized and unrealized gain (loss) on investments | $ | 0.67 | 3.19 | (1.77 | ) | 0.28 | |||||||||||||
| Total from investment operations | $ | 0.66 | 3.17 | (1.77 | ) | 0.28 | |||||||||||||
| Less distributions from: | |||||||||||||||||||
| Net investment income | $ | - | - | 0.04 | - | ||||||||||||||
| Net realized gain from investments | $ | 0.88 | - | 0.11 | - | ||||||||||||||
| Total distributions | $ | 0.88 | - | 0.15 | - | ||||||||||||||
| Net asset value, end of period | $ | 11.31 | 11.53 | 8.36 | 10.28 | ||||||||||||||
| Total Return(2) | % | 5.85 | 37.92 | (16.94 | ) | 2.80 | |||||||||||||
| Ratios and Supplemental Data: | |||||||||||||||||||
| Net assets, end of period (000's) | $ | 76,289 | 58,631 | 15,026 | 25,325 | ||||||||||||||
| Ratios to average net assets: | |||||||||||||||||||
| Net expenses after expense reimbursement/recoupment(3)(4) | % | 1.68 | 1.75 | 1.75 | 1.61 | ||||||||||||||
| Gross expenses prior to expense reimbursement(3) | % | 1.47 | 1.62 | 2.17 | 3.05 | ||||||||||||||
| Net investment income (loss) after expense reimbursement/recoupment(3)(4) | % | (0.25 | ) | (0.18 | ) | (0.10 | ) | 0.04 | |||||||||||
| Portfolio turnover rate | % | 42 | 70 | 72 | 13 | ||||||||||||||
| Class B | |||||||||||||||||||
| Six Months Ended November 30, | Year Ended May 31, | February 4, 2002(1) to May 31, | |||||||||||||||||
| 2004 | 2004 | 2003 | 2002 | ||||||||||||||||
| Per Share Operating Performance: | |||||||||||||||||||
| Net asset value, beginning of period | $ | 11.41 | 8.34 | 10.27 | 9.87 | ||||||||||||||
| Income (loss) from investment operations: | |||||||||||||||||||
| Net investment (loss) | $ | (0.05 | ) | (0.07 | ) | (0.06 | ) | (0.01 | ) | ||||||||||
| Net realized and unrealized gain (loss) on investments | $ | 0.66 | 3.14 | (1.75 | ) | 0.41 | |||||||||||||
| Total from investment operations | $ | 0.61 | 3.07 | (1.81 | ) | 0.40 | |||||||||||||
| Less distributions from: | |||||||||||||||||||
| Net investment income | $ | - | - | 0.01 | - | ||||||||||||||
| Net realized gain from investments | $ | 0.88 | - | 0.11 | - | ||||||||||||||
| Total distributions | $ | 0.88 | - | 0.12 | - | ||||||||||||||
| Net asset value, end of period | $ | 11.14 | 11.41 | 8.34 | 10.27 | ||||||||||||||
| Total Return(2) | % | 5.47 | 36.81 | (17.40 | ) | 4.05 | |||||||||||||
| Ratios and Supplemental Data: | |||||||||||||||||||
| Net assets, end of period (000's) | $ | 43,157 | 34,856 | 12,205 | 11,656 | ||||||||||||||
| Ratios to average net assets: | |||||||||||||||||||
| Net expenses after expense reimbursement/recoupment(3)(4) | % | 2.43 | 2.50 | 2.50 | 2.36 | ||||||||||||||
| Gross expenses prior to expense reimbursement(3) | % | 2.22 | 2.37 | 2.92 | 3.80 | ||||||||||||||
| Net investment (loss) after expense reimbursement/recoupment(3)(4) | % | (0.98 | ) | (0.95 | ) | (0.82 | ) | (0.71 | ) | ||||||||||
| Portfolio turnover rate | % | 42 | 70 | 72 | 13 | ||||||||||||||
(1) Commencement of operations.
(2) Total return is calculated assuming reinvestment of all dividends and capital gain distributions at net asset value and excluding the deduction of sales charges. Total return for less than one year is not annualized.
(3) Annualized for periods less than one year.
(4) The Investment Adviser has agreed to limit expenses, (excluding interest, taxes, brokerage and extraordinary expenses) subject to possible recoupment by ING Investments, LLC within three years.
* Amount represents less than $0.01 per share.
See Accompanying Notes to Financial Statements
61
ING MIDCAP VALUE FUND (UNAUDITED) (CONTINUED)
FINANCIAL HIGHLIGHTS
Selected data for a share of beneficial interest outstanding throughout each period.
| Class C | |||||||||||||||||||
| Six Months Ended November 30, | Year Ended May 31, | February 4, 2002(1) to May 31, | |||||||||||||||||
| 2004 | 2004 | 2003 | 2002 | ||||||||||||||||
| Per Share Operating Performance: | |||||||||||||||||||
| Net asset value, beginning of period | $ | 11.40 | 8.34 | 10.26 | 9.87 | ||||||||||||||
| Income (loss) from investment operations: | |||||||||||||||||||
| Net investment loss | $ | (0.04 | ) | (0.07 | ) | (0.05 | ) | (0.01 | ) | ||||||||||
| Net realized and unrealized gain (loss) on investments | $ | 0.65 | 3.13 | (1.75 | ) | 0.40 | |||||||||||||
| Total from investment operations | $ | 0.61 | 3.06 | (1.80 | ) | 0.39 | |||||||||||||
| Less distributions from: | |||||||||||||||||||
| Net investment income | $ | - | - | 0.01 | - | ||||||||||||||
| Net realized gain from investments | $ | 0.88 | - | 0.11 | - | ||||||||||||||
| Total distributions | $ | 0.88 | - | 0.12 | - | ||||||||||||||
| Net asset value, end of period | $ | 11.13 | 11.40 | 8.34 | 10.26 | ||||||||||||||
| Total Return(2) | % | 5.47 | 36.69 | (17.32 | ) | 3.95 | |||||||||||||
| Ratios and Supplemental Data: | |||||||||||||||||||
| Net assets, end of period (000's) | $ | 46,160 | 31,982 | 12,034 | 9,731 | ||||||||||||||
| Ratios to average net assets: | |||||||||||||||||||
| Net expenses after expense reimbursement/recoupment(3)(4) | % | 2.43 | 2.50 | 2.50 | 2.36 | ||||||||||||||
| Gross expenses prior to expense reimbursement(3) | % | 2.22 | 2.37 | 2.92 | 3.80 | ||||||||||||||
| Net investment loss after expense reimbursement/recoupment(3)(4) | % | (0.97 | ) | (0.94 | ) | (0.81 | ) | (0.71 | ) | ||||||||||
| Portfolio turnover rate | % | 42 | 70 | 72 | 13 | ||||||||||||||
(1) Commencement of operations.
(2) Total return is calculated assuming reinvestment of all dividends and capital gain distributions at net asset value and excluding the deduction of sales charges. Total return for less than one year is not annualized.
(3) Annualized for periods less than one year.
(4) The Investment Adviser has agreed to limit expenses, (excluding interest, taxes, brokerage and extraordinary expenses) subject to possible recoupment by ING Investments, LLC within three years.
See Accompanying Notes to Financial Statements
62
ING SMALLCAP VALUE FUND (UNAUDITED)
FINANCIAL HIGHLIGHTS
Selected data for a share of beneficial interest outstanding throughout each period.
| Class A | |||||||||||||||||||
| Six Months Ended November 30, | Year Ended May 31, | February 1, 2002(1) to May 31, | |||||||||||||||||
| 2004 | 2004 | 2003 | 2002 | ||||||||||||||||
| Per Share Operating Performance: | |||||||||||||||||||
| Net asset value, beginning of period | $ | 13.53 | 9.44 | 10.62 | 10.00 | ||||||||||||||
| Income (loss) from investment operations: | |||||||||||||||||||
| Net investment loss | $ | (0.01 | ) | (0.05 | ) | (0.05 | ) | (0.01 | ) | ||||||||||
| Net realized and unrealized gain (loss) on investments | $ | 0.88 | 4.88 | (1.00 | ) | 0.63 | |||||||||||||
| Total from investment operations | $ | 0.87 | 4.83 | (1.05 | ) | 0.62 | |||||||||||||
| Less distributions from: | |||||||||||||||||||
| Net investment income | $ | - | - | 0.04 | - | ||||||||||||||
| Net realized gain from investments | $ | 0.89 | 0.74 | 0.09 | - | ||||||||||||||
| Total distributions | $ | 0.89 | 0.74 | 0.13 | - | ||||||||||||||
| Net asset value, end of period | $ | 13.51 | 13.53 | 9.44 | 10.62 | ||||||||||||||
| Total Return(2) | % | 6.56 | 52.83 | (9.83 | ) | 6.20 | |||||||||||||
| Ratios and Supplemental Data: | |||||||||||||||||||
| Net assets, end of period (000's) | $ | 88,103 | 45,609 | 12,280 | 18,435 | ||||||||||||||
| Ratios to average net assets: | |||||||||||||||||||
| Net expenses after expense reimbursement/recoupment(3)(4) | % | 1.72 | 1.75 | 1.75 | 1.62 | ||||||||||||||
| Gross expenses prior to expense reimbursement(3) | % | 1.47 | 1.66 | 2.17 | 3.65 | ||||||||||||||
| Net investment loss after expense reimbursement/recoupment(3)(4) | % | (0.29 | ) | (0.67 | ) | (0.54 | ) | (0.39 | ) | ||||||||||
| Portfolio turnover rate | % | 16 | 57 | 54 | 12 | ||||||||||||||
| Class B | |||||||||||||||||||
| Six Months Ended November 30, | Year Ended May 31, | February 4, 2002(1) to May 31, | |||||||||||||||||
| 2004 | 2004 | 2003 | 2002 | ||||||||||||||||
| Per Share Operating Performance: | |||||||||||||||||||
| Net asset value, beginning of period | $ | 13.36 | 9.39 | 10.60 | 9.85 | ||||||||||||||
| Income (loss) from investment operations: | |||||||||||||||||||
| Net investment loss | $ | (0.06 | ) | (0.13 | ) | (0.11 | ) | (0.02 | ) | ||||||||||
| Net realized and unrealized gain (loss) on investments | $ | 0.86 | 4.84 | (1.01 | ) | 0.77 | |||||||||||||
| Total from investment operations | $ | 0.80 | 4.71 | (1.12 | ) | 0.75 | |||||||||||||
| Less distributions from: | |||||||||||||||||||
| Net investment income | $ | - | - | - | - | ||||||||||||||
| Net realized gain from investments | $ | 0.89 | 0.74 | 0.09 | - | ||||||||||||||
| Total distributions | $ | 0.89 | 0.74 | 0.09 | - | ||||||||||||||
| Net asset value, end of period | $ | 13.27 | 13.36 | 9.39 | 10.60 | ||||||||||||||
| Total Return(2) | % | 6.12 | 51.80 | (10.53 | ) | 7.61 | |||||||||||||
| Ratios and Supplemental Data: | |||||||||||||||||||
| Net assets, end of period (000's) | $ | 26,109 | 19,815 | 8,233 | 7,889 | ||||||||||||||
| Ratios to average net assets: | |||||||||||||||||||
| Net expenses after expense reimbursement/recoupment(3)(4) | % | 2.47 | 2.50 | 2.50 | 2.37 | ||||||||||||||
| Gross expenses prior to expense reimbursement(3) | % | 2.22 | 2.41 | 2.92 | 4.40 | ||||||||||||||
| Net investment loss after expense reimbursement/recoupment(3)(4) | % | (1.06 | ) | (1.37 | ) | (1.29 | ) | (1.14 | ) | ||||||||||
| Portfolio turnover rate | % | 16 | 57 | 54 | 12 | ||||||||||||||
(1) Commencement of operations.
(2) Total return is calculated assuming reinvestment of all dividends and capital gain distributions at net asset value and excluding the deduction of sales charges. Total return for less than one year is not annualized.
(3) Annualized for periods less than one year.
(4) The Investment Adviser has agreed to limit expenses, (excluding interest, taxes, brokerage and extraordinary expenses) subject to possible recoupment by ING Investments, LLC within three years.
See Accompanying Notes to Financial Statements
63
ING SMALLCAP VALUE FUND (UNAUDITED) (CONTINUED)
FINANCIAL HIGHLIGHTS
Selected data for a share of beneficial interest outstanding throughout each period.
| Class C | |||||||||||||||||||
| Six Months Ended November 30, | Year Ended May 31, | February 7, 2002(1) to May 31, | |||||||||||||||||
| 2004 | 2004 | 2003 | 2002 | ||||||||||||||||
| Per Share Operating Performance: | |||||||||||||||||||
| Net asset value, beginning of period | $ | 13.35 | 9.38 | 10.60 | 9.76 | ||||||||||||||
| Income (loss) from investment operations: | |||||||||||||||||||
| Net investment loss | $ | (0.05 | ) | (0.12 | ) | (0.10 | ) | (0.01 | ) | ||||||||||
| Net realized and unrealized gain (loss) on investments | $ | 0.85 | 4.83 | (1.02 | ) | 0.85 | |||||||||||||
| Total from investment operations | $ | 0.80 | 4.71 | (1.12 | ) | 0.84 | |||||||||||||
| Less distributions from: | |||||||||||||||||||
| Net investment income | $ | - | - | 0.01 | - | ||||||||||||||
| Net realized gain from investments | $ | 0.89 | 0.74 | 0.09 | - | ||||||||||||||
| Total distributions | $ | 0.89 | 0.74 | 0.10 | - | ||||||||||||||
| Net asset value, end of period | $ | 13.26 | 13.35 | 9.38 | 10.60 | ||||||||||||||
| Total Return(2) | % | 6.13 | 51.86 | (10.55 | ) | 8.61 | |||||||||||||
| Ratios and Supplemental Data: | |||||||||||||||||||
| Net assets, end of period (000's) | $ | 44,235 | 28,906 | 11,241 | 8,468 | ||||||||||||||
| Ratios to average net assets: | |||||||||||||||||||
| Net expenses after expense reimbursement/recoupment(3)(4) | % | 2.47 | 2.50 | 2.50 | 2.37 | ||||||||||||||
| Gross expenses prior to expense reimbursement(3) | % | 2.22 | 2.41 | 2.92 | 4.40 | ||||||||||||||
| Net investment loss after expense reimbursement/recoupment(3)(4) | % | (1.05 | ) | (1.35 | ) | (1.28 | ) | (1.14 | ) | ||||||||||
| Portfolio turnover rate | % | 16 | 57 | 54 | 12 | ||||||||||||||
(1) Commencement of operations.
(2) Total return is calculated assuming reinvestment of all dividends and capital gain distributions at net asset value and excluding the deduction of sales charges. Total return for less than one year is not annualized.
(3) Annualized for periods less than one year.
(4) The Investment Adviser has agreed to limit expenses, (excluding interest, taxes, brokerage and extraordinary expenses) subject to possible recoupment by ING Investments, LLC within three years.
See Accompanying Notes to Financial Statements
64
ING CONVERTIBLE FUND (UNAUDITED)
FINANCIAL HIGHLIGHTS
Selected data for a share of beneficial interest outstanding throughout each period.
| Class A | |||||||||||||||||||||||||||||||
| Six Months Ended November 30, | Year Ended May 31, | Eleven Months Ended May 31, | Year Ended June 30, | Three Months Ended June 30, | |||||||||||||||||||||||||||
| 2004 | 2004 | 2003 | 2002 | 2001(1) | 2000 | 1999(2) | |||||||||||||||||||||||||
| Per Share Operating Performance: | |||||||||||||||||||||||||||||||
| Net asset value, beginning of period | $ | 18.11 | 16.20 | 15.35 | 17.89 | 27.70 | 23.27 | 21.92 | |||||||||||||||||||||||
| Income (loss) from investment operations: | |||||||||||||||||||||||||||||||
| Net investment income | $ | 0.18 | 0.36 | 0.38 | 0.30 | 0.85 | 0.42 | 0.10 | |||||||||||||||||||||||
| Net realized and unrealized gain (loss) | |||||||||||||||||||||||||||||||
| on investments | $ | 0.52 | 1.97 | 0.78 | (2.34 | ) | (5.29 | ) | 8.02 | 1.35 | |||||||||||||||||||||
| Total from investment operations | $ | 0.70 | 2.33 | 1.16 | (2.04 | ) | (4.44 | ) | 8.44 | 1.45 | |||||||||||||||||||||
| Less distributions from: | |||||||||||||||||||||||||||||||
| Net investment income | $ | 0.28 | 0.42 | 0.31 | 0.41 | 0.51 | 0.32 | 0.10 | |||||||||||||||||||||||
| Net realized gain from investments | $ | - | - | - | 0.09 | 4.86 | 3.69 | - | |||||||||||||||||||||||
| Total distributions | $ | 0.28 | 0.42 | 0.31 | 0.50 | 5.37 | 4.01 | 0.10 | |||||||||||||||||||||||
| Net asset value, end of period | $ | 18.53 | 18.11 | 16.20 | 15.35 | 17.89 | 27.70 | 23.27 | |||||||||||||||||||||||
| Total Return(3) | % | 3.89 | 14.52 | 7.80 | (11.44 | ) | (17.78 | ) | 39.88 | 6.62 | |||||||||||||||||||||
| Ratios and Supplemental Data: | |||||||||||||||||||||||||||||||
| Net assets, end of period (000's) | $ | 60,616 | 63,443 | 51,008 | 60,692 | 98,896 | 131,218 | 73,133 | |||||||||||||||||||||||
| Ratios to average net assets: | |||||||||||||||||||||||||||||||
| Net expenses after expense reimbursement(4)(5) | % | 1.41 | 1.48 | 1.59 | 1.46 | 1.42 | 1.35 | 1.45 | |||||||||||||||||||||||
| Gross expenses prior to expense | |||||||||||||||||||||||||||||||
| reimbursement(4) | % | 1.41 | 1.48 | 1.59 | 1.46 | 1.41 | 1.35 | 2.10 | |||||||||||||||||||||||
| Net investment income after expense reimbursement(4)(5) | % | 1.90 | 2.13 | 2.57 | 1.93 | 2.20 | 1.78 | 1.82 | |||||||||||||||||||||||
| Portfolio turnover rate | % | 27 | 138 | 97 | 100 | 145 | 129 | 28 | |||||||||||||||||||||||
| Class B | |||||||||||||||||||||||||||||||
| Six Months Ended November 30, | Year Ended May 31, | Eleven Months Ended May 31, | Year Ended June 30, | Three Months Ended June 30, | |||||||||||||||||||||||||||
| 2004 | 2004 | 2003 | 2002 | 2001(1) | 2000 | 1999(2) | |||||||||||||||||||||||||
| Per Share Operating Performance: | |||||||||||||||||||||||||||||||
| Net asset value, beginning of period | $ | 19.91 | 17.79 | 16.83 | 19.56 | 30.20 | 25.34 | 23.86 | |||||||||||||||||||||||
| Income (loss) from investment operations: | |||||||||||||||||||||||||||||||
| Net investment income | $ | 0.15 | 0.30 | 0.35 | 0.24 | 0.49 | 0.29 | 0.07 | |||||||||||||||||||||||
| Net realized and unrealized gain (loss) | |||||||||||||||||||||||||||||||
| on investments | $ | 0.54 | 2.13 | 0.83 | (2.59 | ) | (5.49 | ) | 8.77 | 1.47 | |||||||||||||||||||||
| Total from investment operations | $ | 0.69 | 2.43 | 1.18 | (2.35 | ) | (5.00 | ) | 9.06 | 1.54 | |||||||||||||||||||||
| Less distributions from: | |||||||||||||||||||||||||||||||
| Net investment income | $ | 0.20 | 0.31 | 0.22 | 0.28 | 0.34 | 0.19 | 0.06 | |||||||||||||||||||||||
| Net realized gain from investments | $ | - | - | - | 0.10 | 5.30 | 4.01 | - | |||||||||||||||||||||||
| Total distributions | $ | 0.20 | 0.31 | 0.22 | 0.38 | 5.64 | 4.20 | 0.06 | |||||||||||||||||||||||
| Net asset value, end of period | $ | 20.40 | 19.91 | 17.79 | 16.83 | 19.56 | 30.20 | 25.34 | |||||||||||||||||||||||
| Total Return(3) | % | 3.52 | 13.75 | 7.16 | (12.04 | ) | (18.26 | ) | 39.21 | 6.47 | |||||||||||||||||||||
| Ratios and Supplemental Data: | |||||||||||||||||||||||||||||||
| Net assets, end of period (000's) | $ | 66,598 | 75,097 | 72,364 | 88,650 | 125,366 | 139,704 | 68,091 | |||||||||||||||||||||||
| Ratios to average net assets: | |||||||||||||||||||||||||||||||
| Net expenses after expense reimbursement(4)(5) | % | 2.06 | 2.13 | 2.24 | 2.11 | 2.07 | 2.00 | 2.10 | |||||||||||||||||||||||
| Gross expenses prior to expense | |||||||||||||||||||||||||||||||
| reimbursement(4) | % | 2.06 | 2.13 | 2.24 | 2.11 | 2.06 | 2.00 | 2.10 | |||||||||||||||||||||||
| Net investment income after expense reimbursement(4)(5) | % | 1.25 | 1.48 | 1.92 | 1.28 | 1.55 | 1.13 | 1.17 | |||||||||||||||||||||||
| Portfolio turnover rate | % | 27 | 138 | 97 | 100 | 145 | 129 | 28 | |||||||||||||||||||||||
(1) The Fund changed its fiscal year end to May 31.
(2) Effective May 24, 1999, ING Investments, LLC became the Investment Adviser of the Fund, concurrently Nicholas-Applegate Capital Management was appointed as Sub-Adviser in which capacity it served until October 1, 2000, and the Fund changed its year end to June 30.
(3) Total return is calculated assuming reinvestment of all dividends and capital gain distributions at net asset value and excluding the deduction of sales charges. Total return for less than one year is not annualized.
(4) Annualized for periods less than one year.
(5) The Investment Adviser has agreed to limit expenses, (excluding interest, taxes, brokerage and extraordinary expenses) subject to possible recoupment by ING Investments, LLC within three years.
See Accompanying Notes to Financial Statements
65
ING CONVERTIBLE FUND (UNAUDITED) (CONTINUED)
FINANCIAL HIGHLIGHTS
Selected data for a share of beneficial interest outstanding throughout each period.
| Class C | |||||||||||||||||||||||||||||||
| Six Months Ended November 30, | Year Ended May 31, | Eleven Months Ended May 31, | Year Ended June 30, | Three Months Ended June 30, | |||||||||||||||||||||||||||
| 2004 | 2004 | 2003 | 2002 | 2001(1) | 2000 | 1999(2) | |||||||||||||||||||||||||
| Per Share Operating Performance: | |||||||||||||||||||||||||||||||
| Net asset value, beginning of period | $ | 18.56 | 16.62 | 15.75 | 18.33 | 28.33 | 23.78 | 22.40 | |||||||||||||||||||||||
| Income (loss) from investment operations: | |||||||||||||||||||||||||||||||
| Net investment income | $ | 0.12 | 0.27 | 0.32 | 0.22 | 0.58 | 0.28 | 0.07 | |||||||||||||||||||||||
| Net realized and unrealized gain (loss) | |||||||||||||||||||||||||||||||
| on investments | $ | 0.53 | 1.99 | 0.78 | (2.42 | ) | (5.26 | ) | 8.22 | 1.37 | |||||||||||||||||||||
| Total from investment operations | $ | 0.65 | 2.26 | 1.10 | (2.20 | ) | (4.68 | ) | 8.50 | 1.44 | |||||||||||||||||||||
| Less distributions from: | |||||||||||||||||||||||||||||||
| Net investment income | $ | 0.21 | 0.32 | 0.23 | 0.29 | 0.35 | 0.19 | 0.06 | |||||||||||||||||||||||
| Net realized gain from investments | $ | - | - | - | 0.09 | 4.97 | 3.76 | - | |||||||||||||||||||||||
| Total distributions | $ | 0.21 | 0.32 | 0.23 | 0.38 | 5.32 | 3.95 | 0.06 | |||||||||||||||||||||||
| Net asset value, end of period | $ | 19.00 | 18.56 | 16.62 | 15.75 | 18.33 | 28.33 | 23.78 | |||||||||||||||||||||||
| Total Return(3) | % | 3.56 | 13.72 | 7.15 | (12.03 | ) | (18.25 | ) | 39.24 | 6.45 | |||||||||||||||||||||
| Ratios and Supplemental Data: | |||||||||||||||||||||||||||||||
| Net assets, end of period (000's) | $ | 68,400 | 71,365 | 66,412 | 81,247 | 118,363 | 156,592 | 100,276 | |||||||||||||||||||||||
| Ratios to average net assets: | |||||||||||||||||||||||||||||||
| Net expenses after expense reimbursement(4)(5) | % | 2.06 | 2.13 | 2.24 | 2.11 | 2.07 | 2.00 | 2.10 | |||||||||||||||||||||||
| Gross expenses prior to expense | |||||||||||||||||||||||||||||||
| reimbursement(4) | % | 2.06 | 2.13 | 2.24 | 2.11 | 2.06 | 2.00 | 2.10 | |||||||||||||||||||||||
| Net investment income after expense reimbursement(4)(5) | % | 1.25 | 1.48 | 1.92 | 1.28 | 1.55 | 1.13 | 1.17 | |||||||||||||||||||||||
| Portfolio turnover rate | % | 27 | 138 | 97 | 100 | 145 | 129 | 28 | |||||||||||||||||||||||
(1) The Fund changed its fiscal year end to May 31.
(2) Effective May 24, 1999, ING Investments, LLC became the Investment Adviser of the Fund, concurrently Nicholas-Applegate Capital Management was appointed as Sub-Adviser in which capacity it served until October 1, 2000, and the Fund changed its year end to June 30.
(3) Total return is calculated assuming reinvestment of all dividends and capital gain distributions at net asset value and excluding the deduction of sales charges. Total return for less than one year is not annualized.
(4) Annualized for periods less than one year.
(5) The Investment Adviser has agreed to limit expenses, (excluding interest, taxes, brokerage and extraordinary expenses) subject to possible recoupment by ING Investments, LLC within three years.
See Accompanying Notes to Financial Statements
66
ING EQUITY AND BOND FUND (UNAUDITED)
FINANCIAL HIGHLIGHTS
Selected data for a share of beneficial interest outstanding throughout each period.
| Class A | |||||||||||||||||||||||||||||||
| Six Months Ended November 30, | Year Ended May 31, | Eleven Months Ended May 31, | Year Ended June 30, | Three Months Ended June 30, | |||||||||||||||||||||||||||
| 2004 | 2004 | 2003 | 2002 | 2001(1) | 2000 | 1999(2) | |||||||||||||||||||||||||
| Per Share Operating Performance: | |||||||||||||||||||||||||||||||
| Net asset value, beginning of period | $ | 12.47 | 11.71 | 12.06 | 13.30 | 15.04 | 19.23 | 19.03 | |||||||||||||||||||||||
| Income (loss) from investment operations: | |||||||||||||||||||||||||||||||
| Net investment income | $ | 0.08 | 0.15 | 0.31 | 0.39 | 0.93 | 0.51 | 0.10 | |||||||||||||||||||||||
| Net realized and unrealized gain (loss) | |||||||||||||||||||||||||||||||
| on investments | $ | 0.31 | 0.87 | (0.41 | ) | (1.13 | ) | (1.01 | ) | (0.60 | ) | 0.17 | |||||||||||||||||||
| Total from investment operations | $ | 0.39 | 1.02 | (0.10 | ) | (0.74 | ) | (0.08 | ) | (0.09 | ) | 0.27 | |||||||||||||||||||
| Less distributions from: | |||||||||||||||||||||||||||||||
| Net investment income | $ | 0.08 | 0.26 | 0.25 | 0.45 | 0.51 | 0.39 | 0.07 | |||||||||||||||||||||||
| Net realized gain from investments | $ | - | - | - | 0.05 | 1.15 | 3.71 | - | |||||||||||||||||||||||
| Total distributions | $ | 0.08 | 0.26 | 0.25 | 0.50 | 1.66 | 4.10 | 0.07 | |||||||||||||||||||||||
| Net asset value, end of period | $ | 12.78 | 12.47 | 11.71 | 12.06 | 13.30 | 15.04 | 19.23 | |||||||||||||||||||||||
| Total Return(3) | % | 3.12 | 8.84 | † | (0.66 | ) | (5.55 | ) | (0.61 | ) | (1.01 | ) | 1.42 | ||||||||||||||||||
| Ratios and Supplemental Data: | |||||||||||||||||||||||||||||||
| Net assets, end of period (000's) | $ | 34,189 | 36,205 | 32,179 | 57,042 | 61,477 | 63,592 | 9,619 | |||||||||||||||||||||||
| Ratios to average net assets: | |||||||||||||||||||||||||||||||
| Net expenses after expense reimbursement/recoupment(4)(5) | % | 1.60 | 1.60 | 1.60 | 1.48 | 1.32 | 1.40 | 1.49 | |||||||||||||||||||||||
| Gross expenses prior to expense reimbursement(4) | % | 1.54 | 1.59 | 1.71 | 1.45 | 1.53 | 1.61 | 1.75 | |||||||||||||||||||||||
| Net investment income after expense reimbursement/recoupment(4)(5) | % | 1.33 | 1.27 | 2.62 | 3.11 | 3.54 | 3.26 | 2.06 | |||||||||||||||||||||||
| Portfolio turnover rate | % | 36 | 302 | 129 | 145 | 76 | 173 | 63 | |||||||||||||||||||||||
| Class B | |||||||||||||||||||||||||||||||
| Six Months Ended November 30, | Year Ended May 31, | Eleven Months Ended May 31, | Year Ended June 30, | Three Months Ended June 30, | |||||||||||||||||||||||||||
| 2004 | 2004 | 2003 | 2002 | 2001(1) | 2000 | 1999(2) | |||||||||||||||||||||||||
| Per Share Operating Performance: | |||||||||||||||||||||||||||||||
| Net asset value, beginning of period | $ | 13.43 | 12.61 | 12.97 | 14.28 | 16.09 | 20.59 | 20.38 | |||||||||||||||||||||||
| Income (loss) from investment operations: | |||||||||||||||||||||||||||||||
| Net investment income | $ | 0.04 | 0.08 | 0.29 | 0.32 | 0.80 | 0.44 | 0.07 | |||||||||||||||||||||||
| Net realized and unrealized gain (loss) | |||||||||||||||||||||||||||||||
| on investments | $ | 0.34 | 0.92 | (0.47 | ) | (1.22 | ) | (0.98 | ) | (0.64 | ) | 0.18 | |||||||||||||||||||
| Total from investment operations | $ | 0.38 | 1.00 | (0.18 | ) | (0.90 | ) | (0.18 | ) | (0.20 | ) | 0.25 | |||||||||||||||||||
| Less distributions from: | |||||||||||||||||||||||||||||||
| Net investment income | $ | 0.03 | 0.18 | 0.18 | 0.36 | 0.39 | 0.33 | 0.04 | |||||||||||||||||||||||
| Net realized gain from investments | $ | - | - | - | 0.05 | 1.24 | 3.97 | - | |||||||||||||||||||||||
| Total distributions | $ | 0.03 | 0.18 | 0.18 | 0.41 | 1.63 | 4.30 | 0.04 | |||||||||||||||||||||||
| Net asset value, end of period | $ | 13.78 | 13.43 | 12.61 | 12.97 | 14.28 | 16.09 | 20.59 | |||||||||||||||||||||||
| Total Return(3) | % | 2.84 | 8.05 | † | (1.29 | ) | (6.26 | ) | (1.21 | ) | (1.58 | ) | 1.24 | ||||||||||||||||||
| Ratios and Supplemental Data: | |||||||||||||||||||||||||||||||
| Net assets, end of period (000's) | $ | 17,407 | 19,386 | 22,348 | 31,682 | 35,828 | 41,026 | 7,157 | |||||||||||||||||||||||
| Ratios to average net assets: | |||||||||||||||||||||||||||||||
| Net expenses after expense reimbursement/recoupment(4)(5) | % | 2.25 | 2.25 | 2.25 | 2.13 | 1.97 | 2.05 | 2.14 | |||||||||||||||||||||||
| Gross expenses prior to expense reimbursement(4) | % | 2.19 | 2.24 | 2.36 | 2.10 | 2.18 | 2.26 | 2.40 | |||||||||||||||||||||||
| Net investment income after expense reimbursement/recoupment(4)(5) | % | 0.67 | 0.62 | 1.97 | 2.46 | 2.89 | 2.61 | 1.41 | |||||||||||||||||||||||
| Portfolio turnover rate | % | 36 | 302 | 129 | 145 | 76 | 173 | 63 | |||||||||||||||||||||||
(1) The Fund changed its fiscal year end to May 31.
(2) Effective May 24, 1999, ING investments, LLC became the Investment Adviser of the Fund, concurrently Nicholas-Applegate Capital Management was appointed as Sub-Adviser and the Fund changed its year end to June 30.
(3) Total return is calculated assuming reinvestment of all dividends and capital gain distributions at net asset value and excluding the deduction of sales charges. Total return for less than one year is not annualized.
(4) Annualized for periods less than one year.
(5) The Investment Adviser has agreed to limit expenses, (excluding interest, taxes, brokerage and extraordinary expenses) subject to possible recoupment by ING Investments, LLC within three years.
† Total return without the effect of reimbursement by affiliate for investment transaction losses would have been 8.76% for Class A, and there was no effect on Class B.
See Accompanying Notes to Financial Statements
67
ING EQUITY AND BOND FUND (UNAUDITED) (CONTINUED)
FINANCIAL HIGHLIGHTS
Selected data for a share of beneficial interest outstanding throughout each period.
| Class C | |||||||||||||||||||||||||||||||
| Six Months Ended | Eleven Months Ended | Year Ended | Three Months Ended | ||||||||||||||||||||||||||||
| November 30, | Year Ended May 31, | May 31, | June 30, | June 30, | |||||||||||||||||||||||||||
| 2004 | 2004 | 2003 | 2002 | 2001(1) | 2000 | 1999(2) | |||||||||||||||||||||||||
| Per Share Operating Performance: | |||||||||||||||||||||||||||||||
| Net asset value, beginning of period | $ | 11.90 | 11.21 | 11.57 | 12.78 | 14.45 | 18.53 | 18.35 | |||||||||||||||||||||||
| Income (loss) from investment operations: | |||||||||||||||||||||||||||||||
| Net investment income | $ | 0.04 | 0.07 | 0.17 | 0.34 | 0.74 | 0.45 | 0.06 | |||||||||||||||||||||||
| Net realized and unrealized gain (loss) | |||||||||||||||||||||||||||||||
| on investments | $ | 0.30 | 0.82 | (0.34 | ) | (1.13 | ) | (0.91 | ) | (0.62 | ) | 0.16 | |||||||||||||||||||
| Total from investment operations | $ | 0.34 | 0.89 | (0.17 | ) | (0.79 | ) | (0.17 | ) | (0.17 | ) | 0.22 | |||||||||||||||||||
| Less distributions from: | |||||||||||||||||||||||||||||||
| Net investment income | $ | 0.04 | 0.20 | 0.19 | 0.37 | 0.39 | 0.34 | 0.04 | |||||||||||||||||||||||
| Net realized gain from investments | $ | - | - | - | 0.05 | 1.11 | 3.57 | - | |||||||||||||||||||||||
| Total distributions | $ | 0.04 | 0.20 | 0.19 | 0.42 | 1.50 | 3.91 | 0.04 | |||||||||||||||||||||||
| Net asset value, end of period | $ | 12.20 | 11.90 | 11.21 | 11.57 | 12.78 | 14.45 | 18.53 | |||||||||||||||||||||||
| Total Return(3) | % | 2.85 | 8.04 | † | (1.27 | ) | (6.20 | ) | (1.28 | ) | (1.53 | ) | 1.21 | ||||||||||||||||||
| Ratios and Supplemental Data: | |||||||||||||||||||||||||||||||
| Net assets, end of period (000's) | $ | 12,409 | 13,566 | 14,240 | 18,007 | 22,679 | 25,838 | 21,331 | |||||||||||||||||||||||
| Ratios to average net assets: | |||||||||||||||||||||||||||||||
| Net expenses after expense reimbursement/recoupment(4)(5) | % | 2.25 | 2.25 | 2.25 | 2.13 | 1.97 | 2.05 | 2.14 | |||||||||||||||||||||||
| Gross expenses prior to expense | |||||||||||||||||||||||||||||||
| reimbursement(4) | % | 2.19 | 2.24 | 2.36 | 2.10 | 2.18 | 2.26 | 2.40 | |||||||||||||||||||||||
| Net investment income after expense reimbursement/recoupment(4)(5) | % | 0.67 | 0.62 | 1.96 | 2.46 | 2.89 | 2.61 | 1.41 | |||||||||||||||||||||||
| Portfolio turnover rate | % | 36 | 302 | 129 | 145 | 76 | 173 | 63 | |||||||||||||||||||||||
(1) The Fund changed its fiscal year end to May 31.
(2) Effective May 24, 1999, ING investments, LLC became the Investment Adviser of the Fund, concurrently Nicholas-Applegate Capital Management was appointed as Sub-Adviser and the Fund changed its year end to June 30.
(3) Total return is calculated assuming reinvestment of all dividends and capital gain distributions at net asset value and excluding the deduction of sales charges. Total return for less than one year is not annualized.
(4) Annualized for periods less than one year.
(5) The Investment Adviser has agreed to limit expenses, (excluding interest, taxes, brokerage and extraordinary expenses) subject to possible recoupment by ING Investments, LLC within three years.
† Total return without the effect of affiliated payments would have been 7.95%.
See Accompanying Notes to Financial Statements
68
ING REAL ESTATE FUND (UNAUDITED)
FINANCIAL HIGHLIGHTS
Selected data for a share of beneficial interest outstanding throughout each period.
| Class A | Class B | ||||||||||||||||||||||||||
| Six Months Ended November 30, 2004 | Year Ended May 31, 2004 | December 20, 2002(1) to May 31, 2003 | Six Months Ended November 30, 2004 | Year Ended May 31, 2004 | November 20, 2002(1) to May 31, 2003 | ||||||||||||||||||||||
| Per Share Operating Performance: | |||||||||||||||||||||||||||
| Net asset value, beginning of period | $ | 12.76 | 11.06 | 10.06 | 12.78 | 11.10 | 10.00 | ||||||||||||||||||||
| Income (loss) from investment operations: | |||||||||||||||||||||||||||
| Net investment income | $ | 0.17 | 0.57 | 0.16 | 0.15 | 0.45 | 0.12 | ||||||||||||||||||||
| Net realized and unrealized gain | |||||||||||||||||||||||||||
| on investments | $ | 2.53 | 2.29 | 1.04 | 2.52 | 2.32 | 1.15 | ||||||||||||||||||||
| Total from investment operations | $ | 2.70 | 2.86 | 1.20 | 2.67 | 2.77 | 1.27 | ||||||||||||||||||||
| Less distributions from: | |||||||||||||||||||||||||||
| Net investment income | $ | 0.25 | 0.65 | 0.20 | 0.20 | 0.58 | 0.17 | ||||||||||||||||||||
| Net realized gain from investments | $ | 0.95 | 0.51 | - | 0.95 | 0.51 | - | ||||||||||||||||||||
| Total distributions | $ | 1.20 | 1.16 | 0.20 | 1.14 | 1.09 | 0.17 | ||||||||||||||||||||
| Net asset value, end of period | $ | 14.26 | 12.76 | 11.06 | 14.30 | 12.78 | 11.10 | ||||||||||||||||||||
| Total Return(2) | % | 21.49 | 26.79 | 12.06 | 21.19 | 25.81 | 12.77 | ||||||||||||||||||||
| Ratios and Supplemental Data: | |||||||||||||||||||||||||||
| Net assets, end of period (000's) | $ | 38,488 | 16,569 | 982 | 3,089 | 1,990 | 149 | ||||||||||||||||||||
| Ratios to average net assets: | |||||||||||||||||||||||||||
| Net expenses after expense reimbursement/ recoupment and brokerage commission recapture(3)(4) | % | 1.17 | 1.27 | 1.45 | 1.92 | 2.02 | 2.20 | ||||||||||||||||||||
| Net expenses after expense | |||||||||||||||||||||||||||
| reimbursement/recoupment(4)(5) | % | 1.24 | 1.31 | 1.45 | 1.99 | 2.06 | 2.20 | ||||||||||||||||||||
| Gross expenses prior to expense reimbursement and brokerage commission recapture(5) | % | 1.14 | 1.37 | 1.53 | 1.89 | 2.12 | 2.30 | ||||||||||||||||||||
| Net investment income after expense | |||||||||||||||||||||||||||
| reimbursement/recoupment and | |||||||||||||||||||||||||||
| brokerage commission recapture(5)(6) | % | 3.35 | 4.84 | 0.01 | 2.61 | 3.28 | 1.91 | ||||||||||||||||||||
| Portfolio turnover rate | % | 37 | 132 | 62 | 37 | 132 | 62 | ||||||||||||||||||||
(1) Commencement of operations.
(2) Total return is calculated assuming reinvestment of all dividends and capital gain distributions at net asset value and excluding the deduction of sales charges. Total return for less than one year is not annualized.
(3) Annualized for periods less than one year.
(4) The Investment Adviser has agreed to limit expenses, (excluding interest, taxes, brokerage and extraordinary expenses) subject to possible recoupment by ING Investments, LLC within three years.
See Accompanying Notes to Financial Statements
69
ING REAL ESTATE FUND (UNAUDITED) (CONTINUED)
FINANCIAL HIGHLIGHTS
Selected data for a share of beneficial interest outstanding throughout each period.
| Class C | Class O | ||||||||||||||||||
| Six Months Ended November 30, 2004 | Year Ended May 31, 2004 | January 17 2003(1) to May 31, 2003 | September 15, 2004(1) to November 30, 2004 | ||||||||||||||||
| Per Share Operating Performance: | |||||||||||||||||||
| Net asset value, beginning of period | $ | 13.11 | 11.37 | 9.96 | 13.52 | ||||||||||||||
| Income (loss) from investment operations: | |||||||||||||||||||
| Net investment income (loss) | $ | 0.16 | 0.43 | (0.01 | )* | 0.30 | |||||||||||||
| Net realized and unrealized gain | |||||||||||||||||||
| on investments | $ | 2.56 | 2.40 | 1.50 | 1.65 | ||||||||||||||
| Total from investment operations | $ | 2.72 | 2.83 | 1.49 | 1.95 | ||||||||||||||
| Less distributions from: | |||||||||||||||||||
| Net investment income | $ | 0.19 | 0.58 | 0.08 | 0.27 | ||||||||||||||
| Net realized gain from investments | $ | 0.95 | 0.51 | - | 0.95 | ||||||||||||||
| Total distributions | $ | 1.14 | 1.09 | 0.08 | 1.22 | ||||||||||||||
| Net asset value, end of period | $ | 14.69 | 13.11 | 11.37 | 14.25 | ||||||||||||||
| Total Return(2) | % | 21.10 | 25.75 | 15.03 | 13.12 | ||||||||||||||
| Ratios and Supplemental Data: | |||||||||||||||||||
| Net assets, end of period (000's) | $ | 3,477 | 2,708 | 157 | 4,033 | ||||||||||||||
| Ratios to average net assets: | |||||||||||||||||||
| Net expenses after expense reimbursement/recoupment and brokerage commission recapture(3)(4) | % | 1.92 | 2.02 | 2.20 | 1.07 | ||||||||||||||
| Net expenses after expense reimbursement/recoupment(4)(5) | % | 1.99 | 2.06 | 2.20 | 1.16 | ||||||||||||||
| Gross expenses prior to expense reimbursement and brokerage commission recapture(5) | % | 1.89 | 2.12 | 2.30 | 1.16 | ||||||||||||||
| Net investment income (loss) after expense reimbursement/ | |||||||||||||||||||
| recoupment and brokerage commission recapture(5)(6) | % | 2.67 | 3.54 | (1.62 | ) | 3.34 | |||||||||||||
| Portfolio turnover rate | % | 37 | 132 | 62 | 37 | ||||||||||||||
(1) Commencement of operations.
(2) Total return is calculated assuming reinvestment of all dividends and capital gain distributions at net asset value and excluding the deduction of sales charges. Total return for less than one year is not annualized.
(3) Annualized for periods less than one year.
(4) The Investment Adviser has agreed to limit expenses, (excluding interest, taxes, brokerage and extraordinary expenses) subject to possible recoupment by ING Investments, LLC within three years.
* Per share data calculated using weighted average number of shares outstanding throughout the period.
See Accompanying Notes to Financial Statements
70
NOTES TO FINANCIAL STATEMENTS AS OF NOVEMBER 30, 2004 (UNAUDITED)
NOTE 1 - ORGANIZATION
Organization. The ING Funds contained within this book are comprised of ING Equity Trust ("IET") and ING Investment Funds, Inc. ("IIF") both of which are open-end investment management companies registered under the Investment Company Act of 1940, as amended.
IET is a Massachusetts business trust organized on June 12, 1998 with twenty-three separate series (Portfolios). Eleven of which ar discussed in this report: ING Disciplined LargeCap Fund ("Disciplined LargeCap"), ING LargeCap Growth Fund ("LargeCap Growth"), ING MidCap Opportunities Fund ("MidCap Opportunities"), ING SmallCap Opportunities Fund ("SmallCap Opportunities"), ING Financial Services Fund ("Financial Services"), ING LargeCap Value Fund ("LargeCap Value"), ING MidCap Value Fund ("MidCap Value"), ING SmallCap Value Fund ("SmallCap Value"), ING Convertible Fund ("Convertible"), ING Equity and Bond Fund ("Equity and Bond") and ING Real Estate Fund ("Real Estate"). IIF is a Maryland Corporation organized on July 7, 1969 with one Portfolio, ING MagnaCap Fund ("MagnaCap").
Each Fund offers at least three of the following classes of shares: Class A, Class B, Class C, Class I, Class M, Class O and Class Q. The separate classes of shares differ principally in the applicable sales charges (if any), distribution fees, shareholder servicing fees and transfer agency fees. Shareholders of each class also bear certain expenses that pertain to that particular class. All shareholders bear the common expenses of the Fund and earn income and realized gains/losses from the Fund pro rata based on the average daily net assets of each class, without distinction between share classes. No class preferential dividend rights exist. Differences in per share dividend rates generally results from the relative weighting of pro rata income and realized gain allocations and from differences in separate class expenses, including distribution, and shareholder servici ng fees. Class B shares, along with their pro rata reinvested dividend shares, automatically convert to Class A shares approximately eight years after purchase.
NOTE 2 - SIGNIFICANT ACCOUNTING POLICIES
The following significant accounting policies are consistently followed by the Funds in the preparation of their financial statements. Such policies are in conformity with accounting principles generally accepted in the United States of America for investment companies.
A. Security Valuation. Investments in equity securities traded on a national securities exchange are
valued at the last reported sale price. Securities reported by NASDAQ will be valued at the NASDAQ official closing prices. Securities traded on an exchange or NASDAQ for which there has been no sale and securities traded in the over-the-counter-market are valued at the mean between the last reported bid and ask prices. All investments quoted in foreign currencies will be valued daily in U.S. dollars on the basis of the foreign currency exchange rates prevailing at that time. Debt securities are valued at prices obtained from independent services or from one or more dealers making markets in the securities and may be adjusted based on the Funds' valuation procedures. U.S. Government obligations are valued by using market quotations or independent pricing services that use prices provided by market-makers or estimates of market values obtained from yield data relating to instruments or securities with sim ilar characteristics.
Securities and assets for which market quotations are not readily available (which may include certain restricted securities which are subject to limitations as to their sale) are valued at their fair values as determined in good faith by or under the supervision of the Funds' Board of Directors/Trustees (''Board''), in accordance with methods that are specifically authorized by the Board. Securities traded on exchanges, including foreign exchanges, which close earlier than the time that a Fund calculates its net asset value may also be valued at their fair values as determined in good faith by or under the supervision of a Fund's Board, in accordance with methods that are specifically authorized by the Board. If a significant event which is likely to impact the value of one or more foreign securities held by a Fund occurs after the time at which the foreign market for such security(ies) closes but befor e the time that the Fund's net asset value is calculated on any business day, such event may be taken into account in determining the fair value of such security(ies) at the time the Fund calculates its net asset value. For these purposes, significant events after the close of trading on a foreign market may include, among others, securities trading in the U.S. and other markets, corporate announcements, natural and other disasters, and political and other events. Among other elements of analysis, the Board has authorized the use of one or more research services to assist with the determination of the fair value of foreign securities. Research services use statistical analyses and quantitative models to help determine fair value as of the time
71
NOTES TO FINANCIAL STATEMENTS AS OF NOVEMBER 30, 2004 (UNAUDITED) (CONTINUED)
NOTE 2 - SIGNIFICANT ACCOUNTING POLICIES (continued)
a Fund calculates its net asset value. Unlike the closing price of a security on an exchange, fair value determinations employ elements of judgment, and the fair value assigned to a security may not represent the actual value that a Fund could obtain if it were to sell the security at the time of the close of the NYSE. Investments in securities maturing in 60 days or less from the date of acquisition are valued at amortized cost, which, when combined with accrued interest, approximates market value.
B. Security Transactions and Revenue Recognition. Securities transactions are accounted for on the trade date. Realized gains and losses are reported on the basis of identified cost of securities sold. Interest income is recorded on an accrual basis. Dividend income is recorded on the ex-dividend date, or for certain foreign securities, when the information becomes available to the funds. Premium amortization and discount accretion are determined by the effective yield method.
C. Foreign Currency Translation. The books and records of the Funds are maintained in U.S. dollars. Any foreign currency amounts are translated into U.S. dollars on the following basis:
(1) Market value of investment securities, other assets and liabilities - at the exchange rates prevailing at the end of the day.
(2) Purchases and sales of investment securities, income and expenses - at the rates of exchange prevailing on the respective dates of such transactions.
Although the net assets and the market values are presented at the foreign exchange rates at the end of the day, the Funds do not isolate the portion of the results of operations resulting from changes in foreign exchange rates on investments from the fluctuations arising from changes in market prices of securities held. Such fluctuations are included with the net realized and unrealized gains or losses from investments. For securities which are subject to foreign withholding tax upon disposition, liabilities are recorded on the Statement of Assets and Liabilities for the estimated tax withholding based on the securities' current market value. Upon disposition, realized gains or losses on such securities are recorded net of foreign withholding tax.
Reported net realized foreign exchange gains or losses arise from sales of foreign currencies,
currency gains or losses realized between the trade and settlement dates on securities transactions, the difference between the amounts of dividends, interest, and foreign withholding taxes recorded on the Fund's books, and the U.S. dollar equivalent of the amounts actually received or paid. Net unrealized foreign exchange gains and losses arise from changes in the value of assets and liabilities other than investments in securities at fiscal year end, resulting from changes in the exchange rate. Foreign security and currency transactions may involve certain considerations and risks not typically associated with investing in U.S. companies and the U.S. Government securities. These risks include but are not limited to revaluation of currencies and future adverse political and economic developments which could cause securities and their markets to be less liquid and prices more volatile than those of compa rable U.S. companies and the U.S. Government securities.
D. Foreign Currency Transactions and Futures Contracts. Certain funds may enter into foreign currency exchange transactions to convert to and from different foreign currencies and to and from the U.S. dollar in connection with the planned purchases or sales of securities. The Funds either enter into these transactions on a spot basis at the spot rate prevailing in the foreign currency exchange market or use forward foreign currency contracts to purchase or sell foreign currencies. When the contract is fulfilled or closed, gains or losses are realized. Until then, the gain or loss is included in unrealized appreciation or depreciation. Risks may arise upon entering into forward contracts from the potential inability of counterparties to meet the terms of their forward contracts and from unanticipated movements in the value of foreign currencies relative to the U.S. dollar.
Each Fund may enter into futures contracts involving foreign currency, interest rates, securities and security indices. A futures contract obligates the seller of the contract to deliver and the purchaser of the contract to take delivery of the type of foreign currency, financial instrument or security called for in the contract at a specified future time for a specified price. Upon entering into such a contract, a Fund is required to deposit and maintain as collateral such initial margin as required by the exchange on which the contract is traded. Pursuant to the contract, a Fund agrees to receive from or pay to the broker an amount equal to the daily fluctuations in the value of the contract. Such receipts or payments are known as
72
NOTES TO FINANCIAL STATEMENTS AS OF NOVEMBER 30, 2004 (UNAUDITED) (CONTINUED)
NOTE 2 - SIGNIFICANT ACCOUNTING POLICIES (continued)
variation margins and are recorded as unrealized gains or losses by the Fund. When the contract is closed, the Fund records a realized gain or loss equal to the difference between the value of the contract at the time it was opened and the value at the time it was closed.
E. Distributions to Shareholders. The Funds record distributions to their shareholders on the ex-dividend date. Each Fund pays dividends, if any, as follows:
| Annually | Semi-Annually | ||||||
| Financial Services | MagnaCap | ||||||
| LargeCap Growth | Quarterly | ||||||
| MidCap Opportunities | |||||||
| SmallCap Opportunities | Convertible | ||||||
| Disciplined LargeCap | Equity and Bond | ||||||
| LargeCap Value | Real Estate | ||||||
| MidCap Value | |||||||
| SmallCap Value | |||||||
Each Fund distributes capital gains, to the extent available, annually. The Funds may make distributions on a more frequent basis to comply with the distribution requirements of the Internal Revenue Code. The characteristics of income and gains to be distributed are determined in accordance with income tax regulations, which may differ from accounting principles generally accepted in the United States of America for investment companies.
F. Federal Income Taxes. It is the policy of the Funds to comply with subchapter M of the Internal Revenue Code and related excise tax provisions applicable to regulated investment companies and to distribute substantially all of their net investment income and any net realized capital gains to their shareholders. Therefore, no federal income tax provision is required. No capital gain distributions shall be made until any capital loss carryforwards have been fully utilized or expired.
The Funds may utilize equalization accounting for tax purposes, where by a portion of redemption payments are treated as distributions of income or gain for income tax purposes.
G. Use of Estimates. Management of the Funds has made certain estimates and assumptions relating to the reporting of assets, liabilities, income, and expenses to prepare these financial statements in conformity with accounting principles generally accepted in the United States of America for investment companies. Actual results could differ from these estimates.
H. Repurchase Agreements. Each Fund may invest in repurchase agreements only with government securities dealers recognized by the Board of Governors of the Federal Reserve System. Under such agreements, the seller of the security agrees to repurchase it at a mutually agreed upon time and price. The resale price is in excess of the purchase price and reflects an agreed upon interest rate for the period of time the agreement is outstanding. The period of the repurchase agreements is usually short, from overnight to one week, while the underlying securities generally have longer maturities. Each Fund will receive as collateral securities acceptable to it whose market value is equ al to at least 100% of the carrying amount of the repurchase agreements, plus accrued interest, being invested by the Fund. The underlying collateral is valued daily on a mark to market basis to assure that the value, including accrued interest is at least equal to the repurchase price. If the seller defaults, a Fund might incur a loss or delay in the realization of proceeds if the value of the collateral securing the repurchase agreement declines, and it might incur disposition costs in liquidating the collateral.
I. Options Contracts. Each Funds may purchase put and call options and may write (sell) put options and covered call options. The Funds may engage in option transactions as a hedge against adverse movements in the value of portfolio holdings or to increase market exposure. Option contracts are valued daily and unrealized gains or losses are recorded based upon the last sales price on the principal exchange on which the options are traded. The Funds will realize a gain or loss upon the expiration or closing of the option contract. When an option is exercised, the proceeds on sales of the underlying security for a written call option, the purchase cost of the sec urity for a written put option, or the cost of the security for a purchased put or call option is adjusted by the amount of premium received or paid. Realized and unrealized gains or losses on option contracts are reflected in the accompanying financial statements. The risk in writing a call option is that the Funds give up the opportunity for profit if the market price of the security increases and the option is exercised. The risk in writing a put option is that the Funds may incur a loss if the market price of the security decreases and the option is exercised. The risk in buying an option is that the Funds pay a premium whether or not the option is exercised. Risks may also arise from an illiquid secondary market or from the inability of counterparties to meet the terms of the contract.
73
NOTES TO FINANCIAL STATEMENTS AS OF NOVEMBER 30, 2004 (UNAUDITED) (CONTINUED)
NOTE 2 - SIGNIFICANT ACCOUNTING POLICIES (continued)
J. Securities Lending. Each Fund has the option to temporarily loan up to 30% of its total assets to brokers, dealers or other financial institutions in exchange for a negotiated lender's fee. The borrower is required to fully collateralize the loans with cash or U.S. Government securities. Generally, in the event of counterparty default, the Fund has the right to use collateral to offset losses incurred. There would be potential loss to the Fund in the event the Fund is delayed or prevented from exercising its right to dispose of the collateral. The Fund bears the risk of loss with respect to the investment of collateral. Engaging in securities lending could have a leveraging effect, which may intensify the credit, market and other risks associated with investing in a Fund.
K. Offering Costs. Offering costs are capitalized and amortized on a straight line basis over a period of twelve months.
L. Illiquid and Restricted Securities. Each Fund may not invest more than 15% of its net assets in illiquid securities. Illiquid securities are not readily marketable. Disposing of illiquid investments may involve time-consuming negotiation and legal expenses, and it may be difficult or impossible for the Funds to sell them promptly at an acceptable price. Each Fund also may invest in restricted securities, which include those sold under Rule 144A of the Securities Act of 1933 ("1933 Act") or securities offered pursuant to Section 4(2) of the 1933 Act, and/or are subject to legal or contractual restrictions on resale and generally may not be publicly sold without reg istration under the 1933 Act. Certain restricted securities may be considered liquid pursuant to procedures adopted by the Board or may be deemed to be illiquid because they may not be readily marketable. Illiquid and restricted securities are valued using market quotations when readily available. In the absence of market quotations, the illiquid and restricted securities are valued based upon their fair value determined under procedures approved by the Board.
M. Delayed Delivery Transactions. Each Funds may purchase or sell securities on a when-issued or forward commitment basis. The price of the underlying securities and date when the securities will be delivered and paid for are fixed at the time the transaction is negotiated. The market value of such is identified in each Fund's Portfolio of
Investments. Losses may arise due to changes in the market value of the securities or from the inability of counterparties to meet the terms of the contract. In connection with such purchases, the Funds are required to segregate liquid assets with the Funds' custodian sufficient to cover the purchase price.
N. Mortgage Dollar Roll Transactions. In connection with a Fund's ability to purchase or sell securities on a when-issued basis, the Funds may engage in dollar roll transactions with respect to mortgage-backed securities issued by Government National Mortgage Association, Federal National Mortgage Association and Federal Home Loan Mortgage Corp. In a dollar roll transaction, a Fund sells a mortgage-backed security to a financial institution, such as a bank or broker/dealer, and simultaneously agrees to repurchase a substantially similar (i.e., same type, coupon, and maturity) security from the institution on a delayed delivery basis at an agreed upon price. The mortgage-backed securities that are repurchased will bear the same interest rate as those sold, but generally will be collateralized by different pools of mortgages with different prepayment histories. The Funds account for dollar roll transactions as purchases and sales.
NOTE 3 - INVESTMENT TRANSACTIONS
For the six months ended November 30, 2004, the cost of purchases and proceeds from the sales of securities, excluding short-term securities, were as follows:
| Purchases | Sales | ||||||||||
| Disciplined LargeCap | $ | 52,790,720 | $ | 81,930,384 | |||||||
| LargeCap Growth | 125,403,346 | 129,217,717 | |||||||||
| MidCap Opportunities | 105,857,740 | 178,501,008 | |||||||||
| SmallCap Opportunities | 77,628,487 | 117,895,157 | |||||||||
| Financial Services | 37,899,983 | 66,013,997 | |||||||||
| LargeCap Value | 24,096,258 | 4,359,730 | |||||||||
| MagnaCap | 37,811,928 | 65,086,971 | |||||||||
| MidCap Value | 88,695,426 | 57,880,610 | |||||||||
| SmallCap Value | 77,638,421 | 19,300,495 | |||||||||
| Convertible | 53,381,754 | 74,327,783 | |||||||||
| Equity and Bond | 24,561,128 | 28,708,066 | |||||||||
| Real Estate | 96,961,140 | 75,381,250 | |||||||||
U.S. Governemnt securities not included above were as follows:
| Purchases | Sales | ||||||||||
| Equity and Bond | $ | 49,664,983 | $ | 53,462,074 | |||||||
NOTE 4 - INVESTMENT MANAGEMENT AND ADMINISTRATIVE FEES
The Funds entered into Investment Management Agreements with ING Investments, LLC (the
74
NOTES TO FINANCIAL STATEMENTS AS OF NOVEMBER 30, 2004 (UNAUDITED) (CONTINUED)
NOTE 4 - INVESTMENT MANAGEMENT AND ADMINISTRATIVE FEES (continued)
"Investment Manager") a wholly-owned subsidiary of ING Groep N.V. ING Groep N.V. is a global financial institution active in the fields of insurance, banking and asset management. The Investment Management Agreements compensate the Investment Manager with a fee, computed daily and payable monthly, based on the average daily net assets of each Fund, at the following annual rates:
| As a Percent of Average Net Assets | |||||||
| Disciplined LargeCap | 0.70 | % | |||||
| LargeCap Growth* | 0.75% on first $500 million; 0.675% on next $500 million; and 0.65% in excess of $1 billion | ||||||
| MidCap Opportunities | 1.00% on first $500 million; and 0.90% thereafter | ||||||
| SmallCap Opportunities | 1.00% on first $100 million; 0.90% on next $150 million; 0.80% on next $250 million; and 0.75% in excess of $500 million | ||||||
| Financial Services | 1.00% on first $30 million; 0.75% on next $95 million; and 0.70% in excess of $125 million | ||||||
| LargeCap Value | 0.90% on first $50 million; 0.85% on next $450 million; and 0.80% thereafter | ||||||
| MagnaCap | 1.00% on first $30 million; 0.75% on next $220 million; 0.625% on next $200 million; and 0.50% in excess of $450 million | ||||||
| MidCap Value | 1.00% on first $50 million; and 0.90% | ||||||
| thereafter | |||||||
| SmallCap Value | 1.00% on first $50 million; and 0.90% | ||||||
| thereafter | |||||||
| Convertible | 0.75% on first $500 million; 0.675% on next $500 million; and 0.65% in excess of $1 billion | ||||||
| Equity and Bond | 0.75% on first $500 million; 0.675% on next $500 million; and 0.65% in excess of $1 billion | ||||||
| Real Estate | 0.70 | % | |||||
* Assets are aggregated with ING VP LargeCap Growth Portfolio to determine fees.
ING Investment Management Co. (formerly, Aeltus Investment Management, Inc. "ING IM"), a registered investment adviser, serves as Sub-Adviser to the MidCap Opportunities Fund, SmallCap Opportunities Fund, Disciplined LargeCap Fund, Financial Services Fund, MagnaCap Fund, Convertible Fund and the Equity and Bond Fund pursuant to Sub-Advisory Agreements between the Investment Manager and ING IM.
Brandes Investment Partners, LP ("Brandes"), a registered investment adviser, serves as Sub-Adviser to the LargeCap Value, MidCap Value and SmallCap Value Funds pursuant to a Sub-Advisory Agreement between the Investment Manager and Brandes.
Wellington Management Company, LLP is the Sub-Adviser to the LargeCap Growth Fund.
ING Clarion Real Estate Securities L.P. ("ING Clarion"), a registered investment adviser, is the Sub-Adviser to the Real Estate Fund pursuant to a Sub-Advisory Agreement between the Investment Manager and ING Clarion.
ING Funds Services, LLC (the "Administrator" or "IFS"), serves as administrator to each Fund except Financial Services and MagnaCap. The Funds pay the Administrator a fee calculated at an annual rate of 0.10% of each Funds' average daily net assets.
Financial Services and MagnaCap have entered into Shareholder Service Agreements with IFS whereby IFS will act as Shareholder Service Agent for the Funds. The agreement provides that IFS will be compensated for incoming and outgoing shareholder telephone calls and letters, and all reasonable out-of-pocket expenses incurred in connection with the performance of such services. Prior to March 1, 2002, IFS acted as Shareholder Service Agent for LargeCap Growth, Convertible and Equity and Bond.
MidCap Opportunities and SmallCap Opportunities also pay IFS an annual shareholder account servicing fee of $5.00, payable semi-annually, for each account of beneficial owners of shares.
The Investment Manager, ING IM, ING Clarion, IFS and the Distributor are indirect wholly-owned subsidiaries of ING Groep N.V., a global financial institution active in the fields of banking, insurance and asset management.
NOTE 5 - DISTRIBUTION AND SERVICE FEES
Each share class of the Funds (except as noted below) has adopted a Plan pursuant to Rule 12b-1 under the 1940 Act (the "12b-1 Plans"), whereby ING Funds Distributor, LLC (the "Distributor") is reimbursed or compensated (depending on the class of shares) by the Funds for expenses incurred in the distribution of each Fund's shares ("Distribution Fees"). Pursuant to the 12b-1 Plans, the Distributor is entitled to a payment each month to reimburse or compensate expenses incurred in the distribution and promotion of each Fund's shares, including expenses incurred in printing prospectuses and reports used for sales purposes, expenses incurred in preparing and printing sales literature and other such distribution related expenses, including any distribution or shareholder servicing fees ("Service Fees") paid to securities dealers who have executed a distribution agreement with the Distributor. Under the 1 2b-1 Plans, each class of shares of the Fund pays the Distributor a combined Distribution and/or
75
NOTES TO FINANCIAL STATEMENTS AS OF NOVEMBER 30, 2004 (UNAUDITED) (CONTINUED)
NOTE 5 - DISTRIBUTION AND SERVICE FEES (continued)
Service Fee based on average daily net assets at the following rates:
| Class A | Class B and C | Class I | Class M | Class O | Class Q | ||||||||||||||||||||||
| Disciplined LargeCap | 0.30 | % | 1.00 | % | N/A | N/A | N/A | N/A | |||||||||||||||||||
| LargeCap Growth | 0.35 | % | 1.00 | % | N/A | N/A | N/A | 0.25 | % | ||||||||||||||||||
| MidCap Opportunities | 0.30 | % | 1.00 | % | N/A | N/A | N/A | 0.25 | % | ||||||||||||||||||
| SmallCap Opportunities | 0.30 | % | 1.00 | % | N/A | N/A | N/A | 0.25 | % | ||||||||||||||||||
| Financial Services | 0.25 | % | 1.00 | % | N/A | N/A | 0.25 | % | 0.25 | % | |||||||||||||||||
| LargeCap Value | 0.25 | % | 1.00 | % | N/A | N/A | N/A | N/A | |||||||||||||||||||
| MagnaCap | 0.30 | % | 1.00 | % | N/A | 0.75 | % | N/A | N/A | ||||||||||||||||||
| MidCap Value | 0.25 | % | 1.00 | % | N/A | N/A | N/A | 0.25 | % | ||||||||||||||||||
| SmallCap Value | 0.25 | % | 1.00 | % | N/A | N/A | N/A | 0.25 | % | ||||||||||||||||||
| Convertible | 0.35 | % | 1.00 | % | N/A | N/A | N/A | 0.25 | % | ||||||||||||||||||
| Equity and Bond | 0.35 | % | 1.00 | % | N/A | N/A | N/A | 0.25 | % | ||||||||||||||||||
| Real Estate | 0.25 | % | 1.00 | % | N/A | N/A | 0.25 | % | 0.25 | % | |||||||||||||||||
For the six months ended November 30, 2004, the Distributor has retained $172,546 as sales charges from the proceeds of Class A Shares sold, $22,017 and $20,318 from the proceeds of Class A Shares and Class C Shares redeemed, respectively and $90 from the proceeds of Class M Shares sold.
NOTE 6 - OTHER TRANSACTIONS WITH AFFILIATES AND RELATED PARTIES
The Investment Manager may direct the Funds' portfolio managers to use their best efforts (subject to obtaining best execution of each transaction) to allocate a Fund's equity security transactions through certain designated broker-dealers. The designated broker-dealer, in turn, will reimburse a portion of the brokerage commissions to pay certain expenses of that Portfolio. Any amounts credited to the Funds are reflected as brokerage commission recapture in the Statements of Operations.
At November 30, 2004, the Funds had the following amounts recorded in payable to affiliates on the accompanying Statements of Assets and Liabilities (see Notes 4 and 5):
| Accrued Investment Management Fees | Accrued Administrative Fees | Accrued Shareholder Services and Distribution Fees | Recoupment | Total | |||||||||||||||||||
| Disciplined LargeCap | $ | 29,088 | $ | 4,155 | $ | 38,588 | $ | - | $ | 71,831 | |||||||||||||
| LargeCap Growth | 195,865 | 26,113 | 169,316 | 52,518 | 443,812 | ||||||||||||||||||
| MidCap Opportunities | 347,009 | 34,698 | 268,401 | 78,604 | 728,712 | ||||||||||||||||||
| SmallCap Opportunities | 178,898 | 18,963 | 119,237 | - | 317,098 | ||||||||||||||||||
| Financial Services | 193,512 | - | 140,499 | - | 334,011 | ||||||||||||||||||
| LargeCap Value | 23,174 | 2,575 | 15,122 | - | 40,871 | ||||||||||||||||||
| MagnaCap | 225,948 | - | 127,002 | 4,785 | 357,735 | ||||||||||||||||||
| MidCap Value | 120,377 | 12,918 | 83,556 | 33,251 | 250,102 | ||||||||||||||||||
| SmallCap Value | 115,731 | 12,402 | 71,079 | 73,000 | 272,212 | ||||||||||||||||||
| Convertible | 122,402 | 16,319 | 129,084 | - | 267,805 | ||||||||||||||||||
| Equity and Bond | 39,852 | 5,313 | 34,567 | 9,999 | 89,731 | ||||||||||||||||||
| Real Estate | 136,515 | 19,501 | 13,026 | 55,129 | 224,171 | ||||||||||||||||||
At November 30, 2004, ING Life Insurance & Annuity Company, a wholly-owned indirect subsidiary of ING Groep N.V., held 11.1% of the Real Estate Fund. At November 30, 2004, certain non-affiliated individuals and entities owned separately the following percentage of the Real Estate Fund: 5.3% and 22.9%. Investment activities of these shareholders could have a material impact on the Funds.
NOTE 7 - OTHER ACCRUED EXPENSES AND LIABILITIES
At November 30, 2004, the funds had following payables included in Other Accrued Expenses and Liabilities on the Statements of Assets and Liabilities that exceeded 5% of total liabilities:
| Payable for Custody and Accounting Fees | |||||||
| Disciplined LargeCap | $ | 14,496 | |||||
| Payable for Transfer Agent Fees | |||||||
| Disciplined LargeCap | $ | 28,931 | |||||
| Financial Services | 112,651 | ||||||
| MagnaCap | 188,311 | ||||||
| Payable for Shareholder Reporting Expense | |||||||
| Disciplined LargeCap | $ | 62,990 | |||||
| Financial Services | 254,818 | ||||||
| MagnaCap | 206,738 | ||||||
NOTE 8 - EXPENSE LIMITATIONS
For the following Funds, the Investment Manager has agreed to limit expenses, excluding interest, taxes, brokerage and extraordinary expenses to the levels listed below:
| Class A | Class B | Class C | Class I | Class O | Class Q | ||||||||||||||||||||||
| LargeCap Growth | 1.45 | % | 2.10 | % | 2.10 | % | 1.10 | % | N/A | 1.35 | % | ||||||||||||||||
| MidCap Opportunities | 1.75 | % | 2.45 | % | 2.45 | % | 1.45 | % | N/A | 1.60 | % | ||||||||||||||||
| LargeCap Value | 1.45 | % | 2.20 | % | 2.20 | % | 1.20 | % | N/A | N/A | |||||||||||||||||
| MidCap Value | 1.75 | % | 2.50 | % | 2.50 | % | 1.50 | % | N/A | 1.75 | % | ||||||||||||||||
| SmallCap Value | 1.75 | % | 2.50 | % | 2.50 | % | 1.50 | % | N/A | 1.75 | % | ||||||||||||||||
| Convertible | 1.60 | % | 2.25 | % | 2.25 | % | N/A | N/A | 1.50 | % | |||||||||||||||||
| Equity and Bond | 1.60 | % | 2.25 | % | 2.25 | % | N/A | N/A | 1.50 | % | |||||||||||||||||
| Real Estate | 1.45 | % | 2.20 | % | 2.20 | % | 1.00 | % | 1.45 | % | 1.45 | % | |||||||||||||||
Each Fund will at a later date reimburse the Investment Manager for management fees waived and other expenses assumed by the Investment Manager during the previous 36 months, but only if, after such reimbursement, the Fund's expense ratio does not exceed the percentage described above. Waived and reimbursed fees and any recoupment by the Investment Manager of such waived and reimbursed fees are reflected on the accompanying Statements of Operations for each Fund.
Outstanding reimbursement balances due to the Funds, if any, under their respective expense limitation
76
NOTES TO FINANCIAL STATEMENTS AS OF NOVEMBER 30, 2004 (UNAUDITED) (CONTINUED)
NOTE 8 - EXPENSE LIMITATIONS (continued)
agreements are reflected in Reimbursement Due from Manager on the accompanying Statements of Assets and Liabilities.
As of November 30, 2004, the cumulative amounts of waived or reimbursed fees that are subject to possible recoupment by the Investment Manager, and the related expiration dates are as follows:
| November 30, | |||||||||||||||||||
| 2005 | 2006 | 2007 | Total | ||||||||||||||||
| LargeCap Growth | $ | 263,850 | $ | 365,234 | $ | 23,483 | $ | 652,567 | |||||||||||
| MidCap Opportunities | 554,148 | 398,893 | - | 953,041 | |||||||||||||||
| LargeCap Value | - | - | 145,120 | 145,120 | |||||||||||||||
| MidCap Value | - | 20,025 | - | 20,025 | |||||||||||||||
| SmallCap Value | 9,105 | 42,868 | - | 51,973 | |||||||||||||||
| Real Estate | - | 123,825 | - | 123,825 | |||||||||||||||
The Expense Limitation Agreements are contractual and shall renew automatically for one-year terms unless ING Investments, LLC provides written notice of the termination of the Expense Limitation Agreement within 90 days of the end of the then current term.
NOTE 9 - LINE OF CREDIT
All of the Funds included in this report, in addition to certain other funds managed by the Investment Manager have entered into an unsecured committed revolving line of credit agreement (the "Credit Agreement") with The Bank of New York for an aggregate amount of $125,000,000. The proceeds may be used to: (1) temporarily finance the purchase and sale of securities; (2) finance the redemption of shares of an investor in the Funds; and (3) enable the Funds to meet other emergency expenses as defined in the Credit Agreement. The Funds to which the line of credit is available pay a commitment fee equal to 0.09% per annum on the daily unused portion of the committed line amount payable quarterly in arrears.
The following Funds utilized the line of credit during the six months ended November 30, 2004:
| Days Utilized | Approximate Average Daily Balance | Approximate Weighted Average Interest Rate | |||||||||||||
| MidCap Opportunities | 8 | 818,125 | 1.82 | % | |||||||||||
| SmallCap Opportunities | 14 | 1,173,996 | 2.13 | % | |||||||||||
| MagnaCap | 3 | 576,667 | 2.35 | % | |||||||||||
| SmallCap Value | 4 | 1,185,000 | 2.49 | % | |||||||||||
| Covertible | 14 | 1,026,951 | 2.22 | % | |||||||||||
| Real Estate | 1 | 4,300,000 | 1.80 | % | |||||||||||
NOTE 10 - CAPITAL SHARES
Transactions in capital shares and dollars were as follows:
| Class A Shares | Class B Shares | Class C Shares | |||||||||||||||||||||||||
| Six Months Ended November 30, 2004 | Year Ended May 31, 2004 | Six Months Ended November 30, 2004 | Year Ended May 31, 2004 | Six Months Ended November 30, 2004 | Year Ended May 31, 2004 | ||||||||||||||||||||||
| Disciplined LargeCap (Number of Shares) | |||||||||||||||||||||||||||
| Shares sold | 51,840 | 113,903 | 166,227 | 389,459 | 19,552 | 84,889 | |||||||||||||||||||||
| Shares redeemed | (122,484 | ) | (453,135 | ) | (591,037 | ) | (1,178,718 | ) | (274,401 | ) | (1,202,854 | ) | |||||||||||||||
| Net decrease in shares outstanding | (70,644) | (339,232 | ) | (424,810 | ) | (789,259 | ) | (254,849 | ) | (1,117,965 | ) | ||||||||||||||||
| Disciplined LargeCap ($) | |||||||||||||||||||||||||||
| Shares sold | $ | 463,191 | $ | 970,844 | $ | 1,432,573 | $ | 3,217,947 | $ | 174,422 | $ | 690,881 | |||||||||||||||
| Shares redeemed | (1,076,198 | ) | (3,704,827 | ) | (4,937,725 | ) | (9,667,160 | ) | (2,294,763 | ) | (9,984,201 | ) | |||||||||||||||
| Net decrease | $ | (613,007 | ) | $ | (2,733,983 | ) | $ | (3,505,152 | ) | $ | (6,449,213 | ) | $ | (2,120,341 | ) | $ | (9,293,320 | ) | |||||||||
| Class I Shares | |||||||||||||||||||||||||||
| Six Months Ended November 30, 2004 | Year Ended May 31, 2004 | ||||||||||||||||||||||||||
| Disciplined LargeCap (Number of Shares) | |||||||||||||||||||||||||||
| Shares sold | - | - | |||||||||||||||||||||||||
| Shares redeemed | (2,531,779 | ) | - | ||||||||||||||||||||||||
| Net decrease in shares outstanding | (2,531,779 | ) | - | ||||||||||||||||||||||||
| Disciplined LargeCap ($) | |||||||||||||||||||||||||||
| Shares sold | $ | - | $ | - | |||||||||||||||||||||||
| Shares redeemed | (23,141,782 | ) | - | ||||||||||||||||||||||||
| Net decrease | $ | (23,141,782 | ) | $ | - | ||||||||||||||||||||||
77
NOTES TO FINANCIAL STATEMENTS AS OF NOVEMBER 30, 2004 (UNAUDITED) (CONTINUED)
NOTE 10 - CAPITAL SHARES (continued)
| Class A Shares | Class B Shares | Class C Shares | |||||||||||||||||||||||||
| Six Months Ended November 30, 2004 | Year Ended May 31, 2004 | Six Months Ended November 30, 2004 | Year Ended May 31, 2004 | Six Months Ended November 30, 2004 | Year Ended May 31, 2004 | ||||||||||||||||||||||
| LargeCap Growth (Number of Shares) | |||||||||||||||||||||||||||
| Shares sold | 2,189,218 | 4,717,809 | 666,364 | 3,033,622 | 465,836 | 1,665,504 | |||||||||||||||||||||
| Dividends reinvested | 146,425 | - | 111,851 | - | 49,176 | - | |||||||||||||||||||||
| Shares redeemed | (2,168,903 | ) | (1,508,196 | ) | (886,581 | ) | (1,409,436 | ) | (500,211 | ) | (842,766 | ) | |||||||||||||||
| Net increase (decrease) in shares outstanding | 166,740 | 3,209,613 | (108,366 | ) | 1,624,186 | 14,801 | 822,738 | ||||||||||||||||||||
| LargeCap Growth ($) | |||||||||||||||||||||||||||
| Shares sold | $ | 38,528,666 | $ | 77,600,379 | $ | 11,338,359 | $ | 48,308,654 | $ | 7,828,856 | $ | 25,792,950 | |||||||||||||||
| Dividends reinvested | 2,601,968 | - | 1,933,909 | - | 847,791 | - | |||||||||||||||||||||
| Shares redeemed | (37,589,048 | ) | (24,659,524 | ) | (14,849,443 | ) | (22,603,682 | ) | (8,385,013 | ) | (13,587,922 | ) | |||||||||||||||
| Net increase (decrease) | $ | 3,541,586 | $ | 52,940,855 | $ | (1,577,175 | ) | $ | 25,704,972 | $ | 291,634 | $ | 12,205,028 | ||||||||||||||
| Class I Shares | Class Q Shares | ||||||||||||||||||||||||||
| Six Months Ended November 30, 2004 | Year Ended May 31, 2004 | Six Months Ended November 30, 2004 | Year Ended May 31, 2004 | ||||||||||||||||||||||||
| LargeCap Growth (Number of Shares) | |||||||||||||||||||||||||||
| Shares sold | 178,623 | 650,093 | 21,137 | 252,367 | |||||||||||||||||||||||
| Dividends reinvested | 66,417 | - | 7,030 | - | |||||||||||||||||||||||
| Shares redeemed | (119,403 | ) | (202,685 | ) | (64,228 | ) | (348,885 | ) | |||||||||||||||||||
| Net increase (decrease) in shares outstanding | 125,637 | 447,408 | (36,061 | ) | (96,518 | ) | |||||||||||||||||||||
| LargeCap Growth ($) | |||||||||||||||||||||||||||
| Shares sold | $ | 3,231,684 | $ | 11,253,002 | $ | 386,471 | $ | 4,054,610 | |||||||||||||||||||
| Dividends reinvested | 1,216,755 | - | 128,161 | - | |||||||||||||||||||||||
| Shares redeemed | (2,129,403 | ) | (3,512,313 | ) | (1,153,459 | ) | (5,867,902 | ) | |||||||||||||||||||
| Net increase (decrease) | $ | 2,319,036 | $ | 7,740,689 | $ | (638,827 | ) | $ | (1,813,292 | ) | |||||||||||||||||
| Class A Shares | Class B Shares | Class C Shares | |||||||||||||||||||||||||
| Six Months Ended November 30, 2004 | Year Ended May 31, 2004 | Six Months Ended November 30, 2004 | Year Ended May 31, 2004 | Six Months Ended November 30, 2004 | Year Ended May 31, 2004 | ||||||||||||||||||||||
| MidCap Opportunities (Number of Shares) | |||||||||||||||||||||||||||
| Shares sold | 761,487 | 1,036,073 | 168,479 | 733,927 | 83,761 | 329,723 | |||||||||||||||||||||
| Shares issued in merger | - | 7,257,045 | - | 13,295,946 | - | 5,847,535 | |||||||||||||||||||||
| Shares redeemed | (1,712,984 | ) | (1,584,581 | ) | (2,736,169 | ) | (1,932,970 | ) | (1,709,173 | ) | (1,727,198 | ) | |||||||||||||||
| Net increase (decrease) in shares outstanding | (951,497 | ) | 6,708,537 | (2,567,690 | ) | 12,096,903 | (1,625,412 | ) | 4,450,060 | ||||||||||||||||||
| MidCap Opportunities ($) | |||||||||||||||||||||||||||
| Shares sold | $ | 8,917,692 | $ | 11,933,398 | $ | 1,919,978 | $ | 8,169,093 | $ | 943,468 | $ | 3,570,794 | |||||||||||||||
| Shares issued in merger | - | 90,057,643 | - | 158,660,384 | - | 69,438,190 | |||||||||||||||||||||
| Shares redeemed | (20,055,661 | ) | (18,290,662 | ) | (30,803,978 | ) | (21,648,477 | ) | (19,115,772 | ) | (19,175,206 | ) | |||||||||||||||
| Net increase (decrease) | $ | (11,137,969 | ) | $ | 83,700,379 | $ | (28,884,000 | ) | $ | 145,181,000 | $ | (18,172,304 | ) | $ | 53,833,778 | ||||||||||||
78
NOTES TO FINANCIAL STATEMENTS AS OF NOVEMBER 30, 2004 (UNAUDITED) (CONTINUED)
NOTE 10 - CAPITAL SHARES (continued)
| Class I Shares | Class Q Shares | ||||||||||||||||||||||||||
| Six Months Ended November 30, 2004 | Year Ended May 31, 2004 | Six Months Ended November 30, 2004 | Year Ended May 31, 2004 | ||||||||||||||||||||||||
| MidCap Opportunities (Number of Shares) | |||||||||||||||||||||||||||
| Shares sold | 32,492 | 137,735 | 2,513 | 295,722 | |||||||||||||||||||||||
| Shares issued in merger | - | 4,319,450 | - | 17,144 | |||||||||||||||||||||||
| Shares redeemed | (14,345 | ) | (5,294,804 | ) | (28,902 | ) | (390,135 | ) | |||||||||||||||||||
| Net increase (decrease) in shares outstanding | 18,147 | (837,619 | ) | (26,389 | ) | (77,269 | ) | ||||||||||||||||||||
| MidCap Opportunities ($) | |||||||||||||||||||||||||||
| Shares sold | $ | 387,678 | $ | 1,697,334 | $ | 29,182 | $ | 3,125,007 | |||||||||||||||||||
| Shares issued in merger | - | 54,791,843 | - | 214,426 | |||||||||||||||||||||||
| Shares redeemed | (174,631 | ) | (64,078,651 | ) | (335,084 | ) | (4,152,761 | ) | |||||||||||||||||||
| Net increase (decrease) | $ | 213,047 | $ | (7,589,474 | ) | $ | (305,902 | ) | $ | (813,328 | ) | ||||||||||||||||
| Class A Shares | Class B Shares | Class C Shares | |||||||||||||||||||||||||
| Six Months Ended November 30, 2004 | Year Ended May 31, 2004 | Six Months Ended November 30, 2004 | Year Ended May 31, 2004 | Six Months Ended November 30, 2004 | Year Ended May 31, 2004 | ||||||||||||||||||||||
| SmallCap Opportunities (Number of Shares) | |||||||||||||||||||||||||||
| Shares sold | 709,123 | 1,922,887 | 42,965 | 324,368 | 23,097 | 110,776 | |||||||||||||||||||||
| Shares redeemed | (1,074,212 | ) | (3,854,778 | ) | (1,065,657 | ) | (1,650,166 | ) | (394,572 | ) | (1,121,973 | ) | |||||||||||||||
| Net increase (decrease) in shares outstanding | (365,089 | ) | (1,931,891 | ) | (1,022,692 | ) | (1,325,798 | ) | (371,475 | ) | (1,011,197 | ) | |||||||||||||||
| SmallCap Opportunities ($) | |||||||||||||||||||||||||||
| Shares sold | $ | 15,788,738 | $ | 41,773,565 | $ | 882,557 | $ | 6,706,707 | $ | 464,323 | $ | 2,424,180 | |||||||||||||||
| Shares redeemed | (23,735,242 | ) | (80,177,493 | ) | (21,785,610 | ) | (33,798,668 | ) | (8,024,914 | ) | (22,678,422 | ) | |||||||||||||||
| Net increase (decrease) | $ | (7,946,504 | ) | $ | (38,403,928 | ) | $ | (20,903,053 | ) | $ | (27,091,961 | ) | $ | (7,560,591 | ) | $ | (20,254,242 | ) | |||||||||
| Class I Shares | Class Q Shares | ||||||||||||||||||||||||||
| Six Months Ended November 30, 2004 | Year Ended May 31, 2004 | Six Months Ended November 30, 2004 | Year Ended May 31, 2004 | ||||||||||||||||||||||||
| SmallCap Opportunities (Number of Shares) | |||||||||||||||||||||||||||
| Shares sold | 66,536 | 186,283 | - | 1,160 | |||||||||||||||||||||||
| Shares redeemed | (52,813 | ) | (145,691 | ) | (7,358 | ) | (30,438 | ) | |||||||||||||||||||
| Net increase (decrease) in shares outstanding | 13,723 | 40,592 | (7,358 | ) | (29,278 | ) | |||||||||||||||||||||
| SmallCap Opportunities ($) | |||||||||||||||||||||||||||
| Shares sold | $ | 1,501,064 | $ | 4,182,902 | $ | - | $ | 28,326 | |||||||||||||||||||
| Shares redeemed | (1,176,441 | ) | (3,235,935 | ) | (161,769 | ) | (651,974 | ) | |||||||||||||||||||
| Net increase (decrease) | $ | 324,623 | $ | 946,967 | $ | (161,769 | ) | $ | (623,648 | ) | |||||||||||||||||
| Class A Shares | Class B Shares | Class C Shares | Class O | ||||||||||||||||||||||||
| Six Months Ended November 30, 2004 | Year Ended May 31, 2004 | Six Months Ended November 30, 2004 | Year Ended May 31, 2004 | August 25, 2004(1) to November 30, 2004 | September 15, 2004(1) to November 30, 2004 | ||||||||||||||||||||||
| Financial Services (Number of Shares) | |||||||||||||||||||||||||||
| Shares sold | 246,320 | 455,137 | 143,236 | 368,220 | 116 | 40,941 | |||||||||||||||||||||
| Dividends reinvested | 416,930 | 277,726 | 281,714 | 192,903 | 8 | 2,154 | |||||||||||||||||||||
| Shares redeemed | (645,481 | ) | (1,417,033 | ) | (669,976 | ) | (1,350,445 | ) | - | (5,238 | ) | ||||||||||||||||
| Net increase (decrease) in shares outstanding | 17,769 | (684,170 | ) | (245,026 | ) | (789,322 | ) | 124 | 37,857 | ||||||||||||||||||
| Financial Services ($) | |||||||||||||||||||||||||||
| Shares sold | $ | 5,462,060 | $ | 9,841,082 | $ | 3,136,133 | $ | 7,767,033 | $ | 2,522 | $ | 922,895 | |||||||||||||||
| Dividends reinvested | 9,134,930 | 5,632,245 | 6,101,924 | 3,886,990 | 182 | 47,107 | |||||||||||||||||||||
| Shares redeemed | (14,283,946 | ) | (30,228,337 | ) | (14,640,566 | ) | (28,619,770 | ) | - | (117,094 | ) | ||||||||||||||||
| Net increase (decrease) | $ | 313,044 | $ | (14,755,010 | ) | $ | (5,402,509 | ) | $ | (16,965,747 | ) | $ | 2,704 | $ | 852,908 | ||||||||||||
79
NOTES TO FINANCIAL STATEMENTS AS OF NOVEMBER 30, 2004 (UNAUDITED) (CONTINUED)
NOTE 10 - CAPITAL SHARES (continued)
| Class A Shares | Class B Shares | Class C Shares | |||||||||||||||||||||||||
| Six Months Ended November 30, 2004 | February 2, 2004(1) to May 31, 2004 | Six Months Ended November 30, 2004 | February 2, 2004(1) to May 31, 2004 | Six Months Ended November 30, 2004 | February 2, 2004(1) to May 31, 2004 | ||||||||||||||||||||||
| LargeCap Value (Number of Shares) | |||||||||||||||||||||||||||
| Shares sold | 998,189 | 518,761 | 413,099 | 283,191 | 493,764 | 400,925 | |||||||||||||||||||||
| Dividends reinvested | 14,581 | - | 4,783 | - | 6,111 | - | |||||||||||||||||||||
| Shares redeemed | (87,531 | ) | (28,776 | ) | (20,073 | ) | (12,978 | ) | (27,131 | ) | (6,833 | ) | |||||||||||||||
| Net increase in shares outstanding | 925,239 | 489,985 | 397,809 | 270,213 | 472,744 | 394,092 | |||||||||||||||||||||
| LargeCap Value ($) | |||||||||||||||||||||||||||
| Shares sold | $ | 9,803,063 | $ | 5,037,124 | $ | 4,039,690 | $ | 2,755,909 | $ | 4,796,388 | $ | 3,887,843 | |||||||||||||||
| Dividends reinvested | 149,894 | - | 48,999 | - | 62,641 | - | |||||||||||||||||||||
| Shares redeemed | (866,916 | ) | (274,359 | ) | (195,910 | ) | (124,117 | ) | (261,156 | ) | (65,883 | ) | |||||||||||||||
| Net increase | $ | 9,086,041 | $ | 4,762,765 | $ | 3,892,779 | $ | 2,631,792 | $ | 4,597,873 | $ | 3,821,960 | |||||||||||||||
| Class I Shares | |||||||||||||||||||||||||||
| August 2, 2004(1) to November 30, 2004 | |||||||||||||||||||||||||||
| LargeCap Value (Number of Shares) | |||||||||||||||||||||||||||
| Shares sold | 257,733 | ||||||||||||||||||||||||||
| Dividends reinvested | 3,887 | ||||||||||||||||||||||||||
| Shares redeemed | - | ||||||||||||||||||||||||||
| Net increase in shares outstanding | 261,620 | ||||||||||||||||||||||||||
| LargeCap Value ($) | |||||||||||||||||||||||||||
| Shares sold | $ | 2,500,000 | |||||||||||||||||||||||||
| Dividends reinvested | 39,923 | ||||||||||||||||||||||||||
| Shares redeemed | - | ||||||||||||||||||||||||||
| Net increase | $ | 2,539,923 | |||||||||||||||||||||||||
| Class A Shares | Class B Shares | Class C Shares | |||||||||||||||||||||||||
| Six Months Ended November 30, 2004 | Year Ended May 31, 2004 | Six Months Ended November 30, 2004 | Year Ended May 31, 2004 | Six Months Ended November 30, 2004 | Year Ended May 31, 2004 | ||||||||||||||||||||||
| MagnaCap (Number of Shares) | |||||||||||||||||||||||||||
| Shares sold | 1,007,491 | 2,598,002 | 127,846 | 715,715 | 26,553 | 263,235 | |||||||||||||||||||||
| Shares issued in merger | - | 14,679,883 | - | 443,560 | - | 235,540 | |||||||||||||||||||||
| Dividends reinvested | 301,850 | 203,397 | 6,892 | - | 1,810 | - | |||||||||||||||||||||
| Shares redeemed | (2,579,765 | ) | (5,008,192 | ) | (1,089,709 | ) | (1,805,792 | ) | (245,138 | ) | (315,710 | ) | |||||||||||||||
| Net increase (decrease) in shares outstanding | (1,270,424 | ) | 12,473,090 | (954,971 | ) | (646,517 | ) | (216,775 | ) | 183,065 | |||||||||||||||||
| MagnaCap ($) | |||||||||||||||||||||||||||
| Shares sold | $ | 10,456,168 | $ | 25,810,263 | $ | 1,286,003 | $ | 7,106,156 | $ | 268,486 | $ | 2,618,410 | |||||||||||||||
| Shares issued in merger | - | 141,208,171 | - | 4,106,720 | - | 2,182,353 | |||||||||||||||||||||
| Dividends reinvested | 3,192,414 | 1,893,245 | 68,642 | - | 18,047 | - | |||||||||||||||||||||
| Shares redeemed | (26,904,590 | ) | (49,598,073 | ) | (10,937,153 | ) | (17,200,575 | ) | (2,487,389 | ) | (2,831,500 | ) | |||||||||||||||
| Net increase (decrease) | $ | (13,256,008 | ) | $ | 119,313,606 | $ | (9,582,508 | ) | $ | (5,987,699 | ) | $ | (2,200,856 | ) | $ | 1,969,263 | |||||||||||
(1) Commencement of operations.
80
NOTES TO FINANCIAL STATEMENTS AS OF NOVEMBER 30, 2004 (UNAUDITED) (CONTINUED)
NOTE 10 - CAPITAL SHARES (continued)
| Class I Shares | Class M Shares | Class Q Shares | |||||||||||||||||||||||||
| Six Months Ended November 30, 2004 | Year Ended May 31, 2004 | Six Months Ended November 30, 2004 | Year Ended May 31, 2004 | Six Months Ended November 30, 2004 | Year Ended May 31, 2004 | ||||||||||||||||||||||
| MagnaCap (Number of Shares) | |||||||||||||||||||||||||||
| Shares sold | 221,490 | - | 1,636 | 30,375 | - | - | |||||||||||||||||||||
| Shares issued in merger | - | 2 | - | - | - | 807 | |||||||||||||||||||||
| Dividends reinvested | 1,995 | 12 | 1,533 | 506 | - | 4,830 | |||||||||||||||||||||
| Shares redeemed | (14,363 | ) | (2 | ) | (78,720 | ) | (369,836 | ) | (814 | ) | (847,215 | ) | |||||||||||||||
| Net increase (decrease) in shares outstanding | 209,122 | 12 | (75,551 | ) | (338,955 | ) | (814 | ) | (841,578 | ) | |||||||||||||||||
| MagnaCap ($) | |||||||||||||||||||||||||||
| Shares sold | $ | 2,294,178 | $ | - | $ | 16,713 | $ | 275,418 | $ | - | $ | - | |||||||||||||||
| Shares issued in merger | - | 18 | - | - | - | 7,766 | |||||||||||||||||||||
| Dividends reinvested | 21,582 | 111 | 15,813 | 4,431 | - | 42,987 | |||||||||||||||||||||
| Shares redeemed | (152,409 | ) | (21 | ) | (805,860 | ) | (3,437,895 | ) | (8,444 | ) | (7,712,659 | ) | |||||||||||||||
| Net increase (decrease) | $ | 2,163,351 | $ | 108 | $ | (773,334 | ) | $ | (3,158,046 | ) | $ | (8,444 | ) | $ | (7,661,906 | ) | |||||||||||
| Class A Shares | Class B Shares | Class C Shares | |||||||||||||||||||||||||
| Six Months Ended November 30, 2004 | Year Ended May 31, 2004 | Six Months Ended November 30, 2004 | Year Ended May 31, 2004 | Six Months Ended November 30, 2004 | Year Ended May 31, 2004 | ||||||||||||||||||||||
| MidCap Value (Number of Shares) | |||||||||||||||||||||||||||
| Shares sold | 3,579,577 | 4,389,175 | 945,597 | 1,916,154 | 1,434,397 | 1,895,746 | |||||||||||||||||||||
| Dividends reinvested | 385,030 | - | 214,551 | - | 213,558 | - | |||||||||||||||||||||
| Shares redeemed | (2,304,605 | ) | (1,100,635 | ) | (340,795 | ) | (323,780 | ) | (306,631 | ) | (534,781 | ) | |||||||||||||||
| Net increase in shares outstanding | 1,660,002 | 3,288,540 | 819,353 | 1,592,374 | 1,341,324 | 1,360,965 | |||||||||||||||||||||
| MidCap Value ($) | |||||||||||||||||||||||||||
| Shares sold | $ | 41,280,708 | $ | 47,731,690 | $ | 10,710,789 | $ | 20,528,670 | $ | 16,189,607 | $ | 20,537,186 | |||||||||||||||
| Dividends reinvested | 4,301,356 | - | 2,360,063 | - | 2,349,128 | - | |||||||||||||||||||||
| Shares redeemed | (25,637,914 | ) | (12,000,827 | ) | (3,790,654 | ) | (3,379,087 | ) | (3,450,323 | ) | (5,326,519 | ) | |||||||||||||||
| Net increase | $ | 19,944,150 | $ | 35,730,863 | $ | 9,280,198 | $ | 17,149,583 | $ | 15,088,412 | $ | 15,210,667 | |||||||||||||||
| Class I Shares | Class Q Shares | ||||||||||||||||||||||||||
| Six Months Ended November 30, 2004 | Year Ended May 31, 2004 | Six Months Ended November 30, 2004 | Year Ended May 31, 2004 | ||||||||||||||||||||||||
| MidCap Value (Number of Shares) | |||||||||||||||||||||||||||
| Shares sold | - | 167,376 | - | - | |||||||||||||||||||||||
| Dividends reinvested | 13,266 | - | 135 | - | |||||||||||||||||||||||
| Shares redeemed | (11,385 | ) | (5,110 | ) | - | - | |||||||||||||||||||||
| Net increase in shares outstanding | 1,881 | 162,266 | 135 | - | |||||||||||||||||||||||
| MidCap Value ($) | |||||||||||||||||||||||||||
| Shares sold | $ | - | $ | 1,880,019 | $ | - | $ | - | |||||||||||||||||||
| Dividends reinvested | 153,787 | - | 1,507 | - | |||||||||||||||||||||||
| Shares redeemed | (135,498 | ) | (58,828 | ) | - | - | |||||||||||||||||||||
| Net increase | $ | 18,289 | $ | 1,821,191 | $ | 1,507 | $ | - | |||||||||||||||||||
81
NOTES TO FINANCIAL STATEMENTS AS OF NOVEMBER 30, 2004 (UNAUDITED) (CONTINUED)
NOTE 10 - CAPITAL SHARES (continued)
| Class A Shares | Class B Shares | Class C Shares | |||||||||||||||||||||||||
| Six Months Ended November 30, 2004 | Year Ended May 31, 2004 | Six Months Ended November 30, 2004 | Year Ended May 31, 2004 | Six Months Ended November 30, 2004 | Year Ended May 31, 2004 | ||||||||||||||||||||||
| SmallCap Value (Number of Shares) | |||||||||||||||||||||||||||
| Shares sold | 4,168,645 | 2,394,934 | 534,967 | 752,515 | 1,306,443 | 1,373,071 | |||||||||||||||||||||
| Dividends reinvested | 324,833 | 83,905 | 98,206 | 55,029 | 137,839 | 50,521 | |||||||||||||||||||||
| Shares redeemed | (1,343,277 | ) | (409,889 | ) | (149,120 | ) | (201,315 | ) | (274,000 | ) | (455,949 | ) | |||||||||||||||
| Net increase in shares outstanding | 3,150,201 | 2,068,950 | 484,053 | 606,229 | 1,170,282 | 967,643 | |||||||||||||||||||||
| SmallCap Value ($) | |||||||||||||||||||||||||||
| Shares sold | $ | 55,188,734 | $ | 30,977,651 | $ | 7,025,405 | $ | 9,220,990 | $ | 17,041,617 | $ | 17,186,034 | |||||||||||||||
| Dividends reinvested | 4,281,297 | 940,575 | 1,271,774 | 611,375 | 1,783,641 | 560,781 | |||||||||||||||||||||
| Shares redeemed | (17,838,218 | ) | (5,024,204 | ) | (1,908,851 | ) | (2,376,307 | ) | (3,537,268 | ) | (5,504,573 | ) | |||||||||||||||
| Net increase | $ | 41,631,813 | $ | 26,894,022 | $ | 6,388,328 | $ | 7,456,058 | $ | 15,287,990 | $ | 12,242,242 | |||||||||||||||
| Class I Shares | Class Q Shares | ||||||||||||||||||||||||||
| Six Months Ended November 30, 2004 | Year Ended May 31, 2004 | Six Months Ended November 30, 2004 | Year Ended May 31, 2004 | ||||||||||||||||||||||||
| SmallCap Value (Number of Shares) | |||||||||||||||||||||||||||
| Shares sold | 205 | 13,396 | 370 | 4,134 | |||||||||||||||||||||||
| Dividends reinvested | 2,260 | 1,983 | 303 | - | |||||||||||||||||||||||
| Shares redeemed | - | (3,604 | ) | - | - | ||||||||||||||||||||||
| Net increase in shares outstanding | 2,465 | 11,775 | 673 | 4,134 | |||||||||||||||||||||||
| SmallCap Value ($) | |||||||||||||||||||||||||||
| Shares sold | $ | 2,810 | $ | 158,274 | $ | 5,000 | $ | 57,676 | |||||||||||||||||||
| Dividends reinvested | 29,951 | 22,291 | 4,047 | - | |||||||||||||||||||||||
| Shares redeemed | - | (46,393 | ) | - | - | ||||||||||||||||||||||
| Net increase | $ | 32,761 | $ | 134,172 | $ | 9,047 | $ | 57,676 | |||||||||||||||||||
| Class A Shares | Class B Shares | Class C Shares | |||||||||||||||||||||||||
| Six Months Ended November 30, 2004 | Year Ended May 31, 2004 | Six Months Ended November 30, 2004 | Year Ended May 31, 2004 | Six Months Ended November 30, 2004 | Year Ended May 31, 2004 | ||||||||||||||||||||||
| Convertible (Number of Shares) | |||||||||||||||||||||||||||
| Shares sold | 374,702 | 1,298,675 | 140,780 | 739,659 | 112,815 | 557,509 | |||||||||||||||||||||
| Dividends reinvested | 37,842 | 60,283 | 24,184 | 42,820 | 21,723 | 35,305 | |||||||||||||||||||||
| Shares redeemed | (644,139 | ) | (1,003,751 | ) | (672,948 | ) | (1,078,475 | ) | (378,972 | ) | (744,929 | ) | |||||||||||||||
| Net increase (decrease) in shares outstanding | (231,595 | ) | 355,207 | (507,984 | ) | (295,996 | ) | (244,434 | ) | (152,115 | ) | ||||||||||||||||
| Convertible ($) | |||||||||||||||||||||||||||
| Shares sold | $ | 6,753,786 | $ | 22,561,007 | $ | 2,780,427 | $ | 14,414,494 | $ | 2,081,591 | $ | 10,042,116 | |||||||||||||||
| Dividends reinvested | 683,419 | 1,052,348 | 481,004 | 813,670 | 402,497 | 627,776 | |||||||||||||||||||||
| Shares redeemed | (11,570,432 | ) | (17,665,114 | ) | (13,314,403 | ) | (20,919,881 | ) | (6,982,232 | ) | (13,528,070 | ) | |||||||||||||||
| Net increase (decrease) | $ | (4,133,227 | ) | $ | 5,948,241 | $ | (10,052,972 | ) | $ | (5,691,717 | ) | $ | (4,498,144 | ) | $ | (2,858,178 | ) | ||||||||||
| Class Q Shares | |||||||||||||||||||||||||||
| Six Months Ended November 30, 2004 | Year Ended May 31, 2004 | ||||||||||||||||||||||||||
| Convertible (Number of Shares) | |||||||||||||||||||||||||||
| Shares sold | 704 | 27,805 | |||||||||||||||||||||||||
| Dividends reinvested | 2,542 | 5,192 | |||||||||||||||||||||||||
| Shares redeemed | (27,818 | ) | (108,400 | ) | |||||||||||||||||||||||
| Net increase (decrease) in shares outstanding | (24,572 | ) | (75,403 | ) | |||||||||||||||||||||||
| Convertible ($) | |||||||||||||||||||||||||||
| Shares sold | $ | 12,150 | $ | 481,790 | |||||||||||||||||||||||
| Dividends reinvested | 44,534 | 87,716 | |||||||||||||||||||||||||
| Shares redeemed | (483,033 | ) | (1,846,310 | ) | |||||||||||||||||||||||
| Net increase (decrease) | $ | (426,349 | ) | $ | (1,276,804 | ) | |||||||||||||||||||||
82
NOTES TO FINANCIAL STATEMENTS AS OF NOVEMBER 30, 2004 (UNAUDITED) (CONTINUED)
NOTE 10 - CAPITAL SHARES (continued)
| Class A Shares | Class B Shares | Class C Shares | |||||||||||||||||||||||||
| Six Months Ended November 30, 2004 | Year Ended May 31, 2004 | Six Months Ended November 30, 2004 | Year Ended May 31, 2004 | Six Months Ended November 30, 2004 | Year Ended May 31, 2004 | ||||||||||||||||||||||
| Equity and Bond (Number of Shares) | |||||||||||||||||||||||||||
| Shares sold | 106,090 | 887,579 | 108,252 | 437,744 | 7,269 | 141,155 | |||||||||||||||||||||
| Dividends reinvested | 13,886 | 53,776 | 2,096 | 15,763 | 2,345 | 13,925 | |||||||||||||||||||||
| Shares redeemed | (349,668 | ) | (1,045,795 | ) | (290,619 | ) | (782,074 | ) | (132,365 | ) | (285,420 | ) | |||||||||||||||
| Net increase (decrease) in shares outstanding | (229,692 | ) | (104,440 | ) | (180,271 | ) | (328,567 | ) | (122,751 | ) | (130,340 | ) | |||||||||||||||
| Equity and Bond ($) | |||||||||||||||||||||||||||
| Shares sold | $ | 1,325,834 | $ | 10,932,304 | $ | 1,459,661 | $ | 5,924,840 | $ | 86,354 | $ | 1,627,156 | |||||||||||||||
| Dividends reinvested | 174,303 | 644,730 | 28,384 | 201,540 | 28,101 | 158,421 | |||||||||||||||||||||
| Shares redeemed | (4,360,582 | ) | (13,177,888 | ) | (3,908,740 | ) | (10,424,076 | ) | (1,570,483 | ) | (3,316,399 | ) | |||||||||||||||
| Net increase (decrease) | $ | (2,860,445 | ) | $ | (1,600,854 | ) | $ | (2,420,695 | ) | $ | (4,297,696 | ) | $ | (1,456,028 | ) | $ | (1,530,822 | ) | |||||||||
| Class Q Shares | |||||||||||||||||||||||||||
| Six Months Ended November 30, 2004 | Year Ended May 31, 2004 | ||||||||||||||||||||||||||
| Equity and Bond (Number of Shares) | |||||||||||||||||||||||||||
| Shares sold | 1,836 | 22,261 | |||||||||||||||||||||||||
| Dividends reinvested | 169 | 556 | |||||||||||||||||||||||||
| Shares redeemed | (5,240 | ) | (15,787 | ) | |||||||||||||||||||||||
| Net increase (decrease) in shares outstanding | (3,235 | ) | 7,030 | ||||||||||||||||||||||||
| Equity and Bond ($) | |||||||||||||||||||||||||||
| Shares sold | $ | 22,904 | $ | 266,462 | |||||||||||||||||||||||
| Dividends reinvested | 2,104 | 6,646 | |||||||||||||||||||||||||
| Shares redeemed | (65,292 | ) | (192,188 | ) | |||||||||||||||||||||||
| Net increase (decrease) | $ | (40,284 | ) | $ | 80,920 | ||||||||||||||||||||||
| Class A Shares | Class B Shares | Class C Shares | |||||||||||||||||||||||||
| Six Months Ended November 30, 2004 | Year Ended May 31, 2004 | Six Months Ended November 30, 2004 | Year Ended May 31, 2004 | Six Months Ended November 30, 2004 | Year Ended May 31, 2004 | ||||||||||||||||||||||
| Real Estate (Number of Shares) | |||||||||||||||||||||||||||
| Shares sold | 1,296,961 | 1,380,337 | 61,751 | 166,580 | 49,705 | 292,977 | |||||||||||||||||||||
| Dividends reinvested | 185,743 | 43,360 | 13,596 | 3,900 | 15,446 | 12,292 | |||||||||||||||||||||
| Shares redeemed | (82,888 | ) | (213,905 | ) | (14,977 | ) | (28,211 | ) | (35,006 | ) | (112,603 | ) | |||||||||||||||
| Net increase (decrease) in shares outstanding | 1,399,816 | 1,209,792 | 60,370 | 142,269 | 30,145 | 192,666 | |||||||||||||||||||||
| Real Estate ($) | |||||||||||||||||||||||||||
| Shares sold | $ | 17,848,353 | $ | 16,994,026 | $ | 849,451 | $ | 2,087,459 | $ | 688,996 | $ | 3,611,743 | |||||||||||||||
| Dividends reinvested | 2,584,373 | 538,693 | 189,646 | 48,871 | 220,956 | 154,981 | |||||||||||||||||||||
| Shares redeemed | (1,121,002 | ) | (2,582,779 | ) | (204,720 | ) | (344,880 | ) | (483,364 | ) | (1,396,621 | ) | |||||||||||||||
| Net increase (decrease) | $ | 19,311,724 | $ | 14,949,940 | $ | 834,377 | $ | 1,791,450 | $ | 426,588 | $ | 2,370,103 | |||||||||||||||
| Class I Shares | Class O | ||||||||||||||||||||||||||
| Six Months Ended November 30, 2004 | Year Ended May 31, 2004 | September 15, 2004(1) to November 30, 2004 | |||||||||||||||||||||||||
| Real Estate (Number of Shares) | |||||||||||||||||||||||||||
| Shares sold | 1,082,086 | 4,052,833 | 292,138 | ||||||||||||||||||||||||
| Dividends reinvested | 665,515 | 735,129 | 14,205 | ||||||||||||||||||||||||
| Shares redeemed | (829,154 | ) | (3,565,560 | ) | (23,335 | ) | |||||||||||||||||||||
| Net increase (decrease) in shares outstanding | 918,447 | 1,222,402 | 283,008 | ||||||||||||||||||||||||
| Real Estate ($) | |||||||||||||||||||||||||||
| Shares sold | $ | 15,222,356 | $ | 51,206,192 | $ | 4,156,760 | |||||||||||||||||||||
| Dividends reinvested | 9,638,943 | 9,236,584 | 198,427 | ||||||||||||||||||||||||
| Shares redeemed | (11,434,487 | ) | (45,266,438 | ) | (338,564 | ) | |||||||||||||||||||||
| Net increase (decrease) | $ | 13,426,812 | $ | 15,176,338 | $ | 4,016,623 | |||||||||||||||||||||
(1) Commencement of operations.
83
NOTES TO FINANCIAL STATEMENTS AS OF NOVEMBER 30, 2004 (UNAUDITED) (CONTINUED)
NOTE 11 - SECURITIES LENDING
Under an agreement with The Bank of New York ("BNY"), the Funds can lend their securities to approved brokers, dealers and other financial institutions. Loans are collateralized by cash and U.S. Government securities. The collateral must be in an amount equal to at least 105% of the market value of non-U.S. securities loaned and 102% of the market value of U.S. securities loaned. The cash collateral received is invested in approved investments as defined in the Securities Lending Agreement with BNY (the "Agreement"). The collateral received is reflected in the Portfolio of Investments as collateral for securities loaned. Generally, in the event of counterparty default, the Funds have the right to use the collateral to offset losses incurred. The Agreement contains certain guarantees by BNY in the event of counterparty default and/or a borrower's failure to return a loaned security; however there would be a potential loss to the Funds in the event the Funds are delayed or prevented from exercising their right to dispose of the collateral. The Funds bear the risk of loss with respect to the investment of collateral. Engaging in securities lending could have a leveraging effect, which may intensify the credit, market and other risks associated with investing in a Fund. At November 30, 2004, the Funds had securities on loan with the following market values:
| Value of Securities Loaned | Value of Collateral | ||||||||||
| Disciplined LargeCap | $ | 369,244 | $ | 379,129 | |||||||
| LargeCap Growth | 33,248,005 | 34,202,610 | |||||||||
| MidCap Opportunities | 42,247,835 | 43,961,923 | |||||||||
| SmallCap Opportunities | 38,383,888 | 39,670,466 | |||||||||
| MidCap Value | 23,864,087 | 25,264,576 | |||||||||
| SmallCap Value | 31,965,747 | 34,093,573 | |||||||||
| Convertible | 52,558,629 | 53,943,311 | |||||||||
| Real Estate | 8,856,992 | 9,043,070 | |||||||||
NOTE 12 - WHEN ISSUED SECURITIES
The Equity and Bond Fund, at times, may purchase FNMA/GNMA certificates on a delayed delivery, forward or when-issued basis with payment and delivery often taking place a month or more after the initiation of the transaction. It is the Fund's policy to record when-issued FNMA/GNMA certificates (and the corresponding obligation to pay for the securities) at the time the purchase commitment becomes fixed - generally on the trade date. It is also the Fund's policy to segregate assets to cover its commitments for when-issued securities on trade date.
NOTE 13 - FEDERAL INCOME TAXES
The amount of distributions from net investment income and net realized capital gains are determined in accordance with federal income tax regulations, which may differ from accounting principles generally accepted in the United States of America for investment companies. These book/tax differences may be either temporary or permanent. Permanent differences are reclassified within the capital accounts based on their federal tax-basis treatment; temporary differences are not reclassified. Key differences include the treatment of short-term capital gains, foreign currency transactions, organizational and offering expenses, and wash sale deferrals. Distributions in excess of available earnings and profits, current and accumulated, for tax purposes are reported as distributions of paid-in capital.
Dividends paid by the Funds from net investment income and distributions of net realized short-term capital gains are, for federal income tax purposes, taxable as ordinary income to shareholders.
The tax composition of dividends and distributions to shareholders were as follows:
| Six Months Ended November 30, 2004 | |||||||||||
| Ordinary | Long-Term | ||||||||||
| Income | Capital Gains | ||||||||||
| LargeCap Growth | $ | 8,477,756 | $ | - | |||||||
| Financial Services | 657,821 | 20,290,967 | |||||||||
| LargeCap Value | 132,790 | 251,668 | |||||||||
| SmallCap Value | - | 9,699,163 | |||||||||
| Convertible | 2,503,049 | - | |||||||||
| Equity and Bond | 305,502 | - | |||||||||
| Real Estate | 3,676,059 | 14,759,993 | |||||||||
| Year Ended May 31, 2004 | |||||||||||
| Ordinary Income | Long-Term Capital Gains | ||||||||||
| Financial Services | $ | 697,897 | $ | 12,536,310 | |||||||
| MagnaCap | 2,245,213 | - | |||||||||
| SmallCap Value | 536,307 | 2,285,376 | |||||||||
| Convertible | 4,038,953 | - | |||||||||
| Equity and Bond | 1,362,049 | - | |||||||||
| Real Estate(1) | 8,704,727 | 6,564,687 | |||||||||
(1) Composition of dividends and distributions presented herein differ from final amounts based on the Fund's tax year end of December 31, 2003.
84
NOTES TO FINANCIAL STATEMENTS AS OF NOVEMBER 30, 2004 (UNAUDITED) (CONTINUED)
NOTE 13 - FEDERAL INCOME TAXES (continued)
The tax-basis components of distributable earnings and the expiration dates of the capital loss carryforwards which may be used to offset future realized capital gains for federal income tax purposes were as follows at May 31, 2004:
| Undistributed Ordinary Income | Undistributed Long-Term Capital Gain | Unrealized Appreciation/ (Depreciation) | Post October Losses Deferred | Capital Loss Carryforwards | Expiration Dates | ||||||||||||||||||||||
| LargeCap Growth | $ | - | $ | - | $ | 51,263,561 | $ | - | $ | (129,467,771 | ) | 2009 | |||||||||||||||
| (140,176,886 | ) | 2010 | |||||||||||||||||||||||||
| (117,098,211 | ) | 2011 | |||||||||||||||||||||||||
| $ | (386,742,868 | )* | |||||||||||||||||||||||||
| MidCap Opportunities | - | - | 74,959,819 | - | $ | (133,027,987 | ) | 2008 | |||||||||||||||||||
| (94,142,180 | ) | 2009 | |||||||||||||||||||||||||
| (21,217,297 | ) | 2010 | |||||||||||||||||||||||||
| (9,824,346 | ) | 2011 | |||||||||||||||||||||||||
| $ | (258,211,810 | )* | |||||||||||||||||||||||||
| SmallCap Opportunities | - | - | 61,768,589 | - | $ | (1,017,516 | ) | 2008 | |||||||||||||||||||
| (74,206,071 | ) | 2009 | |||||||||||||||||||||||||
| (106,886,755 | ) | 2010 | |||||||||||||||||||||||||
| (167,319,500 | ) | 2011 | |||||||||||||||||||||||||
| $ | (349,429,842 | )* | |||||||||||||||||||||||||
| Disciplined LargeCap | - | - | 4,324,900 | - | $ | (1,279,041 | ) | 2008 | |||||||||||||||||||
| (7,339,303 | ) | 2009 | |||||||||||||||||||||||||
| (10,480,954 | ) | 2010 | |||||||||||||||||||||||||
| (24,371,998 | ) | 2011 | |||||||||||||||||||||||||
| (6,531,058 | ) | 2012 | |||||||||||||||||||||||||
| $ | (50,002,354 | ) | |||||||||||||||||||||||||
| Financial Services | 2,075,255 | 15,819,260 | 44,318,646 | - | $ | - | |||||||||||||||||||||
| LargeCap Value | 54,520 | - | (107,145 | ) | - | $ | - | ||||||||||||||||||||
| MagnaCap | 1,364,430 | - | 48,726,275 | (309,679 | ) | $ | (10,576,002 | ) | 2011 | ||||||||||||||||||
| (58,933,684 | ) | 2012 | |||||||||||||||||||||||||
| $ | (69,509,686 | ) | |||||||||||||||||||||||||
| MidCap Value | 3,838,510 | 2,707,472 | 1,618,665 | - | $ | - | |||||||||||||||||||||
| SmallCap Value | 3,161,587 | 3,491,699 | 5,237,983 | - | $ | - | |||||||||||||||||||||
| Convertible | 1,813,064 | - | 14,601,092 | - | $ | (65,571,008 | ) | 2010 | |||||||||||||||||||
| (15,497,044 | ) | 2011 | |||||||||||||||||||||||||
| $ | (81,068,052 | ) | |||||||||||||||||||||||||
| Equity and Bond | 109,754 | - | 2,551,909 | (1,260 | ) | $ | (2,058,681 | ) | 2010 | ||||||||||||||||||
| (4,569,236 | ) | 2011 | |||||||||||||||||||||||||
| (8,878,256 | ) | 2012 | |||||||||||||||||||||||||
| $ | (15,506,173 | ) | |||||||||||||||||||||||||
| Real Estate(1) | - | - | 30,275,162 | - | $ | - | |||||||||||||||||||||
* Utilization of these capital losses is subject to annual limitations under Section 382 of the Internal Revenue Code.
(1) As of the Fund's tax year ended December 31, 2003.
85
NOTES TO FINANCIAL STATEMENTS AS OF NOVEMBER 30, 2004 (UNAUDITED) (CONTINUED)
NOTE 14 - ILLIQUID SECURITIES
Pursuant to guidelines adopted by the Funds' Board, the following securities have been deemed to be illiquid. The Funds currently limit investment in illiquid securities to 15% of the Fund's net assets, at market value, at time of purchase.
| Fund | Security | Shares | Initial Acquisition Date | Cost | Value | Percent of Net Assets | |||||||||||||||||||||
| Convertible | WinStar Communications, Inc. | 51,932 | 11/6/98 | $ | 2,364,096 | $ | 5 | 0.00 | % | ||||||||||||||||||
| Equity and Bond | Dayton Superior Corp. | 400 | 8/31/01 | 7,446 | 4 | 0.00 | % | ||||||||||||||||||||
| Iridium World Comm | 500 | 8/31/01 | 50,507 | - | 0.00 | % | |||||||||||||||||||||
| North Atlantic Trading Co. | 1,209 | 8/31/01 | 12 | 1 | 0.00 | % | |||||||||||||||||||||
| WinStar Communications, Inc. | 500,000 | 1/10/01 | 386,500 | 50 | 0.00 | % | |||||||||||||||||||||
| $ | 444,465 | $ | 55 | 0.00 | % | ||||||||||||||||||||||
NOTE 15 - REORGANIZATION
On November 8, 2003, MagnaCap as listed below ("Acquiring Fund"), acquired the assets and certain liabilities of the ING Large Company Value Fund, also listed below ("Acquired Fund"), in a tax-free reorganization in exchange for shares of the Acquiring Fund, pursuant to a plan of reorganization approved by the Acquired Fund's shareholders. The number and value of shares issued by the Acquiring Fund are presented in Note 10 - Capital Shares. Net assets and unrealized appreciation as of the reorganization dates were as follows:
| Acquiring Fund | Acquired Funds | Total net assets of Acquired Fund (000's) | Total net assets of Acquiring Fund (000's) | Acquired Fund unrealized appreciation (000's) | Conversion Ratio | ||||||||||||||||||
| MagnaCap | ING Large Company Value Fund | $147,505 | $230,749 | $9,420 | 1.40 | ||||||||||||||||||
The net assets of MagnaCap after the acquisition were approximately $378,254,371.
On April 17, 2004, MidCap Opportunities as listed below ("Acquiring Fund"), acquired the assets and certain liabilities of the ING Growth + Value Fund and the ING Growth Opportunities Fund, also listed below ("Acquired Funds"), in a tax-free reorganization in exchange for shares of the Acquiring Fund, pursuant to a plan of reorganization approved by the Acquired Fund's shareholders. The number and value of shares issued by the Acquiring Fund are presented in Note 10 - Capital Shares. Net assets and unrealized appreciation as of the reorganization dates were as follows:
| Acquiring Fund | Acquired Funds | Total net assets of Acquired Fund (000's) | Total net assets of Acquiring Fund (000's) | Acquired Fund unrealized appreciation (000's) | Conversion Ratio | ||||||||||||||||||
| MidCap Opportunities | ING Growth + Value Fund | $ | 196,927 | $ | 173,487 | $ | 36,128 | 0.79 | |||||||||||||||
| MidCap Opportunities | ING Growth Opportunities Fund | 176,236 | 173,487 | 35,037 | 1.10 | ||||||||||||||||||
The net assets of MidCap Opportunities after the acquisition were approximately $546,649,969.
NOTE 16 - INFORMATION REGARDING TRADING OF ING'S U.S. MUTUAL FUNDS
ING Investments, LLC ("Investments"), the adviser to the ING Funds, has reported to the Boards of Directors/Trustees (the "Board") of the ING Funds that, like many U.S. financial services companies, Investments and certain of its U.S. affiliates have received informal and formal requests for information since September 2003 from various governmental and self-regulatory agencies in connection with investigations related to mutual funds and variable insurance products. Investments has advised the Board that it and its affiliates have cooperated fully with each request.
In addition to responding to regulatory and governmental requests, Investments reported that management of U.S. affiliates of ING Groep N.V., including Investments (collectively, "ING"), on their own initiative, have conducted, through independent special counsel and a national accounting firm, an extensive internal review of trading in ING insurance, retirement, and mutual fund products. The goal of this review was to identify any instances of inappropriate trading in those products by third parties or by ING investment professionals and other ING personnel. ING's internal review related to mutual fund trading is now substantially completed. ING has
86
NOTES TO FINANCIAL STATEMENTS AS OF NOVEMBER 30, 2004 (UNAUDITED) (CONTINUED)
NOTE 16 - INFORMATION REGARDING TRADING OF ING'S U.S. MUTUAL FUNDS (continued)
reported that, of the millions of customer relationships that ING maintains, the internal review identified several isolated arrangements allowing third parties to engage in frequent trading of mutual funds within ING's variable insurance and mutual fund products, and identified other circumstances where frequent trading occurred, despite measures taken by ING intended to combat market timing. ING further reported that each of these arrangements has been terminated and fully disclosed to regulators. The results of the internal review were also reported to the independent members of the Board.
Investments has advised the Board that most of the identified arrangements were initiated prior to ING's acquisition of the businesses in question in the U.S. Investments further reported that the companies in question did not receive special benefits in return for any of these arrangements, which have all been terminated. Based on the internal review, Investments has advised the Board that the identified arrangements do not represent a systemic problem in any of the companies that were involved.
More specifically, Investments reported to the Board that, at this time, these instances include the following:
• ING has identified three arrangements, dating from 1995, 1996 and 1998, under which the administrator to the then-Pilgrim Funds, which subsequently became part of the ING Funds, entered formal and informal arrangements that permitted frequent trading. ING Funds Distributor, LLC ("IFD") has received a notice from the staff of the NASD informing IFD that it has made a preliminary determination to recommend that disciplinary action be brought against IFD and one of its registered persons for violations of the NASD Conduct Rules and certain provisions of the federal securities laws in connection with these arrangements.
• Aeltus Investment Management, Inc. (a predecessor entity to ING Investment Management Co.) has identified two investment professionals who engaged in extensive frequent trading in certain ING Funds. One was subsequently terminated for cause and incurred substantial financial penalties in connection with this conduct and the second has been disciplined.
• ReliaStar Life Insurance Company ("ReliaStar") entered into agreements seven years ago permitting the owner of policies issued by the insurer to engage in frequent trading and to submit orders until 4pm Central Time. In 2001 ReliaStar also entered into a selling agreement with a broker-dealer that engaged in frequent trading. Employees of ING affiliates were terminated and/or disciplined in connection with these matters.
• In 1998, Golden American Life Insurance Company entered into arrangements permitting a broker-dealer to frequently trade up to certain specific limits in a fund available in an ING variable annuity product. No employee responsible for this arrangement remains at the company.
For additional information regarding these matters, you may consult the Form 8-K for each of four life insurance companies, ING USA Annuity and Life Insurance Company, ING Life Insurance and Annuity Company, ING Insurance Company of America, and ReliaStar Life Insurance Company of New York, each filed with the Securities and Exchange Commission (the "SEC") on September 9, 2004. These Forms 8-K can be accessed through the SEC's Web site at http://www.sec.gov. Despite the extensive internal review conducted through independent special counsel and a national accounting firm, there can be no assurance that the instances of inappropriate trading reported to the Board are the only instances of such trading respecting the ING Funds. Investments reported to the Board that ING is committed to conducting its business with the highest standards of ethical conduct with zero tolerance for noncompliance .
Accordingly, Investments advised the Board that ING management was disappointed that its voluntary internal review identified these situations. Viewed in the context of the breadth and magnitude of its U.S. business as a whole, ING management does not believe that ING's acquired companies had systemic ethical or compliance issues in these areas. Nonetheless, Investments reported that given ING's refusal to tolerate any lapses, it has taken the steps noted below, and will continue to seek opportunities to further strengthen the internal controls of its affiliates.
• ING has agreed with the ING Funds to indemnify and hold harmless the ING Funds from all damages resulting from wrongful conduct by ING or its employees or from ING's internal investigation, any investigations conducted by any governmental or self-regulatory agencies, litigation or other formal proceedings, including
87
NOTES TO FINANCIAL STATEMENTS AS OF NOVEMBER 30, 2004 (UNAUDITED) (CONTINUED)
NOTE 16 - INFORMATION REGARDING TRADING OF ING'S U.S. MUTUAL FUNDS (continued)
any proceedings by the Securities and Exchange Commission. Investments reported to the Board that ING management believes that the total amount of any indemnification obligations will not be material to ING or its U.S. business.
• ING updated its Code of Conduct for employees reinforcing its employees' obligation to conduct personal trading activity consistent with the law, disclosed limits, and other requirements.
• The ING Funds, upon a recommendation from ING, updated their respective Codes of Ethics applicable to investment professionals with ING entities and certain other fund personnel, requiring such personnel to pre-clear any purchases or sales of ING Funds that are not systematic in nature (i.e., dividend reinvestment), and imposing minimum holding periods for shares of ING Funds.
• ING instituted excessive trading policies for all customers in its variable insurance and retirement products and for shareholders of the ING Funds sold to the public through financial intermediaries. ING does not make exceptions to these policies.
• ING reorganized and expanded its U.S. Compliance Department, and created an Enterprise Compliance team to enhance controls and consistency in regulatory compliance.
NOTE 17 - SUBSEQUENT EVENTS
Effective January 1, 2005, the expense limitations for Disciplined LargeCap, MidCap Opportunities, SmallCap Opportunities, Convertible and Equity and Bond will be lowered based on the following tables:
| Class A | Class B | Class C | Class I | Class Q | |||||||||||||||||||
| Disciplined Large Cap | 1.36 | % | 2.11 | % | 2.11 | % | 1.11 | % | N/A | ||||||||||||||
| MidCap Opportunities | 1.50 | % | 2.25 | % | 2.25 | % | 1.25 | % | 1.50 | % | |||||||||||||
| SmallCap Opportunities | 1.50 | % | 2.25 | % | 2.25 | % | 1.25 | % | 1.50 | % | |||||||||||||
| Convertible | 1.33 | % | 2.08 | % | 2.08 | % | N/A | 1.33 | % | ||||||||||||||
| Equity and Bond | 1.36 | % | 2.11 | % | 2.11 | % | N/A | 1.36 | % | ||||||||||||||
These expense limitation agreements are for the period beginning January 1, 2005 through December 31, 2005.
Effective January 1, 2005, ING Funds Distributor, LLC has contractually agreed to waive 0.05% of the Distribution Fee for Class A shares of Disciplined LargeCap, MidCap Opportunities and SmallCap Opportunities and 0.10% of the Distribution Fee for Class A shares of Convertible and Equity and Bond. The fee waiver is for the period beginning January 1, 2005 through December 31, 2005.
88
PORTFOLIO OF INVESTMENTS
ING DISCIPLINED LARGECAP FUND AS OF NOVEMBER 30, 2004 (UNAUDITED)
| Shares | Value | ||||||||||||||
| COMMON STOCK: 98.1% | |||||||||||||||
| Aerospace/Defense: 2.8% | |||||||||||||||
| 9,700 | Boeing Co. | $ | 519,629 | ||||||||||||
| 3,350 | General Dynamics Corp. | 363,006 | |||||||||||||
| 8,000 | Raytheon Co. | 322,720 | |||||||||||||
| 2,200 | United Technologies Corp. | 214,676 | |||||||||||||
| 1,420,031 | |||||||||||||||
| Agriculture: 1.3% | |||||||||||||||
| 8,850 | Altria Group, Inc. | 508,786 | |||||||||||||
| 3,691 | UST, Inc. | 162,515 | |||||||||||||
| 671,301 | |||||||||||||||
| Apparel: 1.4% | |||||||||||||||
| 4,200 | @ | Coach, Inc. | 209,328 | ||||||||||||
| 4,150 | Nike, Inc. | 351,339 | |||||||||||||
| 2,500 | VF Corp. | 134,975 | |||||||||||||
| 695,642 | |||||||||||||||
| Auto Manufacturers: 1.3% | |||||||||||||||
| 25,650 | Ford Motor Co. | 363,717 | |||||||||||||
| 3,600 | PACCAR, Inc. | 281,160 | |||||||||||||
| 644,877 | |||||||||||||||
| Banks: 5.5% | |||||||||||||||
| 17,750 | Bank of America Corp. | 821,292 | |||||||||||||
| 3,700 | Comerica, Inc. | 227,550 | |||||||||||||
| 8,400 | KeyCorp | 279,636 | |||||||||||||
| 9,634 | National City Corp. | 357,229 | |||||||||||||
| 8,250 | U.S. Bancorp | 244,448 | |||||||||||||
| 7,050 | Wachovia Corp. | 364,837 | |||||||||||||
| 7,450 | Wells Fargo & Co. | 460,186 | |||||||||||||
| 2,755,178 | |||||||||||||||
| Beverages: 2.3% | |||||||||||||||
| 10,600 | Coca-Cola Co. | 416,686 | |||||||||||||
| 15,150 | PepsiCo, Inc. | 756,137 | |||||||||||||
| 1,172,823 | |||||||||||||||
| Biotechnology: 0.2% | |||||||||||||||
| 1,800 | @ | Amgen, Inc. | 108,072 | ||||||||||||
| 108,072 | |||||||||||||||
| Chemicals: 1.6% | |||||||||||||||
| 4,100 | Dow Chemical Co. | 206,927 | |||||||||||||
| 4,700 | E.I. du Pont de Nemours & Co. | 213,004 | |||||||||||||
| 3,750 | PPG Industries, Inc. | 253,013 | |||||||||||||
| 3,300 | Sherwin-Williams Co. | 147,180 | |||||||||||||
| 820,124 | |||||||||||||||
| Commercial Services: 0.5% | |||||||||||||||
| 2,600 | Equifax, Inc. | 71,812 | |||||||||||||
| 3,400 | H&R Block, Inc. | 162,180 | |||||||||||||
| 233,992 | |||||||||||||||
| Computers: 6.0% | |||||||||||||||
| 5,900 | @ | Apple Computer, Inc. | 395,595 | ||||||||||||
| 21,200 | @ | Dell, Inc. | 859,024 | ||||||||||||
| 13,237 | Hewlett-Packard Co. | 264,740 | |||||||||||||
| 12,550 | International Business Machines Corp. | 1,182,711 | |||||||||||||
| 12,700 | @,X | Seagate Technology | 0 | ||||||||||||
| 61,600 | @ | Sun Microsystems, Inc. | 341,880 | ||||||||||||
| 3,043,950 | |||||||||||||||
| Shares | Value | ||||||||||||||
| Cosmetics/Personal Care: 3.1% | |||||||||||||||
| 11,800 | Gillette Co. | $ | 513,182 | ||||||||||||
| 19,800 | Procter & Gamble Co. | 1,058,904 | |||||||||||||
| 1,572,086 | |||||||||||||||
| Distribution/Wholesale: 0.6% | |||||||||||||||
| 3,800 | Genuine Parts Co. | 164,958 | |||||||||||||
| 1,950 | W.W. Grainger, Inc. | 120,627 | |||||||||||||
| 285,585 | |||||||||||||||
| Diversified Financial Services: 6.2% | |||||||||||||||
| 5,650 | American Express Co. | 314,762 | |||||||||||||
| 4,050 | Capital One Financial Corp. | 318,249 | |||||||||||||
| 4,850 | CIT Group, Inc. | 207,338 | |||||||||||||
| 21,850 | Citigroup, Inc. | 977,787 | |||||||||||||
| 10,150 | Countrywide Financial Corp. | 337,081 | |||||||||||||
| 4,250 | Fannie Mae | 291,975 | |||||||||||||
| 4,250 | Lehman Brothers Holdings, Inc. | 356,064 | |||||||||||||
| 4,100 | Merrill Lynch & Co., Inc. | 228,411 | |||||||||||||
| 6,000 | @ | Providian Financial Corp. | 96,300 | ||||||||||||
| 3,127,967 | |||||||||||||||
| Electric: 2.8% | |||||||||||||||
| 11,700 | @ | AES Corp. | 143,208 | ||||||||||||
| 3,700 | Constellation Energy Group, Inc. | 161,690 | |||||||||||||
| 12,550 | Duke Energy Corp. | 317,264 | |||||||||||||
| 6,500 | Edison Intl. | 207,350 | |||||||||||||
| 2,500 | Exelon Corp. | 104,275 | |||||||||||||
| 3,565 | PPL Corp. | 185,202 | |||||||||||||
| 4,450 | TXU Corp. | 279,549 | |||||||||||||
| 1,398,538 | |||||||||||||||
| Electronics: 0.2% | |||||||||||||||
| 3,350 | @ | Thermo Electron Corp. | 101,338 | ||||||||||||
| 101,338 | |||||||||||||||
| Food: 0.8% | |||||||||||||||
| 3,350 | SUPERVALU, Inc. | 105,827 | |||||||||||||
| 4,428 | Wm. Wrigley Jr. Co. | 304,646 | |||||||||||||
| 410,473 | |||||||||||||||
| Forest Products and Paper: 0.8% | |||||||||||||||
| 1,900 | Louisiana-Pacific Corp. | 46,493 | |||||||||||||
| 1,050 | Temple-Inland, Inc. | 62,570 | |||||||||||||
| 4,500 | Weyerhaeuser Co. | 297,000 | |||||||||||||
| 406,063 | |||||||||||||||
| Gas: 0.3% | |||||||||||||||
| 4,550 | L | Sempra Energy | 168,259 | ||||||||||||
| 168,259 | |||||||||||||||
| Hand/Machine Tools: 0.3% | |||||||||||||||
| 1,700 | Black & Decker Corp. | 142,953 | |||||||||||||
| 142,953 | |||||||||||||||
| Healthcare-Products: 3.6% | |||||||||||||||
| 5,100 | Becton Dickinson & Co. | 279,378 | |||||||||||||
| 21,450 | Johnson & Johnson | 1,293,864 | |||||||||||||
| 5,350 | Medtronic, Inc. | 257,068 | |||||||||||||
| 1,830,310 | |||||||||||||||
See Accompanying Notes to Financial Statements
89
PORTFOLIO OF INVESTMENTS
ING DISCIPLINED LARGECAP FUND AS OF NOVEMBER 30, 2004 (UNAUDITED) (CONTINUED)
| Shares | Value | ||||||||||||||
| Healthcare-Services: 3.2% | |||||||||||||||
| 2,750 | Aetna, Inc. | $ | 325,903 | ||||||||||||
| 3,250 | @ | Humana, Inc. | 80,665 | ||||||||||||
| 7,050 | UnitedHealth Group, Inc. | 584,092 | |||||||||||||
| 2,750 | @ | WellPoint Health Networks, Inc. | 344,025 | ||||||||||||
| 2,750 | @ | WellPoint, Inc. | 278,658 | ||||||||||||
| 1,613,343 | |||||||||||||||
| Household Products/Wares: 0.5% | |||||||||||||||
| 4,700 | Clorox Co. | 259,064 | |||||||||||||
| 259,064 | |||||||||||||||
| Insurance: 6.1% | |||||||||||||||
| 19,050 | American International Group, Inc. | 1,206,817 | |||||||||||||
| 3,700 | Chubb Corp. | 281,977 | |||||||||||||
| 3,200 | CIGNA Corp. | 224,064 | |||||||||||||
| 3,600 | Lincoln National Corp. | 165,672 | |||||||||||||
| 3,959 | Loews Corp. | 276,774 | |||||||||||||
| 10,150 | MetLife, Inc. | 395,849 | |||||||||||||
| 7,750 | Prudential Financial, Inc. | 379,362 | |||||||||||||
| 2,950 | Safeco Corp. | 142,987 | |||||||||||||
| 3,073,502 | |||||||||||||||
| Internet: 1.8% | |||||||||||||||
| 2,800 | @ | eBay, Inc. | 314,860 | ||||||||||||
| 5,450 | @ | Symantec Corp. | 347,765 | ||||||||||||
| 5,850 | @ | Yahoo!, Inc. | 220,077 | ||||||||||||
| 882,702 | |||||||||||||||
| Iron/Steel: 0.2% | |||||||||||||||
| 2,300 | United States Steel Corp. | 120,428 | |||||||||||||
| 120,428 | |||||||||||||||
| Leisure Time: 0.4% | |||||||||||||||
| 2,700 | Carnival Corp. | 143,127 | |||||||||||||
| 3,100 | Sabre Holdings Corp. | 71,548 | |||||||||||||
| 214,675 | |||||||||||||||
| Lodging: 0.5% | |||||||||||||||
| 4,600 | Marriott Intl., Inc. | 261,510 | |||||||||||||
| 261,510 | |||||||||||||||
| Machinery-Diversified: 0.2% | |||||||||||||||
| 1,000 | Cummins, Inc. | 79,620 | |||||||||||||
| 79,620 | |||||||||||||||
| Media: 2.3% | |||||||||||||||
| 9,800 | @ | Comcast Corp. | 294,392 | ||||||||||||
| 3,500 | McGraw-Hill Cos., Inc. | 307,055 | |||||||||||||
| 19,550 | @ | Time Warner, Inc. | 346,231 | ||||||||||||
| 8,700 | Walt Disney Co. | 233,856 | |||||||||||||
| 1,181,534 | |||||||||||||||
| Mining: 0.4% | |||||||||||||||
| 2,100 | Phelps Dodge Corp. | 203,973 | |||||||||||||
| 203,973 | |||||||||||||||
| Miscellaneous Manufacturing: 5.0% | |||||||||||||||
| 3,500 | 3M Co. | 278,565 | |||||||||||||
| 6,050 | L | Eastman Kodak Co. | 197,896 | ||||||||||||
| 45,100 | General Electric Co. | 1,594,736 | |||||||||||||
| 4,200 | Honeywell International, Inc. | 148,386 | |||||||||||||
| 8,700 | @@ | Tyco Intl. Ltd. | 295,539 | ||||||||||||
| 2,515,122 | |||||||||||||||
| Shares | Value | ||||||||||||||
| Oil and Gas: 8.8% | |||||||||||||||
| 3,950 | Anadarko Petroleum Corp. | $ | 274,920 | ||||||||||||
| 6,200 | Burlington Resources, Inc. | 287,742 | |||||||||||||
| 15,350 | ChevronTexaco Corp. | 838,110 | |||||||||||||
| 2,678 | ConocoPhillips | 243,671 | |||||||||||||
| 7,200 | Devon Energy Corp. | 298,224 | |||||||||||||
| 36,400 | S | Exxon Mobil Corp. | 1,865,499 | ||||||||||||
| 1,650 | Sunoco, Inc. | 136,224 | |||||||||||||
| 5,100 | Unocal Corp. | 234,804 | |||||||||||||
| 4,800 | Valero Energy Corp. | 224,592 | |||||||||||||
| 4,403,786 | |||||||||||||||
| Pharmaceuticals: 4.7% | |||||||||||||||
| 6,950 | Abbott Laboratories | 291,622 | |||||||||||||
| 2,450 | AmerisourceBergen Corp. | 144,403 | |||||||||||||
| 8,250 | @ | Caremark Rx, Inc. | 295,020 | ||||||||||||
| 5,050 | Eli Lilly & Co. | 269,317 | |||||||||||||
| 9,650 | Merck & Co., Inc. | 270,393 | |||||||||||||
| 32,390 | Pfizer, Inc. | 899,470 | |||||||||||||
| 5,500 | Wyeth | 219,285 | |||||||||||||
| 2,389,510 | |||||||||||||||
| Pipelines: 0.1% | |||||||||||||||
| 10,850 | @,L | Dynegy, Inc. | 61,303 | ||||||||||||
| 61,303 | |||||||||||||||
| Retail: 8.8% | |||||||||||||||
| 4,300 | Circuit City Stores, Inc. | 67,037 | |||||||||||||
| 7,450 | Costco Wholesale Corp. | 362,070 | |||||||||||||
| 15,100 | Gap, Inc. | 329,935 | |||||||||||||
| 18,450 | Home Depot, Inc. | 770,288 | |||||||||||||
| 6,150 | J.C. Penney Co., Inc. Holding Co. | 237,390 | |||||||||||||
| 10,000 | @ | Limited Brands, Inc. | 244,400 | ||||||||||||
| 15,250 | McDonald's Corp. | 468,785 | |||||||||||||
| 9,300 | Staples, Inc. | 296,763 | |||||||||||||
| 6,450 | @ | Starbucks Corp. | 362,877 | ||||||||||||
| 3,800 | Target Corp. | 194,636 | |||||||||||||
| 5,350 | @ | Toys R US, Inc. | 103,469 | ||||||||||||
| 18,350 | Wal-Mart Stores, Inc. | 955,300 | |||||||||||||
| 4,392,950 | |||||||||||||||
| Semiconductors: 1.2% | |||||||||||||||
| 26,750 | Intel Corp. | 597,863 | |||||||||||||
| 597,863 | |||||||||||||||
| Software: 4.7% | |||||||||||||||
| 2,650 | @ | Autodesk, Inc. | 173,337 | ||||||||||||
| 5,100 | @ | BMC Software, Inc. | 94,758 | ||||||||||||
| 10,000 | @ | Compuware Corp. | 57,700 | ||||||||||||
| 46,650 | Microsoft Corp. | 1,250,686 | |||||||||||||
| 50,950 | @ | Oracle Corp. | 645,027 | ||||||||||||
| 5,100 | @ | Parametric Technology Corp. | 29,835 | ||||||||||||
| 12,050 | @ | Siebel Systems, Inc. | 121,464 | ||||||||||||
| 2,372,807 | |||||||||||||||
| Telecommunications: 5.4% | |||||||||||||||
| 9,200 | Alltel Corp. | 521,548 | |||||||||||||
| 28,900 | @ | Cisco Systems, Inc. | 540,719 | ||||||||||||
| 27,250 | Motorola, Inc. | 524,835 | |||||||||||||
| 7,150 | Qualcomm, Inc. | 297,583 | |||||||||||||
| 20,050 | Verizon Communications, Inc. | 826,661 | |||||||||||||
| 2,711,346 | |||||||||||||||
See Accompanying Notes to Financial Statements
90
PORTFOLIO OF INVESTMENTS
ING DISCIPLINED LARGECAP FUND AS OF NOVEMBER 30, 2004 (UNAUDITED) (CONTINUED)
| Shares | Value | ||||||||||||||
| Transportation: 2.2% | |||||||||||||||
| 4,150 | FedEx Corp. | $ | 394,375 | ||||||||||||
| 8,000 | Norfolk Southern Corp. | 274,640 | |||||||||||||
| 5,000 | United Parcel Service, Inc. | 420,750 | |||||||||||||
| 1,089,765 | |||||||||||||||
| Total Common Stock (Cost $45,032,128) | 49,434,365 | ||||||||||||||
| Principal Amount | Value | ||||||||||||||
SHORT-TERM INVESTMENTS: 2.6%
| Repurchase Agreement: 1.8% | |||||||||||||||
| $902,000 | Goldman Sachs Repurchase Agreement 11/30/04, 2.060%, due 12/01/04, $902,052 to be received upon repurchase (Collateralized by $870,000 Federal Home Loan Mortgage Corporation, 5.500%, Market Value plus accrued interest $920,569, due 07/15/06) | | 902,000 | ||||||||||||
| Total Repurchase Agreement (Cost $902,000) | | 902,000 | |||||||||||||
| Securities Lending Collateralcc: 0.8% | |||||||||||||||
| 379,129 | The Bank of New York Institutional Cash Reserves Fund | | 379,129 | ||||||||||||
| Total Securities Lending Collateral (Cost $379,129) | | 379,129 | |||||||||||||
| Total Short-Term Investments (Cost $1,281,129) | | 1,281,129 | |||||||||||||
| Total Investments In Securities (Cost $46,313,257)* | 100.7 | % | $50,715,494 | ||||||||||||
| Other Assets and Liabilities-Net | (0.7 | ) | (341,100 | ) | |||||||||||
| Net Assets | 100.0 | % | $ | 50,374,394 | |||||||||||
@ Non-income producing security
@@ Foreign issuer
cc Securities purchased with cash collateral for securities loaned.
L Loaned security, a portion or all of the security is on loan at November 30, 2004.
S Segregated assets for futures collateral.
X Fair value determined by ING Funds Valuation Committee appointed by the Funds' Board of Directors/Trustees.
* Cost for federal income tax purposes is $46,585,594. Net unrealized appreciation consists of:
| Gross Unrealized Appreciation | $ | 5,254,608 | |||||
| Gross Unrealized Depreciation | (1,124,708 | ) | |||||
| Net Unrealized Appreciation | $ | 4,129,900 | |||||
Information concerning open futures contracts for the ING Discipline LargeCap Fund at November 30, 2004 is shown below:
| Long Contracts | No. of Contracts | Notional Market Value | Expiration Date | Unrealized Gain | |||||||||||||||
| S&P 500 | 3 | $ | 880,575 | 12/16/04 | $ | 648 | |||||||||||||
See Accompanying Notes to Financial Statements
91
PORTFOLIO OF INVESTMENTS
ING LARGECAP GROWTH FUND AS OF NOVEMBER 30, 2004 (UNAUDITED)
| Shares | Value | ||||||||||||||
| COMMON STOCK: 98.2% | |||||||||||||||
| Advertising: 2.2% | |||||||||||||||
| 89,110 | Omnicom Group, Inc. | $ | 7,217,910 | ||||||||||||
| 7,217,910 | |||||||||||||||
| Aerospace/Defense: 1.0% | |||||||||||||||
| 30,300 | General Dynamics Corp. | 3,283,308 | |||||||||||||
| 3,283,308 | |||||||||||||||
| Apparel: 0.0% | |||||||||||||||
| 2,600 | @ | Coach, Inc. | 129,584 | ||||||||||||
| 129,584 | |||||||||||||||
| Auto Parts and Equipment: 1.0% | |||||||||||||||
| 51,370 | Johnson Controls, Inc. | 3,154,118 | |||||||||||||
| 3,154,118 | |||||||||||||||
| Biotechnology: 0.8% | |||||||||||||||
| 44,130 | @ | Genzyme Corp. | 2,471,721 | ||||||||||||
| 2,471,721 | |||||||||||||||
| Commercial Services: 7.5% | |||||||||||||||
| 142,970 | @,@@ | Accenture Ltd. - Class A | 3,708,642 | ||||||||||||
| 208,940 | @,L | Apollo Group, Inc. | 16,652,517 | ||||||||||||
| 46,110 | Moody's Corp. | 3,723,383 | |||||||||||||
| 24,084,542 | |||||||||||||||
| Computers: 10.7% | |||||||||||||||
| 327,290 | @ | Dell, Inc. | 13,261,791 | ||||||||||||
| 37,130 | @ | Lexmark Intl., Inc. | 3,152,337 | ||||||||||||
| 203,510 | @,@@ | Research In Motion Ltd. | 18,106,285 | ||||||||||||
| 34,520,413 | |||||||||||||||
| Cosmetics/Personal Care: 1.8% | |||||||||||||||
| 131,430 | Gillette Co. | 5,715,891 | |||||||||||||
| 5,715,891 | |||||||||||||||
| Distribution/Wholesale: 3.0% | |||||||||||||||
| 148,690 | CDW Corp. | 9,771,907 | |||||||||||||
| 9,771,907 | |||||||||||||||
| Diversified Financial Services: 11.4% | |||||||||||||||
| 40,680 | Capital One Financial Corp. | 3,196,634 | |||||||||||||
| 136,570 | Citigroup, Inc. | 6,111,508 | |||||||||||||
| 472,388 | Countrywide Financial Corp. | 15,688,006 | |||||||||||||
| 74,400 | Franklin Resources, Inc. | 4,882,872 | |||||||||||||
| 97,170 | Freddie Mac | 6,632,824 | |||||||||||||
| 36,511,844 | |||||||||||||||
| Healthcare-Products: 7.7% | |||||||||||||||
| 225,100 | Guidant Corp. | 14,593,233 | |||||||||||||
| 209,800 | Medtronic, Inc. | 10,080,890 | |||||||||||||
| 24,674,123 | |||||||||||||||
| Home Builders: 0.9% | |||||||||||||||
| 67,900 | Lennar Corp. | 3,050,747 | |||||||||||||
| 3,050,747 | |||||||||||||||
| Insurance: 0.5% | |||||||||||||||
| 17,160 | Progressive Corp. | 1,561,388 | |||||||||||||
| 1,561,388 | |||||||||||||||
| Shares | Value | ||||||||||||||
| Internet: 9.6% | |||||||||||||||
| 127,210 | @,L | eBay, Inc. | $ | 14,304,765 | |||||||||||
| 436,550 | @ | Yahoo!, Inc. | 16,423,011 | ||||||||||||
| 30,727,776 | |||||||||||||||
| Media: 2.9% | |||||||||||||||
| 254,040 | @,L | XM Satellite Radio Holdings, Inc. | 9,376,616 | ||||||||||||
| 9,376,616 | |||||||||||||||
| Miscellaneous Manufacturing: 3.7% | |||||||||||||||
| 74,770 | Danaher Corp. | 4,252,918 | |||||||||||||
| 211,760 | General Electric Co. | 7,487,833 | |||||||||||||
| 11,740,751 | |||||||||||||||
| Oil and Gas: 1.2% | |||||||||||||||
| 70,050 | @@ | Petro-Canada | 3,999,855 | ||||||||||||
| 3,999,855 | |||||||||||||||
| Pharmaceuticals: 11.1% | |||||||||||||||
| 141,880 | Abbott Laboratories | 5,953,285 | |||||||||||||
| 283,300 | @,@@,L | AstraZeneca PLC ADR | 11,159,186 | ||||||||||||
| 109,500 | @,@@,L | Elan Corp. PLC ADR | 2,890,800 | ||||||||||||
| 134,550 | Eli Lilly & Co. | 7,175,552 | |||||||||||||
| 39,840 | @ | Forest Laboratories, Inc. | 1,552,565 | ||||||||||||
| 81,680 | @ | Gilead Sciences, Inc. | 2,814,693 | ||||||||||||
| 221,220 | Schering-Plough Corp. | 3,948,777 | |||||||||||||
| 35,494,858 | |||||||||||||||
| Retail: 5.1% | |||||||||||||||
| 81,680 | @,L | Autozone, Inc. | 6,991,808 | ||||||||||||
| 85,890 | Best Buy Co., Inc. | 4,842,478 | |||||||||||||
| 56,660 | Lowe's Cos., Inc. | 3,134,998 | |||||||||||||
| 39,100 | L | PETsMART, Inc. | 1,339,957 | ||||||||||||
| 16,309,241 | |||||||||||||||
| Semiconductors: 1.8% | |||||||||||||||
| 186,850 | L | Xilinx, Inc. | 5,833,457 | ||||||||||||
| 5,833,457 | |||||||||||||||
| Software: 10.7% | |||||||||||||||
| 242,960 | @,L | Electronic Arts, Inc. | 11,880,744 | ||||||||||||
| 258,700 | First Data Corp. | 10,629,983 | |||||||||||||
| 305,990 | Microsoft Corp. | 8,203,592 | |||||||||||||
| 38,760 | @,L | Pixar, Inc. | 3,514,369 | ||||||||||||
| 34,228,688 | |||||||||||||||
| Telecommunications: 3.6% | |||||||||||||||
| 68,860 | @,@@ | America Movil SA de CV ADR | 3,216,451 | ||||||||||||
| 445,670 | @ | Cisco Systems, Inc. | 8,338,485 | ||||||||||||
| 11,554,936 | |||||||||||||||
| Total Common Stock (Cost $259,342,091) | 315,413,674 | ||||||||||||||
See Accompanying Notes to Financial Statements
92
PORTFOLIO OF INVESTMENTS
ING LARGECAP GROWTH FUND AS OF NOVEMBER 30, 2004 (UNAUDITED) (CONTINUED)
| Principal Amount | Value | ||||||||||||||
| SHORT-TERM INVESTMENTS: 10.7% | |||||||||||||||
| Securities Lending Collateralcc: 10.7% | |||||||||||||||
| $ | 34,202,610 | The Bank of New York | |||||||||||||
| Institutional Cash | |||||||||||||||
| Reserves Fund | $ | 34,202,610 | |||||||||||||
| Total Short-Term Investments (Cost $34,202,610) | | 34,202,610 | |||||||||||||
| Total Investments In Securities (Cost $293,544,701)* | �� | 108.9 | % | $349,616,284 | |||||||||||
| Other Assets and Liabilities-Net | (8.9 | ) | (28,459,421 | ) | |||||||||||
| Net Assets | 100.0 | % | $ | 321,156,863 | |||||||||||
@ Non-income producing security
@@ Foreign issuer
ADR American Depositary Receipt
cc Security purchased with cash collateral for securities loaned.
L Loaned security, a portion or all of the security is on loan at November 30, 2004.
* Cost for federal income tax purposes is $303,679,987. Net unrealized appreciation consists of:
| Gross Unrealized Appreciation | $ | 51,664,500 | |||||
| Gross Unrealized Depreciation | (5,728,203 | ) | |||||
| Net Unrealized Appreciation | $ | 45,936,297 | |||||
See Accompanying Notes to Financial Statements
93
PORTFOLIO OF INVESTMENTS
ING MIDCAP OPPORTUNITIES FUND AS OF NOVEMBER 30, 2004 (UNAUDITED)
| Shares | Value | ||||||||||||||
| COMMON STOCK: 97.8% | |||||||||||||||
| Advertising: 0.6% | |||||||||||||||
| 42,200 | @ | Getty Images, Inc. | $ | 2,458,150 | |||||||||||
| 2,458,150 | |||||||||||||||
| Apparel: 3.1% | |||||||||||||||
| 172,500 | @ | Coach, Inc. | 8,597,400 | ||||||||||||
| 109,500 | Polo Ralph Lauren Corp. | 4,313,205 | |||||||||||||
| 12,910,605 | |||||||||||||||
| Auto Parts and Equipment: 1.2% | |||||||||||||||
| 98,800 | L | BorgWarner Inc | 4,945,928 | ||||||||||||
| 4,945,928 | |||||||||||||||
| Banks: 0.5% | |||||||||||||||
| 32,600 | Zions Bancorporation | 2,167,900 | |||||||||||||
| 2,167,900 | |||||||||||||||
| Biotechnology: 3.3% | |||||||||||||||
| 197,520 | @ | Celgene Corp. | 5,415,998 | ||||||||||||
| 85,000 | @ | Charles River Laboratories Intl., Inc. | 3,973,750 | ||||||||||||
| 97,200 | @,L | Millipore Corp. | 4,735,584 | ||||||||||||
| 14,125,332 | |||||||||||||||
| Building Materials: 1.2% | |||||||||||||||
| 130,500 | @ | American Standard Cos., Inc. | 5,081,670 | ||||||||||||
| 5,081,670 | |||||||||||||||
| Coal: 1.4% | |||||||||||||||
| 72,900 | Peabody Energy Corp. | 6,050,700 | |||||||||||||
| 6,050,700 | |||||||||||||||
| Commercial Services: 4.8% | |||||||||||||||
| 120,300 | @ | Alliance Data Systems Corp. | 5,160,870 | ||||||||||||
| 100,000 | @ | CoStar Group, Inc. | 4,380,000 | ||||||||||||
| 133,200 | @ | Education Management Corp. | 4,414,248 | ||||||||||||
| 156,061 | @ | Laureate Education, Inc. | 6,147,243 | ||||||||||||
| 20,102,361 | |||||||||||||||
| Computers: 3.5% | |||||||||||||||
| 63,100 | @ | Anteon Intl. Corp. | 2,335,962 | ||||||||||||
| 121,600 | @ | CACI Intl., Inc. | 7,555,008 | ||||||||||||
| 140,700 | @,L | palmOne, Inc. | 4,930,128 | ||||||||||||
| 14,821,098 | |||||||||||||||
| Distribution/Wholesale: 1.1% | |||||||||||||||
| 135,056 | Hughes Supply, Inc. | 4,440,641 | |||||||||||||
| 4,440,641 | |||||||||||||||
| Diversified Financial Services: 1.4% | |||||||||||||||
| 414,100 | @ | Ameritrade Holding Corp. | 5,768,413 | ||||||||||||
| 5,768,413 | |||||||||||||||
| Electrical Components and Equipment: 1.0% | |||||||||||||||
| 129,700 | Ametek, Inc. | 4,238,596 | |||||||||||||
| 4,238,596 | |||||||||||||||
| Electronics: 2.7% | |||||||||||||||
| 88,000 | @,L | Arrow Electronics, Inc. | 2,158,640 | ||||||||||||
| 66,250 | @ | Benchmark Electronics, Inc. | 2,322,063 | ||||||||||||
| 147,000 | @ | Waters Corp. | 6,859,020 | ||||||||||||
| 11,339,723 | |||||||||||||||
| Shares | Value | ||||||||||||||
| Hand/Machine Tools: 0.5% | |||||||||||||||
| 48,200 | Stanley Works | $ | 2,253,832 | ||||||||||||
| 2,253,832 | |||||||||||||||
| Healthcare-Products: 8.2% | |||||||||||||||
| 90,000 | @ | Gen-Probe, Inc. | 3,591,000 | ||||||||||||
| 120,400 | @ | Inamed Corp. | 6,459,460 | ||||||||||||
| 151,200 | @,L | Patterson Cos., Inc. | 6,178,032 | ||||||||||||
| 185,830 | @ | St. Jude Medical, Inc. | 7,087,556 | ||||||||||||
| 130,400 | @,L | Varian Medical Systems, Inc. | 5,487,232 | ||||||||||||
| 70,000 | @ | Zimmer Holdings, Inc. | 5,712,000 | ||||||||||||
| 34,515,280 | |||||||||||||||
| Healthcare-Services: 6.1% | |||||||||||||||
| 22,800 | Aetna, Inc. | 2,702,028 | |||||||||||||
| 88,450 | @ | Amsurg Corp. | 2,274,050 | ||||||||||||
| 184,500 | @ | Community Health Systems, Inc. | 5,101,425 | ||||||||||||
| 47,300 | L | Quest Diagnostics, Inc. | 4,434,375 | ||||||||||||
| 320,000 | Select Medical Corp. | 5,584,000 | |||||||||||||
| 114,800 | @ | WellChoice, Inc. | 5,624,052 | ||||||||||||
| 25,719,930 | |||||||||||||||
| Home Furnishings: 2.1% | |||||||||||||||
| 72,000 | Harman Intl. Industries, Inc. | 8,845,200 | |||||||||||||
| 8,845,200 | |||||||||||||||
| Household Products/Wares: 1.1% | |||||||||||||||
| 150,600 | @,L | Yankee Candle Co., Inc. | 4,587,276 | ||||||||||||
| 4,587,276 | |||||||||||||||
| Insurance: 2.5% | |||||||||||||||
| 26,700 | AMBAC Financial Group, Inc. | 2,171,511 | |||||||||||||
| 74,500 | L | MBIA, Inc. | 4,467,020 | ||||||||||||
| 96,700 | @ | Proassurance Corp. | 3,776,135 | ||||||||||||
| 10,414,666 | |||||||||||||||
| Internet: 2.6% | |||||||||||||||
| 332,800 | @,L | Akamai Technologies, Inc. | 4,309,760 | ||||||||||||
| 78,400 | @,L | Ask Jeeves, Inc. | 2,025,856 | ||||||||||||
| 402,100 | @ | TIBCO Software, Inc. | 4,624,150 | ||||||||||||
| 10,959,766 | |||||||||||||||
| Iron/Steel: 1.2% | |||||||||||||||
| 99,500 | Nucor Corp. | 5,263,550 | |||||||||||||
| 5,263,550 | |||||||||||||||
| Leisure Time: 1.0% | |||||||||||||||
| 63,500 | Polaris Industries, Inc. | 4,184,650 | |||||||||||||
| 4,184,650 | |||||||||||||||
| Lodging: 1.3% | |||||||||||||||
| 91,300 | L | Harrah's Entertainment, Inc. | 5,605,820 | ||||||||||||
| 5,605,820 | |||||||||||||||
| Machinery-Diversified: 1.8% | |||||||||||||||
| 157,300 | Rockwell Automation, Inc. | 7,440,290 | |||||||||||||
| 7,440,290 | |||||||||||||||
| Miscellaneous Manufacturing: 3.5% | |||||||||||||||
| 98,500 | L | Danaher Corp. | 5,602,680 | ||||||||||||
| 70,800 | Donaldson Co., Inc. | 2,194,800 | |||||||||||||
| 29,200 | ITT Industries, Inc. | 2,485,504 | |||||||||||||
| 115,500 | Pentair, Inc. | 4,622,310 | |||||||||||||
| 14,905,294 | |||||||||||||||
See Accompanying Notes to Financial Statements
94
PORTFOLIO OF INVESTMENTS
ING MIDCAP OPPORTUNITIES FUND AS OF NOVEMBER 30, 2004 (UNAUDITED) (CONTINUED)
| Shares | Value | ||||||||||||||
| Office/Business Equipment: 0.9% | |||||||||||||||
| 256,800 | @,L | Xerox Corp. | $ | 3,934,176 | |||||||||||
| 3,934,176 | |||||||||||||||
| Oil and Gas: 7.7% | |||||||||||||||
| 63,730 | Apache Corp. | 3,445,244 | |||||||||||||
| 399,300 | Chesapeake Energy Corp. | 7,187,400 | |||||||||||||
| 26,600 | Murphy Oil Corp. | 2,269,246 | |||||||||||||
| 67,255 | @,@@ | Nabors Industries Ltd. | 3,497,260 | ||||||||||||
| 70,400 | Patina Oil & Gas Corp. | 2,337,280 | |||||||||||||
| 348,600 | Patterson-UTI Energy, Inc. | 6,972,000 | |||||||||||||
| 190,575 | XTO Energy, Inc. | 6,927,401 | |||||||||||||
| 32,635,831 | |||||||||||||||
| Oil and Gas Services: 1.8% | |||||||||||||||
| 93,000 | BJ Services Co. | 4,712,310 | |||||||||||||
| 50,500 | @,L | Smith Intl., Inc. | 3,058,785 | ||||||||||||
| 7,771,095 | |||||||||||||||
| Pharmaceuticals: 0.5% | |||||||||||||||
| 74,300 | @ | MGI Pharma, Inc. | 2,005,357 | ||||||||||||
| 2,005,357 | |||||||||||||||
| Retail: 12.0% | |||||||||||||||
| 51,400 | @,L | Advance Auto Parts, Inc. | 2,120,764 | ||||||||||||
| 159,550 | Applebees Intl., Inc. | 4,100,435 | |||||||||||||
| 159,100 | @,L | Chico's FAS, Inc. | 6,141,260 | ||||||||||||
| 279,400 | Foot Locker, Inc. | 7,258,812 | |||||||||||||
| 240,200 | L | Michaels Stores, Inc. | 6,564,666 | ||||||||||||
| 88,700 | L | MSC Industrial Direct Co. | 3,159,494 | ||||||||||||
| 93,100 | @ | Pacific Sunwear of California, Inc. | 2,067,751 | ||||||||||||
| 58,700 | @,L | Panera Bread Co. | 2,344,478 | ||||||||||||
| 158,600 | L | PETsMART, Inc. | 5,435,222 | ||||||||||||
| 102,000 | Regis Corp. | 4,554,300 | |||||||||||||
| 255,000 | @ | Sonic Corp. | 7,438,350 | ||||||||||||
| 51,185,532 | |||||||||||||||
| Savings and Loans: 2.7% | |||||||||||||||
| 130,700 | Independence Community Bank Corp. | 5,552,136 | |||||||||||||
| 274,400 | L | Sovereign Bancorp, Inc. | 5,995,640 | ||||||||||||
| 11,547,776 | |||||||||||||||
| Semiconductors: 1.8% | |||||||||||||||
| 91,500 | @,L | Altera Corp. | 2,075,220 | ||||||||||||
| 141,800 | L | Linear Technology Corp. | 5,411,088 | ||||||||||||
| 7,486,308 | |||||||||||||||
| Software: 5.5% | |||||||||||||||
| 147,500 | Adobe Systems, Inc. | 8,932,600 | |||||||||||||
| 147,800 | @,L | Avid Technology, Inc. | 8,434,946 | ||||||||||||
| 99,900 | @ | Dun & Bradstreet Corp. | 5,930,064 | ||||||||||||
| 23,297,610 | |||||||||||||||
| Telecommunications: 2.3% | |||||||||||||||
| 328,400 | @,L | Comverse Technology, Inc. | 6,985,068 | ||||||||||||
| 118,600 | @ | Polycom, Inc. | 2,708,824 | ||||||||||||
| 9,693,892 | |||||||||||||||
| Textiles: 2.0% | |||||||||||||||
| 97,200 | @ | Mohawk Industries, Inc. | 8,524,440 | ||||||||||||
| 8,524,440 | |||||||||||||||
| Shares | Value | ||||||||||||||
| Transportation: 2.9% | |||||||||||||||
| 66,100 | CH Robinson Worldwide, Inc. | $ | 3,552,875 | ||||||||||||
| 97,900 | @,L | Forward Air Corp. | 4,537,665 | ||||||||||||
| 102,250 | J.B. Hunt Transport Services, Inc. | 4,110,450 | |||||||||||||
| 12,200,990 | |||||||||||||||
| Total Common Stock (Cost $320,035,411) | 413,429,678 | ||||||||||||||
| Principal Amount | Value | ||||||||||||||
SHORT-TERM INVESTMENTS: 12.6%
| Repurchase Agreement: 2.2% | |||||||||||||||
| $ | 9,091,000 | Goldman Sachs Repurchase Agreement 11/30/04, 2.060%, due 12/01/04, $9,091,520 to be received upon repurchase (Collateralized by $9,290,000 Federal Home Loan Bank, 3.200%, Market Value plus accrued interest $9,273,453, due 11/29/06) | | 9,091,000 | |||||||||||
| Total Repurchase Agreement (Cost $9,091,000) | | 9,091,000 | |||||||||||||
| Securities Lending Collateralcc: 10.4% | |||||||||||||||
| 43,961,923 | The Bank of New York Institutional Cash Reserves Fund | | 43,961,923 | ||||||||||||
| Total Securities Lending Collateral (Cost $43,961,923) | | 43,961,923 | |||||||||||||
| Total Short-Term Investments (Cost $53,052,923) | | 53,052,923 | |||||||||||||
| Total Investments In Securities (Cost $373,088,334)* | 110.4 | % | $466,482,601 | ||||||||||||
| Other Assets and Liabilities-Net | (10.4 | ) | (43,829,150) | ||||||||||||
| Net Assets | 100.0 | % | $ | 422,653,451 | |||||||||||
@ Non-income producing security
@@ Foreign issuer
cc Security purchased with cash collateral for securities loaned.
L Loaned security, a portion or all of the security is on loan at November 30, 2004.
* Cost for federal income tax purposes is $373,133,784. Net unrealized appreciation consists of:
| Gross Unrealized Appreciation | $ | 94,074,065 | |||||
| Gross Unrealized Depreciation | (725,248 | ) | |||||
| Net Unrealized Appreciation | $ | 93,348,817 | |||||
See Accompanying Notes to Financial Statements
95
PORTFOLIO OF INVESTMENTS
ING SMALLCAP OPPORTUNITIES FUND AS OF NOVEMBER 30, 2004 (UNAUDITED)
| Shares | Value | ||||||||||||||
| COMMON STOCK: 98.5% | |||||||||||||||
| Banks: 5.1% | |||||||||||||||
| 202,700 | L | Southwest Bancorp of Texas, Inc. | $ | 4,958,042 | |||||||||||
| 55,500 | L | UCBH Holdings, Inc. | 2,516,370 | ||||||||||||
| 75,900 | Westamerica Bancorporation | 4,414,344 | |||||||||||||
| 11,888,756 | |||||||||||||||
| Biotechnology: 2.7% | |||||||||||||||
| 51,400 | @ | Celgene Corp. | 1,409,388 | ||||||||||||
| 141,100 | @,L | Integra LifeSciences Holdings Corp. | 4,795,989 | ||||||||||||
| 6,205,377 | |||||||||||||||
| Commercial Services: 3.5% | |||||||||||||||
| 72,100 | @ | CoStar Group, Inc. | 3,157,980 | ||||||||||||
| 45,900 | @ | Education Management Corp. | 1,521,126 | ||||||||||||
| 86,057 | @ | Laureate Education, Inc. | 3,389,785 | ||||||||||||
| 8,068,891 | |||||||||||||||
| Computers: 9.1% | |||||||||||||||
| 41,600 | @ | Anteon Intl. Corp. | 1,540,032 | ||||||||||||
| 79,200 | @ | CACI Intl., Inc. | 4,920,696 | ||||||||||||
| 162,000 | @ | Cognizant Technology Solutions Corp. | 6,177,060 | ||||||||||||
| 114,600 | Jack Henry & Associates, Inc. | 2,209,488 | |||||||||||||
| 48,800 | @ | Micros Systems, Inc. | 3,580,456 | ||||||||||||
| 79,000 | @,L | PalmOne, Inc. | 2,768,160 | ||||||||||||
| 21,195,892 | |||||||||||||||
| Distribution/Wholesale: 3.0% | |||||||||||||||
| 42,164 | Hughes Supply, Inc. | 1,386,352 | |||||||||||||
| 173,550 | SCP Pool Corp. | 5,472,032 | |||||||||||||
| 6,858,384 | |||||||||||||||
| Electrical Components and Equipment: 1.1% | |||||||||||||||
| 89,501 | @ | Intermagnetics General Corp. | 2,637,594 | ||||||||||||
| 2,637,594 | |||||||||||||||
| Electronics: 2.4% | |||||||||||||||
| 68,442 | @,L | Benchmark Electronics, Inc. | 2,398,892 | ||||||||||||
| 22,500 | @ | Dionex Corp. | 1,291,275 | ||||||||||||
| 71,400 | @ | Measurement Specialties, Inc. | 1,821,414 | ||||||||||||
| 5,511,581 | |||||||||||||||
| Entertainment: 6.0% | |||||||||||||||
| 83,100 | @,L | Penn National Gaming, Inc. | 4,385,187 | ||||||||||||
| 127,300 | @ | Scientific Games Corp. | 3,042,470 | ||||||||||||
| 141,922 | @,L | Shuffle Master, Inc. | 6,532,670 | ||||||||||||
| 13,960,327 | |||||||||||||||
| Healthcare-Products: 7.2% | |||||||||||||||
| 78,200 | @,L | Arthrocare Corp. | 2,367,114 | ||||||||||||
| 74,300 | @ | Gen-Probe, Inc. | 2,964,570 | ||||||||||||
| 97,800 | @ | Inamed Corp. | 5,246,970 | ||||||||||||
| 157,401 | @,L | Kyphon, Inc. | 3,787,068 | ||||||||||||
| 63,100 | @ | Quinton Cardiology Systems, Inc. | 646,775 | ||||||||||||
| 43,500 | @ | Techne Corp. | 1,616,025 | ||||||||||||
| 12,553 | @,L | TriPath Imaging, Inc. | 90,131 | ||||||||||||
| 16,718,653 | |||||||||||||||
| Shares | Value | ||||||||||||||
| Healthcare-Services: 7.0% | |||||||||||||||
| 214,000 | @ | Amsurg Corp. | $ | 5,501,940 | |||||||||||
| 81,100 | @ | Pediatrix Medical Group, Inc. | 5,052,530 | ||||||||||||
| 152,100 | Select Medical Corp. | 2,654,145 | |||||||||||||
| 77,840 | @ | United Surgical Partners Intl., Inc. | 3,072,345 | ||||||||||||
| 16,280,960 | |||||||||||||||
| Home Builders: 1.1% | |||||||||||||||
| 74,798 | L | Thor Industries, Inc. | 2,498,253 | ||||||||||||
| 2,498,253 | |||||||||||||||
| Household Products/Wares: 1.3% | |||||||||||||||
| 97,600 | @ | Yankee Candle Co., Inc. | 2,972,896 | ||||||||||||
| 2,972,896 | |||||||||||||||
| Insurance: 2.5% | |||||||||||||||
| 54,900 | @ | Philadelphia Consolidated Holding Co. | 3,746,925 | ||||||||||||
| 50,700 | @ | Proassurance Corp. | 1,979,835 | ||||||||||||
| 5,726,760 | |||||||||||||||
| Internet: 4.1% | |||||||||||||||
| 181,800 | @ | Akamai Technologies, Inc. | 2,354,310 | ||||||||||||
| 42,200 | @,L | Ask Jeeves, Inc. | 1,090,448 | ||||||||||||
| 221,200 | @ | TIBCO Software, Inc. | 2,543,800 | ||||||||||||
| 279,700 | @ | ValueClick, Inc. | 3,608,130 | ||||||||||||
| 9,596,688 | |||||||||||||||
| Investment Companies: 2.6% | |||||||||||||||
| 93,050 | @,L | Ishares Russell 2000 Growth Index Fund | 6,066,860 | ||||||||||||
| 6,066,860 | |||||||||||||||
| Leisure Time: 1.0% | |||||||||||||||
| 36,600 | Polaris Industries, Inc. | 2,411,940 | |||||||||||||
| 2,411,940 | |||||||||||||||
| Lodging: 2.3% | |||||||||||||||
| 95,200 | Station Casinos, Inc. | 5,430,208 | |||||||||||||
| 5,430,208 | |||||||||||||||
| Miscellaneous Manufacturing: 2.4% | |||||||||||||||
| 81,800 | @,L | Ceradyne, Inc. | 4,040,920 | ||||||||||||
| 24,570 | @ | Cuno, Inc. | 1,610,072 | ||||||||||||
| 5,650,992 | |||||||||||||||
| Oil and Gas: 6.0% | |||||||||||||||
| 83,100 | Patina Oil & Gas Corp. | 2,758,920 | |||||||||||||
| 125,200 | @ | Southwestern Energy Co. | 6,873,480 | ||||||||||||
| 107,000 | @ | Unit Corp. | 4,239,340 | ||||||||||||
| 13,871,740 | |||||||||||||||
| Oil and Gas Services: 1.2% | |||||||||||||||
| 310,660 | @,L | Input/Output, Inc. | 2,724,488 | ||||||||||||
| 2,724,488 | |||||||||||||||
| Pharmaceuticals: 3.6% | |||||||||||||||
| 117,000 | @,L | HealthExtras, Inc. | 1,868,490 | ||||||||||||
| 84,100 | @ | MGI Pharma, Inc. | 2,269,859 | ||||||||||||
| 227,298 | @,L | VCA Antech, Inc. | 4,218,651 | ||||||||||||
| 8,357,000 | |||||||||||||||
See Accompanying Notes to Financial Statements
96
PORTFOLIO OF INVESTMENTS
ING SMALLCAP OPPORTUNITIES FUND AS OF NOVEMBER 30, 2004 (UNAUDITED) (CONTINUED)
| Shares | Value | ||||||||||||||
| Retail: 12.6% | |||||||||||||||
| 95,000 | L | Applebees Intl., Inc. | $ | 2,441,500 | |||||||||||
| 86,880 | @ | Chico's FAS, Inc. | 3,353,568 | ||||||||||||
| 58,600 | @ | Copart, Inc. | 1,265,760 | ||||||||||||
| 90,400 | @ | Dave & Buster's, Inc. | 1,690,480 | ||||||||||||
| 100,400 | @,L | Dick's Sporting Goods, Inc. | 3,614,400 | ||||||||||||
| 48,284 | @,L | GameStop Corp. | 1,018,310 | ||||||||||||
| 57,800 | MSC Industrial Direct Co. | 2,058,836 | |||||||||||||
| 192,542 | @ | Pacific Sunwear of California, Inc. | 4,276,357 | ||||||||||||
| 31,900 | @,L | Panera Bread Co. | 1,274,086 | ||||||||||||
| 72,800 | @ | PETCO Animal Supplies, Inc. | 2,632,448 | ||||||||||||
| 49,400 | Regis Corp. | 2,205,710 | |||||||||||||
| 121,950 | @ | Sonic Corp. | 3,557,282 | ||||||||||||
| 29,388,737 | |||||||||||||||
| Semiconductors: 1.9% | |||||||||||||||
| 260,600 | @ | Silicon Image, Inc. | 4,378,080 | ||||||||||||
| 4,378,080 | |||||||||||||||
| Software: 5.3% | |||||||||||||||
| 105,100 | @ | Avid Technology, Inc. | 5,998,057 | ||||||||||||
| 42,300 | L | Global Payments, Inc. | 2,333,268 | ||||||||||||
| 271,820 | @ | Witness Systems, Inc. | 4,074,582 | ||||||||||||
| 12,405,907 | |||||||||||||||
| Telecommunications: 2.1% | |||||||||||||||
| 81,044 | @ | Polycom, Inc. | 1,851,045 | ||||||||||||
| 146,500 | @,L | Powerwave Technologies, Inc. | 1,184,892 | ||||||||||||
| 77,200 | @ | Tekelec | 1,807,252 | ||||||||||||
| 4,843,189 | |||||||||||||||
| Transportation: 1.4% | |||||||||||||||
| 67,820 | @ | Forward Air Corp. | 3,143,457 | ||||||||||||
| 3,143,457 | |||||||||||||||
| Total Common Stock (Cost $151,887,763) | 228,793,610 | ||||||||||||||
| Principal Amount | Value | ||||||||||||||
| SHORT-TERM INVESTMENTS: 17.8% | |||||||||||||||
| Repurchase Agreement: 0.7% | |||||||||||||||
| $ | 1,592,000 | Goldman Sachs Repurchase Agreement 11/30/04, 2.060%, due 12/01/04, $1,592,091 to be received upon repurchase (Collateralized by $1,535,000 Federal Home Loan Bank, 5.500%, Market Value plus accrued interest $1,624,222, due 07/15/06) | | 1,592,000 | |||||||||||
| Total Repurchase Agreement (Cost $1,592,000) | | 1,592,000 | |||||||||||||
| Principal Amount | Value | ||||||||||||||
| Securities Lending Collateralcc: 17.1% | |||||||||||||||
| $ | 39,670,466 | The Bank of New York | |||||||||||||
| Institutional Cash | |||||||||||||||
| Reserves Fund | $ | 39,670,466 | |||||||||||||
| Total Securities Lending Collateral (Cost $39,670,466) | | 39,670,466 | |||||||||||||
| Total Short-Term Investments (Cost $41,262,466) | | 41,262,466 | |||||||||||||
| Total Investments In Securities (Cost $193,150,229)* | 116.3 | % | $ | 270,056,076 | |||||||||||
| Other Assets and Liabilities-Net | (16.3 | ) | (37,806,427 | ) | |||||||||||
| Net Assets | 100.0 | % | $ | 232,249,649 | |||||||||||
@ Non-income producing security
@@ Foreign issuer
cc Security purchased with cash collateral for securities loaned.
L Loaned security, a portion or all of the security is on loan at November 30, 2004.
* Cost for federal income tax purposes is $193,359,874. Net unrealized appreciation consists of:
| Gross Unrealized Appreciation | $ | 77,016,023 | |||||
| Gross Unrealized Depreciation | (319,821 | ) | |||||
| Net Unrealized Appreciation | $ | 76,696,202 | |||||
See Accompanying Notes to Financial Statements
97
PORTFOLIO OF INVESTMENTS
ING FINANCIAL SERVICES FUND AS OF NOVEMBER 30, 2004 (UNAUDITED)
| Shares | Value | ||||||||||||||
| COMMON STOCK: 97.9% | |||||||||||||||
| Banks: 22.9% | |||||||||||||||
| 174,622 | Bank of America Corp. | $ | 8,079,760 | ||||||||||||
| 120,733 | City National Corp. | 8,258,137 | |||||||||||||
| 124,785 | Cullen/Frost Bankers, Inc. | 5,978,449 | |||||||||||||
| 120,964 | Northern Trust Corp. | 5,690,147 | |||||||||||||
| 215,000 | Prosperity Bancshares, Inc. | 6,097,400 | |||||||||||||
| 181,895 | The Bank of New York Co., Inc. | 5,986,164 | |||||||||||||
| 289,667 | U.S. Bancorp | 8,582,833 | |||||||||||||
| 76,400 | UnionBanCal Corp. | 4,723,812 | |||||||||||||
| 99,787 | Wachovia Corp. | 5,163,977 | |||||||||||||
| 222,600 | Wells Fargo & Co. | 13,750,003 | |||||||||||||
| 72,310,682 | |||||||||||||||
| Diversified Financial Services: 45.9% | |||||||||||||||
| 146,740 | @ | Accredited Home Lenders Holding Co. | 6,302,483 | ||||||||||||
| 172,778 | @ | Affiliated Managers Group, Inc. | 10,950,669 | ||||||||||||
| 117,800 | American Express Co. | 6,562,638 | |||||||||||||
| 82,700 | Capital One Financial Corp. | 6,498,566 | |||||||||||||
| 150,700 | CIT Group, Inc. | 6,442,425 | |||||||||||||
| 411,200 | Citigroup, Inc. | 18,401,199 | |||||||||||||
| 204,374 | Countrywide Financial Corp. | 6,787,261 | |||||||||||||
| 547,200 | @ | E*TRADE Financial Corp. | 7,584,192 | ||||||||||||
| 111,513 | Fannie Mae | 7,660,943 | |||||||||||||
| 87,218 | Franklin Resources, Inc. | 5,724,117 | |||||||||||||
| 136,700 | Freddie Mac | 9,331,142 | |||||||||||||
| 95,777 | Goldman Sachs Group, Inc. | 10,033,599 | |||||||||||||
| 267,649 | J.P. Morgan Chase & Co. | 10,076,984 | |||||||||||||
| 79,179 | Lehman Brothers Holdings, Inc. | 6,633,617 | |||||||||||||
| 122,767 | MBNA Corp. | 3,260,692 | |||||||||||||
| 153,254 | Merrill Lynch & Co., Inc. | 8,537,780 | |||||||||||||
| 177,950 | Morgan Stanley | 9,030,963 | |||||||||||||
| 82,362 | T. Rowe Price Group, Inc. | 4,872,536 | |||||||||||||
| 144,691,806 | |||||||||||||||
| Home Builders: 2.3% | |||||||||||||||
| 206,650 | DR Horton, Inc. | 7,276,147 | |||||||||||||
| 7,276,147 | |||||||||||||||
| Insurance: 22.9% | |||||||||||||||
| 176,700 | @@ | ACE Ltd. | 7,142,214 | ||||||||||||
| 121,200 | AFLAC, Inc. | 4,559,544 | |||||||||||||
| 96,759 | Allstate Corp. | 4,886,330 | |||||||||||||
| 184,871 | American International Group, Inc. | 11,711,579 | |||||||||||||
| 125,000 | @@ | Endurance Specialty Holdings Ltd. | 4,196,250 | ||||||||||||
| 138,000 | Hartford Financial Services Group, Inc. | 8,832,000 | |||||||||||||
| 139,919 | MetLife, Inc. | 5,456,841 | |||||||||||||
| 164,285 | PMI Group, Inc. | 6,765,256 | |||||||||||||
| 98,000 | Prudential Financial, Inc. | 4,797,100 | |||||||||||||
| 95,449 | Radian Group, Inc. | 4,891,761 | |||||||||||||
| 81,961 | @@ | RenaissanceRe Holdings Ltd. | 4,126,736 | ||||||||||||
| 130,311 | @@ | Willis Group Holdings Ltd. | 4,932,271 | ||||||||||||
| 72,297,882 | |||||||||||||||
| Software: 3.9% | |||||||||||||||
| 189,900 | First Data Corp. | 7,802,991 | |||||||||||||
| 112,724 | @ | Fiserv, Inc. | 4,341,001 | ||||||||||||
| 12,143,992 | |||||||||||||||
| Total Common Stock (Cost $248,702,301) | 308,720,509 | ||||||||||||||
| Principal Amount | Value | ||||||||||||||
| SHORT-TERM INVESTMENTS: 2.3% | |||||||||||||||
| Repurchase Agreement: 2.3% | |||||||||||||||
| $ | 7,334,000 | Morgan Stanley Repurchase | |||||||||||||
| Agreement 11/30/04, 2.070%, | |||||||||||||||
| due 12/01/04, $7,334,422 to be | |||||||||||||||
| received upon repurchase | |||||||||||||||
| (Collateralized by $7,334,422 | |||||||||||||||
| Federal National Mortgage | |||||||||||||||
| Association, 4.625%, Market Value | |||||||||||||||
| plus accrued interest $7,481,234, | |||||||||||||||
| due 05/01/13) | $ | 7,334,000 | |||||||||||||
| Total Short-Term Investments (Cost $7,334,000) | 7,334,000 | ||||||||||||||
| Total Investments In Securities (Cost $256,036,301)* | 100.2 | % | $ | 316,054,509 | |||||||||||
| Other Assets and Liabilities-Net | (0.2 | ) | (741,237 | ) | |||||||||||
| Net Assets | 100.0 | % | $ | 315,313,272 | |||||||||||
@ Non-income producing security
@@ Foreign issuer
* Cost for federal income tax purposes is the same as for financial statement purposes. Net unrealized appreciation consists of:
| Gross Unrealized Appreciation | $ | 63,116,297 | |||||
| Gross Unrealized Depreciation | (3,098,089 | ) | |||||
| Net Unrealized Appreciation | $ | 60,018,208 | |||||
See Accompanying Notes to Financial Statements
98
PORTFOLIO OF INVESTMENTS
ING LARGECAP VALUE FUND AS OF NOVEMBER 30, 2004 (UNAUDITED)
| Shares | Value | ||||||||||||||
| COMMON STOCK: 97.3% | |||||||||||||||
| Agriculture: 5.8% | |||||||||||||||
| 19,650 | Altria Group, Inc. | $ | 1,129,679 | ||||||||||||
| 5,790 | Reynolds American, Inc. | 437,898 | |||||||||||||
| 7,710 | UST, Inc. | 339,471 | |||||||||||||
| 1,907,048 | |||||||||||||||
| Auto Manufacturers: 6.9% | |||||||||||||||
| 80,030 | Ford Motor Co. | 1,134,825 | |||||||||||||
| 29,100 | General Motors Corp. | 1,122,969 | |||||||||||||
| 2,257,794 | |||||||||||||||
| Auto Parts and Equipment: 1.5% | |||||||||||||||
| 54,230 | Delphi Corp. | 488,070 | |||||||||||||
| 488,070 | |||||||||||||||
| Commercial Services: 2.0% | |||||||||||||||
| 22,200 | McKesson Corp. | 656,010 | |||||||||||||
| 656,010 | |||||||||||||||
| Computers: 7.2% | |||||||||||||||
| 43,320 | Electronic Data Systems Corp. | 972,534 | |||||||||||||
| 46,200 | Hewlett-Packard Co. | 924,000 | |||||||||||||
| 41,150 | @ | Unisys Corp. | 472,814 | ||||||||||||
| 2,369,348 | |||||||||||||||
| Diversified Financial Services: 3.6% | |||||||||||||||
| 12,520 | CIT Group, Inc. | 535,230 | |||||||||||||
| 17,390 | J.P. Morgan Chase & Co. | 654,734 | |||||||||||||
| 1,189,964 | |||||||||||||||
| Electric: 0.9% | |||||||||||||||
| 8,340 | American Electric Power Co., Inc. | 284,978 | |||||||||||||
| 284,978 | |||||||||||||||
| Environmental Control: 0.9% | |||||||||||||||
| 9,420 | Waste Management, Inc. | 280,810 | |||||||||||||
| 280,810 | |||||||||||||||
| Food: 12.5% | |||||||||||||||
| 44,730 | Albertson's, Inc. | 1,131,669 | |||||||||||||
| 11,850 | Kraft Foods, Inc. | 405,270 | |||||||||||||
| 76,820 | @ | Kroger Co. | 1,242,948 | ||||||||||||
| 67,120 | @ | Safeway, Inc. | 1,294,073 | ||||||||||||
| 4,073,960 | |||||||||||||||
| Healthcare-Services: 1.9% | |||||||||||||||
| 57,630 | @ | Tenet Healthcare Corp. | 625,286 | ||||||||||||
| 625,286 | |||||||||||||||
| Housewares: 2.4% | |||||||||||||||
| 33,810 | Newell Rubbermaid, Inc. | 780,335 | |||||||||||||
| 780,335 | |||||||||||||||
| Insurance: 8.6% | |||||||||||||||
| 29,470 | AON Corp. | 622,406 | |||||||||||||
| 13,670 | Loews Corp. | 955,670 | |||||||||||||
| 28,400 | Marsh & McLennan Cos., Inc. | 811,956 | |||||||||||||
| 11,440 | Nationwide Financial Services | 429,915 | |||||||||||||
| 2,819,947 | |||||||||||||||
| Office/Business Equipment: 2.1% | |||||||||||||||
| 44,220 | @ | Xerox Corp. | 677,450 | ||||||||||||
| 677,450 | |||||||||||||||
| Shares | Value | ||||||||||||||
| Pharmaceuticals: 16.4% | |||||||||||||||
| 48,550 | Bristol-Myers Squibb Co. | $ | 1,140,925 | ||||||||||||
| 46,300 | Merck & Co., Inc. | 1,297,325 | |||||||||||||
| 41,800 | Pfizer, Inc. | 1,160,786 | |||||||||||||
| 72,590 | Schering-Plough Corp. | 1,295,732 | |||||||||||||
| 11,470 | Wyeth | 457,309 | |||||||||||||
| 5,352,077 | |||||||||||||||
| Pipelines: 3.1% | |||||||||||||||
| 96,880 | El Paso Corp. | 1,011,427 | |||||||||||||
| 1,011,427 | |||||||||||||||
| Retail: 2.4% | |||||||||||||||
| 27,510 | May Department Stores Co. | 773,581 | |||||||||||||
| 773,581 | |||||||||||||||
| Semiconductors: 2.9% | |||||||||||||||
| 85,210 | @ | Micron Technology, Inc. | 944,127 | ||||||||||||
| 944,127 | |||||||||||||||
| Telecommunications: 14.2% | |||||||||||||||
| 47,900 | BellSouth Corp. | 1,284,679 | |||||||||||||
| 181,040 | @ | Lucent Technologies, Inc. | 711,487 | ||||||||||||
| 44,890 | SBC Communications, Inc. | 1,129,881 | |||||||||||||
| 32,830 | Sprint Corp. | 748,852 | |||||||||||||
| 18,780 | Verizon Communications, Inc. | 774,299 | |||||||||||||
| 4,649,198 | |||||||||||||||
| 34,640 | Mattel, Inc. | 656,428 | |||||||||||||
| 656,428 | |||||||||||||||
| Total Common Stock (Cost $30,722,760) | 31,797,838 | ||||||||||||||
| Total Investments In Securities (Cost $30,722,760)* | 97.3 | % | $ | 31,797,838 | |||||||||||
| Other Assets and Liabilities-Net | 2.7 | 887,198 | |||||||||||||
| Net Assets | 100.0 | % | $ | 32,685,036 | |||||||||||
@ Non-income producing security
* Cost for federal income tax purposes is the same as for financial statement purposes. Net unrealized appreciation consists of:
| Gross Unrealized Appreciation | $ | 1,993,776 | |||||
| Gross Unrealized Depreciation | (918,698 | ) | |||||
| Net Unrealized Appreciation | $ | 1,075,078 | |||||
See Accompanying Notes to Financial Statements
99
PORTFOLIO OF INVESTMENTS
ING MAGNACAP FUND AS OF NOVEMBER 30, 2004 (UNAUDITED)
| Shares | Value | ||||||||||||||
| COMMON STOCK: 99.3% | |||||||||||||||
| Aerospace/Defense: 3.6% | |||||||||||||||
| 125,900 | General Dynamics Corp. | $ | 13,642,524 | ||||||||||||
| 13,642,524 | |||||||||||||||
| Agriculture: 3.6% | |||||||||||||||
| 236,015 | Altria Group, Inc. | 13,568,502 | |||||||||||||
| 13,568,502 | |||||||||||||||
| Apparel: 1.8% | |||||||||||||||
| 81,300 | Nike, Inc. | 6,882,858 | |||||||||||||
| 6,882,858 | |||||||||||||||
| Banks: 7.0% | |||||||||||||||
| 300,800 | Bank of America Corp. | 13,918,016 | |||||||||||||
| 203,400 | Wells Fargo & Co. | 12,564,018 | |||||||||||||
| 26,482,034 | |||||||||||||||
| Building Materials: 1.8% | |||||||||||||||
| 198,200 | Masco Corp. | 6,990,514 | |||||||||||||
| 6,990,514 | |||||||||||||||
| Chemicals: 4.6% | |||||||||||||||
| 195,200 | Dow Chemical Co. | 9,851,744 | |||||||||||||
| 165,700 | Praxair, Inc. | 7,439,930 | |||||||||||||
| 17,291,674 | |||||||||||||||
| Computers: 2.0% | |||||||||||||||
| 80,200 | International Business Machines Corp. | 7,558,048 | |||||||||||||
| 7,558,048 | |||||||||||||||
| Cosmetics/Personal Care: 2.9% | |||||||||||||||
| 174,500 | Kimberly-Clark Corp. | 11,099,945 | |||||||||||||
| 11,099,945 | |||||||||||||||
| Diversified Financial Services: 13.3% | |||||||||||||||
| 205,000 | Citigroup, Inc. | 9,173,750 | |||||||||||||
| 165,300 | Fannie Mae | 11,356,110 | |||||||||||||
| 115,000 | Freddie Mac | 7,849,900 | |||||||||||||
| 203,600 | Merrill Lynch & Co., Inc. | 11,342,556 | |||||||||||||
| 201,200 | Morgan Stanley | 10,210,900 | |||||||||||||
| 49,933,216 | |||||||||||||||
| Electrical Components and Equipment: 2.9% | |||||||||||||||
| 166,800 | Emerson Electric Co. | 11,145,576 | |||||||||||||
| 11,145,576 | |||||||||||||||
| Electronics: 2.6% | |||||||||||||||
| 381,300 | @@ | Koninklijke Philips Electronics NV | 9,814,662 | ||||||||||||
| 9,814,662 | |||||||||||||||
| Food: 4.6% | |||||||||||||||
| 182,600 | @@ | Nestle SA ADR | 11,734,442 | ||||||||||||
| 87,500 | @@ | Unilever NV | 5,512,500 | ||||||||||||
| 17,246,942 | |||||||||||||||
| Forest Products and Paper: 1.9% | |||||||||||||||
| 175,800 | International Paper Co. | 7,299,216 | |||||||||||||
| 7,299,216 | |||||||||||||||
| Shares | Value | ||||||||||||||
| Healthcare-Products: 2.3% | |||||||||||||||
| 134,000 | Beckman Coulter, Inc. | $ | 8,771,640 | ||||||||||||
| 8,771,640 | |||||||||||||||
| Healthcare-Services: 2.3% | |||||||||||||||
| 93,400 | Quest Diagnostics, Inc. | 8,756,250 | |||||||||||||
| 8,756,250 | |||||||||||||||
| Insurance: 8.1% | |||||||||||||||
| 189,000 | Allstate Corp. | 9,544,500 | |||||||||||||
| 175,100 | American International Group, Inc. | 11,092,585 | |||||||||||||
| 257,000 | MetLife, Inc. | 10,023,000 | |||||||||||||
| 30,660,085 | |||||||||||||||
| Media: 2.3% | |||||||||||||||
| 106,200 | Gannett Co., Inc. | 8,760,438 | |||||||||||||
| 8,760,438 | |||||||||||||||
| Miscellaneous Manufacturing: 2.7% | |||||||||||||||
| 288,300 | Honeywell Intl., Inc. | 10,185,639 | |||||||||||||
| 10,185,639 | |||||||||||||||
| Oil and Gas: 12.8% | |||||||||||||||
| 184,700 | Apache Corp. | 9,984,882 | |||||||||||||
| 187,500 | @@ | BP PLC ADR | 11,503,125 | ||||||||||||
| 260,900 | ChevronTexaco Corp. | 14,245,140 | |||||||||||||
| 249,400 | Exxon Mobil Corp. | 12,781,750 | |||||||||||||
| 48,514,897 | |||||||||||||||
| Oil and Gas Services: 2.6% | |||||||||||||||
| 235,980 | Halliburton Co. | 9,757,773 | |||||||||||||
| 9,757,773 | |||||||||||||||
| Pharmaceuticals: 1.7% | |||||||||||||||
| 232,200 | Pfizer, Inc. | 6,448,194 | |||||||||||||
| 6,448,194 | |||||||||||||||
| Retail: 2.1% | |||||||||||||||
| 263,400 | McDonald's Corp. | 8,096,916 | |||||||||||||
| 8,096,916 | |||||||||||||||
| Savings and Loans: 5.6% | |||||||||||||||
| 509,300 | Sovereign Bancorp, Inc. | 11,128,205 | |||||||||||||
| 252,100 | Washington Mutual, Inc. | 10,262,991 | |||||||||||||
| 21,391,196 | |||||||||||||||
| Telecommunications: 4.2% | |||||||||||||||
| 295,700 | SBC Communications, Inc. | 7,442,769 | |||||||||||||
| 206,100 | Verizon Communications, Inc. | 8,497,503 | |||||||||||||
| 15,940,272 | |||||||||||||||
| Total Common Stock (Cost $302,128,558) | 376,239,011 | ||||||||||||||
See Accompanying Notes to Financial Statements
100
PORTFOLIO OF INVESTMENTS
ING MAGNACAP FUND AS OF NOVEMBER 30, 2004 (UNAUDITED) (CONTINUED)
| Shares | Value | ||||||||||||||
| SHORT-TERM INVESTMENTS: 0.7% | |||||||||||||||
| Repurchase Agreement: 0.7% | |||||||||||||||
| $ | 2,837,000 | Goldman Sachs Repurchase | |||||||||||||
| Agreement 11/30/04, 2.060%, | |||||||||||||||
| due 12/01/04, $2,837,162 to be | |||||||||||||||
| received upon repurchase | |||||||||||||||
| (Collateralized by $2,735,000 | |||||||||||||||
| Federal Home Loan Mortgage | |||||||||||||||
| Corporation, 5.500%, Market Value | |||||||||||||||
| plus accrued interest $2,893,972, | |||||||||||||||
| due 07/15/06) | $ | 2,837,000 | |||||||||||||
| Total Short-Term Investments (Cost $2,837,000) | 2,837,000 | ||||||||||||||
| Total Investments In Securities (Cost $304,965,558)* | 100.0 | % | $ | 379,076,011 | |||||||||||
| Other Assets and Liabilities-Net | 0.0 | % | (114,266 | ) | |||||||||||
| Net Assets | 100.0 | % | $ | 378,961,745 | |||||||||||
@@ Foreign issuer
ADR American Depositary Receipt
* Cost for federal income tax purposes is the same as for financial statement purposes. Net unrealized appreciation consists of:
| Gross Unrealized Appreciation | $ | 76,661,734 | |||||
| Gross Unrealized Depreciation | (2,551,281 | ) | |||||
| Net Unrealized Appreciation | $ | 74,110,453 | |||||
See Accompanying Notes to Financial Statements
101
PORTFOLIO OF INVESTMENTS
ING MIDCAP VALUE FUND AS OF NOVEMBER 30, 2004 (UNAUDITED)
| Shares | Value | ||||||||||||||
| COMMON STOCK: 96.4% | |||||||||||||||
| Agriculture: 3.9% | |||||||||||||||
| 184,580 | Loews Corp. | $ | 5,426,652 | ||||||||||||
| 25,640 | UST, Inc. | 1,128,929 | |||||||||||||
| 6,555,581 | |||||||||||||||
| Airlines: 3.0% | |||||||||||||||
| 326,840 | @,L | AMR Corp. | 2,951,365 | ||||||||||||
| 296,400 | @,L | Delta Air Lines, Inc. | 2,065,908 | ||||||||||||
| 5,017,273 | |||||||||||||||
| Apparel: 2.1% | |||||||||||||||
| 354,610 | @,@@ | Tommy Hilfiger Corp. | 3,475,178 | ||||||||||||
| 3,475,178 | |||||||||||||||
| Auto Parts and Equipment: 9.8% | |||||||||||||||
| 112,200 | ArvinMeritor, Inc. | 2,462,790 | |||||||||||||
| 100,000 | Dana Corp. | 1,635,000 | |||||||||||||
| 543,730 | @,L | Goodyear Tire & Rubber Co. | 6,861,872 | ||||||||||||
| 644,310 | L | Visteon Corp. | 5,450,863 | ||||||||||||
| 16,410,525 | |||||||||||||||
| Building Materials: 2.4% | |||||||||||||||
| 110,400 | York Intl. Corp. | 4,070,448 | |||||||||||||
| 4,070,448 | |||||||||||||||
| Chemicals: 5.6% | |||||||||||||||
| 96,690 | Great Lakes Chemical Corp. | 2,833,017 | |||||||||||||
| 87,680 | Lubrizol Corp. | 3,029,344 | |||||||||||||
| 156,300 | L | Sensient Technologies Corp. | 3,602,715 | ||||||||||||
| 9,465,076 | |||||||||||||||
| Commercial Services: 6.7% | |||||||||||||||
| 330,300 | @ | Convergys Corp. | 4,911,561 | ||||||||||||
| 49,000 | Kelly Services, Inc. | 1,489,600 | |||||||||||||
| 683,580 | @ | Service Corp. Intl. | 4,826,075 | ||||||||||||
| 11,227,236 | |||||||||||||||
| Computers: 7.4% | |||||||||||||||
| 323,580 | @,L | Synopsys, Inc. | 5,704,715 | ||||||||||||
| 577,590 | @ | Unisys Corp. | 6,636,510 | ||||||||||||
| 12,341,225 | |||||||||||||||
| Diversified Financial Services: 0.6% | |||||||||||||||
| 24,000 | CIT Group, Inc. | 1,026,000 | |||||||||||||
| 1,026,000 | |||||||||||||||
| Electric: 0.0% | |||||||||||||||
| 162,000 | @,L | Mirant Corp. | 59,738 | ||||||||||||
| 59,738 | |||||||||||||||
| Electronics: 1.6% | |||||||||||||||
| 302,700 | @ | Kemet Corp. | 2,681,922 | ||||||||||||
| 2,681,922 | |||||||||||||||
| Food: 4.5% | |||||||||||||||
| 44,000 | L | Albertson's, Inc. | 1,113,200 | ||||||||||||
| 363,330 | @ | Del Monte Foods Co. | 3,942,131 | ||||||||||||
| 606,064 | @,L | Winn-Dixie Stores, Inc. | 2,424,256 | ||||||||||||
| 7,479,587 | |||||||||||||||
| Shares | Value | ||||||||||||||
| Healthcare-Services: 5.3% | |||||||||||||||
| 122,800 | @ | Health Net, Inc. | $ | 3,342,616 | |||||||||||
| 517,030 | @ | Tenet Healthcare Corp. | 5,609,776 | ||||||||||||
| 8,952,392 | |||||||||||||||
| Home Furnishings: 3.0% | |||||||||||||||
| 253,320 | Maytag Corp. | 5,091,732 | |||||||||||||
| 5,091,732 | |||||||||||||||
| Household Products/Wares: 2.1% | |||||||||||||||
| 189,410 | Tupperware Corp. | 3,545,755 | |||||||||||||
| 3,545,755 | |||||||||||||||
| Insurance: 14.0% | |||||||||||||||
| 132,200 | @ | Allmerica Financial Corp. | 4,303,110 | ||||||||||||
| 255,010 | L | Assured Guaranty Ltd. | 4,697,283 | ||||||||||||
| 62,460 | @ | CNA Financial Corp. | 1,630,831 | ||||||||||||
| 69,400 | Nationwide Financial Services | 2,608,052 | |||||||||||||
| 285,550 | L | Phoenix Cos., Inc. | 3,483,710 | ||||||||||||
| 431,350 | L | UnumProvident Corp. | 6,716,119 | ||||||||||||
| 23,439,105 | |||||||||||||||
| Miscellaneous Manufacturing: 2.4% | |||||||||||||||
| 78,600 | Teleflex, Inc. | 3,969,300 | |||||||||||||
| 3,969,300 | |||||||||||||||
| Office/Business Equipment: 2.8% | |||||||||||||||
| 420,420 | IKON Office Solutions, Inc. | 4,742,338 | |||||||||||||
| 4,742,338 | |||||||||||||||
| Pipelines: 3.4% | |||||||||||||||
| 548,193 | El Paso Corp. | 5,723,135 | |||||||||||||
| 5,723,135 | |||||||||||||||
| Retail: 5.2% | |||||||||||||||
| 90,320 | Dillard's, Inc. | 2,274,258 | |||||||||||||
| 135,000 | @,L | Payless Shoesource, Inc. | 1,576,800 | ||||||||||||
| 248,220 | @ | Toys R US, Inc. | 4,800,574 | ||||||||||||
| 8,651,632 | |||||||||||||||
| Semiconductors: 4.3% | |||||||||||||||
| 5,136,390 | @ | Agere Systems, Inc. | 6,985,490 | ||||||||||||
| 19,958 | @,L | Micron Technology, Inc. | 221,135 | ||||||||||||
| 7,206,625 | |||||||||||||||
| Telecommunications: 6.3% | |||||||||||||||
| 1,182,050 | @ | 3Com Corp. | 5,248,302 | ||||||||||||
| 66,550 | CenturyTel, Inc. | 2,190,826 | |||||||||||||
| 878,600 | @ | Cincinnati Bell, Inc. | 3,162,960 | ||||||||||||
| 10,602,088 | |||||||||||||||
| Total Common Stock (Cost $160,486,053) | 161,733,891 | ||||||||||||||
See Accompanying Notes to Financial Statements
102
PORTFOLIO OF INVESTMENTS
ING MIDCAP VALUE FUND AS OF NOVEMBER 30, 2004 (UNAUDITED) (CONTINUED)
| Principal Amount | Value | ||||||||||||||
| SHORT-TERM INVESTMENTS: 15.1% | |||||||||||||||
| Securities Lending Collateralcc: 15.1% | |||||||||||||||
| $ | 25,264,576 | The Bank of New York Institutional Cash Reserves Fund | $ | 25,264,576 | |||||||||||
| Total Short-Term Investments (Cost $25,264,576) | 25,264,576 | ||||||||||||||
| Total Investments In Securities (Cost $185,750,629)* | 111.5 | % | $186,998,467 | ||||||||||||
| Other Assets and Liabilities-Net | (11.5 | ) | (19,227,357 | ) | |||||||||||
| Net Assets | 100.0 | % | $ | 167,771,110 | |||||||||||
@ Non-income producing security
@@ Foreign issuer
cc Securities purchased with cash collateral for securities loaned.
L Loaned security, a portion or all of the security is on loan at November 30, 2004.
* Cost for federal income tax purposes is $185,798,818. Net unrealized appreciation consists of:
| Gross Unrealized Appreciation | $ | 14,562,208 | |||||
| Gross Unrealized Depreciation | (13,362,559 | ) | |||||
| Net Unrealized Appreciation | $ | 1,199,649 | |||||
See Accompanying Notes to Financial Statements
103
PORTFOLIO OF INVESTMENTS
ING SMALLCAP VALUE FUND AS OF NOVEMBER 30, 2004 (UNAUDITED)
| Shares | Value | ||||||||||||||
| COMMON STOCK: 97.2% | |||||||||||||||
| Airlines: 3.0% | |||||||||||||||
| 685,520 | @,L | Delta Air Lines, Inc. | $ | 4,778,074 | |||||||||||
| 4,778,074 | |||||||||||||||
| Apparel: 4.9% | |||||||||||||||
| 94,848 | Oshkosh B'Gosh, Inc. | 1,944,384 | |||||||||||||
| 132,150 | Russell Corp. | 2,423,631 | |||||||||||||
| 353,940 | @,@@ | Tommy Hilfiger Corp. | 3,468,612 | ||||||||||||
| 7,836,627 | |||||||||||||||
| Auto Parts and Equipment: 9.9% | |||||||||||||||
| 110,140 | @ | Aftermarket Technology Corp. | 1,918,639 | ||||||||||||
| 351,779 | @,L | Goodyear Tire & Rubber Co. | 4,439,451 | ||||||||||||
| 140,590 | L | Superior Industries Intl., Inc. | 3,971,668 | ||||||||||||
| 635,290 | Visteon Corp. | 5,374,553 | |||||||||||||
| 15,704,311 | |||||||||||||||
| Building Materials: 2.0% | |||||||||||||||
| 85,490 | York Intl. Corp. | 3,152,016 | |||||||||||||
| 3,152,016 | |||||||||||||||
| Chemicals: 11.4% | |||||||||||||||
| 95,260 | Great Lakes Chemical Corp. | 2,791,118 | |||||||||||||
| 36,000 | Lubrizol Corp. | 1,243,800 | |||||||||||||
| 55,505 | @@ | Octel Corp. | 1,224,440 | ||||||||||||
| 375,260 | @ | PolyOne Corp. | 3,463,650 | ||||||||||||
| 194,590 | Sensient Technologies Corp. | 4,485,300 | |||||||||||||
| 464,700 | Wellman, Inc. | 4,781,762 | |||||||||||||
| 17,990,070 | |||||||||||||||
| Commercial Services: 3.1% | |||||||||||||||
| 95,330 | Kelly Services, Inc. | 2,898,032 | |||||||||||||
| 281,980 | @ | Service Corp. Intl. | 1,990,779 | ||||||||||||
| 4,888,811 | |||||||||||||||
| Computers: 4.1% | |||||||||||||||
| 630,600 | @ | Gateway, Inc. | 4,294,386 | ||||||||||||
| 173,100 | @,L | Mentor Graphics Corp. | 2,172,405 | ||||||||||||
| 6,466,791 | |||||||||||||||
| Electric: 0.3% | |||||||||||||||
| 25,000 | Westar Energy, Inc. | 553,750 | |||||||||||||
| 553,750 | |||||||||||||||
| Electrical Components and Equipment: 2.3% | |||||||||||||||
| 157,780 | Belden CDT, Inc. | 3,658,918 | |||||||||||||
| 3,658,918 | |||||||||||||||
| Electronics: 2.9% | |||||||||||||||
| 517,940 | @ | Kemet Corp. | 4,588,948 | ||||||||||||
| 4,588,948 | |||||||||||||||
| Food: 6.6% | |||||||||||||||
| 125,440 | @ | Del Monte Foods Co. | 1,361,024 | ||||||||||||
| 675,960 | @,L | Interstate Bakeries Corp. | 3,934,087 | ||||||||||||
| 1,304,837 | @,L | Winn-Dixie Stores, Inc. | 5,219,348 | ||||||||||||
| 10,514,459 | |||||||||||||||
| Hand/Machine Tools: 1.1% | |||||||||||||||
| 90,220 | Starrett (L.S.) Co. | 1,793,574 | |||||||||||||
| 1,793,574 | |||||||||||||||
| Shares | Value | ||||||||||||||
| Healthcare-Services: 2.0% | |||||||||||||||
| 560,900 | @,L | OCA, Inc. | $ | 3,208,348 | |||||||||||
| 3,208,348 | |||||||||||||||
| Home Builders: 0.8% | |||||||||||||||
| 127,500 | @ | National RV Holdings, Inc. | 1,240,575 | ||||||||||||
| 1,240,575 | |||||||||||||||
| Home Furnishings: 2.0% | |||||||||||||||
| 157,100 | Maytag Corp. | 3,157,710 | |||||||||||||
| 3,157,710 | |||||||||||||||
| Household Products/Wares: 8.9% | |||||||||||||||
| 125,500 | American Greetings Corp. | 3,340,810 | |||||||||||||
| 695,740 | @,L | Playtex Products, Inc. | 5,218,050 | ||||||||||||
| 64,900 | Russ Berrie & Co., Inc. | 1,475,826 | |||||||||||||
| 220,770 | Tupperware Corp. | 4,132,814 | |||||||||||||
| 14,167,500 | |||||||||||||||
| Insurance: 8.6% | |||||||||||||||
| 73,900 | @ | Allmerica Financial Corp. | 2,405,445 | ||||||||||||
| 164,700 | @@ | Assured Guaranty Ltd. | 3,033,773 | ||||||||||||
| 29,990 | Kansas City Life Insurance Co. | 1,482,706 | |||||||||||||
| 46,020 | Landamerica Financial Group, Inc. | 2,457,468 | |||||||||||||
| 14,545 | @ | National Western Life Insurance Co. | 2,359,054 | ||||||||||||
| 155,260 | L | Phoenix Cos., Inc. | 1,894,172 | ||||||||||||
| 13,632,618 | |||||||||||||||
| Iron/Steel: 0.0% | |||||||||||||||
| 4,154 | L | Ryerson Tull, Inc. | 67,212 | ||||||||||||
| 67,212 | |||||||||||||||
| Leisure Time: 2.2% | |||||||||||||||
| 272,900 | Callaway Golf Co. | 3,209,304 | |||||||||||||
| 19,800 | @ | K2, Inc. | 334,224 | ||||||||||||
| 3,543,528 | |||||||||||||||
| Machinery-Diversified: 5.3% | |||||||||||||||
| 36,290 | Nacco Industries, Inc. | 3,973,392 | |||||||||||||
| 100,840 | Tecumseh Products Co. | 4,416,792 | |||||||||||||
| 8,390,184 | |||||||||||||||
| Mining: 0.0% | |||||||||||||||
| 5,305 | USEC, Inc. | 55,862 | |||||||||||||
| 55,862 | |||||||||||||||
| Miscellaneous Manufacturing: 1.2% | |||||||||||||||
| 33,453 | Federal Signal Corp. | 575,392 | |||||||||||||
| 116,881 | Myers Industries, Inc. | 1,324,261 | |||||||||||||
| 1,899,653 | |||||||||||||||
| Oil and Gas Services: 1.3% | |||||||||||||||
| 59,850 | Tidewater, Inc. | 2,030,711 | |||||||||||||
| 2,030,711 | |||||||||||||||
| Pipelines: 1.8% | |||||||||||||||
| 504,090 | @,L | Dynegy, Inc. | 2,848,109 | ||||||||||||
| 2,848,109 | |||||||||||||||
| Retail: 7.3% | |||||||||||||||
| 182,150 | L | Dillard's, Inc. | 4,586,537 | ||||||||||||
See Accompanying Notes to Financial Statements
104
PORTFOLIO OF INVESTMENTS
ING SMALLCAP VALUE FUND AS OF NOVEMBER 30, 2004 (UNAUDITED) (CONTINUED)
| Shares | Value | ||||||||||||||
| Retail (continued) | |||||||||||||||
| 78,100 | Lone Star Steakhouse & Saloon, Inc. | $ | 2,107,919 | ||||||||||||
| 415,820 | @,L | Payless ShoeSource, Inc. | 4,856,778 | ||||||||||||
| 11,551,234 | |||||||||||||||
| Software: 1.3% | |||||||||||||||
| 133,760 | @ | SPSS, Inc. | 2,138,822 | ||||||||||||
| 2,138,822 | |||||||||||||||
| Telecommunications: 2.9% | |||||||||||||||
| 1,288,633 | @ | Cincinnati Bell, Inc. | 4,639,079 | ||||||||||||
| 4,639,079 | |||||||||||||||
| Total Common Stock (Cost $143,606,519) | 154,497,494 | ||||||||||||||
| Principal Amount | Value | ||||||||||||||
SHORT-TERM INVESTMENTS: 21.4%
| Securities Lending CollateralCC: 21.4% | |||||||||||||||
| $ | 34,093,573 | The Bank of New York Institutional Cash Reserves | 34,093,573 | ||||||||||||
| Total Short-Term Investments (Cost $34,093,573) | 34,093,573 | ||||||||||||||
| Total Investments In Securities (Cost $177,700,092)* | 118.6 | % | $188,591,067 | ||||||||||||
| Other Assets and Liabilities-Net | (18.6 | ) | (29,562,689 | ) | |||||||||||
| Net Assets | 100.0 | % | $ | 159,028,378 | |||||||||||
@ Non-income producing security
@@ Foreign issuer
cc Security purchased with cash collateral for securities loaned.
L Loaned security, a portion or all of the security is on loan at November 30, 2004.
* Cost for federal income tax purposes $177,739,983. Net unrealized Appreciation consists of:
| Gross Unrealized Appreciation | $ | 19,268,214 | |||||
| Gross Unrealized Depreciation | (8,417,130 | ) | |||||
| Net Unrealized Appreciation | $ | 10,851,084 | |||||
See Accompanying Notes to Financial Statements
105
PORTFOLIO OF INVESTMENTS
ING CONVERTIBLE FUND AS OF NOVEMBER 30, 2004 (UNAUDITED)
| Shares | Value | ||||||||||||||
| COMMON STOCK: 9.3% | |||||||||||||||
| Computers: 0.5% | |||||||||||||||
| 1,462,500 | @,@@ | Bull SA | $ | 913,556 | |||||||||||
| 913,556 | |||||||||||||||
| Food: 0.6% | |||||||||||||||
| 35,000 | @ | Dean Foods Co. | 1,108,450 | ||||||||||||
| 1,108,450 | |||||||||||||||
| Healthcare-Services: 2.1% | |||||||||||||||
| 74,600 | @ | Community Health Systems, Inc. | 2,062,690 | ||||||||||||
| 22,800 | @ | WellPoint, Inc. | 2,310,324 | ||||||||||||
| 4,373,014 | |||||||||||||||
| Investment Companies: 2.6% | |||||||||||||||
| 45,000 | @,L | SPDR Trust Series 1 | 5,305,050 | ||||||||||||
| 5,305,050 | |||||||||||||||
| Miscellaneous Manufacturing: 0.6% | |||||||||||||||
| 36,000 | General Electric Co. | 1,272,960 | |||||||||||||
| 1,272,960 | |||||||||||||||
| Retail: 1.6% | |||||||||||||||
| 18,000 | Wal-Mart Stores, Inc. | 937,080 | |||||||||||||
| 60,000 | L | Wendy's Intl., Inc. | 2,140,200 | ||||||||||||
| 3,077,280 | |||||||||||||||
| Telecommunications: 1.3% | |||||||||||||||
| 60,000 | QUALCOMM, Inc. | 2,497,200 | |||||||||||||
| 2,497,200 | |||||||||||||||
| Total Common Stock (Cost $13,462,240) | 18,547,510 | ||||||||||||||
| PREFERRED STOCK: 22.5% | |||||||||||||||
| Auto Manufacturers: 2.8% | |||||||||||||||
| 55,000 | Ford Motor Co. Capital Trust II | 2,884,750 | |||||||||||||
| 105,000 | General Motors Corp. | 2,680,400 | |||||||||||||
| 5,565,150 | |||||||||||||||
| Chemicals: 0.4% | |||||||||||||||
| 960 | Hercules Trust II | 844,800 | |||||||||||||
| 844,800 | |||||||||||||||
| Diversified Financial Services: 1.8% | |||||||||||||||
| 88,300 | Gabelli Asset Management, Inc. | 2,301,981 | |||||||||||||
| 48,000 | Lehman Brothers Holdings, Inc. | 1,233,600 | |||||||||||||
| 3,535,581 | |||||||||||||||
| Food: 1.3% | |||||||||||||||
| 97,500 | Albertson's, Inc. | 2,570,100 | |||||||||||||
| 2,570,100 | |||||||||||||||
| Home Builders: 0.6% | |||||||||||||||
| 25,000 | @ | Fleetwood Capital Trust | 1,131,250 | ||||||||||||
| 1,131,250 | |||||||||||||||
| Shares | Value | ||||||||||||||
| Insurance: 5.9% | |||||||||||||||
| 60,000 | Hartford Financial Services Group, Inc. | $ | 3,703,800 | ||||||||||||
| 67,800 | Reinsurance Group of America | 4,139,190 | |||||||||||||
| 118,000 | Travelers Property Casualty Corp. | 2,725,800 | |||||||||||||
| 40,000 | @@ | XL Capital Ltd. | 987,200 | ||||||||||||
| 11,555,990 | |||||||||||||||
| Media: 2.2% | |||||||||||||||
| 25,000 | @,L | Comcast Corp. | 1,212,500 | ||||||||||||
| 25,200 | Emmis Communications Corp. | 1,146,600 | |||||||||||||
| 1,985 | News Corp Finance Trust II | 1,990,558 | |||||||||||||
| 4,349,658 | |||||||||||||||
| Mining: 0.9% | |||||||||||||||
| 1,900 | Freeport-McMoRan Copper & Gold, Inc. | 1,869,125 | |||||||||||||
| 1,869,125 | |||||||||||||||
| Office/Business Equipment: 0.7% | |||||||||||||||
| 9,900 | @ | Xerox Corp. | 1,357,290 | ||||||||||||
| 1,357,290 | |||||||||||||||
| Oil and Gas: 1.3% | |||||||||||||||
| 24,700 | Chesapeake Energy Corp. | 2,608,950 | |||||||||||||
| 2,608,950 | |||||||||||||||
| Pharmaceuticals: 1.2% | |||||||||||||||
| 44,500 | Omnicare, Inc. | 2,327,350 | |||||||||||||
| 2,327,350 | |||||||||||||||
| Real Estate Investment Trusts: 1.6% | |||||||||||||||
| 83,000 | @ | FelCor Lodging Trust, Inc. | 2,058,400 | ||||||||||||
| 20,000 | Simon Property Group Inc | 1,142,600 | |||||||||||||
| 3,201,000 | |||||||||||||||
| Savings and Loans: 0.9% | |||||||||||||||
| 39,200 | Sovereign Capital Trust II | 1,871,800 | |||||||||||||
| 1,871,800 | |||||||||||||||
| Telecommunications: 0.9% | |||||||||||||||
| 1,500 | @ | Lucent Technologies Capital Trust I | 1,825,410 | ||||||||||||
| 51,932 | @,I,X,** | Winstar Communications, Inc. | 5 | ||||||||||||
| 1,825,415 | |||||||||||||||
| Total Preferred Stock (Cost $43,418,025) | 44,613,459 | ||||||||||||||
| Principal Amount | Value | ||||||||||||||
| CONVERTIBLE CORPORATE BONDS: 67.1% | |||||||||||||||
| Advertising: 1.1% | |||||||||||||||
| $ | 2,000,000 | L | Lamar Advertising Co., 2.875%, due 12/31/10 | 2,132,500 | |||||||||||
| 2,132,500 | |||||||||||||||
| Aerospace/Defense: 1.3% | |||||||||||||||
| 3,460,000 | Spacehab, Inc., 8.000%, due 10/15/07 | 2,633,925 | |||||||||||||
| 2,633,925 | |||||||||||||||
See Accompanying Notes to Financial Statements
106
PORTFOLIO OF INVESTMENTS
ING CONVERTIBLE FUND AS OF NOVEMBER 30, 2004 (UNAUDITED) (CONTINUED)
| Principal Amount | Value | ||||||||||||||
| Apparel: 1.0% | |||||||||||||||
| $ | 1,950,000 | # | Reebok International Ltd., 2.000%, due 05/01/24 | $ | 2,025,563 | ||||||||||
| 2,025,563 | |||||||||||||||
| Auto Parts and Equipment: 1.0% | |||||||||||||||
| 4,000,000 | L | Lear Corp.,4.000%, due 02/20/22 | 2,035,000 | ||||||||||||
| 2,035,000 | |||||||||||||||
| Biotechnology: 0.6% | |||||||||||||||
| 1,485,000 | ICOS Corp., 2.000%, due 07/01/23 | 1,254,825 | |||||||||||||
| 1,254,825 | |||||||||||||||
| Distribution/Wholesale: 2.0% | |||||||||||||||
| 3,500,000 | Costco Wholesale Corp., 0.000%, due 08/19/17 | 3,876,250 | |||||||||||||
| 3,876,250 | |||||||||||||||
| Diversified Financial Services: 3.9% | |||||||||||||||
| 980,000 | @@,#,L | AngloGold Holdings PLC, 2.375%, due 02/27/09 | 951,825 | ||||||||||||
| 4,875,000 | Lehman Brothers Holdings, Inc., 1.000%, due 09/16/10 | 4,424,062 | |||||||||||||
| 2,000,000 | @@,# | RepCon Lux SA, 4.500%, due 01/26/11 | 2,410,466 | ||||||||||||
| 7,786,353 | |||||||||||||||
| Electric: 2.3% | |||||||||||||||
| 2,000,000 | L | Centerpoint Energy, Inc., 3.750%, due 05/15/23 | 2,285,000 | ||||||||||||
| 2,000,000 | L | PPL Energy Supply LLC, 2.625%, due 05/15/23 | 2,222,500 | ||||||||||||
| 4,507,500 | |||||||||||||||
| Electrical Components and Equipment: 1.9% | |||||||||||||||
| 1,000,000 | @@ | ABB Intl. Finance Ltd., 4.625%, due 05/16/07 | 1,052,500 | ||||||||||||
| 3,000,000 | GrafTech Intl. Ltd., 1.625%, due 01/15/24 | 2,707,500 | |||||||||||||
| 3,760,000 | |||||||||||||||
| Electronics: 3.6% | |||||||||||||||
| 1,500,000 | @@,L | Flextronics Intl. Ltd., 1.000%, due 08/01/10 | 1,753,125 | ||||||||||||
| 3,000,000 | L | Flir Systems, Inc., 3.000%, due 06/01/23 | 4,462,500 | ||||||||||||
| 100,000,000 | @@ | Sony Corp., 0.000%, due 12/18/08 | 972,972 | ||||||||||||
| 7,188,597 | |||||||||||||||
| Energy-Alternate Sources: 1.3% | |||||||||||||||
| 2,000,000 | #,L | Headwaters, Inc., 2.875%, due 06/01/16 | 2,560,000 | ||||||||||||
| 2,560,000 | |||||||||||||||
| Entertainment: 0.9% | |||||||||||||||
| 1,500,000 | International Game Technology, 0.860%, due 01/29/33 | 1,179,375 | |||||||||||||
| 480,000 | Six Flags, Inc., 4.500%, due 05/15/15 | 511,200 | |||||||||||||
| 1,690,575 | |||||||||||||||
| Principal Amount | Value | ||||||||||||||
| Environmental Control: 1.5% | |||||||||||||||
| $ | 3,500,000 | L | Allied Waste Industries, Inc., 4.250%, due 04/15/34 | $ | 3,049,375 | ||||||||||
| 3,049,375 | |||||||||||||||
| Healthcare-Products: 3.1% | |||||||||||||||
| 2,900,000 | L | Advanced Medical Optics Inc, 2.500%, due 07/15/24 | 3,200,875 | ||||||||||||
| 2,900,000 | # | Henry Schein, Inc., 3.000%, due 08/15/34 | 3,026,875 | ||||||||||||
| 6,227,750 | |||||||||||||||
| Healthcare-Services: 1.3% | |||||||||||||||
| 2,000,000 | L | Laboratory Corp. of America Holdings, 1.570%, due 09/11/21 | 1,540,000 | ||||||||||||
| 1,000,000 | L | Quest Diagnostics, Inc., 1.750%, due 11/30/21 | 1,088,750 | ||||||||||||
| 2,628,750 | |||||||||||||||
| Insurance: 3.9% | |||||||||||||||
| 3,770,000 | L | American Intl. Group, Inc., 0.500%, due 05/15/07 | 3,586,213 | ||||||||||||
| 1,970,000 | # | AmerUs Group Co., 2.000%, due 03/06/32 | 2,531,450 | ||||||||||||
| 1,440,000 | L | PMA Capital Corp, 6.500%, due 09/30/22 | 1,564,200 | ||||||||||||
| 7,681,863 | |||||||||||||||
| Internet: 2.1% | |||||||||||||||
| 1,470,000 | L | Equinix Inc, 2.500%, due 02/15/24 | 1,719,900 | ||||||||||||
| 960,000 | @@,# | Shanda Interactive Entertainment Ltd, 0.000%, due 10/15/14 | 1,168,800 | ||||||||||||
| 1,400,000 | Sohu.com, Inc., 0.700%, due 07/14/23 | 1,228,500 | |||||||||||||
| 4,117,200 | |||||||||||||||
| Lodging: 1.2% | |||||||||||||||
| 1,000,000 | L | Hilton Hotels Corp., 3.375%, due 04/15/23 | 1,148,750 | ||||||||||||
| 1,000,000 | L | Starwood Hotels & Resorts Worldwide, Inc., 3.500%, due 05/16/23 | 1,150,000 | ||||||||||||
| 2,298,750 | |||||||||||||||
| Media: 3.8% | |||||||||||||||
| 2,400,000 | #,L | Charter Communications Inc, 5.875%, due 11/16/09 | 2,568,000 | ||||||||||||
| 2,460,000 | Citadel Broadcasting Corp, 1.875%, due 02/15/11 | 2,198,625 | |||||||||||||
| 1,000,000 | Liberty Media Corp, 3.500%, due 01/15/31 | 956,250 | |||||||||||||
| 1,920,000 | @@ | ZEE Telefilms Ltd, 0.500%, due 04/29/09 | 1,850,928 | ||||||||||||
| 7,573,803 | |||||||||||||||
| Mining: 3.4% | |||||||||||||||
| 1,500,000 | @@,L | Inco Ltd., 0.000%, due 03/29/21 | 1,545,000 | ||||||||||||
| 1,985,000 | @@,L | Inco Ltd., 1.000%, due 03/14/23 | 2,654,938 | ||||||||||||
See Accompanying Notes to Financial Statements
107
PORTFOLIO OF INVESTMENTS
ING CONVERTIBLE FUND AS OF NOVEMBER 30, 2004 (UNAUDITED) (CONTINUED)
| Principal Amount | Value | ||||||||||||||
| Mining (continued) | |||||||||||||||
| $ | 2,000,000 | @@,L | Placer Dome, Inc., 2.750%, due 10/15/23 | $ | 2,612,500 | ||||||||||
| 6,812,438 | |||||||||||||||
| Miscellaneous Manufacturing: 2.7% | |||||||||||||||
| 3,500,000 | @@,# | Tyco Intl. Group SA, 2.750%, due 01/15/18 | 5,363,750 | ||||||||||||
| 5,363,750 | |||||||||||||||
| Oil and Gas: 3.3% | |||||||||||||||
| 1,998,000 | Devon Energy Corp., 4.900%, due 08/15/08 | 2,210,288 | |||||||||||||
| 2,000,000 | @@,L | Formosa Petrochemical Corp., 0.000%, due 06/30/11 | 2,199,000 | ||||||||||||
| 1,985,000 | #,L | Pride Intl., Inc., 3.250%, due 05/01/33 | 2,133,875 | ||||||||||||
| 6,543,163 | |||||||||||||||
| Oil and Gas Services: 0.5% | |||||||||||||||
| 1,000,000 | @@,L | Schlumberger Ltd., 2.125%, due 06/01/23 | 1,077,500 | ||||||||||||
| 1,077,500 | |||||||||||||||
| Packaging and Containers: 1.0% | |||||||||||||||
| 2,000,000 | # | Sealed Air Corp., 3.000%, due 06/30/33 | 2,035,000 | ||||||||||||
| 2,035,000 | |||||||||||||||
| Pharmaceuticals: 7.9% | |||||||||||||||
| 1,990,000 | L | Amylin Pharmaceuticals, Inc., 2.250%, due 06/30/08 | 1,947,713 | ||||||||||||
| 4,000,000 | Cephalon, Inc., 2.500%, due 12/15/06 | 3,944,999 | |||||||||||||
| 1,920,000 | # | Isolagen Inc, 3.500%, due 11/01/24 | 2,133,600 | ||||||||||||
| 3,000,000 | NPS Pharmaceuticals, Inc., 3.000%, due 06/15/08 | 2,737,500 | |||||||||||||
| 1,000,000 | L | Sepracor, Inc., 5.000%, due 02/15/07 | 1,028,750 | ||||||||||||
| 1,920,000 | # | Sepracor, Inc., 0.430%, due 10/15/24 | 1,764,000 | ||||||||||||
| 2,000,000 | Teva Pharmaceutical Finance LLC, .500%, due 02/01/24 | 1,962,500 | |||||||||||||
| 15,519,062 | |||||||||||||||
| Retail: 0.6% | |||||||||||||||
| 1,100,000 | Rite Aid Corp., 4.750%, due 12/01/06 | 1,116,500 | |||||||||||||
| 1,116,500 | |||||||||||||||
| Savings and Loans: 2.0% | |||||||||||||||
| 3,870,000 | # | Ocwen Financial Corp., 3.250%, due 08/01/24 | 4,063,500 | ||||||||||||
| 4,063,500 | |||||||||||||||
| Semiconductors: 2.7% | |||||||||||||||
| 3,000,000 | L | Advanced Micro Devices, Inc., 4.750%, due 02/01/22 | 3,393,750 | ||||||||||||
| 1,000,000 | Cypress Semiconductor Corp, 1.250%, due 06/15/08 | 992,500 | |||||||||||||
| 960,000 | # | Vitesse Semiconductor Corp., 1.500%, due 10/01/24 | 1,053,600 | ||||||||||||
| 5,439,850 | |||||||||||||||
| Principal Amount | Value | ||||||||||||||
| Telecommunications: 4.0% | |||||||||||||||
| $ | 2,000,000 | Nextel Partners, Inc., 1.500%, due 11/15/08 | $ | 3,142,499 | |||||||||||
| 1,000,000 | L | NII Holdings, Inc., 2.875%, due 02/01/34 | 1,107,500 | ||||||||||||
| 1,470,000 | L | Primus Telecommunications Group, Inc., 5.750%, due 02/15/07 | 1,288,088 | ||||||||||||
| 1,980,000 | L | RF Micro Devices, Inc., 1.500%, due 07/01/10 | 2,272,050 | ||||||||||||
| 7,810,137 | |||||||||||||||
| Transportation: 1.2% | |||||||||||||||
| 985,000 | # | Yellow Corp., 5.000%, due 08/08/23 | 1,636,331 | ||||||||||||
| 490,000 | # | Yellow Corp., 3.375%, due 11/25/23 | 711,725 | ||||||||||||
| 2,348,056 | |||||||||||||||
| Total Convertible Corporate Bonds (Cost $120,465,883) | 133,157,535 | ||||||||||||||
| CORPORATE BONDS/NOTES: 0.6% | |||||||||||||||
| Building Materials: 0.6% | |||||||||||||||
| 960,000 | #,L | NCI Building Systems Inc, 2.125%, due 11/15/24 | 1,092,000 | ||||||||||||
| Total Corporate Bonds/notes (Cost $960,000) | 1,092,000 | ||||||||||||||
| Total Long-Term Investments (Cost $178,306,148) | 197,410,504 | ||||||||||||||
SHORT-TERM INVESTMENTS: 27.7%
| Repurchase Agreement: 0.5% | |||||||||||||||
| 1,065,000 | Morgan Stanley Repurchase Agreement 11/30/04, 2.070%, due 12/01/04, $1,065,061 to be received upon repurchase (Collateralized by $980,000 Federal National Mortgage Association, 6.250%, Market Value plus accrued interest $1,089,368, due 07/15/06) | | 1,065,000 | ||||||||||||
| Total Repurchase Agreement (Cost $1,065,000) | 1,065,000 | ||||||||||||||
| Securities Lending CollateralCC: 27.2% | |||||||||||||||
| 53,943,311 | The Bank of New York Institutional Cash Reserves Fund | 53,943,311 | |||||||||||||
| Total Securities Lending Collateral (Cost $53,943,311) | 53,943,311 | ||||||||||||||
| Total Short-Term Investments (Cost $55,008,311) | 55,008,311 | ||||||||||||||
| Total Investments In Securities (Cost $233,314,459)* | 127.2 | % | $ | 252,418,815 | |||||||||||
| Other Assets and Liabilities-Net | (27.2 | ) | (53,999,439 | ) | |||||||||||
| Net Assets | 100.0 | % | $ | 198,419,376 | |||||||||||
See Accompanying Notes to Financial Statements
108
PORTFOLIO OF INVESTMENTS
ING CONVERTIBLE FUND AS OF NOVEMBER 30, 2004 (UNAUDITED) (CONTINUED)
@ Non-income producing security
@@ Foreign issuer
# Securities with purchases pursuant to Rule 144A, under the Securities Act of 1933 and may not be resold subject to that rule except to qualified institutional buyers. These securities have been determined to be liquid under the guidelines established by the Funds' Board of Directors/Trustees.
cc Securities purchased with cash collateral for securities loaned.
I Illiquid security
L Loaned security, a portion or all of the security is on loan at November 30, 2004.
X Fair value determined by ING Funds Valuation Committee appointed by the Funds' Board of Directors/Trustees.
** Defaulted security
* Cost for federal income tax purposes is $233,423,855. Net unrealized appreciation consists of:
| Gross Unrealized Appreciation | $ | 24,245,259 | |||||
| Gross Unrealized Depreciation | (5,250,299 | ) | |||||
| Net Unrealized Appreciation | $ | 18,994,960 | |||||
See Accompanying Notes to Financial Statements
109
PORTFOLIO OF INVESTMENTS
ING EQUITY AND BOND FUND AS OF NOVEMBER 30, 2004 (UNAUDITED)
| Shares | Value | ||||||||||||||
| COMMON STOCK: 55.6% | |||||||||||||||
| Aerospace/Defense: 2.2% | |||||||||||||||
| 8,320 | Boeing Co. | $ | 445,702 | ||||||||||||
| 4,170 | General Dynamics Corp. | 451,861 | |||||||||||||
| 5,100 | United Technologies Corp. | 497,659 | |||||||||||||
| 1,395,222 | |||||||||||||||
| Agriculture: 0.8% | |||||||||||||||
| 9,300 | Altria Group, Inc. | 534,657 | |||||||||||||
| 534,657 | |||||||||||||||
| Auto Manufacturers: 0.6% | |||||||||||||||
| 4,800 | PACCAR, Inc. | 374,880 | |||||||||||||
| 374,880 | |||||||||||||||
| Banks: 3.3% | |||||||||||||||
| 9,100 | Bank of America Corp. | 421,057 | |||||||||||||
| 14,785 | North Fork Bancorporation, Inc. | 425,808 | |||||||||||||
| 16,100 | U.S. Bancorp | 477,043 | |||||||||||||
| 5,900 | Wachovia Corp. | 305,325 | |||||||||||||
| 7,900 | Wells Fargo & Co. | 487,983 | |||||||||||||
| 2,117,216 | |||||||||||||||
| Beverages: 0.6% | |||||||||||||||
| 7,900 | PepsiCo, Inc. | 394,289 | |||||||||||||
| 394,289 | |||||||||||||||
| Biotechnology: 1.2% | |||||||||||||||
| 6,600 | @ | Amgen, Inc. | 396,264 | ||||||||||||
| 6,455 | @ | Biogen Idec, Inc. | 378,779 | ||||||||||||
| 775,043 | |||||||||||||||
| Chemicals: 3.2% | |||||||||||||||
| 6,225 | Air Products & Chemicals, Inc. | 356,381 | |||||||||||||
| 12,900 | Dow Chemical Co. | 651,063 | |||||||||||||
| 9,300 | E.I. du Pont de Nemours & Co. | 421,476 | |||||||||||||
| 8,325 | Praxair, Inc. | 373,793 | |||||||||||||
| 5,000 | Sherwin-Williams Co. | 223,000 | |||||||||||||
| 2,025,713 | |||||||||||||||
| Commercial Services: 0.9% | |||||||||||||||
| 26,200 | Cendant Corp. | 593,954 | |||||||||||||
| 593,954 | |||||||||||||||
| Computers: 2.6% | |||||||||||||||
| 11,100 | @ | Dell, Inc. | 449,772 | ||||||||||||
| 36,700 | @ | EMC Corp. | 492,514 | ||||||||||||
| 7,800 | International Business Machines Corp. | 735,072 | |||||||||||||
| 1,677,358 | |||||||||||||||
| Cosmetics/Personal Care: 0.7% | |||||||||||||||
| 8,400 | Procter & Gamble Co. | 449,232 | |||||||||||||
| 449,232 | |||||||||||||||
| Diversified Financial Services: 6.9% | |||||||||||||||
| 23,100 | Citigroup, Inc. | 1,033,726 | |||||||||||||
| 21,800 | Countrywide Financial Corp. | 723,978 | |||||||||||||
| 37,120 | @ | E*TRADE Financial Corp. | 514,483 | ||||||||||||
| 8,900 | Goldman Sachs Group, Inc. | 932,364 | |||||||||||||
| 13,000 | J.P. Morgan Chase & Co. | 489,450 | |||||||||||||
| 8,800 | Lehman Brothers Holdings, Inc. | 737,264 | |||||||||||||
| 1,209 | I,XX | North Atlantic Trading Co., Inc. | 1 | ||||||||||||
| 4,431,266 | |||||||||||||||
| Shares | Value | ||||||||||||||
| Electric: 0.8% | |||||||||||||||
| 11,100 | Consolidated Edison, Inc. | $ | 486,735 | ||||||||||||
| 486,735 | |||||||||||||||
| Electronics: 0.5% | |||||||||||||||
| 4,510 | Parker Hannifin Corp. | 337,348 | |||||||||||||
| 337,348 | |||||||||||||||
| Healthcare-Products: 2.4% | |||||||||||||||
| 6,090 | Guidant Corp. | 394,815 | |||||||||||||
| 10,800 | Johnson & Johnson | 651,456 | |||||||||||||
| 5,800 | @ | Zimmer Holdings, Inc. | 473,280 | ||||||||||||
| 1,519,551 | |||||||||||||||
| Healthcare-Services: 0.8% | |||||||||||||||
| 4,000 | @ | WellPoint Health Networks, Inc. | 500,400 | ||||||||||||
| 500,400 | |||||||||||||||
| Insurance: 2.1% | |||||||||||||||
| 13,380 | American Intl. Group, Inc. | 847,623 | |||||||||||||
| 6,300 | Chubb Corp. | 480,123 | |||||||||||||
| 1,327,746 | |||||||||||||||
| Investment Companies: 1.0% | |||||||||||||||
| 12,400 | iShares Goldman Sachs Semiconductor Index Fund | 651,000 | |||||||||||||
| 651,000 | |||||||||||||||
| Leisure Time: 1.4% | |||||||||||||||
| 10,300 | Carnival Corp. | 546,003 | |||||||||||||
| 6,600 | Harley-Davidson, Inc. | 381,612 | |||||||||||||
| 927,615 | |||||||||||||||
| Lodging: 1.1% | |||||||||||||||
| 8,425 | Marriott Intl., Inc. | 478,961 | |||||||||||||
| 4,900 | Starwood Hotels & Resorts Worldwide, Inc. | 256,221 | |||||||||||||
| 735,182 | |||||||||||||||
| Machinery-Diversified: 0.6% | |||||||||||||||
| 8,700 | Rockwell Automation, Inc. | 411,510 | |||||||||||||
| 411,510 | |||||||||||||||
| Media: 0.8% | |||||||||||||||
| 16,400 | @ | Comcast Corp. | 486,260 | ||||||||||||
| 486,260 | |||||||||||||||
| Mining: 0.7% | |||||||||||||||
| 13,300 | Alcoa, Inc. | 451,934 | |||||||||||||
| 451,934 | |||||||||||||||
| Miscellaneous Manufacturing: 4.7% | |||||||||||||||
| 9,400 | 3M Co. | 748,146 | |||||||||||||
| 3,980 | Eaton Corp. | 268,252 | |||||||||||||
| 37,200 | General Electric Co. | 1,315,392 | |||||||||||||
| 19,480 | @@ | Tyco Intl. Ltd. | 661,736 | ||||||||||||
| 2,993,526 | |||||||||||||||
| Oil and Gas: 3.2% | |||||||||||||||
| 10,500 | ChevronTexaco Corp. | 573,300 | |||||||||||||
| 19,200 | Exxon Mobil Corp. | 984,000 | |||||||||||||
| 9,850 | @,@@ | Nabors Industries Ltd. | 512,200 | ||||||||||||
| 2,069,500 | |||||||||||||||
See Accompanying Notes to Financial Statements
110
PORTFOLIO OF INVESTMENTS
ING EQUITY AND BOND FUND AS OF NOVEMBER 30, 2004 (UNAUDITED) (CONTINUED)
| Shares | Value | ||||||||||||||
| Oil and Gas Services: 2.2% | |||||||||||||||
| 16,230 | Baker Hughes, Inc. | $ | 719,476 | ||||||||||||
| 13,120 | BJ Services Co. | 664,790 | |||||||||||||
| 1,384,266 | |||||||||||||||
| Pharmaceuticals: 2.7% | |||||||||||||||
| 5,900 | Abbott Laboratories | 247,564 | |||||||||||||
| 4,210 | Allergan, Inc. | 309,435 | |||||||||||||
| 11,250 | @ | Barr Pharmaceuticals, Inc. | 439,313 | ||||||||||||
| 13,200 | Merck & Co., Inc. | 369,864 | |||||||||||||
| 13,885 | Pfizer, Inc. | 385,586 | |||||||||||||
| 1,751,762 | |||||||||||||||
| Retail: 3.0% | |||||||||||||||
| 9,440 | CVS Corp. | 428,293 | |||||||||||||
| 9,010 | @ | Kohl's Corp. | 415,902 | ||||||||||||
| 7,900 | Lowe's Cos., Inc. | 437,107 | |||||||||||||
| 12,600 | Wal-Mart Stores, Inc. | 655,955 | |||||||||||||
| 1,937,257 | |||||||||||||||
| Semiconductors: 0.7% | |||||||||||||||
| 19,800 | Intel Corp. | 442,530 | |||||||||||||
| 442,530 | |||||||||||||||
| Software: 1.5% | |||||||||||||||
| 35,200 | Microsoft Corp. | 943,712 | |||||||||||||
| 943,712 | |||||||||||||||
| Telecommunications: 2.4% | |||||||||||||||
| 13,300 | @ | Avaya, Inc. | 218,386 | ||||||||||||
| 26,500 | @ | Cisco Systems, Inc. | 495,815 | ||||||||||||
| 9,900 | Qualcomm, Inc. | 412,038 | |||||||||||||
| 16,400 | SBC Communications, Inc. | 412,788 | |||||||||||||
| 1,539,027 | |||||||||||||||
| Total Common Stock (Cost $31,718,106) | 35,665,691 | ||||||||||||||
| PREFERRED STOCK: 0.3% | |||||||||||||||
| Banks: 0.3% | |||||||||||||||
| 16 | #,XX | DG Funding Trust | 173,100 | ||||||||||||
| 173,100 | |||||||||||||||
| Electric: 0.0% | |||||||||||||||
| 1,025 | XX | TECO Energy, Inc. | 26,045 | ||||||||||||
| 26,045 | |||||||||||||||
| Total Preferred Stock (Cost $199,878) | 199,145 | ||||||||||||||
| WARRANTS: 0.0% | |||||||||||||||
| Building Materials: 0.0% | |||||||||||||||
| 400 | I,# | Dayton Superior Corp. | 4 | ||||||||||||
| Telecommunications: 0.0% | |||||||||||||||
| 500 | I,X | Iridium World Communications, Inc. | - | ||||||||||||
| - | |||||||||||||||
| Total Warrants (Cost $57,953) | 4 | ||||||||||||||
| Principal Amount | Value | ||||||||||||||
| CORPORATE BONDS/NOTES: 10.7% | |||||||||||||||
| Airlines: 0.1% | |||||||||||||||
| $ | 90,000 | American Airlines, Inc., 7.324%, due 10/15/09 | $ | 73,136 | |||||||||||
| 73,136 | |||||||||||||||
| Auto Manufacturers: 0.3% | |||||||||||||||
| 24,000 | Ford Motor Co., 6.625%, due 10/01/28 | 21,743 | |||||||||||||
| 72,000 | Ford Motor Co., 7.450%, due 07/16/31 | 70,244 | |||||||||||||
| 76,000 | General Motors Corp., 8.375%, due 07/15/33 | 77,575 | |||||||||||||
| 169,562 | |||||||||||||||
| Banks: 2.6% | |||||||||||||||
| 40,000 | @@ | Australia & New Zealand Banking Group Ltd., 2.405%, due 10/29/49 | 34,803 | ||||||||||||
| 48,000 | @@ | Banco Bradesco SA/Cayman Islands, 8.750%, due 10/24/13 | 51,840 | ||||||||||||
| 109,000 | @@ | Banco Santander Chile SA, 7.375%, due 07/18/12 | 122,903 | ||||||||||||
| 40,000 | @@ | Bank of Ireland, 2.160%, due 12/29/49 | 34,656 | ||||||||||||
| 30,000 | @@ | Bank of Nova Scotia, 2.115%, due 08/31/85 | 24,885 | ||||||||||||
| 50,000 | BankAmerica Capital II, 8.000%, due 12/15/26 | 54,169 | |||||||||||||
| 43,000 | @@,# | Danske Bank A/S, 5.914%, due 12/29/49 | 45,157 | ||||||||||||
| 20,000 | @@ | Den Norske Bank ASA, 2.125%, due 08/29/49 | 16,575 | ||||||||||||
| 80,000 | # | Dresdner Funding Trust I, 8.151%, due 06/30/31 | 96,579 | ||||||||||||
| 53,000 | FBS Capital I, 8.090%, due 11/15/26 | 57,623 | |||||||||||||
| 45,000 | @@,# | HBOS Capital Funding LP, 6.071%, due 06/30/49 | 47,813 | ||||||||||||
| 150,000 | @@ | HSBC Bank PLC, 1.971%, due 06/29/49 | 129,903 | ||||||||||||
| 80,000 | @@ | Lloyds TSB Bank PLC, 2.090%, due 08/29/49 | 68,263 | ||||||||||||
| 80,000 | @@ | Lloyds TSB Bank PLC, 2.188%, due 06/29/49 | 71,154 | ||||||||||||
| 71,000 | M & T Bank Corp., 3.850%, due 04/01/13 | 70,087 | |||||||||||||
| 51,000 | Mellon Capital I, 7.720%, due 12/01/26 | 55,169 | |||||||||||||
| 30,000 | @@ | National Australia Bank Ltd., 2.361%, due 10/29/49 | 26,102 | ||||||||||||
| 90,000 | National Westminster Bank PLC, 2.563%, due 11/29/49 | 76,704 | |||||||||||||
| 58,000 | # | Rabobank Capital Funding II, 5.260%, due 12/29/49 | 58,704 | ||||||||||||
| 70,000 | @@ | Royal Bank of Canada, 1.750%, due 06/29/85 | 59,921 | ||||||||||||
| 30,000 | @@ | Royal Bank of Scotland Group PLC, 2.063%, due 12/29/49 | 26,414 | ||||||||||||
| 20,000 | @@ | Societe Generale, 2.705%, due 11/29/49 | 17,150 | ||||||||||||
| 130,000 | @@,C | Standard Chartered PLC, 2.070%, due 12/29/49 | 104,325 | ||||||||||||
See Accompanying Notes to Financial Statements
111
PORTFOLIO OF INVESTMENTS
ING EQUITY AND BOND FUND AS OF NOVEMBER 30, 2004 (UNAUDITED) (CONTINUED)
| Principal Amount | Value | ||||||||||||||
| Banks (continued) | |||||||||||||||
| $ | 160,000 | @@,C | Standard Chartered PLC, 2.813%, due 11/29/49 | $ | 127,563 | ||||||||||
| 49,000 | Wells Fargo Capital I, 7.960%, due 12/15/26 | 53,156 | |||||||||||||
| 30,000 | @@ | Westpac Banking Corp., 2.338%, due 09/29/49 | 25,910 | ||||||||||||
| 155,000 | # | Westpac Capital Trust IV, 5.256%, due 12/29/49 | 151,510 | ||||||||||||
| 1,709,038 | |||||||||||||||
| Beverages: 0.4% | |||||||||||||||
| 145,000 | @@ | Cia Brasileira de Bebidas, 8.750%, due 09/15/13 | 165,844 | ||||||||||||
| 11,000 | @@ | Cia Brasileira de Bebidas, 10.500%, due 12/15/11 | 13,640 | ||||||||||||
| 80,000 | #,S | Miller Brewing Co., 4.250%, due 08/15/08 | 80,504 | ||||||||||||
| 259,988 | |||||||||||||||
| Chemicals: 0.1% | |||||||||||||||
| 23,000 | Dow Chemical Co., 5.750%, due 11/15/09 | 24,509 | |||||||||||||
| 22,000 | @@,#,S | Sociedad Quimica y Minera de Chile SA, 7.700%, due 09/15/06 | 23,391 | ||||||||||||
| 47,900 | |||||||||||||||
| Diversified Financial Services: 1.6% | |||||||||||||||
| 22,118 | @@,# | Arcel Finance Ltd., 5.984%, due 02/01/09 | 22,884 | ||||||||||||
| 47,000 | @@,#,S | Arcel Finance Ltd., 6.361%, due 05/01/12 | 46,872 | ||||||||||||
| 46,000 | @@,# | Arcel Finance Ltd., 7.048%, due 09/01/11 | 47,523 | ||||||||||||
| 122,000 | @@,# | Brazilian Merchant Voucher Receivables Ltd., 5.911%, due 06/15/11 | 121,390 | ||||||||||||
| 51,000 | Citigroup Capital II, 7.750%, due 12/01/36 | 54,578 | |||||||||||||
| 51,000 | # | Corestates Capital Trust I, 8.000%, due 12/15/26 | 55,549 | ||||||||||||
| 72,000 | # | Farmers Exchange Capital, 7.200%, due 07/15/48 | 71,661 | ||||||||||||
| 30,000 | @@ | Financiere CSFB NV, 2.125%, due 03/29/49 | 24,877 | ||||||||||||
| 24,000 | Ford Motor Credit Co., 7.000%, due 10/01/13 | 25,081 | |||||||||||||
| 106,000 | # | HVB Funding Trust III, 9.000%, due 10/22/31 | 136,557 | ||||||||||||
| 14,000 | JPM Capital Trust I, 7.540%, due 01/15/27 | 14,946 | |||||||||||||
| 45,000 | JPM Capital Trust II, 7.950%, due 02/01/27 | 48,771 | |||||||||||||
| 135,000 | #,XX | Mangrove Bay Pass-Through Trust, 6.102%, due 07/15/33 | 134,477 | ||||||||||||
| 66,453 | @@,# | PF Export Receivables Master Trust, 3.748%, due 06/01/13 | 64,266 | ||||||||||||
| 101,236 | @@,# | PF Export Receivables Master Trust, 6.436%, due 06/01/15 | 100,308 | ||||||||||||
| 69,000 | @@ | UFJ Finance Aruba AEC, 8.750%, due 11/29/49 | 77,491 | ||||||||||||
| 1,047,231 | |||||||||||||||
| Principal Amount | Value | ||||||||||||||
| Electric: 1.6% | |||||||||||||||
| $ | 100,000 | @@,# | AES Gener SA, 7.500%, due 03/25/14 | $ | 104,750 | ||||||||||
| 74,842 | # | Allegheny Energy Supply Statutory Trust 2001, 10.250%, due 11/15/07 | 85,881 | ||||||||||||
| 8,344 | # | Allegheny Energy Supply Statutory Trust 2001, 13.000%, due 11/15/07 | 9,137 | ||||||||||||
| 91,880 | CE Generation LLC, 7.416%, due 12/15/18 | 95,038 | |||||||||||||
| 81,000 | Consumers Energy Co., 4.250%, due 04/15/08 | 81,636 | |||||||||||||
| 62,000 | S | DTE Energy Co, 2.740%, due 06/01/07 | 62,356 | ||||||||||||
| 98,000 | @@,S | Empresa Nacional de Electricidad SA/Chile, 8.625%, due 08/01/15 | 113,438 | ||||||||||||
| 116,000 | Enterprise Capital Trust II, 3.195%, due 06/30/28 | 110,454 | |||||||||||||
| 69,000 | Monongahela Power Co., 7.360%, due 01/15/10 | 75,630 | |||||||||||||
| 106,000 | Ohio Power Co., 6.375%, due 07/15/33 | 109,111 | |||||||||||||
| 11,970 | #,S | Power Contract Financing LLC, 5.200%, due 02/01/06 | 12,098 | ||||||||||||
| 47,000 | # | Power Contract Financing LLC, 6.256%, due 02/01/10 | 48,951 | ||||||||||||
| 18,094 | PPL Montana LLC, 8.903%, due 07/02/20 | 20,458 | |||||||||||||
| 26,000 | Sithe/Independence Funding, 9.000%, due 12/30/13 | 28,688 | |||||||||||||
| 31,810 | @@,# | Tenaska Virginia Partners LP, 6.119%, due 03/30/24 | 33,073 | ||||||||||||
| 63,000 | S | TXU Corp, 4.446%, due 11/16/06 | 63,785 | ||||||||||||
| 1,054,484 | |||||||||||||||
| Food: 0.4% | |||||||||||||||
| 35,000 | S | Kroger Co., 7.250%, due 06/01/09 | 38,990 | ||||||||||||
| 65,000 | S | Safeway, Inc., 4.800%, due 07/16/07 | 66,517 | ||||||||||||
| 45,000 | Supervalu, Inc., 7.875%, due 08/01/09 | 51,565 | |||||||||||||
| 89,000 | S | Tyson Foods, Inc., 7.250%, due 10/01/06 | 94,698 | ||||||||||||
| 251,770 | |||||||||||||||
| Gas: 0.1% | |||||||||||||||
| 67,000 | #,S | Williams Gas Pipelines Central, Inc., 7.375%, due 11/15/06 | 71,606 | ||||||||||||
| 71,606 | |||||||||||||||
| Healthcare-Services: 0.1% | |||||||||||||||
| 50,000 | HCA, Inc., 5.500%, due 12/01/09 | 49,814 | |||||||||||||
| 49,814 | |||||||||||||||
| Home Builders: 0.0% | |||||||||||||||
| 4,000 | Technical Olympic USA, Inc., 9.000%, due 07/01/10 | 4,330 | |||||||||||||
| 4,330 | |||||||||||||||
See Accompanying Notes to Financial Statements
112
PORTFOLIO OF INVESTMENTS
ING EQUITY AND BOND FUND AS OF NOVEMBER 30, 2004 (UNAUDITED) (CONTINUED)
| Principal Amount | Value | ||||||||||||||
| Insurance: 0.4% | |||||||||||||||
| $ | 18,000 | @@,# | Farmers Insurance Exchange, 6.000%, due 08/01/14 | $ | 17,862 | ||||||||||
| 26,000 | @@,# | Farmers Insurance Exchange, 8.625%, due 05/01/24 | 30,180 | ||||||||||||
| 54,000 | @@,# | Monumental Global Funding II, 3.850%, due 03/03/08 | 53,964 | ||||||||||||
| 53,000 | S | Prudential Financial, Inc., 4.104%, due 11/15/06 | 53,570 | ||||||||||||
| 88,000 | @@,# | Zurich Capital Trust I, 8.376%, due 06/01/37 | 97,489 | ||||||||||||
| 253,065 | |||||||||||||||
| Media: 0.1% | |||||||||||||||
| 48,000 | COX Communications, Inc., 6.850%, due 01/15/18 | 50,132 | |||||||||||||
| 10,000 | @@ | Rogers Cable, Inc., 6.750%, due 03/15/15 | 10,200 | ||||||||||||
| 60,332 | |||||||||||||||
| Mining: 0.2% | |||||||||||||||
| 47,000 | @@,# | Corp Nacional del Cobre de Chile, 5.500%, due 10/15/13 | 48,335 | ||||||||||||
| 74,000 | @@,S | Vale Overseas Ltd., 8.625%, due 03/08/07 | 82,214 | ||||||||||||
| 130,549 | |||||||||||||||
| Multi-National: 0.2% | |||||||||||||||
| 124,000 | @@,S | Corp Andina de Fomento CAF, 6.875%, due 03/15/12 | 137,660 | ||||||||||||
| 137,660 | |||||||||||||||
| Oil and Gas: 1.0% | |||||||||||||||
| 59,000 | Amerada Hess Corp., 6.650%, due 08/15/11 | 64,592 | |||||||||||||
| 67,000 | @@,# | Empresa Nacional de Petroleo, 4.875%, due 03/15/14 | 64,799 | ||||||||||||
| 76,000 | @@,# | Gazprom International SA, 7.201%, due 02/01/20 | 79,420 | ||||||||||||
| 53,000 | @@ | Husky Energy, Inc., 6.150%, due 06/15/19 | 55,969 | ||||||||||||
| 104,000 | # | Pemex Project Funding Master Trust, 3.180%, due 06/15/10 | 106,860 | ||||||||||||
| 37,000 | Pemex Project Funding Master Trust, 7.375%, due 12/15/14 | 40,460 | |||||||||||||
| 37,000 | @@ | Petroleos Mexicanos, 9.250%, due 03/30/18 | 44,955 | ||||||||||||
| 22,868 | @@ | Petrozuata Finance, Inc., 7.630%, due 04/01/09 | 23,868 | ||||||||||||
| 100,000 | @@ | Tengizchevroil Finance Co S.ar.1, 6.124%, due 11/15/14 | 100,000 | ||||||||||||
| 42,000 | Valero Energy Corp., 8.750%, due 06/15/30 | 54,429 | |||||||||||||
| 635,352 | |||||||||||||||
| Packaging and Containers: 0.1% | |||||||||||||||
| 32,000 | # | Sealed Air Corp., 5.375%, due 04/15/08 | 33,308 | ||||||||||||
| 33,308 | |||||||||||||||
| Principal Amount | Value | ||||||||||||||
| Real Estate: 0.2% | |||||||||||||||
| $ | 70,000 | EOP Operating LP, 7.750%, due 11/15/07 | $ | 77,461 | |||||||||||
| 61,000 | S | Liberty Property LP, 7.750%, due 04/15/09 | 68,490 | ||||||||||||
| 145,951 | |||||||||||||||
| Real Estate Investment Trusts: 0.5% | |||||||||||||||
| 11,000 | Liberty Property Trust, 6.375%, due 08/15/12 | 11,824 | |||||||||||||
| 99,000 | Rouse Co., 7.200%, due 09/15/12 | 105,881 | |||||||||||||
| 50,000 | Rouse Co., 8.000%, due 04/30/09 | 54,780 | |||||||||||||
| 54,000 | Simon Property Group LP, 4.875%, due 03/18/10 | 54,711 | |||||||||||||
| 96,000 | S | Simon Property Group LP, 6.375%, due 11/15/07 | 102,489 | ||||||||||||
| 329,685 | |||||||||||||||
| Savings and Loans: 0.1% | |||||||||||||||
| 48,000 | Great Western Financial, 8.206%, due 02/01/27 | 52,248 | |||||||||||||
| 52,248 | |||||||||||||||
| Telecommunications: 0.5% | |||||||||||||||
| 101,000 | AT&T Corp., 9.750%, due 11/15/31 | 117,539 | |||||||||||||
| 65,000 | BellSouth Corp., 4.200%, due 09/15/09 | 64,782 | |||||||||||||
| 43,000 | S | Sprint Capital Corp., 4.780%, due 08/17/06 | 43,877 | ||||||||||||
| 15,000 | S | Sprint Capital Corp., 8.375%, due 03/15/12 | 18,147 | ||||||||||||
| 53,000 | Verizon Virginia, Inc., 4.625%, due 03/15/13 | 51,097 | |||||||||||||
| 500,000 | I,X,** | Winstar Communications, Inc., 0.000%, due 04/15/10 | 50 | ||||||||||||
| 295,492 | |||||||||||||||
| Transportation: 0.1% | |||||||||||||||
| 42,000 | @@,# | MISC Capital Ltd., 6.125%, due 07/01/14 | 44,616 | ||||||||||||
| 44,616 | |||||||||||||||
| Total Corporate Bonds/Notes (Cost $7,204,050) | 6,857,117 | ||||||||||||||
| U.S. GOVERNMENT AGENCY OBLIGATIONS: 13.7% | |||||||||||||||
| Federal Home Loan Bank: 0.4% | |||||||||||||||
| 270,000 | 3.250%, due 12/17/07 | 268,005 | |||||||||||||
| 268,005 | |||||||||||||||
| Federal Home Loan Mortgage Corporation: 4.0% | |||||||||||||||
| 556,000 | 2.700%, due 03/16/07 | 549,128 | |||||||||||||
| 361,000 | 4.500%, due 10/15/12 | 364,106 | |||||||||||||
| 93,437 | 4.500%, due 04/01/14 | 93,307 | |||||||||||||
| 54,000 | W | 5.500%, due 12/15/18 | 55,671 | ||||||||||||
| 96,000 | 5.875%, due 03/21/11 | 103,118 | |||||||||||||
| 93,813 | 6.000%, due 04/01/14 | 98,592 | |||||||||||||
| 556,260 | 6.000%, due 01/15/29 | 576,823 | |||||||||||||
| 193,012 | 6.500%, due 12/01/31 | 202,528 | |||||||||||||
| 488,000 | W | 7.000%, due 12/15/34 | 517,585 | ||||||||||||
| 2,560,858 | |||||||||||||||
See Accompanying Notes to Financial Statements
113
PORTFOLIO OF INVESTMENTS
ING EQUITY AND BOND FUND AS OF NOVEMBER 30, 2004 (UNAUDITED) (CONTINUED)
| Principal Amount | Value | ||||||||||||||
| Federal National Mortgage Association: 9.0% | |||||||||||||||
| $ | 325,000 | 2.875%, due 05/19/08 | $ | 316,724 | |||||||||||
| 141,000 | 4.750%, due 12/25/42 | 141,842 | |||||||||||||
| 420,000 | W | 5.000%, due 12/01/17 | 425,644 | ||||||||||||
| 2,562,000 | W | 5.000%, due 01/15/34 | 2,521,167 | ||||||||||||
| 150,000 | 5.250%, due 08/01/12 | 154,419 | |||||||||||||
| 5,070 | W | 5.500%, due 12/15/19 | 5,230 | ||||||||||||
| 569,000 | W | 5.500%, due 01/01/33 | 574,156 | ||||||||||||
| 199,639 | 6.000%, due 08/01/16 | 209,314 | |||||||||||||
| 67,686 | 6.000%, due 10/01/18 | 70,959 | |||||||||||||
| 344,344 | 6.000%, due 07/25/29 | 355,621 | |||||||||||||
| 145,711 | 6.000%, due 04/25/31 | 150,885 | |||||||||||||
| 96,000 | 6.000%, due 12/15/33 | 99,090 | |||||||||||||
| 211,000 | 6.000%, due 01/15/34 | 217,264 | |||||||||||||
| 231,000 | 6.500%, due 12/15/34 | 242,406 | |||||||||||||
| 135,000 | 6.625%, due 11/15/10 | 152,115 | |||||||||||||
| 35,691 | 7.500%, due 09/01/30 | 38,269 | |||||||||||||
| 65,451 | 7.500%, due 06/25/32 | 70,164 | |||||||||||||
| 84,049 | 7.500%, due 01/25/48 | 89,569 | |||||||||||||
| 5,834,838 | |||||||||||||||
| Government National Mortgage Association: 0.3% | |||||||||||||||
| 164,311 | 6.500%, due 06/15/29 | 173,404 | |||||||||||||
| 173,404 | |||||||||||||||
| Total U.S. Government Agency Obligations (Cost $8,845,801) | 8,837,105 | ||||||||||||||
| U.S. TREASURY OBLIGATIONS: 7.1% | |||||||||||||||
| U.S. Treasury Bonds: 2.4% | |||||||||||||||
| 229,000 | W | 4.250%, due 11/15/14 | 227,104 | ||||||||||||
| 885,000 | S | 5.375%, due 02/15/31 | 931,739 | ||||||||||||
| 121,000 | 6.250%, due 08/15/23 | 138,876 | |||||||||||||
| 228,000 | S | 10.375%, due 11/15/12 | 272,986 | ||||||||||||
| 1,570,705 | |||||||||||||||
| U.S. Treasury Notes: 4.4% | |||||||||||||||
| 1,530,000 | 1.625%, due 01/31/05 | 1,529,284 | |||||||||||||
| 237,000 | 2.875%, due 11/30/06 | 236,426 | |||||||||||||
| 175,000 | 3.000%, due 11/15/07 | 173,742 | |||||||||||||
| 906,000 | S | 3.500%, due 11/15/09 | 898,073 | ||||||||||||
| 2,837,525 | |||||||||||||||
| U.S. Treasury STRIP: 0.3% | |||||||||||||||
| 325,000 | S | 4.870%, due 05/15/16 | 188,545 | ||||||||||||
| 188,545 | |||||||||||||||
| Total U.S. Treasury Obligations (Cost $4,637,354) | 4,596,775 | ||||||||||||||
| ASSET-BACKED SECURITIES: 3.2% | |||||||||||||||
| Automobile Asset-Backed Securities: 0.3% | |||||||||||||||
| 95,000 | Capital One Auto Finance Trust, 3.180%, due 09/15/10 | 94,176 | |||||||||||||
| 50,000 | Nissan Auto Receivables Owner Trust, 2.050%, due 03/16/09 | 48,759 | |||||||||||||
| 40,000 | USAA Auto Owner Trust, 2.040%, due 02/16/10 | 39,319 | |||||||||||||
| 182,254 | |||||||||||||||
| Principal Amount | Value | ||||||||||||||
| Credit Card Asset-Backed Securities: 0.4% | |||||||||||||||
| $ | 55,000 | Bank One Issuance Trust, 4.540%, due 09/15/10 | $ | 55,808 | |||||||||||
| 55,000 | Capital One Master Trust, 4.900%, due 03/15/10 | 56,883 | |||||||||||||
| 95,000 | Citibank Credit Card Issuance Trust, 5.650%, due 06/16/08 | 98,492 | |||||||||||||
| 75,000 | MBNA Credit Card Master Note Trust, 4.950%, due 06/15/09 | 77,624 | |||||||||||||
| 288,807 | |||||||||||||||
| Home Equity Asset-Backed Securities: 2.1% | |||||||||||||||
| 89,900 | Asset Backed Funding Certificates, 2.461%, due 11/25/33 | 89,930 | |||||||||||||
| 157,159 | XX | Bayview Financial Acquisition Trust, 2.694%, due 09/28/43 | 157,343 | ||||||||||||
| 267,966 | Centex Home Equity, 2.460%, due 01/25/34 | 268,383 | |||||||||||||
| 294,505 | Emergent Home Equity Loan Trust, 7.080%, due 12/15/28 | 301,456 | |||||||||||||
| 236,000 | GSAA Trust, 5.242%, due 05/25/35 | 234,553 | |||||||||||||
| 103,738 | Merrill Lynch Mortgage Investors, Inc., 2.541%, due 07/25/34 | 103,847 | |||||||||||||
| 38,662 | Residential Asset Mortgage Products, Inc., 2.491%, due 06/25/33 | 38,654 | |||||||||||||
| 143,994 | Residential Asset Securities Corp., 2.491%, due 12/25/33 | 144,283 | |||||||||||||
| 1,338,449 | |||||||||||||||
| Other Asset-Backed Securities: 0.4% | |||||||||||||||
| 34,678 | XX | Amortizing Residential Collateral Trust, 2.681%, due 05/25/32 | 34,657 | ||||||||||||
| 11,000 | Chase Funding Mortgage Loan, 2.734%, due 09/25/24 | 10,944 | |||||||||||||
| 7,000 | Chase Funding Mortgage Loan, 4.045%, due 05/25/33 | 7,036 | |||||||||||||
| 52,488 | Chase Funding Mortgage Loan Asset-Backed Certificates, 2.481%, due 07/25/33 | 52,550 | |||||||||||||
| 96,000 | XX | First Horizon Asset Back Trust, 0.000%, due 10/25/34 | 96,000 | ||||||||||||
| 8,000 | XX | Popular ABS Mortgage Pass-Through Trust, 3.735%, due 12/25/34 | 7,980 | ||||||||||||
| 8,000 | XX | Popular ABS Mortgage Pass-Through Trust, 4.000%, due 12/25/34 | 7,983 | ||||||||||||
| 217,150 | |||||||||||||||
| Total Asset-backed Securities (Cost $2,022,196) | 2,026,660 | ||||||||||||||
See Accompanying Notes to Financial Statements
114
PORTFOLIO OF INVESTMENTS
ING EQUITY AND BOND FUND AS OF NOVEMBER 30, 2004 (UNAUDITED) (CONTINUED)
| Principal Amount | Value | ||||||||||||||
| COLLATERALIZED MORTGAGE OBLIGATIONS: 11.2% | |||||||||||||||
| Commercial Mortgage-Backed Securities: 2.4% | |||||||||||||||
| $ | 81,000 | Bear Stearns Commercial Mortgage Securities, 4.170%, due 01/12/41 | $ | 81,394 | |||||||||||
| 79,000 | COMM, 3.600%, due 03/10/39 | 77,665 | |||||||||||||
| 303,000 | CS First Boston Mortgage Securities Corp., 3.861%, due 03/15/36 | 302,519 | |||||||||||||
| 40,000 | CS First Boston Mortgage Securities Corp., 7.792%, due 04/14/62 | 46,162 | |||||||||||||
| 215,000 | DLJ Commercial Mortgage Corp., 6.240%, due 11/12/31 | 231,638 | |||||||||||||
| 60,000 | # | DLJ Commercial Mortgage Corp., 6.460%, due 03/10/32 | 65,433 | ||||||||||||
| 570,000 | DLJ Commercial Mortgage Corp., 7.300%, due 06/10/32 | 640,777 | |||||||||||||
| 97,000 | GE Capital Commercial Mortgage Corp., 5.994%, due 12/10/35 | 103,893 | |||||||||||||
| 1,549,481 | |||||||||||||||
| Federal Home Loan Mortgage Corporation: 0.7% | |||||||||||||||
| 469,538 | Freddie Mac, 2.740%, due 04/15/32 | 473,362 | |||||||||||||
| 473,362 | |||||||||||||||
| Whole Loan Collateral PAC: 1.1% | |||||||||||||||
| 141,376 | GSR Mortgage Loan Trust, 2.581%, due 10/25/32 | 141,421 | |||||||||||||
| 184,642 | MASTR Alternative Loans Trust, 2.581%, due 11/25/33 | 184,895 | |||||||||||||
| 112,723 | MASTR Alternative Loans Trust, 8.500%, due 05/25/33 | 114,742 | |||||||||||||
| 239,756 | Washington Mutual, 2.580%, due 03/25/34 | 240,236 | |||||||||||||
| 681,294 | |||||||||||||||
| Whole Loan Collateralized Mortgage Obligations: 7.0% | |||||||||||||||
| 203,712 | Banc of America Funding Corp, 5.750%, due 09/20/34 | 206,434 | |||||||||||||
| 320,763 | Bank of America Alternative Loan Trust, 2.631%, due 12/25/33 | 321,260 | |||||||||||||
| 134,393 | Bank of America Mortgage Securities, 2.631%, due 12/25/33 | 134,582 | |||||||||||||
| 113,471 | Bank of America Mortgage Securities, 5.000%, due 12/25/18 | 114,216 | |||||||||||||
| 115,217 | Bank of America Mortgage Securities, 5.000%, due 06/25/33 | 114,749 | |||||||||||||
| 69,629 | Bank of America Mortgage Securities, 5.250%, due 11/25/19 | 70,586 | |||||||||||||
| 63,823 | Bank of America Mortgage Securities, 5.500%, due 11/25/33 | 63,215 | |||||||||||||
| 111,134 | Citicorp Mortgage Securities, Inc., 2.433%, due 10/25/33 | 110,913 | |||||||||||||
| Principal Amount | Value | ||||||||||||||
| Whole Loan Collateralized Mortgage Obligations: (continued) | |||||||||||||||
| $ | 70,502 | Countrywide Alternative Loan Trust, 2.581%, due 07/25/18 | $ | 70,647 | |||||||||||
| 108,225 | Countrywide Alternative Loan Trust, 5.000%, due 10/25/18 | 108,935 | |||||||||||||
| 117,715 | Countrywide Home Loan Mortgage Pass Through Trust, 5.000%, due 11/25/18 | 118,487 | |||||||||||||
| 99,000 | Countrywide Home Loan Mortgage Pass Through Trust, 6.000%, due 11/25/34 | 102,240 | |||||||||||||
| 114,000 | CS First Boston Mortgage Securities Corp., 4.147%, due 10/25/33 | 113,167 | |||||||||||||
| 139,081 | GMAC Mortgage Corp. Loan Trust, 5.250%, due 04/25/34 | 139,463 | |||||||||||||
| 230,000 | GMAC Mortgage Corp. Loan Trust, 5.500%, due 01/25/34 | 233,620 | |||||||||||||
| 121,455 | GSR Mortgage Loan Trust, 6.500%, due 01/25/34 | 126,655 | |||||||||||||
| 96,432 | Homebanc Mortgage Trust, 2.611%, due 08/25/29 | 96,384 | |||||||||||||
| 161,000 | XX | MASTR Alternative Loans Trust, 0.000%, due 01/15/20 | 165,025 | ||||||||||||
| 109,000 | MASTR Alternative Loans Trust, 5.750%, due 09/25/34 | 110,851 | |||||||||||||
| 198,909 | MASTR Alternative Loans Trust, 6.000%, due 09/25/34 | 204,007 | |||||||||||||
| 92,021 | MASTR Asset Securitization Trust, 2.631%, due 11/25/33 | 92,222 | |||||||||||||
| 98,000 | MASTR Asset Securitization Trust, 5.500%, due 09/25/34 | 96,630 | |||||||||||||
| 80,784 | MLCC Mortgage Investors, Inc., 2.541%, due 04/25/29 | 80,920 | |||||||||||||
| 139,324 | Prime Mortgage Trust, 5.250%, due 11/25/19 | 141,240 | |||||||||||||
| 132,467 | Residential Accredit Loans, Inc., 2.631%, due 03/25/18 | 132,729 | |||||||||||||
| 99,000 | Residential Asset Securitization Trust, 5.500%, due 11/25/34 | 97,580 | |||||||||||||
| 143,000 | Residential Funding Mortgage Sec I, 5.750%, due 09/25/34 | 143,522 | |||||||||||||
| 581,144 | Thornburg Mortgage Securities Trust, 2.531%, due 12/25/33 | 581,322 | |||||||||||||
| 141,004 | Washington Mutual, 6.000%, due 06/25/34 | 144,617 | |||||||||||||
| 182,847 | Wells Fargo Mortgage Backed Securities Trust, 2.681%, due 02/25/34 | 183,185 | |||||||||||||
| 130,000 | Wells Fargo Mortgage Backed Securities Trust, 4.500%, due 08/25/18 | 124,671 | |||||||||||||
| 4,544,074 | |||||||||||||||
| Total Collateralized Mortgage Obligations (Cost $7,298,929) | 7,248,211 | ||||||||||||||
See Accompanying Notes to Financial Statements
115
PORTFOLIO OF INVESTMENTS
ING EQUITY AND BOND FUND AS OF NOVEMBER 30, 2004 (UNAUDITED) (CONTINUED)
| Principal Amount | Value | ||||||||||||||
| OTHER BONDS: 0.5% | |||||||||||||||
| Sovereign: 0.5% | |||||||||||||||
| $ | 29,118 | @@ | Brazilian Government Intl. Bond, 3.125%, due 04/15/12 | $ | 27,367 | ||||||||||
| 22,000 | @@ | Brazilian Government Intl. Bond, 12.250%, due 03/06/30 | 27,940 | ||||||||||||
| 36,000 | @@,S | Colombia Government Intl. Bond, 10.000%, due 01/23/12 | 40,950 | ||||||||||||
| 59,000 | @@ | Dominican Republic, 9.040%, due 01/23/13 | 51,478 | ||||||||||||
| 71,000 | @@ | Russian Federation, 5.000%, due 03/31/30 | 70,840 | ||||||||||||
| 28,000 | @@,S | Turkey Government Intl. Bond, 12.375%, due 06/15/09 | 34,860 | ||||||||||||
| 14,000 | @@,# | Ukraine Government Intl. Bond, 7.650%, due 06/11/13 | 14,175 | ||||||||||||
| 50,847 | @@,S,XX | Uruguay Government Intl. Bond, 10.500%, due 10/20/06 | 58,800 | ||||||||||||
| 15,000 | @@ | Venezuela Government Intl. Bond, 8.500%, due 10/08/14 | 15,638 | ||||||||||||
| Total Other Bonds (Cost $321,737) | 342,048 | ||||||||||||||
| MUNICIPAL BONDS: 0.1% | |||||||||||||||
| Municipal: 0.1% | |||||||||||||||
| 25,000 | City of New York NY, 5.000%, due 11/01/08 | 26,966 | |||||||||||||
| 25,000 | City of New York NY, 5.000%, due 11/01/11 | 27,300 | |||||||||||||
| 25,000 | City of New York NY, 5.000%, due 11/01/15 | 27,156 | |||||||||||||
| Total Municipal Bonds (Cost $82,205) | 81,422 | ||||||||||||||
| Total Long-Term Investments (Cost $62,388,209) | 65,854,178 | ||||||||||||||
SHORT-TERM INVESTMENTS: 5.1%
| Repurchase Agreement: 5.1% | |||||||||||||||
| 3,292,000 | Morgan Stanley Repurchase Agreement 11/30/04, 2.070%, due 12/01/04, $3,292,189 to be received upon repurchase (Collateralized by $3,220,000 various U.S. Government Agency Obligation, 4.750%-5.250%, Market Value plus accrued interest $3,365,716, due 01/02/07-08/01/12) | | 3,292,000 | ||||||||||||
| Total Short-Term Investments (Cost $3,292,000) | 3,292,000 | ||||||||||||||
| Total Investments In Securities (Cost $65,680,209)* | 107.5 | % | $ | 69,146,178 | |||||||||||
| Other Assets and Liabilities-Net | (7.5 | ) | (4,849,488 | ) | |||||||||||
| Net Assets | 100.0 | % | $ | 64,296,690 | |||||||||||
@ Non-income producing security
@@ Foreign issuer
STRIP Separate Trading of Registered Interest and Principal of Securities
# Securities with purchases pursuant to Rule 144A, under the Securities Act of 1933 and may not be resold subject to that rule except to qualified institutional buyers. These securities have been determined to be liquid under the guidelines established by the Funds' Board of Directors/Trustees.
C Bond may be called prior to maturity date.
W When-issued or delayed delivery security.
S Segregated securities for futures, when-issued or delayed delivery securities held at November 30, 2004.
I Illiquid security
X Fair value determined by ING Funds Valuation Committee appointed by the Funds' Board of Directors/Trustees.
XX Value of securities obtained from one or more dealers making markets in the securities in accordance with the Fund's valuation procedures.
** Defaulted security
* Cost for federal income tax purposes is $65,725,180. Net unrealized depreciation consists of:
| Gross Unrealized Appreciation | $ | 4,643,604 | |||||
| Gross Unrealized Depreciation | (1,222,606 | ) | |||||
| Net Unrealized Depreciation | $ | 3,420,998 | |||||
Information concerning open futures for ING Equity and Bond Fund at November 30, 2004 is shown below:
| Short Contracts | No. of Contracts | Notional Market Value | Expiration Date | Unrealized Gain (Loss) | |||||||||||||||
| U.S. 2 Year Treasury Note | 3 | $ | (630,797 | ) | 01/05/05 | $ | 595 | ||||||||||||
| U.S. 10 Year Treasury Note | 10 | (1,114,531 | ) | 12/30/04 | 10,731 | ||||||||||||||
| $ | (1,745,328 | ) | $ | 11,326 | |||||||||||||||
| Long Contracts | |||||||||||||||||||
| U.S. Long Bond | 7 | $ | 777,656 | 12/30/04 | $ | (4,285 | ) | ||||||||||||
See Accompanying Notes to Financial Statements
116
PORTFOLIO OF INVESTMENTS
ING REAL ESTATE FUND AS OF NOVEMBER 30, 2004 (UNAUDITED)
| Shares | Value | ||||||||||||||
| REAL ESTATE INVESTMENT TRUSTS: 93.2% | |||||||||||||||
| Apartments: 19.0% | |||||||||||||||
| 99,600 | L | Apartment Investment & Management Co. | $ | 3,622,452 | |||||||||||
| 338,100 | L | Archstone-Smith Trust | 12,340,650 | ||||||||||||
| 102,600 | L | AvalonBay Communities, Inc. | 7,294,860 | ||||||||||||
| 154,500 | L | Camden Property Trust | 7,575,135 | ||||||||||||
| 60,200 | L | Essex Property Trust, Inc. | 4,847,906 | ||||||||||||
| 30,000 | L | Post Properties, Inc. | 1,023,000 | ||||||||||||
| 424,500 | United Dominion Realty Trust, Inc. | 9,759,255 | |||||||||||||
| 46,463,258 | |||||||||||||||
| Diversified: 8.0% | |||||||||||||||
| 127,100 | @ | American Campus Communities, Inc. | 2,656,390 | ||||||||||||
| 204,000 | Liberty Property Trust | 8,364,000 | |||||||||||||
| 116,600 | Vornado Realty Trust | 8,570,100 | |||||||||||||
| 19,590,490 | |||||||||||||||
| Health Care: 2.0% | |||||||||||||||
| 385,800 | Omega Healthcare Investors, Inc. | 4,826,358 | |||||||||||||
| 4,826,358 | |||||||||||||||
| Hotels: 5.0% | |||||||||||||||
| 465,500 | Host Marriott Corp. | 7,289,730 | |||||||||||||
| 81,100 | LaSalle Hotel Properties | 2,489,770 | |||||||||||||
| 167,800 | Strategic Hotel Capital, Inc. | 2,533,780 | |||||||||||||
| 12,313,280 | |||||||||||||||
| Office Property: 21.7% | |||||||||||||||
| 205,000 | Arden Realty, Inc. | 7,380,000 | |||||||||||||
| 199,100 | Boston Properties, Inc. | 11,981,838 | |||||||||||||
| 176,650 | Corporate Office Properties Trust SBI MD | 4,907,337 | |||||||||||||
| 54,000 | Mack-Cali Realty Corp. | 2,361,960 | |||||||||||||
| 277,800 | Maguire Properties, Inc. | 7,308,918 | |||||||||||||
| 85,400 | Prentiss Properties Trust | 3,193,106 | |||||||||||||
| 150,100 | L | SL Green Realty Corp. | 8,650,263 | ||||||||||||
| 439,000 | Trizec Properties, Inc. | 7,230,330 | |||||||||||||
| 53,013,752 | |||||||||||||||
| Regional Malls: 18.5% | |||||||||||||||
| 70,900 | CBL & Associates Properties, Inc. | 5,196,261 | |||||||||||||
| 182,900 | General Growth Properties, Inc. | 6,275,299 | |||||||||||||
| 140,100 | L | Macerich Co. | 8,509,674 | ||||||||||||
| 198,900 | Mills Corp. | 11,806,704 | |||||||||||||
| 214,800 | Simon Property Group, Inc. | 13,334,784 | |||||||||||||
| 45,122,722 | |||||||||||||||
| Shopping Centers: 10.3% | |||||||||||||||
| 148,400 | Acadia Realty Trust | 2,248,260 | |||||||||||||
| 164,900 | L | Developers Diversified Realty Corp. | 7,098,945 | ||||||||||||
| 122,400 | Pan Pacific Retail Properties, Inc. | 7,258,320 | |||||||||||||
| 166,700 | Regency Centers Corp. | 8,668,400 | |||||||||||||
| 25,273,925 | |||||||||||||||
| Storage: 1.0% | |||||||||||||||
| 173,300 | Extra Space Storage, Inc. | 2,408,870 | |||||||||||||
| 2,408,870 | |||||||||||||||
| Shares | Value | ||||||||||||||
| Warehouse: 7.7% | |||||||||||||||
| 207,279 | L | Catellus Development Corp. | $ | 6,508,561 | |||||||||||
| 305,200 | ProLogis | 12,278,196 | |||||||||||||
| 18,786,757 | |||||||||||||||
| Total Real Estate Investment Trust (Cost $173,275,454) | 227,799,412 | ||||||||||||||
| COMMON STOCK: 5.1% | |||||||||||||||
| Hotels and Motels: 5.1% | |||||||||||||||
| 238,700 | L | Starwood Hotels & Resorts Worldwide, Inc. | 12,481,623 | ||||||||||||
| Total Common Stock (Cost $8,829,008) | 12,481,623 | ||||||||||||||
| Total Long-Term Investments (Cost $182,104,462) | 240,281,035 | ||||||||||||||
| Principal Amount | Value | ||||||||||||||
SHORT-TERM INVESTMENTS: 3.7%
| Securities Lending CollateralCC: 3.7% | |||||||||||||||
| $ | 9,043,070 | The Bank of New York Institutional Cash Reserves Fund | | 9,043,070 | |||||||||||
| Total Short-Term Investments (Cost $9,043,070) | | 9,043,070 | |||||||||||||
| Total Investments In | |||||||||||||||
| Securities (Cost | |||||||||||||||
| $191,147,532)* | 102.0 | % | $ | 249,324,105 | |||||||||||
| Other Assets and Liabilities-Net | (2.0 | ) | (4,954,005 | ) | |||||||||||
| Net Assets | 100.0 | % | $ | 244,370,100 | |||||||||||
@ Non-income producing security
cc Securities purchased with cash collateral for securities loaned.
L Loaned security, a portion or all of the security is on loan at November 30, 2004.
* Cost for federal income tax purposes is $189,916,706. Net unrealized appreciation consists of:
| Gross Unrealized Appreciation | $ | 59,407,399 | |||||
| Gross Unrealized Depreciation | - | ||||||
| Net Unrealized Appreciation | $ | 59,407,399 | |||||
See Accompanying Notes to Financial Statements
117
(THIS PAGE INTENTIONALLY LEFT BLANK)
ING Funds Distributor, LLC offers the funds listed below. Before investing in a fund, shareholders should carefully review the fund's prospectus. Investors may obtain a copy of a prospectus of any ING Fund by calling (800) 992-0180.
Domestic Equity and Income Funds
ING Balanced Fund
ING Convertible Fund
ING Equity and Bond Fund
ING Equity Income Fund
ING Real Estate Fund
Domestic Equity Growth Funds
ING Disciplined LargeCap Fund
ING Growth Fund
ING LargeCap Growth Fund
ING MidCap Opportunities Fund
ING SmallCap Opportunities Fund
ING Small Company Fund
Domestic Equity Index Funds
ING Index Plus LargeCap Fund
ING Index Plus MidCap Fund
ING Index Plus SmallCap Fund
Domestic Equity Value Funds
ING Financial Services Fund
ING LargeCap Value Fund
ING MagnaCap Fund
ING MidCap Value Fund
ING SmallCap Value Fund
ING Value Opportunity Fund
Fixed Income Funds
ING GNMA Income Fund
ING Government Fund
ING High Yield Bond Fund
ING Intermediate Bond Fund
ING National Tax Exempt Bond Fund
Global Equity Funds
ING Global Equity Dividend Fund
ING Global Real Estate Fund
ING Global Science and Technology Fund
ING Worldwide Growth Fund
International Equity Funds
ING Emerging Countries Fund
ING Foreign Fund
ING International Fund
ING International Growth Fund
ING International SmallCap Growth Fund
ING International Value Fund
ING Precious Metals Fund
ING Russia Fund
Loan Participation Fund
ING Senior Income Fund
Money Market Funds*
ING Aeltus Money Market Fund
ING Classic Money Market Fund
ING Lexington Money Market Trust
ING Money Market Fund
Strategic Allocation Funds
ING Strategic Allocation Balanced Fund
ING Strategic Allocation Growth Fund
ING Strategic Allocation Income Fund
* An investment in the Fund is not insured or guaranteed by the Federal Deposit Insurance Corporation or any other government agency. Although the Fund seeks to preserve the value of your investment at $1.00 per share, it is possible to lose money by investing in the Fund.
PROXY VOTING INFORMATION
A description of the policies and procedures that the Registrants use to determine how to vote proxies related to portfolio securities is available (1) without charge, upon request, by calling Shareholder Services toll-free at 800-992-0180; (2) on the Registrants' website at www.ingfunds.com and (3) on the SEC's website at www.sec.gov.
Information regarding how the Registrants voted proxies related to portfolio securities during the most recent 12-month period ended June 30 is available without charge on the Registrants' website at www.ingfunds.com and on the SEC website at www.sec.gov.
QUARTERLY PORTFOLIO HOLDINGS
The Registrants file their complete schedule of portfolio holdings with the Commission for the first and third quarters of each fiscal year on Form N-Q. The Registrants' Forms N-Q are available on the SEC's website at www.sec.gov. The Registrants' Forms N-Q may be reviewed and copied at the Commissions Public Reference Room in Washington, DC, and information on the operation of the Public Reference Room may be obtained by calling 1-800-SEC-0330; and is available upon request from the Registrants by calling Shareholder Services toll-free at 800-992-0180.
Investment Manager
ING Investments, LLC
7337 E. Doubletree Ranch Road
Scottsdale, Arizona 85258
Administrator
ING Funds Services, LLC
7337 E. Doubletree Ranch Road
Scottsdale, Arizona 85258
Distributor
ING Funds Distributor, LLC
7337 E. Doubletree Ranch Road
Scottsdale, Arizona 85258
1-800-334-3444
Transfer Agent
DST Systems, Inc.
P.O. Box 419368
Kansas City, Missouri 64141
Custodian
The Bank of New York
100 Colonial Center Parkway, Suite 300
Lake Mary, Florida 32746
Legal Counsel
Dechert
1775 I Street, N.W.
Washington, D.C. 20006
For more complete information, or to obtain a prospectus on any ING fund, please call your Investment Professional or ING Funds Distributor, LLC at (800) 992-0180 or log on to www.ingfunds.com. The prospectus should be read carefully before investing. Consider the fund's investment objectives, risks, charges and expenses carefully before investing. The prospectus contains this information and other information about the fund. Information regarding how the Funds voted proxies related to portfolio securities during the most recent 12-month period ended June 30 is available without charge on the Funds' website at www.ingfunds.com and on the SEC's website at www.sec.gov.

PRSAR-UFDEABCMO (1104-012805)

Funds
Semi-Annual Report
November 30, 2004
Classes I and Q
| Domestic Equity Growth Funds | Domestic Equity And Income Funds | ||||||
| n ING Disciplined LargeCap Fund | n ING Convertible Fund | ||||||
| n ING LargeCap Growth Fund | n ING Equity and Bond Fund | ||||||
| n ING MidCap Opportunities Fund | n ING Real Estate Fund | ||||||
| n ING SmallCap Opportunities Fund | |||||||
| Domestic Equity Value Funds | |||||||
| n ING LargeCap Value Fund | |||||||
| n ING MagnaCap Fund | |||||||
| n ING MidCap Value Fund | |||||||
| n ING SmallCap Value Fund | |||||||
This report is submitted for general information to shareholders of the ING Funds. It is not authorized for distribution to prospective shareholders unless accompanied or preceded by a prospectus which includes details regarding the funds' investment objectives, risks, charges, expenses and other information. This information should be read carefully.
 E-Delivery Sign-up – details inside

TABLE OF CONTENTS
 Go Paperless with E-Delivery!
Sign up now for on-line prospectuses, fund reports, and proxy statements. In less than five minutes, you can help reduce paper mail and lower fund costs.
Just go to www.ingfunds.com, click on the E-Delivery icon from the home page, follow the directions and complete the quick 5 Steps to Enroll.
You will be notified by e-mail when these communications become available on the internet. Documents that are not available on the internet will continue to be sent by mail.
(THIS PAGE INTENTIONALLY LEFT BLANK)
Dear Shareholder:
The past year has brought about numerous changes in the mutual funds industry, including requests for additional disclosures. I would like to draw your attention to some additional information you will now see in the reports due, in part, to these new requirements:
• You will see a new section entitled "Shareholder Expense Examples". These examples are intended to illustrate for you the ongoing costs of investing in a mutual fund and to provide a method to compare those costs with the ongoing costs of investing in other mutual funds.
• In addition to the normal performance tables included in the Portfolio Managers' Reports, there are now additional graphical or tabular presentations, which illustrate the current holdings of the funds as of the period-end.
• Each fund now also files its complete schedule of portfolio holdings with the Securities Exchange Commission ("SEC") for the first and third quarters of each fiscal year on
Form N-Q. These Forms are available for shareholders to view on the SEC's website at www.sec.gov.
We welcome these changes and believe that they will provide valuable information to our shareholders. We hope you will find these additional disclosures beneficial and easy to understand.
On behalf of ING Funds, I thank you for your continued support and confidence and look forward to serving you in 2005 and beyond.
Sincerely,

James M. Hennessy
President
ING Funds
January 25, 2005

JAMES M. HENNESSY
1
MARKET PERSPECTIVE: SIX MONTHS ENDED NOVEMBER 30, 2004
Two months prior to the start of our fiscal year, the economic outlook had changed radically. On April 2, 2004, a very bullish U.S. employment report had sparked a few days of euphoria that vanished as it became clear that as the job market tightens, inflation picks up and rising interest rates cannot be far away. This was followed up with another strong report in May and by mid-month major stock and bond markets had negative returns for 2004. Markets were off their lows as we started our half year and in this period, as we shall see below, sentiment would undergo two more major reversals, accompanied by record-breaking market movements.
Global equities added 9.0% from the end of May through November according to the Morgan Stanley Capital International ("MSCI") World Index(1) in dollars including net dividends, just under half due to dollar weakness. Among currencies, the euro, yen and pound all gained on the dollar, although the pendulum swung back and forth. Ultimately, the dollar succumbed to record U.S. trade deficits, and latterly, to fears that non-U.S. investors might diversify out of U.S. financial assets. By the end of November 2004, the euro had gained 8.9% and a new all tim e record against the dollar. The yen rose 6.2% to a level not seen since early 2000, while the pound stood 4.2% higher at a remarkable 12-year peak. On a trade-weighted basis, the dollar plumbed 9-year lows.
Investment grade U.S. fixed income classes initially bore the brunt of fears of a new cycle of rising interest rates from multi-decade low levels, as evidence mounted that inflation was on the rise. In the six months ended November 30, 2004, the Federal Open Market Committee (FOMC) would increase the Federal Reserves Funds rate four times to 2.0%, even as the economy clearly decelerated again. During this time, the total return of the Lehman Brothers Aggregate Bond Index(2) of investment grade bonds was 3.8%. High yield bonds fared comparatively well, the Lehman Brothers U.S. Corporate High Yield Bond Index(3) returning 9.6% for the six months. In a similar vein there was a notable flattening of the yield curve, as short-term interest rates marched up in anticipation of continued monetary tightening, while bond yields ignored this and fell in the face of mostly tame economic data. For the six months, the yield on 10-year Treasury Notes fell by 30 basis points to 4.4%, but the yield on 13-week Treasury Bills rose 113 basis points to 2.2%.
The U.S. equities market in the form of the Standard & Poor's ("S&P") 500 Index(4) rose 5.7% including dividends in the six months ended November 30, 2004. At that point the market was trading at a price to earnings ("P/E") level of just under 16 times 2005 estimated earnings. As mentioned above, strong monthly employment reports from April 2004 set the tone. After an initial scare about the rise in interest rates that this implied, investors regained their nerve and as the Federal Reserve embarked on its tightening cycle at the end of June the market was challenging its best levels of 2004. And yet in the week before the increase the wind seemed to shift again with some unexpectedly downbeat economic releases. From July through October 2004, the employment reports were neutral to shockingly weak, while oil prices continued their rise, peaking on Friday, October 22 at 41% above end of May 2004 levels. This effective deflationary "tax" on worldwide consumers troubled equity markets, and the S&P 500 Index reached its lowest point of 2004 on August 12. From there, however, oil prices retreated by 13% and that, combined with a clear election result, perceived to be business and shareholder friendly, plus a new, powerful employment report, caused sentiment to shift yet again. By the end of November, the S&P 500 Index had breached levels not seen since before September 11, 2001, bolstered by an upward revision to third quarter gross domestic product ("GDP") growth to 3.9%.
In international equities markets, for the six months ended November 30, 2004, Japan rose 4.8% in dollars, according to the MSCI Japan Index(5) with net dividends, but fell 2.6% in yen. At that point, stocks were trading at nearly 16 times 2005 estimated earnings. Initially encouraged by surprisingly strong, export led, 6.1% first quarter GDP growth, investors became disillusioned by a likely slow down in China, rising oil prices and a slumping dollar. By the third quarter, GDP growth had fallen to a depressingly flat 0.1%.
Meanwhile, European excluding ("ex") UK markets gained 15.5% in dollars, about five-eighths due to dollar weakness, according to the MSCI Europe ex UK Index(6) with net dividends. In local currency terms, the region's markets reached a 28-month high during November 2004, and were then trading on average at just over 13 times 2005 estimated earnings. Growth in this region is held back by weak domestic demand, restrained by 8.9% unemployment in infl exible labor markets. This region's main attraction is its relative
2
MARKET PERSPECTIVE: SIX MONTHS ENDED NOVEMBER 30, 2004
cheapness; the concern is the fragility of this picture, given its export dependency.
The UK market rose 12.1% in dollars between May and November 2004, based on the MSCI UK Index(7) with net dividends. In pounds, the market rose 7.5%, attaining the highest mark since mid-2002, and traded at about 161/2 times 2005 esti mated earnings. Unlike Continental Europe, the UK economy strains at full employment, with over-committed, property owning consumers, enriched (at least in their own minds), by a housing price bubble. The Bank of England has been trying, with five interest rate increases since November 2003, to cool demand and by the end of November seemed to be succeeding.
(1) The MSCI World Index measures the performance of over 1,400 securities listed on exchanges in the United States, Europe, Canada, Australia, New Zealand and the Far East.
(2) The Lehman Brothers Aggregate Bond Index is composed of securities from the Lehman Brothers Government/Corporate Bond Index, Mortgage-Backed Securities Index, and the Asset-Backed Securities Index. Total return comprises price appreciation/depreciation and income as a percentage of the original investment.
(3) The Lehman Brothers U.S. Corporate High Yield Bond Index is generally representative of corporate bonds rated below investment-grade.
(4) The Standard & Poor's 500 Index is a capitalization-weighted index of 500 stocks designed to measure performance of the broad domestic economy through changes in the aggregate market value of 500 stocks representing all major industries.
(5) The MSCI Japan Index is a free float-adjusted market capitalization index that is designed to measure developed market equity performance in Japan.
(6) The MSCI Europe ex UK Index is a free float-adjusted market capitalization index that is designed to measure developed market equity performance in Europe, excluding the UK.
(7) The MSCI UK Index is a free float-adjusted market capitalization index that is designed to measure developed market equity performance in the UK.
All indices are unmanaged and investors cannot invest directly in an index.
Past performance does not guarantee future results. The performance quoted represents past performance. Investment return and principal value of an investment will fluctuate, and shares, when redeemed, may be worth more or less than their original cost. The Funds' performance is subject to change since the period's end and may be lower or higher than the performance data shown. Please call (800) 992-0180 or log on to www.ingfunds.com to obtain performance data current to the most recent month end.
Market Perspective reflects the views of the Chief Investment Risk Officer only through the end of the period, and is subject to change based on market and other conditions.
3
ING DISCIPLINED LARGECAP FUND
The ING Disciplined LargeCap Fund (the "Fund") seeks capital appreciation. The Fund is managed by a team of investment professionals led by Hugh T.M. Whelan Sr., CFA, ING Investment Management Co. - the Sub-Adviser.
Performance: For the six months ended November 30, 2004, the Fund's Class I shares provided a total return of 7.56% compared to the Standard & Poor's ("S&P") 500 Index(4), which returned 5.67% for the same period.
Portfolio Specifics: Performance benefited from good stock selection. Sector allocation, market timing, and other macro themes played no significant role in the Fund's outperformance of its benchmark.
Relative performance during the first five months of this period was positive, but somewhat restrained. The market headed down going into August weighed by oil's ascent and the beginning of a season full of large events, such as the Olympics and the Democratic and Republican conventions, which were perceived to be prime targets for terrorists. As each potential disaster passed without incident, the market slowly drifted up, until by the end of October it was roughly back to where it had started. Throughout this period, we incrementally added value, especially in the information technology and health care sectors. Stock selection in these sectors was helped by our model's earnings quality and valuation factors. Price momentum and other market recognition factors were detrimental to security selection in these sectors. Security selection during this time was weakest in the financials sector where historically successful factors, such as earnings momentum and earnings surprise, failed to provide positive guidance.
A market catalyst emerged after the election. In November, the S&P 500 Index returned a robust 4.1%, and we generated as much outperformance in November as we did in the preceding five months. The markets seemed to ease its concern over macro fears and concentrate more on individual stock stories. Like the first five months of the reporting period, stock selection within the health care and information technology sectors was particularly successful. However, this time the factors that proved to be the strong indicators of performance were market recognition factors, such as price momentum and analyst estimate revision. Factors that tended not to work as well were those that monitor management behavior, such as capital expenditures intensity. Stock selection in November was weakest in the industrial sector.
For the full six-month performance period, roughly half our outperformance came in November and the other half was spread out over the preceding five months. We had strong stock selection in the health care and information technology sector and weak stock selection in the financial and industrial sectors.
Current Strategy and Outlook: Our strategy going forward is to continue our focus on bottom-up stock selection using the criteria of positive business momentum, valuation, and market recognition. The Fund is overweight in the consumer discretionary and energy sectors and underweight in the industrials and financials sectors. However, our overall sector exposures are a result of our bottom-up stock picking and are by design quite close to the S&P 500 Index so that nearly all of our relative performance is driven by individual stock selection.
The outlook for equities is positive with third calendar quarter earnings hitting seventeen percent and the non-farm payroll report almost double expectations. The Federal Reserve signaled its intentions to continue with its "measured" increase in rates and in November lifted the fed funds rate to 2.00%, still considered to be accommodative. Robust corporate profits, strong jobs numbers and inflation fighting Federal Reserve all bode well for equities.

Top Ten Holdings
as of November 30, 2004
(as a percent of net assets)*
| Exxon Mobil Corp. | 3.7 | % | |||||
| General Electric Co. | 3.1 | % | |||||
| Microsoft Corp. | 2.6 | % | |||||
| Johnson & Johnson | 2.5 | % | |||||
| American International Group, Inc. | 2.5 | % | |||||
| International Business Machines Corp. | 2.4 | % | |||||
| Procter & Gamble Co. | 2.1 | % | |||||
| Citigroup, Inc. | 2.0 | % | |||||
| Wal-Mart Stores, Inc. | 2.0 | % | |||||
| Pfizer, Inc. | 1.9 | % | |||||
Portfolio holdings are subject to change daily.
* Excludes short-term securities related to securities lending.
4
PORTFOLIO MANAGERS' REPORT ING DISCIPLINED LARGECAP FUND

| Average Annual Total Returns for the Periods Ended November 30, 2004 | |||||||||||||||
| 1 Year | 5 Year | Since Inception December 30, 1998 | |||||||||||||
| Class I | 13.90 | % | (2.97 | )% | (0.35 | )% | |||||||||
| S&P 500 Index(1) | 12.85 | % | (1.84 | )% | 0.70 | %(2) | |||||||||
Based on a $1,000,000 initial investment, the graph and table above illustrate the total return of ING Disciplined LargeCap Fund against the S&P 500 Index. The Index is unmanaged and has no cash in its portfolio, imposes no sales charges and incurs no operating expenses. An investor cannot invest directly in an index. The Fund's performance is shown both with and without the imposition of sales charges.
The performance graph and table do not reflect the deduction of taxes that a shareholder will pay on Fund distributions or the redemption of Fund shares.
Total returns reflect the fact that the Investment Manager has waived certain fees and expenses otherwise payable by the Fund. Total returns would have been lower had there been no waiver to the Fund.
Performance data represents past performance and is no assurance of future results. Investment return and principal value of an investment in the Fund will fluctuate. Shares, when sold, may be worth more or less than their original cost. The Fund's performance may be lower or higher than the performance data shown. Please log on to www.ingfunds.com or call (800) 922-0180 to get performance through the most recent month end.
This report contains statements that may be "forward-looking" statements. Actual results may differ materially from those projected in the "forward-looking" statements.
The views expressed in this report reflect those of the portfolio managers, only through the end of the period as stated on the cover. The portfolio managers' views are subject to change at any time based on market and other conditions.
Fund holdings are subject to change daily.
(1) The S&P 500 Index is a capitalization-weighted index of 500 stocks chosen for market size, liquidity, and industry group representation.
(2) Since inception performance for index is shown from January 1, 1999.
5
ING LARGECAP GROWTH FUND
PORTFOLIO MANAGERS' REPORT
The ING LargeCap Growth Fund (the "Fund") seeks long-term capital appreciation by investing primarily in equity securities of large U.S. companies. The Fund is managed by Andrew J. Shilling, CFA, Senior Vice President, Partner and Equity Portfolio Manager, Wellington Management Company, LLP - the Sub-Adviser.
Performance: For the six months ended November 30, 2004, the Fund's Class Q shares provided a total return of 0.48% compared to the Russell 1000 Growth Index(4) and the Standard & Poor's ("S&P") 500 Index(5), which returned 0.81% and 5.67%, respectively, for the same period.
Portfolio Specifics: The summer of 2004 weakness in equities was a result of investor focus on several concerns: a softening economy, uncertainty over presidential elections, continued violence in Iraq, and worries of potential terrorist strikes during the political conventions or the Olympics. By fall, many of these worries had been mitigated and America remained free of terrorist attacks. The economy seemed to be moving forward despite record high oil prices. Equity markets generally rallied beginning in September, resulting in positive performance for the six month period.
In this volatile environment, the Fund maintained its focus on stock selection. Wireless handheld device maker Research In Motion Ltd., the top positive contributor to absolute Fund returns, benefited from the introduction of an appealing new messaging and communication device and a software agreement with cell phone giant Nokia Corp. Internet media company Yahoo!, Inc. also boosted results on favorable trends for online advertising and paid search, while online auctioneer eBay, Inc., a consumer discretionary stock, rose on strong international growth and accelerating PayPal metrics.
Unfavorable performance from Apollo Group, Inc. and a handful of health care stocks contributed to the Fund's relative underperformance during the period. Post-secondary educator Apollo Group, Inc., the bottom contributor on a relative basis, declined on negative news flow for the industry and questions regarding its recruitment practices. In the health care sector, pharmaceuticals were generally weak during the period. Of our holdings, Eli Lilly & Co. and AstraZeneca PLC were particularly weak. AstraZeneca PLC's weakness was driven mainly by FDA concerns about negative side effects of Exanta, a blood thinning drug in the company's product pipeline. Drug distributor Cardinal Health, Inc., which was held during the period, was hurt by an investigation of accounting practices.
Current Strategy and Outlook: Though we believe that the economy will exhibit moderate growth over the intermediate term, we are somewhat challenged to aptly forecast the near-term macroeconomic environment. On the one hand, gross domestic product (GDP) rose at a 3.9% annualized rate in the third calendar quarter of 2004, manufacturing indicators continue to show strength, and interest rates are relatively low. On the other hand, employment growth remains somewhat sluggish, the Federal Reserve continues to raise short-term interest rates, and oil prices remain high. Elevated energy prices, particularly if they persist or rise in the coming months, could serve to restrain corporate spending and/or curtail consumer consumption. In this uncertain environment, we continue to emphasize competitiv ely-advantaged, share-gaining industry leaders that should perform well in most economic scenarios. Our strategy is to build a diversified portfolio on a stock-by-stock basis, identifying companies with sustainable strong revenue and cash flow growth.

Top Ten Holdings
as of November 30, 2004
(as a percent of net assets)*
| Research In Motion Ltd. | 5.6 | % | |||||
| Apollo Group, Inc. | 5.1 | % | |||||
| Yahoo!, Inc. | 5.1 | % | |||||
| Countrywide Financial Corp. | 4.9 | % | |||||
| Guidant Corp. | 4.6 | % | |||||
| eBay, Inc. | 4.5 | % | |||||
| Dell, Inc. | 4.1 | % | |||||
| Electronic Arts, Inc. | 3.7 | % | |||||
| AstraZeneca PLC ADR | 3.4 | % | |||||
| First Data Corp. | 3.3 | % | |||||
Portfolio holdings are subject to change daily.
* Excludes short-term securities related to securities lending.
6
PORTFOLIO MANAGERS' REPORT ING LARGECAP GROWTH FUND
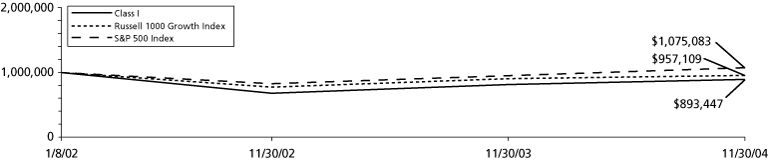
| Average Annual Total Returns for the Periods Ended November 30, 2004 | |||||||||||||||||||
| 1 Year | 5 Year | Since Inception of Class I January 8, 2002 | Since Inception of Class Q July 21, 1997 | ||||||||||||||||
| Class I | 9.81 | % | - | (3.81 | )% | - | |||||||||||||
| Class Q | 9.62 | % | (10.74 | )% | - | 6.27 | % | ||||||||||||
| Russell 1000 Growth Index(1) | 5.83 | % | (8.19 | )% | (1.49 | )%(3) | 1.24 | %(4) | |||||||||||
| S&P 500 Index(2) | 12.85 | % | (1.84 | )% | 2.51 | %(3) | 4.44 | %(4) | |||||||||||
Based on a $1,000,000 initial investment, the graph and table above illustrate the total return of ING LargeCap Growth Fund against the Russell 1000 Growth Index and the S&P 500 Index. The Indices are unmanaged and have no cash in their portfolios, impose no sales charges and incur no operating expenses. An investor cannot invest directly in an index. The Fund's performance is shown both with and without the imposition of sales charges.
The performance graph and table do not reflect the deduction of taxes that a shareholder will pay on Fund distributions or the redemption of Fund shares.
Total returns reflect the fact that the Investment Manager has waived certain fees and expenses otherwise payable by the Fund. Total returns would have been lower had there been no waiver to the Fund.
Performance data represents past performance and is no assurance of future results. Investment return and principal value of an investment in the Fund will fluctuate. Shares, when sold, may be worth more or less than their original cost. The Fund's performance may be lower or higher than the performance data shown. Please log on to www.ingfunds.com or call (800) 922-0180 to get performance through the most recent month end.
This report contains statements that may be "forward-looking" statements. Actual results may differ materially from those projected in the "forward-looking" statements.
The views expressed in this report reflect those of the portfolio managers, only through the end of the period as stated on the cover. The portfolio managers' views are subject to change at any time based on market and other conditions.
Fund holdings are subject to change daily.
(1) The Russell 1000 Growth Index is an index that measures the performance of those Russell 1000 Index companies with higher price-to-book ratios and higher forecasted growth values.
(2) The S&P 500 Index is a capitalization-weighted index of 500 stocks chosen for market size, liquidity, and industry group representation.
(3) Since inception performance for index is shown from January 1, 2002.
(4) Since inception performance for index is shown from August 1, 1997.
7
ING MIDCAP OPPORTUNITIES FUND
PORTFOLIO MANAGERS' REPORT
The ING MidCap Opportunities Fund (the "Fund") seeks long-term capital appreciation. The Fund is managed by a team of investment professionals led by Matthew Price, CFA and David Campbell, ING Investment Management Co. - the Sub-Adviser.
Performance: For the six months ended November 30, 2004, the Fund's Class I shares provided a total return of 5.19% compared to the Russell MidCap Growth Index(4) and the Russell MidCap Index(5), which returned 5.68% and 11.09%, respectively, for the same period.
Portfolio Specifics: The Fund slightly underperformed the Russell MidCap Growth Index as unfavorable sector allocation was offset by good stock selection. A substantial overweight in the energy sector combined with strong stock selection was a major positive factor, as was the industrial sector where superior stock selection more than offset unfavorable sector allocation. With energy prices likely to settle for a period around the $40 price level, we believe that share prices remain attractive in that sector. The health care sector hurt performance most as asset allocation and poor stock selection united to negatively impact results. Stocks that contributed to performance during the past six months were Harman Intl. Industries, Inc., CACI Intl., Inc., and Adobe Systems, Inc., while Omnicare, Inc., Broadcom Corp., and NBTY, Inc., which were all previously held, performed poorly and detracted from results.
Energy represents the most heavily overweighted sector relative to the Russell MidCap Growth Index, while technology remains as the most underweighted. This is an indication as to where the Fund's managers believe the best earnings growth will be found in 2005. The latter sector was reduced sharply during the past six months as profits were taken in successful investments, while several unsuccessful technology positions were sold. The exposure to health care remains above the benchmark as we believe that following a period of difficult earnings comparisons and potential "headline risk" from new product failures, the sector offers above- average potential. Overall, we believe that the Fund is well positioned for the 2005 investment environment we see ahead.
Current Strategy and Outlook: The stock market seems poised to end 2004 on a positive note. The favorable presidential election outcome (from the market's perspective) and the outlook for stable to declining energy prices over the next few months have enabled investors to focus on the more traditional economic and market metrics: valuation, interest rates, corporate profits and inflation. Given our positive economic outlook for the remainder of 2004 and into 2005, we believe that the market is reasonably valued and able to provide positive returns during the coming year. However, our stock selection process is primarily based on a combination of positive earnings growth, relative price strength and reasonable valuation and, as such, is not dependent upon our market or economic outlook.
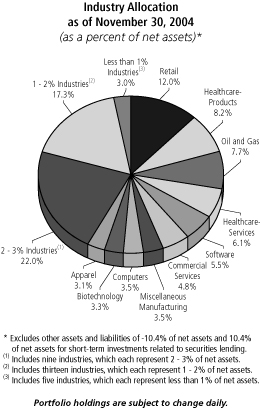
Top Ten Holdings
as of November 30, 2004
(as a percent of net assets)*
| Adobe Systems, Inc. | 2.1 | % | |||||
| Harman Intl. Industries, Inc. | 2.1 | % | |||||
| Coach, Inc. | 2.1 | % | |||||
| Mohawk Industries, Inc. | 2.0 | % | |||||
| Avid Technology, Inc. | 2.0 | % | |||||
| Rockwell Automation, Inc. | 1.8 | % | |||||
| Chesapeake Energy Corp. | 1.8 | % | |||||
| St. Jude Medical, Inc. | 1.8 | % | |||||
| CACI Intl., Inc. | 1.7 | % | |||||
| Sonic Corp. | 1.7 | % | |||||
Portfolio holdings are subject to change daily.
* Excludes short-term securities related to securities lending.
8
PORTFOLIO MANAGERS' REPORT ING MIDCAP OPPORTUNITIES FUND
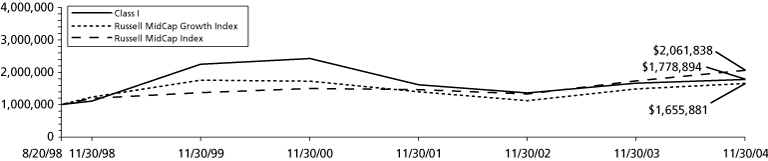
| Average Annual Total Returns for the Periods Ended November 30, 2004 | |||||||||||||||||||
| 1 Year | 5 Year | Since Inception of Class I August 20, 1998 | Since Inception of Class Q April 4, 2000 | ||||||||||||||||
| Class I | 6.92 | % | (4.58 | )% | 9.60 | % | - | ||||||||||||
| Class Q | 6.76 | % | - | - | (9.48 | )% | |||||||||||||
| Russell MidCap Growth Index(1) | 11.40 | % | (1.15 | )% | 8.40 | %(3) | (8.39 | )%(4) | |||||||||||
| Russell MidCap Index(2) | 18.76 | % | 8.51 | % | 12.27 | %(3) | 5.01 | %(4) | |||||||||||
Based on a $1,000,000 initial investment, the graph and table above illustrate the total return of ING MidCap Opportunities Fund against the Russell MidCap Growth Index and the Russell MidCap Index. The Indices are unmanaged and have no cash in their portfolios, impose no sales charges and incur no operating expenses. An investor cannot invest directly in an index. The Fund's performance is shown both with and without the imposition of sales charges.
The performance graph and table do not reflect the deduction of taxes that a shareholder will pay on Fund distributions or the redemption of Fund shares.
Total returns reflect the fact that the Investment Manager has waived certain fees and expenses otherwise payable by the Fund. Total returns would have been lower had there been no waiver to the Fund.
Performance data represents past performance and is no assurance of future results. Investment return and principal value of an investment in the Fund will fluctuate. Shares, when sold, may be worth more or less than their original cost. The Fund's performance may be lower or higher than the performance data shown. Please log on to www.ingfunds.com or call (800) 922-0180 to get performance through the most recent month end.
This report contains statements that may be "forward-looking" statements. Actual results may differ materially from those projected in the "forward-looking" statements.
The views expressed in this report reflect those of the portfolio managers, only through the end of the period as stated on the cover. The portfolio managers' views are subject to change at any time based on market and other conditions.
Fund holdings are subject to change daily.
(1) The Russell MidCap Growth Index consists of those companies included in the Russell MidCap Index with relatively higher price-to-book ratios and higher forecasted growth values with greater than average growth orientation.
(2) The Russell MidCap Index measures the performance of the 800 smallest companies in the Russell 1000 Index.
(3) Since inception performance for index is shown from September 1, 1998.
(4) Since inception performance for index is shown from April 1, 2000.
9
ING SMALLCAP OPPORTUNITIES FUND
PORTFOLIO MANAGERS' REPORT
The ING SmallCap Opportunities Fund (the "Fund") seeks capital appreciation. The Fund is managed by a team of investment professionals led by Matthew Price, CFA and David Campbell, ING Investment Management Co. - the Sub-Adviser.
Performance: For the six months ended November 30, 2004, the Fund's Class I shares provided a total return of 8.08% compared to the Russell 2000 Growth Index(4) and the Russell 2000 Index(5), which returned 7.88% and 12.18%, respectively, for the same period.
Portfolio Specifics: Strong stock selection was able to overcome disappointing results from our sector allocation, providing a return for the six months ended November 30, 2004 that was in line with the Fund's benchmark. The divergence in performance among sectors was very wide during this period. Compared to the benchmark technology experienced very positive results, but these gains were more than offset by disappointing performance in the health care sector. Strong contributors in technology included Cognizant Technology Solutions, Micros Systems, Inc., and Silicon Image, Inc. However, the problems among several small health care-related companies, including previously held Ligand Pharmaceuticals, Martek Biosciences Corp., and Accredo Health, Inc. had a severely negative impact. The e nergy sector contributed to the favorable results due to a combination of good sector weighting decisions and strong stock selection, including Southwestern Energy Co. Favorable stock selections in the consumer discretionary sector, such as Penn National Gaming, Inc. and Dick's Sporting Goods, Inc., also helped performance. Lack of exposure to the strongly performing materials sector detracted from performance.
The sector weightings remained relatively unchanged during the June to November 2004 period. The consumer discretionary sector is the Fund's largest position and represents a substantial overweighting versus the benchmark. As is often the case in small-cap growth portfolios, consumer discretionary, technology, and health care remain the three largest sectors, representing about 70% of the entire Fund versus about 65% of the benchmark. There is a high level of industry diversification within these sectors, but they remain the growth areas of the economy. On the other hand, industrials are the most heavily underweighted sector in the Fund, where a lack of earnings growth and relative price strength has made security selection challenging.
Current Strategy and Outlook: The stock market seems poised to end 2004 on a positive note. The favorable presidential election outcome (from the market's perspective) and the outlook for stable to declining energy prices over the next few months have enabled investors to focus on the more traditional economic and market metrics: valuation, interest rates, corporate profits, and inflation. Given our positive economic outlook, we believe that the market is reasonably valued and able to provide positive returns during the coming year.
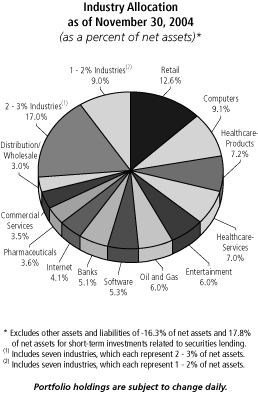
Top Ten Holdings
as of November 30, 2004
(as a percent of net assets)*
| Southwestern Energy Co. | 3.0 | % | |||||
| Shuffle Master, Inc. | 2.8 | % | |||||
| Cognizant Technology Solutions Corp. | 2.6 | % | |||||
| Ishares Russell 2000 Growth Index Fund | 2.6 | % | |||||
| Avid Technology, Inc. | 2.5 | % | |||||
| Amsurg Corp. | 2.4 | % | |||||
| SCP Pool Corp. | 2.4 | % | |||||
| Station Casinos, Inc. | 2.3 | % | |||||
| Inamed Corp. | 2.3 | % | |||||
| Pediatrix Medical Group, Inc. | 2.2 | % | |||||
Portfolio holdings are subject to change daily.
* Excludes short-term securities related to securities lending.
10
PORTFOLIO MANAGERS' REPORT ING SMALLCAP OPPORTUNITIES FUND
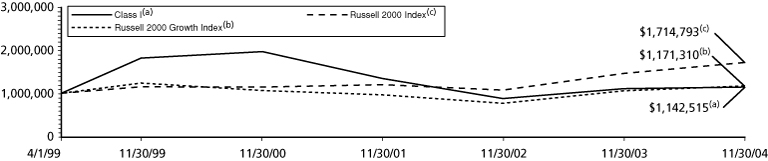
| Average Annual Total Returns for the Periods Ended November 30, 2004 | |||||||||||||||||||
| 1 Year | 5 Year | Since Inception of Class I April 1, 1999 | Since Inception of Class Q April 4, 2000 | ||||||||||||||||
| Class I | 3.10 | % | (8.86 | )% | 2.38 | % | - | ||||||||||||
| Class Q | 2.78 | % | - | - | (14.14 | )% | |||||||||||||
| Russell 2000 Growth Index(1) | 10.83 | % | (1.09 | )% | 2.83 | % | (6.34 | )%(4) | |||||||||||
| Russell 2000 Index(2) | 17.26 | % | 8.29 | % | 9.98 | % | 4.88 | %(4) | |||||||||||
Based on a $1,000,000 initial investment, the graph and table above illustrate the total return of ING SmallCap Opportunities Fund against the Russell 2000 Growth Index and the Russell 2000 Index. The Indices are unmanaged and have no cash in their portfolios, impose no sales charges and incur no operating expenses. An investor cannot invest directly in an index. The Fund's performance is shown both with and without the imposition of sales charges.
The performance graph and table do not reflect the deduction of taxes that a shareholder will pay on Fund distributions or the redemption of Fund shares.
Total returns reflect the fact that the Investment Manager has waived certain fees and expenses otherwise payable by the Fund. Total returns would have been lower had there been no waiver to the Fund.
Performance data represents past performance and is no assurance of future results. Investment return and principal value of an investment in the Fund will fluctuate. Shares, when sold, may be worth more or less than their original cost. The Fund's performance may be lower or higher than the performance data shown. Please log on to www.ingfunds.com or call (800) 922-0180 to get performance through the most recent month end.
This report contains statements that may be "forward-looking" statements. Actual results may differ materially from those projected in the "forward-looking" statements.
The views expressed in this report reflect those of the portfolio managers, only through the end of the period as stated on the cover. The portfolio managers' views are subject to change at any time based on market and other conditions.
Fund holdings are subject to change daily.
(1) The Russell 2000 Growth Index measures the performance of those Russell 2000 Index companies with higher price-to-book ratios and higher forecasted growth values.
(2) The Russell 2000 Index consists of the smallest 2,000 companies in the Russell 3000 Index. The Russell 3000 Index is an unmanaged index that measures the performance of 3000 U.S. companies based on total market capitalization.
(3) The Fund normally invests in small-cap companies that the portfolio managers feel have above average prospects for growth. The Russell 2000 Growth Index tracks the performance of small-cap growth companies.
(4) Since inception performance for index is shown from April 1, 2000.
11
ING LARGECAP VALUE FUND
The ING LargeCap Value Fund (the "Fund") seeks long-term capital appreciation. The Fund is managed by Brandes Investment Partners, L.P. - the Sub-Adviser. Brandes' Large Cap Investment Committee is responsible for making the day-to-day investment decisions for the Fund.
Performance: For the period from August 2, 2004(1) to November 30, 2004, the Fund's Class I shares provided a total return of 6.42% compared to the Russell 1000 Value Index(3)(4) and the Russell 1000 Index(3)(5), which returned 10.00% and 7.83%, respectively, for the period.
Portfolio Specifics: While energy prices increased substantially during the period ended November 30, 2004, U.S. economic output continued to expand. In October, as the price of crude oil reached $55 a barrel, the Commerce Department reported that gross domestic product grew at an annualized 3.7% in the third calendar quarter of 2004.
The Federal Reserve raised U.S. interest rates four times, bringing the federal funds rate to 2.0%. In a November statement, the central bank noted that "output appears to be growing at a moderate pace despite the rise in energy prices, and labor market conditions have improved."
In this environment, U.S. stocks tended to post advances. The Dow Jones Industrial Average(7) gained 3.48%, while the S&P 500 Index(8) climbed 5.67%.
Additionally, the large-cap Russell 1000 Index gained 5.92%, while the small-cap Russell 2000 Index(9) climbed 12.18%, suggesting that returns for large caps trailed returns for small caps during the period. Among large caps, less-expensive "value" stocks tended to outperform their "growth" counterparts. While the Russell 1000 Value Index advanced 11.01%, for example, the Russell 1000 Growth Index(10) gained only 0.81%.
The Fund underperformed the Russell 1000 Value Index, but outperformed the Russell 1000 Index. For the Fund, a majority of holdings posted advances. Gains for positions in industries such as diversified telecom services, oil and gas, and tobacco made the most substantial contributions to returns. Strong performers in these industries included Sprint Corp., El Paso Corp. and Altria Group, Inc.
Returns for holdings in pharmaceuticals were mixed during the period, with Wyeth and Schering-Plough Corp. advancing, while positions such as Merck & Co., Inc. and Pfizer, Inc. declined. On a stock-by-stock basis, declines for positions in Merck & Co., Inc., Micron Technology, Inc., and Safeway, Inc. were the most significant detractors from the Fund's performance.
Current Strategy and Outlook: During the period, we sold several positions as their market prices advanced toward our estimate of their fair values. We used the proceeds to purchase shares of new holdings at prices that we consider attractive.
As a result of this buying and selling, many of the Fund's industry exposures shifted. For example, exposure to the insurance industry increased, while exposure to the diversified telecom services industry declined. Keep in mind that the Fund's industry exposures are not the product of top-down forecasts or industry-level analysis, but merely stem from our company-by-company search for compelling investment opportunities.
Overall, we offer no predictions regarding the short-term direction of the stock market, or regarding large-cap U.S. stocks in particular. Instead, we remain focused on purchasing large-cap stocks at discounts to their intrinsic values and holding them until the broader market recognizes their true worth. We believe that this approach will provide patient investors with favorable returns over the long term.
(1) Commencement of operations for Class I
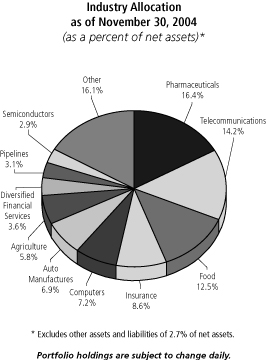
Top Ten Holdings
as of November 30, 2004
(as a percent of net assets)*
| Merck & Co, Inc. | 4.0 | % | |||||
| Schering-Plough Corp. | 4.0 | % | |||||
| Safeway, Inc. | 4.0 | % | |||||
| BellSouth Corp. | 3.9 | % | |||||
| Kroger Co. | 3.8 | % | |||||
| Pfizer, Inc. | 3.6 | % | |||||
| Bristol-Myers Squibb Co. | 3.5 | % | |||||
| Ford Motor Co. | 3.5 | % | |||||
| Albertson's, Inc. | 3.5 | % | |||||
| SBC Communications, Inc. | 3.5 | % | |||||
Portfolio holdings are subject to change daily.
12
PORTFOLIO MANAGERS' REPORT ING LARGECAP VALUE FUND
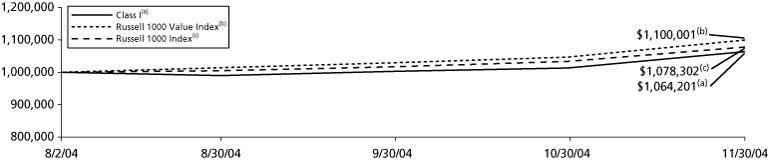
| Cumulative Total Returns for the Periods Ended November 30, 2004 | |||
| Since Inception of Class I August 2, 2004 | |||||||
| Class I | 6.42 | % | |||||
| Russell 1000 Value Index(1) | 10.00 | %(3) | |||||
| Russell 1000 Index(2) | 7.83 | %(3) | |||||
Based on a $1,000,000 initial investment, the graph and table above illustrate the total return of ING LargeCap Value Fund against the Russell 1000 Value Index and the Russell 1000 Index. The Index has no cash in its portfolio, imposes no sales charges and incurs no operating expenses. An investor cannot invest directly in an index. The Fund's performance is shown both with and without the imposition of sales charges.
Performance graph and table do not reflect the deduction of taxes that a shareholder will pay on Fund distributions or the redemption of Fund shares.
Total returns reflect the fact that the Investment Manager has waived certain fees and expenses otherwise payable by the Fund, subject to possible later recoupment during a three-year period. Total returns would have been lower had there been no waiver to the Fund.
Performance data represents past performance and is no assurance of future results. Investment return and principal value of an investment in the Fund will fluctuate. Shares, when sold, may be worth more or less than their original cost. The Fund's current performance may be lower or higher than the performance data shown. Please log on to www.ingfunds.com or call (800) 922-0180 to get performance through the most recent month end.
This report contains statements that may be "forward-looking" statements. Actual results may differ materially from those projected in the "forward-looking" statements.
The views expressed in this report reflect those of the portfolio managers, only through the end of the period as stated on the cover. The portfolio managers' views are subject to change at any time based on market and other conditions.
Fund holdings are subject to change daily.
(1) The Russell 1000 Value Index measures the performance of those Russell 1000 securities with lower price-to-book ratios and lower forecasted growth values.
(2) The Russell 1000 Index measures the performance of the 1,000 largest companies in the Russell 3000 Index, which represents approximately 92% of the total market capitalization of the Russell 3000 Index.
(3) Since inception performance for the index is shown from August 1, 2004.
(4) The Dow Jones Industrial Average is an unmanaged U.S. stock index based on the stock prices of 30 large and actively traded U.S. companies.
(5) The S&P 500 Index is an unmanaged index that measures the performance of securities of approximately 500 large, capitalization companies whose securities are traded on major U.S. stock markets.
(6) The Russell 2000 Index measures the performance of the 2,000 smallest companies in the Russell 3000 Index. The Russell 3000 Index is an unmanaged index that measures the performance of 3,000 U.S. companies based on total market capitalization.
(7) The Russell 1000 Growth Index measures the performance of the 1,000 largest companies in the Russell 3000 Index with higher price-to-book ratios and higher forecasted growth.
13
ING MAGNACAP FUND
PORTFOLIO MANAGERS' REPORT
The ING MagnaCap Fund (the "Fund") seeks growth of capital, with dividend income as a secondary consideration. The Fund is managed by a team of investment professionals led by William F. Coughlin, CFA, ING Investment Management Co. - the Sub-Adviser.
Performance: For the six months ended November 30, 2004, the Fund's Class I shares provided a total return of 7.28% compared to the Russell 1000 Value Index(5) and the Russell 1000 Index(6), which returned 11.01% and 5.92%, respectively, for the same period.
Portfolio Specifics: A combination of sector allocation and disappointing stock selection caused the Fund to underperform its Russell 1000 Value Index benchmark during the past six months. With respect to the Fund's sector allocation, an overweighted position in the poorly performing health care sector had a negative impact on performance as Merck & Co., which was previously held, and Pfizer, Inc. were two of the Fund's worst performing positions. Partially offsetting this weakness, however, was an important overweighting of the energy sector where Apache Corp., Halliburton Co., and ChevronTexaco Corp. made positive contributions. Overall, our holdings in the financial services sector had the most impact on relative results as American Intl. Group, Washington Mutual, Inc. and Morgan Stanley all declined during the period.
There were no major sector changes over the last six months. The largest sector exposure in the Fund remains financial services at approximately 34% of total assets. While this appears to be a relatively high level for a single sector, the Russell 1000 Value Index has a weighting of nearly 33%, so the Fund is relatively in line with its benchmark. Consumer staples continues to the most heavily overweighted sector relative to the benchmark, while technology is the most underweighted. Overall, the Fund's sector weightings have remained sensitive to the weightings of the underlying benchmark as a means of controlling the overall risk and volatility of the Fund's returns.
Current Strategy and Outlook: The stock market seems poised to end 2004 on a positive note. The favorable presidential election outcome (from the market's perspective) and the outlook for stable to declining energy prices over the next few months have enabled investors to focus on the more traditional economic and market metrics: valuation, interest rates, corporate profits, and inflation. Given our positive economic outlook, we believe that the market is reasonably valued and able to provide positive returns during the coming year.
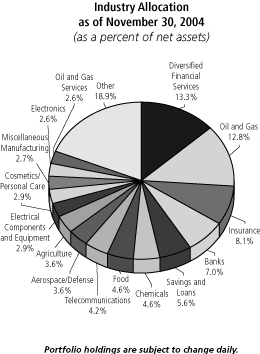
Top Ten Holdings
as of November 30, 2004
(as a percent of net assets)*
| ChevronTexaco Corp. | 3.8 | % | |||||
| Bank of America Corp. | 3.7 | % | |||||
| General Dynamics Corp. | 3.6 | % | |||||
| Altria Group, Inc. | 3.6 | % | |||||
| Exxon Mobil Corp. | 3.4 | % | |||||
| Wells Fargo & Co. | 3.3 | % | |||||
| Nestle SA ADR | 3.1 | % | |||||
| BP PLC ADR | 3.0 | % | |||||
| Fannie Mae | 3.0 | % | |||||
| Merrill Lynch & Co, Inc. | 3.0 | % | |||||
Portfolio holdings are subject to change daily.
14
PORTFOLIO MANAGERS' REPORT ING MAGNACAP FUND
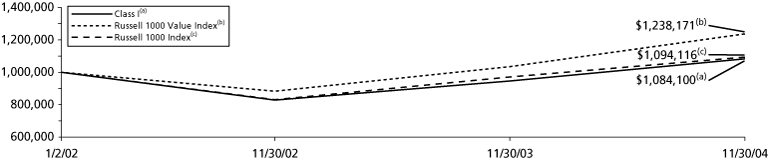
| Average Annual Total Returns for the Periods Ended November 30, 2004 | |||
| 1 Year | Since Inception of Class I March 5, 2003 | ||||||||||
| Class I | 14.65 | % | 25.86 | % | |||||||
| Russell 1000 Value Index(1) | 19.67 | % | 28.14 | %(3) | |||||||
| Russell 1000 Index(2) | 12.66 | % | 23.83 | %(3) | |||||||
Based on a $1,000,000 initial investment, the graph and table above illustrate the total return of ING MagnaCap Fund against the Russell 1000 Value Index, Russell 1000 Index and the S&P Barra Value Index. The Indices are unmanaged and have no cash in their portfolios, impose no sales charges and incur no operating expenses. An investor cannot invest directly in an index. The Fund's performance is shown both with and without the imposition of sales charges.
The performance graph and table do not reflect the deduction of taxes that a shareholder will pay on Fund distributions or the redemption of Fund shares.
Total returns reflect the fact that the Investment Manager has waived certain fees and expenses otherwise payable by the Fund. Total returns would have been lower had there been no waiver to the Fund.
Performance data represents past performance and is no assurance of future results. Investment return and principal value of an investment in the Fund will fluctuate. Shares, when sold, may be worth more or less than their original cost. The Fund's performance may be lower or higher than the performance data shown. Please log on to www.ingfunds.com or call (800) 922-0180 to get performance through the most recent month end.
This report contains statements that may be "forward-looking" statements. Actual results may differ materially from those projected in the "forward-looking" statements.
The views expressed in this report reflect those of the portfolio managers, only through the end of the period as stated on the cover. The portfolio managers' views are subject to change at any time based on market and other conditions.
Fund holdings are subject to change daily.
(1) The Russell 1000 Value Index measures the performance of those Russell 1000 securities with lower price-to-book ratios and lower forecasted growth values.
(2) The Russell 1000 Index measures the performance of the 1,000 largest companies in the Russell 3000 Index, which represents approximately 92% of the total market capitalization of the Russell 3000 Index.
(3) Since inception performance for index is shown from March 1, 2003.
(4) Since inception performance for index is shown from December 1, 1999.
15
ING MIDCAP VALUE FUND
PORTFOLIO MANAGERS' REPORT
The ING MidCap Value Fund (the "Fund") seeks long-term capital appreciation. The Fund is managed by Brandes Investment Partners, L.P. - the Sub-Adviser. Brandes' Mid Cap Investment Committee is responsible for making the day-to-day investment decisions for the Fund.
Performance: For the six months ended November 30, 2004, the Fund's Class I shares provided a total return of 6.15% compared to the Russell MidCap Value Index(4) and the Russell MidCap Index(5), which returned 15.09% and 11.09%, respectively, for the same period.
Portfolio Specifics: While energy prices increased substantially during the period, U.S. economic output continued to expand. In October, as the price of crude oil reached $55 a barrel, the Commerce Department reported that gross domestic product grew at an annualized 3.7% in the third quarter of 2004.
The Federal Reserve raised U.S. interest rates four times, bringing the federal funds rate to 2.0% as of period end. In a November statement, the central bank noted that "output appears to be growing at a moderate pace despite the rise in energy prices, and labor market conditions have improved."
In this environment, U.S. stocks tended to post advances. The Dow Jones Industrial Average(7) gained 3.48%, while the S&P 500 Index(8) climbed 5.67%.
Additionally, the large-cap Russell 1000 Index(9) gained 5.92% while the Russell Midcap Index climbed 11.09%, suggesting that returns for large caps trailed returns for mid caps during the period. Among mid caps, less-expensive "value" stocks tended to outperform their "growth" counterparts. While the Russell Midcap Value Index advanced 15.09%, for example, the Russell Midcap Growth Index(10) gained only 5.68%.
For the Fund, a majority of holdings posted advances; however, the Fund still underperformed its benchmarks. Gains for positions in the oil and gas, tobacco, and chemicals industries made the most substantial contributions to returns. Strong performers in these industries included El Paso Corp., Loews Corp. - Carolina Group, and RPM International, which was sold during the period.
Returns for positions in the auto components industry were mixed, with Goodyear Tire & Rubber Co. advancing while Visteon Corp. declined. On a stock-by-stock basis, declines for positions in Tommy Hilfiger Corp. and Winn-Dixie Stores, Inc. were the most significant detractors from the Fund's performance.
Current Strategy and Outlook: During the six-month period ended November 30, 2004, we sold several positions as their market prices advanced toward our estimate of their fair values. We used the proceeds to purchase shares of new holdings at prices that we consider attractive.
As a result of this buying and selling, many of the Fund's industry exposures shifted. For example, exposure to the health care providers & services industry increased, while exposure to the chemicals industry declined. Keep in mind that the Fund's industry exposures are not the product of top-down forecasts or industry-level analysis, but merely stem from our company-by-company search for compelling investment opportunities.
Overall, we offer no predictions regarding the short-term direction of the stock market, or regarding mid-cap U.S. stocks in particular. Instead, we remain focused on purchasing mid-cap stocks at discounts to their intrinsic values and holding them until the broader market recognizes their true worth. We believe that this approach will provide patient investors with favorable returns over the long term.

Top Ten Industries
as of November 30, 2004
(as a percent of net assets)*
| Agere Systems, Inc. | 4.2 | % | |||||
| Goodyear Tire & Rubber Co. | 4.1 | % | |||||
| UnumProvident Corp. | 4.0 | % | |||||
| Unisys Corp. | 4.0 | % | |||||
| El Paso Corp. | 3.4 | % | |||||
| Synopsys, Inc. | 3.4 | % | |||||
| Tenet Healthcare Corp. | 3.3 | % | |||||
| Visteon Corp. | 3.2 | % | |||||
| Loews Corp. | 3.2 | % | |||||
| 3Com Corp. | 3.1 | % | |||||
Portfolio holdings are subject to change daily.
* Excludes short-term securities related to securities lending.
16
PORTFOLIO MANAGERS' REPORT ING MIDCAP VALUE FUND
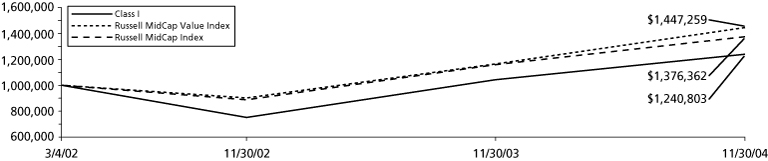
| Average Annual Total Returns for the Periods Ended November 30, 2004 | |||||||||||||||
| 1 Year | Since Inception of Class I March 4, 2002 | Since Inception of Class Q April 17, 2002 | |||||||||||||
| Class I | 19.07 | % | 8.18 | % | - | ||||||||||
| Class Q | 18.28 | % | - | 6.76 | % | ||||||||||
| Russell MidCap Value Index(1) | 24.23 | % | 14.39 | %(3) | 13.21 | %(4) | |||||||||
| Russell MidCap Index(2) | 18.76 | % | 12.32 | %(3) | 11.48 | %(4) | |||||||||
Based on a $1,000,000 initial investment, the graph and table above illustrate the total return of ING MidCap Value Fund against the Russell MidCap Value Index. The Index is unmanaged and has no cash in its portfolio, imposes no sales charges and incurs no operating expenses. An investor cannot invest directly in an index. The Fund's performance is shown both with and without the imposition of sales charges.
The performance graph and table do not reflect the deduction of taxes that a shareholder will pay on Fund distributions or the redemption of Fund shares.
Total returns reflect the fact that the Investment Manager has waived certain fees and expenses otherwise payable by the Fund. Total returns would have been lower had there been no waiver to the Fund.
Performance data represents past performance and is no assurance of future results. Investment return and principal value of an investment in the Fund will fluctuate. Shares, when sold, may be worth more or less than their original cost. The Fund's performance may be lower or higher than the performance data shown. Please log on to www.ingfunds.com or call (800) 922-0180 to get performance through the most recent month end.
This report contains statements that may be "forward-looking" statements. Actual results may differ materially from those projected in the "forward-looking" statements.
The views expressed in this report reflect those of the portfolio managers, only through the end of the period as stated on the cover. The portfolio managers' views are subject to change at any time based on market and other conditions.
Fund holdings are subject to change daily.
(1) The Russell Midcap Value Index is an unmanaged index that measures the performance of Russell Midcap companies with lower price-to-book ratios and lower forecasted growth values.
(2) The Russell MidCap Index measures the performance of the 800 smallest companies in the Russell 1000 Index.
(3) Since inception performance for index is shown from March 1, 2002.
(4) Since inception performance for the index is shown from May 1, 2002.
(5) The Dow Jones Industrial Average is an unmanaged U.S. stock index based on the stock prices of 30 large and actively traded U.S. companies.
(6) The S&P 500 Index is an unmanaged index that measures the performance of securities in approximately 500 large, capitalization companies whose securities are traded on major U.S. stock markets.
(7) The Russell 1000 Index measures the performance of the 1000 largest in the Russell 3000 Index. The Russell 3000 Index is an unmanaged index that measures the performance of 3,000 U.S. companies based on total market capitalization.
(8) The Russell MidCap Growth Index consists of those companies included in the Russell MidCap Index with relatively higher price-to-book ratios and higher forecasted growth values with greater than average growth orientation.
17
ING SMALLCAP VALUE FUND
PORTFOLIO MANAGERS' REPORT
The ING SmallCap Value Fund (the "Fund") seeks long-term capital appreciation. The Fund is managed by Brandes Investment Partners, L.P. - the Sub-Adviser. Brandes' Small Cap Investment Committee is responsible for making the day-to-day investment decisions for the Fund.
Performance: For the six months ended November 30, 2004, the Fund's Class I shares provided a total return of 6.68% compared to the Russell 2000 Value Index(4) and the Russell 2000 Index(5), which returned 16.35% and 12.18%, respectively, for the same period.
Portfolio Specifics: While energy prices increased substantially during the period, U.S. economic output continued to expand. In October, as the price of crude oil reached $55 a barrel, the Commerce Department reported that gross domestic product grew at an annualized 3.7% in the third calendar quarter of 2004.
The Federal Reserve raised U.S. interest rates four times, bringing the federal funds rate to 2.0% as of period end. In a November statement, the central bank noted that "output appears to be growing at a moderate pace despite the rise in energy prices, and labor market conditions have improved."
In this environment, U.S. stocks tended to post advances. The Dow Jones Industrial Average(7) gained 3.48%, while the S&P 500 Index(8) climbed 5.67%.
Additionally, the large-cap Russell 1000 Index(9) gained 5.92%, while the small-cap Russell 2000 Index climbed 12.18%, suggesting that returns for large caps trailed returns for small caps during the period. Among small caps, less-expensive "value" stocks tended to outperform their "growth" counterparts. While the Russell 2000 Value Index advanced 16.35%, for example, the Russell 2000 Growth Index(10) gained only 7.88%.
For the Fund, a majority of holdings posted advances; however, the Fund still underperformed its benchmarks. Gains for positions in industries such as household durables, computers and peripherals, and chemicals made the most substantial contributions to returns. Strong performers in these industries included American Greetings Corp., Gateway, Inc., and PolyOne Corp.
Holdings in food & staples retailing and in specialty retail declined. On a stock-by-stock basis, declines for positions in Winn-Dixie Stores, Inc., Tommy Hilfiger Corp., and Interstate Bakeries Corp. – which was sold during the period – were the most significant detractors from the Fund's performance.
Current Strategy and Outlook: During the six-month period ended November 30, 2004, we sold several positions as their market prices advanced toward our estimate of their fair values. We used the proceeds to purchase shares of new holdings at prices that we consider attractive.
As a result of this buying and selling, many of the Fund's industry exposures shifted. For example, exposure to the textiles, apparel & luxury goods industry increased, while exposure to the machinery industry declined. Keep in mind that the Fund's industry exposures are not the product of top-down forecasts or industry-level analysis, but merely stem from our company-by-company search for compelling investment opportunities.
Overall, we offer no predictions regarding the short-term direction of the stock market, or regarding small-cap U.S. stocks in particular. Instead, we remain focused on purchasing small-cap stocks at discounts to their intrinsic values and holding them until the broader market recognizes their true worth. We believe that this approach will provide patient investors with favorable returns over the long term.

Top Ten Holdings
as of November 30, 2004
(as a percent of net assets)*
| Visteon Corp. | 3.4 | % | |||||
| Winn-Dixie Stores, Inc. | 3.3 | % | |||||
| Playtex Products, Inc. | 3.3 | % | |||||
| Payless Shoesource, Inc. | 3.1 | % | |||||
| Wellman, Inc. | 3.0 | % | |||||
| Delta Air Lines, Inc. | 3.0 | % | |||||
| Cincinnati Bell, Inc. | 2.9 | % | |||||
| Kemet Corp. | 2.9 | % | |||||
| Dillard's, Inc. | 2.9 | % | |||||
| Sensient Technologies Corp. | 2.8 | % | |||||
Portfolio holdings are subject to change daily.
* Excludes short-term securities related to securities lending.
18
PORTFOLIO MANAGERS' REPORT ING SMALLCAP VALUE FUND
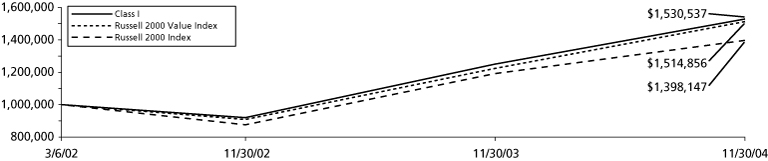
| Average Annual Total Returns for the Periods Ended November 30, 2004 | |||||||||||||||
| 1 Year | Since Inception of Class I March 7, 2002 | Since Inception of Class Q April 30, 2002 | |||||||||||||
| Class I | 22.33 | % | 16.81 | % | - | ||||||||||
| Class Q | 22.04 | % | - | 14.74 | % | ||||||||||
| Russell 2000 Value Index(1) | 23.71 | % | 16.30 | %(3) | 12.68 | %(4) | |||||||||
| Russell 2000 Index(2) | 17.26 | % | 12.96 | %(3) | 10.11 | %(4) | |||||||||
Based on a $1,000,000 initial investment, the graph and table above illustrate the total return of ING SmallCap Value Fund against the Russell 2000 Value Index and Russell 2000 Index. The Index is unmanaged and has no cash in its portfolio, imposes no sales charges and incurs no operating expenses. An investor cannot invest directly in an index. The Fund's performance is shown both with and without the imposition of sales charges.
The performance graph and table do not reflect the deduction of taxes that a shareholder will pay on Fund distributions or the redemption of Fund shares.
Total returns reflect the fact that the Investment Manager has waived certain fees and expenses otherwise payable by the Fund. Total returns would have been lower had there been no waiver to the Fund.
Performance data represents past performance and is no assurance of future results. Investment return and principal value of an investment in the Fund will fluctuate. Shares, when sold, may be worth more or less than their original cost. The Fund's performance may be lower or higher than the performance data shown. Please log on to www.ingfunds.com or call (800) 922-0180 to get performance through the most recent month end.
This report contains statements that may be "forward-looking" statements. Actual results may differ materially from those projected in the "forward-looking" statements.
The views expressed in this report reflect those of the portfolio managers, only through the end of the period as stated on the cover. The portfolio managers' views are subject to change at any time based on market and other conditions.
Fund holdings are subject to change daily.
(1) The Russell 2000 Value Index measures the performance of those Russell 2000 companies with lower price-to-book ratios and lower forecasted growth values.
(2) The Russell 2000 Index consists of the smallest 2,000 companies in the Russell 3000 Index. The Russell 3000 Index is an unmanaged index that measures the performance of 3000 U.S. companies based on total market capitalization.
(3) Since inception performance for index is shown from March 1, 2002.
(4) Since inception performance for index is shown from May 1, 2002.
(5) The Dow Jones Industrial Average is an unmanaged U.S. stock index based on the stock prices of 30 large and actively traded U.S. companies.
(6) The S&P 500 Index is an unmanaged index that measures the performance of securities in approximately 500 large, capitalization companies whose securities are traded on major U.S. stock markets.
(7) The Russell 1000 Index measures the performance of the 1000 largest in the Russell 3000 Index. The Russell 3000 Index is an unmanaged index that measures the performance of 3,000 U.S. companies based on total market capitalization.
(8) The Russell 2000 Growth Index measures the performance of those Russell 2000 Index companies with higher price-to-book ratios and higher forecasted growth values.
19
ING CONVERTIBLE FUND
The ING Convertible Fund (the "Fund") seeks maximum total return, consisting of capital appreciation and current income. The Fund is managed by a team of investment professionals led by Anuradha Sahai, ING Investment Management Co. - the Sub-Adviser.
Performance: For the six months ended November 30, 2004, the Fund's Class Q shares provided a total return of 3.93% compared to the Merrill Lynch All Convertibles Excluding Mandatory All Qualities ("ML Convertible") Index(4) and the First Boston Convertible Index(5), which returned 4.13% and 3.79%, respectively, for the same period.
Portfolio Specifics: The Fund slightly underperformed its benchmark index (the "ML Convertible Index") and comparable mutual funds for the six months ended November 30, 2004. The Fund was relatively defensively positioned versus its peer group, as well as the Index at the beginning of the six-month period. The barbell approach adopted earlier in the year, with heavier weights in more defensive bond-like higher income names, along with some equity sensitive names having good fundamentals, helped the Fund participate more during the rallies.
The technology sector was the driver of the majority of the gains in the convertible market due to its heavy weight in the ML Convertible Index. The Fund lagged due to underweighting in this sector versus the benchmark. Slight overweighting and security selection aided the Fund in beating the benchmark handily in the energy sector, which was a strong performing sector in the Fund. Security selection was the major driver of performance in the consumer discretionary, transportation, and health care sectors as well. An overweight sensitivity in the materials sector also benefited performance. This was offset by significant underperformance in telecommunications, due to pronounced underperformance of Primus Telecommunications Group, Inc. (3.750%, due 09/15/10), which the Fund has since sold. The Fund also underperformed in the industrial sector due to a couple of names not meeting third-quarter earnings expe ctations. We believe the investment thesis for these companies remains intact and that the market has overreacted. Financials were affected negatively due to overexposure to insurers, which were first affected by hurricanes and then by the announcement of investigations into their sales practices.
Current Strategy and Outlook: With the continued redemption of higher interest bond-like convertibles, as well as the continued new issuance of more equity-like convertibles, the convertible market has taken on more equity sensitivity than witnessed in the last couple of years. U.S. economic indicators continue to improve, but we believe that equity market valuations will improve more modestly going into 2005. A weak dollar, combined with relatively high oil prices, could still act as a damper to economic growth going forward. Inflationary fears, along with geopolitical concerns, decrease the visibility for the financial markets going into next year.
As the equity markets have rallied and with spreads tight, the Fund has since shifted from the barbell approach to a more middle of the road stance with most of its weighting in total return convertibles with neither a pure bond-like tilt, nor a pure equity tilt.
In these volatile times, we believe convertible securities are attractive relative to comparable asset classes due to their bond floor downside protection, while providing equity-like upside participation. Despite the fear of higher rates, strong balance sheets and lower default risk should keep bond floors from dropping much. We continue to look for companies across the spectrum that will benefit from a gradually recovering economy as we expect the market will reward companies that typically profit in the recovery part of the cycle. A bottom-up approach, which relies on fundamental analysis and careful security selection within our broader top-down sector positioning strategy, continues to be the foundation for our investment decisions.

Top Ten Industries
as of November 30, 2004
(as a percent of net assets)*
| Electronics | 3.6 | % | |||||
| Pharmaceuticals | 9.6 | % | |||||
| Mining | 4.3 | % | |||||
| Telecommunications | 6.3 | % | |||||
| Miscellaneous Manufacturing | 3.3 | % | |||||
| Insurance | 9.8 | % | |||||
| Media | 6.0 | % | |||||
| Healthcare-Services | 3.5 | % | |||||
| Diversified Financial Services | 5.7 | % | |||||
| Oil and Gas | 4.7 | % | |||||
Portfolio holdings are subject to change daily.
* Excludes short-term securities related to securities lending.
20
PORTFOLIO MANAGERS' REPORT ING CONVERTIBLE FUND
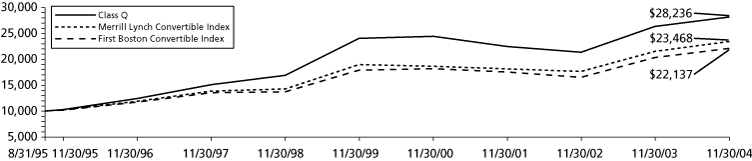
| Average Annual Total Returns for the Periods Ended November 30, 2004 | |||||||||||||||
| 1 Year | 5 Year | Since Inception August 31, 1995 | |||||||||||||
| Class Q | 6.99 | % | 3.22 | % | 11.87 | % | |||||||||
| Merrill Lynch Convertible Index(1) | 8.86 | % | 4.31 | % | 9.66 | %(3) | |||||||||
| First Boston Convertible Index(2) | 8.63 | % | 4.31 | % | 8.97 | %(3) | |||||||||
Based on a $10,000 initial investment, the graph and table above illustrate the total return of ING Convertible Fund against the Merrill Lynch Convertible Index and the First Boston Convertible Index. The Index is unmanaged and has no cash in its portfolio, imposes no sales charges and incurs no operating expenses. An investor cannot invest directly in an index. The Fund's performance is shown both with and without the imposition of sales charges.
The performance graph and table do not reflect the deduction of taxes that a shareholder will pay on Fund distributions or the redemption of Fund shares.
Total returns reflect the fact that the Investment Manager has waived certain fees and expenses otherwise payable by the Fund. Total returns would have been lower had there been no waiver to the Fund.
Performance data represents past performance and is no assurance of future results. Investment return and principal value of an investment in the Fund will fluctuate. Shares, when sold, may be worth more or less than their original cost. The Fund's performance may be lower or higher than the performance data shown. Please log on to www.ingfunds.com or call (800) 922-0180 to get performance through the most recent month end.
This report contains statements that may be "forward-looking" statements. Actual results may differ materially from those projected in the "forward-looking" statements.
The views expressed in this report reflect those of the portfolio managers, only through the end of the period as stated on the cover. The portfolio managers' views are subject to change at any time based on market and other conditions.
Fund holdings are subject to change daily.
(1) The Merrill Lynch Convertible Index is a market capitalization-weighted index including all non-mandatory domestic corporate convertible securities with at least an overall par of $50 million market value.
(2) The First Boston Convertible Index is an index representing the universe of convertible securities.
(3) Since inception performance for index is shown from September 1, 1995.
21
ING EQUITY AND BOND FUND
PORTFOLIO MANAGERS' REPORT
The ING Equity and Bond Fund (the "Fund") seeks a balance of long-term capital appreciation and current income. The equity portion of the Fund is managed by a team of investment professionals led by James A. Vail, CFA. The bond portion of the Fund is managed by a team of investment professionals led by James B. Kauffmann. Both are with ING Investment Management Co. - the Sub-Adviser.
Performance: For the six months ended November 30, 2004, the Fund's Class Q shares provided a total return of 3.20% compared to the Standard & Poor's ("S&P") 500 Index(4), the Lehman Brothers Aggregate Bond Index(5), and a Composite Index (60% S&P 500 Index / 40% Lehman Brothers Aggregate Bond Index), which returned 5.67%, 3.82% and 4.98%, respectively, for the same period.
Portfolio Specifics: Stock selection was the primary reason for the underperformance of the equity portion of the Fund for the six months ended November 30, 2004. Despite being underweight information technology, individual stocks, such as previously held NVIDIA Corp. and Corning, Inc., the Fund encountered company-specific disappointments and negatively impacted performance. Likewise in health care, individual disappointments in biotech and generic pharmaceuticals, specifically Chiron Corp. because of flu vaccine problems and Barr Pharmaceuticals, Inc. and Par Pharmaceuticals, Inc., which was held during the period, due to drug delays, hurt performance.
Performance was aided by our overweight in industrials where demand for a broad array of industrial and heavy duty truck components propelled sales and earnings ahead of expectations. Parker Hannifin Corp., Rockwell Automation, Inc., and Paccar, Inc. all contributed positively to results. The second best supporter of performance was our significant underweight in the consumer staples sector.
Our continuing exposure to emerging markets debt and crossover high yield issues contributed to the outperformance of the fixed income portion of the Fund. The Fund was well positioned for a rising rate environment in which yields of shorter maturities rise more than those of longer maturities. Our underweight in five- and ten-year maturities was particularly beneficial. Overweights in the outperforming securitized sectors -mortgage-backed securities, asset-backed securities, and commercial mortgage-backed securities - also helped. Our underweight in agencies held back performance somewhat.
Overall, our underweight in stocks in favor of cash and bonds detracted from performance.
Current Strategy and Outlook: With domestic gross domestic product and corporate profit growth expected to slow in the quarters ahead, we believe equity returns could also moderate as we go forward. The Fund is positioned for such an environment by stressing later cycle names in the industrial sector that benefit from late cycle corporate spending, such as General Electric Co. and United Technologies Corp. Additionally, we will be seeking individual companies whose particular fundamentals warrant inclusion in the Fund. These would include specialty and discount retailers within the consumer discretionary sector that would benefit from individual company- specific; for example, content providers to a new generation of video games appear ready to outperform. Finally, the Fund will likely maint ain its energy exposure since we continue to believe higher relative prices are here to stay and the sector remains attractive.
While the bond market has renewed its focus on the improving economic releases, we do not believe that the yields on shorter maturity Treasuries fully reflect the future pace of economic activity and the rise in a number of inflation measures. Some projections place a neutral overnight rate around 4% or 5%, indicating that monetary policy is still highly accommodative. Tactically, the Fund is short duration in the anticipation of improving domestic economic fundamentals and the potential for increasing inflation and enduring dollar weakness. The Fund is neutral home mortgages, overweight asset-backed and commercial mortgage-backed securities, and underweight the intermediate and front-end of the yield curve, which appear most vulnerable in a tightening cycle. We are also underweight agencies, which had witnessed some regulatory criticism. While stretched valuations in investment-grade credit still warran t caution, credit continues to post positive excess returns. Exposures to emerging markets debt and crossover high yield remain intact.

Top Ten Industries
as of November 30, 2004
(as a percent of net assets)*
| Diversified Financial Services | 9.2 | % | |||||
| Whole Loan Collaterized Mortgage Obligation | 7.1 | % | |||||
| Banks | 6.7 | % | |||||
| U.S. Treasury Notes | 4.9 | % | |||||
| Federal Home Loan Mortgage Corporation | 4.6 | % | |||||
| Miscelaneous Manufacturing | 4.6 | % | |||||
| Oil and Gas | 4.3 | % | |||||
| Federal National Mortgage Association | 3.9 | % | |||||
| Chemicals | 3.3 | % | |||||
| Retail | 3.0 | % | |||||
Portfolio holdings are subject to change daily.
22
PORTFOLIO MANAGERS' REPORT ING EQUITY AND BOND FUND
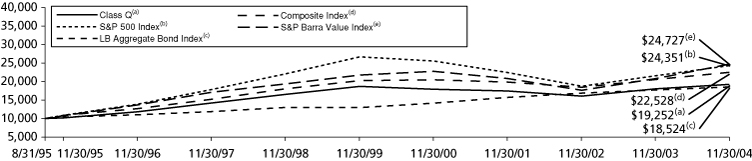
| Average Annual Total Returns for the Periods Ended November 30, 2004 | |||||||||||||||
| 1 Year | 5 Year | Since Inception August 31, 1995 | |||||||||||||
| Class Q | 6.73 | % | 0.60 | % | 7.33 | % | |||||||||
| S&P 500 Index(1) | 12.85 | % | (1.84 | )% | 10.10 | %(4) | |||||||||
| Lehman Brothers Aggregate Bond Index(2) | 4.44 | % | 7.41 | % | 6.89 | %(4) | |||||||||
| Composite Index (60% S&P 500 Index/40% Lehman Brothers Aggregate Bond Index) | 9.50 | % | 2.16 | % | 9.18 | %(4) | |||||||||
| S&P Barra Value Index(3) | 18.99 | % | 2.58 | % | 10.28 | %(4) | |||||||||
Based on a $10,000 initial investment, the graph and table above illustrate the total return of ING Equity and Bond Fund against the S&P 500 Index, Lehman Brothers Aggregate Bond Index, Composite Index and the S&P Barra Value Index. The Indices are unmanaged and have no cash in their portfolios, impose no sales charges and incur no operating expenses. An investor cannot invest directly in an index. The Fund's performance is shown both with and without the imposition of sales charges.
The performance graph and table do not reflect the deduction of taxes that a shareholder will pay on Fund distributions or the redemption of Fund shares.
Total returns reflect the fact that the Investment Manager has waived certain fees and expenses otherwise payable by the Fund. Total returns would have been lower had there been no waiver to the Fund.
Performance data represents past performance and is no assurance of future results. Investment return and principal value of an investment in the Fund will fluctuate. Shares, when sold, may be worth more or less than their original cost. The Fund's performance may be lower or higher than the performance data shown. Please log on to www.ingfunds.com or call (800) 922-0180 to get performance through the most recent month end.
This report contains statements that may be "forward-looking" statements. Actual results may differ materially from those projected in the "forward-looking" statements.
The views expressed in this report reflect those of the portfolio managers, only through the end of the period as stated on the cover. The portfolio managers' views are subject to change at any time based on market and other conditions.
Fund holdings are subject to change daily.
(1) The S&P 500 Index is a capitalization-weighted index of 500 stocks chosen for market size, liquidity, and industry group representation.
(2) The Lehman Brothers Aggregate Bond Index is a widely recognized index of publicly issued fixed rate U.S. government, investment grade mortgage-backed and corporate debt securities.
(3) The S&P Barra Value Index is a capitalization-weighted index of all the stocks in the S&P 500 Index that have low price-to-book ratios.
(4) Since inception performance for index is shown from September 1, 1995.
23
ING REAL ESTATE FUND
PORTFOLIO MANAGERS' REPORT
The ING Real Estate Fund (the "Fund") seeks total return. The Fund is managed by T. Ritson Ferguson, Chief Investment Officer and Kenneth D. Campbell, Managing Director, ING Clarion Real Estate Securities L.P. - the Sub-Adviser.
Performance: For the six months ended November 30, 2004, the Fund's Class I shares, excluding sales charges, provided a total return of 25.63% compared to the Dow Jones Wilshire ("DJW") Real Estate Securities Index(4), which returned 23.01% for the same period.
Portfolio Specifics: Real estate stocks have continued to deliver good returns to investors. The Fund returned 21.49% and 30.54% net of expenses in the last six and 12 months respectively, which trailed the DJW Real Estate Securities Index return of 23.00% and 31.79% for the same time periods. Real estate investment trusts ("REITs") have outperformed other stocks and bonds in the last year. Over the last six months, the Standard & Poor's ("S&P") 500 Index(9) gained 5.67% and the Lehman Brothers Aggregate Bond Index(10) rose 3.82%. For the year ended November 30, 2004, the S&P 500 Index is up 12.85% and the Lehman Bond Aggregate Bond Index is up 4.44%.
The best returns by sector in the last six months were from the retail (malls and shopping centers), industrial and hotel sectors. Our decision to increase the Fund's weighting to hotels, apartments and industrial in the spring of 2004 when evidence of economic growth was becoming more evident has aided performance. We are now overweight in the mall, hotel and apartment sectors reflecting a more positive view of the economy and accelerating earnings growth prospects for these more economically sensitive property types. We have decreased our exposure to the more bond-like health care sector and remain underweight the office sector.
Real estate stocks have rebounded sharply since April's double-digit decline. The market has adjusted to an expectation of measured increases in short-term interest rates over time as the Federal Reserve reacts appropriately to an improving U.S. economy. Importantly, investors have also realized that REITs can prosper in an environment of slowly rising rates if the economic setting is conducive to better real estate fundamentals and improved earnings prospects for the owners of real estate assets.
The Fund's underperformance for the year as a whole traced to the third quarter when we lost nearly 1% alone from the General Growth Properties, Inc. acquisition of Rouse Co. for a 33% premium. We owned the acquirer but not the acquiree.
Current Strategy and Outlook: With growing evidence that the U.S. economic recovery is gaining strength, the outlook for real estate fundamentals appears to be improving. We look for the earnings growth rate for REITs to nearly double from 4% in 2004 to almost 8% in 2005. Positive earnings growth is expected in every property sector next year. The improving earnings outlook should help offset the impact of higher interest rates on REIT stock prices.
REIT valuations are above long-term averages reflecting optimism for the sector. At month end, REIT valuations were roughly 12% higher than our estimate of Net Asset Value (NAV). Prices represented a 14.2 multiple of forward cash earnings before depreciation (FFO), which is about 15% above the 12.2 long-term multiple. The average REIT dividend yield is now 4.79%, down almost 90 basis points from 6 months ago. During the same period, the yield on the 10-year Treasury bond has decreased approximately 30 basis points. The average REIT dividend now represents a 43 basis point spread over the yield on the 10-year Treasury bond. The current "spread" is a little below the average spread over the last 20 years which has been approximately 60 basis points. However, it is not unprecedented for REITs to trade at yields less than the 10-year Treasury yield.
Momentum for REITs may continue as funds flows remain strong. According to data from AMG Data Services, dedicated REIT mutual funds have attracted $5.7 billion of new investment this year including $1.75 billion thus far in the fourth calendar quarter of 2004. The positive funds flows to REITs reflects a widespread desire for investors (both institutions and individuals) to increase their allocation to real estate.
REITs offer an attractive source of high current income and as long as new stock issuance remains disciplined, stock prices should improve with earnings growth. For now, we expect REITs, which offer relatively high yields and solid earnings prospects, to retain their appeal to investors, given the alternatives. We believe that REIT investors can still expect reasonable return.
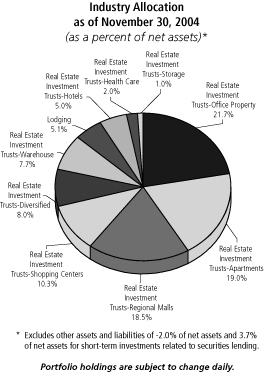
Top Ten Holdings
as of November 30, 2004
(as a percent of net assets)*
| Simon Property Group, Inc. | 5.4 | % | |||||
| Starwood Hotels & Resorts Worldwide, Inc. | 5.1 | % | |||||
| Archstone-Smith Trust | 5.0 | % | |||||
| ProLogis | 5.0 | % | |||||
| Boston Properties, Inc. | 5.0 | % | |||||
| Mills Corp. | 4.8 | % | |||||
| United Dominion Realty Trust, Inc. | 4.0 | % | |||||
| Regency Centers Corp. | 3.5 | % | |||||
| SL Green Realty Corp. | 3.5 | % | |||||
| Vornado Realty Trust | 3.5 | % | |||||
Portfolio holdings are subject to change daily.
* Excludes short-term securities related to securities lending.
24
PORTFOLIO MANAGERS' REPORT ING REAL ESTATE FUND
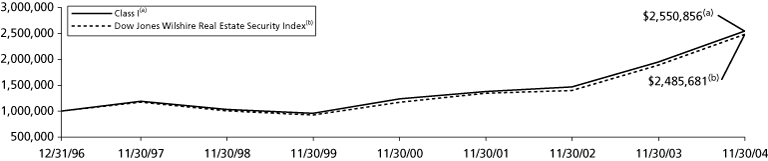
| Average Annual Total Returns for the Periods Ended November 30, 2004 | |||||||||||||||
| 1 Year | 5 Year | Since Inception December 31, 1996 | |||||||||||||
| Class I | 30.88 | % | 21.64 | % | 12.55 | % | |||||||||
| Dow Jones Wilshire Real Estate Security Index(1) | 31.82 | % | 21.91 | % | 12.19 | %(2) | |||||||||
Based on a $1,000,000 initial investment, the graph and table above illustrate the total return of ING Real Estate Fund against the Dow Jones Wilshire Real Estate Security Index. The Index is unmanaged and has no cash in its portfolio, imposes no sales charges and incurs no operating expenses. An investor cannot invest directly in an index. The Fund's performance is shown both with and without the imposition of sales charges.
The performance graph and table does not reflect the deduction of taxes that a shareholder will pay on Fund distributions or the redemption of Fund shares.
Total returns reflect the fact that the Investment Manager has waived certain fees and expenses otherwise payable by the Fund. Total returns would have been lower had there been no waiver to the Fund.
Performance data represents past performance and is no assurance of future results. Investment return and principal value of an investment in the Fund will fluctuate. Shares, when sold, may be worth more or less than their original cost. The Fund's performance may be lower or higher than the performance data shown. Please log on to www.ingfunds.com or call (800) 922-0180 to get performance through the most recent month end.
This report contains statements that may be "forward-looking" statements. Actual results may differ materially from those projected in the "forward-looking" statements.
The views expressed in this report reflect those of the portfolio managers, only through the end of the period as stated on the cover. The portfolio managers' views are subject to change at any time based on market and other conditions.
Fund holdings are subject to change daily.
(1) The Dow Jones Wilshire Real Estate Securities Index measures the performance of publicly traded real estate securities, such as Real Estate Investment Trusts (REITs) and Real Estate Operating Companies (REOCs). The index is capitalization-weighted.
(2) Since inception for the index is shown from January 1, 1997.
(3) The S&P 500 Index is a capitalization-weighted index of 500 stocks chosen for market size, liquidity, and industry group representation.
(4) The Lehman Brothers Aggregated Bond Index is a widely recognized index of publicly issued fixed rate U.S. government investment grade mortgage-backed and corporate debt securities.
25
SHAREHOLDER EXPENSE EXAMPLES (UNAUDITED)
As a shareholder of a Fund, you incur two types of costs: (1) transaction costs, including sales charges (loads) on purchase payments, reinvested dividends, or other distributions; redemption fees; and exchange fees; and (2) ongoing costs, including management fees; distribution [and/or service] (12b–1) fees; and other Fund expenses. These Examples are intended to help you understand your ongoing costs (in dollars) of investing in a Fund and to compare these costs with the ongoing costs of investing in other mutual funds.
The Examples are based on an investment of $1,000 invested at the beginning of the period and held for the entire period from June 1, 2004 to November 30, 2004.
Actual Expenses
The first section of the table shown, "Actual Fund Return," provides information about actual account values and actual expenses. You may use the information in this section, together with the amount you invested, to estimate the expenses that you paid over the period. Simply divide your account value by $1,000 (for example, an $8,600 account value divided by $1,000 = 8.6), then multiply the result by the number in the first section under the heading entitled "Expenses Paid During Period" to estimate the expenses you paid on your account during this period.
Hypothetical Example for Comparison Purposes
The second section of the table shown, "Hypothetical 5% Return," provides information about hypothetical account values and hypothetical expenses based on the Fund's actual expense ratio and an assumed rate of return of 5% per year before expenses, which is not the Fund's actual return. The hypothetical account values and expenses may not be used to estimate the actual ending account balance or expenses you paid for the period. You may use this information to compare the ongoing costs of investing in the Fund and other funds. To do so, compare this 5% hypothetical example with the 5% hypothetical examples that appear in the shareholder reports of the other funds.
Please note that the expenses shown in the table are meant to highlight your ongoing costs only and do not reflect any transactional costs, such as sales charges (loads), redemption fees, or exchange fees. Therefore, the hypothetical lines of the table are useful in comparing ongoing costs only, and will not help you determine the relative total costs of owning different funds. In addition, if these transactional costs were included, your costs would have been higher.
| ING Disciplined LargeCap Fund | Beginning Account Value June 1, 2004 | Ending Account Value November 30, 2004 | Annualized Expense Ratio | Expenses Paid During the Six Months Ended November 30, 2004* | |||||||||||||||
| Actual Fund Return | |||||||||||||||||||
| Class I | $ | 1,000.00 | $ | 1,075.60 | 1.03 | % | $ | 5.36 | |||||||||||
| Hypothetical (5% return before expenses) | |||||||||||||||||||
| Class I | $ | 1,000.00 | $ | 1,019.90 | 1.03 | % | $ | 5.22 | |||||||||||
| ING LargeCap Growth Fund | Beginning Account Value June 1, 2004 | Ending Account Value November 30, 2004 | Annualized Expense Ratio | Expenses Paid During the Six Months Ended November 30, 2004* | |||||||||||||||
| Actual Fund Return | |||||||||||||||||||
| Class I | $ | 1,000 | $ | 1,006 | 0.98 | % | $ | 4.93 | |||||||||||
| Class Q | 1,000 | 1,005 | 1.21 | 6.08 | |||||||||||||||
| Hypothetical (5% return before expenses) | |||||||||||||||||||
| Class I | $ | 1,000 | $ | 1,020 | 0.98 | % | $ | 4.96 | |||||||||||
| Class Q | 1,000 | 1,019 | 1.21 | 6.12 | |||||||||||||||
* Expenses are equal to each Fund's respective annualized expense ratios multiplied by the average account value over the period, multiplied by 183/365 (to reflect the one-half year period).
26
SHAREHOLDER EXPENSE EXAMPLES (UNAUDITED) (CONTINUED)
| ING MidCap Opportunities Fund | Beginning Account Value June 1, 2004 | Ending Account Value November 30, 2004 | Annualized Expense Ratio | Expenses Paid During the Six Months Ended November 30, 2004* | |||||||||||||||
| Actual Fund Return | |||||||||||||||||||
| Class I | $ | 1,000 | $ | 1,052 | 1.30 | % | $ | 6.69 | |||||||||||
| Class Q | 1,000 | 1,051 | 1.55 | 7.97 | |||||||||||||||
| Hypothetical (5% return before expenses) | |||||||||||||||||||
| Class I | $ | 1,000 | $ | 1,019 | 1.30 | % | $ | 6.58 | |||||||||||
| Class Q | 1,000 | 1,017 | 1.55 | 7.84 | |||||||||||||||
| ING SmallCap Opportunities Fund | Beginning Account Value June 1, 2004 | Ending Account Value November 30, 2004 | Annualized Expense Ratio | Expenses Paid During the Six Months Ended November 30, 2004* | |||||||||||||||
| Actual Fund Return | |||||||||||||||||||
| Class I | $ | 1,000 | $ | 1,081 | 1.27 | % | $ | 6.62 | |||||||||||
| Class Q | 1,000 | 1,080 | 1.47 | 7.66 | |||||||||||||||
| Hypothetical (5% return before expenses) | |||||||||||||||||||
| Class I | $ | 1,000 | $ | 1,019 | 1.27 | $ | 6.43 | ||||||||||||
| Class Q | 1,000 | 1,018 | 1.47 | 7.44 | |||||||||||||||
| ING LargeCap Value Fund | Beginning Account Value August 2, 2004 | Ending Account Value November 30, 2004 | Annualized Expense Ratio | Expenses Paid During the Period Ended November 30, 2004** | |||||||||||||||
| Actual Fund Return | |||||||||||||||||||
| Class I | $ | 1,000.00 | $ | 1,064.20 | 1.05 | % | $ | 5.43 | |||||||||||
| Hypothetical (5% return before expenses) | |||||||||||||||||||
| Class I | $ | 1,000.00 | $ | 1,019.80 | 1.05 | $ | 5.32 | ||||||||||||
| ING MagnaCap Fund | Beginning Account Value June 1, 2004 | Ending Account Value November 30, 2004 | Annualized Expense Ratio | Expenses Paid During the Six Months Ended November 30, 2004* | |||||||||||||||
| Actual Fund Return | |||||||||||||||||||
| Class I | $ | 1,000.00 | $ | 1,072.80 | 0.80 | % | $ | 4.16 | |||||||||||
| Hypothetical (5% return before expenses) | |||||||||||||||||||
| Class I | $ | 1,000.00 | $ | 1,021.06 | 0.80 | % | $ | 4.05 | |||||||||||
| ING MidCap Value Fund | Beginning Account Value June 1, 2004 | Ending Account Value November 30, 2004 | Annualized Expense Ratio | Expenses Paid During the Six Months Ended November 30, 2004* | |||||||||||||||
| Actual Fund Return | |||||||||||||||||||
| Class I | $ | 1,000.00 | $ | 1,061.50 | 1.41 | % | $ | 7.29 | |||||||||||
| Class Q | 1,001.00 | 1,056.76 | 2.11 | 10.88 | |||||||||||||||
| Hypothetical (5% return before expenses) | |||||||||||||||||||
| Class I | $ | 1,000.00 | $ | 1,018.00 | 1.41 | % | $ | 7.13 | |||||||||||
| Class Q | 1,000.00 | 1,014.49 | 2.11 | $ | 10.66 | ||||||||||||||
* Expenses are equal to each Fund's respective annualized expense ratios multiplied by the average account value over the period, multiplied by 183/365 (to reflect the one-half year period).
** Expenses are equal to each Fund's respective annualized expense ratios multiplied by the average account value over the period, multiplied by 121/365 (to reflect the period).
27
SHAREHOLDER EXPENSE EXAMPLES (UNAUDITED) (CONTINUED)
| ING SmallCap Value Fund | Beginning Account Value June 1, 2004 | Ending Account Value November 30, 2004 | Annualized Expense Ratio | Expenses Paid During the Six Months Ended November 30, 2004* | |||||||||||||||
| Actual Fund Return | |||||||||||||||||||
| Class I | $ | 1,000.00 | $ | 1,066.80 | 1.46 | % | $ | 7.56 | |||||||||||
| Class Q | 1,001.00 | 1,066.57 | 1.69 | 8.76 | |||||||||||||||
| Hypothetical (5% return before expenses) | |||||||||||||||||||
| Class I | $ | 1,000.00 | $ | 1,017.75 | 1.46 | % | $ | 7.38 | |||||||||||
| Class Q | 1,000.00 | 1,016.60 | 1.69 | 8.54 | |||||||||||||||
| ING Convertible Fund | Beginning Account Value June 1, 2004 | Ending Account Value November 30, 2004 | Annualized Expense Ratio | Expenses Paid During the Six Months Ended November 30, 2004* | |||||||||||||||
| Actual Fund Return | |||||||||||||||||||
| Class Q | $ | 1,000.00 | $ | 1,039.30 | 1.25 | % | $ | 6.39 | |||||||||||
| Hypothetical (5% return before expenses) | |||||||||||||||||||
| Class Q | $ | 1,000.00 | $ | 1,018.80 | 1.25 | % | $ | 6.33 | |||||||||||
| ING Equity and Bond Fund | Beginning Account Value June 1, 2004 | Ending Account Value November 30, 2004 | Annualized Expense Ratio | Expenses Paid During the Six Months Ended November 30, 2004* | |||||||||||||||
| Actual Fund Return | |||||||||||||||||||
| Class Q | $ | 1,000.00 | $ | 1,032.00 | 1.48 | % | $ | 7.54 | |||||||||||
| Hypothetical (5% return before expenses) | |||||||||||||||||||
| Class Q | $ | 1,000.00 | $ | 1,017.65 | 1.48 | % | $ | 7.49 | |||||||||||
| ING Real Estate Fund | Beginning Account Value June 1, 2004 | Ending Account Value November 30, 2004 | Annualized Expense Ratio | Expenses Paid During the Six Months Ended November 30, 2004* | |||||||||||||||
| Actual Fund Return | |||||||||||||||||||
| Class I | $ | 1,000.00 | $ | 1,216.30 | 0.88 | % | $ | 4.89 | |||||||||||
| Hypothetical (5% return before expenses) | |||||||||||||||||||
| Class I | $ | 1,000.00 | $ | 1,020.66 | 0.88 | % | $ | 4.46 | |||||||||||
* Expenses are equal to each Fund's respective annualized expense ratios multiplied by the average account value over the period, multiplied by 183/365 (to reflect the one-half year period).
28
STATEMENTS OF ASSETS AND LIABILITIES AS OF NOVEMBER 30, 2004 (UNAUDITED)
| ING Disciplined LargeCap Fund | ING LargeCap Growth Fund | ING MidCap Opportunities Fund | ING SmallCap Opportunities Fund | ||||||||||||||||
| ASSETS: | |||||||||||||||||||
| Investments in securities at value+* | $ | 49,434,365 | $ | 315,413,674 | $ | 413,429,678 | $ | 228,793,610 | |||||||||||
| Short-term investments at amortized cost | 379,129 | 34,202,610 | 43,961,923 | 39,670,466 | |||||||||||||||
| Repurchase agreement | 902,000 | - | 9,091,000 | 1,592,000 | |||||||||||||||
| Cash | 316 | 7,328,269 | 659 | 209 | |||||||||||||||
| Cash collateral for futures | 48,000 | - | - | - | |||||||||||||||
| Receivables: | |||||||||||||||||||
| Investment securities sold | - | 640,838 | 4,048,270 | 2,647,490 | |||||||||||||||
| Fund shares sold | 2,737 | 400,360 | 50,220 | 13,201 | |||||||||||||||
| Dividends and interest | 242,755 | 1,054,628 | 59,492 | 32,236 | |||||||||||||||
| Prepaid expenses | 23,848 | 33,613 | 30,104 | 19,893 | |||||||||||||||
| Total assets | 51,033,150 | 359,073,992 | 470,671,346 | 272,769,105 | |||||||||||||||
| LIABILITIES: | |||||||||||||||||||
| Payable for investment securities purchased | - | 2,565,568 | 2,150,005 | - | |||||||||||||||
| Payable for fund shares redeemed | 62,059 | 268,303 | 475,779 | 265,376 | |||||||||||||||
| Payable for futures variation margin | 1,425 | - | - | - | |||||||||||||||
| Payable upon receipt of securities loaned | 379,129 | 34,202,610 | 43,961,923 | 39,670,466 | |||||||||||||||
| Payable to affiliates | 71,831 | 443,812 | 728,712 | 317,098 | |||||||||||||||
| Payable for trustee | 5,808 | 11,700 | 20,795 | 11,821 | |||||||||||||||
| Other accrued expenses and liabilities | 138,504 | 425,136 | 680,681 | 254,695 | |||||||||||||||
| Total liabilities | 658,756 | 37,917,129 | 48,017,895 | 40,519,456 | |||||||||||||||
| NET ASSETS | $ | 50,374,394 | $ | 321,156,863 | $ | 422,653,451 | $ | 232,249,649 | |||||||||||
| NET ASSETS WERE COMPRISED OF: | |||||||||||||||||||
| Paid-in capital | $ | 92,502,045 | $ | 665,445,578 | $ | 588,588,790 | $ | 504,183,821 | |||||||||||
| Undistributed net investment income, (accumulated net investment loss or distributions in excess) | 112,247 | (9,331,502 | ) | (3,768,195 | ) | (2,050,927 | ) | ||||||||||||
| Accumulated net realized loss on investments and futures | (46,642,783 | ) | (391,028,796 | ) | (255,561,411 | ) | (346,789,092 | ) | |||||||||||
| Net unrealized appreciation on investments and futures | 4,402,885 | 56,071,583 | 93,394,267 | 76,905,847 | |||||||||||||||
| NET ASSETS | $ | 50,374,394 | $ | 321,156,863 | $ | 422,653,451 | $ | 232,249,649 | |||||||||||
| + Including securities loaned at value | $ | 369,244 | $ | 33,248,005 | $ | 42,247,835 | $ | 38,383,888 | |||||||||||
| * Cost of investments in securities | $ | 45,032,128 | $ | 259,342,091 | $ | 320,035,411 | $ | 151,887,763 | |||||||||||
See Accompanying Notes to Financial Statements
29
STATEMENTS OF ASSETS AND LIABILITIES AS OF NOVEMBER 30, 2004 (UNAUDITED) (CONTINUED)
| ING Disciplined LargeCap Fund | ING LargeCap Growth Fund | ING MidCap Opportunities Fund | ING SmallCap Opportunities Fund | ||||||||||||||||
| Class A: | |||||||||||||||||||
| Net Assets | $ | 5,087,825 | $ | 110,029,149 | $ | 127,958,230 | $ | 105,312,124 | |||||||||||
| Shares authorized | unlimited | unlimited | unlimited | unlimited | |||||||||||||||
| Par value | $ | 0.01 | $ | 0.00 | $ | 0.01 | $ | 0.01 | |||||||||||
| Shares outstanding | 536,986 | 6,233,223 | 10,104,307 | 4,335,379 | |||||||||||||||
| Net asset value and redemption price per share | $ | 9.47 | $ | 17.65 | $ | 12.66 | $ | 24.29 | |||||||||||
| Maximum offering price per share (5.75%)(1) | $ | 10.05 | $ | 18.73 | $ | 13.43 | $ | 25.77 | |||||||||||
| Class B: | |||||||||||||||||||
| Net Assets | $ | 31,295,544 | $ | 115,070,783 | $ | 168,987,832 | $ | 60,704,615 | |||||||||||
| Shares authorized | unlimited | unlimited | unlimited | unlimited | |||||||||||||||
| Par value | $ | 0.01 | $ | 0.00 | $ | 0.01 | $ | 0.01 | |||||||||||
| Shares outstanding | 3,445,103 | 6,701,823 | 13,937,341 | 2,718,854 | |||||||||||||||
| Net asset value and redemption price per share(2) | $ | 9.08 | $ | 17.17 | $ | 12.12 | $ | 22.33 | |||||||||||
| Maximum offering price per share | $ | 9.08 | $ | 17.17 | $ | 12.12 | $ | 22.33 | |||||||||||
| Class C: | |||||||||||||||||||
| Net Assets | $ | 13,986,491 | $ | 52,989,337 | $ | 117,912,829 | $ | 53,120,315 | |||||||||||
| Shares authorized | unlimited | unlimited | unlimited | unlimited | |||||||||||||||
| Par value | $ | 0.01 | $ | 0.00 | $ | 0.01 | $ | 0.01 | |||||||||||
| Shares outstanding | 1,539,823 | 3,096,325 | 9,773,132 | 2,384,367 | |||||||||||||||
| Net asset value and redemption price per share(2) | $ | 9.08 | $ | 17.11 | $ | 12.06 | $ | 22.28 | |||||||||||
| Maximum offering price per share | $ | 9.08 | $ | 17.11 | $ | 12.06 | $ | 22.28 | |||||||||||
| Class I: | |||||||||||||||||||
| Net Assets | $ | 4,534 | $ | 37,838,639 | $ | 2,985,670 | $ | 12,792,928 | |||||||||||
| Shares authorized | unlimited | unlimited | unlimited | unlimited | |||||||||||||||
| Par value | $ | 0.01 | $ | 0.00 | $ | 0.01 | $ | 0.01 | |||||||||||
| Shares outstanding | 469 | 2,078,840 | 230,208 | 520,134 | |||||||||||||||
| Net asset value and redemption price per share | $ | 9.67 | $ | 18.20 | $ | 12.97 | $ | 24.60 | |||||||||||
| Maximum offering price per share | $ | 9.67 | $ | 18.20 | $ | 12.97 | $ | 24.60 | |||||||||||
| Class Q: | |||||||||||||||||||
| Net Assets | n/a | $ | 5,228,955 | $ | 4,808,890 | $ | 319,667 | ||||||||||||
| Shares authorized | n/a | unlimited | unlimited | unlimited | |||||||||||||||
| Par value | n/a | $ | 0.00 | $ | 0.01 | $ | 0.01 | ||||||||||||
| Shares outstanding | n/a | 288,779 | 375,977 | 13,082 | |||||||||||||||
| Net asset value and redemption price per share | n/a | $ | 18.11 | $ | 12.79 | $ | 24.44 | ||||||||||||
| Maximum offering price per share | n/a | $ | 18.11 | $ | 12.79 | $ | 24.44 | ||||||||||||
(1) Maximum offering price is computed at 100/94.25 of net asset value. On purchases of $50,000 or more, the offering price is reduced.
(2) Redemption price per share may be reduced for any applicable contingent deferred sales charges.
See Accompanying Notes to Financial Statements
30
STATEMENTS OF ASSETS AND LIABILITIES AS OF NOVEMBER 30, 2004 (UNAUDITED)
| ING LargeCap Value Fund | ING MagnaCap Fund | ING MidCap Value Fund | |||||||||||||||||
| ASSETS: | |||||||||||||||||||
| Investments in securities at value+* | $ | 31,797,838 | $ | 376,239,011 | $ | 161,733,891 | |||||||||||||
| Short-term investments at amortized cost | - | - | 25,264,576 | ||||||||||||||||
| Repurchase agreement | - | 2,837,000 | - | ||||||||||||||||
| Cash | 2,240,220 | 158 | 8,031,901 | ||||||||||||||||
| Receivables: | |||||||||||||||||||
| Fund shares sold | 224,487 | 677 | 1,666,826 | ||||||||||||||||
| Dividends and interest | 48,249 | 942,827 | 242,279 | ||||||||||||||||
| Prepaid expenses | 47,773 | 30,747 | 18,480 | ||||||||||||||||
| Reimbursement due from manager | 27,466 | - | - | ||||||||||||||||
| Total assets | 34,386,033 | 380,050,420 | 196,957,953 | ||||||||||||||||
| LIABILITIES: | |||||||||||||||||||
| Payable for investment securities purchased | 1,581,306 | - | 3,452,746 | ||||||||||||||||
| Payable for fund shares redeemed | 484 | 185,500 | 156,178 | ||||||||||||||||
| Payable upon receipt of securities loaned | - | - | 25,264,576 | ||||||||||||||||
| Payable to affiliates | 40,871 | 357,735 | 250,102 | ||||||||||||||||
| Payable for trustee fees | 1,157 | 58,030 | 1,754 | ||||||||||||||||
| Other accrued expenses and liabilities | 77,179 | 487,410 | 61,487 | ||||||||||||||||
| Total liabilities | 1,700,997 | 1,088,675 | 29,186,843 | ||||||||||||||||
| NET ASSETS | $ | 32,685,036 | $ | 378,961,745 | $ | 167,771,110 | |||||||||||||
| NET ASSETS WERE COMPRISED OF: | |||||||||||||||||||
| Paid-in capital | $ | 31,290,950 | $ | 377,253,427 | $ | 163,835,217 | |||||||||||||
| Accumulated net investment loss | (37,850 | ) | (274,550 | ) | (471,989 | ) | |||||||||||||
| Accumulated net realized gain (loss) on investments | 356,858 | (71,632,059 | ) | 3,160,044 | |||||||||||||||
| Net unrealized appreciation on investments | 1,075,078 | 73,614,927 | 1,247,838 | ||||||||||||||||
| NET ASSETS | $ | 32,685,036 | $ | 378,961,745 | $ | 167,771,110 | |||||||||||||
| + Including securities loaned at value | $ | - | $ | - | $ | 23,864,087 | |||||||||||||
| * Cost of investments in securities | $ | 30,722,760 | $ | 302,128,558 | $ | 160,486,053 | |||||||||||||
See Accompanying Notes to Financial Statements
31
STATEMENTS OF ASSETS AND LIABILITIES AS OF NOVEMBER 30, 2004 (UNAUDITED) (CONTINUED)
| ING LargeCap Value Fund | ING MagnaCap Fund | ING MidCap Value Fund | |||||||||||||
| Class A: | |||||||||||||||
| Net Assets | $ | 14,422,617 | $ | 315,708,153 | $ | 76,288,758 | |||||||||
| Shares authorized | unlimited | 80,000,000 | unlimited | ||||||||||||
| Par value | $ | 0.00 | $ | 0.00 | $ | 0.001 | |||||||||
| Shares outstanding | 1,415,224 | 28,996,894 | 6,745,688 | ||||||||||||
| Net asset value and redemption price per share | $ | 10.19 | $ | 10.89 | $ | 11.31 | |||||||||
| Maximum offering price per share (5.75%)(1) | $ | 10.81 | $ | 11.55 | $ | 12.00 | |||||||||
| Class B: | |||||||||||||||
| Net Assets | $ | 6,789,543 | $ | 46,213,724 | $ | 43,156,840 | |||||||||
| Shares authorized | unlimited | 80,000,000 | unlimited | ||||||||||||
| Par value | $ | 0.00 | $ | 0.00 | $ | 0.001 | |||||||||
| Shares outstanding | 668,022 | 4,376,450 | 3,875,209 | ||||||||||||
| Net asset value and redemption price per share(2) | $ | 10.16 | $ | 10.56 | $ | 11.14 | |||||||||
| Maximum offering price per share | $ | 10.16 | $ | 10.56 | $ | 11.14 | |||||||||
| Class C: | |||||||||||||||
| Net Assets | $ | 8,807,918 | $ | 9,970,068 | $ | 46,159,703 | |||||||||
| Shares authorized | unlimited | 20,000,000 | unlimited | ||||||||||||
| Par value | $ | 0.00 | $ | 0.00 | $ | 0.001 | |||||||||
| Shares outstanding | 866,836 | 943,545 | 4,145,661 | ||||||||||||
| Net asset value and redemption price per share(2) | $ | 10.16 | $ | 10.57 | $ | 11.13 | |||||||||
| Maximum offering price per share | $ | 10.16 | $ | 10.57 | $ | 11.13 | |||||||||
| Class I: | |||||||||||||||
| Net Assets | $ | 2,664,958 | $ | 2,271,718 | $ | 2,145,009 | |||||||||
| Shares authorized | unlimited | 50,000,000 | unlimited | ||||||||||||
| Par value | $ | 0.00 | $ | 0.00 | $ | 0.001 | |||||||||
| Shares outstanding | 261,620 | 209,911 | 187,674 | ||||||||||||
| Net asset value and redemption price per share | $ | 10.19 | $ | 10.82 | $ | 11.43 | |||||||||
| Maximum offering price per share | $ | 10.19 | $ | 10.82 | $ | 11.43 | |||||||||
| Class M: | |||||||||||||||
| Net Assets | n/a | $ | 4,798,082 | n/a | |||||||||||
| Shares authorized | n/a | 5,000,000 | n/a | ||||||||||||
| Par value | n/a | $ | 0.00 | n/a | |||||||||||
| Shares outstanding | n/a | 443,215 | n/a | ||||||||||||
| Net asset value and redemption price per share | n/a | $ | 10.83 | n/a | |||||||||||
| Maximum offering price per share | n/a | $ | 10.83 | n/a | |||||||||||
| Class Q: | |||||||||||||||
| Net Assets | n/a | n/a | $ | 20,800 | |||||||||||
| Shares authorized | n/a | n/a | unlimited | ||||||||||||
| Par value | n/a | n/a | $ | 0.001 | |||||||||||
| Shares outstanding | n/a | n/a | 1,842 | ||||||||||||
| Net asset value and redemption price per share | n/a | n/a | $ | 11.29 | |||||||||||
| Maximum offering price per share | n/a | n/a | $ | 11.29 | |||||||||||
(1) Maximum offering price is computed at 100/94.25 of net asset value. On purchases of $50,000 or more, the offering price is reduced.
(2) Redemption price per share may be reduced for any applicable contingent deferred sales charges.
See Accompanying Notes to Financial Statements
32
STATEMENTS OF ASSETS AND LIABILITIES AS OF NOVEMBER 30, 2004 (UNAUDITED)
| ING SmallCap Value Fund | ING Convertible Fund | ING Equity and Bond Fund | ING Real Estate Fund | ||||||||||||||||
| ASSETS: | |||||||||||||||||||
| Investments in securities at value+* | $ | 154,497,494 | $ | 197,410,504 | $ | 65,854,178 | $ | 240,281,035 | |||||||||||
| Short-term investments at amortized cost | 34,093,573 | 53,943,311 | - | 9,043,070 | |||||||||||||||
| Repurchase agreement | - | 1,065,000 | 3,292,000 | - | |||||||||||||||
| Cash | 4,310,357 | - | 7,046 | 4,772,647 | |||||||||||||||
| Cash collateral for futures | - | - | 7,131 | - | |||||||||||||||
| Foreign currencies at value*** | - | 388 | - | - | |||||||||||||||
| Receivables: | |||||||||||||||||||
| Investment securities sold | 104,555 | - | 682,795 | 371,916 | |||||||||||||||
| Fund shares sold | 1,545,438 | 59,740 | 744 | 18,500 | |||||||||||||||
| Dividends and interest | 208,077 | 861,652 | 333,554 | 185,499 | |||||||||||||||
| Prepaid expenses | 17,221 | 23,646 | 19,070 | 39,188 | |||||||||||||||
| Total assets | 194,776,715 | 253,364,241 | 70,196,518 | 254,711,855 | |||||||||||||||
| LIABILITIES: | |||||||||||||||||||
| Payable for investment securities purchased | 1,217,883 | - | 5,648,348 | 929,811 | |||||||||||||||
| Payable for fund shares redeemed | 99,170 | 495,859 | 32,672 | - | |||||||||||||||
| Payable for futures variation margin | - | - | 3,141 | - | |||||||||||||||
| Payable upon receipt of securities loaned | 34,093,573 | 53,943,311 | - | 9,043,070 | |||||||||||||||
| Payable to affiliates | 272,212 | 267,805 | 89,731 | 224,171 | |||||||||||||||
| Payable to custodian | - | 4,971 | - | - | |||||||||||||||
| Payable for trustee fees | 3,265 | 14,974 | 4,344 | 5,041 | |||||||||||||||
| Other accrued expenses and liabilities | 62,234 | 217,945 | 121,592 | 139,662 | |||||||||||||||
| Total liabilities | 35,748,337 | 54,944,865 | 5,899,828 | 10,341,755 | |||||||||||||||
| NET ASSETS | $ | 159,028,378 | $ | 198,419,376 | $ | 64,296,690 | $ | 244,370,100 | |||||||||||
| NET ASSETS WERE COMPRISED OF: | |||||||||||||||||||
| Paid-in capital | $ | 146,347,901 | $ | 258,623,990 | $ | 75,549,304 | $ | 180,992,251 | |||||||||||
| Undistributed net investment income (accumulated net investment loss) | (419,868 | ) | 789,019 | 140,828 | 2,242,494 | ||||||||||||||
| Accumulated net realized gain (loss) on investments, foreign currencies and futures | 2,209,370 | (80,098,377 | ) | (14,866,452 | ) | 2,958,782 | |||||||||||||
| Net unrealized appreciation on investments, foreign currencies and futures | 10,890,975 | 19,104,744 | 3,473,010 | 58,176,573 | |||||||||||||||
| NET ASSETS | $ | 159,028,378 | $ | 198,419,376 | $ | 64,296,690 | $ | 244,370,100 | |||||||||||
| + Including securities loaned at value | $ | 31,965,747 | $ | 52,558,629 | $ | - | $ | 8,856,992 | |||||||||||
| * Cost of investments in securities | $ | 143,606,519 | $ | 178,306,148 | $ | 62,388,209 | $ | 182,104,462 | |||||||||||
See Accompanying Notes to Financial Statements
33
STATEMENTS OF ASSETS AND LIABILITIES AS OF NOVEMBER 30, 2004 (UNAUDITED) (CONTINUED)
| ING SmallCap Value Fund | ING Convertible Fund | ING Equity and Bond Fund | ING Real Estate Fund | ||||||||||||||||
| Class A: | |||||||||||||||||||
| Net Assets | $ | 88,102,947 | $ | 60,615,668 | $ | 34,189,443 | $ | 38,487,554 | |||||||||||
| Shares authorized | unlimited | unlimited | unlimited | unlimited | |||||||||||||||
| Par value | $ | 0.00 | $ | 0.00 | $ | 0.00 | $ | 0.00 | |||||||||||
| Shares outstanding | 6,520,546 | 3,271,384 | 2,674,821 | 2,698,366 | |||||||||||||||
| Net asset value and redemption price per share | $ | 13.51 | $ | 18.53 | $ | 12.78 | $ | 14.26 | |||||||||||
| Maximum offering price per share (5.75%)(1) | $ | 14.33 | $ | 19.66 | $ | 13.56 | $ | 15.13 | |||||||||||
| Class B: | |||||||||||||||||||
| Net Assets | $ | 26,109,462 | $ | 66,597,556 | $ | 17,407,222 | $ | 3,088,890 | |||||||||||
| Shares authorized | unlimited | unlimited | unlimited | unlimited | |||||||||||||||
| Par value | $ | 0.00 | $ | 0.00 | $ | 0.00 | $ | 0.00 | |||||||||||
| Shares outstanding | 1,966,957 | 3,264,430 | 1,262,835 | 216,073 | |||||||||||||||
| Net asset value and redemption price per share(2) | $ | 13.27 | $ | 20.40 | $ | 13.78 | $ | 14.30 | |||||||||||
| Maximum offering price per share | $ | 13.27 | $ | 20.40 | $ | 13.78 | $ | 14.30 | |||||||||||
| Class C: | |||||||||||||||||||
| Net Assets | $ | 44,235,075 | $ | 68,400,264 | $ | 12,409,157 | $ | 3,476,512 | |||||||||||
| Shares authorized | unlimited | unlimited | unlimited | unlimited | |||||||||||||||
| Par value | $ | 0.00 | $ | 0.00 | $ | 0.00 | $ | 0.00 | |||||||||||
| Shares outstanding | 3,335,852 | 3,600,076 | 1,017,491 | 236,663 | |||||||||||||||
| Net asset value and redemption price per share(2) | $ | 13.26 | $ | 19.00 | $ | 12.20 | $ | 14.69 | |||||||||||
| Maximum offering price per share | $ | 13.26 | $ | 19.00 | $ | 12.20 | $ | 14.69 | |||||||||||
| Class I: | |||||||||||||||||||
| Net Assets | $ | 514,154 | n/a | n/a | $ | 195,284,167 | |||||||||||||
| Shares authorized | unlimited | n/a | n/a | unlimited | |||||||||||||||
| Par value | $ | 0.00 | n/a | n/a | $ | 0.00 | |||||||||||||
| Shares outstanding | 37,796 | n/a | n/a | 13,112,275 | |||||||||||||||
| Net asset value and redemption price per share | $ | 13.60 | n/a | n/a | $ | 14.89 | |||||||||||||
| Maximum offering price per share | $ | 13.60 | n/a | n/a | $ | 14.89 | |||||||||||||
| Class O: | |||||||||||||||||||
| Net Assets | n/a | n/a | n/a | $ | 4,032,977 | ||||||||||||||
| Shares authorized | n/a | n/a | n/a | unlimited | |||||||||||||||
| Par value | n/a | n/a | n/a | $ | 0.00 | ||||||||||||||
| Shares outstanding | n/a | n/a | n/a | 283,008 | |||||||||||||||
| Net asset value and redemption price per share | n/a | n/a | n/a | $ | 14.25 | ||||||||||||||
| Maximum offering price per share | n/a | n/a | n/a | $ | 14.25 | ||||||||||||||
| Class Q: | |||||||||||||||||||
| Net Assets | $ | 66,740 | $ | 2,805,888 | $ | 290,868 | n/a | ||||||||||||
| Shares authorized | unlimited | unlimited | unlimited | n/a | |||||||||||||||
| Par value | $ | 0.00 | $ | 0.00 | $ | 0.00 | n/a | ||||||||||||
| Shares outstanding | 4,872 | 156,101 | 22,915 | n/a | |||||||||||||||
| Net asset value and redemption price per share | $ | 13.70 | $ | 17.97 | $ | 12.69 | n/a | ||||||||||||
| Maximum offering price per share | $ | 13.70 | $ | 17.97 | $ | 12.69 | n/a | ||||||||||||
(1) Maximum offering price is computed at 100/94.25 of net asset value. On purchases of $50,000 or more, the offering price is reduced.
(2) Redemption price per share may be reduced for any applicable contingent deferred sales charges.
See Accompanying Notes to Financial Statements
34
STATEMENTS OF OPERATIONS FOR THE SIX MONTHS ENDED NOVEMBER 30, 2004 (UNAUDITED)
| ING Disciplined LargeCap Fund | ING LargeCap Growth Fund | ING MidCap Opportunities Fund | ING SmallCap Opportunities Fund | ||||||||||||||||
| INVESTMENT INCOME: | |||||||||||||||||||
| Dividends, net of foreign taxes withheld* | $ | 691,060 | $ | 1,805,856 | $ | 807,753 | $ | 227,471 | |||||||||||
| Interest | 4,425 | 280 | 72,014 | 25,401 | |||||||||||||||
| Securities lending income | 684 | 10,762 | 33,398 | 45,707 | |||||||||||||||
| Other | 8,641 | - | - | - | |||||||||||||||
| Total investment income | 704,810 | 1,816,898 | 913,165 | 298,579 | |||||||||||||||
| EXPENSES: | |||||||||||||||||||
| Investment management fees | 234,184 | 1,172,003 | 2,110,695 | 1,086,573 | |||||||||||||||
| Distribution and service fees: | |||||||||||||||||||
| Class A | 7,838 | 184,836 | 185,922 | 152,861 | |||||||||||||||
| Class B | 158,729 | 567,446 | 859,197 | 321,149 | |||||||||||||||
| Class C | 71,301 | 257,635 | 595,408 | 261,952 | |||||||||||||||
| Class Q | - | 6,963 | 5,760 | 447 | |||||||||||||||
| Transfer agent fees: | |||||||||||||||||||
| Class A | 2,409 | 74,221 | 87,048 | 79,035 | |||||||||||||||
| Class B | 12,043 | 80,355 | 116,212 | 49,945 | |||||||||||||||
| Class C | 6,603 | 36,613 | 87,126 | 40,772 | |||||||||||||||
| Class I | 261 | 5,320 | 32 | 668 | |||||||||||||||
| Class Q | - | 743 | 55 | 20 | |||||||||||||||
| Administrative service fees | 33,455 | 156,265 | 367,700 | 242,224 | |||||||||||||||
| Shareholder reporting expense | 8,105 | 27,414 | 45,600 | 42,520 | |||||||||||||||
| Registration fees | 21,390 | 38,825 | 51,208 | 24,604 | |||||||||||||||
| Professional fees | 5,475 | 12,977 | 12,282 | 12,849 | |||||||||||||||
| Custody and accounting expense | 6,797 | 15,298 | 10,755 | 16,480 | |||||||||||||||
| Trustee fees | 1,983 | 4,657 | 6,341 | 8,281 | |||||||||||||||
| Miscellaneous expense | 21,990 | 6,733 | 15,019 | 9,126 | |||||||||||||||
| Total expenses | 592,563 | 2,648,304 | 4,556,360 | 2,349,506 | |||||||||||||||
| Less: | |||||||||||||||||||
| Net recouped fees | - | (55,000 | ) | (125,000 | ) | - | |||||||||||||
| Brokerage commission recapture | - | 32,660 | - | - | |||||||||||||||
| Net expenses | 592,563 | 2,670,644 | 4,681,360 | 2,349,506 | |||||||||||||||
| Net investment income (loss) | 112,247 | (853,746 | ) | (3,768,195 | ) | (2,050,927 | ) | ||||||||||||
| REALIZED AND UNREALIZED GAIN (LOSS) ON INVESTMENTS AND FUTURES: | |||||||||||||||||||
| Net realized gain (loss) on: | |||||||||||||||||||
| Investments | 4,559,066 | (3,952,007 | ) | 2,749,837 | 2,980,721 | ||||||||||||||
| Futures | (12,554 | ) | - | - | - | ||||||||||||||
| Net realized gain (loss) on investments and futures | 4,546,512 | (3,952,007 | ) | 2,749,837 | 2,980,721 | ||||||||||||||
| Net change in unrealized appreciation or depreciation on: | |||||||||||||||||||
| Investments | (1,107,879 | ) | 4,474,101 | 18,335,010 | 14,797,287 | ||||||||||||||
| Futures | (1,077 | ) | - | - | - | ||||||||||||||
| Net change in unrealized appreciation or depreciation on investments and futures | (1,108,956 | ) | 4,474,101 | 18,335,010 | 14,797,287 | ||||||||||||||
| Net realized and unrealized gain on investments investments and futures | 3,437,556 | 522,094 | 21,084,847 | 17,778,008 | |||||||||||||||
| Increase (decrease) in net assets resulting from operations | $ | 3,549,803 | $ | (331,652 | ) | $ | 17,316,652 | $ | 15,727,081 | ||||||||||
| * Foreign taxes | $ | - | $ | 656 | $ | - | $ | - | |||||||||||
See Accompanying Notes to Financial Statements
35
STATEMENTS OF OPERATIONS FOR THE SIX MONTHS ENDED NOVEMBER 30, 2004 (UNAUDITED)
| ING LargeCap Value Fund | ING MagnaCap Fund | ING MidCap Value Fund | |||||||||||||||||
| INVESTMENT INCOME: | |||||||||||||||||||
| Dividends, net of foreign taxes withheld* | $ | 246,685 | $ | 4,540,680 | $ | 951,578 | |||||||||||||
| Interest | - | 25,519 | 150 | ||||||||||||||||
| Securities lending income | - | 4,382 | 91,306 | ||||||||||||||||
| Total investment income | 246,685 | 4,570,581 | 1,043,034 | ||||||||||||||||
| EXPENSES: | |||||||||||||||||||
| Investment management fees | 99,146 | 1,368,733 | 676,353 | ||||||||||||||||
| Distribution and service fees: | |||||||||||||||||||
| Class A | 11,578 | 465,906 | 84,150 | ||||||||||||||||
| Class B | 23,788 | 243,240 | 192,338 | ||||||||||||||||
| Class C | 31,717 | 54,872 | 184,336 | ||||||||||||||||
| Class M | - | 18,272 | - | ||||||||||||||||
| Class Q | - | - | 24 | ||||||||||||||||
| Transfer agent fees: | |||||||||||||||||||
| Class A | 7,493 | 98,014 | 34,814 | ||||||||||||||||
| Class B | 3,980 | 15,523 | 19,788 | ||||||||||||||||
| Class C | 5,176 | 3,493 | 19,006 | ||||||||||||||||
| Class I | 956 | 14 | 853 | ||||||||||||||||
| Class M | - | 1,553 | - | ||||||||||||||||
| Class Q | 28 | - | 10 | ||||||||||||||||
| Administrative service fees | 11,016 | - | 72,364 | ||||||||||||||||
| Shareholder reporting expense | 4,626 | 23,547 | 9,876 | ||||||||||||||||
| Registration fees | 36,481 | 40,639 | 23,930 | ||||||||||||||||
| Professional fees | 3,254 | 16,285 | 12,414 | ||||||||||||||||
| Custody and accounting expense | 2,314 | 19,905 | 5,604 | ||||||||||||||||
| Trustee fees | 1,102 | 9,006 | 1,614 | ||||||||||||||||
| Offering expense | 50,137 | - | - | ||||||||||||||||
| Miscellaneous expense | 625 | 16,565 | 2,202 | ||||||||||||||||
| Total expenses | 293,417 | 2,395,567 | 1,339,676 | ||||||||||||||||
| Less: | |||||||||||||||||||
| Net waived and reimbursed (recouped) fees | 96,134 | - | (153,977 | ) | |||||||||||||||
| Net expenses | 197,283 | 2,395,567 | 1,493,653 | ||||||||||||||||
| Net investment income (loss) | 49,402 | 2,175,014 | (450,619 | ) | |||||||||||||||
| REALIZED AND UNREALIZED GAIN (LOSS) ON INVESTMENTS: | |||||||||||||||||||
| Net realized gain (loss) on investments | 599,544 | (1,812,694 | ) | 8,657,798 | |||||||||||||||
| Net change in unrealized appreciation or depreciation on investments | 1,182,223 | 25,384,178 | (426,989 | ) | |||||||||||||||
| Net realized and unrealized gain on investments | 1,781,767 | 23,571,484 | 8,230,809 | ||||||||||||||||
| Increase in net assets resulting from operations | $ | 1,831,169 | $ | 25,746,498 | $ | 7,780,190 | |||||||||||||
| * Foreign taxes | $ | - | $ | 42,112 | $ | - | |||||||||||||
See Accompanying Notes to Financial Statements
36
STATEMENTS OF OPERATIONS FOR THE SIX MONTHS ENDED NOVEMBER 30, 2004 (UNAUDITED)
| ING SmallCap Value Fund | ING Convertible Fund | ING Equity and Bond Fund | ING Real Estate Fund | ||||||||||||||||
| INVESTMENT INCOME: | |||||||||||||||||||
| Dividends, net of foreign taxes withheld* | $ | 771,846 | $ | 1,330,249 | $ | 357,175 | $ | 4,680,768 | |||||||||||
| Interest | - | 1,955,962 | 611,485 | - | |||||||||||||||
| Securities lending income | 134,338 | 69,737 | - | 5,047 | |||||||||||||||
| Total investment income | 906,184 | 3,355,948 | 968,660 | 4,685,815 | |||||||||||||||
| EXPENSES: | |||||||||||||||||||
| Investment management fees | 592,957 | 760,810 | 248,784 | 724,287 | |||||||||||||||
| Distribution and service fees: | |||||||||||||||||||
| Class A | 85,829 | 106,825 | 61,183 | 31,007 | |||||||||||||||
| Class B | 110,437 | 348,467 | 91,076 | 12,180 | |||||||||||||||
| Class C | 174,573 | 345,930 | 64,299 | 14,983 | |||||||||||||||
| Class O | - | - | - | 883 | |||||||||||||||
| Class Q | 75 | 3,691 | 382 | - | |||||||||||||||
| Transfer agent fees: | |||||||||||||||||||
| Class A | 39,421 | 25,663 | 19,709 | 2,174 | |||||||||||||||
| Class B | 12,621 | 29,576 | 10,263 | 221 | |||||||||||||||
| Class C | 20,054 | 29,415 | 7,192 | 295 | |||||||||||||||
| Class I | 162 | - | - | 12,266 | |||||||||||||||
| Class O | - | - | - | 159 | |||||||||||||||
| Class Q | 18 | 418 | 143 | - | |||||||||||||||
| Administrative service fees | 63,098 | 101,440 | 33,171 | 103,469 | |||||||||||||||
| Shareholder reporting expense | 8,607 | 57,030 | 17,751 | 12,301 | |||||||||||||||
| Registration fees | 22,427 | 26,150 | 23,127 | 30,867 | |||||||||||||||
| Professional fees | 4,338 | 12,613 | 7,402 | 13,014 | |||||||||||||||
| Custody and accounting expense | 2,910 | 15,718 | 20,156 | 7,850 | |||||||||||||||
| Trustee fees | 1,917 | 5,555 | 2,652 | 2,897 | |||||||||||||||
| Miscellaneous expense | 2,034 | 7,643 | 3,534 | 27,839 | |||||||||||||||
| Total expenses | 1,141,478 | 1,876,944 | 610,824 | 996,692 | |||||||||||||||
| Less: | |||||||||||||||||||
| Net recouped fees | (163,241 | ) | - | (20,000 | ) | (115,001 | ) | ||||||||||||
| Brokerage commission recapture | - | - | - | 72,658 | |||||||||||||||
| Net expenses | 1,304,719 | 1,876,944 | 630,824 | 1,039,035 | |||||||||||||||
| Net investment income/(loss) | (398,535 | ) | 1,479,004 | 337,836 | 3,646,780 | ||||||||||||||
| REALIZED AND UNREALIZED GAIN (LOSS) ON INVESTMENTS, FOREIGN CURRENCIES AND FUTURES: | |||||||||||||||||||
| Net realized gain (loss) on: | |||||||||||||||||||
| Investments | 5,255,247 | 1,064,427 | 707,649 | 9,073,434 | |||||||||||||||
| Foreign currencies | - | 14,642 | - | - | |||||||||||||||
| Futures | - | - | (19,674 | ) | - | ||||||||||||||
| Net realized gain on investments, foreign currencies and futures | 5,255,247 | 1,079,069 | 687,975 | 9,073,434 | |||||||||||||||
| Net change in unrealized appreciation or depreciation on: | |||||||||||||||||||
| Investments | 5,652,992 | 4,393,868 | 837,028 | 28,898,993 | |||||||||||||||
| Foreign currencies | - | 388 | - | - | |||||||||||||||
| Futures | - | - | 35,819 | - | |||||||||||||||
| Net change in unrealized appreciation or depreciation on investments, foreign currencies and futures | 5,652,992 | 4,394,256 | 872,847 | 28,898,993 | |||||||||||||||
| Net realized and unrealized gain on investments, foreign currencies and futures | 10,908,239 | 5,473,325 | 1,560,822 | 37,972,427 | |||||||||||||||
| Increase in net assets resulting from operations | $ | 10,509,704 | $ | 6,952,329 | $ | 1,898,658 | $ | 41,619,207 | |||||||||||
| * Foreign taxes | $ | - | $ | - | $ | 558 | $ | - | |||||||||||
See Accompanying Notes to Financial Statements
37
STATEMENTS OF CHANGES IN NET ASSETS (UNAUDITED)
| ING Disciplined LargeCap Fund | ING LargeCap Growth Fund | ||||||||||||||||||
| Six Months Ended November 30, 2004 | Year Ended May 31, 2004 | Six Months Ended November 30, 2004 | Year Ended May 31, 2004 | ||||||||||||||||
| FROM OPERATIONS: | |||||||||||||||||||
| Net investment income (loss) | $ | 112,247 | $ | (196,511 | ) | $ | (853,746 | ) | $ | (2,863,179 | ) | ||||||||
| Net realized gain (loss) on investments and futures | 4,546,512 | 8,281,222 | (3,952,007 | ) | 39,816,143 | ||||||||||||||
| Net change in unrealized appreciation or depreciation on invesments and futures | (1,108,956 | ) | 4,006,258 | 4,474,101 | 18,934,271 | ||||||||||||||
| Net increase (decrease) in net assets resulting from operations | 3,549,803 | 12,090,969 | (331,652 | ) | 55,887,235 | ||||||||||||||
| FROM DISTRIBUTIONS TO SHAREHOLDERS: | |||||||||||||||||||
| Net investment income: | |||||||||||||||||||
| Class A | - | - | (3,156,967 | ) | - | ||||||||||||||
| Class B | - | - | (2,693,358 | ) | - | ||||||||||||||
| Class C | - | - | (1,248,300 | ) | - | ||||||||||||||
| Class I | - | - | (1,216,755 | ) | - | ||||||||||||||
| Class Q | - | - | (162,376 | ) | - | ||||||||||||||
| Total distributions | - | - | (8,477,756 | ) | - | ||||||||||||||
| FROM CAPITAL SHARE TRANSACTIONS: | |||||||||||||||||||
| Net proceeds from sale of shares | 2,070,186 | 4,879,672 | 61,314,036 | 167,009,595 | |||||||||||||||
| Dividends reinvested | - | - | 6,728,584 | - | |||||||||||||||
| 2,070,186 | 4,879,672 | 68,042,620 | 167,009,595 | ||||||||||||||||
| Cost of shares redeemed | (31,450,468 | ) | (23,356,188 | ) | (64,106,366 | ) | (70,231,343 | ) | |||||||||||
| Net increase (decrease) in net assets resulting from capital share transactions | (29,380,282 | ) | (18,476,516 | ) | 3,936,254 | 96,778,252 | |||||||||||||
| Net increase (decrease) in net assets | (25,830,479 | ) | (6,385,547 | ) | (4,873,154 | ) | 152,665,487 | ||||||||||||
| NET ASSETS: | |||||||||||||||||||
| Beginning of period | 76,204,873 | 82,590,420 | 326,030,017 | 173,364,530 | |||||||||||||||
| End of period | $ | 50,374,394 | $ | 76,204,873 | $ | 321,156,863 | $ | 326,030,017 | |||||||||||
| Undistributed net investment income (accumulated net investment loss) at end of period | $ | 112,247 | $ | - | $ | (9,331,502 | ) | $ | - | ||||||||||
See Accompanying Notes to Financial Statements
38
STATEMENTS OF CHANGES IN NET ASSETS (UNAUDITED)
| ING MidCap Opportunities Fund | ING SmallCap Opportunities Fund | ||||||||||||||||||
| Six Months Ended November 30, 2004 | Year Ended May 31, 2004 | Six Months Ended November 30, 2004 | Year Ended May 31, 2004 | ||||||||||||||||
| FROM OPERATIONS: | |||||||||||||||||||
| Net investment loss | $ | (3,768,195 | ) | $ | (3,189,037 | ) | $ | (2,050,927 | ) | $ | (5,073,085 | ) | |||||||
| Net realized gain on investments | 2,749,837 | 36,005,578 | 2,980,721 | 43,684,508 | |||||||||||||||
| Net change in unrealized appreciation or depreciation on investments | 18,335,010 | (14,157,412 | ) | 14,797,287 | 20,950,754 | ||||||||||||||
| Net increase in net assets resulting from operations | 17,316,652 | 18,659,129 | 15,727,081 | 59,562,177 | |||||||||||||||
| FROM CAPITAL SHARE TRANSACTIONS: | |||||||||||||||||||
| Net proceeds from sale of shares | 12,197,998 | 28,495,626 | 18,636,682 | 55,115,680 | |||||||||||||||
| Dividends reinvested | - | 373,162,486 | - | - | |||||||||||||||
| 12,197,998 | 401,658,112 | 18,636,682 | 55,115,680 | ||||||||||||||||
| Cost of shares redeemed | (70,485,126 | ) | (127,345,757 | ) | (54,883,976 | ) | (140,542,492 | ) | |||||||||||
| Net increase (decrease) in net assets resulting from capital share transactions | (58,287,128 | ) | 274,312,355 | (36,247,294 | ) | (85,426,812 | ) | ||||||||||||
| Net increase (decrease) in net assets | (40,970,476 | ) | 292,971,484 | (20,520,213 | ) | (25,864,635 | ) | ||||||||||||
| NET ASSETS: | |||||||||||||||||||
| Beginning of period | 463,623,927 | 170,652,443 | 252,769,862 | 278,634,497 | |||||||||||||||
| End of period | $ | 422,653,451 | $ | 463,623,927 | $ | 232,249,649 | $ | 252,769,862 | |||||||||||
| Accumualted net investment loss at end of period | $ | (3,768,195 | ) | $ | - | $ | (2,050,927 | ) | $ | - | |||||||||
See Accompanying Notes to Financial Statements
39
STATEMENTS OF CHANGES IN NET ASSETS (UNAUDITED)
| ING LargeCap Value Fund | |||||||||||
| Six Months Ended November 30, 2004 | February 2, 2004(1) to May 31, 2004 | ||||||||||
| FROM OPERATIONS: | |||||||||||
| Net investment income | $ | 49,402 | $ | 5,355 | |||||||
| Net realized gain on investments | 599,544 | 8,982 | |||||||||
| Net change in unrealized appreciation or depreciation on investments | 1,182,223 | (107,145 | ) | ||||||||
| Net increase in net assets resulting from operations | 1,831,169 | (92,808 | ) | ||||||||
| FROM DISTRIBUTIONS TO SHAREHOLDERS: | |||||||||||
| Net investment income: | |||||||||||
| Class A | (82,342 | ) | - | ||||||||
| Class B | (14,178 | ) | - | ||||||||
| Class C | (17,275 | ) | - | ||||||||
| Class I | (18,995 | ) | - | ||||||||
| Class O | |||||||||||
| Net realized gains: | |||||||||||
| Class A | (110,882 | ) | - | ||||||||
| Class B | (52,095 | ) | - | ||||||||
| Class C | (67,763 | ) | - | ||||||||
| Class I | (20,928 | ) | - | ||||||||
| Class O | - | - | |||||||||
| Total distributions | (384,458 | ) | - | ||||||||
| FROM CAPITAL SHARE TRANSACTIONS: | |||||||||||
| Net proceeds from sale of shares | 21,137,141 | 11,680,876 | |||||||||
| Dividends reinvested | 261,534 | - | |||||||||
| 21,398,675 | 11,680,876 | ||||||||||
| Cost of shares redeemed | (1,284,059 | ) | (464,359 | ) | |||||||
| Net increase (decrease) in net assets resulting from capital share transactions | 20,114,616 | 11,216,517 | |||||||||
| Net increase (decrease) in net assets | 21,561,327 | 11,123,709 | |||||||||
| NET ASSETS: | |||||||||||
| Beginning of period | 11,123,709 | - | |||||||||
| End of period | $ | 32,685,036 | $ | 11,123,709 | |||||||
| Undistributed net investment income (accumulated net investment loss) at end of period | $ | (37,850 | ) | $ | 45,538 | ||||||
(1) Commencement of operations
See Accompanying Notes to Financial Statements
40
STATEMENTS OF CHANGES IN NET ASSETS (UNAUDITED)
| ING MagnaCap Fund | ING MidCap Value Fund | ||||||||||||||||||
| Six Months Ended November 30, 2004 | Year Ended May 31, 2004 | Six Months Ended November 30, 2004 | Year Ended May 31, 2004 | ||||||||||||||||
| FROM OPERATIONS: | |||||||||||||||||||
| Net investment income (loss) | $ | 2,175,014 | $ | 2,960,215 | $ | (450,619 | ) | $ | (455,900 | ) | |||||||||
| Net realized gain (loss) on investments | (1,812,694 | ) | 5,922,962 | 8,657,798 | 9,538,762 | ||||||||||||||
| Net change in unrealized appreciation or depreciation on invesments | 25,384,178 | 38,819,962 | (426,989 | ) | 9,173,938 | ||||||||||||||
| Net increase in net assets resulting from operations | 25,746,498 | 47,703,139 | 7,780,190 | 18,256,800 | |||||||||||||||
| FROM DISTRIBUTIONS TO SHAREHOLDERS: | |||||||||||||||||||
| Net investment income: | |||||||||||||||||||
| Class A | (3,660,545 | ) | (2,197,417 | ) | - | - | |||||||||||||
| Class B | (93,647 | ) | - | - | - | ||||||||||||||
| Class C | (21,507 | ) | - | - | - | ||||||||||||||
| Class I | (21,582 | ) | (112 | ) | - | - | |||||||||||||
| Class M | (16,713 | ) | (4,890 | ) | - | - | |||||||||||||
| Class O | - | (42,794 | ) | - | - | ||||||||||||||
| Net realized gains: | |||||||||||||||||||
| Class A | - | - | (5,379,868 | ) | - | ||||||||||||||
| Class B | - | - | (3,140,896 | ) | - | ||||||||||||||
| Class C | - | - | (3,310,535 | ) | - | ||||||||||||||
| Class I | - | - | (154,805 | ) | - | ||||||||||||||
| Class Q | (1,507 | ) | - | ||||||||||||||||
| Total distributions | (3,813,994 | ) | (2,245,213 | ) | (11,987,611 | ) | - | ||||||||||||
| FROM CAPITAL SHARE TRANSACTIONS: | |||||||||||||||||||
| Net proceeds from sale of shares | 14,321,548 | 35,810,247 | 68,181,104 | 90,677,565 | |||||||||||||||
| Net proceeds from shares issued in merger | - | 147,505,028 | - | - | |||||||||||||||
| Dividends reinvested | 3,316,498 | 1,940,774 | 9,165,841 | - | |||||||||||||||
| 17,638,046 | 185,256,049 | 77,346,945 | 90,677,565 | ||||||||||||||||
| Cost of shares redeemed | (41,295,845 | ) | (80,780,723 | ) | (33,014,389 | ) | (20,765,261 | ) | |||||||||||
| Net increase (decrease) in net assets resulting from capital share transactions | (23,657,799 | ) | 104,475,326 | 44,332,556 | 69,912,304 | ||||||||||||||
| Net increase (decrease) in net assets | (1,725,295 | ) | 149,933,252 | 40,125,135 | 88,169,104 | ||||||||||||||
| NET ASSETS: | |||||||||||||||||||
| Beginning of period | 380,687,040 | 230,753,788 | 127,645,975 | 39,476,871 | |||||||||||||||
| End of period | $ | 378,961,745 | $ | 380,687,040 | $ | 167,771,110 | $ | 127,645,975 | |||||||||||
| Undistributed net investment income (accumulated net investment loss) at end of period | $ | (274,550 | ) | $ | 1,364,430 | $ | (471,989 | ) | $ | (21,333 | ) | ||||||||
See Accompanying Notes to Financial Statements
41
STATEMENTS OF CHANGES IN NET ASSETS (UNAUDITED)
| ING SmallCap Value Fund | ING Convertible Fund | ||||||||||||||||||
| Six Months Ended November 30, 2004 | Year Ended May 31, 2004 | Six Months Ended November 30, 2004 | Year Ended May 31, 2004 | ||||||||||||||||
| FROM OPERATIONS: | |||||||||||||||||||
| Net investment income (loss) | $ | (398,535 | ) | $ | (576,767 | ) | $ | 1,479,004 | $ | 3,558,967 | |||||||||
| Net realized gain on investments and foreign currencies | 5,255,247 | 10,868,528 | 1,079,069 | 18,580,712 | |||||||||||||||
| Net change in unrealized appreciation or depreciation on investments and foreign currencies | 5,652,992 | 8,636,660 | 4,394,256 | �� | 5,044,475 | ||||||||||||||
| Net increase in net assets resulting from operations | 10,509,704 | 18,928,421 | 6,952,329 | 27,184,154 | |||||||||||||||
| FROM DISTRIBUTIONS TO SHAREHOLDERS: | |||||||||||||||||||
| Net investment income: | |||||||||||||||||||
| Class A | - | - | (931,468 | ) | (1,433,574 | ) | |||||||||||||
| Class B | - | - | (720,738 | ) | (1,224,775 | ) | |||||||||||||
| Class C | - | - | (801,156 | ) | (1,281,578 | ) | |||||||||||||
| Class Q | - | - | (49,687 | ) | (99,026 | ) | |||||||||||||
| Net realized gains: | |||||||||||||||||||
| Class A | (5,340,181 | ) | (1,073,901 | ) | - | - | |||||||||||||
| Class B | (1,592,895 | ) | (775,481 | ) | - | - | |||||||||||||
| Class C | (2,730,797 | ) | (949,961 | ) | - | - | |||||||||||||
| Class I | (31,243 | ) | (22,291 | ) | - | - | |||||||||||||
| Class Q | (4,047 | ) | (49 | ) | - | - | |||||||||||||
| Total distributions | (9,699,163 | ) | (2,821,683 | ) | (2,503,049 | ) | (4,038,953 | ) | |||||||||||
| FROM CAPITAL SHARE TRANSACTIONS: | |||||||||||||||||||
| Net proceeds from sale of shares | 79,263,566 | 57,600,625 | 11,627,954 | 47,499,407 | |||||||||||||||
| Dividends reinvested | 7,367,984 | 2,135,022 | 1,611,454 | 2,581,510 | |||||||||||||||
| 86,631,550 | 59,735,647 | 13,239,408 | 50,080,917 | ||||||||||||||||
| Cost of shares redeemed | (23,281,611 | ) | (12,951,477 | ) | (32,350,100 | ) | (53,959,375 | ) | |||||||||||
| Net increase (decrease) in net assets resulting from capital share transactions | 63,349,939 | 46,784,170 | (19,110,692 | ) | (3,878,458 | ) | |||||||||||||
| Net increase (decrease) in net assets | 64,160,480 | 62,890,908 | (14,661,412 | ) | 19,266,743 | ||||||||||||||
| NET ASSETS: | |||||||||||||||||||
| Beginning of period | 94,867,898 | 31,976,990 | 213,080,788 | 193,814,045 | |||||||||||||||
| End of period | $ | 159,028,378 | $ | 94,867,898 | $ | 198,419,376 | $ | 213,080,788 | |||||||||||
| Undistributed net investment income (accumulated net investment loss) at end of period | $ | (419,868 | ) | $ | (21,333 | ) | $ | 789,019 | $ | 1,813,063 | |||||||||
See Accompanying Notes to Financial Statements
42
STATEMENTS OF CHANGES IN NET ASSETS (UNAUDITED)
| ING Equity and Bond Fund | ING Real Estate Fund | ||||||||||||||||||
| Six Months Ended November 30, 2004 | Year Ended May 31, 2004 | Six Months Ended November 30, 2004 | Year Ended May 13, 2004 | ||||||||||||||||
| FROM OPERATIONS: | |||||||||||||||||||
| Net investment income | $ | 337,836 | $ | 692,027 | $ | 3,646,780 | $ | 7,739,664 | |||||||||||
| Net realized gain (loss) on investments and futures | 687,975 | (791,892 | ) | 9,073,434 | 18,787,767 | ||||||||||||||
| Net change in unrealized appreciation or depreciation on investments and futures | 872,847 | 6,008,996 | 28,898,993 | 10,691,837 | |||||||||||||||
| Net increase in net assets resulting from operations | 1,898,658 | 5,909,131 | 41,619,207 | 37,219,268 | |||||||||||||||
| FROM DISTRIBUTIONS TO SHAREHOLDERS: | |||||||||||||||||||
| Net investment income: | |||||||||||||||||||
| Class A | (217,758 | ) | (789,960 | ) | (409,850 | ) | (327,077 | ) | |||||||||||
| Class B | (42,676 | ) | (315,822 | ) | (33,431 | ) | (35,510 | ) | |||||||||||
| Class C | (42,964 | ) | (249,621 | ) | (42,116 | ) | (77,403 | ) | |||||||||||
| Class I | - | - | (3,183,919 | ) | (8,236,929 | ) | |||||||||||||
| Class Q | (2,104 | ) | (6,646 | ) | - | - | |||||||||||||
| Class O | - | - | (6,743 | ) | - | ||||||||||||||
| Net realized gains: | |||||||||||||||||||
| Class A | - | - | (2,268,169 | ) | (242,273 | ) | |||||||||||||
| Class B | - | - | (184,964 | ) | (30,332 | ) | |||||||||||||
| Class C | - | - | (206,851 | ) | (87,401 | ) | |||||||||||||
| Class I | - | - | - | (6,232,489 | ) | ||||||||||||||
| Class T | - | - | (11,900,609 | ) | - | ||||||||||||||
| Class O | - | - | (199,400 | ) | - | ||||||||||||||
| Total distributions | (305,502 | ) | (1,362,049 | ) | (18,436,052 | ) | (15,269,414 | ) | |||||||||||
| FROM CAPITAL SHARE TRANSACTIONS: | |||||||||||||||||||
| Net proceeds from sale of shares | 2,894,753 | 18,750,762 | 38,765,916 | 73,899,420 | |||||||||||||||
| Dividends reinvested | 232,892 | 1,011,337 | 12,832,345 | 9,979,129 | |||||||||||||||
| 3,127,645 | 19,762,099 | 51,598,261 | 83,878,549 | ||||||||||||||||
| Cost of shares redeemed | (9,905,097 | ) | (27,110,551 | ) | (13,582,137 | ) | (49,590,718 | ) | |||||||||||
| Net increase (decrease) in net assets resulting from capital share transactions | (6,777,452 | ) | (7,348,452 | ) | 38,016,124 | 34,287,831 | |||||||||||||
| Net increase (decrease) in net assets | (5,184,296 | ) | (2,801,370 | ) | 61,199,279 | 56,237,685 | |||||||||||||
| NET ASSETS: | |||||||||||||||||||
| Beginning of period | 69,480,986 | 72,282,356 | 183,170,821 | 126,933,136 | |||||||||||||||
| End of period | $ | 64,296,690 | $ | 69,480,986 | $ | 244,370,100 | $ | 183,170,821 | |||||||||||
| Undistributed net investment income at end of period | $ | 140,828 | $ | 108,494 | $ | 2,242,494 | $ | 2,271,773 | |||||||||||
See Accompanying Notes to Financial Statements
43
ING DISCIPLINED LARGECAP FUND
Selected data for a share of beneficial interest outstanding throughout each period.
| Class I | |||||||||||||||||||||||||||||||
| Six Months Ended November 30, | Year Ended May 31, | Seven Months Ended May 31, | Year Ended October 31, | December 30, 1998(2) to October 31, | |||||||||||||||||||||||||||
| 2004 | 2004 | 2003 | 2002 | 2001(1) | 2000 | 1999 | |||||||||||||||||||||||||
| Per Share Operating Performance: | |||||||||||||||||||||||||||||||
| Net asset value, beginning of period | $ | 8.99 | 7.72 | 8.52 | 9.94 | 11.25 | 11.17 | 10.00 | |||||||||||||||||||||||
| Income (loss) from investment operations: | |||||||||||||||||||||||||||||||
| Net investment income | $ | 0.07 | 0.05 | 0.05 | 0.04 | 0.02 | 0.04 | 0.06 | |||||||||||||||||||||||
| Net realized and unrealized gain (loss) | |||||||||||||||||||||||||||||||
| on investments | $ | 0.61 | 1.22 | (0.85 | ) | (1.46 | ) | (1.33 | ) | 0.19 | 1.11 | ||||||||||||||||||||
| Total from investment operations | $ | 0.68 | 1.27 | (0.80 | ) | (1.42 | ) | (1.31 | ) | 0.23 | 1.17 | ||||||||||||||||||||
| Less distributions from: | |||||||||||||||||||||||||||||||
| Net realized gain from investments | $ | - | - | - | - | - | 0.15 | - | |||||||||||||||||||||||
| Total distributions | $ | - | - | - | - | - | 0.15 | - | |||||||||||||||||||||||
| Net asset value, end of period | $ | 9.67 | 8.99 | 7.72 | 8.52 | 9.94 | 11.25 | 11.17 | |||||||||||||||||||||||
| Total Return(3) | % | 7.56 | 16.45 | (9.39 | ) | (14.28 | ) | (11.64 | ) | 2.00 | 11.70 | ||||||||||||||||||||
| Ratios and Supplemental Data: | |||||||||||||||||||||||||||||||
| Net assets, end of period (000's) | $ | 5 | 22,762 | 19,550 | 21,578 | 25,172 | 28,473 | 27,927 | |||||||||||||||||||||||
| Ratios to average net assets: | |||||||||||||||||||||||||||||||
| Net expenses after expense | |||||||||||||||||||||||||||||||
| reimbursement(4) | % | 1.03 | 1.09 | 1.12 | 1.00 | 1.04 | 1.07 | 0.98 | (5) | ||||||||||||||||||||||
| Gross expenses prior to expense reimbursement(4) | % | 1.03 | 1.09 | 1.12 | 1.00 | 1.04 | 1.07 | 1.23 | |||||||||||||||||||||||
| Net investment income after expense | |||||||||||||||||||||||||||||||
| reimbursement(4) | % | 0.54 | 0.55 | 0.70 | 0.46 | 0.27 | 0.34 | 0.62 | (5) | ||||||||||||||||||||||
| Portfolio turnover rate | % | 79 | 200 | 106 | 149 | 26 | 57 | 26 | |||||||||||||||||||||||
(1) The Fund changed its fiscal year end to May 31.
(2) The Fund commenced operations on December 30, 1998.
(3) Total return is calculated assuming reinvestment of all dividends and capital gain distributions at net asset value and excluding the deduction of sales charges. Total return for less than one year is not annualized.
(4) Annualized for periods less than one year.
(5) Expenses calculated net of taxes and advisor reimbursement.
See Accompanying Notes to Financial Statements.
44
ING LARGECAP GROWTH FUND (UNAUDITED)
FINANCIAL HIGHLIGHTS
Selected data for a share of beneficial interest outstanding throughout each period.
| Class I | |||||||||||||||||||
| Six Months Ended November 30, | Year Ended May 31, | January 8, 2002(1) to May 31, | |||||||||||||||||
| 2004 | 2004 | 2003 | 2002 | ||||||||||||||||
| Per Share Operating Performance: | |||||||||||||||||||
| Net asset value, beginning of period | $ | 18.69 | 14.71 | 16.93 | 21.04 | ||||||||||||||
| Income (loss) from investment operations: | |||||||||||||||||||
| Net investment loss | $ | 0.04 | (0.05 | ) | (0.06 | ) | (0.02 | ) | |||||||||||
| Net realized and unrealized gain (loss) on investments | $ | 0.08 | 4.03 | (2.16 | ) | (4.09 | ) | ||||||||||||
| Total from investment operations | $ | 0.11 | 3.98 | (2.22 | ) | (4.11 | ) | ||||||||||||
| Less distributions from: | |||||||||||||||||||
| Net investment income | $ | 0.60 | - | - | - | ||||||||||||||
| Total distribution | $ | 0.60 | - | - | - | ||||||||||||||
| Net asset value, end of period | $ | 18.20 | 18.69 | 14.71 | 16.93 | ||||||||||||||
| Total Return(2) | % | 0.58 | 27.06 | (13.11 | ) | (19.53 | ) | ||||||||||||
| Ratios and Supplemental Data: | |||||||||||||||||||
| Net assets, end of period (000's) | $ | 37,839 | 36,504 | 22,156 | 26,106 | ||||||||||||||
| Ratios to average net assets: | |||||||||||||||||||
| Net expenses after expense reimbursement | |||||||||||||||||||
| and brokerage commission recapture(3)(4) | % | 0.96 | 0.91 | 1.05 | 0.96 | ||||||||||||||
| Net expenses after expense reimbursement(3)(4) | % | 0.96 | 0.94 | 1.05 | 0.96 | ||||||||||||||
| Gross expenses prior to expense reimbursement(3) | % | 0.95 | 1.10 | 1.21 | 0.96 | ||||||||||||||
| Net investment loss after expense reimbursement | |||||||||||||||||||
| and brokerage commission recapture(3)(4) | % | 0.22 | (0.31 | ) | (0.42 | ) | (0.43 | ) | |||||||||||
| Portfolio turnover rate | % | 40 | 142 | 291 | 536 | ||||||||||||||
| Class Q | |||||||||||||||||||||||||||||||
| Six Months Ended November 30, | Year Ended May 31, | Eleven Months Ended May 31, | Year Ended June 30, | Three Months Ended June 30, | |||||||||||||||||||||||||||
| 2004 | 2004 | 2003 | 2002 | 2001(5) | 2000 | 1999(6) | |||||||||||||||||||||||||
| Per Share Operating Performance: | |||||||||||||||||||||||||||||||
| Net asset value, beginning of period | $ | 18.58 | 14.66 | 16.92 | 24.81 | 43.71 | 28.43 | 25.24 | |||||||||||||||||||||||
| Income (loss) from investment operations: | |||||||||||||||||||||||||||||||
| Net investment loss | $ | (0.01 | ) | (0.11 | ) | (0.15 | ) | (0.44 | ) | (0.17 | ) | (0.20 | ) | (0.03 | ) | ||||||||||||||||
| Net realized and unrealized gain (loss) | |||||||||||||||||||||||||||||||
| on investments | $ | 0.10 | 4.03 | (2.11 | ) | (7.44 | ) | (18.26 | ) | 15.86 | 3.22 | ||||||||||||||||||||
| Total from investment operations | $ | 0.09 | 3.92 | (2.26 | ) | (7.88 | ) | (18.43 | ) | 15.66 | 3.19 | ||||||||||||||||||||
| Less distributions from: | |||||||||||||||||||||||||||||||
| Net investment income | $ | 0.56 | - | - | 0.01 | - | - | - | |||||||||||||||||||||||
| Net realized gain from investments | $ | - | - | - | - | 0.47 | 0.38 | - | |||||||||||||||||||||||
| Total distributions | $ | 0.56 | - | - | 0.01 | 0.47 | 0.38 | - | |||||||||||||||||||||||
| Net asset value, end of period | $ | 18.11 | 18.58 | 14.66 | 16.92 | 24.81 | 43.71 | 28.43 | |||||||||||||||||||||||
| Total Return(2) | % | 0.48 | 26.74 | (13.36 | ) | (31.77 | ) | (42.50 | ) | 55.57 | 12.64 | ||||||||||||||||||||
| Ratios and Supplemental Data: | |||||||||||||||||||||||||||||||
| Net assets, end of period (000's) | $ | 5,229 | 6,035 | 6,178 | 16,840 | 12,534 | 24,838 | 6,044 | |||||||||||||||||||||||
| Ratios to average net assets: | |||||||||||||||||||||||||||||||
| Net expenses after expense | |||||||||||||||||||||||||||||||
| reimbursement and brokerage | |||||||||||||||||||||||||||||||
| commission recapture(3)(4) | % | 1.21 | 1.14 | 1.31 | 1.21 | 1.19 | 1.26 | 1.23 | |||||||||||||||||||||||
| Net expenses after expense reimbursement(3)(4) | % | 1.21 | 1.17 | 1.31 | 1.21 | 1.19 | 1.26 | 1.23 | |||||||||||||||||||||||
| Gross expenses prior to expense | |||||||||||||||||||||||||||||||
| reimbursement and brokerage | |||||||||||||||||||||||||||||||
| commission recapture(3) | % | 1.20 | 1.32 | 1.47 | 1.21 | 1.19 | 1.26 | 1.25 | |||||||||||||||||||||||
| Net investment loss after expense reimbursement(3)(4) | % | (0.08 | ) | (0.53 | ) | (0.66 | ) | (0.76 | ) | (0.50 | ) | (0.77 | ) | (0.36 | ) | ||||||||||||||||
| Portfolio turnover rate | % | 40 | 142 | 291 | 536 | 331 | 139 | 27 | |||||||||||||||||||||||
(1) Commencement of operations of Class I.
(2) Total return is calculated assuming reinvestment of all dividends and capital gain distributions at net asset value and excluding the deduction of sales charges. Total return for less than one year is not annualized.
(3) Annualized for periods less than one year.
(4) The Investment Adviser has agreed to limit expenses, (excluding interest, taxes, brokerage and extraordinary expenses) subject to possible recoupment by ING Investments, LLC within three years.
(5) The Fund changed its fiscal year end to May 31.
(6) Effective May 24, 1999, ING investments, LLC became the Investment Adviser of the Fund, concurrently Nicholas-Applegate Capital Management was appointed as sub-advisor and the Fund changed its year end to June 30.
See Accompanying Notes to Financial Statements.
45
ING MIDCAP OPPORTUNITIES FUND
FINANCIAL HIGHLIGHTS
Selected data for a share of beneficial interest outstanding throughout each period.
| Class I | |||||||||||||||||||||||||||||||
| Six Months Ended November 30, | Year Ended May 31, | Five Months Ended May 31, | Year Ended December 31, | ||||||||||||||||||||||||||||
| 2004 | 2004 | 2003 | 2002 | 2001(1) | 2000 | 1999 | |||||||||||||||||||||||||
| Per Share Operating Performance: | |||||||||||||||||||||||||||||||
| Net asset value, beginning of period | $ | 12.33 | 10.33 | 11.29 | 14.73 | 19.26 | 21.34 | 12.99 | |||||||||||||||||||||||
| Income (loss) from investment | |||||||||||||||||||||||||||||||
| operations: | |||||||||||||||||||||||||||||||
| Net investment loss | $ | (0.05 | ) | (0.09 | )* | (0.11 | ) | (0.11 | )* | (0.06 | ) | (0.13 | ) | (0.15 | ) | ||||||||||||||||
| Net realized and unrealized gain (loss) | |||||||||||||||||||||||||||||||
| on investments | $ | 0.69 | 2.09 | (0.85 | ) | (3.33 | ) | (4.47 | ) | 0.23 | 12.09 | ||||||||||||||||||||
| Total from investment operations | $ | 0.64 | 2.00 | (0.96 | ) | (3.44 | ) | (4.53 | ) | 0.10 | 11.94 | ||||||||||||||||||||
| Less distributions from: | |||||||||||||||||||||||||||||||
| Net realized gain on investments | $ | - | - | - | - | - | 2.18 | 3.59 | |||||||||||||||||||||||
| Total distributions | $ | - | - | - | - | - | 2.18 | 3.59 | |||||||||||||||||||||||
| Net asset value, end of period | $ | 12.97 | 12.33 | 10.33 | 11.29 | 14.73 | 19.26 | 21.34 | |||||||||||||||||||||||
| Total Return(2) | % | 5.19 | 19.36 | (8.50 | ) | (23.35 | ) | (23.52 | ) | 0.08 | 103.19 | ||||||||||||||||||||
| Ratios and Supplemental Data: | |||||||||||||||||||||||||||||||
| Net assets, end of period (000's) | $ | 2,986 | 2,614 | 10,844 | 39,874 | 52,007 | 68,006 | 67,954 | |||||||||||||||||||||||
| Ratios to average net assets: | |||||||||||||||||||||||||||||||
| Net expenses after expense | |||||||||||||||||||||||||||||||
| reimbursement(3)(4) | % | 1.39 | 1.17 | 1.09 | 1.26 | 1.52 | 1.36 | 1.41 | |||||||||||||||||||||||
| Gross expenses prior to expense | |||||||||||||||||||||||||||||||
| reimbursement(3) | % | 1.34 | 1.31 | 1.41 | 1.50 | 1.52 | 1.36 | 1.41 | |||||||||||||||||||||||
| Net investment loss after expense | |||||||||||||||||||||||||||||||
| reimbursement(3)(4) | % | (0.93 | ) | (0.81 | ) | (0.71 | ) | (0.95 | ) | (0.97 | ) | (0.66 | ) | (1.04 | ) | ||||||||||||||||
| Portfolio turnover rate | % | 25 | 115 | 345 | 399 | 182 | 188 | 201 | |||||||||||||||||||||||
| Class Q | |||||||||||||||||||||||||||
| Six Months Ended November 30, | Year Ended May 31, | Five Months Ended May 31, | April 4, 2000(5) to December 31, | ||||||||||||||||||||||||
| 2004 | 2004 | 2003 | 2002 | 2001(1) | 2000 | ||||||||||||||||||||||
| Per Share Operating Performance: | |||||||||||||||||||||||||||
| Net asset value, beginning of period | $ | 12.17 | 10.19 | 11.16 | 14.63 | 19.16 | 22.57 | ||||||||||||||||||||
| Income (loss) from investment operations: | |||||||||||||||||||||||||||
| Net investment loss | $ | (0.06 | ) | (0.10 | )* | (0.09 | ) | (0.17 | )* | (0.08 | ) | (0.06 | ) | ||||||||||||||
| Net realized and unrealized gain (loss) | |||||||||||||||||||||||||||
| on investments | $ | 0.68 | 2.08 | (0.88 | ) | (3.30 | ) | (4.45 | ) | (1.17 | ) | ||||||||||||||||
| Total from investment operations | $ | 0.62 | 1.98 | (0.97 | ) | (3.47 | ) | (4.53 | ) | (1.23 | ) | ||||||||||||||||
| Less distributions from: | |||||||||||||||||||||||||||
| Net realized gain from investments | $ | - | - | - | - | - | 2.18 | ||||||||||||||||||||
| Total distributions | $ | - | - | - | - | - | 2.18 | ||||||||||||||||||||
| Net asset value, end of period | $ | 12.79 | 12.17 | 10.19 | 11.16 | 14.63 | 19.16 | ||||||||||||||||||||
| Total Return(2) | % | 5.09 | 19.43 | (8.69 | ) | (23.72 | ) | (23.64 | ) | (5.86 | ) | ||||||||||||||||
| Ratios and Supplemental Data: | |||||||||||||||||||||||||||
| Net assets, end of period (000's) | $ | 4,809 | 4,898 | 4,886 | 6,563 | 3,071 | 3,264 | ||||||||||||||||||||
| Ratios to average net assets: | |||||||||||||||||||||||||||
| Net expenses after expense | |||||||||||||||||||||||||||
| reimbursement(3)(4) | % | 1.51 | 1.45 | 1.33 | 1.63 | 1.82 | 1.61 | ||||||||||||||||||||
| Gross expenses prior to expense reimbursement(3) | % | 1.45 | 1.56 | 1.66 | 1.69 | 1.82 | 1.61 | ||||||||||||||||||||
| Net investment loss after expense | |||||||||||||||||||||||||||
| reimbursement(3)(4) | % | (1.00 | ) | (1.00 | ) | (0.98 | ) | (1.35 | ) | (1.28 | ) | (0.91 | ) | ||||||||||||||
| Portfolio turnover rate | % | 25 | 115 | 345 | 399 | 182 | 188 | ||||||||||||||||||||
(1) The Fund changed its fiscal year end to May 31.
(2) Total return is calculated assuming reinvestment of all dividends and capital gain distributions at net asset value and excluding the deduction of sales charges. Total return for less than one year is not annualized.
(3) Annualized for periods less than one year.
(4) The Investment Adviser has agreed to limit expenses, (excluding interest, taxes, brokerage and extraordinary expenses) subject to possible recoupment by ING Investments, LLC within three years.
(5) Commencement of operations of class.
* Per share data calculated using average number of shares outstanding throughout the period.
See Accompanying Notes to Financial Statements.
46
ING SMALLCAP OPPORTUNITIES FUND
FINANCIAL HIGHLIGHTS
Selected data for a share of beneficial interest outstanding throughout each period.
| Class I | |||||||||||||||||||||||||||||||
| Six Months Ended November 30, | Year Ended May 31, | Five Months Ended May 31, | Year Ended December 31, | April 1, 1999(2) to December 31, | |||||||||||||||||||||||||||
| 2004 | 2004 | 2003 | 2002 | 2001(1) | 2000 | 1999 | |||||||||||||||||||||||||
| Per Share Operating Performance: | |||||||||||||||||||||||||||||||
| Net asset value, beginning of period | $ | 22.76 | 18.27 | 24.07 | 39.02 | 47.47 | 59.54 | 31.78 | |||||||||||||||||||||||
| Income (loss) from investment operations: | |||||||||||||||||||||||||||||||
| Net investment loss | $ | (0.11 | ) | (0.23 | ) | (0.23 | ) | (0.36 | )** | (0.14 | ) | (1.00 | ) | (0.08 | ) | ||||||||||||||||
| Net realized and unrealized gain (loss) | |||||||||||||||||||||||||||||||
| on investments | $ | 1.95 | 4.72 | (5.57 | ) | (13.60 | ) | (8.31 | ) | (2.17 | ) | 35.40 | |||||||||||||||||||
| Total from investment operations | $ | 1.84 | 4.49 | (5.80 | ) | (13.96 | ) | (8.45 | ) | (3.17 | ) | 35.32 | |||||||||||||||||||
| Less distributions from: | |||||||||||||||||||||||||||||||
| Net realized gain from investments | $ | - | - | - | 0.99 | - | 8.90 | 7.56 | |||||||||||||||||||||||
| Total distributions | $ | - | - | - | 0.99 | - | 8.90 | 7.56 | |||||||||||||||||||||||
| Net asset value, end of period | $ | 24.60 | 22.76 | 18.27 | 24.07 | 39.02 | 47.47 | 59.54 | |||||||||||||||||||||||
| Total Return(3) | % | 8.08 | 24.58 | † | (24.10 | ) | (36.17 | ) | (17.80 | ) | (5.21 | ) | 126.05 | ||||||||||||||||||
| Ratios and Supplemental Data: | |||||||||||||||||||||||||||||||
| Net assets, end of period (000's) | $ | 12,793 | 11,526 | 8,510 | 10,700 | - | * | - | * | - | * | ||||||||||||||||||||
| Ratios to average net assets: | |||||||||||||||||||||||||||||||
| Expenses(4) | % | 1.27 | 1.31 | 1.46 | 1.41 | 1.31 | 1.15 | 0.47 | |||||||||||||||||||||||
| Net investment loss after expense | |||||||||||||||||||||||||||||||
| reimbursement(4) | % | (1.01 | ) | (1.09 | ) | (1.37 | ) | (1.34 | ) | (1.03 | ) | (0.75 | ) | (0.35 | ) | ||||||||||||||||
| Portfolio turnover rate | % | 34 | 60 | 357 | 423 | 104 | 134 | 223 | |||||||||||||||||||||||
| Class Q | |||||||||||||||||||||||||||
| Six Months Ended November 30, | Year Ended May 31, | Five Months Ended May 31, | April 4, 2000(5) to December 31, | ||||||||||||||||||||||||
| 2004 | 2004 | 2003 | 2002 | 2001(1) | 2000 | ||||||||||||||||||||||
| Per Share Operating Performance: | |||||||||||||||||||||||||||
| Net asset value, beginning of period | $ | 22.64 | 18.22 | 24.07 | 38.81 | 47.20 | 60.86 | ||||||||||||||||||||
| Income (loss) from investment operations: | |||||||||||||||||||||||||||
| Net investment loss | $ | (0.17 | ) | (0.29 | )** | (0.53 | ) | (0.51 | )** | (0.20 | ) | (0.27 | ) | ||||||||||||||
| Net realized and unrealized gain (loss) on investments | $ | 1.97 | 4.91 | (5.32 | ) | (13.24 | ) | (8.19 | ) | (4.49 | ) | ||||||||||||||||
| Total from investment operations | $ | 1.80 | 4.42 | (5.85 | ) | (13.75 | ) | (8.39 | ) | (4.76 | ) | ||||||||||||||||
| Less distributions from: | |||||||||||||||||||||||||||
| Net realized gain from investments | $ | - | - | - | 0.99 | - | 8.90 | ||||||||||||||||||||
| Total distributions | $ | - | - | - | 0.99 | - | 8.90 | ||||||||||||||||||||
| Net asset value, end of period | $ | 24.44 | 22.64 | 18.22 | 24.07 | 38.81 | 47.20 | ||||||||||||||||||||
| Total Return(3) | % | 7.95 | 24.26 | † | (24.30 | ) | (35.83 | ) | (17.78 | ) | (8.29 | ) | |||||||||||||||
| Ratios and Supplemental Data: | |||||||||||||||||||||||||||
| Net assets, end of period (000's) | $ | 320 | 463 | 906 | 3,651 | 2,832 | 2,545 | ||||||||||||||||||||
| Ratios to average net assets: | |||||||||||||||||||||||||||
| Expenses(4) | % | 1.48 | 1.57 | 1.70 | 1.66 | 1.56 | 1.40 | ||||||||||||||||||||
| Net investment loss after expense | |||||||||||||||||||||||||||
| reimbursement(4)(5) | % | (1.23 | ) | (1.36 | ) | (1.62 | ) | (1.62 | ) | (1.28 | ) | (1.10 | ) | ||||||||||||||
| Portfolio turnover rate | % | 34 | 60 | 357 | 423 | 104 | 134 | ||||||||||||||||||||
(1) The Fund changed its fiscal year end to May 31.
(2) Commencement of operations of the Fund.
(3) Total return is calculated assuming reinvestment of all dividends and capital gain distributions at net asset value and excluding the deduction of sales charges. Total return for less than one year is not annualized.
(4) Annualized for periods less than one year.
(5) Commencement of operations of Class Q.
* Amount represents less than $1,000.
** Per share data calculated using average number of shares outstanding throughout the period.
† Total return without the effect of reimbursement by affiliate for investment transaction losses would have been 24.52% and 24.15% for Class I and Class Q respectively.
See Accompanying Notes to Financial Statements.
47
ING LARGECAP VALUE FUND
FINANCIAL HIGHLIGHTS
Selected data for a share of beneficial interest outstanding throughout each period.
| Class I | |||||||
| August 2, 2004(1) to November 30, 2004 | |||||||
| Per Share Operating Performance: | |||||||
| Net asset value, beginning of period | $ | 9.72 | |||||
| Income (loss) from investment operations: | |||||||
| Net investment income | $ | (0.03 | ) | ||||
| Net realized and unrealized gain (loss) on investments | $ | 0.50 | |||||
| Total from investment operations | $ | 0.47 | |||||
| Less distributions from: | |||||||
| Net investment income | $ | - | |||||
| Net asset value, end of period | $ | 10.19 | |||||
| Total Return(2) | % | 6.42 | |||||
| Ratios and Supplemental Data: | |||||||
| Net assets, end of period (000's) | $ | 2,665 | |||||
| Ratios to average net assets: | |||||||
| Net expenses after expense reimbursement(3)(4) | % | 1.05 | |||||
| Gross expenses prior to expense reimbursement(3) | % | 1.93 | |||||
| Net investment after expense reimbursement(3)(4) | % | 1.18 | |||||
| Portfolio turnover rate | % | 21 | |||||
(1) Commencement of operations.
(2) Total return is calculated assuming reinvestment of all dividends and capital gain distributions at net asset value and excluding the deduction of sales charges. Total returns for periods less than one year are not annualized.
(3) Annualized for periods less than one year.
(4) The Investment Manager has agreed to limit expenses, (excluding interest, taxes, brokerage and extraordinary expenses), subject to possible reimbursement to ING Investments, LLC within three years.
See Accompanying Notes to Financial Statements.
48
ING MAGNACAP FUND
FINANCIAL HIGHLIGHTS
Selected data for a share of beneficial interest outstanding throughout each period.
| Class I | |||||||||||||||
| Six Months Ended November 30, 2004 | Year Ended May 31, 2004 | March 5, 2003(1) to May 31, 2003 | |||||||||||||
| Per Share Operating Performance: | |||||||||||||||
| Net asset value, beginning of period | $ | 10.27 | 8.82 | 7.55 | |||||||||||
| Income (loss) from investment operations: | |||||||||||||||
| Net investment income | $ | 0.08 | 0.15 | 0.01 | |||||||||||
| Net realized and unrealized gain (loss) on investments | $ | 0.66 | 1.44 | 1.26 | |||||||||||
| Total from investment operations | $ | 0.74 | 1.59 | 1.27 | |||||||||||
| Less distributions from: | |||||||||||||||
| Net investment income | $ | 0.19 | 0.14 | - | |||||||||||
| Net realized gain from investments | $ | - | - | - | |||||||||||
| Total distributions | $ | 0.19 | 0.14 | - | |||||||||||
| Net asset value, end of period | $ | 10.82 | 10.27 | 8.82 | |||||||||||
| Total Return(4) | % | 7.28 | 18.26 | 16.82 | |||||||||||
| Ratios and Supplemental Data: | |||||||||||||||
| Net assets, end of period (000's) | $ | 2,272 | 8 | 7 | |||||||||||
| Ratios to average net assets: | |||||||||||||||
| Expenses(5) | % | 0.80 | 0.88 | 0.92 | |||||||||||
| Net investment income(5) | % | 2.05 | 1.55 | 2.06 | |||||||||||
| Portfolio turnover rate | % | 10 | 28 | 110 | |||||||||||
(1) Commencement of operations of Class I.
(2) Total return is calculated assuming reinvestment of all dividends and capital gain distributions at net asset value and excluding the deduction of sales charges. Total return for less than one year is not annualized.
(3) Annualized for periods less than one year.
See Accompanying Notes to Financial Statements.
49
ING MIDCAP VALUE FUND
FINANCIAL HIGHLIGHTS
Selected data for a share of beneficial interest outstanding throughout each period.
| Class I | Class Q | ||||||||||||||||||||||||||||||||||
| Six Months Ended November 30, | Year Ended May 31, | March 4, 2002(1) to May 31, | Six Months Ended November 30, | Year Ended May 31, | April 17, 2002(2) to May 31, | ||||||||||||||||||||||||||||||
| 2004 | 2004 | 2003 | 2002 | 2004 | 2004 | 2003 | 2002 | ||||||||||||||||||||||||||||
| Per Share Operating Performance: | |||||||||||||||||||||||||||||||||||
| Net asset value, beginning | |||||||||||||||||||||||||||||||||||
| of period | $ | 11.61 | 8.39 | 10.30 | 10.20 | 11.54 | 8.36 | 10.28 | 10.52 | ||||||||||||||||||||||||||
| Income (loss) from investment | |||||||||||||||||||||||||||||||||||
| operations: | |||||||||||||||||||||||||||||||||||
| Net investment income (loss) | $ | 0.00 | * | 0.01 | ** | 0.01 | 0.01 | (0.04 | ) | (0.02 | )** | 0.00 | * | 0.00 | * | ||||||||||||||||||||
| Net realized and unrealized | |||||||||||||||||||||||||||||||||||
| gain (loss) on investments | $ | 0.70 | 3.21 | (1.74 | ) | 0.09 | 0.67 | 3.20 | (1.75 | ) | (0.24 | ) | |||||||||||||||||||||||
| Total from investment | |||||||||||||||||||||||||||||||||||
| operations | $ | 0.70 | 3.22 | (1.73 | ) | 0.10 | 0.63 | 3.18 | (1.75 | ) | (0.24 | ) | |||||||||||||||||||||||
| Less distributions from: | |||||||||||||||||||||||||||||||||||
| Net investment income | $ | - | - | 0.07 | - | - | - | 0.06 | - | ||||||||||||||||||||||||||
| Net realized gain from | |||||||||||||||||||||||||||||||||||
| investments | $ | 0.88 | - | 0.11 | - | 0.88 | - | 0.11 | - | ||||||||||||||||||||||||||
| Total distributions | $ | 0.88 | - | 0.18 | - | 0.88 | - | 0.17 | - | ||||||||||||||||||||||||||
| Net asset value, end of period | $ | 11.43 | 11.61 | 8.39 | 10.30 | 11.29 | 11.54 | 8.36 | 10.28 | ||||||||||||||||||||||||||
| Total Return(3) | % | 6.15 | 38.38 | (16.35 | ) | 0.98 | 5.57 | 38.04 | (16.62 | ) | (2.28 | ) | |||||||||||||||||||||||
| Ratios and Supplemental Data: | |||||||||||||||||||||||||||||||||||
| Net assets, end of period (000's) | $ | 2,145 | 2,157 | 197 | 71 | 21 | 20 | 14 | 11 | ||||||||||||||||||||||||||
| Ratios to average net assets: | |||||||||||||||||||||||||||||||||||
| Net expenses after expense | |||||||||||||||||||||||||||||||||||
| reimbursement(4)(5) | % | 1.41 | 1.46 | 1.28 | 1.24 | 2.11 | 1.67 | 1.54 | 1.52 | ||||||||||||||||||||||||||
| Gross expenses prior to | |||||||||||||||||||||||||||||||||||
| expense reimbursement(4) | % | 1.20 | 1.34 | 1.70 | 2.60 | 1.47 | 1.54 | 1.96 | 2.28 | ||||||||||||||||||||||||||
| Net investment income (loss) | |||||||||||||||||||||||||||||||||||
| after expense | |||||||||||||||||||||||||||||||||||
| reimbursement(4)(5) | % | 0.05 | 0.22 | 0.46 | 0.38 | (0.66 | ) | (0.16 | ) | 0.14 | 0.43 | ||||||||||||||||||||||||
| Portfolio turnover rate | % | 42 | 70 | 72 | 13 | 42 | 70 | 72 | 13 | ||||||||||||||||||||||||||
(1) Commencement of operations of Class I.
(2) Commencement of operations of Class Q.
(3) Total return is calculated assuming reinvestment of all dividends and capital gain distributions at net asset value and excluding the deduction of sales charges. Total return for less than one year is not annualized.
(4) Annualized for periods less than one year.
(5) The Investment Adviser has agreed to limit expenses, (excluding interest, taxes, brokerage and extraordinary expenses) subject to possible recoupment by ING Investments, LLC within three years.
* Amount represents less than $0.01 per share.
** Per share data calculated using average number of shares outstanding throughout the period.
See Accompanying Notes to Financial Statements.
50
ING SMALLCAP VALUE FUND
FINANCIAL HIGHLIGHTS
Selected data for a share of beneficial interest outstanding throughout each period.
| Class I | Class Q | ||||||||||||||||||||||||||||||||||
| Six Months | March 7, | Six Months | April 30, | ||||||||||||||||||||||||||||||||
| Ended November 30, | Year Ended May 31, | 2002(1) to May 31, | Ended November 30, | Year Ended May 31, | 2002(2) to May 31, | ||||||||||||||||||||||||||||||
| 2004 | 2004 | 2003 | 2002 | 2004 | 2004 | 2003 | 2002 | ||||||||||||||||||||||||||||
| Per Share Operating Performance: | |||||||||||||||||||||||||||||||||||
| Net asset value, beginning | |||||||||||||||||||||||||||||||||||
| of period | $ | 13.60 | 9.44 | 10.63 | 10.32 | 13.71 | 9.53 | 10.63 | 11.01 | ||||||||||||||||||||||||||
| Income (loss) from investment | |||||||||||||||||||||||||||||||||||
| operations: | |||||||||||||||||||||||||||||||||||
| Net investment income (loss) | $ | (0.00 | )* | (0.04 | ) | (0.05 | ) | 0.00 | * | (0.01 | ) | (0.01 | ) | 0.33 | 0.00 | * | |||||||||||||||||||
| Net realized and unrealized | |||||||||||||||||||||||||||||||||||
| gain (loss) on investments | $ | 0.89 | 4.94 | (0.97 | ) | 0.31 | 0.89 | 4.93 | (1.34 | ) | (0.38 | ) | |||||||||||||||||||||||
| Total from investment | |||||||||||||||||||||||||||||||||||
| operations | $ | 0.89 | 4.90 | (1.02 | ) | 0.31 | 0.88 | 4.92 | (1.01 | ) | (0.38 | ) | |||||||||||||||||||||||
| Less distributions from: | |||||||||||||||||||||||||||||||||||
| Net investment income | $ | - | - | 0.08 | - | - | - | - | - | ||||||||||||||||||||||||||
| Net realized gain from | |||||||||||||||||||||||||||||||||||
| investments | $ | 0.89 | 0.74 | 0.09 | - | 0.89 | 0.74 | 0.09 | - | ||||||||||||||||||||||||||
| Total distributions | $ | 0.89 | 0.74 | 0.17 | - | 0.89 | 0.74 | 0.09 | - | ||||||||||||||||||||||||||
| Net asset value, end of period | $ | 13.60 | 13.60 | 9.44 | 10.63 | 13.70 | 13.71 | 9.53 | 10.63 | ||||||||||||||||||||||||||
| Total Return(3) | % | 6.68 | 53.60 | (9.49 | ) | 3.00 | 6.55 | 53.29 | (9.47 | ) | (3.45 | ) | |||||||||||||||||||||||
| Ratios and Supplemental Data: | |||||||||||||||||||||||||||||||||||
| Net assets, end of period (000's) | $ | 514 | 481 | 222 | 26 | 67 | 58 | 1 | 8 | ||||||||||||||||||||||||||
| Ratios to average net assets: | |||||||||||||||||||||||||||||||||||
| Net expenses after expense | |||||||||||||||||||||||||||||||||||
| reimbursement(4)(5) | % | 1.46 | 1.43 | 1.32 | 1.23 | 1.69 | 1.52 | 1.35 | 1.42 | ||||||||||||||||||||||||||
| Gross expenses prior to expense reimbursement(4) | % | 1.18 | 1.35 | 1.73 | 2.78 | 1.42 | 1.52 | 1.73 | 2.42 | ||||||||||||||||||||||||||
| Net investment income (loss) | |||||||||||||||||||||||||||||||||||
| after expense | |||||||||||||||||||||||||||||||||||
| reimbursement(4)(5) | % | (0.03 | ) | (0.37 | ) | (0.13 | ) | 0.17 | (0.25 | ) | (1.03 | ) | (0.32 | ) | 0.00 | ||||||||||||||||||||
| Portfolio turnover rate | % | 16 | 57 | 54 | 12 | 16 | 57 | 54 | 12 | ||||||||||||||||||||||||||
(1) The Fund commenced operations on February 1, 2002.
(2) Class B and Class C commenced offering shares on February 4, 2002.
(3) Total return is calculated assuming reinvestment of all dividends and capital gain distributions at net asset value and excluding the deduction of sales charges. Total return for less than one year is not annualized.
(4) Annualized for periods less than one year.
(5) The Investment Adviser has agreed to limit expenses, (excluding interest, taxes, brokerage and extraordinary expenses) subject to possible recoupment by ING Investments, LLC within three years.
* Amount represents less than $0.01 per share.
See Accompanying Notes to Financial Statements.
51
ING CONVERTIBLE FUND
FINANCIAL HIGHLIGHTS
Selected data for a share of beneficial interest outstanding throughout each period.
| Class Q | |||||||||||||||||||||||||||||||
| Six Months Ended November 30, | Year Ended May 31, | Eleven Months Ended May 31, | Year Ended June 30, | Three Months Ended June 30, | |||||||||||||||||||||||||||
| 2004 | 2004 | 2003 | 2002 | 2001(1) | 2000 | 1999(2) | |||||||||||||||||||||||||
| Per Share Operating Performance: | |||||||||||||||||||||||||||||||
| Net asset value, beginning of period | $ | 17.58 | 15.74 | 14.91 | 17.37 | 26.85 | 22.51 | 21.22 | |||||||||||||||||||||||
| Income (loss) from investment operations: | |||||||||||||||||||||||||||||||
| Net investment income | $ | 0.20 | 0.46 | 0.41 | 0.36 | 0.59 | 0.44 | 0.09 | |||||||||||||||||||||||
| Net realized and unrealized gain (loss) | |||||||||||||||||||||||||||||||
| on investments | $ | 0.48 | 1.84 | 0.76 | (2.28 | ) | (4.84 | ) | 7.82 | 1.31 | |||||||||||||||||||||
| Total from investment operations | $ | 0.68 | 2.30 | 1.17 | (1.92 | ) | (4.25 | ) | 8.26 | 1.40 | |||||||||||||||||||||
| Less distributions from: | |||||||||||||||||||||||||||||||
| Net investment income | $ | 0.29 | 0.46 | 0.34 | 0.45 | 0.53 | 0.35 | 0.11 | |||||||||||||||||||||||
| Net realized gain from investments | $ | - | - | - | 0.09 | 4.70 | 3.57 | - | |||||||||||||||||||||||
| Total distributions | $ | 0.29 | 0.46 | 0.34 | 0.54 | 5.23 | 3.92 | 0.11 | |||||||||||||||||||||||
| Net asset value, end of period | $ | 17.97 | 17.58 | 15.74 | 14.91 | 17.37 | 26.85 | 22.51 | |||||||||||||||||||||||
| Total Return(3) | % | 3.93 | 14.72 | 8.11 | (11.12 | ) | (17.50 | ) | 40.36 | 6.62 | |||||||||||||||||||||
| Ratios and Supplemental Data: | |||||||||||||||||||||||||||||||
| Net assets, end of period (000's) | $ | 2,806 | 3,176 | 4,030 | 8,626 | 29,629 | 56,165 | 17,537 | |||||||||||||||||||||||
| Ratios to average net assets: | |||||||||||||||||||||||||||||||
| Net expenses after expense | |||||||||||||||||||||||||||||||
| reimbursement(4)(5) | % | 1.25 | 1.26 | 1.36 | 1.19 | 1.15 | 1.25 | 1.23 | |||||||||||||||||||||||
| Gross expenses prior to expense | |||||||||||||||||||||||||||||||
| reimbursement(4) | % | 1.25 | 1.26 | 1.36 | 1.19 | 1.14 | 1.25 | 1.23 | |||||||||||||||||||||||
| Net investment income after expense | |||||||||||||||||||||||||||||||
| reimbursement(4)(5) | % | 2.06 | 2.37 | 2.78 | 2.23 | 2.47 | 1.88 | 2.04 | |||||||||||||||||||||||
| Portfolio turnover rate | % | 27 | 138 | 97 | 100 | 145 | 129 | 28 | |||||||||||||||||||||||
(1) The Fund changed its fiscal year end to May 31.
(2) Effective May 24, 1999, ING Investments, LLC became the Investment Manager of the Fund, concurrently Nicholas-Applegate Capital Management was appointed as sub-advisor and the Fund changed its year end to June 30.
(3) Total return is calculated assuming reinvestment of all dividends and capital gain distributions at net asset value and excluding thededuction of sales charges. Total return for less than one year is not annualized.
(4) Annualized for periods less than one year.
(5) The Investment Adviser has agreed to limit expenses, (excluding interest, taxes, brokerage and extraordinary expenses) subject to possible recoupment by ING Investments, LLC within three years.
See Accompanying Notes to Financial Statements.
52
ING EQUITY AND BOND FUND
FINANCIAL HIGHLIGHTS
Selected data for a share of beneficial interest outstanding throughout each period.
| Class Q | |||||||||||||||||||||||||||||||
| Six Months Ended November 30, | Year Ended May 31, | Eleven Months Ended May 31, | Year Ended June 30, | Three Months Ended June 30, | |||||||||||||||||||||||||||
| 2004 | 2004 | 2003 | 2002 | 2001(1) | 2000 | 1999(2) | |||||||||||||||||||||||||
| Per Share Operating Performance: | |||||||||||||||||||||||||||||||
| Net asset value, beginning of period | $ | 12.38 | 11.63 | 11.98 | 13.23 | 14.94 | 19.04 | 18.85 | |||||||||||||||||||||||
| Income (loss) from investment operations: | |||||||||||||||||||||||||||||||
| Net investment income | $ | 0.09 | 0.17 | 0.28 | 0.42 | 0.44 | 0.54 | 0.11 | |||||||||||||||||||||||
| Net realized and unrealized gain (loss) | |||||||||||||||||||||||||||||||
| on investments | $ | 0.30 | 0.86 | (0.38 | ) | (1.15 | ) | (0.54 | ) | (0.57 | ) | 0.16 | |||||||||||||||||||
| Total from investment operations | $ | 0.39 | 1.03 | (0.10 | ) | (0.73 | ) | (0.10 | ) | (0.03 | ) | 0.27 | |||||||||||||||||||
| Less distributions from: | |||||||||||||||||||||||||||||||
| Net investment income | $ | 0.08 | 0.28 | 0.25 | 0.47 | 0.47 | 0.40 | 0.08 | |||||||||||||||||||||||
| Net realized gain from investments | $ | - | - | - | 0.05 | 1.14 | 3.67 | - | |||||||||||||||||||||||
| Total distributions | $ | 0.08 | 0.28 | 0.25 | 0.52 | 1.61 | 4.07 | 0.08 | |||||||||||||||||||||||
| Net asset value, end of period | $ | 12.69 | 12.38 | 11.63 | 11.98 | 13.23 | 14.94 | 19.04 | |||||||||||||||||||||||
| Total Return(3) | % | 3.20 | 8.93 | † | (0.61 | ) | (5.53 | ) | (0.70 | ) | (0.60 | ) | 1.44 | ||||||||||||||||||
| Ratios and Supplemental Data: | |||||||||||||||||||||||||||||||
| Net assets, end of period (000's) | $ | 291 | 324 | 222 | 191 | 373 | 230 | 190 | |||||||||||||||||||||||
| Ratios to average net assets: | |||||||||||||||||||||||||||||||
| Net expenses after expense | |||||||||||||||||||||||||||||||
| reimbursement(4)(5) | % | 1.48 | 1.49 | 1.50 | 1.40 | 1.25 | 1.30 | 1.25 | |||||||||||||||||||||||
| Gross expenses prior to expense | |||||||||||||||||||||||||||||||
| reimbursement(4) | % | 1.42 | 1.48 | 1.61 | 1.40 | 1.46 | 1.51 | 1.51 | |||||||||||||||||||||||
| Net investment income after expense | |||||||||||||||||||||||||||||||
| reimbursement(4)(5) | % | 1.43 | 1.39 | 2.70 | 3.31 | 3.61 | 3.36 | 2.30 | |||||||||||||||||||||||
| Portfolio turnover rate | % | 36 | 302 | 129 | 145 | 76 | 173 | 63 | |||||||||||||||||||||||
(1) The Fund changed its fiscal year end to May 31.
(2) Effective May 24, 1999, ING investments, LLC became the Investment Adviser of the Fund, concurrently Nicholas-Applegate Capital Management was appointed as sub-advisor and the Fund changed its year end to June 30.
(3) Total return is calculated assuming reinvestment of all dividends and capital gain distributions at net asset value and excluding the deduction of sales charges. Total return for less than one year is not annualized.
(4) Annualized for periods less than one year.
(5) The Investment Adviser has agreed to limit expenses, (excluding interest, taxes, brokerage and extraordinary expenses) subject to possible recoupment by ING Investments, LLC within three years.
† Total return without the effect of reimbursement by affiliate for investment transaction losses would have been 8.84% for Class Q.
See Accompanying Notes to Financial Statements.
53
ING REAL ESTATE FUND
FINANCIAL HIGHLIGHTS
Selected data for a share of beneficial interest outstanding throughout each period.
| Class I | |||||||||||||||||||||||||||||||
| Six Months Ended November 30, | Year Ended May 31, | Period Ended May 31, | Year Ended October 31, | ||||||||||||||||||||||||||||
| 2004 | 2003 | 2003(1) | 2002 | 2001 | 2000 | 1999 | |||||||||||||||||||||||||
| Per Share Operating Performance: | |||||||||||||||||||||||||||||||
| Net asset value, beginning of period | $ | 13.28 | 11.45 | 9.98 | 9.77 | 9.57 | 8.24 | 9.10 | |||||||||||||||||||||||
| Income (loss) from investment operations: | |||||||||||||||||||||||||||||||
| Net investment income | $ | 0.25 | 0.58 | 0.20 | 0.60 | 0.50 | 0.69 | 0.49 | |||||||||||||||||||||||
| Net realized and unrealized gain (loss) | |||||||||||||||||||||||||||||||
| on investments | $ | 2.57 | 2.43 | 1.47 | 0.23 | 0.27 | 1.21 | (0.80 | ) | ||||||||||||||||||||||
| Total from investment operations | $ | 2.82 | 3.01 | 1.67 | 0.83 | 0.77 | 1.90 | (0.31 | ) | ||||||||||||||||||||||
| Less distributions from: | |||||||||||||||||||||||||||||||
| Net investment income | $ | 0.26 | 0.67 | 0.20 | 0.62 | 0.57 | 0.57 | 0.55 | |||||||||||||||||||||||
| Net realized gain from investments | $ | 0.95 | 0.51 | - | - | - | - | - | |||||||||||||||||||||||
| Total distributions | $ | 1.21 | 1.18 | 0.20 | 0.62 | 0.57 | 0.57 | 0.55 | |||||||||||||||||||||||
| Net asset value, end of period | $ | 14.89 | 13.28 | 11.45 | 9.98 | 9.77 | 9.57 | 8.24 | |||||||||||||||||||||||
| Total Return(2) | % | 25.63 | 27.24 | 16.95 | 8.06 | 7.88 | 23.78 | 3.70 | |||||||||||||||||||||||
| Ratios and Supplemental Data: | |||||||||||||||||||||||||||||||
| Net assets, end of period (000's) | $ | 195,284 | 161,904 | 125,645 | 97,331 | 76,188 | 64,447 | 55,968 | |||||||||||||||||||||||
| Ratios to average net assets: | |||||||||||||||||||||||||||||||
| Net expenses after expense | |||||||||||||||||||||||||||||||
| reimbursement(3)(4) | % | 0.88 | 0.96 | 1.00 | 0.98 | 1.00 | 1.00 | 1.00 | |||||||||||||||||||||||
| Gross expenses prior to expense | |||||||||||||||||||||||||||||||
| reimbursement(3) | % | 0.83 | 1.06 | 1.19 | 0.98 | 1.03 | 1.05 | 1.11 | |||||||||||||||||||||||
| Net investment income after expense | |||||||||||||||||||||||||||||||
| reimbursement(3)(4) | % | 3.66 | 4.69 | 4.26 | 4.29 | 4.84 | 5.71 | 5.37 | |||||||||||||||||||||||
| Portfolio turnover rate | % | 37 | 132 | 62 | 106 | 77 | 93 | 67 | |||||||||||||||||||||||
(1) On November 4, 2002, pursuant to an Agreement and Plan of Reorganization dated August 20, 2002, all of the assets and liabilities of the CRA Realty Shares Portfolio were transferred to the newly created ING Real Estate Fund in exchange for shares of the ING Real Estate Fund. The financial highlight information presented for periods prior to November 4, 2002 reflects the activity of the CRA Realty Shares Portfolio. The ING Real Estate Fund has adopted a fiscal year end of May 31.
(2) Total return is calculated assuming reinvestment of all dividends and capital gain distributions at net asset value and excluding the deduction of sales charges. Total return for less than one year is not annualized.
(3) Annualized for periods less than one year.
(4) The Investment Adviser has agreed to limit expenses, (excluding interest, taxes, brokerage and extraordinary expenses) subject to possible recoupment by ING Investments, LLC within three years.
See Accompanying Notes to Financial Statements.
54
NOTES TO FINANCIAL STATEMENTS AS OF NOVEMBER 30, 2004 (UNAUDITED)
NOTE 1 - ORGANIZATION
Organization. The ING Funds contained within this book are comprised of ING Equity Trust ("IET") and ING Investment Funds, Inc. ("IIF") both of which are open-end investment management companies registered under the Investment Company Act of 1940, as amended.
IET is a Massachusetts business trust organized on June 12, 1998 with twenty-three separate series (Portfolios). Eleven of which are discussed in this report: ING Disciplined LargeCap Fund ("Disciplined LargeCap"), ING LargeCap Growth Fund ("LargeCap Growth"), ING MidCap Opportunities Fund ("MidCap Opportunities"), ING SmallCap Opportunities Fund ("SmallCap Opportunities"), ING LargeCap Value Fund ("LargeCap Value"), ING MidCap Value Fund ("MidCap Value"), ING SmallCap Value Fund ("SmallCap Value"), ING Convertible Fund ("Convertible"), ING Equity and Bond Fund ("Equity and Bond") and ING Real Estate Fund ("Real Estate"). IIF is a Maryland Corporation organized on July 7, 1969 with one Portfolio, ING MagnaCap Fund ("MagnaCap").
Each Fund offers at least three of the following classes of shares: Class A, Class B, Class C, Class I, Class M, Class O and Class Q. The separate classes of shares differ principally in the applicable sales charges (if any), distribution fees, shareholder servicing fees and transfer agency fees. Shareholders of each class also bear certain expenses that pertain to that particular class. All shareholders bear the common expenses of the Fund and earn income and realized gains/losses from the Fund pro rata based on the average daily net assets of each class, without distinction between share classes. No class preferential dividend rights exist. Differences in per share dividend rates generally results from the relative weighting of pro rata income and realized gain allocations and from differences in separate class expenses, including distribution, and shareholder servici ng fees. Class B shares, along with their pro rata reinvested dividend shares, automatically convert to Class A shares approximately eight years after purchase.
NOTE 2 - SIGNIFICANT ACCOUNTING POLICIES
The following significant accounting policies are consistently followed by the Funds in the preparation of their financial statements. Such policies are in conformity with accounting principles generally accepted in the United States of America for investment companies.
A. Security Valuation. Investments in equity securities traded on a national securities exchange are valued at the last reported sale price. Securities reported by NASDAQ will be valued at the NASDAQ official closing prices. Securities traded on an exchange or NASDAQ for which there has been no sale and securities traded in the over-the-counter-market are valued at the mean between the last reported bid and ask prices. All investments quoted in foreign currencies will be valued daily in U.S. dollars on the basis of the foreign currency exchange rates prevailing at that time. Debt securities are valued at prices obtained from independent services or from one or more dealers making markets in the securities and may be adjusted based on the Funds' valuation procedures. U.S. Government obligations are valued by using market quotations or independent pricing services that use prices provided by market-makers or estimates of market values obtained from yield data relating to instruments or securities with similar characteristics.
Securities and assets for which market quotations are not readily available (which may include certain restricted securities which are subject to limitations as to their sale) are valued at their fair values as determined in good faith by or under the supervision of the Funds' Board of Directors/Trustees (''Board''), in accordance with methods that are specifically authorized by the Board. Securities traded on exchanges, including foreign exchanges, which close earlier than the time that a Fund calculates its net asset value may also be valued at their fair values as determined in good faith by or under the supervision of a Fund's Board, in accordance with methods that are specifically authorized by the Board. If a significant event which is likely to impact the value of one or more foreign securities held by a Fund occurs after the time at which the foreign market for such security(ies) closes but befor e the time that the Fund's net asset value is calculated on any business day, such event may be taken into account in determining the fair value of such security(ies) at the time the Fund calculates its net asset value. For these purposes, significant events after the close of trading on a foreign market may include, among others, securities trading in the U.S. and other markets, corporate announcements, natural and other disasters, and political and other events. Among other elements of analysis, the Board has authorized the use of one or more research services to assist with the determination of the fair value of foreign securities. Research services use statistical analyses and quantitative models to help determine fair value as of the time
55
NOTES TO FINANCIAL STATEMENTS AS OF NOVEMBER 30, 2004 (UNAUDITED) (CONTINUED)
NOTE 2 - SIGNIFICANT ACCOUNTING POLICIES (continued)
a Fund calculates its net asset value. Unlike the closing price of a security on an exchange, fair value determinations employ elements of judgment, and the fair value assigned to a security may not represent the actual value that a Fund could obtain if it were to sell the security at the time of the close of the NYSE. Investments in securities maturing in 60 days or less from the date of acquisition are valued at amortized cost, which, when combined with accrued interest, approximates market value.
B. Security Transactions and Revenue Recognition. Securities transactions are accounted for on the trade date. Realized gains and losses are reported on the basis of identified cost of securities sold. Interest income is recorded on an accrual basis. Dividend income is recorded on the ex-dividend date, or for certain foreign securities, when the information becomes available to the funds. Premium amortization and discount accretion are determined by the effective yield method.
C. Foreign Currency Translation. The books and records of the Funds are maintained in U.S. dollars. Any foreign currency amounts are translated into U.S. dollars on the following basis:
(1) Market value of investment securities, other assets and liabilities - at the exchange rates prevailing at the end of the day.
(2) Purchases and sales of investment securities, income and expenses - at the rates of exchange prevailing on the respective dates of such transactions.
Although the net assets and the market values are presented at the foreign exchange rates at the end of the day, the Funds do not isolate the portion of the results of operations resulting from changes in foreign exchange rates on investments from the fluctuations arising from changes in market prices of securities held. Such fluctuations are included with the net realized and unrealized gains or losses from investments. For securities which are subject to foreign withholding tax upon disposition, liabilities are recorded on the Statement of Assets and Liabilities for the estimated tax withholding based on the securities' current market value. Upon disposition, realized gains or losses on such securities are recorded net of foreign withholding tax.
Reported net realized foreign exchange gains or losses arise from sales of foreign currencies, currency gains or losses realized between the trade and settlement dates on securities transactions, the difference between the amounts of dividends, interest, and foreign withholding taxes recorded on the Fund's books, and the U.S. dollar equivalent of the amounts actually received or paid. Net unrealized foreign exchange gains and losses arise from changes in the value of assets and liabilities other than investments in securities at fiscal year end, resulting from changes in the exchange rate. Foreign security and currency transactions may involve certain considerations and risks not typically associated with investing in U.S. companies and the U.S. Government securities. These risks include but are not limited to revaluation of currencies and future adverse political and economic developments which could cause securities and their markets to be less liquid and prices more volatile than those of comparable U.S. companies and the U.S. Government securities.
D. Foreign Currency Transactions and Futures Contracts. Certain funds may enter into foreign currency exchange transactions to convert to and from different foreign currencies and to and from the U.S. dollar in connection with the planned purchases or sales of securities. The Funds either enter into these transactions on a spot basis at the spot rate prevailing in the foreign currency exchange market or use forward foreign currency contracts to purchase or sell foreign currencies. When the contract is fulfilled or closed, gains or losses are realized. Until then, the gain or loss is included in unrealized appreciation or depreciation. Risks may arise upon entering into forward contracts from the potential inability of counterparties to meet the terms of their forward contracts and from unanticipated movements in the value of foreign currencies relative to the U.S. dollar.
Each Fund may enter into futures contracts involving foreign currency, interest rates, securities and security indices. A futures contract obligates the seller of the contract to deliver and the purchaser of the contract to take delivery of the type of foreign currency, financial instrument or security called for in the contract at a specified future time for a specified price. Upon entering into such a contract, a Fund is required to deposit and maintain as collateral such initial margin as required by the exchange on which the contract is traded. Pursuant to the contract, a Fund agrees to receive from or pay to the broker an amount equal to the daily fluctuations in the value of the contract. Such receipts or payments are known as
56
NOTES TO FINANCIAL STATEMENTS AS OF NOVEMBER 30, 2004 (UNAUDITED) (CONTINUED)
NOTE 2 - SIGNIFICANT ACCOUNTING POLICIES (continued)
variation margins and are recorded as unrealized gains or losses by the Fund. When the contract is closed, the Fund records a realized gain or loss equal to the difference between the value of the contract at the time it was opened and the value at the time it was closed.
E. Distributions to Shareholders. The Funds record distributions to their shareholders on the ex-dividend date. Each Fund pays dividends, if any, as follows:
| Annually | Semi-Annually | ||||||
| Disciplined LargeCap | MagnaCap | ||||||
| LargeCap Growth | |||||||
| Quarterly | |||||||
| MidCap Opportunities | |||||||
| SmallCap Opportunities | Convertible | ||||||
| LargeCap Value | Equity and Bond | ||||||
| MidCap Value | Real Estate | ||||||
| SmallCap Value | |||||||
Each Fund distributes capital gains, to the extent available, annually. The Funds may make distributions on a more frequent basis to comply with the distribution requirements of the Internal Revenue Code. The characteristics of income and gains to be distributed are determined in accordance with income tax regulations, which may differ from accounting principles generally accepted in the United States of America for investment companies.
F. Federal Income Taxes. It is the policy of the Funds to comply with subchapter M of the Internal Revenue Code and related excise tax provisions applicable to regulated investment companies and to distribute substantially all of their net investment income and any net realized capital gains to their shareholders. Therefore, no federal income tax provision is required. No capital gain distributions shall be made until any capital loss carryforwards have been fully utilized or expired.
The Funds may utilize equalization accounting for tax purposes, where by a portion of redemption payments are treated as distributions of income or gain for income tax purposes.
G. Use of Estimates. Management of the Funds has made certain estimates and assumptions relating to the reporting of assets, liabilities, income, and expenses to prepare these financial statements in conformity with accounting principles generally accepted in the United States of America for investment companies. Actual results could differ from these estimates.
H. Repurchase Agreements. Each Fund may invest in repurchase agreements only with government securities dealers recognized by the Board of Governors of the Federal Reserve System. Under such agreements, the seller of the security agrees to repurchase it at a mutually agreed upon time and price. The resale price is in excess of the purchase price and reflects an agreed upon interest rate for the period of time the agreement is outstanding. The period of the repurchase agreements is usually short, from overnight to one week, while the underlying securities generally have longer maturities. Each Fund will receive as collateral securities acceptable to it whose market value is equ al to at least 100% of the carrying amount of the repurchase agreements, plus accrued interest, being invested by the Fund. The underlying collateral is valued daily on a mark to market basis to assure that the value, including accrued interest is at least equal to the repurchase price. If the seller defaults, a Fund might incur a loss or delay in the realization of proceeds if the value of the collateral securing the repurchase agreement declines, and it might incur disposition costs in liquidating the collateral.
I. Options Contracts. Each Funds may purchase put and call options and may write (sell) put options and covered call options. The Funds may engage in option transactions as a hedge against adverse movements in the value of portfolio holdings or to increase market exposure. Option contracts are valued daily and unrealized gains or losses are recorded based upon the last sales price on the principal exchange on which the options are traded. The Funds will realize a gain or loss upon the expiration or closing of the option contract. When an option is exercised, the proceeds on sales of the underlying security for a written call option, the purchase cost of the security for a written put option, or the cost of the security for a purchased put or call option is adjusted by the amount of premium received or paid. Realized and unrealized gains or losses on option contracts are reflected in the accompanying financial statements. The risk in writing a call option is that the Funds give up the opportunity for profit if the market price of the security increases and the option is exercised. The risk in writing a put option is that the Funds may incur a loss if the market price of the security decreases and the option is exercised. The risk in buying an option is that the Funds pay a premium whether or not the option is exercised. Risks may also arise from an illiquid secondary market or from the inability of counterparties to meet the terms of the contract.
57
NOTES TO FINANCIAL STATEMENTS AS OF NOVEMBER 30, 2004 (UNAUDITED) (CONTINUED)
NOTE 2 - SIGNIFICANT ACCOUNTING POLICIES (continued)
J. Securities Lending. Each Fund has the option to temporarily loan up to 30% of its total assets to brokers, dealers or other financial institutions in exchange for a negotiated lender's fee. The borrower is required to fully collateralize the loans with cash or U.S. Government securities. Generally, in the event of counterparty default, the Fund has the right to use collateral to offset losses incurred. There would be potential loss to the Fund in the event the Fund is delayed or prevented from exercising its right to dispose of the collateral. The Fund bears the risk of loss with respect to the investment of collateral. Engaging in securities lending could have a leveraging effect, which may intensify the credit, market and other risks associated with investing in a Fund.
K. Offering Costs. Offering costs are capitalized and amortized on a straight line basis over a period of twelve months.
L. Illiquid and Restricted Securities. Each Fund may not invest more than 15% of its net assets in illiquid securities. Illiquid securities are not readily marketable. Disposing of illiquid investments may involve time-consuming negotiation and legal expenses, and it may be difficult or impossible for the Funds to sell them promptly at an acceptable price. Each Fund also may invest in restricted securities, which include those sold under Rule 144A of the Securities Act of 1933 ("1933 Act") or securities offered pursuant to Section 4(2) of the 1933 Act, and/or are subject to legal or contractual restrictions on resale and generally may not be publicly sold without reg istration under the 1933 Act. Certain restricted securities may be considered liquid pursuant to procedures adopted by the Board or may be deemed to be illiquid because they may not be readily marketable. Illiquid and restricted securities are valued using market quotations when readily available. In the absence of market quotations, the illiquid and restricted securities are valued based upon their fair value determined under procedures approved by the Board.
M. Delayed Delivery Transactions. Each Fund may purchase or sell securities on a when-issued or forward commitment basis. The price of the underlying securities and date when the securities will be delivered and paid for are fixed at the time the transaction is negotiated. The market value of such is identified in each Fund's Portfolio of Investments. Losses may arise due to changes in the market value of the securities or from the inability of counterparties to meet the terms of the contract. In connection with such purchases, the Funds are required to segregate liqui d assets with the Funds' custodian sufficient to cover the purchase price.
N. Mortgage Dollar Roll Transactions. In connection with a Fund's ability to purchase or sell securities on a when-issued basis, the Funds may engage in dollar roll transactions with respect to mortgage-backed securities issued by Government National Mortgage Association, Federal National Mortgage Association and Federal Home Loan Mortgage Corp. In a dollar roll transaction, a Fund sells a mortgage-backed security to a financial institution, such as a bank or broker/dealer, and simultaneously agrees to repurchase a substantially similar (i.e., same type, coupon, and maturity) security from the institution on a delayed delivery basis at an agreed upon price. The mortgage-backed securities that are repurchased will bear the same interest rate as those sold, but generally will be collateralized by different pools of mortgages with different prepayment histories. The Funds account for dollar roll transactions as purchases and sales.
NOTE 3 - INVESTMENT TRANSACTIONS
For the six months ended November 30, 2004, the cost of purchases and proceeds from the sales of securities, excluding short-term securities, were as follows:
| Purchases | Sales | ||||||||||
| Disciplined LargeCap | $ | 52,790,720 | $ | 81,930,384 | |||||||
| LargeCap Growth | 125,403,346 | 129,217,717 | |||||||||
| MidCap Opportunities | 105,857,740 | 178,501,008 | |||||||||
| SmallCap Opportunities | 77,628,487 | 117,895,157 | |||||||||
| LargeCap Value | 24,096,258 | 4,359,730 | |||||||||
| MagnaCap | 37,811,928 | 65,086,971 | |||||||||
| MidCap Value | 88,695,426 | 57,880,610 | |||||||||
| SmallCap Value | 77,638,421 | 19,300,495 | |||||||||
| Convertible | 53,381,754 | 74,327,783 | |||||||||
| Equity and Bond | 24,561,128 | 28,708,066 | |||||||||
| Real Estate | 96,961,140 | 75,381,250 | |||||||||
U.S. Governemnt securities not included above were as follows:
| Purchases | Sales | ||||||||||
| Equity and Bond | $ | 49,664,983 | $ | 53,462,074 | |||||||
NOTE 4 - INVESTMENT MANAGEMENT AND ADMINISTRATIVE FEES
The Funds entered into Investment Management Agreements with ING Investments, LLC (the "Investment Manager"). The Investment Management
58
NOTES TO FINANCIAL STATEMENTS AS OF NOVEMBER 30, 2004 (UNAUDITED) (CONTINUED)
NOTE 4 - INVESTMENT MANAGEMENT AND ADMINISTRATIVE FEES (continued)
Agreements compensate the Investment Manager with a fee, computed daily and payable monthly, based on the average daily net assets of each Fund, at the following annual rates:
| As a Percent of Average Net Assets | |||||||
| Disciplined LargeCap | 0.70 | % | |||||
| LargeCap Growth* | 0.75% on first $500 million; 0.675% onnext $500 million; and 0.65% in excess of $1 billion | ||||||
| MidCap Opportunities | 1.00% on first $500 million; and 0.90% thereafter | ||||||
| SmallCap Opportunities | 1.00% on first $100 million; 0.90% on next $150 million; 0.80% on next $250 million; and 0.75% in excess of $500 million | ||||||
| LargeCap Value | 0.90% on first $50 million; 0.85% on next $450 million; and 0.80% thereafter | ||||||
| MagnaCap | 1.00% on first $30 million; 0.75% on next $220 million; 0.625% on next $200 million; and 0.50% in excess of $450 million | ||||||
| MidCap Value | 1.00% on first $50 million; and 0.90% thereafter | ||||||
| SmallCap Value | 1.00% on first $50 million; and 0.90% thereafter | ||||||
| Convertible | 0.75% on first $500 million; 0.675% on next $500 million; and 0.65% in excess of $1 billion | ||||||
| Equity and Bond | 0.75% on first $500 million; 0.675% on next $500 million; and 0.65% in excess of $1 billion | ||||||
| Real Estate | 0.70 | % | |||||
* Assets are aggregated with ING VP LargeCap Growth Portfolio to determine fees.
ING Investment Management Co. (formerly, Aeltus Investment Management, Inc. "ING IM"), a registered investment adviser, serves as Sub-Adviser to the MidCap Opportunities Fund, SmallCap Opportunities Fund, Disciplined LargeCap Fund, MagnaCap Fund, Convertible Fund and the Equity and Bond Fund pursuant to Sub-Advisory Agreements between the Investment Manager and ING IM.
Brandes Investment Partners, LP ("Brandes"), a registered investment adviser, serves as Sub-Adviser to the LargeCap Value, MidCap Value and SmallCap Value Funds pursuant to a Sub-Advisory Agreement between the Investment Manager and Brandes.
Wellington Management Company, LLP is the Sub-Adviser to the LargeCap Growth Fund.
ING Clarion Real Estate Securities L.P. ("ING Clarion"), a registered investment adviser, is the Sub-Adviser to the Real Estate Fund pursuant to a Sub-Advisory Agreement between the Investment Manager and ING Clarion.
ING Funds Services, LLC (the "Administrator" or "IFS"), serves as administrator to each Fund except MagnaCap. The Funds pay the Administrator a fee calculated at an annual rate of 0.10% of each Fund's average daily net assets.
MagnaCap has entered into a Shareholder Service Agreement with IFS whereby IFS will act as Shareholder Service Agent for the Fund. The agreement provides that IFS will be compensated for incoming and outgoing shareholder telephone calls and letters, and all reasonable out-of-pocket expenses incurred in connection with the performance of such services.
MidCap Opportunities and SmallCap Opportunities also pay IFS an annual shareholder account servicing fee of $5.00, payable semi-annually, for each account of beneficial owners of shares.
The Investment Manager, ING IM, ING Clarion, IFS and the Distributor are indirect wholly-owned subsidiaries of ING Groep N.V., a global financial institution active in the fields of banking, insurance and asset management.
NOTE 5 - DISTRIBUTION AND SERVICE FEES
Each share class of the Funds (except as noted below) has adopted a Plan pursuant to Rule 12b-1 under the 1940 Act (the "12b-1 Plans"), whereby ING Funds Distributor, LLC (the "Distributor") is reimbursed or compensated (depending on the class of shares) by the Funds for expenses incurred in the distribution of each Fund's shares ("Distribution Fees"). Pursuant to the 12b-1 Plans, the Distributor is entitled to a payment each month to reimburse or compensate expenses incurred in the distribution and promotion of each Fund's shares, including expenses incurred in printing prospectuses and reports used for sales purposes, expenses incurred in preparing and printing sales literature and other such distribution related expenses, including any distribution or shareholder servicing fees ("Service Fees") paid to securities dealers who have executed a distribution agreement with the Distributor. Under the 1 2b-1 Plans, each class of shares of the Fund pays the Distributor a combined Distribution and/or
59
NOTES TO FINANCIAL STATEMENTS AS OF NOVEMBER 30, 2004 (UNAUDITED) (CONTINUED)
NOTE 5 - DISTRIBUTION AND SERVICE FEES (continued)
Service Fee based on average daily net assets at the following rates:
| Class A | Class B and C | Class I | Class M | Class O | Class Q | ||||||||||||||||||||||
| Disciplined LargeCap | 0.30 | % | 1.00 | % | N/A | N/A | N/A | N/A | |||||||||||||||||||
| LargeCap Growth | 0.35 | % | 1.00 | % | N/A | N/A | N/A | 0.25 | % | ||||||||||||||||||
| MidCap Opportunities | 0.30 | % | 1.00 | % | N/A | N/A | N/A | 0.25 | % | ||||||||||||||||||
| SmallCap Opportunities | 0.30 | % | 1.00 | % | N/A | N/A | N/A | 0.25 | % | ||||||||||||||||||
| LargeCap Value | 0.25 | % | 1.00 | % | N/A | N/A | N/A | N/A | |||||||||||||||||||
| MagnaCap | 0.30 | % | 1.00 | % | N/A | 0.75 | % | N/A | N/A | ||||||||||||||||||
| MidCap Value | 0.25 | % | 1.00 | % | N/A | N/A | N/A | 0.25 | % | ||||||||||||||||||
| SmallCap Value | 0.25 | % | 1.00 | % | N/A | N/A | N/A | 0.25 | % | ||||||||||||||||||
| Convertible | 0.35 | % | 1.00 | % | N/A | N/A | N/A | 0.25 | % | ||||||||||||||||||
| Equity and Bond | 0.35 | % | 1.00 | % | N/A | N/A | N/A | 0.25 | % | ||||||||||||||||||
| Real Estate | 0.25 | % | 1.00 | % | N/A | N/A | 0.25 | % | 0.25 | % | |||||||||||||||||
For the six months ended November 30, 2004, the Distributor has retained $163,391 as sales charges from the proceeds of Class A Shares sold, $22,085 and $20,318 from the proceeds of Class A Shares and Class C Shares redeemed, respectively and $90 from the proceeds of Class M Shares sold.
NOTE 6 - OTHER TRANSACTIONS WITH AFFILIATES AND RELATED PARTIES
The Investment Manager may direct the Funds' portfolio managers to use their best efforts (subject to obtaining best execution of each transaction) to allocate a Fund's equity security transactions through certain designated broker-dealers. The designated broker-dealer, in turn, will reimburse a portion of the brokerage commissions to pay certain expenses of that Portfolio. Any amounts credited to the Funds are reflected as brokerage commission recapture in the Statements of Operations.
At November 30, 2004, the Funds had the following amounts recorded in payable to affiliates on the accompanying Statements of Assets and Liabilities (see Notes 4 and 5):
| Accrued Investment Management Fees | Accrued Administrative Fees | Accrued Shareholder Services and Distribution Fees | Recoupment | Total | |||||||||||||||||||
| Disciplined LargeCap | $ | 29,088 | $ | 4,155 | $ | 38,588 | $ | - | $ | 71,831 | |||||||||||||
| LargeCap Growth | 195,865 | 26,113 | 169,316 | 52,518 | 443,812 | ||||||||||||||||||
| MidCap Opportunities | 347,009 | 34,698 | 268,401 | 78,604 | 728,712 | ||||||||||||||||||
| SmallCap Opportunities | 178,898 | 18,963 | 119,237 | - | 317,098 | ||||||||||||||||||
| LargeCap Value | 23,174 | 2,575 | 15,122 | - | 40,871 | ||||||||||||||||||
| MagnaCap | 225,948 | - | 127,002 | 4,785 | 357,735 | ||||||||||||||||||
| MidCap Value | 120,377 | 12,918 | 83,556 | 33,251 | 250,102 | ||||||||||||||||||
| SmallCap Value | 115,731 | 12,402 | 71,079 | 73,000 | 272,212 | ||||||||||||||||||
| Convertible | 122,402 | 16,319 | 129,084 | - | 267,805 | ||||||||||||||||||
| Equity and Bond | 39,852 | 5,313 | 34,567 | 9,999 | 89,731 | ||||||||||||||||||
| Real Estate | 136,515 | 19,501 | 13,026 | 55,129 | 224,171 | ||||||||||||||||||
At November 30, 2004, ING Life Insurance & Annuity Company, a wholly-owned indirect subsidiary of ING Groep N.V., held 11.1% of the Real Estate Fund. At November 30, 2004, certain non-affiliated individuals and entities owned separately the following percentage of the Real Estate Fund: 5.3% and 22.9%. Investment activities of these shareholders could have a material impact on the Funds.
NOTE 7 - OTHER ACCRUED EXPENSES AND LIABILITIES
At November 30, 2004, the funds had following payables included in Other Accrued Expenses and Liabilities on the Statements of Assets and Liabilities that exceeded 5% of total liabilities:
| Payable for Custody and Accounting Fees | |||||||
| Disciplined LargeCap | $ | 14,496 | |||||
| Payable for Transfer Agent Fees | |||||||
| Disciplined LargeCap | $ | 28,931 | |||||
| MagnaCap | 188,311 | ||||||
| Payable for Shareholder Reporting Expenses | |||||||
| Disciplined LargeCap | $ | 62,990 | |||||
| MagnaCap | 206,738 | ||||||
NOTE 8 - EXPENSE LIMITATIONS
For the following Funds, the Investment Manager has agreed to limit expenses, excluding interest, taxes, brokerage and extraordinary expenses to the levels listed below:
| Class A | Class B | Class C | Class I | Class O | Class Q | ||||||||||||||||||||||
| LargeCap Growth | 1.45 | % | 2.10 | % | 2.10 | % | 1.10 | % | N/A | 1.35 | % | ||||||||||||||||
| MidCap Opportunities | 1.75 | % | 2.45 | % | 2.45 | % | 1.45 | % | N/A | 1.60 | % | ||||||||||||||||
| LargeCap Value | 1.45 | % | 2.20 | % | 2.20 | % | 1.20 | % | N/A | N/A | |||||||||||||||||
| MidCap Value | 1.75 | % | 2.50 | % | 2.50 | % | 1.50 | % | N/A | 1.75 | % | ||||||||||||||||
| SmallCap Value | 1.75 | % | 2.50 | % | 2.50 | % | 1.50 | % | N/A | 1.75 | % | ||||||||||||||||
| Convertible | 1.60 | % | 2.25 | % | 2.25 | % | N/A | N/A | 1.50 | % | |||||||||||||||||
| Equity and Bond | 1.60 | % | 2.25 | % | 2.25 | % | N/A | N/A | 1.50 | % | |||||||||||||||||
| Real Estate | 1.45 | % | 2.20 | % | 2.20 | % | 1.00 | % | 1.45 | % | 1.45 | % | |||||||||||||||
Each Fund will at a later date reimburse the Investment Manager for management fees waived and other expenses assumed by the Investment Manager during the previous 36 months, but only if, after such reimbursement, the Fund's expense ratio does not exceed the percentage described above. Waived and reimbursed fees and any recoupment by the Investment Manager of such waived and reimbursed fees are reflected on the accompanying Statements of Operations for each Fund.
Outstanding reimbursement balances due to the Funds, if any, under their respective expense limitation agreements are reflected in Reimbursement Due from Manager on the accompanying Statements of Assets and Liabilities.
60
NOTES TO FINANCIAL STATEMENTS AS OF NOVEMBER 30, 2004 (UNAUDITED) (CONTINUED)
NOTE 8 - EXPENSE LIMITATIONS (continued)
As of November 30, 2004, the cumulative amounts of waived or reimbursed fees that are subject to possible recoupment by the Investment Manager, and the related expiration dates are as follows:
| November 30, | |||||||||||||||||||
| 2005 | 2006 | 2007 | Total | ||||||||||||||||
| LargeCap Growth | $ | 263,850 | $ | 365,234 | $ | 23,483 | $ | 652,567 | |||||||||||
| MidCap Opportunities | 554,148 | 398,893 | - | 953,041 | |||||||||||||||
| LargeCap Value | - | - | 145,120 | 145,120 | |||||||||||||||
| MidCap Value | - | 20,025 | - | 20,025 | |||||||||||||||
| SmallCap Value | 9,105 | 42,868 | - | 51,973 | |||||||||||||||
| Real Estate | - | 123,825 | - | 123,825 | |||||||||||||||
The Expense Limitation Agreements are contractual and shall renew automatically for one-year terms unless ING Investments, LLC provides written notice of the termination of the Expense Limitation Agreement within 90 days of the end of the then current term.
NOTE 9 - LINE OF CREDIT
All of the Funds included in this report, in addition to certain other funds managed by the Investment Manager have entered into an unsecured committed revolving line of credit agreement (the "Credit Agreement") with The Bank of New York for an aggregate amount of $125,000,000. The proceeds may be used to: (1) temporarily finance the purchase and sale of securities; (2) finance the redemption of shares of an investor in the Funds; and (3) enable the Funds to meet other emergency expenses as defined in the Credit Agreement. The Funds to which the line of credit is available pay a commitment fee equal to 0.09% per annum on the daily unused portion of the committed line amount payable quarterly in arrears.
The following Funds utilized the line of credit during the six months ended November 30, 2004:
| Days Utilized | Approximate Average Daily Balance | Approximate Weighted Average Interest Rate | |||||||||||||
| MidCap Opportunities | 8 | 818,125 | 1.82 | % | |||||||||||
| SmallCap Opportunities | 14 | 1,173,996 | 2.13 | % | |||||||||||
| MagnaCap | 3 | 576,667 | 2.35 | % | |||||||||||
| SmallCap Value | 4 | 1,185,000 | 2.49 | % | |||||||||||
| Convertible | 14 | 1,026,951 | 2.22 | % | |||||||||||
| Real Estate | 1 | 4,300,000 | 1.80 | % | |||||||||||
NOTE 10 - CAPITAL SHARES
Transactions in capital shares and dollars were as follows:
| Class A Shares | Class B Shares | Class C Shares | |||||||||||||||||||||||||
| Six Months Ended November 30, 2004 | Year Ended May 31, 2004 | Six Months Ended November 30, 2004 | Year Ended May 31, 2004 | Six Months Ended November 30, 2004 | Year Ended May 31, 2004 | ||||||||||||||||||||||
| Disciplined LargeCap (Number of Shares) | |||||||||||||||||||||||||||
| Shares sold | 51,840 | 113,903 | 166,227 | 389,459 | 19,552 | 84,889 | |||||||||||||||||||||
| Shares redeemed | (122,484 | ) | (453,135 | ) | (591,037 | ) | (1,178,718 | ) | (274,401 | ) | (1,202,854 | ) | |||||||||||||||
| Net decrease in shares outstanding | (70,644) | (339,232 | ) | (424,810 | ) | (789,259 | ) | (254,849 | ) | (1,117,965 | ) | ||||||||||||||||
| Disciplined LargeCap ($) | |||||||||||||||||||||||||||
| Shares sold | $ | 463,191 | $ | 970,844 | $ | 1,432,573 | $ | 3,217,947 | $ | 174,422 | $ | 690,881 | |||||||||||||||
| Shares redeemed | (1,076,198 | ) | (3,704,827 | ) | (4,937,725 | ) | (9,667,160 | ) | (2,294,763 | ) | (9,984,201 | ) | |||||||||||||||
| Net decrease | $ | (613,007 | ) | $ | (2,733,983 | ) | $ | (3,505,152 | ) | $ | (6,449,213 | ) | $ | (2,120,341 | ) | $ | (9,293,320 | ) | |||||||||
| Class I Shares | |||||||||||||||||||||||||||
| Six Months Ended November 30, 2004 | Year Ended May 31, 2004 | ||||||||||||||||||||||||||
| Disciplined LargeCap (Number of Shares) | |||||||||||||||||||||||||||
| Shares sold | - | - | |||||||||||||||||||||||||
| Shares redeemed | (2,531,779 | ) | - | ||||||||||||||||||||||||
| Net decrease in shares outstanding | (2,531,779 | ) | - | ||||||||||||||||||||||||
| Disciplined LargeCap ($) | |||||||||||||||||||||||||||
| Shares sold | $ | - | $ | - | |||||||||||||||||||||||
| Shares redeemed | (23,141,782 | ) | - | ||||||||||||||||||||||||
| Net decrease | $ | (23,141,782 | ) | $ | - | ||||||||||||||||||||||
61
NOTES TO FINANCIAL STATEMENTS AS OF NOVEMBER 30, 2004 (UNAUDITED) (CONTINUED)
NOTE 10 - CAPITAL SHARES (continued)
| Class A Shares | Class B Shares | Class C Shares | |||||||||||||||||||||||||
| Six Months Ended November 30, 2004 | Year Ended May 31, 2004 | Six Months Ended November 30, 2004 | Year Ended May 31, 2004 | Six Months Ended November 30, 2004 | Year Ended May 31, 2004 | ||||||||||||||||||||||
| LargeCap Growth (Number of Shares) | |||||||||||||||||||||||||||
| Shares sold | 2,189,218 | 4,717,809 | 666,364 | 3,033,622 | 465,836 | 1,665,504 | |||||||||||||||||||||
| Dividends reinvested | 146,425 | - | 111,851 | - | 49,176 | - | |||||||||||||||||||||
| Shares redeemed | (2,168,903 | ) | (1,508,196 | ) | (886,581 | ) | (1,409,436 | ) | (500,211 | ) | (842,766 | ) | |||||||||||||||
| Net increase (decrease) in shares outstanding | 166,740 | 3,209,613 | (108,366 | ) | 1,624,186 | 14,801 | 822,738 | ||||||||||||||||||||
| LargeCap Growth ($) | |||||||||||||||||||||||||||
| Shares sold | $ | 38,528,666 | $ | 77,600,379 | $ | 11,338,359 | $ | 48,308,654 | $ | 7,828,856 | $ | 25,792,950 | |||||||||||||||
| Dividends reinvested | 2,601,968 | - | 1,933,909 | - | 847,791 | - | |||||||||||||||||||||
| Shares redeemed | (37,589,048 | ) | (24,659,524 | ) | (14,849,443 | ) | (22,603,682 | ) | (8,385,013 | ) | (13,587,922 | ) | |||||||||||||||
| Net increase (decrease) | $ | 3,541,586 | $ | 52,940,855 | $ | (1,577,175 | ) | $ | 25,704,972 | $ | 291,634 | $ | 12,205,028 | ||||||||||||||
| Class I Shares | Class Q Shares | ||||||||||||||||||||||||||
| Six Months Ended November 30, 2004 | Year Ended May 31, 2004 | Six Months Ended November 30, 2004 | Year Ended May 31, 2004 | ||||||||||||||||||||||||
| LargeCap Growth (Number of Shares) | |||||||||||||||||||||||||||
| Shares sold | 178,623 | 650,093 | 21,137 | 252,367 | |||||||||||||||||||||||
| Dividends reinvested | 66,417 | - | 7,030 | - | |||||||||||||||||||||||
| Shares redeemed | (119,403 | ) | (202,685 | ) | (64,228 | ) | (348,885 | ) | |||||||||||||||||||
| Net increase (decrease) in shares outstanding | 125,637 | 447,408 | (36,061 | ) | (96,518 | ) | |||||||||||||||||||||
| LargeCap Growth ($) | |||||||||||||||||||||||||||
| Shares sold | $ | 3,231,684 | $ | 11,253,002 | $ | 386,471 | $ | 4,054,610 | |||||||||||||||||||
| Dividends reinvested | 1,216,755 | - | 128,161 | - | |||||||||||||||||||||||
| Shares redeemed | (2,129,403 | ) | (3,512,313 | ) | (1,153,459 | ) | (5,867,902 | ) | |||||||||||||||||||
| Net increase (decrease) | $ | 2,319,036 | $ | 7,740,689 | $ | (638,827 | ) | $ | (1,813,292 | ) | |||||||||||||||||
| Class A Shares | Class B Shares | Class C Shares | |||||||||||||||||||||||||
| Six Months Ended November 30, 2004 | Year Ended May 31, 2004 | Six Months Ended November 30, 2004 | Year Ended May 31, 2004 | Six Months Ended November 30, 2004 | Year Ended May 31, 2004 | ||||||||||||||||||||||
| MidCap Opportunities (Number of Shares) | |||||||||||||||||||||||||||
| Shares sold | 761,487 | 1,036,073 | 168,479 | 733,927 | 83,761 | 329,723 | |||||||||||||||||||||
| Shares issued in merger | - | 7,257,045 | - | 13,295,946 | - | 5,847,535 | |||||||||||||||||||||
| Shares redeemed | (1,712,984 | ) | (1,584,581 | ) | (2,736,169 | ) | (1,932,970 | ) | (1,709,173 | ) | (1,727,198 | ) | |||||||||||||||
| Net increase (decrease) in shares outstanding | (951,497 | ) | 6,708,537 | (2,567,690 | ) | 12,096,903 | (1,625,412 | ) | 4,450,060 | ||||||||||||||||||
| MidCap Opportunities ($) | |||||||||||||||||||||||||||
| Shares sold | $ | 8,917,692 | $ | 11,933,398 | $ | 1,919,978 | $ | 8,169,093 | $ | 943,468 | $ | 3,570,794 | |||||||||||||||
| Shares issued in merger | - | 90,057,643 | - | 158,660,384 | - | 69,438,190 | |||||||||||||||||||||
| Shares redeemed | (20,055,661 | ) | (18,290,662 | ) | (30,803,978 | ) | (21,648,477 | ) | (19,115,772 | ) | (19,175,206 | ) | |||||||||||||||
| Net increase (decrease) | $ | (11,137,969 | ) | $ | 83,700,379 | $ | (28,884,000 | ) | $ | 145,181,000 | $ | (18,172,304 | ) | $ | 53,833,778 | ||||||||||||
62
NOTES TO FINANCIAL STATEMENTS AS OF NOVEMBER 30, 2004 (UNAUDITED) (CONTINUED)
NOTE 10 - CAPITAL SHARES (continued)
| Class I Shares | Class Q Shares | ||||||||||||||||||||||||||
| Six Months Ended November 30, 2004 | Year Ended May 31, 2004 | Six Months Ended November 30, 2004 | Year Ended May 31, 2004 | ||||||||||||||||||||||||
| MidCap Opportunities (Number of Shares) | |||||||||||||||||||||||||||
| Shares sold | 32,492 | 137,735 | 2,513 | 295,722 | |||||||||||||||||||||||
| Shares issued in merger | - | 4,319,450 | - | 17,144 | |||||||||||||||||||||||
| Shares redeemed | (14,345 | ) | (5,294,804 | ) | (28,902 | ) | (390,135 | ) | |||||||||||||||||||
| Net increase (decrease) in shares outstanding | 18,147 | (837,619 | ) | (26,389 | ) | (77,269 | ) | ||||||||||||||||||||
| MidCap Opportunities ($) | |||||||||||||||||||||||||||
| Shares sold | $ | 387,678 | $ | 1,697,334 | $ | 29,182 | $ | 3,125,007 | |||||||||||||||||||
| Shares issued in merger | - | 54,791,843 | - | 214,426 | |||||||||||||||||||||||
| Shares redeemed | (174,631 | ) | (64,078,651 | ) | (335,084 | ) | (4,152,761 | ) | |||||||||||||||||||
| Net increase (decrease) | $ | 213,047 | $ | (7,589,474 | ) | $ | (305,902 | ) | $ | (813,328 | ) | ||||||||||||||||
| Class A Shares | Class B Shares | Class C Shares | |||||||||||||||||||||||||
| Six Months Ended November 30, 2004 | Year Ended May 31, 2004 | Six Months Ended November 30, 2004 | Year Ended May 31, 2004 | Six Months Ended November 30, 2004 | Year Ended May 31, 2004 | ||||||||||||||||||||||
| SmallCap Opportunities (Number of Shares) | |||||||||||||||||||||||||||
| Shares sold | 709,123 | 1,922,887 | 42,965 | 324,368 | 23,097 | 110,776 | |||||||||||||||||||||
| Shares redeemed | (1,074,212 | ) | (3,854,778 | ) | (1,065,657 | ) | (1,650,166 | ) | (394,572 | ) | (1,121,973 | ) | |||||||||||||||
| Net increase (decrease) in shares outstanding | (365,089 | ) | (1,931,891 | ) | (1,022,692 | ) | (1,325,798 | ) | (371,475 | ) | (1,011,197 | ) | |||||||||||||||
| SmallCap Opportunities ($) | |||||||||||||||||||||||||||
| Shares sold | $ | 15,788,738 | $ | 41,773,565 | $ | 882,557 | $ | 6,706,707 | $ | 464,323 | $ | 2,424,180 | |||||||||||||||
| Shares redeemed | (23,735,242 | ) | (80,177,493 | ) | (21,785,610 | ) | (33,798,668 | ) | (8,024,914 | ) | (22,678,422 | ) | |||||||||||||||
| Net increase (decrease) | $ | (7,946,504 | ) | $ | (38,403,928 | ) | $ | (20,903,053 | ) | $ | (27,091,961 | ) | $ | (7,560,591 | ) | $ | (20,254,242 | ) | |||||||||
| Class I Shares | Class Q Shares | ||||||||||||||||||||||||||
| Six Months Ended November 30, 2004 | Year Ended May 31, 2004 | Six Months Ended November 30, 2004 | Year Ended May 31, 2004 | ||||||||||||||||||||||||
| SmallCap Opportunities (Number of Shares) | |||||||||||||||||||||||||||
| Shares sold | 66,536 | 186,283 | - | 1,160 | |||||||||||||||||||||||
| Shares redeemed | (52,813 | ) | (145,691 | ) | (7,358 | ) | (30,438 | ) | |||||||||||||||||||
| Net increase (decrease) in shares outstanding | 13,723 | 40,592 | (7,358 | ) | (29,278 | ) | |||||||||||||||||||||
| SmallCap Opportunities ($) | |||||||||||||||||||||||||||
| Shares sold | $ | 1,501,064 | $ | 4,182,902 | $ | - | $ | 28,326 | |||||||||||||||||||
| Shares redeemed | (1,176,441 | ) | (3,235,935 | ) | (161,769 | ) | (651,974 | ) | |||||||||||||||||||
| Net increase (decrease) | $ | 324,623 | $ | 946,967 | $ | (161,769 | ) | $ | (623,648 | ) | |||||||||||||||||
| Class A Shares | Class B Shares | Class C Shares | |||||||||||||||||||||||||
| Six Months Ended November 30, 2004 | February 2, 2004(1) to May 31, 2004 | Six Months Ended November 30, 2004 | February 2, 2004(1) to May 31, 2004 | Six Months Ended November 30, 2004 | February 2, 2004(1) to May 31, 2004 | ||||||||||||||||||||||
| LargeCap Value (Number of Shares) | |||||||||||||||||||||||||||
| Shares sold | 998,189 | 518,761 | 413,099 | 283,191 | 493,764 | 400,925 | |||||||||||||||||||||
| Dividends reinvested | 14,581 | - | 4,783 | - | 6,111 | - | |||||||||||||||||||||
| Shares redeemed | (87,531 | ) | (28,776 | ) | (20,073 | ) | (12,978 | ) | (27,131 | ) | (6,833 | ) | |||||||||||||||
| Net increase in shares outstanding | 925,239 | 489,985 | 397,809 | 270,213 | 472,744 | 394,092 | |||||||||||||||||||||
| LargeCap Value ($) | |||||||||||||||||||||||||||
| Shares sold | $ | 9,803,063 | $ | 5,037,124 | $ | 4,039,690 | $ | 2,755,909 | $ | 4,796,388 | $ | 3,887,843 | |||||||||||||||
| Dividends reinvested | 149,894 | - | 48,999 | - | 62,641 | - | |||||||||||||||||||||
| Shares redeemed | (866,916 | ) | (274,359 | ) | (195,910 | ) | (124,117 | ) | (261,156 | ) | (65,883 | ) | |||||||||||||||
| Net increase | $ | 9,086,041 | $ | 4,762,765 | $ | 3,892,779 | $ | 2,631,792 | $ | 4,597,873 | $ | 3,821,960 | |||||||||||||||
(1) Commencement of operations.
63
NOTES TO FINANCIAL STATEMENTS AS OF NOVEMBER 30, 2004 (UNAUDITED) (CONTINUED)
NOTE 10 - CAPITAL SHARES (continued)
| Class I Shares | |||||||||||||||||||||||||||
| August 2, 2004(1) to November 30, 2004 | |||||||||||||||||||||||||||
| LargeCap Value (Number of Shares) | |||||||||||||||||||||||||||
| Shares sold | 257,733 | �� | |||||||||||||||||||||||||
| Dividends reinvested | 3,887 | ||||||||||||||||||||||||||
| Shares redeemed | - | ||||||||||||||||||||||||||
| Net increase in shares outstanding | 261,620 | ||||||||||||||||||||||||||
| LargeCap Value ($) | |||||||||||||||||||||||||||
| Shares sold | $ | 2,500,000 | |||||||||||||||||||||||||
| Dividends reinvested | 39,923 | ||||||||||||||||||||||||||
| Shares redeemed | - | ||||||||||||||||||||||||||
| Net increase | $ | 2,539,923 | |||||||||||||||||||||||||
| Class A Shares | Class B Shares | Class C Shares | |||||||||||||||||||||||||
| Six Months Ended November 30, 2004 | Year Ended May 31, 2004 | Six Months Ended November 30, 2004 | Year Ended May 31, 2004 | Six Months Ended November 30, 2004 | Year Ended May 31, 2004 | ||||||||||||||||||||||
| MagnaCap (Number of Shares) | |||||||||||||||||||||||||||
| Shares sold | 1,007,491 | 2,598,002 | 127,846 | 715,715 | 26,553 | 263,235 | |||||||||||||||||||||
| Shares issued in merger | - | 14,679,883 | - | 443,560 | - | 235,540 | |||||||||||||||||||||
| Dividends reinvested | 301,850 | 203,397 | 6,892 | - | 1,810 | - | |||||||||||||||||||||
| Shares redeemed | (2,579,765 | ) | (5,008,192 | ) | (1,089,709 | ) | (1,805,792 | ) | (245,138 | ) | (315,710 | ) | |||||||||||||||
| Net increase (decrease) in shares outstanding | (1,270,424 | ) | 12,473,090 | (954,971 | ) | (646,517 | ) | (216,775 | ) | 183,065 | |||||||||||||||||
| MagnaCap ($) | |||||||||||||||||||||||||||
| Shares sold | $ | 10,456,168 | $ | 25,810,263 | $ | 1,286,003 | $ | 7,106,156 | $ | 268,486 | $ | 2,618,410 | |||||||||||||||
| Shares issued in merger | - | 141,208,171 | - | 4,106,720 | - | 2,182,353 | |||||||||||||||||||||
| Dividends reinvested | 3,192,414 | 1,893,245 | 68,642 | - | 18,047 | - | |||||||||||||||||||||
| Shares redeemed | (26,904,590 | ) | (49,598,073 | ) | (10,937,153 | ) | (17,200,575 | ) | (2,487,389 | ) | (2,831,500 | ) | |||||||||||||||
| Net increase (decrease) | $ | (13,256,008 | ) | $ | 119,313,606 | $ | (9,582,508 | ) | $ | (5,987,699 | ) | $ | (2,200,856 | ) | $ | 1,969,263 | |||||||||||
| Class I Shares | Class M Shares | Class Q Shares | |||||||||||||||||||||||||
| Six Months Ended November 30, 2004 | Year Ended May 31, 2004 | Six Months Ended November 30, 2004 | Year Ended May 31, 2004 | Six Months Ended November 30, 2004 | Year Ended May 31, 2004 | ||||||||||||||||||||||
| MagnaCap (Number of Shares) | |||||||||||||||||||||||||||
| Shares sold | 221,490 | - | 1,636 | 30,375 | - | - | |||||||||||||||||||||
| Shares issued in merger | - | 2 | - | - | - | 807 | |||||||||||||||||||||
| Dividends reinvested | 1,995 | 12 | 1,533 | 506 | - | 4,830 | |||||||||||||||||||||
| Shares redeemed | (14,363 | ) | (2 | ) | (78,720 | ) | (369,836 | ) | (814 | ) | (847,215 | ) | |||||||||||||||
| Net increase (decrease) in shares outstanding | 209,122 | 12 | (75,551 | ) | (338,955 | ) | (814 | ) | (841,578 | ) | |||||||||||||||||
| MagnaCap ($) | |||||||||||||||||||||||||||
| Shares sold | $ | 2,294,178 | $ | - | $ | 16,713 | $ | 275,418 | $ | - | $ | - | |||||||||||||||
| Shares issued in merger | - | 18 | - | - | - | 7,766 | |||||||||||||||||||||
| Dividends reinvested | 21,582 | 111 | 15,813 | 4,431 | - | 42,987 | |||||||||||||||||||||
| Shares redeemed | (152,409 | ) | (21 | ) | (805,860 | ) | (3,437,895 | ) | (8,444 | ) | (7,712,659 | ) | |||||||||||||||
| Net increase (decrease) | $ | 2,163,351 | $ | 108 | $ | (773,334 | ) | $ | (3,158,046 | ) | $ | (8,444 | ) | $ | (7,661,906 | ) | |||||||||||
(1) Commencement of operations.
64
NOTES TO FINANCIAL STATEMENTS AS OF NOVEMBER 30, 2004 (UNAUDITED) (CONTINUED)
NOTE 10 - CAPITAL SHARES (continued)
| Class A Shares | Class B Shares | Class C Shares | |||||||||||||||||||||||||
| Six Months Ended November 30, 2004 | Year Ended May 31, 2004 | Six Months Ended November 30, 2004 | Year Ended May 31, 2004 | Six Months Ended November 30, 2004 | Year Ended May 31, 2004 | ||||||||||||||||||||||
| MidCap Value (Number of Shares) | |||||||||||||||||||||||||||
| Shares sold | 3,579,577 | 4,389,175 | 945,597 | 1,916,154 | 1,434,397 | 1,895,746 | |||||||||||||||||||||
| Dividends reinvested | 385,030 | - | 214,551 | - | 213,558 | - | |||||||||||||||||||||
| Shares redeemed | (2,304,605 | ) | (1,100,635 | ) | (340,795 | ) | (323,780 | ) | (306,631 | ) | (534,781 | ) | |||||||||||||||
| Net increase in shares outstanding | 1,660,002 | 3,288,540 | 819,353 | 1,592,374 | 1,341,324 | 1,360,965 | |||||||||||||||||||||
| MidCap Value ($) | |||||||||||||||||||||||||||
| Shares sold | $ | 41,280,708 | $ | 47,731,690 | $ | 10,710,789 | $ | 20,528,670 | $ | 16,189,607 | $ | 20,537,186 | |||||||||||||||
| Dividends reinvested | 4,301,356 | - | 2,360,063 | - | 2,349,128 | - | |||||||||||||||||||||
| Shares redeemed | (25,637,914 | ) | (12,000,827 | ) | (3,790,654 | ) | (3,379,087 | ) | (3,450,323 | ) | (5,326,519 | ) | |||||||||||||||
| Net increase | $ | 19,944,150 | $ | 35,730,863 | $ | 9,280,198 | $ | 17,149,583 | $ | 15,088,412 | $ | 15,210,667 | |||||||||||||||
| Class I Shares | Class Q Shares | ||||||||||||||||||||||||||
| Six Months Ended November 30, 2004 | Year Ended May 31, 2004 | Six Months Ended November 30, 2004 | Year Ended May 31, 2004 | ||||||||||||||||||||||||
| MidCap Value (Number of Shares) | |||||||||||||||||||||||||||
| Shares sold | - | 167,376 | - | - | |||||||||||||||||||||||
| Dividends reinvested | 13,266 | - | 135 | - | |||||||||||||||||||||||
| Shares redeemed | (11,385 | ) | (5,110 | ) | - | - | |||||||||||||||||||||
| Net increase in shares outstanding | 1,881 | 162,266 | 135 | - | |||||||||||||||||||||||
| MidCap Value ($) | |||||||||||||||||||||||||||
| Shares sold | $ | - | $ | 1,880,019 | $ | - | $ | - | |||||||||||||||||||
| Dividends reinvested | 153,787 | - | 1,507 | - | |||||||||||||||||||||||
| Shares redeemed | (135,498 | ) | (58,828 | ) | - | - | |||||||||||||||||||||
| Net increase | $ | 18,289 | $ | 1,821,191 | $ | 1,507 | $ | - | |||||||||||||||||||
| Class A Shares | Class B Shares | Class C Shares | |||||||||||||||||||||||||
| Six Months Ended November 30, 2004 | Year Ended May 31, 2004 | Six Months Ended November 30, 2004 | Year Ended May 31, 2004 | Six Months Ended November 30, 2004 | Year Ended May 31, 2004 | ||||||||||||||||||||||
| SmallCap Value (Number of Shares) | |||||||||||||||||||||||||||
| Shares sold | 4,168,645 | 2,394,934 | 534,967 | 752,515 | 1,306,443 | 1,373,071 | |||||||||||||||||||||
| Dividends reinvested | 324,833 | 83,905 | 98,206 | 55,029 | 137,839 | 50,521 | |||||||||||||||||||||
| Shares redeemed | (1,343,277 | ) | (409,889 | ) | (149,120 | ) | (201,315 | ) | (274,000 | ) | (455,949 | ) | |||||||||||||||
| Net increase in shares outstanding | 3,150,201 | 2,068,950 | 484,053 | 606,229 | 1,170,282 | 967,643 | |||||||||||||||||||||
| SmallCap Value ($) | |||||||||||||||||||||||||||
| Shares sold | $ | 55,188,734 | $ | 30,977,651 | $ | 7,025,405 | $ | 9,220,990 | $ | 17,041,617 | $ | 17,186,034 | |||||||||||||||
| Dividends reinvested | 4,281,297 | 940,575 | 1,271,774 | 611,375 | 1,783,641 | 560,781 | |||||||||||||||||||||
| Shares redeemed | (17,838,218 | ) | (5,024,204 | ) | (1,908,851 | ) | (2,376,307 | ) | (3,537,268 | ) | (5,504,573 | ) | |||||||||||||||
| Net increase | $ | 41,631,813 | $ | 26,894,022 | $ | 6,388,328 | $ | 7,456,058 | $ | 15,287,990 | $ | 12,242,242 | |||||||||||||||
| Class I Shares | Class Q Shares | ||||||||||||||||||||||||||
| Six Months Ended November 30, 2004 | Year Ended May 31, 2004 | Six Months Ended November 30, 2004 | Year Ended May 31, 2004 | ||||||||||||||||||||||||
| SmallCap Value (Number of Shares) | |||||||||||||||||||||||||||
| Shares sold | 205 | 13,396 | 370 | 4,134 | |||||||||||||||||||||||
| Dividends reinvested | 2,260 | 1,983 | 303 | - | |||||||||||||||||||||||
| Shares redeemed | - | (3,604 | ) | - | - | ||||||||||||||||||||||
| Net increase in shares outstanding | 2,465 | 11,775 | 673 | 4,134 | |||||||||||||||||||||||
| SmallCap Value ($) | |||||||||||||||||||||||||||
| Shares sold | $ | 2,810 | $ | 158,274 | $ | 5,000 | $ | 57,676 | |||||||||||||||||||
| Dividends reinvested | 29,951 | 22,291 | 4,047 | - | |||||||||||||||||||||||
| Shares redeemed | - | (46,393 | ) | - | - | ||||||||||||||||||||||
| Net increase | $ | 32,761 | $ | 134,172 | $ | 9,047 | $ | 57,676 | |||||||||||||||||||
65
NOTES TO FINANCIAL STATEMENTS AS OF NOVEMBER 30, 2004 (UNAUDITED) (CONTINUED)
NOTE 10 - CAPITAL SHARES (continued)
| Class A Shares | Class B Shares | Class C Shares | |||||||||||||||||||||||||
| Six Months Ended November 30, 2004 | Year Ended May 31, 2004 | Six Months Ended November 30, 2004 | Year Ended May 31, 2004 | Six Months Ended November 30, 2004 | Year Ended May 31, 2004 | ||||||||||||||||||||||
| Convertible (Number of Shares) | |||||||||||||||||||||||||||
| Shares sold | 374,702 | 1,298,675 | 140,780 | 739,659 | 112,815 | 557,509 | |||||||||||||||||||||
| Dividends reinvested | 37,842 | 60,283 | 24,184 | 42,820 | 21,723 | 35,305 | |||||||||||||||||||||
| Shares redeemed | (644,139 | ) | (1,003,751 | ) | (672,948 | ) | (1,078,475 | ) | (378,972 | ) | (744,929 | ) | |||||||||||||||
| Net increase (decrease) in shares outstanding | (231,595 | ) | 355,207 | (507,984 | ) | (295,996 | ) | (244,434 | ) | (152,115 | ) | ||||||||||||||||
| Convertible ($) | |||||||||||||||||||||||||||
| Shares sold | $ | 6,753,786 | $ | 22,561,007 | $ | 2,780,427 | $ | 14,414,494 | $ | 2,081,591 | $ | 10,042,116 | |||||||||||||||
| Dividends reinvested | 683,419 | 1,052,348 | 481,004 | 813,670 | 402,497 | 627,776 | |||||||||||||||||||||
| Shares redeemed | (11,570,432 | ) | (17,665,114 | ) | (13,314,403 | ) | (20,919,881 | ) | (6,982,232 | ) | (13,528,070 | ) | |||||||||||||||
| Net increase (decrease) | $ | (4,133,227 | ) | $ | 5,948,241 | $ | (10,052,972 | ) | $ | (5,691,717 | ) | $ | (4,498,144 | ) | $ | (2,858,178 | ) | ||||||||||
| Class Q Shares | |||||||||||||||||||||||||||
| Six Months Ended November 30, 2004 | Year Ended May 31, 2004 | ||||||||||||||||||||||||||
| Convertible (Number of Shares) | |||||||||||||||||||||||||||
| Shares sold | 704 | 27,805 | |||||||||||||||||||||||||
| Dividends reinvested | 2,542 | 5,192 | |||||||||||||||||||||||||
| Shares redeemed | (27,818 | ) | (108,400 | ) | |||||||||||||||||||||||
| Net increase (decrease) in shares outstanding | (24,572 | ) | (75,403 | ) | |||||||||||||||||||||||
| Convertible ($) | |||||||||||||||||||||||||||
| Shares sold | $ | 12,150 | $ | 481,790 | |||||||||||||||||||||||
| Dividends reinvested | 44,534 | 87,716 | |||||||||||||||||||||||||
| Shares redeemed | (483,033 | ) | (1,846,310 | ) | |||||||||||||||||||||||
| Net increase (decrease) | $ | (426,349 | ) | $ | (1,276,804 | ) | |||||||||||||||||||||
| Class A Shares | Class B Shares | Class C Shares | |||||||||||||||||||||||||
| Six Months Ended November 30, 2004 | Year Ended May 31, 2004 | Six Months Ended November 30, 2004 | Year Ended May 31, 2004 | Six Months Ended November 30, 2004 | Year Ended May 31, 2004 | ||||||||||||||||||||||
| Equity and Bond (Number of Shares) | |||||||||||||||||||||||||||
| Shares sold | 106,090 | 887,579 | 108,252 | 437,744 | 7,269 | 141,155 | |||||||||||||||||||||
| Dividends reinvested | 13,886 | 53,776 | 2,096 | 15,763 | 2,345 | 13,925 | |||||||||||||||||||||
| Shares redeemed | (349,668 | ) | (1,045,795 | ) | (290,619 | ) | (782,074 | ) | (132,365 | ) | (285,420 | ) | |||||||||||||||
| Net increase (decrease) in shares outstanding | (229,692 | ) | (104,440 | ) | (180,271 | ) | (328,567 | ) | (122,751 | ) | (130,340 | ) | |||||||||||||||
| Equity and Bond ($) | |||||||||||||||||||||||||||
| Shares sold | $ | 1,325,834 | $ | 10,932,304 | $ | 1,459,661 | $ | 5,924,840 | $ | 86,354 | $ | 1,627,156 | |||||||||||||||
| Dividends reinvested | 174,303 | 644,730 | 28,384 | 201,540 | 28,101 | 158,421 | |||||||||||||||||||||
| Shares redeemed | (4,360,582 | ) | (13,177,888 | ) | (3,908,740 | ) | (10,424,076 | ) | (1,570,483 | ) | (3,316,399 | ) | |||||||||||||||
| Net increase (decrease) | $ | (2,860,445 | ) | $ | (1,600,854 | ) | $ | (2,420,695 | ) | $ | (4,297,696 | ) | $ | (1,456,028 | ) | $ | (1,530,822 | ) | |||||||||
| Class Q Shares | |||||||||||||||||||||||||||
| Six Months Ended November 30, 2004 | Year Ended May 31, 2004 | ||||||||||||||||||||||||||
| Equity and Bond (Number of Shares) | |||||||||||||||||||||||||||
| Shares sold | 1,836 | 22,261 | |||||||||||||||||||||||||
| Dividends reinvested | 169 | 556 | |||||||||||||||||||||||||
| Shares redeemed | (5,240 | ) | (15,787 | ) | |||||||||||||||||||||||
| Net increase (decrease) in shares outstanding | (3,235 | ) | 7,030 | ||||||||||||||||||||||||
| Equity and Bond ($) | |||||||||||||||||||||||||||
| Shares sold | $ | 22,904 | $ | 266,462 | |||||||||||||||||||||||
| Dividends reinvested | 2,104 | 6,646 | |||||||||||||||||||||||||
| Shares redeemed | (65,292 | ) | (192,188 | ) | |||||||||||||||||||||||
| Net increase (decrease) | $ | (40,284 | ) | $ | 80,920 | ||||||||||||||||||||||
66
NOTES TO FINANCIAL STATEMENTS AS OF NOVEMBER 30, 2004 (UNAUDITED) (CONTINUED)
NOTE 10 - CAPITAL SHARES (continued)
| Class A Shares | Class B Shares | Class C Shares | |||||||||||||||||||||||||
| Six Months Ended November 30, 2004 | Year Ended May 31, 2004 | Six Months Ended November 30, 2004 | Year Ended May 31, 2004 | Six Months Ended November 30, 2004 | Year Ended May 31, 2004 | ||||||||||||||||||||||
| Real Estate (Number of Shares) | |||||||||||||||||||||||||||
| Shares sold | 1,296,961 | 1,380,337 | 61,751 | 166,580 | 49,705 | 292,977 | |||||||||||||||||||||
| Dividends reinvested | 185,743 | 43,360 | 13,596 | 3,900 | 15,446 | 12,292 | |||||||||||||||||||||
| Shares redeemed | (82,888 | ) | (213,905 | ) | (14,977 | ) | (28,211 | ) | (35,006 | ) | (112,603 | ) | |||||||||||||||
| Net increase (decrease) in shares outstanding | 1,399,816 | 1,209,792 | 60,370 | 142,269 | 30,145 | 192,666 | |||||||||||||||||||||
| Real Estate ($) | |||||||||||||||||||||||||||
| Shares sold | $ | 17,848,353 | $ | 16,994,026 | $ | 849,451 | $ | 2,087,459 | $ | 688,996 | $ | 3,611,743 | |||||||||||||||
| Dividends reinvested | 2,584,373 | 538,693 | 189,646 | 48,871 | 220,956 | 154,981 | |||||||||||||||||||||
| Shares redeemed | (1,121,002 | ) | (2,582,779 | ) | (204,720 | ) | (344,880 | ) | (483,364 | ) | (1,396,621 | ) | |||||||||||||||
| Net increase (decrease) | $ | 19,311,724 | $ | 14,949,940 | $ | 834,377 | $ | 1,791,450 | $ | 426,588 | $ | 2,370,103 | |||||||||||||||
| Class I Shares | Class O | ||||||||||||||||||||||||||
| Six Months Ended November 30, 2004 | Year Ended May 31, 2004 | September 15, 2004(1) to November 30, 2004 | |||||||||||||||||||||||||
| Real Estate (Number of Shares) | |||||||||||||||||||||||||||
| Shares sold | 1,082,086 | 4,052,833 | 292,138 | ||||||||||||||||||||||||
| Dividends reinvested | 665,515 | 735,129 | 14,205 | ||||||||||||||||||||||||
| Shares redeemed | (829,154 | ) | (3,565,560 | ) | (23,335 | ) | |||||||||||||||||||||
| Net increase (decrease) in shares outstanding | 918,447 | 1,222,402 | 283,008 | ||||||||||||||||||||||||
| Real Estate ($) | |||||||||||||||||||||||||||
| Shares sold | $ | 15,222,356 | $ | 51,206,192 | $ | 4,156,760 | |||||||||||||||||||||
| Dividends reinvested | 9,638,943 | 9,236,584 | 198,427 | ||||||||||||||||||||||||
| Shares redeemed | (11,434,487 | ) | (45,266,438 | ) | (338,564 | ) | |||||||||||||||||||||
| Net increase (decrease) | $ | 13,426,812 | $ | 15,176,338 | $ | 4,016,623 | |||||||||||||||||||||
(1) Commencement of operations.
67
NOTES TO FINANCIAL STATEMENTS AS OF NOVEMBER 30, 2004 (UNAUDITED) (CONTINUED)
NOTE 11 - SECURITIES LENDING
Under an agreement with The Bank of New York ("BNY"), the Funds can lend their securities to approved brokers, dealers and other financial institutions. Loans are collateralized by cash and U.S. Government securities. The collateral must be in an amount equal to at least 105% of the market value of non-U.S. securities loaned and 102% of the market value of U.S. securities loaned. The cash collateral received is invested in approved investments as defined in the Securities Lending Agreement with BNY (the "Agreement"). The collateral received is reflected in the Portfolio of Investments as collateral for securities loaned. Generally, in the event of counterparty default, the Funds have the right to use the collateral to offset losses incurred. The Agreement contains certain guarantees by BNY in the event of counterparty default and/or a borrower's failure to return a loaned security; however there would be a potential loss to the Funds in the event the Funds are delayed or prevented from exercising their right to dispose of the collateral. The Funds bear the risk of loss with respect to the investment of collateral. Engaging in securities lending could have a leveraging effect, which may intensify the credit, market and other risks associated with investing in a Fund. At November 30, 2004, the Funds had securities on loan with the following market values:
| Value of Securities Loaned | Value of Collateral | ||||||||||
| Disciplined LargeCap | $ | 369,244 | $ | 379,129 | |||||||
| LargeCap Growth | 33,248,005 | �� | 34,202,610 | ||||||||
| MidCap Opportunities | 42,247,835 | 43,961,923 | |||||||||
| SmallCap Opportunities | 38,383,888 | 39,670,466 | |||||||||
| MidCap Value | 23,864,087 | 25,264,576 | |||||||||
| SmallCap Value | 31,965,747 | 34,093,573 | |||||||||
| Convertible | 52,558,629 | 53,943,311 | |||||||||
| Real Estate | 8,856,992 | 9,043,070 | |||||||||
NOTE 12 - WHEN ISSUED SECURITIES
The Equity and Bond Fund, at times, may purchase FNMA/GNMA certificates on a delayed delivery, forward or when-issued basis with payment and delivery often taking place a month or more after the initiation of the transaction. It is the Fund's policy to record when-issued FNMA/GNMA certificates (and the corresponding obligation to pay for the securities) at the time the purchase commitment becomes fixed - generally on the trade date. It is also the Fund's policy to segregate assets to cover its commitments for when-issued securities on trade date.
NOTE 13 - FEDERAL INCOME TAXES
The amount of distributions from net investment income and net realized capital gains are determined in accordance with federal income tax regulations, which may differ from accounting principles generally accepted in the United States of America for investment companies. These book/tax differences may be either temporary or permanent. Permanent differences are reclassified within the capital accounts based on their federal tax-basis treatment; temporary differences are not reclassified. Key differences include the treatment of short-term capital gains, foreign currency transactions, organizational and offering expenses, and wash sale deferrals. Distributions in excess of available earnings and profits, current and accumulated, for tax purposes are reported as distributions of paid-in capital.
Dividends paid by the Funds from net investment income and distributions of net realized short-term capital gains are, for federal income tax purposes, taxable as ordinary income to shareholders.
The tax composition of dividends and distributions to shareholders were as follows:
| Six Months Ended November 30, 2004 | |||||||||||
| Ordinary Income | Long-Term Capital Gains | ||||||||||
| LargeCap Growth | $ | 8,477,756 | $ | - | |||||||
| LargeCap Value | 132,790 | 251,668 | |||||||||
| SmallCap Value | - | 9,699,163 | |||||||||
| Convertible | 2,503,049 | - | |||||||||
| Equity and Bond | 305,502 | - | |||||||||
| Real Estate | 3,676,059 | 14,759,993 | |||||||||
| Year Ended May 31, 2004 | |||||||||||
| Ordinary Income | Long-Term Capital Gains | ||||||||||
| MagnaCap | $ | 2,245,213 | $ | - | |||||||
| SmallCap Value | 536,307 | 2,285,376 | |||||||||
| Convertible | 4,038,953 | - | |||||||||
| Equity and Bond | 1,362,049 | - | |||||||||
| Real Estate(1) | 8,704,727 | 6,564,687 | |||||||||
(1) Composition of dividends and distributions presented herein differ from final amounts based on the Fund's tax year end of December 31, 2003.
68
NOTES TO FINANCIAL STATEMENTS AS OF NOVEMBER 30, 2004 (UNAUDITED) (CONTINUED)
NOTE 13 - FEDERAL INCOME TAXES (continued)
The tax-basis components of distributable earnings and the expiration dates of the capital loss carryforwards which may be used to offset future realized capital gains for federal income tax purposes were as follows at May 31, 2004:
| Undistributed Ordinary Income | Undistributed Long-Term Capital Gain | Unrealized Appreciation/ (Depreciation) | Post October Losses Deferred | Capital Loss Carryforwards | Expiration Dates | ||||||||||||||||||||||
| LargeCap Growth | $ | - | $ | - | $ | 51,263,561 | $ | - | $ | (129,467,771 | ) | 2009 | |||||||||||||||
| (140,176,886 | ) | 2010 | |||||||||||||||||||||||||
| (117,098,211 | ) | 2011 | |||||||||||||||||||||||||
| $ | (386,742,868 | )* | |||||||||||||||||||||||||
| MidCap Opportunities | - | - | 74,959,819 | - | $ | (133,027,987 | ) | 2008 | |||||||||||||||||||
| (94,142,180 | ) | 2009 | |||||||||||||||||||||||||
| (21,217,297 | ) | 2010 | |||||||||||||||||||||||||
| (9,824,346 | ) | 2011 | |||||||||||||||||||||||||
| $ | (258,211,810 | )* | |||||||||||||||||||||||||
| SmallCap Opportunities | - | - | 61,768,589 | - | $ | (1,017,516 | ) | 2008 | |||||||||||||||||||
| (74,206,071 | ) | 2009 | |||||||||||||||||||||||||
| (106,886,755 | ) | 2010 | |||||||||||||||||||||||||
| (167,319,500 | ) | 2011 | |||||||||||||||||||||||||
| $ | (349,429,842 | )* | |||||||||||||||||||||||||
| Disciplined LargeCap | - | - | 4,324,900 | - | $ | (1,279,041 | ) | 2008 | |||||||||||||||||||
| (7,339,303 | ) | 2009 | |||||||||||||||||||||||||
| (10,480,954 | ) | 2010 | |||||||||||||||||||||||||
| (24,371,998 | ) | 2011 | |||||||||||||||||||||||||
| (6,531,058 | ) | 2012 | |||||||||||||||||||||||||
| $ | (50,002,354 | ) | |||||||||||||||||||||||||
| LargeCap Value | 54,520 | - | (107,145 | ) | - | $ | - | ||||||||||||||||||||
| MagnaCap | 1,364,430 | - | 48,726,275 | (309,679 | ) | $ | (10,576,002 | ) | 2011 | ||||||||||||||||||
| (58,933,684 | ) | 2012 | |||||||||||||||||||||||||
| $ | (69,509,686 | ) | |||||||||||||||||||||||||
| MidCap Value | 3,838,510 | 2,707,472 | 1,618,665 | - | $ | - | |||||||||||||||||||||
| SmallCap Value | 3,161,587 | 3,491,699 | 5,237,983 | - | $ | - | |||||||||||||||||||||
| Convertible | 1,813,064 | - | 14,601,092 | - | $ | (65,571,008 | ) | 2010 | |||||||||||||||||||
| (15,497,044 | ) | 2011 | |||||||||||||||||||||||||
| $ | (81,068,052 | ) | |||||||||||||||||||||||||
| Equity and Bond | 109,754 | - | 2,551,909 | (1,260 | ) | $ | (2,058,681 | ) | 2010 | ||||||||||||||||||
| (4,569,236 | ) | 2011 | |||||||||||||||||||||||||
| (8,878,256 | ) | 2012 | |||||||||||||||||||||||||
| $ | (15,506,173 | ) | |||||||||||||||||||||||||
| Real Estate(1) | - | - | 30,275,162 | - | $ | - | |||||||||||||||||||||
* Utilization of these capital losses is subject to annual limitations under Section 382 of the Internal Revenue Code.
(1) As of the Fund's tax year ended December 31, 2003.
69
NOTES TO FINANCIAL STATEMENTS AS OF NOVEMBER 30, 2004 (UNAUDITED) (CONTINUED)
NOTE 14 - ILLIQUID SECURITIES
Pursuant to guidelines adopted by the Funds' Board, the following securities have been deemed to be illiquid. The Funds currently limit investment in illiquid securities to 15% of the Fund's net assets, at market value, at time of purchase.
| Fund | Security | Shares | Initial Acquisition Date | Cost | Value | Percent of Net Assets | |||||||||||||||||||||
| Convertible | WinStar Communications, Inc. | 51,932 | 11/6/98 | $ | 2,364,096 | $ | 5 | 0.00 | % | ||||||||||||||||||
| Equity and Bond | Dayton Superior Corp. | 400 | 8/31/01 | 7,446 | 4 | 0.00 | % | ||||||||||||||||||||
| Iridium World Comm | 500 | 8/31/01 | 50,507 | - | 0.00 | % | |||||||||||||||||||||
| North Atlantic Trading Co. | 1,209 | 8/31/01 | 12 | 1 | 0.00 | % | |||||||||||||||||||||
| WinStar Communications, Inc. | 500,000 | 1/10/01 | 386,500 | 50 | 0.00 | % | |||||||||||||||||||||
| $ | 444,465 | $ | 55 | 0.00 | % | ||||||||||||||||||||||
NOTE 15 - REORGANIZATION
On November 8, 2003, MagnaCap as listed below ("Acquiring Fund"), acquired the assets and certain liabilities of the ING Large Company Value Fund, also listed below ("Acquired Fund"), in a tax-free reorganization in exchange for shares of the Acquiring Fund, pursuant to a plan of reorganization approved by the Acquired Fund's shareholders. The number and value of shares issued by the Acquiring Fund are presented in Note 10 - Capital Shares. Net assets and unrealized appreciation as of the reorganization dates were as follows:
| Acquiring Fund | Acquired Funds | Total net assets of Acquired Fund (000's) | Total net assets of Acquiring Fund (000's) | Acquired Fund unrealized appreciation (000's) | Conversion Ratio | ||||||||||||||||||
| MagnaCap | ING Large Company Value Fund | $147,505 | $230,749 | $9,420 | 1.40 | ||||||||||||||||||
The net assets of MagnaCap after the acquisition were approximately $378,254,371.
On April 17, 2004, MidCap Opportunities as listed below ("Acquiring Fund"), acquired the assets and certain liabilities of the ING Growth + Value Fund and the ING Growth Opportunities Fund, also listed below ("Acquired Funds"), in a tax-free reorganization in exchange for shares of the Acquiring Fund, pursuant to a plan of reorganization approved by the Acquired Fund's shareholders. The number and value of shares issued by the Acquiring Fund are presented in Note 10 - Capital Shares. Net assets and unrealized appreciation as of the reorganization dates were as follows:
| Acquiring Fund | Acquired Funds | Total net assets of Acquired Fund (000's) | Total net assets of Acquiring Fund (000's) | Acquired Fund unrealized appreciation (000's) | Conversion Ratio | ||||||||||||||||||
| MidCap Opportunities | ING Growth + Value Fund | $ | 196,927 | $ | 173,487 | $ | 36,128 | 0.79 | |||||||||||||||
| MidCap Opportunities | ING Growth Opportunities Fund | 176,236 | 173,487 | 35,037 | 1.10 | ||||||||||||||||||
The net assets of MidCap Opportunities after the acquisition were approximately $546,649,969.
NOTE 16 - INFORMATION REGARDING TRADING OF ING'S U.S. MUTUAL FUNDS
ING Investments, LLC ("Investments"), the adviser to the ING Funds, has reported to the Boards of Directors/Trustees (the "Board") of the ING Funds that, like many U.S. financial services companies, Investments and certain of its U.S. affiliates have received informal and formal requests for information since September 2003 from various governmental and self-regulatory agencies in connection with investigations related to mutual funds and variable insurance products. Investments has advised the Board that it and its affiliates have cooperated fully with each request.
In addition to responding to regulatory and governmental requests, Investments reported that management of U.S. affiliates of ING Groep N.V., including Investments (collectively, "ING"), on their own initiative, have conducted, through independent special counsel and a national accounting firm, an extensive internal review of trading in ING insurance, retirement, and mutual fund products. The goal of this review was to identify any instances of inappropriate trading in those products by third parties or by ING investment professionals and other ING personnel. ING's internal review related to mutual fund trading is now substantially completed. ING has
70
NOTES TO FINANCIAL STATEMENTS AS OF NOVEMBER 30, 2004 (UNAUDITED) (CONTINUED)
NOTE 16 - INFORMATION REGARDING TRADING OF ING'S U.S. MUTUAL FUNDS (continued)
reported that, of the millions of customer relationships that ING maintains, the internal review identified several isolated arrangements allowing third parties to engage in frequent trading of mutual funds within ING's variable insurance and mutual fund products, and identified other circumstances where frequent trading occurred, despite measures taken by ING intended to combat market timing. ING further reported that each of these arrangements has been terminated and fully disclosed to regulators. The results of the internal review were also reported to the independent members of the Board.
Investments has advised the Board that most of the identified arrangements were initiated prior to ING's acquisition of the businesses in question in the U.S. Investments further reported that the companies in question did not receive special benefits in return for any of these arrangements, which have all been terminated. Based on the internal review, Investments has advised the Board that the identified arrangements do not represent a systemic problem in any of the companies that were involved.
More specifically, Investments reported to the Board that, at this time, these instances include the following:
• ING has identified three arrangements, dating from 1995, 1996 and 1998, under which the administrator to the then-Pilgrim Funds, which subsequently became part of the ING Funds, entered formal and informal arrangements that permitted frequent trading. ING Funds Distributor, LLC ("IFD") has received a notice from the staff of the NASD informing IFD that it has made a preliminary determination to recommend that disciplinary action be brought against IFD and one of its registered persons for violations of the NASD Conduct Rules and certain provisions of the federal securities laws in connection with these arrangements.
• Aeltus Investment Management, Inc. (a predecessor entity to ING Investment Management Co.) has identified two investment professionals who engaged in extensive frequent trading in certain ING Funds. One was subsequently terminated for cause and incurred substantial financial penalties in connection with this conduct and the second has been disciplined.
• ReliaStar Life Insurance Company ("ReliaStar") entered into agreements seven years ago permitting the owner of policies issued by the insurer to engage in frequent trading and to submit orders until 4pm Central Time. In 2001 ReliaStar also entered into a selling agreement with a broker-dealer that engaged in frequent trading. Employees of ING affiliates were terminated and/or disciplined in connection with these matters.
• In 1998, Golden American Life Insurance Company entered into arrangements permitting a broker-dealer to frequently trade up to certain specific limits in a fund available in an ING variable annuity product. No employee responsible for this arrangement remains at the company.
For additional information regarding these matters, you may consult the Form 8-K for each of four life insurance companies, ING USA Annuity and Life Insurance Company, ING Life Insurance and Annuity Company, ING Insurance Company of America, and ReliaStar Life Insurance Company of New York, each filed with the Securities and Exchange Commission (the "SEC") on September 9, 2004. These Forms 8-K can be accessed through the SEC's Web site at http://www.sec.gov. Despite the extensive internal review conducted through independent special counsel and a national accounting firm, there can be no assurance that the instances of inappropriate trading reported to the Board are the only instances of such trading respecting the ING Funds. Investments reported to the Board that ING is committed to conducting its business with the highest standards of ethical conduct with zero tolerance for noncompliance .
Accordingly, Investments advised the Board that ING management was disappointed that its voluntary internal review identified these situations. Viewed in the context of the breadth and magnitude of its U.S. business as a whole, ING management does not believe that ING's acquired companies had systemic ethical or compliance issues in these areas. Nonetheless, Investments reported that given ING's refusal to tolerate any lapses, it has taken the steps noted below, and will continue to seek opportunities to further strengthen the internal controls of its affiliates.
• ING has agreed with the ING Funds to indemnify and hold harmless the ING Funds from all damages resulting from wrongful conduct by ING or its employees or from ING's internal investigation, any investigations conducted by any governmental or self-regulatory agencies, litigation or other formal proceedings, including
71
NOTES TO FINANCIAL STATEMENTS AS OF NOVEMBER 30, 2004 (UNAUDITED) (CONTINUED)
NOTE 16 - INFORMATION REGARDING TRADING OF ING'S U.S. MUTUAL FUNDS (continued)
any proceedings by the Securities and Exchange Commission. Investments reported to the Board that ING management believes that the total amount of any indemnification obligations will not be material to ING or its U.S. business.
• ING updated its Code of Conduct for employees reinforcing its employees' obligation to conduct personal trading activity consistent with the law, disclosed limits, and other requirements.
• The ING Funds, upon a recommendation from ING, updated their respective Codes of Ethics applicable to investment professionals with ING entities and certain other fund personnel, requiring such personnel to pre-clear any purchases or sales of ING Funds that are not systematic in nature (i.e., dividend reinvestment), and imposing minimum holding periods for shares of ING Funds.
• ING instituted excessive trading policies for all customers in its variable insurance and retirement products and for shareholders of the ING Funds sold to the public through financial intermediaries. ING does not make exceptions to these policies.
• ING reorganized and expanded its U.S. Compliance Department, and created an Enterprise Compliance team to enhance controls and consistency in regulatory compliance.
NOTE 17 - SUBSEQUENT EVENTS
Effective January 1, 2005, the expense limitations for Disciplined LargeCap, MidCap Opportunities, SmallCap Opportunities, Convertible and Equity and Bond will be lowered based on the following tables:
| Class A | Class B | Class C | Class I | Class Q | |||||||||||||||||||
| Disciplined Large Cap | 1.36 | % | 2.11 | % | 2.11 | % | 1.11 | % | N/A | ||||||||||||||
| MidCap Opportunities | 1.50 | % | 2.25 | % | 2.25 | % | 1.25 | % | 1.50 | % | |||||||||||||
| SmallCap Opportunities | 1.50 | % | 2.25 | % | 2.25 | % | 1.25 | % | 1.50 | % | |||||||||||||
| Convertible | 1.33 | % | 2.08 | % | 2.08 | % | N/A | 1.33 | % | ||||||||||||||
| Equity and Bond | 1.36 | % | 2.11 | % | 2.11 | % | N/A | 1.36 | % | ||||||||||||||
These expense limitation agreements are for the period beginning January 1, 2005 through December 31, 2005.
Effective January 1, 2005, ING Funds Distributor, LLC has contractually agreed to waive 0.05% of the Distribution Fee for Class A shares of Disciplined LargeCap, MidCap Opportunities and SmallCap Opportunities and 0.10% of the Distribution Fee for Class A shares of Convertible and Equity and Bond. The fee waiver is for the period beginning January 1, 2005 through December 31, 2005.
72
PORTFOLIO OF INVESTMENTS
ING DISCIPLINED LARGECAP FUND AS OF NOVEMBER 30, 2004 (UNAUDITED)
| Shares | Value | ||||||||||||||
| COMMON STOCK: 98.1% | |||||||||||||||
| Aerospace/Defense: 2.8% | |||||||||||||||
| 9,700 | Boeing Co. | $ | 519,629 | ||||||||||||
| 3,350 | General Dynamics Corp. | 363,006 | |||||||||||||
| 8,000 | Raytheon Co. | 322,720 | |||||||||||||
| 2,200 | United Technologies Corp. | 214,676 | |||||||||||||
| 1,420,031 | |||||||||||||||
| Agriculture: 1.3% | |||||||||||||||
| 8,850 | Altria Group, Inc. | 508,786 | |||||||||||||
| 3,691 | UST, Inc. | 162,515 | |||||||||||||
| 671,301 | |||||||||||||||
| Apparel: 1.4% | |||||||||||||||
| 4,200 | @ | Coach, Inc. | 209,328 | ||||||||||||
| 4,150 | Nike, Inc. | 351,339 | |||||||||||||
| 2,500 | VF Corp. | 134,975 | |||||||||||||
| 695,642 | |||||||||||||||
| Auto Manufacturers: 1.3% | |||||||||||||||
| 25,650 | Ford Motor Co. | 363,717 | |||||||||||||
| 3,600 | PACCAR, Inc. | 281,160 | |||||||||||||
| 644,877 | |||||||||||||||
| Banks: 5.5% | |||||||||||||||
| 17,750 | Bank of America Corp. | 821,292 | |||||||||||||
| 3,700 | Comerica, Inc. | 227,550 | |||||||||||||
| 8,400 | KeyCorp | 279,636 | |||||||||||||
| 9,634 | National City Corp. | 357,229 | |||||||||||||
| 8,250 | U.S. Bancorp | 244,448 | |||||||||||||
| 7,050 | Wachovia Corp. | 364,837 | |||||||||||||
| 7,450 | Wells Fargo & Co. | 460,186 | |||||||||||||
| 2,755,178 | |||||||||||||||
| Beverages: 2.3% | |||||||||||||||
| 10,600 | Coca-Cola Co. | 416,686 | |||||||||||||
| 15,150 | PepsiCo, Inc. | 756,137 | |||||||||||||
| 1,172,823 | |||||||||||||||
| Biotechnology: 0.2% | |||||||||||||||
| 1,800 | @ | Amgen, Inc. | 108,072 | ||||||||||||
| 108,072 | |||||||||||||||
| Chemicals: 1.6% | |||||||||||||||
| 4,100 | Dow Chemical Co. | 206,927 | |||||||||||||
| 4,700 | E.I. du Pont de Nemours & Co. | 213,004 | |||||||||||||
| 3,750 | PPG Industries, Inc. | 253,013 | |||||||||||||
| 3,300 | Sherwin-Williams Co. | 147,180 | |||||||||||||
| 820,124 | |||||||||||||||
| Commercial Services: 0.5% | |||||||||||||||
| 2,600 | Equifax, Inc. | 71,812 | |||||||||||||
| 3,400 | H&R Block, Inc. | 162,180 | |||||||||||||
| 233,992 | |||||||||||||||
| Computers: 6.0% | |||||||||||||||
| 5,900 | @ | Apple Computer, Inc. | 395,595 | ||||||||||||
| 21,200 | @ | Dell, Inc. | 859,024 | ||||||||||||
| 13,237 | Hewlett-Packard Co. | 264,740 | |||||||||||||
| 12,550 | International Business Machines Corp. | 1,182,711 | |||||||||||||
| 12,700 | @,X | Seagate Technology | 0 | ||||||||||||
| 61,600 | @ | Sun Microsystems, Inc. | 341,880 | ||||||||||||
| 3,043,950 | |||||||||||||||
| Shares | Value | ||||||||||||||
| Cosmetics/Personal Care: 3.1% | |||||||||||||||
| 11,800 | Gillette Co. | $ | 513,182 | ||||||||||||
| 19,800 | Procter & Gamble Co. | 1,058,904 | |||||||||||||
| 1,572,086 | |||||||||||||||
| Distribution/Wholesale: 0.6% | |||||||||||||||
| 3,800 | Genuine Parts Co. | 164,958 | |||||||||||||
| 1,950 | W.W. Grainger, Inc. | 120,627 | |||||||||||||
| 285,585 | |||||||||||||||
| Diversified Financial Services: 6.2% | |||||||||||||||
| 5,650 | American Express Co. | 314,762 | |||||||||||||
| 4,050 | Capital One Financial Corp. | 318,249 | |||||||||||||
| 4,850 | CIT Group, Inc. | 207,338 | |||||||||||||
| 21,850 | Citigroup, Inc. | 977,787 | |||||||||||||
| 10,150 | Countrywide Financial Corp. | 337,081 | |||||||||||||
| 4,250 | Fannie Mae | 291,975 | |||||||||||||
| 4,250 | Lehman Brothers Holdings, Inc. | 356,064 | |||||||||||||
| 4,100 | Merrill Lynch & Co., Inc. | 228,411 | |||||||||||||
| 6,000 | @ | Providian Financial Corp. | 96,300 | ||||||||||||
| 3,127,967 | |||||||||||||||
| Electric: 2.8% | |||||||||||||||
| 11,700 | @ | AES Corp. | 143,208 | ||||||||||||
| 3,700 | Constellation Energy Group, Inc. | 161,690 | |||||||||||||
| 12,550 | Duke Energy Corp. | 317,264 | |||||||||||||
| 6,500 | Edison Intl. | 207,350 | |||||||||||||
| 2,500 | Exelon Corp. | 104,275 | |||||||||||||
| 3,565 | PPL Corp. | 185,202 | |||||||||||||
| 4,450 | TXU Corp. | 279,549 | |||||||||||||
| 1,398,538 | |||||||||||||||
| Electronics: 0.2% | |||||||||||||||
| 3,350 | @ | Thermo Electron Corp. | 101,338 | ||||||||||||
| 101,338 | |||||||||||||||
| Food: 0.8% | |||||||||||||||
| 3,350 | SUPERVALU, Inc. | 105,827 | |||||||||||||
| 4,428 | Wm. Wrigley Jr. Co. | 304,646 | |||||||||||||
| 410,473 | |||||||||||||||
| Forest Products and Paper: 0.8% | |||||||||||||||
| 1,900 | Louisiana-Pacific Corp. | 46,493 | |||||||||||||
| 1,050 | Temple-Inland, Inc. | 62,570 | |||||||||||||
| 4,500 | Weyerhaeuser Co. | 297,000 | |||||||||||||
| 406,063 | |||||||||||||||
| Gas: 0.3% | |||||||||||||||
| 4,550 | L | Sempra Energy | 168,259 | ||||||||||||
| 168,259 | |||||||||||||||
| Hand/Machine Tools: 0.3% | |||||||||||||||
| 1,700 | Black & Decker Corp. | 142,953 | |||||||||||||
| 142,953 | |||||||||||||||
| Healthcare-Products: 3.6% | |||||||||||||||
| 5,100 | Becton Dickinson & Co. | 279,378 | |||||||||||||
| 21,450 | Johnson & Johnson | 1,293,864 | |||||||||||||
| 5,350 | Medtronic, Inc. | 257,068 | |||||||||||||
| 1,830,310 | |||||||||||||||
See Accompanying Notes to Financial Statements
73
PORTFOLIO OF INVESTMENTS
ING DISCIPLINED LARGECAP FUND AS OF NOVEMBER 30, 2004 (UNAUDITED) (CONTINUED)
| Shares | Value | ||||||||||||||
| Healthcare-Services: 3.2% | |||||||||||||||
| 2,750 | Aetna, Inc. | $ | 325,903 | ||||||||||||
| 3,250 | @ | Humana, Inc. | 80,665 | ||||||||||||
| 7,050 | UnitedHealth Group, Inc. | 584,092 | |||||||||||||
| 2,750 | @ | WellPoint Health Networks, Inc. | 344,025 | ||||||||||||
| 2,750 | @ | WellPoint, Inc. | 278,658 | ||||||||||||
| 1,613,343 | |||||||||||||||
| Household Products/Wares: 0.5% | |||||||||||||||
| 4,700 | Clorox Co. | 259,064 | |||||||||||||
| 259,064 | |||||||||||||||
| Insurance: 6.1% | |||||||||||||||
| 19,050 | American International Group, Inc. | 1,206,817 | |||||||||||||
| 3,700 | Chubb Corp. | 281,977 | |||||||||||||
| 3,200 | CIGNA Corp. | 224,064 | |||||||||||||
| 3,600 | Lincoln National Corp. | 165,672 | |||||||||||||
| 3,959 | Loews Corp. | 276,774 | |||||||||||||
| 10,150 | MetLife, Inc. | 395,849 | |||||||||||||
| 7,750 | Prudential Financial, Inc. | 379,362 | |||||||||||||
| 2,950 | Safeco Corp. | 142,987 | |||||||||||||
| 3,073,502 | |||||||||||||||
| Internet: 1.8% | |||||||||||||||
| 2,800 | @ | eBay, Inc. | 314,860 | ||||||||||||
| 5,450 | @ | Symantec Corp. | 347,765 | ||||||||||||
| 5,850 | @ | Yahoo!, Inc. | 220,077 | ||||||||||||
| 882,702 | |||||||||||||||
| Iron/Steel: 0.2% | |||||||||||||||
| 2,300 | United States Steel Corp. | 120,428 | |||||||||||||
| 120,428 | |||||||||||||||
| Leisure Time: 0.4% | |||||||||||||||
| 2,700 | Carnival Corp. | 143,127 | |||||||||||||
| 3,100 | Sabre Holdings Corp. | 71,548 | |||||||||||||
| 214,675 | |||||||||||||||
| Lodging: 0.5% | |||||||||||||||
| 4,600 | Marriott Intl., Inc. | 261,510 | |||||||||||||
| 261,510 | |||||||||||||||
| Machinery-Diversified: 0.2% | |||||||||||||||
| 1,000 | Cummins, Inc. | 79,620 | |||||||||||||
| 79,620 | |||||||||||||||
| Media: 2.3% | |||||||||||||||
| 9,800 | @ | Comcast Corp. | 294,392 | ||||||||||||
| 3,500 | McGraw-Hill Cos., Inc. | 307,055 | |||||||||||||
| 19,550 | @ | Time Warner, Inc. | 346,231 | ||||||||||||
| 8,700 | Walt Disney Co. | 233,856 | |||||||||||||
| 1,181,534 | |||||||||||||||
| Mining: 0.4% | |||||||||||||||
| 2,100 | Phelps Dodge Corp. | 203,973 | |||||||||||||
| 203,973 | |||||||||||||||
| Miscellaneous Manufacturing: 5.0% | |||||||||||||||
| 3,500 | 3M Co. | 278,565 | |||||||||||||
| 6,050 | L | Eastman Kodak Co. | 197,896 | ||||||||||||
| 45,100 | General Electric Co. | 1,594,736 | |||||||||||||
| 4,200 | Honeywell International, Inc. | 148,386 | |||||||||||||
| 8,700 | @@ | Tyco Intl. Ltd. | 295,539 | ||||||||||||
| 2,515,122 | |||||||||||||||
| Shares | Value | ||||||||||||||
| Oil and Gas: 8.8% | |||||||||||||||
| 3,950 | Anadarko Petroleum Corp. | $ | 274,920 | ||||||||||||
| 6,200 | Burlington Resources, Inc. | 287,742 | |||||||||||||
| 15,350 | ChevronTexaco Corp. | 838,110 | |||||||||||||
| 2,678 | ConocoPhillips | 243,671 | |||||||||||||
| 7,200 | Devon Energy Corp. | 298,224 | |||||||||||||
| 36,400 | S | Exxon Mobil Corp. | 1,865,499 | ||||||||||||
| 1,650 | Sunoco, Inc. | 136,224 | |||||||||||||
| 5,100 | Unocal Corp. | 234,804 | |||||||||||||
| 4,800 | Valero Energy Corp. | 224,592 | |||||||||||||
| 4,403,786 | |||||||||||||||
| Pharmaceuticals: 4.7% | |||||||||||||||
| 6,950 | Abbott Laboratories | 291,622 | |||||||||||||
| 2,450 | AmerisourceBergen Corp. | 144,403 | |||||||||||||
| 8,250 | @ | Caremark Rx, Inc. | 295,020 | ||||||||||||
| 5,050 | Eli Lilly & Co. | 269,317 | |||||||||||||
| 9,650 | Merck & Co., Inc. | 270,393 | |||||||||||||
| 32,390 | Pfizer, Inc. | 899,470 | |||||||||||||
| 5,500 | Wyeth | 219,285 | |||||||||||||
| 2,389,510 | |||||||||||||||
| Pipelines: 0.1% | |||||||||||||||
| 10,850 | @,L | Dynegy, Inc. | 61,303 | ||||||||||||
| 61,303 | |||||||||||||||
| Retail: 8.8% | |||||||||||||||
| 4,300 | Circuit City Stores, Inc. | 67,037 | |||||||||||||
| 7,450 | Costco Wholesale Corp. | 362,070 | |||||||||||||
| 15,100 | Gap, Inc. | 329,935 | |||||||||||||
| 18,450 | Home Depot, Inc. | 770,288 | |||||||||||||
| 6,150 | J.C. Penney Co., Inc. Holding Co. | 237,390 | |||||||||||||
| 10,000 | @ | Limited Brands, Inc. | 244,400 | ||||||||||||
| 15,250 | McDonald's Corp. | 468,785 | |||||||||||||
| 9,300 | Staples, Inc. | 296,763 | |||||||||||||
| 6,450 | @ | Starbucks Corp. | 362,877 | ||||||||||||
| 3,800 | Target Corp. | 194,636 | |||||||||||||
| 5,350 | @ | Toys R US, Inc. | 103,469 | ||||||||||||
| 18,350 | Wal-Mart Stores, Inc. | 955,300 | |||||||||||||
| 4,392,950 | |||||||||||||||
| Semiconductors: 1.2% | |||||||||||||||
| 26,750 | Intel Corp. | 597,863 | |||||||||||||
| 597,863 | |||||||||||||||
| Software: 4.7% | |||||||||||||||
| 2,650 | @ | Autodesk, Inc. | 173,337 | ||||||||||||
| 5,100 | @ | BMC Software, Inc. | 94,758 | ||||||||||||
| 10,000 | @ | Compuware Corp. | 57,700 | ||||||||||||
| 46,650 | Microsoft Corp. | 1,250,686 | |||||||||||||
| 50,950 | @ | Oracle Corp. | 645,027 | ||||||||||||
| 5,100 | @ | Parametric Technology Corp. | 29,835 | ||||||||||||
| 12,050 | @ | Siebel Systems, Inc. | 121,464 | ||||||||||||
| 2,372,807 | |||||||||||||||
| Telecommunications: 5.4% | |||||||||||||||
| 9,200 | Alltel Corp. | 521,548 | |||||||||||||
| 28,900 | @ | Cisco Systems, Inc. | 540,719 | ||||||||||||
| 27,250 | Motorola, Inc. | 524,835 | |||||||||||||
| 7,150 | Qualcomm, Inc. | 297,583 | |||||||||||||
| 20,050 | Verizon Communications, Inc. | 826,661 | |||||||||||||
| 2,711,346 | |||||||||||||||
See Accompanying Notes to Financial Statements
74
PORTFOLIO OF INVESTMENTS
ING DISCIPLINED LARGECAP FUND AS OF NOVEMBER 30, 2004 (UNAUDITED) (CONTINUED)
| Shares | Value | ||||||||||||||
| Transportation: 2.2% | |||||||||||||||
| 4,150 | FedEx Corp. | $ | 394,375 | ||||||||||||
| 8,000 | Norfolk Southern Corp. | 274,640 | |||||||||||||
| 5,000 | United Parcel Service, Inc. | 420,750 | |||||||||||||
| 1,089,765 | |||||||||||||||
| Total Common Stock (Cost $45,032,128) | 49,434,365 | ||||||||||||||
| Principal Amount | Value | ||||||||||||||
SHORT-TERM INVESTMENTS: 2.6%
| Repurchase Agreement: 1.8% | |||||||||||||||
| $902,000 | Goldman Sachs Repurchase Agreement 11/30/04, 2.060%, due 12/01/04, $902,052 to be received upon repurchase (Collateralized by $870,000 Fed eral Home Loan Mortgage Corporation, 5.500%, Market Value plus accrued interest $920,569, due 07/15/06) | | 902,000 | ||||||||||||
| Total Repurchase Agreement (Cost $902,000) | | 902,000 | |||||||||||||
| Securities Lending Collateralcc: 0.8% | |||||||||||||||
| 379,129 | The Bank of New York Institutional Cash Reserves Fund | | 379,129 | ||||||||||||
| Total Securities Lending Collateral (Cost $379,129) | | 379,129 | |||||||||||||
| Total Short-Term Investments (Cost $1,281,129) | | 1,281,129 | |||||||||||||
| Total Investments In Securities (Cost $46,313,257)* | 100.7 | % | $50,715,494 | ||||||||||||
| Other Assets and Liabilities-Net | (0.7 | ) | (341,100 | ) | |||||||||||
| Net Assets | 100.0 | % | $ | 50,374,394 | |||||||||||
@ Non-income producing security
@@ Foreign issuer
cc Securities purchased with cash collateral for securities loaned.
L Loaned security, a portion or all of the security is on loan at November 30, 2004.
S Segregated assets for futures collateral.
X Fair value determined by ING Funds Valuation Committee appointed by the Funds' Board of Directors/Trustees.
* Cost for federal income tax purposes is $46,585,594. Net unrealized appreciation consists of:
| Gross Unrealized Appreciation | $ | 5,254,608 | |||||
| Gross Unrealized Depreciation | (1,124,708 | ) | |||||
| Net Unrealized Appreciation | $ | 4,129,900 | |||||
Information concerning open futures contracts for the ING Discipline LargeCap Fund at November 30, 2004 is shown below:
| Long Contracts | No. of Contracts | Notional Market Value | Expiration Date | Unrealized Gain | |||||||||||||||
| S&P 500 | 3 | $ | 880,575 | 12/16/04 | $ | 648 | |||||||||||||
See Accompanying Notes to Financial Statements
75
PORTFOLIO OF INVESTMENTS
ING LARGECAP GROWTH FUND AS OF NOVEMBER 30, 2004 (UNAUDITED)
| Shares | Value | ||||||||||||||
| COMMON STOCK: 98.2% | |||||||||||||||
| Advertising: 2.2% | |||||||||||||||
| 89,110 | Omnicom Group, Inc. | $ | 7,217,910 | ||||||||||||
| 7,217,910 | |||||||||||||||
| Aerospace/Defense: 1.0% | |||||||||||||||
| 30,300 | General Dynamics Corp. | 3,283,308 | |||||||||||||
| 3,283,308 | |||||||||||||||
| Apparel: 0.0% | |||||||||||||||
| 2,600 | @ | Coach, Inc. | 129,584 | ||||||||||||
| 129,584 | |||||||||||||||
| Auto Parts and Equipment: 1.0% | |||||||||||||||
| 51,370 | Johnson Controls, Inc. | 3,154,118 | |||||||||||||
| 3,154,118 | |||||||||||||||
| Biotechnology: 0.8% | |||||||||||||||
| 44,130 | @ | Genzyme Corp. | 2,471,721 | ||||||||||||
| 2,471,721 | |||||||||||||||
| Commercial Services: 7.5% | |||||||||||||||
| 142,970 | @,@@ | Accenture Ltd. - Class A | 3,708,642 | ||||||||||||
| 208,940 | @,L | Apollo Group, Inc. | 16,652,517 | ||||||||||||
| 46,110 | Moody's Corp. | 3,723,383 | |||||||||||||
| 24,084,542 | |||||||||||||||
| Computers: 10.7% | |||||||||||||||
| 327,290 | @ | Dell, Inc. | 13,261,791 | ||||||||||||
| 37,130 | @ | Lexmark Intl., Inc. | 3,152,337 | ||||||||||||
| 203,510 | @,@@ | Research In Motion Ltd. | 18,106,285 | ||||||||||||
| 34,520,413 | |||||||||||||||
| Cosmetics/Personal Care: 1.8% | |||||||||||||||
| 131,430 | Gillette Co. | 5,715,891 | |||||||||||||
| 5,715,891 | |||||||||||||||
| Distribution/Wholesale: 3.0% | |||||||||||||||
| 148,690 | CDW Corp. | 9,771,907 | |||||||||||||
| 9,771,907 | |||||||||||||||
| Diversified Financial Services: 11.4% | |||||||||||||||
| 40,680 | Capital One Financial Corp. | 3,196,634 | |||||||||||||
| 136,570 | Citigroup, Inc. | 6,111,508 | |||||||||||||
| 472,388 | Countrywide Financial Corp. | 15,688,006 | |||||||||||||
| 74,400 | Franklin Resources, Inc. | 4,882,872 | |||||||||||||
| 97,170 | Freddie Mac | 6,632,824 | |||||||||||||
| 36,511,844 | |||||||||||||||
| Healthcare-Products: 7.7% | |||||||||||||||
| 225,100 | Guidant Corp. | 14,593,233 | �� | ||||||||||||
| 209,800 | Medtronic, Inc. | 10,080,890 | |||||||||||||
| 24,674,123 | |||||||||||||||
| Home Builders: 0.9% | |||||||||||||||
| 67,900 | Lennar Corp. | 3,050,747 | |||||||||||||
| 3,050,747 | |||||||||||||||
| Insurance: 0.5% | |||||||||||||||
| 17,160 | Progressive Corp. | 1,561,388 | |||||||||||||
| 1,561,388 | |||||||||||||||
| Shares | Value | ||||||||||||||
| Internet: 9.6% | |||||||||||||||
| 127,210 | @,L | eBay, Inc. | $ | 14,304,765 | |||||||||||
| 436,550 | @ | Yahoo!, Inc. | 16,423,011 | ||||||||||||
| 30,727,776 | |||||||||||||||
| Media: 2.9% | |||||||||||||||
| 254,040 | @,L | XM Satellite Radio Holdings, Inc. | 9,376,616 | ||||||||||||
| 9,376,616 | |||||||||||||||
| Miscellaneous Manufacturing: 3.7% | |||||||||||||||
| 74,770 | Danaher Corp. | 4,252,918 | |||||||||||||
| 211,760 | General Electric Co. | 7,487,833 | |||||||||||||
| 11,740,751 | |||||||||||||||
| Oil and Gas: 1.2% | |||||||||||||||
| 70,050 | @@ | Petro-Canada | 3,999,855 | ||||||||||||
| 3,999,855 | |||||||||||||||
| Pharmaceuticals: 11.1% | |||||||||||||||
| 141,880 | Abbott Laboratories | 5,953,285 | |||||||||||||
| 283,300 | @,@@,L | AstraZeneca PLC ADR | 11,159,186 | ||||||||||||
| 109,500 | @,@@,L | Elan Corp. PLC ADR | 2,890,800 | ||||||||||||
| 134,550 | Eli Lilly & Co. | 7,175,552 | |||||||||||||
| 39,840 | @ | Forest Laboratories, Inc. | 1,552,565 | ||||||||||||
| 81,680 | @ | Gilead Sciences, Inc. | 2,814,693 | ||||||||||||
| 221,220 | Schering-Plough Corp. | 3,948,777 | |||||||||||||
| 35,494,858 | |||||||||||||||
| Retail: 5.1% | |||||||||||||||
| 81,680 | @,L | Autozone, Inc. | 6,991,808 | ||||||||||||
| 85,890 | Best Buy Co., Inc. | 4,842,478 | |||||||||||||
| 56,660 | Lowe's Cos., Inc. | 3,134,998 | |||||||||||||
| 39,100 | L | PETsMART, Inc. | 1,339,957 | ||||||||||||
| 16,309,241 | |||||||||||||||
| Semiconductors: 1.8% | |||||||||||||||
| 186,850 | L | Xilinx, Inc. | 5,833,457 | ||||||||||||
| 5,833,457 | |||||||||||||||
| Software: 10.7% | |||||||||||||||
| 242,960 | @,L | Electronic Arts, Inc. | 11,880,744 | ||||||||||||
| 258,700 | First Data Corp. | 10,629,983 | |||||||||||||
| 305,990 | Microsoft Corp. | 8,203,592 | |||||||||||||
| 38,760 | @,L | Pixar, Inc. | 3,514,369 | ||||||||||||
| 34,228,688 | |||||||||||||||
| Telecommunications: 3.6% | |||||||||||||||
| 68,860 | @,@@ | America Movil SA de CV ADR | 3,216,451 | ||||||||||||
| 445,670 | @ | Cisco Systems, Inc. | 8,338,485 | ||||||||||||
| 11,554,936 | |||||||||||||||
| Total Common Stock (Cost $259,342,091) | 315,413,674 | ||||||||||||||
See Accompanying Notes to Financial Statements
76
PORTFOLIO OF INVESTMENTS
ING LARGECAP GROWTH FUND AS OF NOVEMBER 30, 2004 (UNAUDITED) (CONTINUED)
| Principal Amount | Value | ||||||||||||||
| SHORT-TERM INVESTMENTS: 10.7% | |||||||||||||||
| Securities Lending Collateralcc: 10.7% | |||||||||||||||
| $ | 34,202,610 | The Bank of New York | |||||||||||||
| Institutional Cash | |||||||||||||||
| Reserves Fund | $ | 34,202,610 | |||||||||||||
| Total Short-Term Investments (Cost $34,202,610) | | 34,202,610 | |||||||||||||
| Total Investments In Securities (Cost $293,544,701)* | 108.9 | % | $349,616,284 | ||||||||||||
| Other Assets and Liabilities-Net | (8.9 | ) | (28,459,421 | ) | |||||||||||
| Net Assets | 100.0 | % | $ | 321,156,863 | |||||||||||
@ Non-income producing security
@@ Foreign issuer
ADR American Depositary Receipt
cc Security purchased with cash collateral for securities loaned.
L Loaned security, a portion or all of the security is on loan at November 30, 2004.
* Cost for federal income tax purposes is $303,679,987. Net unrealized appreciation consists of:
| Gross Unrealized Appreciation | $ | 51,664,500 | |||||
| Gross Unrealized Depreciation | (5,728,203 | ) | |||||
| Net Unrealized Appreciation | $ | 45,936,297 | |||||
See Accompanying Notes to Financial Statements
77
PORTFOLIO OF INVESTMENTS
ING MIDCAP OPPORTUNITIES FUND AS OF NOVEMBER 30, 2004 (UNAUDITED)
| Shares | Value | ||||||||||||||
| COMMON STOCK: 97.8% | |||||||||||||||
| Advertising: 0.6% | |||||||||||||||
| 42,200 | @ | Getty Images, Inc. | $ | 2,458,150 | |||||||||||
| 2,458,150 | |||||||||||||||
| Apparel: 3.1% | |||||||||||||||
| 172,500 | @ | Coach, Inc. | 8,597,400 | ||||||||||||
| 109,500 | Polo Ralph Lauren Corp. | 4,313,205 | |||||||||||||
| 12,910,605 | |||||||||||||||
| Auto Parts and Equipment: 1.2% | |||||||||||||||
| 98,800 | L | BorgWarner Inc | 4,945,928 | ||||||||||||
| 4,945,928 | |||||||||||||||
| Banks: 0.5% | |||||||||||||||
| 32,600 | Zions Bancorporation | 2,167,900 | |||||||||||||
| 2,167,900 | |||||||||||||||
| Biotechnology: 3.3% | |||||||||||||||
| 197,520 | @ | Celgene Corp. | 5,415,998 | ||||||||||||
| 85,000 | @ | Charles River Laboratories Intl., Inc. | 3,973,750 | ||||||||||||
| 97,200 | @,L | Millipore Corp. | 4,735,584 | ||||||||||||
| 14,125,332 | |||||||||||||||
| Building Materials: 1.2% | |||||||||||||||
| 130,500 | @ | American Standard Cos., Inc. | 5,081,670 | ||||||||||||
| 5,081,670 | |||||||||||||||
| Coal: 1.4% | |||||||||||||||
| 72,900 | Peabody Energy Corp. | 6,050,700 | |||||||||||||
| 6,050,700 | |||||||||||||||
| Commercial Services: 4.8% | |||||||||||||||
| 120,300 | @ | Alliance Data Systems Corp. | 5,160,870 | ||||||||||||
| 100,000 | @ | CoStar Group, Inc. | 4,380,000 | ||||||||||||
| 133,200 | @ | Education Management Corp. | 4,414,248 | ||||||||||||
| 156,061 | @ | Laureate Education, Inc. | 6,147,243 | ||||||||||||
| 20,102,361 | |||||||||||||||
| Computers: 3.5% | |||||||||||||||
| 63,100 | @ | Anteon Intl. Corp. | 2,335,962 | ||||||||||||
| 121,600 | @ | CACI Intl., Inc. | 7,555,008 | ||||||||||||
| 140,700 | @,L | palmOne, Inc. | 4,930,128 | ||||||||||||
| 14,821,098 | |||||||||||||||
| Distribution/Wholesale: 1.1% | |||||||||||||||
| 135,056 | Hughes Supply, Inc. | 4,440,641 | |||||||||||||
| 4,440,641 | |||||||||||||||
| Diversified Financial Services: 1.4% | |||||||||||||||
| 414,100 | @ | Ameritrade Holding Corp. | 5,768,413 | ||||||||||||
| 5,768,413 | |||||||||||||||
| Electrical Components and Equipment: 1.0% | |||||||||||||||
| 129,700 | Ametek, Inc. | 4,238,596 | |||||||||||||
| 4,238,596 | |||||||||||||||
| Electronics: 2.7% | |||||||||||||||
| 88,000 | @,L | Arrow Electronics, Inc. | 2,158,640 | ||||||||||||
| 66,250 | @ | Benchmark Electronics, Inc. | 2,322,063 | ||||||||||||
| 147,000 | @ | Waters Corp. | 6,859,020 | ||||||||||||
| 11,339,723 | |||||||||||||||
| Shares | Value | ||||||||||||||
| Hand/Machine Tools: 0.5% | |||||||||||||||
| 48,200 | Stanley Works | $ | 2,253,832 | ||||||||||||
| 2,253,832 | |||||||||||||||
| Healthcare-Products: 8.2% | |||||||||||||||
| 90,000 | @ | Gen-Probe, Inc. | 3,591,000 | ||||||||||||
| 120,400 | @ | Inamed Corp. | 6,459,460 | ||||||||||||
| 151,200 | @,L | Patterson Cos., Inc. | 6,178,032 | ||||||||||||
| 185,830 | @ | St. Jude Medical, Inc. | 7,087,556 | ||||||||||||
| 130,400 | @,L | Varian Medical Systems, Inc. | 5,487,232 | ||||||||||||
| 70,000 | @ | Zimmer Holdings, Inc. | 5,712,000 | ||||||||||||
| 34,515,280 | |||||||||||||||
| Healthcare-Services: 6.1% | |||||||||||||||
| 22,800 | Aetna, Inc. | 2,702,028 | |||||||||||||
| 88,450 | @ | Amsurg Corp. | 2,274,050 | ||||||||||||
| 184,500 | @ | Community Health Systems, Inc. | 5,101,425 | ||||||||||||
| 47,300 | L | Quest Diagnostics, Inc. | 4,434,375 | ||||||||||||
| 320,000 | Select Medical Corp. | 5,584,000 | |||||||||||||
| 114,800 | @ | WellChoice, Inc. | 5,624,052 | ||||||||||||
| 25,719,930 | |||||||||||||||
| Home Furnishings: 2.1% | |||||||||||||||
| 72,000 | Harman Intl. Industries, Inc. | 8,845,200 | |||||||||||||
| 8,845,200 | |||||||||||||||
| Household Products/Wares: 1.1% | |||||||||||||||
| 150,600 | @,L | Yankee Candle Co., Inc. | 4,587,276 | ||||||||||||
| 4,587,276 | |||||||||||||||
| Insurance: 2.5% | |||||||||||||||
| 26,700 | AMBAC Financial Group, Inc. | 2,171,511 | |||||||||||||
| 74,500 | L | MBIA, Inc. | 4,467,020 | ||||||||||||
| 96,700 | @ | Proassurance Corp. | 3,776,135 | ||||||||||||
| 10,414,666 | |||||||||||||||
| Internet: 2.6% | |||||||||||||||
| 332,800 | @,L | Akamai Technologies, Inc. | 4,309,760 | ||||||||||||
| 78,400 | @,L | Ask Jeeves, Inc. | 2,025,856 | ||||||||||||
| 402,100 | @ | TIBCO Software, Inc. | 4,624,150 | ||||||||||||
| 10,959,766 | |||||||||||||||
| Iron/Steel: 1.2% | |||||||||||||||
| 99,500 | Nucor Corp. | 5,263,550 | |||||||||||||
| 5,263,550 | |||||||||||||||
| Leisure Time: 1.0% | |||||||||||||||
| 63,500 | Polaris Industries, Inc. | 4,184,650 | |||||||||||||
| 4,184,650 | |||||||||||||||
| Lodging: 1.3% | |||||||||||||||
| 91,300 | L | Harrah's Entertainment, Inc. | 5,605,820 | ||||||||||||
| 5,605,820 | |||||||||||||||
| Machinery-Diversified: 1.8% | |||||||||||||||
| 157,300 | Rockwell Automation, Inc. | 7,440,290 | |||||||||||||
| 7,440,290 | |||||||||||||||
| Miscellaneous Manufacturing: 3.5% | |||||||||||||||
| 98,500 | L | Danaher Corp. | 5,602,680 | ||||||||||||
| 70,800 | Donaldson Co., Inc. | 2,194,800 | |||||||||||||
| 29,200 | ITT Industries, Inc. | 2,485,504 | |||||||||||||
| 115,500 | Pentair, Inc. | 4,622,310 | |||||||||||||
| 14,905,294 | |||||||||||||||
See Accompanying Notes to Financial Statements
78
PORTFOLIO OF INVESTMENTS
ING MIDCAP OPPORTUNITIES FUND AS OF NOVEMBER 30, 2004 (UNAUDITED) (CONTINUED)
| Shares | Value | ||||||||||||||
| Office/Business Equipment: 0.9% | |||||||||||||||
| 256,800 | @,L | Xerox Corp. | $ | 3,934,176 | |||||||||||
| 3,934,176 | |||||||||||||||
| Oil and Gas: 7.7% | |||||||||||||||
| 63,730 | Apache Corp. | 3,445,244 | |||||||||||||
| 399,300 | Chesapeake Energy Corp. | 7,187,400 | |||||||||||||
| 26,600 | Murphy Oil Corp. | 2,269,246 | |||||||||||||
| 67,255 | @,@@ | Nabors Industries Ltd. | 3,497,260 | ||||||||||||
| 70,400 | Patina Oil & Gas Corp. | 2,337,280 | |||||||||||||
| 348,600 | Patterson-UTI Energy, Inc. | 6,972,000 | |||||||||||||
| 190,575 | XTO Energy, Inc. | 6,927,401 | |||||||||||||
| 32,635,831 | |||||||||||||||
| Oil and Gas Services: 1.8% | |||||||||||||||
| 93,000 | BJ Services Co. | 4,712,310 | |||||||||||||
| 50,500 | @,L | Smith Intl., Inc. | 3,058,785 | ||||||||||||
| 7,771,095 | |||||||||||||||
| Pharmaceuticals: 0.5% | |||||||||||||||
| 74,300 | @ | MGI Pharma, Inc. | 2,005,357 | ||||||||||||
| 2,005,357 | |||||||||||||||
| Retail: 12.0% | |||||||||||||||
| 51,400 | @,L | Advance Auto Parts, Inc. | 2,120,764 | ||||||||||||
| 159,550 | Applebees Intl., Inc. | 4,100,435 | |||||||||||||
| 159,100 | @,L | Chico's FAS, Inc. | 6,141,260 | ||||||||||||
| 279,400 | Foot Locker, Inc. | 7,258,812 | |||||||||||||
| 240,200 | L | Michaels Stores, Inc. | 6,564,666 | ||||||||||||
| 88,700 | L | MSC Industrial Direct Co. | 3,159,494 | ||||||||||||
| 93,100 | @ | Pacific Sunwear of California, Inc. | 2,067,751 | ||||||||||||
| 58,700 | @,L | Panera Bread Co. | 2,344,478 | ||||||||||||
| 158,600 | L | PETsMART, Inc. | 5,435,222 | ||||||||||||
| 102,000 | Regis Corp. | 4,554,300 | |||||||||||||
| 255,000 | @ | Sonic Corp. | 7,438,350 | ||||||||||||
| 51,185,532 | |||||||||||||||
| Savings and Loans: 2.7% | |||||||||||||||
| 130,700 | Independence Community Bank Corp. | 5,552,136 | |||||||||||||
| 274,400 | L | Sovereign Bancorp, Inc. | 5,995,640 | ||||||||||||
| 11,547,776 | |||||||||||||||
| Semiconductors: 1.8% | |||||||||||||||
| 91,500 | @,L | Altera Corp. | 2,075,220 | ||||||||||||
| 141,800 | L | Linear Technology Corp. | 5,411,088 | ||||||||||||
| 7,486,308 | |||||||||||||||
| Software: 5.5% | |||||||||||||||
| 147,500 | Adobe Systems, Inc. | 8,932,600 | |||||||||||||
| 147,800 | @,L | Avid Technology, Inc. | 8,434,946 | ||||||||||||
| 99,900 | @ | Dun & Bradstreet Corp. | 5,930,064 | ||||||||||||
| 23,297,610 | |||||||||||||||
| Telecommunications: 2.3% | |||||||||||||||
| 328,400 | @,L | Comverse Technology, Inc. | 6,985,068 | ||||||||||||
| 118,600 | @ | Polycom, Inc. | 2,708,824 | ||||||||||||
| 9,693,892 | |||||||||||||||
| Textiles: 2.0% | |||||||||||||||
| 97,200 | @ | Mohawk Industries, Inc. | 8,524,440 | ||||||||||||
| 8,524,440 | |||||||||||||||
| Shares | Value | ||||||||||||||
| Transportation: 2.9% | |||||||||||||||
| 66,100 | CH Robinson Worldwide, Inc. | $ | 3,552,875 | ||||||||||||
| 97,900 | @,L | Forward Air Corp. | 4,537,665 | ||||||||||||
| 102,250 | J.B. Hunt Transport Services, Inc. | 4,110,450 | |||||||||||||
| 12,200,990 | |||||||||||||||
| Total Common Stock (Cost $320,035,411) | 413,429,678 | ||||||||||||||
| Principal Amount | Value | ||||||||||||||
SHORT-TERM INVESTMENTS: 12.6%
| Repurchase Agreement: 2.2% | |||||||||||||||
| $ | 9,091,000 | Goldman Sachs Repurchase Agreement 11/30/04, 2.060%, due 12/01/04, $9,091,520 to be received upon repurchase (Collateralized by $9,290,000 Federal Home Loan Bank, 3.200%, Market Value plus accrued interest $9,273,453, due 11/29/06) | | 9,091,000 | |||||||||||
| Total Repurchase Agreement (Cost $9,091,000) | | 9,091,000 | |||||||||||||
| Securities Lending Collateralcc: 10.4% | |||||||||||||||
| 43,961,923 | The Bank of New York Institutional Cash Reserves Fund | | 43,961,923 | ||||||||||||
| Total Securities Lending Collateral (Cost $43,961,923) | | 43,961,923 | |||||||||||||
| Total Short-Term Investments (Cost $53,052,923) | | 53,052,923 | |||||||||||||
| Total Investments In Securities (Cost $373,088,334)* | 110.4 | % | $466,482,601 | ||||||||||||
| Other Assets and Liabilities-Net | (10.4 | ) | (43,829,150) | ||||||||||||
| Net Assets | 100.0 | % | $ | 422,653,451 | |||||||||||
@ Non-income producing security
@@ Foreign issuer
cc Security purchased with cash collateral for securities loaned.
L Loaned security, a portion or all of the security is on loan at November 30, 2004.
* Cost for federal income tax purposes is $373,133,784. Net unrealized appreciation consists of:
| Gross Unrealized Appreciation | $ | 94,074,065 | |||||
| Gross Unrealized Depreciation | (725,248 | ) | |||||
| Net Unrealized Appreciation | $ | 93,348,817 | |||||
See Accompanying Notes to Financial Statements
79
PORTFOLIO OF INVESTMENTS
ING SMALLCAP OPPORTUNITIES FUND AS OF NOVEMBER 30, 2004 (UNAUDITED)
| Shares | Value | ||||||||||||||
| COMMON STOCK: 98.5% | |||||||||||||||
| Banks: 5.1% | |||||||||||||||
| 202,700 | L | Southwest Bancorp of Texas, Inc. | $ | 4,958,042 | |||||||||||
| 55,500 | L | UCBH Holdings, Inc. | 2,516,370 | ||||||||||||
| 75,900 | Westamerica Bancorporation | 4,414,344 | |||||||||||||
| 11,888,756 | |||||||||||||||
| Biotechnology: 2.7% | |||||||||||||||
| 51,400 | @ | Celgene Corp. | 1,409,388 | ||||||||||||
| 141,100 | @,L | Integra LifeSciences Holdings Corp. | 4,795,989 | ||||||||||||
| 6,205,377 | |||||||||||||||
| Commercial Services: 3.5% | |||||||||||||||
| 72,100 | @ | CoStar Group, Inc. | 3,157,980 | ||||||||||||
| 45,900 | @ | Education Management Corp. | 1,521,126 | ||||||||||||
| 86,057 | @ | Laureate Education, Inc. | 3,389,785 | ||||||||||||
| 8,068,891 | |||||||||||||||
| Computers: 9.1% | |||||||||||||||
| 41,600 | @ | Anteon Intl. Corp. | 1,540,032 | ||||||||||||
| 79,200 | @ | CACI Intl., Inc. | 4,920,696 | ||||||||||||
| 162,000 | @ | Cognizant Technology Solutions Corp. | 6,177,060 | ||||||||||||
| 114,600 | Jack Henry & Associates, Inc. | 2,209,488 | |||||||||||||
| 48,800 | @ | Micros Systems, Inc. | 3,580,456 | ||||||||||||
| 79,000 | @,L | PalmOne, Inc. | 2,768,160 | ||||||||||||
| 21,195,892 | |||||||||||||||
| Distribution/Wholesale: 3.0% | |||||||||||||||
| 42,164 | Hughes Supply, Inc. | 1,386,352 | |||||||||||||
| 173,550 | SCP Pool Corp. | 5,472,032 | |||||||||||||
| 6,858,384 | |||||||||||||||
| Electrical Components and Equipment: 1.1% | |||||||||||||||
| 89,501 | @ | Intermagnetics General Corp. | 2,637,594 | ||||||||||||
| 2,637,594 | |||||||||||||||
| Electronics: 2.4% | |||||||||||||||
| 68,442 | @,L | Benchmark Electronics, Inc. | 2,398,892 | ||||||||||||
| 22,500 | @ | Dionex Corp. | 1,291,275 | ||||||||||||
| 71,400 | @ | Measurement Specialties, Inc. | 1,821,414 | ||||||||||||
| 5,511,581 | |||||||||||||||
| Entertainment: 6.0% | |||||||||||||||
| 83,100 | @,L | Penn National Gaming, Inc. | 4,385,187 | ||||||||||||
| 127,300 | @ | Scientific Games Corp. | 3,042,470 | ||||||||||||
| 141,922 | @,L | Shuffle Master, Inc. | 6,532,670 | ||||||||||||
| 13,960,327 | |||||||||||||||
| Healthcare-Products: 7.2% | |||||||||||||||
| 78,200 | @,L | Arthrocare Corp. | 2,367,114 | ||||||||||||
| 74,300 | @ | Gen-Probe, Inc. | 2,964,570 | ||||||||||||
| 97,800 | @ | Inamed Corp. | 5,246,970 | ||||||||||||
| 157,401 | @,L | Kyphon, Inc. | 3,787,068 | ||||||||||||
| 63,100 | @ | Quinton Cardiology Systems, Inc. | 646,775 | ||||||||||||
| 43,500 | @ | Techne Corp. | 1,616,025 | ||||||||||||
| 12,553 | @,L | TriPath Imaging, Inc. | 90,131 | ||||||||||||
| 16,718,653 | |||||||||||||||
| Shares | Value | ||||||||||||||
| Healthcare-Services: 7.0% | |||||||||||||||
| 214,000 | @ | Amsurg Corp. | $ | 5,501,940 | |||||||||||
| 81,100 | @ | Pediatrix Medical Group, Inc. | 5,052,530 | ||||||||||||
| 152,100 | Select Medical Corp. | 2,654,145 | |||||||||||||
| 77,840 | @ | United Surgical Partners Intl., Inc. | 3,072,345 | ||||||||||||
| 16,280,960 | |||||||||||||||
| Home Builders: 1.1% | |||||||||||||||
| 74,798 | L | Thor Industries, Inc. | 2,498,253 | ||||||||||||
| 2,498,253 | |||||||||||||||
| Household Products/Wares: 1.3% | |||||||||||||||
| 97,600 | @ | Yankee Candle Co., Inc. | 2,972,896 | ||||||||||||
| 2,972,896 | |||||||||||||||
| Insurance: 2.5% | |||||||||||||||
| 54,900 | @ | Philadelphia Consolidated Holding Co. | 3,746,925 | ||||||||||||
| 50,700 | @ | Proassurance Corp. | 1,979,835 | ||||||||||||
| 5,726,760 | |||||||||||||||
| Internet: 4.1% | |||||||||||||||
| 181,800 | @ | Akamai Technologies, Inc. | 2,354,310 | ||||||||||||
| 42,200 | @,L | Ask Jeeves, Inc. | 1,090,448 | ||||||||||||
| 221,200 | @ | TIBCO Software, Inc. | 2,543,800 | ||||||||||||
| 279,700 | @ | ValueClick, Inc. | 3,608,130 | ||||||||||||
| 9,596,688 | |||||||||||||||
| Investment Companies: 2.6% | |||||||||||||||
| 93,050 | @,L | Ishares Russell 2000 Growth Index Fund | 6,066,860 | ||||||||||||
| 6,066,860 | |||||||||||||||
| Leisure Time: 1.0% | |||||||||||||||
| 36,600 | Polaris Industries, Inc. | 2,411,940 | |||||||||||||
| 2,411,940 | |||||||||||||||
| Lodging: 2.3% | |||||||||||||||
| 95,200 | Station Casinos, Inc. | 5,430,208 | |||||||||||||
| 5,430,208 | |||||||||||||||
| Miscellaneous Manufacturing: 2.4% | |||||||||||||||
| 81,800 | @,L | Ceradyne, Inc. | 4,040,920 | ||||||||||||
| 24,570 | @ | Cuno, Inc. | 1,610,072 | ||||||||||||
| 5,650,992 | |||||||||||||||
| Oil and Gas: 6.0% | |||||||||||||||
| 83,100 | Patina Oil & Gas Corp. | 2,758,920 | |||||||||||||
| 125,200 | @ | Southwestern Energy Co. | 6,873,480 | ||||||||||||
| 107,000 | @ | Unit Corp. | 4,239,340 | ||||||||||||
| 13,871,740 | |||||||||||||||
| Oil and Gas Services: 1.2% | |||||||||||||||
| 310,660 | @,L | Input/Output, Inc. | 2,724,488 | ||||||||||||
| 2,724,488 | |||||||||||||||
| Pharmaceuticals: 3.6% | |||||||||||||||
| 117,000 | @,L | HealthExtras, Inc. | 1,868,490 | ||||||||||||
| 84,100 | @ | MGI Pharma, Inc. | 2,269,859 | ||||||||||||
| 227,298 | @,L | VCA Antech, Inc. | 4,218,651 | ||||||||||||
| 8,357,000 | |||||||||||||||
See Accompanying Notes to Financial Statements
80
PORTFOLIO OF INVESTMENTS
ING SMALLCAP OPPORTUNITIES FUND AS OF NOVEMBER 30, 2004 (UNAUDITED) (CONTINUED)
| Shares | Value | ||||||||||||||
| Retail: 12.6% | |||||||||||||||
| 95,000 | L | Applebees Intl., Inc. | $ | 2,441,500 | |||||||||||
| 86,880 | @ | Chico's FAS, Inc. | 3,353,568 | ||||||||||||
| 58,600 | @ | Copart, Inc. | 1,265,760 | ||||||||||||
| 90,400 | @ | Dave & Buster's, Inc. | 1,690,480 | ||||||||||||
| 100,400 | @,L | Dick's Sporting Goods, Inc. | 3,614,400 | ||||||||||||
| 48,284 | @,L | GameStop Corp. | 1,018,310 | ||||||||||||
| 57,800 | MSC Industrial Direct Co. | 2,058,836 | |||||||||||||
| 192,542 | @ | Pacific Sunwear of California, Inc. | 4,276,357 | ||||||||||||
| 31,900 | @,L | Panera Bread Co. | 1,274,086 | ||||||||||||
| 72,800 | @ | PETCO Animal Supplies, Inc. | 2,632,448 | ||||||||||||
| 49,400 | Regis Corp. | 2,205,710 | |||||||||||||
| 121,950 | @ | Sonic Corp. | 3,557,282 | ||||||||||||
| 29,388,737 | |||||||||||||||
| Semiconductors: 1.9% | |||||||||||||||
| 260,600 | @ | Silicon Image, Inc. | 4,378,080 | ||||||||||||
| 4,378,080 | |||||||||||||||
| Software: 5.3% | |||||||||||||||
| 105,100 | @ | Avid Technology, Inc. | 5,998,057 | ||||||||||||
| 42,300 | L | Global Payments, Inc. | 2,333,268 | ||||||||||||
| 271,820 | @ | Witness Systems, Inc. | 4,074,582 | ||||||||||||
| 12,405,907 | |||||||||||||||
| Telecommunications: 2.1% | |||||||||||||||
| 81,044 | @ | Polycom, Inc. | 1,851,045 | ||||||||||||
| 146,500 | @,L | Powerwave Technologies, Inc. | 1,184,892 | ||||||||||||
| 77,200 | @ | Tekelec | 1,807,252 | ||||||||||||
| 4,843,189 | |||||||||||||||
| Transportation: 1.4% | |||||||||||||||
| 67,820 | @ | Forward Air Corp. | 3,143,457 | ||||||||||||
| 3,143,457 | |||||||||||||||
| Total Common Stock (Cost $151,887,763) | 228,793,610 | ||||||||||||||
| Principal Amount | Value | ||||||||||||||
| SHORT-TERM INVESTMENTS: 17.8% | |||||||||||||||
| Repurchase Agreement: 0.7% | |||||||||||||||
| $ | 1,592,000 | Goldman Sachs Repurchase Agreement 11/30/04, 2.060%, due 12/01/04, $1,592,091 to be received upon repurchase (Collateralized by $1,535,000 Federal Home Loan Bank, 5.500%, Market Value plus accrued interest $1,624,222, due 07/15/06) | | 1,592,000 | |||||||||||
| Total Repurchase Agreement (Cost $1,592,000) | | 1,592,000 | |||||||||||||
| Principal Amount | Value | ||||||||||||||
| Securities Lending Collateralcc: 17.1% | |||||||||||||||
| $ | 39,670,466 | The Bank of New York | |||||||||||||
| Institutional Cash | |||||||||||||||
| Reserves Fund | $ | 39,670,466 | |||||||||||||
| Total Securities Lending Collateral (Cost $39,670,466) | | 39,670,466 | |||||||||||||
| Total Short-Term Investments (Cost $41,262,466) | | 41,262,466 | |||||||||||||
| Total Investments In Securities (Cost $193,150,229)* | 116.3 | % | $ | 270,056,076 | |||||||||||
| Other Assets and Liabilities-Net | (16.3 | ) | (37,806,427 | ) | |||||||||||
| Net Assets | 100.0 | % | $ | 232,249,649 | |||||||||||
@ Non-income producing security
@@ Foreign issuer
cc Security purchased with cash collateral for securities loaned.
L Loaned security, a portion or all of the security is on loan at November 30, 2004.
* Cost for federal income tax purposes is $193,359,874. Net unrealized appreciation consists of:
| Gross Unrealized Appreciation | $ | 77,016,023 | |||||
| Gross Unrealized Depreciation | (319,821 | ) | |||||
| Net Unrealized Appreciation | $ | 76,696,202 | |||||
See Accompanying Notes to Financial Statements
81
PORTFOLIO OF INVESTMENTS
ING LARGECAP VALUE FUND AS OF NOVEMBER 30, 2004 (UNAUDITED)
| Shares | Value | ||||||||||||||
| COMMON STOCK: 97.3% | |||||||||||||||
| Agriculture: 5.8% | |||||||||||||||
| 19,650 | Altria Group, Inc. | $ | 1,129,679 | ||||||||||||
| 5,790 | Reynolds American, Inc. | 437,898 | |||||||||||||
| 7,710 | UST, Inc. | 339,471 | |||||||||||||
| 1,907,048 | |||||||||||||||
| Auto Manufacturers: 6.9% | |||||||||||||||
| 80,030 | Ford Motor Co. | 1,134,825 | |||||||||||||
| 29,100 | General Motors Corp. | 1,122,969 | |||||||||||||
| 2,257,794 | |||||||||||||||
| Auto Parts and Equipment: 1.5% | |||||||||||||||
| 54,230 | Delphi Corp. | 488,070 | |||||||||||||
| 488,070 | |||||||||||||||
| Commercial Services: 2.0% | |||||||||||||||
| 22,200 | McKesson Corp. | 656,010 | |||||||||||||
| 656,010 | |||||||||||||||
| Computers: 7.2% | |||||||||||||||
| 43,320 | Electronic Data Systems Corp. | 972,534 | |||||||||||||
| 46,200 | Hewlett-Packard Co. | 924,000 | |||||||||||||
| 41,150 | @ | Unisys Corp. | 472,814 | ||||||||||||
| 2,369,348 | |||||||||||||||
| Diversified Financial Services: 3.6% | |||||||||||||||
| 12,520 | CIT Group, Inc. | 535,230 | |||||||||||||
| 17,390 | J.P. Morgan Chase & Co. | 654,734 | |||||||||||||
| 1,189,964 | |||||||||||||||
| Electric: 0.9% | |||||||||||||||
| 8,340 | American Electric Power Co., Inc. | 284,978 | |||||||||||||
| 284,978 | |||||||||||||||
| Environmental Control: 0.9% | |||||||||||||||
| 9,420 | Waste Management, Inc. | 280,810 | |||||||||||||
| 280,810 | |||||||||||||||
| Food: 12.5% | |||||||||||||||
| 44,730 | Albertson's, Inc. | 1,131,669 | |||||||||||||
| 11,850 | Kraft Foods, Inc. | 405,270 | |||||||||||||
| 76,820 | @ | Kroger Co. | 1,242,948 | ||||||||||||
| 67,120 | @ | Safeway, Inc. | 1,294,073 | ||||||||||||
| 4,073,960 | |||||||||||||||
| Healthcare-Services: 1.9% | |||||||||||||||
| 57,630 | @ | Tenet Healthcare Corp. | 625,286 | ||||||||||||
| 625,286 | |||||||||||||||
| Housewares: 2.4% | |||||||||||||||
| 33,810 | Newell Rubbermaid, Inc. | 780,335 | |||||||||||||
| 780,335 | |||||||||||||||
| Insurance: 8.6% | |||||||||||||||
| 29,470 | AON Corp. | 622,406 | |||||||||||||
| 13,670 | Loews Corp. | 955,670 | |||||||||||||
| 28,400 | Marsh & McLennan Cos., Inc. | 811,956 | |||||||||||||
| 11,440 | Nationwide Financial Services | 429,915 | |||||||||||||
| 2,819,947 | |||||||||||||||
| Office/Business Equipment: 2.1% | |||||||||||||||
| 44,220 | @ | Xerox Corp. | 677,450 | ||||||||||||
| 677,450 | |||||||||||||||
| Shares | Value | ||||||||||||||
| Pharmaceuticals: 16.4% | |||||||||||||||
| 48,550 | Bristol-Myers Squibb Co. | $ | 1,140,925 | ||||||||||||
| 46,300 | Merck & Co., Inc. | 1,297,325 | |||||||||||||
| 41,800 | Pfizer, Inc. | 1,160,786 | |||||||||||||
| 72,590 | Schering-Plough Corp. | 1,295,732 | |||||||||||||
| 11,470 | Wyeth | 457,309 | |||||||||||||
| 5,352,077 | |||||||||||||||
| Pipelines: 3.1% | |||||||||||||||
| 96,880 | El Paso Corp. | 1,011,427 | |||||||||||||
| 1,011,427 | |||||||||||||||
| Retail: 2.4% | |||||||||||||||
| 27,510 | May Department Stores Co. | 773,581 | |||||||||||||
| 773,581 | |||||||||||||||
| Semiconductors: 2.9% | |||||||||||||||
| 85,210 | @ | Micron Technology, Inc. | 944,127 | ||||||||||||
| 944,127 | |||||||||||||||
| Telecommunications: 14.2% | |||||||||||||||
| 47,900 | BellSouth Corp. | 1,284,679 | |||||||||||||
| 181,040 | @ | Lucent Technologies, Inc. | 711,487 | ||||||||||||
| 44,890 | SBC Communications, Inc. | 1,129,881 | |||||||||||||
| 32,830 | Sprint Corp. | 748,852 | |||||||||||||
| 18,780 | Verizon Communications, Inc. | 774,299 | |||||||||||||
| 4,649,198 | |||||||||||||||
| Toys/Games/Hobbies: 2.0% | |||||||||||||||
| 34,640 | Mattel, Inc. | 656,428 | |||||||||||||
| 656,428 | |||||||||||||||
| Total Common Stock (Cost $30,722,760) | 31,797,838 | ||||||||||||||
| Total Investments In Securities (Cost $30,722,760)* | 97.3 | % | $ | 31,797,838 | |||||||||||
| Other Assets and Liabilities-Net | 2.7 | 887,198 | |||||||||||||
| Net Assets | 100.0 | % | $ | 32,685,036 | |||||||||||
@ Non-income producing security
* Cost for federal income tax purposes is the same as for financial statement purposes. Net unrealized appreciation consists of:
| Gross Unrealized Appreciation | $ | 1,993,776 | |||||
| Gross Unrealized Depreciation | (918,698 | ) | |||||
| Net Unrealized Appreciation | $ | 1,075,078 | |||||
See Accompanying Notes to Financial Statements
82
PORTFOLIO OF INVESTMENTS
ING MAGNACAP FUND AS OF NOVEMBER 30, 2004 (UNAUDITED)
| Shares | Value | ||||||||||||||
| COMMON STOCK: 99.3% | |||||||||||||||
| Aerospace/Defense: 3.6% | |||||||||||||||
| 125,900 | General Dynamics Corp. | $ | 13,642,524 | ||||||||||||
| 13,642,524 | |||||||||||||||
| Agriculture: 3.6% | |||||||||||||||
| 236,015 | Altria Group, Inc. | 13,568,502 | |||||||||||||
| 13,568,502 | |||||||||||||||
| Apparel: 1.8% | |||||||||||||||
| 81,300 | Nike, Inc. | 6,882,858 | |||||||||||||
| 6,882,858 | |||||||||||||||
| Banks: 7.0% | |||||||||||||||
| 300,800 | Bank of America Corp. | 13,918,016 | |||||||||||||
| 203,400 | Wells Fargo & Co. | 12,564,018 | |||||||||||||
| 26,482,034 | |||||||||||||||
| Building Materials: 1.8% | |||||||||||||||
| 198,200 | Masco Corp. | 6,990,514 | |||||||||||||
| 6,990,514 | |||||||||||||||
| Chemicals: 4.6% | |||||||||||||||
| 195,200 | Dow Chemical Co. | 9,851,744 | |||||||||||||
| 165,700 | Praxair, Inc. | 7,439,930 | |||||||||||||
| 17,291,674 | |||||||||||||||
| Computers: 2.0% | |||||||||||||||
| 80,200 | International Business Machines Corp. | 7,558,048 | |||||||||||||
| 7,558,048 | |||||||||||||||
| Cosmetics/Personal Care: 2.9% | |||||||||||||||
| 174,500 | Kimberly-Clark Corp. | 11,099,945 | |||||||||||||
| 11,099,945 | |||||||||||||||
| Diversified Financial Services: 13.3% | |||||||||||||||
| 205,000 | Citigroup, Inc. | 9,173,750 | |||||||||||||
| 165,300 | Fannie Mae | 11,356,110 | |||||||||||||
| 115,000 | Freddie Mac | 7,849,900 | |||||||||||||
| 203,600 | Merrill Lynch & Co., Inc. | 11,342,556 | |||||||||||||
| 201,200 | Morgan Stanley | 10,210,900 | |||||||||||||
| 49,933,216 | |||||||||||||||
| Electrical Components and Equipment: 2.9% | |||||||||||||||
| 166,800 | Emerson Electric Co. | 11,145,576 | |||||||||||||
| 11,145,576 | |||||||||||||||
| Electronics: 2.6% | |||||||||||||||
| 381,300 | @@ | Koninklijke Philips Electronics NV | 9,814,662 | ||||||||||||
| 9,814,662 | |||||||||||||||
| Food: 4.6% | |||||||||||||||
| 182,600 | @@ | Nestle SA ADR | 11,734,442 | ||||||||||||
| 87,500 | @@ | Unilever NV | 5,512,500 | ||||||||||||
| 17,246,942 | |||||||||||||||
| Forest Products and Paper: 1.9% | |||||||||||||||
| 175,800 | International Paper Co. | 7,299,216 | |||||||||||||
| 7,299,216 | |||||||||||||||
| Shares | Value | ||||||||||||||
| Healthcare-Products: 2.3% | |||||||||||||||
| 134,000 | Beckman Coulter, Inc. | $ | 8,771,640 | ||||||||||||
| 8,771,640 | |||||||||||||||
| Healthcare-Services: 2.3% | |||||||||||||||
| 93,400 | Quest Diagnostics, Inc. | 8,756,250 | |||||||||||||
| 8,756,250 | |||||||||||||||
| Insurance: 8.1% | |||||||||||||||
| 189,000 | Allstate Corp. | 9,544,500 | |||||||||||||
| 175,100 | American International Group, Inc. | 11,092,585 | |||||||||||||
| 257,000 | MetLife, Inc. | 10,023,000 | |||||||||||||
| 30,660,085 | |||||||||||||||
| Media: 2.3% | |||||||||||||||
| 106,200 | Gannett Co., Inc. | 8,760,438 | |||||||||||||
| 8,760,438 | |||||||||||||||
| Miscellaneous Manufacturing: 2.7% | |||||||||||||||
| 288,300 | Honeywell Intl., Inc. | 10,185,639 | |||||||||||||
| 10,185,639 | |||||||||||||||
| Oil and Gas: 12.8% | |||||||||||||||
| 184,700 | Apache Corp. | 9,984,882 | |||||||||||||
| 187,500 | @@ | BP PLC ADR | 11,503,125 | ||||||||||||
| 260,900 | ChevronTexaco Corp. | 14,245,140 | |||||||||||||
| 249,400 | Exxon Mobil Corp. | 12,781,750 | |||||||||||||
| 48,514,897 | |||||||||||||||
| Oil and Gas Services: 2.6% | |||||||||||||||
| 235,980 | Halliburton Co. | 9,757,773 | |||||||||||||
| 9,757,773 | |||||||||||||||
| Pharmaceuticals: 1.7% | |||||||||||||||
| 232,200 | Pfizer, Inc. | 6,448,194 | |||||||||||||
| 6,448,194 | |||||||||||||||
| Retail: 2.1% | |||||||||||||||
| 263,400 | McDonald's Corp. | 8,096,916 | |||||||||||||
| 8,096,916 | |||||||||||||||
| Savings and Loans: 5.6% | |||||||||||||||
| 509,300 | Sovereign Bancorp, Inc. | 11,128,205 | |||||||||||||
| 252,100 | Washington Mutual, Inc. | 10,262,991 | |||||||||||||
| 21,391,196 | |||||||||||||||
| Telecommunications: 4.2% | |||||||||||||||
| 295,700 | SBC Communications, Inc. | 7,442,769 | |||||||||||||
| 206,100 | Verizon Communications, Inc. | 8,497,503 | |||||||||||||
| 15,940,272 | |||||||||||||||
| Total Common Stock (Cost $302,128,558) | 376,239,011 | ||||||||||||||
See Accompanying Notes to Financial Statements
83
PORTFOLIO OF INVESTMENTS
ING MAGNACAP FUND AS OF NOVEMBER 30, 2004 (UNAUDITED) (CONTINUED)
| Shares | Value | ||||||||||||||
| SHORT-TERM INVESTMENTS: 0.7% | |||||||||||||||
| Repurchase Agreement: 0.7% | |||||||||||||||
| $ | 2,837,000 | Goldman Sachs Repurchase | |||||||||||||
| Agreement 11/30/04, 2.060%, | |||||||||||||||
| due 12/01/04, $2,837,162 to be | |||||||||||||||
| received upon repurchase | |||||||||||||||
| (Collateralized by $2,735,000 | |||||||||||||||
| Federal Home Loan Mortgage | |||||||||||||||
| Corporation, 5.500%, Market Value | |||||||||||||||
| plus accrued interest $2,893,972, | |||||||||||||||
| due 07/15/06) | $ | 2,837,000 | |||||||||||||
| Total Short-Term Investments (Cost $2,837,000) | 2,837,000 | ||||||||||||||
| Total Investments In Securities (Cost $304,965,558)* | 100.0 | % | $ | 379,076,011 | |||||||||||
| Other Assets and Liabilities-Net | 0.0 | % | (114,266 | ) | |||||||||||
| Net Assets | 100.0 | % | $ | 378,961,745 | |||||||||||
@@ Foreign issuer
ADR American Depositary Receipt
* Cost for federal income tax purposes is the same as for financial statement purposes. Net unrealized appreciation consists of:
| Gross Unrealized Appreciation | $ | 76,661,734 | |||||
| Gross Unrealized Depreciation | (2,551,281 | ) | |||||
| Net Unrealized Appreciation | $ | 74,110,453 | |||||
See Accompanying Notes to Financial Statements
84
PORTFOLIO OF INVESTMENTS
ING MIDCAP VALUE FUND AS OF NOVEMBER 30, 2004 (UNAUDITED)
| Shares | Value | ||||||||||||||
| COMMON STOCK: 96.4% | |||||||||||||||
| Agriculture: 3.9% | |||||||||||||||
| 184,580 | Loews Corp. | $ | 5,426,652 | ||||||||||||
| 25,640 | UST, Inc. | 1,128,929 | |||||||||||||
| 6,555,581 | |||||||||||||||
| Airlines: 3.0% | |||||||||||||||
| 326,840 | @,L | AMR Corp. | 2,951,365 | ||||||||||||
| 296,400 | @,L | Delta Air Lines, Inc. | 2,065,908 | ||||||||||||
| 5,017,273 | |||||||||||||||
| Apparel: 2.1% | |||||||||||||||
| 354,610 | @,@@ | Tommy Hilfiger Corp. | 3,475,178 | ||||||||||||
| 3,475,178 | |||||||||||||||
| Auto Parts and Equipment: 9.8% | |||||||||||||||
| 112,200 | ArvinMeritor, Inc. | 2,462,790 | |||||||||||||
| 100,000 | Dana Corp. | 1,635,000 | |||||||||||||
| 543,730 | @,L | Goodyear Tire & Rubber Co. | 6,861,872 | ||||||||||||
| 644,310 | L | Visteon Corp. | 5,450,863 | ||||||||||||
| 16,410,525 | |||||||||||||||
| Building Materials: 2.4% | |||||||||||||||
| 110,400 | York Intl. Corp. | 4,070,448 | |||||||||||||
| 4,070,448 | |||||||||||||||
| Chemicals: 5.6% | |||||||||||||||
| 96,690 | Great Lakes Chemical Corp. | 2,833,017 | |||||||||||||
| 87,680 | Lubrizol Corp. | 3,029,344 | |||||||||||||
| 156,300 | L | Sensient Technologies Corp. | 3,602,715 | ||||||||||||
| 9,465,076 | |||||||||||||||
| Commercial Services: 6.7% | |||||||||||||||
| 330,300 | @ | Convergys Corp. | 4,911,561 | ||||||||||||
| 49,000 | Kelly Services, Inc. | 1,489,600 | |||||||||||||
| 683,580 | @ | Service Corp. Intl. | 4,826,075 | ||||||||||||
| 11,227,236 | |||||||||||||||
| Computers: 7.4% | |||||||||||||||
| 323,580 | @,L | Synopsys, Inc. | 5,704,715 | ||||||||||||
| 577,590 | @ | Unisys Corp. | 6,636,510 | ||||||||||||
| 12,341,225 | |||||||||||||||
| Diversified Financial Services: 0.6% | |||||||||||||||
| 24,000 | CIT Group, Inc. | 1,026,000 | |||||||||||||
| 1,026,000 | |||||||||||||||
| Electric: 0.0% | |||||||||||||||
| 162,000 | @,L | Mirant Corp. | 59,738 | ||||||||||||
| 59,738 | |||||||||||||||
| Electronics: 1.6% | |||||||||||||||
| 302,700 | @ | Kemet Corp. | 2,681,922 | ||||||||||||
| 2,681,922 | |||||||||||||||
| Food: 4.5% | |||||||||||||||
| 44,000 | L | Albertson's, Inc. | 1,113,200 | ||||||||||||
| 363,330 | @ | Del Monte Foods Co. | 3,942,131 | ||||||||||||
| 606,064 | @,L | Winn-Dixie Stores, Inc. | 2,424,256 | ||||||||||||
| 7,479,587 | |||||||||||||||
| Shares | Value | ||||||||||||||
| Healthcare-Services: 5.3% | |||||||||||||||
| 122,800 | @ | Health Net, Inc. | $ | 3,342,616 | |||||||||||
| 517,030 | @ | Tenet Healthcare Corp. | 5,609,776 | ||||||||||||
| 8,952,392 | |||||||||||||||
| Home Furnishings: 3.0% | |||||||||||||||
| 253,320 | Maytag Corp. | 5,091,732 | |||||||||||||
| 5,091,732 | |||||||||||||||
| Household Products/Wares: 2.1% | |||||||||||||||
| 189,410 | Tupperware Corp. | 3,545,755 | |||||||||||||
| 3,545,755 | |||||||||||||||
| Insurance: 14.0% | |||||||||||||||
| 132,200 | @ | Allmerica Financial Corp. | 4,303,110 | ||||||||||||
| 255,010 | L | Assured Guaranty Ltd. | 4,697,283 | ||||||||||||
| 62,460 | @ | CNA Financial Corp. | 1,630,831 | ||||||||||||
| 69,400 | Nationwide Financial Services | 2,608,052 | |||||||||||||
| 285,550 | L | Phoenix Cos., Inc. | 3,483,710 | ||||||||||||
| 431,350 | L | UnumProvident Corp. | 6,716,119 | ||||||||||||
| 23,439,105 | |||||||||||||||
| Miscellaneous Manufacturing: 2.4% | |||||||||||||||
| 78,600 | Teleflex, Inc. | 3,969,300 | |||||||||||||
| 3,969,300 | |||||||||||||||
| Office/Business Equipment: 2.8% | |||||||||||||||
| 420,420 | IKON Office Solutions, Inc. | 4,742,338 | |||||||||||||
| 4,742,338 | |||||||||||||||
| Pipelines: 3.4% | |||||||||||||||
| 548,193 | El Paso Corp. | 5,723,135 | |||||||||||||
| 5,723,135 | |||||||||||||||
| Retail: 5.2% | |||||||||||||||
| 90,320 | Dillard's, Inc. | 2,274,258 | |||||||||||||
| 135,000 | @,L | Payless Shoesource, Inc. | 1,576,800 | ||||||||||||
| 248,220 | @ | Toys R US, Inc. | 4,800,574 | ||||||||||||
| 8,651,632 | |||||||||||||||
| Semiconductors: 4.3% | |||||||||||||||
| 5,136,390 | @ | Agere Systems, Inc. | 6,985,490 | ||||||||||||
| 19,958 | @,L | Micron Technology, Inc. | 221,135 | ||||||||||||
| 7,206,625 | |||||||||||||||
| Telecommunications: 6.3% | |||||||||||||||
| 1,182,050 | @ | 3Com Corp. | 5,248,302 | ||||||||||||
| 66,550 | CenturyTel, Inc. | 2,190,826 | |||||||||||||
| 878,600 | @ | Cincinnati Bell, Inc. | 3,162,960 | ||||||||||||
| 10,602,088 | |||||||||||||||
| Total Common Stock (Cost $160,486,053) | 161,733,891 | ||||||||||||||
See Accompanying Notes to Financial Statements
85
PORTFOLIO OF INVESTMENTS
ING MIDCAP VALUE FUND AS OF NOVEMBER 30, 2004 (UNAUDITED) (CONTINUED)
| Principal Amount | Value | ||||||||||||||
| SHORT-TERM INVESTMENTS: 15.1% | |||||||||||||||
| Securities Lending Collateralcc: 15.1% | |||||||||||||||
| $ | 25,264,576 | The Bank of New York Institutional Cash Reserves Fund | $ | 25,264,576 | |||||||||||
| Total Short-Term Investments (Cost $25,264,576) | 25,264,576 | ||||||||||||||
| Total Investments In Securities (Cost $185,750,629)* | 111.5 | % | $186,998,467 | ||||||||||||
| Other Assets and Liabilities-Net | (11.5 | ) | (19,227,357 | ) | |||||||||||
| Net Assets | 100.0 | % | $ | 167,771,110 | |||||||||||
@ Non-income producing security
@@ Foreign issuer
cc Securities purchased with cash collateral for securities loaned.
L Loaned security, a portion or all of the security is on loan at November 30, 2004.
* Cost for federal income tax purposes is $185,798,818. Net unrealized appreciation consists of:
| Gross Unrealized Appreciation | $ | 14,562,208 | |||||
| Gross Unrealized Depreciation | (13,362,559 | ) | |||||
| Net Unrealized Appreciation | $ | 1,199,649 | |||||
See Accompanying Notes to Financial Statements
86
PORTFOLIO OF INVESTMENTS
ING SMALLCAP VALUE FUND AS OF NOVEMBER 30, 2004 (UNAUDITED)
| Shares | Value | ||||||||||||||
| COMMON STOCK: 97.2% | |||||||||||||||
| Airlines: 3.0% | |||||||||||||||
| 685,520 | @,L | Delta Air Lines, Inc. | $ | 4,778,074 | |||||||||||
| 4,778,074 | |||||||||||||||
| Apparel: 4.9% | |||||||||||||||
| 94,848 | Oshkosh B'Gosh, Inc. | 1,944,384 | |||||||||||||
| 132,150 | Russell Corp. | 2,423,631 | |||||||||||||
| 353,940 | @,@@ | Tommy Hilfiger Corp. | 3,468,612 | ||||||||||||
| 7,836,627 | |||||||||||||||
| Auto Parts and Equipment: 9.9% | |||||||||||||||
| 110,140 | @ | Aftermarket Technology Corp. | 1,918,639 | ||||||||||||
| 351,779 | @,L | Goodyear Tire & Rubber Co. | 4,439,451 | ||||||||||||
| 140,590 | L | Superior Industries Intl., Inc. | 3,971,668 | ||||||||||||
| 635,290 | Visteon Corp. | 5,374,553 | |||||||||||||
| 15,704,311 | |||||||||||||||
| Building Materials: 2.0% | |||||||||||||||
| 85,490 | York Intl. Corp. | 3,152,016 | |||||||||||||
| 3,152,016 | |||||||||||||||
| Chemicals: 11.4% | |||||||||||||||
| 95,260 | Great Lakes Chemical Corp. | 2,791,118 | |||||||||||||
| 36,000 | Lubrizol Corp. | 1,243,800 | |||||||||||||
| 55,505 | @@ | Octel Corp. | 1,224,440 | ||||||||||||
| 375,260 | @ | PolyOne Corp. | 3,463,650 | ||||||||||||
| 194,590 | Sensient Technologies Corp. | 4,485,300 | |||||||||||||
| 464,700 | Wellman, Inc. | 4,781,762 | |||||||||||||
| 17,990,070 | |||||||||||||||
| Commercial Services: 3.1% | |||||||||||||||
| 95,330 | Kelly Services, Inc. | 2,898,032 | |||||||||||||
| 281,980 | @ | Service Corp. Intl. | 1,990,779 | ||||||||||||
| 4,888,811 | |||||||||||||||
| Computers: 4.1% | |||||||||||||||
| 630,600 | @ | Gateway, Inc. | 4,294,386 | ||||||||||||
| 173,100 | @,L | Mentor Graphics Corp. | 2,172,405 | ||||||||||||
| 6,466,791 | |||||||||||||||
| Electric: 0.3% | |||||||||||||||
| 25,000 | Westar Energy, Inc. | 553,750 | |||||||||||||
| 553,750 | |||||||||||||||
| Electrical Components and Equipment: 2.3% | |||||||||||||||
| 157,780 | Belden CDT, Inc. | 3,658,918 | |||||||||||||
| 3,658,918 | |||||||||||||||
| Electronics: 2.9% | |||||||||||||||
| 517,940 | @ | Kemet Corp. | 4,588,948 | ||||||||||||
| 4,588,948 | |||||||||||||||
| Food: 6.6% | |||||||||||||||
| 125,440 | @ | Del Monte Foods Co. | 1,361,024 | ||||||||||||
| 675,960 | @,L | Interstate Bakeries Corp. | 3,934,087 | ||||||||||||
| 1,304,837 | @,L | Winn-Dixie Stores, Inc. | 5,219,348 | ||||||||||||
| 10,514,459 | |||||||||||||||
| Hand/Machine Tools: 1.1% | |||||||||||||||
| 90,220 | Starrett (L.S.) Co. | 1,793,574 | |||||||||||||
| 1,793,574 | |||||||||||||||
| Shares | Value | ||||||||||||||
| Healthcare-Services: 2.0% | |||||||||||||||
| 560,900 | @,L | OCA, Inc. | $ | 3,208,348 | |||||||||||
| 3,208,348 | |||||||||||||||
| Home Builders: 0.8% | |||||||||||||||
| 127,500 | @ | National RV Holdings, Inc. | 1,240,575 | ||||||||||||
| 1,240,575 | |||||||||||||||
| Home Furnishings: 2.0% | |||||||||||||||
| 157,100 | Maytag Corp. | 3,157,710 | |||||||||||||
| 3,157,710 | |||||||||||||||
| Household Products/Wares: 8.9% | |||||||||||||||
| 125,500 | American Greetings Corp. | 3,340,810 | |||||||||||||
| 695,740 | @,L | Playtex Products, Inc. | 5,218,050 | ||||||||||||
| 64,900 | Russ Berrie & Co., Inc. | 1,475,826 | |||||||||||||
| 220,770 | Tupperware Corp. | 4,132,814 | |||||||||||||
| 14,167,500 | |||||||||||||||
| Insurance: 8.6% | |||||||||||||||
| 73,900 | @ | Allmerica Financial Corp. | 2,405,445 | ||||||||||||
| 164,700 | @@ | Assured Guaranty Ltd. | 3,033,773 | ||||||||||||
| 29,990 | Kansas City Life Insurance Co. | 1,482,706 | |||||||||||||
| 46,020 | Landamerica Financial Group, Inc. | 2,457,468 | |||||||||||||
| 14,545 | @ | National Western Life Insurance Co. | 2,359,054 | ||||||||||||
| 155,260 | L | Phoenix Cos., Inc. | 1,894,172 | ||||||||||||
| 13,632,618 | |||||||||||||||
| Iron/Steel: 0.0% | |||||||||||||||
| 4,154 | L | Ryerson Tull, Inc. | 67,212 | ||||||||||||
| 67,212 | |||||||||||||||
| Leisure Time: 2.2% | |||||||||||||||
| 272,900 | Callaway Golf Co. | 3,209,304 | |||||||||||||
| 19,800 | @ | K2, Inc. | 334,224 | ||||||||||||
| 3,543,528 | |||||||||||||||
| Machinery-Diversified: 5.3% | |||||||||||||||
| 36,290 | Nacco Industries, Inc. | 3,973,392 | |||||||||||||
| 100,840 | Tecumseh Products Co. | 4,416,792 | |||||||||||||
| 8,390,184 | |||||||||||||||
| Mining: 0.0% | |||||||||||||||
| 5,305 | USEC, Inc. | 55,862 | |||||||||||||
| 55,862 | |||||||||||||||
| Miscellaneous Manufacturing: 1.2% | |||||||||||||||
| 33,453 | Federal Signal Corp. | 575,392 | |||||||||||||
| 116,881 | Myers Industries, Inc. | 1,324,261 | |||||||||||||
| 1,899,653 | |||||||||||||||
| Oil and Gas Services: 1.3% | |||||||||||||||
| 59,850 | Tidewater, Inc. | 2,030,711 | |||||||||||||
| 2,030,711 | |||||||||||||||
| Pipelines: 1.8% | |||||||||||||||
| 504,090 | @,L | Dynegy, Inc. | 2,848,109 | ||||||||||||
| 2,848,109 | |||||||||||||||
| Retail: 7.3% | |||||||||||||||
| 182,150 | L | Dillard's, Inc. | 4,586,537 | ||||||||||||
See Accompanying Notes to Financial Statements
87
PORTFOLIO OF INVESTMENTS
ING SMALLCAP VALUE FUND AS OF NOVEMBER 30, 2004 (UNAUDITED) (CONTINUED)
| Shares | Value | ||||||||||||||
| Retail (continued) | |||||||||||||||
| 78,100 | Lone Star Steakhouse & Saloon, Inc. | $ | 2,107,919 | ||||||||||||
| 415,820 | @,L | Payless ShoeSource, Inc. | 4,856,778 | ||||||||||||
| 11,551,234 | |||||||||||||||
| Software: 1.3% | |||||||||||||||
| 133,760 | @ | SPSS, Inc. | 2,138,822 | ||||||||||||
| 2,138,822 | |||||||||||||||
| Telecommunications: 2.9% | |||||||||||||||
| 1,288,633 | @ | Cincinnati Bell, Inc. | 4,639,079 | ||||||||||||
| 4,639,079 | |||||||||||||||
| Total Common Stock (Cost $143,606,519) | 154,497,494 | ||||||||||||||
| Principal Amount | Value | ||||||||||||||
SHORT-TERM INVESTMENTS: 21.4%
| Securities Lending CollateralCC: 21.4% | |||||||||||||||
| $ | 34,093,573 | The Bank of New York Institutional Cash Reserves | | 34,093,573 | |||||||||||
| Total Short-Term Investments (Cost $34,093,573) | | 34,093,573 | |||||||||||||
| Total Investments In Securities (Cost $177,700,092)* | 118.6 | % | $ | 188,591,067 | |||||||||||
| Other Assets and Liabilities-Net | (18.6 | ) | (29,562,689 | ) | |||||||||||
| Net Assets | 100.0 | % | $ | 159,028,378 | |||||||||||
@ Non-income producing security
@@ Foreign issuer
cc Security purchased with cash collateral for securities loaned.
L Loaned security, a portion or all of the security is on loan at November 30, 2004.
* Cost for federal income tax purposes $177,739,983. Net unrealized Appreciation consists of:
| Gross Unrealized Appreciation | $ | 19,268,214 | |||||
| Gross Unrealized Depreciation | (8,417,130 | ) | |||||
| Net Unrealized Appreciation | $ | 10,851,084 | |||||
See Accompanying Notes to Financial Statements
88
PORTFOLIO OF INVESTMENTS
ING CONVERTIBLE FUND AS OF NOVEMBER 30, 2004 (UNAUDITED)
| Shares | Value | ||||||||||||||
| COMMON STOCK: 9.3% | |||||||||||||||
| Computers: 0.5% | |||||||||||||||
| 1,462,500 | @,@@ | Bull SA | $ | 913,556 | |||||||||||
| 913,556 | |||||||||||||||
| Food: 0.6% | |||||||||||||||
| 35,000 | @ | Dean Foods Co. | 1,108,450 | ||||||||||||
| 1,108,450 | |||||||||||||||
| Healthcare-Services: 2.1% | |||||||||||||||
| 74,600 | @ | Community Health Systems, Inc. | 2,062,690 | ||||||||||||
| 22,800 | @ | WellPoint, Inc. | 2,310,324 | ||||||||||||
| 4,373,014 | |||||||||||||||
| Investment Companies: 2.6% | |||||||||||||||
| 45,000 | @,L | SPDR Trust Series 1 | 5,305,050 | ||||||||||||
| 5,305,050 | |||||||||||||||
| Miscellaneous Manufacturing: 0.6% | |||||||||||||||
| 36,000 | General Electric Co. | 1,272,960 | |||||||||||||
| 1,272,960 | |||||||||||||||
| Retail: 1.6% | |||||||||||||||
| 18,000 | Wal-Mart Stores, Inc. | 937,080 | |||||||||||||
| 60,000 | L | Wendy's Intl., Inc. | 2,140,200 | ||||||||||||
| 3,077,280 | |||||||||||||||
| Telecommunications: 1.3% | |||||||||||||||
| 60,000 | QUALCOMM, Inc. | 2,497,200 | |||||||||||||
| 2,497,200 | |||||||||||||||
| Total Common Stock (Cost $13,462,240) | 18,547,510 | ||||||||||||||
| PREFERRED STOCK: 22.5% | |||||||||||||||
| Auto Manufacturers: 2.8% | |||||||||||||||
| 55,000 | Ford Motor Co. Capital Trust II | 2,884,750 | |||||||||||||
| 105,000 | General Motors Corp. | 2,680,400 | |||||||||||||
| 5,565,150 | |||||||||||||||
| Chemicals: 0.4% | |||||||||||||||
| 960 | Hercules Trust II | 844,800 | |||||||||||||
| 844,800 | |||||||||||||||
| Diversified Financial Services: 1.8% | |||||||||||||||
| 88,300 | Gabelli Asset Management, Inc. | 2,301,981 | |||||||||||||
| 48,000 | Lehman Brothers Holdings, Inc. | 1,233,600 | |||||||||||||
| 3,535,581 | |||||||||||||||
| Food: 1.3% | |||||||||||||||
| 97,500 | Albertson's, Inc. | 2,570,100 | |||||||||||||
| 2,570,100 | |||||||||||||||
| Home Builders: 0.6% | |||||||||||||||
| 25,000 | @ | Fleetwood Capital Trust | 1,131,250 | ||||||||||||
| 1,131,250 | |||||||||||||||
| Shares | Value | ||||||||||||||
| Insurance: 5.9% | |||||||||||||||
| 60,000 | Hartford Financial Services Group, Inc. | $ | 3,703,800 | ||||||||||||
| 67,800 | Reinsurance Group of America | 4,139,190 | |||||||||||||
| 118,000 | Travelers Property Casualty Corp. | 2,725,800 | |||||||||||||
| 40,000 | @@ | XL Capital Ltd. | 987,200 | ||||||||||||
| 11,555,990 | |||||||||||||||
| Media: 2.2% | |||||||||||||||
| 25,000 | @,L | Comcast Corp. | 1,212,500 | ||||||||||||
| 25,200 | Emmis Communications Corp. | 1,146,600 | |||||||||||||
| 1,985 | News Corp Finance Trust II | 1,990,558 | |||||||||||||
| 4,349,658 | |||||||||||||||
| Mining: 0.9% | |||||||||||||||
| 1,900 | Freeport-McMoRan Copper & Gold, Inc. | 1,869,125 | |||||||||||||
| 1,869,125 | |||||||||||||||
| Office/Business Equipment: 0.7% | |||||||||||||||
| 9,900 | @ | Xerox Corp. | 1,357,290 | ||||||||||||
| 1,357,290 | |||||||||||||||
| Oil and Gas: 1.3% | |||||||||||||||
| 24,700 | Chesapeake Energy Corp. | 2,608,950 | |||||||||||||
| 2,608,950 | |||||||||||||||
| Pharmaceuticals: 1.2% | |||||||||||||||
| 44,500 | Omnicare, Inc. | 2,327,350 | |||||||||||||
| 2,327,350 | |||||||||||||||
| Real Estate Investment Trusts: 1.6% | |||||||||||||||
| 83,000 | @ | FelCor Lodging Trust, Inc. | 2,058,400 | ||||||||||||
| 20,000 | Simon Property Group Inc | 1,142,600 | |||||||||||||
| 3,201,000 | |||||||||||||||
| Savings and Loans: 0.9% | |||||||||||||||
| 39,200 | Sovereign Capital Trust II | 1,871,800 | |||||||||||||
| 1,871,800 | |||||||||||||||
| Telecommunications: 0.9% | |||||||||||||||
| 1,500 | @ | Lucent Technologies Capital Trust I | 1,825,410 | ||||||||||||
| 51,932 | @,I,X,** | Winstar Communications, Inc. | 5 | ||||||||||||
| 1,825,415 | |||||||||||||||
| Total Preferred Stock (Cost $43,418,025) | 44,613,459 | ||||||||||||||
| Principal Amount | Value | ||||||||||||||
| CONVERTIBLE CORPORATE BONDS: 67.1% | |||||||||||||||
| Advertising: 1.1% | |||||||||||||||
| $ | 2,000,000 | L | Lamar Advertising Co., 2.875%, due 12/31/10 | 2,132,500 | |||||||||||
| 2,132,500 | |||||||||||||||
| Aerospace/Defense: 1.3% | |||||||||||||||
| 3,460,000 | Spacehab, Inc., 8.000%, due 10/15/07 | 2,633,925 | |||||||||||||
| 2,633,925 | |||||||||||||||
See Accompanying Notes to Financial Statements
89
PORTFOLIO OF INVESTMENTS
ING CONVERTIBLE FUND AS OF NOVEMBER 30, 2004 (UNAUDITED) (CONTINUED)
| Principal Amount | Value | ||||||||||||||
| Apparel: 1.0% | |||||||||||||||
| $ | 1,950,000 | # | Reebok International Ltd., 2.000%, due 05/01/24 | $ | 2,025,563 | ||||||||||
| 2,025,563 | |||||||||||||||
| Auto Parts and Equipment: 1.0% | |||||||||||||||
| 4,000,000 | L | Lear Corp.,4.000%, due 02/20/22 | 2,035,000 | ||||||||||||
| 2,035,000 | |||||||||||||||
| Biotechnology: 0.6% | |||||||||||||||
| 1,485,000 | ICOS Corp., 2.000%, due 07/01/23 | 1,254,825 | |||||||||||||
| 1,254,825 | |||||||||||||||
| Distribution/Wholesale: 2.0% | |||||||||||||||
| 3,500,000 | Costco Wholesale Corp., 0.000%, due 08/19/17 | 3,876,250 | |||||||||||||
| 3,876,250 | |||||||||||||||
| Diversified Financial Services: 3.9% | |||||||||||||||
| 980,000 | @@,#,L | AngloGold Holdings PLC, 2.375%, due 02/27/09 | 951,825 | ||||||||||||
| 4,875,000 | Lehman Brothers Holdings, Inc., 1.000%, due 09/16/10 | 4,424,062 | |||||||||||||
| 2,000,000 | @@,# | RepCon Lux SA, 4.500%, due 01/26/11 | 2,410,466 | ||||||||||||
| 7,786,353 | |||||||||||||||
| Electric: 2.3% | |||||||||||||||
| 2,000,000 | L | Centerpoint Energy, Inc., 3.750%, due 05/15/23 | 2,285,000 | ||||||||||||
| 2,000,000 | L | PPL Energy Supply LLC, 2.625%, due 05/15/23 | 2,222,500 | ||||||||||||
| 4,507,500 | |||||||||||||||
| Electrical Components and Equipment: 1.9% | |||||||||||||||
| 1,000,000 | @@ | ABB Intl. Finance Ltd., 4.625%, due 05/16/07 | 1,052,500 | ||||||||||||
| 3,000,000 | GrafTech Intl. Ltd., 1.625%, due 01/15/24 | 2,707,500 | |||||||||||||
| 3,760,000 | |||||||||||||||
| Electronics: 3.6% | |||||||||||||||
| 1,500,000 | @@,L | Flextronics Intl. Ltd., 1.000%, due 08/01/10 | 1,753,125 | ||||||||||||
| 3,000,000 | L | Flir Systems, Inc., 3.000%, due 06/01/23 | 4,462,500 | ||||||||||||
| 100,000,000 | @@ | Sony Corp., 0.000%, due 12/18/08 | 972,972 | ||||||||||||
| 7,188,597 | |||||||||||||||
| Energy-Alternate Sources: 1.3% | |||||||||||||||
| 2,000,000 | #,L | Headwaters, Inc., 2.875%, due 06/01/16 | 2,560,000 | ||||||||||||
| 2,560,000 | |||||||||||||||
| Entertainment: 0.9% | |||||||||||||||
| 1,500,000 | International Game Technology, 0.860%, due 01/29/33 | 1,179,375 | |||||||||||||
| 480,000 | Six Flags, Inc., 4.500%, due 05/15/15 | 511,200 | |||||||||||||
| 1,690,575 | |||||||||||||||
| Principal Amount | Value | ||||||||||||||
| Environmental Control: 1.5% | |||||||||||||||
| $ | 3,500,000 | L | Allied Waste Industries, Inc., 4.250%, due 04/15/34 | $ | 3,049,375 | ||||||||||
| 3,049,375 | |||||||||||||||
| Healthcare-Products: 3.1% | |||||||||||||||
| 2,900,000 | L | Advanced Medical Optics Inc, 2.500%, due 07/15/24 | 3,200,875 | ||||||||||||
| 2,900,000 | # | Henry Schein, Inc., 3.000%, due 08/15/34 | 3,026,875 | ||||||||||||
| 6,227,750 | |||||||||||||||
| Healthcare-Services: 1.3% | |||||||||||||||
| 2,000,000 | L | Laboratory Corp. of America Holdings, 1.570%, due 09/11/21 | 1,540,000 | ||||||||||||
| 1,000,000 | L | Quest Diagnostics, Inc., 1.750%, due 11/30/21 | 1,088,750 | ||||||||||||
| 2,628,750 | |||||||||||||||
| Insurance: 3.9% | |||||||||||||||
| 3,770,000 | L | American Intl. Group, Inc., 0.500%, due 05/15/07 | 3,586,213 | ||||||||||||
| 1,970,000 | # | AmerUs Group Co., 2.000%, due 03/06/32 | 2,531,450 | ||||||||||||
| 1,440,000 | L | PMA Capital Corp, 6.500%, due 09/30/22 | 1,564,200 | ||||||||||||
| 7,681,863 | |||||||||||||||
| Internet: 2.1% | |||||||||||||||
| 1,470,000 | L | Equinix Inc, 2.500%, due 02/15/24 | 1,719,900 | ||||||||||||
| 960,000 | @@,# | Shanda Interactive Entertainment Ltd, 0.000%, due 10/15/14 | 1,168,800 | ||||||||||||
| 1,400,000 | Sohu.com, Inc., 0.700%, due 07/14/23 | 1,228,500 | |||||||||||||
| 4,117,200 | |||||||||||||||
| Lodging: 1.2% | |||||||||||||||
| 1,000,000 | L | Hilton Hotels Corp., 3.375%, due 04/15/23 | 1,148,750 | ||||||||||||
| 1,000,000 | L | Starwood Hotels & Resorts Worldwide, Inc., 3.500%, due 05/16/23 | 1,150,000 | ||||||||||||
| 2,298,750 | |||||||||||||||
| Media: 3.8% | |||||||||||||||
| 2,400,000 | #,L | Charter Communications Inc, 5.875%, due 11/16/09 | 2,568,000 | ||||||||||||
| 2,460,000 | Citadel Broadcasting Corp, 1.875%, due 02/15/11 | 2,198,625 | |||||||||||||
| 1,000,000 | Liberty Media Corp, 3.500%, due 01/15/31 | 956,250 | |||||||||||||
| 1,920,000 | @@ | ZEE Telefilms Ltd, 0.500%, due 04/29/09 | 1,850,928 | ||||||||||||
| 7,573,803 | |||||||||||||||
| Mining: 3.4% | |||||||||||||||
| 1,500,000 | @@,L | Inco Ltd., 0.000%, due 03/29/21 | 1,545,000 | ||||||||||||
| 1,985,000 | @@,L | Inco Ltd., 1.000%, due 03/14/23 | 2,654,938 | ||||||||||||
See Accompanying Notes to Financial Statements
90
PORTFOLIO OF INVESTMENTS
ING CONVERTIBLE FUND AS OF NOVEMBER 30, 2004 (UNAUDITED) (CONTINUED)
| Principal Amount | Value | ||||||||||||||
| Mining (continued) | |||||||||||||||
| $ | 2,000,000 | @@,L | Placer Dome, Inc., 2.750%, due 10/15/23 | $ | 2,612,500 | ||||||||||
| 6,812,438 | |||||||||||||||
| Miscellaneous Manufacturing: 2.7% | |||||||||||||||
| 3,500,000 | @@,# | Tyco Intl. Group SA, 2.750%, due 01/15/18 | 5,363,750 | ||||||||||||
| 5,363,750 | |||||||||||||||
| Oil and Gas: 3.3% | |||||||||||||||
| 1,998,000 | Devon Energy Corp., 4.900%, due 08/15/08 | 2,210,288 | |||||||||||||
| 2,000,000 | @@,L | Formosa Petrochemical Corp., 0.000%, due 06/30/11 | 2,199,000 | ||||||||||||
| 1,985,000 | #,L | Pride Intl., Inc., 3.250%, due 05/01/33 | 2,133,875 | ||||||||||||
| 6,543,163 | |||||||||||||||
| Oil and Gas Services: 0.5% | |||||||||||||||
| 1,000,000 | @@,L | Schlumberger Ltd., 2.125%, due 06/01/23 | 1,077,500 | ||||||||||||
| 1,077,500 | |||||||||||||||
| Packaging and Containers: 1.0% | |||||||||||||||
| 2,000,000 | # | Sealed Air Corp., 3.000%, due 06/30/33 | 2,035,000 | ||||||||||||
| 2,035,000 | |||||||||||||||
| Pharmaceuticals: 7.9% | |||||||||||||||
| 1,990,000 | L | Amylin Pharmaceuticals, Inc., 2.250%, due 06/30/08 | 1,947,713 | ||||||||||||
| 4,000,000 | Cephalon, Inc., 2.500%, due 12/15/06 | 3,944,999 | |||||||||||||
| 1,920,000 | # | Isolagen Inc, 3.500%, due 11/01/24 | 2,133,600 | ||||||||||||
| 3,000,000 | NPS Pharmaceuticals, Inc., 3.000%, due 06/15/08 | 2,737,500 | |||||||||||||
| 1,000,000 | L | Sepracor, Inc., 5.000%, due 02/15/07 | 1,028,750 | ||||||||||||
| 1,920,000 | # | Sepracor, Inc., 0.430%, due 10/15/24 | 1,764,000 | ||||||||||||
| 2,000,000 | Teva Pharmaceutical Finance LLC, .500%, due 02/01/24 | 1,962,500 | |||||||||||||
| 15,519,062 | |||||||||||||||
| Retail: 0.6% | |||||||||||||||
| 1,100,000 | Rite Aid Corp., 4.750%, due 12/01/06 | 1,116,500 | |||||||||||||
| 1,116,500 | |||||||||||||||
| Savings and Loans: 2.0% | |||||||||||||||
| 3,870,000 | # | Ocwen Financial Corp., 3.250%, due 08/01/24 | 4,063,500 | ||||||||||||
| 4,063,500 | |||||||||||||||
| Semiconductors: 2.7% | |||||||||||||||
| 3,000,000 | L | Advanced Micro Devices, Inc., 4.750%, due 02/01/22 | 3,393,750 | ||||||||||||
| 1,000,000 | Cypress Semiconductor Corp, 1.250%, due 06/15/08 | 992,500 | |||||||||||||
| 960,000 | # | Vitesse Semiconductor Corp., 1.500%, due 10/01/24 | 1,053,600 | ||||||||||||
| 5,439,850 | |||||||||||||||
| Principal Amount | Value | ||||||||||||||
| Telecommunications: 4.0% | |||||||||||||||
| $ | 2,000,000 | Nextel Partners, Inc., 1.500%, due 11/15/08 | $ | 3,142,499 | |||||||||||
| 1,000,000 | L | NII Holdings, Inc., 2.875%, due 02/01/34 | 1,107,500 | ||||||||||||
| 1,470,000 | L | Primus Telecommunications Group, Inc., 5.750%, due 02/15/07 | 1,288,088 | ||||||||||||
| 1,980,000 | L | RF Micro Devices, Inc., 1.500%, due 07/01/10 | 2,272,050 | ||||||||||||
| 7,810,137 | |||||||||||||||
| Transportation: 1.2% | |||||||||||||||
| 985,000 | # | Yellow Corp., 5.000%, due 08/08/23 | 1,636,331 | ||||||||||||
| 490,000 | # | Yellow Corp., 3.375%, due 11/25/23 | 711,725 | ||||||||||||
| 2,348,056 | |||||||||||||||
| Total Convertible Corporate Bonds (Cost $120,465,883) | 133,157,535 | ||||||||||||||
| CORPORATE BONDS/NOTES: 0.6% | |||||||||||||||
| Building Materials: 0.6% | |||||||||||||||
| 960,000 | #,L | NCI Building Systems Inc, 2.125%, due 11/15/24 | 1,092,000 | ||||||||||||
| Total Corporate Bonds/notes (Cost $960,000) | 1,092,000 | ||||||||||||||
| Total Long-Term Investments (Cost $178,306,148) | 197,410,504 | ||||||||||||||
SHORT-TERM INVESTMENTS: 27.7%
| Repurchase Agreement: 0.5% | |||||||||||||||
| 1,065,000 | Morgan Stanley Repurchase Agreement 11/30/04, 2.070%, due 12/01/04, $1,065,061 to be received upon repurchase (Collateralized by $980,000 Federal National Mortgage Association, 6.250%, Market Value plus accrued interest $1,089,368, due 07/15/06) | | 1,065,000 | ||||||||||||
| Total Repurchase Agreement (Cost $1,065,000) | 1,065,000 | ||||||||||||||
| Securities Lending CollateralCC: 27.2% | |||||||||||||||
| 53,943,311 | The Bank of New York Institutional Cash Reserves Fund | 53,943,311 | |||||||||||||
| Total Securities Lending Collateral (Cost $53,943,311) | 53,943,311 | ||||||||||||||
| Total Short-Term Investments (Cost $55,008,311) | 55,008,311 | ||||||||||||||
| Total Investments In Securities (Cost $233,314,459)* | 127.2 | % | $ | 252,418,815 | |||||||||||
| Other Assets and Liabilities-Net | (27.2 | ) | (53,999,439 | ) | |||||||||||
| Net Assets | 100.0 | % | $ | 198,419,376 | |||||||||||
See Accompanying Notes to Financial Statements
91
PORTFOLIO OF INVESTMENTS
ING CONVERTIBLE FUND AS OF NOVEMBER 30, 2004 (UNAUDITED) (CONTINUED)
@ Non-income producing security
@@ Foreign issuer
# Securities with purchases pursuant to Rule 144A, under the Securities Act of 1933 and may not be resold subject to that rule except to qualified institutional buyers. These securities have been determined to be liquid under the guidelines established by the Funds' Board of Directors/Trustees.
cc Securities purchased with cash collateral for securities loaned.
I Illiquid security
L Loaned security, a portion or all of the security is on loan at November 30, 2004.
X Fair value determined by ING Funds Valuation Committee appointed by the Funds' Board of Directors/Trustees.
** Defaulted security
* Cost for federal income tax purposes is $233,423,855. Net unrealized appreciation consists of:
| Gross Unrealized Appreciation | $ | 24,245,259 | |||||
| Gross Unrealized Depreciation | (5,250,299 | ) | |||||
| Net Unrealized Appreciation | $ | 18,994,960 | |||||
See Accompanying Notes to Financial Statements
92
PORTFOLIO OF INVESTMENTS
ING EQUITY AND BOND FUND AS OF NOVEMBER 30, 2004 (UNAUDITED)
| Shares | Value | ||||||||||||||
| COMMON STOCK: 55.6% | |||||||||||||||
| Aerospace/Defense: 2.2% | |||||||||||||||
| 8,320 | Boeing Co. | $ | 445,702 | ||||||||||||
| 4,170 | General Dynamics Corp. | 451,861 | |||||||||||||
| 5,100 | United Technologies Corp. | 497,659 | |||||||||||||
| 1,395,222 | |||||||||||||||
| Agriculture: 0.8% | |||||||||||||||
| 9,300 | Altria Group, Inc. | 534,657 | |||||||||||||
| 534,657 | |||||||||||||||
| Auto Manufacturers: 0.6% | |||||||||||||||
| 4,800 | PACCAR, Inc. | 374,880 | |||||||||||||
| 374,880 | |||||||||||||||
| Banks: 3.3% | |||||||||||||||
| 9,100 | Bank of America Corp. | 421,057 | |||||||||||||
| 14,785 | North Fork Bancorporation, Inc. | 425,808 | |||||||||||||
| 16,100 | U.S. Bancorp | 477,043 | |||||||||||||
| 5,900 | Wachovia Corp. | 305,325 | |||||||||||||
| 7,900 | Wells Fargo & Co. | 487,983 | |||||||||||||
| 2,117,216 | |||||||||||||||
| Beverages: 0.6% | |||||||||||||||
| 7,900 | PepsiCo, Inc. | 394,289 | |||||||||||||
| 394,289 | |||||||||||||||
| Biotechnology: 1.2% | |||||||||||||||
| 6,600 | @ | Amgen, Inc. | 396,264 | ||||||||||||
| 6,455 | @ | Biogen Idec, Inc. | 378,779 | ||||||||||||
| 775,043 | |||||||||||||||
| Chemicals: 3.2% | |||||||||||||||
| 6,225 | Air Products & Chemicals, Inc. | 356,381 | |||||||||||||
| 12,900 | Dow Chemical Co. | 651,063 | |||||||||||||
| 9,300 | E.I. du Pont de Nemours & Co. | 421,476 | |||||||||||||
| 8,325 | Praxair, Inc. | 373,793 | |||||||||||||
| 5,000 | Sherwin-Williams Co. | 223,000 | |||||||||||||
| 2,025,713 | |||||||||||||||
| Commercial Services: 0.9% | |||||||||||||||
| 26,200 | Cendant Corp. | 593,954 | |||||||||||||
| 593,954 | |||||||||||||||
| Computers: 2.6% | |||||||||||||||
| 11,100 | @ | Dell, Inc. | 449,772 | ||||||||||||
| 36,700 | @ | EMC Corp. | 492,514 | ||||||||||||
| 7,800 | International Business Machines Corp. | 735,072 | |||||||||||||
| 1,677,358 | |||||||||||||||
| Cosmetics/Personal Care: 0.7% | |||||||||||||||
| 8,400 | Procter & Gamble Co. | 449,232 | |||||||||||||
| 449,232 | |||||||||||||||
| Diversified Financial Services: 6.9% | |||||||||||||||
| 23,100 | Citigroup, Inc. | 1,033,726 | |||||||||||||
| 21,800 | Countrywide Financial Corp. | 723,978 | |||||||||||||
| 37,120 | @ | E*TRADE Financial Corp. | 514,483 | ||||||||||||
| 8,900 | Goldman Sachs Group, Inc. | 932,364 | |||||||||||||
| 13,000 | J.P. Morgan Chase & Co. | 489,450 | |||||||||||||
| 8,800 | Lehman Brothers Holdings, Inc. | 737,264 | |||||||||||||
| 1,209 | I,XX | North Atlantic Trading Co., Inc. | 1 | ||||||||||||
| 4,431,266 | |||||||||||||||
| Shares | Value | ||||||||||||||
| Electric: 0.8% | |||||||||||||||
| 11,100 | Consolidated Edison, Inc. | $ | 486,735 | ||||||||||||
| 486,735 | |||||||||||||||
| Electronics: 0.5% | |||||||||||||||
| 4,510 | Parker Hannifin Corp. | 337,348 | |||||||||||||
| 337,348 | |||||||||||||||
| Healthcare-Products: 2.4% | |||||||||||||||
| 6,090 | Guidant Corp. | 394,815 | |||||||||||||
| 10,800 | Johnson & Johnson | 651,456 | |||||||||||||
| 5,800 | @ | Zimmer Holdings, Inc. | 473,280 | ||||||||||||
| 1,519,551 | |||||||||||||||
| Healthcare-Services: 0.8% | |||||||||||||||
| 4,000 | @ | WellPoint Health Networks, Inc. | 500,400 | ||||||||||||
| 500,400 | |||||||||||||||
| Insurance: 2.1% | |||||||||||||||
| 13,380 | American Intl. Group, Inc. | 847,623 | |||||||||||||
| 6,300 | Chubb Corp. | 480,123 | |||||||||||||
| 1,327,746 | |||||||||||||||
| Investment Companies: 1.0% | |||||||||||||||
| 12,400 | iShares Goldman Sachs Semiconductor Index Fund | 651,000 | |||||||||||||
| 651,000 | |||||||||||||||
| Leisure Time: 1.4% | |||||||||||||||
| 10,300 | Carnival Corp. | 546,003 | |||||||||||||
| 6,600 | Harley-Davidson, Inc. | 381,612 | |||||||||||||
| 927,615 | |||||||||||||||
| Lodging: 1.1% | |||||||||||||||
| 8,425 | Marriott Intl., Inc. | 478,961 | |||||||||||||
| 4,900 | Starwood Hotels & Resorts Worldwide, Inc. | 256,221 | |||||||||||||
| 735,182 | |||||||||||||||
| Machinery-Diversified: 0.6% | |||||||||||||||
| 8,700 | Rockwell Automation, Inc. | 411,510 | |||||||||||||
| 411,510 | |||||||||||||||
| Media: 0.8% | |||||||||||||||
| 16,400 | @ | Comcast Corp. | 486,260 | ||||||||||||
| 486,260 | |||||||||||||||
| Mining: 0.7% | |||||||||||||||
| 13,300 | Alcoa, Inc. | 451,934 | |||||||||||||
| 451,934 | |||||||||||||||
| Miscellaneous Manufacturing: 4.7% | |||||||||||||||
| 9,400 | 3M Co. | 748,146 | |||||||||||||
| 3,980 | Eaton Corp. | 268,252 | |||||||||||||
| 37,200 | General Electric Co. | 1,315,392 | |||||||||||||
| 19,480 | @@ | Tyco Intl. Ltd. | 661,736 | ||||||||||||
| 2,993,526 | |||||||||||||||
| Oil and Gas: 3.2% | |||||||||||||||
| 10,500 | ChevronTexaco Corp. | 573,300 | |||||||||||||
| 19,200 | Exxon Mobil Corp. | 984,000 | |||||||||||||
| 9,850 | @,@@ | Nabors Industries Ltd. | 512,200 | ||||||||||||
| 2,069,500 | |||||||||||||||
See Accompanying Notes to Financial Statements
93
PORTFOLIO OF INVESTMENTS
ING EQUITY AND BOND FUND AS OF NOVEMBER 30, 2004 (UNAUDITED) (CONTINUED)
| Shares | Value | ||||||||||||||
| Oil and Gas Services: 2.2% | |||||||||||||||
| 16,230 | Baker Hughes, Inc. | $ | 719,476 | ||||||||||||
| 13,120 | BJ Services Co. | 664,790 | |||||||||||||
| 1,384,266 | |||||||||||||||
| Pharmaceuticals: 2.7% | |||||||||||||||
| 5,900 | Abbott Laboratories | 247,564 | |||||||||||||
| 4,210 | Allergan, Inc. | 309,435 | |||||||||||||
| 11,250 | @ | Barr Pharmaceuticals, Inc. | 439,313 | ||||||||||||
| 13,200 | Merck & Co., Inc. | 369,864 | |||||||||||||
| 13,885 | Pfizer, Inc. | 385,586 | |||||||||||||
| 1,751,762 | |||||||||||||||
| Retail: 3.0% | |||||||||||||||
| 9,440 | CVS Corp. | 428,293 | |||||||||||||
| 9,010 | @ | Kohl's Corp. | 415,902 | ||||||||||||
| 7,900 | Lowe's Cos., Inc. | 437,107 | |||||||||||||
| 12,600 | Wal-Mart Stores, Inc. | 655,955 | |||||||||||||
| 1,937,257 | |||||||||||||||
| Semiconductors: 0.7% | |||||||||||||||
| 19,800 | Intel Corp. | 442,530 | |||||||||||||
| 442,530 | |||||||||||||||
| Software: 1.5% | |||||||||||||||
| 35,200 | Microsoft Corp. | 943,712 | |||||||||||||
| 943,712 | |||||||||||||||
| Telecommunications: 2.4% | |||||||||||||||
| 13,300 | @ | Avaya, Inc. | 218,386 | ||||||||||||
| 26,500 | @ | Cisco Systems, Inc. | 495,815 | ||||||||||||
| 9,900 | Qualcomm, Inc. | 412,038 | |||||||||||||
| 16,400 | SBC Communications, Inc. | 412,788 | |||||||||||||
| 1,539,027 | |||||||||||||||
| Total Common Stock (Cost $31,718,106) | 35,665,691 | ||||||||||||||
| PREFERRED STOCK: 0.3% | |||||||||||||||
| Banks: 0.3% | |||||||||||||||
| 16 | #,XX | DG Funding Trust | 173,100 | ||||||||||||
| 173,100 | |||||||||||||||
| Electric: 0.0% | |||||||||||||||
| 1,025 | XX | TECO Energy, Inc. | 26,045 | ||||||||||||
| 26,045 | |||||||||||||||
| Total Preferred Stock (Cost $199,878) | 199,145 | ||||||||||||||
| WARRANTS: 0.0% | |||||||||||||||
| Building Materials: 0.0% | |||||||||||||||
| 400 | I,# | Dayton Superior Corp. | 4 | ||||||||||||
| Telecommunications: 0.0% | |||||||||||||||
| 500 | I,X | Iridium World Communications, Inc. | - | ||||||||||||
| - | |||||||||||||||
| Total Warrants (Cost $57,953) | 4 | ||||||||||||||
| Principal Amount | Value | ||||||||||||||
| CORPORATE BONDS/NOTES: 10.7% | |||||||||||||||
| Airlines: 0.1% | |||||||||||||||
| $ | 90,000 | American Airlines, Inc., 7.324%, due 10/15/09 | $ | 73,136 | |||||||||||
| 73,136 | |||||||||||||||
| Auto Manufacturers: 0.3% | |||||||||||||||
| 24,000 | Ford Motor Co., 6.625%, due 10/01/28 | 21,743 | |||||||||||||
| 72,000 | Ford Motor Co., 7.450%, due 07/16/31 | 70,244 | |||||||||||||
| 76,000 | General Motors Corp., 8.375%, due 07/15/33 | 77,575 | |||||||||||||
| 169,562 | |||||||||||||||
| Banks: 2.6% | |||||||||||||||
| 40,000 | @@ | Australia & New Zealand Banking Group Ltd., 2.405%, due 10/29/49 | 34,803 | ||||||||||||
| 48,000 | @@ | Banco Bradesco SA/Cayman Islands, 8.750%, due 10/24/13 | 51,840 | ||||||||||||
| 109,000 | @@ | Banco Santander Chile SA, 7.375%, due 07/18/12 | 122,903 | ||||||||||||
| 40,000 | @@ | Bank of Ireland, 2.160%, due 12/29/49 | 34,656 | ||||||||||||
| 30,000 | @@ | Bank of Nova Scotia, 2.115%, due 08/31/85 | 24,885 | ||||||||||||
| 50,000 | BankAmerica Capital II, 8.000%, due 12/15/26 | 54,169 | |||||||||||||
| 43,000 | @@,# | Danske Bank A/S, 5.914%, due 12/29/49 | 45,157 | ||||||||||||
| 20,000 | @@ | Den Norske Bank ASA, 2.125%, due 08/29/49 | 16,575 | ||||||||||||
| 80,000 | # | Dresdner Funding Trust I, 8.151%, due 06/30/31 | 96,579 | ||||||||||||
| 53,000 | FBS Capital I, 8.090%, due 11/15/26 | 57,623 | |||||||||||||
| 45,000 | @@,# | HBOS Capital Funding LP, 6.071%, due 06/30/49 | 47,813 | ||||||||||||
| 150,000 | @@ | HSBC Bank PLC, 1.971%, due 06/29/49 | 129,903 | ||||||||||||
| 80,000 | @@ | Lloyds TSB Bank PLC, 2.090%, due 08/29/49 | 68,263 | ||||||||||||
| 80,000 | @@ | Lloyds TSB Bank PLC, 2.188%, due 06/29/49 | 71,154 | ||||||||||||
| 71,000 | M & T Bank Corp., 3.850%, due 04/01/13 | 70,087 | |||||||||||||
| 51,000 | Mellon Capital I, 7.720%, due 12/01/26 | 55,169 | |||||||||||||
| 30,000 | @@ | National Australia Bank Ltd., 2.361%, due 10/29/49 | 26,102 | ||||||||||||
| 90,000 | National Westminster Bank PLC, 2.563%, due 11/29/49 | 76,704 | |||||||||||||
| 58,000 | # | Rabobank Capital Funding II, 5.260%, due 12/29/49 | 58,704 | ||||||||||||
| 70,000 | @@ | Royal Bank of Canada, 1.750%, due 06/29/85 | 59,921 | ||||||||||||
| 30,000 | @@ | Royal Bank of Scotland Group PLC, 2.063%, due 12/29/49 | 26,414 | ||||||||||||
| 20,000 | @@ | Societe Generale, 2.705%, due 11/29/49 | 17,150 | ||||||||||||
| 130,000 | @@,C | Standard Chartered PLC, 2.070%, due 12/29/49 | 104,325 | ||||||||||||
See Accompanying Notes to Financial Statements
94
PORTFOLIO OF INVESTMENTS
ING EQUITY AND BOND FUND AS OF NOVEMBER 30, 2004 (UNAUDITED) (CONTINUED)
| Principal Amount | Value | ||||||||||||||
| Banks (continued) | |||||||||||||||
| $ | 160,000 | @@,C | Standard Chartered PLC, 2.813%, due 11/29/49 | $ | 127,563 | ||||||||||
| 49,000 | Wells Fargo Capital I, 7.960%, due 12/15/26 | 53,156 | |||||||||||||
| 30,000 | @@ | Westpac Banking Corp., 2.338%, due 09/29/49 | 25,910 | ||||||||||||
| 155,000 | # | Westpac Capital Trust IV, 5.256%, due 12/29/49 | 151,510 | ||||||||||||
| 1,709,038 | |||||||||||||||
| Beverages: 0.4% | |||||||||||||||
| 145,000 | @@ | Cia Brasileira de Bebidas, 8.750%, due 09/15/13 | 165,844 | ||||||||||||
| 11,000 | @@ | Cia Brasileira de Bebidas, 10.500%, due 12/15/11 | 13,640 | ||||||||||||
| 80,000 | #,S | Miller Brewing Co., 4.250%, due 08/15/08 | 80,504 | ||||||||||||
| 259,988 | |||||||||||||||
| Chemicals: 0.1% | |||||||||||||||
| 23,000 | Dow Chemical Co., 5.750%, due 11/15/09 | 24,509 | |||||||||||||
| 22,000 | @@,#,S | Sociedad Quimica y Minera de Chile SA, 7.700%, due 09/15/06 | 23,391 | ||||||||||||
| 47,900 | |||||||||||||||
| Diversified Financial Services: 1.6% | |||||||||||||||
| 22,118 | @@,# | Arcel Finance Ltd., 5.984%, due 02/01/09 | 22,884 | ||||||||||||
| 47,000 | @@,#,S | Arcel Finance Ltd., 6.361%, due 05/01/12 | 46,872 | ||||||||||||
| 46,000 | @@,# | Arcel Finance Ltd., 7.048%, due 09/01/11 | 47,523 | ||||||||||||
| 122,000 | @@,# | Brazilian Merchant Voucher Receivables Ltd., 5.911%, due 06/15/11 | 121,390 | ||||||||||||
| 51,000 | Citigroup Capital II, 7.750%, due 12/01/36 | 54,578 | |||||||||||||
| 51,000 | # | Corestates Capital Trust I, 8.000%, due 12/15/26 | 55,549 | ||||||||||||
| 72,000 | # | Farmers Exchange Capital, 7.200%, due 07/15/48 | 71,661 | ||||||||||||
| 30,000 | @@ | Financiere CSFB NV, 2.125%, due 03/29/49 | 24,877 | ||||||||||||
| 24,000 | Ford Motor Credit Co., 7.000%, due 10/01/13 | 25,081 | |||||||||||||
| 106,000 | # | HVB Funding Trust III, 9.000%, due 10/22/31 | 136,557 | ||||||||||||
| 14,000 | JPM Capital Trust I, 7.540%, due 01/15/27 | 14,946 | |||||||||||||
| 45,000 | JPM Capital Trust II, 7.950%, due 02/01/27 | 48,771 | |||||||||||||
| 135,000 | #,XX | Mangrove Bay Pass-Through Trust, 6.102%, due 07/15/33 | 134,477 | ||||||||||||
| 66,453 | @@,# | PF Export Receivables Master Trust, 3.748%, due 06/01/13 | 64,266 | ||||||||||||
| 101,236 | @@,# | PF Export Receivables Master Trust, 6.436%, due 06/01/15 | 100,308 | ||||||||||||
| 69,000 | @@ | UFJ Finance Aruba AEC, 8.750%, due 11/29/49 | 77,491 | ||||||||||||
| 1,047,231 | |||||||||||||||
| Principal Amount | Value | ||||||||||||||
| Electric: 1.6% | |||||||||||||||
| $ | 100,000 | @@,# | AES Gener SA, 7.500%, due 03/25/14 | $ | 104,750 | ||||||||||
| 74,842 | # | Allegheny Energy Supply Statutory Trust 2001, 10.250%, due 11/15/07 | 85,881 | ||||||||||||
| 8,344 | # | Allegheny Energy Supply Statutory Trust 2001, 13.000%, due 11/15/07 | 9,137 | ||||||||||||
| 91,880 | CE Generation LLC, 7.416%, due 12/15/18 | 95,038 | |||||||||||||
| 81,000 | Consumers Energy Co., 4.250%, due 04/15/08 | 81,636 | |||||||||||||
| 62,000 | S | DTE Energy Co, 2.740%, due 06/01/07 | 62,356 | ||||||||||||
| 98,000 | @@,S | Empresa Nacional de Electricidad SA/Chile, 8.625%, due 08/01/15 | 113,438 | ||||||||||||
| 116,000 | Enterprise Capital Trust II, 3.195%, due 06/30/28 | 110,454 | |||||||||||||
| 69,000 | Monongahela Power Co., 7.360%, due 01/15/10 | 75,630 | |||||||||||||
| 106,000 | Ohio Power Co., 6.375%, due 07/15/33 | 109,111 | |||||||||||||
| 11,970 | #,S | Power Contract Financing LLC, 5.200%, due 02/01/06 | 12,098 | ||||||||||||
| 47,000 | # | Power Contract Financing LLC, 6.256%, due 02/01/10 | 48,951 | ||||||||||||
| 18,094 | PPL Montana LLC, 8.903%, due 07/02/20 | 20,458 | |||||||||||||
| 26,000 | Sithe/Independence Funding, 9.000%, due 12/30/13 | 28,688 | |||||||||||||
| 31,810 | @@,# | Tenaska Virginia Partners LP, 6.119%, due 03/30/24 | 33,073 | ||||||||||||
| 63,000 | S | TXU Corp, 4.446%, due 11/16/06 | 63,785 | ||||||||||||
| 1,054,484 | |||||||||||||||
| Food: 0.4% | |||||||||||||||
| 35,000 | S | Kroger Co., 7.250%, due 06/01/09 | 38,990 | ||||||||||||
| 65,000 | S | Safeway, Inc., 4.800%, due 07/16/07 | 66,517 | ||||||||||||
| 45,000 | Supervalu, Inc., 7.875%, due 08/01/09 | 51,565 | |||||||||||||
| 89,000 | S | Tyson Foods, Inc., 7.250%, due 10/01/06 | 94,698 | ||||||||||||
| 251,770 | |||||||||||||||
| Gas: 0.1% | |||||||||||||||
| 67,000 | #,S | Williams Gas Pipelines Central, Inc., 7.375%, due 11/15/06 | 71,606 | ||||||||||||
| 71,606 | |||||||||||||||
| Healthcare-Services: 0.1% | |||||||||||||||
| 50,000 | HCA, Inc., 5.500%, due 12/01/09 | 49,814 | |||||||||||||
| 49,814 | |||||||||||||||
| Home Builders: 0.0% | |||||||||||||||
| 4,000 | Technical Olympic USA, Inc., 9.000%, due 07/01/10 | 4,330 | |||||||||||||
| 4,330 | |||||||||||||||
See Accompanying Notes to Financial Statements
95
PORTFOLIO OF INVESTMENTS
ING EQUITY AND BOND FUND AS OF NOVEMBER 30, 2004 (UNAUDITED) (CONTINUED)
| Principal Amount | Value | ||||||||||||||
| Insurance: 0.4% | |||||||||||||||
| $ | 18,000 | @@,# | Farmers Insurance Exchange, 6.000%, due 08/01/14 | $ | 17,862 | ||||||||||
| 26,000 | @@,# | Farmers Insurance Exchange, 8.625%, due 05/01/24 | 30,180 | ||||||||||||
| 54,000 | @@,# | Monumental Global Funding II, 3.850%, due 03/03/08 | 53,964 | ||||||||||||
| 53,000 | S | Prudential Financial, Inc., 4.104%, due 11/15/06 | 53,570 | ||||||||||||
| 88,000 | @@,# | Zurich Capital Trust I, 8.376%, due 06/01/37 | 97,489 | ||||||||||||
| 253,065 | |||||||||||||||
| Media: 0.1% | |||||||||||||||
| 48,000 | COX Communications, Inc., 6.850%, due 01/15/18 | 50,132 | |||||||||||||
| 10,000 | @@ | Rogers Cable, Inc., 6.750%, due 03/15/15 | 10,200 | ||||||||||||
| 60,332 | |||||||||||||||
| Mining: 0.2% | |||||||||||||||
| 47,000 | @@,# | Corp Nacional del Cobre de Chile, 5.500%, due 10/15/13 | 48,335 | ||||||||||||
| 74,000 | @@,S | Vale Overseas Ltd., 8.625%, due 03/08/07 | 82,214 | ||||||||||||
| 130,549 | |||||||||||||||
| Multi-National: 0.2% | |||||||||||||||
| 124,000 | @@,S | Corp Andina de Fomento CAF, 6.875%, due 03/15/12 | 137,660 | ||||||||||||
| 137,660 | |||||||||||||||
| Oil and Gas: 1.0% | |||||||||||||||
| 59,000 | Amerada Hess Corp., 6.650%, due 08/15/11 | 64,592 | |||||||||||||
| 67,000 | @@,# | Empresa Nacional de Petroleo, 4.875%, due 03/15/14 | 64,799 | ||||||||||||
| 76,000 | @@,# | Gazprom International SA, 7.201%, due 02/01/20 | 79,420 | ||||||||||||
| 53,000 | @@ | Husky Energy, Inc., 6.150%, due 06/15/19 | 55,969 | ||||||||||||
| 104,000 | # | Pemex Project Funding Master Trust, 3.180%, due 06/15/10 | 106,860 | ||||||||||||
| 37,000 | Pemex Project Funding Master Trust, 7.375%, due 12/15/14 | 40,460 | |||||||||||||
| 37,000 | @@ | Petroleos Mexicanos, 9.250%, due 03/30/18 | 44,955 | ||||||||||||
| 22,868 | @@ | Petrozuata Finance, Inc., 7.630%, due 04/01/09 | 23,868 | ||||||||||||
| 100,000 | @@ | Tengizchevroil Finance Co S.ar.1, 6.124%, due 11/15/14 | 100,000 | ||||||||||||
| 42,000 | Valero Energy Corp., 8.750%, due 06/15/30 | 54,429 | |||||||||||||
| 635,352 | |||||||||||||||
| Packaging and Containers: 0.1% | |||||||||||||||
| 32,000 | # | Sealed Air Corp., 5.375%, due 04/15/08 | 33,308 | ||||||||||||
| 33,308 | |||||||||||||||
| Principal Amount | Value | ||||||||||||||
| Real Estate: 0.2% | |||||||||||||||
| $ | 70,000 | EOP Operating LP, 7.750%, due 11/15/07 | $ | 77,461 | |||||||||||
| 61,000 | S | Liberty Property LP, 7.750%, due 04/15/09 | 68,490 | ||||||||||||
| 145,951 | |||||||||||||||
| Real Estate Investment Trusts: 0.5% | |||||||||||||||
| 11,000 | Liberty Property Trust, 6.375%, due 08/15/12 | 11,824 | |||||||||||||
| 99,000 | Rouse Co., 7.200%, due 09/15/12 | 105,881 | |||||||||||||
| 50,000 | Rouse Co., 8.000%, due 04/30/09 | 54,780 | |||||||||||||
| 54,000 | Simon Property Group LP, 4.875%, due 03/18/10 | 54,711 | |||||||||||||
| 96,000 | S | Simon Property Group LP, 6.375%, due 11/15/07 | 102,489 | ||||||||||||
| 329,685 | |||||||||||||||
| Savings and Loans: 0.1% | |||||||||||||||
| 48,000 | Great Western Financial, 8.206%, due 02/01/27 | 52,248 | |||||||||||||
| 52,248 | |||||||||||||||
| Telecommunications: 0.5% | |||||||||||||||
| 101,000 | AT&T Corp., 9.750%, due 11/15/31 | 117,539 | |||||||||||||
| 65,000 | BellSouth Corp., 4.200%, due 09/15/09 | 64,782 | |||||||||||||
| 43,000 | S | Sprint Capital Corp., 4.780%, due 08/17/06 | 43,877 | ||||||||||||
| 15,000 | S | Sprint Capital Corp., 8.375%, due 03/15/12 | 18,147 | ||||||||||||
| 53,000 | Verizon Virginia, Inc., 4.625%, due 03/15/13 | 51,097 | |||||||||||||
| 500,000 | I,X,** | Winstar Communications, Inc., 0.000%, due 04/15/10 | 50 | ||||||||||||
| 295,492 | |||||||||||||||
| Transportation: 0.1% | |||||||||||||||
| 42,000 | @@,# | MISC Capital Ltd., 6.125%, due 07/01/14 | 44,616 | ||||||||||||
| 44,616 | |||||||||||||||
| Total Corporate Bonds/Notes (Cost $7,204,050) | 6,857,117 | ||||||||||||||
| U.S. GOVERNMENT AGENCY OBLIGATIONS: 13.7% | |||||||||||||||
| Federal Home Loan Bank: 0.4% | |||||||||||||||
| 270,000 | 3.250%, due 12/17/07 | 268,005 | |||||||||||||
| 268,005 | |||||||||||||||
| Federal Home Loan Mortgage Corporation: 4.0% | |||||||||||||||
| 556,000 | 2.700%, due 03/16/07 | 549,128 | |||||||||||||
| 361,000 | 4.500%, due 10/15/12 | 364,106 | |||||||||||||
| 93,437 | 4.500%, due 04/01/14 | 93,307 | |||||||||||||
| 54,000 | W | 5.500%, due 12/15/18 | 55,671 | ||||||||||||
| 96,000 | 5.875%, due 03/21/11 | 103,118 | |||||||||||||
| 93,813 | 6.000%, due 04/01/14 | 98,592 | |||||||||||||
| 556,260 | 6.000%, due 01/15/29 | 576,823 | |||||||||||||
| 193,012 | 6.500%, due 12/01/31 | 202,528 | |||||||||||||
| 488,000 | W | 7.000%, due 12/15/34 | 517,585 | ||||||||||||
| 2,560,858 | |||||||||||||||
See Accompanying Notes to Financial Statements
96
PORTFOLIO OF INVESTMENTS
ING EQUITY AND BOND FUND AS OF NOVEMBER 30, 2004 (UNAUDITED) (CONTINUED)
| Principal Amount | Value | ||||||||||||||
| Federal National Mortgage Association: 9.0% | |||||||||||||||
| $ | 325,000 | 2.875%, due 05/19/08 | $ | 316,724 | |||||||||||
| 141,000 | 4.750%, due 12/25/42 | 141,842 | |||||||||||||
| 420,000 | W | 5.000%, due 12/01/17 | 425,644 | ||||||||||||
| 2,562,000 | W | 5.000%, due 01/15/34 | 2,521,167 | ||||||||||||
| 150,000 | 5.250%, due 08/01/12 | 154,419 | |||||||||||||
| 5,070 | W | 5.500%, due 12/15/19 | 5,230 | ||||||||||||
| 569,000 | W | 5.500%, due 01/01/33 | 574,156 | ||||||||||||
| 199,639 | 6.000%, due 08/01/16 | 209,314 | |||||||||||||
| 67,686 | 6.000%, due 10/01/18 | 70,959 | |||||||||||||
| 344,344 | 6.000%, due 07/25/29 | 355,621 | |||||||||||||
| 145,711 | 6.000%, due 04/25/31 | 150,885 | |||||||||||||
| 96,000 | 6.000%, due 12/15/33 | 99,090 | |||||||||||||
| 211,000 | 6.000%, due 01/15/34 | 217,264 | |||||||||||||
| 231,000 | 6.500%, due 12/15/34 | 242,406 | |||||||||||||
| 135,000 | 6.625%, due 11/15/10 | 152,115 | |||||||||||||
| 35,691 | 7.500%, due 09/01/30 | 38,269 | |||||||||||||
| 65,451 | 7.500%, due 06/25/32 | 70,164 | |||||||||||||
| 84,049 | 7.500%, due 01/25/48 | 89,569 | |||||||||||||
| 5,834,838 | |||||||||||||||
| Government National Mortgage Association: 0.3% | |||||||||||||||
| 164,311 | 6.500%, due 06/15/29 | 173,404 | |||||||||||||
| 173,404 | |||||||||||||||
| Total U.S. Government Agency Obligations (Cost $8,845,801) | 8,837,105 | ||||||||||||||
| U.S. TREASURY OBLIGATIONS: 7.1% | |||||||||||||||
| U.S. Treasury Bonds: 2.4% | |||||||||||||||
| 229,000 | W | 4.250%, due 11/15/14 | 227,104 | ||||||||||||
| 885,000 | S | 5.375%, due 02/15/31 | 931,739 | ||||||||||||
| 121,000 | 6.250%, due 08/15/23 | 138,876 | |||||||||||||
| 228,000 | S | 10.375%, due 11/15/12 | 272,986 | ||||||||||||
| 1,570,705 | |||||||||||||||
| U.S. Treasury Notes: 4.4% | |||||||||||||||
| 1,530,000 | 1.625%, due 01/31/05 | 1,529,284 | |||||||||||||
| 237,000 | 2.875%, due 11/30/06 | 236,426 | |||||||||||||
| 175,000 | 3.000%, due 11/15/07 | 173,742 | |||||||||||||
| 906,000 | S | 3.500%, due 11/15/09 | 898,073 | ||||||||||||
| 2,837,525 | |||||||||||||||
| U.S. Treasury STRIP: 0.3% | |||||||||||||||
| 325,000 | S | 4.870%, due 05/15/16 | 188,545 | ||||||||||||
| 188,545 | |||||||||||||||
| Total U.S. Treasury Obligations (Cost $4,637,354) | 4,596,775 | ||||||||||||||
| ASSET-BACKED SECURITIES: 3.2% | |||||||||||||||
| Automobile Asset-Backed Securities: 0.3% | |||||||||||||||
| 95,000 | Capital One Auto Finance Trust, 3.180%, due 09/15/10 | 94,176 | |||||||||||||
| 50,000 | Nissan Auto Receivables Owner Trust, 2.050%, due 03/16/09 | 48,759 | |||||||||||||
| 40,000 | USAA Auto Owner Trust, 2.040%, due 02/16/10 | 39,319 | |||||||||||||
| 182,254 | |||||||||||||||
| Principal Amount | Value | ||||||||||||||
| Credit Card Asset-Backed Securities: 0.4% | |||||||||||||||
| $ | 55,000 | Bank One Issuance Trust, 4.540%, due 09/15/10 | $ | 55,808 | |||||||||||
| 55,000 | Capital One Master Trust, 4.900%, due 03/15/10 | 56,883 | |||||||||||||
| 95,000 | Citibank Credit Card Issuance Trust, 5.650%, due 06/16/08 | 98,492 | |||||||||||||
| 75,000 | MBNA Credit Card Master Note Trust, 4.950%, due 06/15/09 | 77,624 | |||||||||||||
| 288,807 | |||||||||||||||
| Home Equity Asset-Backed Securities: 2.1% | |||||||||||||||
| 89,900 | Asset Backed Funding Certificates, 2.461%, due 11/25/33 | 89,930 | |||||||||||||
| 157,159 | XX | Bayview Financial Acquisition Trust, 2.694%, due 09/28/43 | 157,343 | ||||||||||||
| 267,966 | Centex Home Equity, 2.460%, due 01/25/34 | 268,383 | |||||||||||||
| 294,505 | Emergent Home Equity Loan Trust, 7.080%, due 12/15/28 | 301,456 | |||||||||||||
| 236,000 | GSAA Trust, 5.242%, due 05/25/35 | 234,553 | |||||||||||||
| 103,738 | Merrill Lynch Mortgage Investors, Inc., 2.541%, due 07/25/34 | 103,847 | |||||||||||||
| 38,662 | Residential Asset Mortgage Products, Inc., 2.491%, due 06/25/33 | 38,654 | |||||||||||||
| 143,994 | Residential Asset Securities Corp., 2.491%, due 12/25/33 | 144,283 | |||||||||||||
| 1,338,449 | |||||||||||||||
| Other Asset-Backed Securities: 0.4% | |||||||||||||||
| 34,678 | XX | Amortizing Residential Collateral Trust, 2.681%, due 05/25/32 | 34,657 | ||||||||||||
| 11,000 | Chase Funding Mortgage Loan, 2.734%, due 09/25/24 | 10,944 | |||||||||||||
| 7,000 | Chase Funding Mortgage Loan, 4.045%, due 05/25/33 | 7,036 | |||||||||||||
| 52,488 | Chase Funding Mortgage Loan Asset-Backed Certificates, 2.481%, due 07/25/33 | 52,550 | |||||||||||||
| 96,000 | XX | First Horizon Asset Back Trust, 0.000%, due 10/25/34 | 96,000 | ||||||||||||
| 8,000 | XX | Popular ABS Mortgage Pass-Through Trust, 3.735%, due 12/25/34 | 7,980 | ||||||||||||
| 8,000 | XX | Popular ABS Mortgage Pass-Through Trust, 4.000%, due 12/25/34 | 7,983 | ||||||||||||
| 217,150 | |||||||||||||||
| Total Asset-backed Securities (Cost $2,022,196) | 2,026,660 | ||||||||||||||
See Accompanying Notes to Financial Statements
97
PORTFOLIO OF INVESTMENTS
ING EQUITY AND BOND FUND AS OF NOVEMBER 30, 2004 (UNAUDITED) (CONTINUED)
| Principal Amount | Value | ||||||||||||||
| COLLATERALIZED MORTGAGE OBLIGATIONS: 11.2% | |||||||||||||||
| Commercial Mortgage-Backed Securities: 2.4% | |||||||||||||||
| $ | 81,000 | Bear Stearns Commercial Mortgage Securities, 4.170%, due 01/12/41 | $ | 81,394 | |||||||||||
| 79,000 | COMM, 3.600%, due 03/10/39 | 77,665 | |||||||||||||
| 303,000 | CS First Boston Mortgage Securities Corp., 3.861%, due 03/15/36 | 302,519 | |||||||||||||
| 40,000 | CS First Boston Mortgage Securities Corp., 7.792%, due 04/14/62 | 46,162 | |||||||||||||
| 215,000 | DLJ Commercial Mortgage Corp., 6.240%, due 11/12/31 | 231,638 | |||||||||||||
| 60,000 | # | DLJ Commercial Mortgage Corp., 6.460%, due 03/10/32 | 65,433 | ||||||||||||
| 570,000 | DLJ Commercial Mortgage Corp., 7.300%, due 06/10/32 | 640,777 | |||||||||||||
| 97,000 | GE Capital Commercial Mortgage Corp., 5.994%, due 12/10/35 | 103,893 | |||||||||||||
| 1,549,481 | |||||||||||||||
| Federal Home Loan Mortgage Corporation: 0.7% | |||||||||||||||
| 469,538 | Freddie Mac, 2.740%, due 04/15/32 | 473,362 | |||||||||||||
| 473,362 | |||||||||||||||
| Whole Loan Collateral PAC: 1.1% | |||||||||||||||
| 141,376 | GSR Mortgage Loan Trust, 2.581%, due 10/25/32 | 141,421 | |||||||||||||
| 184,642 | MASTR Alternative Loans Trust, 2.581%, due 11/25/33 | 184,895 | |||||||||||||
| 112,723 | MASTR Alternative Loans Trust, 8.500%, due 05/25/33 | 114,742 | |||||||||||||
| 239,756 | Washington Mutual, 2.580%, due 03/25/34 | 240,236 | |||||||||||||
| 681,294 | |||||||||||||||
| Whole Loan Collateralized Mortgage Obligations: 7.0% | |||||||||||||||
| 203,712 | Banc of America Funding Corp, 5.750%, due 09/20/34 | 206,434 | |||||||||||||
| 320,763 | Bank of America Alternative Loan Trust, 2.631%, due 12/25/33 | 321,260 | |||||||||||||
| 134,393 | Bank of America Mortgage Securities, 2.631%, due 12/25/33 | 134,582 | |||||||||||||
| 113,471 | Bank of America Mortgage Securities, 5.000%, due 12/25/18 | 114,216 | |||||||||||||
| 115,217 | Bank of America Mortgage Securities, 5.000%, due 06/25/33 | 114,749 | |||||||||||||
| 69,629 | Bank of America Mortgage Securities, 5.250%, due 11/25/19 | 70,586 | |||||||||||||
| 63,823 | Bank of America Mortgage Securities, 5.500%, due 11/25/33 | 63,215 | |||||||||||||
| 111,134 | Citicorp Mortgage Securities, Inc., 2.433%, due 10/25/33 | 110,913 | |||||||||||||
| Principal Amount | Value | ||||||||||||||
| Whole Loan Collateralized Mortgage Obligations: (continued) | |||||||||||||||
| $ | 70,502 | Countrywide Alternative Loan Trust, 2.581%, due 07/25/18 | $ | 70,647 | |||||||||||
| 108,225 | Countrywide Alternative Loan Trust, 5.000%, due 10/25/18 | 108,935 | |||||||||||||
| 117,715 | Countrywide Home Loan Mortgage Pass Through Trust, 5.000%, due 11/25/18 | 118,487 | |||||||||||||
| 99,000 | Countrywide Home Loan Mortgage Pass Through Trust, 6.000%, due 11/25/34 | 102,240 | |||||||||||||
| 114,000 | CS First Boston Mortgage Securities Corp., 4.147%, due 10/25/33 | 113,167 | |||||||||||||
| 139,081 | GMAC Mortgage Corp. Loan Trust, 5.250%, due 04/25/34 | 139,463 | |||||||||||||
| 230,000 | GMAC Mortgage Corp. Loan Trust, 5.500%, due 01/25/34 | 233,620 | |||||||||||||
| 121,455 | GSR Mortgage Loan Trust, 6.500%, due 01/25/34 | 126,655 | |||||||||||||
| 96,432 | Homebanc Mortgage Trust, 2.611%, due 08/25/29 | 96,384 | |||||||||||||
| 161,000 | XX | MASTR Alternative Loans Trust, 0.000%, due 01/15/20 | 165,025 | ||||||||||||
| 109,000 | MASTR Alternative Loans Trust, 5.750%, due 09/25/34 | 110,851 | |||||||||||||
| 198,909 | MASTR Alternative Loans Trust, 6.000%, due 09/25/34 | 204,007 | |||||||||||||
| 92,021 | MASTR Asset Securitization Trust, 2.631%, due 11/25/33 | 92,222 | |||||||||||||
| 98,000 | MASTR Asset Securitization Trust, 5.500%, due 09/25/34 | 96,630 | |||||||||||||
| 80,784 | MLCC Mortgage Investors, Inc., 2.541%, due 04/25/29 | 80,920 | |||||||||||||
| 139,324 | Prime Mortgage Trust, 5.250%, due 11/25/19 | 141,240 | |||||||||||||
| 132,467 | Residential Accredit Loans, Inc., 2.631%, due 03/25/18 | 132,729 | |||||||||||||
| 99,000 | Residential Asset Securitization Trust, 5.500%, due 11/25/34 | 97,580 | |||||||||||||
| 143,000 | Residential Funding Mortgage Sec I, 5.750%, due 09/25/34 | 143,522 | |||||||||||||
| 581,144 | Thornburg Mortgage Securities Trust, 2.531%, due 12/25/33 | 581,322 | |||||||||||||
| 141,004 | Washington Mutual, 6.000%, due 06/25/34 | 144,617 | |||||||||||||
| 182,847 | Wells Fargo Mortgage Backed Securities Trust, 2.681%, due 02/25/34 | 183,185 | |||||||||||||
| 130,000 | Wells Fargo Mortgage Backed Securities Trust, 4.500%, due 08/25/18 | 124,671 | |||||||||||||
| 4,544,074 | |||||||||||||||
| Total Collateralized Mortgage Obligations (Cost $7,298,929) | 7,248,211 | ||||||||||||||
See Accompanying Notes to Financial Statements
98
PORTFOLIO OF INVESTMENTS
ING EQUITY AND BOND FUND AS OF NOVEMBER 30, 2004 (UNAUDITED) (CONTINUED)
| Principal Amount | Value | ||||||||||||||
| OTHER BONDS: 0.5% | |||||||||||||||
| Sovereign: 0.5% | |||||||||||||||
| $ | 29,118 | @@ | Brazilian Government Intl. Bond, 3.125%, due 04/15/12 | $ | 27,367 | ||||||||||
| 22,000 | @@ | Brazilian Government Intl. Bond, 12.250%, due 03/06/30 | 27,940 | ||||||||||||
| 36,000 | @@,S | Colombia Government Intl. Bond, 10.000%, due 01/23/12 | 40,950 | ||||||||||||
| 59,000 | @@ | Dominican Republic, 9.040%, due 01/23/13 | 51,478 | ||||||||||||
| 71,000 | @@ | Russian Federation, 5.000%, due 03/31/30 | 70,840 | ||||||||||||
| 28,000 | @@,S | Turkey Government Intl. Bond, 12.375%, due 06/15/09 | 34,860 | ||||||||||||
| 14,000 | @@,# | Ukraine Government Intl. Bond, 7.650%, due 06/11/13 | 14,175 | ||||||||||||
| 50,847 | @@,S,XX | Uruguay Government Intl. Bond, 10.500%, due 10/20/06 | 58,800 | ||||||||||||
| 15,000 | @@ | Venezuela Government Intl. Bond, 8.500%, due 10/08/14 | 15,638 | ||||||||||||
| Total Other Bonds (Cost $321,737) | 342,048 | ||||||||||||||
| MUNICIPAL BONDS: 0.1% | |||||||||||||||
| Municipal: 0.1% | |||||||||||||||
| 25,000 | City of New York NY, 5.000%, due 11/01/08 | 26,966 | |||||||||||||
| 25,000 | City of New York NY, 5.000%, due 11/01/11 | 27,300 | |||||||||||||
| 25,000 | City of New York NY, 5.000%, due 11/01/15 | 27,156 | |||||||||||||
| Total Municipal Bonds (Cost $82,205) | 81,422 | ||||||||||||||
| Total Long-Term Investments (Cost $62,388,209) | 65,854,178 | ||||||||||||||
SHORT-TERM INVESTMENTS: 5.1%
| Repurchase Agreement: 5.1% | |||||||||||||||
| 3,292,000 | Morgan Stanley Repurchase Agreement 11/30/04, 2.070%, due 12/01/04, $3,292,189 to be received upon repurchase (Collateralized by $3,220,000 various U.S. Government Agency Obligation, 4.750%-5.250%, Market Value plus accrued interest $3,365,716, due 01/02/07-08/01/12) | | 3,292,000 | ||||||||||||
| Total Short-Term Investments (Cost $3,292,000) | 3,292,000 | ||||||||||||||
| Total Investments In Securities (Cost $65,680,209)* | 107.5 | % | $ | 69,146,178 | |||||||||||
| Other Assets and Liabilities-Net | (7.5 | ) | (4,849,488 | ) | |||||||||||
| Net Assets | 100.0 | % | $ | 64,296,690 | |||||||||||
@ Non-income producing security
@@ Foreign issuer
STRIP Separate Trading of Registered Interest and Principal of Securities
# Securities with purchases pursuant to Rule 144A, under the Securities Act of 1933 and may not be resold subject to that rule except to qualified institutional buyers. These securities have been determined to be liquid under the guidelines established by the Funds' Board of Directors/Trustees.
C Bond may be called prior to maturity date.
W When-issued or delayed delivery security.
S Segregated securities for futures, when-issued or delayed delivery securities held at November 30, 2004.
I Illiquid security
X Fair value determined by ING Funds Valuation Committee appointed by the Funds' Board of Directors/Trustees.
XX Value of securities obtained from one or more dealers making markets in the securities in accordance with the Fund's valuation procedures.
** Defaulted security
* Cost for federal income tax purposes is $65,725,180. Net unrealized depreciation consists of:
| Gross Unrealized Appreciation | $ | 4,643,604 | |||||
| Gross Unrealized Depreciation | (1,222,606 | ) | |||||
| Net Unrealized Depreciation | $ | 3,420,998 | |||||
Information concerning open futures for ING Equity and Bond Fund at November 30, 2004 is shown below:
| Short Contracts | No. of Contracts | Notional Market Value | Expiration Date | Unrealized Gain (Loss) | |||||||||||||||
| U.S. 2 Year Treasury Note | 3 | $ | (630,797 | ) | 01/05/05 | $ | 595 | ||||||||||||
| U.S. 10 Year Treasury Note | 10 | (1,114,531 | ) | 12/30/04 | 10,731 | ||||||||||||||
| $ | (1,745,328 | ) | $ | 11,326 | |||||||||||||||
| Long Contracts | |||||||||||||||||||
| U.S. Long Bond | 7 | $ | 777,656 | 12/30/04 | $ | (4,285 | ) | ||||||||||||
See Accompanying Notes to Financial Statements
99
PORTFOLIO OF INVESTMENTS
ING REAL ESTATE FUND AS OF NOVEMBER 30, 2004 (UNAUDITED)
| Shares | Value | ||||||||||||||
| REAL ESTATE INVESTMENT TRUSTS: 93.2% | |||||||||||||||
| Apartments: 19.0% | |||||||||||||||
| 99,600 | L | Apartment Investment & Management Co. | $ | 3,622,452 | |||||||||||
| 338,100 | L | Archstone-Smith Trust | 12,340,650 | ||||||||||||
| 102,600 | L | AvalonBay Communities, Inc. | 7,294,860 | ||||||||||||
| 154,500 | L | Camden Property Trust | 7,575,135 | ||||||||||||
| 60,200 | L | Essex Property Trust, Inc. | 4,847,906 | ||||||||||||
| 30,000 | L | Post Properties, Inc. | 1,023,000 | ||||||||||||
| 424,500 | United Dominion Realty Trust, Inc. | 9,759,255 | |||||||||||||
| 46,463,258 | |||||||||||||||
| Diversified: 8.0% | |||||||||||||||
| 127,100 | @ | American Campus Communities, Inc. | 2,656,390 | ||||||||||||
| 204,000 | Liberty Property Trust | 8,364,000 | |||||||||||||
| 116,600 | Vornado Realty Trust | 8,570,100 | |||||||||||||
| 19,590,490 | |||||||||||||||
| Health Care: 2.0% | |||||||||||||||
| 385,800 | Omega Healthcare Investors, Inc. | 4,826,358 | |||||||||||||
| 4,826,358 | |||||||||||||||
| Hotels: 5.0% | |||||||||||||||
| 465,500 | Host Marriott Corp. | 7,289,730 | |||||||||||||
| 81,100 | LaSalle Hotel Properties | 2,489,770 | |||||||||||||
| 167,800 | Strategic Hotel Capital, Inc. | 2,533,780 | |||||||||||||
| 12,313,280 | |||||||||||||||
| Office Property: 21.7% | |||||||||||||||
| 205,000 | Arden Realty, Inc. | 7,380,000 | |||||||||||||
| 199,100 | Boston Properties, Inc. | 11,981,838 | |||||||||||||
| 176,650 | Corporate Office Properties Trust SBI MD | 4,907,337 | |||||||||||||
| 54,000 | Mack-Cali Realty Corp. | 2,361,960 | |||||||||||||
| 277,800 | Maguire Properties, Inc. | 7,308,918 | |||||||||||||
| 85,400 | Prentiss Properties Trust | 3,193,106 | |||||||||||||
| 150,100 | L | SL Green Realty Corp. | 8,650,263 | ||||||||||||
| 439,000 | Trizec Properties, Inc. | 7,230,330 | |||||||||||||
| 53,013,752 | |||||||||||||||
| Regional Malls: 18.5% | |||||||||||||||
| 70,900 | CBL & Associates Properties, Inc. | 5,196,261 | |||||||||||||
| 182,900 | General Growth Properties, Inc. | 6,275,299 | |||||||||||||
| 140,100 | L | Macerich Co. | 8,509,674 | ||||||||||||
| 198,900 | Mills Corp. | 11,806,704 | |||||||||||||
| 214,800 | Simon Property Group, Inc. | 13,334,784 | |||||||||||||
| 45,122,722 | |||||||||||||||
| Shopping Centers: 10.3% | |||||||||||||||
| 148,400 | Acadia Realty Trust | 2,248,260 | |||||||||||||
| 164,900 | L | Developers Diversified Realty Corp. | 7,098,945 | ||||||||||||
| 122,400 | Pan Pacific Retail Properties, Inc. | 7,258,320 | |||||||||||||
| 166,700 | Regency Centers Corp. | 8,668,400 | |||||||||||||
| 25,273,925 | |||||||||||||||
| Storage: 1.0% | |||||||||||||||
| 173,300 | Extra Space Storage, Inc. | 2,408,870 | |||||||||||||
| 2,408,870 | |||||||||||||||
| Shares | Value | ||||||||||||||
| Warehouse: 7.7% | |||||||||||||||
| 207,279 | L | Catellus Development Corp. | $ | 6,508,561 | |||||||||||
| 305,200 | ProLogis | 12,278,196 | |||||||||||||
| 18,786,757 | |||||||||||||||
| Total Real Estate Investment Trust (Cost $173,275,454) | 227,799,412 | ||||||||||||||
| COMMON STOCK: 5.1% | |||||||||||||||
| Hotels and Motels: 5.1% | |||||||||||||||
| 238,700 | L | Starwood Hotels & Resorts Worldwide, Inc. | 12,481,623 | ||||||||||||
| Total Common Stock (Cost $8,829,008) | 12,481,623 | ||||||||||||||
| Total Long-Term Investments (Cost $182,104,462) | 240,281,035 | ||||||||||||||
| Principal Amount | Value | ||||||||||||||
SHORT-TERM INVESTMENTS: 3.7%
| Securities Lending CollateralCC: 3.7% | |||||||||||||||
| $ | 9,043,070 | The Bank of New York Institutional Cash Reserves Fund | | 9,043,070 | |||||||||||
| Total Short-Term Investments (Cost $9,043,070) | | 9,043,070 | |||||||||||||
| Total Investments In Securities (Cost $191,147,532)* | 102.0 | % | $249,324,105 | ||||||||||||
| Other Assets and Liabilities-Net | (2.0 | ) | (4,954,005) | ||||||||||||
| Net Assets | 100.0 | % | $ | 244,370,100 | |||||||||||
@ Non-income producing security
cc Securities purchased with cash collateral for securities loaned.
L Loaned security, a portion or all of the security is on loan at November 30, 2004.
* Cost for federal income tax purposes is $189,916,706. Net unrealized appreciation consists of:
| Gross Unrealized Appreciation | $ | 59,407,399 | |||||
| Gross Unrealized Depreciation | - | ||||||
| Net Unrealized Appreciation | $ | 59,407,399 | |||||
See Accompanying Notes to Financial Statements
100
(THIS PAGE INTENTIONALLY LEFT BLANK)
ING Funds Distributor, LLC offers the funds listed below. Before investing in a fund, shareholders should carefully review the fund's prospectus. Investors may obtain a copy of a prospectus of any ING Fund by calling (800) 992-0180.
Domestic Equity and Income Funds
ING Balanced Fund
ING Convertible Fund
ING Equity and Bond Fund
ING Equity Income Fund
ING Real Estate Fund
Domestic Equity Growth Funds
ING Disciplined LargeCap Fund
ING Growth Fund
ING LargeCap Growth Fund
ING MidCap Opportunities Fund
ING SmallCap Opportunities Fund
ING Small Company Fund
Domestic Equity Index Funds
ING Index Plus LargeCap Fund
ING Index Plus MidCap Fund
ING Index Plus SmallCap Fund
Domestic Equity Value Funds
ING Financial Services Fund
ING LargeCap Value Fund
ING MagnaCap Fund
ING MidCap Value Fund
ING SmallCap Value Fund
ING Value Opportunity Fund
Fixed Income Funds
ING GNMA Income Fund
ING Government Fund
ING High Yield Bond Fund
ING Intermediate Bond Fund
ING National Tax Exempt Bond Fund
Global Equity Funds
ING Global Equity Dividend Fund
ING Global Real Estate Fund
ING Global Science and Technology Fund
ING Worldwide Growth Fund
International Equity Funds
ING Emerging Countries Fund
ING Foreign Fund
ING International Fund
ING International Growth Fund
ING International SmallCap Growth Fund
ING International Value Fund
ING Precious Metals Fund
ING Russia Fund
Loan Participation Fund
ING Senior Income Fund
Money Market Funds*
ING Aeltus Money Market Fund
ING Classic Money Market Fund
ING Lexington Money Market Trust
ING Money Market Fund
Strategic Allocation Funds
ING Strategic Allocation Balanced Fund
ING Strategic Allocation Growth Fund
ING Strategic Allocation Income Fund
* An investment in the Fund is not insured or guaranteed by the Federal Deposit Insurance Corporation or any other government agency. Although the Fund seeks to preserve the value of your investment at $1.00 per share, it is possible to lose money by investing in the Fund.
PROXY VOTING INFORMATION
A description of the policies and procedures that the Registrants use to determine how to vote proxies related to portfolio securities is available (1) without charge, upon request, by calling Shareholder Services toll-free at 800-992-0180; (2) on the Registrants' website at www.ingfunds.com and (3) on the SEC's website at www.sec.gov.
Information regarding how the Registrants voted proxies related to portfolio securities during the most recent 12-month period ended June 30 is available without charge on the Registrants' website at www.ingfunds.com and on the SEC website at www.sec.gov.
QUARTERLY PORTFOLIO HOLDINGS
The Registrants file their complete schedule of portfolio holdings with the Commission for the first and third quarters of each fiscal year on Form N-Q. The Registrants' Forms N-Q are available on the SEC's website at www.sec.gov. The Registrants' Forms N-Q may be reviewed and copied at the Commissions Public Reference Room in Washington, DC, and information on the operation of the Public Reference Room may be obtained by calling 1-800-SEC-0330; and is available upon request from the Registrants by calling Shareholder Services toll-free at 800-992-0180.
Investment Manager
ING Investments, LLC
7337 E. Doubletree Ranch Road
Scottsdale, Arizona 85258
Administrator
ING Funds Services, LLC
7337 E. Doubletree Ranch Road
Scottsdale, Arizona 85258
Distributor
ING Funds Distributor, LLC
7337 E. Doubletree Ranch Road
Scottsdale, Arizona 85258
1-800-334-3444
Transfer Agent
DST Systems, Inc.
P.O. Box 419368
Kansas City, Missouri 64141
Custodian
The Bank of New York
100 Colonial Center Parkway, Suite 300
Lake Mary, Florida 32746
Legal Counsel
Dechert
1775 I Street, N.W.
Washington, D.C. 20006
For more complete information, or to obtain a prospectus on any ING fund, please call your Investment Professional or ING Funds Distributor, LLC at (800) 992-0180 or log on to www.ingfunds.com. The prospectus should be read carefully before investing. Consider the fund's investment objectives, risks, charges and expenses carefully before investing. The prospectus contains this information and other information about the fund. Information regarding how the Funds voted proxies related to portfolio securities during the most recent 12-month period ended June 30 is available without charge on the Funds' website at www.ingfunds.com and on the SEC's website at www.sec.gov.

PRSAR-UFDEIQ (1104-012805)
ITEM 2. CODE OF ETHICS.
Not required for semi-annual filing.
ITEM 3. AUDIT COMMITTEE FINANCIAL EXPERT.
Not required for semi-annual filing.
ITEM 4. PRINCIPAL ACCOUNTANT FEES AND SERVICES.
Not required for semi-annual filing.
ITEM 5. AUDIT COMMITTEE OF LISTED REGISTRANTS.
Not required for semi-annual filing.
ITEM 6. SCHEDULE OF INVESTMENTS.
Schedule is included as part of the report to shareholders filed under Item 1 of
this Form.
ITEM 7. DISCLOSURE OF PROXY VOTING POLICIES AND PROCEDURES FOR CLOSED-END MANAGEMENT INVESTMENT COMPANIES.
Not required for semi-annual filing.
ITEM 8. PURCHASES OF EQUITY SECURITIES BY CLOSED-END MANAGEMENT INVESTMENT COMPANY AND AFFILIATED PURCHASERS.
Not applicable.
ITEM 9. SUBMISSION OF MATTERS TO A VOTE OF SECURITY HOLDERS.
The Board has a Nominating Committee (“Committee”) for the purpose of considering and presenting to the Board candidates it proposes for nomination to fill Trustee vacancies on the Board. The Committee currently consists of four Trustees of the Board, none of whom are considered “interested persons” of the Trust within the meaning of Section 2(a)(19) of the Investment Company Act of 1940. The Committee has adopted a written charter that sets forth the policies and procedures of the Committee. The Committee will accept referrals for potential candidates from Board members, Fund shareholders, legal counsel to the disinterested Trustees or such other sources as the Committee deems appropriate. Shareholders can submit recommendations in writing to the attention of the Chairperson of the Committee at an address to be maintained by Fund management for this purpose. In order for the Committee to consider a potential candidate, the Committee initially must receive at least the following information regarding such person: (1) name; (2) date of birth; (3) education; (4) business, professional or other relevant experience and areas of expertise; (5) current business, professional or other relevant experience and areas of expertise; (6) current business and home addresses and contact information; (7) other board positions or prior experience; and (8) any knowledge and experience relating to investment companies and investment company governance.
earlier than the 90th day prior to such meeting and not later than the close of business on the later of the 60th day prior to such meeting or the 10th day following the day on which public announcement of the date of the meeting is first made, by either disclosure in a press release or in a document publicly filed by the Fund with the Securities and Exchange Commission.
ITEM 10. CONTROLS AND PROCEDURES.
(a) Based on our evaluation conducted within 90 days of the filing date, hereof, the design and operation of the registrant’s disclosure controls and procedures are effective to ensure that material information relating to the registrant is made known to the certifying officers by others within the appropriate entities, particularly during the period in which Forms N-CSR are being prepared, and the registrant’s disclosure controls and procedures allow timely preparation and review of the information for the registrant’s Form N-CSR and the officer certifications of such Form N-CSR.
(b) There were no significant changes in the registrant’s internal controls that occurred during the second fiscal quarter of the period covered by this report that has materially affected, or is reasonably likely to materially affect, the registrant’s internal control over financial reporting.
ITEM 11. EXHIBITS.
(a)(1) The Code of Ethics is not required for the semi-annual filing.
(a)(2) A separate certification for each principal executive officer and principal financial officer of the registrant as required by Rule 30a-2 under the Act (17 CFR 270.30a-2) is attached hereto as EX-99.CERT.
(a)(3) Not required for semi-annual filing.
(b) The officer certifications required by Section 906 of the Sarbanes-Oxley Act of 2002 are attached hereto as EX-99.906CERT
SIGNATURES
Pursuant to the requirements of the Securities Exchange Act of 1934 and the Investment Company Act of 1940, the registrant has duly caused this report to be signed on its behalf by the undersigned, thereunto duly authorized.
(Registrant): ING Equity Trust
By | /s/ | James M. Hennessy |
| |
|
| James M. Hennessy | ||
|
| President and Chief Executive Officer | ||
|
| |||
|
| |||
Date: | February 7, 2005 |
| ||
Pursuant to the requirements of the Securities Exchange Act of 1934 and the Investment Company Act of 1940, this report has been signed below by the following persons on behalf of the registrant and in the capacities and on the dates indicated.
By | /s/ | James M. Hennessy |
| |||
|
| James M. Hennessy | ||||
|
| President and Chief Executive Officer | ||||
|
| |||||
Date: | February 7, 2005 |
| ||||
|
| |||||
|
| |||||
By | /s/ | Michael J. Roland |
| |||
|
| Michael J. Roland | ||||
|
| Executive Vice President and Chief Financial Officer | ||||
|
| |||||
|
| |||||
Date: | February 7, 2005 |
| ||||