Table of Contents
UNITED STATES
SECURITIES AND EXCHANGE COMMISSION
Washington, D.C. 20549
FORM N-CSR
CERTIFIED SHAREHOLDER REPORT OF REGISTERED
MANAGEMENT INVESTMENT COMPANIES
Investment Company Act File Number 811-09025
New Covenant Funds
(Exact name of registrant as specified in charter)
SEI Investments
One Freedom Valley Drive
Oaks, PA 19456
(Address of principal executive offices) (Zip code)
The Corporation Trust Company
Corporation Trust Center
1209 Orange Street
Wilmington, Delaware 19801
(Name and address of agent for service)
Registrant’s telephone number, including area code: 1-877-835-4531
Date of fiscal year end: June 30, 2013
Date of reporting period: June 30, 2013
Table of Contents
Item 1. Reports to Stockholders.
Table of Contents


June 30, 2013
ANNUAL REPORT
New Covenant Funds
† New Covenant Growth Fund
† New Covenant Income Fund
† New Covenant Balanced Growth Fund
† New Covenant Balanced Income Fund

Table of Contents
| 1 | ||||
| 9 | ||||
| 34 | ||||
| 35 | ||||
| 36 | ||||
| 38 | ||||
| 42 | ||||
| 51 | ||||
| 52 | ||||
| 55 | ||||
| 56 | ||||
The Trust files its complete schedule of portfolio holdings with the Securities and Exchange Commission (the “Commission”) for the first and third quarters of each fiscal year on Form N-Q within sixty days after the end of the period. The Trust’s Forms N-Q are available on the Commission’s website at http://www.sec.gov, and may be reviewed and copied at the Commission’s Public Reference Room in Washington, DC. Information on the operation of the Public Reference Room may be obtained by calling 1-800-SEC-0330.
A description of the policies and procedures that the Trust uses to determine how to vote proxies relating to portfolio securities, as well as information relating to how a Fund voted proxies relating to portfolio securities during the most recent 12-month period ended June 30, is available (i) without charge, upon request, by calling 1-877-835-4531; and (ii) on the Commission’s website at http://www.sec.gov.
Table of Contents
MANAGEMENT’S DISCUSSION AND ANALYSIS OF FUND PERFORMANCE
NEW COVENANT FUNDS — JUNE 30, 2013
New Covenant Growth Fund
I. Objective:
The New Covenant Growth Fund (the “Fund”) seeks to provide long-term capital appreciation.
II. Multi-Manager Approach Statement:
The Fund uses a multi-manager approach, relying on a number of sub-advisers with differing investment approaches to manage portions of the Fund’s portfolio under the general supervision of SEI Investments Management Corp. (SIMC). The Fund utilized the following sub-advisers as of June 30, 2013: Baillie Gifford Overseas Limited, Sustainable Growth Advisors, LP, Parametric Portfolio Associates, Tocqueville Asset Management L.P., WestEnd Advisors LLC and Waddell & Reed Investment Management Company. There were no sub-advisor changes made during the year.
III. Return vs. Benchmark:
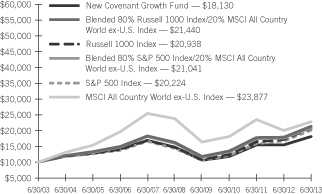
For the year ended June 30, 2013, the Fund returned 17.11%, while the Russell 1000 Index returned 21.24% and the blended benchmark of 80% Russell 1000 Index and 20% MSCI All Country World ex-U.S. Index advanced 19.74%.
IV. Market Commentary:
Domestic and international stock markets experienced a strong rally despite continued uncertainty among investors. The expanded central bank intervention in the U.S. and the promise of action within the eurozone bolstered investor confidence. European Central Bank (ECB) President Mario Draghi’s promise to do “whatever it takes” to preserve the euro, the outright monetary transactions program (to prop up banks through unlimited purchases of sovereign bonds on the secondary market), and the €500 billion European Stability Mechanism, were all designed to provide financial assistance to struggling members of the eurozone. Within the U.S., the re-election of President Obama and the last-minute resolution of the fiscal cliff paved the way for a strong start to 2013, despite the expiration of the payroll tax holiday. Abroad, we saw the election of Shinzo Abe in Japan and the introduction of “Abenomics”—a multi-step plan to boost Japan’s ailing economy through devaluation of the yen and domestic stimulus measures to shift the country from an environment of deflation to one of inflation. These announcements boosted investor
sentiment toward Japan and sparked a broad uptrend in Japanese equity markets. However, markets in Japan corrected in May 2013 after a few strong months, as investors became somewhat tentative of the long-term efficacy of Abe’s pledged actions. Near the end of the period under review, the potential scaling back of bond purchases by the Federal Reserve in the U.S., or “tapering‘” became a focus, as concerns cropped up that a slowdown in the world’s largest economy could have a carry-on effect on global markets. Overall, Europe and the Middle East ex-U.K. was the top-performing regional benchmark in the period, with the remaining developed regions performing roughly equally. Emerging markets lagged.
V. Fund Attribution:
The Fund underperformed as both sector allocation and stock selection each detracted. An underweight to Financials, one of the best-performing sectors during the year, was the largest detractor. Stock selection within Consumer Staples and Energy also proved challenging during the year. On the positive side, an underweight to Utilities helped, as investors sought riskier issues. Strong stock selection within Materials contributed as well, though this was partially offset by an overweight to the sector. From a regional perspective, the majority of underperformance stemmed from North America, while emerging markets within Europe, the Middle East and Africa were positive. From a market-cap perspective, the Fund was challenged across the capitalization spectrum with the exception of mega caps.
| New Covenant Funds / Annual Report / June 30, 2013 | 1 |
Table of Contents
MANAGEMENT’S DISCUSSION AND ANALYSIS OF FUND PERFORMANCE
NEW COVENANT FUNDS — JUNE 30, 2013
New Covenant Growth Fund (Concluded)
New Covenant Growth Fund
AVERAGE ANNUAL TOTAL RETURN1,2
| One Year Return | Annualized 3-Year Return | Annualized 5-Year Return | Annualized 10-Year Return | Annualized Inception to Date | ||||||||||||||||
| New Covenant Growth Fund | 17.11% | 15.14% | 4.12% | 6.13% | 5.28% | |||||||||||||||
| Russell 1000 Index3 | 21.24% | 18.63% | 7.12% | 7.67% | 9.12% | |||||||||||||||
| S&P 500 Index3 | 20.60% | 18.45% | 7.01% | 7.30% | 8.95% | |||||||||||||||
| Blended 80% Russell 1000 Index/20% MSCI All Country World ex-U.S. Index3 | 19.74% | 16.49% | 5.57% | 7.93% | 8.35% | |||||||||||||||
| Blended 80% S&P 500 Index/20% MSCI All Country World ex-U.S. Index3 | 19.34% | 16.46% | 5.58% | 7.72% | 8.29% | |||||||||||||||
Comparison of Change in the Value of a $10,000 Investment in the New Covenant Growth Fund, versus the Blended 80% Russell 1000 Index/20% MSCI All Country World ex-U.S. Index, Russell 1000 Index, Blended 80% S&P 500 Index/20% MSCI All Country World ex-U.S. Index, S&P 500 Index and MSCI All Country World ex-U.S. Index.
| 1 | For the years ended June 30, 2013. Past performance is not an indication of future performance. Fund Shares were offered beginning 7/1/99. Returns shown do not reflect the deduction of taxes that a shareholder would pay on fund distributions or the redemption of fund shares. The returns for certain periods reflect fee waivers and/or reimbursements in effect for that year; absent fee waivers and reimbursements, performance would have been lower. |
| 2 | This table compares the Fund’s average annual total returns to those of a broad-based index and the Fund’s 80/20 Blended Benchmark, which consists of the Russell 1000 Index and the MSCI All Country World ex-U.S. Index. The Fund’s Blended Benchmark is designed to provide a useful comparison to the Fund’s overall performance and more accurately reflects the Fund’s investment strategy than the broad-based index. |
| 3 | The Fund has changed its primary benchmark from the S&P 500 Index to the Russell 1000 Index because the Adviser and Sub-Advisers believe that the Russell 1000 Index is more representative of the type of securities in which the Fund invests. |
| 2 | New Covenant Funds / Annual Report / June 30, 2013 |
Table of Contents
MANAGEMENT’S DISCUSSION AND ANALYSIS OF FUND PERFORMANCE
NEW COVENANT FUNDS — JUNE 30, 2013
New Covenant Income Fund
I. Objective:
The New Covenant Income Fund’s (the “Fund”) investment objective is a high level of current income with preservation of capital.
II. Multi-Manager Approach Statement:
The Fund uses a multi-manager approach, relying on a number of sub-advisers with differing investment approaches to manage portions of the Fund’s portfolio under the general supervision of SEI Investments Management Corp. (SIMC). The Fund utilized the following sub-advisers as of June 30, 2013: Western Asset Management Company, Western Asset Management Company Limited and J.P. Morgan Investment Management Inc.
III. Return vs. Benchmark:
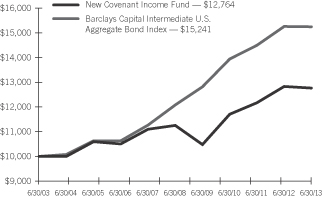
For the year ended June 30, 2013, the Fund returned -0.55%, compared to -0.12% for the benchmark, the Barclays Capital Intermediate U.S. Aggregate Bond Index.
IV. Market Commentary:
For the twelve-month period ending June 30, 2013, non-Treasuries generally outperformed duration-neutral Treasuries, thanks to global central banks’ accommodative policies. In 2012, the European Central Bank launched two rounds of long-term refinancing operations, which helped alleviate short-term funding pressure in the eurozone. In the U.S., the Federal Reserve (Fed) continued Operation Twist until December 2012, and started a third quantitative-easing program (QE3) to purchase $85 billion of agency mortgage-backed and long-term Treasury securities every month. In addition, economic and corporate fundamentals continued to improve, while inflation in the U.S. remained benign. The housing market experienced a strong recovery, with the S&P/Case-Shiller home-price index up double digits from a year ago. The non-agency mortgage-backed securities (MBS) market saw strong price appreciation over the year, helped by improving credit fundamentals and attractive valuations. Corporations, especially financial companies, have much stronger balance sheets and solid earnings after a few years of de-leveraging. Primary issuance was robust and has been met with strong demand from investors.
However, the market turned a corner at the beginning of May 2013, as fear of the Fed tapering QE3 caused interest rates to surge and
triggered a broad market selloff. The 10-year Treasury yield rose by 82 basis points and the 30-year Treasury yield increased by 62 basis points from beginning of May to the end of June. Credit spreads widened across sectors, and fixed-income funds witnessed the largest cash outflow since beginning of the year. Liquidity was hammered and dealer balance sheets were constrained by new financial regulations. Agency MBS were hit especially hard, as the sharp rise in Treasury yields resulted in significant extension risk and the QE3 uncertainty caused selling from real-estate investment trusts and overseas investors.
V. Fund Attribution:
The Fund’s flattening yield-curve position (Western) detracted from performance, as the curve significantly steepened. This was partially offset by the short-duration position (J.P. Morgan, Western), as Treasury yields rose sharply. The Fund’s allocation to non-agency MBS (J.P. Morgan, Western) was a big contributor, as the sector continued to be supported by improving housing fundamentals, strong technicals and still-attractive valuations. Lastly, security selection within agency MBS (J.P. Morgan, Western) added to performance. This was particularly true in collateralized mortgage obligations, which are less prepayment sensitive. During the year, the Fund utilized Treasury futures, euro-dollar futures and options on futures to manage the duration and yield-curve exposure.
| New Covenant Funds / Annual Report / June 30, 2013 | 3 |
Table of Contents
MANAGEMENT’S DISCUSSION AND ANALYSIS OF FUND PERFORMANCE
NEW COVENANT FUNDS — JUNE 30, 2013
New Covenant Income Fund (Concluded)
New Covenant Income Fund
AVERAGE ANNUAL TOTAL RETURN1
| One Year Return | Annualized 3-Year Return | Annualized 5-Year Return | Annualized 10-Year Return | Annualized Inception to Date | ||||||||||||||||
| New Covenant Income Fund | (0.55)% | 2.93% | 2.55% | 2.47% | 2.76% | |||||||||||||||
| Barclays Capital Intermediate U.S. Aggregate Bond Index | (0.12)% | 3.03% | 4.76% | 4.30% | 6.63% | |||||||||||||||
Comparison of Change in the Value of a $10,000 Investment in the New Covenant Income Fund, versus the Barclays Capital Intermediate U.S. Aggregate Bond Index
| 1 | For the years ended June 30, 2013. Past performance is not an indication of future performance. Fund Shares were offered beginning 7/1/99. Returns shown do not reflect the deduction of taxes that a shareholder would pay on fund distributions or the redemption of fund shares. The returns for certain periods reflect fee waivers and/or reimbursements in effect for that year; absent fee waivers and reimbursements, performance would have been lower. |
| 4 | New Covenant Funds / Annual Report / June 30, 2013 |
Table of Contents
MANAGEMENT’S DISCUSSION AND ANALYSIS OF FUND PERFORMANCE
NEW COVENANT FUNDS — JUNE 30, 2013
New Covenant Balanced Growth Fund
I. Objective:
The New Covenant Balanced Growth Fund (the “Fund”) seeks to produce capital appreciation with less risk than would be present in a portfolio of only common stocks.
II. Multi-Manager Approach Statement:
The Fund invests 60% in the New Covenant Growth Fund and 40% in the New Covenant Income Fund. Each underlying Fund uses a multi-manager approach, relying on a number of sub-advisers with differing investment approaches to manage portions of the portfolios under the general supervision of SEI Investments Management Corp. (SIMC). The New Covenant Growth Fund utilized the following sub-advisers as of June 30, 2013: Baillie Gifford Overseas Limited, Sustainable Growth Advisors, LP, Parametric Portfolio Associates, Tocqueville Asset Management L.P., WestEnd Advisors LLC and Waddell & Reed Investment Management Company. The New Covenant Income Fund used the following sub-advisers as of June 30, 2013: Western Asset Management Company, Western Asset Management Company Limited and J.P. Morgan Investment Management Inc. There were no sub-advisor changes made during the year.
III. Return vs. Benchmark:
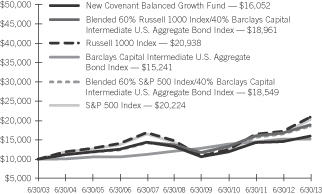
For the year ended June 30, 2013, the Fund returned 9.77%, while the blended benchmark of 60% Russell 1000 Index and 40% Barclays Capital Intermediate U.S. Aggregate Bond Index returned 12.30% and the blended reporting benchmark of 48% Russell 1000 Index, 12% MSCI All Country World ex-U.S. Index and 40% Barclays Capital Intermediate U.S. Aggregate Index advanced 11.38%.
IV. Market Commentary:
Domestic and international stock markets experienced a strong rally despite continued uncertainty among investors. The expanded central bank intervention in the U.S. and the promise of action within the eurozone bolstered investor confidence. European Central Bank (ECB) President Mario Draghi’s promise to do “whatever it takes” to preserve the euro, the outright monetary transactions program (to prop up banks through unlimited purchases of sovereign bonds on the secondary market), and the €500 billion European Stability Mechanism, were all designed to provide financial assistance to
struggling members of the eurozone. Within the U.S., the re-election of President Obama and the last-minute resolution of the fiscal cliff paved the way for a strong start to 2013, despite the expiration of the payroll tax holiday. Abroad, we saw the election of Shinzo Abe in Japan and the introduction of “Abenomics” — a multi-step plan to boost Japan’s ailing economy through devaluation of the yen and domestic stimulus measures to shift the country from an environment of deflation to one of inflation. These announcements boosted investor sentiment toward Japan and sparked a broad uptrend in Japanese equity markets. However, markets in Japan corrected in May 2013 after a few strong months, as investors became somewhat tentative of the long-term efficacy of Abe’s pledged actions. Near the end of the period under review, the potential scaling back of bond purchases by the Federal Reserve in the U.S., or “tapering‘” became a focus, as concerns cropped up that a slowdown in the world’s largest economy could have a carry-on effect on global markets.
Overall, Europe and the Middle East ex-U.K. was the top-performing regional benchmark in the period, with the remaining developed regions performing roughly equally. Emerging markets lagged.
Within fixed-income markets, non-Treasuries generally outperformed duration-neutral Treasuries, thanks to global central banks’ accommodative policies. In 2012, the ECB launched two rounds of long-term refinancing operations, which helped alleviate short-term funding pressure in the eurozone. In the U.S., the Federal Reserve (Fed) continued Operation Twist until December 2012, and started a third quantitative-easing program (QE3) to purchase $85 billion of agency mortgage-backed and long-term Treasury securities every month. In addition, economic and corporate fundamentals continued to improve, while inflation in the U.S. remained benign. The housing market experienced a strong recovery, with the S&P/Case-Shiller home-price index up double digits from a year ago. The non-agency mortgage-backed securities (MBS) market saw strong price appreciation over the year, helped by improving credit fundamentals and attractive valuations. Corporations, especially financial companies, have much stronger balance sheets and solid earnings after a few years of de-leveraging. Primary issuance was robust and has been met with strong demand from investors. However, the market turned a corner at the beginning of May 2013, as fear of the Fed tapering QE3 caused interest rates to surge and triggered a broad
| New Covenant Funds / Annual Report / June 30, 2013 | 5 |
Table of Contents
MANAGEMENT’S DISCUSSION AND ANALYSIS OF FUND PERFORMANCE
NEW COVENANT FUNDS — JUNE 30, 2013
New Covenant Balanced Growth Fund (Concluded)
market selloff. The 10-year Treasury yield rose by 82 basis points and the 30-year Treasury yield increased by 62 basis points from beginning of May to the end of June. Credit spreads widened across sectors, and fixed-income funds witnessed the largest cash outflow since beginning of the year. Liquidity was hammered and dealer balance sheets were constrained by new financial regulations. Agency MBS were hit especially hard, as the sharp rise in Treasury yields resulted in significant extension risk and the QE3 uncertainty caused selling from real-estate investment trusts and overseas investors.
V. Fund Attribution:
The Fund underperformed overall. For equities, both sector allocation and stock selection detracted. An underweight to Financials, one of the best-performing sectors during the year, was the largest detractor. Stock selection within Consumer Staples and Energy also proved challenging. On the positive side, an underweight to Utilities helped, as investors sought riskier issues. Strong stock selection within Materials contributed as well, though this was partially offset by an overweight to the sector. From a regional perspective, the majority of underperformance stemmed from North America, while emerging markets within Europe, the Middle East and Africa were positive. From a market-cap perspective, the Fund was challenged across the capitalization spectrum, with the exception of mega caps.
Within fixed income, the Fund’s flattening yield-curve position (Western) detracted from performance, as the curve significantly steepened. This was partially offset by the short-duration position (J.P. Morgan, Western), as Treasury yields rose sharply. The Fund’s allocation to non-agency MBS (J.P. Morgan, Western) was a big contributor, as the sector continued to be supported by improving housing fundamentals, strong technicals and still-attractive valuations. Lastly, security selection within agency MBS (J.P. Morgan, Western) added to performance. This was particularly true in collateralized mortgage obligations, which are less prepayment sensitive. During the year, the Fund utilized Treasury futures, euro-dollar futures and options on futures to manage the duration and yield-curve exposure.
New Covenant Balanced Growth Fund
AVERAGE ANNUAL TOTAL RETURN1,2
| One Year Return | Annualized 3-Year Return | Annualized 5-Year Return | Annualized 10-Year Return | Annualized Inception to Date | ||||||||||||||||
| New Covenant Balanced Growth Fund | 9.77% | 10.37% | 3.70% | 4.85% | 4.72% | |||||||||||||||
| Russell 1000 Index3 | 21.24% | 18.63% | 7.12% | 7.67% | 9.12% | |||||||||||||||
| S&P 500 Index3 | 20.60% | 18.45% | 7.01% | 7.30% | 8.95% | |||||||||||||||
| Barclays Capital Intermediate U.S. Aggregate Bond Index | (0.12)% | 3.03% | 4.76% | 4.30% | 6.63% | |||||||||||||||
| Blended 60% Russell 1000 Index/40% Barclays Capital Intermediate U.S. Aggregate Bond Index3 | 12.30% | 12.41% | 6.62% | 6.61% | 8.80% | |||||||||||||||
| Blended 60% S&P 500 Index/40% Barclays Capital Intermediate U.S. Aggregate Bond Index3 | 11.94% | 12.29% | 6.54% | 6.37% | 8.70% | |||||||||||||||
Comparison of Change in the Value of a $10,000 Investment in the New Covenant Balanced Growth Fund, versus the Blended 60% Russell 1000 Index/40% Barclays Capital Intermediate U.S. Aggregate Bond Index, Russell 1000 Index, Barclays Capital Intermediate U.S. Aggregate Bond Index, Blended 60% S&P 500 Index/40% Barclays Capital Intermediate U.S. Aggregate Bond Index and S&P 500 Index.
| 1 | For the years ended June 30, 2013. Past performance is not an indication of future performance. Fund Shares were offered beginning 7/1/99. Returns shown do not reflect the deduction of taxes that a shareholder would pay on fund distributions or the redemption of fund shares. The returns for certain periods reflect fee waivers and/or reimbursements in effect for that year; absent fee waivers and reimbursements, performance would have been lower. |
| 2 | This table compares the Fund’s average annual total returns to those of a broad-based index and the Fund’s 60/40 Blended Benchmark, which consists of the Russell 1000 Index and the Barclays Capital Intermediate U.S. Aggregate Bond Index. The Fund’s Blended Benchmark is designed to provide a useful comparison to the Fund’s overall performance and more accurately reflects the Fund’s investment strategy than the broad-based index. |
| 3 | The Fund has changed one of its primary benchmarks from the S&P 500 Index to the Russell 1000 Index in connection with the corresponding change to the Growth Fund’s benchmark. |
| 6 | New Covenant Funds / Annual Report / June 30, 2013 |
Table of Contents
MANAGEMENT’S DISCUSSION AND ANALYSIS OF FUND PERFORMANCE
NEW COVENANT FUNDS — JUNE 30, 2013
New Covenant Balanced Income Fund
I. Objective:
The New Covenant Balanced Income Fund (the “Fund”) seeks to produce current income and long-term growth of capital.
II. Multi-Manager Approach Statement:
The Fund invests 60% in the New Covenant Income Fund and 40% in the New Covenant Growth Fund. Each underlying Fund uses a multi-manager approach, relying on a number of sub-advisers with differing investment approaches to manage portions of the portfolios under the general supervision of SEI Investments Management Corp. (SIMC). The New Covenant Income Fund used the following sub-advisers as of June 30, 2013: Western Asset Management Company, Western Asset Management Company Limited and J.P. Morgan Investment Management Inc. The New Covenant Growth Fund utilized the following sub-advisers as of June 30, 2013: Baillie Gifford Overseas Limited, Sustainable Growth Advisers, LP, Parametric Portfolio Associates, Tocqueville Asset Management L.P., WestEnd Advisors LLC and Waddell & Reed Investment Management Company. There were no sub-adviser changes made during the year.
III. Return vs. Benchmark:
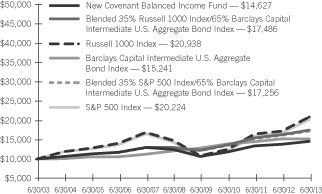
For the year ended June 30, 2013, the Fund returned 5.34%, while the blended benchmark of 35% Russell 1000 Index and 35% Barclays Capital Intermediate U.S. Aggregate Bond Index returned 6.98% and the blended reporting benchmark of 28% Russell 1000 Index, 7% MSCI All Country World ex-U.S. Index and 65% Barclays Capital Intermediate U.S. Aggregate Index advanced 6.47%.
IV. Market Commentary:
Domestic and international stock markets experienced a strong rally despite continued uncertainty among investors. The expanded central bank intervention in the U.S. and the promise of action within the eurozone bolstered investor confidence. European Central Bank (ECB) President Mario Draghi’s promise to do “whatever it takes” to preserve the euro, the outright monetary transactions program (to prop up banks through unlimited purchases of sovereign bonds on the secondary market), and the €500 billion European Stability Mechanism, were all designed to provide financial assistance to struggling members of the eurozone. Within the U.S., the re-election
of President Obama and the last-minute resolution of the fiscal cliff paved the way for a strong start to 2013, despite the expiration of the payroll tax holiday. Abroad, we saw the election of Shinzo Abe in Japan and the introduction of “Abenomics” — a multi-step plan to boost Japan’s ailing economy through devaluation of the yen and domestic stimulus measures to shift the country from an environment of deflation to one of inflation. These announcements boosted investor sentiment toward Japan and sparked a broad uptrend in Japanese equity markets. However, markets in Japan corrected in May 2013 after a few strong months, as investors became somewhat tentative of the long-term efficacy of Abe’s pledged actions. Near the end of the period under review, the potential scaling back of bond purchases by the Federal Reserve in the U.S., or “tapering‘” became a focus, as concerns cropped up that a slowdown in the world’s largest economy could have a carry-on effect on global markets.
Overall, Europe and the Middle East ex-U.K. was the top-performing regional benchmark in the period, with the remaining developed regions performing roughly equally. Emerging markets lagged.
Within fixed-income markets, non-Treasuries generally outperformed duration-neutral Treasuries, thanks to global central banks’ accommodative policies. In 2012, the ECB launched two rounds of long-term refinancing operations, which helped alleviate short-term funding pressure in the eurozone. In the U.S., the Federal Reserve (Fed) continued Operation Twist until December 2012, and started a third quantitative-easing program (QE3) to purchase $85 billion of agency mortgage-backed and long-term Treasury securities every month. In addition, economic and corporate fundamentals continued to improve, while inflation in the U.S. remained benign. The housing market experienced a strong recovery, with the S&P/Case-Shiller home-price index up double digits from a year ago. The non-agency mortgage-backed securities (MBS) market saw strong price appreciation over the year, helped by improving credit fundamentals and attractive valuations. Corporations, especially financial companies, have much stronger balance sheets and solid earnings after a few years of de-leveraging. Primary issuance was robust and has been met with strong demand from investors. However, the market turned a corner at the beginning of May 2013, as fear of the Fed tapering QE3 caused interest rates to surge and triggered a broad market selloff. The 10-year Treasury yield rose by 82 basis points and
| New Covenant Funds / Annual Report / June 30, 2013 | 7 |
Table of Contents
MANAGEMENT’S DISCUSSION AND ANALYSIS OF FUND PERFORMANCE
NEW COVENANT FUNDS — JUNE 30, 2013
New Covenant Balanced Income Fund (Concluded)
the 30-year Treasury yield increased by 62 basis points from beginning of May to the end of June. Credit spreads widened across sectors, and fixed-income funds witnessed the largest cash outflow since beginning of the year. Liquidity was hammered and dealer balance sheets were constrained by new financial regulations. Agency MBS were hit especially hard, as the sharp rise in Treasury yields resulted in significant extension risk and the QE3 uncertainty caused selling from real-estate investment trusts and overseas investors.
V. Fund Attribution:
The Fund underperformed overall. Within fixed income, the Fund’s flattening yield-curve position (Western) detracted from performance, as the curve significantly steepened. This was partially offset by the short-duration position (J.P. Morgan, Western), as Treasury yields rose sharply. The Fund’s allocation to non-agency MBS (J.P. Morgan, Western) was a big contributor, as the sector continued to be supported by improving housing fundamentals, strong technicals and still-attractive valuations. Lastly, security selection within agency MBS (J.P. Morgan, Western) added to performance. This was particularly true in collateralized mortgage obligations, which are less prepayment sensitive. During the year, the Fund utilized Treasury futures, euro-dollar futures and options on futures to manage the duration and yield-curve exposure.
For equities, both sector allocation and stock selection detracted. An underweight to Financials, one of the best-performing sectors during the year, was the largest detractor. Stock selection within Consumer Staples and Energy also proved challenging. On the positive side, an underweight to Utilities helped, as investors sought riskier issues. Strong stock selection within Materials contributed as well, although this was partially offset by an overweight to the sector. From a regional perspective, the majority of underperformance stemmed from North America, while emerging markets within Europe, the Middle East and Africa were positive. From a market-cap perspective, the Fund was challenged across the capitalization spectrum, with the exception of mega caps.
New Covenant Balanced Income Fund
AVERAGE ANNUAL TOTAL RETURN1,2
| One Year Return | Annualized 3-Year Return | Annualized 5-Year Return | Annualized 10-Year Return | Annualized Inception to Date | ||||||||||||||||
| New Covenant Balanced Income Fund | 5.34% | 7.20% | �� | 3.21% | 3.88% | 3.77% | ||||||||||||||
| Russell 1000 Index3 | 21.24% | 18.63% | 7.12% | 7.67% | 9.12% | |||||||||||||||
| S&P 500 Index3 | 20.60% | 18.45% | 7.01% | 7.30% | 8.95% | |||||||||||||||
| Barclays Capital Intermediate U.S. Aggregate Bond Index | (0.12)% | 3.03% | 4.76% | 4.30% | 6.63% | |||||||||||||||
| Blended 35% Russell 1000 Index/65% Barclays Capital Intermediate U.S. Aggregate Bond Index3 | 6.98% | 8.50% | 6.00% | 5.75% | 7.65% | |||||||||||||||
| Blended 35% S&P 500 Index/65% Barclays Capital Intermediate U.S. Aggregate Bond Index3 | 6.78% | 8.43% | 5.95% | 5.61% | 7.58% | |||||||||||||||
Comparison of Change in the Value of a $10,000 Investment in the New Covenant Balanced Income Fund, versus the Blended 35% Russell 1000 Index/65% Barclays Capital Intermediate U.S. Aggregate Bond Index, Russell 1000 Index, Barclays Capital Intermediate U.S. Aggregate Bond Index, Blended 35% S&P 500 Index/65% Barclays Capital Intermediate U.S. Aggregate Bond Index and S&P 500 Index.
| 1 | For the years ended June 30, 2013. Past performance is not an indication of future performance. Fund Shares were offered beginning 7/1/99. Returns shown do not reflect the deduction of taxes that a shareholder would pay on fund distributions or the redemption of fund shares. The returns for certain periods reflect fee waivers and/or reimbursements in effect for that year; absent fee waivers and reimbursements, performance would have been lower. |
| 2 | This table compares the Fund’s average annual total returns to those of a broad-based index and the Fund’s 35/65 Blended Benchmark, which consists of the Russell 1000 Index and the Barclays Capital Intermediate U.S. Aggregate Bond Index. The Fund’s Blended Benchmark is designed to provide a useful comparison to the Fund’s overall performance and more accurately reflects the Fund’s investment strategy than the broad-based index. |
| 3 | The Fund has changed one of its primary benchmarks from the S&P 500 Index to the Russell 1000 Index in connection with the corresponding change to the Growth Fund’s primary benchmark. |
| 8 | New Covenant Funds / Annual Report / June 30, 2013 |
Table of Contents
New Covenant Growth Fund
June 30, 2013
| Description | Shares | Market Value ($ Thousands) | ||||||
COMMON STOCK — 97.6% | ||||||||
Argentina — 0.3% | ||||||||
MercadoLibre | 11,500 | $ | 1,239 | |||||
|
| |||||||
Australia — 0.8% | ||||||||
Brambles (A) | 101,481 | 865 | ||||||
Cochlear (A) | 10,089 | 567 | ||||||
Diana Shipping* | 75,986 | 763 | ||||||
Woolworths (A) | 23,136 | 693 | ||||||
|
| |||||||
| 2,888 | ||||||||
|
| |||||||
Belgium — 0.1% | ||||||||
Groupe Bruxelles Lambert (A) | 7,239 | 544 | ||||||
|
| |||||||
Brazil — 0.2% | ||||||||
Embraer ADR | 11,236 | 414 | ||||||
Itau Unibanco Holding ADR | 36,677 | 474 | ||||||
|
| |||||||
| 888 | ||||||||
|
| |||||||
Canada — 1.5% | ||||||||
Cameco | 28,879 | 597 | ||||||
Canadian Pacific Railway | 18,895 | 2,293 | ||||||
Catamaran | 1,804 | 88 | ||||||
Cenovus Energy | 14,102 | 401 | ||||||
Fairfax Financial Holdings | 3,138 | 1,230 | ||||||
Ritchie Bros Auctioneers | 23,399 | 447 | ||||||
Thomson Reuters | 3,958 | 129 | ||||||
Westport Innovations* | 11,830 | 398 | ||||||
|
| |||||||
| 5,583 | ||||||||
|
| |||||||
China — 0.6% | ||||||||
Baidu ADR* | 9,368 | 886 | ||||||
China Shenhua Energy, Cl H (A) | 231,000 | 587 | ||||||
Want Want China Holdings (A) | 599,000 | 839 | ||||||
|
| |||||||
| 2,312 | ||||||||
|
| |||||||
Denmark — 0.7% | ||||||||
DSV (A) | 32,012 | 779 | ||||||
| Description | Shares | Market Value ($ Thousands) | ||||||
Novo Nordisk ADR | 8,025 | $ | 1,243 | |||||
Novozymes, Cl B (A) | 19,317 | 618 | ||||||
|
| |||||||
| 2,640 | ||||||||
|
| |||||||
Finland — 0.7% | ||||||||
Kone, Cl B (A) | 18,464 | 1,463 | ||||||
Sampo, Cl A (A) | 25,922 | 1,008 | ||||||
|
| |||||||
| 2,471 | ||||||||
|
| |||||||
France — 1.0% | ||||||||
Danone ADR | 60,030 | 900 | ||||||
Edenred (A) | 25,451 | 778 | ||||||
Essilor International (A) | 11,365 | 1,209 | ||||||
Lafarge (A) | 12,467 | 765 | ||||||
|
| |||||||
| 3,652 | ||||||||
|
| |||||||
Germany — 1.5% | ||||||||
Brenntag (A) | 4,412 | 670 | ||||||
Continental (A) | 6,066 | 807 | ||||||
Deutsche Boerse (A) | 13,408 | 880 | ||||||
SAP ADR | 31,822 | 2,318 | ||||||
SKY Deutschland (A) | 110,734 | 768 | ||||||
|
| |||||||
| 5,443 | ||||||||
|
| |||||||
Hong Kong — 0.9% | ||||||||
China Mobile (A) | 67,000 | 694 | ||||||
Hang Seng Bank (A) | 39,600 | 583 | ||||||
Hong Kong Exchanges and Clearing (A) | 72,400 | 1,087 | ||||||
Kunlun Energy (A) | 580,000 | 1,024 | ||||||
|
| |||||||
| 3,388 | ||||||||
|
| |||||||
Ireland — 1.8% | ||||||||
Accenture, Cl A | 781 | 56 | ||||||
Covidien | 521 | 33 | ||||||
CRH (A) | 33,302 | 674 | ||||||
Eaton | 2,465 | 162 | ||||||
Experian (A) | 64,403 | 1,116 | ||||||
Ingersoll-Rand | 14,112 | 784 | ||||||
Ryanair Holdings ADR | 22,504 | 1,160 | ||||||
Shire ADR | 15,121 | 1,438 | ||||||
Willis Group Holdings | 25,512 | 1,040 | ||||||
|
| |||||||
| 6,463 | ||||||||
|
| |||||||
Israel — 0.3% | ||||||||
Check Point Software Technologies | 22,211 | 1,103 | ||||||
|
| |||||||
Japan — 2.0% | ||||||||
FANUC (A) | 4,600 | 664 | ||||||
Fast Retailing (A) | 2,700 | 910 | ||||||
Mitsui (A) | 35,300 | 442 | ||||||
Olympus (A) | 30,200 | 916 | ||||||
Rakuten (A) | 97,200 | 1,148 | ||||||
Shimano (A) | 8,500 | 723 | ||||||
| New Covenant Funds / Annual Report / June 30, 2013 | 9 |
Table of Contents
SCHEDULE OF INVESTMENTS
New Covenant Growth Fund (Continued)
June 30, 2013
| Description | Shares | Market Value ($ Thousands) | ||||||
SMC (A) | 4,800 | $ | 961 | |||||
Tokyo Electron (A) | 10,400 | 525 | ||||||
Toyota Tsusho (A) | 22,100 | 567 | ||||||
Trend Micro (A) | 20,500 | 651 | ||||||
|
| |||||||
| 7,507 | ||||||||
|
| |||||||
Netherlands — 0.5% | ||||||||
Chicago Bridge & Iron | 509 | 31 | ||||||
CNH Global | 2,142 | 89 | ||||||
James Hardie Industries (A) | 72,273 | 621 | ||||||
QIAGEN | 1,417 | 28 | ||||||
Unilever (A) | 28,714 | 1,129 | ||||||
|
| |||||||
| 1,898 | ||||||||
|
| |||||||
Norway — 0.3% | ||||||||
Aker Solutions (A) | 36,344 | 494 | ||||||
Seadrill (A) | 13,177 | 528 | ||||||
|
| |||||||
| 1,022 | ||||||||
|
| |||||||
Portugal — 0.1% | ||||||||
Galp Energia, Cl B (A) | 24,181 | 358 | ||||||
|
| |||||||
Russia — 0.5% | ||||||||
Magnit GDR (A) | 19,728 | 1,126 | ||||||
Sberbank of Russia ADR (A) | 46,618 | 529 | ||||||
|
| |||||||
| 1,655 | ||||||||
|
| |||||||
Singapore — 0.4% | ||||||||
Avago Technologies, Cl A | 4,239 | 159 | ||||||
United Overseas Bank (A) | 75,552 | 1,179 | ||||||
|
| |||||||
| 1,338 | ||||||||
|
| |||||||
South Africa — 0.7% | ||||||||
Massmart Holdings | 29,394 | 531 | ||||||
Naspers, N Shares (A) | 26,735 | 1,965 | ||||||
|
| |||||||
| 2,496 | ||||||||
|
| |||||||
South Korea — 0.8% | ||||||||
Hyundai Mobis (A) | 2,276 | 542 | ||||||
NHN (A) | 2,005 | 509 | ||||||
Samsung Electronics GDR (A) | 3,200 | 1,860 | ||||||
|
| |||||||
| 2,911 | ||||||||
|
| |||||||
Spain — 0.3% | ||||||||
Inditex (A) | 8,508 | 1,048 | ||||||
|
| |||||||
Sweden — 1.0% | ||||||||
Allied World Assurance Holdings | 34 | 3 | ||||||
Atlas Copco, B Shares (A) | 64,927 | 1,381 | ||||||
Svenska Handelsbanken, A Shares (A) | 37,873 | 1,507 | ||||||
Volvo, Cl B (A) | 53,034 | 703 | ||||||
|
| |||||||
| 3,594 | ||||||||
|
| |||||||
| Description | Shares | Market Value ($ Thousands) | ||||||
Switzerland — 1.3% | ||||||||
Garmin | 3,446 | $ | 125 | |||||
Nestle (A) | 31,433 | 2,059 | ||||||
Pentair | 43,228 | 2,494 | ||||||
|
| |||||||
| 4,678 | ||||||||
|
| |||||||
Taiwan — 0.7% | ||||||||
Hon Hai Precision Industry GDR (A) | 101,826 | 494 | ||||||
Taiwan Semiconductor Manufacturing ADR | 117,993 | 2,162 | ||||||
|
| |||||||
| 2,656 | ||||||||
|
| |||||||
Turkey — 0.3% | ||||||||
BIM Birlesik Magazalar (A) | 29,202 | 633 | ||||||
Turkiye Garanti Bankasi ADR | 123,460 | 531 | ||||||
|
| |||||||
| 1,164 | ||||||||
|
| |||||||
United Kingdom — 3.2% | ||||||||
Amlin (A) | 121,563 | 725 | ||||||
Antofagasta (A) | 39,786 | 481 | ||||||
Aon | 440 | 28 | ||||||
ARM Holdings (A) | 97,000 | 1,170 | ||||||
BG Group (A) | 40,125 | 680 | ||||||
BHP Billiton (A) | 24,018 | 610 | ||||||
Burberry Group (A) | 16,285 | 334 | ||||||
Capita (A) | 67,879 | 995 | ||||||
Hargreaves Lansdown (A) | 37,885 | 510 | ||||||
Liberty Global, Cl A* | 93 | 7 | ||||||
Petrofac (A) | 30,000 | 545 | ||||||
Premier Farnell (A) | 124,129 | 380 | ||||||
Prudential (A) | 64,394 | 1,048 | ||||||
Rio Tinto (A) | 34,521 | 1,400 | ||||||
St. James’s Place (A) | 52,499 | 430 | ||||||
Standard Chartered (A) | 28,252 | 612 | ||||||
Tullow Oil (A) | 70,124 | 1,065 | ||||||
Wolseley (A) | 21,035 | 968 | ||||||
|
| |||||||
| 11,988 | ||||||||
|
| |||||||
United States — 75.1% | ||||||||
Consumer Discretionary — 14.4% | ||||||||
Aeropostale* | 64,213 | 886 | ||||||
Amazon.com | 873 | 242 | ||||||
Ascena Retail Group | 72,513 | 1,265 | ||||||
Cablevision Systems, Cl A | 5,421 | 91 | ||||||
CBS, Cl B | 49,234 | 2,406 | ||||||
Charter Communications, Cl A | 9,323 | 1,155 | ||||||
Chipotle Mexican Grill, Cl A | 3,815 | 1,390 | ||||||
Coach | 62,207 | 3,551 | ||||||
Comcast, Cl A | 6,120 | 256 | ||||||
Delphi Automotive | 2,133 | 108 | ||||||
DIRECTV* | 1,202 | 74 | ||||||
Expedia | 662 | 40 | ||||||
| 10 | New Covenant Funds / Annual Report / June 30, 2013 |
Table of Contents
| Description | Shares | Market Value ($ Thousands) | ||||||
Ford Motor | 4,525 | $ | 70 | |||||
Gannett | 313 | 8 | ||||||
General Motors | 4,000 | 133 | ||||||
Gentex | 172 | 4 | ||||||
Genuine Parts | 256 | 20 | ||||||
Harley-Davidson | 42,181 | 2,313 | ||||||
Home Depot | 23,561 | 1,825 | ||||||
Jarden* | 3,272 | 143 | ||||||
Johnson Controls | 857 | 31 | ||||||
L Brands | 445 | 22 | ||||||
Lennar, Cl A | 1,057 | 38 | ||||||
Liberty Interactive, Cl A* | 1,140 | 26 | ||||||
Liberty Media, Cl A* | 249 | 31 | ||||||
Lowe’s | 67,438 | 2,758 | ||||||
Macy’s | 19 | 1 | ||||||
Marriott International, Cl A | 213 | 8 | ||||||
Mattel | 2,653 | 120 | ||||||
McDonald’s | 2,429 | 240 | ||||||
McGraw Hill Financial | 16,914 | 900 | ||||||
Michael Kors Holdings | 492 | 31 | ||||||
Mohawk Industries | 490 | 55 | ||||||
Morningstar | 2,128 | 165 | ||||||
News, Cl A | 6,756 | 220 | ||||||
News, Cl B | 72,975 | 2,395 | ||||||
NIKE, Cl B | 58,611 | 3,732 | ||||||
Nordstrom | 57,434 | 3,443 | ||||||
Panera Bread, Cl A | 6,028 | 1,121 | ||||||
Polaris Industries | 76 | 7 | ||||||
priceline.com* | 60 | 50 | ||||||
PulteGroup | 443 | 9 | ||||||
Ralph Lauren, Cl A | 9,894 | 1,719 | ||||||
Ross Stores | 363 | 24 | ||||||
Signet Jewelers | 454 | 31 | ||||||
Staples | 81,579 | 1,294 | ||||||
Starbucks | 44,998 | 2,947 | ||||||
Starwood Hotels & Resorts Worldwide | 32,738 | 2,069 | ||||||
Target | 53,225 | 3,665 | ||||||
Tiffany | 8,101 | 590 | ||||||
Time Warner | 1,084 | 63 | ||||||
Time Warner Cable | 14,779 | 1,662 | ||||||
TJX | 2,126 | 106 | ||||||
Tupperware Brands | 1,523 | 118 | ||||||
Walt Disney | 56,845 | 3,590 | ||||||
Yum! Brands | 54,827 | 3,802 | ||||||
|
| |||||||
| 53,063 | ||||||||
|
| |||||||
Consumer Staples — 10.1% | ||||||||
Archer-Daniels-Midland | 3,910 | 133 | ||||||
Avon Products | 6,123 | 129 | ||||||
Bunge | 1,900 | 135 | ||||||
Campbell Soup | 19,827 | 888 | ||||||
Church & Dwight | 2,343 | 145 | ||||||
Clorox | 1,706 | 142 | ||||||
Coca-Cola | 69,208 | 2,776 | ||||||
| Description | Shares | Market Value ($ Thousands) | ||||||
Coca-Cola Enterprises | 3,360 | $ | 118 | |||||
Colgate-Palmolive | 63,700 | 3,649 | ||||||
ConAgra Foods | 4,128 | 144 | ||||||
Costco Wholesale | 46,839 | 5,179 | ||||||
CVS Caremark | 61,575 | 3,521 | ||||||
Dean Foods* | 6,848 | 69 | ||||||
Dr. Pepper Snapple Group | 2,621 | 120 | ||||||
Energizer Holdings | 1,290 | 130 | ||||||
Estee Lauder, Cl A | 69,468 | 4,569 | ||||||
Flowers Foods | 5,820 | 128 | ||||||
Fresh Market* | 2,766 | 138 | ||||||
General Mills | 3,656 | 177 | ||||||
Green Mountain Coffee Roasters* | 2,240 | 168 | ||||||
Hershey | 1,759 | 157 | ||||||
Hillshire Brands | 4,379 | 145 | ||||||
Hormel Foods | 3,334 | 129 | ||||||
Ingredion | 2,197 | 144 | ||||||
JM Smucker | 1,311 | 135 | ||||||
Kellogg | 2,537 | 163 | ||||||
Kimberly-Clark | 1,854 | 180 | ||||||
Kraft Foods Group | 3,280 | 183 | ||||||
Kroger | 4,206 | 145 | ||||||
McCormick | 1,682 | 118 | ||||||
Mead Johnson Nutrition, Cl A | 19,326 | 1,531 | ||||||
Mondelez International, Cl A | 123,243 | 3,516 | ||||||
Monster Beverage | 2,325 | 141 | ||||||
Nu Skin Enterprises, Cl A | 2,571 | 157 | ||||||
PepsiCo | 19,690 | 1,611 | ||||||
Pricesmart | 5,528 | 484 | ||||||
Procter & Gamble | 4,469 | 344 | ||||||
Safeway | 5,985 | 142 | ||||||
Smithfield Foods | 527 | 17 | ||||||
Sysco | 4,724 | 161 | ||||||
Tyson Foods, Cl A | 5,401 | 139 | ||||||
Wal-Mart Stores | 19,983 | 1,489 | ||||||
WhiteWave Foods, Cl A | 8,038 | 131 | ||||||
Whole Foods Market | 70,810 | 3,645 | ||||||
|
| |||||||
| 37,465 | ||||||||
|
| |||||||
Energy — 4.8% | ||||||||
Anadarko Petroleum | 2,042 | 175 | ||||||
Apache | 18,794 | 1,575 | ||||||
Baker Hughes | 25,364 | 1,170 | ||||||
Cameron International | 235 | 14 | ||||||
Chevron | 2,929 | 347 | ||||||
ConocoPhillips | 1,362 | 82 | ||||||
EOG Resources | 1,217 | 160 | ||||||
Exxon Mobil | 18,684 | 1,688 | ||||||
Kinder Morgan | 853 | 33 | ||||||
Murphy Oil | 14,281 | 870 | ||||||
National Oilwell Varco | 59,282 | 4,085 | ||||||
Noble Energy | 28,674 | 1,722 | ||||||
Occidental Petroleum | 12,057 | 1,076 | ||||||
Phillips 66 | 19,332 | 1,139 | ||||||
| New Covenant Funds / Annual Report / June 30, 2013 | 11 |
Table of Contents
SCHEDULE OF INVESTMENTS
New Covenant Growth Fund (Continued)
June 30, 2013
| Description | Shares | Market Value ($ Thousands) | ||||||
Schlumberger | 49,757 | $ | 3,566 | |||||
Spectra Energy | 845 | 29 | ||||||
Williams | 764 | 25 | ||||||
|
| |||||||
| 17,756 | ||||||||
|
| |||||||
Financials — 7.4% | ||||||||
Aflac | 11,210 | 652 | ||||||
American Express | 49,511 | 3,701 | ||||||
American International Group* | 69,822 | 3,121 | ||||||
Ameriprise Financial | 295 | 24 | ||||||
Arch Capital Group | 558 | 29 | ||||||
Ares Capital | 1,320 | 23 | ||||||
Axis Capital Holdings | 3,078 | 141 | ||||||
Bank of America | 12,876 | 166 | ||||||
Bank of New York Mellon | 1,615 | 45 | ||||||
BB&T | 906 | 31 | ||||||
Berkshire Hathaway, Cl B | 2,551 | 285 | ||||||
BlackRock, Cl A | 504 | 129 | ||||||
Boston Properties‡ | 97 | 10 | ||||||
Capital One Financial | 36,155 | 2,271 | ||||||
CBRE Group, Cl A | 31,725 | 741 | ||||||
Charles Schwab | 54,249 | 1,152 | ||||||
Chubb | 1,345 | 114 | ||||||
Citigroup | 45,120 | 2,164 | ||||||
Credicorp | 5,555 | 711 | ||||||
Discover Financial Services | 435 | 21 | ||||||
Equity Residential‡ | 2,092 | 121 | ||||||
Erie Indemnity, Cl A | 25 | 2 | ||||||
Everest Re Group | 226 | 29 | ||||||
Fidelity National Financial, Cl A | 247 | 6 | ||||||
Forest City Enterprises, Cl A* | 179 | 3 | ||||||
General Growth Properties‡ | 246 | 5 | ||||||
Goldman Sachs Group | 673 | 102 | ||||||
HCP‡ | 2,081 | 95 | ||||||
JPMorgan Chase | 42,116 | 2,223 | ||||||
Lazard, Cl A | 37,338 | 1,200 | ||||||
Leucadia National | 4,980 | 131 | ||||||
Loews | 544 | 24 | ||||||
Marsh & McLennan | 713 | 28 | ||||||
MetLife | 32,440 | 1,484 | ||||||
Morgan Stanley | 1,152 | 28 | ||||||
MSCI, Cl A* | 29,276 | 974 | ||||||
Northern Trust | 204 | 12 | ||||||
PartnerRe | 316 | 29 | ||||||
Plum Creek Timber‡ | 149 | 7 | ||||||
PNC Financial Services Group | 684 | 50 | ||||||
ProLogis‡ | 596 | 23 | ||||||
Prudential Financial | 632 | 46 | ||||||
Simon Property Group‡ | 1,047 | 165 | ||||||
SLM | 686 | 16 | ||||||
State Street | 46,432 | 3,028 | ||||||
US Bancorp | 2,716 | 98 | ||||||
Vornado Realty Trust‡ | 1,113 | 92 | ||||||
Wells Fargo | 7,955 | 328 | ||||||
| Description | Shares | Market Value ($ Thousands) | ||||||
Weyerhaeuser‡ | 43,789 | $ | 1,248 | |||||
White Mountains Insurance Group | 41 | 24 | ||||||
|
| |||||||
| 27,152 | ||||||||
|
| |||||||
Health Care — 10.4% | ||||||||
Abbott Laboratories | 1,908 | 66 | ||||||
AbbVie | 1,789 | 74 | ||||||
Agilent Technologies | 24,576 | 1,051 | ||||||
Alexion Pharmaceuticals* | 11,051 | 1,019 | ||||||
Allergan | 1,959 | 165 | ||||||
Amgen | 18,570 | 1,832 | ||||||
Baxter International | 881 | 61 | ||||||
Biogen Idec | 12,420 | 2,673 | ||||||
Bristol-Myers Squibb | 36,344 | 1,624 | ||||||
Celgene* | 14,352 | 1,678 | ||||||
Cerner | 20,832 | 2,002 | ||||||
DENTSPLY International | 183 | 7 | ||||||
Eli Lilly | 1,831 | 90 | ||||||
Express Scripts Holding* | 56,018 | 3,456 | ||||||
Forest Laboratories | 35,483 | 1,455 | ||||||
Gilead Sciences | 36,387 | 1,863 | ||||||
HCA Holdings | 1,295 | 46 | ||||||
Hologic | 52,776 | 1,019 | ||||||
IDEXX Laboratories | 7,826 | 703 | ||||||
Intuitive Surgical | 3,680 | 1,864 | ||||||
Johnson & Johnson | 58,886 | 5,056 | ||||||
Life Technologies | 232 | 17 | ||||||
Medtronic | 561 | 29 | ||||||
Merck | 5,629 | 261 | ||||||
Mettler-Toledo International | 42 | 9 | ||||||
Mylan* | 480 | 15 | ||||||
Perrigo | 17,034 | 2,061 | ||||||
Pfizer | 138,292 | 3,874 | ||||||
Regeneron Pharmaceuticals | 5,467 | 1,230 | ||||||
St. Jude Medical | 27,871 | 1,272 | ||||||
Teleflex | 11,338 | 879 | ||||||
Thermo Fisher Scientific | 1,016 | 86 | ||||||
UnitedHealth Group | 13,942 | 913 | ||||||
WellPoint | 452 | 37 | ||||||
|
| |||||||
| 38,487 | ||||||||
|
| |||||||
Industrials — 5.3% | ||||||||
3M | 1,695 | 186 | ||||||
ADT | 195 | 8 | ||||||
Alliant Techsystems | 1,840 | 152 | ||||||
AMETEK | 314 | 13 | ||||||
Armstrong World Industries | 462 | 22 | ||||||
BE Aerospace | 1,593 | 100 | ||||||
Caterpillar | 1,716 | 141 | ||||||
Cintas | 551 | 25 | ||||||
Copa Holdings, Cl A | 869 | 114 | ||||||
Crane | 2,252 | 135 | ||||||
CSX | 1,434 | 33 | ||||||
Cummins | 17,894 | 1,941 | ||||||
| 12 | New Covenant Funds / Annual Report / June 30, 2013 |
Table of Contents
| Description | Shares | Market Value ($ Thousands) | ||||||
Danaher | 2,292 | $ | 145 | |||||
Deere | 1,846 | 150 | ||||||
Delta Air Lines | 2,350 | 44 | ||||||
Dover | 243 | 19 | ||||||
Emerson Electric | 23,899 | 1,303 | ||||||
Exelis | 72,788 | 1,004 | ||||||
Fastenal | 37,800 | 1,733 | ||||||
FedEx | 224 | 22 | ||||||
General Electric | 77,714 | 1,802 | ||||||
GrafTech International | 110,526 | 805 | ||||||
Honeywell International | 2,483 | 197 | ||||||
Huntington Ingalls Industries | 2,320 | 131 | ||||||
IHS, Cl A | 64 | 7 | ||||||
Illinois Tool Works | 17,517 | 1,212 | ||||||
Kansas City Southern | 13,663 | 1,448 | ||||||
Masco | 4,598 | 90 | ||||||
Nielsen Holdings | 3,499 | 117 | ||||||
Norfolk Southern | 429 | 31 | ||||||
PACCAR | 497 | 27 | ||||||
Pall | 34,548 | 2,295 | ||||||
Parker Hannifin | 1,607 | 153 | ||||||
Precision Castparts | 217 | 49 | ||||||
Republic Services, Cl A | 692 | 23 | ||||||
Southwest Airlines | 2,246 | 29 | ||||||
Stanley Black & Decker | 1,500 | 116 | ||||||
Textron | 4,669 | 122 | ||||||
Timken | 2,717 | 153 | ||||||
Toro | 1,239 | 56 | ||||||
Towers Watson, Cl A | 74 | 6 | ||||||
TransDigm Group | 918 | 144 | ||||||
Triumph Group | 119 | 9 | ||||||
Union Pacific | 16,327 | 2,519 | ||||||
United Continental Holdings | 1,868 | 58 | ||||||
United Parcel Service, Cl B | 2,448 | 212 | ||||||
United Technologies | 2,323 | 216 | ||||||
URS | 102 | 5 | ||||||
Waste Management | 3,917 | 158 | ||||||
Xylem | 232 | 6 | ||||||
|
| |||||||
| 19,486 | ||||||||
|
| |||||||
Information Technology — 16.0% | ||||||||
Activision Blizzard | 1,707 | 24 | ||||||
Adobe Systems* | 83,462 | 3,802 | ||||||
Alliance Data Systems* | 67 | 12 | ||||||
Altera | 25,900 | 854 | ||||||
Amdocs | 3,848 | 143 | ||||||
Amphenol, Cl A | 366 | 28 | ||||||
Analog Devices | 25,447 | 1,147 | ||||||
ANSYS | 120 | 9 | ||||||
Apple | 10,527 | 4,170 | ||||||
Applied Materials | 127,266 | 1,898 | ||||||
Automatic Data Processing | 59,092 | 4,069 | ||||||
BMC Software | 214 | 10 | ||||||
Broadcom, Cl A | 697 | 24 | ||||||
| Description | Shares | Market Value ($ Thousands) | ||||||
CA | 799 | $ | 23 | |||||
Cisco Systems | 95,531 | 2,322 | ||||||
Citrix Systems | 245 | 15 | ||||||
Cognizant Technology Solutions, Cl A* | 248 | 16 | ||||||
Corning | 2,041 | 29 | ||||||
Cree | 139 | 9 | ||||||
Dell | 3,957 | 53 | ||||||
eBay* | 61,559 | 3,184 | ||||||
EMC | 145,618 | 3,439 | ||||||
F5 Networks* | 173 | 12 | ||||||
Facebook, Cl A* | 33,136 | 824 | ||||||
Freescale Semiconductor* | 6,600 | 89 | ||||||
Gartner* | 127 | 7 | ||||||
Genpact | 1,342 | 26 | ||||||
Google, Cl A* | 3,563 | 3,137 | ||||||
Hewlett-Packard | 2,215 | 55 | ||||||
Intel | 11,456 | 277 | ||||||
International Business Machines | 19,095 | 3,649 | ||||||
Intuit | 314 | 19 | ||||||
Juniper Networks | 693 | 13 | ||||||
LSI* | 117,887 | 842 | ||||||
Marvell Technology Group | 1,401 | 16 | ||||||
Mastercard, Cl A | 4,825 | 2,772 | ||||||
Maxim Integrated Products | 2,676 | 74 | ||||||
Microchip Technology | 234 | 9 | ||||||
MICROS Systems | 105 | 5 | ||||||
Microsoft | 61,073 | 2,109 | ||||||
Molex | 5,187 | 152 | ||||||
Motorola Solutions | 2,038 | 118 | ||||||
NetApp | 456 | 17 | ||||||
Oracle | 107,979 | 3,317 | ||||||
Paychex | 615 | 22 | ||||||
QUALCOMM | 100,303 | 6,127 | ||||||
Red Hat | 213 | 10 | ||||||
Riverbed Technology | 78,780 | 1,226 | ||||||
Salesforce.com* | 37,536 | 1,433 | ||||||
SanDisk | 310 | 19 | ||||||
Skyworks Solutions | 246 | 5 | ||||||
Solera Holdings | 92 | 5 | ||||||
Symantec | 982 | 22 | ||||||
Teradata | 35,867 | 1,802 | ||||||
Texas Instruments | 49,839 | 1,738 | ||||||
Total System Services | 6,302 | 154 | ||||||
Trimble Navigation | 3,253 | 85 | ||||||
VeriSign | 857 | 38 | ||||||
Visa, Cl A | 17,304 | 3,162 | ||||||
Xerox | 34,580 | 314 | ||||||
Yahoo! | 1,578 | 39 | ||||||
Zebra Technologies, Cl A | 1,845 | 80 | ||||||
|
| |||||||
| 59,100 | ||||||||
|
| |||||||
Materials — 5.2% | ||||||||
Air Products & Chemicals | 274 | 25 | ||||||
Ball | 3,167 | 132 | ||||||
| New Covenant Funds / Annual Report / June 30, 2013 | 13 |
Table of Contents
SCHEDULE OF INVESTMENTS
New Covenant Growth Fund (Concluded)
June 30, 2013
| Description | Shares | Market Value ($ Thousands) | ||||||
Crown Holdings | 2,386 | $ | 98 | |||||
Dow Chemical | 70,051 | 2,254 | ||||||
Ecolab | 32,943 | 2,806 | ||||||
E.I. du Pont de Nemours | 28,070 | 1,474 | ||||||
International Paper | 1,686 | 75 | ||||||
LyondellBasell Industries, Cl A | 13,269 | 879 | ||||||
MeadWestvaco | 694 | 23 | ||||||
Monsanto | 49,728 | 4,913 | ||||||
Newmont Mining | 24,630 | 738 | ||||||
Owens-Illinois | 34,827 | 968 | ||||||
Packaging Corp of America | 50 | 2 | ||||||
Praxair | 17,611 | 2,028 | ||||||
Sealed Air | 57,215 | 1,370 | ||||||
Sherwin-Williams | 97 | 17 | ||||||
Sonoco Products | 320 | 11 | ||||||
Southern Copper | 699 | 19 | ||||||
Vulcan Materials | 947 | 46 | ||||||
WR Grace* | 13,689 | 1,151 | ||||||
|
| |||||||
| 19,029 | ||||||||
|
| |||||||
Telecommunication Services — 1.3% |
| |||||||
AT&T | 8,653 | 306 | ||||||
CenturyLink* | 554 | 20 | ||||||
Crown Castle International | 50,530 | 3,658 | ||||||
SBA Communications, Cl A | 8,424 | 624 | ||||||
Verizon Communications | 5,444 | 274 | ||||||
Windstream | 1,862 | 14 | ||||||
|
| |||||||
| 4,896 | ||||||||
|
| |||||||
Utilities — 0.2% | ||||||||
Dominion Resources | 2,840 | 161 | ||||||
Duke Energy | 2,553 | 172 | ||||||
Entergy | 232 | 16 | ||||||
Exelon | 3,536 | 109 | ||||||
FirstEnergy | 225 | 9 | ||||||
NextEra Energy | 541 | 44 | ||||||
Northeast Utilities | 406 | 17 | ||||||
PG&E | 1,643 | 75 | ||||||
Southern | 3,498 | 155 | ||||||
Xcel Energy | 243 | 7 | ||||||
|
| |||||||
| 765 | ||||||||
|
| |||||||
| 277,199 | ||||||||
|
| |||||||
Total Common Stock | 360,126 | |||||||
|
| |||||||
| Description | Shares/Face Amount (Thousands) (1) | Market Value ($ Thousands) | ||||||||||
EXCHANGE-TRADED FUND — 0.3% |
| |||||||||||
SPDR Gold Trust | 9,170 | $ | 1,093 | |||||||||
|
| |||||||||||
Total Exchange-Traded Fund |
| 1,093 | ||||||||||
|
| |||||||||||
CASH EQUIVALENT — 1.2% |
| |||||||||||
SEI Daily Income Trust, Prime Obligation Fund, Cl A 0.010%†** |
| 4,660,971 | 4,661 | |||||||||
|
| |||||||||||
Total Cash Equivalent |
| 4,661 | ||||||||||
|
| |||||||||||
TIME DEPOSITS — 0.7% |
| |||||||||||
Brown Brothers Harriman | ||||||||||||
0.265%, 07/01/2013 | CAD | 3 | 2 | |||||||||
0.030%, 07/01/2013 | 2,540 | 2,540 | ||||||||||
0.005%, 07/01/2013 | JPY | 357 | 4 | |||||||||
|
| |||||||||||
Total Time Deposits | 2,546 | |||||||||||
|
| |||||||||||
U.S. TREASURY OBLIGATIONS — 0.1% |
| |||||||||||
U.S. Treasury Bills (B)(C) | ||||||||||||
0.091%, 02/06/2014 | $ | 91 | 91 | |||||||||
0.020%, 07/25/2013 | 200 | 200 | ||||||||||
|
| |||||||||||
Total U.S. Treasury Obligations |
| 291 | ||||||||||
|
| |||||||||||
Total Investments — 99.9% |
| $ | 368,717 | |||||||||
|
| |||||||||||
The open futures contracts held by the Fund at June 30, 2013 are as follows:
| Type of Contract | Number Of Contracts Long | Expiration Date | Unrealized Appreciation (Depreciation) ($ Thousands) | |||||||||
DJ Euro Stoxx 50 Index | 8 | Sep-2013 | $ | (10 | ) | |||||||
FTSE 100 Index | 2 | Sep-2013 | (1 | ) | ||||||||
S&P 500 Index EMINI | 50 | Sep-2013 | (11 | ) | ||||||||
S&P TSE 60 Index | 1 | Sep-2013 | (2 | ) | ||||||||
SPI 200 Index | 1 | Sep-2013 | (1 | ) | ||||||||
Topix Index | 2 | Sep-2013 | 3 | |||||||||
|
| |||||||||||
| $ | (22 | ) | ||||||||||
|
| |||||||||||
For the year ended June 30, 2013, the total amount of all open futures contracts, as presented in the table above, are representative of the volume of activity for the derivative type during the year.
The futures contracts are considered to have equity risk associated with them.
Percentages are based on a Net Assets of $369,133 ($ Thousands).
| * | Non-income producing security. |
| ** | The rate reported is the 7-day effective yield as of June 30, 2013. |
| † | Investment in Affiliated Security (see Note 3). |
| ‡ | Real Estate Investment Trust. |
| (1) | In U.S. Dollars unless otherwise indicated. |
| 14 | New Covenant Funds / Annual Report / June 30, 2013 |
Table of Contents
| (A) | Security fair valued using methods determined in good faith by the Valuation Committee of the Board of Trustees. The total market value of such securities as of June 30, 2013 was $57,143 ($ Thousands) and represented 15.5% of Net Assets. |
| (B) | The rate reported is the effective yield at time of purchase. |
| (C) | Security, or portion thereof, has been pledged as collateral on open futures contracts. |
ADR — American Depositary Receipt
CAD — Canadian Dollar
Cl — Class
DJ — Dow Jones
FTSE — Financial Times and the London Stock Exchange
GDR — Global Depositary Receipt
JPY — Japanese Yen
S&P — Standard & Poor’s
SPDR — Standard & Poor’s Depositary Receipt
SPI — Share Price Index
Topix — Tokyo Stock Price Index
TSE — Toronto Stock Exchange
The following is a list of the inputs used as of June 30, 2013 in valuing the Fund’s investments and other financial instruments carried at value ($ Thousands):
| Investments in Securities | Level 1 | Level 2 | Level 3 | Total | ||||||||||||
|
|
|
|
|
|
|
| |||||||||
Common Stock | $ | 302,983 | $ | 57,143 | $ | — | $ | 360,126 | ||||||||
Exchange-Traded Fund | 1,093 | — | — | 1,093 | ||||||||||||
Cash Equivalent | 4,661 | — | — | 4,661 | ||||||||||||
Time Deposits | 2,546 | — | — | 2,546 | ||||||||||||
U.S. Treasury Obligations | — | 291 | — | 291 | ||||||||||||
|
|
|
|
|
|
|
| |||||||||
Total Investments in Securities | $ | 311,283 | $ | 57,434 | $ | — | $ | 368,717 | ||||||||
|
|
|
|
|
|
|
| |||||||||
Other Financial Instruments | Level 1 | Level 2 | Level 3 | Total | ||||||||||||
|
|
|
|
|
|
|
| |||||||||
Futures Contracts* | $ | (22 | ) | $ | — | $ | — | $ | (22 | ) | ||||||
|
|
|
|
|
|
|
| |||||||||
| * | Futures contracts are valued at the unrealized appreciation (depreciation) on the instrument. |
For the year ended June 30, 2013, there were transfers between Level 1 and Level 2 assets and liabilities. The primary reason for changes in the classifications between Levels 1 and 2 occurs when the foreign equity securities are fair valued using other observable market-based inputs in place of the closing exchange price due to events occurring after the close of the exchange or market on which the investment is principally traded.
For the year ended June 30, 2013, there were no transfers between Level 2 and Level 3 assets and liabilities.
For more information on valuation inputs, see Note 2 — Significant Accounting Policies in Note to Financial Statements.
The accompanying notes are an integral part of the financial statements.
| New Covenant Funds / Annual Report / June 30, 2013 | 15 |
Table of Contents
SCHEDULE OF INVESTMENTS
New Covenant Income Fund
June 30, 2013
| Description | Face Amount ($ Thousands) | Market Value ($ Thousands) | ||||||
MORTGAGE-BACKED SECURITIES — 46.3% |
| |||||||
Agency Mortgage-Backed Obligations — 41.1% |
| |||||||
FHLMC | ||||||||
5.500%, 12/01/2036 | $ | 313 | $ | 337 | ||||
5.500%, 08/01/2038 | 237 | 254 | ||||||
5.500%, 11/01/2038 | 142 | 153 | ||||||
5.500%, 12/01/2038 | 1,021 | 1,106 | ||||||
5.000%, 12/01/2020 | 509 | 545 | ||||||
5.000%, 05/01/2022 | 229 | 245 | ||||||
5.000%, 04/01/2024 | 207 | 222 | ||||||
5.000%, 08/01/2038 | 67 | 72 | ||||||
5.000%, 03/01/2039 | 40 | 42 | ||||||
5.000%, 02/01/2040 | 749 | 809 | ||||||
4.500%, 11/01/2039 | 763 | 804 | ||||||
4.500%, 08/01/2040 | 2,516 | 2,651 | ||||||
4.500%, 08/01/2040 | 2,156 | 2,272 | ||||||
4.000%, 09/01/2040 | 178 | 185 | ||||||
4.000%, 06/01/2043 | 100 | 105 | ||||||
4.000%, 06/01/2043 | 100 | 105 | ||||||
4.000%, 07/01/2043 | 100 | 105 | ||||||
4.000%, 07/01/2043 | 100 | 106 | ||||||
3.990%, 07/01/2040 (A) | 558 | 592 | ||||||
3.500%, 11/01/2042 | 396 | 397 | ||||||
3.500%, 01/01/2043 | 198 | 199 | ||||||
3.500%, 02/01/2043 | 99 | 100 | ||||||
3.500%, 04/01/2043 | 99 | 100 | ||||||
3.500%, 05/01/2043 | 396 | 403 | ||||||
3.500%, 05/01/2043 | 999 | 1,002 | ||||||
3.500%, 06/01/2043 | 998 | 1,001 | ||||||
FHLMC CMO, | ||||||||
Ser 2007-3349, Cl AS, IO | ||||||||
6.308%, 07/15/2037 (A) | 1,595 | 242 | ||||||
FHLMC CMO, | ||||||||
Ser 2011-3947, Cl SG, IO | ||||||||
5.758%, 10/15/2041 (A) | 909 | 227 | ||||||
FHLMC CMO, Ser 2012-274, Cl F1 | ||||||||
0.693%, 08/15/2042 (A) | 487 | 490 | ||||||
| Description | Face Amount ($ Thousands) | Market Value ($ Thousands) | ||||||
FHLMC CMO, Ser 2012-279, Cl F6 | ||||||||
0.643%, 09/15/2042 (A) | $ | 486 | $ | 489 | ||||
FHLMC CMO, | ||||||||
Ser 2012-4013, Cl AI, IO | ||||||||
4.000%, 02/15/2039 | 652 | 127 | ||||||
FHLMC CMO, | ||||||||
Ser 2012-4057, Cl SA, IO | ||||||||
5.858%, 04/15/2039 (A) | 592 | 121 | ||||||
FHLMC CMO, | ||||||||
Ser 2012-4057, Cl UI, IO | ||||||||
3.000%, 05/15/2027 | 545 | 59 | ||||||
FHLMC CMO, | ||||||||
Ser 2012-4068, Cl DS, IO | ||||||||
5.808%, 06/15/2042 (A) | 95 | 22 | ||||||
FHLMC CMO, | ||||||||
Ser 2012-4085, Cl IO, IO | ||||||||
3.000%, 06/15/2027 | 1,193 | 165 | ||||||
FHLMC CMO, | ||||||||
Ser 2012-4092, Cl AI, IO | ||||||||
3.000%, 09/15/2031 | 1,485 | 188 | ||||||
FHLMC CMO, | ||||||||
Ser 2012-4097, Cl ES, IO | ||||||||
5.908%, 08/15/2042 (A) | 189 | 44 | ||||||
FHLMC CMO, | ||||||||
Ser 2012-4097, Cl ST, IO | ||||||||
5.858%, 08/15/2042 (A) | 95 | 22 | ||||||
FHLMC CMO, | ||||||||
Ser 2012-4116, Cl LS, IO | ||||||||
6.008%, 10/15/2042 (A) | 562 | 122 | ||||||
FHLMC CMO, | ||||||||
Ser 2012-4120, Cl SV, IO | ||||||||
5.958%, 10/15/2042 (A) | 484 | 105 | ||||||
FHLMC CMO, | ||||||||
Ser 2012-4136, Cl SW, IO | ||||||||
5.958%, 11/15/2042 (A) | 97 | 25 | ||||||
FHLMC CMO, | ||||||||
Ser 2012-4147, Cl CS, IO | ||||||||
5.908%, 12/15/2042 (A) | 98 | 26 | ||||||
FHLMC CMO, | ||||||||
Ser 2013-4150, Cl SP, IO | ||||||||
5.958%, 01/15/2043 (A) | 195 | 44 | ||||||
FHLMC CMO, | ||||||||
Ser 2013-4199, Cl CS, IO | ||||||||
5.958%, 05/15/2043 (A) | 199 | 53 | ||||||
FHLMC CMO, | ||||||||
Ser 2013-4199, Cl SB, IO | ||||||||
6.008%, 05/15/2040 (A) | 199 | 48 | ||||||
FHLMC CMO, | ||||||||
Ser 2013-4203, Cl PS, IO | ||||||||
6.058%, 09/15/2042 (A) | 497 | 102 | ||||||
FHLMC CMO, | ||||||||
Ser 2013-4219, Cl JA | ||||||||
3.500%, 08/15/2039 | 1,000 | 1,057 | ||||||
| 16 | New Covenant Funds / Annual Report / June 30, 2013 |
Table of Contents
| Description | Face Amount ($ Thousands) | Market Value ($ Thousands) | ||||||
FHLMC Multifamily Structured | ||||||||
1.646%, 06/25/2022 (A) | $ | 559 | $ | 57 | ||||
FHLMC Multifamily Structured | ||||||||
1.026%, 09/25/2022 (A) | 279 | 18 | ||||||
FHLMC TBA | ||||||||
3.500%, 07/15/2041 | 1,400 | 1,418 | ||||||
2.500%, 07/15/2027 | 1,000 | 1,005 | ||||||
FNMA | ||||||||
7.000%, 11/01/2037 | 11 | 13 | ||||||
7.000%, 11/01/2037 | 5 | 6 | ||||||
7.000%, 12/01/2037 | 12 | 14 | ||||||
7.000%, 02/01/2038 | 14 | 16 | ||||||
7.000%, 09/01/2038 | 4 | 4 | ||||||
7.000%, 11/01/2038 | 15 | 18 | ||||||
7.000%, 11/01/2038 | 22 | 26 | ||||||
7.000%, 11/01/2038 | 10 | 11 | ||||||
7.000%, 11/01/2038 | 91 | 106 | ||||||
6.500%, 08/01/2017 | 158 | 171 | ||||||
6.000%, 12/01/2035 | 110 | 117 | ||||||
6.000%, 07/01/2037 | 246 | 267 | ||||||
6.000%, 09/01/2037 | 291 | 316 | ||||||
6.000%, 11/01/2038 | 376 | 409 | ||||||
5.500%, 09/01/2034 | 1,061 | 1,163 | ||||||
5.500%, 02/01/2035 | 636 | 697 | ||||||
5.000%, 01/01/2021 | 441 | 471 | ||||||
5.000%, 11/01/2025 | 296 | 322 | ||||||
5.000%, 06/01/2035 | 318 | 344 | ||||||
5.000%, 07/01/2035 | 1,612 | 1,740 | ||||||
5.000%, 02/01/2036 | 556 | 600 | ||||||
5.000%, 03/01/2036 | 788 | 849 | ||||||
5.000%, 03/01/2040 | 350 | 377 | ||||||
5.000%, 06/01/2040 | 859 | 933 | ||||||
5.000%, 06/01/2040 | 626 | 679 | ||||||
5.000%, 06/01/2040 | 80 | 86 | ||||||
4.601%, 04/01/2020 | 1,367 | 1,518 | ||||||
4.530%, 12/01/2019 | 997 | 1,130 | ||||||
4.501%, 01/01/2020 | 757 | 847 | ||||||
4.500%, 07/01/2037 | 1,700 | 1,799 | ||||||
4.377%, 11/01/2019 | 520 | 578 | ||||||
4.000%, 06/01/2025 | 549 | 579 | ||||||
4.000%, 07/13/2039 | 1,900 | 1,979 | ||||||
4.000%, 02/01/2041 | 1,934 | 2,022 | ||||||
4.000%, 09/01/2041 | 803 | 838 | ||||||
4.000%, 04/01/2042 | 5,522 | 5,781 | ||||||
4.000%, 07/01/2042 | 966 | 997 | ||||||
4.000%, 05/01/2043 | 199 | 209 | ||||||
4.000%, 06/01/2043 | 100 | 105 | ||||||
4.000%, 06/01/2043 | 100 | 105 | ||||||
4.000%, 06/01/2043 | 100 | 105 | ||||||
4.000%, 06/01/2043 | 100 | 105 | ||||||
4.000%, 06/01/2043 | 199 | 210 | ||||||
| Description | Face Amount ($ Thousands) | Market Value ($ Thousands) | ||||||
4.000%, 07/01/2043 | $ | 200 | $ | 210 | ||||
4.000%, 07/01/2043 | 100 | 105 | ||||||
4.000%, 07/01/2043 | 200 | 210 | ||||||
3.686%, 01/01/2021 | 1,470 | 1,556 | ||||||
3.500%, 05/01/2033 | 498 | 505 | ||||||
3.500%, 03/01/2041 | 947 | 963 | ||||||
3.500%, 10/01/2042 | 98 | 98 | ||||||
3.500%, 12/01/2042 | 198 | 199 | ||||||
3.500%, 12/01/2042 | 197 | 197 | ||||||
3.500%, 12/01/2042 | 98 | 98 | ||||||
3.500%, 03/01/2043 | 1,189 | 1,192 | ||||||
3.500%, 04/01/2043 | 696 | 698 | ||||||
3.500%, 06/01/2043 | 998 | 1,003 | ||||||
3.030%, 12/01/2021 | 732 | 737 | ||||||
3.000%, 07/01/2042 | 5,600 | 5,471 | ||||||
2.575%, 03/01/2036 (A) | 136 | 145 | ||||||
2.500%, 10/01/2042 | 1,068 | 994 | ||||||
2.500%, 07/25/2043 | 400 | 372 | ||||||
2.400%, 12/01/2022 | 250 | 239 | ||||||
1.940%, 07/01/2019 | 400 | 403 | ||||||
1.880%, 05/01/2043 (A) | 2,447 | 2,454 | ||||||
0.648%, 01/01/2023 (A) | 496 | 497 | ||||||
0.558%, 01/01/2023 (A) | 496 | 497 | ||||||
0.548%, 01/01/2023 (A) | 496 | 497 | ||||||
0.538%, 01/01/2023 (A) | 500 | 501 | ||||||
0.538%, 01/01/2023 (A) | 400 | 401 | ||||||
FNMA CMO, Ser 1992-1, Cl F | ||||||||
1.019%, 01/25/2022 (A) | 247 | 249 | ||||||
FNMA CMO, Ser 2003-W2, Cl 2A9 | ||||||||
5.900%, 07/25/2042 | 1,012 | 1,144 | ||||||
FNMA CMO, Ser 2004-90, Cl LH | ||||||||
5.000%, 04/25/2034 | 1,509 | 1,582 | ||||||
FNMA CMO, Ser 2005-22, Cl DA | ||||||||
5.500%, 12/25/2034 | 915 | 1,010 | ||||||
FNMA CMO, Ser 2009-86, Cl CA | ||||||||
4.500%, 09/25/2024 | 88 | 89 | ||||||
FNMA CMO, Ser 2010-100, Cl CS, IO | ||||||||
6.457%, 09/25/2040 (A) | 1,647 | 265 | ||||||
FNMA CMO, Ser 2012-108, Cl F | ||||||||
0.693%, 10/25/2042 (A) | 486 | 490 | ||||||
FNMA CMO, Ser 2012-111, Cl JS, IO | ||||||||
5.907%, 07/25/2040 (A) | 677 | 153 | ||||||
FNMA CMO, Ser 2012-111, Cl SB, IO | ||||||||
6.407%, 10/25/2042 (A) | 193 | 49 | ||||||
FNMA CMO, Ser 2012-128, Cl SL, IO | ||||||||
5.957%, 11/25/2042 (A) | 98 | 25 | ||||||
FNMA CMO, Ser 2012-128, Cl SQ, IO | ||||||||
5.957%, 11/25/2042 (A) | 97 | 25 | ||||||
FNMA CMO, Ser 2012-134, Cl SC, IO | ||||||||
5.957%, 12/25/2042 (A) | 194 | 46 | ||||||
FNMA CMO, Ser 2012-134, Cl SK, IO | ||||||||
5.957%, 12/25/2042 (A) | 97 | 23 | ||||||
FNMA CMO, Ser 2012-74, Cl AI, IO | ||||||||
3.000%, 07/25/2027 | 1,960 | 251 | ||||||
| New Covenant Funds / Annual Report / June 30, 2013 | 17 |
Table of Contents
SCHEDULE OF INVESTMENTS
New Covenant Income Fund (Continued)
June 30, 2013
| Description | Face Amount ($ Thousands) | Market Value ($ Thousands) | ||||||
FNMA CMO, Ser 2012-89, Cl AS, IO | ||||||||
5.857%, 05/25/2039 (A) | $ | 857 | $ | 162 | ||||
FNMA CMO, Ser 2012-93, Cl SG, IO | ||||||||
5.907%, 09/25/2042 (A) | 381 | 80 | ||||||
FNMA CMO, Ser 2012-93, Cl SM, IO | ||||||||
5.907%, 09/25/2042 (A) | 382 | 86 | ||||||
FNMA CMO, Ser 2012-93, Cl UI, IO | ||||||||
3.000%, 09/25/2027 | 1,515 | 194 | ||||||
FNMA CMO, Ser 2012-98, Cl SA, IO | ||||||||
5.857%, 05/25/2039 (A) | 95 | 20 | ||||||
FNMA CMO, Ser 2012-M11, Cl FA | ||||||||
0.723%, 08/25/2019 (A) | 432 | 433 | ||||||
FNMA CMO, Ser 2013-19, Cl SK, IO | ||||||||
5.957%, 03/25/2043 (A) | 99 | 25 | ||||||
FNMA CMO, Ser 2013-9, Cl SG, IO | ||||||||
6.007%, 03/25/2039 (A) | 99 | 23 | ||||||
FNMA CMO, Ser 2013-M7, Cl A2 | ||||||||
2.280%, 12/27/2022 | 219 | 204 | ||||||
FNMA TBA | ||||||||
5.481%, 06/01/2017 | 2,123 | 2,415 | ||||||
3.500%, 07/01/2041 | 4,700 | 4,771 | ||||||
2.500%, 07/01/2027 | 4,000 | 4,023 | ||||||
GNMA | ||||||||
5.500%, 02/20/2037 | 307 | 336 | ||||||
5.500%, 07/20/2038 | 177 | 194 | ||||||
5.500%, 01/15/2039 | 410 | 447 | ||||||
5.000%, 12/20/2038 | 144 | 149 | ||||||
5.000%, 03/15/2039 | 399 | 432 | ||||||
5.000%, 03/20/2039 | 289 | 304 | ||||||
5.000%, 07/20/2040 | 3,095 | 3,413 | ||||||
4.863%, 06/20/2061 | 1,676 | 1,851 | ||||||
4.826%, 06/20/2061 | 1,442 | 1,596 | ||||||
4.697%, 09/20/2061 | 1,392 | 1,536 | ||||||
4.650%, 12/20/2060 | 1,384 | 1,517 | ||||||
4.626%, 07/20/2061 | 1,509 | 1,646 | ||||||
4.500%, 07/20/2038 | 309 | 328 | ||||||
4.500%, 05/20/2040 | 1,738 | 1,871 | ||||||
4.500%, 07/20/2040 | 2,709 | 2,905 | ||||||
4.500%, 01/20/2041 | 951 | 1,025 | ||||||
4.500%, 07/20/2041 | 374 | 401 | ||||||
4.295%, 07/20/2061 | 1,330 | 1,457 | ||||||
3.500%, 07/01/2042 | 1,100 | 1,128 | ||||||
2.500%, 02/20/2027 | 2,595 | 2,623 | ||||||
GNMA CMO, Ser 2004-10, Cl C | ||||||||
4.666%, 07/16/2031 | 182 | 183 | ||||||
GNMA CMO, Ser 2004-108, Cl AB | ||||||||
4.397%, 12/16/2032 (A) | 148 | 151 | ||||||
GNMA CMO, Ser 2009-108, Cl WG | ||||||||
4.000%, 09/20/2038 | 827 | 888 | ||||||
GNMA CMO, Ser 2009-31, Cl MA | ||||||||
4.500%, 08/20/2033 | 137 | 140 | ||||||
GNMA CMO, Ser 2009-86, Cl A | ||||||||
3.536%, 09/16/2035 | 251 | 255 | ||||||
GNMA CMO, Ser 2010-48, Cl AC | ||||||||
4.229%, 02/16/2040 | 203 | 207 | ||||||
| Description | Face Amount ($ Thousands) | Market Value ($ Thousands) | ||||||
GNMA CMO, Ser 2010-71, Cl AD | ||||||||
3.489%, 03/16/2039 | $ | 711 | $ | 728 | ||||
GNMA CMO, Ser 2011-147, Cl A | ||||||||
2.174%, 07/16/2038 | 1,433 | 1,457 | ||||||
GNMA CMO, Ser 2012-22, Cl AB | ||||||||
1.661%, 03/16/2033 | 1,341 | 1,351 | ||||||
GNMA CMO, Ser 2012-H18, Cl NA | ||||||||
0.718%, 08/20/2062 (A) | 384 | 383 | ||||||
GNMA CMO, Ser 2012-66, Cl CI, IO | ||||||||
3.500%, 02/20/2038 | 279 | 44 | ||||||
GNMA CMO, Ser 2012-77, Cl KI, IO | ||||||||
7.500%, 04/20/2031 | 286 | 67 | ||||||
GNMA TBA | ||||||||
3.500%, 07/15/2041 | 1,100 | 1,129 | ||||||
NCUA Guaranteed Notes Trust, | ||||||||
2.900%, 10/29/2020 | 350 | 365 | ||||||
NCUA Guaranteed Notes Trust, | ||||||||
2.650%, 10/29/2020 | 362 | 376 | ||||||
|
| |||||||
| 119,812 | ||||||||
|
| |||||||
Non-Agency Mortgage-Backed Obligations — 5.2% |
| |||||||
American Home Mortgage Investment Trust, Ser 2004-4, Cl 1A1 | ||||||||
0.533%, 02/25/2045 (A) | 381 | 350 | ||||||
American Home Mortgage Investment Trust, Ser 2005-1, Cl 7A1 | ||||||||
2.414%, 06/25/2045 (A) | 388 | 387 | ||||||
Banc of America Commercial Mortgage Trust, Ser 2006-2, Cl AM | ||||||||
5.954%, 05/10/2045 (A) | 100 | 109 | ||||||
Banc of America Funding, | ||||||||
3.000%, 10/26/2039 (B)(C) | 185 | 185 | ||||||
Banc of America Merrill Lynch | ||||||||
5.743%, 06/10/2039 (A) | 382 | 393 | ||||||
Banc of America Mortgage Trust, | ||||||||
5.500%, 04/25/2034 | 124 | 127 | ||||||
Banc of America Mortgage Trust, | ||||||||
6.500%, 09/25/2032 | 155 | 163 | ||||||
BCAP Trust, Ser 2012-RR10, Cl 3A1 | ||||||||
0.383%, 05/26/2036 (A)(B) | 411 | 382 | ||||||
Bear Stearns ALT-A Trust, | ||||||||
0.833%, 07/25/2034 (A) | 132 | 125 | ||||||
Bear Stearns Commercial Mortgage Securities, Ser 2005-PWR9, Cl A4A | ||||||||
4.871%, 09/11/2042 | 328 | 350 | ||||||
| 18 | New Covenant Funds / Annual Report / June 30, 2013 |
Table of Contents
| Description | Face Amount ($ Thousands) | Market Value ($ Thousands) | ||||||
Bear Stearns Commercial Mortgage Securities, Ser 2007-PW16, Cl A4 | ||||||||
5.905%, 06/11/2040 (A) | $ | 550 | $ | 621 | ||||
Bear Stearns Commercial Mortgage Securities Trust, Ser 2007-PW16, Cl AM | ||||||||
5.905%, 06/11/2040 (A) | 50 | 55 | ||||||
Citigroup Mortgage Loan Trust, | ||||||||
2.500%, 06/25/2051 (B)(C) | 114 | 113 | ||||||
COBALT CMBS Commercial Mortgage Trust, Ser 2007-C2, Cl AMFX | ||||||||
5.526%, 04/15/2047 (A) | 70 | 77 | ||||||
Commercial Mortgage Pass-Through Certificates, Ser CR3, Cl A3 | ||||||||
2.822%, 11/15/2045 | 10 | 9 | ||||||
Commercial Mortgage Pass-Through Certificates, Ser 2005-C6, Cl A5A | ||||||||
5.116%, 06/10/2044 (A) | 360 | 386 | ||||||
Commercial Mortgage Pass-Through Certificates, Ser 2012- MVP, Cl A | ||||||||
2.139%, 11/17/2026 (A)(B) | 99 | 99 | ||||||
Commercial Mortgage Pass-Through Certificates, Ser WWP, Cl A2 | ||||||||
3.424%, 03/10/2031 (B) | 100 | 96 | ||||||
Countrywide Alternative Loan Trust, | ||||||||
Ser 2003-20CB, Cl 1A1 | ||||||||
5.500%, 10/25/2033 | 558 | 589 | ||||||
CSMC, Ser 2012-11R, Cl A6 | ||||||||
1.194%, 06/28/2047 (A)(B)(C) | 447 | 432 | ||||||
DBRR Trust, Ser 2013-EZ2, Cl A | ||||||||
0.853%, 02/25/2045 (A)(B) | 98 | 98 | ||||||
Extended Stay America Trust, | ||||||||
Ser 2013-ESH7, Cl A27 | ||||||||
2.958%, 12/05/2031 (B) | 110 | 107 | ||||||
GE Capital Commercial Mortgage, | ||||||||
Ser 2004-C1, Cl A3 | ||||||||
4.596%, 11/10/2038 | 431 | 435 | ||||||
GMAC Commercial Mortgage Securities, Ser 2004-C2, Cl A4 | ||||||||
5.301%, 08/10/2038 (A) | 416 | 429 | ||||||
Homestar Mortgage Acceptance, | ||||||||
Ser 2004-6, Cl M2 | ||||||||
0.863%, 01/25/2035 (A) | 689 | 637 | ||||||
Homestar Mortgage Acceptance, | ||||||||
Ser 2004-6, Cl M3 | ||||||||
1.293%, 01/25/2035 (A) | 410 | 365 | ||||||
Impac CMB Trust, | ||||||||
0.973%, 10/25/2034 (A) | 132 | 125 | ||||||
Impac CMB Trust, | ||||||||
Ser 2007-A, Cl M1 | ||||||||
0.593%, 05/25/2037 (A) | 541 | 486 | ||||||
Impac Secured Assets Trust, | ||||||||
Ser 2007-2, Cl 2A | ||||||||
0.443%, 04/25/2037 (A) | 244 | 220 | ||||||
| Description | Face Amount ($ Thousands) | Market Value ($ Thousands) | ||||||
JPMorgan Chase Commercial Mortgage Securities, Ser 2006-LDP8, Cl AM | ||||||||
5.440%, 05/15/2045 | $ | 30 | $ | 33 | ||||
JPMorgan Chase Commercial Mortgage Securities Trust, Ser 2011-C5, Cl A3 | ||||||||
4.171%, 08/15/2046 | 10 | 10 | ||||||
JPMorgan Mortgage Trust, | ||||||||
4.257%, 02/25/2035 (A) | 199 | 200 | ||||||
LB-UBS Commercial Mortgage Trust, | ||||||||
5.372%, 09/15/2039 | 103 | 113 | ||||||
LB-UBS Commercial Mortgage Trust, | ||||||||
6.425%, 09/15/2045 (A) | 280 | 314 | ||||||
MASTR Alternative Loans Trust, | ||||||||
Ser 2004-2, Cl 4A1 | ||||||||
5.000%, 02/25/2019 | 161 | 166 | ||||||
MASTR Asset Securitization Trust, | ||||||||
Ser 2003-11, Cl 8A1 | ||||||||
5.500%, 12/25/2033 | 405 | 423 | ||||||
MASTR Asset Securitization Trust, | ||||||||
Ser 2003-7, Cl 1A1 | ||||||||
5.500%, 09/25/2033 | 152 | 160 | ||||||
MASTR Seasoned Securities Trust, | ||||||||
Ser 2004-2, Cl A2 | ||||||||
6.500%, 08/25/2032 | 194 | 214 | ||||||
Merrill Lynch/Countrywide Commercial Mortgage Trust, Ser 2007-8, Cl A3 | ||||||||
6.093%, 08/12/2049 (A) | 200 | 226 | ||||||
ML-CFC Commercial Mortgage Trust, | ||||||||
5.204%, 12/12/2049 (A) | 100 | 108 | ||||||
Morgan Stanley Bank of America Merrill Lynch Trust, Ser 2012-C6, Cl AS | ||||||||
3.476%, 11/15/2045 | 40 | 38 | ||||||
Morgan Stanley Bank of America Merrill Lynch Trust, Ser 2013-C7, Cl A4 | ||||||||
2.918%, 02/15/2046 | 60 | 56 | ||||||
Morgan Stanley Bank of America Merrill Lynch Trust, Ser 2013-C7, Cl AS | ||||||||
3.214%, 02/15/2046 | 61 | 57 | ||||||
Morgan Stanley Capital I, | ||||||||
Ser 2007-IQ14, Cl A4 | ||||||||
5.692%, 04/15/2049 (A) | 35 | 39 | ||||||
Morgan Stanley Reremic Trust, | ||||||||
Ser 2012-XA, Cl A | ||||||||
2.000%, 07/27/2049 (B) | 294 | 298 | ||||||
MSSR, Ser 12-IO, Cl AXA | ||||||||
1.000%, 03/27/2051 (B) | 114 | 113 | ||||||
NorthStar Mortgage Trust, | ||||||||
Ser 2012-1, Cl A | ||||||||
1.393%, 08/25/2029 (A)(B) | 125 | 124 | ||||||
| New Covenant Funds / Annual Report / June 30, 2013 | 19 |
Table of Contents
SCHEDULE OF INVESTMENTS
New Covenant Income Fund (Continued)
June 30, 2013
| Description | Face Amount ($ Thousands) | Market Value ($ Thousands) | ||||||
RALI Trust, Ser 2003-QS13, Cl A5 | ||||||||
0.843%, 07/25/2033 (A) | $ | 116 | $ | 109 | ||||
RALI Trust, Ser 2004-QS5, Cl A1 | ||||||||
4.600%, 04/25/2034 | 221 | 228 | ||||||
Residential Asset Securitization Trust, | ||||||||
5.500%, 07/25/2033 | 246 | 248 | ||||||
Residential Asset Securitization Trust, | ||||||||
2.703%, 12/25/2034 (A) | 148 | 144 | ||||||
Sequoia Mortgage Trust, | ||||||||
Ser 2004-11, Cl A1 | ||||||||
0.492%, 12/20/2034 (A) | 400 | 380 | ||||||
Sequoia Mortgage Trust, | ||||||||
Ser 2004-5, Cl A2 | ||||||||
0.712%, 06/20/2034 (A) | 205 | 190 | ||||||
Springleaf Mortgage Loan Trust, | ||||||||
Ser 2012-2A, Cl A | ||||||||
2.220%, 10/25/2057 (A)(B) | 391 | 397 | ||||||
Springleaf Mortgage Loan Trust, | ||||||||
Ser 2012-2A, Cl M2 | ||||||||
4.610%, 10/25/2057 (A)(B) | 200 | 201 | ||||||
Springleaf Mortgage Loan Trust, | ||||||||
Ser 2012-3A, Cl A | ||||||||
1.570%, 12/25/2059 (A)(B) | 145 | 146 | ||||||
Springleaf Mortgage Loan Trust, | ||||||||
Ser 2013-1A, Cl A | ||||||||
1.270%, 06/25/2058 (A)(B) | 337 | 337 | ||||||
Springleaf Mortgage Loan Trust, | ||||||||
Ser 2013-1A, Cl M1 | ||||||||
2.310%, 06/25/2058 (A)(B) | 103 | 103 | ||||||
Structured Adjustable Rate Mortgage Loan Trust, Ser 2004- 3AC, Cl A2 | ||||||||
2.499%, 03/25/2034 (A) | 495 | 490 | ||||||
Thornburg Mortgage Securities Trust, | ||||||||
0.833%, 09/25/2043 (A) | 288 | 274 | ||||||
UBS-BAMLL Trust, Ser 2012- WRM, Cl A | ||||||||
3.663%, 06/10/2030 (B) | 116 | 113 | ||||||
UBS-Barclays Commercial Mortgage Trust, Ser 2012-C2, Cl A4 | ||||||||
3.525%, 05/10/2063 | 73 | 72 | ||||||
UBS-Barclays Commercial Mortgage Trust, Ser 2012-C4, Cl AS | ||||||||
3.317%, 12/10/2045 (B) | 120 | 113 | ||||||
UBS-Barclays Commercial Mortgage Trust IO, Ser 2012-CN, Cl XA | ||||||||
1.968%, 05/10/2063 (A)(B) | 494 | 47 | ||||||
Vericrest Opportunity Loan Transferee, | ||||||||
2.734%, 11/25/2060 (A)(B)(C) | 206 | 206 | ||||||
Vericrest Opportunity Loan Trust, | ||||||||
Ser 2013-1A, Cl A | ||||||||
3.105%, 11/25/2050 (A)(B)(C) | 189 | 189 | ||||||
| Description | Face Amount ($ Thousands) | Market Value ($ Thousands) | ||||||
Wachovia Bank Commercial Mortgage Trust, Ser 2004-C12, Cl A4 | ||||||||
5.478%, 07/15/2041 (A) | $ | 316 | $ | 324 | ||||
Wachovia Bank Commercial Mortgage Trust, Ser 2006-C29, Cl A4 | ||||||||
5.308%, 11/15/2048 | 25 | 28 | ||||||
Wachovia Bank Commercial Mortgage Trust, Ser 2007-C30, Cl AM | ||||||||
5.383%, 12/15/2043 | 70 | 74 | ||||||
WFRBS Commercial Mortgage Trust, | ||||||||
3.311%, 03/15/2045 | 160 | 150 | ||||||
WFRBS Commercial Mortgage Trust IO, Ser 2012-C7, Cl XA | ||||||||
1.755%, 06/15/2045 (A)(B) | 1,331 | 135 | ||||||
|
| |||||||
| 15,340 | ||||||||
|
| |||||||
Total Mortgage-Backed Securities | 135,152 | |||||||
|
| |||||||
CORPORATE OBLIGATIONS — 22.5% |
| |||||||
Consumer Discretionary — 1.8% |
| |||||||
American Honda Finance | ||||||||
1.000%, 08/11/2015 (B) | 490 | 491 | ||||||
CBS | ||||||||
7.875%, 09/01/2023 | 80 | 99 | ||||||
Daimler Finance North America | ||||||||
6.500%, 11/15/2013 | 420 | 429 | ||||||
2.250%, 07/31/2019 (B) | 200 | 194 | ||||||
Ford Motor Credit | ||||||||
8.125%, 01/15/2020 | 340 | 410 | ||||||
5.875%, 08/02/2021 | 230 | 251 | ||||||
3.000%, 06/12/2017 | 200 | 200 | ||||||
Historic TW | ||||||||
6.625%, 05/15/2029 | 50 | 58 | ||||||
Hyundai Capital America | ||||||||
1.625%, 10/02/2015 (B) | 180 | 179 | ||||||
Macy’s Retail Holdings | ||||||||
5.750%, 07/15/2014 | 510 | 535 | ||||||
2.875%, 02/15/2023 | 33 | 31 | ||||||
NBC Universal Media | ||||||||
2.875%, 01/15/2023 | 100 | 95 | ||||||
News America | ||||||||
5.300%, 12/15/2014 | 510 | 543 | ||||||
Nissan Motor Acceptance | ||||||||
1.800%, 03/15/2018 (B) | 102 | 99 | ||||||
TCI Communications | ||||||||
8.750%, 08/01/2015 | 536 | 620 | ||||||
Time Warner | ||||||||
4.750%, 03/29/2021 | 50 | 54 | ||||||
Time Warner Cable | ||||||||
8.250%, 02/14/2014 | 370 | 387 | ||||||
5.000%, 02/01/2020 | 490 | 511 | ||||||
| 20 | New Covenant Funds / Annual Report / June 30, 2013 |
Table of Contents
| Description | Face Amount ($ Thousands) | Market Value ($ Thousands) | ||||||
Walt Disney | ||||||||
0.450%, 12/01/2015 | $ | 13 | $ | 13 | ||||
|
| |||||||
| 5,199 | ||||||||
|
| |||||||
Consumer Staples — 1.1% |
| |||||||
Bunge Finance | ||||||||
8.500%, 06/15/2019 | 60 | 74 | ||||||
ConAgra Foods | ||||||||
2.100%, 03/15/2018 | 14 | 14 | ||||||
1.300%, 01/25/2016 | 10 | 10 | ||||||
CVS Caremark | ||||||||
4.125%, 05/15/2021 | 300 | 317 | ||||||
Kimberly-Clark | ||||||||
6.125%, 08/01/2017 | 140 | 164 | ||||||
Kraft Foods Group | ||||||||
5.375%, 02/10/2020 | 206 | 232 | ||||||
3.500%, 06/06/2022 | 320 | 317 | ||||||
Kroger | ||||||||
8.000%, 09/15/2029 | 40 | 50 | ||||||
3.900%, 10/01/2015 | 660 | 700 | ||||||
Mondelez International | ||||||||
5.375%, 02/10/2020 | 184 | 206 | ||||||
PepsiCo | ||||||||
3.000%, 08/25/2021 | 290 | 285 | ||||||
2.750%, 03/05/2022 | 80 | 77 | ||||||
2.500%, 05/10/2016 | 280 | 291 | ||||||
1.250%, 08/13/2017 | 52 | 51 | ||||||
0.700%, 08/13/2015 | 250 | 250 | ||||||
Wal-Mart Stores | ||||||||
4.250%, 04/15/2021 | 210 | 229 | ||||||
|
| |||||||
| 3,267 | ||||||||
|
| |||||||
Energy — 2.0% |
| |||||||
Anadarko Holding | ||||||||
7.150%, 05/15/2028 | 80 | 92 | ||||||
Anadarko Petroleum | ||||||||
6.375%, 09/15/2017 | 550 | 632 | ||||||
5.950%, 09/15/2016 | 40 | 45 | ||||||
Apache | ||||||||
3.625%, 02/01/2021 | 60 | 62 | ||||||
3.250%, 04/15/2022 | 460 | 453 | ||||||
2.625%, 01/15/2023 | 19 | 18 | ||||||
Baker Hughes | ||||||||
3.200%, 08/15/2021 | 90 | 91 | ||||||
Cameron International | ||||||||
1.600%, 04/30/2015 | 22 | 22 | ||||||
Canadian Natural Resources | ||||||||
3.450%, 11/15/2021 | 60 | 60 | ||||||
Chevron | ||||||||
3.191%, 06/24/2023 | 103 | 102 | ||||||
2.427%, 06/24/2020 | 85 | 84 | ||||||
ConocoPhillips | ||||||||
6.000%, 01/15/2020 | 230 | 274 | ||||||
4.750%, 02/01/2014 | 43 | 44 | ||||||
| Description | Face Amount ($ Thousands) | Market Value ($ Thousands) | ||||||
Devon Energy | ||||||||
6.300%, 01/15/2019 | $ | 320 | $ | 371 | ||||
3.250%, 05/15/2022 | 38 | 37 | ||||||
1.875%, 05/15/2017 | 80 | 79 | ||||||
EOG Resources | ||||||||
2.625%, 03/15/2023 | 26 | 24 | ||||||
Hess | ||||||||
8.125%, 02/15/2019 | 200 | 251 | ||||||
7.875%, 10/01/2029 | 70 | 87 | ||||||
Kinder Morgan Energy Partners LP | ||||||||
6.000%, 02/01/2017 | 230 | 259 | ||||||
Magellan Midstream Partners | ||||||||
4.250%, 02/01/2021 | 70 | 74 | ||||||
Marathon Oil | ||||||||
6.000%, 10/01/2017 | 56 | 64 | ||||||
0.900%, 11/01/2015 | 66 | 66 | ||||||
Nabors Industries | ||||||||
9.250%, 01/15/2019 | 60 | 74 | ||||||
4.625%, 09/15/2021 | 60 | 59 | ||||||
National Oilwell Varco | ||||||||
1.350%, 12/01/2017 | 18 | 18 | ||||||
NextEra Energy Capital Holdings | ||||||||
1.200%, 06/01/2015 | 29 | 29 | ||||||
Noble Energy | ||||||||
4.150%, 12/15/2021 | 290 | 299 | ||||||
Occidental Petroleum | ||||||||
3.125%, 02/15/2022 | 230 | 223 | ||||||
2.700%, 02/15/2023 | 237 | 219 | ||||||
Petrodrill Five | ||||||||
4.390%, 04/15/2016 (C) | 337 | 352 | ||||||
Petrodrill Four | ||||||||
4.240%, 01/15/2016 (C) | 486 | 495 | ||||||
Spectra Energy Capital | ||||||||
5.650%, 03/01/2020 | 53 | 59 | ||||||
Statoil | ||||||||
2.650%, 01/15/2024 | 64 | 59 | ||||||
1.150%, 05/15/2018 | 60 | 58 | ||||||
Texas Eastern Transmission | ||||||||
2.800%, 10/15/2022 (B) | 92 | 86 | ||||||
Tosco | ||||||||
7.800%, 01/01/2027 | 50 | 67 | ||||||
TransCanada PipeLines | ||||||||
2.500%, 08/01/2022 | 90 | 83 | ||||||
Transocean | ||||||||
6.375%, 12/15/2021 | 60 | 67 | ||||||
Weatherford International | ||||||||
9.875%, 03/01/2039 | 40 | 54 | ||||||
Williams Partners LP | ||||||||
7.250%, 02/01/2017 | 135 | 157 | ||||||
|
| |||||||
| 5,749 | ||||||||
|
| |||||||
| New Covenant Funds / Annual Report / June 30, 2013 | 21 |
Table of Contents
SCHEDULE OF INVESTMENTS
New Covenant Income Fund (Continued)
June 30, 2013
| Description | Face Amount ($ Thousands) | Market Value ($ Thousands) | ||||||
Financials — 9.1% |
| |||||||
Allstate | ||||||||
3.150%, 06/15/2023 | $ | 28 | $ | 27 | ||||
American Express | ||||||||
2.650%, 12/02/2022 | 615 | 568 | ||||||
American Tower Trust I‡ | ||||||||
1.551%, 03/15/2018 (B) | 50 | 49 | ||||||
Arden Realty LP‡ | ||||||||
5.250%, 03/01/2015 | 664 | 705 | ||||||
Bank of America | ||||||||
7.625%, 06/01/2019 | 365 | 439 | ||||||
5.625%, 07/01/2020 | 250 | 275 | ||||||
5.420%, 03/15/2017 | 200 | 214 | ||||||
5.000%, 05/13/2021 | 360 | 384 | ||||||
Bank of Montreal | ||||||||
2.550%, 11/06/2022 | 145 | 134 | ||||||
1.400%, 09/11/2017 | 86 | 84 | ||||||
Bank of New York Mellon | ||||||||
4.600%, 01/15/2020 | 136 | 149 | ||||||
Bank of Nova Scotia | ||||||||
1.375%, 12/18/2017 | 200 | 194 | ||||||
Barrick North America Finance | ||||||||
4.400%, 05/30/2021 | 90 | 81 | ||||||
BB&T | ||||||||
6.850%, 04/30/2019 | 240 | 292 | ||||||
1.600%, 08/15/2017 | 56 | 55 | ||||||
Bear Stearns | ||||||||
7.250%, 02/01/2018 | 140 | 167 | ||||||
Berkshire Hathaway Finance | ||||||||
3.000%, 05/15/2022 | 154 | 149 | ||||||
BlackRock | ||||||||
3.375%, 06/01/2022 | 58 | 58 | ||||||
Blackstone Holdings Finance | ||||||||
4.750%, 02/15/2023 (B) | 66 | 70 | ||||||
Canadian Imperial Bank of Commerce | ||||||||
0.900%, 10/01/2015 | 35 | 35 | ||||||
Capital One Bank USA | ||||||||
3.375%, 02/15/2023 | 300 | 284 | ||||||
Caterpillar Financial Services | ||||||||
6.200%, 09/30/2013 | 400 | 406 | ||||||
2.850%, 06/01/2022 | 53 | 51 | ||||||
1.250%, 11/06/2017 | 43 | 42 | ||||||
Citigroup | ||||||||
6.125%, 11/21/2017 | 815 | 926 | ||||||
6.010%, 01/15/2015 | 160 | 171 | ||||||
6.000%, 12/13/2013 | 325 | 333 | ||||||
5.375%, 08/09/2020 | 373 | 412 | ||||||
4.050%, 07/30/2022 | 140 | 135 | ||||||
3.500%, 05/15/2023 | 200 | 180 | ||||||
2.250%, 08/07/2015 | 400 | 407 | ||||||
CME Group | ||||||||
3.000%, 09/15/2022 | 80 | 75 | ||||||
CNA Financial | ||||||||
5.875%, 08/15/2020 | 332 | 376 | ||||||
| Description | Face Amount ($ Thousands) | Market Value ($ Thousands) | ||||||
Commonwealth Bank of Australia NY | ||||||||
1.250%, 09/18/2015 | $ | 320 | $ | 322 | ||||
ERAC USA Finance | ||||||||
4.500%, 08/16/2021 (B) | 80 | 84 | ||||||
1.400%, 04/15/2016 (B) | 22 | 22 | ||||||
ERP Operating LP‡ | ||||||||
5.375%, 08/01/2016 | 104 | 116 | ||||||
4.625%, 12/15/2021 | 104 | 110 | ||||||
General Electric Capital | ||||||||
6.000%, 08/07/2019 | 1,629 | 1,891 | ||||||
2.100%, 12/11/2019 | 40 | 39 | ||||||
1.625%, 07/02/2015 | 184 | 186 | ||||||
1.000%, 12/11/2015 | 25 | 25 | ||||||
Goldman Sachs Group | ||||||||
6.150%, 04/01/2018 | 320 | 361 | ||||||
6.000%, 06/15/2020 | 480 | 539 | ||||||
5.950%, 01/18/2018 | 660 | 739 | ||||||
5.375%, 03/15/2020 | 320 | 347 | ||||||
5.350%, 01/15/2016 | 427 | 463 | ||||||
HCP‡ | ||||||||
2.625%, 02/01/2020 | 110 | 103 | ||||||
HSBC Finance | ||||||||
6.676%, 01/15/2021 | 180 | 199 | ||||||
5.000%, 06/30/2015 | 264 | 282 | ||||||
HSBC USA | ||||||||
1.625%, 01/16/2018 | 250 | 244 | ||||||
Jefferies Group | ||||||||
8.500%, 07/15/2019 | 136 | 164 | ||||||
John Deere Capital | ||||||||
2.250%, 04/17/2019 | 60 | 60 | ||||||
1.700%, 01/15/2020 | 49 | 46 | ||||||
1.200%, 10/10/2017 | 22 | 21 | ||||||
0.950%, 06/29/2015 | 46 | 46 | ||||||
JPMorgan Chase | ||||||||
3.375%, 05/01/2023 | 240 | 223 | ||||||
1.100%, 10/15/2015 | 360 | 358 | ||||||
KeyCorp | ||||||||
5.100%, 03/24/2021 | 72 | 80 | ||||||
Lincoln National | ||||||||
8.750%, 07/01/2019 | 35 | 45 | ||||||
Macquarie Bank | ||||||||
3.450%, 07/27/2015 (B) | 40 | 41 | ||||||
MassMutual Global Funding II | ||||||||
2.500%, 10/17/2022 (B) | 106 | 96 | ||||||
Merrill Lynch | ||||||||
6.875%, 04/25/2018 | 390 | 449 | ||||||
MetLife | ||||||||
6.750%, 06/01/2016 | 290 | 332 | ||||||
Metropolitan Life Global Funding I | ||||||||
1.700%, 06/29/2015 (B) | 213 | 216 | ||||||
1.500%, 01/10/2018 (B) | 100 | 97 | ||||||
Morgan Stanley | ||||||||
6.000%, 05/13/2014 | 660 | 686 | ||||||
5.625%, 09/23/2019 | 200 | 215 | ||||||
| 22 | New Covenant Funds / Annual Report / June 30, 2013 |
Table of Contents
| Description | Face Amount ($ Thousands) | Market Value ($ Thousands) | ||||||
5.500%, 01/26/2020 | $ | 100 | $ | 107 | ||||
5.500%, 07/28/2021 | 280 | 299 | ||||||
Nationsbank | ||||||||
10.200%, 07/15/2015 | 264 | 306 | ||||||
New York Life Global Funding | ||||||||
0.750%, 07/24/2015 (B) | 160 | 160 | ||||||
Nordea Bank | ||||||||
1.625%, 05/15/2018 (B) | 220 | 213 | ||||||
PNC Bank | ||||||||
6.875%, 04/01/2018 | 250 | 300 | ||||||
2.700%, 11/01/2022 | 260 | 236 | ||||||
Principal Life Global Funding II | ||||||||
1.000%, 12/11/2015 (B) | 37 | 37 | ||||||
0.904%, 07/09/2014 (A)(B) | 48 | 48 | ||||||
Private Export Funding | ||||||||
4.550%, 05/15/2015 | 624 | 673 | ||||||
ProLogis‡ | ||||||||
6.875%, 03/15/2020 | 70 | 81 | ||||||
Prudential Financial | ||||||||
5.100%, 09/20/2014 | 490 | 515 | ||||||
Prudential Holdings | ||||||||
8.695%, 12/18/2023 (B) | 564 | 709 | ||||||
Prudential Insurance of America | ||||||||
8.300%, 07/01/2025 (B) | 150 | 194 | ||||||
Royal Bank of Canada | ||||||||
1.200%, 09/19/2017 | 129 | 126 | ||||||
Royal Bank of Scotland Group | ||||||||
2.550%, 09/18/2015 | 180 | 183 | ||||||
Simon Property Group‡ | ||||||||
5.650%, 02/01/2020 | 80 | 91 | ||||||
Skandinaviska Enskilda Banken | ||||||||
1.375%, 05/29/2018 (B) | 800 | 771 | ||||||
SLM | ||||||||
3.875%, 09/10/2015 | 110 | 111 | ||||||
0.576%, 01/27/2014 (A) | 550 | 545 | ||||||
Standard Chartered Bank | ||||||||
6.400%, 09/26/2017 (B) | 150 | 169 | ||||||
State Street | ||||||||
3.100%, 05/15/2023 | 36 | 34 | ||||||
SunTrust Banks | ||||||||
3.500%, 01/20/2017 | 70 | 73 | ||||||
Toronto-Dominion Bank | ||||||||
1.400%, 04/30/2018 | 77 | 75 | ||||||
Toyota Motor Credit | ||||||||
1.250%, 10/05/2017 | 374 | 363 | ||||||
UBS | ||||||||
5.875%, 12/20/2017 | 100 | 115 | ||||||
US Bancorp | ||||||||
4.200%, 05/15/2014 | 290 | 299 | ||||||
2.950%, 07/15/2022 | 120 | 111 | ||||||
Wachovia | ||||||||
5.750%, 02/01/2018 | 320 | 369 | ||||||
Wachovia Bank | ||||||||
6.000%, 11/15/2017 | 500 | 571 | ||||||
| Description | Face Amount ($ Thousands) | Market Value ($ Thousands) | ||||||
WEA Finance | ||||||||
3.375%, 10/03/2022 (B) | $ | 79 | $ | 74 | ||||
Wells Fargo | ||||||||
5.625%, 12/11/2017 | 585 | 665 | ||||||
4.600%, 04/01/2021 | 480 | 523 | ||||||
3.450%, 02/13/2023 | 120 | 115 | ||||||
1.500%, 01/16/2018 | 140 | 136 | ||||||
|
| |||||||
| 26,571 | ||||||||
|
| |||||||
Health Care — 1.5% |
| |||||||
AbbVie | ||||||||
2.900%, 11/06/2022 (B) | 180 | 168 | ||||||
1.750%, 11/06/2017 (B) | 399 | 391 | ||||||
Agilent Technologies | ||||||||
5.000%, 07/15/2020 | 320 | 345 | ||||||
Baxter International | ||||||||
5.900%, 09/01/2016 | 300 | 342 | ||||||
Celgene | ||||||||
1.900%, 08/15/2017 | 50 | 49 | ||||||
Express Scripts Holding | ||||||||
3.500%, 11/15/2016 | 480 | 510 | ||||||
Humana | ||||||||
3.150%, 12/01/2022 | 260 | 241 | ||||||
Johnson & Johnson | ||||||||
1.200%, 05/15/2014 | 510 | 514 | ||||||
Medtronic | ||||||||
3.125%, 03/15/2022 | 190 | 185 | ||||||
Novartis Capital | ||||||||
2.400%, 09/21/2022 | 50 | 47 | ||||||
Pfizer | ||||||||
3.000%, 06/15/2023 | 70 | 68 | ||||||
Quest Diagnostics | ||||||||
4.750%, 01/30/2020 | 40 | 42 | ||||||
UnitedHealth Group | ||||||||
4.700%, 02/15/2021 | 68 | 75 | ||||||
2.750%, 02/15/2023 | 17 | 16 | ||||||
1.875%, 11/15/2016 | 320 | 326 | ||||||
1.625%, 03/15/2019 | 200 | 193 | ||||||
WellPoint | ||||||||
3.300%, 01/15/2023 | 36 | 34 | ||||||
3.125%, 05/15/2022 | 400 | 379 | ||||||
1.250%, 09/10/2015 | 50 | 50 | ||||||
Wyeth | ||||||||
5.450%, 04/01/2017 | 230 | 261 | ||||||
Zoetis | ||||||||
3.250%, 02/01/2023 (B) | 50 | 48 | ||||||
1.875%, 02/01/2018 (B) | 85 | 83 | ||||||
|
| |||||||
| 4,367 | ||||||||
|
| |||||||
Industrials — 2.6% |
| |||||||
3M | ||||||||
1.000%, 06/26/2017 | 60 | 59 | ||||||
| New Covenant Funds / Annual Report / June 30, 2013 | 23 |
Table of Contents
SCHEDULE OF INVESTMENTS
New Covenant Income Fund (Continued)
June 30, 2013
| Description | Face Amount ($ Thousands) | Market Value ($ Thousands) | ||||||
ADT | ||||||||
4.125%, 06/15/2023 | $ | 100 | $ | 94 | ||||
3.500%, 07/15/2022 | 30 | 28 | ||||||
American Airlines Pass-Through Trust, | ||||||||
5.250%, 01/31/2021 | 119 | 127 | ||||||
Burlington Northern and Santa Fe Railway 2002-2, Pass-Through Trust | ||||||||
5.140%, 01/15/2021 | 789 | 839 | ||||||
Canal Barge | ||||||||
4.500%, 11/12/2034 (C) | 964 | 1,085 | ||||||
Caterpillar | ||||||||
1.500%, 06/26/2017 | 46 | 45 | ||||||
Continental Airlines 1999-1, | ||||||||
6.545%, 02/02/2019 | 37 | 41 | ||||||
Continental Airlines 2012-2, | ||||||||
4.000%, 10/29/2024 | 53 | 52 | ||||||
CSX | ||||||||
3.700%, 10/30/2020 | 56 | 58 | ||||||
CSX Transportation | ||||||||
6.251%, 01/15/2023 | 784 | 913 | ||||||
Deere | ||||||||
2.600%, 06/08/2022 | 48 | 46 | ||||||
Delta Air Lines 2012-1, | ||||||||
4.750%, 05/07/2020 | 44 | 46 | ||||||
Eaton | ||||||||
2.750%, 11/02/2022 (B) | 410 | 384 | ||||||
1.500%, 11/02/2017 (B) | 133 | 129 | ||||||
Enterprise Products Operating | ||||||||
5.250%, 01/31/2020 | 670 | 749 | ||||||
General Electric | ||||||||
2.700%, 10/09/2022 | 42 | 40 | ||||||
0.850%, 10/09/2015 | 100 | 100 | ||||||
Ingersoll-Rand Global Holding | ||||||||
2.875%, 01/15/2019 (B) | 31 | 31 | ||||||
Koninklijke Philips | ||||||||
3.750%, 03/15/2022 | 80 | 80 | ||||||
Matson Navigation | ||||||||
5.337%, 09/04/2028 (C) | 725 | 812 | ||||||
News America | ||||||||
9.500%, 07/15/2024 | 80 | 107 | ||||||
Penske Truck Leasing LP | ||||||||
4.875%, 07/11/2022 (B) | 72 | 74 | ||||||
Republic Services | ||||||||
3.550%, 06/01/2022 | 40 | 39 | ||||||
Ryder System | ||||||||
3.500%, 06/01/2017 | 70 | 72 | ||||||
Union Pacific | ||||||||
5.404%, 07/02/2025 | 1,159 | 1,235 | ||||||
United Parcel Service | ||||||||
2.450%, 10/01/2022 | 23 | 22 | ||||||
| Description | Face Amount ($ Thousands) | Market Value ($ Thousands) | ||||||
United Technologies | ||||||||
3.100%, 06/01/2022 | $ | 42 | $ | 41 | ||||
Waste Management | ||||||||
7.375%, 03/11/2019 | 40 | 48 | ||||||
|
| |||||||
| 7,396 | ||||||||
|
| |||||||
Information Technology — 0.8% |
| |||||||
Apple | ||||||||
2.400%, 05/03/2023 | 494 | 458 | ||||||
0.523%, 05/03/2018 (A) | 79 | 79 | ||||||
Arrow Electronics | ||||||||
3.000%, 03/01/2018 | 21 | 21 | ||||||
eBay | ||||||||
2.600%, 07/15/2022 | 19 | 18 | ||||||
1.350%, 07/15/2017 | 44 | 43 | ||||||
EMC | ||||||||
2.650%, 06/01/2020 | 115 | 113 | ||||||
Hewlett-Packard | ||||||||
4.650%, 12/09/2021 | 88 | 88 | ||||||
3.750%, 12/01/2020 | 160 | 155 | ||||||
International Business Machines | ||||||||
1.625%, 05/15/2020 | 222 | 208 | ||||||
Microsoft | ||||||||
0.875%, 11/15/2017 | 15 | 15 | ||||||
Oracle | ||||||||
2.500%, 10/15/2022 | 121 | 112 | ||||||
1.200%, 10/15/2017 | 190 | 184 | ||||||
Texas Instruments | ||||||||
1.650%, 08/03/2019 | 26 | 25 | ||||||
0.450%, 08/03/2015 | 34 | 34 | ||||||
Xerox | ||||||||
1.672%, 09/13/2013 (A) | 797 | 798 | ||||||
|
| |||||||
| 2,351 | ||||||||
|
| |||||||
Materials — 0.7% |
| |||||||
Barrick | ||||||||
4.100%, 05/01/2023 (B) | 210 | 175 | ||||||
Dow Chemical | ||||||||
3.000%, 11/15/2022 | 71 | 66 | ||||||
Ecolab | ||||||||
4.350%, 12/08/2021 | 80 | 85 | ||||||
1.450%, 12/08/2017 | 56 | 54 | ||||||
1.000%, 08/09/2015 | 38 | 38 | ||||||
Freeport-McMoRan Copper & Gold | ||||||||
3.550%, 03/01/2022 | 280 | 254 | ||||||
3.100%, 03/15/2020 (B) | 60 | 55 | ||||||
2.375%, 03/15/2018 (B) | 40 | 38 | ||||||
2.150%, 03/01/2017 | 65 | 64 | ||||||
Mosaic | ||||||||
3.750%, 11/15/2021 | 70 | 70 | ||||||
Plum Creek Timberlands LP | ||||||||
5.875%, 11/15/2015 | 332 | 364 | ||||||
PPG Industries | ||||||||
7.400%, 08/15/2019 | 80 | 97 | ||||||
| 24 | New Covenant Funds / Annual Report / June 30, 2013 |
Table of Contents
| Description | Face Amount ($ Thousands) | Market Value ($ Thousands) | ||||||
Rio Tinto Finance USA | ||||||||
4.125%, 05/20/2021 | $ | 550 | $ | 559 | ||||
1.625%, 08/21/2017 | 33 | 33 | ||||||
Southern Copper | ||||||||
3.500%, 11/08/2022 | 130 | 117 | ||||||
|
| |||||||
| 2,069 | ||||||||
|
| |||||||
Telecommunication Services — 0.7% |
| |||||||
AT&T | ||||||||
5.500%, 02/01/2018 | 330 | 377 | ||||||
4.450%, 05/15/2021 | 40 | 43 | ||||||
3.875%, 08/15/2021 | 70 | 72 | ||||||
1.400%, 12/01/2017 | 150 | 146 | ||||||
0.800%, 12/01/2015 | 55 | 55 | ||||||
BellSouth Telecommunications | ||||||||
6.375%, 06/01/2028 | 128 | 145 | ||||||
Cellco Partnership | ||||||||
8.500%, 11/15/2018 | 160 | 208 | ||||||
COX Communications | ||||||||
3.250%, 12/15/2022 (B) | 60 | 56 | ||||||
DIRECTV Holdings | ||||||||
5.000%, 03/01/2021 | 80 | 84 | ||||||
Discovery Communications | ||||||||
3.300%, 05/15/2022 | 96 | 92 | ||||||
GTE | ||||||||
6.940%, 04/15/2028 | 120 | 144 | ||||||
Qwest | ||||||||
6.875%, 09/15/2033 | 90 | 87 | ||||||
TCI Communications | ||||||||
7.875%, 02/15/2026 | 240 | 318 | ||||||
Verizon Communications | ||||||||
6.350%, 04/01/2019 | 90 | 107 | ||||||
3.500%, 11/01/2021 | 90 | 90 | ||||||
2.450%, 11/01/2022 | 130 | 118 | ||||||
|
| |||||||
| 2,142 | ||||||||
|
| |||||||
Utilities — 2.2% |
| |||||||
AGL Capital | ||||||||
3.500%, 09/15/2021 | 70 | 72 | ||||||
American Electric Power | ||||||||
1.650%, 12/15/2017 | 10 | 10 | ||||||
American Water Capital | ||||||||
6.085%, 10/15/2017 | 765 | 882 | ||||||
Atmos Energy | ||||||||
8.500%, 03/15/2019 | 80 | 105 | ||||||
Baltimore Gas & Electric | ||||||||
2.800%, 08/15/2022 | 38 | 36 | ||||||
CenterPoint Energy Houston Electric | ||||||||
2.250%, 08/01/2022 | 70 | 64 | ||||||
CMS Energy | ||||||||
8.750%, 06/15/2019 | 40 | 52 | ||||||
Consumers Energy | ||||||||
5.650%, 04/15/2020 | 60 | 70 | ||||||
| Description | Face Amount ($ Thousands) | Market Value ($ Thousands) | ||||||
Detroit Edison | ||||||||
2.650%, 06/15/2022 | $ | 21 | $ | 20 | ||||
Duke Energy | ||||||||
3.550%, 09/15/2021 | 170 | 170 | ||||||
Duke Energy Indiana | ||||||||
3.750%, 07/15/2020 | 88 | 92 | ||||||
Duke Energy Progress | ||||||||
2.800%, 05/15/2022 | 58 | 56 | ||||||
Entergy Louisiana | ||||||||
6.500%, 09/01/2018 | 1,172 | 1,375 | ||||||
Exelon | ||||||||
4.900%, 06/15/2015 | 400 | 428 | ||||||
FirstEnergy | ||||||||
4.250%, 03/15/2023 | 290 | 269 | ||||||
2.750%, 03/15/2018 | 340 | 331 | ||||||
Hydro-Quebec | ||||||||
8.400%, 01/15/2022 | 80 | 109 | ||||||
Kansas City Power & Light | ||||||||
6.375%, 03/01/2018 | 64 | 74 | ||||||
Nevada Power | ||||||||
6.500%, 08/01/2018 | 92 | 110 | ||||||
New Valley Generation I | ||||||||
7.299%, 03/15/2019 | 941 | 1,098 | ||||||
Nisource Finance | ||||||||
3.850%, 02/15/2023 | 100 | 97 | ||||||
Pacific Gas & Electric | ||||||||
2.450%, 08/15/2022 | 26 | 24 | ||||||
PG&E | ||||||||
5.750%, 04/01/2014 | 290 | 301 | ||||||
PPL Capital Funding | ||||||||
4.200%, 06/15/2022 | 40 | 40 | ||||||
PSEG Power | ||||||||
5.125%, 04/15/2020 | 110 | 121 | ||||||
Public Service of Oklahoma | ||||||||
5.150%, 12/01/2019 | 150 | 170 | ||||||
San Diego Gas & Electric | ||||||||
6.000%, 06/01/2026 | 56 | 69 | ||||||
Sempra Energy | ||||||||
6.150%, 06/15/2018 | 120 | 140 | ||||||
Wisconsin Electric Power | ||||||||
1.700%, 06/15/2018 | 100 | 99 | ||||||
Xcel Energy | ||||||||
0.750%, 05/09/2016 | 35 | 34 | ||||||
|
| |||||||
| 6,518 | ||||||||
|
| |||||||
Total Corporate Obligations |
| 65,629 | ||||||
|
| |||||||
ASSET-BACKED SECURITIES — 8.9% |
| |||||||
Automotive — 2.7% |
| |||||||
American Credit Acceptance Receivables Trust, Ser 2012-2, Cl A | ||||||||
1.890%, 07/15/2016 (B) | 66 | 66 | ||||||
| New Covenant Funds / Annual Report / June 30, 2013 | 25 |
Table of Contents
SCHEDULE OF INVESTMENTS
New Covenant Income Fund (Continued)
June 30, 2013
| Description | Face Amount ($ Thousands) | Market Value ($ Thousands) | ||||||
American Credit Acceptance Receivables Trust, Ser 2012-3, Cl A | ||||||||
1.640%, 11/15/2016 (B) | $ | 61 | $ | 61 | ||||
American Credit Acceptance Receivables Trust, Ser 2013-1, Cl A | ||||||||
1.450%, 04/16/2018 (B) | 214 | 213 | ||||||
AmeriCredit Automobile Receivables Trust, Ser 2012-1, Cl A2 | ||||||||
0.910%, 10/08/2015 | 176 | 177 | ||||||
AmeriCredit Automobile Receivables Trust, Ser 2012-3, Cl A2 | ||||||||
0.710%, 12/08/2015 | 77 | 78 | ||||||
AmeriCredit Automobile Receivables Trust, Ser 2012-3, Cl A3 | ||||||||
0.960%, 01/09/2017 | 80 | 80 | ||||||
AmeriCredit Automobile Receivables Trust, Ser 2013-1, Cl A2 | ||||||||
0.490%, 06/08/2016 | 98 | 98 | ||||||
ARI Fleet Lease Trust, Ser 2012-B, Cl A | ||||||||
0.493%, 01/15/2021 (A)(B) | 423 | 422 | ||||||
Avis Budget Rental Car Funding AESOP, Ser 2012-3A, Cl A | ||||||||
2.100%, 03/20/2019 (B) | 400 | 396 | ||||||
BMW Floorplan Master Owner Trust, | ||||||||
0.593%, 09/15/2017 (A)(B) | 680 | 680 | ||||||
California Republic Auto Receivables Trust, Ser 2012-1, Cl A | ||||||||
1.180%, 08/15/2017 (B) | 72 | 72 | ||||||
Capital Auto Receivables Asset Trust, | ||||||||
0.620%, 07/20/2016 | 106 | 106 | ||||||
Capital Auto Receivables Asset Trust, | ||||||||
0.920%, 09/20/2016 | 250 | 250 | ||||||
CarNow Auto Receivables Trust, | ||||||||
1.160%, 10/16/2017 (B) | 217 | 217 | ||||||
CPS Auto Trust, Ser 2013-B, Cl A | ||||||||
1.820%, 09/15/2020 (B) | 300 | 298 | ||||||
DT Auto Owner Trust, Ser 2012-2A, Cl A | ||||||||
0.910%, 11/16/2015 (B) | 81 | 81 | ||||||
Exeter Automobile Receivables Trust, | ||||||||
1.290%, 10/16/2017 (B) | 120 | 120 | ||||||
First Investors Auto Owner Trust, | ||||||||
0.900%, 10/15/2018 (B) | 38 | 38 | ||||||
Flagship Credit Auto Trust, | ||||||||
1.320%, 04/16/2018 (B) | 234 | 233 | ||||||
Ford Credit Auto Lease Trust, | ||||||||
0.460%, 05/15/2015 | 320 | 320 | ||||||
| Description | Face Amount ($ Thousands) | Market Value ($ Thousands) | ||||||
Ford Credit Auto Owner Trust, | ||||||||
0.400%, 09/15/2015 | $ | 81 | $ | 81 | ||||
Ford Credit Floorplan Master Owner Trust, Ser 2013-1, Cl A2 | ||||||||
0.573%, 01/15/2018 (A) | 100 | 100 | ||||||
Honda Auto Receivables Owner Trust, | ||||||||
1.130%, 10/15/2014 | 34 | 34 | ||||||
Honda Auto Receivables Owner Trust, | ||||||||
0.350%, 06/22/2015 | 85 | 85 | ||||||
Honda Auto Receivables Owner Trust, | ||||||||
0.530%, 02/16/2017 | 164 | 163 | ||||||
Honda Auto Receivables Owner Trust, | ||||||||
0.520%, 08/18/2016 | 650 | 648 | ||||||
Hyundai Auto Receivables Trust, | ||||||||
0.620%, 09/15/2016 | 109 | 109 | ||||||
Hyundai Auto Receivables Trust, | ||||||||
0.540%, 01/15/2015 | 138 | 138 | ||||||
Mercedes-Benz Auto Lease Trust, | ||||||||
0.490%, 06/15/2015 | 335 | 334 | ||||||
Mercedes-Benz Auto Receivables Trust, Ser 2012-1, Cl A2 | ||||||||
0.370%, 03/16/2015 | 111 | 111 | ||||||
Mercedes-Benz Auto Receivables Trust, Ser 2012-1, Cl A3 | ||||||||
0.470%, 10/17/2016 | 260 | 259 | ||||||
Nissan Auto Lease Trust, | ||||||||
0.450%, 06/15/2015 | 44 | 44 | ||||||
Nissan Auto Receivables Owner Trust, | ||||||||
0.730%, 05/16/2016 | 240 | 240 | ||||||
Nissan Auto Receivables Owner Trust, | ||||||||
0.390%, 04/15/2015 | 133 | 133 | ||||||
Nissan Auto Receivables Owner Trust, | ||||||||
0.370%, 09/15/2015 | 52 | 52 | ||||||
Nissan Auto Receivables Owner Trust, | ||||||||
0.500%, 05/15/2017 | 250 | 249 | ||||||
Santander Drive Auto Receivables Trust, Ser 2013-1, Cl A2 | ||||||||
0.480%, 02/16/2016 | 91 | 91 | ||||||
SNAAC Auto Receivables Trust, | ||||||||
1.140%, 07/16/2018 (B) | 108 | 108 | ||||||
| 26 | New Covenant Funds / Annual Report / June 30, 2013 |
Table of Contents
| Description | Face Amount ($ Thousands) | Market Value ($ Thousands) | ||||||
Toyota Auto Receivables Owner Trust, | ||||||||
0.370%, 09/15/2015 | $ | 240 | $ | 240 | ||||
USAA Auto Owner Trust, | ||||||||
0.380%, 06/15/2015 | 95 | 95 | ||||||
Volkswagen Auto Lease Trust, | ||||||||
0.870%, 07/20/2015 | 110 | 110 | ||||||
Volkswagen Auto Loan Enhanced Trust, Ser 2012-1, Cl A3 | ||||||||
0.850%, 08/22/2016 | 120 | 120 | ||||||
World Omni Auto Receivables Trust, | ||||||||
0.520%, 06/15/2015 | 104 | 104 | ||||||
World Omni Auto Receivables Trust, | ||||||||
0.640%, 02/15/2017 | 94 | 94 | ||||||
World Omni Auto Receivables Trust, | ||||||||
0.430%, 11/16/2015 | 61 | 61 | ||||||
|
| |||||||
| 7,809 | ||||||||
|
| |||||||
Credit Card — 1.1% |
| |||||||
American Express Credit Account Master Trust, Ser 2012-3, Cl A | ||||||||
0.343%, 03/15/2018 (A) | 670 | 664 | ||||||
American Express Credit Account Master Trust, Ser 2012-5, Cl A | ||||||||
0.590%, 05/15/2018 | 400 | 398 | ||||||
Citibank Credit Card Issuance Trust, | ||||||||
5.300%, 03/15/2018 | 650 | 724 | ||||||
Citibank Credit Card Issuance Trust, | ||||||||
0.293%, 04/24/2017 (A) | 750 | 749 | ||||||
Golden Credit Card Trust, | ||||||||
0.443%, 02/15/2018 (A)(B) | 600 | 598 | ||||||
|
| |||||||
| 3,133 | ||||||||
|
| |||||||
Home — 1.1% |
| |||||||
Argent Securities, Ser 2004-W5, Cl AV2 | ||||||||
1.233%, 04/25/2034 (A) | 321 | 321 | ||||||
Bayview Financial Acquisition Trust, | ||||||||
6.205%, 05/28/2037 | 336 | 361 | ||||||
Bear Stearns Asset-Backed Securities I Trust, Ser 2004-BO1, Cl M5 | ||||||||
1.593%, 10/25/2034 (A) | 290 | 277 | ||||||
Bear Stearns Asset-Backed Securities I Trust, Ser 2004-HE10, Cl M1 | ||||||||
1.168%, 12/25/2034 (A) | 708 | 646 | ||||||
| Description | Face Amount ($ Thousands) | Market Value ($ Thousands) | ||||||
Centex Home Equity, Ser 2005-C, Cl AF5 | ||||||||
5.048%, 06/25/2035 | $ | 606 | $ | 615 | ||||
Citifinancial Mortgage Securities, | ||||||||
4.570%, 04/25/2034 | 300 | 312 | ||||||
Countrywide Home Equity Loan Trust, | ||||||||
0.333%, 07/15/2036 (A) | 117 | 96 | ||||||
NovaStar Mortgage Funding Trust, | ||||||||
1.253%, 12/25/2033 (A) | 264 | 242 | ||||||
NovaStar Mortgage Funding Trust, | ||||||||
1.843%, 03/25/2035 (A) | 430 | 422 | ||||||
|
| |||||||
| 3,292 | ||||||||
|
| |||||||
Other Asset-Backed Securities — 4.0% |
| |||||||
Academic Loan Funding Trust, | ||||||||
0.993%, 12/27/2022 (A)(B) | 141 | 143 | ||||||
Brazos Higher Education Authority, | ||||||||
0.393%, 12/26/2019 (A) | 1,500 | 1,487 | ||||||
CenterPoint Energy Transition Bond, | ||||||||
5.090%, 08/01/2015 | 729 | 741 | ||||||
Consumers Funding, Ser 2001-1, Cl A6 | ||||||||
5.760%, 10/20/2016 | 1,447 | 1,536 | ||||||
Countrywide Asset-Backed Certificates, Ser 2005-1, CL AF6 | ||||||||
5.030%, 07/25/2035 (A) | 245 | 252 | ||||||
Educational Funding of the South, | ||||||||
0.926%, 04/25/2035 (A) | 700 | 696 | ||||||
HLSS Servicer Advance Receivables Backed Notes, Ser 2012-T2, Cl A1 | ||||||||
1.340%, 10/15/2043 (B) | 116 | 116 | ||||||
HLSS Servicer Advance Receivables Backed Notes, Ser 2012-T2, Cl A2 | ||||||||
1.990%, 10/15/2045 (B) | 100 | 100 | ||||||
HLSS Servicer Advance Receivables Backed Notes, Ser 2013-T1, Cl A1 | ||||||||
0.898%, 01/15/2044 (B) | 593 | 591 | ||||||
HLSS Servicer Advance Receivables Backed Notes, Ser 2013-T1, Cl A2 | ||||||||
1.495%, 01/16/2046 (B) | 135 | 133 | ||||||
John Deere Owner Trust, | ||||||||
0.410%, 09/15/2015 | 320 | 320 | ||||||
Nationstar Agency Advance Funding Trust, Ser 2013-T1A, Cl AT1 | ||||||||
0.997%, 02/15/2045 (B) | 100 | 99 | ||||||
| New Covenant Funds / Annual Report / June 30, 2013 | 27 |
Table of Contents
SCHEDULE OF INVESTMENTS
New Covenant Income Fund (Continued)
June 30, 2013
| Description | Face Amount ($ Thousands) | Market Value ($ Thousands) | ||||||
Nationstar Mortgage Advance Receivable Trust, Ser 2013-T2A, Cl A2 | ||||||||
1.679%, 06/20/2046 (B) | $ | 150 | $ | 149 | ||||
Nelnet Student Loan Trust, | ||||||||
0.436%, 01/25/2037 (A) | 90 | 87 | ||||||
NYMT Residential, Ser 2012-RP1A, | ||||||||
4.250%, 12/25/2017 (A)(B)(C) | 150 | 150 | ||||||
Real Estate Asset Trust, | ||||||||
2.734%, 11/25/2042 (A)(B)(C) | 10 | 10 | ||||||
SLM Private Education Loan Trust, | ||||||||
0.793%, 08/15/2022 (A)(B) | 312 | 310 | ||||||
SLM Private Education Loan Trust, | ||||||||
0.443%, 09/25/2019 (A) | 600 | 595 | ||||||
SLM Student Loan Trust, | ||||||||
0.676%, 04/25/2023 (A)(B) | 500 | 500 | ||||||
SLM Student Loan Trust, | ||||||||
0.396%, 01/25/2027 (A) | 160 | 154 | ||||||
SLM Student Loan Trust, | ||||||||
0.426%, 10/25/2029 (A) | 480 | 438 | ||||||
SLM Student Loan Trust, | ||||||||
0.473%, 09/25/2019 (A) | 800 | 795 | ||||||
SLM Student Loan Trust, | ||||||||
0.943%, 05/26/2026 (A) | 550 | 544 | ||||||
SLM Student Loan Trust, | ||||||||
0.353%, 02/27/2017 (A) | 745 | 744 | ||||||
Springleaf Funding Trust, | ||||||||
2.580%, 09/15/2021 (B) | 300 | 300 | ||||||
Springleaf Funding Trust, | ||||||||
3.920%, 01/16/2023 (B) | 150 | 149 | ||||||
Stanwich Mortgage Loan Trust, | ||||||||
3.228%, 04/16/2059 (B)(C) | 246 | 246 | ||||||
Structured Asset Securities, | ||||||||
0.493%, 05/25/2035 (A) | 230 | 227 | ||||||
VOLT, Ser 2012-RP3A, Cl A | ||||||||
3.475%, 11/27/2017 (B)(C) | 37 | 36 | ||||||
VOLT, Ser 2012-RLF1, Cl A | ||||||||
3.475%, 12/25/2017 (B)(C) | 98 | 98 | ||||||
|
| |||||||
| 11,746 | ||||||||
|
| |||||||
Total Asset-Backed Securities | 25,980 | |||||||
|
| |||||||
| Description | Face Amount ($ Thousands) | Market Value ($ Thousands) | ||||||
FOREIGN BONDS — 4.8% |
| |||||||
America Movil | ||||||||
5.500%, 03/01/2014 | $ | 300 | $ | 309 | ||||
3.125%, 07/16/2022 | 200 | 184 | ||||||
Bank Nederlandse Gemeenten | ||||||||
1.000%, 11/17/2014 | 700 | 705 | ||||||
Barclays Bank | ||||||||
5.125%, 01/08/2020 | 100 | 111 | ||||||
BBVA US Senior SAU | ||||||||
4.664%, 10/09/2015 | 600 | 618 | ||||||
BHP Billiton Finance USA | ||||||||
6.500%, 04/01/2019 | 210 | 251 | ||||||
3.250%, 11/21/2021 | 140 | 137 | ||||||
BNP Paribas | ||||||||
2.375%, 09/14/2017 | 360 | 356 | ||||||
BP Capital Markets | ||||||||
3.561%, 11/01/2021 | 50 | 50 | ||||||
3.245%, 05/06/2022 | 550 | 534 | ||||||
1.375%, 11/06/2017 | 58 | 57 | ||||||
0.700%, 11/06/2015 | 200 | 199 | ||||||
Celulosa Arauco y Constitucion | ||||||||
4.750%, 01/11/2022 | 270 | 268 | ||||||
Cooperatieve Centrale Raiffeisen- Boerenleenbank | ||||||||
3.375%, 01/19/2017 | 310 | 326 | ||||||
Deutsche Telekom International Finance | ||||||||
5.750%, 03/23/2016 | 290 | 322 | ||||||
FMS Wertmanagement AoeR | ||||||||
1.000%, 11/21/2017 | 200 | 195 | ||||||
HSBC Holdings | ||||||||
4.000%, 03/30/2022 | 80 | 82 | ||||||
Hutchison Whampoa International 12 II | ||||||||
3.250%, 11/08/2022 | 200 | 183 | ||||||
ING Bank | ||||||||
2.000%, 09/25/2015 | 200 | 202 | ||||||
Intesa Sanpaolo | ||||||||
3.125%, 01/15/2016 | 400 | 393 | ||||||
Landwirtschaftliche Rentenbank | ||||||||
1.375%, 10/23/2019 | 180 | 172 | ||||||
Macquarie Bank | ||||||||
5.000%, 02/22/2017 | 280 | 300 | ||||||
National Australia Bank | ||||||||
1.250%, 03/08/2018 | 1,150 | 1,111 | ||||||
Nippon Telegraph & Telephone | ||||||||
1.400%, 07/18/2017 | 35 | 34 | ||||||
Petrobras Global Finance BV | ||||||||
4.375%, 05/20/2023 | 36 | 33 | ||||||
Petrobras International Finance - Pifco | ||||||||
7.875%, 03/15/2019 | 80 | 93 | ||||||
5.375%, 01/27/2021 | 1,160 | 1,165 | ||||||
Petroleos Mexicanos | ||||||||
4.875%, 01/24/2022 | 570 | 581 | ||||||
3.500%, 01/30/2023 | 260 | 240 | ||||||
| 28 | New Covenant Funds / Annual Report / June 30, 2013 |
Table of Contents
| Description | Face Amount ($ Thousands) | Market Value ($ Thousands) | ||||||
Potash Corp. of Saskatchewan | ||||||||
4.875%, 03/30/2020 | $ | 64 | $ | 71 | ||||
Santander US Debt | ||||||||
2.991%, 10/07/2013 | 995 | 1,001 | ||||||
Schlumberger Norge | ||||||||
4.200%, 01/15/2021 | 20 | 21 | ||||||
Shell International Finance | ||||||||
4.375%, 03/25/2020 | 200 | 222 | ||||||
1.125%, 08/21/2017 | 47 | 46 | ||||||
Siemens Financieringsmaatschappij | ||||||||
6.125%, 08/17/2026 (B) | 100 | 119 | ||||||
Statoil | ||||||||
1.200%, 01/17/2018 | 56 | 55 | ||||||
Talisman Energy | ||||||||
7.750%, 06/01/2019 | 70 | 85 | ||||||
Telefonica Emisiones SAU | ||||||||
5.877%, 07/15/2019 | 80 | 86 | ||||||
5.462%, 02/16/2021 | 80 | 83 | ||||||
5.134%, 04/27/2020 | 80 | 82 | ||||||
Temasek Financial I | ||||||||
2.375%, 01/23/2023 | 250 | 222 | ||||||
Teva Pharmaceutical Finance IV | ||||||||
3.650%, 11/10/2021 | 220 | 220 | ||||||
Total Capital | ||||||||
4.250%, 12/15/2021 | 56 | 60 | ||||||
Total Capital International | ||||||||
1.550%, 06/28/2017 | 33 | 33 | ||||||
0.750%, 01/25/2016 | 11 | 11 | ||||||
UBS | ||||||||
0.750%, 03/24/2016 | 900 | 890 | ||||||
Vale Overseas | ||||||||
4.375%, 01/11/2022 | 915 | 869 | ||||||
Westpac Banking | ||||||||
4.200%, 02/27/2015 | 205 | 216 | ||||||
Xstrata Finance Canada | ||||||||
5.800%, 11/15/2016 | 40 | 44 | ||||||
2.700%, 10/25/2017 | 190 | 184 | ||||||
2.050%, 10/23/2015 | 180 | 180 | ||||||
|
| |||||||
Total Foreign Bonds | 14,011 | |||||||
|
| |||||||
U.S. GOVERNMENT AGENCY OBLIGATIONS — 3.4% |
| |||||||
FHLMC | ||||||||
2.375%, 01/13/2022 | 790 | 768 | ||||||
0.643%, 08/15/2039 (A) | 472 | 473 | ||||||
0.098%, 12/09/2013 | 110 | 110 | ||||||
0.098%, 12/18/2013 (E) | 110 | 110 | ||||||
FICO STRIPS, PO | ||||||||
0.000%, 05/11/2018 (D) | 340 | 312 | ||||||
FNMA | ||||||||
1.997%, 10/09/2019 (D) | 1,190 | 1,000 | ||||||
1.250%, 08/20/2013 | 838 | 839 | ||||||
0.120%, 02/24/2014 (E) | 210 | 210 | ||||||
| Description | Face Amount ($ Thousands) | Market Value ($ Thousands) | ||||||
GNMA | ||||||||
1.650%, 02/20/2063 | $ | 502 | $ | 489 | ||||
0.698%, 01/20/2063 (A) | 494 | 496 | ||||||
0.548%, 12/20/2062 (A) | 1,468 | 1,465 | ||||||
0.400%, 03/20/2063 (A) | 1,244 | 1,237 | ||||||
Resolution Funding Corp. STRIPS | ||||||||
1.610%, 07/15/2020 (D) | 970 | 829 | ||||||
1.352%, 10/15/2019 (D) | 760 | 667 | ||||||
Tennessee Valley Authority | ||||||||
3.875%, 02/15/2021 | 790 | 854 | ||||||
|
| |||||||
Total U.S. Government Agency Obligations |
| 9,859 | ||||||
|
| |||||||
SOVEREIGN DEBT — 0.8% |
| |||||||
African Development Bank | ||||||||
8.800%, 09/01/2019 | 80 | 106 | ||||||
Province of Ontario Canada | ||||||||
4.400%, 04/14/2020 | 840 | 931 | ||||||
1.100%, 10/25/2017 | 500 | 488 | ||||||
0.950%, 05/26/2015 | 160 | 161 | ||||||
Province of Quebec Canada | ||||||||
2.625%, 02/13/2023 | 500 | 469 | ||||||
|
| |||||||
Total Sovereign Debt | 2,155 | |||||||
|
| |||||||
MUNICIPAL BOND — 0.0% |
| |||||||
Los Angeles, Department of Airports, RB | ||||||||
6.582%, 05/15/2039 | 25 | 30 | ||||||
|
| |||||||
Total Municipal Bond | 30 | |||||||
|
| |||||||
U.S. TREASURY OBLIGATIONS — 18.7% |
| |||||||
U.S. Treasury Bills | ||||||||
0.078%, 11/14/2013 (D) | 10,400 | 10,397 | ||||||
U.S. Treasury Bonds | ||||||||
8.750%, 05/15/2020 | 1,201 | 1,740 | ||||||
4.750%, 02/15/2037 | 100 | 123 | ||||||
2.875%, 05/15/2043 | 260 | 230 | ||||||
U.S. Treasury Inflation-Protected Securities | ||||||||
2.000%, 01/15/2014 | 768 | 778 | ||||||
1.250%, 04/15/2014 | 2,265 | 2,296 | ||||||
0.500%, 04/15/2015 | 945 | 969 | ||||||
U.S. Treasury Notes | ||||||||
4.500%, 02/15/2016 | 2,001 | 2,207 | ||||||
3.625%, 02/15/2021 | 400 | 445 | ||||||
3.500%, 02/15/2018 | 150 | 165 | ||||||
3.500%, 05/15/2020 | 400 | 443 | ||||||
3.375%, 07/31/2013 | 3,200 | 3,209 | ||||||
3.125%, 04/30/2017 | 800 | 864 | ||||||
3.125%, 05/15/2021 | 500 | 537 | ||||||
2.625%, 08/15/2020 | 200 | 209 | ||||||
2.625%, 11/15/2020 | 100 | 104 | ||||||
| New Covenant Funds / Annual Report / June 30, 2013 | 29 |
Table of Contents
SCHEDULE OF INVESTMENTS
New Covenant Income Fund (Concluded)
June 30, 2013
| Description | Face Amount ($ Thousands) Shares/Contracts | Market Value ($ Thousands) | ||||||||
1.875%, 04/30/2014 | $ | 160 | $ | 162 | ||||||
1.875%, 06/30/2020 | 3,580 | 3,567 | ||||||||
1.750%, 05/15/2022 | 1,000 | 954 | ||||||||
1.750%, 05/15/2023 | 860 | 805 | ||||||||
1.500%, 08/31/2018 | 600 | 602 | ||||||||
1.375%, 05/31/2020 | 8,520 | 8,222 | ||||||||
1.250%, 02/15/2014 | 2,000 | 2,014 | ||||||||
1.125%, 04/30/2020 | 2,460 | 2,339 | ||||||||
0.750%, 06/30/2017 | 1,200 | 1,185 | ||||||||
0.125%, 08/31/2013 | 3,500 | 3,500 | ||||||||
U.S. Treasury STRIPS (D) |
| |||||||||
1.733%, 11/15/2021 | 200 | 164 | ||||||||
1.602%, 05/15/2021 | 880 | 739 | ||||||||
1.401%, 02/15/2021 | 1,000 | 848 | ||||||||
1.224%, 02/15/2020 | 1,601 | 1,412 | ||||||||
1.093%, 08/15/2020 | 801 | 693 | ||||||||
1.082%, 05/15/2020 | 480 | 419 | ||||||||
1.041%, 11/15/2019 | 801 | 713 | ||||||||
0.850%, 05/15/2018 | 400 | 373 | ||||||||
0.495%, 05/15/2016 | 1,201 | 1,179 | ||||||||
|
| |||||||||
Total U.S. Treasury Obligations | 54,606 | |||||||||
|
| |||||||||
REPURCHASE AGREEMENT — 2.5% |
| |||||||
Barclays Capital, 0.060%, 06/28/2013, to be repurchased 07/01/2013, repurchase price $7,400,037 (collateralized by a U.S. Treasury Notes, par value $7,673,000, 0.625%, 05/31/2017; with a total market value $7,548,000) | 7,400 | 7,400 | ||||||
|
| |||||||
Total Repurchase Agreement | 7,400 | |||||||
|
| |||||||
CASH EQUIVALENT — 0.8% | ||||||||
SEI Daily Income Trust, Prime Obligation Fund, Cl A | ||||||||
0.010%†** | 2,349,748 | 2,350 | ||||||
|
| |||||||
Total Cash Equivalent | 2,350 | |||||||
|
| |||||||
Total Investments — 108.7% | $ | 317,172 | ||||||
|
| |||||||
WRITTEN OPTIONS††* — 0.0% | ||||||||
U.S. 10 Treasury Note, Put Option, Expires 07/26/2013, Strike Price $124.00 | (8 | ) | $ | (2 | ) | |||
U.S. 10 Treasury Note, Call Option, Expires 07/26/2013, Strike Price $128.00 | (8 | ) | (3 | ) | ||||
|
| |||||||
Total Written Options | $ | (5 | ) | |||||
|
| |||||||
The open futures contracts held by the Fund at June 30, 2013 are as follows:
| Type of Contract | Number of Contracts Long (Short) | Expiration Date | Unrealized Appreciation (Depreciation) ($ Thousands) | |||||||||
90-Day Euro$ | 16 | Mar-2014 | $ | 2 | ||||||||
90-Day Euro$ | 8 | Mar-2015 | 4 | |||||||||
U.S. 10-Year Treasury Note | (145 | ) | Sep-2013 | 400 | ||||||||
U.S. 2-Year Treasury Note | 46 | Sep-2013 | (9 | ) | ||||||||
U.S. 5-Year Treasury Note | 44 | Oct-2013 | (98 | ) | ||||||||
U.S. Long Treasury Bond | (10 | ) | Sep-2013 | 19 | ||||||||
|
| |||||||||||
| $ | 318 | |||||||||||
|
| |||||||||||
For the year ended June 30, 2013, the total amount of all open futures contracts, as presented in the table above, are representative of the volume of activity for the derivative type during the year.
The options contracts and futures contracts are both considered to have interest rate risk associated with them.
Percentages are based on a Net Assets of $291,669 ($ Thousands).
| * | Non-income producing security. |
| ** | The rate reported is the 7-day effective yield as of June 30, 2013. |
| † | Investment in Affiliated Security (see Note 3). |
| †† | For the year ended June 30, 2013, the total amount of all open written options, as presented in the Schedule of Investments, are representative of the volume of activity for these derivative types during the year. |
| ‡ | Real Estate Investment Trust. |
| (A) | Variable Rate Security — The rate reported on the Schedule of Investments is the rate in effect as of June 30, 2013. The date reported is the final maturity date. |
| (B) | Securities sold within terms of a private placement memorandum, exempt from registration under Section 144A of the Securities Act of 1933, as amended, and may be sold only to dealers in that program or other “accredited investors”. These securities have been determined to be liquid under guidelines established by the Board of Trustees. |
| (C) | Securities considered illiquid. The total value of such securities as of June 30, 2013 was $4,409 and represented 1.5% of Net Assets. |
| (D) | The rate reported is the effective yield at time of purchase. |
| (E) | Security, or portion thereof, has been pledged as collateral on open futures contracts. |
Cl — Class
CMO — Collateralized Mortgage Obligation
FHLMC — Federal Home Loan Mortgage Corporation
FICO — Financing Corporation
FNMA — Federal National Mortgage Association
GNMA — Government National Mortgage Association
IO — Interest Only — face amount represents notional amount
LP — Limited Partnership
NCUA — National Credit Union Association
NY — New York
PO — Principal Only
RB — Revenue Bond
REMIC — Real Estate Mortgage Investment Conduit
Ser — Series
STRIPS — Separately Traded Registered Interest and Principal Security
TBA — To Be Announced
| 30 | New Covenant Funds / Annual Report / June 30, 2013 |
Table of Contents
The following is a list of the inputs used as of June 30, 2013 in valuing the Fund’s investments and other financial instruments carried at value ($ Thousands):
| Investments in Securities | Level 1 | Level 2 | Level 3 | Total | ||||||||||||
|
|
|
|
|
|
|
| |||||||||
Mortgage-Backed Securities | $ | — | $ | 135,152 | $ | — | $ | 135,152 | ||||||||
Corporate Obligations | — | 65,629 | — | 65,629 | ||||||||||||
Asset-Backed Securities | — | 25,980 | — | 25,980 | ||||||||||||
Foreign Bonds | — | 14,011 | — | 14,011 | ||||||||||||
U.S. Government Agency | ||||||||||||||||
Obligations | — | 9,859 | — | 9,859 | ||||||||||||
Sovereign Debt | — | 2,155 | — | 2,155 | ||||||||||||
Municipal Bond | — | 30 | — | 30 | ||||||||||||
U.S. Treasury Obligations | — | 54,606 | — | 54,606 | ||||||||||||
Repurchase Agreement | — | 7,400 | — | 7,400 | ||||||||||||
Cash Equivalent | 2,350 | — | — | 2,350 | ||||||||||||
|
|
|
|
|
|
|
| |||||||||
Total Investments in Securities | $ | 2,350 | $ | 314,822 | $ | — | $ | 317,172 | ||||||||
|
|
|
|
|
|
|
| |||||||||
Other Financial Instruments | Level 1 | Level 2 | Level 3 | Total | ||||||||||||
|
|
|
|
|
|
|
| |||||||||
Written Options | $ | (5 | ) | $ | — | $ | — | $ | (5 | ) | ||||||
Futures Contracts* | 318 | — | — | 318 | ||||||||||||
|
|
|
|
|
|
|
| |||||||||
Total Other Financial Instruments | $ | 313 | $ | — | $ | — | $ | 313 | ||||||||
|
|
|
|
|
|
|
| |||||||||
| * | Futures contracts are valued at the unrealized appreciation (depreciation) on the instrument. |
For the year ended June 30, 2013, there were no transfers between Level 1 and Level 2 assets and liabilities.
For the year ended June 30, 2013, there were no transfers between Level 2 and Level 3 assets and liabilities.
Amounts designated as “—” are either $0 or have been rounded to $0.
For more information on valuation inputs, see Note 2 — Significant Accounting Policies in Note to Financial Statements.
The accompanying notes are an integral part of the financial statements.
| New Covenant Funds / Annual Report / June 30, 2013 | 31 |
Table of Contents
SCHEDULE OF INVESTMENTS
New Covenant Balanced Growth Fund
June 30, 2013

| Description | Shares | Market Value ($ Thousands) | ||||||
INVESTMENT COMPANIES — 98.9% |
| |||||||
New Covenant Growth Fund† | 4,317,978 | $ | 160,975 | |||||
New Covenant Income Fund† | 4,721,300 | 107,504 | ||||||
|
| |||||||
Total Investment Companies |
| 268,479 | ||||||
|
| |||||||
CASH EQUIVALENT — 1.1% |
| |||||||
SEI Daily Income Trust, Prime Obligation Fund, Cl A 0.010%†* | 3,057,376 | 3,057 | ||||||
|
| |||||||
Total Cash Equivalent |
| 3,057 | ||||||
|
| |||||||
Total Investments — 100.0% |
| $ | 271,536 | |||||
|
| |||||||
Percentages are based on a Net Assets of $271,518 ($ Thousands).
| * | The rate reported is the 7-day effective yield as of June 30, 2013. |
| † | Investment in Affiliated Security (see Note 3). |
Cl — Class
As of June 30, 2013, all of the Fund’s investments were considered Level 1.
For the year ended June 30, 2013, there were no transfers between Level 1 and Level 2 assets and liabilities.
For the year ended June 30, 2013, there were no transfers between Level 2 and Level 3 assets and liabilities.
For more information on valuation inputs, see Note 2 — Significant Accounting Policies in Note to Financial Statements.
The accompanying notes are an integral part of the financial statements.
| 32 | New Covenant Funds / Annual Report / June 30, 2013 |
Table of Contents
SCHEDULE OF INVESTMENTS
New Covenant Balanced Income Fund
June 30, 2013
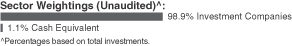
| Description | Shares | Market Value ($ Thousands) | ||||||
INVESTMENT COMPANIES — 98.9% |
| |||||||
New Covenant Growth Fund† | 756,715 | $ | 28,210 | |||||
New Covenant Income Fund† | 2,315,655 | 52,728 | ||||||
|
| |||||||
Total Investment Companies |
| 80,938 | ||||||
|
| |||||||
CASH EQUIVALENT — 1.1% |
| |||||||
SEI Daily Income Trust, Prime Obligation Fund, Cl A 0.010%†* | 858,992 | 859 | ||||||
|
| |||||||
Total Cash Equivalent |
| 859 | ||||||
|
| |||||||
Total Investments — 100.0% |
| $ | 81,797 | |||||
|
| |||||||
Percentages are based on a Net Assets of $81,818 ($ Thousands).
| * | The rate reported is the 7-day effective yield as of June 30, 2013. |
| † | Investment in Affiliated Security (see Note 3). |
Cl — Class
As of June 30, 2013, all of the Fund’s investments were considered Level 1.
For the year ended June 30, 2013, there were no transfers between Level 1 and Level 2 assets and liabilities.
For the year ended June 30, 2013, there were no transfers between Level 2 and Level 3 assets and liabilities.
For more information on valuation inputs, see Note 2 — Significant Accounting Policies in Note to Financial Statements.
The accompanying notes are an integral part of the financial statements.
| New Covenant Funds / Annual Report / June 30, 2013 | 33 |
Table of Contents
Statements of Assets and Liabilities ($ Thousands)
June 30, 2013
| Growth Fund | Income Fund | Balanced Growth Fund | Balanced Income Fund | |||||||||||||
ASSETS: | ||||||||||||||||
Investments, at value† | $ | 364,056 | $ | 314,822 | $ | — | $ | — | ||||||||
Affiliated investments, at value†† | 4,661 | 2,350 | 271,536 | 81,797 | ||||||||||||
Cash | 1 | 1,038 | — | — | ||||||||||||
Foreign currency, at value††† | 2 | — | — | — | ||||||||||||
Receivable for investment securities sold | 574 | 14,486 | — | — | ||||||||||||
Dividends and interest receivable | 385 | 1,557 | 150 | 74 | ||||||||||||
Foreign tax reclaim receivable | 169 | — | — | — | ||||||||||||
Receivable for variation margin | 6 | 21 | — | — | ||||||||||||
Receivable for fund shares sold | — | 3 | 5 | 1 | ||||||||||||
Prepaid expenses | 19 | 15 | 13 | 4 | ||||||||||||
Total Assets | 369,873 | 334,292 | 271,704 | 81,876 | ||||||||||||
LIABILITIES: | ||||||||||||||||
Payable for investment securities purchased | 231 | 41,894 | — | — | ||||||||||||
Investment advisory fees payable | 202 | 85 | — | — | ||||||||||||
Administration fees payable | 61 | 48 | 47 | 20 | ||||||||||||
Social witness and licensing fees payable | 44 | 35 | — | — | ||||||||||||
Shareholder servicing fees payable | 31 | 24 | — | — | ||||||||||||
Payable for variation margin | 22 | 5 | — | — | ||||||||||||
Trustees’ fees payable | 16 | 12 | 12 | 3 | ||||||||||||
Payable for fund shares redeemed | 2 | 44 | 48 | 10 | ||||||||||||
Income distribution payable | — | 357 | — | — | ||||||||||||
Options written, at value†††† | — | 5 | — | — | ||||||||||||
Accrued expense payable | 131 | 114 | 79 | 25 | ||||||||||||
Total Liabilities | 740 | 42,623 | 186 | 58 | ||||||||||||
Net Assets | $ | 369,133 | $ | 291,669 | $ | 271,518 | $ | 81,818 | ||||||||
† Cost of investments | $ | 311,845 | $ | 314,048 | $ | — | $ | — | ||||||||
†† Cost of affiliated investments | 4,661 | 2,350 | 226,531 | 73,744 | ||||||||||||
††† Cost of foreign currency | 2 | — | — | — | ||||||||||||
†††† Option premiums received | — | (5 | ) | — | — | |||||||||||
NET ASSETS: | ||||||||||||||||
Paid-in Capital — (unlimited authorization — par value $0.001) | $ | 314,668 | $ | 348,430 | $ | 244,531 | $ | 74,859 | ||||||||
Undistributed net investment income | 209 | 217 | 16 | 2 | ||||||||||||
Accumulated net realized gain (loss) on investments, affiliated investments, written and purchased options, futures contracts and foreign currency transactions | 2,076 | (58,070 | ) | (18,034 | ) | (1,096 | ) | |||||||||
Net unrealized appreciation on investments, affiliated investments and written and purchased options | 52,211 | 774 | 45,005 | 8,053 | ||||||||||||
Net unrealized appreciation (depreciation) on futures contracts | (22 | ) | 318 | — | — | |||||||||||
Net unrealized depreciation on foreign currencies and translation of other assets and liabilities denominated in foreign currencies | (9 | ) | — | — | — | |||||||||||
Net Assets | $ | 369,133 | $ | 291,669 | $ | 271,518 | $ | 81,818 | ||||||||
Net Asset Value, Offering and Redemption Price Per Share | $ | 37.28 | $ | 22.77 | $ | 89.69 | $ | 19.95 | ||||||||
| | ($369,132,994÷ 9,902,508 shares | ) | | ($291,668,543÷ 12,807,452 shares | ) | | ($271,518,322÷ 3,027,323 shares | ) | | ($81,818,103÷ 4,100,463 shares | ) | |||||
Amounts designated as “—” are $0 or have been rounded to $0.
The accompanying notes are an integral part of the financial statements.
| 34 | New Covenant Funds / Annual Report / June 30, 2013 |
Table of Contents
Statements of Operations ($ Thousands)
For the year ended June 30, 2013
| Growth Fund | Income Fund | Balanced Growth Fund | Balanced Income Fund | |||||||||||||
Investment Income: | ||||||||||||||||
Dividend income | $ | 7,961 | $ | — | $ | — | $ | — | ||||||||
Dividend income from affiliated registered investment company | 2 | 5 | 3,703 | 1,234 | ||||||||||||
Interest income | 1 | 6,266 | — | — | ||||||||||||
Less: foreign taxes withheld | (197 | ) | — | — | — | |||||||||||
| 7,767 | 6,271 | 3,703 | 1,234 | |||||||||||||
Expenses: | ||||||||||||||||
Investment advisory fees | 2,692 | 1,317 | — | — | ||||||||||||
Administration fees | 868 | 627 | 536 | 165 | ||||||||||||
Social witness and licensing fees | 651 | 470 | — | — | ||||||||||||
Shareholder servicing fees | 434 | 314 | — | — | ||||||||||||
Chief compliance officer fees | 2 | 2 | 2 | 1 | ||||||||||||
Transfer agent fees | 101 | 74 | 60 | 14 | ||||||||||||
Professional fees | 71 | 51 | 48 | 14 | ||||||||||||
Printing fees | 49 | 38 | 35 | 11 | ||||||||||||
Registration fees | 37 | 22 | 17 | 8 | ||||||||||||
Custodian fees | 21 | 11 | 10 | 3 | ||||||||||||
Trustee fees | 2 | 4 | 6 | 2 | ||||||||||||
Other expenses | 45 | 55 | 14 | 4 | ||||||||||||
Total Expenses | 4,973 | 2,985 | 728 | 222 | ||||||||||||
Less: | ||||||||||||||||
Waiver of investment advisory fees | (697 | ) | (561 | ) | — | — | ||||||||||
Waiver of administration fees | — | — | (346 | ) | (55 | ) | ||||||||||
Net Expenses | 4,276 | 2,424 | 382 | 167 | ||||||||||||
Net Investment Income | 3,491 | 3,847 | 3,321 | 1,067 | ||||||||||||
Net Realized and Change in Unrealized Gain (Loss) | ||||||||||||||||
Net Realized Gain (Loss) on: | ||||||||||||||||
Investments | 79,587 | (1) | 3,497 | (1) | — | — | ||||||||||
Affiliated investments | — | — | 10,708 | 3,357 | ||||||||||||
Written and purchased options | — | (14 | ) | — | — | |||||||||||
Futures contracts | 817 | 366 | — | — | ||||||||||||
Foreign currency transactions | (4 | ) | — | — | — | |||||||||||
Net Change in Unrealized Appreciation (Depreciation) on: | ||||||||||||||||
Investments | (4,843 | ) | (8,745 | ) | — | — | ||||||||||
Affiliated investments | — | — | 10,872 | (142 | ) | |||||||||||
Written and purchased options | — | 4 | — | — | ||||||||||||
Futures contracts | (22 | ) | 477 | — | — | |||||||||||
Foreign currency and translation of other assets and liabilities denominated in foreign currencies | (19 | ) | — | — | — | |||||||||||
Net Increase (Decrease) in Net Assets Resulting from Operations | $ | 79,007 | $ | (568 | ) | $ | 24,901 | $ | 4,282 | |||||||
| (1) | Includes realized gains from an in-kind transfer of securities (see Note 7). |
Amounts designated as “—” are $0 or have been rounded to $0.
The accompanying notes are an integral part of the financial statements.
| New Covenant Funds / Annual Report / June 30, 2013 | 35 |
Table of Contents
Statements of Changes in Net Assets ($ Thousands)
For the years ended June 30,
| Growth Fund | Income Fund | |||||||||||||||
| 2013 | 2012 | 2013 | 2012 | |||||||||||||
Operations: | ||||||||||||||||
Net investment income | $ | 3,491 | $ | 6,828 | $ | 3,847 | $ | 11,354 | ||||||||
Net realized gain from investments, affiliated investments, written and purchased options and futures contracts | 80,404 | (2) | 74,483 | 3,849 | (2) | 14,481 | ||||||||||
Net realized loss on foreign currency transactions | (4 | ) | (97 | ) | — | — | ||||||||||
Net change in unrealized depreciation on investments, affiliated investments, written and purchased options and futures contracts | (4,865 | ) | (79,477 | ) | (8,264 | ) | (2,345 | ) | ||||||||
Net change in unrealized depreciation on foreign currency and translation of other assets and liabilities denominated in foreign currency | (19 | ) | (44 | ) | — | — | ||||||||||
Net Increase (Decrease) in Net Assets Resulting from Operations | 79,007 | 1,693 | (568 | ) | 23,490 | |||||||||||
Dividends and Distributions From: | ||||||||||||||||
Net investment income | (5,361 | ) | (5,067 | ) | (5,268 | ) | (15,213 | ) | ||||||||
Total Dividends and Distributions | (5,361 | ) | (5,067 | ) | (5,268 | ) | (15,213 | ) | ||||||||
Capital Share Transactions: | ||||||||||||||||
Proceeds from shares issued | 19,080 | 44,541 | 37,011 | 43,115 | ||||||||||||
Reinvestment of dividends & distributions | 709 | 413 | 649 | 1,156 | ||||||||||||
Cost of shares redeemed | (376,613 | )(1) | (110,902 | ) | (115,025 | )(1) | (132,814 | )(1) | ||||||||
Decrease in Net Assets Derived from Capital Share Transactions | (356,824 | ) | (65,948 | ) | (77,365 | ) | (88,543 | ) | ||||||||
Net Decrease in Net Assets | (283,178 | ) | (69,322 | ) | (83,201 | ) | (80,266 | ) | ||||||||
Net Assets: | ||||||||||||||||
Beginning of Year | 652,311 | 721,633 | 374,870 | 455,136 | ||||||||||||
End of Year | $ | 369,133 | $ | 652,311 | $ | 291,669 | $ | 374,870 | ||||||||
Undistributed Net Investment Income Included in Net Assets at Year End | $ | 209 | $ | 2,053 | $ | 217 | $ | 529 | ||||||||
Share Transactions: | ||||||||||||||||
Shares issued | 551 | 1,482 | 1,585 | 1,865 | ||||||||||||
Shares issued in lieu of dividends and distributions | 21 | 14 | 28 | 50 | ||||||||||||
Shares redeemed | (10,906 | ) | (3,442 | ) | (4,906 | ) | (5,735 | ) | ||||||||
Decrease in Net Assets Derived from Share Transactions | (10,334 | ) | (1,946 | ) | (3,293 | ) | (3,820 | ) | ||||||||
| (1) | Includes redemptions as a result of an in-kind transfer of securities (see Note 7). |
| (2) | Includes realized gains from an in-kind transfer of securities (see Note 7). |
Amounts designated as “—” are $0 or have been rounded to $0.
The accompanying notes are an integral part of the financial statements.
| 36 | New Covenant Funds / Annual Report / June 30, 2013 |
Table of Contents
Statements of Changes in Net Assets ($ Thousands)
For the years ended June 30,
| Balanced Growth Fund | Balanced Income Fund | |||||||||||||||
| 2013 | 2012 | 2013 | 2012 | |||||||||||||
Operations: | ||||||||||||||||
Net investment income | $ | 3,321 | $ | 4,021 | $ | 1,067 | $ | 1,891 | ||||||||
Net realized gain from affiliated investments | 10,708 | 311 | 3,357 | 260 | ||||||||||||
Net change in unrealized appreciation (depreciation) on affiliated investments | 10,872 | 915 | (142 | ) | 563 | |||||||||||
Net Increase in Net Assets Resulting from Operations | 24,901 | 5,247 | 4,282 | 2,714 | ||||||||||||
Dividends and Distributions From: | ||||||||||||||||
Net investment income | (3,744 | ) | (3,583 | ) | (1,330 | ) | (1,626 | ) | ||||||||
Total Dividends and Distributions | (3,744 | ) | (3,583 | ) | (1,330 | ) | (1,626 | ) | ||||||||
Capital Share Transactions: | ||||||||||||||||
Proceeds from shares issued | 13,766 | 14,122 | 4,966 | 4,504 | ||||||||||||
Reinvestment of dividends & distributions | 2,954 | 2,837 | 832 | 1,050 | ||||||||||||
Cost of shares redeemed | (24,858 | ) | (31,438 | ) | (12,534 | ) | (13,171 | ) | ||||||||
Decrease in Net Assets Derived from Capital Share Transactions | (8,138 | ) | (14,479 | ) | (6,736 | ) | (7,617 | ) | ||||||||
Net Increase (Decrease) in Net Assets | 13,019 | (12,815 | ) | (3,784 | ) | (6,529 | ) | |||||||||
Net Assets: | ||||||||||||||||
Beginning of Year | 258,499 | 271,314 | 85,602 | 92,131 | ||||||||||||
End of Year | $ | 271,518 | $ | 258,499 | $ | 81,818 | $ | 85,602 | ||||||||
Undistributed Net Investment Income Included in Net Assets at Year End | $ | 16 | $ | 439 | $ | 2 | $ | 265 | ||||||||
Share Transactions: | ||||||||||||||||
Shares issued | 157 | 177 | 251 | 238 | ||||||||||||
Shares issued in lieu of dividends and distributions | 34 | 36 | 42 | 57 | ||||||||||||
Shares redeemed | (283 | ) | (389 | ) | (639 | ) | (706 | ) | ||||||||
Decrease in Net Assets Derived from Share Transactions | (92 | ) | (176 | ) | (346 | ) | (411 | ) | ||||||||
Amounts designated as “—” are $0 or have been rounded to $0.
The accompanying notes are an integral part of the financial statements.
| New Covenant Funds / Annual Report / June 30, 2013 | 37 |
Table of Contents
For the years ended June 30,
For a share outstanding throughout the year
| Growth Fund | ||||||||||||||||||||
| 2013 | 2012 | 2011 | 2010 | 2009 | ||||||||||||||||
Net Asset Value, Beginning of Year | $ | 32.23 | $ | 32.53 | $ | 25.11 | $ | 22.68 | $ | 31.95 | ||||||||||
INVESTMENT ACTIVITIES: | ||||||||||||||||||||
Net investment income | 0.28 | (1) | 0.31 | (1) | 0.24 | 0.21 | 0.29 | |||||||||||||
Net realized and unrealized gains (losses) on securities and foreign currency transactions | 5.20 | (1) | (0.38 | )(1) | 7.41 | 2.43 | (9.29 | ) | ||||||||||||
Total from investment activities | 5.48 | (0.07 | ) | 7.65 | 2.64 | (9.00 | ) | |||||||||||||
DIVIDENDS AND DISTRIBUTIONS FROM: | ||||||||||||||||||||
Net investment income | (0.43 | ) | (0.23 | ) | (0.23 | ) | (0.18 | ) | (0.25 | ) | ||||||||||
Tax return of capital | — | — | — | (0.03 | ) | (0.02 | ) | |||||||||||||
Total dividends and distributions | (0.43 | ) | (0.23 | ) | (0.23 | ) | (0.21 | ) | (0.27 | ) | ||||||||||
| Net Asset Value, End of Year | $ | 37.28 | $ | 32.23 | $ | 32.53 | $ | 25.11 | $ | 22.68 | ||||||||||
Total Return† | 17.11 | % | (0.15 | )% | 30.54 | % | 11.54 | % | (28.16 | )% | ||||||||||
SUPPLEMENTAL DATA AND RATIOS: | ||||||||||||||||||||
Net assets, end of year ($ Thousands) | $ | 369,133 | $ | 652,311 | $ | 721,633 | $ | 624,923 | $ | 598,209 | ||||||||||
Ratio of net expenses to average net assets | 0.99 | % | 0.97 | % | 1.08 | % | 1.19 | % | 1.12 | % | ||||||||||
Ratio of expenses to average net assets, excluding waivers | 1.15 | % | 1.03 | % | 1.12 | % | 1.29 | % | 1.30 | % | ||||||||||
Ratio of net investment income to average net assets | 0.81 | % | 1.01 | % | 0.78 | % | 0.68 | % | 1.15 | % | ||||||||||
Portfolio turnover rate | 47 | % | 83 | % | 44 | % | 81 | % | 94 | % | ||||||||||
| † | Returns shown do not reflect the deduction of taxes the shareholder would pay on fund distributions or redemption of fund shares. |
| (1) | Per share net investment income and net realized and unrealized gains (losses) calculated using average shares. |
Amounts designated as “—” are $0 or have been rounded to $0.
The accompanying notes are an integral part of the financial statements.
| 38 | New Covenant Funds / Annual Report / June 30, 2013 |
Table of Contents
Financial Highlights
For the years ended June 30,
For a share outstanding throughout the year
| Income Fund | ||||||||||||||||||||
| 2013 | 2012 | 2011 | 2010 | 2009 | ||||||||||||||||
Net Asset Value, Beginning of Year | $ | 23.28 | $ | 22.85 | $ | 22.57 | $ | 20.93 | $ | 23.73 | ||||||||||
INVESTMENT ACTIVITIES: | ||||||||||||||||||||
Net investment income | 0.29 | (1) | 0.60 | (1) | 0.62 | 0.81 | 1.11 | |||||||||||||
Net realized and unrealized gains (losses) on securities | (0.41 | )(1) | 0.62 | (1) | 0.27 | 1.62 | (2.79 | ) | ||||||||||||
Total from investment activities | (0.12 | ) | 1.22 | 0.89 | 2.43 | (1.68 | ) | |||||||||||||
DIVIDENDS AND DISTRIBUTIONS FROM: | ||||||||||||||||||||
Net investment income | (0.39 | ) | (0.79 | ) | (0.61 | ) | (0.79 | ) | (1.12 | ) | ||||||||||
Total dividends and distributions | (0.39 | ) | (0.79 | ) | (0.61 | ) | (0.79 | ) | (1.12 | ) | ||||||||||
| Net Asset Value, End of Year | $ | 22.77 | $ | 23.28 | $ | 22.85 | $ | 22.57 | $ | 20.93 | ||||||||||
Total Return† | (0.55 | )% | 5.45 | % | 4.00 | % | 11.72 | % | (6.90 | )% | ||||||||||
SUPPLEMENTAL DATA AND RATIOS: | ||||||||||||||||||||
Net assets, end of year ($ Thousands) | $ | 291,669 | $ | 374,870 | $ | 455,136 | $ | 401,736 | $ | 373,446 | ||||||||||
Ratio of net expenses to average net assets | 0.77 | % | 0.75 | % | 0.83 | % | 0.87 | % | 0.86 | % | ||||||||||
Ratio of expenses to average net assets, excluding waivers | 0.95 | % | 0.81 | % | 0.89 | % | 1.03 | % | 1.02 | % | ||||||||||
Ratio of net investment income to average net assets | 1.23 | % | 2.60 | % | 2.76 | % | 3.68 | % | 5.15 | % | ||||||||||
Portfolio turnover rate | 295 | % | 95 | % | 38 | % | 76 | % | 230 | % | ||||||||||
| † | Returns shown do not reflect the deduction of taxes the shareholder would pay on fund distributions or redemption of fund shares. |
| (1) | Per share net investment income and net realized and unrealized gains (losses) calculated using average shares. |
Amounts designated as “—” are $0 or have been rounded to $0.
The accompanying notes are an integral part of the financial statements.
| New Covenant Funds / Annual Report / June 30, 2013 | 39 |
Table of Contents
Financial Highlights
For the years ended June 30,
For a share outstanding throughout the year
| Balanced Growth Fund | ||||||||||||||||||||
| 2013 | 2012 | 2011 | 2010 | 2009 | ||||||||||||||||
Net Asset Value, Beginning of Year | $ | 82.87 | $ | 82.33 | $ | 69.47 | $ | 63.31 | $ | 82.49 | ||||||||||
INVESTMENT ACTIVITIES: | ||||||||||||||||||||
Net investment income | 1.08 | (1) | 1.25 | (1) | 0.99 | 1.11 | 1.70 | |||||||||||||
Net realized and unrealized gains (losses) on securities | 6.96 | (1) | 0.41 | (1) | 12.86 | 6.16 | (18.25 | ) | ||||||||||||
Total from investment activities | 8.04 | 1.66 | 13.85 | 7.27 | (16.55 | ) | ||||||||||||||
DIVIDENDS AND DISTRIBUTIONS FROM: | ||||||||||||||||||||
Net investment income | (1.22 | ) | (1.12 | ) | (0.99 | ) | (1.06 | ) | (1.69 | ) | ||||||||||
Net realized gains | — | — | — | — | (0.93 | ) | ||||||||||||||
Tax return of capital | — | — | — | (2) | (0.05 | ) | (0.01 | ) | ||||||||||||
Total dividends and distributions | (1.22 | ) | (1.12 | ) | (0.99 | ) | (1.11 | ) | (2.63 | ) | ||||||||||
| Net Asset Value, End of Year | $ | 89.69 | $ | 82.87 | $ | 82.33 | $ | 69.47 | $ | 63.31 | ||||||||||
Total Return† | 9.77 | % | 2.07 | % | 19.99 | % | 11.43 | % | (19.96 | )% | ||||||||||
SUPPLEMENTAL DATA AND RATIOS: | ||||||||||||||||||||
Net assets, end of year ($ Thousands) | $ | 271,518 | $ | 258,499 | $ | 271,314 | $ | 237,504 | $ | 221,070 | ||||||||||
Ratio of net expenses to average net assets* | 0.14 | % | 0.14 | % | 0.18 | % | 0.23 | % | 0.13 | % | ||||||||||
Ratio of expenses to average net assets, excluding waivers* | 0.27 | % | 0.17 | % | 0.26 | % | 0.40 | % | 0.37 | % | ||||||||||
Ratio of net investment income to average net assets | 1.24 | % | 1.55 | % | 1.25 | % | 1.56 | % | 2.56 | % | ||||||||||
Portfolio turnover rate | 7 | % | 9 | % | 8 | % | 7 | % | 7 | % | ||||||||||
| † | Returns shown do not reflect the deduction of taxes the shareholder would pay on fund distributions or redemption of fund shares. |
| * | The expense ratios do not include expenses of the underlying affiliated investment companies. |
| (1) | Per share net investment income and net realized and unrealized gains (losses) calculated using average shares. |
| (2) | Less than $0.005. |
Amounts designated as “—” are $0 or have been rounded to $0.
The accompanying notes are an integral part of the financial statements.
| 40 | New Covenant Funds / Annual Report / June 30, 2013 |
Table of Contents
Financial Highlights
For the years ended June 30,
For a share outstanding throughout the year
| Balanced Income Fund | ||||||||||||||||||||
| 2013 | 2012 | 2011 | 2010 | 2009 | ||||||||||||||||
Net Asset Value, Beginning of Year | $ | 19.25 | $ | 18.97 | $ | 17.06 | $ | 15.66 | $ | 19.01 | ||||||||||
INVESTMENT ACTIVITIES: | ||||||||||||||||||||
Net investment income | 0.26 | (1) | 0.41 | (1) | 0.31 | 0.38 | 0.56 | |||||||||||||
Net realized and unrealized gains (losses) on securities | 0.76 | (1) | 0.22 | (1) | 1.91 | 1.39 | (3.35 | ) | ||||||||||||
Total from investment activities | 1.02 | 0.63 | 2.22 | 1.77 | (2.79 | ) | ||||||||||||||
DIVIDENDS AND DISTRIBUTIONS FROM: | ||||||||||||||||||||
Net investment income | (0.32 | ) | (0.35 | ) | (0.31 | ) | (0.36 | ) | (0.55 | ) | ||||||||||
Tax return of capital | — | — | — | (2) | (0.01 | ) | (0.01 | ) | ||||||||||||
Total dividends and distributions | (0.32 | ) | (0.35 | ) | (0.31 | ) | (0.37 | ) | (0.56 | ) | ||||||||||
| Net Asset Value, End of Year | $ | 19.95 | $ | 19.25 | $ | 18.97 | $ | 17.06 | $ | 15.66 | ||||||||||
Total Return† | 5.34 | % | 3.42 | % | 13.07 | % | 11.31 | % | (14.60 | )% | ||||||||||
SUPPLEMENTAL DATA AND RATIOS: | ||||||||||||||||||||
Net assets, end of year ($ Thousands) | $ | 81,818 | $ | 85,602 | $ | 92,131 | $ | 85,037 | $ | 78,665 | ||||||||||
Ratio of net expenses to average net assets* | 0.20 | % | 0.18 | % | 0.22 | % | 0.24 | % | 0.16 | % | ||||||||||
Ratio of expenses to average net assets, excluding waivers* | 0.27 | % | 0.20 | % | 0.30 | % | 0.40 | % | 0.40 | % | ||||||||||
Ratio of net investment income to average net assets | 1.30 | % | 2.18 | % | 1.65 | % | 2.17 | % | 3.47 | % | ||||||||||
Portfolio turnover rate | 7 | % | 9 | % | 8 | % | 7 | % | 10 | % | ||||||||||
| † | Returns shown do not reflect the deduction of taxes the shareholder would pay on fund distributions or redemption of fund shares. |
| * | The expense ratios do not include expenses of the underlying affiliated investment companies. |
| (1) | Per share net investment income and net realized and unrealized gains (losses) calculated using average shares. |
| (2) | Less than $0.005. |
Amounts designated as “—” are $0 or have been rounded to $0.
The accompanying notes are an integral part of the financial statements.
| New Covenant Funds / Annual Report / June 30, 2013 | 41 |
Table of Contents
June 30, 2013
1. ORGANIZATION
New Covenant Funds (the “Trust”), an open-end, diversified management investment company, was organized as a Delaware business trust on September 30, 1998. It currently consists of four investment funds: New Covenant Growth Fund (“Growth Fund”), New Covenant Income Fund (“Income Fund”), New Covenant Balanced Growth Fund (“Balanced Growth Fund”), and New Covenant Balanced Income Fund (“Balanced Income Fund”), (individually, a “Fund,” and collectively, the “Funds”). The Funds commenced operations on July 1, 1999. The Trust’s authorized capital consists of an unlimited number of shares of beneficial interest of $0.001 par value. Effective February 20, 2012, the Funds’ investment adviser is SEI Investments Management Corporation (the “Adviser”). Prior to February 20, 2012, the Funds’ investment adviser was One Compass Advisors, a wholly owned subsidiary of the Presbyterian Church (U.S.A.) Foundation.
The objectives of the Funds are as follows:
| Growth Fund | Long-term capital appreciation. | |
| Income Fund | High level of current income with preservation of capital. | |
| Balanced Growth Fund | Capital appreciation with less risk than would be present in a portfolio of only common stocks. | |
| Balanced Income Fund | Current income and long-term growth of capital. | |
2. SIGNIFICANT ACCOUNTING POLICIES
The following is a summary of the significant accounting policies followed by the Funds.
Use of Estimates — The preparation of financial statements, in conformity with U.S. generally accepted accounting principles (“U.S. GAAP”), requires management to make estimates and assumptions that affect the reported amount of assets and liabilities and disclosure of contingent assets and liabilities as of the date of the financial statements and the reported amounts of increases and decreases in net assets from operations during the reporting period. Actual results could differ from those estimates.
Security Valuation — Securities listed on a securities exchange, market or automated quotation system for which quotations are readily available (except for securities traded on NASDAQ) are valued at the last quoted sale price on the primary exchange or market (foreign or domestic) on which they are traded, or, if there is no such reported sale, at the most recent quoted bid price. For securities traded on NASDAQ, the NASDAQ Official Closing Price will be used. Debt securities are priced based upon valuations provided by independent, third-party pricing agents, if available. Such values generally reflect the last reported sales price if the security is actively traded. The third-party pricing agents may also value debt securities at an evaluated bid price by employing methodologies that utilize actual market transactions, broker-supplied valuations, or other methodologies designed to identify the market value for such securities. Debt obligations acquired with remaining maturities of sixty days or less may be valued at their amortized cost, which approximates market value. The prices for foreign securities are reported in local currency and converted to U.S. dollars using currency exchange rates. Prices for most securities held in the Funds are provided daily by recognized independent pricing agents. If a security price cannot be obtained from an independent, third-party pricing agent, the Funds seek to obtain a bid price from at least one independent broker.
Securities for which market prices are not “readily available” are valued in accordance with fair value procedures established by the Trust’s Board of Trustees. The Trust’s fair value procedures are implemented through a fair value committee (the “Committee”) designated by the Trust’s Board of Trustees. Some of the more common reasons that may necessitate that a security be valued using fair value procedures include: the security’s trading has been halted or suspended; the security has been de-listed from a national exchange; the security’s primary trading market is temporarily closed at a time when under normal conditions it would be open; or the security’s primary pricing source is not able or willing to provide a price. When a security is valued in accordance with the fair value procedures, the Committee will determine the value after taking into consideration relevant information reasonably available to the Committee.
For securities that principally trade on a foreign market or exchange, a significant gap in time can exist between the time of a particular security’s last trade and the time at which a Fund calculates its net asset value. The closing prices of such securities may no longer reflect their market value at the time a Fund calculates net asset value if an event that could materially affect the value of those securities (a “Significant Event”) has occurred between the time of the security’s last close and the time that a Fund calculates net asset value. A Significant Event may relate to a single issuer or to an entire market sector. If the adviser or sub-adviser of a Fund becomes aware of a Significant Event that has occurred with respect to a security or group of securities after the closing of the exchange or market on which the security or securities principally trade, but before the time at which a Fund calculates net asset value, the adviser or sub-adviser may request that a Fair Value Committee Meeting be called. In addition, the Trust’s administrator monitors price movements among certain selected indices, securities and/or baskets of securities that may be an indicator that the closing prices received earlier from foreign exchanges or markets may not reflect market value at the time a
| 42 | New Covenant Funds / Annual Report / June 30, 2013 |
Table of Contents
Fund calculates net asset value. If price movements in a monitored index or security exceed levels established by the administrator, the administrator notifies the adviser or sub-adviser for any Fund holding the relevant securities that such limits have been exceeded. In such event, the adviser or sub-adviser makes the determination whether a Fair Value Committee Meeting should be called based on the information provided.
The Growth Fund holds international securities that also use a third-party fair valuation vendor. The vendor provides a fair value for foreign securities held by this Fund based on certain factors and methodologies (involving, generally, tracking valuation correlations between the U.S. market and each non-U.S. security). Values from the fair value vendor are applied in the event that there is a movement in the U.S. market that exceeds a specific threshold that has been established by the Committee. The Committee has also established a “confidence interval” which is used to determine the level of historical correlation between the value of a specific foreign security and movements in the U.S. market before a particular security will be fair valued when the threshold is exceeded. In the event that the threshold established by the Committee is exceeded on a specific day, the Growth Fund will value the non-U.S. securities that exceed the applicable “confidence interval” based upon the adjusted prices provided by the fair valuation vendor.
Options for which the primary market is a national securities exchange are valued at the last sale price on the exchange on which they are traded, or, in the absence of any sale, at the closing bid price. Options not traded on a national securities exchange are valued at the last quoted bid price.
The assets of the Balanced Growth Fund and the Balanced Income Fund (the “Balanced Funds”) consist primarily of investments in underlying affiliated investment companies, which are valued at their respective daily net asset values in accordance with Board-approved pricing procedures.
In accordance with U.S. GAAP, fair value is defined as the price that a Fund would receive upon selling an investment in an orderly transaction to an independent buyer in the principal or most advantageous market of the investment. A three tier hierarchy has been established to maximize the use of observable and minimize the use of unobservable inputs and to establish classification of fair value measurements for disclosure purposes. Inputs refer broadly to the assumptions that market participants would use in pricing an asset. Inputs may be observable or unobservable. Observable inputs are inputs that reflect the assumptions market participants would use in pricing the asset or liability based on market data obtained from sources independent of the reporting entity. Unobservable inputs are inputs that reflect the reporting entity’s own assumptions about the assumptions market participants would use in pricing the asset or liability based on the best information available in the circumstances.
The three-tier hierarchy of inputs is summarized in the three broad Levels listed below:
| Level 1 — | quoted prices in active markets for identical investments | |
| Level 2 — | other significant observable inputs (including quoted prices for similar investments, interest rates, prepayment speeds, credit risks, etc.) | |
| Level 3 — | significant unobservable inputs (including the Fund’s own assumptions in determining the fair value of investments) | |
The valuation techniques used by the Funds to measure fair value during the year ended June 30, 2013 maximized the use of observable inputs and minimized the use of unobservable inputs.
For the year ended June 30, 2013, there have been no significant changes to the Trust’s fair valuation methodologies. For details of the investment classification reference the Schedule of Investments.
Securities Transactions and Investment Income — Security transactions are recorded on the trade date. Cost used in determining net realized capital gains and losses on the sale of securities is determined on the basis of specific identification. Dividend income and expense is recognized on the ex-dividend date, and interest income or expense is recognized using the accrual basis of accounting.
Distributions received on securities that represent a return of capital or capital gains are recorded as a reduction of cost of investments and/or as a realized gain. The Trust estimates the components of distributions received that may be considered nontaxable distributions or capital gain distributions.
Amortization and accretion is calculated using the scientific interest method, which approximates the effective interest method over the holding period of the security. Amortization of premiums and discounts is included in interest income.
Expenses — Expenses that are directly related to a Fund are charged directly to that Fund. Other operating expenses of the Funds are prorated to the Funds on the basis of relative net assets.
| New Covenant Funds / Annual Report / June 30, 2013 | 43 |
Table of Contents
Notes to Financial Statements (Continued)
June 30, 2013
Foreign Currency Translation — The books and records of the Funds investing in international securities are maintained in U.S. dollars on the following basis:
(I) market value of investment securities, assets and liabilities at the current rate of exchange; and
(II) purchases and sales of investment securities, income and expenses at the relevant rates of exchange prevailing on the respective dates of such transactions.
The Funds do not isolate that portion of gains and losses on investments in equity securities that is due to changes in the foreign exchange rates from that which is due to changes in market prices of equity securities.
The Funds report certain foreign-currency-related transactions as components of realized gains for financial reporting purposes, whereas such components are treated as ordinary income for Federal income tax purposes.
Repurchase Agreements — To the extent consistent with its investment objective and strategies, a Fund may enter into repurchase agreements which are secured by obligations of the U.S. government with a bank, broker-dealer or other financial institution. Each repurchase agreement is at least 102% collateralized and marked-to-market. However, in the event of default or bankruptcy by the counterparty to the repurchase agreement, realization of the collateral may by subject to certain costs, losses or delays.
Futures Contracts — To the extent consistent with its investment objective and strategies, a Fund may use futures contracts for tactical hedging purposes as well as to enhance the Fund’s returns. These Funds’ investments in futures contracts are designed to enable the Funds to more closely approximate the performance of their benchmark indices. Initial margin deposits of cash or securities are made upon entering into futures contracts. The contracts are marked-to-market daily and the resulting changes in value are accounted for as unrealized gains and losses. Variation margin payments are paid or received, depending upon whether unrealized gains or losses are incurred. When contracts are closed, the Funds record a realized gain or loss equal to the difference between the proceeds from (or cost of) the closing transaction and the amount invested in the contract.
Risks of entering into futures contracts include the possibility that there will be an imperfect price correlation between the futures and the underlying securities. Second, it is possible that a lack of liquidity for futures contracts could exist in the secondary market, resulting in an inability to close a position prior to its maturity date. Third, futures contracts involve the risk that a Fund could lose more than the original margin deposit required to initiate a futures transaction.
Finally, the risk exists that losses could exceed amounts disclosed on the Statements of Assets and Liabilities. Refer to each Fund’s Schedule of Investments for details regarding open futures contracts as of June 30, 2013, if applicable.
Options Writing/Purchasing — To the extent consistent with its investment objective and strategies, a Fund may invest in financial options contracts for the purpose of hedging its existing portfolio securities, or securities that a Fund intends to purchase, against fluctuations in fair market value caused by changes in prevailing market interest rates. A Fund may also invest in financial option contracts to enhance its returns. When the Fund writes or purchases an option, an amount equal to the premium received or paid by the Fund is recorded as a liability or an asset and is subsequently adjusted to the current market value of the option written or purchased. Premiums received or paid from writing or purchasing options which expire unexercised are treated by the Fund on the expiration date as realized gains or losses. The difference between the premium and the amount paid or received on effecting a closing purchase or sale transaction, including brokerage commissions, is also treated as a realized gain or loss. If an option is exercised, the premium paid or received is added to the cost of the purchase or proceeds from the sale in determining whether the Fund has realized a gain or a loss. The Income Fund had option contracts as of June 30, 2013, as disclosed in the Fund’s Schedule of Investments.
The risk in writing a call option is a Fund may give up the opportunity for profit if the market price of the security increases. The risk in writing a put option is a Fund may incur a loss if the market price of the security decreases and the option is exercised. The risk in purchasing an option is a Fund may pay a premium whether or not the option is exercised. The Funds also have the additional risk of being unable to enter into a closing transaction at an acceptable price if a liquid secondary market does not exist. Option contracts also involve the risk that they may not work as intended due to unanticipated developments in market conditions or other causes.
| 44 | New Covenant Funds / Annual Report / June 30, 2013 |
Table of Contents
Written options transactions entered into during the year ended June 30, 2013, if applicable are summarized as follows:
| Income Fund | ||||||||
| Number of Contracts | Premiums ($ Thousands) | |||||||
| Balance at beginning of year | — | $ | — | |||||
| Written | (190 | ) | (52 | ) | ||||
| Expired | 97 | 24 | ||||||
| Closing buys | 77 | 23 | ||||||
| Balance at end of year | (16 | ) | $ | (5 | ) | |||
Forward Treasury Commitments — To the extent consistent with its investment objective and strategies, the Growth Fund and Income Funds may invest in commitments to purchase U.S. Treasury securities on an extended settlement basis. Such transactions involve the commitment to purchase a security with payment and delivery taking place in the future, sometimes a month or more after the transaction date. The Funds account for such transactions as purchases and sales and record an unrealized gain or loss each day equal to the difference between the cost of the purchase commitment and the current market value. Realized gains or losses are recorded upon closure or settlement of such commitments. No interest is earned prior to settlement of the transaction. These instruments are subject to market fluctuation due to changes in interest rates and the market value at the time of settlement could be higher or lower than the purchase price. A Fund may incur losses due to changes in the value of the underlying treasury securities from interest rate fluctuations or as a result of counterparty nonperformance.
Master Limited Partnerships — To the extent consistent with its investment objective and strategies, a Fund may invest in entities commonly referred to as “MLPs” are generally organized under state law as limited partnerships or limited liability companies. The Funds intend to primarily invest in MLPs receiving partnership taxation treatment under the Internal Revenue Code of 1986 (the “Code”), and whose interests or “units” are traded on securities exchanges like shares of corporate stock. To be treated as a partnership for U.S. federal income tax purposes, an MLP whose units are traded on a securities exchange must receive at least 90% of its income from qualifying sources such as interest, dividends, real estate rents, gain from the sale or disposition of real property, income and gain from mineral or natural resources activities, income and gain from the transportation or storage of certain fuels, and, in certain circumstances, income and gain from commodities or futures, forwards and options with respect to commodities. Mineral or natural resources activities include exploration, development, production, processing, mining, refining, marketing and transportation (including pipelines) of oil and gas, minerals, geothermal energy, fertilizer, timber or industrial source carbon dioxide. An MLP consists of a general partner and limited partners (or in the case of MLPs organized as limited liability companies, a managing member and members). The general partner or managing member typically controls the operations and management of the MLP and has an ownership stake in the partnership. The limited partners or members, through their ownership of limited partner or member interests, provide capital to the entity, are intended to have no role in the operation and management of the entity and receive cash distributions. The MLPs themselves generally do not pay U.S. Federal income taxes. Thus, unlike investors in corporate securities, direct MLP investors are generally not subject to double taxation (i.e., corporate level tax and tax on corporate dividends). Currently, most MLPs operate in the energy and/or natural resources sector.
Delayed Delivery Transactions — To the extent consistent with its investment objective and strategies, the Growth Fund and Income Fund may purchase or sell securities on a when-issued or delayed delivery basis. These transactions involve a commitment by those Funds to purchase or sell securities for a predetermined price or yield, with payment and delivery taking place beyond the customary settlement period. When purchasing a security on a delayed delivery basis, that Fund assumes the rights and risks of ownership of the security, including the risk of price and yield fluctuations, and takes such fluctuations into account when determining its net asset value. Those Funds may dispose of or renegotiate a delayed delivery transaction after it is entered into, and may sell when-issued securities before they are delivered, which may result in a capital gain or loss. When those Funds have sold a security on a delayed delivery basis, that Fund does not participate in future gains and losses with respect to the security.
Dividends and Distributions to Shareholders — Dividends from net investment income are declared and paid to shareholders quarterly for the Growth Fund, Balanced Growth Fund and Balanced Income Fund; declared and paid monthly for the Income Fund. Dividends and distributions are recorded on the ex-dividend date. Any net realized capital gains will be distributed at least annually by the Funds.
Illiquid Securities — A security is considered illiquid if it cannot be sold or disposed of in the ordinary course of business within seven days or less for its approximate carrying value on the books of a Fund. Valuations of illiquid securities may differ significantly from the values that would have been used had an active market value for these securities existed.
| New Covenant Funds / Annual Report / June 30, 2013 | 45 |
Table of Contents
Notes to Financial Statements (Continued)
June 30, 2013
Investments in Real Estate Investment Trusts (“REITs”) — Dividend income is recorded based on the income included in distributions received from the REIT investments using published REIT reclassifications including some management estimates when actual amounts are not available. Distributions received in excess of this estimated amount are recorded as a reduction of the cost of investments or reclassified to capital gains. The actual amounts of income, return of capital, and capital gains are only determined by each REIT after its fiscal year-end, and may differ from the estimated amounts.
3. AGREEMENTS AND OTHER TRANSACTIONS WITH AFFILIATES
Administration Agreement — The Trust entered into an Administration Agreement with SEI Investments Global Funds Services (the “Administrator”). Under the Administration Agreement, the Administrator provides administrative and accounting services to the Funds. Under the terms of the Administration Agreement, the Administrator is entitled to a fee of 0.20% of each Fund’s average daily net assets. The Administrator has voluntarily agreed to waive a portion of its fee so that the total annual expenses of the Balanced Growth Fund and the Balanced Income Fund, exclusive of acquired fund fees and expenses, will not exceed certain voluntary expense limitations adopted by the Adviser. Accordingly, the voluntary expense limitations are 0.14% and 0.20% for the Balanced Growth Fund and the Balanced Income Fund, respectively. These voluntary waivers may be terminated at any time.
Transfer Agent Servicing Agreement — In 2008, the Trust entered into a transfer agent servicing agreement (“Agreement”) with U.S. Bancorp Fund Services, LLC (“USBFS”), an indirect, wholly-owned subsidiary of U.S. Bancorp. Under the terms of the Agreement, USBFS is entitled to account based fees and annual fund level fees, as well as reimbursement of out-of-pocket expenses incurred in providing transfer agency services.
Investment Advisory Agreement — The Trust, on behalf of each Fund, entered into an Investment Advisory Agreement (“Agreement”) with SEI Investments Management Corporation (the “Adviser”). Under the Agreement, the Adviser is responsible for the investment management of the Funds and receives an annual advisory fee of 0.62% for the Growth Fund and 0.42% for the Income Fund. The Adviser does not receive an advisory fee for the Balanced Growth Fund and Balanced Income Fund. The Adviser has voluntarily agreed to waive a portion of its fee so that the total annual expenses of the Growth and Income Funds, exclusive of acquired fund fees and expenses, will not exceed certain voluntary expense limitations adopted by the Adviser. Effectiver October 1, 2012 the voluntary expense limitations are 1.02% and 0.80% for the Growth Fund and Income Fund, respectively. Prior to October 1, 2012 the voluntary expense limitations were 0.92% and 0.70% for the Growth Fund and Income Fund, respectively. These voluntary waivers may be terminated by the Adviser at any time.
The Adviser has entered into sub-advisory agreements to assist in the selection and management of investment securities in the Growth Fund and the Income Fund. It is the responsibility of the sub-advisers, under the direction of the Adviser, to make day-to-day investment decisions for these Funds. The Adviser, not the Funds, pays each sub-adviser a quarterly fee, in arrears, for their services. The Adviser pays sub-advisory fees directly from its own advisory fee. The sub-advisory fees are based on the assets of the Fund allocated to the sub-adviser for which the sub-adviser is responsible for making investment decisions.
The following are the sub-advisers for the Growth Fund: Baillie Gifford Overseas Limited., Parametric Portfolio Associates, Sustainable Growth Advisers, LP, Tocqueville Asset Management L.P., Waddell & Reed Investment Management Company, and WestEnd Advisors LLC.
The following are the sub-advisers for the Income Fund: J.P. Morgan Investment Management Inc., Western Asset Management Company and Western Asset Management Company Limited.
Shareholder Service Plan and Agreement — The Trust entered into a Shareholder Service Plan and Agreement (the “Agreement”) with the Distributor. Per the Agreement, a Fund is authorized to make payments to certain entities which may include investment advisors, banks, trust companies and other types of organizations (“Authorized Service Providers”) for providing administrative services with respect to shares of the Funds attributable to or held in the name of the Authorized Service Providers for its clients or other parties with whom they have a servicing relationship. Under the terms of the Agreement, the Growth Fund and the Income Funds are authorized to pay an Authorized Service Provider a shareholder servicing fee at an annual rate of up to 0.10% of the average daily net asset value of the Growth Fund and Income Fund, respectively, which fee will be computed daily and paid monthly, for providing certain administrative services to Fund shareholders with whom the Authorized Service Provider has a servicing relationship.
Distribution Agreement — The Trust issues shares of the Funds pursuant to a Distribution Agreement with SEI Investments Distribution Co. (the “Distributor”), a wholly owned subsidiary of SEI Investments Company (“SEI”). The Funds do not compensate the Distributor in its capacity as principal distributor.
| 46 | New Covenant Funds / Annual Report / June 30, 2013 |
Table of Contents
Social Witness Services and License Agreement — The Trust retained New Covenant Trust Company (“NCTC”) to ensure that each Fund continues to invest consistent with social witness principles adopted by the General Assembly of the Presbyterian Church (U.S.A.). No less than annually, NCTC will provide the Trust with an updated list of issuers in which the Funds will be prohibited from investing.
NCTC will distribute to the Trust proxy voting guidelines and shareholder advocacy services for the Funds that NCTC deems to be consistent with social witness principles adopted by the General Assembly of the Presbyterian Church (U.S.A.). The Trust also engages NCTC to vote Fund proxies consistent with such proxy voting guidelines. NCTC shall monitor and review and, as necessary, amend the Proxy Voting Guidelines periodically to ensure that they remain consistent with the social witness principles.
NCTC also grants to the Trust a non-exclusive right and license to use and refer to the trade name, trademark and/or service mark rights to the name “New Covenant Funds” and the phrase “Funds with a Mission”, in the name of the Trust and each Fund, and in connection with the offering, marketing, promotion, management and operation of the Trust and the Funds.
In consideration of the services provided by NCTC, the Growth Fund and the Income Fund will each pay to NCTC a fee at an annual rate of 0.15% of the average daily net asset value of the shares of such Fund, which fee will be computed daily and paid monthly.
Payment to Affiliates — Certain officers and/or interested trustees of the Trust are also officers of the Distributor, the Adviser, the Administrator or NCTC. The Trust pays each unaffiliated Trustee an annual fee for attendance at quarterly and interim board meetings. Compensation of officers and affiliated Trustees of the Trust is paid by the Adviser, the Administrator or NCTC.
A portion of the services provided by the Chief Compliance Officer (“CCO”) and his staff, whom are employees of the Administrator, are paid for by the Trust as incurred. The services include regulatory oversight of the Trust’s Adviser, sub-advisers and service providers as required by SEC regulations. The CCO’s services have been approved by and are reviewed annually by the Board.
Investment in Affiliated Security — The Funds may invest excess cash in the SEI Daily Income Trust Prime Obligation Fund, an affiliated money market fund. The Balanced Funds invest in the Growth Fund and Income Fund.
Interfund Lending — The SEC has granted an exemption that permits the Trust to participate in an interfund lending program (the ‘‘Program’’) with existing or future investment companies registered under the 1940 Act that are advised by SIMC (the ‘‘SEI Funds’’). The Program allows the SEI Funds to lend money to and borrow money from each other for temporary or emergency purposes. Participation in the Program is voluntary for both borrowing and lending funds. Interfund loans may be made only when the rate of interest to be charged is more favorable to the lending fund than an investment in overnight repurchase agreements (‘‘Repo Rate’’), and more favorable to the borrowing fund than the rate of interest that would be charged by a bank for short-term borrowings (‘‘Bank Loan Rate’’). The Bank Loan Rate will be determined using a formula reviewed annually by the SEI Funds’ Board of Trustees. The interest rate imposed on interfund loans is the average of the Repo Rate and the Bank Loan Rate. During the year ended June 30, 2013, the Trust did not participate in interfund lending.
4. INVESTMENT TRANSACTIONS
The cost of security purchases and the proceeds from the sale and maturities of securities, excluding U.S. government and other short-term investments, for the year ended June 30, 2013, were as follows:
| Fund | Purchases (excluding Short-Term Investments & U.S. Government Securities) ($ Thousands) | Sales (excluding Short-Term Investments & U.S. Government Securities) ($ Thousands) | Purchases of U.S. Government Securities ($ Thousands) | Sales of U.S. Government Securities ($ Thousands) | ||||||||||||
| Growth Fund | $ | 198,035 | $ | 557,881 | $ | — | $ | — | ||||||||
| Income Fund | 64,768 | 43,610 | 784,196 | 850,168 | ||||||||||||
| Balanced Growth Fund | 18,619 | 27,626 | — | — | ||||||||||||
| Balanced Income Fund | 5,781 | 12,771 | — | — | ||||||||||||
5. FEDERAL TAX INFORMATION
It is each Fund’s intention to continue to qualify as a regulated investment company under Subchapter M of the Internal Revenue Code and distribute all of its taxable income (including net capital gains). Accordingly, no provision for federal income tax is required.
Dividends from net investment income and distributions from net realized capital gains are determined in accordance with U.S. Federal income tax regulations, which may differ from those amounts determined under U.S. GAAP. These book/tax differences are either temporary or perma-
| New Covenant Funds / Annual Report / June 30, 2013 | 47 |
Table of Contents
Notes to Financial Statements (Continued)
June 30, 2013
nent in nature. To the extent these differences are permanent, they are charged or credited to paid-in capital, undistributed net investment income or accumulated net realized gain, as appropriate, in the period that the differences arise.
Accordingly, the following permanent differences, primarily attributable to different treatment for gains and losses on paydowns of mortgage and asset-backed securities for tax purposes, reclassification of long term capital gain distributions on Real Estate Investment Trust securities, basis adjustments for investments in partnerships, and gains and losses on passive foreign investment companies and certain foreign currency related transactions and non taxable in-kind redemption, have been reclassified to/ (from) the following accounts as of June 30, 2013:
| Accumulated Net Realized Gain (Loss) ($ Thousands) | Undistributed Net Investment Income (Loss) ($ Thousands) | Paid-in Capital ($ Thousands) | ||||||||||
| Growth Fund | $ | (54,918 | ) | $ | 26 | $ | 54,892 | |||||
| Income Fund | (3,387 | ) | 1,109 | 2,278 | ||||||||
These reclassifications have no impact on net assets or net asset value per share.
The tax character of dividends and distributions paid during the last two years ended June 30 were as follows:
| Ordinary Income ($ Thousands) | Long Term Capital Gains ($ Thousands) | Total Taxable Deductions ($ Thousands) | Return of Capital ($ Thousands) | Total Distributions Paid ($ Thousands) | ||||||||||||||||||||
| Growth Fund | 2013 | $ | 5,361 | $ | — | $ | 5,361 | $ | — | $ | 5,361 | |||||||||||||
| 2012 | 5,067 | — | 5,067 | — | 5,067 | |||||||||||||||||||
| Income Fund | 2013 | 5,268 | — | 5,268 | — | 5,268 | ||||||||||||||||||
| 2012 | 15,213 | — | 15,213 | — | 15,213 | |||||||||||||||||||
| Balanced Growth Fund | 2013 | 3,744 | — | 3,744 | — | 3,744 | ||||||||||||||||||
| 2012 | 3,583 | — | 3,583 | — | 3,583 | |||||||||||||||||||
| Balanced Income Fund | 2013 | 1,330 | — | 1,330 | — | 1,330 | ||||||||||||||||||
| 2012 | 1,626 | — | 1,626 | — | 1,626 | |||||||||||||||||||
As of June 30, 2013, the components of distributable earnings (accumulated losses) were as follows:
| Undistributed Ordinary Income ($ Thousands) | Undistributed Long-Term Capital Gains ($ Thousands) | Post-October Losses ($ Thousands) | Capital Loss Carryforwards ($ Thousands) | Unrealized Appreciation/ (Depreciation) ($ Thousands) | Other Temporary Differences ($ Thousands) | Total Distributable Earnings (Accumulated Losses) ($ Thousands) | ||||||||||||||||||||||
| Growth Fund | $ | 200 | $ | 3,245 | $ | — | $ | — | $ | 50,996 | $ | 24 | $ | 54,465 | ||||||||||||||
| Income Fund | 625 | — | (676 | ) | (56,962 | ) | 984 | (732 | ) | (56,761 | ) | |||||||||||||||||
| Balanced Growth Fund | 16 | — | — | (8,223 | ) | 35,194 | — | 26,987 | ||||||||||||||||||||
| Balanced Income Fund | 2 | 74 | — | — | 6,883 | — | 6,959 | |||||||||||||||||||||
Post-October losses represent losses realized on investment transactions from November 1, 2012 through June 30, 2013 that, in accordance with Federal income tax regulations, the Funds may elect to defer and treat as having arisen in the following fiscal year.
For Federal income tax purposes, capital loss carryforwards incurred in taxable years beginning before December 22, 2010, may be carried forwards for a maximum period of eight years and applied against future net realized gains. At June 30, 2013, the breakdown of capital loss carryforwards was as follow:
| Expires 2017 ($ Thousands) | Expires 2018 ($ Thousands) | Expires 2019 ($ Thousands) | Total Capital Loss Carryforwards ($ Thousands) June 30, 2013 | |||||||||||||
| Income Fund | $ | (291 | ) | $ | (56,671 | ) | $ | — | $ | (56,962 | ) | |||||
| Balanced Growth Fund | — | (5,125 | ) | (3,098 | ) | (8,223 | ) | |||||||||
Under the recently enacted Regulated Investment Company Modernization Act of 2010, the Funds are permitted to carry forward capital losses incurred in taxable years beginning after December 22, 2010 for an unlimited period. However, any losses incurred during those future taxable years will be required to be utilized prior to the losses incurred in pre-enactment taxable years. As a result of this ordering rule, pre-enactment capital loss carryforwards may be more likely to expire unused. Additionally, post-enactment capital losses that are carried forward will retain their character as either short-term or long-term capital losses rather than being considered all short-term as under previous law.
| 48 | New Covenant Funds / Annual Report / June 30, 2013 |
Table of Contents
During the fiscal year ended June 30, 2013, the following Funds utilized capital loss carryforwards to offset capital gains:
| Amount Utilized ($ Thousands) | ||||
| Growth Fund | $ | 19,928 | ||
| Income Fund | 1,287 | |||
| Balanced Growth Fund | 9,877 | |||
| Balanced Income Fund | 3,089 | |||
For Federal income tax purposes, the cost of securities owned at June 30, 2013, and the net realized gains or losses on securities sold for the period were not materially different from amounts reported for financial reporting purposes. These differences are primarily due to wash sales which cannot be used for Federal income tax purposes in the current year and have been deferred for use in future years. The aggregate gross unrealized appreciation and depreciation on total investments, held by the Funds at June 30, 2013, was as follows:
| Federal Tax Cost ($ Thousands) | Appreciated Securities ($ Thousands) | Depreciated Securities ($ Thousands) | Net Unrealized Appreciation ($ Thousands) | |||||||||||||
| Growth Fund | $ | 317,690 | $ | 58,582 | $ | (7,555 | ) | $ | 51,027 | |||||||
| Income Fund | 316,506 | 4,928 | (4,262 | ) | 666 | |||||||||||
| Balanced Growth Fund | 236,342 | 39,965 | (4,771 | ) | 35,194 | |||||||||||
| Balanced Income Fund | 74,914 | 9,910 | (3,027 | ) | 6,883 | |||||||||||
Management has analyzed the Funds’ tax positions taken on Federal income tax returns for all open tax years and has concluded that as of June 30, 2013, no provision for income tax would be required in the Funds’ financial statements. The Funds’ Federal and state income and Federal excise tax returns for tax years for which the applicable statutes of limitations have not expired are subject to examination by the Internal Revenue Service and state departments of revenue.
6. CONCENTRATION/RISKS
In the normal course of business, the Trust enters into contracts that provide general indemnifications by the Trust to the counterparty to the contract. The Trust’s maximum exposure under these arrangements is dependent on future claims that may be made against the Trust and, therefore, cannot be estimated; however, management believes that, based on experience, the risk of loss from such claims is considered remote.
The market values of the Income Fund’s investments may change in response to interest rate changes and other factors. During periods of falling interest rates, the values of fixed income securities generally rise. Conversely, during periods of rising interest rates, the values of such securities generally decline. Changes by recognized rating agencies in the ratings of any fixed income security and in the ability of an issuer to make payments of interest and principal may also affect the value of these investments.
The Growth Fund concentrates its investments in securities of foreign issuers in various countries. These investments may involve certain considerations and risks not typically associated with investments in the United States, as a result of, among other factors, the possibility of future political and economic developments and the level of governmental supervision and regulation of securities markets in the respective countries.
The Funds will not invest more than 15% of the value of their net assets in securities that are illiquid because of restrictions on transferability or other reasons. Repurchase agreements with deemed maturities in excess of seven days are subject to this 15% limit. The Funds may purchase securities which are not registered under the Securities Act of 1933 (the “Securities Act”) but which can be sold to “qualified institutional buyers” in accordance with Rule 144A under the Securities Act. In some cases, such securities are classified as “illiquid securities;” however, any such security will not be considered illiquid so long as it is determined by the Adviser, under guidelines approved by the Board of Trustees, that an adequate trading market exists for that security. This investment practice could have the effect of increasing the level of illiquidity in a Fund during any period that qualified institutional buyers become uninterested in purchasing these restricted securities.
The Income Fund may invest a limited amount of assets in debt securities which are rated below investment grade (hereinafter referred to as “lower-rated securities”) or which are unrated but deemed equivalent to those rated below investment grade by the portfolio managers. The lower the ratings of such debt securities, the greater their risks. These debt instruments generally offer a higher current yield than that available from higher-grade issues, and typically involve greater risks. The yields on lower-rated securities will fluctuate over time. In general, prices of all bonds rise when interest rates fall and fall when interest rates rise. Lower-rated securities are subject to adverse changes in general economic conditions and to changes in the financial condition of their issuers. During periods of economic downturn or rising interest rates, issuers of these instruments may experience financial stress that could adversely affect their ability to make payments of principal and interest, and increase the possibility of default.
| New Covenant Funds / Annual Report / June 30, 2013 | 49 |
Table of Contents
Notes to Financial Statements (Concluded)
June 30, 2013
The Balanced Growth Fund and Balanced Income Fund invest their assets primarily in the Growth Fund and the Income Fund. By investing primarily in shares of these Funds, shareholders of the Balanced Funds indirectly pay a portion of the operating expenses, management fees and brokerage costs of the underlying Funds as well as their own operating expenses. Thus, shareholders of the Balanced Funds may indirectly pay slightly higher total operating expenses and other costs than they would pay by directly owning shares of the Growth Fund and Income Fund. A change in the asset allocation of either Balanced Fund could increase or reduce the fees and expenses actually borne by investors in that Fund. The Balanced Funds are also subject to rebalancing risk. Rebalancing activities, while undertaken to maintain a Fund’s investment risk-to-reward ratio, may cause the Fund to under-perform other funds with similar investment objectives. For the Balanced Growth Fund, it is possible after rebalancing from equities into a greater percentage of fixed-income securities, that equities will outperform fixed income investments. For the Balanced Income Fund, it is possible that after rebalancing from fixed-income securities into a greater percentage of equity securities, that fixed-income securities will outperform equity investments. The performance of the Balanced Growth Fund and the Balanced Income Fund depends on the performance of the underlying Funds in which they invest.
7. IN-KIND TRANSFER OF SECURITIES
During the year ended June 30, 2013, the Growth Fund redeemed shares of beneficial interest in the form of securities and cash totaling $326,398 ($ Thousands). These securities were transferred at their current value on the date of such transactions.
| Date of Transfer | Shares Redeemed (Thousands) | Value of Investment Securities ($ Thousands) | Gains ($ Thousands) | Cash ($ Thousands) | ||||||||||||
| 09/25/12 | 9,472 | $ | 309,299 | $ | 57,120 | $ | 17,099 | |||||||||
During the year ended June 30, 2013, the Income Fund redeemed shares of beneficial interest in the form of securities and cash totaling $78,475 ($ Thousands). These securities were transferred at their current value on the date of such transactions.
| Date of Transfer | Shares Redeemed (Thousands) | Value of Investment Securities ($ Thousands) | Gains ($ Thousands) | Cash ($ Thousands) | ||||||||||||
| 09/25/12 | 3,342 | $ | 69,860 | $ | 2,278 | $ | 8,615 | |||||||||
During the year ended June 30, 2012, the Income Fund redeemed shares of beneficial interest in the form of securities and cash totaling $80,000 ($ Thousands). These securities were transferred at their current value on the date of such transactions.
| Date of Transfer | Shares Redeemed (Thousands) | Value of Investment Securities ($ Thousands) | Gains ($ Thousands) | Cash ($ Thousands) | ||||||||||||
| 04/18/12 | 3,450 | $ | 75,544 | $ | 2,602 | $ | 4,456 | |||||||||
8. RECENT ACCOUNTING PRONOUNCEMENT
In December 2011, the Financial Accounting Standards Board (“FASB”) issued a further update to the guidance “Balance Sheet — Disclosures about Offsetting Assets and Liabilities”. The amendments to this standard require an entity to disclose information about offsetting and related arrangements to enable users of its financial statements to understand the effect of those arrangements on its financial position. The amended guidance is effective for interim and annual reporting periods beginning after January 1, 2013. The adoption of the amendments had no material impact on the financial statements.
In June 2013, the FASB issued an update (“ASU 2013-08”) to ASC Topic 946, Financial Services—Investment Companies (“Topic 946”). ASU 2013-08 amends the guidance in Topic 946 for determining whether an entity qualifies as an investment company and requires certain additional disclosures. ASU 2013-08 is effective for interim and annual reporting periods in fiscal years that begin after December 15, 2013. Management is currently evaluating the impact, if any, of ASU 2013-08 on the Funds’ financial statements.
9. SUBSEQUENT EVENTS
Management has evaluated the need for disclosures and/or adjustments resulting from subsequent events through the date the financial statements were issued. Based on this evaluation, no disclosures and/or adjustments were required to the financial statements as of June 30, 2013.
| 50 | New Covenant Funds / Annual Report / June 30, 2013 |
Table of Contents
Report of Independent Registered Public Accounting Firm
THE BOARD OF TRUSTEES AND SHAREHOLDERS
NEW COVENANT FUNDS:
We have audited the accompanying statements of assets and liabilities of the New Covenant Funds comprised of the New Covenant Growth Fund, New Covenant Income Fund, New Covenant Balanced Growth Fund and New Covenant Balanced Income Fund (collectively, the “Funds”), including the schedules of investments, as of June 30, 2013, and the related statements of operations for the year then ended, the statements of changes in net assets and the financial highlights for each of the years in the two-year period then ended. These financial statements and financial highlights are the responsibility of the Funds’ management. Our responsibility is to express an opinion on these financial statements and financial highlights based on our audits. The financial highlights for each of the years in the three-year period ended June 30, 2011, were audited by other auditors. Those auditors expressed an unqualified opinion on the financial highlights in their report dated August 29, 2011.
We conducted our audits in accordance with the standards of the Public Company Accounting Oversight Board (United States). Those standards require that we plan and perform the audits to obtain reasonable assurance about whether the financial statements and financial highlights are free of material misstatement. An audit includes examining, on a test basis, evidence supporting the amounts and disclosures in the financial statements. Our procedures included confirmation of securities owned as of June 30, 2013, by correspondence with custodians, brokers and the transfer agent or other appropriate auditing procedures. An audit also includes assessing the accounting principles used and significant estimates made by management, as well as evaluating the overall financial statement presentation. We believe that our audits provide a reasonable basis for our opinion.
In our opinion, the financial statements and financial highlights referred to above present fairly, in all material respects, the financial position of each of the funds comprising the New Covenant Funds as of June 30, 2013, the results of their operations for the year then ended, the changes in their net assets and the financial highlights for each of the years in the two-year period then ended, in conformity with U.S. generally accepted accounting principles.

Philadelphia, Pennsylvania
August 27, 2013
| New Covenant Funds / Annual Report / June 30, 2013 | 51 |
Table of Contents
TRUSTEES AND OFFICERS OF THE TRUST (Unaudited)
The following chart lists Trustees and Officers as of June 30, 2013.
Set forth below are the names, addresses, ages, position with the Trust, Term of Office and Length of Time Served, the principal occupations for the last five years, number of portfolios in fund complex overseen by trustee, and other directorships outside the fund complex of each of the persons currently serving as Trustees and Officers of the Trust. The Trust’s Statement of Additional Information (“SAI”) includes additional information about the Trustees and Officers. The SAI may be obtained without charge by calling 1-800-342-5734.
| Name Address, and Age | Position(s) Held with Trusts | Term of Office And Length of Time Served1 | Principal Occupation(s) During Past Five Years | Number of Portfolios in Fund Complex Overseen by Trustee2 | Other Directorships Held by Trustee | |||||
| INTERESTED TRUSTEES | ||||||||||
Robert A. Nesher One Freedom Oaks, PA 19456 66 yrs. old | Chairman of the Board of Trustees and President* | since 1982 | Currently performs various services on behalf of SEI for which Mr. Nesher is compensated. | 96 | Trustee of The Advisors’ Inner Circle Fund, The Advisors’ Inner Circle Fund II, Bishop Street Funds, Director of SEI Global Master Fund, plc, SEI Global Assets Fund, plc, SEI Global Investments Fund, plc, SEI Investments Global, Limited, SEI Investments — Global Fund Services, Limited, SEI Investments (Europe), Limited, SEI Investments — Unit Trust Management (UK), Limited, SEI Global Nominee Ltd., SEI Structured Credit Fund, L.P. | |||||
William M. Doran One Freedom Oaks, PA 19456 72 yrs. old | Trustee* | since 1982 | Self-employed consultant since 2003. Partner, Morgan, Lewis & Bockius LLP (law firm) from 1976 to 2003, counsel to the Trust, SEI, SIMC, the Administrator and the Distributor. Secretary of SEI since 1978. | 96 | Trustee of The Advisors’ Inner Circle Fund, The Advisors’ Inner Circle Fund II, Bishop Street Funds, Director of SEI since 1974. Director of the Distributor since 2003. Director of SEI Investments — Global Fund Services, Limited, SEI Investments Global, Limited, SEI Investments (Europe), Limited, SEI Investments (Asia), and SEI Global Nominee Ltd., Limited. | |||||
| TRUSTEES | ||||||||||
George J. Sullivan, Jr. One Freedom Oaks, PA 19456 70 yrs. old | Trustee | since 1996 | Retired since January 2012. Self-Employed Consultant, Newfound Consultants Inc. since April 1997-December 2011. | 96 | Trustee of The Advisors’ Inner Circle Fund, The Advisors’ Inner Circle Fund II, Bishop Street Funds, State Street Navigator Securities Lending Trust, and SEI Structured Credit Fund, L.P., member of the independent review committee for SEI’s Canadian-registered mutual funds. | |||||
| * | Messrs. Nesher and Doran are Trustees who may be deemed as “interested” persons of the Trust as that term is defined in the 1940 Act by virtue of their affiliation with SIMC and the Trust’s Distributor. |
| 1 | There is no stated term of office for the Trustees of the Trust. However, a Trustee must retire from the Board by the end of the calendar year in which the Trustee turns 75 provided that, although there shall be a presumption that each Trustee attaining such age shall retire, the Board may, if it deems doing so to be consistent with the best interest of the Trust, and with the consent of any Trustee that is eligible for retirement, by unanimous vote, extend the term of such Trustee for successive periods of one year. |
| 2 | The Fund Complex includes the following Trusts: SEI Asset Allocation Trust, SEI Daily Income Trust, SEI Institutional Investments Trust, Adviser Managed Trust, SEI Institutional International Trust, SEI Institutional Managed Trust, SEI Liquid Asset Trust, SEI Tax Exempt Trust and SEI Alpha Strategy Portfolios, L.P and New Covenant Funds. |
| 52 | New Covenant Funds / Annual Report / June 30, 2013 |
Table of Contents
The following chart lists Trustees and Officers as of June 30, 2013.
| Name Address, and Age | Position(s) Held with Trusts | Term of Office And Length of Time Served1 | Principal Occupation(s) During Past Five Years | Number of Portfolios in Fund Complex Overseen by Trustee2 | Other Directorships Held by Trustee | |||||
| TRUSTEES (Continued) | ||||||||||
Nina Lesavoy One Freedom Oaks, PA 19456 55 yrs. old | Trustee | since 2003 | Founder and Managing Director, Avec Capital since 2008. Managing Director, Cue Capital from March 2002-March 2008. | 96 | Director of SEI Structured Credit Fund, L.P. | |||||
James M. Williams One Freedom Oaks, PA 19456 65 yrs. old | Trustee | since 2004 | Vice President and Chief Investment Officer, J. Paul Getty Trust, Non-Profit Foundation for Visual Arts, since December 2002. | 96 | Trustee/Director of Ariel Mutual Funds, and SEI Structured Credit Fund, L.P. | |||||
Mitchell A. Johnson One Freedom Oaks, PA 19456 71 yrs. old | Trustee | Since 2007 | Private Investor since 1994. | 96 | Trustee of the Advisors’ Inner Circle Fund, The Advisors’ Inner Circle Fund II, and Bishop Street Funds. | |||||
Hubert L. Harris, Jr. One Freedom Oaks, PA 19456 69 yrs. old | Trustee | since 2008 | Retired since December 2005. Chief Executive Officer and Chair of the Board of Directors, AMVESCAP Retirement, Inc., 1997-December 2005. Chief Executive Officer, INVESCO North America, September 2003-December 2005. | 96 | Director of Colonial BancGroup, Inc. and St. Joseph’s Translational Research Institute; Chair of the Board of Trustees, Georgia Tech Foundation, Inc. (nonprofit corporation); Board of Councilors of the Carter Center. | |||||
| OFFICERS | ||||||||||
Robert A. Nesher One Freedom Oaks, PA 19456 66 yrs. old | President & CEO | since 2005 | Currently performs various services on behalf of SEI for which Mr. Nesher is compensated. | N/A | N/A | |||||
Peter A. Rodriguez One Freedom Oaks, PA 19456 51 yrs. old | Controller and Chief Financial Officer | since 2011 | Director, Fund Accounting, SEI Investments Global Funds Services (March 2011, September 2002 to March 2005 and 1997- 2002); Director, Mutual Fund Trading, SEI Private Trust Company (May 2009 to February 2011); Director, Asset Data Services, Global Wealth Services (June 2006 to April 2009); Director, Portfolio Accounting, SEI Investments Global Funds Services (March 2005 to June 2006). | N/A | N/A | |||||
Russell Emery One Freedom Oaks, PA 19456 50 yrs. old | Chief Compliance Officer | since 2006 | Chief Compliance Officer of SEI Institutional Managed Trust, SEI Asset Allocation Trust, SEI Institutional International Trust, SEI Liquid Asset Trust, SEI Tax Exempt Trust, SEI Institutional Investments Trust, The Advisors’ Inner Circle Fund, The Advisors’ Inner Circle Fund II, and Bishop Street Funds, since March 2006. Chief Compliance Officer of SEI Structured Credit Fund, LP and SEI Alpha Strategy Portfolios, LP since June 2007. Chief Compliance Officer of Adviser Managed Trust since December 2010. | N/A | N/A | |||||
| New Covenant Funds / Annual Report / June 30, 2013 | 53 |
Table of Contents
TRUSTEES AND OFFICERS OF THE TRUST (Unaudited)
The following chart lists Trustees and Officers as of June 30, 2013.
| Name Address, and Age | Position(s) Held with Trusts | Term of Office And Length of Time Served1 | Principal Occupation(s) During Past Five Years | Number of Portfolios in Fund Complex Overseen by Trustee2 | Other Directorships Held by Trustee | |||||
| OFFICERS (Continued) | ||||||||||
Timothy D. Barto One Freedom Oaks, PA 19456 45 yrs. old | Vice President and Secretary | since 2002 | General Counsel, Vice President and Secretary of SIMC and the Administrator since 2004. Vice President and Assistant Secretary of SEI since 2001. Vice President of SIMC and the Administrator since 1999. | N/A | N/A | |||||
Aaron Buser One Freedom Oaks, PA 19456 42 yrs. old | Vice President and Assistant Secretary | since 2008 | Vice President and Assistant Secretary of SIMC since 2007. Associate at Stark & Stark (2004-2007). | N/A | N/A | |||||
David F. McCann One Freedom Oaks, PA 19456 37 yrs. old | Vice President and Assistant Secretary | since 2009 | Vice President and Assistant Secretary of SIMC since 2008. Attorney, Drinker Biddle & Reath, LLP (law firm), May 2005-October 2008. Attorney, Pepper Hamilton, LLP (law firm), September 2001-May 2005. | N/A | N/A | |||||
Stephen G. MacRae One Freedom Oaks, PA 19456 45 yrs. old | Vice President | since 2012 | Director of Global Investment Product Management, January 2004 to present. | N/A | N/A | |||||
Edward McCusker One Freedom Oaks, PA 19456 29 yrs. old | Privacy Officer and Anti-Money Laundering Compliance Officer | since 2013 | Compliance Officer of SEI Investments Company, May 2011-April 2013. Project Manager and AML Operations Lead of SEI Private Trust Company, September 2010-May 2011. Private Banking Client Service Professional of SEI Private Banking and Trust, September 2008-September 2010. | N/A | N/A |
| 1 | There is no stated term of office for the Trustees of the Trust. However, a Trustee must retire from the Board by the end of the calendar year in which the Trustee turns 75 provided that, although there shall be a presumption that each Trustee attaining such age shall retire, the Board may, if it deems doing so to be consistent with the best interest of the Trust, and with the consent of any Trustee that is eligible for retirement, by unanimous vote, extend the term of such Trustee for successive periods of one year. |
| 2 | The Fund Complex includes the following Trusts: SEI Asset Allocation Trust, SEI Daily Income Trust, SEI Institutional Investments Trust, Adviser Managed Trust, SEI Institutional International Trust, SEI Institutional Managed Trust, SEI Liquid Asset Trust, SEI Tax Exempt Trust and SEI Alpha Strategy Portfolios, L.P. and New Covenant Funds |
| 54 | New Covenant Funds / Annual Report / June 30, 2013 |
Table of Contents
Disclosure of Fund Expenses (Unaudited)
June 30, 2013
All mutual funds have operating expenses. As a shareholder of a mutual fund, your investment is affected by these ongoing costs, which include (among others) costs for portfolio management, administrative services, and shareholder reports like this one. It is important for you to understand the impact of these costs on your investment returns.
Operating expenses such as these are deducted from the mutual fund’s gross income and directly reduce its final investment return. These expenses are expressed as a percentage of the mutual fund’s average net assets; this percentage is known as the mutual fund’s expense ratio.
The following examples use the expense ratio and are intended to help you understand the ongoing costs (in dollars) of investing in your Fund and to compare these costs with those of other mutual funds. The examples are based on an investment of $1,000 made at the beginning of the period shown and held for the entire period.
The table below illustrates your Fund’s costs in two ways:
Actual Fund Return. This section helps you to estimate the actual expenses after fee waivers that your Fund incurred over the period. The “Expenses Paid During Period” column shows the actual dollar expense cost incurred by a $1,000 investment in the Fund, and the “Ending Account Value” number is derived from deducting that expense cost from the Fund’s gross investment return.
You can use this information, together with the actual amount you invested in your Fund, to estimate the expenses you paid over that period. Simply divide your actual starting account value by $1,000 to arrive at a ratio (for example, an $8,600 account value divided by $1,000 = 8.6), then multiply that ratio by the number shown for your Fund under “Expenses Paid During Period.”
Hypothetical 5% Return. This section helps you compare your Fund’s costs with those of other mutual funds. It assumes that your Fund had an annual 5% return before expenses during the year, but that the expense ratio (Column 3) is unchanged. This example is useful in making comparisons because the Securities and Exchange Commission requires all mutual funds to make this 5% calculation. You can assess your Fund’s comparative cost by comparing the hypothetical result for your Fund in the “Expenses Paid During Period” column with those that appear in the same charts in the shareholder reports for other mutual funds.
NOTE: Because the return is set at 5% for comparison purposes — NOT your Fund’s actual return — the account values shown do not apply to your specific investment.
| Beginning Account Value 1/1/2013 | Ending Account Value 6/30/13 | Annualized Expense Ratios | Expenses Paid During Period* | |||||||||||||
Growth Fund | ||||||||||||||||
Actual Fund Return | $ | 1,000.00 | $ | 1,084.20 | 1.02 | % | $ | 5.27 | ||||||||
Hypothetical 5% Return | $ | 1,000.00 | $ | 1,019.74 | 1.02 | % | $ | 5.11 | ||||||||
Income Fund | ||||||||||||||||
Actual Fund Return | $ | 1,000.00 | $ | 979.20 | 0.80 | % | $ | 3.93 | ||||||||
Hypothetical 5% Return | $ | 1,000.00 | $ | 1,020.83 | 0.80 | % | $ | 4.01 | ||||||||
Balanced Growth Fund | ||||||||||||||||
Actual Fund Return | $ | 1,000.00 | $ | 1,041.20 | 0.14 | % | $ | 0.71 | ||||||||
Hypothetical 5% Return | $ | 1,000.00 | $ | 1,024.10 | 0.14 | % | $ | 0.70 | ||||||||
Balanced Income Fund | ||||||||||||||||
Actual Fund Return | $ | 1,000.00 | $ | 1,014.90 | 0.20 | % | $ | 1.00 | ||||||||
Hypothetical 5% Return | $ | 1,000.00 | $ | 1,023.80 | 0.20 | % | $ | 1.00 | ||||||||
* Expenses are equal to the Fund’s annualized expense ratio multiplied by the average account value over the period, multiplied by 181/365 (to reflect the one-half year period shown).
| New Covenant Funds / Annual Report / June 30, 2013 | 55 |
Table of Contents
Notice to Shareholders (Unaudited)
For shareholders who do not have a June 30, 2013 taxable year end, this notice is for information purposes only. For shareholders with a June 30, 2013, taxable year end, please consult your tax adviser as to the pertinence of this notice.
For the fiscal year ended June 30, 2013 the Funds are designating long term and qualifying dividend income with regard to distributions paid during the year as follows:
| Fund | (A) Long-Term Capital Gains Distributions (Tax Basis) | (B) Ordinary Income Distributions (Tax Basis) | Total Distributions (Tax Basis) | (C) Dividends Qualifying for Corporate Dividends Rec. Deduction (1) | (D) Qualifying Dividend Income (15% Tax Rate for QDI) (2) | (E) U.S. Government Interest (3) | Interest Related Dividends (4) | Short-Term Capital Gain Dividends (5) | ||||||||||||||||||||||||
| New Covenant Growth Fund | 0.00 | % | 100.00 | % | 100.00 | % | 100.00 | % | 100.00 | % | 0.00 | % | 0.01 | % | 0.00 | % | ||||||||||||||||
| New Covenant Income Fund | 0.00 | % | 100.00 | % | 100.00 | % | 0.00 | % | 0.00 | % | 6.93 | % | 99.12 | % | 0.00 | % | ||||||||||||||||
| New Covenant Balanced Growth Fund | 0.00 | % | 100.00 | % | 100.00 | % | 74.54 | % | 72.23 | % | 2.76 | % | 48.01 | % | 0.00 | % | ||||||||||||||||
| New Covenant Balanced Income Fund | 0.00 | % | 100.00 | % | 100.00 | % | 57.49 | % | 53.87 | % | 3.80 | % | 74.77 | % | 0.00 | % | ||||||||||||||||
| (1) | Qualifying dividends represent dividends which qualify for the corporate dividends received deduction. |
| (2) | The percentage in this column represents the amount of “Qualifying Dividend Income” and is reflected as a percentage of “Ordinary Income Distributions.” It is the intention of each of the aforementioned Funds to designate the maximum amount permitted by law. The information reported herein may differ from the information and distributions taxable to the shareholders for the calendar year ending December 31, 2013. Complete information will be computed and reported in conjunction with your 2013 Form 1099-DIV. |
| (3) | “U.S. Government Interest” represents the amount of interest that was derived from direct U.S. Government obligations and distributed during the fiscal year. This amount is reflected as a percentage of total ordinary income distributions (the total of short-term capital gain and net investment income distributions). Generally, interest from direct U.S. Government obligations is exempt from state income tax. However, for shareholders who are residents of California, Connecticut and New York, the statutory threshold requirements were not satisfied to permit exemption of these amounts from state income. |
| (4) | The percentage in this column represents the amount of “Interest Related Dividends” and is reflected as a percentage of net investment income distributions that is exempt from U.S. withholding tax when paid to foreign investors. |
| (5) | The percentage in this column represents the amount of “Short-Term Capital Gain Dividends” and is reflected as a percentage of short-term capital gain distributions that is exempt from U.S. withholding tax when paid to foreign investors. |
Items (A) and (B) are based on the percentage of each Fund’s total distribution.
Items (C) and (D) are based on the percentage of ordinary income distributions of each Fund. Item (E) is based on the percentage of gross income of each Fund.
Please consult your tax adviser for proper treatment of this information. This notification should be kept with your permanent tax records.
| 56 | New Covenant Funds / Annual Report / June 30, 2013 |
Table of Contents
NEW COVENANT FUNDS ANNUAL REPORT JUNE 30, 2013
Robert A. Nesher, Chairman
Trustees
William M. Doran
George J. Sullivan, Jr.
Nina Lesavoy
James M. Williams
Mitchell A. Johnson
Hubert L. Harris, Jr.
Officers
Robert A. Nesher
President and Chief Executive Officer
Peter A. Rodriguez
Controller and Chief Financial Officer
Russell Emery
Chief Compliance Officer
Timothy D. Barto
Vice President, Secretary
David F. McCann
Vice President, Assistant Secretary
Aaron Buser
Vice President, Assistant Secretary
Stephen G. MacRae
Vice President
Edward McCusker
Anti-Money Laundering Compliance Officer Privacy Officer
Investment Adviser
SEI Investments Management Corporation
Administrator
SEI Investments Global Funds Services
Distributor
SEI Investments Distribution Co.
Legal Counsel
Morgan, Lewis & Bockius LLP
Independent Registered Public Accounting Firm
KPMG LLP
This report and the financial statements contained herein are submitted for the general information of the shareholders of the Trust and must be preceded or accompanied by a current prospectus. Shares of the Funds are not deposits or obligations of, or guaranteed or endorsed by, any bank. The shares are not federally insured by the Federal Deposit Insurance Corporation (FDIC), the Federal Reserve Board, or any other government agency. Investment in the shares involves risk, including the possible loss of principal.
Table of Contents
One Freedom Valley Drive
Oaks, Pennsylvania 19456
NCF-F-001 (06/13)
Table of Contents
Item 2. Code of Ethics.
The Registrant has adopted a code of ethics that applies to the Registrant’s principal executive officer, principal financial officer, comptroller or principal accounting officer, and any person who performs a similar function.
Item 3. Audit Committee Financial Expert.
(a)(1) The Registrant’s Board of Trustees has determined that the Registrant has at least two audit committee financial experts serving on the audit committee.
(a) (2) The audit committee financial experts are George J. Sullivan, Jr. and Hubert L. Harris, Jr. Messrs. Sullivan and Harris are independent as defined in Form N-CSR Item 3 (a) (2).
Item 4. Principal Accountant Fees and Services.
Fees billed by KPMG LLP (“KPMG”) related to the Registrant.
KPMG billed the Registrant aggregate fees for services rendered to the Registrant for the fiscal years 2013 and 2012 as follows:
| Fiscal 2013 | Fiscal 2012 | |||||||||||||||||||||||||
| All fees and services to the Registrant that were pre- approved | All fees and services to service affiliates that were pre- approved | All other fees and services to service affiliates that did not require pre-approval | All fees and services to the Registrant that were pre- approved | All fees and services to service affiliates that were pre- approved | All other fees and services to service affiliates that did not require pre-approval | |||||||||||||||||||||
(a) | Audit Fees(1) | $ | 60,500 | N/A | $ | 0 | $ | 69,500 | N/A | $ | 0 | |||||||||||||||
(b) | Audit-Related Fees(3) | $ | 0 | $ | 20,000 | $ | 0 | $ | 0 | $ | 20,000 | $ | 0 | |||||||||||||
(c) | Tax Fees (Tax return review | $ | 0 | $ | 8,000 | $ | 0 | $ | 0 | $ | 5,000 | $ | 0 | |||||||||||||
(d) | All Other Fees(2) | $ | 0 | $ | 237,000 | $ | 0 | $ | 0 | $ | 236,000 | $ | 0 | |||||||||||||
Notes:
| (1) | Audit fees include amounts related to the audit of the Registrant’s annual financial statements and services normally provided by the accountant in connection with statutory and regulatory filings. |
| (2) | See Item 4(g) for a description of the services comprising the fees disclosed under this category. |
| (3) | Audit-related fees include amounts related to attestation reporting over compliance with an exemptive order under the federal securities laws. |
| (4) | Tax fees include amounts related to tax compliance and consulting services. |
Table of Contents
(e)(1) The Registrant’s Audit Committee has adopted an Audit and Non-Audit Services Pre-Approval Policy (the “Policy”), which sets forth the procedures and the conditions pursuant to which services proposed to be performed by the independent auditor of the Registrant may be pre-approved.
The Policy provides that all requests or applications for proposed services to be provided by the independent auditor must be submitted to the Registrant’s Chief Financial Officer (“CFO”) and must include a detailed description of the services proposed to be rendered. The CFO will determine whether such services: (1) require specific pre-approval; (2) are included within the list of services that have received the general pre-approval of the Audit Committee pursuant to the Policy; or (3) have been previously pre-approved in connection with the independent auditor’s annual engagement letter for the applicable year or otherwise. In any instance where services require pre-approval, the Audit Committee will consider whether such services are consistent with SEC’s rules and whether the provision of such services would impair the auditor’s independence.
Requests or applications to provide services that require specific pre-approval by the Audit Committee will be submitted to the Audit Committee by the CFO. The Audit Committee will be informed by the CFO on a quarterly basis of all services rendered by the independent auditor. The Audit Committee has delegated specific pre-approval authority to either the Audit Committee Chair or financial experts, provided that the estimated fee for any such proposed pre-approved service does not exceed $100,000 and any pre-approval decisions are reported to the Audit Committee at its next regularly scheduled meeting.
Services that have received the general pre-approval of the Audit Committee are identified and described in the Policy. In addition, the Policy sets forth a maximum fee per engagement with respect to each identified service that has received general pre-approval.
All services to be provided by the independent auditor shall be provided pursuant to a signed written engagement letter with the Registrant, the investment advisor or applicable control affiliate (except that matters as to which an engagement letter would be impractical because of timing issues or because the matter is small may not be the subject of an engagement letter) that sets forth both the services to be provided by the independent auditor and the total fees to be paid to the independent auditor for those services.
In addition, the Audit Committee has determined to take additional measures on an annual basis to meet its responsibility to oversee the work of the independent auditor and to assure the auditor’s independence from the Registrant, such as reviewing a formal written statement from the independent auditor delineating all relationships between the independent auditor and the Registrant, and discussing with the independent auditor its methods and procedures for ensuring independence.
(e)(2) Percentage of fees billed applicable to non-audit services pursuant to waiver of pre-approval requirement were as follows:
| Fiscal 2013 | Fiscal 2012 | |||||||
Audit-Related Fees | 0 | % | 0 | % | ||||
Tax Fees | 0 | % | 0 | % | ||||
All Other Fees | 0 | % | 0 | % | ||||
(f) Not Applicable.
(g)(1) The aggregate non-audit fees and services billed by KPMG for the fiscal years 2013 and 2012 were $237,000 and $236,000, respectively. Non-audit fees consist of SSAE No. 16 review of fund accounting and administration operations, attestation report in accordance with Rule 17Ad-13, and agreed upon procedures report over certain internal controls related to compliance with federal securities laws and regulations and tax compliance and consulting services for various services affiliates of the registrant.
Table of Contents
(h) During the past fiscal year, Registrant’s principal accountant provided certain non-audit services to Registrant’s investment adviser or to entities controlling, controlled by, or under common control with Registrant’s investment adviser that provide ongoing services to Registrant that were not subject to pre-approval pursuant to paragraph (c)(7)(ii) of Rule 2-01 of Regulation S-X. The Audit Committee of Registrant’s Board of Trustees reviewed and considered these non-audit services provided by Registrant’s principal accountant to Registrant’s affiliates, including whether the provision of these non-audit services is compatible with maintaining the principal accountant’s independence.
Item 5. Audit Committee of Listed Registrants.
Not applicable.
Item 6. Schedule of Investments
(a) The Schedules of Investments are included as part of the report to shareholders filed under Item 1 of this form.
Item 7. Disclosure of Proxy Voting Policies and Procedures for Closed-End Management Investment Companies.
Not applicable.
Item 8. Portfolio Managers of Closed-End Management Investment Companies
Not applicable.
Item 9. Purchases of Equity Securities by Closed-End Management Company and Affiliated Purchasers.
Not applicable.
Item 10. Submission of Matters to a Vote of Security Holders.
The Registrant has a standing Governance Committee (the “Committee”) currently consisting of the Independent Trustees. The Committee is responsible for evaluating and recommending nominees for election to the Registrant’s Board of Trustees (the “Board”). Pursuant to the Committee’s Charter, adopted on February 22, 2012, the Committee will review all shareholder recommendations for nominations to fill vacancies on the Board if such recommendations are submitted in writing and addressed to the Committee at the Registrant’s office.
Item 11. Controls and Procedures.
(a) The Registrant’s principal executive and principal financial officers, or persons performing similar functions, have concluded that the Registrant’s disclosure controls and procedures (as defined in Rule 30a-3(c) under the Investment Company Act of 1940 (the “1940 Act”)) are effective, based on the evaluation of these controls and procedures required by Rule 30a-3(b) under the 1940 Act and Rules 13a-15(b) or 15d-15(b) under the Securities Exchange Act of 1934 as of a date within 90 days of the filing date of this report.
(b) There were no changes in the Registrant’s internal control over financial reporting (as defined in Rule 30a-3(d) under the 1940 Act) that occurred during the second fiscal quarter of the period covered by this report that have materially affected, or are reasonably likely to materially affect, the Registrant’s internal control over financial reporting.
Items 12. Exhibits.
(a)(1) Code of Ethics attached hereto.
(a)(2) A separate certification for the principal executive officer and the principal financial officer of the Registrant as required by Rule 30a-2(a) under the Investment Company Act of 1940, as amended (17 CFR 270.30a-2(a)), are filed herewith.
(b) Officer certifications as required by Rule 30a-2(b) under the Investment Company Act of 1940, as amended (17 CFR 270.30a-2(b)) also accompany this filing as an exhibit.
Table of Contents
SIGNATURES
Pursuant to the requirements of the Securities Exchange Act of 1934 and the Investment Company Act of 1940, the Registrant has duly caused this report to be signed on its behalf by the undersigned, thereunto duly authorized.
| New Covenant Funds | ||
| By | /s/ Robert A. Nesher | |
| Robert A. Nesher | ||
| President & CEO | ||
Date: September 5, 2013
Pursuant to the requirements of the Securities Exchange Act of 1934 and the Investment Company Act of 1940, this report has been signed below by the following persons on behalf of the Registrant and in the capacities and on the dates indicated.
| By | /s/ Robert A. Nesher | |||||||
| Robert A. Nesher | ||||||||
| President & CEO |
Date: September 5, 2013
| By | /s/ Peter A. Rodriguez | |
| Peter A. Rodriguez | ||
| Controller & CFO |
Date: September 5, 2013