UNITED STATES
SECURITIES AND EXCHANGE COMMISSION
Washington, D.C. 20549
FORM N-CSR
CERTIFIED SHAREHOLDER REPORT OF REGISTERED
MANAGEMENT INVESTMENT COMPANIES
Investment Company Act File Number 811-09025
New Covenant Funds
(Exact name of registrant as specified in charter)
SEI Investments
One Freedom Valley Drive
Oaks, PA 19456
(Address of principal executive offices) (Zip code)
The Corporation Trust Company
Corporation Trust Center
1209 Orange Street
Wilmington, Delaware 19801
(Name and address of agent for service)
Registrant’s telephone number, including area code: 1-877-835-4531
Date of fiscal year end: June 30, 2016
Date of reporting period: June 30, 2016
| Item 1. | Reports to Stockholders. |

| | |
| | June 30, 2016 ANNUAL REPORT |
| |
| | New Covenant Funds |
| |
| | ➤ New Covenant Growth Fund |
| | ➤ New Covenant Income Fund |
| | ➤ New Covenant Balanced Growth Fund |
| | ➤ New Covenant Balanced Income Fund |

TABLE OF CONTENTS
The Trust files its complete schedule of portfolio holdings with the Securities and Exchange Commission (the ‘‘Commission’’) for the first and third quarters of each fiscal year on Form N-Q within sixty days after the end of the period. The Trust’s Forms N-Q are available on the Commission’s website at http://www.sec.gov, and may be reviewed and copied at the Commission’s Public Reference Room in Washington, DC. Information on the operation of the Public Reference Room may be obtained by calling 1-800-SEC-0330.
A description of the policies and procedures that the Trust uses to determine how to vote proxies relating to portfolio securities, as well as information relating to how a Fund voted proxies relating to portfolio securities during the most recent 12-month period ended June 30, is available (i) without charge, upon request, by calling 1-877-835-4531; and (ii) on the Commission’s website at http://www.sec.gov.
NEW COVENANT FUNDS — JUNE 30, 2016 (Unaudited)
To Our Shareholders:
The Funds’ fiscal year — July 1, 2015 through June 30, 2016 — was notable for several key themes: energy-sector volatility spread to other areas of the market amid continued oil-price weakness, followed by a partial recovery; major central-bank policies diverged, with the Federal Reserve (Fed) commencing rate increases while the European Central Bank (ECB), Bank of Japan (BOJ) and People’s Bank of China (PBOC) deepened their commitments to monetary accommodation; and, as a result of the diverging policies, major developed-market sovereign-bond yields continued to fall, with some edging into negative-rate territory. A vote (Brexit) by U.K. citizens in favor of leaving the European Union (EU) took place with roughly a week left in the reporting period, briefly upending global financial markets and presenting major questions about how the relationship will be dissolved.
Geopolitical events
Severe unrest continued in certain areas of the Middle East, driven by the sometimes-opposing and sometimes-overlapping interests of Islamic State, the Syrian regime, Syrian nationalists, Kurdish forces and the Iraqi military. Regional superpowers Iran, Saudi Arabia and Turkey also applied varying degrees of indirect influence. Broader involvement escalated, with Russia’s airpower commitment in early fall and a redoubled coalition of Western powers targeting Islamic State after a series of attacks by religious extremists across the globe. A U.S.-Russia-brokered ceasefire between the Syrian regime and nationalist rebels (excluding Islamic State and other terrorist groups) came into effect during late February, maintaining a questionable hold through the end of the reporting period. Iraqi forces, supported by U.S. air and ground resources, began to make notable progress in reversing Islamic State gains as the end of the reporting period approached; at the same time, incidences of terrorism appeared to increase in Africa, Asia, Europe, the Middle East and North America. While the conflict that originated in Syria and Iraq appears to have influenced destabilizing events elsewhere around the globe, and taken a terrible human toll, it has not had a significant impact on global markets or the economy at this point.
It will be interesting, however, to see the ultimate effects of the ensuing Syrian migrant crisis on the European Union (EU). Immigration served as one of the key points of contention leading up to Great Britain’s EU referendum, which resulted in a vote to leave the EU just before the end of the reporting period. U.K. Prime Minister David Cameron tendered his resignation as a result, and a litany of questions entered the public dialogue on topics ranging from when the government would commence the formal withdrawal process, to how negotiations would fare regarding trade agreements, and the likelihood that immigration goals espoused by the Leave campaign would come to pass.
Immigration-driven ballot-box uncertainty has also taken center stage in the U.S. presidential election, where the leading primary candidates of the two major political parties were essentially positioned to clinch their nominations at the end of the reporting period.
Despite the considerable aforementioned instability in the Middle East, the price of oil remained mostly insulated from regional developments. Oil-price weakness, which persisted for the first two-thirds of the reporting period, remained primarily attributable to oversupply: members of the Organization of Petroleum Exporting Countries failed to agree on production cuts; U.S. Congress approved the restoration of oil exports in mid-December; and Iran’s multilateral agreement on the scope of its nuclear program paved the way for its post-sanction return as a major low-cost oil supplier. The International Energy Agency, however, projected a return to supply-demand balance in 2017.
Energy-export-dependent Venezuela succumbed to the economically depressive effects of low oil prices during the fiscal year. Food shortages and a breakdown of the rule of law appeared to worsen as the reporting period concluded, despite a partial rebound in the price of oil. Brazil’s prospects also paled during the reporting period, as a corruption investigation centering on its lead state-run oil company enveloped a cross-section of political leaders — culminating in the impeachment of President Dilma Rousseff.
Economic performance
U.S. economic growth in the second quarter of 2015 bordered on impressive, due in large part to strong consumer activity. The pace of growth essentially halved during the third quarter amid slow sales and lackluster export activity. Fourth-quarter growth decelerated further, as industrial production and manufacturing came under pressure from the effects of U.S. dollar strength. Growth during the first quarter of 2016 slowed more still; although business activity improved toward the end of the quarter and early in the second quarter. Retail sales and consumer spending surged in April 2016, foreshadowing a potential rebound in second-quarter economic growth. At the end of the reporting
| | |
| New Covenant Funds / Annual Report / June 30, 2016 | | 1 |
NEW COVENANT FUNDS — JUNE 30, 2016 (Unaudited) (Continued)
period, the Federal Reserve Bank of Atlanta projected second-quarter economic growth would roughly double the first quarter’s pace; while welcomed, it falls far short of the growth rate achieved during the second quarter of 2015. The labor market improved consistently for most of the fiscal year, with the unemployment rate declining from 5.3% in July 2015 to 4.9% in June 2016. Average hourly earnings and real personal incomes gained with relative steadiness, bouncing around a rough mean of about 0.2% per month over the reporting period. The Fed raised its target interest rate in mid-December for the first time since 2006, leaving behind a near-zero rate that had been in place since late 2008.
Europe maintained steady, if modest, economic expansion during the second, third and fourth quarters of 2015, with an uptick in the growth rate during the first quarter of 2016. The ECB’s expansion of its asset-purchase program and introduction of a negative deposit rate in early 2015 (prior to the start of the Funds’ fiscal year) was followed during the reporting period by a deeper foray into negative-rate territory and additional asset-purchase commitments. The eurozone contended with negotiations at the beginning of the reporting period regarding the restructuring of Greek public-debt obligations, which pitted Greece’s ruling Syriza Party against other euro-member states, the ECB and the International Monetary Fund. A new round of discussions on Greek debt relief occurred toward the end of the reporting period, but with less conflict among parties. As the end of the fiscal year approached, U.K. economic data increasingly depicted moderating conditions or outright slowdown amid uncertainty caused by the looming Brexit vote.
In the Asia-Pacific region, Japan’s economy swung between advances and declines during the fiscal year, beginning with a small contraction in gross domestic product (GDP) during the second quarter of 2015. Modest growth during the third quarter was followed by a fourth-quarter contraction, and then a return to expansion during the first quarter of 2016. The yen remained in a relatively narrow range compared to the U.S. dollar during most of the reporting period, then strengthened substantially starting at the end of 2015. A renewed surge in yen value relative to other major currencies was one of the more notable post-Brexit outcomes, despite expansions during the period to the BOJ’s asset-purchase program and the adoption of a negative benchmark interest rate. China, meanwhile, experienced steadily declining growth, albeit from levels considerably higher than most other economies. The PBOC loosened its monetary-policy stance, reducing benchmark interest rates and bank-reserve requirements at multiple points during the reporting period. The government’s decision to peg its currency (the renminbi) to a basket of currencies instead of just the U.S. dollar, along with the decline of the renminbi against the U.S. dollar during the third quarter of 2015, had significant global repercussions — especially given the implications for a potential rebalancing of global trade and uncertainty about potential future actions.
Market developments
Risk assets were treading water at the start of the fiscal year after spending June 2015 (immediately prior to the start of the reporting period) in a downtrend that originated with deep losses on China’s mainland stock exchanges. More severe declines in late summer, when China moderately devalued its currency, were followed by a partial recovery through October. As 2015 came to a close, the questionable health of U.S. energy companies (which was caused by a persistent, multi-year oil-price decline) raised concerns among high-yield bond investors. This resulted in a selloff that likely discouraged investor risk appetite, keeping a lid on performance at year end and into the new year.
The beginning of 2016 was marked by a global flight to quality, benefitting safe-haven assets at the expense of risk assets. A trend reversal took place in mid-February, with risk assets rallying into April, followed by mixed performance until late June. The price of oil, and commodities in general, also advanced sharply from mid-February into June. Brexit caused a major spike in global stock-market volatility, yields were driven downward to record levels on perceived safe-haven investments like developed-market government bonds, and the currencies at the center of the developments — sterling and the euro — weakened substantially relative to the U.S. dollar and Japanese yen. Most of the stock-market losses, however, were recovered within a week’s time as the reporting period drew to a close.
The U.S. dollar ended the fiscal year less than 1% higher against a trade-weighted basket of major currencies, having been as much as 6.5% higher in late January, and 2.5% lower in early May.
First-quarter 2016 earnings declined for companies in the S&P 500 Index; although a majority fared better than analysts’ late-quarter average estimates. The consumer discretionary sector fared best, reporting earnings growth approaching 20% year over year; the energy sector lagged, reporting an aggregate year-over-year loss of about 7%. Analysts forecast another decline in earnings for second-quarter 2016, and estimates of the shortfall continued to deepen through the end of the fiscal year.
| | |
| 2 | | New Covenant Funds / Annual Report / June 30, 2016 |
For the full reporting period, the MSCI All-Country World Index, a proxy for global equities, fell 3.73% in U.S. dollar terms. The MSCI All-Country World ex U.S. Index fell by 10.24%, considerably sharper than the decline of its U.S.-inclusive counterpart. Emerging-market equity returns were more negative in U.S. dollar terms, with the MSCI Emerging Markets Index falling by 12.05%.
U.S. equity returns were modestly positive; the S&P 500 Index returned 3.99% during the fiscal year. U.S. large caps (represented by the Russell 1000 Index) continued to outpace small caps (represented by the Russell 2000 Index), returning 2.93% and -6.73%, respectively. The persistence of U.S. large-cap outperformance relative to other equities has been remarkable — both within the U.S. and internationally — with returns topping not just small caps, but also emerging markets, Europe, Japan and the global stock market when annualized over one, three, five and ten years through the end of the reporting period. The extended stretch of U.S. large-cap outperformance has coincided with a challenging environment for active U.S. large-cap strategies; conversely, active managers have fared much better in benchmark-relative terms within international and emerging-market equity strategies.
Defensive and less-cyclically sensitive equity sectors (which typically exhibit lower volatility in challenging market environments compared to cyclically sensitive sectors) fared relatively well. Utilities, consumer staples and telecommunications were the top-performing sectors in the U.S. and globally, while energy, materials and financials suffered the steepest declines.
Global fixed income, as measured by the Barclays Global Aggregate Bond Index, advanced 8.87% in U.S. dollar terms during the fiscal year. Interest rates generally declined during the reporting period, as major central banks outside of the U.S. guided benchmark rates downward (into negative territory in some cases) and expanded their asset-purchase programs.
U.S. Treasurys generally performed well as the yield curve flattened (bond yields move inversely to prices) and rates fell across most maturities, with only the yields on Treasurys with maturities shorter than two years increasing during the full reporting period.
U.S. investment-grade corporate debt performed well, and the high-yield market was modestly positive. The BofA Merrill Lynch US High Yield Constrained Index increased by 1.74% during the full fiscal year, although a sharp advance beginning in mid-February eliminated a double-digit decline by the end of the reporting period. Mortgage- and asset-backed securities also delivered positive returns during the reporting period.
Emerging-market debt delivered mixed gains. The J.P. Morgan GBI Emerging Markets Global Diversified Index, which tracks local-currency-denominated emerging-market bonds, increased by 2.24% in U.S. dollar terms during the reporting period, bolstered by an impressive late-period rally as U.S. dollar strength waned. The J.P. Morgan EMBI Global Diversified Index, which tracks emerging-market debt denominated in external currencies (such as the U.S. dollar), advanced by 9.79%.
A combination of subdued inflation and dollar strength began to ease in the latter part of the reporting period, reducing headwinds to the performance of inflation-sensitive assets such as Treasury inflation-protected securities and commodities. The latter declined by 15% over the Funds’ fiscal year, according to the TR/CC CRB Commodities Total Return Index, but dropped by almost 32% as recently as mid-February before staging a steep partial recovery.
Our view
The U.K.’s vote to leave the EU is a major political and economic event that will likely weigh on international financial markets, not just for weeks and months, but perhaps for years. The leap into the unknown will likely depress economic growth as business spending freezes until some clarity re-emerges on the country’s trading relationships. Sterling’s plunge immediately following the Leave vote, however, should provide a much-needed offset to the mostly negative impact of all the uncertainty, as U.K. exporters find themselves in a more competitive position.
Britain’s growth prospects were decent prior to Brexit; by contrast, continental Europe was already struggling to improve. Of the many economic imbalances that exist in the world, among the greatest is the huge trade surplus run by the eurozone. In the aftermath of the Leave vote, nationalist parties in various countries are lobbying for their own referendums on continued membership in the EU, which adds to the uncertainty facing investors. The ability of the
| | |
| New Covenant Funds / Annual Report / June 30, 2016 | | 3 |
NEW COVENANT FUNDS — JUNE 30, 2016 (Unaudited) (Concluded)
equity market to bounce back from the immediate shock is heartening, but it is hard to draw firm conclusions on how disruptive Brexit will be on future EU and eurozone economic activity. The fragility of the recovery going into this crisis is a matter of deep concern.
The U.S. has remained resilient despite numerous shocks over the past seven years, and we expect this resilience will once again be on display following the U.K. vote. May’s employment figure was the weakest since 2010, but other labor-market data are not quite as downbeat. Job openings remain in a solid uptrend, rising well beyond the previous cycle’s peak in mid-2007. The first hints of wage pressure have appeared, with a moderate acceleration in wages and total labor compensation apparent on a year-over-year basis. As corporate margins get squeezed by the pick-up in labor costs, the pressure to raise prices will likely intensify.
This puts the Fed in something of a quandary, since the Brexit shock has seemingly upended any possibility of a near-term rise in the funds rate. Market-implied expectations for the next policy-rate move have been pushed out to late 2017; in fact, futures traders have priced in the mild possibility of a rate cut in the near term. Yet, we admit to a growing uneasiness that the central bank may be a falling behind the inflation curve.
We understand that the still-soggy global economy and the shock delivered by the U.K. vote argue for a very cautious process of interest-rate normalization. But if the upward trend in labor costs is sustained, a more aggressive response by the U.S. central bank eventually will be justified.
In the months immediately ahead, investors’ attention will be focused on the U.S. presidential election. Investors need to be prepared for a bit of volatility in the coming months, since the uncertainty level has been ratcheted upward, and will likely remain elevated between now and the election. For now, we lean toward the optimistic side, mainly because U.S. economic and financial fundamentals appear relatively healthy.
One of the more surprising market responses to the Brexit vote is the sharp appreciation of the Japanese yen. This is the last thing that the country needs, since an ultra-strong currency exacerbates downward pressure on inflation. Corporate earnings have begun to roll over in response to the currency’s appreciation. As Japanese yields sink further into negative territory across the curve, we wonder what measures the BOJ will introduce next, since the most recent interest rate moves have failed to weaken the currency or boost the economy.
Investor fears earlier this year of an imminent Chinese debt and currency meltdown have receded. China’s economy mostly appears to be treading water, much like the rest of the world. The government continues to encourage growth fuelled by additional debt, prop up state-owned enterprises and allow its currency to fall. Economic and financial reforms are proceeding, but at an erratic pace. Chinese equities have not shown much spark, however, despite the risk-on environment for emerging-market assets that began in late January.
Globally, the points of general consistency in our investment outlook and positioning are that stability and momentum appear expensive within equities, and that fixed-income managers favor credit at the expense of interest-rate duration.
On behalf of SEI Investments, I want to thank you for your continued confidence. We are working every day to maintain that confidence, and we look forward to serving your investment needs in the future.
Sincerely,

William T. Lawrence, CFA
Managing Director, Portfolio Management Team
| | |
| 4 | | New Covenant Funds / Annual Report / June 30, 2016 |
MANAGEMENT’S DISCUSSION AND ANALYSIS OF FUND PERFORMANCE
JUNE 30, 2016 (Unaudited)
New Covenant Growth Fund
I. Objective
The New Covenant Growth Fund’s (the “Fund”) investment objective is long-term capital appreciation. Dividend income, if any, will be incidental.
II. Investment Approach
The Fund uses a multi-manager approach, relying on a number of sub-advisers with different investment approaches to manage portions of the Fund’s portfolio, under the general supervision of SEI Investments Management Corporation (SIMC). The Fund utilized the following sub-advisers as of June 30, 2016: BlackRock Investment Management, LLC, Brandywine Global Investment Management Company LLC, Coho Partners, Ltd., Parametric Portfolio Associates LLC, and Waddell & Reed Investment Management Company. Coho Partners, Ltd. was added in July of 2015.
III. Return vs. Benchmark
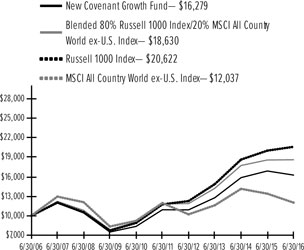
For the one-year period ending June 30, 2016, the Fund returned -3.68% and the Russell 1000 Index returned 2.93%.
IV. Fund Attribution
Market expectations of an improving domestic economy and the Federal Reserve’s (Fed) managed transition from an easing mindset derailed in August as concerns about oil prices, energy stocks, high-yield bonds and emerging markets came to the forefront for investors. This led to a short-lived market correction, during which losses were more pronounced within energy and cyclical sectors, smaller-cap companies and non-U.S. names.
Most of the losses were recovered by early November, as data — including an impressive U.S. jobs report — indicated the domestic economy was improving. This gave way to a modest Fed funds rate hike in December and, as the shareholder letter addressed, set a backdrop of monetary policy differences between the U.S. and other major developed nations that remained on an easing track. This divergence led to strong appreciation of the U.S. dollar versus other currencies, which further exacerbated weakness among non-U.S. investments from a U.S. investor perspective.
High-yield bond market spreads widened again in late November due to concerns about energy companies and emerging markets. As noted in the shareholder letter, investor preference turned back to safety-based assets in both fixed income and equities during December and January. By early February, riskier out-of-favor investments regained momentum and clawed back most of their recent losses on the hopes that the worst had past.
Fund performance struggled due to a combination of forward-looking allocations and traditional stock selection, especially from our value-oriented specialist manager. Sector allocation detracted primarily due to an underweight to the utilities sector during an environment in which safety and stability were favored. All Fund managers were underweight utilities not only for the time period, but also strategically in terms of their respective philosophies. Losses were greater from a stylistic perspective, where forward mean-reverting value strategies (buying inexpensive companies as measured by price-to-earnings or price-to-cash flow ratios, for example) were strongly disfavored. This trend was highly correlated to the declines in oil and energy prices, and continued through the end of the period in response to Brexit and other global growth worries. By contrast, pure safety measures (such as exposure to dividend yield and lower trailing stock volatility) had one of their strongest performances on record.
These crosswinds within the market created an environment that was difficult for Brandywine, our value specialist. The angst about future growth prospects as well as declining sell-side earnings also presented headwinds for Waddell and Blackrock, which trade more on growth prospects. Coho, our defensive specialist that was hired during the period, benefitted from systematic tailwinds, but not by enough to compensate for the underperformance of other managers. Selection outside of these value-oriented headwinds was also negative, particularly within the pharmaceuticals portion of healthcare, and also within diversified financials and the automobile industry.
| | | | | | | | | | | | | | | | | | | | |
| AVERAGE ANNUAL TOTAL RETURN 1,2 | |
| | | | | | Annualized | | | Annualized | | | Annualized | | | Annualized | |
| | | One Year | | | 3 Year | | | 5 Year | | | 10 Year | | | Inception | |
| | | Return | | | Return | | | Return | | | Return | | | to Date | |
New Covenant Growth Fund | | | -3.68% | | | | 8.37% | | | | 8.28% | | | | 4.99% | | | | 5.62% | |
Russell 1000 Index | | | 2.93% | | | | 11.48% | | | | 11.88% | | | | 7.51% | | | | 9.38% | |
MSCI All Country World ex-U.S. Index | | | -10.24% | | | | 1.16% | | | | 0.10% | | | | 1.87% | | | | 4.36% | |
Blended 80% Russell 1000 Index/20% MSCI All Country World ex-U.S. Index | | | 0.19% | | | | 9.38% | | | | 9.48% | | | | 6.42% | | | | 8.47% | |
| | |
| New Covenant Funds / Annual Report / June 30, 2016 | | 5 |
MANAGEMENT’S DISCUSSION AND ANALYSIS OF FUND PERFORMANCE
JUNE 30, 2016 (Unaudited)
New Covenant Growth Fund (Concluded)
Comparison of Change in the Value of a $10,000 Investment in the New Covenant Growth Fund, versus the Russell 1000 Index, MSCI All Country World ex-U.S. Index and Blended 80% Russell 1000 Index/20% MSCI All Country World ex-U.S. Index.
| 1 | For the years ended June 30, 2016. Past performance is not an indication of future performance. Fund Shares were offered beginning 7/1/99. Returns shown do not reflect the deduction of taxes that a shareholder would pay on fund distributions or the redemption of fund shares. The returns for certain periods reflect fee waivers and/or reimbursements in effect for that year; absent fee waivers and reimbursements, performance would have been lower. |
| 2 | This table compares the Fund’s average annual total returns to those of a broad-based index and the Fund’s 80/20 Blended Benchmark, which consists of the Russell 1000 Index and the MSCI All Country World ex-U.S. Index. The Fund’s Blended Benchmark is designed to provide a useful comparison to the Fund’s overall performance and more accurately reflects the Fund’s investment strategy than the broad-based index. |
| | |
| 6 | | New Covenant Funds / Annual Report / June 30, 2016 |
MANAGEMENT’S DISCUSSION AND ANALYSIS OF FUND PERFORMANCE
JUNE 30, 2016 (Unaudited)
New Covenant Income Fund
I. Objective
The New Covenant Income Fund’s (the “Fund”) investment objective is a high level of current income with preservation of capital.
II. Investment Approach
The Fund uses a multi-manager approach, relying on a number of sub-advisers with different investment approaches to manage portions of the Fund’s portfolio, under the general supervision of SEI Investments Management Corporation (SIMC). The Fund utilized the following sub-advisers as of June 30, 2016: Income Research & Management, Western Asset Management Company and Western Asset Management Company Limited. Income Research & Management was added and J.P. Morgan Investment Management Inc. was removed in January of 2016.
III. Return vs. Benchmark
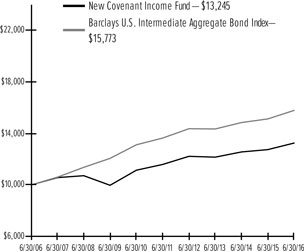
For the one-year period ending June 30, 2016, the Fund returned 4.00% and the Barclays U.S. Intermediate Aggregate Bond Index returned 4.36%.
IV. Fund Attribution
U.S. Treasury yields were volatile during the fiscal year, with short-term yields rising and long-term yields declining as noted in the shareholder letter, resulting in generally positive returns for bonds. Returns were positive for non-Treasurys, including asset-backed, commercial-mortgage securities and agency-mortgage bonds, which all outperformed comparable duration-neutral U.S. Treasurys. While corporate bonds as a whole underperformed comparable Treasurys, the utilities and financials sub-sectors outperformed, while industrial bonds underperformed given the decline in commodity prices.
The Fund provided a positive return as interest rates generally declined over the period. The Fund’s underweight to U.S. Treasurys detracted, as that sector outperformed investment-grade credit as credit spreads widened in the period, although overweights to the financials and utilities sub-sectors added to relative performance. An overweight to mortgage-backed securities (MBS), specifically non-agency MBS, contributed to relative performance, while selection within agency MBS detracted. Overweights to asset-backed securities (ABS) and commercial MBS, as well as selection within the latter with an emphasis on senior securities, also benefitted relative performance over the fiscal year. Additionally, yield-curve positioning
contributed to relative performance with an overweight to 30-year bonds and an underweight to two-year bonds. Western Asset Management’s duration and yield curve posture detracted, while positions in non-agency MBS and ABS contributed. JP Morgan (which was removed from the Fund in January) underperformed due to MBS security selection. Income Research & Management (which was added to the Fund in January) benefited from an overweight to and selection within commercial MBS.
The Fund used Treasury futures, eurodollar futures and to-be-announced (TBA) forward contracts to effectively manage duration, yield-curve and market exposures. (TBA contracts confer the obligation to buy or sell future debt obligations of the three U.S. government-sponsored agencies that issue or guarantee MBS — Fannie Mae, Freddie Mac and Ginnie Mae.) None of these had a meaningful impact on the Fund’s performance.
| | | | | | | | | | | | | | | | | | | | |
| AVERAGE ANNUAL TOTAL RETURN 1 | |
| | | One Year
Return | | | Annualized 3 Year Return | | | Annualized 5 Year Return | | | Annualized 10 Year Return | | | Annualized Inception to Date | |
| New Covenant Income Fund | | | 4.00% | �� | | | 2.92% | | | | 2.71% | | | | 2.85% | | | | 2.78% | |
| Barclays U.S. Intermediate Aggregate Bond Index | | | 4.36% | | | | 3.24% | | | | 2.96% | | | | 4.66% | | | | 6.26% | |
Comparison of Change in the Value of a $10,000 Investment in the New Covenant Income Fund, versus the Barclays U.S. Intermediate Aggregate Bond Index.
| | |
| New Covenant Funds / Annual Report / June 30, 2016 | | 7 |
MANAGEMENT’S DISCUSSION AND ANALYSIS OF FUND PERFORMANCE
JUNE 30, 2016 (Unaudited)
New Covenant Income Fund (Concluded)
| 1 | For the years ended June 30, 2016. Past performance is not an indication of future performance. Fund Shares were offered beginning 7/1/99. Returns shown do not reflect the deduction of taxes that a shareholder would pay on fund distributions or the redemption of fund shares. The returns for certain periods reflect fee waivers and/or reimbursements in effect for that year; absent fee waivers and reimbursements, performance would have been lower. |
| | |
| 8 | | New Covenant Funds / Annual Report / June 30, 2016 |
MANAGEMENT’S DISCUSSION AND ANALYSIS OF FUND PERFORMANCE
JUNE 30, 2016 (Unaudited)
New Covenant Balanced Growth Fund
I. Objective
The New Covenant Balanced Growth Fund’s (the “Fund”) investment objective is to produce capital appreciation with less risk than would be present in a portfolio of only common stocks.
II. Investment Approach
The Fund’s assets are managed under the direction of SEI Investments Management Corporation (“SIMC”), which manages the Fund’s assets, in a way that it believes will achieve the Fund’s investment objective. In order to achieve its investment objective, SIMC allocates the Fund’s assets primarily in shares of the New Covenant Growth Fund (the “Growth Fund”) and the New Covenant Income Fund (the “Income Fund”), with a majority of its assets generally invested in shares of the Growth Fund. Between 45% and 75% of the Fund’s net assets (with a neutral position of approximately 60% of the Fund’s net assets) are invested in shares of the Growth Fund, with the balance of its assets invested in shares of the Income Fund. The Growth and Income Funds, in turn, invest directly in securities in accordance with their own varying investment objectives and policies.
III. Return vs. Benchmark
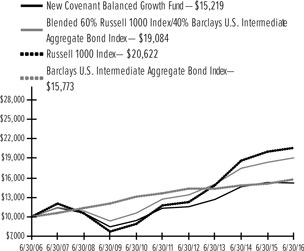
For the one-year period ending June 30, 2016, the Fund returned -0.50% and the Russell 1000 Index returned 2.93%.
IV. Fund Attribution
Both equities and fixed income provided positive returns over the period. For equities, market expectations of an improving domestic economy and the Federal Reserve’s (Fed) managed transition from an easing mindset derailed in August as concerns about oil prices, energy stocks, high-yield bonds and emerging markets came to the forefront for investors. This led to a short-lived market correction, during which losses were more pronounced within energy and cyclical sectors, smaller-cap companies and non-U.S. names.
Most of the losses were recovered by early November, as data — including an impressive U.S. jobs report — indicated the domestic economy was improving. This gave way to a modest Fed funds rate hike in December and, as the shareholder letter addressed, set a backdrop of monetary policy differences between the U.S. and other major developed nations that remained on an easing track. This divergence led to strong appreciation of the U.S. dollar versus other currencies, which further
exacerbated weakness among non-U.S. investments from a U.S. investor perspective.
High-yield bond market spreads widened again in late November due to concerns about energy companies and emerging markets. As noted in the shareholder letter, investor preference turned back to safety-based assets in both fixed income and equities during December and January. By early February, riskier out-of-favor investments regained momentum and clawed back most of their recent losses on the hopes that the worst had past.
U.S. Treasury yields were volatile during the fiscal year, with short-term yields rising and long-term yields declining as noted in the shareholder letter, resulting in generally positive returns for bonds. Returns were positive for non-Treasurys, including asset-backed, commercial-mortgage securities and agency-mortgage bonds, which all outperformed comparable duration-neutral U.S. Treasurys. While corporate bonds as a whole underperformed comparable Treasurys, the utilities and financials sub-sectors outperformed, while industrial bonds underperformed given the decline in commodity prices.
In the Growth Fund, performance struggled due to a combination of forward-looking allocations and traditional stock selection. Sector allocation detracted primarily due to an underweight to the utilities sector during an environment in which safety and stability were favored. All Growth Fund managers were underweight utilities not only for the time period, but also strategically in terms of their respective philosophies. Losses were greater from a stylistic perspective, where forward mean-reverting value strategies (buying inexpensive companies as measured by price-to-earnings or price-to-cash flow ratios, for example) were strongly disfavored. This trend was highly correlated to the declines in oil and energy prices, and continued through the end of the period in response to Brexit and other global growth worries. By contrast, pure safety measures (such as exposure to dividend yield and lower trailing stock volatility) had one of their strongest performances on record. Selection outside of these value-orientated headwinds was also negative, particularly within the pharmaceuticals portion of healthcare, and also within diversified financials and the automobile industry.
The Income Fund provided a positive return as interest rates generally declined over the period. The Income Fund’s underweight to U.S. Treasurys detracted, as that sector outperformed investment-grade credit as credit spreads widened in the period, although overweights
| | |
| New Covenant Funds / Annual Report / June 30, 2016 | | 9 |
MANAGEMENT’S DISCUSSION AND ANALYSIS OF FUND PERFORMANCE
JUNE 30, 2016 (Unaudited)
New Covenant Balanced Growth Fund (Concluded)
to the financials and utilities sub-sectors added to relative performance. An overweight to mortgage-backed securities (MBS), specifically non-agency MBS, contributed to relative performance, while selection within agency MBS detracted. Overweights to asset-backed securities (ABS) and commercial MBS, as well as selection within the latter with an emphasis on senior securities, also benefitted relative performance over the fiscal year. Additionally, yield-curve positioning contributed to relative performance with an overweight to 30-year bonds and an underweight to two-year bonds.
The Income Fund used Treasury futures, eurodollar futures and to-be-announced (TBA) forward contracts to effectively manage duration, yield-curve and market exposures. (TBA contracts confer the obligation to buy or sell future debt obligations of the three U.S. government-sponsored agencies that issue or guarantee MBS — Fannie Mae, Freddie Mac and Ginnie Mae.) None of these had a meaningful impact on the Fund’s performance.
| | | | | | | | | | | | | | | | | | | | |
AVERAGE ANNUAL TOTAL RETURN 1,2 | |
| |
| |
| One
Year
Return |
| |
| Annualized
3 Year
Return |
| |
| Annualized
5 Year
Return |
| |
| Annualized
10 Year
Return |
| |
| Annualized
Inception
to Date |
|
| |
| New Covenant Balanced Growth Fund | | | -0.50% | | | | 6.25% | | | | 6.09% | | | | 4.29% | | | | 4.88% | |
| |
| Russell 1000 Index | | | 2.93% | | | | 11.48% | | | | 11.88% | | | | 7.51% | | | | 9.94% | |
| |
| Barclays U.S. Intermediate Aggregate Bond Index | | | 4.36% | | | | 3.24% | | | | 2.96% | | | | 4.66% | | | | 6.27% | |
| |
| Blended 60% Russell 1000 Index/40% Barclays U.S. Intermediate Aggregate Bond Index | | | 3.76% | | | | 8.28% | | | | 8.43% | | | | 6.68% | | | | 8.74% | |
| |
Comparison of Change in the Value of a $10,000 Investment in the New Covenant Balanced Growth Fund, versus the Russell 1000 Index, Barclays U.S. Intermediate Aggregate Bond Index and Blended 60% Russell 1000 Index/40% Barclays U.S. Intermediate Aggregate Bond Index.
| 1 | For the years ended June 30, 2016. Past performance is not an indication of future performance. Fund Shares were offered beginning 7/1/99. Returns shown do not reflect the deduction of taxes that a shareholder would pay on fund distributions or the redemption of fund shares. The returns for certain periods reflect fee waivers and/or reimbursements in effect for that year; absent fee waivers and reimbursements, performance would have been lower. |
| 2 | This table compares the Fund’s average annual total returns to those of a broad based index and the Fund’s 60/40 Blended Benchmark, which consists of the Russell 1000 Index and the Barclays U.S. Intermediate Aggregate Bond Index. The Fund’s Blended Benchmark is designed to provide a useful comparison to the Fund’s overall performance and more accurately reflects the Fund’s investment strategy than the broad-based index. |
| | |
| 10 | | New Covenant Funds / Annual Report / June 30, 2016 |
MANAGEMENT’S DISCUSSION AND ANALYSIS OF FUND PERFORMANCE
JUNE 30, 2016 (Unaudited)
New Covenant Balanced Income Fund
I. Objective
The New Covenant Balanced Income Fund’s (the “Fund”) investment objective is to produce current income and long-term growth of capital.
II. Investment Approach
The Fund’s assets are managed under the direction of SEI Investments Management Corporation (“SIMC”), which manages the Fund’s assets, in a way that it believes will achieve the Fund’s investment objective. In order to achieve its investment objective, SIMC allocates the Fund’s assets primarily in shares of the New Covenant Growth Fund (the “Growth Fund”) and the New Covenant Income Fund (the “Income Fund”), with a majority of its assets generally invested in shares of the Income Fund. Between fifty percent and seventy-five percent of the Fund’s net assets (with a neutral position of approximately 65%) are invested in shares of the Income Fund, with the balance of its net assets invested in shares of the Growth Fund. The Growth and Income Funds, in turn, invest directly in securities in accordance with their own varying investment objectives and policies.
III. Return vs. Benchmark
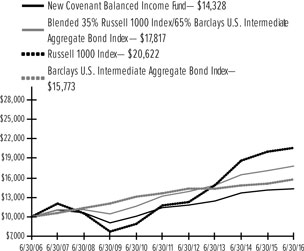
For the one-year period ending June 30, 2016, the Fund returned 1.41% and the Russell 1000 Index returned 2.93%.
IV. Fund Attribution
Both equities and fixed income provided positive returns over the period. U.S. Treasury yields were volatile during the fiscal year, with short-term yields rising and long-term yields declining as noted in the shareholder letter, resulting in generally positive returns for bonds. Returns were positive for non-Treasurys, including asset-backed, commercial-mortgage securities and agency-mortgage bonds, which all outperformed comparable duration-neutral U.S. Treasurys. While corporate bonds as a whole underperformed comparable Treasurys, the utilities and financials sub-sectors outperformed, while industrial bonds underperformed given the decline in commodity prices.
For equities, market expectations of an improving domestic economy and the Federal Reserve’s (Fed) managed transition from an easing mindset derailed in August as concerns about oil prices, energy stocks, high-yield bonds and emerging markets came to the forefront for investors. This led to a short-lived market correction, during which losses were more pronounced within
energy and cyclical sectors, smaller-cap companies and non-U.S. names.
Most of the losses were recovered by early November, as data — including an impressive U.S. jobs report — indicated the domestic economy was improving. This gave way to a modest Fed funds rate hike in December and, as the shareholder letter addressed, set a backdrop of monetary policy differences between the U.S. and other major developed nations that remained on an easing track. This divergence led to strong appreciation of the U.S. dollar versus other currencies, which further exacerbated weakness among non-U.S. investments from a U.S. investor perspective.
High-yield bond market spreads widened again in late November due to concerns about energy companies and emerging markets. As noted in the shareholder letter, investor preference turned back to safety-based assets in both fixed income and equities during December and January. By early February, riskier out-of-favor investments regained momentum and clawed back most of their recent losses on the hopes that the worst had past.
The Income Fund provided a positive return as interest rates generally declined over the period. The Income Fund’s underweight to U.S. Treasurys detracted, as that sector outperformed investment-grade credit as credit spreads widened in the period, although overweights to the financials and utilities sub-sectors added to relative performance. An overweight to mortgage-backed securities (MBS), specifically non-agency MBS, contributed to relative performance, while selection within agency MBS detracted. Overweights to asset-backed securities (ABS) and commercial MBS, as well as selection within the latter with an emphasis on senior securities, also benefitted relative performance over the fiscal year. Additionally, yield-curve positioning contributed to relative performance with an overweight to 30-year bonds and an underweight to two-year bonds.
In the Growth Fund, performance struggled due to a combination of forward-looking allocations and traditional stock selection. Sector allocation detracted primarily due to an underweight to the utilities sector during an environment in which safety and stability were favored. All Growth Fund managers were underweight utilities not only for the time period, but also strategically in terms of their respective philosophies. Losses were greater from a stylistic perspective, where forward mean-reverting value strategies (buying inexpensive companies as measured by price-to-earnings or price-to-cash flow ratios, for example) were strongly disfavored.
| | |
| New Covenant Funds / Annual Report / June 30, 2016 | | 11 |
MANAGEMENT’S DISCUSSION AND ANALYSIS OF FUND PERFORMANCE
JUNE 30, 2016 (Unaudited)
New Covenant Balanced Income Fund (Concluded)
This trend was highly correlated to the declines in oil and energy prices, and continued through the end of the period in response to Brexit and other global growth worries. By contrast, pure safety measures (such as exposure to dividend yield and lower trailing stock volatility) had one of their strongest performances on record. Selection outside of these value-orientated headwinds was also negative, particularly within the pharmaceuticals portion of healthcare, and also within diversified financials and the automobile industry.
The Income Fund used Treasury futures, eurodollar futures and to-be-announced (TBA) forward contracts to effectively manage duration, yield-curve and market exposures. (TBA contracts confer the obligation to buy or sell future debt obligations of the three U.S. government-sponsored agencies that issue or guarantee MBS — Fannie Mae, Freddie Mac and Ginnie Mae.) None of these had a meaningful impact on the Fund’s performance.
| | | | | | | | | | | | | | | | | | | | |
| AVERAGE ANNUAL TOTAL RETURN 1,2 | |
| | | One
Year
Return | | | Annualized
3 Year
Return | | | Annualized
5 Year
Return | | | Annualized
10 Year
Return | | | Annualized
Inception
to Date | |
| New Covenant Balanced Income Fund | | | 1.41% | | | | 4.81% | | | | 4.64% | | | | 3.66% | | | | 3.88% | |
| Russell 1000 Index | | | 2.93% | | | | 11.48% | | | | 11.88% | | | | 7.51% | | | | 9.38% | |
| Barclays U.S. Intermediate Aggregate Bond Index | | | 4.36% | | | | 3.24% | | | | 2.96% | | | | 4.66% | | | | 6.07% | |
| Blended 35% Russell 1000 Index/65% Barclays U.S. Intermediate Aggregate Bond Index | | | 4.10% | | | | 6.21% | | | | 6.20% | | | | 5.95% | | | | 7.48% | |
Comparison of Change in the Value of a $10,000 Investment in the New Covenant Balanced Income Fund, versus the Russell 1000 Index, Barclays U.S. Intermediate Aggregate Bond Index and Blended 35% Russell 1000 Index/65% Barclays U.S. Intermediate Aggregate Bond Index.
| 1 | For the years ended June 30, 2016. Past performance is not an indication of future performance. Fund Shares were offered beginning 7/1/99. Returns shown do not reflect the deduction of taxes that a shareholder would pay on fund distributions or the redemption of fund shares. The returns for certain periods reflect fee waivers and/or reimbursements in effect for that year; absent fee waivers and reimbursements, performance would have been lower. |
| 2 | This table compares the Fund’s average annual total returns to those of a broad-based index and the Fund’s 35/65 Blended Benchmark, which consists of the Russell 1000 Index and the Barclays U.S. Intermediate Aggregate Bond Index. The Fund’s Blended Benchmark is designed to provide a useful comparison to the Fund’s overall performance and more accurately reflects the Fund’s investment strategy than the broad-based index. |
| | |
| 12 | | New Covenant Funds / Annual Report / June 30, 2016 |
SCHEDULE OF INVESTMENTS
June 30, 2016
New Covenant Growth Fund
| | | | |
| Sector Weightings (Unaudited)†: | | | | |
|
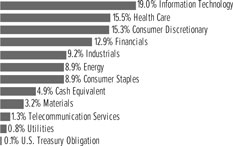 |
†Percentages are based on total investments.
| | | | | | | | |
| Description | | Shares | | | Market Value
($ Thousands) | |
| | |
COMMON STOCK — 92.1% | | | | | | | | |
Canada — 1.5% | | | | | | | | |
Canadian Natural Resources | | | 80,545 | | | $ | 2,483 | |
Canadian Pacific Railway | | | 10,082 | | | | 1,298 | |
Magna International | | | 58,954 | | | | 2,068 | |
| | | | | | | 5,849 | |
| | |
China — 0.7% | | | | | | | | |
Tencent Holdings ADR | | | 123,615 | | | | 2,839 | |
| | |
Hong Kong — 0.5% | | | | | | | | |
China Mobile ADR | | | 33,332 | | | | 1,930 | |
| | |
Ireland — 1.4% | | | | | | | | |
Accenture, Cl A | | | 2,147 | | | | 243 | |
Ingersoll-Rand | | | 3,390 | | | | 216 | |
Jazz Pharmaceuticals * | | | 1,291 | | | | 182 | |
Mallinckrodt * | | | 11,336 | | | | 689 | |
Medtronic | | | 17,662 | | | | 1,533 | |
Shire ADR | | | 14,058 | | | | 2,588 | |
| | | | | | | 5,451 | |
| | |
Israel — 0.6% | | | | | | | | |
Teva Pharmaceutical Industries ADR | | | 47,023 | | | | 2,362 | |
| | |
Japan — 0.5% | | | | | | | | |
Toyota Motor ADR | | | 18,984 | | | | 1,898 | |
| | |
Netherlands — 0.2% | | | | | | | | |
Chicago Bridge & Iron | | | 23,052 | | | | 798 | |
| | |
Puerto Rico — 0.1% | | | | | | | | |
Popular | | | 23,691 | | | | 694 | |
| | |
United Kingdom — 1.7% | | | | | | | | |
BP ADR | | | 131,639 | | | | 4,675 | |
Liberty Global, Cl A * | | | 67,623 | | | | 1,965 | |
| | | | | | | 6,640 | |
| | |
United States — 84.9% | | | | | | | | |
| | |
Consumer Discretionary — 13.2% | | | | | | | | |
Amazon.com * | | | 13,360 | | | | 9,561 | |
Best Buy | | | 6,116 | | | | 187 | |
Cable One | | | 417 | | | | 213 | |
| | | | | | | | |
| Description | | Shares | | | Market Value
($ Thousands) | |
| | |
COMMON STOCK (continued) | | | | | | | | |
Charter Communications, Cl A * | | | 916 | | | $ | 209 | |
Chipotle Mexican Grill, Cl A * | | | 6,468 | | | | 2,605 | |
Comcast, Cl A | | | 32,437 | | | | 2,115 | |
Dillard’s, Cl A | | | 12,657 | | | | 767 | |
Dollar General | | | 34,792 | | | | 3,270 | |
Domino’s Pizza | | | 5,741 | | | | 754 | |
Ford Motor | | | 17,445 | | | | 219 | |
General Motors | | | 91,915 | | | | 2,601 | |
Goodyear Tire & Rubber | | | 48,221 | | | | 1,237 | |
Hasbro | | | 3,540 | | | | 297 | |
Hilton Worldwide Holdings | | | 9,039 | | | | 204 | |
Home Depot | | | 29,525 | | | | 3,770 | |
John Wiley & Sons, Cl A | | | 4,244 | | | | 221 | |
Johnson Controls | | | 9,270 | | | | 410 | |
Kohl’s | | | 35,518 | | | | 1,347 | |
L Brands | | | 1,988 | | | | 133 | |
Liberty Global LiLAC * | | | 8,437 | | | | 272 | |
Liberty Ventures, Ser A * | | | 14,720 | | | | 546 | |
Lowe’s | | | 17,966 | | | | 1,422 | |
Macy’s | | | 41,112 | | | | 1,382 | |
Madison Square Garden * | | | 1,136 | | | | 196 | |
Michael Kors Holdings * | | | 42,430 | | | | 2,099 | |
Netflix * | | | 25,655 | | | | 2,347 | |
Newell Brands | | | 10,273 | | | | 499 | |
NIKE, Cl B | | | 43,661 | | | | 2,410 | |
Omnicom Group | | | 40,282 | | | | 3,283 | |
priceline.com * | | | 1,507 | | | | 1,881 | |
Scripps Networks Interactive, Cl A | | | 11,302 | | | | 704 | |
ServiceMaster Global Holdings * | | | 4,767 | | | | 190 | |
Staples | | | 20,697 | | | | 178 | |
Starbucks | | | 21,282 | | | | 1,216 | |
Target | | | 5,064 | | | | 354 | |
Tesla Motors * | | | 1,290 | | | | 274 | |
Thomson Reuters | | | 12,073 | | | | 488 | |
TripAdvisor * | | | 16,799 | | | | 1,080 | |
Tupperware Brands | | | 7,571 | | | | 426 | |
Twenty-First Century Fox, Cl A | | | 18,283 | | | | 495 | |
Under Armour, Cl C * | | | 5,368 | | | | 195 | |
Visteon | | | 3,720 | | | | 245 | |
Walt Disney | | | 1,816 | | | | 178 | |
Williams-Sonoma | | | 3,319 | | | | 173 | |
| | |
| | | | | | | 52,653 | |
| | |
Consumer Staples — 8.7% | | | | | | | | |
Campbell Soup | | | 19,200 | | | | 1,277 | |
Clorox | | | 11,827 | | | | 1,637 | |
Coca-Cola | | | 43,634 | | | | 1,978 | |
Colgate-Palmolive | | | 5,492 | | | | 402 | |
Costco Wholesale | | | 20,790 | | | | 3,265 | |
CVS Caremark | | | 33,266 | | | | 3,185 | |
Dr. Pepper Snapple Group | | | 18,651 | | | | 1,802 | |
General Mills | | | 15,944 | | | | 1,137 | |
Hershey | | | 4,367 | | | | 496 | |
| | |
| New Covenant Funds / Annual Report / June 30, 2016 | | 13 |
SCHEDULE OF INVESTMENTS
June 30, 2016
New Covenant Growth Fund (Continued)
| | | | | | | | |
| Description | | Shares | | | Market Value
($ Thousands) | |
| | |
COMMON STOCK (continued) | | | | | | | | |
JM Smucker | | | 17,312 | | | $ | 2,639 | |
Kellogg | | | 13,042 | | | | 1,065 | |
Kimberly-Clark | | | 8,984 | | | | 1,235 | |
Kraft Heinz | | | 33,784 | | | | 2,989 | |
Kroger | | | 42,369 | | | | 1,559 | |
Mead Johnson Nutrition, Cl A | | | 13,346 | | | | 1,211 | |
Monster Beverage * | | | 3,589 | | | | 577 | |
PepsiCo | | | 18,163 | | | | 1,924 | |
Procter & Gamble | | | 39,359 | | | | 3,333 | |
Rite Aid * | | | 25,211 | | | | 189 | |
Spectrum Brands Holdings | | | 1,514 | | | | 181 | |
Sysco | | | 7,853 | | | | 398 | |
US Foods Holding * | | | 36,187 | | | | 877 | |
Walgreens Boots Alliance | | | 10,512 | | | | 875 | |
| | |
| | | | | | | 34,231 | |
| | |
Energy — 6.9% | | | | | | | | |
Anadarko Petroleum | | | 23,440 | | | | 1,248 | |
Apache | | | 26,622 | | | | 1,482 | |
Baker Hughes | | | 11,697 | | | | 528 | |
Cabot Oil & Gas | | | 55,134 | | | | 1,419 | |
Chevron | | | 9,547 | | | | 1,001 | |
Cimarex Energy | | | 17,084 | | | | 2,038 | |
Concho Resources * | | | 9,021 | | | | 1,076 | |
Devon Energy | | | 79,215 | | | | 2,872 | |
Diamondback Energy * | | | 6,408 | | | | 584 | |
EOG Resources | | | 31,284 | | | | 2,610 | |
EQT | | | 2,732 | | | | 212 | |
Exxon Mobil | | | 2,218 | | | | 208 | |
Gulfport Energy * | | | 7,288 | | | | 228 | |
Halliburton | | | 64,606 | | | | 2,926 | |
Helmerich & Payne | | | 15,340 | | | | 1,030 | |
Hess | | | 4,700 | | | | 282 | |
Newfield Exploration * | | | 4,642 | | | | 205 | |
Occidental Petroleum | | | 42,871 | | | | 3,239 | |
PrairieSky Royalty | | | 1,765 | | | | 33 | |
Royal Dutch Shell ADR, Cl A | | | 62,587 | | | | 3,456 | |
Schlumberger | | | 5,289 | | | | 418 | |
| | |
| | | | | | | 27,095 | |
| | |
Financials — 12.2% | | | | | | | | |
Aflac | | | 35,263 | | | | 2,545 | |
American International Group | | | 23,177 | | | | 1,226 | |
American Tower, Cl A ‡ | | | 27,576 | | | | 3,133 | |
Arthur J Gallagher | | | 5,408 | | | | 257 | |
AvalonBay Communities ‡ | | | 2,286 | | | | 412 | |
Bank of America | | | 335,151 | | | | 4,447 | |
Berkshire Hathaway, Cl B * | | | 30,200 | | | | 4,373 | |
Blackstone Group (A) | | | 67,613 | | | | 1,659 | |
Chimera Investment ‡ | | | 27,516 | | | | 432 | |
Citigroup | | | 105,092 | | | | 4,455 | |
Corporate Office Properties Trust ‡ | | | 21,890 | | | | 647 | |
Crown Castle International ‡ | | | 25,457 | | | | 2,582 | |
| | | | | | | | |
| Description | | Shares | | | Market Value
($ Thousands) | |
| | |
COMMON STOCK (continued) | | | | | | | | |
Cullen | | | 9,288 | | | $ | 592 | |
Forest City Realty Trust, Cl A ‡ | | | 10,256 | | | | 229 | |
Goldman Sachs Group | | | 6,238 | | | | 927 | |
JPMorgan Chase | | | 83,577 | | | | 5,193 | |
KKR (A) | | | 189,329 | | | | 2,336 | |
Marsh & McLennan | | | 39,761 | | | | 2,722 | |
MetLife | | | 32,110 | | | | 1,279 | |
Morgan Stanley | | | 18,121 | | | | 471 | |
Morningstar | | | 2,226 | | | | 182 | |
Northern Trust | | | 18,122 | | | | 1,201 | |
ProLogis ‡ | | | 16,644 | | | | 816 | |
Prudential Financial | | | 3,399 | | | | 242 | |
Regency Centers ‡ | | | 6,727 | | | | 563 | |
Santander Consumer USA Holdings * | | | 108,741 | | | | 1,123 | |
State Street | | | 45,310 | | | | 2,443 | |
Synchrony Financial * | | | 28,395 | | | | 718 | |
Validus Holdings | | | 4,808 | | | | 234 | |
Wells Fargo | | | 17,038 | | | | 806 | |
Weyerhaeuser ‡ | | | 15,108 | | | | 450 | |
| | |
| | | | | | | 48,695 | |
| | |
Health Care — 13.1% | | | | | | | | |
Abbott Laboratories | | | 26,354 | | | | 1,036 | |
AbbVie | | | 29,915 | | | | 1,852 | |
Acadia Healthcare * | | | 3,163 | | | | 175 | |
Alexion Pharmaceuticals * | �� | | 8,455 | | | | 987 | |
Allergan * | | | 12,995 | | | | 3,003 | |
AmerisourceBergen, Cl A | | | 22,183 | | | | 1,760 | |
Amgen | | | 19,034 | | | | 2,896 | |
Baxter International | | | 61,982 | | | | 2,803 | |
Becton Dickinson and | | | 29,117 | | | | 4,938 | |
Biogen Idec * | | | 2,700 | | | | 653 | |
Boston Scientific * | | | 57,338 | | | | 1,340 | |
Bristol-Myers Squibb | | | 36,636 | | | | 2,695 | |
Celgene * | | | 20,592 | | | | 2,031 | |
Cigna | | | 4,415 | | | | 565 | |
Edwards Lifesciences * | | | 3,081 | | | | 307 | |
Eli Lilly | | | 2,709 | | | | 213 | |
Gilead Sciences | | | 39,557 | | | | 3,300 | |
HCA Holdings * | | | 18,054 | | | | 1,390 | |
Horizon Pharma * | | | 66,714 | | | | 1,099 | |
Illumina * | | | 13,931 | | | | 1,956 | |
Intuitive Surgical * | | | 320 | | | | 212 | |
Johnson & Johnson | | | 29,946 | | | | 3,632 | |
Medivation * | | | 3,950 | | | | 238 | |
Merck | | | 14,063 | | | | 810 | |
Mylan * | | | 14,258 | | | | 617 | |
Pfizer | | | 36,793 | | | | 1,295 | |
Regeneron Pharmaceuticals * | | | 4,140 | | | | 1,446 | |
ResMed | | | 2,930 | | | | 185 | |
UnitedHealth Group | | | 50,911 | | | | 7,189 | |
Varian Medical Systems * | | | 2,214 | | | | 182 | |
Vertex Pharmaceuticals * | | | 10,023 | | | | 862 | |
| | |
| 14 | | New Covenant Funds / Annual Report / June 30, 2016 |
| | | | | | | | |
| Description | | Shares | | | Market Value
($ Thousands) | |
| | |
COMMON STOCK (continued) | | | | | | | | |
VWR * | | | 7,046 | | | $ | 204 | |
| | |
| | | | | | | 51,871 | |
Industrials — 8.4% | | | | | | | | |
3M | | | 21,029 | | | | 3,683 | |
Acuity Brands | | | 2,979 | | | | 739 | |
AECOM Technology * | | | 18,799 | | | | 597 | |
AerCap Holdings * | | | 44,389 | | | | 1,491 | |
Allegion | | | 2,910 | | | | 202 | |
American Airlines Group | | | 60,013 | | | | 1,699 | |
BE Aerospace | | | 13,074 | | | | 604 | |
Caterpillar | | | 5,994 | | | | 454 | |
Covanta Holding | | | 32,357 | | | | 532 | |
Deere | | | 3,383 | | | | 274 | |
Delta Air Lines | | | 69,296 | | | | 2,524 | |
Eaton | | | 22,899 | | | | 1,368 | |
General Electric | | | 19,163 | | | | 603 | |
Hexcel | | | 4,105 | | | | 171 | |
Illinois Tool Works | | | 32,012 | | | | 3,334 | |
Kansas City Southern | | | 12,614 | | | | 1,136 | |
ManpowerGroup | | | 8,258 | | | | 531 | |
Norfolk Southern | | | 23,254 | | | | 1,980 | |
Orbital ATK | | | 4,890 | | | | 416 | |
Owens Corning | | | 4,196 | | | | 216 | |
Southwest Airlines | | | 4,455 | | | | 175 | |
Stanley Black & Decker | | | 1,841 | | | | 205 | |
Terex | | | 51,698 | | | | 1,050 | |
TransDigm Group * | �� | | 5,740 | | | | 1,514 | |
Union Pacific | | | 18,424 | | | | 1,607 | |
United Parcel Service, Cl B | | | 6,206 | | | | 669 | |
United Technologies | | | 1,811 | | | | 186 | |
Waste Management | | | 3,397 | | | | 225 | |
WW Grainger | | | 18,783 | | | | 4,268 | |
Xylem | | | 5,835 | | | | 261 | |
| | |
| | | | | | | 32,714 | |
| | |
Information Technology — 17.6% | | | | | | | | |
Activision Blizzard | | | 52,300 | | | | 2,073 | |
Adobe Systems * | | | 29,116 | | | | 2,789 | |
Alliance Data Systems * | | | 904 | | | | 177 | |
Alphabet, Cl A * | | | 14,167 | | | | 9,967 | |
Alphabet, Cl C * | | | 1,671 | | | | 1,157 | |
Analog Devices | | | 4,506 | | | | 255 | |
Apple | | | 20,038 | | | | 1,916 | |
Applied Materials | | | 196,729 | | | | 4,716 | |
Automatic Data Processing | | | 23,809 | | | | 2,187 | |
Black Knight Financial Services, Cl A * | | | 6,144 | | | | 231 | |
CA | | | 12,146 | | | | 399 | |
Cisco Systems | | | 81,984 | | | | 2,352 | |
Cognizant Technology Solutions, Cl A * | | | 5,218 | | | | 299 | |
eBay * | | | 7,634 | | | | 179 | |
EMC | | | 30,157 | | | | 819 | |
Facebook, Cl A * | | | 70,191 | | | | 8,021 | |
| | | | | | | | |
| Description | | Shares | | | Market Value
($ Thousands) | |
| | |
COMMON STOCK (continued) | | | | | | | | |
FleetCor Technologies * | | | 9,375 | | | $ | 1,342 | |
Global Payments | | | 13,035 | | | | 930 | |
Ingram Micro, Cl A | | | 6,261 | | | | 218 | |
Intel | | | 33,132 | | | | 1,087 | |
International Business Machines | | | 4,066 | | | | 617 | |
Juniper Networks | | | 7,785 | | | | 175 | |
Lam Research | | | 12,708 | | | | 1,068 | |
Lexmark International, Cl A | | | 5,543 | | | | 209 | |
Mastercard, Cl A | | | 19,576 | | | | 1,724 | |
Microchip Technology | | | 49,356 | | | | 2,505 | |
Micron Technology * | | | 188,783 | | | | 2,598 | |
Microsoft | | | 133,298 | | | | 6,821 | |
Motorola Solutions | | | 4,687 | | | | 309 | |
NVIDIA | | | 4,150 | | | | 195 | |
NXP Semiconductors * | | | 21,635 | | | | 1,695 | |
Oracle | | | 11,032 | | | | 452 | |
Salesforce.com * | | | 34,716 | | | | 2,757 | |
Symantec | | | 15,350 | | | | 315 | |
Texas Instruments | | | 7,575 | | | | 475 | |
Visa, Cl A | | | 88,286 | | | | 6,548 | |
| | |
| | | | | | | 69,577 | |
| | |
Materials — 3.1% | | | | | | | | |
Air Products & Chemicals | | | 13,366 | | | | 1,899 | |
Alcoa | | | 18,948 | | | | 176 | |
Ball | | | 9,099 | | | | 658 | |
Dow Chemical | | | 18,722 | | | | 931 | |
Eastman Chemical | | | 14,450 | | | | 981 | |
Ecolab | | | 10,832 | | | | 1,285 | |
Louisiana-Pacific * | | | 34,939 | | | | 606 | |
Newmont Mining | | | 5,259 | | | | 206 | |
Praxair | | | 11,097 | | | | 1,247 | |
Reliance Steel & Aluminum | | | 8,576 | | | | 660 | |
Sherwin-Williams | | | 11,326 | | | | 3,326 | |
Sonoco Products | | | 5,855 | | | | 291 | |
| | |
| | | | | | | 12,266 | |
| | |
Telecommunication Services — 0.9% | | | | | | | | |
AT&T | | | 5,187 | | | | 224 | |
Level 3 Communications * | | | 20,480 | | | | 1,055 | |
Liberty SiriusXM Group, Cl C * | | | 5,993 | | | | 185 | |
SBA Communications, Cl A * | | | 5,603 | | | | 605 | |
Verizon Communications | | | 20,491 | | | | 1,144 | |
| | |
| | | | | | | 3,213 | |
| | |
Utilities — 0.8% | | | | | | | | |
American Water Works | | | 10,442 | | | | 882 | |
Calpine * | | | 12,748 | | | | 188 | |
CMS Energy | | | 23,592 | | | | 1,082 | |
Eversource Energy | | | 4,495 | | | | 269 | |
Exelon | | | 5,418 | | | | 197 | |
Sempra Energy | | | 1,856 | | | | 212 | |
| | |
| New Covenant Funds / Annual Report / June 30, 2016 | | 15 |
SCHEDULE OF INVESTMENTS
June 30, 2016
New Covenant Growth Fund (Concluded)
| | | | | | | | |
| Description | | Shares | | | Market Value
($ Thousands) | |
COMMON STOCK (continued) | | | | | | | | |
Xcel Energy | | | 4,714 | | | $ | 211 | |
| | |
| | | | | | | 3,041 | |
| | | | | | | 335,356 | |
Total Common Stock | | | | | | | | |
(Cost $317,830) ($ Thousands) | | | | | | | 363,817 | |
| | | Face Amount
($ Thousands) | | | | |
U.S. TREASURY OBLIGATION — 0.1% | | | | | | | | |
U.S. Treasury Bill | | | | | | | | |
0.225%, 08/18/2016 (B) | | $ | 175 | | | | 175 | |
| | |
Total U.S. Treasury Obligation | | | | | | | | |
(Cost $175) ($ Thousands) | | | | | | | 175 | |
| | | Shares | | | | | |
CASH EQUIVALENT — 4.7% | | | | | | | | |
SEI Daily Income Trust, Government Fund, Cl A 0.150% **† | | | 18,617,587 | | | | 18,618 | |
| | |
Total Cash Equivalent | | | | | | | | |
(Cost $18,618) ($ Thousands) | | | | | | | 18,618 | |
| | |
Total Investments — 96.9% | | | | | | | | |
(Cost $336,623) ($ Thousands) | | | | | | $ | 382,610 | |
| | | | | | | | |
A list of the open futures contracts held by the Fund at June 30, 2016 are as follows:
| | | | | | | | | | | | |
| Type of Contract | | Number of
Contracts
Long | | | Expiration
Date | | | Unrealized
Appreciation
($ Thousands) | |
| S&P Mid Cap 400 Index E-MINI | | | 2 | | | | Sep-2016 | | | | $ 6 | |
S&P 500 Index E-MINI | | | 29 | | | | Sep-2016 | | | | 44 | |
| | | | | | | | | | | $50 | |
| | | | | | | | | | | | |
For the year ended June 30, 2016, the total amount of all open futures contracts, as presented in the table above, are representative of the volume of activity for the derivative type during the year.
The futures contracts are considered to have interest rate risk associated with them.
Percentages are based on a Net Assets of $394,943 ($ Thousands).
| ‡ | Real Estate Investment Trust. |
| * | Non-income producing security. |
| ** | Rate shown is the 7-day effective yield as of June 30, 2016. |
| † | Investment in Affiliated Security (see Note 3). |
| (A) | Security is a Master Limited Partnership. At June 30, 2016, such securities amounted to $3,995 ($ Thousands), or 1.01% of Net Assets (See Note 2). |
| (B) | The rate reported is the effective yield at time of purchase. |
ADR — American Depositary Receipt
Cl — Class
S&P — Standard & Poor’s
The following is a list of the levels of inputs used as of June 30, 2016 in valuing the Fund’s investments and other financial instruments carried at value ($ Thousands):
| | | | | | | | | | | | | | | | |
Investments in Securities | | | Level 1 | | | | Level 2 | | | | Level 3 | | | | Total | |
Common Stock | | $ | 363,817 | | | $ | – | | | $ | – | | | $ | 363,817 | |
U.S. Treasury Obligation | | | – | | | | 175 | | | | – | | | | 175 | |
Cash Equivalent | | | 18,618 | | | | – | | | | – | | | | 18,618 | |
| | | | | | | | | | | | | | | | |
Total Investments in Securities | | $ | 382,435 | | | $ | 175 | | | $ | – | | | $ | 382,610 | |
| | | | | | | | | | | | | | | | |
| | | | | | | | | | | | | | | | |
Other Financial Instruments | | | Level 1 | | | | Level 2 | | | | Level 3 | | | | Total | |
Futures Contracts * | | | | | | | | | | | | | | | | |
Unrealized Appreciation | | $ | 50 | | | $ | — | | | $ | — | | | $ | 50 | |
| | | | | | | | | | | | | | | | |
Total Other Financial Instruments | | $ | 50 | | | $ | — | | | $ | — | | | $ | 50 | |
| | | | | | | | | | | | | | | | |
* Futures contracts are valued at the unrealized appreciation on the instrument.
For the year ended June 30, 2016, there were no transfers between Level 1 and Level 2 assets and liabilities.
For the year ended June 30, 2016, there were no transfers between Level 2 and Level 3 assets and liabilities.
Amounts designated as “—” are either $0 or have been rounded to $0.
For more information on valuation inputs, see Note 2 – Significant Accounting Policies in Notes to Financial Statements.
The accompanying notes are an integral part of the financial statements.
| | |
| 16 | | New Covenant Funds / Annual Report / June 30, 2016 |
SCHEDULE OF INVESTMENTS
June 30, 2016
New Covenant Income Fund
Sector Weightings (Unaudited)†:
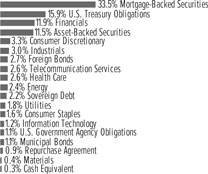
†Percentages based on total investments.
| | | | | | | | |
| Description | | Face Amount
($ Thousands) | | | Market Value
($ Thousands) | |
MORTGAGE-BACKED SECURITIES — 34.0% | |
Agency Mortgage-Backed Obligations — 24.8% | |
FHLMC | | | | | | | | |
6.500%, 09/01/2039 | | $ | 79 | | | $ | 92 | |
5.500%, 12/01/2035 to 12/01/2038 | | | 2,304 | | | | 2,655 | |
5.000%, 12/01/2020 to 02/01/2040 | | | 722 | | | | 784 | |
4.500%, 05/01/2042 | | | 2,109 | | | | 2,303 | |
4.000%, 04/01/2043 to 08/01/2043 | | | 586 | | | | 639 | |
3.953%, 07/01/2040 (A) | | | 176 | | | | 184 | |
3.500%, 11/01/2042 to 12/01/2045 | | | 4,991 | | | | 5,298 | |
FHLMC CMO, Ser 2005-2990, Cl UZ | | | | | | | | |
5.750%, 06/15/2035 | | | 644 | | | | 747 | |
FHLMC CMO, Ser 2009-3558, Cl G | | | | | | | | |
4.000%, 08/15/2024 | | | 270 | | | | 300 | |
FHLMC CMO, Ser 2012-4013, Cl AI, IO | | | | | | | | |
4.000%, 02/15/2039 | | | 394 | | | | 31 | |
FHLMC CMO, Ser 2012-4057, Cl UI, IO | | | | | | | | |
3.000%, 05/15/2027 | | | 326 | | | | 31 | |
FHLMC CMO, Ser 2012-4085, Cl IO, IO | | | | | | | | |
3.000%, 06/15/2027 | | | 750 | | | | 72 | |
FHLMC CMO, Ser 2012-4092, Cl AI, IO | | | | | | | | |
3.000%, 09/15/2031 | | | 968 | | | | 83 | |
FHLMC CMO, Ser 2013-4203, Cl PS, IO | | | | | | | | |
5.808%, 09/15/2042 (A) | | | 334 | | | | 64 | |
FHLMC CMO, Ser 2013-4219, Cl JA | | | | | | | | |
3.500%, 08/15/2039 | | | 755 | | | | 800 | |
FHLMC CMO, Ser 2013-4231, Cl FB | | | | | | | | |
0.892%, 07/15/2038 (A) | | | 425 | | | | 428 | |
FHLMC Multifamily Structured Pass-Through Certificates, Ser K715, Cl X1, IO | | | | | | | | |
1.153%, 01/25/2021 (A) | | | 3,150 | | | | 137 | |
FHLMC Structured Agency Credit Risk Debt Notes, Ser 2014-HQ1, Cl M2 | | | | | | | | |
2.953%, 08/25/2024 (A) | | | 250 | | | | 253 | |
FHLMC TBA | | | | | | | | |
3.500%, 08/25/2041 | | | 700 | | | | 737 | |
| | | | | | | | |
| Description | | Face Amount
($ Thousands) | | | Market Value
($ Thousands) | |
MORTGAGE-BACKED SECURITIES (continued) | |
2.500%, 08/15/2027 | | $ | 1,000 | | | $ | 1,032 | |
FHLMC, Ser 2011-3947, Cl SG, IO | | | | | | | | |
5.508%, 10/15/2041 (A) | | | 548 | | | | 91 | |
FHLMC, Ser 2012-4073, Cl MF | | | | | | | | |
0.892%, 08/15/2039 (A) | | | 245 | | | | 246 | |
FHLMC, Ser 2012-4099, Cl ST, IO | | | | | | | | |
5.558%, 08/15/2042 (A) | | | 204 | | | | 38 | |
FHLMC, Ser 2013-4194, Cl BI, IO | | | | | | | | |
3.500%, 04/15/2043 | | | 543 | | | | 68 | |
FHLMC, Ser 2014-326, Cl F2 | | | | | | | | |
0.992%, 03/15/2044 (A) | | | 495 | | | | 496 | |
FHLMC, Ser 2014-4310, Cl SA, IO | | | | | | | | |
5.508%, 02/15/2044 (A) | | | 84 | | | | 16 | |
FHLMC, Ser 2014-4335, Cl SW, IO | | | | | | | | |
5.558%, 05/15/2044 (A) | | | 171 | | | | 33 | |
FHLMC, Ser 2014-4415, Cl IO, IO | | | | | | | | |
1.858%, 04/15/2041 (A) | | | 152 | | | | 11 | |
FNMA | | | | | | | | |
7.000%, 11/01/2037 to 11/01/2038 | | | 58 | | | | 66 | |
6.500%, 08/01/2017 to 05/01/2040 | | | 518 | | | | 592 | |
6.000%, 07/01/2037 to 11/01/2038 | | | 319 | | | | 364 | |
5.500%, 02/01/2035 | | | 262 | | | | 298 | |
5.000%, 01/01/2021 to 06/01/2040 | | | 2,184 | | | | 2,425 | |
4.500%, 01/01/2041 to 01/01/2045 | | | 2,175 | | | | 2,414 | |
4.000%, 06/01/2025 to 01/01/2045 | | | 11,666 | | | | 12,602 | |
3.500%, 12/01/2032 to 01/01/2046 | | | 8,967 | | | | 9,503 | |
2.763%, 03/01/2036 (A) | | | 48 | | | | 50 | |
2.517%, 01/01/2036 (A) | | | 71 | | | | 74 | |
2.500%, 10/01/2042 | | | 833 | | | | 843 | |
1.845%, 05/01/2043 (A) | | | 1,565 | | | | 1,611 | |
FNMA CMO, Ser 1992-1, Cl F | | | | | | | | |
1.246%, 01/25/2022 (A) | | | 67 | | | | 68 | |
FNMA CMO, Ser 2003-W2, Cl 2A9 | | | | | | | | |
5.900%, 07/25/2042 | | | 708 | | | | 821 | |
FNMA CMO, Ser 2004-90, Cl LH | | | | | | | | |
5.000%, 04/25/2034 | | | 397 | | | | 413 | |
FNMA CMO, Ser 2005-22, Cl DA | | | | | | | | |
5.500%, 12/25/2034 | | | 374 | | | | 405 | |
FNMA CMO, Ser 2011-44, Cl EB | | | | | | | | |
3.000%, 05/25/2026 | | | 500 | | | | 532 | |
FNMA CMO, Ser 2012-108, Cl F | | | | | | | | |
0.946%, 10/25/2042 (A) | | | 355 | | | | 355 | |
FNMA CMO, Ser 2012-128, Cl SQ, IO | | | | | | | | |
5.704%, 11/25/2042 (A) | | | 72 | | | | 16 | |
FNMA CMO, Ser 2012-128, Cl SL, IO | | | | | | | | |
5.704%, 11/25/2042 (A) | | | 146 | | | | 35 | |
FNMA CMO, Ser 2012-74, Cl AI, IO | | | | | | | | |
3.000%, 07/25/2027 | | | 1,189 | | | | 117 | |
FNMA CMO, Ser 2012-93, Cl UI, IO | | | | | | | | |
3.000%, 09/25/2027 | | | 916 | | | | 86 | |
FNMA CMO, Ser 2012-93, Cl SG, IO | | | | | | | | |
5.647%, 09/25/2042 (A) | | | 252 | | | | 47 | |
| | |
| New Covenant Funds / Annual Report / June 30, 2016 | | 17 |
SCHEDULE OF INVESTMENTS
June 30, 2016
New Covenant Income Fund (Continued)
| | | | | | | | |
| Description | | Face Amount
($ Thousands) | | | Market Value
($ Thousands) | |
MORTGAGE-BACKED SECURITIES (continued) | |
FNMA TBA | | | | | | | | |
4.000%, 07/13/2039 | | $ | 2,700 | | | $ | 2,895 | |
3.500%, 08/01/2040 to 08/01/2040 | | | 1,100 | | | | 1,165 | |
3.000%, 08/25/2026 | | | 200 | | | | 209 | |
2.500%, 08/25/2027 | | | 200 | | | | 207 | |
FNMA TBA | | | | | | | | |
5.000%, 07/15/2038 | | | 1,500 | | | | 1,667 | |
FNMA, Ser 2005-29, Cl ZA | | | | | | | | |
5.500%, 04/25/2035 | | | 232 | | | | 263 | |
FNMA, Ser 2014-47, Cl AI, IO | | | | | | | | |
1.890%, 08/25/2044 (A) | | | 710 | | | | 48 | |
FNMA, Ser 2015-55, Cl IO, IO | | | | | | | | |
1.686%, 08/25/2055 (A) | | | 85 | | | | 5 | |
FNMA, Ser 2015-56, Cl AS, IO | | | | | | | | |
5.697%, 08/25/2045 (A) | | | 93 | | | | 25 | |
FNMA, Ser M3, Cl X2, IO | | | | | | | | |
0.385%, 10/25/2024 (A) | | | 4,908 | | | | 133 | |
FNMA, Ser M5, Cl SA, IO | | | | | | | | |
1.579%, 01/25/2017 (A) | | | 310 | | | | – | |
FNMA, Ser M7, Cl AB2 | | | | | | | | |
2.502%, 12/25/2024 | | | 100 | | | | 103 | |
FREMF Mortgage Trust, Ser K44, Cl C | | | | | | | | |
3.811%, 01/25/2048 (A)(B) | | | 130 | | | | 109 | |
FREMF Mortgage Trust, Ser K503, Cl C | | | | | | | | |
3.009%, 10/25/2047 (A)(B) | | | 140 | | | | 136 | |
GNMA | | | | | | | | |
5.500%, 02/20/2037 to 01/15/2039 | | | 348 | | | | 389 | |
5.000%, 12/20/2038 to 07/20/2040 | | | 1,710 | | | | 1,895 | |
4.500%, 07/20/2038 to 07/20/2041 | | | 1,552 | | | | 1,689 | |
4.000%, 03/20/2046 | | | 2,135 | | | | 2,289 | |
3.500%, 08/20/2045 to 09/20/2045 | | | 1,652 | | | | 1,755 | |
2.500%, 02/20/2027 | | | 1,479 | | | | 1,540 | |
GNMA CMO, Ser 2009-108, Cl WG | | | | | | | | |
4.000%, 09/20/2038 | | | 282 | | | | 294 | |
GNMA CMO, Ser 2012-66, Cl CI, IO | | | | | | | | |
3.500%, 02/20/2038 | | | 171 | | | | 12 | |
GNMA CMO, Ser 2012-77, Cl KI, IO | | | | | | | | |
7.500%, 04/20/2031 | | | 23 | | | | 4 | |
GNMA CMO, Ser 2012-H18, Cl NA | | | | | | | | |
0.956%, 08/20/2062 (A) | | | 281 | | | | 279 | |
GNMA CMO, Ser 2013-H21, Cl FB | | | | | | | | |
1.137%, 09/20/2063 (A) | | | 665 | | | | 667 | |
GNMA TBA | | | | | | | | |
3.500%, 07/15/2041 to 07/01/2042 | | | (300 | ) | | | (319 | ) |
3.000%, 08/15/2042 | | | 700 | | | | 731 | |
GNMA, Ser 101, Cl VM | | | | | | | | |
2.532%, 02/16/2039 (A) | | | 177 | | | | 186 | |
GNMA, Ser 186, Cl IO, IO | | | | | | | | |
0.840%, 08/16/2054 (A) | | | 1,879 | | | | 117 | |
GNMA, Ser 2012-34, Cl SA, IO | | | | | | | | |
5.602%, 03/20/2042 (A) | | | 61 | | | | 13 | |
| | | | | | | | |
| Description | | Face Amount
($ Thousands) | | | Market Value
($ Thousands) | |
MORTGAGE-BACKED SECURITIES (continued) | |
GNMA, Ser 2012-44, Cl A | | | | | | | | |
2.170%, 04/16/2041 | | $ | 120 | | | $ | 121 | |
GNMA, Ser 2012-H30, Cl GA | | | | | | | | |
0.786%, 12/20/2062 (A) | | | 1,162 | | | | 1,149 | |
GNMA, Ser 2013-H01, Cl TA | | | | | | | | |
0.936%, 01/20/2063 (A) | | | 359 | | | | 359 | |
GNMA, Ser 2013-H08, Cl BF | | | | | | | | |
0.837%, 03/20/2063 (A) | | | 1,094 | | | | 1,082 | |
GNMA, Ser 2014-105, IO | | | | | | | | |
1.100%, 06/16/2054 | | | 1,787 | | | | 126 | |
GNMA, Ser 2015-167, Cl OI, IO | | | | | | | | |
4.000%, 04/16/2045 | | | 187 | | | | 36 | |
GNMA, Ser 2015-H20, Cl FA | | | | | | | | |
0.663%, 08/20/2065 (A) | | | 377 | | | | 373 | |
GNMA, Ser 7, Cl IO, IO | | | | | | | | |
0.957%, 01/16/2057 (A) | | | 1,462 | | | | 108 | |
GNMA, Ser 85, Cl IA, IO | | | | | | | | |
0.754%, 03/16/2047 (A) | | | 3,619 | | | | 176 | |
GNMA, Ser 95, Cl IO, IO | | | | | | | | |
0.711%, 04/16/2047 (A) | | | 2,198 | | | | 110 | |
NCUA Guaranteed Notes Trust, Ser 2010-C1, Cl APT | | | | | | | | |
2.650%, 10/29/2020 | | | 11 | | | | 11 | |
NCUA Guaranteed Notes Trust, Ser 2010-C1, Cl A2 | | | | | | | | |
2.900%, 10/29/2020 | | | 14 | | | | 14 | |
| | | | | | | 73,577 | |
Non-Agency Mortgage-Backed Obligations — 9.2% | |
A10 Securitization, Ser 1, Cl A1 | | | | | | | | |
2.100%, 04/15/2034 (B) | | | 206 | | | | 205 | |
A10 Term Asset Financing, Ser 2013-2, Cl A | | | | | | | | |
2.620%, 11/15/2027 (B) | | | 88 | | | | 88 | |
A10 Term Asset Financing, Ser 2014-1, Cl A1 | | | | | | | | |
1.720%, 04/15/2033 (B) | | | 123 | | | | 123 | |
Bear Stearns ALT-A Trust, Ser 2004-6, Cl 1A | | | | | | | | |
1.093%, 07/25/2034 (A) | | | 141 | | | | 134 | |
Bear Stearns Commercial Mortgage Securities Trust, Ser PW17, Cl A4 | | | | | | | | |
5.694%, 06/11/2050 (A) | | | 630 | | | | 652 | |
CD 2007-CD5 Mortgage Trust, Ser CD5, Cl A4 | | | | | | | | |
5.886%, 11/15/2044 (A) | | | 1,425 | | | | 1,477 | |
Citigroup Commercial Mortgage Trust, | | | | | | | | |
Ser 2014-GC25, Cl AS | | | | | | | | |
4.017%, 10/10/2047 | | | 100 | | | | 109 | |
Citigroup Commercial Mortgage Trust, Ser C6, Cl A4 | | | | | | | | |
5.711%, 12/10/2049 (A) | | | 2,213 | | | | 2,278 | |
Citigroup Commercial Mortgage Trust, Ser GC33, Cl D | | | | | | | | |
3.172%, 09/10/2058 | | | 200 | | | | 128 | |
| | |
| 18 | | New Covenant Funds / Annual Report / June 30, 2016 |
| | | | | | | | |
| Description | | Face Amount
($ Thousands) | | | Market Value
($ Thousands) | |
MORTGAGE-BACKED SECURITIES (continued) | |
COMM Mortgage Trust, Ser 2014-PAT, Cl A | | | | | | | | |
1.235%, 08/13/2027 (A)(B) | | $ | 116 | | | $ | 115 | |
COMM Mortgage Trust, Ser CR5, Cl AM | | | | | | | | |
3.223%, 12/10/2045 (B) | | | 590 | | | | 618 | |
Commercial Mortgage Pass-Through Certificates, Ser 2012-CR3, Cl A3 | | | | | | | | |
2.822%, 11/15/2045 | | | 10 | | | | 10 | |
Commercial Mortgage Pass-Through | | | | | | | | |
Certificates, Ser 2013-WWP, Cl A2 | | | | | | | | |
3.424%, 03/10/2031 (B) | | | 100 | | | | 107 | |
Commercial Mortgage Trust, Ser 2013-CC13, Cl XA, IO | | | | | | | | |
0.974%, 12/10/2023 (A) | | | 768 | | | | 35 | |
Commercial Mortgage Trust, Ser 2013-CR12, Cl C | | | | | | | | |
5.084%, 10/10/2046 (A) | | | 10 | | | | 11 | |
Commercial Mortgage Trust, Ser 2013-CR12, Cl AM | | | | | | | | |
4.300%, 10/10/2046 | | | 50 | | | | 55 | |
Commercial Mortgage Trust, Ser 2013-CR12, Cl B | | | | | | | | |
4.762%, 10/10/2046 (A) | | | 20 | | | | 22 | |
Commercial Mortgage Trust, Ser 2014-TWC, Cl A | | | | | | | | |
1.285%, 02/13/2032 (A)(B) | | | 200 | | | | 199 | |
Commercial Mortgage Trust, Ser GG11, Cl A4 | | | | | | | | |
5.736%, 12/10/2049 | | | 1,337 | | | | 1,388 | |
Commercial Mortgage Trust, Ser GG9, Cl A4 | | | | | | | | |
5.444%, 03/10/2039 | | | 2,064 | | | | 2,083 | |
Core Industrial Trust, Ser TEXW, Cl D | | | | | | | | |
3.849%, 02/10/2034 (A)(B) | | | 180 | | | | 180 | |
Credit Suisse Commercial Mortgage Trust, Ser C3, Cl A4 | | | | | | | | |
5.890%, 06/15/2039 (A) | | | 1,061 | | | | 1,079 | |
Credit Suisse Commercial Mortgage Trust, Ser C5, Cl A4 | | | | | | | | |
5.695%, 09/15/2040 (A) | | | 922 | | | | 953 | |
CSMC Trust, Ser 2014-TIKI, Cl B | | | | | | | | |
1.785%, 09/15/2038 (A)(B) | | | 233 | | | | 227 | |
CSMC Trust, Ser 2014-TIKI, Cl A | | | | | | | | |
1.384%, 09/15/2038 (A)(B) | | | 310 | | | | 305 | |
DBRR Trust, Ser 2013-EZ3, Cl A | | | | | | | | |
1.636%, 12/18/2049 (A)(B) | | | 455 | | | | 452 | |
GE Business Loan Trust, Ser 1A, Cl A | | | | | | | | |
0.605%, 04/16/2035 (A)(B) | | | 428 | | | | 393 | |
GMAC Commercial Mortgage Securities Trust, Ser 2006-C1, Cl AM | | | | | | | | |
5.290%, 11/10/2045 (A) | | | 110 | | | | 110 | |
GS Mortgage Securities Trust, Ser 2013-GC16, Cl B | | | | | | | | |
5.161%, 11/10/2046 (A) | | | 80 | | | | 91 | |
| | | | | | | | |
| Description | | Face Amount
($ Thousands) | | | Market Value
($ Thousands) | |
MORTGAGE-BACKED SECURITIES (continued) | |
Homestar Mortgage Acceptance, Ser 2004-6, Cl M2 | | | | | | | | |
1.116%, 01/25/2035 (A) | | $ | 689 | | | $ | 665 | |
Impac Secured Assets Trust, Ser 2007-2, Cl 2A | | | | | | | | |
0.696%, 04/25/2037 (A) | | | 142 | | | | 131 | |
JP Morgan Chase Commercial Mortgage Securities, Ser LC9, Cl A2 | | | | | | | | |
1.677%, 12/15/2047 | | | 2,190 | | | | 2,200 | |
JP Morgan Chase Commercial Mortgage Securities, Ser LD11, Cl A4 | | | | | | | | |
5.927%, 06/15/2049 (A) | | | 557 | | | | 567 | |
JP Morgan Mortgage Trust, Ser 2016-1, Cl A5 | | | | | | | | |
3.500%, 05/25/2046 (B) | | | 1,021 | | | | 1,051 | |
JP Morgan Trust, Ser 2015-5, Cl A9 | | | | | | | | |
2.897%, 05/25/2045 (A)(B) | | | 319 | | | | 317 | |
JPMBB Commercial Mortgage Securities Trust, Ser 2013-C15, Cl C | | | | | | | | |
5.047%, 11/15/2045 (A) | | | 50 | | | | 54 | |
JPMBB Commercial Mortgage Securities Trust, Ser 2013-C15, Cl B | | | | | | | | |
4.927%, 11/15/2045 | | | 210 | | | | 236 | |
JPMBB Commercial Mortgage Securities Trust, Ser 2013-C17, Cl B | | | | | | | | |
4.887%, 01/15/2047 (A) | | | 30 | | | | 34 | |
JPMBB Commercial Mortgage Securities Trust, Ser 2014-C22, Cl C | | | | | | | | |
4.560%, 09/15/2047 (A) | | | 80 | | | | 79 | |
JPMBB Commercial Mortgage Securities Trust, Ser C29, Cl C | | | | | | | | |
4.202%, 05/15/2048 (A) | | | 380 | | | | 356 | |
JPMBB Commercial Mortgage Securities Trust, Ser C30, Cl A5 | | | | | | | | |
3.822%, 07/15/2048 | | | 490 | | | | 539 | |
JPMBB Commercial Mortgage Securities Trust, Ser C31, Cl A3 | | | | | | | | |
3.801%, 08/15/2048 | | | 560 | | | | 616 | |
JPMorgan Chase Commercial Mortgage Securities Trust, Ser 2011-C5, Cl A3 | | | | | | | | |
4.171%, 08/15/2046 | | | 10 | | | | 11 | |
JPMorgan Chase Commercial Mortgage Securities Trust, Ser 2014-PHH, Cl C | | | | | | | | |
2.535%, 08/15/2027 (A)(B) | | | 110 | | | | 110 | |
JPMorgan Chase Commercial Mortgage Securities Trust, Ser FL7, Cl D | | | | | | | | |
4.184%, 05/15/2028 (A)(B) | | | 200 | | | | 191 | |
JPMorgan Chase Commercial Mortgage Securities Trust, Ser LC9, Cl AS | | | | | | | | |
3.353%, 12/15/2047 (B) | | | 380 | | | | 398 | |
LB-UBS Commercial Mortgage Trust, Ser 2006- C6, Cl A4 | | | | | | | | |
5.372%, 09/15/2039 | | | 33 | | | | 33 | |
| | |
| New Covenant Funds / Annual Report / June 30, 2016 | | 19 |
SCHEDULE OF INVESTMENTS
June 30, 2016
New Covenant Income Fund (Continued)
| | | | | | | | |
| Description | | Face Amount
($ Thousands) | | | Market Value
($ Thousands) | |
MORTGAGE-BACKED SECURITIES (continued) | |
LB-UBS Commercial Mortgage Trust, Ser C1, Cl A4 | | | | | | | | |
5.424%, 02/15/2040 | | $ | 2,005 | | | $ | 2,030 | |
Lehman Brothers Small Balance Commercial, Ser 2A, Cl 1A | | | | | | | | |
0.703%, 09/25/2030 (A)(B) | | | 155 | | | | 144 | |
MASTR Alternative Loans Trust, Ser 2004-2, Cl 4A1 | | | | | | | | |
5.000%, 02/25/2019 | | | 43 | | | | 44 | |
Morgan Stanley Bank of America Merrill Lynch Trust, Ser 2013-C7, Cl AS | | | | | | | | |
3.214%, 02/15/2046 | | | 21 | | | | 22 | |
Morgan Stanley Bank of America Merrill Lynch Trust, Ser 2013-C10, Cl A4 | | | | | | | | |
4.083%, 07/15/2046 (A) | | | 120 | | | | 135 | |
Morgan Stanley Capital I Trust, Ser 2007-IQ15, Cl A4 | | | | | | | | |
6.102%, 06/11/2049 (A) | | | 826 | | | | 857 | |
Morgan Stanley Re-Remic Trust, Ser 2012-IO, Cl AXA | | | | | | | | |
1.000%, 03/27/2051 (B) | | | 43 | | | | 43 | |
Morgan Stanley Re-Remic Trust, Ser 2012-XA, Cl A | | | | | | | | |
2.000%, 07/27/2049 (B) | | | 60 | | | | 59 | |
MSCG Trust 2015-ALDR, Ser ALDR, Cl A2 | | | | | | | | |
3.577%, 06/07/2035 (A)(B) | | | 410 | | | | 422 | |
Nomura Asset Acceptance Alternative Loan Trust, Ser 2007-1, Cl 1A3 | | | | | | | | |
5.957%, 03/25/2047 | | | 115 | | | | 115 | |
Structured Adjustable Rate Mortgage Loan Trust, Ser 2004-3AC, Cl A2 | | | | | | | | |
2.711%, 03/25/2034 (A) | | | 294 | | | | 293 | |
Towd Point Mortgage Trust, Ser 2015-5, Cl A1B | | | | | | | | |
2.750%, 05/25/2055 (A)(B) | | | 598 | | | | 605 | |
UBS-BAMLL Trust, Ser 2012-WRM, Cl A | | | | | | | | |
3.663%, 06/10/2030 (B) | | | 116 | | | | 123 | |
UBS-Barclays Commercial Mortgage Trust, Ser 2012-C2, Cl A4 | | | | | | | | |
3.525%, 05/10/2063 | | | 73 | | | | 79 | |
UBS-Barclays Commercial Mortgage Trust, Ser 2012-CN, Cl XA, IO | | | | | | | | |
1.653%, 05/10/2063 (A)(B) | | | 459 | | | | 26 | |
Wachovia Bank Commercial Mortgage Trust, Ser C30, Cl AMFL | | | | | | | | |
0.646%, 12/15/2043 (A)(B) | | | 250 | | | | 241 | |
Wells Fargo Commercial Mortgage Trust, Ser 2014-LC16, Cl XA, IO | | | | | | | | |
1.455%, 08/15/2050 (A) | | | 2,583 | | | | 183 | |
WFRBS Commercial Mortgage Trust, Ser 2012-C7, Cl XA, IO | | | | | | | | |
1.514%, 06/15/2045 (A)(B) | | | 1,233 | | | | 83 | |
| | | | | | | | |
| Description | | Face Amount
($ Thousands) | | | Market Value
($ Thousands) | |
MORTGAGE-BACKED SECURITIES (continued) | |
WFRBS Commercial Mortgage Trust, Ser 2013-C11, Cl AS | | | | | | | | |
3.311%, 03/15/2045 | | $ | 160 | | | $ | 168 | |
WFRBS Commercial Mortgage Trust, Ser 2013-C13, Cl XA, IO | | | | | | | | |
1.407%, 05/15/2045 (A)(B) | | | 1,391 | | | | 90 | |
WFRBS Commercial Mortgage Trust, Ser 2014-C23, Cl XA, IO | | | | | | | | |
0.702%, 10/15/2057 (A) | | | 1,212 | | | | 47 | |
WFRBS Commercial Mortgage Trust, Ser 2014-C23, Cl B | | | | | | | | |
4.377%, 10/15/2057 (A) | | | 270 | | | | 295 | |
WFRBS Commercial Mortgage Trust, Ser C10, Cl XA, IO | | | | | | | | |
1.729%, 12/15/2045 (A)(B) | | | 1,236 | | | | 96 | |
WFRBS Commercial Mortgage Trust, Ser C23, Cl C | | | | | | | | |
3.850%, 10/15/2057 (A) | | | 150 | | | | 144 | |
| | | | | | | 27,559 | |
Total Mortgage-Backed Securities (Cost $99,625) ($ Thousands) | | | | | | | 101,136 | |
|
CORPORATE OBLIGATIONS — 31.3% | |
Consumer Discretionary — 3.3% | |
21st Century Fox America | | | | | | | | |
6.900%, 03/01/2019 | | | 900 | | | | 1,024 | |
Charter Communications Operating | | | | | | | | |
4.908%, 07/23/2025 (B) | | | 300 | | | | 328 | |
Comcast Cable Communications Holdings | | | | | | | | |
9.455%, 11/15/2022 | | | 900 | | | | 1,284 | |
Ford Motor Credit | | | | | | | | |
8.125%, 01/15/2020 | | | 340 | | | | 405 | |
5.875%, 08/02/2021 | | | 230 | | | | 264 | |
General Motors Financial | | | | | | | | |
4.200%, 03/01/2021 | | | 1,365 | | | | 1,428 | |
3.700%, 11/24/2020 | | | 80 | | | | 82 | |
3.700%, 05/09/2023 | | | 190 | | | | 191 | |
Hyundai Capital America MTN | | | | | | | | |
2.500%, 03/18/2019 (B) | | | 569 | | | | 582 | |
2.400%, 10/30/2018 (B) | | | 1,324 | | | | 1,342 | |
McDonald’s MTN | | | | | | | | |
2.750%, 12/09/2020 | | | 280 | | | | 292 | |
NBCUniversal Media | | | | | | | | |
4.375%, 04/01/2021 | | | 10 | | | | 11 | |
Newell Brands | | | | | | | | |
4.200%, 04/01/2026 | | | 70 | | | | 76 | |
3.850%, 04/01/2023 | | | 100 | | | | 106 | |
3.150%, 04/01/2021 | | | 30 | | | | 31 | |
TCI Communications | | | | | | | | |
7.875%, 02/15/2026 | | | 240 | | | | 344 | |
| | |
| 20 | | New Covenant Funds / Annual Report / June 30, 2016 |
| | | | | | | | |
| Description | | Face Amount
($ Thousands) | | | Market Value
($ Thousands) | |
CORPORATE OBLIGATIONS (continued) | |
Time Warner | | | | | | | | |
4.875%, 03/15/2020 | | $ | 995 | | | $ | 1,105 | |
3.600%, 07/15/2025 | | | 80 | | | | 85 | |
Time Warner Cable | | | | | | | | |
5.000%, 02/01/2020 | | | 350 | | | | 381 | |
Viacom | | | | | | | | |
5.625%, 09/15/2019 | | | 422 | | | | 465 | |
3.875%, 04/01/2024 | | | 30 | | | | 31 | |
| | | | | | | 9,857 | |
Consumer Staples — 1.7% | |
CVS Health | | | | | | | | |
4.125%, 05/15/2021 | | | 300 | | | | 329 | |
3.875%, 07/20/2025 | | | 195 | | | | 214 | |
2.800%, 07/20/2020 | | | 190 | | | | 198 | |
CVS Pass-Through Trust | | | | | | | | |
7.507%, 01/10/2032 (B) | | | 1,362 | | | | 1,714 | |
Kimberly-Clark | | | | | | | | |
6.125%, 08/01/2017 | | | 140 | | | | 148 | |
Kraft Heinz Foods | | | | | | | | |
5.375%, 02/10/2020 | | | 86 | | | | 97 | |
4.875%, 02/15/2025 (B) | | | 80 | | | | 88 | |
3.950%, 07/15/2025 (B) | | | 120 | | | | 130 | |
3.500%, 06/06/2022 | | | 10 | | | | 11 | |
Kroger | | | | | | | | |
4.000%, 02/01/2024 | | | 260 | | | | 288 | |
Mondelez International | | | | | | | | |
4.000%, 02/01/2024 | | | 170 | | | | 186 | |
PepsiCo | | | | | | | | |
3.000%, 08/25/2021 | | | 290 | | | | 308 | |
2.750%, 03/05/2022 | | | 80 | | | | 84 | |
Tyson Foods | | | | | | | | |
4.875%, 08/15/2034 | | | 150 | | | | 167 | |
3.950%, 08/15/2024 | | | 60 | | | | 65 | |
Walgreens Boots Alliance | | | | | | | | |
3.450%, 06/01/2026 | | | 150 | | | | 154 | |
Wal-Mart Stores | | | | | | | | |
4.250%, 04/15/2021 | | | 210 | | | | 238 | |
WM Wrigley Jr | | | | | | | | |
2.900%, 10/21/2019 (B) | | | 360 | | | | 374 | |
2.400%, 10/21/2018 (B) | | | 140 | | | | 143 | |
| | | | | | | 4,936 | |
Energy — 2.4% | |
Anadarko Petroleum | | | | | | | | |
6.375%, 09/15/2017 | | | 67 | | | | 71 | |
5.550%, 03/15/2026 | | | 90 | | | | 99 | |
5.022%, 10/10/2036 (C) | | | 3,000 | | | | 1,133 | |
Apache | | | | | | | | |
3.250%, 04/15/2022 | | | 243 | | | | 249 | |
Baker Hughes | | | | | | | | |
3.200%, 08/15/2021 | | | 26 | | | | 27 | |
| | | | | | | | |
| Description | | Face Amount
($ Thousands) | | | Market Value
($ Thousands) | |
CORPORATE OBLIGATIONS (continued) | |
Chevron | | | | | | | | |
2.954%, 05/16/2026 | | $ | 170 | | | $ | 176 | |
1.211%, 03/03/2022 (A) | | | 490 | | | | 478 | |
CNOOC Finance 2015 USA | | | | | | | | |
3.500%, 05/05/2025 | | | 330 | | | | 334 | |
ConocoPhillips | | | | | | | | |
6.000%, 01/15/2020 | | | 20 | | | | 23 | |
4.200%, 03/15/2021 | | | 444 | | | | 480 | |
Continental Resources | | | | | | | | |
5.000%, 09/15/2022 | | | 10 | | | | 10 | |
Devon Energy | | | | | | | | |
6.300%, 01/15/2019 | | | 320 | | | | 347 | |
Ecopetrol | | | | | | | | |
5.375%, 06/26/2026 | | | 140 | | | | 136 | |
Ensco | | | | | | | | |
4.700%, 03/15/2021 | | | 120 | | | | 100 | |
Enterprise Products Operating | | | | | | | | |
3.900%, 02/15/2024 | | | 457 | | | | 484 | |
EOG Resources | | | | | | | | |
4.150%, 01/15/2026 | | | 60 | | | | 66 | |
Exxon Mobil | | | | | | | | |
3.043%, 03/01/2026 | | | 150 | | | | 159 | |
Halliburton | | | | | | | | |
3.800%, 11/15/2025 | | | 140 | | | | 146 | |
Hess | | | | | | | | |
8.125%, 02/15/2019 | | | 90 | | | | 100 | |
Kinder Morgan Energy Partners | | | | | | | | |
4.150%, 02/01/2024 | | | 770 | | | | 774 | |
Noble Energy | | | | | | | | |
4.150%, 12/15/2021 | | | 290 | | | | 305 | |
Occidental Petroleum | | | | | | | | |
3.400%, 04/15/2026 | | | 80 | | | | 84 | |
3.125%, 02/15/2022 | | | 100 | | | | 105 | |
Schlumberger Holdings | | | | | | | | |
3.000%, 12/21/2020 (B) | | | 970 | | | | 1,012 | |
Shell International Finance BV | | | | | | | | |
2.875%, 05/10/2026 | | | 40 | | | | 41 | |
Sinopec Group Overseas Development | | | | | | | | |
4.375%, 04/10/2024 (B) | | | 290 | | | | 313 | |
| | | | | | | 7,252 | |
Financials — 12.1% | |
AgriBank FCB | | | | | | | | |
9.125%, 07/15/2019 (B) | | | 600 | | | | 601 | |
American Express | | | | | | | | |
7.000%, 03/19/2018 | | | 660 | | | | 721 | |
2.650%, 12/02/2022 | | | 264 | | | | 267 | |
American Express Credit MTN | | | | | | | | |
2.375%, 05/26/2020 | | | 39 | | | | 40 | |
1.800%, 07/31/2018 | | | 46 | | | | 46 | |
American Tower Trust I | | | | | | | | |
3.070%, 03/15/2023 (B) | | | 80 | | | | 82 | |
| | |
| New Covenant Funds / Annual Report / June 30, 2016 | | 21 |
SCHEDULE OF INVESTMENTS
June 30, 2016
New Covenant Income Fund (Continued)
| | | | | | | | |
| Description | | Face Amount
($ Thousands) | | | Market Value
($ Thousands) | |
CORPORATE OBLIGATIONS (continued) | |
1.551%, 03/15/2018 (B) | | $ | 100 | | | $ | 100 | |
Bank of America MTN | | | | | | | | |
7.625%, 06/01/2019 | | | 75 | | | | 87 | |
6.875%, 04/25/2018 | | | 390 | | | | 426 | |
5.625%, 07/01/2020 | | | 30 | | | | 34 | |
5.420%, 03/15/2017 | | | 200 | | | | 206 | |
5.000%, 05/13/2021 | | | 80 | | | | 89 | |
5.000%, 01/21/2044 | | | 240 | | | | 278 | |
4.450%, 03/03/2026 | | | 678 | | | | 709 | |
4.250%, 10/22/2026 | | | 38 | | | | 39 | |
4.200%, 08/26/2024 | | | 210 | | | | 217 | |
4.125%, 01/22/2024 | | | 370 | | | | 398 | |
4.100%, 07/24/2023 | | | 280 | | | | 300 | |
4.000%, 04/01/2024 | | | 440 | | | | 470 | |
4.000%, 01/22/2025 | | | 80 | | | | 81 | |
3.875%, 08/01/2025 | | | 140 | | | | 148 | |
3.500%, 04/19/2026 | | | 130 | | | | 134 | |
3.300%, 01/11/2023 | | | 60 | | | | 62 | |
2.600%, 01/15/2019 | | | 170 | | | | 174 | |
1.950%, 05/12/2018 | | | 458 | | | | 461 | |
Bank of New York Mellon MTN | | | | | | | | |
4.600%, 01/15/2020 | | | 836 | | | | 923 | |
Barclays Bank | | | | | | | | |
10.179%, 06/12/2021 (B) | | | 370 | | | | 466 | |
BB&T MTN | | | | | | | | |
6.850%, 04/30/2019 | | | 240 | | | | 275 | |
2.050%, 05/10/2021 | | | 1,025 | | | | 1,040 | |
Bear Stearns | | | | | | | | |
7.250%, 02/01/2018 | | | 140 | | | | 153 | |
Blackstone Holdings Finance | | | | | | | | |
6.625%, 08/15/2019 (B) | | | 987 | | | | 1,131 | |
4.750%, 02/15/2023 (B) | | | 66 | | | | 73 | |
Chubb INA Holdings | | | | | | | | |
3.350%, 05/03/2026 | | | 40 | | | | 42 | |
2.300%, 11/03/2020 | | | 60 | | | | 62 | |
Citigroup | | | | | | | | |
8.125%, 07/15/2039 | | | 12 | | | | 19 | |
5.500%, 09/13/2025 | | | 150 | | | | 168 | |
5.300%, 05/06/2044 | | | 40 | | | | 43 | |
4.650%, 07/30/2045 | | | 50 | | | | 55 | |
4.450%, 09/29/2027 | | | 150 | | | | 155 | |
4.400%, 06/10/2025 | | | 160 | | | | 167 | |
4.300%, 11/20/2026 | | | 40 | | | | 41 | |
4.050%, 07/30/2022 | | | 40 | | | | 42 | |
3.500%, 05/15/2023 | | | 100 | | | | 102 | |
3.400%, 05/01/2026 | | | 673 | | | | 690 | |
2.700%, 03/30/2021 | | | 455 | | | | 463 | |
2.150%, 07/30/2018 | | | 110 | | | | 111 | |
1.700%, 04/27/2018 | | | 228 | | | | 229 | |
Credit Suisse NY MTN | | | | | | | | |
2.300%, 05/28/2019 | | | 310 | | | | 314 | |
| | | | | | | | |
| Description | | Face Amount
($ Thousands) | | | Market Value
($ Thousands) | |
CORPORATE OBLIGATIONS (continued) | |
General Electric Capital MTN | | | | | | | | |
6.000%, 08/07/2019 | | $ | 414 | | | $ | 475 | |
4.650%, 10/17/2021 | | | 180 | | | | 206 | |
4.375%, 09/16/2020 | | | 10 | | | | 11 | |
Glencore Funding | | | | | | | | |
2.875%, 04/16/2020 (B) | | | 240 | | | | 226 | |
Goldman Sachs Group MTN | | | | | | | | |
7.500%, 02/15/2019 | | | 662 | | | | 757 | |
6.150%, 04/01/2018 | | | 320 | | | | 345 | |
6.000%, 06/15/2020 | | | 480 | | | | 548 | |
5.950%, 01/18/2018 | | | 660 | | | | 703 | |
5.375%, 03/15/2020 | | | 320 | | | | 356 | |
5.150%, 05/22/2045 | | | 20 | | | | 21 | |
4.750%, 10/21/2045 | | | 40 | | | | 44 | |
4.250%, 10/21/2025 | | | 90 | | | | 93 | |
4.000%, 03/03/2024 | | | 420 | | | | 449 | |
HCP | | | | | | | | |
2.625%, 02/01/2020 | | | 145 | | | | 146 | |
HSBC Finance | | | | | | | | |
6.676%, 01/15/2021 | | | 180 | | | | 202 | |
HSBC Holdings | | | | | | | | |
4.250%, 08/18/2025 | | | 230 | | | | 232 | |
3.400%, 03/08/2021 | | | 360 | | | | 371 | |
2.950%, 05/25/2021 | | | 380 | | | | 384 | |
International Lease Finance | | | | | | | | |
6.750%, 09/01/2016 (B) | | | 110 | | | | 111 | |
John Deere Capital MTN | | | | | | | | |
2.250%, 04/17/2019 | | | 60 | | | | 62 | |
1.700%, 01/15/2020 | | | 40 | | | | 40 | |
JPMorgan Chase | | | | | | | | |
4.500%, 01/24/2022 | | | 786 | | | | 874 | |
3.875%, 09/10/2024 | | | 360 | | | | 373 | |
3.375%, 05/01/2023 | | | 150 | | | | 153 | |
3.150%, 07/05/2016 | | | 100 | | | | 100 | |
Liberty Mutual Group | | | | | | | | |
4.250%, 06/15/2023 (B) | | | 600 | | | | 637 | |
Lincoln National | | | | | | | | |
6.250%, 02/15/2020 | | | 570 | | | | 641 | |
Lloyds Bank | | | | | | | | |
2.300%, 11/27/2018 | | | 260 | | | | 262 | |
MetLife | | | | | | | | |
1.903%, 12/15/2017 | | | 110 | | | | 111 | |
Morgan Stanley MTN | | | | | | | | |
5.500%, 01/26/2020 | | | 100 | | | | 111 | |
5.500%, 07/28/2021 | | | 280 | | | | 320 | |
3.700%, 10/23/2024 | | | 33 | | | | 34 | |
2.800%, 06/16/2020 | | | 1,051 | | | | 1,077 | |
2.500%, 04/21/2021 | | | 859 | | | | 868 | |
New York Life Global Funding MTN | | | | | | | | |
2.000%, 04/13/2021 (B) | | | 872 | | | | 884 | |
Principal Life Global Funding II | | | | | | | | |
2.625%, 11/19/2020 (B) | | | 570 | | | | 587 | |
| | |
| 22 | | New Covenant Funds / Annual Report / June 30, 2016 |
| | | | | | | | |
| | | |
| Description | | Face Amount
($ Thousands) | | | Market Value
($ Thousands) | |
CORPORATE OBLIGATIONS (continued) | | | | | |
Prudential Financial MTN | | | | | | | | |
7.375%, 06/15/2019 | | $ | 400 | | | $ | 464 | |
Royal Bank of Scotland | | | | | | | | |
4.650%, 06/04/2018 | | | 190 | | | | 195 | |
Santander Holdings USA | | | | | | | | |
3.450%, 08/27/2018 | | | 180 | | | | 184 | |
Simon Property Group | | | | | | | | |
4.375%, 03/01/2021 | | | 430 | | | | 477 | |
Skandinaviska Enskilda Banken | | | | | | | | |
1.375%, 05/29/2018 (B) | | | 800 | | | | 801 | |
Synchrony Financial | | | | | | | | |
3.000%, 08/15/2019 | | | 120 | | | | 122 | |
Toyota Motor Credit MTN | | | | | | | | |
1.900%, 04/08/2021 | | | 1,046 | | | | 1,062 | |
1.375%, 01/10/2018 | | | 260 | | | | 262 | |
UBS Group Funding Jersey | | | | | | | | |
4.125%, 09/24/2025 (B) | | | 250 | | | | 259 | |
4.125%, 04/15/2026 (B) | | | 634 | | | | 656 | |
Ventas Realty | | | | | | | | |
4.125%, 01/15/2026 | | | 566 | | | | 609 | |
3.500%, 02/01/2025 | | | 488 | | | | 500 | |
WEA Finance | | | | | | | | |
2.700%, 09/17/2019 (B) | | | 310 | | | | 316 | |
Wells Fargo MTN | | | | | | | | |
5.625%, 12/11/2017 | | | 585 | | | | 622 | |
4.900%, 11/17/2045 | | | 30 | | | | 33 | |
4.600%, 04/01/2021 | | | 480 | | | | 536 | |
4.300%, 07/22/2027 | | | 260 | | | | 281 | |
3.450%, 02/13/2023 | | | 120 | | | | 124 | |
1.500%, 01/16/2018 | | | 90 | | | | 91 | |
Wells Fargo Bank | | | | | | | | |
6.000%, 11/15/2017 | | | 250 | | | | 266 | |
1.750%, 05/24/2019 | | | 1,428 | | | | 1,447 | |
Welltower | | | | | | | | |
4.500%, 01/15/2024 | | | 902 | | | | 978 | |
| | | | | | | 36,033 | |
Health Care — 2.7% | | | | | | | | |
AbbVie | | | | | | | | |
3.600%, 05/14/2025 | | | 10 | | | | 10 | |
2.500%, 05/14/2020 | | | 700 | | | | 716 | |
Actavis Funding SCS | | | | | | | | |
3.800%, 03/15/2025 | | | 100 | | | | 104 | |
3.450%, 03/15/2022 | | | 70 | | | | 73 | |
Aetna | | | | | | | | |
3.200%, 06/15/2026 | | | 130 | | | | 134 | |
2.800%, 06/15/2023 | | | 20 | | | | 20 | |
2.400%, 06/15/2021 | | | 80 | | | | 82 | |
Agilent Technologies | | | | | | | | |
5.000%, 07/15/2020 | | | 320 | | | | 353 | |
Anthem | | | | | | | | |
3.125%, 05/15/2022 | | | 340 | | | | 352 | |
| | | | | | | | |
| | | |
| Description | | Face Amount
($ Thousands) | | | Market Value
($ Thousands) | |
CORPORATE OBLIGATIONS (continued) | | | | | |
Baylor Scott & White Holdings | | | | | | | | |
1.947%, 11/15/2021 | | $ | 1,226 | | | $ | 1,229 | |
Becton Dickinson | | | | | | | | |
4.685%, 12/15/2044 | | | 50 | | | | 56 | |
3.734%, 12/15/2024 | | | 50 | | | | 54 | |
Blue Cross & Blue Shield of Minnesota | | | | | | | | |
3.790%, 05/01/2025 (B) | | | 475 | | | | 481 | |
Celgene | | | | | | | | |
3.875%, 08/15/2025 | | | 200 | | | | 213 | |
3.550%, 08/15/2022 | | | 60 | | | | 63 | |
Gilead Sciences | | | | | | | | |
2.050%, 04/01/2019 | | | 410 | | | | 420 | |
Howard Hughes Medical Institute | | | | | | | | |
3.500%, 09/01/2023 | | | 902 | | | | 997 | |
Humana | | | | | | | | |
7.200%, 06/15/2018 | | | 50 | | | | 55 | |
3.150%, 12/01/2022 | | | 240 | | | | 247 | |
Medtronic | | | | | | | | |
3.500%, 03/15/2025 | | | 10 | | | | 11 | |
3.125%, 03/15/2022 | | | 190 | | | | 201 | |
2.500%, 03/15/2020 | | | 700 | | | | 726 | |
Merck | | | | | | | | |
2.750%, 02/10/2025 | | | 70 | | | | 73 | |
Perrigo | | | | | | | | |
2.300%, 11/08/2018 | | | 220 | | | | 222 | |
Thermo Fisher Scientific | | | | | | | | |
2.400%, 02/01/2019 | | | 150 | | | | 153 | |
UnitedHealth Group | | | | | | | | |
1.875%, 11/15/2016 | | | 320 | | | | 321 | |
1.625%, 03/15/2019 | | | 200 | | | | 202 | |
Wyeth | | | | | | | | |
5.450%, 04/01/2017 | | | 230 | | | | 238 | |
Zoetis | | | | | | | | |
1.875%, 02/01/2018 | | | 70 | | | | 70 | |
| | | | | | | 7,876 | |
Industrials — 3.0% | | | | | | | | |
American Airlines Pass Through Trust, Ser 2013-2 | | | | | | | | |
4.950%, 01/15/2023 | | | 483 | | | | 525 | |
American Airlines Pass-Through Trust, Ser 2011-1 | | | | | | | | |
5.250%, 01/31/2021 | | | 84 | | | | 91 | |
Aviation Capital Group | | | | | | | | |
6.750%, 04/06/2021 (B) | | | 120 | | | | 136 | |
Burlington Northern and Santa Fe Railway Pass-Through Trust, Ser 2002-2 | | | | | | | | |
5.140%, 01/15/2021 | | | 424 | | | | 450 | |
Burlington Northern Santa Fe | | | | | | | | |
4.550%, 09/01/2044 | | | 10 | | | | 12 | |
Continental Airlines Pass-Through Trust, Ser 1999-1 | | | | | | | | |
6.545%, 02/02/2019 | | | 27 | | | | 29 | |
| | |
| New Covenant Funds / Annual Report / June 30, 2016 | | 23 |
SCHEDULE OF INVESTMENTS
June 30, 2016
New Covenant Income Fund (Continued)
| | | | | | | | |
| | | |
| Description | | Face Amount
($ Thousands) | | | Market Value
($ Thousands) | |
CORPORATE OBLIGATIONS (continued) | | | | | |
Continental Airlines Pass-Through Trust, Ser 2012-2, Cl A | | | | | | | | |
4.000%, 10/29/2024 | | $ | 792 | | | $ | 831 | |
CSX Transportation | | | | | | | | |
6.251%, 01/15/2023 | | | 645 | | | | 757 | |
Delta Air Lines Pass-Through Trust, Ser 2010-2, Cl A | | | | | | | | |
4.950%, 05/23/2019 | | | 413 | | | | 437 | |
Delta Air Lines Pass-Through Trust, Ser 2012-1, Cl A | | | | | | | | |
4.750%, 05/07/2020 | | | 206 | | | | 218 | |
Eaton | | | | | | | | |
2.750%, 11/02/2022 | | | 450 | | | | 461 | |
1.500%, 11/02/2017 | | | 20 | | | | 20 | |
GE Capital International Funding | | | | | | | | |
2.342%, 11/15/2020 (B) | | | 1,205 | | | | 1,241 | |
General Electric | | | | | | | | |
6.875%, 01/10/2039 | | | 30 | | | | 45 | |
4.500%, 03/11/2044 | | | 90 | | | | 104 | |
General Electric Capital MTN | | | | | | | | |
5.300%, 02/11/2021 | | | 160 | | | | 186 | |
John Deere Capital MTN | | | | | | | | |
2.375%, 07/14/2020 | | | 1,150 | | | | 1,187 | |
Norfolk Southern | | | | | | | | |
2.900%, 06/15/2026 | | | 1,126 | | | | 1,159 | |
United Airlines Pass Through Trust | | | | | | | | |
4.000%, 04/11/2026 | | | 888 | | | | 936 | |
Waste Management | | | | | | | | |
3.500%, 05/15/2024 | | | 120 | | | | 130 | |
| | | | | | | 8,955 | |
Information Technology — 1.2% | | | | | | | | |
Apple | | | | | | | | |
2.250%, 02/23/2021 | | | 1,750 | | | | 1,800 | |
Intel | | | | | | | | |
3.700%, 07/29/2025 | | | 30 | | | | 33 | |
Juniper Networks | | | | | | | | |
4.600%, 03/15/2021 | | | 452 | | | | 485 | |
KLA-Tencor | | | | | | | | |
4.125%, 11/01/2021 | | | 280 | | | | 298 | |
MasterCard | | | | | | | | |
3.375%, 04/01/2024 | | | 190 | | | | 206 | |
Oracle | | | | | | | | |
1.200%, 10/15/2017 | | | 190 | | | | 191 | |
Visa | | | | | | | | |
4.300%, 12/14/2045 | | | 10 | | | | 12 | |
3.150%, 12/14/2025 | | | 140 | | | | 150 | |
2.200%, 12/14/2020 | | | 300 | | | | 309 | |
| | | | | | | 3,484 | |
Materials — 0.4% | | | | | | | | |
Barrick Gold | | | | | | | | |
4.100%, 05/01/2023 | | | 207 | | | | 218 | |
| | | | | | | | |
| | | |
| Description | | Face Amount
($ Thousands) | | | Market Value
($ Thousands) | |
CORPORATE OBLIGATIONS (continued) | | | | | |
Freeport-McMoRan | | | | | | | | |
4.000%, 11/14/2021 | | $ | 170 | | | $ | 154 | |
Freeport-McMoran Oil & Gas | | | | | | | | |
6.500%, 11/15/2020 | | | 26 | | | | 26 | |
OCP | | | | | | | | |
4.500%, 10/22/2025 (B) | | | 400 | | | | 391 | |
Rio Tinto Finance USA | | | | | | | | |
3.750%, 09/20/2021 | | | 150 | | | | 161 | |
Southern Copper | | | | | | | | |
3.500%, 11/08/2022 | | | 130 | | | | 129 | |
| | | | | | | 1,079 | |
Telecommunication Services — 2.7% | | | | | |
AT&T | | | | | | | | |
4.450%, 05/15/2021 | | | 40 | | | | 44 | |
4.125%, 02/17/2026 | | | 408 | | | | 438 | |
3.875%, 08/15/2021 | | | 20 | | | | 21 | |
3.660%, 11/27/2022 (B)(C) | | | 1,000 | | | | 808 | |
3.400%, 05/15/2025 | | | 770 | | | | 788 | |
2.450%, 06/30/2020 | | | 700 | | | | 715 | |
1.400%, 12/01/2017 | | | 100 | | | | 100 | |
Bharti Airtel | | | | | | | | |
4.375%, 06/10/2025 (B) | | | 200 | | | | 210 | |
British Telecommunications | | | | | | | | |
2.350%, 02/14/2019 | | | 270 | | | | 276 | |
Cox Communications | | | | | | | | |
3.250%, 12/15/2022 (B) | | | 615 | | | | 613 | |
Rogers Communications | | | | | | | | |
6.800%, 08/15/2018 | | | 715 | | | | 792 | |
Verizon Communications | | | | | | | | |
5.150%, 09/15/2023 | | | 220 | | | | 256 | |
4.500%, 09/15/2020 | | | 2,215 | | | | 2,459 | |
2.625%, 02/21/2020 | | | 268 | | | | 277 | |
2.450%, 11/01/2022 | | | 130 | | | | 131 | |
| | | | | | | 7,928 | |
Utilities — 1.8% | | | | | | | | |
Arizona Public Service | | | | | | | | |
2.200%, 01/15/2020 | | | 12 | | | | 12 | |
Consumers Energy | | | | | | | | |
5.650%, 04/15/2020 | | | 752 | | | | 862 | |
Duke Energy | | | | | | | | |
3.750%, 04/15/2024 | | | 900 | | | | 966 | |
3.550%, 09/15/2021 | | | 170 | | | | 181 | |
FirstEnergy | | | | | | | | |
4.250%, 03/15/2023 | | | 290 | | | | 299 | |
2.750%, 03/15/2018 | | | 340 | | | | 344 | |
Northern States Power | | | | | | | | |
7.125%, 07/01/2025 | | | 1,190 | | | | 1,633 | |
Pacific Gas & Electric | | | | | | | | |
3.400%, 08/15/2024 | | | 70 | | | | 75 | |
| | |
| 24 | | New Covenant Funds / Annual Report / June 30, 2016 |
| | | | | | | | |
| | | |
| Description | | Face Amount
($ Thousands) | | | Market Value
($ Thousands) | |
CORPORATE OBLIGATIONS (continued) | | | | | | | | |
PSEG Power | | | | | | | | |
2.450%, 11/15/2018 | | $ | 44 | | | $ | 45 | |
Sempra Energy | | | | | | | | |
2.400%, 03/15/2020 | | | 840 | | | | 857 | |
Southern | | | | | | | | |
2.150%, 09/01/2019 | | | 44 | | | | 45 | |
Virginia Electric and Power | | | | | | | | |
3.450%, 02/15/2024 | | | 32 | | | | 35 | |
Wisconsin Electric Power | | | | | | | | |
1.700%, 06/15/2018 | | | 100 | | | | 101 | |
| | | | | | | 5,455 | |
| |
Total Corporate Obligations (Cost $90,158) ($ Thousands) | | | | 92,855 | |
| |
U.S. TREASURY OBLIGATIONS — 16.2% | | | | | |
U.S. Treasury Bills | | | | | | | | |
0.158%, 07/21/2016 (C) | | | 739 | | | | 739 | |
U.S. Treasury Bond | | | | | | | | |
3.000%, 11/15/2045 | | | 200 | | | | 230 | |
2.875%, 05/15/2043 | | | 1,960 | | | | 2,204 | |
2.295%, 08/15/2023 (C) | | | 280 | | | | 254 | |
2.034%, 08/15/2022 (C) | | | 200 | | | | 185 | |
U.S. Treasury Inflation-Protected Securities | | | | | | | | |
2.375%, 01/15/2025 | | | 977 | | | | 1,167 | |
1.375%, 02/15/2044 | | | 452 | | | | 522 | |
0.750%, 02/15/2045 | | | 386 | | | | 388 | |
0.625%, 01/15/2024 | | | 708 | | | | 741 | |
0.625%, 01/15/2026 | | | 101 | | | | 105 | |
0.375%, 07/15/2023 | | | 915 | | | | 946 | |
0.375%, 07/15/2025 | | | 1,150 | | | | 1,184 | |
0.125%, 07/15/2024 | | | 353 | | | | 356 | |
U.S. Treasury Notes | | | | | | | | |
3.375%, 05/15/2044 | | | 950 | | | | 1,171 | |
2.875%, 03/31/2018 | | | 335 | | | | 348 | |
2.625%, 11/15/2020 | | | 540 | | | | 579 | |
2.125%, 08/31/2020 | | | 1,365 | | | | 1,432 | |
2.125%, 01/31/2021 | | | 210 | | | | 221 | |
2.000%, 11/30/2022 | | | 5,330 | | | | 5,578 | |
1.875%, 06/30/2020 | | | 820 | | | | 851 | |
1.875%, 05/31/2022 | | | 2,480 | | | | 2,579 | |
1.625%, 03/31/2019 | | | 20 | | | | 21 | |
1.625%, 06/30/2019 | | | 120 | | | | 123 | |
1.625%, 06/30/2020 | | | 920 | | | | 946 | |
1.500%, 08/31/2018 | | | 160 | | | | 163 | |
1.500%, 01/31/2019 | | | 380 | | | | 388 | |
1.500%, 02/28/2019 | | | 350 | | | | 358 | |
1.500%, 05/31/2019 | | | 60 | | | | 61 | |
1.500%, 02/28/2023 | | | 270 | | | | 274 | |
1.375%, 03/31/2020 | | | 160 | | | | 163 | |
1.375%, 01/31/2021 | | | 5,000 | | | | 5,088 | |
1.375%, 05/31/2021 | | | 7,310 | | | | 7,442 | |
| | | | | | | | |
| | | |
| Description | | Face Amount
($ Thousands) | | | Market Value
($ Thousands) | |
U.S. TREASURY OBLIGATIONS (continued) | | | | | | | | |
1.375%, 06/30/2023 | | $ | 3,310 | | | $ | 3,327 | |
1.250%, 12/15/2018 | | | 414 | | | | 420 | |
1.250%, 03/31/2021 | | | 6,675 | | | | 6,753 | |
0.875%, 04/15/2017 | | | 60 | | | | 60 | |
0.875%, 10/15/2017 | | | 80 | | | | 80 | |
0.875%, 11/15/2017 | | | 30 | | | | 30 | |
0.750%, 03/15/2017 | | | 310 | | | | 311 | |
0.750%, 02/28/2018 | | | 120 | | | | 120 | |
U.S. Treasury STRIPS | | | | | | | | |
2.458%, 11/15/2024 (C) | | | 350 | | | | 309 | |
| | |
Total U.S. Treasury Obligations (Cost $46,860) ($ Thousands) | | | | | | | 48,217 | |
| |
ASSET-BACKED SECURITIES — 11.7% | | | | | |
Automotive — 2.1% | | | | | | | | |
| | |
Avis Budget Rental Car Funding AESOP, Ser 2012-3A, Cl A | | | | | | | | |
2.100%, 03/20/2019 (B) | | | 400 | | | | 401 | |
Ford Credit Floorplan Master Owner Trust, Ser 2016-1, Cl A1 | | | | | | | | |
1.760%, 02/15/2021 | | | 2,800 | | | | 2,829 | |
Honda Auto Receivables Owner Trust, Ser 2016-1, Cl A4 | | | | | | | | |
1.380%, 04/18/2022 | | | 1,307 | | | | 1,318 | |
NextGear Floorplan Master Owner Trust, Ser 2016-1A, Cl A2 | | | | | | | | |
2.740%, 04/15/2021 (B) | | | 1,557 | | | | 1,568 | |
| | | | | | | 6,116 | |
| | |
Home — 0.6% | | | | | | | | |
| | |
Ameriquest Mortgage Securities, Ser 2003-9, Cl AV1 | | | | | | | | |
1.213%, 09/25/2033 (A) | | | 118 | | | | 109 | |
Argent Securities, Ser 2004-W5, Cl AV2 | | | | | | | | |
1.486%, 04/25/2034 (A) | | | 321 | | | | 291 | |
Bayview Financial Acquisition Trust, Ser 2007-A, Cl 1A2 | | | | | | | | |
6.205%, 05/28/2037 | | | 168 | | | | 175 | |
Citifinancial Mortgage Securities, Ser 2004-1, Cl AF4 | | | | | | | | |
4.570%, 04/25/2034 | | | 300 | | | | 311 | |
Lake Country Mortgage Loan Trust, Ser 2006-HE1, Cl M5 | | | | | | | | |
2.446%, 07/25/2034 (A)(B) | | | 390 | | | | 397 | |
Master Asset-Backed Securities Trust, Ser 2007-NCW, Cl A1 0.746%, 05/25/2037 (A)(B) | | | 356 | | | | 295 | |
| | |
| New Covenant Funds / Annual Report / June 30, 2016 | | 25 |
SCHEDULE OF INVESTMENTS
June 30, 2016
New Covenant Income Fund (Continued)
| | | | | | | | |
| | | |
| Description | | Face Amount
($ Thousands) | | | Market Value
($ Thousands) | |
ASSET-BACKED SECURITIES (continued) | | | | | | | | |
New Century Home Equity Loan Trust, Ser 2003-A, Cl A
1.173%, 10/25/2033 (A)(B) | | $ | 117 | | | $ | 107 | |
| | | | | | | 1,685 | |
| | |
Industrials — 1.1% | | | | | | | | |
| | |
Ally Master Owner Trust, Ser 2015-3, Cl A | | | | | | | | |
1.630%, 05/15/2020 | | | 3,339 | | | | 3,355 | |
| | |
Other Asset-Backed Securities — 7.9% | | | | | | | | |
| | |
Academic Loan Funding Trust, Ser 2012-1A, Cl A1 | | | | | | | | |
1.239%, 12/27/2022 (A)(B) | | | 37 | | | | 37 | |
Academic Loan Funding Trust, Ser 2013-1A, Cl A | | | | | | | | |
1.253%, 12/26/2044 (A)(B) | | | 102 | | | | 100 | |
Brazos Higher Education Authority, Ser 2005-2, Cl A10 | | | | | | | | |
0.760%, 12/26/2019 (A) | | | 128 | | | | 127 | |
CNH Equipment Trust, Ser 2012-D, Cl A4 | | | | | | | | |
0.870%, 11/15/2019 | | | 749 | | | | 749 | |
Consumer Credit Origination Loan Trust, Ser 2015-1, Cl A | | | | | | | | |
2.820%, 03/15/2021 (B) | | | 192 | | | | 192 | |
Countrywide Asset-Backed Certificates, Ser 2007-13, Cl 2A2M | | | | | | | | |
1.696%, 10/25/2047 (A) | | | 231 | | | | 199 | |
Countrywide Asset-Backed Certificates, Ser 2007-4, Cl A4W | | | | | | | | |
5.264%, 04/25/2047 | | | 361 | | | | 347 | |
Countrywide Home Equity Loan Trust, Ser 2006-F, Cl 2A1A | | | | | | | | |
0.582%, 07/15/2036 (A) | | | 716 | | | | 628 | |
DRB Prime Student Loan Trust, Ser 2015-B, Cl A1 | | | | | | | | |
2.346%, 10/27/2031 (A)(B) | | | 600 | | | | 601 | |
DRB Prime Student Loan Trust, Ser 2015-D, Cl A2 | | | | | | | | |
3.200%, 01/25/2040 (B) | | | 707 | | | | 722 | |
Invitation Homes Trust, Ser 2015-SFR3, Cl A | | | | | | | | |
1.734%, 08/17/2032 (A)(B) | | | 1,427 | | | | 1,419 | |
John Deere Owner Trust, Ser 2015-A, Cl A4 | | | | | | | | |
1.650%, 12/15/2021 | | | 3,214 | | | | 3,235 | |
SLM Student Loan Trust, Ser 2002-A, Cl A2 | | | | | | | | |
1.184%, 12/16/2030 (A) | | | 476 | | | | 456 | |
SLM Student Loan Trust, Ser 2003-4, Cl B | | | | | | | | |
1.284%, 06/15/2038 (A) | | | 445 | | | | 369 | |
SLM Student Loan Trust, Ser 2005-5, Cl B | | | | | | | | |
0.888%, 10/25/2040 (A) | | | 559 | | | | 474 | |
SLM Student Loan Trust, Ser 2005-6, Cl B | | | | | | | | |
0.928%, 01/25/2044 (A) | | | 990 | | | | 838 | |
SLM Student Loan Trust, Ser 2005-7, Cl A4 | | | | | | | | |
0.788%, 10/25/2029 (A) | | | 662 | | | | 631 | |
| | | | | | | | |
| | | |
| Description | | Face Amount
($ Thousands) | | | Market Value
($ Thousands) | |
ASSET-BACKED SECURITIES (continued) | | | | | | | | |
SLM Student Loan Trust, Ser 2013-A, Cl A1 | | | | | | | | |
1.042%, 08/15/2022 (A)(B) | | $ | 87 | | | $ | 87 | |
Small Business Administration, Ser 2015-20C, Cl 1 | | | | | | | | |
2.720%, 03/01/2035 | | | 1,306 | | | | 1,353 | |
SMB Private Education Loan Trust, Ser 2014-A, Cl A1 | | | | | | | | |
0.933%, 09/15/2021 (A)(B) | | | 589 | | | | 589 | |
SMB Private Education Loan Trust, Ser 2015-B, Cl A1 | | | | | | | | |
1.133%, 02/15/2023 (A)(B) | | | 317 | | | | 317 | |
Trade Maps, Ser 2013-1A, Cl A | | | | | | | | |
1.145%, 12/10/2018 (A)(B) | | | 760 | | | | 757 | |
United States Small Business Administration, Ser 2010-20H, Cl 1 | | | | | | | | |
3.520%, 08/01/2030 | | | 585 | | | | 627 | |
United States Small Business Administration, Ser 2011-20B, Cl 1 | | | | | | | | |
4.220%, 02/01/2031 | | | 636 | | | | 709 | |
United States Small Business Administration, Ser 2011-20J, Cl 1 | | | | | | | | |
2.760%, 10/01/2031 | | | 326 | | | | 339 | |
United States Small Business Administration, Ser 2013-20K, Cl 1 | | | | | | | | |
3.380%, 11/01/2033 | | | 1,298 | | | | 1,390 | |
United States Small Business Administration, Ser 2014-20F, Cl 1 | | | | | | | | |
2.990%, 06/01/2034 | | | 1,317 | | | | 1,383 | |
United States Small Business Administration, Ser 2015-20E, Cl 1 | | | | | | | | |
2.770%, 05/01/2035 | | | 759 | | | | 781 | |
United States Small Business Administration, Ser 2015-20K, Cl 1 | | | | | | | | |
2.700%, 11/01/2035 | | | 774 | | | | 802 | |
United States Small Business Administration, Ser 2016-20A, Cl 1 | | | | | | | | |
2.780%, 01/01/2036 | | | 80 | | | | 83 | |
United States Small Business Administration, Ser 2016-20B, Cl 1 | | | | | | | | |
2.270%, 02/01/2036 | | | 2,600 | | | | 2,632 | |
United States Small Business Administration, Ser 2016-20D, Cl 1 | | | | | | | | |
2.260%, 04/01/2036 | | | 647 | | | | 654 | |
| | | | | | | 23,627 | |
| | |
Total Asset-Backed Securities (Cost $34,634) ($ Thousands) | | | | | | | 34,783 | |
| | |
FOREIGN BONDS — 2.8% | | | | | | | | |
BHP Billiton Finance USA | | | | | | | | |
6.500%, 04/01/2019 | | | 210 | | | | 237 | |
3.250%, 11/21/2021 | | | 120 | | | | 127 | |
2.875%, 02/24/2022 | | | 20 | | | | 21 | |
| | |
| 26 | | New Covenant Funds / Annual Report / June 30, 2016 |
| | | | | | | | |
| | | |
| Description | | Face Amount
($ Thousands) | | | Market Value
($ Thousands) | |
FOREIGN BONDS (continued) | | | | | | | | |
BNP Paribas MTN | | | | | | | | |
2.700%, 08/20/2018 | | $ | 300 | | | $ | 307 | |
2.375%, 09/14/2017 | | | 320 | | | | 325 | |
BP Capital Markets | | | | | | | | |
3.506%, 03/17/2025 | | | 20 | | | | 21 | |
3.119%, 05/04/2026 | | | 170 | | | | 174 | |
Celulosa Arauco y Constitucion | | | | | | | | |
4.750%, 01/11/2022 | | | 270 | | | | 287 | |
Cooperatieve Rabobank UA | | | | | | | | |
4.375%, 08/04/2025 | | | 250 | | | | 261 | |
3.375%, 01/19/2017 | | | 310 | | | | 314 | |
Ecopetrol | | | | | | | | |
4.250%, 09/18/2018 | | | 140 | | | | 145 | |
Electricite de France | | | | | | | | |
2.150%, 01/22/2019 (B) | | | 44 | | | | 45 | |
FMS Wertmanagement AoeR | | | | | | | | |
1.000%, 11/21/2017 | | | 200 | | | | 201 | |
Glencore Finance Canada | | | | | | | | |
5.800%, 11/15/2016 (B) | | | 40 | | | | 41 | |
2.700%, 10/25/2017 (B) | | | 210 | | | | 209 | |
Intesa Sanpaolo MTN | | | | | | | | |
5.017%, 06/26/2024 (B) | | | 200 | | | | 183 | |
Landwirtschaftliche Rentenbank | | | | | �� | | | |
1.375%, 10/23/2019 | | | 110 | | | | 111 | |
National Australia Bank | | | | | | | | |
1.250%, 03/08/2018 (B) | | | 1,150 | | | | 1,152 | |
Petrobras Global Finance BV | | | | | | | | |
6.850%, 06/05/2115 | | | 150 | | | | 114 | |
5.375%, 01/27/2021 | | | 1,030 | | | | 944 | |
3.536%, 03/17/2020 (A) | | | 110 | | | | 97 | |
Petroleos Mexicanos | | | | | | | | |
6.875%, 08/04/2026 (B) | | | 80 | | | | 89 | |
4.875%, 01/24/2022 | | | 430 | | | | 440 | |
4.875%, 01/18/2024 | | | 270 | | | | 274 | |
3.500%, 01/30/2023 | | | 260 | | | | 245 | |
Shell International Finance | | | | | | | | |
4.375%, 03/25/2020 | | | 130 | | | | 143 | |
Shell International Finance BV | | | | | | | | |
3.250%, 05/11/2025 | | | 150 | | | | 157 | |
2.250%, 11/10/2020 | | | 360 | | | | 370 | |
Siemens Financieringsmaatschappij | | | | | | | | |
2.150%, 05/27/2020 (B) | | | 1,000 | | | | 1,023 | |
Telefonica Emisiones SAU | | | | | | | | |
5.134%, 04/27/2020 | | | 80 | | | | 88 | |
Vale Overseas | | | | | | | | |
6.875%, 11/21/2036 | | | 100 | | | | 91 | |
4.375%, 01/11/2022 | | | 55 | | | | 51 | |
| | |
Total Foreign Bonds (Cost $8,354) ($ Thousands) | | | | | | | 8,287 | |
| | | | | | | | |
| | | |
| Description | | Face Amount
($ Thousands) | | | Market Value
($ Thousands) | |
SOVEREIGN DEBT — 2.3% | | | | | | | | |
Colombia Government International Bond | | | | | | | | |
5.625%, 02/26/2044 | | $ | 280 | | | $ | 310 | |
Indonesia Government International Bond MTN | | | | | | | | |
3.750%, 04/25/2022 | | | 370 | | | | 383 | |
Mexico Government International Bond MTN | | | | | | | | |
3.600%, 01/30/2025 | | | 380 | | | | 397 | |
3.500%, 01/21/2021 | | | 639 | | | | 674 | |
Peruvian Government International Bond | | | | | | | | |
6.550%, 03/14/2037 | | | 60 | | | | 81 | |
5.625%, 11/18/2050 | | | 270 | | | | 335 | |
Poland Government International Bond | | | | | | | | |
5.125%, 04/21/2021 | | | 440 | | | | 494 | |
4.000%, 01/22/2024 | | | 450 | | | | 486 | |
Province of Ontario Canada | | | | | | | | |
4.400%, 04/14/2020 | | | 840 | | | | 935 | |
1.100%, 10/25/2017 | | | 500 | | | | 502 | |
Province of Quebec Canada MTN | | | | | | | | |
6.350%, 01/30/2026 | | | 1,010 | | | | 1,330 | |
2.625%, 02/13/2023 | | | 500 | | | | 525 | |
Russian Foreign Bond | | | | | | | | |
7.500%, 03/31/2030 | | | 252 | | | | 307 | |
| | |
Total Sovereign Debt (Cost $6,421) ($ Thousands) | | | | | | | 6,759 | |
| | |
U.S. GOVERNMENT AGENCY OBLIGATIONS — 1.1% | | | | | | | | |
FHLMC | | | | | | | | |
2.375%, 01/13/2022 | | | 1,090 | | | | 1,155 | |
1.250%, 10/02/2019 | | | 70 | | | | 71 | |
FNMA | | | | | | | | |
2.149%, 10/09/2019 (C) | | | 1,190 | | | | 1,143 | |
Tennessee Valley Authority | | | | | | | | |
3.875%, 02/15/2021 | | | 790 | | | | 886 | |
1.750%, 10/15/2018 | | | 98 | | | | 100 | |
Total U.S. Government Agency Obligations (Cost $3,235) ($ Thousands) | | | | | | | 3,355 | |
| | |
MUNICIPAL BONDS — 1.1% | | | | | | | | |
California — 0.2% | | | | | | | | |
University of California, Ser AU, RB Callable 02/15/2021 @ 100 | | | | | | | | |
1.910%, 05/15/2021 | | | 612 | | | | 623 | |
| | |
Florida — 0.5% | | | | | | | | |
Florida State, Board of Administration Finance,
Ser A, RB | | | | | | | | |
2.638%, 07/01/2021 | | | 795 | | | | 829 | |
| | |
| New Covenant Funds / Annual Report / June 30, 2016 | | 27 |
SCHEDULE OF INVESTMENTS
June 30, 2016
New Covenant Income Fund (Concluded)
| | | | | | | | |
| | | |
| Description | | Face Amount
($ Thousands) | | | Market Value
($ Thousands) | |
MUNICIPAL BONDS (continued) | | | | | | | | |
Florida State, State Board of Administration Finance, Ser A, RB | | | | | | | | |
2.163%, 07/01/2019 | | $ | 535 | | | $ | 549 | |
| | |
| | | | | | | 1,378 | |
| | |
Wisconsin — 0.4% | | | | | | | | |
Wisconsin State, Ser A, RB, AGM | | | | | | | | |
5.700%, 05/01/2026 | | | 970 | | | | 1,195 | |
| | |
Total Municipal Bonds (Cost $3,092) ($ Thousands) | | | | | | | 3,196 | |
| | |
| | | Shares | | | | |
CASH EQUIVALENT — 0.3% | | | | | | | | |
SEI Daily Income Trust, Government Fund, Cl A | | | | | | | | |
0.150% **† | | | 935,256 | | | | 935 | |
| | |
Total Cash Equivalent (Cost $935) ($ Thousands) | | | | | | | 935 | |
| | | Face Amount
($ Thousands) | | | | |
REPURCHASE AGREEMENT — 0.9% | | | | | | | | |
Goldman Sachs | | | | | | | | |
0.400%, dated 06/30/2016, to be repurchased on 07/01/2016, repurchase price $2,800,031 (collateralized by a U.S. Government Obligation, 1.985%, 09/29/2021, par value $2,800,000; with total market value $2,847,000) | | $ | 2,800 | | | | 2,800 | |
| | |
Total Repurchase Agreement (Cost $2,800) ($ Thousands) | | | | | | | 2,800 | |
Total Investments — 101.7% (Cost $296,114) ($ Thousands) | | | | | | $ | 302,323 | |
| | | | | | | | |
| | | Contracts | | | | |
WRITTEN OPTIONS (D)* — 0.0% | | | | | | | | |
August 2016, U.S. 10-Year Treasury Note Future Option Call, Expires 07/16/2016 | | | | | | | | |
Strike Price $133.50 | | | (9 | ) | | $ | (4) | |
July 2016, U.S. 10-Year Treasury Note Future | | | | | | | | |
Option Call, Expires 07/16/2016 | | | | | | | | |
Strike Price $132.25 | | | (3 | ) | | | (2) | |
| | |
Total Written Options (Premiums Received $5) ($ Thousands) | | | | | | $ | (6 | ) |
A list of the open futures contracts held by the Fund at June 30, 2016 are as follows:
| | | | | | | | | | | | |
| Type of Contract | | Number of
Contracts
Long (Short) | | | Expiration
Date | | | Unrealized
Appreciation
(Depreciation)
($ Thousands) | |
90-Day Euro$ | | | (152) | | | | Dec-2016 | | | | $ (99) | |
90-Day Euro$ | | | 16 | | | | Mar-2017 | | | | 24 | |
Ultra 10-Year U.S. Treasury Bond | | | 15 | | | | Sep-2016 | | | | 77 | |
U.S. 10-Year Treasury Note | | | (176) | | | | Sep-2016 | | | | (501) | |
U.S. 2-Year Treasury Note | | | 40 | | | | Sep-2016 | | | | 59 | |
U.S. 5-Year Treasury Note | | | 295 | | | | Sep-2016 | | | | 534 | |
U.S. Long Treasury Bond | | | (11) | | | | Sep-2016 | | | | (62) | |
U.S. Ultra Long Treasury Bond | | | (7) | | | | Sep-2016 | | | | (79) | |
| | | | | | | | | | | $ (47) | |
| | | | | | | | | | | | |
For the year ended June 30, 2016, the total amount of all open futures contracts, as presented in the table above, are representative of the volume of activity for the derivative type during the year.
The futures contracts are considered to have interest rate risk associated with them.
Percentages are based on a Net Assets of $297,165 ($ Thousands).
| * | Non-income producing security. |
| ** | Rate shown is the 7-day effective yield as of June 30, 2016. |
| † | Investment in Affiliated Security (see Note 3). |
| (A) | Variable Rate Security — The rate reported on the Schedule of Investments is the rate in effect as of June 30, 2016. |
| (B) | Security exempt from registration under Rule 144A of the Securities Act of 1933. These securities may be resold in transactions exempt from registration normally to qualified institutions. On June 30, 2016, the value of these securities amounted to $34,423 ($ Thousands), representing 11.6% of the net assets of the Fund. |
| (C) | The rate reported is the effective yield at time of purchase. |
| (D) | For the year ended June 30, 2016, the total amount of open written, as presented in the Schedule of Investments, are representative of the volume of activity for these derivative types during the period. |
AESOP — Auto Employee Stock Ownership Plan
AGM — Assured Guaranty Municipal Corp.
Cl — Class
CMO — Collateralized Mortgage Obligation
FHLMC — Federal Home Loan Mortgage Corporation
FNMA — Federal National Mortgage Association
GNMA — Government National Mortgage Association
IO — Interest Only - face amount represents notional amount
MTN — Medium Term Note
NCUA — National Credit Union Association
RB — Revenue Bond
Re-Remic — Resecuritization of Real Estate Mortgage Investment Conduit
Ser — Series
STRIPS — Separately Traded Registered Interest and Principal Securities
TBA — To Be Announced
| | |
| 28 | | New Covenant Funds / Annual Report / June 30, 2016 |
The following is a list of the levels of inputs used as of June 30, 2016 in valuing the Fund’s investments and other financial instruments carried at value ($ Thousands):
| | | | | | | | | | | | | | | | |
| | | | | |
| Investments in Securities | | Level 1 | | | Level 2 | | | Level 3 | | | Total | |
Mortgage-Backed Securities | | $ | – | | | $ | 101,136 | | | $ | – | | | $ | 101,136 | |
Corporate Obligations | | | – | | | | 92,855 | | | | – | | | | 92,855 | |
U.S. Treasury Obligations | | | – | | | | 48,217 | | | | – | | | | 48,217 | |
Asset-Backed Securities | | | – | | | | 34,783 | | | | – | | | | 34,783 | |
Foreign Bonds | | | – | | | | 8,287 | | | | – | | | | 8,287 | |
Sovereign Debt | | | – | | | | 6,759 | | | | – | | | | 6,759 | |
U.S. Government Agency Obligations | | | – | | | | 3,355 | | | | – | | | | 3,355 | |
Municipal Bonds | | | – | | | | 3,196 | | | | – | | | | 3,196 | |
Cash Equivalent | | | 935 | | | | – | | | | – | | | | 935 | |
Repurchase Agreement | | | – | | | | 2,800 | | | | – | | | | 2,800 | |
| | | | | | | | | | | | | | | | |
| | | | |
Total Investments in Securities | | $ | 935 | | | $ | 301,388 | | | $ | – | | | $ | 302,323 | |
| | | | | | | | | | | | | | | | |
| | | | |
| | | | | | | | | | | | | | | | |
| Other Financial Instruments | | Level 1 | | | Level 2 | | | Level 3 | | | Total | |
Written Options | | $ | (6) | | | $ | – | | | $ | – | | | $ | (6) | |
Futures Contracts * | | | | | | | | | | | | | | | | |
Unrealized Appreciation | | | 694 | | | | – | | | | – | | | | 694 | |
Unrealized Depreciation | | | (741) | | | | – | | | | – | | | | (741) | |
| | | | | | | | | | | | | | | | |
Total Other Financial Instruments | | $ | (53) | | | $ | – | | | $ | – | | | $ | (53) | |
| | | | | | | | | | | | | | | | |
| * | Futures contracts are valued at the unrealized appreciation (depreciation) on the instrument. |
For the year ended June 30, 2016, there were no transfers between Level 1 and Level 2 assets and liabilities.
For the year ended June 30, 2016, there were no transfers between Level 2 and Level 3 assets and liabilities.
Amounts designated as “—” are either $0 or have been rounded to $0.
For more information on valuation inputs, see Note 2 – Significant Accounting Policies in Notes to Financial Statements.
The accompanying notes are an integral part of the financial statements.
| | |
| New Covenant Funds / Annual Report / June 30, 2016 | | 29 |
SCHEDULE OF INVESTMENTS
June 30, 2016
New Covenant Balanced Growth Fund
| | | | | | | | |
| | | | | | | | |
| |
Sector Weightings (Unaudited)†:  100.0% Affiliated Investment Companies 100.0% Affiliated Investment Companies
| |
|
†Percentages are based on total investments. | |
| |
| Description | | Shares | | | Market Value
($ Thousands) | |
| |
AFFILIATED INVESTMENT COMPANIES — 100.0% | | | | | |
New Covenant Growth Fund † | | | 5,040 | | | $ | 172,525 | |
New Covenant Income Fund † | | | 4,624 | | | | 109,043 | |
SEI Daily Income Trust, Government Fund, Cl A 0.150% **† | | | 2,769,399 | | | | 2,769 | |
| | | | | | | | |
Total Affiliated Investment Companies (Cost $249,793) ($ Thousands) | | | | | | | 284,337 | |
| | | | | | | | |
| | |
Total Investments — 100.0%
(Cost $249,793) ($ Thousands) | | | | | | $ | 284,337 | |
| | | | | | | | |
Percentages are based on a Net Assets of $284,430 ($ Thousands). † Investment in Affiliated Security (see Note 3). ** Rate shown is the 7-day effective yield as of June 30, 2016. Cl — Class As of June 30, 2016, all of the Fund’s investments were considered Level 1, in accordance with the authoritative guidance on fair value measurements and disclosure under U.S. GAAP. For the year ended June 30, 2016, there were no transfers between Level 1 and Level 2 assets and liabilities. For the year ended June 30, 2016, there were no transfers between Level 2 and Level 3 assets and liabilities. For more information on valuation inputs, see Note 2 – Significant Accounting Policies in Notes to Financial Statements. The accompanying notes are an integral part of the financial statements. | |
| | |
| 30 | | New Covenant Funds / Annual Report / June 30, 2016 |
SCHEDULE OF INVESTMENTS
June 30, 2016
New Covenant Balanced Income Fund
| | | | | | | | |
| | | | | | | | |
| |
Sector Weightings (Unaudited)†: | |
 100.0% Affiliated Investment Companies 100.0% Affiliated Investment Companies
| |
|
†Percentages are based on total investments. | |
| |
| Description | | Shares | | | Market Value
($ Thousands) | |
| |
AFFILIATED INVESTMENT COMPANIES — 100.0% | | | | | |
New Covenant Growth Fund † | | | 811 | | | $ | 27,763 | |
New Covenant Income Fund † | | | 2,094 | | | | 49,375 | |
SEI Daily Income Trust, Government Fund, Cl A 0.150%** † | | | 780,159 | | | | 780 | |
Total Affiliated Investment Companies
(Cost $69,140) ($ Thousands) | | | | | | | 77,918 | |
| | | | | | | | |
Total Investments — 100.0%
(Cost $69,140) ($ Thousands) | | | | | | $ | 77,918 | |
| | | | | | | | |
Percentages are based on a Net Assets of $77,945 ($ Thousands). ** Rate shown is the 7-day effective yield as of June 30, 2016. † Investment in Affiliated Security (see Note 3). Cl — Class As of June 30, 2016, all of the Fund’s investments were considered Level 1, in accordance with the authoritative guidance on fair value measurements and disclosure under U.S. GAAP. For the year ended June 30, 2016, there were no transfers between Level 1 and Level 2 assets and liabilities. For the year ended June 30, 2016, there were no transfers between Level 2 and Level 3 assets and liabilities. For more information on valuation inputs, see Note 2 – Significant Accounting Policies in Notes to Financial Statements. The accompanying notes are an integral part of the financial statements. | |
| | |
| New Covenant Funds / Annual Report / June 30, 2016 | | 31 |
STATEMENTS OF ASSETS AND LIABILITIES ($ THOUSANDS)
June 30, 2016
| | | | | | | | | | | | | | | | |
| | | Growth Fund | | | Income Fund | | | Balanced Growth
Fund | | | Balanced Income Fund | |
Assets: | | | | | | | | | | | | | | | | |
Investments, at value† | | $ | 363,992 | | | $ | 298,588 | | | $ | — | | | $ | — | |
Repurchase Agreements, at value †† | | | — | | | | 2,800 | | | | — | | | | — | |
Affiliated investments, at value††† | | | 18,618 | | | | 935 | | | | 284,337 | | | | 77,918 | |
Cash | | | 11,361 | | | | 992 | | | | — | | | | — | |
Receivable for investment securities sold | | | 1,000 | | | | 6,602 | | | | — | | | | — | |
Dividends and interest receivable | | | 367 | | | | 1,693 | | | | 185 | | | | 83 | |
Foreign tax reclaim receivable | | | 55 | | | | 1 | | | | — | | | | — | |
Receivable for variation margin | | | 44 | | | | 58 | | | | — | | | | — | |
Cash pledged as collateral for futures contracts | | | — | | | | 295 | | | | — | | | | — | |
Receivable for fund shares sold | | | — | | | | 871 | | | | — | | | | — | |
Prepaid expenses | | | 26 | | | | 20 | | | | 19 | | | | 5 | |
Total Assets | | | 395,463 | | | | 312,855 | | | | 284,541 | | | | 78,006 | |
Liabilities: | | | | | | | | | | | | | | | | |
Options written, at value †††† | | | — | | | | 6 | | | | — | | | | — | |
Payable for investment securities purchased | | | 101 | | | | 14,959 | | | | — | | | | — | |
Income distribution payable | | | — | | | | 436 | | | | — | | | | — | |
Investment advisory fees payable | | | 168 | | | | 67 | | | | — | | | | — | |
Administration fees payable | | | 64 | | | | 49 | | | | 20 | | | | 9 | |
Social witness and licensing fees payable | | | 46 | | | | 35 | | | | — | | | | — | |
Shareholder servicing fees payable | | | 32 | | | | 24 | | | | — | | | | — | |
Payable for fund shares redeemed | | | 6 | | | | 3 | | | | 21 | | | | 33 | |
Trustees’ fees payable | | | 3 | | | | 2 | | | | 2 | | | | 1 | |
Payable for variation margin | | | — | | | | 8 | | | | — | | | | — | |
Accrued expense payable | | | 100 | | | | 101 | | | | 68 | | | | 18 | |
Total Liabilities | | | 520 | | | | 15,690 | | | | 111 | | | | 61 | |
Net Assets | | $ | 394,943 | | | $ | 297,165 | | | $ | 284,430 | | | $ | 77,945 | |
† Cost of investments | | $ | 318,005 | | | $ | 292,379 | | | $ | — | | | $ | — | |
†† Cost of repurchase agreements | | | — | | | | 2,800 | | | | — | | | | — | |
††† Cost of affiliated investments | | | 18,618 | | | | 935 | | | | 249,793 | | | | 69,140 | |
†††† Premiums received | | | — | | | | (5 | ) | | | — | | | | — | |
Net Assets: | | | | | | | | | | | | | | | | |
Paid-in Capital — (unlimited authorization — par value $0.001) | | $ | 367,062 | | | $ | 343,340 | | | $ | 253,968 | | | $ | 70,172 | |
Undistributed net investment income | | | 406 | | | | 18 | | | | 447 | | | | 204 | |
Accumulated net realized loss on investments, affiliated investments, capital gain distributions from affiliated investments, written options, futures contracts and foreign currency transactions | | | (18,554 | ) | | | (52,359 | ) | | | (4,529 | ) | | | (1,209 | ) |
Net unrealized appreciation on investments and affiliated investments | | | 45,987 | | | | 6,209 | | | | 34,544 | | | | 8,778 | |
Net unrealized depreciation on written option contracts | | | — | | | | (1 | ) | | | — | | | | — | |
Net unrealized appreciation (depreciation) on futures contracts | | | 50 | | | | (47 | ) | | | — | | | | — | |
Net unrealized appreciation (depreciation) on foreign currencies and translation of other assets and liabilities denominated in foreign currencies | | | (8 | ) | | | 5 | | | | — | | | | — | |
Net Assets | | $ | 394,943 | | | $ | 297,165 | | | $ | 284,430 | | | $ | 77,945 | |
Net Asset Value, Offering and Redemption Price Per Share | | $ | 34.23 | | | $ | 23.58 | | | $ | 90.32 | | | $ | 20.06 | |
| | | ($394,942,979 ÷ | | | | ($297,165,313 ÷ | | | | ($284,430,463 ÷ | | | | ($77,944,521 ÷ | |
| | | | 11,538,521 shares) | | | | 12,600,773 shares) | | | | 3,149,178 shares) | | | | 3,885,194 shares) | |
Amounts designated as “—” are $0 or have been rounded to $0.
The accompanying notes are an integral part of the financial statements.
| | |
| 32 | | New Covenant Funds / Annual Report / June 30, 2016 |
STATEMENTS OF OPERATIONS ($ THOUSANDS)
For the year ended June 30, 2016
| | | | | | | | | | | | | | | | |
| | | Growth Fund | | | Income Fund | | | Balanced Growth
Fund | | | Balanced Income
Fund | |
Investment Income: | | | | | | | | | | | | | | | | |
Dividend income | | $ | 7,020 | | | $ | — | | | $ | — | | | $ | — | |
Dividend income from affiliated registered investment company | | | 21 | | | | 12 | | | | 3,080 | | | | 1,087 | |
Interest income | | | 8 | | | | 7,465 | | | | — | | | | — | |
Less: foreign taxes withheld | | | — | | | | — | | | | — | | | | — | |
Total Investment Income | | | 7,049 | | | | 7,477 | | | | 3,080 | | | | 1,087 | |
Expenses: | | | | | | | | | | | | | | | | |
Investment advisory fees | | | 2,451 | | | | 1,249 | | | | — | | | | — | |
Administration fees | | | 791 | | | | 595 | | | | 570 | | | | 156 | |
Social witness and licensing fees | | | 593 | | | | 446 | | | | — | | | | — | |
Shareholder servicing fees | | | 395 | | | | 297 | | | | — | | | | — | |
Trustee fees | | | 7 | | | | 5 | | | | 5 | | | | 1 | |
Chief compliance officer fees | | | 2 | | | | 1 | | | | 1 | | | | — | |
Transfer agent fees | | | 89 | | | | 72 | | | | 69 | | | | 20 | |
Professional fees | | | 57 | | | | 42 | | | | 41 | | | | 11 | |
Registration fees | | | 38 | | | | 27 | | | | 27 | | | | 7 | |
Printing fees | | | 26 | | | | 21 | | | | 19 | | | | 6 | |
Custodian fees | | | 6 | | | | 19 | | | | 18 | | | | 5 | |
Other expenses | | | 36 | | | | 137 | | | | 12 | | | | 3 | |
Total Expenses | | | 4,491 | | | | 2,911 | | | | 762 | | | | 209 | |
Less: | | | | | | | | | | | | | | | | |
Waiver of investment advisory fees (See – Note 3) | | | (450 | ) | | | (526 | ) | | | — | | | | — | |
Waiver of administration fees (See – Note 3) | | | — | | | | — | | | | (359 | ) | | | (52 | ) |
Net Expenses | | | 4,041 | | | | 2,385 | | | | 403 | | | | 157 | |
Net Investment Income | | | 3,008 | | | | 5,092 | | | | 2,677 | | | | 930 | |
Net Realized and Change in Unrealized Gain (Loss) on Investments: | | | | | | | | | | | | | | | | |
Net Realized Gain (Loss) on: | | | | | | | | | | | | | | | | |
Investments | | | (14,096 | ) | | | 3,318 | | | | — | | | | — | |
Affiliated investments | | | — | | | | — | | | | (2,208 | ) | | | (674 | ) |
Capital gain distributions received from affiliated investments | | | — | | | | — | | | | 11,355 | | | | 1,784 | |
Written options | | | — | | | | (67 | ) | | | — | | | | — | |
Futures contracts | | | 888 | | | | 271 | | | | — | | | | — | |
Foreign currency transactions | | | (3 | ) | | | — | | | | — | | | | — | |
Net Change in Unrealized Appreciation (Depreciation) on: | | | | | | | | | | | | | | | | |
Investments | | | (3,977 | ) | | | 2,861 | | | | — | | | | — | |
Affiliated investments | | | — | | | | — | | | | (13,521 | ) | | | (970 | ) |
Written options | | | — | | | | (1 | ) | | | — | | | | — | |
Futures contracts | | | 50 | | | | 179 | | | | — | | | | — | |
Foreign currency transactions and translation of other assets and liabilities denominated in foreign currencies | | | — | | | | 5 | | | | — | | | | — | |
Net Increase (Decrease) in Net Assets Resulting from Operations | | $ | (14,130 | ) | | $ | 11,658 | | | $ | (1,697 | ) | | $ | 1,070 | |
Amounts designated as “—” are $0 or have been rounded to $0.
The accompanying notes are an integral part of the financial statements.
| | |
| New Covenant Funds / Annual Report / June 30, 2016 | | 33 |
STATEMENTS OF CHANGES IN NET ASSETS ($ THOUSANDS)
For the years ended June 30,
| | | | | | | | | | | | | | | | |
| | | Growth Fund | | | Income Fund | |
| | | 2016 | | | 2015 | | | 2016 | | | 2015 | |
Operations: | | | | | | | | | | | | | | | | |
Net investment income | | $ | 3,008 | | | $ | 2,250 | | | $ | 5,092 | | | $ | 4,606 | |
Net realized gain (loss) from investments, affiliated investments, written and purchased options and futures contracts | | | (13,208 | ) | | | 52,508 | | | | 3,522 | | | | 1,944 | |
Net realized loss on foreign currency transactions | | | (3 | ) | | | (2 | ) | | | — | | | | — | |
Net change in unrealized appreciation (depreciation) on investments, affiliated investments, written options and futures contracts | | | (3,927 | ) | | | (27,889 | ) | | | 3,039 | | | | (2,016 | ) |
Net change in unrealized appreciation (depreciation) on foreign currency transactions and translation of other assets and liabilities denominated in foreign currency | | | — | | | | (8 | ) | | | 5 | | | | — | |
Net increase (decrease) in net assets resulting from operations | | | (14,130 | ) | | | 26,859 | | | | 11,658 | | | | 4,534 | |
Dividends and Distributions From: | | | | | | | | | | | | | | | | |
Net investment income | | | (2,425 | ) | | | (2,335 | ) | | | (5,431 | ) | | | (4,984 | ) |
Net realized gains | | | (26,424 | ) | | | (71,687 | ) | | | — | | | | — | |
Total dividends and distributions | | | (28,849 | ) | | | (74,022 | ) | | | (5,431 | ) | | | (4,984 | ) |
Capital Share Transactions: | | | | | | | | | | | | | | | | |
Proceeds from shares issued | | | 40,997 | | | | 25,692 | | | | 30,013 | | | | 35,466 | |
Reinvestment of dividends & distributions | | | 25,637 | | | | 69,245 | | | | 602 | | | | 546 | |
Cost of shares redeemed | | | (44,870 | ) | | | (56,468 | ) | | | (43,972 | ) | | | (40,306 | ) |
Increase (decrease) in net assets derived from capital share transactions | | | 21,764 | | | | 38,469 | | | | (13,357 | ) | | | (4,294 | ) |
Net decrease in net assets | | | (21,215 | ) | | | (8,694 | ) | | | (7,130 | ) | | | (4,744 | ) |
Net Assets: | | | | | | | | | | | | | | | | |
Beginning of Year | | | 416,158 | | | | 424,852 | | | | 304,295 | | | | 309,039 | |
End of Year | | $ | 394,943 | | | $ | 416,158 | | | $ | 297,165 | | | $ | 304,295 | |
Undistributed (Distributions in Excess of) Net Investment Income Included in Net Assets at Year End | | $ | 406 | | | $ | 1 | | | $ | 18 | | | $ | (1 | ) |
Share Transactions: | | | | | | | | | | | | | | | | |
Shares issued | | | 1,207 | | | | 634 | | | | 1,297 | | | | 1,530 | |
Shares issued in lieu of dividends and distributions | | | 740 | | | | 1,868 | | | | 26 | | | | 24 | |
Shares redeemed | | | (1,280 | ) | | | (1,351 | ) | | | (1,900 | ) | | | (1,739 | ) |
Increase (Decrease) in net assets derived from share transactions | | | 667 | | | | 1,151 | | | | (577 | ) | | | (185 | ) |
Amounts designated as “—” are $0 or have been rounded to $0.
The accompanying notes are an integral part of the financial statements.
| | |
| 34 | | New Covenant Funds / Annual Report / June 30, 2016 |
| | | | | | | | | | | | | | | | |
| | | Balanced Growth Fund | | | Balanced Income Fund | |
| | | 2016 | | | 2015 | | | 2016 | | | 2015 | |
Operations: | | | | | | | | | | | | | | | | |
Net investment income | | $ | 2,677 | | | $ | 2,528 | | | $ | 930 | | | $ | 860 | |
Net realized gain (loss) from investments, affiliated investments, written and purchased options and futures contracts | | | (2,208 | ) | | | 482 | | | | (674 | ) | | | 473 | |
Capital gain distributions received from affiliated investments | | | 11,355 | | | | 31,515 | | | | 1,784 | | | | 5,086 | |
Net change in unrealized appreciation (depreciation) on affiliated investments | | | (13,521 | ) | | | (21,051 | ) | | | (970 | ) | | | (3,802 | ) |
Net increase (decrease) in net assets resulting from operations | | | (1,697 | ) | | | 13,474 | | | | 1,070 | | | | 2,617 | |
Dividends and Distributions From: | | | | | | | | | | | | | | | | |
Net investment income | | | (5,355 | ) | | | (8,482 | ) | | | (1,221 | ) | | | (1,821 | ) |
Net realized gains | | | (25,693 | ) | | | (5,579 | ) | | | (4,082 | ) | | | (2,156 | ) |
Total dividends and distributions | | | (31,048 | ) | | | (14,061 | ) | | | (5,303 | ) | | | (3,977 | ) |
Capital Share Transactions: | | | | | | | | | | | | | | | | |
Proceeds from shares issued | | | 19,348 | | | | 17,616 | | | | 5,760 | | | | 6,727 | |
Reinvestment of dividends & distributions | | | 28,515 | | | | 11,934 | | | | 4,631 | | | | 3,222 | |
Cost of shares redeemed | | | (28,248 | ) | | | (37,327 | ) | | | (8,416 | ) | | | (14,008 | ) |
Increase (decrease) in net assets derived from capital share transactions | | | 19,615 | | | | (7,777 | ) | | | 1,975 | | | | (4,059 | ) |
Net decrease in net assets | | | (13,130 | ) | | | (8,364 | ) | | | (2,258 | ) | | | (5,419 | ) |
Net Assets: | | | | | | | | | | | | | | | | |
Beginning of Year | | | 297,560 | | | | 305,924 | | | | 80,203 | | | | 85,622 | |
End of Year | | $ | 284,430 | | | $ | 297,560 | | | $ | 77,945 | | | $ | 80,203 | |
Undistributed Net Investment Income Included in Net Assets at Year End | | $ | 447 | | | $ | 24 | | | $ | 204 | | | $ | 8 | |
Share Transactions: | | | | | | | | | | | | | | | | |
Shares issued | | | 209 | | | | 171 | | | | 283 | | | | 314 | |
Shares issued in lieu of dividends and distributions | | | 317 | | | | 118 | | | | 234 | | | | 151 | |
Shares redeemed | | | (303 | ) | | | (365 | ) | | | (415 | ) | | | (654 | ) |
Increase (Decrease) in net assets derived from share transactions | | | 223 | | | | (76 | ) | | | 102 | | | | (189 | ) |
Amounts designated as “—” are $0 or have been rounded to $0.
The accompanying notes are an integral part of the financial statements.
| | |
| New Covenant Funds / Annual Report / June 30, 2016 | | 35 |
FINANCIAL HIGHLIGHTS
For the years ended June 30,
For a Share Outstanding Throughout the Year
| | | | | | | | | | | | | | | | | | | | |
| | | Growth Fund | |
| | | 2016 | | | 2015 | | | 2014 | | | 2013 | | | 2012(2) | |
Net Asset Value, Beginning of Year | | | $38.28 | | | | $43.70 | | | | $37.28 | | | | $32.23 | | | | $32.53 | |
Investment Activities: | | | | | | | | | | | | | | | | | | | | |
Net investment income(1) | | | 0.27 | | | | 0.22 | | | | 0.23 | | | | 0.28 | | | | 0.31 | |
Net realized and unrealized gains (losses) on investments and foreign currency transactions(1) | | | (1.67) | | | | 2.29 | | | | 8.55 | | | | 5.20 | | | | (0.38) | |
Total from investment activities | | | (1.40) | | | | 2.51 | | | | 8.78 | | | | 5.48 | | | | (0.07) | |
Dividends and Distributions from: | | | | | | | | | | | | | | | | | | | | |
Net investment income | | | (0.21) | | | | (0.22) | | | | (0.24) | | | | (0.43) | | | | (0.23) | |
Net realized gains | | | (2.44) | | | | (7.71) | | | | (2.12) | | | | – | | | | – | |
Total dividends and distributions | | | (2.65) | | | | (7.93) | | | | (2.36) | | | | (0.43) | | | | (0.23) | |
Net Asset Value, End of Year | | | $34.23 | | | | $38.28 | | | | $43.70 | | | | $37.28 | | | | $32.23 | |
Total Return† | | | (3.68)% | | | | 6.41% | | | | 24.18% | | | | 17.11% | | | | (0.15)% | |
Supplemental Data and Ratios: | | | | | | | | | | | | | | | | | | | | |
Net assets, end of year ($ Thousands) | | | $394,943 | | | | $416,158 | | | | $424,852 | | | | $369,133 | | | | $652,311 | |
Ratio of net expenses to average net assets | | | 1.02% | | | | 1.02% | | | | 1.02% | | | | 0.99% | | | | 0.97% | |
Ratio of expenses to average net assets, excluding waivers | | | 1.14% | | | | 1.12% | | | | 1.15% | | | | 1.15% | | | | 1.03% | |
Ratio of net investment income to average net assets | | | 0.76% | | | | 0.54% | | | | 0.55% | | | | 0.81% | | | | 1.01% | |
Portfolio turnover rate | | | 103% | | | | 107% | | | | 86% | | | | 47% | | | | 83% | |
| | † | Returns shown do not reflect the deduction of taxes that a shareholder would pay on fund distributions or the redemption of fund shares. |
| | (1) | Per share net investment income and net realized and unrealized gains (losses) calculated using average shares. |
| | (2) | As disclosed in Note 1, prior to February 20, 2012, the Funds’ investment advisor was One Compass Advisors, a wholly owned subsidiary of the Presbyterian Church (U.S.A.) Foundation. |
Amounts designated as ‘‘—‘‘ are $0 or have been rounded to $0.
The accompanying notes are an integral part of the financial statements
| | |
| 36 | | New Covenant Funds / Annual Report / June 30, 2016 |
| | | | | | | | | | | | | | | | | | | | |
| | | Income Fund | |
| | | 2016 | | | 2015 | | | 2014 | | | 2013 | | | 2012(2) | |
Net Asset Value, Beginning of Year | | | $23.09 | | | | $23.13 | | | | $22.77 | | | | $23.28 | | | | $22.85 | |
Investment Activities: | | | | | | | | | | | | | | | | | | | | |
Net investment income(1) | | | 0.40 | | | | 0.35 | | | | 0.34 | | | | 0.29 | | | | 0.60 | |
Net realized and unrealized gains (losses) on investments(1) | | | 0.51 | | | | (0.01) | | | | 0.41 | | | | (0.41) | | | | 0.62 | |
Total from investment activities | | | 0.91 | | | | 0.34 | | | | 0.75 | | | | (0.12) | | | | 1.22 | |
Dividends and Distributions from: | | | | | | | | | | | | | | | | | | | | |
Net investment income | | | (0.42) | | | | (0.38) | | | | (0.39) | | | | (0.39) | | | | (0.79) | |
Total dividends and distributions | | | (0.42) | | | | (0.38) | | | | (0.39) | | | | (0.39) | | | | (0.79) | |
Net Asset Value, End of Year | | | $23.58 | | | | $23.09 | | | | $23.13 | | | | $22.77 | | | | $23.28 | |
Total Return† | | | 4.00% | | | | 1.46% | | | | 3.31% | | | | (0.55)% | | | | 5.45% | |
Supplemental Data and Ratios: | | | | | | | | | | | | | | | | | | | | |
Net assets, end of year ($ Thousands) | | | $297,165 | | | | $304,295 | | | | $309,039 | | | | $291,669 | | | | $374,870 | |
Ratio of net expenses to average net assets | | | 0.80% | | | | 0.80% | | | | 0.80% | | | | 0.77% | | | | 0.75% | |
Ratio of expenses to average net assets, excluding waivers | | | 0.98% | | | | 0.95% | | | | 0.98% | | | | 0.95% | | | | 0.81% | |
Ratio of net investment income to average net assets | | | 1.71% | | | | 1.50% | | | | 1.50% | | | | 1.23% | | | | 2.60% | |
Portfolio turnover rate | | | 202% | | | | 115% | | | | 168% | | | | 295% | | | | 95% | |
| | † | Returns shown do not reflect the deduction of taxes that a shareholder would pay on fund distributions or the redemption of fund shares. |
| | (1) | Per share net investment income and net realized and unrealized gains (losses) calculated using average shares. |
| | (2) | As disclosed in Note 1, prior to February 20, 2012, the Funds’ investment advisor was One Compass Advisors, a wholly owned subsidiary of the Presbyterian Church (U.S.A.) Foundation. |
The accompanying notes are an integral part of the financial statements.
| | |
| New Covenant Funds / Annual Report / June 30, 2016 | | 37 |
FINANCIAL HIGHLIGHTS (Concluded)
For the years ended June 30,
For a Share Outstanding Throughout the Year
| | | | | | | | | | | | | | | | | | | | |
| | | Balanced Growth Fund | |
| | | 2016 | | | 2015 | | | 2014 | | | 2013 | | | 2012(2) | |
Net Asset Value, Beginning of Year | | | $101.71 | | | | $101.92 | | | | $89.69 | | | | $82.87 | | | | $82.33 | |
Investment Activities: | | | | | | | | | | | | | | | | | | | | |
Net investment income(1) | | | 0.88 | | | | 0.85 | | | | 1.43 | | | | 1.08 | | | | 1.25 | |
Net realized and unrealized gains (losses) on Affiliated Funds (1) | | | (1.63) | | | | 3.71 | | | | 12.23 | | | | 6.96 | | | | 0.41 | |
Total from investment activities | | | (0.75) | | | | 4.56 | | | | 13.66 | | | | 8.04 | | | | 1.66 | |
Dividends and Distributions from: | | | | | | | | | | | | | | | | | | | | |
Net investment income | | | (1.72) | | | | (2.86) | | | | (1.43) | | | | (1.22) | | | | (1.12) | |
Net realized gains | | | (8.92) | | | | (1.91) | | | | – | | | | – | | | | – | |
Total dividends and distributions | | | (10.64) | | | | (4.77) | | | | (1.43) | | | | (1.22) | | | | (1.12) | |
Net Asset Value, End of Year | | | $90.32 | | | | $101.71 | | | | $101.92 | | | | $89.69 | | | | $82.87 | |
Total Return† | | | (0.50)% | | | | 4.54% | | | | 15.30% | | | | 9.77% | | | | 2.07% | |
Supplemental Data and Ratios: | | | | | | | | | | | | | | | | | | | | |
Net assets, end of year ($ Thousands) | | | $284,430 | | | | $297,560 | | | | $305,924 | | | | $271,518 | | | | $258,499 | |
Ratio of net expenses to average net assets* | | | 0.14% | | | | 0.14% | | | | 0.14% | | | | 0.14% | | | | 0.14% | |
Ratio of expenses to average net assets, excluding waivers* | | | 0.27% | | | | 0.26% | | | | 0.27% | | | | 0.27% | | | | 0.17% | |
Ratio of net investment income to average net assets | | | 0.94% | | | | 0.83% | | | | 1.48% | | | | 1.24% | | | | 1.55% | |
Portfolio turnover rate | | | 14% | | | | 13% | | | | 6% | | | | 7% | | | | 9% | |
| | † | Returns shown do not reflect the deduction of taxes that a shareholder would pay on fund distributions or the redemption of fund shares. |
| | * | The expense ratios do not include expenses of the underlying affiliated investment companies. |
| | (1) | Per share net investment income and net realized and unrealized gains (losses) calculated using average shares. |
| | (2) | As disclosed in Note 1, prior to February 20, 2012, the Funds’ investment advisor was One Compass Advisors, a wholly owned subsidiary of the Presbyterian Church (U.S.A.) Foundation. |
Amounts designated as ‘‘—‘‘ are $0 or have been rounded to $0.
The accompanying notes are an integral part of the financial statements.
| | |
| 38 | | New Covenant Funds / Annual Report / June 30, 2016 |
| | | | | | | | | | | | | | | | | | | | |
| | | Balanced Income Fund | |
| | | 2016 | | | 2015 | | | 2014 | | | 2013 | | | 2012(2) | |
Net Asset Value, Beginning of Year | | | $21.20 | | | | $21.55 | | | | $19.95 | | | | $19.25 | | | | $18.97 | |
Investment Activities: | | | | | | | | | | | | | | | | | | | | |
Net investment income(1) | | | 0.24 | | | | 0.22 | | | | 0.30 | | | | 0.26 | | | | 0.41 | |
Net realized and unrealized gains on Affiliated Funds(1) | | | 0.02 | | | | 0.46 | | | | 1.68 | | | | 0.76 | | | | 0.22 | |
Total from investment activities | | | 0.26 | | | | 0.68 | | | | 1.98 | | | | 1.02 | | | | 0.63 | |
Dividends and Distributions from: | | | | | | | | | | | | | | | | | | | | |
Net investment income | | | (0.31) | | | | (0.47) | | | | (0.30) | | | | (0.32) | | | | (0.35) | |
Net realized gains | | | (1.09) | | | | (0.56) | | | | (0.08) | | | | – | | | | – | |
Total dividends and distributions | | | (1.40) | | | | (1.03) | | | | (0.38) | | | | (0.32) | | | | (0.35) | |
Net Asset Value, End of Year | | | $20.06 | | | | $21.20 | | | | $21.55 | | | | $19.95 | | | | $19.25 | |
Total Return† | | | 1.41% | | | | 3.22% | | | | 10.01% | | | | 5.34% | | | | 3.42% | |
Supplemental Data and Ratios: | | | | | | | | | | | | | | | | | | | | |
Net assets, end of year ($ Thousands) | | | $77,945 | | | | $80,203 | | | | $85,622 | | | | $81,818 | | | | $85,602 | |
Ratio of net expenses to average net assets* | | | 0.20% | | | | 0.20% | | | | 0.20% | | | | 0.20% | | | | 0.18% | |
Ratio of expenses to average net assets, excluding waivers* | | | 0.27% | | | | 0.25% | | | | 0.26% | | | | 0.27% | | | | 0.20% | |
Ratio of net investment income to average net assets | | | 1.19% | | | | 1.04% | | | | 1.44% | | | | 1.30% | | | | 2.18% | |
Portfolio turnover rate | | | 17% | | | | 15% | | | | 9% | | | | 7% | | | | 9% | |
| | † | Returns shown do not reflect the deduction of taxes that a shareholder would pay on fund distributions or the redemption of fund shares. |
| | * | The expense ratios do not include expenses of the underlying affiliated investment companies. |
| | (1) | Per share net investment income and net realized and unrealized gains (losses) calculated using average shares. |
| | (2) | As disclosed in Note 1, prior to February 20, 2012, the Funds’ investment advisor was One Compass Advisors, a wholly owned subsidiary of the Presbyterian Church (U.S.A.) Foundation. |
Amounts designated as ‘‘—‘‘ are $0 or have been rounded to $0.
The accompanying notes are an integral part of the financial statements.
| | |
| New Covenant Funds / Annual Report / June 30, 2016 | | 39 |
NOTES TO FINANCIAL STATEMENTS
June 30, 2016
1. ORGANIZATION
New Covenant Funds (the “Trust”), an open-end, diversified management investment company, was organized as a Delaware business trust on September 30, 1998. It currently consists of four investment funds: New Covenant Growth Fund (“Growth Fund”), New Covenant Income Fund (“Income Fund”), New Covenant Balanced Growth Fund (“Balanced Growth Fund”), and New Covenant Balanced Income Fund (“Balanced Income Fund”), (individually, a “Fund,” and collectively, the “Funds”). The Funds commenced operations on July 1, 1999. The Trust’s authorized capital consists of an unlimited number of shares of beneficial interest of $0.001 par value. Effective February 20, 2012, the Funds’ investment adviser is SEI Investments Management Corporation (the “Adviser”). Prior to February 20, 2012, the Funds’ investment adviser was One Compass Advisors, a wholly owned subsidiary of the Presbyterian Church (U.S.A.) Foundation.
The objectives of the Funds are as follows:
| | |
| Growth Fund | | Long-term capital appreciation. |
| |
Income Fund | | High level of current income with preservation of capital. |
| |
Balanced Growth Fund | | Capital appreciation with less risk than would be present in a portfolio of only common stocks. |
| |
Balanced Income Fund | | Current income and long-term growth of capital. |
2. SIGNIFICANT ACCOUNTING POLICIES
The following is a summary of the significant accounting policies followed by the Funds.
Use of Estimates — The preparation of financial statements, in conformity with U.S. generally accepted accounting principles (“U.S. GAAP”), requires management to make estimates and assumptions that affect the reported amount of assets and liabilities and disclosure of contingent assets and liabilities as of the date of the financial statements and the reported amounts of increases and decreases in net assets from operations during the reporting period. Actual results could differ from those estimates.
Security Valuation — Securities listed on a securities exchange, market or automated quotation system for which quotations are readily available (except for securities traded on NASDAQ) are valued at the last quoted sale price on the primary exchange or market (foreign or domestic) on which they are traded, or, if there is no such reported sale, at the most recent quoted bid price. For securities traded on NASDAQ, the NASDAQ Official Closing Price will be used. Debt securities are priced based upon valuations provided by independent, third-party pricing agents, if available. Such values generally reflect the last reported sales price if the security is actively traded. The third-party pricing agents may also value debt securities at an evaluated bid price by employing methodologies that utilize actual market transactions, broker-supplied valuations, or other methodologies designed to identify the market value for such securities. Debt obligations acquired with remaining maturities of sixty days or less may be valued at their amortized cost, which approximates market value. The prices for foreign securities are reported in local currency and converted to U.S. dollars using currency exchange rates. Prices for most securities held in the Funds are provided daily by recognized independent pricing agents. If a security price cannot be obtained from an independent, third-party pricing agent, the Funds seek to obtain a bid price from at least one independent broker.
Securities for which market prices are not “readily available” are valued in accordance with fair value procedures established by the Trust’s Board of Trustees. The Trust’s fair value procedures are implemented through a fair value committee (the “Committee”) designated by the Trust’s Board of Trustees. Some of the more common reasons that may necessitate that a security be valued using fair value procedures include: the security’s trading has been halted or suspended; the security has been de-listed from a national exchange; the security’s primary trading market is temporarily closed at a time when under normal conditions it would be open; or the security’s primary pricing source is not able or willing to provide a price. When a security is valued in accordance with the fair value procedures, the Committee will determine the value after taking into consideration relevant information reasonably available to the Committee.
For securities that principally trade on a foreign market or exchange, a significant gap in time can exist between the time of a particular security’s last trade and the time at which a Fund calculates its net asset value. The closing prices of such securities may no longer reflect their market value at the time a Fund calculates net asset value if an event that could materially affect the value of those securities (a “Significant Event”) has occurred between the time of the
| | |
| 40 | | New Covenant Funds / Annual Report / June 30, 2016 |
security’s last close and the time that a Fund calculates net asset value. A Significant Event may relate to a single issuer or to an entire market sector. If the adviser or sub-adviser of a Fund becomes aware of a Significant Event that has occurred with respect to a security or group of securities after the closing of the exchange or market on which the security or securities principally trade, but before the time at which a Fund calculates net asset value, the adviser or sub-adviser may request that a Fair Value Committee Meeting be called. In addition, the Trust’s administrator monitors price movements among certain selected indices, securities and/or baskets of securities that may be an indicator that the closing prices received earlier from foreign exchanges or markets may not reflect market value at the time a Fund calculates net asset value. If price movements in a monitored index or security exceed levels established by the administrator, the administrator notifies the adviser or sub-adviser for any Fund holding the relevant securities that such limits have been exceeded. In such event, the adviser or sub-adviser makes the determination whether a Fair Value Committee Meeting should be called based on the information provided.
The Growth Fund holds international securities that also use a third-party fair valuation vendor. The vendor provides a fair value for foreign securities held by this Fund based on certain factors and methodologies (involving, generally, tracking valuation correlations between the U.S. market and each non-U.S. security). Values from the fair value vendor are applied in the event that there is a movement in the U.S. market that exceeds a specific threshold that has been established by the Committee. The Committee has also established a “confidence interval” which is used to determine the level of historical correlation between the value of a specific foreign security and movements in the U.S. market before a particular security will be fair valued when the threshold is exceeded. In the event that the threshold established by the Committee is exceeded on a specific day, the Growth Fund will value the non-U.S. securities that exceed the applicable “confidence interval” based upon the adjusted prices provided by the fair valuation vendor.
Options for which the primary market is a national securities exchange are valued at the last sale price on the exchange on which they are traded, or, in the absence of any sale, at the closing bid price. Options not traded on a national securities exchange are valued at the last quoted bid price.
The assets of the Balanced Growth Fund and the Balanced Income Fund (the “Balanced Funds”) consist primarily of investments in underlying affiliated investment companies, which are valued at their respective daily net asset values in accordance with the established NAV of each fund.
In accordance with U.S. GAAP, fair value is defined as the price that a Fund would receive upon selling an investment in an orderly transaction to an independent buyer in the principal or most advantageous market of the investment. A three tier hierarchy has been established to maximize the use of observable and minimize the use of unobservable inputs and to establish classification of fair value measurements for disclosure purposes. Inputs refer broadly to the assumptions that market participants would use in pricing an asset. Inputs may be observable or unobservable. Observable inputs are inputs that reflect the assumptions market participants would use in pricing the asset or liability based on market data obtained from sources independent of the reporting entity. Unobservable inputs are inputs that reflect the reporting entity’s own assumptions about the assumptions market participants would use in pricing the asset or liability based on the best information available in the circumstances.
The three-tier hierarchy of inputs is summarized in the three broad Levels listed below:
Level 1 — quoted prices in active markets for identical investments
Level 2 — other significant observable inputs (including quoted prices for similar investments, interest rates, prepayment speeds, credit risks, etc.)
Level 3 — significant unobservable inputs (including the Fund’s own assumptions in determining the fair value of investments)
The valuation techniques used by the Funds to measure fair value during the year ended June 30, 2016 maximized the use of observable inputs and minimized the use of unobservable inputs.
For the year ended June 30, 2016, there have been no significant changes to the Trust’s fair valuation methodologies. For details of the investment classifications reference the Schedules of Investments.
| | |
| New Covenant Funds / Annual Report / June 30, 2016 | | 41 |
NOTES TO FINANCIAL STATEMENTS (Continued)
June 30, 2016
Securities Transactions and Investment Income — Security transactions are recorded on the trade date. Cost used in determining net realized capital gains and losses on the sale of securities is determined on the basis of specific identification. Dividend income and expense is recognized on the ex-dividend date, and interest income or expense is recognized using the accrual basis of accounting.
Distributions received on securities that represent a return of capital or capital gains are recorded as a reduction of cost of investments and/or as a realized gain. The Trust estimates the components of distributions received that may be considered nontaxable distributions or capital gain distributions.
Amortization and accretion is calculated using the scientific interest method, which approximates the effective interest method over the holding period of the security. Amortization of premiums and discounts is included in interest income.
Cash and Cash Equivalents — Idle cash and currency balances may be swept into various overnight sweep accounts and are classified as cash equivalents on the Statement of Assets and Liabilities. These amounts, at times, may exceed United States federally insured limits. Amounts swept are available on the next business day.
Expenses — Expenses that are directly related to a Fund are charged directly to that Fund. Other operating expenses of the Funds are prorated to the Funds on the basis of relative net assets.
Foreign Currency Translation — The books and records of the Funds investing in international securities are maintained in U.S. dollars on the following basis:
(I) market value of investment securities, assets and liabilities at the current rate of exchange; and
(II) purchases and sales of investment securities, income and expenses at the relevant rates of exchange prevailing on the respective dates of such transactions.
The Funds do not isolate that portion of gains and losses on investments in equity securities that is due to changes in the foreign exchange rates from that which is due to changes in market prices of equity securities.
The Funds report certain foreign-currency-related transactions as components of realized gains for financial reporting purposes, whereas such components are treated as ordinary income for Federal income tax purposes.
Repurchase Agreements — To the extent consistent with its investment objective and strategies, a Fund may enter into repurchase agreements which are secured by obligations of the U.S. Government with a bank, broker-dealer or other financial institution. Each repurchase agreement is at least 102% collateralized and marked-to-market. However, in the event of default or bankruptcy by the counterparty to the repurchase agreement, realization of the collateral may by subject to certain costs, losses or delays.
Futures Contracts — To the extent consistent with its investment objective and strategies, a Fund may use futures contracts for tactical hedging purposes as well as to enhance the Fund’s returns. These Funds’ investments in futures contracts are designed to enable the Funds to more closely approximate the performance of their benchmark indices. Initial margin deposits of cash or securities are made upon entering into futures contracts. The contracts are marked-to-market daily and the resulting changes in value are accounted for as unrealized gains and losses. Variation margin payments are paid or received, depending upon whether unrealized gains or losses are incurred. When contracts are closed, the Funds record a realized gain or loss equal to the difference between the proceeds from (or cost of) the closing transaction and the amount invested in the contract.
Risks of entering into futures contracts include the possibility that there will be an imperfect price correlation between the futures and the underlying securities. Second, it is possible that a lack of liquidity for futures contracts could exist in the secondary market, resulting in an inability to close a position prior to its maturity date. Third, futures contracts involve the risk that a Fund could lose more than the original margin deposit required to initiate a futures transaction.
Finally, the risk exists that losses could exceed amounts disclosed on the Statements of Assets and Liabilities. Refer to each Fund’s Schedule of Investments for details regarding open futures contracts as of June 30, 2016, if applicable.
Options Writing/Purchasing — To the extent consistent with its investment objective and strategies, a Fund may invest in financial options contracts for the purpose of hedging its existing portfolio securities, or securities that a Fund intends to purchase, against fluctuations in fair market value caused by changes in prevailing market interest rates. A Fund may also invest in financial option contracts to enhance its returns. When the Fund writes or purchases
| | |
| 42 | | New Covenant Funds / Annual Report / June 30, 2016 |
an option, an amount equal to the premium received or paid by the Fund is recorded as a liability or an asset and is subsequently adjusted to the current market value of the option written or purchased. Premiums received or paid from writing or purchasing options which expire unexercised are treated by the Fund on the expiration date as realized gains or losses. The difference between the premium and the amount paid or received on affecting a closing purchase or sale transaction, including brokerage commissions, is also treated as a realized gain or loss. If an option is exercised, the premium paid or received is added to the cost of the purchase or proceeds from the sale in determining whether the Fund has realized a gain or a loss.
The risk in writing a call option is a Fund may give up the opportunity for profit if the market price of the security increases. The risk in writing a put option is a Fund may incur a loss if the market price of the security decreases and the option is exercised. The risk in purchasing an option is a Fund may pay a premium whether or not the option is exercised. The Funds also have the additional risk of being unable to enter into a closing transaction at an acceptable price if a liquid secondary market does not exist. Option contracts also involve the risk that they may not work as intended due to unanticipated developments in market conditions or other causes.
Forward Treasury Commitments — To the extent consistent with its investment objective and strategies, the Growth Fund and Income Fund may invest in commitments to purchase U.S. Treasury securities on an extended settlement basis. Such transactions involve the commitment to purchase a security with payment and delivery taking place in the future, sometimes a month or more after the transaction date. The Funds account for such transactions as purchases and sales and record an unrealized gain or loss each day equal to the difference between the cost of the purchase commitment and the current market value. Realized gains or losses are recorded upon closure or settlement of such commitments. No interest is earned prior to settlement of the transaction. These instruments are subject to market fluctuation due to changes in interest rates and the market value at the time of settlement could be higher or lower than the purchase price. A Fund may incur losses due to changes in the value of the underlying treasury securities from interest rate fluctuations or as a result of counterparty nonperformance. These transactions may increase the overall investment exposure for a Fund (and so may also create investment leverage) and involve a risk of loss if the value of the securities declines prior to the settlement date.
Master Limited Partnerships — To the extent consistent with its investment objective and strategies, a Fund may invest in entities commonly referred to as “MLPs” that are generally organized under state law as limited partnerships or limited liability companies. The Funds intend to primarily invest in MLPs receiving partnership taxation treatment under the Internal Revenue Code of 1986 (the “Code”), and whose interests or “units” are traded on securities exchanges like shares of corporate stock. To be treated as a partnership for U.S. federal income tax purposes, an MLP whose units are traded on a securities exchange must receive at least 90% of its income from qualifying sources such as interest, dividends, real estate rents, gain from the sale or disposition of real property, income and gain from mineral or natural resources activities, income and gain from the transportation or storage of certain fuels, and, in certain circumstances, income and gain from commodities or futures, forwards and options with respect to commodities. Mineral or natural resources activities include exploration, development, production, processing, mining, refining, marketing and transportation (including pipelines) of oil and gas, minerals, geothermal energy, fertilizer, timber or industrial source carbon dioxide. An MLP consists of a general partner and limited partners (or in the case of MLPs organized as limited liability companies, a managing member and members). The general partner or managing member typically controls the operations and management of the MLP and has an ownership stake in the partnership. The limited partners or members, through their ownership of limited partner or member interests, provide capital to the entity, are intended to have no role in the operation and management of the entity and receive cash distributions. The MLPs themselves generally do not pay U.S. Federal income taxes. Thus, unlike investors in corporate securities, direct MLP investors are generally not subject to double taxation (i.e., corporate level tax and tax on corporate dividends). Currently, most MLPs operate in the energy and/or natural resources sector.
Delayed Delivery Transactions — To the extent consistent with its investment objective and strategies, the Growth Fund and Income Fund may purchase or sell securities on a when-issued or delayed delivery basis. These transactions involve a commitment by those Funds to purchase or sell securities for a predetermined price or yield, with payment and delivery taking place beyond the customary settlement period. When delayed delivery purchases are outstanding, the Funds will set aside liquid assets in an amount sufficient to meet the purchase price. When purchasing a security on a delayed delivery basis, that Fund assumes the rights and risks of ownership of the security, including the risk of price and yield fluctuations, and takes such fluctuations into account when determining its net asset value. Those Funds may dispose of or renegotiate a delayed delivery transaction after it is entered into, and may sell when-issued securities before they are delivered, which may result in a capital gain or loss. When those Funds have sold a security on a delayed delivery basis, that Fund does not participate in future gains and losses with respect to the security.
| | |
| New Covenant Funds / Annual Report / June 30, 2016 | | 43 |
NOTES TO FINANCIAL STATEMENTS (Continued)
June 30, 2016
Dividends and Distributions to Shareholders — Dividends from net investment income are declared and paid to shareholders quarterly for the Growth Fund, Balanced Growth Fund and Balanced Income Fund; declared and paid monthly for the Income Fund. Dividends and distributions are recorded on the ex-dividend date. Any net realized capital gains will be distributed at least annually by the Funds.
Illiquid Securities — A security is considered illiquid if it cannot be sold or disposed of in the ordinary course of business within seven days or less for its approximate carrying value on the books of a Fund. Valuations of illiquid securities may differ significantly from the values that would have been used had an active market value for these securities existed. As of June 30, 2016, the Funds did not own any illiquid securities.
Investments in Real Estate Investment Trusts (“REITs”) — Dividend income is recorded based on the income included in distributions received from the REIT investments using published REIT reclassifications including some management estimates when actual amounts are not available. Distributions received in excess of this estimated amount are recorded as a reduction of the cost of investments or reclassified to capital gains. The actual amounts of income, return of capital, and capital gains are only determined by each REIT after its fiscal year-end, and may differ from the estimated amounts.
3. AGREEMENTS AND OTHER TRANSACTIONS WITH AFFILIATES
Administration Agreement — The Trust entered into an Administration Agreement with SEI Investments Global Funds Services (the “Administrator”). Under the Administration Agreement, the Administrator provides administrative and accounting services to the Funds. Under the terms of the Administration Agreement, the Administrator is entitled to a fee of 0.20% of each Fund’s average daily net assets. The Administrator has voluntarily agreed to waive a portion of its fee so that the total annual expenses of the Balanced Growth Fund and the Balanced Income Fund, exclusive of acquired fund fees and expenses, will not exceed certain voluntary expense limitations adopted by the Adviser. Accordingly, the voluntary expense limitations are 0.14% and 0.20% for the Balanced Growth Fund and the Balanced Income Fund, respectively. These voluntary waivers may be terminated at any time.
Transfer Agent Servicing Agreement — In 2008, the Trust entered into a transfer agent servicing agreement (“Agreement”) with U.S. Bancorp Fund Services, LLC (“USBFS”), an indirect, wholly-owned subsidiary of U.S. Bancorp. Under the terms of the Agreement, USBFS is entitled to account based fees and annual fund level fees, as well as reimbursement of out-of-pocket expenses incurred in providing transfer agency services.
Investment Advisory Agreement — The Trust, on behalf of each Fund, entered into an Investment Advisory Agreement (“Agreement”) with SEI Investments Management Corporation (the “Adviser”). Under the Agreement, the Adviser is responsible for the investment management of the Funds and receives an annual advisory fee of 0.62% for the Growth Fund and 0.42% for the Income Fund. The Adviser does not receive an advisory fee for the Balanced Growth Fund and Balanced Income Fund. The Adviser has voluntarily agreed to waive a portion of its fee so that the total annual expenses of the Growth and Income Funds, exclusive of acquired fund fees and expenses, will not exceed certain voluntary expense limitations adopted by the Adviser. The voluntary expense limitations are 1.02% and 0.80% for the Growth Fund and Income Fund, respectively. These voluntary waivers may be terminated by the Adviser at any time.
The Adviser has entered into sub-advisory agreements to assist in the selection and management of investment securities in the Growth Fund and the Income Fund. It is the responsibility of the sub-advisers, under the direction of the Adviser, to make day-to-day investment decisions for these Funds. The Adviser, not the Funds, pays each sub-adviser a quarterly fee, in arrears, for their services. The Adviser pays sub-advisory fees directly from its own advisory fee. The sub-advisory fees are based on the assets of the Fund allocated to the sub-adviser for which the sub-adviser is responsible for making investment decisions.
The following are the sub-advisers for the Growth Fund: BlackRock Investment Management, LLC, Brandywine Global Investment Management, LLC, Coho Partners, Ltd., Parametric Portfolio Associates LLC and Waddell & Reed Investment Management Company.
The following are the sub-advisers for the Income Fund: Income Research & Management and Western Asset Management Company.
| | |
| 44 | | New Covenant Funds / Annual Report / June 30, 2016 |
Shareholder Service Plan and Agreement—The Trust entered into a Shareholder Service Plan and Agreement (the “Agreement”) with the Distributor. Per the Agreement, a Fund is authorized to make payments to certain entities which may include investment advisors, banks, trust companies and other types of organizations (“Authorized Service Providers”) for providing administrative services with respect to shares of the Funds attributable to or held in the name of the Authorized Service Providers for its clients or other parties with whom they have a servicing relationship. Under the terms of the Agreement, the Growth Fund and the Income Funds are authorized to pay an Authorized Service Provider a shareholder servicing fee at an annual rate of up to 0.10% of the average daily net asset value of the Growth Fund and Income Fund, respectively, which fee will be computed daily and paid monthly, for providing certain administrative services to Fund shareholders with whom the Authorized Service Provider has a servicing relationship.
Distribution Agreement — The Trust issues shares of the Funds pursuant to a Distribution Agreement with SEI Investments Distribution Co. (the “Distributor”), a wholly owned subsidiary of SEI Investments Company (“SEI”). In consideration of the services and facilities to be provided by the Distributor or any service provider, each of the Growth Fund and the Income Fund (if such Fund has issued Shares) will pay to the Distributor a fee, as agreed from time to time, at an annual rate of up to 0.10% (ten basis points) of the average daily net asset value of the Growth Fund and the Income Fund, respectively, which fee will be computed daily and paid monthly.
Social Witness Services and License Agreement — The Trust retained New Covenant Trust Company (“NCTC”) to ensure that each Fund continues to invest consistent with social witness principles adopted by the General Assembly of the Presbyterian Church (U.S.A.). No less than annually, NCTC will provide the Trust with an updated list of issuers in which the Funds will be prohibited from investing.
NCTC will distribute to the Trust proxy voting guidelines and shareholder advocacy services for the Funds that NCTC deems to be consistent with social witness principles adopted by the General Assembly of the Presbyterian Church (U.S.A.). The Trust also engages NCTC to vote Fund proxies consistent with such proxy voting guidelines. NCTC shall monitor and review and, as necessary, amend the Proxy Voting Guidelines periodically to ensure that they remain consistent with the social witness principles.
NCTC also grants to the Trust a non-exclusive right and license to use and refer to the trade name, trademark and/or service mark rights to the name “New Covenant Funds” and the phrase “Funds with a Mission”, in the name of the Trust and each Fund, and in connection with the offering, marketing, promotion, management and operation of the Trust and the Funds.
In consideration of the services provided by NCTC, the Growth Fund and the Income Fund will each pay to NCTC a fee at an annual rate of 0.15% of the average daily net asset value of the shares of such Fund, which fee will be computed daily and paid monthly.
Payment to Affiliates — Certain officers and/or interested trustees of the Trust are also officers of the Distributor, the Adviser, the Administrator or NCTC. The Trust pays each unaffiliated Trustee an annual fee for attendance at quarterly and interim board meetings. Compensation of officers and affiliated Trustees of the Trust is paid by the Adviser, the Administrator or NCTC.
A portion of the services provided by the Chief Compliance Officer (“CCO”) and his staff, whom are employees of the Administrator, are paid for by the Trust as incurred. The services include regulatory oversight of the Trust’s Adviser, sub-advisers and service providers as required by SEC regulations. The CCO’s services have been approved by and are reviewed annually by the Board.
Investment in Affiliated Security — The Funds may invest excess cash in the SEI Daily Income Trust (SDIT) Government Fund, an affiliated money market fund. The Balanced Funds invest in the Growth Fund and Income Fund.
Interfund Lending — The SEC has granted an exemption that permits the Trust to participate in an interfund lending program (the ‘‘Program’’) with existing or future investment companies registered under the 1940 Act that are advised by SIMC (the ‘‘SEI Funds’’). The Program allows the SEI Funds to lend money to and borrow money from each other for temporary or emergency purposes. Participation in the Program is voluntary for both borrowing and lending funds. Interfund loans may be made only when the rate of interest to be charged is more favorable to the lending fund than an investment in overnight repurchase agreements (‘‘Repo Rate’’), and more favorable to the borrowing fund than the rate of interest that would be charged by a bank for short-term borrowings (‘‘Bank Loan Rate’’). The Bank Loan Rate will be determined using a formula reviewed annually by the SEI Funds’ Board of Trustees. The interest rate imposed on interfund loans is the average of the Repo Rate and the Bank Loan Rate. During the year ended June 30, 2016, the Trust did not participate in interfund lending.
| | |
| New Covenant Funds / Annual Report / June 30, 2016 | | 45 |
NOTES TO FINANCIAL STATEMENTS (Continued)
June 30, 2016
4. DERIVATIVE TRANSACTIONS
The International Swaps and Derivatives Association, Inc. Master Agreements and Credit Support Annexes (“ISDA Master Agreements”) maintain provisions for general obligations, representations, agreements, collateral, and events of default or termination. The occurrence of a specified event of termination may give a counterparty the right to terminate all of its contracts and affect settlement of all outstanding transactions under the applicable ISDA Master Agreement.
To reduce counterparty risk with respect to Over The Counter (“OTC”) transactions, the Funds have entered into master netting arrangements, established within the Fund’s ISDA master agreements, which allow the Funds to make (or to have an entitlement to receive) a single net payment in the event of default (close-out netting) for outstanding payables and receivables with respect to certain OTC positions in swaps for each individual counterparty. In addition, the Funds may require that certain counterparties post cash and/or securities in collateral accounts to cover their net payment obligations for those derivative contracts subject to ISDA Master Agreements. If the counterparty fails to perform under these contracts and agreements, the cash and/or securities will be made available to the Funds.
For financial reporting purposes, the Funds do not offset derivative assets and derivative liabilities that are subject to netting arrangements in the Statement of Assets and Liabilities and therefore disclose these derivative assets and derivative liabilities on a gross basis. Bankruptcy or insolvency laws of a particular jurisdiction may impose restrictions on or prohibitions against the right of offset in bankruptcy, insolvency or other events.
Collateral terms are contract specific for OTC derivatives. For derivatives traded under an ISDA Master Agreement, the collateral requirements are typically calculated by netting the mark to market amount of each transaction under such agreement and comparing that amount to the value of any collateral currently pledged by the Funds or the counterparty. For financial reporting purposes, cash collateral that has been pledged to cover obligations of the Funds, if any, is reported separately on the Statement of Assets and Liabilities as cash pledged as collateral. Non-cash collateral pledged by the Funds, if any, is noted in the Schedules of Investments. Generally, the amount of collateral due from or to a party must exceed a minimum transfer amount threshold before a transfer has to be made. To the extent amounts due to the Funds from its counterparties are not fully collateralized, contractually or otherwise, the Funds bear the risk of loss from counterparty nonperformance.
The following is a summary of the variation margin of exchange-traded financial derivative instruments of the Funds as of June 30, 2016 ($ Thousands):
| | | | | | | | | | |
| | Financial Derivative Asset | | Financial Derivative Liability | |
| | | | | |
| | Variation Margin Asset | | Market value | | Variation Margin Liability | | | | |
| | | | | | | | |
Fund | | Futures | | Written Options | | Futures | | | Total | |
| | | |
Growth Fund | | $ 44 | | $ – | | $ – | | | $ – | |
Income Fund | | $ 58 | | $ 6 | | $ 8 | | | $14 | |
Cash with a total market value of $295 ($ Thousands) has been pledged as collateral for exchange-traded derivative instruments as of June 30, 2016.
Written options transactions entered into during the year ended June 30, 2016 are summarized as follows:
| | | | | | | | |
| | | Income Fund | |
| |
| |
| Number of
Contracts |
| |
| Premiums
($ Thousands) |
|
| |
Balance at beginning of year | | | – | | | | $ – | |
Written | | | 488 | | | | 160 | |
Expired | | | (348) | | | | (107) | |
Closing buys | | | (128) | | | | (48) | |
| | | | |
Balance at end of year | | | 12 | | | | $ 5 | |
| | | | |
| | |
| 46 | | New Covenant Funds / Annual Report / June 30, 2016 |
5. INVESTMENT TRANSACTIONS
The cost of security purchases and the proceeds from the sale and maturities of securities, excluding U.S. government and other short-term investments, for the year ended June 30, 2016, were as follows:
| | | | | | | | | | | | | | | | | | | | | | | | | | | | |
| |
Fund | | |
| Purchases
(excluding
Short-Term
Investments &
U.S. Government
Securities)
($ Thousands) |
| |
| Sales (excluding
Short-Term
Investments &
U.S. Government
Securities)
($ Thousands) |
| |
| Purchases of
U.S. Government
Securities
($ Thousands) |
| |
| Sales of
U.S. Government
Securities
($ Thousands) |
|
| |
Growth Fund | | | | $ 385,832 | | | | $ 400,279 | | | | $ – | | | | $ – | |
Income Fund | | | | 245,827 | | | | 215,157 | | | | 322,326 | | | | 354,830 | |
Balanced Growth Fund | | | | 41,713 | | | | 40,653 | | | | – | | | | – | |
Balanced Income Fund | | | | 13,346 | | | | 13,800 | | | | – | | | | – | |
|
| The following is a summary of the transactions with affiliates for the year ended June 30, 2016: | |
| | | | | | | |
| |
| Value
6/30/2015
($ Thousands) |
| |
| Purchases
at Cost
($ Thousands) |
| |
| Proceeds
from Sales
($ Thousands) |
| |
| Realized
Gain (Loss)
($ Thousands) |
| |
| Unrealized
Gain (Loss)
($ Thousands) |
| |
| Value
6/30/2016
($ Thousands) |
| |
| Dividends from
Affiliates
($ Thousands) |
|
| |
Growth Fund | | | | | | | | | | | | | | | | | | | | | | | | | | | | |
SDIT Prime Obligation Fund | | | $ 10,750 | | | | $ 51,390 | | | | $ (62,140 | ) | | | $ – | | | | $ – | | | | $ – | | | | $ 20 | |
SDIT Government Fund | | | – | | | | 18,656 | | | | (38 | ) | | | – | | | | – | | | | 18,618 | | | | 1 | |
Income Fund | | | | | | | | | | | | | | | | | | | | | | | | | | | | |
SDIT Prime Obligation Fund | | | 5,644 | | | | 146,362 | | | | (152,006 | ) | | | – | | | | – | | | | – | | | | 12 | |
SDIT Government Fund | | | – | | | | 2,758 | | | | (1,823 | ) | | | – | | | | – | | | | 935 | | | | – | |
Balanced Growth Fund | | | | | | | | | | | | | | | | | | | | | | | | | | | | |
New Covenant Growth Fund | | | 179,776 | | | | 30,541 | | | | (19,767 | ) | | | (982 | ) | | | (17,043) | | | | 172,525 | | | | 1,048 | |
New Covenant Income Fund | | | 116,459 | | | | 11,172 | | | | (20,885 | ) | | | (1,225 | ) | | | 3,522 | | | | 109,043 | | | | 2,028 | |
SDIT Prime Obligation Fund | | | 523 | | | | 30,384 | | | | (30,907 | ) | | | – | | | | – | | | | – | | | | 4 | |
SDIT Government Fund | | | – | | | | 2,915 | | | | (146 | ) | | | – | | | | – | | | | 2,769 | | | | – | |
Balanced Income Fund | | | | | | | | | | | | | | | | | | | | | | | | | | | | |
New Covenant Growth Fund | | | 27,695 | | | | 8,565 | | | | (5,802 | ) | | | (119 | ) | | | (2,576) | | | | 27,763 | | | | 169 | |
New Covenant Income Fund | | | 51,540 | | | | 4,781 | | | | (7,998 | ) | | | (554 | ) | | | 1,606 | | | | 49,375 | | | | 917 | |
SDIT Prime Obligation Fund | | | 955 | | | | 9,062 | | | | (10,017 | ) | | | – | | | | – | | | | – | | | | 1 | |
SDIT Government Fund | | | – | | | | 794 | | | | (14 | ) | | | – | | | | – | | | | 780 | | | | – | |
6. FEDERAL TAX INFORMATION
It is each Fund’s intention to continue to qualify as a regulated investment company under Subchapter M of the Internal Revenue Code and distribute all of its taxable income (including net capital gains). Accordingly, no provision for federal income tax is required.
Dividends from net investment income and distributions from net realized capital gains are determined in accordance with U.S. Federal income tax regulations, which may differ from those amounts determined under U.S. GAAP. These book/tax differences are either temporary or permanent in nature. To the extent these differences are permanent, they are charged or credited to paid-in capital, undistributed net investment income or accumulated net realized gain, as appropriate, in the period that the differences arise.
Accordingly, the following permanent differences, primarily attributable to different treatment for gains and losses on paydowns of mortgage and asset-backed securities for tax purposes, reclassification of long term capital gain distributions on Real Estate Investment Trust securities, FX gain and loss, distribution re-designation, RIC distribution reclassification, TIP adjustment and basis adjustments for investments in partnerships, have been reclassified to/(from) the following accounts as of June 30, 2016:
| | |
| New Covenant Funds / Annual Report / June 30, 2016 | | 47 |
NOTES TO FINANCIAL STATEMENTS (Continued)
June 30, 2016
| | | | | | | | | | | | | | | | | | | | |
| |
| | | | | | | | | Undistributed
Net Investment
Income (Loss)
($ Thousands) | | | Accumulated
Net Realized
Gain (Loss)
($ Thousands) | | | Paid-in
Capital
($ Thousands) | |
| |
Growth Fund | | | | | | | | | | | $ (178) | | | | $ 178 | | | | $ – | |
Income Fund | | | | | | | | | | | 358 | | | | (358 | ) | | | – | |
Balanced Growth Fund | | | | | | | | | | | 3,101 | | | | (3,101 | ) | | | – | |
Balanced Income Fund | | | | | | | | | | | 487 | | | | (487 | ) | | | – | |
These reclassifications have no impact on net assets or net asset value per share. The tax character of dividends and distributions paid during the last two years ended June 30 were as follows: | |
| |
| | | | | | Ordinary
Income
($ Thousands) | | | Long Term
Capital Gains
($ Thousands) | | | Total Taxable
Deductions
($ Thousands) | | | Total
Distributions Paid
($ Thousands) | |
| |
Growth Fund | | | 2016 | | | | $ 9,729 | | | | $ 19,120 | | | | $ 28,849 | | | | $ 28,849 | |
| | | 2015 | | | | 15,913 | | | | 58,109 | | | | 74,022 | | | | 74,022 | |
Income Fund | | | 2016 | | | | 5,431 | | | | – | | | | 5,431 | | | | 5,431 | |
| | | 2015 | | | | 4,984 | | | | – | | | | 4,984 | | | | 4,984 | |
Balanced Growth Fund | | | 2016 | | | | 5,830 | | | | 25,218 | | | | 31,048 | | | | 31,048 | |
| | | 2015 | | | | 9,579 | | | | 4,482 | | | | 14,061 | | | | 14,061 | |
Balanced Income Fund | | | 2016 | | | | 1,340 | | | | 3,963 | | | | 5,303 | | | | 5,303 | |
| | | 2015 | | | | 2,080 | | | | 1,897 | | | | 3,977 | | | | 3,977 | |
As of June 30, 2016, the components of distributable earnings (accumulated losses) were as follows:
| | | | | | | | | | | | | | | | | | | | | | | | | | | | | | | | | | | | | | | | | | |
| |
| | | | | Undistributed
Ordinary
Income
($ Thousands) | | | | | Undistributed
Long-Term
Capital Gain
($ Thousands) | | | | | Capital Loss
Carryforwards
($ Thousands) | | | | | Post- October
Losses
($ Thousands) | | | | | Unrealized
Appreciation
(Depreciation)
($ Thousands) | | | | | Other
Temporary
Differences
($ Thousands) | | | | | Total
Distributable
Earnings
(Accumulated
Losses)
($ Thousands) | |
| |
Growth Fund | | $ | | | 407 | | | $ | | | – | | | $ | | | – | | | $ | | | (13,780 | ) | | $ | | | 41,305 | | | $ | | | (51) | | | $ | | | 27,881 | |
Income Fund | | | | | 509 | | | | | | – | | | | | | (51,027 | ) | | | | | – | | | | | | 6,152 | | | | | | (1,809 | ) | | | | | (46,175) | |
Balanced Growth Fund | | | | | 520 | | | | | | 6,916 | | | | | | – | | | | | | – | | | | | | 23,026 | | | | | | – | | | | | | 30,462 | |
Balanced Income Fund | | | | | 259 | | | | | | 967 | | | | | | – | | | | | | – | | | | | | 6,547 | | | | | | – | | | | | | 7,773 | |
Post October losses represent losses realized on investment transactions from November 1, 2015 through June 30, 2016 that, in accordance with Federal income tax regulations, the Funds may defer and treat as having arisen in the following fiscal year. Deferred Late-Year Losses represent ordinary losses realized on investment transactions from January 1, 2016 through June 30, 2016 and specified losses realized on investment transactions from November 1, 2015 through June 30, 2016, that, in accordance with Federal income tax regulations, the Fund defers and treats as having arisen in the following fiscal year.
For Federal income tax purposes, capital loss carryforwards incurred in taxable years beginning before December 22, 2010 may be carried forwards for a maximum period of eight years and applied against future net realized gains. At June 30, 2016, the breakdown of capital loss carryforwards was as follow:
| | | | | | | | |
| |
| | | Expires 2018
($ Thousands) | | | Total Capital Loss Carryforwards
($ Thousands) June 30, 2016 | |
| |
Income Fund | | | $ 51,027 | | | | $51,027 | |
Under the recently enacted Regulated Investment Company Modernization Act of 2010, the Funds are permitted to carry forward capital losses incurred in taxable years beginning after December 22, 2010 for an unlimited period. However, any losses incurred during those future taxable years will be required to be utilized prior to the losses incurred in pre-enactment taxable years. As a result of this ordering rule, pre-enactment capital loss carryforwards may be more likely to expire unused. Additionally, post-enactment capital losses that are carried forward will retain their character as either short-term or long-term capital losses rather than being considered all short-term as under previous law.
| | |
| 48 | | New Covenant Funds / Annual Report / June 30, 2016 |
During the fiscal year ended June 30, 2016, the following Funds utilized capital loss carryforwards to offset capital gains.
| | | | |
| |
| | | Amount Utilized
($ Thousands) | |
| |
Income Fund | | | $ 4,074 | |
For Federal income tax purposes, the cost of securities owned at June 30, 2016, and the net realized gains or losses on securities sold for the period were not materially different from amounts reported for financial reporting purposes. These differences are primarily due to wash sales, MLP basis adjustments and basis adjustments from investments in registered investment companies which cannot be used for Federal income tax purposes in the current year and have been deferred for use in future years.
The aggregate gross unrealized appreciation and depreciation on total investments held by the Funds at June 30, 2016 was as follows:
| | | | | | | | | | | | | | | | |
| |
| | | Federal
Tax Cost ($ Thousands) | | | Aggregate
Gross
Unrealized
Appreciation ($ Thousands) | | | Aggregate
Gross
Unrealized
Depreciation
($ Thousands) | | | Net Unrealized
Appreciation
($ Thousands) | |
| |
Growth Fund | | $ | 341,346 | | | $ | 55,743 | | | $ | (14,479) | | | $ | 41,264 | |
Income Fund | | | 293,327 | | | | 7,345 | | | | (1,149) | | | | 6,196 | |
Balanced Growth Fund | | | 261,311 | | | | 35,915 | | | | (12,889) | | | | 23,026 | |
Balanced Income Fund | | | 71,371 | | | | 9,261 | | | | (2,714) | | | | 6,547 | |
Management has analyzed the Funds’ tax positions taken on Federal income tax returns for all open tax years and has concluded that as of June 30, 2016, no provision for income tax would be required in the Funds’ financial statements. The Funds’ Federal and state income and Federal excise tax returns for tax years for which the applicable statutes of limitations have not expired are subject to examination by the Internal Revenue Service and state departments of revenue.
7. CONCENTRATIONS/RISKS
In the normal course of business, the Trust enters into contracts that provide general indemnifications by the Trust to the counterparty to the con- tract. The Trust’s maximum exposure under these arrangements is dependent on future claims that may be made against the Trust and, therefore, cannot be estimated; however, management believes that, based on experience, the risk of loss from such claims is considered remote.
The market values of the Income Fund’s investments may change in response to interest rate changes and other factors. During periods of falling interest rates, the values of fixed income securities generally rise. Conversely, during periods of rising interest rates, the values of such securities generally decline. Changes by recognized rating agencies in the ratings of any fixed income security and in the ability of an issuer to make payments of interest and principal may also affect the value of these investments.
The Growth Fund concentrates its investments in securities of foreign issuers in various countries. These investments may involve certain considerations and risks not typically associated with investments in the United States, as a result of, among other factors, the possibility of future political and economic developments and the level of governmental supervision and regulation of securities markets in the respective countries.
The Funds will not invest more than 15% of the value of their net assets in securities that are illiquid because of restrictions on transferability or other reasons. Repurchase agreements with deemed maturities in excess of seven days are subject to this 15% limit. The Funds may purchase securities which are not registered under the Securities Act of 1933 (the “Securities Act”) but which can be sold to “qualified institutional buyers” in accordance with Rule 144A under the Securities Act. In some cases, such securities are classified as “illiquid securities;” however, any such security will not be considered illiquid so long as it is determined by the Adviser, under guidelines approved by the Board of Trustees, that an adequate trading market exists for that security. This investment practice could have the effect of increasing the level of illiquidity in a Fund during any period that qualified institutional buyers become uninterested in purchasing these restricted securities.
| | |
| New Covenant Funds / Annual Report / June 30, 2016 | | 49 |
NOTES TO FINANCIAL STATEMENTS (Concluded)
June 30, 2016
The Income Fund may invest a limited amount of assets in debt securities which are rated below investment grade (hereinafter referred to as “lower-rated securities”) or which are unrated but deemed equivalent to those rated below investment grade by the portfolio managers. The lower the ratings of such debt securities, the greater their risks. These debt instruments generally offer a higher current yield than that available from higher-grade issues, and typically involve greater risks. The yields on lower-rated securities will fluctuate over time. In general, prices of all bonds rise when interest rates fall and fall when interest rates rise. Lower-rated securities are subject to adverse changes in general economic conditions and to changes in the financial condition of their issuers. During periods of economic downturn or rising interest rates, issuers of these instruments may experience financial stress that could adversely affect their ability to make payments of principal and interest, and increase the possibility of default.
The Balanced Growth Fund and Balanced Income Fund invest their assets primarily in the Growth Fund and the Income Fund. By investing primarily in shares of these Funds, shareholders of the Balanced Funds indirectly pay a portion of the operating expenses, management fees and brokerage costs of the underlying Funds as well as their own operating expenses. Thus, shareholders of the Balanced Funds may indirectly pay slightly higher total operating expenses and other costs than they would pay by directly owning shares of the Growth Fund and Income Fund. A change in the asset allocation of either Balanced Fund could increase or reduce the fees and expenses actually borne by investors in that Fund. The Balanced Funds are also subject to rebalancing risk. Rebalancing activities, while undertaken to maintain a Fund’s investment risk-to- reward ratio, may cause the Fund to under-perform other funds with similar investment objectives. For the Balanced Growth Fund, it is possible after rebalancing from equities into a greater percentage of fixed-income securities, that equities will outperform fixed income investments. For the Balanced Income Fund, it is possible that after rebalancing from fixed-income securities into a greater percentage of equity securities, that fixed-income securities will outperform equity investments. The performance of the Balanced Growth Fund and the Balanced Income Fund depends on the performance of the underlying Funds in which they invest.
8. CONCENTRATION OF SHAREHOLDERS
On June 30, 2016, the number of shareholders below held the following percentage of the outstanding shares of the Funds. These shareholders are affiliated with the Funds.
| | | | | | | | |
| | | | # of Shareholders | | | | % of Outstanding Shares | |
Growth Fund | | | 3 | | | | 53.05% | |
Income Fund | | | 3 | | | | 56.68% | |
Balanced Growth Fund | | | 1 | | | | 0.01% | |
Balanced Income Fund | | | 1 | | | | 0.69% | |
9. SUBSEQUENT EVENTS
Management has evaluated the need for disclosures and/or adjustments resulting from subsequent events through the date the financial statements were issued. Based on this evaluation, no disclosures and/or adjustments were required to the financial statements as of June 30, 2016.
| | |
| 50 | | New Covenant Funds / Annual Report / June 30, 2016 |
REPORT OF INDEPENDENT REGISTERED PUBLIC ACCOUNTING FIRM
THE BOARD OF TRUSTEES AND SHAREHOLDERS
NEW COVENANT FUNDS:
We have audited the accompanying statements of assets and liabilities, including the schedules of investments, of New Covenant Funds, comprised of the New Covenant Growth Fund, New Covenant Income Fund, New Covenant Balanced Growth Fund and New Covenant Balanced Income Fund (collectively, the “Funds”), as of June 30, 2016, and the related statements of operations for the year then ended, changes in net assets for each of the years in the two-year period then ended, and the financial highlights for each of the years in the five-year period then ended. These financial statements and financial highlights are the responsibility of the Funds’ management. Our responsibility is to express an opinion on these financial statements and financial highlights based on our audits.
We conducted our audits in accordance with standards of the Public Company Accounting Oversight Board (United States). Those standards require that we plan and perform the audit to obtain reasonable assurance about whether the financial statements and financial highlights are free of material misstatement. An audit includes examining, on a test basis, evidence supporting the amounts and disclosures in the financial statements. Our procedures included confirmation of securities owned as of June 30, 2016, by correspondence with the custodian, transfer agent on the underlying funds, and brokers or other appropriate auditing procedures. An audit also includes assessing the accounting principles used and significant estimates made by management, as well as evaluating the overall financial statement presentation. We believe that our audits provide a reasonable basis for our opinion.
In our opinion, the financial statements and financial highlights referred to above present fairly, in all material respects, the financial position of each of the Funds comprising the New Covenant Funds as of June 30, 2016, and the results of their operations for the year then ended, the changes in their net assets for each of the years in the two-year period then ended, and the financial highlights for each of the years in the five-year period then ended, in conformity with U.S. generally accepted accounting principles.

Philadelphia, Pennsylvania
August 26, 2016
| | |
| New Covenant Funds / Annual Report / June 30, 2016 | | 51 |
TRUSTEES AND OFFICERS OF THE TRUST (Unaudited)
The following chart lists Trustees and Officers as of June 30, 2016.
Set forth below are the names, addresses, ages, position with the Trust, Term of Office and Length of Time Served, the principal occupations for the last five years, number of portfolios in fund complex overseen by trustee, and other directorships outside the fund complex of each of the persons currently serving as Trustees and Officers of the Trust. The Trust’s Statement of Additional Information (‘‘SAI’’) includes additional information about the Trustees and Officers. The SAI may be obtained without charge by calling 1-877-835-4531.
| | | | | | | | | | |
Name Address, and Age | | Position(s)
Held with
Trusts | | Term of
Office and
Length of
Time Served 1 | | Principal Occupation(s) During Past Five Years | | Number of Portfolios in
Fund Complex
Overseen by Trustee 2 | | Other Directorships
Held by Trustee |
INTERESTED TRUSTEES | | | | | | | | |
| | | | | |
Robert A. Nesher
One Freedom
Valley Drive
Oaks, PA 19456
68 yrs. old | | Chairman of the Board of Trustees* | | since 1982 | | Currently performs various services on behalf of SEI for which Mr. Nesher is compensated. | | 104 | | Vice Chairman of The Advisors’ Inner Circle Fund III, O’Connor EQUUS, Winton Series Trust and Winton Diversified Opportunities Fund since 2014. Vice Chairman of Gallery Trust since 2015. President and Director of SEI Structured Credit Fund, LP. Director of SEI Global Master Fund plc, SEI Global Assets Fund plc, SEI Global Investments Fund plc, SEI Investments—Global Funds Services, Limited, SEI Investments Global, Limited, SEI Investments (Europe) Ltd., SEI Multi-Strategy Funds PLC, SEI Global Nominee Ltd and SEI Investments—Unit Trust Management (UK) Limited. Director and President of SEI Opportunity Fund, L.P. to 2010. Director of SEI Alpha Strategy Portfolios, LP from 2007 to 2013. Trustee of The Advisors’ Inner Circle Fund, The Advisors’ Inner Circle Fund II, Bishop Street Funds and The KP Funds. |
William M. Doran
One Freedom
Valley Drive
Oaks, PA 19456
74 yrs. old | | Trustee* | | since 1982 | | Self-employed consultant since 2003. Partner, Morgan, Lewis & Bockius LLP (law firm) from 1976 to 2003, counsel to the Trust, SEI, SIMC, the Administrator and the Distributor. | | 104 | | Director of SEI since 1974; Director of SEI Investments Distribution Co. since 2003. Director of SEI Investments— Global Funds Services, Limited, SEI Investments Global, Limited, SEI Investments (Europe), Limited, SEI Investments (Asia) Limited, SEI Global Nominee Ltd. and SEI Investments— Unit Trust Management (UK) Limited. Director of SEI Opportunity Fund, L.P. to 2010. Director of SEI Alpha Strategy Portfolios, LP from 2007 to 2013. Trustee/Director of The Advisors’ Inner Circle Fund, The Advisors’ Inner Circle Fund II, The Advisors’ Inner Circle Fund III, O’Connor EQUUS, Winton Series Trust, Winton Diversified Opportunities Fund, Gallery Trust, Bishop Street Funds, and The KP Funds. |
| * | Messrs. Nesher and Doran are Trustees who may be deemed as “interested” persons of the Trust as that term is defined in the 1940 Act by virtue of their affiliation with SIMC and the Trust’s Distributor. |
| 1 | There is no stated term of office for the Trustees of the Trust. However, a Trustee must retire from the Board by the end of the calendar year in which the Trustee turns 75 provided that, although there shall be a presumption that each Trustee attaining such age shall retire, the Board may, if it deems doing so to be consistent with the best interest of the Trust, and with the consent of any Trustee that is eligible for retirement, by unanimous vote, extend the term of such Trustee for successive periods of one year. |
| 2 | The Fund Complex includes the following Trusts: SEI Asset Allocation Trust, SEI Daily Income Trust, SEI Institutional Investments Trust, Adviser Managed Trust, SEI Institutional International Trust, SEI Institutional Managed Trust, SEI Liquid Asset Trust, SEI Tax Exempt Trust, SEI Insurance Products Trust, New Covenant Funds and SEI Catholic Values Trust. |
| | |
| 52 | | New Covenant Funds / Annual Report / June 30, 2016 |
| | | | | | | | | | |
Name Address, and Age | | Position(s)
Held with
Trusts | | Term of Office and Length of Time Served 1 | | Principal Occupation(s)
During Past Five Years | | Number of Portfolios in Fund Complex Overseen by Trustee 2 | | Other Directorships
Held by Trustee |
| TRUSTEES | | | | | | | | | | |
George J. Sullivan, Jr. One Freedom Valley Drive
Oaks, PA 19456
72 yrs. old | | Trustee | | since 1996 | | Retired since January 2012. Self-Employed Consultant, Newfound Consultants Inc. since April 1997-December 2011. | | 104 | | Director of SEI Opportunity Fund, L.P. to 2010. Director of SEI Alpha Strategy Portfolios, LP from 2007 to 2013. Trustee/Director of State Street Navigator Securities Lending Trust, The Advisors’ Inner Circle Fund, The Advisors’ Inner Circle Fund II, Bishop Street Funds, and The KP Funds. |
Nina Lesavoy
One Freedom
Valley Drive
Oaks, PA 19456
57 yrs. old | | Trustee | | since 2003 | | Founder and Managing Director, Avec Capital since 2008. Managing Director, Cue Capital from March 2002-March 2008. | | 104 | | Director of SEI Opportunity Fund, L.P. to 2010. Director of SEI Alpha Strategy Portfolios, LP from 2007 to 2013. Director of SEI Structured Credit Fund, L.P. |
James M. Williams
One Freedom
Valley Drive
Oaks, PA 19456
67 yrs. Old | | Trustee | | since 2004 | | Vice President and Chief Investment Officer, J. Paul Getty Trust, Non-Profit Foundation for Visual Arts, since December 2002. President, Harbor Capital Advisors and Harbor Mutual Funds, 2000-2002. Manager, Pension Asset Management, Ford Motor Company, 1997-1999. | | 104 | | Director of SEI Opportunity Fund, L.P. to 2010. Director of SEI Alpha Strategy Portfolios, LP from 2007 to 2013. Trustee/Director of Ariel Mutual Funds, and SEI Structured Credit Fund, L.P. |
Mitchell A. Johnson
One Freedom
Valley Drive
Oaks, PA 19456
73 yrs. old | | Trustee | | since 2007 | | Private Investor since 1994. | | 104 | | Director, Federal Agricultural Mortgage Corporation (Farmer Mac) since 1997. Director of SEI Alpha Strategy Portfolios, LP from 2007 to 2013. Trustee of the Advisors’ Inner Circle Fund, The Advisors’ Inner Circle Fund II, and Bishop Street Funds and The KP Funds. |
Hubert L. Harris, Jr.
One Freedom
Valley Drive
Oaks, PA 19456
71 yrs. old | | Trustee | | since 2008 | | Retired since December 2005. Owner of Harris Plantation, Inc. since 1995. Chief Executive Officer of Harris CAPM, a consulting asset and property management entity. Chief Executive Officer, INVESCO North America, August 2003-December 2005. Chief Executive Officer and Chair of the Board of Directors, AMVESCAP Retirement, Inc., January 1998- August 2003. | | 104 | | Director of AMVESCAP PLC from 1993-2004. Served as a director of a bank holding company, 2003-2009. Director, Aaron’s Inc., 2012-present. President and CEO, Oasis Ornamentals LLC, 2011-present. Serves as a member of the Board of Councilors of the Carter Center (nonprofit corporation) and served on the board of other non-profit organizations. Director of SEI Alpha Strategy Portfolios, LP from 2008 to 2013. |
Susan C. Cote
One Freedom
Valley Drive
Oaks, PA 19456
61 yrs. old | | Trustee | | Since 2015 | | Retired since July 2015. Americas Director of Asset Management, Ernst & Young LLP from 2006-2013. Global Asset Management Assurance Leader, Ernst & Young LLP from 2006-2015. Partner, Ernst & Young LLP from 1997-2015. Prudential, 1983-1997. Member of Ernst & Young LLP Retirement Investment Committee. Treasurer and Chair of Finance, Investment and Audit Committee of the New York Women’s Foundation. Independent Consultant to SEI Liquid Asset Allocation Trust. | | 104 | | N/A |
| | |
| New Covenant Funds / Annual Report / June 30, 2016 | | 53 |
TRUSTEES AND OFFICERS OF THE TRUST (Unaudited) (Concluded)
| | | | | | | | | | |
Name Address, and Age | | Position(s)
Held with
Trusts | | Term of
Office and
Length of
Time Served 1 | | Principal Occupation(s)
During Past Five Years | | Number of
Portfolios in
Fund Complex
Overseen by
Trustee 2 | | Other Directorships
Held by Trustee |
| OFFICERS | | | | | | | | | | |
Robert A. Nesher
One Freedom
Valley Drive
Oaks, PA 19456
68 yrs. old | | President and CEO | | since 2005 | | Currently performs various services on behalf of SEI for which Mr. Nesher is compensated. | | N/A | | N/A |
Arthur Ramanjulu
One Freedom
Valley Drive
Oaks, PA 19456
51 yrs. old | | Controller and Chief Financial Office | | since 2015 | | Director, Funds Accounting, SEI Investments Global Funds Services (March 2015); Senior Manager, Funds Accounting, SEI Global Funds Services (March 2007 to February 2015). | | N/A | | N/A |
Russell Emery
One Freedom
Valley Drive
Oaks, PA 19456
52 yrs. old | | Chief Compliance Officer | | since 2006 | | Chief Compliance Officer of SEI Institutional Investments Trust, SEI Asset Allocation Trust, SEI Institutional International Trust, SEI Liquid Asset Trust, SEI Daily Income Trust, SEI Institutional Managed Trust, SEI Tax Exempt Trust, The Advisors’ Inner Circle Fund, The Advisors’ Inner Circle Fund II and Bishop Street Funds since March 2006. Chief Compliance Officer of SEI Structured Credit Fund, LP since June 2007. Chief Compliance Officer of SEI Opportunity Fund, L.P. to 2010. Chief Compliance Officer of SEI Alpha Strategy Portfolios, LP from 2007 to 2013. Chief Compliance Officer of Adviser Managed Trust since December 2010. Chief Compliance Officer of New Covenant Funds since February 2012. Chief Compliance Officer of SEI Insurance Products Trust and The KP Funds since 2013. Chief Compliance Officer of The Advisors’ Inner Circle Fund III, O’Connor EQUUS, Winton Series Trust and Winton Diversified Opportunities Fund since 2014. Chief Compliance Officer of SEI Catholic Values Trust and Gallery Trust since 2015. | | N/A | | N/A |
Timothy D. Barto
One Freedom
Valley Drive
Oaks, PA 19456
47 yrs. old | | Vice President and Secretary | | since 2002 | | Vice President and Secretary of SEI Institutional Transfer Agent, Inc. since 2009. General Counsel and Secretary of SIMC and the Administrator since 2004. Vice President of SIMC and the Administrator since 1999. Vice President and Assistant Secretary of SEI since 2001. | | N/A | | N/A |
Aaron Buser
One Freedom
Valley Drive
Oaks, PA 19456
44 yrs. old | | Vice President and Assistant Secretary | | since 2008 | | Vice President and Assistant Secretary of SEI Institutional Transfer Agent, Inc. since 2009. Vice President and Assistant Secretary of SIMC since 2007. Attorney, Stark & Stark (law firm), March 2004-July 2007. | | N/A | | N/A |
| 1 | There is no stated term of office for the Trustees of the Trust. However, a Trustee must retire from the Board by the end of the calendar year in which the Trustee turns 75 provided that, although there shall be a presumption that each Trustee attaining such age shall retire, the Board may, if it deems doing so to be consistent with the best interest of the Trust, and with the consent of any Trustee that is eligible for retirement, by unanimous vote, extend the term of such Trustee for successive periods of one year. |
| 2 | The Fund Complex includes the following Trusts: SEI Asset Allocation Trust, SEI Daily Income Trust, SEI Institutional Investments Trust, Adviser Managed Trust, SEI Institutional International Trust, SEI Institutional Managed Trust, SEI Liquid Asset Trust, SEI Tax Exempt Trust, SEI Insurance Products Trust, New Covenant Funds and SEI Catholic Values Trust. |
| | |
| 54 | | New Covenant Funds / Annual Report / June 30, 2016 |
| | | | | | | | | | |
Name Address, and Age | | Position(s)
Held with
Trusts | | Term of
Office and
Length of
Time Served 1 | | Principal Occupation(s)
During Past Five Years | | Number of
Portfolios in
Fund Complex
Overseen by
Trustee 2 | | Other Directorships
Held by Trustee |
| OFFICERS (continued) | | | | | | | | |
David F. McCann
One Freedom
Valley Drive
Oaks, PA 19456
39 yrs. old | | Vice President and Assistant Secretary | | since 2009 | | Vice President and Assistant Secretary of SEI Institutional Transfer Agent, Inc. since 2009. Vice President and Assistant Secretary of SIMC since 2008. Attorney, Drinker Biddle & Reath, LLP (law firm), May 2005-October 2008. | | N/A | | N/A |
Stephen G. MacRae
One Freedom
Valley Drive
Oaks, PA 19456
47 yrs. old | | Vice President | | since 2012 | | Director of Global Investment Product Management, January 2004 to present. | | N/A | | N/A |
Bridget E. Sudall
One Freedom
Valley Drive
Oaks, PA 19456
35 yrs. old | | Anti-Money Laundering Compliance Officer and Privacy Officer | | since 2015 | | Anti-Money Laundering Compliance Officer and Privacy Officer (since 2015), Senior Associate and AML Officer, Morgan Stanley Alternative Investment Partners, April 2011-March 2015. Investor Services Team Lead, Morgan Stanley Alternative Investment Partners, July 2007-April 2011. | | N/A | | N/A |
| | |
| New Covenant Funds / Annual Report / June 30, 2016 | | 55 |
DISCLOSURE OF FUND EXPENSES (UNAUDITED)
June 30, 2016
All mutual funds have operating expenses. As a shareholder of a mutual fund, your investment is affected by these ongoing costs, which include (among others) costs for portfolio management, administrative services, and shareholder reports like this one. It is important for you to understand the impact of these costs on your investment returns.
Operating expenses such as these are deducted from the mutual fund‘s gross income and directly reduce its final investment return. These expenses are expressed as a percentage of the mutual fund’s average net assets; this percentage is known as the mutual fund’s expense ratio.
The following examples use the expense ratio and are intended to help you understand the ongoing costs (in dollars) of investing in your Fund and to compare these costs with those of other mutual funds. The examples are based on an investment of $1,000 made at the beginning of the period shown and held for the entire period (January 1, 2016 to June 30, 2016).
The table on this page illustrates your Fund’s costs in two ways:
Actual Fund Return: This section helps you to estimate the actual expenses after fee waivers that your Fund incurred over the period. The “Expenses Paid During Period” column shows the actual dollar expense cost incurred by a $1,000 investment in the Fund, and the “Ending Account Value” number is derived from deducting that expense cost from the Fund’s gross investment return.
You can use this information, together with the actual amount you invested in your Fund, to estimate the expenses you paid over that period. Simply divide your actual starting account value by $1,000 to arrive at a ratio (for example, an $8,600 account value divided by $1,000 = 8.6), then multiply that ratio by the number shown for your Fund under “Expenses Paid During Period.”
Hypothetical 5% Return: This section helps you compare your Fund’s costs with those of other mutual funds. It assumes that your Fund had an annual 5% return before expenses during the year, but that the expense ratio (Column 3) is unchanged. This example is useful in making comparisons because the Securities and Exchange Commission requires all mutual funds to make this 5% calculation. You can assess your Fund’s comparative cost by comparing the hypothetical result for your Fund in the “Expenses Paid During Period” column with those that appear in the same charts in the shareholder reports for other mutual funds.
NOTE: Because the return is set at 5% for comparison purposes — NOT your Fund’s actual return — the account values shown do not apply to your specific investment.
| | | | | | | | | | | | | | | | |
| | | Beginning
Account
Value
1/1/16 | | | Ending
Account
Value
6/30/16 | | | Annualized
Expense
Ratios | | | Expenses
Paid
During
Period* | |
Growth Fund | | | | | | | | | | | | | | | | |
Actual Fund Return | | | $1,000.00 | | | | $1,000.10 | | | | 1.02 | % | | | $5.07 | |
Hypothetical 5% Return | | | $1,000.00 | | | | $1,019.79 | | | | 1.02 | % | | | $5.12 | |
Income Fund | | | | | | | | | | | | | | | | |
Actual Fund Return | | | $1,000.00 | | | | $1,038.50 | | | | 0.80 | % | | | $4.05 | |
Hypothetical 5% Return | | | $1,000.00 | | | | $1,020.89 | | | | 0.80 | % | | | $4.02 | |
Balanced Growth Fund† | | | | | | | | | | | | | | | | |
Actual Fund Return | | | $1,000.00 | | | | $1,016.00 | | | | 0.14 | % | | | $0.70 | |
Hypothetical 5% Return | | | $1,000.00 | | | | $1,024.17 | | | | 0.14 | % | | | $0.70 | |
Balanced Income Fund† | | | | | | | | | | | | | | | | |
Actual Fund Return | | | $1,000.00 | | | | $1,025.10 | | | | 0.20 | % | | | $1.01 | |
Hypothetical 5% Return | | | $1,000.00 | | | | $1,023.87 | | | | 0.20 | % | | | $1.01 | |
| * | Expenses are equal to the Fund’s annualized expense ratio multiplied by the average account value over the period, multiplied by 182/366 (to reflect the one-half year period shown). |
| † | Excludes expenses of the underlying affiliated investment companies. |
| | |
| 56 | | New Covenant Funds / Annual Report / June 30, 2016 |
BOARD OF TRUSTEES CONSIDERATIONS IN APPROVING THE ADVISORY AND SUB-ADVISORY AGREEMENTS (UNAUDITED)
New Covenant Funds (the “Trust”) and SEI Investments Management Corporation (“SIMC”) have entered into an investment advisory agreement (the “Advisory Agreement”). Pursuant to the Advisory Agreement, SIMC is responsible for the investment advisory services provided to the series of the Trust (the “Funds”). Pursuant to separate sub-advisory agreements with SIMC (the “Sub-Advisory Agreements” and, together with the Advisory Agreement, the “Investment Advisory Agreements”), and under the supervision of SIMC and the Trust’s Board of Trustees (the “Board”), the sub-advisers (each, a “Sub-Adviser” and collectively, the “Sub-Advisers”) provide security selection and certain other advisory services with respect to all or a discrete portion of the assets of the Funds. The Sub-Advisers are also responsible for managing their employees who provide services to the Funds. The Sub-Advisers are selected based primarily upon the research and recommendations of SIMC, which evaluates quantitatively and qualitatively the Sub-Advisers’ skills and investment results in managing assets for specific asset classes, investment styles and strategies.
The Investment Company Act of 1940, as amended (the “1940 Act”), requires that the initial approval of, as well as the continuation of, the Funds’ Investment Advisory Agreements be specifically approved: (i) by the vote of the Board or by a vote of the shareholders of the Funds; and (ii) by the vote of a majority of the Trustees who are not parties to the Investment Advisory Agreements or “interested persons” of any party (the “Independent Trustees”), cast in person at a meeting called for the purpose of voting on such approval(s). In connection with their consideration of such approval(s), the Funds’ Trustees must request and evaluate, and SIMC and the Sub-Advisers are required to furnish, such information as may be reasonably necessary to evaluate the terms of the Investment Advisory Agreements. In addition, the Securities and Exchange Commission takes the position that, as part of their fiduciary duties with respect to a mutual fund’s fees, mutual fund boards are required to evaluate the material factors applicable to a decision to approve an Investment Advisory Agreement.
Consistent with these responsibilities, the Board calls and holds meetings each year to consider whether to approve new and/or renew existing Investment Advisory Agreements between the Trust and SIMC and SIMC and the Sub-Advisers with respect to the Funds of the Trust. In preparation for these meetings, the Board requests and reviews a wide variety of materials provided by SIMC and the Sub-Advisers, including information about SIMC’s and the Sub-Advisers’ affiliates, personnel and operations and the services provided pursuant to the Investment Advisory Agreements. The Board also receives data from third parties. This information is provided in addition to the detailed information about the Funds that the Board reviews during the course of each year, including information that relates to Fund operations and Fund performance. The Trustees also receive a memorandum from counsel regarding the responsibilities of Trustees in connection with their consideration of whether to approve the Trust’s Investment Advisory Agreements. Finally, the Independent Trustees receive advice from independent counsel to the Independent Trustees, meet in executive sessions outside the presence of Fund management and participate in question and answer sessions with representatives of SIMC and the Sub-Advisers.
Specifically, during the course of the Trust’s fiscal year, the Board requested and received written materials from SIMC and the Sub-Advisers regarding: (i) the quality of SIMC’s and the Sub-Advisers’ investment management and other services; (ii) SIMC’s and the Sub-Advisers’ investment management personnel; (iii) SIMC’s and the Sub-Advisers’ operations and financial condition; (iv) SIMC’s and the Sub-Advisers’ brokerage practices (including any soft dollar arrangements) and investment strategies; (v) the level of the advisory fees that SIMC charges the Funds and the level of the sub-advisory fees that SIMC pays the Sub-Advisers, compared with fees each charge to comparable accounts; (vi) the advisory fees charged by SIMC and the Funds’ overall fees and operating expenses compared with peer groups of mutual funds prepared by Broadridge, an independent provider of investment company data; (vii) the level of SIMC’s and the Sub-Advisers’ profitability from their Fund-related operations; (viii) SIMC’s and the Sub-Advisers’ compliance program, including a description of material compliance matters and material compliance violations; (ix) SIMC’s potential economies of scale; (x) SIMC’s and the Sub-Advisers’ policies on and compliance procedures for personal securities transactions; (xi) SIMC’s and the Sub-Advisers’ expertise and resources in domestic and/or international financial markets; and (xii) the Funds’ performance over various periods of time or compared with peer groups of mutual funds prepared by Broadridge and the Funds’ benchmark indices.
At the March 28-29, 2016 meeting of the Board, the Trustees, including a majority of the Independent Trustees, approved the renewal of the Advisory Agreement. Also, each Sub-Advisory Agreement (unless operating under an initial two-year term) was either initially approved or, if the Sub-Advisory Agreement was already in effect, renewed at a meeting of the Board during the course of the Trust’s fiscal year. In each case, the Board’s approvals were based on its consideration and evaluation of the factors described above, as discussed at the meetings and at prior meetings. The following discusses some, but not all, of the factors that were considered by the Board in connection with its assessment of the Investment Advisory Agreements.
| | |
| New Covenant Funds / Annual Report / June 30, 2016 | | 57 |
BOARD OF TRUSTEES CONSIDERATIONS IN APPROVING THE ADVISORY AND SUB-ADVISORY AGREEMENTS (UNAUDITED) (Concluded)
Nature, Extent and Quality of Services. The Board considered the nature, extent and quality of the services provided by SIMC and the Sub-Advisers to the Funds and the resources of SIMC and the Sub-Advisers and their affiliates dedicated to the Funds. In this regard, the Trustees evaluated, among other things, SIMC’s and each Sub-Adviser’s personnel, experience, track record and compliance program. Following evaluation, the Board concluded that, within the context of its full deliberations, the nature, extent and quality of services provided by SIMC and the Sub-Advisers to the Funds and the resources of SIMC and the Sub-Advisers and their affiliates dedicated to the Funds were sufficient to support renewal of the Investment Advisory Agreements. In addition to advisory services, the Board considered the nature and quality of certain administrative, transfer agency and other non-investment advisory services provided to the Funds by SIMC and/or its affiliates.
Performance. In determining whether to renew SIMC’s Advisory Agreement, the Trustees considered the Funds’ performance relative to their peer groups and appropriate indices/benchmarks. The Trustees reviewed performance information for each Fund, noting that they receive performance reports that permit them to monitor each Fund’s performance at board meetings throughout the year. As part of this review, the Trustees considered the composition of each peer group and selection criteria. In assessing Fund performance, the Trustees considered a report compiled by Broadridge, an independent third-party, which was engaged to prepare an assessment of the Funds in connection with the renewal of the Advisory Agreement (the “Broadridge Report”). The Broadridge Report included metrics on risk analysis, volatility versus total return, net total return and performance consistency for the Funds and a universe of comparable funds. Based on the materials considered and discussed at the meetings, the Trustees found Fund performance satisfactory, or, where performance was materially below the benchmark and/or peer group, the Trustees were satisfied with the reasons provided to explain such performance. In connection with the approval or renewal of Sub-Advisory Agreements, the Board considered the performance of the Sub-Adviser relative to appropriate indices/benchmarks. Following evaluation, the Board concluded that, within the context of its full deliberations, the performance of the Funds was sufficient to support renewal of SIMC’s Advisory Agreement, and the performance of each Sub-Adviser was sufficient to support approval or renewal of the Sub-Advisory Agreement.
Fees. With respect to the Funds’ expenses under the Investment Advisory Agreements, the Trustees considered the rate of compensation called for by the Investment Advisory Agreements and the Funds’ net operating expense ratio in comparison to those of the Funds’ respective peer groups. In assessing Fund expenses, the Trustees considered the information in the Broadridge Report, which included various metrics related to fund expenses, including, but not limited to, contractual management fees at various fee levels, actual management fees, and actual total expenses (including underlying fund expenses) for the Funds and a universe of comparable funds. Based on the materials considered and discussion at the meetings, the Trustees further determined that fees were either shown to be below the peer average in the comparative fee analysis, or that there was a reasonable basis for the fee level. The Trustees also considered the effects of SIMC’s voluntary waiver of management and other fees to prevent total Fund operating expenses from exceeding a specified cap and concluded that SIMC, through waivers, has maintained the Funds’ net operating expenses at competitive levels for its distribution channels. In determining the appropriateness of fees, the Board also took into consideration the impact of fees incurred indirectly by the Funds as a result of investments into underlying funds, including funds from which SIMC or its affiliates earn fees. The Board also took into consideration compensation earned from the Funds by SIMC or its affiliates for non-advisory services, such as administration, transfer agency, shareholder services or brokerage, and considered whether SIMC and its affiliates may have realized other benefits from their relationship with the Funds, such as any research and brokerage services received under soft dollar arrangements. When considering fees paid to Sub-Advisers, the Board took into account the fact that the Sub-Advisers are compensated by SIMC and not by the Funds directly, and that such compensation with respect to any unaffiliated Sub-Adviser reflects an arms-length negotiation between the Sub-Adviser and SIMC. Following evaluation, the Board concluded that, within the context of its full deliberations, the expenses of the Funds are reasonable and supported renewal of the Investment Advisory Agreements. The Board also considered whether the Sub-Advisers and their affiliates may have realized other benefits from their relationship with the Funds, such as any research and brokerage services received under soft dollar arrangements.
Profitability. With regard to profitability, the Trustees considered compensation flowing to SIMC and the Sub-Advisers and their affiliates, directly or indirectly. The Trustees considered whether the levels of compensation and profitability were reasonable. As with the fee levels, when considering the profitability of the Sub-Advisers, the Board
| | |
| 58 | | New Covenant Funds / Annual Report / June 30, 2016 |
took into account the fact that compensation with respect to any unaffiliated Sub-Adviser reflects an arms-length negotiation between the Sub-Adviser and SIMC. In connection with the approval or renewal of each Sub-Advisory Agreement, the Board also took into consideration the impact that the fees paid to the Sub-Adviser have on SIMC’s advisory fee margin and profitability. Based on this evaluation, the Board concluded that, within the context of its full deliberations, the profitability of each of SIMC and the Sub-Advisers is reasonable and supported renewal of the Investment Advisory Agreements.
Economies of Scale. With respect to the Advisory Agreement, the Trustees considered whether any economies of scale were being realized by SIMC and their affiliates and, if so, whether the benefits of such economies of scale were passed along to the Funds’ shareholders through a graduated investment advisory fee schedule or other means, including any fee waivers by SIMC and its affiliates. The Trustees recognized that economies of scale are difficult to identify and quantify and are rarely identifiable on a fund-by-fund basis. Based on this evaluation, the Board determined that the fees were reasonable in light of the information that was provided by SIMC with respect to economies of scale.
Based on the Trustees’ deliberation and their evaluation of the information described above, the Board, including all of the Independent Trustees, with the assistance of Fund counsel and Independent Trustees’ counsel, unanimously approved the approval or renewal, as applicable, of the Investment Advisory Agreements and concluded that the compensation under the Investment Advisory Agreements is fair and reasonable in light of such services and expenses and such other matters as the Trustees considered to be relevant in the exercise of their reasonable judgment. In the course of its deliberations, the Board did not identify any particular factor (or conclusion with respect thereto) or single piece of information that was all-important, controlling or determinative of its decision, but considered all of the factors together, and each Trustee may have attributed different weights to the various factors (and conclusions with respect thereto) and information.
| | |
| New Covenant Funds / Annual Report / June 30, 2016 | | 59 |
NOTICE TO SHAREHOLDERS (Unaudited)
For shareholders who do not have a June 30, 2016 taxable year end, this notice is for information purposes only. For shareholders with a June 30, 2016 taxable year end, please consult your tax adviser as to the pertinence of this notice.
For the fiscal year ended June 30, 2016, the Funds are designating long term and qualifying dividend income with regard to distributions paid during the year as follows:
| | | | | | | | | | | | | | | | |
| Fund | | (A)
Long Term
Capital Gains
Distributions
(Tax Basis) | | (B) Ordinary
Income
Distributions
(Tax Basis) | | Total
Distributions
(Tax Basis) | | (C) Dividends
Qualifying
for Corporate
Dividends Rec.
Deduction (1) | | (D)
Qualifying
Dividend
Income
(15% Tax
Rate
for QDI) (2) | | (E) U.S.
Government
Interest (3) | | Interest
Related
Dividends (4) | | Short-Term
Capital Gain
Dividends
(5) |
New Covenant Growth Fund | | 66.28% | | 33.72% | | 100.00% | | 50.48% | | 52.25% | | 0.00% | | 0.04% | | 100.00% |
New Covenant Income Fund | | 0.00% | | 100.00% | | 100.00% | | 0.00% | | 0.00% | | 12.01% | | 85.10% | | 0.00% |
New Covenant Balanced Growth Fund | | 81.22% | | 18.78% | | 100.00% | | 30.25% | | 31.81% | | 0.00% | | 0.00% | | 100.00% |
New Covenant Balanced Income Fund | | 74.74% | | 25.26% | | 100.00% | | 19.49% | | 20.40% | | 0.00% | | 0.00% | | 100.00% |
| (1) | Qualifying dividends represent dividends which qualify for the corporate dividends received deduction. |
| (2) | The percentage in this column represents the amount of ‘‘Qualifying Dividend Income’’ and is reflected as a percentage of ‘‘Ordinary Income Distributions.’’ It is the intention of each of the aforementioned Funds to designate the maximum amount permitted by law. The information reported herein may differ from the information and distributions taxable to the shareholders for the calendar year ending December 31, 2016. Complete information will be computed and reported in conjunction with your 2016 Form 1099-DIV. |
| (3) | ‘‘U.S. Government Interest’’ represents the amount of interest that was derived from direct U.S. Government obligations and distributed during the fiscal year. This amount is reflected as a percentage of total ordinary income distributions (the total of short-term capital gain and net investment income distributions). Generally, interest from direct U.S. Government obligations is exempt from state income tax. However, for shareholders who are residents of California, Connecticut and New York, the statutory threshold requirements were not satisfied to permit exemption of these amounts from state income. |
| (4) | The percentage in this column represents the amount of “Interest Related Dividends” and is reflected as a percentage of net investment income distributions that is exempt from U.S. withholding tax when paid to foreign investors. |
| (5) | The percentage in this column represents the amount of “Short-Term Capital Gain Dividends” and is reflected as a percentage of short-term capital gain distributions that is exempt from U.S. withholding tax when paid to foreign investors. |
Items (A) and (B) are based on the percentage of each Fund’s total distribution.
Items (C) and (D) are based on the percentage of ordinary income distributions of each Fund. Item (E) is based on the percentage of gross income of each Fund.
Please consult your tax adviser for proper treatment of this information. This notification should be kept with your permanent tax records.
| | |
| 60 | | New Covenant Funds / Annual Report / June 30, 2016 |
NEW COVENANT FUNDS ANNUAL REPORT JUNE 30, 2016
Robert A. Nesher, Chairman
Trustees
William M. Doran
George J. Sullivan, Jr.
Nina Lesavoy
James M. Williams
Mitchell A. Johnson
Hubert L. Harris, Jr.
Officers
Robert A. Nesher
President and Chief Executive Officer
Arthur Ramanjulu
Controller and Chief Financial Officer
Russell Emery
Chief Compliance Officer
Timothy D. Barto
Vice President, Secretary
Aaron Buser
Vice President, Assistant Secretary
David F. McCann
Vice President, Assistant Secretary
Stephen G. MacRae
Vice President
Bridget E. Sudall
Anti-Money Laundering Compliance Officer
Privacy Officer
Investment Adviser
SEI Investments Management Corporation
Administrator
SEI Investments Global Funds Services
Distributor
SEI Investments Distribution Co.
Legal Counsel
Morgan, Lewis & Bockius LLP
Independent Registered Public Accounting Firm
KPMG LLP
This report and the financial statements contained herein are submitted for the general information of the shareholders of the Trust and must be preceded or accompanied by a current prospectus. Shares of the Funds are not deposits or obligations of, or guaranteed or endorsed by, any bank. The shares are not federally insured by the Federal Deposit Insurance Corporation (FDIC), the Federal Reserve Board, or any other government agency. Investment in the shares involves risk, including the possible loss of principal.

NCF-F-001 (06/16)
The Registrant has adopted a code of ethics that applies to the Registrant’s principal executive officer, principal financial officer, comptroller or principal accounting officer, and any person who performs a similar function.
| Item 3. | Audit Committee Financial Expert. |
(a)(1) The Registrant’s Board of Trustees has determined that the Registrant has at least two audit committee financial experts serving on the audit committee.
(a) (2) The audit committee financial experts are George J. Sullivan, Jr. and Hubert L. Harris, Jr. Messrs. Sullivan and Harris are independent as defined in Form N-CSR Item 3 (a) (2).
| Item 4. | Principal Accountant Fees and Services. |
Fees billed by KPMG LLP (“KPMG”) related to the Registrant.
KPMG billed the Registrant aggregate fees for services rendered to the Registrant for the fiscal years 2015 and 2014 as follows:
| | | | | | | | | | | | | | |
| | | | | Fiscal 2016 | | Fiscal 2015 |
| | | | | All fees and
services to
the
Registrant that were
pre-approved | | All fees and
services to
service affiliates
that were
pre-approved | | All other fees
and services to
service affiliates
that did
not require
pre-approval | | All fees and
services to
the
Registrant
that were
pre-approved | | All fees and
services to
service affiliates
that were
pre-approved | | All other fees
and services to
service affiliates
that did
not require
pre-approval |
(a) | | Audit Fees(1) | | $66,000 | | N/A | | $0 | | $66,000 | | N/A | | $0 |
(b) | | Audit-Related Fees | | $0 | | $0 | | $0 | | $0 | | $0 | | $0 |
(c) | | Tax Fees(3) | | $0 | | $0 | | $0 | | $0 | | $0 | | $0 |
(d) | | All Other Fees(2) | | $0 | | $240,350 | | $0 | | $0 | | $240,350 | | $0 |
Notes:
| (1) | Audit fees include amounts related to the audit of the Registrant’s annual financial statements and services normally provided by the accountant in connection with statutory and regulatory filings. |
| (2) | See Item 4(g) for a description of the services comprising the fees disclosed under this category. |
| (3) | Tax fees include amounts related to tax compliance and consulting services |
(e)(1) The Registrant’s Audit Committee has adopted an Audit and Non-Audit Services Pre-Approval Policy (the “Policy”), which sets forth the procedures and the conditions pursuant to which services proposed to be performed by the independent auditor of the Registrant may be pre-approved.
The Policy provides that all requests or applications for proposed services to be provided by the independent auditor must be submitted to the Registrant’s Chief Financial Officer (“CFO”) and must include a detailed description of the services proposed to be rendered. The CFO will determine whether such services: (1) require specific pre-approval; (2) are included within the list of services that have received the general pre-approval of the Audit Committee pursuant to the Policy; or (3) have been previously pre-approved in connection with the independent auditor’s annual engagement letter for the applicable year or otherwise. In any instance where services require pre-approval, the Audit Committee will consider whether such services are consistent with SEC’s rules and whether the provision of such services would impair the auditor’s independence.
Requests or applications to provide services that require specific pre-approval by the Audit Committee will be submitted to the Audit Committee by the CFO. The Audit Committee will be informed by the CFO on a quarterly basis of all services rendered by the independent auditor. The Audit Committee has delegated specific pre-approval authority to either the Audit Committee Chair or financial experts, provided that the estimated fee for any such proposed pre-approved service does not exceed $100,000 and any pre-approval decisions are reported to the Audit Committee at its next regularly scheduled meeting.
Services that have received the general pre-approval of the Audit Committee are identified and described in the Policy. In addition, the Policy sets forth a maximum fee per engagement with respect to each identified service that has received general pre-approval.
All services to be provided by the independent auditor shall be provided pursuant to a signed written engagement letter with the Registrant, the investment advisor or applicable control affiliate (except that matters as to which an engagement letter would be impractical because of timing issues or because the matter is small may not be the subject of an engagement letter) that sets forth both the services to be provided by the independent auditor and the total fees to be paid to the independent auditor for those services.
In addition, the Audit Committee has determined to take additional measures on an annual basis to meet its responsibility to oversee the work of the independent auditor and to assure the auditor’s independence from the Registrant, such as reviewing a formal written statement from the independent auditor delineating all relationships between the independent auditor and the Registrant, and discussing with the independent auditor its methods and procedures for ensuring independence.
(e)(2) Percentage of fees billed applicable to non-audit services pursuant to waiver of pre-approval requirement were as follows:
| | | | |
| | | Fiscal 2016 | | Fiscal 2015 |
Audit-Related Fees | | 0% | | 0% |
Tax Fees | | 0% | | 0% |
All Other Fees | | 0% | | 0% |
(f) Not Applicable.
(g)(1) The aggregate non-audit fees and services billed by KPMG for the fiscal years 2015 and 2014 were $240,350 and $240,350, respectively. Non-audit fees consist of SSAE No. 16 review of fund accounting and administration operations, attestation report in accordance with Rule 17Ad-13, and agreed upon procedures report over certain internal controls related to compliance with federal securities laws and regulations and tax compliance and consulting services for various service affiliates of the registrant.
(h) During the past fiscal year, the Registrant’s principal accountant provided certain non-audit services to the Registrant’s investment adviser or to entities controlling, controlled by, or under common control with the Registrant’s investment adviser that provide ongoing services to the Registrant that were not subject to pre-approval pursuant to
paragraph (c)(7)(ii) of Rule 2-01 of Regulation S-X. The Audit Committee of the Registrant’s Board of Trustees reviewed and considered these non-audit services provided by the Registrant’s principal accountant to the Registrant’s affiliates, including whether the provision of these non-audit services is compatible with maintaining the principal accountant’s independence.
| Item 5. | Audit Committee of Listed Registrants. |
Not applicable.
| Item 6. | Schedule of Investments |
(a) The Schedules of Investments are included as part of the report to shareholders filed under Item 1 of this form.
| Item 7. | Disclosure of Proxy Voting Policies and Procedures for Closed-End Management Investment Companies. |
Not applicable.
| Item 8. | Portfolio Managers of Closed-End Management Investment Companies |
Not applicable.
| Item 9. | Purchases of Equity Securities by Closed-End Management Company and Affiliated Purchasers. |
Not applicable.
| Item 10. | Submission of Matters to a Vote of Security Holders. |
The Registrant has a standing Governance Committee (the “Committee”) currently consisting of the Independent Trustees. The Committee is responsible for evaluating and recommending nominees for election to the Registrant’s Board of Trustees (the “Board”). Pursuant to the Committee’s Charter, adopted on February 22, 2012, the Committee will review all shareholder recommendations for nominations to fill vacancies on the Board if such recommendations are submitted in writing and addressed to the Committee at the Registrant’s office.
| Item 11. | Controls and Procedures. |
(a) The Registrant’s principal executive and principal financial officers, or persons performing similar functions, have concluded that the Registrant’s disclosure controls and procedures (as defined in Rule 30a-3(c) under the Investment Company Act of 1940 (the “1940 Act”)) (17 CFR 270.30a-3(c)) are effective, based on the evaluation of these controls and procedures required by Rule 30a-3(b) under the 1940 Act (17 CFR 270.30a-3(b)) and Rules 13a-15(b) or 15d-15(b) under the Securities Exchange Act of 1934 (17 CFR 240.13a-15(b) or 240.15d-15(b)) as of a date within 90 days of the filing date of this report.
(b) There were no changes in the Registrant’s internal control over financial reporting (as defined in Rule 30a-3(d) under the 1940 Act) (17 CFR 270.30a-3(d)) that occurred during the second fiscal quarter of the period covered by this report that have materially affected, or are reasonably likely to materially affect, the Registrant’s internal control over financial reporting.
(a)(1) Code of Ethics attached hereto.
(a)(2) A separate certification for the principal executive officer and the principal financial officer of the Registrant as required by Rule 30a-2(a) under the Investment Company Act of 1940, as amended (17 CFR 270.30a-2(a)), are filed herewith.
(b) Officer certifications as required by Rule 30a-2(b) under the Investment Company Act of 1940, as amended (17 CFR 270.30a-2(b)) also accompany this filing as an exhibit.
SIGNATURES
Pursuant to the requirements of the Securities Exchange Act of 1934 and the Investment Company Act of 1940, the Registrant has duly caused this report to be signed on its behalf by the undersigned, thereunto duly authorized.
| | | | | | |
| | | | | | New Covenant Funds |
| | | |
| By | | | | | | /s/ Robert A. Nesher |
| | | | | | Robert A. Nesher |
| | | | | | President & CEO |
Date: September 2, 2016
Pursuant to the requirements of the Securities Exchange Act of 1934 and the Investment Company Act of 1940, this report has been signed below by the following persons on behalf of the Registrant and in the capacities and on the dates indicated.
| | | | | | |
| By | | | | | | /s/ Robert A. Nesher |
| | | | | | Robert A. Nesher |
| | | | | | President & CEO |
Date: September 2, 2016
| | | | | | |
| By | | | | | | /s/ Arthur Ramanjulu |
| | | | | | Arthur Ramanjulu |
| | | | | | Controller & CFO |
Date: September 2, 2016