UNITED STATES
SECURITIES AND EXCHANGE COMMISSION
Washington, D.C. 20549
FORMN-CSR
CERTIFIED SHAREHOLDER REPORT OF REGISTERED MANAGEMENT
INVESTMENT COMPANIES
Investment Company Act File Number811-09025
New Covenant Funds
(Exact name of registrant as specified in charter)
SEI Investments
One Freedom Valley Drive
Oaks, PA 19456
(Address of principal executive offices) (Zip code)
Timothy D. Barto, Esp.
SEI Investments
One Freedom Valley Drive
Oaks, PA 19456
(Name and address of agent for service)
Registrant’s telephone number, including area code:1-610-676-1000
Date of fiscal year end: June 30, 2019
Date of reporting period: June 30, 2019
| Item 1. | Reports to Stockholders. |
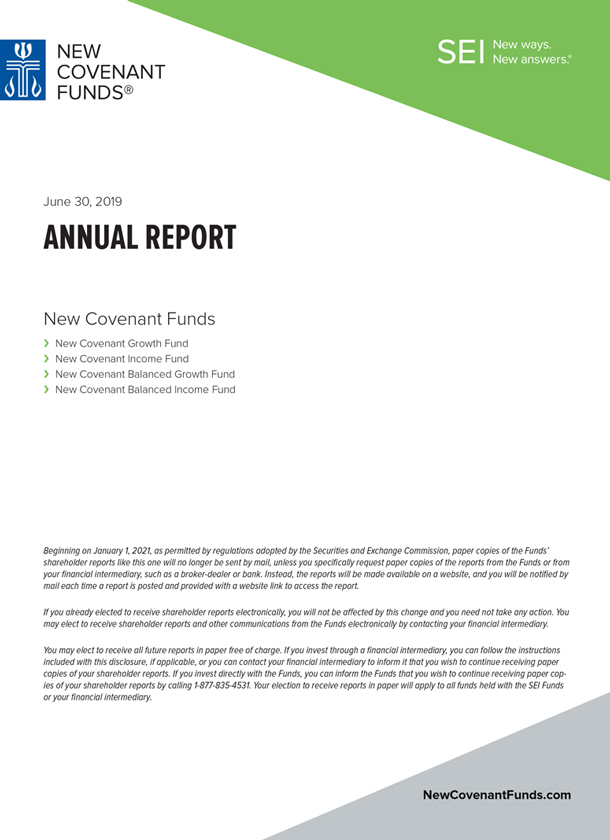
TABLE OF CONTENTS
The Trust files its complete schedule of portfolio holdings with the Securities and Exchange Commission for the first and third quarters of each fiscal year as an exhibit to its reports on FormN-PORT. The Trust’s FormN-PORT reports are available on the Commission’s website at http://www.sec.gov.
A description of the policies and procedures that the Trust uses to determine how to vote proxies relating to portfolio securities, as well as information relating to how a Fund voted proxies relating to portfolio securities during the most recent12-month period ended June 30, is available (i) without charge, upon request, by calling1-877-835-4531; and (ii) on the Commission’s website at http://www.sec.gov.
NEW COVENANT FUNDS — JUNE 30, 2019 (Unaudited)
To Our Shareholders:
After an extended period of historical calm and steady gains, volatility returned to financial markets during the fiscal year ending June 30, 2019, with a selloff toward the end of 2018 that sent most global indexes into or near bear market territory before an early-2019 rebound that saw the S&P 500 Index deliver its bestfirst-quarter performance in 20 years. Trade war fears, ongoing Brexit discussions and the U.S. yield curve all weighed on investor expectations.
The pace of interest-rate increases by the Federal Reserve (Fed) mostly followed the market’s projections. Long-term rates fell by a greater magnitude than short-term rates after the Federal Reserve raised rates twice during the reporting period; the yield curve flattened to a post-recession low and even inverted at multiple maturities.
The European Central Bank ended its bond-buying program at the end of 2018 but made assurances that it would reinvest maturing securities for some time to help keep rates low. Christine Lagarde (who resigned as president of the International Monetary Fund after the reporting period) was named to succeed Mario Draghi as European Central Bank (ECB) President at the end of October 2019. Lagarde is expected to maintain her predecessor’s dovish policies.
The Japanese yen, typically viewed as a safe-haven asset inrisk-off environments, finished the period higher against the U.S. dollar while the Bank of Japan (BOJ) held monetary policy stable. Driven by trade-related tensions, the Chinese yuan slid to a10-year low against the U.S. dollar in the first half of the fiscal period. While China’s currency strengthened earlier this year as trade negotiations appeared to be reaching a favorable conclusion, its value weakened again following a breakdown in talks at the beginning of May.
Oil prices rose during the first half of the reporting period to a four-year high, supported by geopolitical tensions and news that Saudi Arabia and Russia would extend an agreement to curb output. However, growing concerns over falling demand and increasing global supply, along with a broad selloff in risk assets, helped drive a correction during the last three months of 2018 that sent the commodity down as much as 40% from its earlier highs. Support at the start of the new year saw anear-50% recovery from its lows, and oil closed the fiscal year down about 20%.
Geopolitical Events
U.S. elections in November 2018 produced a partial shift in power away from Republicans and toward Democrats in Congress and statehouses across the country. The new balance of authority in Congress could substantially limit the ability of President Donald Trump and Republicans to pass meaningful legislation; it also enhances the investigatory powers available to Democrats, thereby adding to political risk for the Trump administration.
The partial shutdown of the U.S. government in December lasted over a month due to an impasse between Congress and President Trump’s administration about whether to fund a multi-billion dollar wall on the U.S.-Mexico border championed by the president. The Trump administration also received a measure of resolution in March, when the special counsel investigating the 2016 election “did not establish that members of the Trump campaign conspired or coordinated with the Russian government” to sway the election. The special counsel reportedly could not conclude that the president committed criminal obstruction of justice, although neither did it exonerate him. Congressional Democrats intend to review the special counsel’s report to make a separate determination in conjunction with information gathered through Congressional investigations.
NAFTA’s successor came into focus during the year—first when the U.S. and Mexico came to an agreement in August, and then when the U.S. and Canada finally ironed out their differences in September. Now called the United States-Mexico-Canada Agreement, the revised deal is expected to strengthen its predecessor’s provisions and improve labor standards. The U.S. is projected to offer Canada and Mexico relief from automobile-related trade barriers as a result of the new agreement, although aluminum and steel tariffs will remain.
Trade negotiations between the U.S. and China deteriorated in early May. The U.S. announced an escalation of existing tariffs on $200 billion of Chinese imports from 10% to 25% and proposed expanding the scope of the 25% tariffs to an additional $300 billion of imports—prompting smaller retaliatory tariffs from China. However, the U.S. stalled the proposed tariffs in late June to entice Chinese President Xi Jinping to meet with President Donald Trump on the sidelines of a Group of 20 summit (an international forum for governments and central bank governors from 19 countries and the EU); the meeting produced a temporary truce as both sides agreed to return to the negotiating table.
| | | | |
New Covenant Funds / Annual Report / June 30, 2019 | | | 1 | |
NEW COVENANT FUNDS — JUNE 30, 2019 (Unaudited) (Continued)
U.K. Prime Minister Theresa May announced on May 24 her intention to resign following a poor showing for Conservatives in European Parliamentary elections. May’s inability to establish sufficient support for her Brexit deal or a viable alternative had become an impasse, and her recent overtures for a second referendum alienated a large subset of her party’s leadership. More than a dozen candidates announced plans to run for Prime Minister and leader of the Conservative Party following May’s announcement; Boris Johnson was eventually named as May’s successor just after the end of the fiscal year. Johnson campaigned on an explicit willingness to depart the EU without a deal upon the October 31 deadline but has made conflicting comments on the likelihood of this outcome.
Elections for European Parliament exposed support for centrist parties shifting toward more polarizing alternatives on the left and right. Concerns about the impact of climate change bolstered the Green Party alliance, especially in Germany, where it outpaced the Social Democratic Party (which serves as the junior partner in Chancellor Angela Merkel’s coalition government). Eurosceptic nationalist parties also fared well, particularly in France and Italy, where they earned a plurality of votes.
Economic Performance
The U.S. economy grew 3.4% at the start of the fiscal period, a drop from 4.2% in the previous quarter, pointing to a slight decrease in consumer spending and a broader decline in exports. Economic growth slowed to 2.2% in the fourth quarter of 2018, primarily due to a softer environment for business investment that was only modestly affected by the partial government shutdown. Still, GDP for the 2018 calendar year finished at 2.9%, equaling growth in 2015 as the best in 10 years. The government shutdown that continued through most of January likely detracted in 2019; however, growth rebounded to 3.1% in the first quarter, driven by increases in inventories and trade.
The labor market remained robust throughout the fiscal year: the unemployment rate fell, finishing the period near a49-year low at 3.7%; the labor-force participation rate ended at 62.9%, unchanged from a year ago. Average hourly earnings gained 3.1% over the year, although a modest increase in price pressures weighed on real personal income growth as the period progressed. The historically strong labor market and improving wage growth helped boost the debt profile of the U.S. consumer. The Fed raised its target interest rate two times during the period but took a dovish turn toward the end of the fiscal year, with new economic projections that showed zero interest-rate increases in 2019. The central bank also unveiled a plan to start slowing the reduction of its balance sheet in May—before halting reduction altogether in September and converting its allocation of mortgage-related assets to Treasurys.
The ECB held its benchmark interest rate unchanged at a historic low through the fiscal year, while the Bank of England raised its official bank rate for only the second time since the global financial crisis, by 0.25%. Committee guidance noted a bias toward higher rates in the future, depending on the Brexit outcome. Broad economic growth in the eurozone slowed to its weakest pace in four years at the end of the fourth quarter of 2018, as tightening auto emission standards in Germany and a stagnating Italian economy hampered expansion; growth rebounded in the first quarter but likely did not weaken the case for continued accommodative policy by the ECB for some time. The U.K. economy grew 1.8%year-on-year through the first quarter of 2019, up from asix-year low of 1.4% in the fourth quarter of 2018.
Japanese GDP grew 0.6%year-on-year at the end of the first quarter of 2019; the BOJ maintained monetary stimulus in an attempt to counter slowing growth and weak productivity gains. Meanwhile, GDP in China expanded by just 6.2%year-on-year in the second quarter of 2019, its weakest pace in 28 years, as a lack of consumer confidence due to the U.S. trade war continued to put pressure on economic growth.
Market Developments
For the fiscal year ending June 30, 2019, growth stocks generally outperformed value stocks. The U.S. equity market experienced a significant decline midway through the fiscal year as concerns about rising interest rates, trade issues, and softening global economic growth weighed on investor sentiment. The highly-cyclical energy sector experienced a significant selloff, while the health care and utilities sectors, in particular, outperformed and helped mitigate some damage in the falling market. However, January marked the best start for equities in thirty years; the recovery rally continued until a slight retreat in May, but touched a record high in June before the end of the fiscal year.
| | |
| 2 | | New Covenant Funds / Annual Report / June 30, 2019 |
The Russell 1000 Growth Index finished up 11.56% during the fiscal year, while the Russell 1000 Value Index lagged, gaining 8.46% over the same period.Small-cap stocks (Russell 2000 Index) failed to keep up with large caps (Russell 1000 Index) during the fiscal year. Large caps finished up 10.02%, easily outpacing small caps, which lost 3.31%.
Brexit concerns continued to overshadow the outlook for business in the U.K.; the FTSE UK SeriesAll-Share Index shed 3.05% in U.S. dollar terms but managed to gain 0.57% in sterling. The MSCI ACWI Index, a proxy for global equities in both developed and emerging markets, rose 5.74% in U.S. dollar terms; U.S. markets did better, as the S&P 500 Index returned 10.42%. Despite continued accommodative monetary policy from the ECB, European equities lagged, as fears over trade wars and policy uncertainty grew. The MSCI Europe Index finished up 1.88% in U.S. dollar terms and 4.25% higher in euros; the euro finished down 2.82% versus the U.S. dollar for the period.
Emerging markets failed to keep pace over the full reporting period. The MSCI Emerging Markets Index finished the fiscal year 1.21% ahead in U.S. dollar terms, after a generous rally over the final six months. Asian markets ended the period lower as trade-related concerns drove regional market weakness.
Led by the dovish tone of global central banks and better-than-expected earnings toward the end of the reporting period, global high-yield bonds outperformed global government bonds. A continuing theme for U.S.fixed-income markets was the flattening yield curve, as short-term yields fell less than long-term yields. In early December, the spread between2-year and10-year Treasury bonds compressed to 11 basis points, its narrowest point in more than 12 years. At the same time, the spread between2-year and5-year Treasurys inverted, as did the spread between3-year and5-year Treasurys. Notably, the3-month and10-year rates inverted at the end of the reporting period, a signal of impending recession to some market watchers. The Federal Open Market Committee increased the federal-funds rate inmid-December—the second hike of the reporting period and ninth during this tightening cycle—while softening its projections for future rate increases. The rate hikes failed to sustain an impact on higher short-term yields, while subdued inflation and long-term economic growth expectations pressured the long end of the curve. Yields for10-year government bonds declined and ended the period 85 basis points lower at 2.00%, while2-year yields rose to almost 3% during the first half of the fiscal year but finished the period down 77 basis points at 1.75%.
Inflation-sensitive assets, such as commodities and Treasury inflation-protected securities, were mixed. The Bloomberg Commodity Total Return Index (which represents the broad commodity market) slid 6.75%, primarily due to oil market headwinds, while the Bloomberg Barclays1-10 Year US TIPS Index (USD) moved 4.67% higher.
Global fixed income, as measured by the Bloomberg Barclays Global Aggregate Index, climbed 5.85% in U.S. dollar terms during the reporting period, while the high-yield market did slightly better, with the ICE BofAML US High Yield Constrained Index up 7.58%.
U.S. investment-grade corporate debt performed well, as the Bloomberg Barclays US Corporate Investment Grade Index returned 10.72%. U.S. asset-backed and mortgage-backed securities also managed gains during the fiscal year.
Emerging-market debt delivered strong performance. The JP Morgan GBI Emerging Markets Global Diversified Index, which tracks local-currency-denominated emerging-market bonds, climbed 8.99% higher in U.S. dollar terms, with almost all of its gains coming over the last six months. The JP Morgan EMBI Global Diversified Index, which tracks emerging-market debt denominated in external currencies (such as the U.S. dollar), gained 12.45%, also with most of its gains coming during the second half of the fiscal year.
Our view
The U.S. economic expansion turns 10 years old in July. The bull market in the S&P 500 Index marked its tenth anniversary back in March, and it appears to be celebrating these achievements by poking intonew-high territory. But there is anxiety that the bull market in equities is on its last legs, the victim of a slowing global economy, the lagged impact of last year’s interest-rate increases and, most importantly, a trade war between the U.S. and China.
To be sure, the U.S. economy is hardly firing on all cylinders. There’s a good chance that capital spending will continue to ease in the months ahead, but we’re not forecasting a significant downturn. Corporate cash generation continues to run slightly ahead of capital expenditures. The main point to remember: It’s not unusual for capital expenditures to run well in excess of cash flow, especially toward the end of the economicup-cycle. That’s not happening yet.
| | | | |
New Covenant Funds / Annual Report / June 30, 2019 | | | 3 | |
NEW COVENANT FUNDS — JUNE 30, 2019 (Unaudited) (Concluded)
We need to see a severe deterioration in financial and leading economic indicators before climbing onto the recession train. Even after the past two years of multiple Fed rate increases, there are still few signs of abuild-up in financial stress.
The big question, of course, is how the evolving tariff war with China affects U.S. economic growth and global trade in the months ahead. Tensions with China and worries about global growth have so far put only a modest dent in the confidence of U.S. businesses. But it certainly looks as if the U.S.-China trade relationship is frosty at best, even though another tariff truce has been declared in order to pursue additional discussions.
We believe the U.S. economy should be able to weather this storm. Anall-out tariff war between the two largest economies in the world will undoubtedly be disruptive to supply chains and will likely lead to higher prices for a broad range of consumer goods. Still, it is helpful to keep the problem in perspective. Even if a 25% tariff is eventually imposed on all Chinese imports into the U.S., total duties will equal roughly 0.5% of U.S. GDP.
It is not our intention to minimize the importance of the shift in U.S. trade policy toward protectionism. The speed and ease with which supply chains can be relocated to other countries will be a critical factor, either exacerbating or tempering the tariff impact on consumers and companies in both the U.S. and China. An escalation of the trade wars by the U.S. against other countries would prove far more dangerous for the near-term growth prospects in the U.S. than if trade is disrupted only with China.
We have been thinking that the U.S. would avoid waging multiple tariff wars as it concentrated its firepower on China. Our persistent optimism might not hold. Tariffs on German and Japanese autos are still a possibility later this year.
In all, we think the U.S. economy will show resilience in the face of what is admittedly a stiff headwind. Household income growth continues to advance at a good pace. The decline in interest rates that began late last year will also certainly help consumers.
The market-implied rate forecasts a federal-funds rate of 1.7% atyear-end, consistent with three 25 basis point cuts. Although the forecasts of the Federal Open Market Committee members are more cautious, they are moving in the direction of the markets. The recent decline in bond yields to levels last seen in 2016 ranks as one of the biggest surprises of the year. We find it hard to justify these moves. In our view, recession is not likely in the absence of a severe policy mistake, such as fighting a tariff war on multiple fronts.
In emerging economies, when one considers all the headwinds they face—a significant slowdown in Chinese economic growth, theon-going trade tensions between the U.S. and China, weak commodity pricing and a still-resilient U.S. dollar—it’s surprising that emerging stock markets have appreciated at all this year. But as long as a tariff truce remains in place with the U.S., SEI expects China’s economy to improve in the months ahead. Scores of measures, both monetary and fiscal, have been put in place over the past year.
Europe currently faces a variety of distinctive challenges, both economic and political, that makes it hard even for a contrarian investor to get enthusiastic about the near term. Economically, the downward trajectory is similar to that of the2011-to-2012 period, when the region was in the midst of the periphery debt crisis. However, this time, Germany’s industrial economy is fully participating in the slowdown.
It’s not just the region’s massive exposure to manufacturing and international trade that makes German industrialists glum. There is also a worrisome vacuum of political leadership. Chancellor Angela Merkel is on her way out, and given the country’s central importance in the eurozone and EU, a politically distracted Germany is a concerning issue.
And then, there’s the looming cloud of Brexit. Although it has been delayed until October 31, there is little sign that the breathing space will be put to good use. Boris Johnson was named Prime Minister just after the end of the fiscal year. It’s hard to see how that improves the chances of an orderly exit.
Although economic growth is sluggish, the U.K. economy is not exactly cratering as the deadline approaches. In fact, the unemployment rate has fallen to a multi-decade low. The eurozone also is recording steady labor-market improvement, although the jobless rate itself remains far higher owing to structural factors.
| | |
| 4 | | New Covenant Funds / Annual Report / June 30, 2019 |
That said, we can’t help but think Brexit will prove to be a highly disruptive event for the U.K. and the EU if it indeed occurs. Roughly half of the U.K.’s trade in goods, both imports and exports, is with the EU.
We think there is still life in the economic expansion, both in the U.S. and globally. If we’re right, that means corporate profits should continue to expand and push global stock markets to higher levels in the months ahead. This may seem like a bold statement at a time when the world looks increasingly unpredictable, and the economic data point to slowing growth. But we do not yet see the economic imbalances or nosebleed equity-market valuations that typically bring on recessions and an associated contraction in earnings and stock prices. It is also clear that central banks have investors’ backs, as monetary policymakers promise to, or already are, cutting interest rates and providing additional liquidity to their banking systems in both developed and emerging countries.
Sincerely,

William T. Lawrence, CFA
Head and Chief Investment Officer of Traditional Asset Management
| | | | |
New Covenant Funds / Annual Report / June 30, 2019 | | | 5 | |
MANAGEMENT’S DISCUSSION AND ANALYSIS OF FUND PERFORMANCE
June 30, 2019 (Unaudited)
New Covenant Growth Fund
I. Objective
The New Covenant Growth Fund’s (the “Fund”) investment objective is long-term capital appreciation. A modest amount of dividend income may be provided by the Fund’s equity securities.
II. Investment Approach
During the fiscal year, the Fund’s management approach changed from an active to mostly passive implementation, while still maintaining the Fund’s social screen and environmental, social, and governance (ESG) tilt as key components for the entire reporting period. For the period from July 1, 2018 through May 13, 2019, the Fund utilized a multi-manager approach, relying on a multiplesub-advisers with different investment approaches to more actively manage portions of the Fund’s portfolio, under the general supervision of SEI Investments Management Corporation (SIMC). From May 14, 2019 through the end of the reporting period on June 30, 2019, the Fund’s sole remainingsub-adviser managed the Fund as a generally passive implementation along with the social screen and ESG tilt, also under the supervision of SIMC. The sole remainingsub-adviser as of June 30, 2019, was Parametric Portfolio Associates LLC (Parametric). During the reporting period, BlackRock Investment Management, LLC (BlackRock), Brandywine Global Investment Management Company LLC (Brandywine), and Coho Partners, Ltd. (Coho), were removed from the Fund, while Fred Alger Management, Inc. (Alger), was added but later also terminated.
III. Return vs. Benchmark
For theone-year period ending June 30, 2019, the Fund returned 7.21%. The Fund’s primary benchmark—the Russell 1000® Index—returned 10.02%.
IV. Fund Attribution
The fiscal year produced positive returns for equity investors as the global economy expanded gradually and U.S. long-term interest rates declined. Heightened concerns about a potential trade war, along with possible signs of a slowdown in global economic growth, weighed on investors’ minds.
Interest-rate-sensitive bond proxies, such as utilities, consumer staples and real-estate investment trusts, outperformed. These sectors represented a significant portion of thelow-volatility stock universe and, as a result,low-volatility stocks outperformed. Economically-sensitive sectors, such as energy, materials and financials, underperformed. These stocks comprised
a meaningful portion of the value stock universe, and value indexes lagged relative to growth, as noted in the shareholder letter; the information technology and health care sectors outperformed, and this helped propel growth indexes higher. Small- andmid-cap stocks lagged relative to the largest-capitalization stocks.
In this environment, the Fund underperformed relative to its benchmark as a result of its underweight to the largest-capitalization names, as well as underweights to real-estate investment trusts and utilities. The Fund’s value tilt—and associated overweight to the energy sector and underweight to information technology—also detracted.
During their time in the Fund, Coho and Brandywine underperformed as a result of their value orientation; an overweight to the energy sector and underweight to information technology detracted for both. Alger and BlackRock contributed to performance due to their growth mandates.
| | | | | | | | | | | | | | | | | | | | |
| AVERAGE ANNUAL TOTAL RETURN1 | |
| | | One Year
Return | | | Annualized
3 Year
Return | | | Annualized
5 Year
Return | | | Annualized
10 Year
Return | | | Annualized
Inception
to Date | |
| New Covenant Growth Fund | | | 7.21% | | | | 13.26% | | | | 8.29% | | | | 12.15% | | | | 6.37% | |
| Russell 1000® Index | | | 10.02% | | | | 14.15% | | | | 10.45% | | | | 14.77% | | | | 9.86% | |
| | |
| 6 | | New Covenant Funds / Annual Report / June 30, 2019 |
Comparison of Change in the Value of a $10,000 Investment in the New Covenant Growth Fund, versus the Russell 1000® Index.
| 1 | For the periods ended June 30, 2019. Past performance is not an indication of future performance. Fund Shares were offered beginning 7/1/99. Returns shown do not reflect the deduction of taxes that a shareholder would pay on fund distributions or the redemption of fund shares. The returns for certain periods reflect fee waivers and/or reimbursements in effect for that year; absent fee waivers and reimbursements, performance would have been lower. |
| | | | |
New Covenant Funds / Annual Report / June 30, 2019 | | | 7 | |
MANAGEMENT’S DISCUSSION AND ANALYSIS OF FUND PERFORMANCE
June 30, 2019 (Unaudited)
New Covenant Income Fund
I. Objective
The New Covenant Income Fund’s (the Fund) investment objective is a high level of current income with preservation of capital.
II. Investment Approach
The Fund uses a multi-manager approach, relying on a number ofsub-advisors with different investment approaches to manage portions of the Fund’s portfolio, under the general supervision of SEI Investments Management Corporation (SIMC). The Fund utilized the followingsub-advisors as of June 30, 2019: Income Research & Management, Western Asset Management Company and Western Asset Management Company Limited. There were nosub-advisor changes during the fiscal period.
III. Return vs. Benchmark
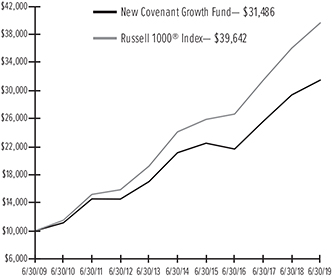
For theone-year period ending June 30, 2019, the Fund returned 6.46%. The Fund’s primary benchmark—the Bloomberg Barclays Intermediate US Aggregate Bond Index—returned 6.73%.
IV. Fund Attribution
As noted in the shareholder letter, the Federal Reserve (Fed) increased the federal-funds rate two times in 25 basis point increments in the first half of the fiscal year but made a dovish pivot during early 2019 in response to concerns of downside risk and the impact of global trade developments on the U.S. economy.30-year Treasury yields declined by a lesser magnitude than2-year yields over the period, with2-year yields down 77 basis points and30-year yields 46 basis points lower;3-month Treasury bill yields were 19 basis points higher during the 12 months after the Fed hiked rates in September and December of 2018, causing an inversion between3-month bills and10-year bonds. Within this environment, spread sectors generally managed to outperform, with the exception of agency mortgage-backed securities (MBS). Expanding GDP, low unemployment and gradually improving wages supported the housing sector and enablednon-agency mortgages, commercial mortgage-backed securities (CMBS) and MBS to outperform.
With the sharp decline in overall yields during the reporting period, the Fund’s absolute returns were strong. An overweight to non-Treasury sectors enhanced performance, while a small overweight to agency MBS detracted. Overweights to the securitized sectors, and strong security selection innon-agency mortgages and CMBS, added to relative performance. An overweight
to ABS was positive from a sector perspective, but selection within student loan securitizations subtracted. The Fund’s yield-curve posture, which included an overweight to the30-year segment, aided as yields declined.
Western Asset Management outperformed primarily due to its corporate overweight, holdings innon-agency MBS and overweight to the30-year part of the curve as yields declined. Income Research & Management also outperformed due to security selection in corporates, particularly within the industrial sector, and an underweight to agency MBS.
The Fund used Treasury futures, eurodollar futures andto-be-announced (TBA) forward contracts to effectively manage duration, yield-curve and market exposures. (TBA contracts confer the obligation to buy or sell future debt obligations of the three U.S. government-sponsored agencies that issue or guarantee MBS—Fannie Mae, Freddie Mac and Ginnie Mae.) None of these had a meaningful impact on the Fund’s performance.
| | | | | | | | | | | | | | | | | | | | |
| AVERAGE ANNUAL TOTAL RETURN1 | |
| | | One Year
Return | | | Annualized
3 Year
Return | | | Annualized
5 Year
Return | | | Annualized
10 Year
Return | | | Annualized
Inception
to Date | |
| New Covenant Income Fund | | | 6.46% | | | | 2.02% | | | | 2.30% | | | | 3.50% | | | | 2.70% | |
| Bloomberg Barclays U.S. Intermediate Aggregate Bond Index | | | 6.73% | | | | 2.03% | | | | 2.46% | | | | 3.34% | | | | 5.83% | |
| | |
| 8 | | New Covenant Funds / Annual Report / June 30, 2019 |
Comparison of Change in the Value of a $10,000 Investment in the New Covenant Income Fund, versus the Bloomberg Barclays U.S. Intermediate Aggregate Bond Index.
| 1 | For the periods ended June 30, 2019. Past performance is not an indication of future performance. Fund Shares were offered beginning 7/1/99. Returns shown do not reflect the deduction of taxes that a shareholder would pay on fund distributions or the redemption of fund shares. The returns for certain periods reflect fee waivers and/or reimbursements in effect for that year; absent fee waivers and reimbursements, performance would have been lower. |
| | | | |
New Covenant Funds / Annual Report / June 30, 2019 | | | 9 | |
MANAGEMENT’S DISCUSSION AND ANALYSIS OF FUND PERFORMANCE
June 30, 2019 (Unaudited)
New Covenant Balanced Growth Fund
I. Objective
The Balanced Growth Fund’s (the “Fund”) investment objective is to produce capital appreciation with less risk than would be present in a portfolio of only common stocks.
II. Investment Approach
The Fund’s assets are managed under the direction of SEI Investments Management Corporation (“SIMC”), which manages the Fund’s assets in a way that it believes will achieve the Fund’s investment objective. In order to achieve its investment objective, SIMC allocates the Fund’s assets primarily in shares of the New Covenant Growth Fund (the “Growth Fund”) and the New Covenant Income Fund (the “Income Fund”), with a majority of its assets generally invested in shares of the Growth Fund. Between 45% and 75% of the Fund’s net assets (with a neutral position of approximately 60% of the Fund’s net assets) are invested in shares of the Growth Fund, with the balance of its assets invested in shares of the Income Fund. The Growth and Income Funds, in turn, invest directly in securities in accordance with their own varying investment objectives and policies.
III. Return vs. Benchmark
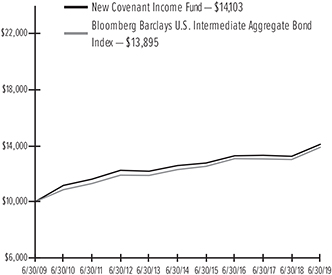
For theone-year period ending June 30, 2019, the Fund returned 7.12%. The Fund’s primary benchmark—the Russell 1000® Index—returned 10.02%.
IV. Fund Attribution
Equity andfixed-income markets both provided positive returns over the fiscal period. The fiscal year produced positive returns for equity investors as the global economy expanded gradually and U.S. long-term interest rates declined. Heightened concerns about a potential trade war, along with possible signs of a slowdown in global economic growth, weighed on investors’ minds.
Interest-rate-sensitive bond proxies, such as utilities, consumer staples and real-estate investment trusts, outperformed. These sectors represented a significant portion of thelow-volatility stock universe and, as a result,low-volatility stocks outperformed. Economically-sensitive sectors, such as energy, materials and financials, underperformed. These stocks comprised a meaningful portion of the value stock universe, and value indexes lagged relative to growth, as noted in the shareholder letter; the information technology and health care sectors outperformed, and this helped propel
growth indexes higher. Small- andmid-cap stocks lagged relative to the largest-capitalization stocks.
As mentioned in the shareholder letter, the Federal Reserve (Fed) increased the federal-funds rate two times in 25 basis point increments in the first half of the fiscal year, but made a dovish pivot during early 2019, in response to concerns of downside risk and the impact of global trade developments on the U.S. economy.30-year Treasury yields declined by a lesser magnitude than2-year yields over the period, with2-year yields down 77 basis points and30-year yields 46 basis points lower;3-month Treasury bill yields were 19 basis points higher during the 12 months after the Fed hiked rates in September and December of 2018, causing an inversion between3-month bills and10-year bonds. Within this environment, spread sectors generally managed to outperform, with the exception of agency mortgage-backed securities (MBS). Expanding GDP, low unemployment and gradually improving wages supported the housing sector and enablednon-agency mortgages, commercial mortgage-backed securities (CMBS) and MBS to outperform.
In the Growth Fund, underperformance was driven by an underweight to the largest-capitalization names, as well as underweights to real-estate investment trusts and utilities. The Fund’s value tilt—and associated overweight to the energy sector and underweight to information technology—also detracted.
With the sharp decline in overall yields during the reporting period, the Fund’s absolute returns were strong. An overweight tonon-Treasury sectors enhanced performance, while a small overweight to agency MBS detracted. Overweights to the securitized sectors and strong security selection innon-agency mortgages and CMBS added to performance. An overweight to ABS was positive from a sector perspective, but selection within student loan securitizations subtracted. The Fund’s yield-curve posture, which included an overweight to the30-year segment, aided as yields declined.
The Income Fund used Treasury futures, eurodollar futures andto-be-announced (TBA) forward contracts to effectively manage duration, yield-curve and market exposures. (TBA contracts confer the obligation to buy or sell future debt obligations of the three U.S. government-sponsored agencies that issue or guarantee MBS—Fannie Mae, Freddie Mac and Ginnie Mae.) None of these had a meaningful impact on the Fund’s performance.
| | |
| 10 | | New Covenant Funds / Annual Report / June 30, 2019 |
| | | | | | | | | | | | | | | | | | | | |
| AVERAGE ANNUAL TOTAL RETURN1,2 | |
| | | One Year
Return | | | Annualized
3 Year
Return | | | Annualized
5 Year
Return | | | Annualized
10 Year
Return | | | Annualized
Inception
to Date | |
| New Covenant Balanced Growth Fund | | | 7.12% | | | | 8.71% | | | | 5.97% | | | | 8.73% | | | | 5.26% | |
| Russell 1000® Index | | | 10.02% | | | | 14.15% | | | | 10.45% | | | | 14.77% | | | | 10.35% | |
| Bloomberg Barclays U.S. Intermediate Aggregate Bond Index | | | 6.73% | | | | 2.03% | | | | 2.46% | | | | 3.34% | | | | 5.84% | |
| Blended 60% Russell 1000® Index/40% Bloomberg Barclays U.S. Intermediate Aggregate Bond Index | | | 9.17% | | | | 9.36% | | | | 7.39% | | | | 10.30% | | | | 8.80% | |
Comparison of Change in the Value of a $10,000
Investment in the New Covenant Balanced Growth Fund, versus the Russell 1000® Index, Bloomberg Barclays U.S. Intermediate Aggregate Bond Index and Blended 60% Russell 1000 Index/40% Bloomberg Barclays U.S. Intermediate Aggregate Bond Index.
| 1 | For the periods ended June 30, 2019. Past performance is not an indication of future performance. Fund Shares were offered beginning 7/1/99. Returns shown do not reflect the deduction of taxes that a shareholder would pay on fund distributions or the redemption of fund shares. The returns for certain periods reflect fee waivers and/or reimbursements in effect for that year; absent fee waivers and reimbursements, performance would have been lower. |
| 2 | This table compares the Fund’s average annual total returns to those of a broad based index and the Fund’s 60/40 Blended Benchmark, which consists of the Russell 1000® Index and the Bloomberg Barclays U.S. Intermediate Aggregate Bond Index. The Fund’s Blended Benchmark is designed to provide a useful comparison to the Fund’s overall performance and more accurately reflects the Fund’s investment strategy than the broad-based index. |
| | | | |
New Covenant Funds / Annual Report / June 30, 2019 | | | 11 | |
MANAGEMENT’S DISCUSSION AND ANALYSIS OF FUND PERFORMANCE
June 30, 2019 (Unaudited)
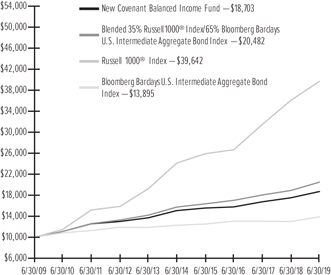
New Covenant Balanced Income Fund
I. Objective
The Balanced Income Fund’s (the “Fund”) investment objective is to produce current income and long-term growth of capital.
II. Investment Approach
The Fund’s assets are managed under the direction of SEI Investments Management Corporation (“SIMC”), which manages the Fund’s assets in a way that it believes will achieve the Fund’s investment objective. In order to achieve its investment objective, SIMC allocates the Fund’s assets primarily in shares of the New Covenant Growth Fund (the “Growth Fund”) and the New Covenant Income Fund (the “Income Fund”), with a majority of its assets generally invested in shares of the Income Fund. Between fifty percent and seventy-five percent of the Fund’s net assets (with a neutral position of approximately 65%) are invested in shares of the Income Fund, with the balance of its net assets invested in shares of the Growth Fund. The Growth and Income Funds, in turn, invest directly in securities in accordance with their own varying investment objectives and policies.
III. Return vs. Benchmark
For theone-year period ending June 30, 2019, the Fund returned 6.76%. The Fund’s primary benchmark—the Russell 1000® Index—returned 10.02%.
IV. Fund Attribution
Equity andfixed-income markets both provided positive returns over the fiscal period. As noted in the shareholder letter, the Federal Reserve (Fed) increased the federal-funds rate two times in 25 basis point increments in the first half of the fiscal year, but made a dovish pivot during early 2019 in response to concerns of downside risk and the impact of global trade developments on the U.S. economy.30-year Treasury yields declined by a lesser magnitude than2-year yields over the period, with2-year yields down 77 basis points and30-year yields 46 basis points lower;3-month Treasury bill yields were 19 basis points higher during the 12 months after the Fed hiked rates in September and December of 2018, causing an inversion between3-month bills and10-year bonds. Within this environment, spread sectors generally managed to outperform, with the exception of agency mortgage-backed securities (MBS). Expanding GDP, low unemployment and gradually improving wages supported the housing sector and enablednon-agency mortgages, commercial mortgage-backed securities (CMBS) and MBS to outperform.
The fiscal year produced positive returns for equity investors as the global economy expanded gradually and U.S. long-term interest rates declined. Heightened concerns about a potential trade war, along with possible signs of a slowdown in global economic growth, weighed on investors’ minds.
Interest-rate-sensitive bond proxies, such as utilities, consumer staples and real-estate investment trusts, outperformed. These sectors represented a significant portion of thelow-volatility stock universe and, as a result,low-volatility stocks outperformed. Economically-sensitive sectors, such as energy, materials and financials, underperformed. These stocks comprised a meaningful portion of the value stock universe, and value indexes lagged relative to growth, as mentioned in the shareholder letter; the information technology and health care sectors outperformed, and this helped propel growth indexes higher. Small- andmid-cap stocks lagged relative to the largest-capitalization stocks.
With the sharp decline in overall yields during the reporting period, the Fund’s absolute returns were strong. An overweight tonon-Treasury sectors enhanced performance, while a small overweight to agency MBS detracted. Overweights to the securitized sectors and strong security selection innon-agency mortgages and CMBS added to performance. An overweight to ABS was positive from a sector perspective, but selection within student loan securitizations subtracted. The Fund’s yield-curve posture, which included an overweight to the30-year segment, aided as yields declined.
In the Growth Fund, underperformance was driven by an underweight to the largest-capitalization names, as well as underweights to real-estate investment trusts and utilities. The Fund’s value tilt—and associated overweight to the energy sector and underweight to information technology—also detracted.
The Income Fund used Treasury futures, eurodollar futures andto-be-announced (TBA) forward contracts to effectively manage duration, yield-curve and market exposures. (TBA contracts confer the obligation to buy or sell future debt obligations of the three U.S. government-sponsored agencies that issue or guarantee MBS—Fannie Mae, Freddie Mac and Ginnie Mae.) None of these had a meaningful impact on the Fund’s performance.
| | |
| 12 | | New Covenant Funds / Annual Report / June 30, 2019 |
| | | | | | | | | | | | | | | | | | | | |
| AVERAGE ANNUAL TOTAL RETURN1,2 | |
| | | One Year
Return | | | Annualized
3 Year
Return | | | Annualized
5 Year
Return | | | Annualized
10 Year
Return | | | Annualized
Inception
to Date | |
| New Covenant Balanced Income Fund | | | 6.76% | | | | 5.81% | | | | 4.40% | | | | 6.46% | | | | 4.08% | |
| Russell 1000® Index | | | 10.02% | | | | 14.15% | | | | 10.45% | | | | 14.77% | | | | 9.86% | |
| Bloomberg Barclays U.S. Intermediate Aggregate Bond Index | | | 6.73% | | | | 2.03% | | | | 2.46% | | | | 3.34% | | | | 5.66% | |
| Blended 35% Russell 1000® Index/65% Bloomberg Barclays U.S. Intermediate Aggregate Bond Index | | | 8.32% | | | | 6.33% | | | | 5.38% | | | | 7.43% | | | | 7.37% | |
Comparison of Change in the Value of a $10,000
Investment in the New Covenant Balanced Income Fund, versus the Russell 1000® Index, Bloomberg Barclays U.S. Intermediate Aggregate Bond Index and Blended 35% Russell 1000® Index/65% Bloomberg Barclays U.S. Intermediate Aggregate Bond Index.
| 1 | For the periods ended June 30, 2019. Past performance is not an indication of future performance. Fund Shares were offered beginning 7/1/99. Returns shown do not reflect the deduction of taxes that a shareholder would pay on fund distributions or the redemption of fund shares. The returns for certain periods reflect fee waivers and/or reimbursements in effect for that year; absent fee waivers and reimbursements, performance would have been lower. |
| 2 | This table compares the Fund’s average annual total returns to those of a broad-based index and the Fund’s 35/65 Blended Benchmark, which consists of the Russell 1000® Index and the Bloomberg Barclays U.S. Intermediate Aggregate Bond Index. The Fund’s Blended Benchmark is designed to provide a useful comparison to the Fund’s overall performance and more accurately reflects the Fund’s investment strategy than the broad-based index. |
| | | | |
New Covenant Funds / Annual Report / June 30, 2019 | | | 13 | |
SCHEDULE OF INVESTMENTS
June 30, 2019
New Covenant Growth Fund
|
Sector Weightings (Unaudited)†: |
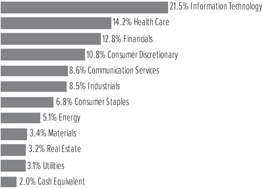
†Percentages are based on total investments.
| | | | | | | | |
| | | |
| Description | | Shares | | | Market Value ($ Thousands) | |
COMMON STOCK — 97.5% | | | | | | | | |
Canada — 0.0% | | | | | | | | |
Lululemon Athletica lnc * | | | 771 | | | $ | 139 | |
| | | | | | | | |
| | |
Ireland — 1.1% | | | | | | | | |
Accenture PLC, CI A | | | 11,297 | | | | 2,087 | |
Ingersoll-Rand PLC | | | 7,234 | | | | 916 | |
Jazz Pharmaceuticals PLC * | | | 616 | | | | 88 | |
Medtronic PLC | | | 19,976 | | | | 1,946 | |
Perrigo Co PLC | | | 1,650 | | | | 79 | |
| | | | | | | | |
| | | | | | | 5,116 | |
| | | | | | | | |
| | |
Puerto Rico — 0.0% | | | | | | | | |
Popular Inc | | | 1,507 | | | | 82 | |
| | | | | | | | |
| | |
Switzerland — 0.1% | | | | | | | | |
Garmin Ltd | | | 2,934 | | | | 234 | |
| | | | | | | | |
| | |
United Kingdom — 0.1% | | | | | | | | |
Aon PLC | | | 2,921 | | | | 564 | |
| | | | | | | | |
| | |
United States — 96.2% | | | | | | | | |
| | |
Communication Services — 8.6% | | | | | | | | |
Activision Blizzard Inc | | | 8,449 | | | | 399 | |
Alphabet Inc, CI A * | | | 4,600 | | | | 4,981 | |
Alphabet Inc, CI C * | | | 4,691 | | | | 5,071 | |
AT&T Inc | | | 133,201 | | | | 4,464 | |
CenturyLink Inc | | | 7,881 | | | | 93 | |
Charter Communications Inc, CI A* | | | 2,147 | | | | 848 | |
Cinemark Holdings Inc | | | 2,104 | | | | 76 | |
Comcast Corp, CI A | | | 66,971 | | | | 2,832 | |
Electronic Arts lnc * | | | 2,980 | | | | 302 | |
Facebook Inc, CI A* | | | 41,503 | | | | 8,010 | |
Fox Corp, CI A | | | 1,372 | | | | 50 | |
Fox Corp, CI B | | | 5,833 | | | | 213 | |
Interpublic Group of Cos Inc/The | | | 8,487 | | | | 192 | |
John Wiley & Sons Inc, CI A | | | 3,657 | | | | 168 | |
Liberty Media Corp-Liberty Formula One, CI A * | | | 4,776 | | | | 171 | |
| | | | | | | | |
| | | |
| Description | | Shares | | | Market Value ($ Thousands) | |
COMMON STOCK (continued) | | | | | | | | |
Liberty Media Corp-Liberty Formula One, CI C * | | | 5,721 | | | $ | 214 | |
Live Nation Entertainment lnc * | | | 1,313 | | | | 87 | |
News Corp | | | 7,134 | | | | 100 | |
Omnicom Group Inc | | | 18,116 | | | | 1,485 | |
Spotify Technology SA * | | | 607 | | | | 89 | |
Sprint Corp * | | | 31,627 | | | | 208 | |
Take-Two Interactive Software Inc * | | | 830 | | | | 94 | |
T-Mobile US lnc * | | | 3,026 | | | | 224 | |
Twitter Inc * | | | 6,144 | | | | 214 | |
Verizon Communications Inc | | | 62,462 | | | | 3,568 | |
Viacom Inc, CI A | | | 2,473 | | | | 84 | |
Viacom Inc, CI B | | | 7,351 | | | | 220 | |
Walt Disney Co/The | | | 26,709 | | | | 3,730 | |
Zayo Group Holdings lnc * | | | 2,614 | | | | 86 | |
Zillow Group Inc, CI C * | | | 2,383 | | | | 111 | |
Zynga Inc, CI A * | | | 14,448 | | | | 89 | |
| | | | | | | | |
| | | | | | | 38,473 | |
| | | | | | | | |
Consumer Discretionary — 10.6% | | | | | | | | |
Amazon.com lnc * | | | 6,511 | | | | 12,329 | |
Aptiv PLC | | | 3,490 | | | | 282 | |
Aramark | | | 6,162 | | | | 222 | |
AutoZone lnc * | | | 235 | | | | 258 | |
Best Buy Co Inc | | | 3,307 | | | | 231 | |
Booking Holdings lnc * | | | 624 | | | | 1,170 | |
BorgWarner Inc | | | 4,528 | | | | 190 | |
Bright Horizons Family Solutions Inc * | | | 649 | | | | 98 | |
Burlington Stores Inc * | | | 1,183 | | | | 201 | |
Cable One Inc | | | 79 | | | | 92 | |
CarMax Inc * | | | 1,086 | | | | 94 | |
Carnival Corp | | | 11,633 | | | | 542 | |
Carvana Co, CI A * | | | 1,405 | | | | 88 | |
CBS Corp, CI B | | | 1,742 | | | | 87 | |
Chipotle Mexican Grill Inc, CI A * | | | 122 | | | | 89 | |
Choice Hotels International Inc | | | 1,031 | | | | 90 | |
Columbia Sportswear Co | | | 891 | | | | 89 | |
Darden Restaurants Inc | | | 705 | | | | 86 | |
Discovery Inc, CI A * | | | 3,016 | | | | 93 | |
Discovery Inc, CI C * | | | 3,206 | | | | 91 | |
Dollar General Corp | | | 2,859 | | | | 387 | |
Dollar Tree lnc * | | | 2,154 | | | | 231 | |
Domino’s Pizza Inc | | | 309 | | | | 86 | |
DR Horton Inc | | | 1,973 | | | | 85 | |
Dunkin’ Brands Group Inc | | | 2,803 | | | | 223 | |
eBay Inc | | | 24,197 | | | | 956 | |
Expedia Group Inc | | | 723 | | | | 96 | |
Floor & Decor Holdings Inc, CI A * | | | 2,075 | | | | 87 | |
Ford Motor Co | | | 41,791 | | | | 427 | |
frontdoor lnc * | | | 2,205 | | | | 96 | |
Gap Inc/The | | | 14,224 | | | | 256 | |
General Motors Co | | | 51,542 | | | | 1,986 | |
Gentex Corp | | | 3,795 | | | | 94 | |
| | |
| 14 | | New Covenant Funds / Annual Report / June 30, 2019 |
| | | | | | | | |
| | | |
| Description | | Shares | | Market Value
($ Thousands) | |
| | |
COMMON STOCK (continued) | | | | | | | | |
Genuine Parts Co | | | 871 | | | $ | 90 | |
Goodyear Tire & Rubber Co/The | | | 5,710 | | | | 87 | |
Grand Canyon Education lnc * | | | 729 | | | | 85 | |
GrubHub lnc * | | | 1,289 | | | | 101 | |
H&R Block Inc | | | 3,157 | | | | 93 | |
Hanesbrands Inc | | | 13,319 | | | | 229 | |
Harley-Davidson Inc | | | 2,391 | | | | 86 | |
Hasbro Inc | | | 2,632 | | | | 278 | |
Hilton Grand Vacations lnc * | | | 3,016 | | | | 96 | |
Hilton Worldwide Holdings Inc | | | 4,365 | | | | 427 | |
Home Depot Inc/The | | | 16,979 | | | | 3,531 | |
Hyatt Hotels Corp, CI A | | | 2,635 | | | | 201 | |
Kohl’s Corp | | | 1,859 | | | | 88 | |
L Brands Inc | | | 5,950 | | | | 155 | |
Lear Corp | | | 1,457 | | | | 203 | |
Leggett & Platt Inc | | | 2,232 | | | | 86 | |
Lennar Corp, CI A | | | 1,654 | | | | 80 | |
LKQ Corp * | | | 3,141 | | | | 84 | |
Lowe’s Cos Inc | | | 23,723 | | | | 2,394 | |
Macy’s Inc | | | 4,042 | | | | 87 | |
Madison Square Garden Co/The * | | | 284 | | | | 79 | |
Marriott International lnc/MD, CI A | | | 3,599 | | | | 505 | |
Mattel lnc * | | | 18,661 | | | | 209 | |
McDonald’s Corp | | | 11,361 | | | | 2,359 | |
Mohawk Industries Inc * | | | 634 | | | | 93 | |
Netflix Inc * | | | 6,211 | | | | 2,281 | |
Newell Brands Inc | | | 5,602 | | | | 86 | |
News Corp | | | 7,212 | | | | 97 | |
NIKE Inc, CI B | | | 17,157 | | | | 1,440 | |
Nordstrom Inc | | | 3,866 | | | | 123 | |
Norwegian Cruise Line Holdings Ltd * | | | 1,482 | | | | 79 | |
O’Reilly Automotive lnc * | | | 677 | | | | 250 | |
Polaris Industries Inc | | | 966 | | | | 88 | |
Pool Corp | | | 466 | | | | 89 | |
PulteGroup Inc | | | 26,308 | | | | 832 | |
PVH Corp | | | 1,776 | | | | 168 | |
Qurate Retail lnc * | | | 9,266 | | | | 115 | |
Ralph Lauren Corp, CI A | | | 690 | | | | 79 | |
Roku Inc, CI A * | | | 933 | | | | 85 | |
Ross Stores Inc | | | 13,755 | | | | 1,363 | |
Royal Caribbean Cruises Ltd | | | 8,804 | | | | 1,067 | |
Service Corp International/US | | | 2,015 | | | | 94 | |
Six Flags Entertainment Corp | | | 1,563 | | | | 78 | |
Starbucks Corp | | | 16,902 | | | | 1,417 | |
Tapestry Inc | | | 2,803 | | | | 89 | |
Target Corp | | | 6,577 | | | | 570 | |
Tesla lnc * | | | 1,323 | | | | 296 | |
Tiffany & Co | | | 2,287 | | | | 214 | |
TJX Cos Inc/The | | | 15,858 | | | | 838 | |
Toll Brothers Inc | | | 2,246 | | | | 82 | |
Tractor Supply Co | | | 2,377 | | | | 259 | |
Tribune Media Co, CI A | | | 1,847 | | | | 85 | |
| | | | | | | | |
| | | |
| Description | | Shares | | Market Value
($ Thousands) | |
| | |
COMMON STOCK (continued) | | | | | | | | |
Ulta Beauty lnc * | | | 279 | | | $ | 97 | |
Under Armour Inc, CI A * | | | 3,938 | | | | 100 | |
Under Armour Inc, CI C * | | | 4,463 | | | | 99 | |
Urban Outfitters lnc * | | | 3,059 | | | | 70 | |
Vail Resorts Inc | | | 381 | | | | 85 | |
VF Corp | | | 4,023 | | | | 352 | |
Wayfair Inc, CI A* | | | 590 | | | | 86 | |
Wendy’s Co/The | | | 11,419 | | | | 224 | |
Whirlpool Corp | | | 638 | | | | 91 | |
Williams-Sonoma Inc | | | 3,319 | | | | 216 | |
Wyndham Destinations Inc | | | 4,669 | | | | 205 | |
Wyndham Hotels & Resorts Inc | | | 3,409 | | | | 190 | |
Yum China Holdings Inc | | | 1,913 | | | | 88 | |
Yum! Brands Inc | | | 3,237 | | | | 358 | |
| | | | | | | | |
| | | | | | | 47,683 | |
| | | | | | | | |
| | |
Consumer Staples — 6.8% | | | | | | | | |
Archer-Daniels-Midland Co | | | 4,997 | | | | 204 | |
Beyond Meat Inc * | | | 535 | | | | 86 | |
Bunge Ltd | | | 1,596 | | | | 89 | |
Campbell Soup Co | | | 10,354 | | | | 415 | |
Church & Dwight Co Inc | | | 3,000 | | | | 219 | |
Clorox Co/The | | | 3,366 | | | | 516 | |
Coca-Cola Co/The | | | 77,274 | | | | 3,935 | |
Colgate-Palmolive Co | | | 14,526 | | | | 1,041 | |
Conagra Brands Inc | | | 30,656 | | | | 813 | |
Costco Wholesale Corp | | | 6,316 | | | | 1,669 | |
Coty Inc, CI A | | | 7,317 | | | | 98 | |
Energizer Holdings Inc | | | 1,973 | | | | 76 | |
Estee Lauder Cos Inc/The, CI A | | | 2,390 | | | | 438 | |
Flowers Foods Inc | | | 9,872 | | | | 230 | |
General Mills Inc | | | 13,887 | | | | 729 | |
Hain Celestial Group Inc/The * | | | 3,752 | | | | 82 | |
Hershey Co/The | | | 2,295 | | | | 308 | |
Hormel Foods Corp | | | 4,797 | | | | 194 | |
Ingredion Inc | | | 4,380 | | | | 361 | |
JM Smucker Co/The | | | 10,889 | | | | 1,254 | |
Kellogg Co | | | 6,713 | | | | 360 | |
Keurig Dr Pepper Inc | | | 38,334 | | | | 1,108 | |
Kimberly-Clark Corp | | | 6,484 | | | | 864 | |
Kraft Heinz Co/The | | | 4,224 | | | | 131 | |
Kroger Co/The | | | 57,546 | | | | 1,249 | |
McCormick & Co Inc/MD | | | 2,916 | | | | 452 | |
Mondelez International Inc, CI A | | | 18,714 | | | | 1,009 | |
Monster Beverage Corp * | | | 2,979 | | | | 190 | |
PepsiCo Inc | | | 31,732 | | | | 4,161 | |
Pilgrim’s Pride Corp * | | | 3,030 | | | | 77 | |
Post Holdings lnc * | | | 793 | | | | 82 | |
Procter & Gamble Co/The | | | 37,857 | | | | 4,151 | |
Spectrum Brands Holdings Inc | | | 1,320 | | | | 71 | |
Sprouts Farmers Market lnc * | | | 9,458 | | | | 179 | |
Sysco Corp | | | 8,925 | | | | 631 | |
TreeHouse Foods lnc * | | | 1,471 | | | | 80 | |
| | | | |
New Covenant Funds / Annual Report / June 30, 2019 | | | 15 | |
SCHEDULE OF INVESTMENTS
June 30, 2019
New Covenant Growth Fund (Continued)
| | | | | | | | |
| | | |
| Description | | Shares | | Market Value
($ Thousands) | |
| | |
COMMON STOCK (continued) | | | | | | | | |
Tyson Foods Inc, CI A | | | 1,963 | | | $ | 158 | |
US Foods Holding Corp * | | | 2,211 | | | | 79 | |
Walgreens Boots Alliance Inc | | | 8,946 | | | | 489 | |
Walmart Inc | | | 20,825 | | | | 2,301 | |
| | | | | | | | |
| | | | | | | 30,579 | |
| | | | | | | | |
| | |
Energy — 5.1% | | | | | | | | |
Anadarko Petroleum Corp | | | 5,131 | | | | 362 | |
Apache Corp | | | 4,822 | | | | 140 | |
Apergy Corp * | | | 5,586 | | | | 187 | |
Baker Hughes a GE Co, CI A | | | 7,765 | | | | 191 | |
Cabot Oil & Gas Corp | | | 3,306 | | | | 76 | |
Cheniere Energy Inc * | | | 1,265 | | | | 87 | |
Chesapeake Energy Corp * | | | 32,883 | | | | 64 | |
Chevron Corp | | | 39,996 | | | | 4,977 | |
Concho Resources Inc | | | 1,204 | | | | 124 | |
ConocoPhillips | | | 28,755 | | | | 1,754 | |
Continental Resources Inc/OK | | | 2,048 | | | | 86 | |
Devon Energy Corp | | | 8,276 | | | | 236 | |
Diamondback Energy Inc | | | 796 | | | | 87 | |
EOG Resources Inc | | | 6,996 | | | | 652 | |
EQT Corp | | | 2,732 | | | | 43 | |
Equitrans Midstream Corp | | | 2,185 | | | | 43 | |
Exxon Mobil Corp | | | 65,031 | | | | 4,983 | |
Halliburton Co | | | 23,046 | | | | 524 | |
Helmerich & Payne Inc | | | 1,494 | | | | 76 | |
Hess Corp | | | 7,788 | | | | 495 | |
HollyFrontier Corp | | | 3,119 | | | | 144 | |
Kinder Morgan Inc/DE | | | 21,442 | | | | 448 | |
Kosmos Energy Ltd | | | 31,233 | | | | 196 | |
Marathon Oil Corp | | | 10,930 | | | | 155 | |
Marathon Petroleum Corp | | | 7,000 | | | | 391 | |
Murphy Oil Corp | | | 3,117 | | | | 77 | |
National Oilwell Varco Inc | | | 3,446 | | | | 77 | |
Noble Energy Inc | | | 6,179 | | | | 138 | |
Occidental Petroleum Corp | | | 33,170 | | | | 1,668 | |
ONEOK Inc | | | 3,505 | | | | 241 | |
PBF Energy Inc, CI A | | | 2,828 | | | | 89 | |
Phillips 66 | | | 4,879 | | | | 456 | |
Pioneer Natural Resources Co | | | 1,910 | | | | 294 | |
Range Resources Corp | | | 22,746 | | | | 159 | |
Schlumberger Ltd | | | 51,478 | | | | 2,046 | |
Targa Resources Corp | | | 5,515 | | | | 217 | |
Valero Energy Corp | | | 4,219 | | | | 361 | |
Williams Cos Inc/The | | | 13,098 | | | | 367 | |
| | | | | | | | |
| | | | | | | 22,711 | |
| | | | | | | | |
| | |
Financials — 12.6% | | | | | | | | |
Affiliated Managers Group Inc | | | 910 | | | | 84 | |
Aflac Inc | | | 8,664 | | | | 475 | |
Alleghany Corp * | | | 128 | | | | 87 | |
Allstate Corp/The | | | 3,458 | | | | 352 | |
American Express Co | | | 9,360 | | | | 1,155 | |
| | | | | | | | |
| | | |
| Description | | Shares | | Market Value
($ Thousands) | |
| | |
COMMON STOCK (continued) | | | | | | | | |
American International Group Inc | | | 10,083 | | | $ | 537 | |
Ameriprise Financial Inc | | | 1,604 | | | | 233 | |
Annaly Capital Management Inc ‡ | | | 8,922 | | | | 81 | |
Arch Capital Group Ltd * | | | 2,404 | | | | 89 | |
Arthur J Gallagher & Co | | | 1,029 | | | | 90 | |
Assurant Inc | | | 883 | | | | 94 | |
AXA Equitable Holdings Inc | | | 37,558 | | | | 785 | |
Bank of America Corp | | | 166,804 | | | | 4,837 | |
Bank of Hawaii Corp | | | 1,051 | | | | 87 | |
Bank of New York Mellon Corp/The | | | 12,656 | | | | 559 | |
Bank OZK | | | 2,609 | | | | 78 | |
BankUnited Inc | | | 2,418 | | | | 82 | |
BB&T Corp | | | 8,015 | | | | 394 | |
Berkshire Hathaway Inc, CI B * | | | 30,259 | | | | 6,451 | |
BlackRock Inc, CI A | | | 1,478 | | | | 694 | |
Brighthouse Financial lnc * | | | 2,182 | | | | 80 | |
Brown & Brown Inc | | | 2,667 | | | | 89 | |
Capital One Financial Corp | | | 5,083 | | | | 461 | |
Cboe Global Markets Inc | | | 830 | | | | 86 | |
Charles Schwab Corp/The | | | 14,548 | | | | 585 | |
Chubb Ltd | | | 5,856 | | | | 863 | |
Cincinnati Financial Corp | | | 891 | | | | 92 | |
Citigroup Inc | | | 55,008 | | | | 3,852 | |
Citizens Financial Group Inc | | | 2,381 | | | | 84 | |
CME Group Inc, CI A | | | 4,747 | | | | 921 | |
CNA Financial Corp | | | 1,871 | | | | 88 | |
Comerica Inc | | | 2,799 | | | | 203 | |
Commerce Bancshares Inc/MO | | | 1,418 | | | | 85 | |
Credit Acceptance Corp * | | | 177 | | | | 86 | |
Cullen/Frost Bankers Inc | | | 850 | | | | 80 | |
Discover Financial Services | | | 3,009 | | | | 233 | |
E*TRADE Financial Corp | | | 1,729 | | | | 77 | |
East West Bancorp Inc | | | 1,710 | | | | 80 | |
Erie Indemnity Co, CI A | | | 433 | | | | 110 | |
FactSet Research Systems Inc | | | 306 | | | | 88 | |
Fifth Third Bancorp | | | 4,599 | | | | 128 | |
First Hawaiian Inc | | | 3,126 | | | | 81 | |
First Republic Bank/CA | | | 831 | | | | 81 | |
Franklin Resources Inc | | | 6,856 | | | | 239 | |
Goldman Sachs Group Inc/The | | | 5,574 | | | | 1,140 | |
Hanover Insurance Group Inc/The | | | 694 | | | | 89 | |
Hartford Financial Services Group Inc/The | | | 4,042 | | | | 225 | |
Huntington Bancshares Inc/OH | | | 6,282 | | | | 87 | |
Intercontinental Exchange Inc | | | 6,350 | | | | 546 | |
Invesco Ltd | | | 50,690 | | | | 1,037 | |
JPMorgan Chase & Co | | | 59,458 | | | | 6,647 | |
KeyCorp | | | 12,904 | | | | 229 | |
Lazard Ltd, CI A (A) | | | 2,316 | | | | 80 | |
Lincoln National Corp | | | 3,621 | | | | 234 | |
Loews Corp | | | 1,670 | | | | 91 | |
LPL Financial Holdings Inc | | | 1,036 | | | | 84 | |
M&T Bank Corp | | | 929 | | | | 158 | |
| | |
| 16 | | New Covenant Funds / Annual Report / June 30, 2019 |
| | | | | | | | |
| | | |
| Description | | Shares | | Market Value
($ Thousands) | |
| | |
COMMON STOCK (continued) | | | | | | | | |
Markel Corp * | | | 81 | | | $ | 88 | |
MarketAxess Holdings Inc | | | 305 | | | | 98 | |
Marsh & McLennan Cos Inc | | | 20,171 | | | | 2,012 | |
Mercury General Corp | | | 1,523 | | | | 95 | |
MetLife Inc | | | 8,552 | | | | 425 | |
Moody’s Corp | | | 1,782 | | | | 348 | |
Morgan Stanley | | | 35,755 | | | | 1,566 | |
Morningstar Inc | | | 1,607 | | | | 232 | |
MSCl lnc, CI A | | | 1,669 | | | | 399 | |
Nasdaq Inc | | | 2,378 | | | | 229 | |
New York Community Bancorp Inc | | | 7,595 | | | | 76 | |
Northern Trust Corp | | | 8,350 | | | | 751 | |
OneMain Holdings Inc, CI A | | | 2,529 | | | | 86 | |
People’s United Financial Inc | | | 5,001 | | | | 84 | |
Pinnacle Financial Partners Inc | | | 1,489 | | | | 86 | |
PNC Financial Services Group Inc/The | | | 5,690 | | | | 781 | |
Principal Financial Group Inc | | | 7,045 | | | | 408 | |
Progressive Corp/The | | | 6,981 | | | | 558 | |
Prosperity Bancshares Inc | | | 1,192 | | | | 79 | |
Prudential Financial Inc | | | 16,015 | | | | 1,618 | |
Raymond James Financial Inc | | | 980 | | | | 83 | |
Regions Financial Corp | | | 5,703 | | | | 85 | |
Reinsurance Group of America Inc, CI A | | | 578 | | | | 90 | |
S&P Global Inc | | | 8,103 | | | | 1,846 | |
Santander Consumer USA Holdings Inc | | | 4,038 | | | | 97 | |
Signature Bank/New York NY | | | 676 | | | | 82 | |
SLM Corp | | | 8,316 | | | | 81 | |
State Street Corp | | | 23,884 | | | | 1,339 | |
SunTrust Banks Inc | | | 4,136 | | | | 260 | |
SVB Financial Group * | | | 346 | | | | 78 | |
Synchrony Financial | | | 6,500 | | | | 225 | |
T Rowe Price Group Inc | | | 2,711 | | | | 297 | |
TD Ameritrade Holding Corp | | | 1,608 | | | | 80 | |
TFS Financial Corp | | | 4,940 | | | | 89 | |
Torchmark Corp | | | 972 | | | | 87 | |
Travelers Cos Inc/The | | | 2,743 | | | | 410 | |
Two Harbors Investment Corp | | | 6,390 | | | | 81 | |
US Bancorp | | | 20,106 | | | | 1,054 | |
Voya Financial Inc | | | 4,001 | | | | 221 | |
Wells Fargo & Co | | | 61,564 | | | | 2,913 | |
Western Alliance Bancorp * | | | 1,801 | | | | 80 | |
Willis Towers Watson PLC | | | 1,386 | | | | 266 | |
WR Berkley Corp | | | 1,397 | | | | 92 | |
Zions Bancorp NA | | | 1,771 | | | | 81 | |
| | | | | | | | |
| | |
| | | | | | | 56,699 | |
| | | | | | | | |
| | |
Health Care — 13.6% | | | | | | | | |
Abbott Laboratories | | | 42,548 | | | | 3,578 | |
AbbVie Inc | | | 21,492 | | | | 1,563 | |
ABIOMED Inc * | | | 332 | | | | 87 | |
Agilent Technologies Inc | | | 7,874 | | | | 588 | |
Alexion Pharmaceuticals lnc * | | | 2,032 | | | | 266 | |
Align Technology Inc * | | | 602 | | | | 165 | |
| | | | | | | | |
| | | |
| Description | | Shares | | Market Value
($ Thousands) | |
| | |
COMMON STOCK (continued) | | | | | | | | |
Allergan PLC | | | 4,194 | | | $ | 702 | |
Alnylam Pharmaceuticals lnc * | | | 1,202 | | | | 87 | |
AmerisourceBergen Corp, CI A | | | 1,108 | | | | 94 | |
Amgen Inc | | | 16,833 | | | | 3,102 | |
Anthem Inc | | | 3,366 | | | | 950 | |
Baxter International Inc | | | 12,373 | | | | 1,013 | |
Becton Dickinson and Co | | | 4,437 | | | | 1,118 | |
Biogen lnc * | | | 3,113 | | | | 728 | |
BioMarin Pharmaceutical lnc * | | | 1,042 | | | | 89 | |
Bio-Rad Laboratories Inc, CI A * | | | 813 | | | | 254 | |
Bio-Techne Corp | | | 426 | | | | 89 | |
Bluebird Bio lnc * | | | 645 | | | | 82 | |
Boston Scientific Corp * | | | 40,840 | | | | 1,755 | |
Bristol-Myers Squibb Co | | | 29,745 | | | | 1,349 | |
Bruker Corp | | | 1,999 | | | | 100 | |
Cantel Medical Corp | | | 1,233 | | | | 100 | |
Cardinal Health Inc | | | 4,140 | | | | 195 | |
Celgene Corp * | | | 8,987 | | | | 831 | |
Centene Corp * | | | 3,110 | | | | 163 | |
Cerner Corp | | | 2,541 | | | | 186 | |
Charles River Laboratories International lnc * | | | 629 | | | | 89 | |
Cigna Corp | | | 5,007 | | | | 789 | |
Cooper Cos Inc/The | | | 295 | | | | 100 | |
Covetrus lnc * | | | 1,045 | | | | 25 | |
CVS Health Corp | | | 41,565 | | | | 2,265 | |
Danaher Corp | | | 10,230 | | | | 1,462 | |
DaVita lnc * | | | 1,647 | | | | 93 | |
DENTSPLY SIRONA Inc | | | 3,113 | | | | 182 | |
DexCom lnc * | | | 723 | | | | 108 | |
Edwards Lifesciences Corp * | | | 2,828 | | | | 523 | |
Elanco Animal Health lnc * | | | 6,958 | | | | 235 | |
Eli Lilly & Co | | | 12,283 | | | | 1,361 | |
Encompass Health Corp | | | 1,377 | | | | 87 | |
Exact Sciences Corp * | | | 930 | | | | 110 | |
Exelixis Inc * | | | 4,344 | | | | 93 | |
Gilead Sciences Inc | | | 18,126 | | | | 1,224 | |
HCA Healthcare Inc | | | 2,683 | | | | 363 | |
Henry Schein lnc * | | | 2,612 | | | | 183 | |
Hill-Rom Holdings Inc | | | 2,029 | | | | 212 | |
Hologic lnc * | | | 1,882 | | | | 90 | |
Humana Inc | | | 2,054 | | | | 545 | |
ICU Medical lnc * | | | 374 | | | | 94 | |
IDEXX Laboratories lnc * | | | 690 | | | | 190 | |
IlIumina lnc * | | | 3,352 | | | | 1,234 | |
Incyte Corp * | | | 1,063 | | | | 90 | |
Insulet Corp * | | | 831 | | | | 99 | |
Integra LifeSciences Holdings Corp * | | | 1,632 | | | | 91 | |
Intuitive Surgical Inc * | | | 1,480 | | | | 776 | |
IQVIA Holdings Inc * | | | 1,493 | | | | 240 | |
Johnson & Johnson | | | 51,318 | | | | 7,147 | |
Laboratory Corp of America Holdings * | | | 515 | | | | 89 | |
McKesson Corp | | | 1,711 | | | | 230 | |
| | | | |
New Covenant Funds / Annual Report / June 30, 2019 | | | 17 | |
SCHEDULE OF INVESTMENTS
June 30, 2019
New Covenant Growth Fund (Continued)
| | | | | | | | |
| | | |
| Description | | Shares | | Market Value
($Thousands) | |
| | |
COMMON STOCK (continued) | | | | | | | | |
MEDNAX Inc * | | | 2,907 | | | $ | 73 | |
Merck & Co Inc | | | 56,489 | | | | 4,737 | |
Mettler-Toledo International Inc * | | | 562 | | | | 472 | |
Moderna Inc * | | | 8,718 | | | | 128 | |
Mylan NV * | | | 3,872 | | | | 74 | |
Neurocrine Biosciences lnc * | | | 1,089 | | | | 92 | |
Penumbra lnc * | | | 654 | | | | 105 | |
PerkinElmer Inc | | | 928 | | | | 90 | |
Pfizer Inc | | | 86,529 | | | | 3,748 | |
PRA Health Sciences lnc * | | | 931 | | | | 92 | |
Premier Inc, CI A * | | | 2,266 | | | | 89 | |
QIAGEN NV * | | | 2,338 | | | | 95 | |
Quest Diagnostics Inc | | | 865 | | | | 88 | |
Regeneron Pharmaceuticals lnc * | | | 1,105 | | | | 346 | |
ResMed Inc | | | 2,930 | | | | 358 | |
Sage Therapeutics Inc * | | | 516 | | | | 94 | |
Sarepta Therapeutics lnc * | | | 703 | | | | 107 | |
STERIS PLC | | | 1,661 | | | | 247 | |
Stryker Corp | | | 4,567 | | | | 939 | |
Teleflex Inc | | | 742 | | | | 246 | |
Thermo Fisher Scientific Inc | | | 5,791 | | | | 1,701 | |
UnitedHealth Group Inc | | | 20,119 | | | | 4,909 | |
Universal Health Services Inc, CI B | | | 698 | | | | 91 | |
Varian Medical Systems Inc * | | | 1,773 | | | | 241 | |
Veeva Systems Inc, CI A * | | | 904 | | | | 147 | |
Vertex Pharmaceuticals lnc * | | | 3,090 | | | | 567 | |
Waters Corp * | | | 395 | | | | 85 | |
WellCare Health Plans lnc * | | | 313 | | | | 89 | |
West Pharmaceutical Services Inc | | | 1,875 | | | | 235 | |
Zimmer Biomet Holdings Inc | | | 4,581 | | | | 539 | |
Zoetis Inc, CI A | | | 6,097 | | | | 692 | |
| | | | | | | | |
| | |
| | | | | | | 61,169 | |
| | | | | | | | |
| | |
Industrials — 8.3% | | | | | | | | |
3M Co | | | 13,677 | | | | 2,371 | |
Acuity Brands Inc | | | 598 | | | | 82 | |
AECOM * | | | 6,633 | | | | 251 | |
AGCO Corp | | | 1,171 | | | | 91 | |
Alaska Air Group Inc | | | 3,175 | | | | 203 | |
Allegion PLC | | | 855 | | | | 94 | |
Allison Transmission Holdings Inc | | | 1,870 | | | | 87 | |
American Airlines Group Inc | | | 26,880 | | | | 876 | |
AMETEK Inc | | | 1,712 | | | | 156 | |
AO Smith Corp | | | 1,708 | | | | 80 | |
Arconic Inc | | | 7,379 | | | | 191 | |
Armstrong World Industries Inc | | | 979 | | | | 95 | |
BWX Technologies Inc | | | 6,269 | | | | 327 | |
CH Robinson Worldwide Inc | | | 1,051 | | | | 89 | |
Cintas Corp | | | 4,567 | | | | 1,084 | |
Clean Harbors Inc * | | | 1,228 | | | | 87 | |
Copart lnc * | | | 1,284 | | | | 96 | |
CoStar Group Inc * | | | 266 | | | | 147 | |
Crane Co | | | 999 | | | | 83 | |
| | | | | | | | |
| | | |
| Description | | Shares | | Market Value
($ Thousands) | |
| | |
COMMON STOCK (continued) | | | | | | | | |
CSX Corp | | | 9,694 | | | $ | 750 | |
Cummins Inc | | | 3,179 | | | | 545 | |
Curtiss-Wright Corp | | | 1,789 | | | | 227 | |
Deere & Co | | | 4,735 | | | | 785 | |
Delta Air Lines Inc | | | 28,033 | | | | 1,591 | |
Donaldson Co Inc | | | 1,646 | | | | 84 | |
Dover Corp | | | 2,207 | | | | 221 | |
Eaton Corp PLC | | | 13,217 | | | | 1,101 | |
Emerson Electric Co | | | 6,592 | | | | 440 | |
Equifax Inc | | | 719 | | | | 97 | |
Expeditors International of Washington Inc | | | 1,163 | | | | 88 | |
Fastenal Co | | | 6,120 | | | | 199 | |
FedEx Corp | | | 3,607 | | | | 592 | |
Flowserve Corp | | | 1,726 | | | | 91 | |
Fluor Corp | | | 4,373 | | | | 147 | |
Fortune Brands Home & Security Inc | | | 1,585 | | | | 91 | |
Gardner Denver Holdings lnc * | | | 2,502 | | | | 87 | |
Gates Industrial Corp PLC * | | | 6,472 | | | | 74 | |
General Electric Co | | | 121,638 | | | | 1,277 | |
Graco Inc | | | 1,670 | | | | 84 | |
GrafTech International Ltd | | | 7,088 | | | | 82 | |
HD Supply Holdings Inc * | | | 1,986 | | | | 80 | |
HEICO Corp | | | 4,884 | | | | 654 | |
HEICO Corp, CI A | | | 1,813 | | | | 187 | |
Hexcel Corp | | | 4,105 | | | | 332 | |
Honeywell International Inc | | | 10,659 | | | | 1,861 | |
Hubbell, Inc CI B | | | 682 | | | | 89 | |
IDEX Corp | | | 555 | | | | 95 | |
IHS Markit Ltd * | | | 3,910 | | | | 249 | |
Illinois Tool Works Inc | | | 12,876 | | | | 1,942 | |
ITT Inc | | | 1,404 | | | | 92 | |
Jacobs Engineering Group Inc | | | 1,091 | | | | 92 | |
JetBlue Airways Corp * | | | 4,688 | | | | 87 | |
Johnson Controls International plc | | | 19,263 | | | | 796 | |
Kansas City Southern | | | 1,741 | | | | 212 | |
Kirby Corp * | | | 1,032 | | | | 81 | |
Landstar System Inc | | | 2,284 | | | | 247 | |
Lennox International Inc | | | 310 | | | | 85 | |
Lincoln Electric Holdings Inc | | | 1,027 | | | | 84 | |
Lyft Inc, CI A * | | | 1,333 | | | | 88 | |
Macquarie Infrastructure Corp | | | 2,041 | | | | 83 | |
ManpowerGroup Inc | | | 3,586 | | | | 347 | |
Masco Corp | | | 6,315 | | | | 248 | |
Middleby Corp/The * | | | 632 | | | | 86 | |
MSC Industrial Direct Co Inc, CI A | | | 1,115 | | | | 83 | |
Nielsen Holdings PLC | | | 10,117 | | | | 229 | |
Nordson Corp | | | 600 | | | | 85 | |
Norfolk Southern Corp | | | 3,218 | | | | 641 | |
nVent Electric PLC | | | 3,298 | | | | 82 | |
Oshkosh Corp | | | 2,762 | | | | 231 | |
Owens Corning | | | 4,958 | | | | 289 | |
PACCAR Inc | | | 3,029 | | | | 217 | |
| | |
| 18 | | New Covenant Funds / Annual Report / June 30, 2019 |
| | | | | | | | |
| | | |
| Description | | Shares | | Market Value
($ Thousands) |
| | |
COMMON STOCK (continued) | | | | | | | | |
Parker-Hannifin Corp | | | 1,231 | | | $ | 209 | |
Pentair PLC | | | 4,928 | | | | 183 | |
Quanta Services Inc | | | 2,291 | | | | 88 | |
Regal Beloit Corp | | | 1,068 | | | | 87 | |
Republic Services Inc, CI A | | | 2,647 | | | | 229 | |
Resideo Technologies lnc * | | | 448 | | | | 10 | |
Rockwell Automation Inc | | | 1,620 | | | | 265 | |
Rollins Inc | | | 2,355 | | | | 85 | |
Roper Technologies Inc | | | 1,151 | | | | 421 | |
Ryder System Inc | | | 1,425 | | | | 83 | |
Schneider National Inc, CI B | | | 4,347 | | | | 79 | |
Sensate Technologies Holding PLC * | | | 4,273 | | | | 209 | |
Southwest Airlines Co | | | 4,524 | | | | 230 | |
Spirit AeroSystems Holdings Inc, CI A | | | 8,213 | | | | 668 | |
Stanley Black & Decker Inc | | | 1,349 | | | | 195 | |
Stericycle lnc * | | | 1,710 | | | | 82 | |
Teledyne Technologies Inc * | | | 878 | | | | 240 | |
Timken Co/The | | | 1,715 | | | | 88 | |
Toro Co/The | | | 1,175 | | | | 79 | |
TransDigm Group lnc * | | | 1,732 | | | | 838 | |
TransUnion | | | 3,412 | | | | 251 | |
Trinity Industries Inc | | | 3,977 | | | | 82 | |
Union Pacific Corp | | | 12,488 | | | | 2,112 | |
United Airlines Holdings Inc * | | | 2,850 | | | | 249 | |
United Parcel Service Inc, CI B | | | 9,414 | | | | 972 | |
United Rentals lnc * | | | 1,692 | | | | 224 | |
Univar lnc * | | | 10,632 | | | | 234 | |
Valmont Industries Inc | | | 689 | | | | 87 | |
Verisk Analytics Inc, CI A | | | 1,729 | | | | 253 | |
WABCO Holdings Inc * | | | 649 | | | | 86 | |
Wabtec Corp | | | 465 | | | | 33 | |
Waste Management Inc | | | 6,467 | | | | 746 | |
Watsco Inc | | | 537 | | | | 88 | |
WESCO International lnc * | | | 3,527 | | | | 179 | |
Woodward Inc | | | 769 | | | | 87 | |
WW Grainger Inc | | | 5,055 | | | | 1,356 | |
XPO Logistics lnc * | | | 1,396 | | | | 81 | |
Xylem Inc/NY | | | 8,168 | | | | 683 | |
| | | | | | | | |
| | |
| | | | | | | 37,288 | |
| | | | | | | | |
| | |
Information Technology — 20.9% | | | | | | | | |
2U lnc * | | | 2,061 | | | | 78 | |
Adobe lnc * | | | 12,031 | | | | 3,545 | |
Advanced Micro Devices lnc * | | | 9,113 | | | | 277 | |
Akamai Technologies lnc * | | | 3,119 | | | | 250 | |
Alliance Data Systems Corp | | | 1,335 | | | | 187 | |
Alteryx Inc, CIA * | | | 810 | | | | 88 | |
Amdocs Ltd | | | 3,632 | | | | 226 | |
Amphenol Corp, CI A | | | 2,838 | | | | 272 | |
Analog Devices Inc | | | 4,564 | | | | 515 | |
Anaplan Inc * | | | 1,752 | | | | 88 | |
AHSYS Inc * | | | 448 | | | | 92 | |
Apple Inc | | | 74,954 | | | | 14,835 | |
| | | | | | | | |
| | | |
| Description | | Shares | | Market Value
($ Thousands) |
| | |
COMMON STOCK (continued) | | | | | | | | |
Applied Materials Inc | | | 10,761 | | | $ | 483 | |
Arista Networks lnc * | | | 768 | | | | 199 | |
Arrow Electronics lnc * | | | 2,550 | | | | 182 | |
Atlassian Corp PLC, CI A* | | | 665 | | | | 87 | |
Autodesk lnc * | | | 3,559 | | | | 580 | |
Automatic Data Processing Inc | | | 14,168 | | | | 2,342 | |
Avnet Inc | | | 1,892 | | | | 86 | |
Black Knight lnc * | | | 1,569 | | | | 94 | |
Booz Allen Hamilton Holding Corp, CI A | | | 1,402 | | | | 93 | |
Broadcom Inc | | | 6,023 | | | | 1,734 | |
Broadridge Financial Solutions Inc | | | 720 | | | | 92 | |
Cadence Design Systems lnc * | | | 1,372 | | | | 97 | |
CDK Global Inc | | | 1,636 | | | | 81 | |
CDW Corp/DE | | | 806 | | | | 89 | |
Cisco Systems Inc | | | 68,588 | | | | 3,754 | |
Citrix Systems Inc | | | 1,980 | | | | 194 | |
Cognex Corp | | | 1,834 | | | | 88 | |
Cognizant Technology Solutions Corp, CI A | | | 8,315 | | | | 527 | |
Coherent lnc * | | | 626 | | | | 85 | |
CommScope Holding Co lnc * | | | 7,086 | | | | 112 | |
CoreLogic Inc/United States * | | | 2,160 | | | | 90 | |
Corning Inc | | | 6,104 | | | | 203 | |
Coupa Software lnc * | | | 688 | | | | 87 | |
Cree lnc * | | | 1,483 | | | | 83 | |
Cypress Semiconductor Corp | | | 13,021 | | | | 290 | |
Dell Technologies Inc, CI C * | | | 4,108 | | | | 209 | |
DocuSign Inc, CI A * | | | 1,618 | | | | 80 | |
DXC Technology Co | | | 5,395 | | | | 298 | |
Elastic NV * | | | 2,388 | | | | 178 | |
EPAM Systems lnc * | | | 1,434 | | | | 248 | |
Euronet Worldwide Inc * | | | 567 | | | | 95 | |
F5 Networks lnc * | | | 578 | | | | 84 | |
Fair Isaac Corp * | | | 299 | | | | 94 | |
Fidelity National Information Services Inc | | | 3,381 | | | | 415 | |
FireEye Inc * | | | 5,502 | | | | 82 | |
First Data Corp, CI A * | | | 6,781 | | | | 184 | |
First Solar Inc * | | | 3,538 | | | | 232 | |
Fiserv Inc * | | | 4,409 | | | | 402 | |
FleetCor Technologies Inc * | | | 729 | | | | 205 | |
FLIR Systems Inc | | | 1,671 | | | | 90 | |
Fortinet lnc * | | | 1,036 | | | | 80 | |
Genpact Ltd | | | 6,870 | | | | 262 | |
Global Payments Inc | | | 1,393 | | | | 223 | |
GoDaddy Inc, CI A * | | | 1,102 | | | | 77 | |
Guidewire Software Inc * | | | 824 | | | | 84 | |
IAC/lnterActiveCorp * | | | 376 | | | | 82 | |
Intel Corp | | | 67,438 | | | | 3,228 | |
International Business Machines Corp | | | 13,123 | | | | 1,810 | |
Intuit Inc | | | 3,714 | | | | 971 | |
IPG Photonics Corp * | | | 558 | | | | 86 | |
Jabil lnc | | | 6,948 | | | | 220 | |
Jack Henry & Associates Inc | | | 636 | | | | 85 | |
| | | | |
New Covenant Funds / Annual Report / June 30, 2019 | | | 19 | |
SCHEDULE OF INVESTMENTS
June 30, 2019
New Covenant Growth Fund (Continued)
| | | | | | | | |
| | | |
| Description | | Shares | | Market Value
($ Thousands) | |
COMMON STOCK (continued) | | | | | | | | |
Juniper Networks Inc | | | 7,826 | | | $ | 208 | |
Keysight Technologies Inc * | | | 3,329 | | | | 299 | |
KLA-Tencor Corp | | | 1,904 | | | | 225 | |
Lam Research Corp | | | 5,705 | | | | 1,072 | |
Littelfuse Inc | | | 487 | | | | 86 | |
LogMeln Inc | | | 1,076 | | | | 79 | |
Manhattan Associates Inc * | | | 1,278 | | | | 89 | |
Marvell Technology Group Ltd | | | 10,344 | | | | 247 | |
Mastercard Inc, CI A | | | 13,682 | | | | 3,619 | |
Maxim Integrated Products Inc | | | 3,740 | | | | 224 | |
Microchip Technology Inc | | | 16,703 | | | | 1,448 | |
Micron Technology Inc * | | | 29,536 | | | | 1,140 | |
Microsoft Corp | | | 119,663 | | | | 16,030 | |
MKS Instruments Inc | | | 1,029 | | | | 80 | |
MongoDB Inc, CI A * | | | 574 | | | | 87 | |
Monolithic Power Systems Inc | | | 630 | | | | 85 | |
National Instruments Corp | | | 4,960 | | | | 208 | |
NCR Corp * | | | 2,759 | | | | 86 | |
NetApp Inc | | | 2,936 | | | | 181 | |
Nutanix Inc, CI A * | | | 2,317 | | | | 60 | |
NVIDIA Corp | | | 9,892 | | | | 1,625 | |
Okta Inc, CI A * | | | 812 | | | | 100 | |
ON Semiconductor Corp * | | | 9,649 | | | | 195 | |
Oracle Corp | | | 34,708 | | | | 1,977 | |
Pagerduty Inc * | | | 1,821 | | | | 86 | |
Palo Alto Networks Inc * | | | 541 | | | | 110 | |
Paychex Inc | | | 2,612 | | | | 215 | |
PayPal Holdings Inc * | | | 18,658 | | | | 2,136 | |
Pegasystems Inc | | | 1,214 | | | | 86 | |
Pluralsight Inc, CI A * | | | 2,621 | | | | 80 | |
Proofpoint Inc * | | | 706 | | | | 85 | |
Pure Storage Inc, CI A * | | | 3,883 | | | | 59 | |
Qorvo Inc * | | | 2,803 | | | | 187 | |
QUALCOMM Inc | | | 31,230 | | | | 2,376 | |
RealPage Inc * | | | 1,444 | | | | 85 | |
Red Hat Inc * | | | 1,935 | | | | 363 | |
RingCentral lnc, CI A * | | | 699 | | | | 80 | |
Sabre Corp | | | 4,174 | | | | 93 | |
salesforce.com * | | | 18,882 | | | | 2,865 | |
ServiceNow Inc * | | | 2,242 | | | | 616 | |
Skyworks Solutions Inc | | | 2,779 | | | | 215 | |
Smartsheet Inc, CI A * | | | 1,824 | | | | 88 | |
SolarWinds Corp * | | | 11,567 | | | | 212 | |
Splunk Inc * | | | 733 | | | | 92 | |
Square Inc, CI A * | | | 2,891 | | | | 210 | |
Switch Inc, CI A | | | 7,588 | | | | 99 | |
Symantec Corp | | | 13,065 | | | | 284 | |
Synopsys Inc * | | | 716 | | | | 92 | |
Teradata Corp * | | | 4,437 | | | | 159 | |
Teradyne Inc | | | 4,784 | | | | 229 | |
Texas Instruments Inc | | | 13,483 | | | | 1,547 | |
Total System Services Inc | | | 2,202 | | | | 283 | |
| | | | | | | | |
| | | |
| Description | | Shares | | Market Value
($ Thousands) | |
COMMON STOCK (continued) | | | | | | | | |
Trade Desk Inc/The, CI A * | | | 376 | | | $ | 86 | |
Trimble Inc * | | | 2,035 | | | | 92 | |
Twilio Inc, CI A * | | | 639 | | | | 87 | |
Tyler Technologies Inc * | | | 393 | | | | 85 | |
Universal Display Corp | | | 521 | | | | 98 | |
VeriSign Inc * | | | 780 | | | | 163 | |
Versum Materials Inc | | | 4,128 | | | | 213 | |
Visa Inc, CI A | | | 35,410 | | | | 6,145 | |
VMware Inc, CI A * | | | 1,343 | | | | 225 | |
Western Digital Corp | | | 2,423 | | | | 115 | |
Western Union Co/The | | | 4,423 | | | | 88 | |
WEX Inc * | | | 415 | | | | 86 | |
Workday Inc, CI A * | | | 2,079 | | | | 427 | |
Worldpay Inc, CI A * | | | 3,442 | | | | 422 | |
Xerox Corp | | | 7,073 | | | | 250 | |
Xilinx Inc | | | 2,240 | | | | 264 | |
Zebra Technologies Corp, CI A * | | | 438 | | | | 92 | |
Zendesk Inc * | | | 968 | | | | 86 | |
Zscaler Inc * | | | 1,122 | | | | 86 | |
| | | | | | | | |
| | |
| | | | | | | 93,901 | |
| | | | | | | | |
| | |
Materials — 3.4% | | | | | | | | |
Air Products & Chemicals Inc | | | 4,688 | | | | 1,061 | |
Albemarle Corp | | | 1,720 | | | | 121 | |
Alcoa Corp * | | | 5,657 | | | | 132 | |
AptarGroup Inc | | | 1,944 | | | | 242 | |
Ashland Global Holdings Inc | | | 1,131 | | | | 90 | |
Avery Dennison Corp | | | 2,082 | | | | 241 | |
Axalta Coating Systems Ltd * | | | 7,963 | | | | 237 | |
Ball Corp | | | 14,154 | | | | 991 | |
Berry Global Group Inc * | | | 4,123 | | | | 217 | |
Cabot Corp | | | 5,731 | | | | 273 | |
Celanese Corp, CI A | | | 1,119 | | | | 121 | |
Corteva Inc | | | 9,937 | | | | 294 | |
Crown Holdings Inc * | | | 15,718 | | | | 960 | |
Domtar Corp | | | 4,337 | | | | 193 | |
Dow Inc | | | 7,697 | | | | 380 | |
DuPont de Nemours Inc | | | 9,937 | | | | 746 | |
Eagle Materials Inc | | | 964 | | | | 90 | |
Eastman Chemical Co | | | 11,106 | | | | 864 | |
Ecolab Inc | | | 3,153 | | | | 623 | |
Element Solutions Inc * | | | 7,705 | | | | 80 | |
FMC Corp | | | 2,400 | | | | 199 | |
Freeport-McMoRan Inc | | | 55,083 | | | | 640 | |
Graphic Packaging Holding Co | | | 6,282 | | | | 88 | |
Huntsman Corp | | | 4,321 | | | | 88 | |
International Flavors & Fragrances Inc | | | 2,307 | | | | 335 | |
International Paper Co | | | 4,549 | | | | 197 | |
Linde PLC | | | 7,642 | | | | 1,535 | |
LyondellBasell lndustries NV, CI A | | | 2,182 | | | | 188 | |
Martin Marietta Materials Inc | | | 397 | | | | 91 | |
Mosaic Co/The | | | 3,590 | | | | 90 | |
Newmont Goldcorp Corp | | | 32,004 | | | | 1,231 | |
| | |
| 20 | | New Covenant Funds / Annual Report / June 30, 2019 |
| | | | | | | | |
| | | |
| Description | | Shares | | Market Value
($ Thousands) |
COMMON STOCK (continued) | | | | | | | | |
Nucor Corp | | | 1,510 | | | $ | 83 | |
Packaging Corp of America | | | 876 | | | | 83 | |
PPG Industries Inc | | | 2,274 | | | | 265 | |
Sealed Air Corp | | | 1,978 | | | | 85 | |
Sherwin-Williams Co/The | | | 2,451 | | | | 1,123 | |
Sunoco Products Co | | | 3,525 | | | | 230 | |
Southern Copper Corp | | | 2,407 | | | | 94 | |
Steel Dynamics Inc | | | 2,648 | | | | 80 | |
Valvoline Inc | | | 11,216 | | | | 219 | |
Vulcan Materials Co | | | 665 | | | | 91 | |
Westrock Co | | | 6,045 | | | | 220 | |
| | | | | | | | |
| | |
| | | | | | | 15,211 | |
| | | | | | | | |
| | |
Real Estate — 3.2% | | | | | | | | |
Alexandria Real Estate Equities Inc ‡ | | | 1,497 | | | | 211 | |
American Campus Communities Inc ‡ | | | 1,870 | | | | 86 | |
American Tower Corp, CI A ‡ | | | 6,167 | | | | 1,261 | |
Apartment Investment & Management Co, CI A ‡ | | | 1,721 | | | | 86 | |
Apple Hospitality REIT Inc ‡ | | | 5,196 | | | | 82 | |
AvalonBay Communities Inc ‡ | | | 3,261 | | | | 663 | |
Boston Properties Inc ‡ | | | 1,468 | | | | 189 | |
Brandywine Realty Trust ‡ | | | 14,492 | | | | 208 | |
Brixmor Property Group Inc ‡ | | | 4,703 | | | | 84 | |
Brookfield Property REIT Inc, CI A ‡ | | | 11,155 | | | | 211 | |
Camden Property Trust ‡ | | | 850 | | | | 89 | |
CBRE Group Inc, CI A * | | | 4,438 | | | | 228 | |
Colony Capital Inc ‡ | | | 41,643 | | | | 208 | |
Columbia Property Trust Inc ‡ | | | 3,886 | | | | 81 | |
Corporate Office Properties Trust ‡ | | | 7,752 | | | | 204 | |
Crown Castle International Corp ‡ | | | 5,303 | | | | 691 | |
CubeSmart ‡ | | | 2,615 | | | | 87 | |
CyrusOne Inc ‡ | | | 1,416 | | | | 82 | |
Digital Realty Trust Inc ‡ | | | 1,874 | | | | 221 | |
Douglas Emmett Inc ‡ | | | 5,367 | | | | 214 | |
Duke Realty Corp ‡ | | | 2,798 | | | | 88 | |
Empire State Realty Trust Inc, CI A ‡ | | | 5,592 | | | | 83 | |
Equinix Inc ‡ | | | 963 | | | | 486 | |
Equity Commonwealth *‡ | | | 2,677 | | | | 87 | |
Equity LifeStyle Properties Inc ‡ | | | 734 | | | | 89 | |
Equity Residential ‡ | | | 3,485 | | | | 265 | |
Essex Property Trust Inc ‡ | | | 303 | | | | 88 | |
Extra Space Storage Inc ‡ | | | 811 | | | | 86 | |
Federal Realty Investment Trust ‡ | | | 664 | | | | 86 | |
Gaming and Leisure Properties Inc ‡ | | | 2,146 | | | | 84 | |
HCP Inc ‡ | | | 6,436 | | | | 206 | |
Healthcare Trust of America Inc, CI A ‡ | | | 3,127 | | | | 86 | |
Highwoods Properties Inc ‡ | | | 1,945 | | | | 80 | |
Hospitality Properties Trust ‡ | | | 3,299 | | | | 83 | |
Host Hotels & Resorts Inc ‡ | | | 17,568 | | | | 320 | |
Howard Hughes Corp/The * | | | 795 | | | | 98 | |
Hudson Pacific Properties Inc ‡ | | | 2,475 | | | | 82 | |
Iron Mountain Inc ‡ | | | 5,996 | | | | 188 | |
| | | | | | | | |
| | | |
| Description | | Shares | | Market Value
($ Thousands) |
COMMON STOCK (continued) | | | | | | | | |
JBG SMITH Properties ‡ | | | 2,065 | | | $ | 81 | |
Jones Lang LaSalle Inc | | | 1,270 | | | | 179 | |
Kilroy Realty Corp ‡ | | | 4,516 | | | | 333 | |
Kimco Realty Corp ‡ | | | 4,679 | | | | 86 | |
Lamar Advertising Co, CI A ‡ | | | 1,059 | | | | 86 | |
Liberty Property Trust ‡ | | | 1,784 | | | | 89 | |
Life Storage Inc ‡ | | | 901 | | | | 86 | |
Macerich Co/The ‡ | | | 5,238 | | | | 175 | |
Mid-America Apartment Communities Inc ‡ | | | 772 | | | | 91 | |
Paramount Group Inc ‡ | | | 5,922 | | | | 83 | |
Prologis Inc ‡ | | | 18,853 | | | | 1,510 | |
Public Storage ‡ | | | 1,632 | | | | 389 | |
Realty Income Corp ‡ | | | 2,296 | | | | 158 | |
Regency Centers Corp ‡ | | | 3,123 | | | | 208 | |
Retail Properties of America Inc, CI A ‡ | | | 6,789 | | | | 80 | |
SBA Communications Corp, CI A *‡ | | | 994 | | | | 224 | |
Simon Property Group Inc ‡ | | | 3,706 | | | | 592 | |
SL Green Realty Corp ‡ | | | 2,476 | | | | 199 | |
STORE Capital Corp ‡ | | | 2,555 | | | | 85 | |
Taubman Centers Inc ‡ | | | 1,690 | | | | 69 | |
UDR Inc ‡ | | | 1,932 | | | | 87 | |
Ventas Inc ‡ | | | 3,279 | | | | 224 | |
VEREIT Inc ‡ | | | 10,217 | | | | 92 | |
Vornado Realty Trust ‡ | | | 2,903 | | | | 186 | |
Weingarten Realty Investors ‡ | | | 2,933 | | | | 80 | |
Welltower Inc ‡ | | | 4,270 | | | | 348 | |
Weyerhaeuser Co ‡ | | | 17,005 | | | | 448 | |
WP Carey Inc ‡ | | | 1,084 | | | | 88 | |
| | | | | | | | |
| | |
| | | | | | | 14,127 | |
| | | | | | | | |
| | |
Utilities — 3.1% | | | | | | | | |
AES Corp/VA | | | 5,282 | | | | 88 | |
Alliant Energy Corp | | | 4,695 | | | | 230 | |
Ameren Corp | | | 1,172 | | | | 88 | |
American Electric Power Co Inc | | | 5,930 | | | | 522 | |
American Water Works Co Inc | | | 2,717 | | | | 315 | |
Aqua America Inc | | | 2,221 | | | | 92 | |
Avangrid Inc | | | 1,720 | | | | 87 | |
CenterPoint Energy Inc | | | 7,150 | | | | 205 | |
CMS Energy Corp | | | 22,380 | | | | 1,296 | |
Consolidated Edison Inc | | | 3,086 | | | | 271 | |
Dominion Energy Inc | | | 9,975 | | | | 771 | |
DTE Energy Co | | | 9,809 | | | | 1,254 | |
Duke Energy Corp | | | 9,540 | | | | 842 | |
Edison International | | | 3,288 | | | | 222 | |
Entergy Corp | | | 2,276 | | | | 234 | |
Evergy Inc | | | 1,477 | | | | 89 | |
Eversource Energy | | | 10,983 | | | | 832 | |
Exelon Corp | | | 11,090 | | | | 532 | |
FirstEnergy Corp | | | 3,859 | | | | 165 | |
Hawaiian Electric Industries Inc | | | 2,040 | | | | 89 | |
MDU Resources Group Inc | | | 3,334 | | | | 86 | |
National Fuel Gas Co | | | 1,502 | | | | 79 | |
| | | | |
New Covenant Funds / Annual Report / June 30, 2019 | | | 21 | |
SCHEDULE OF INVESTMENTS
June 30, 2019
New Covenant Growth Fund (Concluded)
| | | | | | | | |
| | | |
| Description | | Shares | | Market Value
($ Thousands) |
COMMON STOCK (continued) | | | | | | | | |
NextEra Energy Inc | | | 6,768 | | | $ | 1,386 | |
NiSource Inc | | | 13,892 | | | | 400 | |
NRG Energy Inc | | | 2,300 | | | | 81 | |
OGE Energy Corp | | | 2,067 | | | | 88 | |
PG&E Corp * | | | 4,614 | | | | 106 | |
Pinnacle West Capital Corp | | | 2,640 | | | | 248 | |
PPL Corp | | | 7,025 | | | | 218 | |
Public Service Enterprise Group Inc | | | 4,452 | | | | 262 | |
Sempra Energy | | | 3,086 | | | | 424 | |
Southern Co/The | | | 13,370 | | | | 739 | |
UGI Corp | | | 1,560 | | | | 84 | |
WEC Energy Group Inc | | | 2,779 | | | | 232 | |
Xcel Energy Inc | | | 21,147 | | | | 1,258 | |
| | | | | | | | |
| | |
| | | | | | | 13,915 | |
| | | | | | | | |
| | | | | | | 431,756 | |
| | | | | | | | |
| | | | | | | | |
| | | |
| Description | | Shares | | Market Value
($ Thousands) |
COMMON STOCK (continued) | | | | | | | | |
Total Common Stock | | | | | | | | |
(Cost $330,160) ($ Thousands) | | | | | | $ | 437,891 | |
| | | | | | | | |
| | |
CASH EQUIVALENT — 2.0% | | | | | | | | |
SEI Daily Income Trust, Government Fund, CI F 2.140%**† | | | 8,829,487 | | | | 8,829 | |
| | | | | | | | |
Total Cash Equivalent | | | | | | | | |
(Cost $8,829) ($ Thousands) | | | | | | | 8,829 | |
| | | | | | | | |
Total Investments in Securities — 99.5% | | | | | | | | |
(Cost $338,989) ($ Thousands) | | | | | | $ | 446,720 | |
| | | | | | | | |
A list of the open futures contracts held by the Fund at June 30, 2019 are as follows:
| | | | | | | | | | | | | | | | | | | | |
| | | | | | |
| Type of Contract | | Number of
Contracts
Long | | | Expiration
Date | | | Notional Amount
(Thousands) | | | Value
(Thousands) | | | Unrealized
Appreciation
(Thousands) | |
S&P 500 IndexE-MINI | | | 59 | | | | Sep-2019 | | | $ | 8,541 | | | $ | 8,685 | | | $ | 144 | |
S&P Mid Cap 400 IndexE-MINI | | | 4 | | | | Sep-2019 | | | | 767 | | | | 780 | | | | 13 | |
| | | | | | | | | | | | | | | | | | | | |
| | | | | | | | | | $ | 9,308 | | | $ | 9,465 | | | $ | 157 | |
| | | | | | | | | | | | | | | | | | | | |
The futures contracts are considered to have interest rate risk associated with them.
| | | Percentages are based on Net Assets of $448,958 ($ Thousands). |
| | ‡ | Real Estate Investment Trust. |
| | * | Non-income producing security. |
| | ** | Rate shown is the 7-day effective yield as of June 30, 2019. |
| | † | Investment in Affiliated Security (see Note 3). |
| | (A) | Security is a Master Limited Partnership. At June 30, 2019, such securities amounted to $80 ($ Thousands), or 0.02% of the net assets of the Fund. |
CI — Class
Ltd. — Limited
MSCI — Morgan Stanley Capital International
PLC — Public Limited Company
S&P — Standard & Poor’s
The following is a list of the levels of inputs used as of June 30, 2019 in valuing the Fund’s investments and other financial instruments carried at value ($ Thousands):
| | | | | | | | | | | | | | | | |
| | | | | |
| Investments in Securities | | Level 1 | | | Level 2 | | | Level 3 | | | Total | |
Common Stock | | $ | 437,891 | | | $ | – | | | $ | – | | | $ | 437,891 | |
Cash Equivalent | | | 8,829 | | | | – | | | | – | | | | 8,829 | |
| | | | | | | | | | | | | | | | |
Total Investments in Securities | | $ | 446,720 | | | $ | – | | | $ | – | | | $ | 446,720 | |
| | | | | | | | | | | | | | | | |
| | | | | | | | | | | | | | | | |
| | | | | |
| Other Financial Instruments | | Level 1 | | | Level 2 | | | Level 3 | | | Total | |
Futures Contracts * | | | | | | | | | | | | | | | | |
Unrealized Appreciation | | $ | 157 | | | $ | — | | | $ | — | | | $ | 157 | |
| | | | | | | | | | | | | | | | |
Total Other Financial Instruments | | $ | 157 | | | $ | — | | | $ | — | | | $ | 157 | |
| | | | | | | | | | | | | | | | |
* Futures contracts are valued at the unrealized appreciation on the instrument.
For the period ended June 30, 2019, there were no transfers between Level 1 and Level 2 assets and liabilities.
For the period ended June 30, 2019, there were no transfers between Level 2 and Level 3 assets and liabilities.
For more information on valuation inputs, see Note 2 – Significant Accounting Policies in Notes to Financial Statements.
| | |
| 22 | | New Covenant Funds / Annual Report / June 30, 2019 |
The following is a summary of the Fund’s transactions with affiliates for the year ended June 30, 2019 ($ Thousands):
| | | | | | | | | | | | | | | | | | | | | | | | | | | | | | | | | | | | | | | | | | | | | |
| | | | | | | | | | |
| Security Description | | Value
6/30/2018 | | Purchases
at Cost | | Proceeds
from
Sales | | Realized
Gain
(Loss) | | Change in
Unrealized
Appreciation/
(Depreciation) | | Value
6/30/2019 | | Shares | | Income | | Capital
Gains |
SEI Daily Income Trust, Government Fund, CI F | | | $ | 6,521 | | | | $ | 57,787 | | | | $ | (55,479) | | | | $ | — | | | | $ | — | | | | $ | 8,829 | | | | | 8,829,487 | | | | $ | 251 | | | | $ | — | |
| | | | | | | | | | | | | | | | | | | | | | | | | | | | | | | | | | | | | | | | | | | | | |
The accompanying notes are an integral part of the financial statements.
| | | | |
New Covenant Funds / Annual Report / June 30, 2019 | | | 23 | |
SCHEDULE OF INVESTMENTS
June 30, 2019
New Covenant Income Fund
Sector Weightings (Unaudited)†:
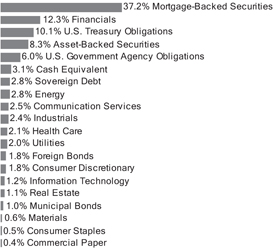
†Percentages based on total investments.
| | | | | | | | |
| | | |
| Description | | Face Amount
(Thousands) | | | Market Value
($ Thousands) | |
MORTGAGE-BACKED SECURITIES — 39.7% | |
Agency Mortgage-Backed Obligations — 32.3% | |
FHLMC | | | | | | | | |
6.500%, 09/01/2039 | | $ | 35 | | | $ | 40 | |
5.500%, 12/01/2036 to 12/01/2038 | | | 297 | | | | 329 | |
5.000%, 12/01/2020 to 01/01/2049 | | | 2,404 | | | | 2,603 | |
4.500%, 06/01/2038 to 04/01/2047 | | | 4,680 | | | | 4,994 | |
4.000%, 07/01/2037 to 09/01/2048 | | | 6,085 | | | | 6,344 | |
3.500%, 11/01/2042 to 03/01/2049 | | | 2,094 | | | | 2,170 | |
3.000%, 08/01/2046 to 02/01/2048 | | | 4,092 | | | | 4,162 | |
2.500%, 03/01/2033 to 04/01/2033 | | | 941 | | | | 949 | |
2.000%, 09/01/2023 | | | 459 | | | | 458 | |
FHLMC CMO, Ser 2011-3947, CI SG, IO | | | | | | | | |
3.556%, VAR LIBOR USD 1
Month+5.950%, 10/15/2041 | | | 286 | | | | 44 | |
FHLMC CMO, Ser 2012-4057, CI UI, IO | | | | | | | | |
3.000%, 05/15/2027 | | | 165 | | | | 12 | |
FHLMC CMO, Ser 2012-4085, CI IO, IO | | | | | | | | |
3.000%, 06/15/2027 | | | 343 | | | | 25 | |
FHLMC CMO, Ser 2012-4099, CI ST, IO | | | | | | | | |
3.606%, VAR LIBOR USD 1
Month+6.000%, 08/15/2042 | | | 133 | | | | 23 | |
FHLMC CMO, Ser 2013-4194, CI BI, IO | | | | | | | | |
3.500%, 04/15/2043 | | | 344 | | | | 46 | |
FHLMC CMO, Ser 2013-4203, CI PS, IO | | | | | | | | |
3.856%, VAR LIBOR USD 1
Month+6.250%, 09/15/2042 | | | 201 | | | | 30 | |
FHLMC CMO, Ser 2014-4310, CI SA, IO | | | | | | | | |
3.556%, VAR LIBOR USD 1
Month+5.950%, 02/15/2044 | | | 54 | | | | 9 | |
| | | | | | | | |
| | | |
| Description | | Face Amount
(Thousands) | | | Market Value
($ Thousands) | |
MORTGAGE-BACKED SECURITIES (continued) | | | | | | | | |
FHLMC CMO, Ser 2014-4335, CI SW, IO | | | | | | | | |
3.606%, VAR LIBOR USD 1
Month+6.000%, 05/15/2044 | | $ | 111 | | | $ | 18 | |
FHLMC CMO, Ser 2014-4415, CI I0, IO | | | | | | | | |
1.753%, 04/15/2041 (A) | | | 59 | | | | 3 | |
FHLMC Multifamily Structured Pass Through | | | | | | | | |
Certificates, Ser K091, CI A2
3.505%, 03/25/2029 | | | 180 | | | | 195 | |
FHLMC Multifamily Structured Pass Through | | | | | | | | |
Certificates, Ser K712, CI X1, IO
1.425%, 11/25/2019 (A) | | | 1,008 | | | | 3 | |
FHLMC Structured Agency Credit Risk Debt Notes, Ser 2017-DNA1, CI M1 | | | | | | | | |
3.604%, VAR ICE LIBOR USD 1
Month+1.200%, 07/25/2029 | | | 223 | | | | 224 | |
FHLMC, Ser2016-353, CI S1, IO | | | | | | | | |
3.606%, VAR LIBOR USD 1
Month+6.000%, 12/15/2046 | | | 154 | | | | 25 | |
FNMA | | | | | | | | |
7.000%, 11/01/2037 to 11/01/2038 | | | 30 | | | | 35 | |
6.500%, 01/01/2038 to 05/01/2040 | | | 224 | | | | 263 | |
6.000%, 07/01/2037 to 11/01/2038 | | | 161 | | | | 179 | |
5.500%, 02/01/2035 | | | 136 | | | | 151 | |
5.000%, 01/01/2021 to 02/01/2049 | | | 8,855 | | | | 9,538 | |
4.893%, VAR US Treas Yield Curve Rate T Note Const Mat 1Yr+2.268%,
01/01/2036 | | | 25 | | | | 26 | |
4.750%, VAR ICE LIBOR USD 12
Month+1.700%, 03/01/2036 | | | 27 | | | | 29 | |
4.500%, 02/01/2035 to 04/01/2056 | | | 3,649 | | | | 3,893 | |
4.381%, VAR ICE LIBOR USD 12
Month+1.420%, 05/01/2043 | | | 311 | | | | 320 | |
4.000%, 06/01/2025 to 09/01/2047 | | | 12,788 | | | | 13,420 | |
3.796%, 11/25/2017 | | | 73 | | | | 12 | |
3.500%, 04/01/2033 to 03/01/2057 | | | 11,870 | | | | 12,294 | |
3.350%, 05/01/2029 | | | 20 | | | | 21 | |
3.160%, 06/01/2029 | | | 370 | | | | 388 | |
3.000%, 08/01/2046 to 01/01/2048 | | | 1,013 | | | | 1,027 | |
2.500%, 10/01/2042 | | | 572 | | | | 570 | |
2.240%, 09/01/2026 | | | 142 | | | | 142 | |
FNMA CMO, Ser2003-W2, CI 2A9 | | | | | | | | |
5.900%, 07/25/2042 | | | 477 | | | | 536 | |
FNMA CMO, Ser2012-93, CI UI, IO | | | | | | | | |
3.000%, 09/25/2027 | | | 456 | | | | 33 | |
FNMA CMO, Ser2014-47, CI AI, IO | | | | | | | | |
1.835%, 08/25/2044 (A) | | | 144 | | | | 8 | |
FNMA CMO, Ser2015-55, CI I0, IO | | | | | | | | |
1.604%, 08/25/2055 (A) | | | 34 | | | | 2 | |
FNMA CMO, Ser2015-56, CI AS, IO | | | | | | | | |
3.746%, VAR LIBOR USD 1
Month+6.150%, 08/25/2045 | | | 65 | | | | 14 | |
FNMA CMO, Ser M3, CI X2, I0 | | | | | | | | |
0.462%, 10/25/2024 (A) | | | 4,357 | | | | 72 | |
| | |
| 24 | | New Covenant Funds / Annual Report / June 30, 2019 |
| | | | | | | | |
| | | |
| Description | | Face Amount
(Thousands) | | | Market Value ($ Thousands) | |
MORTGAGE-BACKED SECURITIES (continued) | |
FNMA Connecticut Avenue Securities,
Ser2014-C04, CI 1M2 | | | | | | | | |
7.304%, VAR ICE LIBOR USD 1 Month+4.900%, 11/25/2024 | | $ | 287 | | | $ | 317 | |
FNMA Connecticut Avenue Securities, Ser2017-C01, CI 1M1 | | | | | | | | |
3.704%, VAR ICE LIBOR USD 1 Month+1.300%, 07/25/2029 | | | 178 | | | | 179 | |
FNMA Connecticut Avenue Securities, Ser2019-R03, CI 1M1 3.154%, VAR ICE LIBOR USD 1 Month+0.750%, 09/25/2031 (B) | | | 393 | | | | 393 | |
FNMA TBA | | | | | | | | |
5.000%, 07/15/2038 | | | 1,000 | | | | 1,057 | |
4.500%, 07/01/2037 | | | 1,000 | | | | 1,045 | |
4.000%, 07/13/2039 | | | 300 | | | | 310 | |
3.500%, 07/25/2026 to 07/01/2041 | | | 4,400 | | | | 4,526 | |
3.000%, 07/01/2042 | | | 500 | | | | 504 | |
FNMA, Ser2005-29, CI ZA | | | | | | | | |
5.500%, 04/25/2035 | | | 143 | | | | 163 | |
FNMA, Ser 2012-101, Cl BI IO | | | | | | | | |
4.000%, 09/25/2027 | | | 17 | | | | 1 | |
FNMA, Ser2013-54, CI BS, IO | | | | | | | | |
3.746%, VAR LIBOR USD 1 Month+6.150%, 06/25/2043 | | | 52 | | | | 11 | |
FNMA, Ser2017-76, CI SB, IO | | | | | | | | |
3.696%, VAR LIBOR USD 1 Month+6.100%, 10/25/2057 | | | 300 | | | | 55 | |
FNMA, Ser M4, CI A2 | | | | | | | | |
3.610%, 02/25/2031 | | | 80 | | | | 87 | |
FNMA, Ser M6, CI A2 | | | | | | | | |
3.450%, 01/01/2029 | | | 170 | | | | 182 | |
FRESB Mortgage Trust, Ser SB48, CI A10F | | | | | | | | |
3.370%, 02/25/2028 (A) | | | 743 | | | | 779 | |
FRESB Mortgage Trust, Ser SB58, CI A10F | | | | | | | | |
3.610%,10/25/2028(A) | | | 1,080 | | | | 1,150 | |
GNMA | | | | | | | | |
5.500%, 02/20/2037 to 01/15/2039 | | | 140 | | | | 153 | |
5.000%, 12/20/2038 to 01/20/2049 | | | 2,277 | | | | 2,430 | |
4.600%, 09/15/2034 | | | 2,211 | | | | 2,350 | |
4.500%, 07/20/2038 to 03/20/2049 | | | 4,854 | | | | 5,109 | |
4.000%, 01/15/2041 to 01/20/2049 | | | 3,125 | | | | 3,280 | |
3.500%, 06/20/2044 to 06/15/2048 | | | 1,307 | | | | 1,352 | |
3.000%, 09/15/2042 to 02/20/2048 | | | 3,397 | | | | 3,476 | |
2.500%, 02/20/2027 | | | 714 | | | | 725 | |
GNMA CMO, Ser 186, CI IO, lO | | | | | | | | |
0.756%, 08/16/2054 (A) | | | 1,595 | | | | 74 | |
GNMA CMO, Ser2012-34, CI SA, IO | | | | | | | | |
3.667%, VAR LIBOR USD 1 Month+6.050%, 03/20/2042 | | | 38 | | | | 7 | |
GNMA CMO, Ser2012-66, CI CI, IO | | | | | | | | |
3.500%, 02/20/2038 | | | 75 | | | | 4 | |
| | | | | | | | |
| | | |
| Description | | Face Amount
(Thousands) | | | Market Value ($ Thousands) | |
MORTGAGE-BACKED SECURITIES (continued) | |
GNMA CMO, Ser2012-H18, CI NA | | | | | | | | |
2.987%, VAR ICE LIBOR USD 1 Month+0.520%, 08/20/2062 | | $ | 198 | | | $ | 198 | |
GNMA CMO, Ser2012-H30, Cl GA | | | | | | | | |
2.817%, VAR ICE LIBOR USD 1 Month+0.350%, 12/20/2062 | | | 902 | | | | 900 | |
GNMA CMO, Ser2013-H01, CI TA | | | | | | | | |
2.967%, VAR ICE LIBOR USD 1 Month+0.500%, 01/20/2063 | | | 16 | | | | 16 | |
GNMA CMO, Ser2013-H08, CI BF | | | | | | | | |
2.867%, VAR ICE LIBOR USD 1 Month+0.400%, 03/20/2063 | | | 849 | | | | 846 | |
GNMA CMO, Ser2014-105, IO | | | | | | | | |
1.100%, 06/16/2054 | | | 1,233 | | | | 61 | |
GNMA CMO, Ser2015-167, Cl Ol, lO | | | | | | | | |
4.000%, 04/16/2045 | | | 115 | | | | 20 | |
GNMA CMO, Ser2015-H20, Cl FA | | | | | | | | |
2.937%, VAR ICE LIBOR USD 1 Month+0.470%, 08/20/2065 | | | 281 | | | | 281 | |
GNMA CMO, Ser 85, CI IA, lO | | | | | | | | |
0.703%, 03/16/2047 (A) | | | 2,942 | | | | 106 | |
GNMA CM0, Ser 95, Cl lO, lO | | | | | | | | |
0.589%, 04/16/2047 (A) | | | 1,512 | | | | 57 | |
GNMA TBA | | | | | | | | |
4.500%, 07/15/2039 | | | 160 | | | | 167 | |
4.000%, 07/01/2039 | | | 1,600 | | | | 1,659 | |
3.500%, 07/15/2041 to 08/15/2041 | | | 4,700 | | | | 4,855 | |
3.000%, 07/15/2042 | | | 1,400 | | | | 1,431 | |
GNMA, Ser2013-H21, Cl FB | | | | | | | | |
3.167%, VAR ICE LIBOR USD 1 Month+0.700%, 09/20/2063 | | | 525 | | | | 527 | |
GNMA, Ser 28, Cl AB | | | | | | | | |
3.150%, 06/16/2060 | | | 80 | | | | 81 | |
| | | | | | | | |
| | | | | | | 106,603 | |
| | | | | | | | |
Non-Agency Mortgage-Backed Obligations — 7.5% | | | | | |
280 Park Avenue Mortgage Trust, Ser 280P, CI A | | | | | | | | |
3.274%, VAR ICE LIBOR USD 1 Month+0.880%, 09/15/2034 (B) | | | 130 | | | | 130 | |
Bear Stearns Trust, Ser2004-6, Cl 1A | | | | | | | | |
3.044%, VAR ICE LIBOR USD 1 Month+0.640%, 07/25/2034 | | | 79 | | | | 79 | |
BX Trust, Ser APPL, Cl A | | | | | | | | |
3.274%, VAR ICE LIBOR USD 1 Month+0.880%, 07/15/2034 (B) | | | 127 | | | | 127 | |
Citigroup Commercial Mortgage Trust, Ser 2014-GC25, CI AS | | | | | | | | |
4.017%, 10/10/2047 | | | 100 | | | | 106 | |
Citigroup Commercial Mortgage Trust, Ser2016-P6, CI AAB | | | | | | | | |
3.512%, 12/10/2049 | | | 810 | | | | 852 | |
| | | | |
New Covenant Funds / Annual Report / June 30, 2019 | | | 25 | |
SCHEDULE OF INVESTMENTS
June 30, 2019
New Covenant Income Fund (Continued)
| | | | | | | | |
| | | |
| Description | | Face Amount
(Thousands) | | | Market Value
($ Thousands) |
MORTGAGE-BACKED SECURITIES (continued) | | | | | |
Citigroup Commercial Mortgage Trust, Ser 375P, CI A | | | | | | | | |
3.251%, 05/10/2035 (B) | | $ | 190 | | | $ | 196 | |
COMM Mortgage Trust, Ser CR5, Cl A4 | | | | | |
2.771%, 12/10/2045 | | | 700 | | | | 711 | |
COMM Mortgage Trust, Ser CR5, Cl AM | | | | | |
3.223%, 12/10/2045 (B) | | | 590 | | | | 606 | |
COMM Mortgage Trust, Ser CR8, Cl A4 | | | | | |
3.334%, 06/10/2046 | | | 662 | | | | 683 | |
Commercial Mortgage Trust, Ser 2013-CR12, Cl AM | | | | | | | | |
4.300%, 10/10/2046 | | | 20 | | | | 21 | |
Commercial Mortgage Trust, Ser 2013-CR12, Cl C | | | | | | | | |
5.254%, 10/10/2046 (A) | | | 10 | | | | 10 | |
Commercial Mortgage Trust, Ser 2013-CR12, Cl B | | | | | | | | |
4.762%, 10/10/2046 (A) | | | 20 | | | | 21 | |
CSMC Trust, Ser2018-J1, Cl A2 | | | | | | | | |
3.500%, 02/25/2048 (A)(B) | | | 1,380 | | | | 1,381 | |
DBUBS Mortgage Trust, Ser LC2A, Cl A4 | | | | | | | | |
4.537%, 07/10/2044 (B) | | | 1,009 | | | | 1,043 | |
DRB Prime Student Loan Trust, Ser2015-B, CI A1 | | | | | | | | |
4.304%, VAR ICE LIBOR USD 1 Month+1.900%, 10/27/2031 (B) | | | 142 | | | | 144 | |
Flagstar Mortgage Trust, Ser2018-2, Cl A4 | | | | | | | | |
3.500%, 04/25/2048 (A)(B) | | | 552 | | | | 557 | |
GS Mortgage Securities Trust, Ser 2013- GC16, Cl B | | | | | | | | |
5.161%, 11/10/2046 (A) | | | 80 | | | | 88 | |
GS Mortgage Securities Trust, Ser 2018-SRP5, Cl A | | | | | | | | |
3.281%, 06/09/2021 | | | 620 | | | | 611 | |
GS Mortgage Securities Trust, Ser 2018-SRP5, Cl B | | | | | | | | |
4.481%, 06/09/2021 | | | 430 | | | | 424 | |
JPMBB Commercial Mortgage Securities Trust, Ser2013-C15, CI B | | | | | | | | |
4.927%, 11/15/2045 (A) | | | 210 | | | | 227 | |
JPMBB Commercial Mortgage Securities Trust, Ser2013-C17, CI B | | | | | | | | |
5.054%, 01/15/2047 (A) | | | 30 | | | | 32 | |
JPMBB Commercial Mortgage Securities Trust, Ser2014-C22, Cl C | | | | | | | | |
4.709%, 09/15/2047 (A) | | | 80 | | | | 82 | |
JPMorgan Chase Commercial Mortgage Securities Trust, Ser C6, Cl A3 | | | | | | | | |
3.507%, 05/15/2045 | | | 1,191 | | | | 1,228 | |
JPMorgan Chase Commercial Mortgage Securities Trust, Ser FL7, Cl D | | | | | | | | |
6.144%, VAR LIBOR USD 1 Month+3.750%, 05/15/2028 (B) | | | 195 | | | | 194 | |
| | | | | | | | |
| | | |
| Description | | Face Amount
(Thousands) | | | Market Value
($ Thousands) |
MORTGAGE-BACKED SECURITIES (continued) | | | | | |
JPMorgan Chase Commercial Mortgage Securities Trust, Ser LC9, Cl AS | | | | | | | | |
3.353%, 12/15/2047 (B) | | $ | 380 | | | $ | 389 | |
JPMorgan Mortgage Trust, Ser2015-5, Cl A9 | | | | | | | | |
3.342%, 05/25/2045 (A)(B) | | | 120 | | | | 120 | |
JPMorgan Mortgage Trust, Ser2016-1, Cl A5 | | | | | | | | |
3.500%, 05/25/2046 (A)(B) | | | 493 | | | | 500 | |
JPMorgan Mortgage Trust, Ser2018-3, Cl A1 | | | | | | | | |
3.500%, 09/25/2048 (A)(B) | | | 716 | | | | 722 | |
JPMorgan Mortgage Trust, Ser2018-4, Cl A1 | | | | | | | | |
3.500%, 10/25/2048 (A)(B) | | | 278 | | | | 281 | |
JPMorgan Mortgage Trust, Ser2018-5, Cl A1 | | | | | | | | |
3.500%, 10/25/2048 (A)(B) | | | 940 | | | | 950 | |
JPMorgan Mortgage Trust, Ser2018-6, Cl 1A4 | | | | | | | | |
3.500%, 12/25/2048 (A)(B) | | | 795 | | | | 804 | |
Lanark Master Issuer, Ser2018-1A, Cl 1A | | | | | | | | |
2.943%, VAR ICE LIBOR USD 3 Month+0.420%, 12/22/2069 (B) | | | 672 | | | | 671 | |
MAD Mortgage Trust, Ser 330M, Cl A | | | | | | | | |
3.294%, 08/15/2034 (A)(B) | | | 220 | | | | 227 | |
Morgan Stanley Bank of America Merrill Lynch Trust, Ser C34, Cl ASB | | | | | | | | |
3.354%, 11/15/2052 | | | 615 | | | | 639 | |
Morgan Stanley Bank of America Merrill Lynch Trust, Ser C5, Cl A4 | | | | | | | | |
3.176%, 08/15/2045 | | | 1,475 | | | | 1,510 | |
Morgan Stanley Bank of America Merrill Lynch Trust, Ser C9 | | | | | | | | |
3.102%, 05/15/2046 | | | 714 | | | | 734 | |
Morgan Stanley Capital l Trust, Ser2012-C4, CI A4 | | | | | | | | |
3.244%, 03/15/2045 | | | 220 | | | | 225 | |
MSCG Trust, Ser2016-SNR, Cl C | | | | | | | | |
5.205%, 11/15/2034 (B) | | | 128 | | | | 129 | |
MSCG Trust, Ser ALDR, Cl A2 | | | | | | | | |
3.577%, 06/07/2035 (A)(B) | | | 410 | | | | 423 | |
Nomura Asset Acceptance Alternative Loan Trust, Ser2007-1, Cl 1A3 | | | | | | | | |
5.957%, 03/25/2047 | | | 76 | | | | 80 | |
Seasoned Credit Risk Transfer Trust, Ser2019-1, Cl MA | | | | | | | | |
3.500%, 07/25/2058 | | | 1,008 | | | | 1,045 | |
Seasoned Credit Risk Transfer Trust, Ser2019-2, Cl MA | | | | | | | | |
3.500%, 08/25/2058 | | | 504 | | | | 524 | |
Sequoia Mortgage Trust, Ser2017-1, Cl A4 | | | | | | | | |
3.500%, 02/25/2047 (A)(B) | | | 767 | | | | 781 | |
Sequoia Mortgage Trust, Ser2017-5, Cl A4 | | | | | | | | |
3.500%, 08/25/2047 (A)(B) | | | 855 | | | | 869 | |
Sequoia Mortgage Trust, Ser2017-6, Cl A4 | | | | | | | | |
3.500%, 09/25/2047 (A)(B) | | | 426 | | | | 433 | |
| | |
| 26 | | New Covenant Funds / Annual Report / June 30, 2019 |
| | | | | | | | |
| | | |
| Description | | Face Amount
(Thousands) | | | Market Value
($ Thousands) | |
MORTGAGE-BACKED SECURITIES (continued) | | | | | |
Towd Point Mortgage Trust, Ser2015-5, CI A1B | | | | | | | | |
2.750%, 05/25/2055 (A)(B) | | $ | 249 | | | $ | 250 | |
UBS-BAMLL Trust, Ser2012-WRM, Cl A | | | | | | | | |
3.663%, 06/10/2030 (B) | | | 116 | | | | 119 | |
UBS-Barclays Commercial Mortgage Trust, Ser2012-C2, Cl A4 | | | | | | | | |
3.525%, 05/10/2063 | | | 73 | | | | 75 | |
UBS-Barclays Commercial Mortgage Trust, Ser2012-CN, CI XA, I0 | | | | | | | | |
1.474%, 05/10/2063 (A)(B) | | | 337 | | | | 11 | |
Wells Fargo Commercial Mortgage Trust, Ser 2015-NXS3, CI NXS3 | | | | | | | | |
3.371%, 09/15/2057 | | | 160 | | | | 166 | |
WFRBS Commercial Mortgage Trust, Ser2012-C7, CI XA, I0 | | | | | | | | |
1.518%, 06/15/2045 (A)(B) | | | 1,096 | | | | 34 | |
WFRBS Commercial Mortgage Trust, Ser2013-C13, Cl XA, l0 | | | | | | | | |
1.335%, 05/15/2045 (A)(B) | | | 1,122 | | | | 43 | |
WFRBS Commercial Mortgage Trust, Ser2014-C23, CI XA, I0 | | | | | | | | |
0.740%,10/15/2057 (A) | | | 1,128 | | | | 28 | |
WFRBS Commercial Mortgage Trust, Ser2014-C23, CI B | | | | | | | | |
4.529%, 10/15/2057 (A) | | | 270 | | | | 288 | |
WFRBS Commercial Mortgage Trust, Ser C11, CI AS | | | | | | | | |
3.311%, 03/15/2045 | | | 160 | | | | 164 | |
WFRBS Commercial Mortgage Trust, Ser C4, CI A4 | | | | | | | | |
4.902%, 06/15/2044 (A)(B) | | | 1,796 | | | | 1,871 | |
| | | | | | | | |
| | | | | | | 24,658 | |
| | | | | | | | |
Total Mortgage-Backed Securities
(Cost $130,160) ($ Thousands) | | | | | | | 131,261 | |
| | | | | | | | |
| | |
CORPORATE OBLIGATIONS — 31.2% | | | | | | | | |
Communication Services — 2.7% | | | | | | | | |
AT&T | | | | | | | | |
4.250%, 03/01/2027 | | | 150 | | | | 161 | |
4.125%, 02/17/2026 | | | 408 | | | | 434 | |
3.875%, 08/15/2021 | | | 10 | | | | 10 | |
3.721%, 11/27/2022 (B)(C) | | | 2,000 | | | | 1,826 | |
3.400%, 05/15/2025 | | | 460 | | | | 473 | |
3.000%, 06/30/2022 | | | 10 | | | | 10 | |
Charter Communications Operating | | | | | | | | |
5.050%, 03/30/2029 | | | 20 | | | | 22 | |
4.908%, 07/23/2025 | | | 110 | | | | 120 | |
3.750%, 02/15/2028 | | | 20 | | | | 20 | |
3.579%, 07/23/2020 | | | 30 | | | | 30 | |
| | | | | | | | |
| | | |
| Description | | Face Amount
(Thousands) | | | Market Value
($ Thousands) | |
CORPORATE OBLIGATIONS (continued) | | | | | |
Comcast | | | | | | | | |
4.150%, 10/15/2028 | | $ | 180 | | | $ | 198 | |
3.950%,10/15/2025 | | | 150 | | | | 162 | |
Comcast Cable Communications Holdings | | | | | | | | |
9.455%, 11/15/2022 | | | 1,116 | | | | 1,375 | |
Cox Communications | | | | | | | | |
3.250%, 12/15/2022 (B) | | | 859 | | | | 877 | |
Fox | | | | | | | | |
4.709%, 01/25/2029 (B) | | | 100 | | | | 112 | |
4.030%, 01/25/2024 (B) | | | 50 | | | | 53 | |
NBCUniversal Media | | | | | | | | |
4.375%, 04/01/2021 | | | 10 | | | | 10 | |
Sprint Spectrum | | | | | | | | |
3.360%, 09/20/2021 (B) | | | 433 | | | | 433 | |
TCI Communications | | | | | | | | |
7.875%, 02/15/2026 | | | 240 | | | | 313 | |
Telefonica Emisiones SAU | | | | | | | | |
4.895%, 03/06/2048 | | | 340 | | | | 359 | |
Tencent Holdings MTN | | | | | | | | |
3.595%, 01/19/2028 (B) | | | 250 | | | | 255 | |
Verizon Communications | | | | | | | | |
4.329%, 09/21/2028 | | | 102 | | | | 113 | |
3.875%, 02/08/2029 | | | 60 | | | | 65 | |
3.376%, 02/15/2025 | | | 532 | | | | 555 | |
2.625%, 08/15/2026 | | | 513 | | | | 510 | |
Viacom | | | | | | | | |
3.875%, 04/01/2024 | | | 20 | | | | 21 | |
Vodafone Group PLC | | | | | | | | |
3.750%, 01/16/2024 | | | 410 | | | | 429 | |
Walt Disney | | | | | | | | |
3.000%, 09/15/2022 (B) | | | 30 | | | | 31 | |
| | | | | | | | |
| | | | | | | 8,977 | |
| | | | | | | | |
Consumer Discretionary — 1.9% | | | | | | | | |
Amazon.com | | | | | | | | |
3.150%, 08/22/2027 | | | 470 | | | | 494 | |
BMW US Capital | | | | | | | | |
2.150%, 04/06/2020 (B) | | | 950 | | | | 949 | |
1.850%, 09/15/2021 (B) | | | 20 | | | | 20 | |
Ford Motor Credit | | | | | | | | |
8.125%, 01/15/2020 | | | 340 | | | | 349 | |
2.597%,11/04/2019 | | | 800 | | | | 799 | |
General Motors Financial | | | | | | | | |
4.150%, 06/19/2023 | | | 600 | | | | 618 | |
3.700%, 11/24/2020 | | | 80 | | | | 81 | |
3.700%, 05/09/2023 | | | 190 | | | | 193 | |
3.150%, 01/15/2020 | | | 330 | | | | 331 | |
2.450%, 11/06/2020 | | | 30 | | | | 30 | |
KazMunayGas National JSC | | | | | | | | |
5.375%, 04/24/2030 (B) | | | 400 | | | | 443 | |
McDonald’s MTN | | | | | | | | |
3.350%, 04/01/2023 | | | 280 | | | | 291 | |
| | | | |
New Covenant Funds / Annual Report / June 30, 2019 | | | 27 | |
SCHEDULE OF INVESTMENTS
June 30, 2019
New Covenant Income Fund(Continued)
| | | | | | | | |
| | | |
| Description | | Face Amount
(Thousands) | | | Market Value
($ Thousands) | |
CORPORATE OBLIGATIONS (continued) | | | | | | | | |
Newell Brands | | | | | | | | |
3.850%, 04/01/2023 | | $ | 80 | | | $ | 81 | |
Time Warner Cable | | | | | | | | |
5.000%, 02/01/2020 | | | 990 | | | | 1,003 | |
Volkswagen Group of America Finance | | | | | | | | |
4.625%, 11/13/2025 (B) | | | 461 | | | | 501 | |
| | | | | | | | |
| | | | | | | 6,183 | |
| | | | | | | | |
| | |
Consumer Staples — 0.5% | | | | | | | | |
Kraft Heinz Foods | | | | | | | | |
5.375%, 02/10/2020 | | | 86 | | | | 88 | |
4.875%, 02/15/2025 (B) | | | 70 | | | | 72 | |
Kroger | | | | | | | | |
4.000%, 02/01/2024 | | | 140 | | | | 148 | |
Mars | | | | | | | | |
3.200%, 04/01/2030 (B) | | | 30 | | | | 31 | |
2.700%, 04/01/2025 (B) | | | 60 | | | | 61 | |
PepsiCo | | | | | | | | |
3.000%, 08/25/2021 | | | 290 | | | | 295 | |
2.750%, 03/05/2022 | | | 80 | | | | 82 | |
Smithfield Foods | | | | | | | | |
2.700%, 01/31/2020 (B) | | | 330 | | | | 329 | |
Walgreens Boots Alliance | | | | | | | | |
3.450%, 06/01/2026 | | | 150 | | | | 151 | |
Walmart | | | | | | | | |
3.050%, 07/08/2026 | | | 100 | | | | 105 | |
WM Wrigley Jr | | | | | | | | |
2.900%, 10/21/2019 (B) | | | 360 | | | | 360 | |
| | | | | | | | |
| | | | | | | 1,722 | |
| | | | | | | | |
| | |
Energy — 3.0% | | | | | | | | |
Anadarko Petroleum | | | | | | | | |
5.822%, 10/10/2036 (C) | | | 3,000 | | | | 1,417 | |
5.550%, 03/15/2026 | | | 180 | | | | 202 | |
Apache | | | | | | | | |
3.250%, 04/15/2022 | | | 616 | | | | 625 | |
Baker Hughes a GE | | | | | | | | |
3.200%, 08/15/2021 | | | 26 | | | | 26 | |
BP Capital Markets America | | | | | | | | |
3.790%, 02/06/2024 | | | 80 | | | | 85 | |
3.410%, 02/11/2026 | | | 40 | | | | 42 | |
3.216%, 11/28/2023 | | | 140 | | | | 144 | |
3.119%, 05/04/2026 | | | 170 | | | | 173 | |
BP Capital Markets PLC | | | | | | | | |
3.535%, 11/04/2024 | | | 20 | | | | 21 | |
Chevron | | | | | | | | |
2.100%, 05/16/2021 | | | 130 | | | | 130 | |
1.991%, 03/03/2020 | | | 1,150 | | | | 1,149 | |
Cimarex Energy | | | | | | | | |
4.375%, 06/01/2024 | | | 50 | | | | 53 | |
3.900%, 05/15/2027 | | | 40 | | | | 41 | |
| | | | | | | | |
| | | |
| Description | | Face Amount
(Thousands) | | | Market Value ($ Thousands) | |
CORPORATE OBLIGATIONS (continued) | | | | | | | | |
Concho Resources | | | | | | | | |
4.375%, 01/15/2025 | | $ | 10 | | | $ | 10 | |
4.300%, 08/15/2028 | | | 40 | | | | 43 | |
3.750%, 10/01/2027 | | | 20 | | | | 21 | |
Continental Resources | | | | | | | | |
4.375%, 01/15/2028 | | | 20 | | | | 21 | |
3.800%, 06/01/2024 | | | 160 | | | | 165 | |
Devon Energy | | | | | | | | |
5.850%, 12/15/2025 | | | 130 | | | | 154 | |
3.250%, 05/15/2022 | | | 630 | | | | 642 | |
Energy Transfer Operating | | | | | | | | |
5.500%, 06/01/2027 | | | 604 | | | | 675 | |
5.250%, 04/15/2029 | | | 20 | | | | 22 | |
4.500%, 04/15/2024 | | | 60 | | | | 64 | |
Enterprise Products Operating | | | | | | | | |
4.150%, 10/16/2028 | | | 80 | | | | 87 | |
3.900%, 02/15/2024 | | | 457 | | | | 484 | |
EOG Resources | | | | | | | | |
4.150%, 01/15/2026 | | | 60 | | | | 65 | |
ExxonMobil | | | | | | | | |
3.043%, 03/01/2026 | | | 150 | | | | 155 | |
Halliburton | | | | | | | | |
3.800%, 11/15/2025 | | | 10 | | | | 10 | |
3.250%, 11/15/2021 | | | 180 | | | | 184 | |
Kinder Morgan Energy Partners | | | | | | | | |
3.500%, 03/01/2021 | | | 30 | | | | 31 | |
MidAmerican Energy | | | | | | | | |
3.650%, 04/15/2029 | | | 140 | | | | 151 | |
MPLX | | | | | | | | |
4.800%, 02/15/2029 | | | 50 | | | | 55 | |
4.125%, 03/01/2027 | | | 110 | | | | 115 | |
4.000%, 03/15/2028 | | | 140 | | | | 145 | |
Noble Energy | | | | | | | | |
4.150%, 12/15/2021 | | | 290 | | | | 299 | |
3.850%, 01/15/2028 | | | 60 | | | | 61 | |
Occidental Petroleum | | | | | | | | |
4.100%, 02/01/2021 | | | 50 | | | | 51 | |
3.400%, 04/15/2026 | | | 80 | | | | 82 | |
3.125%, 02/15/2022 | | | 100 | | | | 102 | |
3.000%, 02/15/2027 | | | 130 | | | | 129 | |
Schlumberger Holdings | | | | | | | | |
3.900%, 05/17/2028 (B) | | | 978 | | | | 1,018 | |
Sinopec Group Overseas Development | | | | | | | | |
4.375%, 04/10/2024 (B) | | | 290 | | | | 310 | |
Sunoco Logistics Partners Operations | | | | | | | | |
3.900%, 07/15/2026 | | | 439 | | | | 448 | |
Williams | | | | | | | | |
5.250%, 03/15/2020 | | | 40 | | | | 41 | |
| | | | | | | | |
| | | | | | | 9,948 | |
| | | | | | | | |
| | |
| 28 | | New Covenant Funds / Annual Report / June 30, 2019 |
| | | | | | | | |
| | | |
| Description | | Face Amount (Thousands) | | | Market Value ($ Thousands) | |
CORPORATE OBLIGATIONS (continued) | | | | | | | | |
Financials — 13.1% | | | | | | | | |
American Express | | | | | | | | |
3.400%, 02/27/2023 | | $ | 972 | | | $ | 1,006 | |
2.650%, 12/02/2022 | | | 264 | | | | 267 | |
American Express Credit MTN | | | | | | | | |
2.375%, 05/26/2020 | | | 80 | | | | 80 | |
2.200%, 03/03/2020 | | | 710 | | | | 709 | |
American International Group | | | | | | | | |
4.875%, 06/01/2022 | | | 415 | | | | 445 | |
Anglo American Capital | | | | | | | | |
3.625%, 09/11/2024 (B) | | | 200 | | | | 204 | |
Banco Santander | | | | | | | | |
4.379%, 04/12/2028 | | | 200 | | | | 213 | |
3.724%, VAR ICE LIBOR USD 3 Month+1.120%, 04/12/2023 | | | 200 | | | | 199 | |
Bank of America | | | | | | | | |
3.419%, VAR ICE LIBOR USD 3 Month+1.040%, 12/20/2028 | | | 234 | | | | 241 | |
3.004%, VAR ICE LIBOR USD 3 Month+0.790%, 12/20/2023 | | | 258 | | | | 263 | |
Bank of America MTN | | | | | | | | |
4.450%, 03/03/2026 | | | 678 | | | | 731 | |
4.200%, 08/26/2024 | | | 210 | | | | 223 | |
4.125%, 01/22/2024 | | | 370 | | | | 396 | |
4.100%, 07/24/2023 | | | 280 | | | | 299 | |
4.000%, 04/01/2024 | | | 440 | | | | 469 | |
4.000%, 01/22/2025 | | | 80 | | | | 84 | |
3.974%, VAR ICE LIBOR USD 3 Month+1.210%, 02/07/2030 | | | 80 | | | | 86 | |
3.593%, VAR ICE LIBOR USD 3 Month+1.370%, 07/21/2028 | | | 210 | | | | 219 | |
3.550%, VAR ICE LIBOR USD 3 Month+0.780%, 03/05/2024 | | | 80 | | | | 83 | |
3.500%, 04/19/2026 | | | 130 | | | | 136 | |
3.300%, 01/11/2023 | | | 60 | | | | 62 | |
Bank of New York Mellon MTN | | | | | | | | |
3.300%, 08/23/2029 | | | 790 | | | | 819 | |
Barclays Bank | | | | | | | | |
2.650%, 01/11/2021 | | | 1,199 | | | | 1,202 | |
BNP Paribas | | | | | | | | |
5.198%, VAR ICE LIBOR USD 3 Month+2.567%, 01/10/2030 (B) | | | 400 | | | | 458 | |
4.705%, VAR ICE LIBOR USD 3 Month+2.235%, 01/10/2025 (B) | | | 270 | | | | 290 | |
4.400%, 08/14/2028 (B) | | | 200 | | | | 216 | |
BPCE MTN | | | | | | | | |
3.000%, 05/22/2022 (B) | | | 640 | | | | 646 | |
Capital One | | | | | | | | |
2.650%, 08/08/2022 | | | 830 | | | | 835 | |
Charles Schwab | | | | | | | | |
3.850%, 05/21/2025 | | | 110 | | | | 117 | |
| | | | | | | | |
| | | |
| Description | | Face Amount
(Thousands) | | | Market Value
($ Thousands) | |
CORPORATE OBLIGATIONS (continued) | | | | | | | | |
Citigroup | | | | | | | | |
8.125%, 07/15/2039 | | $ | 12 | | | $ | 19 | |
5.500%, 09/13/2025 | | | 150 | | | | 170 | |
5.300%, 05/06/2044 | | | 31 | | | | 37 | |
4.650%, 07/30/2045 | | | 28 | | | | 32 | |
4.450%, 09/29/2027 | | | 150 | | | | 162 | |
4.400%, 06/10/2025 | | | 160 | | | | 171 | |
4.300%, 11/20/2026 | | | 40 | | | | 42 | |
4.125%, 07/25/2028 | | | 40 | | | | 42 | |
4.075%, VAR ICE LIBOR USD 3 Month+1.192%, 04/23/2029 | | | 240 | | | | 258 | |
4.050%, 07/30/2022 | | | 40 | | | | 42 | |
3.668%, VAR ICE LIBOR USD 3 Month+1.390%, 07/24/2028 | | | 340 | | | | 355 | |
3.500%, 05/15/2023 | | | 100 | | | | 103 | |
3.400%, 05/01/2026 | | | 673 | | | | 697 | |
2.700%, 03/30/2021 | | | 455 | | | | 457 | |
Cooperatieve Rabobank UA | | | | | | | | |
3.950%, 11/09/2022 | | | 670 | | | | 695 | |
3.875%, 09/26/2023 (B) | | | 595 | | | | 628 | |
Credit Suisse Group | | | | | | | | |
4.282%, 01/09/2028 (B) | | | 280 | | | | 296 | |
Daiwa Securities Group | | | | | | | | |
3.129%, 04/19/2022 (B) | | | 50 | | | | 51 | |
Danske Bank | | | | | | | | |
5.000%, 01/12/2022 (B) | | | 200 | | | | 209 | |
Ferguson Finance | | | | | | | | |
4.500%,10/24/2028 (B) | | | 780 | | | | 815 | |
General Electric Capital MTN | | | | | | | | |
6.000%, 08/07/2019 | | | 414 | | | | 415 | |
4.650%, 10/17/2021 | | | 180 | | | | 188 | |
4.375%, 09/16/2020 | | | 10 | | | | 10 | |
Glencore Funding | | | | | | | | |
2.875%, 04/16/2020 (B) | | | 20 | | | | 20 | |
Goldman Sachs Group | | | | | | | | |
5.750%, 01/24/2022 | | | 662 | | | | 715 | |
5.150%, 05/22/2045 | | | 20 | | | | 23 | |
4.750%, 10/21/2045 | | | 40 | | | | 46 | |
4.250%, 10/21/2025 | | | 90 | | | | 95 | |
4.223%, VAR ICE LIBOR USD 3 Month+1.301%, 05/01/2029 | | | 550 | | | | 590 | |
3.691%, VAR ICE LIBOR USD 3 Month+1.510%, 06/05/2028 | | | 300 | | | | 310 | |
3.500%, 11/16/2026 | | | 90 | | | | 92 | |
2.300%, 12/13/2019 | | | 460 | | | | 460 | |
Goldman Sachs Group MTN | | | | | | | | |
6.000%, 06/15/2020 | | | 480 | | | | 496 | |
5.375%, 03/15/2020 | | | 640 | | | | 653 | |
4.000%, 03/03/2024 | | | 420 | | | | 446 | |
HSBC Holdings PLC | | | | | | | | |
4.583%, VAR ICE LIBOR USD 3 Month+1.535%, 06/19/2029 | | | 400 | | | | 437 | |
| | | | |
New Covenant Funds / Annual Report / June 30, 2019 | | | 29 | |
SCHEDULE OF INVESTMENTS
June 30, 2019
New Covenant Income Fund (Continued)
| | | | | | | | |
| | | |
| Description | | Face Amount
(Thousands) | | | Market Value
($ Thousands) | |
CORPORATE OBLIGATIONS (continued) | | | | | | | | |
3.400%, 03/08/2021 | | $ | 360 | | | $ | 366 | |
2.950%, 05/25/2021 | | | 380 | | | | 383 | |
Intesa Sanpaolo | | | | | | | | |
3.375%, 01/12/2023 (B) | | | 200 | | | | 199 | |
John Deere Capital | | | | | | | | |
1.700%, 01/15/2020 | | | 40 | | | | 40 | |
JPMorgan Chase | | | | | | | | |
4.500%, 01/24/2022 | | | 786 | | | | 828 | |
4.452%, VAR ICE LIBOR USD 3 Month+1.330%, 12/05/2029 | | | 200 | | | | 223 | |
4.203%, VAR ICE LIBOR USD 3 Month+1.260%, 07/23/2029 | | | 773 | | | | 845 | |
4.023%, VAR ICE LIBOR USD 3 Month+1.000%, 12/05/2024 | | | 230 | | | | 244 | |
4.005%, VAR ICE LIBOR USD 3 Month+1.120%, 04/23/2029 | | | 100 | | | | 108 | |
3.875%, 09/10/2024 | | | 290 | | | | 305 | |
2.550%, 03/01/2021 | | | 30 | | | | 30 | |
KKR Group Finance | | | | | | | | |
6.375%, 09/29/2020 (B) | | | 915 | | | | 958 | |
KKR Group Finance VI | | | | | | | | |
3.750%, 07/01/2029 (B) | | | 664 | | | | 681 | |
Liberty Mutual Group | | | | | | | | |
4.569%, 02/01/2029 (B) | | | 321 | | | | 353 | |
4.250%, 06/15/2023 (B) | | | 91 | | | | 96 | |
Lincoln National | | | | | | | | |
6.250%, 02/15/2020 | | | 570 | | | | 582 | |
Metropolitan Life Global Funding I | | | | | | | | |
3.000%, 01/10/2023 (B) | | | 507 | | | | 517 | |
Mitsubishi UFJ Financial Group | | | | | | | | |
3.407%, 03/07/2024 | | | 510 | | | | 529 | |
Morgan Stanley MTN | | | | | | | | |
3.772%, VAR ICE LIBOR USD 3 Month+1.140%, 01/24/2029 | | | 320 | | | | 336 | |
3.750%, 02/25/2023 | | | 1,810 | | | | 1,891 | |
National Rural Utilities Cooperative Finance | | | | | | | | |
2.850%, 01/27/2025 | | | 1,060 | | | | 1,083 | |
ORIX | | | | | | | | |
4.050%, 01/16/2024 | | | 365 | | | | 387 | |
Peachtree Corners Funding Trust | | | | | | | | |
3.976%, 02/15/2025 (B) | | | 944 | | | | 983 | |
Penske Truck Leasing Lp | | | | | | | | |
3.900%, 02/01/2024 (B) | | | 965 | | | | 1,009 | |
PNC Financial Services Group | | | | | | | | |
3.500%, 01/23/2024 | | | 805 | | | | 848 | |
Principal Life Global Funding II | | | | | | | | |
2.625%, 11/19/2020 (B) | | | 570 | | | | 573 | |
Reliance Standard Life Global Funding II MTN | | | | | | | | |
2.500%, 01/15/2020 (B) | | | 30 | | | | 30 | |
Royal Bank of Canada MTN | | | | | | | | |
2.150%, 10/26/2020 | | | 70 | | | | 70 | |
| | | | | | | | |
| | | |
| Description | | Face Amount (Thousands) | | | Market Value ($ Thousands) | |
CORPORATE OBLIGATIONS (continued) | | | | | | | | |
Royal Bank of Scotland Group | | | | | | | | |
4.269%, VAR ICE LIBOR USD 3 Month+1.762%, 03/22/2025 | | $ | 200 | | | $ | 207 | |
Royal Bank of Scotland Group PLC | | | | | | | | |
4.519%, VAR ICE LIBOR USD 3 Month+1.550%, 06/25/2024 | | | 290 | | | | 302 | |
Santander UK Group Holdings PLC | | | | | | | | |
3.571%, 01/10/2023 | | | 200 | | | | 204 | |
Santander UK PLC | | | | | | | | |
2.375%, 03/16/2020 | | | 40 | | | | 40 | |
SMBC Aviation Capital Finance DAC | | | | | | | | |
4.125%, 07/15/2023 (B) | | | 200 | | | | 210 | |
SunTrust Bank | | | | | | | | |
2.800%, 05/17/2022 | | | 1,146 | | | | 1,161 | |
Svenska Handelsbanken MTN | | | | | | | | |
3.350%, 05/24/2021 | | | 250 | | | | 255 | |
Synchrony Financial | | | | | | | | |
3.000%, 08/15/2019 | | | 64 | | | | 64 | |
UBS Group Funding Jersey | | | | | | | | |
4.125%, 04/15/2026 (B) | | | 634 | | | | 677 | |
UBS Group Funding Switzerland | | | | | | | | |
4.253%, 03/23/2028 (B) | | | 250 | | | | 269 | |
3.491%, 05/23/2023 (B) | | | 390 | | | | 400 | |
US Bancorp | | | | | | | | |
3.375%, 02/05/2024 | | | 540 | | | | 565 | |
USAA Capital MTN | | | | | | | | |
2.625%, 06/01/2021 (B) | | | 350 | | | | 353 | |
WEA Finance | | | | | | | | |
2.700%, 09/17/2019 (B) | | | 310 | | | | 310 | |
Wells Fargo | | | | | | | | |
3.069%, 01/24/2023 | | | 808 | | | | 820 | |
3.000%, 10/23/2026 | | | 190 | | | | 192 | |
Wells Fargo MTN | | | | | | | | |
4.900%, 11/17/2045 | | | 30 | | | | 35 | |
4.600%, 04/01/2021 | | | 480 | | | | 498 | |
4.300%, 07/22/2027 | | | 260 | | | | 281 | |
3.750%, 01/24/2024 | | | 540 | | | | 568 | |
3.450%, 02/13/2023 | | | 120 | | | | 123 | |
| | | | | | | | |
| | | | | | | 43,306 | |
| | | | | | | | |
| | |
Health Care — 2.2% | | | | | | | | |
Abbott Laboratories | | | | | | | | |
3.400%, 11/30/2023 | | | 175 | | | | 183 | |
AbbVie | | | | | | | | |
3.600%, 05/14/2025 | | | 10 | | | | 10 | |
Aetna | | | | | | | | |
2.800%, 06/15/2023 | | | 20 | | | | 20 | |
Amgen | | | | | | | | |
2.125%, 05/01/2020 | | | 20 | | | | 20 | |
Anthem | | | | | | | | |
3.125%, 05/15/2022 | | | 340 | | | | 346 | |
| | |
| 30 | | New Covenant Funds / Annual Report / June 30, 2019 |
| | | | | | | | |
| | | |
| Description | | Face Amount
(Thousands) | | | Market Value ($ Thousands) | |
CORPORATE OBLIGATIONS (continued) | | | | | | | | |
Baylor Scott & White Holdings | | | | | | | | |
1.947%, 11/15/2021 | | $ | 1,226 | | | $ | 1,211 | |
Becton Dickinson | | | | | | | | |
4.685%, 12/15/2044 | | | 40 | | | | 45 | |
3.734%, 12/15/2024 | | | 24 | | | | 25 | |
3.363%, 06/06/2024 | | | 210 | | | | 216 | |
Bristol-Myers Squibb | | | | | | | | |
3.400%, 07/26/2029 (B) | | | 50 | | | | 52 | |
3.200%, 06/15/2026 (B) | | | 120 | | | | 125 | |
2.900%, 07/26/2024 (B) | | | 180 | | | | 184 | |
2.600%, 05/16/2022 (B) | | | 80 | | | | 81 | |
Celgene | | | | | | | | |
3.875%, 08/15/2025 | | | 130 | | | | 139 | |
3.550%, 08/15/2022 | | | 60 | | | | 62 | |
2.250%, 08/15/2021 | | | 70 | | | | 70 | |
Cigna | | | | | | | | |
4.375%, 10/15/2028 (B) | | | 120 | | | | 130 | |
4.125%, 11/15/2025 (B) | | | 50 | | | | 53 | |
3.400%, 09/17/2021 (B) | | | 60 | | | | 61 | |
CVS Health | | | | | | | | |
4.300%, 03/25/2028 | | | 80 | | | | 84 | |
4.125%, 05/15/2021 | | | 300 | | | | 308 | |
3.875%, 07/20/2025 | | | 95 | | | | 99 | |
3.350%, 03/09/2021 | | | 60 | | | | 61 | |
2.800%, 07/20/2020 | | | 190 | | | | 191 | |
CVS Pass-Through Trust | | | | | | | | |
7.507%, 01/10/2032 (B) | | | 1,184 | | | | 1,430 | |
Eli Lilly | | | | | | | | |
2.350%, 05/15/2022 | | | 170 | | | | 171 | |
Express Scripts Holding | | | | | | | | |
3.500%, 06/15/2024 | | | 160 | | | | 165 | |
Gilead Sciences | | | | | | | | |
2.550%, 09/01/2020 | | | 20 | | | | 20 | |
2.500%, 09/01/2023 | | | 50 | | | | 51 | |
1.850%, 09/20/2019 | | | 130 | | | | 130 | |
Humana | | | | | | | | |
3.150%, 12/01/2022 | | | 240 | | | | 245 | |
2.900%, 12/15/2022 | | | 290 | | | | 294 | |
Medtronic | | | | | | | | |
3.125%, 03/15/2022 | | | 190 | | | | 195 | |
Merck | | | | | | | | |
2.750%, 02/10/2025 | | | 20 | | | | 21 | |
SSM Health Care | | | | | | | | |
3.688%, 06/01/2023 | | | 644 | | | | 672 | |
Teva Pharmaceutical Finance BV | | | | | | | | |
2.950%, 12/18/2022 | | | 30 | | | | 27 | |
UnitedHealth Group | | | | | | | | |
3.875%, 12/15/2028 | | | 30 | | | | 33 | |
2.875%, 12/15/2021 | | | 50 | | | | 51 | |
2.700%, 07/15/2020 | | | 70 | | | | 70 | |
| | | | | | | | |
| | | | | | | 7,351 | |
| | | | | | | | |
| | | | | | | | |
| | | |
| Description | | Face Amount (Thousands) | | | Market Value ($ Thousands) | |
CORPORATE OBLIGATIONS (continued) | | | | | | | | |
Industrials — 2.5% | | | | | | | | |
AerCap Ireland Capital DAC | | | | | | | | |
4.625%, 10/30/2020 | | $ | 730 | | | $ | 748 | |
4.500%, 05/15/2021 | | | 310 | | | | 320 | |
American Airlines, Ser2016-3, Cl A | | | | | | | | |
3.250%,10/15/2028 | | | 1,119 | | | | 1,109 | |
American Airlines Pass-Through Trust,
Ser2013-2, Cl A | | | | | | | | |
4.950%, 01/15/2023 | | | 294 | | | | 308 | |
Aviation Capital Group | | | | | | | | |
6.750%, 04/06/2021 (B) | | | 80 | | | | 86 | |
4.125%, 08/01/2025 (B) | | | 160 | | | | 167 | |
Burlington Northern and Santa Fe Railway Pass-Through Trust, Ser2002-2 | | | | | | | | |
5.140%, 01/15/2021 | | | 44 | | | | 45 | |
Burlington Northern Santa Fe | | | | | | | | |
4.550%, 09/01/2044 | | | 10 | | | | 12 | |
Continental Airlines Pass-Through Trust,
Ser2012-2, Cl A | | | | | | | | |
4.000%, 10/29/2024 | | | 657 | | | | 686 | |
Delta Air Lines Pass-Through Trust, Ser 2015-1, Cl AA | | | | | | | | |
3.625%, 07/30/2027 | | | 558 | | | | 588 | |
Delta Air Lines Pass-Through Trust, Ser 2019-1, Cl AA | | | | | | | | |
3.204%, 04/25/2024 | | | 621 | | | | 643 | |
Eaton | | | | | | | | |
2.750%, 11/02/2022 | | | 450 | | | | 456 | |
GE Capital International Funding Unlimited Co | | | | | | | | |
2.342%, 11/15/2020 | | | 1,205 | | | | 1,199 | |
General Electric | | | | | | | | |
4.500%, 03/11/2044 | | | 90 | | | | 87 | |
General Electric MTN | | | | | | | | |
6.875%, 01/10/2039 | | | 30 | | | | 38 | |
5.500%, 01/08/2020 | | | 10 | | | | 10 | |
General Electric Capital MTN | | | | | | | | |
5.300%, 02/11/2021 | | | 160 | | | | 166 | |
International Lease Finance | | | | | | | | |
5.875%, 08/15/2022 | | | 400 | | | | 436 | |
Republic Services | | | | | | | | |
3.200%, 03/15/2025 | | | 180 | | | | 186 | |
Union Pacific | | | | | | | | |
3.950%, 09/10/2028 | | | 20 | | | | 22 | |
3.750%, 07/15/2025 | | | 20 | | | | 21 | |
United Airlines Pass-Through Trust, Ser 2014-1, CI A | | | | | | | | |
4.000%, 04/11/2026 | | | 733 | | | | 770 | |
Waste Management | | | | | | | | |
3.500%, 05/15/2024 | | | 120 | | | | 126 | |
3.450%, 06/15/2029 | | | 30 | | | | 32 | |
| | | | |
New Covenant Funds / Annual Report / June 30, 2019 | | | 31 | |
SCHEDULE OF INVESTMENTS
June 30, 2019
New Covenant Income Fund (Continued)
| | | | | | | | |
| | | |
| Description | | Face Amount
(Thousands) | | | Market Value
($ Thousands) | |
| | |
CORPORATE OBLIGATIONS (continued) | | | | | | | | |
3.200%, 06/15/2026 | | $ | 30 | | | $ | 31 | |
| | | | | | | | |
| | | | | | | 8,292 | |
| | | | | | | | |
| | |
Information Technology — 1.3% | | | | | | | | |
Apple | | | | | | | | |
3.350%, 02/09/2027 | | | 210 | | | | 220 | |
2.900%, 09/12/2027 | | | 110 | | | | 113 | |
2.450%, 08/04/2026 | | | 70 | | | | 70 | |
2.000%, 11/13/2020 | | | 80 | | | | 80 | |
1.550%, 08/04/2021 | | | 60 | | | | 59 | |
Broadcom | | | | | | | | |
3.625%, 10/15/2024 (B) | | | 485 | | | | 488 | |
3.125%, 01/15/2025 | | | 80 | | | | 78 | |
Diamond 1 Finance | | | | | | | | |
4.420%, 06/15/2021 (B) | | | 430 | | | | 443 | |
Intel | | | | | | | | |
3.700%, 07/29/2025 | | | 30 | | | | 32 | |
International Business Machines | | | | | | | | |
3.000%, 05/15/2024 | | | 180 | | | | 185 | |
Mastercard | | | | | | | | |
3.375%, 04/01/2024 | | | 190 | | | | 201 | |
Microsoft | | | | | | | | |
3.300%, 02/06/2027 | | | 140 | | | | 149 | |
2.400%, 02/06/2022 | | | 150 | | | | 151 | |
2.400%, 08/08/2026 | | | 210 | | | | 211 | |
1.850%, 02/06/2020 | | | 360 | | | | 359 | |
1.550%, 08/08/2021 | | | 110 | | | | 109 | |
NXP BV | | | | | | | | |
3.875%, 06/18/2026 (B) | | | 495 | | | | 509 | |
Oracle | | | | | | | | |
2.500%, 10/15/2022 | | | 130 | | | | 131 | |
salesforce.com | | | | | | | | |
3.700%, 04/11/2028 | | | 150 | | | | 162 | |
3.250%, 04/11/2023 | | | 70 | | | | 73 | |
Visa | | | | | | | | |
4.300%, 12/14/2045 | | | 10 | | | | 12 | |
3.150%, 12/14/2025 | | | 110 | | | | 115 | |
2.200%, 12/14/2020 | | | 300 | | | | 300 | |
| | | | | | | | |
| | | | | | | 4,250 | |
| | | | | | | | |
| | |
Materials — 0.6% | | | | | | | | |
ArcelorMittal | | | | | | | | |
4.550%, 03/11/2026 | | | 100 | | | | 106 | |
Equate Petrochemical BV MTN | | | | | | | | |
4.250%, 11/03/2026 (B) | | | 200 | | | | 209 | |
Freeport-McMoRan | | | | | | | | |
4.000%, 11/14/2021 | | | 170 | | | | 173 | |
Glencore Funding | | | | | | | | |
4.125%, 05/30/2023 (B) | | | 890 | | | | 925 | |
4.125%, 03/12/2024 (B) | | | 120 | | | | 125 | |
4.000%, 03/27/2027 (B) | | | 120 | | | | 121 | |
| | | | | | | | |
| | | |
| Description | | Face Amount (Thousands) | | | Market Value ($ Thousands) | |
| | |
CORPORATE OBLIGATIONS (continued) | | | | | | | | |
Southern Copper | | | | | | | | |
3.500%, 11/08/2022 | | $ | 130 | | | $ | 132 | |
Vale Overseas | | | | | | | | |
6.250%, 08/10/2026 | | | 140 | | | | 159 | |
| | | | | | | | |
| | | | | | | 1,950 | |
| | | | | | | | |
| | |
Real Estate — 1.2% | | | | | | | | |
American Tower Trust, Ser2013-13, Cl 2A | | | | | | | | |
3.070%, 03/15/2048 (B) | | | 700 | | | | 711 | |
Digital Realty Trust | | | | | | | | |
3.600%, 07/01/2029 | | | 815 | | | | 826 | |
Simon Property Group | | | | | | | | |
2.350%, 01/30/2022 | | | 413 | | | | 414 | |
Ventas Realty | | | | | | | | |
4.125%, 01/15/2026 | | | 566 | | | | 599 | |
3.500%, 02/01/2025 | | | 488 | | | | 505 | |
Welltower | | | | | | | | |
4.500%, 01/15/2024 | | | 902 | | | | 969 | |
| | | | | | | | |
| | | | | | | 4,024 | |
| | | | | | | | |
| | |
Utilities — 2.2% | | | | | | | | |
Aquarion | | | | | | | | |
4.000%, 08/15/2024 (B) | | | 227 | | | | 238 | |
Commonwealth Edison | | | | | | | | |
3.700%, 08/15/2028 | | | 1,118 | | | | 1,202 | |
Dominion Energy | | | | | | | | |
2.579%, 07/01/2020 | | | 260 | | | | 260 | |
Duke Energy | | | | | | | | |
3.750%, 04/15/2024 | | | 900 | | | | 949 | |
3.550%, 09/15/2021 | | | 170 | | | | 174 | |
2.400%, 08/15/2022 | | | 150 | | | | 150 | |
FirstEnergy | | | | | | | | |
4.250%, 03/15/2023 | | | 380 | | | | 399 | |
2.850%, 07/15/2022 | | | 330 | | | | 334 | |
Northern States Power | | | | | | | | |
7.125%, 07/01/2025 | | | 1,190 | | | | 1,476 | |
Perusahaan Listrik Negara MTN | | | | | | | | |
5.450%, 05/21/2028 (B) | | | 370 | | | | 410 | |
Public Service Enterprise Group | | | | | | | | |
2.875%, 06/15/2024 | | | 713 | | | | 722 | |
Sempra Energy | | | | | | | | |
2.400%, 03/15/2020 | | | 840 | | | | 839 | |
| | | | | | | | |
| | | | | | | 7,153 | |
| | | | | | | | |
Total Corporate Obligations
(Cost $99,925) ($ Thousands) | | | | | | | 103,156 | |
| | | | | | | | |
| | |
U.S. TREASURY OBLIGATIONS — 10.7% | | | | | | | | |
U.S. Treasury Bills | | | | | | | | |
2.314%, 09/05/2019 (C) | | | 811 | | | | 808 | |
2.077%, 09/19/2019 (C) | | | 6,384 | | | | 6,355 | |
| | |
| 32 | | New Covenant Funds / Annual Report / June 30, 2019 |
| | | | | | | | |
| | | |
| Description | | Face Amount
(Thousands) | | | Market Value
($ Thousands) | |
U.S. TREASURY OBLIGATIONS (continued) | | | | | | | | |
U.S. Treasury Bonds | | | | | | | | |
3.750%, 11/15/2043 | | $ | 250 | | | $ | 308 | |
3.125%, 05/15/2048 | | | 40 | | | | 45 | |
3.000%, 05/15/2045 | | | 250 | | | | 273 | |
3.000%, 02/15/2048 | | | 480 | | | | 526 | |
3.000%, 08/15/2048 | | | 1,400 | | | | 1,535 | |
3.000%, 02/15/2049 | | | 360 | | | | 395 | |
2.875%, 08/15/2045 | | | 200 | | | | 214 | |
2.875%, 05/15/2049 | | | 960 | | | | 1,030 | |
2.750%, 08/15/2047 | | | 120 | | | | 125 | |
U.S. Treasury Inflation-Protected Securities | | | | | | | | |
2.375%, 01/15/2025 | | | 176 | | | | 197 | |
1.750%, 01/15/2028 | | | 85 | | | | 96 | |
1.375%, 02/15/2044 | | | 537 | | | | 610 | |
1.000%, 02/15/2046 | | | 388 | | | | 407 | |
1.000%, 02/15/2049 | | | 1,483 | | | | 1,544 | |
0.750%, 02/15/2042 | | | 464 | | | | 465 | |
U.S. Treasury Notes | | | | | | | | |
2.750%, 09/15/2021 | | | 4,022 | | | | 4,111 | |
2.750%, 02/15/2028 | | | 4 | | | | 4 | |
2.625%, 02/15/2029 | | | 850 | | | | 896 | |
2.500%, 01/31/2021 | | | 580 | | | | 586 | |
2.375%, 02/29/2024 | | | 5,221 | | | | 5,368 | |
2.250%, 03/31/2021 | | | 800 | | | | 806 | |
2.250%, 04/30/2024 | | | 30 | | | | 31 | |
2.250%, 03/31/2026 | | | 710 | | | | 728 | |
2.250%, 02/15/2027 | | | 4,184 | | | | 4,288 | |
2.000%, 02/15/2025 | | | 50 | | | | 51 | |
1.625%, 06/30/2021 | | | 3,690 | | | | 3,681 | |
| | | | | | | | |
Total U.S. Treasury Obligations
(Cost $34,670)($ Thousands) | | | | | | | 35,483 | |
| | | | | | | | |
| |
ASSET-BACKED SECURITIES — 8.9% | | | | | |
Automotive — 1.3% | | | | | | | | |
Avis Budget Rental Car Funding AESOP,
Ser2017-2A, Cl A | | | | | | | | |
2.970%, 03/20/2024 (B) | | | 310 | | | | 315 | |
Avis Budget Rental Car Funding AESOP,
Ser2019-2A, CI A | | | | | | | | |
3.350%, 09/22/2025 (B) | | | 320 | | | | 330 | |
Hertz Vehicle Financing II, Ser2018-1A, Cl A | | | | | | | | |
3.290%, 02/25/2024 (B) | | | 350 | | | | 356 | |
Honda Auto Receivables Owner Trust,
Ser2019-2, Cl A3 | | | | | | | | |
2.520%, 06/21/2023 | | | 572 | | | | 578 | |
Hyundai Auto Lease Securitization Trust,
Ser2017-A,CI A3 | | | | | | | | |
1.880%, 08/17/2020 (B) | | | 158 | | | | 158 | |
| | | | | | | | |
| | | |
| Description | | Face Amount (Thousands) | | | Market Value ($ Thousands) | |
ASSET-BACKED SECURITIES (continued) | | | | | | | | |
NextGear Floorplan Master Owner Trust,
Ser2019-1A, Cl A2 | | | | | | | | |
3.210%, 02/15/2024 (B) | | $ | 1,182 | | | $ | 1,208 | |
World Omni Auto Receivables Trust,
Ser2019-B,CI A3 | | | | | | | | |
2.590%, 07/15/2024 | | | 1,299 | | | | 1,313 | |
| | | | | | | | |
| | | | | | | 4,258 | |
| | | | | | | | |
Home — 0.5% | | | | | | | | |
Argent Securities, Ser2004-W5, Cl AV2 | | | | | | | | |
3.444%, VAR ICE LIBOR USD 1
Month+1.040%, 04/25/2034 | | | 321 | | | | 325 | |
Citifinancial Mortgage Securities, Ser 2004-1, Cl AF4 | | | | | | | | |
5.070%, 04/25/2034 | | | 224 | | | | 234 | |
GS Mortgage-Backed Securities Trust, Ser 2018-RPL1, CI A1A | | | | | | | | |
3.750%, 10/25/2057 (B) | | | 378 | | | | 391 | |
Lake Country Mortgage Loan Trust, Ser2006-HE1,CI M5 | | | | | | | | |
4.404%, VAR ICE LIBOR USD 1
Month+2.000%, 07/25/2034 (B) | | | 390 | | | | 401 | |
Master Asset-Backed Securities Trust, Ser2007-NCW, Cl A1 | | | | | | | | |
2.704%, VAR ICE LIBOR USD 1
Month+0.300%, 05/25/2037 (B) | | | 232 | | | | 221 | |
New Century Home Equity Loan Trust, Ser2003-A, Cl A | | | | | | | | |
3.124%, VAR ICE LIBOR USD 1
Month+0.720%, 10/25/2033 (B) | | | 91 | | | | 90 | |
| | | | | | | | |
| | | | | | | 1,662 | |
| | | | | | | | |
Other Asset-Backed Securities — 7.1% | | | | | | | | |
Ally Master Owner Trust, Ser2018-2, Cl A | | | | | | | | |
3.290%, 05/15/2023 | | | 1,572 | | | | 1,605 | |
Ameriquest Mortgage Securities Asset-
Backed Pass-Through Certificates,
Ser2005-R7, Cl M2 | | | | | | | | |
2.904%, VAR ICE LIBOR USD 1
Month+0.500%, 09/25/2035 | | | 403 | | | | 405 | |
Applebee’s Funding, Ser2019-1A, Cl A2I | | | | | | | | |
4.194%, 06/07/2049 (B) | | | 300 | | | | 303 | |
Ascentium Equipment Receivables, Ser 2019-1A, CI A2 | | | | | | | | |
2.840%, 06/10/2022 (B) | | | 645 | | | | 650 | |
Capital One Multi-Asset Execution Trust, Ser2019-A1, CI A1 | | | | | | | | |
2.840%, 12/15/2024 | | | 996 | | | | 1,015 | |
Citigroup Mortgage Loan Trust, Ser 2007-WFH3, Cl A3 | | | | | | | | |
2.654%, VAR ICE LIBOR USD 1
Month+0.250%, 06/25/2037 | | | 308 | | | | 308 | |
| | | | |
New Covenant Funds / Annual Report / June 30, 2019 | | | 33 | |
SCHEDULE OF INVESTMENTS
June 30, 2019
New Covenant Income Fund(Continued)
| | | | | | | | |
| | | |
| Description | | Face Amount
(Thousands) | | | Market Value
($ Thousands) | |
ASSET-BACKED SECURITIES (continued) | | | | | | | | |
Countrywide Asset-Backed Certificates,Ser 2007-13, Cl 2A2M | | | | | | | | |
3.654%, VAR ICE LIBOR USD 1 Month+1.250%, 10/25/2047 | | $ | 165 | | | $ | 163 | |
Countrywide Home Equity Loan Trust,Ser 2006-F, CI 2A1A | | | | | | | | |
2.534%, VAR ICE LIBOR USD 1 Month+0.140%, 07/15/2036 | | | 358 | | | | 345 | |
DB Master Finance, Ser2017-1A, Cl A2l | | | | | | | | |
3.629%, 11/20/2047 (B) | | | 531 | | | | 539 | |
Domino’s Pizza Master Issuer,Ser 2017-1A, CI A2I | | | | | | | | |
3.830%, VAR ICE LIBOR USD 3 Month+1.250%, 07/25/2047 (B) | | | 699 | | | | 695 | |
Invitation Homes Trust, Ser 2018-SFR1, Cl A | | | | | | | | |
3.094%, VAR LIBOR USD 1 Month+0.700%, 03/17/2037 (B) | | | 1,444 | | | | 1,426 | |
MMAF Equipment Finance,Ser 2018-A, Cl A3 | | | | | | | | |
3.200%, 09/12/2022 (B) | | | 1,255 | | | | 1,271 | |
Morgan Stanley ABS Capital l Trust,Ser 2004-0P1, CI M1 | | | | | | | | |
3.274%, VAR ICE LIBOR USD 1 Month+0.870%, 11/25/2034 | | | 493 | | | | 497 | |
Morgan Stanley Capital l Trust, Ser BPR, Cl A | | | | | | | | |
3.794%, VAR LIBOR USD 1 Month+1.400%, 05/15/2036 (B) | | | 320 | | | | 320 | |
Navient Student Loan Trust,Ser 2016-6A, Cl A3 | | | | | | | | |
3.704%, VAR ICE LIBOR USD 1 Month+1.300%, 03/25/2066 (B) | | | 900 | | | | 917 | |
Progress Residential Trust, Ser 2018-SFR3, CI A | | | | | | | | |
3.880%, 10/17/2035 (B) | | | 640 | | | | 660 | |
RAAC Series Trust, Ser2005-SP3, Cl M2 | | | | | | | | |
3.204%, VAR ICE LIBOR USD 1 Month+0.800%, 12/25/2035 | | | 390 | | | | 392 | |
SBA Small Business Investment, Ser 2019-10A, Cl 1 | | | | | | | | |
3.113%, 03/10/2029 | | | 200 | | | | 209 | |
Shops at Crystals Trust, Ser CSTL, Cl A | | | | | | | | |
3.126%, 07/05/2036 (B) | | | 100 | | | | 101 | |
SLC Student Loan Trust,Ser 2010-1, Cl A | | | | | | | | |
3.396%, VAR ICE LIBOR USD 3 Month+0.875%, 11/25/2042 | | | 307 | | | | 308 | |
SLM Private Credit Student Loan Trust,Ser 2006-A, CI A5 | | | | | | | | |
2.700%, VAR ICE LIBOR USD 3 Month+0.290%, 06/15/2039 | | | 315 | | | | 306 | |
SLM Student Loan Trust,Ser 2002-A, Cl A2 | | | | | | | | |
2.960%, VAR ICE LIBOR USD 3 Month+0.550%, 12/16/2030 | | | 203 | | | | 203 | |
| | | | | | | | |
| | | |
| Description | | Face Amount
(Thousands) | | | Market Value
($ Thousands) | |
ASSET-BACKED SECURITIES (continued) | | | | | | | | |
SLM Student Loan Trust,Ser 2003-7A, Cl A5A | | | | | | | | |
3.610%, VAR ICE LIBOR USD 3 Month+1.200%, 12/15/2033 (B) | | $ | 148 | | | $ | 148 | |
Store Master Fundingl-VII,Ser 2018-1A,
Cl A1 | | | | | | | | |
3.960%, 10/20/2048 (B) | | | 386 | | | | 404 | |
United States Small Business Administration,Ser 2010-20H, CI 1 | | | | | | | | |
3.520%, 08/01/2030 | | | 333 | | | | 345 | |
United States Small Business Administration,Ser 2011-20B, CI 1 | | | | | | | | |
4.220%, 02/01/2031 | | | 358 | | | | 381 | |
United States Small Business Administration,Ser 2011-20J, Cl 1 | | | | | | | | |
2.760%, 10/01/2031 | | | 200 | | | | 201 | |
United States Small Business Administration, Ser2013-20K, Cl 1 | | | | | | | | |
3.380%, 11/01/2033 | | | 827 | | | | 859 | |
United States Small Business Administration,Ser 2014-20F, Cl 1 | | | | | | | | |
2.990%, 06/01/2034 | | | 919 | | | | 947 | |
United States Small Business Administration,Ser 2015-20C, CI 1 | | | | | | | | |
2.720%, 03/01/2035 | | | 973 | | | | 991 | |
United States Small Business Administration,Ser 2015-20E, CI 1 | | | | | | | | |
2.770%, 05/01/2035 | | | 542 | | | | 554 | |
United States Small Business Administration,Ser 2015-20K, CI 1 | | | | | | | | |
2.700%, 11/01/2035 | | | 557 | | | | 568 | |
United States Small Business Administration,Ser 2017-20J, Cl 1 | | | | | | | | |
2.850%, 10/01/2037 | | | 707 | | | | 723 | |
United States Small Business Administration,Ser 2018-20E, CI 1 | | | | | | | | |
3.500%, 05/01/2038 | | | 1,332 | | | | 1,417 | |
United States Small Business Administration,Ser 2018-20J, CI 1 | | | | | | | | |
3.770%, 10/01/2038 | | | 657 | | | | 710 | |
Verizon Owner Trust,Ser 2018-A, Cl A1A | | | | | | | | |
3.230%, 04/20/2023 | | | 1,465 | | | | 1,493 | |
Verizon Owner Trust,Ser 2019-B, Cl A1A | | | | | | | | |
2.330%, 12/20/2023 | | | 624 | | | | 626 | |
Wendy’s Funding,Ser 2019-1A, Cl A2I | | | | | | | | |
3.783%, 06/15/2049 (B) | | | 340 | | | | 340 | |
| | | | | | | | |
| | | | | | | 23,345 | |
| | | | | | | | |
Total Asset-Backed Securities
(Cost $28,762) ($ Thousands) | | | | | | | 29,265 | |
| | | | | | | | |
U.S. GOVERNMENT AGENCY OBLIGATIONS — 6.4% | | | | | |
FHLB DN | | | | | | | | |
2.460%, 09/27/2019 (C) | | | 190 | | | | 189 | |
2.407%, 08/01/2019 (C) | | | 100 | | | | 100 | |
| | |
| 34 | | New Covenant Funds / Annual Report / June 30, 2019 |
| | | | | | | | |
| | | |
| Description | | Face Amount
(Thousands) | | | Market Value ($ Thousands) | |
U.S. GOVERNMENT AGENCY OBLIGATIONS (continued) | | | | | |
FHLMC | | | | | | | | |
6.500%, 12/01/2035 | | $ | 821 | | | $ | 913 | |
6.000%, 03/01/2035 | | | 1,233 | | | | 1,404 | |
5.000%, 10/01/2048 | | | 84 | | | | 89 | |
4.000%, 04/01/2048 | | | 91 | | | | 95 | |
4.000%, 05/01/2048 | | | 737 | | | | 766 | |
3.500%, 09/01/2048 | | | 659 | | | | 675 | |
3.500%, 10/01/2048 | | | 930 | | | | 954 | |
3.500%, 01/01/2049 | | | 96 | | | | 99 | |
3.500%, 04/01/2049 | | | 1,089 | | | | 1,115 | |
3.000%, 02/01/2038 | | | 90 | | | | 91 | |
3.000%, 04/01/2038 | | | 92 | | | | 93 | |
3.000%, 11/01/2043 | | | 683 | | | | 693 | |
3.000%, 01/01/2048 | | | 99 | | | | 100 | |
3.000%, 03/01/2049 | | | 99 | | | | 100 | |
3.000%, 04/01/2049 | | | 1,969 | | | | 1,989 | |
2.375%, 01/13/2022 | | | 1,090 | | | | 1,106 | |
1.250%, 10/02/2019 | | | 70 | | | | 70 | |
FHLMC, Ser 2018-4813, Cl CJ | | | | | | | | |
3.000%, 08/15/2048 | | | 332 | | | | 337 | |
FNMA | | | | | | | | |
4.500%, 09/01/2057 | | | 260 | | | | 278 | |
4.000%, 02/01/2056 | | | 75 | | | | 79 | |
4.000%, 06/01/2057 | | | 83 | | | | 88 | |
3.830%, 01/01/2029 | | | 490 | | | | 539 | |
3.500%, 10/01/2047 | | | 1,336 | | | | 1,375 | |
3.500%, 06/01/2048 | | | 745 | | | | 765 | |
3.500%, 07/01/2048 | | | 478 | | | | 492 | |
3.500%, 02/01/2049 | | | 96 | | | | 100 | |
3.000%, 12/01/2037 | | | 89 | | | | 90 | |
3.000%, 03/01/2046 | | | 1,343 | | | | 1,370 | |
3.000%, 05/01/2046 | | | 86 | | | | 87 | |
3.000%, 07/01/2046 | | | 153 | | | | 156 | |
3.000%, 10/01/2046 | | | 235 | | | | 239 | |
3.000%, 11/01/2046 | | | 1,957 | | | | 1,983 | |
3.000%, 09/01/2047 | | | 368 | | | | 374 | |
2.932%, 10/09/2019 (C) | | | 1,190 | | | | 1,183 | |
FNMA, Ser M1, Cl A2 | | | | | | | | |
3.673%, 09/25/2028 (A) | | | 270 | | | | 292 | |
Tennessee Valley Authority | | | | | | | | |
3.875%, 02/15/2021 | | | 790 | | | | 815 | |
| | | | | | | | |
Total U.S. Government Agency Obligations
(Cost $20,737)($ Thousands) | | | | | | | 21,283 | |
| | | | | | | | |
| | |
SOVEREIGN DEBT — 3.0% | | | | | | | | |
Abu Dhabi Government International Bond | | | | | | | | |
2.500%, 10/11/2022 (B) | | | 490 | | | | 494 | |
Colombia Government International Bond | | | | | | | | |
5.625%, 02/26/2044 | | | 280 | | | | 331 | |
| | | | | | | | |
| | | |
| Description | | Face Amount
(Thousands) | | | Market Value
($ Thousands) | |
SOVEREIGN DEBT (continued) | | | | | |
5.200%, 05/15/2049 | | $ | 310 | | | $ | 352 | |
4.500%, 03/15/2029 | | | 200 | | | | 218 | |
Indonesia Government International Bond MTN | | | | | | | | |
5.125%, 01/15/2045 (B) | | | 200 | | | | 225 | |
3.850%, 07/18/2027 (B) | | | 200 | | | | 207 | |
3.750%, 04/25/2022 | | | 370 | | | | 379 | |
Kuwait International Government Bond | | | | | | | | |
3.500%, 03/20/2027 (B) | | | 210 | | | | 224 | |
Mexico Government International Bond | | | | | | | | |
4.000%, 10/02/2023 | | | 610 | | | | 636 | |
3.600%, 01/30/2025 | | | 380 | | | | 389 | |
Panama Government International Bond | | | | | | | | |
6.700%, 01/26/2036 | | | 190 | | | | 258 | |
Peruvian Government International Bond | | | | | | | | |
6.550%, 03/14/2037 | | | 250 | | | | 353 | |
5.625%, 11/18/2050 | | | 310 | | | | 427 | |
Poland Government International Bond | | | | | | | | |
5.125%, 04/21/2021 | | | 440 | | | | 463 | |
4.000%, 01/22/2024 | | | 450 | | | | 484 | |
Province of Ontario Canada | | | | | | | | |
4.400%, 04/14/2020 | | | 840 | | | | 854 | |
Province of Quebec Canada | | | | | | | | |
2.625%, 02/13/2023 | | | 500 | | | | 512 | |
Province of Quebec Canada, Ser A MTN | | | | | | | | |
6.350%, 01/30/2026 | | | 1,010 | | | | 1,226 | |
Qatar Government International Bond | | | | | | | | |
3.250%, 06/02/2026 | | | 370 | | | | 380 | |
Russian Foreign Bond—Eurobond | | | | | | | | |
7.500%, 03/31/2030 | | | 167 | | | | 189 | |
5.875%, 09/16/2043 | | | 400 | | | | 486 | |
5.625%, 04/04/2042 | | | 400 | | | | 469 | |
Uruguay Government International Bond | | | | | | | | |
4.375%, 01/23/2031 | | | 390 | | | | 422 | |
| | | | | | | | |
Total Sovereign Debt
(Cost $9,447) ($ Thousands) | | | | | | | 9,978 | |
| | | | | | | | |
| | |
FOREIGN BONDS — 2.0% | | | | | | | | |
Allergan Funding SCS | | | | | | | | |
3.800%, 03/15/2025 | | | 40 | | | | 41 | |
3.450%, 03/15/2022 | | | 120 | | | | 123 | |
Banco Santander | | | | | | | | |
3.125%, 02/23/2023 | | | 200 | | | | 203 | |
Banco Santander Chile | | | | | | | | |
2.500%, 12/15/2020 (B) | | | 240 | | | | 240 | |
Barclays Bank | | | | | | | | |
10.179%, 06/12/2021 (B) | | | 370 | | | | 419 | |
BHP Billiton Finance USA | | | | | | | | |
2.875%, 02/24/2022 | | | 10 | | | | 10 | |
| | | | |
New Covenant Funds / Annual Report / June 30, 2019 | | | 35 | |
SCHEDULE OF INVESTMENTS
June 30, 2019
New Covenant Income Fund(Continued)
| | | | | | | | |
| | | |
| Description | | Face Amount
(Thousands) | | | Market Value
($ Thousands) | |
FOREIGN BONDS (continued) | | | | | |
BP Capital Markets PLC | | | | | | | | |
3.561%, 11/01/2021 | | $ | 230 | | | $ | 237 | |
CNOOC Finance | | | | | | | | |
3.500%, 05/05/2025 | | | 330 | | | | 340 | |
Cooperatieve Rabobank UA | | | | | | | | |
4.375%, 08/04/2025 | | | 500 | | | | 531 | |
Ecopetrol | | | | | | | | |
5.375%, 06/26/2026 | | | 140 | | | | 154 | |
HSBC Holdings PLC | | | | | | | | |
4.250%, 08/18/2025 | | | 230 | | | | 242 | |
Intesa Sanpaolo | | | | | | | | |
5.017%, 06/26/2024 (B) | | | 200 | | | | 200 | |
3.125%, 07/14/2022 (B) | | | 200 | | | | 198 | |
Landwirtschaftliche Rentenbank | | | | | | | | |
1.375%, 10/23/2019 | | | 110 | | | | 110 | |
OCP | | | | | | | | |
4.500%, 10/22/2025 (B) | | | 400 | | | | 409 | |
Petrobras Global Finance BV | | | | | | | | |
6.850%, 06/05/2115 | | | 150 | | | | 156 | |
Petroleos del Peru | | | | | | | | |
4.750%, 06/19/2032 (B) | | | 400 | | | | 438 | |
Petroleos Mexicanos | | | | | | | | |
4.875%, 01/18/2024 | | | 190 | | | | 186 | |
Shell International Finance | | | | | | | | |
4.375%, 03/25/2020 | | | 130 | | | | 132 | |
Shell International Finance BV | | | | | | | | |
3.250%, 05/11/2025 | | | 150 | | | | 157 | |
2.875%, 05/10/2026 | | | 40 | | | | 41 | |
2.250%, 11/10/2020 | | | 360 | | | | 361 | |
1.750%, 09/12/2021 | | | 690 | | | | 684 | |
Telefonica Emisiones SAU | | | | | | | | |
5.134%, 04/27/2020 | | | 80 | | | | 82 | |
Teva Pharmaceutical Finance Netherlands III BV | | | | | |
2.200%, 07/21/2021 | | | 730 | | | | 692 | |
Vale Overseas | | | | | | | | |
6.875%, 11/21/2036 | | | 48 | | | | 58 | |
4.375%, 01/11/2022 | | | 8 | | | | 8 | |
| | | | | | | | |
Total Foreign Bonds
(Cost $6,271) ($ Thousands) | | | | | | | 6,452 | |
| | | | | | | | |
MUNICIPAL BONDS — 1.1% | | | | | |
Florida — 0.3% | | | | | |
Florida State, Board of Administration Finance, Ser A, RB | | | | | | | | |
2.638%, 07/01/2021 | | | 420 | | | | 424 | |
2.163%, 07/01/2019 | | | 535 | | | | 535 | |
| | | | | | | | |
| | | | | | | 959 | |
| | | | | | | | |
| | | | | | | | |
| | | |
| Description | | Face Amount
(Thousands) | | | Market Value
($ Thousands) | |
MUNICIPAL BONDS (continued) | | | | | | | | |
Michigan — 0.3% | | | | | | | | |
Michigan State, Finance Authority, RB Callable 03/01/2024 @ 100 | | | | | | | | |
2.988%, 09/01/2049 (A) | | $ | 755 | | | $ | 770 | |
| | | | | | | | |
New York — 0.2% | | | | | | | | |
New York State, Urban Development, RB | | | | | | | | |
3.350%, 03/15/2026 | | | 665 | | | | 697 | |
| | | | | | | | |
Wisconsin — 0.3% | | | | | | | | |
Wisconsin State, Ser A, RB, AGM | | | | | | | | |
5.700%, 05/01/2026 | | | 890 | | | | 1,016 | |
| | | | | | | | |
| | |
Total Municipal Bonds
(Cost $3,379) ($ Thousands) | | | | | | | 3,442 | |
| | | | | | | | |
| | |
COMMERCIAL PAPER — 0.4% | | | | | | | | |
Standard Chartered Bank | | | | | | | | |
2.592%, 07/24/2019 (C) | | | 560 | | | | 559 | |
| | |
Toronto-Dominion Bank | | | | | | | | |
2.536%, 07/25/2019 (C) | | | 770 | | | | 769 | |
| | | | | | | | |
| | |
Total Commercial Paper
(Cost $1,328) ($ Thousands) | | | | | | | 1,328 | |
| | | | | | | | |
| | | Shares | | | | |
CASH EQUIVALENT — 3.3% | | | | | | | | |
SEI Daily Income Trust, Government Fund, Cl F | | | | | |
2.140% **† | | | 11,030,519 | | | | 11,031 | |
| | | | | | | | |
Total Cash Equivalent
(Cost $11,031) ($ Thousands) | | | | | | | 11,031 | |
| | | | | | | | |
Total Investments in Securities — 106.7%
(Cost $345,710) ($ Thousands) | | | | | | $ | 352,679 | |
| | | | | | | | |
| | | Contracts | | | | |
PURCHASED OPTION* — 0.0% | | | | | | | | |
Total Purchased Option(D)
(Cost $26) ($ Thousands) | | | 66 | | | $ | 83 | |
| | | | | | | | |
WRITTEN OPTIONS* — 0.0% | | | | | | | | |
Total Written Options(D)
(Premiums Received $106) ($ Thousands) | | | (223 | ) | | $ | (131 | ) |
| | | | | | | | |
| | |
| 36 | | New Covenant Funds / Annual Report / June 30, 2019 |
A list of open option contracts by the Fund at June 30, 2019 are as follows:
| | | | | | | | | | | | | | | | | | | | |
| | | | | | |
Description | | Number of
Contracts | | | Notional Amount
(Thousands) | | | Exercise Price | | | Expiration Date | | | Value
(Thousands) | |
PURCHASED OPTION — 0.0% | | | | | | | | | | | | | |
Call Options | | | | | | | | | | | | | | | | | |
December 2019, EurodollarMid-Curve Option* | | | 66 | | | $ | 16,235 | | | $ | 98.00 | | | | 12/21/19 | | | $ | 83 | |
| | | | | | | | | | | | | | | | | | | | |
Total Purchased Option | | | | | | $ | 16,235 | | | | | | | | | | | $ | 83 | |
| | | | | | | | | | | | | | | | | | | | |
WRITTEN OPTIONS — 0.0% | | | | | | | | | | | | | | | | | |
Put Options | | | | | | | | | | | | | | | | | |
August 2019, U.S. 10 Year Future Option* | | | (10 | ) | | $ | (1,277 | ) | | | 127.25 | | | | 07/20/19 | | | $ | (3 | ) |
September 2019, U.S. 10 Year Future Option* | | | (73 | ) | | | (9,321 | ) | | | 126.50 | | | | 08/17/19 | | | | (23 | ) |
September 2019, U.S. 10 Year Future Option* | | | (47 | ) | | | (6,001 | ) | | | 127.00 | | | | 08/17/19 | | | | (21 | ) |
August 2019, U.S. 5 Year Future Option* | | | (9 | ) | | | (1,062 | ) | | | 117.25 | | | | 07/20/19 | | | | (1 | ) |
September 2019, U.S. 5 Year Future Option* | | | (9 | ) | | | (1,062 | ) | | | 117.25 | | | | 08/17/19 | | | | (2 | ) |
| | | | | | | | | | | | | | | | | | | | |
| | | | | | | (18,723 | ) | | | | | | | | | | | (50 | ) |
| | | | | | | | | | | | | | | | | | | | |
Call Options | | | | | | | | | | | | | | | | | |
December 2019, EurodollarMid-Curve Option* | | | (33 | ) | | | (8,117 | ) | | | 97.75 | | | | 12/21/19 | | | | (59 | ) |
December 2019, EurodollarMid-Curve Option* | | | (33 | ) | | | (8,118 | ) | | | 98.50 | | | | 12/21/19 | | | | (16 | ) |
August 2019, U.S. 10 Year Future Option* | | | (9 | ) | | | (1,149 | ) | | | 128.00 | | | | 07/20/19 | | | | (6 | ) |
| | | | | | | | | | | | | | | | | | | | |
| | | | | | | (17,384 | ) | | | | | | | | | | | (81 | ) |
| | | | | | | | | | | | | | | | | | | | |
Total Written Options | | | | | | $ | (36,107 | ) | | | | | | | | | | $ | (131 | ) |
| | | | | | | | | | | | | | | | | | | | |
A list of the open futures contracts held by the Fund at June 30, 2019 are as follows:
| | | | | | | | | | | | | | | | | | | | |
| | | | | | |
| Type of Contract | | Number of
Contracts
Long (Short) | | | Expiration Date | | | Notional Amount
(Thousands) | | | Value
(Thousands) | | | Unrealized
Appreciation/
(Depreciation)
(Thousands) | |
90-Day Euro$ | | | 66 | | | | Dec-2019 | | | $ | 16,062 | | | $ | 16,185 | | | $ | 123 | |
90-Day Euro$ | | | 118 | | | | Jun-2020 | | | | 28,695 | | | | 29,022 | | | | 327 | |
U.S.2-Year Treasury Note | | | 39 | | | | Oct-2019 | | | | 8,341 | | | | 8,392 | | | | 51 | |
U.S.5-Year Treasury Note | | | 205 | | | | Oct-2019 | | | | 23,910 | | | | 24,222 | | | | 312 | |
U.S.10-Year Treasury Note | | | (235 | ) | | | Sep-2019 | | | | (29,332 | ) | | | (30,073 | ) | | | (741 | ) |
U.S. Long Treasury Bond | | | (134 | ) | | | Sep-2019 | | | | (20,314 | ) | | | (20,850 | ) | | | (536 | ) |
U.S. Ultra Long Treasury Bond | | | 50 | | | | Sep-2019 | | | | 8,539 | | | | 8,878 | | | | 339 | |
Ultra 10-Year U.S. Treasury Note | | | 24 | | | | Sep-2019 | | | | 3,253 | | | | 3,315 | | | | 62 | |
| | | | | | | | | | | | | | | | | | | | |
| | | | | | | | | | $ | 39,154 | | | $ | 39,091 | | | $ | (63 | ) |
| | | | | | | | | | | | | | | | | | | | |
The futures contracts are considered to have interest rate risk associated with them.
| | | Percentages are based on Net Assets of $330,498 ($ Thousands). |
| | * | Non-income producing security. |
| | ** | Rate shown is the7-day effective yield as of June 30, 2019. |
| | † | Investment in Affiliated Security (see Note 3). |
| | (A) | Variable or floating rate security, the interest rate of which adjusts periodically based on changes in current interest rates and prepayments on the underlying pool of assets. |
| | (B) | Security exempt from registration under Rule 144A of the Securities Act of 1933. These securities may be resold in transactions exempt from registration normally to qualified institutions. On June 30, 2019, the value of these securities amounted to $54,374 ($ Thousands), representing 16.5% of the Net Assets of the Fund. |
| | (C) | Zero coupon security. The rate shown on the Schedule of Investments is the security’s effective yield at the time of purchase. |
| | (D) | Refer to table below for details on Options Contracts. |
AGM – Assured Guaranty Municipal
Cl – Class
CMO – Collateralized Mortgage Obligation
DN – Discount Note
FHLB – Federal Home Loan Bank
FHLMC – Federal Home Loan Mortgage Corporation
FNMA – Federal National Mortgage Association
GNMA – Government National Mortgage Association
ICE – Intercontinental Exchange
IO – Interest Only - face amount represents notional amount.
LIBOR – London Interbank Offered Rate
MTN – Medium Term Note
| | | | |
New Covenant Funds / Annual Report / June 30, 2019 | | | 37 | |
SCHEDULE OF INVESTMENTS
June 30, 2019
New Covenant Income Fund(Concluded)
PLC – Public Limited Company
RB – Revenue Bond
Ser – Series
TBA – To Be Announced
USD – United States Dollar
VAR – Variable Rate
The following is a list of the levels of inputs used as of June 30, 2019 in valuing the Fund’s investments and other financial instruments carried at value ($ Thousands):
| | | | | | | | | | | | | | | | |
| | | | | |
| Investments in Securities | | Level 1 | | | Level 2 | | | Level 3 | | | Total | |
Mortgage-Backed Securities | | $ | – | | | $ | 131,261 | | | $ | – | | | $ | 131,261 | |
Corporate Obligations | | | – | | | | 103,156 | | | | – | | | | 103,156 | |
U.S. Treasury Obligations | | | – | | | | 35,483 | | | | – | | | | 35,483 | |
Asset-Backed Securities | | | – | | | | 29,265 | | | | – | | | | 29,265 | |
U.S. Government Agency Obligations | | | – | | | | 21,283 | | | | – | | | | 21,283 | |
Sovereign Debt | | | – | | | | 9,978 | | | | – | | | | 9,978 | |
Foreign Bonds | | | – | | | | 6,452 | | | | – | | | | 6,452 | |
Municipal Bonds | | | – | | | | 3,442 | | | | – | | | | 3,442 | |
Commercial Paper | | | – | | | | 1,328 | | | | – | | | | 1,328 | |
Cash Equivalent | | | 11,031 | | | | – | | | | – | | | | 11,031 | |
| | | | | | | | | | | | | | | | |
Total Investments in Securities | | $ | 11,031 | | | $ | 341,648 | | | $ | – | | | $ | 352,679 | |
| | | | | | | | | | | | | | | | |
| | | | | | | | | | | | | | | | |
| | | | | |
| Other Financial Instruments | | Level 1 | | | Level 2 | | | Level 3 | | | Total | |
Purchase Options | | $ | 83 | | | $ | – | | | $ | – | | | $ | 83 | |
Written Options | | | (131 | ) | | | – | | | | – | | | | (131 | ) |
Futures Contracts * | | | | | | | | | | | | | | | | |
Unrealized Appreciation | | | 1,214 | | | | – | | | | – | | | | 1,214 | |
Unrealized Depreciation | | | (1,277 | ) | | | – | | | | – | | | | (1,277 | ) |
| | | | | | | | | | | | | | | | |
Total Other Financial Instruments | | $ | (111 | ) | | $ | – | | | $ | — | | | $ | (111 | ) |
| | | | | | | | | | | | | | | | |
* Futures contracts are valued at the unrealized appreciation (depreciation) on the instrument.
For the period ended June 30, 2019, there were no transfers between Level 1 and Level 2 assets and liabilities.
For the period ended June 30, 2019, there were no transfers between Level 2 and Level 3 assets and liabilities.
Amounts designated as “–” are either $0 or have been rounded to $0.
For more information on valuation inputs, see Note 2 – Significant Accounting Policies in Notes to Financial Statements.
The following is a summary of the transactions with affiliates for the period ended June 30, 2019 ($ Thousands):
| | | | | | | | | | | | | | | | | | | | | | | | | | | | | | | | | | | | | | | | | | | | | |
| | | | | | | | | | |
Security
Description | | Value 6/30/2018 | | Purchases at
Cost | | Proceeds
from Sales | | Realized Gain/
(Loss) | | Change in
Unrealized
Appreciation/
(Depreciation) | | Value
6/30/2019 | | Shares | | Income | | Capital
Gains |
SEI Daily Income Trust, Government Fund, Cl F | | | $ | 5,833 | | | | $ | 190,367 | | | | $ | (185,169) | | | | $ | — | | | | $ | — | | | | $ | 11,031 | | | | | 11,030,519 | | | | $ | 125 | | | | $ | — | |
| | | | | | | | | | | | | | | | | | | | | | | | | | | | | | | | | | | | | | | | | | | | | |
The accompanying notes are an integral part of the financial statements.
| | |
| 38 | | New Covenant Funds / Annual Report / June 30, 2019 |
SCHEDULE OF INVESTMENTS
June 30, 2019
New Covenant Balanced Growth Fund
| | | | | | | | |
Sector Weightings (Unaudited)†: 
| |
| † Percentages are based on total investments. | |
| | | |
| Description | | Shares | | | Market Value
($ Thousands) | |
AFFILIATED INVESTMENT FUNDS — 99.2% | | | | | | | | |
Equity Fund — 60.8% | | | | | | | | |
New Covenant Growth Fund † | | | 4,166,850 | | | $ | 178,591 | |
| | | | | | | | |
| | |
Total Equity Fund
(Cost $110,885) ($ Thousands) | | | | | | | 178,591 | |
| | | | | | | | |
| | |
Fixed Income Fund — 38.4% | | | | | | | | |
New Covenant Income Fund † | | | 4,803,009 | | | | 112,871 | |
| | | | | | | | |
| | |
Total Fixed Income Fund
(Cost $109,932) ($ Thousands) | | | | | | | 112,871 | |
| | | | | | | | |
| | | | | | | | |
| | | |
| Description | | Shares | | | Market Value
($ Thousands) | |
| | |
CASH EQUIVALENT — 0.7% | | | | | | | | |
SEI Daily Income Trust, Government Fund, Cl F 2.140%**† | | | 2,176,393 | | | $ | 2,176 | |
| | | | | | | | |
| | |
Total Cash Equivalent
(Cost $2,176) ($ Thousands) | | | | | | | 2,176 | |
| | | | | | | | |
| | |
Total Investments in Securities — 99.9%
(Cost $222,993) ($ Thousands) | | | | | | $ | 293,638 | |
| | | | | | | | |
Percentages are based on a Net Assets of $293,822 ($ Thousands).
| | † | Investment in Affiliated Security (see Note 3). |
| | ** | Rate shown is the7-day effective yield as of June 30, 2019. |
Cl — Class
As of June 30, 2019, all of the Fund’s investments were considered Level 1, in accordance with the authoritative guidance on fair value measurements and disclosure under U.S. GAAP.
For the year ended June 30, 2019, there were no transfers between Level 1 and Level 2 assets and liabilities.
For the year ended June 30, 2019, there were no transfers between Level 2 and Level 3 assets and liabilities.
For more information on valuation inputs, see Note 2 – Significant Accounting Policies in Notes to Financial Statements.
The following is a summary of the transactions with affiliates for the period ended June 30, 2019 ($ Thousands):
| | | | | | | | | | | | | | | | | | | | | | | | | | | | | | | | | | | | |
| | | | | | | | | | |
| Security Description | | Value 6/30/18 | | | Purchases at
Cost | | | Proceeds from
Sales | | | Realized Gain | | | Change in
Unrealized
Appreciation
(Depreciation) | | | Value 6/30/19 | | | Shares | | | Dividend
Income | | | Capital Gains | |
New Covenant Growth Fund | | | $172,416 | | | | $30,220 | | | | $(24,839) | | | | $1,635 | | | | $ (841) | | | | $178,591 | | | | 4,166,850 | | | | $2,083 | | | | $10,539 | |
New Covenant Income Fund | | | 114,510 | | | | 16,198 | | | | (22,043) | | | | (773 | ) | | | 4,979 | | | | 112,871 | | | | 4,803,009 | | | | 2,757 | | | | — | |
SEI Daily Income Trust, Government Fund, Cl F | | | 3,325 | | | | 34,190 | | | | (35,339) | | | | — | | | | — | | | | 2,176 | | | | 2,176,393 | | | | 59 | | | | — | |
| | | | | | | | | | | | | | | | | | | | | | | | | | | | | | | | | | | | |
Totals | | | $290,251 | | | | $80,608 | | | | $(82,221) | | | | $ 862 | | | | $4,138 | | | | $293,638 | | | | 11,146,252 | | | | $4,899 | | | | $10,539 | |
| | | | | | | | | | | | | | | | | | | | | | | | | | | | | | | | | | | | |
The accompanying notes are an integral part of the financial statements.
| | | | |
New Covenant Funds / Annual Report / June 30, 2019 | | | 39 | |
SCHEDULE OF INVESTMENTS
June 30, 2019
New Covenant Balanced Income Fund
| | | | | | | | |
Sector Weightings (Unaudited)†: 
| |
|
| † Percentages are based on total investments. | |
| | | |
| Description | | Shares | | | Market Value
($ Thousands) | |
AFFILIATED INVESTMENT FUNDS — 98.9% | | | | | |
Fixed Income Fund — 63.8% | | | | | | | | |
New Covenant Income Fund† | | | 2,129,475 | | | $ | 50,043 | |
| | | | | | | | |
Total Fixed Income Fund
(Cost $49,095) ($ Thousands) | | | | | | | 50,043 | |
| | | | | | | | |
| | |
Equity Fund — 35.1% | | | | | | | | |
New Covenant Growth Fund† | | | 642,544 | | | | 27,539 | |
| | | | | | | | |
| | |
Total Equity Fund
(Cost $14,735) ($ Thousands) | | | | | | | 27,539 | |
| | | | | | | | |
| | | | | | | | |
| | | |
| Description | | Shares | | | Market Value
($ Thousands) | |
| | |
CASH EQUIVALENT — 1.5% | | | | | | | | |
SEI Daily Income Trust, Government Fund, Cl F 2.140%**† | | | 1,206,851 | | | $ | 1,207 | |
| | | | | | | | |
| | |
Total Cash Equivalent
(Cost $1,207) ($ Thousands) | | | | | | | 1,207 | |
| | | | | | | | |
| | |
Total Investments in Securities — 100.4%
(Cost $65,037) ($ Thousands) | | | | | | $ | 78,789 | |
| | | | | | | | |
Percentages are based on a Net Assets of $78,448 ($ Thousands).
| | † | Investment in Affiliated Security (see Note 3). |
| | ** | Rate shown is the7-day effective yield as of June 30, 2019. |
Cl — Class
As of June 30, 2019, all of the Fund’s investments were considered Level 1, in accordance with the authoritative guidance on fair value measurements and disclosure under U.S. GAAP.
For the year ended June 30, 2019, there were no transfers between Level 1 and Level 2 assets and liabilities.
For the year ended June 30, 2019, there were no transfers between Level 2 and Level 3 assets and liabilities.
For more information on valuation inputs, see Note 2 – Significant Accounting Policies in Notes to Financial Statements.
The following is a summary of the transactions with affiliates for the period ended June 30, 2019 ($ Thousands):
| | | | | | | | | | | | | | | | | | | | | | | | | | | | | | | | | | | | |
| | | | | | | | | | |
Security Description | | Value 6/30/18 | | | Purchases at
Cost | | | Proceeds from
Sales | | | Realized Gain | | | Change in
Unrealized
Appreciation
(Depreciation) | | | Value 6/30/19 | | | Shares | | | Dividend
Income | | | Capital Gains | |
New Covenant Growth Fund | | | $27,004 | | | �� | $ 4,694 | | | | $ (4,308 | ) | | | $683 | | | | $(534) | | | | $27,539 | | | | 642,544 | | | | $ 320 | | | | $1,618 | |
New Covenant Income Fund | | | 49,339 | | | | 3,706 | | | | (4,837 | ) | | | (339 | ) | | | 2,174 | | | | 50,043 | | | | 2,129,475 | | | | 1,187 | | | | — | |
SEI Daily Income Trust, Government Fund, Cl F | | | 888 | | | | 9,223 | | | | (8,904 | ) | | | — | | | | — | | | | 1,207 | | | | 1,206,851 | | | | 14 | | | | — | |
| | | | | | | | | | | | | | | | | | | | | | | | | | | | | | | | | | | | |
Totals | | | $ 77,231 | | | | $17,623 | | | | $(18,049 | ) | | | $344 | | | | $1,640 | | | | $78,789 | | | | 3,978,870 | | | | $1,521 | | | | $1,618 | |
| | | | | | | | | | | | | | | | | | | | | | | | | | | | | | | | | | | | |
The accompanying notes are an integral part of the financial statements.
| | |
| 40 | | New Covenant Funds / Annual Report / June 30, 2019 |
STATEMENTS OF ASSETS AND LIABILITIES ($ THOUSANDS)
June 30, 2019
| | | | | | | | | | | | | | | | |
| | | | | |
| | | Growth Fund | | | Income Fund | | | Balanced
Growth Fund | | | Balanced Income
Fund | |
Assets: | | | | | | | | | | | | | | | | |
Investments, at value† | | $ | 437,891 | | | $ | 341,648 | | | $ | — | | | $ | — | |
Affiliated investments, at value†† | | | 8,829 | | | | 11,031 | | | | 293,638 | | | | 78,789 | |
Options purchased, at value†††† | | | — | | | | 83 | | | | — | | | | — | |
Cash and cash equivalents | | | 2,926 | | | | — | | | | — | | | | — | |
Receivable for investment securities sold | | | 2,924 | | | | 4,708 | | | | — | | | | — | |
Dividends and interest receivable | | | 406 | | | | 1,909 | | | | 242 | | | | 105 | |
Cash pledged as collateral for futures contracts | | | 402 | | | | 395 | | | | — | | | | — | |
Receivable for fund shares sold | | | 188 | | | | 269 | | | | 2 | | | | 2 | |
Foreign tax reclaim receivable | | | 79 | | | | 19 | | | | — | | | | — | |
Receivable for variation margin | | | 46 | | | | 18 | | | | — | | | | — | |
Prepaid expenses | | | 19 | | | | 14 | | | | 13 | | | | 3 | |
Total Assets | | | 453,710 | | | | 360,094 | | | | 293,895 | | | | 78,899 | |
Liabilities: | | | | | | | | | | | | | | | | |
Options written, at value†††† | | | — | | | | 131 | | | | — | | | | — | |
Payable for investment securities purchased | | | 4,433 | | | | 28,544 | | | | — | | | | 425 | |
Investment advisory fees payable | | | 138 | | | | 70 | | | | — | | | | — | |
Social witness and licensing fees payable | | | 55 | | | | 39 | | | | — | | | | — | |
Shareholder servicing fees payable | | | 36 | | | | 27 | | | | — | | | | — | |
Administration fees payable | | | 14 | | | | 54 | | | | 18 | | | | 6 | |
Payable for fund shares redeemed | | | 6 | | | | — | | | | 10 | | | | 8 | |
Trustees’ fees payable | | | 2 | | | | 2 | | | | 2 | | | | — | |
CCO fees payable | | | 1 | | | | — | | | | — | | | | — | |
Income distribution payable | | | — | | | | 624 | | | | — | | | | — | |
Payable to Custodian | | | — | | | | 2 | | | | — | | | | — | |
Payable for variation margin | | | — | | | | 29 | | | | — | | | | — | |
Accrued expense payable | | | 67 | | | | 74 | | | | 43 | | | | 12 | |
Total Liabilities | | | 4,752 | | | | 29,596 | | | | 73 | | | | 451 | |
Net Assets | | $ | 448,958 | | | $ | 330,498 | | | $ | 293,822 | | | $ | 78,448 | |
† Cost of investments | | $ | 330,160 | | | $ | 334,679 | | | $ | — | | | $ | — | |
†† Cost of affiliated investments | | | 8,829 | | | | 11,031 | | | | 222,993 | | | | 65,037 | |
††† Cost (premiums received) | | | — | | | | (79 | ) | | | — | | | | — | |
Net Assets: | | | | | | | | | | | | | | | | |
Paid-in Capital — (unlimited authorization — par value $0,001) | | $ | 324,527 | | | $ | 326,285 | | | $ | 223,048 | | | $ | 65,306 | |
Total distributable earnings | | | 124,431 | | | | 4,213 | | | | 70,774 | | | | 13,142 | |
Net Assets | | $ | 448,958 | | | $ | 330,498 | | | $ | 293,822 | | | $ | 78,448 | |
Net Asset Value, Offering and Redemption Price Per Share | | $ | 42.86 | | | $ | 23.50 | | | $ | 103.45 | | | $ | 21.41 | |
| | |
| (448,958,038 ÷
10,476,111 shares |
) | |
| (330,497,724 ÷
14,061,163 shares |
) | |
| (293,821,867 ÷
2,840,278 shares |
) | |
| (78,447,615 ÷
3,663,711 shares |
) |
Amounts designated as “—” are $0 or have been rounded to $0.
The accompanying notes are an integral part of the financial statements.
| | | | |
New Covenant Funds / Annual Report / June 30, 2019 | | | 41 | |
STATEMENTS OF OPERATIONS ($ THOUSANDS)
For the year ended June 30, 2019
| | | | | | | | | | | | | | | | |
| | | | | |
| | | Growth Fund | | | Income Fund | | | Balanced Growth
Fund | | | Balanced Income
Fund |
Investment Income: | | | | | | | | | | | | | | | | |
Dividend income | | $ | 8,245 | | | $ | — | | | $ | — | | | $ | — | |
Dividend income from affiliated registered investment company | | | 251 | | | | 125 | | | | 4,899 | | | | 1,521 | |
Interest income | | | 325 | | | | 9,687 | | | | — | | | | — | |
Less: foreign taxes withheld | | | — | | | | (7 | ) | | | — | | | | — | |
Total Investment Income | | | 8,821 | | | | 9,805 | | | | 4,899 | | | | 1,521 | |
Expenses: | | | | | | | | | | | | | | | | |
Investment advisory fees | | | 2,676 | | | | 1,331 | | | | — | | | | — | |
Administration fees | | | 863 | | | | 634 | | | | 433 | | | | 114 | |
Social witness and licensing fees | | | 658 | | | | 475 | | | | — | | | | — | |
Shareholder servicing fees | | �� | 432 | | | | 317 | | | | — | | | | — | |
Trustee fees | | | 8 | | | | 6 | | | | 5 | | | | 1 | |
Chief compliance officer fees | | | 2 | | | | 2 | | | | 2 | | | | — | |
Transfer agent fees | | | 95 | | | | 69 | | | | 64 | | | | 17 | |
Professional fees | | | 43 | | | | 32 | | | | 29 | | | | 8 | |
Registration fees | | | 39 | | | | 29 | | | | 26 | | | | 7 | |
Printing fees | | | 22 | | | | 16 | | | | 14 | | | | 2 | |
Custodian fees | | | 6 | | | | 17 | | | | 15 | | | | 4 | |
Other expenses | | | 11 | | | | 90 | | | | 5 | | | | 1 | |
Total Expenses | | | 4,855 | | | | 3,018 | | | | 593 | | | | 154 | |
Less: | | | | | | | | | | | | | | | | |
Waiver of investment advisory fees | | | (1,045 | ) | | | (466 | ) | | | — | | | | — | |
Waiver of administration fees | | | (135 | ) | | | (14 | ) | | | (212 | ) | | | (39 | ) |
Net Expenses | | | 3,675 | | | | 2,538 | | | | 381 | | | | 115 | |
Net Investment Income | | | 5,146 | | | | 7,267 | | | | 4,518 | | | | 1,406 | |
Net Realized and Change in Unrealized Gain (Loss) on Investments: | | | | | | | | | | | | | |
Net Realized Gain (Loss) on: | | | | | | | | | | | | | | | | |
Investments | | | 21,065 | | | | 1,249 | | | | — | | | | — | |
Affiliated investments | | | — | | | | — | | | | 862 | | | | 344 | |
Written and purchased options | | | — | | | | 270 | | | | — | | | | — | |
Capital gain distributions received from affiliated investment | | | — | | | | — | | | | 10,539 | | | | 1,618 | |
Futures contracts | | | 1,450 | | | | (818 | ) | | | — | | | | — | |
Net Change in Unrealized Appreciation (Depreciation) on: | | | | | | | | | | | | | | | | |
Investments | | | 3,742 | | | | 11,813 | | | | — | | | | — | |
Affiliated investments | | | — | | | | — | | | | 4,138 | | | | 1,640 | |
Written and purchased options | | | — | | | | 32 | | | | — | | | | — | |
Futures contracts | | | 157 | | | | 68 | | | | — | | | | — | |
Foreign currency transactions and translation of other assets and liabilities denominated in foreign currencies | | | (1 | ) | | | — | | | | — | | | | — | |
Net Increase in Net Assets Resulting from Operations | | $ | 31,559 | | | $ | 19,881 | | | $ | 20,057 | | | $ | 5,008 | |
Amounts designated as “—” are $0 or have been rounded to $0.
The accompanying notes are an integral part of the financial statements.
| | |
| 42 | | New Covenant Funds / Annual Report / June 30, 2019 |
STATEMENTS OF CHANGES IN NET ASSETS ($ THOUSANDS)
For the year ended June 30,
| | | | | | | | | | | | | | | | |
| | | Growth Fund | | | Income Fund | |
| | | 2019 | | | 2018 | | | 2019 | | | 2018 | |
Operations: | | | | | | | | | | | | | | | | |
Net investment income | | $ | 5,146 | | | $ | 4,664 | | | $ | 7,267 | | | $ | 6,130 | |
Net realized gain (loss) from investments, affiliated investments, written and purchased options and futures contracts | | | 22,515 | | | | 24,587 | | | | 701 | | | | (1,082 | ) |
Net change in unrealized appreciation (depreciation) on investments, affiliated investments, written and purchased options and futures contracts | | | 3,899 | | | | 30,412 | | | | 11,913 | | | | (6,815 | ) |
Net change in unrealized depreciation on foreign currency transactions and translation of other assets and liabilities denominated in foreign currency | | | (1 | ) | | | (1 | ) | | | — | | | | — | |
Net increase (decrease) in net assets resulting from operations | | | 31,559 | | | | 59,662 | | | | 19,881 | | | | (1,767 | ) |
Distributions:1 | | | (31,095 | ) | | | (28,040 | ) | | | (7,780 | ) | | | (6,403 | ) |
Total distributions | | | (31,095 | ) | | | (28,040 | ) | | | (7,780 | ) | | | (6,403 | ) |
Capital Share Transactions: | | | | | | | | | | | | | | | | |
Proceeds from shares issued | | | 41,305 | | | | 26,353 | | | | 40,669 | | | | 46,144 | |
Reinvestment of dividends & distributions | | | 25,807 | | | | 23,504 | | | | 749 | | | | 626 | |
Cost of shares redeemed | | | (47,292 | ) | | | (65,034 | ) | | | (41,976 | ) | | | (24,802 | ) |
Increase (decrease) in net assets derived from capital share transactions | | | 19,820 | | | | (15,177 | ) | | | (558 | ) | | | 21,968 | |
Net increase in net assets | | | 20,284 | | | | 16,445 | | | | 11,543 | | | | 13,798 | |
Net Assets: | | | | | | | | | | | | | | | | |
Beginning of Year | | | 428,674 | | | | 412,229 | | | | 318,955 | | | | 305,157 | |
End of Year2 | | $ | 448,958 | | | $ | 428,674 | | | $ | 330,498 | | | $ | 318,955 | |
Share Transactions: | | | | | | | | | | | | | | | | |
Shares issued | | | 1,019 | | | | 628 | | | | 1,781 | | | | 2,010 | |
Shares issued in lieu of dividends and distributions | | | 665 | | | | 563 | | | | 33 | | | | 27 | |
Shares redeemed | | | (1,139 | ) | | | (1,527 | ) | | | (1,852 | ) | | | (1,084 | ) |
Increase (Decrease) in net assets derived from share transactions | | | 545 | | | | (336) | | | | (38) | | | | 953 | |
| (1) | Current year presentation of distributions conforms with S-X Disclosure Simplification. Prior year distributions have been consolidated to conform with S-X Disclosure Simplification. |
| (2) | Includes undistributed net investment income of $1,072 and $22, as of year ended June 30, 2018. The SEC eliminated the requirement to disclose undistributed net investment income on November 5, 2018. |
Amounts designated as “—” are $0 or have been rounded to $0.
The accompanying notes are an integral part of the financial statements.
| | | | |
New Covenant Funds / Annual Report / June 30, 2019 | | | 43 | |
STATEMENTS OF CHANGES IN NET ASSETS ($ THOUSANDS) (Concluded)
For the year ended June 30,
| | | | | | | | | | | | | | | | |
| | | Balanced Growth Fund | | | Balanced Income Fund | |
| | | 2019 | | | 2018 | | | 2019 | | | 2018 | |
Operations: | | | | | | | | | | | | | | | | |
Net investment income | | $ | 4,518 | | | $ | 3,576 | | | $ | 1,406 | | | $ | 1,169 | |
Net realized gain from affiliated investments | | | 862 | | | | 2,984 | | | | 344 | | | | 878 | |
Capital gain distributions received from affiliated investments | | | 10,539 | | | | 9,743 | | | | 1,618 | | | | 1,540 | |
Net change in unrealized appreciation (depreciation) on affiliated investments | | | 4,138 | | | | 7,325 | | | | 1,640 | | | | (25 | ) |
Net increase in net assets resulting from operations | | | 20,057 | | | | 23,628 | | | | 5,008 | | | | 3,562 | |
Distributions:1 | | | (17,635 | ) | | | (4,706 | ) | | | (4,160 | ) | | | (1,697 | ) |
Total distributions | | | (17,635 | ) | | | (4,706 | ) | | | (4,160 | ) | | | (1,697 | ) |
Capital Share Transactions: | | | | | | | | | | | | | | | | |
Proceeds from shares issued | | | 16,016 | | | | 17,404 | | | | 3,589 | | | | 6,327 | |
Reinvestment of dividends & distributions | | | 16,007 | | | | 4,118 | | | | 3,509 | | | | 1,322 | |
Cost of shares redeemed | | | (31,067 | ) | | | (35,970 | ) | | | (6,827 | ) | | | (11,285 | ) |
Increase (decrease) in net assets derived from capital share transactions | | | 956 | | | | (14,448 | ) | | | 271 | | | | (3,636 | ) |
Net increase (decrease) in net assets | | | 3,378 | | | | 4,474 | | | | 1,119 | | | | (1,771 | ) |
Net Assets: | | | | | | | | | | | | | | | | |
Beginning of Year | | | 290,444 | | | | 285,970 | | | | 77,329 | | | | 79,100 | |
End of Year2 | | $ | 293,822 | | | $ | 290,444 | | | $ | 78,448 | | | $ | 77,329 | |
Share Transactions: | | | | | | | | | | | | | | | | |
Shares issued | | | 163 | | | | 172 | | | | 173 | | | | 300 | |
Shares issued in lieu of dividends and distributions | | | 166 | | | | 41 | | | | 174 | | | | 63 | |
Shares redeemed | | | (310 | ) | | | (356 | ) | | | (325 | ) | | | (534 | ) |
Increase (Decrease) in net assets derived from share transactions | | | 19 | | | | (143 | ) | | | 22 | | | | (171 | ) |
| (1) | Current year presentation of distributions conforms with S-X Disclosure Simplification. Prior year distributions have been consolidated to conform with S-X Disclosure Simplification. |
| (2) | Includes undistributed net investment income of $1,799 and $339, as of year ended June 30, 2018. The SEC eliminated the requirement to disclose undistributed net investment income on November 5, 2018. |
Amounts designated as “—” are $0 or have been rounded to $0.
The accompanying notes are an integral part of the financial statements.
| | |
| 44 | | New Covenant Funds / Annual Report / June 30, 2019 |
FINANCIAL HIGHLIGHTS
For the years ended June 30,
For a Share Outstanding Throughout the Year
| | | | | | | | | | | | | | | | | | | | |
| | | Growth Fund | |
| | | 2019 | | | 2018 | | | 2017 | | | 2016 | | | 2015 | |
Net Asset Value, Beginning of Period | | $ | 43.17 | | | $ | 40.15 | | | $ | 34.23 | | | $ | 38.28 | | | $ | 43.70 | |
Investment Activities: | | | | | | | | | | | | | | | | | | | | |
Net investment income(1) | | | 0.50 | | | | 0.46 | | | | 0.27 | | | | 0.27 | | | | 0.22 | |
Net realized and unrealized gains(losses) on securities and foreign currency transactions(1) | | | 2.28 | | | | 5.34 | | | | 5.91 | | | | (1.67 | ) | | | 2.29 | |
Total from investment activities | | | 2.78 | | | | 5.80 | | | | 6.18 | | | | (1.40 | ) | | | 2.51 | |
Dividends and Distributions from: | | | | | | | | | | | | | | | | | | | | |
Net investment income | | | (0.50 | ) | | | (0.39 | ) | | | (0.26 | ) | | | (0.21 | ) | | | (0.22 | ) |
Net realized gains | | | (2.59 | ) | | | (2.39 | ) | | | – | | | | (2.44 | ) | | | (7.71 | ) |
Total dividends and distributions | | | (3.09 | ) | | | (2.78 | ) | | | (0.26 | ) | | | (2.65 | ) | | | (7.93 | ) |
Net Asset Value, End of Period | | $ | 42.86 | | | $ | 43.17 | | | $ | 40.15 | | | $ | 34.23 | | | $ | 38.28 | |
Total Return† | | | 7.21 | % | | | 14.74 | % | | | 18.12 | % | | | (3.68 | )% | | | 6.41 | % |
Supplemental Data and Ratios: | | | | | | | | | | | | | | | | | | | | |
Net assets, end of period ($ Thousands) | | $ | 448,958 | | | $ | 428,674 | | | $ | 412,229 | | | $ | 394,943 | | | $ | 416,158 | |
Ratio of net expenses to average net assets | | | 0.85 | % | | | 0.87% | | | | 0.95 | % | | | 1.02 | % | | | 1.02 | % |
Ratio of expenses to average net assets, excluding waivers | | | 1.12 | % | | | 1.12 | % | | | 1.13 | % | | | 1.14 | % | | | 1.12 | % |
Ratio of net investment income to average net assets | | | 1.19 | % | | | 1.08 | % | | | 0.73 | % | | | 0.76 | % | | | 0.54 | % |
Portfolio turnover rate | | | 47 | % | | | 24 | % | | | 50 | % | | | 103 | % | | | 107 | % |
| † | Returns shown do not reflect the deduction of taxes that a shareholder would pay on Fund distributions or the redemption of Fund shares. |
| (1) | Per share net investment income and net realized and unrealized gains/(losses) calculated using average shares. |
Amounts designated as ‘‘—‘‘ are $0 or have been rounded to $0.
The accompanying notesare an integral part of the financial statements
| | | | |
New Covenant Funds / Annual Report / June 30, 2019 | | | 45 | |
FINANCIAL HIGHLIGHTS (Continued)
For the years ended June 30,
For a Share Outstanding Throughout the Year
| | | | | | | | | | | | | | | | | | | | |
| | | Income Fund | |
| | | 2019 | | | 2018 | | | 2017 | | | 2016 | | | 2015 | |
Net Asset Value, Beginning of Period | | $ | 22.62 | | | $ | 23.21 | | | $ | 23.58 | | | $ | 23.09 | | | $ | 23.13 | |
Investment Activities: | | | | | | | | | | | | | | | | | | | | |
Net investment income(1) | | | 0.52 | | | | 0.45 | | | | 0.37 | | | | 0.40 | | | | 0.35 | |
Net realized and unrealized gains(losses) on securities(1) | | | 0.92 | | | | (0.57 | ) | | | (0.31 | ) | | | 0.51 | | | | (0.01 | ) |
Total from investment activities | | | 1.44 | | | | (0.12 | ) | | | 0.06 | | | | 0.91 | | | | 0.34 | |
Dividends and Distributions from: | | | | | | | | | | | | | | | | | | | | |
Net investment income | | | (0.56 | ) | | | (0.47 | ) | | | (0.43 | ) | | | (0.42 | ) | | | (0.38 | ) |
Total dividends and distributions | | | (0.56 | ) | | | (0.47 | ) | | | (0.43 | ) | | | (0.42 | ) | | | (0.38 | ) |
Net Asset Value, End of Period | | $ | 23.50 | | | $ | 22.62 | | | $ | 23.21 | | | $ | 23.58 | | | $ | 23.09 | |
Total Return† | | | 6.46 | % | | | (0.54 | )% | | | 0.27 | % | | | 4.00 | % | | | 1.46 | % |
Supplemental Data and Ratios: | | | | | | | | | | | | | | | | | | | | |
Net assets, end of period ($ Thousands) | | $ | 330,498 | | | $ | 318,955 | | | $ | 305,157 | | | $ | 297,165 | | | $ | 304,295 | |
Ratio of net expenses to average net assets | | | 0.80 | % | | | 0.80 | % | | | 0.80 | % | | | 0.80 | % | | | 0.80 | % |
Ratio of expenses to average net assets, excluding waivers | | | 0.95 | % | | | 0.95 | % | | | 0.95 | % | | | 0.98 | % | | | 0.95 | % |
Ratio of net investment income to average net assets | | | 2.29 | % | | | 1.95 | % | | | 1.58 | % | | | 1.71 | % | | | 1.50 | % |
Portfolio turnover rate | | | 188 | % | | | 210 | % | | | 140 | % | | | 202 | % | | | 115 | % |
| † | Returns shown do not reflect the deduction of taxes that a shareholder would pay on Fund distributions or the redemption of Fund shares. |
| (1) | Per share net investment income and net realized and unrealized gains/(losses) calculated using average shares. |
The accompanying notes are an integral part of the financial statements.
| | |
| 46 | | New Covenant Funds / Annual Report / June 30, 2019 |
FINANCIAL HIGHLIGHTS
For the years ended June 30,
For a Share Outstanding Throughout the Year
| | | | | | | | | | | | | | | | | | | | |
| | | Balanced Growth Fund | |
| | | 2019 | | | 2018 | | | 2017 | | | 2016 | | | 2015 | |
Net Asset Value, Beginning of Period | | | $102.94 | | | | $96.48 | | | | $90.32 | | | | $101.71 | | | | $101.92 | |
Investment Activities: | | | | | | | | | | | | | | | | | | | | |
Net investment income(1) | | | 1.58 | | | | 1.23 | | | | 0.94 | | | | 0.88 | | | | 0.85 | |
Net realized and unrealized gains(losses) on securities(1) | | | 5.21 | | | | 6.86 | | | | 8.44 | | | | (1.63 | ) | | | 3.71 | |
Total from investment activities | | | 6.79 | | | | 8.09 | | | | 9.38 | | | | (0.75 | ) | | | 4.56 | |
Dividends and Distributions from: | | | | | | | | | | | | | | | | | | | | |
Net investment income | | | (1.83 | ) | | | (0.90 | ) | | | (0.94 | ) | | | (1.72 | ) | | | (2.86 | ) |
Net realized gains | | | (4.45 | ) | | | (0.73 | ) | | | (2.28 | ) | | | (8.92 | ) | | | (1.91 | ) |
Total dividends and distributions | | | (6.28 | ) | | | (1.63 | ) | | | (3.22 | ) | | | (10.64 | ) | | | (4.77 | ) |
Net Asset Value, End of Period | | | $103.45 | | | | $102.94 | | | | $96.48 | | | | $90.32 | | | | $101.71 | |
Total Return† | | | 7.12 | % | | | 8.45 | % | | | 10.59 | % | | | (0.50 | )% | | | 4.54 | % |
Supplemental Data and Ratios: | | | | | | | | | | | | | | | | | | | | |
Net assets, end of period ($ Thousands) | | | $293,822 | | | | $290,444 | | | | $285,970 | | | | $284,430 | | | | $297,560 | |
Ratio of net expenses to average net assets | | | 0.13 | % | | | 0.13 | % | | | 0.14 | % | | | 0.14 | % | | | 0.14 | % |
Ratio of expenses to average net assets, excluding waivers | | | 0.21 | % | | | 0.21 | % | | | 0.23 | % | | | 0.27 | % | | | 0.26 | % |
Ratio of net investment income to average net assets | | | 1.56 | % | | | 1.22 | % | | | 1.01 | % | | | 0.94 | % | | | 0.83 | % |
Portfolio turnover rate | | | 16 | % | | | 11 | % | | | 4 | % | | | 14 | % | | | 13 | % |
| † | Returns shown do not reflect the deduction of taxes that a shareholder would pay on Fund distributions or the redemption of Fund shares. |
| (1) | Per share net investment income and net realized and unrealized gains/(losses) calculated using average shares. |
Amounts designated as ‘‘—‘‘ are $0 or have been rounded to $0.
The accompanying notes are an integral part of the financial statements.
| | | | |
New Covenant Funds / Annual Report / June 30, 2019 | | | 47 | |
FINANCIAL HIGHLIGHTS
For the years ended June 30,
For a Share Outstanding Throughout the Year
| | | | | | | | | | | | | | | | | | | | |
| | | Balanced Income Fund | |
| | | 2019 | | | 2018 | | | 2017 | | | 2016 | | | 2015 | |
Net Asset Value, Beginning of Period | | | $21.23 | | | | $20.74 | | | | $20.06 | | | | $21.20 | | | | $21.55 | |
Investment Activities: | | | | | | | | | | | | | | | | | | | | |
Net investment income(1) | | | 0.39 | | | | 0.31 | | | | 0.25 | | | | 0.24 | | | | 0.22 | |
Net realized and unrealized gains(losses) on securities(1) | | | 0.96 | | | | 0.63 | | | | 0.95 | | | | 0.02 | | | | 0.46 | |
Total from investment activities | | | 1.35 | | | | 0.94 | | | | 1.20 | | | | 0.26 | | | | 0.68 | |
Dividends and Distributions from: | | | | | | | | | | | | | | | | | | | | |
Net investment income | | | (0.42 | ) | | | (0.29 | ) | | | (0.25 | ) | | | (0.31 | ) | | | (0.47 | ) |
Net realized gains | | | (0.75 | ) | | | (0.16 | ) | | | (0.27 | ) | | | (1.09 | ) | | | (0.56 | ) |
Total dividends and distributions | | | (1.17 | ) | | | (0.45 | ) | | | (0.52 | ) | | | (1.40 | ) | | | (1.03 | ) |
Net Asset Value, End of Period | | | $21.41 | | | | $21.23 | | | | $20.74 | | | | $20.06 | | | | $21.20 | |
Total Return† | | | 6.76 | % | | | 4.57 | % | | | 6.11 | % | | | 1.41 | % | | | 3.22 | % |
Supplemental Data and Ratios: | | | | | | | | | | | | | | | | | | | | |
Net assets, end of period ($ Thousands) | | | $78,448 | | | | $77,329 | | | | $79,100 | | | | $77,945 | | | | $80,203 | |
Ratio of net expenses to average net assets | | | 0.15 | % | | | 0.15 | % | | | 0.19 | % | | | 0.20 | % | | | 0.20 | % |
Ratio of expenses to average net assets, excluding waivers | | | 0.20 | % | | | 0.21 | % | | | 0.23 | % | | | 0.27 | % | | | 0.25 | % |
Ratio of net investment income to average net assets | | | 1.86 | % | | | 1.48 | % | | | 1.25 | % | | | 1.19 | % | | | 1.04 | % |
Portfolio turnover rate | | | 11 | % | | | 10 | % | | | 5 | % | | | 17 | % | | | 15 | % |
| † | Returns shown do not reflect the deduction of taxes that a shareholder would pay on Fund distributions or the redemption of Fund shares. |
| (1) | Per share net investment income and net realized and unrealized gains/(losses) calculated using average shares. |
Amounts designated as ‘‘—‘‘ are $0 or have been rounded to $0.
The accompanying notes are an integral part of the financial statements.
| | |
| 48 | | New Covenant Funds / Annual Report / June 30, 2019 |
NOTES TO FINANCIAL STATEMENTS
June 30, 2019
1. ORGANIZATION
New Covenant Funds (the “Trust”), anopen-end, diversified management investment company, was organized as a Delaware business trust on September 30, 1998. It currently consists of four investment funds: New Covenant Growth Fund (“Growth Fund”), New Covenant Income Fund (“Income Fund”), New Covenant Balanced Growth Fund (“Balanced Growth Fund”), and New Covenant Balanced Income Fund (“Balanced Income Fund”), (individually, a “Fund,” and collectively, the “Funds”). The Funds commenced operations on July 1, 1999. The Trust’s authorized capital consists of an unlimited number of shares of beneficial interest of $0.001 par value. Effective February 20, 2012, the Funds’ investment adviser is SEI Investments Management Corporation (the “Adviser”). Prior to February 20, 2012, the Funds’ investment adviser was One Compass Advisors, a wholly owned subsidiary of the Presbyterian Church (U.S.A.) Foundation.
The objectives of the Funds are as follows:
| | |
Growth Fund | | Long-term capital appreciation. A modest amount of dividend income may be produced by the Fund’s equity securities. |
| |
Income Fund | | High level of current income with preservation of capital. |
| |
Balanced Growth Fund | | Capital appreciation with less risk than would be present in a portfolio of only common stocks. |
| |
Balanced Income Fund | | Current income and long-term growth of capital. |
2. SIGNIFICANT ACCOUNTING POLICIES
The following are significant accounting policies, which are consistently followed in the preparation of its financial statements by the Funds. The Funds are investment companies that apply the accounting and reporting guidance issued in Topic 946 by the U.S. Financial Accounting Standards Board (“FASB”).
Use of Estimates— The preparation of financial statements, in conformity with U.S. generally accepted accounting principles (“U.S. GAAP”), requires management to make estimates and assumptions that affect the reported amount of assets and liabilities and disclosure of contingent assets and liabilities as of the date of the financial statements and the reported amounts of increases and decreases in net assets from operations during the reporting period. Actual results could differ from those estimates.
Security Valuation— Securities listed on a securities exchange, market or automated quotation system for which quotations are readily available (except for securities traded on NASDAQ) are valued at the last quoted sale price on the primary exchange or market (foreign or domestic) on which they are traded, or, if there is no such reported sale, at the most recent quoted bid price. For securities traded on NASDAQ, the NASDAQ Official Closing Price will be used. Debt securities are priced based upon valuations provided by independent, third-party pricing agents, if available. Such values generally reflect the last reported sales price if the security is actively traded. The third-party pricing agents may also value debt securities at an evaluated bid price by employing methodologies that utilize actual market transactions, broker-supplied valuations, or other methodologies designed to identify the market value for such securities. Debt obligations acquired with remaining maturities of sixty days or less may be valued at their amortized cost, which approximates market value. The prices for foreign securities are reported in local currency and converted to U.S. dollars using currency exchange rates. Prices for most securities held in the Funds are provided daily by recognized independent pricing agents. If a security price cannot be obtained from an independent, third-party pricing agent, the Funds seek to obtain a bid price from at least one independent broker.
Securities for which market prices are not “readily available” are valued in accordance with fair value procedures established by the Trust’s Board of Trustees. The Trust’s fair value procedures are implemented through a Fair Value Committee (the “Committee”) designated by the Trust’s Board of Trustees. Some of the more common reasons that may necessitate that a security be valued using fair value procedures include: the security’s trading has been halted or suspended; the security has beende-listed from a national exchange; the security’s primary trading market is temporarily closed at a time when under normal conditions it would be open; or the security’s primary pricing source is not able or willing to provide a price. When a security is valued in accordance with the fair value procedures, the Committee will determine the value after taking into consideration relevant information reasonably available to the Committee.
| | | | |
New Covenant Funds / Annual Report / June 30, 2019 | | | 49 | |
NOTES TO FINANCIAL STATEMENTS (Continued)
June 30, 2019
For securities that principally trade on a foreign market or exchange, a significant gap in time can exist between the time of a particular security’s last trade and the time at which a Fund calculates its net asset value. The closing prices of such securities may no longer reflect their market value at the time a Fund calculates net asset value if an event that could materially affect the value of those securities (a “Significant Event”) has occurred between the time of the security’s last close and the time that a Fund calculates net asset value. A Significant Event may relate to a single issuer or to an entire market sector. If the adviser orsub-adviser of a Fund becomes aware of a Significant Event that has occurred with respect to a security or group of securities after the closing of the exchange or market on which the security or securities principally trade, but before the time at which a Fund calculates net asset value, the adviser orsub-adviser may request that a Committee Meeting be called. In addition, the Trust’s administrator monitors price movements among certain selected indices, securities and/or baskets of securities that may be an indicator that the closing prices received earlier from foreign exchanges or markets may not reflect market value at the time a Fund calculates net asset value. If price movements in a monitored index or security exceed levels established by the administrator, the administrator notifies the adviser orsub-adviser for any Fund holding the relevant securities that such limits have been exceeded. In such event, the adviser orsub-adviser makes the determination whether a Committee Meeting should be called based on the information provided.
The Growth Fund holds international securities that also use a third-party fair valuation vendor. The vendor provides a fair value for foreign securities held by this Fund based on certain factors and methodologies (involving, generally, tracking valuation correlations between the U.S. market and eachnon-U.S. security). Values from the fair value vendor are applied in the event that there is a movement in the U.S. market that exceeds a specific threshold that has been established by the Committee. The Committee has also established a “confidence interval” which is used to determine the level of historical correlation between the value of a specific foreign security and movements in the U.S. market before a particular security will be fair valued when the threshold is exceeded. In the event that the threshold established by the Committee is exceeded on a specific day, the Growth Fund will value thenon-U.S. securities that exceed the applicable “confidence interval” based upon the adjusted prices provided by the fair valuation vendor.
Options for which the primary market is a national securities exchange are valued at the last sale price on the exchange on which they are traded, or, in the absence of any sale, at the closing bid price. Options not traded on a national securities exchange are valued at the last quoted bid price.
Futures cleared through a central clearing house (“centrally cleared futures”) are valued at the settlement price established each day by the board of exchange on which they are traded. The daily settlement prices for financial futures is provided by an independent source. On days when there is excessive volume, market volatility or the future does not end trading by the time a Fund calculates its NAV, the settlement price may not be available at the time at which the Fund calculates its NAV. On such days, the best available price (which is typically the last sales price) may be used to value a Fund’s futures position.
The assets of the Balanced Growth Fund and the Balanced Income Fund (the “Balanced Funds”) consist primarily of investments in underlying affiliated investment companies, which are valued at their respective daily net asset values in accordance with the established NAV of each fund.
In accordance with U.S. GAAP, fair value is defined as the price that a Fund would receive upon selling an investment in an orderly transaction to an independent buyer in the principal or most advantageous market of the investment. A three tier hierarchy has been established to maximize the use of observable and minimize the use of unobservable inputs and to establish classification of fair value measurements for disclosure purposes. Inputs refer broadly to the assumptions that market participants would use in pricing an asset. Inputs may be observable or unobservable. Observable inputs are inputs that reflect the assumptions market participants would use in pricing the asset or liability based on market data obtained from sources independent of the reporting entity. Unobservable inputs are inputs that reflect the reporting entity’s own assumptions about the assumptions market participants would use in pricing the asset or liability based on the best information available in the circumstances.
The three-tier hierarchy of inputs is summarized in the three broad Levels listed below:
Level 1 — quoted prices in active markets for identical investments
Level 2 — other significant observable inputs (including quoted prices for similar investments, interest rates, prepayment speeds, credit risks, etc.)
| | |
| 50 | | New Covenant Funds / Annual Report / June 30, 2019 |
Level 3 — significant unobservable inputs (including the Fund’s own assumptions in determining the fair value of investments)
The valuation techniques used by the Funds to measure fair value during the year ended June 30, 2019 maximized the use of observable inputs and minimized the use of unobservable inputs.
For the year ended June 30, 2019, there have been no significant changes to the Trust’s fair valuation methodologies. For details of the investment classifications reference the Schedules of Investments.
Securities Transactions and Investment Income— Security transactions are recorded on the trade date. Cost used in determining net realized capital gains and losses on the sale of securities is determined on the basis of specific identification. Dividend income and expense is recognized on theex-dividend date, and interest income or expense is recognized using the accrual basis of accounting.
Distributions received on securities that represent a return of capital or capital gains are recorded as a reduction of cost of investments and/or as a realized gain. The Trust estimates the components of distributions received that may be considered nontaxable distributions or capital gain distributions.
Amortization and accretion is calculated using the scientific interest method, which approximates the effective interest method over the holding period of the security. Amortization of premiums and discounts is included in interest income.
Cash and Cash Equivalents— Idle cash and currency balances may be swept into various overnight sweep accounts and are classified as cash equivalents on the Statement of Assets and Liabilities. These amounts, at times, may exceed United States federally insured limits. Amounts swept are available on the next business day.
Expenses— Expenses that are directly related to a Fund are charged directly to that Fund. Other operating expenses of the Funds are prorated to the Funds on the basis of relative net assets.
Foreign Currency Translation— The books and records of the Funds investing in international securities are maintained in U.S. dollars on the following basis:
(I) market value of investment securities, assets and liabilities at the current rate of exchange; and
(II) purchases and sales of investment securities, income and expenses at the relevant rates of exchange prevailing on the respective dates of such transactions.
The Funds do not isolate that portion of gains and losses on investments in equity securities that is due to changes in the foreign exchange rates from that which is due to changes in market prices of equity securities.
The Funds report certain foreign-currency-related transactions as components of realized gains for financial reporting purposes, whereas such components are treated as ordinary income for Federal income tax purposes.
Repurchase Agreements— To the extent consistent with its investment objective and strategies, a Fund may enter into repurchase agreements which are secured by obligations of the U.S. Government with a bank, broker-dealer or other financial institution. Each repurchase agreement is at least 102% collateralized andmarked-to-market. However, in the event of default or bankruptcy by the counterparty to the repurchase agreement, realization of the collateral may by subject to certain costs, losses or delays.
Futures Contracts— To the extent consistent with its investment objective and strategies, a Fund may use futures contracts for tactical hedging purposes as well as to enhance the Fund’s returns. These Funds’ investments in futures contracts are designed to enable the Funds to more closely approximate the performance of their benchmark indices. Initial margin deposits of cash or securities are made upon entering into futures contracts. The contracts aremarked-to-market daily and the resulting changes in value are accounted for as unrealized gains and losses. Variation margin payments are paid or received, depending upon whether unrealized gains or losses are incurred. When contracts are closed, the Funds record a realized gain or loss equal to the difference between the proceeds from (or cost of) the closing transaction and the amount invested in the contract.
Risks of entering into futures contracts include the possibility that there will be an imperfect price correlation between the futures and the underlying securities. Second, it is possible that a lack of liquidity for futures contracts could exist in the secondary market, resulting in an inability to close a position prior to its maturity date. Third, futures contracts involve the risk that a Fund could lose more than the original margin deposit required to initiate a futures transaction.
| | | | |
New Covenant Funds / Annual Report / June 30, 2019 | | | 51 | |
NOTES TO FINANCIAL STATEMENTS (Continued)
June 30, 2019
Finally, the risk exists that losses could exceed amounts disclosed on the Statements of Assets and Liabilities. Refer to each Fund’s Schedule of Investments for details regarding open futures contracts as of June 30, 2019, if applicable.
Options Writing/Purchasing— To the extent consistent with its investment objective and strategies, a Fund may invest in financial options contracts for the purpose of hedging its existing portfolio securities, or securities that a Fund intends to purchase, against fluctuations in fair market value caused by changes in prevailing market interest rates. A Fund may also invest in financial option contracts to enhance its returns. When the Fund writes or purchases an option, an amount equal to the premium received or paid by the Fund is recorded as a liability or an asset and is subsequently adjusted to the current market value of the option written or purchased. Premiums received or paid from writing or purchasing options which expire unexercised are treated by the Fund on the expiration date as realized gains or losses. The difference between the premium and the amount paid or received on affecting a closing purchase or sale transaction, including brokerage commissions, is also treated as a realized gain or loss. If an option is exercised, the premium paid or received is added to the cost of the purchase or proceeds from the sale in determining whether the Fund has realized a gain or a loss.
The risk in writing a call option is a Fund may give up the opportunity for profit if the market price of the security increases. The risk in writing a put option is a Fund may incur a loss if the market price of the security decreases and the option is exercised. The risk in purchasing an option is a Fund may pay a premium whether or not the option is exercised. The Funds also have the additional risk of being unable to enter into a closing transaction at an acceptable price if a liquid secondary market does not exist. Option contracts also involve the risk that they may not work as intended due to unanticipated developments in market conditions or other causes.
Forward Treasury Commitments— To the extent consistent with its investment objective and strategies, the Growth Fund and Income Fund may invest in commitments to purchase U.S. Treasury securities on an extended settlement basis. Such transactions involve the commitment to purchase a security with payment and delivery taking place in the future, sometimes a month or more after the transaction date. The Funds account for such transactions as purchases and sales and record an unrealized gain or loss each day equal to the difference between the cost of the purchase commitment and the current market value. Realized gains or losses are recorded upon closure or settlement of such commitments. No interest is earned prior to settlement of the transaction. These instruments are subject to market fluctuation due to changes in interest rates and the market value at the time of settlement could be higher or lower than the purchase price. A Fund may incur losses due to changes in the value of the underlying treasury securities from interest rate fluctuations or as a result of counterparty nonperformance. These transactions may increase the overall investment exposure for a Fund (and so may also create investment leverage) and involve a risk of loss if the value of the securities declines prior to the settlement date.
Master Limited Partnerships— To the extent consistent with its investment objective and strategies, a Fund may invest in entities commonly referred to as “MLPs” that are generally organized under state law as limited partnerships or limited liability companies. The Funds intend to primarily invest in MLPs receiving partnership taxation treatment under the Internal Revenue Code of 1986 (the “Code”), and whose interests or “units” are traded on securities exchanges like shares of corporate stock. To be treated as a partnership for U.S. federal income tax purposes, an MLP whose units are traded on a securities exchange must receive at least 90% of its income from qualifying sources such as interest, dividends, real estate rents, gain from the sale or disposition of real property, income and gain from mineral or natural resources activities, income and gain from the transportation or storage of certain fuels, and, in certain circumstances, income and gain from commodities or futures,for- wards and options with respect to commodities. Mineral or natural resources activities include exploration, development, production, processing, mining, refining, marketing and transportation (including pipelines) of oil and gas, minerals, geothermal energy, fertilizer, timber or industrial source carbon dioxide. An MLP consists of a general partner and limited partners (or in the case of MLPs organized as limited liability companies, a managing member and members). The general partner or managing member typically controls the operations and management of the MLP and has an ownership stake in the partnership. The limited partners or members, through their ownership of limited partner or member interests, provide capital to the entity, are intended to have no role in the operation and management of the entity and receive cash distributions. The MLPs themselves generally do not pay U.S. Federal income taxes. Thus, unlike investors in corporate securities, direct MLP investors are generally not subject to double taxation (i.e., corporate level tax and tax on corporate dividends). Currently, most MLPs operate in the energy and/or natural resources sector.
Delayed Delivery Transactions— To the extent consistent with its investment objective and strategies, the Growth Fund and Income Fund may purchase or sell securities on a when-issued or delayed delivery basis. These
| | |
| 52 | | New Covenant Funds / Annual Report / June 30, 2019 |
transactions involve a commitment by those Funds to purchase or sell securities for a predetermined price or yield, with payment and delivery taking place beyond the customary settlement period. When delayed delivery purchases are outstanding, the Funds will set aside liquid assets in an amount sufficient to meet the purchase price. When purchasing a security on a delayed delivery basis, that Fund assumes the rights and risks of ownership of the security, including the risk of price and yield fluctuations, and takes such fluctuations into account when determining its net asset value. Those Funds may dispose of or renegotiate a delayed delivery transaction after it is entered into, and may sell when-issued securities before they are delivered, which may result in a capital gain or loss. When those Funds have sold a security on a delayed delivery basis, that Fund does not participate in future gains and losses with respect to the security.
Dividends and Distributions to Shareholders— Dividends from net investment income are declared and paid to shareholders quarterly for the Growth Fund, Balanced Growth Fund and Balanced Income Fund; declared and paid monthly for the Income Fund. Dividends and distributions are recorded on theex-dividend date. Any net realized capital gains will be distributed at least annually by the Funds.
Illiquid Securities— A security is considered illiquid if it cannot be sold or disposed of in the ordinary course of business within seven days or less for its approximate carrying value on the books of a Fund. Valuations of illiquid securities may differ significantly from the values that would have been used had an active market value for these securities existed. As of June 30, 2019, the Funds did not own any illiquid securities.
Investments in Real Estate Investment Trusts (“REITs”)— Dividend income is recorded based on the income included in distributions received from the REIT investments using published REIT reclassifications including some management estimates when actual amounts are not available. Distributions received in excess of this estimated amount are recorded as a reduction of the cost of investments or reclassified to capital gains. The actual amounts of income, return of capital, and capital gains are only determined by each REIT after its fiscalyear-end, and may differ from the estimated amounts.
3. AGREEMENTS AND OTHER TRANSACTIONS WITH AFFILIATES
Administration Agreement— The Trust entered into an Administration Agreement with SEI Investments Global Funds Services (the “Administrator”). Under the Administration Agreement, the Administrator provides administrative and accounting services to the Funds. The Administrator has voluntarily agreed to waive a portion of its fee so that the total annual expenses of the Balanced Growth Fund and the Balanced Income Fund, exclusive of acquired fund fees and expenses, will not exceed certain voluntary expense limitations adopted by the Adviser. Accordingly, effective April 1, 2017, the voluntary expense limitations are 0.13% and 0.15% for the Balanced Growth Fund and the Balanced Income Fund, respectively. These voluntary waivers may be terminated by the adviser at any time.
| | | | | | | | | | |
| | | First $2.5 Billion | | Next $500 Million | | Over $3 Billion | | | | |
Growth Fund | | 0.2000% | | 0.1650% | | 0.1200% |
| | | | | |
| | | First $1.5 Billion | | Next $500 Million | | Next $500 Million | | Next $500 Million | | Over $3 Billion |
Income Fund | | 0.2000% | | 0.1775% | | 0.1550% | | 0.1325% | | 0.1100% |
Balanced Growth Fund | | 0.1500% | | 0.1375% | | 0.1250% | | 0.1125% | | 0.1000% |
Balanced Income Fund | | 0.1500% | | 0.1375% | | 0.1250% | | 0.1125% | | 0.1000% |
Transfer Agent Servicing Agreement— In 2008, the Trust entered into a transfer agent servicing agreement (“Agreement”) with U.S. Bancorp Fund Services, LLC (“USBFS”), an indirect, wholly-owned subsidiary of U.S. Bancorp. Under the terms of the Agreement, USBFS is entitled to account based fees and annual fund level fees, as well as reimbursement ofout-of-pocket expenses incurred in providing transfer agency services.
Investment Advisory Agreement— The Trust, on behalf of each Fund, entered into an Investment Advisory Agreement (“Agreement”) with SEI Investments Management Corporation (the “Adviser”). Under the Agreement, the Adviser is responsible for the investment management of the Funds and receives an annual advisory fee of 0.62% for the Growth Fund and 0.42% for the Income Fund. The Adviser does not receive an advisory fee for the Balanced Growth Fund and Balanced Income Fund. The Adviser has voluntarily agreed to waive a portion of its fee so that the total annual expenses of the Growth and Income Funds, exclusive of acquired fund fees and expenses, will not exceed certain voluntary expense limitations adopted by the Adviser. Accordingly, effective April 1, 2017, the
| | | | |
New Covenant Funds / Annual Report / June 30, 2019 | | | 53 | |
NOTES TO FINANCIAL STATEMENTS (Continued)
June 30, 2019
voluntary expense limitation is 0.80% for the Income Fund. The voluntary expense limitation for the Growth Fund was 0.87% until May 13, 2019 when the voluntary expense limitation was changed to be 0.72%.
The Adviser has entered intosub-advisory agreements to assist in the selection and management of investment securities in the Growth Fund and the Income Fund. It is the responsibility of thesub-advisers, under the direction of the Adviser, to makeday-to-day investment decisions for these Funds. The Adviser, not the Funds, pays eachsub-adviser a quarterly fee, in arrears, for their services. The Adviser payssub-advisory fees directly from its own advisory fee. Thesub-advisory fees are based on the assets of the Fund allocated to thesub-adviser for which thesub-adviser is responsible for making investment decisions.
The following is thesub-adviser for the Growth Fund: Parametric Portfolio Associates LLC.
The following are thesub-advisers for the Income Fund: Income Research & Management, Western Asset Management Company and Western Asset Management Company Limited.
Shareholder Service Plan and Agreement — The Trust entered into a Shareholder Service Plan and Agreement (the “Agreement”) with the Distributor. Per the Agreement, a Fund is authorized to make payments to certain entities which may include investment advisors, banks, trust companies and other types of organizations (“Authorized Service Providers”) for providing administrative services with respect to shares of the Funds attributable to or held in the name of the Authorized Service Providers for its clients or other parties with whom they have a servicing relationship. Under the terms of the Agreement, the Growth Fund and the Income Funds are authorized to pay an Authorized Service Provider a shareholder servicing fee at an annual rate of up to 0.10% of the average daily net asset value of the Growth Fund and Income Fund, respectively, which fee will be computed daily and paid monthly, for providing certain administrative services to Fund shareholders with whom the Authorized Service Provider has a servicing relationship.
Distribution Agreement— The Trust issues shares of the Funds pursuant to a Distribution Agreement with SEI Investments Distribution Co. (the “Distributor”), a wholly owned subsidiary of SEI Investments Company (“SEI”). In consideration of the services and facilities to be provided by the Distributor or any service provider, each of the Growth Fund and the Income Fund (if such Fund has issued Shares) will pay to the Distributor a fee, as agreed from time to time, at an annual rate of up to 0.10% (ten basis points) of the average daily net asset value of the Growth Fund and the Income Fund, respectively, which fee will be computed daily and paid monthly.
Social Witness Services and License Agreement— The Trust retained New Covenant Trust Company (“NCTC”) to ensure that each Fund continues to invest consistent with social witness principles adopted by the General Assembly of the Presbyterian Church (U.S.A.). No less than annually, NCTC will provide the Trust with an updated list of issuers in which the Funds will be prohibited from investing.
NCTC will distribute to the Trust proxy voting guidelines and shareholder advocacy services for the Funds that NCTC deems to be consistent with social witness principles adopted by the General Assembly of the Presbyterian Church (U.S.A.). The Trust also engages NCTC to vote Fund proxies consistent with such proxy voting guidelines. NCTC shall monitor and review and, as necessary, amend the Proxy Voting Guidelines periodically to ensure that they remain consistent with the social witness principles.
NCTC also grants to the Trust anon-exclusive right and license to use and refer to the trade name, trademark and/ or service mark rights to the name “New Covenant Funds” and the phrase “Funds with a Mission”, in the name of the Trust and each Fund, and in connection with the offering, marketing, promotion, management and operation of the Trust and the Funds.
In consideration of the services provided by NCTC, the Growth Fund and the Income Fund will each pay to NCTC a fee at an annual rate of 0.15% of the average daily net asset value of the shares of such Fund, which fee will be computed daily and paid monthly.
Payment to Affiliates— Certain officers and/or interested trustees of the Trust are also officers of the Distributor, the Adviser, the Administrator or NCTC. The Trust pays each unaffiliated Trustee an annual fee for attendance at quarterly and interim board meetings. Compensation of officers and affiliated Trustees of the Trust is paid by the Adviser, the Administrator or NCTC.
A portion of the services provided by the Chief Compliance Officer (“CCO”) and his staff, whom are employees of the Administrator, are paid for by the Trust as incurred. The services include regulatory oversight of the Trust’s Adviser,
| | |
| 54 | | New Covenant Funds / Annual Report / June 30, 2019 |
sub-advisers and service providers as required by SEC regulations. The CCO’s services have been approved by and are reviewed annually by the Board.
Investment in Affiliated Security— The Funds may invest excess cash in the SEI Daily Income Trust (SDIT) Government Fund, an affiliated money market fund. The Balanced Funds invest in the Growth Fund and Income Fund.
Interfund Lending— The SEC has granted an exemption that permits the Trust to participate in an interfund lending program (the ‘‘Program’’) with existing or future investment companies registered under the 1940 Act that are advised by SIMC (the ‘‘SEI Funds’’). The Program allows the SEI Funds to lend money to and borrow money from each other for temporary or emergency purposes. Participation in the Program is voluntary for both borrowing and lending funds. Interfund loans may be made only when the rate of interest to be charged is more favorable to the lending fund than an investment in overnight repurchase agreements (‘‘Repo Rate’’), and more favorable to the borrowing fund than the rate of interest that would be charged by a bank for short-term borrowings (‘‘Bank Loan Rate’’). The Bank Loan Rate will be determined using a formula reviewed annually by the SEI Funds’ Board of Trustees. The interest rate imposed on interfund loans is the average of the Repo Rate and the Bank Loan Rate. During the year ended June 30, 2019, the Trust did not participate in interfund lending.
4. DERIVATIVE TRANSACTIONS
The International Swaps and Derivatives Association, Inc. Master Agreements and Credit Support Annexes (“ISDA Master Agreements”) maintain provisions for general obligations, representations, agreements, collateral, and events of default or termination. The occurrence of a specified event of termination may give a counterparty the right to terminate all of its contracts and affect settlement of all outstanding transactions under the applicable ISDA Master Agreement.
To reduce counterparty risk with respect to Over The Counter (“OTC”) transactions, the Funds have entered into master netting arrangements, established within the Funds’ ISDA master agreements, which allow the Funds to make (or to have an entitlement to receive) a single net payment in the event of default(close-out netting) for outstanding payables and receivables with respect to certain OTC positions in swaps for each individual counterparty. In addition, the Funds may require that certain counterparties post cash and/or securities in collateral accounts to cover their net payment obligations for those derivative contracts subject to ISDA Master Agreements. If the counterparty fails to perform under these contracts and agreements, the cash and/or securities will be made available to the Funds.
For financial reporting purposes, the Funds do not offset derivative assets and derivative liabilities that are subject to netting arrangements in the Statement of Assets and Liabilities and therefore disclose these derivative assets and derivative liabilities on a gross basis. Bankruptcy or insolvency laws of a particular jurisdiction may impose restrictions on or prohibitions against the right of offset in bankruptcy, insolvency or other events.
Collateral terms are contract specific for OTC derivatives. For derivatives traded under an ISDA Master Agreement, the collateral requirements are typically calculated by netting the mark to market amount of each transaction under such agreement and comparing that amount to the value of any collateral currently pledged by the Funds or the counterparty. For financial reporting purposes, cash collateral that has been pledged to cover obligations of the Funds, if any, is reported separately on the Statement of Assets and Liabilities as cash pledged as collateral.Non-cash collateral pledged by the Funds, if any, is noted in the Schedules of Investments. Generally, the amount of collateral due from or to a party must exceed a minimum transfer amount threshold before a transfer has to be made. To the extent amounts due to the Funds from its counterparties are not fully collateralized, contractually or otherwise, the Funds bear the risk of loss from counterparty nonperformance.
The following is a summary of the variation margin of exchange-traded financial derivative instruments of the Funds as of June 30, 2019 ($ Thousands):
| | | | | | |
| | | Financial Derivative Asset | | | | Financial Derivative Liability |
| | | Variation Margin Asset | | | | Variation Margin Liability |
| Fund | | Futures | | | | Futures |
Growth Fund | | $46 | | | | $— |
Income Fund | | $18 | | | | $29 |
Cash with a total market value of $402 and 395 ($ Thousands) for the Growth Fund and Income Fund, respectively, has been pledged as collateral for exchange-traded derivative instruments as of June 30, 2019.
| | | | |
New Covenant Funds / Annual Report / June 30, 2019 | | | 55 | |
NOTES TO FINANCIAL STATEMENTS (Continued)
June 30, 2019
The following table discloses the volume of the Fund’s futures contracts activity during the year ended June 30, 2019
($ Thousands):
| | | | | | | | | | | | |
| | | Growth Fund | | | | | Income Fund | | | |
Futures Contracts: | | | | | | | | | | | | |
Equity Contracts | | | | | | | | | | | | |
Average Notional Balance Long | | | $ 8,214 | | | | | | $ 142,383 | | | |
Average Notional Balance Short | | | — | | | | | | 60,619 | | | |
Ending Notional Balance Long | | | — | | | | | | 88,800 | | | |
Ending Notional Balance Short | | | 9,308 | | | | | | 49,646 | | | |
Options: | | | | | | | | | | | | |
Equity Contracts | | | | | | | | | | | | |
Average Notional Balance Long | | | $ — | | | | | | $ 9 | | | |
Average Notional Balance Short | | | — | | | | | | 36 | | | |
Ending Notional Balance Long | | | — | | | | | | 26 | | | |
Ending Notional Balance Short | | | — | | | | | | 106 | | | |
5. INVESTMENT TRANSACTIONS
The cost of security purchases and the proceeds from the sale and maturities of securities, excluding U.S. government and other short-term investments, for the year ended June 30, 2019, were as follows:
| | | | | | | | | | | | | | | | |
| Fund | | Purchases
(excluding
Short-Term
Investments &
U.S. Government
Securities)
($ Thousands) | | | Sales (excluding
Short-Term
Investments &
U.S. Government
Securities)
($ Thousands) | | | Purchases of
U.S. Government
Securities
($ Thousands) | | | Sales of
U.S. Government
Securities
($ Thousands) | |
Growth Fund | | | $ 195,790 | | | | $ 200,189 | | | | $ — | | | | $ — | |
Income Fund | | | 44,361 | | | | 53,089 | | | | 556,179 | | | | 552,032 | |
Balanced Growth Fund | | | 46,418 | | | | 46,882 | | | | — | | | | — | |
Balanced Income Fund | | | 8,400 | | | | 9,145 | | | | — | | | | — | |
6. FEDERAL TAX INFORMATION
It is each Fund’s intention to continue to qualify as a regulated investment company under Subchapter M of the Internal Revenue Code and distribute all of its taxable income (including net capital gains). Accordingly, no provision for federal income tax is required.
Dividends from net investment income and distributions from net realized capital gains are determined in accordance with U.S. Federal income tax regulations, which may differ from those amounts determined under U.S. GAAP. These book/tax differences are either temporary or permanent in nature. To the extent these differences are permanent, they are charged or credited topaid-in capital or distributable earnings (loss), as appropriate, in the period that the differences arise.
Accordingly, the following permanent differences, primarily attributable to reclassification of long term capital gain distributions on Real Estate Investment Trust securities, foreign exchange gain and loss, reclassification of income from Regulated Investment Companies,non-deductible expenses, and basis adjustments for investments in partnerships, have been reclassified to/ (from) the following accounts as of June 30, 2019:
| | | | | | | | |
| | | Paid-in Capital
($ Thousands) | | | Distributable Earnings/
(Accumulated Losses)
($ Thousands) | |
Growth Fund | | | $ | (1) | | | $1 | |
| | |
| 56 | | New Covenant Funds / Annual Report / June 30, 2019 |
The tax character of dividends and distributions paid during the last two years ended June 30 were as follows:
| | | | | | | | | | | | | | | | | | | | |
| | | | | | |
| | | | | | Ordinary
Income ($ Thousands) | | | Long Term
Capital Gains ($ Thousands) | | | Total Taxable
Deductions
($ Thousands) | | | Total
Distributions Paid ($ Thousands) | |
Growth Fund | | | 2019 | | | | $ 5,700 | | | | $ 25,395 | | | | $ 31,095 | | | | $ 31,095 | |
| | | 2018 | | | | 5,007 | | | | 23,033 | | | | 28,040 | | | | 28,040 | |
Income Fund | | | 2019 | | | | 7,780 | | | | — | | | | 7,780 | | | | 7,780 | |
| | | 2018 | | | | 6,403 | | | | — | | | | 6,403 | | | | 6,403 | |
Balanced Growth Fund | | | 2019 | | | | 5,632 | | | | 12,003 | | | | 17,635 | | | | 17,635 | |
| | | 2018 | | | | 2,619 | | | | 2,087 | | | | 4,706 | | | | 4,706 | |
Balanced Income Fund | | | 2019 | | | | 1,606 | | | | 2,554 | | | | 4,160 | | | | 4,160 | |
| | | 2018 | | | | 1,114 | | | | 583 | | | | 1,697 | | | | 1,697 | |
As of June 30, 2019, the components of distributable earnings (accumulated losses) were as follows:
| | | | | | | | | | | | | | | | | | | | | | | | | | | | | | | | | | | | | | | | | | | | | | | | | | | | | | | | |
| | | | | | Undistributed
Ordinary
Income ($ Thousands) | | | | | | Undistributed
Long-Term
Capital Gain
($ Thousands) | | | | | | Capital Loss
Carryforwards
($ Thousands) | | | | | | Post- October
Losses ($ Thousands) | | | | | | Unrealized
Appreciation
(Depreciation)
($ Thousands) | | | | | | Other
Temporary
Differences ($ Thousands) | | | | | | Total
Distributable
Earnings
(Accumulated
Losses) ($ Thousands) | |
New Covenant Growth Fund | | $ | | | | | 857 | | | $ | | | | | 17,284 | | | $ | | | | | — | | | $ | | | | | — | | | $ | | | | | 106,288 | | | $ | | | | | 2 | | | $ | | | | | 124,431 | |
New Covenant Income Fund | | | | | | | 715 | | | | | | | | — | | | | | | | | (1,950 | ) | | | | | | | — | | | | | | | | 6,967 | | | | | | | | (1,519 | ) | | | | | | | 4,213 | |
New Covenant Balanced Growth Fund | | | | | | | 2,544 | | | | | | | | 9,488 | | | | | | | | — | | | | | | | | — | | | | | | | | 58,742 | | | | | | | | — | | | | | | | | 70,774 | |
New Covenant Balanced Income Fund | | | | | | | 483 | | | | | | | | 1,371 | | | | | | | | — | | | | | | | | — | | | | | | | | 11,288 | | | | | | | | — | | | | | | | | 13,142 | |
Post October losses represent losses realized on investment transactions from November 1, 2018 through June 30, 2019 that, in accordance with Federal income tax regulations, the Funds may defer and treat as having arisen in the following fiscal year. Deferred Late-Year Losses represent ordinary losses realized on investment transactions from January 1, 2019 through June 30, 2019 and specified losses realized on investment transactions from November 1, 2016 through June 30, 2019, that, in accordance with Federal income tax regulations, the Fund defers and treats as having arisen in the following fiscal year.
The Funds are permitted to carry forward capital losses incurred in taxable years beginning after December 22, 2010 for an unlimited period. Additionally, post-enactment capital losses that are carried forward will retain their character as either short-term or long-term capital losses rather than being considered all short-term as under previous law. Losses carried forward under these new provisions are as follows:
| | | | | | | | | | | | |
| | | Short-Term Loss ($ Thousands) | | | Long-Term Loss ($ Thousands) | | | Total* ($ Thousands) | |
Income Fund | | | $ — | | | | $ 1,950 | | | | $ 1,950 | |
*This table should be used in conjunction with the capital loss carryforwards table.
For Federal income tax purposes, the cost of securities owned at June 30, 2019, and the net realized gains or losses on securities sold for the period were not materially different from amounts reported for financial reporting purposes. These differences are primarily due to wash sales, MLP basis adjustments and basis adjustments from investments in registered investment companies which cannot be used for Federal income tax purposes in the current year and have been deferred for use in future years.
| | | | |
New Covenant Funds / Annual Report / June 30, 2019 | | | 57 | |
NOTES TO FINANCIAL STATEMENTS (Continued)
June 30, 2019
The aggregate gross unrealized appreciation and depreciation on total investments held by the Funds at June 30, 2019 was as follows:
| | | | | | | | | | | | | | | | |
| | | Federal Tax Cost ($ Thousands) | | | Appreciated
Securities
($ Thousands) | | | Depreciated
Securities
($ Thousands) | | | Net Unrealized
Appreciation
(Depreciation)
($ Thousands) | |
Growth Fund | | | $ 340,421 | | | | $ 119,568 | | | | $ (13,269) | | | | $ 106,299 | |
Income Fund | | | 345,714 | | | | 7,755 | | | | (792) | | | | 6,963 | |
Balanced Growth Fund | | | 234,896 | | | | 58,742 | | | | — | | | | 58,742 | |
Balanced Income Fund | | | 67,501 | | | | 11,288 | | | | — | | | | 11,288 | |
Management has analyzed the Funds’ tax positions taken on Federal income tax returns for all open tax years and has concluded that as of June 30, 2019, no provision for income tax would be required in the Funds’ financial statements. The Funds’ Federal and state income and Federal excise tax returns for tax years for which the applicable statutes of limitations have not expired are subject to examination by the Internal Revenue Service and state departments of revenue.
7. CONCENTRATIONS/RISKS
In the normal course of business, the Trust enters into contracts that provide general indemnifications by the Trust to the counterparty to the contract. The Trust’s maximum exposure under these arrangements is dependent on future claims that may be made against the Trust and, therefore, cannot be estimated; however, management believes that, based on experience, the risk of loss from such claims is considered remote.
Asset Allocation Risk— The risk that SIMC’s decisions regarding the allocation of Fund assets to the Growth Fund and Income Fund will not anticipate market trends successfully.
Asset-Backed Securities Risk— Payment of principal and interest on asset-backed securities is dependent largely on the cash flows generated by the assets backing the securities. Securitization trusts generally do not have any assets or sources of funds other than the receivables and related property they own, and asset-backed securities are generally not insured or guaranteed by the related sponsor or any other entity. Asset-backed securities may be more illiquid than more conventional types of fixed income securities that the Fund may acquire.
Below Investment Grade Securities (Junk Bonds) Risk— Fixed income securities rated below investment grade (junk bonds) involve greater risks of default or downgrade and are generally more volatile than investment grade securities because the prospect for repayment of principal and interest of many of these securities is speculative. Because these securities typically offer a higher rate of return to compensate investors for these risks, they are sometimes referred to as “high yield bonds,” but there is no guarantee that an investment in these securities will result in a high rate of return. These risks may be increased in foreign and emerging markets.
Corporate Fixed Income Securities Risk— Corporate fixed income securities respond to economic developments, especially changes in interest rates, as well as perceptions of the creditworthiness and business prospects of individual issuers.
Credit Risk— The risk that the issuer of a security or the counterparty to a contract will default or otherwise become unable to honor a financial obligation.
Depositary Receipts Risk— Depositary receipts, such as American Depositary Receipts, are certificates evidencing ownership of shares of a foreign issuer that are issued by depositary banks and generally trade on an established market. Depositary receipts are subject to many of the risks associated with investing directly in foreign securities,
| | |
| 58 | | New Covenant Funds / Annual Report / June 30, 2019 |
including, among other things, political, social and economic developments abroad, currency movements and different legal, regulatory and tax environments.
Duration Risk— The longer-term securities in which the Fund may invest are more volatile. A portfolio with a longer average portfolio duration is more sensitive to changes in interest rates than a portfolio with a shorter average portfolio duration.
Equity Market Risk— The risk that stock prices will fall over short or extended periods of time.
Extension Risk— The risk that rising interest rates may extend the duration of a fixed income security, typically reducing the security’s value.
Fixed Income Market Risk— The prices of the Fund’s fixed income securities respond to economic developments, particularly interest rate changes, as well as to perceptions about the creditworthiness of individual issuers, including governments and their agencies. Generally, the Fund’s fixed income securities will decrease in value if interest rates rise and vice versa. In a low interest rate environment, risks associated with rising rates are heightened. In the case of foreign securities, price fluctuations will reflect international economic and political events, as well as changes in currency valuations relative to the U.S. dollar.
Foreign Investment/Emerging Markets Risk— The risk thatnon-U.S. securities may be subject to additional risks due to, among other things, political, social and economic developments abroad, currency movements and different legal, regulatory and tax environments. These additional risks may be heightened with respect to emerging market countries because political turmoil and rapid changes in economic conditions are more likely to occur in these countries.
Foreign Sovereign Debt Securities Risk— The risks that (i) the governmental entity that controls the repayment of sovereign debt may not be willing or able to repay the principal and/or interest when it becomes due because of factors such as debt service burden, political constraints, cash flow problems and other national economic factors; (ii) governments may default on their debt securities, which may require holders of such securities to participate in debt rescheduling or additional lending to defaulting governments; and (iii) there is no bankruptcy proceeding by which defaulted sovereign debt may be collected in whole or in part.
Interest Rate Risk— The risk that a rise in interest rates will cause a fall in the value of fixed income securities, including U.S. Government securities, in which the Fund invests. Although U.S. Government securities are considered to be among the safest investments, they are not guaranteed against price movements due to changing interest rates. A low interest rate environment may present greater interest rate risk, because there may be a greater likelihood of rates increasing and rates may increase more rapidly.
Investment Style Risk— The risk that the equity securities in which the Fund invests may underperform other segments of the equity markets or the equity markets as a whole.
Liquidity Risk— The risk that certain securities may be difficult or impossible to sell at the time and the price that the Fund would like. The Fund may have to accept a lower price to sell a security, sell other securities to raise cash or give up an investment opportunity, any of which could have a negative effect on Fund management or performance.
Mortgage-Backed Securities Risk— Mortgage-backed securities are affected significantly by the rate of prepayments and modifications of the mortgage loans backing those securities, as well as by other factors such as borrower defaults, delinquencies, realized or liquidation losses and other shortfalls. Mortgage-backed securities are particularly sensitive to prepayment risk, which is described below, given that the term to maturity for mortgage loans is generally substantially longer than the expected lives of those securities; however, the timing and amount of prepayments cannot be accurately predicted. The timing of changes in the rate of prepayments of the mortgage loans may significantly affect the Fund’s actual yield to maturity on any mortgage-backed securities, even if the average rate of principal payments is consistent with the Fund’s expectation. Along with prepayment risk, mortgage-backed securities are significantly affected by interest rate risk, which is described above. In a low interest rate environment, mortgage loan prepayments would generally be expected to increase due to factors such as refinancings and loan modifications at lower interest rates. In contrast, if prevailing interest rates rise, prepayments
| | | | |
New Covenant Funds / Annual Report / June 30, 2019 | | | 59 | |
NOTES TO FINANCIAL STATEMENTS (Concluded)
June 30, 2019
of mortgage loans would generally be expected to decline and therefore extend the weighted average lives of mortgage-backed securities held or acquired by the Fund.
Opportunity Risk— The risk of missing out on an investment opportunity because the assets necessary to take advantage of it are tied up in other investments.
Portfolio Turnover Risk— Due to its investment strategy, the Fund may buy and sell securities frequently. This may result in higher transaction costs and additional capital gains tax liabilities, which may affect the Fund’s performance.
Prepayment Risk— The risk that, in a declining interest rate environment, fixed income securities with stated interest rates may have the principal paid earlier than expected, requiring the Fund to invest the proceeds at generally lower interest rates.
Repurchase Agreement Risk— Although repurchase agreement transactions must be fully collateralized at all times, they generally create leverage and involve some counterparty risk to the Fund whereby a defaulting counterparty could delay or prevent the Fund’s recovery of collateral.
Small Capitalization Risk— Smaller capitalization companies in which the Fund may invest may be more vulnerable to adverse business or economic events than larger, more established companies. In particular, small capitalization companies may have limited product lines, markets and financial resources and may depend upon a relatively small management group. Therefore, small capitalization stocks may be more volatile than those of larger companies. Small capitalization stocks may be tradedover-the-counter or listed on an exchange.
Social-Witness Principles/Socially Responsible Investing Risk— The Fund considers various social- witness principles and other socially responsible investing principles in its investment process and may choose not to purchase, or may sell, otherwise profitable investments in companies which have been identified as being in conflict with its established social-witness principles and other socially responsible investing principles. This means that the Fund may underperform other similar mutual funds that do not consider social-witness principles and other socially responsible investing principles in their investing.
U.S. Government Securities Risk— Although U.S. Government securities are considered to be among the safest investments, they are not guaranteed against price movements due to changing interest rates. Obligations issued by some U.S. Government agencies are backed by the U.S. Treasury, while others are backed solely by the ability of the agency to borrow from the U.S. Treasury or by the agency’s own resources.
The Balanced Growth Fund and Balanced Income Fund invest their assets primarily in the Growth Fund and the Income Fund. By investing primarily in shares of these Funds, shareholders of the Balanced Funds indirectly pay a portion of the operating expenses, management fees and brokerage costs of the underlying Funds as well as their own operating expenses. Thus, shareholders of the Balanced Funds may indirectly pay slightly higher total operating expenses and other costs than they would pay by directly owning shares of the Growth Fund and Income Fund. A change in the asset allocation of either Balanced Fund could increase or reduce the fees and expenses actually borne by investors in that Fund. The Balanced Funds are also subject to rebalancing risk. Rebalancing activities, while undertaken to maintain a Fund’s investmentrisk-to- reward ratio, may cause the Fund to under-perform other funds with similar investment objectives. For the Balanced Growth Fund, it is possible after rebalancing from equities into a greater percentage offixed-income securities, that equities will outperform fixed income investments. For the Balanced Income Fund, it is possible that after rebalancing fromfixed-income securities into a greater percentage of equity securities, thatfixed-income securities will outperform equity investments. The performance of the Balanced Growth Fund and the Balanced Income Fund depends on the performance of the underlying Funds in which they invest.
8. CONCENTRATION OF SHAREHOLDERS
On June 30, 2019, the number of shareholders below held the following percentage of the outstanding shares of the Funds. These shareholders are affiliated with the Funds.
| | | | |
| | | |
| | | # of Shareholders | | % of Outstanding Shares |
Growth Fund | | 3 | | 76.98% |
Income Fund | | 3 | | 83.38% |
Balanced Growth Fund | | 1 | | 1.38% |
Balanced Income Fund | | 1 | | 0.23% |
| | |
| 60 | | New Covenant Funds / Annual Report / June 30, 2019 |
9. REGULATORY MATTERS
On August 17, 2018, the SEC adopted amendments to RegulationS-X. These changes are effective for periods after November 5, 2018. The updates to Registered Investment Companies were mainly focused on simplifying the presentation of distributable earnings by eliminating the need to present the components of distributable earning on a book basis in the Statements of Assets and Liabilities. The update also impacted the presentation of undistributed net investment income and distributions to shareholders on the Statements of Changes in Net Assets.
The amounts presented in the current Statements of Changes in Net Assets represent the aggregated total distributions of net investment income and realized capital gains, except for distributions classified as return of capital which are still presented separately. The disaggregated amounts from the prior fiscal year are broken out below if there were both distributions from net investment income and realized capital gains. Otherwise, the amount on the current Statement of Changes for the prior fiscal year end represents distributions of net investment income.
| | | | | | | | |
| | | | |
| | | Net Investment Income | | | Net Realized Gains | | Total |
Growth Fund | | | $3,990 | | | $24,050 | | $28,040 |
Balanced Growth Fund | | | 2,619 | | | 2,087 | | 4,706 |
Balanced Income Fund | | | 1,097 | | | 600 | | 1,697 |
10. ACCOUNTING PRONOUNCEMENT
In August 2018, The FASB issued Accounting Standards Update2018-13, Fair Value Measurement (Topic 820). The new guidance includes additions and modifications to disclosures requirements for fair value measurements. For public entities, the amendments are effective for financial statements issued for fiscal years beginning after December 15, 2019, and interim periods within those fiscal years. At this time, management is currently evaluating the impact of this new guidance on the financial statements and disclosures.
11. SUBSEQUENT EVENTS
At a meeting of the Board of Trustees of New Covenant Funds (the “Board”) held on June 25, 2019, the Board approved a reduction of the contractual investment advisory fee for the New Covenant Growth Fund (the “Fund”) from .62% to .47%. This change to the Fund became effective on or about July 2, 2019.
| | | | |
New Covenant Funds / Annual Report / June 30, 2019 | | | 61 | |
REPORT OF INDEPENDENT REGISTERED PUBLIC ACCOUNTING FIRM
THE BOARD OF TRUSTEES AND SHAREHOLDERS
NEW COVENANT FUNDS:
Opinion on the Financial Statements
We have audited the accompanying statements of assets and liabilities, including the schedules of investments, of New Covenant Funds (the “Trust”), comprised of the New Covenant Growth Fund, New Covenant Income Fund, New Covenant Balanced Growth Fund, and New Covenant Balanced Income Fund (collectively, the “Funds”), as of June 30, 2019, and the related statements of operations for the year then ended, the statements of changes in net assets for each of the years in thetwo-year period then ended and the related notes (collectively, the financial statements) and the financial highlights for each of the years in thefive-year period then ended. In our opinion, the financial statements and financial highlights present fairly, in all material respects, the financial position of the Funds as of June 30, 2019, the results of their operations for the year then ended, the changes in their net assets for each of the years in thetwo-year period then ended, and the financial highlights for each of the years in thefive-year period then ended, are in conformity with U.S. generally accepted accounting principles.
Basis for Opinion
These financial statements and financial highlights are the responsibility of the Funds’ management. Our responsibility is to express an opinion on these financial statements and financial highlights based on our audits. We are a public accounting firm registered with the Public Company Accounting Oversight Board (United States) (“PCAOB”) and are required to be independent with respect to the Funds in accordance with the U.S. federal securities laws and the applicable rules and regulations of the Securities and Exchange Commission and the PCAOB.
We conducted our audits in accordance with the standards of the PCAOB. Those standards require that we plan and perform the audits to obtain reasonable assurance about whether the financial statements and financial highlights are free of material misstatement, whether due to error or fraud. Our audits included performing procedures to assess the risks of material misstatement of the financial statements and financial highlights, whether due to error or fraud, and performing procedures that respond to those risks. Such procedures included examining, on a test basis, evidence regarding the amounts and disclosures in the financial statements and financial highlights. Such procedures also included confirmation of securities owned as of June 30, 2019, by correspondence with the custodians, transfer agents, and brokers or by other appropriate auditing procedures when replies from brokers were not received. Our audits also included evaluating the accounting principles used and significant estimates made by management, as well as evaluating the overall presentation of the financial statements and financial highlights. We believe that our audits provide a reasonable basis for our opinion.

We have served as the auditor of one or more SEI Funds investment companies since 2005.
Philadelphia, Pennsylvania
August 29, 2019
| | |
| 62 | | New Covenant Funds / Annual Report / June 30, 2019 |
TRUSTEES AND OFFICERS OF THE TRUST (Unaudited)
The following chart lists Trustees and Officers as of June 30, 2019.
Set forth below are the names, addresses, ages, position with the Trust, Term of Office and Length of Time Served, the principal occupations for the last five years, number of positions in fund complex overseen by trustee, and other directorships outside the fund complex of each of the persons currently serving as Trustees and Officers of the Trust. The Trust’s Statement of Additional Information (“SAI”) includes additional information about the Trustees and Officers. The SAI may be obtained without charge by calling1-877-835-4531.
| | | | | | | | | | |
Name, Address, and Age | | Position(s)
Held with
Trusts | | Term of Office and
Length of Time Served1 | | Principal Occupation(s) During Past Five Years | | Number of
Portfolios in Fund Complex Overseen
by Trustee2 | | Other Directorships Held by Trustee |
INTERESTED TRUSTEES | | | | | | | | |
Robert A. Nesher One Freedom Valley Drive Oaks, PA 19456 72 yrs. old | | Chairman
of the
Board of
Trustees* | | since 1995 | | Currently performs various services on behalf of SEI for which Mr. Nesher is compensated. | | 99 | | President and Director of SEI Structured Credit Fund, LP. Director of SEI Global Master Fund plc, SEI Global Assets Fund plc, SEI Global Investments Fund plc, SEI Investments—Global Funds Services, Limited, SEI Investments Global, Limited, SEI Investments (Europe) Ltd., SEI Multi-Strategy Funds PLC, SEI Global Nominee Ltd and SEI Investments—Unit Trust Management (UK) Limited. President, Director and Chief Executive Officer of SEI Alpha Strategy Portfolios, LP from 2007 to 2013. Trustee of SEI Liquid Asset Trust from 1989 to 2016. Vice Chairman of O’Connor EQUUS(closed-end investment company) from 2014 to 2016. Vice Chairman of Winton Series Trust from 2014 to 2017. Vice Chairman of The Advisors’ Inner Circle Fund III and Winton Diversified Opportunities Fund(closed-end investment company) from 2014 to 2018. Vice Chairman of Gallery Trust, Schroder Series Trust and Schroder Global Series Trust from 2015 to 2018. Trustee of The Advisors’ Inner Circle Fund, The Advisors’ Inner Circle Fund II, Bishop Street Funds, and the KP Funds. President, Chief Executive Officer and Trustee of SEI Asset Allocation Trust, SEI Daily Income Trust, SEI Institutional Managed Trust, SEI Institutional International Trust, SEI Institutional Investments Trust, SEI Tax Exempt Trust, SEI Insurance Products Trust, Adviser Managed Trust, The New Covenant Funds and SEI Catholic Values Trust. |
William M. Doran One Freedom Valley Drive Oaks, PA 19456 79 yrs. old | | Trustee* | | since 1995 | | Self-employed consultant since 2003. Partner, Morgan, Lewis & Bockius LLP (law firm) from 1976 to 2003, counsel to the Trust, SEI, SIMC, the Administrator and the Distributor. | | 99 | | Director of SEI since 1974; Secretary of SEI since 1978. Director of SEI Investments Distribution Co. since 2003. Director of SEI Investments—Global Funds Services, Limited, SEI Investments Global, Limited, SEI Investments (Europe), Limited, SEI Investments (Asia) Limited, SEI Global Nominee Ltd. and SEI Investments—Unit Trust Management (UK) Limited. Trustee of SEI Liquid Asset Trust from 1982 to 2016. Trustee of O’Connor EQUUS from 2014 to 2016. Director of SEI Alpha Strategy Portfolios, LP from 2007 to 2013. Trustee of The Advisors’ Inner Circle Fund, The Advisors’ Inner Circle Fund II, The Advisors’ Inner Circle Fund III, Winton Series Trust, Winton Diversified Opportunities Fund, Gallery Trust, Bishop Street Funds, SEI Asset Allocation Trust, SEI Daily Income Trust, SEI Institutional Managed Trust, SEI Institutional International Trust, SEI Institutional Investments Trust, SEI Tax Exempt Trust, SEI Insurance Products Trust, Adviser Managed Trust, New Covenant Funds, The KP Funds and SEI Catholic Values Trust. |
TRUSTEES | | | | | | | | | | |
George J. Sullivan Jr. One Freedom Valley Drive, Oaks, PA 19456 76 yrs. old | | Trustee | | since 1996 | | Retired since January 2012. Self-Employed Consultant, Newfound Consultants Inc. April 1997-December 2011. | | 99 | | Member of the independent review committee for SEI’s Canadian-registered mutual funds. Director of SEI Opportunity Fund, L.P. to 2010. Director of SEI Alpha Strategy Portfolios, LP from 2007 to 2013. Trustee of SEI Liquid Asset Trust from 1996 to 2016. Trustee/Director of State Street Navigator Securities Lending Trust, The Advisors’ Inner Circle Fund, The Advisors’ Inner Circle Fund II, Bishop Street Funds, SEI Structured Credit Fund, LP, SEI Asset Allocation Trust, SEI Daily Income Trust, SEI Institutional Managed Trust, SEI Institutional International Trust, SEI Institutional Investments Trust, SEI Tax Exempt Trust, SEI Insurance Products Trust, Adviser Managed Trust, New Covenant Funds, The KP Funds and SEI Catholic Values Trust. |
| * | Messrs. Nesher and Doran are Trustees who may be deemed as “interested” persons of the Trust as that term is defined in the 1940 Act by virtue of their affiliation with SIMC and the Trust’s Distributor. |
| 1 | Each trustee shall hold office during the lifetime of this Trust until the election and qualification of his or her successor, or until he or she sooner dies, resigns or is removed in accordance with the Trust’s Declaration of Trust |
| 2 | The Fund Complex includes the following Trusts: SEI Asset Allocation Trust, SEI Daily Income Trust, SEI Institutional Investments Trust, Adviser Managed Trust, SEI Institutional International Trust, SEI Institutional Managed Trust, SEI Tax Exempt Trust, SEI Insurance Products Trust, SEI Catholic Values Trust and New Covenant Funds. |
| | | | |
New Covenant Funds / Annual Report / June 30, 2019 | | | 63 | |
TRUSTEES AND OFFICERS OF THE TRUST (Unaudited) (Concluded)
| | | | | | | | | | |
Name Address, and Age | | Position(s)
Held with
Trusts | | Term of Office and Length of Time Served1 | | Principal Occupation(s) During Past Five Years | | Number of
Portfolios in Fund Complex Overseen by Trustee2 | | Other Directorships Held by Trustee |
TRUSTEES (continued) | | | | | | | | |
Nina Lesavoy One Freedom Valley Drive, Oaks, PA 19456 61 yrs. old | | Trustee | | since 2003 | | Founder and Managing Director, Avec Capital (strategic fundraising firm) since 2008. Managing Director, Cue Capital (strategic fundraising firm) from March 2002-March 2008. | | 99 | | Director of SEI Alpha Strategy Portfolios, LP from 2007 to 2013. Trustee of SEI Liquid Asset Trust from 2003 to 2016. Trustee/Director of SEI Structured Credit Fund, L.P., SEI Asset Allocation Trust, SEI Daily Income Trust, SEI Institutional Managed Trust, SEI Institutional International Trust, SEI Institutional Investments Trust, SEI Tax Exempt Trust, SEI Insurance Products Trust, New Covenant Funds, Adviser Managed Trust and SEI Catholic Values Trust. |
James M. Williams One Freedom Valley Drive, Oaks, PA 19456 71 yrs. old | | Trustee | | since 2004 | | Vice President and Chief Investment Officer, J. Paul Getty Trust,Non-Profit Foundation for Visual Arts, since December 2002. President, Harbor Capital Advisors and Harbor Mutual Funds, 2000-2002. Director of SEI Alpha Strategy Portfolios, L.P. from 2007 to 2013. Manager, Pension Asset Management, Ford Motor Company, 1997-1999. | | 99 | | Director of SEI Alpha Strategy Portfolios, LP from 2007 to 2013, Trustee of SEI Liquid Asset Trust from 2004 to 2016. Trustee/Director of Ariel Mutual Funds, SEI Structured Credit Fund, LP, SEI Asset Allocation Trust, SEI Daily Income Trust, SEI Institutional Managed Trust, SEI Institutional International Trust, SEI Institutional Investments Trust, SEI Tax Exempt Trust, New Covenant Funds, SEI Insurance Products Trust, Adviser Managed Trust and SEI Catholic Values Trust. |
Mitchell A. Johnson One Freedom Valley Drive, Oaks, PA 19456 77 yrs. old | | Trustee | | since 2007 | | Retired Private Investor since 1994. | | 99 | | Director, Federal Agricultural Mortgage Corporation (Farmer Mac) since 1997. Director of SEI Alpha Strategy Portfolios, LP from 2007 to 2013. Trustee of SEI Liquid Asset Trust from 2007 to 2016. Trustee of the Advisors’ Inner Circle Fund, The Advisors’ Inner Circle Fund II, Bishop Street Funds, SEI Asset Allocation Trust, SEI Daily Income Trust, SEI Institutional Managed Trust, SEI Institutional International Trust, SEI Institutional Investments Trust, SEI Tax Exempt Trust, SEI Insurance Products Trust, Adviser Managed Trust, The KP Funds and SEI Catholic Values Trust. |
Hubert L. Harris, Jr. One Freedom Valley Drive, Oaks, PA 19456 75 yrs. old | | Trustee | | since 2008 | | Retired since December 2005. Owner of Harris Plantation, Inc. since 1995. Chief Executive Officer of Harris CAPM, a consulting asset and property management entity. Chief Executive Officer, INVESCO North America, August 2003-December 2005. Chief Executive Officer and Chair of the Board of Directors, AMVESCAP Retirement, Inc., January 1998- August 2003. | | 99 | | Director of AMVESCAP PLC from 1993-2004. Served as a director of a bank holding company, 2003-2009. Director, Aaron’s Inc., 2012-present. President and CEO of Oasis Ornamentals LLC since 2011. Member of the Board of Councilors of the Carter Center (nonprofit corporation) and served on the board of othernon-profit organizations. Director of SEI Alpha Strategy Portfolios, LP from 2008 to 2013. Trustee of Liquid Asset Trust from 2008 to 2016. Trustee of SEI Asset Allocation Trust, SEI Daily Income Trust, SEI Institutional Managed Trust, SEI Institutional International Trust, SEI Institutional Investments Trust, SEI Tax Exempt Trust, SEI Insurance Products Trust, New Covenant Funds, Adviser Managed Trust and SEI Catholic Values Trust. |
Susan C. Cote One Freedom Valley Drive Oaks, PA 19456 64 years old | | Trustee | | since 2016 | | Retired since July 2015. Americas Director of Asset Management, Ernst & Young LLP from 2006-2013. Global Asset Management Assurance Leader, Ernest & Young LLP from 2006- 2015. Partner Ernest & Young LLP from 1997-2015. Prudential, 1983-1997.Member of the Ernst & Young LLP Retirement Investment Committee, Treasurer and Chair of Finance, Investment and Audit Committee of the New York Women’s Foundation. | | 99 | | Trustee of SEI Tax Exempt Trust, SEI Daily Income Trust, SEI Institutional International Trust, SEI Institutional Managed Trust, SEI Asset Allocation Trust, SEI Institutional Investments Trust, SEI Insurance Products Trust, New Covenant Funds, Adviser Managed Trust and SEI Catholic Values Trust. |
James B. Taylor One Freedom Valley Drive Oaks, PA 19456 68 years old | | Trustee | | since 2018 | | Retired since December 2017. Chief Investment Officer at Georgia Teach Foundation from 2008 to 2017. Chief Investment Officer at Delta Air Lines from 1983 to 2007. Member of the Investment Committee at the Institute of Electrical and Electronic Engineers from 1999 to 2004. President, Vice President and Treasurer at Southern Benefits Conference from 1998 to 2000. | | 99 | | Trustee of SEI Daily Income Trust, SEI Tax Exempt Trust, SEI Institutional Managed Trust, SEI Institutional International Trust, SEI Institutional Investments Trust, SEI Asset Allocation Trust, Adviser Managed Trust, New Covenant Funds, SEI Insurance Products Trust and SEI Catholic Values Trust. |
| 1 | Each trustee shall hold office during the lifetime of this Trust until the election and qualification of his or her successor, or until he or she sooner dies, resigns or is removed in accordance with the Trust’s Declaration of Trust. |
| 2 | The Fund Complex includes the following Trusts: SEI Asset Allocation Trust, SEI Daily Income Trust, SEI Institutional Investments Trust, Adviser Managed Trust, SEI Institutional International Trust, SEI Institutional Managed Trust, SEI Tax Exempt Trust, SEI Insurance Products Trust, SEI Catholic Values Trust and New Covenant Funds. |
| | |
| 64 | | New Covenant Funds / Annual Report / June 30, 2019 |
| | | | | | | | | | | | |
Name Address, and Age | | Position(s)
Held with
Trusts | | | Term of Office and
Length of Time Served1 | | Principal Occupation(s) During Past Five Years | | Number of
Portfolios in
Fund Complex Overseen by Trustee2 | | Other Directorships Held by Trustee |
OFFICERS | | | | | | | | | | | | |
Robert A. Nesher One Freedom Valley Drive, Oaks, PA 19456 72 yrs. Old | |
| President
and CEO |
| | since 2005 | | Currently performs various services on behalf of SEI for which Mr. Nesher is compensated. | | N/A | | N/A |
James J. Hoffmayer One Freedom Valley Drive Oaks, PA 19456 45 yrs. old | |
| Controller
and Chief
Financial
Officer |
| | since 2016 | | Senior Director, Funds Accounting and Fund Administration, SEI Investments Global Funds Services (since September 2016); Senior Director of Fund Administration, SEI Investments Global Funds Services (since October 2014). Director of Financial Reporting, SEI Investments Global Funds Services (November 2004 – October 2014). | | N/A | | N/A |
Glenn R. Kurdziel One Freedom Valley Drive Oaks, PA 19456 45 yrs. old | |
| Assistant
Controller |
| | since 2017 | | Assistant Controller, Funds Accounting, SEI Investments Global Funds Services (March 2017); Senior Manager, Funds Accounting, SEI Investments Global Funds Services since 2005. | | N/A | | N/A |
Russell Emery One Freedom Valley Drive Oaks, PA 19456 56 yrs. old | |
| Chief
Compliance
Officer |
| | since 2006 | | Chief Compliance Officer of SEI Daily Income Trust, SEI Institutional Investments Trust, SEI Institutional Managed Trust, SEI Asset Allocation Trust, SEI Institutional International Trust, SEI Tax Exempt Trust, The Advisors’ Inner Circle Fund, The Advisors’ Inner Circle Fund II and Bishop Street Funds since March 2006. Chief Compliance Officer of SEI Liquid Asset Trust from 2006 to 2016. Chief Compliance Officer of SEI Structured Credit Fund, LP June 2007. Chief Compliance Officer of Adviser Managed Trust since December 2010. Chief Compliance Officer of SEI Alpha Strategy Portfolios, LP from 2007 to 2013. Chief Compliance Officer of New Covenant Funds since February 2012.Chief Compliance Officer of SEI Insurance Products Trust and The KP Funds since 2013. Chief Compliance Officer of New Covenant Funds since February 2012. Chief Compliance Officer of O’Connor EQUUS from 2014 to 2016. Chief Compliance Officer of The Advisors’ Inner Circle Fund III, Winton Series Trust and Winton Diversified Opportunities Fund since 2014. Chief Compliance Officer of SEI Catholic Values Trust and Gallery Trust since 2015. | | N/A | | N/A |
Timothy D Barto One Freedom Valley Drive Oaks, PA 19456 51 yrs. old | |
| Vice
President
and
Secretary |
| | since 2002 | | Vice President and Secretary of SEI Institutional Transfer Agent, Inc. since 2009. General Counsel and Secretary of SIMC and the Administrator since 2004. Vice President of SIMC and the Administrator since 1999. Vice President and Assistant Secretary of SEI since 2001. | | N/A | | N/A |
Aaron Buser One Freedom Valley Drive, Oaks, PA 19456 48 yrs. old | |
| Vice
President
and
Assistant
Secretary |
| | since 2008 | | Vice President and Assistant Secretary of SEI Institutional Transfer Agent, Inc. since 2009. Vice President and Assistant Secretary of SIMC since 2007. Attorney Stark & Stark (law firm), March 2004-July 2007. | | N/A | | N/A |
David F. McCann One Freedom Valley Drive, Oaks, PA 19456 43 yrs. old | |
| Vice
President and
Assistant
Secretary |
| | since 2009 | | Vice President and Assistant Secretary of SEI Institutional Transfer Agent, Inc. since 2009. Vice President and Assistant Secretary of SIMC since 2008. Attorney, Drinker Biddle & Reath, LLP (law firm), May 2005 - October 2008. | | N/A | | N/A |
Stephen G. MacRae One Freedom Valley Drive, Oaks, PA 19456 51 yrs. old | |
| Vice
President |
| | since 2012 | | Director of Global Investment Product Management January 2004 - to present. | | N/A | | N/A |
Bridget E. Sudall One Freedom Valley Drive Oaks, PA 19456 38 yrs. old | |
| Anti-Money
Laundering
Compliance
Officer and
Privacy
Officer |
| | since 2015 | | Anti-Money Laundering Compliance Officer and Privacy Officer (since 2015), Senior Associate and AML Officer, Morgan Stanley Alternative Investment Partners, April 2011-March 2015, Investor Services Team Lead, Morgan Stanley Alternative Investment Partners, July 2007-April 2011. | | N/A | | N/A |
| 1 | Each trustee shall hold office during the lifetime of this Trust until the election and qualification of his or her successor, or until he or she sooner dies, resigns or is removed in accordance with the Trust’s Declaration of Trust. |
| 2 | The Fund Complex includes the following Trusts: SEI Asset Allocation Trust, SEI Daily Income Trust, SEI Institutional Investments Trust, Adviser Managed Trust, SEI Institutional International Trust, SEI Institutional Managed Trust, SEI Tax Exempt Trust, SEI Insurance Products Trust, SEI Catholic Values Trust and New Covenant Funds. |
| | | | |
New Covenant Funds / Annual Report / June 30, 2019 | | | 65 | |
DISCLOSURE OF FUND EXPENSES (UNAUDITED)
June 30, 2019
All mutual funds have operating expenses. As a shareholder of a mutual fund, your investment is affected by these ongoing costs, which include (among others) costs for portfolio management, administrative services, and shareholder reports like this one. It is important for you to understand the impact of these costs on your investment returns.
Operating expenses such as these are deducted from the mutual fund‘s gross income and directly reduce its final investment return. These expenses are expressed as a percentage of the mutual fund’s average net assets; this percentage is known as the mutual fund’s expense ratio.
The following examples use the expense ratio and are intended to help you understand the ongoing costs (in dollars) of investing in your Fund and to compare these costs with those of other mutual funds. The examples are based on an investment of $1,000 made at the beginning of the period shown and held for the entire period (January 1, 2019 to June 30, 2019).
The table on this page illustrates your Fund’s costs in two ways:
Actual Fund Return: This section helps you to estimate the actual expenses after fee waivers that your Fund incurred over the period. The “Expenses Paid During Period” column shows the actual dollar expense cost incurred by a $1,000 investment in the Fund, and the “Ending Account Value” number is derived from deducting that expense cost from the Fund’s gross investment return.
You can use this information, together with the actual amount you invested in your Fund, to estimate the expenses you paid over that period. Simply divide your actual starting account value by $1,000 to arrive at a ratio (for example, an $8,600 account value divided by $1,000 = 8.6), then multiply that ratio by the number shown for your Fund under “Expenses Paid During Period.”
Hypothetical 5% Return: This section helps you compare your Fund’s costs with those of other mutual funds. It assumes that your Fund had an annual 5% return before expenses during the year, but that the expense ratio (Column 3) is unchanged. This example is useful in making comparisons because the Securities and Exchange Commission requires all mutual funds to make this 5% calculation. You can assess your Fund’s comparative cost by comparing the hypothetical result for your Fund in the “Expenses Paid During Period” column with those that appear in the same charts in the shareholder reports for other mutual funds.
NOTE:Because the return is set at 5% for comparison purposes — NOT your Fund’s actual return — the account values shown do not apply to your specific investment.
| | | | | | | | | | | | | | | | |
| | | Beginning
Account
Value
1/1/2019 | | | Ending
Account
Value
6/30/19 | | | Annualized
Expense
Ratios | | | Expenses
Paid
During
Period* | |
Growth Fund | | | | | | | | | | | | | | | | |
Actual Fund Return | | | $1,000.00 | | | | $1,176.70 | | | | 0.83 | % | | | $4.48 | |
Hypothetical 5% Return | | | $1,000.00 | | | | $1,020.68 | | | | 0.83 | % | | | $4.16 | |
Income Fund | | | | | | | | | | | | | | | | |
Actual Fund Return | | | $1,000.00 | | | | $1,050.20 | | | | 0.80 | % | | | $4.07 | |
Hypothetical 5% Return | | | $1,000.00 | | | | $1,020.83 | | | | 0.80 | % | | | $4.01 | |
Balanced Growth Fund† | | | | | | | | | | | | | | | | |
Actual Fund Return | | | $1,000.00 | | | | $1,124.40 | | | | 0.13 | % | | | $0.68 | |
Hypothetical 5% Return | | | $1,000.00 | | | | $1,024.15 | | | | 0.13 | % | | | $0.65 | |
Balanced Income Fund† | | | | | | | | | | | | | | | | |
Actual Fund Return | | | $1,000.00 | | | | $1,092.70 | | | | 0.15 | % | | | $0.78 | |
Hypothetical 5% Return | | | $1,000.00 | | | | $1,024.05 | | | | 0.15 | % | | | $0.75 | |
| * | Expenses are equal to the Fund’s annualized expense ratio multiplied by the average account value over the period, multiplied by 181/365 (to reflect theone-half year period shown). |
| † | Excludes expenses of the underlying affiliated investment companies. |
| | |
| 66 | | New Covenant Funds / Annual Report / June 30, 2019 |
BOARD OF TRUSTEES CONSIDERATIONS IN APPROVING THE ADVISORY ANDSUB-ADVISORY AGREEMENTS (UNAUDITED)
New Covenant Funds (the “Trust”) and SEI Investments Management Corporation (“SIMC”) have entered into an investment advisory agreement (the “Advisory Agreement”). Pursuant to the Advisory Agreement, SIMC is responsible for the investment advisory services provided to the series of the Trust (the “Funds”). Pursuant to separatesub-advisory agreements with SIMC (the“Sub-Advisory Agreements” and, together with the Advisory Agreement, the “Investment Advisory Agreements”), and under the supervision of SIMC and the Trust’s Board of Trustees (the “Board”), thesub-advisers (each, a“Sub-Adviser” and collectively, the“Sub-Advisers”) provide security selection and certain other advisory services with respect to all or a discrete portion of the assets of the Funds. TheSub-Advisers are also responsible for managing their employees who provide services to the Funds. TheSub-Advisers are selected based primarily upon the research and recommendations of SIMC, which evaluates quantitatively and qualitatively theSub-Advisers’ skills and investment results in managing assets for specific asset classes, investment styles and strategies.
The Investment Company Act of 1940, as amended (the “1940 Act”), requires that the initial approval of, as well as the continuation of, the Funds’ Investment Advisory Agreements be specifically approved: (i) by the vote of the Board or by a vote of the shareholders of the Funds; and (ii) by the vote of a majority of the Trustees who are not parties to the Investment Advisory Agreements or “interested persons” of any party (the “Independent Trustees”), cast in person at a meeting called for the purpose of voting on such approval(s). In connection with their consideration of such approval(s), the Funds’ Trustees must request and evaluate, and SIMC and theSub-Advisers are required to furnish, such information as may be reasonably necessary to evaluate the terms of the Investment Advisory Agreements. In addition, the Securities and Exchange Commission takes the position that, as part of their fiduciary duties with respect to a mutual fund’s fees, mutual fund boards are required to evaluate the material factors applicable to a decision to approve an investment advisory agreement.
Consistent with these responsibilities, the Board calls and holds meetings each year to consider whether to approve new and/or renew existing Investment Advisory Agreements between the Trust and SIMC and SIMC and theSub-Advisers with respect to the Funds of the Trust. In preparation for these meetings, the Board requests and reviews a wide variety of materials provided by SIMC and theSub-Advisers, including information about SIMC’s and theSub-Advisers’ affiliates, personnel and operations and the services provided pursuant to the Investment Advisory Agreements. The Board also receives data from third parties. This information is provided in addition to the detailed information about the Funds that the Board reviews during the course of each year, including information that relates to Fund operations and Fund performance. The Trustees also receive a memorandum from counsel regarding the responsibilities of Trustees in connection with their consideration of whether to approve the Trust’s Investment Advisory Agreements. Finally, the Independent Trustees receive advice from independent counsel to the Independent Trustees, meet in executive sessions outside the presence of Fund management and participate in question and answer sessions with representatives of SIMC and theSub-Advisers.
Specifically, during the course of the Trust’s fiscal year, the Board requested and received written materials from SIMC and theSub-Advisers regarding: (i) the quality of SIMC’s and theSub-Advisers’ investment management and other services; (ii) SIMC’s and theSub-Advisers’ investment management personnel; (iii) SIMC’s and theSub-Advisers’ operations and financial condition; (iv) SIMC’s and theSub-Advisers’ brokerage practices (including any soft dollar arrangements) and investment strategies; (v) the level of the advisory fees that SIMC charges the Funds and the level of thesub-advisory fees that SIMC pays theSub-Advisers, compared with fees each charge to comparable accounts; (vi) the advisory fees charged by SIMC and the Funds’ overall fees and operating expenses compared with peer groups of mutual funds prepared by Broadridge, an independent provider of investment company data; (vii) the level of SIMC’s and theSub-Advisers’ profitability from their Fund-related operations; (viii) SIMC’s and theSub-Advisers’ compliance program, including a description of material compliance matters and material compliance violations; (ix) SIMC’s potential economies of scale; (x) SIMC’s and theSub-Advisers’ policies on and compliance procedures for personal securities transactions; (xi) SIMC’s and theSub-Advisers’ expertise and resources in domestic and/or international financial markets; and (xii) the Funds’ performance over various periods of time compared with peer groups of mutual funds prepared by Broadridge and the Funds’ benchmark indexes.
At the December4-5, 2018 meeting of the Board, the Trustees approved a brief extension of the Advisory Agreement to accommodate a revised meeting schedule. Accordingly, at the April 2-3, 2019 meeting of the Board, the Trustees, including a majority of the Independent Trustees, approved the renewal of the Advisory Agreement. Also, eachSub-Advisory Agreement was either initially approved or, if theSub-Advisory Agreement was already in effect (unless operating under an initialtwo-year term), renewed at meetings of the Board held during the course of the Trust’s fiscal year on September10-12, 2018, and December 4-5, 2018. In each case, the Board’s approval (or renewal) was based on its consideration and evaluation of the factors described above, as discussed at the meetings and at prior meetings. The following discusses some, but not all, of the factors that were considered by the Board in connection with its assessment of the Investment Advisory Agreements.
Nature, Extent and Quality of Services. The Board considered the nature, extent and quality of the services provided by SIMC
| | | | |
New Covenant Funds / Annual Report / June 30, 2019 | | | 67 | |
BOARD OF TRUSTEES CONSIDERATIONS IN APPROVING THE ADVISORY ANDSUB-ADVISORY AGREEMENTS (UNAUDITED) (Concluded)
and theSub-Advisers to the Funds and the resources of SIMC and theSub-Advisers and their affiliates dedicated to the Funds. In this regard, the Trustees evaluated, among other things, SIMC’s and eachSub-Adviser’s personnel, experience, track record and compliance program. Following evaluation, the Board concluded that, within the context of its full deliberations, the nature, extent and quality of services provided by SIMC and theSub-Advisers to the Funds and the resources of SIMC and theSub-Advisers and their affiliates dedicated to the Funds were sufficient to support the renewal of the Investment Advisory Agreements. In addition to advisory services, the Board considered the nature and quality of certain administrative, transfer agency and othernon-investment advisory services provided to the Funds by SIMC and/or its affiliates.
Performance. In determining whether to renew SIMC’s Advisory Agreement, the Trustees considered the Funds’ performance relative to their peer groups and appropriate indexes/benchmarks. The Trustees reviewed performance information for each Fund, noting that they receive performance reports that permit them to monitor each Fund’s performance at board meetings throughout the year. As part of this review, the Trustees considered the composition of each peer group and selection criteria. In assessing Fund performance, the Trustees considered a report compiled by Broadridge, an independent third-party that was engaged to prepare an assessment of the Funds in connection with the renewal of the Advisory Agreement (the “Broadridge Report”). The Broadridge Report included metrics on risk analysis, volatility versus total return, net total return and performance consistency for the Funds and a universe of comparable funds. Based on the materials considered and discussed at the meetings, the Trustees found Fund performance satisfactory, or, where performance was materially below the benchmark and/or peer group, the Trustees were satisfied with the reasons provided to explain such performance. In connection with the approval or renewal ofSub-Advisory Agreements, the Board considered the performance of theSub-Adviser relative to appropriate indexes/benchmarks. Following evaluation, the Board concluded that, within the context of its full deliberations, the performance of the Funds was sufficient to support renewal of SIMC’s Advisory Agreement, and the performance of eachSub-Adviser was sufficient to support approval or renewal of theSub-Advisory Agreement.
Fees. With respect to the Funds’ expenses under the Investment Advisory Agreements, the Trustees considered the rate of compensation called for by the Investment Advisory Agreements and the Funds’ net operating expense ratio in comparison to those of the Funds’ respective peer groups. In assessing Fund expenses, the Trustees considered the information in the Broadridge Report, which included various metrics related to fund expenses, including, but not limited to, contractual management fees at various asset levels, actual management fees (including transfer agent expenses), and actual total expenses (including underlying fund expenses) for the Funds and a universe of comparable funds. Based on the materials considered and discussion at the meetings, the Trustees further determined that fees were either shown to be below the peer average in the comparative fee analysis, or that there was a reasonable basis for the fee level. The Trustees also considered the effects of SIMC’s waiver of management and other fees to prevent total Fund operating expenses from exceeding a specified cap and concluded that SIMC, through waivers, has maintained the Funds’ net operating expenses at competitive levels for its distribution channels. In determining the appropriateness of fees, the Board also took into consideration the impact of fees incurred indirectly by the Funds as a result of investments into underlying funds, including funds from which SIMC or its affiliates earn fees. The Board also took into consideration compensation earned from the Funds by SIMC or its affiliates fornon-advisory services, such as administration, transfer agency, shareholder services or brokerage, and considered whether SIMC and its affiliates may have realized other benefits from their relationship with the Funds, such as any research and brokerage services received under soft dollar arrangements. When considering fees paid toSub-Advisers, the Board took into account the fact that theSub-Advisers are compensated by SIMC and not by the Funds directly, and that such compensation with respect to any unaffiliatedSub-Adviser reflects an arms-length negotiation between theSub-Adviser and SIMC. Following evaluation, the Board concluded that, within the context of its full deliberations, the expenses of the Funds are reasonable and supported renewal of the Investment Advisory Agreements. The Board also considered whether theSub-Advisers and their affiliates may have realized other benefits from their relationship with the Funds, such as any research and brokerage services received under soft dollar arrangements.
Profitability. With regard to profitability, the Trustees considered compensation flowing to SIMC and theSub-Advisers and their affiliates, directly or indirectly. The Trustees considered whether the levels of compensation and profitability were reasonable. As with the fee levels, when considering the profitability of theSub-Advisers, the Board took into account the fact that compensation with respect to any unaffiliatedSub-Adviser reflects an arms-length negotiation between theSub-Adviser and SIMC. In connection with the approval or renewal of eachSub-Advisory Agreement, the Board also took into consideration the impact that the fees paid to theSub-Adviser have on SIMC’s advisory fee margin and profitability. Based on this evaluation, the Board concluded that, within the context of its full deliberations, the profitability of each of SIMC and theSub-Advisers is reasonable and supported renewal of the Investment Advisory Agreements.
Economies of Scale. With respect to the Advisory Agreement, the Trustees considered whether any economies of scale were
| | |
| 68 | | New Covenant Funds / Annual Report / June 30, 2019 |
being realized by SIMC and its affiliates and, if so, whether the benefits of such economies of scale were passed along to the Funds’ shareholders through a graduated investment advisory fee schedule or other means, including any fee waivers by SIMC and its affiliates. The Trustees recognized that economies of scale are difficult to identify and quantify and are rarely identifiable on afund-by-fund basis. Based on this evaluation, the Board determined that the fees were reasonable in light of the information that was provided by SIMC with respect to economies of scale.
Based on the Trustees’ deliberation and their evaluation of the information described above, the Board, including all of the Independent Trustees, with the assistance of Fund counsel and Independent Trustees’ counsel, unanimously approved the approval or renewal, as applicable, of the Investment Advisory Agreements and concluded that the compensation under the Investment Advisory Agreements is fair and reasonable in light of such services and expenses and such other matters as the Trustees considered to be relevant in the exercise of their reasonable judgment. In the course of its deliberations, the Board did not identify any particular factor (or conclusion with respect thereto) or single piece of information that wasall-important, controlling or determinative of its decision, but considered all of the factors together, and each Trustee may have attributed different weights to the various factors (and conclusions with respect thereto) and information.
| | | | |
New Covenant Funds / Annual Report / June 30, 2019 | | | 69 | |
(This page intentionally left blank)
(This page intentionally left blank)
NOTICE TO SHAREHOLDERS (Unaudited)
For shareholders who do not have a June 30, 2019 taxable year end, this notice is for information purposes only. For shareholders with a June 30, 2019 taxable year end, please consult your tax adviser as to the pertinence of this notice.
For the fiscal year ended June 30, 2019, the Funds are designating long term and qualifying dividend income with regard to distributions paid during the year as follows:
| | | | | | | | | | | | | | | | |
| | | | | | | | | |
| Fund | | (A) Long Term
Capital Gains
Distributions
(Tax Basis) | | (B)
Ordinary
Income | | Total
Distributions
(Tax Basis) | | (C) Dividends
Qualifying
for Corporate
Dividends Rec.
Deduction (1) | | (D)
Qualifying
Dividend
Income
(15% Tax
Rate for QDI) (2) | | (E) U.S.
Government
Interest (3) | | Interest
Related
Dividends
(4) | | Short-Term
Capital
Gain
Dividends
(5) |
New Covenant Growth Fund | | 81.67% | | 18.33% | | 100.00% | | 73.71% | | 73.71% | | 0.00% | | 17.79% | | 100.00% |
New Covenant Income Fund | | 0.00% | | 100.00% | | 100.00% | | 0.00% | | 0.00% | | 9.33% | | 85.49% | | 0.00% |
New Covenant Balanced Growth Fund | | 68.06% | | 31.94% | | 100.00% | | 31.71% | | 40.89% | | 0.00% | | 0.00% | | 100.00% |
New Covenant Balanced Income Fund | | 61.38% | | 38.62% | | 100.00% | | 16.86% | | 21.68% | | 0.00% | | 0.00% | | 100.00% |
| | (1) | Qualifying dividends represent dividends which qualify for the corporate dividends received deduction. |
| | (2) | The percentage in this column represents the amount of ‘‘Qualifying Dividend Income’’ and is reflected as a percentage of ‘‘Ordinary Income Distributions.’’ It is the intention of each of the aforementioned Funds to designate the maximum amount permitted by law. The information reported herein may differ from the information and distributions taxable to the shareholders for the calendar year ending December 31, 2017. Complete information will be computed and reported in conjunction with your 2017 Form1099-DIV. |
| | (3) | ‘‘U.S. Government Interest’’ represents the amount of interest that was derived from direct U.S. Government obligations and distributed during the fiscal year. This amount is reflected as a percentage of total ordinary income distributions (the total of short-term capital gain and net investment income distributions). Generally interest from direct U.S. Government obligations is exempt from state income tax. However, for shareholders who are residents of California, Connecticut and New York, the statutory threshold requirements were not satisfied to permit exemption of these amounts from state income. |
| | (4) | The percentage in this column represents the amount of “Interest Related Dividends” and is reflected as a percentage of net investment income distributions that is exempt from U.S. withholding tax when paid to foreign investors. |
| | (5) | The percentage in this column represents the amount of “Short-Term Capital Gain Dividends” and is reflected as a percentage of short-term capital gain distributions that is exempt from U.S. withholding tax when paid to foreign investors. |
Items (A) and (B) are based on the percentage of each Fund’s total distribution.
Items (C) and (D) are based on the percentage of ordinary income distributions of each Fund. Item (E) is based on the percentage of gross income of each Fund.
Please consult your tax adviser for proper treatment of this information. This notification should be kept with your permanent tax records.
| | |
| 72 | | New Covenant Funds / Annual Report / June 30, 2019 |
NEW COVENANT FUNDS ANNUAL REPORT JUNE 30, 2019
Robert A. Nesher,Chairman
Trustees
William M. Doran
George J. Sullivan, Jr.
Nina Lesavoy
James M. Williams
Mitchell A. Johnson
Hubert L. Harris, Jr.
Susan C. Cote
James B. Taylor
Officers
Robert A. Nesher
President and Chief Executive Officer
James J. Hoffmayer
Controller and Chief Financial Officer
Glenn R. Kurdziel
Assistant Controller
Russell Emery
Chief Compliance Officer
Timothy D. Barto
Vice President, Secretary
Aaron Buser
Vice President, Assistant Secretary
David F. McCann
Vice President, Assistant Secretary
Stephen G. MacRae
Vice President
Bridget E. Sudall
Anti-Money Laundering Compliance Officer
Privacy Officer
Investment Adviser
SEI Investments Management Corporation
Administrator
SEI Investments Global Funds Services
Distributor
SEI Investments Distribution Co.
Legal Counsel
Morgan, Lewis & Bockius LLP
Independent Registered Public Accounting Firm
KPMG LLP
This report and the financial statements contained herein are submitted for the general information of the shareholders of the Trust and must be preceded or accompanied by a current prospectus. Shares of the Funds are not deposits or obligations of, or guaranteed or endorsed by, any bank. The shares are not federally insured by the Federal Deposit Insurance Corporation (FDIC), the Federal Reserve Board, or any other government agency. Investment in the shares involves risk, including the possible loss of principal.
For more information call
New Covenant Fund
877-835-4531

NF-Annual (06/19)
The Registrant has adopted a code of ethics that applies to the Registrant’s principal executive officer, principal financial officer, comptroller or principal accounting officer, and any person who performs a similar function.
| Item 3. | Audit Committee Financial Expert. |
(a) (1) The Registrant’s Board of Trustees has determined that the Registrant has three audit committee financial experts serving on the audit committee.
(a) (2) The audit committee financial experts are Susan Cote, George J. Sullivan, Jr. and Hubert L. Harris. Ms. Cote and Messrs. Sullivan and Harris are independent as defined in Form N-CSR Item 3 (a) (2).
| Item 4. | Principal Accountant Fees and Services. |
Fees billed by KPMG LLP (“KPMG”) related to the Registrant.
KPMG billed the Registrant aggregate fees for services rendered to the Registrant for the fiscal years 2019 and 2018 as follows:
| | | | | | | | | | | | | | |
| | | | | Fiscal 2019 | | Fiscal 2018 |
| | | | | All fees and
services to
the
Registrant
that were
pre-approved | | All fees and
services to
service
affiliates
that were
pre-approved | | All other fees and services to service affiliates that did not require pre-approval | | All fees and
services to
the
Registrant
that were
pre-approved | | All fees and
services to
service
affiliates
that were
pre-approved | | All other fees and services to service affiliates that did not require pre-approval |
(a) | | Audit Fees(1) | | $68,640 | | N/A | | $0 | | $67,960 | | N/A | | $0 |
(b) | | Audit-Related Fees | | $0 | | $0 | | $0 | | $0 | | $0 | | $0 |
(c) | | Tax Fees (3) | | $0 | | $0 | | $0 | | $0 | | $0 | | $0 |
(d) | | All Other Fees(2) | | $0 | | $273,762 | | $0 | | $0 | | $341,386 | | $0 |
Notes:
| (1) | Audit fees include amounts related to the audit of the Registrant’s annual financial statements and services normally provided by the accountant in connection with statutory and regulatory filings. |
| (2) | See Item 4(g) for a description of the services comprising the fees disclosed under this category. |
| (3) | Tax fees include amounts related to tax compliance and consulting services |
(e)(1) The Registrant’s Audit Committee has adopted an Audit andNon-Audit ServicesPre-Approval Policy (the “Policy”), which sets forth the procedures and the conditions pursuant to which services proposed to be performed by the independent auditor of the Registrant may bepre-approved. In any instance where services requirepre-approval, the Audit Committee will consider whether such services are consistent with SEC’s rules on auditor independence and whether the provision of such services would compromise the auditor’s independence.
The Policy provides that all requests or applications for proposed services to be provided by the independent auditor must be submitted to the Registrant’s Chief Financial Officer (“CFO”) and must include a detailed description of the services proposed to be rendered. The CFO will determine whether such services: (1) require specificpre-approval; (2) are included within the list of services that have received the generalpre-approval of the Audit Committee pursuant to the Policy; or (3) have been previouslypre-approved in connection with the independent auditor’s annual engagement letter for the applicable year or otherwise.
Requests or applications to provide services that require specificpre-approval by the Audit Committee will be submitted to the Audit Committee by the CFO. Audit Committee has delegated specificpre-approval authority to either the Audit Committee Chair or financial experts, provided that the estimated fee for any such proposedpre-approved service does not exceed $100,000 and anypre-approval decisions are reported to the Audit Committee at its next regularly scheduled meeting.
Services that have received the generalpre-approval of the Audit Committee are identified and described in the Policy. In addition, the Policy sets forth a maximum fee per engagement with respect to each identified service that has received generalpre-approval. The Audit Committee will annually review andpre-approve the services that may be provided by the independent auditors during the following twelve months without obtaining specificpre-approval from the Audit Committee.
The Audit Committee will be informed by the CFO on a quarterly basis of all services rendered by the independent auditor.
All services to be provided by the independent auditor shall be provided pursuant to a signed written engagement letter with the Registrant, the investment advisor or applicable control affiliate (except that matters as to which an engagement letter would be impractical because of timing issues or because the matter is small may not be the subject of an engagement letter) that sets forth both the services to be provided by the independent auditor and the total fees (or the manner of their determination) to be paid to the independent auditor for those services.
In addition, the Audit Committee has determined to take additional measures on an annual basis to meet its responsibility to oversee the work of the independent auditor and to assure the auditor’s independence from the Registrant, such as reviewing a formal written statement from the independent auditor delineating all relationships between the independent auditor and the Registrant, and discussing with the independent auditor its methods and procedures for ensuring independence.
(e)(2) Percentage of fees billed pursuant to waiver ofpre-approval requirement were as follows:
| | | | |
| | | Fiscal 2019 | | Fiscal 2018 |
Audit-Related Fees | | 0% | | 0% |
Tax Fees | | 0% | | 0% |
All Other Fees | | 0% | | 0% |
(f) Not Applicable.
(g)(1) The aggregatenon-audit fees billed by KPMG for the fiscal years 2019 and 2018 were $273,762 and $341,386, respectively.Non-audit fees consist of a service organization controls report review of fund accounting and administration operations and an attestation report in accordance with Rule17Ad-13.
(h) During the past fiscal year, the Registrant’s principal accountant provided certainnon-audit services to the Registrant’s investment adviser or to entities controlling, controlled by, or under common control with the Registrant’s investment adviser that provide ongoing services to the Registrant that were not subject topre-approval pursuant to paragraph (c)(7)(ii) of Rule2-01 of RegulationS-X. The Audit Committee of the Registrant’s Board of
Trustees reviewed and considered thesenon-audit services provided by the Registrant’s principal accountant to the Registrant’s affiliates, including whether the provision of thesenon-audit services is compatible with maintaining the principal accountant’s independence.
| Item 5. | Audit Committee of Listed Registrants. |
Not applicable.
(a) The Schedules of Investments are included as part of the report to shareholders filed under Item 1 of this form.
| Item 7. | Disclosure of Proxy Voting Policies and Procedures forClosed-End Management Investment Companies. |
Not applicable.
| Item 8. | Portfolio Managers ofClosed-End Management Investment Companies |
Not applicable.
| Item 9. | Purchases of Equity Securities byClosed-End Management Company and Affiliated Purchasers. |
Not applicable.
| Item 10. | Submission of Matters to a Vote of Security Holders. |
There have been no material changes to the procedures by which shareholders may recommend nominees to the Registrant’s Board of Trustees (the “Board”). The Registrant has a standing Governance Committee (the “Committee”) currently consisting of the Independent Trustees. The Committee is responsible for evaluating and recommending nominees for election to the Board. Pursuant to the Committee’s Charter, adopted on February 22, 2012, the Committee will review all shareholder recommendations for nominations to fill vacancies on the Board if such recommendations are submitted in writing and addressed to the Committee at the Registrant’s office.
| Item 11. | Controls and Procedures. |
(a) The Registrant’s principal executive and principal financial officers, or persons performing similar functions, have concluded that the Registrant’s disclosure controls and procedures (as defined in Rule30a-3(c) under the Investment Company Act of 1940 (the “1940 Act”)) (17 CFR270.30a-3(c)) are effective, based on the evaluation of these controls and procedures required by Rule30a-3(b) under the 1940 Act (17 CFR270.30a-3(b)) and Rules13a-15(b) or15d-15(b) under the Securities Exchange Act of 1934 (17 CFR240.13a-15(b) or240.15d-15(b)) as of a date within 90 days of the filing date of this report.
(b) There were no changes in the Registrant’s internal control over financial reporting (as defined in Rule30a-3(d) under the 1940 Act) (17 CFR270.30a-3(d)) that occurred during the period covered by this report that have materially affected, or are reasonably likely to materially affect, the Registrant’s internal control over financial reporting.
| Item 12. | Disclosure of Securities Lending Activities forClosed-End Management Investment Companies |
Not applicable.
(a)(1) Code of Ethics attached hereto.
(a)(2) A separate certification for the principal executive officer and the principal financial officer of the Registrant as required by Rule30a-2(a) under the Investment Company Act of 1940, as amended, are filed herewith.
(b) Officer certifications as required by Rule30a-2(b) under the Investment Company Act of 1940, as amended also accompany this filing as an exhibit.
SIGNATURES
Pursuant to the requirements of the Securities Exchange Act of 1934 and the Investment Company Act of 1940, the Registrant has duly caused this report to be signed on its behalf by the undersigned, thereunto duly authorized.
| | | | | | |
| | | | | | New Covenant Funds |
| | | |
| By | | | | | | /s/ Robert A. Nesher |
| | | | | | Robert A. Nesher |
| | | | | | President & CEO |
Date: September 6, 2019
Pursuant to the requirements of the Securities Exchange Act of 1934 and the Investment Company Act of 1940, this report has been signed below by the following persons on behalf of the Registrant and in the capacities and on the dates indicated.
| | | | | | |
| By | | | | | | /s/ Robert A. Nesher |
| | | | | | Robert A. Nesher |
| | | | | | President & CEO |
Date: September 6, 2019
| | | | | | |
By | | | | | | /s/ James J. Hoffmayer |
| | | | | | James J. Hoffmayer |
| | | | | | Controller & CFO |
Date: September 6, 2019