UNITED STATES
SECURITIES AND EXCHANGE COMMISSION
Washington, D.C. 20549
FORM N-CSR
CERTIFIED SHAREHOLDER REPORT OF REGISTERED
MANAGEMENT INVESTMENT COMPANIES
Investment Company Act File Number 811-09025
New Covenant Funds
(Exact name of registrant as specified in charter)
SEI Investments
One Freedom Valley Drive
Oaks, PA 19456
(Address of principal executive offices) (Zip code)
Timothy D. Barto, Esp.
SEI Investments
One Freedom Valley Drive
Oaks, PA 19456
(Name and address of agent for service)
Registrant’s telephone number, including area code: 1-610-676-1000
Date of fiscal year end: June 30, 2018
Date of reporting period: June 30, 2018
| Item 1. | Reports to Stockholders. |
June 30, 2018 ANNUAL REPORT New Covenant Funds New Covenant Growth Fund New Covenant Income Fund New Covenant Balanced Growth Fund New Covenant Balanced Income Fund
TABLE OF CONTENTS
The Trust files its complete schedule of portfolio holdings with the Securities and Exchange Commission (the ‘‘Commission’’) for the first and third quarters of each fiscal year on Form N-Q within sixty days after the end of the period. The Trust’s Forms N-Q are available on the Commission’s website at http://www.sec.gov, and may be reviewed and copied at the Commission’s Public Reference Room in Washington, DC. Information on the operation of the Public Reference Room may be obtained by calling 1-800-SEC-0330.
A description of the policies and procedures that the Trust uses to determine how to vote proxies relating to portfolio securities, as well as information relating to how a Fund voted proxies relating to portfolio securities during the most recent 12-month period ended June 30, is available (i) without charge, upon request, by calling 1-877-835-4531; and (ii) on the Commission’s website at http://www.sec.gov.
NEW COVENANT FUNDS — June 30, 2018 (Unaudited)
To Our Shareholders:
Financial markets completed the fiscal year without any enduring missteps in an environment defined by strong investor appetite for higher-risk market segments. Fixed-income performance ran the gamut regarding strength across markets—with high-yield debt near the top end and U.S. Treasurys at the bottom, in keeping with the risk-on sentiment. However, the second half of the fiscal year saw the sudden return of volatility to the markets. The VIX index rose to a three-year high, and risk-asset prices fell sharply in February, with the S&P 500 Index touching down 10% from its earlier highs before a range-bound recovery through the end of the fiscal year. Robust economic data and consumer confidence in a healthy economy likely prevented a more sizeable market correction. By the end of the reporting period, trade war concerns served as a significant catalyst while markets tried to gain support from robust macro data and earnings momentum.
Most of the expectations we had at the start of the Funds’ most recently completed fiscal year, from the start of July 2017 through the end of June 2018, were actualized. The pace of interest-rate increases by the Federal Reserve (Fed) largely followed the market’s projections. U.S. Treasury yields increased across the curve during the fiscal year as a combination of policy, fundamental and political events influenced the markets. Short-term rates rose by a greater magnitude than long-term rates after the Federal Reserve raised rates three times during the reporting period, and the yield curve flattened to a post-recession low. Strength in the euro relative to the U.S. dollar for most of the fiscal year prevented a quick end to the European Central Bank’s (ECB) commitment to stimulus; the Japanese yen remained mostly range-bound while the Bank of Japan (BOJ) held monetary policy stable through the fiscal year. China’s currency hit a low toward the end of the fiscal period amid trade-related tensions.
Oil prices gained during the fiscal year, supported by rising global demand and geopolitical tensions, as well as news that Saudi Arabia and Russia would extend an agreement to curb output.
We suggested that market sentiment would remain attuned to geopolitical developments; these accounted for the only significant exceptions to the global tranquility trend. Also, a fixation on tax reform and continued yield-curve flattening drove market movements throughout the latter part of the fiscal year.
Geopolitical events
Geopolitical threats and an assortment of other noneconomic influences continued in various regions: civil war and domestic struggle in parts of the Middle East and Africa, the suffering of refugees and migrants in bordering countries and Europe, and acts of global terror. Severe unrest continued in some regions of the Middle East, driven by the conflicting and overlapping regional interests of extremist groups, nationalist fighters and state actors.
In the U.S., the controversy over President Trump’s response to violent clashes between protesters in Charlottesville, Virginia briefly drove market sentiment early in the fiscal period after the president dissolved two advisory councils. Setbacks in the Trump administration’s efforts to repeal and replace Obamacare initially sparked volatility, as investors assumed that tax and budget resolutions would have to wait until healthcare legislation was resolved. Trump demonstrated a commitment to follow through on tighter U.S. immigration policy that authorized U.S. border agents to separate children from parents who crossed the border illegally. The ongoing special counsel investigation on the possibility of collusion between Donald Trump’s presidential campaign and Russia remained topical. However, longer-term market reactions to geopolitical events were surprisingly muted.
U.S. equities were hit toward the end of the fiscal year by fears of a global trade war after President Trump announced tariffs on steel and aluminum imports. The Trump administration cited national security concerns as it imposed steel and aluminum tariffs on the EU, Canada and Mexico; this came after the expiration of a two-month waiver that had been extended to these major trading partners, which have traditionally been U.S. allies. All three responded with rebukes and retaliatory measures in the form of tariffs on U.S. goods; additionally, the EU opened a formal case with the World Trade Organization. The Chinese government appeared to step back from assurances that it would underwrite increased purchases of American products as part of negotiations to reduce its trade imbalance with the U.S., bristling at re-proposed plans by the Trump administration to apply China-specific tariffs.
Immigration became a key point of contention in the U.S. and Europe at the end of the fiscal year. The Trump administration enacted a zero-tolerance policy that targeted illegal immigration at the southern border; this attracted condemnation from across the political spectrum for its practice of separating and detaining families, including children. In Europe, the governing coalitions in Italy and Germany pointed a spotlight on the issue, forcing action at a European Council meeting in late June with a deal that seeks to establish an EU-wide approach centered on financial-burden sharing and more restrictive borders.
| | | | |
New Covenant Funds / Annual Report / June 30, 2018 | | | 1 | |
NEW COVENANT FUNDS — June 30, 2018 (Unaudited) (Continued)
A raft of political surprises unfolded during the fiscal period, but most played only a minor role in market movements. Brexit negotiators continued struggling to find a way around the Irish border. A Brexit proposal by U.K. negotiators for Northern Ireland to have joint EU and U.K. status was floated to avoid hard borders, but it did not appear to garner much support; still, Brexit negotiations were less critical to investors globally than was Europe’s sustained economic expansion. While the euro’s appreciation versus sterling may offer a clue about the market’s perception of post-divorce relative advantages, both currencies gained against the U.S. dollar. The U.K. Conservative party relinquished its parliamentary majority and was forced to seek a partner to form a minority government.
The swearing in of Italy’s Prime Minister Giuseppe Conte—a relative newcomer to politics—signaled continued viability of the euro-skeptic coalition, which formed from the two populist parties that won the country’s March election. Financial markets were rattled in May by the anti-EU implications of the new Italian government taking shape, then again as a rejection of the coalition’s first choice for economy minister seemed to set the stage for another round of elections and associated delays. Spain’s government also experienced turnover as center-right Prime Minister Mariano Rajoy suffered a no-confidence vote and was replaced by socialist leader Pedro Sanchez at the beginning of June.
Rogue-state nuclear programs earned a significant share of the spotlight: North Korean Supreme Leader Kim Jong-Un announced a willingness to mothball his country’s efforts and, in an unprecedented display of unity, crossed the border as he clasped hands with South Korean President Moon Jae-in. Trump also stated that aggression from North Korea would be met with “fire and fury.” An eventual meeting with North Korea’s leader garnered headlines but ended with vague commitments. Elsewhere, Israeli Prime Minister Benjamin Netanyahu televised evidence of the Iranian Republic’s plans to reignite its nuclear ambitions—raising questions about Iran’s adherence to the terms of its multi-party disarmament agreement. Although the International Atomic Energy Agency refuted the claims, President Trump signaled he would back out of the accord.
Economic performance
U.S. economic growth rebounded solidly at the start of the fiscal period, as consumer spending boosted the economy. Third-quarter GDP grew at the fastest annual rate in three years, supported by a rebound in government investment and business spending on equipment. However, fourth-quarter growth slowed slightly to a 2.9% yearly rate as strong consumer spending drove a surge in imports. Preliminary first-quarter economic growth was reported at a 2.3% annualized rate—in line with the typically mild pace of the three-month period ending March, yet slower than the rate of expansion recorded in the fourth quarter.
The labor market remained historically strong throughout the year: the unemployment rate fell, finishing the period at 4.0%, near an 18-year low, while the labor-force participation rate ended at 62.9%, slightly higher than a year ago. Average hourly earnings gained, bouncing around a mean of about 0.2% growth per month over the year; although a modest increase in price pressures weighed on real personal income growth as the period progressed. The Fed raised its target interest rate just before the fiscal period began, as well as three times during the period, with two additional rate increases still projected for the remainder of 2018. The Fed also began to unwind its balance sheet starting in October, reversing some of the quantitative easing that has been so supportive of bond prices in recent years.
The ECB held its benchmark interest rate unchanged at a historic low through the fiscal period, while the Bank of England raised its official bank rate for the first time in ten years, by 0.25%. Quarterly growth in the eurozone slowed in the first quarter, after growing at its quickest pace since 2011 during the fourth quarter at a time that many thought would be plagued by political uncertainty. Year-on-year growth was 2.5% at the end of the first quarter of 2018. The U.K. economy grew just 1.2% year-on-year through the first quarter of 2018 as Brexit uncertainty continued to hurt the economy and a weakened pound dampened consumer spending to its lowest level in almost six years.
Japanese GDP grew just 1.1% year-on-year at the end of the first quarter of 2018; the BOJ maintained monetary stimulus in an attempt to drive higher inflation. Meanwhile, economic growth in China expanded by 6.8% year-on-year in the first quarter of 2018 after China’s government provided substantial fiscal stimulus early in the period to support the government’s growth goals, targeted at 6.5%.
| | |
| 2 | | New Covenant Funds / Annual Report / June 30, 2018 |
Market developments
For the fiscal year ending June 30, 2018, growth stocks in general and the technology sector, in particular, outperformed, while high-dividend-yield segments of the market, such as utilities, lagged as they were seen as less attractive in a rising interest-rate environment. Stocks corrected in the first quarter of 2018, with the S&P 500 Index falling close to 10% from its all-time high, precipitated by indications of accelerating U.S. inflation and similar concerns that future interest-rate increases by the Fed could come quicker than anticipated. The index had recovered most of that loss by the end of the fiscal year, and the current bull market is now the second-longest on record.
Energy stocks outperformed globally, while the telecommunications services sector ended in the red, presumably weakened by the repeal of net-neutrality regulations in the U.S.
Growth typically outperformed value, as internet-commerce and information-technology stocks were the best-performing sectors for the full fiscal year, while the utilities and telecommunication services sectors lagged. The final quarter of the fiscal period helped propel the FTSE/Russell 1000 Growth Index to 22.51% for the reporting year, while the FTSE/Russell 1000 Value Index returned 6.77% over the same period.
Small-cap stock outperformance pivoted higher as well. U.S. small caps (FTSE/Russell 2000 Index) outpaced large caps (FTSE/Russell 1000 Index), delivering 17.57% and 14.54%, respectively.
European growth and inflation accelerated during the fiscal year, and unemployment fell. Equities remained bolstered by accommodative monetary policy from the ECB, which only slightly began to remove stimulus; the euro finished up 1.06% versus the U.S. dollar for the year.
Looking back on market performance for the full period, the FTSE UK Series All-Share Index was up 10.81% in U.S. dollar terms and 9.02% in sterling, as Brexit concerns continued to overshadow the outlook for businesses. The MSCI ACWI Index, a proxy for global equities in both developed and emerging markets, rose 10.73% in U.S. dollar terms; U.S. markets did better, as the S&P 500 Index returned 14.37%.
Emerging markets failed to keep pace with the developed world across asset classes amid a synchronized global economic expansion. The MSCI Emerging Markets Index finished the fiscal year up 8.20% in U.S. dollar terms, losing about half its year-to-date gains over the second half of the fiscal period.
Asia, notably China and Japan, was the top-performing international region for equity markets; Europe was positive over the period but lagged behind, while Latin America finished down for the fiscal period after a final-quarter selloff.
The risk-on sentiment that pushed equities higher was also visible in fixed-income markets, with high-yield outperforming government bonds. A continuing theme for U.S. fixed-income markets was the flattening yield curve. Yields for 10-year government bonds rose and ended the period 54 basis points higher at 2.85%, while 2-year yields climbed 114 basis points during the year to 2.52%. The U.S. Treasury yield curve flattened to a 10-year low, with short-term yields rising more than long-term yields. The Fed hiked rates three times during the fiscal period and pushed short-term yields higher, while longer-term bond yields were flat as inflationary and long-term economic growth expectations remained subdued.
Front-end Treasury yields moved higher in response to the Fed increasing the fed-funds target rate to 1.75%-2.00%, marking the seventh rate hike during this tightening cycle. The Fed’s interest-rate projections, known as the dot plot, still suggest two additional rate hikes in 2018, subject to inflation moving toward, and staying in a band around, the Federal Open Market Committee’s 2% target. Jerome Powell succeeded Janet Yellen as Fed Chair, Randal Quarles was named vice chair for bank supervision and Marvin Goodfriend, the former Fed economist, was chosen to fill one of three open governor seats. President Trump signed the Tax Cuts and Jobs Act into law, introducing several new policies, including a cap on state and local tax deductions, a one-time repatriation tax on overseas cash, a move to a territorial tax system and a permanent drop in the corporate tax rate from 35% to 21%.
Inflation-sensitive assets, such as commodities and Treasury Inflation-Protected Securities, gained. The Bloomberg Commodity Total Return Index (which represents the broad commodity market) rose 7.35% during the period, as oil price increases and metal sector gains far outpaced weakness in the agriculture sector, while the Bloomberg Barclays 1-10 Year US TIPS Index (USD) edged 1.45% higher.
The price of oil ended the year up 70.1% and finished the period near its fiscal-year high.
| | | | |
New Covenant Funds / Annual Report / June 30, 2018 | | | 3 | |
NEW COVENANT FUNDS — June 30, 2018 (Unaudited) (Continued)
Global fixed income, as measured by the Bloomberg Barclays Global Aggregate Index, climbed 1.36% in U.S. dollar terms during the reporting period, while the high-yield market did slightly better, with the ICE BofAML US High Yield Constrained Index up 2.54%.
U.S. investment-grade corporate debt was marginally lower, as the Bloomberg Barclays Investment Grade US Corporate Index returned -0.83%. U.S. asset-backed securities and mortgage-backed securities both managed marginal gains during the fiscal year despite facing headwinds from rising interest rates and expectations for further rate increases.
Emerging-market debt delivered strong performance. The J.P. Morgan GBI Emerging Markets Global Diversified Index, which tracks local-currency-denominated emerging-market bonds, lost 2.33% in U.S. dollar terms during the reporting period, trending lower after an impressive rally in the first half of the period. The J.P. Morgan EMBI Global Diversified Index, which tracks emerging-market debt denominated in external currencies (such as the U.S. dollar), slid 1.60%.
Our view
Investors were raging bulls at the beginning of 2018 as equity prices vaulted higher. But that optimism faded dramatically as the news flow turned less favourable. As far as we’re concerned, that’s okay—because the potential for a meaningful advance in equities is greater when investors are pessimistic and bad news is already largely discounted in the price of riskier assets.
If one believes, as we do, that the global economy is sound and that the political uncertainties currently roiling markets will be contained, then the proper course (in our view) is to remain exposed to equities and other risk assets and ride out the short-term ups and downs.
The economic data coming out of Europe has been hugely disappointing this year. Instead of building upon the improved business activity of 2016 and 2017, there has been a widespread deceleration. At SEI, we have been reluctant to get too bearish on Europe’s fundamentals, but there’s no denying that financial-market participants are disbelievers. Analysts’ 2018 and 2019 earnings-growth estimates for the companies within the MSCI EMU (European Economic and Monetary Union) Index are quite low compared to those of other major regions and countries.
ECB President Mario Draghi and other bank governors decided to conclude net asset purchases by the end of this year because they view deflation risks as having moderated significantly. Since the ECB will no longer be a price-insensitive buyer of eurozone debt, we could see yield spreads rise as investors demand a risk premium for those countries with a heavy debt burden relative to the size of their economy. Italy’s new government wants to institute several expensive propositions that would blow a hole in the government’s budget, likely causing the country’s bonds to be further discounted by investors—with other periphery bond yields rising in sympathy.
Recent U.K. economic data reports, like those of other countries in Europe, suggest that Great Britain is wending its way through a soft patch. Underlying growth nevertheless appears solid, indicating the U.K. economy is in stable condition; although the trade sector looks to be a problem spot.
The biggest source of uncertainty facing the U.K. is its looming withdrawal from the EU. The Conservative Party’s internal fight over the country’s future relationship with the EU has stalled progress toward a clear post-Brexit status. Maybe it’s sheer coincidence, but sterling versus the U.S. dollar is almost where it was the day after the Brexit vote on 23 June 2016. The recent trend has been to the downside, as currency-market participants worry about the rising odds of a hard Brexit and more-thorough disruption of U.K. trade with the EU. We would not be surprised to see further downside volatility in sterling as we draw closer to the EU exit date.
Fears of a trade war pitting the U.S. against foes and allies alike notwithstanding, American investors, businesses and consumers have much to applaud. Corporate tax reform, tax cuts for households and reduced or modified regulation of various industries have led to record-high consumer and business confidence.
But sabre-rattling between the U.S. and China has deteriorated into actual skirmishing, and the latest back-and-forth suggests this spat will get worse before it gets better. To be blunt, the Trump administration’s strategy of waging a trade war with China could prove to be the equivalent of cutting off one’s nose to spite one’s face.
| | |
| 4 | | New Covenant Funds / Annual Report / June 30, 2018 |
A trade war will likely lead to higher prices for consumers and hurt the bottom lines of companies that sell imported goods and those that depend on global supply chains in their production process. The result is a net loss for society. A small group of producers will probably benefit substantially from the trade impediments while most consuming industries and households suffer declines in purchasing power—declines that may be small at the level of the individual, but would add up to an enormous loss across the affected economies.
SEI will be watching closely how this drama plays out in the months ahead. With any luck, the Trump administration will shy away from further ratcheting tensions. But we must admit that doesn’t seem to be in the cards in the near-term.
A confluence of events has conspired to hurt the performance of emerging-market assets. An extensive trade war that disrupts multinationals’ supply chains would disrupt the flow of raw commodities and semi-finished materials from developing economies used as inputs. Rising U.S. interest rates, resulting in another period of sustained U.S. dollar strength, is a second threat. The soft patch in Europe and recent signs of deceleration in China’s economic growth is a third.
But while emerging-market stocks and bonds have come under pressure this year, we’ve yet to see any widespread deterioration in economic performance or financial conditions. On balance, we think most emerging markets have the ability to weather the storm—again, assuming the disruption to global trade does not devolve into something more encompassing. The majority of developing countries have recorded an improvement in their current-account positions in recent years, allowing them to accumulate foreign currencies.
Make no mistake about it: the headwinds blowing in the face of risk assets have picked up. Growth in business activity has slowed a bit, especially in Europe. Monetary policy in the U.S. is getting tighter, and is set to become less expansionary in Europe as well. Inflation has ticked higher, driven by synchronised global growth and a tightening of labour markets and industrial capacity in the U.S., Germany, the U.K., China, and elsewhere in Asia. A jump in oil prices is also pushing headline consumer-price index readings to their highest levels in several years; OPEC and Russia have shown a fair degree of discipline in constraining the supply of crude oil at a time when demand is strong and inventory levels have fallen. Some developing countries have been forced to raise their policy rates dramatically to defend their currencies.
Most important, the stoking of trade-war tensions by the U.S. threatens to undermine the very foundation of the system that has supported the global economy since the end of World War II. Although the actual trade actions to date have been very modest, the impact on global supply chains bears close watching.
But the economic fundamentals that drive the stock market still appear solid, even in places like Europe and developing economies. Plus, interest rates remain at levels that will crunch global economic growth. The key risks—escalating trade tensions and the polarization of electorates over issues like immigration and fiscal sovereignty—appear more political in nature. The positives include a still-solid global economy; strong momentum in corporate-profits growth; and equity valuations that still appear reasonable against the backdrop of still-low, albeit rising, interest rates.
Signs of financial stress remain isolated to the weaker economies; although Italy is an important case, owing to its size and position as a major eurozone country.
A broadening of the trade war with China or a U.S. departure from the NAFTA accord would likely have a severely negative impact on the profitability of U.S. manufacturers, prompting us to reassess our still-positive view. Impediments to trade also could lead to a higher inflation rate as domestic companies use the tariffs umbrella to raise their selling prices. The Fed may feel compelled to lean against this threat to price stability, thereby aggravating any economic shock arising from the disruption of global supply chains—which is how a bear market could develop.
This is not our base-case scenario. We still think this old bull has some life left in it, but the risks to the equity market now seem more balanced than skewed to the bullish side.
| | | | |
New Covenant Funds / Annual Report / June 30, 2018 | | | 5 | |
NEW COVENANT FUNDS — June 30, 2018 (Unaudited) (Concluded)
On behalf of SEI Investments, I want to thank you for your continued confidence. We are working every day to maintain that trust, and we look forward to serving your investment needs in the future.
Sincerely,

William T. Lawrence, CFA
Head and Chief Investment Officer of Traditional Asset Management
| | |
| 6 | | New Covenant Funds / Annual Report / June 30, 2018 |
MANAGEMENT’S DISCUSSION AND ANALYSIS OF FUND PERFORMANCE
June 30, 2018 (Unaudited)
New Covenant Growth Fund
I. Objective
The New Covenant Growth Fund’s (the “Fund”) investment objective is long-term capital appreciation. Dividend income, if any, will be incidental.
II. Investment Approach
The Fund uses a multi-manager approach, relying on a number of sub-advisers with different investment approaches to manage portions of the Fund’s portfolio, under the general supervision of SEI Investments Management Corporation (SIMC). The Fund utilized the following sub-advisers as of June 30, 2018: BlackRock Investment Management, LLC, Brandywine Global Investment Management Company LLC, Coho Partners, Ltd., Parametric Portfolio Associates LLC.
III. Return vs. Benchmark
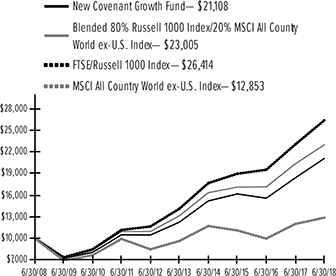
For the one-year period ending June 30, 2018, the Fund returned 14.74%. The Fund’s primary benchmark — the FTSE/Russell 1000 Index — returned 14.54%.
IV. Fund Attribution
Market volatility remained low through the first half of the fiscal year; investors were unflappable as potential macro or geopolitical concerns surfaced. Although short-term interest rates rose, longer-term rates were relatively stable. Better-than-expected corporate earnings and a continued global economic expansion helped drive positive sentiment toward U.S. equities. As noted in the shareholder letter, the passage of a U.S. corporate tax cut at the end of the calendar year provided additional fuel for the market and support for earnings growth.
The beginning of 2018 saw a sharp uptick in volatility, driven by spiking bond rates that began to price in inflationary fears; most major indexes fell close to 10% during a two-week span. Investors feared that the Federal Reserve might raise rates more aggressively to calm an overheated market. After recovering somewhat through the end of February, the market again tested its lows in March, pushed lower by ongoing trade war fears and regulatory concerns over large-cap user-data-driven technology firms.
Momentum-driven growth stocks led the market higher, with information technology producing the best returns among the Fund’s benchmark sectors. The so-called “FANG” stocks — Facebook, Amazon, Netflix and Google — generated outsized returns and drove broader market performance. The Russell 1000 Growth index climbed 22.51% during the fiscal year, while the Russell 1000 Value index was up 6.77%. As short-term
interest rates increased, high dividend-yield stocks such as utilities, telecommunication services, and real-estate investment trusts fell out of favor. Also, the underperformance of the energy sector was one reason that value stocks lagged relative to growth stocks. However, steadily rising oil prices helped the energy sector rebound from underperformance in the second quarter; energy ended the period as the third-best performing sector.
Though increasing wages, continued job growth and high consumer confidence helped traditionally growth-oriented sectors outperform, trade war talk and the implementation of protective tariffs by the U.S. (combined with retaliatory tariffs from its international trade partners) triggered a risk-off trade toward the end of the period in June. Further escalation of trade war rhetoric poses a threat to global growth going forward, though the Federal Reserve remains optimistic on the U.S. economy and raised the federal funds rate three times during the fiscal period, with two more hikes planned for the second half of 2018.
Overweights to the energy and consumer discretionary sectors contributed to excess return, and the Fund also benefited from strong security selection within the consumer staples and financials sectors. An underweight to the information technology sector, specifically the “FANG” stocks, was the largest detractor from performance.
Blackrock was the best performing manager in the Fund during the fiscal period and benefited from an overweight to and selection within the consumer discretionary sector. Blackrock also benefited from an overweight to and selection within information technology. Overall, Blackrock’s growth exposure in these key areas was a significant tailwind.
Coho and Brandywine both detracted from excess return, though not by enough to outweigh Blackrock’s outperformance. Both stability and value underperformed relative to momentum and growth over the period, and these managers faced significant headwinds. Coho’s underweight to the information technology sector and overweight to the consumer staples sector detracted. Brandywine also suffered from an underweight to information technology, as well as poor selection within the consumer discretionary sector.
| | | | |
New Convenant Funds / Annual Report / June 30, 2018 | | | 7 | |
MANAGEMENT’S DISCUSSION AND ANALYSIS OF FUND PERFORMANCE
June 30, 2018 (Unaudited)
New Covenant Growth Fund (Concluded)
| | | | | | | | | | | | | | | | | | | | |
| AVERAGE ANNUAL TOTAL RETURN 1,2 | |
| | | One Year
Return | | | Annualized
3 Year
Return | | | Annualized
5 Year
Return | | | Annualized
10 Year
Return | | | Annualized
Inception
to Date | |
| New Covenant Growth Fund | | | 14.74% | | | | 9.29% | | | | 11.52% | | | | 7.76% | | | | 6.34% | |
| FTSE/Russell 1000 Index | | | 14.54% | | | | 11.64% | | | | 13.37% | | | | 10.20% | | | | 9.85% | |
| MSCI All Country World ex-U.S. Index | | | 7.28% | | | | 5.07% | | | | 5.99% | | | | 2.54% | | | | 4.98% | |
| Blended 80% Russell 1000 Index/20% MSCI All Country World ex-U.S. Index | | | 13.08% | | | | 10.34% | | | | 11.90% | | | | 8.69% | | | | 8.96% | |
Comparison of Change in the Value of a $10,000 Investment in the New Covenant Growth Fund, versus the FTSE/Russell 1000 Index, MSCI All Country World ex-U.S. Index and Blended 80% Russell 1000 Index/20% MSCI All Country World ex-U.S. Index.
| 1 | For the periods ended June 30, 2018. Past performance is not an indication of future performance. Fund Shares were offered beginning 7/1/99. Returns shown do not reflect the deduction of taxes that a shareholder would pay on fund distributions or the redemption of fund shares. The returns for certain periods reflect fee waivers and/or reimbursements in effect for that year; absent fee waivers and reimbursements, performance would have been lower. |
| 2 | This table compares the Fund’s average annual total returns to those of a broad-based index and the Fund’s 80/20 Blended Benchmark, which consists of the Russell 1000 Index and the MSCI All Country World ex-U.S. Index. The Fund’s Blended Benchmark is designed to provide a useful comparison to the Fund’s overall performance and more accurately reflects the Fund’s investment strategy than the broad-based index. |
| | |
| 8 | | New Convenant Funds / Annual Report / June 30, 2018 |
MANAGEMENT’S DISCUSSION AND ANALYSIS OF FUND PERFORMANCE
June 30, 2018 (Unaudited)
New Covenant Income Fund
I. Objective
The New Covenant Income Fund’s (the “Fund”) investment objective is a high level of current income with preservation of capital.
II. Investment Approach
The Fund uses a multi-manager approach, relying on a number of sub-advisers with different investment approaches to manage portions of the Fund’s portfolio, under the general supervision of SEI Investments Management Corporation (SIMC). The Fund utilized the following sub-advisers as of June 30, 2018: Income Research & Management and Western Asset Management Company.
III. Return vs. Benchmark
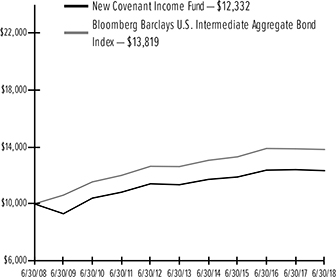
For the one-year period ending June 30, 2018, the Fund returned -0.54%. The Fund’s primary benchmark — the Bloomberg Barclays Intermediate US Aggregate Bond Index — returned -0.32%.
IV. Fund Attribution
U.S. Treasury yields began the fiscal year moving lower before reversing and rising rapidly, driven by the lowering of the corporate income tax rate from 35% to 21% and an increase in fiscal spending. Both measures were expected to increase economic growth and potentially add to inflationary pressures. For the fiscal year, 10-year U.S. Treasury yields were 54 basis points higher; the Fed increased the federal funds rate three times in 25 basis points increments during the fiscal period, as noted in the shareholder letter. On a relative basis, all spread sectors outperformed comparable Treasury bonds, and securitized sectors outperformed corporates. Expanding GDP, low unemployment and gradually improving wages buffered the housing sector and enabled non-agency mortgages, commercial mortgage-backed securities (CMBS) and agency mortgage-backed securities (MBS) to outperform.
With the rise in yields over the period, absolute returns for the Fund were slightly negative. An underweight to agency MBS detracted, while an overweight to non-Treasury sectors aided performance. Overweights to the securitized sectors and strong security selection in non-agency mortgages and CMBS enhanced relative returns. An underweight to sub-prime auto asset-backed securities (ABS) added, as those securitizations struggled with rising borrowing costs; an overweight to student loan securitizations was also positive. Additionally, yield-curve positioning contributed to
relative performance with an overweight to long-term bonds and underweight to two-year bonds.
Western Asset Management outperformed as its yield-curve posture, corporate-bond positioning and holdings in non-agency MBS and ABS contributed. Income Research & Management also outperformed due to security selection in corporates, particularly in industrial bonds, while an underweight to agency MBS subtracted.
The Fund used Treasury futures, eurodollar futures and to-be-announced (TBA) forward contracts to effectively manage duration, yield-curve and market exposures. (TBA contracts confer the obligation to buy or sell future debt obligations of the three U.S. government-sponsored agencies that issue or guarantee MBS — Fannie Mae, Freddie Mac and Ginnie Mae.) None of these had a meaningful impact on the Fund’s performance.
| | | | | | | | | | | | | | | | | | | | |
| AVERAGE ANNUAL TOTAL RETURN 1 | |
| | | One Year
Return | | | Annualized
3 Year
Return | | | Annualized
5 Year
Return | | | Annualized
10 Year
Return | | | Annualized
Inception
to Date | |
| New Covenant Income Fund | | | -0.54% | | | | 1.23% | | | | 1.69% | | | | 2.12% | | | | 3.37% | |
| Bloomberg Barclays U.S. Intermediate Aggregate Bond Index | | | -0.32% | | | | 1.27% | | | | 1.83% | | | | 3.29% | | | | 5.80% | |
Comparison of Change in the Value of a $10,000 Investment in the New Covenant Income Fund, versus the Bloomberg Barclays U.S. Intermediate Aggregate Bond Index.
| | | | |
New Covenant Funds / Annual Report / June 30, 2018 | | | 9 | |
MANAGEMENT’S DISCUSSION AND ANALYSIS OF FUND PERFORMANCE
June 30, 2018 (Unaudited)
New Covenant Income Fund (Concluded)
| 1 | For the periods ended June 30, 2018. Past performance is not an indication of future performance. Fund Shares were offered beginning 7/1/99. Returns shown do not reflect the deduction of taxes that a shareholder would pay on fund distributions or the redemption of fund shares. The returns for certain periods reflect fee waivers and/or reimbursements in effect for that year; absent fee waivers and reimbursements, performance would have been lower. |
| | |
| 10 | | New Covenant Funds / Annual Report / June 30, 2018 |
MANAGEMENT’S DISCUSSION AND ANALYSIS OF FUND PERFORMANCE
June 30, 2018 (Unaudited)
New Covenant Balanced Growth Fund
I. Objective
The Balanced Growth Fund’s (the “Fund”) investment objective is to produce capital appreciation with less risk than would be present in a portfolio of only common stocks.
II. Investment Approach
The Fund’s assets are managed under the direction of SEI Investments Management Corporation (“SIMC”), which manages the Fund’s assets, in a way that it believes will achieve the Fund’s investment objective. In order to achieve its investment objective, SIMC allocates the Fund’s assets primarily in shares of the New Covenant Growth Fund (the “Growth Fund”) and the New Covenant Income Fund (the “Income Fund”), with a majority of its assets generally invested in shares of the Growth Fund. Between 45% and 75% of the Fund’s net assets (with a neutral position of approximately 60% of the Fund’s net assets) are invested in shares of the Growth Fund, with the balance of its assets invested in shares of the Income Fund. The Growth and Income Funds, in turn, invest directly in securities in accordance with their own varying investment objectives and policies.
III. Return vs. Benchmark
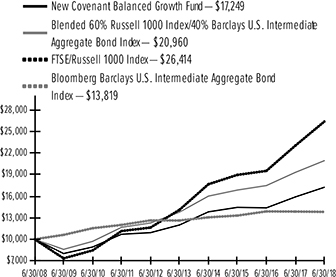
For the one-year period ending June 30, 2018, the Fund returned 8.45%. The Fund’s primary benchmark—the FTSE/Russell 1000 Index—returned 14.54%.
IV. Fund Attribution
Equity markets provided positive returns over the fiscal period, while fixed-income markets were marginally lower. Market volatility remained low through the first half of the fiscal year; investors were unflappable as potential macro or geopolitical concerns surfaced. Although short-term interest rates rose, longer-term rates were relatively stable. Better-than-expected corporate earnings and a continued global economic expansion helped drive positive sentiment toward U.S. equities. As noted in the shareholder letter, the passage of a U.S. corporate tax cut at the end of the calendar year provided additional fuel for the market and support for earnings growth.
The beginning of 2018 saw a sharp uptick in volatility, driven by spiking bond rates that began to price in inflationary fears; most major indexes fell close to 10% during a two-week span. Investors feared that the Federal Reserve might raise rates more aggressively to calm an overheated market. After recovering somewhat through the end of February, the market again tested its
lows in March, pushed lower by ongoing trade war fears and regulatory concerns over large-cap user-data-driven technology firms.
Momentum-driven growth stocks led the market higher, with information technology producing the best returns among the Fund’s benchmark sectors. The so-called “FANG” stocks — Facebook, Amazon, Netflix and Google — generated outsized returns and drove broader market performance. The Russell 1000 Growth index climbed 22.51% during the fiscal year, while the Russell 1000 Value index was up 6.77%. As short-term interest rates increased, high dividend-yield stocks such as utilities, telecommunication services, and real-estate investment trusts fell out of favor. Also, the underperformance of the energy sector was one reason that value stocks lagged relative to growth stocks. However, steadily rising oil prices helped the energy sector rebound from underperformance in the second quarter; energy ended the period as the third-best performing sector.
Though increasing wages, continued job growth and high consumer confidence helped traditionally growth-oriented sectors outperform, trade war talk and the implementation of protective tariffs by the U.S. (combined with retaliatory tariffs from its international trade partners) triggered a risk-off trade toward the end of the period in June. Further escalation of trade war rhetoric poses a threat to global growth going forward, though the Federal Reserve remains optimistic on the U.S. economy and raised the federal funds rate three times during the fiscal period, with two more hikes planned for the second half of 2018.
U.S. Treasury yields began the fiscal year moving lower before reversing and rising rapidly, driven by the lowering of the corporate income tax rate from 35% to 21% and an increase in fiscal spending. Both measures were expected to increase economic growth and potentially add to inflationary pressures. For the fiscal year, 10-year U.S. Treasury yields were 54 basis points higher; the Fed increased the federal funds rate three times in 25 basis points increments during the fiscal period. On a relative basis, all spread sectors outperformed comparable Treasury bonds, and securitized sectors outperformed corporates. Expanding GDP, low unemployment and gradually improving wages buffered the housing sector and enabled non-agency mortgages, commercial mortgage-backed securities (CMBS) and agency mortgage-backed securities (MBS) to outperform.
| | | | |
New Covenant Funds / Annual Report / June 30, 2018 | | | 11 | |
MANAGEMENT’S DISCUSSION AND ANALYSIS OF FUND PERFORMANCE
June 30, 2018 (Unaudited)
New Covenant Balanced Growth Fund (Concluded)
In the Growth Fund, performance was driven by a combination of forward-looking allocations and stock selection. Overweights to the energy and consumer discretionary sectors contributed to excess return, and strong security selection within the consumer staples and financials sectors also contributed to performance. An underweight to the information technology sector, specifically the “FANG” stocks, was the largest detractor.
With the rise in yields over the period, absolute returns for the Income Fund were slightly negative. An underweight to agency MBS detracted, while an overweight to non-Treasury sectors aided performance. Overweights to the securitized sectors and strong security selection in non-agency mortgages and CMBS enhanced relative returns. An underweight to sub-prime auto asset-backed securities (ABS) added, as those securitizations struggled with rising borrowing costs; an overweight to student loan securitizations was also positive. Additionally, yield-curve positioning contributed to relative performance with an overweight to long-term bonds and underweight to two-year bonds.
The Income Fund used Treasury futures, eurodollar futures and to-be-announced (TBA) forward contracts to effectively manage duration, yield-curve and market exposures. (TBA contracts confer the obligation to buy or sell future debt obligations of the three U.S. government-sponsored agencies that issue or guarantee MBS—Fannie Mae, Freddie Mac and Ginnie Mae.) None of these had a meaningful impact on the Fund’s performance.
| | | | | | | | | | | | | | | | | | | | |
| AVERAGE ANNUAL TOTAL RETURN 1,2 | |
| | | One Year
Return | | | Annualized
3 Year
Return | | | Annualized
5 Year
Return | | | Annualized
10 Year
Return | | | Annualized
Inception
to Date | |
| New Covenant Balanced Growth Fund | | | 8.45% | | | | 6.07% | | | | 7.54% | | | | 5.60% | | | | 5.19% | |
| FTSE/Russell 1000 Index | | | 14.54% | | | | 11.64% | | | | 13.37% | | | | 10.20% | | | | 10.37% | |
| Bloomberg Barclays U.S. Intermediate Aggregate Bond Index | | | -0.32% | | | | 1.27% | | | | 1.83% | | | | 3.29% | | | | 5.81% | |
| Blended 60% Russell 1000 Index/40% Bloomberg Barclays U.S. Intermediate Aggregate Bond Index | | | 8.46% | | | | 7.53% | | | | 8.75% | | | | 7.68% | | | | 8.79% | |
Comparison of Change in the Value of a $10,000 Investment in the New Covenant Balanced Growth Fund, versus the FTSE/Russell 1000 Index, Bloomberg Barclays U.S. Intermediate Aggregate Bond Index and Blended 60% Russell 1000 Index/40% Bloomberg Barclays U.S. Intermediate Aggregate Bond Index.
| 1 | For the periods ended June 30, 2018. Past performance is not an indication of future performance. Fund Shares were offered beginning 7/1/99. Returns shown do not reflect the deduction of taxes that a shareholder would pay on fund distributions or the redemption of fund shares. The returns for certain periods reflect fee waivers and/or reimbursements in effect for that year; absent fee waivers and reimbursements, performance would have been lower. |
| 2 | This table compares the Fund’s average annual total returns to those of a broad based index and the Fund’s 60/40 Blended Benchmark, which consists of the Russell 1000 Index and the Bloomberg Barclays U.S. Intermediate Aggregate Bond Index. The Fund’s Blended Benchmark is designed to provide a useful comparison to the Fund’s overall performance and more accurately reflects the Fund’s investment strategy than the broad-based index. |
| | |
| 12 | | New Covenant Funds / Annual Report / June 30, 2018 |
MANAGEMENT’S DISCUSSION AND ANALYSIS OF FUND PERFORMANCE
June 30, 2018 (Unaudited)
New Covenant Balanced Income Fund
I. Objective
The New Covenant Balanced Income Fund’s (the “Fund”) investment objective is to produce current income and long-term growth of capital.
II. Investment Approach
The Fund’s assets are managed under the direction of SEI Investments Management Corporation (“SIMC”), which manages the Fund’s assets, in a way that it believes will achieve the Fund’s investment objective. In order to achieve its investment objective, SIMC allocates the Fund’s assets primarily in shares of the New Covenant Growth Fund (the “Growth Fund”) and the New Covenant Income Fund (the “Income Fund”), with a majority of its assets generally invested in shares of the Income Fund. Between fifty percent and seventy-five percent of the Fund’s net assets (with a neutral position of approximately 65%) are invested in shares of the Income Fund, with the balance of its net assets invested in shares of the Growth Fund. The Growth and Income Funds, in turn, invest directly in securities in accordance with their own varying investment objectives and policies.
III. Return vs. Benchmark
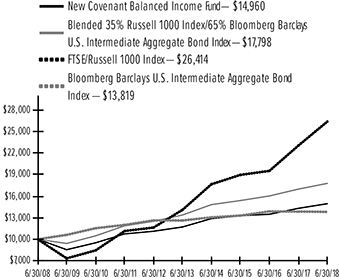
For the one-year period ending June 30, 2018, the Fund returned 4.57%. The Fund’s primary benchmark—the FTSE/Russell 1000 Index — returned 14.54%.
IV. Fund Attribution
Equity markets provided positive returns over the fiscal period, while fixed-income markets were marginally lower. U.S. Treasury yields began the fiscal year moving lower before reversing and rising rapidly, driven by the lowering of the corporate income tax rate from 35% to 21% and an increase in fiscal spending. Both measures were expected to increase economic growth and potentially add to inflationary pressures. For the fiscal year, 10-year U.S. Treasury yields were 54 basis points higher; the Fed increased the federal funds rate three times in 25 basis points increments during the fiscal period. On a relative basis, all spread sectors outperformed comparable Treasury bonds, and securitized sectors outperformed corporates. Expanding GDP, low unemployment and gradually improving wages buffered the housing sector and enabled non-agency mortgages, commercial mortgage-backed securities (CMBS) and agency mortgage-backed securities (MBS) to outperform.
Market volatility remained low through the first half of the fiscal year; investors were unflappable as potential macro or geopolitical concerns surfaced. Although short-term interest rates rose, longer-term rates were relatively stable. Better-than-expected corporate earnings and a continued global economic expansion helped drive positive sentiment toward U.S. equities. As noted in the shareholder letter, the passage of a U.S. corporate tax cut at the end of the calendar year provided additional fuel for the market and support for earnings growth.
The beginning of 2018 saw a sharp uptick in volatility, driven by spiking bond rates that began to price in inflationary fears; most major indexes fell close to 10% during a two-week span. Investors feared that the Federal Reserve might raise rates more aggressively to calm an overheated market. After recovering somewhat through the end of February, the market again tested its lows in March, pushed lower by ongoing trade war fears and regulatory concerns over large-cap user-data-driven technology firms.
Momentum-driven growth stocks led the market higher, with information technology producing the best returns among the Fund’s benchmark sectors. The so-called “FANG” stocks — Facebook, Amazon, Netflix and Google—generated outsized returns and drove broader market performance. The Russell 1000 Growth index climbed 22.51% during the fiscal year, while the Russell 1000 Value index was up 6.77%. As short-term interest rates increased, high dividend-yield stocks such as utilities, telecommunication services, and real-estate investment trusts fell out of favor. Also, the underperformance of the energy sector was one reason that value stocks lagged relative to growth stocks. However, steadily rising oil prices helped the energy sector rebound from underperformance in the second quarter; energy ended the period as the third-best performing sector.
Though increasing wages, continued job growth and high consumer confidence helped traditionally growth-oriented sectors outperform, trade war talk and the implementation of protective tariffs by the U.S. (combined with retaliatory tariffs from its international trade partners) triggered a risk-off trade toward the end of the period in June. Further escalation of trade war rhetoric poses a threat to global growth going forward, though the Federal Reserve remains optimistic on the U.S. economy and raised the federal funds rate three times during the fiscal period, with two more hikes planned for the second half of 2018.
| | | | |
New Covenant Funds / Annual Report / June 30, 2018 | | | 13 | |
MANAGEMENT’S DISCUSSION AND ANALYSIS OF FUND PERFORMANCE
June 30, 2018 (Unaudited)
New Covenant Balanced Income Fund (Concluded)
With the rise in yields over the period, absolute returns for the Income Fund were slightly negative. An underweight to agency MBS detracted, while an overweight to non-Treasury sectors aided performance. Overweights to the securitized sectors and strong security selection in non-agency mortgages and CMBS enhanced relative returns. An underweight to sub-prime auto asset-backed securities (ABS) added, as those securitizations struggled with rising borrowing costs; an overweight to student loan securitizations was also positive. Additionally, yield-curve positioning contributed to relative performance with an overweight to long-term bonds and underweight to two-year bonds.
In the Growth Fund, performance was driven by a combination of forward-looking allocations and stock selection. Overweights to the energy and consumer discretionary sectors contributed to excess return, and strong security selection within the consumer staples and financials sectors also contributed to performance. An underweight to the information technology sector, specifically the “FANG” stocks, was the largest detractor.
The Income Fund used Treasury futures, eurodollar futures and to-be-announced (TBA) forward contracts to effectively manage duration, yield-curve and market exposures. (TBA contracts confer the obligation to buy or sell future debt obligations of the three U.S. government-sponsored agencies that issue or guarantee MBS — Fannie Mae, Freddie Mac and Ginnie Mae.) None of these had a meaningful impact on the Fund’s performance.
| | | | | | | | | | | | | | | | | | | | |
| AVERAGE ANNUAL TOTAL RETURN 1,2 | |
| | | One Year
Return | | | Annualized
3 Year
Return | | | Annualized
5 Year
Return | | | Annualized
10 Year
Return | | | Annualized
Inception
to Date | |
| New Covenant Balanced Income Fund | | | 4.57% | | | | 4.01% | | | | 5.02% | | | | 4.11% | | | | 3.98% | |
| FTSE/Russell 1000 Index | | | 14.54% | | | | 11.64% | | | | 13.37% | | | | 10.20% | | | | 9.85% | |
| Bloomberg Barclays U.S. Intermediate Aggregate Bond Index | | | -0.32% | | | | 1.27% | | | | 1.83% | | | | 3.294% | | | | 9.85% | |
| Blended 35% Russell 1000 Index/65% Bloomberg Barclays U.S. Intermediate Aggregate Bond Index | | | 4.75% | | | | 4.93% | | | | 5.86% | | | | 5.93% | | | | 7.33% | |
Comparison of Change in the Value of a $10,000 Investment in the New Covenant Balanced Income Fund, versus the Russell 1000 Index, Bloomberg Barclays U.S. Intermediate Aggregate Bond Index and Blended 35% FTSE/Russell 1000 Index/65% Bloomberg Barclays U.S. Intermediate Aggregate Bond Index.
| 1 | For the periods ended June 30, 2018. Past performance is not an indication of future performance. Fund Shares were offered beginning 7/1/99. Returns shown do not reflect the deduction of taxes that a shareholder would pay on fund distributions or the redemption of fund shares. The returns for certain periods reflect fee waivers and/or reimbursements in effect for that year; absent fee waivers and reimbursements, performance would have been lower. |
| 2 | This table compares the Fund’s average annual total returns to those of a broad-based index and the Fund’s 35/65 Blended Benchmark, which consists of the Russell 1000 Index and the Bloomberg Barclays U.S. Intermediate Aggregate Bond Index. The Fund’s Blended Benchmark is designed to provide a useful comparison to the Fund’s overall performance and more accurately reflects the Fund’s investment strategy than the broad-based index. |
| | |
| 14 | | New Covenant Funds / Annual Report / June 30, 2018 |
SCHEDULE OF INVESTMENTS
June 30, 2018
New Covenant Growth Fund
|
Sector Weightings (Unaudited)†: |
 |
†Percentages are based on total investments.
| | | | | | | | |
| | | |
| Description | | Shares | | | Market Value ($ Thousands) | |
COMMON STOCK — 97.4% | | | | | | | | |
Argentina — 0.2% | | | | | | | | |
MercadoLibre Inc * | | | 2,986 | | | $ | 892 | |
| | | | | | | | |
| | |
Canada — 1.1% | | | | | | | | |
Canadian Natural Resources Ltd | | | 95,296 | | | | 3,437 | |
Magna International Inc | | | 19,005 | | | | 1,105 | |
| | | | | | | | |
| | | | | | | 4,542 | |
| | | | | | | | |
| | |
China — 0.6% | | | | | | | | |
Alibaba Group Holding Ltd ADR * | | | 2,264 | | | | 420 | |
Tencent Holdings Ltd ADR | | | 44,452 | | | | 2,234 | |
| | | | | | | | |
| | | | | | | 2,654 | |
| | | | | | | | |
| | |
Ireland — 1.2% | | | | | | | | |
Accenture PLC, Cl A | | | 11,601 | | | | 1,898 | |
Ingersoll-Rand PLC | | | 9,666 | | | | 867 | |
Jazz Pharmaceuticals PLC * | | | 1,568 | | | | 270 | |
Medtronic PLC | | | 12,549 | | | | 1,074 | |
Shire PLC ADR | | | 5,532 | | | | 934 | |
| | | | | | | | |
| | | | | | | 5,043 | |
| | | | | | | | |
| | |
Netherlands — 0.7% | | | | | | | | |
Royal Dutch Shell PLC ADR, Cl A | | | 43,244 | | | | 2,994 | |
| | | | | | | | |
| | |
United Kingdom — 1.0% | | | | | | | | |
Aon PLC | | | 2,642 | | | | 363 | |
BP PLC ADR | | | 84,545 | | | | 3,860 | |
| | | | | | | | |
| | | | | | | 4,223 | |
| | | | | | | | |
| | |
United States — 92.6% | | | | | | | | |
Consumer Discretionary — 15.1% | | | | | | | | |
Advance Auto Parts Inc | | | 6,129 | | | | 832 | |
Amazon.com Inc * | | | 6,990 | | | | 11,882 | |
Best Buy Co Inc | | | 5,659 | | | | 422 | |
Booking Holdings Inc * | | | 1,294 | | | | 2,623 | |
BorgWarner Inc | | | 4,528 | | | | 195 | |
Carnival Corp | | | 8,886 | | | | 509 | |
Charter Communications Inc, Cl A * | | | 903 | | | | 265 | |
Chipotle Mexican Grill Inc, Cl A * | | | 450 | | | | 194 | |
| | | | | | | | |
| | | |
| Description | | Shares | | Market Value ($ Thousands) |
COMMON STOCK (continued) | | | | | | | | |
Cinemark Holdings Inc | | | 9,696 | | | $ | 340 | |
Comcast Corp, Cl A | | | 74,924 | | | | 2,458 | |
Delphi Automotive PLC * | | | 4,164 | | | | 382 | |
Dollar General Corp | | | 36,125 | | | | 3,562 | |
Dollar Tree Inc * | | | 2,077 | | | | 177 | |
Domino’s Pizza Inc | | | 1,958 | | | | 552 | |
DR Horton Inc | | | 18,672 | | | | 766 | |
Dunkin’ Brands Group Inc | | | 4,863 | | | | 336 | |
Floor & Decor Holdings Inc, Cl A * | | | 4,282 | | | | 211 | |
Ford Motor Co | | | 17,445 | | | | 193 | |
Gap Inc/The | | | 8,437 | | | | 273 | |
General Motors Co | | | 68,742 | | | | 2,708 | |
Goodyear Tire & Rubber Co/The | | | 41,326 | | | | 962 | |
Hanesbrands Inc | | | 31,606 | | | | 696 | |
Hasbro Inc | | | 2,632 | | | | 243 | |
Hilton Worldwide Holdings Inc | | | 10,242 | | | | 811 | |
Home Depot Inc/The | | | 14,245 | | | | 2,779 | |
Hyatt Hotels Corp, Cl A | | | 2,635 | | | | 203 | |
Interpublic Group of Cos Inc/The | | | 8,487 | | | | 199 | |
John Wiley & Sons Inc, Cl A | | | 3,657 | | | | 228 | |
Kohl’s Corp | | | 4,263 | | | | 311 | |
L Brands Inc | | | 5,950 | | | | 219 | |
Lear Corp | | | 3,009 | | | | 559 | |
Liberty Media Corp-Liberty Formula One, Cl C * | | | 8,635 | | | | 321 | |
Lowe’s Cos Inc | | | 38,644 | | | | 3,693 | |
Macy’s Inc | | | 8,056 | | | | 302 | |
Marriott International Inc/MD, Cl A | | | 5,030 | | | | 637 | |
McDonald’s Corp | | | 4,567 | | | | 716 | |
Mohawk Industries Inc * | | | 1,870 | | | | 401 | |
Netflix Inc * | | | 9,668 | | | | 3,784 | |
Newell Brands Inc | | | 9,871 | | | | 255 | |
NIKE Inc, Cl B | | | 30,087 | | | | 2,397 | |
Nordstrom Inc | | | 4,790 | | | | 248 | |
Norwegian Cruise Line Holdings Ltd * | | | 18,110 | | | | 856 | |
Omnicom Group Inc | | | 33,823 | | | | 2,580 | |
PVH Corp | | | 1,776 | | | | 266 | |
Qurate Retail Inc * | | | 12,704 | | | | 270 | |
Ross Stores Inc | | | 22,076 | | | | 1,871 | |
Royal Caribbean Cruises Ltd | | | 6,243 | | | | 647 | |
Starbucks Corp | | | 22,152 | | | | 1,082 | |
Target Corp | | | 5,064 | | | | 385 | |
Tesla Inc * | | | 3,305 | | | | 1,133 | |
TJX Cos Inc/The | | | 5,087 | | | | 484 | |
Tupperware Brands Corp | | | 19,351 | | | | 798 | |
Ulta Beauty Inc * | | | 5,459 | | | | 1,274 | |
VF Corp | | | 4,023 | | | | 328 | |
Viacom Inc, Cl B | | | 7,351 | | | | 222 | |
Visteon Corp * | | | 2,689 | | | | 348 | |
Walt Disney Co/The | | | 22,923 | | | | 2,403 | |
Wendy’s Co/The | | | 14,280 | | | | 245 | |
Williams-Sonoma Inc | | | 3,319 | | | | 204 | |
| | | | |
New Covenant Funds / Annual Report / June 30, 2018 | | | 15 | |
SCHEDULE OF INVESTMENTS
June 30, 2018
New Covenant Growth Fund (Continued)
| | | | | | | | |
| | | |
| Description | | Shares | | Market Value
($ Thousands) | |
COMMON STOCK (continued) | | | | | | | | |
Wyndham Destinations Inc | | | 7,174 | | | $ | 318 | |
Wyndham Hotels & Resorts Inc | | | 3,409 | | | | 201 | |
| | | | | | | | |
| | | | | | | 64,759 | |
| | | | | | | | |
| | |
Consumer Staples — 6.5% | | | | | | | | |
Bunge Ltd | | | 7,176 | | | | 500 | |
Campbell Soup Co | | | 25,848 | | | | 1,048 | |
Clorox Co/The | | | 9,102 | | | | 1,231 | |
Coca-Cola Co/The | | | 52,459 | | | | 2,301 | |
Colgate-Palmolive Co | | | 14,526 | | | | 941 | |
Conagra Brands Inc | | | 35,665 | | | | 1,274 | |
Costco Wholesale Corp | | | 1,787 | | | | 373 | |
Dr Pepper Snapple Group Inc | | | 14,903 | | | | 1,818 | |
Estee Lauder Cos Inc/The, Cl A | | | 1,768 | | | | 252 | |
General Mills Inc | | | 15,944 | | | | 706 | |
Hershey Co/The | | | 2,295 | | | | 214 | |
JM Smucker Co/The | | | 27,827 | | | | 2,991 | |
Kellogg Co | | | 11,356 | | | | 793 | |
Kimberly-Clark Corp | | | 12,277 | | | | 1,293 | |
Kroger Co/The | | | 115,208 | | | | 3,278 | |
McCormick & Co Inc/MD | | | 8,882 | | | | 1,031 | |
Mondelez International Inc, Cl A | | | 11,943 | | | | 490 | |
Monster Beverage Corp * | | | 20,892 | | | | 1,197 | |
PepsiCo Inc | | | 20,539 | | | | 2,236 | |
Procter & Gamble Co/The | | | 33,304 | | | | 2,600 | |
Sysco Corp | | | 8,925 | | | | 609 | |
Walmart Inc | | | 10,031 | | | | 859 | |
| | | | | | | | |
| | | | | | | 28,035 | |
| | | | | | | | |
| | |
Energy — 6.4% | | | | | | | | |
Anadarko Petroleum Corp | | | 13,228 | | | | 969 | |
Andeavor | | | 2,130 | | | | 279 | |
Apache Corp | | | 4,822 | | | | 225 | |
Apergy Corp * | | | 5,586 | | | | 233 | |
Baker Hughes a GE Co | | | 7,765 | | | | 256 | |
Cheniere Energy Inc * | | | 3,759 | | | | 245 | |
Chevron Corp | | | 28,747 | | | | 3,634 | |
ConocoPhillips | | | 34,963 | | | | 2,434 | |
Devon Energy Corp | | | 60,536 | | | | 2,661 | |
Diamondback Energy Inc | | | 1,805 | | | | 237 | |
EOG Resources Inc | | | 1,968 | | | | 245 | |
EQT Corp | | | 2,732 | | | | 151 | |
Exxon Mobil Corp | | | 30,329 | | | | 2,509 | |
Halliburton Co | | | 24,071 | | | | 1,085 | |
Helmerich & Payne Inc | | | 15,394 | | | | 981 | |
Hess Corp | | | 13,839 | | | | 926 | |
HollyFrontier Corp | | | 4,208 | | | | 288 | |
Kinder Morgan Inc/DE | | | 47,034 | | | | 831 | |
Kosmos Energy Ltd * | | | 28,750 | | | | 238 | |
Marathon Oil Corp | | | 13,374 | | | | 279 | |
Marathon Petroleum Corp | | | 5,168 | | | | 363 | |
Newfield Exploration Co * | | | 12,145 | | | | 367 | |
Noble Energy Inc | | | 6,179 | | | | 218 | |
| | | | | | | | |
| | | |
| Description | | Shares | | Market Value
($ Thousands) | |
COMMON STOCK (continued) | | | | | | | | |
Occidental Petroleum Corp | | | 46,787 | | | $ | 3,915 | |
Oceaneering International Inc * | | | 23,125 | | | | 589 | |
ONEOK Inc | | | 3,505 | | | | 245 | |
Pioneer Natural Resources Co | | | 2,417 | | | | 457 | |
Schlumberger Ltd | | | 33,513 | | | | 2,246 | |
Weatherford International PLC * | | | 53,775 | | | | 177 | |
| | | | | | | | |
| | | | | | | 27,283 | |
| | | | | | | | |
| | |
Financials — 13.5% | | | | | | | | |
Aflac Inc | | | 66,350 | | | | 2,854 | |
Allstate Corp/The | | | 3,458 | | | | 316 | |
American Express Co | | | 2,173 | | | | 213 | |
Arthur J Gallagher & Co | | | 4,912 | | | | 321 | |
Bank of America Corp | | | 191,612 | | | | 5,402 | |
Bank of New York Mellon Corp/The | | | 12,656 | | | | 683 | |
Berkshire Hathaway Inc, Cl B * | | | 25,959 | | | | 4,845 | |
Blackstone Group LP/The (A) | | | 57,555 | | | | 1,852 | |
BNP Paribas SA ADR | | | 37,191 | | | | 1,144 | |
Brighthouse Financial Inc * | | | 3,743 | | | | 150 | |
Citigroup Inc | | | 92,928 | | | | 6,219 | |
Comerica Inc | | | 7,408 | | | | 674 | |
E*TRADE Financial Corp * | | | 16,529 | | | | 1,011 | |
First Republic Bank/CA | | | 7,339 | | | | 710 | |
Goldman Sachs Group Inc/The | | | 6,736 | | | | 1,486 | |
Hartford Financial Services Group Inc/The | | | 4,042 | | | | 207 | |
Invesco Ltd | | | 18,123 | | | | 481 | |
JPMorgan Chase & Co | | | 56,777 | | | | 5,916 | |
KKR | | | 134,862 | | | | 3,351 | |
Marsh & McLennan Cos Inc | | | 34,714 | | | | 2,845 | |
MetLife Inc | | | 7,446 | | | | 325 | |
Moody’s Corp | | | 1,518 | | | | 259 | |
Morgan Stanley | | | 11,024 | | | | 523 | |
Morningstar Inc | | | 1,607 | | | | 206 | |
MSCI Inc, Cl A | | | 1,897 | | | | 314 | |
Northern Trust Corp | | | 11,179 | | | | 1,150 | |
OneMain Holdings Inc, Cl A * | | | 22,691 | | | | 755 | |
Pinnacle Financial Partners Inc | | | 3,213 | | | | 197 | |
Principal Financial Group Inc | | | 12,977 | | | | 687 | |
Prudential Financial Inc | | | 12,809 | | | | 1,198 | |
S&P Global Inc | | | 12,054 | | | | 2,458 | |
Santander Consumer USA Holdings Inc | | | 65,560 | | | | 1,252 | |
SLM Corp * | | | 47,263 | | | | 541 | |
State Street Corp | | | 42,292 | | | | 3,937 | |
SVB Financial Group * | | | 1,492 | | | | 431 | |
Synchrony Financial | | | 15,373 | | | | 513 | |
T Rowe Price Group Inc | | | 2,711 | | | | 315 | |
US Bancorp | | | 4,373 | | | | 219 | |
Voya Financial Inc | | | 4,001 | | | | 188 | |
Wells Fargo & Co | | | 30,925 | | | | 1,714 | |
Willis Towers Watson PLC | | | 1,386 | | | | 210 | |
| | | | | | | | |
| | | | | | | 58,072 | |
| | | | | | | | |
| | |
| 16 | | New Covenant Funds / Annual Report / June 30, 2018 |
| | | | | | | | |
| | | |
| Description | | Shares | | Market Value
($ Thousands) |
COMMON STOCK (continued) | | | | | | | | |
| | |
Health Care — 14.2% | | | | | | | | |
Abbott Laboratories | | | 66,606 | | | $ | 4,062 | |
AbbVie Inc | | | 20,710 | | | | 1,919 | |
ABIOMED Inc * | | | 481 | | | | 197 | |
Agilent Technologies Inc | | | 10,177 | | | | 629 | |
Allergan PLC | | | 2,345 | | | | 391 | |
Alnylam Pharmaceuticals Inc * | | | 1,692 | | | | 167 | |
AmerisourceBergen Corp, Cl A | | | 30,788 | | | | 2,625 | |
Amgen Inc | | | 23,384 | | | | 4,316 | |
Anthem Inc | | | 1,320 | | | | 314 | |
Baxter International Inc | | | 16,343 | | | | 1,207 | |
Becton Dickinson and Co | | | 10,836 | | | | 2,596 | |
Biogen Inc * | | | 3,715 | | | | 1,078 | |
Boston Scientific Corp * | | | 60,424 | | | | 1,976 | |
Bristol-Myers Squibb Co | | | 18,294 | | | | 1,012 | |
Celgene Corp * | | | 15,455 | | | | 1,227 | |
Cigna Corp | | | 5,764 | | | | 980 | |
CVS Health Corp | | | 76,027 | | | | 4,892 | |
DENTSPLY SIRONA Inc | | | 3,113 | | | | 136 | |
Edwards Lifesciences Corp * | | | 3,775 | | | | 550 | |
Eli Lilly & Co | | | 5,249 | | | | 448 | |
Exelixis Inc * | | | 10,371 | | | | 223 | |
Gilead Sciences Inc | | | 15,033 | | | | 1,065 | |
HCA Healthcare Inc | | | 4,246 | | | | 436 | |
Horizon Pharma Plc * | | | 42,100 | | | | 697 | |
Humana Inc | | | 1,424 | | | | 424 | |
Illumina Inc * | | | 5,429 | | | | 1,516 | |
IQVIA Holdings Inc * | | | 3,474 | | | | 347 | |
Johnson & Johnson | | | 39,209 | | | | 4,758 | |
McKesson Corp | | | 1,329 | | | | 177 | |
Merck & Co Inc | | | 65,853 | | | | 3,997 | |
Mettler-Toledo International Inc * | | | 562 | | | | 325 | |
Mylan NV * | | | 17,337 | | | | 627 | |
Neurocrine Biosciences Inc * | | | 2,042 | | | | 201 | |
Pfizer Inc | | | 69,025 | | | | 2,504 | |
Portola Pharmaceuticals Inc * | | | 10,749 | | | | 406 | |
Quest Diagnostics Inc | | | 1,980 | | | | 218 | |
Regeneron Pharmaceuticals Inc * | | | 1,231 | | | | 425 | |
ResMed Inc | | | 2,930 | | | | 303 | |
Sarepta Therapeutics Inc * | | | 1,410 | | | | 186 | |
TESARO Inc * | | | 1,475 | | | | 66 | |
Thermo Fisher Scientific Inc | | | 2,235 | | | | 463 | |
UnitedHealth Group Inc | | | 36,132 | | | | 8,865 | |
Varian Medical Systems Inc * | | | 2,214 | | | | 252 | |
Vertex Pharmaceuticals Inc * | | | 4,167 | | | | 708 | |
Zimmer Biomet Holdings Inc | | | 4,581 | | | | 510 | |
Zoetis Inc, Cl A | | | 7,745 | | | | 660 | |
| | | | | | | | |
| | | | | | | 61,081 | |
| | | | | | | | |
| | |
Industrials — 8.3% | | | | | | | | |
3M Co | | | 16,041 | | | | 3,156 | |
AECOM * | | | 21,002 | | | | 694 | |
AerCap Holdings NV * | | | 17,598 | | | | 953 | |
| | | | | | | | |
| | | |
| Description | | Shares | | Market Value
($ Thousands) |
COMMON STOCK (continued) | | | | | | | | |
American Airlines Group Inc | | | 24,177 | | | $ | 918 | |
Arconic Inc | | | 7,379 | | | | 125 | |
CoStar Group Inc * | | | 1,308 | | | | 540 | |
CSX Corp | | | 4,792 | | | | 306 | |
Cummins Inc | | | 3,879 | | | | 516 | |
Deere & Co | | | 5,117 | | | | 715 | |
Delta Air Lines Inc | | | 39,107 | | | | 1,937 | |
Eaton Corp PLC | | | 17,819 | | | | 1,332 | |
Equifax Inc | | | 4,644 | | | | 581 | |
FedEx Corp | | | 3,607 | | | | 819 | |
Fluor Corp | | | 6,066 | | | | 296 | |
General Electric Co | | | 86,732 | | | | 1,180 | |
HEICO Corp | | | 4,351 | | | | 317 | |
Hexcel Corp | | | 4,105 | | | | 272 | |
Honeywell International Inc | | | 2,388 | | | | 344 | |
Illinois Tool Works Inc | | | 15,910 | | | | 2,204 | |
Johnson Controls International plc | | | 36,216 | | | | 1,211 | |
Landstar System Inc | | | 2,284 | | | | 249 | |
Macquarie Infrastructure Corp | | | 12,643 | | | | 534 | |
ManpowerGroup Inc | | | 9,116 | | | | 784 | |
Nielsen Holdings PLC | | | 13,602 | | | | 421 | |
Norfolk Southern Corp | | | 3,083 | | | | 465 | |
Oshkosh Corp | | | 2,762 | | | | 194 | |
Owens Corning | | | 4,958 | | | | 314 | |
Rockwell Automation Inc | | | 5,714 | | | | 950 | |
Roper Technologies Inc | | | 2,056 | | | | 567 | |
Southwest Airlines Co | | | 5,376 | | | | 274 | |
Spirit AeroSystems Holdings Inc, Cl A | | | 10,661 | | | | 916 | |
Stanley Black & Decker Inc | | | 1,349 | | | | 179 | |
Teledyne Technologies Inc * | | | 1,544 | | | | 307 | |
TransDigm Group Inc * | | | 3,057 | | | | 1,055 | |
TransUnion | | | 3,412 | | | | 244 | |
Union Pacific Corp | | | 14,289 | | | | 2,024 | |
United Continental Holdings Inc * | | | 15,701 | | | | 1,095 | |
United Parcel Service Inc, Cl B | | | 6,206 | | | | 659 | |
United Rentals Inc * | | | 1,692 | | | | 250 | |
United Technologies Corp | | | 7,686 | | | | 961 | |
Univar Inc * | | | 8,027 | | | | 211 | |
Waste Management Inc | | | 6,467 | | | | 526 | |
WESCO International Inc * | | | 3,527 | | | | 201 | |
WW Grainger Inc | | | 10,392 | | | | 3,205 | |
Xylem Inc/NY | | | 9,204 | | | | 620 | |
| | | | | | | | |
| | | | | | | 35,621 | |
| | | | | | | | |
| | |
Information Technology — 20.6% | | | | | | | | |
Activision Blizzard Inc | | | 5,315 | | | | 406 | |
Adobe Systems Inc * | | | 15,137 | | | | 3,691 | |
Advanced Micro Devices Inc * | | | 13,558 | | | | 203 | |
Alphabet Inc, Cl A * | | | 5,610 | | | | 6,335 | |
Alphabet Inc, Cl C * | | | 2,147 | | | | 2,395 | |
Amdocs Ltd | | | 7,734 | | | | 512 | |
Analog Devices Inc | | | 9,734 | | | | 934 | |
Apple Inc | | | 39,492 | | | | 7,310 | |
| | | | |
New Covenant Funds / Annual Report / June 30, 2018 | | | 17 | |
SCHEDULE OF INVESTMENTS
June 30, 2018
New Covenant Growth Fund (Concluded)
| | | | | | | | |
| | | |
| Description | | Shares | | Market Value
($ Thousands) |
COMMON STOCK (continued) | | | | | | | | |
ARRIS International PLC * | | | 8,086 | | | $ | 198 | |
ASML Holding NV, Cl G | | | 8,837 | | | | 1,749 | |
Autodesk Inc * | | | 11,096 | | | | 1,455 | |
Automatic Data Processing Inc | | | 22,212 | | | | 2,979 | |
Broadcom Inc | | | 5,329 | | | | 1,293 | |
CA Inc | | | 12,146 | | | | 433 | |
Cisco Systems Inc | | | 101,969 | | | | 4,388 | |
Cognizant Technology Solutions Corp, Cl A | | | 8,315 | | | | 657 | |
CommScope Holding Co Inc * | | | 7,086 | | | | 207 | |
Dell Technologies Inc Class V, Cl V * | | | 9,455 | | | | 800 | |
DXC Technology Co | | | 6,114 | | | | 493 | |
eBay Inc * | | | 11,819 | | | | 429 | |
Electronic Arts Inc * | | | 7,003 | | | | 988 | |
Facebook Inc, Cl A * | | | 28,055 | | | | 5,452 | |
First Data Corp, Cl A * | | | 54,191 | | | | 1,134 | |
Intel Corp | | | 43,733 | | | | 2,174 | |
International Business Machines Corp | | | 12,333 | | | | 1,723 | |
Intuit Inc | | | 2,390 | | | | 488 | |
Keysight Technologies Inc * | | | 17,454 | | | | 1,030 | |
Lam Research Corp | | | 3,010 | | | | 520 | |
Mastercard Inc, Cl A | | | 15,578 | | | | 3,061 | |
Microchip Technology Inc | | | 24,007 | | | | 2,183 | |
Micron Technology Inc * | | | 45,891 | | | | 2,407 | |
Microsoft Corp | | | 113,323 | | | | 11,175 | |
National Instruments Corp | | | 6,033 | | | | 253 | |
NetApp Inc | | | 2,936 | | | | 231 | |
NVIDIA Corp | | | 10,682 | | | | 2,531 | |
NXP Semiconductors NV * | | | 5,423 | | | | 593 | |
ON Semiconductor Corp * | | | 18,593 | | | | 413 | |
Oracle Corp | | | 27,586 | | | | 1,215 | |
PayPal Holdings Inc * | | | 18,658 | | | | 1,554 | |
QUALCOMM Inc | | | 11,619 | | | | 652 | |
salesforce.com * | | | 19,678 | | | | 2,684 | |
Symantec Corp | | | 24,246 | | | | 501 | |
Teradata Corp * | | | 6,164 | | | | 247 | |
Texas Instruments Inc | | | 8,328 | | | | 918 | |
Twitter Inc * | | | 6,144 | | | | 268 | |
Visa Inc, Cl A | | | 44,331 | | | | 5,872 | |
Western Digital Corp | | | 2,423 | | | | 188 | |
Workday Inc, Cl A * | | | 5,850 | | | | 709 | |
Xerox Corp | | | 8,750 | | | | 210 | |
| | | | | | | | |
| | |
| | | | | | | 88,241 | |
| | | | | | | | |
| | |
Materials — 2.9% | | | | | | | | |
Air Products & Chemicals Inc | | | 6,511 | | | | 1,014 | |
Albemarle Corp | | | 1,720 | | | | 162 | |
Alcoa Corp * | | | 8,537 | | | | 400 | |
Avery Dennison Corp | | | 2,597 | | | | 265 | |
Axalta Coating Systems Ltd * | | | 7,963 | | | | 241 | |
Ball Corp | | | 30,101 | | | | 1,070 | |
Cabot Corp | | | 5,731 | | | | 354 | |
Crown Holdings Inc * | | | 3,847 | | | | 172 | |
DowDuPont Inc | | | 22,355 | | | | 1,474 | |
| | | | | | | | |
| | | |
| Description | | Shares | | Market Value
($ Thousands) |
COMMON STOCK (continued) | | | | | | | | |
Eastman Chemical Co | | | 13,134 | | | $ | 1,313 | |
Ecolab Inc | | | 3,922 | | | | 550 | |
FMC Corp | | | 2,400 | | | | 214 | |
Freeport-McMoRan Inc | | | 11,218 | | | | 194 | |
International Flavors & Fragrances Inc | | | 2,307 | | | | 286 | |
Newmont Mining Corp | | | 7,550 | | | | 285 | |
PPG Industries Inc | | | 1,829 | | | | 190 | |
Praxair Inc | | | 9,298 | | | | 1,470 | |
Reliance Steel & Aluminum Co | | | 4,694 | | | | 411 | |
Sherwin-Williams Co/The | | | 2,680 | | | | 1,092 | |
Sonoco Products Co | | | 7,897 | | | | 415 | |
Vulcan Materials Co | | | 7,592 | | | | 980 | |
| | | | | | | | |
| | |
| | | | | | | 12,552 | |
| | | | | | | | |
| | |
Real Estate — 2.0% | | | | | | | | |
AvalonBay Communities Inc ‡ | | | 3,261 | | | | 561 | |
Boston Properties Inc ‡ | | | 1,468 | | | | 184 | |
Brandywine Realty Trust ‡ | | | 14,492 | | | | 245 | |
CBRE Group Inc, Cl A * | | | 6,418 | | | | 306 | |
Corporate Office Properties Trust ‡ | | | 30,789 | | | | 893 | |
Equinix Inc ‡ | | | 963 | | | | 414 | |
Forest City Realty Trust Inc, Cl A ‡ | | | 25,236 | | | | 576 | |
Host Hotels & Resorts Inc ‡ | | | 39,832 | | | | 839 | |
Iron Mountain Inc | | | 5,996 | | | | 210 | |
Jones Lang LaSalle Inc | | | 1,910 | | | | 317 | |
Kilroy Realty Corp | | | 4,516 | | | | 342 | |
Prologis Inc ‡ | | | 21,281 | | | | 1,398 | |
Regency Centers Corp ‡ | | | 7,367 | | | | 457 | |
SBA Communications Corp, Cl A *‡ | | | 3,551 | | | | 586 | |
Welltower Inc ‡ | | | 3,658 | | | | 229 | |
Weyerhaeuser Co ‡ | | | 26,925 | | | | 982 | |
| | | | | | | | |
| | |
| | | | | | | 8,539 | |
| | | | | | | | |
| | |
Telecommunication Services — 1.4% | | | | | | | | |
AT&T Inc | | | 106,673 | | | | 3,425 | |
Sprint Corp * | | | 46,477 | | | | 253 | |
T-Mobile US Inc * | | | 3,257 | | | | 195 | |
Verizon Communications Inc | | | 36,358 | | | | 1,829 | |
Zayo Group Holdings Inc * | | | 6,376 | | | | 233 | |
| | | | | | | | |
| | |
| | | | | | | 5,935 | |
| | | | | | | | |
| | |
Utilities — 1.7% | | | | | | | | |
American Water Works Co Inc | | | 11,171 | | | | 954 | |
CMS Energy Corp | | | 26,565 | | | | 1,256 | |
DTE Energy Co | | | 11,997 | | | | 1,243 | |
Eversource Energy | | | 20,693 | | | | 1,213 | |
Exelon Corp | | | 5,072 | | | | 216 | |
NiSource Inc | | | 13,892 | | | | 365 | |
PG&E Corp * | | | 19,905 | | | | 847 | |
| | |
| 18 | | New Covenant Funds / Annual Report / June 30, 2018 |
| | | | | | | | |
| | | |
| Description | | Shares | | Market Value
($ Thousands) |
COMMON STOCK (continued) | | | | | | | | |
Xcel Energy Inc | | | 22,986 | | | $ | 1,050 | |
| | | | | | | | |
| | | | | | | 7,144 | |
| | | | | | | | |
| | | | | | | 397,262 | |
| | | | | | | | |
Total Common Stock | | | | | | | | |
(Cost $313,621) ($ Thousands) | | | | | | | 417,610 | |
| | | | | | | | |
| | |
CASH EQUIVALENT — 1.5% | | | | | | | | |
SEI Daily Income Trust, Government Fund, Cl F 1.660%** | | | 6,520,609 | | | | 6,521 | |
| | | | | | | | |
Total Cash Equivalent | | | | | | | | |
(Cost $6,521) ($ Thousands) | | | | | | | 6,521 | |
| | | | | | | | |
Total Investments in Securities — 98.9% | | | | | | | | |
(Cost $320,142) ($ Thousands) | | | | | | $ | 424,131 | |
| | | | | | | | |
Percentages are based on a Net Assets of $428,674 ($ Thousands).
| | ‡ | Real Estate Investment Trust. |
| | * | Non-income producing security. |
| | ** | Rate shown is the 7-day effective yield as of June 30, 2018. |
| | (A) | Security is a Master Limited Partnership. At June 30, 2018, such securities amounted to $1,852 ($ Thousands), or 0.4% of the net assets of the Fund (See Note 2). |
ADR — American Depositary Receipt
Cl — Class
Ltd. — Limited
MSCI — Morgan Stanley Capital International
PLC — Public Limited Company
As of June 30, 2018, all of the Fund’s investments were considered level 1, in accordance with the authoritative guidance on fair value measurements and disclosure under U.S. GAAP.
For the period ended June 30, 2018, there were no transfers between Level 1 and Level 2 assets and liabilities.
For the period ended June 30, 2018, there were no transfers between Level 2 and Level 3 assets and liabilities.
For more information on valuation inputs, see Note 2 – Significant Accounting Policies in Notes to Financial Statements.
The following is a summary of the transactions with affiliates for the period ended June 30, 2018 ($ Thousands):
| | | | | | | | | | | | | | | | | | | | | | | | | |
| Security Description | | Value
6/30/2017 | | Purchases
at Cost | | Proceeds
from
Sales | | Value
6/30/2018 | | Dividend
Income |
SEI Daily Income Trust, Government Fund, CI F | | | $ | 16,381 | | | | $ | 59,782 | | | | $ | (69,642 | ) | | | $ | 6,521 | | | | $ | 133 | |
| | | | | | | | | | | | | | | | | | | | | | | | | |
The accompanying notes are an integral part of the financial statements.
| | | | |
New Covenant Funds / Annual Report / June 30, 2018 | | | 19 | |
SCHEDULE OF INVESTMENTS
June 30, 2018
New Covenant Income Fund
Sector Weightings (Unaudited)†:
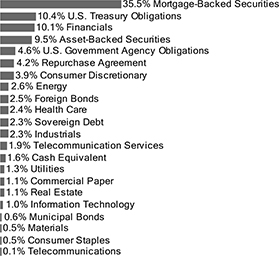
†Percentages based on total investments.
| | | | | | | | |
| | | |
| Description | | Face Amount
(Thousands) | | | Market Value
($Thousands) | |
MORTGAGE-BACKED SECURITIES — 40.2% | | | | | |
Agency Mortgage-Backed Obligations — 33.2% | | | | | |
FHLMC | | | | | | | | |
6.500%, 09/01/2039 | | $ | 41 | | | $ | 46 | |
5.500%, 12/01/2036 to 12/01/2038 | | | 359 | | | | 388 | |
5.000%, 12/01/2020 to 08/01/2044 | | | 1,566 | | | | 1,665 | |
4.500%, 06/01/2038 to 04/01/2047 | | | 5,616 | | | | 5,863 | |
4.000%, 07/01/2037 to 07/01/2047 | | | 3,884 | | | | 3,982 | |
3.500%, 11/01/2042 to 03/01/2045 | | | 2,146 | | | | 2,147 | |
3.000%, 08/01/2046 to 05/15/2048 | | | 4,113 | | | | 3,990 | |
2.000%, 09/01/2023 | | | 688 | | | | 672 | |
FHLMC CMO, Ser 2011-3947, Cl SG, IO | | | | | | | | |
3.877%, VAR LIBOR USD 1 Month+5.950%, 10/15/2041 | | | 335 | | | | 48 | |
FHLMC CMO, Ser 2012-4057, Cl UI, IO | | | | | | | | |
3.000%, 05/15/2027 | | | 207 | | | | 17 | |
FHLMC CMO, Ser 2012-4085, Cl IO, IO | | | | | | | | |
3.000%, 06/15/2027 | | | 446 | | | | 35 | |
FHLMC CMO, Ser 2012-4099, Cl ST, IO | | | | | | | | |
3.927%, VAR LIBOR USD 1 Month+6.000%, 08/15/2042 | | | 152 | | | | 25 | |
FHLMC CMO, Ser 2013-4194, Cl BI, IO | | | | | | | | |
3.500%, 04/15/2043 | | | 393 | | | | 63 | |
FHLMC CMO, Ser 2013-4203, Cl PS, IO | | | | | | | | |
4.177%, VAR LIBOR USD 1 Month+6.250%, 09/15/2042 | | | 237 | | | | 30 | |
FHLMC CMO, Ser 2014-4310, Cl SA, IO | | | | | | | | |
3.877%, VAR LIBOR USD 1 Month+5.950%, 02/15/2044 | | | 62 | | | | 9 | |
| | | | | | | | |
| | | |
| Description | | Face Amount
(Thousands) | | | Market Value ($ Thousands) | |
MORTGAGE-BACKED SECURITIES (continued) | | | | | | | | |
FHLMC CMO, Ser 2014-4335, Cl SW, IO | | | | | | | | |
3.927%, VAR LIBOR USD 1 Month+6.000%, 05/15/2044 | | $ | 131 | | | $ | 20 | |
FHLMC CMO, Ser 2014-4415, Cl IO, IO | | | | | | | | |
1.404%, 04/15/2041 (A) | | | 88 | | | | 4 | |
FHLMC Multifamily Structured Pass Through Certificates, Ser K712, Cl X1, IO | | | | | | | | |
1.448%, 11/25/2019 (A) | | | 1,329 | | | | 18 | |
FHLMC Multifamily Structured Pass Through Certificates, Ser Q005, Cl A2 | | | | | | | | |
3.352%, 10/25/2033 | | | 80 | | | | 78 | |
FHLMC Structured Agency Credit Risk Debt Notes, Ser 2014-HQ1, Cl M2 | | | | | | | | |
4.591%, VAR ICE LIBOR USD 1 Month+2.500%, 08/25/2024 | | | 39 | | | | 40 | |
FHLMC Structured Agency Credit Risk Debt Notes, Ser 2017-DNA1, Cl M1 | | | | | | | | |
3.291%, VAR ICE LIBOR USD 1 Month+1.200%, 07/25/2029 | | | 348 | | | | 351 | |
FHLMC TBA | | | | | | | | |
4.000%, 07/15/2041 | | | 3,000 | | | | 3,058 | |
3.500%, 07/15/2041 | | | 3,100 | | | | 3,084 | |
3.000%, 07/15/2043 | | | 500 | | | | 484 | |
2.500%, 07/15/2027 | | | 1,000 | | | | 970 | |
FHLMC, Ser 2016-353, Cl S1, IO | | | | | | | | |
3.927%, VAR LIBOR USD 1 Month+6.000%, 12/15/2046 | | | 176 | | | | 31 | |
FNMA | | | | | | | | |
7.000%, 11/01/2037 to 11/01/2038 | | | 35 | | | | 40 | |
6.500%, 01/01/2038 to 05/01/2040 | | | 272 | | | | 301 | |
6.000%, 07/01/2037 to 11/01/2038 | | | 175 | | | | 192 | |
5.500%, 02/01/2035 | | | 161 | | | | 175 | |
5.000%, 01/01/2021 to 07/01/2045 | | | 4,347 | | | | 4,656 | |
4.500%, 02/01/2035 to 04/01/2056 | | | 2,982 | | | | 3,125 | |
4.240%, 11/25/2017 | | | 87 | | | | 13 | |
4.000%, 06/01/2025 to 08/01/2047 | | | 12,967 | | | | 13,291 | |
3.690%, VAR ICE LIBOR USD 12 Month+1.700%, 03/01/2036 | | | 31 | | | | 32 | |
3.643%, VAR US Treas Yield Curve Rate T Note Const Mat 1 Yr+2.268%, 01/01/2036 | | | 47 | | | | 49 | |
3.619%, VAR ICE LIBOR USD 12 Month+1.431%, 05/01/2043 | | | 658 | | | | 675 | |
3.500%, 12/01/2032 to 03/01/2057 | | | 9,982 | | | | 10,004 | |
3.000%, 11/01/2046 | | | 347 | | | | 336 | |
2.500%, 10/01/2042 | | | 629 | | | | 592 | |
2.240%, 09/01/2026 | | | 145 | | | | 135 | |
FNMA CMO, Ser 2003-W2, Cl 2A9 | | | | | | | | |
5.900%, 07/25/2042 | | | 565 | | | | 613 | |
FNMA CMO, Ser 2012-93, Cl UI, IO | | | | | | | | |
3.000%, 09/25/2027 | | | 579 | | | | 49 | |
FNMA CMO, Ser 2014-47, Cl AI, IO | | | | | | | | |
1.444%, 08/25/2044 (A) | | | 202 | | | | 11 | |
| | |
| 20 | | New Covenant Funds / Annual Report / June 30, 2018 |
| | | | | | | | |
| | | |
| Description | | Face Amount
(Thousands) | | | Market Value ($ Thousands) | |
MORTGAGE-BACKED SECURITIES (continued) | | | | | | | | |
FNMA CMO, Ser 2015-55, Cl IO, IO | | | | | | | | |
1.238%, 08/25/2055 (A) | | $ | 48 | | | $ | 2 | |
FNMA CMO, Ser 2015-56, Cl AS, IO | | | | | | | | |
4.059%, VAR LIBOR USD 1 Month+6.150%, 08/25/2045 | | | 72 | | | | 14 | |
FNMA CMO, Ser 2015-M3, Cl X2, IO | | | | | | | | |
0.468%, 10/25/2024 (A) | | | 4,510 | | | | 87 | |
FNMA Connecticut Avenue Securities, Ser 2014-C04, Cl 1M2 | | | | | | | | |
6.991%, VAR ICE LIBOR USD 1 Month+4.900%, 11/25/2024 | | | 331 | | | | 379 | |
FNMA Connecticut Avenue Securities, Ser 2017-C01, Cl 1M1 | | | | | | | | |
3.391%, VAR ICE LIBOR USD 1 Month+1.300%, 07/25/2029 | | | 346 | | | | 349 | |
FNMA TBA | | | | | | | | |
5.000%, 07/15/2038 | | | 1,300 | | | | 1,377 | |
4.500%, 08/01/2033 to 07/01/2037 | | | 7,700 | | | | 8,009 | |
4.000%, 07/13/2039 | | | 700 | | | | 714 | |
3.500%, 07/25/2026 | | | 3,200 | | | | 3,238 | |
3.000%, 07/01/2026 to 07/01/2042 | | | 800 | | | | 780 | |
FNMA, Ser 2005-29, Cl ZA | | | | | | | | |
5.500%, 04/25/2035 | | | 156 | | | | 173 | |
FNMA, Ser 2013-54, Cl BS, IO | | | | | | | | |
4.059%, VAR LIBOR USD 1 Month+6.150%, 06/25/2043 | | | 61 | | | | 11 | |
FNMA, Ser 2017-76, Cl SB, IO | | | | | | | | |
4.009%, VAR LIBOR USD 1 Month+6.100%, 10/25/2057 | | | 346 | | | | 59 | |
GNMA | | | | | | | | |
5.500%, 02/20/2037 to 01/15/2039 | | | 164 | | | | 177 | |
5.000%, 12/20/2038 to 06/20/2048 | | | 1,232 | | | | 1,316 | |
4.600%, 09/15/2034 | | | 2,482 | | | | 2,599 | |
4.500%, 07/20/2038 to 10/20/2047 | | | 1,050 | | | | 1,099 | |
4.000%, 01/15/2041 to 08/20/2047 | | | 1,309 | | | | 1,347 | |
3.500%, 02/20/2047 to 10/20/2047 | | | 1,110 | | | | 1,116 | |
3.000%, 09/20/2047 to 11/20/2047 | | | 2,040 | | | | 1,997 | |
2.500%, 02/20/2027 | | | 908 | | | | 892 | |
GNMA CMO, Ser 2012-34, Cl SA, IO | | | | | | | | |
3.966%, VAR LIBOR USD 1 Month+6.050%, 03/20/2042 | | | 44 | | | | 6 | |
GNMA CMO, Ser 2012-66, Cl CI, IO | | | | | | | | |
3.500%, 02/20/2038 | | | 100 | | | | 8 | |
GNMA CMO, Ser 2012-H18, Cl NA | | | | | | | | |
2.437%, VAR ICE LIBOR USD 1 Month+0.520%, 08/20/2062 | | | 230 | | | | 231 | |
GNMA CMO, Ser 2012-H30, Cl GA | | | | | | | | |
2.267%, VAR LIBOR USD 1 Month+0.350%, 12/20/2062 | | | 1,002 | | | | 1,001 | |
GNMA CMO, Ser 2013-85, Cl IA, IO | | | | | | | | |
0.738%, 03/16/2047 (A) | | | 3,166 | | | | 122 | |
GNMA CMO, Ser 2013-95, Cl IO, IO | | | | | | | | |
0.651%, 04/16/2047 (A) | | | 1,735 | | | | 71 | |
| | | | | | | | |
| | | |
| Description | | Face Amount
(Thousands) | | | Market Value ($ Thousands) | |
MORTGAGE-BACKED SECURITIES (continued) | | | | | | | | |
GNMA CMO, Ser 2013-H01, Cl TA | | | | | | | | |
2.417%, VAR ICE LIBOR USD 1 Month+0.500%, 01/20/2063 | | $ | 106 | | | $ | 106 | |
GNMA CMO, Ser 2013-H08, Cl BF | | | | | | | | |
2.317%, VAR LIBOR USD 1 Month+0.400%, 03/20/2063 | | | 929 | | | | 929 | |
GNMA CMO, Ser 2014-105, IO | | | | | | | | |
1.100%, 06/16/2054 | | | 1,276 | | | | 67 | |
GNMA CMO, Ser 2014-186, Cl IO, IO | | | | | | | | |
0.756%, 08/16/2054 (A) | | | 1,627 | | | | 75 | |
GNMA CMO, Ser 2015-167, Cl OI, IO | | | | | | | | |
4.000%, 04/16/2045 | | | 133 | | | | 26 | |
GNMA CMO, Ser 2015-H20, Cl FA | | | | | | | | |
2.387%, VAR ICE LIBOR USD 1 Month+0.470%, 08/20/2065 | | | 289 | | | | 290 | |
GNMA TBA | | | | | | | | |
5.000%, 07/01/2039 | | | 600 | | | | 630 | |
4.500%, 07/15/2039 | | | 5,360 | | | | 5,571 | |
4.000%, 07/01/2039 | | | 7,100 | | | | 7,277 | |
3.500%, 07/15/2041 | | | 600 | | | | 602 | |
3.000%, 07/15/2042 | | | 1,100 | | | | 1,076 | |
GNMA, Ser 2013-H21, Cl FB | | | | | | | | |
2.617%, VAR ICE LIBOR USD 1 Month+0.700%, 09/20/2063 | | | 574 | | | | 579 | |
| | | | | | | | |
| | | | | | | 105,809 | |
| | | | | | | | |
Non-Agency Mortgage-Backed Obligations — 7.0% | | | | | |
280 Park Avenue Mortgage Trust, Ser 2017- 280P, Cl A | | | | | | | | |
2.953%, VAR LIBOR USD 1 Month+0.880%, 09/15/2034 (B) | | | 410 | | | | 410 | |
Bear Stearns ALT-A Trust, Ser 2004-6, Cl 1A | | | | | | | | |
2.731%, VAR ICE LIBOR USD 1 Month+0.640%, 07/25/2034 | | | 148 | | | | 147 | |
BX Trust, Ser 2017-APPL, Cl A | | | | | | | | |
2.953%, VAR LIBOR USD 1 Month+0.880%, 07/15/2034 (B) | | | 136 | | | | 136 | |
BX Trust, Ser 2017-IMC, Cl A | | | | | | | | |
3.123%, VAR LIBOR USD 1 Month+1.050%, 10/15/2032 (B) | | | 670 | | | | 671 | |
CD Commercial Mortgage Trust, Ser CD2, Cl A4 | | | | | | | | |
3.526%, 11/10/2049 (A) | | | 140 | | | | 139 | |
Citigroup Commercial Mortgage Trust, Ser 2014-GC25, Cl AS | | | | | | | | |
4.017%, 10/10/2047 | | | 100 | | | | 100 | |
Citigroup Commercial Mortgage Trust, Ser 2015-GC33, Cl A4 | | | | | | | | |
3.778%, 09/10/2058 | | | 140 | | | | 141 | |
Citigroup Commercial Mortgage Trust, Ser 2016-P6, Cl AAB | | | | | | | | |
3.512%, 12/10/2049 | | | 810 | | | | 810 | |
| | | | |
New Covenant Funds / Annual Report / June 30, 2018 | | | 21 | |
SCHEDULE OF INVESTMENTS
June 30, 2018
New Covenant Income Fund (Continued)
| | | | | | | | |
| | | |
| Description | | Face Amount
(Thousands) | | | Market Value ($ Thousands) | |
MORTGAGE-BACKED SECURITIES (continued) | | | | | |
Citigroup Commercial Mortgage Trust, Ser GC33, Cl D | | | | | | | | |
3.172%, 09/10/2058 | | $ | 200 | | | $ | 160 | |
COMM Mortgage Trust, Ser 2012-CR5, Cl AM | | | | | | | | |
3.223%, 12/10/2045 (B) | | | 590 | | | | 580 | |
COMM Mortgage Trust, Ser 2014-CR19, Cl C | | | | | | | | |
4.871%, 08/10/2047 (A) | | | 200 | | | | 198 | |
COMM Mortgage Trust, Ser 2014-PAT, Cl A | | | | | | | | |
2.846%, VAR LIBOR USD 1 Month+0.800%, 08/13/2027 (B) | | | 116 | | | | 116 | |
COMM Mortgage Trust, Ser CR8, Cl A4 | | | | | | | | |
3.334%, 06/10/2046 | | | 1,041 | | | | 1,040 | |
Commercial Mortgage Trust, Ser 2013-CC13, Cl XA, IO | | | | | | | | |
1.050%, 11/10/2046 (A) | | | 744 | | | | 22 | |
Commercial Mortgage Trust, Ser 2013-CR12, Cl B | | | | | | | | |
4.762%, 10/10/2046 (A) | | | 20 | | | | 21 | |
Commercial Mortgage Trust, Ser 2013-CR12, Cl C | | | | | | | | |
5.247%, 10/10/2046 (A) | | | 10 | | | | 10 | |
Commercial Mortgage Trust, Ser 2013-CR12, Cl AM | | | | | | | | |
4.300%, 10/10/2046 | | | 20 | | | | 21 | |
Commercial Mortgage Trust, Ser 2014-TWC, Cl A | | | | | | | | |
2.896%, VAR LIBOR USD 1 Month+0.850%, 02/13/2032 (B) | | | 200 | | | | 200 | |
CSMC Trust, Ser 2016-BDWN, Cl B | | | | | | | | |
6.573%, VAR LIBOR USD 1 Month+4.500%, 02/15/2029 (B) | | | 200 | | | | 201 | |
CSMC Trust, Ser 2018-J1, Cl A2 | | | | | | | | |
3.500%, 02/25/2048 (A) | | | 1,500 | | | | 1,463 | |
DBUBS Mortgage Trust, Ser 2011-LC2A, Cl A4 | | | | | | | | |
4.537%, 07/10/2044 (B) | | | 1,010 | | | | 1,042 | |
GS Mortgage Securities Trust, Ser 2013- GC16, Cl B | | | | | | | | |
5.161%, 11/10/2046 (A) | | | 80 | | | | 85 | |
Homestar Mortgage Acceptance, Ser 2004- 6, Cl M2 | | | | | | | | |
2.761%, VAR ICE LIBOR USD 1 Month+0.670%, 01/25/2035 | | | 394 | | | | 395 | |
JPMBB Commercial Mortgage Securities Trust, Ser 2013-C15, Cl B | | | | | | | | |
4.927%, 11/15/2045 (A) | | | 210 | | | | 219 | |
JPMBB Commercial Mortgage Securities Trust, Ser 2013-C15, Cl C | | | | | | | | |
5.253%, 11/15/2045 (A) | | | 50 | | | | 52 | |
JPMBB Commercial Mortgage Securities Trust, Ser 2013-C17, Cl B | | | | | | | | |
5.044%, 01/15/2047 (A) | | | 30 | | | | 31 | |
| | | | | | | | |
| | | |
| Description | | Face Amount
(Thousands) | | | Market Value ($ Thousands) | |
MORTGAGE-BACKED SECURITIES (continued) | | | | | |
JPMBB Commercial Mortgage Securities Trust, Ser 2014-C22, Cl C | | | | | | | | |
4.710%, 09/15/2047 (A) | | $ | 80 | | | $ | 77 | |
JPMBB Commercial Mortgage Securities Trust, Ser 2015-C29, Cl C | | | | | | | | |
4.317%, 05/15/2048 (A) | | | 380 | | | | 366 | |
JPMBB Commercial Mortgage Securities Trust, Ser 2015-C30, Cl A5 | | | | | | | | |
3.822%, 07/15/2048 | | | 250 | | | | 253 | |
JPMBB Commercial Mortgage Securities Trust, Ser 2015-C31, Cl A3 | | | | | | | | |
3.801%, 08/15/2048 | | | 390 | | | | 394 | |
JPMDB Commercial Mortgage Securities Trust, Ser 2017-C5, Cl C | | | | | | | | |
4.512%, 03/15/2050 (A) | | | 110 | | | | 109 | |
JPMorgan Chase Commercial Mortgage Securities Trust, Ser 2011-C5, Cl A3 | | | | | | | | |
4.171%, 08/15/2046 | | | 8 | | | | 8 | |
JPMorgan Chase Commercial Mortgage Securities Trust, Ser 2012-LC9, Cl AS | | | | | | | | |
3.353%, 12/15/2047 (B) | | | 380 | | | | 375 | |
JPMorgan Chase Commercial Mortgage Securities Trust, Ser 2015-FL7, Cl D | | | | | | | | |
5.823%, VAR LIBOR USD 1 Month+3.750%, 05/15/2028 (B) | | | 200 | | | | 199 | |
JPMorgan Chase Commercial Mortgage Securities Trust, Ser 2016-C6, Cl A3 | | | | | | | | |
3.507%, 05/15/2045 | | | 1,320 | | | | 1,327 | |
JPMorgan Mortgage Trust, Ser 2015-5, Cl A9 | | | | | | | | |
2.972%, 05/25/2045 (A)(B) | | | 171 | | | | 170 | |
JPMorgan Mortgage Trust, Ser 2016-1, Cl A5 | | | | | | | | |
3.500%, 05/25/2046 (A)(B) | | | 580 | | | | 576 | |
JPMorgan Mortgage Trust, Ser 2018-3, Cl A1 | | | | | | | | |
3.500%, 09/25/2048 (A)(B) | | | 783 | | | | 770 | |
JPMorgan Mortgage Trust, Ser 2018-4, Cl A1 | | | | | | | | |
3.500%, 10/25/2048 (A)(B) | | | 306 | | | | 303 | |
JPMorgan Mortgage Trust, Ser 2018-5, Cl A1 | | | | | | | | |
3.500%, 10/25/2048 (A)(B) | | | 1,024 | | | | 1,003 | |
JPMorgan Mortgage Trust, Ser 2018-6, Cl 1A4 | | | | | | | | |
3.500%, 12/25/2048 (A)(B) | | | 994 | | | | 987 | |
MASTR Alternative Loans Trust, Ser 2004-2, Cl 4A1 | | | | | | | | |
5.000%, 02/25/2019 | | | 7 | | | | 7 | |
Morgan Stanley Bank of America Merrill Lynch Trust, Ser 2013-C10, Cl A4 | | | | | | | | |
4.219%, 07/15/2046 (A) | | | 120 | | | | 123 | |
Morgan Stanley Bank of America Merrill Lynch Trust, Ser 2016-C5, Cl A4 | | | | | | | | |
3.176%, 08/15/2045 | | | 1,475 | | | | 1,464 | |
Morgan Stanley Bank of America Merrill Lynch Trust, Ser 2017-C34, Cl ASB | | | | | | | | |
3.354%, 11/15/2052 | | | 615 | | | | 612 | |
| | |
| 22 | | New Covenant Funds / Annual Report / June 30, 2018 |
| | | | | | | | |
| | | |
| Description | | Face Amount
(Thousands) | | | Market Value ($ Thousands) | |
MORTGAGE-BACKED SECURITIES (continued) | | | | | |
Morgan Stanley Capital I Trust, Ser 2012-C4, Cl A4 | | | | | | | | |
3.244%, 03/15/2045 | | $ | 220 | | | $ | 219 | |
Morgan Stanley Capital I Trust, Ser 2016- BNK2, Cl A4 | | | | | | | | |
3.049%, 11/15/2049 | | | 140 | | | | 133 | |
Morgan Stanley Capital I Trust, Ser 2016- UB12, Cl A4 | | | | | | | | |
3.596%, 12/15/2049 | | | 160 | | | | 158 | |
Morgan Stanley Re-Remic Trust, Ser 2012-IO, Cl AXA | | | | | | | | |
1.000%, 03/27/2051 (B) | | | 9 | | | | 9 | |
MSCG Trust, Ser 2016-SNR, Cl C | | | | | | | | |
5.205%, 11/15/2034 (B) | | | 134 | | | | 133 | |
MSCG Trust, Ser ALDR, Cl A2 | | | | | | | | |
3.577%, 06/07/2035 (A)(B) | | | 410 | | | | 400 | |
Nomura Asset Acceptance Alternative Loan Trust, Ser 2007-1, Cl 1A3 | | | | | | | | |
5.957%, 03/25/2047 | | | 88 | | | | 89 | |
Sequoia Mortgage Trust, Ser 2017-1, Cl A4 | | | | | | | | |
3.500%, 02/25/2047 (A)(B) | | | 852 | | | | 849 | |
Towd Point Mortgage Trust, Ser 2015-5, Cl A1B | | | | | | | | |
2.750%, 05/25/2055 (A)(B) | | | 340 | | | | 336 | |
UBS-BAMLL Trust, Ser 2012-WRM, Cl A | | | | | | | | |
3.663%, 06/10/2030 (B) | | | 116 | | | | 115 | |
UBS-Barclays Commercial Mortgage Trust, Ser 2012-C2, Cl A4 | | | | | | | | |
3.525%, 05/10/2063 | | | 73 | | | | 73 | |
UBS-Barclays Commercial Mortgage Trust, Ser 2012-CN, Cl XA, IO | | | | | | | | |
1.492%, 05/10/2063 (A)(B) | | | 348 | | | | 15 | |
Wells Fargo Commercial Mortgage Trust, Ser 2015-NXS3, Cl NXS3 | | | | | | | | |
3.371%, 09/15/2057 | | | 160 | | | | 160 | |
WFRBS Commercial Mortgage Trust, Ser 2011-C4, Cl A4 | | | | | | | | |
4.902%, 06/15/2044 (A)(B) | | | 1,354 | | | | 1,408 | |
WFRBS Commercial Mortgage Trust, Ser 2012-C7, Cl XA, IO | | | | | | | | |
1.580%, 06/15/2045 (A)(B) | | | 1,146 | | | | 49 | |
WFRBS Commercial Mortgage Trust, Ser 2013-C11, Cl AS | | | | | | | | |
3.311%, 03/15/2045 | | | 160 | | | | 158 | |
WFRBS Commercial Mortgage Trust, Ser 2013-C13, Cl XA, IO | | | | | | | | |
1.352%, 05/15/2045 (A)(B) | | | 1,174 | | | | 57 | |
WFRBS Commercial Mortgage Trust, Ser 2014-C23, Cl C | | | | | | | | |
3.995%, 10/15/2057 (A) | | | 150 | | | | 145 | |
WFRBS Commercial Mortgage Trust, Ser 2014-C23, Cl B | | | | | | | | |
4.522%, 10/15/2057 (A) | | | 270 | | | | 273 | |
| | | | | | | | |
| | | |
| Description | | Face Amount
(Thousands) | | | Market Value ($ Thousands) | |
MORTGAGE-BACKED SECURITIES (continued) | | | | | |
WFRBS Commercial Mortgage Trust, Ser 2014-C23, Cl XA, IO | | | | | | | | |
0.788%, 10/15/2057 (A) | | $ | 1,178 | | | $ | 35 | |
| | | | | | | | |
| | | | | | | 22,347 | |
| | | | | | | | |
Total Mortgage-Backed Securities (Cost $130,066) ($ Thousands) | | | | | | | 128,156 | |
| | | | | | | | |
| | |
CORPORATE OBLIGATIONS — 31.2% | | | | | | | | |
Consumer Discretionary — 4.4% | | | | | | | | |
21st Century Fox America | | | | | | | | |
6.900%, 03/01/2019 | | | 900 | | | | 924 | |
3.000%, 09/15/2022 | | | 30 | | | | 29 | |
Amazon.com | | | | | | | | |
3.150%, 08/22/2027 | | | 470 | | | | 450 | |
2.400%, 02/22/2023 | | | 1,000 | | | | 962 | |
BMW US Capital | | | | | | | | |
2.150%, 04/06/2020 (B) | | | 950 | | | | 935 | |
1.850%, 09/15/2021 (B) | | | 20 | | | | 19 | |
Charter Communications Operating | | | | | | | | |
4.908%, 07/23/2025 | | | 40 | | | | 40 | |
3.750%, 02/15/2028 | | | 20 | | | | 18 | |
3.579%, 07/23/2020 | | | 30 | | | | 30 | |
Comcast Cable Communications Holdings | | | | | | | | |
9.455%, 11/15/2022 | | | 1,116 | | | | 1,372 | |
Danone | | | | | | | | |
2.077%, 11/02/2021 (B) | | | 500 | | | | 478 | |
Ford Motor Credit | | | | | | | | |
8.125%, 01/15/2020 | | | 340 | | | | 364 | |
2.597%, 11/04/2019 | | | 1,060 | | | | 1,051 | |
2.262%, 03/28/2019 | | | 759 | | | | 755 | |
General Motors Financial | | | | | | | | |
4.150%, 06/19/2023 | | | 600 | | | | 600 | |
3.700%, 11/24/2020 | | | 80 | | | | 81 | |
3.700%, 05/09/2023 | | | 190 | | | | 186 | |
3.150%, 01/15/2020 | | | 330 | | | | 329 | |
2.450%, 11/06/2020 | | | 30 | | | | 29 | |
Hyundai Capital America MTN | | | | | | | | |
2.400%, 10/30/2018 (B) | | | 240 | | | | 240 | |
KazMunayGas National JSC | | | | | | | | |
5.375%, 04/24/2030 (B) | | | 400 | | | | 401 | |
McDonald’s MTN | | | | | | | | |
2.750%, 12/09/2020 | | | 280 | | | | 278 | |
NBCUniversal Media | | | | | | | | |
4.375%, 04/01/2021 | | | 10 | | | | 10 | |
Newell Brands | | | | | | | | |
4.200%, 04/01/2026 | | | 10 | | | | 10 | |
3.850%, 04/01/2023 | | | 90 | | | | 89 | |
3.150%, 04/01/2021 | | | 60 | | | | 59 | |
TCI Communications | | | | | | | | |
7.875%, 02/15/2026 | | | 240 | | | | 294 | |
| | | | |
New Covenant Funds / Annual Report / June 30, 2018 | | | 23 | |
SCHEDULE OF INVESTMENTS
June 30, 2018
New Covenant Income Fund (Continued)
| | | | | | | | |
| | | |
| Description | | Face Amount
(Thousands) | | | Market Value
($ Thousands) |
CORPORATE OBLIGATIONS (continued) | | | | | | | | |
Time Warner Cable | | | | | | | | |
5.000%, 02/01/2020 | | $ | 990 | | | $ | 1,011 | |
Viacom | | | | | | | | |
5.625%, 09/15/2019 | | | 422 | | | | 432 | |
3.875%, 04/01/2024 | | | 20 | | | | 20 | |
Warner Media | | | | | | | | |
4.875%, 03/15/2020 | | | 995 | | | | 1,022 | |
Yale University MTN | | | | | | | | |
2.086%, 04/15/2019 | | | 1,019 | | | | 1,015 | |
ZF North America Capital | | | | | | | | |
4.750%, 04/29/2025 (B) | | | 160 | | | | 160 | |
4.000%, 04/29/2020 (B) | | | 280 | | | | 282 | |
| | | | | | | | |
| | | | | | | 13,975 | |
| | | | | | | | |
| | |
Consumer Staples — 0.5% | | | | | | | | |
Kraft Heinz Foods | | | | | | | | |
5.375%, 02/10/2020 | | | 86 | | | | 89 | |
4.875%, 02/15/2025 (B) | | | 80 | | | | 82 | |
3.950%, 07/15/2025 | | | 30 | | | | 29 | |
3.000%, 06/01/2026 | | | 10 | | | | 9 | |
Kroger | | | | | | | | |
4.000%, 02/01/2024 | | | 140 | | | | 140 | |
PepsiCo | | | | | | | | |
3.000%, 08/25/2021 | | | 290 | | | | 290 | |
2.750%, 03/05/2022 | | | 80 | | | | 79 | |
Smithfield Foods | | | | | | | | |
2.700%, 01/31/2020 (B) | | | 330 | | | | 325 | |
Walgreens Boots Alliance | | | | | | | | |
3.450%, 06/01/2026 | | | 150 | | | | 140 | |
WM Wrigley Jr | | | | | | | | |
2.900%, 10/21/2019 (B) | | | 360 | | | | 359 | |
2.400%, 10/21/2018 (B) | | | 140 | | | | 140 | |
| | | | | | | | |
| | | | | | | 1,682 | |
| | | | | | | | |
| | |
Energy — 2.9% | | | | | | | | |
Anadarko Petroleum | | | | | | | | |
8.700%, 03/15/2019 | | | 590 | | | | 613 | |
5.550%, 03/15/2026 | | | 190 | | | | 204 | |
5.542%, 10/10/2036 (C) | | | 3,000 | | | | 1,269 | |
Apache | | | | | | | | |
3.250%, 04/15/2022 | | | 783 | | | | 770 | |
Baker Hughes a GE | | | | | | | | |
3.200%, 08/15/2021 | | | 26 | | | | 26 | |
BP Capital Markets | | | | | | | | |
3.535%, 11/04/2024 | | | 20 | | | | 20 | |
3.216%, 11/28/2023 | | | 140 | | | | 137 | |
Chevron | | | | | | | | |
2.100%, 05/16/2021 | | | 130 | | | | 127 | |
1.991%, 03/03/2020 | | | 1,150 | | | | 1,136 | |
Continental Resources | | | | | | | | |
3.800%, 06/01/2024 | | | 160 | | | | 156 | |
| | | | | | | | |
| | | |
| Description | | Face Amount
(Thousands) | | | Market Value
($ Thousands) |
CORPORATE OBLIGATIONS (continued) | | | | | | | | |
Devon Energy | | | | | | | | |
5.850%, 12/15/2025 | | $ | 120 | | | $ | 132 | |
3.250%, 05/15/2022 | | | 630 | | | | 619 | |
Enterprise Products Operating | | | | | | | | |
3.900%, 02/15/2024 | | | 457 | | | | 458 | |
EOG Resources | | | | | | | | |
4.150%, 01/15/2026 | | | 60 | | | | 61 | |
ExxonMobil | | | | | | | | |
3.043%, 03/01/2026 | | | 150 | | | | 146 | |
Halliburton | | | | | | | | |
3.800%, 11/15/2025 | | | 10 | | | | 10 | |
3.250%, 11/15/2021 | | | 180 | | | | 180 | |
Kinder Morgan Energy Partners | | | | | | | | |
4.150%, 02/01/2024 | | | 770 | | | | 766 | |
3.500%, 03/01/2021 | | | 30 | | | | 30 | |
MPLX | | | | | | | | |
4.125%, 03/01/2027 | | | 110 | | | | 105 | |
4.000%, 03/15/2028 | | | 140 | | | | 133 | |
Noble Energy | | | | | | | | |
4.150%, 12/15/2021 | | | 290 | | | | 295 | |
3.850%, 01/15/2028 | | | 140 | | | | 134 | |
Occidental Petroleum | | | | | | | | |
4.100%, 02/01/2021 | | | 50 | | | | 51 | |
3.400%, 04/15/2026 | | | 80 | | | | 78 | |
3.125%, 02/15/2022 | | | 100 | | | | 100 | |
3.000%, 02/15/2027 | | | 130 | | | | 123 | |
Petrofac | | | | | | | | |
3.400%, 10/10/2018 (B) | | | 150 | | | | 149 | |
Schlumberger Holdings | | | | | | | | |
3.000%, 12/21/2020 (B) | | | 970 | | | | 964 | |
Sinopec Group Overseas Development | | | | | | | | |
4.375%, 04/10/2024 (B) | | | 290 | | | | 296 | |
Williams Partners | | | | | | | | |
5.250%, 03/15/2020 | | | 40 | | | | 41 | |
| | | | | | | | |
| | | | | | | 9,329 | |
| | | | | | | | |
| | |
Financials — 11.4% | | | | | | | | |
American Express | | | | | | | | |
2.650%, 12/02/2022 | | | 264 | | | | 254 | |
American Express Credit MTN | | | | | | | | |
2.375%, 05/26/2020 | | | 80 | | | | 79 | |
2.200%, 03/03/2020 | | | 710 | | | | 701 | |
American International Group | | | | | | | | |
4.875%, 06/01/2022 | | | 415 | | | | 435 | |
Anglo American Capital | | | | | | | | |
3.625%, 09/11/2024 (B) | | | 200 | | | | 189 | |
Banco Santander | | | | | | | | |
4.379%, 04/12/2028 | | | 200 | | | | 191 | |
3.459%, VAR ICE LIBOR USD 3 Month+1.120%, 04/12/2023 | | | 200 | | | | 200 | |
| | |
| 24 | | New Covenant Funds / Annual Report / June 30, 2018 |
| | | | | | | | |
| | | |
| Description | | Face Amount (Thousands) | | | Market Value ($ Thousands) | |
CORPORATE OBLIGATIONS (continued) | | | | | | | | |
Bank of America | | | | | | | | |
3.419%, VAR ICE LIBOR USD 3 Month+1.040%, 12/20/2028 | | $ | 234 | | | $ | 220 | |
3.004%, VAR ICE LIBOR USD 3 Month+0.790%, 12/20/2023 | | | 258 | | | | 250 | |
Bank of America MTN | | | | | | | | |
4.450%, 03/03/2026 | | | 678 | | | | 680 | |
4.200%, 08/26/2024 | | | 210 | | | | 211 | |
4.125%, 01/22/2024 | | | 370 | | | | 376 | |
4.100%, 07/24/2023 | | | 280 | | | | 285 | |
4.000%, 04/01/2024 | | | 440 | | | | 444 | |
4.000%, 01/22/2025 | | | 80 | | | | 79 | |
3.593%, VAR ICE LIBOR USD 3 Month+1.370%, 07/21/2028 | | | 210 | | | | 200 | |
3.550%, VAR ICE LIBOR USD 3 Month+0.780%, 03/05/2024 | | | 80 | | | | 79 | |
3.500%, 04/19/2026 | | | 130 | | | | 126 | |
3.300%, 01/11/2023 | | | 60 | | | | 59 | |
2.600%, 01/15/2019 | | | 25 | | | | 25 | |
Bank of New York Mellon MTN | | | | | | | | |
4.600%, 01/15/2020 | | | 836 | | | | 857 | |
3.300%, 08/23/2029 | | | 790 | | | | 734 | |
Barclays Bank | | | | | | | | |
2.650%, 01/11/2021 | | | 1,199 | | | | 1,172 | |
BB&T MTN | | | | | | | | |
6.850%, 04/30/2019 | | | 240 | | | | 248 | |
BPCE MTN | | | | | | | | |
3.000%, 05/22/2022 (B) | | | 640 | | | | 618 | |
Brighthouse Financial | | | | | | | | |
3.700%, 06/22/2027 | | | 90 | | | | 80 | |
Capital One | | | | | | | | |
2.650%, 08/08/2022 | | | 830 | | | | 796 | |
Charles Schwab | | | | | | | | |
3.850%, 05/21/2025 | | | 110 | | | | 111 | |
Chubb INA Holdings | | | | | | | | |
2.300%, 11/03/2020 | | | 60 | | | | 59 | |
Citibank | | | | | | | | |
2.000%, 03/20/2019 | | | 470 | | | | 468 | |
Citigroup | | | | | | | | |
8.125%, 07/15/2039 | | | 12 | | | | 17 | |
5.500%, 09/13/2025 | | | 150 | | | | 159 | |
5.300%, 05/06/2044 | | | 31 | | | | 32 | |
4.650%, 07/30/2045 | | | 28 | | | | 28 | |
4.450%, 09/29/2027 | | | 150 | | | | 148 | |
4.400%, 06/10/2025 | | | 160 | | | | 159 | |
4.300%, 11/20/2026 | | | 40 | | | | 39 | |
4.125%, 07/25/2028 | | | 40 | | | | 38 | |
4.075%, VAR ICE LIBOR USD 3 Month+1.192%, 04/23/2029 | | | 240 | | | | 235 | |
4.050%, 07/30/2022 | | | 40 | | | | 40 | |
3.668%, VAR ICE LIBOR USD 3 Month+1.390%, 07/24/2028 | | | 340 | | | | 324 | |
| | | | | | | | |
| | | |
| Description | | Face Amount (Thousands) | | | Market Value ($ Thousands) | |
CORPORATE OBLIGATIONS (continued) | | | | | | | | |
3.500%, 05/15/2023 | | $ | 100 | | | $ | 98 | |
3.400%, 05/01/2026 | | | 673 | | | | 638 | |
2.700%, 03/30/2021 | | | 455 | | | | 446 | |
Cooperatieve Rabobank UA | | | | | | | | |
3.950%, 11/09/2022 | | | 670 | | | | 664 | |
Credit Suisse Group | | | | | | | | |
4.282%, 01/09/2028 (B) | | | 280 | | | | 272 | |
Daiwa Securities Group | | | | | | | | |
3.129%, 04/19/2022 (B) | | | 50 | | | | 49 | |
General Electric Capital MTN | | | | | | | | |
6.000%, 08/07/2019 | | | 414 | | | | 428 | |
4.650%, 10/17/2021 | | | 180 | | | | 187 | |
4.375%, 09/16/2020 | | | 10 | | | | 11 | |
Glencore Funding | | | | | | | | |
2.875%, 04/16/2020 (B) | | | 20 | | | | 20 | |
Goldman Sachs Group | | | | | | | | |
5.750%, 01/24/2022 | | | 662 | | | | 708 | |
5.150%, 05/22/2045 | | | 20 | | | | 20 | |
4.750%, 10/21/2045 | | | 40 | | | | 40 | |
4.250%, 10/21/2025 | | | 90 | | | | 89 | |
4.223%, VAR ICE LIBOR USD 3 Month+1.301%, 05/01/2029 | | | 470 | | | | 463 | |
3.691%, VAR ICE LIBOR USD 3 Month+1.510%, 06/05/2028 | | | 300 | | | | 284 | |
3.500%, 11/16/2026 | | | 90 | | | | 85 | |
2.300%, 12/13/2019 | | | 460 | | | | 455 | |
Goldman Sachs Group MTN | | | | | | | | |
6.000%, 06/15/2020 | | | 480 | | | | 505 | |
5.375%, 03/15/2020 | | | 640 | | | | 663 | |
4.000%, 03/03/2024 | | | 420 | | | | 420 | |
HSBC Holdings | | | | | | | | |
4.583%, VAR ICE LIBOR USD 3 Month+1.535%, 06/19/2029 | | | 400 | | | | 404 | |
3.400%, 03/08/2021 | | | 360 | | | | 360 | |
2.950%, 05/25/2021 | | | 380 | | | | 374 | |
Intesa Sanpaolo | | | | | | | | |
3.375%, 01/12/2023 (B) | | | 200 | | | | 184 | |
John Deere Capital | | | | | | | | |
1.700%, 01/15/2020 | | | 40 | | | | 39 | |
John Deere Capital MTN | | | | | | | | |
2.250%, 04/17/2019 | | | 60 | | | | 60 | |
JPMorgan Chase | | | | | | | | |
4.500%, 01/24/2022 | | | 786 | | | | 813 | |
4.005%, VAR ICE LIBOR USD 3 Month+1.120%, 04/23/2029 | | | 100 | | | | 99 | |
3.875%, 09/10/2024 | | | 290 | | | | 287 | |
2.550%, 03/01/2021 | | | 30 | | | | 29 | |
KKR Group Finance | | | | | | | | |
6.375%, 09/29/2020 (B) | | | 915 | | | | 974 | |
Liberty Mutual Group | | | | | | | | |
4.250%, 06/15/2023 (B) | | | 412 | | | | 416 | |
| | | | |
New Covenant Funds / Annual Report / June 30, 2018 | | | 25 | |
SCHEDULE OF INVESTMENTS
June 30, 2018
New Covenant Income Fund (Continued)
| | | | | | | | |
| | | |
| Description | | Face Amount (Thousands) | | | Market Value ($ Thousands) | |
CORPORATE OBLIGATIONS (continued) | | | | | | | | |
Lincoln National | | | | | | | | |
6.250%, 02/15/2020 | | $ | 570 | | | $ | 597 | |
Manufacturers & Traders Trust | | | | | | | | |
2.625%, 01/25/2021 | | | 1,163 | | | | 1,145 | |
Metropolitan Life Global Funding I | | | | | | | | |
3.000%, 01/10/2023 (B) | | | 507 | | | | 497 | |
Morgan Stanley MTN | | | | | | | | |
3.772%, VAR ICE LIBOR USD 3 Month+1.140%, 01/24/2029 | | | 320 | | | | 308 | |
3.750%, 02/25/2023 | | | 1,810 | | | | 1,812 | |
Nuveen Finance | | | | | | | | |
2.950%, 11/01/2019 (B) | | | 50 | | | | 50 | |
Peachtree Corners Funding Trust | | | | | | | | |
3.976%, 02/15/2025 (B) | | | 779 | | | | 758 | |
Penske Truck Leasing Lp | | | | | | | | |
3.900%, 02/01/2024 (B) | | | 965 | | | | 954 | |
Principal Life Global Funding II | | | | | | | | |
2.625%, 11/19/2020 (B) | | | 570 | | | | 561 | |
Reliance Standard Life Global Funding II MTN | | | | | | | | |
2.500%, 01/15/2020 (B) | | | 30 | | | | 30 | |
Royal Bank of Canada MTN | | | | | | | | |
2.150%, 10/26/2020 | | | 70 | | | | 69 | |
2.125%, 03/02/2020 | | | 900 | | | | 886 | |
Royal Bank of Scotland Group | | | | | | | | |
4.519%, VAR ICE LIBOR USD 3 Month+1.550%, 06/25/2024 | | | 290 | | | | 290 | |
Santander UK | | | | | | | | |
2.375%, 03/16/2020 | | | 40 | | | | 39 | |
Santander UK Group Holdings | | | | | | | | |
3.571%, 01/10/2023 | | | 200 | | | | 194 | |
Sumitomo Mitsui Trust Bank | | | | | | | | |
2.050%, 03/06/2019 (B) | | | 599 | | | | 596 | |
Svenska Handelsbanken MTN | | | | | | | | |
3.350%, 05/24/2021 | | | 250 | | | | 250 | |
Synchrony Financial | | | | | | | | |
3.000%, 08/15/2019 | | | 120 | | | | 120 | |
Toronto-Dominion Bank MTN | | | | | | | | |
1.950%, 01/22/2019 | | | 740 | | | | 737 | |
UBS Group Funding Jersey | | | | | | | | |
4.125%, 04/15/2026 (B) | | | 634 | | | | 627 | |
UBS Group Funding Switzerland | | | | | | | | |
4.253%, 03/23/2028 (B) | | | 250 | | | | 249 | |
3.491%, 05/23/2023 (B) | | | 390 | | | | 381 | |
WEA Finance | | | | | | | | |
2.700%, 09/17/2019 (B) | | | 310 | | | | 309 | |
Wells Fargo | | | | | | | | |
3.069%, 01/24/2023 | | | 808 | | | | 786 | |
3.000%, 10/23/2026 | | | 190 | | | | 175 | |
Wells Fargo MTN | | | | | | | | |
4.900%, 11/17/2045 | | | 30 | | | | 30 | |
4.600%, 04/01/2021 | | | 480 | | | | 496 | |
4.300%, 07/22/2027 | | | 260 | | | | 256 | |
| | | | | | | | |
| | | |
| Description | | Face Amount (Thousands) | | | Market Value ($ Thousands) | |
CORPORATE OBLIGATIONS (continued) | | | | | | | | |
3.450%, 02/13/2023 | | $ | 120 | | | $ | 117 | |
Westpac Banking | | | | | | | | |
2.600%, 11/23/2020 | | | 80 | | | | 79 | |
2.300%, 05/26/2020 | | | 10 | | | | 10 | |
XLIT | | | | | | | | |
6.375%, 11/15/2024 | | | 818 | | | | 919 | |
| | | | | | | | |
| | | | | | | 36,356 | |
| | | | | | | | |
| | |
Health Care — 2.7% | | | | | | | | |
Abbott Laboratories | | | | | | | | |
3.400%, 11/30/2023 | | | 250 | | | | 247 | |
2.350%, 11/22/2019 | | | 19 | | | | 19 | |
AbbVie | | | | | | | | |
3.600%, 05/14/2025 | | | 10 | | | | 10 | |
2.500%, 05/14/2020 | | | 700 | | | | 691 | |
Aetna | | | | | | | | |
2.800%, 06/15/2023 | | | 20 | | | | 19 | |
Amgen | | | | | | | | |
2.125%, 05/01/2020 | | | 20 | | | | 20 | |
Anthem | | | | | | | | |
3.125%, 05/15/2022 | | | 340 | | | | 335 | |
Baylor Scott & White Holdings | | | | | | | | |
1.947%, 11/15/2021 | | | 1,226 | | | | 1,172 | |
Becton Dickinson | | | | | | | | |
4.685%, 12/15/2044 | | | 50 | | | | 49 | |
3.734%, 12/15/2024 | | | 24 | | | | 23 | |
3.363%, 06/06/2024 | | | 210 | | | | 202 | |
Cardinal Health | | | | | | | | |
2.616%, 06/15/2022 | | | 100 | | | | 96 | |
Celgene | | | | | | | | |
3.875%, 08/15/2025 | | | 130 | | | | 126 | |
3.550%, 08/15/2022 | | | 60 | | | | 60 | |
2.250%, 08/15/2021 | | | 70 | | | | 67 | |
CVS Health | | | | | | | | |
4.125%, 05/15/2021 | | | 300 | | | | 306 | |
3.875%, 07/20/2025 | | | 95 | | | | 92 | |
3.350%, 03/09/2021 | | | 60 | | | | 60 | |
2.800%, 07/20/2020 | | | 190 | | | | 188 | |
CVS Pass-Through Trust | | | | | | | | |
7.507%, 01/10/2032 (B) | | | 1,260 | | | | 1,477 | |
Eli Lilly | | | | | | | | |
2.350%, 05/15/2022 | | | 170 | | | | 165 | |
Gilead Sciences | | | | | | | | |
2.550%, 09/01/2020 | | | 20 | | | | 20 | |
2.500%, 09/01/2023 | | | 50 | | | | 48 | |
2.050%, 04/01/2019 | | | 290 | | | | 288 | |
1.850%, 09/20/2019 | | | 130 | | | | 128 | |
Humana | | | | | | | | |
3.150%, 12/01/2022 | | | 240 | | | | 233 | |
2.900%, 12/15/2022 | | | 290 | | | | 282 | |
Medtronic | | | | | | | | |
3.125%, 03/15/2022 | | | 190 | | | | 189 | |
| | |
| 26 | | New Covenant Funds / Annual Report / June 30, 2018 |
| | | | | | | | |
| | | |
| Description | | Face Amount (Thousands) | | | Market Value ($ Thousands) | |
CORPORATE OBLIGATIONS (continued) | | | | | | | | |
Medtronic Global Holdings SCA | | | | | | | | |
1.700%, 03/28/2019 | | $ | 930 | | | $ | 924 | |
Merck | | | | | | | | |
2.750%, 02/10/2025 | | | 20 | | | | 19 | |
SSM Health Care | | | | | | | | |
3.688%, 06/01/2023 | | | 644 | | | | 647 | |
Teva Pharmaceutical Finance BV | | | | | | | | |
2.950%, 12/18/2022 | | | 30 | | | | 27 | |
UnitedHealth Group | | | | | | | | |
2.875%, 12/15/2021 | | | 50 | | | | 49 | |
2.700%, 07/15/2020 | | | 70 | | | | 70 | |
1.625%, 03/15/2019 | | | 200 | | | | 199 | |
| | | | | | | | |
| | | | | | | 8,547 | |
| | | | | | | | |
| | |
Industrials — 2.6% | | | | | | | | |
AerCap Ireland Capital DAC | | | | | | | | |
4.625%, 10/30/2020 | | | 730 | | | | 744 | |
4.500%, 05/15/2021 | | | 310 | | | | 316 | |
American Airlines, Ser 2016-3, Cl A | | | | | | | | |
3.250%, 10/15/2028 | | | 1,182 | | | | 1,124 | |
American Airlines Pass-Through Trust, Ser 2013-2, Cl A | | | | | | | | |
4.950%, 01/15/2023 | | | 401 | | | | 414 | |
Aviation Capital Group | | | | | | | | |
6.750%, 04/06/2021 (B) | | | 80 | | | | 86 | |
Burlington Northern and Santa Fe Railway Pass-Through Trust, Ser 2002-2 | | | | | | | | |
5.140%, 01/15/2021 | | | 161 | | | | 164 | |
Burlington Northern Santa Fe | | | | | | | | |
4.550%, 09/01/2044 | | | 10 | | | | 10 | |
Cintas No. 2 | | | | | | | | |
3.700%, 04/01/2027 | | | 120 | | | | 118 | |
2.900%, 04/01/2022 | | | 120 | | | | 117 | |
Continental Airlines Pass-Through Trust, Ser 1999-1 | | | | | | | | |
6.545%, 02/02/2019 | | | 11 | | | | 11 | |
Continental Airlines Pass-Through Trust, Ser 2012-2, Cl A | | | | | | | | |
4.000%, 10/29/2024 | | | 701 | | | | 704 | |
Delta Air Lines Pass-Through Trust, Ser 2010- 2, Cl A | | | | | | | | |
4.950%, 05/23/2019 | | | 243 | | | | 245 | |
Delta Air Lines Pass-Through Trust, Ser 2015- 1, Cl AA | | | | | | | | |
3.625%, 07/30/2027 | | | 587 | | | | 583 | |
Eaton | | | | | | | | |
2.750%, 11/02/2022 | | | 450 | | | | 437 | |
GE Capital International Funding Unlimited | | | | | | | | |
2.342%, 11/15/2020 | | | 1,205 | | | | 1,178 | |
General Electric | | | | | | | | |
4.500%, 03/11/2044 | | | 90 | | | | 88 | |
| | | | | | | | |
| | | |
| Description | | Face Amount (Thousands) | | | Market Value ($ Thousands) | |
CORPORATE OBLIGATIONS (continued) | | | | | | | | |
General Electric MTN | | | | | | | | |
6.875%, 01/10/2039 | | $ | 30 | | | $ | 38 | |
5.500%, 01/08/2020 | | | 10 | | | | 10 | |
General Electric Capital MTN | | | | | | | | |
5.300%, 02/11/2021 | | | 160 | | | | 167 | |
International Lease Finance | | | | | | | | |
5.875%, 08/15/2022 | | | 400 | | | | 424 | |
Republic Services | | | | | | | | |
3.200%, 03/15/2025 | | | 180 | | | | 173 | |
Union Pacific | | | | | | | | |
3.950%, 09/10/2028 | | | 20 | | | | 20 | |
3.750%, 07/15/2025 | | | 20 | | | | 20 | |
United Airlines Pass-Through Trust, Ser 2014-1, Cl A | | | | | | | | |
4.000%, 04/11/2026 | | | 785 | | | | 787 | |
United Parcel Service | | | | | | | | |
2.500%, 04/01/2023 | | | 60 | | | | 58 | |
Waste Management | | | | | | | | |
3.500%, 05/15/2024 | | | 120 | | | | 119 | |
| | | | | | | | |
| | | | | | | 8,155 | |
| | | | | | | | |
| | |
Information Technology — 1.1% | | | | | | | | |
Apple | | | | | | | | |
3.350%, 02/09/2027 | | | 210 | | | | 205 | |
2.900%, 09/12/2027 | | | 110 | | | | 103 | |
2.450%, 08/04/2026 | | | 70 | | | | 64 | |
2.000%, 11/13/2020 | | | 80 | | | | 79 | |
1.550%, 08/04/2021 | | | 60 | | | | 58 | |
Broadcom | | | | | | | | |
3.125%, 01/15/2025 | | | 80 | | | | 74 | |
Diamond 1 Finance | | | | | | | | |
4.420%, 06/15/2021 (B) | | | 430 | | | | 436 | |
3.480%, 06/01/2019 (B) | | | 90 | | | | 90 | |
Intel | | | | | | | | |
3.700%, 07/29/2025 | | | 30 | | | | 30 | |
Juniper Networks | | | | | | | | |
4.600%, 03/15/2021 | | | 452 | | | | 459 | |
Mastercard | | | | | | | | |
3.375%, 04/01/2024 | | | 190 | | | | 190 | |
Microsoft | | | | | | | | |
3.300%, 02/06/2027 | | | 140 | | | | 138 | |
2.400%, 02/06/2022 | | | 150 | | | | 147 | |
2.400%, 08/08/2026 | | | 210 | | | | 194 | |
1.850%, 02/06/2020 | | | 360 | | | | 355 | |
1.550%, 08/08/2021 | | | 110 | | | | 106 | |
Oracle | | | | | | | | |
2.500%, 10/15/2022 | | | 130 | | | | 126 | |
QUALCOMM | | | | | | | | |
2.100%, 05/20/2020 | | | 180 | | | | 180 | |
salesforce.com | | | | | | | | |
3.700%, 04/11/2028 | | | 150 | | | | 149 | |
3.250%, 04/11/2023 | | | 70 | | | | 70 | |
| | | | |
New Covenant Funds / Annual Report / June 30, 2018 | | | 27 | |
SCHEDULE OF INVESTMENTS
June 30, 2018
New Covenant Income Fund (Continued)
| | | | | | | | |
| | | |
| Description | | Face Amount (Thousands) | | | Market Value ($ Thousands) | |
CORPORATE OBLIGATIONS (continued) | | | | | | | | |
Visa | | | | | | | | |
4.300%, 12/14/2045 | | $ | 10 | | | $ | 10 | |
3.150%, 12/14/2025 | | | 110 | | | | 107 | |
2.200%, 12/14/2020 | | | 300 | | | | 295 | |
| | | | | | | | |
| | | | | | | 3,665 | |
| | | | | | | | |
| | |
Materials — 0.5% | | | | | | | | |
Equate Petrochemical BV MTN | | | | | | | | |
4.250%, 11/03/2026 (B) | | | 200 | | | | 194 | |
Freeport-McMoRan | | | | | | | | |
4.000%, 11/14/2021 | | | 170 | | | | 166 | |
Glencore Funding | | | | | | | | |
4.125%, 05/30/2023 (B) | | | 900 | | | | 898 | |
4.000%, 03/27/2027 (B) | | | 190 | | | | 179 | |
Southern Copper | | | | | | | | |
3.500%, 11/08/2022 | | | 130 | | | | 127 | |
Vale Overseas | | | | | | | | |
6.250%, 08/10/2026 | | | 140 | | | | 152 | |
| | | | | | | | |
| | | | | | | 1,716 | |
| | | | | | | | |
| | |
Real Estate — 1.2% | | | | | | | | |
American Tower Trust I, Ser 2013-13, Cl 2A | | | | | | | | |
3.070%, 03/15/2048 (B) | | | 700 | | | | 687 | |
Crown Castle Towers | | | | | | | | |
4.241%, 07/15/2028 (B) | | | 420 | | | | 422 | |
Simon Property Group | | | | | | | | |
4.375%, 03/01/2021 | | | 430 | | | | 443 | |
2.350%, 01/30/2022 | | | 413 | | | | 398 | |
Ventas Realty | | | | | | | | |
4.125%, 01/15/2026 | | | 566 | | | | 557 | |
3.500%, 02/01/2025 | | | 488 | | | | 467 | |
Welltower | | | | | | | | |
4.500%, 01/15/2024 | | | 902 | | | | 917 | |
| | | | | | | | |
| | | | | | | 3,891 | |
| | | | | | | | |
| | |
Telecommunication Services — 2.2% | | | | | | | | |
AT&T | | | | | | | | |
7.195%, 11/27/2022 (B)(C) | | | 2,000 | | | | 1,691 | |
5.800%, 02/15/2019 | | | 820 | | | | 834 | |
4.125%, 02/17/2026 | | | 408 | | | | 399 | |
3.875%, 08/15/2021 | | | 10 | | | | 10 | |
3.400%, 05/15/2025 | | | 460 | | | | 431 | |
3.000%, 06/30/2022 | | | 10 | | | | 10 | |
2.375%, 11/27/2018 | | | 290 | | | | 290 | |
Bharti Airtel | | | | | | | | |
4.375%, 06/10/2025 (B) | | | 200 | | | | 184 | |
Cox Communications | | | | | | | | |
3.250%, 12/15/2022 (B) | | | 859 | | | | 834 | |
Sprint Spectrum | | | | | | | | |
3.360%, 09/20/2021 (B) | | | 626 | | | | 619 | |
Verizon Communications | | | | | | | | |
5.150%, 09/15/2023 | | | 600 | | | | 638 | |
| | | | | | | | |
| | | |
| Description | | Face Amount (Thousands) | | | Market Value ($ Thousands) | |
CORPORATE OBLIGATIONS (continued) | | | | | | | | |
4.329%, 09/21/2028 (B) | | $ | 102 | | | $ | 101 | |
3.376%, 02/15/2025 | | | 532 | | | | 509 | |
Vodafone Group | | | | | | | | |
3.750%, 01/16/2024 | | | 410 | | | | 407 | |
| | | | | | | | |
| | | | | | | 6,957 | |
| | | | | | | | |
| | |
Telecommunications — 0.2% | | | | | | | | |
Telefonica Emisiones SAU | | | | | | | | |
4.895%, 03/06/2048 | | | 340 | | | | 313 | |
Tencent Holdings MTN | | | | | | | | |
3.595%, 01/19/2028 (B) | | | 250 | | | | 237 | |
| | | | | | | | |
| | | | | | | 550 | |
| | | | | | | | |
| | |
Utilities — 1.5% | | | | | | | | |
Dominion Energy | | | | | | | | |
2.579%, 07/01/2020 | | | 260 | | | | 256 | |
Duke Energy | | | | | | | | |
3.750%, 04/15/2024 | | | 900 | | | | 898 | |
3.550%, 09/15/2021 | | | 170 | | | | 171 | |
2.400%, 08/15/2022 | | | 150 | | | | 144 | |
FirstEnergy | | | | | | | | |
4.250%, 03/15/2023 | | | 380 | | | | 386 | |
2.850%, 07/15/2022 | | | 330 | | | | 320 | |
Northern States Power | | | | | | | | |
7.125%, 07/01/2025 | | | 1,190 | | | | 1,433 | |
Perusahaan Listrik Negara MTN | | | | | | | | |
5.450%, 05/21/2028 (B) | | | 370 | | | | 376 | |
Sempra Energy | | | | | | | | |
2.400%, 03/15/2020 | | | 840 | | | | 828 | |
| | | | | | | | |
| | | | | | | 4,812 | |
| | | | | | | | |
Total Corporate Obligations
(Cost $101,316) ($ Thousands) | | | | | | | 99,635 | |
| | | | | | | | |
| | |
U.S. TREASURY OBLIGATIONS — 11.7% | | | | | | | | |
U.S. Treasury Bonds | | | | | | | | |
4.500%, 02/15/2036 | | | 2,254 | | | | 2,756 | |
3.750%, 11/15/2043 | | | 250 | | | | 284 | |
3.125%, 05/15/2048 | | | 100 | | | | 103 | |
3.000%, 05/15/2045 | | | 1,260 | | | | 1,265 | |
3.000%, 02/15/2047 | | | 10 | | | | 10 | |
3.000%, 05/15/2047 | | | 120 | | | | 120 | |
3.000%, 02/15/2048 | | | 750 | | | | 753 | |
U.S. Treasury Inflation-Protected Securities | | | | | | | | |
2.375%, 01/15/2025 | | | 173 | | | | 191 | |
1.375%, 02/15/2044 | | | 172 | | | | 192 | |
0.750%, 02/15/2042 | | | 455 | | | | 444 | |
0.375%, 07/15/2023 | | | 161 | | | | 160 | |
U.S. Treasury Notes | | | | | | | | |
2.875%, 05/15/2028 | | | 1 | | | | 1 | |
2.750%, 05/31/2023 | | | 546 | | | | 547 | |
| | |
| 28 | | New Covenant Funds / Annual Report / June 30, 2018 |
| | | | | | | | |
| | | |
| Description | | Face Amount (Thousands) | | | Market Value ($ Thousands) | |
U.S. TREASURY OBLIGATIONS (continued) | | | | | | | | |
2.750%, 02/15/2028 | | $ | 4 | | | $ | 4 | |
2.625%, 05/15/2021 | | | 1,071 | | | | 1,071 | |
2.625%, 06/30/2023 | | | 700 | | | | 696 | |
2.375%, 01/31/2023 | | | 11,705 | | | | 11,530 | |
2.250%, 02/15/2027 | | | 5,750 | | | | 5,487 | |
2.250%, 11/15/2027 | | | 4,395 | | | | 4,178 | |
2.000%, 10/31/2022 | | | 150 | | | | 146 | |
1.625%, 02/15/2026 | | | 3,258 | | | | 2,989 | |
United States Treasury Bills | | | | | | | | |
2.056%, 11/15/2018 (C) | | | 2,090 | | | | 2,074 | |
1.870%, 08/23/2018 (C) | | | 810 | | | | 808 | |
1.857%, 08/16/2018 (C) | | | 1,559 | | | | 1,556 | |
| | | | | | | | |
Total U.S. Treasury Obligations
(Cost $37,992) ($ Thousands) | | | | | | | 37,365 | |
| | | | | | | | |
| |
ASSET-BACKED SECURITIES — 10.8% | | | | | |
Automotive — 2.6% | | | | | | | | |
Avis Budget Rental Car Funding AESOP, Ser 2017-2A, Cl A | | | | | | | | |
2.970%, 03/20/2024 (B) | | | 310 | | | | 303 | |
Ford Credit Floorplan Master Owner Trust, Ser 2016-1, Cl A1 | | | | | | | | |
1.760%, 02/15/2021 | | | 2,800 | | | | 2,785 | |
Hertz Vehicle Financing II, Ser 2018-1A, Cl A | | | | | | | | |
3.290%, 02/25/2024 (B) | | | 490 | | | | 479 | |
Honda Auto Receivables Owner Trust, Ser 2016-1, Cl A4 | | | | | | | | |
1.380%, 04/18/2022 | | | 1,307 | | | | 1,294 | |
Hyundai Auto Lease Securitization Trust, Ser 2017-A, Cl A3 | | | | | | | | |
1.880%, 08/17/2020 (B) | | | 2,029 | | | | 2,020 | |
NextGear Floorplan Master Owner Trust, Ser 2016-1A, Cl A2 | | | | | | | | |
2.740%, 04/15/2021 (B) | | | 1,557 | | | | 1,555 | |
| | | | | | | | |
| | | | | | | 8,436 | |
| | | | | | | | |
| | |
Home — 0.5% | | | | | | | | |
Ameriquest Mortgage Securities, Ser 2003- 9, Cl AV1 | | | | | | | | |
2.851%, VAR ICE LIBOR USD 1 Month+0.760%, 09/25/2033 | | | 88 | | | | 88 | |
Argent Securities, Ser 2004-W5, Cl AV2 | | | | | | | | |
3.131%, VAR ICE LIBOR USD 1 Month+1.040%, 04/25/2034 | | | 321 | | | | 320 | |
Citifinancial Mortgage Securities, Ser 2004- 1, Cl AF4 | | | | | | | | |
5.070%, 04/25/2034 | | | 268 | | | | 273 | |
| | | | | | | | |
| | | |
| Description | | Face Amount (Thousands) | | | Market Value ($ Thousands) | |
ASSET-BACKED SECURITIES (continued) | | | | | | | | |
Lake Country Mortgage Loan Trust, Ser 2006-HE1, Cl M5 | | | | | | | | |
4.091%, VAR ICE LIBOR USD 1 Month+2.000%, 07/25/2034 (B) | | $ | 390 | | | $ | 400 | |
Master Asset-Backed Securities Trust, Ser 2007-NCW, Cl A1 | | | | | | | | |
2.391%, VAR ICE LIBOR USD 1 Month+0.300%, 05/25/2037 (B) | | | 264 | | | | 247 | |
New Century Home Equity Loan Trust, Ser 2003-A, Cl A | | | | | | | | |
2.811%, VAR ICE LIBOR USD 1 Month+0.720%, 10/25/2033 (B) | | | 98 | | | | 96 | |
| | | | | | | | |
| | | | | | | 1,424 | |
| | | | | | | | |
| | |
Industrials — 0.5% | | | | | | | | |
Ally Master Owner Trust, Ser 2018-2, Cl A | | | | | | | | |
3.290%, 05/15/2023 | | | 1,572 | | | | 1,576 | |
| | | | | | | | |
| |
Information Technology — 0.3% | | | | | |
COMM Mortgage Trust, Ser COR3, Cl A3 | | | | | | | | |
4.228%, 05/10/2051 | | | 932 | | | | 964 | |
| | | | | | | | |
| |
Other Asset-Backed Securities — 6.9% | | | | | |
Citigroup Commercial Mortgage Trust, Ser 375P, Cl A | | | | | | | | |
3.251%, 05/10/2035 (B) | | | 400 | | | | 397 | |
Countrywide Asset-Backed Certificates, Ser 2007-13, Cl 2A2M | | | | | | | | |
3.341%, VAR ICE LIBOR USD 1 Month+1.250%, 10/25/2047 | | | 181 | | | | 184 | |
Countrywide Asset-Backed Certificates, Ser 2007-4, Cl A4W | | | | | | | | |
4.734%, 04/25/2047 | | | 325 | | | | 313 | |
Countrywide Home Equity Loan Trust, Ser 2006-F, Cl 2A1A | | | | | | | | |
2.213%, VAR ICE LIBOR USD 1 Month+0.140%, 07/15/2036 | | | 448 | | | | 423 | |
CSAIL Commercial Mortgage Trust, Ser 2018- CX11, Cl A5 | | | | | | | | |
4.033%, 04/15/2051 | | | 160 | | | | 163 | |
DB Master Finance, Ser 2017-1A, Cl A2I | | | | | | | | |
3.629%, 11/20/2047 (B) | | | 536 | | | | 527 | |
Domino’s Pizza Master Issuer, Ser 2017-1A, Cl A2I | | | | | | | | |
3.610%, VAR ICE LIBOR USD 3 Month+1.250%, 07/25/2047 (B) | | | 471 | | | | 472 | |
DRB Prime Student Loan Trust, Ser 2015-B, Cl A1 | | | | | | | | |
3.991%, VAR ICE LIBOR USD 1 Month+1.900%, 10/27/2031 (B) | | | 256 | | | | 263 | |
| | | | |
New Covenant Funds / Annual Report / June 30, 2018 | | | 29 | |
SCHEDULE OF INVESTMENTS
June 30, 2018
New Covenant Income Fund (Continued)
| | | | | | | | |
| | | |
| Description | | Face Amount (Thousands) | | | Market Value ($ Thousands) | |
ASSET-BACKED SECURITIES (continued) | | | | | | | | |
DRB Prime Student Loan Trust, Ser 2015-D, Cl A2 | | | | | |
3.200%, 01/25/2040 (B) | | $ | 420 | | | $ | 419 | |
Flagstar Mortgage Trust, Ser 2018-2, Cl A4 | | | | | | | | |
3.500%, 04/25/2048 (A)(B) | | | 619 | | | | 609 | |
GM Mortgage Securities Trust,
Ser 2018- SRP5, Cl B | | | | | | | | |
4.481%, 06/09/2021 | | | 430 | | | | 430 | |
GS Mortgage Securities Trust,
Ser 2018- SRP5, Cl A | | | | | | | | |
3.281%, 06/09/2021 | | | 620 | | | | 620 | |
Invitation Homes Trust, Ser 2015-SFR3, Cl A | | | | | | | | |
3.373%, VAR LIBOR USD 1 Month+1.300%, 08/17/2032 (B) | | | 2,094 | | | | 2,096 | |
Invitation Homes Trust, Ser 2018-SFR1, Cl A | | | | | | | | |
2.785%, VAR LIBOR USD 1 Month+0.700%, 03/17/2037 (B) | | | 1,493 | | | | 1,489 | |
Lanark Master Issuer, Ser 2018-1A, Cl 1A | | | | | | | | |
2.749%, VAR ICE LIBOR USD 3 Month+0.420%, 12/22/2069 (B) | | | 902 | | | | 903 | |
MAD Mortgage Trust, Ser 2017-330M, Cl A | | | | | | | | |
3.294%, 08/15/2034 (A)(B) | | | 220 | | | | 216 | |
MMAF Equipment Finance,
Ser 2018-A, Cl A3 | | | | | | | | |
3.200%, 09/12/2022 (B) | | | 1,255 | | | | 1,257 | |
Navient Student Loan Trust,
Ser 2017-3A, Cl A3 | | | | | | | | |
3.141%, VAR ICE LIBOR USD 1 Month+1.050%, 07/26/2066 (B) | | | 420 | | | | 430 | |
Navient Student Loan Trust,
Ser 2017-5A, Cl A | | | | | | | | |
2.891%, VAR ICE LIBOR USD 1 Month+0.800%, 07/26/2066 (B) | | | 178 | | | | 179 | |
People’s Choice Home Loan Securities Trust, Ser 2004-1, Cl M1 | | | | | | | | |
2.976%, VAR ICE LIBOR USD 1 Month+0.885%, 06/25/2034 | | | 410 | | | | 405 | |
Prosper Marketplace Issuance Trust, Ser 2017-3A, Cl A | | | | | | | | |
2.360%, 11/15/2023 (B) | | | 233 | | | | 232 | |
Sequoia Mortgage Trust, Ser 2017-5, Cl A4 | | | | | | | | |
3.500%, 08/25/2047 (A)(B) | | | 937 | | | | 928 | |
Sequoia Mortgage Trust, Ser 2017-6, Cl A4 | | | | | | | | |
3.500%, 09/25/2047 (A)(B) | | | 483 | | | | 482 | |
Shops at Crystals Trust,
Ser 2016-CSTL, Cl A | | | | | | | | |
3.126%, 07/05/2036 (B) | | | 100 | | | | 95 | |
SLM Private Credit Student Loan Trust, Ser 2006-A, Cl A5 | | | | | | | | |
2.631%, VAR ICE LIBOR USD 3 Month+0.290%, 06/15/2039 | | | 383 | | | | 375 | |
SLM Student Loan Trust, Ser 2002-A, Cl A2 | | | | | | | | |
2.891%, VAR ICE LIBOR USD 3 Month+0.550%, 12/16/2030 | | | 288 | | | | 287 | |
| | | | | | | | |
| | | |
| Description | | Face Amount (Thousands) | | | Market Value ($ Thousands) | |
ASSET-BACKED SECURITIES (continued) | | | | | | | | |
SLM Student Loan Trust, Ser 2003-7A, Cl A5A | | | | | | | | |
3.541%, VAR ICE LIBOR USD 3 Month+1.200%, 12/15/2033 (B) | | $ | 168 | | | $ | 170 | |
SLM Student Loan Trust, Ser 2006-10, Cl A6 | | | | | | | | |
2.510%, VAR ICE LIBOR USD 3 Month+0.150%, 03/25/2044 | | | 1,630 | | | | 1,575 | |
Small Business Administration,
Ser 2015- 20C, Cl 1 | | | | | | | | |
2.720%, 03/01/2035 | | | 1,089 | | | | 1,073 | |
United States Small Business Administration, Ser 2010-20H, Cl 1 | | | | | | | | |
3.520%, 08/01/2030 | | | 398 | | | | 405 | |
United States Small Business Administration, Ser 2011-20B, Cl 1 | | | | | | | | |
4.220%, 02/01/2031 | | | 420 | | | | 439 | |
United States Small Business Administration, Ser 2011-20J, Cl 1 | | | | | | | | |
2.760%, 10/01/2031 | | | 233 | | | | 230 | |
United States Small Business Administration, Ser 2013-20K, Cl 1 | | | | | | | | |
3.380%, 11/01/2033 | | | 971 | | | | 980 | |
United States Small Business Administration, Ser 2014-20F, Cl 1 | | | | | | | | |
2.990%, 06/01/2034 | | | 1,039 | | | | 1,026 | |
United States Small Business Administration, Ser 2015-20E, Cl 1 | | | | | | | | |
2.770%, 05/01/2035 | | | 611 | | | | 601 | |
United States Small Business Administration, Ser 2015-20K, Cl 1 | | | | | | | | |
2.700%, 11/01/2035 | | | 611 | | | | 598 | |
United States Small Business Administration, Ser 2017-20J, Cl 1 | | | | | | | | |
2.850%, 10/01/2037 | | | 769 | | | | 746 | |
| | | | | | | | |
| | | | | | | 22,037 | |
| | | | | | | | |
| | |
Total Asset-Backed Securities
(Cost $34,571) ($ Thousands) | | | | | | | 34,437 | |
| | | | | | | | |
| |
U.S. GOVERNMENT AGENCY OBLIGATIONS — 5.2% | | | | | |
FHLB | | | | | | | | |
1.801%, 07/26/2018 | | | 570 | | | | 569 | |
FHLB DN | | | | | | | | |
1.920%, 08/17/2018 (C) | | | 200 | | | | 200 | |
1.902%, 08/27/2018 (C) | | | 210 | | | | 209 | |
1.881%, 08/15/2018 (C) | | | 340 | | | | 339 | |
1.872%, 08/14/2018 (C) | | | 1,140 | | | | 1,138 | |
1.856%, 08/03/2018 (C) | | | 990 | | | | 988 | |
1.799%, 07/02/2018 (C) | | | 1,980 | | | | 1,980 | |
1.735%, 07/05/2018 (C) | | | 2,000 | | | | 2,000 | |
FHLMC | | | | | | | | |
4.000%, 04/01/2048 | | | 99 | | | | 101 | |
4.000%, 05/01/2048 | | | 790 | | | | 806 | |
| | |
| 30 | | New Covenant Funds / Annual Report / June 30, 2018 |
| | | | | | | | |
| | | |
| Description | | Face Amount (Thousands) | | | Market Value ($ Thousands) | |
U.S. GOVERNMENT AGENCY OBLIGATIONS (continued) | | | | | |
3.000%, 11/01/2043 | | $ | 779 | | | $ | 760 | |
2.375%, 01/13/2022 | | | 1,090 | | | | 1,076 | |
1.250%, 10/02/2019 | | | 70 | | | | 69 | |
FHLMC DN | | | | | | | | |
1.806%, 07/18/2018 (C) | | | 170 | | | | 170 | |
FNMA | | | | | | | | |
5.000%, 05/01/2048 | | | 98 | | | | 104 | |
4.500%, 09/01/2057 | | | 294 | | | | 308 | |
4.000%, 02/01/2056 | | | 86 | | | | 88 | |
4.000%, 06/01/2057 | | | 95 | | | | 98 | |
3.000%, 03/01/2046 | | | 1,493 | | | | 1,458 | |
2.846%, 10/09/2019 (C) | | | 1,190 | | | | 1,152 | |
FNMA, Ser 2012-101, Cl BI, IO | | | | | | | | |
4.000%, 09/25/2027 | | | 23 | | | | 2 | |
FRESB Mortgage Trust, Ser SB48, Cl A10F | | | | | | | | |
3.370%, 02/25/2028 (A) | | | 770 | | | | 762 | |
Tennessee Valley Authority | | | | | | | | |
3.875%, 02/15/2021 | | | 790 | | | | 813 | |
United States Small Business Administration, Ser 2018-20E, Cl 1 | | | | | | | | |
3.500%, 05/01/2038 | | | 1,409 | | | | 1,407 | |
| | | | | | | | |
| | |
Total U.S. Government Agency Obligations
(Cost $16,644) ($ Thousands) | | | | | | | 16,597 | |
| | | | | | | | |
| | |
FOREIGN BONDS — 2.8% | | | | | | | | |
Allergan Funding SCS | | | | | | | | |
3.800%, 03/15/2025 | | | 100 | | | | 97 | |
3.450%, 03/15/2022 | | | 120 | | | | 118 | |
Banco Santander | | | | | | | | |
3.125%, 02/23/2023 | | | 200 | | | | 190 | |
Banco Santander Chile | | | | | | | | |
2.500%, 12/15/2020 (B) | | | 240 | | | | 233 | |
Barclays Bank | | | | | | | | |
10.179%, 06/12/2021 (B) | | | 370 | | | | 427 | |
BHP Billiton Finance USA | | | | | | | | |
2.875%, 02/24/2022 | | | 10 | | | | 10 | |
BNP Paribas MTN | | | | | | | | |
2.700%, 08/20/2018 | | | 300 | | | | 300 | |
BP Capital Markets | | | | | | | | |
3.561%, 11/01/2021 | | | 230 | | | | 232 | |
3.119%, 05/04/2026 | | | 170 | | | | 163 | |
British Telecommunications | | | | | | | | |
2.350%, 02/14/2019 | | | 270 | | | | 269 | |
CNOOC Finance | | | | | | | | |
3.500%, 05/05/2025 | | | 330 | | | | 318 | |
Commonwealth Bank of Australia | | | | | | | | |
2.200%, 11/09/2020 (B) | | | 420 | | | | 409 | |
Cooperatieve Rabobank UA | | | | | | | | |
4.375%, 08/04/2025 | | | 500 | | | | 490 | |
| | | | | | | | |
| | | |
| Description | | Face Amount (Thousands) | | | Market Value ($ Thousands) | |
FOREIGN BONDS (continued) | | | | | | | | |
Credit Suisse NY MTN | | | | | | | | |
2.300%, 05/28/2019 | | $ | 310 | | | $ | 309 | |
Ecopetrol | | | | | | | | |
5.375%, 06/26/2026 | | | 140 | | | | 144 | |
HSBC Holdings | | | | | | | | |
4.250%, 08/18/2025 | | | 230 | | | | 226 | |
Intesa Sanpaolo | | | | | | | | |
5.017%, 06/26/2024 (B) | | | 200 | | | | 181 | |
3.125%, 07/14/2022 (B) | | | 200 | | | | 185 | |
Landwirtschaftliche Rentenbank | | | | | | | | |
1.375%, 10/23/2019 | | | 110 | | | | 108 | |
OCP | | | | | | | | |
4.500%, 10/22/2025 (B) | | | 400 | | | | 380 | |
Petrobras Global Finance BV | | | | | | | | |
6.850%, 06/05/2115 | | | 150 | | | | 126 | |
Petroleos del Peru | | | | | | | | |
4.750%, 06/19/2032 (B) | | | 400 | | | | 383 | |
Petroleos Mexicanos | | | | | | | | |
4.875%, 01/18/2024 | | | 190 | | | | 188 | |
Shell International Finance | | | | | | | | |
4.375%, 03/25/2020 | | | 130 | | | | 133 | |
Shell International Finance BV | | | | | | | | |
3.250%, 05/11/2025 | | | 150 | | | | 147 | |
2.875%, 05/10/2026 | | | 40 | | | | 38 | |
2.250%, 11/10/2020 | | | 360 | | | | 354 | |
1.750%, 09/12/2021 | | | 1,592 | | | | 1,525 | |
Telefonica Emisiones SAU | | | | | | | | |
5.134%, 04/27/2020 | | | 80 | | | | 83 | |
Teva Pharmaceutical Finance Netherlands III BV | | | | | |
2.200%, 07/21/2021 | | | 1,056 | | | | 979 | |
Vale Overseas | | | | | | | | |
6.875%, 11/21/2036 | | | 100 | | | | 112 | |
4.375%, 01/11/2022 | | | 18 | | | | 18 | |
| | | | | | | | |
Total Foreign Bonds (Cost $9,100) ($ Thousands) | | | | | | | 8,875 | |
| | | | | | | | |
| | |
SOVEREIGN DEBT — 2.7% | | | | | | | | |
Abu Dhabi Government International Bond | | | | | | | | |
2.500%, 10/11/2022 (B) | | | 490 | | | | 469 | |
Colombia Government International Bond | | | | | | | | |
5.625%, 02/26/2044 | | | 280 | | | | 297 | |
Indonesia Government International Bond MTN | | | | | | | | |
5.125%, 01/15/2045 (B) | | | 200 | | | | 196 | |
3.850%, 07/18/2027 (B) | | | 200 | | | | 190 | |
3.750%, 04/25/2022 | | | 370 | | | | 366 | |
Kuwait International Government Bond | | | | | | | | |
3.500%, 03/20/2027 (B) | | | 210 | | | | 204 | |
| | | | |
New Covenant Funds / Annual Report / June 30, 2018 | | | 31 | |
SCHEDULE OF INVESTMENTS
June 30, 2018
New Covenant Income Fund (Continued)
| | | | | | | | |
| | | |
| Description | | Face Amount
(Thousands) | | | Market Value
($ Thousands) | |
SOVEREIGN DEBT (continued) | | | | | | | | |
Mexico Government International Bond | | | | | | | | |
4.000%, 10/02/2023 | | $ | 610 | | | $ | 612 | |
3.600%, 01/30/2025 | | | 380 | | | | 367 | |
Panama Government International Bond | | | | | | | | |
6.700%, 01/26/2036 | | | 190 | | | | 233 | |
Peruvian Government International Bond | | | | | | | | |
6.550%, 03/14/2037 | | | 540 | | | | 674 | |
Poland Government International Bond | | | | | | | | |
5.125%, 04/21/2021 | | | 440 | | | | 462 | |
4.000%, 01/22/2024 | | | 450 | | | | 457 | |
Province of Ontario Canada | | | | | | | | |
4.400%, 04/14/2020 | | | 840 | | | | 863 | |
Province of Quebec Canada | | | | | | | | |
2.625%, 02/13/2023 | | | 500 | | | | 490 | |
Province of Quebec Canada, Ser A MTN | | | | | | | | |
6.350%, 01/30/2026 | | | 1,010 | | | | 1,177 | |
Russian Foreign Bond | | | | | | | | |
7.500%, 03/31/2030 | | | 198 | | | | 218 | |
Russian Foreign Bond—Eurobond | | | | | | | | |
5.875%, 09/16/2043 | | | 400 | | | | 430 | |
5.625%, 04/04/2042 | | | 400 | | | | 418 | |
Saudi Government International Bond MTN | | | | | | | | |
2.875%, 03/04/2023 (B) | | | 370 | | | | 356 | |
| | | | | | | | |
Total Sovereign Debt
(Cost $8,655) ($ Thousands) | | | | | | | 8,479 | |
| | | | | | | | |
| | |
COMMERCIAL PAPER — 1.3% | | | | | | | | |
BPCE | | | | | | | | |
2.365%, 10/01/2018 (C) | | | 1,460 | | | | 1,451 | |
Mitsubishi UFJ | | | | | | | | |
2.335%, 10/10/2018 (C) | | | 980 | | | | 973 | |
Standard Chartered BK US | | | | | | | | |
2.314%, 10/03/2018 (C) | | | 1,670 | | | | 1,660 | |
| | | | | | | | |
Total Commercial Paper
(Cost $4,085) ($ Thousands) | | | | | | | 4,084 | |
| | | | | | | | |
| | |
MUNICIPAL BONDS — 0.6% | | | | | | | | |
Florida — 0.3% | | | | | | | | |
Florida State, Board of Administration Finance, Ser A, RB | | | | | | | | |
2.638%, 07/01/2021 | | | 420 | | | | 416 | |
State Board of Administration Finance, Ser A, RB | | | | | | | | |
2.163%, 07/01/2019 | | | 535 | | | | 532 | |
| | | | | | | | |
| | |
| | | | | | | 948 | |
| | | | | | | | |
| | | | | | | | |
| | | |
| Description | | Face Amount
(Thousands) | | | Market Value
($ Thousands) | |
MUNICIPAL BONDS (continued) | | | | | | | | |
Wisconsin — 0.3% | | | | | | | | |
Wisconsin State, Ser A, RB, AGM | | | | | | | | |
5.700%, 05/01/2026 | | $ | 970 | | | $ | 1,078 | |
| | | | | | | | |
| | |
Total Municipal Bonds
(Cost $2,069) ($ Thousands) | | | | | | | 2,026 | |
| | | | | | | | |
| | |
| | | Shares | | | | |
| | |
CASH EQUIVALENT — 1.8% | | | | | | | | |
SEI Daily Income Trust, Government Fund, Cl F 1.660%**† | | | 5,833,477 | | | | 5,833 | |
| | | | | | | | |
Total Cash Equivalent
(Cost $5,833) ($ Thousands) | | | | | | | 5,833 | |
| | | | | | | | |
| | |
| . | | Face Amount
(Thousands) | | | | |
REPURCHASE AGREEMENT — 4.7% | | | | | | | | |
Deutsche Bank | | | | | | | | |
2.050%, dated 06/29/2018, to be repurchased on 07/02/2018, repurchase price $15,002,563 (collateralized by a U.S. Treasury Obligation, par value $15,471,650, 0.125%, 04/15/2020; with total market value $15,306,676) (D) | | $ | 15,000 | | | | 15,000 | |
| | | | | | | | |
Total Repurchase Agreement
(Cost $15,000) ($ Thousands) | | | | | | | 15,000 | |
| | | | | | | | |
Total Investments in Securities — 113.0%
(Cost $365,331) ($ Thousands) | | | | | | $ | 360,487 | |
| | | | | | | | |
| | | Contracts | | | | |
WRITTEN OPTION*(E) — 0.0% | | | | | | | | |
Total Written Option (E)
(Premiums Received $13) ($ Thousands) | | | (14 | ) | | $ | (14 | ) |
| | | | | | | | |
| | |
| 32 | | New Covenant Funds / Annual Report / June 30, 2018 |
A list of open option contracts by the Fund at June 30, 2018 are as follows:
| | | | | | | | | | | | | | | | | | | | |
| | | | | | |
| Description | | Number of Contracts | | | Notional Amount
(Thousands) | | | Exercise Price | | | Expiration Date | | | Value
(Thousands) | |
WRITTEN OPTION — 0.0% | | | | | | | | | | | | | |
Call Options | | | | | | | | | | | | | | | | | |
U.S. Bond Future Option* | | | (14 | ) | | $ | (2,030 | ) | | $ | 145.00 | | | | 07/21/18 | | | $ | (14 | ) |
| | | | | | | | | | | | | | | | | | | | |
Total Written Option | | | | | | $ | (2,030 | ) | | | | | | | | | | $ | (14 | ) |
| | | | | | | | | | | | | | | | | | | | |
A list of the open futures contracts held by the Fund at June 30, 2018 are as follows:
| | | | | | | | | | | | | | | | | | | | |
| | | | | | |
| Type of Contract | | Number of
Contracts
Long (Short) | | | Expiration Date | | | Notional Amount
(Thousands) | | | Value
(Thousands) | | | Unrealized
Appreciation/
(Depreciation)
(Thousands) | |
90-Day Euro$ | | | 145 | | | | Jun-2020 | | | $ | 35,254 | | | $ | 35,170 | | | $ | (84 | ) |
90-Day Euro$ | | | 291 | | | | Dec-2019 | | | | 70,679 | | | | 70,593 | | | | (86 | ) |
90-Day Euro$ | | | (37 | ) | | | Dec-2018 | | | | (9,062 | ) | | | (9,006 | ) | | | 57 | |
90-Day Euro$ | | | (149 | ) | | | Sep-2018 | | | | (36,343 | ) | | | (36,336 | ) | | | 7 | |
U.S. 2-Year Treasury Note | | | (59 | ) | | | Sep-2018 | | | | (12,529 | ) | | | (12,498 | ) | | | 31 | |
U.S. 5-Year Treasury Note | | | 456 | | | | Sep-2018 | | | | 51,698 | | | | 51,809 | | | | 111 | |
U.S. 10-Year Treasury Note | | | (73 | ) | | | Sep-2018 | | | | (8,723 | ) | | | (8,774 | ) | | | (50 | ) |
U.S. Long Treasury Bond | | | (136 | ) | | | Sep-2018 | | | | (19,486 | ) | | | (19,720 | ) | | | (234 | ) |
U.S. Ultra Long Treasury Bond | | | 22 | | | | Sep-2018 | | | | 3,417 | | | | 3,510 | | | | 93 | |
Ultra 10-Year U.S. Treasury Note | | | 22 | | | | Sep-2018 | | | | 2,797 | | | | 2,821 | | | | 24 | |
| | | | | | | | | | | | | | | | | | | | |
| | | | | | | | | | $ | 77,702 | | | $ | 77,569 | | | $ | (131 | ) |
| | | | | | | | | | | | | | | | | | | | |
The futures contracts are considered to have interest rate risk associated with them.
| | | Percentages are based on Net Assets of $318,955 ($ Thousands). |
| | * | Non-income producing security. |
| | ** | Rate shown is the 7-day effective yield as of June 30, 2018. |
| | † | Investment in Affiliated Security (see Note 3). |
| | (A) | Variable or floating rate security, the interest rate of which adjusts periodically based on changes in current interest rates and prepayments on the underlying pool of assets. |
| | (B) | Security exempt from registration under Rule 144A of the Securities Act of 1933. These securities may be resold in transactions exempt from registration normally to qualified institutions. On June 30, 2018, the value of these securities amounted to $52,061 ($ Thousands), representing 16.3% of the Net Assets of the Fund. |
| | (C) | Zero coupon security. The rate shown on the Schedule of Investments is the security’s effective yield at the time of purchase. |
| | (D) | Tri-Party Repurchase Agreement. |
| | (E) | Refer to table below for details on Options Contracts. |
AGM – Assured Guaranty Municipal
Cl – Class
CMO – Collateralized Mortgage Obligation
DN – Discount Note
FHLB – Federal Home Loan Bank
FHLMC – Federal Home Loan Mortgage Corporation
FNMA – Federal National Mortgage Association
GNMA – Government National Mortgage Association
ICE – Intercontinental Exchange
IO – Interest Only - face amount represents notional amount.
LIBOR – London Interbank Offered Rate
MTN – Medium Term Note
NY – New York
RB – Revenue Bond
REMIC – Real Estate Mortgage Investment Conduit
Ser – Series
TBA – To Be Announced
USD – United States Dollar
VAR – Variable Rate
| | | | |
New Covenant Funds / Annual Report / June 30, 2018 | | | 33 | |
SCHEDULE OF INVESTMENTS
June 30, 2018
New Covenant Income Fund (Concluded)
The following is a list of the levels of inputs used as of June 30, 2018 in valuing the Fund’s investments and other financial instruments carried at value ($ Thousands):
| | | | | | | | | | | | | | | | |
| | | | | |
| Investments in Securities | | Level 1 | | | Level 2 | | | Level 3 | | | Total | |
Mortgage-Backed Securities | | $ | – | | | $ | 128,156 | | | $ | – | | | $ | 128,156 | |
Corporate Obligations | | | – | | | | 99,635 | | | | – | | | | 99,635 | |
U.S. Treasury Obligations | | | – | | | | 37,365 | | | | – | | | | 37,365 | |
Asset-Backed Securities | | | – | | | | 34,437 | | | | – | | | | 34,437 | |
U.S. Government Agency Obligations | | | – | | | | 16,597 | | | | – | | | | 16,597 | |
Foreign Bonds | | | – | | | | 8,875 | | | | – | | | | 8,875 | |
Sovereign Debt | | | – | | | | 8,479 | | | | – | | | | 8,479 | |
Commercial Paper | | | – | | | | 4,084 | | | | – | | | | 4,084 | |
Municipal Bonds | | | – | | | | 2,026 | | | | – | | | | 2,026 | |
Cash Equivalent | | | 5,833 | | | | – | | | | – | | | | 5,833 | |
Repurchase Agreement | | | – | | | | 15,000 | | | | – | | | | 15,000 | |
| | | | | | | | | | | | | | | | |
Total Investments in Securities | | $ | 5,833 | | | $ | 354,654 | | | $ | – | | | $ | 360,487 | |
| | | | | | | | | | | | | | | | |
| | | | | | | | | | | | | | | | |
| | | | | |
| Other Financial Instruments | | Level 1 | | | Level 2 | | | Level 3 | | | Total | |
Written Options | | $ | (14 | ) | | $ | – | | | $ | – | | | $ | (14 | ) |
Futures Contracts * | | | | | | | | | | | | | | | | |
Unrealized Appreciation | | | 323 | | | | – | | | | – | | | | 323 | |
Unrealized Depreciation | | | (454 | ) | | | – | | | | – | | | | (454 | ) |
| | | | | | | | | | | | | | | | |
Total Other Financial Instruments | | $ | (145 | ) | | $ | – | | | $ | – | | | $ | (145 | ) |
| | | | | | | | | | | | | | | | |
* Futures contracts are valued at the unrealized appreciation (depreciation) on the instrument.
For the period ended June 30, 2018, there were no transfers between Level 1 and Level 2 assets and liabilities.
For the period ended June 30, 2018, there were no transfers between Level 2 and Level 3 assets and liabilities.
Amounts designated as “–” are either $0 or have been rounded to $0.
For more information on valuation inputs, see Note 2 – Significant Accounting Policies in Notes to Financial Statements.
The following is a summary of the transactions with affiliates for the period ended June 30, 2018 ($ Thousands):
| | | | | | | | | | | | | | | | | | | | | | | | | |
| Security Description | | Value 6/30/2017 | | Purchases at
Cost | | Proceeds from
Sales | | Value 6/30/2018 | | Dividend Income |
SEI Daily Income Trust, Government Fund, CI F | | | $ | 2,407 | | | | $ | 83,846 | | | | $ | (80,420) | | | | $ | 5,833 | | | | $ | 28 | |
| | | | | | | | | | | | | | | | | | | | | | | | | |
The accompanying notes are an integral part of the financial statements.
| | |
| 34 | | New Covenant Funds / Annual Report / June 30, 2018 |
SCHEDULE OF INVESTMENTS
June 30, 2018
New Covenant Balanced Growth Fund
| | | | |
Sector Weightings (Unaudited)†: 
†Percentages are based on total investments. | | | | |
| | | | | | | | |
| | | |
| Description | | Shares | | | Market Value
($ Thousands) | |
AFFILIATED INVESTMENT FUNDS — 98.8% | | | | | | | | |
Equity Fund — 59.4% | | | | | | | | |
New Covenant Growth Fund † | | | 3,993,887 | | | $ | 172,416 | |
| | | | | | | | |
| | |
Total Equity Fund
(Cost $103,869) ($ Thousands) | | | | | | | 172,416 | |
| | | | | | | | |
Fixed Income Fund — 39.4% | | | | | | | | |
New Covenant Income Fund † | | | 5,062,311 | | | | 114,510 | |
| | | | | | | | |
| | |
Total Fixed Income Fund
(Cost $116,550) ($ Thousands) | | | | | | | 114,510 | |
| | | | | | | | |
| | | | | | | | |
| | | |
| Description | | Shares | | | Market Value
($ Thousands) | |
| | |
CASH EQUIVALENT — 1.1% | | | | | | | | |
SEI Daily Income Trust, Government Fund,
Cl F 1.660%**† | | | 3,325,095 | | | $ | 3,325 | |
| | | | | | | | |
| | |
Total Cash Equivalent
(Cost $3,325) ($ Thousands) | | | | | | | 3,325 | |
| | | | | | | | |
Total Investments in Securities — 99.9%
(Cost $223,744) ($ Thousands) | | | | | | $ | 290,251 | |
| | | | | | | | |
Percentages are based on a Net Assets of $290,444 ($ Thousands).
| | † | Investment in Affiliated Security (see Note 3). |
| | * | Non-income producing security. |
| | ** | Rate shown is the 7-day effective yield as of June 30, 2018. |
Cl — Class
As of June 30, 2018, all of the Fund’s investments were considered Level 1, in accordance with the authoritative guidance on fair value measurements and disclosure under U.S. GAAP.
For the year ended June 30, 2018, there were no transfers between Level 1 and Level 2 assets and liabilities.
For the year ended June 30, 2018, there were no transfers between Level 2 and Level 3 assets and liabilities.
For more information on valuation inputs, see Note 2 – Significant Accounting Policies in Notes to Financial Statements.
The following is a summary of the transactions with affiliates for the period ended June 30, 2018 ($ Thousands):
| | | | | | | | | | | | | | | | | | | | | | | | | | | | | | | | | | | |
| Security Description | | Value
6/30/2017 | | Purchases at
Cost | | Proceeds
from
Sales | | Realized
Gain (Loss) | | Change in Unrealized
Appreciation (Depreciation) | | Value
6/30/2018 | | Dividend
Income |
New Covenant Growth Fund | | | $ | 172,045 | | | | $ | 16,588 | | | | $ | (38,809 | ) | | | $ | 12,857 | | | | $ | 9,735 | | | | $ | 172,416 | | | | $ | 1,632 | |
New Covenant Income Fund | | | | 111,344 | | | | | 15,691 | | | | | (9,573 | ) | | | | (542 | ) | | | | (2,410 | ) | | | | 114,510 | | | | | 2,303 | |
SEI Daily Income Trust, Government Fund, CI F | | | | 2,520 | | | | | 30,848 | | | | | (30,043 | ) | | | | — | | | | | — | | | | | 3,325 | | | | | 28 | |
| | | | | | | | | | | | | | | | | | | | | | | | | | | | | | | | | | | |
Totals | | | $ | 285,909 | | | | $ | 63,127 | | | | $ | (78,425 | ) | | | $ | 12,315 | | | | $ | 7,325 | | | | $ | 290,251 | | | | $ | 3,963 | |
| | | | | | | | | | | | | | | | | | | | | | | | | | | | | | | | | | | |
The accompanying notes are an integral part of the financial statements.
| | | | |
New Covenant Funds / Annual Report / June 30, 2018 | | | 35 | |
SCHEDULE OF INVESTMENTS
June 30, 2018
New Covenant Balanced Income Fund
| | | | |
| |
Sector Weightings (Unaudited)†:
†Percentages are based on total investments. |
| | | | | | | | |
| | | |
| Description | | Shares | | | Market Value
($ Thousands) | |
AFFILIATED INVESTMENT FUNDS — 98.7% | | | | | | | | |
Fixed Income Fund — 63.8% | | | | | | | | |
New Covenant Income Fund † | | | 2,181,219 | | | $ | 49,339 | |
| | | | | | | | |
Total Fixed Income Fund
(Cost $50,565) ($ Thousands) | | | | | | | 49,339 | |
| | | | | | | | |
Equity Fund — 34.9% | | | | | | | | |
New Covenant Growth Fund † | | | 625,537 | | | | 27,004 | |
| | | | | | | | |
Total Equity Fund
(Cost $13,666) ($ Thousands) | | | | | | | 27,004 | |
| | | | | | | | |
| | | | | | | | |
| | | |
| Description | | Shares | | | Market Value
($ Thousands) | |
| | |
CASH EQUIVALENT — 1.2% | | | | | | | | |
SEI Daily Income Trust, Government Fund,
Cl F 1.660%**† | | | 887,773 | | | $ | 888 | |
| | | | | | | | |
| | |
Total Cash Equivalent
(Cost $888) ($ Thousands) | | | | | | | 888 | |
| | | | | | | | |
| | |
Total Investments in Securities — 99.9%
(Cost $65,119) ($ Thousands) | | | | | | $ | 77,231 | |
| | | | | | | | |
Percentages are based on a Net Assets of $77,329 ($ Thousands).
| | ** | Rate shown is the 7-day effective yield as of June 30, 2018. |
| | † | Investment in Affiliated Security (see Note 3). |
Cl — Class
As of June 30, 2018, all of the Fund’s investments were considered Level 1, in accordance with the authoritative guidance on fair value measurements and disclosure under U.S. GAAP.
For the year ended June 30, 2018, there were no transfers between Level 1 and Level 2 assets and liabilities.
For the year ended June 30, 2018, there were no transfers between Level 2 and Level 3 assets and liabilities.
For more information on valuation inputs, see Note 2 – Significant Accounting Policies in Notes to Financial Statements.
The following is a summary of the transactions with affiliates for the period ended June 30, 2018 ($ Thousands):
| | | | | | | | | | | | | | | | | | | | | | | | | | | | | | | | | | | |
| Security Description | | Value
6/30/2017 | | Purchases
at Cost | | Proceeds
from
Sales | | Realized
Gain (Loss) | | Change in Unrealized
Appreciation (Depreciation) | | Value
6/30/2018 | | Dividend
Income |
New Covenant Growth Fund | | | $ | 27,879 | | | | $ | 3,678 | | | | $ | (8,181 | ) | | | $ | 2,591 | | | | $ | 1,037 | | | | $ | 27,004 | | | | $ | 261 | |
New Covenant Income Fund | | | | 50,299 | | | | | 3,733 | | | | | (3,393 | ) | | | | (238 | ) | | | | (1,062 | ) | | | | 49,339 | | | | | 1,021 | |
SEI Daily Income Trust, Government Fund, CI F | | | | 922 | | | | | 10,583 | | | | | (10,617 | ) | | | | — | | | | | — | | | | | 888 | | | | | 9 | |
| | | | | | | | | | | | | | | | | | | | | | | | | | | | | | | | | | | |
Totals | | | $ | 79,100 | | | | $ | 17,994 | | | | $ | (22,191 | ) | | | $ | 2,353 | | | | $ | (25 | ) | | | $ | 77,231 | | | | $ | 1,291 | |
| | | | | | | | | | | | | | | | | | | | | | | | | | | | | | | | | | | |
The accompanying notes are an integral part of the financial statements.
| | |
| 36 | | New Covenant Funds / Annual Report / June 30, 2018 |
STATEMENTS OF ASSETS AND LIABILITIES ($ THOUSANDS)
June 30, 2018
| | | | | | | | | | | | | | | | |
| | | | | |
| | | Growth Fund | | | Income Fund | | | Balanced Growth
Fund | | | Balanced Income
Fund | |
Assets: | | | | | | | | | | | | | | | | |
Investments, at value† | | $ | 417,610 | | | $ | 339,654 | | | $ | — | | | $ | — | |
Repurchase Agreements, at value †† | | | — | | | | 15,000 | | | | — | | | | — | |
Affiliated investments, at value†† | | | 6,521 | | | | 5,833 | | | | 290,251 | | | | 77,231 | |
Cash and cash equivalents | | | 4,568 | | | | — | | | | — | | | | — | |
Dividends and interest receivable | | | 369 | | | | 1,849 | | | | 260 | | | | 97 | |
Foreign tax reclaim receivable | | | 74 | | | | — | | | | — | | | | — | |
Receivable for fund shares sold | | | 58 | | | | 37 | | | | — | | | | 20 | |
Receivable for investment securities sold | | | — | | | | 9,770 | | | | — | | | | — | |
Cash pledged as collateral for futures contracts | | | — | | | | 209 | | | | — | | | | — | |
Receivable for variation margin | | | — | | | | 2 | | | | — | | | | — | |
Prepaid expenses | | | 31 | | | | 22 | | | | 20 | | | | 5 | |
Total Assets | | | 429,231 | | | | 372,376 | | | | 290,531 | | | | 77,353 | |
Liabilities: | | | | | | | | | | | | | | | | |
Options written, at value †††† | | | — | | | | 14 | | | | — | | | | — | |
Payable for investment securities purchased | | | 172 | | | | 52,518 | | | | — | | | | — | |
Investment advisory fees payable | | | 137 | | | | 73 | | | | — | | | | — | |
Administration fees payable | | | 70 | | | | 52 | | | | 20 | | | | 10 | |
Social witness and licensing fees payable | | | 44 | | | | 38 | | | | — | | | | — | |
Shareholder servicing fees payable | | | 36 | | | | 26 | | | | — | | | | — | |
Payable for fund shares redeemed | | | 6 | | | | 38 | | | | 12 | | | | 3 | |
Trustees’ fees payable | | | 2 | | | | 1 | | | | 15 | | | | — | |
CCO fees payable | | | 1 | | | | — | | | | — | | | | — | |
Income distribution payable | | | — | | | | 555 | | | | — | | | | — | |
Payable for variation margin | | | — | | | | 29 | | | | — | | | | — | |
Accrued expense payable | | | 89 | | | | 77 | | | | 40 | | | | 11 | |
Total Liabilities | | | 557 | | | | 53,421 | | | | 87 | | | | 24 | |
Net Assets | | $ | 428,674 | | | $ | 318,955 | | | $ | 290,444 | | | $ | 77,329 | |
† Cost of investments | | $ | 313,621 | | | $ | 344,498 | | | $ | — | | | $ | — | |
†† Cost of repurchase agreements | | | — | | | | 15,000 | | | | — | | | | — | |
††† Cost of affiliated investments | | | 6,521 | | | | 5,833 | | | | 223,744 | | | | 65,119 | |
†††† Cost (premiums received) | | | — | | | | 13 | | | | — | | | | — | |
Net Assets: | | | | | | | | | | | | | | | | |
Paid-in Capital — (unlimited authorization — par value $0.001) | | $ | 304,708 | | | $ | 326,843 | | | $ | 222,092 | | | $ | 65,035 | |
Undistributed net investment income | | | 1,072 | | | | 22 | | | | 1,799 | | | | 339 | |
Accumulated net realized gain (loss) on investments, affiliated investments, capital gain distributions from affiliated investments, written options, futures contracts and foreign currency transactions | | | 18,914 | | | | (2,939 | ) | | | 46 | | | | (157 | ) |
Net unrealized appreciation (depreciation) on investments and affiliated investments | | | 103,989 | | | | (4,844 | ) | | | 66,507 | | | | 12,112 | |
Net unrealized depreciation on futures contracts | | | — | | | | (131 | ) | | | — | | | | — | |
Net unrealized depreciation on written option contracts | | | — | | | | (1 | ) | | | — | | | | — | |
Net unrealized appreciation (depreciation) on foreign currencies and translation of other assets and liabilities denominated in foreign currencies | | | (9 | ) | | | 5 | | | | — | | | | — | |
Net Assets | | $ | 428,674 | | | $ | 318,955 | | | $ | 290,444 | | | $ | 77,329 | |
Net Asset Value, Offering and Redemption Price Per Share | | $ | 43.17 | | | $ | 22.62 | | | $ | 102.94 | | | $ | 21.23 | |
| | |
| (428,673,986 ÷
9,930,968 shares |
) | |
| (318,955,176 ÷
14,099,089 shares |
) | |
| (290,443,671 ÷
2,821,395 shares |
) | |
| (77,328,849 ÷
3,641,819 shares |
) |
Amounts designated as “—” are $0 or have been rounded to $0.
The accompanying notes are an integral part of the financial statements.
| | | | |
New Covenant Funds / Annual Report / June 30, 2018 | | | 37 | |
STATEMENTS OF OPERATIONS ($ THOUSANDS)
For the year ended June 30, 2018
| | | | | | | | | | | | | | | | |
| | | | | |
| | | Growth Fund | | | Income Fund | | | Balanced Growth
Fund | | | Balanced Income
Fund |
Investment Income: | | | | | | | | | | | | | | | | |
Dividend income | | $ | 8,116 | | | $ | — | | | $ | — | | | $ | — | |
Dividend income from affiliated registered investment company | | | 133 | | | | 28 | | | | 3,963 | | | | 1,291 | |
Interest income | | | 182 | | | | 8,614 | | | | — | | | | — | |
Less: foreign taxes withheld | | | — | | | | (1 | ) | | | — | | | | — | |
Total Investment Income | | | 8,431 | | | | 8,641 | | | | 3,963 | | | | 1,291 | |
Expenses: | | | | | | | | | | | | | | | | |
Investment advisory fees | | | 2,683 | | | | 1,320 | | | | — | | | | — | |
Administration fees | | | 865 | | | | 629 | | | | 438 | | | | 118 | |
Social witness and licensing fees | | | 649 | | | | 472 | | | | — | | | | — | |
Shareholder servicing fees | | | 433 | | | | 314 | | | | — | | | | — | |
Trustee fees | | | 7 | | | | 5 | | | | 5 | | | | 1 | |
Chief compliance officer fees | | | 2 | | | | 1 | | | | 1 | | | | — | |
Transfer agent fees | | | 95 | | | | 69 | | | | 64 | | | | 17 | |
Professional fees | | | 44 | | | | 32 | | | | 28 | | | | 8 | |
Registration fees | | | 34 | | | | 25 | | | | 24 | | | | 6 | |
Printing fees | | | 30 | | | | 22 | | | | 11 | | | | 6 | |
Custodian fees | | | 7 | | | | 15 | | | | 12 | | | | 4 | |
Proxy Fees | | | 2 | | | | 2 | | | | 2 | | | | 2 | |
Other expenses | | | 13 | | | | 80 | | | | 18 | | | | 4 | |
Total Expenses | | | 4,864 | | | | 2,986 | | | | 603 | | | | 166 | |
Less: | | | | | | | | | | | | | | | | |
Waiver of investment advisory fees | | | (1,095 | ) | | | (475 | ) | | | — | | | | — | |
Waiver of administration fees | | | (2 | ) | | | — | | | | (216 | ) | | | (44 | ) |
Net Expenses | | | 3,767 | | | | 2,511 | | | | 387 | | | | 122 | |
Net Investment Income | | | 4,664 | | | | 6,130 | | | | 3,576 | | | | 1,169 | |
Net Realized and Change in Unrealized Gain (Loss) on Investments: | | | | | | | | | | | | | |
Net Realized Gain (Loss) on: | | | | | | | | | | | | | | | | |
Investments | | | 24,491 | | | | (1,388 | ) | | | — | | | | — | |
Affiliated investments | | | — | | | | — | | | | 2,984 | | | | 878 | |
Written and purchased options | | | — | | | | 203 | | | | — | | | | — | |
Capital gain distributions received from affiliated investment | | | — | | | | — | | | | 9,743 | | | | 1,540 | |
Futures contracts | | | 96 | | | | 103 | | | | — | | | | — | |
Net Change in Unrealized Appreciation (Depreciation) on: | | | | | | | | | | | | | | | | |
Investments | | | 30,412 | | | | (6,654 | ) | | | — | | | | — | |
Affiliated investments | | | — | | | | — | | | | 7,325 | | | | (25 | ) |
Written and purchased options | | | — | | | | (1 | ) | | | — | | | | — | |
Futures contracts | | | — | | | | (160 | ) | | | — | | | | — | |
Foreign currency transactions and translation of other assets and liabilities denominated in foreign currencies | | | (1 | ) | | | — | | | | — | | | | — | |
Net Increase (Decrease) in Net Assets Resulting from Operations | | $ | 59,662 | | | | $ (1,767) | | | | $ 23,628 | | | $ | 3,562 | |
Amounts designated as “—” are $0 or have been rounded to $0.
The accompanying notes are an integral part of the financial statements.
| | |
| 38 | | New Covenant Funds / Annual Report / June 30, 2018 |
STATEMENTS OF CHANGES IN NET ASSETS ($ THOUSANDS)
For the year ended June 30,
| | | | | | | | | | | | | | | | |
| | | Growth Fund | | | Income Fund | |
| | | 2018 | | | 2017 | | | 2018 | | | 2017 | |
Operations: | | | | | | | | | | | | | | | | |
Net investment income | | $ | 4,664 | | | $ | 2,960 | | | $ | 6,130 | | | $ | 4,775 | |
Net realized gain (loss) from investments, affiliated investments, written and purchased options and futures contracts | | | 24,587 | | | | 36,775 | | | | (1,082 | ) | | | 578 | |
Net change in unrealized appreciation (depreciation) on investments, affiliated investments, written and purchased options and futures contracts | | | 30,412 | | | | 27,540 | | | | (6,815 | ) | | | (4,322 | ) |
Net change in unrealized depreciation on foreign currency transactions and translation of other assets and liabilities denominated in foreign currency | | | (1 | ) | | | — | | | | — | | | | — | |
Net increase (decrease) in net assets resulting from operations | | | 59,662 | | | | 67,275 | | | | (1,767 | ) | | | 1,031 | |
Dividends and Distributions From: | | | | | | | | | | | | | | | | |
Net investment income | | | (3,990 | ) | | | (2,811 | ) | | | (6,403 | ) | | | (5,601 | ) |
Net realized gains | | | (24,050 | ) | | | — | | | | — | | | | — | |
Total dividends and distributions | | | (28,040 | ) | | | (2,811 | ) | | | (6,403 | ) | | | (5,601 | ) |
Capital Share Transactions: | | | | | | | | | | | | | | | | |
Proceeds from shares issued | | | 26,353 | | | | 9,910 | | | | 46,144 | | | | 31,435 | |
Reinvestment of dividends & distributions | | | 23,504 | | | | 490 | | | | 626 | | | | 620 | |
Cost of shares redeemed | | | (65,034 | ) | | | (57,578 | ) | | | (24,802 | ) | | | (19,493 | ) |
increase (decrease) in net assets derived from capital share transactions | | | (15,177 | ) | | | (47,178 | ) | | | 21,968 | | | | 12,562 | |
Net increase in net assets | | | 16,445 | | | | 17,286 | | | | 13,798 | | | | 7,992 | |
Net Assets: | | | | | | | | | | | | | | | | |
Beginning of Year | | | 412,229 | | | | 394,943 | | | | 305,157 | | | | 297,165 | |
End of Year | | $ | 428,674 | | | $ | 412,229 | | | $ | 318,955 | | | $ | 305,157 | |
Undistributed Net Investment Income Included in Net Assets at Year End | | $ | 1,072 | | | $ | 471 | | | $ | 22 | | | $ | 18 | |
Share Transactions: | | | | | | | | | | | | | | | | |
Shares issued | | | 628 | | | | 259 | | | | 2,010 | | | | 1,355 | |
Shares issued in lieu of dividends and distributions | | | 563 | | | | 13 | | | | 27 | | | | 27 | |
Shares redeemed | | | (1,527 | ) | | | (1,544 | ) | | | (1,084 | ) | | | (837 | ) |
Increase (Decrease) in net assets derived from share transactions | | | (336 | ) | | | (1,272 | ) | | | 953 | | | | 545 | |
Amounts designated as “—” are $0 or have been rounded to $0.
The accompanying notes are an integral part of the financial statements.
| | | | |
New Covenant Funds / Annual Report / June 30, 2018 | | | 39 | |
STATEMENTS OF CHANGES IN NET ASSETS ($ THOUSANDS) (Concluded)
For the year ended June 30,
| | | | | | | | | | | | | | | | |
| | | Balanced Growth Fund | | | Balanced Income Fund | |
| | | 2018 | | | 2017 | | | 2018 | | | 2017 | |
Operations: | | | | | | | | | | | | | | | | |
Net investment income | | $ | 3,576 | | | $ | 2,885 | | | $ | 1,169 | | | $ | 977 | |
Net realized gain from investments, affiliated investments, written and purchased options and futures contracts | | | 2,984 | | | | 1,337 | | | | 878 | | | | 320 | |
Capital gain distributions received from affiliated investments | | | 9,743 | | | | — | | | | 1,540 | | | | — | |
Net change in unrealized appreciation (depreciation) on investments, affiliated investments, written and purchased options and futures contracts | | | 7,325 | | | | 24,638 | | | | (25 | ) | | | 3,359 | |
Net increase in net assets resulting from operations | | | 23,628 | | | | 28,860 | | | | 3,562 | | | | 4,656 | |
Dividends and Distributions From: | | | | | | | | | | | | | | | | |
Net investment income | | | (2,619 | ) | | | (2,917 | ) | | | (1,097 | ) | | | (982 | ) |
Net realized gains | | | (2,087 | ) | | | (6,990 | ) | | | (600 | ) | | | (1,021 | ) |
Total dividends and distributions | | | (4,706 | ) | | | (9,907 | ) | | | (1,697 | ) | | | (2,003 | ) |
Capital Share Transactions: | | | | | | | | | | | | | | | | |
Proceeds from shares issued | | | 17,404 | | | | 13,386 | | | | 6,327 | | | | 4,903 | |
Reinvestment of dividends & distributions | | | 4,118 | | | | 9,013 | | | | 1,322 | | | | 1,632 | |
Cost of shares redeemed | | | (35,970 | ) | | | (39,812 | ) | | | (11,285 | ) | | | (8,033 | ) |
decrease in net assets derived from capital share transactions | | | (14,448 | ) | | | (17,413 | ) | | | (3,636 | ) | | | (1,498 | ) |
Net increase (decrease) in net assets | | | 4,474 | | | | 1,540 | | | | (1,771 | ) | | | 1,155 | |
Net Assets: | | | | | | | | | | | | | | | | |
Beginning of Year | | | 285,970 | | | | 284,430 | | | | 79,100 | | | | 77,945 | |
End of Year | | $ | 290,444 | | | $ | 285,970 | | | $ | 77,329 | | | $ | 79,100 | |
Undistributed Net Investment Income Included in Net Assets at Year End | | $ | 1,799 | | | $ | 415 | | | $ | 339 | | | $ | 199 | |
Share Transactions: | | | | | | | | | | | | | | | | |
Shares issued | | | 172 | | | | 143 | | | | 300 | | | | 241 | |
Shares issued in lieu of dividends and distributions | | | 41 | | | | 98 | | | | 63 | | | | 81 | |
Shares redeemed | | | (356 | ) | | | (426 | ) | | | (534 | ) | | | (394 | ) |
Decrease in net assets derived from share transactions | | | (143 | ) | | | (185 | ) | | | (171 | ) | | | (72 | ) |
Amounts designated as “—” are $0 or have been rounded to $0.
The accompanying notes are an integral part of the financial statements.
| | |
| 40 | | New Covenant Funds / Annual Report / June 30, 2018 |
FINANCIAL HIGHLIGHTS
For the years ended June 30,
For a Share Outstanding Throughout the Year
| | | | | | | | | | | | | | | | | | | | |
| | | Growth Fund | |
| | | 2018 | | | 2017 | | | 2016 | | | 2015 | | | 2014 | |
Net Asset Value, Beginning of Period | | | $40.15 | | | | $34.23 | | | | $38.28 | | | | $43.70 | | | | $37.28 | |
Investment Activities: | | | | | | | | | | | | | | | | | | | | |
Net investment income(1) | | | 0.46 | | | | 0.27 | | | | 0.27 | | | | 0.22 | | | | 0.23 | |
Net realized and unrealized gains(losses) on securities and foreign currency transactions(1) | | | 5.34 | | | | 5.91 | | | | (1.67) | | | | 2.29 | | | | 8.55 | |
Total from investment activities | | | 5.80 | | | | 6.18 | | | | (1.40) | | | | 2.51 | | | | 8.78 | |
Dividends and Distributions from: | | | | | | | | | | | | | | | | | | | | |
Net investment income | | | (0.39) | | | | (0.26) | | | | (0.21) | | | | (0.22) | | | | (0.24) | |
Net realized gains | | | (2.39) | | | | – | | | | (2.44) | | | | (7.71) | | | | (2.12) | |
Total dividends and distributions | | | (2.78) | | | | (0.26) | | | | (2.65) | | | | (7.93) | | | | (2.36) | |
Net Asset Value, End of Period | | | $43.17 | | | | $40.15 | | | | $34.23 | | | | $38.28 | | | | $43.70 | |
Total Return† | | | 14.74% | | | | 18.12% | | | | (3.68)% | | | | 6.41% | | | | 24.18% | |
Supplemental Data and Ratios: | | | | | | | | | | | | | | | | | | | | |
Net assets, end of period ($ Thousands) | | | $428,674 | | | | $412,229 | | | | $394,943 | | | | $416,158 | | | | $424,852 | |
Ratio of net expenses to average net assets | | | 0.87% | | | | 0.95% | | | | 1.02% | | | | 1.02% | | | | 1.02% | |
Ratio of expenses to average net assets, excluding waivers | | | 1.12% | | | | 1.13% | | | | 1.14% | | | | 1.12% | | | | 1.15% | |
Ratio of net investment income to average net assets | | | 1.08% | | | | 0.73% | | | | 0.76% | | | | 0.54% | | | | 0.55% | |
Portfolio turnover rate | | | 24% | | | | 50% | | | | 103% | | | | 107% | | | | 86% | |
| † | Returns shown do not reflect the deduction of taxes that a shareholder would pay on Fund distributions or the redemption of Fund shares. |
| (1) | Per share net investment income and net realized and unrealized gains/(losses) calculated using average shares. |
Amounts designated as ‘‘—‘‘ are $0 or have been rounded to $0.
The accompanying notes are an integral part of the financial statements
| | | | |
New Covenant Funds / Annual Report / June 30, 2018 | | | 41 | |
FINANCIAL HIGHLIGHTS (Continued)
For the years ended June 30,
For a Share Outstanding Throughout the Year
| | | | | | | | | | | | | | | | | | | | |
| | | Income Fund | |
| | | 2018 | | | 2017 | | | 2016 | | | 2015 | | | 2014 | |
Net Asset Value, Beginning of Period | | | $23.21 | | | | $23.58 | | | | $23.09 | | | | $23.13 | | | | $22.77 | |
Investment Activities: | | | | | | | | | | | | | | | | | | | | |
Net investment income(1) | | | 0.45 | | | | 0.37 | | | | 0.40 | | | | 0.35 | | | | 0.34 | |
Net realized and unrealized gains(losses) on securities (1) | | | (0.57) | | | | (0.31) | | | | 0.51 | | | | (0.01) | | | | 0.41 | |
Total from investment activities | | | (0.12) | | | | 0.06 | | | | 0.91 | | | | 0.34 | | | | 0.75 | |
Dividends and Distributions from: | | | | | | | | | | | | | | | | | | | | |
Net investment income | | | (0.47) | | | | (0.43) | | | | (0.42) | | | | (0.38) | | | | (0.39) | |
Total dividends and distributions | | | (0.47) | | | | (0.43) | | | | (0.42) | | | | (0.38) | | | | (0.39) | |
Net Asset Value, End of Period | | | $22.62 | | | | $23.21 | | | | $23.58 | | | | $23.09 | | | | $23.13 | |
Total Return† | | | (0.54)% | | | | 0.27% | | | | 4.00% | | | | 1.46% | | | | 3.31% | |
Supplemental Data and Ratios: | | | | | | | | | | | | | | | | | | | | |
Net assets, end of period ($ Thousands) | | | $318,955 | | | | $305,157 | | | | $297,165 | | | | $304,295 | | | | $309,039 | |
Ratio of net expenses to average net assets | | | 0.80% | | | | 0.80% | | | | 0.80% | | | | 0.80% | | | | 0.80% | |
Ratio of expenses to average net assets, excluding waivers | | | 0.95% | | | | 0.95% | | | | 0.98% | | | | 0.95% | | | | 0.98% | |
Ratio of net investment income to average net assets | | | 1.95% | | | | 1.58% | | | | 1.71% | | | | 1.50% | | | | 1.50% | |
Portfolio turnover rate | | | 210% | | | | 140% | | | | 202% | | | | 115% | | | | 168% | |
| † | Returns shown do not reflect the deduction of taxes that a shareholder would pay on Fund distributions or the redemption of Fund shares. |
| (1) | Per share net investment income and net realized and unrealized gains/(losses) calculated using average shares. |
The accompanying notes are an integral part of the financial statements.
| | |
| 42 | | New Covenant Funds / Annual Report / June 30, 2018 |
| | | | | | | | | | | | | | | | | | | | |
| | | Balanced Growth Fund | |
| | | 2018 | | | 2017 | | | 2016 | | | 2015 | | | 2014 | |
Net Asset Value, Beginning of Period | | | $96.48 | | | | $90.32 | | | | $101.71 | | | | $101.92 | | | | $89.69 | |
Investment Activities: | | | | | | | | | | | | | | | | | | | | |
Net investment income(1) | | | 1.23 | | | | 0.94 | | | | 0.88 | | | | 0.85 | | | | 1.43 | |
Net realized and unrealized gains(losses) on securities (1) | | | 6.86 | | | | 8.44 | | | | (1.63) | | | | 3.71 | | | | 12.23 | |
Total from investment activities | | | 8.09 | | | | 9.38 | | | | (0.75) | | | | 4.56 | | | | 13.66 | |
Dividends and Distributions from: | | | | | | | | | | | | | | | | | | | | |
Net investment income | | | (0.90) | | | | (0.94) | | | | (1.72) | | | | (2.86) | | | | (1.43) | |
Net realized gains | | | (0.73) | | | | (2.28) | | | | (8.92) | | | | (1.91) | | | | – | |
Total dividends and distributions | | | (1.63) | | | | (3.22) | | | | (10.64) | | | | (4.77) | | | | (1.43) | |
Net Asset Value, End of Period | | | $102.94 | | | | $96.48 | | | | $90.32 | | | | $101.71 | | | | $101.92 | |
Total Return† | | | 8.45% | | | | 10.59% | | | | (0.50)% | | | | 4.54% | | | | 15.30% | |
Supplemental Data and Ratios: | | | | | | | | | | | | | | | | | | | | |
Net assets, end of period ($ Thousands) | | | $290,444 | | | | $285,970 | | | | $284,430 | | | | $297,560 | | | | $305,924 | |
Ratio of net expenses to average net assets | | | 0.13% | | | | 0.14% | | | | 0.14% | | | | 0.14% | | | | 0.14% | |
Ratio of expenses to average net assets, excluding waivers | | | 0.21% | | | | 0.23% | | | | 0.27% | | | | 0.26% | | | | 0.27% | |
Ratio of net investment income to average net assets | | | 1.22% | | | | 1.01% | | | | 0.94% | | | | 0.83% | | | | 1.48% | |
Portfolio turnover rate | | | 11% | | | | 4% | | | | 14% | | | | 13% | | | | 6% | |
| † | Returns shown do not reflect the deduction of taxes that a shareholder would pay on Fund distributions or the redemption of Fund shares. |
| (1) | Per share net investment income and net realized and unrealized gains/(losses) calculated using average shares. |
Amounts designated as ‘‘—‘‘ are $0 or have been rounded to $0.
The accompanying notes are an integral part of the financial statements.
| | | | |
New Covenant Funds / Annual Report / June 30, 2018 | | | 43 | |
FINANCIAL HIGHLIGHTS (Concluded)
For the years ended June 30,
For a Share Outstanding Throughout the Year
| | | | | | | | | | | | | | | | | | | | |
| | | Balanced Income Fund | |
| | | 2018 | | | 2017 | | | 2016 | | | 2015 | | | 2014 | |
Net Asset Value, Beginning of Period | | | $20.74 | | | | $20.06 | | | | $21.20 | | | | $21.55 | | | | $19.95 | |
Investment Activities: | | | | | | | | | | | | | | | | | | | | |
Net investment income(1) | | | 0.31 | | | | 0.25 | | | | 0.24 | | | | 0.22 | | | | 0.30 | |
Net realized and unrealized gains(losses) on securities (1) | | | 0.63 | | | | 0.95 | | | | 0.02 | | | | 0.46 | | | | 1.68 | |
Total from investment activities | | | 0.94 | | | | 1.20 | | | | 0.26 | | | | 0.68 | | | | 1.98 | |
Dividends and Distributions from: | | | | | | | | | | | | | | | | | | | | |
Net investment income | | | (0.29) | | | | (0.25) | | | | (0.31) | | | | (0.47) | | | | (0.30) | |
Net realized gains | | | (0.16) | | | | (0.27) | | | | (1.09) | | | | (0.56) | | | | (0.08) | |
Total dividends and distributions | | | (0.45) | | | | (0.52) | | | | (1.40) | | | | (1.03) | | | | (0.38) | |
Net Asset Value, End of Period | | | $21.23 | | | | $20.74 | | | | $20.06 | | | | $21.20 | | | | $21.55 | |
Total Return† | | | 4.57% | | | | 6.11% | | | | 1.41% | | | | 3.22% | | | | 10.01% | |
Supplemental Data and Ratios: | | | | | | | | | | | | | | | | | | | | |
Net assets, end of period ($ Thousands) | | | $77,329 | | | | $79,100 | | | | $77,945 | | | | $80,203 | | | | $85,622 | |
Ratio of net expenses to average net assets | | | 0.15% | | | | 0.19% | | | | 0.20% | | | | 0.20% | | | | 0.20% | |
Ratio of expenses to average net assets, excluding waivers | | | 0.21% | | | | 0.23% | | | | 0.27% | | | | 0.25% | | | | 0.26% | |
Ratio of net investment income to average net assets | | | 1.48% | | | | 1.25% | | | | 1.19% | | | | 1.04% | | | | 1.44% | |
Portfolio turnover rate | | | 10% | | | | 5% | | | | 17% | | | | 15% | | | | 9% | |
| † | Returns shown do not reflect the deduction of taxes that a shareholder would pay on Fund distributions or the redemption of Fund shares. |
| (1) | Per share net investment income and net realized and unrealized gains/(losses) calculated using average shares. |
Amounts designated as ‘‘—‘‘ are $0 or have been rounded to $0.
The accompanying notes are an integral part of the financial statements.
| | |
| 44 | | New Covenant Funds / Annual Report / June 30, 2018 |
NOTES TO FINANCIAL STATEMENTS
June 30, 2018
1. ORGANIZATION
New Covenant Funds (the “Trust”), an open-end, diversified management investment company, was organized as a Delaware business trust on September 30, 1998. It currently consists of four investment funds: New Covenant Growth Fund (“Growth Fund”), New Covenant Income Fund (“Income Fund”), New Covenant Balanced Growth Fund (“Balanced Growth Fund”), and New Covenant Balanced Income Fund (“Balanced Income Fund”), (individually, a “Fund,” and collectively, the “Funds”). The Funds commenced operations on July 1, 1999. The Trust’s authorized capital consists of an unlimited number of shares of beneficial interest of $0.001 par value. Effective February 20, 2012, the Funds’ investment adviser is SEI Investments Management Corporation (the “Adviser”). Prior to February 20, 2012, the Funds’ investment adviser was One Compass Advisors, a wholly owned subsidiary of the Presbyterian Church (U.S.A.) Foundation.
The objectives of the Funds are as follows:
| | |
Growth Fund | | Long-term capital appreciation. |
| |
Income Fund | | High level of current income with preservation of capital. |
| |
Balanced Growth Fund | | Capital appreciation with less risk than would be present in a portfolio of only common stocks. |
| |
Balanced Income Fund | | Current income and long-term growth of capital. |
2. SIGNIFICANT ACCOUNTING POLICIES
The following is a summary of the significant accounting policies followed by the Funds.
Use of Estimates — The preparation of financial statements, in conformity with U.S. generally accepted accounting principles (“U.S. GAAP”), requires management to make estimates and assumptions that affect the reported amount of assets and liabilities and disclosure of contingent assets and liabilities as of the date of the financial statements and the reported amounts of increases and decreases in net assets from operations during the reporting period. Actual results could differ from those estimates.
Security Valuation — Securities listed on a securities exchange, market or automated quotation system for which quotations are readily available (except for securities traded on NASDAQ) are valued at the last quoted sale price on the primary exchange or market (foreign or domestic) on which they are traded, or, if there is no such reported sale, at the most recent quoted bid price. For securities traded on NASDAQ, the NASDAQ Official Closing Price will be used. Debt securities are priced based upon valuations provided by independent, third-party pricing agents, if available. Such values generally reflect the last reported sales price if the security is actively traded. The third-party pricing agents may also value debt securities at an evaluated bid price by employing methodologies that utilize actual market transactions, broker-supplied valuations, or other methodologies designed to identify the market value for such securities. Debt obligations acquired with remaining maturities of sixty days or less may be valued at their amortized cost, which approximates market value. The prices for foreign securities are reported in local currency and converted to U.S. dollars using currency exchange rates. Prices for most securities held in the Funds are provided daily by recognized independent pricing agents. If a security price cannot be obtained from an independent, third-party pricing agent, the Funds seek to obtain a bid price from at least one independent broker.
Securities for which market prices are not “readily available” are valued in accordance with fair value procedures established by the Trust’s Board of Trustees. The Trust’s fair value procedures are implemented through a Fair Value Committee (the “Committee”) designated by the Trust’s Board of Trustees. Some of the more common reasons that may necessitate that a security be valued using fair value procedures include: the security’s trading has been halted or suspended; the security has been de-listed from a national exchange; the security’s primary trading market is temporarily closed at a time when under normal conditions it would be open; or the security’s primary pricing source is not able or willing to provide a price. When a security is valued in accordance with the fair value procedures, the Committee will determine the value after taking into consideration relevant information reasonably available to the Committee.
For securities that principally trade on a foreign market or exchange, a significant gap in time can exist between the time of a particular security’s last trade and the time at which a Fund calculates its net asset value. The closing prices of such securities may no longer reflect their market value at the time a Fund calculates net asset value if an event that could materially affect the value of those securities (a “Significant Event”) has occurred between the time of the
| | | | |
New Covenant Funds / Annual Report / June 30, 2018 | | | 45 | |
NOTES TO FINANCIAL STATEMENTS (Continued)
June 30, 2018
security’s last close and the time that a Fund calculates net asset value. A Significant Event may relate to a single issuer or to an entire market sector. If the adviser or sub-adviser of a Fund becomes aware of a Significant Event that has occurred with respect to a security or group of securities after the closing of the exchange or market on which the security or securities principally trade, but before the time at which a Fund calculates net asset value, the adviser or sub-adviser may request that a Committee Meeting be called. In addition, the Trust’s administrator monitors price movements among certain selected indices, securities and/or baskets of securities that may be an indicator that the closing prices received earlier from foreign exchanges or markets may not reflect market value at the time a Fund calculates net asset value. If price movements in a monitored index or security exceed levels established by the administrator, the administrator notifies the adviser or sub-adviser for any Fund holding the relevant securities that such limits have been exceeded. In such event, the adviser or sub-adviser makes the determination whether a Committee Meeting should be called based on the information provided.
The Growth Fund holds international securities that also use a third-party fair valuation vendor. The vendor provides a fair value for foreign securities held by this Fund based on certain factors and methodologies (involving, generally, tracking valuation correlations between the U.S. market and each non-U.S. security). Values from the fair value vendor are applied in the event that there is a movement in the U.S. market that exceeds a specific threshold that has been established by the Committee. The Committee has also established a “confidence interval” which is used to determine the level of historical correlation between the value of a specific foreign security and movements in the U.S. market before a particular security will be fair valued when the threshold is exceeded. In the event that the threshold established by the Committee is exceeded on a specific day, the Growth Fund will value the non-U.S. securities that exceed the applicable “confidence interval” based upon the adjusted prices provided by the fair valuation vendor.
Options for which the primary market is a national securities exchange are valued at the last sale price on the exchange on which they are traded, or, in the absence of any sale, at the closing bid price. Options not traded on a national securities exchange are valued at the last quoted bid price.
Futures cleared through a central clearing house (“centrally cleared futures”) are valued at the settlement price established each day by the board of exchange on which they are traded. The daily settlement prices for financial futures is provided by an independent source. On days when there is excessive volume, market volatility or the future does not end trading by the time a Fund calculates its NAV, the settlement price may not be available at the time at which the Fund calculates its NAV. On such days, the best available price (which is typically the last sales price) may be used to value a Fund’s futures position.
The assets of the Balanced Growth Fund and the Balanced Income Fund (the “Balanced Funds”) consist primarily of investments in underlying affiliated investment companies, which are valued at their respective daily net asset values in accordance with the established NAV of each fund.
In accordance with U.S. GAAP, fair value is defined as the price that a Fund would receive upon selling an investment in an orderly transaction to an independent buyer in the principal or most advantageous market of the investment. A three tier hierarchy has been established to maximize the use of observable and minimize the use of unobservable inputs and to establish classification of fair value measurements for disclosure purposes. Inputs refer broadly to the assumptions that market participants would use in pricing an asset. Inputs may be observable or unobservable. Observable inputs are inputs that reflect the assumptions market participants would use in pricing the asset or liability based on market data obtained from sources independent of the reporting entity. Unobservable inputs are inputs that reflect the reporting entity’s own assumptions about the assumptions market participants would use in pricing the asset or liability based on the best information available in the circumstances.
The three-tier hierarchy of inputs is summarized in the three broad Levels listed below:
Level 1 — quoted prices in active markets for identical investments
Level 2 — other significant observable inputs (including quoted prices for similar investments, interest rates, prepayment speeds, credit risks, etc.)
Level 3 — significant unobservable inputs (including the Fund’s own assumptions in determining the fair value of investments)
The valuation techniques used by the Funds to measure fair value during the year ended June 30, 2018 maximized the use of observable inputs and minimized the use of unobservable inputs.
| | |
| 46 | | New Covenant Funds / Annual Report / June 30, 2018 |
For the year ended June 30, 2018, there have been no significant changes to the Trust’s fair valuation methodologies. For details of the investment classifications reference the Schedules of Investments.
Securities Transactions and Investment Income — Security transactions are recorded on the trade date. Cost used in determining net realized capital gains and losses on the sale of securities is determined on the basis of specific identification. Dividend income and expense is recognized on the ex-dividend date, and interest income or expense is recognized using the accrual basis of accounting.
Distributions received on securities that represent a return of capital or capital gains are recorded as a reduction of cost of investments and/or as a realized gain. The Trust estimates the components of distributions received that may be considered nontaxable distributions or capital gain distributions.
Amortization and accretion is calculated using the scientific interest method, which approximates the effective interest method over the holding period of the security. Amortization of premiums and discounts is included in interest income.
Cash and Cash Equivalents — Idle cash and currency balances may be swept into various overnight sweep accounts and are classified as cash equivalents on the Statement of Assets and Liabilities. These amounts, at times, may exceed United States federally insured limits. Amounts swept are available on the next business day.
Expenses — Expenses that are directly related to a Fund are charged directly to that Fund. Other operating expenses of the Funds are prorated to the Funds on the basis of relative net assets.
Foreign Currency Translation — The books and records of the Funds investing in international securities are maintained in U.S. dollars on the following basis:
(I) market value of investment securities, assets and liabilities at the current rate of exchange; and
(II) purchases and sales of investment securities, income and expenses at the relevant rates of exchange prevailing on the respective dates of such transactions.
The Funds do not isolate that portion of gains and losses on investments in equity securities that is due to changes in the foreign exchange rates from that which is due to changes in market prices of equity securities.
The Funds report certain foreign-currency-related transactions as components of realized gains for financial reporting purposes, whereas such components are treated as ordinary income for Federal income tax purposes.
Repurchase Agreements — To the extent consistent with its investment objective and strategies, a Fund may enter into repurchase agreements which are secured by obligations of the U.S. Government with a bank, broker-dealer or other financial institution. Each repurchase agreement is at least 102% collateralized and marked-to-market. However, in the event of default or bankruptcy by the counterparty to the repurchase agreement, realization of the collateral may by subject to certain costs, losses or delays.
Futures Contracts — To the extent consistent with its investment objective and strategies, a Fund may use futures contracts for tactical hedging purposes as well as to enhance the Fund’s returns. These Funds’ investments in futures contracts are designed to enable the Funds to more closely approximate the performance of their benchmark indices. Initial margin deposits of cash or securities are made upon entering into futures contracts. The contracts are marked-to-market daily and the resulting changes in value are accounted for as unrealized gains and losses. Variation margin payments are paid or received, depending upon whether unrealized gains or losses are incurred. When contracts are closed, the Funds record a realized gain or loss equal to the difference between the proceeds from (or cost of) the closing transaction and the amount invested in the contract.
Risks of entering into futures contracts include the possibility that there will be an imperfect price correlation between the futures and the underlying securities. Second, it is possible that a lack of liquidity for futures contracts could exist in the secondary market, resulting in an inability to close a position prior to its maturity date. Third, futures contracts involve the risk that a Fund could lose more than the original margin deposit required to initiate a futures transaction.
Finally, the risk exists that losses could exceed amounts disclosed on the Statements of Assets and Liabilities. Refer to each Fund’s Schedule of Investments for details regarding open futures contracts as of June 30, 2018, if applicable.
| | | | |
New Covenant Funds / Annual Report / June 30, 2018 | | | 47 | |
NOTES TO FINANCIAL STATEMENTS (Continued)
June 30, 2018
Options Writing/Purchasing — To the extent consistent with its investment objective and strategies, a Fund may invest in financial options contracts for the purpose of hedging its existing portfolio securities, or securities that a Fund intends to purchase, against fluctuations in fair market value caused by changes in prevailing market interest rates. A Fund may also invest in financial option contracts to enhance its returns. When the Fund writes or purchases an option, an amount equal to the premium received or paid by the Fund is recorded as a liability or an asset and is subsequently adjusted to the current market value of the option written or purchased. Premiums received or paid from writing or purchasing options which expire unexercised are treated by the Fund on the expiration date as realized gains or losses. The difference between the premium and the amount paid or received on affecting a closing purchase or sale transaction, including brokerage commissions, is also treated as a realized gain or loss. If an option is exercised, the premium paid or received is added to the cost of the purchase or proceeds from the sale in determining whether the Fund has realized a gain or a loss.
The risk in writing a call option is a Fund may give up the opportunity for profit if the market price of the security increases. The risk in writing a put option is a Fund may incur a loss if the market price of the security decreases and the option is exercised. The risk in purchasing an option is a Fund may pay a premium whether or not the option is exercised. The Funds also have the additional risk of being unable to enter into a closing transaction at an acceptable price if a liquid secondary market does not exist. Option contracts also involve the risk that they may not work as intended due to unanticipated developments in market conditions or other causes.
Forward Treasury Commitments — To the extent consistent with its investment objective and strategies, the Growth Fund and Income Fund may invest in commitments to purchase U.S. Treasury securities on an extended settlement basis. Such transactions involve the commitment to purchase a security with payment and delivery taking place in the future, sometimes a month or more after the transaction date. The Funds account for such transactions as purchases and sales and record an unrealized gain or loss each day equal to the difference between the cost of the purchase commitment and the current market value. Realized gains or losses are recorded upon closure or settlement of such commitments. No interest is earned prior to settlement of the transaction. These instruments are subject to market fluctuation due to changes in interest rates and the market value at the time of settlement could be higher or lower than the purchase price. A Fund may incur losses due to changes in the value of the underlying treasury securities from interest rate fluctuations or as a result of counterparty nonperformance. These transactions may increase the overall investment exposure for a Fund (and so may also create investment leverage) and involve a risk of loss if the value of the securities declines prior to the settlement date.
Master Limited Partnerships — To the extent consistent with its investment objective and strategies, a Fund may invest in entities commonly referred to as “MLPs” that are generally organized under state law as limited partnerships or limited liability companies. The Funds intend to primarily invest in MLPs receiving partnership taxation treatment under the Internal Revenue Code of 1986 (the “Code”), and whose interests or “units” are traded on securities exchanges like shares of corporate stock. To be treated as a partnership for U.S. federal income tax purposes, an MLP whose units are traded on a securities exchange must receive at least 90% of its income from qualifying sources such as interest, dividends, real estate rents, gain from the sale or disposition of real property, income and gain from mineral or natural resources activities, income and gain from the transportation or storage of certain fuels, and, in certain circumstances, income and gain from commodities or futures, for- wards and options with respect to commodities. Mineral or natural resources activities include exploration, development, production, processing, mining, refining, marketing and transportation (including pipelines) of oil and gas, minerals, geothermal energy, fertilizer, timber or industrial source carbon dioxide. An MLP consists of a general partner and limited partners (or in the case of MLPs organized as limited liability companies, a managing member and members). The general partner or managing member typically controls the operations and management of the MLP and has an ownership stake in the partnership. The limited partners or members, through their ownership of limited partner or member interests, provide capital to the entity, are intended to have no role in the operation and management of the entity and receive cash distributions. The MLPs themselves generally do not pay U.S. Federal income taxes. Thus, unlike investors in corporate securities, direct MLP investors are generally not subject to double taxation (i.e., corporate level tax and tax on corporate dividends). Currently, most MLPs operate in the energy and/or natural resources sector.
Delayed Delivery Transactions — To the extent consistent with its investment objective and strategies, the Growth Fund and Income Fund may purchase or sell securities on a when-issued or delayed delivery basis. These transactions involve a commitment by those Funds to purchase or sell securities for a predetermined price or yield, with payment and delivery taking place beyond the customary settlement period. When delayed delivery purchases are outstanding, the Funds will set aside liquid assets in an amount sufficient to meet the purchase price. When
| | |
| 48 | | New Covenant Funds / Annual Report / June 30, 2018 |
purchasing a security on a delayed delivery basis, that Fund assumes the rights and risks of ownership of the security, including the risk of price and yield fluctuations, and takes such fluctuations into account when determining its net asset value. Those Funds may dispose of or renegotiate a delayed delivery transaction after it is entered into, and may sell when-issued securities before they are delivered, which may result in a capital gain or loss. When those Funds have sold a security on a delayed delivery basis, that Fund does not participate in future gains and losses with respect to the security.
Dividends and Distributions to Shareholders — Dividends from net investment income are declared and paid to shareholders quarterly for the Growth Fund, Balanced Growth Fund and Balanced Income Fund; declared and paid monthly for the Income Fund. Dividends and distributions are recorded on the ex-dividend date. Any net realized capital gains will be distributed at least annually by the Funds.
Illiquid Securities — A security is considered illiquid if it cannot be sold or disposed of in the ordinary course of business within seven days or less for its approximate carrying value on the books of a Fund. Valuations of illiquid securities may differ significantly from the values that would have been used had an active market value for these securities existed. As of June 30, 2018, the Funds did not own any illiquid securities.
Investments in Real Estate Investment Trusts (“REITs”) — Dividend income is recorded based on the income included in distributions received from the REIT investments using published REIT reclassifications including some management estimates when actual amounts are not available. Distributions received in excess of this estimated amount are recorded as a reduction of the cost of investments or reclassified to capital gains. The actual amounts of income, return of capital, and capital gains are only determined by each REIT after its fiscal year-end, and may differ from the estimated amounts.
3. AGREEMENTS AND OTHER TRANSACTIONS WITH AFFILIATES
Administration Agreement — The Trust entered into an Administration Agreement with SEI Investments Global Funds Services (the “Administrator”). Under the Administration Agreement, the Administrator provides administrative and accounting services to the Funds. Under the terms of the Administration Agreement, the Administrator is entitled to a fee of 0.20% of each Fund’s average daily net assets. The Administrator has voluntarily agreed to waive a portion of its fee so that the total annual expenses of the Balanced Growth Fund and the Balanced Income Fund, exclusive of acquired fund fees and expenses, will not exceed certain voluntary expense limitations adopted by the Adviser. Accordingly, effective April 1, 2017, the voluntary expense limitations are 0.13% and 0.15% for the Balanced Growth Fund and the Balanced Income Fund, respectively. These voluntary waivers may be terminated by the adviser at any time.
Transfer Agent Servicing Agreement — In 2008, the Trust entered into a transfer agent servicing agreement (“Agreement”) with U.S. Bancorp Fund Services, LLC (“USBFS”), an indirect, wholly-owned subsidiary of U.S. Bancorp. Under the terms of the Agreement, USBFS is entitled to account based fees and annual fund level fees, as well as reimbursement of out-of-pocket expenses incurred in providing transfer agency services.
Investment Advisory Agreement — The Trust, on behalf of each Fund, entered into an Investment Advisory Agreement (“Agreement”) with SEI Investments Management Corporation (the “Adviser”). Under the Agreement, the Adviser is responsible for the investment management of the Funds and receives an annual advisory fee of 0.62% for the Growth Fund and 0.42% for the Income Fund. The Adviser does not receive an advisory fee for the Balanced Growth Fund and Balanced Income Fund. The Adviser has voluntarily agreed to waive a portion of its fee so that the total annual expenses of the Growth and Income Funds, exclusive of acquired fund fees and expenses, will not exceed certain voluntary expense limitations adopted by the Adviser. Accordingly, effective April 1, 2017, the voluntary expense limitation is 0.80% and 0.87% for the Income Fund and Groth Fund, respectively.
The Adviser has entered into sub-advisory agreements to assist in the selection and management of investment securities in the Growth Fund and the Income Fund. It is the responsibility of the sub-advisers, under the direction of the Adviser, to make day-to-day investment decisions for these Funds. The Adviser, not the Funds, pays each sub-adviser a quarterly fee, in arrears, for their services. The Adviser pays sub-advisory fees directly from its own advisory fee. The sub-advisory fees are based on the assets of the Fund allocated to the sub-adviser for which the sub- adviser is responsible for making investment decisions.
The following are the sub-advisers for the Growth Fund: BlackRock Investment Management, LLC, Brandywine Global Investment Management, LLC, Coho Partners, Ltd. and Parametric Portfolio Associates LLC.
| | | | |
New Covenant Funds / Annual Report / June 30, 2018 | | | 49 | |
NOTES TO FINANCIAL STATEMENTS (Continued)
June 30, 2018
The following are the sub-advisers for the Income Fund: Income Research & Management, Western Asset Management Company and Western Asset Management Company Limited.
Shareholder Service Plan and Agreement — The Trust entered into a Shareholder Service Plan and Agreement (the “Agreement”) with the Distributor. Per the Agreement, a Fund is authorized to make payments to certain entities which may include investment advisors, banks, trust companies and other types of organizations (“Authorized Service Providers”) for providing administrative services with respect to shares of the Funds attributable to or held in the name of the Authorized Service Providers for its clients or other parties with whom they have a servicing relationship. Under the terms of the Agreement, the Growth Fund and the Income Funds are authorized to pay an Authorized Service Provider a shareholder servicing fee at an annual rate of up to 0.10% of the average daily net asset value of the Growth Fund and Income Fund, respectively, which fee will be computed daily and paid monthly, for providing certain administrative services to Fund shareholders with whom the Authorized Service Provider has a servicing relationship.
Distribution Agreement — The Trust issues shares of the Funds pursuant to a Distribution Agreement with SEI Investments Distribution Co. (the “Distributor”), a wholly owned subsidiary of SEI Investments Company (“SEI”). In consideration of the services and facilities to be provided by the Distributor or any service provider, each of the Growth Fund and the Income Fund (if such Fund has issued Shares) will pay to the Distributor a fee, as agreed from time to time, at an annual rate of up to 0.10% (ten basis points) of the average daily net asset value of the Growth Fund and the Income Fund, respectively, which fee will be computed daily and paid monthly.
Social Witness Services and License Agreement — The Trust retained New Covenant Trust Company (“NCTC”) to ensure that each Fund continues to invest consistent with social witness principles adopted by the General Assembly of the Presbyterian Church (U.S.A.). No less than annually, NCTC will provide the Trust with an updated list of issuers in which the Funds will be prohibited from investing.
NCTC will distribute to the Trust proxy voting guidelines and shareholder advocacy services for the Funds that NCTC deems to be consistent with social witness principles adopted by the General Assembly of the Presbyterian Church (U.S.A.). The Trust also engages NCTC to vote Fund proxies consistent with such proxy voting guidelines. NCTC shall monitor and review and, as necessary, amend the Proxy Voting Guidelines periodically to ensure that they remain consistent with the social witness principles.
NCTC also grants to the Trust a non-exclusive right and license to use and refer to the trade name, trademark and/ or service mark rights to the name “New Covenant Funds” and the phrase “Funds with a Mission”, in the name of the Trust and each Fund, and in connection with the offering, marketing, promotion, management and operation of the Trust and the Funds.
In consideration of the services provided by NCTC, the Growth Fund and the Income Fund will each pay to NCTC a fee at an annual rate of 0.15% of the average daily net asset value of the shares of such Fund, which fee will be computed daily and paid monthly.
Payment to Affiliates — Certain officers and/or interested trustees of the Trust are also officers of the Distributor, the Adviser, the Administrator or NCTC. The Trust pays each unaffiliated Trustee an annual fee for attendance at quarterly and interim board meetings. Compensation of officers and affiliated Trustees of the Trust is paid by the Adviser, the Administrator or NCTC.
A portion of the services provided by the Chief Compliance Officer (“CCO”) and his staff, whom are employees of the Administrator, are paid for by the Trust as incurred. The services include regulatory oversight of the Trust’s Adviser, sub-advisers and service providers as required by SEC regulations. The CCO’s services have been approved by and are reviewed annually by the Board.
Investment in Affiliated Security — The Funds may invest excess cash in the SEI Daily Income Trust (SDIT) Government Fund, an affiliated money market fund. The Balanced Funds invest in the Growth Fund and Income Fund.
Interfund Lending — The SEC has granted an exemption that permits the Trust to participate in an interfund lending program (the ‘‘Program’’) with existing or future investment companies registered under the 1940 Act that are advised by SIMC (the ‘‘SEI Funds’’). The Program allows the SEI Funds to lend money to and borrow money from each other for temporary or emergency purposes. Participation in the Program is voluntary for both borrowing and lending funds. Interfund loans may be made only when the rate of interest to be charged is more favorable to the lending fund than an investment in overnight repurchase agreements (‘‘Repo Rate’’), and more favorable
| | |
| 50 | | New Covenant Funds / Annual Report / June 30, 2018 |
to the borrowing fund than the rate of interest that would be charged by a bank for short-term borrowings (‘‘Bank Loan Rate’’). The Bank Loan Rate will be determined using a formula reviewed annually by the SEI Funds’ Board of Trustees. The interest rate imposed on interfund loans is the average of the Repo Rate and the Bank Loan Rate. During the year ended June 30, 2018, the Trust did not participate in interfund lending.
4. DERIVATIVE TRANSACTIONS
The International Swaps and Derivatives Association, Inc. Master Agreements and Credit Support Annexes (“ISDA Master Agreements”) maintain provisions for general obligations, representations, agreements, collateral, and events of default or termination. The occurrence of a specified event of termination may give a counterparty the right to terminate all of its contracts and affect settlement of all outstanding transactions under the applicable ISDA Master Agreement.
To reduce counterparty risk with respect to Over The Counter (“OTC”) transactions, the Funds have entered into master netting arrangements, established within the Fund’s ISDA master agreements, which allow the Funds to make (or to have an entitlement to receive) a single net payment in the event of default (close-out netting) for outstanding payables and receivables with respect to certain OTC positions in swaps for each individual counterparty. In addition, the Funds may require that certain counterparties post cash and/or securities in collateral accounts to cover their net payment obligations for those derivative contracts subject to ISDA Master Agreements. If the counterparty fails to perform under these contracts and agreements, the cash and/or securities will be made available to the Funds.
For financial reporting purposes, the Funds do not offset derivative assets and derivative liabilities that are subject to netting arrangements in the Statement of Assets and Liabilities and therefore disclose these derivative assets and derivative liabilities on a gross basis. Bankruptcy or insolvency laws of a particular jurisdiction may impose restrictions on or prohibitions against the right of offset in bankruptcy, insolvency or other events.
Collateral terms are contract specific for OTC derivatives. For derivatives traded under an ISDA Master Agreement, the collateral requirements are typically calculated by netting the mark to market amount of each transaction under such agreement and comparing that amount to the value of any collateral currently pledged by the Funds or the counterparty. For financial reporting purposes, cash collateral that has been pledged to cover obligations of the Funds, if any, is reported separately on the Statement of Assets and Liabilities as cash pledged as collateral. Non-cash collateral pledged by the Funds, if any, is noted in the Schedules of Investments. Generally, the amount of collateral due from or to a party must exceed a minimum transfer amount threshold before a transfer has to be made. To the extent amounts due to the Funds from its counterparties are not fully collateralized, contractually or otherwise, the Funds bear the risk of loss from counterparty nonperformance.
The following is a summary of the variation margin of exchange-traded financial derivative instruments of the Funds as of June 30, 2018 ($ Thousands):
| | | | | | |
| | | Financial Derivative Asset | | | | Financial Derivative Liability |
| | | Variation Margin Asset | | | | Variation Margin Liability |
| Fund | | Futures | | | | Futures |
Income Fund | | $2 | | | | $29 |
Cash with a total market value of $209 ($ Thousands) has been pledged as collateral for exchange-traded derivative instruments as of June 30, 2018.
| | | | |
New Covenant Funds / Annual Report / June 30, 2018 | | | 51 | |
NOTES TO FINANCIAL STATEMENTS (Continued)
June 30, 2018
5. INVESTMENT TRANSACTIONS
The cost of security purchases and the proceeds from the sale and maturities of securities, excluding U.S. government and other short-term investments, for the year ended June 30, 2018, were as follows:
| | | | | | | | | | | | | | | | |
| Fund | | Purchases
(excluding Short-Term
Investments &
U.S. Government
Securities) ($ Thousands) | | | Sales (excluding
Short-Term
Investments &
U.S. Government
Securities) ($ Thousands) | | | Purchases of
U.S. Government
Securities ($ Thousands) | | | Sales of U.S. Government
Securities ($ Thousands) | |
Growth Fund | | $ | 101,091 | | | $ | 129,832 | | | | $ — | | | | $ — | |
Income Fund | | | 55,942 | | | | 37,899 | | | | 638,560 | | | | 633,127 | |
Balanced Growth Fund | | | 32,279 | | | | 39,051 | | | | — | | | | — | |
Balanced Income Fund | | | 7,411 | | | | 10,099 | | | | — | | | | — | |
6. FEDERAL TAX INFORMATION
It is each Fund’s intention to continue to qualify as a regulated investment company under Subchapter M of the Internal Revenue Code and distribute all of its taxable income (including net capital gains). Accordingly, no provision for federal income tax is required.
Dividends from net investment income and distributions from net realized capital gains are determined in accordance with U.S. Federal income tax regulations, which may differ from those amounts determined under U.S. GAAP. These book/tax differences are either temporary or permanent in nature. To the extent these differences are permanent, they are charged or credited to paid-in capital, undistributed net investment income or accumulated net realized gain, as appropriate, in the period that the differences arise.
Accordingly, the following permanent differences, primarily attributable to different treatment for gains and losses on paydowns of mortgage and asset-backed securities for tax purposes, reclassification of long term capital gain distributions on Real Estate Investment Trust securities, foreign exchange gain and loss, reclassification of income from Passive Foreign Investment Companies, non-deductible expenses, expired CLCO and basis adjustments for investments in partnerships, have been reclassified to/ (from) the following accounts as of June 30, 2018:
| | | | | | | | | | | | |
| | | Undistributed
Net Investment
Income (Loss)
($ Thousands) | | | Accumulated
Net Realized
Gain (Loss)
($ Thousands) | | | Paid-in
Capital ($ Thousands) | |
Growth Fund | | | $ (73) | | | | $ 72 | | | | $ 1 | |
Income Fund | | | 277 | | | | 50,750 | | | | (51,027) | |
Balanced Growth Fund | | | 427 | | | | (412) | | | | (15) | |
Balanced Income Fund | | | 68 | | | | (65) | | | | (3) | |
The tax character of dividends and distributions paid during the last two years ended June 30 were as follows:
| | | | | | | | | | | | | | | | | | | | |
| | | | | | |
| | | | | | Ordinary
Income
($ Thousands) | | | Long Term
Capital Gains
($ Thousands) | | | Total Taxable
Deductions
($ Thousands) | | | Total
Distributions Paid
($ Thousands) | |
Growth Fund | | | 2018 | | | | $ 5,007 | | | | $ 23,033 | | | | $ 28,040 | | | | $ 28,040 | |
| | | 2017 | | | | 2,811 | | | | — | | | | 2,811 | | | | 2,811 | |
Income Fund | | | 2018 | | | | 6,403 | | | | — | | | | 6,403 | | | | 6,403 | |
| | | 2017 | | | | 5,601 | | | | — | | | | 5,601 | | | | 5,601 | |
Balanced Growth Fund | | | 2018 | | | | 2,619 | | | | 2,087 | | | | 4,706 | | | | 4,706 | |
| | | 2017 | | | | 2,992 | | | | 6,915 | | | | 9,907 | | | | 9,907 | |
Balanced Income Fund | | | 2018 | | | | 1,114 | | | | 583 | | | | 1,697 | | | | 1,697 | |
| | | 2017 | | | | 1,036 | | | | 967 | | | | 2,003 | | | | 2,003 | |
| | |
| 52 | | New Covenant Funds / Annual Report / June 30, 2018 |
As of June 30, 2018, the components of distributable earnings (accumulated losses) were as follows:
| | | | | | | | | | | | | | | | | | | | | | | | | | | | | | | | | | | | | | | | | | | | | | | | | | | | | | | | |
| | | | | | Undistributed
Ordinary
Income ($ Thousands) | | | | | | Undistributed
Long-Term
Capital Gain
($ Thousands) | | | | | | Capital Loss
Carryforwards
($ Thousands) | | | | | | Post- October
Losses
($ Thousands) | | | | | | Unrealized
Appreciation
(Depreciation) ($ Thousands) | | | | | | Other
Temporary
Differences ($ Thousands) | | | | | | Total
Distributable
Earnings
(Accumulated
Losses) ($ Thousands) | |
New Covenant Growth Fund | | $ | | | | | 1,498 | | | $ | | | | | 20,398 | | | $ | | | | | — | | | $ | | | | | — | | | $ | | | | | 102,068 | | | $ | | | | | — | | | $ | | | | | 123,964 | |
New Covenant Income Fund | | | | | | | 634 | | | | | | | | — | | | | | | | | (898 | ) | | | | | | | (2,070 | ) | | | | | | | (4,870 | ) | | | | | | | (685 | ) | | | | | | | (7,889 | ) |
New Covenant Balanced Growth Fund | | | | | | | 2,249 | | | | | | | | 10,962 | | | | | | | | — | | | | | | | | — | | | | | | | | 55,141 | | | | | | | | — | | | | | | | | 68,352 | |
New Covenant Balanced Income Fund | | | | | | | 430 | | | | | | | | 1,990 | | | | | | | | — | | | | | | | | — | | | | | | | | 9,873 | | | | | | | | — | | | | | | | | 12,293 | |
Post October losses represent losses realized on investment transactions from November 1, 2017 through June 30, 2018 that, in accordance with Federal income tax regulations, the Funds may defer and treat as having arisen in the following fiscal year. Deferred Late-Year Losses represent ordinary losses realized on investment transactions from January 1, 2018 through June 30, 2018 and specified losses realized on investment transactions from November 1, 2016 through June 30, 2018, that, in accordance with Federal income tax regulations, the Fund defers and treats as having arisen in the following fiscal year.
For Federal income tax purposes, capital loss carryforwards incurred in taxable years beginning before December 22, 2010 may be carried forwards for a maximum period of eight years and applied against future net realized gains. At June 30, 2018, the breakdown of capital loss carryforwards was as follow:
| | | | | | | | |
| | | Expires 2018 ($ Thousands) | | | Total Capital Loss Carryforwards
($ Thousands) June 30, 2018 | |
Income Fund | | | $ 51,027 | | | | $0 | |
Under the recently enacted Regulated Investment Company Modernization Act of 2010, the Funds are permitted to carry forward capital losses incurred in taxable years beginning after December 22, 2010 for an unlimited period. However, any losses incurred during those future taxable years will be required to be utilized prior to the losses incurred in pre-enactment taxable years. As a result of this ordering rule, pre-enactment capital loss carryforwards may be more likely to expire unused. Additionally, post-enactment capital losses that are carried forward will retain their character as either short-term or long-term capital losses rather than being considered all short-term as under previous law. Losses carried forward under these new provisions are as follows:
| | | | | | | | | | | | |
| | | Short-Term Loss
($ Thousands) | | | Long-Term Loss
($ Thousands) | | | Total* ($ Thousands) | |
Income Fund | | | $0 | | | | $898 | | | | $898 | |
*This table should be used in conjunction with the capital loss carryforwards table.
For Federal income tax purposes, the cost of securities owned at June 30, 2018, and the net realized gains or losses on securities sold for the period were not materially different from amounts reported for financial reporting purposes. These differences are primarily due to wash sales, MLP basis adjustments and basis adjustments from investments in registered investment companies which cannot be used for Federal income tax purposes in the current year and have been deferred for use in future years.
The aggregate gross unrealized appreciation and depreciation on total investments held by the Funds at June 30, 2018 was as follows:
| | | | | | | | | | | | | | | | |
| | | Federal Tax Cost ($ Thousands) | | | Appreciated
Securities ($ Thousands) | | | Depreciated
Securities ($ Thousands) | | | Net Unrealized
Appreciation
(Depreciation) ($ Thousands) | |
Growth Fund | | | $ 322,054 | | | | $ 114,002 | | | | $ (11,934) | | | | $ 102,068 | |
Income Fund | | | 442,918 | | | | 8 | | | | (4,882) | | | | (4,874) | |
Balanced Growth Fund | | | 235,110 | | | | 57,182 | | | | (2,041) | | | | 55,141 | |
Balanced Income Fund | | | 67,358 | | | | 12,112 | | | | (2,239) | | | | 9,873 | |
| | | | |
New Covenant Funds / Annual Report / June 30, 2018 | | | 53 | |
NOTES TO FINANCIAL STATEMENTS (Concluded)
June 30, 2018
Management has analyzed the Funds’ tax positions taken on Federal income tax returns for all open tax years and has concluded that as of June 30, 2018, no provision for income tax would be required in the Funds’ financial statements. The Funds’ Federal and state income and Federal excise tax returns for tax years for which the applicable statutes of limitations have not expired are subject to examination by the Internal Revenue Service and state departments of revenue.
7. CONCENTRATIONS/RISKS
In the normal course of business, the Trust enters into contracts that provide general indemnifications by the Trust to the counterparty to the con- tract. The Trust’s maximum exposure under these arrangements is dependent on future claims that may be made against the Trust and, therefore, cannot be estimated; however, management believes that, based on experience, the risk of loss from such claims is considered remote.
The market values of the Income Fund’s investments may change in response to interest rate changes and other factors. During periods of falling interest rates, the values of fixed income securities generally rise. Conversely, during periods of rising interest rates, the values of such securities generally decline. Changes by recognized rating agencies in the ratings of any fixed income security and in the ability of an issuer to make payments of interest and principal may also affect the value of these investments.
The Growth Fund concentrates its investments in securities of foreign issuers in various countries. These investments may involve certain considerations and risks not typically associated with investments in the United States, as a result of, among other factors, the possibility of future political and economic developments and the level of governmental supervision and regulation of securities markets in the respective countries.
The Funds will not invest more than 15% of the value of their net assets in securities that are illiquid because of restrictions on transferability or other reasons. Repurchase agreements with deemed maturities in excess of seven days are subject to this 15% limit. The Funds may purchase securities which are not registered under the Securities Act of 1933 (the “Securities Act”) but which can be sold to “qualified institutional buyers” in accordance with Rule 144A under the Securities Act. In some cases, such securities are classified as “illiquid securities;” however, any such security will not be considered illiquid so long as it is determined by the Adviser, under guidelines approved by the Board of Trustees, that an adequate trading market exists for that security. This investment practice could have the effect of increasing the level of illiquidity in a Fund during any period that qualified institutional buyers become uninterested in purchasing these restricted securities.
The Income Fund may invest a limited amount of assets in debt securities which are rated below investment grade (hereinafter referred to as “lower- rated securities”) or which are unrated but deemed equivalent to those rated below investment grade by the portfolio managers. The lower the ratings of such debt securities, the greater their risks. These debt instruments generally offer a higher current yield than that available from higher-grade issues, and typically involve greater risks. The yields on lower-rated securities will fluctuate over time. In general, prices of all bonds rise when interest rates fall and fall when interest rates rise. Lower-rated securities are subject to adverse changes in general economic conditions and to changes in the financial condition of their issuers. During periods of economic downturn or rising interest rates, issuers of these instruments may experience financial stress that could adversely affect their ability to make payments of principal and interest, and increase the possibility of default.
The Balanced Growth Fund and Balanced Income Fund invest their assets primarily in the Growth Fund and the Income Fund. By investing primarily in shares of these Funds, shareholders of the Balanced Funds indirectly pay a portion of the operating expenses, management fees and brokerage costs of the underlying Funds as well as their own operating expenses. Thus, shareholders of the Balanced Funds may indirectly pay slightly higher total operating expenses and other costs than they would pay by directly owning shares of the Growth Fund and Income Fund. A change in the asset allocation of either Balanced Fund could increase or reduce the fees and expenses actually borne by investors in that Fund. The Balanced Funds are also subject to rebalancing risk. Rebalancing activities, while undertaken to maintain a Fund’s investment risk-to- reward ratio, may cause the Fund to under-perform other funds with similar investment objectives. For the Balanced Growth Fund, it is possible after rebalancing from equities into a greater percentage of fixed-income securities, that equities will outperform fixed income investments. For the Balanced Income Fund, it is possible that after rebalancing from fixed-income securities into a greater percentage of equity securities, that fixed-income securities will outperform equity investments. The performance of the Balanced Growth Fund and the Balanced Income Fund depends on the performance of the underlying Funds in which they invest.
| | |
| 54 | | New Covenant Funds / Annual Report / June 30, 2018 |
8. CONCENTRATION OF SHAREHOLDERS
On June 30, 2018, the number of shareholders below held the following percentage of the outstanding shares of the Funds. These shareholders are affiliated with the Funds.
| | | | |
| | | |
| | | # of Shareholders | | % of Outstanding Shares |
Growth Fund | | 3 | | 50.22% |
Income Fund | | 3 | | 56.35% |
Balanced Growth Fund | | 1 | | 1.0% |
Balanced Income Fund | | 1 | | 0.9% |
9. SUBSEQUENT EVENTS
Management has evaluated the need for disclosures and/or adjustments resulting from subsequent events through the date the financial statements were issued. Based on this evaluation, no disclosures and/or adjustments were required to the financial statements as of June 30, 2018.
| | | | |
New Covenant Funds / Annual Report / June 30, 2018 | | | 55 | |
REPORT OF INDEPENDENT REGISTERED PUBLIC ACCOUNTING FIRM
THE BOARD OF TRUSTEES AND SHAREHOLDERS
NEW COVENANT FUNDS:
Opinion on the Financial Statements
We have audited the accompanying statements of assets and liabilities, including the schedules of investments, of New Covenant Funds (the “Trust”), comprised of the New Covenant Growth Fund, New Covenant Income Fund, New Covenant Balanced Growth Fund, and New Covenant Balanced Income Fund (collectively, the “Funds”), as of June 30, 2018, and the related statements of operations for the year then ended, the statements of changes in net assets for each of the years in the two-year period then ended, and the financial highlights for each of the years in the five-year period then ended. In our opinion, the financial statements and financial highlights present fairly, in all material respects, the financial position of the Funds as of June 30, 2018, the results of their operations for the year then ended, the changes in their net assets for each of the years in the two-year period then ended, and the financial highlights for each of the years in the five-year period then ended, in conformity with U.S. generally accepted accounting principles.
Basis for Opinion
These financial statements and financial highlights are the responsibility of the Funds’ management. Our responsibility is to express an opinion on these financial statements and financial highlights based on our audits. We are a public accounting firm registered with the Public Company Accounting Oversight Board (United States) (“PCAOB”) and are required to be independent with respect to the Funds in accordance with the U.S. federal securities laws and the applicable rules and regulations of the Securities and Exchange Commission and the PCAOB.
We conducted our audits in accordance with the standards of the PCAOB. Those standards require that we plan and perform the audits to obtain reasonable assurance about whether the financial statements and financial highlights are free of material misstatement, whether due to error or fraud. Our audits included performing procedures to assess the risks of material misstatement of the financial statements and financial highlights, whether due to error or fraud, and performing procedures that respond to those risks. Such procedures included examining, on a test basis, evidence regarding the amounts and disclosures in the financial statements and financial highlights. Such procedures also included confirmation of securities owned as of June 30, 2018, by correspondence with the custodian, transfer agent, and brokers or by other appropriate auditing procedures when replies from brokers were not received. Our audits also included evaluating the accounting principles used and significant estimates made by management, as well as evaluating the overall presentation of the financial statements and financial highlights. We believe that our audits provide a reasonable basis for our opinion.

We have served as the auditor of one or more SEI Funds investment companies since 2005.
Philadelphia, Pennsylvania
August 28, 2018
| | |
| 56 | | New Covenant Funds / Annual Report / June 30, 2018 |
TRUSTEES AND OFFICERS OF THE TRUST (Unaudited)
The following chart lists Trustees and Officers as of June 30, 2018.
Set forth below are the names, addresses, ages, position with the Trust, Term of Office and Length of Time Served, the principal occupations for the last five years, number of positions in fund complex overseen by trustee, and other directorships outside the fund complex of each of the persons currently serving as Trustees and Officers of the Trust. The Trust’s Statement of Additional Information (“SAI”) includes additional information about the Trustees and Officers. The SAI may be obtained without charge by calling 1-800-342-5734.
| | | | | | | | | | |
Name, Address, and Age | | Position(s)
Held with
Trusts | | Term of
Office and
Length of
Time Served1 | | Principal Occupation(s) During Past Five Years | | Number of
Portfolios in Fund Complex Overseen
by Trustee2 | | Other Directorships Held by Trustee |
INTERESTED TRUSTEES | | | | | | | | |
Robert A. Nesher One Freedom Valley Drive Oaks, PA 19456 70 yrs. old | | Chairman
of the
Board of
Trustees* | | since 1995 | | Currently performs various services on behalf of SEI for which Mr. Nesher is compensated. | | 104 | | Vice Chairman of The Advisors’ Inner Circle Fund III, Winton Series Trust and Winton Diversified Opportunities Fund since 2014. Vice Chairman of Gallery Trust since 2015. President and Director of SEI Structured Credit Fund, LP. Director of SEI Global Master Fund plc, SEI Global Assets Fund plc, SEI Global Investments Fund plc, SEI Investments—Global Funds Services, Limited, SEI Investments Global, Limited, SEI Investments (Europe) Ltd., SEI Multi-Strategy Funds PLC, SEI Global Nominee Ltd and SEI Investments—Unit Trust Management (UK) Limited. Director and President of SEI Opportunity Fund, L.P. to 2010. President, Director and Chief Executive Officer of SEI Alpha Strategy Portfolios, LP from 2007 to 2013. Trustee of SEI Liquid Asset Trust from 1989 to 2016. Vice Chairman of O’Connor EQUUS (closed-end investment company) from 2014 to 2016. Vice Chairman of The Advisors’ Inner Circle Fund III, Winton Series Trust, Winton Diversified Opportunities Fund (closed-end investment company) and Gallery Trust. Trustee of The Advisors’ Inner Circle Fund, The Advisors’ Inner Circle Fund II, Bishop Street Funds, and the KP Funds. President, Chief Executive Officer and Trustee of SEI Asset Allocation Trust, SEI Daily Income Trust, SEI Institutional Managed Trust, SEI Institutional International Trust, SEI Institutional Investments Trust, SEI Tax Exempt Trust, SEI Insurance Products Trust, Adviser Managed Trust, The New Covenant Funds and SEI Catholic Values Trust. |
William M. Doran One Freedom Valley Drive Oaks, PA 19456 76 yrs. old | | Trustee* | | since 1995 | | Self-employed consultant since 2003. Partner, Morgan, Lewis & Bockius LLP (law firm) from 1976 to 2003, counsel to the Trust, SEI, SIMC, the Administrator and the Distributor. | | 104 | | Director of SEI since 1974; Secretary of SEI since 1978. Director of SEI Investments Distribution Co. since 2003. Director of SEI Investments—Global Funds Services, Limited, SEI Investments Global, Limited, SEI Investments (Europe), Limited, SEI Investments (Asia) Limited, SEI Global Nominee Ltd. and SEI Investments—Unit Trust Management (UK) Limited. Trustee of SEI Liquid Asset Trust from 1982 to 2016. Trustee of O’Connor EQUUS from 2014 to 2016. Director of SEI Alpha Strategy Portfolios, LP from 2007 to 2013. Trustee of The Advisors’ Inner Circle Fund, The Advisors’ Inner Circle Fund II, The Advisors’ Inner Circle Fund III, Winton Series Trust, Winton Diversified Opportunities Fund, Gallery Trust, Bishop Street Funds, SEI Asset Allocation Trust, SEI Daily Income Trust, SEI Institutional Managed Trust, SEI Institutional International Trust, SEI Institutional Investments Trust, SEI Tax Exempt Trust, SEI Insurance Products Trust, Adviser Managed Trust, New Covenant Funds, The KP Funds and SEI Catholic Values Trust. |
TRUSTEES | | | | | | | | | | |
George J. Sullivan Jr. One Freedom Valley Drive, Oaks, PA 19456 74 yrs. old | | Trustee | | since 1996 | | Retired since January 2012. Self-Employed Consultant, Newfound Consultants Inc. April 1997-December 2011. | | 104 | | Member of the independent review committee for SEI’s Canadian-registered mutual funds. Director of SEI Opportunity Fund, L.P. to 2010. Director of SEI Alpha Strategy Portfolios, LP from 2007 to 2013. Trustee of SEI Liquid Asset Trust from 1996 to 2016. Trustee/Director of State Street Navigator Securities Lending Trust, The Advisors’ Inner Circle Fund, The Advisors’ Inner Circle Fund II, Bishop Street Funds, SEI Structured Credit Fund, LP, SEI Asset Allocation Trust, SEI Daily Income Trust, SEI Institutional Managed Trust, SEI Institutional International Trust, SEI Institutional Investments Trust, SEI Tax Exempt Trust, SEI Insurance Products Trust, Adviser Managed Trust, New Covenant Funds, The KP Funds and SEI Catholic Values Trust. |
| * | Messrs. Nesher and Doran are Trustees who may be deemed as “interested” persons of the Trust as that term is defined in the 1940 Act by virtue of their affiliation with SIMC and the Trust’s Distributor. |
| 1 | Each trustee shall hold office during the lifetime of this Trust until the election and qualification of his or her successor, or until he or she sooner dies, resigns or is removed in accordance with the Trust’s Declaration of Trust |
| 2 | The Fund Complex includes the following Trusts: SEI Asset Allocation Trust, SEI Daily Income Trust, SEI Institutional Investments Trust, Adviser Managed Trust, SEI Institutional International Trust, SEI Institutional Managed Trust, SEI Tax Exempt Trust, SEI Insurance Products Trust, SEI Catholic Values Trust and New Covenant Funds. |
| | | | |
New Covenant Funds / Annual Report / June 30, 2018 | | | 57 | |
TRUSTEES AND OFFICERS OF THE TRUST (Unaudited)(Concluded)
| | | | | | | | | | |
Name Address, and Age | | Position(s)
Held with
Trusts | | Term of
Office and
Length of
Time Served1 | | Principal Occupation(s) During Past Five Years | | Number of
Portfolios in Fund
Complex Overseen
by Trustee2 | | Other Directorships Held by Trustee |
TRUSTEES (continued) | | | | | | | | |
Nina Lesavoy One Freedom Valley Drive, Oaks, PA 19456 59 yrs. old | | Trustee | | since 2003 | | Founder and Managing Director, Avec Capital (strategic fundraising firm) since 2008. Managing Director, Cue Capital (strategic fundraising firm) from March 2002-March 2008. | | 104 | | Director of SEI Alpha Strategy Portfolios, LP from 2007 to 2013. Trustee of SEI Liquid Asset Trust from 2003 to 2016. Trustee/Director of SEI Structured Credit Fund, L.P., SEI Asset Allocation Trust, SEI Daily Income Trust, SEI Institutional Managed Trust, SEI Institutional International Trust, SEI Institutional Investments Trust, SEI Tax Exempt Trust, SEI Insurance Products Trust, New Covenant Funds, Adviser Managed Trust and SEI Catholic Values Trust. |
James M. Williams One Freedom Valley Drive, Oaks, PA 19456 69 yrs. old | | Trustee | | since 2004 | | Vice President and Chief Investment Officer, J. Paul Getty Trust, Non-Profit Foundation for Visual Arts, since December 2002. President, Harbor Capital Advisors and Harbor Mutual Funds, 2000-2002. Director of SEI Alpha Strategy Portfolios, L.P. from 2007 to 2013. Manager, Pension Asset Management, Ford Motor Company, 1997-1999. | | 104 | | Director of SEI Alpha Strategy Portfolios, LP from 2007 to 2013, Trustee of SEI Liquid Asset Trust from 2004 to 2016. Trustee/Director of Ariel Mutual Funds, SEI Structured Credit Fund, LP, SEI Asset Allocation Trust, SEI Daily Income Trust, SEI Institutional Managed Trust, SEI Institutional International Trust, SEI Institutional Investments Trust, SEI Tax Exempt Trust, New Covenant Funds, SEI Insurance Products Trust, Adviser Managed Trust and SEI Catholic Values Trust. |
Mitchell A. Johnson One Freedom Valley Drive, Oaks, PA 19456 74 yrs. old | | Trustee | | since 2007 | | Retired Private Investor since 1994. | | 104 | | Director, Federal Agricultural Mortgage Corporation (Farmer Mac) since 1997. Director of SEI Alpha Strategy Portfolios, LP from 2007 to 2013. Trustee of SEI Liquid Asset Trust from 2007 to 2016. Trustee of the Advisors’ Inner Circle Fund, The Advisors’ Inner Circle Fund II, Bishop Street Funds, SEI Asset Allocation Trust, SEI Daily Income Trust, SEI Institutional Managed Trust, SEI Institutional International Trust, SEI Institutional Investments Trust, SEI Tax Exempt Trust, SEI Insurance Products Trust, Adviser Managed Trust, The KP Funds and SEI Catholic Values Trust. |
Hubert L. Harris, Jr. One Freedom Valley Drive, Oaks, PA 19456 73 yrs. old | | Trustee | | since 2008 | | Retired since December 2005. Owner of Harris Plantation, Inc. since 1995. Chief Executive Officer of Harris CAPM, a consulting asset and property management entity. Chief Executive Officer, INVESCO North America, August 2003-December 2005. Chief Executive Officer and Chair of the Board of Directors, AMVESCAP Retirement, Inc., January 1998- August 2003. | | 104 | | Director of AMVESCAP PLC from 1993-2004. Served as a director of a bank holding company, 2003-2009. Director, Aaron’s Inc., 2012-present. President and CEO of Oasis Ornamentals LLC since 2011. Member of the Board of Councilors of the Carter Center (nonprofit corporation) and served on the board of other non-profit organizations. Director of SEI Alpha Strategy Portfolios, LP from 2008 to 2013. Trustee of Liquid Asset Trust from 2008 to 2016. Trustee of SEI Asset Allocation Trust, SEI Daily Income Trust, SEI Institutional Managed Trust, SEI Institutional International Trust, SEI Institutional Investments Trust, SEI Tax Exempt Trust, SEI Insurance Products Trust, New Covenant Funds, Adviser Managed Trust and SEI Catholic Values Trust. |
Susan C. Cote One Freedom Valley Drive Oaks, PA 19456 62 years old | | Trustee | | since 2016 | | Retired since July 2015. Americas Director of Asset Management, Ernst & Young LLP from 2006-2013. Global Asset Management Assurance Leader, Ernest & Young LLP from 2006- 2015. Partner Ernest & Young LLP from 1997-2015. Prudential, 1983-1997.Member of the Ernst & Young LLP Retirement Investment Committee, Treasurer and Chair of Finance, Investment and Audit Committee of the New York Women’s Foundation. | | 104 | | Trustee of SEI Tax Exempt Trust, SEI Daily Income Trust, SEI Institutional International Trust, SEI Institutional Managed Trust, SEI Asset Allocation Trust, SEI Institutional Investments Trust, SEI Insurance Products Trust, New Covenant Funds, Adviser Managed Trust and SEI Catholic Values Trust. |
Joan A. Binstock One Freedom Valley Drive Oaks, PA 19456 64 years old | | Trustee | | since 2018 | | Retired since February 2018. Chief Financial Officer and Chief Operations Officer at Lord, Abbett & Co. LLC from 1999 to 2018. Chief Financial Officer and Vice President at Lord, Abbett Family of Mutual Funds from 1999 to 2017. Chief Operating Officer at Morgan Grenfell Asset Management from 1997 to 1999. Director and Head of the Asset Management Regulatory Advisory Practice at Ernst & Young, LLP from 1995-1997. Vice President of Mutual Fund Accounting and Compliance at JPMorgan Fund Services from 1993-1995. Director and Chief Administrative/Compliance Officer at BEA Associates from 1991 to 1993. Member of the Board and Audit Committee at DTCC Institutional Trade Processing since 2013. Founding Board Member at Association of Institutional Investors since 2010. Vice Chair of the Board at Bronx High School of Science Endowment Fund since 2015. Board Member at Greyston Foundation since 2003 and at Greyston Bakery from 2003 to 2009 and since 2014. | | 104 | | Trustee of SEI Daily Income Trust, SEI Tax Exempt Trust, SEI Institutional Managed Trust, SEI Institutional International Trust, SEI Institutional Investments Trust, SEI Asset Allocation Trust, Adviser Managed Trust, New Covenant Funds, SEI Insurance Products Trust and SEI Catholic Values Trust |
James B. Taylor One Freedom Valley Drive Oaks, PA 19456 67 years old | | Trustee | | since 2018 | | Retired since December 2017. Chief Investment Officer at Georgia Teach Foundation from 2008 to 2017. Chief Investment Officer at Delta Air Lines from 1983 to 2007. Member of the Investment Committee at the Institute of Electrical and Electronic Engineers from 1999 to 2004. President, Vice President and Treasurer at Southern Benefits Conference from 1998 to 2000. | | 104 | | Trustee of SEI Daily Income Trust, SEI Tax Exempt Trust, SEI Institutional Managed Trust, SEI Institutional International Trust, SEI Institutional Investments Trust, SEI Asset Allocation Trust, Adviser Managed Trust, New Covenant Funds, SEI Insurance Products Trust and SEI Catholic Values Trust. |
| 1 | Each trustee shall hold office during the lifetime of this Trust until the election and qualification of his or her successor, or until he or she sooner dies, resigns or is removed in accordance with the Trust’s Declaration of Trust. |
| 2 | The Fund Complex includes the following Trusts: SEI Asset Allocation Trust, SEI Daily Income Trust, SEI Institutional Investments Trust, Adviser Managed Trust, SEI Institutional International Trust, SEI Institutional Managed Trust, SEI Tax Exempt Trust, SEI Insurance Products Trust, SEI Catholic Values Trust and New Covenant Funds. |
| | |
| 58 | | New Covenant Funds / Annual Report / June 30, 2018 |
| | | | | | | | | | | | |
Name Address, and Age | | Position(s)
Held with
Trusts | | | Term of Office and Length of
Time Served1 | | Principal Occupation(s) During Past Five Years | | Number of
Portfolios in
Fund Complex
Overseen by Trustee2 | | Other Directorships Held by Trustee |
OFFICERS | | | | | | | | | | | | |
Robert A. Nesher One Freedom Valley Drive, Oaks, PA 19456 70 yrs. Old | |
| President
and CEO |
| | since 2005 | | Currently performs various services on behalf of SEI for which Mr. Nesher is compensated. | | N/A | | N/A |
James J. Hoffmayer One Freedom Valley Drive Oaks, PA 19456 43 yrs. old | |
| Controller
and Chief
Financial
Officer |
| | since 2016 | | Senior Director, Funds Accounting and Fund Administration, SEI Investments Global Funds Services (since September 2016); Senior Director of Fund Administration, SEI Investments Global Funds Services (since October 2014). Director of Financial Reporting, SEI Investments Global Funds Services (November 2004 – October 2014). | | N/A | | N/A |
Glenn R. Kurdziel One Freedom Valley Drive Oaks, PA 19456 43 yrs. old | |
| Assistant
Controller
since 2017 |
| | | | Assistant Controller, Funds Accounting, SEI Investments Global Funds Services (March 2017); Senior Manager, Funds Accounting, SEI Investments Global Funds Services since 2005. | | N/A | | N/A |
Russell Emery One Freedom Valley Drive Oaks, PA 19456 54 yrs. old | |
| Chief
Compliance
Officer |
| | since 2006 | | Chief Compliance Officer of SEI Daily Income Trust, SEI Institutional Investments Trust, SEI Institutional Managed Trust, SEI Asset Allocation Trust, SEI Institutional International Trust, SEI Tax Exempt Trust, The Advisors’ Inner Circle Fund, The Advisors’ Inner Circle Fund II and Bishop Street Funds since March 2006. Chief Compliance Officer of SEI Liquid Asset Trust from 2006 to 2016. Chief Compliance Officer of SEI Structured Credit Fund, LP June 2007. Chief Compliance Officer of Adviser Managed Trust since December 2010. Chief Compliance Officer of SEI Alpha Strategy Portfolios, LP from 2007 to 2013. Chief Compliance Officer of New Covenant Funds since February 2012.Chief Compliance Officer of SEI Insurance Products Trust and The KP Funds since 2013. Chief Compliance Officer of New Covenant Funds since February 2012. Chief Compliance Officer of O’Connor EQUUS from 2014 to 2016. Chief Compliance Officer of The Advisors’ Inner Circle Fund III, Winton Series Trust and Winton Diversified Opportunities Fund since 2014. Chief Compliance Officer of SEI Catholic Values Trust and Gallery Trust since 2015. | | N/A | | N/A |
Timothy D Barto One Freedom Valley Drive Oaks, PA 19456 48 yrs. old | |
| Vice
President
and
Secretary |
| | since 2002 | | Vice President and Secretary of SEI Institutional Transfer Agent, Inc. since 2009. General Counsel and Secretary of SIMC and the Administrator since 2004. Vice President of SIMC and the Administrator since 1999. Vice President and Assistant Secretary of SEI since 2001. | | N/A | | N/A |
Aaron Buser One Freedom Valley Drive, Oaks, PA 19456 46 yrs. old | |
| Vice
President
and
Assistant
Secretary |
| | since 2008 | | Vice President and Assistant Secretary of SEI Institutional Transfer Agent, Inc. since 2009. Vice President and Assistant Secretary of SIMC since 2007. Attorney Stark & Stark (law firm), March 2004-July 2007. | | N/A | | N/A |
David F. McCann One Freedom Valley Drive, Oaks, PA 19456 40 yrs. old | |
| Vice
President
and
Assistant
Secretary |
| | since 2009 | | Vice President and Assistant Secretary of SEI Institutional Transfer Agent, Inc. since 2009. Vice President and Assistant Secretary of SIMC since 2008. Attorney, Drinker Biddle & Reath, LLP (law firm), May 2005 - October 2008. | | N/A | | N/A |
Stephen G. MacRae One Freedom Valley Drive, Oaks, PA 19456 49 yrs. old | |
| Vice
President |
| | since 2012 | | Director of Global Investment Product Management January 2004 - to present. | | N/A | | N/A |
Bridget E. Sudall One Freedom Valley Drive Oaks, PA 19456 36 yrs. old | |
| Anti-Money
Laundering
Compliance
Officer and
Privacy
Officer |
| | since 2015 | | Anti-Money Laundering Compliance Officer and Privacy Officer (since 2015), Senior Associate and AML Officer, Morgan Stanley Alternative Investment Partners, April 2011-March 2015, Investor Services Team Lead, Morgan Stanley Alternative Investment Partners, July 2007-April 2011. | | N/A | | N/A |
| 1 | Each trustee shall hold office during the lifetime of this Trust until the election and qualification of his or her successor, or until he or she sooner dies, resigns or is removed in accordance with the Trust’s Declaration of Trust. |
| 2 | The Fund Complex includes the following Trusts: SEI Asset Allocation Trust, SEI Daily Income Trust, SEI Institutional Investments Trust, Adviser Managed Trust, SEI Institutional International Trust, SEI Institutional Managed Trust, SEI Tax Exempt Trust, SEI Insurance Products Trust, SEI Catholic Values Trust and New Covenant Funds. |
| | | | |
New Covenant Funds / Annual Report / June 30, 2018 | | | 59 | |
DISCLOSURE OF FUND EXPENSES (UNAUDITED)
June 30, 2018
All mutual funds have operating expenses. As a shareholder of a mutual fund, your investment is affected by these ongoing costs, which include (among others) costs for portfolio management, administrative services, and shareholder reports like this one. It is important for you to understand the impact of these costs on your investment returns.
Operating expenses such as these are deducted from the mutual fund‘s gross income and directly reduce its final investment return. These expenses are expressed as a percentage of the mutual fund’s average net assets; this percentage is known as the mutual fund’s expense ratio.
The following examples use the expense ratio and are intended to help you understand the ongoing costs (in dollars) of investing in your Fund and to compare these costs with those of other mutual funds. The examples are based on an investment of $1,000 made at the beginning of the period shown and held for the entire period (July 1, 2017 to June 30, 2018).
The table on this page illustrates your Fund’s costs in two ways:
Actual Fund Return: This section helps you to estimate the actual expenses after fee waivers that your Fund incurred over the period. The “Expenses Paid During Period” column shows the actual dollar expense cost incurred by a $1,000 investment in the Fund, and the “Ending Account Value” number is derived from deducting that expense cost from the Fund’s gross investment return.
You can use this information, together with the actual amount you invested in your Fund, to estimate the expenses you paid over that period. Simply divide your actual starting account value by $1,000 to arrive at a ratio (for example, an $8,600 account value divided by $1,000 = 8.6), then multiply that ratio by the number shown for your Fund under “Expenses Paid During Period.”
Hypothetical 5% Return: This section helps you compare your Fund’s costs with those of other mutual funds. It assumes that your Fund had an annual 5% return before expenses during the year, but that the expense ratio (Column 3) is unchanged. This example is useful in making comparisons because the Securities and Exchange Commission requires all mutual funds to make this 5% calculation. You can assess your Fund’s comparative cost by comparing the hypothetical result for your Fund in the “Expenses Paid During Period” column with those that appear in the same charts in the shareholder reports for other mutual funds.
NOTE: Because the return is set at 5% for comparison purposes — NOT your Fund’s actual return — the account values shown do not apply to your specific investment.
| | | | | | | | | | | | | | | | |
| | | Beginning
Account
Value 7/1/17 | | | Ending
Account
Value
6/30/18 | | | Annualized
Expense
Ratios | | | Expenses
Paid
During
Period* | |
Growth Fund | | | | | | | | | | | | | | | | |
Actual Fund Return | | | $1,000.00 | | | | $1,031.00 | | | | 0.87 | % | | | $4.38 | |
Hypothetical 5% Return | | | $1,000.00 | | | | $1,020.48 | | | | 0.87 | % | | | $4.36 | |
Income Fund | | | | | | | | | | | | | | | | |
Actual Fund Return | | | $1,000.00 | | | | $987.10 | | | | 0.80 | % | | | $3.94 | |
Hypothetical 5% Return | | | $1,000.00 | | | | $1,020.83 | | | | 0.80 | % | | | $4.01 | |
Balanced Growth Fund† | | | | | | | | | | | | | | | | |
Actual Fund Return | | | $1,000.00 | | | | $1,014.30 | | | | 0.13 | % | | | $0.65 | |
Hypothetical 5% Return | | | $1,000.00 | | | | $1,024.15 | | | | 0.13 | % | | | $0.65 | |
Balanced Income Fund† | | | | | | | | | | | | | | | | |
Actual Fund Return | | | $1,000.00 | | | | $1,003.10 | | | | 0.15 | % | | | $0.74 | |
Hypothetical 5% Return | | | $1,000.00 | | | | $1,024.50 | | | | 0.15 | % | | | $0.75 | |
| * | Expenses are equal to the Fund’s annualized expense ratio multiplied by the average account value over the period, multiplied by 181/365 (to reflect the one-half year period shown). |
| † | Excludes expenses of the underlying affiliated investment companies. |
| | |
| 60 | | New Covenant Funds / Annual Report / June 30, 2018 |
BOARD OF TRUSTEES CONSIDERATIONS IN APPROVING THE ADVISORY AND SUB-ADVISORY AGREEMENTS (UNAUDITED)
New Covenant Funds (the “Trust”) and SEI Investments Management Corporation (“SIMC”) have entered into an investment advisory agreement (the “Advisory Agreement”). Pursuant to the Advisory Agreement, SIMC is responsible for the investment advisory services provided to the series of the Trust (the “Funds”). Pursuant to separate sub-advisory agreements with SIMC (the “Sub-Advisory Agreements” and, together with the Advisory Agreement, the “Investment Advisory Agreements”), and under the supervision of SIMC and the Trust’s Board of Trustees (the “Board”), the sub-advisers (each, a “Sub-Adviser” and collectively, the “Sub-Advisers”) provide security selection and certain other advisory services with respect to all or a discrete portion of the assets of the Funds. The Sub-Advisers are also responsible for managing their employees who provide services to the Funds. The Sub-Advisers are selected based primarily upon the research and recommendations of SIMC, which evaluates quantitatively and qualitatively the Sub-Advisers’ skills and investment results in managing assets for specific asset classes, investment styles and strategies.
The Investment Company Act of 1940, as amended (the “1940 Act”), requires that the initial approval of, as well as the continuation of, the Funds’ Investment Advisory Agreements be specifically approved: (i) by the vote of the Board or by a vote of the shareholders of the Funds; and (ii) by the vote of a majority of the Trustees who are not parties to the Investment Advisory Agreements or “interested persons” of any party (the “Independent Trustees”), cast in person at a meeting called for the purpose of voting on such approval(s). In connection with their consideration of such approval(s), the Funds’ Trustees must request and evaluate, and SIMC and the Sub-Advisers are required to furnish, such information as may be reasonably necessary to evaluate the terms of the Investment Advisory Agreements. In addition, the Securities and Exchange Commission takes the position that, as part of their fiduciary duties with respect to a mutual fund’s fees, mutual fund boards are required to evaluate the material factors applicable to a decision to approve an Investment Advisory Agreement.
Consistent with these responsibilities, the Board calls and holds meetings each year to consider whether to approve new and/or renew existing Investment Advisory Agreements between the Trust and SIMC and SIMC and the Sub-Advisers with respect to the Funds of the Trust. In preparation for these meetings, the Board requests and reviews a wide variety of materials provided by SIMC and the Sub-Advisers, including information about SIMC’s and the Sub-Advisers’ affiliates, personnel and operations and the services provided pursuant to the Investment Advisory Agreements. The Board also receives data from third parties. This information is provided in addition to the detailed information about the Funds that the Board reviews during the course of each year, including information that relates to Fund operations and Fund performance. The Trustees also receive a memorandum from counsel regarding the responsibilities of Trustees in connection with their consideration of whether to approve the Trust’s Investment Advisory Agreements. Finally, the Independent Trustees receive advice from independent counsel to the Independent Trustees, meet in executive sessions outside the presence of Fund management and participate in question and answer sessions with representatives of SIMC and the Sub-Advisers.
Specifically, during the course of the Trust’s fiscal year, the Board requested and received written materials from SIMC and the Sub-Advisers regarding: (i) the quality of SIMC’s and the Sub-Advisers’ investment management and other services; (ii) SIMC’s and the Sub-Advisers’ investment management personnel; (iii) SIMC’s and the Sub-Advisers’ operations and financial condition; (iv) SIMC’s and the Sub-Advisers’ brokerage practices (including any soft dollar arrangements) and investment strategies; (v) the level of the advisory fees that SIMC charges the Funds and the level of the sub-advisory fees that SIMC pays the Sub-Advisers, compared with fees each charge to comparable accounts; (vi) the advisory fees charged by SIMC and the Funds’ overall fees and operating expenses compared with peer groups of mutual funds prepared by Broadridge, an independent provider of investment company data; (vii) the level of SIMC’s and the Sub-Advisers’ profitability from their Fund-related operations; (viii) SIMC’s and the Sub-Advisers’ compliance program, including a description of material compliance matters and material compliance violations; (ix) SIMC’s potential economies of scale; (x) SIMC’s and the Sub-Advisers’ policies on and compliance procedures for personal securities transactions; (xi) SIMC’s and the Sub-Advisers’ expertise and resources in domestic and/or international financial markets; and (xii) the Funds’ performance over various periods of time compared with peer groups of mutual funds prepared by Broadridge and the Funds’ benchmark indexes.
At the March 27-28, 2018 meeting of the Board, the Trustees, including a majority of the Independent Trustees, approved the renewal of the Advisory Agreement. Also, each Sub-Advisory Agreement was either initially approved or, if the Sub-Advisory Agreement was already in effect (unless operating under an initial two-year term), renewed at meetings of the Board held during the course of the Trust’s fiscal year on September 11-13, 2017 and December 5-6, 2017. In each case, the Board’s approval (or renewal) was based on its consideration and evaluation of the
| | | | |
New Covenant Funds / Annual Report / June 30, 2018 | | | 61 | |
BOARD OF TRUSTEES CONSIDERATIONS IN APPROVING THE ADVISORY AND SUB-ADVISORY AGREEMENTS (UNAUDITED) (Concluded)
factors described above, as discussed at the meetings and at prior meetings. The following discusses some, but not all, of the factors that were considered by the Board in connection with its assessment of the Investment Advisory Agreements.
Nature, Extent and Quality of Services. The Board considered the nature, extent and quality of the services provided by SIMC and the Sub-Advisers to the Funds and the resources of SIMC and the Sub-Advisers and their affiliates dedicated to the Funds. In this regard, the Trustees evaluated, among other things, SIMC’s and each Sub-Adviser’s personnel, experience, track record and compliance program. Following evaluation, the Board concluded that, within the context of its full deliberations, the nature, extent and quality of services provided by SIMC and the Sub-Advisers to the Funds and the resources of SIMC and the Sub-Advisers and their affiliates dedicated to the Funds were sufficient to support the renewal of the Investment Advisory Agreements. In addition to advisory services, the Board considered the nature and quality of certain administrative, transfer agency and other non-investment advisory services provided to the Funds by SIMC and/or its affiliates.
Performance. In determining whether to renew SIMC’s Advisory Agreement, the Trustees considered the Funds’ performance relative to their peer groups and appropriate indexes/benchmarks. The Trustees reviewed performance information for each Fund, noting that they receive performance reports that permit them to monitor each Fund’s performance at board meetings throughout the year. As part of this review, the Trustees considered the composition of each peer group and selection criteria. In assessing Fund performance, the Trustees considered a report compiled by Broadridge, an independent third-party that was engaged to prepare an assessment of the Funds in connection with the renewal of the Advisory Agreement (the “Broadridge Report”). The Broadridge Report included metrics on risk analysis, volatility versus total return, net total return and performance consistency for the Funds and a universe of comparable funds. Based on the materials considered and discussed at the meetings, the Trustees found Fund performance satisfactory, or, where performance was materially below the benchmark and/or peer group, the Trustees were satisfied with the reasons provided to explain such performance. In connection with the approval or renewal of Sub-Advisory Agreements, the Board considered the performance of the Sub-Adviser relative to appropriate indexes/benchmarks. Following evaluation, the Board concluded that, within the context of its full deliberations, the performance of the Funds was sufficient to support renewal of SIMC’s Advisory Agreement, and the performance of each Sub-Adviser was sufficient to support approval or renewal of the Sub-Advisory Agreement.
Fees. With respect to the Funds’ expenses under the Investment Advisory Agreements, the Trustees considered the rate of compensation called for by the Investment Advisory Agreements and the Funds’ net operating expense ratio in comparison to those of the Funds’ respective peer groups. In assessing Fund expenses, the Trustees considered the information in the Broadridge Report, which included various metrics related to fund expenses, including, but not limited to, contractual management fees at various fee levels, actual management fees, and actual total expenses (including underlying fund expenses) for the Funds and a universe of comparable funds. Based on the materials considered and discussion at the meetings, the Trustees further determined that fees were either shown to be below the peer average in the comparative fee analysis, or that there was a reasonable basis for the fee level. The Trustees also considered the effects of SIMC’s voluntary waiver of management and other fees to prevent total Fund operating expenses from exceeding a specified cap and concluded that SIMC, through waivers, has maintained the Funds’ net operating expenses at competitive levels for its distribution channels. In determining the appropriateness of fees, the Board also took into consideration the impact of fees incurred indirectly by the Funds as a result of investments into underlying funds, including funds from which SIMC or its affiliates earn fees. The Board also took into consideration compensation earned from the Funds by SIMC or its affiliates for non-advisory services, such as administration, transfer agency, shareholder services or brokerage, and considered whether SIMC and its affiliates may have realized other benefits from their relationship with the Funds, such as any research and brokerage services received under soft dollar arrangements. When considering fees paid to Sub-Advisers, the Board took into account the fact that the Sub-Advisers are compensated by SIMC and not by the Funds directly, and that such compensation with respect to any unaffiliated Sub-Adviser reflects an arms-length negotiation between the Sub-Adviser and SIMC. Following evaluation, the Board concluded that, within the context of its full deliberations, the expenses of the Funds are reasonable and supported renewal of the Investment Advisory Agreements. The Board also considered whether the Sub-Advisers and their affiliates may have realized other benefits from their relationship with the Funds, such as any research and brokerage services received under soft dollar arrangements.
Profitability. With regard to profitability, the Trustees considered compensation flowing to SIMC and the Sub-Advisers and their affiliates, directly or indirectly. The Trustees considered whether the levels of compensation and
| | |
| 62 | | New Covenant Funds / Annual Report / June 30, 2018 |
profitability were reasonable. As with the fee levels, when considering the profitability of the Sub-Advisers, the Board took into account the fact that compensation with respect to any unaffiliated Sub-Adviser reflects an arms-length negotiation between the Sub-Adviser and SIMC. In connection with the approval or renewal of each Sub-Advisory Agreement, the Board also took into consideration the impact that the fees paid to the Sub-Adviser have on SIMC’s advisory fee margin and profitability. Based on this evaluation, the Board concluded that, within the context of its full deliberations, the profitability of each of SIMC and the Sub-Advisers is reasonable and supported renewal of the Investment Advisory Agreements.
Economies of Scale. With respect to the Advisory Agreement, the Trustees considered whether any economies of scale were being realized by SIMC and their affiliates and, if so, whether the benefits of such economies of scale were passed along to the Funds’ shareholders through a graduated investment advisory fee schedule or other means, including any fee waivers by SIMC and its affiliates. The Trustees recognized that economies of scale are difficult to identify and quantify and are rarely identifiable on a fund-by-fund basis. Based on this evaluation, the Board determined that the fees were reasonable in light of the information that was provided by SIMC with respect to economies of scale.
Based on the Trustees’ deliberation and their evaluation of the information described above, the Board, including all of the Independent Trustees, with the assistance of Fund counsel and Independent Trustees’ counsel, unanimously approved the approval or renewal, as applicable, of the Investment Advisory Agreements and concluded that the compensation under the Investment Advisory Agreements is fair and reasonable in light of such services and expenses and such other matters as the Trustees considered to be relevant in the exercise of their reasonable judgment. In the course of its deliberations, the Board did not identify any particular factor (or conclusion with respect thereto) or single piece of information that was all-important, controlling or determinative of its decision, but considered all of the factors together, and each Trustee may have attributed different weights to the various factors (and conclusions with respect thereto) and information.
| | | | |
New Covenant Funds / Annual Report / June 30, 2018 | | | 63 | |
NOTICE TO SHAREHOLDERS (Unaudited)
For shareholders who do not have a June 30, 2018 taxable year end, this notice is for information purposes only. For shareholders with a June 30, 2018 taxable year end, please consult your tax adviser as to the pertinence of this notice.
For the fiscal year ended June 30, 2018, the Funds are designating long term and qualifying dividend income with regard to distributions paid during the year as follows:
| | | | | | | | | | | | | | | | |
| | | | | | | | | |
| Fund | | (A) Long Term
Capital Gains
Distributions
(Tax Basis) | | (B)
Ordinary
Income | | Total
Distributions
(Tax Basis) | | (C) Dividends
Qualifying
for Corporate
Dividends Rec. Deduction (1) | | (D) Qualifying
Dividend
Income
(15% Tax Rate for QDI) (2) | | (E) U.S.
Government
Interest (3) | | Interest
Related
Dividends
(4) | | Short-Term
Capital
Gain
Dividends
(5) |
New Covenant Growth Fund | | 82.14% | | 17.86% | | 100.00% | | 100.00% | | 100.00% | | 0.00% | | 0.47% | | 100.00% |
New Covenant Income Fund | | 0.00% | | 100.00% | | 100.00% | | 0.00% | | 0.00% | | 11.19% | | 68.05% | | 0.00% |
New Covenant Balanced Growth Fund | | 44.35% | | 55.65% | | 100.00% | | 34.76% | | 43.00% | | 0.00% | | 0.00% | | 0.00% |
New Covenant Balanced Income Fund | | 34.38% | | 65.62% | | 100.00% | | 18.01% | | 22.08% | | 0.00% | | 0.00% | | 100.00% |
| | (1) | Qualifying dividends represent dividends which qualify for the corporate dividends received deduction. |
| | (2) | The percentage in this column represents the amount of ‘‘Qualifying Dividend Income’’ and is reflected as a percentage of ‘‘Ordinary Income Distributions.’’ It is the intention of each of the aforementioned Funds to designate the maximum amount permitted by law. The information reported herein may differ from the information and distributions taxable to the shareholders for the calendar year ending December 31, 2017. Complete information will be computed and reported in conjunction with your 2017 Form 1099-DIV. |
| | (3) | ‘‘U.S. Government Interest’’ represents the amount of interest that was derived from direct U.S. Government obligations and distributed during the fiscal year. This amount is reflected as a percentage of total ordinary income distributions (the total of short-term capital gain and net investment income distributions). Generally, interest from direct U.S. Government obligations is exempt from state income tax. However, for shareholders who are residents of California, Connecticut and New York, the statutory threshold requirements were not satisfied to permit exemption of these amounts from state income. |
| | (4) | The percentage in this column represents the amount of “Interest Related Dividends” and is reflected as a percentage of net investment income distributions that is exempt from U.S. withholding tax when paid to foreign investors. |
| | (5) | The percentage in this column represents the amount of “Short-Term Capital Gain Dividends” and is reflected as a percentage of short-term capital gain distributions that is exempt from U.S. withholding tax when paid to foreign investors. |
Items (A) and (B) are based on the percentage of each Fund’s total distribution.
Items (C) and (D) are based on the percentage of ordinary income distributions of each Fund. Item (E) is based on the percentage of gross income of each Fund.
Please consult your tax adviser for proper treatment of this information. This notification should be kept with your permanent tax records.
| | |
| 64 | | New Covenant Funds / Annual Report / June 30, 2018 |
NEW COVENANT FUNDS ANNUAL REPORT JUNE 30, 2018
Robert A. Nesher, Chairman
Trustees
William M. Doran
George J. Sullivan, Jr.
Nina Lesavoy
James M. Williams
Mitchell A. Johnson
Hubert L. Harris, Jr.
Susan C. Cote
James B. Taylor
Officers
Robert A. Nesher
President and Chief Executive Officer
James J. Hoffmayer
Controller and Chief Financial Officer
Glenn R. Kurdziel
Assistant Controller
Russell Emery
Chief Compliance Officer
Timothy D. Barto
Vice President, Secretary
Aaron Buser
Vice President, Assistant Secretary
David F. McCann
Vice President, Assistant Secretary
Stephen G. MacRae
Vice President
Bridget E. Sudall
Anti-Money Laundering Compliance Officer
Privacy Officer
Investment Adviser
SEI Investments Management Corporation
Administrator
SEI Investments Global Funds Services
Distributor
SEI Investments Distribution Co.
Legal Counsel
Morgan, Lewis & Bockius LLP
Independent Registered Public Accounting Firm
KPMG LLP
This report and the financial statements contained herein are submitted for the general information of the shareholders of the Trust and must be preceded or accompanied by a current prospectus. Shares of the Funds are not deposits or obligations of, or guaranteed or endorsed by, any bank. The shares are not federally insured by the Federal Deposit Insurance Corporation (FDIC), the Federal Reserve Board, or any other government agency. Investment in the shares involves risk, including the possible loss of principal.
For more information call
New Covenant Fund
877-835-4531
NCF-F-001 (06/18)
The Registrant has adopted a code of ethics that applies to the Registrant’s principal executive officer, principal financial officer, comptroller or principal accounting officer, and any person who performs a similar function.
| Item 3. | Audit Committee Financial Expert. |
(a)(1) The Registrant’s Board of Trustees has determined that the Registrant has at least three audit committee financial experts serving on the audit committee.
(a) (2) The audit committee financial experts are Susan Cote, George J. Sullivan, Jr., Hubert L. Harris, and Jim Taylor, Jr. Messrs. Cote, Sullivan, Harris, and Taylor are independent as defined in Form N-CSR Item 3 (a) (2).
| Item 4. | Principal Accountant Fees and Services. |
Fees billed by KPMG LLP (“KPMG”) related to the Registrant.
KPMG billed the Registrant aggregate fees for services rendered to the Registrant for the fiscal years 2018 and 2017 as follows:
| | | | | | | | | | | | | | |
| | | | | Fiscal 2018 | | Fiscal 2017 |
| | | | | All fees and
services to
the
Registrant
that were
pre-approved | | All fees and
services to
service affiliates
that were
pre-approved | | All other fees
and services to
service affiliates
that did not require
pre-approval | | All fees and
services to
the
Registrant
that were
pre-approved | | All fees and
services to
service affiliates
that were
pre-approved | | All other fees
and services to
service affiliates
that did not require
pre-approval |
(a) | | Audit Fees(1) | | $67,960 | | N/A | | $0 | | $66,000 | | N/A | | $0 |
(b) | | Audit-Related Fees | | $0 | | $0 | | $0 | | $0 | | $0 | | $0 |
(c) | | Tax Fees (3) | | $0 | | $0 | | $0 | | $0 | | $0 | | $0 |
(d) | | All Other Fees(2) | | $0 | | $341,386 | | $0 | | $0 | | $415,697 | | $0 |
Notes:
| (1) | Audit fees include amounts related to the audit of the Registrant’s annual financial statements and services normally provided by the accountant in connection with statutory and regulatory filings. |
| (2) | See Item 4(g) for a description of the services comprising the fees disclosed under this category. |
| (3) | Tax fees include amounts related to tax compliance and consulting services |
(e)(1) The Registrant’s Audit Committee has adopted an Audit and Non-Audit Services Pre-Approval Policy (the “Policy”), which sets forth the procedures and the conditions pursuant to which services proposed to be performed by the independent auditor of the Registrant may be pre-approved. In any instance where services require pre-approval, the Audit Committee will consider whether such services are consistent with SEC’s rules and whether the provision of such services would impair the auditor’s independence.
The Policy provides that all requests or applications for proposed services to be provided by the independent auditor must be submitted to the Registrant’s Chief Financial Officer (“CFO”) and must include a detailed description of the services proposed to be rendered. The CFO will determine whether such services: (1) require specific pre-approval; (2) are included within the list of services that have received the general pre-approval of the Audit Committee pursuant to the Policy; or (3) have been previously pre-approved in connection with the independent auditor’s annual engagement letter for the applicable year or otherwise.
Requests or applications to provide services that require specific pre-approval by the Audit Committee will be submitted to the Audit Committee by the CFO. Audit Committee has delegated specific pre-approval authority to either the Audit Committee Chair or financial experts, provided that the estimated fee for any such proposed pre-approved service does not exceed $100,000 and any pre-approval decisions are reported to the Audit Committee at its next regularly scheduled meeting.
Services that have received the general pre-approval of the Audit Committee are identified and described in the Policy. In addition, the Policy sets forth a maximum fee per engagement with respect to each identified service that has received general pre-approval. The Audit Committee will annually review and pre-approve the services that may be provided by the independent auditors during the following twelve months without obtaining specific pre-approval from the Audit Committee.
The Audit Committee will be informed by the CFO on a quarterly basis of all services rendered by the independent auditor.
All services to be provided by the independent auditor shall be provided pursuant to a signed written engagement letter with the Registrant, the investment advisor or applicable control affiliate (except that matters as to which an engagement letter would be impractical because of timing issues or because the matter is small may not be the subject of an engagement letter) that sets forth both the services to be provided by the independent auditor and the total fees (or the manner of their determination) to be paid to the independent auditor for those services.
In addition, the Audit Committee has determined to take additional measures on an annual basis to meet its responsibility to oversee the work of the independent auditor and to assure the auditor’s independence from the Registrant, such as reviewing a formal written statement from the independent auditor delineating all relationships between the independent auditor and the Registrant, and discussing with the independent auditor its methods and procedures for ensuring independence.
(e)(2) Percentage of fees billed pursuant to waiver of pre-approval requirement were as follows:
| | | | |
| | | Fiscal 2018 | | Fiscal 2017 |
Audit-Related Fees | | 0% | | 0% |
Tax Fees | | 0% | | 0% |
All Other Fees | | 0% | | 0% |
(f) Not Applicable.
(g)(1) The aggregate non-audit fees billed by KPMG for the fiscal years 2018 and 2017 were $341,386 and $415,697, respectively. Non-audit fees consist of a service organization controls report review of fund accounting and administration operations and an attestation report in accordance with Rule 17Ad-13.
(h) During the past fiscal year, the Registrant’s principal accountant provided certain non-audit services to the Registrant’s investment adviser or to entities controlling, controlled by, or under common control with the Registrant’s investment adviser that provide ongoing services to the Registrant that were not subject to pre-approval pursuant to paragraph (c)(7)(ii) of Rule 2-01 of Regulation S-X. The Audit Committee of the Registrant’s Board of Trustees reviewed and considered these non-audit services provided by the Registrant’s principal accountant to the Registrant’s affiliates, including whether the provision of these non-audit services is compatible with maintaining the principal accountant’s independence.
| Item 5. | Audit Committee of Listed Registrants. |
Not applicable.
(a) The Schedules of Investments are included as part of the report to shareholders filed under Item 1 of this form.
| Item 7. | Disclosure of Proxy Voting Policies and Procedures for Closed-End Management Investment Companies. |
Not applicable.
| Item 8. | Portfolio Managers of Closed-End Management Investment Companies |
Not applicable.
| Item 9. | Purchases of Equity Securities by Closed-End Management Company and Affiliated Purchasers. |
Not applicable.
| Item 10. | Submission of Matters to a Vote of Security Holders. |
There have been no material changes to the procedures by which shareholders may recommend nominees to the Registrant’s Board of Trustees (the “Board”). The Registrant has a standing Governance Committee (the “Committee”) currently consisting of the Independent Trustees. The Committee is responsible for evaluating and recommending nominees for election to the Board. Pursuant to the Committee’s Charter, adopted on February 22, 2012, the Committee will review all shareholder recommendations for nominations to fill vacancies on the Board if such recommendations are submitted in writing and addressed to the Committee at the Registrant’s office.
| Item 11. | Controls and Procedures. |
(a) The Registrant’s principal executive and principal financial officers, or persons performing similar functions, have concluded that the Registrant’s disclosure controls and procedures (as defined in Rule 30a-3(c) under the Investment Company Act of 1940 (the “1940 Act”)) (17 CFR 270.30a-3(c)) are effective, based on the evaluation of these controls and procedures required by Rule 30a-3(b) under the 1940 Act (17 CFR 270.30a-3(b)) and Rules 13a-15(b) or 15d-15(b) under the Securities Exchange Act of 1934 (17 CFR 240.13a-15(b) or 240.15d-15(b)) as of a date within 90 days of the filing date of this report.
(b) There were no changes in the Registrant’s internal control over financial reporting (as defined in Rule 30a-3(d) under the 1940 Act) (17 CFR 270.30a-3(d)) that occurred during the last fiscal quarter of the period covered by this report that have materially affected, or are reasonably likely to materially affect, the Registrant’s internal control over financial reporting.
| Item 12. | Disclosure of Securities Lending Activities for Closed-End Management Investment Companies |
Not applicable.
(a)(1) Code of Ethics attached hereto.
(a)(2) A separate certification for the principal executive officer and the principal financial officer of the Registrant as required by Rule 30a-2(a) under the Investment Company Act of 1940, as amended, are filed herewith.
(b) Officer certifications as required by Rule 30a-2(b) under the Investment Company Act of 1940, as amended also accompany this filing as an exhibit.
SIGNATURES
Pursuant to the requirements of the Securities Exchange Act of 1934 and the Investment Company Act of 1940, the Registrant has duly caused this report to be signed on its behalf by the undersigned, thereunto duly authorized.
| | | | | | |
| | | | | | New Covenant Funds |
| | | |
| By | | | | | | /s/ Robert A. Nesher |
| | | | | | Robert A. Nesher |
| | | | | | President & CEO |
Date: September 7, 2018
Pursuant to the requirements of the Securities Exchange Act of 1934 and the Investment Company Act of 1940, this report has been signed below by the following persons on behalf of the Registrant and in the capacities and on the dates indicated.
| | | | | | |
| By | | | | | | /s/ Robert A. Nesher |
| | | | | | Robert A. Nesher |
| | | | | | President & CEO |
Date: September 7, 2018
| | | | | | |
By | | | | | | /s/ James J. Hoffmayer |
| | | | | | James J. Hoffmayer |
| | | | | | Controller & CFO |
Date: September 7, 2018