UNITED STATES
SECURITIES AND EXCHANGE COMMISSION
Washington, D.C. 20549
FORM N-CSR
CERTIFIED SHAREHOLDER REPORT OF REGISTERED
MANAGEMENT INVESTMENT COMPANIES
Investment Company Act File Number 811-09025
New Covenant Funds
(Exact name of registrant as specified in charter)
SEI Investments
One Freedom Valley Drive
Oaks, PA 19456
(Address of principal executive offices) (Zip code)
Timothy D. Barto, Esq.
SEI Investments
One Freedom Valley Drive
Oaks, PA 19456
(Name and address of agent for service)
Registrant’s telephone number, including area code: 1-610-676-1000
Date of fiscal year end: June 30, 2020
Date of reporting period: June 30, 2020
| Item 1. | Reports to Stockholders. |
TABLE OF CONTENTS
The Trust files its complete schedule of portfolio holdings with the Securities and Exchange Commission for the first and third quarters of each fiscal year as an exhibit to its reports on Form N-PORT. The Trust’s Form N-PORT reports are available on the Commission’s website at http://www.sec.gov.
A description of the policies and procedures that the Trust uses to determine how to vote proxies relating to portfolio securities, as well as information relating to how a Fund voted proxies relating to portfolio securities during the most recent 12-month period ended June 30, is available (i) without charge, upon request, by calling 1-877-835-4531; and (ii) on the Commission’s website at http://www.sec.gov.
NEW COVENANT FUNDS — JUNE 30, 2020 (Unaudited)
To Our Shareholders:
The fiscal year ending June 30, 2020 began with strong returns in the equity markets over the final half of 2019. After hitting all-time highs in February, concerns about the international spread of a novel coronavirus (COVID-19) dominated investor concerns, and by the end of March most equity indexes had fallen into bear-market territory. Plans to reopen economic activity and developments in the race for COVID-19 treatments encouraged investors in April and May; global financial markets rallied sharply amid renewed “risk-on” sentiment but still finished below their peaks from earlier in the year. Despite tension around a U.S.-China trade deal and ongoing Brexit concerns in late 2019, the lingering effects of COVID-19 demanded plenty of attention from investors.
The Federal Reserve (Fed) cut interest rates three times prior to March. The Fed’s accommodative turn in monetary policy midway through the reporting period included an early conclusion in August to its balance-sheet reduction program that came amid below-target inflation and uncertainty about trade developments. Two off-cycle moves in the final month brought the federal-funds rate to near zero and were designed to bolster the economy in response to the economic threat posed by the coronavirus outbreak; the emergency actions were the first since the global financial crisis. Additionally, the Fed committed to purchasing unlimited amounts of Treasurys and established or renewed multiple facilities designed to support the economy.
The European Central Bank (ECB) sought to provide fresh stimulus following its mid-September meeting by reducing its deposit rate from -0.40% to a record low of -0.50%—and adopting a new system to offset possible consequent bank-reserve losses. Christine Lagarde succeeded Mario Draghi as ECB President in November. The ECB restarted its asset-purchase program in November with a monthly pace of €20 billion and stated it intends to continue to fully reinvest the principal payments from maturing securities purchased under the program. In response to COVID-19, the ECB announced a new quantitative easing (QE) package in March—the Pandemic Emergency Purchase Programme—amounting to €750 billion, which should bring total QE-related asset purchases to more than €1.3 trillion in 2020.
The Japanese yen, typically viewed as a “safe-haven” asset in “risk-off” environments, finished the period 0.2% higher against the U.S. dollar, while the Bank of Japan held monetary policy stable and signaled it did not intend to raise rates before 2023. The Chinese yuan finished the fiscal year down 3.0% against the U.S. dollar as trade-related tensions initially drove the exchange rate to an 11-year low in September. The currency rebounded some after confidence grew that a limited U.S.-China trade agreement would be reached but faltered again as COVID-19 worries grew early in 2020.
West Texas Intermediate crude-oil prices stayed mostly range-bound over the first half of the reporting period. From January onward, the commodity became a victim of an oil-production impasse between Saudi Arabia and Russia and travel restrictions that sapped usage due to the coronavirus pandemic. Between the high toward the end of 2019 and the April lows, crude-oil prices fell over 80%. Record supply cuts and a pickup in global fuel demand toward the end of the reporting period helped drive a partial price recovery, and oil finished down about 32% for the 12-month period.
Geopolitical Events
Market volatility accelerated in the first quarter of 2020 following concerns about COVID-19 and its eventual economic effect: A deadly strain originated in Wuhan, China, and began spreading at an exponential pace. As the outbreak spread to other countries, governments issued stay-at-home orders, and public health leaders preached “social distancing” in order to “flatten the curve” (that is, slow the rate of transmission in order to provide health systems time to manage the viral outbreak). Beyond the threat to public health, the outbreak and resulting containment measures evoked concerns about the potential halt to global economic activity. April saw the official infection rate more than triple to over three-million cases worldwide, while in the U.S., the total recorded number of COVID-19-related deaths neared 130,000 by late June—out of about 500,000 total worldwide. Nevertheless, stocks advanced globally almost without exception over the last three months of the period as forward-looking investors attempted to spot sources of encouragement.
The United States-Mexico-Canada trade agreement was ratified by all three countries in December and officially replaced the North American Free Trade Agreement just after the reporting period ended on July 1. President Trump and France’s President Emmanuel Macron successfully walked back threats of tariffs that originated with French
| | | | |
New Covenant Funds / Annual Report / June 30, 2020 | | | 1 | |
NEW COVENANT FUNDS — JUNE 30, 2020 (Unaudited) (Continued)
plans for a digital tax that would have targeted US-based multi-national technology companies. The prospect of a digital tax re-surfaced in other countries—including the U.K., Italy, Austria and Turkey—which prompted more threats of retailiatory tariffs by Treasury Secretary Steven Mnuchin. Sajid Javid, the UK’s former Chancellor of the Exchequer, disappointed Secretary Mnuchin by explaining during a joint interview in late January at the World Economic Forum that the U.K. would prioritize trade negotiations with the EU over a deal with the U.S.
China and the U.S. formalized a “phase one” trade deal in mid-January that offered tariff relief to China (via the reduction of existing tariffs and the delay of additional scheduled tariffs). In exchange, China committed to purchasing $200 billion in U.S. products over a two-year period; addressing its long-standing practice of forcing the transfer of intellectual property and technology to Chinese counterparts in exchange for access to the Chinese market; and promising to continue opening its financial-services industry to foreign investors. The tense U.S.-China relationship was stressed in May by a U.S. push for more transparency in the ownership of U.S.-listed Chinese companies and the U.S. government’s barring of certain Chinese holdings from its retirement plans.
President Trump’s impeachment trial ended with an acquittal by the U.S. Senate in February—even as the U.S. media surfaced corroborating first-hand accounts of President Trump directing underlying events central to the articles of impeachment. The Democratic presidential primary process neared completion with Joe Biden, considered to represent the more moderate wing of the Democratic Party, as the likely nominee.
Boris Johnson succeeded Theresa May as prime minister in the U.K. early in the fiscal year but faced sharp resistance from the outset of his tenure; however, the UK’s Conservative Party consolidated its power in a mid-December election—winning a majority of seats in the House of Commons and gaining approval for Prime Minister Boris Johnson’s EU departure deal. The country officially left the EU at the end of January 2020, giving way to an 11-month transition period to negotiate terms of the future U.K.-EU relationship. Johnson emerged from his personal battle with COVID-19 in April, having been hospitalized in intensive care and temporarily deputizing Foreign Secretary Dominic Raab to fulfil his role while incapacitated.
Elsewhere, after months of demonstrations, protesters in Hong Kong saw some success when a proposed law that would have allowed for extradition to mainland China was withdrawn. Protests continued, however, amid a reported increase in China’s police presence and undercover activity, although coronavirus concerns put an end to most large-scale demonstrations. China passed a new national security law for Hong Kong in June, categorizing an array of subversive activities as criminal behavior and carrying sentences as steep as life imprisonment. The ruling also enables Beijing to supervise and intervene in the policing of these activities, as well as the final word on interpreting the law, marking a significant dilution of the “one country, two systems” governance ethos that has defined the relationship since the U.K.’s handoff of Hong Kong to China in 1997.
Economic Performance
The U.S. economy grew by a seasonally-adjusted annualized 2.0% in the second quarter of 2019 as a decline in exports and inventory builds countered robust consumer spending. The third quarter saw a slight increase in annualized growth at 2.1%, as the robust U.S. labor market helped to support the moderate pace of activity, allowing the 10-year expansion to continue despite decelerating global trends. Economic growth again registered 2.1% in the fourth quarter, driven by an increase in net trade but weakened by a sharp slowdown in consumer spending. The third estimate for gross domestic product (GDP) in the first quarter of 2020 saw a decline of 5.0%, the largest decline since the global financial crisis. GDPNow, not an official forecast but a model of real GDP growth by the Federal Reserve Bank of Atlanta, estimated an almost 35% drop for the second quarter at the end of the reporting period. The abrupt halt to the 10-year economic expansion came amid mandated lockdowns throughout most of the country.
The U.S. unemployment rate touched a 50-year low of 3.5% during the fiscal year before jumping as high as 14.7% in April and settling at 11.1% in the final reading; the number of Americans filing for initial unemployment benefits hit record numbers as many non-essential businesses were forced to close in the wake of the pandemic. The labor-force participation rate ended at 61.5%, down from 63.0% a year earlier. Average hourly earnings gained 5.0% over the year, as the increase in unemployment tended to hit lower-wage workers hardest.
Broad economic growth in the eurozone slowed to its weakest pace since records began in 1995 during the first quarter of 2020; the 14.4% annualized decline far exceeded that in the U.S. as measures imposed to limit the spread
| | |
| 2 | | New Covenant Funds / Annual Report / June 30, 2020 |
of COVID-19 reflected the closing of everything from restaurants to factories. The magnitude and speed of the contraction solidified the case for continued accommodative policy by the ECB for some time.
The Bank of England’s Monetary Policy Committee cut the Bank Rate to 0.1%, the lowest in the 325-year history of its lending rate, during the fiscal year. It also announced a £200 billion asset-purchase program, mostly of government bonds, to be conducted at a monthly pace that will eclipse previous rounds of QE. Additionally, it launched a so-called funding-for-lending scheme to spur banks to lend to small- and medium-sized enterprises as well as a commercial paper facility with no cap limit, both to be financed by central-bank reserves. Following its mid-June meeting, the central bank announced that it would expand its stock of asset purchases (from an initial £200 billion increase announced in March) by another £100 billion, to £745 billion. The U.K. economy shrank 1.6% seasonally-adjusted at annual rates through the first quarter of 2020, its weakest level in over 10 years.
Japanese GDP contracted 7.1% in seasonally-adjusted annualized terms in the fourth quarter of 2019 as the country’s sales tax hike weakened consumer and business spending; an additional 2.2% decline in the first quarter of 2020 confirmed that Japan had fallen into recession for the first time in over four years. The Bank of Japan expanded monetary stimulus as pandemic pain worsened late in the period. Meanwhile, GDP in China shrank by 6.8% year-on-year and seasonally-adjusted in the first quarter of 2020, its worst pace in several decades, as consumer spending, exports and fixed-asset investments all were affected by the lockdowns in January and early February.
Market Developments
The S&P 500 Index finished the fiscal year up 7.51%, despite falling over 30% from peak to trough in February and March. Prior to the coronavirus onset, investors enjoyed the continuation of the modest U.S. economic expansion, reasonably strong corporate profitability and accommodative Fed monetary policy. Over the full reporting period, mega-large-cap stocks, a narrow group of companies with unusually large weights in the broad equity index, outperformed, and growth companies in the information technology sector generally led, while many value stocks underperformed. Commodity-sensitive stocks, particularly those within the energy sector, lagged the most.
U.S. large-cap stocks (Russell 1000 Index) finished the reporting period up 7.48%; small-cap stocks (Russell 2000 Index) were hit harder in the coronavirus-driven selloff toward the end of the year, as investors tended to avoid smaller companies with lesser financial strength, and finished the period down 6.63%.
Despite continued accommodative monetary policy from the ECB, European equities lagged, as fears over trade wars and COVID-19 grew. The MSCI Europe Index (Net) fell 6.78% in U.S. dollar terms and was 5.71% lower in euros; the euro finished down 1.14% versus the U.S. dollar for the period. The MSCI ACWI Index (Net), a proxy for global equities in both developed and emerging markets, climbed 2.11% in U.S. dollar terms.
The FTSE UK Series All-Share Index was hit hard in the second half of the year; the index lost 15.55% in U.S. dollar terms over the full reporting period, while it fell 12.99% in sterling.
Emerging-market equities were down. Despite gaining 18.08% in the final quarter, the MSCI Emerging Markets Index (Net) finished the reporting period down 3.39% in U.S. dollar terms. U.S.-China trade news generally drove performance for the first six months; however, a mid-period rally after the U.S. and China agreed to a “phase-one” trade deal was wiped out after COVID-19 concerns accelerated.
Global government bonds outperformed global high-yield bonds as the rapid worldwide escalation of COVID-19 at the end of the period hit the bond market’s most economically sensitive sectors the hardest. The U.S. high-yield market, as measured by the ICE BofA US High Yield Constrained Index, was off 1.17% during the reporting period, while global fixed income, as measured by the Bloomberg Barclays Global Treasury Index, did better and climbed 3.75%.
A continuing theme for U.S. fixed-income markets was the inverted yield curve. In August, the spread between
2-year and 5-year Treasurys yields inverted, as did the spread between 3-year and 5-year Treasurys. Notably, the spread between 3-month and 10-year rates inverted for only the second time in about 12 years early in the reporting period, a signal of impending recession to some market watchers. The differential reverted in October, turned negative again for a short time in February, and then stayed in positive territory from March onward.
| | | | |
New Covenant Funds / Annual Report / June 30, 2020 | | | 3 | |
NEW COVENANT FUNDS — JUNE 30, 2020 (Unaudited) (Continued)
Yields for 10-year U.S. government bonds ended the period down 134 basis points at 0.66%, after hitting an all-time low of 0.54% in March as investors rushed to “safe-haven” securities; 2-year yields declined during the fiscal year to finish down 159 basis points at 0.16%.
Inflation-sensitive assets, such as commodities and Treasury inflation-protected securities, were mixed. The Bloomberg Commodity Total Return Index (which represents the broad commodity market) finished down 17.38% over the full one-year period, after an oil-production impasse between Saudi Arabia and Russia created a downdraft in the oil market around the same time that demand contracted due to the coronavirus pandemic; the Bloomberg Barclays 1-10 Year US TIPS Index (USD) moved 5.75% higher during the reporting period.
U.S. investment-grade corporate debt was higher; the Bloomberg Barclays US Corporate Investment Grade Index returned 9.50% as investors remained eager to buy higher-yielding securities. U.S. asset- and mortgage-backed securities also managed to rise during the fiscal year.
Despite coronavirus concerns and the steep drop in global oil prices, which led to a declining outlook for economic growth in the region, the J.P. Morgan Global Bond Index-Emerging Markets (GBI-EM) Global Diversified Index, which tracks local-currency-denominated EM bonds, declined 2.82% in U.S. dollar terms. The J.P. Morgan Emerging Markets Bond Index (EMBI) Global Diversified Index, which tracks EMD denominated in external currencies (such as the U.S. dollar), eked out a 0.49% gain for the fiscal year.
Our view
Despite mounting infections, hospitalizations and deaths from the pandemic—as well as the unprecedented stoppage of global economic activity—stock markets around the world managed to mount a resounding comeback over the final quarter of the fiscal year.
Our working assumption is that there will likely be another significant wave of infections going into the fall-to-winter flu season. The question is, how disruptive will it be to the global economy?
Investors seem to be ignoring the possibility that, even if a sustainable recovery gets under way, it may be a long time before most companies achieve previous levels of profitability. The after-tax profit margins of U.S. domestic businesses were already on a declining trend before the onset of the virus and shelter-in-place orders.
Margins will likely remain well below their previous peaks around the globe as long as the COVID-19 is a severe health threat. Most businesses, to one degree or another, are expected to endure lower sales, higher costs and a decline in productivity. There also will probably be a deadweight loss for industries needing extra inventory on hand in order to guard against future shortages and supply-chain disruptions caused by periodic flare-ups of the virus. “Just-in-time” inventory management will turn into “just-in-case” inventory management, tying up cash. Supply chains will likely be diversified over time, a process that was already under way as a result of the trade war between China and the US.
The extraordinary March-to-April lockdown in the U.S. necessitated fiscal measures unparalleled in scope and speed of implementation. The result has been a tsunami of red ink. The Congressional Budget Office projected the deficit will reach nearly 18% of U.S. gross domestic product (GDP) in 2020 and improve to only 10% of GDP in 2021. U.S. debt relative to GDP is forecast to rise to 108% by the end of fiscal year 2021 versus 79% at the end of fiscal year 2019.
These are unsettling numbers. Many investors wonder whether such a surge in government debt will provoke an economic crisis even after the pandemic runs its course. We don’t think that it will. The U.S. has a large, dynamic economy and deep capital markets. If investors were truly concerned about the long-run fiscal viability of the U.S., the value of its currency would have been falling more convincingly and long-term U.S. interest rates would have been going up (not down).
The policies pursued by the Fed have also served to keep interest rates low. Its balance sheet has ballooned this year, far exceeding the increases logged by the ECB or the BOJ.
The U.S. certainly is not alone in engaging in a huge fiscal response that is then monetized by the central bank. In our opinion, governments are treating the fight against COVID-19 like they would a war. As many resources as possible are being thrown into the fight, supported by debt issuance that is absorbed primarily by the central banks.
| | |
| 4 | | New Covenant Funds / Annual Report / June 30, 2020 |
Those who remember the 1970s are understandably worried by the inflationary potential of such extraordinary debt monetization. If it does lead to inflation, it probably won’t be any time soon, in our opinion. Given our view that the economy will remain below full utilization of labor or productive capacity for the next few years, we believe inflation is unlikely to break out of the 0%-to-3% range it has been in for much of the past decade.
Investors do not seem too concerned about the speed of Europe’s economic recovery or the impact of the health crisis on countries’ fiscal positions. The bond yields of the most economically-fragile European countries remain close to those of German bund yields, although spreads have widened from pre-pandemic levels. The ECB has been quite successful in short-circuiting the liquidity crisis and flight-to-safety that threatened the euro area’s financial structure.
This laid-back view would be severely challenged if the 27 members of the EU fail to approve a €750 billion emergency fund when the EU’s leaders meet again in July. Although Germany has joined forces with France to push the package forward, there is still resistance from the likes of the Netherlands, Sweden, Denmark and Austria. There is disagreement, for example, over the split between grants and loans. Italy and Spain would be the biggest beneficiaries of grants to help offset their current fiscal dilemmas, while the remainder of the package would be distributed as conditional loans. Paying for the grants is an even greater source of contention. The European Commission (EC) would be empowered to issue long-term bonds, which would be paid down by giving the EC taxation authority (a power it currently does not have). The only alternative would be to increase contributions from member states (a bigger problem now that the U.K. is leaving the EU) or enact spending cuts in other parts of the EU budget.
Speaking of the U.K., the COVID-19 crisis has pushed Brexit concerns off the front pages. As the 31 December transition deadline nears, it could become an economic factor nearly as important as a second wave of the virus. If a deal on the UK-EU trading relationship is to be delivered before year-end, it probably should be concluded by the end of October so that countries have time to approve the treaty into law. Any free-trade agreement would require the U.K. to agree to permanently align its rules and regulations to those of the EU on an array of matters. The U.K. would essentially bear much of the EU membership cost without having a voice at the table that sets the rules. It is becoming increasingly likely that there either will be a modest agreement that includes tariffs or, in the worst-case scenario, a no-deal result that falls back on the World Trade Organization’s most-favored-nation rules.
While many factors determine equity performance, in the emerging-market space it has correlated with the extent of economic disruption caused by the virus. Asian and central European countries have pulled back the most on their mandates to restrict movement and social interaction. Latin America and India have eased some of those constraints, but not nearly as much as the other two regions. We continue to keep close tabs on China, as it was the first to lock down and first to unlock activity. We expect recovery patterns elsewhere in the world to follow that of China.
Central banks in the emerging world are also doing their part to help restore their economies. Interest rates have come down in almost every country in recent months to record-low levels in many cases. In addition, a dozen emerging-country central banks—including those with shakier reputations, such as South Africa and Turkey—are either buying or planning to purchase their government’s debt. We think this debt-monetization may lead to an inflation problem in the future.
It’s been said many times that bull markets climb a wall of worry. Maybe now they must learn to swim through waves of worry that include:
| | • | | The possibility of a second wave of COVID-19 infections forcing another round of extensive lockdowns and shelter-in-place orders that could lead to a double-dip recession |
| | • | | A possible break down of political consensus regarding the way forward as economies struggle to regain strength |
| | • | | The likelihood that economic recovery will take at least a year, and likely longer—and that few economies are likely to rebound fully to pre-pandemic levels, even if most countries manage to avoid a disruptive second wave of the virus |
| | | | |
New Covenant Funds / Annual Report / June 30, 2020 | | | 5 | |
NEW COVENANT FUNDS — JUNE 30, 2020 (Unaudited) (Concluded)
| | • | | Expectations that companies will face higher costs and increased inefficiencies; that taxes will almost certainly rise across many economies in the years ahead; and that bankruptcies and defaults will climb as government aid programs end |
We believe that an ebb and flow of assorted concerns in the coming months will continue to spark volatility across financial markets. Such periods of instability are expected in any long-term investing plan; as such, SEI is just as prepared as always to navigate the current wave of deep uncertainty.
Sincerely,

William T. Lawrence, CFA
Head and Chief Investment Officer of Traditional Asset Management
| | |
| 6 | | New Covenant Funds / Annual Report / June 30, 2020 |
MANAGEMENT’S DISCUSSION AND ANALYSIS OF FUND PERFORMANCE
June 30, 2020 (Unaudited)
New Covenant Growth Fund
I. Objective
The New Covenant Growth Fund’s (the “Fund”) investment objective is long-term capital appreciation. A modest amount of dividend income may be provided by the Fund’s equity securities.
II. Investment Approach
The Fund uses a sub-adviser to manage the Fund under the supervision of SEI Investments Management Corporation (SIMC). The sole sub-adviser as of June 30, 2020, was Parametric Portfolio Associates LLC (Parametric). There were no sub-adviser changes during the fiscal period.
III. Return vs. Benchmark
For the one-year period ending June 30, 2020, the Fund returned 7.18%. In order to provide broader exposure to U.S. equity markets, the Fund changed its investment strategy during the reporting period. In connection with this strategy change, the Fund’s primary benchmark was changed from the Russell 1000® Index to the Russell 3000® Index, effective December 18, 2019. The Russell 1000® Index returned 9.19% for the period from July
1, 2019 through December 18, 2019, while the Russell 3000® Index returned -2.29% for the period from December 18, 2019 through June 30, 2020. Over the full fiscal year, the Russell 3000® Index returned 6.53%.
IV. Fund Attribution
The fiscal year ended up producing positive returns for equity investors after a year full of volatility as investors struggled to account for the economic effects of the COVID-19 pandemic. While the initial reaction to the virus in March 2020 resulted in a sharp drop in equities, markets recovered most of the losses over the next three months as monetary and fiscal stimulus actions taken by the U.S. government to help the economy were viewed positively by investors.
Information technology and consumer discretionary were the best-performing sectors during the full fiscal year. Both sectors especially benefited over the final quarter of the period as investors perceived them to provide a solution to the problems caused by the pandemic. Information technology led as a large portion of the domestic workforce began working from home during the lockdowns; consumer discretionary also outperformed as the sector benefited from stay-at-home orders and an increase in online shopping. Energy was the worst-performing sector as global fossil-fuel consumption plummeted due to a sharp
decrease in global travel as the virus spread; financials also underperformed as lower rates impacted the profit margins of banks.
In this environment, the Fund outperformed as its ESG tilt had a positive effect on performance. Sectors that held up better in the downturn—such as information technology, health care and consumer staples—typically were not prohibited by the Fund’s ESG guidelines; as a result, the Fund was overweight those names during the period. Underweights to real estate and industrials—as a result of their ESG screens—were also beneficial as both sectors underperformed due to the effects of the pandemic.
| | | | | | | | | | | | | | | | | | | | |
|
| AVERAGE ANNUAL TOTAL RETURN 1 | |
| | | One Year
Return | | | Annualized
3 Year
Return | | | Annualized
5 Year
Return | | | Annualized
10 Year
Return | | | Annualized
Inception
to Date | |
| New Covenant Growth Fund | | | 7.18% | | | | 9.65% | | | | 8.45% | | | | 11.71% | | | | 4.86% | |
| Russell 3000® Index | | | 6.53% | | | | 10.04% | | | | 10.03% | | | | 13.72% | | | | 11.68% | |
| Russell 1000® Index | | | 7.48% | | | | 10.64% | | | | 10.47% | | | | 13.97% | | | | 11.76% | |
| | | | |
New Covenant Funds / Annual Report / June 30, 2020 | | | 7 | |
MANAGEMENT’S DISCUSSION AND ANALYSIS OF FUND PERFORMANCE
June 30, 2020 (Unaudited)
New Covenant Growth Fund (Concluded)
Comparison of Change in the Value of a $10,000 Investment in the New Covenant Growth Fund, versus the Russell 3000® Index and Russell 1000® Index.

| 1 | For the periods ended June 30, 2020. Past performance is not an indication of future performance. Fund Shares were offered beginning 7/1/99. Returns shown do not reflect the deduction of taxes that a shareholder would pay on fund distributions or the redemption of fund shares. The returns for certain periods reflect fee waivers and/or reimbursements in effect for that year; absent fee waivers and reimbursements, performance would have been lower. |
| | |
| 8 | | New Covenant Funds / Annual Report / June 30, 2020 |
MANAGEMENT’S DISCUSSION AND ANALYSIS OF FUND PERFORMANCE
June 30, 2020 (Unaudited)
New Covenant Income Fund
I. Objective
The New Covenant Income Fund’s (the “Fund”) investment objective is a high level of current income with preservation of capital.
II. Investment Approach
The Fund uses a multi-manager approach, relying on a number of sub-advisers with different investment approaches to manage portions of the Fund’s portfolio, under the general supervision of SEI Investments Management Corporation (SIMC). The Fund utilized the following sub-advisers as of June 30, 2020: Income Research & Management, Western Asset Management Company and Western Asset Management Company Limited. There were no sub-adviser changes during the fiscal period.
III. Return vs. Benchmark
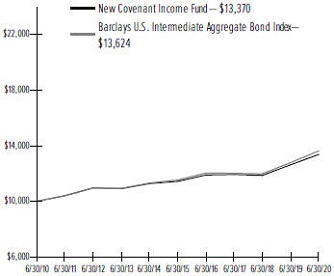
For the one-year period ending June 30, 2020, the Fund returned 5.91%. The Fund’s primary benchmark—the Bloomberg Barclays Intermediate US Aggregate Bond Index—returned 6.60%.
IV. Fund Attribution
An escalation of trade tensions between the U.S. and China early in the fiscal year created uncertainty in the market. Soon after the signing of a “phase one” trade deal in January appeared to calm investor concerns, market volatility escalated as the COVID-19 virus began to spread rapidly from China around the globe, resulting in a global pandemic. As noted in the shareholder letter, governments induced economic shutdowns and shelter-in-place orders, caused a severe contraction of economic activity. The Federal Reserve (Fed) lowered rates three times in 25-basis-point increments prior to the virus outbreak; the central bank then helped support markets as the virus impact magnified, with two emergency meetings in March that lowered the federal-funds target rate by 150 basis points to 0-0.25%. Credit spreads narrowed through the reporting period before widening dramatically in March to nearly 375 basis points, although spreads retraced over three quarters of the widening by the end of the reporting period. All non-Treasury sectors suffered losses during the March selloff. For the fiscal year, only agency mortgage-backed securities (MBS) and asset-backed securities (ABS) produced positive excess returns. As a result of Fed action and the flight to safety, Treasury yields declined sharply throughout the year, with 2-year yields declining 160 basis points, 10-year yields falling 135 basis points and 30-year yields off 112 basis points.
With the sharp decline in overall yields during the reporting period, the Fund’s absolute returns were strong, although it underperformed its primary benchmark. An overweight to and selection within commercial mortgage-backed securities (CMBS) detracted as economic concerns developed late in the period. Security selection within student loans also detracted, while selection within agency MBS through specified pools added to relative performance. An overweight to investment-grade corporates enhanced performance, especially within financials and industrials. An overweight to ABS was positive. The Fund’s yield-curve posture, which oscillated between long and short during the period, contributed to relative outperformance.
Western Asset Management outperformed primarily due to its corporate overweight, as well as strong selection within agency MBS through specified pools. Income Research & Management underperformed the benchmark and was hurt by its overweight to CMBS; selection within financials contributed to performance.
The Fund used Treasury futures, eurodollar futures and to-be-announced (TBA) forward contracts to effectively manage duration (a measure of a bond’s price sensitivity to changes in interest rates), yield-curve and market exposures. (TBA contracts confer the obligation to buy or sell future debt obligations of the three U.S. government-sponsored agencies that issue or guarantee MBS—Fannie Mae, Freddie Mac and Ginnie Mae.) None of these had a meaningful impact on the Fund’s performance.
| | | | | | | | | | | | | | | | | | | | |
| AVERAGE ANNUAL TOTAL RETURN 1 | |
| | | One Year
Return | | | Annualized
3 Year
Return | | | Annualized
5 Year
Return | | | Annualized
10 Year
Return | | | Annualized
Inception
to Date | |
| New Covenant Income Fund | | | 5.91% | | | | 3.90% | | | | 3.18% | | | | 2.95% | | | | 3.63% | |
| Bloomberg Barclays U.S. Intermediate Aggregate Bond Index | | | 6.60% | | | | 4.28% | | | | 3.40% | | | | 3.14% | | | | 7.09% | |
| | | | |
New Covenant Funds / Annual Report / June 30, 2020 | | | 9 | |
MANAGEMENT’S DISCUSSION AND ANALYSIS OF FUND PERFORMANCE
June 30, 2020 (Unaudited)
New Covenant Income Fund (Concluded)
Comparison of Change in the Value of a $10,000 Investment in the New Covenant Income Fund, versus the Bloomberg Barclays U.S. Intermediate Aggregate Bond Index.
| 1 | For the periods ended June 30, 2020. Past performance is not an indication of future performance. Fund Shares were offered beginning 7/1/99. Returns shown do not reflect the deduction of taxes that a shareholder would pay on fund distributions or the redemption of fund shares. The returns for certain periods reflect fee waivers and/or reimbursements in effect for that year; absent fee waivers and reimbursements, performance would have been lower. |
| | |
| 10 | | New Covenant Funds / Annual Report / June 30, 2020 |
MANAGEMENT’S DISCUSSION AND ANALYSIS OF FUND PERFORMANCE
June 30, 2020 (Unaudited)
New Covenant Balanced Growth Fund
I. Objective
The Balanced Growth Fund’s (the “Fund”) investment objective is to produce capital appreciation with less risk than would be present in a portfolio of only common stocks.
II. Investment Approach
The Fund’s assets are managed under the direction of SEI Investments Management Corporation (“SIMC”), which manages the Fund’s assets in a way that it believes will achieve the Fund’s investment objective. In order to achieve its investment objective, SIMC allocates the Fund’s assets primarily in shares of the New Covenant Growth Fund (the “Growth Fund”) and the New Covenant Income Fund (the “Income Fund”), with a majority of its assets generally invested in shares of the Growth Fund. Between 45% and 75% of the Fund’s net assets (with a neutral position of approximately 60% of the Fund’s net assets) are invested in shares of the Growth Fund, with the balance of its assets invested in shares of the Income Fund. The Growth and Income Funds, in turn, invest directly in securities in accordance with their own varying investment objectives and policies.
III. Return vs. Benchmark
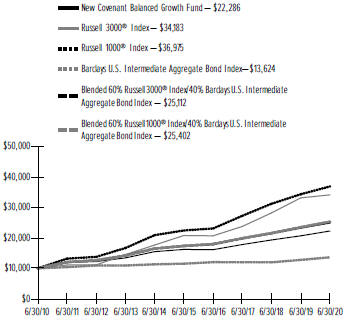
For the one-year period ending June 30, 2020, the Fund returned 7.57%. During the fiscal year, the Fund’s primary benchmark was changed from the Russell 1000® Index to the Russell 3000® Index, effective January 24, 2020. The Russell 1000® Index returned 13.02% for the period from July 1, 2019 through January, 24, 2020, while the Russell 3000® Index returned -5.40% for the period from January, 24, 2020 through June 30, 2020. Over the full fiscal year, the Russell 3000® Index returned 6.53%.
IV. Fund Attribution
Equity and fixed-income markets both provided positive returns over the fiscal period after a year full of volatility as investors struggled to account for the economic effects of the COVID-19 pandemic and U.S. long-term interest rates declined.
Information technology and consumer discretionary were the best-performing sectors during the full fiscal year. Both sectors especially benefited over the final quarter of the period as investors perceived them to provide a solution to the problems caused by the pandemic. Information technology led as a large portion of the domestic workforce began working from home during the lockdowns; consumer discretionary also
outperformed as the sector benefited from stay-at-home orders and an increase in online shopping. Energy was the worst-performing sector as global fossil-fuel consumption plummeted due to a sharp decrease in global travel; financials also underperformed as lower rates impacted the profit margins of banks.
As noted in the shareholder letter, governments induced economic shutdowns and shelter-in-place orders, caused a severe contraction of economic activity. The Federal Reserve (Fed) lowered rates three times in 25-basis-point increments prior to the virus outbreak; the central bank then helped support markets as the virus impact magnified, with two emergency meetings in March that lowered the federal-funds target rate by 150 basis points to 0-0.25%. Credit spreads narrowed through the reporting period before widening dramatically in March to nearly 375 basis points, although spreads retraced over three quarters of the widening by the end of the reporting period. All non-Treasury sectors suffered losses during the March selloff. For the fiscal year, only agency mortgage-backed securities (MBS) and asset-backed securities (ABS) produced positive excess returns. As a result of Fed action and the flight to safety, Treasury yields declined sharply throughout the year, with 2-year yields declining 160 basis points, 10-year yields falling 135 basis points and 30-year yields off 112 basis points.
In the Growth Fund, outperformance was driven by its environmental, social and governance (ESG) tilt, which had a positive effect on performance. Sectors that held up better in the downturn—such as information technology, health care and consumer staples—typically were not prohibited by the Fund’s ESG guidelines; as a result, the Fund was overweight those names during the period. Underweights to real estate and industrials—as a result of their ESG screens—were also beneficial as both sectors underperformed due to the effects of the pandemic.
With the sharp decline in overall yields during the reporting period, the Income Fund’s absolute returns were strong, although it underperformed its primary benchmark. An overweight to and selection within commercial mortgage-backed securities (CMBS) detracted as economic concerns developed late in the period. Security selection within student loans also detracted, while selection within agency MBS through specified pools added to relative performance. An overweight to investment-grade corporates enhanced performance, especially within financials and industrials. An overweight to ABS was positive. The Fund’s yield-curve posture, which oscillated between long
| | | | |
New Covenant Funds / Annual Report / June 30, 2020 | | | 11 | |
MANAGEMENT’S DISCUSSION AND ANALYSIS OF FUND PERFORMANCE
June 30, 2020 (Unaudited)
New Covenant Balanced Growth Fund (Concluded)
and short during the period, contributed to relative outperformance.
The Income Fund used Treasury futures, eurodollar futures and to-be-announced (TBA) forward contracts to effectively manage duration (a measure of a bond’s price sensitivity to changes in interest rates), yield-curve and market exposures. (TBA contracts confer the obligation to buy or sell future debt obligations of the three U.S. government-sponsored agencies that issue or guarantee MBS—Fannie Mae, Freddie Mac and Ginnie Mae.) None of these had a meaningful impact on the Fund’s performance.
| | | | | | | | | | | | | | | | | | | | |
| AVERAGE ANNUAL TOTAL RETURN 1,2 | |
| | | | | |
| | | One Year
Return | | | Annualized
3 Year
Return | | | Annualized
5 Year
Return | | | Annualized
10 Year
Return | | | Annualized
Inception
to Date | |
| New Covenant Balanced Growth Fund | | | 7.57% | | | | 7.71% | | | | 6.58% | | | | 8.34% | | | | 5.33% | |
| Russell 3000® Index | | | 6.53% | | | | 10.04% | | | | 10.03% | | | | 13.72% | | | | 11.68% | |
| Russell 1000® Index | | | 7.48% | | | | 10.64% | | | | 10.47% | | | | 13.97% | | | | 11.76% | |
| Bloomberg Barclays U.S. Intermediate Aggregate Bond Index | | | 6.60% | | | | 4.28% | | | | 3.40% | | | | 3.14% | | | | 7.09% | |
| Blended 60% Russell 3000® Index/40% Bloomberg Barclays U.S. Intermediate Aggregate Bond Index | | | 7.22% | | | | 8.13% | | | | 7.65% | | | | 9.64% | | | | 5.98% | |
| Blended 60% Russell 1000® Index/40% Bloomberg Barclays U.S. Intermediate Aggregate Bond Index | | | 7.69% | | | | 8.44% | | | | 7.89% | | | | 9.77% | | | | 8.77% | |
Comparison of Change in the Value of a $10,000 Investment in the New Covenant Balanced Growth Fund versus the Russell 3000® Index, the Russell 1000® Index, Bloomberg Barclays U.S. Intermediate Aggregate Bond Index , Blended 60% Russell 3000® Index/40% Bloomberg Barclays U.S. Intermediate Aggregate Bond Index and Blended 60% Russell 1000® Index/40% Bloomberg Barclays U.S. Intermediate Aggregate Bond Index.
| 1 | For the periods ended June 30, 2020. Past performance is not an indication of future performance. Fund Shares were offered beginning 7/1/99. Returns shown do not reflect the deduction of taxes that a shareholder would pay on fund distributions or the redemption of fund shares. The returns for certain periods reflect fee waivers and/or reimbursements in effect for that year; absent fee waivers and reimbursements, performance would have been lower. |
| 2 | This table compares the Fund’s average annual total returns to those of a broad based index and the Fund’s 60/40 Blended Benchmark, which consists of the Russell 3000® Index and the Bloomberg Barclays U.S. Intermediate Aggregate Bond Index. The Fund’s Blended Benchmark is designed to provide a useful comparison to the Fund’s overall performance and more accurately reflects the Fund’s investment strategy than the broad-based index. |
| | |
| 12 | | New Covenant Funds / Annual Report / June 30, 2020 |
MANAGEMENT’S DISCUSSION AND ANALYSIS OF FUND PERFORMANCE
June 30, 2020 (Unaudited)
New Covenant Balanced Income Fund
I. Objective
The Balanced Income Fund’s (the “Fund”) investment objective is to produce current income and long-term growth of capital.
II. Investment Approach
The Fund’s assets are managed under the direction of SEI Investments Management Corporation (“SIMC”), which manages the Fund’s assets in a way that it believes will achieve the Fund’s investment objective. In order to achieve its investment objective, SIMC allocates the Fund’s assets primarily in shares of the New Covenant Growth Fund (the “Growth Fund”) and the New Covenant Income Fund (the “Income Fund”), with a majority of its assets generally invested in shares of the Income Fund. Between fifty percent and seventy-five percent of the Fund’s net assets (with a neutral position of approximately 65%) are invested in shares of the Income Fund, with the balance of its net assets invested in shares of the Growth Fund. The Growth and Income Funds, in turn, invest directly in securities in accordance with their own varying investment objectives and policies.
III. Return vs. Benchmark
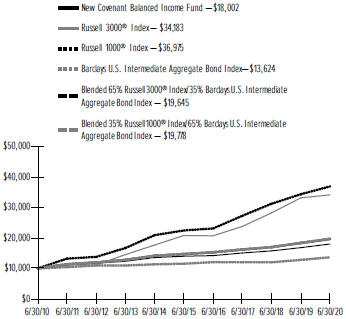
For the one-year period ending June 30, 2020, the Fund returned 7.14%. During the fiscal year, the Fund’s primary benchmark was changed from the Russell 1000® Index to the Russell 3000® Index, effective January 24, 2020. The Russell 1000® Index returned 13.02% for the period from July 1, 2019 through January, 24, 2020, while the Russell 3000® Index return -5.40% for the period from January, 24, 2020 through June 30, 2020. Over the full fiscal year, the Russell 3000® Index returned 6.53%.
IV. Fund Attribution
Equity and fixed-income markets both provided positive returns over the fiscal period after a year full of volatility as investors struggled to account for the economic effects of the COVID-19 pandemic and U.S. long-term interest rates declined.
As noted in the shareholder letter, governments induced economic shutdowns and shelter-in-place orders, caused a severe contraction of economic activity. The Federal Reserve (Fed) lowered rates three times in 25-basis-point increments prior to the virus outbreak; the central bank then helped support markets as the virus impact magnified, with two emergency meetings in March that lowered the federal-funds target rate by 150 basis points to 0-0.25%. Credit spreads narrowed through
the reporting period before widening dramatically in March to nearly 375 basis points, although spreads retraced over three quarters of the widening by the end of the reporting period. All non-Treasury sectors suffered losses during the March selloff. For the fiscal year, only agency mortgage-backed securities (MBS) and asset-backed securities (ABS) produced positive excess returns. As a result of Fed action and the flight to safety, Treasury yields declined sharply throughout the year, with 2-year yields declining 160 basis points, 10-year yields falling 135 basis points and 30-year yields off 112 basis points.
While the initial reaction to the virus in March 2020 resulted in a sharp drop in equities, markets recovered most of the losses over the next three months as monetary and fiscal stimulus actions taken by the U.S. government to help the economy were viewed positively by investors.
The best-performing sectors during the year were those that investors perceived to provide a solution to the problems caused by the pandemic. Information technology led as a large portion of the domestic workforce began working from home during the lockdowns; consumer discretionary also outperformed as the sector benefited from stay-at-home orders and an increase in online shopping. Energy was the worst-performing sector as global fossil-fuel consumption plummeted due to a sharp decrease in global travel; financials also underperformed as lower rates impacted the profit margins of banks.
With the sharp decline in overall yields during the reporting period, the Income Fund’s absolute returns were strong, although it underperformed its primary benchmark. An overweight to and selection within commercial mortgage-backed securities (CMBS) detracted as economic concerns developed late in the period. Security selection within student loans also detracted, while selection within agency MBS through specified pools added to relative performance. An overweight to investment-grade corporates enhanced performance, especially within financials and industrials. An overweight to ABS was positive. The Fund’s yield-curve posture, which oscillated between long and short during the period, contributed to relative outperformance.
In the Growth Fund, outperformance was driven by its environmental, social and governance (ESG) tilt, which had a positive effect on performance. Sectors that held up better in the downturn—such as information technology, health care and consumer staples—typically
| | | | |
New Covenant Funds / Annual Report / June 30, 2020 | | | 13 | |
MANAGEMENT’S DISCUSSION AND ANALYSIS OF FUND PERFORMANCE
June 30, 2020 (Unaudited)
New Covenant Balanced Income Fund (Concluded)
were not prohibited by the Fund’s ESG guidelines; as a result, the Fund was overweight those names during the period. Underweights to real estate and industrials—as a result of their ESG screens—were also beneficial as both sectors underperformed due to the effects of the pandemic.
The Income Fund used Treasury futures, eurodollar futures and to-be-announced (TBA) forward contracts to effectively manage duration (a measure of a bond’s price sensitivity to changes in interest rates), yield-curve and market exposures. (TBA contracts confer the obligation to buy or sell future debt obligations of the three U.S. government-sponsored agencies that issue or guarantee MBS���Fannie Mae, Freddie Mac and Ginnie Mae.) None of these had a meaningful impact on the Fund’s performance.
| | | | | | | | | | | | | | | | | | | | |
| AVERAGE ANNUAL TOTAL RETURN 1,2 | |
| | | | | |
| | | One Year
Return | | | Annualized
3 Year
Return | | | Annualized
5 Year
Return | | | Annualized
10 Year
Return | | | Annualized
Inception
to Date | |
| New Covenant Balanced Income Fund | | | 7.14% | | | | 6.15% | | | | 5.18% | | | | 6.06% | | | | 4.17% | |
| Russell 3000® Index | | | 6.53% | | | | 10.04% | | | | 10.03% | | | | 13.72% | | | | 11.68% | |
| Russell 1000® Index | | | 7.48% | | | | 10.64% | | | | 10.47% | | | | 13.97% | | | | 11.76% | |
| Bloomberg Barclays U.S. Intermediate Aggregate Bond Index | | | 6.60% | | | | 4.28% | | | | 3.40% | | | | 3.14% | | | | 7.09% | |
| Blended 35% Russell 3000® Index/65% Bloomberg Barclays U.S. Intermediate Aggregate Bond Index | | | 7.20% | | | | 6.66% | | | | 5.97% | | | | 6.99% | | | | 5.55% | |
| Blended 35% Russell 1000® Index/65% Bloomberg Barclays U.S. Intermediate Aggregate Bond Index | | | 7.51% | | | | 6.85% | | | | 6.11% | | | | 7.06% | | | | 7.38% | |
Comparison of Change in the Value of a $10,000 Investment in the New Covenant Balanced Income Fund, versus the Russell 3000® Index, Russell 1000® Index, Bloomberg Barclays U.S. Intermediate Aggregate Bond Index, Blended 35% Russell 3000® Index/65% Bloomberg Barclays U.S. Intermediate Aggregate Bond Index and Blended 35% Russell 1000® Index/65% Bloomberg Barclays U.S. Intermediate Aggregate Bond Index.
| 1 | For the periods ended June 30, 2020. Past performance is not an indication of future performance. Fund Shares were offered beginning 7/1/99. Returns shown do not reflect the deduction of taxes that a shareholder would pay on fund distributions or the redemption of fund shares. The returns for certain periods reflect fee waivers and/or reimbursements in effect for that year; absent fee waivers and reimbursements, performance would have been lower. |
| 2 | This table compares the Fund’s average annual total returns to those of a broad-based index and the Fund’s 35/65 Blended Benchmark, which consists of the Russell 3000® Index and the Bloomberg Barclays U.S. Intermediate Aggregate Bond Index. The Fund’s Blended Benchmark is designed to provide a useful comparison to the Fund’s overall performance and more accurately reflects the Fund’s investment strategy than the broad-based index. |
| | |
| 14 | | New Covenant Funds / Annual Report / June 30, 2020 |
SCHEDULE OF INVESTMENTS
June 30, 2020
New Covenant Growth Fund
Sector Weightings (Unaudited)†:
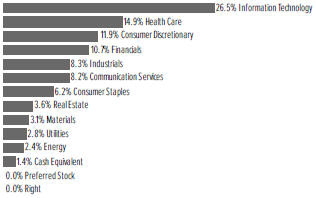
†Percentages are based on total investments.
| | | | | | | | |
| | | |
| Description | | Shares | | | Market Value
($ Thousands) | |
COMMON STOCK — 98.0% | | | | | | | | |
Bosnia and Herzegovina — 0.0% | | | | | | | | |
RenaissanceRe Holdings Ltd | | | 248 | | | $ | 42 | |
| | | | | | | | |
| | |
Canada — 0.1% | | | | | | | | |
Lululemon Athletica Inc * | | | 1,171 | | | | 365 | |
| | | | | | | | |
| | |
Cayman Islands — 0.0% | | | | | | | | |
Herbalife Nutrition Ltd * | | | 1,088 | | | | 49 | |
| | | | | | | | |
| | |
Ireland — 1.0% | | | | | | | | |
Accenture PLC, Cl A | | | 11,297 | | | | 2,426 | |
Jazz Pharmaceuticals PLC * | | | 616 | | | | 68 | |
Medtronic PLC | | | 19,976 | | | | 1,832 | |
NortonLifeLock Inc | | | 13,065 | | | | 259 | |
Perrigo Co PLC | | | 211 | | | | 11 | |
| | | | | | | | |
| | | | | | | 4,596 | |
| | | | | | | | |
| | |
Puerto Rico — 0.0% | | | | | | | | |
Popular Inc | | | 1,507 | | | | 56 | |
| | | | | | | | |
| | |
Switzerland — 0.0% | | | | | | | | |
Garmin Ltd | | | 1,092 | | | | 107 | |
| | | | | | | | |
| | |
United Kingdom — 0.1% | | | | | | | | |
Healthpeak Properties Inc | | | 9,384 | | | | 259 | |
| | | | | | | | |
| | |
United States — 96.8% | | | | | | | | |
| | |
Communication Services — 8.2% | | | | | | | | |
Activision Blizzard Inc | | | 8,807 | | | | 668 | |
Alphabet Inc, Cl A * | | | 4,332 | | | | 6,143 | |
Alphabet Inc, Cl C * | | | 4,333 | | | | 6,125 | |
AT&T Inc | | | 124,429 | | | | 3,761 | |
Bandwidth Inc, Cl A * | | | 821 | | | | 104 | |
Cardlytics Inc * | | | 1,255 | | | | 88 | |
Cargurus Inc, Cl A * | | | 1,369 | | | | 35 | |
Cars.com Inc * | | | 4,178 | | | | 24 | |
CenturyLink Inc | | | 872 | | | | 9 | |
Charter Communications Inc, Cl A * | | | 1,859 | | | | 948 | |
Cinemark Holdings Inc | | | 2,104 | | | | 24 | |
| | | | | | | | |
| | | |
| Description | | Shares | | | Market Value
($ Thousands) | |
COMMON STOCK (continued) | | | | | | | | |
Cogent Communications Holdings Inc | | | 807 | | | $ | 62 | |
Comcast Corp, Cl A | | | 62,118 | | | | 2,421 | |
DISH Network Corp, Cl A * | | | 1,451 | | | | 50 | |
Electronic Arts Inc * | | | 2,676 | | | | 353 | |
Emerald Holding Inc | | | 4,781 | | | | 15 | |
Eventbrite Inc, Cl A * | | | 2,537 | | | | 22 | |
EverQuote Inc, Cl A * | | | 1,468 | | | | 85 | |
EW Scripps Co/The, Cl A | | | 3,299 | | | | 29 | |
Facebook Inc, Cl A * | | | 34,781 | | | | 7,898 | |
Fox Corp, Cl A | | | 1,372 | | | | 37 | |
IMAX Corp * | | | 2,244 | | | | 25 | |
Interpublic Group of Cos Inc/The | | | 8,487 | | | | 146 | |
Iridium Communications Inc * | | | 366 | | | | 9 | |
John Wiley & Sons Inc, Cl A | | | 236 | | | | 9 | |
Liberty Broadband Corp, Cl A * | | | 113 | | | | 14 | |
Liberty Broadband Corp, Cl C * | | | 405 | | | | 50 | |
Liberty Media Corp-Liberty Formula One, Cl C * | | | 1,355 | | | | 43 | |
Live Nation Entertainment Inc * | | | 181 | | | | 8 | |
Madison Square Garden Entertainment Corp * | | | 39 | | | | 3 | |
Match Group * | | | 703 | | | | 75 | |
Meredith Corp | | | 1,401 | | | | 20 | |
MSG Networks Inc * | | | 2,988 | | | | 30 | |
New York Times Co/The, Cl A | | | 1,515 | | | | 64 | |
Nexstar Media Group Inc, Cl A | | | 455 | | | | 38 | |
Omnicom Group Inc | | | 10,137 | | | | 553 | |
Scholastic Corp | | | 1,266 | | | | 38 | |
Shenandoah Telecommunications Co | | | 1,286 | | | | 63 | |
Sirius XM Holdings Inc | | | 7,153 | | | | 42 | |
Spotify Technology SA * | | | 1,084 | | | | 280 | |
Take-Two Interactive Software Inc * | | | 830 | | | | 116 | |
TechTarget Inc * | | | 1,986 | | | | 60 | |
TEGNA Inc | | | 3,052 | | | | 34 | |
T-Mobile US Inc * | | | 4,039 | | | | 421 | |
Twitter Inc * | | | 7,369 | | | | 220 | |
Verizon Communications Inc | | | 57,853 | | | | 3,189 | |
ViacomCBS Inc, Cl B | | | 1,000 | | | | 23 | |
Walt Disney Co/The | | | 26,709 | | | | 2,978 | |
World Wrestling Entertainment Inc, Cl A | | | 780 | | | | 34 | |
Yelp Inc, Cl A * | | | 1,470 | | | | 34 | |
Zillow Group Inc, Cl C * | | | 230 | | | | 13 | |
Zynga Inc, Cl A * | | | 14,448 | | | | 138 | |
| | | | | | | | |
| | | | | | | 37,671 | |
| | | | | | | | |
Consumer Discretionary — 11.7% | | | | | | | | |
1-800-Flowers.com Inc, Cl A * | | | 3,668 | | | | 73 | |
Aaron’s Inc | | | 832 | | | | 38 | |
Abercrombie & Fitch Co, Cl A | | | 2,970 | | | | 32 | |
Adient PLC * | | | 2,126 | | | | 35 | |
Adtalem Global Education Inc * | | | 1,460 | | | | 45 | |
Advance Auto Parts Inc | | | 317 | | | | 45 | |
Amazon.com Inc * | | | 6,217 | | | | 17,152 | |
| | | | |
New Covenant Funds / Annual Report / June 30, 2020 | | | 15 | |
SCHEDULE OF INVESTMENTS
June 30, 2020
New Covenant Growth Fund (Continued)
| | | | | | | | |
| | | |
| Description | | Shares | | | Market Value
($ Thousands) | |
| | |
COMMON STOCK (continued) | | | | | | | | |
AMC Networks Inc, Cl A * | | | 1,349 | | | $ | 32 | |
American Eagle Outfitters Inc | | | 3,416 | | | | 37 | |
American Public Education Inc * | | | 1,831 | | | | 54 | |
Aptiv PLC | | | 3,490 | | | | 272 | |
Aramark | | | 260 | | | | 6 | |
Asbury Automotive Group Inc * | | | 425 | | | | 33 | |
At Home Group Inc * | | | 6,757 | | | | 44 | |
AutoNation Inc * | | | 970 | | | | 36 | |
AutoZone Inc * | | | 235 | | | | 265 | |
Bed Bath & Beyond Inc | | | 2,963 | | | | 31 | |
Best Buy Co Inc | | | 14,724 | | | | 1,285 | |
Big Lots Inc | | | 1,758 | | | | 74 | |
Bloomin’ Brands Inc | | | 2,259 | | | | 24 | |
Booking Holdings Inc * | | | 563 | | | | 896 | |
Boot Barn Holdings Inc * | | | 1,181 | | | | 25 | |
BorgWarner Inc | | | 2,278 | | | | 80 | |
Bright Horizons Family Solutions Inc * | | | 76 | | | | 9 | |
Brinker International Inc | | | 1,180 | | | | 28 | |
Brunswick Corp/DE | | | 839 | | | | 54 | |
Buckle Inc/The | | | 1,885 | | | | 30 | |
Burlington Stores Inc * | | | 482 | | | | 95 | |
Cable One Inc | | | 79 | | | | 140 | |
Callaway Golf Co | | | 2,383 | | | | 42 | |
Camping World Holdings Inc, Cl A | | | 1,968 | | | | 53 | |
Capri Holdings Ltd * | | | 1,319 | | | | 21 | |
CarMax Inc * | | | 1,086 | | | | 97 | |
Carnival Corp | | | 15,800 | | | | 259 | |
Carter’s Inc | | | 471 | | | | 38 | |
Carvana Co, Cl A * | | | 1,196 | | | | 144 | |
Cavco Industries Inc * | | | 255 | | | | 49 | |
Century Communities Inc * | | | 1,662 | | | | 51 | |
Cheesecake Factory Inc/The | | | 1,236 | | | | 28 | |
Chegg Inc * | | | 2,422 | | | | 163 | |
Children’s Place Inc/The | | | 812 | | | | 30 | |
Chipotle Mexican Grill Inc, Cl A * | | | 232 | | | | 244 | |
Choice Hotels International Inc | | | 113 | | | | 9 | |
Columbia Sportswear Co | | | 891 | | | | 72 | |
Cooper Tire & Rubber Co | | | 1,668 | | | | 46 | |
Cracker Barrel Old Country Store Inc | | | 323 | | | | 36 | |
Dana Inc | | | 2,660 | | | | 32 | |
Darden Restaurants Inc | | | 705 | | | | 53 | |
Dave & Buster’s Entertainment Inc | | | 1,283 | | | | 17 | |
Deckers Outdoor Corp * | | | 306 | | | | 60 | |
Denny’s Corp * | | | 2,500 | | | | 25 | |
Designer Brands Inc, Cl A | | | 3,316 | | | | 22 | |
Dick’s Sporting Goods Inc | | | 1,054 | | | | 43 | |
Dillard’s Inc, Cl A | | | 726 | | | | 19 | |
Dine Brands Global Inc | | | 1,227 | | | | 52 | |
Discovery Inc, Cl C * | | | 354 | | | | 7 | |
Dollar General Corp | | | 2,783 | | | | 530 | |
Dollar Tree Inc * | | | 1,707 | | | | 158 | |
Domino’s Pizza Inc | | | 309 | | | | 114 | |
| | | | | | | | |
| | | |
| Description | | Shares | | | Market Value
($ Thousands) | |
| | |
COMMON STOCK (continued) | | | | | | | | |
Dorman Products Inc * | | | 677 | | | $ | 45 | |
DR Horton Inc | | | 1,973 | | | | 109 | |
Dunkin’ Brands Group Inc | | | 2,803 | | | | 183 | |
eBay Inc | | | 24,197 | | | | 1,269 | |
Etsy Inc * | | | 1,162 | | | | 123 | |
Expedia Group Inc | | | 103 | | | | 8 | |
Five Below Inc * | | | 410 | | | | 44 | |
Floor & Decor Holdings Inc, Cl A * | | | 232 | | | | 13 | |
Foot Locker Inc | | | 1,308 | | | | 38 | |
Ford Motor Co | | | 36,252 | | | | 220 | |
Fox Factory Holding Corp * | | | 749 | | | | 62 | |
frontdoor Inc * | | | 251 | | | | 11 | |
Gap Inc/The | | | 11,382 | | | | 144 | |
General Motors Co | | | 11,713 | | | | 296 | |
Gentex Corp | | | 3,795 | | | | 98 | |
Gentherm Inc * | | | 1,113 | | | | 43 | |
Genuine Parts Co | | | 109 | | | | 9 | |
Goodyear Tire & Rubber Co/The | | | 690 | | | | 6 | |
Graham Holdings Co, Cl B | | | 78 | | | | 27 | |
Grand Canyon Education Inc * | | | 121 | | | | 11 | |
Group 1 Automotive Inc | | | 479 | | | | 32 | |
Grubhub Inc * | | | 1,289 | | | | 91 | |
Guess? Inc | | | 2,341 | | | | 23 | |
H&R Block Inc | | | 3,157 | | | | 45 | |
Hanesbrands Inc | | | 13,319 | | | | 150 | |
Harley-Davidson Inc | | | 306 | | | | 7 | |
Hasbro Inc | | | 2,632 | | | | 197 | |
Helen of Troy Ltd * | | | 304 | | | | 57 | |
Hilton Grand Vacations Inc * | | | 3,016 | | | | 59 | |
Hilton Worldwide Holdings Inc | | | 4,365 | | | | 321 | |
Home Depot Inc/The | | | 16,979 | | | | 4,253 | |
Hyatt Hotels Corp, Cl A | | | 135 | | | | 7 | |
Installed Building Products Inc * | | | 694 | | | | 48 | |
iRobot Corp * | | | 1,013 | | | | 85 | |
Jack in the Box Inc | | | 658 | | | | 49 | |
Johnson Outdoors Inc, Cl A | | | 659 | | | | 60 | |
K12 Inc * | | | 2,452 | | | | 67 | |
KB Home | | | 4,733 | | | | 145 | |
Kohl’s Corp | | | 1,859 | | | | 39 | |
Kontoor Brands Inc | | | 1,282 | | | | 23 | |
L Brands Inc | | | 638 | | | | 10 | |
Laureate Education Inc, Cl A * | | | 2,881 | | | | 29 | |
La-Z-Boy Inc, Cl Z | | | 1,597 | | | | 43 | |
LCI Industries | | | 483 | | | | 56 | |
Lear Corp | | | 6,486 | | | | 707 | |
Leggett & Platt Inc | | | 222 | | | | 8 | |
Lennar Corp, Cl B | | | 728 | | | | 34 | |
LGI Homes Inc * | | | 127 | | | | 11 | |
Liberty Media Corp-Liberty SiriusXM, Cl C * | | | 234 | | | | 8 | |
LKQ Corp * | | | 317 | | | | 8 | |
Lowe’s Cos Inc | | | 15,716 | | | | 2,124 | |
M/I Homes Inc * | | | 1,195 | | | | 41 | |
| | |
| 16 | | New Covenant Funds / Annual Report / June 30, 2020 |
| | | | | | | | |
| | | |
| Description | | Shares | | | Market Value
($ Thousands) | |
| | |
COMMON STOCK (continued) | | | | | | | | |
Macy’s Inc | | | 4,042 | | | $ | 28 | |
Madison Square Garden Sports Corp * | | | 39 | | | | 6 | |
Malibu Boats Inc, Cl A * | | | 1,232 | | | | 64 | |
Marriott International Inc/MD, Cl A | | | 3,599 | | | | 309 | |
Marriott Vacations Worldwide Corp | | | 394 | | | | 32 | |
Mattel Inc * | | | 14,805 | | | | 143 | |
McDonald’s Corp | | | 11,361 | | | | 2,096 | |
MDC Holdings Inc | | | 1,302 | | | | 46 | |
Meritage Homes Corp * | | | 794 | | | | 60 | |
Michaels Cos Inc/The * | | | 7,530 | | | | 53 | |
Mohawk Industries Inc * | | | 127 | | | | 13 | |
Monro Inc | | | 626 | | | | 34 | |
Murphy USA Inc * | | | 422 | | | | 48 | |
National Vision Holdings Inc * | | | 1,563 | | | | 48 | |
Netflix Inc * | | | 6,295 | | | | 2,864 | |
Newell Brands Inc | | | 605 | | | | 10 | |
News Corp, Cl A | | | 829 | | | | 10 | |
NIKE Inc, Cl B | | | 17,693 | | | | 1,735 | |
Nordstrom Inc | | | 3,866 | | | | 60 | |
Norwegian Cruise Line Holdings Ltd * | | | 14,956 | | | | 246 | |
NVR Inc * | | | 13 | | | | 42 | |
Office Depot | | | 19,011 | | | | 45 | |
Ollie’s Bargain Outlet Holdings Inc * | | | 746 | | | | 73 | |
OneSpaWorld Holdings Ltd | | | 3,063 | | | | 15 | |
O’Reilly Automotive Inc * | | | 677 | | | | 285 | |
Oxford Industries Inc | | | 665 | | | | 29 | |
Papa John’s International Inc | | | 806 | | | | 64 | |
Penske Automotive Group Inc | | | 957 | | | | 37 | |
PetMed Express Inc | | | 2,172 | | | | 77 | |
Planet Fitness Inc, Cl A * | | | 3,228 | | | | 196 | |
Polaris Inc | | | 966 | | | | 89 | |
Pool Corp | | | 54 | | | | 15 | |
PulteGroup Inc | | | 5,125 | | | | 174 | |
PVH Corp | | | 108 | | | | 5 | |
Quotient Technology Inc * | | | 4,484 | | | | 33 | |
Qurate Retail Inc * | | | 1,412 | | | | 13 | |
Ralph Lauren Corp, Cl A | | | 690 | | | | 50 | |
RealReal Inc/The * | | | 2,868 | | | | 37 | |
Rent-A-Center Inc/TX, Cl A | | | 1,764 | | | | 49 | |
RH * | | | 224 | | | | 56 | |
Roku Inc, Cl A * | | | 1,351 | | | | 157 | |
Ross Stores Inc | | | 3,209 | | | | 274 | |
Royal Caribbean Cruises Ltd | | | 8,804 | | | | 443 | |
Rubicon Project * | | | 1,140 | | | | 8 | |
Sally Beauty Holdings Inc * | | | 2,794 | | | | 35 | |
SeaWorld Entertainment Inc * | | | 1,594 | | | | 24 | |
Service Corp International/US | | | 250 | | | | 10 | |
ServiceMaster Global Holdings Inc * | | | 1,327 | | | | 47 | |
Shake Shack Inc, Cl A * | | | 157 | | | | 8 | |
Shutterstock Inc | | | 1,176 | | | | 41 | |
Signet Jewelers Ltd | | | 2,402 | | | | 25 | |
Six Flags Entertainment Corp | | | 248 | | | | 5 | |
| | | | | | | | |
| | | |
| Description | | Shares | | | Market Value
($ Thousands) | |
| | |
COMMON STOCK (continued) | | | | | | | | |
Sleep Number Corp * | | | 1,033 | | | $ | 43 | |
Stamps.com Inc * | | | 630 | | | | 116 | |
Standard Motor Products Inc | | | 943 | | | | 39 | |
Starbucks Corp | | | 16,902 | | | | 1,244 | |
Steven Madden Ltd | | | 1,178 | | | | 29 | |
Stitch Fix Inc, Cl A * | | | 1,950 | | | | 49 | |
Strategic Education Inc | | | 331 | | | | 51 | |
Tapestry Inc | | | 2,803 | | | | 37 | |
Target Corp | | | 6,577 | | | | 789 | |
Taylor Morrison Home Corp, Cl A * | | | 12,743 | | | | 246 | |
Tempur Sealy International Inc * | | | 568 | | | | 41 | |
Tenneco Inc, Cl A * | | | 3,599 | | | | 27 | |
Tesla Inc * | | | 2,039 | | | | 2,202 | |
Texas Roadhouse Inc, Cl A | | | 889 | | | | 47 | |
Thor Industries Inc | | | 721 | | | | 77 | |
Tiffany & Co | | | 483 | | | | 59 | |
TJX Cos Inc/The | | | 14,736 | | | | 745 | |
Toll Brothers Inc | | | 2,246 | | | | 73 | |
TopBuild Corp * | | | 476 | | | | 54 | |
Tractor Supply Co | | | 2,377 | | | | 313 | |
TRI Pointe Group Inc * | | | 3,236 | | | | 48 | |
TripAdvisor Inc | | | 1,712 | | | | 33 | |
Ulta Beauty Inc * | | | 279 | | | | 57 | |
Under Armour Inc, Cl C * | | | 556 | | | | 5 | |
Urban Outfitters Inc * | | | 417 | | | | 6 | |
Vail Resorts Inc | | | 46 | | | | 8 | |
VF Corp | | | 4,023 | | | | 245 | |
Visteon Corp * | | | 551 | | | | 38 | |
Wayfair Inc, Cl A * | | | 882 | | | | 174 | |
Wendy’s Co/The | | | 11,419 | | | | 249 | |
Whirlpool Corp | | | 638 | | | | 83 | |
Williams-Sonoma Inc | | | 160 | | | | 13 | |
Wingstop Inc | | | 582 | | | | 81 | |
Winnebago Industries Inc | | | 191 | | | | 13 | |
Wolverine World Wide Inc | | | 1,511 | | | | 36 | |
WW International Inc * | | | 1,262 | | | | 32 | |
Wyndham Destinations Inc | | | 4,669 | | | | 132 | |
Wyndham Hotels & Resorts Inc | | | 189 | | | | 8 | |
Yum China Holdings Inc | | | 1,913 | | | | 92 | |
Yum! Brands Inc | | | 8,356 | | | | 726 | |
Zumiez Inc * | | | 1,593 | | | | 44 | |
| | | | | | | | |
| | | | | | | 53,850 | |
| | | | | | | | |
| | |
Consumer Staples — 6.2% | | | | | | | | |
Andersons Inc/The | | | 1,960 | | | | 27 | |
Archer-Daniels-Midland Co | | | 4,581 | | | | 183 | |
B&G Foods Inc | | | 2,907 | | | | 71 | |
Beyond Meat Inc * | | | 535 | | | | 72 | |
BJ’s Wholesale Club Holdings Inc * | | | 2,099 | | | | 78 | |
Bunge Ltd | | | 1,596 | | | | 66 | |
Calavo Growers Inc | | | 571 | | | | 36 | |
Campbell Soup Co | | | 10,354 | | | | 514 | |
Casey’s General Stores Inc | | | 319 | | | | 48 | |
| | | | |
New Covenant Funds / Annual Report / June 30, 2020 | | | 17 | |
SCHEDULE OF INVESTMENTS
June 30, 2020
New Covenant Growth Fund (Continued)
| | | | | | | | |
| | | |
| Description | | Shares | | | Market Value
($ Thousands) | |
| | |
COMMON STOCK (continued) | | | | | | | | |
Chefs’ Warehouse Inc/The * | | | 1,366 | | | $ | 19 | |
Church & Dwight Co Inc | | | 1,714 | | | | 132 | |
Clorox Co/The | | | 3,366 | | | | 738 | |
Coca-Cola Co/The | | | 65,159 | | | | 2,911 | |
Colgate-Palmolive Co | | | 14,526 | | | | 1,064 | |
Conagra Brands Inc | | | 14,479 | | | | 509 | |
Costco Wholesale Corp | | | 6,288 | | | | 1,907 | |
Coty Inc, Cl A | | | 1,026 | | | | 5 | |
Darling Ingredients Inc * | | | 1,847 | | | | 45 | |
Edgewell Personal Care Co * | | | 1,589 | | | | 50 | |
Energizer Holdings Inc | | | 231 | | | | 11 | |
Estee Lauder Cos Inc/The, Cl A | | | 2,390 | | | | 451 | |
Flowers Foods Inc | | | 9,872 | | | | 221 | |
Fresh Del Monte Produce Inc | | | 1,442 | | | | 36 | |
General Mills Inc | | | 13,887 | | | | 856 | |
Grocery Outlet Holding Corp * | | | 1,603 | | | | 65 | |
Hain Celestial Group Inc/The * | | | 461 | | | | 15 | |
Hershey Co/The | | | 2,295 | | | | 297 | |
HF Foods Group Inc * | | | 2,213 | | | | 20 | |
Hormel Foods Corp | | | 4,797 | | | | 232 | |
Hostess Brands Inc, Cl A * | | | 3,470 | | | | 42 | |
Ingredion Inc | | | 1,110 | | | | 92 | |
J & J Snack Foods Corp | | | 274 | | | | 35 | |
J M Smucker Co/The | | | 7,294 | | | | 772 | |
John B Sanfilippo & Son Inc | | | 544 | | | | 46 | |
Kellogg Co | | | 6,713 | | | | 443 | |
Keurig Dr Pepper Inc | | | 18,064 | | | | 513 | |
Kimberly-Clark Corp | | | 6,484 | | | | 917 | |
Kraft Heinz Co/The | | | 4,224 | | | | 135 | |
Kroger Co/The | | | 25,293 | | | | 856 | |
Lamb Weston Holdings Inc | | | 594 | | | | 38 | |
Lancaster Colony Corp | | | 319 | | | | 49 | |
McCormick & Co Inc/MD | | | 2,916 | | | | 523 | |
Medifast Inc | | | 533 | | | | 74 | |
Mondelez International Inc, Cl A | | | 17,402 | | | | 890 | |
Monster Beverage Corp * | | | 2,682 | | | | 186 | |
National Beverage Corp * | | | 975 | | | | 59 | |
New Age Beverages Corp * | | | 27,322 | | | | 42 | |
PepsiCo Inc | | | 28,780 | | | | 3,806 | |
Performance Food Group Co * | | | 1,023 | | | | 30 | |
Pilgrim’s Pride Corp * | | | 355 | | | | 6 | |
Post Holdings Inc * | | | 108 | | | | 9 | |
PriceSmart Inc | | | 690 | | | | 42 | |
Procter & Gamble Co/The | | | 34,144 | | | | 4,083 | |
Sanderson Farms Inc | | | 297 | | | | 34 | |
SpartanNash Co | | | 1,252 | | | | 27 | |
Spectrum Brands Holdings Inc | | | 183 | | | | 8 | |
Sprouts Farmers Market Inc * | | | 6,575 | | | | 168 | |
Sysco Corp | | | 19,266 | | | | 1,053 | |
Tootsie Roll Industries Inc | | | 1,504 | | | | 52 | |
TreeHouse Foods Inc * | | | 237 | | | | 10 | |
Tyson Foods Inc, Cl A | | | 2,073 | | | | 124 | |
| | | | | | | | |
| | | |
| Description | | Shares | | | Market Value
($ Thousands) | |
| | |
COMMON STOCK (continued) | | | | | | | | |
US Foods Holding Corp * | | | 2,211 | | | $ | 44 | |
Walgreens Boots Alliance Inc | | | 8,946 | | | | 379 | |
Walmart Inc | | | 18,551 | | | | 2,222 | |
WD-40 Co | | | 259 | | | | 51 | |
| | | | | | | | |
| | | | | | | 28,539 | |
| | | | | | | | |
| | |
Energy — 2.4% | | | | | | | | |
Antero Midstream Corp | | | 7,912 | | | | 40 | |
Apache Corp | | | 7,933 | | | | 107 | |
Baker Hughes Co, Cl A | | | 4,496 | | | | 69 | |
Cabot Oil & Gas Corp | | | 3,306 | | | | 57 | |
Cactus Inc, Cl A | | | 1,525 | | | | 31 | |
ChampionX Corp * | | | 383 | | | | 4 | |
Cheniere Energy Inc * | | | 1,265 | | | | 61 | |
Chesapeake Energy Corp * | | | 164 | | | | 1 | |
Chevron Corp | | | 26,616 | | | | 2,375 | |
Cimarex Energy Co | | | 995 | | | | 27 | |
CNX Resources Corp * | | | 6,091 | | | | 53 | |
Concho Resources Inc | | | 142 | | | | 7 | |
ConocoPhillips | | | 28,755 | | | | 1,208 | |
Continental Resources Inc/OK | | | 337 | | | | 6 | |
Devon Energy Corp | | | 8,276 | | | | 94 | |
Diamond S Shipping Inc * | | | 3,276 | | | | 26 | |
Diamondback Energy Inc | | | 133 | | | | 6 | |
Dril-Quip Inc * | | | 1,072 | | | | 32 | |
EOG Resources Inc | | | 6,126 | | | | 310 | |
EQT Corp | | | 2,732 | | | | 33 | |
Equitrans Midstream Corp | | | 2,185 | | | | 18 | |
Exxon Mobil Corp | | | 59,127 | | | | 2,644 | |
Frank’s International NV * | | | 9,174 | | | | 20 | |
Golar LNG Ltd | | | 3,888 | | | | 28 | |
Halliburton Co | | | 4,450 | | | | 58 | |
Helmerich & Payne Inc | | | 1,494 | | | | 29 | |
Hess Corp | | | 4,195 | | | | 217 | |
HollyFrontier Corp | | | 3,119 | | | | 91 | |
International Seaways Inc | | | 1,773 | | | | 29 | |
Kinder Morgan Inc | | | 21,442 | | | | 325 | |
Kosmos Energy Ltd | | | 2,007 | | | | 3 | |
Magnolia Oil & Gas Corp * | | | 3,984 | | | | 24 | |
Marathon Oil Corp | | | 5,472 | | | | 33 | |
Marathon Petroleum Corp | | | 7,000 | | | | 262 | |
Murphy Oil Corp | | | 449 | | | | 6 | |
Nabors Industries Ltd | | | 367 | | | | 14 | |
National Oilwell Varco Inc | | | 482 | | | | 6 | |
Noble Energy Inc | | | 6,179 | | | | 55 | |
Occidental Petroleum Corp | | | 8,202 | | | | 150 | |
Oceaneering International Inc * | | | 3,376 | | | | 22 | |
ONEOK Inc | | | 3,505 | | | | 116 | |
Parsley Energy Inc, Cl A | | | 2,802 | | | | 30 | |
Patterson-UTI Energy Inc | | | 4,952 | | | | 17 | |
PBF Energy Inc, Cl A | | | 363 | | | | 4 | |
Phillips 66 | | | 5,367 | | | | 386 | |
Pioneer Natural Resources Co | | | 1,910 | | | | 187 | |
| | |
| 18 | | New Covenant Funds / Annual Report / June 30, 2020 |
| | | | | | | | |
| | | |
| Description | | Shares | | | Market Value
($ Thousands) | |
| | |
COMMON STOCK (continued) | | | | | | | | |
Range Resources Corp | | | 2,413 | | | $ | 14 | |
RPC Inc | | | 10,482 | | | | 32 | |
Schlumberger Ltd | | | 41,175 | | | | 757 | |
Southwestern Energy Co * | | | 21,739 | | | | 56 | |
Targa Resources Corp | | | 11,252 | | | | 226 | |
Transocean Ltd * | | | 8,264 | | | | 15 | |
Valero Energy Corp | | | 4,715 | | | | 277 | |
Williams Cos Inc/The | | | 11,002 | | | | 209 | |
WPX Energy Inc * | | | 3,940 | | | | 25 | |
| | | | | | | | |
| | | | | | | 10,932 | |
| | | | | | | | |
| | |
Financials — 10.6% | | | | | | | | |
Affiliated Managers Group Inc | | | 910 | | | | 68 | |
Aflac Inc | | | 6,398 | | | | 231 | |
AGNC Investment Corp | | | 2,838 | | | | 37 | |
Alleghany Corp | | | 15 | | | | 7 | |
Allegiance Bancshares Inc | | | 1,318 | | | | 33 | |
Allstate Corp/The | | | 3,458 | | | | 335 | |
Ally Financial Inc | | | 1,575 | | | | 31 | |
American Express Co | | | 9,360 | | | | 891 | |
American Financial Group Inc/OH | | | 449 | | | | 28 | |
American Homes 4 Rent, Cl A ‡ | | | 1,974 | | | | 53 | |
American International Group Inc | | | 8,217 | | | | 256 | |
American National Insurance | | | 421 | | | | 30 | |
Ameriprise Financial Inc | | | 1,250 | | | | 188 | |
Ameris Bancorp | | | 1,129 | | | | 27 | |
AMERISAFE Inc | | | 743 | | | | 45 | |
Annaly Capital Management Inc ‡ | | | 8,922 | | | | 59 | |
Aon PLC, Cl A | | | 2,921 | | | | 563 | |
Apollo Commercial Real Estate Finance Inc | | | 2,686 | | | | 26 | |
Arch Capital Group Ltd * | | | 2,404 | | | | 69 | |
Argo Group International Holdings Ltd | | | 750 | | | | 26 | |
ARMOUR Residential REIT Inc | | | 2,854 | | | | 27 | |
Arthur J Gallagher & Co | | | 743 | | | | 72 | |
Artisan Partners Asset Management Inc, Cl A | | | 1,589 | | | | 52 | |
Assetmark Financial Holdings Inc * | | | 1,796 | | | | 49 | |
Associated Banc-Corp | | | 4,274 | | | | 58 | |
Assurant Inc | | | 87 | | | | 9 | |
Assured Guaranty Ltd | | | 994 | | | | 24 | |
Athene Holding Ltd, Cl A * | | | 1,071 | | | | 33 | |
Atlantic Union Bankshares Corp | | | 1,302 | | | | 30 | |
Axis Capital Holdings Ltd | | | 825 | | | | 33 | |
Axos Financial Inc * | | | 1,657 | | | | 37 | |
Banc of California Inc | | | 2,959 | | | | 32 | |
BancorpSouth Bank | | | 1,525 | | | | 35 | |
Bank of America Corp | | | 115,778 | | | | 2,750 | |
Bank of Hawaii Corp | | | 1,051 | | | | 65 | |
Bank of Marin Bancorp | | | 1,079 | | | | 36 | |
Bank of New York Mellon Corp/The | | | 12,656 | | | | 489 | |
Bank of NT Butterfield & Son Ltd/The | | | 1,324 | | | | 32 | |
Bank OZK | | | 366 | | | | 9 | |
BankUnited Inc | | | 2,418 | | | | 49 | |
Banner Corp | | | 851 | | | | 32 | |
| | | | | | | | |
| | | |
| Description | | Shares | | | Market Value
($ Thousands) | |
| | |
COMMON STOCK (continued) | | | | | | | | |
Berkshire Hathaway Inc, Cl B * | | | 28,456 | | | $ | 5,080 | |
Berkshire Hills Bancorp Inc | | | 1,501 | | | | 17 | |
BGC Partners Inc, Cl A | | | 8,389 | | | | 23 | |
BlackRock Inc, Cl A | | | 1,878 | | | | 1,022 | |
Blackstone Mortgage Trust Inc, Cl A | | | 1,347 | | | | 32 | |
BOK Financial Corp | | | 568 | | | | 32 | |
Boston Private Financial Holdings Inc | | | 4,112 | | | | 28 | |
Bridge Bancorp Inc | | | 1,467 | | | | 34 | |
Brighthouse Financial Inc * | | | 268 | | | | 7 | |
Brown & Brown Inc | | | 290 | | | | 12 | |
Bryn Mawr Bank Corp | | | 1,221 | | | | 34 | |
Camden National Corp | | | 1,097 | | | | 38 | |
Capital One Financial Corp | | | 4,592 | | | | 287 | |
Capitol Federal Financial Inc | | | 3,529 | | | | 39 | |
Capstead Mortgage Corp | | | 6,235 | | | | 34 | |
Cathay General Bancorp | | | 1,291 | | | | 34 | |
Cboe Global Markets Inc | | | 99 | | | | 9 | |
Central Pacific Financial Corp | | | 1,651 | | | | 26 | |
Charles Schwab Corp/The | | | 13,043 | | | | 440 | |
Chimera Investment Corp | | | 2,402 | | | | 23 | |
Chubb Ltd | | | 6,169 | | | | 781 | |
Cincinnati Financial Corp | | | 891 | | | | 57 | |
CIT Group Inc | | | 1,060 | | | | 22 | |
Citigroup Inc | | | 29,852 | | | | 1,525 | |
Citizens Financial Group Inc | | | 2,381 | | | | 60 | |
City Holding Co | | | 607 | | | | 40 | |
CME Group Inc, Cl A | | | 4,726 | | | | 768 | |
CNA Financial Corp | | | 253 | | | | 8 | |
Cohen & Steers Inc | | | 764 | | | | 52 | |
Colony Credit Real Estate Inc | | | 3,608 | | | | 25 | |
Columbia Banking System Inc | | | 1,223 | | | | 35 | |
Comerica Inc | | | 1,232 | | | | 47 | |
Commerce Bancshares Inc/MO | | | 1,488 | | | | 88 | |
Community Bank System Inc | | | 710 | | | | 40 | |
ConnectOne Bancorp Inc | | | 1,891 | | | | 30 | |
Credit Acceptance Corp * | | | 177 | | | | 74 | |
Cullen/Frost Bankers Inc | | | 850 | | | | 64 | |
CVB Financial Corp | | | 2,268 | | | | 43 | |
Discover Financial Services | | | 26,226 | | | | 1,314 | |
E*TRADE Financial Corp | | | 1,729 | | | | 86 | |
Eagle Bancorp Inc | | | 1,035 | | | | 34 | |
East West Bancorp Inc | | | 1,710 | | | | 62 | |
eHealth Inc * | | | 512 | | | | 50 | |
Ellington Financial Inc | | | 2,748 | | | | 32 | |
Enterprise Financial Services Corp | | | 1,063 | | | | 33 | |
Equitable Holdings Inc | | | 432 | | | | 8 | |
Erie Indemnity Co, Cl A | | | 433 | | | | 83 | |
Essent Group Ltd * | | | 970 | | | | 35 | |
Evercore Inc, Cl A | | | 659 | | | | 39 | |
Everest Re Group Ltd | | | 179 | | | | 37 | |
FactSet Research Systems Inc | | | 306 | | | | 101 | |
FB Financial Corp | | | 1,250 | | | | 31 | |
| | | | |
New Covenant Funds / Annual Report / June 30, 2020 | | | 19 | |
SCHEDULE OF INVESTMENTS
June 30, 2020
New Covenant Growth Fund (Continued)
| | | | | | | | |
| | | |
| Description | | Shares | | | Market Value
($ Thousands) | |
| | |
COMMON STOCK (continued) | | | | | | | | |
Federal Agricultural Mortgage Corp, Cl C | | | 597 | | | $ | 38 | |
Federated Hermes Inc, Cl B | | | 1,492 | | | | 35 | |
Fidelity National Financial Inc | | | 1,063 | | | | 33 | |
Fifth Third Bancorp | | | 4,599 | | | | 89 | |
First American Financial Corp | | | 814 | | | | 39 | |
First BanCorp/Puerto Rico | | | 4,571 | | | | 26 | |
First Busey Corp | | | 1,790 | | | | 33 | |
First Citizens BancShares Inc/NC, Cl A | | | 94 | | | | 38 | |
First Commonwealth Financial Corp | | | 3,365 | | | | 28 | |
First Financial Bancorp | | | 1,921 | | | | 27 | |
First Financial Bankshares Inc | | | 1,378 | | | | 40 | |
First Hawaiian Inc | | | 3,126 | | | | 54 | |
First Horizon National Corp | | | 3,007 | | | | 30 | |
First Merchants Corp | | | 1,182 | | | | 33 | |
First Midwest Bancorp Inc/IL | | | 2,129 | | | | 28 | |
First Republic Bank/CA | | | 831 | | | | 88 | |
FirstCash Inc | | | 612 | | | | 41 | |
FNB Corp/PA | | | 3,907 | | | | 29 | |
Franklin Resources Inc | | | 6,856 | | | | 144 | |
Fulton Financial Corp | | | 2,789 | | | | 29 | |
Genworth Financial Inc, Cl A * | | | 10,439 | | | | 24 | |
German American Bancorp Inc | | | 1,414 | | | | 44 | |
Globe Life Inc | | | 108 | | | | 8 | |
Goldman Sachs Group Inc/The | | | 3,960 | | | | 783 | |
Goosehead Insurance Inc, Cl A * | | | 215 | | | | 16 | |
Great Western Bancorp Inc | | | 1,390 | | | | 19 | |
Hancock Whitney Corp | | | 1,142 | | | | 24 | |
Hannon Armstrong Sustainable | | | | | | | | |
Infrastructure Capital Inc | | | 30,657 | | | | 873 | |
Hanover Insurance Group Inc/The | | | 694 | | | | 70 | |
HarborOne Bancorp Inc * | | | 4,621 | | | | 39 | |
Hartford Financial Services Group Inc/The | | | 4,042 | | | | 156 | |
Heartland Financial USA Inc | | | 1,003 | | | | 34 | |
Heritage Financial Corp/WA | | | 1,744 | | | | 35 | |
Home BancShares Inc/AR | | | 2,523 | | | | 39 | |
HomeStreet Inc | | | 1,465 | | | | 36 | |
Hope Bancorp Inc | | | 3,233 | | | | 30 | |
Horace Mann Educators Corp | | | 1,125 | | | | 41 | |
Houlihan Lokey Inc, Cl A | | | 1,032 | | | | 57 | |
Huntington Bancshares Inc/OH | | | 6,282 | | | | 57 | |
IBERIABANK Corp | | | 662 | | | | 30 | |
Independent Bank Corp | | | 580 | | | | 39 | |
Independent Bank Group Inc | | | 846 | | | | 34 | |
Intercontinental Exchange Inc | | | 6,879 | | | | 630 | |
International Bancshares Corp | | | 1,137 | | | | 36 | |
Invesco Ltd | | | 18,276 | | | | 197 | |
Invesco Mortgage Capital Inc | | | 2,946 | | | | 11 | |
Investors Bancorp Inc | | | 4,061 | | | | 35 | |
James River Group Holdings Ltd | | | 1,180 | | | | 53 | |
Jefferies Financial Group Inc | | | 2,313 | | | | 36 | |
JPMorgan Chase & Co | | | 52,401 | | | | 4,929 | |
KeyCorp | | | 12,904 | | | | 157 | |
| | | | | | | | |
| | | |
| Description | | Shares | | | Market Value
($ Thousands) | |
| | |
COMMON STOCK (continued) | | | | | | | | |
Kinsale Capital Group Inc | | | 488 | | | $ | 76 | |
KKR Real Estate Finance Trust Inc | | | 2,440 | | | | 40 | |
Lakeland Bancorp Inc | | | 2,890 | | | | 33 | |
Lazard Ltd, Cl A (A) | | | 2,316 | | | | 66 | |
Legg Mason Inc | | | 1,356 | | | | 67 | |
LendingTree Inc * | | | 175 | | | | 51 | |
Lincoln National Corp | | | 3,621 | | | | 133 | |
Loews Corp | | | 222 | | | | 8 | |
LPL Financial Holdings Inc | | | 1,036 | | | | 81 | |
M&T Bank Corp | | | 929 | | | | 97 | |
Markel Corp * | | | 48 | | | | 44 | |
MarketAxess Holdings Inc | | | 305 | | | | 153 | |
Marsh & McLennan Cos Inc | | | 16,703 | | | | 1,793 | |
Mercury General Corp | | | 233 | | | | 9 | |
Meta Financial Group Inc | | | 1,407 | | | | 26 | |
MetLife Inc | | | 7,024 | | | | 257 | |
MFA Financial Inc | | | 6,337 | | | | 16 | |
MGIC Investment Corp | | | 3,455 | | | | 28 | |
Moelis & Co, Cl A | | | 1,564 | | | | 49 | |
Moody’s Corp | | | 1,782 | | | | 490 | |
Morgan Stanley | | | 35,755 | | | | 1,727 | |
Morningstar Inc | | | 1,261 | | | | 178 | |
Mr Cooper Group Inc * | | | 3,903 | | | | 49 | |
MSCI Inc, Cl A | | | 1,669 | | | | 557 | |
Nasdaq Inc | | | 2,378 | | | | 284 | |
Navient Corp | | | 3,513 | | | | 25 | |
NBT Bancorp Inc | | | 1,213 | | | | 37 | |
Nelnet Inc, Cl A | | | 793 | | | | 38 | |
New Residential Investment Corp | | | 14,139 | | | | 105 | |
New York Community Bancorp Inc | | | 951 | | | | 10 | |
New York Mortgage Trust Inc | | | 7,776 | | | | 20 | |
NMI Holdings Inc, Cl A * | | | 1,470 | | | | 24 | |
Northern Trust Corp | | | 7,549 | | | | 599 | |
Northfield Bancorp Inc | | | 2,868 | | | | 33 | |
OFG Bancorp | | | 2,119 | | | | 28 | |
Old National Bancorp/IN | | | 2,680 | | | | 37 | |
Old Republic International Corp | | | 2,203 | | | | 36 | |
OneMain Holdings Inc, Cl A | | | 258 | | | | 6 | |
Pacific Premier Bancorp Inc | | | 3,188 | | | | 69 | |
PacWest Bancorp | | | 1,283 | | | | 25 | |
Palomar Holdings Inc, Cl A * | | | 929 | | | | 80 | |
PennyMac Mortgage Investment Trust | | | 5,185 | | | | 91 | |
People’s United Financial Inc | | | 5,001 | | | | 58 | |
Pinnacle Financial Partners Inc | | | 1,489 | | | | 63 | |
PNC Financial Services Group Inc/The | | | 5,690 | | | | 599 | |
PRA Group Inc * | | | 1,320 | | | | 51 | |
Preferred Bank/Los Angeles CA | | | 845 | | | | 36 | |
Primerica Inc | | | 365 | | | | 43 | |
Principal Financial Group Inc | | | 662 | | | | 28 | |
ProAssurance Corp | | | 1,351 | | | | 20 | |
Progressive Corp/The | | | 6,981 | | | | 559 | |
ProSight Global Inc * | | | 2,999 | | | | 27 | |
| | |
| 20 | | New Covenant Funds / Annual Report / June 30, 2020 |
| | | | | | | | |
| | | |
| Description | | Shares | | | Market Value
($ Thousands) | |
| | |
COMMON STOCK (continued) | | | | | | | | |
Prosperity Bancshares Inc | | | 1,192 | | | $ | 71 | |
Provident Financial Services Inc | | | 1,988 | | | | 29 | |
Prudential Financial Inc | | | 16,015 | | | | 975 | |
PS Business Parks Inc ‡ | | | 306 | | | | 41 | |
Radian Group Inc | | | 1,924 | | | | 30 | |
Raymond James Financial Inc | | | 980 | | | | 67 | |
Redwood Trust Inc | | | 2,992 | | | | 21 | |
Regions Financial Corp | | | 72,286 | | | | 804 | |
Reinsurance Group of America Inc, Cl A | | | 578 | | | | 45 | |
Renasant Corp | | | 1,366 | | | | 34 | |
RLI Corp | | | 545 | | | | 45 | |
S&P Global Inc | | | 7,309 | | | | 2,408 | |
S&T Bancorp Inc | | | 1,247 | | | | 29 | |
Sandy Spring Bancorp Inc | | | 1,350 | | | | 33 | |
Santander Consumer USA Holdings Inc | | | 476 | | | | 9 | |
Seacoast Banking Corp of Florida * | | | 1,616 | | | | 33 | |
Selective Insurance Group Inc | | | 739 | | | | 39 | |
ServisFirst Bancshares Inc | | | 1,306 | | | | 47 | |
Signature Bank/New York NY | | | 676 | | | | 72 | |
Simmons First National Corp, Cl A | | | 1,836 | | | | 31 | |
SLM Corp | | | 8,316 | | | | 58 | |
South State Corp | | | 1,155 | | | | 55 | |
Starwood Property Trust Inc ‡ | | | 2,000 | | | | 30 | |
State Street Corp | | | 9,970 | | | | 634 | |
Sterling Bancorp/DE | | | 2,321 | | | | 27 | |
Stifel Financial Corp | | | 807 | | | | 38 | |
SVB Financial Group * | | | 346 | | | | 75 | |
Synchrony Financial | | | 4,720 | | | | 105 | |
Synovus Financial Corp | | | 1,267 | | | | 26 | |
T Rowe Price Group Inc | | | 2,711 | | | | 335 | |
TCF Financial Corp | | | 1,085 | | | | 32 | |
TD Ameritrade Holding Corp | | | 221 | | | | 8 | |
Texas Capital Bancshares Inc * | | | 822 | | | | 25 | |
TFS Financial Corp | | | 573 | | | | 8 | |
Tompkins Financial Corp | | | 549 | | | | 36 | |
TPG RE Finance Trust Inc | | | 2,439 | | | | 21 | |
Travelers Cos Inc/The | | | 2,743 | | | | 313 | |
TriCo Bancshares | | | 1,219 | | | | 37 | |
TriState Capital Holdings Inc * | | | 1,917 | | | | 30 | |
Triumph Bancorp Inc * | | | 1,296 | | | | 31 | |
Truist Financial Corp | | | 16,871 | | | | 634 | |
Trustmark Corp | | | 1,410 | | | | 35 | |
Two Harbors Investment Corp | | | 6,390 | | | | 32 | |
UMB Financial Corp | | | 715 | | | | 37 | |
Umpqua Holdings Corp | | | 2,753 | | | | 29 | |
United Bankshares Inc/WV | | | 1,306 | | | | 36 | |
Universal Insurance Holdings Inc | | | 1,696 | | | | 30 | |
Univest Financial Corp | | | 1,820 | | | | 29 | |
Unum Group | | | 1,638 | | | | 27 | |
US Bancorp | | | 20,106 | | | | 740 | |
Valley National Bancorp | | | 4,269 | | | | 33 | |
Veritex Holdings Inc | | | 1,729 | | | | 31 | |
| | | | | | | | |
| | | |
| Description | | Shares | | | Market Value
($ Thousands) | |
| | |
COMMON STOCK (continued) | | | | | | | | |
Virtu Financial Inc, Cl A | | | 3,026 | | | $ | 71 | |
Voya Financial Inc | | | 4,001 | | | | 187 | |
W R Berkley Corp | | | 165 | | | | 9 | |
Waddell & Reed Financial Inc, Cl A | | | 2,974 | | | | 46 | |
Walker & Dunlop Inc | | | 749 | | | | 38 | |
Washington Federal Inc | | | 1,337 | | | | 36 | |
Washington Trust Bancorp Inc | | | 924 | | | | 30 | |
Watford Holdings Ltd * | | | 1,869 | | | | 31 | |
Webster Financial Corp | | | 934 | | | | 27 | |
Wells Fargo & Co | | | 50,687 | | | | 1,298 | |
Westamerica BanCorp | | | 731 | | | | 42 | |
Western Alliance Bancorp | | | 1,801 | | | | 68 | |
White Mountains Insurance Group Ltd | | | 44 | | | | 39 | |
Willis Towers Watson PLC | | | 907 | | | | 179 | |
Wintrust Financial Corp | | | 708 | | | | 31 | |
Zions Bancorp NA | | | 1,771 | | | | 60 | |
| | | | | | | | |
| | |
| | | | | | | 49,116 | |
| | | | | | | | |
| | |
Health Care — 14.4% | | | | | | | | |
Abbott Laboratories | | | 35,040 | | | | 3,204 | |
AbbVie Inc | | | 25,124 | | | | 2,467 | |
ABIOMED Inc * | | | 332 | | | | 80 | |
Acadia Healthcare Co Inc * | | | 1,517 | | | | 38 | |
Acceleron Pharma Inc * | | | 123 | | | | 12 | |
Adaptive Biotechnologies Corp * | | | 1,704 | | | | 82 | |
Addus HomeCare Corp * | | | 545 | | | | 50 | |
Adverum Biotechnologies Inc * | | | 4,537 | | | | 95 | |
Aerie Pharmaceuticals Inc * | | | 2,282 | | | | 34 | |
Agilent Technologies Inc | | | 7,874 | | | | 696 | |
Agios Pharmaceuticals Inc * | | | 1,062 | | | | 57 | |
Aimmune Therapeutics Inc * | | | 1,579 | | | | 26 | |
Akebia Therapeutics Inc * | | | 7,149 | | | | 97 | |
Alector Inc * | | | 2,628 | | | | 64 | |
Alexion Pharmaceuticals Inc * | | | 1,593 | | | | 179 | |
Align Technology Inc * | | | 602 | | | | 165 | |
Alkermes PLC * | | | 2,433 | | | | 47 | |
Allakos Inc * | | | 378 | | | | 27 | |
Allogene Therapeutics Inc * | | | 1,838 | | | | 79 | |
Alnylam Pharmaceuticals Inc * | | | 1,202 | | | | 178 | |
Amedisys Inc * | | | 309 | | | | 61 | |
AmerisourceBergen Corp, Cl A | | | 759 | | | | 76 | |
Amgen Inc | | | 11,116 | | | | 2,622 | |
Amicus Therapeutics Inc * | | | 5,193 | | | | 78 | |
AMN Healthcare Services Inc * | | | 832 | | | | 38 | |
Anika Therapeutics Inc * | | | 920 | | | | 35 | |
Anthem Inc | | | 3,134 | | | | 824 | |
Apellis Pharmaceuticals Inc * | | | 1,618 | | | | 53 | |
Apollo Medical Holdings Inc * | | | 2,730 | | | | 45 | |
Arcus Biosciences Inc * | | | 2,371 | | | | 59 | |
Arena Pharmaceuticals Inc * | | | 1,077 | | | | 68 | |
Arrowhead Pharmaceuticals Inc * | | | 2,046 | | | | 88 | |
Arvinas Inc * | | | 1,559 | | | | 52 | |
Assembly Biosciences Inc * | | | 2,159 | | | | 50 | |
| | | | |
New Covenant Funds / Annual Report / June 30, 2020 | | | 21 | |
SCHEDULE OF INVESTMENTS
June 30, 2020
New Covenant Growth Fund (Continued)
| | | | | | | | |
| | | |
| Description | | Shares | | | Market Value
($ Thousands) | |
| | |
COMMON STOCK (continued) | | | | | | | | |
Atara Biotherapeutics Inc * | | | 3,254 | | | $ | 47 | |
Atrion Corp | | | 71 | | | | 45 | |
Avanos Medical Inc * | | | 1,561 | | | | 46 | |
Avantor Inc * | | | 2,699 | | | | 46 | |
Axonics Modulation Technologies Inc * | | | 351 | | | | 12 | |
Axsome Therapeutics Inc * | | | 618 | | | | 51 | |
Baxter International Inc | | | 12,373 | | | | 1,065 | |
Becton Dickinson and Co | | | 4,437 | | | | 1,062 | |
BioCryst Pharmaceuticals Inc * | | | 26,852 | | | | 128 | |
BioDelivery Sciences International Inc * | | | 7,746 | | | | 34 | |
Biogen Inc * | | | 3,113 | | | | 833 | |
Biohaven Pharmaceutical Holding Co Ltd * | | | 941 | | | | 69 | |
BioMarin Pharmaceutical Inc * | | | 1,042 | | | | 129 | |
Bio-Rad Laboratories Inc, Cl A * | | | 32 | | | | 14 | |
BioSpecifics Technologies Corp * | | | 871 | | | | 53 | |
Bio-Techne Corp | | | 53 | | | | 14 | |
BioTelemetry Inc * | | | 1,100 | | | | 50 | |
Bluebird Bio Inc * | | | 645 | | | | 39 | |
Boston Scientific Corp * | | | 16,399 | | | | 576 | |
Bridgebio Pharma Inc * | | | 1,432 | | | | 47 | |
Bristol-Myers Squibb Co | | | 38,732 | | | | 2,277 | |
Brookdale Senior Living Inc * | | | 7,397 | | | | 22 | |
Bruker Corp | | | 233 | | | | 9 | |
Cantel Medical Corp | | | 163 | | | | 7 | |
Cara Therapeutics Inc * | | | 2,942 | | | | 50 | |
Cardinal Health Inc | | | 2,213 | | | | 115 | |
Catalent Inc * | | | 949 | | | | 70 | |
Catalyst Pharmaceuticals Inc * | | | 11,416 | | | | 53 | |
Centene Corp * | | | 5,875 | | | | 373 | |
Cerner Corp | | | 16,243 | | | | 1,113 | |
Change Healthcare Inc * | | | 3,522 | | | | 39 | |
Charles River Laboratories International Inc * | | | 77 | | | | 13 | |
Chemed Corp | | | 114 | | | | 51 | |
ChemoCentryx Inc * | | | 2,278 | | | | 131 | |
Cigna Corp | | | 4,819 | | | | 904 | |
CONMED Corp | | | 450 | | | | 32 | |
Constellation Pharmaceuticals Inc * | | | 1,060 | | | | 32 | |
Cooper Cos Inc/The | | | 236 | | | | 67 | |
Corbus Pharmaceuticals Holdings Inc * | | | 9,057 | | | | 76 | |
Corcept Therapeutics Inc * | | | 3,878 | | | | 65 | |
CorVel Corp * | | | 606 | | | | 43 | |
Covetrus Inc * | | | 1,045 | | | | 19 | |
Crinetics Pharmaceuticals Inc * | | | 2,310 | | | | 40 | |
Cue Biopharma Inc * | | | 2,087 | | | | 51 | |
CVS Health Corp | | | 28,143 | | | | 1,828 | |
Cytokinetics Inc * | | | 7,134 | | | | 168 | |
Danaher Corp | | | 8,116 | | | | 1,435 | |
DaVita Inc * | | | 160 | | | | 13 | |
Deciphera Pharmaceuticals Inc * | | | 716 | | | | 43 | |
Denali Therapeutics Inc * | | | 2,631 | | | | 64 | |
DENTSPLY SIRONA Inc | | | 3,113 | | | | 137 | |
DexCom Inc * | | | 847 | | | | 343 | |
| | | | | | | | |
| | | |
| Description | | Shares | | | Market Value
($ Thousands) | |
| | |
COMMON STOCK (continued) | | | | | | | | |
Dicerna Pharmaceuticals Inc * | | | 1,898 | | | $ | 48 | |
Dynavax Technologies Corp * | | | 8,733 | | | | 77 | |
Eagle Pharmaceuticals Inc/DE * | | | 828 | | | | 40 | |
Editas Medicine Inc * | | | 1,596 | | | | 47 | |
Edwards Lifesciences Corp * | | | 8,484 | | | | 586 | |
Eidos Therapeutics Inc * | | | 786 | | | | 37 | |
Elanco Animal Health Inc * | | | 398 | | | | 9 | |
Eli Lilly and Co | | | 11,942 | | | | 1,961 | |
Emergent BioSolutions Inc * | | | 950 | | | | 75 | |
Enanta Pharmaceuticals Inc * | | | 785 | | | | 39 | |
Encompass Health Corp | | | 164 | | | | 10 | |
Envista Holdings Corp * | | | 1,731 | | | | 37 | |
Epizyme Inc * | | | 2,749 | | | | 44 | |
Esperion Therapeutics Inc * | | | 962 | | | | 49 | |
Evofem Biosciences Inc * | | | 1,811 | | | | 5 | |
Exact Sciences Corp * | | | 930 | | | | 81 | |
Exelixis Inc * | | | 4,344 | | | | 103 | |
Fate Therapeutics Inc * | | | 3,277 | | | | 112 | |
FibroGen Inc * | | | 1,053 | | | | 43 | |
Flexion Therapeutics Inc * | | | 2,711 | | | | 36 | |
G1 Therapeutics Inc * | | | 1,715 | | | | 42 | |
Gilead Sciences Inc | | | 18,126 | | | | 1,395 | |
Glaukos Corp * | | | 167 | | | | 6 | |
Global Blood Therapeutics Inc * | | | 643 | | | | 41 | |
Globus Medical Inc, Cl A * | | | 851 | | | | 41 | |
Gossamer Bio Inc * | | | 3,279 | | | | 43 | |
Guardant Health Inc * | | | 615 | | | | 50 | |
Halozyme Therapeutics Inc * | | | 2,641 | | | | 71 | |
Hanger Inc * | | | 1,891 | | | | 31 | |
Harpoon Therapeutics Inc * | | | 2,825 | | | | 47 | |
HCA Healthcare Inc | | | 2,314 | | | | 225 | |
Health Catalyst Inc * | | | 1,594 | | | | 46 | |
HealthEquity Inc * | | | 673 | | | | 39 | |
Henry Schein Inc * | | | 2,612 | | | | 153 | |
Heron Therapeutics Inc * | | | 1,977 | | | | 29 | |
Heska Corp * | | | 532 | | | | 50 | |
Hill-Rom Holdings Inc | | | 825 | | | | 91 | |
HMS Holdings Corp * | | | 1,707 | | | | 55 | |
Hologic Inc * | | | 216 | | | | 12 | |
Horizon Therapeutics Plc * | | | 1,437 | | | | 80 | |
Humana Inc | | | 1,529 | | | | 593 | |
ICU Medical Inc * | | | 62 | | | | 11 | |
IDEXX Laboratories Inc * | | | 707 | | | | 233 | |
Illumina Inc * | | | 3,200 | | | | 1,185 | |
ImmunoGen Inc * | | | 11,173 | | | | 51 | |
Immunomedics Inc * | | | 2,499 | | | | 89 | |
Incyte Corp * | | | 1,063 | | | | 111 | |
Innoviva Inc * | | | 3,557 | | | | 50 | |
Inogen Inc * | | | 706 | | | | 25 | |
Inovalon Holdings Inc, Cl A * | | | 2,733 | | | | 53 | |
Inovio Pharmaceuticals Inc * | | | 2,095 | | | | 56 | |
Insmed Inc * | | | 2,129 | | | | 59 | |
| | |
| 22 | | New Covenant Funds / Annual Report / June 30, 2020 |
| | | | | | | | |
| | | |
| Description | | Shares | | | Market Value
($ Thousands) | |
| | |
COMMON STOCK (continued) | | | | | | | | |
Inspire Medical Systems Inc * | | | 715 | | | $ | 62 | |
Insulet Corp * | | | 65 | | | | 13 | |
Integer Holdings Corp * | | | 625 | | | | 46 | |
Integra LifeSciences Holdings Corp * | | | 188 | | | | 9 | |
Intercept Pharmaceuticals Inc * | | | 417 | | | | 20 | |
Intra-Cellular Therapies Inc * | | | 3,894 | | | | 100 | |
Intuitive Surgical Inc * | | | 1,403 | | | | 799 | |
Invitae Corp * | | | 2,884 | | | | 87 | |
Ionis Pharmaceuticals Inc * | | | 782 | | | | 46 | |
Iovance Biotherapeutics Inc * | | | 1,782 | | | | 49 | |
IQVIA Holdings Inc * | | | 1,378 | | | | 196 | |
Ironwood Pharmaceuticals Inc, Cl A * | | | 3,844 | | | | 40 | |
Johnson & Johnson | | | 40,148 | | | | 5,646 | |
Kala Pharmaceuticals Inc * | | | 7,142 | | | | 75 | |
Karuna Therapeutics Inc * | | | 717 | | | | 80 | |
Karyopharm Therapeutics Inc * | | | 2,929 | | | | 55 | |
Kiniksa Pharmaceuticals Ltd, Cl A * | | | 4,016 | | | | 102 | |
Kodiak Sciences Inc * | | | 702 | | | | 38 | |
Krystal Biotech Inc * | | | 823 | | | | 34 | |
Kura Oncology Inc * | | | 3,438 | | | | 56 | |
Laboratory Corp of America Holdings * | | | 515 | | | | 86 | |
Lantheus Holdings Inc * | | | 2,408 | | | | 34 | |
LHC Group Inc * | | | 383 | | | | 67 | |
Ligand Pharmaceuticals Inc * | | | 462 | | | | 52 | |
LivaNova PLC * | | | 657 | | | | 32 | |
Livongo Health Inc * | | | 1,898 | | | | 143 | |
Luminex Corp | | | 2,284 | | | | 74 | |
MacroGenics Inc * | | | 1,782 | | | | 50 | |
Madrigal Pharmaceuticals Inc * | | | 531 | | | | 60 | |
McKesson Corp | | | 1,288 | | | | 198 | |
MEDNAX Inc * | | | 417 | | | | 7 | |
Merck & Co Inc | | | 39,446 | | | | 3,050 | |
Meridian Bioscience Inc * | | | 5,130 | | | | 119 | |
Mettler-Toledo International Inc * | | | 1,565 | | | | 1,261 | |
Mirati Therapeutics Inc * | | | 429 | | | | 49 | |
Moderna Inc * | | | 4,368 | | | | 280 | |
Mylan NV * | | | 607 | | | | 10 | |
MyoKardia Inc * | | | 751 | | | | 73 | |
Myriad Genetics Inc * | | | 1,860 | | | | 21 | |
Natera Inc * | | | 1,361 | | | | 68 | |
National Research Corp | | | 779 | | | | 45 | |
Natus Medical Inc * | | | 1,614 | | | | 35 | |
Nektar Therapeutics, Cl A * | | | 2,328 | | | | 54 | |
Neogen Corp * | | | 721 | | | | 56 | |
Neurocrine Biosciences Inc * | | | 1,089 | | | | 133 | |
Nevro Corp * | | | 83 | | | | 10 | |
NextCure Inc * | | | 952 | | | | 20 | |
NextGen Healthcare Inc * | | | 3,392 | | | | 37 | |
Novavax Inc * | | | 1,079 | | | | 90 | |
NuVasive Inc * | | | 653 | | | | 36 | |
Ocular Therapeutix Inc * | | | 5,747 | | | | 48 | |
Omeros Corp * | | | 3,345 | | | | 49 | |
| | | | | | | | |
| | | |
| Description | | Shares | | | Market Value
($ Thousands) | |
| | |
COMMON STOCK (continued) | | | | | | | | |
Option Care Health Inc * | | | 648 | | | $ | 9 | |
OraSure Technologies Inc * | | | 6,042 | | | | 70 | |
Pennant Group Inc/The * | | | 1,609 | | | | 36 | |
Penumbra Inc * | | | 72 | | | | 13 | |
PerkinElmer Inc | | | 120 | | | | 12 | |
Pfizer Inc | | | 86,529 | | | | 2,829 | |
Phreesia Inc * | | | 361 | | | | 10 | |
Portola Pharmaceuticals Inc * | | | 1,960 | | | | 35 | |
PRA Health Sciences Inc * | | | 108 | | | | 11 | |
Premier Inc, Cl A * | | | 2,266 | | | | 78 | |
Principia Biopharma Inc * | | | 925 | | | | 55 | |
PTC Therapeutics Inc * | | | 1,021 | | | | 52 | |
Puma Biotechnology Inc * | | | 5,574 | | | | 58 | |
QIAGEN NV * | | | 2,338 | | | | 100 | |
Quest Diagnostics Inc | | | 865 | | | | 99 | |
Quidel Corp * | | | 249 | | | | 56 | |
Radius Health Inc * | | | 2,352 | | | | 32 | |
Reata Pharmaceuticals Inc, Cl A * | | | 235 | | | | 37 | |
Regeneron Pharmaceuticals Inc * | | | 1,105 | | | | 689 | |
Repligen Corp * | | | 553 | | | | 68 | |
ResMed Inc | | | 2,930 | | | | 563 | |
Retrophin Inc * | | | 3,434 | | | | 70 | |
Revance Therapeutics Inc * | | | 3,056 | | | | 75 | |
Rhythm Pharmaceuticals Inc * | | | 2,112 | | | | 47 | |
Rubius Therapeutics Inc * | | | 3,679 | | | | 22 | |
Sage Therapeutics Inc * | | | 516 | | | | 21 | |
Sangamo Therapeutics Inc * | | | 5,482 | | | | 49 | |
Sarepta Therapeutics Inc * | | | 87 | | | | 14 | |
Scholar Rock Holding Corp * | | | 2,520 | | | | 46 | |
Seattle Genetics Inc * | | | 750 | | | | 127 | |
Shockwave Medical Inc * | | | 1,114 | | | | 53 | |
Simulations Plus Inc | | | 1,477 | | | | 88 | |
Sorrento Therapeutics Inc * | | | 12,406 | | | | 78 | |
STAAR Surgical Co * | | | 1,343 | | | | 83 | |
STERIS PLC | | | 1,661 | | | | 255 | |
Stryker Corp | | | 4,213 | | | | 759 | |
Supernus Pharmaceuticals Inc * | | | 2,174 | | | | 52 | |
Surgery Partners Inc * | | | 4,621 | | | | 53 | |
Surmodics Inc * | | | 1,169 | | | | 51 | |
Syndax Pharmaceuticals Inc * | | | 3,272 | | | | 48 | |
Syros Pharmaceuticals Inc * | | | 1,610 | | | | 17 | |
Tactile Systems Technology Inc * | | | 728 | | | | 30 | |
Tandem Diabetes Care Inc * | | | 144 | | | | 14 | |
Teladoc Health Inc * | | | 430 | | | | 82 | |
Teleflex Inc | | | 742 | | | | 270 | |
TG Therapeutics Inc * | | | 4,916 | | | | 96 | |
Theravance Biopharma Inc * | | | 2,200 | | | | 46 | |
Thermo Fisher Scientific Inc | | | 5,343 | | | | 1,936 | |
Translate Bio Inc * | | | 2,224 | | | | 40 | |
Turning Point Therapeutics Inc * | | | 828 | | | | 53 | |
Twist Bioscience Corp * | | | 1,681 | | | | 76 | |
Ultragenyx Pharmaceutical Inc * | | | 1,143 | | | | 89 | |
| | | | |
New Covenant Funds / Annual Report / June 30, 2020 | | | 23 | |
SCHEDULE OF INVESTMENTS
June 30, 2020
New Covenant Growth Fund (Continued)
| | | | | | | | |
| | | |
| Description | | Shares | | | Market Value
($ Thousands) | |
| | |
COMMON STOCK (continued) | | | | | | | | |
United Therapeutics Corp * | | | 559 | | | $ | 68 | |
UnitedHealth Group Inc | | | 17,164 | | | | 5,062 | |
Universal Health Services Inc, Cl B | | | 80 | | | | 7 | |
UroGen Pharma Ltd * | | | 1,543 | | | | 40 | |
US Physical Therapy Inc | | | 428 | | | | 35 | |
Vapotherm Inc * | | | 1,281 | | | | 53 | |
Varex Imaging Corp * | | | 1,631 | | | | 25 | |
Varian Medical Systems Inc * | | | 1,773 | | | | 217 | |
Veeva Systems Inc, Cl A * | | | 1,157 | | | | 271 | |
Vertex Pharmaceuticals Inc * | | | 3,305 | | | | 959 | |
Viking Therapeutics Inc * | | | 6,150 | | | | 44 | |
Waters Corp * | | | 395 | | | | 71 | |
West Pharmaceutical Services Inc | | | 1,875 | | | | 426 | |
Wright Medical Group NV * | | | 1,682 | | | | 50 | |
Zimmer Biomet Holdings Inc | | | 3,501 | | | | 418 | |
Zoetis Inc, Cl A | | | 6,022 | | | | 825 | |
Zogenix Inc * | | | 947 | | | | 26 | |
| | | | | | | | |
| | |
| | | | | | | 66,520 | |
| | | | | | | | |
| | |
Industrials — 8.2% | | | | | | | | |
3M Co | | | 10,841 | | | | 1,691 | |
A O Smith Corp | | | 1,708 | | | | 80 | |
AAON Inc | | | 997 | | | | 54 | |
AAR Corp | | | 1,101 | | | | 23 | |
ABM Industries Inc | | | 1,349 | | | | 49 | |
ACCO Brands Corp | | | 5,214 | | | | 37 | |
Acuity Brands Inc | | | 84 | | | | 8 | |
ADT Inc | | | 6,039 | | | | 48 | |
Advanced Disposal Services Inc * | | | 1,523 | | | | 46 | |
AECOM * | | | 6,633 | | | | 249 | |
AGCO Corp | | | 149 | | | | 8 | |
Air Lease Corp, Cl A | | | 1,053 | | | | 31 | |
Alamo Group Inc | | | 424 | | | | 44 | |
Alaska Air Group Inc | | | 10,133 | | | | 367 | |
Albany International Corp, Cl A | | | 636 | | | | 37 | |
Allegiant Travel Co, Cl A | | | 281 | | | | 31 | |
Allegion plc | | | 855 | | | | 87 | |
Allison Transmission Holdings Inc | | | 1,870 | | | | 69 | |
Altra Industrial Motion Corp | | | 1,437 | | | | 46 | |
AMERCO | | | 136 | | | | 41 | |
American Airlines Group Inc | | | 405 | | | | 5 | |
American Woodmark Corp * | | | 461 | | | | 35 | |
AMETEK Inc | | | 3,390 | | | | 303 | |
Apogee Enterprises Inc | | | 1,229 | | | | 28 | |
Applied Industrial Technologies Inc | | | 745 | | | | 46 | |
ArcBest Corp | | | 1,766 | | | | 47 | |
Arcosa Inc | | | 1,128 | | | | 48 | |
Argan Inc | | | 1,315 | | | | 62 | |
Armstrong World Industries Inc | | | 979 | | | | 76 | |
ASGN Inc * | | | 723 | | | | 48 | |
Astec Industries Inc | | | 1,175 | | | | 54 | |
Atkore International Group Inc * | | | 1,234 | | | | 34 | |
Avis Budget Group Inc * | | | 2,276 | | | | 52 | |
| | | | | | | | |
| | | |
| Description | | Shares | | | Market Value
($ Thousands) | |
| | |
COMMON STOCK (continued) | | | | | | | | |
Axon Enterprise Inc * | | | 1,934 | | | $ | 190 | |
AZZ Inc | | | 1,071 | | | | 37 | |
Barnes Group Inc | | | 807 | | | | 32 | |
Bloom Energy Corp, Cl A * | | | 2,773 | | | | 30 | |
Brady Corp, Cl A | | | 873 | | | | 41 | |
Brink’s Co/The | | | 540 | | | | 25 | |
Carlisle Cos Inc | | | 311 | | | | 37 | |
Carrier Global Corp | | | 2,809 | | | | 62 | |
Casella Waste Systems Inc, Cl A * | | | 1,080 | | | | 56 | |
CBIZ Inc * | | | 1,805 | | | | 43 | |
CH Robinson Worldwide Inc | | | 148 | | | | 12 | |
Chart Industries Inc * | | | 807 | | | | 39 | |
Cimpress PLC * | | | 398 | | | | 30 | |
Cintas Corp | | | 1,907 | | | | 508 | |
CIRCOR International Inc * | | | 1,110 | | | | 28 | |
Clean Harbors Inc * | | | 137 | | | | 8 | |
Colfax Corp * | | | 1,455 | | | | 41 | |
Comfort Systems USA Inc | | | 988 | | | | 40 | |
Construction Partners Inc, Cl A * | | | 2,838 | | | | 50 | |
Copa Holdings SA, Cl A | | | 469 | | | | 24 | |
Copart Inc * | | | 1,284 | | | | 107 | |
CoStar Group Inc * | | | 266 | | | | 189 | |
Covanta Holding Corp | | | 3,388 | | | | 32 | |
Crane Co | | | 135 | | | | 8 | |
CSW Industrials Inc | | | 645 | | | | 45 | |
CSX Corp | | | 9,694 | | | | 676 | |
Cummins Inc | | | 3,179 | | | | 551 | |
Curtiss-Wright Corp | | | 1,789 | | | | 160 | |
Deere & Co | | | 4,735 | | | | 744 | |
Delta Air Lines Inc | | | 39,597 | | | | 1,111 | |
Deluxe Corp | | | 981 | | | | 23 | |
Donaldson Co Inc | | | 202 | | | | 9 | |
Douglas Dynamics Inc | | | 918 | | | | 32 | |
Dover Corp | | | 2,207 | | | | 213 | |
Dycom Industries Inc * | | | 1,064 | | | | 44 | |
Eaton Corp PLC | | | 13,217 | | | | 1,156 | |
EMCOR Group Inc | | | 565 | | | | 37 | |
Emerson Electric Co | | | 6,592 | | | | 409 | |
EnerSys | | | 664 | | | | 43 | |
EnPro Industries Inc | | | 738 | | | | 36 | |
Equifax Inc | | | 691 | | | | 119 | |
ESCO Technologies Inc | | | 568 | | | | 48 | |
Expeditors International of Washington Inc | | | 1,163 | | | | 88 | |
Exponent Inc | | | 727 | | | | 59 | |
Fastenal Co | | | 6,120 | | | | 262 | |
Federal Signal Corp | | | 1,560 | | | | 46 | |
FedEx Corp | | | 3,239 | | | | 454 | |
Flowserve Corp | | | 239 | | | | 7 | |
Fluor Corp | | | 4,373 | | | | 53 | |
Forrester Research Inc * | | | 1,169 | | | | 37 | |
Fortune Brands Home & Security Inc | | | 174 | | | | 11 | |
Forward Air Corp | | | 727 | | | | 36 | |
| | |
| 24 | | New Covenant Funds / Annual Report / June 30, 2020 |
| | | | | | | | |
| | | |
| Description | | Shares | | | Market Value
($ Thousands) | |
| | |
COMMON STOCK (continued) | | | | | | | | |
Franklin Electric Co Inc | | | 897 | | | $ | 47 | |
FTI Consulting Inc * | | | 443 | | | | 51 | |
Gates Industrial Corp PLC * | | | 886 | | | | 9 | |
GATX Corp | | | 603 | | | | 37 | |
Generac Holdings Inc * | | | 496 | | | | 60 | |
General Electric Co | | | 121,638 | | | | 831 | |
Gibraltar Industries Inc * | | | 959 | | | | 46 | |
Graco Inc | | | 223 | | | | 11 | |
GrafTech International Ltd | | | 954 | | | | 8 | |
Granite Construction Inc | | | 1,780 | | | | 34 | |
Great Lakes Dredge & Dock Corp * | | | 4,289 | | | | 40 | |
Greenbrier Cos Inc/The | | | 1,583 | | | | 36 | |
Hawaiian Holdings Inc | | | 1,619 | | | | 23 | |
HD Supply Holdings Inc * | | | 1,986 | | | | 69 | |
Healthcare Services Group Inc | | | 2,050 | | | | 50 | |
Heartland Express Inc | | | 2,380 | | | | 50 | |
HEICO Corp | | | 4,884 | | | | 487 | |
HEICO Corp, Cl A | | | 4,197 | | | | 341 | |
Helios Technologies Inc | | | 1,091 | | | | 41 | |
Herc Holdings Inc * | | | 1,012 | | | | 31 | |
Herman Miller Inc | | | 1,053 | | | | 25 | |
Hexcel Corp | | | 4,105 | | | | 186 | |
Hillenbrand Inc | | | 1,501 | | | | 41 | |
HNI Corp | | | 1,268 | | | | 39 | |
Honeywell International Inc | | | 10,659 | | | | 1,541 | |
Howmet Aerospace Inc | | | 7,379 | | | | 117 | |
Hub Group Inc, Cl A * | | | 976 | | | | 47 | |
Hubbell Inc, Cl B | | | 682 | | | | 85 | |
IAA Inc * | | | 253 | | | | 10 | |
ICF International Inc | | | 545 | | | | 35 | |
IDEX Corp | | | 68 | | | | 11 | |
IHS Markit Ltd | | | 3,910 | | | | 295 | |
Illinois Tool Works Inc | | | 10,512 | | | | 1,838 | |
Ingersoll Rand Inc * | | | 6,701 | | | | 188 | |
Insperity Inc | | | 592 | | | | 38 | |
Interface Inc, Cl A | | | 2,949 | | | | 24 | |
ITT Inc | | | 1,404 | | | | 82 | |
Jacobs Engineering Group Inc | | | 1,091 | | | | 93 | |
JB Hunt Transport Services Inc | | | 437 | | | | 53 | |
JetBlue Airways Corp * | | | 4,688 | | | | 51 | |
John Bean Technologies Corp | | | 439 | | | | 38 | |
Johnson Controls International plc | | | 22,116 | | | | 755 | |
Kadant Inc | | | 475 | | | | 47 | |
Kaman Corp | | | 743 | | | | 31 | |
Kansas City Southern | | | 1,741 | | | | 260 | |
KAR Auction Services Inc | | | 2,303 | | | | 32 | |
Kelly Services Inc, Cl A | | | 2,214 | | | | 35 | |
Kennametal Inc | | | 1,343 | | | | 39 | |
Kforce Inc | | | 1,239 | | | | 36 | |
Kirby Corp * | | | 1,032 | | | | 55 | |
Knight-Swift Transportation Holdings Inc, Cl A | | | 1,357 | | | | 57 | |
| | | | | | | | |
| | | |
| Description | | Shares | | | Market Value
($ Thousands) | |
| | |
COMMON STOCK (continued) | | | | | | | | |
Knoll Inc | | | 1,853 | | | $ | 23 | |
Korn Ferry | | | 1,193 | | | | 37 | |
Landstar System Inc | | | 432 | | | | 49 | |
Lennox International Inc | | | 44 | | | | 10 | |
Lincoln Electric Holdings Inc | | | 1,027 | | | | 87 | |
Lindsay Corp | | | 523 | | | | 48 | |
Lyft Inc, Cl A * | | | 240 | | | | 8 | |
Macquarie Infrastructure Corp | | | 266 | | | | 8 | |
ManpowerGroup Inc | | | 3,586 | | | | 247 | |
Marten Transport Ltd | | | 2,313 | | | | 58 | |
Masco Corp | | | 6,315 | | | | 317 | |
MasTec Inc * | | | 795 | | | | 36 | |
Matson Inc | | | 1,273 | | | | 37 | |
Maxar Technologies Inc | | | 6,794 | | | | 122 | |
McGrath RentCorp | | | 666 | | | | 36 | |
Mercury Systems Inc * | | | 2,386 | | | | 188 | |
Meritor Inc * | | | 2,088 | | | | 41 | |
Middleby Corp/The * | | | 103 | | | | 8 | |
Mobile Mini Inc | | | 1,315 | | | | 39 | |
Moog Inc, Cl A | | | 580 | | | | 31 | |
MRC Global Inc * | | | 3,597 | | | | 21 | |
MSA Safety Inc | | | 392 | | | | 45 | |
MSC Industrial Direct Co Inc, Cl A | | | 1,115 | | | | 81 | |
Nielsen Holdings PLC | | | 7,584 | | | | 113 | |
Nordson Corp | | | 600 | | | | 114 | |
Norfolk Southern Corp | | | 3,218 | | | | 565 | |
NOW Inc * | | | 4,359 | | | | 38 | |
NV5 Global Inc * | | | 1,080 | | | | 55 | |
nVent Electric PLC | | | 457 | | | | 9 | |
Old Dominion Freight Line Inc | | | 400 | | | | 68 | |
Omega Flex Inc | | | 448 | | | | 47 | |
Oshkosh Corp | | | 2,762 | | | | 198 | |
Otis Worldwide Corp | | | 2,746 | | | | 156 | |
Owens Corning | | | 4,958 | | | | 276 | |
PACCAR Inc | | | 5,034 | | | | 377 | |
Parker-Hannifin Corp | | | 1,231 | | | | 226 | |
Parsons Corp * | | | 1,198 | | | | 43 | |
Pentair PLC | | | 4,928 | | | | 187 | |
Pitney Bowes Inc | | | 11,792 | | | | 31 | |
Plug Power Inc * | | | 10,246 | | | | 84 | |
Proto Labs Inc * | | | 491 | | | | 55 | |
Quanex Building Products Corp | | | 2,637 | | | | 37 | |
Quanta Services Inc | | | 2,291 | | | | 90 | |
Raven Industries Inc | | | 1,437 | | | | 31 | |
RBC Bearings Inc * | | | 320 | | | | 43 | |
Regal Beloit Corp | | | 1,068 | | | | 93 | |
Republic Services Inc, Cl A | | | 1,046 | | | | 86 | |
Resideo Technologies Inc * | | | 448 | | | | 5 | |
Rexnord Corp | | | 1,539 | | | | 45 | |
Robert Half International Inc | | | 806 | | | | 43 | |
Rockwell Automation Inc | | | 1,620 | | | | 345 | |
Rollins Inc | | | 2,355 | | | | 100 | |
| | | | |
New Covenant Funds / Annual Report / June 30, 2020 | | | 25 | |
SCHEDULE OF INVESTMENTS
June 30, 2020
New Covenant Growth Fund (Continued)
| | | | | | | | |
| | | |
| Description | | Shares | | | Market Value
($ Thousands) | |
| | |
COMMON STOCK (continued) | | | | | | | | |
Roper Technologies Inc | | | 1,565 | | | $ | 608 | |
Ryder System Inc | | | 1,425 | | | | 53 | |
Saia Inc * | | | 547 | | | | 61 | |
Schneider National Inc, Cl B | | | 521 | | | | 13 | |
Sensata Technologies Holding PLC * | | | 4,273 | | | | 159 | |
Shyft Group Inc/The | | | 2,836 | | | | 48 | |
Simpson Manufacturing Co Inc | | | 643 | | | | 54 | |
Snap-on Inc | | | 318 | | | | 44 | |
Southwest Airlines Co | | | 3,131 | | | | 107 | |
SP Plus Corp * | | | 1,169 | | | | 24 | |
Spirit AeroSystems Holdings Inc, Cl A | | | 9,098 | | | | 218 | |
Spirit Airlines Inc * | | | 1,221 | | | | 22 | |
SPX Corp * | | | 999 | | | | 41 | |
SPX FLOW Inc * | | | 1,044 | | | | 39 | |
Stanley Black & Decker Inc | | | 1,349 | | | | 188 | |
Steelcase Inc, Cl A | | | 2,620 | | | | 32 | |
Stericycle Inc * | | | 179 | | | | 10 | |
Teledyne Technologies Inc * | | | 878 | | | | 273 | |
Tennant Co | | | 639 | | | | 42 | |
Terex Corp | | | 1,651 | | | | 31 | |
Tetra Tech Inc | | | 564 | | | | 45 | |
Timken Co/The | | | 204 | | | | 9 | |
Toro Co/The | | | 1,175 | | | | 78 | |
TPI Composites Inc * | | | 472 | | | | 11 | |
Trane Technologies PLC | | | 7,234 | | | | 644 | |
TransDigm Group Inc | | | 1,732 | | | | 766 | |
TransUnion | | | 2,713 | | | | 236 | |
Trex Co Inc * | | | 567 | | | | 74 | |
TriMas Corp * | | | 1,583 | | | | 38 | |
TriNet Group Inc * | | | 898 | | | | 55 | |
Trinity Industries Inc | | | 511 | | | | 11 | |
Triumph Group Inc | | | 1,853 | | | | 17 | |
TrueBlue Inc * | | | 2,106 | | | | 32 | |
Uber Technologies Inc * | | | 12,223 | | | | 380 | |
UFP Industries Inc | | | 1,033 | | | | 51 | |
UniFirst Corp/MA | | | 235 | | | | 42 | |
Union Pacific Corp | | | 12,488 | | | | 2,111 | |
United Airlines Holdings Inc * | | | 2,850 | | | | 99 | |
United Parcel Service Inc, Cl B | | | 9,414 | | | | 1,047 | |
United Rentals Inc * | | | 1,692 | | | | 252 | |
Univar Solutions Inc * | | | 476 | | | | 8 | |
US Ecology Inc | | | 900 | | | | 30 | |
Valmont Industries Inc | | | 76 | | | | 9 | |
Vectrus Inc * | | | 984 | | | | 48 | |
Verisk Analytics Inc, Cl A | | | 1,729 | | | | 294 | |
Vivint Solar Inc * | | | 4,980 | | | | 49 | |
Wabash National Corp | | | 3,217 | | | | 34 | |
Waste Management Inc | | | 6,467 | | | | 685 | |
Watsco Inc | | | 537 | | | | 95 | |
Watts Water Technologies Inc, Cl A | | | 507 | | | | 41 | |
Welbilt Inc * | | | 3,137 | | | | 19 | |
Werner Enterprises Inc | | | 1,360 | | | | 59 | |
| | | | | | | | |
| | | |
| Description | | Shares | | | Market Value
($ Thousands) | |
| | |
COMMON STOCK (continued) | | | | | | | | |
WESCO International Inc * | | | 3,661 | | | $ | 129 | |
Westinghouse Air Brake Technologies Corp | | | 465 | | | | 27 | |
Woodward Inc | | | 769 | | | | 60 | |
WW Grainger Inc | | | 4,161 | | | | 1,307 | |
XPO Logistics Inc * | | | 1,396 | | | | 108 | |
Xylem Inc/NY | | | 16,416 | | | | 1,066 | |
| | | | | | | | |
| | |
| | | | | | | 37,818 | |
| | | | | | | | |
| | |
Information Technology — 25.8% | | | | | | | | |
2U Inc * | | | 2,061 | | | | 78 | |
8x8 Inc * | | | 2,725 | | | | 44 | |
Acacia Communications Inc * | | | 744 | | | | 50 | |
ACI Worldwide Inc * | | | 1,373 | | | | 37 | |
Adobe Inc * | | | 9,813 | | | | 4,272 | |
ADTRAN Inc | | | 5,303 | | | | 58 | |
Advanced Energy Industries Inc * | | | 725 | | | | 49 | |
Advanced Micro Devices Inc * | | | 12,867 | | | | 677 | |
Agilysys Inc * | | | 323 | | | | 6 | |
Akamai Technologies Inc * | | | 7,949 | | | | 851 | |
Akoustis Technologies Inc * | | | 6,091 | | | | 50 | |
Alarm.com Holdings Inc * | | | 1,192 | | | | 77 | |
Alliance Data Systems Corp | | | 1,335 | | | | 60 | |
Altair Engineering Inc, Cl A * | | | 1,454 | | | | 58 | |
Alteryx Inc, Cl A * | | | 1,551 | | | | 255 | |
Ambarella Inc * | | | 160 | | | | 7 | |
Amdocs Ltd | | | 3,632 | | | | 221 | |
Amkor Technology Inc * | | | 3,864 | | | | 48 | |
Amphenol Corp, Cl A | | | 2,558 | | | | 245 | |
Analog Devices Inc | | | 4,564 | | | | 560 | |
Anaplan Inc * | | | 217 | | | | 10 | |
ANSYS Inc * | | | 683 | | | | 199 | |
Appian Corp, Cl A * | | | 1,246 | | | | 64 | |
Apple Inc | | | 62,732 | | | | 22,885 | |
Applied Materials Inc | | | 10,761 | | | | 651 | |
Arista Networks Inc * | | | 768 | | | | 161 | |
Arrow Electronics Inc * | | | 2,550 | | | | 175 | |
Aspen Technology Inc * | | | 413 | | | | 43 | |
Atlassian Corp PLC, Cl A * | | | 665 | | | | 120 | |
Autodesk Inc * | | | 3,559 | | | | 851 | |
Automatic Data Processing Inc | | | 12,646 | | | | 1,883 | |
Avaya Holdings Corp * | | | 4,140 | | | | 51 | |
Avnet Inc | | | 1,892 | | | | 53 | |
Axcelis Technologies Inc * | | | 2,104 | | | | 59 | |
Badger Meter Inc | | | 775 | | | | 49 | |
Belden Inc | | | 900 | | | | 29 | |
Benchmark Electronics Inc | | | 1,447 | | | | 31 | |
Black Knight Inc * | | | 1,569 | | | | 114 | |
Blackbaud Inc | | | 629 | | | | 36 | |
Blackline Inc * | | | 185 | | | | 15 | |
Booz Allen Hamilton Holding Corp, Cl A | | | 1,402 | | | | 109 | |
Bottomline Technologies DE Inc * | | | 943 | | | | 48 | |
Box Inc, Cl A * | | | 2,984 | | | | 62 | |
Broadcom Inc | | | 6,023 | | | | 1,901 | |
| | |
| 26 | | New Covenant Funds / Annual Report / June 30, 2020 |
| | | | | | | | |
| | | |
| Description | | Shares | | | Market Value
($ Thousands) | |
| | |
COMMON STOCK (continued) | | | | | | | | |
Broadridge Financial Solutions Inc | | | 720 | | | $ | 91 | |
Brooks Automation Inc | | | 1,150 | | | | 51 | |
Cabot Microelectronics Corp | | | 373 | | | | 52 | |
Cadence Design Systems Inc * | | | 2,046 | | | | 196 | |
Cardtronics PLC * | | | 1,198 | | | | 29 | |
Cass Information Systems Inc | | | 865 | | | | 34 | |
CDK Global Inc | | | 1,636 | | | | 68 | |
CDW Corp/DE | | | 806 | | | | 94 | |
Cerence Inc * | | | 493 | | | | 20 | |
Ceridian HCM Holding Inc * | | | 792 | | | | 63 | |
Ciena Corp * | | | 1,223 | | | | 66 | |
Cirrus Logic Inc * | | | 640 | | | | 40 | |
Cisco Systems Inc | | | 68,588 | | | | 3,199 | |
Citrix Systems Inc | | | 1,980 | | | | 293 | |
Cloudera Inc * | | | 4,481 | | | | 57 | |
Cognex Corp | | | 203 | | | | 12 | |
Cognizant Technology Solutions Corp, Cl A | | | 8,315 | | | | 472 | |
Coherent Inc * | | | 626 | | | | 82 | |
Cohu Inc | | | 2,351 | | | | 41 | |
CommScope Holding Co Inc * | | | 7,086 | | | | 59 | |
CommVault Systems Inc * | | | 1,095 | | | | 42 | |
CoreLogic Inc/United States | | | 271 | | | | 18 | |
Cornerstone OnDemand Inc * | | | 862 | | | | 33 | |
Corning Inc | | | 6,104 | | | | 158 | |
Coupa Software Inc * | | | 970 | | | | 269 | |
Cree Inc * | | | 248 | | | | 15 | |
CSG Systems International Inc | | | 965 | | | | 40 | |
CTS Corp | | | 1,735 | | | | 35 | |
Dell Technologies Inc, Cl C * | | | 4,108 | | | | 226 | |
Diebold Nixdorf Inc * | | | 4,695 | | | | 28 | |
Digital Turbine Inc * | | | 6,346 | | | | 80 | |
DocuSign Inc, Cl A * | | | 1,618 | | | | 279 | |
Dolby Laboratories Inc, Cl A | | | 731 | | | | 48 | |
Domo Inc, Cl B * | | | 1,639 | | | | 53 | |
Dropbox Inc, Cl A * | | | 2,914 | | | | 63 | |
DXC Technology Co | | | 5,395 | | | | 89 | |
Dynatrace Inc * | | | 465 | | | | 19 | |
Ebix Inc | | | 1,517 | | | | 34 | |
EchoStar Corp, Cl A * | | | 1,124 | | | | 31 | |
Elastic NV * | | | 183 | | | | 17 | |
Enphase Energy Inc * | | | 2,127 | | | | 101 | |
Entegris Inc | | | 980 | | | | 58 | |
Envestnet Inc * | | | 717 | | | | 53 | |
EPAM Systems Inc * | | | 1,434 | | | | 361 | |
ePlus Inc * | | | 592 | | | | 42 | |
Euronet Worldwide Inc * | | | 74 | | | | 7 | |
Everbridge Inc * | | | 1,814 | | | | 251 | |
EVERTEC Inc | | | 1,569 | | | | 44 | |
ExlService Holdings Inc * | | | 711 | | | | 45 | |
Extreme Networks Inc * | | | 6,878 | | | | 30 | |
F5 Networks Inc * | | | 578 | | | | 81 | |
Fair Isaac Corp * | | | 299 | | | | 125 | |
| | | | | | | | |
| | | |
| Description | | Shares | | | Market Value
($ Thousands) | |
| | |
COMMON STOCK (continued) | | | | | | | | |
Fidelity National Information Services Inc | | | 7,874 | | | $ | 1,056 | |
FireEye Inc * | | | 5,502 | | | | 67 | |
First Solar Inc * | | | 3,538 | | | | 175 | |
Fiserv Inc * | | | 6,758 | | | | 660 | |
Fitbit Inc, Cl A * | | | 7,553 | | | | 49 | |
Five9 Inc * | | | 751 | | | | 83 | |
FleetCor Technologies Inc * | | | 729 | | | | 183 | |
FLIR Systems Inc | | | 1,671 | | | | 68 | |
ForeScout Technologies Inc * | | | 1,454 | | | | 31 | |
FormFactor Inc * | | | 1,939 | | | | 57 | |
Fortinet Inc * | | | 928 | | | | 127 | |
Genpact Ltd | | | 6,870 | | | | 251 | |
Global Payments Inc | | | 3,359 | | | | 570 | |
GoDaddy Inc, Cl A * | | | 1,102 | | | | 81 | |
Guidewire Software Inc * | | | 109 | | | | 12 | |
Hackett Group Inc/The | | | 3,129 | | | | 42 | |
HubSpot Inc * | | | 322 | | | | 72 | |
IAC/InterActiveCorp * | | | 376 | | | | 122 | |
Ichor Holdings Ltd * | | | 1,480 | | | | 39 | |
II-VI Inc * | | | 1,509 | | | | 71 | |
Infinera Corp * | | | 6,579 | | | | 39 | |
Inphi Corp * | | | 680 | | | | 80 | |
Inseego Corp * | | | 7,132 | | | | 83 | |
Insight Enterprises Inc * | | | 754 | | | | 37 | |
Intel Corp | | | 67,438 | | | | 4,035 | |
Intelligent Systems Corp * | | | 1,128 | | | | 38 | |
InterDigital Inc | | | 917 | | | | 52 | |
International Business Machines Corp | | | 13,123 | | | | 1,585 | |
Intuit Inc | | | 3,714 | | | | 1,100 | |
IPG Photonics Corp * | | | 558 | | | | 89 | |
Itron Inc * | | | 588 | | | | 39 | |
J2 Global Inc * | | | 540 | | | | 34 | |
Jabil Inc | | | 6,948 | | | | 223 | |
Jack Henry & Associates Inc | | | 636 | | | | 117 | |
Juniper Networks Inc | | | 7,826 | | | | 179 | |
KBR Inc | | | 1,640 | | | | 37 | |
Keysight Technologies Inc * | | | 12,701 | | | | 1,280 | |
KLA Corp | | | 1,904 | | | | 370 | |
Knowles Corp * | | | 2,314 | | | | 35 | |
Lam Research Corp | | | 3,493 | | | | 1,130 | |
Lattice Semiconductor Corp * | | | 2,475 | | | | 70 | |
Littelfuse Inc | | | 60 | | | | 10 | |
LivePerson Inc * | | | 1,299 | | | | 54 | |
LogMeIn Inc | | | 1,076 | | | | 91 | |
Lumentum Holdings Inc * | | | 660 | | | | 54 | |
Manhattan Associates Inc * | | | 1,278 | | | | 120 | |
Marvell Technology Group Ltd | | | 4,705 | | | | 165 | |
Mastercard Inc, Cl A | | | 13,112 | | | | 3,877 | |
Maxim Integrated Products Inc | | | 3,740 | | | | 227 | |
MAXIMUS Inc | | | 682 | | | | 48 | |
Medallia Inc * | | | 1,562 | | | | 39 | |
Microchip Technology Inc | | | 1,615 | | | | 170 | |
| | | | |
New Covenant Funds / Annual Report / June 30, 2020 | | | 27 | |
SCHEDULE OF INVESTMENTS
June 30, 2020
New Covenant Growth Fund (Continued)
| | | | | | | | |
| | | |
| Description | | Shares | | | Market Value
($ Thousands) | |
| | |
COMMON STOCK (continued) | | | | | | | | |
Micron Technology Inc * | | | 13,124 | | | $ | 676 | |
Microsoft Corp | | | 112,888 | | | | 22,974 | |
MicroStrategy Inc, Cl A * | | | 339 | | | | 40 | |
MKS Instruments Inc | | | 103 | | | | 12 | |
Model N Inc * | | | 1,438 | | | | 50 | |
MongoDB Inc, Cl A * | | | 574 | | | | 130 | |
Monolithic Power Systems Inc | | | 64 | | | | 15 | |
National Instruments Corp | | | 2,353 | | | | 91 | |
NCR Corp * | | | 334 | | | | 6 | |
NetApp Inc | | | 2,936 | | | | 130 | |
NetScout Systems Inc * | | | 2,073 | | | | 53 | |
New Relic Inc * | | | 749 | | | | 52 | |
NIC Inc | | | 2,268 | | | | 52 | |
Novanta Inc * | | | 547 | | | | 58 | |
Nuance Communications Inc * | | | 2,832 | | | | 72 | |
Nutanix Inc, Cl A * | | | 359 | | | | 9 | |
NVIDIA Corp | | | 9,892 | | | | 3,758 | |
Okta Inc, Cl A * | | | 812 | | | | 163 | |
ON Semiconductor Corp * | | | 9,649 | | | | 191 | |
Oracle Corp | | | 34,708 | | | | 1,918 | |
OSI Systems Inc * | | | 497 | | | | 37 | |
PagerDuty Inc * | | | 1,821 | | | | 52 | |
Palo Alto Networks Inc * | | | 541 | | | | 124 | |
Paychex Inc | | | 2,612 | | | | 198 | |
Paycom Software Inc * | | | 194 | | | | 60 | |
Paylocity Holding Corp * | | | 417 | | | | 61 | |
PayPal Holdings Inc * | | | 18,658 | | | | 3,251 | |
Paysign Inc * | | | 4,721 | | | | 46 | |
Pegasystems Inc | | | 150 | | | | 15 | |
Perficient Inc * | | | 1,142 | | | | 41 | |
Perspecta Inc | | | 1,895 | | | | 44 | |
Photronics Inc * | | | 3,197 | | | | 36 | |
Plantronics Inc | | | 1,930 | | | | 28 | |
Plexus Corp * | | | 633 | | | | 45 | |
Pluralsight Inc, Cl A * | | | 2,621 | | | | 47 | |
Power Integrations Inc | | | 531 | | | | 63 | |
Progress Software Corp | | | 1,206 | | | | 47 | |
Proofpoint Inc * | | | 98 | | | | 11 | |
PROS Holdings Inc * | | | 818 | | | | 36 | |
PTC Inc * | | | 677 | | | | 53 | |
Pure Storage Inc, Cl A * | | | 685 | | | | 12 | |
Q2 Holdings Inc * | | | 633 | | | | 54 | |
Qorvo Inc * | | | 100 | | | | 11 | |
QUALCOMM Inc | | | 17,833 | | | | 1,627 | |
Qualys Inc * | | | 591 | | | | 61 | |
Rambus Inc * | | | 3,633 | | | | 55 | |
Rapid7 Inc * | | | 892 | | | | 46 | |
RealPage Inc * | | | 211 | | | | 14 | |
RingCentral Inc, Cl A * | | | 699 | | | | 199 | |
Rogers Corp * | | | 392 | | | | 49 | |
Sabre Corp | | | 506 | | | | 4 | |
Sailpoint Technologies Holdings Inc * | | | 2,129 | | | | 56 | |
| | | | | | | | |
| | | |
| Description | | Shares | | | Market Value
($ Thousands) | |
| | |
COMMON STOCK (continued) | | | | | | | | |
salesforce.com * | | | 17,861 | | | $ | 3,346 | |
Sanmina Corp * | | | 1,459 | | | | 37 | |
ScanSource Inc * | | | 1,292 | | | | 31 | |
Semtech Corp * | | | 1,000 | | | | 52 | |
ServiceNow Inc * | | | 2,349 | | | | 951 | |
Silicon Laboratories Inc * | | | 437 | | | | 44 | |
Skyworks Solutions Inc | | | 2,779 | | | | 355 | |
Smartsheet Inc, Cl A * | | | 266 | | | | 14 | |
SolarWinds Corp * | | | 634 | | | | 11 | |
Splunk Inc * | | | 1,357 | | | | 270 | |
SPS Commerce Inc * | | | 882 | | | | 66 | |
Square Inc, Cl A * | | | 3,587 | | | | 376 | |
SS&C Technologies Holdings Inc | | | 831 | | | | 47 | |
Switch Inc, Cl A | | | 779 | | | | 14 | |
Synaptics Inc * | | | 142 | | | | 9 | |
SYNNEX Corp | | | 387 | | | | 46 | |
Synopsys Inc * | | | 1,083 | | | | 211 | |
Teradata Corp * | | | 4,437 | | | | 92 | |
Teradyne Inc | | | 4,784 | | | | 404 | |
Texas Instruments Inc | | | 13,483 | | | | 1,712 | |
Trade Desk Inc/The, Cl A * | | | 829 | | | | 337 | |
Trimble Inc * | | | 2,035 | | | | 88 | |
TTEC Holdings Inc | | | 1,378 | | | | 64 | |
TTM Technologies Inc * | | | 3,357 | | | | 40 | |
Tucows Inc, Cl A * | | | 834 | | | | 48 | |
Twilio Inc, Cl A * | | | 2,168 | | | | 476 | |
Tyler Technologies Inc * | | | 393 | | | | 136 | |
Ubiquiti Inc | | | 263 | | | | 46 | |
Unisys Corp * | | | 689 | | | | 8 | |
Universal Display Corp | | | 521 | | | | 78 | |
Upland Software Inc * | | | 1,378 | | | | 48 | |
Varonis Systems Inc * | | | 653 | | | | 58 | |
Verint Systems Inc * | | | 947 | | | | 43 | |
VeriSign Inc * | | | 802 | | | | 166 | |
Verra Mobility Corp, Cl A * | | | 3,479 | | | | 36 | |
ViaSat Inc * | | | 693 | | | | 27 | |
Viavi Solutions Inc * | | | 3,355 | | | | 43 | |
Virtusa Corp * | | | 1,123 | | | | 36 | |
Visa Inc, Cl A | | | 29,770 | | | | 5,751 | |
VMware Inc, Cl A * | | | 1,343 | | | | 208 | |
Western Digital Corp | | | 2,423 | | | | 107 | |
Western Union Co/The | | | 425 | | | | 9 | |
WEX Inc * | | | 55 | | | | 9 | |
Workday Inc, Cl A * | | | 2,079 | | | | 390 | |
Workiva Inc, Cl A * | | | 1,224 | | | | 65 | |
Xerox Holdings Corp | | | 7,073 | | | | 108 | |
Xilinx Inc | | | 2,632 | | | | 259 | |
Xperi Holding Corp | | | 2,351 | | | | 35 | |
Zebra Technologies Corp, Cl A * | | | 438 | | | | 112 | |
Zendesk Inc * | | | 152 | | | | 13 | |
Zoom Video Communications Inc, Cl A * | | | 1,700 | | | | 431 | |
Zscaler Inc * | | | 681 | | | | 75 | |
| | |
| 28 | | New Covenant Funds / Annual Report / June 30, 2020 |
| | | | | | | | |
| | | |
| Description | | Shares | | | Market Value
($ Thousands) | |
| | |
COMMON STOCK (continued) | | | | | | | | |
Zuora Inc, Cl A * | | | 3,498 | | | $ | 45 | |
| | | | | | | | |
| | |
| | | | | | | 118,835 | |
| | | | | | | | |
| | |
Materials — 3.0% | | | | | | | | |
Air Products and Chemicals Inc | | | 4,688 | | | | 1,132 | |
Albemarle Corp | | | 167 | | | | 13 | |
Alcoa Corp * | | | 5,657 | | | | 64 | |
Allegheny Technologies Inc * | | | 2,362 | | | | 24 | |
AptarGroup Inc | | | 1,944 | | | | 218 | |
Arconic Corp * | | | 1,844 | | | | 26 | |
Ashland Global Holdings Inc | | | 152 | | | | 11 | |
Avery Dennison Corp | | | 88 | | | | 10 | |
Axalta Coating Systems Ltd * | | | 7,963 | | | | 180 | |
Balchem Corp | | | 488 | | | | 46 | |
Ball Corp | | | 14,154 | | | | 984 | |
Berry Global Group Inc * | | | 4,123 | | | | 183 | |
Cabot Corp | | | 238 | | | | 9 | |
Carpenter Technology Corp | | | 1,006 | | | | 24 | |
Celanese Corp, Cl A | | | 93 | | | | 8 | |
CF Industries Holdings Inc | | | 1,066 | | | | 30 | |
Chase Corp | | | 421 | | | | 43 | |
Chemours Co/The | | | 2,832 | | | | 43 | |
Cleveland-Cliffs Inc | | | 11,888 | | | | 66 | |
Coeur Mining Inc * | | | 6,945 | | | | 35 | |
Commercial Metals Co | | | 2,280 | | | | 47 | |
Compass Minerals International Inc | | | 851 | | | | 41 | |
Corteva Inc | | | 4,112 | | | | 110 | |
Crown Holdings Inc * | | | 6,925 | | | | 451 | |
Domtar Corp | | | 298 | | | | 6 | |
Dow Inc | | | 6,685 | | | | 272 | |
DuPont de Nemours Inc | | | 7,322 | | | | 389 | |
Eagle Materials Inc | | | 126 | | | | 9 | |
Eastman Chemical Co | | | 9,101 | | | | 634 | |
Ecolab Inc | | | 3,153 | | | | 627 | |
Element Solutions Inc * | | | 1,023 | | | | 11 | |
FMC Corp | | | 2,400 | | | | 239 | |
Freeport-McMoRan Inc | | | 31,087 | | | | 360 | |
GCP Applied Technologies Inc * | | | 2,199 | | | | 41 | |
Graphic Packaging Holding Co | | | 681 | | | | 10 | |
Greif Inc, Cl A | | | 1,122 | | | | 39 | |
HB Fuller Co | | | 976 | | | | 44 | |
Huntsman Corp | | | 475 | | | | 9 | |
Ingevity Corp * | | | 563 | | | | 30 | |
Innospec Inc | | | 499 | | | | 39 | |
International Flavors & Fragrances Inc | | | 2,307 | | | | 283 | |
International Paper Co | | | 785 | | | | 28 | |
Kraton Corp * | | | 2,033 | | | | 35 | |
Linde PLC | | | 8,150 | | | | 1,729 | |
Livent Corp * | | | 5,807 | | | | 36 | |
Louisiana-Pacific Corp | | | 1,740 | | | | 45 | |
LyondellBasell Industries NV, Cl A | | | 2,182 | | | | 143 | |
Martin Marietta Materials Inc | | | 397 | | | | 82 | |
Minerals Technologies Inc | | | 880 | | | | 41 | |
| | | | | | | | |
| | | |
| Description | | Shares | | | Market Value
($ Thousands) | |
| | |
COMMON STOCK (continued) | | | | | | | | |
Mosaic Co/The | | | 3,590 | | | $ | 45 | |
Neenah Inc | | | 693 | | | | 34 | |
NewMarket Corp | | | 102 | | | | 41 | |
Newmont Corp | | | 29,273 | | | | 1,807 | |
Novagold Resources Inc * | | | 6,675 | | | | 61 | |
Nucor Corp | | | 1,510 | | | | 63 | |
P H Glatfelter Co | | | 2,740 | | | | 44 | |
Packaging Corp of America | | | 101 | | | | 10 | |
PPG Industries Inc | | | 2,274 | | | | 241 | |
Quaker Chemical Corp | | | 309 | | | | 57 | |
Reliance Steel & Aluminum Co | | | 412 | | | | 39 | |
Royal Gold Inc | | | 437 | | | | 54 | |
RPM International Inc | | | 664 | | | | 50 | |
Scotts Miracle-Gro Co/The | | | 482 | | | | 65 | |
Sealed Air Corp | | | 293 | | | | 10 | |
Sensient Technologies Corp | | | 779 | | | | 41 | |
Sherwin-Williams Co/The | | | 2,451 | | | | 1,416 | |
Silgan Holdings Inc | | | 1,635 | | | | 53 | |
Sonoco Products Co | | | 185 | | | | 10 | |
Southern Copper Corp | | | 272 | | | | 11 | |
Steel Dynamics Inc | | | 2,648 | | | | 69 | |
Stepan Co | | | 510 | | | | 50 | |
Summit Materials Inc, Cl A * | | | 2,136 | | | | 34 | |
Trinseo SA | | | 1,345 | | | | 30 | |
Tronox Holdings PLC | | | 4,385 | | | | 32 | |
United States Lime & Minerals Inc | | | 581 | | | | 49 | |
United States Steel Corp | | | 3,709 | | | | 27 | |
Valvoline Inc | | | 11,216 | | | | 217 | |
Verso Corp | | | 2,760 | | | | 33 | |
Vulcan Materials Co | | | 665 | | | | 77 | |
W R Grace & Co | | | 733 | | | | 37 | |
Warrior Met Coal Inc | | | 2,378 | | | | 37 | |
Westlake Chemical Corp | | | 718 | | | | 39 | |
Westrock Co | | | 3,989 | | | | 113 | |
Worthington Industries Inc | | | 1,149 | | | | 43 | |
| | | | | | | | |
| | |
| | | | | | | 14,018 | |
| | | | | | | | |
| | |
Real Estate — 3.5% | | | | | | | | |
Acadia Realty Trust ‡ | | | 1,946 | | | | 25 | |
Agree Realty Corp ‡ | | | 736 | | | | 48 | |
Alexander & Baldwin Inc ‡ | | | 2,342 | | | | 29 | |
Alexandria Real Estate Equities Inc ‡ | | | 1,497 | | | | 243 | |
American Assets Trust Inc ‡ | | | 1,128 | | | | 31 | |
American Campus Communities Inc ‡ | | | 252 | | | | 9 | |
American Finance Trust Inc ‡ | | | 3,743 | | | | 30 | |
American Tower Corp, Cl A ‡ | | | 6,167 | | | | 1,594 | |
Americold Realty Trust ‡ | | | 346 | | | | 13 | |
Apartment Investment and Management Co, Cl A ‡ | | | 1,721 | | | | 65 | |
Apple Hospitality REIT Inc ‡ | | | 718 | | | | 7 | |
AvalonBay Communities Inc ‡ | | | 3,261 | | | | 504 | |
Boston Properties Inc ‡ | | | 1,468 | | | | 133 | |
Brandywine Realty Trust ‡ | | | 14,492 | | | | 158 | |
| | | | |
New Covenant Funds / Annual Report / June 30, 2020 | | | 29 | |
SCHEDULE OF INVESTMENTS
June 30, 2020
New Covenant Growth Fund (Continued)
| | | | | | | | |
| | | |
| Description | | Shares | | | Market Value
($ Thousands) | |
| | |
COMMON STOCK (continued) | | | | | | | | |
Brixmor Property Group Inc ‡ | | | 4,703 | | | $ | 60 | |
Brookfield Property REIT Inc, Cl A ‡ | | | 622 | | | | 6 | |
Camden Property Trust ‡ | | | 850 | | | | 78 | |
CareTrust REIT Inc ‡ | | | 2,438 | | | | 42 | |
CBRE Group Inc, Cl A * | | | 29,020 | | | | 1,312 | |
Colony Capital Inc ‡ | | | 41,643 | | | | 100 | |
Columbia Property Trust Inc ‡ | | | 565 | | | | 7 | |
Community Healthcare Trust Inc ‡ | | | 1,136 | | | | 46 | |
Corporate Office Properties Trust ‡ | | | 7,752 | | | | 196 | |
Cousins Properties Inc ‡ | | | 289 | | | | 9 | |
Crown Castle International Corp ‡ | | | 5,046 | | | | 844 | |
CubeSmart ‡ | | | 377 | | | | 10 | |
Cushman & Wakefield PLC *‡ | | | 2,593 | | | | 32 | |
CyrusOne Inc ‡ | | | 181 | | | | 13 | |
DiamondRock Hospitality Co ‡ | | | 4,575 | | | | 25 | |
Digital Realty Trust Inc ‡ | | | 2,674 | | | | 380 | |
Diversified Healthcare Trust ‡ | | | 6,702 | | | | 30 | |
Douglas Emmett Inc ‡ | | | 2,338 | | | | 72 | |
Duke Realty Corp ‡ | | | 2,798 | | | | 99 | |
EastGroup Properties Inc ‡ | | | 379 | | | | 45 | |
Empire State Realty Trust Inc, Cl A ‡ | | | 5,592 | | | | 39 | |
EPR Properties ‡ | | | 735 | | | | 24 | |
Equinix Inc ‡ | | | 1,035 | | | | 727 | |
Equity Commonwealth ‡ | | | 2,677 | | | | 86 | |
Equity LifeStyle Properties Inc ‡ | | | 167 | | | | 10 | |
Equity Residential ‡ | | | 3,485 | | | | 205 | |
Essential Properties Realty Trust Inc ‡ | | | 2,028 | | | | 30 | |
Essex Property Trust Inc ‡ | | | 454 | | | | 104 | |
Extra Space Storage Inc ‡ | | | 811 | | | | 75 | |
Federal Realty Investment Trust ‡ | | | 664 | | | | 57 | |
First Industrial Realty Trust Inc ‡ | | | 1,226 | | | | 47 | |
Four Corners Property Trust Inc ‡ | | | 1,848 | | | | 45 | |
Franklin Street Properties Corp ‡ | | | 5,897 | | | | 30 | |
Gaming and Leisure Properties Inc ‡ | | | 278 | | | | 10 | |
Global Net Lease Inc ‡ | | | 2,484 | | | | 42 | |
Healthcare Realty Trust Inc ‡ | | | 1,555 | | | | 46 | |
Healthcare Trust of America Inc, Cl A ‡ | | | 392 | | | | 10 | |
Highwoods Properties Inc ‡ | | | 247 | | | | 9 | |
Host Hotels & Resorts Inc ‡ | | | 17,568 | | | | 190 | |
Howard Hughes Corp/The * | | | 795 | | | | 41 | |
Hudson Pacific Properties Inc ‡ | | | 2,475 | | | | 62 | |
Independence Realty Trust Inc ‡ | | | 3,625 | | | | 42 | |
Industrial Logistics Properties Trust ‡ | | | 2,389 | | | | 49 | |
Invitation Homes Inc ‡ | | | 398 | | | | 11 | |
Iron Mountain Inc ‡ | | | 5,996 | | | | 156 | |
JBG SMITH Properties ‡ | | | 2,065 | | | | 61 | |
Jones Lang LaSalle Inc | | | 1,270 | | | | 131 | |
Kennedy-Wilson Holdings Inc ‡ | | | 2,254 | | | | 34 | |
Kilroy Realty Corp ‡ | | | 4,516 | | | | 265 | |
Kimco Realty Corp ‡ | | | 4,679 | | | | 60 | |
Kite Realty Group Trust ‡ | | | 2,741 | | | | 32 | |
Lamar Advertising Co, Cl A ‡ | | | 1,059 | | | | 71 | |
| | | | | | | | |
| | | |
| Description | | Shares | | | Market Value
($ Thousands) | |
| | |
COMMON STOCK (continued) | | | | | | | | |
Lexington Realty Trust, Cl B ‡ | | | 4,761 | | | $ | 50 | |
Life Storage Inc ‡ | | | 110 | | | | 10 | |
LTC Properties Inc ‡ | | | 1,142 | | | | 43 | |
Macerich Co/The ‡ | | | 5,508 | | | | 49 | |
Marcus & Millichap Inc *‡ | | | 1,380 | | | | 40 | |
Medical Properties Trust Inc ‡ | | | 2,513 | | | | 47 | |
Mid-America Apartment Communities Inc ‡ | | | 772 | | | | 89 | |
Monmouth Real Estate Investment Corp ‡ | | | 3,365 | | | | 49 | |
National Health Investors Inc ‡ | | | 635 | | | | 39 | |
National Retail Properties Inc ‡ | | | 975 | | | | 35 | |
National Storage Affiliates Trust ‡ | | | 1,534 | | | | 44 | |
Newmark Group Inc, Cl A ‡ | | | 3,753 | | | | 18 | |
Office Properties Income Trust ‡ | | | 1,618 | | | | 42 | |
Omega Healthcare Investors Inc ‡ | | | 1,229 | | | | 37 | |
Outfront Media Inc ‡ | | | 1,951 | | | | 28 | |
Paramount Group Inc ‡ | | | 5,922 | | | | 46 | |
Park Hotels & Resorts Inc ‡ | | | 1,996 | | | | 20 | |
Pebblebrook Hotel Trust ‡ | | | 1,899 | | | | 26 | |
Physicians Realty Trust ‡ | | | 2,753 | | | | 48 | |
Piedmont Office Realty Trust Inc, Cl A ‡ | | | 2,333 | | | | 39 | |
PotlatchDeltic Corp ‡ | | | 1,174 | | | | 45 | |
Prologis Inc ‡ | | | 20,608 | | | | 1,923 | |
Public Storage ‡ | | | 1,626 | | | | 312 | |
QTS Realty Trust Inc, Cl A ‡ | | | 981 | | | | 63 | |
Rayonier Inc ‡ | | | 1,593 | | | | 39 | |
RE/MAX Holdings Inc, Cl A | | | 1,292 | | | | 41 | |
Realogy Holdings Corp | | | 4,621 | | | | 34 | |
Realty Income Corp ‡ | | | 2,296 | | | | 137 | |
Redfin Corp * | | | 458 | | | | 19 | |
Regency Centers Corp ‡ | | | 28,376 | | | | 1,302 | |
Retail Opportunity Investments Corp ‡ | | | 2,907 | | | | 33 | |
Retail Properties of America Inc, Cl A ‡ | | | 876 | | | | 6 | |
Rexford Industrial Realty Inc ‡ | | | 1,114 | | | | 46 | |
RLJ Lodging Trust | | | 2,849 | | | | 27 | |
RMR Group Inc/The, Cl A ‡ | | | 1,095 | | | | 32 | |
RPT Realty ‡ | | | 3,429 | | | | 24 | |
Ryman Hospitality Properties Inc ‡ | | | 577 | | | | 20 | |
Sabra Health Care REIT Inc ‡ | | | 2,410 | | | | 35 | |
Safehold Inc ‡ | | | 226 | | | | 13 | |
SBA Communications Corp, Cl A ‡ | | | 994 | | | | 296 | |
Service Properties Trust ‡ | | | 483 | | | | 3 | |
Simon Property Group Inc ‡ | | | 3,706 | | | | 253 | |
SITE Centers Corp ‡ | | | 3,734 | | | | 30 | |
SL Green Realty Corp ‡ | | | 2,476 | | | | 122 | |
Spirit Realty Capital Inc ‡ | | | 237 | | | | 8 | |
St Joe Co/The *‡ | | | 2,464 | | | | 48 | |
STAG Industrial Inc ‡ | | | 1,647 | | | | 48 | |
STORE Capital Corp ‡ | | | 2,555 | | | | 61 | |
Summit Hotel Properties Inc ‡ | | | 4,173 | | | | 25 | |
Sunstone Hotel Investors Inc ‡ | | | 3,516 | | | | 29 | |
Tanger Factory Outlet Centers Inc ‡ | | | 3,357 | | | | 24 | |
Taubman Centers Inc ‡ | | | 1,690 | | | | 64 | |
| | |
| 30 | | New Covenant Funds / Annual Report / June 30, 2020 |
| | | | | | | | |
| | | |
| Description | | Shares | | | Market Value ($ Thousands) | |
| | |
COMMON STOCK (continued) | | | | | | | | |
Terreno Realty Corp ‡ | | | 941 | | | $ | 50 | |
UDR Inc ‡ | | | 250 | | | | 9 | |
Uniti Group Inc ‡ | | | 6,587 | | | | 62 | |
Universal Health Realty Income Trust ‡ | | | 439 | | | | 35 | |
Urban Edge Properties ‡ | | | 2,679 | | | | 32 | |
Urstadt Biddle Properties Inc, Cl A ‡ | | | 2,126 | | | | 25 | |
Ventas Inc ‡ | | | 3,279 | | | | 120 | |
VEREIT Inc ‡ | | | 10,217 | | | | 66 | |
VICI Properties Inc ‡ | | | 2,012 | | | | 41 | |
Vornado Realty Trust ‡ | | | 2,903 | | | | 111 | |
Washington Real Estate Investment Trust ‡ | | | 1,705 | | | | 38 | |
Weingarten Realty Investors ‡ | | | 2,933 | | | | 56 | |
Welltower Inc ‡ | | | 4,270 | | | | 221 | |
Weyerhaeuser Co ‡ | | | 17,005 | | | | 382 | |
WP Carey Inc ‡ | | | 149 | | | | 10 | |
Xenia Hotels & Resorts Inc ‡ | | | 2,347 | | | | 22 | |
| | | | | | | | |
| | |
| | | | | | | 16,337 | |
| | | | | | | | |
| | |
Utilities — 2.8% | | | | | | | | |
AES Corp/The | | | 5,282 | | | | 77 | |
ALLETE Inc | | | 620 | | | | 34 | |
Alliant Energy Corp | | | 213 | | | | 10 | |
Ameren Corp | | | 1,172 | | | | 82 | |
American Electric Power Co Inc | | | 5,930 | | | | 472 | |
American States Water Co | | | 580 | | | | 46 | |
American Water Works Co Inc | | | 2,717 | | | | 350 | |
Atmos Energy Corp | | | 461 | | | | 46 | |
Avangrid Inc | | | 1,720 | | | | 72 | |
Black Hills Corp | | | 641 | | | | 36 | |
California Water Service Group | | | 978 | | | | 47 | |
CenterPoint Energy Inc | | | 434 | | | | 8 | |
Clearway Energy Inc, Cl C | | | 2,583 | | | | 60 | |
CMS Energy Corp | | | 20,708 | | | | 1,210 | |
Consolidated Edison Inc | | | 3,086 | | | | 222 | |
Dominion Energy Inc | | | 9,854 | | | | 800 | |
DTE Energy Co | | | 9,809 | | | | 1,054 | |
Duke Energy Corp | | | 9,540 | | | | 762 | |
Edison International | | | 3,288 | | | | 179 | |
El Paso Electric Co | | | 742 | | | | 50 | |
Entergy Corp | | | 2,276 | | | | 214 | |
Essential Utilities Inc | | | 331 | | | | 14 | |
Evergy Inc | | | 180 | | | | 11 | |
Eversource Energy | | | 10,983 | | | | 915 | |
Exelon Corp | | | 11,090 | | | | 402 | |
FirstEnergy Corp | | | 4,900 | | | | 190 | |
Hawaiian Electric Industries Inc | | | 249 | | | | 9 | |
IDACORP Inc | | | 108 | | | | 9 | |
MDU Resources Group Inc | | | 386 | | | | 9 | |
MGE Energy Inc | | | 631 | | | | 41 | |
Middlesex Water Co | | | 790 | | | | 53 | |
National Fuel Gas Co | | | 245 | | | | 10 | |
New Jersey Resources Corp | | | 1,111 | | | | 36 | |
NextEra Energy Inc | | | 6,768 | | | | 1,625 | |
| | | | | | | | |
| | | |
| Description | | Shares | | | Market Value ($ Thousands) | |
| | |
COMMON STOCK (continued) | | | | | | | | |
NiSource Inc | | | 419 | | | $ | 10 | |
Northwest Natural Holding Co | | | 699 | | | | 39 | |
NRG Energy Inc | | | 2,300 | | | | 75 | |
OGE Energy Corp | | | 261 | | | | 8 | |
ONE Gas Inc | | | 534 | | | | 41 | |
Ormat Technologies Inc | | | 644 | | | | 41 | |
PG&E Corp * | | | 692 | | | | 6 | |
Pinnacle West Capital Corp | | | 2,640 | | | | 193 | |
PNM Resources Inc | | | 975 | | | | 37 | |
Portland General Electric Co | | | 894 | | | | 37 | |
PPL Corp | | | 7,025 | | | | 182 | |
Public Service Enterprise Group Inc | | | 5,257 | | | | 258 | |
Sempra Energy | | | 3,086 | | | | 362 | |
SJW Group | | | 716 | | | | 44 | |
South Jersey Industries Inc | | | 1,556 | | | | 39 | |
Southern Co/The | | | 13,370 | | | | 693 | |
Sunnova Energy International Inc * | | | 717 | | | | 12 | |
UGI Corp | | | 253 | | | | 8 | |
Unitil Corp | | | 794 | | | | 36 | |
Vistra Energy Corp | | | 2,088 | | | | 39 | |
WEC Energy Group Inc | | | 2,560 | | | | 224 | |
Xcel Energy Inc | | | 21,147 | | | | 1,322 | |
| | | | | | | | |
| | |
| | | | | | | 12,861 | |
| | | | | | | | |
| | | | | | | 446,497 | |
| | | | | | | | |
Total Common Stock | | | | | | | | |
(Cost $326,434) ($ Thousands) | | | | | | | 451,971 | |
| | | | | | | | |
| | |
PREFERRED STOCK — 0.0% | | | | | | | | |
WESCO International, 10.625% | | | 356 | | | | 10 | |
| | | | | | | | |
Total Preferred Stock | | | | | | | | |
(Cost $9) ($ Thousands) | | | | | | | 10 | |
| | | | | | | | |
| | |
| | | Number of
Rights | | | | |
RIGHT — 0.0% | | | | | | | | |
T-Mobile US Inc, Expires 07/30/2020 | | | 3,577 | | | | 1 | |
| | | | | | | | |
| | |
Total Right | | | | | | | | |
(Cost $—) ($ Thousands) | | | | | | | 1 | |
| | | | | | | | |
| | | | |
New Covenant Funds / Annual Report / June 30, 2020 | | | 31 | |
SCHEDULE OF INVESTMENTS
June 30, 2020
New Covenant Growth Fund (Concluded)
| | | | | | | | |
| | | |
| Description | | Shares | | | Market Value
($ Thousands) | |
| | |
CASH EQUIVALENT — 1.4% | | | | | | | | |
SEI Daily Income Trust, Government Fund, Cl F 0.030%**† | | | 6,613,241 | | | $ | 6,613 | |
| | | | | | | | |
| | |
Total Cash Equivalent | | | | | | | | |
(Cost $6,613) ($ Thousands) | | | | | | | 6,613 | |
| | | | | | | | |
| | |
Total Investments in Securities — 99.4% | | | | | | | | |
(Cost $333,056) ($ Thousands) | | | | | | $ | 458,595 | |
| | | | | | | | |
A list of the open futures contracts held by the Fund at June 30, 2020 are as follows:
| | | | | | | | | | | | | | | | | | | | |
| | | | | | |
| Type of Contract | | Number of Contracts
Long | | | Expiration
Date | | | Notional Amount
(Thousands) | | | Value
(Thousands) | | | Unrealized
Appreciation (Thousands) | |
Russell 2000 Index E-MINI | | | 11 | | | | Sep-2020 | | | $ | 777 | | | $ | 791 | | | $ | 14 | |
S&P 500 Index E-MINI | | | 42 | | | | Sep-2020 | | | | 6,382 | | | | 6,490 | | | | 108 | |
| | | | | | | | | | | | | | | | | | | | |
| | | | | | | | | | $ | 7,159 | | | $ | 7,281 | | | $ | 122 | |
| | | | | | | | | | | | | | | | | | | | |
The futures contracts are considered to have interest rate risk associated with them.
| | | Percentages are based on Net Assets of $461,493 ($ Thousands). |
| | ‡ | Real Estate Investment Trust. |
| | * | Non-income producing security. |
| | ** | The rate reported is the 7-day effective yield as of June 30, 2020. |
| | † | Investment in Affiliated Security (see Note 3). |
| | (A) | Security is a Master Limited Partnership. At June 30, 2020, such securities amounted to $66 ($ Thousands), or 0.0% of the net assets (see Note 2). |
Cl — Class
Ltd. — Limited
MSCI — Morgan Stanley Capital International
PLC — Public Limited Company
REIT— Real Estate investment Trust
S&P — Standard & Poor’s
The following is a list of the levels of inputs used as of June 30, 2020 in valuing the Fund’s investments and other financial instruments carried at value ($ Thousands):
| | | | | | | | | | | | | | | | |
| | | | | |
| Investments in Securities | | Level 1 ($) | | | Level 2 ($) | | | Level 3
($) | | | Total ($) | |
Common Stock | | | 451,971 | | | | – | | | | – | | | | 451,971 | |
Preferred Stock | | | – | | | | 10 | | | | – | | | | 10 | |
Right | | | 1 | | | | – | | | | – | | | | 1 | |
Cash Equivalent | | | 6,613 | | | | – | | | | – | | | | 6,613 | |
| | | | | | | | | | | | | | | | |
Total Investments in Securities | | | 458,585 | | | | 10 | | | | – | | | | 458,595 | |
| | | | | | | | | | | | | | | | |
| | | | | | | | | | | | | | | | |
| | | | | |
| Other Financial Instruments | | Level 1
($) | | | Level 2
($) | | | Level 3
($) | | | Total
($) | |
Futures Contracts* | | | | | | | | | | | | | | | | |
Unrealized Appreciation | | | 122 | | | | — | | | | — | | | | 122 | |
| | | | | | | | | | | | | | | | |
Total Other Financial Instruments | | | 122 | | | | — | | | | — | | | | 122 | |
| | | | | | | | | | | | | | | | |
* Futures contracts are valued at the unrealized appreciation on the instrument.
For the year ended June 30, 2020, there were no transfers in or out of Level 3.
Amounts designated as “—” are either $0 or have been rounded to $0.
For more information on valuation inputs, see Note 2 – Significant Accounting Policies in Notes to Financial Statements.
The following is a summary of the Fund’s transactions with affiliates for the year ended June 30, 2020 ($ Thousands):
| | | | | | | | | | | | | | | | | | | | | | | | | | | | | | | | | | | | | | | | | | | | | |
| | | | | | | | | | |
| Security Description | | Value
6/30/19 | | Purchases
at Cost | | Proceeds
from
Sales | | Realized
Gain/
(Loss) | | Change in
Unrealized
Appreciation
(Depreciation) | | Value
6/30/2020 | | Shares | | Dividend
Income | | Capital
Gains |
SEI Daily Income Trust, Government Fund, Cl F | | | $ | 8,829 | | | | $ | 85,535 | | | | $ | (87,751) | | | | $ | — | | | | $ | — | | | | $ | 6,613 | | | | | 6,613,241 | | | | $ | 90 | | | | $ | — | |
| | | | | | | | | | | | | | | | | | | | | | | | | | | | | | | | | | | | | | | | | | | | | |
The accompanying notes are an integral part of the financial statements.
| | |
| 32 | | New Covenant Funds / Annual Report / June 30, 2020 |
SCHEDULE OF INVESTMENTS
June 30, 2020
New Covenant Income Fund
Sector Weightings (Unaudited)†:
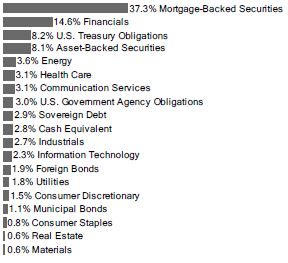
†Percentages based on total investments.
| | | | | | | | |
| | | |
| Description | | Face Amount
(Thousands) | | | Market Value
($ Thousands) | |
MORTGAGE-BACKED SECURITIES — 38.0% | |
Agency Mortgage-Backed Obligations — 29.6% | |
FHLMC | | | | | | | | |
6.500%, 09/01/2039 | | $ | 30 | | | $ | 34 | |
5.500%, 12/01/2036 to 12/01/2038 | | | 245 | | | | 280 | |
5.000%, 12/01/2020 to 03/01/2050 | | | 1,306 | | | | 1,467 | |
4.500%, 06/01/2038 to 04/01/2050 | | | 7,013 | | | | 7,633 | |
4.000%, 07/01/2037 to 03/01/2050 | | | 3,033 | | | | 3,284 | |
3.500%, 11/01/2042 to 03/01/2050 | | | 3,923 | | | | 4,205 | |
3.000%, 08/01/2046 to 03/01/2050 | | | 5,882 | | | | 6,283 | |
2.500%, 08/01/2030 to 06/01/2050 | | | 2,853 | | | | 3,004 | |
FHLMC CMO, Ser 2011-3947, Cl SG, IO | | | | | | | | |
5.765%, VAR LIBOR USD 1
Month+5.950%, 10/15/2041 | | | 217 | | | | 38 | |
FHLMC CMO, Ser 2012-4057, Cl UI, IO | | | | | | | | |
3.000%, 05/15/2027 | | | 124 | | | | 7 | |
FHLMC CMO, Ser 2012-4085, Cl IO, IO | | | | | | | | |
3.000%, 06/15/2027 | | | 255 | | | | 14 | |
FHLMC CMO, Ser 2012-4099, Cl ST, IO | | | | | | | | |
5.815%, VAR LIBOR USD 1
Month+6.000%, 08/15/2042 | | | 109 | | | | 19 | |
FHLMC CMO, Ser 2013-4194, Cl BI, IO | | | | | | | | |
3.500%, 04/15/2043 | | | 126 | | | | 13 | |
FHLMC CMO, Ser 2013-4203, Cl PS, IO | | | | | | | | |
6.065%, VAR LIBOR USD 1
Month+6.250%, 09/15/2042 | | | 153 | | | | 26 | |
FHLMC CMO, Ser 2014-4310, Cl SA, IO | | | | | | | | |
5.765%, VAR LIBOR USD 1
Month+5.950%, 02/15/2044 | | | 44 | | | | 7 | |
| | | | | | | | |
| | | |
| Description | | Face Amount
(Thousands) | | | Market Value
($ Thousands) | |
MORTGAGE-BACKED SECURITIES (continued) | |
FHLMC CMO, Ser 2014-4335, Cl SW, IO | | | | | | | | |
5.295%, VAR LIBOR USD 1
Month+6.000%, 05/15/2044 | | $ | 91 | | | $ | 18 | |
FHLMC CMO, Ser 2014-4415, Cl IO, IO | | | | | | | | |
3.371%, 04/15/2041 (A) | | | 44 | | | | 3 | |
FHLMC Multifamily Structured Pass Through Certificates, Ser K091, Cl A2 | | | | | | | | |
3.505%, 03/25/2029 | | | 120 | | | | 142 | |
FHLMC Structured Agency Credit Risk Debt Notes, Ser 2016-DNA1, Cl M3 | | | | | | | | |
5.718%, VAR ICE LIBOR USD 1
Month+5.550%, 07/25/2028 | | | 349 | | | | 364 | |
FHLMC Structured Agency Credit Risk Debt Notes, Ser 2017-DNA1, Cl M1 | | | | | | | | |
1.385%, VAR ICE LIBOR USD 1
Month+1.200%, 07/25/2029 | | | 23 | | | | 23 | |
FHLMC, Ser 2016-353, Cl S1, IO | | | | | | | | |
5.815%, VAR LIBOR USD 1
Month+6.000%, 12/15/2046 | | | 136 | | | | 28 | |
FHLMC, Ser 2018-4813, Cl CJ | | | | | | | | |
3.000%, 08/15/2048 | | | 145 | | | | 150 | |
FNMA | | | | | | | | |
7.000%, 11/01/2037 to 11/01/2038 | | | 28 | | | | 33 | |
6.500%, 01/01/2038 to 05/01/2040 | | | 187 | | | | 217 | |
6.000%, 07/01/2037 to 11/01/2038 | | | 141 | | | | 159 | |
5.500%, 02/01/2035 | | | 112 | | | | 128 | |
5.000%, 01/01/2021 to 12/01/2049 | | | 6,196 | | | | 6,835 | |
4.893%, VAR US Treas Yield Curve Rate T Note Const Mat 1 Yr+2.268%, 01/01/2036 | | | 24 | | | | 24 | |
4.500%, 02/01/2035 to 04/01/2056 | | | 7,365 | | | | 8,083 | |
4.174%, VAR ICE LIBOR USD 12
Month+1.700%, 03/01/2036 | | | 21 | | | | 21 | |
4.075%, VAR ICE LIBOR USD 12
Month+1.435%, 05/01/2043 | | | 217 | | | | 225 | |
4.000%, 06/01/2025 to 03/01/2050 | | | 11,561 | | | | 12,563 | |
3.500%, 04/01/2033 to 03/01/2057 | | | 11,037 | | | | 11,925 | |
3.000%, 08/01/2046 to 06/01/2050 | | | 4,308 | | | | 4,575 | |
2.850%, 08/01/2031 | | | 100 | | | | 113 | |
2.790%, 08/01/2029 | | | 200 | | | | 224 | |
2.770%, 08/01/2031 | | | 100 | | | | 112 | |
2.765%, 08/01/2031 | | | 100 | | | | 112 | |
2.260%, 04/01/2030 | | | 100 | | | | 108 | |
2.240%, 09/01/2026 | | | 139 | | | | 149 | |
FNMA CMO, Ser 2003-W2, Cl 2A9 | | | | | | | | |
5.900%, 07/25/2042 | | | 419 | | | | 489 | |
FNMA CMO, Ser 2012-93, Cl UI, IO | | | | | | | | |
3.000%, 09/25/2027 | | | 344 | | | | 20 | |
FNMA CMO, Ser 2014-47, Cl AI, IO | | | | | | | | |
2.212%, 08/25/2044 (A) | | | 109 | | | | 7 | |
FNMA CMO, Ser 2015-55, Cl IO, IO | | | | | | | | |
1.900%, 08/25/2055 (A) | | | 27 | | | | 1 | |
| | | | |
New Covenant Funds / Annual Report / June 30, 2020 | | | 33 | |
SCHEDULE OF INVESTMENTS
June 30, 2020
New Covenant Income Fund (Continued)
| | | | | | | | |
| | | |
| Description | | Face Amount
(Thousands) | | | Market Value
($ Thousands) | |
MORTGAGE-BACKED SECURITIES (continued) | |
FNMA CMO, Ser 2015-56, Cl AS, IO | | | | | | | | |
5.203%, VAR LIBOR USD 1
Month+6.150%, 08/25/2045 | | $ | 54 | | | $ | 14 | |
FNMA Connecticut Avenue Securities, Ser 2014-C04, Cl 1M2 | | | | | | | | |
5.085%, VAR ICE LIBOR USD 1
Month+4.900%, 11/25/2024 | | | 233 | | | | 239 | |
FNMA TBA | | | | | | | | |
2.500%, 07/25/2043 | | | 2,300 | | | | 2,398 | |
FNMA, Ser 2005-29, Cl ZA | | | | | | | | |
5.500%, 04/25/2035 | | | 133 | | | | 158 | |
FNMA, Ser 2012-101, Cl BI, IO | | | | | | | | |
4.000%, 09/25/2027 | | | 12 | | | | 1 | |
FNMA, Ser 2013-54, Cl BS, IO | | | | | | | | |
5.966%, VAR LIBOR USD 1
Month+6.150%, 06/25/2043 | | | 43 | | | | 11 | |
FNMA, Ser 2017-76, Cl SB, IO | | | | | | | | |
5.916%, VAR LIBOR USD 1
Month+6.100%, 10/25/2057 | | | 245 | | | | 46 | |
FNMA, Ser 2017-85, Cl SC, IO | | | | | | | | |
5.253%, VAR LIBOR USD 1
Month+6.200%, 11/25/2047 | | | 61 | | | | 12 | |
FNMA, Ser 2020-47, Cl GZ | | | | | | | | |
2.000%, 07/25/2050 | | | 100 | | | | 99 | |
FNMA, Ser M19, Cl A2 | | | | | | | | |
2.560%, 09/25/2029 | | | 389 | | | | 428 | |
FNMA, Ser M23, Cl 3A3 | | | | | | | | |
2.720%, 10/25/2031 (A) | | | 100 | | | | 108 | |
FNMA, Ser M4, Cl A2 | | | | | | | | |
3.610%, 02/25/2031 | | | 80 | | | | 95 | |
FNMA, Ser M6, Cl A2 | | | | | | | | |
3.450%, 01/01/2029 | | | 170 | | | | 196 | |
FRESB Mortgage Trust, Ser SB48, Cl A10F | | | | | | | | |
3.370%, 02/25/2028 (A) | | | 696 | | | | 751 | |
FRESB Mortgage Trust, Ser SB58, Cl A10F | | | | | | | | |
3.610%, 10/25/2028 (A) | | | 1,043 | | | | 1,129 | |
GNMA | | | | | | | | |
5.500%, 02/20/2037 to 01/15/2039 | | | 108 | | | | 123 | |
5.000%, 12/20/2038 to 01/20/2049 | | | 1,034 | | | | 1,154 | |
4.600%, 09/15/2034 | | | 1,844 | | | | 2,055 | |
4.500%, 07/20/2038 to 03/20/2050 | | | 4,021 | | | | 4,372 | |
4.000%, 01/15/2041 to 11/20/2049 | | | 2,896 | | | | 3,134 | |
3.500%, 06/20/2044 to 05/15/2050 | | | 1,793 | | | | 1,916 | |
3.000%, 09/15/2042 to 01/20/2050 | | | 653 | | | | 692 | |
2.500%, 02/20/2027 | | | 543 | | | | 568 | |
GNMA CMO, Ser 186, Cl IO, IO | | | | | | | | |
0.700%, 08/16/2054 (A) | | | 973 | | | | 35 | |
GNMA CMO, Ser 2012-34, Cl SA, IO | | | | | | | | |
5.860%, VAR LIBOR USD 1 Month+6.050%, 03/20/2042 | | | 32 | | | | 7 | |
GNMA CMO, Ser 2012-66, Cl CI, IO | | | | | | | | |
3.500%, 02/20/2038 | | | 50 | | | | 2 | |
| | | | | | | | |
| | | |
| Description | | Face Amount
(Thousands) | | | Market Value
($ Thousands) | |
MORTGAGE-BACKED SECURITIES (continued) | |
GNMA CMO, Ser 2012-H18, Cl NA | | | | | | | | |
0.823%, VAR ICE LIBOR USD 1
Month+0.520%, 08/20/2062 | | $ | 153 | | | $ | 153 | |
GNMA CMO, Ser 2012-H30, Cl GA | | | | | | | | |
0.653%, VAR ICE LIBOR USD 1
Month+0.350%, 12/20/2062 | | | 706 | | | | 703 | |
GNMA CMO, Ser 2013-H01, Cl TA | | | | | | | | |
0.803%, VAR ICE LIBOR USD 1
Month+0.500%, 01/20/2063 | | | 6 | | | | 6 | |
GNMA CMO, Ser 2013-H08, Cl BF | | | | | | | | |
0.703%, VAR ICE LIBOR USD 1
Month+0.400%, 03/20/2063 | | | 662 | | | | 660 | |
GNMA CMO, Ser 2014-105, Cl IO, IO | | | | | | | | |
0.921%, 06/16/2054 (A) | | | 1,091 | | | | 44 | |
GNMA CMO, Ser 2015-H20, Cl FA | | | | | | | | |
0.773%, VAR ICE LIBOR USD 1
Month+0.470%, 08/20/2065 | | | 257 | | | | 256 | |
GNMA CMO, Ser 85, Cl IA, IO | | | | | | | | |
0.685%, 03/16/2047 (A) | | | 2,693 | | | | 79 | |
GNMA CMO, Ser 95, Cl IO, IO | | | | | | | | |
0.547%, 04/16/2047 (A) | | | 1,357 | | | | 40 | |
GNMA TBA | | | | | | | | |
2.500%, 07/01/2045 | | | 100 | | | | 105 | |
GNMA, Ser 107, Cl AD | | | | | | | | |
2.694%, 11/16/2047 (A) | | | 94 | | | | 99 | |
GNMA, Ser 2013-H21, Cl FB | | | | | | | | |
1.003%, VAR ICE LIBOR USD 1
Month+0.700%, 09/20/2063 | | | 477 | | | | 478 | |
GNMA, Ser 2015-167, Cl OI, IO | | | | | | | | |
4.000%, 04/16/2045 | | | 96 | | | | 15 | |
GNMA, Ser 2020-H04, Cl FP | | | | | | | | |
0.803%, VAR ICE LIBOR USD 1
Month+0.500%, 06/20/2069 | | | 196 | | | | 196 | |
GNMA, Ser 2020-H09, Cl FL | | | | | | | | |
1.340%, VAR ICE LIBOR USD 1
Month+1.150%, 05/20/2070 | | | 100 | | | | 104 | |
GNMA, Ser 28, Cl AB | | | | | | | | |
3.150%, 06/16/2060 | | | 77 | | | | 81 | |
UMBS TBA | | | | | | | | |
2.000%, 07/14/2169 to 07/16/2169 | | | 3,300 | | | | 3,391 | |
| | | | | | | | |
| | | | | | | 99,318 | |
| | | | | | | | |
Non-Agency Mortgage-Backed Obligations — 8.4% | |
280 Park Avenue Mortgage Trust, Ser 280P, Cl A | | | | | | | | |
1.065%, VAR ICE LIBOR USD 1
Month+0.880%, 09/15/2034 (B) | | | 130 | | | | 129 | |
BX Commercial Mortgage Trust, Ser XL, Cl A | | | | | | | | |
1.625%, VAR ICE LIBOR USD 1 Month+0.920%, 10/15/2036 (B) | | | 1,056 | | | | 1,048 | |
Citigroup Commercial Mortgage Trust, Ser 2014-GC25, Cl AS | | | | | | | | |
4.017%, 10/10/2047 | | | 100 | | | | 107 | |
| | |
| 34 | | New Covenant Funds / Annual Report / June 30, 2020 |
| | | | | | | | |
| | | |
| Description | | Face Amount
(Thousands) | | | Market Value
($ Thousands) | |
MORTGAGE-BACKED SECURITIES (continued) | |
Citigroup Commercial Mortgage Trust, Ser 2016-P6, Cl AAB | | | | | | | | |
3.512%, 12/10/2049 | | $ | 810 | | | $ | 872 | |
Citigroup Commercial Mortgage Trust, Ser 375P, Cl A | | | | | | | | |
3.251%, 05/10/2035 (B) | | | 190 | | | | 198 | |
COMM Mortgage Trust, Ser CR5, Cl A4 | | | | | | | | |
2.771%, 12/10/2045 | | | 700 | | | | 713 | |
COMM Mortgage Trust, Ser CR5, Cl AM | | | | | | | | |
3.223%, 12/10/2045 (B) | | | 590 | | | | 600 | |
COMM Mortgage Trust, Ser CR8, Cl A4 | | | | | | | | |
3.334%, 06/10/2046 | | | 565 | | | | 595 | |
Commercial Mortgage Trust, Ser 2013-CR12, Cl C | | | | | | | | |
5.240%, 10/10/2046 (A) | | | 10 | | | | 9 | |
Commercial Mortgage Trust, Ser 2013-CR12, Cl B | | | | | | | | |
4.762%, 10/10/2046 (A) | | | 20 | | | | 21 | |
Commercial Mortgage Trust, Ser 2013-CR12, Cl AM | | | | | | | | |
4.300%, 10/10/2046 | | | 20 | | | | 21 | |
Credit Suisse Mortgage Trust, Ser 2019- NQM1, Cl A3 | | | | | | | | |
3.064%, 10/25/2059 (B) | | | 356 | | | | 362 | |
CSMC Trust, Ser 2018-J1, Cl A2 | | | | | | | | |
3.500%, 02/25/2048 (A)(B) | | | 999 | | | | 1,035 | |
CSMC, Ser USA, Cl B | | | | | | | | |
4.185%, 09/15/2037 (B) | | | 470 | | | | 430 | |
DBUBS Mortgage Trust, Ser LC2A, Cl A4 | | | | | | | | |
4.537%, 07/10/2044 (B) | | | 1,009 | | | | 1,025 | |
DRB Prime Student Loan Trust, Ser 2015-B, Cl A1 | | | | | | | | |
2.085%, VAR ICE LIBOR USD 1 Month+1.900%, 10/27/2031 (B) | | | 78 | | | | 79 | |
Flagstar Mortgage Trust, Ser 2018-2, Cl A4 | | | | | | | | |
3.500%, 04/25/2048 (A)(B) | | | 191 | | | | 197 | |
GS Mortage-Backed Securities Trust, Ser 2020-PJ1, Cl A6 | | | | | | | | |
3.500%, 05/25/2050 (A)(B) | | | 678 | | | | 682 | |
GS Mortgage Securities Trust, Ser 2013- GC16, Cl B | | | | | | | | |
5.161%, 11/10/2046 (A) | | | 80 | | | | 85 | |
GS Mortgage Securities Trust, Ser 2018- SRP5, Cl A | | | | | | | | |
3.281%, 06/09/2021 | | | 620 | | | | 593 | |
GS Mortgage Securities Trust, Ser 2018- SRP5, Cl B | | | | | | | | |
4.481%, 06/09/2021 | | | 430 | | | | 406 | |
GS Mortgage-Backed Securities Trust, Ser 2018-RPL1, Cl A1A | | | | | | | | |
3.750%, 10/25/2057 (B) | | | 331 | | | | 348 | |
| | | | | | | | |
| | | |
| Description | | Face Amount
(Thousands) | | | Market Value
($ Thousands) | |
MORTGAGE-BACKED SECURITIES (continued) | |
GS Mortgage-Backed Securities Trust, Ser 2020-INV1, Cl A14 | | | | | | | | |
3.000%, 08/25/2050 (A)(B) | | $ | 850 | | | $ | 877 | |
JPMBB Commercial Mortgage Securities Trust, Ser 2013-C15, Cl B | | | | | | | | |
4.927%, 11/15/2045 (A) | | | 210 | | | | 216 | |
JPMBB Commercial Mortgage Securities Trust, Ser 2013-C17, Cl B | | | | | | | | |
5.053%, 01/15/2047 (A) | | | 30 | | | | 31 | |
JPMBB Commercial Mortgage Securities Trust, Ser 2014-C22, Cl C | | | | | | | | |
4.706%, 09/15/2047 (A) | | | 80 | | | | 66 | |
JPMorgan Chase Commercial Mortgage Securities Trust, Ser C6, Cl A3 | | | | | | | | |
3.507%, 05/15/2045 | | | 1,071 | | | | 1,105 | |
JPMorgan Chase Commercial Mortgage Securities Trust, Ser FL7, Cl D | | | | | | | | |
4.455%, VAR ICE LIBOR USD 1 Month+3.750%, 05/15/2028 (B) | | | 129 | | | | 126 | |
JPMorgan Chase Commercial Mortgage Securities Trust, Ser LC9, Cl AS | | | | | | | | |
3.353%, 12/15/2047 (B) | | | 380 | | | | 388 | |
JPMorgan Mortgage Trust, Ser 2015-5, Cl A9 | | | | | | | | |
2.755%, 05/25/2045 (A)(B) | | | 72 | | | | 73 | |
JPMorgan Mortgage Trust, Ser 2016-1, Cl A5 | | | | | | | | |
3.500%, 05/25/2046 (A)(B) | | | 269 | | | | 271 | |
JPMorgan Mortgage Trust, Ser 2018-3, Cl A1 | | | | | | | | |
3.500%, 09/25/2048 (A)(B) | | | 523 | | | | 536 | |
JPMorgan Mortgage Trust, Ser 2018-4, Cl A1 | | | | | | | | |
3.500%, 10/25/2048 (A)(B) | | | 193 | | | | 198 | |
JPMorgan Mortgage Trust, Ser 2018-5, Cl A1 | | | | | | | | |
3.500%, 10/25/2048 (A)(B) | | | 360 | | | | 367 | |
JPMorgan Mortgage Trust, Ser 2018-6, Cl 1A4 | | | | | | | | |
3.500%, 12/25/2048 (A)(B) | | | 138 | | | | 138 | |
Lanark Master Issuer, Ser 2018-1A, Cl 1A | | | | | | | | |
0.778%, VAR ICE LIBOR USD 3 Month+0.420%, 12/22/2069 (B) | | | 518 | | | | 518 | |
MAD Mortgage Trust, Ser 330M, Cl A | | | | | | | | |
3.082%, 08/15/2034 (A)(B) | | | 220 | | | | 231 | |
Morgan Stanley Bank of America Merrill Lynch Trust, Ser C34, Cl ASB | | | | | | | | |
3.354%, 11/15/2052 | | | 615 | | | | 660 | |
Morgan Stanley Bank of America Merrill Lynch Trust, Ser C5, Cl A4 | | | | | | | | |
3.176%, 08/15/2045 | | | 1,475 | | | | 1,507 | |
Morgan Stanley Bank of America Merrill Lynch Trust, Ser C9, Cl A4 | | | | | | | | |
3.102%, 05/15/2046 | | | 714 | | | | 741 | |
Morgan Stanley Capital I Trust, Ser 2012-C4, Cl A4 | | | | | | | | |
3.244%, 03/15/2045 | | | 220 | | | | 224 | |
| | | | |
New Covenant Funds / Annual Report / June 30, 2020 | | | 35 | |
SCHEDULE OF INVESTMENTS
June 30, 2020
New Covenant Income Fund (Continued)
| | | | | | | | |
| | | |
| Description | | Face Amount
(Thousands) | | | Market Value
($ Thousands) | |
MORTGAGE-BACKED SECURITIES (continued) | |
Morgan Stanley Capital I Trust, Ser BPR, Cl A | | | | | | | | |
2.105%, VAR ICE LIBOR USD 1 Month+1.400%, 05/15/2036 (B) | | $ | 320 | | | $ | 284 | |
MSCG Trust, Ser 2016-SNR, Cl C | | | | | | | | |
5.205%, 11/15/2034 (B) | | | 128 | | | | 125 | |
MSCG Trust, Ser ALDR, Cl A2 | | | | | | | | |
3.577%, 06/07/2035 (A)(B) | | | 410 | | | | 403 | |
Natixis Commercial Mortgage Securities Trust, Ser FAME, Cl B | | | | | | | | |
3.655%, 08/15/2036 (B) | | | 410 | | | | 382 | |
New Residential Mortgage Loan Trust, Ser 2019-4A, Cl A1B | | | | | | | | |
3.500%, 12/25/2058 (A)(B) | | | 344 | | | | 364 | |
New Residential Mortgage Loan Trust, Ser 2019-NQM4, Cl A1 | | | | | | | | |
2.492%, 09/25/2059 (A)(B) | | | 496 | | | | 499 | |
Residential Mortgage Loan Trust, Ser 2019- 3, Cl A2 | | | | | | | | |
2.941%, 09/25/2059 (A)(B) | | | 344 | | | | 343 | |
Residential Mortgage Loan Trust, Ser 2019- 3, Cl A3 | | | | | | | | |
3.044%, 09/25/2059 (A)(B) | | | 344 | | | | 340 | |
Residential Mortgage Loan Trust, Ser 2020- 2, Cl A1 | | | | | | | | |
1.654%, 05/25/2060 (A)(B) | | | 550 | | | | 550 | |
Seasoned Credit Risk Transfer Trust, Ser 2019-4, Cl MA | | | | | | | | |
3.000%, 02/25/2059 | | | 522 | | | | 556 | |
Seasoned Credit Risk Transfer Trust, Ser 2019-1, Cl MA | | | | | | | | |
3.500%, 07/25/2058 | | | 871 | | | | 948 | |
Seasoned Credit Risk Transfer Trust, Ser 2019-2, Cl MA | | | | | | | | |
3.500%, 08/25/2058 | | | 736 | | | | 801 | |
Sequoia Mortgage Trust, Ser 2017-1, Cl A4 | | | | | | | | |
3.500%, 02/25/2047 (A)(B) | | | 536 | | | | 550 | |
Sequoia Mortgage Trust, Ser 2017-5, Cl A4 | | | | | | | | |
3.500%, 08/25/2047 (A)(B) | | | 490 | | | | 497 | |
Sequoia Mortgage Trust, Ser 2017-6, Cl A4 | | | | | | | | |
3.500%, 09/25/2047 (A)(B) | | | 239 | | | | 243 | |
Towd Point Mortgage Trust, Ser 2015-5, Cl A1B | | | | | | | | |
2.750%, 05/25/2055 (A)(B) | | | 142 | | | | 143 | |
UBS-BAMLL Trust, Ser 2012-WRM, Cl A | | | | | | | | |
3.663%, 06/10/2030 (B) | | | 116 | | | | 117 | |
UBS-Barclays Commercial Mortgage Trust, Ser 2012-C2, Cl A4 | | | | | | | | |
3.525%, 05/10/2063 | | | 73 | | | | 75 | |
UBS-Barclays Commercial Mortgage Trust, Ser 2012-CN, Cl XA, IO | | | | | | | | |
1.456%, 05/10/2063 (A)(B) | | | 327 | | | | 7 | |
| | | | | | | | |
| | | |
| Description | | Face Amount
(Thousands) | | | Market Value
($ Thousands) | |
MORTGAGE-BACKED SECURITIES (continued) | |
Wells Fargo Commercial Mortgage Trust, Ser 2015-NXS3, Cl NXS3 | | | | | | | | |
3.371%, 09/15/2057 | | $ | 160 | | | $ | 168 | |
WF-RBS Commercial Mortgage Trust, Ser 2012-C7, Cl XA, IO | | | | | | | | |
1.480%, 06/15/2045 (A)(B) | | | 1,064 | | | | 19 | |
WFRBS Commercial Mortgage Trust, Ser 2013-C13, Cl XA, IO | | | | | | | | |
1.329%, 05/15/2045 (A)(B) | | | 1,057 | | | | 29 | |
WFRBS Commercial Mortgage Trust, Ser 2014-C23, Cl XA, IO | | | | | | | | |
0.712%, 10/15/2057 (A) | | | 1,047 | | | | 21 | |
WFRBS Commercial Mortgage Trust, Ser 2014-C23, Cl B | | | | | | | | |
4.526%, 10/15/2057 (A) | | | 270 | | | | 281 | |
WFRBS Commercial Mortgage Trust, Ser C11, Cl AS | | | | | | | | |
3.311%, 03/15/2045 | | | 160 | | | | 165 | |
WFRBS Commercial Mortgage Trust, Ser C2, Cl A4 | | | | | | | | |
4.869%, 02/15/2044 (A)(B) | | | 770 | | | | 779 | |
WFRBS Commercial Mortgage Trust, Ser C4, Cl A4 | | | | | | | | |
4.902%, 06/15/2044 (A)(B) | | | 1,796 | | | | 1,824 | |
| | | | | | | | |
| | | | | | | 28,341 | |
| | | | | | | | |
Total Mortgage-Backed Securities
(Cost $124,429) ($ Thousands) | | | | | | | 127,659 | |
| | | | | | | | |
|
CORPORATE OBLIGATIONS — 35.2% | |
Communication Services — 3.2% | |
AT&T | | | | | | | | |
4.250%, 03/01/2027 | | | 150 | | | | 171 | |
4.125%, 02/17/2026 | | | 408 | | | | 465 | |
3.849%, 11/27/2022 (B)(C) | | | 2,000 | | | | 1,957 | |
3.000%, 06/30/2022 | | | 10 | | | | 10 | |
2.300%, 06/01/2027 | | | 120 | | | | 124 | |
Charter Communications Operating | | | | | | | | |
5.050%, 03/30/2029 | | | 20 | | | | 24 | |
4.908%, 07/23/2025 | | | 310 | | | | 355 | |
4.800%, 03/01/2050 | | | 40 | | | | 44 | |
3.750%, 02/15/2028 | | | 20 | | | | 22 | |
Comcast | | | | | | | | |
4.700%, 10/15/2048 | | | 20 | | | | 27 | |
4.150%, 10/15/2028 | | | 80 | | | | 96 | |
3.950%, 10/15/2025 | | | 210 | | | | 241 | |
3.750%, 04/01/2040 | | | 20 | | | | 23 | |
3.450%, 02/01/2050 | | | 70 | | | | 80 | |
3.400%, 04/01/2030 | | | 40 | | | | 46 | |
3.300%, 04/01/2027 | | | 30 | | | | 34 | |
3.250%, 11/01/2039 | | | 30 | | | | 33 | |
| | |
| 36 | | New Covenant Funds / Annual Report / June 30, 2020 |
| | | | | | | | |
| | | |
| Description | | Face Amount
(Thousands) | | | Market Value
($ Thousands) | |
CORPORATE OBLIGATIONS (continued) | |
3.150%, 03/01/2026 | | $ | 30 | | | $ | 33 | |
3.100%, 04/01/2025 | | | 10 | | | | 11 | |
Comcast Cable Communications Holdings | | | | | | | | |
9.455%, 11/15/2022 | | | 1,116 | | | | 1,355 | |
Cox Communications | | | | | | | | |
3.250%, 12/15/2022 (B) | | | 859 | | | | 905 | |
Fox | | | | | | | | |
4.709%, 01/25/2029 | | | 40 | | | | 48 | |
Sprint Spectrum | | | | | | | | |
3.360%, 09/20/2021 (B) | | | 241 | | | | 244 | |
TCI Communications | | | | | | | | |
7.875%, 02/15/2026 | | | 240 | | | | 328 | |
Telefonica Emisiones SAU | | | | | | | | |
4.895%, 03/06/2048 | | | 340 | | | | 410 | |
Tencent Holdings MTN | | | | | | | | |
3.595%, 01/19/2028 (B) | | | 250 | | | | 272 | |
T-Mobile USA | | | | | | | | |
3.875%, 04/15/2030 (B) | | | 170 | | | | 189 | |
3.750%, 04/15/2027 (B) | | | 20 | | | | 22 | |
3.500%, 04/15/2025 (B) | | | 289 | | | | 315 | |
Verizon Communications | | | | | | | | |
4.862%, 08/21/2046 | | | 40 | | | | 54 | |
4.329%, 09/21/2028 | | | 435 | | | | 524 | |
4.125%, 08/15/2046 | | | 40 | | | | 50 | |
4.000%, 03/22/2050 | | | 40 | | | | 51 | |
3.875%, 02/08/2029 | | | 30 | | | | 36 | |
3.850%, 11/01/2042 | | | 10 | | | | 12 | |
3.376%, 02/15/2025 | | | 282 | | | | 314 | |
3.000%, 03/22/2027 | | | 20 | | | | 22 | |
2.625%, 08/15/2026 | | | 513 | | | | 558 | |
Viacom | | | | | | | | |
3.875%, 04/01/2024 | | | 20 | | | | 21 | |
Vodafone Group PLC | | | | | | | | |
3.750%, 01/16/2024 | | | 410 | | | | 448 | |
Walt Disney | | | | | | | | |
3.350%, 03/24/2025 | | | 469 | | | | 520 | |
3.000%, 09/15/2022 | | | 30 | | | | 32 | |
| | | | | | | | |
| | | | | | | 10,526 | |
| | | | | | | | |
Consumer Discretionary — 1.5% | | | | | | | | |
Amazon.com | | | | | | | | |
4.250%, 08/22/2057 | | | 10 | | | | 13 | |
3.150%, 08/22/2027 | | | 470 | | | | 538 | |
1.200%, 06/03/2027 | | | 20 | | | | 20 | |
BMW US Capital | | | | | | | | |
1.850%, 09/15/2021 (B) | | | 20 | | | | 20 | |
Cargill | | | | | | | | |
1.375%, 07/23/2023 (B) | | | 70 | | | | 71 | |
Dollar General | | | | | | | | |
3.250%, 04/15/2023 | | | 10 | | | | 11 | |
General Motors | | | | | | | | |
5.400%, 10/02/2023 | | | 576 | | | | 623 | |
| | | | | | | | |
| | | |
| Description | | Face Amount
(Thousands) | | | Market Value
($ Thousands) | |
CORPORATE OBLIGATIONS (continued) | | | | | | | | |
General Motors Financial | | | | | | | | |
4.150%, 06/19/2023 | | $ | 600 | | | $ | 627 | |
3.700%, 11/24/2020 | | | 80 | | | | 80 | |
3.700%, 05/09/2023 | | | 190 | | | | 195 | |
2.450%, 11/06/2020 | | | 30 | | | | 30 | |
Home Depot | | | | | | | | |
3.900%, 12/06/2028 | | | 10 | | | | 12 | |
3.900%, 06/15/2047 | | | 10 | | | | 12 | |
3.350%, 04/15/2050 | | | 140 | | | | 160 | |
3.300%, 04/15/2040 | | | 40 | | | | 45 | |
2.500%, 04/15/2027 | | | 450 | | | | 493 | |
KazMunayGas National JSC | | | | | | | | |
5.375%, 04/24/2030 (B) | | | 400 | | | | 452 | |
Lowe’s | | | | | | | | |
5.125%, 04/15/2050 | | | 100 | | | | 136 | |
5.000%, 04/15/2040 | | | 30 | | | | 39 | |
4.500%, 04/15/2030 | | | 30 | | | | 37 | |
McDonald’s MTN | | | | | | | | |
4.200%, 04/01/2050 | | | 70 | | | | 85 | |
3.700%, 01/30/2026 | | | 20 | | | | 23 | |
3.625%, 09/01/2049 | | | 10 | | | | 11 | |
3.500%, 03/01/2027 | | | 20 | | | | 23 | |
3.350%, 04/01/2023 | | | 280 | | | | 300 | |
3.300%, 07/01/2025 | | | 50 | | | | 56 | |
1.450%, 09/01/2025 | | | 10 | | | | 10 | |
Newell Brands | | | | | | | | |
4.350%, 04/01/2023 | | | 53 | | | | 55 | |
NIKE | | | | | | | | |
3.375%, 03/27/2050 | | | 90 | | | | 104 | |
2.750%, 03/27/2027 | | | 40 | | | | 44 | |
2.400%, 03/27/2025 | | | 355 | | | | 382 | |
Starbucks | | | | | | | | |
2.000%, 03/12/2027 | | | 136 | | | | 142 | |
Target | | | | | | | | |
2.650%, 09/15/2030 | | | 100 | | | | 110 | |
2.250%, 04/15/2025 | | | 80 | | | | 86 | |
TJX | | | | | | | | |
3.500%, 04/15/2025 | | | 50 | | | | 56 | |
| | | | | | | | |
| | | | | | | 5,101 | |
| | | | | | | | |
Consumer Staples — 0.8% | | | | | | | | |
Coca-Cola | | | | | | | | |
4.200%, 03/25/2050 | | | 190 | | | | 248 | |
4.125%, 03/25/2040 | | | 20 | | | | 25 | |
3.375%, 03/25/2027 | | | 30 | | | | 34 | |
2.950%, 03/25/2025 | | | 50 | | | | 55 | |
2.600%, 06/01/2050 | | | 20 | | | | 20 | |
1.450%, 06/01/2027 | | | 80 | | | | 82 | |
Costco Wholesale | | | | | | | | |
1.600%, 04/20/2030 | | | 90 | | | | 91 | |
1.375%, 06/20/2027 | | | 120 | | | | 123 | |
| | | | |
New Covenant Funds / Annual Report / June 30, 2020 | | | 37 | |
SCHEDULE OF INVESTMENTS
June 30, 2020
New Covenant Income Fund (Continued)
| | | | | | | | |
| | | |
| Description | | Face Amount
(Thousands) | | | Market Value
($ Thousands) | |
CORPORATE OBLIGATIONS (continued) | | | | | | | | |
Hershey | | | | | | | | |
0.900%, 06/01/2025 | | $ | 20 | | | $ | 20 | |
Kimberly-Clark | | | | | | | | |
3.100%, 03/26/2030 | | | 20 | | | | 23 | |
Mars | | | | | | | | |
3.200%, 04/01/2030 (B) | | | 30 | | | | 34 | |
2.700%, 04/01/2025 (B) | | | 60 | | | | 64 | |
Mondelez International | | | | | | | | |
2.125%, 04/13/2023 | | | 30 | | | | 31 | |
1.500%, 05/04/2025 | | | 80 | | | | 82 | |
PepsiCo | | | | | | | | |
3.875%, 03/19/2060 | | | 20 | | | | 25 | |
3.625%, 03/19/2050 | | | 30 | | | | 36 | |
3.000%, 08/25/2021 | | | 290 | | | | 298 | |
2.875%, 10/15/2049 | | | 20 | | | | 22 | |
2.750%, 03/05/2022 | | | 80 | | | | 83 | |
2.625%, 03/19/2027 | | | 10 | | | | 11 | |
2.250%, 03/19/2025 | | | 331 | | | | 354 | |
1.625%, 05/01/2030 | | | 70 | | | | 71 | |
0.750%, 05/01/2023 | | | 80 | | | | 81 | |
Procter & Gamble | | | | | | | | |
3.600%, 03/25/2050 | | | 50 | | | | 63 | |
3.550%, 03/25/2040 | | | 50 | | | | 60 | |
3.000%, 03/25/2030 | | | 40 | | | | 46 | |
2.800%, 03/25/2027 | | | 10 | | | | 11 | |
2.450%, 03/25/2025 | | | 339 | | | | 368 | |
Walmart | | | | | | | | |
3.550%, 06/26/2025 | | | 20 | | | | 23 | |
3.400%, 06/26/2023 | | | 30 | | | | 33 | |
3.050%, 07/08/2026 | | | 100 | | | | 113 | |
| | | | | | | | |
| | | | | | | 2,630 | |
| | | | | | | | |
Energy — 3.6% | | | | | | | | |
Apache | | | | | | | | |
3.250%, 04/15/2022 | | | 616 | | | | 596 | |
Berkshire Hathaway Energy | | | | | | | | |
3.700%, 07/15/2030 (B) | | | 140 | | | | 164 | |
BP Capital Markets America | | | | | | | | |
3.790%, 02/06/2024 | | | 80 | | | | 87 | |
3.633%, 04/06/2030 | | | 50 | | | | 57 | |
3.410%, 02/11/2026 | | | 40 | | | | 44 | |
3.216%, 11/28/2023 | | | 90 | | | | 97 | |
3.119%, 05/04/2026 | | | 170 | | | | 186 | |
2.937%, 04/06/2023 | | | 281 | | | | 297 | |
BP Capital Markets PLC | | | | | | | | |
3.535%, 11/04/2024 | | | 20 | | | | 22 | |
Cameron LNG | | | | | | | | |
2.902%, 07/15/2031 (B) | | | 60 | | | | 64 | |
Chevron | | | | | | | | |
3.078%, 05/11/2050 | | | 10 | | | | 11 | |
2.100%, 05/16/2021 | | | 130 | | | | 132 | |
1.995%, 05/11/2027 | | | 40 | | | | 42 | |
| | | | | | | | |
| | | |
| Description | | Face Amount
(Thousands) | | | Market Value
($ Thousands) | |
CORPORATE OBLIGATIONS (continued) | |
1.554%, 05/11/2025 | | $ | 70 | | | $ | 72 | |
Cimarex Energy | | | | | | | | |
4.375%, 06/01/2024 | | | 50 | | | | 53 | |
4.375%, 03/15/2029 | | | 50 | | | | 51 | |
3.900%, 05/15/2027 | | | 160 | | | | 162 | |
Concho Resources | | | | | | | | |
4.375%, 01/15/2025 | | | 455 | | | | 470 | |
4.300%, 08/15/2028 | | | 30 | | | | 33 | |
3.750%, 10/01/2027 | | | 160 | | | | 170 | |
Continental Resources | | | | | | | | |
5.000%, 09/15/2022 | | | 120 | | | | 118 | |
4.500%, 04/15/2023 | | | 150 | | | | 144 | |
4.375%, 01/15/2028 | | | 20 | | | | 18 | |
3.800%, 06/01/2024 | | | 190 | | | | 178 | |
Devon Energy | | | | | | | | |
5.850%, 12/15/2025 | | | 210 | | | | 232 | |
Diamondback Energy | | | | | | | | |
5.375%, 05/31/2025 | | | 50 | | | | 51 | |
3.250%, 12/01/2026 | | | 30 | | | | 30 | |
2.875%, 12/01/2024 | | | 290 | | | | 290 | |
Energy Transfer Operating | | | | | | | | |
4.950%, 06/15/2028 | | | 10 | | | | 11 | |
3.750%, 05/15/2030 | | | 160 | | | | 159 | |
2.900%, 05/15/2025 | | | 40 | | | | 41 | |
Energy Transfer Partners | | | | | | | | |
4.500%, 11/01/2023 | | | 60 | | | | 64 | |
Enterprise Products Operating | | | | | | | | |
4.150%, 10/16/2028 | | | 140 | | | | 160 | |
3.900%, 02/15/2024 | | | 457 | | | | 501 | |
3.750%, 02/15/2025 | | | 100 | | | | 111 | |
3.125%, 07/31/2029 | | | 60 | | | | 64 | |
2.800%, 01/31/2030 | | | 170 | | | | 177 | |
EOG Resources | | | | | | | | |
4.375%, 04/15/2030 | | | 30 | | | | 36 | |
4.150%, 01/15/2026 | | | 160 | | | | 184 | |
Exxon Mobil | | | | | | | | |
4.327%, 03/19/2050 | | | 30 | | | | 37 | |
3.043%, 03/01/2026 | | | 150 | | | | 165 | |
2.992%, 03/19/2025 | | | 758 | | | | 823 | |
1.571%, 04/15/2023 | | | 717 | | | | 736 | |
Halliburton | | | | | | | | |
3.250%, 11/15/2021 | | | 180 | | | | 184 | |
Kinder Morgan | | | | | | | | |
4.300%, 06/01/2025 | | | 60 | | | | 67 | |
Kinder Morgan Energy Partners | | | | | | | | |
3.500%, 03/01/2021 | | | 30 | | | | 30 | |
MidAmerican Energy | | | | | | | | |
3.650%, 04/15/2029 | | | 140 | | | | 167 | |
MPLX | | | | | | | | |
4.800%, 02/15/2029 | | | 50 | | | | 56 | |
4.125%, 03/01/2027 | | | 110 | | | | 117 | |
4.000%, 03/15/2028 | | | 40 | | | | 42 | |
| | |
| 38 | | New Covenant Funds / Annual Report / June 30, 2020 |
| | | | | | | | |
| | | |
| Description | | Face Amount
(Thousands) | | | Market Value
($ Thousands) | |
CORPORATE OBLIGATIONS (continued) | |
Noble Energy | | | | | | | | |
3.850%, 01/15/2028 | | $ | 30 | | | $ | 29 | |
3.250%, 10/15/2029 | | | 80 | | | | 73 | |
Occidental Petroleum | | | | | | | | |
5.550%, 03/15/2026 | | | 180 | | | | 164 | |
4.476%, 10/10/2036 (C) | | | 2,000 | | | | 840 | |
4.100%, 02/01/2021 | | | 50 | | | | 50 | |
3.400%, 04/15/2026 | | | 80 | | | | 65 | |
3.200%, 08/15/2026 | | | 130 | | | | 106 | |
3.125%, 02/15/2022 | | | 100 | | | | 96 | |
3.000%, 02/15/2027 | | | 130 | | | | 101 | |
2.600%, 08/13/2021 | | | 250 | | | | 244 | |
Phillips 66 | | | | | | | | |
3.700%, 04/06/2023 | | | 582 | | | | 622 | |
Phillips 66 Partners | | | | | | | | |
2.450%, 12/15/2024 | | | 413 | | | | 425 | |
Schlumberger Holdings | | | | | | | | |
3.900%, 05/17/2028 (B) | | | 456 | | | | 492 | |
Sinopec Group Overseas Development | | | | | | | | |
4.375%, 04/10/2024 (B) | | | 290 | | | | 320 | |
Tennessee Gas Pipeline | | | | | | | | |
2.900%, 03/01/2030 (B) | | | 160 | | | | 164 | |
Western Midstream Operating | | | | | | | | |
4.050%, 02/01/2030 | | | 120 | | | | 115 | |
3.100%, 02/01/2025 | | | 30 | | | | 28 | |
2.161%, VAR ICE LIBOR USD 3
Month+0.850%, 01/13/2023 | | | 20 | | | | 18 | |
Williams | | | | | | | | |
3.750%, 06/15/2027 | | | 390 | | | | 417 | |
| | | | | | | | |
| | | | | | | 12,172 | |
| | | | | | | | |
Financials — 14.9% | | | | | | | | |
American Express | | | | | | | | |
3.400%, 02/27/2023 | | | 972 | | | | 1,040 | |
2.650%, 12/02/2022 | | | 264 | | | | 276 | |
American International Group | | | | | | | | |
2.500%, 06/30/2025 | | | 40 | | | | 42 | |
Anglo American Capital | | | | | | | | |
3.625%, 09/11/2024 (B) | | | 200 | | | | 210 | |
Banco Santander | | | | | | | | |
4.379%, 04/12/2028 | | | 200 | | | | 223 | |
2.746%, 05/28/2025 | | | 200 | | | | 207 | |
2.431%, VAR ICE LIBOR USD 3 Month+1.120%, 04/12/2023 | | | 200 | | | | 197 | |
Bank of America | | | | | | | | |
3.419%, VAR ICE LIBOR USD 3 Month+1.040%, 12/20/2028 | | | 234 | | | | 261 | |
3.004%, VAR ICE LIBOR USD 3 Month+0.790%, 12/20/2023 | | | 258 | | | | 271 | |
2.592%, VAR United States Secured Overnight Financing Rate+2.150%, 04/29/2031 | | | 80 | | | | 85 | |
| | | | | | | | |
| | | |
| Description | | Face Amount
(Thousands) | | | Market Value
($ Thousands) | |
CORPORATE OBLIGATIONS (continued) | |
Bank of America MTN | | | | | | | | |
4.450%, 03/03/2026 | | $ | 678 | | | $ | 781 | |
4.250%, 10/22/2026 | | | 10 | | | | 11 | |
4.200%, 08/26/2024 | | | 210 | | | | 233 | |
4.125%, 01/22/2024 | | | 370 | | | | 411 | |
4.100%, 07/24/2023 | | | 280 | | | | 308 | |
4.083%, 03/20/2051 (A) | | | 190 | | | | 238 | |
4.000%, 04/01/2024 | | | 440 | | | | 488 | |
4.000%, 01/22/2025 | | | 80 | | | | 88 | |
3.974%, VAR ICE LIBOR USD 3 Month+1.210%, 02/07/2030 | | | 80 | | | | 93 | |
3.593%, VAR ICE LIBOR USD 3 Month+1.370%, 07/21/2028 | | | 210 | | | | 235 | |
3.550%, VAR ICE LIBOR USD 3 Month+0.780%, 03/05/2024 | | | 80 | | | | 86 | |
3.500%, 04/19/2026 | | | 130 | | | | 146 | |
3.300%, 01/11/2023 | | | 60 | | | | 64 | |
Bank of Montreal MTN | | | | | | | | |
1.850%, 05/01/2025 | | | 130 | | | | 135 | |
Bank of New York Mellon MTN | | | | | | | | |
3.300%, 08/23/2029 | | | 790 | | | | 888 | |
1.600%, 04/24/2025 | | | 40 | | | | 41 | |
Bank of Nova Scotia | | | | | | | | |
1.625%, 05/01/2023 | | | 584 | | | | 598 | |
1.300%, 06/11/2025 | | | 70 | | | | 70 | |
Barclays Bank | | | | | | | | |
2.650%, 01/11/2021 | | | 1,199 | | | | 1,211 | |
1.700%, 05/12/2022 | | | 200 | | | | 204 | |
BNP Paribas | | | | | | | | |
5.198%, VAR ICE LIBOR USD 3 Month+2.567%, 01/10/2030 (B) | | | 200 | | | | 245 | |
4.705%, VAR ICE LIBOR USD 3 Month+2.235%, 01/10/2025 (B) | | | 270 | | | | 299 | |
4.400%, 08/14/2028 (B) | | | 200 | | | | 231 | |
BPCE MTN | | | | | | | | |
3.000%, 05/22/2022 (B) | | | 640 | | | | 662 | |
Capital One Financial | | | | | | | | |
3.300%, 10/30/2024 | | | 480 | | | | 516 | |
Charles Schwab | | | | | | | | |
3.850%, 05/21/2025 | | | 110 | | | | 125 | |
Citigroup | | | | | | | | |
8.125%, 07/15/2039 | | | 12 | | | | 21 | |
5.500%, 09/13/2025 | | | 150 | | | | 178 | |
5.300%, 05/06/2044 | | | 31 | | | | 41 | |
4.650%, 07/30/2045 | | | 28 | | | | 36 | |
4.450%, 09/29/2027 | | | 120 | | | | 137 | |
4.412%, VAR United States Secured Overnight Financing Rate+3.914%, 03/31/2031 | | | 100 | | | | 119 | |
4.400%, 06/10/2025 | | | 160 | | | | 179 | |
4.300%, 11/20/2026 | | | 40 | | | | 45 | |
4.125%, 07/25/2028 | | | 40 | | | | 45 | |
| | | | |
New Covenant Funds / Annual Report / June 30, 2020 | | | 39 | |
SCHEDULE OF INVESTMENTS
June 30, 2020
New Covenant Income Fund (Continued)
| | | | | | | | |
| | | |
| Description | | Face Amount
(Thousands) | | | Market Value
($ Thousands) | |
CORPORATE OBLIGATIONS (continued) | |
4.075%, VAR ICE LIBOR USD 3
Month+1.192%, 04/23/2029 | | $ | 240 | | | $ | 274 | |
4.050%, 07/30/2022 | | | 40 | | | | 42 | |
3.668%, VAR ICE LIBOR USD 3
Month+1.390%, 07/24/2028 | | | 340 | | | | 379 | |
3.500%, 05/15/2023 | | | 100 | | | | 107 | |
3.400%, 05/01/2026 | | | 354 | | | | 392 | |
3.200%, 10/21/2026 | | | 287 | | | | 315 | |
3.106%, VAR United States Secured Overnight Financing Rate+2.750%, 04/08/2026 | | | 50 | | | | 54 | |
2.572%, VAR United States Secured Overnight Financing Rate+2.107%, 06/03/2031 | | | 200 | | | | 207 | |
1.678%, VAR United States Secured Overnight Financing Rate+1.667%, 05/15/2024 | | | 903 | | | | 921 | |
Cooperatieve Rabobank UA | | | | | | | | |
3.950%, 11/09/2022 | | | 670 | | | | 709 | |
3.875%, 09/26/2023 (B) | | | 595 | | | | 650 | |
Credit Suisse Group | | | | | | | | |
4.194%, VAR United States Secured Overnight Financing Rate+3.730%, 04/01/2031 (B) | | | 250 | | | | 285 | |
Credit Suisse NY | | | | | | | | |
2.950%, 04/09/2025 | | | 250 | | | | 271 | |
Daiwa Securities Group | | | | | | | | |
3.129%, 04/19/2022 (B) | | | 50 | | | | 52 | |
Danske Bank | | | | | | | | |
5.000%, 01/12/2022 (B) | | | 200 | | | | 210 | |
3.001%, VAR ICE LIBOR USD 3
Month+1.249%, 09/20/2022 (B) | | | 200 | | | | 203 | |
1.226%, 06/22/2024 (B) | | | 200 | | | | 201 | |
Equitable Financial Life Global Funding | | | | | | | | |
1.400%, 07/07/2025 (B) | | | 673 | | | | 674 | |
Ferguson Finance | | | | | | | | |
4.500%, 10/24/2028 (B) | | | 459 | | | | 510 | |
Goldman Sachs Group | | | | | | | | |
5.750%, 01/24/2022 | | | 662 | | | | 714 | |
5.150%, 05/22/2045 | | | 20 | | | | 26 | |
4.750%, 10/21/2045 | | | 40 | | | | 52 | |
4.250%, 10/21/2025 | | | 90 | | | | 101 | |
4.223%, VAR ICE LIBOR USD 3
Month+1.301%, 05/01/2029 | | | 550 | | | | 640 | |
3.800%, 03/15/2030 | | | 530 | | | | 602 | |
3.691%, VAR ICE LIBOR USD 3
Month+1.510%, 06/05/2028 | | | 300 | | | | 336 | |
3.500%, 04/01/2025 | | | 80 | | | | 88 | |
3.500%, 11/16/2026 | | | 90 | | | | 99 | |
Goldman Sachs Group MTN | | | | | | | | |
4.000%, 03/03/2024 | | | 420 | | | | 465 | |
Guardian Life Global Funding | | | | | | | | |
1.100%, 06/23/2025 (B) | | | 30 | | | | 30 | |
| | | | | | | | |
| | | |
| Description | | Face Amount
(Thousands) | | | Market Value
($ Thousands) | |
CORPORATE OBLIGATIONS (continued) | |
HSBC Holdings | | | | | | | | |
4.950%, 03/31/2030 | | $ | 200 | | | $ | 240 | |
2.099%, VAR United States Secured Overnight Financing Rate+1.929%, 06/04/2026 | | | 200 | | | | 202 | |
HSBC Holdings PLC | | | | | | | | |
4.583%, VAR ICE LIBOR USD 3
Month+1.535%, 06/19/2029 | | | 400 | | | | 462 | |
2.950%, 05/25/2021 | | | 380 | | | | 388 | |
Intesa Sanpaolo | | | | | | | | |
3.375%, 01/12/2023 (B) | | | 200 | | | | 206 | |
JPMorgan Chase | | | | | | | | |
4.500%, 01/24/2022 | | | 786 | | | | 834 | |
4.452%, VAR ICE LIBOR USD 3
Month+1.330%, 12/05/2029 | | | 200 | | | | 240 | |
4.203%, VAR ICE LIBOR USD 3
Month+1.260%, 07/23/2029 | | | 773 | | | | 906 | |
4.023%, VAR ICE LIBOR USD 3
Month+1.000%, 12/05/2024 | | | 230 | | | | 253 | |
4.005%, VAR ICE LIBOR USD 3
Month+1.120%, 04/23/2029 | | | 100 | | | | 115 | |
3.875%, 09/10/2024 | | | 290 | | | | 322 | |
2.550%, 03/01/2021 | | | 30 | | | | 30 | |
2.522%, VAR United States Secured Overnight Financing Rate+2.040%, 04/22/2031 | | | 110 | | | | 116 | |
2.083%, VAR United States Secured Overnight Financing Rate+1.850%, 04/22/2026 | | | 130 | | | | 135 | |
1.514%, VAR United States Secured Overnight Financing Rate+1.455%, 06/01/2024 | | | 210 | | | | 214 | |
KKR Group Finance VI | | | | | | | | |
3.750%, 07/01/2029 (B) | | | 1,149 | | | | 1,319 | |
Liberty Mutual Group | | | | | | | | |
4.569%, 02/01/2029 (B) | | | 321 | | | | 376 | |
4.250%, 06/15/2023 (B) | | | 91 | | | | 99 | |
Lincoln National | | | | | | | | |
3.400%, 01/15/2031 | | | 451 | | | | 490 | |
Lloyds Banking Group | | | | | | | | |
2.858%, VAR ICE LIBOR USD 3
Month+1.249%, 03/17/2023 | | | 434 | | | | 447 | |
1.326%, VAR US Treas Yield Curve Rate T Note Const Mat 1 Yr+1.100%, 06/15/2023 | | | 360 | | | | 362 | |
Macquarie Bank | | | | | | | | |
2.300%, 01/22/2025 (B) | | | 1,188 | | | | 1,244 | |
MassMutual Global Funding II MTN | | | | | | | | |
0.850%, 06/09/2023 (B) | | | 220 | | | | 221 | |
Mitsubishi UFJ Financial Group | | | | | | | | |
3.407%, 03/07/2024 | | | 510 | | | | 551 | |
Morgan Stanley MTN | | | | | | | | |
5.597%, 03/24/2051 (A) | | | 30 | | | | 46 | |
| | |
| 40 | | New Covenant Funds / Annual Report / June 30, 2020 |
| | | | | | | | |
| | | |
| Description | | Face Amount
(Thousands) | | | Market Value
($ Thousands) | |
CORPORATE OBLIGATIONS (continued) | |
3.772%, VAR ICE LIBOR USD 3 Month+1.140%, 01/24/2029 | | $ | 150 | | | $ | 171 | |
3.750%, 02/25/2023 | | | 1,110 | | | | 1,198 | |
3.622%, VAR United States Secured Overnight Financing Rate+3.120%, 04/01/2031 | | | 475 | | | | 542 | |
2.699%, VAR United States Secured Overnight Financing Rate+1.143%, 01/22/2031 | | | 100 | | | | 106 | |
2.188%, VAR United States Secured Overnight Financing Rate+1.990%, 04/28/2026 | | | 200 | | | | 208 | |
National Rural Utilities Cooperative Finance | | | | | | | | |
2.850%, 01/27/2025 | | | 1,060 | | | | 1,164 | |
National Securities Clearing | | | | | | | | |
1.500%, 04/23/2025 (B) | | | 1,046 | | | | 1,070 | |
1.200%, 04/23/2023 (B) | | | 250 | | | | 253 | |
New York Life Global Funding | | | | | | | | |
0.950%, 06/24/2025 (B) | | | 60 | | | | 60 | |
ORIX | | | | | | | | |
4.050%, 01/16/2024 | | | 365 | | | | 401 | |
Peachtree Corners Funding Trust | | | | | | | | |
3.976%, 02/15/2025 (B) | | | 944 | | | | 1,031 | |
Penske Truck Leasing Lp | | | | | | | | |
3.900%, 02/01/2024 (B) | | | 965 | | | | 1,029 | |
Principal Life Global Funding II | | | | | | | | |
2.625%, 11/19/2020 (B) | | | 570 | | | | 575 | |
1.250%, 06/23/2025 (B) | | | 20 | | | | 20 | |
Royal Bank of Canada MTN | | | | | | | | |
2.150%, 10/26/2020 | | | 70 | | | | 70 | |
1.600%, 04/17/2023 | | | 120 | | | | 123 | |
1.150%, 06/10/2025 | | | 70 | | | | 70 | |
Royal Bank of Scotland Group | | | | | | | | |
4.269%, VAR ICE LIBOR USD 3
Month+1.762%, 03/22/2025 | | | 200 | | | | 218 | |
Royal Bank of Scotland Group PLC | | | | | | | | |
4.519%, VAR ICE LIBOR USD 3
Month+1.550%, 06/25/2024 | | | 290 | | | | 315 | |
Santander UK Group Holdings PLC | | | | | | | | |
3.571%, 01/10/2023 | | | 200 | | | | 208 | |
SMBC Aviation Capital Finance DAC | | | | | | | | |
4.125%, 07/15/2023 (B) | | | 200 | | | | 208 | |
State Street | | | | | | | | |
3.152%, VAR United States Secured Overnight Financing Rate+2.650%, 03/30/2031 (B) | | | 50 | | | | 56 | |
SunTrust Bank | | | | | | | | |
2.800%, 05/17/2022 | | | 1,146 | | | | 1,193 | |
Svenska Handelsbanken MTN | | | | | | | | |
3.350%, 05/24/2021 | | | 250 | | | | 256 | |
Swedbank | | | | | | | | |
1.300%, 06/02/2023 (B) | | | 200 | | | | 202 | |
| | | | | | | | |
| | | |
| Description | | Face Amount
(Thousands) | | | Market Value
($ Thousands) | |
CORPORATE OBLIGATIONS (continued) | |
Toronto-Dominion Bank MTN | | | | | | | | |
1.150%, 06/12/2025 | | $ | 918 | | | $ | 929 | |
0.750%, 06/12/2023 | | | 130 | | | | 131 | |
UBS | | | | | | | | |
1.750%, 04/21/2022 (B) | | | 611 | | | | 623 | |
UBS Group Funding Jersey | | | | | | | | |
4.125%, 04/15/2026 (B) | | | 634 | | | | 721 | |
UBS Group Funding Switzerland | | | | | | | | |
4.253%, 03/23/2028 (B) | | | 250 | | | | 284 | |
3.491%, 05/23/2023 (B) | | | 390 | | | | 408 | |
US Bancorp | | | | | | | | |
3.375%, 02/05/2024 | | | 540 | | | | 590 | |
1.450%, 05/12/2025 | | | 160 | | | | 165 | |
USAA Capital | | | | | | | | |
2.125%, 05/01/2030 (B) | | | 150 | | | | 154 | |
USAA Capital MTN | | | | | | | | |
2.625%, 06/01/2021 (B) | | | 350 | | | | 357 | |
Wells Fargo | | | | | | | | |
3.069%, 01/24/2023 | | | 808 | | | | 837 | |
3.000%, 10/23/2026 | | | 190 | | | | 207 | |
2.188%, VAR United States Secured Overnight Financing Rate+2.000%, 04/30/2026 | | | 130 | | | | 134 | |
Wells Fargo MTN | | | | | | | | |
5.013%, 04/04/2051 (A) | | | 440 | | | | 611 | |
4.900%, 11/17/2045 | | | 30 | | | | 39 | |
4.600%, 04/01/2021 | | | 480 | | | | 495 | |
4.478%, VAR ICE LIBOR USD 3
Month+3.770%, 04/04/2031 | | | 50 | | | | 60 | |
4.300%, 07/22/2027 | | | 200 | | | | 230 | |
3.750%, 01/24/2024 | | | 540 | | | | 590 | |
3.450%, 02/13/2023 | | | 120 | | | | 127 | |
2.393%, VAR United States Secured Overnight Financing Rate+2.100%, 06/02/2028 | | | 90 | | | | 93 | |
1.654%, VAR United States Secured Overnight Financing Rate+1.600%, 06/02/2024 | | | 160 | | | | 163 | |
| | | | | | | | |
| | | | | | | 50,142 | |
| | | | | | | | |
Health Care — 3.2% | | | | | | | | |
Abbott Laboratories | | | | | | | | |
3.400%, 11/30/2023 | | | 175 | | | | 191 | |
AbbVie | | | | | | | | |
4.250%, 11/21/2049 (B) | | | 30 | | | | 36 | |
3.800%, 03/15/2025 (B) | | | 40 | | | | 44 | |
3.750%, 11/14/2023 | | | 20 | | | | 22 | |
3.600%, 05/14/2025 | | | 10 | | | | 11 | |
3.450%, 03/15/2022 (B) | | | 120 | | | | 125 | |
3.200%, 11/21/2029 (B) | | | 40 | | | | 44 | |
2.950%, 11/21/2026 (B) | | | 20 | | | | 22 | |
2.600%, 11/21/2024 (B) | | | 140 | | | | 149 | |
| | | | |
New Covenant Funds / Annual Report / June 30, 2020 | | | 41 | |
SCHEDULE OF INVESTMENTS
June 30, 2020
New Covenant Income Fund (Continued)
| | | | | | | | |
| | | |
Description | | Face Amount
(Thousands) | | | Market Value
($ Thousands) | |
CORPORATE OBLIGATIONS (continued) | |
2.300%, 11/21/2022 (B) | | $ | 1,046 | | | $ | 1,082 | |
Adventist Health System | | | | | | | | |
2.433%, 09/01/2024 | | | 431 | | | | 447 | |
Aetna | | | | | | | | |
2.800%, 06/15/2023 | | | 20 | | | | 21 | |
Anthem | | | | | | | | |
3.125%, 05/15/2022 | | | 340 | | | | 356 | |
Baylor Scott & White Holdings | | | | | | | | |
1.947%, 11/15/2021 | | | 1,226 | | | | 1,229 | |
Becton Dickinson | | | | | | | | |
4.685%, 12/15/2044 | | | 40 | | | | 49 | |
3.734%, 12/15/2024 | | | 24 | | | | 26 | |
3.363%, 06/06/2024 | | | 210 | | | | 227 | |
Bristol-Myers Squibb | | | | | | | | |
3.875%, 08/15/2025 (B) | | | 150 | | | | 171 | |
3.550%, 08/15/2022 (B) | | | 60 | | | | 64 | |
3.400%, 07/26/2029 (B) | | | 50 | | | | 58 | |
3.200%, 06/15/2026 (B) | | | 120 | | | | 135 | |
2.900%, 07/26/2024 (B) | | | 240 | | | | 260 | |
2.600%, 05/16/2022 (B) | | | 80 | | | | 83 | |
2.250%, 08/15/2021 (B) | | | 70 | | | | 71 | |
Cigna | | | | | | | | |
4.375%, 10/15/2028 | | | 120 | | | | 142 | |
4.125%, 11/15/2025 | | | 50 | | | | 57 | |
3.750%, 07/15/2023 | | | 30 | | | | 33 | |
3.500%, 06/15/2024 (B) | | | 160 | | | | 175 | |
3.400%, 09/17/2021 | | | 60 | | | | 62 | |
CommonSpirit Health | | | | | | | | |
4.200%, 08/01/2023 | | | 473 | | | | 504 | |
CVS Health | | | | | | | | |
5.050%, 03/25/2048 | | | 60 | | | | 79 | |
4.300%, 03/25/2028 | | | 80 | | | | 94 | |
3.875%, 07/20/2025 | | | 95 | | | | 107 | |
3.625%, 04/01/2027 | | | 180 | | | | 202 | |
3.350%, 03/09/2021 | | | 32 | | | | 33 | |
2.800%, 07/20/2020 | | | 190 | | | | 190 | |
CVS Pass-Through Trust | | | | | | | | |
7.507%, 01/10/2032 (B) | | | 1,123 | | | | 1,400 | |
Eli Lilly | | | | | | | | |
2.350%, 05/15/2022 | | | 170 | | | | 177 | |
Gilead Sciences | | | | | | | | |
2.550%, 09/01/2020 | | | 20 | | | | 20 | |
2.500%, 09/01/2023 | | | 50 | | | | 53 | |
Humana | | | | | | | | |
4.500%, 04/01/2025 | | | 10 | | | | 11 | |
3.150%, 12/01/2022 | | | 240 | | | | 251 | |
2.900%, 12/15/2022 | | | 290 | | | | 303 | |
Merck | | | | | | | | |
1.450%, 06/24/2030 | | | 50 | | | | 50 | |
0.750%, 02/24/2026 | | | 80 | | | | 80 | |
Pfizer | | | | | | | | |
2.625%, 04/01/2030 | | | 100 | | | | 110 | |
| | | | | | | | |
| | | |
| Description | | Face Amount
(Thousands) | | | Market Value
($ Thousands) | |
CORPORATE OBLIGATIONS (continued) | |
1.700%, 05/28/2030 | | $ | 50 | | | $ | 51 | |
0.800%, 05/28/2025 | | | 110 | | | | 110 | |
SSM Health Care | | | | | | | | |
3.688%, 06/01/2023 | | | 644 | | | | 691 | |
Teva Pharmaceutical Finance BV | | | | | | | | |
2.950%, 12/18/2022 | | | 30 | | | | 29 | |
Thermo Fisher Scientific | | | | | | | | |
4.133%, 03/25/2025 | | | 463 | | | | 528 | |
Unitedhealth | | | | | | | | |
3.125%, 05/15/2060 | | | 10 | | | | 11 | |
UnitedHealth Group | | | | | | | | |
4.450%, 12/15/2048 | | | 10 | | | | 13 | |
4.250%, 06/15/2048 | | | 10 | | | | 13 | |
3.875%, 12/15/2028 | | | 30 | | | | 36 | |
3.750%, 07/15/2025 | | | 30 | | | | 34 | |
3.500%, 06/15/2023 | | | 20 | | | | 22 | |
2.875%, 12/15/2021 | | | 50 | | | | 52 | |
2.700%, 07/15/2020 | | | 70 | | | | 70 | |
2.375%, 10/15/2022 | | | 10 | | | | 10 | |
2.000%, 05/15/2030 | | | 30 | | | | 31 | |
1.250%, 01/15/2026 | | | 20 | | | | 20 | |
| | | | | | | | |
| | | | | | | 10,777 | |
| | | | | | | | |
Industrials — 2.7% | | | | | | | | |
3M | | | | | | | | |
3.700%, 04/15/2050 | | | 180 | | | | 214 | |
2.375%, 08/26/2029 | | | 30 | | | | 32 | |
AerCap Ireland Capital DAC | | | | | | | | |
4.625%, 10/30/2020 | | | 730 | | | | 733 | |
4.500%, 05/15/2021 | | | 310 | | | | 312 | |
American Airlines, Ser 2016-3, Cl A | | | | | | | | |
3.250%, 10/15/2028 | | | 1,056 | | | | 863 | |
American Airlines Pass-Through Trust, Ser 2013-2, Cl A | | | | | | | | |
4.950%, 01/15/2023 | | | 271 | | | | 220 | |
Aviation Capital Group | | | | | | | | |
4.125%, 08/01/2025 (B) | | | 160 | | | | 143 | |
Burlington Northern and Santa Fe Railway Pass-Through Trust, Ser 2002-2 | | | | | | | | |
5.140%, 01/15/2021 | | | — | | | | — | |
Burlington Northern Santa Fe | | | | | | | | |
4.550%, 09/01/2044 | | | 10 | | | | 13 | |
Carrier Global | | | | | | | | |
2.700%, 02/15/2031 (B) | | | 20 | | | | 20 | |
Continental Airlines Pass-Through Trust, Ser 2012-2, Cl A | | | | | | | | |
4.000%, 10/29/2024 | | | 612 | | | | 559 | |
Deere | | | | | | | | |
3.750%, 04/15/2050 | | | 60 | | | | 74 | |
3.100%, 04/15/2030 | | | 10 | | | | 11 | |
| | |
| 42 | | New Covenant Funds / Annual Report / June 30, 2020 |
| | | | | | | | |
| | | |
| Description | | Face Amount
(Thousands) | | | Market Value
($ Thousands) | |
CORPORATE OBLIGATIONS (continued) | |
Delta Air Lines Pass-Through Trust, Ser 2015- 1, Cl AA | | | | | | | | |
3.625%, 07/30/2027 | | $ | 530 | | | $ | 524 | |
Delta Air Lines Pass-Through Trust, Ser 2019- 1, Cl AA | | | | | | | | |
3.204%, 04/25/2024 | | | 621 | | | | 622 | |
Eaton | | | | | | | | |
2.750%, 11/02/2022 | | | 450 | | | | 473 | |
FedEx | | | | | | | | |
3.800%, 05/15/2025 | | | 722 | | | | 803 | |
General Electric | | | | | | | | |
4.350%, 05/01/2050 | | | 40 | | | | 39 | |
4.250%, 05/01/2040 | | | 30 | | | | 30 | |
3.625%, 05/01/2030 | | | 30 | | | | 30 | |
3.450%, 05/01/2027 | | | 20 | | | | 20 | |
General Electric MTN | | | | | | | | |
6.875%, 01/10/2039 | | | 30 | | | | 37 | |
Honeywell International | | | | | | | | |
1.350%, 06/01/2025 | | | 50 | | | | 51 | |
International Lease Finance | | | | | | | | |
5.875%, 08/15/2022 | | | 400 | | | | 421 | |
Nutrien | | | | | | | | |
1.900%, 05/13/2023 | | | 501 | | | | 517 | |
Republic Services | | | | | | | | |
3.200%, 03/15/2025 | | | 180 | | | | 197 | |
Ryder System MTN | | | | | | | | |
3.350%, 09/01/2025 | | | 836 | | | | 891 | |
Union Pacific | | | | | | | | |
3.950%, 09/10/2028 | | | 20 | | | | 24 | |
3.750%, 07/15/2025 | | | 20 | | | | 23 | |
United Airlines Pass-Through Trust, Ser 2014- 1, Cl A | | | | | | | | |
4.000%, 04/11/2026 | | | 682 | | | | 625 | |
United Parcel Service | | | | | | | | |
3.900%, 04/01/2025 | | | 398 | | | | 452 | |
Waste Management | | | | | | | | |
3.500%, 05/15/2024 | | | 120 | | | | 131 | |
3.450%, 06/15/2029 | | | 30 | | | | 31 | |
3.200%, 06/15/2026 | | | 30 | | | | 31 | |
| | | | | | | | |
| | | | | | | 9,166 | |
| | | | | | | | |
Information Technology — 2.3% | | | | | | | | |
Adobe | | | | | | | | |
2.300%, 02/01/2030 | | | 210 | | | | 227 | |
Apple | | | | | | | | |
3.350%, 02/09/2027 | | | 210 | | | | 239 | |
2.900%, 09/12/2027 | | | 110 | | | | 123 | |
2.450%, 08/04/2026 | | | 70 | | | | 76 | |
2.000%, 11/13/2020 | | | 80 | | | | 81 | |
1.125%, 05/11/2025 | | | 130 | | | | 133 | |
Broadcom | | | | | | | | |
4.700%, 04/15/2025 (B) | | | 180 | | | | 203 | |
| | | | | | | | |
| | | |
| Description | | Face Amount
(Thousands) | | | Market Value
($ Thousands) | |
CORPORATE OBLIGATIONS (continued) | |
4.110%, 09/15/2028 (B) | | $ | 515 | | | $ | 561 | |
3.150%, 11/15/2025 (B) | | | 140 | | | | 149 | |
2.250%, 11/15/2023 (B) | | | 100 | | | | 103 | |
Diamond 1 Finance | | | | | | | | |
4.420%, 06/15/2021 (B) | | | 430 | | | | 442 | |
Intel | | | | | | | | |
4.950%, 03/25/2060 | | | 30 | | | | 44 | |
4.750%, 03/25/2050 | | | 160 | | | | 226 | |
4.600%, 03/25/2040 | | | 10 | | | | 13 | |
3.700%, 07/29/2025 | | | 30 | | | | 34 | |
Mastercard | | | | | | | | |
3.850%, 03/26/2050 | | | 10 | | | | 12 | |
3.375%, 04/01/2024 | | | 190 | | | | 210 | |
Micron Technology | | | | | | | | |
2.497%, 04/24/2023 | | | 70 | | | | 73 | |
Microsoft | | | | | | | | |
3.300%, 02/06/2027 | | | 90 | | | | 103 | |
2.400%, 02/06/2022 | | | 150 | | | | 155 | |
1.550%, 08/08/2021 | | | 110 | | | | 112 | |
NVIDIA | | | | | | | | |
3.700%, 04/01/2060 | | | 90 | | | | 107 | |
3.500%, 04/01/2040 | | | 130 | | | | 152 | |
3.500%, 04/01/2050 | | | 330 | | | | 377 | |
2.850%, 04/01/2030 | | | 40 | | | | 44 | |
NXP BV | | | | | | | | |
4.625%, 06/01/2023 (B) | | | 479 | | | | 525 | |
2.700%, 05/01/2025 (B) | | | 40 | | | | 42 | |
Oracle | | | | | | | | |
2.500%, 10/15/2022 | | | 130 | | | | 136 | |
2.500%, 04/01/2025 | | | 738 | | | | 790 | |
PayPal Holdings | | | | | | | | |
1.650%, 06/01/2025 | | | 60 | | | | 62 | |
1.350%, 06/01/2023 | | | 571 | | | | 582 | |
salesforce.com | | | | | | | | |
3.700%, 04/11/2028 | | | 150 | | | | 175 | |
3.250%, 04/11/2023 | | | 70 | | | | 75 | |
Texas Instruments | | | | | | | | |
1.750%, 05/04/2030 | | | 40 | | | | 41 | |
Visa | | | | | | | | |
4.300%, 12/14/2045 | | | 10 | | | | 13 | |
3.150%, 12/14/2025 | | | 110 | | | | 123 | |
2.200%, 12/14/2020 | | | 300 | | | | 302 | |
1.900%, 04/15/2027 | | | 879 | | | | 919 | |
| | | | | | | | |
| | | | | | | 7,784 | |
| | | | | | | | |
Materials — 0.6% | | | | | | | | |
ArcelorMittal | | | | | | | | |
4.550%, 03/11/2026 | | | 100 | | | | 101 | |
3.600%, 07/16/2024 | | | 180 | | | | 178 | |
Equate Petrochemical BV MTN | | | | | | | | |
4.250%, 11/03/2026 (B) | | | 200 | | | | 211 | |
| | | | |
New Covenant Funds / Annual Report / June 30, 2020 | | | 43 | |
SCHEDULE OF INVESTMENTS
June 30, 2020
New Covenant Income Fund (Continued)
| | | | | | | | |
| | | |
| Description | | Face Amount
(Thousands) | | | Market Value
($ Thousands) | |
CORPORATE OBLIGATIONS (continued) | |
Glencore Funding | | | | | | | | |
4.125%, 05/30/2023 (B) | | $ | 890 | | | $ | 952 | |
4.125%, 03/12/2024 (B) | | | 110 | | | | 118 | |
4.000%, 03/27/2027 (B) | | | 110 | | | | 118 | |
Southern Copper | | | | | | | | |
3.500%, 11/08/2022 | | | 130 | | | | 136 | |
Vale Overseas | | | | | | | | |
6.250%, 08/10/2026 | | | 140 | | | | 165 | |
| | | | | | | | |
| | | | | | | 1,979 | |
| | | | | | | | |
Real Estate — 0.6% | | | | | | | | |
American Tower Trust, Ser 2013-13, Cl 2A | | | | | | | | |
3.070%, 03/15/2048 (B) | | | 620 | | | | 634 | |
Digital Realty Trust | | | | | | | | |
3.600%, 07/01/2029 | | | 815 | | | | 936 | |
Ventas Realty | | | | | | | | |
3.500%, 02/01/2025 | | | 488 | | | | 504 | |
| | | | | | | | |
| | | | | | | 2,074 | |
| | | | | | | | |
Utilities — 1.8% | | | | | | | | |
Aquarion | | | | | | | | |
4.000%, 08/15/2024 (B) | | | 227 | | | | 250 | |
Commonwealth Edison | | | | | | | | |
3.700%, 08/15/2028 | | | 468 | | | | 542 | |
Dominion Energy | | | | | | | | |
2.579%, 07/01/2020 | | | 260 | | | | 260 | |
Duke Energy | | | | | | | | |
3.550%, 09/15/2021 | | | 170 | | | | 175 | |
2.400%, 08/15/2022 | | | 150 | | | | 156 | |
Duke Energy Florida | | | | | | | | |
3.200%, 01/15/2027 | | | 440 | | | | 491 | |
FirstEnergy | | | | | | | | |
4.250%, 03/15/2023 | | | 380 | | | | 411 | |
2.850%, 07/15/2022 | | | 330 | | | | 342 | |
1.600%, 01/15/2026 | | | 30 | | | | 30 | |
NextEra Energy Capital Holdings | | | | | | | | |
2.403%, 09/01/2021 | | | 513 | | | | 525 | |
Northern States Power | | | | | | | | |
7.125%, 07/01/2025 | | | 1,190 | | | | 1,518 | |
Pacific Gas and Electric | | | | | | | | |
2.100%, 08/01/2027 | | | 130 | | | | 129 | |
1.750%, 06/16/2022 | | | 100 | | | | 100 | |
Perusahaan Listrik Negara MTN | | | | | | | | |
5.450%, 05/21/2028 (B) | | | 370 | | | | 426 | |
Public Service Enterprise Group | | | | | | | | |
2.875%, 06/15/2024 | | | 713 | | | | 761 | |
| | | | | | | | |
| | | | | | | 6,116 | |
| | | | | | | | |
Total Corporate Obligations
(Cost $111,799) ($ Thousands) | | | | | | | 118,467 | |
| | | | | | | | |
| | | | | | | | |
| | | |
| Description | | Face Amount
(Thousands) | | | Market Value
($ Thousands) | |
U.S. TREASURY OBLIGATIONS — 8.4% | |
U.S. Treasury Bills | | | | | | | | |
0.180%, 10/15/2020 (C) | | $ | 1,510 | | | $ | 1,509 | |
0.166%, 10/08/2020 (C) | | | 310 | | | | 310 | |
0.155%, 10/22/2020 (C) | | | 2,450 | | | | 2,449 | |
0.135%, 08/18/2020 (C) | | | 1,170 | | | | 1,170 | |
U.S. Treasury Bonds | | | | | | | | |
2.000%, 02/15/2050 | | | 730 | | | | 836 | |
1.250%, 05/15/2050 | | | 810 | | | | 778 | |
U.S. Treasury Inflation-Protected Securities | | | | | | | | |
2.375%, 01/15/2025 | | | 177 | | | | 203 | |
1.750%, 01/15/2028 | | | 86 | | | | 102 | |
1.375%, 02/15/2044 | | | 539 | | | | 735 | |
1.000%, 02/15/2046 | | | 390 | | | | 504 | |
1.000%, 02/15/2048 | | | 457 | | | | 604 | |
1.000%, 02/15/2049 | | | 2,160 | | | | 2,825 | |
0.750%, 02/15/2042 | | | 465 | | | | 557 | |
0.250%, 02/15/2050 | | | 768 | | | | 861 | |
0.125%, 10/15/2024 | | | 3,005 | | | | 3,147 | |
0.125%, 01/15/2030 | | | 764 | | | | 826 | |
U.S. Treasury Notes | | | | | | | | |
0.625%, 05/15/2030 | | | 1,292 | | | | 1,288 | |
0.500%, 03/15/2023 | | | 976 | | | | 985 | |
0.500%, 04/30/2027 | | | 10 | | | | 10 | |
0.375%, 03/31/2022 | | | 2,923 | | | | 2,933 | |
0.375%, 04/30/2025 | | | 2,097 | | | | 2,107 | |
0.250%, 05/31/2025 | | | 1,030 | | | | 1,029 | |
0.125%, 04/30/2022 | | | 2,442 | | | | 2,440 | |
| | | | | | | | |
Total U.S. Treasury Obligations (Cost $26,921) ($ Thousands) | | | | | | | 28,208 | |
| | | | | | | | |
| | |
ASSET-BACKED SECURITIES — 8.3% | | | | | | | | |
Automotive — 1.9% | | | | | | | | |
Avis Budget Rental Car Funding AESOP, Ser 2017-2A, Cl A | | | | | | | | |
2.970%, 03/20/2024 (B) | | | 310 | | | | 311 | |
Avis Budget Rental Car Funding AESOP, Ser 2019-2A, Cl A | | | | | | | | |
3.350%, 09/22/2025 (B) | | | 320 | | | | 324 | |
Capital One Prime Auto Receivables Trust, Ser 2019-2, Cl A4 | | | | | | | | |
1.960%, 02/18/2025 | | | 1,662 | | | | 1,719 | |
Hertz Vehicle Financing II, Ser 2018-1A, Cl A | | | | | | | | |
3.290%, 02/25/2024 (B) | | | 201 | | | | 200 | |
Honda Auto Receivables Owner Trust, Ser 2019-2, Cl A3 | | | | | | | | |
2.520%, 06/21/2023 | | | 572 | | | | 589 | |
NextGear Floorplan Master Owner Trust, Ser 2019-1A, Cl A2 | | | | | | | | |
3.210%, 02/15/2024 (B) | | | 1,182 | | | | 1,193 | |
| | |
| 44 | | New Covenant Funds / Annual Report / June 30, 2020 |
| | | | | | | | |
| | | |
| Description | | Face Amount
(Thousands) | | | Market Value
($ Thousands) | |
ASSET-BACKED SECURITIES (continued) | |
NextGear Floorplan Master Owner Trust, Ser 2019-2A, Cl A2 | | | | | | | | |
2.070%, 10/15/2024 (B) | | $ | 556 | | | $ | 548 | |
World Omni Auto Receivables Trust, Ser 2019-B, Cl A3 | | | | | | | | |
2.590%, 07/15/2024 | | | 1,299 | | | | 1,334 | |
| | | | | | | | |
| | | | | | | 6,218 | |
| | | | | | | | |
Home — 0.3% | | | | | | | | |
Citifinancial Mortgage Securities, Ser 2004- 1, Cl AF4 | | | | | | | | |
5.070%, 04/25/2034 | | | 194 | | | | 201 | |
Lake Country Mortgage Loan Trust, Ser 2006-HE1, Cl M5 | | | | | | | | |
2.185%, VAR ICE LIBOR USD 1 Month+2.000%, 07/25/2034 (B) | | | 390 | | | | 398 | |
Master Asset-Backed Securities Trust, Ser 2007-NCW, Cl A1 | | | | | | | | |
0.485%, VAR ICE LIBOR USD 1 Month+0.300%, 05/25/2037 (B) | | | 206 | | | | 184 | |
New Century Home Equity Loan Trust, Ser 2003-A, Cl A | | | | | | | | |
0.905%, VAR ICE LIBOR USD 1 Month+0.720%, 10/25/2033 (B) | | | 82 | | | | 78 | |
Tricon American Homes Trust, Ser 2019- SFR1, Cl A | | | | | | | | |
2.750%, 03/17/2038 (B) | | | 272 | | | | 283 | |
| | | | | | | | |
| | | | | | | 1,144 | |
| | | | | | | | |
Other Asset-Backed Securities — 6.1% | |
AEP Texas Restoration Funding, Ser 2019-1, Cl A2 | | | | | | | | |
2.294%, 08/01/2031 | | | 1,646 | | | | 1,723 | |
Ameriquest Mortgage Securities Asset- Backed Pass-Through Certificates, Ser 2005-R7, Cl M2 | | | | | | | | |
0.685%, VAR ICE LIBOR USD 1
Month+0.500%, 09/25/2035 | | | 267 | | | | 266 | |
Applebee’s Funding, Ser 2019-1A, Cl A2I | | | | | | | | |
4.194%, 06/07/2049 (B) | | | 300 | | | | 266 | |
Atrium Hotel Portfolio Trust, Ser ATRM, Cl C | | | | | | | | |
2.355%, VAR ICE LIBOR USD 1
Month+1.650%, 12/15/2036 (B) | | | 410 | | | | 356 | |
Citigroup Mortgage Loan Trust, Ser 2007- WFH3, Cl A3 | | | | | | | | |
0.435%, VAR ICE LIBOR USD 1
Month+0.250%, 06/25/2037 | | | 209 | | | | 207 | |
Countrywide Asset-Backed Certificates, Ser 2007-13, Cl 2A2M | | | | | | | | |
1.435%, VAR ICE LIBOR USD 1
Month+1.250%, 10/25/2047 | | | 147 | | | | 140 | |
| | | | | | | | |
| | | |
| Description | | Face Amount
(Thousands) | | | Market Value
($ Thousands) | |
ASSET-BACKED SECURITIES (continued) | |
Countrywide Home Equity Loan Trust, Ser 2006-F, Cl 2A1A | | | | | | | | |
0.325%, VAR ICE LIBOR USD 1
Month+0.140%, 07/15/2036 | | $ | 297 | | | $ | 266 | |
DB Master Finance, Ser 2017-1A, Cl A2I | | | | | | | | |
3.629%, 11/20/2047 (B) | | | 429 | | | | 443 | |
Domino’s Pizza Master Issuer, Ser 2017-1A, Cl A2I | | | | | | | | |
2.241%, VAR ICE LIBOR USD 3 Month+1.250%, 07/25/2047 (B) | | | 693 | | | | 687 | |
Education Loan Asset-Backed Trust, Ser 2013-1, Cl A2 | | | | | | | | |
0.985%, VAR ICE LIBOR USD 1
Month+0.800%, 04/26/2032 (B) | | | 500 | | | | 489 | |
Invitation Homes Trust, Ser 2018-SFR1, Cl A | | | | | | | | |
0.894%, VAR ICE LIBOR USD 1
Month+0.700%, 03/17/2037 (B) | | | 1,342 | | | | 1,318 | |
MMAF Equipment Finance, Ser 2018-A, Cl A3 | | | | | | | | |
3.200%, 09/12/2022 (B) | | | 1,255 | | | | 1,276 | |
Morgan Stanley ABS Capital I Trust, Ser 2004-NC7, Cl M1 | | | | | | | | |
1.040%, VAR ICE LIBOR USD 1
Month+0.855%, 07/25/2034 | | | 465 | | | | 439 | |
Navient Student Loan Trust, Ser 2016-6A, Cl A3 | | | | | | | | |
1.485%, VAR ICE LIBOR USD 1
Month+1.300%, 03/25/2066 (B) | | | 900 | | | | 871 | |
Progress Residential Trust, Ser 2018-SFR3, Cl A | | | | | | | | |
3.880%, 10/17/2035 (B) | | | 640 | | | | 660 | |
Progress Residential Trust, Ser 2019-SFR2, Cl A | | | | | | | | |
3.147%, 05/17/2036 (B) | | | 302 | | | | 312 | |
RAAC Series Trust, Ser 2005-SP3, Cl M2 | | | | | | | | |
0.985%, VAR ICE LIBOR USD 1
Month+0.800%, 12/25/2035 | | | 390 | | | | 385 | |
Sabey Data Center Issuer, Ser 2020-1, Cl A2 | | | | | | | | |
3.812%, 04/20/2045 (B) | | | 339 | | | | 344 | |
SBA Small Business Investment, Ser 2019- 10A, Cl 1 | | | | | | | | |
3.113%, 03/10/2029 | | | 181 | | | | 193 | |
Shops at Crystals Trust, Ser CSTL, Cl A | | | | | | | | |
3.126%, 07/05/2036 (B) | | | 100 | | | | 95 | |
SLC Student Loan Trust, Ser 2010-1, Cl A | | | | | | | | |
1.235%, VAR ICE LIBOR USD 3 Month+0.875%, 11/25/2042 | | | 248 | | | | 247 | |
SLM Private Credit Student Loan Trust, Ser 2006-A, Cl A5 | | | | | | | | |
0.603%, VAR ICE LIBOR USD 3 Month+0.290%, 06/15/2039 | | | 261 | | | | 242 | |
SLM Student Loan Trust, Ser 2003-7A, Cl A5A | | | | | | | | |
1.513%, VAR ICE LIBOR USD 3 Month+1.200%, 12/15/2033 (B) | | | 134 | | | | 129 | |
| | | | |
New Covenant Funds / Annual Report / June 30, 2020 | | | 45 | |
SCHEDULE OF INVESTMENTS
June 30, 2020
New Covenant Income Fund (Continued)
| | | | | | | | |
| | | |
| Description | | Face Amount
(Thousands) | | | Market Value
($ Thousands) | |
ASSET-BACKED SECURITIES (continued) | |
Stack Infrastructure Issuer, Ser 2019-1A, Cl A2 | | | | | | | | |
4.540%, 02/25/2044 (B) | | $ | 467 | | | $ | 489 | |
Store Master Funding I-VII, Ser 2018-1A, Cl A1 | | | | | | | | |
3.960%, 10/20/2048 (B) | | | 378 | | | | 379 | |
Store Master Funding I-VII, Ser 2019-1, Cl A1 | | | | | | | | |
2.820%, 11/20/2049 (B) | | | 327 | | | | 328 | |
United States Small Business Administration, Ser 2010-20H, Cl 1 | | | | | | | | |
3.520%, 08/01/2030 | | | 263 | | | | 280 | |
United States Small Business Administration, Ser 2011-20B, Cl 1 | | | | | | | | |
4.220%, 02/01/2031 | | | 267 | | | | 294 | |
United States Small Business Administration, Ser 2011-20J, Cl 1 | | | | | | | | |
2.760%, 10/01/2031 | | | 155 | | | | 164 | |
United States Small Business Administration, Ser 2013-20K, Cl 1 | | | | | | | | |
3.380%, 11/01/2033 | | | 706 | | | | 757 | |
United States Small Business Administration, Ser 2014-20F, Cl 1 | | | | | | | | |
2.990%, 06/01/2034 | | | 800 | | | | 848 | |
United States Small Business Administration, Ser 2015-20C, Cl 1 | | | | | | | | |
2.720%, 03/01/2035 | | | 805 | | | | 842 | |
United States Small Business Administration, Ser 2015-20E, Cl 1 | | | | | | | | |
2.770%, 05/01/2035 | | | 451 | | | | 483 | |
United States Small Business Administration, Ser 2015-20K, Cl 1 | | | | | | | | |
2.700%, 11/01/2035 | | | 468 | | | | 495 | |
United States Small Business Administration, Ser 2017-20J, Cl 1 | | | | | | | | |
2.850%, 10/01/2037 | | | 623 | | | | 664 | |
United States Small Business Administration, Ser 2018-20E, Cl 1 | | | | | | | | |
3.500%, 05/01/2038 | | | 1,211 | | | | 1,330 | |
United States Small Business Administration, Ser 2018-20J, Cl 1 | | | | | | | | |
3.770%, 10/01/2038 | | | 616 | | | | 689 | |
United States Small Business Administration, Ser 2019-25G, Cl 1 | | | | | | | | |
2.690%, 07/01/2044 | | | 59 | | | | 63 | |
Verizon Owner Trust, Ser 2019-B, Cl A1A | | | | | | | | |
2.330%, 12/20/2023 | | | 624 | | | | 640 | |
Wendy’s Funding, Ser 2019-1A, Cl A2I | | | | | | | | |
3.783%, 06/15/2049 (B) | | | 333 | | | | 352 | |
| | | | | | | | |
| | | | | | | 20,451 | |
| | | | | | | | |
Total Asset-Backed Securities
(Cost $27,329) ($ Thousands) | | | | | | | 27,813 | |
| | | | | | | | |
| | | | | | | | |
| | | |
| Description | | Face Amount
(Thousands) | | | Market Value
($ Thousands) | |
U.S. GOVERNMENT AGENCY OBLIGATIONS — 3.0% | |
FHLB DN | | | | | | | | |
0.150%, 08/17/2020 (C) | | $ | 320 | | | $ | 320 | |
FHLMC | | | | | | | | |
6.500%, 12/01/2035 | | | 669 | | | | 755 | |
6.000%, 03/01/2035 | | | 1,060 | | | | 1,239 | |
5.000%, 10/01/2048 | | | 51 | | | | 56 | |
4.000%, 04/01/2048 | | | 5 | | | | 5 | |
4.000%, 05/01/2048 | | | 43 | | | | 46 | |
3.000%, 11/01/2043 | | | 587 | | | | 627 | |
2.375%, 01/13/2022 | | | 1,090 | | | | 1,126 | |
FNMA | | | | | | | | |
4.500%, 09/01/2057 | | | 211 | | | | 236 | |
4.000%, 02/01/2056 | | | 64 | | | | 71 | |
4.000%, 06/01/2057 | | | 70 | | | | 77 | |
3.500%, 10/01/2047 | | | 1,036 | | | | 1,095 | |
3.500%, 07/01/2048 | | | 352 | | | | 373 | |
3.500%, 02/01/2049 | | | 82 | | | | 89 | |
3.000%, 03/01/2046 | | | 1,161 | | | | 1,260 | |
3.000%, 05/01/2046 | | | 78 | | | | 84 | |
3.000%, 07/01/2046 | | | 134 | | | | 143 | |
3.000%, 10/01/2046 | | | 208 | | | | 225 | |
3.000%, 11/01/2046 | | | 832 | | | | 880 | |
3.000%, 09/01/2047 | | | 317 | | | | 339 | |
FNMA, Ser M1, Cl A2 | | | | | | | | |
3.673%, 09/25/2028 (A) | | | 300 | | | | 351 | |
Tennessee Valley Authority | | | | | | | | |
3.875%, 02/15/2021 | | | 790 | | | | 808 | |
| | | | | | | | |
Total U.S. Government Agency Obligations (Cost $9,612) ($ Thousands) | | | | | | | 10,205 | |
| | | | | | | | |
| | |
SOVEREIGN DEBT — 3.0% | | | | | | | | |
Abu Dhabi Government International Bond | | | | | | | | |
2.500%, 10/11/2022 (B) | | | 490 | | | | 506 | |
Colombia Government International Bond | | | | | | | | |
5.625%, 02/26/2044 | | | 280 | | | | 336 | |
5.200%, 05/15/2049 | | | 310 | | | | 364 | |
4.500%, 03/15/2029 | | | 200 | | | | 220 | |
Indonesia Government International Bond MTN | | | | | | | | |
5.125%, 01/15/2045 (B) | | | 200 | | | | 245 | |
3.850%, 07/18/2027 (B) | | | 200 | | | | 216 | |
3.750%, 04/25/2022 | | | 370 | | | | 384 | |
Kuwait International Government Bond | | | | | | | | |
3.500%, 03/20/2027 (B) | | | 210 | | | | 234 | |
Mexico Government International Bond | | | | | | | | |
4.000%, 10/02/2023 | | | 610 | | | | 651 | |
3.600%, 01/30/2025 | | | 380 | | | | 403 | |
Panama Government International Bond | | | | | | | | |
6.700%, 01/26/2036 | | | 190 | | | | 273 | |
| | |
| 46 | | New Covenant Funds / Annual Report / June 30, 2020 |
| | | | | | | | |
| | | |
| Description | | Face Amount
(Thousands) | | | Market Value
($ Thousands) | |
SOVEREIGN DEBT (continued) | |
4.300%, 04/29/2053 | | $ | 300 | | | $ | 357 | |
Peruvian Government International Bond | | | | | | | | |
6.550%, 03/14/2037 | | | 250 | | | | 380 | |
5.625%, 11/18/2050 | | | 310 | | | | 489 | |
Poland Government International Bond | | | | | | | | |
5.125%, 04/21/2021 | | | 440 | | | | 457 | |
4.000%, 01/22/2024 | | | 450 | | | | 499 | |
Province of Quebec Canada | | | | | | | | |
2.625%, 02/13/2023 | | | 500 | | | | 528 | |
Province of Quebec Canada, Ser A MTN | | | | | | | | |
6.350%, 01/30/2026 | | | 1,010 | | | | 1,302 | |
Qatar Government International Bond | | | | | | | | |
3.250%, 06/02/2026 | | | 370 | | | | 401 | |
Russian Foreign Bond—Eurobond | | | | | | | | |
7.500%, 03/31/2030 | | | 132 | | | | 151 | |
5.875%, 09/16/2043 | | | 400 | | | | 562 | |
5.625%, 04/04/2042 | | | 400 | | | | 542 | |
Uruguay Government International Bond | | | | | | | | |
4.375%, 01/23/2031 | | | 390 | | | | 456 | |
| | | | | | | | |
Total Sovereign Debt
(Cost $8,845) ($ Thousands) | | | | | | | 9,956 | |
| | | | | | | | |
| | |
FOREIGN BONDS — 1.9% | | | | | | | | |
Banco Santander | | | | | | | | |
3.125%, 02/23/2023 | | | 200 | | | | 208 | |
Banco Santander Chile | | | | | | | | |
2.500%, 12/15/2020 (B) | | | 240 | | | | 241 | |
Barclays Bank | | | | | | | | |
10.179%, 06/12/2021 (B) | | | 370 | | | | 400 | |
BHP Billiton Finance USA | | | | | | | | |
2.875%, 02/24/2022 | | | 10 | | | | 10 | |
BP Capital Markets | | | | | | | | |
3.062%, 03/17/2022 | | | 20 | | | | 21 | |
BP Capital Markets PLC | | | | | | | | |
3.561%, 11/01/2021 | | | 230 | | | | 239 | |
CNOOC Finance | | | | | | | | |
3.500%, 05/05/2025 | | | 330 | | | | 360 | |
Cooperatieve Rabobank UA | | | | | | | | |
4.375%, 08/04/2025 | | | 500 | | | | 563 | |
Ecopetrol | | | | | | | | |
5.375%, 06/26/2026 | | | 140 | | | | 147 | |
HSBC Holdings PLC | | | | | | | | |
4.250%, 08/18/2025 | | | 230 | | | | 251 | |
Intesa Sanpaolo | | | | | | | | |
5.017%, 06/26/2024 (B) | | | 200 | | | | 205 | |
3.125%, 07/14/2022 (B) | | | 200 | | | | 204 | |
OCP | | | | | | | | |
4.500%, 10/22/2025 (B) | | | 400 | | | | 416 | |
Petrobras Global Finance BV | | | | | | | | |
6.850%, 06/05/2115 | | | 150 | | | | 149 | |
| | | | | | | | |
| | | |
| Description | | Face Amount
(Thousands) | | | Market Value
($ Thousands) | |
FOREIGN BONDS (continued) | |
Petroleos del Peru | | | | | | | | |
4.750%, 06/19/2032 (B) | | $ | 400 | | | $ | 444 | |
Petroleos Mexicanos | | | | | | | | |
4.875%, 01/18/2024 | | | 190 | | | | 182 | |
Shell International Finance BV | | | | | | | | |
3.250%, 05/11/2025 | | | 150 | | | | 166 | |
3.250%, 04/06/2050 | | | 160 | | | | 170 | |
2.875%, 05/10/2026 | | | 40 | | | | 44 | |
2.750%, 04/06/2030 | | | 40 | | | | 43 | |
2.375%, 04/06/2025 | | | 548 | | | | 582 | |
2.250%, 11/10/2020 | | | 360 | | | | 363 | |
1.750%, 09/12/2021 | | | 690 | | | | 700 | |
Teva Pharmaceutical Finance Netherlands III BV | | | | | | | | |
2.200%, 07/21/2021 | | | 227 | | | | 222 | |
Vale Overseas | | | | | | | | |
6.875%, 11/21/2036 | | | 48 | | | | 63 | |
| | | | | | | | |
Total Foreign Bonds
(Cost $6,024) ($ Thousands) | | | | | | | 6,393 | |
| | | | | | | | |
| | |
MUNICIPAL BONDS — 1.1% | | | | | | | | |
Florida — 0.1% | | | | | | | | |
Florida State, Board of Administration Finance, Ser A, RB | | | | | | | | |
2.638%, 07/01/2021 | | | 420 | | | | 429 | |
| | | | | | | | |
Michigan — 0.2% | | | | | | | | |
Michigan State, Finance Authority, RB Callable 03/01/2024 @ 100 | | | | | | | | |
2.988%, 09/01/2049 (D) | | | 755 | | | | 761 | |
| | | | | | | | |
Missouri — 0.2% | | | | | | | | |
University of Missouri, System Facilities, RB Callable 10/01/2025 @ 100 | | | | | | | | |
1.714%, 11/01/2025 | | | 725 | | | | 752 | |
| | | | | | | | |
New Jersey — 0.1% | | | | | | | | |
New Jersey State, Transportation Trust Fund Authority, RB | | | | | | | | |
2.551%, 06/15/2023 | | | 125 | | | | 120 | |
| | | | | | | | |
New York — 0.2% | | | | | | | | |
New York State, Urban Development, RB | | | | | | | | |
3.350%, 03/15/2026 | | | 665 | | | | 731 | |
| | | | | | | | |
| | | | |
New Covenant Funds / Annual Report / June 30, 2020 | | | 47 | |
SCHEDULE OF INVESTMENTS
June 30, 2020
New Covenant Income Fund (Concluded)
| | | | | | | | |
| | | |
| Description | | Face Amount
(Thousands) | | | Market Value
($ Thousands) | |
MUNICIPAL BONDS (continued) | |
Wisconsin — 0.3% | | | | | | | | |
Wisconsin State, Ser A, RB, AGM | | | | | | | | |
5.700%, 05/01/2026 | | $ | 795 | | | $ | 914 | |
| | | | | | | | |
Total Municipal Bonds
(Cost $3,574) ($ Thousands) | | | | | | | 3,707 | |
| | | | | | | | |
| | |
| | | Shares | | | | |
CASH EQUIVALENT — 2.9% | | | | | | | | |
SEI Daily Income Trust, Government Fund, Cl F | | | | | | | | |
0.030%**† | | | 9,706,589 | | | | 9,707 | |
| | | | | | | | |
Total Cash Equivalent
(Cost $9,707) ($ Thousands) | | | | | | | 9,707 | |
| | | | | | | | |
Total Investments in Securities — 101.8%
(Cost $328,240) ($ Thousands) | | | | | | $ | 342,115 | |
| | | | | | | | |
A list of the open futures contracts held by the Fund at June 30, 2020 are as follows:
| | | | | | | | | | | | | | | | | | | | |
| | | | | | |
| Type of Contract | | Number of
Contracts
Long (Short) | | | Expiration Date | | | Notional Amount
(Thousands) | | | Value
(Thousands) | | | Unrealized Appreciation/ (Depreciation) (Thousands) | |
90-Day Euro$ | | | (265 | ) | | | Mar-2021 | | | $ | (66,035 | ) | | $ | (66,117 | ) | | $ | (82 | ) |
90-Day Euro$ | | | (108 | ) | | | Dec-2021 | | | | (26,770 | ) | | | (26,946 | ) | | | (176 | ) |
90-Day Euro$ | | | 33 | | | | Dec-2020 | | | | 8,085 | | | | 8,226 | | | | 141 | |
U.S. 2-Year Treasury Note | | | 142 | | | | Oct-2020 | | | | 31,354 | | | | 31,358 | | | | 4 | |
U.S. 5-Year Treasury Note | | | 510 | | | | Oct-2020 | | | | 63,966 | | | | 64,128 | | | | 162 | |
U.S. 10-Year Treasury Note | | | (88 | ) | | | Sep-2020 | | | | (12,136 | ) | | | (12,247 | ) | | | (111 | ) |
U.S. Long Treasury Bond | | | (183 | ) | | | Sep-2020 | | | | (32,473 | ) | | | (32,677 | ) | | | (204 | ) |
U.S. Ultra Long Treasury Bond | | | 15 | | | | Sep-2020 | | | | 3,178 | | | | 3,273 | | | | 95 | |
Ultra 10-Year U.S. Treasury Note | | | 14 | | | | Sep-2020 | | | | 2,196 | | | | 2,204 | | | | 8 | |
| | | | | | | | | | | | | | | | | | | | |
| | | | | | | | | | $ | (28,635 | ) | | $ | (28,798 | ) | | $ | (163 | ) |
| | | | | | | | | | | | | | | | | | | | |
The futures contracts are considered to have interest rate risk associated with them.
| | | Percentages are based on Net Assets of $336,213 ($ Thousands). |
| | ** | The rate reported is the 7-day effective yield as of June 30, 2020. |
| | † | Investment in Affiliated Security (see Note 3). |
| | (A) | Variable or floating rate security, the interest rate of which adjusts periodically based on changes in current interest rates and prepayments on the underlying pool of assets. |
| | (B) | Security exempt from registration under Rule 144A of the Securities Act of 1933. These securities may be resold in transactions exempt from registration normally to qualified institutions. On June 30, 2020, the value of these securities amounted to $62,321 ($ Thousands), representing 18.5% of the Net Assets of the Fund. |
| | (C) | Zero coupon security. The rate shown on the Schedule of Investments is the security’s effective yield at the time of purchase. |
| | (D) | Variable or floating rate security, the interest rate of which adjusts periodically based on prevailing interest rates. |
AGM – Assured Guaranty Municipal
Cl – Class
CMO – Collateralized Mortgage Obligation
DAC – Designated Activity Company
DN – Discount Note
FHLB – Federal Home Loan Bank
FHLMC – Federal Home Loan Mortgage Corporation
FNMA – Federal National Mortgage Association
GNMA – Government National Mortgage Association
ICE – Intercontinental Exchange
IO – Interest Only - face amount represents notional amount.
LIBOR – London Interbank Offered Rate
MTN – Medium Term Note
PLC – Public Limited Company
RB – Revenue Bond
Ser – Series
TBA – To Be Announced
| | |
| 48 | | New Covenant Funds / Annual Report / June 30, 2020 |
UMBS – Uniform Mortgage Backed Securities
USD – United States Dollar
VAR – Variable Rate
The following is a list of the levels of inputs used as of June 30, 2020 in valuing the Fund’s investments and other financial instruments carried at value ($ Thousands):
| | | | | | | | | | | | | | | | |
| | | | | |
| Investments in Securities | | Level 1 ($) | | | Level 2 ($) | | | Level 3 ($) | | | Total ($) | |
Mortgage-Backed Securities | | | – | | | | 127,659 | | | | – | | | | 127,659 | |
Corporate Obligations | | | – | | | | 118,467 | | | | – | | | | 118,467 | |
U.S. Treasury Obligations | | | – | | | | 28,208 | | | | – | | | | 28,208 | |
Asset-Backed Securities | | | – | | | | 27,813 | | | | – | | | | 27,813 | |
U.S. Government Agency Obligations | | | – | | | | 10,205 | | | | – | | | | 10,205 | |
Sovereign Debt | | | – | | | | 9,956 | | | | – | | | | 9,956 | |
Foreign Bonds | | | – | | | | 6,393 | | | | – | | | | 6,393 | |
Municipal Bonds | | | – | | | | 3,707 | | | | – | | | | 3,707 | |
Cash Equivalent | | | 9,707 | | | | – | | | | – | | | | 9,707 | |
| | | | | | | | | | | | | | | | |
Total Investments in Securities | | | 9,707 | | | | 332,408 | | | | – | | | | 342,115 | |
| | | | | | | | | | | | | | | | |
| | | | | | | | | | | | | | | | |
| | | | | |
| Other Financial Instruments | | Level 1
($) | | | Level 2
($) | | | Level 3
($) | | | Total
($) | |
Futures Contracts * | | | | | | | | | | | | | | | | |
Unrealized Appreciation | | | 410 | | | | — | | | | — | | | | 410 | |
Unrealized Depreciation | | | (573 | ) | | | — | | | | — | | | | (573 | ) |
| | | | | | | | | | | | | | | | |
Total Other Financial Instruments | | | (163 | ) | | | — | | | | — | | | | (163 | ) |
| | | | | | | | | | | | | | | | |
* Futures contracts are valued at the unrealized appreciation (depreciation) on the instrument.
For the year ended June 30, 2020, there were no transfers in or out of Level 3.
Amounts designated as “-” are either $0 or have been rounded to $0.
For more information on valuation inputs, see Note 2 – Significant Accounting Policies in Notes to Financial Statements.
The following is a summary of the transactions with affiliates for the year ended June 30, 2020 ($ Thousands):
| | | | | | | | | | | | | | | | | | | | | | | | | | | | | | | | | | | | |
| | | | | | | | | | |
| Security Description | | Value 6/30/19 | | | Purchases at
Cost | | | Proceeds
from Sales | | | Realized Gain/
(Loss) | | | Change in
Unrealized
Appreciation/
(Depreciation) | | | Value 6/30/20 | | | Shares | | | Dividend
Income | | | Capital Gains | |
SEI Daily Income Trust, Government Fund, Cl F | | $ | 11,031 | | | $ | 164,299 | | | $ | (165,623) | | | $ | — | | | $ | — | | | $ | 9,707 | | | | 9,706,589 | | | $ | 70 | | | $ | — | |
| | | | | | | | | | | | | | | | | | | | | | | | | | | | | | | | | | | | |
The accompanying notes are an integral part of the financial statements.
| | | | |
New Covenant Funds / Annual Report / June 30, 2020 | | | 49 | |
SCHEDULE OF INVESTMENTS
June 30, 2020
New Covenant Balanced Growth Fund
Sector Weightings (Unaudited)†:

†Percentages are based on total investments.
| | | | | | | | |
| | | |
| Description | | Shares | | | Market Value
($ Thousands) | |
AFFILIATED INVESTMENT FUNDS — 98.9% | | | | | | | | |
Equity Fund — 60.4% | | | | | | | | |
New Covenant Growth Fund † | | | 4,108,347 | | | $ | 178,467 | |
| | | | | | | | |
| | |
Total Equity Fund
(Cost $109,831) ($ Thousands) | | | | | | | 178,467 | |
| | | | | | | | |
| | |
Fixed Income Fund — 38.5% | | | | | | | | |
New Covenant Income Fund † | | | 4,672,368 | | | | 113,632 | |
| | | | | | | | |
| | |
Total Fixed Income Fund
(Cost $107,138) ($ Thousands) | | | | | | | 113,632 | |
| | | | | | | | |
| | | | | | | | |
| | | |
| Description | | Shares | | | Market Value
($ Thousands) | |
| | |
CASH EQUIVALENT — 1.1% | | | | | | | | |
SEI Daily Income Trust, Government Fund, Cl F 0.030%**† | | | 3,298,407 | | | $ | 3,298 | |
| | | | | | | | |
| | |
Total Cash Equivalent
(Cost $3,298) ($ Thousands) | | | | | | | 3,298 | |
| | | | | | | | |
| | |
Total Investments in Securities — 100.0%
(Cost $220,267) ($ Thousands) | | | | | | $ | 295,397 | |
| | | | | | | | |
Percentages are based on a Net Assets of $295,481 ($ Thousands).
| | † | Investment in Affiliated Security (see Note 3). |
| | ** | The rate reported is the 7-day effective yield as of June 30, 2020. |
Cl — Class
As of June 30, 2020, all of the Fund’s investments were considered level 1, in accordance with the authoritative guidance on fair value measurements and disclosure under U.S. GAAP.
For the year ended June 30, 2020, there were no transfers in or out of Level 3.
For more information on valuation inputs, see Note 2 – Significant Accounting Policies in Notes to Financial Statements.
The following is a summary of the transactions with affiliates for the year ended June 30, 2020 ($ Thousands):
| | | | | | | | | | | | | | | | | | | | | | | | | | | | | | | | | | | | |
| | | | | | | | | | |
| Security Description | | Value 6/30/2019 | | | Purchases at
Cost | | | Proceeds from
Sales | | | Realized Gain | | | Change in
Unrealized
Appreciation | | | Value 6/30/2020 | | | Shares | | | Dividend
Income | | | Capital Gains | |
New Covenant Growth Fund | | | $178,591 | | | | $36,525 | | | | $(42,130) | | | | $4,552 | | | | $929 | | | | $178,467 | | | | 4,108,347 | | | | $2,046 | | | | $7,788 | |
New Covenant Income Fund | | | 112,871 | | | | 26,790 | | | | (29,796) | | | | 211 | | | | 3,556 | | | | 113,632 | | | | 4,672,368 | | | | 2,621 | | | | — | |
SEI Daily Income Trust, Government Fund, Cl F | | | 2,176 | | | | 26,461 | | | | (25,339) | | | | — | | | | — | | | | 3,298 | | | | 3,298,407 | | | | 33 | | | | — | |
| | | | | | | | | | | | | | | | | | | | | | | | | | | | | | | | | | | | |
Totals | | | $293,638 | | | | $89,776 | | | | $(97,265) | | | | $ 4,763 | | | | $4,485 | | | | $295,397 | | | | | | | | $4,700 | | | | $7,788 | |
| | | | | | | | | | | | | | | | | | | | | | | | | | | | | | | | | | | | |
The accompanying notes are an integral part of the financial statements.
| | |
| 50 | | New Covenant Funds / Annual Report / June 30, 2020 |
SCHEDULE OF INVESTMENTS
June 30, 2020
New Covenant Balanced Income Fund
Sector Weightings (Unaudited)†:

†Percentages are based on total investments.
| | | | | | | | |
| | | |
| Description | | Shares | | | Market Value
($ Thousands) | |
AFFILIATED INVESTMENT FUNDS — 98.9% | | | | | |
Fixed Income Fund — 63.5% | | | | | | | | |
New Covenant Income Fund † | | | 2,057,178 | | | $ | 50,030 | |
| | | | | | | | |
Total Fixed Income Fund
(Cost $47,344) ($ Thousands) | | | | | | | 50,030 | |
| | | | | | | | |
| | |
Equity Fund — 35.5% | | | | | | | | |
New Covenant Growth Fund † | | | 643,112 | | | | 27,937 | |
| | | | | | | | |
| | |
Total Equity Fund
(Cost $14,497) ($ Thousands) | | | | | | | 27,937 | |
| | | | | | | | |
| | | | | | | | |
| | | |
| Description | | Shares | | | Market Value
($ Thousands) | |
| | |
CASH EQUIVALENT — 0.9% | | | | | | | | |
SEI Daily Income Trust, Government Fund, Cl F 0.030%**† | | | 753,743 | | | $ | 754 | |
| | | | | | | | |
| | |
Total Cash Equivalent
(Cost $754) ($ Thousands) | | | | | | | 754 | |
| | | | | | | | |
| | |
Total Investments in Securities — 99.9%
(Cost $62,595) ($ Thousands) | | | | | | $ | 78,721 | |
| | | | | | | | |
Percentages are based on Net Assets of $78,790 ($ Thousands).
| | ** | Rate shown is the 7-day effective yield as of June 30, 2020. |
| | † | Investment in Affiliated Security (see Note 3). |
Cl — Class
As of June 30, 2020, all of the Fund’s investments were considered level 1, in accordance with the authoritative guidance on fair value measurements and disclosure under U.S. GAAP.
For the year ended June 30, 2020, there were no transfers in or out of Level 3.
For more information on valuation inputs, see Note 2 – Significant Accounting Policies in Notes to Financial Statements.
The following is a summary of the transactions with affiliates for the year ended June 30, 2020 ($ Thousands):
| | | | | | | | | | | | | | | | | | | | | | | | | | | | | | | | | | | | |
| | | | | | | | | | |
| Security Description | | Value 6/30/2019 | | | Purchases at
Cost | | | Proceeds from
Sales | | | Realized Gain/
(Loss) | | | Change in
Unrealized
Appreciation | | | Value 6/30/2020 | | | Shares | | | Dividend
Income | | | Capital Gains | |
New Covenant Income Fund | | | $50,043 | | | | $6,529 | | | | $ (8,219) | | | | $(60) | | | | $1,737 | | | | $50,030 | | | | 2,057,178 | | | | $ 1,137 | | | | $— | |
New Covenant Growth Fund | | | 27,539 | | | | 8,161 | | | | (8,926 | ) | | | 526 | | | | 637 | | | | 27,937 | | | | 643,112 | | | | 322 | | | | 1,204 | |
SEI Daily Income Trust, Government Fund, Cl F | | | 1,207 | | | | 9,781 | | | | (10,234 | ) | | | — | | | | — | | | | 754 | | | | 753,743 | | | | 9 | | | | — | |
| | | | | | | | | | | | | | | | | | | | | | | | | | | | | | | | | | | | |
Totals | | | $78,789 | | | | $24,471 | | | | $(27,379) | | | | $466 | | | | $2,374 | | | | $78,721 | | | | | | | | $1,468 | | | | $1,204 | |
| | | | | | | | | | | | | | | | | | | | | | | | | | | | | | | | | | | | |
The accompanying notes are an integral part of the financial statements.
| | | | |
New Covenant Funds / Annual Report / June 30, 2020 | | | 51 | |
STATEMENTS OF ASSETS AND LIABILITIES ($ THOUSANDS)
June 30, 2020
| | | | | | | | | | | | | | | | |
| | | | | |
| | | Growth Fund | | | Income Fund | | | Balanced Growth Fund | | | Balanced Income
Fund | |
Assets: | | | | | | | | | | | | | | | | |
Investments, at value† | | $ | 451,982 | | | $ | 332,408 | | | $ | — | | | $ | — | |
Affiliated investments, at value†† | | | 6,613 | | | | 9,707 | | | | 295,397 | | | | 78,721 | |
Cash and cash equivalents | | | 1,805 | | | | — | | | | — | | | | — | |
Cash pledged as collateral for futures contracts | | | 569 | | | | 825 | | | | — | | | | — | |
Dividends and interest receivable | | | 338 | | | | 1,658 | | | | 187 | | | | 82 | |
Receivable for fund shares sold | | | 310 | | | | 371 | | | | 6 | | | | 2 | |
Receivable for variation margin | | | 96 | | | | 102 | | | | — | | | | — | |
Foreign tax reclaim receivable | | | 88 | | | | 33 | | | | — | | | | — | |
Receivable for investment securities sold | | | — | | | | 5,821 | | | | — | | | | — | |
Prepaid expenses | | | 14 | | | | 11 | | | | 9 | | | | 2 | |
Total Assets | | | 461,815 | | | | 350,936 | | | | 295,599 | | | | 78,807 | |
Liabilities: | | | | | | | | | | | | | | | | |
Investment advisory fees payable | | | 91 | | | | 79 | | | | — | | | | — | |
Administration fees payable | | | 59 | | | | 43 | | | | 10 | | | | 3 | |
Social witness and licensing fees payable | | | 57 | | | | 39 | | | | — | | | | — | |
Shareholder servicing fees payable | | | 37 | | | | 27 | | | | — | | | | — | |
Payable for fund shares redeemed | | | 8 | | | | — | | | | 64 | | | | 3 | |
Trustees’ fees payable | | | 3 | | | | 2 | | | | 2 | | | | — | |
CCO fees payable | | | 1 | | | | — | | | | — | | | | — | |
Payable for investment securities purchased | | | — | | | | 13,931 | | | | — | | | | — | |
Income distribution payable | | | — | | | | 489 | | | | — | | | | — | |
Payable to custodian | | | — | | | | 2 | | | | — | | | | — | |
Payable for variation margin | | | — | | | | 38 | | | | — | | | | — | |
Accrued expense payable | | | 66 | | | | 73 | | | | 42 | | | | 11 | |
Total Liabilities | | | 322 | | | | 14,723 | | | | 118 | | | | 17 | |
Net Assets | | $ | 461,493 | | | $ | 336,213 | | | $ | 295,481 | | | $ | 78,790 | |
† Cost of investments | | $ | 326,443 | | | $ | 318,533 | | | $ | — | | | $ | — | |
†† Cost of affiliated investments | | | 6,613 | | | | 9,707 | | | | 220,267 | | | | 62,595 | |
Net Assets: | | | | | | | | | | | | | | | | |
Paid-in Capital — (unlimited authorization — par value $0.001) | | $ | 325,977 | | | $ | 320,854 | | | $ | 220,405 | | | $ | 63,432 | |
Total distributable earnings | | | 135,516 | | | | 15,359 | | | | 75,076 | | | | 15,358 | |
Net Assets | | $ | 461,493 | | | $ | 336,213 | | | $ | 295,481 | | | $ | 78,790 | |
Net Asset Value, Offering and Redemption Price Per Share | | $ | 43.44 | | | $ | 24.32 | | | $ | 104.95 | | | $ | 22.01 | |
| | |
| (461,493,155 ÷
10,623,827 shares |
) | |
| (336,213,359 ÷
13,825,205 shares |
) | |
| (295,480,573 ÷
2,815,436 shares |
) | |
| (78,789,517 ÷
3,579,291 shares |
) |
Amounts designated as “—” are $0 or have been rounded to $0.
The accompanying notes are an integral part of the financial statements.
| | |
| 52 | | New Covenant Funds / Annual Report / June 30, 2020 |
STATEMENTS OF OPERATIONS ($ THOUSANDS)
For the year ended June 30, 2020
| | | | | | | | | | | | | | | | |
| | | | | |
| | | Growth Fund | | | Income Fund | | | Balanced Growth
Fund | | | Balanced Income
Fund |
Investment Income: | | | | | | | | | | | | | | | | |
Dividend income | | $ | 8,365 | | | $ | — | | | $ | — | | | $ | — | |
Dividend income from affiliated registered investment company | | | 90 | | | | 70 | | | | 4,700 | | | | 1,468 | |
Interest income | | | 24 | | | | 9,267 | | | | — | | | | — | |
Total Investment Income | | | 8,479 | | | | 9,337 | | | | 4,700 | | | | 1,468 | |
Expenses: | | | | | | | | | | | | | | | | |
Investment advisory fees | | | 2,084 | | | | 1,396 | | | | — | | | | — | |
Administration fees | | | 887 | | | | 665 | | | | 436 | | | | 116 | |
Social witness and licensing fees | | | 665 | | | | 499 | | | | — | | | | — | |
Shareholder servicing fees | | | 443 | | | | 332 | | | | — | | | | — | |
Trustee fees | | | 9 | | | | 6 | | | | 6 | | | | 1 | |
Chief compliance officer fees | | | 3 | | | | 2 | | | | 2 | | | | — | |
Transfer agent fees | | | 88 | | | | 67 | | | | 58 | | | | 15 | |
Professional fees | | | 68 | | | | 49 | | | | 44 | | | | 12 | |
Printing fees | | | 40 | | | | 30 | | | | 27 | | | | 7 | |
Registration fees | | | 37 | | | | 27 | | | | 24 | | | | 7 | |
Custodian fees | | | 22 | | | | 16 | | | | 13 | | | | 4 | |
Other expenses | | | 28 | | | | 98 | | | | 3 | | | | 1 | |
Total Expenses | | | 4,374 | | | | 3,187 | | | | 613 | | | | 163 | |
Less: | | | | | | | | | | | | | | | | |
Waiver of investment advisory fees | | | (1,058 | ) | | | (478 | ) | | | — | | | | — | |
Waiver of administration fees | | | (114 | ) | | | (46 | ) | | | (228 | ) | | | (46 | ) |
Net Expenses | | | 3,202 | | | | 2,663 | | | | 385 | | | | 117 | |
Net Investment Income | | | 5,277 | | | | 6,674 | | | | 4,315 | | | | 1,351 | |
Net Realized and Change in Unrealized Gain (Loss) on Investments: | | | | | | | | | | | | | |
Net Realized Gain (Loss) on: | | | | | | | | | | | | | | | | |
Investments | | | 13,740 | | | | 5,525 | | | | — | | | | — | |
Affiliated investments | | | — | | | | — | | | | 4,763 | | | | 466 | |
Written and purchased options | | | — | | | | 591 | | | | — | | | | — | |
Capital gain distributions received from affiliated investment | | | — | | | | — | | | | 7,788 | | | | 1,204 | |
Futures contracts | | | (673 | ) | | | (724 | ) | | | — | | | | — | |
Net Change in Unrealized Appreciation (Depreciation) on: | | | | | | | | | | | | | | | | |
Investments | | | 17,808 | | | | 6,906 | | | | — | | | | — | |
Affiliated investments | | | — | | | | — | | | | 4,485 | | | | 2,374 | |
Written and purchased options | | | — | | | | (31 | ) | | | — | | | | — | |
Futures contracts | | | (35 | ) | | | (100 | ) | | | — | | | | — | |
Net Increase in Net Assets Resulting from Operations | | $ | 36,117 | | | $ | 18,841 | | | $ | 21,351 | | | $ | 5,395 | |
Amounts designated as “—” are $0 or have been rounded to $0.
The accompanying notes are an integral part of the financial statements.
| | | | |
New Covenant Funds / Annual Report / June 30, 2020 | | | 53 | |
STATEMENTS OF CHANGES IN NET ASSETS ($ THOUSANDS)
For the year ended June 30,
| | | | | | | | | | | | | | | | |
| | | Growth Fund | | | Income Fund | |
| | | 2020 | | | 2019 | | | 2020 | | | 2019 | |
Operations: | | | | | | | | | | | | | | | | |
Net investment income | | $ | 5,277 | | | $ | 5,146 | | | $ | 6,674 | | | $ | 7,267 | |
Net realized gain from investments, affiliated investments, written and purchased options and futures contracts | | | 13,067 | | | | 22,515 | | | | 5,392 | | | | 701 | |
Net change in unrealized appreciation on investments, affiliated investments, written and purchased options and futures contracts | | | 17,773 | | | | 3,899 | | | | 6,775 | | | | 11,913 | |
Net change in unrealized depreciation on foreign currency transactions and translation of other assets and liabilities denominated in foreign currency | | | — | | | | (1 | ) | | | — | | | | — | |
Net increase in net assets resulting from operations | | | 36,117 | | | | 31,559 | | | | 18,841 | | | | 19,881 | |
Distributions: | | | | | | | | | | | | | | | | |
Total distributions | | | (25,032 | ) | | | (31,095 | ) | | | (7,695 | ) | | | (7,780 | ) |
Capital Share Transactions: | | | | | | | | | | | | | | | | |
Proceeds from shares issued | | | 57,107 | | | | 41,305 | | | | 54,297 | | | | 40,669 | |
Reinvestment of dividends & distributions | | | 19,985 | | | | 25,807 | | | | 775 | | | | 749 | |
Cost of shares redeemed | | | (75,642 | ) | | | (47,292 | ) | | | (60,503 | ) | | | (41,976 | ) |
Increase (decrease) in net assets derived from capital share transactions | | | 1,450 | | | | 19,820 | | | | (5,431 | ) | | | (558 | ) |
Net increase in net assets | | | 12,535 | | | | 20,284 | | | | 5,715 | | | | 11,543 | |
Net Assets: | | | | | | | | | | | | | | | | |
Beginning of Year | | | 448,958 | | | | 428,674 | | | | 330,498 | | | | 318,955 | |
End of Year | | $ | 461,493 | | | $ | 448,958 | | | $ | 336,213 | | | $ | 330,498 | |
Share Transactions: | | | | | | | | | | | | | | | | |
Shares issued | | | 1,471 | | | | 1,019 | | | | 2,282 | | | | 1,781 | |
Shares issued in lieu of dividends and distributions | | | 453 | | | | 665 | | | | 33 | | | | 33 | |
Shares redeemed | | | (1,776 | ) | | | (1,139 | ) | | | (2,551 | ) | | | (1,852 | ) |
Increase (decrease) in net assets derived from share transactions | | | 148 | | | | 545 | | | | (236) | | | | (38) | |
Amounts designated as “—” are $0 or have been rounded to $0.
The accompanying notes are an integral part of the financial statements.
| | |
| 54 | | New Covenant Funds / Annual Report / June 30, 2020 |
| | | | | | | | | | | | | | | | |
| | | Balanced Growth Fund | | | Balanced Income Fund | |
| | | 2020 | | | 2019 | | | 2020 | | | 2019 | |
Operations: | | | | | | | | | | | | | | | | |
Net investment income | | $ | 4,315 | | | $ | 4,518 | | | $ | 1,351 | | | $ | 1,406 | |
Net realized gain from affiliated investments | | | 4,763 | | | | 862 | | | | 466 | | | | 344 | |
Capital gain distributions received from affiliated investments | | | 7,788 | | | | 10,539 | | | | 1,204 | | | | 1,618 | |
Net change in unrealized appreciation on affiliated investments | | | 4,485 | | | | 4,138 | | | | 2,374 | | | | 1,640 | |
Net increase in net assets resulting from operations | | | 21,351 | | | | 20,057 | | | | 5,395 | | | | 5,008 | |
Distributions: | | | | | | | | | | | | | | | | |
Total distributions | | | (17,049 | ) | | | (17,635 | ) | | | (3,179 | ) | | | (4,160 | ) |
Capital Share Transactions: | | | | | | | | | | | | | | | | |
Proceeds from shares issued | | | 12,711 | | | | 16,016 | | | | 5,066 | | | | 3,589 | |
Reinvestment of dividends & distributions | | | 15,444 | | | | 16,007 | | | | 2,578 | | | | 3,509 | |
Cost of shares redeemed | | | (30,798 | ) | | | (31,067 | ) | | | (9,518 | ) | | | (6,827 | ) |
Increase (decrease) in net assets derived from capital share transactions | | | (2,643 | ) | | | 956 | | | | (1,874 | ) | | | 271 | |
Net increase in net assets | | | 1,659 | | | | 3,378 | | | | 342 | | | | 1,119 | |
Net Assets: | | | | | | | | | | | | | | | | |
Beginning of Year | | | 293,822 | | | | 290,444 | | | | 78,448 | | | | 77,329 | |
End of Year | | $ | 295,481 | | | $ | 293,822 | | | $ | 78,790 | | | $ | 78,448 | |
Share Transactions: | | | | | | | | | | | | | | | | |
Shares issued | | | 122 | | | | 163 | | | | 237 | | | | 173 | |
Shares issued in lieu of dividends and distributions | | | 150 | | | | 166 | | | | 120 | | | | 174 | |
Shares redeemed | | | (297 | ) | | | (310 | ) | | | (442 | ) | | | (325 | ) |
Increase (decrease) in net assets derived from share transactions | | | (25 | ) | | | 19 | | | | (85 | ) | | | 22 | |
The accompanying notes are an integral part of the financial statements.
| | | | |
New Covenant Funds / Annual Report / June 30, 2020 | | | 55 | |
FINANCIAL HIGHLIGHTS
For the years ended June 30,
For a Share Outstanding Throughout the Year
| | | | | | | | | | | | | | | | | | | | |
| | | Growth Fund | |
| | | 2020 | | | 2019 | | | 2018 | | | 2017 | | | 2016 | |
Net Asset Value, Beginning of Year | | $ | 42.86 | | | $ | 43.17 | | | $ | 40.15 | | | $ | 34.23 | | | $ | 38.28 | |
Investment Activities: | | | | | | | | | | | | | | | | | | | | |
Net investment income(1) | | | 0.51 | | | | 0.50 | | | | 0.46 | | | | 0.27 | | | | 0.27 | |
Net realized and unrealized gains (losses) on securities (1) | | | 2.56 | | | | 2.28 | | | | 5.34 | | | | 5.91 | | | | (1.67 | ) |
Total from investment activities | | | 3.07 | | | | 2.78 | | | | 5.80 | | | | 6.18 | | | | (1.40 | ) |
Dividends and Distributions from: | | | | | | | | | | | | | | | | | | | | |
Net investment income | | | (0.50 | ) | | | (0.50 | ) | | | (0.39 | ) | | | (0.26 | ) | | | (0.21 | ) |
Net realized gains | | | (1.99 | ) | | | (2.59 | ) | | | (2.39 | ) | | | – | | | | (2.44 | ) |
Total dividends and distributions | | | (2.49 | ) | | | (3.09 | ) | | | (2.78 | ) | | | (0.26 | ) | | | (2.65 | ) |
Net Asset Value, End of Year | | $ | 43.44 | | | $ | 42.86 | | | $ | 43.17 | | | $ | 40.15 | | | $ | 34.23 | |
Total Return† | | | 7.18% | | | | 7.21 | % | | | 14.74 | % | | | 18.12 | % | | | (3.68 | )% |
Supplemental Data and Ratios: | | | | | | | | | | | | | | | | | | | | |
Net assets, end of year ($ Thousands) | | $ | 461,493 | | | $ | 448,958 | | | $ | 428,674 | | | $ | 412,229 | | | $ | 394,943 | |
Ratio of net expenses to average net assets | | | 0.72 | % | | | 0.85 | % | | | 0.87 | % | | | 0.95 | % | | | 1.02 | % |
Ratio of expenses to average net assets, excluding waivers | | | 0.99 | % | | | 1.12 | % | | | 1.12 | % | | | 1.13 | % | | | 1.14 | % |
Ratio of net investment income to average net assets | | | 1.19 | % | | | 1.19 | % | | | 1.08 | % | | | 0.73 | % | | | 0.76 | % |
Portfolio turnover rate | | | 19 | % | | | 47 | % | | | 24 | % | | | 50 | % | | | 103 | % |
| † | Returns shown do not reflect the deduction of taxes that a shareholder would pay on Fund distributions or the redemption of Fund shares. |
| (1) | Per share net investment income and net realized and unrealized gains/(losses) calculated using average shares. |
Amounts designated as “—” are $0 or have been rounded to $0.
The accompanying notes are an integral part of the financial statements
| | |
| 56 | | New Covenant Funds / Annual Report / June 30, 2020 |
FINANCIAL HIGHLIGHTS
For the years ended June 30,
For a Share Outstanding Throughout the Year
| | | | | | | | | | | | | | | | | | | | |
| | | Income Fund | |
| | | 2020 | | | 2019 | | | 2018 | | | 2017 | | | 2016 | |
Net Asset Value, Beginning of Year | | $ | 23.50 | | | $ | 22.62 | | | $ | 23.21 | | | $ | 23.58 | | | $ | 23.09 | |
Investment Activities: | | | | | | | | | | | | | | | | | | | | |
Net investment income(1) | | | 0.48 | | | | 0.52 | | | | 0.45 | | | | 0.37 | | | | 0.40 | |
Net realized and unrealized gains (losses) on securities (1) | | | 0.89 | | | | 0.92 | | | | (0.57 | ) | | | (0.31 | ) | | | 0.51 | |
Total from investment activities | | | 1.37 | | | | 1.44 | | | | (0.12 | ) | | | 0.06 | | | | 0.91 | |
Dividends and Distributions from: | | | | | | | | | | | | | | | | | | | | |
Net investment income | | | (0.55 | ) | | | (0.56 | ) | | | (0.47 | ) | | | (0.43 | ) | | | (0.42 | ) |
Total dividends and distributions | | | (0.55 | ) | | | (0.56 | ) | | | (0.47 | ) | | | (0.43 | ) | | | (0.42 | ) |
Net Asset Value, End of Year | | $ | 24.32 | | | $ | 23.50 | | | $ | 22.62 | | | $ | 23.21 | | | $ | 23.58 | |
Total Return† | | | 5.91 | % | | | 6.46 | % | | | (0.54 | )% | | | 0.27 | % | | | 4.00 | % |
Supplemental Data and Ratios: | | | | | | | | | | | | | | | | | | | | |
Net assets, end of year ($ Thousands) | | $ | 336,213 | | | $ | 330,498 | | | $ | 318,955 | | | $ | 305,157 | | | $ | 297,165 | |
Ratio of net expenses to average net assets | | | 0.80 | % | | | 0.80 | % | | | 0.80 | % | | | 0.80 | % | | | 0.80 | % |
Ratio of expenses to average net assets, excluding waivers | | | 0.96 | % | | | 0.95 | % | | | 0.95 | % | | | 0.95 | % | | | 0.98 | % |
Ratio of net investment income to average net assets | | | 2.01 | % | | | 2.29 | % | | | 1.95 | % | | | 1.58 | % | | | 1.71 | % |
Portfolio turnover rate | | | 144 | % | | | 188 | % | | | 210 | % | | | 140 | % | | | 202 | % |
| † | Returns shown do not reflect the deduction of taxes that a shareholder would pay on Fund distributions or the redemption of Fund shares. |
| (1) | Per share net investment income and net realized and unrealized gains/(losses) calculated using average shares. |
The accompanying notes are an integral part of the financial statements.
| | | | |
New Covenant Funds / Annual Report / June 30, 2020 | | | 57 | |
FINANCIAL HIGHLIGHTS
For the years ended June 30,
For a Share Outstanding Throughout the Year
| | | | | | | | | | | | | | | | | | | | |
| | | Balanced Growth Fund | |
| | | 2020 | | | 2019 | | | 2018 | | | 2017 | | | 2016 | |
Net Asset Value, Beginning of Year | | $ | 103.45 | | | $ | 102.94 | | | $ | 96.48 | | | $ | 90.32 | | | $ | 101.71 | |
Investment Activities: | | | | | | | | | | | | | | | | | | | | |
Net investment income(1) | | | 1.53 | | | | 1.58 | | | | 1.23 | | | | 0.94 | | | | 0.88 | |
Net realized and unrealized gains (losses) on securities (1) | | | 6.09 | | | | 5.21 | | | | 6.86 | | | | 8.44 | | | | (1.63 | ) |
Total from investment activities | | | 7.62 | | | | 6.79 | | | | 8.09 | | | | 9.38 | | | | (0.75 | ) |
Dividends and Distributions from: | | | | | | | | | | | | | | | | | | | | |
Net investment income | | | (1.95 | ) | | | (1.83 | ) | | | (0.90 | ) | | | (0.94 | ) | | | (1.72 | ) |
Net realized gains | | | (4.17 | ) | | | (4.45 | ) | | | (0.73 | ) | | | (2.28 | ) | | | (8.92 | ) |
Total dividends and distributions | | | (6.12 | ) | | | (6.28 | ) | | | (1.63 | ) | | | (3.22 | ) | | | (10.64 | ) |
Net Asset Value, End of Year | | $ | 104.95 | | | $ | 103.45 | | | $ | 102.94 | | | $ | 96.48 | | | $ | 90.32 | |
Total Return† | | | 7.57 | % | | | 7.12 | % | | | 8.45 | % | | | 10.59 | % | | | (0.50 | )% |
Supplemental Data and Ratios: | | | | | | | | | | | | | | | | | | | | |
Net assets, end of year ($ Thousands) | | $ | 295,481 | | | $ | 293,822 | | | $ | 290,444 | | | $ | 285,970 | | | $ | 284,430 | |
Ratio of net expenses to average net assets | | | 0.13 | % | | | 0.13 | % | | | 0.13 | % | | | 0.14 | % | | | 0.14 | % |
Ratio of expenses to average net assets, excluding waivers | | | 0.21 | % | | | 0.21 | % | | | 0.21 | % | | | 0.23 | % | | | 0.27 | % |
Ratio of net investment income to average net assets | | | 1.49 | % | | | 1.56 | % | | | 1.22 | % | | | 1.01 | % | | | 0.94 | % |
Portfolio turnover rate | | | 22 | % | | | 16 | % | | | 11 | % | | | 4 | % | | | 14 | % |
| † | Returns shown do not reflect the deduction of taxes that a shareholder would pay on Fund distributions or the redemption of Fund shares. |
| (1) | Per share net investment income and net realized and unrealized gains/(losses) calculated using average shares. |
Amounts designated as ‘‘—‘‘ are $0 or have been rounded to $0.
The accompanying notes are an integral part of the financial statements.
| | |
| 58 | | New Covenant Funds / Annual Report / June 30, 2020 |
FINANCIAL HIGHLIGHTS
For the years ended June 30,
For a Share Outstanding Throughout the Year
| | | | | | | | | | | | | | | | | | | | |
| | | Balanced Income Fund | |
| | | 2020 | | | 2019 | | | 2018 | | | 2017 | | | 2016 | |
Net Asset Value, Beginning of Year | | $ | 21.41 | | | $ | 21.23 | | | $ | 20.74 | | | $ | 20.06 | | | $ | 21.20 | |
Investment Activities: | | | | | | | | | | | | | | | | | | | | |
Net investment income(1) | | | 0.38 | | | | 0.39 | | | | 0.31 | | | | 0.25 | | | | 0.24 | |
Net realized and unrealized gains (losses) on securities (1) | | | 1.11 | | | | 0.96 | | | | 0.63 | | | | 0.95 | | | | 0.02 | |
Total from investment activities | | | 1.49 | | | | 1.35 | | | | 0.94 | | | | 1.20 | | | | 0.26 | |
Dividends and Distributions from: | | | | | | | | | | | | | | | | | | | | |
Net investment income | | | (0.40 | ) | | | (0.42 | ) | | | (0.29 | ) | | | (0.25 | ) | | | (0.31 | ) |
Net realized gains | | | (0.49 | ) | | | (0.75 | ) | | | (0.16 | ) | | | (0.27 | ) | | | (1.09 | ) |
Total dividends and distributions | | | (0.89 | ) | | | (1.17 | ) | | | (0.45 | ) | | | (0.52 | ) | | | (1.40 | ) |
Net Asset Value, End of Year | | $ | 22.01 | | | $ | 21.41 | | | $ | 21.23 | | | $ | 20.74 | | | $ | 20.06 | |
Total Return† | | | 7.14 | % | | | 6.76 | % | | | 4.57 | % | | | 6.11 | % | | | 1.41 | % |
Supplemental Data and Ratios: | | | | | | | | | | | | | | | | | | | | |
Net assets, end of year ($ Thousands) | | $ | 78,790 | | | $ | 78,448 | | | $ | 77,329 | | | $ | 79,100 | | | $ | 77,945 | |
Ratio of net expenses to average net assets | | | 0.15 | % | | | 0.15 | % | | | 0.15 | % | | | 0.19 | % | | | 0.20 | % |
Ratio of expenses to average net assets, excluding waivers | | | 0.21 | % | | | 0.20 | % | | | 0.21 | % | | | 0.23 | % | | | 0.27 | % |
Ratio of net investment income to average net assets | | | 1.76 | % | | | 1.86 | % | | | 1.48 | % | | | 1.25 | % | | | 1.19 | % |
Portfolio turnover rate | | | 19 | % | | | 11 | % | | | 10 | % | | | 5 | % | | | 17 | % |
| † | Returns shown do not reflect the deduction of taxes that a shareholder would pay on Fund distributions or the redemption of Fund shares. |
| (1) | Per share net investment income and net realized and unrealized gains/(losses) calculated using average shares. |
The accompanying notes are an integral part of the financial statements.
| | | | |
New Covenant Funds / Annual Report / June 30, 2020 | | | 59 | |
NOTES TO FINANCIAL STATEMENTS
June 30, 2020
1. ORGANIZATION
New Covenant Funds (the “Trust”), an open-end, diversified management investment company, was organized as a Delaware business trust on September 30, 1998. It currently consists of four investment funds: New Covenant Growth Fund (“Growth Fund”), New Covenant Income Fund (“Income Fund”), New Covenant Balanced Growth Fund (“Balanced Growth Fund”), and New Covenant Balanced Income Fund (“Balanced Income Fund”), (individually, a “Fund,” and collectively, the “Funds”). The Funds commenced operations on July 1, 1999. The Trust’s authorized capital consists of an unlimited number of shares of beneficial interest of $0.001 par value. Effective February 20, 2012, the Funds’ investment adviser is SEI Investments Management Corporation (the “Adviser”). Prior to February 20, 2012, the Funds’ investment adviser was One Compass Advisors, a wholly owned subsidiary of the Presbyterian Church (U.S.A.) Foundation.
The objectives of the Funds are as follows:
| | |
Growth Fund | | Long-term capital appreciation. A modest amount of dividend income may be produced by the Fund’s equity securities. |
| |
Income Fund | | High level of current income with preservation of capital. |
| |
Balanced Growth Fund | | Capital appreciation with less risk than would be present in a portfolio of only common stocks. |
| |
Balanced Income Fund | | Current income and long-term growth of capital. |
2. SIGNIFICANT ACCOUNTING POLICIES
The following are significant accounting policies, which are consistently followed in the preparation of its financial statements by the Funds. The Funds are investment companies that apply the accounting and reporting guidance issued in Topic 946 by the U.S. Financial Accounting Standards Board (“FASB”).
Use of Estimates — The preparation of financial statements, in conformity with U.S. generally accepted accounting principles (“U.S. GAAP”), requires management to make estimates and assumptions that affect the reported amount of assets and liabilities and disclosure of contingent assets and liabilities as of the date of the financial statements and the reported amounts of increases and decreases in net assets from operations during the reporting period. Actual results could differ from those estimates.
Security Valuation — Securities listed on a securities exchange, market or automated quotation system for which quotations are readily available (except for securities traded on NASDAQ) are valued at the last quoted sale price on the primary exchange or market (foreign or domestic) on which they are traded, or, if there is no such reported sale, at the most recent quoted bid price. For securities traded on NASDAQ, the NASDAQ Official Closing Price will be used. Debt securities are priced based upon valuations provided by independent, third-party pricing agents, if available. Such values generally reflect the last reported sales price if the security is actively traded. The third-party pricing agents may also value debt securities at an evaluated bid price by employing methodologies that utilize actual market transactions, broker-supplied valuations, or other methodologies designed to identify the market value for such securities. Debt obligations acquired with remaining maturities of sixty days or less may be valued at their amortized cost, which approximates market value. The prices for foreign securities are reported in local currency and converted to U.S. dollars using currency exchange rates. Prices for most securities held in the Funds are provided daily by recognized independent pricing agents. If a security price cannot be obtained from an independent, third-party pricing agent, the Funds seek to obtain a bid price from at least one independent broker.
Securities for which market prices are not “readily available” are valued in accordance with fair value procedures established by the Trust’s Board of Trustees. The Trust’s fair value procedures are implemented through a Fair Value Committee (the “Committee”) designated by the Trust’s Board of Trustees. Some of the more common reasons that may necessitate that a security be valued using fair value procedures include: the security’s trading has been halted or suspended; the security has been de-listed from a national exchange; the security’s primary trading market is temporarily closed at a time when under normal conditions it would be open; or the security’s primary pricing source is not able or willing to provide a price. When a security is valued in accordance with the fair value procedures, the Committee will determine the value after taking into consideration relevant information reasonably available to the Committee.
| | |
| 60 | | New Covenant Funds / Annual Report / June 30, 2020 |
For securities that principally trade on a foreign market or exchange, a significant gap in time can exist between the time of a particular security’s last trade and the time at which a Fund calculates its net asset value. The closing prices of such securities may no longer reflect their market value at the time a Fund calculates net asset value if an event that could materially affect the value of those securities (a “Significant Event”) has occurred between the time of the security’s last close and the time that a Fund calculates net asset value. A Significant Event may relate to a single issuer or to an entire market sector. If the adviser or sub-adviser of a Fund becomes aware of a Significant Event that has occurred with respect to a security or group of securities after the closing of the exchange or market on which the security or securities principally trade, but before the time at which a Fund calculates net asset value, the adviser or sub-adviser may request that a Committee Meeting be called. In addition, the Trust’s administrator monitors price movements among certain selected indices, securities and/or baskets of securities that may be an indicator that the closing prices received earlier from foreign exchanges or markets may not reflect market value at the time a Fund calculates net asset value. If price movements in a monitored index or security exceed levels established by the administrator, the administrator notifies the adviser or sub-adviser for any Fund holding the relevant securities that such limits have been exceeded. In such event, the adviser or sub-adviser makes the determination whether a Committee Meeting should be called based on the information provided.
The Growth Fund holds international securities that also use a third-party fair valuation vendor. The vendor provides a fair value for foreign securities held by this Fund based on certain factors and methodologies (involving, generally, tracking valuation correlations between the U.S. market and each non-U.S. security). Values from the fair value vendor are applied in the event that there is a movement in the U.S. market that exceeds a specific threshold that has been established by the Committee. The Committee has also established a “confidence interval” which is used to determine the level of historical correlation between the value of a specific foreign security and movements in the U.S. market before a particular security will be fair valued when the threshold is exceeded. In the event that the threshold established by the Committee is exceeded on a specific day, the Growth Fund will value the non-U.S. securities that exceed the applicable “confidence interval” based upon the adjusted prices provided by the fair valuation vendor.
Options for which the primary market is a national securities exchange are valued at the last sale price on the exchange on which they are traded, or, in the absence of any sale, at the closing bid price. Options not traded on a national securities exchange are valued at the last quoted bid price.
Futures cleared through a central clearing house (“centrally cleared futures”) are valued at the settlement price established each day by the board of exchange on which they are traded. The daily settlement prices for financial futures is provided by an independent source. On days when there is excessive volume, market volatility or the future does not end trading by the time a Fund calculates its NAV, the settlement price may not be available at the time at which the Fund calculates its NAV. On such days, the best available price (which is typically the last sales price) may be used to value a Fund’s futures position.
The assets of the Balanced Growth Fund and the Balanced Income Fund (the “Balanced Funds”) consist primarily of investments in underlying affiliated investment companies, which are valued at their respective daily net asset values in accordance with the established NAV of each fund.
In accordance with U.S. GAAP, fair value is defined as the price that a Fund would receive upon selling an investment in an orderly transaction to an independent buyer in the principal or most advantageous market of the investment. A three tier hierarchy has been established to maximize the use of observable and minimize the use of unobservable inputs and to establish classification of fair value measurements for disclosure purposes. Inputs refer broadly to the assumptions that market participants would use in pricing an asset. Inputs may be observable or unobservable. Observable inputs are inputs that reflect the assumptions market participants would use in pricing the asset or liability based on market data obtained from sources independent of the reporting entity. Unobservable inputs are inputs that reflect the reporting entity’s own assumptions about the assumptions market participants would use in pricing the asset or liability based on the best information available in the circumstances.
The three-tier hierarchy of inputs is summarized in the three broad Levels listed below:
Level 1 — quoted prices in active markets for identical investments
Level 2 — other significant observable inputs (including quoted prices for similar investments, interest rates, prepayment speeds, credit risks, etc.)
| | | | |
New Covenant Funds / Annual Report / June 30, 2020 | | | 61 | |
NOTES TO FINANCIAL STATEMENTS (Continued)
June 30, 2020
Level 3 — significant unobservable inputs (including the Fund’s own assumptions in determining the fair value of investments)
The valuation techniques used by the Funds to measure fair value during the year ended June 30, 2020 maximized the use of observable inputs and minimized the use of unobservable inputs.
For the year ended June 30, 2020, there have been no significant changes to the Trust’s fair valuation methodologies. For details of the investment classifications reference the Schedules of Investments.
Securities Transactions and Investment Income — Security transactions are recorded on the trade date. Cost used in determining net realized capital gains and losses on the sale of securities is determined on the basis of specific identification. Dividend income and expense is recognized on the ex-dividend date, and interest income or expense is recognized using the accrual basis of accounting.
Distributions received on securities that represent a return of capital or capital gains are recorded as a reduction of cost of investments and/or as a realized gain. The Trust estimates the components of distributions received that may be considered nontaxable distributions or capital gain distributions.
Amortization and accretion is calculated using the scientific interest method, which approximates the effective interest method over the holding period of the security. Amortization of premiums and discounts is included in interest income.
Cash and Cash Equivalents — Idle cash and currency balances may be swept into various overnight sweep accounts and are classified as cash equivalents on the Statement of Assets and Liabilities. These amounts, at times, may exceed United States federally insured limits. Amounts swept are available on the next business day.
Expenses — Expenses that are directly related to a Fund are charged directly to that Fund. Other operating expenses of the Funds are prorated to the Funds on the basis of relative net assets.
Foreign Currency Translation — The books and records of the Funds investing in international securities are maintained in U.S. dollars on the following basis:
(I) market value of investment securities, assets and liabilities at the current rate of exchange; and
(II) purchases and sales of investment securities, income and expenses at the relevant rates of exchange prevailing on the respective dates of such transactions.
The Funds do not isolate that portion of gains and losses on investments in equity securities that is due to changes in the foreign exchange rates from that which is due to changes in market prices of equity securities.
The Funds report certain foreign-currency-related transactions as components of realized gains for financial reporting purposes, whereas such components are treated as ordinary income for Federal income tax purposes.
Repurchase Agreements — To the extent consistent with its investment objective and strategies, a Fund may enter into repurchase agreements which are secured by obligations of the U.S. Government with a bank, broker-dealer or other financial institution. Each repurchase agreement is at least 102% collateralized and marked-to-market. However, in the event of default or bankruptcy by the counterparty to the repurchase agreement, realization of the collateral may by subject to certain costs, losses or delays.
Futures Contracts — To the extent consistent with its investment objective and strategies, a Fund may use futures contracts for tactical hedging purposes as well as to enhance the Fund’s returns. These Funds’ investments in futures contracts are designed to enable the Funds to more closely approximate the performance of their benchmark indices. Initial margin deposits of cash or securities are made upon entering into futures contracts. The contracts are marked-to-market daily and the resulting changes in value are accounted for as unrealized gains and losses. Variation margin payments are paid or received, depending upon whether unrealized gains or losses are incurred. When contracts are closed, the Funds record a realized gain or loss equal to the difference between the proceeds from (or cost of) the closing transaction and the amount invested in the contract.
Risks of entering into futures contracts include the possibility that there will be an imperfect price correlation between the futures and the underlying securities. Second, it is possible that a lack of liquidity for futures contracts could exist in the secondary market, resulting in an inability to close a position prior to its maturity date. Third, futures contracts involve the risk that a Fund could lose more than the original margin deposit required to initiate a futures transaction.
| | |
| 62 | | New Covenant Funds / Annual Report / June 30, 2020 |
Finally, the risk exists that losses could exceed amounts disclosed on the Statements of Assets and Liabilities. Refer to each Fund’s Schedule of Investments for details regarding open futures contracts as of June 30, 2020, if applicable.
Options Writing/Purchasing — To the extent consistent with its investment objective and strategies, a Fund may invest in financial options contracts for the purpose of hedging its existing portfolio securities, or securities that a Fund intends to purchase, against fluctuations in fair market value caused by changes in prevailing market interest rates. A Fund may also invest in financial option contracts to enhance its returns. When the Fund writes or purchases an option, an amount equal to the premium received or paid by the Fund is recorded as a liability or an asset and is subsequently adjusted to the current market value of the option written or purchased. Premiums received or paid from writing or purchasing options which expire unexercised are treated by the Fund on the expiration date as realized gains or losses. The difference between the premium and the amount paid or received on affecting a closing purchase or sale transaction, including brokerage commissions, is also treated as a realized gain or loss. If an option is exercised, the premium paid or received is added to the cost of the purchase or proceeds from the sale in determining whether the Fund has realized a gain or a loss.
The risk in writing a call option is a Fund may give up the opportunity for profit if the market price of the security increases. The risk in writing a put option is a Fund may incur a loss if the market price of the security decreases and the option is exercised. The risk in purchasing an option is a Fund may pay a premium whether or not the option is exercised. The Funds also have the additional risk of being unable to enter into a closing transaction at an acceptable price if a liquid secondary market does not exist. Option contracts also involve the risk that they may not work as intended due to unanticipated developments in market conditions or other causes.
Forward Treasury Commitments — To the extent consistent with its investment objective and strategies, the Growth Fund and Income Fund may invest in commitments to purchase U.S. Treasury securities on an extended settlement basis. Such transactions involve the commitment to purchase a security with payment and delivery taking place in the future, sometimes a month or more after the transaction date. The Funds account for such transactions as purchases and sales and record an unrealized gain or loss each day equal to the difference between the cost of the purchase commitment and the current market value. Realized gains or losses are recorded upon closure or settlement of such commitments. No interest is earned prior to settlement of the transaction. These instruments are subject to market fluctuation due to changes in interest rates and the market value at the time of settlement could be higher or lower than the purchase price. A Fund may incur losses due to changes in the value of the underlying treasury securities from interest rate fluctuations or as a result of counterparty nonperformance. These transactions may increase the overall investment exposure for a Fund (and so may also create investment leverage) and involve a risk of loss if the value of the securities declines prior to the settlement date.
Master Limited Partnerships — To the extent consistent with its investment objective and strategies, a Fund may invest in entities commonly referred to as “MLPs” that are generally organized under state law as limited partnerships or limited liability companies. The Funds intend to primarily invest in MLPs receiving partnership taxation treatment under the Internal Revenue Code of 1986 (the “Code”), and whose interests or “units” are traded on securities exchanges like shares of corporate stock. To be treated as a partnership for U.S. federal income tax purposes, an MLP whose units are traded on a securities exchange must receive at least 90% of its income from qualifying sources such as interest, dividends, real estate rents, gain from the sale or disposition of real property, income and gain from mineral or natural resources activities, income and gain from the transportation or storage of certain fuels, and, in certain circumstances, income and gain from commodities or futures, for- wards and options with respect to commodities. Mineral or natural resources activities include exploration, development, production, processing, mining, refining, marketing and transportation (including pipelines) of oil and gas, minerals, geothermal energy, fertilizer, timber or industrial source carbon dioxide. An MLP consists of a general partner and limited partners (or in the case of MLPs organized as limited liability companies, a managing member and members). The general partner or managing member typically controls the operations and management of the MLP and has an ownership stake in the partnership. The limited partners or members, through their ownership of limited partner or member interests, provide capital to the entity, are intended to have no role in the operation and management of the entity and receive cash distributions. The MLPs themselves generally do not pay U.S. Federal income taxes. Thus, unlike investors in corporate securities, direct MLP investors are generally not subject to double taxation (i.e., corporate level tax and tax on corporate dividends). Currently, most MLPs operate in the energy and/or natural resources sector.
Delayed Delivery Transactions — To the extent consistent with its investment objective and strategies, the Growth Fund and Income Fund may purchase or sell securities on a when-issued or delayed delivery basis. These
| | | | |
New Covenant Funds / Annual Report / June 30, 2020 | | | 63 | |
NOTES TO FINANCIAL STATEMENTS (Continued)
June 30, 2020
transactions involve a commitment by those Funds to purchase or sell securities for a predetermined price or yield, with payment and delivery taking place beyond the customary settlement period. When delayed delivery purchases are outstanding, the Funds will set aside liquid assets in an amount sufficient to meet the purchase price. When purchasing a security on a delayed delivery basis, that Fund assumes the rights and risks of ownership of the security, including the risk of price and yield fluctuations, and takes such fluctuations into account when determining its net asset value. Those Funds may dispose of or renegotiate a delayed delivery transaction after it is entered into, and may sell when-issued securities before they are delivered, which may result in a capital gain or loss. When those Funds have sold a security on a delayed delivery basis, that Fund does not participate in future gains and losses with respect to the security.
Dividends and Distributions to Shareholders — Dividends from net investment income are declared and paid to shareholders quarterly for the Growth Fund, Balanced Growth Fund and Balanced Income Fund; declared and paid monthly for the Income Fund. Dividends and distributions are recorded on the ex-dividend date. Any net realized capital gains will be distributed at least annually by the Funds.
Illiquid Securities — A security is considered illiquid if it cannot be sold or disposed of in the ordinary course of business within seven days or less for its approximate carrying value on the books of a Fund. Valuations of illiquid securities may differ significantly from the values that would have been used had an active market value for these securities existed. As of June 30, 2020, the Funds did not own any illiquid securities.
Investments in Real Estate Investment Trusts (“REITs”) — Dividend income is recorded based on the income included in distributions received from the REIT investments using published REIT reclassifications including some management estimates when actual amounts are not available. Distributions received in excess of this estimated amount are recorded as a reduction of the cost of investments or reclassified to capital gains. The actual amounts of income, return of capital, and capital gains are only determined by each REIT after its fiscal year-end, and may differ from the estimated amounts.
3. AGREEMENTS AND OTHER TRANSACTIONS WITH AFFILIATES
Administration Agreement — The Trust entered into an Administration Agreement with SEI Investments Global Funds Services (the “Administrator”). Under the Administration Agreement, the Administrator provides administrative and accounting services to the Funds. The Administrator has voluntarily agreed to waive a portion of its fee so that the total annual expenses of the Balanced Growth Fund and the Balanced Income Fund, exclusive of acquired fund fees and expenses, will not exceed certain voluntary expense limitations adopted by the Adviser. Accordingly, effective April 1, 2017, the voluntary expense limitations are 0.13% and 0.15% for the Balanced Growth Fund and the Balanced Income Fund, respectively. These voluntary waivers may be terminated by the adviser at any time. The following is a summary of annual fees payable to the Administrator:
| | | | | | | | | | |
| | | First $2.5 Billion | | Next $500 Million | | Over $3 Billion | | | | |
Growth Fund | | 0.2000% | | 0.1650% | | 0.1200% |
| | | | | |
| | | First $1.5 Billion | | Next $500 Million | | Next $500 Million | | Next $500 Million | | Over $3 Billion |
Income Fund | | 0.2000% | | 0.1775% | | 0.1550% | | 0.1325% | | 0.1100% |
Balanced Growth Fund | | 0.1500% | | 0.1375% | | 0.1250% | | 0.1125% | | 0.1000% |
Balanced Income Fund | | 0.1500% | | 0.1375% | | 0.1250% | | 0.1125% | | 0.1000% |
Transfer Agent Servicing Agreement — In 2008, the Trust entered into a transfer agent servicing agreement (“Agreement”) with U.S. Bancorp Fund Services, LLC (“USBFS”), an indirect, wholly-owned subsidiary of U.S. Bancorp. Under the terms of the Agreement, USBFS is entitled to account based fees and annual fund level fees, as well as reimbursement of out-of-pocket expenses incurred in providing transfer agency services.
Investment Advisory Agreement — The Trust, on behalf of each Fund, entered into an Investment Advisory Agreement (“Agreement”) with SEI Investments Management Corporation (the “Adviser”). Under the Agreement, the Adviser is responsible for the investment management of the Funds and receives an annual advisory fee of 0.47% for the Growth Fund and 0.42% for the Income Fund. The Adviser does not receive an advisory fee for the Balanced Growth Fund and Balanced Income Fund. The Adviser has voluntarily agreed to waive a portion of its fee so that the total annual expenses of the Growth and Income Funds, exclusive of acquired fund fees and expenses, will not exceed certain voluntary expense limitations adopted by the Adviser. Accordingly, effective April 1, 2017, the
| | |
| 64 | | New Covenant Funds / Annual Report / June 30, 2020 |
voluntary expense limitation is 0.80% for the Income Fund. The voluntary expense limitation for the Growth Fund was 0.87% until May 13, 2019 when the voluntary expense limitation was changed to 0.72%.
The Adviser has entered into sub-advisory agreements to assist in the selection and management of investment securities in the Growth Fund and the Income Fund. It is the responsibility of the sub-advisers, under the direction of the Adviser, to make day-to-day investment decisions for these Funds. The Adviser, not the Funds, pays each sub-adviser a quarterly fee, in arrears, for their services. The Adviser pays sub-advisory fees directly from its own advisory fee. The sub-advisory fees are based on the assets of the Fund allocated to the sub-adviser for which the sub- adviser is responsible for making investment decisions.
The following is the sub-adviser for the Growth Fund: Parametric Portfolio Associates LLC.
The following are the sub-advisers for the Income Fund: Income Research & Management, Western Asset Management Company and Western Asset Management Company Limited.
Shareholder Service Plan and Agreement — The Trust entered into a Shareholder Service Plan and Agreement (the “Agreement”) with the Distributor. Per the Agreement, a Fund is authorized to make payments to certain entities which may include investment advisors, banks, trust companies and other types of organizations (“Authorized Service Providers”) for providing administrative services with respect to shares of the Funds attributable to or held in the name of the Authorized Service Providers for its clients or other parties with whom they have a servicing relationship. Under the terms of the Agreement, the Growth Fund and the Income Funds are authorized to pay an Authorized Service Provider a shareholder servicing fee at an annual rate of up to 0.10% of the average daily net asset value of the Growth Fund and Income Fund, respectively, which fee will be computed daily and paid monthly, for providing certain administrative services to Fund shareholders with whom the Authorized Service Provider has a servicing relationship.
Distribution Agreement — The Trust issues shares of the Funds pursuant to a Distribution Agreement with SEI Investments Distribution Co. (the “Distributor”), a wholly-owned subsidiary of SEI Investments Company (“SEI”). The Funds do not compensate the Distributor in its capacity as principal distributor.
Social Witness Services and License Agreement — The Trust retained New Covenant Trust Company (“NCTC”) to ensure that each Fund continues to invest consistent with social witness principles adopted by the General Assembly of the Presbyterian Church (U.S.A.). No less than annually, NCTC will provide the Trust with an updated list of issuers in which the Funds will be prohibited from investing.
NCTC will distribute to the Trust proxy voting guidelines and shareholder advocacy services for the Funds that NCTC deems to be consistent with social witness principles adopted by the General Assembly of the Presbyterian Church (U.S.A.). The Trust also engages NCTC to vote Fund proxies consistent with such proxy voting guidelines. NCTC shall monitor and review and, as necessary, amend the Proxy Voting Guidelines periodically to ensure that they remain consistent with the social witness principles.
NCTC also grants to the Trust a non-exclusive right and license to use and refer to the trade name, trademark and/ or service mark rights to the name “New Covenant Funds” and the phrase “Funds with a Mission”, in the name of the Trust and each Fund, and in connection with the offering, marketing, promotion, management and operation of the Trust and the Funds.
In consideration of the services provided by NCTC, the Growth Fund and the Income Fund will each pay to NCTC a fee at an annual rate of 0.15% of the average daily net asset value of the shares of such Fund, which fee will be computed daily and paid monthly.
Payment to Affiliates — Certain officers and/or interested trustees of the Trust are also officers of the Distributor, the Adviser, the Administrator or NCTC. The Trust pays each unaffiliated Trustee an annual fee for attendance at quarterly and interim board meetings. Compensation of officers and affiliated Trustees of the Trust is paid by the Adviser, the Administrator or NCTC.
A portion of the services provided by the Chief Compliance Officer (“CCO”) and his staff, whom are employees of the Administrator, are paid for by the Trust as incurred. The services include regulatory oversight of the Trust’s Adviser, sub-advisers and service providers as required by SEC regulations. The CCO’s services have been approved by and are reviewed annually by the Board.
| | | | |
New Covenant Funds / Annual Report / June 30, 2020 | | | 65 | |
NOTES TO FINANCIAL STATEMENTS (Continued)
June 30, 2020
Investment in Affiliated Security — The Funds may invest excess cash in the SEI Daily Income Trust (SDIT) Government Fund, an affiliated money market fund. The Balanced Funds invest in the Growth Fund and Income Fund.
Interfund Lending — The SEC has granted an exemption that permits the Trust to participate in an interfund lending program (the ‘‘Program’’) with existing or future investment companies registered under the 1940 Act that are advised by SIMC (the ‘‘SEI Funds’’). The Program allows the SEI Funds to lend money to and borrow money from each other for temporary or emergency purposes. Participation in the Program is voluntary for both borrowing and lending funds. Interfund loans may be made only when the rate of interest to be charged is more favorable to the lending fund than an investment in overnight repurchase agreements (‘‘Repo Rate’’), and more favorable to the borrowing fund than the rate of interest that would be charged by a bank for short-term borrowings (‘‘Bank Loan Rate’’). The Bank Loan Rate will be determined using a formula reviewed annually by the SEI Funds’ Board of Trustees. The interest rate imposed on interfund loans is the average of the Repo Rate and the Bank Loan Rate. During the year ended June 30, 2020, the Trust did not participate in interfund lending.
4. DERIVATIVE TRANSACTIONS
The International Swaps and Derivatives Association, Inc. Master Agreements and Credit Support Annexes (“ISDA Master Agreements”) maintain provisions for general obligations, representations, agreements, collateral, and events of default or termination. The occurrence of a specified event of termination may give a counterparty the right to terminate all of its contracts and affect settlement of all outstanding transactions under the applicable ISDA Master Agreement.
To reduce counterparty risk with respect to Over The Counter (“OTC”) transactions, the Funds have entered into master netting arrangements, established within the Funds’ ISDA master agreements, which allow the Funds to make (or to have an entitlement to receive) a single net payment in the event of default (close-out netting) for outstanding payables and receivables with respect to certain OTC positions in swaps for each individual counterparty. In addition, the Funds may require that certain counterparties post cash and/or securities in collateral accounts to cover their net payment obligations for those derivative contracts subject to ISDA Master Agreements. If the counterparty fails to perform under these contracts and agreements, the cash and/or securities will be made available to the Funds.
For financial reporting purposes, the Funds do not offset derivative assets and derivative liabilities that are subject to netting arrangements in the Statement of Assets and Liabilities and therefore disclose these derivative assets and derivative liabilities on a gross basis. Bankruptcy or insolvency laws of a particular jurisdiction may impose restrictions on or prohibitions against the right of offset in bankruptcy, insolvency or other events.
Collateral terms are contract specific for OTC derivatives. For derivatives traded under an ISDA Master Agreement, the collateral requirements are typically calculated by netting the mark to market amount of each transaction under such agreement and comparing that amount to the value of any collateral currently pledged by the Funds or the counterparty. For financial reporting purposes, cash collateral that has been pledged to cover obligations of the Funds, if any, is reported separately on the Statement of Assets and Liabilities as cash pledged as collateral. Non-cash collateral pledged by the Funds, if any, is noted in the Schedules of Investments. Generally, the amount of collateral due from or to a party must exceed a minimum transfer amount threshold before a transfer has to be made. To the extent amounts due to the Funds from its counterparties are not fully collateralized, contractually or otherwise, the Funds bear the risk of loss from counterparty nonperformance.
The following is a summary of the variation margin of exchange-traded financial derivative instruments of the Funds as of June 30, 2020 ($Thousands):
| | | | | | |
| | | Financial Derivative Asset | | | | Financial Derivative Liability |
| | | Variation Margin Asset | | | | Variation Margin Liability |
| Fund | | Futures | | | | Futures |
Growth Fund | | $96 | | | | $— |
Income Fund | | $102 | | | | $38 |
Cash with a total market value of $569 and 825 ($Thousands) for the Growth Fund and Income Fund, respectively, has been pledged as collateral for exchange-traded derivative instruments as of June 30, 2020.
| | |
| 66 | | New Covenant Funds / Annual Report / June 30, 2020 |
The following table discloses the volume of the Fund’s futures contracts activity during the year ended June 30, 2020 ($Thousands):
| | | | | | | | | | | | |
| | | Growth Fund | | | | | Income Fund | | | |
Futures Contracts: | | | | | | | | | | | | |
Equity Contracts | | | | | | | | | | | | |
Average Notional Balance Long | | $ | 9,077 | | | | | $ | 111,600 | | | |
Average Notional Balance Short | | | — | | | | | | 81,986 | | | |
Ending Notional Balance Long | | | 7,158 | | | | | | 108,779 | | | |
Ending Notional Balance Short | | | — | | | | | | 137,415 | | | |
Options: | | | | | | | | | | | | |
Equity Contracts | | | | | | | | | | | | |
Average Notional Balance Long | | $ | — | | | | | $ | 24 | | | |
Average Notional Balance Short | | | — | | | | | | 61 | | | |
Ending Notional Balance Long | | | — | | | | | | — | | | |
Ending Notional Balance Short | | | — | | | | | | — | | | |
For the year ended June 30, 2020, the Funds held only interest rate risk derivatives. Additional information can be found on the Schedules of Investments, Statements of Assets and Liabilities, and Statements of Operations.
5. INVESTMENT TRANSACTIONS
The cost of security purchases and the proceeds from the sale and maturities of securities, excluding U.S. government and other short-term investments, for the year ended June 30, 2020, were as follows:
| | | | | | | | | | | | | | | | |
| Fund | | Purchases (excluding Short-Term Investments & U.S. Government Securities) ($ Thousands) | | | Sales (excluding Short-Term Investments & U.S. Government Securities) ($ Thousands) | | | Purchases of U.S. Government Securities ($ Thousands) | | | Sales of U.S. Government Securities ($ Thousands) | |
Growth Fund | | | $80,097 | | | | $97,374 | | | | $ — | | | | $ — | |
Income Fund | | | 62,455 | | | | 49,974 | | | | 416,835 | | | | 446,430 | |
Balanced Growth Fund | | | 63,315 | | | | 71,926 | | | | — | | | | — | |
Balanced Income Fund | | | 14,690 | | | | 17,145 | | | | — | | | | — | |
6. FEDERAL TAX INFORMATION
It is each Fund’s intention to continue to qualify as a regulated investment company under Subchapter M of the Internal Revenue Code and distribute all of its taxable income (including net capital gains). Accordingly, no provision for federal income tax is required.
Dividends from net investment income and distributions from net realized capital gains are determined in accordance with U.S. Federal income tax regulations, which may differ from those amounts determined under U.S. GAAP. These book/tax differences are either temporary or permanent in nature. To the extent these differences are permanent, they are charged or credited to paid-in capital or distributable earnings (loss), as appropriate, in the period that the differences arise.
The permanent differences primarily consist of reclassification of capital gain distribution on REITs and RICs, investments in publicly traded partnerships, and gains and losses on paydowns of mortgage and asset-backed securities for tax purposes. There are no permanent difference that are credited or charged to Paid-in Capital and Distributable Earnings as of June 30, 2020.
| | | | |
New Covenant Funds / Annual Report / June 30, 2020 | | | 67 | |
NOTES TO FINANCIAL STATEMENTS (Continued)
June 30, 2020
The tax character of dividends and distributions paid during the last two years ended June 30 were as follows:
| | | | | | | | | | | | | | | | | | | | |
| | | | | | |
| | | | | | Ordinary Income ($ Thousands) | | | Long Term Capital Gains ($ Thousands) | | | Total Taxable Deductions ($ Thousands) | | | Total Distributions Paid ($ Thousands) | |
Growth Fund | | | 2020 | | | | $ 5,915 | | | | $ 19,117 | | | | $ 25,032 | | | | $ 25,032 | |
| | | 2019 | | | | 5,700 | | | | 25,395 | | | | 31,095 | | | | 31,095 | |
Income Fund | | | 2020 | | | | 7,695 | | | | — | | | | 7,695 | | | | 7,695 | |
| | | 2019 | | | | 7,780 | | | | — | | | | 7,780 | | | | 7,780 | |
Balanced Growth Fund | | | 2020 | | | | 7,282 | | | | 9,767 | | | | 17,049 | | | | 17,049 | |
| | | 2019 | | | | 5,632 | | | | 12,003 | | | | 17,635 | | | | 17,635 | |
Balanced Income Fund | | | 2020 | | | | 1,809 | | | | 1,370 | | | | 3,179 | | | | 3,179 | |
| | | 2019 | | | | 1,606 | | | | 2,554 | | | | 4,160 | | | | 4,160 | |
As of June 30, 2020, the components of distributable earnings (accumulated losses) were as follows:
| | | | | | | | | | | | | | | | | | | | | | | | | | | | | | | | | | | | | | | | | | | | | | | | | | | | | | | | |
| | | | | | Undistributed Ordinary Income ($ Thousands) | | | | | | Undistributed Long-Term Capital Gain ($ Thousands) | | | | | | Capital Loss Carryforwards ($ Thousands) | | | | | | Post- October Losses ($ Thousands) | | | | | | Unrealized Appreciation (Depreciation) ($ Thousands) | | | | | | Other Temporary Differences ($ Thousands) | | | | | | Total Distributable Earnings (Accumulated Losses) ($ Thousands) | |
Growth Fund | | $ | | | | | 2,663 | | | $ | | | | | 8,820 | | | $ | | | | | — | | | $ | | | | | — | | | $ | | | | | 124,030 | | | $ | | | | | 3 | | | $ | | | | | 135,516 | |
Income Fund | | | | | | | 3,377 | | | | | | | | — | | | | | | | | — | | | | | | | | — | | | | | | | | 13,840 | | | | | | | | (1,858 | ) | | | | | | | 15,359 | |
Balanced Growth Fund | | | | | | | 617 | | | | | | | | 11,699 | | | | | | | | — | | | | | | | | — | | | | | | | | 62,761 | | | | | | | | (1 | ) | | | | | | | 75,076 | |
Balanced Income Fund | | | | | | | 394 | | | | | | | | 1,178 | | | | | | | | — | | | | | | | | — | | | | | | | | 13,784 | | | | | | | | 2 | | | | | | | | 15,358 | |
During the year ended June 30, 2020, the Income Fund utilized capital loss carryforwards to offset capital gains of $1,950 ($Thousands).
For Federal income tax purposes, the cost of securities owned at June 30, 2020, and the net realized gains or losses on securities sold for the period were not materially different from amounts reported for financial reporting purposes. These differences are primarily due to wash sales, MLP basis adjustments and basis adjustments from investments in registered investment companies which cannot be used for Federal income tax purposes in the current year and have been deferred for use in future years.
The aggregate gross unrealized appreciation and depreciation on total investments held by the Funds at June 30, 2020 was as follows:
| | | | | | | | | | | | | | | | |
| | | Federal Tax Cost ($ Thousands) | | | Appreciated Securities ($ Thousands) | | | Depreciated Securities ($ Thousands) | | | Net Unrealized Appreciation (Depreciation) ($ Thousands) | |
Growth Fund | | | $ 334,555 | | | | $ 157,940 | | | $ | (33,908 | ) | | | $ 124,032 | |
Income Fund | | | 328,278 | | | | 15,666 | | | | (1,829) | | | | 13,837 | |
Balanced Growth Fund | | | 232,636 | | | | 62,761 | | | | — | | | | 62,761 | |
Balanced Income Fund | | | 64,937 | | | | 13,784 | | | | — | | | | 13,784 | |
Management has analyzed the Funds’ tax positions taken on Federal income tax returns for all open tax years and has concluded that as of June 30, 2020, no provision for income tax would be required in the Funds’ financial statements. The Funds’ Federal and state income and Federal excise tax returns for tax years for which the applicable statutes of limitations have not expired are subject to examination by the Internal Revenue Service and state departments of revenue.
7. CONCENTRATIONS/RISKS
In the normal course of business, the Trust enters into contracts that provide general indemnifications by the Trust to the counterparty to the contract. The Trust’s maximum exposure under these arrangements is dependent on future
| | |
| 68 | | New Covenant Funds / Annual Report / June 30, 2020 |
claims that may be made against the Trust and, therefore, cannot be estimated; however, management believes that, based on experience, the risk of loss from such claims is considered remote.
Asset Allocation Risk — The risk that SIMC’s decisions regarding the allocation of Fund assets to the Growth Fund and Income Fund will not anticipate market trends successfully.
Asset-Backed Securities Risk — Payment of principal and interest on asset-backed securities is dependent largely on the cash flows generated by the assets backing the securities. Securitization trusts generally do not have any assets or sources of funds other than the receivables and related property they own, and asset-backed securities are generally not insured or guaranteed by the related sponsor or any other entity. Asset-backed securities may be more illiquid than more conventional types of fixed income securities that the Fund may acquire.
Below Investment Grade Securities (Junk Bonds) Risk — Fixed income securities rated below investment grade (junk bonds) involve greater risks of default or downgrade and are generally more volatile than investment grade securities because the prospect for repayment of principal and interest of many of these securities is speculative. Because these securities typically offer a higher rate of return to compensate investors for these risks, they are sometimes referred to as “high yield bonds,” but there is no guarantee that an investment in these securities will result in a high rate of return. These risks may be increased in foreign and emerging markets.
Corporate Fixed Income Securities Risk — Corporate fixed income securities respond to economic developments, especially changes in interest rates, as well as perceptions of the creditworthiness and business prospects of individual issuers.
Credit Risk — The risk that the issuer of a security or the counterparty to a contract will default or otherwise become unable to honor a financial obligation.
Duration Risk — The longer-term securities in which the Fund may invest are more volatile. A portfolio with a longer average portfolio duration is more sensitive to changes in interest rates than a portfolio with a shorter average portfolio duration.
Economic Risks of Global Health Events — Global health events and pandemics, such as COVID-19, have the ability to affect—quickly, drastically and substantially the economies of many nations, states, individual companies and the markets in general and can cause disruptions that cannot necessarily be foreseen. The spread of COVID-19 around the world in 2020 resulted in a substantial number of nations implementing social distancing measures, quarantines, and the shutdown of non-essential businesses and governmental services. Further, it has caused significant volatility in U.S. and international markets. The impact of the outbreak may be short term or may last for an extended period of time.
Equity Market Risk — The risk that the market value of a security may move up and down, sometimes rapidly and unpredictably. Market risk may affect a single issuer, an industry, a sector or the equity or bond market as a whole.
Extension Risk — The risk that rising interest rates may extend the duration of a fixed income security, typically reducing the security’s value.
Fixed Income Market Risk — The prices of the Fund’s fixed income securities respond to economic developments, particularly interest rate changes, as well as to perceptions about the creditworthiness of individual issuers, including governments and their agencies. Generally, the Fund’s fixed income securities will decrease in value if interest rates rise and vice versa. In a low interest rate environment, risks associated with rising rates are heightened. In the case of foreign securities, price fluctuations will reflect international economic and political events, as well as changes in currency valuations relative to the U.S. dollar.
Foreign Investment/Emerging Markets Risk — The risk that non-U.S. securities may be subject to additional risks due to, among other things, political, social and economic developments abroad, currency movements and different legal, regulatory and tax environments. These additional risks may be heightened with respect to emerging market countries because political turmoil and rapid changes in economic conditions are more likely to occur in these countries.
Foreign Sovereign Debt Securities Risk — The risks that (i) the governmental entity that controls the repayment of sovereign debt may not be willing or able to repay the principal and/or interest when it becomes due because of factors such as debt service burden, political constraints, cash flow problems and other national economic factors; (ii) governments may default on their debt securities, which may require holders of such securities to participate in debt
| | | | |
New Covenant Funds / Annual Report / June 30, 2020 | | | 69 | |
NOTES TO FINANCIAL STATEMENTS (Concluded)
June 30, 2020
rescheduling or additional lending to defaulting governments; and (iii) there is no bankruptcy proceeding by which defaulted sovereign debt may be collected in whole or in part.
Interest Rate Risk — The risk that a rise in interest rates will cause a fall in the value of fixed income securities, including U.S. Government securities, in which the Fund invests. A low interest rate environment may present greater interest rate risk, because there may be a greater likelihood of rates increasing and rates may increase more rapidly.
Investment Style Risk — The risk that the equity securities in which the Fund invests may underperform other segments of the equity markets or the equity markets as a whole.
Liquidity Risk — The risk that certain securities may be difficult or impossible to sell at the time and the price that the Fund would like. The Fund may have to accept a lower price to sell a security, sell other securities to raise cash or give up an investment opportunity, any of which could have a negative effect on Fund management or performance.
Mortgage-Backed Securities Risk — Mortgage-backed securities are affected significantly by the rate of prepayments and modifications of the mortgage loans backing those securities, as well as by other factors such as borrower defaults, delinquencies, realized or liquidation losses and other shortfalls. Mortgage-backed securities are particularly sensitive to prepayment risk, which is described below, given that the term to maturity for mortgage loans is generally substantially longer than the expected lives of those securities; however, the timing and amount of prepayments cannot be accurately predicted. The timing of changes in the rate of prepayments of the mortgage loans may significantly affect the Fund’s actual yield to maturity on any mortgage-backed securities, even if the average rate of principal payments is consistent with the Fund’s expectation. Along with prepayment risk, mortgage-backed securities are significantly affected by interest rate risk, which is described above. In a low interest rate environment, mortgage loan prepayments would generally be expected to increase due to factors such as refinancings and loan modifications at lower interest rates. In contrast, if prevailing interest rates rise, prepayments of mortgage loans would generally be expected to decline and therefore extend the weighted average lives of mortgage-backed securities held or acquired by the Fund.
Opportunity Risk — The risk of missing out on an investment opportunity because the assets necessary to take advantage of it are tied up in other investments.
Portfolio Turnover Risk — Due to its investment strategy, the Fund may buy and sell securities frequently. This may result in higher transaction costs and additional capital gains tax liabilities, which may affect the Fund’s performance.
Prepayment Risk — The risk that, in a declining interest rate environment, fixed income securities with stated interest rates may have the principal paid earlier than expected, requiring the Fund to invest the proceeds at generally lower interest rates.
Repurchase Agreement Risk — Although repurchase agreement transactions must be fully collateralized at all times, they generally create leverage and involve some counterparty risk to the Fund whereby a defaulting counterparty could delay or prevent the Fund’s recovery of collateral.
Small Capitalization Risk — Smaller capitalization companies in which the Fund may invest may be more vulnerable to adverse business or economic events than larger, more established companies. In particular, small capitalization companies may have limited product lines, markets and financial resources and may depend upon a relatively small management group. Therefore, small capitalization stocks may be more volatile than those of larger companies. Small capitalization stocks may be traded over-the-counter or listed on an exchange.
Social-Witness Principles/Socially Responsible Investing Risk — The Fund considers various social- witness principles and other socially responsible investing principles in its investment process and may choose not to purchase, or may sell, otherwise profitable investments in companies which have been identified as being in conflict with its established social-witness principles and other socially responsible investing principles. This means that the Fund may underperform other similar mutual funds that do not consider social-witness principles and other socially responsible investing principles in their investing.
U.S. Government Securities Risk — Although U.S. Government securities are considered to be among the safest investments, they are not guaranteed against price movements due to changing interest rates. Obligations issued by some U.S. Government agencies are backed by the U.S. Treasury, while others are backed solely by the ability of the agency to borrow from the U.S. Treasury or by the agency’s own resources.
The Balanced Growth Fund and Balanced Income Fund invest their assets primarily in the Growth Fund and the Income Fund. By investing primarily in shares of these Funds, shareholders of the Balanced Funds indirectly pay a
| | |
| 70 | | New Covenant Funds / Annual Report / June 30, 2020 |
portion of the operating expenses, management fees and brokerage costs of the underlying Funds as well as their own operating expenses. Thus, shareholders of the Balanced Funds may indirectly pay slightly higher total operating expenses and other costs than they would pay by directly owning shares of the Growth Fund and Income Fund. A change in the asset allocation of either Balanced Fund could increase or reduce the fees and expenses actually borne by investors in that Fund. The Balanced Funds are also subject to rebalancing risk. Rebalancing activities, while undertaken to maintain a Fund’s investment risk-to- reward ratio, may cause the Fund to under-perform other funds with similar investment objectives. For the Balanced Growth Fund, it is possible after rebalancing from equities into a greater percentage of fixed-income securities, that equities will outperform fixed income investments. For the Balanced Income Fund, it is possible that after rebalancing from fixed-income securities into a greater percentage of equity securities, that fixed-income securities will outperform equity investments. The performance of the Balanced Growth Fund and the Balanced Income Fund depends on the performance of the underlying Funds in which they invest.
8. CONCENTRATION OF SHAREHOLDERS
On June 30, 2020, the number of shareholders below held the following percentage of the outstanding shares of the Funds. These shareholders are affiliated with the Funds.
| | | | |
| | | |
| | | # of Shareholders | | % of Outstanding Shares |
Growth Fund | | 3 | | 77.78% |
Income Fund | | 3 | | 82.29% |
Balanced Growth Fund | | 1 | | 0.00% |
Balanced Income Fund | | 1 | | 0.61% |
9. ACCOUNTING PRONOUNCEMENT
In August 2018, The FASB issued Accounting Standards Update 2018-13, Fair Value Measurement (Topic 820). The new guidance includes additions and modifications to disclosures requirements for fair value measurements. For public entities, the amendments are effective for financial statements issued for fiscal years beginning after December 15, 2019, and interim periods within those fiscal years. Management elected to early adopt the removal and modifications of certain disclosures and delay the adoption of additional disclosures until the effective date.
10. SUBSEQUENT EVENTS
Management has evaluated the need for disclosures and/or adjustments resulting from subsequent events through the date the financial statements were issued. Based on this evaluation, no disclosures and/or adjustments were required to the financial statements as of June 30, 2020.
| | | | |
New Covenant Funds / Annual Report / June 30, 2020 | | | 71 | |
REPORT OF INDEPENDENT REGISTERED PUBLIC ACCOUNTING FIRM
To the Shareholders of the Funds and Board of Trustees
New Covenant Funds:
Opinion on the Financial Statements
We have audited the accompanying statements of assets and liabilities of New Covenant Funds (the “Trust”), comprised of the New Covenant Growth Fund, New Covenant Income Fund, New Covenant Balanced Growth Fund, and New Covenant Balanced Income Fund (collectively, the “Funds”), including the schedules of investments, as of June 30, 2020, the related statements of operations for the year then ended, the statements of changes in net assets for each of the years in the two-year period then ended, and the related notes (collectively, the financial statements) and the financial highlights for each of the years in the five-year period then ended. In our opinion, the financial statements and financial highlights present fairly, in all material respects, the financial position of the Funds as of June 30, 2020, the results of their operations for the year then ended, the changes in their net assets for each of the years in the two year period then ended, and the financial highlights for each of the years in the five-year period then ended, in conformity with U.S. generally accepted accounting principles.
Basis for Opinion
These financial statements and financial highlights are the responsibility of the Funds’ management. Our responsibility is to express an opinion on these financial statements and financial highlights based on our audits. We are a public accounting firm registered with the Public Company Accounting Oversight Board (United States) (“PCAOB”) and are required to be independent with respect to the Funds in accordance with the U.S. federal securities laws and the applicable rules and regulations of the Securities and Exchange Commission and the PCAOB.
We conducted our audits in accordance with the standards of the PCAOB. Those standards require that we plan and perform the audits to obtain reasonable assurance about whether the financial statements and financial highlights are free of material misstatement, whether due to error or fraud. Our audits included performing procedures to assess the risks of material misstatement of the financial statements and financial highlights, whether due to error or fraud, and performing procedures that respond to those risks. Such procedures included examining, on a test basis, evidence regarding the amounts and disclosures in the financial statements and financial highlights. Such procedures also included confirmation of securities owned as of June 30, 2020, by correspondence with the custodians, transfer agents, and brokers or by other appropriate auditing procedures when replies from brokers were not received. Our audits also included evaluating the accounting principles used and significant estimates made by management, as well as evaluating the overall presentation of the financial statements and financial highlights. We believe that our audits provide a reasonable basis for our opinion.

We have served as the auditor of one or more SEI Funds investment companies since 2005.
Philadelphia, Pennsylvania
August 28, 2020
| | |
| 72 | | New Covenant Funds / Annual Report / June 30, 2020 |
TRUSTEES AND OFFICERS OF THE TRUST (Unaudited)
The following chart lists Trustees and Officers as of June 30, 2020.
Set forth below are the names, addresses, ages, position with the Trust, Term of Office and Length of Time Served, the principal occupations for the last five years, number of positions in fund complex overseen by trustee, and other directorships outside the fund complex of each of the persons currently serving as Trustees and Officers of the Trust. The Trust’s Statement of Additional Information (“SAI”) includes additional information about the Trustees and Officers. The SAI may be obtained without charge by calling 1-877-835-4531.
| | | | | | | | | | |
Name, Address, and Age | | Position(s) Held with Trusts | | Term of Office and Length of Time Served1 | | Principal Occupation(s) During Past Five Years | | Number of Portfolios in Fund Complex Overseen by Trustee2 | | Other Directorships Held by Trustee |
INTERESTED TRUSTEES | | | | | | | | |
Robert A. Nesher One Freedom Valley Drive Oaks, PA 19456 73 yrs. old | | Chairman
of the
Board of
Trustees* | | since 1995 | | Currently performs various services on behalf of SEI for which Mr. Nesher is compensated. | | 98 | | President and Director of SEI Structured Credit Fund, LP. Director of SEI Global Master Fund plc, SEI Global Assets Fund plc, SEI Global Investments Fund plc, SEI Investments—Global Funds Services, Limited, SEI Investments Global, Limited, SEI Investments (Europe) Ltd., SEI Multi-Strategy Funds PLC, SEI Global Nominee Ltd and SEI Investments—Unit Trust Management (UK) Limited. President, Director and Chief Executive Officer of SEI Alpha Strategy Portfolios, LP from 2007 to 2013. Trustee of SEI Liquid Asset Trust from 1989 to 2016. Vice Chairman of O’Connor EQUUS (closed-end investment company) from 2014 to 2016. Vice Chairman of Winton Series Trust from 2014 to 2017. Vice Chairman of The Advisors’ Inner Circle Fund III and Winton Diversified Opportunities Fund (closed-end investment company) from 2014 to 2018. Vice Chairman of Gallery Trust, Schroder Series Trust and Schroder Global Series Trust from 2015 to 2018. Trustee of The Advisors’ Inner Circle Fund, The Advisors’ Inner Circle Fund II, Bishop Street Funds, and the KP Funds. President, Chief Executive Officer and Trustee of SEI Asset Allocation Trust, SEI Daily Income Trust, SEI Institutional Managed Trust, SEI Institutional International Trust, SEI Institutional Investments Trust, SEI Tax Exempt Trust, SEI Insurance Products Trust, Adviser Managed Trust, The New Covenant Funds and SEI Catholic Values Trust. |
William M. Doran One Freedom Valley Drive Oaks, PA 19456 80 yrs. old | | Trustee* | | since 1995 | | Self-employed consultant since 2003.Partner, Morgan, Lewis & Bockius LLP (law firm) from 1976 to 2003, counsel to the Trust, SEI, SIMC, the Administrator and the Distributor. | | 98 | | Director of SEI since 1974; Secretary of SEI since 1978. Director of SEI Investments Distribution Co. since 2003. Director of SEI Investments—Global Funds Services, Limited, SEI Investments Global, Limited, SEI Investments (Europe), Limited, SEI Investments (Asia) Limited, SEI Global Nominee Ltd. and SEI Investments—Unit Trust Management (UK) Limited. Trustee of SEI Liquid Asset Trust from 1982 to 2016. Trustee of O’Connor EQUUS from 2014 to 2016. Director of SEI Alpha Strategy Portfolios, LP from 2007 to 2013. Trustee of The Advisors’ Inner Circle Fund, The Advisors’ Inner Circle Fund II, The Advisors’ Inner Circle Fund III, Winton Series Trust, Winton Diversified Opportunities Fund, Gallery Trust, Bishop Street Funds, SEI Asset Allocation Trust, SEI Daily Income Trust, SEI Institutional Managed Trust, SEI Institutional International Trust, SEI Institutional Investments Trust, SEI Tax Exempt Trust, SEI Insurance Products Trust, Adviser Managed Trust, New Covenant Funds, The KP Funds and SEI Catholic Values Trust. |
TRUSTEES | | | | | | | | | | |
George J. Sullivan Jr. One Freedom Valley Drive, Oaks, PA 19456 77 yrs. old | | Trustee | | since 1996 | | Retired since January 2012. Self-Employed Consultant, Newfound Consultants Inc. April 1997-December 2011. | | 98 | | Member of the independent review committee for SEI’s Canadian-registered mutual funds. Director of SEI Opportunity Fund, L.P. to 2010. Director of SEI Alpha Strategy Portfolios, LP from 2007 to 2013. Trustee of SEI Liquid Asset Trust from 1996 to 2016. Trustee/Director of State Street Navigator Securities Lending Trust, The Advisors’ Inner Circle Fund, The Advisors’ Inner Circle Fund II, Bishop Street Funds, SEI Structured Credit Fund, LP, SEI Asset Allocation Trust, SEI Daily Income Trust, SEI Institutional Managed Trust, SEI Institutional International Trust, SEI Institutional Investments Trust, SEI Tax Exempt Trust, SEI Insurance Products Trust, Adviser Managed Trust, New Covenant Funds, The KP Funds and SEI Catholic Values Trust. |
| * | Messrs. Nesher and Doran are Trustees who may be deemed as “interested” persons of the Trust as that term is defined in the 1940 Act by virtue of their affiliation with SIMC and the Trust’s Distributor. |
| 1 | Each trustee shall hold office during the lifetime of this Trust until the election and qualification of his or her successor, or until he or she sooner dies, resigns or is removed in accordance with the Trust’s Declaration of Trust |
| 2 | The Fund Complex includes the following Trusts: SEI Asset Allocation Trust, SEI Daily Income Trust, SEI Institutional Investments Trust, Adviser Managed Trust, SEI Institutional International Trust, SEI Institutional Managed Trust, SEI Tax Exempt Trust, SEI Insurance Products Trust, SEI Catholic Values Trust and New Covenant Funds. |
| | | | |
New Covenant Funds / Annual Report / June 30, 2020 | | | 73 | |
TRUSTEES AND OFFICERS OF THE TRUST (Unaudited) (Concluded)
| | | | | | | | | | |
Name Address, and Age | | Position(s)
Held with
Trusts | | Term of Office and
Length of Time Served1 | | Principal Occupation(s) During Past Five Years | | Number of
Portfolios in Fund Complex Overseen
by Trustee2 | | Other Directorships Held by Trustee |
TRUSTEES (continued) | | | | | | | | |
Nina Lesavoy One Freedom Valley Drive, Oaks, PA 19456 62 yrs. old | | Trustee | | since 2003 | | Founder and Managing Director, Avec Capital (strategic fundraising firm) since 2008. Managing Director, Cue Capital (strategic fundraising firm) from March 2002-March 2008. | | 98 | | Director of SEI Alpha Strategy Portfolios, LP from 2007 to 2013. Trustee of SEI Liquid Asset Trust from 2003 to 2016. Trustee/Director of SEI Structured Credit Fund, L.P., SEI Asset Allocation Trust, SEI Daily Income Trust, SEI Institutional Managed Trust, SEI Institutional International Trust, SEI Institutional Investments Trust, SEI Tax Exempt Trust, SEI Insurance Products Trust, New Covenant Funds, Adviser Managed Trust and SEI Catholic Values Trust. |
James M. Williams One Freedom Valley Drive, Oaks, PA 19456 72 yrs. old | | Trustee | | since 2004 | | Vice President and Chief Investment Officer, J. Paul Getty Trust, Non-Profit Foundation for Visual Arts, since December 2002. President, Harbor Capital Advisors and Harbor Mutual Funds, 2000-2002. Director of SEI Alpha Strategy Portfolios, L.P. from 2007 to 2013. Manager, Pension Asset Management, Ford Motor Company, 1997-1999. | | 98 | | Director of SEI Alpha Strategy Portfolios, LP from 2007 to 2013, Trustee of SEI Liquid Asset Trust from 2004 to 2016. Trustee/Director of Ariel Mutual Funds, SEI Structured Credit Fund, LP, SEI Asset Allocation Trust, SEI Daily Income Trust, SEI Institutional Managed Trust, SEI Institutional International Trust, SEI Institutional Investments Trust, SEI Tax Exempt Trust, New Covenant Funds, SEI Insurance Products Trust, Adviser Managed Trust and SEI Catholic Values Trust. |
Mitchell A. Johnson One Freedom Valley Drive, Oaks, PA 19456 78 yrs. old | | Trustee | | since 2007 | | Retired Private Investor since 1994. | | 98 | | Director, Federal Agricultural Mortgage Corporation (Farmer Mac) since 1997. Director of SEI Alpha Strategy Portfolios, LP from 2007 to 2013. Trustee of SEI Liquid Asset Trust from 2007 to 2016. Trustee of the Advisors’ Inner Circle Fund, The Advisors’ Inner Circle Fund II, Bishop Street Funds, SEI Asset Allocation Trust, SEI Daily Income Trust, SEI Institutional Managed Trust, SEI Institutional International Trust, SEI Institutional Investments Trust, SEI Tax Exempt Trust, SEI Insurance Products Trust, Adviser Managed Trust, The KP Funds and SEI Catholic Values Trust. |
Hubert L. Harris, Jr. One Freedom Valley Drive, Oaks, PA 19456 76 yrs. old | | Trustee | | since 2008 | | Retired since December 2005. Owner of Harris Plantation, Inc. since 1995. Chief Executive Officer of Harris CAPM, a consulting asset and property management entity. Chief Executive Officer, INVESCO North America, August 2003-December 2005. Chief Executive Officer and Chair of the Board of Directors, AMVESCAP Retirement, Inc., January 1998- August 2003. | | 98 | | Director of AMVESCAP PLC from 1993-2004. Served as a director of a bank holding company, 2003-2009. Director, Aaron’s Inc., 2012-present. President and CEO of Oasis Ornamentals LLC since 2011. Member of the Board of Councilors of the Carter Center (nonprofit corporation) and served on the board of other non-profit organizations. Director of SEI Alpha Strategy Portfolios, LP from 2008 to 2013. Trustee of Liquid Asset Trust from 2008 to 2016. Trustee of SEI Asset Allocation Trust, SEI Daily Income Trust, SEI Institutional Managed Trust, SEI Institutional International Trust, SEI Institutional Investments Trust, SEI Tax Exempt Trust, SEI Insurance Products Trust, New Covenant Funds, Adviser Managed Trust and SEI Catholic Values Trust. |
Susan C. Cote One Freedom Valley Drive Oaks, PA 19456 65 years old | | Trustee | | since 2016 | | Retired since July 2015. Americas Director of Asset Management, Ernst & Young LLP from 2006-2013. Global Asset Management Assurance Leader, Ernest & Young LLP from 2006- 2015. Partner Ernest & Young LLP from 1997-2015. Prudential, 1983-1997. Member of the Ernst & Young LLP Retirement Investment Committee, Treasurer and Chair of Finance, Investment and Audit Committee of the New York Women’s Foundation. | | 98 | | Trustee of SEI Tax Exempt Trust, SEI Daily Income Trust, SEI Institutional International Trust, SEI Institutional Managed Trust, SEI Asset Allocation Trust, SEI Institutional Investments Trust, SEI Insurance Products Trust, New Covenant Funds, Adviser Managed Trust and SEI Catholic Values Trust. |
James B. Taylor One Freedom Valley Drive Oaks, PA 19456 69 years old | | Trustee | | since 2018 | | Retired since December 2017. Chief Investment Officer at Georgia Teach Foundation from 2008 to 2017. Chief Investment Officer at Delta Air Lines from 1983 to 2007. Member of the Investment Committee at the Institute of Electrical and Electronic Engineers from 1999 to 2004. President, Vice President and Treasurer at Southern Benefits Conference from 1998 to 2000. | | 98 | | Trustee of SEI Daily Income Trust, SEI Tax Exempt Trust, SEI Institutional Managed Trust, SEI Institutional International Trust, SEI Institutional Investments Trust, SEI Asset Allocation Trust, Adviser Managed Trust, New Covenant Funds, SEI Insurance Products Trust and SEI Catholic Values Trust. |
Christine Reynolds One Freedom Valley Drive Oaks, PA 19456 61 years old | | Trustee | | since 2019 | | Retired since December 2016. Executive Vice President, Fidelity Investments from 2014-2016. President, Fidelity Pricing and Cash Management Services and Chief Financial Officer of Fidelity Funds from 2008-2014. Chief Operating Officer, Fidelity Pricing and Cash Management Services from 2007-2018. President and Treasurer, Fidelity Funds from 2004-2007. Anti-Money Laundering Officer, Fidelity Funds in 2004. Executive Vice President, Fidelity Funds from 2002-2004. Audit Partner, PricewaterhouseCoopers from 1992-2002. | | 98 | | Trustee of SEI Daily Income Trust, SEI Tax Exempt Trust, SEI Institutional Managed Trust, SEI Institutional International Trust, SEI Institutional Investments Trust, SEI Asset Allocation Trust, Adviser Managed Trust, New Covenant Funds, SEI Insurance Products Trust and SEI Catholic Values Trust. |
| 1 | Each trustee shall hold office during the lifetime of this Trust until the election and qualification of his or her successor, or until he or she sooner dies, resigns or is removed in accordance with the Trust’s Declaration of Trust. |
| 2 | The Fund Complex includes the following Trusts: SEI Asset Allocation Trust, SEI Daily Income Trust, SEI Institutional Investments Trust, Adviser Managed Trust, SEI Institutional International Trust, SEI Institutional Managed Trust, SEI Tax Exempt Trust, SEI Insurance Products Trust, SEI Catholic Values Trust and New Covenant Funds. |
| | |
| 74 | | New Covenant Funds / Annual Report / June 30, 2020 |
| | | | | | | | | | | | |
Name Address, and Age | | Position(s) Held with Trusts | | | Term of Office and Length of Time Served1 | | Principal Occupation(s) During Past Five Years | | Number of Portfolios in Fund Complex Overseen by Trustee2 | | Other Directorships Held by Trustee |
OFFICERS | | | | | | | | | | | | |
Robert A. Nesher One Freedom Valley Drive, Oaks, PA 19456 73 yrs. Old | |
| President
and CEO |
| | since 2005 | | Currently performs various services on behalf of SEI for which Mr. Nesher is compensated. | | N/A | | N/A |
Peter Rodriguez One Freedom Valley Drive Oaks, PA 19456 58 yrs. old | |
| Controller
and Chief
Financial
Officer |
| | since 2020 | | Director, Fund Accounting, SEI Investments Global Funds Services since April 2020 and previously from March 2011 to March 2015; Director, Financial Reporting from June 2017 to March 2020. Director, Centralized Operations from March 2015 to June 2017. | | N/A | | N/A |
Glenn R. Kurdziel One Freedom Valley Drive Oaks, PA 19456 46 yrs. old | |
| Assistant
Controller |
| | since 2017 | | Assistant Controller, Funds Accounting, SEI Investments Global Funds Services (March 2017); Senior Manager, Funds Accounting, SEI Investments Global Funds Services since 2005. | | N/A | | N/A |
Russell Emery One Freedom Valley Drive Oaks, PA 19456 57 yrs. old | |
| Chief
Compliance
Officer |
| | since 2006 | | Chief Compliance Officer of SEI Daily Income Trust, SEI Institutional Investments Trust, SEI Institutional Managed Trust, SEI Asset Allocation Trust, SEI Institutional International Trust, SEI Tax Exempt Trust, The Advisors’ Inner Circle Fund, The Advisors’ Inner Circle Fund II and Bishop Street Funds since March 2006. Chief Compliance Officer of SEI Liquid Asset Trust from 2006 to 2016. Chief Compliance Officer of SEI Structured Credit Fund, LP June 2007. Chief Compliance Officer of Adviser Managed Trust since December 2010. Chief Compliance Officer of SEI Alpha Strategy Portfolios, LP from 2007 to 2013. Chief Compliance Officer of New Covenant Funds since February 2012. Chief Compliance Officer of SEI Insurance Products Trust and The KP Funds since 2013. Chief Compliance Officer of New Covenant Funds since February 2012. Chief Compliance Officer of O’Connor EQUUS from 2014 to 2016. Chief Compliance Officer of The Advisors’ Inner Circle Fund III, Winton Series Trust and Winton Diversified Opportunities Fund since 2014. Chief Compliance Officer of SEI Catholic Values Trust and Gallery Trust since 2015. | | N/A | | N/A |
Timothy D Barto One Freedom Valley Drive Oaks, PA 19456 52 yrs. old | |
| Vice
President
and
Secretary |
| | since 2002 | | Vice President and Secretary of SEI Institutional Transfer Agent, Inc. since 2009. General Counsel and Secretary of SIMC and the Administrator since 2004. Vice President of SIMC and the Administrator since 1999. Vice President and Assistant Secretary of SEI since 2001. | | N/A | | N/A |
Aaron Buser One Freedom Valley Drive, Oaks, PA 19456 49 yrs. old | |
| Vice
President
and
Assistant
Secretary |
| | since 2008 | | Vice President and Assistant Secretary of SEI Institutional Transfer Agent, Inc. since 2009. Vice President and Assistant Secretary of SIMC since 2007. Attorney Stark & Stark (law firm), March 2004 - July 2007. | | N/A | | N/A |
David F. McCann One Freedom Valley Drive, Oaks, PA 19456 44 yrs. old | |
| Vice
President
and
Assistant
Secretary |
| | since 2009 | | Vice President and Assistant Secretary of SEI Institutional Transfer Agent, Inc. since 2009. Vice President and Assistant Secretary of SIMC since 2008. Attorney, Drinker Biddle & Reath, LLP (law firm), May 2005 - October 2008. | | N/A | | N/A |
Stephen G. MacRae One Freedom Valley Drive, Oaks, PA 19456 52 yrs. old | |
| Vice
President |
| | since 2012 | | Director of Global Investment Product Management January 2004 - to present. | | N/A | | N/A |
Bridget E. Sudall One Freedom Valley Drive Oaks, PA 19456 39 yrs. old | |
| Anti-Money
Laundering
Compliance
Officer and
Privacy
Officer |
| | since 2015 | | Anti-Money Laundering Compliance Officer and Privacy Officer (since 2015), Senior Associate and AML Officer, Morgan Stanley Alternative Investment Partners, April 2011 -March 2015, Investor Services Team Lead, Morgan Stanley Alternative Investment Partners, July 2007 - April 2011. | | N/A | | N/A |
| 1 | Each trustee shall hold office during the lifetime of this Trust until the election and qualification of his or her successor, or until he or she sooner dies, resigns or is removed in accordance with the Trust’s Declaration of Trust. |
| 2 | The Fund Complex includes the following Trusts: SEI Asset Allocation Trust, SEI Daily Income Trust, SEI Institutional Investments Trust, Adviser Managed Trust, SEI Institutional International Trust, SEI Institutional Managed Trust, SEI Tax Exempt Trust, SEI Insurance Products Trust, SEI Catholic Values Trust and New Covenant Funds. |
| | | | |
New Covenant Funds / Annual Report / June 30, 2020 | | | 75 | |
DISCLOSURE OF FUND EXPENSES
June 30, 2020
All mutual funds have operating expenses. As a shareholder of a mutual fund, your investment is affected by these ongoing costs, which include (among others) costs for portfolio management, administrative services, and shareholder reports like this one. It is important for you to understand the impact of these costs on your investment returns.
Operating expenses such as these are deducted from the mutual fund‘s gross income and directly reduce its final investment return. These expenses are expressed as a percentage of the mutual fund’s average net assets; this percentage is known as the mutual fund’s expense ratio.
The following examples use the expense ratio and are intended to help you understand the ongoing costs (in dollars) of investing in your Fund and to compare these costs with those of other mutual funds. The examples are based on an investment of $1,000 made at the beginning of the period shown and held for the entire period (December 31, 2019 to June 30, 2020).
The table on this page illustrates your Fund’s costs in two ways:
Actual Fund Return: This section helps you to estimate the actual expenses after fee waivers that your Fund incurred over the period. The “Expenses Paid During Period” column shows the actual dollar expense cost incurred by a $1,000 investment in the Fund, and the “Ending Account Value” number is derived from deducting that expense cost from the Fund’s gross investment return.
You can use this information, together with the actual amount you invested in your Fund, to estimate the expenses you paid over that period. Simply divide your actual starting account value by $1,000 to arrive at a ratio (for example, an $8,600 account value divided by $1,000 = 8.6), then multiply that ratio by the number shown for your Fund under “Expenses Paid During Period.”
Hypothetical 5% Return: This section helps you compare your Fund’s costs with those of other mutual funds. It assumes that your Fund had an annual 5% return before expenses during the year, but that the expense ratio (Column 3) is unchanged. This example is useful in making comparisons because the Securities and Exchange Commission requires all mutual funds to make this 5% calculation. You can assess your Fund’s comparative cost by comparing the hypothetical result for your Fund in the “Expenses Paid During Period” column with those that appear in the same charts in the shareholder reports for other mutual funds.
NOTE: Because the return is set at 5% for comparison purposes — NOT your Fund’s actual return — the account values shown do not apply to your specific investment.
| | | | | | | | | | | | | | | | |
| | | Beginning Account Value 1/1/2020 | | | Ending Account Value 6/30/20 | | | Annualized Expense Ratios | | | Expenses Paid During Period* | |
Growth Fund | | | | | | | | | | | | | | | | |
Actual Fund Return | | | $1,000.00 | | | | $968.80 | | | | 0.72 | % | | | $3.52 | |
Hypothetical 5% Return | | | $1,000.00 | | | | $1,021.28 | | | | 0.72 | % | | | $3.62 | |
Income Fund | | | | | | | | | | | | | | | | |
Actual Fund Return | | | $1,000.00 | | | | $1,039.90 | | | | 0.80 | % | | | $4.06 | |
Hypothetical 5% Return | | | $1,000.00 | | | | $1,020.89 | | | | 0.80 | % | | | $4.02 | |
Balanced Growth Fund | | | | | | | | | | | | | | | | |
Actual Fund Return | | | $1,000.00 | | | | $1,004.90 | | | | 0.13 | % | | | $0.65 | |
Hypothetical 5% Return | | | $1,000.00 | | | | $1,024.22 | | | | 0.13 | % | | | $0.65 | |
Balanced Income Fund | | | | | | | | | | | | | | | | |
Actual Fund Return | | | $1,000.00 | | | | $1,021.50 | | | | 0.15 | % | | | $0.75 | |
Hypothetical 5% Return | | | $1,000.00 | | | | $1,024.12 | | | | 0.15 | % | | | $0.75 | |
| * | Expenses are equal to the Fund’s annualized expense ratio multiplied by the average account value over the period, multiplied by 182/366 (to reflect the one-half year period shown). |
| † | Excludes expenses of the underlying affiliated investment companies. |
| | |
| 76 | | New Covenant Funds / Annual Report / June 30, 2020 |
REVIEW OF LIQUIDITY RISK MANAGEMENT PROGRAM (Unaudited)
Pursuant to Rule 22e-4 under the 1940 Act, the Trust, on behalf of the Funds, has adopted a liquidity risk management program (the “Program”) to govern the Trust’s approach to managing liquidity risk. The Program is overseen by the SIMC Liquidity Risk Oversight Committee, and the Program’s principal objectives include assessing, managing and periodically reviewing each Fund’s liquidity risk, based on factors specific to the circumstances of the Fund.
At a meeting of the Board held on March 24, 2020, the Trustees received a report from the SIMC Liquidity Risk Oversight Committee addressing the operations of the Program and assessing its adequacy and effectiveness of implementation. The SIMC Liquidity Risk Oversight Committee determined, and reported to the Board, that the Program is reasonably designed to assess and manage each Fund’s liquidity risk and has operated adequately and effectively to manage each Fund’s liquidity risk since the Program was implemented on December 1, 2018. The SIMC Liquidity Risk Oversight Committee reported that during the period covered by the report, there were no liquidity events that impacted the Funds or their ability to timely meet redemptions without dilution to existing shareholders. The SIMC Liquidity Risk Oversight Committee further noted that no material changes have been made to the Program since its implementation.
There can be no assurance that the Program will achieve its objectives in the future. Please refer to the prospectus for more information regarding a Fund’s exposure to liquidity risk and other principal risks to which an investment in the Funds may be subject.
| | | | |
New Covenant Funds / Annual Report / June 30, 2020 | | | 77 | |
BOARD OF TRUSTEES CONSIDERATIONS IN APPROVING THE ADVISORY AND SUB-ADVISORY AGREEMENTS (UNAUDITED)
New Covenant Funds (the “Trust”) and SEI Investments Management Corporation (“SIMC”) have entered into an investment advisory agreement (the “Advisory Agreement”), pursuant to which SIMC provides investment advisory services to the series of the Trust (the “Funds”). Pursuant to separate sub-advisory agreements with SIMC (the “Sub-Advisory Agreements” and, together with the Advisory Agreement, the “Investment Advisory Agreements”), and under the supervision of SIMC and the Trust’s Board of Trustees (the “Board”), the sub-advisers (each, a “Sub-Adviser” and collectively, the “Sub-Advisers”) provide security selection and certain other advisory services with respect to all or a discrete portion of the assets of the Funds. The Sub-Advisers are also responsible for managing their employees who provide services to the Funds. The Sub-Advisers are selected based primarily upon the research and recommendations of SIMC, which evaluates quantitatively and qualitatively the Sub-Advisers’ skills and investment results in managing assets for specific asset classes, investment styles and strategies.
The Investment Company Act of 1940, as amended (the “1940 Act”), requires that the initial approval of a Fund’s Investment Advisory Agreements be specifically approved by the vote of a majority of the outstanding shareholders of the Funds and the vote of a majority of the Trustees who are not parties to the Investment Advisory Agreements or “interested persons” of any party (the “Independent Trustees”) cast in person at a meeting called for such purpose. In addition, the 1940 Act requires that the continuation or renewal of any Investment Advisory Agreement be approved at least annually (after an initial period of up to two years), which also requires the vote of a majority of the Board, including a majority of the Independent Trustees. In the case of the initial approval of a Sub-Advisory Agreement, only the approval of a majority of the Board, including a majority of the Independent Trustees, is required, pursuant to an exemptive order that has been granted to the Trust by the Securities and Exchange Commission. In connection with their consideration of such initial approvals and renewals, the Funds’ Trustees must request and evaluate, and SIMC and the Sub-Advisers are required to furnish, such information as may be reasonably necessary to evaluate the terms of the Investment Advisory Agreements. In addition, the Securities and Exchange Commission takes the position that, as part of their fiduciary duties with respect to a mutual fund’s fees, mutual fund boards are required to evaluate the material factors applicable to a decision to approve an investment advisory agreement.
Consistent with these responsibilities, the Board calls and holds meetings each year to consider whether to approve new and/or renew existing Investment Advisory Agreements between the Trust and SIMC and SIMC and the Sub-Advisers with respect to the Funds of the Trust. In preparation for these meetings, the Board requests and reviews a wide variety of materials provided by SIMC and the Sub-Advisers, including information about SIMC’s and the Sub-Advisers’ affiliates, personnel and operations and the services provided pursuant to the Investment Advisory Agreements. The Board also receives data from third parties. This information is provided in addition to the detailed information about the Funds that the Board reviews during the course of each year, including information that relates to Fund operations and Fund performance. The Trustees also receive a memorandum from counsel regarding the responsibilities of Trustees in connection with their consideration of whether to approve the Trust’s Investment Advisory Agreements. Finally, the Independent Trustees receive advice from independent counsel to the Independent Trustees, meet in executive sessions outside the presence of Fund management and participate in question and answer sessions with representatives of SIMC and the Sub-Advisers.
Specifically, during the course of the Trust’s fiscal year, the Board requested and received written materials from SIMC and the Sub-Advisers regarding: (i) the quality of SIMC’s and the Sub-Advisers’ investment management and other services; (ii) SIMC’s and the Sub-Advisers’ investment management personnel; (iii) SIMC’s and the Sub-Advisers’ operations and financial condition; (iv) SIMC’s and the Sub-Advisers’ brokerage practices (including any soft dollar arrangements) and investment strategies; (v) the level of the advisory fees that SIMC charges the Funds and the level of the sub-advisory fees that SIMC pays the Sub-Advisers, compared with fees each charge to comparable accounts; (vi) the advisory fees charged by SIMC and the Funds’ overall fees and operating expenses compared with peer groups of mutual funds prepared by Broadridge, an independent provider of investment company data; (vii) the level of SIMC’s and the Sub-Advisers’ profitability from their Fund-related operations; (viii) SIMC’s and the Sub-Advisers’ compliance program, including a description of material compliance matters and material compliance violations; (ix) SIMC’s potential economies of scale; (x) SIMC’s and the Sub-Advisers’ policies on and compliance procedures for personal securities transactions; (xi) SIMC’s and the Sub-Advisers’ expertise and resources in domestic and/or international financial markets; and (xii) the Funds’ performance over various periods of time compared with peer groups of mutual funds prepared by Broadridge and the Funds’ benchmark indexes.
At the March 23-25, 2020 meeting of the Board, the Trustees, including a majority of the Independent Trustees, approved the renewal of the Advisory Agreement. Also, each Sub-Advisory Agreement was either initially approved
| | |
| 78 | | New Covenant Funds / Annual Report / June 30, 2020 |
or, if the Sub-Advisory Agreement was already in effect (unless operating under an initial two-year term), renewed at meetings of the Board held during the course of the Trust’s fiscal year on September 10-11, 2019, December 3-4, 2019 and June 23-24, 2020. In each case, the Board’s approval (or renewal) was based on its consideration and evaluation of the factors described above, as discussed at the meetings and at prior meetings. The following discusses some, but not all, of the factors that were considered by the Board in connection with its assessment of the Investment Advisory Agreements.
Nature, Extent and Quality of Services. The Board considered the nature, extent and quality of the services provided by SIMC and the Sub-Advisers to the Funds and the resources of SIMC and the Sub-Advisers and their affiliates dedicated to the Funds. In this regard, the Trustees evaluated, among other things, SIMC’s and each Sub-Adviser’s personnel, experience, track record and compliance program. Following evaluation, the Board concluded that, within the context of its full deliberations, the nature, extent and quality of services provided by SIMC and the Sub-Advisers to the Funds and the resources of SIMC and the Sub-Advisers and their affiliates dedicated to the Funds were sufficient to support the renewal of the Investment Advisory Agreements. In addition to advisory services, the Board considered the nature and quality of certain administrative, transfer agency and other non-investment advisory services provided to the Funds by SIMC and/or its affiliates.
Performance. In determining whether to renew SIMC’s Advisory Agreement, the Trustees considered the Funds’ performance relative to their peer groups and appropriate indexes/benchmarks. The Trustees reviewed performance information for each Fund, noting that they receive performance reports that permit them to monitor each Fund’s performance at board meetings throughout the year. As part of this review, the Trustees considered the composition of each peer group and selection criteria. In assessing Fund performance, the Trustees considered a report compiled by Broadridge, an independent third-party that was engaged to prepare an assessment of the Funds in connection with the renewal of the Advisory Agreement (the “Broadridge Report”). The Broadridge Report included metrics on risk analysis, volatility versus total return, net total return and performance consistency for the Funds and a universe of comparable funds. Based on the materials considered and discussed at the meetings, the Trustees found Fund performance satisfactory, or, where performance was materially below the benchmark and/or peer group, the Trustees were satisfied with the reasons provided to explain such performance. In connection with the approval or renewal of Sub-Advisory Agreements, the Board considered the performance of the Sub-Adviser relative to appropriate indexes/benchmarks. Following evaluation, the Board concluded that, within the context of its full deliberations, the performance of the Funds was sufficient to support renewal of SIMC’s Advisory Agreement, and the performance of each Sub-Adviser was sufficient to support approval or renewal of the Sub-Advisory Agreement.
Fees. With respect to the Funds’ expenses under the Investment Advisory Agreements, the Trustees considered the rate of compensation called for by the Investment Advisory Agreements and the Funds’ net operating expense ratios in comparison to those of the Funds’ respective peer groups. In assessing Fund expenses, the Trustees considered the information in the Broadridge Report, which included various metrics related to fund expenses, including, but not limited to, contractual management fees at various asset levels, actual management fees (including transfer agent expenses), and actual total expenses (including underlying fund expenses) for the Funds and a universe of comparable funds. Based on the materials considered and discussion at the meetings, the Trustees further determined that fees were either shown to be below the peer average in the comparative fee analysis, or that there was a reasonable basis for the fee level. The Trustees also considered the effects of SIMC’s and its affiliates voluntary waivers of management and other fees to prevent total Fund operating expenses from exceeding any applicable cap and concluded that SIMC, through waivers, has maintained the Funds’ net operating expenses at competitive levels for its distribution channels. In determining the appropriateness of fees, the Board also took into consideration the impact of fees incurred indirectly by the Funds as a result of investments into underlying funds, including funds from which SIMC or its affiliates earn fees. The Board also took into consideration compensation earned from the Funds by SIMC or its affiliates for non-advisory services, such as administration, transfer agency, shareholder services or brokerage, and considered whether SIMC and its affiliates may have realized other benefits from their relationship with the Funds, such as any research and brokerage services received under soft dollar arrangements. When considering fees paid to Sub-Advisers, the Board took into account the fact that the Sub-Advisers are compensated by SIMC and not by the Funds directly, and that such compensation with respect to any unaffiliated Sub-Adviser reflects an arms-length negotiation between the Sub-Adviser and SIMC. Following evaluation, the Board concluded that, within the context of its full deliberations, the expenses of the Funds are reasonable and supported renewal of the Investment Advisory Agreements. The Board also considered whether the Sub-Advisers and their affiliates may have realized other benefits from their relationship with the Funds, such as any research and brokerage services received under soft dollar arrangements.
| | | | |
New Covenant Funds / Annual Report / June 30, 2020 | | | 79 | |
BOARD OF TRUSTEES CONSIDERATIONS IN APPROVING THE ADVISORY AND SUB-ADVISORY AGREEMENTS (UNAUDITED) (Concluded)
Profitability. With regard to profitability, the Trustees considered compensation flowing to SIMC and the Sub-Advisers and their affiliates, directly or indirectly. The Trustees considered whether the levels of compensation and profitability were reasonable. As with the fee levels, when considering the profitability of the Sub-Advisers, the Board took into account the fact that compensation with respect to any unaffiliated Sub-Adviser reflects an arms-length negotiation between the Sub-Adviser and SIMC. In connection with the approval or renewal of each Sub-Advisory Agreement, the Board also took into consideration the impact that the fees paid to the Sub-Adviser have on SIMC’s advisory fee margin and profitability. Based on this evaluation, the Board concluded that, within the context of its full deliberations, the profitability of each of SIMC and the Sub-Advisers is reasonable and supported renewal of the Investment Advisory Agreements.
Economies of Scale. With respect to the Advisory Agreement, the Trustees considered whether any economies of scale were being realized by SIMC and its affiliates and, if so, whether the benefits of such economies of scale were passed along to the Funds’ shareholders through a graduated investment advisory fee schedule or other means, including any fee waivers by SIMC and its affiliates. The Trustees recognized that economies of scale are difficult to identify and quantify and are rarely identifiable on a fund-by-fund basis. Based on this evaluation, the Board determined that the fees were reasonable in light of the information that was provided by SIMC with respect to economies of scale.
Based on the Trustees’ deliberation and their evaluation of the information described above, the Board, including all of the Independent Trustees, with the assistance of Fund counsel and Independent Trustees’ counsel, unanimously approved the approval or renewal, as applicable, of the Investment Advisory Agreements and concluded that the compensation under the Investment Advisory Agreements is fair and reasonable in light of such services and expenses and such other matters as the Trustees considered to be relevant in the exercise of their reasonable judgment. In the course of its deliberations, the Board did not identify any particular factor (or conclusion with respect thereto) or single piece of information that was all-important, controlling or determinative of its decision, but considered all of the factors together, and each Trustee may have attributed different weights to the various factors (and conclusions with respect thereto) and information.
| | |
| 80 | | New Covenant Funds / Annual Report / June 30, 2020 |
NOTICE TO SHAREHOLDERS
For shareholders who do not have a June 30, 2020 taxable year end, this notice is for information purposes only. For shareholders with a June 30, 2020 taxable year end, please consult your tax adviser as to the pertinence of this notice.
For the fiscal year ended June 30, 2020, the Funds are designating long term and qualifying dividend income with regard to distributions paid during the year as follows:
| | | | | | | | | | | | | | | | |
| | | | | | | | | |
| Fund | | (A) Long Term Capital Gains Distributions (Tax Basis) | | (B) Ordinary Income | | Total Distributions (Tax Basis) | | (C) Dividends Qualifying for Corporate Dividends Rec. Deduction (1) | | (D) Qualifying Dividend Income (15% Tax Rate for QDI) (2) | | (E) U.S. Government Interest (3) | | Interest Related Dividends (4) | | Short-Term Capital Gain Dividends (5) |
New Covenant Growth Fund | | 76.37% | | 23.63% | | 100.00% | | 97.71% | | 100.00% | | 0.00% | | 0.19% | | 100.00% |
New Covenant Income Fund | | 0.00% | | 100.00% | | 100.00% | | 0.00% | | 0.00% | | 4.65% | | 44.29% | | 0.00% |
New Covenant Balanced Growth Fund | | 57.29% | | 42.71% | | 100.00% | | 6.11% | | 5.93% | | 0.00% | | 0.00% | | 100.00% |
New Covenant Balanced Income Fund | | 43.11% | | 56.89% | | 100.00% | | 19.63% | | 20.60% | | 0.00% | | 0.00% | | 100.00% |
| | (1) | Qualifying dividends represent dividends which qualify for the corporate dividends received deduction. |
| | (2) | The percentage in this column represents the amount of ‘‘Qualifying Dividend Income’’ and is reflected as a percentage of ‘‘Ordinary Income Distributions.’’ It is the intention of each of the aforementioned Funds to designate the maximum amount permitted by law. The information reported herein may differ from the information and distributions taxable to the shareholders for the calendar year ending December 31, 2020. Complete information will be computed and reported in conjunction with your 2020 Form 1099-DIV. |
| | (3) | ‘‘U.S. Government Interest’’ represents the amount of interest that was derived from direct U.S. Government obligations and distributed during the fiscal year. This amount is reflected as a percentage of total ordinary income distributions (the total of short-term capital gain and net investment income distributions). Generally, interest from direct U.S. Government obligations is exempt from state income tax. However, for shareholders who are residents of California, Connecticut and New York, the statutory threshold requirements were not satisfied to permit exemption of these amounts from state income. |
| | (4) | The percentage in this column represents the amount of “Interest Related Dividends” and is reflected as a percentage of net investment income distributions that is exempt from U.S. withholding tax when paid to foreign investors. |
| | (5) | The percentage in this column represents the amount of “Short-Term Capital Gain Dividends” and is reflected as a percentage of short-term capital gain distributions that is exempt from U.S. withholding tax when paid to foreign investors. |
Items (A) and (B) are based on the percentage of each Fund’s total distribution.
Items (C) and (D) are based on the percentage of ordinary income distributions of each Fund. Item (E) is based on the percentage of gross income of each Fund.
Please consult your tax adviser for proper treatment of this information. This notification should be kept with your permanent tax records.
| | | | |
New Covenant Funds / Annual Report / June 30, 2020 | | | 81 | |
NEW COVENANT FUNDS ANNUAL REPORT JUNE 30, 2020
Robert A. Nesher, Chairman
Trustees
William M. Doran
George J. Sullivan, Jr.
Nina Lesavoy
James M. Williams
Mitchell A. Johnson
Hubert L. Harris, Jr.
Susan C. Cote
James B. Taylor
Christine Reynolds
Officers
Robert A. Nesher
President and Chief Executive Officer
Peter A. Rodriguez
Controller and Chief Financial Officer
Glenn R. Kurdziel
Assistant Controller
Russell Emery
Chief Compliance Officer
Timothy D. Barto
Vice President, Secretary
Aaron Buser
Vice President, Assistant Secretary
David F. McCann
Vice President, Assistant Secretary
Stephen G. MacRae
Vice President
Bridget E. Sudall
Anti-Money Laundering Compliance Officer
Privacy Officer
Investment Adviser
SEI Investments Management Corporation
Administrator
SEI Investments Global Funds Services
Distributor
SEI Investments Distribution Co.
Legal Counsel
Morgan, Lewis & Bockius LLP
Independent Registered Public Accounting Firm
KPMG LLP
This report and the financial statements contained herein are submitted for the general information of the shareholders of the Trust and must be preceded or accompanied by a current prospectus. Shares of the Funds are not deposits or obligations of, or guaranteed or endorsed by, any bank. The shares are not federally insured by the Federal Deposit Insurance Corporation (FDIC), the Federal Reserve Board, or any other government agency. Investment in the shares involves risk, including the possible loss of principal.
For more information call
New Covenant Fund
877-835-4531

NF-Annual (06/20)
The Registrant has adopted a code of ethics that applies to the Registrant’s principal executive officer, principal financial officer, principal accounting officer or controller, or persons performing similar functions.
| Item 3. | Audit Committee Financial Expert. |
(a) (1) The Registrant’s Board of Trustees has determined that the Registrant has three audit committee financial experts serving on the audit committee.
(a) (2) The audit committee financial experts are Susan Cote, George J. Sullivan, Jr. and Hubert L. Harris. Ms. Cote and Messrs. Sullivan and Harris are independent as defined in Form N-CSR Item 3 (a) (2).
| Item 4. | Principal Accountant Fees and Services. |
Fees billed by KPMG LLP (“KPMG”) related to the Registrant.
KPMG billed the Registrant aggregate fees for services rendered to the Registrant for the fiscal years 2020 and 2019 as follows:
| | | | | | | | | | | | | | |
| | | | | Fiscal Year 2020 | | Fiscal Year 2019 |
| | | | | All fees and
services to
the Registrant
that were
pre-approved | | All fees and
services to
service
affiliates that were
pre-approved | | All other fees
and services
to service
affiliates that
did not require
pre-approval | | All fees and
services to
the Registrant
that were
pre-approved | | All fees and
services to
service
affiliates
that were
pre-approved | | All other fees
and services
to service
affiliates that
did not require
pre-approval |
(a) | | Audit Fees(1) | | $69,330 | | N/A | | $0 | | $68,640 | | N/A | | $0 |
(b) | | Audit-Related Fees | | $0 | | $0 | | $0 | | $0 | | $0 | | $0 |
(c) | | Tax Fees | | $0 | | $0 | | $0 | | $0 | | $0 | | $0 |
(d) | | All Other Fees(2) | | $0 | | $417,252 | | $0 | | $0 | | $273,762 | | $0 |
Notes:
| (1) | Audit fees include amounts related to the audit of the Registrant’s annual financial statements and services normally provided by the accountant in connection with statutory and regulatory filings. |
| (2) | See Item 4(g) for a description of the services comprising the fees disclosed under this category. |
(e)(1) The Registrant’s Audit Committee has adopted and the Board of Trustees has ratified an Audit and Non-Audit Services Pre-Approval Policy (the “Policy”), which sets forth the procedures and the conditions pursuant to which services proposed to be performed by the independent auditor of the Registrant may be pre-approved. In any instance where services require pre-approval, the Audit Committee will consider
whether such services are consistent with SEC’s rules on auditor independence and whether the provision of such services would compromise the auditor’s independence.
The Policy provides that all requests or applications for proposed services to be provided by the independent auditor must be submitted to the Registrant’s Chief Financial Officer (“CFO”) and must include a detailed description of the services proposed to be rendered. The CFO will determine whether such services: (1) require specific pre-approval; (2) are included within the list of services that have received the general pre-approval of the Audit Committee pursuant to the Policy; or (3) have been previously pre-approved in connection with the independent auditor’s annual engagement letter for the applicable year or otherwise.
Requests or applications to provide services that require specific pre-approval by the Audit Committee will be submitted to the Audit Committee by the CFO. The Audit Committee has delegated specific pre-approval authority to either the Audit Committee Chair or financial experts, provided that the estimated fee for any such proposed pre-approved service does not exceed $100,000 and any pre-approval decisions are reported to the Audit Committee at its next regularly scheduled meeting.
Services that have received the general pre-approval of the Audit Committee are identified and described in the Policy. In addition, the Policy sets forth a maximum fee per engagement with respect to each identified service that has received general pre-approval. The Audit Committee will annually review and pre-approve the services that may be provided by the independent auditor during the following twelve months without obtaining specific pre-approval from the Audit Committee.
The Audit Committee will be informed by the CFO on a quarterly basis of all services rendered by the independent auditor.
All services to be provided by the independent auditor shall be provided pursuant to a signed written engagement letter with the Registrant, the investment advisor or applicable control affiliate (except that matters as to which an engagement letter would be impractical because of timing issues or because the matter is small may not be the subject of an engagement letter) that sets forth both the services to be provided by the independent auditor and the total fees (or the manner of their determination) to be paid to the independent auditor for those services.
In addition, the Audit Committee has determined to take additional measures on an annual basis to meet its responsibility to oversee the work of the independent auditor and to assure the auditor’s independence from the Registrant, such as reviewing a formal written statement from the independent auditor delineating all relationships between the independent auditor and the Registrant, and discussing with the independent auditor its methods and procedures for ensuring independence.
(e)(2) Percentage of fees billed applicable to non-audit services pursuant to waiver of pre-approval requirement were as follows:
| | | | |
| | | Fiscal
Year 2020 | | Fiscal
Year 2019 |
Audit-Related Fees | | 0% | | 0% |
Tax Fees | | 0% | | 0% |
All Other Fees | | 0% | | 0% |
(f) Not Applicable.
(g)(1) The aggregate non-audit fees and services billed by KPMG for the fiscal years 2020 and 2019 were $417,252 and $273,762, respectively. Non-audit fees consist of a service organization controls report review of fund accounting and administration operations and an attestation report in accordance with Rule 17Ad-13.
(h) During the past fiscal year, the Registrant’s principal accountant provided certain non-audit services to the Registrant’s investment adviser or to entities controlling, controlled by, or under common control with the Registrant’s investment adviser that provide ongoing services to the Registrant that were not subject to pre-approval pursuant to paragraph (c)(7)(ii) of Rule 2-01 of Regulation S-X. The Audit Committee of the Registrant’s Board of Trustees reviewed and considered these non-audit services provided by the Registrant’s principal accountant to the Registrant’s affiliates, including whether the provision of these non-audit services is compatible with maintaining the principal accountant’s independence.
| Item 5. | Audit Committee of Listed Registrants. |
Not applicable.
(a) The Schedules of Investments are included as part of the report to shareholders filed under Item 1 of this form.
| Item 7. | Disclosure of Proxy Voting Policies and Procedures for Closed-End Management Investment Companies. |
Not applicable.
| Item 8. | Portfolio Managers of Closed-End Management Investment Companies |
Not applicable.
| Item 9. | Purchases of Equity Securities by Closed-End Management Company and Affiliated Purchasers. |
Not applicable.
| Item 10. | Submission of Matters to a Vote of Security Holders. |
There have been no material changes to the procedures by which shareholders may recommend nominees to the Registrant’s Board of Trustees (the “Board”). The Registrant has a standing Governance Committee (the “Committee”) currently consisting of the Independent Trustees. The Committee is responsible for evaluating and recommending nominees for election to the Board. Pursuant to the Committee’s Charter, adopted on February 22, 2012, the Committee will review all shareholder recommendations for nominations to fill vacancies on the Board if such recommendations are submitted in writing and addressed to the Committee at the Registrant’s office.
| Item 11. | Controls and Procedures. |
(a) The Registrant’s principal executive and principal financial officers, or persons performing similar functions, have concluded that the Registrant’s disclosure controls and procedures (as defined in Rule 30a-3(c) under the Investment Company Act of 1940 (the “1940 Act”)) are effective, based on the evaluation of these controls and procedures required by Rule 30a-3(b) under the 1940 Act and Rules 13a-15(b) or 15d-15(b) under the Securities Exchange Act of 1934 as of a date within 90 days of the filing date of this report.
(b) There were no changes in the Registrant’s internal control over financial reporting (as defined in Rule 30a-3(d) under the 1940 Act) that occurred during the period covered by this report that have materially affected, or are reasonably likely to materially affect, the Registrant’s internal control over financial reporting.
| Item 12. | Disclosure of Securities Lending Activities for Closed-End Management Investment Companies |
Not applicable.
(a)(1) Code of Ethics attached hereto.
(a)(2) A separate certification for the principal executive officer and the principal financial officer of the Registrant as required by Rule 30a-2(a) under the Investment Company Act of 1940, are filed herewith.
(b) Officer certifications as required by Rule 30a-2(b) under the Investment Company Act of 1940, as amended also accompany this filing as exhibits.
SIGNATURES
Pursuant to the requirements of the Securities Exchange Act of 1934 and the Investment Company Act of 1940, the Registrant has duly caused this report to be signed on its behalf by the undersigned, thereunto duly authorized.
| | | | | | |
| | | | | | New Covenant Funds |
| | | |
| By | | | | | | /s/ Robert A. Nesher |
| | | | | | Robert A. Nesher |
| | | | | | President & CEO |
Date: September 4, 2020
Pursuant to the requirements of the Securities Exchange Act of 1934 and the Investment Company Act of 1940, this report has been signed below by the following persons on behalf of the Registrant and in the capacities and on the dates indicated.
| | | | | | |
| By | | | | | | /s/ Robert A. Nesher |
| | | | | | Robert A. Nesher |
| | | | | | President & CEO |
Date: September 4, 2020
| | | | | | |
| By | | | | | | /s/ Peter A. Rodriguez |
| | | | | | Peter A. Rodriguez |
| | | | | | Controller & CFO |
Date: September 4, 2020