UNITED STATES
SECURITIES AND EXCHANGE COMMISSION
Washington, D.C. 20549
FORM N-CSR
CERTIFIED SHAREHOLDER REPORT OF REGISTERED MANAGEMENT
INVESTMENT COMPANIES
Investment Company Act File Number 811-09025
New Covenant Funds
(Exact name of registrant as specified in charter)
SEI Investments
One Freedom Valley Drive
Oaks, PA 19456
(Address of principal executive offices) (Zip code)
Timothy D. Barto, Esq.
SEI Investments
One Freedom Valley Drive
Oaks, PA 19456
(Name and address of agent for service)
Registrant’s telephone number, including area code: 1-610-676-1000
Date of fiscal year end: June 30, 2023
Date of reporting period: June 30, 2023
Item 1. Reports to Stockholders.
 | NEW COVENANT FUNDS® |

June 30, 2023
ANNUAL REPORT
New Covenant Funds
❯ | New Covenant Growth Fund |
❯ | New Covenant Income Fund |
❯ | New Covenant Balanced Growth Fund |
❯ | New Covenant Balanced Income Fund |
Paper copies of the Funds’ shareholder reports are no longer sent by mail, unless you specifically request them from the Funds or from your financial intermediary, such as a broker-dealer or bank. Shareholder reports are available online and you will be notified by mail each time a report is posted on the Funds’ website and provided with a link to access the report online.
You may elect to receive all future reports in paper free of charge. If you invest through a financial intermediary, you can contact your financial intermediary to inform it that you wish to continue receiving paper copies of your shareholder reports. If you invest directly with the Funds, you can inform the Funds that you wish to continue receiving paper copies of your shareholder reports by calling 1-877-835-4531. Your election to receive reports in paper will apply to all funds held with the SEI Funds or your financial intermediary.
newcovenantfunds.com
TABLE OF CONTENTS
| Letter to Shareholders | 1 |
| Management’s Discussion and Analysis of Fund Performance | 8 |
| Schedules of Investments | 17 |
| Statements of Assets and Liabilities | 56 |
| Statements of Operations | 57 |
| Statements of Changes in Net Assets | 58 |
| Financial Highlights | 60 |
| Notes to Financial Statements | 64 |
| Report of Independent Registered Public Accounting Firm | 79 |
| Trustees and Officers of the Trust | 80 |
| Disclosure of Fund Expenses | 84 |
| Board of Trustees Considerations in Approving the Advisory and Sub-Advisory Agreements | 85 |
| Notice to Shareholders | 88 |
The Trust files its complete schedule of portfolio holdings with the Securities and Exchange Commission for the first and third quarters of each fiscal year as an exhibit to its reports on Form N-PORT. The Trust’s Form N-PORT reports are available on the Commission’s website at http://www.sec.gov.
A description of the policies and procedures that the Trust uses to determine how to vote proxies relating to portfolio securities, as well as information relating to how a Fund voted proxies relating to portfolio securities during the most recent 12-month period ended June 30, is available (i) without charge, upon request, by calling 1-877-835-4531; and (ii) on the Commission’s website at http://www.sec.gov.
NEW COVENANT FUNDS — JUNE 30, 2023 (Unaudited)
To Our Shareholders:
During the 12-month reporting period ending June 30, 2023, global financial markets gyrated in response to concerns about central bank monetary policy, the strength of the global economy, a crisis in the U.S. regional banking sector, and the politically charged U.S. debt-ceiling standoff.
The U.S. equity market experienced numerous periods of volatility as the Fed maintained its interest rate-hiking cycle for most of the reporting period in an effort to tame rising inflation. Headline inflation, as measured by the U.S. consumer-price index (“CPI”), decelerated during the one-year reporting period. The Fed raised the federal funds rate in seven increments totaling 2.25% between July and December 2022, then slowed the pace of increases to 0.25% in February, March and May 2023. The central bank then left its benchmark rate unchanged in a range of 5.00% to 5.25% in June.
In its announcement of the pause in its rate-hiking cycle following its meeting in mid-June, the Federal Open Market Committee (“FOMC”) commented, “Tighter credit conditions for households and businesses are likely to weigh on economic activity, hiring, and inflation. Holding the target range steady at this meeting allows the Committee to assess additional information and its implications for monetary policy.” During an appearance before the U.S. House of Representatives Committee on Financial Services the following week, Fed Chair Jerome Powell stated, “Nearly all [Federal Open Market Committee] participants expect that it will be appropriate to raise interest rates somewhat further by the end of the year. We will continue to make our decisions meeting by meeting, based on the totality of incoming data and their implications for the outlook for economic activity and inflation, as well as the balance of risks. We remain committed to bringing inflation back down to our 2 percent goal and to keeping longer-term inflation expectations well anchored.”
In early March 2023, the financial markets’ focus turned to the banking sector as two U.S.-based regional banks–Silicon Valley Bank (“SVB”) and Signature Bank–failed after depositors withdrew funds on fears regarding the valuation of the institutions’ bond portfolios. The Federal Deposit Insurance Corporation (“FDIC”) was appointed as receiver to SVB after the California Department of Financial Protection and Innovation– which oversees the operations of state-licensed financial institutions, including banks and credit unions–closed the bank. Occurring on the heels of the collapse of Silvergate Capital a few days earlier, SVB’s failure prompted investors to reconsider the safety of their positions across the banking industry. SVB is a unique entity, with a client base highly concentrated among startup, venture capital-backed companies. The deposits of the bank increased tremendously over the past few years and poor liquidity management of these assets appears to have been a significant contributor to the collapse. Both Silvergate Capital and Signature Bank, which was shut down by New York state regulators in mid-March, were closely aligned with the highly speculative cryptocurrency industry. In early May, U.S. regulators took control of California-based First Republic Bank. The California Department of Financial Protection and Innovation issued a statement announcing that it had taken over the bank and appointed the FDIC as receiver. The FDIC subsequently announced that it had accepted J.P. Morgan Chase Bank’s bid to “assume all deposits, including all uninsured deposits, and substantially all assets of First Republic Bank.”
The administration of President Joe Biden and the Republican Party majority in the U.S. House of Representatives engaged in a heated debate about raising the U.S. government’s $31.4 trillion debt ceiling. The debt ceiling comprises the total amount of money that the U.S. government is authorized to borrow to meet its existing legal obligations, including Social Security and Medicare benefits, military salaries, interest on the national debt, tax refunds, and other payments. U.S. Treasury Secretary Janet Yellen had warned that the U.S. would no longer be able to meet its financial obligations as of early June. After numerous one-on-one discussions, Biden and Kevin McCarthy, who had been elected Speaker of the House of Representatives after the Republicans secured a majority in the lower house of Congress following the national election in November 2022, reached an agreement on the debt
New Covenant Funds
1
NEW COVENANT FUNDS — JUNE 30, 2023 (Unaudited) (Continued)
ceiling during the last week of May. Both the U.S. House of Representatives and the Senate passed the legislation –the Fiscal Responsibility Act– by wide margins, with strong support from Republicans and Democrats. The bill suspends the debt ceiling through January 1, 2025; maintains non-military spending close to current levels for the 2024 fiscal year, which begins in October; and implements a 1% cap on increases in non-military spending for the 2025 fiscal year. The fast-track approval of the legislation enabled the government to avoid a potential default on its debt.
Geopolitical Events
The ongoing Russia-Ukraine war dominated the geopolitical news during the reporting period. Ukraine’s president, Volodymyr Zelenskyy, traveled to Washington, D.C., to address a joint session of the U.S. Congress in late December 2022, in an effort to secure additional financial aid from the U.S. and its allies. President Biden reiterated the U.S. government’s support for Ukraine in its conflict with Russia. In late December, the U.S. Congress approved $45 billion in additional financial assistance to Ukraine. In February 2023, nearly a year after the conflict began, President Biden made an unannounced trip to Ukraine to meet with President Volodymyr Zelenskyy and to encourage ongoing support from U.S. allies. The visit occurred as Russian President Vladimir Putin increased military activity in eastern Ukraine. President Biden’s trip was particularly risky as there was no protection from U.S. military personnel on the ground in Ukraine. In March, President Xi Jinping of China met with Russian President Vladimir Putin in Moscow to discuss China’s proposal to end the conflict with Ukraine. The Biden administration criticized the plan as “the ratification of Russian conquest” as it proposed a ceasefire that would recognize Russia’s right to occupy territory in Ukraine and provide Putin with time to bolster the nation’s military forces.
Late in the reporting period, the Wagner Group, a Russian paramilitary organization, began to retreat from the city of Bakhmut, Ukraine, in late May. The mercenaries were scheduled to complete their retreat by the beginning of June, and would be replaced by regular Russian troops. The Wagner Group had been fighting in Bakhmut since the summer of 2022. The withdrawal from the city occurred after the group’s leader, Yevgeny Prigozhin, claimed that Russian Defence Minister Sergei Shoigu and Valery Gerasimov, Chief of the General Staff, had intentionally withheld ammunition from Wagner Group fighters. In late June, the Wagner Group organized a short-lived mutiny against Russian President Vladimir Putin’s regime. The group occupied Rostov-On-Don in southern Russia, a significant command center for the Russian government’s invasion of Ukraine. The group’s leader, Yevgeny Prigozhin, subsequently agreed to be exiled to Belarus, and the mercenaries retreated from Rostov-On-Don.
Western nations responded to Russia’s invasion of Ukraine in late February with an array of sanctions, bans, and other coordinated actions—largely focused on disrupting the country’s financial, energy, technology and transportation activities, as well as state-owned enterprises and high-profile individuals in public and business positions. In addition to having mounted a fierce resistance to Russia’s invasion, Ukraine submitted a formal application for admission to the European Union (“EU”).
Liz Truss was elected U.K. Prime Minister in September 2022, but served just seven weeks before resigning. The disastrous reaction to her fiscal program sent gilt and sterling markets reeling, collapsing her support within the Conservative Party. Her departure cleared the way for Rishi Sunak to ascend as the Conservative Party leader and Prime Minister. Sunak’s administration was plagued by public-sector employee strikes and other job actions during the reporting period, as pay increases have not kept up with the U.K.’s inflation rate, which stood at 7.9% year-over-year in May. In the spring of 2023, however, the labor tensions appeared to be easing. The GMB union, which represent National Health Service (“NHS”) workers, announced that its members voted to accept the U.K. government’s offer to resolve a labor dispute following five months of contentious negotiations and strikes.
Economic Performance
U.S. inflation, as measured by the CPI, peaked at an annual rate of 9.1% in June 2022, the largest year-over-year increase since December 1981, and then showed signs of cooling in the second half of the reporting period. The Department of Labor reported that the U.S. CPI, rose 4.0% year-over-year in May–the smallest annual increase since March 2021–due mainly to the sharp decline in energy prices. However, the annual inflation rate remains well above the Fed’s 2% target. The slowdown in core inflation, as measured by the CPI for all items less food and energy, has not kept pace with that of the headline inflation (as measured by the CPI), rising 5.3% over the previous 12 months. According to the Department of Commerce, the personal-consumption-expenditures (“PCE”) price index rose 3.8% over the 12-month period ending in May 2023. Food prices increased 5.8% year-over-year, while energy prices fell 13.4% during the same period. The PCE price
2
New Covenant Funds
index is the Fed’s preferred gauge of inflation, as it tracks the change in prices paid by or on behalf of consumers for a more comprehensive set of goods and services than that of the CPI.
The Department of Commerce also reported that U.S. gross domestic product (“GDP”) grew at a better-than-expected annualized rate of 2.0% in the first quarter of 2023, up significantly from the second estimate of 1.3%, but down from the 2.6% rise in the fourth quarter of 2022. The largest increases for the first quarter of the year were in consumer spending, exports, and federal government spending. These gains offset reductions in private inventory investment (a measure of the changes in values of inventories from one time period to the next) and residential fixed investment (purchases of private residential structures and residential equipment that property owners use for rentals). The government attributed the increase in the GDP growth rate relative to the previous estimate to upward revisions to exports, consumer spending, state and local government spending, and residential fixed investment. These offset downward revisions to nonresidential fixed investment (purchases of both nonresidential structures and equipment and software) and federal government spending.
According to the Office for National Statistics, consumer prices in the U.K. rose 7.9% year-over-year in May, marginally higher than the 7.8% annual increase in April, but down from its peak of 9.6% in October 2022. Food and non-alcoholic beverages, as well as restaurants and hotels, were the most notable contributors to the annual increase in prices. Core inflation, which excludes volatile food and energy prices, rose at an annual rate of 6.5% in May, an upturn from the 6.2% year-over-year increase for the previous month. Eurostat estimated that the inflation rate in the eurozone fell 0.6% to 5.5% for the 12-month period ending in June, and that energy prices decreased 5.6% year-over-year, following a 1.8% decline in May. While prices for food, alcohol and tobacco, as well as industrial goods, led the upturn in the annual inflation rate in June, the pace of acceleration slowed. Core inflation, which excludes energy and food, rose to 5.4% for the month, up from 5.3% in May.
Market Developments
Global equity markets garnered positive returns despite numerous periods of volatility over the reporting period. Developed markets posted double-digit gains and significantly outperformed their emerging-market counterparts. The eurozone was the top-performing region among the developed markets for the reporting period due mainly to strength in Italy and Denmark. The Pacific ex-Japan market recorded a relatively modest positive return and was the most notable laggard among developed markets, hampered by significant weakness in Hong Kong, which posted a negative return for the period. The strongest performers among emerging markets included Europe (particularly Greece and Turkey) and Latin America (most notably Mexico and Brazil), which achieved double-digit gains for the reporting period. Conversely, China and Hong Kong experienced substantial downturns and were the weakest performers among emerging markets.
Global fixed-income assets saw modest losses over the reporting period, with the Bloomberg Global Aggregate Bond Index returning -1.3% in U.S. Dollar terms. Global high-yield and corporate bonds, however, posted gains and outperformed government securities. The U.S. Treasury yield curve became inverted in early July 2022, when yields on shorter-term bonds exceeded those on longer-dated securities (bond prices move inversely to interest rates). Yields on 1-month U.S. Treasury bills (“T-bills”) with maturities close to the U.S. government’s “X-date” for the default on its financial obligations in early June 2023, surged 2.11% over a 30-day period between late April and late May 2023, to 6.02% – the highest level since the introduction of the 1-month T-bill in July 2001–before tumbling to 5.28% over the last two days of the month following the announcement of an agreement on raising the debt ceiling. Investors had demanded higher yields as compensation for the additional risk that the U.S. government could default on its debt. The yield on the 10-year U.S. Treasury note ended the one-year reporting period up 0.83% to 3.81%, while the 2-year yield rose 1.95% to 4.87%. The spread between 10- and 2-year notes widened from +0.06% to -1.06%. The significant upturn in shorter-term bond yields reflected expectations for continued interest-rate hikes by the Fed; longer-term bonds showed signs of concerns regarding how monetary tightening might have a negative effect on economic growth. U.S. high-yield bonds ended the period with notable gains, outperforming Treasurys, corporate bonds, and mortgage-backed securities (“MBS”).
Global commodity prices, as measured by the Bloomberg Commodity Total Return Index, fell -9.6% in U.S. Dollar terms during the reporting period. However, gold prices rallied and ended the period in positive territory as the U.S. Dollar weakened (gold prices move inversely to the U.S. Dollar) and the Fed began to slow the pace of its interest-rate hikes. Prices for West Texas Intermediate crude oil and Brent crude oil declined sharply during the period amid concerns that additional interest-rate hikes from central banks will weigh on global economic growth and reduce demand. Wheat prices tumbled after Russia renewed a deal with the UN, Ukraine, and Turkey that allows the shipment of Ukrainian grain through the Black Sea. Additionally, Egypt made a large purchase tender for Russian wheat at a relatively low price.
New Covenant Funds
3
NEW COVENANT FUNDS — JUNE 30, 2023 (Unaudited) (Continued)
Our view
Economists have been spending much of their time this year arguing when or if economic growth, inflation, corporate profits, interest rates, and equities will peak. Optimists and pessimists alike have been confounded by the ebb and flow of the data and the gyrations of the financial markets.
In general, input-price inflation has decelerated dramatically. Canada’s industrial producer price index has registered an outright decline in its price level, with a year-over-year change of -6.3% through May. The eurozone’s producer-price index (“PPI”) has witnessed the sharpest deceleration, falling from a peak annual rate of 43% through August 2022 to an April 2023 reading of just 1.0%. By contrast, the improvement in producer prices has been less dramatic in Japan (still rising at a 5.1% year-over-year pace as of May), although the country has logged a steep deceleration from earlier this year. We believe that these annual inflation PPI readings should continue to show improvement in the months immediately ahead owing to favorable base effects.
Core inflation, which excludes food and energy prices. Inflation is still accelerating in both the U.K. (reaching 7.1% in May) and in Japan (+2.7%). Improvement in the U.S. and the euro area has been modest, with annual core inflation running at 5.3% and 6.1%, respectively, in May. Only Canada has recorded significant progress in its core inflation rate, declining from a 12-month rate of 6.0% in June 2022 to 3.6% as of May 2023.
On a longer-term basis, we believe that demographic shifts are likely to keep labor markets tighter than has been the case at any point since the baby boomers–who were born between 1946 and 1964–first made their presence felt in the workforce in the 1970s. The new focus on supply-chain resiliency, reduced dependence on China as a manufacturing hub, the transition away from relatively cheap fossil-fuel energy to greener but more expensive sources of power, and the likelihood of significantly higher corporate taxes and financing costs in the years ahead, all suggest to us that inflation will tend to settle at 3% or more in advanced industrial economies instead of the previous norm of 2% or less.
Persistent inflation and ongoing labor-market tightness have forced most major developed-country central banks to keep raising their benchmark interest rates. The Fed, the Bank of Canada, and the European Central Bank already have benchmark rates that match or exceed the peak recorded in 2008. We think it’s likely that the Bank of England will soon join this group.
Although the FOMC chose to keep the funds rate unchanged at its June 2023 meeting, the central bank left open the possibility of more rate hikes. It wasn’t too long ago that markets were pricing in a June 2023 peak in the federal-funds rate, followed by at least three rate cuts before the end of 2023. Those cuts have now been taken out of the equation. As of the end of June, the CME Group’s FedWatch Tool had pushed the first rate cut out to January 2024, with a year-end 2024 implied rate at roughly 4%.
SEI does not dispute the fact that inflation will continue to decelerate, especially given the current weakness in energy and goods prices. It is only a question of timing and end point. We maintain our view that inflation pressures will remain persistent in labor-intensive service industries, at least until some slack opens up in the labor markets and spending by households fades more dramatically.
4
New Covenant Funds
The rally in U.S. equities broadened at the end of the reporting period in June, but we think the valuation in the market again is a problem. The upturn occurred despite additional monetary tightening by the Fed and other central banks and a rebound in bond yields from the dip that took place following the panic in the U.S. banking system in mid-March. The overall market also appears to be overvalued relative to current bond yields. If corporate earnings experience a substantial contraction, history suggests that stock valuations also will fall.
Sincerely,

James Smigiel
Chief Investment Officer
New Covenant Funds
5
NEW COVENANT FUNDS — JUNE 30, 2023 (Unaudited) (Concluded)
Index Definitions
Bloomberg Global Aggregate Index: is a broad-based benchmark that is considered representative of global investment-grade, fixed-income markets.
Bloomberg US Corporate Investment Grade Index: is a broad-based benchmark that measures the investment-grade, fixed-rate, taxable corporate bond market.
Bloomberg US Aggregate Bond Index: The Bloomberg U.S. Aggregate Bond Index is a benchmark index composed of U.S. securities in Treasury, government-related, corporate and securitized sectors. It includes securities that are of investment-grade quality or better, have at least one year to maturity and have an outstanding par value of at least $250 million.
Bloomberg U.S. Intermediate Aggregate Bond Index: is an unmanaged index generally representative of intermediate investment grade government and corporate debt securities with maturities of 10 years or less (Income Fund, Balanced Growth Fund and Balanced Income Fund).
Blended 60% Russell 3000® Index/40% Bloomberg U.S. Intermediate Aggregate Bond Index: is a composite composed of 60% Russell 3000® Index and 40% Bloomberg U.S. Intermediate Aggregate Bond Index (Balanced Growth Fund).
Blended 35% Russell 3000® Index/65% Bloomberg U.S. Intermediate Aggregate Bond Index: is a composite composed of 35% Russell 3000® Index and 65% Bloomberg U.S. Intermediate Aggregate Bond Index (Balanced Income Fund).
Dow Jones Industrial Average: The Index measures the stock performance of 30 large companies listed on stock exchanges in the United States.
FTSE UK Series All-Share Index: is a capitalization-weighted index, comprising around 600 of more than 2,000 companies traded on the London Stock Exchange.
ICE BofA US High Yield Constrained Index: tracks the performance of below-investment-grade, U.S. dollar-denominated corporate bonds publicly issued in the U.S. domestic market; exposure to individual issuers is capped at 2%.
JP Morgan EMBI Global Diversified Index: tracks the performance of external debt instruments (including U.S.-dollar-denominated and other external-currency-denominated Brady bonds, loans, eurobonds and local-market instruments) in emerging markets.
JP Morgan GBI-EM Global Diversified Composite Index: tracks the performance of debt instruments issued in local currencies by emerging-market governments.
MSCI Europe Index: is a free float-adjusted market-capitalization-weighted index designed to measure the performance of large- and mid-capitalization stocks across developed-market countries in Europe.
MSCI Emerging Markets Index: is a free float-adjusted market-capitalization-weighted index designed to measure the performance of global emerging-market equities.
MSCI World Index: is a free float-adjusted market-capitalization-weighted index that is designed to measure the equity-market performance of developed markets. The Index consists of 24 developed-market country indexes.
6
New Covenant Funds
Russell 1000® Index: includes 1,000 of the largest U.S. stocks based on market cap and current index membership; it is used to measure the activity of the U.S. large-cap equity market.
Russell 2000® Index: The Russell 2000® Index measures the performance of the 2,000 smallest companies in the Russell 3000® Index, which represents approximately 8% of the total market capitalization of the Russell 3000® Index.
Russell 3000® Index: measures the performance of the largest 3000 U.S. companies representing approximately 98% of the investable U.S. equity market.
S&P 500 Index: is an unmanaged, market-weighted index that consists of 500 of the largest publicly-traded U.S. companies and is considered representative of the broad U.S. stock market.
New Covenant Funds
7
MANAGEMENT’S DISCUSSION AND ANALYSIS OF FUND PERFORMANCE
June 30, 2023 (Unaudited)
New Covenant Growth Fund
I. Objective
The New Covenant Growth Fund’s (the “Fund”) investment objective is long-term capital appreciation. A modest amount of dividend income may be produced by the Fund’s equity securities.
II. Investment Approach
The Fund uses a sub-adviser to manage the Fund under the supervision of SEI Investments Management Corporation (“SIMC”). The sole sub-adviser as of June 30, 2023, was Parametric Portfolio Associates LLC (“Parametric”). There were no sub-adviser changes during the reporting period.
III. Return vs. Benchmark
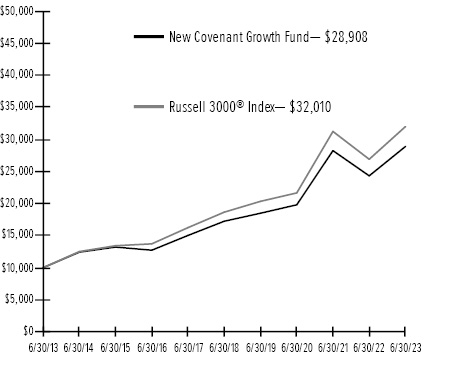
For the 12-month period ending June 30, 2023, the Fund’s Class A shares returned 18.83%. The Fund’s primary benchmark, the Russell 3000® Index – which measures the performance of the 3000 largest U.S. companies and represents approximately 98% of the investable U.S. equity market–returned 18.95%.
IV. Fund Attribution
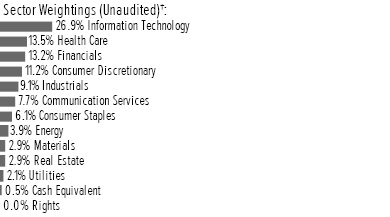
Information technology sector was the strongest-performing sector within the Russell 3000® Index for the reporting period as growth stocks outperformed. The only two sectors to produce negative returns were real estate and utilities, which are sometimes thought of as bond substitutes. This explains some of their correlation with the poorly performing bond market during the period. Other traditionally less cyclical areas of the market, such as consumer staples and health care, also underperformed.
In this environment, the Fund marginally underperformed its benchmark for the reporting period. The Fund’s holdings in the consumer staples sector and in the retail segment of the consumer discretionary sector detracted from performance. Fund performance benefited from a modestly overweight allocation to the information technology sector, an underweight to the aerospace and defense industry, as wells as a modest underweight to the real estate sector.
Investing is subject to risk, including the possible loss of principal. Past performance is no indication of future results.
AVERAGE ANNUAL TOTAL RETURN1 | |||||
One Year | Annualized | Annualized | Annualized | Annualized | |
New Covenant Growth Fund | 18.83% | 13.41% | 10.88% | 11.20% | 5.89% |
Russell 3000® Index | 18.95% | 13.89% | 11.39% | 12.34% | 7.23% |
Comparison of Change in the Value of a $10,000 Investment in the New Covenant Growth Fund versus the Russell 3000® Index.
1 | For the periods ended June 30, 2023. Past performance is not an indication of future performance. Fund Shares were offered beginning 7/1/99. Returns shown do not reflect the deduction of taxes that a shareholder would pay on fund distributions or the redemption of fund shares. The returns for certain periods reflect fee waivers and/or reimbursements in effect for that year; absent fee waivers and reimbursements, performance would have been lower. |
8
New Covenant Funds
MANAGEMENT’S DISCUSSION AND ANALYSIS OF FUND PERFORMANCE
June 30, 2023 (Unaudited)
New Covenant Income Fund
I. Objective
The New Covenant Income Fund’s (the “Fund”) investment objective is a high level of current income with preservation of capital.
II. Investment Approach
The Fund uses a multi-manager approach, relying on a number of sub-advisers with different investment approaches to manage portions of the Fund’s portfolio, under the general supervision of SEI Investments Management Corporation (“SIMC”). The Fund utilized the following sub-advisers as of June 30, 2023: Income Research & Management (“IRM”), Western Asset Management Company and Western Asset Management Company Limited (“Western”). There were no sub-adviser changes during the fiscal period.
III. Return vs. Benchmark
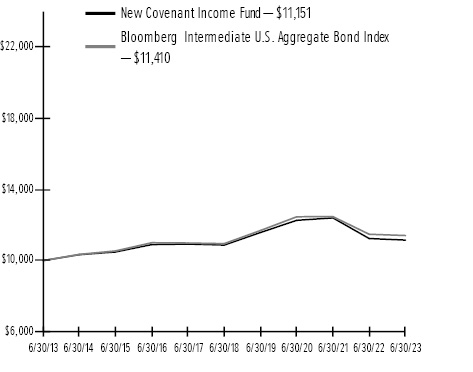
For the 12-month period ending June 30, 2023, the Fund’s Class A shares returned -0.78%. The Fund’s primary benchmark, the Bloomberg Intermediate US Aggregate Bond Index–a capitalization-weighted index that measures the performance of investment-grade bonds in the U.S. with maturities of less than 10 years–returned -0.60%.
IV. Fund Attribution
In a determined effort to tame historically high inflation, the U.S. Federal Reserve (“Fed”) raised its benchmark federal-funds rate by a total of 350 basis points (3.50%) to a range of 5.00% - 5.25% during the 12-month reporting period. The Fed hiked the rate by 25 basis points in February, March, and May, and then held rates steady for the first time since January 2022 at its meeting in June 2023. U.S. economic growth slowed in the first quarter of 2023, as the lagged effects of monetary policy continued to work their way through the financial system. Meanwhile, inflation moderated, but remained stubbornly elevated relative to its historical average and to central bank target levels. At the end of the reporting period, the core inflation rate (which excludes volatile food and energy prices) of 5.3% was more than twice the Fed’s 2% target. Markets have priced Fed rate cuts later into 2024 and began pricing-in additional rate hikes after the Fed’s June dot plot signaled the median federal funds rate increasing by an additional 50 basis points. Yields ratcheted higher across the U.S. Treasury curve, with short-term yields moving higher at a quicker pace than long-term yields, pushing the yield curve inversion closer to a record level. The yield curve, a predictor of past economic downturns, has been inverted for nearly a year, which is in the time frame typically associated with the onset of a recession. Following the collapse of Silicon
Valley Bank, a U.S. regional bank, in March 2023, credit conditions tightened further, providing a degree of offset for central bank monetary policy tightening that would have otherwise been required. The combination of tight labor markets, sticky core inflation, and tightening credit conditions during the reporting period challenged the Fed, and the runway for a soft landing for the economy continues to narrow.
The two-year Treasury note yield rose by 195 basis points over the 12 month reporting period, while the 10- and 30-year yields increased by 83 and 71 basis points, respectively. The rise in yields led to negative absolute returns for U.S. Treasury securities. Risk assets generally outperformed duration-neutral Treasurys during the period. Corporate bonds generated both positive absolute and excess returns during the period, with spreads tightening year-over-year. The Fed continued to grapple with inflation, while fears about a hard economic landing endured. Uncertainty surrounding the U.S. government’s debt ceiling contributed to volatility during the spring of 2023, but a resolution was reached and the debt ceiling was suspended until January 2025. From a credit-quality perspective, BBB rated issues outperformed higher quality bonds. Agency mortgage-backed securities (“MBS”) underperformed Treasurys during the reporting period; however, valuations became more attractive. Agency MBS are considered to be a liquid, high-quality substitute for Treasurys with a higher yield. Asset-backed securities (“ABS”) outperformed the overall market during the period, bolstered by strong fundamentals within consumer-related subsectors as the U.S. labor market remains healthy. Consumers were resilient, even in the face of elevated inflation, with rising wages supporting a robust level of consumer spending reflected in strong consumption and spending on services. With the COVID-19 pandemic fading as a health threat, consumers have been making up for lost time, adopting a more mobile lifestyle, thereby pressuring on labor-intensive, consumer-facing industries such as restaurants, airlines, hotels and entertainment/sporting events. Commercial mortgage-backed securities (“CMBS”) underperformed duration-neutral Treasurys as office buildings continue to be hampered by lower occupancy as many employees continue to work remotely.
The Fund modestly underperformed its benchmark, the Bloomberg Intermediate Aggregate Bond Index, during the reporting period. An overweight allocation to CMBS detracted from Fund performance for the period. Office space, in particular, remains under stress as companies continue to utilize remote work and the need for office space has declined since March 2020. The Fund’s long duration posture also weighed on performance as yields
New Covenant Funds
9
MANAGEMENT’S DISCUSSION AND ANALYSIS OF FUND PERFORMANCE
June 30, 2023 (Unaudited)
New Covenant Income Fund (Concluded)
continued to move higher given tightening monetary policy. Both the Fund’s overweight and positioning within corporate credit benefited Fund performance for the reporting period. Relative sector positioning within the corporate sector such as the overweight to industrials contributed positively to Fund performance, and security selection within the banking sector enhanced performance as the Fund’s managers preferred large money center banks. Security selection within agency MBS bolstered Fund performance as the managers preferred specified pools to TBA (to-be-announced) securities—which confer the obligation to buy or sell future debt obligations of the three U.S. government-sponsored agencies (Fannie Mae, Freddie Mac and Ginnie Mae) that issue or guarantee MBS. This was partially offset by the Fund’s overweight to the sector as agency MBS underperformed during the period. An overweight to ABS had a positive impact on Fund performance. The sector continues to be supported by strong consumer spending as unemployment remains at historically low levels.
Among the Fund’s sub-advisers, IRM outperformed during the reporting period. Both security selection and an overweight position in the financials sector enhanced performance, while security selection in industrials had a negative impact. Positioning within ABS aided Fund performance, while an overweight allocation to CMBS was a detractor. Security selection in CMBS benefited Fund performance as IRM favored up-in-the-capital structure tranches. Western Asset Management Company and Western Asset Management Company Limited outperformed in part due to an overweight to corporate credit. Security selection within agency MBS also was a positive contributor to performance. Western moved the Fund to an overweight position in the MBS sector as valuations became more compelling during the first half of 2023. Western’s long duration posture detracted from Fund performance as yields continued to rise during the reporting period.
Regarding the use of derivatives, the Fund employed U.S. Treasury futures, eurodollar futures, and TBA forward contracts to effectively manage duration (a measure of a bond’s price sensitivity to changes in interest rates), yield-curve and market exposures. None of these derivative positions had a meaningful impact on the Fund’s performance during the reporting period.
Investing is subject to risk, including the possible loss of principal. Past performance is no indication of future results.
AVERAGE ANNUAL TOTAL RETURN 1 | |||||
One Year | Annualized | Annualized | Annualized | Annualized | |
New Covenant Income Fund | -0.78% | -3.11% | 0.51% | 1.10% | 2.76% |
Bloomberg Intermediate U.S. Aggregate Bond Index | -0.60% | -2.89% | 0.83% | 1.33% | 3.89% |
Comparison of Change in the Value of a $10,000 Investment in the New Covenant Income Fund versus the Bloomberg Intermediate U.S. Aggregate Bond Index.
1 | For the periods ended June 30, 2023. Past performance is not an indication of future performance. Fund Shares were offered beginning 7/1/99. Returns shown do not reflect the deduction of taxes that a shareholder would pay on fund distributions or the redemption of fund shares. The returns for certain periods reflect fee waivers and/or reimbursements in effect for that year; absent fee waivers and reimbursements, performance would have been lower. |
10
New Covenant Funds
MANAGEMENT’S DISCUSSION AND ANALYSIS OF FUND PERFORMANCE
June 30, 2023 (Unaudited)
New Covenant Balanced Growth Fund
I. Objective
The Balanced Growth Fund’s (the “Fund”) investment objective is to produce capital appreciation with less risk than would be present in a portfolio of only common stocks.
II. Investment Approach
The Fund’s assets are managed under the direction of SEI Investments Management Corporation (“SIMC”), which manages the Fund’s assets in a way that it believes will achieve the Fund’s investment objective. In order to achieve its investment objective, SIMC allocates the Fund’s assets primarily in shares of the New Covenant Growth Fund (“the Growth Fund”) and the New Covenant Income Fund (“the Income Fund”), with a majority of its assets generally invested in shares of the Growth Fund. Between 45% and 75% of the Fund’s net assets (with a neutral position of approximately 60% of the Fund’s net assets) are invested in shares of the Growth Fund, with the balance of its assets invested in shares of the Income Fund. The Growth and Income Funds, in turn, invest directly in securities in accordance with their own varying investment objectives and policies.
III. Return vs. Benchmark
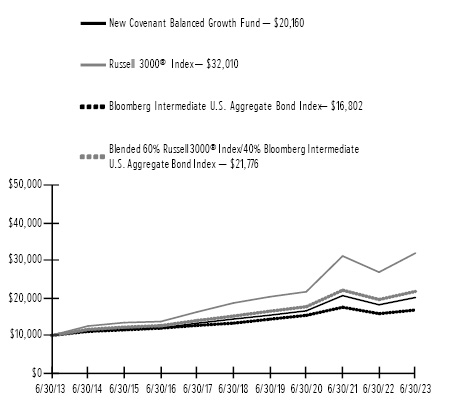
For the 12-month period ending June 30, 2023, the Fund’s Class A shares returned 10.83%. The Fund’s primary benchmark, the Russell 3000® Index – which measures the performance of the 3000 largest U.S. companies and represents approximately 98% of the investable U.S. equity market – returned 18.95%.
IV. Fund Attribution
U.S. equities rebounded during the 12-month reporting period as investors became somewhat less concerned about inflation, rising interest rates, and the Russia-Ukraine war. Supply-chain issues were believed to be largely resolved. The reduction in these concerns brought a “relief rally” in which the relatively more expensive stocks generally rose more than the lower-priced stocks, and larger-capitalization stocks outgained smaller-capitalization stocks.
Information technology was the strongest-performing sector within the Russell 3000® Index for the reporting period as growth stocks outperformed. The only two sectors to produce negative returns were real estate and utilities, which are sometimes thought of as bond substitutes. This explains some of their correlation with the poorly performing bond market during the period. Other traditionally less cyclical areas of the market, such as consumer staples and health care, also underperformed.
In this environment, the Growth Fund marginally underperformed its benchmark, the Russell 3000® Index, for the reporting period. The Fund’s holdings in the consumer staples sector and in the retail segment of the consumer discretionary sector detracted from performance. Fund performance benefited from a modestly overweight allocation to the information technology sector, an underweight to the aerospace and defense industry, as wells as a modest underweight to the real estate sector.
In a determined effort to tame historically high inflation, the U.S. Federal Reserve (“Fed”) raised its benchmark federal-funds rate by a total of 350 basis points (3.50%) to a range of 5.00% - 5.25% during the 12-month reporting period. The Fed hiked the rate by 25 basis points in February, March, and May, and then held rates steady for the first time since January 2022 at its meeting in June 2023. U.S. economic growth slowed in the first quarter of 2023, as the lagged effects of monetary policy continued to work their way through the financial system. Meanwhile, inflation moderated, but remained stubbornly elevated relative to its historical average and to central bank target levels. At the end of the reporting period, the core inflation rate (which excludes volatile food and energy prices) of 5.3% was more than twice the Fed’s 2% target. Markets have priced Fed rate cuts later into 2024 and began pricing-in additional rate hikes after the Fed’s June dot plot signaled the median federal funds rate increasing by an additional 50 basis points. Yields ratcheted higher across the U.S. Treasury curve, with short-term yields moving higher at a quicker pace than long-term yields, pushing the yield curve inversion closer to a record level. The yield curve, a predictor of past economic downturns, has been inverted for nearly a year, which is in the time frame typically associated with the onset of a recession. Following the collapse of Silicon Valley Bank, a U.S. regional bank, in March 2023, credit conditions tightened further, providing a degree of offset for central bank monetary policy tightening that would have otherwise been required. The combination of tight labor markets, sticky core inflation, and tightening credit conditions during the reporting period challenged the Fed, and the runway for a soft landing for the economy continues to narrow.
The two-year Treasury note yield rose by 195 basis points over the 12 month reporting period, while the 10- and 30-year yields increased by 83 and 71 basis points, respectively. The rise in yields led to negative absolute returns for U.S. Treasury securities. Risk assets generally outperformed duration-neutral Treasurys during the period. Corporate bonds generated both positive absolute and excess returns during the period, with spreads tightening year-over-year. The Fed continued to grapple with inflation, while fears
New Covenant Funds
11
MANAGEMENT’S DISCUSSION AND ANALYSIS OF FUND PERFORMANCE
June 30, 2023 (Unaudited)
New Covenant Balanced Growth Fund (Concluded)
about a hard economic landing endured. Uncertainty surrounding the U.S. government’s debt ceiling contributed to volatility during the spring of 2023, but a resolution was reached and the debt ceiling was suspended until January 2025. From a credit-quality perspective, BBB rated issues outperformed higher quality bonds. Agency mortgage-backed securities (“MBS”) underperformed Treasurys during the reporting period; however, valuations became more attractive. Agency MBS are considered to be a liquid, high-quality substitute for Treasurys with a higher yield. Asset-backed securities (“ABS”) outperformed the overall market during the period, bolstered by strong fundamentals within consumer-related subsectors as the U.S. labor market remains healthy. Consumers were resilient, even in the face of elevated inflation, with rising wages supporting a robust level of consumer spending reflected in strong consumption and spending on services. With the COVID-19 pandemic fading as a health threat, consumers have been making up for lost time, adopting a more mobile lifestyle, thereby pressuring on labor-intensive, consumer-facing industries such as restaurants, airlines, hotels and entertainment/sporting events. Commercial mortgage-backed securities (“CMBS”) underperformed duration-neutral Treasurys as office buildings continue to be hampered by lower occupancy as many employees continue to work remotely.
In this environment, the Income Fund modestly underperformed its benchmark, the Bloomberg Intermediate US Aggregate Bond Index, during the reporting period. An overweight allocation to CMBS detracted from Fund performance. Office space, in particular, remains under stress as companies continue to utilize remote work and the need for office space has declined since March 2020. The Fund’s long duration posture also weighed on performance as yields continued to move higher given tightening monetary policy. Both the Fund’s overweight and positioning within corporate credit benefited Fund performance for the reporting period. Relative sector positioning within the corporate sector such as the overweight to industrials contributed positively to Fund performance, and security selection within the banking sector enhanced performance as the Fund’s managers preferred large money center banks. Security selection within agency MBS bolstered Fund performance as the managers preferred specified pools to TBA (to-be-announced) securities—which confer the obligation to buy or sell future debt obligations of the three U.S. government-sponsored agencies (Fannie Mae, Freddie Mac and Ginnie Mae) that issue or guarantee MBS. This was partially offset by the Fund’s overweight to the sector as agency MBS underperformed during the period. An overweight to ABS had a positive impact on Fund performance. The sector
continues to be supported by strong consumer spending as unemployment remains at historically low levels.
The Income Fund employed U.S. Treasury futures, eurodollar futures, and TBA forward contracts to effectively manage duration (a measure of a bond’s price sensitivity to changes in interest rates), yield-curve and market exposures. None of these derivative positions had a meaningful impact on the Fund’s performance during the reporting period.
Investing is subject to risk, including the possible loss of principal. Past performance is no indication of future results.
AVERAGE ANNUAL TOTAL RETURN1,2 | |||||
One Year | Annualized | Annualized | Annualized | Annualized | |
New Covenant Balanced Growth Fund | 10.83% | 6.74% | 6.98% | 7.26% | 4.88% |
Russell 3000® Index | 18.95% | 13.89% | 11.39% | 12.34% | 7.23% |
Bloomberg Intermediate U.S. Aggregate Bond Index | -0.60% | -2.89% | 0.83% | 1.33% | 3.69% |
Blended 60% Russell 3000® Index/40% Bloomberg U.S. Intermediate Aggregate Bond Index | 11.07% | 7.20% | 7.48% | 8.09% | 6.12% |
12
New Covenant Funds
Comparison of Change in the Value of a $10,000 Investment in the New Covenant Balanced Growth Fund versus the Russell 3000® Index, Bloomberg Intermediate U.S. Aggregate Bond Index and Blended 60% Russell 3000® Index/40% Bloomberg Intermediate U.S. Aggregate Bond Index.
1 | For the periods ended June 30, 2023. Past performance is not an indication of future performance. Fund Shares were offered beginning 7/1/99. Returns shown do not reflect the deduction of taxes that a shareholder would pay on fund distributions or the redemption of fund shares. The returns for certain periods reflect fee waivers and/or reimbursements in effect for that year; absent fee waivers and reimbursements, performance would have been lower. |
2 | This table compares the Fund’s average annual total returns to those of a broad based index and the Fund’s 60/40 Blended Benchmark, which consists of the Russell 3000® Index and the Bloomberg Intermediate U.S. Aggregate Bond Index. The Fund’s Blended Benchmark is designed to provide a useful comparison to the Fund’s overall performance and more accurately reflects the Fund’s investment strategy than the broad-based index. |
New Covenant Funds
13
MANAGEMENT’S DISCUSSION AND ANALYSIS OF FUND PERFORMANCE
June 30, 2023 (Unaudited)
New Covenant Balanced Income Fund
I. Objective
The Balanced Income Fund’s (the “Fund”) investment objective is to produce current income and long-term growth of capital.
II. Investment Approach
The Balanced Income Fund’s assets are managed under the direction of SEI Investments Management Corporation (“SIMC”), which manages the Fund’s assets in a way that it believes will achieve the Fund’s investment objective. In order to achieve its investment objective, SIMC allocates the Fund’s assets primarily in shares of the New Covenant Growth Fund (“the Growth Fund”) and the New Covenant Income Fund (“the Income Fund”), with a majority of its assets generally invested in shares of the Income Fund. Between 50% and 75% of the Fund’s net assets (with a neutral position of approximately 65%) are invested in shares of the Income Fund, with the balance of its net assets invested in shares of the Growth Fund. The Growth and Income Funds, in turn, invest directly in securities in accordance with their own varying investment objectives and policies.
III. Return vs. Benchmark
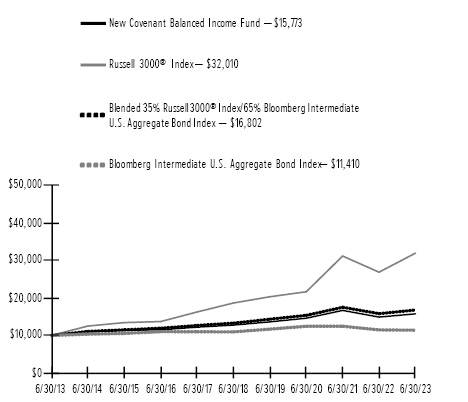
For the 12-month period ending June 30, 2023, the Fund’s Class A shares returned 5.84%. The Fund’s primary benchmark, the Bloomberg Intermediate U.S. Aggregate Bond Index – which tracks the performance of U.S. securities in the Treasury, government-related, corporate and securitized sectors with a remaining maturity of less than 10 years – returned -0.60%.
IV. Fund Attribution
In a determined effort to tame historically high inflation, the U.S. Federal Reserve (“Fed”) raised its benchmark federal-funds rate by a total of 350 basis points (3.50%) to a range of 5.00% - 5.25% during the 12-month reporting period. The Fed hiked the rate by 25 basis points in February, March, and May, and then held rates steady for the first time since January 2022 at its meeting in June 2023. U.S. economic growth slowed in the first quarter of 2023, as the lagged effects of monetary policy continued to work their way through the financial system. Meanwhile, inflation moderated, but remained stubbornly elevated relative to its historical average and to central bank target levels. At the end of the reporting period, the core inflation rate (which excludes volatile food and energy prices) of 5.3% was more than twice the Fed’s 2% target. Markets have priced Fed rate cuts later into 2024 and began pricing-in additional rate hikes after the Fed’s June dot plot signaled the median federal funds rate increasing by an additional
50 basis points. Yields ratcheted higher across the U.S. Treasury curve, with short-term yields moving higher at a quicker pace than long-term yields, pushing the yield curve inversion closer to a record level. The yield curve, a predictor of past economic downturns, has been inverted for nearly a year, which is in the time frame typically associated with the onset of a recession. Following the collapse of Silicon Valley Bank, a U.S. regional bank, in March 2023, credit conditions tightened further, providing a degree of offset for central bank monetary policy tightening that would have otherwise been required. The combination of tight labor markets, sticky core inflation, and tightening credit conditions during the reporting period challenged the Fed, and the runway for a soft landing for the economy continues to narrow.
The two-year Treasury note yield rose by 195 basis points over the 12 month reporting period, while the 10- and 30-year yields increased by 83 and 71 basis points, respectively. The rise in yields led to negative absolute returns for U.S. Treasury securities. Risk assets generally outperformed duration-neutral Treasurys during the period. Corporate bonds generated both positive absolute and excess returns during the period, with spreads tightening year-over-year. The Fed continued to grapple with inflation, while fears about a hard economic landing endured. Uncertainty surrounding the U.S. government’s debt ceiling contributed to volatility during the spring of 2023, but a resolution was reached and the debt ceiling was suspended until January 2025. From a credit-quality perspective, BBB rated issues outperformed higher quality bonds. Agency mortgage-backed securities (“MBS”) underperformed Treasurys during the reporting period; however, valuations became more attractive. Agency MBS are considered to be a liquid, high-quality substitute for Treasurys with a higher yield. Asset-backed securities (“ABS”) outperformed the overall market during the period, bolstered by strong fundamentals within consumer-related subsectors as the U.S. labor market remains healthy. Consumers were resilient, even in the face of elevated inflation, with rising wages supporting a robust level of consumer spending reflected in strong consumption and spending on services. With the COVID-19 pandemic fading as a health threat, consumers have been making up for lost time, adopting a more mobile lifestyle, thereby pressuring on labor-intensive, consumer-facing industries such as restaurants, airlines, hotels and entertainment/sporting events. Commercial mortgage-backed securities (“CMBS”) underperformed duration-neutral Treasurys as office buildings continue to be hampered by lower occupancy as many employees continue to work remotely.
14
New Covenant Funds
In this market environment, the Income Fund modestly underperformed its benchmark, the Bloomberg Intermediate US Aggregate Bond Index, during the reporting period. An overweight allocation to CMBS detracted from Fund performance. Office space, in particular, remains under stress as companies continue to utilize remote work and the need for office space has declined since March 2020. The Fund’s long duration posture also weighed on performance as yields continued to move higher given tightening monetary policy. Both the Fund’s overweight and positioning within corporate credit benefited Fund performance for the reporting period. Relative sector positioning within the corporate sector such as the overweight to industrials contributed positively to Fund performance, and security selection within the banking sector enhanced performance as the Fund’s managers preferred large money center banks. Security selection within agency MBS bolstered Fund performance as the managers preferred specified pools to TBA (to-be-announced) securities — which confer the obligation to buy or sell future debt obligations of the three U.S. government-sponsored agencies (Fannie Mae, Freddie Mac and Ginnie Mae) that issue or guarantee MBS. This was partially offset by the Fund’s overweight to the sector as agency MBS underperformed during the period. An overweight to ABS had a positive impact on Fund performance. The sector continues to be supported by strong consumer spending as unemployment remains at historically low levels.
U.S. equities rebounded during the 12-month reporting period as investors became somewhat less concerned about inflation, rising interest rates, and the Russia-Ukraine war. Supply-chain issues were believed to be largely resolved. The reduction in these concerns brought a “relief rally” in which the relatively more expensive stocks generally rose more than the lower-priced stocks, and larger-capitalization stocks outgained smaller-capitalization stocks.
Information technology was the strongest-performing sector within the Russell 3000® Index for the reporting period as growth stocks outperformed. The only two sectors to produce negative returns were real estate and utilities, which are sometimes thought of as bond substitutes. This explains some of their correlation with the poorly performing bond market during the period. Other traditionally less cyclical areas of the market, such as consumer staples and health care, also underperformed.
In this environment, the Growth Fund marginally underperformed its benchmark, the Russell 3000® Index, for the reporting period. The Growth Fund’s holdings in the consumer staples sector and in the retail segment
of the consumer discretionary sector detracted from performance. Fund performance benefited from a modestly overweight allocation to the information technology sector, an underweight to the aerospace and defense industry, as wells as a modest underweight to the real estate sector.
The Income Fund employed U.S. Treasury futures, eurodollar futures, and TBA forward contracts to effectively manage duration (a measure of a bond’s price sensitivity to changes in interest rates), yield-curve and market exposures. None of these derivative positions had a meaningful impact on the Fund’s performance during the reporting period.
Investing is subject to risk, including the possible loss of principal. Past performance is no indication of future results.
AVERAGE ANNUAL TOTAL RETURN1,2 | |||||
One Year | Annualized | Annualized | Annualized | Annualized | |
New Covenant Balanced Income Fund | 5.84%3 | 2.58% | 4.30% | 4.66% | 4.00% |
Russell 3000® Index | 18.95% | 13.89% | 11.39% | 12.34% | 7.23% |
Bloomberg Intermediate U.S. Aggregate Bond Index | -0.60% | -2.89% | 0.83% | 1.33% | 3.69% |
Blended 35% Russell 3000® Index/65% Bloomberg Intermediate U.S. Aggregate Bond Index | 6.18% | 3.00% | 4.81% | 5.33% | 5.22% |
New Covenant Funds
15
MANAGEMENT’S DISCUSSION AND ANALYSIS OF FUND PERFORMANCE
June 30, 2023 (Unaudited)
New Covenant Balanced Income Fund (Concluded)
Comparison of Change in the Value of a $10,000 Investment in the New Covenant Balanced Income Fund versus the Russell 3000® Index, Bloomberg Intermediate U.S. Aggregate Bond Index and Blended 35% Russell 3000® Index/65% Bloomberg Intermediate U.S. Aggregate Bond Index.
1 | For the periods ended June 30, 2023. Past performance is not an indication of future performance. Fund Shares were offered beginning 7/1/99. Returns shown do not reflect the deduction of taxes that a shareholder would pay on fund distributions or the redemption of fund shares. The returns for certain periods reflect fee waivers and/or reimbursements in effect for that year; absent fee waivers and reimbursements, performance would have been lower. |
2 | This table compares the Fund’s average annual total returns to those of a broad-based index and the Fund’s 35/65 Blended Benchmark, which consists of the Russell 3000® Index and the Bloomberg Intermediate U.S. Aggregate Bond Index. The Fund’s Blended Benchmark is designed to provide a useful comparison to the Fund’s overall performance and more accurately reflects the Fund’s investment strategy than the broad-based index. |
3 | Total returns disclosed in the Financial Highlights of the Annual Report may reflect adjustments to conform to generally accepted accounting principles. |
16
New Covenant Funds
SCHEDULE OF INVESTMENTS
June 30, 2023
New Covenant Growth Fund
† Percentages based on total investments. Total investments do not include derivatives such as options, futures contracts, forward contracts, and swap contracts, if applicable.
Description | Shares | Market Value | ||||||
COMMON STOCK†† — 98.2% | ||||||||
Communication Services — 7.7% | ||||||||
Activision Blizzard Inc | 3,725 | $ | 314 | |||||
Alphabet Inc, Cl A * | 75,260 | 9,009 | ||||||
Alphabet Inc, Cl C * | 69,700 | 8,432 | ||||||
AT&T Inc | 119,675 | 1,909 | ||||||
Bandwidth Inc, Cl A * | 74 | 1 | ||||||
Cable One Inc | 79 | 52 | ||||||
Cardlytics Inc * | 761 | 5 | ||||||
Cars.com Inc * | 4,178 | 83 | ||||||
Charter Communications Inc, Cl A * | 1,268 | 466 | ||||||
Cinemark Holdings Inc * | 4,289 | 71 | ||||||
Cogent Communications Holdings Inc | 148 | 10 | ||||||
Comcast Corp, Cl A | 52,817 | 2,195 | ||||||
EchoStar Corp, Cl A * | 1,124 | 19 | ||||||
Electronic Arts Inc | 6,385 | 828 | ||||||
EverQuote Inc, Cl A * | 1,468 | 10 | ||||||
EW Scripps Co/The, Cl A * | 3,299 | 30 | ||||||
Fox Corp, Cl A | 1,372 | 47 | ||||||
Fox Corp, Cl B | 1,428 | 46 | ||||||
IAC Inc * | 376 | 24 | ||||||
IMAX Corp * | 2,244 | 38 | ||||||
Interpublic Group of Cos Inc/The | 8,487 | 327 | ||||||
Iridium Communications Inc | 366 | 23 | ||||||
John Wiley & Sons Inc, Cl A | 236 | 8 | ||||||
Liberty Broadband Corp, Cl A * | 81 | 6 | ||||||
Liberty Broadband Corp, Cl C * | 343 | 27 | ||||||
Liberty Media Corp-Liberty Braves * | 3,670 | 148 | ||||||
Liberty Media Corp-Liberty SiriusXM, Cl C * | 234 | 8 | ||||||
Live Nation Entertainment Inc * | 181 | 16 | ||||||
Lumen Technologies Inc | 872 | 2 | ||||||
Madison Square Garden Entertainment, Cl A * | 697 | 23 | ||||||
Madison Square Garden Sports Corp | 39 | 7 | ||||||
Magnite Inc * | 2,551 | 35 | ||||||
Match Group Inc * | 1,841 | 77 | ||||||
Meta Platforms Inc, Cl A * | 25,682 | 7,370 | ||||||
Netflix Inc * | 4,263 | 1,878 | ||||||
Description | Shares | Market Value | ||||||
COMMON STOCK†† (continued) | ||||||||
New York Times Co/The, Cl A | 439 | $ | 17 | |||||
News Corp, Cl A | 829 | 16 | ||||||
Nexstar Media Group Inc, Cl A | 94 | 16 | ||||||
Omnicom Group Inc | 8,814 | 839 | ||||||
Paramount Global, Cl B | 7,304 | 116 | ||||||
Pinterest Inc, Cl A * | 3,339 | 91 | ||||||
ROBLOX Corp, Cl A * | 6,473 | 261 | ||||||
Shenandoah Telecommunications Co | 222 | 4 | ||||||
Shutterstock Inc | 205 | 10 | ||||||
Sirius XM Holdings Inc | 7,153 | 32 | ||||||
Sphere Entertainment Co * | 697 | 19 | ||||||
Spotify Technology SA * | 1,265 | 203 | ||||||
Take-Two Interactive Software Inc * | 1,416 | 208 | ||||||
TechTarget Inc * | 1,986 | 62 | ||||||
TEGNA Inc | 3,052 | 50 | ||||||
T-Mobile US Inc * | 6,126 | 851 | ||||||
Trade Desk Inc/The, Cl A * | 8,290 | 640 | ||||||
TripAdvisor Inc * | 1,712 | 28 | ||||||
Verizon Communications Inc | 57,853 | 2,152 | ||||||
Vimeo Inc * | 610 | 3 | ||||||
Walt Disney Co/The * | 21,958 | 1,960 | ||||||
Warner Bros Discovery Inc * | 4,164 | 52 | ||||||
World Wrestling Entertainment Inc, Cl A | 780 | 85 | ||||||
Yelp Inc, Cl A * | 1,355 | 49 | ||||||
Ziff Davis Inc * | 2,547 | 178 | ||||||
ZoomInfo Technologies, Cl A * | 2,021 | 51 | ||||||
| 41,537 | ||||||||
Consumer Discretionary — 11.1% | ||||||||
1-800-Flowers.com Inc, Cl A * | 3,668 | 29 | ||||||
2U Inc * | 871 | 4 | ||||||
Abercrombie & Fitch Co, Cl A * | 788 | 30 | ||||||
Acushnet Holdings Corp | 987 | 54 | ||||||
Adient PLC * | 732 | 28 | ||||||
ADT Inc | 4,942 | 30 | ||||||
Adtalem Global Education Inc * | 5,431 | 187 | ||||||
Advance Auto Parts Inc | 317 | 22 | ||||||
Airbnb Inc, Cl A * | 3,103 | 398 | ||||||
Amazon.com Inc * | 107,065 | 13,957 | ||||||
American Eagle Outfitters Inc | 3,416 | 40 | ||||||
AMMO Inc * | 6,414 | 14 | ||||||
Aptiv PLC * | 3,490 | 356 | ||||||
Aramark | 260 | 11 | ||||||
Asbury Automotive Group Inc * | 70 | 17 | ||||||
AutoNation Inc * | 970 | 160 | ||||||
AutoZone Inc * | 235 | 586 | ||||||
Bath & Body Works Inc | 638 | 24 | ||||||
Best Buy Co Inc | 7,091 | 581 | ||||||
Big Lots Inc | 1,758 | 16 | ||||||
Bloomin' Brands Inc | 2,259 | 61 | ||||||
Booking Holdings Inc * | 563 | 1,520 | ||||||
Boot Barn Holdings Inc * | 199 | 17 | ||||||
BorgWarner Inc | 321 | 16 | ||||||
New Covenant Funds
17
SCHEDULE OF INVESTMENTS
June 30, 2023
New Covenant Growth Fund (Continued)
Description | Shares | Market Value | ||||||
COMMON STOCK†† (continued) | ||||||||
Bright Horizons Family Solutions Inc * | 76 | $ | 7 | |||||
Brinker International Inc * | 1,180 | 43 | ||||||
Brunswick Corp/DE | 839 | 73 | ||||||
Buckle Inc/The | 1,885 | 65 | ||||||
Burlington Stores Inc * | 482 | 76 | ||||||
Capri Holdings Ltd * | 1,319 | 47 | ||||||
CarMax Inc * | 1,086 | 91 | ||||||
Carnival Corp * | 15,800 | 298 | ||||||
Carter's Inc | 471 | 34 | ||||||
Carvana Co, Cl A * | 5,499 | 143 | ||||||
Cavco Industries Inc * | 60 | 18 | ||||||
Cheesecake Factory Inc/The | 1,236 | 43 | ||||||
Chegg Inc * | 176 | 2 | ||||||
Chico's FAS Inc * | 7,300 | 39 | ||||||
Children's Place Inc/The * | 812 | 19 | ||||||
Chipotle Mexican Grill Inc, Cl A * | 232 | 496 | ||||||
Choice Hotels International Inc | 113 | 13 | ||||||
Columbia Sportswear Co | 891 | 69 | ||||||
Cracker Barrel Old Country Store Inc | 323 | 30 | ||||||
Dana Inc | 2,660 | 45 | ||||||
Darden Restaurants Inc | 705 | 118 | ||||||
Dave & Buster's Entertainment Inc * | 1,283 | 57 | ||||||
Deckers Outdoor Corp * | 1,186 | 626 | ||||||
Denny's Corp * | 2,500 | 31 | ||||||
Designer Brands Inc, Cl A | 3,316 | 33 | ||||||
Dick's Sporting Goods Inc | 1,054 | 139 | ||||||
Dillard's Inc, Cl A | 45 | 15 | ||||||
Domino's Pizza Inc | 33 | 11 | ||||||
DoorDash Inc, Cl A * | 523 | 40 | ||||||
Dorman Products Inc * | 128 | 10 | ||||||
DR Horton Inc | 1,973 | 240 | ||||||
eBay Inc | 20,542 | 918 | ||||||
Etsy Inc * | 1,162 | 98 | ||||||
Expedia Group Inc * | 389 | 43 | ||||||
Fisker Inc * | 2,626 | 15 | ||||||
Five Below Inc * | 410 | 81 | ||||||
Floor & Decor Holdings Inc, Cl A * | 232 | 24 | ||||||
Foot Locker Inc | 1,308 | 35 | ||||||
Ford Motor Co | 12,719 | 192 | ||||||
Fox Factory Holding Corp * | 749 | 81 | ||||||
Frontdoor Inc * | 251 | 8 | ||||||
GameStop Corp, Cl A * | 2,040 | 49 | ||||||
Gap Inc/The | 11,382 | 102 | ||||||
Garmin Ltd | 418 | 44 | ||||||
General Motors Co | 2,763 | 107 | ||||||
Gentex Corp | 440 | 13 | ||||||
Gentherm Inc * | 184 | 10 | ||||||
Genuine Parts Co | 67 | 11 | ||||||
Goodyear Tire & Rubber Co/The * | 989 | 14 | ||||||
Graham Holdings Co, Cl B | 78 | 45 | ||||||
Grand Canyon Education Inc * | 121 | 12 | ||||||
Group 1 Automotive Inc | 86 | 22 | ||||||
Description | Shares | Market Value | ||||||
COMMON STOCK†† (continued) | ||||||||
GrowGeneration Corp * | 2,599 | $ | 9 | |||||
H&R Block Inc | 3,157 | 101 | ||||||
Hanesbrands Inc | 13,319 | 60 | ||||||
Harley-Davidson Inc | 306 | 11 | ||||||
Hasbro Inc | 2,632 | 170 | ||||||
Helen of Troy Ltd * | 57 | 6 | ||||||
Hilton Grand Vacations Inc * | 3,016 | 137 | ||||||
Hilton Worldwide Holdings Inc | 11,607 | 1,689 | ||||||
Home Depot Inc/The | 13,012 | 4,042 | ||||||
Hyatt Hotels Corp, Cl A | 135 | 15 | ||||||
Installed Building Products Inc | 125 | 18 | ||||||
iRobot Corp * | 1,013 | 46 | ||||||
Jack in the Box Inc | 658 | 64 | ||||||
Johnson Outdoors Inc, Cl A | 659 | 41 | ||||||
KB Home | 4,733 | 245 | ||||||
Kohl's Corp | 1,859 | 43 | ||||||
Kontoor Brands Inc | 1,282 | 54 | ||||||
La-Z-Boy Inc, Cl Z | 1,597 | 46 | ||||||
LCI Industries | 483 | 61 | ||||||
Lear Corp | 6,486 | 931 | ||||||
Leggett & Platt Inc | 222 | 7 | ||||||
Lennar Corp, Cl B | 122 | 14 | ||||||
LGI Homes Inc * | 127 | 17 | ||||||
LKQ Corp | 317 | 18 | ||||||
Lowe's Cos Inc | 12,159 | 2,744 | ||||||
Lululemon Athletica Inc * | 1,171 | 443 | ||||||
M/I Homes Inc * | 198 | 17 | ||||||
Macy's Inc | 4,042 | 65 | ||||||
Malibu Boats Inc, Cl A * | 202 | 12 | ||||||
Marriott International Inc/MD, Cl A | 3,599 | 661 | ||||||
Marriott Vacations Worldwide Corp | 394 | 48 | ||||||
Mattel Inc * | 711 | 14 | ||||||
McDonald's Corp | 11,361 | 3,390 | ||||||
Meritage Homes Corp | 794 | 113 | ||||||
Mohawk Industries Inc * | 127 | 13 | ||||||
Monro Inc | 626 | 25 | ||||||
Murphy USA Inc | 422 | 131 | ||||||
National Vision Holdings Inc * | 447 | 11 | ||||||
Newell Brands Inc | 605 | 5 | ||||||
NIKE Inc, Cl B | 17,693 | 1,953 | ||||||
Nordstrom Inc | 3,866 | 79 | ||||||
Norwegian Cruise Line Holdings Ltd * | 14,956 | 326 | ||||||
NVR Inc * | 13 | 83 | ||||||
ODP Corp/The * | 283 | 13 | ||||||
Ollie's Bargain Outlet Holdings Inc * | 212 | 12 | ||||||
O'Reilly Automotive Inc * | 677 | 647 | ||||||
Oxford Industries Inc | 665 | 65 | ||||||
Papa John's International Inc | 151 | 11 | ||||||
Peloton Interactive Inc, Cl A * | 2,845 | 22 | ||||||
Penske Automotive Group Inc | 957 | 159 | ||||||
PetMed Express Inc | 366 | 5 | ||||||
Planet Fitness Inc, Cl A * | 173 | 12 | ||||||
18
New Covenant Funds
Description | Shares | Market Value | ||||||
COMMON STOCK†† (continued) | ||||||||
Polaris Inc | 966 | $ | 117 | |||||
PulteGroup Inc | 5,125 | 398 | ||||||
PVH Corp | 108 | 9 | ||||||
Ralph Lauren Corp, Cl A | 690 | 85 | ||||||
Revolve Group Inc, Cl A * | 2,223 | 36 | ||||||
RH * | 45 | 15 | ||||||
Rivian Automotive Inc, Cl A * | 1,274 | 21 | ||||||
Ross Stores Inc | 3,209 | 360 | ||||||
Royal Caribbean Cruises Ltd * | 8,804 | 913 | ||||||
Sabre Corp * | 506 | 2 | ||||||
Sally Beauty Holdings Inc * | 2,794 | 35 | ||||||
SeaWorld Entertainment Inc * | 251 | 14 | ||||||
Service Corp International/US | 250 | 16 | ||||||
Shake Shack Inc, Cl A * | 157 | 12 | ||||||
Signet Jewelers Ltd | 2,402 | 157 | ||||||
Six Flags Entertainment Corp * | 248 | 6 | ||||||
Sleep Number Corp * | 1,033 | 28 | ||||||
Standard Motor Products Inc | 943 | 35 | ||||||
Starbucks Corp | 16,902 | 1,674 | ||||||
Steven Madden Ltd | 1,178 | 39 | ||||||
Stitch Fix Inc, Cl A * | 1,021 | 4 | ||||||
Strategic Education Inc | 331 | 22 | ||||||
Stride Inc * | 348 | 13 | ||||||
Tapestry Inc | 2,803 | 120 | ||||||
Taylor Morrison Home Corp, Cl A * | 12,743 | 621 | ||||||
Tempur Sealy International Inc | 2,272 | 91 | ||||||
Tesla Inc * | 32,614 | 8,537 | ||||||
Texas Roadhouse Inc, Cl A | 889 | 100 | ||||||
Thor Industries Inc | 106 | 11 | ||||||
TJX Cos Inc/The | 14,736 | 1,249 | ||||||
Toll Brothers Inc | 269 | 21 | ||||||
TopBuild Corp * | 476 | 127 | ||||||
Topgolf Callaway Brands Corp * | 2,383 | 47 | ||||||
Tractor Supply Co | 2,377 | 526 | ||||||
Travel + Leisure Co | 307 | 12 | ||||||
Tri Pointe Homes Inc * | 3,236 | 106 | ||||||
Udemy Inc * | 3,378 | 36 | ||||||
Ulta Beauty Inc * | 279 | 131 | ||||||
Under Armour Inc, Cl C * | 556 | 4 | ||||||
Upbound Group Inc, Cl A | 1,764 | 55 | ||||||
Urban Outfitters Inc * | 417 | 14 | ||||||
Vail Resorts Inc | 46 | 12 | ||||||
Valvoline Inc | 11,216 | 421 | ||||||
VF Corp | 4,023 | 77 | ||||||
Victoria's Secret & Co * | 212 | 4 | ||||||
Visteon Corp * | 85 | 12 | ||||||
Wayfair Inc, Cl A * | 320 | 21 | ||||||
Wendy's Co/The | 11,419 | 248 | ||||||
Whirlpool Corp | 638 | 95 | ||||||
Williams-Sonoma Inc | 160 | 20 | ||||||
Wingstop Inc | 582 | 116 | ||||||
Winnebago Industries Inc | 191 | 13 | ||||||
Description | Shares | Market Value | ||||||
COMMON STOCK†† (continued) | ||||||||
Wolverine World Wide Inc | 1,511 | $ | 22 | |||||
Wyndham Hotels & Resorts Inc | 189 | 13 | ||||||
Yum! Brands Inc | 8,356 | 1,158 | ||||||
| 60,028 | ||||||||
Consumer Staples — 6.1% | ||||||||
Andersons Inc/The | 338 | 16 | ||||||
Archer-Daniels-Midland Co | 5,103 | 386 | ||||||
B&G Foods Inc | 862 | 12 | ||||||
BellRing Brands Inc * | 136 | 5 | ||||||
Beyond Meat Inc * | 166 | 2 | ||||||
Bunge Ltd | 1,596 | 151 | ||||||
Calavo Growers Inc | 571 | 17 | ||||||
Campbell Soup Co | 10,354 | 473 | ||||||
Casey's General Stores Inc | 65 | 16 | ||||||
Chefs' Warehouse Inc/The * | 1,366 | 49 | ||||||
Church & Dwight Co Inc | 1,025 | 103 | ||||||
Clorox Co/The | 2,716 | 432 | ||||||
Coca-Cola Co/The | 48,833 | 2,941 | ||||||
Colgate-Palmolive Co | 13,653 | 1,052 | ||||||
Conagra Brands Inc | 14,479 | 488 | ||||||
Costco Wholesale Corp | 5,215 | 2,808 | ||||||
Coty Inc, Cl A * | 1,026 | 13 | ||||||
Darling Ingredients Inc * | 716 | 46 | ||||||
Dollar General Corp | 2,608 | 443 | ||||||
Dollar Tree Inc * | 1,320 | 189 | ||||||
Edgewell Personal Care Co | 310 | 13 | ||||||
elf Beauty Inc * | 1,902 | 217 | ||||||
Energizer Holdings Inc | 231 | 8 | ||||||
Estee Lauder Cos Inc/The, Cl A | 2,390 | 469 | ||||||
Flowers Foods Inc | 555 | 14 | ||||||
Fresh Del Monte Produce Inc | 1,442 | 37 | ||||||
General Mills Inc | 13,887 | 1,065 | ||||||
Grocery Outlet Holding Corp * | 263 | 8 | ||||||
Hain Celestial Group Inc/The * | 461 | 6 | ||||||
Herbalife Nutrition Ltd * | 1,088 | 14 | ||||||
Hershey Co/The | 2,295 | 573 | ||||||
HF Foods Group Inc * | 2,213 | 10 | ||||||
Hormel Foods Corp | 4,797 | 193 | ||||||
Ingredion Inc | 1,110 | 118 | ||||||
J M Smucker Co/The | 6,494 | 959 | ||||||
Kellogg Co | 6,713 | 452 | ||||||
Keurig Dr Pepper Inc | 32,477 | 1,016 | ||||||
Kimberly-Clark Corp | 6,484 | 895 | ||||||
Kraft Heinz Co/The | 3,923 | 139 | ||||||
Kroger Co/The | 17,094 | 803 | ||||||
Lamb Weston Holdings Inc | 594 | 68 | ||||||
McCormick & Co Inc/MD | 5,832 | 509 | ||||||
Medifast Inc | 71 | 7 | ||||||
Mondelez International Inc, Cl A | 17,402 | 1,269 | ||||||
Monster Beverage Corp * | 889 | 51 | ||||||
National Beverage Corp * | 344 | 17 | ||||||
PepsiCo Inc | 23,368 | 4,328 | ||||||
New Covenant Funds
19
SCHEDULE OF INVESTMENTS
June 30, 2023
New Covenant Growth Fund (Continued)
Description | Shares | Market Value | ||||||
COMMON STOCK†† (continued) | ||||||||
Performance Food Group Co * | 1,023 | $ | 62 | |||||
Pilgrim's Pride Corp * | 355 | 8 | ||||||
Post Holdings Inc * | 108 | 9 | ||||||
PriceSmart Inc | 179 | 13 | ||||||
Procter & Gamble Co/The | 29,205 | 4,432 | ||||||
SpartanNash Co | 1,252 | 28 | ||||||
Spectrum Brands Holdings Inc | 183 | 14 | ||||||
Sprouts Farmers Market Inc * | 623 | 23 | ||||||
Sysco Corp | 17,657 | 1,310 | ||||||
Target Corp | 6,577 | 867 | ||||||
TreeHouse Foods Inc * | 237 | 12 | ||||||
Tyson Foods Inc, Cl A | 1,410 | 72 | ||||||
US Foods Holding Corp * | 2,211 | 97 | ||||||
Vita Coco Co Inc/The * | 1,354 | 36 | ||||||
Walgreens Boots Alliance Inc | 30,476 | 868 | ||||||
Walmart Inc | 14,496 | 2,278 | ||||||
| 33,029 | ||||||||
Energy — 3.9% | ||||||||
Antero Midstream Corp | 26,635 | 309 | ||||||
Antero Resources Corp * | 6,426 | 148 | ||||||
APA Corp | 332 | 11 | ||||||
Arch Resources Inc | 94 | 11 | ||||||
Baker Hughes Co, Cl A | 9,516 | 301 | ||||||
Borr Drilling Ltd * | 11,900 | 90 | ||||||
Cactus Inc, Cl A | 298 | 13 | ||||||
Callon Petroleum Co * | 2,548 | 89 | ||||||
ChampionX Corp | 383 | 12 | ||||||
Cheniere Energy Inc | 6,249 | 952 | ||||||
Chesapeake Energy Corp | 1,851 | 155 | ||||||
Civitas Resources Inc | 179 | 12 | ||||||
Clean Energy Fuels Corp * | 4,579 | 23 | ||||||
CNX Resources Corp * | 1,745 | 31 | ||||||
ConocoPhillips | 25,233 | 2,614 | ||||||
CONSOL Energy Inc | 213 | 14 | ||||||
Coterra Energy Inc | 22,434 | 568 | ||||||
CVR Energy Inc | 1,596 | 48 | ||||||
Delek US Holdings Inc | 2,494 | 60 | ||||||
Denbury Inc * | 1,205 | 104 | ||||||
Devon Energy Corp | 10,747 | 519 | ||||||
DHT Holdings Inc | 1,338 | 11 | ||||||
Diamondback Energy Inc | 4,378 | 575 | ||||||
Dril-Quip Inc * | 1,072 | 25 | ||||||
DT Midstream Inc | 405 | 20 | ||||||
EOG Resources Inc | 12,533 | 1,434 | ||||||
EQT Corp | 7,282 | 299 | ||||||
Equitrans Midstream Corp | 2,185 | 21 | ||||||
Expro Group Holdings NV * | 1,529 | 27 | ||||||
FLEX LNG Ltd | 2,301 | 70 | ||||||
Golar LNG Ltd | 3,888 | 78 | ||||||
Green Plains Inc * | 2,069 | 67 | ||||||
Halliburton Co | 9,891 | 326 | ||||||
Helix Energy Solutions Group Inc * | 10,917 | 81 | ||||||
Description | Shares | Market Value | ||||||
COMMON STOCK†† (continued) | ||||||||
Helmerich & Payne Inc | 4,134 | $ | 147 | |||||
Hess Corp | 6,554 | 891 | ||||||
HF Sinclair Corp | 5,184 | 231 | ||||||
International Seaways Inc | 329 | 13 | ||||||
Kinder Morgan Inc | 89,784 | 1,546 | ||||||
Kinetik Holdings Inc, Cl A | 2,668 | 94 | ||||||
Kosmos Energy Ltd * | 44,503 | 267 | ||||||
Magnolia Oil & Gas Corp, Cl A | 1,806 | 38 | ||||||
Marathon Oil Corp | 16,949 | 390 | ||||||
Murphy Oil Corp | 449 | 17 | ||||||
Nabors Industries Ltd * | 367 | 34 | ||||||
New Fortress Energy Inc, Cl A | 2,307 | 62 | ||||||
NextDecade Corp * | 10,122 | 83 | ||||||
Noble Corp PLC * | 1,325 | 55 | ||||||
Nordic American Tankers Ltd | 3,610 | 13 | ||||||
NOV Inc | 482 | 8 | ||||||
Occidental Petroleum Corp | 6,975 | 410 | ||||||
ONEOK Inc | 9,782 | 604 | ||||||
Ovintiv Inc | 4,569 | 174 | ||||||
Patterson-UTI Energy Inc | 4,952 | 59 | ||||||
PBF Energy Inc, Cl A | 316 | 13 | ||||||
PDC Energy Inc | 183 | 13 | ||||||
Peabody Energy Corp | 612 | 13 | ||||||
Pioneer Natural Resources Co | 5,512 | 1,142 | ||||||
Range Resources Corp | 4,411 | 130 | ||||||
RPC Inc | 1,226 | 9 | ||||||
Schlumberger NV | 36,941 | 1,814 | ||||||
Scorpio Tankers Inc | 270 | 13 | ||||||
SM Energy Co | 840 | 27 | ||||||
Southwestern Energy Co * | 21,739 | 131 | ||||||
Targa Resources Corp | 10,556 | 803 | ||||||
Teekay Tankers Ltd, Cl A | 1,755 | 67 | ||||||
Texas Pacific Land Corp | 431 | 567 | ||||||
Uranium Energy Corp * | 15,244 | 52 | ||||||
Valaris Ltd * | 739 | 46 | ||||||
Vitesse Energy Inc | 272 | 6 | ||||||
Williams Cos Inc/The | 49,246 | 1,607 | ||||||
World Fuel Services Corp | 4,395 | 91 | ||||||
| 20,798 | ||||||||
Financials — 13.2% | ||||||||
Affiliated Managers Group Inc | 910 | 136 | ||||||
Affirm Holdings Inc, Cl A * | 2,309 | 35 | ||||||
Aflac Inc | 4,907 | 343 | ||||||
AGNC Investment Corp ‡ | 2,838 | 29 | ||||||
Allstate Corp/The | 3,458 | 377 | ||||||
Ally Financial Inc | 1,575 | 43 | ||||||
Amalgamated Financial Corp | 2,110 | 34 | ||||||
American Express Co | 9,360 | 1,631 | ||||||
American Financial Group Inc/OH | 89 | 11 | ||||||
American International Group Inc | 6,597 | 380 | ||||||
Ameriprise Financial Inc | 1,250 | 415 | ||||||
Ameris Bancorp | 1,129 | 39 | ||||||
20
New Covenant Funds
Description | Shares | Market Value | ||||||
COMMON STOCK†† (continued) | ||||||||
AMERISAFE Inc | 743 | $ | 40 | |||||
Annaly Capital Management Inc ‡ | 655 | 13 | ||||||
Aon PLC, Cl A | 3,101 | 1,070 | ||||||
Apollo Commercial Real Estate Finance Inc ‡ | 2,686 | 30 | ||||||
Apollo Global Management Inc | 614 | 47 | ||||||
Arch Capital Group Ltd * | 2,404 | 180 | ||||||
Ares Management Corp, Cl A | 632 | 61 | ||||||
Argo Group International Holdings Ltd | 750 | 22 | ||||||
Arthur J Gallagher & Co | 1,610 | 354 | ||||||
Artisan Partners Asset Management Inc, Cl A | 1,589 | 62 | ||||||
Associated Banc-Corp | 4,274 | 69 | ||||||
Assurant Inc | 87 | 11 | ||||||
Assured Guaranty Ltd | 994 | 55 | ||||||
Atlantic Union Bankshares Corp | 1,302 | 34 | ||||||
Axis Capital Holdings Ltd | 825 | 44 | ||||||
Axos Financial Inc * | 310 | 12 | ||||||
Bank of America Corp | 87,545 | 2,512 | ||||||
Bank of Hawaii Corp | 1,051 | 43 | ||||||
Bank of Marin Bancorp | 1,079 | 19 | ||||||
Bank of New York Mellon Corp/The | 12,656 | 563 | ||||||
Bank of NT Butterfield & Son Ltd/The | 1,324 | 36 | ||||||
Bank OZK | 366 | 15 | ||||||
BankUnited Inc | 346 | 7 | ||||||
Banner Corp | 851 | 37 | ||||||
Berkshire Hathaway Inc, Cl B * | 21,019 | 7,167 | ||||||
Berkshire Hills Bancorp Inc | 1,501 | 31 | ||||||
BlackRock Inc, Cl A | 1,878 | 1,298 | ||||||
Blackstone Inc | 6,935 | 645 | ||||||
Block Inc, Cl A * | 4,127 | 275 | ||||||
BOK Financial Corp | 568 | 46 | ||||||
Bread Financial Holdings Inc | 1,335 | 42 | ||||||
Brighthouse Financial Inc * | 268 | 13 | ||||||
Brown & Brown Inc | 290 | 20 | ||||||
Cadence Bank | 1,525 | 30 | ||||||
Capital One Financial Corp | 3,914 | 428 | ||||||
Capitol Federal Financial Inc | 3,529 | 22 | ||||||
Carlyle Group Inc/The | 923 | 29 | ||||||
Cass Information Systems Inc | 865 | 34 | ||||||
Cathay General Bancorp | 1,291 | 42 | ||||||
Cboe Global Markets Inc | 99 | 14 | ||||||
Central Pacific Financial Corp | 1,651 | 26 | ||||||
Charles Schwab Corp/The | 16,432 | 931 | ||||||
Chimera Investment Corp ‡ | 2,402 | 14 | ||||||
Chubb Ltd | 6,169 | 1,188 | ||||||
Cincinnati Financial Corp | 891 | 87 | ||||||
Citigroup Inc | 24,313 | 1,119 | ||||||
Citizens Financial Group Inc | 3,587 | 94 | ||||||
City Holding Co | 607 | 55 | ||||||
CME Group Inc, Cl A | 4,726 | 876 | ||||||
CNA Financial Corp | 253 | 10 | ||||||
Description | Shares | Market Value | ||||||
COMMON STOCK†† (continued) | ||||||||
Cohen & Steers Inc | 764 | $ | 44 | |||||
Columbia Banking System Inc | 1,640 | 33 | ||||||
Comerica Inc | 1,232 | 52 | ||||||
Commerce Bancshares Inc/MO | 1,722 | 84 | ||||||
Community Bank System Inc | 710 | 33 | ||||||
ConnectOne Bancorp Inc | 1,891 | 31 | ||||||
Credit Acceptance Corp * | 177 | 90 | ||||||
Cullen/Frost Bankers Inc | 121 | 13 | ||||||
Dime Community Bancshares Inc | 1,467 | 26 | ||||||
Discover Financial Services | 11,446 | 1,337 | ||||||
Eagle Bancorp Inc | 1,035 | 22 | ||||||
East West Bancorp Inc | 1,710 | 90 | ||||||
eHealth Inc * | 512 | 4 | ||||||
Ellington Financial Inc ‡ | 2,748 | 38 | ||||||
Enterprise Financial Services Corp | 1,063 | 42 | ||||||
Equitable Holdings Inc | 432 | 12 | ||||||
Essent Group Ltd | 970 | 45 | ||||||
Euronet Worldwide Inc * | 74 | 9 | ||||||
Evercore Inc, Cl A | 659 | 81 | ||||||
Everest Re Group Ltd | 179 | 61 | ||||||
Eversource Energy | 10,983 | 779 | ||||||
EVERTEC Inc | 1,569 | 58 | ||||||
F&G Annuities & Life Inc | 2,571 | 64 | ||||||
FactSet Research Systems Inc | 306 | 123 | ||||||
FB Financial Corp | 1,250 | 35 | ||||||
Federal Agricultural Mortgage Corp, Cl C | 119 | 17 | ||||||
Fidelity National Financial Inc | 1,063 | 38 | ||||||
Fidelity National Information Services Inc | 7,874 | 431 | ||||||
Fifth Third Bancorp | 4,599 | 121 | ||||||
First American Financial Corp | 814 | 46 | ||||||
First BanCorp/Puerto Rico | 821 | 10 | ||||||
First Busey Corp | 1,790 | 36 | ||||||
First Citizens BancShares Inc/NC, Cl A | 159 | 204 | ||||||
First Commonwealth Financial Corp | 3,365 | 43 | ||||||
First Financial Bancorp | 1,921 | 39 | ||||||
First Financial Bankshares Inc | 1,378 | 39 | ||||||
First Hawaiian Inc | 3,126 | 56 | ||||||
First Horizon Corp | 22,027 | 248 | ||||||
First Interstate BancSystem Inc, Cl A | 1,171 | 28 | ||||||
First Merchants Corp | 1,182 | 33 | ||||||
FirstCash Holdings Inc | 612 | 57 | ||||||
Fiserv Inc * | 5,664 | 715 | ||||||
FleetCor Technologies Inc * | 277 | 70 | ||||||
FNB Corp/PA | 3,907 | 45 | ||||||
Franklin Resources Inc | 6,856 | 183 | ||||||
Fulton Financial Corp | 2,789 | 33 | ||||||
Genworth Financial Inc, Cl A * | 10,439 | 52 | ||||||
German American Bancorp Inc | 1,414 | 38 | ||||||
Global Payments Inc | 2,965 | 292 | ||||||
Globe Life Inc | 108 | 12 | ||||||
Goldman Sachs Group Inc/The | 3,960 | 1,277 | ||||||
Goosehead Insurance Inc, Cl A * | 215 | 14 | ||||||
New Covenant Funds
21
SCHEDULE OF INVESTMENTS
June 30, 2023
New Covenant Growth Fund (Continued)
Description | Shares | Market Value | ||||||
COMMON STOCK†† (continued) | ||||||||
Hancock Whitney Corp | 1,142 | $ | 44 | |||||
Hannon Armstrong Sustainable Infrastructure Capital Inc | 9,246 | 231 | ||||||
Hanover Insurance Group Inc/The | 124 | 14 | ||||||
HarborOne Bancorp Inc | 861 | 7 | ||||||
Hartford Financial Services Group Inc/The | 1,006 | 72 | ||||||
Heartland Financial USA Inc | 1,003 | 28 | ||||||
Heritage Financial Corp/WA | 1,744 | 28 | ||||||
Home BancShares Inc/AR | 2,523 | 58 | ||||||
HomeStreet Inc | 309 | 2 | ||||||
Hope Bancorp Inc | 3,233 | 27 | ||||||
Horace Mann Educators Corp | 1,125 | 33 | ||||||
Houlihan Lokey Inc, Cl A | 192 | 19 | ||||||
Huntington Bancshares Inc/OH | 9,540 | 103 | ||||||
Independent Bank Corp | 580 | 26 | ||||||
Independent Bank Group Inc | 846 | 29 | ||||||
Intercontinental Exchange Inc | 5,170 | 585 | ||||||
Invesco Ltd | 18,276 | 307 | ||||||
Invesco Mortgage Capital Inc ‡ | 323 | 4 | ||||||
Jack Henry & Associates Inc | 636 | 106 | ||||||
James River Group Holdings Ltd | 1,180 | 22 | ||||||
Janus Henderson Group PLC | 1,207 | 33 | ||||||
Jefferies Financial Group Inc | 2,313 | 77 | ||||||
JPMorgan Chase & Co | 35,839 | 5,212 | ||||||
KeyCorp | 12,904 | 119 | ||||||
Kinsale Capital Group Inc | 73 | 27 | ||||||
KKR & Co Inc | 3,222 | 180 | ||||||
Lakeland Bancorp Inc | 2,890 | 39 | ||||||
Lazard Ltd, Cl A | 2,316 | 74 | ||||||
Lemonade Inc * | 1,665 | 28 | ||||||
LendingTree Inc * | 175 | 4 | ||||||
Lincoln National Corp | 3,621 | 93 | ||||||
Loews Corp | 222 | 13 | ||||||
LPL Financial Holdings Inc | 1,036 | 225 | ||||||
M&T Bank Corp | 1,519 | 188 | ||||||
MarketAxess Holdings Inc | 144 | 38 | ||||||
Marsh & McLennan Cos Inc | 12,569 | 2,364 | ||||||
Mastercard Inc, Cl A | 12,101 | 4,759 | ||||||
Mercury General Corp | 233 | 7 | ||||||
MetLife Inc | 6,576 | 372 | ||||||
MFA Financial Inc ‡ | 1,584 | 18 | ||||||
MGIC Investment Corp | 3,455 | 55 | ||||||
Moelis & Co, Cl A | 461 | 21 | ||||||
Moody's Corp | 4,810 | 1,673 | ||||||
Morgan Stanley | 15,681 | 1,339 | ||||||
Morningstar Inc | 67 | 13 | ||||||
Mr Cooper Group Inc * | 335 | 17 | ||||||
MSCI Inc, Cl A | 635 | 298 | ||||||
Nasdaq Inc | 7,134 | 356 | ||||||
NBT Bancorp Inc | 1,213 | 39 | ||||||
Nelnet Inc, Cl A | 145 | 14 | ||||||
New York Community Bancorp Inc | 951 | 11 | ||||||
Description | Shares | Market Value | ||||||
COMMON STOCK†† (continued) | ||||||||
New York Mortgage Trust Inc ‡ | 1,944 | $ | 19 | |||||
NMI Holdings Inc, Cl A * | 1,470 | 38 | ||||||
Northern Trust Corp | 7,549 | 560 | ||||||
Northfield Bancorp Inc | 2,868 | 31 | ||||||
OFG Bancorp | 2,119 | 55 | ||||||
Old National Bancorp/IN | 5,093 | 71 | ||||||
OneMain Holdings Inc, Cl A | 258 | 11 | ||||||
Orchid Island Capital Inc, Cl A ‡ | 3,472 | 36 | ||||||
Pacific Premier Bancorp Inc | 3,188 | 66 | ||||||
PacWest Bancorp | 1,283 | 10 | ||||||
Palomar Holdings Inc, Cl A * | 145 | 8 | ||||||
Pathward Financial Inc | 266 | 12 | ||||||
PayPal Holdings Inc * | 16,718 | 1,116 | ||||||
PennyMac Mortgage Investment Trust ‡ | 24,099 | 325 | ||||||
Pinnacle Financial Partners Inc | 1,489 | 84 | ||||||
PNC Financial Services Group Inc/The | 5,690 | 717 | ||||||
Popular Inc | 1,507 | 91 | ||||||
PRA Group Inc * | 1,320 | 30 | ||||||
Primerica Inc | 323 | 64 | ||||||
Principal Financial Group Inc | 662 | 50 | ||||||
Priority Technology Holdings Inc * | 10,659 | 39 | ||||||
ProAssurance Corp | 1,351 | 20 | ||||||
PROG Holdings Inc * | 832 | 27 | ||||||
Progressive Corp/The | 7,459 | 987 | ||||||
Prosperity Bancshares Inc | 1,192 | 67 | ||||||
Provident Financial Services Inc | 1,988 | 32 | ||||||
Prudential Financial Inc | 15,519 | 1,369 | ||||||
Radian Group Inc | 1,924 | 49 | ||||||
Raymond James Financial Inc | 1,949 | 202 | ||||||
Redwood Trust Inc ‡ | 2,992 | 19 | ||||||
Regions Financial Corp | 62,324 | 1,111 | ||||||
Reinsurance Group of America Inc, Cl A | 578 | 80 | ||||||
RenaissanceRe Holdings Ltd | 69 | 13 | ||||||
Renasant Corp | 1,366 | 36 | ||||||
Repay Holdings Corp, Cl A * | 7,436 | 58 | ||||||
Rithm Capital Corp ‡ | 1,403 | 13 | ||||||
RLI Corp | 545 | 74 | ||||||
S&P Global Inc | 7,012 | 2,811 | ||||||
Sandy Spring Bancorp Inc | 1,350 | 31 | ||||||
Seacoast Banking Corp of Florida | 1,616 | 36 | ||||||
ServisFirst Bancshares Inc | 187 | 8 | ||||||
SLM Corp | 8,316 | 136 | ||||||
SouthState Corp | 216 | 14 | ||||||
Starwood Property Trust Inc ‡ | 2,000 | 39 | ||||||
State Street Corp | 9,970 | 730 | ||||||
Stellar Bancorp Inc | 1,869 | 43 | ||||||
Stifel Financial Corp | 245 | 15 | ||||||
Synchrony Financial | 4,720 | 160 | ||||||
Synovus Financial Corp | 1,267 | 38 | ||||||
T Rowe Price Group Inc | 2,711 | 304 | ||||||
Texas Capital Bancshares Inc * | 822 | 42 | ||||||
TFS Financial Corp | 573 | 7 | ||||||
22
New Covenant Funds
Description | Shares | Market Value | ||||||
COMMON STOCK†† (continued) | ||||||||
TPG RE Finance Trust Inc ‡ | 2,439 | $ | 18 | |||||
Travelers Cos Inc/The | 4,033 | 700 | ||||||
TriCo Bancshares | 1,219 | 40 | ||||||
Triumph Financial Inc * | 822 | 50 | ||||||
Truist Financial Corp | 14,236 | 432 | ||||||
Trustmark Corp | 1,410 | 30 | ||||||
Two Harbors Investment Corp ‡ | 1,597 | 22 | ||||||
UMB Financial Corp | 715 | 44 | ||||||
Univest Financial Corp | 1,820 | 33 | ||||||
Unum Group * | 1,638 | 78 | ||||||
Upstart Holdings Inc * | 1,290 | 46 | ||||||
US Bancorp | 12,299 | 406 | ||||||
Valley National Bancorp | 4,269 | 33 | ||||||
Veritex Holdings Inc | 348 | 6 | ||||||
Virtu Financial Inc, Cl A | 3,026 | 52 | ||||||
Visa Inc, Cl A | 21,213 | 5,038 | ||||||
W R Berkley Corp | 247 | 15 | ||||||
Walker & Dunlop Inc | 749 | 59 | ||||||
Washington Trust Bancorp Inc | 924 | 25 | ||||||
Webster Financial Corp | 2,008 | 76 | ||||||
Wells Fargo & Co | 34,863 | 1,488 | ||||||
Westamerica BanCorp | 731 | 28 | ||||||
Western Alliance Bancorp | 1,801 | 66 | ||||||
Western Union Co/The | 425 | 5 | ||||||
WEX Inc * | 55 | 10 | ||||||
Willis Towers Watson PLC | 907 | 214 | ||||||
Wintrust Financial Corp | 708 | 51 | ||||||
Zions Bancorp NA | 1,771 | 48 | ||||||
| 71,296 | ||||||||
Health Care — 13.0% | ||||||||
10X Genomics Inc, Cl A * | 954 | 53 | ||||||
Abbott Laboratories | 27,119 | 2,957 | ||||||
AbbVie Inc | 25,124 | 3,385 | ||||||
Acadia Healthcare Co Inc * | 220 | 18 | ||||||
Accolade Inc * | 956 | 13 | ||||||
AdaptHealth Corp, Cl A * | 2,632 | 32 | ||||||
Adaptive Biotechnologies Corp * | 1,704 | 11 | ||||||
Addus HomeCare Corp * | 495 | 46 | ||||||
Agilent Technologies Inc | 7,874 | 947 | ||||||
Agios Pharmaceuticals Inc * | 1,062 | 30 | ||||||
Akero Therapeutics Inc * | 913 | 43 | ||||||
Alector Inc * | 2,628 | 16 | ||||||
Align Technology Inc * | 691 | 244 | ||||||
Allogene Therapeutics Inc * | 1,838 | 9 | ||||||
Alnylam Pharmaceuticals Inc * | 1,202 | 228 | ||||||
Amedisys Inc * | 56 | 5 | ||||||
American Well Corp, Cl A * | 10,093 | 21 | ||||||
AmerisourceBergen Corp, Cl A | 589 | 113 | ||||||
Amgen Inc | 7,498 | 1,665 | ||||||
Amicus Therapeutics Inc * | 5,193 | 65 | ||||||
AMN Healthcare Services Inc * | 832 | 91 | ||||||
AnaptysBio Inc * | 1,908 | 39 | ||||||
Description | Shares | Market Value | ||||||
COMMON STOCK†† (continued) | ||||||||
Anika Therapeutics Inc * | 920 | $ | 24 | |||||
Apollo Medical Holdings Inc * | 344 | 11 | ||||||
Arcturus Therapeutics Holdings Inc * | 483 | 14 | ||||||
Arcus Biosciences Inc * | 2,371 | 48 | ||||||
Arrowhead Pharmaceuticals Inc * | 251 | 9 | ||||||
Arvinas Inc * | 1,298 | 32 | ||||||
Atara Biotherapeutics Inc * | 3,254 | 5 | ||||||
AtriCure Inc * | 1,029 | 51 | ||||||
Atrion Corp | 71 | 40 | ||||||
Avanos Medical Inc * | 301 | 8 | ||||||
Avantor Inc * | 1,656 | 34 | ||||||
Avidity Biosciences Inc * | 2,388 | 26 | ||||||
Avista Public Acquisition Corp II, Cl W * | 2,263 | 11 | ||||||
Axonics Inc * | 351 | 18 | ||||||
Azenta Inc * | 207 | 10 | ||||||
Baxter International Inc | 12,373 | 564 | ||||||
Becton Dickinson & Co | 4,437 | 1,171 | ||||||
BioCryst Pharmaceuticals Inc * | 1,030 | 7 | ||||||
Biogen Inc * | 2,874 | 819 | ||||||
Biohaven Ltd * | 45 | 1 | ||||||
BioLife Solutions Inc * | 2,163 | 48 | ||||||
BioMarin Pharmaceutical Inc * | 1,042 | 90 | ||||||
Bio-Rad Laboratories Inc, Cl A * | 32 | 12 | ||||||
Bio-Techne Corp | 212 | 17 | ||||||
Bluebird Bio Inc * | 645 | 2 | ||||||
Boston Scientific Corp * | 16,399 | 887 | ||||||
Bridgebio Pharma Inc * | 241 | 4 | ||||||
Bristol-Myers Squibb Co | 34,297 | 2,193 | ||||||
Brookdale Senior Living Inc * | 7,397 | 31 | ||||||
Bruker Corp | 233 | 17 | ||||||
Cara Therapeutics Inc * | 2,942 | 8 | ||||||
Cardinal Health Inc | 2,213 | 209 | ||||||
CareDx Inc * | 6,310 | 54 | ||||||
Cassava Sciences Inc * | 614 | 15 | ||||||
Castle Biosciences Inc * | 730 | 10 | ||||||
Catalent Inc * | 949 | 41 | ||||||
Catalyst Pharmaceuticals Inc * | 11,416 | 153 | ||||||
Centene Corp * | 4,805 | 324 | ||||||
Charles River Laboratories International Inc * | 77 | 16 | ||||||
Cigna Group/The | 7,185 | 2,016 | ||||||
Collegium Pharmaceutical Inc * | 2,915 | 63 | ||||||
Cooper Cos Inc/The | 236 | 90 | ||||||
Corcept Therapeutics Inc * | 3,878 | 86 | ||||||
CorVel Corp * | 125 | 24 | ||||||
Crinetics Pharmaceuticals Inc * | 2,310 | 42 | ||||||
CryoPort Inc * | 871 | 15 | ||||||
CVS Health Corp | 8,384 | 580 | ||||||
Cytokinetics Inc * | 7,134 | 233 | ||||||
Danaher Corp | 7,586 | 1,821 | ||||||
DaVita Inc * | 160 | 16 | ||||||
Deciphera Pharmaceuticals Inc * | 716 | 10 | ||||||
New Covenant Funds
23
SCHEDULE OF INVESTMENTS
June 30, 2023
New Covenant Growth Fund (Continued)
Description | Shares | Market Value | ||||||
COMMON STOCK†† (continued) | ||||||||
Denali Therapeutics Inc * | 2,631 | $ | 78 | |||||
DENTSPLY SIRONA Inc | 3,113 | 125 | ||||||
Dexcom Inc * | 3,388 | 435 | ||||||
DICE Therapeutics * | 2,263 | 105 | ||||||
Dynavax Technologies Corp * | 4,355 | 56 | ||||||
Eagle Pharmaceuticals Inc/DE * | 1,045 | 20 | ||||||
Editas Medicine Inc, Cl A * | 1,596 | 13 | ||||||
Edwards Lifesciences Corp * | 8,484 | 800 | ||||||
Elanco Animal Health Inc * | 398 | 4 | ||||||
Elevance Health Inc | 5,483 | 2,436 | ||||||
Eli Lilly & Co | 11,234 | 5,269 | ||||||
Embecta Corp | 887 | 19 | ||||||
Emergent BioSolutions Inc * | 950 | 7 | ||||||
Enanta Pharmaceuticals Inc * | 785 | 17 | ||||||
Encompass Health Corp | 164 | 11 | ||||||
Enhabit Inc * | 82 | 1 | ||||||
Enovis Corp * | 485 | 31 | ||||||
Envista Holdings Corp * | 317 | 11 | ||||||
Exact Sciences Corp * | 930 | 87 | ||||||
Exelixis Inc * | 4,344 | 83 | ||||||
Fate Therapeutics Inc * | 3,277 | 16 | ||||||
FibroGen Inc * | 1,053 | 3 | ||||||
Fulgent Genetics Inc * | 853 | 32 | ||||||
GE HealthCare Technologies Inc | 153 | 12 | ||||||
Gilead Sciences Inc | 14,228 | 1,097 | ||||||
Glaukos Corp * | 167 | 12 | ||||||
Globus Medical Inc, Cl A * | 179 | 11 | ||||||
Haemonetics * | 195 | 17 | ||||||
Halozyme Therapeutics Inc * | 2,641 | 95 | ||||||
HCA Healthcare Inc | 2,314 | 702 | ||||||
Health Catalyst Inc * | 1,594 | 20 | ||||||
HealthEquity Inc * | 673 | 43 | ||||||
Henry Schein Inc * | 2,612 | 212 | ||||||
Hologic Inc * | 927 | 75 | ||||||
Horizon Therapeutics PLC * | 1,437 | 148 | ||||||
Humana Inc | 887 | 397 | ||||||
ICON * | 572 | 143 | ||||||
ICU Medical Inc * | 62 | 11 | ||||||
Ideaya Biosciences Inc * | 4,068 | 96 | ||||||
IDEXX Laboratories Inc * | 707 | 355 | ||||||
IGM Biosciences Inc * | 1,084 | 10 | ||||||
Illumina Inc * | 3,200 | 600 | ||||||
ImmunityBio Inc * | 12,691 | 35 | ||||||
Inari Medical Inc * | 419 | 24 | ||||||
Incyte Corp * | 1,063 | 66 | ||||||
Innoviva Inc * | 3,557 | 45 | ||||||
Inogen Inc * | 706 | 8 | ||||||
Insmed Inc * | 2,129 | 45 | ||||||
Insulet Corp * | 65 | 19 | ||||||
Integer Holdings Corp * | 625 | 55 | ||||||
Integra LifeSciences Holdings Corp * | 188 | 8 | ||||||
Intellia Therapeutics Inc * | 1,231 | 50 | ||||||
Description | Shares | Market Value | ||||||
COMMON STOCK†† (continued) | ||||||||
Intercept Pharmaceuticals Inc * | 417 | $ | 5 | |||||
Intra-Cellular Therapies Inc * | 3,894 | 247 | ||||||
Intuitive Surgical Inc * | 4,209 | 1,439 | ||||||
Ionis Pharmaceuticals Inc * | 782 | 32 | ||||||
Iovance Biotherapeutics Inc * | 1,433 | 10 | ||||||
IQVIA Holdings Inc * | 968 | 218 | ||||||
iRhythm Technologies Inc * | 210 | 22 | ||||||
Ironwood Pharmaceuticals Inc, Cl A * | 3,844 | 41 | ||||||
IVERIC bio Inc * | 2,336 | 92 | ||||||
Johnson & Johnson | 32,711 | 5,414 | ||||||
Karyopharm Therapeutics Inc * | 2,929 | 5 | ||||||
Kezar Life Sciences Inc * | 45,653 | 112 | ||||||
Kiniksa Pharmaceuticals Ltd, Cl A * | 801 | 11 | ||||||
Kodiak Sciences Inc * | 1,218 | 8 | ||||||
Krystal Biotech Inc * | 823 | 97 | ||||||
Kura Oncology Inc * | 3,438 | 36 | ||||||
Laboratory Corp of America Holdings | 515 | 124 | ||||||
Lantheus Holdings Inc * | 2,408 | 202 | ||||||
Ligand Pharmaceuticals Inc * | 462 | 33 | ||||||
LivaNova PLC * | 657 | 34 | ||||||
MacroGenics Inc * | 1,782 | 10 | ||||||
Madrigal Pharmaceuticals Inc * | 531 | 123 | ||||||
McKesson Corp | 1,233 | 527 | ||||||
MeiraGTx Holdings plc * | 4,240 | 28 | ||||||
Merck & Co Inc | 36,681 | 4,233 | ||||||
Mersana Therapeutics Inc * | 13,514 | 44 | ||||||
Mettler-Toledo International Inc * | 771 | 1,011 | ||||||
Mirati Therapeutics Inc * | 429 | 16 | ||||||
Moderna Inc * | 4,368 | 531 | ||||||
Myriad Genetics Inc * | 1,860 | 43 | ||||||
Natera Inc * | 229 | 11 | ||||||
National Research Corp | 779 | 34 | ||||||
Neogen Corp * | 300 | 7 | ||||||
Neurocrine Biosciences Inc * | 1,089 | 103 | ||||||
Nevro Corp * | 83 | 2 | ||||||
NextGen Healthcare Inc * | 3,392 | 55 | ||||||
Novavax Inc * | 816 | 6 | ||||||
Novocure Ltd * | 905 | 38 | ||||||
Omnicell Inc * | 466 | 34 | ||||||
Option Care Health Inc * | 648 | 21 | ||||||
OraSure Technologies Inc * | 6,042 | 30 | ||||||
Organon & Co | 649 | 14 | ||||||
Pediatrix Medical Group Inc * | 417 | 6 | ||||||
Pennant Group Inc/The * | 1,609 | 20 | ||||||
Penumbra Inc * | 72 | 25 | ||||||
Pfizer Inc | 73,662 | 2,702 | ||||||
Phreesia Inc * | 361 | 11 | ||||||
PMV Pharmaceuticals * | 18,090 | 113 | ||||||
Premier Inc, Cl A | 2,266 | 63 | ||||||
Protagonist Therapeutics Inc * | 1,083 | 30 | ||||||
PTC Therapeutics Inc * | 1,021 | 42 | ||||||
QIAGEN NV * | 2,338 | 105 | ||||||
24
New Covenant Funds
Description | Shares | Market Value | ||||||
COMMON STOCK†† (continued) | ||||||||
Quest Diagnostics Inc | 865 | $ | 122 | |||||
Reata Pharmaceuticals Inc, Cl A * | 537 | 55 | ||||||
Regeneron Pharmaceuticals Inc * | 1,105 | 794 | ||||||
REGENXBIO * | 456 | 9 | ||||||
Repligen Corp * | 553 | 78 | ||||||
ResMed Inc | 2,930 | 640 | ||||||
Revance Therapeutics Inc * | 3,056 | 77 | ||||||
Revvity Inc | 120 | 14 | ||||||
Rocket Pharmaceuticals Inc * | 932 | 19 | ||||||
Sage Therapeutics Inc * | 516 | 24 | ||||||
Sarepta Therapeutics Inc * | 87 | 10 | ||||||
Seagen Inc * | 750 | 144 | ||||||
Shockwave Medical Inc * | 49 | 14 | ||||||
Simulations Plus Inc | 1,477 | 64 | ||||||
STAAR Surgical Co * | 2,233 | 117 | ||||||
Stryker Corp | 3,476 | 1,060 | ||||||
Supernus Pharmaceuticals Inc * | 2,174 | 65 | ||||||
Surmodics Inc * | 1,169 | 37 | ||||||
Tactile Systems Technology Inc * | 728 | 18 | ||||||
Tandem Diabetes Care Inc * | 144 | 4 | ||||||
Teleflex Inc | 742 | 180 | ||||||
Theravance Biopharma Inc * | 2,200 | 23 | ||||||
Thermo Fisher Scientific Inc | 4,827 | 2,518 | ||||||
Travere Therapeutics Inc * | 3,434 | 53 | ||||||
Twist Bioscience Corp * | 606 | 12 | ||||||
Ultragenyx Pharmaceutical Inc * | 1,143 | 53 | ||||||
United Therapeutics Corp * | 559 | 123 | ||||||
UnitedHealth Group Inc | 11,675 | 5,611 | ||||||
Universal Health Services Inc, Cl B | 80 | 13 | ||||||
US Physical Therapy Inc | 428 | 52 | ||||||
Utah Medical Products Inc | 515 | 48 | ||||||
Varex Imaging Corp * | 1,631 | 38 | ||||||
Vaxcyte Inc * | 1,042 | 52 | ||||||
Veeva Systems Inc, Cl A * | 1,157 | 229 | ||||||
Veradigm Inc * | 3,611 | 46 | ||||||
Vericel Corp * | 1,218 | 46 | ||||||
Vertex Pharmaceuticals Inc * | 3,305 | 1,163 | ||||||
Viatris Inc, Cl W | 1,277 | 13 | ||||||
Waters Corp * | 395 | 105 | ||||||
West Pharmaceutical Services Inc | 1,875 | 717 | ||||||
Xencor Inc * | 1,686 | 42 | ||||||
Y-mAbs Therapeutics Inc * | 3,117 | 21 | ||||||
Zentalis Pharmaceuticals Inc * | 497 | 14 | ||||||
Zimmer Biomet Holdings Inc | 3,501 | 510 | ||||||
Zimvie Inc * | 350 | 4 | ||||||
Zoetis Inc, Cl A | 6,022 | 1,037 | ||||||
| 70,439 | ||||||||
Industrials — 8.9% | ||||||||
374Water * | 37,665 | 90 | ||||||
3M Co | 10,841 | 1,085 | ||||||
A O Smith Corp | 1,708 | 124 | ||||||
AAON Inc | 192 | 18 | ||||||
Description | Shares | Market Value | ||||||
COMMON STOCK†† (continued) | ||||||||
ABM Industries Inc | 3,427 | $ | 146 | |||||
ACCO Brands Corp | 5,214 | 27 | ||||||
Acuity Brands Inc | 84 | 14 | ||||||
AerSale Corp * | 12,013 | 177 | ||||||
AGCO Corp | 149 | 20 | ||||||
Air Lease Corp, Cl A | 1,053 | 44 | ||||||
Alamo Group Inc | 86 | 16 | ||||||
Alaska Air Group Inc * | 9,238 | 491 | ||||||
Albany International Corp, Cl A | 652 | 61 | ||||||
Allegion PLC | 855 | 103 | ||||||
Allison Transmission Holdings Inc | 1,870 | 106 | ||||||
American Airlines Group Inc * | 405 | 7 | ||||||
American Woodmark Corp * | 461 | 35 | ||||||
AMETEK Inc | 1,369 | 222 | ||||||
Amprius Technologies * | 12,555 | 90 | ||||||
Apogee Enterprises Inc | 1,229 | 58 | ||||||
Applied Industrial Technologies Inc | 745 | 108 | ||||||
ArcBest Corp | 336 | 33 | ||||||
Archer Aviation Inc, Cl A * | 42,816 | 176 | ||||||
Arcosa Inc | 1,128 | 86 | ||||||
Argan Inc | 1,315 | 52 | ||||||
Armstrong World Industries Inc | 161 | 12 | ||||||
ASGN Inc * | 146 | 11 | ||||||
Astec Industries Inc | 204 | 9 | ||||||
Astronics Corp * | 3,653 | 73 | ||||||
Atkore Inc * | 453 | 71 | ||||||
Automatic Data Processing Inc | 9,709 | 2,134 | ||||||
Avis Budget Group Inc * | 784 | 179 | ||||||
Axon Enterprise Inc * | 2,519 | 492 | ||||||
AZZ Inc | 1,071 | 47 | ||||||
Barnes Group Inc | 807 | 34 | ||||||
BlackSky Technology * | 55,215 | 123 | ||||||
Blink Charging Co * | 1,491 | 9 | ||||||
Bloom Energy Corp, Cl A * | 4,597 | 75 | ||||||
Brink's Co/The | 540 | 37 | ||||||
Broadridge Financial Solutions Inc | 720 | 119 | ||||||
Cadre Holdings Inc | 1,351 | 29 | ||||||
Carlisle Cos Inc | 311 | 80 | ||||||
Carrier Global Corp | 6,184 | 307 | ||||||
CBIZ Inc * | 1,805 | 96 | ||||||
Ceridian HCM Holding Inc * | 792 | 53 | ||||||
CH Robinson Worldwide Inc | 148 | 14 | ||||||
Chart Industries Inc * | 576 | 92 | ||||||
Cintas Corp | 1,907 | 948 | ||||||
Clarivate * | 11,944 | 114 | ||||||
Clean Harbors Inc * | 137 | 23 | ||||||
Comfort Systems USA Inc | 988 | 162 | ||||||
Concentrix Corp | 387 | 31 | ||||||
Construction Partners Inc, Cl A * | 391 | 12 | ||||||
Copart Inc * | 2,568 | 234 | ||||||
Crane | 135 | 12 | ||||||
Crane NXT Co | 135 | 8 | ||||||
New Covenant Funds
25
SCHEDULE OF INVESTMENTS
June 30, 2023
New Covenant Growth Fund (Continued)
Description | Shares | Market Value | ||||||
COMMON STOCK†† (continued) | ||||||||
CSG Systems International Inc | 965 | $ | 51 | |||||
CSW Industrials Inc | 116 | 19 | ||||||
CSX Corp | 29,082 | 992 | ||||||
Cummins Inc | 3,179 | 779 | ||||||
Custom Truck One Source * | 15,463 | 104 | ||||||
Deere & Co | 4,735 | 1,919 | ||||||
Delta Air Lines Inc | 35,179 | 1,672 | ||||||
Deluxe Corp | 981 | 17 | ||||||
Distribution Solutions Group * | 2,445 | 127 | ||||||
Donaldson Co Inc | 202 | 13 | ||||||
Dover Corp | 383 | 57 | ||||||
Dycom Industries Inc * | 1,064 | 121 | ||||||
Eaton Corp PLC | 10,892 | 2,190 | ||||||
EMCOR Group Inc | 565 | 104 | ||||||
Emerson Electric Co | 6,592 | 596 | ||||||
Enerpac Tool Group Corp, Cl A | 2,369 | 64 | ||||||
EnerSys | 664 | 72 | ||||||
Enovix Corp * | 4,020 | 73 | ||||||
EnPro Industries Inc | 738 | 99 | ||||||
Enviri * | 7,225 | 71 | ||||||
Equifax Inc | 64 | 15 | ||||||
Esab Corp | 485 | 32 | ||||||
ESCO Technologies Inc | 568 | 59 | ||||||
ExlService Holdings Inc * | 136 | 21 | ||||||
Expeditors International of Washington Inc | 1,163 | 141 | ||||||
Exponent Inc | 135 | 13 | ||||||
Fastenal Co | 242 | 14 | ||||||
Federal Signal Corp | 1,560 | 100 | ||||||
FedEx Corp | 2,712 | 672 | ||||||
Flowserve Corp | 239 | 9 | ||||||
Forrester Research Inc * | 1,169 | 34 | ||||||
Fortune Brands Innovations Inc | 174 | 13 | ||||||
Forward Air Corp | 144 | 15 | ||||||
Franklin Electric Co Inc | 180 | 19 | ||||||
FTC Solar Inc * | 10,081 | 32 | ||||||
FTI Consulting Inc * | 443 | 84 | ||||||
FuelCell Energy Inc * | 8,509 | 18 | ||||||
Generac Holdings Inc * | 203 | 30 | ||||||
General Electric Co | 13,038 | 1,432 | ||||||
Genpact Ltd | 6,870 | 258 | ||||||
Gibraltar Industries Inc * | 164 | 10 | ||||||
Graco Inc | 223 | 19 | ||||||
GrafTech International Ltd | 954 | 5 | ||||||
Granite Construction Inc | 1,780 | 71 | ||||||
Great Lakes Dredge & Dock Corp * | 4,289 | 35 | ||||||
Greenbrier Cos Inc/The | 1,583 | 68 | ||||||
GXO Logistics Inc * | 1,041 | 65 | ||||||
Healthcare Services Group Inc | 422 | 6 | ||||||
HEICO Corp | 4,351 | 770 | ||||||
HEICO Corp, Cl A | 2,955 | 416 | ||||||
Helios Technologies Inc | 1,091 | 72 | ||||||
Herc Holdings Inc | 1,012 | 139 | ||||||
Description | Shares | Market Value | ||||||
COMMON STOCK†† (continued) | ||||||||
Hexcel Corp | 17,118 | $ | 1,301 | |||||
Hillenbrand Inc | 300 | 15 | ||||||
HireRight Holdings Corp * | 4,409 | 50 | ||||||
HNI Corp | 1,910 | 54 | ||||||
Howmet Aerospace Inc | 7,379 | 366 | ||||||
Hubbell Inc, Cl B | 78 | 26 | ||||||
Hyliion Holdings Corp * | 4,149 | 7 | ||||||
ICF International Inc | 545 | 68 | ||||||
IDEX Corp | 68 | 15 | ||||||
Illinois Tool Works Inc | 8,556 | 2,140 | ||||||
Ingersoll Rand Inc | 2,900 | 190 | ||||||
Insperity Inc | 592 | 70 | ||||||
Interface Inc, Cl A | 23,910 | 210 | ||||||
ITT Inc | 1,404 | 131 | ||||||
JB Hunt Transport Services Inc | 437 | 79 | ||||||
JetBlue Airways Corp * | 837 | 7 | ||||||
Joby Aviation * | 15,834 | 162 | ||||||
John Bean Technologies Corp | 439 | 53 | ||||||
Kadant Inc | 65 | 14 | ||||||
Kaman Corp | 36,136 | 879 | ||||||
Kelly Services Inc, Cl A | 2,214 | 39 | ||||||
Kennametal Inc | 1,343 | 38 | ||||||
Kforce Inc | 444 | 28 | ||||||
Kirby Corp * | 1,032 | 79 | ||||||
Knight-Swift Transportation Holdings Inc, Cl A | 1,357 | 75 | ||||||
Korn Ferry | 1,193 | 59 | ||||||
Landstar System Inc | 83 | 16 | ||||||
Lennox International Inc | 44 | 14 | ||||||
Leonardo DRS * | 6,243 | 108 | ||||||
Li-Cycle Holdings Corp * | 8,390 | 47 | ||||||
Lincoln Electric Holdings Inc | 1,027 | 204 | ||||||
Lindsay Corp | 91 | 11 | ||||||
Liquidity Services Inc * | 2,249 | 37 | ||||||
Luxfer Holdings | 3,194 | 45 | ||||||
Lyft Inc, Cl A * | 7,511 | 72 | ||||||
ManpowerGroup Inc | 3,586 | 285 | ||||||
Marten Transport Ltd | 592 | 13 | ||||||
Masco Corp | 245 | 14 | ||||||
Masterbrand Inc * | 174 | 2 | ||||||
Matson Inc | 1,273 | 99 | ||||||
Maximus Inc | 682 | 58 | ||||||
McGrath RentCorp | 666 | 62 | ||||||
MDU Resources Group Inc | 386 | 8 | ||||||
Middleby Corp/The * | 103 | 15 | ||||||
MillerKnoll Inc | 2,900 | 43 | ||||||
MRC Global Inc * | 3,597 | 36 | ||||||
MSC Industrial Direct Co Inc, Cl A | 1,115 | 106 | ||||||
Nordson Corp | 600 | 149 | ||||||
Norfolk Southern Corp | 2,628 | 596 | ||||||
NOW Inc * | 4,359 | 45 | ||||||
NV5 Global Inc * | 202 | 22 | ||||||
26
New Covenant Funds
Description | Shares | Market Value | ||||||
COMMON STOCK†† (continued) | ||||||||
Old Dominion Freight Line Inc | 42 | $ | 16 | |||||
Omega Flex Inc | 70 | 7 | ||||||
OPENLANE Inc * | 2,303 | 35 | ||||||
Oshkosh Corp | 2,762 | 239 | ||||||
Otis Worldwide Corp | 2,457 | 219 | ||||||
Owens Corning | 4,958 | 647 | ||||||
PACCAR Inc | 2,950 | 247 | ||||||
Park Aerospace Corp | 965 | 13 | ||||||
Parker-Hannifin Corp | 1,231 | 480 | ||||||
Paychex Inc | 2,612 | 292 | ||||||
Paycom Software Inc | 194 | 62 | ||||||
Paylocity Holding Corp * | 417 | 77 | ||||||
Pentair PLC | 245 | 16 | ||||||
Pitney Bowes Inc | 11,792 | 42 | ||||||
Planet Labs PBC * | 11,494 | 37 | ||||||
Plug Power Inc * | 4,368 | 45 | ||||||
Primoris Services | 1,960 | 60 | ||||||
Proto Labs Inc * | 91 | 3 | ||||||
Quanta Services Inc | 2,291 | 450 | ||||||
RB Global | 132 | 8 | ||||||
RBC Bearings Inc * | 64 | 14 | ||||||
Redwire Corp * | 40,312 | 103 | ||||||
Regal Rexnord Corp | 1,068 | 164 | ||||||
Republic Services Inc, Cl A | 969 | 148 | ||||||
Resideo Technologies Inc * | 448 | 8 | ||||||
Robert Half International Inc | 806 | 61 | ||||||
Rocket Lab USA Inc * | 16,898 | 101 | ||||||
Rockwell Automation Inc | 1,620 | 534 | ||||||
Rollins Inc | 3,532 | 151 | ||||||
RXO Inc * | 1,041 | 24 | ||||||
Ryder System Inc | 1,425 | 121 | ||||||
Saia Inc * | 96 | 33 | ||||||
Schneider National Inc, Cl B | 521 | 15 | ||||||
Shyft Group Inc/The | 429 | 9 | ||||||
Simpson Manufacturing Co Inc | 643 | 89 | ||||||
SiteOne Landscape Supply Inc * | 361 | 60 | ||||||
Snap-on Inc | 318 | 92 | ||||||
Southwest Airlines Co | 322 | 12 | ||||||
SP Plus Corp * | 1,169 | 46 | ||||||
Spirit AeroSystems Holdings Inc, Cl A | 22,727 | 663 | ||||||
Spirit Airlines Inc | 1,221 | 21 | ||||||
SPX Technologies Inc * | 999 | 85 | ||||||
Stanley Black & Decker Inc | 1,349 | 126 | ||||||
Steelcase Inc, Cl A | 2,620 | 20 | ||||||
Stem Inc * | 5,869 | 34 | ||||||
Stericycle Inc * | 179 | 8 | ||||||
Sunrun Inc * | 1,979 | 35 | ||||||
Tennant Co | 639 | 52 | ||||||
Terex Corp | 341 | 20 | ||||||
Tetra Tech Inc | 564 | 92 | ||||||
Timken Co/The | 204 | 19 | ||||||
Toro Co/The | 1,175 | 119 | ||||||
Description | Shares | Market Value | ||||||
COMMON STOCK†† (continued) | ||||||||
TPI Composites Inc * | 472 | $ | 5 | |||||
TransUnion | 135 | 11 | ||||||
Trex Co Inc * | 1,134 | 74 | ||||||
Trinity Industries Inc | 511 | 13 | ||||||
Triton International Ltd | 827 | 69 | ||||||
Triumph Group Inc * | 1,853 | 23 | ||||||
TrueBlue Inc * | 12,400 | 220 | ||||||
TTEC Holdings Inc | 202 | 7 | ||||||
Uber Technologies Inc * | 11,601 | 501 | ||||||
UFP Industries Inc | 196 | 19 | ||||||
U-Haul Holding Co | 28 | 2 | ||||||
U-Haul Holding Co, Cl B | 252 | 13 | ||||||
UniFirst Corp/MA | 235 | 36 | ||||||
Union Pacific Corp | 7,120 | 1,457 | ||||||
United Airlines Holdings Inc * | 289 | 16 | ||||||
United Parcel Service Inc, Cl B | 8,569 | 1,536 | ||||||
United Rentals Inc | 1,692 | 754 | ||||||
Univar Solutions Inc * | 476 | 17 | ||||||
Upwork Inc * | 3,753 | 35 | ||||||
Valmont Industries Inc | 76 | 22 | ||||||
Verisk Analytics Inc, Cl A | 1,729 | 391 | ||||||
Virgin Galactic Holdings Inc * | 91,477 | 355 | ||||||
Wabash National Corp | 3,217 | 83 | ||||||
Waste Management Inc | 6,467 | 1,122 | ||||||
Watsco Inc | 52 | 20 | ||||||
Watts Water Technologies Inc, Cl A | 507 | 93 | ||||||
WESCO International Inc | 3,661 | 656 | ||||||
Westinghouse Air Brake Technologies Corp | 465 | 51 | ||||||
WillScot Mobile Mini Holdings Corp, Cl A * | 590 | 28 | ||||||
Woodward Inc | 139 | 17 | ||||||
WW Grainger Inc | 2,142 | 1,689 | ||||||
XPO Inc * | 1,041 | 61 | ||||||
Xylem Inc/NY | 12,492 | 1,407 | ||||||
Zurn Elkay Water Solutions Corp | 1,629 | 44 | ||||||
| 48,039 | ||||||||
Information Technology — 26.9% | ||||||||
8x8 Inc * | 2,725 | 12 | ||||||
Accenture PLC, Cl A | 11,297 | 3,486 | ||||||
ACI Worldwide Inc * | 1,373 | 32 | ||||||
Adeia Inc | 2,351 | 26 | ||||||
Adobe Inc * | 8,090 | 3,956 | ||||||
ADTRAN Holdings Inc | 979 | 10 | ||||||
Advanced Energy Industries Inc | 725 | 81 | ||||||
Advanced Micro Devices Inc * | 18,853 | 2,148 | ||||||
Agilysys Inc * | 323 | 22 | ||||||
Akamai Technologies Inc * | 7,949 | 714 | ||||||
Akoustis Technologies Inc * | 2,669 | 8 | ||||||
Alarm.com Holdings Inc * | 1,192 | 62 | ||||||
Altair Engineering Inc, Cl A * | 269 | 20 | ||||||
Alteryx Inc, Cl A * | 635 | 29 | ||||||
Ambarella Inc * | 160 | 13 | ||||||
Amdocs Ltd | 3,632 | 359 | ||||||
New Covenant Funds
27
SCHEDULE OF INVESTMENTS
June 30, 2023
New Covenant Growth Fund (Continued)
Description | Shares | Market Value | ||||||
COMMON STOCK†† (continued) | ||||||||
Amkor Technology Inc | 3,864 | $ | 115 | |||||
Amphenol Corp, Cl A | 4,648 | 395 | ||||||
Analog Devices Inc | 5,627 | 1,096 | ||||||
ANSYS Inc * | 683 | 226 | ||||||
Appian Corp, Cl A * | 1,246 | 59 | ||||||
Apple Inc | 190,542 | 36,959 | ||||||
Applied Materials Inc | 13,913 | 2,011 | ||||||
Arista Networks Inc * | 3,072 | 498 | ||||||
Arlo Technologies Inc * | 7,542 | 82 | ||||||
Arrow Electronics Inc * | 1,639 | 235 | ||||||
Asana Inc, Cl A * | 3,091 | 68 | ||||||
Aspen Technology Inc * | 173 | 29 | ||||||
Atlassian Corp Ltd, Cl A * | 76 | 13 | ||||||
Autodesk Inc * | 3,559 | 728 | ||||||
Avnet Inc | 325 | 16 | ||||||
Axcelis Technologies Inc * | 1,474 | 270 | ||||||
Badger Meter Inc | 775 | 114 | ||||||
Belden Inc | 155 | 15 | ||||||
Benchmark Electronics Inc | 1,447 | 37 | ||||||
Bentley Systems Inc, Cl B | 1,422 | 77 | ||||||
BigCommerce Holdings Inc * | 3,803 | 38 | ||||||
BILL Holdings Inc * | 185 | 22 | ||||||
Black Knight Inc * | 1,569 | 94 | ||||||
Blackbaud Inc * | 629 | 45 | ||||||
Blackline Inc * | 185 | 10 | ||||||
Box Inc, Cl A * | 539 | 16 | ||||||
Broadcom Inc | 4,787 | 4,152 | ||||||
Cadence Design Systems Inc * | 2,312 | 542 | ||||||
CDW Corp/DE | 806 | 148 | ||||||
Cerence Inc * | 493 | 14 | ||||||
Ciena Corp * | 1,223 | 52 | ||||||
Cirrus Logic Inc * | 640 | 52 | ||||||
Cisco Systems Inc | 73,689 | 3,813 | ||||||
Cloudflare Inc, Cl A * | 1,522 | 99 | ||||||
Cognex Corp | 203 | 11 | ||||||
Cognizant Technology Solutions Corp, Cl A | 8,315 | 543 | ||||||
Coherent Corp * | 265 | 14 | ||||||
CommScope Holding Co Inc * | 7,086 | 40 | ||||||
CommVault Systems Inc * | 219 | 16 | ||||||
Consensus Cloud Solutions Inc * | 180 | 6 | ||||||
Corning Inc | 6,104 | 214 | ||||||
Crowdstrike Holdings Inc, Cl A * | 80 | 12 | ||||||
CTS Corp | 301 | 13 | ||||||
Datadog Inc, Cl A * | 1,589 | 156 | ||||||
Digital Turbine Inc * | 4,674 | 43 | ||||||
DocuSign Inc, Cl A * | 1,618 | 83 | ||||||
Dolby Laboratories Inc, Cl A | 731 | 61 | ||||||
Domo Inc, Cl B * | 297 | 4 | ||||||
Dropbox Inc, Cl A * | 2,914 | 78 | ||||||
Dynatrace Inc * | 465 | 24 | ||||||
Ebix Inc | 299 | 8 | ||||||
Elastic NV * | 183 | 12 | ||||||
Description | Shares | Market Value | ||||||
COMMON STOCK†† (continued) | ||||||||
Enphase Energy Inc * | 60 | $ | 10 | |||||
Envestnet Inc * | 717 | 43 | ||||||
EPAM Systems Inc * | 121 | 27 | ||||||
Extreme Networks Inc * | 6,878 | 179 | ||||||
F5 Inc * | 578 | 85 | ||||||
Fair Isaac Corp * | 16 | 13 | ||||||
Fastly Inc, Cl A * | 905 | 14 | ||||||
First Solar Inc * | 3,538 | 673 | ||||||
Five9 Inc * | 93 | 8 | ||||||
FormFactor Inc * | 353 | 12 | ||||||
Fortinet Inc * | 4,535 | 343 | ||||||
Gartner Inc * | 326 | 114 | ||||||
Gen Digital Inc | 4,737 | 88 | ||||||
Globant SA * | 271 | 49 | ||||||
GoDaddy Inc, Cl A * | 1,102 | 83 | ||||||
Guidewire Software Inc * | 109 | 8 | ||||||
Hackett Group Inc/The | 3,129 | 70 | ||||||
HubSpot Inc * | 322 | 171 | ||||||
Infinera Corp * | 6,579 | 32 | ||||||
Insight Enterprises Inc * | 132 | 19 | ||||||
Intel Corp | 51,878 | 1,735 | ||||||
InterDigital Inc | 917 | 89 | ||||||
International Business Machines Corp | 13,123 | 1,756 | ||||||
Intuit Inc | 3,714 | 1,702 | ||||||
IPG Photonics Corp * | 558 | 76 | ||||||
Itron Inc * | 588 | 42 | ||||||
Jabil Inc | 3,162 | 341 | ||||||
Juniper Networks Inc | 7,826 | 245 | ||||||
Keysight Technologies Inc * | 8,514 | 1,426 | ||||||
Kimball Electronics Inc * | 2,142 | 59 | ||||||
KLA Corp | 1,904 | 923 | ||||||
Knowles Corp * | 2,314 | 42 | ||||||
Kulicke & Soffa Industries Inc | 764 | 45 | ||||||
Kyndryl Holdings Inc * | 2,624 | 35 | ||||||
Lam Research Corp | 2,584 | 1,661 | ||||||
Lattice Semiconductor Corp * | 369 | 35 | ||||||
Littelfuse Inc | 60 | 17 | ||||||
Lumentum Holdings Inc * | 660 | 37 | ||||||
Manhattan Associates Inc * | 1,278 | 255 | ||||||
Marathon Digital Holdings Inc * | 3,468 | 48 | ||||||
Marvell Technology Inc | 7,143 | 427 | ||||||
Matterport Inc * | 11,962 | 38 | ||||||
Microchip Technology Inc | 1,268 | 114 | ||||||
Micron Technology Inc | 11,221 | 708 | ||||||
Microsoft Corp | 95,357 | 32,473 | ||||||
MicroStrategy Inc, Cl A * | 69 | 24 | ||||||
MicroVision Inc * | 2,858 | 13 | ||||||
MKS Instruments Inc | 103 | 11 | ||||||
MongoDB Inc, Cl A * | 574 | 236 | ||||||
Monolithic Power Systems Inc | 64 | 35 | ||||||
N-able Inc * | 317 | 5 | ||||||
National Instruments Corp | 2,353 | 135 | ||||||
28
New Covenant Funds
Description | Shares | Market Value | ||||||
COMMON STOCK†† (continued) | ||||||||
NCR Corp * | 334 | $ | 8 | |||||
NetApp Inc | 2,936 | 224 | ||||||
NetScout Systems Inc * | 2,073 | 64 | ||||||
New Relic Inc * | 952 | 62 | ||||||
Novanta Inc * | 98 | 18 | ||||||
Nutanix Inc, Cl A * | 359 | 10 | ||||||
NVIDIA Corp | 32,100 | 13,579 | ||||||
Okta Inc, Cl A * | 812 | 56 | ||||||
ON Semiconductor Corp * | 9,649 | 913 | ||||||
Oracle Corp | 24,339 | 2,899 | ||||||
OSI Systems Inc * | 497 | 59 | ||||||
PagerDuty Inc * | 1,821 | 41 | ||||||
Palantir Technologies Inc, Cl A * | 12,031 | 184 | ||||||
Palo Alto Networks Inc * | 2,616 | 668 | ||||||
Pegasystems Inc | 150 | 7 | ||||||
Perficient Inc * | 181 | 15 | ||||||
Plexus Corp * | 589 | 58 | ||||||
Power Integrations Inc | 196 | 19 | ||||||
Procore Technologies Inc * | 1,013 | 66 | ||||||
Progress Software Corp | 1,206 | 70 | ||||||
PROS Holdings Inc * | 818 | 25 | ||||||
PTC Inc * | 677 | 96 | ||||||
Pure Storage Inc, Cl A * | 685 | 25 | ||||||
Qorvo Inc * | 100 | 10 | ||||||
QUALCOMM Inc | 17,833 | 2,123 | ||||||
Qualys Inc * | 591 | 76 | ||||||
Rambus Inc * | 3,633 | 233 | ||||||
Rapid7 Inc * | 393 | 18 | ||||||
RingCentral Inc, Cl A * | 699 | 23 | ||||||
Riot Platforms Inc * | 3,379 | 40 | ||||||
Rogers Corp * | 392 | 63 | ||||||
Roper Technologies Inc | 187 | 90 | ||||||
Salesforce Inc * | 16,945 | 3,580 | ||||||
Sanmina Corp * | 189 | 11 | ||||||
ScanSource Inc * | 1,292 | 38 | ||||||
Semtech Corp * | 1,000 | 25 | ||||||
ServiceNow Inc * | 2,243 | 1,261 | ||||||
Silicon Laboratories Inc * | 437 | 69 | ||||||
Skyworks Solutions Inc | 308 | 34 | ||||||
Smartsheet Inc, Cl A * | 266 | 10 | ||||||
Snowflake Inc, Cl A * | 3,330 | 586 | ||||||
SolarWinds Corp * | 317 | 3 | ||||||
Splunk Inc * | 1,357 | 144 | ||||||
SPS Commerce Inc * | 152 | 29 | ||||||
Synaptics Inc * | 142 | 12 | ||||||
Synopsys Inc * | 1,235 | 538 | ||||||
TD SYNNEX Corp | 387 | 36 | ||||||
Teledyne Technologies Inc * | 31 | 13 | ||||||
Teradata Corp * | 4,437 | 237 | ||||||
Teradyne Inc | 4,784 | 533 | ||||||
Texas Instruments Inc | 10,356 | 1,864 | ||||||
| Trimble Inc * | 2,035 | 108 | ||||||
Description | Shares | Market Value | ||||||
COMMON STOCK†† (continued) | ||||||||
TTM Technologies Inc * | 3,386 | $ | 47 | |||||
Tucows Inc, Cl A * | 170 | 5 | ||||||
Twilio Inc, Cl A * | 2,168 | 138 | ||||||
Tyler Technologies Inc * | 393 | 164 | ||||||
Ubiquiti Inc | 48 | 8 | ||||||
UiPath Inc, Cl A * | 4,174 | 69 | ||||||
Unisys Corp * | 689 | 3 | ||||||
Unity Software Inc * | 2,638 | 115 | ||||||
Universal Display Corp | 2,553 | 368 | ||||||
Varonis Systems Inc, Cl B * | 327 | 9 | ||||||
Verint Systems Inc * | 947 | 33 | ||||||
VeriSign Inc * | 802 | 181 | ||||||
ViaSat Inc * | 693 | 29 | ||||||
Viavi Solutions Inc * | 3,355 | 38 | ||||||
VMware Inc, Cl A * | 3,153 | 453 | ||||||
Western Digital Corp * | 2,423 | 92 | ||||||
Wolfspeed Inc * | 248 | 14 | ||||||
Workday Inc, Cl A * | 2,079 | 470 | ||||||
Workiva Inc, Cl A * | 1,224 | 124 | ||||||
Xerox Holdings Corp | 4,697 | 70 | ||||||
Xperi Inc * | 940 | 12 | ||||||
Zebra Technologies Corp, Cl A * | 438 | 130 | ||||||
Zoom Video Communications Inc, Cl A * | 2,001 | 136 | ||||||
Zscaler Inc * | 786 | 115 | ||||||
| 145,081 | ||||||||
Materials — 2.5% | ||||||||
AdvanSix Inc | 1,143 | 40 | ||||||
Air Products and Chemicals Inc | 4,688 | 1,404 | ||||||
Albemarle Corp | 752 | 168 | ||||||
Alcoa Corp | 5,657 | 192 | ||||||
Amcor PLC | 4,821 | 48 | ||||||
AptarGroup Inc | 1,944 | 225 | ||||||
Arconic Corp * | 1,844 | 55 | ||||||
Ashland Inc | 152 | 13 | ||||||
ATI Inc * | 2,362 | 105 | ||||||
Avery Dennison Corp | 88 | 15 | ||||||
Avient Corp | 1,216 | 50 | ||||||
Axalta Coating Systems Ltd * | 7,963 | 261 | ||||||
Balchem Corp | 107 | 14 | ||||||
Ball Corp | 15,648 | 911 | ||||||
Berry Global Group Inc | 3,314 | 213 | ||||||
Cabot Corp | 238 | 16 | ||||||
Carpenter Technology Corp | 1,006 | 56 | ||||||
Celanese Corp, Cl A | 93 | 11 | ||||||
CF Industries Holdings Inc | 1,865 | 129 | ||||||
Chemours Co/The | 2,832 | 105 | ||||||
Cleveland-Cliffs Inc * | 11,888 | 199 | ||||||
Coeur Mining Inc * | 6,945 | 20 | ||||||
Commercial Metals Co | 1,211 | 64 | ||||||
Compass Minerals International Inc | 851 | 29 | ||||||
Constellium SE, Cl A * | 4,520 | 78 | ||||||
Corteva Inc | 885 | 51 | ||||||
New Covenant Funds
29
SCHEDULE OF INVESTMENTS
June 30, 2023
New Covenant Growth Fund (Continued)
Description | Shares | Market Value | ||||||
COMMON STOCK†† (continued) | ||||||||
Crown Holdings Inc | 6,925 | $ | 602 | |||||
Dow Inc | 6,392 | 340 | ||||||
DuPont de Nemours Inc | 3,212 | 229 | ||||||
Eagle Materials Inc | 126 | 24 | ||||||
Eastman Chemical Co | 9,101 | 762 | ||||||
Ecolab Inc | 2,293 | 428 | ||||||
FMC Corp | 2,400 | 250 | ||||||
Freeport-McMoRan Inc | 27,003 | 1,080 | ||||||
Graphic Packaging Holding Co | 681 | 16 | ||||||
Greif Inc, Cl A | 1,122 | 77 | ||||||
HB Fuller Co | 158 | 11 | ||||||
Huntsman Corp | 475 | 13 | ||||||
Ingevity Corp * | 563 | 33 | ||||||
Innospec Inc | 499 | 50 | ||||||
International Flavors & Fragrances Inc | 2,307 | 184 | ||||||
International Paper Co | 360 | 11 | ||||||
Knife River * | 96 | 4 | ||||||
Livent Corp * | 5,807 | 159 | ||||||
Louisiana-Pacific Corp | 1,740 | 130 | ||||||
LyondellBasell Industries NV, Cl A | 2,182 | 200 | ||||||
Martin Marietta Materials Inc | 397 | 183 | ||||||
Minerals Technologies Inc | 182 | 11 | ||||||
Mosaic Co/The | 3,590 | 126 | ||||||
Newmont Corp | 21,956 | 937 | ||||||
Novagold Resources Inc * | 1,266 | 5 | ||||||
Nucor Corp | 1,828 | 300 | ||||||
Packaging Corp of America | 101 | 13 | ||||||
PPG Industries Inc | 2,274 | 337 | ||||||
Quaker Chemical Corp | 55 | 11 | ||||||
Reliance Steel & Aluminum Co | 412 | 112 | ||||||
Royal Gold Inc | 512 | 59 | ||||||
Schnitzer Steel Industries Inc, Cl A | 1,418 | 43 | ||||||
Scotts Miracle-Gro Co/The | 163 | 10 | ||||||
Sealed Air Corp | 293 | 12 | ||||||
Sensient Technologies Corp | 161 | 11 | ||||||
Sherwin-Williams Co/The | 4,705 | 1,249 | ||||||
Sonoco Products Co | 185 | 11 | ||||||
Southern Copper Corp | 272 | 20 | ||||||
Steel Dynamics Inc | 2,648 | 288 | ||||||
Stepan Co | 138 | 13 | ||||||
Summit Materials Inc, Cl A * | 447 | 17 | ||||||
Sylvamo Corp | 32 | 1 | ||||||
TriMas Corp | 1,583 | 44 | ||||||
Trinseo PLC | 1,345 | 17 | ||||||
Tronox Holdings PLC | 4,385 | 56 | ||||||
United States Lime & Minerals Inc | 98 | 20 | ||||||
United States Steel Corp | 3,709 | 93 | ||||||
Vulcan Materials Co | 665 | 150 | ||||||
Warrior Met Coal Inc | 969 | 38 | ||||||
Westlake Corp | 137 | 16 | ||||||
Westrock Co | 336 | 10 | ||||||
Description | Shares | Market Value | ||||||
COMMON STOCK†† (continued) | ||||||||
Worthington Industries Inc | 223 | $ | 16 | |||||
| 13,304 | ||||||||
Real Estate — 2.9% | ||||||||
Acadia Realty Trust ‡ | 1,946 | 28 | ||||||
Agree Realty Corp ‡ | 736 | 48 | ||||||
Alexander & Baldwin Inc ‡ | 2,342 | 44 | ||||||
Alexandria Real Estate Equities Inc ‡ | 1,497 | 170 | ||||||
American Homes 4 Rent, Cl A ‡ | 375 | 13 | ||||||
American Tower Corp, Cl A ‡ | 5,189 | 1,006 | ||||||
Anywhere Real Estate Inc * | 4,621 | 31 | ||||||
Apartment Income Corp ‡ | 304 | 11 | ||||||
Apartment Investment and Management Co, Cl A ‡ | 1,711 | 15 | ||||||
Apple Hospitality Inc ‡ | 718 | 11 | ||||||
AvalonBay Communities Inc ‡ | 3,261 | 617 | ||||||
Boston Properties Inc ‡ | 1,468 | 85 | ||||||
Brandywine Realty Trust ‡ | 14,492 | 67 | ||||||
Brixmor Property Group Inc ‡ | 4,703 | 103 | ||||||
Camden Property Trust ‡ | 125 | 14 | ||||||
CareTrust Inc ‡ | 2,438 | 48 | ||||||
CBRE Group Inc, Cl A * | 17,256 | 1,393 | ||||||
Community Healthcare Trust Inc ‡ | 1,136 | 38 | ||||||
Corporate Office Properties Trust ‡ | 7,752 | 184 | ||||||
CoStar Group Inc * | 3,260 | 290 | ||||||
Cousins Properties Inc ‡ | 289 | 7 | ||||||
Crown Castle Inc ‡ | 4,174 | 476 | ||||||
CubeSmart ‡ | 377 | 17 | ||||||
DiamondRock Hospitality Co ‡ | 4,575 | 37 | ||||||
Digital Realty Trust Inc ‡ | 2,674 | 304 | ||||||
Douglas Emmett Inc ‡ | 448 | 6 | ||||||
EastGroup Properties Inc ‡ | 306 | 53 | ||||||
Elme Communities ‡ | 1,705 | 28 | ||||||
Empire State Realty Trust Inc, Cl A ‡ | 5,592 | 42 | ||||||
EPR Properties ‡ | 735 | 34 | ||||||
Equinix Inc ‡ | 1,035 | 811 | ||||||
Equity Commonwealth ‡ | 846 | 17 | ||||||
Equity LifeStyle Properties Inc ‡ | 167 | 11 | ||||||
Equity Residential ‡ | 3,485 | 230 | ||||||
Essential Properties Realty Trust Inc ‡ | 2,028 | 48 | ||||||
Essex Property Trust Inc ‡ | 454 | 106 | ||||||
Extra Space Storage Inc ‡ | 811 | 121 | ||||||
Federal Realty Investment Trust ‡ | 114 | 11 | ||||||
First Industrial Realty Trust Inc ‡ | 263 | 14 | ||||||
Four Corners Property Trust Inc ‡ | 1,848 | 47 | ||||||
Gaming and Leisure Properties Inc ‡ | 283 | 14 | ||||||
Global Net Lease Inc ‡ | 2,484 | 26 | ||||||
Healthcare Realty Trust Inc, Cl A ‡ | 392 | 7 | ||||||
Healthpeak Properties Inc ‡ | 9,384 | 189 | ||||||
Highwoods Properties Inc ‡ | 247 | 6 | ||||||
Host Hotels & Resorts Inc ‡ | 17,568 | 296 | ||||||
Howard Hughes Corp/The * | 795 | 63 | ||||||
Hudson Pacific Properties Inc ‡ | 2,475 | 10 | ||||||
30
New Covenant Funds
Description | Shares | Market Value | ||||||
COMMON STOCK†† (continued) | ||||||||
Innovative Industrial Properties Inc, Cl A ‡ | 59 | $ | 4 | |||||
Invitation Homes Inc ‡ | 1,509 | 52 | ||||||
Iron Mountain Inc ‡ | 5,996 | 341 | ||||||
JBG SMITH Properties ‡ | 2,065 | 31 | ||||||
Jones Lang LaSalle Inc * | 1,270 | 198 | ||||||
Kilroy Realty Corp ‡ | 4,516 | 136 | ||||||
Kimco Realty Corp ‡ | 5,716 | 113 | ||||||
Kite Realty Group Trust ‡ | 3,286 | 73 | ||||||
Lamar Advertising Co, Cl A ‡ | 1,059 | 105 | ||||||
Life Storage Inc ‡ | 165 | 22 | ||||||
LTC Properties Inc ‡ | 1,142 | 38 | ||||||
LXP Industrial Trust ‡ | 966 | 9 | ||||||
Macerich Co/The ‡ | 5,508 | 62 | ||||||
Marcus & Millichap Inc | 1,380 | 43 | ||||||
Medical Properties Trust Inc ‡ | 2,513 | 23 | ||||||
Mid-America Apartment Communities Inc ‡ | 318 | 48 | ||||||
National Health Investors Inc ‡ | 635 | 33 | ||||||
Newmark Group Inc, Cl A | 3,753 | 23 | ||||||
Office Properties Income Trust ‡ | 1,618 | 12 | ||||||
Omega Healthcare Investors Inc ‡ | 1,229 | 38 | ||||||
Orion Office Inc ‡ | 124 | 1 | ||||||
Outfront Media Inc ‡ | 1,951 | 31 | ||||||
Paramount Group Inc ‡ | 5,922 | 26 | ||||||
Park Hotels & Resorts Inc ‡ | 1,996 | 26 | ||||||
Pebblebrook Hotel Trust ‡ | 1,899 | 26 | ||||||
Physicians Realty Trust ‡ | 2,753 | 39 | ||||||
Piedmont Office Realty Trust Inc, Cl A ‡ | 2,333 | 17 | ||||||
PotlatchDeltic Corp ‡ | 231 | 12 | ||||||
Prologis Inc ‡ | 19,306 | 2,368 | ||||||
Public Storage ‡ | 1,303 | 380 | ||||||
Rayonier Inc ‡ | 1,593 | 50 | ||||||
RE/MAX Holdings Inc, Cl A | 1,292 | 25 | ||||||
Realty Income Corp ‡ | 4,725 | 283 | ||||||
Redfin Corp * | 458 | 6 | ||||||
Regency Centers Corp ‡ | 19,332 | 1,194 | ||||||
Rexford Industrial Realty Inc ‡ | 241 | 13 | ||||||
RLJ Lodging Trust ‡ | 2,849 | 29 | ||||||
RMR Group Inc/The, Cl A | 1,095 | 25 | ||||||
RPT Realty ‡ | 3,429 | 36 | ||||||
Ryman Hospitality Properties Inc ‡ | 577 | 54 | ||||||
Safehold Inc ‡ | 968 | 23 | ||||||
SBA Communications Corp, Cl A ‡ | 684 | 159 | ||||||
Service Properties Trust ‡ | 483 | 4 | ||||||
Simon Property Group Inc ‡ | 3,706 | 428 | ||||||
SITE Centers Corp ‡ | 3,734 | 49 | ||||||
SL Green Realty Corp ‡ | 2,468 | 74 | ||||||
Spirit Realty Capital Inc ‡ | 237 | 9 | ||||||
St Joe Co/The | 460 | 22 | ||||||
STAG Industrial Inc ‡ | 359 | 13 | ||||||
Star Holdings *‡ | 480 | 7 | ||||||
Summit Hotel Properties Inc ‡ | 4,173 | 27 | ||||||
Sun Communities Inc ‡ | 272 | 35 | ||||||
Description | Shares | Market Value | ||||||
COMMON STOCK†† (continued) | ||||||||
Tanger Factory Outlet Centers Inc ‡ | 647 | $ | 14 | |||||
UDR Inc ‡ | 250 | 11 | ||||||
Uniti Group Inc ‡ | 1,247 | 6 | ||||||
Urban Edge Properties ‡ | 2,679 | 41 | ||||||
Ventas Inc ‡ | 3,279 | 155 | ||||||
VICI Properties Inc, Cl A ‡ | 5,265 | 165 | ||||||
Vornado Realty Trust ‡ | 2,903 | 53 | ||||||
Welltower Inc ‡ | 4,270 | 345 | ||||||
Weyerhaeuser Co ‡ | 17,005 | 570 | ||||||
WP Carey Inc ‡ | 149 | 10 | ||||||
Xenia Hotels & Resorts Inc ‡ | 2,347 | 29 | ||||||
Zillow Group Inc, Cl C * | 1,112 | 56 | ||||||
| 15,597 | ||||||||
Utilities — 2.0% | ||||||||
AES Corp/The | 5,282 | 109 | ||||||
ALLETE Inc | 620 | 36 | ||||||
Alliant Energy Corp | 213 | 11 | ||||||
Ameren Corp | 141 | 11 | ||||||
American Electric Power Co Inc | 5,930 | 499 | ||||||
American States Water Co | 580 | 50 | ||||||
American Water Works Co Inc | 2,717 | 388 | ||||||
Atmos Energy Corp | 461 | 54 | ||||||
Avangrid Inc | 1,720 | 65 | ||||||
CenterPoint Energy Inc | 434 | 13 | ||||||
Clearway Energy Inc, Cl A | 1,758 | 47 | ||||||
Clearway Energy Inc, Cl C | 456 | 13 | ||||||
CMS Energy Corp | 20,708 | 1,217 | ||||||
Consolidated Edison Inc | 6,234 | 564 | ||||||
Constellation Energy Corp | 631 | 58 | ||||||
Dominion Energy Inc | 10,171 | 527 | ||||||
DTE Energy Co | 876 | 96 | ||||||
Duke Energy Corp | 11,833 | 1,062 | ||||||
Edison International | 3,288 | 228 | ||||||
Entergy Corp | 2,276 | 222 | ||||||
Essential Utilities Inc | 331 | 13 | ||||||
Evergy Inc | 180 | 11 | ||||||
Exelon Corp | 11,090 | 452 | ||||||
FirstEnergy Corp | 1,531 | 60 | ||||||
Hawaiian Electric Industries Inc | 249 | 9 | ||||||
IDACORP Inc | 108 | 11 | ||||||
MGE Energy Inc | 631 | 50 | ||||||
National Fuel Gas Co | 223 | 11 | ||||||
New Jersey Resources Corp | 1,111 | 52 | ||||||
NextEra Energy Inc | 27,072 | 2,009 | ||||||
NiSource Inc | 419 | 11 | ||||||
Northwest Natural Holding Co | 699 | 30 | ||||||
NRG Energy Inc | 323 | 12 | ||||||
OGE Energy Corp | 261 | 9 | ||||||
Ormat Technologies Inc | 644 | 52 | ||||||
PG&E Corp * | 692 | 12 | ||||||
Pinnacle West Capital Corp | 2,640 | 215 | ||||||
PNM Resources Inc | 975 | 44 | ||||||
New Covenant Funds
31
SCHEDULE OF INVESTMENTS
June 30, 2023
New Covenant Growth Fund (Concluded)
Description | Shares | Market Value | ||||||
COMMON STOCK†† (continued) | ||||||||
Portland General Electric Co | 894 | $ | 42 | |||||
PPL Corp | 2,577 | 68 | ||||||
Public Service Enterprise Group Inc | 210 | 13 | ||||||
Sempra Energy | 3,093 | 450 | ||||||
SJW Group | 716 | 50 | ||||||
Southern Co/The | 6,656 | 468 | ||||||
Sunnova Energy International Inc * | 810 | 15 | ||||||
UGI Corp | 253 | 7 | ||||||
Vistra Corp | 2,088 | 55 | ||||||
WEC Energy Group Inc | 2,560 | 226 | ||||||
Xcel Energy Inc | 21,147 | 1,315 | ||||||
| 11,042 | ||||||||
Total Common Stock | ||||||||
(Cost $274,993) ($ Thousands) | 530,190 | |||||||
FOREIGN COMMON STOCK†† — 1.0% | ||||||||
Ireland — 0.7% | ||||||||
Ardmore Shipping Corp | 5,335 | 66 | ||||||
Cimpress PLC * | 398 | 24 | ||||||
Jazz Pharmaceuticals PLC * | 616 | 76 | ||||||
Linde PLC | 4,706 | 1,793 | ||||||
Medtronic PLC | 19,976 | 1,760 | ||||||
Perrigo Co PLC | 211 | 7 | ||||||
| 3,726 | ||||||||
United Kingdom — 0.3% | ||||||||
Alkermes PLC * | 2,433 | 76 | ||||||
Cushman & Wakefield PLC * | 2,593 | 21 | ||||||
Gates Industrial Corp PLC * | 886 | 12 | ||||||
Johnson Controls International PLC | 8,308 | 566 | ||||||
nVent Electric PLC | 457 | 24 | ||||||
Sensata Technologies Holding PLC | 4,273 | 192 | ||||||
STERIS PLC | 1,716 | 386 | ||||||
Trane Technologies PLC | 1,779 | 341 | ||||||
| 1,618 | ||||||||
Total Foreign Common Stock | ||||||||
(Cost $4,112) ($ Thousands) | 5,344 | |||||||
| Number of Rights | ||||||||
RIGHTS — 0.0% | ||||||||
Abiomed Inc *‡‡ | 332 | – | ||||||
Total Rights | ||||||||
(Cost $—) ($ Thousands) | – | |||||||
Description | Shares | Market Value | ||||||
CASH EQUIVALENT — 0.5% | ||||||||
SEI Daily Income Trust, Government Fund, Institutional Class | ||||||||
4.880%**† | 2,866,682 | $ | 2,867 | |||||
Total Cash Equivalent | ||||||||
(Cost $2,867) ($ Thousands) | 2,867 | |||||||
Total Investments in Securities — 99.7% | ||||||||
(Cost $281,972) ($ Thousands) | $ | 538,401 | ||||||
32
New Covenant Funds
A list of the open futures contracts held by the Fund at June 30, 2023 are as follows:
Type of Contract | Number of | Expiration Date | Notional Amount (Thousands) | Value | Unrealized Appreciation(Thousands) | |||||||||||||||
Long Contracts | ||||||||||||||||||||
Russell 2000 Index E-MINI | 4 | Sep-2023 | $ | 374 | $ | 381 | $ | 7 | ||||||||||||
S&P 500 Index E-MINI | 12 | Sep-2023 | 2,654 | 2,693 | 39 | |||||||||||||||
| $ | 3,028 | $ | 3,074 | $ | 46 | |||||||||||||||
| Percentages are based on Net Assets of $540,035 ($ Thousands). |
†† | Narrow industries are utilized for compliance purposes, whereas broad sectors are utilized for reporting. |
† | Investment in Affiliated Security (see Note 3). |
‡ | Real Estate Investment Trust. |
* | Non-income producing security. |
** | The rate reported is the 7-day effective yield as of June 30, 2023. |
‡‡ | Expiration date not available. |
The following is a summary of the level of inputs used as of June 30, 2023, in valuing the Fund's investments and other financial instruments carried at value ($ Thousands): | ||||||||||||||||
Investments in Securities | Level 1 | Level 2 | Level 3 | Total | ||||||||||||
Common Stock | 530,190 | – | – | 530,190 | ||||||||||||
Foreign Common Stock | 5,344 | – | – | 5,344 | ||||||||||||
Rights | – | ^ | – | – | – | ^ | ||||||||||
Cash Equivalent | 2,867 | – | – | 2,867 | ||||||||||||
Total Investments in Securities | 538,401 | – | – | 538,401 | ||||||||||||
Other Financial Instruments | Level 1 | Level 2 | Level 3 | Total | ||||||||||||
Futures Contracts* | ||||||||||||||||
Unrealized Appreciation | 46 | – | – | 46 | ||||||||||||
Total Other Financial Instruments | 46 | – | – | 46 | ||||||||||||
| ^ | This category includes securities with a value of $—. |
* | Futures contracts are valued at the unrealized appreciation on the instrument. |
The following is a summary of the Fund’s transactions with affiliates for the year ended June 30, 2023 ($ Thousands):
Security Description | Value 6/30/2022 | Purchases at Cost | Proceeds from Sales | Realized Gain/(Loss) | Change in Unrealized Appreciation/(Depreciation) | Value 6/30/2023 | Income | Capital Gains | ||||||||||||||||||||||||
SEI Daily Income Trust, Government Fund, Institutional Class | $ | 17,346 | $ | 36,701 | $ | (51,180 | ) | $ | — | $ | — | $ | 2,867 | $ | 175 | $ — | ||||||||||||||||
Amounts designated as “—” are either $0 or have been rounded to $0.
For more information on valuation inputs, see Note 2 – Significant Accounting Policies in Notes to Financial Statements.
See “Glossary” for abbreviations.
The accompanying notes are an integral part of the financial statements.
New Covenant Funds
33
SCHEDULE OF INVESTMENTS
June 30, 2023
New Covenant Income Fund
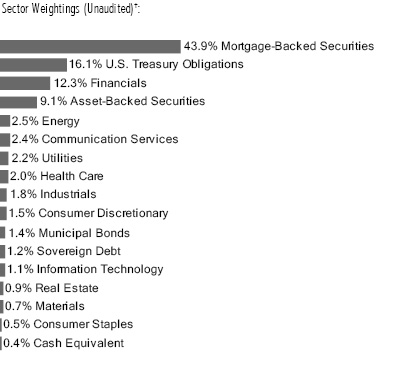
† Percentages based on total investments. Total investments do not include derivatives such as options, futures contracts, forward contracts, and swap contracts, if applicable.
Description | Face Amount | Market Value | ||||||
MORTGAGE-BACKED SECURITIES — 44.5% | ||||||||
Agency Mortgage-Backed Obligations — 37.4% | ||||||||
FHLMC | ||||||||
6.500%, 12/01/2035 to 05/01/2053 | $ | 539 | $ | 553 | ||||
6.000%, 03/01/2035 to 03/01/2053 | 763 | 786 | ||||||
5.500%, 12/01/2036 to 05/01/2053 | 1,501 | 1,504 | ||||||
5.000%, 04/01/2024 to 04/01/2053 | 1,253 | 1,244 | ||||||
4.500%, 06/01/2038 to 12/01/2052 | 3,379 | 3,305 | ||||||
4.278%, ICE LIBOR USD 12 Month + 1.598%, 06/01/2047(A) | 338 | 335 | ||||||
4.118%, ICE LIBOR USD 12 Month + 1.625%, 10/01/2046(A) | 511 | 509 | ||||||
4.000%, 07/01/2037 to 02/01/2053 | 2,772 | 2,648 | ||||||
3.500%, 04/01/2033 to 06/01/2052 | 2,865 | 2,649 | ||||||
3.098%, ICE LIBOR USD 12 Month + 1.621%, 02/01/2050(A) | 115 | 109 | ||||||
3.005%, ICE LIBOR USD 12 Month + 1.628%, 11/01/2048(A) | 361 | 338 | ||||||
3.000%, 09/01/2032 to 11/01/2051 | 3,747 | 3,352 | ||||||
2.872%, ICE LIBOR USD 12 Month + 1.619%, 11/01/2047(A) | 114 | 108 | ||||||
2.500%, 08/01/2030 to 04/01/2052 | 9,015 | 7,807 | ||||||
2.000%, 10/01/2041 to 03/01/2052 | 5,731 | 4,742 | ||||||
1.500%, 11/01/2040 to 02/01/2051 | 1,462 | 1,184 | ||||||
FHLMC CMO, Ser 2011-3947, Cl SG, IO | ||||||||
0.757%, 10/15/2041(A) | 71 | 6 | ||||||
FHLMC CMO, Ser 2012-4057, Cl UI, IO | ||||||||
3.000%, 05/15/2027 | 32 | 1 | ||||||
Description | Face Amount | Market Value | ||||||
MORTGAGE-BACKED SECURITIES (continued) | ||||||||
FHLMC CMO, Ser 2012-4085, Cl IO, IO | ||||||||
3.000%, 06/15/2027 | $ | 70 | $ | 2 | ||||
FHLMC CMO, Ser 2012-4099, Cl ST, IO | ||||||||
0.807%, 08/15/2042(A) | 44 | 4 | ||||||
FHLMC CMO, Ser 2013-4194, Cl BI, IO | ||||||||
3.500%, 04/15/2043 | 47 | 7 | ||||||
FHLMC CMO, Ser 2013-4203, Cl PS, IO | ||||||||
1.057%, 09/15/2042(A) | 67 | 5 | ||||||
FHLMC CMO, Ser 2014-4310, Cl SA, IO | ||||||||
0.757%, 02/15/2044(A) | 18 | 2 | ||||||
FHLMC CMO, Ser 2014-4335, Cl SW, IO | ||||||||
0.807%, 05/15/2044(A) | 38 | 3 | ||||||
FHLMC CMO, Ser 2014-4415, Cl IO, IO | ||||||||
0.000%, 04/15/2041(A)(B) | 18 | 1 | ||||||
FHLMC Multifamily Structured Pass Through Certificates, Ser 157, Cl A2 | ||||||||
4.200%, 05/25/2033 | 200 | 196 | ||||||
FHLMC Multifamily Structured Pass Through Certificates, Ser K109, Cl A2 | ||||||||
1.558%, 04/25/2030 | 100 | 83 | ||||||
FHLMC Multifamily Structured Pass Through Certificates, Ser K143, Cl A2 | ||||||||
2.350%, 03/25/2032 | 100 | 85 | ||||||
FHLMC Multifamily Structured Pass Through Certificates, Ser K149, Cl A2 | ||||||||
3.530%, 08/25/2032 | 200 | 186 | ||||||
FHLMC Multifamily Structured Pass-Through Certificates, Ser 1515, Cl X1, IO | ||||||||
1.636%, 02/25/2035(A) | 2,286 | 263 | ||||||
FHLMC Multifamily Structured Pass-Through Certificates, Ser 1516, Cl X1, IO | ||||||||
1.629%, 05/25/2035(A) | 844 | 99 | ||||||
FHLMC Multifamily Structured Pass-Through Certificates, Ser K118, Cl X1, IO | ||||||||
1.051%, 09/25/2030(A) | 5,708 | 306 | ||||||
FHLMC Multifamily Structured Pass-Through Certificates, Ser K-1517, Cl X1, IO | ||||||||
1.436%, 07/25/2035(A) | 235 | 25 | ||||||
FHLMC Multifamily Structured Pass-Through Certificates, Ser K740, Cl X1, IO | ||||||||
0.833%, 09/25/2027(A) | 7,893 | 205 | ||||||
FHLMC Multifamily Structured Pass-Through Certificates, Ser KG06, Cl X1, IO | ||||||||
0.626%, 10/25/2031(A) | 6,494 | 222 | ||||||
FHLMC STACR REMIC Trust, Ser 2021-DNA6, Cl M2 | ||||||||
6.567%, SOFR30A + 1.500%, 10/25/2041(A)(C) | 230 | 224 | ||||||
FHLMC STACR REMIC Trust, Ser 2022-DNA1, Cl M1B | ||||||||
6.917%, SOFR30A + 1.850%, 01/25/2042(A)(C) | 420 | 406 | ||||||
34
New Covenant Funds
SCHEDULE OF INVESTMENTS
June 30, 2023
New Covenant Income Fund (Continued)
Description | Face Amount | Market Value | ||||||
MORTGAGE-BACKED SECURITIES (continued) | ||||||||
FHLMC STACR REMIC Trust, Ser 2022-DNA2, Cl M1A | ||||||||
6.367%, SOFR30A + 1.300%, 02/25/2042(A)(C) | $ | 164 | $ | 164 | ||||
FHLMC STACR REMIC Trust, Ser 2022-DNA4, Cl M1A | ||||||||
7.267%, SOFR30A + 2.200%, 05/25/2042(A)(C) | 248 | 249 | ||||||
FHLMC, Ser 2014-334, Cl S7, IO | ||||||||
0.907%, 08/15/2044(A) | 21 | 2 | ||||||
FHLMC, Ser 2014-4391, Cl MZ | ||||||||
3.000%, 09/15/2044 | 130 | 112 | ||||||
FHLMC, Ser 2016-353, Cl S1, IO | ||||||||
0.807%, 12/15/2046(A) | 65 | 6 | ||||||
FHLMC, Ser 2018-4813, Cl CJ | ||||||||
3.000%, 08/15/2048 | 29 | 25 | ||||||
FHLMC, Ser 2020-5010, Cl JI, IO | ||||||||
2.500%, 09/25/2050 | 241 | 38 | ||||||
FHLMC, Ser 2020-5010, Cl IK, IO | ||||||||
2.500%, 09/25/2050 | 267 | 39 | ||||||
FHLMC, Ser 2020-5013, Cl IN, IO | ||||||||
2.500%, 09/25/2050 | 81 | 12 | ||||||
FHLMC, Ser 2020-5018, Cl MI, IO | ||||||||
2.000%, 10/25/2050 | 84 | 11 | ||||||
FHLMC, Ser 2021-5071, Cl IH, IO | ||||||||
2.500%, 02/25/2051 | 502 | 68 | ||||||
FHLMC, Ser 2022-5224, Cl HL | ||||||||
4.000%, 04/25/2052 | 300 | 275 | ||||||
FNMA | ||||||||
7.000%, 11/01/2037 to 11/01/2038 | 12 | 12 | ||||||
6.500%, 01/01/2038 to 02/01/2053 | 382 | 395 | ||||||
6.000%, 07/01/2041 to 05/01/2053 | 292 | 299 | ||||||
5.500%, 02/01/2035 to 05/01/2053 | 1,714 | 1,718 | ||||||
5.000%, 11/01/2025 to 04/01/2053 | 3,280 | 3,265 | ||||||
4.680%, 07/01/2033 | 100 | 101 | ||||||
4.510%, 08/01/2033 | 400 | 403 | ||||||
4.500%, 02/01/2035 to 08/01/2058 | 6,554 | 6,402 | ||||||
4.393%, 01/01/2036(A) | 20 | 19 | ||||||
4.310%, 02/01/2030 | 100 | 98 | ||||||
4.246%, ICE LIBOR USD 12 Month + 1.700%, 03/01/2036(A) | 17 | 17 | ||||||
4.190%, ICE LIBOR USD 12 Month + 1.423%, 05/01/2043(A) | 123 | 120 | ||||||
4.000%, 06/01/2025 to 06/01/2057 | 8,894 | 8,492 | ||||||
3.560%, 07/01/2032 | 100 | 93 | ||||||
3.500%, 04/01/2033 to 03/01/2057 | 9,505 | 8,808 | ||||||
3.450%, 03/01/2029 | 57 | 54 | ||||||
3.250%, 05/01/2029 | 77 | 72 | ||||||
3.000%, 07/01/2035 to 06/01/2052 | 10,661 | 9,567 | ||||||
2.930%, 06/01/2030 | 94 | 87 | ||||||
2.500%, 03/01/2035 to 09/01/2061 | 16,247 | 14,064 | ||||||
2.149%, 02/01/2032(A) | 299 | 249 | ||||||
Description | Face Amount | Market Value | ||||||
MORTGAGE-BACKED SECURITIES (continued) | ||||||||
2.000%, 07/01/2031 to 04/01/2052 | $ | 12,463 | $ | 10,392 | ||||
1.500%, 01/01/2051 to 03/01/2051 | 400 | 310 | ||||||
FNMA CMO, Ser 2003-W2, Cl 2A9 | ||||||||
5.900%, 07/25/2042 | 280 | 278 | ||||||
FNMA CMO, Ser 2012-93, Cl UI, IO | ||||||||
3.000%, 09/25/2027 | 105 | 4 | ||||||
FNMA CMO, Ser 2014-47, Cl AI, IO | ||||||||
0.000%, 08/25/2044(A)(B) | 102 | 4 | ||||||
FNMA CMO, Ser 2015-55, Cl IO, IO | ||||||||
0.000%, 08/25/2055(A)(B) | 12 | – | ||||||
FNMA CMO, Ser 2015-56, Cl AS, IO | ||||||||
1.000%, 08/25/2045(A) | 30 | 3 | ||||||
FNMA Interest, Ser 2012-409, Cl C18, IO | ||||||||
4.000%, 04/25/2042 | 8 | 1 | ||||||
FNMA TBA | ||||||||
6.500%, 07/15/2053 | 100 | 102 | ||||||
6.000%, 07/15/2053 | 100 | 101 | ||||||
5.000%, 07/15/2053 | 300 | 294 | ||||||
4.000%, 07/15/2053 | 600 | 563 | ||||||
3.500%, 07/15/2053 | 800 | 729 | ||||||
3.000%, 07/15/2053 | 1,400 | 1,232 | ||||||
2.500%, 07/15/2053 | 600 | 509 | ||||||
2.000%, 07/15/2053 | 100 | 81 | ||||||
FNMA, Ser 2005-29, Cl ZA | ||||||||
5.500%, 04/25/2035 | 79 | 81 | ||||||
FNMA, Ser 2012-101, Cl BI, IO | ||||||||
4.000%, 09/25/2027 | 2 | – | ||||||
FNMA, Ser 2012-118, Cl VZ | ||||||||
3.000%, 11/25/2042 | 136 | 123 | ||||||
FNMA, Ser 2013-124, Cl SB, IO | ||||||||
0.800%, 12/25/2043(A) | 21 | 2 | ||||||
FNMA, Ser 2013-26, Cl HI, IO | ||||||||
3.000%, 04/25/2032 | 1 | – | ||||||
FNMA, Ser 2013-54, Cl BS, IO | ||||||||
1.000%, 06/25/2043(A) | 18 | 2 | ||||||
FNMA, Ser 2013-73, Cl IA, IO | ||||||||
3.000%, 09/25/2032 | 29 | 2 | ||||||
FNMA, Ser 2014-6, Cl Z | ||||||||
2.500%, 02/25/2044 | 127 | 105 | ||||||
FNMA, Ser 2017-76, Cl SB, IO | ||||||||
0.950%, 10/25/2057(A) | 120 | 13 | ||||||
FNMA, Ser 2017-85, Cl SC, IO | ||||||||
1.050%, 11/25/2047(A) | 59 | 5 | ||||||
FNMA, Ser 2018-74, Cl AB | ||||||||
3.500%, 10/25/2048 | 69 | 64 | ||||||
FNMA, Ser 2019-M19, Cl A2 | ||||||||
2.560%, 09/25/2029 | 79 | 71 | ||||||
FNMA, Ser 2020-47, Cl GZ | ||||||||
2.000%, 07/25/2050 | 106 | 64 | ||||||
FNMA, Ser 2020-56, Cl AQ | ||||||||
2.000%, 08/25/2050 | 200 | 154 | ||||||
New Covenant Funds
35
SCHEDULE OF INVESTMENTS
June 30, 2023
New Covenant Income Fund (Continued)
Description | Face Amount | Market Value | ||||||
MORTGAGE-BACKED SECURITIES (continued) | ||||||||
FNMA, Ser 2020-56, Cl DI, IO | ||||||||
2.500%, 08/25/2050 | $ | 78 | $ | 12 | ||||
FNMA, Ser 2020-57, Cl TA | ||||||||
2.000%, 04/25/2050 | 103 | 88 | ||||||
FNMA, Ser 2020-96, Cl IN, IO | ||||||||
3.000%, 01/25/2051 | 719 | 114 | ||||||
FNMA, Ser 2021-1, Cl IG, IO | ||||||||
2.500%, 02/25/2051 | 428 | 70 | ||||||
FNMA, Ser 2021-61, Cl KI, IO | ||||||||
2.500%, 04/25/2049 | 537 | 73 | ||||||
FRESB Mortgage Trust, Ser 2018-SB48, Cl A10F | ||||||||
3.370%, 02/25/2028(A) | 408 | 379 | ||||||
FRESB Mortgage Trust, Ser 2019-SB58, Cl A10F | ||||||||
3.610%, 10/25/2028(A) | 568 | 535 | ||||||
GNMA | ||||||||
6.000%, 03/20/2053 | 99 | 100 | ||||||
5.500%, 02/20/2037 to 02/20/2053 | 354 | 355 | ||||||
5.000%, 12/20/2038 to 05/20/2053 | 1,466 | 1,460 | ||||||
4.600%, 09/15/2034 | 911 | 898 | ||||||
4.500%, 05/20/2040 to 09/20/2052 | 2,701 | 2,645 | ||||||
4.000%, 01/15/2041 to 06/20/2052 | 2,153 | 2,065 | ||||||
3.500%, 06/20/2044 to 12/20/2052 | 2,263 | 2,103 | ||||||
3.000%, 09/15/2042 to 12/20/2052 | 3,151 | 2,823 | ||||||
2.500%, 02/20/2027 to 02/20/2053 | 6,224 | 5,391 | ||||||
2.000%, 12/20/2050 to 01/20/2052 | 1,528 | 1,285 | ||||||
GNMA CMO, Ser 2012-34, Cl SA, IO | ||||||||
0.904%, 03/20/2042(A) | 17 | 2 | ||||||
GNMA CMO, Ser 2012-H18, Cl NA | ||||||||
5.614%, ICE LIBOR USD 1 Month + 0.520%, 08/20/2062(A) | 50 | 50 | ||||||
GNMA CMO, Ser 2012-H30, Cl GA | ||||||||
5.444%, ICE LIBOR USD 1 Month + 0.350%, 12/20/2062(A) | 208 | 207 | ||||||
GNMA CMO, Ser 2013-85, Cl IA, IO | ||||||||
0.523%, 03/16/2047(A) | 299 | 2 | ||||||
GNMA CMO, Ser 2013-95, Cl IO, IO | ||||||||
0.420%, 04/16/2047(A) | 736 | 6 | ||||||
GNMA CMO, Ser 2013-H01, Cl TA | ||||||||
4.694%, ICE LIBOR USD 1 Month + 0.500%, 01/20/2063(A) | 1 | 1 | ||||||
GNMA CMO, Ser 2013-H08, Cl BF | ||||||||
5.494%, ICE LIBOR USD 1 Month + 0.400%, 03/20/2063(A) | 232 | 229 | ||||||
GNMA CMO, Ser 2014-105, Cl IO, IO | ||||||||
0.123%, 06/16/2054(A) | 61 | – | ||||||
GNMA CMO, Ser 2014-186, Cl IO, IO | ||||||||
0.373%, 08/16/2054(A) | 205 | 2 | ||||||
GNMA CMO, Ser 2015-H20, Cl FA | ||||||||
5.564%, ICE LIBOR USD 1 Month + 0.470%, 08/20/2065(A) | 177 | 175 | ||||||
Description | Face Amount | Market Value | ||||||
MORTGAGE-BACKED SECURITIES (continued) | ||||||||
GNMA TBA | ||||||||
6.000%, 07/01/2034 | $ | 100 | $ | 101 | ||||
5.000%, 07/01/2039 | 100 | 98 | ||||||
4.500%, 07/15/2039 | 200 | 193 | ||||||
4.000%, 07/01/2039 | 100 | 94 | ||||||
3.500%, 07/15/2041 | 600 | 554 | ||||||
2.500%, 07/15/2053 | 300 | 260 | ||||||
2.000%, 07/15/2053 | 200 | 168 | ||||||
GNMA, Ser 103, Cl AD | ||||||||
1.450%, 01/16/2063 | 117 | 90 | ||||||
GNMA, Ser 113, Cl Z | ||||||||
2.000%, 09/16/2061 | 2,244 | 1,439 | ||||||
GNMA, Ser 2013-107, Cl AD | ||||||||
2.841%, 11/16/2047(A) | 38 | 34 | ||||||
GNMA, Ser 2013-H21, Cl FB | ||||||||
5.794%, ICE LIBOR USD 1 Month + 0.700%, 09/20/2063(A) | 133 | 132 | ||||||
GNMA, Ser 2015-167, Cl OI, IO | ||||||||
4.000%, 04/16/2045 | 45 | 8 | ||||||
GNMA, Ser 2018-168, Cl PA | ||||||||
4.000%, 08/20/2048 | 45 | 43 | ||||||
GNMA, Ser 2020-123, Cl NI, IO | ||||||||
2.500%, 08/20/2050 | 78 | 11 | ||||||
GNMA, Ser 2020-127, Cl IN, IO | ||||||||
2.500%, 08/20/2050 | 77 | 10 | ||||||
GNMA, Ser 2020-129, Cl IE, IO | ||||||||
2.500%, 09/20/2050 | 79 | 11 | ||||||
GNMA, Ser 2020-160, Cl YI, IO | ||||||||
2.500%, 10/20/2050 | 160 | 21 | ||||||
GNMA, Ser 2020-175, Cl GI, IO | ||||||||
2.000%, 11/20/2050 | 304 | 33 | ||||||
GNMA, Ser 2020-181, Cl WI, IO | ||||||||
2.000%, 12/20/2050 | 379 | 40 | ||||||
GNMA, Ser 2020-H04, Cl FP | ||||||||
4.938%, ICE LIBOR USD 1 Month + 0.500%, 06/20/2069(A) | 119 | 118 | ||||||
GNMA, Ser 2020-H09, Cl FL | ||||||||
4.855%, ICE LIBOR USD 1 Month + 1.150%, 05/20/2070(A) | 62 | 62 | ||||||
GNMA, Ser 2020-H13, Cl FA | ||||||||
4.423%, ICE LIBOR USD 1 Month + 0.450%, 07/20/2070(A) | 389 | 375 | ||||||
GNMA, Ser 2020-H13, Cl FM | ||||||||
5.494%, ICE LIBOR USD 1 Month + 0.400%, 08/20/2070(A) | 187 | 185 | ||||||
GNMA, Ser 2021-176, Cl IN, IO | ||||||||
2.500%, 10/20/2051 | 1,068 | 138 | ||||||
GNMA, Ser 2021-188, Cl PA | ||||||||
2.000%, 10/20/2051 | 222 | 186 | ||||||
GNMA, Ser 2021-57, Cl BI, IO | ||||||||
3.000%, 03/20/2051 | 1,377 | 201 | ||||||
36
New Covenant Funds
SCHEDULE OF INVESTMENTS
June 30, 2023
New Covenant Income Fund (Continued)
Description | Face Amount | Market Value | ||||||
MORTGAGE-BACKED SECURITIES (continued) | ||||||||
GNMA, Ser 2021-96, Cl VI, IO | ||||||||
2.500%, 06/20/2051 | $ | 1,241 | $ | 163 | ||||
GNMA, Ser 2022-189, Cl PT | ||||||||
2.500%, 10/20/2051 | 193 | 161 | ||||||
GNMA, Ser 220, Cl E | ||||||||
3.000%, 10/16/2064(A) | 100 | 75 | ||||||
GNMA, Ser 3, Cl IO, IO | ||||||||
0.640%, 02/16/2061(A) | 974 | 48 | ||||||
GNMA, Ser 82, Cl Z | ||||||||
2.000%, 02/16/2064 | 204 | 125 | ||||||
| 130,376 | ||||||||
Non-Agency Mortgage-Backed Obligations — 7.1% | ||||||||
280 Park Avenue Mortgage Trust, Ser 2017-280P, Cl A | ||||||||
6.062%, ICE LIBOR USD 1 Month + 0.880%, 09/15/2034(A)(C) | 130 | 126 | ||||||
Atrium Hotel Portfolio Trust, Ser 2017-ATRM, Cl C | ||||||||
7.093%, ICE LIBOR USD 1 Month + 1.650%, 12/15/2036(A)(C) | 410 | 382 | ||||||
Benchmark Mortgage Trust, Ser 2021-B26, Cl A3 | ||||||||
2.391%, 06/15/2054 | 604 | 516 | ||||||
BPR Trust, Ser TY, Cl B | ||||||||
6.343%, ICE LIBOR USD 1 Month + 1.150%, 09/15/2038(A)(C) | 370 | 344 | ||||||
BRAVO Residential Funding Trust, Ser 2021-NQM2, Cl A1 | ||||||||
0.970%, 03/25/2060(A)(C) | 27 | 25 | ||||||
BRAVO Residential Funding Trust, Ser 2022-NQM3, Cl A1 | ||||||||
5.108%, 07/25/2062(A)(C) | 345 | 332 | ||||||
BX Commercial Mortgage Trust, Ser 2019-XL, Cl A | ||||||||
6.182%, ICE LIBOR USD 1 Month + 0.920%, 10/15/2036(A)(C) | 808 | 802 | ||||||
BX Commercial Mortgage Trust, Ser AHP, Cl A | ||||||||
6.137%, TSFR1M + 0.990%, 01/17/2039(A)(C) | 630 | 612 | ||||||
BX Commercial Mortgage Trust, Ser LP2, Cl A | ||||||||
6.160%, TSFR1M + 1.013%, 02/15/2039(A)(C) | 381 | 369 | ||||||
BX Commercial Mortgage Trust, Ser VOLT, Cl A | ||||||||
5.893%, ICE LIBOR USD 1 Month + 0.700%, 09/15/2036(A)(C) | 635 | 614 | ||||||
BX Trust, Ser CLS, Cl A | ||||||||
5.760%, 10/13/2027(C) | 534 | 514 | ||||||
Description | Face Amount | Market Value | ||||||
MORTGAGE-BACKED SECURITIES (continued) | ||||||||
BX Trust, Ser LBA6, Cl A | ||||||||
6.147%, TSFR1M + 1.000%, 01/15/2039(A)(C) | $ | 110 | $ | 107 | ||||
CAMB Commercial Mortgage Trust, Ser LIFE, Cl A | ||||||||
6.263%, ICE LIBOR USD 1 Month + 1.070%, 12/15/2037(A)(C) | 110 | 109 | ||||||
Citigroup Commercial Mortgage Trust, Ser 2013-375P, Cl A | ||||||||
3.251%, 05/10/2035(C) | 183 | 170 | ||||||
Citigroup Commercial Mortgage Trust, Ser 2014-GC25, Cl AS | ||||||||
4.017%, 10/10/2047 | 100 | 95 | ||||||
Citigroup Commercial Mortgage Trust, Ser 2016-P6, Cl AAB | ||||||||
3.512%, 12/10/2049 | 576 | 551 | ||||||
COLT Mortgage Loan Trust, Ser 2022-2, Cl A1 | ||||||||
2.994%, 02/25/2067(C)(D) | 82 | 72 | ||||||
COMM Mortgage Trust, Ser 2013-CR12, Cl AM | ||||||||
4.300%, 10/10/2046 | 20 | 18 | ||||||
COMM Mortgage Trust, Ser 2013-CR12, Cl C | ||||||||
5.201%, 10/10/2046(A) | 10 | 5 | ||||||
COMM Mortgage Trust, Ser 2013-CR12, Cl B | ||||||||
4.762%, 10/10/2046(A) | 20 | 15 | ||||||
Connecticut Avenue Securities Trust, Ser 2021-R03, Cl 1M2 | ||||||||
6.717%, SOFR30A + 1.650%, 12/25/2041(A)(C) | 440 | 426 | ||||||
Credit Suisse Mortgage Trust, Ser 2019-NQM1, Cl A3 | ||||||||
3.064%, 10/25/2059(C)(D) | 141 | 135 | ||||||
CSMC Trust, Ser 2014-USA, Cl B | ||||||||
4.185%, 09/15/2037(C) | 470 | 378 | ||||||
CSMC Trust, Ser 2018-J1, Cl A2 | ||||||||
3.500%, 02/25/2048(A)(C) | 279 | 247 | ||||||
CSMC Trust, Ser 2021-NQM3, Cl A3 | ||||||||
1.632%, 04/25/2066(A)(C) | 158 | 129 | ||||||
CSMC Trust, Ser 2021-NQM5, Cl A1 | ||||||||
0.938%, 05/25/2066(A)(C) | 128 | 99 | ||||||
CSMC Trust, Ser 2021-NQM7, Cl A1 | ||||||||
1.756%, 10/25/2066(A)(C) | 103 | 85 | ||||||
CSMC Trust, Ser 2021-RPL3, Cl M3 | ||||||||
3.910%, 01/25/2060(A)(C) | 120 | 84 | ||||||
CSMC Trust, Ser 2021-RPL6, Cl A1 | ||||||||
2.000%, 10/25/2060(A)(C) | 131 | 113 | ||||||
CSMC Trust, Ser 2022-NQM1, Cl A1 | ||||||||
2.265%, 11/25/2066(A)(C) | 367 | 311 | ||||||
Deephaven Residential Mortgage Trust, Ser 2022-1, Cl A1 | ||||||||
2.205%, 01/25/2067(A)(C) | 287 | 251 | ||||||
New Covenant Funds
37
SCHEDULE OF INVESTMENTS
June 30, 2023
New Covenant Income Fund (Continued)
Description | Face Amount | Market Value | ||||||
MORTGAGE-BACKED SECURITIES (continued) | ||||||||
Ellington Financial Mortgage Trust, Ser 2021-2, Cl A1 | ||||||||
0.931%, 06/25/2066(A)(C) | $ | 287 | $ | 227 | ||||
Ellington Financial Mortgage Trust, Ser 2022-1, Cl A1 | ||||||||
2.206%, 01/25/2067(A)(C) | 96 | 80 | ||||||
GS Mortgage Securities II, Ser 2018-SRP5, Cl A | ||||||||
6.993%, ICE LIBOR USD 1 Month + 1.800%, 09/15/2031(A)(C) | 556 | 456 | ||||||
GS Mortgage Securities II, Ser 2018-SRP5, Cl B | ||||||||
8.193%, ICE LIBOR USD 1 Month + 3.000%, 09/15/2031(A)(C) | 386 | 204 | ||||||
GS Mortgage Securities Trust, Ser 2014-GC24, Cl A5 | ||||||||
3.931%, 09/10/2047 | 419 | 404 | ||||||
GS Mortgage Securities Trust, Ser 2015-GC30, Cl A3 | ||||||||
3.119%, 05/10/2050 | 951 | 900 | ||||||
GS Mortgage Securities Trust, Ser 2019-GC39, Cl A2 | ||||||||
3.457%, 05/10/2052 | 466 | 455 | ||||||
GS Mortgage-Backed Securities Trust, Ser 2018-RPL1, Cl A1A | ||||||||
3.750%, 10/25/2057(C) | 134 | 126 | ||||||
GS Mortgage-Backed Securities Trust, Ser 2020-INV1, Cl A14 | ||||||||
2.927%, 10/25/2050(A)(C) | 262 | 220 | ||||||
HarborView Mortgage Loan Trust, Ser 2005-9, Cl 2A1B | ||||||||
5.897%, ICE LIBOR USD 1 Month + 0.740%, 06/20/2035(A) | 135 | 123 | ||||||
ILPT Commercial Mortgage Trust, Ser LPF2, Cl A | ||||||||
7.392%, TSFR1M + 2.245%, 10/15/2039(A)(C) | 230 | 229 | ||||||
JPMBB Commercial Mortgage Securities Trust, Ser 2013-C15, Cl B | ||||||||
4.927%, 11/15/2045(A) | 210 | 204 | ||||||
JPMBB Commercial Mortgage Securities Trust, Ser 2013-C17, Cl B | ||||||||
5.048%, 01/15/2047(A) | 30 | 27 | ||||||
JPMBB Commercial Mortgage Securities Trust, Ser 2014-C22, Cl C | ||||||||
4.698%, 09/15/2047(A) | 80 | 65 | ||||||
JPMBB Commercial Mortgage Securities Trust, Ser 2014-C25, Cl A5 | ||||||||
3.672%, 11/15/2047 | 578 | 554 | ||||||
JPMorgan Chase Commercial Mortgage Securities Trust, Ser 2015-FL7, Cl D | ||||||||
8.943%, ICE LIBOR USD 1 Month + 3.750%, 05/15/2028(A)(C) | 115 | 102 | ||||||
Description | Face Amount | Market Value | ||||||
MORTGAGE-BACKED SECURITIES (continued) | ||||||||
JPMorgan Chase Commercial Mortgage Securities Trust, Ser ACB, Cl A | ||||||||
6.467%, SOFR30A + 1.400%, 03/15/2039(A)(C) | $ | 300 | $ | 294 | ||||
JPMorgan Mortgage Trust, Ser 2015-5, Cl A9 | ||||||||
6.347%, 05/25/2045(A)(C) | 17 | 17 | ||||||
JPMorgan Mortgage Trust, Ser 2018-3, Cl A1 | ||||||||
3.500%, 09/25/2048(A)(C) | 87 | 76 | ||||||
MAD Mortgage Trust, Ser 2017-330M, Cl A | ||||||||
3.294%, 08/15/2034(A)(C) | 220 | 202 | ||||||
Metlife Securitization Trust, Ser 2020-INV1, Cl A2A | ||||||||
2.500%, 05/25/2050(A)(C) | 255 | 208 | ||||||
Mill City Mortgage Loan Trust, Ser 2019-1, Cl A1 | ||||||||
3.250%, 10/25/2069(A)(C) | 166 | 156 | ||||||
Morgan Stanley Bank of America Merrill Lynch Trust 2016-C30, Ser C30, Cl A4 | ||||||||
2.600%, 09/15/2049 | 471 | 432 | ||||||
Morgan Stanley Bank of America Merrill Lynch Trust, Ser 2015-C24, Cl A4 | ||||||||
3.732%, 05/15/2048 | 473 | 449 | ||||||
Morgan Stanley Bank of America Merrill Lynch Trust, Ser 2015-C25, Cl A5 | ||||||||
3.635%, 10/15/2048 | 510 | 481 | ||||||
Morgan Stanley Bank of America Merrill Lynch Trust, Ser 2017-C34, Cl ASB | ||||||||
3.354%, 11/15/2052 | 508 | 480 | ||||||
Morgan Stanley Capital I Trust, Ser 2019-BPR, Cl A | ||||||||
7.093%, ICE LIBOR USD 1 Month + 1.650%, 05/15/2036(A)(C) | 252 | 244 | ||||||
MSCG Trust, Ser 2015-ALDR, Cl A2 | ||||||||
3.577%, 06/07/2035(A)(C) | 410 | 374 | ||||||
MTN Commercial Mortgage Trust, Ser LPFL, Cl A | ||||||||
6.544%, TSFR1M + 1.397%, 03/15/2039(A)(C) | 410 | 402 | ||||||
Natixis Commercial Mortgage Securities Trust, Ser 2019-FAME, Cl B | ||||||||
3.655%, 08/15/2036(C) | 410 | 309 | ||||||
New Residential Mortgage Loan Trust, Ser 2018-RPL1, Cl M2 | ||||||||
3.500%, 12/25/2057(A)(C) | 240 | 195 | ||||||
New Residential Mortgage Loan Trust, Ser 2019-4A, Cl A1B | ||||||||
3.500%, 12/25/2058(A)(C) | 154 | 140 | ||||||
New Residential Mortgage Loan Trust, Ser 2019-6A, Cl B2 | ||||||||
4.250%, 09/25/2059(A)(C) | 196 | 177 | ||||||
38
New Covenant Funds
SCHEDULE OF INVESTMENTS
June 30, 2023
New Covenant Income Fund (Continued)
Description | Face Amount | Market Value | ||||||
MORTGAGE-BACKED SECURITIES (continued) | ||||||||
New Residential Mortgage Loan Trust, Ser 2019-6A, Cl B1 | ||||||||
4.000%, 09/25/2059(A)(C) | $ | 196 | $ | 178 | ||||
New Residential Mortgage Loan Trust, Ser 2019-NQM4, Cl A1 | ||||||||
2.492%, 09/25/2059(A)(C) | 91 | 82 | ||||||
New Residential Mortgage Loan Trust, Ser 2021-NQM3, Cl A3 | ||||||||
1.516%, 11/27/2056(A)(C) | 64 | 51 | ||||||
New Residential Mortgage Loan Trust, Ser 2021-NQM3, Cl A1 | ||||||||
1.156%, 11/27/2056(A)(C) | 99 | 80 | ||||||
New Residential Mortgage Loan Trust, Ser 2022-NQM4, Cl A1 | ||||||||
5.000%, 06/25/2062(C)(D) | 336 | 324 | ||||||
OBX Trust, Ser 2021-NQM2, Cl A3 | ||||||||
1.563%, 05/25/2061(A)(C) | 203 | 154 | ||||||
OBX Trust, Ser 2021-NQM2, Cl A1 | ||||||||
1.101%, 05/25/2061(A)(C) | 246 | 191 | ||||||
OBX Trust, Ser 2021-NQM3, Cl A1 | ||||||||
1.054%, 07/25/2061(A)(C) | 142 | 107 | ||||||
OBX Trust, Ser 2022-NQM1, Cl A1 | ||||||||
2.305%, 11/25/2061(A)(C) | 343 | 287 | ||||||
Onslow Bay Mortgage Loan Trust, Ser 2021-NQM4, Cl A1 | ||||||||
1.957%, 10/25/2061(A)(C) | 224 | 181 | ||||||
PRKCM Trust, Ser 2021-AFC1, Cl A1 | ||||||||
1.510%, 08/25/2056(A)(C) | 196 | 153 | ||||||
PRKCM Trust, Ser 2021-AFC2, Cl A1 | ||||||||
2.071%, 11/25/2056(A)(C) | 136 | 111 | ||||||
Provident Funding Mortgage Trust, Ser 2021-INV1, Cl A1 | ||||||||
2.500%, 08/25/2051(A)(C) | 540 | 434 | ||||||
Residential Mortgage Loan Trust, Ser 2019-3, Cl A2 | ||||||||
2.941%, 09/25/2059(A)(C) | 40 | 39 | ||||||
Residential Mortgage Loan Trust, Ser 2019-3, Cl A3 | ||||||||
3.044%, 09/25/2059(A)(C) | 40 | 38 | ||||||
Residential Mortgage Loan Trust, Ser 2020-2, Cl A1 | ||||||||
1.654%, 05/25/2060(A)(C) | 39 | 38 | ||||||
Seasoned Credit Risk Transfer Trust Series, Ser 2017-2, Cl MA | ||||||||
3.000%, 08/25/2056 | 191 | 176 | ||||||
Seasoned Credit Risk Transfer Trust, Ser 2018-4, Cl MA | ||||||||
3.500%, 03/25/2058 | 495 | 464 | ||||||
Seasoned Credit Risk Transfer Trust, Ser 2019-1, Cl MA | ||||||||
3.500%, 07/25/2058 | 410 | 384 | ||||||
Description | Face Amount | Market Value | ||||||
MORTGAGE-BACKED SECURITIES (continued) | ||||||||
Seasoned Credit Risk Transfer Trust, Ser 2019-2, Cl MA | ||||||||
3.500%, 08/25/2058 | $ | 567 | $ | 529 | ||||
Seasoned Credit Risk Transfer Trust, Ser 2019-4, Cl MA | ||||||||
3.000%, 02/25/2059 | 743 | 678 | ||||||
Seasoned Credit Risk Transfer Trust, Ser 2020-2, Cl MA | ||||||||
2.000%, 11/25/2059 | 272 | 241 | ||||||
Seasoned Credit Risk Transfer Trust, Ser 2022-1, Cl MAU | ||||||||
3.250%, 11/25/2061 | 894 | 809 | ||||||
Sequoia Mortgage Trust, Ser 2021-1, Cl A1 | ||||||||
2.500%, 03/25/2051(A)(C) | 106 | 86 | ||||||
SG Residential Mortgage Trust, Ser 2022-1, Cl A1 | ||||||||
3.166%, 03/27/2062(A)(C) | 378 | 332 | ||||||
Shops at Crystals Trust, Ser 2016-CSTL, Cl A | ||||||||
3.126%, 07/05/2036(C) | 100 | 90 | ||||||
SLG Office Trust, Ser 2021-OVA, Cl A | ||||||||
2.585%, 07/15/2041(C) | 510 | 409 | ||||||
Towd Point Mortgage Trust, Ser 2019-HY2, Cl M2 | ||||||||
7.050%, ICE LIBOR USD 1 Month + 1.900%, 05/25/2058(A)(C) | 100 | 98 | ||||||
UBS-Barclays Commercial Mortgage Trust, Ser 2012-CN, Cl XA, IO | ||||||||
0.663%, 05/10/2063(A)(C) | 48 | – | ||||||
Wells Fargo Commercial Mortgage Trust, Ser 2015-NXS3, Cl ASB | ||||||||
3.371%, 09/15/2057 | 76 | 73 | ||||||
Wells Fargo Commercial Mortgage Trust, Ser C29, Cl A4 | ||||||||
3.637%, 06/15/2048 | 606 | 575 | ||||||
WFRBS Commercial Mortgage Trust, Ser 2014-C23, Cl B | ||||||||
4.535%, 10/15/2057(A) | 270 | 251 | ||||||
WFRBS Commercial Mortgage Trust, Ser 2014-C23, Cl XA, IO | ||||||||
0.694%, 10/15/2057(A) | 901 | 4 | ||||||
| 24,695 | ||||||||
Total Mortgage-Backed Securities | ||||||||
(Cost $169,221) ($ Thousands) | 155,071 | |||||||
CORPORATE OBLIGATIONS — 28.3% | ||||||||
Communication Services — 2.4% | ||||||||
Alphabet | ||||||||
2.050%, 08/15/2050 | 30 | 19 | ||||||
1.900%, 08/15/2040 | 40 | 28 | ||||||
New Covenant Funds
39
SCHEDULE OF INVESTMENTS
June 30, 2023
New Covenant Income Fund (Continued)
Description | Face Amount | Market Value | ||||||
CORPORATE OBLIGATIONS (continued) | ||||||||
1.100%, 08/15/2030 | $ | 40 | $ | 32 | ||||
0.450%, 08/15/2025 | 20 | 18 | ||||||
AT&T | ||||||||
4.250%, 03/01/2027 | 150 | 146 | ||||||
2.550%, 12/01/2033 | 492 | 386 | ||||||
2.300%, 06/01/2027 | 120 | 108 | ||||||
1.650%, 02/01/2028 | 400 | 344 | ||||||
Charter Communications Operating | ||||||||
5.050%, 03/30/2029 | 220 | 210 | ||||||
4.908%, 07/23/2025 | 490 | 480 | ||||||
4.800%, 03/01/2050 | 40 | 30 | ||||||
4.400%, 04/01/2033 | 110 | 97 | ||||||
3.750%, 02/15/2028 | 200 | 183 | ||||||
Comcast | ||||||||
4.250%, 10/15/2030 | 40 | 38 | ||||||
4.150%, 10/15/2028 | 250 | 242 | ||||||
3.950%, 10/15/2025 | 210 | 205 | ||||||
3.750%, 04/01/2040 | 20 | 17 | ||||||
3.450%, 02/01/2050 | 40 | 30 | ||||||
3.400%, 04/01/2030 | 140 | 129 | ||||||
3.300%, 04/01/2027 | 30 | 28 | ||||||
3.250%, 11/01/2039 | 30 | 24 | ||||||
3.150%, 03/01/2026 | 30 | 29 | ||||||
2.937%, 11/01/2056 | 27 | 18 | ||||||
2.800%, 01/15/2051 | 30 | 20 | ||||||
Fox | ||||||||
4.709%, 01/25/2029 | 30 | 29 | ||||||
Prosus MTN | ||||||||
3.061%, 07/13/2031 (C) | 410 | 320 | ||||||
TCI Communications | ||||||||
7.875%, 02/15/2026 | 240 | 255 | ||||||
T-Mobile USA | ||||||||
3.875%, 04/15/2030 | 390 | 359 | ||||||
3.750%, 04/15/2027 | 20 | 19 | ||||||
3.500%, 04/15/2025 | 369 | 355 | ||||||
2.550%, 02/15/2031 | 190 | 158 | ||||||
2.050%, 02/15/2028 | 20 | 17 | ||||||
Verizon Communications | ||||||||
4.862%, 08/21/2046 | 40 | 37 | ||||||
4.500%, 08/10/2033 | 30 | 28 | ||||||
4.329%, 09/21/2028 | 435 | 419 | ||||||
4.125%, 08/15/2046 | 40 | 33 | ||||||
4.000%, 03/22/2050 | 40 | 33 | ||||||
3.875%, 02/08/2029 | 30 | 28 | ||||||
3.850%, 11/01/2042 | 10 | 8 | ||||||
3.000%, 03/22/2027 | 120 | 112 | ||||||
2.650%, 11/20/2040 | 300 | 209 | ||||||
2.550%, 03/21/2031 | 1,264 | 1,055 | ||||||
2.355%, 03/15/2032 | 983 | 791 | ||||||
2.100%, 03/22/2028 | 90 | 79 | ||||||
Walt Disney | ||||||||
3.350%, 03/24/2025 | 223 | 216 | ||||||
Description | Face Amount | Market Value | ||||||
CORPORATE OBLIGATIONS (continued) | ||||||||
Warnermedia Holdings | ||||||||
6.412%, 03/15/2026 | $ | 80 | $ | 80 | ||||
4.279%, 03/15/2032 | 330 | 293 | ||||||
4.054%, 03/15/2029 | 447 | 409 | ||||||
3.755%, 03/15/2027 | 190 | 177 | ||||||
| 8,380 | ||||||||
Consumer Discretionary — 1.6% | ||||||||
Amazon.com | ||||||||
4.250%, 08/22/2057 | 10 | 9 | ||||||
3.450%, 04/13/2029 | 160 | 151 | ||||||
3.300%, 04/13/2027 | 140 | 133 | ||||||
3.150%, 08/22/2027 | 470 | 442 | ||||||
1.200%, 06/03/2027 | 20 | 18 | ||||||
Aptiv | ||||||||
3.250%, 03/01/2032 | 639 | 547 | ||||||
Ferguson Finance | ||||||||
4.500%, 10/24/2028 (C) | 459 | 440 | ||||||
3.250%, 06/02/2030 (C) | 851 | 738 | ||||||
General Motors | ||||||||
5.600%, 10/15/2032 | 210 | 203 | ||||||
Home Depot | ||||||||
3.900%, 12/06/2028 | 10 | 10 | ||||||
3.900%, 06/15/2047 | 10 | 9 | ||||||
3.350%, 04/15/2050 | 50 | 38 | ||||||
3.300%, 04/15/2040 | 40 | 32 | ||||||
2.875%, 04/15/2027 | 170 | 160 | ||||||
2.500%, 04/15/2027 | 450 | 417 | ||||||
Honda Motor | ||||||||
2.534%, 03/10/2027 | 632 | 582 | ||||||
LKQ | ||||||||
5.750%, 06/15/2028 (C) | 682 | 680 | ||||||
Lowe's | ||||||||
4.500%, 04/15/2030 | 30 | 29 | ||||||
1.700%, 09/15/2028 | 80 | 68 | ||||||
McDonald's MTN | ||||||||
4.200%, 04/01/2050 | 70 | 61 | ||||||
3.800%, 04/01/2028 | 280 | 268 | ||||||
3.700%, 01/30/2026 | 10 | 10 | ||||||
3.625%, 09/01/2049 | 10 | 8 | ||||||
3.500%, 03/01/2027 | 20 | 19 | ||||||
3.500%, 07/01/2027 | 10 | 9 | ||||||
3.300%, 07/01/2025 | 50 | 48 | ||||||
1.450%, 09/01/2025 | 10 | 9 | ||||||
NIKE | ||||||||
3.375%, 03/27/2050 | 30 | 24 | ||||||
2.750%, 03/27/2027 | 40 | 38 | ||||||
2.400%, 03/27/2025 | 40 | 38 | ||||||
Target | ||||||||
2.250%, 04/15/2025 | 80 | 76 | ||||||
40
New Covenant Funds
SCHEDULE OF INVESTMENTS
June 30, 2023
New Covenant Income Fund (Continued)
Description | Face Amount | Market Value | ||||||
CORPORATE OBLIGATIONS (continued) | ||||||||
Toyota Motor | ||||||||
1.339%, 03/25/2026 | $ | 210 | $ | 191 | ||||
| 5,505 | ||||||||
Consumer Staples — 0.5% | ||||||||
Cargill | ||||||||
1.375%, 07/23/2023 (C) | 70 | 70 | ||||||
Coca-Cola | ||||||||
3.375%, 03/25/2027 | 30 | 29 | ||||||
2.600%, 06/01/2050 | 10 | 7 | ||||||
1.450%, 06/01/2027 | 80 | 71 | ||||||
Costco Wholesale | ||||||||
1.600%, 04/20/2030 | 90 | 75 | ||||||
1.375%, 06/20/2027 | 120 | 106 | ||||||
Hershey | ||||||||
0.900%, 06/01/2025 | 20 | 18 | ||||||
Kimberly-Clark | ||||||||
3.100%, 03/26/2030 | 20 | 18 | ||||||
Kroger | ||||||||
7.700%, 06/01/2029 | 565 | 632 | ||||||
Mars | ||||||||
3.200%, 04/01/2030 (C) | 30 | 27 | ||||||
2.700%, 04/01/2025 (C) | 60 | 58 | ||||||
Mondelez International | ||||||||
1.500%, 05/04/2025 | 180 | 168 | ||||||
PepsiCo | ||||||||
3.900%, 07/18/2032 | 90 | 87 | ||||||
2.625%, 03/19/2027 | 10 | 9 | ||||||
2.250%, 03/19/2025 | 10 | 10 | ||||||
1.625%, 05/01/2030 | 70 | 58 | ||||||
Procter & Gamble | ||||||||
3.000%, 03/25/2030 | 40 | 37 | ||||||
2.800%, 03/25/2027 | 10 | 9 | ||||||
Walmart | ||||||||
1.800%, 09/22/2031 | 160 | 133 | ||||||
| 1,622 | ||||||||
Energy — 2.4% | ||||||||
Berkshire Hathaway Energy | ||||||||
3.700%, 07/15/2030 | 140 | 129 | ||||||
BP Capital Markets America | ||||||||
3.633%, 04/06/2030 | 50 | 46 | ||||||
3.410%, 02/11/2026 | 90 | 87 | ||||||
3.119%, 05/04/2026 | 170 | 162 | ||||||
Cameron LNG | ||||||||
2.902%, 07/15/2031 (C) | 60 | 52 | ||||||
Continental Resources | ||||||||
5.750%, 01/15/2031 (C) | 10 | 9 | ||||||
4.375%, 01/15/2028 | 120 | 113 | ||||||
3.800%, 06/01/2024 | 190 | 186 | ||||||
Coterra Energy | ||||||||
4.375%, 03/15/2029 | 300 | 280 | ||||||
Description | Face Amount | Market Value | ||||||
CORPORATE OBLIGATIONS (continued) | ||||||||
3.900%, 05/15/2027 | $ | 160 | $ | 151 | ||||
Devon Energy | ||||||||
5.850%, 12/15/2025 | 210 | 211 | ||||||
5.250%, 10/15/2027 | 64 | 63 | ||||||
5.000%, 06/15/2045 | 70 | 61 | ||||||
4.500%, 01/15/2030 | 32 | 30 | ||||||
Diamondback Energy | ||||||||
3.500%, 12/01/2029 | 50 | 45 | ||||||
3.250%, 12/01/2026 | 30 | 28 | ||||||
3.125%, 03/24/2031 | 40 | 34 | ||||||
Ecopetrol | ||||||||
5.375%, 06/26/2026 | 140 | 134 | ||||||
Energy Transfer | ||||||||
4.950%, 06/15/2028 | 10 | 10 | ||||||
4.500%, 11/01/2023 | 60 | 60 | ||||||
3.750%, 05/15/2030 | 220 | 198 | ||||||
2.900%, 05/15/2025 | 140 | 133 | ||||||
Enterprise Products Operating | ||||||||
4.800%, 02/01/2049 | 30 | 28 | ||||||
4.200%, 01/31/2050 | 10 | 8 | ||||||
4.150%, 10/16/2028 | 140 | 134 | ||||||
3.950%, 02/15/2027 | 150 | 145 | ||||||
3.950%, 01/31/2060 | 10 | 8 | ||||||
3.700%, 01/31/2051 | 80 | 61 | ||||||
3.125%, 07/31/2029 | 210 | 188 | ||||||
2.800%, 01/31/2030 | 230 | 201 | ||||||
EOG Resources | ||||||||
4.375%, 04/15/2030 | 190 | 186 | ||||||
4.150%, 01/15/2026 | 160 | 156 | ||||||
EQT | ||||||||
6.125%, 02/01/2025 | 56 | 56 | ||||||
3.900%, 10/01/2027 | 140 | 129 | ||||||
KazMunayGas National JSC | ||||||||
5.375%, 04/24/2030 (C) | 400 | 371 | ||||||
Kinder Morgan | ||||||||
5.550%, 06/01/2045 | 20 | 18 | ||||||
4.300%, 06/01/2025 | 60 | 59 | ||||||
Lukoil Capital DAC | ||||||||
3.600%, 10/26/2031 (C) | 230 | 176 | ||||||
Occidental Petroleum | ||||||||
5.550%, 03/15/2026 | 170 | 168 | ||||||
3.400%, 04/15/2026 | 80 | 74 | ||||||
3.200%, 08/15/2026 | 130 | 118 | ||||||
3.000%, 02/15/2027 | 130 | 116 | ||||||
0.000%, 10/10/2036 (E) | 1,346 | 715 | ||||||
Oncor Electric Delivery | ||||||||
4.150%, 06/01/2032 | 300 | 285 | ||||||
Petrobras Global Finance BV | ||||||||
6.850%, 06/05/2115 | 150 | 130 | ||||||
Petroleos del Peru | ||||||||
4.750%, 06/19/2032 (C) | 400 | 306 | ||||||
New Covenant Funds
41
SCHEDULE OF INVESTMENTS
June 30, 2023
New Covenant Income Fund (Continued)
Description | Face Amount | Market Value | ||||||
CORPORATE OBLIGATIONS (continued) | ||||||||
Pioneer Natural Resources | ||||||||
2.150%, 01/15/2031 | $ | 70 | $ | 58 | ||||
1.900%, 08/15/2030 | 220 | 178 | ||||||
1.125%, 01/15/2026 | 50 | 45 | ||||||
Reliance Industries | ||||||||
3.625%, 01/12/2052 (C) | 250 | 178 | ||||||
Schlumberger Holdings | ||||||||
3.900%, 05/17/2028 (C) | 456 | 430 | ||||||
Shell International Finance BV | ||||||||
3.250%, 05/11/2025 | 150 | 145 | ||||||
3.250%, 04/06/2050 | 110 | 82 | ||||||
2.875%, 05/10/2026 | 90 | 85 | ||||||
2.750%, 04/06/2030 | 40 | 36 | ||||||
Sinopec Group Overseas Development | ||||||||
4.375%, 04/10/2024 (C) | 290 | 287 | ||||||
Targa Resources | ||||||||
5.200%, 07/01/2027 | 170 | 167 | ||||||
Tennessee Gas Pipeline | ||||||||
2.900%, 03/01/2030 (C) | 160 | 137 | ||||||
Transcontinental Gas Pipe Line | ||||||||
3.250%, 05/15/2030 | 100 | 89 | ||||||
Western Midstream Operating | ||||||||
4.300%, 02/01/2030 | 20 | 18 | ||||||
3.350%, 02/01/2025 | 30 | 29 | ||||||
Williams | ||||||||
5.100%, 09/15/2045 | 70 | 63 | ||||||
4.900%, 01/15/2045 | 90 | 78 | ||||||
3.750%, 06/15/2027 | 390 | 368 | ||||||
3.500%, 11/15/2030 | 20 | 18 | ||||||
| 8,549 | ||||||||
Financials — 12.4% | ||||||||
American Express | ||||||||
4.050%, 05/03/2029 | 200 | 191 | ||||||
3.375%, 05/03/2024 | 140 | 137 | ||||||
American International Group | ||||||||
2.500%, 06/30/2025 | 26 | 24 | ||||||
Aviation Capital Group | ||||||||
4.125%, 08/01/2025 (C) | 160 | 149 | ||||||
1.950%, 01/30/2026 (C) | 567 | 505 | ||||||
Banco Santander | ||||||||
4.175%, US Treas Yield Curve Rate T Note Const Mat 1 Yr + 2.000%, 03/24/2028 (A) | 200 | 187 | ||||||
2.746%, 05/28/2025 | 200 | 188 | ||||||
Bank of America | ||||||||
6.204%, U.S. SOFR + 1.990%, 11/10/2028 (A) | 584 | 600 | ||||||
3.841%, U.S. SOFR + 1.110%, 04/25/2025 (A) | 100 | 98 | ||||||
3.419%, ICE LIBOR USD 3 Month + 1.040%, 12/20/2028 (A) | 234 | 215 | ||||||
Description | Face Amount | Market Value | ||||||
CORPORATE OBLIGATIONS (continued) | ||||||||
2.592%, U.S. SOFR + 2.150%, 04/29/2031 (A) | $ | 380 | $ | 319 | ||||
2.572%, U.S. SOFR + 1.210%, 10/20/2032 (A) | 240 | 195 | ||||||
1.734%, U.S. SOFR + 0.960%, 07/22/2027 (A) | 2,006 | 1,791 | ||||||
Bank of America MTN | ||||||||
4.376%, U.S. SOFR + 1.580%, 04/27/2028 (A) | 100 | 96 | ||||||
4.250%, 10/22/2026 | 10 | 9 | ||||||
4.200%, 08/26/2024 | 210 | 206 | ||||||
4.125%, 01/22/2024 | 370 | 367 | ||||||
4.100%, 07/24/2023 | 280 | 280 | ||||||
4.083%, ICE LIBOR USD 3 Month + 3.150%, 03/20/2051 (A) | 40 | 33 | ||||||
4.000%, 04/01/2024 | 440 | 435 | ||||||
4.000%, 01/22/2025 | 80 | 78 | ||||||
3.974%, ICE LIBOR USD 3 Month + 1.210%, 02/07/2030 (A) | 80 | 74 | ||||||
3.593%, ICE LIBOR USD 3 Month + 1.370%, 07/21/2028 (A) | 210 | 195 | ||||||
3.500%, 04/19/2026 | 130 | 125 | ||||||
2.972%, U.S. SOFR + 1.330%, 02/04/2033 (A) | 200 | 167 | ||||||
Bank of Montreal MTN | ||||||||
1.850%, 05/01/2025 | 130 | 121 | ||||||
Bank of New York Mellon MTN | ||||||||
4.289%, U.S. SOFR + 1.418%, 06/13/2033 (A) | 320 | 303 | ||||||
3.300%, 08/23/2029 | 790 | 708 | ||||||
1.600%, 04/24/2025 | 40 | 38 | ||||||
Bank of Nova Scotia | ||||||||
1.300%, 06/11/2025 | 70 | 64 | ||||||
Blackstone Holdings Finance | ||||||||
1.600%, 03/30/2031 (C) | 590 | 438 | ||||||
BNP Paribas | ||||||||
5.198%, ICE LIBOR USD 3 Month + 2.567%, 01/10/2030 (A)(C) | 200 | 193 | ||||||
5.125%, US Treas Yield Curve Rate T Note Const Mat 1 Yr + 1.450%, 01/13/2029 (A)(C) | 270 | 264 | ||||||
4.705%, ICE LIBOR USD 3 Month + 2.235%, 01/10/2025 (A)(C) | 270 | 267 | ||||||
4.400%, 08/14/2028 (C) | 200 | 189 | ||||||
2.871%, U.S. SOFR + 1.387%, 04/19/2032 (A)(C) | 200 | 164 | ||||||
1.675%, U.S. SOFR + 0.912%, 06/30/2027 (A)(C) | 290 | 256 | ||||||
BPCE | ||||||||
1.625%, 01/14/2025 (C) | 1,085 | 1,013 | ||||||
Capital One Financial | ||||||||
4.927%, U.S. SOFR + 2.057%, 05/10/2028 (A) | 30 | 29 | ||||||
42
New Covenant Funds
SCHEDULE OF INVESTMENTS
June 30, 2023
New Covenant Income Fund (Continued)
Description | Face Amount | Market Value | ||||||
CORPORATE OBLIGATIONS (continued) | ||||||||
3.300%, 10/30/2024 | $ | 480 | $ | 461 | ||||
Carlyle Finance Subsidiary | ||||||||
3.500%, 09/19/2029 (C) | 716 | 628 | ||||||
Charles Schwab | ||||||||
3.850%, 05/21/2025 | 110 | 106 | ||||||
Citigroup | ||||||||
8.125%, 07/15/2039 | 12 | 15 | ||||||
5.500%, 09/13/2025 | 450 | 447 | ||||||
5.300%, 05/06/2044 | 31 | 29 | ||||||
4.658%, U.S. SOFR + 1.887%, 05/24/2028 (A) | 140 | 136 | ||||||
4.650%, 07/30/2045 | 28 | 25 | ||||||
4.450%, 09/29/2027 | 120 | 114 | ||||||
4.412%, U.S. SOFR + 3.914%, 03/31/2031 (A) | 100 | 94 | ||||||
4.400%, 06/10/2025 | 160 | 155 | ||||||
4.300%, 11/20/2026 | 40 | 38 | ||||||
4.125%, 07/25/2028 | 40 | 38 | ||||||
4.075%, ICE LIBOR USD 3 Month + 1.192%, 04/23/2029 (A) | 240 | 226 | ||||||
3.785%, U.S. SOFR + 1.939%, 03/17/2033 (A) | 250 | 221 | ||||||
3.668%, ICE LIBOR USD 3 Month + 1.390%, 07/24/2028 (A) | 340 | 318 | ||||||
3.400%, 05/01/2026 | 354 | 337 | ||||||
3.200%, 10/21/2026 | 287 | 269 | ||||||
3.106%, U.S. SOFR + 2.842%, 04/08/2026 (A) | 150 | 143 | ||||||
2.572%, U.S. SOFR + 2.107%, 06/03/2031 (A) | 200 | 167 | ||||||
2.520%, U.S. SOFR + 1.177%, 11/03/2032 (A) | 110 | 89 | ||||||
Cooperatieve Rabobank UA | ||||||||
4.375%, 08/04/2025 | 500 | 483 | ||||||
3.649%, US Treas Yield Curve Rate T Note Const Mat 1 Yr + 1.220%, 04/06/2028 (A)(C) | 580 | 537 | ||||||
Credit Agricole MTN | ||||||||
1.907%, U.S. SOFR + 1.676%, 06/16/2026 (A)(C) | 250 | 230 | ||||||
Credit Suisse NY | ||||||||
7.950%, 01/09/2025 | 250 | 255 | ||||||
5.000%, 07/09/2027 | 530 | 512 | ||||||
4.750%, 08/09/2024 | 250 | 244 | ||||||
2.950%, 04/09/2025 | 250 | 235 | ||||||
Danske Bank | ||||||||
4.298%, US Treas Yield Curve Rate T Note Const Mat 1 Yr + 1.750%, 04/01/2028 (A)(C) | 240 | 224 | ||||||
3.773%, US Treas Yield Curve Rate T Note Const Mat 1 Yr + 1.450%, 03/28/2025 (A)(C) | 310 | 303 | ||||||
Description | Face Amount | Market Value | ||||||
CORPORATE OBLIGATIONS (continued) | ||||||||
Equitable Financial Life Global Funding | ||||||||
1.400%, 07/07/2025 (C) | $ | 673 | $ | 612 | ||||
GA Global Funding Trust | ||||||||
3.850%, 04/11/2025 (C) | 1,114 | 1,061 | ||||||
Goldman Sachs Group | ||||||||
4.387%, U.S. SOFR + 1.510%, 06/15/2027 (A) | 400 | 389 | ||||||
4.250%, 10/21/2025 | 190 | 183 | ||||||
4.223%, ICE LIBOR USD 3 Month + 1.301%, 05/01/2029 (A) | 650 | 614 | ||||||
3.691%, ICE LIBOR USD 3 Month + 1.510%, 06/05/2028 (A) | 400 | 376 | ||||||
3.615%, U.S. SOFR + 1.846%, 03/15/2028 (A) | 30 | 28 | ||||||
3.500%, 04/01/2025 | 80 | 77 | ||||||
3.500%, 11/16/2026 | 90 | 84 | ||||||
2.650%, U.S. SOFR + 1.264%, 10/21/2032 (A) | 110 | 90 | ||||||
Goldman Sachs Group MTN | ||||||||
4.000%, 03/03/2024 | 420 | 415 | ||||||
Guardian Life Global Funding | ||||||||
1.100%, 06/23/2025 (C) | 30 | 27 | ||||||
HSBC Holdings PLC | ||||||||
4.583%, ICE LIBOR USD 3 Month + 1.535%, 06/19/2029 (A) | 200 | 188 | ||||||
Intercontinental Exchange | ||||||||
4.600%, 03/15/2033 | 70 | 68 | ||||||
Intesa Sanpaolo MTN | ||||||||
5.017%, 06/26/2024 (C) | 200 | 194 | ||||||
JPMorgan Chase | ||||||||
4.565%, U.S. SOFR + 1.750%, 06/14/2030 (A) | 998 | 959 | ||||||
4.452%, ICE LIBOR USD 3 Month + 1.330%, 12/05/2029 (A) | 200 | 191 | ||||||
4.203%, ICE LIBOR USD 3 Month + 1.260%, 07/23/2029 (A) | 773 | 735 | ||||||
4.023%, ICE LIBOR USD 3 Month + 1.000%, 12/05/2024 (A) | 230 | 228 | ||||||
4.005%, ICE LIBOR USD 3 Month + 1.120%, 04/23/2029 (A) | 100 | 94 | ||||||
3.875%, 09/10/2024 | 290 | 283 | ||||||
3.845%, U.S. SOFR + 0.980%, 06/14/2025 (A) | 1,180 | 1,154 | ||||||
2.545%, U.S. SOFR + 1.180%, 11/08/2032 (A) | 110 | 90 | ||||||
2.522%, U.S. SOFR + 2.040%, 04/22/2031 (A) | 190 | 161 | ||||||
2.083%, U.S. SOFR + 1.850%, 04/22/2026 (A) | 130 | 122 | ||||||
KKR Group Finance VI | ||||||||
3.750%, 07/01/2029 (C) | 1,149 | 1,023 | ||||||
Lincoln National | ||||||||
3.400%, 01/15/2031 | 451 | 381 | ||||||
New Covenant Funds
43
SCHEDULE OF INVESTMENTS
June 30, 2023
New Covenant Income Fund (Continued)
Description | Face Amount | Market Value | ||||||
CORPORATE OBLIGATIONS (continued) | ||||||||
Macquarie Bank | ||||||||
2.300%, 01/22/2025 (C) | $ | 1,188 | $ | 1,127 | ||||
Mitsubishi UFJ Financial Group | ||||||||
3.837%, US Treas Yield Curve Rate T Note Const Mat 1 Yr + 1.125%, 04/17/2026 (A) | 200 | 192 | ||||||
3.407%, 03/07/2024 | 510 | 502 | ||||||
Moody's | ||||||||
2.000%, 08/19/2031 | 1,000 | 806 | ||||||
Morgan Stanley MTN | ||||||||
3.772%, ICE LIBOR USD 3 Month + 1.140%, 01/24/2029 (A) | 150 | 140 | ||||||
3.622%, U.S. SOFR + 3.120%, 04/01/2031 (A) | 475 | 428 | ||||||
2.699%, U.S. SOFR + 1.143%, 01/22/2031 (A) | 200 | 170 | ||||||
2.188%, U.S. SOFR + 1.990%, 04/28/2026 (A) | 400 | 376 | ||||||
NatWest Group | ||||||||
4.269%, ICE LIBOR USD 3 Month + 1.762%, 03/22/2025 (A) | 200 | 196 | ||||||
New York Life Global Funding | ||||||||
0.950%, 06/24/2025 (C) | 60 | 55 | ||||||
Peachtree Corners Funding Trust | ||||||||
3.976%, 02/15/2025 (C) | 944 | 909 | ||||||
PNC Financial Services Group | ||||||||
5.812%, U.S. SOFR + 1.322%, 06/12/2026 (A) | 240 | 239 | ||||||
Principal Life Global Funding II | ||||||||
1.250%, 06/23/2025 (C) | 20 | 18 | ||||||
Royal Bank of Canada MTN | ||||||||
6.000%, 11/01/2027 | 1,209 | 1,238 | ||||||
1.150%, 06/10/2025 | 70 | 65 | ||||||
State Street | ||||||||
4.164%, U.S. SOFR + 1.726%, 08/04/2033 (A) | 1,095 | 1,014 | ||||||
3.152%, U.S. SOFR + 2.650%, 03/30/2031 (A) | 50 | 44 | ||||||
Swedbank | ||||||||
1.538%, 11/16/2026 (C) | 400 | 350 | ||||||
Toronto-Dominion Bank MTN | ||||||||
4.693%, 09/15/2027 | 1,951 | 1,909 | ||||||
4.456%, 06/08/2032 | 210 | 199 | ||||||
3.200%, 03/10/2032 | 807 | 698 | ||||||
1.150%, 06/12/2025 | 80 | 74 | ||||||
Truist Financial MTN | ||||||||
6.047%, U.S. SOFR + 2.050%, 06/08/2027 (A) | 90 | 90 | ||||||
UBS Group | ||||||||
4.253%, 03/23/2028 (C) | 250 | 232 | ||||||
4.125%, 04/15/2026 (C) | 634 | 605 | ||||||
Description | Face Amount | Market Value | ||||||
CORPORATE OBLIGATIONS (continued) | ||||||||
2.746%, US Treas Yield Curve Rate T Note Const Mat 1 Yr + 1.100%, 02/11/2033 (A)(C) | $ | 575 | $ | 448 | ||||
UBS Group AG | ||||||||
4.194%, U.S. SOFR + 3.730%, 04/01/2031 (A)(C) | 250 | 223 | ||||||
US Bancorp | ||||||||
5.775%, U.S. SOFR + 2.020%, 06/12/2029 (A) | 100 | 100 | ||||||
3.375%, 02/05/2024 | 540 | 532 | ||||||
1.450%, 05/12/2025 | 160 | 149 | ||||||
US Bancorp MTN | ||||||||
2.215%, U.S. SOFR + 0.730%, 01/27/2028 (A) | 60 | 53 | ||||||
USAA Capital | ||||||||
2.125%, 05/01/2030 (C) | 150 | 125 | ||||||
Wells Fargo | ||||||||
3.000%, 10/23/2026 | 190 | 176 | ||||||
2.188%, U.S. SOFR + 2.000%, 04/30/2026 (A) | 130 | 122 | ||||||
Wells Fargo MTN | ||||||||
5.013%, U.S. SOFR + 4.502%, 04/04/2051 (A) | 380 | 354 | ||||||
4.900%, 11/17/2045 | 30 | 26 | ||||||
4.540%, U.S. SOFR + 1.560%, 08/15/2026 (A) | 300 | 293 | ||||||
4.478%, U.S. SOFR + 4.032%, 04/04/2031 (A) | 220 | 209 | ||||||
4.300%, 07/22/2027 | 200 | 192 | ||||||
3.750%, 01/24/2024 | 540 | 534 | ||||||
3.350%, U.S. SOFR + 1.500%, 03/02/2033 (A) | 40 | 34 | ||||||
2.879%, TSFR3M + 1.432%, 10/30/2030 (A) | 100 | 86 | ||||||
2.393%, U.S. SOFR + 2.100%, 06/02/2028 (A) | 290 | 259 | ||||||
| 43,208 | ||||||||
Health Care — 2.1% | ||||||||
Abbott Laboratories | ||||||||
3.400%, 11/30/2023 | 175 | 173 | ||||||
AbbVie | ||||||||
4.250%, 11/21/2049 | 30 | 26 | ||||||
3.800%, 03/15/2025 | 40 | 39 | ||||||
3.750%, 11/14/2023 | 20 | 20 | ||||||
3.600%, 05/14/2025 | 10 | 10 | ||||||
3.200%, 11/21/2029 | 150 | 135 | ||||||
2.950%, 11/21/2026 | 20 | 19 | ||||||
2.600%, 11/21/2024 | 140 | 134 | ||||||
Becton Dickinson | ||||||||
4.685%, 12/15/2044 | 36 | 32 | ||||||
3.734%, 12/15/2024 | 7 | 7 | ||||||
3.363%, 06/06/2024 | 186 | 182 | ||||||
44
New Covenant Funds
SCHEDULE OF INVESTMENTS
June 30, 2023
New Covenant Income Fund (Continued)
Description | Face Amount | Market Value | ||||||
CORPORATE OBLIGATIONS (continued) | ||||||||
Bristol-Myers Squibb | ||||||||
3.400%, 07/26/2029 | $ | 16 | $ | 15 | ||||
3.200%, 06/15/2026 | 79 | 75 | ||||||
2.900%, 07/26/2024 | 154 | 150 | ||||||
Cigna | ||||||||
4.375%, 10/15/2028 | 420 | 406 | ||||||
4.125%, 11/15/2025 | 200 | 195 | ||||||
3.750%, 07/15/2023 | 16 | 16 | ||||||
3.500%, 06/15/2024 | 160 | 157 | ||||||
1.250%, 03/15/2026 | 725 | 651 | ||||||
CommonSpirit Health | ||||||||
6.073%, 11/01/2027 | 890 | 907 | ||||||
CVS Health | ||||||||
5.050%, 03/25/2048 | 60 | 55 | ||||||
4.300%, 03/25/2028 | 164 | 158 | ||||||
3.875%, 07/20/2025 | 95 | 92 | ||||||
3.625%, 04/01/2027 | 180 | 171 | ||||||
2.125%, 09/15/2031 | 150 | 121 | ||||||
1.875%, 02/28/2031 | 20 | 16 | ||||||
1.750%, 08/21/2030 | 200 | 160 | ||||||
CVS Pass-Through Trust | ||||||||
7.507%, 01/10/2032 (C) | 912 | 952 | ||||||
5.773%, 01/10/2033 (C) | 329 | 316 | ||||||
Elevance Health | ||||||||
4.100%, 05/15/2032 | 80 | 75 | ||||||
Gilead Sciences | ||||||||
2.500%, 09/01/2023 | 50 | 50 | ||||||
Humana | ||||||||
4.500%, 04/01/2025 | 10 | 10 | ||||||
3.700%, 03/23/2029 | 160 | 146 | ||||||
2.150%, 02/03/2032 | 30 | 24 | ||||||
Johnson & Johnson | ||||||||
0.950%, 09/01/2027 | 100 | 87 | ||||||
0.550%, 09/01/2025 | 50 | 46 | ||||||
Kenvue | ||||||||
5.350%, 03/22/2026 (C) | 150 | 151 | ||||||
5.050%, 03/22/2028 (C) | 200 | 202 | ||||||
Merck | ||||||||
1.900%, 12/10/2028 | 430 | 376 | ||||||
1.450%, 06/24/2030 | 50 | 41 | ||||||
0.750%, 02/24/2026 | 80 | 72 | ||||||
Pfizer | ||||||||
2.625%, 04/01/2030 | 100 | 89 | ||||||
1.700%, 05/28/2030 | 50 | 41 | ||||||
0.800%, 05/28/2025 | 110 | 102 | ||||||
UnitedHealth Group | ||||||||
4.450%, 12/15/2048 | 10 | 9 | ||||||
4.250%, 06/15/2048 | 10 | 9 | ||||||
4.000%, 05/15/2029 | 200 | 191 | ||||||
3.875%, 12/15/2028 | 30 | 29 | ||||||
3.750%, 07/15/2025 | 30 | 29 | ||||||
2.300%, 05/15/2031 | 20 | 17 | ||||||
Description | Face Amount | Market Value | ||||||
CORPORATE OBLIGATIONS (continued) | ||||||||
2.000%, 05/15/2030 | $ | 30 | $ | 25 | ||||
1.250%, 01/15/2026 | 20 | 18 | ||||||
| 7,229 | ||||||||
Industrials — 1.9% | ||||||||
3M | ||||||||
3.700%, 04/15/2050 | 150 | 119 | ||||||
2.375%, 08/26/2029 | 30 | 26 | ||||||
AerCap Ireland Capital DAC | ||||||||
3.000%, 10/29/2028 | 1,226 | 1,060 | ||||||
2.450%, 10/29/2026 | 190 | 170 | ||||||
Air Lease | ||||||||
5.300%, 02/01/2028 | 90 | 88 | ||||||
3.375%, 07/01/2025 | 100 | 95 | ||||||
Burlington Northern Santa Fe | ||||||||
4.550%, 09/01/2044 | 10 | 9 | ||||||
Carlisle | ||||||||
2.200%, 03/01/2032 | 634 | 500 | ||||||
Carrier Global | ||||||||
2.700%, 02/15/2031 | 10 | 8 | ||||||
Continental Airlines Pass-Through Trust, Ser 2012-2, Cl A | ||||||||
4.000%, 10/29/2024 | 479 | 463 | ||||||
Deere | ||||||||
3.750%, 04/15/2050 | 30 | 27 | ||||||
3.100%, 04/15/2030 | 10 | 9 | ||||||
Delta Air Lines Pass-Through Trust, Ser 2015-1, Cl AA | ||||||||
3.625%, 07/30/2027 | 443 | 403 | ||||||
Delta Air Lines Pass-Through Trust, Ser 2019-1, Cl AA | ||||||||
3.204%, 04/25/2024 | 621 | 609 | ||||||
John Deere Capital MTN | ||||||||
3.350%, 04/18/2029 | 934 | 869 | ||||||
Penske Truck Leasing Lp | ||||||||
5.550%, 05/01/2028 (C) | 916 | 902 | ||||||
Republic Services | ||||||||
3.200%, 03/15/2025 | 180 | 173 | ||||||
Ryder System MTN | ||||||||
5.250%, 06/01/2028 | 609 | 601 | ||||||
3.350%, 09/01/2025 | 197 | 187 | ||||||
SMBC Aviation Capital Finance DAC | ||||||||
4.125%, 07/15/2023 (C) | 200 | 200 | ||||||
Union Pacific | ||||||||
3.750%, 07/15/2025 | 20 | 19 | ||||||
2.891%, 04/06/2036 | 20 | 16 | ||||||
| 6,553 | ||||||||
Information Technology — 1.1% | ||||||||
Adobe | ||||||||
2.300%, 02/01/2030 | 210 | 184 | ||||||
New Covenant Funds
45
SCHEDULE OF INVESTMENTS
June 30, 2023
New Covenant Income Fund (Continued)
Description | Face Amount | Market Value | ||||||
CORPORATE OBLIGATIONS (continued) | ||||||||
Apple | ||||||||
3.350%, 02/09/2027 | $ | 210 | $ | 202 | ||||
2.900%, 09/12/2027 | 110 | 103 | ||||||
2.450%, 08/04/2026 | 70 | 65 | ||||||
1.125%, 05/11/2025 | 130 | 121 | ||||||
Broadcom | ||||||||
4.926%, 05/15/2037 (C) | 33 | 30 | ||||||
4.150%, 11/15/2030 | 26 | 24 | ||||||
3.137%, 11/15/2035 (C) | 420 | 322 | ||||||
Intel | ||||||||
5.125%, 02/10/2030 | 70 | 71 | ||||||
4.750%, 03/25/2050 | 10 | 9 | ||||||
3.700%, 07/29/2025 | 30 | 29 | ||||||
1.600%, 08/12/2028 | 50 | 43 | ||||||
Mastercard | ||||||||
3.850%, 03/26/2050 | 10 | 9 | ||||||
3.375%, 04/01/2024 | 60 | 59 | ||||||
Micron Technology | ||||||||
5.875%, 09/15/2033 | 20 | 20 | ||||||
2.703%, 04/15/2032 | 260 | 205 | ||||||
Microsoft | ||||||||
3.300%, 02/06/2027 | 210 | 202 | ||||||
NVIDIA | ||||||||
3.700%, 04/01/2060 | 90 | 74 | ||||||
3.500%, 04/01/2040 | 130 | 111 | ||||||
2.850%, 04/01/2030 | 90 | 82 | ||||||
NXP BV | ||||||||
5.000%, 01/15/2033 | 404 | 388 | ||||||
2.700%, 05/01/2025 | 40 | 38 | ||||||
Oracle | ||||||||
4.650%, 05/06/2030 | 70 | 68 | ||||||
2.875%, 03/25/2031 | 30 | 25 | ||||||
1.650%, 03/25/2026 | 130 | 118 | ||||||
PayPal Holdings | ||||||||
4.400%, 06/01/2032 | 80 | 77 | ||||||
1.650%, 06/01/2025 | 60 | 56 | ||||||
Salesforce | ||||||||
3.700%, 04/11/2028 | 150 | 145 | ||||||
1.500%, 07/15/2028 | 510 | 439 | ||||||
Texas Instruments | ||||||||
1.750%, 05/04/2030 | 40 | 34 | ||||||
TSMC Arizona | ||||||||
2.500%, 10/25/2031 | 250 | 210 | ||||||
1.750%, 10/25/2026 | 230 | 206 | ||||||
Visa | ||||||||
4.300%, 12/14/2045 | 10 | 9 | ||||||
3.150%, 12/14/2025 | 110 | 105 | ||||||
1.900%, 04/15/2027 | 60 | 55 | ||||||
| 3,938 | ||||||||
Description | Face Amount | Market Value | ||||||
CORPORATE OBLIGATIONS (continued) | ||||||||
Materials — 0.7% | ||||||||
Anglo American Capital | ||||||||
3.625%, 09/11/2024 (C) | $ | 200 | $ | 194 | ||||
Corp Nacional del Cobre de Chile | ||||||||
3.150%, 01/15/2051 | 420 | 294 | ||||||
Glencore Funding | ||||||||
4.125%, 03/12/2024 (C) | 60 | 60 | ||||||
1.625%, 04/27/2026 (C) | 90 | 81 | ||||||
MEGlobal BV MTN | ||||||||
4.250%, 11/03/2026 (C) | 200 | 192 | ||||||
2.625%, 04/28/2028 (C) | 230 | 200 | ||||||
OCP | ||||||||
4.500%, 10/22/2025 (C) | 400 | 387 | ||||||
Orbia Advance | ||||||||
2.875%, 05/11/2031 (C) | 200 | 159 | ||||||
Suzano Austria GmbH | ||||||||
3.125%, 01/15/2032 | 510 | 408 | ||||||
Vale Overseas | ||||||||
6.875%, 11/21/2036 | 148 | 155 | ||||||
6.250%, 08/10/2026 | 240 | 247 | ||||||
| 2,377 | ||||||||
Real Estate — 0.9% | ||||||||
Alexandria Real Estate Equities | ||||||||
3.450%, 04/30/2025 | 802 | 767 | ||||||
American Tower Trust #1 | ||||||||
5.490%, 03/15/2028 (C) | 554 | 554 | ||||||
Digital Realty Trust | ||||||||
3.600%, 07/01/2029 | 815 | 724 | ||||||
Healthpeak Properties | ||||||||
2.125%, 12/01/2028 | 769 | 648 | ||||||
Spirit Realty | ||||||||
2.100%, 03/15/2028 | 583 | 489 | ||||||
| 3,182 | ||||||||
Utilities — 2.3% | ||||||||
American Transmission Systems | ||||||||
2.650%, 01/15/2032 (C) | 60 | 50 | ||||||
American Water Capital | ||||||||
4.450%, 06/01/2032 | 1,311 | 1,269 | ||||||
Commonwealth Edison | ||||||||
3.700%, 08/15/2028 | 468 | 441 | ||||||
Duke Energy Carolinas | ||||||||
2.850%, 03/15/2032 | 1,057 | 898 | ||||||
Duke Energy Florida | ||||||||
3.200%, 01/15/2027 | 440 | 417 | ||||||
Exelon | ||||||||
5.625%, 06/15/2035 | 343 | 347 | ||||||
FirstEnergy | ||||||||
1.600%, 01/15/2026 | 30 | 27 | ||||||
Florida Power & Light | ||||||||
2.450%, 02/03/2032 | 544 | 458 | ||||||
46
New Covenant Funds
SCHEDULE OF INVESTMENTS
June 30, 2023
New Covenant Income Fund (Continued)
Description | Face Amount | Market Value | ||||||
CORPORATE OBLIGATIONS (continued) | ||||||||
MidAmerican Energy | ||||||||
3.650%, 04/15/2029 | $ | 140 | $ | 130 | ||||
Northern States Power | ||||||||
7.125%, 07/01/2025 | 1,190 | 1,226 | ||||||
NSTAR Electric | ||||||||
1.950%, 08/15/2031 | 1,000 | 801 | ||||||
Pacific Gas and Electric | ||||||||
2.100%, 08/01/2027 | 130 | 111 | ||||||
Perusahaan Perseroan Persero Perusahaan Listrik Negara MTN | ||||||||
5.450%, 05/21/2028 (C) | 370 | 371 | ||||||
PG&E Wildfire Recovery Funding | ||||||||
4.022%, 06/01/2031 | 744 | 713 | ||||||
3.594%, 06/01/2030 | 720 | 682 | ||||||
| 7,941 | ||||||||
Total Corporate Obligations | ||||||||
(Cost $107,900) ($ Thousands) | 98,484 | |||||||
U.S. TREASURY OBLIGATIONS — 16.3% | ||||||||
U.S. Treasury Bonds | ||||||||
4.000%, 11/15/2052 | 610 | 627 | ||||||
3.875%, 05/15/2043 | 380 | 371 | ||||||
3.625%, 08/15/2043 | 40 | 38 | ||||||
3.625%, 02/15/2053 | 100 | 96 | ||||||
3.625%, 05/15/2053 | 510 | 490 | ||||||
3.375%, 11/15/2048 | 190 | 172 | ||||||
3.125%, 08/15/2044 | 50 | 43 | ||||||
3.000%, 02/15/2049 | 1,010 | 854 | ||||||
2.875%, 08/15/2045 | 60 | 49 | ||||||
2.875%, 05/15/2049 | 320 | 264 | ||||||
2.875%, 05/15/2052 | 480 | 398 | ||||||
2.375%, 02/15/2042 | 618 | 481 | ||||||
2.375%, 05/15/2051 | 1,920 | 1,427 | ||||||
2.250%, 08/15/2049 | 280 | 203 | ||||||
2.250%, 02/15/2052 | 1,186 | 857 | ||||||
2.000%, 11/15/2041 | 830 | 608 | ||||||
2.000%, 08/15/2051 | 900 | 613 | ||||||
1.875%, 02/15/2041 | 600 | 436 | ||||||
1.875%, 02/15/2051 | 1,520 | 1,006 | ||||||
1.875%, 11/15/2051 | 780 | 515 | ||||||
1.750%, 08/15/2041 | 640 | 450 | ||||||
1.625%, 11/15/2050 | 1,080 | 671 | ||||||
1.375%, 11/15/2040 | 880 | 589 | ||||||
1.375%, 08/15/2050 | 2,130 | 1,238 | ||||||
1.250%, 05/15/2050 | 1,020 | 574 | ||||||
1.125%, 08/15/2040 | 430 | 276 | ||||||
U.S. Treasury Inflation-Protected Securities | ||||||||
1.125%, 01/15/2033 | 2,108 | 2,019 | ||||||
0.125%, 01/15/2030 | 1,053 | 945 | ||||||
Description | Face Amount | Market Value | ||||||
U.S. TREASURY OBLIGATIONS (continued) | ||||||||
U.S. Treasury Notes | ||||||||
3.625%, 05/15/2026 | $ | 901 | $ | 879 | ||||
3.500%, 01/31/2028 | 7,567 | 7,348 | ||||||
3.375%, 05/15/2033 | 660 | 637 | ||||||
3.125%, 08/31/2027 | 8,114 | 7,760 | ||||||
2.750%, 08/15/2032 | 7,542 | 6,914 | ||||||
1.500%, 01/31/2027 | 3,769 | 3,414 | ||||||
1.250%, 11/30/2026 | 2,260 | 2,036 | ||||||
0.750%, 05/31/2026 | 11,310 | 10,159 | ||||||
0.250%, 05/31/2025 | 1,590 | 1,455 | ||||||
0.250%, 09/30/2025 | 10 | 9 | ||||||
Total U.S. Treasury Obligations | ||||||||
(Cost $63,808) ($ Thousands) | 56,921 | |||||||
ASSET-BACKED SECURITIES — 9.3% | ||||||||
Automotive — 0.5% | ||||||||
Avis Budget Rental Car Funding AESOP, Ser 2020-2A, Cl A | ||||||||
2.020%, 02/20/2027 (C) | 440 | 398 | ||||||
Avis Budget Rental Car Funding AESOP, Ser 2021-1A, Cl A | ||||||||
1.380%, 08/20/2027 (C) | 430 | 378 | ||||||
Hertz Vehicle Financing III, Ser 2021-2A, Cl B | ||||||||
2.120%, 12/27/2027 (C) | 160 | 140 | ||||||
Hertz Vehicle Financing III, Ser 2021-2A, Cl C | ||||||||
2.520%, 12/27/2027 (C) | 300 | 259 | ||||||
Hertz Vehicle Financing, Ser 2021-1A, Cl B | ||||||||
1.560%, 12/26/2025 (C) | 240 | 224 | ||||||
Hertz Vehicle Financing, Ser 2021-1A, Cl C | ||||||||
2.050%, 12/26/2025 (C) | 210 | 195 | ||||||
| 1,594 | ||||||||
Home — 0.0% | ||||||||
Bayview Financial Mortgage Pass-Through Trust, Ser 2006-A, Cl M3 | ||||||||
6.153%, ICE LIBOR USD 1 Month + 0.975%, 02/28/2041 (A) | 11 | 10 | ||||||
Cascade MH Asset Trust, Ser 2021-MH1, Cl A1 | ||||||||
1.753%, 02/25/2046 (C) | 73 | 62 | ||||||
Master Asset-Backed Securities Trust, Ser 2007-NCW, Cl A1 | ||||||||
5.450%, ICE LIBOR USD 1 Month + 0.300%, 05/25/2037 (A)(C) | 145 | 121 | ||||||
| 193 | ||||||||
New Covenant Funds
47
SCHEDULE OF INVESTMENTS
June 30, 2023
New Covenant Income Fund (Continued)
Description | Face Amount | Market Value | ||||||
ASSET-BACKED SECURITIES (continued) | ||||||||
Other Asset-Backed Securities — 8.8% | ||||||||
AEP Texas Restoration Funding, Ser 2019-1, Cl A2 | ||||||||
2.294%, 08/01/2031 | $ | 1,646 | $ | 1,474 | ||||
AMSR Trust, Ser 2023-SFR1, Cl A | ||||||||
4.000%, 04/17/2040 (C) | 960 | 893 | ||||||
CF Hippolyta Issuer, Ser 2020-1, Cl A1 | ||||||||
1.690%, 07/15/2060 (C) | 205 | 184 | ||||||
CWHEQ Revolving Home Equity Loan Trust, Ser 2006-F, Cl 2A1A | ||||||||
5.333%, ICE LIBOR USD 1 Month + 0.140%, 07/15/2036 (A) | 131 | 118 | ||||||
DB Master Finance, Ser 2021-1A, Cl A2II | ||||||||
2.493%, 11/20/2051 (C) | 1,033 | 874 | ||||||
FirstKey Homes Trust, Ser 2021-SFR1, Cl A | ||||||||
1.538%, 08/17/2038 (C) | 788 | 689 | ||||||
FirstKey Homes Trust, Ser 2021-SFR3, Cl A | ||||||||
2.135%, 12/17/2038 (C) | 437 | 385 | ||||||
GoodLeap Sustainable Home Solutions Trust, Ser 2022-1GS, Cl B | ||||||||
2.940%, 01/20/2049 (C) | 577 | 435 | ||||||
Hardee's Funding, Ser 2021-1A, Cl A2 | ||||||||
2.865%, 06/20/2051 (C) | 392 | 312 | ||||||
Home Partners of America Trust, Ser 2022-1, Cl A | ||||||||
3.930%, 04/17/2039 (C) | 990 | 926 | ||||||
Merrill Lynch Mortgage Investors Trust, Ser 2004-WMC5, Cl M1 | ||||||||
6.080%, ICE LIBOR USD 1 Month + 0.930%, 07/25/2035 (A) | 141 | 136 | ||||||
MMAF Equipment Finance, Ser 2022-B, Cl A3 | ||||||||
5.610%, 07/10/2028 (C) | 339 | 338 | ||||||
Morgan Stanley ABS Capital I Trust, Ser 2004-NC7, Cl M1 | ||||||||
6.005%, ICE LIBOR USD 1 Month + 0.855%, 07/25/2034 (A) | 316 | 295 | ||||||
Navient Student Loan Trust, Ser 2016-3A, Cl A3 | ||||||||
6.500%, ICE LIBOR USD 1 Month + 1.350%, 06/25/2065 (A)(C) | 281 | 279 | ||||||
Navient Student Loan Trust, Ser 2016-6A, Cl A3 | ||||||||
6.450%, ICE LIBOR USD 1 Month + 1.300%, 03/25/2066 (A)(C) | 532 | 528 | ||||||
Oak Street Investment Grade Net Lease Fund, Ser 2021-1A, Cl A1 | ||||||||
1.480%, 01/20/2051 (C) | 934 | 818 | ||||||
Palmer Square CLO, Ser 2021-2A, Cl A1A3 | ||||||||
6.260%, ICE LIBOR USD 3 Month + 1.000%, 10/17/2031 (A)(C) | 693 | 685 | ||||||
Description | Face Amount | Market Value | ||||||
ASSET-BACKED SECURITIES (continued) | ||||||||
Palmer Square CLO, Ser 2022-2A, Cl A1 | ||||||||
6.619%, TSFR3M + 1.570%, 07/20/2034 (A)(C) | $ | 400 | $ | 395 | ||||
Palmer Square Loan Funding, Ser 2022-2A, Cl A1 | ||||||||
6.256%, TSFR3M + 1.270%, 10/15/2030 (A)(C) | 764 | 756 | ||||||
Progress Residential Trust, Ser 2021-SFR2, Cl A | ||||||||
1.546%, 04/19/2038 (C) | 592 | 526 | ||||||
Progress Residential Trust, Ser 2022-SFR2, Cl A | ||||||||
2.950%, 04/17/2027 (C) | 978 | 881 | ||||||
Progress Residential Trust, Ser 2022-SFR3, Cl A | ||||||||
3.200%, 04/17/2039 (C) | 509 | 462 | ||||||
Sabey Data Center Issuer, Ser 2020-1, Cl A2 | ||||||||
3.812%, 04/20/2045 (C) | 339 | 320 | ||||||
Sabey Data Center Issuer, Ser 2021-1, Cl A2 | ||||||||
1.881%, 06/20/2046 (C) | 1,027 | 891 | ||||||
SBA Small Business Investment, Ser 2023-10A, Cl 1 | ||||||||
5.168%, 03/10/2033 | 910 | 901 | ||||||
SLC Student Loan Trust, Ser 2010-1, Cl A | ||||||||
6.271%, ICE LIBOR USD 3 Month + 0.875%, 11/25/2042 (A) | 91 | 90 | ||||||
SLM Private Credit Student Loan Trust, Ser 2006-A, Cl A5 | ||||||||
5.842%, ICE LIBOR USD 3 Month + 0.290%, 06/15/2039 (A) | 153 | 145 | ||||||
SLM Private Education Loan Trust, Ser 2010-C, Cl A5 | ||||||||
9.943%, ICE LIBOR USD 1 Month + 4.750%, 10/15/2041 (A)(C) | 295 | 308 | ||||||
SLM Student Loan Trust, Ser 2021-10A, Cl A4 | ||||||||
6.222%, ICE LIBOR USD 3 Month + 0.670%, 12/17/2068 (A)(C) | 77 | 74 | ||||||
SMB Private Education Loan Trust 2020-A, Ser 2020-A, Cl A2A | ||||||||
2.230%, 09/15/2037 (C) | 155 | 142 | ||||||
SMB Private Education Loan Trust, Ser 2021-A, Cl A2B | ||||||||
1.590%, 01/15/2053 (C) | 286 | 248 | ||||||
SMB Private Education Loan Trust, Ser 2021-C, Cl B | ||||||||
2.300%, 01/15/2053 (C) | 170 | 152 | ||||||
Stack Infrastructure Issuer, Ser 2019-1A, Cl A2 | ||||||||
4.540%, 02/25/2044 (C) | 332 | 327 | ||||||
Store Master Funding I-VII, Ser 2018-1A, Cl A1 | ||||||||
3.960%, 10/20/2048 (C) | 364 | 352 | ||||||
48
New Covenant Funds
SCHEDULE OF INVESTMENTS
June 30, 2023
New Covenant Income Fund (Continued)
Description | Face Amount | Market Value | ||||||
ASSET-BACKED SECURITIES (continued) | ||||||||
Store Master Funding I-VII, Ser 2019-1, Cl A1 | ||||||||
2.820%, 11/20/2049 (C) | $ | 315 | $ | 283 | ||||
Structured Asset Investment Loan Trust, Ser 2004-7, Cl A8 | ||||||||
6.350%, ICE LIBOR USD 1 Month + 1.200%, 08/25/2034 (A) | 140 | 136 | ||||||
Taco Bell Funding, Ser 2021-1A, Cl A2II | ||||||||
2.294%, 08/25/2051 (C) | 584 | 480 | ||||||
Tricon American Homes Trust, Ser 2019-SFR1, Cl A | ||||||||
2.750%, 03/17/2038 (C) | 270 | 249 | ||||||
Tricon Residential Trust, Ser 2021-SFR1, Cl A | ||||||||
1.943%, 07/17/2038 (C) | 850 | 756 | ||||||
Triumph Rail Holdings, Ser 2021-2, Cl A | ||||||||
2.150%, 06/19/2051 (C) | 266 | 229 | ||||||
TRP 2021, Ser 2021-1, Cl A | ||||||||
2.070%, 06/19/2051 (C) | 480 | 410 | ||||||
United States Small Business Administration, Ser 2010-20H, Cl 1 | ||||||||
3.520%, 08/01/2030 | 112 | 106 | ||||||
United States Small Business Administration, Ser 2011-20B, Cl 1 | ||||||||
4.220%, 02/01/2031 | 104 | 99 | ||||||
United States Small Business Administration, Ser 2011-20J, Cl 1 | ||||||||
2.760%, 10/01/2031 | 73 | 67 | ||||||
United States Small Business Administration, Ser 2013-20K, Cl 1 | ||||||||
3.380%, 11/01/2033 | 324 | 306 | ||||||
United States Small Business Administration, Ser 2014-20F, Cl 1 | ||||||||
2.990%, 06/01/2034 | 448 | 413 | ||||||
United States Small Business Administration, Ser 2015-20C, Cl 1 | ||||||||
2.720%, 03/01/2035 | 382 | 350 | ||||||
United States Small Business Administration, Ser 2015-20E, Cl 1 | ||||||||
2.770%, 05/01/2035 | 226 | 208 | ||||||
United States Small Business Administration, Ser 2015-20K, Cl 1 | ||||||||
2.700%, 11/01/2035 | 283 | 261 | ||||||
United States Small Business Administration, Ser 2017-20J, Cl 1 | ||||||||
2.850%, 10/01/2037 | 367 | 333 | ||||||
United States Small Business Administration, Ser 2018-20E, Cl 1 | ||||||||
3.500%, 05/01/2038 | 736 | 682 | ||||||
United States Small Business Administration, Ser 2019-25G, Cl 1 | ||||||||
2.690%, 07/01/2044 | 43 | 38 | ||||||
United States Small Business Administration, Ser 2021-25H, Cl 1 | ||||||||
1.450%, 08/01/2046 | 1,466 | 1,170 | ||||||
Description | Face Amount | Market Value | ||||||
ASSET-BACKED SECURITIES (continued) | ||||||||
United States Small Business Administration, Ser 2022-25D, Cl 1 | ||||||||
3.500%, 04/01/2047 | $ | 682 | $ | 626 | ||||
United States Small Business Administration, Ser 2022-25E, Cl 1 | ||||||||
3.940%, 05/01/2047 | 950 | 896 | ||||||
United States Small Business Administration, Ser 2022-25F, Cl 1 | ||||||||
4.010%, 06/01/2047 | 962 | 916 | ||||||
United States Small Business Administration, Ser 2022-25G, Cl 1 | ||||||||
3.930%, 07/01/2047 | 953 | 904 | ||||||
United States Small Business Administration, Ser 2022-25H, Cl 1 | ||||||||
3.800%, 08/01/2047 | 464 | 435 | ||||||
United States Small Business Administration, Ser 2022-25K, Cl 1 | ||||||||
5.130%, 11/01/2047 | 541 | 546 | ||||||
United States Small Business Administration, Ser 2023-25F, Cl 1 | ||||||||
4.930%, 06/01/2048 | 871 | 869 | ||||||
Vantage Data Centers, Ser 2020-2A, Cl A2 | ||||||||
1.992%, 09/15/2045 (C) | 1,000 | 842 | ||||||
Wendy's Funding, Ser 2019-1A, Cl A2I | ||||||||
3.783%, 06/15/2049 (C) | 308 | 285 | ||||||
Wendy's Funding, Ser 2021-1A, Cl A2I | ||||||||
2.370%, 06/15/2051 (C) | 606 | 501 | ||||||
Wendy's Funding, Ser 2021-1A, Cl A2II | ||||||||
2.775%, 06/15/2051 (C) | 260 | 207 | ||||||
Wind River CLO, Ser 2021-3A, Cl A | ||||||||
6.400%, ICE LIBOR USD 3 Month + 1.150%, 07/20/2033 (A)(C) | 614 | 597 | ||||||
| 30,539 | ||||||||
Total Asset-Backed Securities | ||||||||
(Cost $35,436) ($ Thousands) | 32,326 | |||||||
MUNICIPAL BONDS — 1.4% | ||||||||
California — 0.4% | ||||||||
California Health Facilities Financing Authority, RB | ||||||||
3.378%, 06/01/2028 | 575 | 536 | ||||||
Regents of the University of California Medical Center Pooled Revenue, RB | ||||||||
4.132%, 05/15/2032 | 600 | 570 | ||||||
San Jose, Financing Authority, RB | ||||||||
1.311%, 06/01/2026 | 540 | 486 | ||||||
| 1,592 | ||||||||
New Covenant Funds
49
SCHEDULE OF INVESTMENTS
June 30, 2023
New Covenant Income Fund (Continued)
Description | Face Amount | Market Value | ||||||
MUNICIPAL BONDS (continued) | ||||||||
Illinois — 0.3% | ||||||||
Sales Tax Securitization, RB | ||||||||
4.847%, 01/01/2031 | $ | 930 | $ | 920 | ||||
Michigan — 0.2% | ||||||||
Michigan State, Finance Authority, RB | ||||||||
2.988%, 09/01/2049 (A) | 755 | 735 | ||||||
New York — 0.3% | ||||||||
New York State Dormitory Authority, Ser B, RB | ||||||||
3.329%, 03/15/2031 | 415 | 374 | ||||||
New York State Urban Development, RB | ||||||||
3.350%, 03/15/2026 (F) | 380 | 363 | ||||||
3.350%, 03/15/2026 | 285 | 272 | ||||||
| 1,009 | ||||||||
Wisconsin — 0.2% | ||||||||
State of Wisconsin, Ser A, RB, AGM | ||||||||
5.700%, 05/01/2026 | 595 | 600 | ||||||
Total Municipal Bonds | ||||||||
(Cost $5,085) ($ Thousands) | 4,856 | |||||||
SOVEREIGN DEBT — 1.2% | ||||||||
Colombia Government International Bond | ||||||||
5.625%, 02/26/2044 | 280 | 208 | ||||||
5.200%, 05/15/2049 | 310 | 212 | ||||||
3.125%, 04/15/2031 | 220 | 166 | ||||||
Indonesia Government International Bond MTN | ||||||||
5.125%, 01/15/2045(C) | 200 | 199 | ||||||
Korea Housing Finance | ||||||||
4.625%, 02/24/2033(C) | 360 | 353 | ||||||
Mexico Government International Bond | ||||||||
3.500%, 02/12/2034 | 1,040 | 871 | ||||||
Panama Government International Bond | ||||||||
6.700%, 01/26/2036 | 190 | 203 | ||||||
4.300%, 04/29/2053 | 300 | 223 | ||||||
Peruvian Government International Bond | ||||||||
3.550%, 03/10/2051 | 90 | 67 | ||||||
Province of Quebec Canada, Ser A MTN | ||||||||
6.350%, 01/30/2026 | 1,010 | 1,037 | ||||||
Uruguay Government International Bond | ||||||||
5.750%, 10/28/2034 | 440 | 475 | ||||||
4.375%, 01/23/2031 | 120 | 118 | ||||||
Total Sovereign Debt | ||||||||
(Cost $4,728) ($ Thousands) | 4,132 | |||||||
Description | Shares | Market Value | ||||||
CASH EQUIVALENT — 0.4% | ||||||||
SEI Daily Income Trust, Government Fund, Institutional Class | ||||||||
4.880%**† | 1,278,066 | $ | 1,278 | |||||
Total Cash Equivalent | ||||||||
(Cost $1,278) ($ Thousands) | 1,278 | |||||||
PURCHASED OPTIONS — 0.1% | ||||||||
Total Purchased Options | ||||||||
(Cost $132) ($ Thousands) | 216 | |||||||
Total Investments in Securities — 101.5% | ||||||||
(Cost $387,588) ($ Thousands) | $ | 353,284 | ||||||
WRITTEN OPTIONS — (0.1)% | ||||||||
Total Written Options | ||||||||
(Premiums Received $116) ($ Thousands) | $ | (216 | ) | |||||
50
New Covenant Funds
SCHEDULE OF INVESTMENTS
June 30, 2023
New Covenant Income Fund (Continued)
A list of open exchange-traded options contracts held by the Fund at June 30, 2023 is as follows:
Description | Number of Contracts | Notional Amount | Exercise Price | Expiration Date | Value | |||||||||||||||
PURCHASED OPTIONS — 0.1% | ||||||||||||||||||||
Put Options | ||||||||||||||||||||
October 2023, SOFR 1 Year MidCurve Future Option* | 35 | $ | 8,398 | $ | 97.00 | 10/21/2023 | $ | 97 | ||||||||||||
December 2023, SOFR 1 Year MidCurve Future Option* | 72 | 17,276 | 96.00 | 12/16/2023 | 87 | |||||||||||||||
December 2023, SOFR 1 Year MidCurve Future Option* | 31 | 7,439 | 95.88 | 12/16/2023 | 32 | |||||||||||||||
| 33,113 | 216 | |||||||||||||||||||
Total Purchased Options | $ | 33,113 | $ | 216 | ||||||||||||||||
WRITTEN OPTIONS — (0.1)% | ||||||||||||||||||||
Put Options | ||||||||||||||||||||
October 2023, SOFR 1 Year MidCurve Future Option* | (35 | ) | $ | (8,398 | ) | $ | 96.50 | 10/21/2023 | $ | (62 | ) | |||||||||
October 2023, SOFR 1 Year MidCurve Future Option* | (35 | ) | (8,398 | ) | 96.25 | 10/21/2023 | (47 | ) | ||||||||||||
December 2023, SOFR 1 Year MidCurve Future Option* | (62 | ) | (14,877 | ) | 95.25 | 12/16/2023 | (28 | ) | ||||||||||||
December 2023, SOFR 1 Year MidCurve Future Option* | (144 | ) | (34,553 | ) | 95.38 | 12/16/2023 | (79 | ) | ||||||||||||
| (66,226 | ) | (216 | ) | |||||||||||||||||
Total Written Options | $ | (66,226 | ) | $ | (216 | ) | ||||||||||||||
A list of the open futures contracts held by the Fund at June 30, 2023 are as follows:
Type of Contract | Number of | Expiration Date | Notional Amount (Thousands) | Value | Unrealized Appreciation/ | |||||||||||||||
Long Contracts | ||||||||||||||||||||
3 Month SOFR | 61 | Dec-2023 | $ | 14,433 | $ | 14,433 | $ | – | ||||||||||||
3 Month SOFR | 105 | Dec-2024 | 25,249 | 25,193 | (56 | ) | ||||||||||||||
U.S. 5-Year Treasury Note | 205 | Sep-2023 | 22,359 | 21,954 | (405 | ) | ||||||||||||||
U.S. 10-Year Treasury Note | 16 | Sep-2023 | 1,817 | 1,796 | (21 | ) | ||||||||||||||
Ultra 10-Year U.S. Treasury Note | 90 | Sep-2023 | 10,789 | 10,659 | (130 | ) | ||||||||||||||
| 74,647 | 74,035 | (612 | ) | |||||||||||||||||
Short Contracts | ||||||||||||||||||||
U.S. 2-Year Treasury Note | (25 | ) | Sep-2023 | $ | (5,156 | ) | $ | (5,083 | ) | $ | 73 | |||||||||
U.S. Long Treasury Bond | (192 | ) | Sep-2023 | (24,323 | ) | (24,366 | ) | (43 | ) | |||||||||||
U.S. Ultra Long Treasury Bond | (30 | ) | Sep-2023 | (4,066 | ) | (4,086 | ) | �� | (20 | ) | ||||||||||
| (33,545 | ) | (33,535 | ) | 10 | ||||||||||||||||
| $ | 41,102 | $ | 40,500 | $ | (602 | ) | ||||||||||||||
For the year ended June 30, 2023, the total amount of all open options and futures contracts, as presented in the table above, are representative of the volume of activity for this derivative type during the period.
The options contracts and futures contracts are considered to have interest rate risk associated with them.
New Covenant Funds
51
SCHEDULE OF INVESTMENTS
June 30, 2023
New Covenant Income Fund (Concluded)
| Percentages are based on Net Assets of $348,025 ($ Thousands). |
** | The rate reported is the 7-day effective yield as of June 30, 2023. |
† | Investment in Affiliated Security (see Note 3). |
(A) | Variable or floating rate security. The rate shown is the effective interest rate as of period end. The rates on certain securities are not based on published reference rates and spreads and are either determined by the issuer or agent based on current market conditions; by using a formula based on the rates of underlying loans; or by adjusting periodically based on prevailing interest rates. |
(B) | No interest rate available. |
(C) | Security exempt from registration under Rule 144A of the Securities Act of 1933. These securities may be resold in transactions exempt from registration normally to qualified institutions. On June 30, 2023, the value of these securities amounted to $58,099 ($ Thousands), representing 16.7% of the Net Assets of the Fund. |
(D) | Step coupon security. Coupon rate will either increase (step-up bond) or decrease (step-down bond) at regular intervals until maturity. Interest rate shown reflects the rate currently in effect. |
(E) | Zero coupon security. |
(F) | Security is escrowed to maturity. |
| The following is a summary of the level of inputs used as of June 30, 2023, in valuing the Fund's investments and other financial instruments carried at value ($ Thousands): | ||||||||||||||||
Investments in Securities | Level 1 | Level 2 | Level 3 | Total | ||||||||||||
Mortgage-Backed Securities | – | 155,071 | – | 155,071 | ||||||||||||
Corporate Obligations | – | 98,484 | – | 98,484 | ||||||||||||
U.S. Treasury Obligations | – | 56,921 | – | 56,921 | ||||||||||||
Asset-Backed Securities | – | 32,326 | – | 32,326 | ||||||||||||
Municipal Bonds | – | 4,856 | – | 4,856 | ||||||||||||
Sovereign Debt | – | 4,132 | – | 4,132 | ||||||||||||
Purchased Options | 216 | – | – | 216 | ||||||||||||
Cash Equivalent | 1,278 | – | – | 1,278 | ||||||||||||
Total Investments in Securities | 1,494 | 351,790 | – | 353,284 | ||||||||||||
Other Financial Instruments | Level 1 | Level 2 | Level 3 | Total | ||||||||||||
Written Options | (216 | ) | – | – | (216 | ) | ||||||||||
Futures Contracts* | ||||||||||||||||
Unrealized Appreciation | 73 | – | – | 73 | ||||||||||||
Unrealized Depreciation | (675 | ) | – | – | (675 | ) | ||||||||||
Total Other Financial Instruments | (818 | ) | – | – | (818 | ) | ||||||||||
* | Futures contracts are valued at the unrealized appreciation (depreciation) on the instrument. |
For more information on valuation inputs, see Note 2 – Significant Accounting Policies in Notes to Financial Statements.
The following is a summary of the transactions with affiliates for the year ended June 30, 2023 ($ Thousands):
Security Description | Value 6/30/2022 | Purchases at Cost | Proceeds from Sales | Realized Gain/(Loss) | Change in Unrealized Appreciation/(Depreciation) | Value 6/30/2023 | Income | Capital Gains | ||||||||||||||||||||||||
SEI Daily Income Trust, Government Fund, Institutional Class | $ | 2,168 | $ | 148,160 | $ | (149,050 | ) | $ | — | $ | — | $ | 1,278 | $ | 159 | $ — | ||||||||||||||||
Amounts designated as “—” are either $0 or have been rounded to $0.
See “Glossary” for abbreviations.
The accompanying notes are an integral part of the financial statements.
52
New Covenant Funds
SCHEDULE OF INVESTMENTS
June 30, 2023
New Covenant Balanced Growth Fund

† | Percentages are based on total investments. |
Description | Shares | Market Value | ||||||
AFFILIATED INVESTMENT FUNDS — 99.0% | ||||||||
Equity Fund — 61.7% | ||||||||
New Covenant Growth Fund † | 3,668,326 | $ | 207,077 | |||||
Total Equity Fund | ||||||||
(Cost $96,090) ($ Thousands) | 207,077 | |||||||
Fixed Income Fund — 37.3% | ||||||||
New Covenant Income Fund † | 6,095,356 | 125,381 | ||||||
Total Fixed Income Fund | ||||||||
(Cost $137,795) ($ Thousands) | 125,381 | |||||||
Description | Shares | Market Value | ||||||
CASH EQUIVALENT — 0.9% | ||||||||
SEI Daily Income Trust, Government Fund, Institutional Class | ||||||||
4.880%**† | 3,144,919 | $ | 3,145 | |||||
Total Cash Equivalent | ||||||||
(Cost $3,145) ($ Thousands) | 3,145 | |||||||
Total Investments in Securities — 99.9% | ||||||||
(Cost $237,030) ($ Thousands) | $ | 335,603 | ||||||
Percentages are based on Net Assets of $335,791 ($ Thousands). | |
† | Investment in Affiliated Security (see Note 3). |
** | The rate reported is the 7-day effective yield as of June 30, 2023. |
As of June 30, 2023, all of the Fund's investments were considered Level 1, in accordance with the authoritative guidance on fair value measurements and disclosure under U.S. GAAP. |
The following is a summary of the transactions with affiliates for the year ended June 30, 2023 ($ Thousands):
Security Description | Value 6/30/2022 | Purchases at Cost | Proceeds from Sales | Realized Gain/(Loss) | Change in Unrealized Appreciation/(Depreciation) | Value 6/30/2023 | Income | Capital Gains | ||||||||||||||||||||||||
New Covenant Income Fund | $ | 125,653 | $ | 17,881 | $ | (13,553 | ) | $ | (2,637 | ) | $ | (1,963 | ) | $ | 125,381 | $ | 3,187 | $ — | ||||||||||||||
New Covenant Growth Fund | 197,912 | 8,933 | (31,514 | ) | 942 | 30,804 | 207,077 | 1,716 | 2,093 | |||||||||||||||||||||||
SEI Daily Income Trust, Government Fund, Institutional Class | 2,729 | 27,914 | (27,498 | ) | — | — | 3,145 | 88 | — | |||||||||||||||||||||||
Totals | $ | 326,294 | $ | 54,728 | $ | (72,565 | ) | $ | (1,695 | ) | $ | 28,841 | $ | 335,603 | $ | 4,991 | $ | 2,093 | ||||||||||||||
Amounts designated as “—” are either $0 or have been rounded to $0.
For more information on valuation inputs, see Note 2 – Significant Accounting Policies in Notes to Financial Statements.
See “Glossary” for abbreviations.
The accompanying notes are an integral part of the financial statements.
New Covenant Funds
53
SCHEDULE OF INVESTMENTS
June 30, 2023
New Covenant Balanced Income Fund

† | Percentages are based on total investments. |
Description | Shares | Market Value | ||||||
AFFILIATED INVESTMENT FUNDS — 98.9% | ||||||||
Fixed Income Fund — 63.4% | ||||||||
New Covenant Income Fund † | 2,401,394 | $ | 49,397 | |||||
Total Fixed Income Fund | ||||||||
(Cost $54,832) ($ Thousands) | 49,397 | |||||||
Equity Fund — 35.5% | ||||||||
New Covenant Growth Fund † | 489,236 | 27,617 | ||||||
Total Equity Fund | ||||||||
(Cost $10,554) ($ Thousands) | 27,617 | |||||||
Description | Shares | Market Value | ||||||
CASH EQUIVALENT — 1.0% | ||||||||
SEI Daily Income Trust, Government Fund, Institutional Class | ||||||||
4.880%**† | 764,874 | $ | 765 | |||||
Total Cash Equivalent | ||||||||
(Cost $765) ($ Thousands) | 765 | |||||||
Total Investments in Securities — 99.9% | ||||||||
(Cost $66,151) ($ Thousands) | $ | 77,779 | ||||||
| Percentages are based on Net Assets of $77,879 ($ Thousands). |
** | The rate reported is the 7-day effective yield as of June 30, 2023. |
† | Investment in Affiliated Security (see Note 3). |
As of June 30, 2023, all of the Fund's investments were considered Level 1, in accordance with the authoritative guidance on fair value measurements and disclosure under U.S. GAAP. |
The following is a summary of the transactions with affiliates for the year ended June 30, 2023 ($ Thousands):
Security Description | Value 6/30/2022 | Purchases at Cost | Proceeds from Sales | Realized Gain/(Loss) | Change in Unrealized Appreciation/(Depreciation) | Value 6/30/2023 | Income | Capital Gains | ||||||||||||||||||||||||
New Covenant Income Fund | $ | 59,566 | $ | 3,423 | $ | (11,504 | ) | $ | (1,911 | ) | $ | (177 | ) | $ | 49,397 | $ | 1,374 | $ — | ||||||||||||||
New Covenant Growth Fund | 33,346 | 1,235 | (11,649 | ) | (267 | ) | 4,952 | 27,617 | 273 | 316 | ||||||||||||||||||||||
SEI Daily Income Trust, Government Fund, Institutional Class | 597 | 15,718 | (15,550 | ) | — | — | 765 | 21 | — | |||||||||||||||||||||||
Totals | $ | 93,509 | $ | 20,376 | $ | (38,703 | ) | $ | (2,178 | ) | $ | 4,775 | $ | 77,779 | $ | 1,668 | $ | 316 | ||||||||||||||
Amounts designated as “—” are either $0 or have been rounded to $0.
For more information on valuation inputs, see Note 2 – Significant Accounting Policies in Notes to Financial Statements.
See “Glossary” for abbreviations.
The accompanying notes are an integral part of the financial statements.
54
New Covenant Funds
Glossary (abbeviations which may be used in the preceding Schedules of Investments):
Portfolio Abbreviations |
ABS — Asset-Backed Security |
AGM — Assured Guaranty Municipal |
Cl — Class |
CLO — Collateralized Loan Obligation |
CMO — Collateralized Mortgage Obligation |
DAC — Designated Activity Company |
FHLMC — Federal Home Loan Mortgage Corporation |
FNMA — Federal National Mortgage Association |
FRESB — Freddie Mac Small Balance Mortgage Trust |
GNMA — Government National Mortgage Association |
ICE — Intercontinental Exchange |
IO — Interest Only - face amount represents notional amount |
JSC — Joint Stock Company |
L.P. — Limited Partnership |
MSCI — Morgan Stanley Capital International |
MTN — Medium Term Note |
PLC — Public Limited Company |
RB — Revenue Bond |
REMIC — Real Estate Mortgage Investment Conduit |
SOFR — Secured Overnight Financing Rate |
SOFR30A — Secured Overnight Financing Rate 30-day Average |
STACR — Structured Agency Credit Risk |
TBA — To Be Announced |
TSFR1M — Term Secured Overnight Financing Rate 1 Month |
TSFR3M — Term Secured Overnight Financing Rate 3 Month |
USD — U.S. Dollar |
New Covenant Funds
55
STATEMENTS OF ASSETS AND LIABILITIES ($ THOUSANDS)
June 30, 2023
Growth Fund | Income Fund | Balanced Growth Fund | Balanced Income Fund | |||||||||||||
Assets: | ||||||||||||||||
Investments, at value† | $ | 535,534 | $ | 352,006 | $ | — | $ | — | ||||||||
Affiliated investments, at value†† | 2,867 | 1,278 | 335,603 | 77,779 | ||||||||||||
Cash and cash equivalents | 1,395 | 129 | — | — | ||||||||||||
Dividends and interest receivable | 377 | 2,146 | 302 | 120 | ||||||||||||
Cash pledged as collateral for futures contracts | 166 | 615 | — | — | ||||||||||||
Receivable for fund shares sold | 35 | 2 | 25 | — | ||||||||||||
Foreign tax reclaim receivable | 81 | 42 | — | — | ||||||||||||
Receivable for variation margin on futures contracts | 33 | 37 | — | — | ||||||||||||
Receivable for investment securities sold | — | 906 | — | — | ||||||||||||
Due from Broker | — | 41 | — | — | ||||||||||||
Prepaid expenses | 24 | 17 | 16 | 4 | ||||||||||||
Total Assets | 540,512 | 357,219 | 335,946 | 77,903 | ||||||||||||
Liabilities: | ||||||||||||||||
Options written, at value††† | — | 216 | — | — | ||||||||||||
Payable for fund shares redeemed | 80 | 36 | 69 | — | ||||||||||||
Investment advisory fees payable | 101 | 80 | — | — | ||||||||||||
Administration fees payable | 90 | 47 | 25 | 8 | ||||||||||||
Social witness and licensing fees payable | 66 | 41 | — | — | ||||||||||||
Shareholder servicing fees payable | 43 | 29 | — | — | ||||||||||||
Trustees' fees payable | 4 | 3 | 3 | 1 | ||||||||||||
CCO fees payable | 2 | 1 | 1 | — | ||||||||||||
Payable for investment securities purchased | — | 7,697 | — | — | ||||||||||||
Income distribution payable | — | 747 | — | — | ||||||||||||
Payable for variation margin on futures contracts | — | 194 | — | — | ||||||||||||
Accrued expense payable | 91 | 103 | 57 | 15 | ||||||||||||
Total Liabilities | 477 | 9,194 | 155 | 24 | ||||||||||||
Net Assets | $ | 540,035 | $ | 348,025 | $ | 335,791 | $ | 77,879 | ||||||||
† Cost of investments | $ | 279,105 | $ | 386,310 | $ | — | $ | — | ||||||||
†† Cost of affiliated investments | 2,867 | 1,278 | 237,030 | 66,151 | ||||||||||||
††† Premiums Received | — | 116 | — | — | ||||||||||||
Net Assets: | ||||||||||||||||
Paid-in Capital — (unlimited authorization — par value $0.001) | $ | 271,764 | $ | 400,920 | $ | 249,194 | $ | 70,299 | ||||||||
Total distributable earnings/(loss) | 268,271 | (52,895 | ) | 86,597 | 7,580 | |||||||||||
Net Assets | $ | 540,035 | $ | 348,025 | $ | 335,791 | $ | 77,879 | ||||||||
Net Asset Value, Offering and Redemption Price Per Share | $ | 56.45 | $ | 20.57 | $ | 109.90 | $ | 20.88 | ||||||||
| ($540,035,170 ÷ 9,566,044 shares | ) | ($348,025,183 ÷ 16,918,929 shares | ) | ($335,790,842 ÷ 3,055,339 shares | ) | ($77,879,112 ÷ 3,729,432 shares | ) | |||||||||
Amounts designated as "—" are $0 or have been rounded to $0. | ||||||||||||||||
The accompanying notes are an integral part of the financial statements. | ||||||||||||||||
56
New Covenant Funds
STATEMENTS OF OPERATIONS ($ THOUSANDS)
For the year ended June 30, 2023
Growth Fund | Income Fund | Balanced Growth Fund | Balanced Income Fund | |||||||||||||
Investment Income: | ||||||||||||||||
Dividend income | $ | 8,244 | $ | — | $ | — | $ | — | ||||||||
Dividend income from affiliated registered investment company | 175 | 159 | 4,991 | 1,668 | ||||||||||||
Interest income | 75 | 11,511 | — | — | ||||||||||||
Total Investment Income | 8,494 | 11,670 | 4,991 | 1,668 | ||||||||||||
Expenses: | ||||||||||||||||
Investment advisory fees | 2,398 | 1,527 | — | — | ||||||||||||
Administration fees | 1,021 | 727 | 493 | 129 | ||||||||||||
Social witness and licensing fees | 765 | 545 | — | — | ||||||||||||
Shareholder servicing fees | 510 | 364 | — | — | ||||||||||||
Trustee fees | 14 | 10 | 9 | 2 | ||||||||||||
Chief compliance officer fees | 4 | 3 | 2 | 1 | ||||||||||||
Transfer agent fees | 78 | 57 | 51 | 14 | ||||||||||||
Professional fees | 54 | 38 | 35 | 8 | ||||||||||||
Registration fees | 39 | 27 | 25 | 7 | ||||||||||||
Printing fees | 19 | 13 | 12 | 3 | ||||||||||||
Custodian fees | 6 | 26 | 23 | 6 | ||||||||||||
Other expenses | 50 | 188 | 6 | 2 | ||||||||||||
Total Expenses | 4,958 | 3,525 | 656 | 172 | ||||||||||||
Less: | ||||||||||||||||
Waiver of investment advisory fees | (1,217 | ) | (522 | ) | — | — | ||||||||||
Waiver of administration fees | (53 | ) | (83 | ) | (220 | ) | (40 | ) | ||||||||
Net Expenses | 3,688 | 2,920 | 436 | 132 | ||||||||||||
Net Investment Income | 4,806 | 8,750 | 4,555 | 1,536 | ||||||||||||
Net Realized and Change in Unrealized Gain (Loss) on Investments: | ||||||||||||||||
Net Realized Gain (Loss) on: | ||||||||||||||||
Investments | 12,926 | (11,150 | ) | — | — | |||||||||||
Affiliated investments | — | — | (1,695 | ) | (2,178 | ) | ||||||||||
Written options | — | 654 | — | — | ||||||||||||
Purchased options | — | (579 | ) | — | — | |||||||||||
Capital gain distributions received from affiliated investment | — | — | 2,093 | 316 | ||||||||||||
Futures contracts | 1,439 | 1,072 | — | — | ||||||||||||
Net Realized Gain (Loss) | 14,365 | (10,003 | ) | 398 | (1,862 | ) | ||||||||||
Net Change in Unrealized Appreciation (Depreciation) on: | ||||||||||||||||
Investments | 70,191 | (1,730 | ) | — | — | |||||||||||
Affiliated investments | — | — | 28,841 | 4,775 | ||||||||||||
Written options | — | (131 | ) | — | — | |||||||||||
Purchased options | — | 75 | — | — | ||||||||||||
Futures contracts | 231 | (652 | ) | — | — | |||||||||||
Net Change in Unrealized Appreciation (Depreciation) | 70,422 | (2,438 | ) | 28,841 | 4,775 | |||||||||||
Net Realized and Unrealized Gain (Loss) | 84,787 | (12,441 | ) | 29,239 | 2,913 | |||||||||||
Net Increase (Decrease) in Net Assets Resulting from Operations | $ | 89,593 | $ | (3,691 | ) | $ | 33,794 | $ | 4,449 | |||||||
Amounts designated as "—" are $0 or have been rounded to $0. | ||||||||||||||||
The accompanying notes are an integral part of the financial statements. | ||||||||||||||||
New Covenant Funds
57
STATEMENTS OF CHANGES IN NET ASSETS ($ THOUSANDS)
For the year ended June 30,
Growth Fund | Income Fund | |||||||||||||||
| 2023 | 2022 | 2023 | 2022 | |||||||||||||
Operations: | ||||||||||||||||
Net investment income | $ | 4,806 | $ | 3,665 | $ | 8,750 | $ | 4,903 | ||||||||
Net realized gain (loss) | 14,365 | 13,643 | (10,003 | ) | (6,337 | ) | ||||||||||
Net change in unrealized appreciation (depreciation) | 70,422 | (94,548 | ) | (2,438 | ) | (39,277 | ) | |||||||||
Net increase (decrease) in net assets resulting from operations | 89,593 | (77,240 | ) | (3,691 | ) | (40,711 | ) | |||||||||
Distributions: | ||||||||||||||||
Total distributions | (9,786 | ) | (33,098 | ) | (9,100 | ) | (7,722 | ) | ||||||||
Capital Share Transactions: | ||||||||||||||||
Proceeds from shares issued | 21,164 | 54,825 | 30,227 | 63,080 | ||||||||||||
Reinvestment of dividends & distributions | 6,039 | 29,378 | 767 | 1,569 | ||||||||||||
Cost of shares redeemed | (64,130 | ) | (59,338 | ) | (51,440 | ) | (44,923 | ) | ||||||||
Increase (decrease) in net assets derived from capital share transactions | (36,927 | ) | 24,865 | (20,446 | ) | 19,726 | ||||||||||
Net increase (decrease) in net assets | 42,880 | (85,473 | ) | (33,237 | ) | (28,707 | ) | |||||||||
Net Assets: | ||||||||||||||||
Beginning of Year | 497,155 | 582,628 | 381,262 | 409,969 | ||||||||||||
End of Year | $ | 540,035 | $ | 497,155 | $ | 348,025 | $ | 381,262 | ||||||||
Share Transactions: | ||||||||||||||||
Shares issued | 420 | 996 | 1,440 | 2,725 | ||||||||||||
Shares issued in lieu of dividends and distributions | 122 | 482 | 37 | 68 | ||||||||||||
Shares redeemed | (1,237 | ) | (1,008 | ) | (2,487 | ) | (2,025 | ) | ||||||||
Increase (decrease) in net assets derived from share transactions | (695 | ) | 470 | (1,010 | ) | 768 | ||||||||||
Amounts designated as "—" are $0 or have been rounded to $0. | ||||||||||||||||
The accompanying notes are an integral part of the financial statements. | ||||||||||||||||
58
New Covenant Funds
STATEMENTS OF CHANGES IN NET ASSETS ($ THOUSANDS)
For the year ended June 30,
Balanced Growth Fund | Balanced Income Fund | |||||||||||||||
| 2023 | 2022 | 2023 | 2022 | |||||||||||||
Operations: | ||||||||||||||||
Net investment income | $ | 4,555 | $ | 3,150 | $ | 1,536 | $ | 1,059 | ||||||||
Net realized gain (loss) | 398 | 13,073 | (1,862 | ) | 1,843 | |||||||||||
Net change in unrealized appreciation (depreciation) | 28,841 | (60,291 | ) | 4,775 | (14,588 | ) | ||||||||||
Net increase (decrease) in net assets resulting from operations | 33,794 | (44,068 | ) | 4,449 | (11,686 | ) | ||||||||||
Distributions: | ||||||||||||||||
Total distributions | (14,169 | ) | (15,484 | ) | (2,721 | ) | (4,562 | ) | ||||||||
Capital Share Transactions: | ||||||||||||||||
Proceeds from shares issued | 11,638 | 26,058 | 3,029 | 24,478 | ||||||||||||
Reinvestment of dividends & distributions | 13,117 | 14,207 | 2,249 | 3,968 | ||||||||||||
Cost of shares redeemed | (34,954 | ) | (27,362 | ) | (22,715 | ) | (7,107 | ) | ||||||||
Increase (decrease) in net assets derived from capital share transactions | (10,199 | ) | 12,903 | (17,437 | ) | 21,339 | ||||||||||
Net increase (decrease) in net assets | 9,426 | (46,649 | ) | (15,709 | ) | 5,091 | ||||||||||
Net Assets: | ||||||||||||||||
Beginning of Year | 326,365 | 373,014 | 93,588 | 88,497 | ||||||||||||
End of Year | $ | 335,791 | $ | 326,365 | $ | 77,879 | $ | 93,588 | ||||||||
Share Transactions: | ||||||||||||||||
Shares issued | 111 | 214 | 149 | 1,023 | ||||||||||||
Shares issued in lieu of dividends and distributions | 128 | 116 | 112 | 170 | ||||||||||||
Shares redeemed | (332 | ) | (226 | ) | (1,127 | ) | (310 | ) | ||||||||
Increase (decrease) in net assets derived from share transactions | (93 | ) | 104 | (866 | ) | 883 | ||||||||||
Amounts designated as "—" are $0 or have been rounded to $0. | ||||||||||||||||
The accompanying notes are an integral part of the financial statements. | ||||||||||||||||
New Covenant Funds
59
FINANCIAL HIGHLIGHTS
For the years ended June 30,
For a Share Outstanding Throughout the Year
Growth Fund | ||||||||||||||||||||
| 2023 | 2022 | 2021 | 2020 | 2019 | ||||||||||||||||
Net Asset Value, Beginning of Year | $ | 48.45 | $ | 59.51 | $ | 43.44 | $ | 42.86 | $ | 43.17 | ||||||||||
Investment Activities: | ||||||||||||||||||||
Net investment income(1) | 0.48 | 0.37 | 0.36 | 0.51 | 0.50 | |||||||||||||||
Net realized and unrealized gains (losses) on securities and foreign currency transactions (1) | 8.50 | (7.95 | ) | 17.75 | 2.56 | 2.28 | ||||||||||||||
Total from investment activities | 8.98 | (7.58 | ) | 18.11 | 3.07 | 2.78 | ||||||||||||||
Dividends and Distributions from: | ||||||||||||||||||||
Net investment income | (0.44 | ) | (0.35 | ) | (0.40 | ) | (0.50 | ) | (0.50 | ) | ||||||||||
Net realized gains | (0.54 | ) | (3.13 | ) | (1.64 | ) | (1.99 | ) | (2.59 | ) | ||||||||||
Total dividends and distributions | (0.98 | ) | (3.48 | ) | (2.04 | ) | (2.49 | ) | (3.09 | ) | ||||||||||
Net Asset Value, End of Year | $ | 56.45 | $ | 48.45 | $ | 59.51 | $ | 43.44 | $ | 42.86 | ||||||||||
Total Return† | 18.83 | % | (13.92 | )% | 42.58 | % | 7.18 | % | 7.21 | % | ||||||||||
Supplemental Data and Ratios: | ||||||||||||||||||||
Net assets, end of year ($ Thousands) | $ | 540,035 | $ | 497,155 | $ | 582,628 | $ | 461,493 | $ | 448,958 | ||||||||||
Ratio of net expenses to average net assets | 0.72 | % | 0.72 | % | 0.72 | % | 0.72 | % | 0.85 | % | ||||||||||
Ratio of expenses to average net assets, excluding waivers | 0.97 | % | 0.97 | % | 0.97 | % | 0.99 | % | 1.12 | % | ||||||||||
Ratio of net investment income to average net assets | 0.94 | % | 0.64 | % | 0.69 | % | 1.19 | % | 1.19 | % | ||||||||||
Portfolio turnover rate | 7 | % | 5 | % | 4 | % | 19 | % | 47 | % | ||||||||||
† | Returns shown do not reflect the deduction of taxes that a shareholder would pay on Fund distributions or the redemption of Fund shares. |
(1) | Per share net investment income and net realized and unrealized gains/(losses) calculated using average shares. |
Amounts designated as ‘‘—‘‘ are $0 or have been rounded to $0.
The accompanying notes are an integral part of the financial statements
60
New Covenant Funds
FINANCIAL HIGHLIGHTS
For the years ended June 30,
For a Share Outstanding Throughout the Year
Income Fund | ||||||||||||||||||||
| 2023 | 2022 | 2021 | 2020 | 2019 | ||||||||||||||||
Net Asset Value, Beginning of Year | $ | 21.26 | $ | 23.89 | $ | 24.32 | $ | 23.50 | $ | 22.62 | ||||||||||
Investment Activities: | ||||||||||||||||||||
Net investment income(1) | 0.50 | 0.27 | 0.30 | 0.48 | 0.52 | |||||||||||||||
Net realized and unrealized gains (losses) on securities (1) | (0.67 | ) | (2.48 | ) | (0.02 | ) | 0.89 | 0.92 | ||||||||||||
Total from investment activities | (0.17 | ) | (2.21 | ) | 0.28 | 1.37 | 1.44 | |||||||||||||
Dividends and Distributions from: | ||||||||||||||||||||
Net investment income | (0.52 | ) | (0.37 | ) | (0.43 | ) | (0.55 | ) | (0.56 | ) | ||||||||||
Net realized gains | – | (0.05 | ) | (0.28 | ) | – | – | |||||||||||||
Total dividends and distributions | (0.52 | ) | (0.42 | ) | (0.71 | ) | (0.55 | ) | (0.56 | ) | ||||||||||
Net Asset Value, End of Year | $ | 20.57 | $ | 21.26 | $ | 23.89 | $ | 24.32 | $ | 23.50 | ||||||||||
Total Return† | (0.78 | )% | (9.34 | )% | 1.13 | % | 5.91 | % | 6.46 | % | ||||||||||
Supplemental Data and Ratios: | ||||||||||||||||||||
Net assets, end of year ($ Thousands) | $ | 348,025 | $ | 381,262 | $ | 409,969 | $ | 336,213 | $ | 330,498 | ||||||||||
Ratio of net expenses to average net assets | 0.80 | % | 0.80 | % | 0.80 | % | 0.80 | % | 0.80 | % | ||||||||||
Ratio of expenses to average net assets, excluding waivers | 0.97 | % | 0.96 | % | 0.96 | % | 0.96 | % | 0.95 | % | ||||||||||
Ratio of net investment income to average net assets | 2.41 | % | 1.18 | % | 1.22 | % | 2.01 | % | 2.29 | % | ||||||||||
Portfolio turnover rate | 106 | % | 97 | % | 112 | % | 144 | % | 188 | % | ||||||||||
† | Returns shown do not reflect the deduction of taxes that a shareholder would pay on Fund distributions or the redemption of Fund shares. |
(1) | Per share net investment income and net realized and unrealized gains/(losses) calculated using average shares. |
The accompanying notes are an integral part of the financial statements.
New Covenant Funds
61
FINANCIAL HIGHLIGHTS
For the years ended June 30,
For a Share Outstanding Throughout the Year
Balanced Growth Fund | ||||||||||||||||||||
| 2023 | 2022 | 2021 | 2020 | 2019 | ||||||||||||||||
Net Asset Value, Beginning of Year | $ | 103.68 | $ | 122.54 | $ | 104.95 | $ | 103.45 | $ | 102.94 | ||||||||||
Investment Activities: | ||||||||||||||||||||
Net investment income(1) | 1.46 | 1.01 | 1.18 | 1.53 | 1.58 | |||||||||||||||
Net realized and unrealized gains (losses) on securities (1) | 9.37 | (14.80 | ) | 23.76 | 6.09 | 5.21 | ||||||||||||||
Total from investment activities | 10.83 | (13.79 | ) | 24.94 | 7.62 | 6.79 | ||||||||||||||
Dividends and Distributions from: | ||||||||||||||||||||
Net investment income | (1.30 | ) | (1.43 | ) | (2.03 | ) | (1.95 | ) | (1.83 | ) | ||||||||||
Net realized gains | (3.31 | ) | (3.64 | ) | (5.32 | ) | (4.17 | ) | (4.45 | ) | ||||||||||
Total dividends and distributions | (4.61 | ) | (5.07 | ) | (7.35 | ) | (6.12 | ) | (6.28 | ) | ||||||||||
Net Asset Value, End of Year | $ | 109.90 | $ | 103.68 | $ | 122.54 | $ | 104.95 | $ | 103.45 | ||||||||||
Total Return† | 10.83 | % | (11.85 | )% | 24.50 | % | 7.57 | % | 7.12 | % | ||||||||||
Supplemental Data and Ratios: | ||||||||||||||||||||
Net assets, end of year ($ Thousands) | $ | 335,791 | $ | 326,365 | $ | 373,014 | $ | 295,481 | $ | 293,822 | ||||||||||
Ratio of net expenses to average net assets | 0.13 | % | 0.13 | % | 0.13 | % | 0.13 | % | 0.13 | % | ||||||||||
Ratio of expenses to average net assets, excluding waivers | 0.20 | % | 0.20 | % | 0.21 | % | 0.21 | % | 0.21 | % | ||||||||||
Ratio of net investment income to average net assets | 1.39 | % | 0.85 | % | 1.02 | % | 1.49 | % | 1.56 | % | ||||||||||
Portfolio turnover rate | 8 | % | 14 | % | 11 | % | 22 | % | 16 | % | ||||||||||
† | Returns shown do not reflect the deduction of taxes that a shareholder would pay on Fund distributions or the redemption of Fund shares. |
(1) | Per share net investment income and net realized and unrealized gains/(losses) calculated using average shares. |
Amounts designated as ‘‘—‘‘ are $0 or have been rounded to $0.
The accompanying notes are an integral part of the financial statements.
62
New Covenant Funds
FINANCIAL HIGHLIGHTS
For the years ended June 30,
For a Share Outstanding Throughout the Year
Balanced Income Fund | ||||||||||||||||||||
| 2023 | 2022 | 2021 | 2020 | 2019 | ||||||||||||||||
Net Asset Value, Beginning of Year | $ | 20.37 | $ | 23.84 | $ | 22.01 | $ | 21.41 | $ | 21.23 | ||||||||||
Investment Activities: | ||||||||||||||||||||
Net investment income(1) | 0.36 | 0.25 | 0.29 | 0.38 | 0.39 | |||||||||||||||
Net realized and unrealized gains (losses) on securities (1) | 0.79 | (2.67 | ) | 2.76 | 1.11 | 0.96 | ||||||||||||||
Total from investment activities | 1.15 | (2.42 | ) | 3.05 | 1.49 | 1.35 | ||||||||||||||
Dividends and Distributions from: | ||||||||||||||||||||
Net investment income | (0.35 | ) | (0.30 | ) | (0.49 | ) | (0.40 | ) | (0.42 | ) | ||||||||||
Net realized gains | (0.29 | ) | (0.75 | ) | (0.73 | ) | (0.49 | ) | (0.75 | ) | ||||||||||
Total dividends and distributions | (0.64 | ) | (1.05 | ) | (1.22 | ) | (0.89 | ) | (1.17 | ) | ||||||||||
Net Asset Value, End of Year | $ | 20.88 | $ | 20.37 | $ | 23.84 | $ | 22.01 | $ | 21.41 | ||||||||||
Total Return† | 5.84 | % | (10.70 | )% | 14.24 | % | 7.14 | % | 6.76 | % | ||||||||||
Supplemental Data and Ratios: | ||||||||||||||||||||
Net assets, end of year ($ Thousands) | $ | 77,879 | $ | 93,588 | $ | 88,497 | $ | 78,790 | $ | 78,448 | ||||||||||
Ratio of net expenses to average net assets | 0.15 | % | 0.15 | % | 0.15 | % | 0.15 | % | 0.15 | % | ||||||||||
Ratio of expenses to average net assets, excluding waivers | 0.20 | % | 0.20 | % | 0.21 | % | 0.21 | % | 0.20 | % | ||||||||||
Ratio of net investment income to average net assets | 1.78 | % | 1.09 | % | 1.25 | % | 1.76 | % | 1.86 | % | ||||||||||
Portfolio turnover rate | 5 | % | 11 | % | 15 | % | 19 | % | 11 | % | ||||||||||
† | Returns shown do not reflect the deduction of taxes that a shareholder would pay on Fund distributions or the redemption of Fund shares. |
(1) | Per share net investment income and net realized and unrealized gains/(losses) calculated using average shares. |
The accompanying notes are an integral part of the financial statements.
New Covenant Funds
63
NOTES TO FINANCIAL STATEMENTS
June 30, 2023
1. ORGANIZATION
New Covenant Funds (the “Trust”), an open-end, diversified management investment company, was organized as a Delaware business trust on September 30, 1998. It currently consists of four investment funds: New Covenant Growth Fund (“Growth Fund”), New Covenant Income Fund (“Income Fund”), New Covenant Balanced Growth Fund (“Balanced Growth Fund”), and New Covenant Balanced Income Fund (“Balanced Income Fund”), (individually, a “Fund,” and collectively, the “Funds”). The Funds commenced operations on July 1, 1999. The Trust’s authorized capital consists of an unlimited number of shares of beneficial interest of $0.001 par value. Effective February 20, 2012, the Funds’ investment adviser is SEI Investments Management Corporation (“SIMC” or the “Adviser”). Prior to February 20, 2012, the Funds’ investment adviser was One Compass Advisors, a wholly owned subsidiary of the Presbyterian Church (U.S.A.) Foundation.
The objectives of the Funds are as follows:
Growth Fund | Long-term capital appreciation. A modest amount of dividend income may be produced by the Fund’s equity securities. | |
Income Fund | High level of current income with preservation of capital. | |
Balanced Growth Fund | Capital appreciation with less risk than would be present in a portfolio of only common stocks. | |
Balanced Income Fund | Current income and long-term growth of capital. |
2. SIGNIFICANT ACCOUNTING POLICIES
The following are significant accounting policies, which are consistently followed in the preparation of its financial statements by the Funds. The Funds are investment companies that apply the accounting and reporting guidance issued in Topic 946 by the U.S. Financial Accounting Standards Board (“FASB”).
Use of Estimates — The preparation of financial statements, in conformity with U.S. generally accepted accounting principles (“U.S. GAAP”), requires management to make estimates and assumptions that affect the reported amount of assets and liabilities and disclosure of contingent assets and liabilities as of the date of the financial statements and the reported amounts of increases and decreases in net assets from operations during the reporting period. Actual results could differ from those estimates.
Security Valuation — Effective September 8, 2022, and pursuant to the requirements of the 1940 Act and Rule 2a-5, the administrator, as delegated by the Board of Trustees (the “Board”), has the responsibility for the valuation of Fund investments with readily available market quotations in accordance with the Funds' Valuation and Pricing Policy. The Trust's Board of Trustees has designated SEI Investments Management Corporation (“SIMC”) as the Valuation Designee for the Funds pursuant to Rule 2a-5 (the “Rule”) under the 1940 Act. The Valuation Designee has the responsibility for the fair value determination with respect to all Fund investments that do not have readily available market quotations or quotations that are no longer reliable. SIMC, in furtherance of the Board’s designation, has appointed a valuation committee of SIMC persons to function as the Valuation Designee (the “Committee”) and has established a Valuation and Pricing Policy to implement the Rule and the Fund’s' Valuation and Pricing Policy (together with SIMC’s Valuation and Pricing Policy, the “Fair Value Procedures”). Prior to September 8, 2022, fair-value determinations were performed in accordance with the Trust's Fair Value Procedures established by the Funds' Board of Trustees and were implemented through a Fair Value Committee designated by the Board.
When valuing portfolio securities, a Fund values securities listed on a securities exchange, market or automated quotation system for which quotations are readily available (other than securities traded on National Association of Securities Dealers Automated Quotations (NASDAQ) or as otherwise noted below) at the last quoted sale price on an exchange or market (foreign or domestic) on which the securities are traded, or, if there is no such reported sale, at the most recent quoted bid price. A Fund values securities traded on NASDAQ at the NASDAQ Official Closing Price. If available, debt securities, swaps (which are not centrally cleared), bank loans or debt tranches of collateralized debt obligations (including collateralized loan obligations), such as those held by the Funds, are priced based upon valuations provided by independent, third-party pricing agents. Such values generally reflect the last reported sales price if the security is actively traded. The third-party pricing agents may also value debt securities at an evaluated bid price by employing methodologies that utilize actual market transactions, broker-supplied valuations or other methodologies designed to identify the market value for such securities. The assets of the Balanced Growth Fund and the Balanced Income Fund (the “Balanced Funds”) consist primarily
64
New Covenant Funds
of investments in underlying affiliated investment companies. Redeemable securities issued by open-end investment companies are valued at the investment company’s applicable NAV per share. The prices of foreign securities are reported in local currency and converted to U.S. dollars using currency exchange rates. If a security’s price cannot be obtained, as noted above or in the case of an equity tranche of a CDO/CLO, a Fund will value the securities using a bid price from at least one independent broker.
On the first day a new debt security purchase is recorded, if a price is not available from a third-party pricing agent or an independent broker, the security may be valued at its purchase price. Each day thereafter, the debt security will be valued according to the Procedures until an independent source can be secured. Debt securities held by a Fund with remaining maturities of 60 days or less will be valued by the amortized cost method, which involves valuing a security at its cost on the date of purchase and thereafter (absent unusual circumstances) assuming a constant amortization to maturity of any discount or premium, regardless of the impact of fluctuations in general market rates of interest on the value of the instrument. While this method provides certainty in valuation, it may result in periods during which value, as determined by this method, is higher or lower than the price a Fund would receive if it sold the instrument, and the value of securities in the Fund can be expected to vary inversely with changes in prevailing interest rates. Should existing credit, liquidity or interest rate conditions in the relevant markets and issuer-specific circumstances suggest that amortized cost does not approximate fair value, then the amortized cost method may not be used.
Options are valued at the last quoted sales price. If there is no such reported sale on the valuation date, long positions are valued at the most recent bid price, and short positions are valued at the most recent ask price. Futures and swaps cleared through a central clearing house (centrally cleared swaps) are valued at the settlement price established each day by the board of exchange on which they are traded. The daily settlement prices for financial futures and centrally cleared swaps are provided by an independent source. On days when there is excessive volume, market volatility or the future or centrally cleared swap does not end trading by the time a fund calculates its NAV, the settlement price may not be available at the time at which a fund calculates its NAV. On such days, the best available price (which is typically the last sales price) may be used to value a fund’s futures or centrally cleared swaps position. Foreign currency forward contracts are valued at the current day's interpolated foreign exchange rate, as calculated using forward rates provided by an independent source.
Prices for most securities held by a Fund are provided daily by third-party independent pricing agents. SIMC or a Sub-Adviser, as applicable, reasonably believes that prices provided by independent pricing agents are reliable. However, there can be no assurance that such pricing service's prices will be reliable. SIMC or a Sub-Adviser, as applicable, will continuously monitor the reliability of prices obtained from any pricing service and shall promptly notify the Funds' administrator if it believes that a particular pricing service is no longer a reliable source of prices. The Funds' administrator, in turn, will notify the Committee if it receives such notification from a Sub-Adviser, as applicable, or if the Funds' administrator reasonably believes that a particular pricing service is no longer a reliable source for prices.
The Procedures provide that any change in a primary pricing agent or a pricing methodology requires prior approval by the Board. However, when the change would not materially affect the valuation of a Fund’s net assets or involve a material departure in pricing methodology from that of the Fund’s existing pricing agent or pricing methodology, ratification may be obtained at the next regularly scheduled meeting of the Board. Securities for which market prices are not "readily available" are valued in accordance with Rule 2a-5 and the Procedures. The Committee must monitor for circumstances that may necessitate that a security be valued using Fair Value Procedures which can include: (i) the security's trading has been halted or suspended, (ii) the security has been de-listed from a national exchange, (iii) the security's primary trading market is temporarily closed at a time when under normal conditions it would be open, (iv) the security has not been traded for an extended period of time, (v) the security's primary pricing source is not able or willing to provide a price, (vi) trading of the security is subject to local government-imposed restrictions; or (vii) a significant event (as defined below). When a security is valued in accordance with the Fair Value Procedures, the Committee will determine the value after taking into consideration relevant information reasonably available to the Committee. Examples of factors the Committee may consider include: (i) the type of security or asset, (ii) the last trade price, (iii) evaluation of the forces that influence the market in which the security is purchased and sold, (iv) the liquidity of the security, (v) the size of the holding in a Fund or (vi) any other appropriate information.
The Committee is responsible for selecting and applying, in a consistent manner, the appropriate methodologies for determining and calculating the fair value of holdings of the Funds, including specifying the key inputs and assumptions specific to each asset class or holding. The determination of a security’s fair value price often involves the consideration of a number of subjective factors and is therefore subject to the unavoidable risk that the value assigned to a security may be higher or lower than the security’s value would be if a reliable market quotation for the security was readily available.
New Covenant Funds
65
NOTES TO FINANCIAL STATEMENTS (Continued)
June 30, 2023
The Growth Fund uses a third-party fair valuation vendor. The vendor provides a fair value for foreign securities held by the Fund based on certain factors and methodologies (involving, generally, tracking valuation correlations between the U.S. market and each non-U.S. security). Values from the fair value vendor are applied in the event that there is a movement in the U.S. market that exceeds a specific threshold that has been established by the Committee. The Committee has also established a “confidence interval” which is used to determine the level of historical correlation between the value of a specific foreign security and movements in the U.S. market before a particular security will be fair valued when the threshold is exceeded. In the event that the threshold established by the Committee is exceeded on a specific day, the Growth Fund will value the non-U.S. securities in its portfolio that exceed the applicable “confidence interval” based upon the adjusted prices provided by the fair valuation vendor.
For securities that principally trade on a foreign market or exchange, a significant gap in time can exist between the time of a particular security’s last trade and the time at which a Fund calculates its NAV. The closing prices of such securities may no longer reflect their market value at the time a Fund calculates NAV if an event that could materially affect the value of those securities (a Significant Event), including substantial fluctuations in domestic or foreign markets or occurrences not tied directly to the securities markets, such as natural disasters, armed conflicts or significant governmental actions, has occurred between the time of the security’s last close and the time that the Fund calculates NAV. A Fund may invest in securities that are primarily listed on foreign exchanges that trade on weekends or other days when the Fund does not price its shares. As a result, the NAV of the Fund’s shares may change on days when shareholders will not be able to purchase or redeem Fund shares. A Significant Event may relate to a single issuer or to an entire market sector. If SIMC or a Sub-Adviser becomes aware of a Significant Event that has occurred with respect to a security or group of securities after the closing of the exchange or market on which the security or securities principally trade, but before the time at which a Fund calculate NAV, it may request that a Committee meeting be called. In addition, with respect to certain securities, the Funds’ administrator performs price comparisons and price movement review (among other processes), to monitor the pricing data supplied by various sources. Any identified discrepancies are researched and subject to the procedures described above.
In accordance with U.S. GAAP, fair value is defined as the price that a Fund would receive upon selling an investment in an orderly transaction to an independent buyer in the principal or most advantageous market of the investment. A three tier hierarchy has been established to maximize the use of observable and minimize the use of unobservable inputs and to establish classification of fair value measurements for disclosure purposes. Inputs refer broadly to the assumptions that market participants would use in pricing an asset. Inputs may be observable or unobservable. Observable inputs are inputs that reflect the assumptions market participants would use in pricing the asset or liability based on market data obtained from sources independent of the reporting entity. Unobservable inputs are inputs that reflect the reporting entity’s own assumptions about the assumptions market participants would use in pricing the asset or liability based on the best information available in the circumstances.
The three-tier hierarchy of inputs is summarized in the three broad Levels listed below:
Level 1 — quoted prices in active markets for identical investments
Level 2 — other significant observable inputs (including quoted prices for similar investments, interest rates, prepayment speeds, credit risks, etc.)
Level 3 — significant unobservable inputs (including the Fund’s own assumptions in determining the fair value of investments)
The valuation techniques used by the Funds to measure fair value during the year ended June 30, 2023 maximized the use of observable inputs and minimized the use of unobservable inputs.
For details of the investment classifications reference the Schedules of Investments.
Securities Transactions and Investment Income — Security transactions are recorded on the trade date. Cost used in determining net realized capital gains and losses on the sale of securities is determined on the basis of specific identification. Dividend income and expense is recognized on the ex-dividend date, and interest income or expense is recognized using the accrual basis of accounting.
Distributions received on securities that represent a return of capital or capital gains are recorded as a reduction of cost of investments and/or as a realized gain. The Trust estimates the components of distributions received that may be considered nontaxable distributions or capital gain distributions.
66
New Covenant Funds
Amortization and accretion is calculated using the scientific interest method, which approximates the effective interest method over the holding period of the security. Amortization of premiums and discounts is included in interest income.
Cash and Cash Equivalents — Idle cash and currency balances may be swept into various overnight sweep accounts and are classified as cash equivalents on the Statement of Assets and Liabilities. These amounts, at times, may exceed United States federally insured limits. Amounts swept are available on the next business day.
Expenses — Expenses that are directly related to a Fund are charged directly to that Fund. Other operating expenses of the Funds are prorated to the Funds on the basis of relative net assets.
Foreign Currency Translation — The books and records of the Funds investing in international securities are maintained in U.S. dollars on the following basis:
(I) market value of investment securities, assets and liabilities at the current rate of exchange; and
(II) purchases and sales of investment securities, income and expenses at the relevant rates of exchange prevailing on the respective dates of such transactions.
The Funds do not isolate that portion of gains and losses on investments in equity securities that is due to changes in the foreign exchange rates from that which is due to changes in market prices of equity securities.
The Funds report certain foreign-currency-related transactions as components of realized gains for financial reporting purposes, whereas such components are treated as ordinary income for Federal income tax purposes.
Repurchase Agreements — To the extent consistent with its investment objective and strategies, a Fund may enter into repurchase agreements which are secured by obligations of the U.S. Government with a bank, broker-dealer or other financial institution. Each repurchase agreement is at least 102% collateralized and marked-to-market. However, in the event of default or bankruptcy by the counterparty to the repurchase agreement, realization of the collateral may by subject to certain costs, losses or delays.
Futures Contracts — To the extent consistent with its investment objective and strategies, a Fund may use futures contracts for tactical hedging purposes as well as to enhance the Fund’s returns. These Funds’ investments in futures contracts are designed to enable the Funds to more closely approximate the performance of their benchmark indices. Initial margin deposits of cash or securities are made upon entering into futures contracts. The contracts are marked-to-market daily and the resulting changes in value are accounted for as unrealized gains and losses. Variation margin payments are paid or received, depending upon whether unrealized gains or losses are incurred. When contracts are closed, the Funds record a realized gain or loss equal to the difference between the proceeds from (or cost of) the closing transaction and the amount invested in the contract.
Risks of entering into futures contracts include the possibility that there will be an imperfect price correlation between the futures and the underlying securities. Second, it is possible that a lack of liquidity for futures contracts could exist in the secondary market, resulting in an inability to close a position prior to its maturity date. Third, futures contracts involve the risk that a Fund could lose more than the original margin deposit required to initiate a futures transaction.
Finally, the risk exists that losses could exceed amounts disclosed on the Statements of Assets and Liabilities. Refer to each Fund’s Schedule of Investments for details regarding open futures contracts as of June 30, 2023, if applicable.
Options Writing/Purchasing — To the extent consistent with its investment objective and strategies, a Fund may invest in financial options contracts for the purpose of hedging its existing portfolio securities, or securities that a Fund intends to purchase, against fluctuations in fair market value caused by changes in prevailing market interest rates. A Fund may also invest in financial option contracts to enhance its returns. When the Fund writes or purchases an option, an amount equal to the premium received or paid by the Fund is recorded as a liability or an asset and is subsequently adjusted to the current market value of the option written or purchased. Premiums received or paid from writing or purchasing options which expire unexercised are treated by the Fund on the expiration date as realized gains or losses. The difference between the premium and the amount paid or received on affecting a closing purchase or sale transaction, including brokerage commissions, is also treated as a realized gain or loss. If an option is exercised, the premium paid or received is added to the cost of the purchase or proceeds from the sale in determining whether the Fund has realized a gain or a loss.
The risk in writing a call option is a Fund may give up the opportunity for profit if the market price of the security increases. The risk in writing a put option is a Fund may incur a loss if the market price of the security decreases and the option is exercised. The risk in purchasing an option is a Fund may pay a premium whether or not the option is exercised. The Funds also have the additional risk of being unable to enter into a closing transaction at an acceptable price if a liquid secondary
New Covenant Funds
67
NOTES TO FINANCIAL STATEMENTS (Continued)
June 30, 2023
market does not exist. Option contracts also involve the risk that they may not work as intended due to unanticipated developments in market conditions or other causes.
Swap Agreements — To the extent consistent with its investment objective and strategies, a Fund may invest in swap contracts as an efficient means to take and manage risk in the portfolio, including interest rate risk, credit risk and overall yield sensitivity. A swap agreement is a two-party contract under which an agreement is made to exchange returns from predetermined investments or instruments, including a particular interest rate, foreign currency, or “basket” of securities representing a particular index. Swap agreements are privately negotiated in the over-the- counter market (“OTC swaps”) or may be executed in a multilateral or other trade facility platform, such as a registered commodities exchange (“Centrally Cleared swaps”). Interest rate swaps involve the exchange by a Fund with another party of their respective commitments to pay or receive interest (e.g., an exchange of floating rate payments for fixed rate payments) with respect to a notional amount of principal. Credit default swaps involve the periodic payment by a Fund or counterparty of interest based on a specified rate multiplied by a notional amount assigned to an underlying debt instrument or group of debt instruments in exchange for the assumption of credit risk on the same instruments. In the event of a credit event, usually in the form of a credit rating downgrade, the party receiving periodic payments (i.e. floating rate payer) must pay the other party (i.e. fixed rate payer) an amount equal to the outstanding principal of the downgraded debt instrument. Total return swaps allow an investor to benefit from the cash flow without ever actually owning the underlying security. The receiver must pay any decline in value to the payer at the end of the total return swap. However, the investor does not need to make a payment if there is no decline in price. Payments can be made on various indices, bonds (i.e. mortgage backed securities, bank debt and corporate), loans or commodities. The value of a total return swap is equal to the change in value of the underlying asset versus the accrued income payment based on LIBOR (London Interbank Offered Rate) or some other form of index on the notional amount. Interest rate swaps involve the exchange by a Fund with another party of their respective commitments to pay or receive interest (e.g., an exchange of floating rate payments for fixed rate payments) with respect to a notional amount of principal to manage a Fund’s exposure to interest rates. Payments received or made are recorded as realized gains or losses. A Fund could be exposed to credit or market risk due to unfavorable changes in the fluctuation of interest rates or if the counterparty defaults on its obligation to perform. Risk of loss may exceed amounts recognized on the statement of assets and liabilities. In connection with swap agreements, securities/cash may be set aside as collateral by the Fund’s custodian. A Fund may enter into swap agreements in order to, among other things, change the maturity or duration of the investment portfolio; protect a Fund’s value from changes in interest rates; or expose a Fund to a different security or market.
Swaps are marked-to-market daily based upon quotations from market makers and the resulting changes in market values, if any, are recorded as unrealized gains or losses in the Statement of Operations. Centrally cleared swaps are valued at the settlement price established each day by the board of exchange on which they are traded. The daily settlement prices for centrally cleared swaps are provided by an independent source. Net payments of interest are recorded as realized gains or losses. Daily changes in valuation of Centrally Cleared swaps, if any, are recorded as a receivable or payable for the change in value as appropriate (“variation margin”) on the Statements of Assets and Liabilities.
Entering into swap agreements involves, to varying degrees, elements of credit and market risk in excess of the amounts recognized on the Schedule of Investments or the Statement of Assets and Liabilities. Such risks involve the possibility that there will be no liquid market for these agreements, that the counterparty to the agreement may default on its obligation to perform and that there may be unfavorable changes in the fluctuation of interest rates. Risks also arise from potential losses from adverse market movements. Counterparty risk may be mitigated by having a master netting arrangement between a Fund and the counterparty and by having the counterparty post collateral to cover a Fund’s exposure to the counterparty.
Forward Treasury Commitments — To the extent consistent with its investment objective and strategies, the Growth Fund and Income Fund may invest in commitments to purchase U.S. Treasury securities on an extended settlement basis. Such transactions involve the commitment to purchase a security with payment and delivery taking place in the future, sometimes a month or more after the transaction date. The Funds account for such transactions as purchases and sales and record an unrealized gain or loss each day equal to the difference between the cost of the purchase commitment and the current market value. Realized gains or losses are recorded upon closure or settlement of such commitments. No interest is earned prior to settlement of the transaction. These instruments are subject to market fluctuation due to changes in interest rates and the market value at the time of settlement could be higher or lower than the purchase price. A Fund may incur losses due to changes in the value of the underlying treasury securities from interest rate fluctuations or as a result of
68
New Covenant Funds
counterparty nonperformance. These transactions may increase the overall investment exposure for a Fund (and so may also create investment leverage) and involve a risk of loss if the value of the securities declines prior to the settlement date.
Master Limited Partnerships — To the extent consistent with its investment objective and strategies, a Fund may invest in entities commonly referred to as “MLPs” that are generally organized under state law as limited partnerships or limited liability companies. The Funds intend to primarily invest in MLPs receiving partnership taxation treatment under the Internal Revenue Code of 1986 (the “Code”), and whose interests or “units” are traded on securities exchanges like shares of corporate stock. To be treated as a partnership for U.S. federal income tax purposes, an MLP whose units are traded on a securities exchange must receive at least 90% of its income from qualifying sources such as interest, dividends, real estate rents, gain from the sale or disposition of real property, income and gain from mineral or natural resources activities, income and gain from the transportation or storage of certain fuels, and, in certain circumstances, income and gain from commodities or futures, forwards and options with respect to commodities. Mineral or natural resources activities include exploration, development, production, processing, mining, refining, marketing and transportation (including pipelines) of oil and gas, minerals, geothermal energy, fertilizer, timber or industrial source carbon dioxide. An MLP consists of a general partner and limited partners (or in the case of MLPs organized as limited liability companies, a managing member and members). The general partner or managing member typically controls the operations and management of the MLP and has an ownership stake in the partnership. The limited partners or members, through their ownership of limited partner or member interests, provide capital to the entity, are intended to have no role in the operation and management of the entity and receive cash distributions. The MLPs themselves generally do not pay U.S. Federal income taxes. Thus, unlike investors in corporate securities, direct MLP investors are generally not subject to double taxation (i.e., corporate level tax and tax on corporate dividends). Currently, most MLPs operate in the energy and/or natural resources sector.
Delayed Delivery Transactions — To the extent consistent with its investment objective and strategies, the Growth Fund and Income Fund may purchase or sell securities on a when-issued or delayed delivery basis. These transactions involve a commitment by those Funds to purchase or sell securities for a predetermined price or yield, with payment and delivery taking place beyond the customary settlement period. When delayed delivery purchases are outstanding, the Funds will set aside liquid assets in an amount sufficient to meet the purchase price. When purchasing a security on a delayed delivery basis, that Fund assumes the rights and risks of ownership of the security, including the risk of price and yield fluctuations, and takes such fluctuations into account when determining its net asset value. Those Funds may dispose of or renegotiate a delayed delivery transaction after it is entered into, and may sell when-issued securities before they are delivered, which may result in a capital gain or loss. When those Funds have sold a security on a delayed delivery basis, that Fund does not participate in future gains and losses with respect to the security.
Dividends and Distributions to Shareholders — Dividends from net investment income are declared and paid to shareholders quarterly for the Growth Fund, Balanced Growth Fund and Balanced Income Fund; declared and paid monthly for the Income Fund. Dividends and distributions are recorded on the ex-dividend date. Any net realized capital gains will be distributed at least annually by the Funds.
Investments in Real Estate Investment Trusts (“REITs”) — Dividend income is recorded based on the income included in distributions received from the REIT investments using published REIT reclassifications including some management estimates when actual amounts are not available. Distributions received in excess of this estimated amount are recorded as a reduction of the cost of investments or reclassified to capital gains. The actual amounts of income, return of capital, and capital gains are only determined by each REIT after its fiscal year-end, and may differ from the estimated amounts.
3. AGREEMENTS AND OTHER TRANSACTIONS WITH AFFILIATES
Administration Agreement — The Trust entered into an Administration Agreement with SEI Investments Global Funds Services (the “Administrator”). Under the Administration Agreement, the Administrator provides administrative and accounting services to the Funds. The Administrator has voluntarily agreed to waive a portion of its fee so that the total annual expenses of the Balanced Growth Fund and the Balanced Income Fund, exclusive of acquired fund fees and expenses, will not exceed certain voluntary expense limitations adopted by the Adviser. Accordingly, effective April 1, 2017, the voluntary expense limitations are 0.13% and 0.15% for the Balanced Growth Fund and the Balanced Income Fund, respectively. These voluntary waivers may be terminated by the Adviser at any time. The following is a summary of annual fees payable to the Administrator:
| First $2.5 Billion | Next $500 Million | Over $3 Billion | ||||||||||
Growth Fund | 0.2000 | % | 0.1650 | % | 0.1200 | % |
New Covenant Funds
69
NOTES TO FINANCIAL STATEMENTS (Continued)
June 30, 2023
| First $1.5 Billion | Next $500 Million | Next $500 Million | Next $500 Million | Over $3 Billion | ||||||||||||||||
Income Fund | 0.2000 | % | 0.1775 | % | 0.1550 | % | 0.1325 | % | 0.1100 | % | ||||||||||
Balanced Growth Fund | 0.1500 | % | 0.1375 | % | 0.1250 | % | 0.1125 | % | 0.1000 | % | ||||||||||
Balanced Income Fund | 0.1500 | % | 0.1375 | % | 0.1250 | % | 0.1125 | % | 0.1000 | % |
Transfer Agent Servicing Agreement — In 2008, the Trust entered into a transfer agent servicing agreement (“Agreement”) with U.S. Bancorp Fund Services, LLC (“USBFS”), an indirect, wholly-owned subsidiary of U.S. Bancorp. Under the terms of the Agreement, USBFS is entitled to account based fees and annual fund level fees, as well as reimbursement of out-of-pocket expenses incurred in providing transfer agency services.
Investment Advisory Agreement — The Trust, on behalf of each Fund, entered into an Investment Advisory Agreement (“Agreement”) with the Adviser. Under the Agreement, the Adviser is responsible for the investment management of the Funds and receives an annual advisory fee of 0.47% for the Growth Fund and 0.42% for the Income Fund. The Adviser does not receive an advisory fee for the Balanced Growth Fund and Balanced Income Fund. The Adviser has voluntarily agreed to waive a portion of its fee so that the total annual expenses of the Growth and Income Funds, exclusive of acquired fund fees and expenses, will not exceed certain voluntary expense limitations adopted by the Adviser. Accordingly, effective April 1, 2017, the voluntary expense limitation is 0.80% for the Income Fund. Effective May 13, 2019, the voluntary expense limitation is 0.72% for the Growth Fund.
The Adviser has entered into sub-advisory agreements to assist in the selection and management of investment securities in the Growth Fund and the Income Fund. It is the responsibility of the sub-advisers, under the direction of the Adviser, to make day-to-day investment decisions for these Funds. The Adviser, not the Funds, pays each sub-adviser a quarterly fee, in arrears, for their services. The Adviser pays sub-advisory fees directly from its own advisory fee. The sub-advisory fees are based on the assets of the Fund allocated to the sub-adviser for which the sub-adviser is responsible for making investment decisions.
The following is the sub-adviser for the Growth Fund: Parametric Portfolio Associates LLC.
The following are the sub-advisers for the Income Fund: Income Research & Management, Western Asset Management Company and Western Asset Management Company Limited.
Distribution Agreement — The Trust issues shares of the Funds pursuant to a Distribution Agreement with SEI Investments Distribution Co. (the “Distributor”), a wholly-owned subsidiary of SEI Investments Company (“SEI”). The Funds do not compensate the Distributor in its capacity as principal distributor.
Shareholder Service Plan and Agreement—The Trust entered into a Shareholder Service Plan and Agreement (the “Agreement”) with the Distributor. Per the Agreement, a Fund is authorized to make payments to certain entities which may include investment advisors, banks, trust companies and other types of organizations (“Authorized Service Providers”) for providing administrative services with respect to shares of the Funds attributable to or held in the name of the Authorized Service Providers for its clients or other parties with whom they have a servicing relationship. Under the terms of the Agreement, the Growth Fund and the Income Funds are authorized to pay an Authorized Service Provider a shareholder servicing fee at an annual rate of up to 0.10% of the average daily net asset value of the Growth Fund and Income Fund, respectively, which fee will be computed daily and paid monthly, for providing certain administrative services to Fund shareholders with whom the Authorized Service Provider has a servicing relationship.
Social Witness Services and License Agreement — The Trust retained New Covenant Trust Company (“NCTC”) to ensure that each Fund continues to invest consistent with social witness principles adopted by the General Assembly of the Presbyterian Church (U.S.A.). No less than annually, NCTC will provide the Trust with an updated list of issuers in which the Funds will be prohibited from investing.
NCTC will distribute to the Trust proxy voting guidelines and shareholder advocacy services for the Funds that NCTC deems to be consistent with social witness principles adopted by the General Assembly of the Presbyterian Church (U.S.A.). The Trust also engages NCTC to vote Fund proxies consistent with such proxy voting guidelines. NCTC shall monitor and review and, as necessary, amend the Proxy Voting Guidelines periodically to ensure that they remain consistent with the social witness principles.
NCTC also grants to the Trust a non-exclusive right and license to use and refer to the trade name, trademark and/or service mark rights to the name “New Covenant Funds” and the phrase “Funds with a Mission”, in the name of the Trust and each Fund, and in connection with the offering, marketing, promotion, management and operation of the Trust and the Funds.
70
New Covenant Funds
In consideration of the services provided by NCTC, the Growth Fund and the Income Fund will each pay to NCTC a fee at an annual rate of 0.15% of the average daily net asset value of the shares of such Fund, which fee will be computed daily and paid monthly.
Payment to Affiliates — Certain officers and/or interested trustees of the Trust are also officers of the Distributor, the Adviser, the Administrator or NCTC. The Trust pays each unaffiliated Trustee an annual fee for attendance at quarterly and interim board meetings. Compensation of officers and affiliated Trustees of the Trust is paid by the Adviser, the Administrator or NCTC.
A portion of the services provided by the Chief Compliance Officer (“CCO”) and his staff, whom are employees of the Administrator, are paid for by the Trust as incurred. The services include regulatory oversight of the Trust’s Adviser, sub-advisers and service providers as required by SEC regulations. The CCO’s services have been approved by and are reviewed annually by the Board.
Investment in Affiliated Security — The Funds may invest excess cash in the SEI Daily Income Trust (SDIT) Government Fund, an affiliated money market fund. The Balanced Funds invest in the Growth Fund and Income Fund.
Interfund Lending — The SEC has granted an exemption that permits the Trust to participate in an interfund lending program (the ‘‘Program’’) with existing or future investment companies registered under the 1940 Act that are advised by SIMC (the ‘‘SEI Funds’’). The Program allows the SEI Funds to lend money to and borrow money from each other for temporary or emergency purposes. Participation in the Program is voluntary for both borrowing and lending funds. Interfund loans may be made only when the rate of interest to be charged is more favorable to the lending fund than an investment in overnight repurchase agreements (‘‘Repo Rate’’), and more favorable to the borrowing fund than the rate of interest that would be charged by a bank for short-term borrowings (‘‘Bank Loan Rate’’). The Bank Loan Rate will be determined using a formula reviewed annually by the SEI Funds’ Board of Trustees. The interest rate imposed on interfund loans is the average of the Repo Rate and the Bank Loan Rate. During the year ended June 30, 2023, the Trust did not participate in interfund lending.
4. DERIVATIVE TRANSACTIONS
The International Swaps and Derivatives Association, Inc. Master Agreements and Credit Support Annexes (“ISDA Master Agreements”) maintain provisions for general obligations, representations, agreements, collateral, and events of default or termination. The occurrence of a specified event of termination may give a counterparty the right to terminate all of its contracts and affect settlement of all outstanding transactions under the applicable ISDA Master Agreement.
To reduce counterparty risk with respect to Over The Counter (“OTC”) transactions, the Funds have entered into master netting arrangements, established within the Funds’ ISDA Master Agreements, which allow the Funds to make (or to have an entitlement to receive) a single net payment in the event of default (close-out netting) for outstanding payables and receivables with respect to certain OTC positions in swaps for each individual counterparty. In addition, the Funds may require that certain counterparties post cash and/or securities in collateral accounts to cover their net payment obligations for those derivative contracts subject to ISDA Master Agreements. If the counterparty fails to perform under these contracts and agreements, the cash and/or securities will be made available to the Funds.
For financial reporting purposes, the Funds do not offset derivative assets and derivative liabilities that are subject to netting arrangements in the Statement of Assets and Liabilities and therefore disclose these derivative assets and derivative liabilities on a gross basis. Bankruptcy or insolvency laws of a particular jurisdiction may impose restrictions on or prohibitions against the right of offset in bankruptcy, insolvency or other events.
Collateral terms are contract specific for OTC derivatives. For derivatives traded under an ISDA Master Agreement, the collateral requirements are typically calculated by netting the mark to market amount of each transaction under such agreement and comparing that amount to the value of any collateral currently pledged by the Funds or the counterparty. For financial reporting purposes, cash collateral that has been pledged to cover obligations of the Funds, if any, is reported separately on the Statement of Assets and Liabilities as cash pledged as collateral. Non-cash collateral pledged by the Funds, if any, is noted in the Schedules of Investments. Generally, the amount of collateral due from or to a party must exceed a minimum transfer amount threshold before a transfer has to be made. To the extent amounts due to the Funds from its counterparties are not fully collateralized, contractually or otherwise, the Funds bear the risk of loss from counterparty nonperformance.
Cash with a total market value of $166 and $615 ($ Thousands) for the Growth Fund and Income Fund, respectively, has been pledged as collateral for exchange-traded derivative instruments as of June 30, 2023.
New Covenant Funds
71
NOTES TO FINANCIAL STATEMENTS (Continued)
June 30, 2023
Asset Derivatives | Liability Derivatives | |||||||||
Statements of Assets and Liabilities Location | Fair Value | Statements of Assets and Liabilities Location | Fair Value | |||||||
Growth Fund | ||||||||||
Equity contracts | Unrealized appreciation on futures contracts | $ | 46 | * | Unrealized depreciation on futures contracts | $ | — | * | ||
Total derivatives not accounted for as hedging instruments | $ | 46 | $ | — | ||||||
Income Fund | ||||||||||
Interest rate contracts | Investments, at value** | $ | 216 | * | Options written, at value | $ | 216 | * | ||
Equity contracts | Unrealized appreciation on futures contracts | $ | 73 | * | Unrealized depreciation on futures contracts | $ | 675 | * | ||
Total derivatives not accounted for as hedging instruments | $ | 289 | $ | 891 | ||||||
* Includes cumulative appreciation/depreciation of futures contracts as reported in the Schedules of Investments. Only current day’s variation margin is reported within the Statements of Assets and Liabilities.
** Includes purchased options and/or swaptions.
The effect of derivative instruments on the Statements of Operations or Consolidated Statements of Operations for the period ended June 30, 2023.
Amount of realized gain or (loss) on derivatives recognized in income ($ Thousands):
Derivatives Not Accounted for as Hedging Instruments | Purchased Options and Swaptions | Written Options and Swaptions | Futures | Forward | Swaps | Total | ||||||||||||||||||
Growth Fund | ||||||||||||||||||||||||
Equity contracts | $ | — | $ | — | $ | 1,439 | $ | — | $ | — | $ | 1,439 | ||||||||||||
Income Fund | ||||||||||||||||||||||||
Equity contracts | $ | (579 | ) | $ | 654 | $ | 1,072 | $ | — | $ | — | $ | 1,147 | |||||||||||
Change in unrealized appreciation or (depreciation) on derivatives recognized in income ($ Thousands):
Derivatives Not Accounted for as Hedging Instruments | Purchased Options and Swaptions | Written Options and Swaptions | Futures | Forward | Swaps | Total | ||||||||||||||||||
Growth Fund | ||||||||||||||||||||||||
Equity contracts | $ | — | $ | — | $ | 231 | $ | — | $ | — | $ | 231 | ||||||||||||
Income Fund | ||||||||||||||||||||||||
Equity contracts | $ | 75 | $ | (131 | ) | $ | (652 | ) | $ | — | $ | — | $ | (708 | ) | |||||||||
The following table discloses the volume of the Funds' futures contracts, option contracts, forward foreign currency
contracts and swap contracts (if applicable) activity during the year ended June 30, 2023 ($ Thousands):
Growth Fund | Income Fund | |||||||
Futures Contracts: | ||||||||
Interest Contracts | ||||||||
Average Notional Balance Long | $ | 6,026 | $ | 77,510 | ||||
Average Notional Balance Short | — | 62,944 | ||||||
Options/Swaptions: | ||||||||
Interest | ||||||||
Average Notional Balance Long | — | 80 | ||||||
Average Notional Balance Short | — | 117 | ||||||
72
New Covenant Funds
5. INVESTMENT TRANSACTIONS
The cost of security purchases and the proceeds from the sale and maturities of securities, excluding U.S. government and other short-term investments, for the year ended June 30, 2023, were as follows:
U.S. Gov't | Other | Total | ||||||||||
Growth Fund | ||||||||||||
Purchases | $ | — | $ | 33,390 | $ | 33,390 | ||||||
Sales | — | 57,516 | 57,516 | |||||||||
Income Fund | ||||||||||||
Purchases | 361,485 | 24,491 | 385,976 | |||||||||
Sales | 356,814 | 47,392 | 404,206 | |||||||||
Balanced Growth Fund | ||||||||||||
Purchases | — | 26,815 | 26,815 | |||||||||
Sales | — | 45,069 | 45,069 | |||||||||
Balanced Income Fund | ||||||||||||
Purchases | — | 4,659 | 4,659 | |||||||||
Sales | — | 23,154 | 23,154 | |||||||||
6. FEDERAL TAX INFORMATION
It is each Fund’s intention to continue to qualify as a regulated investment company under Subchapter M of the Internal Revenue Code and distribute all of its taxable income (including net capital gains). Accordingly, no provision for federal income tax is required.
Dividends from net investment income and distributions from net realized capital gains are determined in accordance with U.S. Federal income tax regulations, which may differ from those amounts determined under U.S. GAAP. These book/tax differences are either temporary or permanent in nature. To the extent these differences are permanent, they are charged or credited to paid-in capital or distributable earnings (loss), as appropriate, in the period that the differences arise.
The permanent differences primarily consist of reclassification of capital gain distribution on REITs and RICs, investments in publicly traded partnerships, reclassifications of distributions, sales of passive foreign investment companies, and gains and losses on paydowns of mortgage and asset-backed securities for tax purposes. There are no permanent differences that are credited or charged to Paid-in Capital and Distributable Earnings as of June 30, 2023.
The tax character of dividends and distributions paid during the last two years ended June 30 were as follows:
Ordinary | Long Term | Total | ||||||||||||||
Growth Fund | 2023 | $ | 4,978 | $ | 4,808 | $ | 9,786 | |||||||||
| 2022 | 6,699 | 26,399 | 33,098 | |||||||||||||
Income Fund | 2023 | 9,100 | — | 9,100 | ||||||||||||
| 2022 | 7,072 | 650 | 7,772 | |||||||||||||
Balanced Growth Fund | 2023 | 4,071 | 10,098 | 14,169 | ||||||||||||
| 2022 | 5,584 | 9,900 | 15,584 | |||||||||||||
Balanced Income Fund | 2023 | 1,501 | 1,220 | 2,721 | ||||||||||||
| 2022 | 1,378 | 3,184 | 4,562 | |||||||||||||
New Covenant Funds
73
NOTES TO FINANCIAL STATEMENTS (Continued)
June 30, 2023
As of June 30, 2023, the components of distributable earnings (accumulated losses) were as follows:
Undistributed | Undistributed | Capital | Post- | Unrealized | Other | Total | ||||||||||||||||||||||
Growth Fund | $ | 841 | $ | 12,252 | $ | — | $ | — | $ | 255,177 | $ | 1 | $ | 268,271 | ||||||||||||||
Income Fund | 834 | — | (12,334 | ) | (6,121 | ) | (34,411 | ) | (863 | ) | (52,895 | ) | ||||||||||||||||
Balanced Growth Fund | 940 | — | — | — | 85,656 | 1 | 86,597 | |||||||||||||||||||||
Balanced Income Fund | 311 | — | (2,053 | ) | — | 9,320 | 2 | 7,580 | ||||||||||||||||||||
For Federal income tax purposes, the cost of securities owned at June 30, 2023, and the net realized gains or losses on securities sold for the period were not materially different from amounts reported for financial reporting purposes. These differences are primarily due to wash sales, MLP basis adjustments and basis adjustments from investments in registered investment companies which cannot be used for Federal income tax purposes in the current year and have been deferred for use in future years.
For Federal income tax purposes, capital loss carryforwards may be carried forward and applied against future capital gains. Under the Regulated Investment Company Modernization Act of 2010, Funds are permitted to carry forward capital losses for an unlimited period. Losses carried forward are as follows:
Short-Term | Long-Term | Total | ||||||||||
Income Fund | $ | 6,454 | $ | 5,880 | $ | 12,334 | ||||||
Balanced Income Fund | 1,555 | 498 | 2,053 | |||||||||
The aggregate gross unrealized appreciation and depreciation on total investments held by the Funds at June 30, 2023 was as follows:
Federal | Appreciated | Depreciated | Net Unrealized | |||||||||||||
Growth Fund | $ | 283,213 | $ | 279,256 | $ | (24,079 | ) | $ | 255,177 | |||||||
Income Fund | 387,698 | 511 | (34,922 | ) | (34,411 | ) | ||||||||||
Balanced Growth Fund | 249,947 | 110,987 | (25,331 | ) | 85,656 | |||||||||||
Balanced Income Fund | 68,459 | 17,064 | (7,744 | ) | 9,320 | |||||||||||
Management has analyzed the Funds’ tax positions taken on Federal income tax returns for all open tax years and has concluded that as of June 30, 2023, no provision for income tax would be required in the Funds’ financial statements. The Funds’ Federal and state income and Federal excise tax returns for tax years for which the applicable statutes of limitations have not expired are subject to examination by the Internal Revenue Service and state departments of revenue.
7. CONCENTRATIONS/RISKS
In the normal course of business, the Trust enters into contracts that provide general indemnifications by the Trust to the counterparty to the contract. The Trust’s maximum exposure under these arrangements is dependent on future claims that may be made against the Trust and, therefore, cannot be estimated; however, management believes that, based on experience, the risk of loss from such claims is considered remote.
Asset Allocation Risk — The risk that SIMC’s decisions regarding the allocation of a Balance Funds assets to the Growth Fund and Income Fund will not anticipate market trends successfully.
Asset-Backed Securities Risk — Payment of principal and interest on asset-backed securities is dependent largely on the cash flows generated by the assets backing the securities. Securitization trusts generally do not have any assets or sources of funds other than the receivables and related property they own, and asset-backed securities are generally not
74
New Covenant Funds
insured or guaranteed by the related sponsor or any other entity. Asset-backed securities may be more illiquid than more conventional types of fixed income securities that the Fund may acquire.
Below Investment Grade Securities (Junk Bonds) Risk — Fixed income securities rated below investment grade (junk bonds) involve greater risks of default or downgrade and are generally more volatile than investment grade securities because the prospect for repayment of principal and interest of many of these securities is speculative. Because these securities typically offer a higher rate of return to compensate investors for these risks, they are sometimes referred to as “high yield bonds,” but there is no guarantee that an investment in these securities will result in a high rate of return. These risks may be increased in foreign and emerging markets.
Corporate Fixed Income Securities Risk — Corporate fixed income securities respond to economic developments, especially changes in interest rates, as well as perceptions of the creditworthiness and business prospects of individual issuers.
Credit Risk — The risk that the issuer of a security or the counterparty to a contract will default or otherwise become unable to honor a financial obligation.
Derivatives Risk — The Funds’ use of futures, options and swaps is subject to market risk, leverage risk, correlation risk and liquidity risk. Market risk and liquidity risk are described below. Leverage risk is the risk that the Fund's total investment exposure substantially exceeds the value of its portfolio securities. Correlation risk is the risk that changes in the value of the derivative may not correlate perfectly with the underlying asset, rate or index. Liquidity risk is the risk that certain securities may be difficult or impossible to sell at the time and the price that the Fund would like. The Fund may have to lower the price of the security, sell other securities instead or forego an investment opportunity, any of which could have a negative effect on Fund management or performance. Each of these risks could cause the Fund to lose more than the principal amount invested in a derivative instrument. The Fund's use of derivatives may also increase the amount of taxes payable by shareholders. Both U.S. and non-U.S. regulators have adopted and implemented regulations governing derivatives markets, the ultimate impact of which remains unclear.
Duration Risk — The longer-term securities in which the Fund may invest are more volatile. A portfolio with a longer average portfolio duration is more sensitive to changes in interest rates than a portfolio with a shorter average portfolio duration.
Economic Risks of Global Health Events — Global health events and pandemics, such as COVID-19, have the ability to affect—quickly, drastically and substantially the economies of many nations, states, individual companies and the markets in general and can cause disruptions that cannot necessarily be foreseen. The spread of COVID-19 around the world in 2020 resulted in a substantial number of nations implementing social distancing measures, quarantines, and the shutdown of non-essential businesses and governmental services. Further, it has caused significant volatility in U.S. and international markets. The impact of the outbreak may be short term or may last for an extended period of time.
Equity Market Risk — The risk that the market value of a security may move up and down, sometimes rapidly and unpredictably. Market risk may affect a single issuer, an industry, a sector or the equity or bond market as a whole. Markets may decline significantly in response to adverse issuer, political, regulatory, market, economic or other developments that may cause broad changes in market value, public perceptions concerning these developments, and adverse investor sentiment or publicity. Similarly, environmental and public health risks, such as natural disasters, epidemics, pandemics or widespread fear that such events may occur, may impact markets adversely and cause market volatility in both the short- and long-term.
Extension Risk — The risk that rising interest rates may extend the duration of a fixed income security, typically reducing the security’s value.
Fixed Income Market Risk — The prices of the Fund’s fixed income securities respond to economic developments, particularly interest rate changes, as well as to perceptions about the creditworthiness of individual issuers, including governments and their agencies. Generally, the Fund’s fixed income securities will decrease in value if interest rates rise and vice versa. In a low interest rate environment, risks associated with rising rates are heightened. In the case of foreign securities, price fluctuations will reflect international economic and political events, as well as changes in currency valuations relative to the U.S. dollar. Markets for fixed income securities may decline significantly in response to adverse issuer, political, regulatory, market, economic or other developments that may cause broad changes in market value, public perceptions concerning these developments, and adverse investor sentiment or publicity. Similarly, environmental
New Covenant Funds
75
NOTES TO FINANCIAL STATEMENTS (Continued)
June 30, 2023
and public health risks, such as natural disasters, epidemics, pandemics or widespread fear that such events may occur, may impact markets adversely and cause market volatility in both the short- and long-term.
Foreign Investment/Emerging Markets Risk — The risk that non-U.S. securities may be subject to additional risks due to, among other things, political, social and economic developments abroad, currency movements and different legal, regulatory, tax, accounting and audit environments. These additional risks may be heightened with respect to emerging market countries because political turmoil and rapid changes in economic conditions are more likely to occur in these countries. Investments in emerging markets are subject to the added risk that information in emerging market investments may be unreliable or outdated due to differences in regulatory, accounting or auditing and financial record keeping standards, or because less information about emerging market investments is publicly available. In addition, the rights and remedies associated with emerging market investments may be different than investments in developed markets. A lack of reliable information, rights and remedies increase the risks of investing in emerging markets in comparison to more developed markets. In addition, periodic U.S. Government restrictions on investments in issuers from certain foreign countries may require the Fund to sell such investments at inopportune times, which could result in losses to the Fund.
Foreign Sovereign Debt Securities Risk — The risks that (i) the governmental entity that controls the repayment of sovereign debt may not be willing or able to repay the principal and/or interest when it becomes due because of factors such as debt service burden, political constraints, cash flow problems and other national economic factors; (ii) governments may default on their debt securities, which may require holders of such securities to participate in debt rescheduling or additional lending to defaulting governments; and (iii) there is no bankruptcy proceeding by which defaulted sovereign debt may be collected in whole or in part.
Interest Rate Risk — The risk that a change in interest rates will cause a fall in the value of fixed income securities, including U.S. Government securities, in which the Fund invests. Generally, the value of the Fund’s fixed income securities will vary inversely with the direction of prevailing interest rates. Changing interest rates may have unpredictable effects on the markets and may affect the value and liquidity of instruments held by the Fund. Although U.S. Government securities are considered to be among the safest investments, they are not guaranteed against price movement movements due to changing interest rates.
Investment Style Risk — The risk that the equity securities in which the Fund invests may underperform other segments of the equity markets or the equity markets as a whole.
Liquidity Risk — The risk that certain securities may be difficult or impossible to sell at the time and the price that the Fund would like. The Fund may have to accept a lower price to sell a security, sell other securities to raise cash or give up an investment opportunity, any of which could have a negative effect on Fund management or performance.
Mortgage-Backed Securities Risk —Mortgage-backed securities are affected significantly by the rate of prepayments and modifications of the mortgage loans backing those securities, as well as by other factors such as borrower defaults, delinquencies, realized or liquidation losses and other shortfalls. Mortgage-backed securities are particularly sensitive to prepayment risk, which is described below, given that the term to maturity for mortgage loans is generally substantially longer than the expected lives of those securities; however, the timing and amount of prepayments cannot be accurately predicted. The timing of changes in the rate of prepayments of the mortgage loans may significantly affect the Fund’s actual yield to maturity on any mortgage-backed securities, even if the average rate of principal payments is consistent with the Fund’s expectation. Along with prepayment risk, mortgage-backed securities are significantly affected by interest rate risk, which is described above. In a low interest rate environment, mortgage loan prepayments would generally be expected to increase due to factors such as refinancings and loan modifications at lower interest rates. In contrast, if
76
New Covenant Funds
prevailing interest rates rise, prepayments of mortgage loans would generally be expected to decline and therefore extend the weighted average lives of mortgage-backed securities held or acquired by the Fund.
Opportunity Risk — The risk of missing out on an investment opportunity because the assets necessary to take advantage of it are tied up in other investments.
Portfolio Turnover Risk — Due to its investment strategy, the Fund may buy and sell securities frequently. This may result in higher transaction costs and taxes subject to ordinary income tax rates as opposed to more favorable capital gains rates, which may affect the Fund’s performance.
Prepayment Risk — The risk that, in a declining interest rate environment, fixed income securities with stated interest rates may have the principal paid earlier than expected, requiring the Fund to invest the proceeds at generally lower interest rates.
Repurchase Agreement Risk — Although repurchase agreement transactions must be fully collateralized at all times, they generally create leverage and involve some counterparty risk to the Fund whereby a defaulting counterparty could delay or prevent the Fund’s recovery of collateral.
Small Capitalization Risk — Smaller capitalization companies in which the Fund may invest may be more vulnerable to adverse business or economic events than larger, more established companies. In particular, small capitalization companies may have limited product lines, markets and financial resources and may depend upon a relatively small management group. Therefore, small capitalization stocks may be more volatile than those of larger companies. Small capitalization stocks may be traded over-the-counter (OTC). OTC stocks may trade less frequently and in smaller volume than exchange listed stocks and may have more price volatility than that of exchange-listed stocks.
Social-Witness Principles/Socially Responsible Investing Risk — The Fund considers social-witness principles and Sub-Advisers’ ESG criteria in its investment process and may choose not to purchase, or may sell, otherwise profitable investments in companies which have been identified as being in conflict with its established social-witness principles and other socially responsible investing principles. This means that the Fund may underperform other similar mutual funds that do not consider social-witness principles and other socially responsible investing principles in their investing.
U.S. Government Securities Risk — Although U.S. Government securities are considered to be among the safest investments, they are still subject to the credit risk of the U.S. Government and are not guaranteed against price movements due to changing interest rates. Obligations issued by some U.S. Government agencies are backed by the U.S. Treasury, while others are backed solely by the ability of the agency to borrow from the U.S. Treasury or by the agency’s own resources. No assurance can be given that the U.S. Government will provide financial support to its agencies and instrumentalities if it is not obligated by law to do so.
The Balanced Growth Fund and Balanced Income Fund invest their assets primarily in the Growth Fund and the Income Fund. By investing primarily in shares of these Funds, shareholders of the Balanced Funds indirectly pay a portion of the operating expenses, management fees and brokerage costs of the underlying Funds as well as their own operating expenses. Thus, shareholders of the Balanced Funds may indirectly pay slightly higher total operating expenses and other costs than they would pay by directly owning shares of the Growth Fund and Income Fund. A change in the asset allocation of either Balanced Fund could increase or reduce the fees and expenses actually borne by investors in that Fund. The Balanced Funds are also subject to rebalancing risk. Rebalancing activities, while undertaken to maintain a Fund’s investment risk-to- reward ratio, may cause the Fund to under-perform other funds with similar investment objectives. For the Balanced Growth Fund, it is possible after rebalancing from equities into a greater percentage of fixed-income securities, that equities will outperform fixed income investments. For the Balanced Income Fund, it is possible that after rebalancing from fixed-income securities into a greater percentage of equity securities, that fixed-income securities will outperform equity investments. The performance of the Balanced Growth Fund and the Balanced Income Fund depends on the performance of the underlying Funds in which they invest.
8. CONCENTRATION OF SHAREHOLDERS
On June 30, 2023, the number of shareholders below held the following percentage of the outstanding shares of the Funds. These shareholders are affiliated with the Funds.
# of Shareholders | % of Outstanding Shares | ||||||||||||||
Growth Fund | 3 | 77 | % | ||||||||||||
Income Fund | 3 | 86 | % | ||||||||||||
Balanced Growth Fund | 0 | 0 | % | ||||||||||||
Balanced Income Fund | 1 | 6 | % | ||||||||||||
New Covenant Funds
77
NOTES TO FINANCIAL STATEMENTS (Concluded)
June 30, 2023
9. REGULATORY MATTERS
The U.K. Financial Conduct Authority stopped compelling or inducing banks to submit certain London Inter-Bank Offered Rate (LIBOR) rates. The publication of LIBOR on a representative basis ceased for the one-week and two-month U.S. dollar LIBOR settings immediately after December 31, 2021, and ceased for the remaining U.S. dollar LIBOR settings immediately after June 30, 2023. Investments impacted by the discontinuation of LIBOR may include bank loans, derivatives, floating rate securities, and other assets or liabilities tied to LIBOR. Actions by regulators have resulted in the establishment of alternative reference rates to LIBOR in most major currencies. The U.S. Federal Reserve, based on the recommendations of the New York Federal Reserve’s Alternative Reference Rate Committee (comprised of major derivative market participants and their regulators), has begun publishing a Secured Overnight Financing Rate (SOFR), which is intended to replace U.S. dollar LIBOR. Alternative reference rates for other currencies have also been announced or have already begun publication. In response to the discontinuation of LIBOR, investors have added fallback provisions to existing contracts for investments whose value is tied to LIBOR, with most fallback provisions requiring the adoption of SOFR as a replacement rate. On March 15, 2022, President Biden signed the Adjustable Interest Rate Act into law (the “LIBOR Act”), which, in conjunction with regulations adopted by the Federal Reserve Board, establishes SOFR as the default fallback rate for any U.S. contract without a fallback provision. In addition, on March 4, 2023, the U.K. Financial Conduct Authority announced that, starting July 1, 2023 and continuing through September 30, 2024, it will permit the publishing of 1-, 3- and 6-month synthetic U.S. dollar LIBOR settings based on SOFR to serve as a fallback for non-U.S. contracts.
10. SUBSEQUENT EVENTS
Management has evaluated the need for disclosures and/or adjustments resulting from subsequent events through the date the financial statements were issued. Based on this evaluation, no disclosures and/or adjustments were required to the financial statements as of June 30, 2023.
78
New Covenant Funds
REPORT OF INDEPENDENT REGISTERED PUBLIC ACCOUNTING FIRM
To the Shareholders of the Funds and Board of Trustees New Covenant Funds:
Opinion on the Financial Statements
We have audited the accompanying statements of assets and liabilities of New Covenant Funds, comprised of New Covenant Growth Fund, New Covenant Income Fund, New Covenant Balanced Growth Fund, and New Covenant Balanced Income Fund (collectively, the Funds), including the schedules of investments, as of June 30, 2023, the related statements of operations for the year then ended, the statements of changes in net assets for each of the years in the two-year period then ended, and the related notes (collectively, the financial statements) and the financial highlights for each of the years in the five-year period then ended. In our opinion, the financial statements and financial highlights present fairly, in all material respects, the financial position of the Funds as of June 30, 2023, the results of their operations for the year then ended, the changes in their net assets for each of the years in the two-year period then ended, and the financial highlights for each of the years in the five-year period then ended, in conformity with U.S. generally accepted accounting principles.
Basis for Opinion
These financial statements and financial highlights are the responsibility of the Funds' management. Our responsibility is to express an opinion on these financial statements and financial highlights based on our audits. We are a public accounting firm registered with the Public Company Accounting Oversight Board (United States) (PCAOB) and are required to be independent with respect to the Funds in accordance with the U.S. federal securities laws and the applicable rules and regulations of the Securities and Exchange Commission and the PCAOB.
We conducted our audits in accordance with the standards of the PCAOB. Those standards require that we plan and perform the audit to obtain reasonable assurance about whether the financial statements and financial highlights are free of material misstatement, whether due to error or fraud. Our audits included performing procedures to assess the risks of material misstatement of the financial statements and financial highlights, whether due to error or fraud, and performing procedures that respond to those risks. Such procedures included examining, on a test basis, evidence regarding the amounts and disclosures in the financial statements and financial highlights. Such procedures also included confirmation of securities owned as of June 30, 2023, by correspondence with custodians, transfer agents, and brokers or by other appropriate auditing procedures when replies from brokers were not received. Our audits also included evaluating the accounting principles used and significant estimates made by management, as well as evaluating the overall presentation of the financial statements and financial highlights. We believe that our audits provide a reasonable basis for our opinion.
| /s/ KPMG LLP |
We have served as the auditor of one or more SEI Funds investment companies since 2005.
Philadelphia, Pennsylvania
August 29, 2023
New Covenant Funds
79
TRUSTEES AND OFFICERS OF THE TRUST (Unaudited)
The following chart lists Trustees and Officers as of June 30, 2023.
Set forth below are the names, addresses, ages, position with the Trust, Term of Office and Length of Time Served, the principal occupations for the last five years, number of positions in fund complex overseen by trustee, and other directorships outside the fund complex of each of the persons currently serving as Trustees and Officers of the Trust. The Trust's Statement of Additional Information ("SAI") includes additional information about the Trustees and Officers. The SAI may be obtained without charge by calling 1-877-835-4531.
Name, Address, and Age | Position(s) Held with Trusts | Term of Office and Length of Time Served1 | Principal Occupation(s) During Past Five Years | Number of Portfolios in Fund Complex Overseen by Trustee2 | Other Directorships Held by Trustee |
INTERESTED TRUSTEES | |||||
Robert A. Nesher One Freedom Valley Drive Oaks, PA 19456 76 yrs. old | Chairman of the Board of Trustees*
| since 2012 | Currently performs various services on behalf of SEI for which Mr. Nesher is compensated.
| 97 | President and Director of SEI Structured Credit Fund, LP. Director of SEI Global Master Fund plc, SEI Global Assets Fund plc, SEI Global Investments Fund plc, SEI Investments—Global Funds Services, Limited, SEI Investments Global, Limited, SEI Investments (Europe) Ltd., SEI Multi-Strategy Funds PLC, SEI Global Nominee Ltd and SEI Investments—Unit Trust Management (UK) Limited. President, Director and Chief Executive Officer of SEI Alpha Strategy Portfolios, LP from 2007 to 2013. President, Chief Executive Officer and Trustee of SEI Liquid Asset Trust from 1989 to 2016. President, Chief Executive Officer and Trustee of SEI Insurance Products Trust from 2013 to 2020. Trustee of The KP Funds from 2013 to 2020. Vice Chairman of O'Connor EQUUS (closed-end investment company) from 2014 to 2016. Vice Chairman of Winton Series Trust from 2014 to 2017. Vice Chairman of The Advisors' Inner Circle Fund III and Winton Diversified Opportunities Fund (closed-end investment company) from 2014 to 2018. Vice Chairman of Gallery Trust from 2015 to 2018. Vice Chairman of Schroder Series Trust and Schroder Global Series Trust from 2017 to 2018. Trustee of The Advisors’ Inner Circle Fund, The Advisors’ Inner Circle Fund II, Bishop Street Funds, Frost Family of Funds and Catholic Responsible Investments Funds. President, Chief Executive Officer and Trustee of SEI Asset Allocation Trust, SEI Daily Income Trust, SEI Institutional Managed Trust, SEI Institutional International Trust, SEI Institutional Investments Trust, SEI Tax Exempt Trust, Adviser Managed Trust, New Covenant Funds, SEI Catholic Values Trust and SEI Exchange Traded Funds. |
William M. Doran One Freedom Valley Drive Oaks, PA 19456 83 yrs. old | Trustee* | since 2012 | Self-employed consultant since 2003. Partner, Morgan, Lewis & Bockius LLP (law firm) from 1976 to 2003). Counsel to the Trust, SEI Investments, SIMC, the Administrator and the Distributor.
| 97 | Director of SEI Investments since 1985; Secretary of SEI Investments since 1978. Director of SEI Investments Distribution Co. since 2003. Director of SEI Investments—Global Funds Services, Limited, SEI Investments Global, Limited, SEI Investments (Europe), Limited, SEI Investments (Asia) Limited, SEI Global Nominee Ltd. and SEI Investments—Unit Trust Management (UK) Limited. Trustee of SEI Liquid Asset Trust from 1982 to 2016. Trustee of O'Connor EQUUS (closed-end investment company) from 2014 to 2016. Director of SEI Alpha Strategy Portfolios, LP from 2007 to 2013. Trustee of Winton Series Trust from 2014 to 2017. Trustee of The Advisors’ Inner Circle Fund and The Advisors’ Inner Circle Fund II from 1991 to 2018. Trustee of Bishop Street Funds from 2006 to 2018. Trustee of The KP Funds from 2013 to 2018. Trustee of Winton Diversified Opportunities Fund (closed-end investment company) from 2014 to 2018. Trustee of SEI Insurance Products Trust from 2013 to 2020. Trustee of Schroder Series Trust and Schroder Global Series Trust from 2017 to 2021. Trustee of The Advisors’ Inner Circle Fund III, Gallery Trust, Delaware Wilshire Private Markets Fund, Delaware Wilshire Private Markets Master Fund, Delaware Wilshire Private Markets Tender Fund, SEI Asset Allocation Trust, SEI Daily Income Trust, SEI Institutional Managed Trust, SEI Institutional International Trust, SEI Institutional Investments Trust, SEI Tax Exempt Trust, Adviser Managed Trust, New Covenant Funds, SEI Catholic Values Trust and SEI Exchange Traded Funds. |
TRUSTEES |
|
|
|
|
|
Nina Lesavoy One Freedom Valley Drive, Oaks, PA 19456 65 yrs. old | Trustee | since 2012 | Founder and Managing Director, Avec Capital (strategic fundraising firm) since 2008. Managing Director, Cue Capital (strategic fundraising firm) from March 2002-March 2008. | 97 | Director of SEI Alpha Strategy Portfolios, LP from 2007 to 2013. Trustee of SEI Liquid Asset Trust from 2003 to 2016. Trustee of SEI Insurance Products Trust from 2013 to 2020. Trustee/Director of SEI Structured Credit Fund, L.P., SEI Asset Allocation Trust, SEI Daily Income Trust, SEI Institutional Managed Trust, SEI Institutional International Trust, SEI Institutional Investments Trust, SEI Tax Exempt Trust, New Covenant Funds, Adviser Managed Trust, SEI Catholic Values Trust and SEI Exchange Traded Funds. |
James M. Williams One Freedom Valley Drive, Oaks, PA 19456 75 yrs. old | Trustee | since 2012 | Vice President and Chief Investment Officer, J. Paul Getty Trust, Non-Profit Foundation for Visual Arts, since December 2002. President, Harbor Capital Advisors and Harbor Mutual Funds, 2000-2002. Manager, Pension Asset Management, Ford Motor Company, 1997-1999. | 97 | Director of SEI Alpha Strategy Portfolios, LP from 2007 to 2013. Trustee of SEI Liquid Asset Trust from 2004 to 2016. Trustee of SEI Insurance Products Trust from 2013 to 2020. Trustee/Director of Ariel Mutual Funds, SEI Structured Credit Fund, LP, SEI Asset Allocation Trust, SEI Daily Income Trust, SEI Institutional Managed Trust, SEI Institutional International Trust, SEI Institutional Investments Trust, SEI Tax Exempt Trust, New Covenant Funds, Adviser Managed Trust, SEI Catholic Values Trust and SEI Exchange Traded Funds.
|
| * | Messrs. Nesher and Doran are Trustees who may be deemed as “interested” persons of the Trust as that term is defined in the 1940 Act by virtue of their affiliation with SIMC and the Trust’s Distributor. |
| 1 | Each trustee shall hold office during the lifetime of this Trust until the election and qualification of his or her successor, or until he or she sooner dies, resigns or is removed in accordance with the Trust’s Declaration of Trust |
| 2 | The Fund Complex includes the following Trusts: SEI Asset Allocation Trust, SEI Daily Income Trust, SEI Institutional Investments Trust, Adviser Managed Trust, SEI Institutional International Trust, SEI Institutional Managed Trust, SEI Tax Exempt Trust, SEI Catholic Values Trust, New Covenant Funds and SEI Exchange Traded Funds. |
80
New Covenant Funds
Name Address, and Age | Position(s) Held with Trusts | Term of Office and Length of Time Served1 | Principal Occupation(s) During Past Five Years | Number of Portfolios in Fund Complex Overseen by Trustee2 | Other Directorships Held by Trustee |
TRUSTEES (continued) | |||||
Hubert L. Harris, Jr. One Freedom Valley Drive, Oaks, PA 19456 79 yrs. old | Trustee | since 2012 | Retired since December 2005. Owner of Harris Plantation, Inc. since 1995. Chief Executive Officer of Harris CAPM, a consulting asset and property management entity. Chief Executive Officer, INVESCO North America, August 2003-December 2005. Chief Executive Officer and Chair of the Board of Directors, AMVESCAP Retirement, Inc., January 1998- August 2005. | 97 | Director of AMVESCAP PLC from 1993-2004. Served as a director of a bank holding company, 2003-2009. Director, Aaron’s Inc., 2012-present. Member of the Board of Councilors of the Carter Center (nonprofit corporation) and served on the boards of other non-profit organizations. Director of SEI Alpha Strategy Portfolios, LP from 2008 to 2013. Trustee of SEI Liquid Asset Trust from 2008 to 2016. Trustee of SEI Insurance Products Trust from 2013 to 2020. Trustee of SEI Asset Allocation Trust, SEI Daily Income Trust, SEI Institutional Managed Trust, SEI Institutional International Trust, SEI Institutional Investments Trust, SEI Tax Exempt Trust, New Covenant Funds, Adviser Managed Trust, SEI Catholic Values Trust and SEI Exchange Traded Funds. |
Susan C. Cote One Freedom Valley Drive Oaks, PA 19456 68 years old | Trustee | since 2015 | Retired since July 2015. Treasurer and Chair of Finance, Investment and Audit Committee of the New York Women's Foundation from 2012 to 2017. Member of the Ernst & Young LLP Retirement Investment Committee, 2009-2015. Global Asset Management Assurance Leader, Ernst & Young LLP from 2006-2015. Partner, Ernst & Young LLP from 1997-2015. Americas Director of Asset Management, Ernst & Young LLP from 2006-2013. Prudential, 1983-1997. | 97 | Trustee of SEI Insurance Products Trust from 2015 to 2020. Trustee/Director of SEI Structured Credit Fund, LP, SEI Tax Exempt Trust, SEI Daily Income Trust, SEI Institutional International Trust, SEI Institutional Managed Trust, SEI Asset Allocation Trust, SEI Institutional Investments Trust, New Covenant Funds, Adviser Managed Trust, SEI Catholic Values Trust and SEI Exchange Traded Funds. |
James B. Taylor One Freedom Valley Drive Oaks, PA 19456 72 years old
| Trustee | since 2018 | Retired since December 2017. Chief Investment Officer at Georgia Tech Foundation from 2008 to 2017. Chief Investment Officer at Delta Air Lines from 1983 to 2007. Member of the Investment Committee of Institute of Electrical and Electronic Engineers from 1999 to 2004. President, Vice President and Treasurer for Southern Benefits Conference from 1998 to 2000. | 97 | Trustee of SEI Insurance Products Trust from 2018 to 2020. Trustee of SEI Daily Income Trust, SEI Tax Exempt Trust, SEI Institutional Managed Trust, SEI Institutional International Trust, SEI Institutional Investments Trust, SEI Asset Allocation Trust, Adviser Managed Trust, New Covenant Funds, SEI Catholic Values Trust and SEI Exchange Traded Funds. |
Christine Reynolds One Freedom Valley Drive Oaks, PA 19456 64 years old
| Trustee | since 2019 | Retired since December 2016. Executive Vice President, Fidelity Investments from 2014-2016. President, Fidelity Pricing and Cash Management Services and Chief Financial Officer of Fidelity Funds from 2008-2014. Chief Operating Officer, Fidelity Pricing and Cash Management Services from 2007-2008. President and Treasurer, Fidelity Funds from 2004-2007. Anti-Money Laundering Officer, Fidelity Funds in 2004. Executive Vice President, Fidelity Funds from 2002-2004. Audit Partner, PricewaterhouseCoopers from 1992-2002. | 97 | Trustee of SEI Insurance Products Trust from 2019 to 2020. Trustee of SEI Daily Income Trust, SEI Tax Exempt Trust, SEI Institutional Managed Trust, SEI Institutional International Trust, SEI Institutional Investments Trust, SEI Asset Allocation Trust, Adviser Managed Trust, New Covenant Funds, SEI Catholic Values Trust and SEI Exchange Traded Funds. |
1 | Each trustee shall hold office during the lifetime of this Trust until the election and qualification of his or her successor, or until he or she sooner dies, resigns or is removed in accordance with the Trust’s Declaration of Trust. |
2 | The Fund Complex includes the following Trusts: SEI Asset Allocation Trust, SEI Daily Income Trust, SEI Institutional Investments Trust, Adviser Managed Trust, SEI Institutional International Trust, SEI Institutional Managed Trust, SEI Tax Exempt Trust, Catholic Values Trust, New Covenant Funds and SEI Exchange Traded Funds. |
New Covenant Funds
81
TRUSTEES AND OFFICERS OF THE TRUST (Unaudited) (Concluded)
Name Address, and Age | Position(s) Held with Trusts | Term of Office and Length of Time Served1 | Principal Occupation(s) During Past Five Years | Number of Portfolios in Fund Complex Overseen by Trustee2 | Other Directorships Held by Trustee |
OFFICERS | |||||
Robert A. Nesher One Freedom Valley Drive, Oaks, PA 19456 76 yrs. Old
| President and CEO
| since 2012 | Currently performs various services on behalf of SEI for which Mr. Nesher is compensated. | N/A | N/A |
Glenn R. Kurdziel3 One Freedom Valley Drive Oaks, PA 19456 49 yrs. old
| Controller and Chief Financial Officer | since 2023 | Controller and Chief Financial Officer of SEI Daily Income Trust, SEI Tax Exempt Trust, SEI Institutional Managed Trust, SEI Institutional International Trust, SEI Asset Allocation Trust, SEI Institutional Investments Trust, Adviser Managed Trust, New Covenant Funds, SEI Catholic Values Trust and SEI Exchange Traded Funds since August 2023. Assistant Controller of SEI Daily Income Trust, SEI Tax Exempt Trust, SEI Institutional Managed Trust, SEI Institutional International Trust, SEI Asset Allocation Trust, SEI Institutional Investments Trust, Adviser Managed Trust, New Covenant Funds and SEI Catholic Values Trust from 2017 to 2023. Assistant Controller of SEI Exchange Traded Funds from 2022 to 2023. Senior Manager, Funds Accounting, SEI Investments Global Funds Services from 2005-2023. | N/A | N/A |
Stephen Panner One Freedom Valley Drive Oaks, PA 19456 53 yrs. old | Chief Compliance Officer | since 2022 | Chief Compliance Officer of SEI Asset Allocation Trust, SEI Daily Income Trust, SEI Institutional Investments Trust, SEI Institutional International Trust, SEI Institutional Managed Trust, SEI Tax Exempt Trust, Adviser Managed Trust, New Covenant Funds, SEI Catholic Values Trust, SEI Exchange Traded Funds, SEI Structured Credit Fund, L.P., The Advisors' Inner Circle Fund, The Advisors' Inner Circle Fund II, The Advisors' Inner Circle Fund III, Bishop Street Funds, Frost Family of Funds, Gallery Trust, Delaware Wilshire Private Markets Fund, Delaware Wilshire Private Markets Master Fund, Delaware Wilshire Private Markets Tender Fund and Catholic Responsible Investments Funds since September 2022. Fund Compliance Officer of SEI Investments Company from February 2011 to September 2022. Fund Accounting Director and CFO and Controller for the SEI Funds from July 2005 to February 2011. | N/A | N/A |
Timothy D Barto One Freedom Valley Drive Oaks, PA 19456 55 yrs. old | Vice President and Secretary | since 2012 | Vice President and Secretary of SEI Institutional Transfer Agent, Inc. since 2009. General Counsel and Secretary of SIMC since 2004. Vice President of SIMC and the Administrator since 1999. Vice President and Assistant Secretary of SEI since 2001. | N/A | N/A |
David F. McCann One Freedom Valley Drive, Oaks, PA 19456 47 yrs. old | Vice President and Assistant Secretary | since 2012 | General Counsel and Secretary of SEI Institutional Transfer Agent, Inc. since 2020. Vice President and Assistant Secretary of SEI Institutional Transfer Agent, Inc. from 2009-2020. Vice President and Assistant Secretary of SIMC since 2008. Attorney, Drinker Biddle & Reath, LLP (law firm), May 2005 - October 2008. | N/A | N/A |
Katherine Mason One Freedom Valley Drive Oaks, PA 19456 43 yrs. Old | Vice President and Assistant Secretary | since 2022 | Consulting Attorney, Hirtle, Callaghan & Co. from October 2021 – June 2022. Attorney, Stradley Ronon Stevens & Young from September 2007 – July 2012. | N/A | N/A |
Stephen G. MacRae One Freedom Valley Drive, Oaks, PA 19456 55 yrs. old | Vice President | since 2012 | Director of Global Investment Product Management since January 2004. | N/A | N/A |
Donald Duncan One Freedom Valley Drive Oaks, PA 19456 59 yrs. old | Anti-Money Laundering Compliance Officer and Privacy Officer | since 2023 | Anti-Money Laundering Compliance Officer and Privacy Officer of SEI Asset Allocation Trust, SEI Institutional International Trust, SEI Institutional Investments Trust, SEI Institutional Managed Trust, SEI Tax Exempt Trust, Adviser Managed Trust, New Covenant Funds, SEI Catholic Values Trust, SEI Exchange Traded Funds since 2023. Chief Compliance Officer and Global Head of Anti-Money Laundering Strategy of SEI Investments Company since January 2023. Head of Global Anti-Money Laundering Program for Hamilton Lane Advisors, LLC from August 2021 until December 2022. Senior VP and Supervising Principal of Hamilton Lane Securities, LLC from June 2016 to August 2021. Senior Director at AXA-Equitable from June 2011 until May 2016. Senior Director at PRUCO Securities, a subsidiary of Prudential Financial, Inc. from October 2005 until December 2009. | N/A | N/A |
82
New Covenant Funds
1 | Each trustee shall hold office during the lifetime of this Trust until the election and qualification of his or her successor, or until he or she sooner dies, resigns or is removed in accordance with the Trust’s Declaration of Trust. |
2 | The Fund Complex includes the following Trusts: SEI Asset Allocation Trust, SEI Daily Income Trust, SEI Institutional Investments Trust, Adviser Managed Trust, SEI Institutional International Trust, SEI Institutional Managed Trust, SEI Tax Exempt Trust, SEI Catholic Values Trust, New Covenant Funds and SEI Exchange Traded Funds. |
3 | Prior to August 2, 2023, Ankit Puri served as the Controller and Chief Financial Officer. |
New Covenant Funds
83
DISCLOSURE OF FUND EXPENSES (Unaudited)
June 30, 2023
All mutual funds have operating expenses. As a shareholder of a mutual fund, your investment is affected by these ongoing costs, which include (among others) costs for portfolio management, administrative services, and shareholder reports like this one. It is important for you to understand the impact of these costs on your investment returns.
Operating expenses such as these are deducted from the mutual fund‘s gross income and directly reduce its final investment return. These expenses are expressed as a percentage of the mutual fund’s average net assets; this percentage is known as the mutual fund’s expense ratio.
The following examples use the expense ratio and are intended to help you understand the ongoing costs (in dollars) of investing in your Fund and to compare these costs with those of other mutual funds. The examples are based on an investment of $1,000 made at the beginning of the period shown and held for the entire period (January 1, 2023 to June 30, 2023).
The table on this page illustrates your Fund’s costs in two ways:
Actual Fund Return: This section helps you to estimate the actual expenses after fee waivers that your Fund incurred over the period. The “Expenses Paid During Period” column shows the actual dollar expense cost incurred by a $1,000 investment in the Fund, and the “Ending Account Value” number is derived from deducting that expense cost from the Fund’s gross investment return.
You can use this information, together with the actual amount you invested in your Fund, to estimate the expenses you paid over that period. Simply divide your actual starting account value by $1,000 to arrive at a ratio (for example, an $8,600 account value divided by $1,000 = 8.6), then multiply that ratio by the number shown for your Fund under “Expenses Paid During Period.”
Hypothetical 5% Return: This section helps you compare your Fund’s costs with those of other mutual funds. It assumes that your Fund had an annual 5% return before expenses during the year, but that the expense ratio (Column 3) is unchanged. This example is useful in making comparisons because the Securities and Exchange Commission requires all mutual funds to make this 5% calculation. You can assess your Fund’s comparative cost by comparing the hypothetical result for your Fund in the “Expenses Paid During Period” column with those that appear in the same charts in the shareholder reports for other mutual funds.
NOTE: Because the return is set at 5% for comparison purposes — NOT your Fund’s actual return — the account values shown do not apply to your specific investment.
Beginning | Ending | Annualized | Expenses | |
Growth Fund | ||||
Actual Fund Return | $ 1,000.00 | $1,159.20 | 0.72% | $3.85 |
Hypothetical 5% Return | $ 1,000.00 | $1,021.22 | 0.72% | $3.61 |
Income Fund | ||||
Actual Fund Return | $ 1,000.00 | $1,017.84 | 0.80% | $4.00 |
Hypothetical 5% Return | $ 1,000.00 | $1,020.83 | 0.80% | $4.01 |
Balanced Growth Fund | ||||
Actual Fund Return | $ 1,000.00 | $1,100.74 | 0.13% | $0.68 |
Hypothetical 5% Return | $ 1,000.00 | $1,024.15 | 0.13% | $0.65 |
Balanced Income Fund | ||||
Actual Fund Return | $ 1,000.00 | $1,065.42 | 0.15% | $0.77 |
Hypothetical 5% Return | $1,000.00 | $1,024.05 | 0.15% | $0.75 |
* Expenses are equal to the Fund’s annualized expense ratio multiplied by the average account value over the period, multiplied by 181/365 (to reflect the one-half year period shown). |
84
New Covenant Funds
BOARD OF TRUSTEES CONSIDERATIONS IN APPROVING THE ADVISORY AND SUB-ADVISORY AGREEMENTS (Unaudited)
New Covenant Funds (the “Trust”) and SEI Investments Management Corporation (“SIMC”) have entered into an investment advisory agreement (the “Advisory Agreement”), pursuant to which SIMC provides investment advisory services to the series of the Trust (the “Funds”). Pursuant to separate sub-advisory agreements with SIMC (the “Sub-Advisory Agreements” and, together with the Advisory Agreement, the “Investment Advisory Agreements”), and under the supervision of SIMC and the Trust’s Board of Trustees (each member, a “Trustee” and, collectively, the “Trustees” or the “Board”), the sub-advisers (each, a “Sub-Adviser” and collectively, the “Sub-Advisers”) provide security selection and certain other advisory services with respect to all or a discrete portion of the assets of the Funds. The Sub-Advisers are also responsible for managing their employees who provide services to the Funds. The Sub-Advisers are selected based primarily upon the research and recommendations of SIMC, which evaluates quantitatively and qualitatively the Sub-Advisers’ skills and investment results in managing assets for specific asset classes, investment styles and strategies.
The Investment Company Act of 1940, as amended (the “1940 Act”), requires that the initial approval of a Fund’s Investment Advisory Agreements be specifically approved by the vote of a majority of the outstanding shareholders of the Funds and the vote of a majority of the Trustees who are not parties to the Investment Advisory Agreements or “interested persons” of any party (the “Independent Trustees”) cast in person (or otherwise, as consistent with applicable laws, regulations and related guidance and relief) at a meeting called for such purpose. In addition, the 1940 Act requires that the continuation or renewal of any Investment Advisory Agreement be approved at least annually (after an initial period of up to two years), which also requires the vote of a majority of the Board, including a majority of the Independent Trustees. In connection with their consideration of such renewals, the Funds’ Trustees must request and evaluate, and SIMC and the Sub-Advisers are required to furnish, such information as may be reasonably necessary to evaluate the terms of the Investment Advisory Agreements. In addition, the Securities and Exchange Commission takes the position that, as part of their fiduciary duties with respect to a mutual fund’s fees, mutual fund boards are required to evaluate the material factors applicable to a decision to renew an Investment Advisory Agreement.
Consistent with these responsibilities, the Board calls and holds meetings each year to consider whether to approve new and/or renew existing Investment Advisory Agreements between the Trust and SIMC and SIMC and the Sub-Advisers with respect to the Funds of the Trust. In preparation for these meetings, the Board requests and reviews a wide variety of materials provided by SIMC and the Sub-Advisers, including information about SIMC’s and the Sub-Advisers’ affiliates, personnel and operations and the services provided pursuant to the Investment Advisory Agreements. The Board also receives data from third parties. This information is provided in addition to the detailed information about the Funds that the Board reviews during the course of each year, including information that relates to Fund operations and Fund performance. The Trustees also receive a memorandum from counsel regarding the responsibilities of Trustees in connection with their consideration of whether to renew the Trust’s Investment Advisory Agreements. Finally, the Independent Trustees receive advice from independent counsel to the Independent Trustees, meet in executive sessions outside the presence of Fund management and participate in question and answer sessions with representatives of SIMC and the Sub-Advisers.
Specifically, during the course of the Trust’s fiscal year, the Board requested and received written materials from SIMC and the Sub-Advisers regarding: (i) the quality of SIMC’s and the Sub-Advisers’ investment management and other services; (ii) SIMC’s and the Sub-Advisers’ investment management personnel; (iii) SIMC’s and the Sub-Advisers’ operations and financial condition; (iv) SIMC’s and the Sub-Advisers’ brokerage practices (including any soft dollar arrangements) and investment strategies; (v) the level of the advisory fees that SIMC charges the Funds and the level of the sub-advisory fees that SIMC pays the Sub-Advisers, compared with fees each charge to comparable accounts; (vi) the advisory fees charged by SIMC and the Funds’ overall fees and operating expenses compared with peer groups of mutual funds prepared by Broadridge, an independent provider of investment company data that was engaged to prepare an assessment of the Funds in connection with the renewal of the Investment Advisory Agreements (the “Broadridge Report”); (vii) the level of SIMC’s and the Sub-Advisers’ profitability from their Fund-related operations; (viii) SIMC’s and the Sub-Advisers’ compliance program, including a description of material compliance matters and material compliance violations; (ix) SIMC’s potential economies of scale; (x) SIMC’s and the Sub-Advisers’ policies on and compliance procedures for personal securities transactions; (xi) SIMC’s and the Sub-Advisers’ expertise and resources in domestic and/or international financial markets; and (xii) the Funds’ performance over various periods of time compared with peer groups of mutual funds prepared by Broadridge and the Funds’ benchmark indexes.
At the March 20-22, 2023 meeting of the Board, the Trustees, including a majority of the Independent Trustees, approved the renewal of the Advisory Agreement. Also, each Sub-Advisory Agreement was renewed at meetings of the Board held during the course of the Trust’s fiscal year on September 6-8, 2022 and December 5-7, 2022. In each case, the Board’s
New Covenant Funds
85
BOARD OF TRUSTEES CONSIDERATIONS IN APPROVING THE ADVISORY AND SUB-ADVISORY AGREEMENTS (Unaudited) (Concluded)
renewal was based on its consideration and evaluation of the factors described above, as discussed at the meetings and at prior meetings. The following discusses some, but not all, of the factors that were considered by the Board in connection with its assessment of the Investment Advisory Agreements.
Nature, Extent and Quality of Services. The Board considered the nature, extent and quality of the services provided by SIMC and the Sub-Advisers to the Funds and the resources of SIMC and the Sub-Advisers and their affiliates dedicated to the Funds. In this regard, the Trustees evaluated, among other things, SIMC’s and each Sub-Adviser’s personnel, experience, track record and compliance program. Following evaluation, the Board concluded that, within the context of its full deliberations, the nature, extent and quality of services provided by SIMC and the Sub-Advisers to the Funds and the resources of SIMC and the Sub-Advisers and their affiliates dedicated to the Funds were sufficient to support the renewal of the Investment Advisory Agreements. In addition to advisory services, the Board considered the nature and quality of certain administrative, transfer agency and other non-investment advisory services provided to the Funds by SIMC and/or its affiliates.
Performance. In determining whether to renew SIMC’s Advisory Agreement, the Trustees considered the Funds’ performance relative to their peer groups and appropriate indexes/benchmarks. The Trustees reviewed performance information for each Fund, noting that they receive performance reports that permit them to monitor each Fund’s performance at board meetings throughout the year. As part of this review, the Trustees considered the composition of each peer group and selection criteria. In assessing Fund performance, the Trustees considered the Broadridge Report. The Broadridge Report included metrics on risk analysis, volatility versus total return, net total return and performance consistency for the Funds and a universe of comparable funds. Based on the materials considered and discussed at the meetings, the Trustees found Fund performance satisfactory, or, where performance was materially below the benchmark and/or peer group, the Trustees were satisfied with the reasons provided to explain such performance. In connection with the renewal of Sub-Advisory Agreements, the Board considered the performance of the Sub-Adviser relative to appropriate indexes/benchmarks. Following evaluation, the Board concluded that, within the context of its full deliberations, the performance of the Funds was sufficient to support renewal of SIMC’s Advisory Agreement, and the performance of each Sub-Adviser was sufficient to support the renewal of the Sub-Advisory Agreement.
Fees. With respect to the Funds’ expenses under the Investment Advisory Agreements, the Trustees considered the rate of compensation called for by the Investment Advisory Agreements and the Funds’ net operating expense ratios in comparison to those of the Funds’ respective peer groups. In assessing Fund expenses, the Trustees considered the information in the Broadridge Report, which included various metrics related to fund expenses, including, but not limited to, contractual management fees at various asset levels, actual management fees (including transfer agent expenses), and actual total expenses (including underlying fund expenses) for the Funds and a universe of comparable funds. Based on the materials considered and discussion at the meetings, the Trustees further determined that fees were either shown to be below the peer average in the comparative fee analysis, or that there was a reasonable basis for the fee level. The Trustees also considered the effects of SIMC’s and its affiliates’ voluntary waivers of management and other fees to prevent total Fund operating expenses from exceeding any applicable cap and concluded that SIMC, through waivers, has maintained the Funds’ net operating expenses at competitive levels for its distribution channels. In determining the appropriateness of fees, the Board also took into consideration the impact of fees incurred indirectly by the Funds as a result of investments into underlying funds, including funds from which SIMC or its affiliates earn fees. The Board also took into consideration compensation earned from the Funds by SIMC or its affiliates for non-advisory services, such as administration, transfer agency, shareholder services or brokerage, and considered whether SIMC and its affiliates may have realized other benefits from their relationship with the Funds, such as any research and brokerage services received under soft dollar arrangements. When considering fees paid to Sub-Advisers, the Board took into account the fact that the Sub-Advisers are compensated by SIMC and not by the Funds directly, and that such compensation with respect to any unaffiliated Sub-Adviser reflects an arms-length negotiation between the Sub-Adviser and SIMC. Following evaluation, the Board concluded that, within the context of its full deliberations, the expenses of the Funds are reasonable and supported the renewal of the Investment Advisory Agreements. The Board also considered whether the Sub-Advisers and their affiliates may have realized other benefits from their relationship with the Funds, such as any research and brokerage services received under soft dollar arrangements.
Profitability. With regard to profitability, the Trustees considered compensation flowing to SIMC and the Sub-Advisers and their affiliates, directly or indirectly. The Trustees considered whether the levels of compensation and profitability were reasonable. As with the fee levels, when considering the profitability of the Sub-Advisers, the Board took into account the fact that compensation with respect to any unaffiliated Sub-Adviser reflects an arms-length negotiation between the Sub-Adviser and SIMC. In connection with the renewal of each Sub-Advisory Agreement, the Board also took into consideration
86
New Covenant Funds
the impact that the fees paid to the Sub-Adviser have on SIMC’s advisory fee margin and profitability. Based on this evaluation, the Board concluded that, within the context of its full deliberations, the profitability of each of SIMC and the Sub-Advisers is reasonable and supported the renewal of the Investment Advisory Agreements.
Economies of Scale. With respect to the Advisory Agreement, the Trustees considered whether any economies of scale were being realized by SIMC and its affiliates and, if so, whether the benefits of such economies of scale were passed along to the Funds’ shareholders through a graduated investment advisory fee schedule or other means, including any fee waivers by SIMC and its affiliates. The Trustees recognized that economies of scale are difficult to identify and quantify and are rarely identifiable on a fund-by-fund basis. Based on this evaluation, the Board determined that the fees were reasonable in light of the information that was provided by SIMC with respect to economies of scale.
Based on the Trustees’ deliberation and their evaluation of the information described above, the Board, including all of the Independent Trustees, with the assistance of Fund counsel and Independent Trustees’ counsel, unanimously approved the renewal of the Investment Advisory Agreements and concluded that the compensation under the Investment Advisory Agreements is fair and reasonable in light of such services and expenses and such other matters as the Trustees considered to be relevant in the exercise of their reasonable judgment. In the course of its deliberations, the Board did not identify any particular factor (or conclusion with respect thereto) or single piece of information that was all-important, controlling or determinative of its decision, but considered all of the factors together, and each Trustee may have attributed different weights to the various factors (and conclusions with respect thereto) and information.
REVIEW OF LIQUIDITY RISK MANAGEMENT PROGRAM
Pursuant to Rule 22e-4 under the 1940 Act, the Trust, on behalf of the Funds, has adopted a liquidity risk management program (the “Program”) to govern the Trust’s approach to managing liquidity risk. The Program is overseen by the SIMC Liquidity Risk Oversight Committee, and the Program’s principal objectives include assessing, managing and periodically reviewing each Fund’s liquidity risk, based on factors specific to the circumstances of the Fund.
At a meeting of the Board held on March 20-22, 2023, the Trustees received a report from the SIMC Liquidity Risk Oversight Committee addressing the operations of the Program and assessing its adequacy and effectiveness of implementation. The SIMC Liquidity Risk Oversight Committee determined, and reported to the Board, that the Program remains reasonably designed to assess and manage each Fund’s liquidity risk and that the Program adequately and effectively managed each Fund’s liquidity risk during the 2022 calendar year. The SIMC Liquidity Risk Oversight Committee also reported that with respect to the Trust there were no reportable liquidity events during the period. The SIMC Liquidity Risk Oversight Committee noted that additional monitoring processes, including manual reviews of upcoming market closures, have been implemented.
There can be no assurance that the Program will achieve its objectives in the future. Please refer to the prospectus for more information regarding a Fund’s exposure to liquidity risk and other principal risks to which an investment in the Funds may be subject.
New Covenant Funds
87
NOTICE TO SHAREHOLDERS (Unaudited)
For shareholders who do not have a June 30, 2023 taxable year end, this notice is for information purposes only. For shareholders with a June 30, 2023 taxable year end, please consult your tax adviser as to the pertinence of this notice.
For the fiscal year ended June 30, 2023, the Funds are designating long term and qualifying dividend income with regard to distributions paid during the year as follows:
(A) | (B) | (C) | Total | (D) | ||||||||||||||||
Growth Fund | 49.14% | 0.00% | 50.86% | 100.00% | 97.87% | |||||||||||||||
Income Fund | 0.00% | 0.00% | 100.00% | 100.00% | 100.00% | |||||||||||||||
Balanced Growth Fund | 71.27% | 0.00% | 28.73% | 100.00% | 38.53% | |||||||||||||||
Balanced Income Fund | 44.83% | 0.00% | 55.17% | 100.00% | 19.12% | |||||||||||||||
(E) | (F) | Interest | Short-Term | Qualifying Business Income (6) | ||||||||||||||||
Growth Fund | 98.07% | 0.00% | 0.75% | 100.00% | 4.60% | |||||||||||||||
Income Fund | 0.00% | 10.71% | 98.00% | 0.00% | 0.00% | |||||||||||||||
Balanced Growth Fund | 39.43% | 0.00% | 0.00% | 0.00% | 0.00% | |||||||||||||||
Balanced Income Fund | 19.16% | 0.00% | 0.00% | 0.00% | 0.00% | |||||||||||||||
(1) Qualifying dividends represent dividends which qualify for the corporate dividends received deduction.
(2) The percentage in this column represents the amount of ‘‘Qualifying Dividend Income’’ and is reflected as a percentage of ‘‘Ordinary Income Distributions.’’ It is the intention of each of the aforementioned Funds to designate the maximum amount permitted by law. The information reported herein may differ from the information and distributions taxable to the shareholders for the calendar year ending December 31, 2023. Complete information will be computed and reported in conjunction with your 2023 Form 1099-DIV.
(3) ‘‘U.S. Government Interest’’ represents the amount of interest that was derived from direct U.S. Government obligations and distributed during the fiscal year. This amount is reflected as a percentage of total ordinary income distributions (the total of short-term capital gain and net investment income distributions). Generally, interest from direct U.S. Government obligations is exempt from state income tax. However, for shareholders who are residents of California, Connecticut and New York, the statutory threshold requirements were not satisfied to permit exemption of these amounts from state income.
(4) The percentage in this column represents the amount of “Interest Related Dividends” and is reflected as a percentage of net investment income distributions that is exempt from U.S. withholding tax when paid to foreign investors.
(5) The percentage in this column represents the amount of “Short-Term Capital Gain Dividends” and is reflected as a percentage of short-term capital gain distributions that is exempt from U.S. withholding tax when paid to foreign investors.
(6) The percentage in this column represents the amount of ordinary dividend income that qualified for 20% Business Income Deduction.
Items (A), (B) and (C) are based on the percentage of each Fund’s total distribution.
Items (D) and (E) are based on the percentage of ordinary income distributions of each Fund.
Item (F) is based on the percentage of gross income of each Fund.
Please consult your tax adviser for proper treatment of this information. This notification should be kept with your permanent tax records.
88
New Covenant Funds
NEW COVENANT FUNDS ANNUAL REPORT JUNE 30, 2023
Trustees
Robert A. Nesher, Chairman
William M. Doran
Nina Lesavoy
James M. Williams
Hubert L. Harris, Jr.
Susan C. Cote
James B. Taylor
Christine Reynolds
Officers
Robert A. Nesher
President and Chief Executive Officer
Glenn R. Kurdziel
Controller and Chief Financial Officer
Stephen Panner
Chief Compliance Officer
Timothy D. Barto
Vice President, Assistant Secretary
David F. McCann
Vice President, Assistant Secretary
Katie Mason
Vice President, Assistant Secretary
Stephen G. MacRae
Vice President
Donald Duncan
Anti-Money Laundering Compliance Officer
Privacy Officer
Investment Adviser
SEI Investments Management Corporation
Administrator
SEI Investments Global Funds Services
Distributor
SEI Investments Distribution Co.
Legal Counsel
Morgan, Lewis & Bockius LLP
Independent Registered Public Accounting Firm
KPMG LLP
This report and the financial statements contained herein are submitted for the general information of the shareholders of the Trust and must be preceded or accompanied by a current prospectus. Shares of the Funds are not deposits or obligations of, or guaranteed or endorsed by, any bank. The shares are not federally insured by the Federal Deposit Insurance Corporation (FDIC), the Federal Reserve Board, or any other government agency. Investment in the shares involves risk, including the possible loss of principal.
For more information call
New Covenant Fund
877-835-4531

 | NEW COVENANT FUNDS® |
NF-ANNUAL (06/23)
Item 2. Code of Ethics.
The Registrant has adopted a code of ethics that applies to the Registrant’s principal executive officer, principal financial officer, principal accounting officer or controller, or persons performing similar functions.
Item 3. Audit Committee Financial Expert.
(a) (1) The Registrant’s Board of Trustees has determined that the Registrant has two audit committee financial experts serving on the audit committee.
(a) (2) The audit committee financial experts are Susan C. Cote and Hubert L. Harris, Jr. Ms. Cote and Mr. Harris are independent as defined in Form N-CSR Item 3 (a) (2).
Item 4. Principal Accountant Fees and Services.
Fees billed by KPMG LLP (“KPMG”) related to the Registrant.
KPMG billed the Registrant aggregate fees for services rendered to the Registrant for the fiscal years 2023 and 2022 as follows:
| Fiscal Year 2023 | Fiscal Year 2022 | |||||||
| All fees and services to the Registrant that were pre-approved | All fees and services to service affiliates that were pre-approved | All other fees and services to service affiliates that did not require pre-approval | All fees and services to the Registrant that were pre-approved | All fees and services to service affiliates that were pre-approved | All other fees and services to service affiliates that did not require pre-approval | |||
| (a) | Audit Fees(1) | $77,330 | N/A | $0 | $73,330 | N/A | $0 | |
| (b) | Audit-Related Fees | $0 | $0 | $0 | $0 | $0 | $0 | |
| (c) | Tax Fees | $0 | $0 | $0 | $0 | $0 | $0 | |
| (d) | All Other Fees(2) | $0 | $301,000 | $0 | $0 | $331,000 | $0 | |
Notes:
| (1) | Audit fees include amounts related to the audit of the Registrant’s annual financial statements and services normally provided by the accountant in connection with statutory and regulatory filings. |
| (2) | See Item 4(g) for a description of the services comprising the fees disclosed in this category. |
(e)(1) The Registrant’s Audit Committee has adopted and the Board of Trustees has ratified an Audit and Non-Audit Services Pre-Approval Policy (the “Policy”), which sets forth the procedures and the conditions pursuant to which services proposed to be performed by the independent auditor of the Registrant may be pre-approved. In any instance where services require pre-approval, the Audit Committee will consider whether such services are consistent with SEC’s rules on auditor independence and whether the provision of such services would compromise the auditor’s independence.
The Policy provides that all requests or applications for proposed services to be provided by the independent auditor must be submitted to the Registrant’s Chief Financial Officer (“CFO”) and must include a detailed description of the services proposed to be rendered. The CFO will determine whether such services: (1) require specific pre-approval; (2) are included within the list of services that have received the general pre-approval of the Audit Committee pursuant to the Policy; or (3) have been previously pre-approved in connection with the independent auditor’s annual engagement letter for the applicable year or otherwise.
Requests or applications to provide services that require specific pre-approval by the Audit Committee will be submitted to the Audit Committee by the CFO. The Audit Committee has delegated specific pre-approval authority to either the Audit Committee Chair or financial experts, provided that the estimated fee for any such proposed pre-approved service does not exceed $100,000 and any pre-approval decisions are reported to the Audit Committee at its next regularly scheduled meeting.
Services that have received the general pre-approval of the Audit Committee are identified and described in the Policy. In addition, the Policy sets forth a maximum fee per engagement with respect to each identified service that has received general pre-approval. The Audit Committee will annually review and pre-approve the services that may be provided by the independent auditor during the following twelve months without obtaining specific pre-approval from the Audit Committee.
The Audit Committee will be informed by the CFO on a quarterly basis of all services rendered by the independent auditor.
All services to be provided by the independent auditor shall be provided pursuant to a signed written engagement letter with the Registrant, the investment advisor or applicable control affiliate (except that matters as to which an engagement letter would be impractical because of timing issues or because the matter is small may not be the subject of an engagement letter) that sets forth both the services to be provided by the independent auditor and the total fees (or the manner of their determination) to be paid to the independent auditor for those services.
In addition, the Audit Committee has determined to take additional measures on an annual basis to meet its responsibility to oversee the work of the independent auditor and to assure the auditor's independence from the Registrant, such as reviewing a formal written statement from the independent auditor delineating all relationships between the independent auditor and the Registrant, and discussing with the independent auditor its methods and procedures for ensuring independence.
(e)(2) Percentage of fees billed applicable to non-audit services pursuant to waiver of pre-approval requirement were as follows:
| Fiscal Year 2023 | Fiscal Year 2022 | |
Audit-Related Fees | 0% | 0% |
| Tax Fees | 0% | 0% |
All Other Fees | 0% | 0% |
(f) Not Applicable.
(g)(1) The aggregate non-audit fees and services billed by KPMG for the fiscal years 2023 and 2022 were $301,000 and $331,000, respectively. Non-audit fees consist of SSAE No. 16 review of fund accounting and administration operations and an attestation report in accordance with Rule 17Ad-13.
(h) During the past fiscal year, the Registrant’s principal accountant provided certain non-audit services to the Registrant’s investment adviser or to entities controlling, controlled by, or under common control with the Registrant’s investment adviser that provide ongoing services to the Registrant that were not subject to pre-approval pursuant to paragraph (c)(7)(ii) of Rule 2-01 of Regulation S-X. The Audit Committee of the Registrant’s Board of Trustees reviewed and considered these non-audit services provided by the Registrant’s principal accountant to the Registrant’s affiliates, including whether the provision of these non-audit services is compatible with maintaining the principal accountant’s independence.
(i) Not applicable.
(j) Not applicable.
Item 5. Audit Committee of Listed Registrants.
Not applicable.
Item 6. Investments.
(a) The Schedules of Investments in securities of unaffiliated issuers as of the close of the reporting period for the New Covenant Growth Fund, New Covenant Income Fund, New Covenant Balanced Growth Fund and New Covenant Balanced Income Fund are included as part of the report to shareholders filed under Item 1 of this form.
Item 7. Disclosure of Proxy Voting Policies and Procedures for Closed-End Management Investment Companies.
Not applicable.
Item 8. Portfolio Managers of Closed-End Management Investment Companies.
Not applicable.
Item 9. Purchases of Equity Securities by Closed-End Management Investment Company and Affiliated Purchasers.
Not applicable.
Item 10. Submission of Matters to a Vote of Security Holders.
There have been no material changes to the procedures by which shareholders may recommend nominees to the Registrant’s Board of Trustees (the “Board”). The Registrant has a standing Governance Committee (the “Committee”) currently consisting of the Independent Trustees. The Committee is responsible for evaluating and recommending nominees for election to the Board. Pursuant to the Committee’s Charter, adopted on February 22, 2012, the Committee will review all shareholder recommendations for nominations to fill vacancies on the Board if such recommendations are submitted in writing and addressed to the Committee at the Registrant’s office.
Item 11. Controls and Procedures.
(a) The Registrant’s principal executive and principal financial officers, or persons performing similar functions, have concluded that the Registrant’s disclosure controls and procedures (as defined in Rule 30a-3(c) under the Investment Company Act of 1940 (the “1940 Act��)) are effective, based on the evaluation of these controls and procedures required by Rule 30a-3(b) under the 1940 Act and Rules 13a-15(b) or 15d-15(b) under the Securities Exchange Act of 1934 as of a date within 90 days of the filing date of this report.
(b) There were no changes in the Registrant’s internal control over financial reporting (as defined in Rule 30a-3(d) under the 1940 Act) that occurred during the period covered by this report that have materially affected, or are reasonably likely to materially affect, the Registrant’s internal control over financial reporting.
Item 12. Disclosure of Securities Lending Activities for Closed-End Management Investment Companies.
Not applicable.
Item 13. Exhibits.
(a)(1) Code of Ethics attached hereto.
SIGNATURES
Pursuant to the requirements of the Securities Exchange Act of 1934 and the Investment Company Act of 1940, the Registrant has duly caused this report to be signed on its behalf by the undersigned, thereunto duly authorized.
| New Covenant Funds | ||
| By | /s/ Robert A. Nesher | |
| Robert A. Nesher | ||
| President & CEO |
Date: September 7, 2023
Pursuant to the requirements of the Securities Exchange Act of 1934 and the Investment Company Act of 1940, this report has been signed below by the following persons on behalf of the Registrant and in the capacities and on the dates indicated.
| By | /s/ Robert A. Nesher | |
| Robert A. Nesher | ||
| President & CEO |
Date: September 7, 2023
| By | /s/ Glenn Kurdziel | |
| Glenn Kurdziel | ||
| Controller & CFO |
Date: September 7, 2023