
> | For the fiscal year ended November 30, 2007, Vanguard Massachusetts Tax-Exempt Fund returned 2.2%. This performance was 1 percentage point ahead of the average return of the fund’s peers, but it lagged the gain of the benchmark index. |
> | After rising for three years, interest rates began to decline in midsummer as investors became more concerned about the larger impact of subprime lending woes. The Federal Reserve Board stepped in during, and after, the period, lowering interest rate targets to address concerns about liquidity and a slowing economy. |
Contents | |
| |
Your Fund’s Total Returns | 1 |
Chairman’s Letter | 2 |
Advisor’s Report | 7 |
Fund Profile | 10 |
Performance Summary | 11 |
Financial Statements | 13 |
About Your Fund’s Expenses | 28 |
Glossary | 30 |
Please note: The opinions in this report are just that – informed opinions. They should not be considered promises or advice. Also, please keep in mind that the opinions cover the period through the date on the cover of this report. Of course, the risks of investing in your fund are spelled out in the prospectus.
Your Fund’s Total Returns
Fiscal Year Ended November 30, 2007 | | |
| Ticker | Total |
| Symbol | Returns |
Vanguard Massachusetts Tax-Exempt Fund | VMATX | 2.2% |
SEC 30-Day Annualized Yield: 3.90% | | |
Taxable-Equivalent Yield: 6.34%1 | | |
Lehman 10 Year Municipal Bond Index | | 3.5 |
Average Massachusetts Municipal Debt Fund2 | | 1.2 |
Your Fund’s Performance at a Glance | | |
November 30, 2006–November 30, 2007 | Distributions Per Share |
| Starting Share Price | Ending Share Price | Income Dividends | Capital Gains |
Vanguard Massachusetts Tax-Exempt Fund | $10.33 | $10.12 | $0.424 | $0.000 |
1 | This calculation, which assumes a typical itemized tax return, is based on the maximum federal tax rate of 35% and the maximum commonwealth of Massachusetts income tax rate. Local taxes were not considered. Please see the prospectus for a detailed explanation of the calculation. |
2 | Derived from data provided by Lipper Inc. |
1

Chairman’s Letter
Dear Shareholder,
The past fiscal year was a tale of two markets. For most of this period, concerns about inflation drove interest rates higher (and bond prices lower), especially at the longer end of the maturity spectrum. Beginning in midsummer, however, as the subprime mortgage crisis reverberated through the markets, investors bid up ultra-safe U.S. Treasury securities, driving their yields lower. These interest rate dynamics were less pronounced in the tax-exempt bond market, and on balance, municipal securities lagged their Treasury counterparts. As municipal bond prices declined, their tax-exempt yields increased to exceptionally attractive levels relative to taxable bond yields.
In this environment, Vanguard Massachusetts Tax-Exempt Fund returned 2.2% for the 12 months ended November 30. The fund’s yield at fiscal year-end was 3.90%, up from 3.79% a year earlier. The fund’s taxable-equivalent yield at November 30 was 6.34% for investors in the highest income tax bracket.
Federal Reserve rate cuts depressed short-term yields
Ongoing turmoil in the subprime lending market engendered a “flight to quality” that drove prices of U.S. Treasury bonds
2
sharply higher, and as the bonds’ prices rose, their yields fell. Declines in Treasury yields were steepest at the short end of the maturity spectrum.
The declines were prompted largely by the actions of the Federal Reserve Board, which cut its target for the federal funds rate on two separate occasions. (On December 11, 2007, after the end of the fiscal period, the central bank again lowered the target for short-term interest rates by 0.25 percentage point, to 4.25%.) The yield of the 3-month Treasury bill, which started the fiscal year at 5.02%, had dropped nearly 2 percentage points, to 3.15%, by the end of the period.
The broad taxable bond market returned 6.0% for the fiscal 12 months. Returns from tax-exempt municipal bonds were lower, at 2.7%.
A volatile stock market produced solid gains
Although the U.S. economy began to slow toward the end of the fiscal year, stocks produced solid returns for the 12 months. These gains came despite a recession in housing and intensified problems among subprime mortgage-loan lenders—problems that first erupted in midsummer and continued to rattle the financial markets for the remainder of the period. In November, the stock market was quite volatile, as crude oil prices hovered near
Market Barometer | | | |
| Average Annual Total Returns |
| Periods Ended November 30, 2007 |
| One Year | Three Years | Five Years |
Bonds | | | |
Lehman U.S. Aggregate Bond Index (Broad taxable market) | 6.0% | 4.8% | 4.8% |
Lehman Municipal Bond Index | 2.7 | 4.2 | 4.7 |
Citigroup 3-Month Treasury Bill Index | 4.9 | 4.1 | 2.9 |
| | | |
Stocks | | | |
Russell 1000 Index (Large-caps) | 7.8% | 10.6% | 12.3% |
Russell 2000 Index (Small-caps) | –1.2 | 7.9 | 14.9 |
Dow Jones Wilshire 5000 Index (Entire market) | 7.6 | 10.7 | 12.9 |
MSCI All Country World Index ex USA (International) | 22.5 | 22.7 | 24.1 |
| | | |
CPI | | | |
Consumer Price Index | 4.3% | 3.2% | 3.0% |
3
historic highs while the U.S. dollar continued to lose ground against other major currencies.
The broad U.S. stock market returned 7.6% for the year. Returns from large-capitalization stocks far outpaced those of small-cap issues, and growth stocks outperformed their value-oriented counterparts.
International stocks continued to outpace domestic issues. Emerging-markets stocks did particularly well, followed by stocks in Europe and the Pacific regions—excluding Japan, where returns were slight. The dollar’s ongoing weakness further enhanced international markets’ gains for U.S.-based investors.
Portfolios skillfully navigated choppy waters
During the second half of fiscal-year 2007, U.S. Treasury securities outperformed almost all other fixed income investments, from below-investment-grade bonds to AAA tax-exempt securities. Investors seeking refuge in virtually risk-free securities drove Treasury yields lower and prices higher. The relative performance of muni bonds was also held in check by a significant increase in supply. Nationwide, total tax-exempt issuance increased almost 25% for the 12 months ended November 30, and is on track to reach a new yearly record in calendar 2007.
Compared with Treasury bonds, interest rate movements among tax-exempt bonds were more subdued, though still
Total Returns | | |
December 9, 19981–November 30, 2007 | | |
| Average |
| Annual Return |
| | Average |
| Vanguard | Competing |
| Fund | Fund2 |
Massachusetts Tax-Exempt Fund | 4.7% | 4.0% |
|
The figures shown represent past performance, which is not a guarantee of future |
results. (Current performance may be lower or higher than the performance data cited. |
For performance data current to the most recent month- website at |
www.vanguard.com/performance.) Note, too, that both investment returns and principal |
value can fluctuate widely, so an investor’s shares, when sold, could be worth more or |
less than their original cost. |
1 | The fund’s inception date. |
2 | Peer-group returns are derived from data provided by Lipper Inc. |
4
significant. The midsummer reversal in interest rates helped the Massachusetts Tax-Exempt Fund finish the fiscal year on a positive note. Rising rates in the first half put pressure on the fund’s portfolio, holding the fund’s return to –0.2% for the six months. Later in the year, however, falling interest rates (or, put differently, rising prices) combined with interest income to help the fund deliver a 2.2% return for the full 12 months.
The fund’s return was higher than the average result for competing Massachusetts municipal bond funds, but trailed the return of the benchmark index because of the fund’s slightly longer duration. Duration measures bonds’ sensitivity to interest rate changes. When interest rates rise, as they did at the longer end of the maturity spectrum, prices suffer most for bonds with the longest maturities and the longest duration. This explains the better relative performance of the fund’s benchmark index.
Low expenses help sustain the funds’ long-term performance
Over time, Vanguard’s emphasis on high-quality securities, prudent portfolio management, and low costs has helped to produce impressive results relative to competing tax-exempt portfolios.
Since the fund’s December 1998 inception, it has earned an average annual return of 4.7%. By comparison, the average return for competing funds was 4.0% over the same period. The
Expense Ratios1 | | |
Your fund compared with its peer group | | |
| | Average |
| | Massachusetts |
| | Municipal |
| Fund | Debt Fund |
Massachusetts Tax-Exempt Fund | 0.13% | 1.22% |
1 | Fund expense ratio reflects the 12 months ended November 30, 2007. Peer-group expense ratio is derived from data provided by Lipper Inc. and captures information through year-end 2006. |
5
Massachusetts Tax-Exempt Fund benefits from Vanguard’s low costs, which enable the fund’s portfolio managers to focus their efforts on identifying high-quality securities from diverse municipal issuers.
Income and quality are anchors for diversified portfolios
Over the past year, both equity and fixed income markets have experienced increased volatility. Because market cycles are hard to predict with accuracy, Vanguard always encourages shareholders to invest with a long-term view, to diversify within and across asset classes, and to pay attention to costs.
Fixed income investments have an important role to play in a balanced, diversified portfolio. A fixed income allocation can moderate the volatility of an all-stock portfolio while generating a steady stream of income. For investors in higher tax brackets, municipal bonds can be an especially attractive option.
Your fund’s advisor, Vanguard Fixed Income Group, has a large and experienced credit analysis group that independently evaluates high-quality municipal securities issued by a broad cross section of Massachusetts state and local governments as well as regional authorities. And, by keeping expenses low, the advisor helps investors keep more of their returns. The Massachusetts Tax-Exempt Fund can play an important role in helping you build a diversified portfolio to achieve your financial goals.
Thank you for entrusting your assets to Vanguard.
Sincerely,

John J. Brennan
Chairman and Chief Executive Officer
December 17, 2007
6
Advisor’s Report
For the fiscal year ended November 30, 2007, Vanguard Massachusetts Tax-Exempt Fund returned 2.2%, exceeding the average return of its peers but lagging its benchmark.
The investment environment
Over the past year, the U.S. economy expanded slightly below its potential long-run growth rate. The Commerce Department’s estimate of growth in real gross domestic product (GDP) for the 12 months ended September 30, 2007, was 2.8%. Robust GDP growth in the July–September quarter was fueled by surging global demand for U.S. exports (made more attractive by a relatively weak dollar) and an expanding service sector.
Consumer spending, adjusted for inflation, grew at a 2.9% pace for the 12 months ended November 30, thanks to rising incomes and a fairly tight labor market. Consensus expectations point to a moderation in real GDP growth going forward as the housing recession continues and the attendant “credit crunch” increases financing costs.
The rate of consumer inflation accelerated toward the end of 2007 as food and energy prices rose. For the 12 months ended November 30, the Consumer Price Index (CPI) increased 4.3%. Expectations for core CPI inflation (excluding food and
Yields of Municipal Securities | | |
(AAA-Rated General-Obligation Issues) | | |
| November 30, | November 30, |
Maturity | 2006 | 2007 |
2 years | 3.45% | 3.18% |
5 years | 3.43 | 3.26 |
10 years | 3.56 | 3.62 |
30 years | 3.91 | 4.32 |
Yields of U.S. Treasury Securities | | |
| November 30, | November 30, |
Maturity | 2006 | 2007 |
2 years | 4.61% | 3.00% |
5 years | 4.45 | 3.39 |
10 years | 4.46 | 3.94 |
30 years | 4.56 | 4.38 |
Source: Vanguard.
7
energy prices) are for a modest and gradual deceleration toward or even below 2% in coming months.
Following its 50-basis-point reduction in the federal funds target rate in September, the Federal Reserve Board again lowered its target, by 25 basis points, to 4.5% on October 31. On December 11, after the end of the fiscal year, the Fed reduced the target rate by another 25 basis points, to 4.25%. In its statement at that time, the Fed commented that “economic growth is slowing, reflecting the intensification of the housing correction and some softening in business and consumer spending,” although recent actions “should help promote moderate growth over time.” Many financial market participants expect further reductions in the federal funds rate in 2008, given expectations for slower growth, stable core inflation rates, and ongoing concerns about credit availability.
Impact of subprime lending woes
Over the 12 months ended November 30, municipal bonds underperformed U.S. Treasuries across the yield curve. This reflected a global “flight to quality” that produced a rally in Treasuries as the subprime lending crisis continued to unnerve the credit markets. The relative underperformance of municipal bonds was exacerbated by credit concerns surrounding some of the municipal insurance companies that backstop many AAA-rated municipal bonds. The net effect of these forces was to cheapen high-quality tax-exempt bonds to extraordinarily attractive levels on an after-tax basis.
For fiscal-year 2007, total tax-exempt issuance increased 24.6% to $451.9 billion. At the end of the period, municipal market issuance appeared headed toward a calendar-year record. In Massachusetts, total tax-exempt issuance increased 18.2%.
Management of the fund
Yields rose in the Massachusetts Tax-Exempt Fund during the first half of the fiscal year, then fell in the second half, finishing the period mostly unchanged. The fund topped the average return of its peer group by a full percentage point, benefiting from our emphasis on the market’s highest-quality securities and from the fund’s low expenses. On an absolute basis, however, the fund’s 2.2% return was modest, as rising interest rates for longer-term bonds put pressure on the prices of the portfolio holdings.
About half of all outstanding municipal debt is guaranteed by various insurance companies. Recent news about some of these companies has brought into question the durability of AAA ratings, given the insurers’ exposure to guaranteed residential mortgage-backed securities. It is important to remember that the decision to invest in insured bonds and money market instruments depends first and foremost on the quality of the underlying tax-exempt issuer.
8
As a matter of course, Vanguard always looks carefully beneath the surface, to an evaluation of the underlying credit as the key factor in the purchase of a tax-exempt instrument. Our large and experienced municipal credit group conducts a focused and diligent examination of all holdings, and we believe our shareholders can continue to rely on the rigorous review and oversight process that is consistent with our funds’ objectives.
We expect that the Massachusetts Tax-Exempt Fund’s combination of low costs, prudent management, and bias toward high-quality issues will continue to produce more-than-competitive returns.
John M. Carbone, Principal
Vanguard Fixed Income Group
December 18, 2007
9
Fund Profile
As of November 30, 2007
Financial Attributes | | | |
| Comparative | Broad |
| Fund | Index1 | Index2 |
Number of Issues | 194 | 7,034 | 42,147 |
Yield | 3.9% | — | — |
Yield to Maturity | 4.0%3 | 3.8% | 4.0% |
Average Coupon | 5.0% | 5.0% | 5.0% |
Average Effective | | | |
Maturity | 8.6 years | 9.9 years | 13.4 years |
Average Quality | AA+ | AAA | AA+ |
Average Duration | 6.3 years | 6.2 years | 7.2 years |
Expense Ratio | 0.13% | — | — |
Short-Term Reserves | 0.0% | — | — |
Distribution by Maturity (% of portfolio) |
| |
Under 1 Year | 9.0% |
1–5 Years | 32.3 |
5–10 Years | 28.9 |
10–20 Years | 20.8 |
20–30 Years | 9.0 |
Volatility Measures4 | |
| Fund Versus | Fund Versus |
| Comparative Index1 | Broad Index2 |
R-Squared | 0.94 | 0.98 |
Beta | 1.03 | 1.22 |
Distribution by Credit Quality (% of portfolio) |
| |
AAA | 66.0% |
AA | 24.7 |
A | 5.9 |
BBB | 3.1 |
Other | 0.3 |
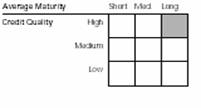
Investment Focus
| 1 | Lehman 10 Year Municipal Bond Index. |
| 2 | Lehman Municipal Bond Index. |
| 4 | For an explanation of R-squared, beta, and other terms used here, |
see the Glossary on page 30.
10
Performance Summary
All of the returns in this report represent past performance, which is not a guarantee of future results that may be achieved by the fund. (Current performance may be lower or higher than the performance data cited. For performance data current to the most recent month-end, visit our website at www.vanguard.com/performance.) Note, too, that both investment returns and principal value can fluctuate widely, so an investor’s shares, when sold, could be worth more or less than their original cost. The returns shown do not reflect taxes that a shareholder would pay on fund distributions or on the sale of fund shares.
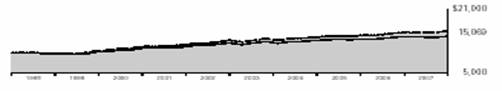
Cumulative Performance: December 9, 1998–November 30, 2007
Initial Investment of $10,000
| Average Annual Total Returns | |
Periods Ended November 30, 2007 | |
| | | | Final Value |
| One Year | Five Years | Since Inception1 | of a $10,000 Investment |
Massachusetts Long-Term Tax-Exempt Fund2 | 2.15% | 4.42% | 4.67% | $15,069 |
Lehman Municipal Bond Index | 2.71 | 4.68 | 5.01 | 15,503 |
Lehman 10 Year Municipal Bond Index | 3.51 | 4.71 | 5.02 | 15,517 |
Average Massachusetts Municipal Debt Fund3 | 1.18 | 3.78 | 3.95 | 14,161 |
1 | Performance for the fund and its comparative standards is calculated since the fund’s inception: December 9, 1998. |
2 | Total returns do not include the account service fee that may be applicable to certain accounts with balances below $10,000. |
3 | Derived from data provided by Lipper Inc. |
11
Fiscal-Year Total Returns (%): December 9, 1998–November 30, 2007
| | | | Lehman1 |
Fiscal | Capital | Income | Total | Total |
Year | Return | Return | Return | Return |
1999 | –7.5 | 4.1 | –3.4 | –0.8 |
2000 | 3.8 | 5.4 | 9.2 | 7.7 |
2001 | 3.9 | 5.0 | 8.9 | 8.2 |
2002 | 0.8 | 4.8 | 5.6 | 6.7 |
2003 | 2.2 | 4.5 | 6.7 | 6.9 |
2004 | –0.9 | 4.2 | 3.3 | 4.0 |
2005 | –0.6 | 4.1 | 3.5 | 3.0 |
2006 | 2.2 | 4.3 | 6.5 | 6.2 |
2007 | –2.0 | 4.2 | 2.2 | 3.5 |
Average Annual Total Returns: Periods Ended September 30, 2007
This table presents average annual total returns through the latest calendar quarter—rather than through the end of the fiscal period. Securities and Exchange Commission rules require that we provide this information.
| | | | Since Inception |
| Inception Date | One Year | Five Years | Capital | Income | Total |
Massachusetts Tax-Exempt Fund2 | 12/9/1998 | 2.54% | 3.70% | 0.08% | 4.53% | 4.61% |
1 | Lehman 10 Year Municipal Bond Index. |
2 | Total returns do not include the account service fee that may be applicable to certain accounts with balances below $10,000. Note: See Financial Highlights table on page 23 for dividend and capital gains information. |
12
Financial Statements
Statement of Net Assets
As of November 30, 2007
The fund provides a complete list of its holdings four times in each fiscal year, at the quarter-ends. For the second and fourth fiscal quarters, the lists appear in the fund’s semiannual and annual reports to shareholders. For the first and third fiscal quarters, the fund files the lists with the Securities and Exchange Commission on Form N-Q. Shareholders can look up the fund’s Forms N-Q on the SEC’s website at www.sec.gov. Forms N-Q may also be reviewed and copied at the SEC’s Public Reference Room (see the back cover of this report for further information).
| | | | Face | Market |
| | | Maturity | Amount | Value• |
| | Coupon | Date | ($000) | ($000) |
Municipal Bonds (100.3%) | | | | |
| Beverly MA GO | 5.250% | 11/1/12 (1) | 1,925 | 2,094 |
| Beverly MA GO | 5.250% | 11/1/13 (1) | 1,855 | 2,042 |
| Boston MA Convention Center Rev. | 5.000% | 5/1/18 (2) | 4,975 | 5,205 |
| Boston MA GO | 5.750% | 2/1/10 (Prere.) | 1,955 | 2,056 |
| Boston MA GO | 5.000% | 2/1/12 (1)(Prere.) | 3,765 | 4,014 |
| Boston MA GO | 5.000% | 3/1/16 | 7,295 | 8,038 |
| Boston MA Special Obligation Rev. | | | | |
| (Boston City Hosp.) | 5.000% | 8/1/17 (1) | 2,000 | 2,119 |
| Boston MA Water & Sewer Comm. Rev. | 5.750% | 11/1/13 | 540 | 580 |
| Chelsea MA GO | 5.500% | 6/15/09 (2) | 90 | 93 |
| Foxborough MA Stadium Infrastructure | | | | |
| Improvement Rev. | 5.750% | 6/1/10 (Prere.) | 2,500 | 2,672 |
| Framingham MA Housing Auth. Mortgage Rev. | 6.200% | 2/20/21 | 900 | 983 |
| Framingham MA Housing Auth. Mortgage Rev. | 6.350% | 2/20/32 | 2,000 | 2,161 |
| Holyoke MA Gas & Electric Dept. Rev. | 5.000% | 12/1/21 (1) | 2,395 | 2,522 |
| Littleton MA GO | 5.000% | 1/15/22 (3) | 1,280 | 1,358 |
| Lynn MA GO | 5.250% | 6/1/13 (2) | 1,530 | 1,585 |
| Marlborough MA GO | 6.750% | 6/15/08 (3) | 1,400 | 1,426 |
| Mashpee MA GO | 5.125% | 2/1/08 (1)(Prere.) | 1,025 | 1,038 |
| Mashpee MA GO | 5.350% | 2/1/08 (1)(Prere.) | 1,525 | 1,545 |
| Massachusetts Bay Transp. Auth. Rev. | 7.000% | 3/1/09 | 2,000 | 2,090 |
| Massachusetts Bay Transp. Auth. Rev. | 5.250% | 7/1/10 (Prere.) | 3,950 | 4,143 |
| Massachusetts Bay Transp. Auth. Rev. | 5.250% | 7/1/10 (Prere.) | 630 | 661 |
1 | Massachusetts Bay Transp. Auth. Rev. | 5.000% | 7/1/18 (Prere.) | 10,000 | 11,111 |
| Massachusetts Bay Transp. Auth. Rev. | 5.500% | 7/1/22 | 5,285 | 6,116 |
| Massachusetts Bay Transp. Auth. Rev. | 5.000% | 7/1/23 | 10,000 | 11,029 |
| Massachusetts Bay Transp. Auth. Rev. | 5.250% | 7/1/23 | 5,325 | 6,025 |
| Massachusetts Bay Transp. Auth. Rev. | 5.500% | 7/1/24 | 2,500 | 2,902 |
| Massachusetts Bay Transp. Auth. Rev. | 5.500% | 7/1/26 (1) | 3,000 | 3,478 |
| Massachusetts Bay Transp. Auth. Rev. | 5.500% | 7/1/29 (1) | 3,000 | 3,489 |
| Massachusetts Bay Transp. Auth. Rev. | 5.250% | 7/1/30 | 420 | 434 |
| Massachusetts College Building Auth. Rev. | 0.000% | 5/1/17 (10) | 3,340 | 2,262 |
| Massachusetts Dev. Finance Agency | | | | |
| Higher Educ. Rev. (Emerson College) | 5.000% | 1/1/18 | 2,000 | 2,104 |
| Massachusetts Dev. Finance Agency | | | | |
| Higher Educ. Rev. (Emerson College) | 5.000% | 1/1/20 | 3,105 | 3,239 |
| Massachusetts Dev. Finance Agency | | | | |
| Higher Educ. Rev. (Emerson College) | 5.000% | 1/1/22 | 3,985 | 4,129 |
| Massachusetts Dev. Finance Agency | | | | |
| Higher Educ. Rev. (Emerson College) | 5.000% | 1/1/23 | 3,710 | 3,833 |
13
| | | | Face | Market |
| | | Maturity | Amount | Value• |
| | Coupon | Date | ($000) | ($000) |
| Massachusetts Dev. Finance Agency Rev. | | | | |
| (Boston Univ.) | 6.000% | 5/15/29 (2) | 1,400 | 1,674 |
| Massachusetts Dev. Finance Agency Rev. | | | | |
| (Boston Univ.) | 5.000% | 10/1/35 (2) | 2,000 | 2,072 |
| Massachusetts Dev. Finance Agency Rev. | | | | |
| (Boston Univ.) | 5.375% | 5/15/39 | 1,575 | 1,583 |
| Massachusetts Dev. Finance Agency Rev. | | | | |
| (College of Pharmacy and Allied | | | | |
| Health Services) | 5.750% | 7/1/13 (Prere.) | 1,000 | 1,127 |
| Massachusetts Dev. Finance Agency Rev. | | | | |
| (Deerfield Academy) | 5.000% | 10/1/28 | 1,500 | 1,551 |
| Massachusetts Dev. Finance Agency Rev. | | | | |
| (Harvard Univ.) VRDO | 3.550% | 12/3/07 | 12,245 | 12,245 |
| Massachusetts Dev. Finance Agency Rev. | | | | |
| (Jewish Philanthropies) | 5.250% | 2/1/22 | 2,750 | 2,917 |
| Massachusetts Dev. Finance Agency Rev. | | | | |
| (Mount Holyoke College) | 5.250% | 7/1/31 | 4,000 | 4,163 |
| Massachusetts Dev. Finance Agency Rev. | | | | |
| (Neville Communities) | 6.000% | 6/20/44 | 1,500 | 1,630 |
| Massachusetts Dev. Finance Agency Rev. | | | | |
| (Simmons College) | 5.250% | 10/1/33 (10) | 10,000 | 11,017 |
| Massachusetts Dev. Finance Agency Rev. | | | | |
| (Smith College) | 5.750% | 7/1/10 (Prere.) | 3,000 | 3,211 |
| Massachusetts Dev. Finance Agency Rev. | | | | |
| (Smith College) | 5.750% | 7/1/10 (Prere.) | 1,195 | 1,279 |
| Massachusetts Dev. Finance Agency Rev. | | | | |
| (Smith College) | 5.000% | 7/1/35 | 5,000 | 5,188 |
| Massachusetts Dev. Finance Agency Rev. | | | | |
| (Suffolk Univ.) | 5.850% | 7/1/09 (Prere.) | 2,000 | 2,095 |
| Massachusetts Dev. Finance Agency Rev. | | | | |
| (Western New England College) | 5.875% | 12/1/12 (Prere.) | 600 | 660 |
| Massachusetts Dev. Finance Agency Rev. | | | | |
| (Western New England College) | 6.125% | 12/1/12 (Prere.) | 1,000 | 1,134 |
| Massachusetts Dev. Finance Agency Rev. | | | | |
| (Xaverian Brothers High School) | 5.550% | 7/1/19 | 1,000 | 1,020 |
| Massachusetts Dev. Finance Agency Rev. | | | | |
| (Xaverian Brothers High School) | 5.650% | 7/1/29 | 1,500 | 1,514 |
| Massachusetts GAN | 5.125% | 12/15/10 | 1,480 | 1,521 |
| Massachusetts GAN | 5.750% | 12/15/10 | 3,000 | 3,214 |
| Massachusetts GAN | 5.125% | 12/15/12 | 1,750 | 1,796 |
| Massachusetts GO | 5.250% | 9/1/08 | 1,850 | 1,876 |
| Massachusetts GO | 5.625% | 6/1/10 (Prere.) | 1,450 | 1,532 |
| Massachusetts GO | 5.750% | 6/1/10 (Prere.) | 8,545 | 9,052 |
| Massachusetts GO | 5.000% | 3/1/15 (Prere.) | 10,000 | 10,946 |
| Massachusetts GO | 5.000% | 9/1/15 (Prere.) | 10,000 | 11,003 |
| Massachusetts GO | 5.500% | 12/1/17 (4) | 10,000 | 11,450 |
| Massachusetts GO | 5.250% | 8/1/18 (4) | 5,060 | 5,684 |
| Massachusetts GO | 5.500% | 10/1/18 | 4,955 | 5,627 |
| Massachusetts GO | 5.500% | 10/1/18 (4) | 10,200 | 11,699 |
| Massachusetts GO | 5.250% | 8/1/22 | 5,000 | 5,570 |
| Massachusetts GO | 5.500% | 12/1/22 (4) | 2,000 | 2,311 |
| Massachusetts GO | 5.500% | 12/1/23 (2) | 1,030 | 1,189 |
| Massachusetts GO | 5.500% | 8/1/30 (2) | 10,000 | 11,599 |
| Massachusetts GO VRDO | 3.630% | 12/3/07 | 7,650 | 7,650 |
| Massachusetts GO VRDO | 3.670% | 12/3/07 | 14,100 | 14,100 |
| Massachusetts Health & Educ. Fac. Auth. Rev. | | | | |
| (Baystate Medical Center) | 5.750% | 7/1/33 | 5,000 | 5,156 |
14
| | | | Face | Market |
| | | Maturity | Amount | Value• |
| | Coupon | Date | ($000) | ($000) |
| Massachusetts Health & Educ. Fac. Auth. Rev. | | | | |
| (Berklee College of Music) | 5.000% | 10/1/26 | 6,255 | 6,411 |
| Massachusetts Health & Educ. Fac. Auth. Rev. | | | | |
| (Berklee College of Music) | 5.000% | 10/1/27 | 5,575 | 5,696 |
| Massachusetts Health & Educ. Fac. Auth. Rev. | | | | |
| (Boston Medical Center) | 5.000% | 7/1/19 (1) | 50 | 51 |
| Massachusetts Health & Educ. Fac. Auth. Rev. | | | | |
| (Caritas Christi Obligated Group) | 6.750% | 7/1/16 | 2,000 | 2,169 |
| Massachusetts Health & Educ. Fac. Auth. Rev. | | | | |
| (Children’s Hospital) VRDO | 3.620% | 12/3/07 (2) | 2,100 | 2,100 |
| Massachusetts Health & Educ. Fac. Auth. Rev. | | | | |
| (Harvard Univ.) | 6.000% | 7/1/10 (Prere.) | 5,825 | 6,271 |
| Massachusetts Health & Educ. Fac. Auth. Rev. | | | | |
| (Harvard Univ.) | 6.250% | 4/1/20 | 1,000 | 1,231 |
| Massachusetts Health & Educ. Fac. Auth. Rev. | | | | |
| (Harvard Univ.) | 5.125% | 7/15/37 | 9,350 | 9,782 |
| Massachusetts Health & Educ. Fac. Auth. Rev. | | | | |
| (Harvard Univ.) VRDO | 3.400% | 12/3/07 | 3,100 | 3,100 |
| Massachusetts Health & Educ. Fac. Auth. Rev. | | | | |
| (Lahey Clinic Medical Center) | 5.250% | 8/15/37 | 7,000 | 7,079 |
| Massachusetts Health & Educ. Fac. Auth. Rev. | | | | |
| (Massachusetts General Hosp.) | 6.250% | 7/1/12 (2) | 385 | 410 |
| Massachusetts Health & Educ. Fac. Auth. Rev. | | | | |
| (Milton Hosp.) | 5.500% | 7/1/10 | 520 | 533 |
| Massachusetts Health & Educ. Fac. Auth. Rev. | | | | |
| (Milton Hosp.) | 5.500% | 7/1/16 | 1,235 | 1,258 |
| Massachusetts Health & Educ. Fac. Auth. Rev. (MIT) | 5.250% | 7/1/21 | 6,765 | 7,690 |
| Massachusetts Health & Educ. Fac. Auth. Rev. (MIT) | 5.000% | 7/1/23 | 5,000 | 5,533 |
| Massachusetts Health & Educ. Fac. Auth. Rev. (MIT) | 5.250% | 7/1/24 | 3,060 | 3,480 |
| Massachusetts Health & Educ. Fac. Auth. Rev. (MIT) | 5.250% | 7/1/30 | 5,000 | 5,682 |
| Massachusetts Health & Educ. Fac. Auth. Rev. (MIT) | 5.500% | 7/1/32 | 7,730 | 9,064 |
| Massachusetts Health & Educ. Fac. Auth. Rev. | | | | |
| (New England Medical Center Hosp.) | 5.375% | 5/15/12 (3)(Prere.) | 3,000 | 3,255 |
| Massachusetts Health & Educ. Fac. Auth. Rev. | | | | |
| (New England Medical Center Hosp.) | 5.375% | 5/15/13 (3) | 3,835 | 4,101 |
| Massachusetts Health & Educ. Fac. Auth. Rev. | | | | |
| (Partners Healthcare System) | 5.250% | 7/1/11 | 2,080 | 2,152 |
| Massachusetts Health & Educ. Fac. Auth. Rev. | | | | |
| (Partners Healthcare System) | 5.250% | 7/1/12 | 2,850 | 2,942 |
| Massachusetts Health & Educ. Fac. Auth. Rev. | | | | |
| (Partners Healthcare System) | 5.250% | 7/1/14 | 1,000 | 1,034 |
| Massachusetts Health & Educ. Fac. Auth. Rev. | | | | |
| (Partners Healthcare System) | 5.250% | 7/1/15 (1) | 390 | 394 |
| Massachusetts Health & Educ. Fac. Auth. Rev. | | | | |
| (Partners Healthcare System) | 5.250% | 7/1/15 | 3,000 | 3,101 |
| Massachusetts Health & Educ. Fac. Auth. Rev. | | | | |
| (Partners Healthcare System) | 5.375% | 7/1/24 (1) | 1,605 | 1,623 |
| Massachusetts Health & Educ. Fac. Auth. Rev. | | | | |
| (Partners Healthcare System) VRDO | 3.530% | 12/6/07 | 2,400 | 2,400 |
| Massachusetts Health & Educ. Fac. Auth. Rev. | | | | |
| (Simmons College) | 5.000% | 10/1/13 (3)(Prere.) | 1,090 | 1,183 |
| Massachusetts Health & Educ. Fac. Auth. Rev. | | | | |
| (Simmons College) | 5.000% | 10/1/13 (3)(Prere.) | 1,175 | 1,276 |
| Massachusetts Health & Educ. Fac. Auth. Rev. | | | | |
| (Sterling & Francine Clark) | 5.000% | 7/1/36 | 8,000 | 8,305 |
| Massachusetts Health & Educ. Fac. Auth. Rev. | | | | |
| (Tufts Univ.) | 5.250% | 2/15/30 | 2,000 | 2,057 |
15
| | | | Face | Market |
| | | Maturity | Amount | Value• |
| | Coupon | Date | ($000) | ($000) |
| Massachusetts Health & Educ. Fac. Auth. Rev. | | | | |
| (Univ. of Massachusetts Memorial Health Care Inc.) | 5.250% | 7/1/14 (2) | 1,000 | 1,027 |
| Massachusetts Health & Educ. Fac. Auth. Rev. | | | | |
| (Univ. of Massachusetts Memorial Health Care Inc.) | 6.500% | 7/1/21 | 5,000 | 5,245 |
| Massachusetts Health & Educ. Fac. Auth. Rev. | | | | |
| (Univ. of Massachusetts Memorial Health Care Inc.) | 6.625% | 7/1/32 | 1,000 | 1,044 |
| Massachusetts Health & Educ. Fac. Auth. Rev. | | | | |
| (Univ. of Massachusetts) | 5.875% | 10/1/10 (3)(Prere.) | 4,000 | 4,317 |
| Massachusetts Health & Educ. Fac. Auth. Rev. | | | | |
| (Univ. of Massachusetts) | 5.125% | 10/1/27 (3) | 1,850 | 1,936 |
| Massachusetts Health & Educ. Fac. Auth. Rev. | | | | |
| (Univ. of Massachusetts/Worcester) | 5.125% | 10/1/11 (3)(Prere.) | 435 | 464 |
| Massachusetts Health & Educ. Fac. Auth. Rev. | | | | |
| (Univ. of Massachusetts/Worcester) | 5.250% | 10/1/12 (1)(Prere.) | 4,000 | 4,348 |
| Massachusetts Health & Educ. Fac. Auth. Rev. | | | | |
| (Univ. of Massachusetts/Worcester) | 5.125% | 10/1/23 (3) | 565 | 588 |
| Massachusetts Health & Educ. Fac. Auth. Rev. | | | | |
| (Wellesley College) | 5.000% | 7/1/23 | 2,400 | 2,509 |
| Massachusetts Health & Educ. Fac. Auth. Rev. | | | | |
| (Williams College) | 5.000% | 7/1/28 | 1,000 | 1,030 |
| Massachusetts Health & Educ. Fac. Auth. Rev. | | | | |
| (Williams College) | 5.000% | 7/1/31 | 5,000 | 5,260 |
2 | Massachusetts Health & Educ. Fac. Auth. Rev. | | | | |
| (Williams College) | 5.000% | 7/1/36 | 10,000 | 10,490 |
| Massachusetts Muni. Wholesale Electric Co. | | | | |
| Power System Rev. | 5.000% | 7/1/10 (2)(ETM) | 815 | 835 |
| Massachusetts Muni. Wholesale Electric Co. | | | | |
| Power System Rev. | 5.250% | 7/1/12 (1) | 2,975 | 3,212 |
| Massachusetts Muni. Wholesale Electric Co. | | | | |
| Power System Rev. | 5.250% | 7/1/13 (1) | 3,255 | 3,503 |
| Massachusetts Muni. Wholesale Electric Co. | | | | |
| Power System Rev. | 5.250% | 7/1/16 (1) | 4,500 | 4,840 |
| Massachusetts Port Auth. Rev. | 5.250% | 7/1/08 | 1,325 | 1,339 |
| Massachusetts Port Auth. Rev. | 5.750% | 7/1/10 | 1,000 | 1,059 |
| Massachusetts Port Auth. Rev. | 5.500% | 7/1/16 (4) | 10,000 | 11,321 |
| Massachusetts Port Auth. Rev. | 5.000% | 7/1/17 (4) | 10,000 | 10,982 |
| Massachusetts Port Auth. Rev. | 5.375% | 7/1/18 | 2,000 | 2,038 |
| Massachusetts School Building Auth. | | | | |
| Dedicated Sales Tax Rev. | 5.000% | 8/15/25 (4) | 10,125 | 10,612 |
| Massachusetts Special Obligation | | | | |
| Dedicated Tax Rev. | 5.500% | 1/1/27 (3) | 15,000 | 17,284 |
| Massachusetts Special Obligation Rev. | 5.500% | 6/1/12 | 10,000 | 10,910 |
| Massachusetts Special Obligation Rev. | 5.000% | 6/1/17 | 2,040 | 2,075 |
| Massachusetts Turnpike Auth. Rev. | | | | |
| (Metro. Highway System) | 0.000% | 1/1/20 (1) | 3,000 | 1,752 |
| Massachusetts Turnpike Auth. Rev. | | | | |
| (Metro. Highway System) | 0.000% | 1/1/25 (1) | 5,000 | 2,249 |
| Massachusetts Turnpike Auth. Rev. | | | | |
| (Metro. Highway System) | 0.000% | 1/1/28 (1) | 13,660 | 5,258 |
| Massachusetts Water Pollution Abatement Trust | 5.375% | 8/1/09 (Prere.) | 1,435 | 1,497 |
| Massachusetts Water Pollution Abatement Trust | 5.750% | 8/1/09 (Prere.) | 615 | 645 |
| Massachusetts Water Pollution Abatement Trust | 5.250% | 8/1/15 (Prere.) | 4,460 | 4,978 |
| Massachusetts Water Pollution Abatement Trust | 5.000% | 8/1/16 | 5,000 | 5,512 |
| Massachusetts Water Pollution Abatement Trust | 5.250% | 8/1/17 | 540 | 598 |
| Massachusetts Water Pollution Abatement Trust | 5.250% | 8/1/17 | 5,000 | 5,620 |
| Massachusetts Water Pollution Abatement Trust | 5.250% | 8/1/22 | 3,500 | 3,957 |
16
| | | | Face | Market |
| | | Maturity | Amount | Value• |
| | Coupon | Date | ($000) | ($000) |
| Massachusetts Water Pollution Abatement Trust | 5.375% | 8/1/27 | 2,565 | 2,647 |
| Massachusetts Water Pollution Abatement Trust | 5.500% | 8/1/29 | 1,000 | 1,035 |
| Massachusetts Water Pollution Abatement Trust | 5.750% | 8/1/29 | 2,490 | 2,588 |
| Massachusetts Water Pollution Abatement Trust | 5.250% | 8/1/30 | 5,000 | 5,660 |
| Massachusetts Water Resources Auth. Rev. | 6.000% | 12/1/11 (3) | 4,120 | 4,420 |
| Massachusetts Water Resources Auth. Rev. | 5.250% | 8/1/16 (4) | 13,630 | 15,214 |
| Massachusetts Water Resources Auth. Rev. | 5.250% | 8/1/32 (4) | 5,000 | 5,627 |
| Narragansett MA Regional School Dist. GO | 6.500% | 6/1/13 (2) | 1,210 | 1,311 |
| Pittsfield MA GO | 5.000% | 4/15/18 (1) | 1,000 | 1,055 |
| Quaboag MA Regional School Dist. GO | 5.500% | 6/1/18 (4) | 1,355 | 1,430 |
| Quaboag MA Regional School Dist. GO | 5.500% | 6/1/19 (4) | 1,355 | 1,429 |
| Rail Connections Inc. Massachusetts Rev. | 5.250% | 7/1/08 (ETM) | 705 | 713 |
| Rail Connections Inc. Massachusetts Rev. | 5.300% | 7/1/09 (ETM) | 340 | 351 |
| Rail Connections Inc. Massachusetts Rev. | 5.400% | 7/1/09 (Prere.) | 520 | 547 |
| Rail Connections Inc. Massachusetts Rev. | 5.500% | 7/1/09 (Prere.) | 1,175 | 1,238 |
| Rail Connections Inc. Massachusetts Rev. | 6.000% | 7/1/09 (Prere.) | 570 | 605 |
| Rail Connections Inc. Massachusetts Rev. | 6.000% | 7/1/09 (Prere.) | 1,030 | 1,093 |
| Route 3 North Transp. Improvement Assn. | | | | |
| Massachusetts Lease Rev. | 5.375% | 6/15/10 (1)(Prere.) | 2,500 | 2,628 |
| Shrewsbury MA GO | 5.000% | 8/15/13 | 1,030 | 1,097 |
| Shrewsbury MA GO | 5.000% | 8/15/17 | 1,900 | 2,021 |
| Shrewsbury MA GO | 5.000% | 8/15/18 | 3,185 | 3,351 |
| Shrewsbury MA GO | 5.000% | 8/15/19 | 1,000 | 1,052 |
| Tantasqua MA Regional School Dist. GO | 5.125% | 8/15/10 (4)(Prere.) | 2,575 | 2,722 |
| Univ. of Massachusetts Building Auth. | | | | |
| Refunding Rev. | 6.875% | 5/1/14 (ETM) | 1,000 | 1,168 |
| Univ. of Massachusetts Building Auth. Rev. | 5.125% | 11/1/10 (Prere.) | 1,135 | 1,192 |
| Univ. of Massachusetts Building Auth. Rev. | 5.500% | 11/1/10 (2)(Prere.) | 2,600 | 2,761 |
| Univ. of Massachusetts Building Auth. Rev. | 5.500% | 11/1/10 (2)(Prere.) | 2,400 | 2,548 |
| Univ. of Massachusetts | | | | |
| Health & Educ. Fac. Auth. Rev. | 5.000% | 11/1/21 (2) | 5,680 | 6,026 |
| Univ. of Massachusetts | | | | |
| Health & Educ. Fac. Auth. Rev. | 5.000% | 11/1/22 (2) | 2,695 | 2,849 |
| Univ. of Massachusetts | | | | |
| Health & Educ. Fac. Auth. Rev. | 5.000% | 11/1/23 (2) | 1,760 | 1,853 |
| Univ. of Massachusetts | | | | |
| Health & Educ. Fac. Auth. Rev. | 5.000% | 11/1/24 (2) | 1,980 | 2,078 |
| Univ. of Massachusetts | | | | |
| Health & Educ. Fac. Auth. Rev. | 5.000% | 11/1/25 (2) | 1,990 | 2,083 |
| Westborough MA GO | 5.000% | 11/15/08 | 3,460 | 3,515 |
| Westfield MA GO | 5.000% | 5/1/10 (3)(Prere.) | 1,715 | 1,800 |
| Worcester MA GO | 5.500% | 10/1/09 (3) | 1,000 | 1,040 |
| Worcester MA GO | 5.750% | 4/1/10 (4)(Prere.) | 1,000 | 1,065 |
| Worcester MA GO | 5.625% | 8/15/10 (3)(Prere.) | 1,640 | 1,755 |
| Worcester MA GO | 5.500% | 8/15/14 (3) | 1,445 | 1,553 |
| Worcester MA GO | 5.500% | 8/15/15 (3) | 1,190 | 1,277 |
| Worcester MA GO | 5.250% | 8/15/21 (3) | 1,500 | 1,573 |
| | | | | |
| Outside Massachusetts: | | | | |
| Puerto Rico Electric Power Auth. Rev. | 5.500% | 7/1/17 (1) | 5,000 | 5,669 |
| Puerto Rico GO | 5.000% | 7/1/13 (Prere.) | 860 | 933 |
| Puerto Rico GO | 5.500% | 7/1/19 (2) | 2,500 | 2,796 |
| Puerto Rico GO | 5.500% | 7/1/22 (3) | 3,500 | 3,899 |
| Puerto Rico GO | 5.000% | 7/1/33 | 740 | 728 |
| Puerto Rico Highway & Transp. Auth. Rev. | 5.500% | 7/1/12 (3) | 5,080 | 5,462 |
| Puerto Rico Highway & Transp. Auth. Rev. VRDO | 3.500% | 12/5/07 (2) | 1,385 | 1,385 |
17
| | | | Face | Market |
| | | Maturity | Amount | Value• |
| | Coupon | Date | ($000) | ($000) |
| Puerto Rico Infrastructure Financing Auth. | | | | |
| Special Obligation Bonds | 5.500% | 10/1/40 | 5,000 | 5,286 |
| Puerto Rico Public Buildings Auth. Govt. Fac. Rev. | 5.250% | 7/1/12 (Prere.) | 1,100 | 1,188 |
| Puerto Rico Public Buildings Auth. Govt. Fac. Rev. | 5.250% | 7/1/36 | 400 | 402 |
| Puerto Rico Public Finance Corp. | 5.500% | 2/1/12 (Prere.) | 665 | 722 |
| Puerto Rico Public Finance Corp. | 5.500% | 2/1/12 (Prere.) | 2,015 | 2,181 |
| Puerto Rico Public Finance Corp. | 5.125% | 6/1/24 (2) | 2,155 | 2,384 |
| Puerto Rico Public Finance Corp. | 6.000% | 8/1/26 (4)(ETM) | 4,000 | 4,949 |
| Puerto Rico Sales Tax Financing Corp. Rev. | 0.000% | 8/1/54 (2) | 5,000 | 451 |
| Virgin Islands Public Finance Auth. Rev. | 5.000% | 10/1/09 | 1,450 | 1,477 |
| Virgin Islands Public Finance Auth. Rev. | 5.250% | 10/1/20 | 1,000 | 1,034 |
| Total Municipal Bonds (Cost $673,525) | | | | 686,244 |
| Other Assets and Liabilities (–0.3%) | | | | |
| Other Assets—Note B | | | | 11,546 |
| Liabilities | | | | (13,711) |
| | | | | (2,165) |
| Net Assets (100%) | | | | |
| Applicable to 67,588,697 outstanding $.001 par value shares | | | |
| of beneficial interest (unlimited authorization) | | | | 684,079 |
| Net Asset Value Per Share | | | | $10.12 |
18
At November 30, 2007, net assets consisted of:3
| Amount | Per |
| ($000) | Share |
Paid-in Capital | 675,451 | $9.99 |
Undistributed Net Investment Income | — | — |
Accumulated Net Realized Losses | (4,094) | (.06) |
Unrealized Appreciation | | |
Investment Securities | 12,719 | .19 |
Futures Contracts | 3 | — |
Net Assets | 684,079 | $10.12 |
• | See Note A in Notes to Financial Statements. |
1 | Security purchased on a when-issued or delayed-delivery basis for which the fund has not taken delivery as of November 30, 2007. |
2 | Securities with a value of $1,574,000 have been segregated as initial margin for open futures contracts. |
3 | See Note D in Notes to Financial Statements for the tax-basis components of net assets.
For a key to abbreviations and other references, see page 20. |
19
Key to Abbreviations
ARS | —Auction Rate Security. |
BAN | —Bond Anticipation Note. |
COP | —Certificate of Participation. |
CP | —Commercial Paper. |
FR | —Floating Rate. |
GAN | —Grant Anticipation Note. |
GO | —General Obligation Bond. |
IDA | —Industrial Development Authority Bond. |
IDR | —Industrial Development Revenue Bond. |
PCR | —Pollution Control Revenue Bond. |
PUT | —Put Option Obligation. |
RAN | —Revenue Anticipation Note. |
TAN | —Tax Anticipation Note. |
TOB | —Tender Option Bond. |
TRAN | —Tax Revenue Anticipation Note. |
UFSD | —Union Free School District. |
USD | —United School District. |
VRDO | —Variable Rate Demand Obligation. |
ETM) | — (Escrowed to Maturity. |
(Prere.) | —Prerefunded. |
Scheduled principal and interest payments are guaranteed by: |
(1) | MBIA (Municipal Bond Insurance Association). |
(2) | AMBAC (Ambac Assurance Corporation). |
(3) | FGIC (Financial Guaranty Insurance Company). |
(4) | FSA (Financial Security Assurance). |
(5) | BIGI (Bond Investors Guaranty Insurance). |
(6) | Connie Lee Inc. |
(7) | FHA (Federal Housing Authority). |
(8) | CapMAC (Capital Markets Assurance Corporation). |
(9) | American Capital Access Financial Guaranty Corporation. |
(10) | XL Capital Assurance Inc. |
(11) | CIFG (CDC IXIS Financial Guaranty). |
(12) | Assured Guaranty Corp. |
| The insurance does not guarantee the market value of the municipal bonds. |
| |
LOC | —Scheduled principal and interest payments are guaranteed by bank letter of credit. |
20
Statement of Operations
| Year Ended |
| November 30, 2007 |
| ($000) |
Investment Income | |
Income | |
Interest | 27,324 |
Total Income | 27,324 |
Expenses | |
The Vanguard Group—Note B | |
Investment Advisory Services | 52 |
Management and Administrative | 571 |
Marketing and Distribution | 162 |
Custodian Fees | 5 |
Auditing Fees | 22 |
Shareholders’ Reports | 11 |
Trustees’ Fees and Expenses | 1 |
Total Expenses | 824 |
Expenses Paid Indirectly—Note C | (18) |
Net Expenses | 806 |
Net Investment Income | 26,518 |
Realized Net Gain (Loss) | |
Investment Securities Sold | (436) |
Futures Contracts | (1,531) |
Realized Net Gain (Loss) | (1,967) |
Change in Unrealized Appreciation (Depreciation) | |
Investment Securities | (10,186) |
Futures Contracts | 186 |
Change in Unrealized Appreciation (Depreciation) | (10,000) |
Net Increase (Decrease) in Net Assets Resulting from Operations | 14,551 |
21
Statement of Changes in Net Assets
| Year Ended November 30, |
| 2007 | 2006 |
| ($000) | ($000) |
Increase (Decrease) in Net Assets | | |
Operations | | |
Net Investment Income | 26,518 | 22,596 |
Realized Net Gain (Loss) | (1,967) | 224 |
Change in Unrealized Appreciation (Depreciation) | (10,000) | 11,639 |
Net Increase (Decrease) in Net Assets Resulting from Operations | 14,551 | 34,459 |
Distributions | | |
Net Investment Income | (26,518) | (22,596) |
Realized Capital Gain | — | (395) |
Total Distributions | (26,518) | (22,991) |
Capital Share Transactions—Note F | | |
Issued | 235,045 | 146,990 |
Issued in Lieu of Cash Distributions | 19,084 | 15,956 |
Redeemed | (131,445) | (97,954) |
Net Increase (Decrease) from Capital Share Transactions | 122,684 | 64,992 |
Total Increase (Decrease) | 110,717 | 76,460 |
Net Assets | | |
Beginning of Period | 573,362 | 496,902 |
End of Period | 684,079 | 573,362 |
22
Financial Highlights
| Year Ended November 30, |
For a Share Outstanding | | | | | |
Throughout Each Period | 2007 | 2006 | 2005 | 2004 | 2003 |
Net Asset Value, Beginning of Period | $10.33 | $10.12 | $10.18 | $10.27 | $10.05 |
Investment Operations | | | | | |
Net Investment Income | .424 | .427 | .417 | .418 | .443 |
Net Realized and Unrealized Gain (Loss) | | | | | |
on Investments | (.210) | .218 | (.060) | (.090) | .220 |
Total from Investment Operations | .214 | .645 | .357 | .328 | .663 |
Distributions | | | | | |
Dividends from Net Investment Income | (.424) | (.427) | (.417) | (.418) | (.443) |
Distributions from Realized Capital Gains | — | (.008) | — | — | — |
Total Distributions | (.424) | (.435) | (.417) | (.418) | (.443) |
Net Asset Value, End of Period | $10.12 | $10.33 | $10.12 | $10.18 | $10.27 |
| | | | | |
Total Return1 | 2.15% | 6.54% | 3.53% | 3.25% | 6.70% |
| | | | | |
Ratios/Supplemental Data | | | | | |
Net Assets, End of Period (Millions) | $684 | $573 | $497 | $450 | $414 |
Ratio of Total Expenses to | | | | | |
Average Net Assets | 0.13% | 0.14% | 0.14% | 0.14% | 0.16% |
Ratio of Net Investment Income to | | | | | |
Average Net Assets | 4.19% | 4.22% | 4.07% | 4.08% | 4.35% |
Portfolio Turnover Rate | 16% | 5% | 9% | 7% | 24% |
1 | Total returns do not include the account service fee that may be applicable to certain accounts with balances below $10,000. See accompanying Notes, which are an integral part of the Financial Statements. |
23
Notes to Financial Statements
Vanguard Massachusetts Tax-Exempt Fund is registered under the Investment Company Act of 1940 as an open-end investment company, or mutual fund. The fund invests in debt instruments of municipal issuers whose ability to meet their obligations may be affected by economic and political developments in the Commonwealth of Massachusetts.
A. The following significant accounting policies conform to generally accepted accounting principles for U.S. mutual funds. The fund consistently follows such policies in preparing its financial statements.
1. Security Valuation: Bonds, and temporary cash investments acquired over 60 days to maturity, are valued using the latest bid prices or using valuations based on a matrix system (which considers such factors as security prices, yields, maturities, and ratings), both as furnished by independent pricing services. Other temporary cash investments are valued at amortized cost, which approximates market value. Securities for which market quotations are not readily available, or whose values have been materially affected by events occurring before the fund’s pricing time but after the close of the securities’ primary markets, are valued by methods deemed by the board of trustees to represent fair value.
2. Futures Contracts: The fund uses futures contracts to invest in fixed income asset classes with greater efficiency and lower cost than is possible through direct investment, to add value when these instruments are attractively priced, or to adjust sensitivity to changes in interest rates. The primary risks associated with the use of futures contracts are imperfect correlation between changes in market values of bonds held by the fund and the prices of futures contracts, and the possibility of an illiquid market.
Futures contracts are valued based upon their quoted daily settlement prices. The aggregate principal amounts of the contracts are not recorded in the Statement of Net Assets. Fluctuations in the value of the contracts are recorded in the Statement of Net Assets as an asset (liability) and in the Statement of Operations as unrealized appreciation (depreciation) until the contracts are closed, when they are recorded as realized futures gains (losses).
3. Federal Income Taxes: The fund intends to continue to qualify as a regulated investment company and distribute all of its income. Accordingly, no provision for federal income taxes is required in the financial statements.
4. Distributions: Distributions from net investment income are declared daily and paid on the first business day of the following month. Annual distributions from realized capital gains, if any, are recorded on the ex-dividend date.
5. Other: Interest income is accrued daily. Premiums and discounts on debt securities purchased are amortized and accreted, respectively, to interest income over the lives of the respective securities. Security transactions are accounted for on the date securities are bought or sold. Costs used to determine realized gains (losses) on the sale of investment securities are those of the specific securities sold.
B. The Vanguard Group furnishes at cost investment advisory, corporate management, administrative, marketing, and distribution services. The costs of such services are allocated to the fund under methods approved by the board of trustees. The fund has committed to provide up to 0.40% of its net
24
assets in capital contributions to Vanguard. At November 30, 2007, the fund had contributed capital of $55,000 to Vanguard (included in Other Assets), representing 0.01% of the fund’s net assets and 0.05% of Vanguard’s capitalization. The fund’s trustees and officers are also directors and officers of Vanguard.
C. The fund’s investment advisor may direct new issue purchases, subject to obtaining the best price and execution, to underwriters who have agreed to rebate or credit to the fund part of the underwriting fees generated. Such rebates or credits are used solely to reduce the fund’s management and administrative expenses. The fund’s custodian bank has also agreed to reduce its fees when the fund maintains cash on deposit in the non-interest-bearing custody account. For the year ended November 30, 2007, these arrangements reduced the fund’s management and administrative expenses by $16,000 and custodian fees by $2,000.
D. Capital gain distributions are determined on a tax basis and may differ from realized capital gains for financial reporting purposes. Differences may be permanent or temporary. Permanent differences are reclassified among capital accounts in the financial statements to reflect their tax character. Temporary differences arise when gains or losses are recognized in different periods for financial statement and tax purposes; these differences will reverse at some time in the future.
For tax purposes, at November 30, 2007, the fund had available realized losses of $1,711,000 to offset future net capital gains of $99,000 through November 30, 2014, and $1,612,000 through November 30, 2015.
The fund had realized losses totaling $2,380,000 through November 30, 2007, which are deferred for tax purposes and reduce the amount of unrealized appreciation on investment securities for tax purposes.
At November 30, 2007, the cost of investment securities for tax purposes was $675,905,000. Net unrealized appreciation of investment securities for tax purposes was $10,339,000, consisting of unrealized gains of $13,227,000 on securities that had risen in value since their purchase and $2,888,000 in unrealized losses on securities that had fallen in value since their purchase.
At November 30, 2007, the aggregate settlement value of open futures contracts expiring in March 2008 and the related unrealized appreciation (depreciation) were:
| | ($000) |
| Number of | Aggregate | Unrealized |
| Long (Short) | Settlement | Appreciation |
Futures Contracts | Contracts | Value | (Depreciation) |
30-Year U.S. Treasury Bond | (54) | 6,328 | 3 |
Unrealized appreciation (depreciation) on open futures contracts is required to be treated as realized gain (loss) for tax purposes.
E. During the year ended November 30, 2007, the fund purchased $203,456,000 of investment securities and sold $94,514,000 of investment securities, other than temporary cash investments.
25
F. Capital shares issued and redeemed were:
| Year Ended November 30, |
| 2007 | 2006 |
| Shares | Shares |
| (000) | (000) |
Issued | 23,210 | 14,509 |
Issued in Lieu of Cash Distributions | 1,887 | 1,573 |
Redeemed | (13,012) | (9,678) |
Net Increase (Decrease) in Shares Outstanding | 12,085 | 6,404 |
G. In June 2006, the Financial Accounting Standards Board issued Interpretation No. 48 (“FIN 48”), “Accounting for Uncertainty in Income Taxes”. FIN 48 establishes the minimum threshold for recognizing, and a system for measuring, the benefits of tax-return positions in financial statements, and is effective for the fund’s fiscal year beginning December 1, 2007. Management has analyzed the fund’s tax positions taken on federal income tax returns for all open tax years (tax years ended November 30, 2004–2007) for purposes of implementing FIN 48, and has concluded that as of November 30, 2007, no provision for income tax would be required in the fund’s financial statements.
26
Report of Independent Registered
Public Accounting Firm
To the Trustees and Shareholders of Vanguard Massachusetts Tax-Exempt Fund:
In our opinion, the accompanying statement of net assets and the related statements of operations and of changes in net assets and the financial highlights present fairly, in all material respects, the financial position of The Vanguard Massachusetts Tax-Exempt Fund (the “Fund”) at November 30, 2007, the results of its operations for the year then ended, the changes in its net assets for each of the two years in the period then ended and the financial highlights for each of the five years in the period then ended, in conformity with accounting principles generally accepted in the United States of America. These financial statements and financial highlights (hereafter referred to as “financial statements”) are the responsibility of the Fund’s management; our responsibility is to express an opinion on these financial statements based on our audits. We conducted our audits of these financial statements in accordance with the standards of the Public Company Accounting Oversight Board (United States). Those standards require that we plan and perform the audit to obtain reasonable assurance about whether the financial statements are free of material misstatement. An audit includes examining, on a test basis, evidence supporting the amounts and disclosures in the financial statements, assessing the accounting principles used and significant estimates made by management, and evaluating the overall financial statement presentation. We believe that our audits, which included confirmation of securities at November 30, 2007 by correspondence with the custodian and broker, provide a reasonable basis for our opinion.
PricewaterhouseCoopers LLP
Philadelphia, Pennsylvania
January 11, 2008
Special 2007 tax information (unaudited) for Vanguard Massachusetts Tax-Exempt Fund
This information for the fiscal year ended November 30, 2007, is included pursuant to provisions of the Internal Revenue Code.
The fund designates 100% of its income dividends as exempt-interest dividends.
27
About Your Fund’s Expenses
As a shareholder of the fund, you incur ongoing costs, which include costs for portfolio management, administrative services, and shareholder reports (like this one), among others. Operating expenses, which are deducted from a fund’s gross income, directly reduce the investment return of the fund.
A fund’s expenses are expressed as a percentage of its average net assets. This figure is known as the expense ratio. The following examples are intended to help you understand the ongoing costs (in dollars) of investing in your fund and to compare these costs with those of other mutual funds. The examples are based on an investment of $1,000 made at the beginning of the period shown and held for the entire period.
The table below illustrates your fund’s costs in two ways:
• Based on actual fund return. This section helps you to estimate the actual expenses that you paid over the period. The “Ending Account Value” shown is derived from the fund’s actual return, and the third column shows the dollar amount that would have been paid by an investor who started with $1,000 in the fund. You may use the information here, together with the amount you invested, to estimate the expenses that you paid over the period.
To do so, simply divide your account value by $1,000 (for example, an $8,600 account value divided by $1,000 = 8.6), then multiply the result by the number given for your fund under the heading “Expenses Paid During Period.”
• Based on hypothetical 5% yearly return. This section is intended to help you compare your fund’s costs with those of other mutual funds. It assumes that the fund had a yearly return of 5% before expenses, but that the expense ratio is unchanged. In this case—because the return used is not the fund’s actual return—the results do not apply to your investment. The example is useful in making comparisons because the Securities and Exchange Commission requires all mutual funds to calculate expenses based on a 5% return. You can assess your fund’s costs by comparing this hypothetical example with the hypothetical examples that appear in shareholder reports of other funds.
Six Months Ended November 30, 2007 | | | |
| Beginning | Ending | Expenses |
| Account Value | Account Value | Paid During |
Massachusetts Tax-Exempt Fund | 5/31/2007 | 11/30/2007 | Period1 |
Based on Actual Fund Return | $1,000.00 | $1,023.23 | $0.66 |
Based on Hypothetical 5% Yearly Return | $1,000.00 | $1,024.42 | $0.66 |
Note that the expenses shown in the table are meant to highlight and help you compare ongoing costs only and do not reflect transaction costs incurred by the fund for buying and selling securities. Further, the expenses do not include the account service fee described in the prospectus. If such a fee were applied to your account, your costs would be higher. Your fund does not charge transaction fees, such as purchase or redemption fees, nor does it carry a “sales load.”
1 | The calculations are based on expenses incurred in the most recent six-month period. The fund’s annualized six-month expense ratio for that period was 0.13%. The dollar amounts shown as “Expenses Paid” are equal to the annualized expense ratio multiplied by the average account value over the period, multiplied by the number of days in the most recent six-month period, then divided by the number of days in the most recent 12-month period. |
28
The calculations assume no shares were bought or sold during the period. Your actual costs may have been higher or lower, depending on the amount of your investment and the timing of any purchases or redemptions.
You can find more information about the fund’s expenses, including annual expense ratios, in the Financial Statements section of this report. For additional information on operating expenses and other shareholder costs, please refer to your fund’s current prospectus.
29
Glossary
Average Coupon. The average interest rate paid on the fixed income securities held by a fund. It is expressed as a percentage of face value.
Average Duration. An estimate of how much the value of the bonds held by a fund will fluctuate in response to a change in interest rates. To see how the value could change, multiply the average duration by the change in rates. If interest rates rise by 1 percentage point, the value of the bonds in a fund with an average duration of five years would decline by about 5%. If rates decrease by a percentage point, the value would rise by 5%.
Average Effective Maturity. The average length of time until fixed income securities held by a fund reach maturity and are repaid, taking into consideration the possibility that the issuer may call the bond before its maturity date. The figure reflects the proportion of fund assets represented by each security; it also reflects any futures contracts held. In general, the longer the average effective maturity, the more a fund’s share price will fluctuate in response to changes in market interest rates.
Average Quality. An indicator of credit risk, this figure is the average of the ratings assigned to a fund’s holdings by credit-rating agencies. The agencies make their judgment after appraising an issuer’s ability to meet its obligations. Quality is graded on a scale, with Aaa or AAA indicating the most creditworthy bond issuers.
Beta. A measure of the magnitude of a fund’s past share-price fluctuations in relation to the ups and downs of a given market index. The index is assigned a beta of 1.00. Compared with a given index, a fund with a beta of 1.20 typically would have seen its share price rise or fall by 12% when the index rose or fell by 10%. A fund’s beta should be reviewed in conjunction with its R-squared (see definition below). The lower the R-squared, the less correlation there is between the fund and the index, and the less reliable beta is as an indicator of volatility.
Expense Ratio. The percentage of a fund’s average net assets used to pay its annual administrative and advisory expenses. These expenses directly reduce returns to investors.
Inception Date. The date on which the assets of a fund (or one of its share classes) are first invested in accordance with the fund’s investment objective. For funds with a subscription period, the inception date is the day after that period ends. Investment performance is measured from the inception date.
R-Squared. A measure of how much of a fund’s past returns can be explained by the returns from the market in general, as measured by a given index. If a fund’s total returns were precisely synchronized with an index’s returns, its R-squared would be 1.00. If the fund’s returns bore no relationship to the index’s returns, its R-squared would be 0.
Short-Term Reserves. The percentage of a fund invested in highly liquid, short-term securities that can be readily converted to cash.
Yield. A snapshot of a fund’s interest income. The yield, expressed as a percentage of the fund’s net asset value, is based on income earned over the past 30 days (7 days for money market funds) and is annualized, or projected forward for the coming year.
Yield to Maturity. The rate of return an investor would receive if the fixed income securities held by a fund were held to their maturity dates.
30
This page intentionally left blank.
The People Who Govern Your Fund
The trustees of your mutual fund are there to see that the fund is operated and managed in your best interests since, as a shareholder, you are a part owner of the fund. Your fund’s trustees also serve on the board of directors of The Vanguard Group, Inc., which is owned by the Vanguard funds and provides services to them on an at-cost basis.
A majority of Vanguard’s board members are independent, meaning that they have no affiliation with Vanguard or the funds they oversee, apart from the sizable personal investments they have made as private individuals.
Our independent board members bring distinguished backgrounds in business, academia, and public service to their task of working with Vanguard officers to establish the policies and oversee the activities of the funds. Among board members’ responsibilities are selecting investment advisors for the funds; monitoring fund operations, performance, and costs; reviewing contracts; nominating and selecting new trustees/directors; and electing Vanguard officers.
Each trustee serves a fund until its termination; or until the trustee’s retirement, resignation, or death; or otherwise as specified in the fund’s organizational documents. Any trustee may be removed at a shareholders’ meeting by a vote representing two-thirds of the net asset value of all shares of the fund together with shares of other Vanguard funds organized within the same trust. The table on these two pages shows information for each trustee and executive officer of the fund. The mailing address of the trustees and officers is P.O. Box 876, Valley Forge, PA 19482.
Chairman of the Board, Chief Executive Officer, and Trustee |
| |
| |
John J. Brennan1 | |
Born 1954 | Principal Occupation(s) During the Past Five Years: |
Trustee since May 1987; | Chairman of the Board, Chief Executive Officer, and |
Chairman of the Board and | Director/Trustee of The Vanguard Group, Inc., and of |
Chief Executive Officer | each of the investment companies served by |
148 Vanguard Funds Overseen | The Vanguard Group. |
| |
Independent Trustees | |
| |
Charles D. Ellis | |
Born 1937 | Principal Occupation(s) During the Past Five Years: |
| Applecore Partners (pro bono ventures in education); |
Trustee since January 2001 | Senior Advisor to Greenwich Associates (international |
148 Vanguard Funds Overseen | business strategy consulting); Successor Trustee of |
| Yale University; Overseer of the Stern School of |
| Business at New York University; Trustee of the |
| Whitehead Institute for Biomedical Research. |
| |
Rajiv L. Gupta | |
Born 1945 | Principal Occupation(s) During the Past Five Years: |
Trustee since December 20012 | Chairman, President, and Chief Executive Officer of |
148 Vanguard Funds Overseen | Rohm and Haas Co. (chemicals); Board Member of the |
| American Chemistry Council; Director of Tyco |
| International, Ltd. (diversified manufacturing and |
| services) since 2005; Trustee of Drexel University and of |
| the Chemical Heritage Foundation. |
| |
Amy Gutmann | |
Born 1949 | Principal Occupation(s) During the Past Five Years: |
Trustee since June 2006 | President of the University of Pennsylvania since 2004; |
148 Vanguard Funds Overseen | Professor in the School of Arts and Sciences, |
| Annenberg School for Communication, and Graduate |
| School of Education of the University of Pennsylvania |
| since 2004; Provost (2001–2004) and Laurance S. |
| Rockefeller Professor of Politics and the University |
| Center for Human Values (1990–2004), Princeton |
| University; Director of Carnegie Corporation of New York |
| since 2005 and of Schuylkill River Development |
| Corporation and Greater Philadelphia Chamber of |
| Commerce since 2004. |
JoAnn Heffernan Heisen | |
Born 1950 | Principal Occupation(s) During the Past Five Years: |
Trustee since July 1998 | Corporate Vice President and Chief Global Diversity |
148 Vanguard Funds Overseen | Officer since 2006, Vice President and Chief Information |
| Officer (1997–2005), and Member of the Executive |
| Committee of Johnson & Johnson (pharmaceuticals/ |
| consumer products); Director of the University Medical |
| Center at Princeton and Women’s Research and |
| Education Institute. |
| |
André F. Perold | |
Born 1952 | Principal Occupation(s) During the Past Five Years: |
Trustee since December 2004 | George Gund Professor of Finance |
148 Vanguard Funds Overseen | and Banking, Harvard Business School; Senior Associate |
| Dean, Director of Faculty Recruiting, and Chair of |
| Finance Faculty, Harvard Business School; Director and |
| Chairman of UNX, Inc. (equities trading firm) since 2003; |
| Chair of the Investment Committee of HighVista |
| Strategies LLC (private investment firm) since 2005. |
| |
Alfred M. Rankin, Jr. | |
Born 1941 | Principal Occupation(s) During the Past Five Years: |
Trustee since January 1993 | Chairman, President, Chief Executive Officer, and |
148 Vanguard Funds Overseen | Director of NACCO Industries, Inc. (forklift |
| trucks/housewares/lignite); Director of Goodrich |
| Corporation (industrial products/aircraft systems and |
| services). |
| |
J. Lawrence Wilson | |
Born 1936 | Principal Occupation(s) During the Past Five Years: |
Trustee since April 1985 | Retired Chairman and Chief Executive |
148 Vanguard Funds Overseen | Officer of Rohm and Haas Co. (chemicals); Director of |
| Cummins Inc. (diesel engines) and |
| AmerisourceBergen Corp. (pharmaceutical distribution); |
| Trustee of Vanderbilt University |
| and of Culver Educational Foundation. |
| |
Executive Officers1 | |
| |
Thomas J. Higgins | |
Born 1957 | Principal Occupation(s) During the Past Five Years: |
Treasurer since July 1998 | Principal of The Vanguard Group, Inc.; |
148 Vanguard Funds Overseen | Treasurer of each of the investment companies served |
| by The Vanguard Group. |
| |
Heidi Stam | |
Born 1956 | Principal Occupation(s) During the Past Five Years: |
Secretary since July 2005 | Managing Director of The Vanguard Group, Inc., |
148 Vanguard Funds Overseen | since 2006; General Counsel of The Vanguard Group |
| since 2005; Secretary of The Vanguard Group, and of |
| each of the investment companies served by |
| The Vanguard Group, since 2005; Principal of |
| The Vanguard Group (1997–2006). |
| |
Vanguard Senior Management Team | | |
| | | |
R. Gregory Barton | Kathleen C. Gubanich | F. William McNabb, III | Ralph K. Packard |
Mortimer J. Buckley | Paul A. Heller | Michael S. Miller | George U. Sauter |
| | | |
| | | |
Founder | | | |
| | | |
John C. Bogle | | | |
Chairman and Chief Executive Officer, 1974-1996 | | |
1 | Officers of the funds are “interested persons” as defined in the Investment Company Act of 1940. |
2 | December 2002 for Vanguard Equity Income Fund, Vanguard Growth Equity Fund, the Vanguard Municipal Bond Funds, and the Vanguard State Tax-Exempt Funds. |
More information about the trustees is in the Statement of Additional Information, available from The Vanguard Group.

P.O. Box 2600
Valley Forge, PA 19482-2600
Connect with Vanguard® > www.vanguard.com
Fund Information > 800-662-7447 | Vanguard, Admiral, Connect with Vanguard, |
| Wellington, and the ship logo are trademarks of |
Direct Investor Account Services > 800-662-2739 | The Vanguard Group, Inc. |
| |
Institutional Investor Services > 800-523-1036 | |
| All other marks are the exclusive property of their |
Text Telephone for People | respective owners. |
With Hearing Impairment > 800-952-3335 | |
| All comparative mutual fund data are from Lipper Inc. |
| or Morningstar, Inc., unless otherwise noted. |
| |
| You can obtain a free copy of Vanguard’s proxy voting |
This material may be used in conjunction | guidelines by visiting our website, www.vanguard.com, |
with the offering of shares of any Vanguard | and searching for “proxy voting guidelines,” or by |
fund only if preceded or accompanied by | calling Vanguard at 800-662-2739. The guidelines are |
the fund’s current prospectus. | also available from the SEC’s website, www.sec.gov. |
| In addition, you may obtain a free report on how your |
| fund voted the proxies for securities it owned during |
| the 12 months ended June 30. To get the report, visit |
| either www.vanguard.com or www.sec.gov. |
| |
| You can review and copy information about your fund |
| at the SEC’s Public Reference Room in Washington, D.C. |
| To find out more about this public service, call the SEC |
| at 202-551-8090. Information about your fund is also |
| available on the SEC’s website, and you can receive |
| copies of this information, for a fee, by sending a |
| request in either of two ways: via e-mail addressed to |
| publicinfo@sec.gov or via regular mail addressed to the |
| Public Reference Section, Securities and Exchange |
| Commission, Washington, DC 20549-0102. |
| |
| |
| |
| |
| © 2008 The Vanguard Group, Inc. |
| All rights reserved. |
| Vanguard Marketing Corporation, Distributor. |
| |
| Q1680 012008 |
Item 2: Code of Ethics. The Registrant has adopted a code of ethics that applies to the Registrant’s principal executive officer, principal financial officer, principal accounting officer or controller or persons performing similar functions. The Code of Ethics was amended during the reporting period covered by this report to make certain technical, non-material changes.
Item 3: Audit Committee Financial Expert. The following members of the Audit Committee have been determined by the Registrant’s Board of Trustees to be Audit Committee Financial Experts serving on its Audit Committee, and to be independent: Charles D. Ellis, Rajiv L. Gupta, JoAnn Heffernan Heisen, André F. Perold, Alfred M. Rankin, Jr., and J. Lawrence Wilson.
Item 4: Principal Accountant Fees and Services.
(a) Audit Fees.
Audit Fees of the Registrant
Fiscal Year Ended November 30, 2007: $22,000
Fiscal Year Ended November 30, 2006: $23,000
Aggregate Audit Fees of Registered Investment Companies in the Vanguard Group.
Fiscal Year Ended November 30, 2007: $2,835,320
Fiscal Year Ended November 30, 2006: $2,347,620
(b) Audit-Related Fees.
Fiscal Year Ended November 30, 2007: $630,400
Fiscal Year Ended November 30, 2006: $530,000
Includes fees billed in connection with assurance and related services provided to the Registrant, The Vanguard Group, Inc., Vanguard Marketing Corporation, and other registered investment companies in the Vanguard Group.
(c) Tax Fees.
Fiscal Year Ended November 30, 2007: $215,900
Fiscal Year Ended November 30, 2006: $101,300
Includes fees billed in connection with tax compliance, planning and advice services provided to the Registrant, The Vanguard Group, Inc., Vanguard Marketing Corporation, and other registered investment companies in the Vanguard Group and related to income and excise taxes.
(d) All Other Fees.
Fiscal Year Ended November 30, 2007: $0
Fiscal Year Ended November 30, 2006: $0
Includes fees billed for services related to risk management and privacy matters. Services were provided to the Registrant, The Vanguard Group, Inc., Vanguard Marketing Corporation, and other registered investment companies in the Vanguard Group.
(e) (1) Pre-Approval Policies. The policy of the Registrant’s Audit Committee is to consider and, if appropriate, approve before the principal accountant is engaged for such services, all specific audit and non-audit services provided to: (1) the Registrant; (2) The Vanguard Group, Inc.; (3) other entities
controlled by The Vanguard Group, Inc. that provide ongoing services to the Registrant; and (4) other registered investment companies in the Vanguard Group. In making a determination, the Audit Committee considers whether the services are consistent with maintaining the principal accountant’s independence.
In the event of a contingency situation in which the principal accountant is needed to provide services in between scheduled Audit Committee meetings, the Chairman of the Audit Committee would be called on to consider and, if appropriate, pre-approve audit or permitted non-audit services in an amount sufficient to complete services through the next Audit Committee meeting, and to determine if such services would be consistent with maintaining the accountant’s independence. At the next scheduled Audit Committee meeting, services and fees would be presented to the Audit Committee for formal consideration, and, if appropriate, approval by the entire Audit Committee. The Audit Committee would again consider whether such services and fees are consistent with maintaining the principal accountant’s independence.
The Registrant’s Audit Committee is informed at least annually of all audit and non-audit services provided by the principal accountant to the Vanguard complex, whether such services are provided to: (1) the Registrant; (2) The Vanguard Group, Inc.; (3) other entities controlled by The Vanguard Group, Inc. that provide ongoing services to the Registrant; or (4) other registered investment companies in the Vanguard Group.
(2) No percentage of the principal accountant’s fees or services were approved pursuant to the waiver provision of paragraph (c)(7)(i)(C) of Rule 2-01 of Regulation S-X.
(f) For the most recent fiscal year, over 50% of the hours worked under the principal accountant’s engagement were not performed by persons other than full-time, permanent employees of the principal accountant.
(g) Aggregate Non-Audit Fees.
Fiscal Year Ended November 30, 2007: $215,900
Fiscal Year Ended November 30, 2006: $101,300
Includes fees billed for non-audit services provided to the Registrant, The Vanguard Group, Inc., Vanguard Marketing Corporation, and other registered investment companies in the Vanguard Group.
(h) For the most recent fiscal year, the Audit Committee has determined that the provision of all non-audit services was consistent with maintaining the principal accountant’s independence.
Item 5: Not Applicable.
Item 6: Not Applicable.
Item 7: Not Applicable.
Item 8: Not Applicable.
Item 9: Not Applicable.
Item 10: Not Applicable.
Item 11: Controls and Procedures.
(a) Disclosure Controls and Procedures. The Principal Executive and Financial Officers concluded that the Registrant's Disclosure Controls and Procedures are effective based on their evaluation of the Disclosure Controls and Procedures as of a date within 90 days of the filing date of this report.
(b) Internal Control Over Financial Reporting. There were no significant changes in Registrant’s Internal Control Over Financial Reporting or in other factors that could significantly affect this control subsequent to the date of the evaluation, including any corrective actions with regard to significant deficiencies and material weaknesses.
Item 12: Exhibits.
(a) Code of Ethics.
(b) Certifications.
Pursuant to the requirements of the Securities Exchange Act of 1934 and the Investment Company Act of 1940, the registrant has duly caused this report to be signed on its behalf by the undersigned, thereunto duly authorized.
VANGUARD MASSACHUSETTS TAX-FREE FUNDS |
BY: | (signature) |
| (HEIDI STAM) |
| JOHN J. BRENNAN* |
| CHIEF EXECUTIVE OFFICER |
Date: January 17, 2008
Pursuant to the requirements of the Securities Exchange Act of 1934 and the Investment Company Act of 1940, this report has been signed below by the following persons on behalf of the registrant and in the capacities and on the dates indicated.
VANGUARD MASSACHUSETTS TAX-FREE FUNDS |
BY: | (signature) |
| (HEIDI STAM) |
| JOHN J. BRENNAN* |
| CHIEF EXECUTIVE OFFICER |
Date: January 17, 2008
VANGUARD MASSACHUSETTS TAX-FREE FUNDS |
BY: | (signature) |
| (HEIDI STAM) |
| THOMAS J. HIGGINS* |
| TREASURER |
Date: January 17, 2008
*By Power of Attorney. Filed on January 18, 2008, see File Number 2-29601. Incorporated by Reference.