UNITED STATES
SECURITIES AND EXCHANGE COMMISSION
Washington, D.C. 20549
FORM N-CSR
CERTIFIED SHAREHOLDER REPORT
OF
REGISTERED MANAGEMENT INVESTMENT COMPANIES
| |
| Investment Company Act file number: 811-09005 |
| Name of Registrant: Vanguard Massachusetts Tax-Exempt Funds |
| Address of Registrant: P.O. Box 2600 | |
| Valley Forge, PA 19482 |
| Name and address of agent for service: Heidi Stam, Esquire |
| P.O. Box 876 |
| Valley Forge, PA 19482 |
| Registrant’s telephone number, including area code: (610) 669-1000 |
| Date of fiscal year end: November 30 | |
| Date of reporting period: December 1, 2008 – November 30, 2009 |

| Vanguard Massachusetts |
| Tax-Exempt Fund Annual Report |
| November 30, 2009 |

> The long-term municipal bond market roared back from its loss in fiscal-year
2008 to a double-digit gain for the fiscal year ended November 30, 2009.
> Vanguard Massachusetts Tax-Exempt Fund returned about 12% for the
12-month period, in line with the index’s return but behind the average
return of the fund’s peers.
> For the decade ended November 30, the fund’s average annual return was almost
1 percentage point ahead of the average annual return of competing funds.
| |
| Contents | |
| |
| Your Fund’s Total Returns | 1 |
| President’s Letter | 2 |
| Advisor’s Report | 9 |
| Results of Proxy Voting | 12 |
| Fund Profile | 13 |
| Performance Summary | 14 |
| Financial Statements | 16 |
| About Your Fund’s Expenses | 32 |
| Glossary | 34 |
The figures shown represent past performance, which is not a guarantee of future results. (Current performance may be lower or higher than the performance data cited. For performance data current to the most recent month-end, visit our website at www.vanguard.com/performance.)
Please note: The opinions expressed in this report are just that—informed opinions. They should not be considered promises or advice. Also, please keep in mind that the information and opinions cover the period through the date on the front of this report. Of course, the risks of investing in your fund are spelled out in the prospectus.
Cover photograph: Veronica Coia.
Your Fund’s Total Returns
| | |
| Fiscal Year Ended November 30, 2009 | | |
| | Ticker | Total |
| | Symbol | Returns |
| Vanguard Massachusetts Tax-Exempt Fund | VMATX | 12.36% |
| 30-Day SEC Yield: 3.20% | | |
| Taxable-Equivalent Yield: 5.20%1 | | |
| Barclays Capital 10 Year Municipal Bond Index | | 12.67 |
| Massachusetts Municipal Debt Funds Average2 | | 16.15 |
| | | | |
| Your Fund’s Performance at a Glance | | | | |
| November 30, 2008–November 30, 2009 | | | | |
| | | | Distributions Per Share |
| | Starting | Ending | Income | Capital |
| | Share Price | Share Price | Dividends | Gains |
| Vanguard Massachusetts Tax-Exempt Fund | $9.44 | $10.19 | $0.401 | $0.000 |
1 This calculation, which assumes a typical itemized tax return, is based on the maximum federal tax rate of 35% and the maximum
commonwealth of Massachusetts income tax rate. Local taxes were not considered. Please see the prospectus for a detailed
explanation of the calculation.
2 Derived from data provided by Lipper Inc.
1

President’s Letter
Dear Shareholder,
Fiscal-year 2009 began amid fears about the viability of the nation’s financial institutions and a related plunge in municipal bond prices.
As the year progressed, government rescue programs began to take hold, accompanied by a strong rally in municipal bonds.
Simultaneously, to a greater or lesser extent, Massachusetts and other states grappled with the disruption in revenues brought about by the worst economic slump since the Great Depression. To help address the fiscal squeeze, Massachusetts increased the state sales tax rate from 5.00% to 6.25%, effective August 1. And even though Massachusetts’ unemployment rate rose to about 9%, it was below the national average, which exceeded 10%. Fears of defaults were in the air (generally unwarranted in our view).
In this environment, Vanguard Massachusetts Tax-Exempt Fund performed well, returning 12.36%, and fully participated in the national muni bond market rally. Rising bond prices go hand-in-hand with declining yields: As of November 30, 2009, the fund’s yield was 3.20%, down from 4.23% a year earlier. On a taxable-equivalent basis, the yield was 5.20% for investors in the highest income tax bracket.
2
Note: The fund is permitted to invest in securities whose income is subject to the alternative minimum tax (AMT).
As of November 30, the fund owned no securities that would generate income distributions subject to the AMT.
For bonds, a period of panic was followed by robust returns
Volatility was a theme in the fixed income market over the 12 months ended November 30. At the peak of the credit crisis in late 2008, investors shunned just about any security not issued by the U.S. Treasury. This stampede to quality led to the widest gap between the very low yields of Treasuries and the much higher yields of corporate bonds since the
Great Depression. The crisis also rattled the municipal bond market, propelling muni bond yields above those of Treasury bonds—a reversal of the typical relationship.
In early spring, “green shoots” began to emerge—signs that aggressive fiscal and monetary policies were getting the global economy back on its feet. Investors regained their appetite for risk, and then some: Not only did they propel the stock market to an amazingly strong bounce-back, but many sought out some of the riskiest bonds. For the 12 months ended November 30, taxable and municipal bonds each notched double-digit results, returning about 12% and 14%, respectively.
| | | |
| Market Barometer | | | |
| | Average Annual Total Returns |
| | Periods Ended November 30, 2009 |
| | One Year | Three Years | Five Years |
| Bonds | | | |
| Barclays Capital U.S. Aggregate Bond Index | | | |
| (Broad taxable market) | 11.63% | 6.40% | 5.49% |
| Barclays Capital Municipal Bond Index | 14.17 | 4.17 | 4.50 |
| Citigroup 3-Month Treasury Bill Index | 0.20 | 2.36 | 2.91 |
| |
| Stocks | | | |
| Russell 1000 Index (Large-caps) | 27.38% | –5.71% | 1.02% |
| Russell 2000 Index (Small-caps) | 24.53 | –8.36 | –0.46 |
| Dow Jones U.S. Total Stock Market Index | 28.06 | –5.55 | 1.24 |
| MSCI All Country World Index ex USA (International) | 47.13 | –2.73 | 6.75 |
| |
| CPI | | | |
| Consumer Price Index | 1.84% | 2.40% | 2.52% |
3
Shorter-term savings vehicles, including money market funds, didn’t fare as well. They became casualties of the Fed’s dramatic cuts in short-term interest rates and other policies that pumped up the money supply, all intended to nurse the economy, markets, and banks back to health. In December 2008, the Fed reduced its target for the federal funds rate, a benchmark for the interest rates paid by money market instruments and other very short-term securities, to between 0% and 0.25%. The target has stayed there ever since. After its meeting in early November, the Fed said it expected to maintain the target at this level “for an extended period.”
Stock markets worldwide produced double-digit returns
U.S. stocks posted unusually large gains as the steep losses suffered during the first few months of the fiscal year were more than erased by the rally that began in March. The stock market’s rebound seemed to anticipate an improvement in the broader economy, which began to show signs of growth in the second half of the period.
The story was similar in many international markets: They collapsed in late 2008 and early 2009, then rebounded at a startling rate. The recovery was especially swift and powerful in emerging markets, many
| | |
| Expense Ratios1 | | |
| Your Fund Compared With Its Peer Group | | |
| | | Massachusetts |
| | | Municipal Debt |
| | Fund | Funds Average |
| Massachusetts Tax-Exempt Fund | 0.17% | 1.20% |
1 The fund expense ratio shown is from the prospectus dated March 27, 2009, and represents estimated costs for the current fiscal year
based on the fund’s net assets as of the prospectus date. For the fiscal year ended November 30, 2009, the fund’s expense ratio was
0.17%. The peer-group expense ratio is derived from data provided by Lipper Inc. and captures information through year-end 2008.
4
of which came out of the financial crisis in relatively better fiscal and economic shape than their developed-market counterparts.
Despite the strong performance seen since March, the longer-term returns of most stock market indexes bear witness to the trials suffered by many investors in the not-so-distant past. Over the past three years, for example, both U.S. and international stock indexes have declined. Five-year annualized returns for U.S. stocks as of November 30 were mostly positive, but far from impressive. Stock markets abroad fared better over this longer period, posting average annual returns of almost 7%.
Fear, the Fed, and a rally put a squeeze on yields
Fiscal 2009 was a period of falling tax-exempt yields across the maturity spectrum. In the longer-term tax-exempt market, yields declined because of a rally that took hold early in the year and didn’t let up.
The rally got its start early in the fiscal year when the credit-market crisis put extreme pressure on certain institutional investors to raise capital in a hurry. The resulting forced sales of municipal bonds drove prices down to levels that would soon prove attractive to investors. Yields on munis rose accordingly, even climbing above those of Treasuries (see the
| | |
| Total Returns | | |
| Ten Years Ended November 30, 2009 | | |
| | Average Annual Return |
| | | Massachusetts |
| | Vanguard | Municipal Debt |
| | Fund | Funds Average1 |
| Massachusetts Tax-Exempt Fund | 5.48% | 4.56% |
The figures shown represent past performance, which is not a guarantee of future results. (Current performance may be lower or higher than the performance data cited. For performance data current to the most recent month-end, visit our website at www.vanguard.com/performance.) Note, too, that both investment returns and principal value can fluctuate widely, so an investor’s shares, when sold, could be worth more or less than their original cost.
1 Derived from data provided by Lipper Inc.
5
| Investment insight |
| A historical yield pattern |
| has reasserted itself |
| Atypical times can upend typical |
| relationships. At the start of the |
| 2009 fiscal year, municipal securities |
| generally offered higher pre-tax yields |
| than taxable Treasuries—an inversion |
| of the historical relationship. A variety |
| of investor fears about the financial |
| outlook drove demand for Treasuries |
| up and their yields down, while market |
| turmoil was doing the opposite for |
| municipal bonds. Munis have usually |
| yielded less than Treasuries, because |
| their interest income is generally |
| exempt from federal taxes. As the |
| period progressed, Treasury yields |
| rose and muni yields declined— |
| returning to the more usual |
| relationship in the spring. |
| |
| Comparing Treasury and Municipal Yields |
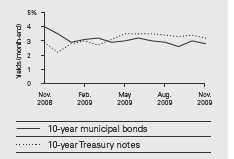
| Sources: Bloomberg L.P. and Thomson Reuters. |
“Investment insight” chart, opposite). As investors’ appetite for risk grew, the combination of relatively low prices and high yields contributed to strong muni demand.
Also helping to boost muni bond prices was a decline in tax-exempt supply. Issuance of tax-exempt bonds dropped as states and municipalities took advantage of the newly created Build America Bonds (BABs). Issuers in many other states got a head start on Massachusetts. For example, the University of Massachusetts Building Authority issued BABs in October, and Massachusetts issued its first state general-obligation BABs on December 1, the day after the fiscal year-end. The new BABs, which are taxable, are one element of the federal economic stimulus package and were designed to subsidize states’ and local governments’ borrowing costs. (The stimulus program also included direct payments to state and local governments, another factor that reduced tax-exempt bond supply.)
Against this favorable backdrop, the Massachusetts Tax-Exempt Fund returned more than 12%, the fund’s best fiscal-year return since its inception in 1998. The fund’s return was in line with that of its benchmark index, but the fund’s higher-quality orientation held back performance compared with the average return of the peer group.
6
Diligent analysis and low costs support long-term returns
Even though the economic signals seem to point to renewed growth for the U.S. economy as a whole, the finances of states and municipalities are likely to be strained for a while longer—if experience is any guide. This means that close monitoring of the finances of Massachusetts and other municipal bond issuers will continue to be of paramount importance to investors.
Vanguard Fixed Income Group’s seasoned credit analysts bring an informed skeptic’s view to the monitoring task. They perform rigorous, thorough, and independent analysis not only of issues being considered for purchase but also of those already in the portfolio. The advisor believes that concerns about the potential defaults of Massachusetts tax-exempt securities, and of those of other states represented in Vanguard’s array of tax-exempt portfolios, are generally unwarranted. In fact, we have not witnessed a surge in municipal defaults across the country in 2009, despite the fiscal squeeze.
Investors have been well-served by the advisor’s diligent credit analysis, as well as by the strategy of maintaining low-cost portfolios of high-quality, liquid assets with tightly controlled exposure to interest rate risk. For the decade ended November 30, 2009, the Massachusetts Tax-Exempt
Fund’s average annual return was almost 1 full percentage point higher than the comparable average return of its peers.
The importance of low costs should not be underestimated in fixed income investing, because bond returns fall within a narrower range than stock returns. This simple fact provides two interrelated advantages for the skilled bond fund manager who has low costs. He or she has a lower hurdle to overcome in seeking to produce competitive returns, because expenses are deducted directly from returns. And the manager needn’t pursue higher-risk strategies in an effort to overcome the drag from higher costs. As you can see in the expense ratio table on page 4, your fund’s costs are far below the norm for its peers.
Diversification and low costs stand the test of time
As the financial crisis unfolded and the economy fell into recession, risk-averse investors sought refuge in the relative safety of Treasury securities. This made Treasuries the star performers in fiscal year 2008, when virtually all other asset classes suffered double-digit losses. In 2009, however, as the outlook for credit markets and the economy brightened, investors returned to embracing other investments, including municipal securities. The double-digit returns of many long-term municipal bond funds
7
were several steps ahead of the returns of intermediate- and long-term Treasury bonds.
Because asset classes rotate in and out of favor over time, we recommend that you diversify your portfolio among, and within, different asset classes based on your goals, time horizon, and tolerance for risk. And always pay attention to costs, a key factor in any fund’s performance and especially critical in fixed income investing.
When held as part of a balanced and well-diversified portfolio, the Massachusetts Tax-Exempt Fund can play an important role, particularly for investors in higher tax brackets. And the fund’s low expenses also help you to keep more of the returns, a benefit that compounds over time.
On another matter, I would like to inform you that on January 1, 2010, we will complete a leadership transition that began in March 2008. I will succeed Jack Brennan as chairman of Vanguard’s board of directors and of the fund boards. Jack has agreed to serve as chairman emeritus and senior advisor.
Under Jack’s leadership, Vanguard has grown to become a preeminent firm in the mutual fund industry. Jack’s energy, his relentless pursuit of perfection, and his unwavering focus on always doing the right thing for our clients are evident in every facet of Vanguard policy today.
Thank you for entrusting your assets to Vanguard.
Sincerely,

F. William McNabb III
President and Chief Executive Officer
December 15, 2009
8
Advisor’s Report
For the fiscal year ended November 30, 2009, Vanguard Massachusetts Tax-Exempt Fund returned 12.36%—showing just how far and fast the bond market recovered from the dark days of 2008 and early 2009 when credit was essentially frozen. The fund’s return was in line with that of its diversified Barclays Capital index benchmark but behind the average return of competing funds.
The investment environment
In the past 12 months we have seen a significant rebound in the municipal bond market. The fiscal year began in December amid a seemingly desperate crisis: Major financial firms had imploded; the credit markets were frozen; hedge funds
and closed-end funds were unloading high-quality assets, including municipal bonds, at fire-sale prices to meet collateral requirements; and investors were fleeing securities with any hint of risk for the perceived safety of U.S. Treasury securities.
By early 2009, federal government and Federal Reserve initiatives aimed at combating the financial crisis and the intertwined economic slump started gaining some traction. The banks and brokerage firms that underwrite municipal issues and facilitate liquidity began to operate normally once again, helping to stabilize the muni market. And munis’ depressed prices began to attract buyers, helping to fuel a rally that continued for
| | |
| Yields of Municipal Securities | | |
| (AAA-Rated General-Obligation Issues) | | |
| | November 30, | November 30, |
| Maturity | 2008 | 2009 |
| 2 years | 2.13% | 0.61% |
| 5 years | 2.93 | 1.50 |
| 10 years | 4.02 | 2.78 |
| 30 years | 5.38 | 4.28 |
Source: Vanguard.
9
the remainder of the year. Toward the end of the fiscal year, tax-free bond yields had fallen (and prices risen) to levels not seen for four decades.
Prices also got a boost from the shortage of traditional tax-exempt securities. After the yields demanded by muni investors became exceptionally high in early 2009, many municipal borrowers began shifting a significant portion of their issuance to a new and lower-cost type of municipal bond—the subsidized and taxable Build America Bond. These bonds were created as part of the federal government’s stimulus package (signed into law in February). They are intended to encourage investment in public infrastructure and to help state and local governments, as well as other municipal issuers, meet their financing needs.
Although Build America Bonds may not have become a household name yet, these bonds’ impact on the municipal bond market should not be underestimated. From April—when the first such bond was issued—through November 2009, more than $55 billion in taxable Build America Bonds was issued nationwide. In October alone, about one-third of all new municipal bond issues were taxable, and most of those were Build America Bonds. Because these bonds siphoned off some of the potential supply of new tax-exempt bonds, investors seeking traditional munis found their prices being bid up.
Still, tax-exempt bonds represented close to 80% of the $373 billion of muni issues marketed nationwide in 2009 through November. And the total value of new municipal issues—including taxable bonds—appeared on track to exceed $400 billion in calendar year 2009, which would join 2005 and 2007 in the $400 billion-plus record book. In Massachusetts, based on preliminary data, $10.4 billion of municipal bonds were issued in fiscal year 2009 ($2 billion were Build America Bonds, including a $1 billion state issue on December 1, one day after the fiscal year-end). Total municipal issuance was down from the two previous fiscal years.
As economic conditions improved during the year, investors sought out higher yields—by moving out of money market securities into longer-term bonds and by taking on more credit risk. Indeed, with state and local finances remaining shaky throughout the period, it was the market’s shift toward risk that led to a narrowing of the yield gap between lower-quality municipals and U.S. Treasuries. In this environment, lower-quality bonds performed best in both the taxable and municipal markets—generally creating headwinds for Vanguard funds because of our focus on quality.
Management of the fund
The economic slump and high unemployment at the national level have translated into historic budget challenges for states and municipalities, leading them to resort
10
to a variety of measures—cutting spending, increasing taxes and fees, and tapping into reserves—to help meet their fiscal needs. Federal stimulus payments also helped bridge budget gaps. In Massachusetts, the legislature increased the state sales tax to help avoid even steeper cuts in education and community-services budgets.
In anticipation of the market’s recovery, we increased the fund’s exposure to lower-quality securities, while maintaining our overall emphasis on securities with high credit quality. Indeed, compared with the peer group, our allocation to lower-rated issues remains quite modest.
The fund’s interest rate positioning, as measured by its average weighted duration, had no meaningful impact on performance relative to benchmark indexes.
Outlook
We expect slow and stable economic growth to continue. Although the ultimate strength and pace of the recovery are open to question, the muni market has clearly priced out depression and priced in recovery. And, while we expect the Federal Reserve to keep interest rates low, we will be closely watching for any serious
uptick in inflation. If inflation becomes a concern, we are prepared to act quickly. As the economic expansion proceeds, yield spreads between lower-risk and higher-risk bonds should continue to tighten, albeit at a more moderate pace.
At the state and local levels, we do not expect any immediate respite from financial stress. If the historical pattern holds, fiscal pressure on state and local governments will continue for the next few years. Changes in the financial picture of municipal bond issuers tend to lag the broader economic cycle by one to two years. As we always do, we will continue to independently monitor developments in Massachusetts and nationally, and closely analyze the finances of the muni issuers. We strive to make sure that any financial pressure or problems of issuers won’t become the problems of the shareholders in our funds.
Marlin G. Brown, Portfolio Manager
Christopher W. Alwine, CFA
Principal and Head of Municipal Money
Market and Municipal Bond Groups
Vanguard Fixed Income Group
December 18, 2009
11
Results of Proxy Voting
At a special meeting of shareholders on July 2, 2009, fund shareholders approved the following two proposals:
Proposal 1—Elect trustees for each fund.*
The individuals listed in the table below were elected as trustees for each fund. All trustees with the exception of Messrs. McNabb and Volanakis (both of whom already served as directors of The Vanguard Group, Inc.) served as trustees to the funds prior to the shareholder meeting.
| | | |
| | | | Percentage |
| Trustee | For | Withheld | For |
| John J. Brennan | 52,109,958 | 1,577,800 | 97.1% |
| Charles D. Ellis | 51,703,909 | 1,983,848 | 96.3% |
| Emerson U. Fullwood | 52,055,159 | 1,632,599 | 97.0% |
| Rajiv L. Gupta | 51,959,206 | 1,728,551 | 96.8% |
| Amy Gutmann | 51,881,008 | 1,806,750 | 96.6% |
| JoAnn Heffernan Heisen | 52,034,772 | 1,652,986 | 96.9% |
| F. William McNabb III | 51,997,314 | 1,690,443 | 96.9% |
| André F. Perold | 52,000,850 | 1,686,908 | 96.9% |
| Alfred M. Rankin, Jr. | 51,994,442 | 1,693,316 | 96.8% |
| Peter F. Volanakis | 52,073,167 | 1,614,590 | 97.0% |
| * Results are for all funds within the same trust. | | | |
Proposal 2—Update and standardize the funds’ fundamental policies regarding:
(a) Purchasing and selling real estate.
(b) Issuing senior securities.
(c) Borrowing money.
(d) Making loans.
(e) Purchasing and selling commodities.
(f) Concentrating investments in a particular industry or group of industries.
(g) Eliminating outdated fundamental investment policies not required by law.
The revised fundamental policies are clearly stated and simple, yet comprehensive, making oversight and compliance more efficient than under the former policies. The revised fundamental policies will allow the funds to respond more quickly to regulatory and market changes, while avoiding the costs and delays associated with successive shareholder meetings.
| | | | | |
| | | | | Broker | Percentage |
| Vanguard Fund | For | Abstain | Against | Non-Votes | For |
| Massachusetts Tax-Exempt Fund | | | | | |
| 2a | 43,904,130 | 1,438,888 | 1,851,498 | 6,493,241 | 81.8% |
| 2b | 43,826,164 | 1,479,545 | 1,888,809 | 6,493,239 | 81.6% |
| 2c | 42,933,363 | 1,316,193 | 2,944,962 | 6,493,240 | 80.0% |
| 2d | 42,853,361 | 1,393,829 | 2,947,328 | 6,493,239 | 79.8% |
| 2e | 42,728,675 | 1,395,267 | 3,070,576 | 6,493,239 | 79.6% |
| 2f | 42,884,648 | 1,601,211 | 2,708,660 | 6,493,239 | 79.9%�� |
| 2g | 44,394,323 | 1,335,862 | 1,464,334 | 6,493,239 | 82.7% |
12
Massachusetts Tax-Exempt Fund
Fund Profile
As of November 30, 2009
| | | |
| Financial Attributes | | |
| | | Comparative | Broad |
| | Fund | Index1 | Index2 |
| Number of Issues | 230 | 8,323 | 46,048 |
| Yield3 | 3.2% | 3.6% | 3.6% |
| Yield to Maturity | 3.3%4 | 3.6% | 3.6% |
| Average Coupon | 4.8% | 5.0% | 5.0% |
| Average Effective | | | |
| Maturity | 8.2 years | 9.9 years | 13.5 years |
| Average Quality | AA | AA | AA |
| Average Duration | 7.2 years | 7.2 years | 8.4 years |
| Expense Ratio5 | 0.17% | — | — |
| Short-Term Reserves | 4.9% | — | — |
| | |
| Volatility Measures6 | |
| | Fund Versus | Fund Versus |
| | Comparative Index1 | Broad Index2 |
| R-Squared | 0.92 | 0.98 |
| Beta | 1.01 | 1.05 |
| |
| Distribution by Maturity (% of portfolio) | |
| |
| Under 1 Year | 11.5% |
| 1–5 Years | 19.0 |
| 5–10 Years | 48.7 |
| 10–20 Years | 11.5 |
| 20–30 Years | 9.0 |
| Over 30 Years | 0.3 |
| |
| Distribution by Credit Quality (% of portfolio) |
| |
| AAA | 41.5% |
| AA | 34.9 |
| A | 18.6 |
| BBB | 3.5 |
| BB | 0.2 |
| Other | 1.3 |
Investment Focus
1 Barclays Capital 10 Year Municipal Bond Index.
2 Barclays Capital Municipal Bond Index.
3 30-day SEC yield for the fund; index yield assumes that all bonds are called or prepaid at the earliest possible dates. See the Glossary.
4 Before expenses.
5 The expense ratio shown is from the prospectus dated March 27, 2009, and represents estimated costs for the current fiscal year based on
the fund’s net assets as of the prospectus date. For the fiscal year ended November 30, 2009, the expense ratio was 0.17%
6 For an explanation of R-squared, beta, and other terms used here, see the Glossary.
13
Massachusetts Tax-Exempt Fund
Performance Summary
All of the returns in this report represent past performance, which is not a guarantee of future results that may be achieved by the fund. (Current performance may be lower or higher than the performance data cited. For performance data current to the most recent month-end, visit our website at www.vanguard.com/performance.) Note, too, that both investment returns and principal value can fluctuate widely, so an investor’s shares, when sold, could be worth more or less than their original cost. The returns shown do not reflect taxes that a shareholder would pay on fund distributions or on the sale of fund shares.
Cumulative Performance: November 30, 1999–November 30, 2009
Initial Investment of $10,000

| | | | |
| | Average Annual Total Returns | Final Value |
| | Periods Ended November 30, 2009 | of a $10,000 |
| | One Year | Five Years | Ten Years | Investment |
| Massachusetts Tax-Exempt Fund1 | 12.36% | 4.25% | 5.48% | $17,047 |
| Barclays Capital Municipal Bond Index | 14.17 | 4.50 | 5.64 | 17,302 |
| Barclays Capital 10 Year Municipal Bond Index | 12.67 | 4.90 | 5.79 | 17,549 |
| Massachusetts Municipal Debt Funds Average2 | 16.15 | 3.19 | 4.56 | 15,618 |
1 Total returns do not include the account service fee that may be applicable to certain accounts with balances below $10,000.
2 Derived from data provided by Lipper Inc.
See Financial Highlights for dividend and capital gains information.
14
Massachusetts Tax-Exempt Fund
Fiscal-Year Total Returns (%): November 30, 1999–November 30, 2009
| | | | |
| | | | | Barclays1 |
| Fiscal | Capital | Income | Total | Total |
| Year | Return | Return | Return | Return |
| 2000 | 3.8% | 5.4% | 9.2% | 7.7% |
| 2001 | 3.9 | 5.0 | 8.9 | 8.2 |
| 2002 | 0.8 | 4.8 | 5.6 | 6.7 |
| 2003 | 2.2 | 4.5 | 6.7 | 6.9 |
| 2004 | –0.9 | 4.2 | 3.3 | 4.0 |
| 2005 | –0.6 | 4.1 | 3.5 | 3.0 |
| 2006 | 2.2 | 4.3 | 6.5 | 6.2 |
| 2007 | –2.0 | 4.2 | 2.2 | 3.5 |
| 2008 | –6.7 | 4.0 | –2.7 | –0.4 |
| 2009 | 7.9 | 4.5 | 12.4 | 12.7 |
Average Annual Total Returns: Periods Ended September 30, 2009
This table presents average annual total returns through the latest calendar quarter—rather than through the end of the fiscal period. Securities and Exchange Commission rules require that we provide this information.
| | | | | | |
| | | | | Ten Years |
| | Inception Date | One Year | Five Years | Capital | Income | Total |
| Massachusetts Tax-Exempt Fund2 | 12/9/1998 | 14.37% | 4.54% | 1.13% | 4.52% | 5.65% |
1 Barclays Capital 10 Year Municipal Bond Index.
2 Total returns do not include the account service fee that may be applicable to certain accounts with balances below $10,000.
15
Massachusetts Tax-Exempt Fund
Financial Statements
Statement of Net Assets
As of November 30, 2009
The fund reports a complete list of its holdings in regulatory filings four times in each fiscal year, at the quarter-ends. For the second and fourth fiscal quarters, the lists appear in the fund’s semiannual and annual reports to shareholders. For the first and third fiscal quarters, the fund files the lists with the Securities and Exchange Commission on Form N-Q. Shareholders can look up the fund’s Forms N-Q on the SEC’s website at www.sec.gov. Forms N-Q may also be reviewed and copied at the SEC’s Public Reference Room (see the back cover of this report for further information).
| | | | |
| | | | Face | Market |
| | | Maturity | Amount | Value• |
| | Coupon | Date | ($000) | ($000) |
| Tax-Exempt Municipal Bonds (99.2%) | | | | |
| Massachusetts (95.8%) | | | | |
| Beverly MA GO | 5.250% | 11/1/12 (14) | 1,925 | 2,162 |
| Beverly MA GO | 5.250% | 11/1/13 (14) | 1,855 | 2,135 |
| Boston MA Convention Center Rev. | 5.000% | 5/1/18 (2) | 4,975 | 5,288 |
| Boston MA GO | 5.750% | 2/1/10 (Prere.) | 1,955 | 1,973 |
| Boston MA GO | 5.000% | 2/1/12 (14)(Prere.) | 3,765 | 4,113 |
| Boston MA GO | 5.000% | 3/1/16 | 7,295 | 8,564 |
| Boston MA Housing Auth. Rev. | 5.000% | 4/1/23 (4) | 2,000 | 2,159 |
| Boston MA Housing Auth. Rev. | 5.000% | 4/1/25 (4) | 5,440 | 5,798 |
| Boston MA Special Obligation Rev. | | | | |
| (Boston City Hosp.) | 5.000% | 8/1/17 (14) | 2,000 | 2,068 |
| Boston MA Water & Sewer Comm. Rev. | 5.750% | 11/1/13 | 380 | 416 |
| Boston MA Water & Sewer Comm. Rev. | 5.000% | 11/1/25 | 3,725 | 4,142 |
| Braintree MA GO | 5.000% | 5/15/27 | 4,000 | 4,306 |
| Foxborough MA Stadium Infrastructure | | | | |
| Improvement Rev. | 5.750% | 6/1/10 (Prere.) | 2,500 | 2,593 |
| Framingham MA Housing Auth. Mortgage Rev. | 6.200% | 2/20/21 | 900 | 955 |
| Framingham MA Housing Auth. Mortgage Rev. | 6.350% | 2/20/32 | 2,000 | 2,176 |
| Holyoke MA Gas & Electric Dept. Rev. | 5.000% | 12/1/21 (14) | 2,395 | 2,420 |
| Littleton MA GO | 5.000% | 1/15/22 (14) | 1,280 | 1,337 |
| Massachusetts Bay Transp. Auth. Rev. | 5.250% | 7/1/10 (Prere.) | 630 | 648 |
| Massachusetts Bay Transp. Auth. Rev. | 5.250% | 7/1/10 (Prere.) | 3,950 | 4,065 |
| Massachusetts Bay Transp. Auth. Rev. | 5.000% | 7/1/14 (Prere.) | 5,000 | 5,819 |
| Massachusetts Bay Transp. Auth. Rev. | 5.250% | 7/1/14 | 5,000 | 5,838 |
| Massachusetts Bay Transp. Auth. Rev. | 6.200% | 3/1/16 | 5,325 | 6,154 |
| Massachusetts Bay Transp. Auth. Rev. | 5.500% | 7/1/22 | 5,285 | 6,402 |
| Massachusetts Bay Transp. Auth. Rev. | 5.250% | 7/1/23 | 5,325 | 6,215 |
| Massachusetts Bay Transp. Auth. Rev. | 5.000% | 7/1/24 | 1,325 | 1,515 |
| Massachusetts Bay Transp. Auth. Rev. | 5.500% | 7/1/24 | 2,500 | 2,994 |
| Massachusetts Bay Transp. Auth. Rev. | 5.500% | 7/1/26 (14) | 2,000 | 2,396 |
| Massachusetts Bay Transp. Auth. Rev. | 5.000% | 7/1/27 | 5,000 | 5,688 |
| Massachusetts Bay Transp. Auth. Rev. | 0.000% | 7/1/29 | 1,020 | 378 |
| Massachusetts Bay Transp. Auth. Rev. | 5.250% | 7/1/29 | 5,000 | 5,747 |
| Massachusetts Bay Transp. Auth. Rev. | 5.500% | 7/1/29 (14) | 3,000 | 3,548 |
| Massachusetts Bay Transp. Auth. Rev. | 5.250% | 7/1/30 | 420 | 425 |
| Massachusetts Bay Transp. Auth. Rev. | 5.250% | 7/1/33 | 3,850 | 4,285 |
| Massachusetts Bay Transp. Auth. Rev. | 5.250% | 7/1/34 | 14,500 | 15,437 |
| Massachusetts Bay Transp. Auth. Rev. Sales Tax | 5.000% | 7/1/12 (Prere.) | 3,000 | 3,321 |
| Massachusetts Bay Transp. Auth. Rev. Sales Tax | 5.000% | 7/1/18 (Prere.) | 10,000 | 11,819 |
| Massachusetts Bay Transp. Auth. Rev. Sales Tax | 5.250% | 7/1/22 | 3,500 | 4,151 |
16
| | | | |
| Massachusetts Tax-Exempt Fund | | | | |
| |
| |
| |
| | | | Face | Market |
| | | Maturity | Amount | Value• |
| | Coupon | Date | ($000) | ($000) |
| Massachusetts Bay Transp. Auth. Rev. Sales Tax | 5.250% | 7/1/33 | 15,000 | 16,694 |
| Massachusetts College Building Auth. Rev. | 0.000% | 5/1/17 (10) | 3,340 | 2,550 |
| Massachusetts College Building Auth. Rev. | 5.000% | 5/1/38 (12) | 10,000 | 10,151 |
| Massachusetts Dev. Finance Agency | | | | |
| Higher Educ. Rev. (Emerson College) | 5.000% | 1/1/18 | 2,000 | 2,064 |
| Massachusetts Dev. Finance Agency | | | | |
| Higher Educ. Rev. (Emerson College) | 5.000% | 1/1/20 | 3,105 | 3,146 |
| Massachusetts Dev. Finance Agency | | | | |
| Higher Educ. Rev. (Emerson College) | 5.000% | 1/1/22 | 3,985 | 4,008 |
| Massachusetts Dev. Finance Agency | | | | |
| Higher Educ. Rev. (Emerson College) | 5.000% | 1/1/23 | 3,710 | 3,714 |
| Massachusetts Dev. Finance Agency Rev. | 5.000% | 1/1/36 (12) | 10,000 | 10,052 |
| Massachusetts Dev. Finance Agency Rev. | | | | |
| (Boston Univ.) | 6.000% | 5/15/29 (2) | 1,400 | 1,655 |
| Massachusetts Dev. Finance Agency Rev. | | | | |
| (Boston Univ.) | 5.000% | 10/1/35 (2) | 2,000 | 1,941 |
| Massachusetts Dev. Finance Agency Rev. | | | | |
| (Boston Univ.) | 5.375% | 5/15/39 | 1,575 | 1,591 |
| Massachusetts Dev. Finance Agency Rev. | | | | |
| (Boston Univ.) | 5.000% | 7/1/42 | 5,000 | 5,063 |
| Massachusetts Dev. Finance Agency Rev. | | | | |
| (Boston Univ.) VRDO | 0.210% | 12/1/09 LOC | 6,700 | 6,700 |
| Massachusetts Dev. Finance Agency Rev. | | | | |
| (Boston Univ.) VRDO | 0.210% | 12/1/09 LOC | 1,000 | 1,000 |
| Massachusetts Dev. Finance Agency Rev. | | | | |
| (Boston Univ.) VRDO | 0.210% | 12/1/09 LOC | 1,720 | 1,720 |
| Massachusetts Dev. Finance Agency Rev. | | | | |
| (College of Pharmacy and Allied Health Services) | 5.750% | 7/1/13 (Prere.) | 1,000 | 1,170 |
| Massachusetts Dev. Finance Agency Rev. | | | | |
| (Deerfield Academy) | 5.000% | 10/1/28 | 1,500 | 1,554 |
| Massachusetts Dev. Finance Agency Rev. | | | | |
| (Draper Laboratory) | 5.750% | 9/1/25 | 5,000 | 5,448 |
| Massachusetts Dev. Finance Agency Rev. | | | | |
| (Jewish Philanthropies) | 5.250% | 2/1/22 | 2,750 | 2,936 |
| Massachusetts Dev. Finance Agency Rev. | | | | |
| (Mount Holyoke College) | 5.250% | 7/1/31 | 4,000 | 4,046 |
| Massachusetts Dev. Finance Agency Rev. | | | | |
| (Mount Holyoke College) | 5.000% | 7/1/36 | 5,000 | 5,091 |
| Massachusetts Dev. Finance Agency Rev. | | | | |
| (Neville Communities) | 6.000% | 6/20/44 | 1,500 | 1,565 |
| Massachusetts Dev. Finance Agency Rev. | | | | |
| (Simmons College) | 5.250% | 10/1/33 (10) | 3,000 | 2,716 |
| Massachusetts Dev. Finance Agency Rev. | | | | |
| (Smith College) | 5.750% | 7/1/10 (Prere.) | 3,000 | 3,125 |
| Massachusetts Dev. Finance Agency Rev. | | | | |
| (Smith College) | 5.750% | 7/1/10 (Prere.) | 1,195 | 1,245 |
| Massachusetts Dev. Finance Agency Rev. | | | | |
| (Smith College) | 5.000% | 7/1/35 | 8,000 | 8,105 |
| Massachusetts Dev. Finance Agency Rev. | | | | |
| (Western New England College) | 5.875% | 12/1/12 (Prere.) | 570 | 639 |
| Massachusetts Dev. Finance Agency Rev. | | | | |
| (Western New England College) | 6.125% | 12/1/12 (Prere.) | 1,000 | 1,160 |
| Massachusetts GAN | 5.125% | 12/15/10 | 1,480 | 1,485 |
| Massachusetts GAN | 5.125% | 12/15/12 | 1,750 | 1,756 |
| Massachusetts GAN | 5.750% | 6/15/14 | 9,665 | 10,126 |
| Massachusetts GO | 5.625% | 6/1/10 (Prere.) | 1,450 | 1,489 |
17
Massachusetts Tax-Exempt Fund
| | | | |
| | | | Face | Market |
| | | Maturity | Amount | Value• |
| | Coupon | Date | ($000) | ($000) |
| Massachusetts GO | 5.000% | 8/1/12 | 4,945 | 5,470 |
| Massachusetts GO | 5.000% | 9/1/12 | 2,170 | 2,407 |
| Massachusetts GO | 5.000% | 8/1/14 | 3,000 | 3,461 |
| Massachusetts GO | 5.000% | 11/1/14 | 3,275 | 3,791 |
| Massachusetts GO | 5.000% | 12/1/14 (4)(Prere.) | 3,150 | 3,626 |
| Massachusetts GO | 5.000% | 3/1/15 (Prere.) | 10,000 | 11,675 |
| Massachusetts GO | 5.000% | 9/1/15 (Prere.) | 10,000 | 11,700 |
| Massachusetts GO | 5.500% | 10/1/15 | 2,280 | 2,707 |
| Massachusetts GO | 5.500% | 11/1/17 | 5,000 | 6,016 |
| Massachusetts GO | 5.250% | 8/1/18 (4) | 5,060 | 5,990 |
| Massachusetts GO | 5.500% | 10/1/18 (4) | 10,200 | 12,285 |
| Massachusetts GO | 5.500% | 10/1/18 | 4,955 | 5,968 |
| Massachusetts GO | 5.500% | 11/1/19 (4) | 5,550 | 6,709 |
| Massachusetts GO | 5.000% | 8/1/22 | 4,500 | 5,020 |
| Massachusetts GO | 5.250% | 8/1/22 | 5,000 | 5,892 |
| Massachusetts GO | 5.000% | 3/1/26 | 5,000 | 5,489 |
| Massachusetts GO | 5.000% | 8/1/28 | 4,535 | 4,892 |
| Massachusetts GO | 5.000% | 7/1/36 | 5,070 | 5,257 |
| Massachusetts GO | 5.000% | 8/1/37 (2) | 15,000 | 15,442 |
| Massachusetts GO | 5.000% | 8/1/38 | 5,000 | 5,159 |
| 1 Massachusetts GO TOB VRDO | 0.230% | 12/7/09 (3) | 1,400 | 1,400 |
| Massachusetts GO VRDO | 0.240% | 12/1/09 | 12,175 | 12,175 |
| Massachusetts Health & Educ. Fac. Auth. Rev. | 5.250% | 2/15/26 | 1,880 | 2,188 |
| Massachusetts Health & Educ. Fac. Auth. Rev. | 5.000% | 7/1/39 | 6,000 | 5,656 |
| Massachusetts Health & Educ. Fac. Auth. Rev. | | | | |
| (Baystate Medical Center) | 5.750% | 7/1/33 | 5,000 | 5,043 |
| Massachusetts Health & Educ. Fac. Auth. Rev. | | | | |
| (Baystate Medical Center) VRDO | 0.220% | 12/7/09 LOC | 2,500 | 2,500 |
| Massachusetts Health & Educ. Fac. Auth. Rev. | | | | |
| (Berklee College of Music) | 5.000% | 10/1/26 | 6,255 | 6,556 |
| Massachusetts Health & Educ. Fac. Auth. Rev. | | | | |
| (Berklee College of Music) | 5.000% | 10/1/27 | 5,575 | 5,817 |
| Massachusetts Health & Educ. Fac. Auth. Rev. | | | | |
| (Boston Medical Center) | 5.000% | 7/1/19 (14) | 50 | 48 |
| Massachusetts Health & Educ. Fac. Auth. Rev. | | | | |
| (Boston Medical Center) | 5.000% | 7/1/28 | 3,000 | 2,704 |
| Massachusetts Health & Educ. Fac. Auth. Rev. | | | | |
| (Caregroup) | 5.000% | 7/1/13 | 5,200 | 5,446 |
| Massachusetts Health & Educ. Fac. Auth. Rev. | | | | |
| (Caregroup) | 5.125% | 7/1/33 | 3,000 | 2,731 |
| Massachusetts Health & Educ. Fac. Auth. Rev. | | | | |
| (Caregroup) | 5.125% | 7/1/38 | 4,000 | 3,579 |
| Massachusetts Health & Educ. Fac. Auth. Rev. | | | | |
| (Caritas Christi Obligated Group) | 6.750% | 7/1/16 | 2,000 | 2,091 |
| Massachusetts Health & Educ. Fac. Auth. Rev. | | | | |
| (Children’s Hosp.) | 5.500% | 12/1/39 | 4,000 | 4,080 |
| Massachusetts Health & Educ. Fac. Auth. Rev. | | | | |
| (Dana-Farber Cancer Institute) | 5.000% | 12/1/37 | 5,000 | 4,933 |
| Massachusetts Health & Educ. Fac. Auth. Rev. | | | | |
| (Harvard Univ.) | 6.250% | 4/1/20 | 1,000 | 1,299 |
| Massachusetts Health & Educ. Fac. Auth. Rev. | | | | |
| (Harvard Univ.) | 5.125% | 7/15/37 | 9,350 | 9,540 |
| Massachusetts Health & Educ. Fac. Auth. Rev. | | | | |
| (Henry Heywood Memorial Hosp.) VRDO | 0.220% | 12/1/09 LOC | 3,700 | 3,700 |
| Massachusetts Health & Educ. Fac. Auth. Rev. | | | | |
| (Isabella Stewart Gardner Museum) | 5.000% | 5/1/27 | 1,650 | 1,720 |
18
| | | | |
| Massachusetts Tax-Exempt Fund | | | | |
| |
| |
| |
| | | | Face | Market |
| | | Maturity | Amount | Value• |
| | Coupon | Date | ($000) | ($000) |
| Massachusetts Health & Educ. Fac. Auth. Rev. | | | | |
| (Isabella Stewart Gardner Museum) | 5.000% | 5/1/28 | 2,780 | 2,879 |
| Massachusetts Health & Educ. Fac. Auth. Rev. | | | | |
| (Isabella Stewart Gardner Museum) | 5.000% | 5/1/29 | 1,420 | 1,461 |
| Massachusetts Health & Educ. Fac. Auth. Rev. | | | | |
| (Lahey Clinic Medical Center) | 5.250% | 8/15/37 | 8,000 | 7,448 |
| Massachusetts Health & Educ. Fac. Auth. Rev. | | | | |
| (Massachusetts General Hosp.) | 6.250% | 7/1/12 (2) | 245 | 257 |
| Massachusetts Health & Educ. Fac. Auth. Rev. | | | | |
| (Milton Hosp.) | 5.500% | 7/1/10 | 520 | 520 |
| Massachusetts Health & Educ. Fac. Auth. Rev. | | | | |
| (Milton Hosp.) | 5.500% | 7/1/16 | 1,235 | 1,069 |
| Massachusetts Health & Educ. Fac. Auth. Rev. | | | | |
| (MIT) | 5.250% | 7/1/21 | 6,765 | 8,227 |
| Massachusetts Health & Educ. Fac. Auth. Rev. | | | | |
| (MIT) | 5.250% | 7/1/30 | 5,000 | 5,933 |
| Massachusetts Health & Educ. Fac. Auth. Rev. | | | | |
| (MIT) | 5.500% | 7/1/32 | 5,000 | 6,041 |
| Massachusetts Health & Educ. Fac. Auth. Rev. | | | | |
| (New England Medical Center Hosp.) | 5.375% | 5/15/12 (3)(Prere.) | 3,000 | 3,306 |
| Massachusetts Health & Educ. Fac. Auth. Rev. | | | | |
| (New England Medical Center Hosp.) | 5.375% | 5/15/12 (3)(Prere.) | 2,580 | 2,843 |
| Massachusetts Health & Educ. Fac. Auth. Rev. | | | | |
| (New England Medical Center Hosp.) | 5.375% | 5/15/13 (3) | 1,255 | 1,293 |
| Massachusetts Health & Educ. Fac. Auth. Rev. | | | | |
| (Northeastern Univ.) | 5.000% | 10/1/33 | 3,000 | 3,004 |
| Massachusetts Health & Educ. Fac. Auth. Rev. | | | | |
| (Partners Healthcare System) | 5.250% | 7/1/11 | 2,080 | 2,107 |
| Massachusetts Health & Educ. Fac. Auth. Rev. | | | | |
| (Partners Healthcare System) | 5.250% | 7/1/12 | 2,850 | 2,886 |
| Massachusetts Health & Educ. Fac. Auth. Rev. | | | | |
| (Partners Healthcare System) | 5.250% | 7/1/14 | 1,000 | 1,013 |
| Massachusetts Health & Educ. Fac. Auth. Rev. | | | | |
| (Partners Healthcare System) | 5.250% | 7/1/15 | 3,000 | 3,040 |
| Massachusetts Health & Educ. Fac. Auth. Rev. | | | | |
| (Partners Healthcare System) | 5.250% | 7/1/15 (14) | 390 | 391 |
| Massachusetts Health & Educ. Fac. Auth. Rev. | | | | |
| (Partners Healthcare System) | 5.375% | 7/1/24 (14) | 1,605 | 1,606 |
| Massachusetts Health & Educ. Fac. Auth. Rev. | | | | |
| (Partners Healthcare System) | 5.000% | 7/1/47 | 2,500 | 2,499 |
| Massachusetts Health & Educ. Fac. Auth. Rev. | | | | |
| (Partners Healthcare System) VRDO | 0.200% | 12/7/09 | 10,285 | 10,285 |
| Massachusetts Health & Educ. Fac. Auth. Rev. | | | | |
| (Partners Healthcare System) VRDO | 0.200% | 12/7/09 | 3,685 | 3,685 |
| Massachusetts Health & Educ. Fac. Auth. Rev. | | | | |
| (Simmons College) | 5.000% | 10/1/13 (3)(Prere.) | 1,090 | 1,246 |
| Massachusetts Health & Educ. Fac. Auth. Rev. | | | | |
| (Simmons College) | 5.000% | 10/1/13 (3)(Prere.) | 1,175 | 1,343 |
| Massachusetts Health & Educ. Fac. Auth. Rev. | | | | |
| (Simmons College) | 8.000% | 10/1/39 | 2,500 | 2,730 |
| Massachusetts Health & Educ. Fac. Auth. Rev. | | | | |
| (Sterling & Francine Clark) | 5.000% | 7/1/36 | 5,500 | 5,580 |
| Massachusetts Health & Educ. Fac. Auth. Rev. | | | | |
| (Tufts Univ.) | 5.250% | 2/15/30 | 2,000 | 2,044 |
| Massachusetts Health & Educ. Fac. Auth. Rev. | | | | |
| (Tufts Univ.) VRDO | 0.190% | 12/1/09 | 1,900 | 1,900 |
19
| | | | |
| Massachusetts Tax-Exempt Fund | | | | |
| |
| |
| |
| | | | Face | Market |
| | | Maturity | Amount | Value• |
| | Coupon | Date | ($000) | ($000) |
| Massachusetts Health & Educ. Fac. Auth. Rev. | | | | |
| (Univ. of Massachusetts Memorial | | | | |
| Health Care Inc.) | 5.250% | 7/1/14 (2) | 1,000 | 1,010 |
| Massachusetts Health & Educ. Fac. Auth. Rev. | | | | |
| (Univ. of Massachusetts Memorial | | | | |
| Health Care Inc.) | 6.500% | 7/1/21 | 5,000 | 5,084 |
| Massachusetts Health & Educ. Fac. Auth. Rev. | | | | |
| (Univ. of Massachusetts Memorial | | | | |
| Health Care Inc.) | 6.625% | 7/1/32 | 1,000 | 1,009 |
| Massachusetts Health & Educ. Fac. Auth. Rev. | | | | |
| (Univ. of Massachusetts) | 5.875% | 10/1/10 (3)(Prere.) | 4,000 | 4,226 |
| Massachusetts Health & Educ. Fac. Auth. Rev. | | | | |
| (Univ. of Massachusetts) | 5.125% | 10/1/27 (14) | 1,850 | 1,881 |
| Massachusetts Health & Educ. Fac. Auth. Rev. | | | | |
| (Univ. of Massachusetts/Worcester) | 5.125% | 10/1/11 (3)(Prere.) | 435 | 470 |
| Massachusetts Health & Educ. Fac. Auth. Rev. | | | | |
| (Univ. of Massachusetts/Worcester) | 5.250% | 10/1/12 (14)(Prere.) | 4,000 | 4,483 |
| Massachusetts Health & Educ. Fac. Auth. Rev. | | | | |
| (Univ. of Massachusetts/Worcester) | 5.125% | 10/1/23 (14) | 565 | 574 |
| 2 Massachusetts Health & Educ. Fac. Auth. Rev. | | | | |
| (Wellesley College) | 5.000% | 7/1/23 | 2,400 | 2,536 |
| Massachusetts Health & Educ. Fac. Auth. Rev. | | | | |
| (Williams College) | 5.000% | 7/1/31 | 5,000 | 5,254 |
| Massachusetts Housing Finance Agency | | | | |
| Housing Rev. | 5.125% | 12/1/28 | 4,000 | 4,082 |
| Massachusetts Housing Finance Agency | | | | |
| Housing Rev. VRDO | 0.320% | 12/7/09 (4) | 300 | 300 |
| Massachusetts Muni. Wholesale Electric Co. | | | | |
| Power System Rev. | 5.000% | 7/1/10 (2)(ETM) | 415 | 422 |
| Massachusetts Muni. Wholesale Electric Co. | | | | |
| Power System Rev. | 5.250% | 7/1/12 (14) | 2,975 | 3,196 |
| Massachusetts Muni. Wholesale Electric Co. | | | | |
| Power System Rev. | 5.250% | 7/1/13 (14) | 3,255 | 3,463 |
| Massachusetts Muni. Wholesale Electric Co. | | | | |
| Power System Rev. | 5.250% | 7/1/16 (14) | 4,500 | 4,732 |
| Massachusetts Port Auth. Rev. | 5.750% | 7/1/10 | 1,000 | 1,032 |
| Massachusetts Port Auth. Rev. | 5.500% | 7/1/16 (4) | 4,000 | 4,690 |
| Massachusetts Port Auth. Rev. | 5.000% | 7/1/17 (4) | 9,600 | 10,967 |
| Massachusetts School Building Auth. Dedicated | | | | |
| Sales Tax Rev. | 5.000% | 8/15/14 (4) | 5,000 | 5,774 |
| Massachusetts School Building Auth. Dedicated | | | | |
| Sales Tax Rev. | 5.000% | 8/15/18 (4) | 10,000 | 11,295 |
| Massachusetts School Building Auth. Dedicated | | | | |
| Sales Tax Rev. | 5.000% | 8/15/24 (4) | 15,000 | 16,152 |
| Massachusetts School Building Auth. Dedicated | | | | |
| Sales Tax Rev. | 5.000% | 8/15/25 (4) | 16,125 | 17,270 |
| Massachusetts School Building Auth. Dedicated | | | | |
| Sales Tax Rev. | 5.000% | 8/15/26 (4) | 8,000 | 8,509 |
| Massachusetts School Building Auth. Dedicated | | | | |
| Sales Tax Rev. | 5.000% | 8/15/27 (14) | 8,500 | 8,930 |
| Massachusetts School Building Auth. Dedicated | | | | |
| Sales Tax Rev. | 4.750% | 8/15/32 (2) | 9,360 | 9,371 |
| Massachusetts School Building Auth. Dedicated | | | | |
| Sales Tax Rev. | 5.000% | 8/15/37 (2) | 12,000 | 12,418 |
| Massachusetts Special Obligation Dedicated | | | | |
| Tax Rev. | 5.750% | 1/1/14 (3)(Prere.) | 4,000 | 4,656 |
20
Massachusetts Tax-Exempt Fund
| | | | |
| | | | Face | Market |
| | | Maturity | Amount | Value• |
| | Coupon | Date | ($000) | ($000) |
| Massachusetts Special Obligation Dedicated | | | | |
| Tax Rev. | 5.500% | 1/1/27 (14) | 15,000 | 17,142 |
| Massachusetts Special Obligation Rev. | 5.000% | 12/15/09 (4) | 3,010 | 3,016 |
| Massachusetts Special Obligation Rev. | 5.000% | 12/15/13 (4) | 1,895 | 2,131 |
| Massachusetts Turnpike Auth. Rev. | | | | |
| (Metro. Highway System) | 0.000% | 1/1/20 (14) | 3,000 | 1,767 |
| Massachusetts Turnpike Auth. Rev. | | | | |
| (Metro. Highway System) | 0.000% | 1/1/25 (14) | 5,000 | 2,080 |
| Massachusetts Turnpike Auth. Rev. | | | | |
| (Metro. Highway System) | 0.000% | 1/1/28 (14) | 7,000 | 2,349 |
| Massachusetts Water Pollution Abatement Trust | 5.250% | 8/1/15 (Prere.) | 4,460 | 5,291 |
| Massachusetts Water Pollution Abatement Trust | 5.000% | 8/1/16 | 5,000 | 5,859 |
| Massachusetts Water Pollution Abatement Trust | 5.250% | 8/1/17 | 540 | 628 |
| Massachusetts Water Pollution Abatement Trust | 5.250% | 8/1/17 | 5,000 | 5,965 |
| Massachusetts Water Pollution Abatement Trust | 5.250% | 8/1/22 | 3,500 | 4,124 |
| Massachusetts Water Pollution Abatement Trust | 5.375% | 8/1/27 | 2,565 | 2,594 |
| Massachusetts Water Pollution Abatement Trust | 5.250% | 8/1/29 | 1,520 | 1,766 |
| Massachusetts Water Pollution Abatement Trust | 5.500% | 8/1/29 | 1,000 | 1,011 |
| Massachusetts Water Pollution Abatement Trust | 5.750% | 8/1/29 | 190 | 193 |
| Massachusetts Water Pollution Abatement Trust | 5.250% | 8/1/30 | 5,550 | 6,383 |
| Massachusetts Water Resources Auth. Rev. | 6.000% | 12/1/11 (14) | 4,120 | 4,322 |
| Massachusetts Water Resources Auth. Rev. | 5.500% | 8/1/22 (4) | 990 | 1,165 |
| Massachusetts Water Resources Auth. Rev. | 5.250% | 8/1/31 (4) | 1,000 | 1,116 |
| Massachusetts Water Resources Auth. Rev. | 5.250% | 8/1/32 (4) | 5,000 | 5,552 |
| Massachusetts Water Resources Auth. Rev. | 5.000% | 8/1/34 (14) | 8,000 | 8,184 |
| Massachusetts Water Resources Auth. Rev. | 5.000% | 8/1/35 (14) | 14,000 | 14,294 |
| Massachusetts Water Resources Auth. Rev. | 5.250% | 8/1/35 (4) | 1,310 | 1,437 |
| Massachusetts Water Resources Auth. Rev. | 5.000% | 8/1/36 (2) | 5,000 | 5,090 |
| Massachusetts Water Resources Auth. Rev. | 5.000% | 8/1/36 | 11,370 | 11,576 |
| Massachusetts Water Resources Auth. Rev. | 5.250% | 8/1/36 (4) | 2,520 | 2,766 |
| Massachusetts Water Resources Auth. Rev. | 5.000% | 8/1/39 | 2,000 | 2,068 |
| Narragansett MA Regional School Dist. GO | 6.500% | 6/1/13 (2) | 1,210 | 1,258 |
| Newton Massachusetts School Dist. | 4.500% | 6/15/34 | 3,000 | 3,040 |
| Pittsfield MA GO | 5.000% | 4/15/18 (14) | 1,000 | 1,055 |
| Quaboag MA Regional School Dist. GO | 5.500% | 6/1/18 (4) | 1,355 | 1,399 |
| Quaboag MA Regional School Dist. GO | 5.500% | 6/1/19 (4) | 1,355 | 1,399 |
| Route 3 North Transp. Improvement Assn. | | | | |
| Massachusetts Lease Rev. | 5.375% | 6/15/10 (14)(Prere.) | 2,500 | 2,569 |
| Shrewsbury MA GO | 5.000% | 8/15/13 | 1,030 | 1,113 |
| Shrewsbury MA GO | 5.000% | 8/15/17 | 1,900 | 2,049 |
| Shrewsbury MA GO | 5.000% | 8/15/18 | 3,185 | 3,396 |
| Shrewsbury MA GO | 5.000% | 8/15/19 | 1,000 | 1,066 |
| Tantasqua MA Regional School Dist. GO | 5.125% | 8/15/10 (4)(Prere.) | 2,575 | 2,689 |
| Univ. of Massachusetts Building Auth. | | | | |
| Refunding Rev. | 6.875% | 5/1/14 (ETM) | 1,000 | 1,166 |
| Univ. of Massachusetts Building Auth. Rev. | 5.125% | 11/1/10 (Prere.) | 1,135 | 1,185 |
| Univ. of Massachusetts Building Auth. Rev. | 5.500% | 11/1/10 (2)(Prere.) | 2,600 | 2,724 |
| Univ. of Massachusetts Building Auth. Rev. | 5.500% | 11/1/10 (2)(Prere.) | 2,400 | 2,515 |
| Univ. of Massachusetts Health & Educ. Fac. | | | | |
| Auth. Rev. | 5.000% | 11/1/21 (2) | 5,680 | 5,999 |
| Univ. of Massachusetts Health & Educ. Fac. | | | | |
| Auth. Rev. | 5.000% | 11/1/22 (2) | 2,695 | 2,833 |
| Univ. of Massachusetts Health & Educ. Fac. | | | | |
| Auth. Rev. | 5.000% | 11/1/23 (2) | 1,760 | 1,843 |
| Univ. of Massachusetts Health & Educ. Fac. | | | | |
| Auth. Rev. | 5.000% | 11/1/24 (2) | 1,980 | 2,064 |
21
Massachusetts Tax-Exempt Fund
| | | | |
| | | | Face | Market |
| | | Maturity | Amount | Value• |
| | Coupon | Date | ($000) | ($000) |
| Univ. of Massachusetts Health & Educ. Fac. | | | | |
| Auth. Rev. | 5.000% | 11/1/25 (2) | 1,990 | 2,066 |
| Westfield MA GO | 5.000% | 5/1/10 (3)(Prere.) | 1,715 | 1,766 |
| Worcester MA GO | 5.750% | 4/1/10 (4)(Prere.) | 1,000 | 1,028 |
| Worcester MA GO | 5.625% | 8/15/10 (3)(Prere.) | 1,640 | 1,718 |
| Worcester MA GO | 5.500% | 8/15/14 (14) | 1,445 | 1,520 |
| Worcester MA GO | 5.500% | 8/15/15 (14) | 1,190 | 1,243 |
| Worcester MA GO | 5.250% | 8/15/21 (14) | 1,500 | 1,530 |
| | | | | 899,841 |
| Puerto Rico (3.1%) | | | | |
| Puerto Rico Electric Power Auth. Rev. | 5.500% | 7/1/17 (14) | 5,000 | 5,482 |
| Puerto Rico GO | 5.500% | 7/1/19 (2) | 2,250 | 2,364 |
| Puerto Rico GO | 5.500% | 7/1/22 (3) | 3,500 | 3,547 |
| Puerto Rico Highway & Transp. Auth. Rev. | 5.500% | 7/1/12 (3) | 5,080 | 5,396 |
| Puerto Rico Public Buildings Auth. Govt. Fac. Rev. | 5.250% | 7/1/12 (Prere.) | 1,100 | 1,217 |
| Puerto Rico Public Buildings Auth. Govt. Fac. Rev. | 5.250% | 7/1/36 | 400 | 366 |
| Puerto Rico Public Finance Corp. | 5.500% | 2/1/12 (Prere.) | 2,015 | 2,212 |
| Puerto Rico Public Finance Corp. | 5.500% | 2/1/12 (Prere.) | 665 | 730 |
| Puerto Rico Public Finance Corp. | 5.125% | 6/1/24 (2)(ETM) | 2,155 | 2,469 |
| Puerto Rico Public Finance Corp. | 6.000% | 8/1/26 (4)(ETM) | 4,000 | 4,966 |
| | | | | 28,749 |
| Guam (0.2%) | | | | |
| Guam Econ. Dev. & Comm. Auth. Rev. | 5.250% | 6/1/32 | 2,245 | 1,851 |
| |
| Virgin Islands (0.1%) | | | | |
| Virgin Islands Public Finance Auth. Rev. | 5.250% | 10/1/20 | 1,000 | 1,021 |
| Total Tax-Exempt Municipal Bonds (Cost $905,900) | | | | 931,462 |
| Other Assets and Liabilities (0.8%) | | | | |
| Other Assets | | | | 16,290 |
| Liabilities | | | | (8,920) |
| | | | | 7,370 |
| Net Assets (100%) | | | | |
| Applicable to 92,162,068 outstanding $.001 par value shares of | | | |
| beneficial interest (unlimited authorization) | | | | 938,832 |
| Net Asset Value Per Share | | | | $10.19 |
22
Massachusetts Tax-Exempt Fund
| |
| At November 30, 2009, net assets consisted of: | |
| | Amount |
| | ($000) |
| Paid-in Capital | 923,838 |
| Undistributed Net Investment Income | — |
| Accumulated Net Realized Losses | (10,534) |
| Unrealized Appreciation (Depreciation) | |
| Investment Securities | 25,562 |
| Futures Contracts | (34) |
| Net Assets | 938,832 |
• See Note A in Notes to Financial Statements.
1 Security exempt from registration under Rule 144A of the Securities Act of 1933. Such securities may be sold in transactions exempt from
registration, normally to qualified institutional buyers. At November 30, 2009, the value of this security represented 0.1% of net assets.
2 Securities with a value of $740,000 have been segregated as initial margin for open futures contracts.
A key to abbreviations and other references follows the Statement of Net Assets.
See accompanying Notes, which are an integral part of the Financial Statements.
23
Massachusetts Tax-Exempt Fund
Key to Abbreviations
ARS—Auction Rate Security.
BAN—Bond Anticipation Note.
COP—Certificate of Participation.
CP—Commercial Paper.
FR—Floating Rate.
GAN—Grant Anticipation Note.
GO—General Obligation Bond.
IDA—Industrial Development Authority Bond.
IDR—Industrial Development Revenue Bond.
PCR—Pollution Control Revenue Bond.
PUT—Put Option Obligation.
RAN—Revenue Anticipation Note.
TAN—Tax Anticipation Note.
TOB—Tender Option Bond.
TRAN—Tax Revenue Anticipation Note.
UFSD—Union Free School District.
USD—United School District.
VRDO—Variable Rate Demand Obligation.
(ETM)—Escrowed to Maturity.
(Prere.)—Prerefunded.
Scheduled principal and interest payments are guaranteed by:
(1) MBIA (Municipal Bond Investors Assurance).
(2) AMBAC (Ambac Assurance Corporation).
(3) FGIC (Financial Guaranty Insurance Company).
(4) FSA (Financial Security Assurance).
(5) BIGI (Bond Investors Guaranty Insurance).
(6) Connie Lee Inc.
(7) FHA (Federal Housing Authority).
(8) CapMAC (Capital Markets Assurance Corporation).
(9) American Capital Access Financial Guaranty Corporation.
(10) XL Capital Assurance Inc.
(11) CIFG (CDC IXIS Financial Guaranty).
(12) Assured Guaranty Corp.
(13) Berkshire Hathaway Assurance Corp.
(14) National Public Finance Guarantee Corp.
The insurance does not guarantee the market value of the municipal bonds.
LOC—Scheduled principal and interest payments are guaranteed by bank letter of credit.
24
Massachusetts Tax-Exempt Fund
Statement of Operations
| |
| | Year Ended |
| | November 30, 2009 |
| | ($000) |
| Investment Income | |
| Income | |
| Interest | 34,781 |
| Total Income | 34,781 |
| Expenses | |
| The Vanguard Group—Note B | |
| Investment Advisory Services | 79 |
| Management and Administrative | 1,050 |
| Marketing and Distribution | 222 |
| Custodian Fees | 8 |
| Auditing Fees | 24 |
| Shareholders’ Reports and Proxies | 17 |
| Trustees’ Fees and Expenses | 1 |
| Total Expenses | 1,401 |
| Net Investment Income | 33,380 |
| Realized Net Gain (Loss) | |
| Investment Securities Sold | 1,792 |
| Futures Contracts | (1,806) |
| Realized Net Gain (Loss) | (14) |
| Change in Unrealized Appreciation (Depreciation) | |
| Investment Securities | 58,825 |
| Futures Contracts | 700 |
| Change in Unrealized Appreciation (Depreciation) | 59,525 |
| Net Increase (Decrease) in Net Assets Resulting from Operations | 92,891 |
See accompanying Notes, which are an integral part of the Financial Statements.
25
| | |
| Massachusetts Tax-Exempt Fund | | |
| |
| |
| Statement of Changes in Net Assets | | |
| |
| | Year Ended November 30, |
| | 2009 | 2008 |
| | ($000) | ($000) |
| Increase (Decrease) in Net Assets | | |
| Operations | | |
| Net Investment Income | 33,380 | 30,696 |
| Realized Net Gain (Loss) | (14) | (6,426) |
| Change in Unrealized Appreciation (Depreciation) | 59,525 | (46,719) |
| Net Increase (Decrease) in Net Assets Resulting from Operations | 92,891 | (22,449) |
| Distributions | | |
| Net Investment Income | (33,380) | (30,696) |
| Realized Capital Gain | — | — |
| Total Distributions | (33,380) | (30,696) |
| Capital Share Transactions | | |
| Issued | 284,222 | 300,403 |
| Issued in Lieu of Cash Distributions | 25,094 | 22,957 |
| Redeemed | (140,265) | (244,024) |
| Net Increase (Decrease) from Capital Share Transactions | 169,051 | 79,336 |
| Total Increase (Decrease) | 228,562 | 26,191 |
| Net Assets | | |
| Beginning of Period | 710,270 | 684,079 |
| End of Period | 938,832 | 710,270 |
See accompanying Notes, which are an integral part of the Financial Statements.
26
Massachusetts Tax-Exempt Fund
Financial Highlights
| | | | | |
| For a Share Outstanding | Year Ended November 30, |
| Throughout Each Period | 2009 | 2008 | 2007 | 2006 | 2005 |
| Net Asset Value, Beginning of Period | $9.44 | $10.12 | $10.33 | $10.12 | $10.18 |
| Investment Operations | | | | | |
| Net Investment Income | .401 | .414 | .424 | .427 | .417 |
| Net Realized and Unrealized Gain (Loss) | | | | | |
| on Investments | .750 | (.680) | (.210) | .218 | (.060) |
| Total from Investment Operations | 1.151 | (.266) | .214 | .645 | .357 |
| Distributions | | | | | |
| Dividends from Net Investment Income | (.401) | (.414) | (.424) | (.427) | (.417) |
| Distributions from Realized Capital Gains | — | — | — | (.008) | — |
| Total Distributions | (.401) | (.414) | (.424) | (.435) | (.417) |
| Net Asset Value, End of Period | $10.19 | $9.44 | $10.12 | $10.33 | $10.12 |
| |
| Total Return1 | 12.36% | –2.72% | 2.15% | 6.54% | 3.53% |
| |
| Ratios/Supplemental Data | | | | | |
| Net Assets, End of Period (Millions) | $939 | $710 | $684 | $573 | $497 |
| Ratio of Total Expenses to | | | | | |
| Average Net Assets | 0.17% | 0.12% | 0.13% | 0.14% | 0.14% |
| Ratio of Net Investment Income to | | | | | |
| Average Net Assets | 4.02% | 4.17% | 4.19% | 4.22% | 4.07% |
| Portfolio Turnover Rate | 15% | 29% | 16% | 5% | 9% |
1 Total returns do not include the account service fee that may be applicable to certain accounts with balances below $10,000.
See accompanying Notes, which are an integral part of the Financial Statements.
27
Massachusetts Tax-Exempt Fund
Notes to Financial Statements
Vanguard Massachusetts Tax-Exempt Fund is registered under the Investment Company Act of 1940 as an open-end investment company, or mutual fund. The fund invests in debt instruments of municipal issuers whose ability to meet their obligations may be affected by economic and political developments in the state.
A. The following significant accounting policies conform to generally accepted accounting principles for U.S. mutual funds. The fund consistently follows such policies in preparing its financial statements.
1. Security Valuation: Bonds, and temporary cash investments acquired over 60 days to maturity, are valued using the latest bid prices or using valuations based on a matrix system (which considers such factors as security prices, yields, maturities, and ratings), both as furnished by independent pricing services. Other temporary cash investments are valued at amortized cost, which approximates market value. Securities for which market quotations are not readily available, or whose values have been affected by events occurring before the fund’s pricing time but after the close of the securities’ primary markets, are valued by methods deemed by the board of trustees to represent fair value.
2. Futures Contracts: The fund uses futures contracts to invest in fixed income asset classes with greater efficiency and lower cost than is possible through direct investment, to add value when these instruments are attractively priced, or to adjust sensitivity to changes in interest rates. The primary risks associated with the use of futures contracts are imperfect correlation between changes in market values of bonds held by the fund and the prices of futures contracts, and the possibility of an illiquid market.
Futures contracts are valued based upon their quoted daily settlement prices. The aggregate principal amounts of the contracts are not recorded in the Statement of Net Assets. Fluctuations in the value of the contracts are recorded in the Statement of Net Assets as an asset (liability) and in the Statement of Operations as unrealized appreciation (depreciation) until the contracts are closed, when they are recorded as realized futures gains (losses).
3. Federal Income Taxes: The fund intends to continue to qualify as a regulated investment company and distribute all of its income. Management has analyzed the fund’s tax positions taken for all open federal income tax years (November 30, 2006–2009), and has concluded that no provision for federal income tax is required in the fund’s financial statements.
4. Distributions: Distributions from net investment income are declared daily and paid on the first business day of the following month. Annual distributions from realized capital gains, if any, are recorded on the ex-dividend date.
5. Other: Interest income is accrued daily. Premiums and discounts on debt securities purchased are amortized and accreted, respectively, to interest income over the lives of the respective securities. Security transactions are accounted for on the date securities are bought or sold. Costs used to determine realized gains (losses) on the sale of investment securities are those of the specific securities sold.
B. The Vanguard Group furnishes at cost investment advisory, corporate management, administrative, marketing, and distribution services. The costs of such services are allocated to the fund under methods approved by the board of trustees. The fund has committed to provide up to 0.40% of its net assets in capital contributions to Vanguard. At November 30, 2009, the fund had contributed capital of $192,000 to Vanguard (included in Other Assets), representing 0.02% of the fund’s net assets and 0.08% of Vanguard’s capitalization. The fund’s trustees and officers are also directors and officers of Vanguard.
28
Massachusetts Tax-Exempt Fund
C. Various inputs may be used to determine the value of the fund’s investments. These inputs are summarized in three broad levels for financial statement purposes. The inputs or methodologies used to value securities are not necessarily an indication of the risk associated with investing in those securities.
Level 1—Quoted prices in active markets for identical securities.
Level 2—Other significant observable inputs (including quoted prices for similar securities, interest rates, prepayment speeds, credit risk, etc.).
Level 3—Significant unobservable inputs (including the fund’s own assumptions used to determine the fair value of investments).
The following table summarizes the fund’s investments as of November 30, 2009, based on the inputs used to value them:
| | | |
| | Level 1 | Level 2 | Level 3 |
| Investments | ($000) | ($000) | ($000) |
| Tax-Exempt Municipal Bonds | — | 931,462 | — |
| Futures Contracts—Liabilities1 | (1) | — | — |
| Total | (1) | 931,462 | — |
| 1 Represents variation margin on the last day of the reporting period. | | |
D. At November 30, 2009, the aggregate settlement value of open futures contracts and the related unrealized appreciation (depreciation) were:
| | | | |
| | | | ($000) |
| | | Number of | Aggregate | Unrealized |
| | | Long (Short) | Settlement | Appreciation |
| Futures Contracts | Expiration | Contracts | Value | (Depreciation) |
| 10-Year United States Treasury Note | March 2010 | (20) | 2,399 | (32) |
| 30-Year United States Treasury Bond | March 2010 | (1) | 122 | (2) |
Unrealized appreciation (depreciation) on open futures contracts is required to be treated as realized gain (loss) for tax purposes.
E. Capital gain distributions are determined on a tax basis and may differ from realized capital gains for financial reporting purposes. Differences may be permanent or temporary. Permanent differences are reclassified among capital accounts in the financial statements to reflect their tax character. Temporary differences arise when gains or losses are recognized in different periods for financial statement and tax purposes; these differences will reverse at some time in the future.
For tax purposes, at November 30, 2009, the fund had available capital loss carryforwards totaling $8,848,000 to offset future net capital gains of $1,178,000 through November 30, 2015 and $7,670,000 through November 30, 2016.
The fund had realized losses totaling $1,721,000 through November 30, 2009, which are deferred for tax purposes and reduce the amount of tax-basis unrealized appreciation on investment securities.
29
Massachusetts Tax-Exempt Fund
At November 30, 2009, the cost of investment securities for tax purposes was $907,621,000. Net unrealized appreciation of investment securities for tax purposes was $23,841,000, consisting of unrealized gains of $30,004,000 on securities that had risen in value since their purchase and $6,163,000 in unrealized losses on securities that had fallen in value since their purchase.
F. During the year ended November 30, 2009, the fund purchased $273,821,000 of investment securities and sold $118,719,000 of investment securities, other than temporary cash investments.
| | |
| G. Capital shares issued and redeemed were: | | |
| | Year Ended November 30, |
| | 2009 | 2008 |
| | Shares | Shares |
| | (000) | (000) |
| Issued | 28,562 | 30,292 |
| Issued in Lieu of Cash Distributions | 2,511 | 2,333 |
| Redeemed | (14,143) | (24,982) |
| Net Increase (Decrease) in Shares Outstanding | 16,930 | 7,643 |
H. In preparing the financial statements as of November 30, 2009, management considered the impact of subsequent events occurring through January 11, 2010, for potential recognition or disclosure in these financial statements.
30
Report of Independent Registered
Public Accounting Firm
To the Trustees of Vanguard Massachusetts Tax-Exempt Funds and the Shareholders of Vanguard Massachusetts Tax-Exempt Fund:
In our opinion, the accompanying statement of net assets and the related statements of operations and of changes in net assets and the financial highlights present fairly, in all material respects, the financial position of Vanguard Massachusetts Tax-Exempt Fund (the “Fund”) at November 30, 2009, the results of its operations for the year then ended, the changes in its net assets for each of the two years in the period then ended and the financial highlights for each of the five years in the period then ended, in conformity with accounting principles generally accepted in the United States of America. These financial statements and financial highlights (hereafter referred to as “financial statements”) are the responsibility of the Fund’s management; our responsibility is to express an opinion on these financial statements based on our audits. We conducted our audits of these financial statements in accordance with the standards of the Public Company Accounting Oversight Board (United States). Those standards require that we plan and perform the audit to obtain reasonable assurance about whether the financial statements are free of material misstatement. An audit includes examining, on a test basis, evidence supporting the amounts and disclosures in the financial statements, assessing the accounting principles used and significant estimates made by management, and evaluating the overall financial statement presentation. We believe that our audits, which included confirmation of securities at November 30, 2009 by correspondence with the custodian and broker, provide a reasonable basis for our opinion.
PricewaterhouseCoopers LLP
Philadelphia, Pennsylvania
January 11, 2010

Special 2009 tax information (unaudited) for Vanguard Massachusetts Tax-Exempt Fund
This information for the fiscal year ended November 30, 2009, is included pursuant to provisions of the
Internal Revenue Code.
The fund designates 100% of its income dividends as exempt-interest dividends.
31
About Your Fund’s Expenses
As a shareholder of the fund, you incur ongoing costs, which include costs for portfolio management, administrative services, and shareholder reports (like this one), among others. Operating expenses, which are deducted from a fund’s gross income, directly reduce the investment return of the fund.
A fund’s expenses are expressed as a percentage of its average net assets. This figure is known as the expense ratio. The following examples are intended to help you understand the ongoing costs (in dollars) of investing in your fund and to compare these costs with those of other mutual funds. The examples are based on an investment of $1,000 made at the beginning of the period shown and held for the entire period.
The accompanying table illustrates your fund’s costs in two ways:
• Based on actual fund return. This section helps you to estimate the actual expenses that you paid over the period. The “Ending Account Value” shown is derived from the fund’s actual return, and the third column shows the dollar amount that would have been paid by an investor who started with $1,000 in the fund. You may use the information here, together with the amount you invested, to estimate the expenses that you paid over the period.
To do so, simply divide your account value by $1,000 (for example, an $8,600 account value divided by $1,000 = 8.6), then multiply the result by the number given for your fund under the heading “Expenses Paid During Period.”
• Based on hypothetical 5% yearly return. This section is intended to help you compare your fund’s costs with those of other mutual funds. It assumes that the fund had a yearly return of 5% before expenses, but that the expense ratio is unchanged. In this case—because the return used is not the fund’s actual return—the results do not apply to your investment. The example is useful in making comparisons because the Securities and Exchange Commission requires all mutual funds to calculate expenses based on a 5% return. You can assess your fund’s costs by comparing this hypothetical example with the hypothetical examples that appear in shareholder reports of other funds.
Note that the expenses shown in the table are meant to highlight and help you compare ongoing costs only and do not reflect transaction costs incurred by the fund for buying and selling securities. Further, the expenses do not include the account service fee described in the prospectus. If such a fee were applied to your account, your costs would be higher. Your fund does not charge transaction fees, such as purchase or redemption fees, nor does it carry a “sales load.”
The calculations assume no shares were bought or sold during the period. Your actual costs may have been higher or lower, depending on the amount of your investment and the timing of any purchases or redemptions.
You can find more information about the fund’s expenses, including annual expense ratios, in the Financial Statements section of this report. For additional information on operating expenses and other shareholder costs, please refer to your fund’s current prospectus.
32
| | | |
| Six Months Ended November 30, 2009 | | | |
| | Beginning | Ending | Expenses |
| | Account Value | Account Value | Paid During |
| Massachusetts Tax-Exempt Fund | 5/31/2009 | 11/30/2009 | Period1 |
| Based on Actual Fund Return | $1,000.00 | $1,038.09 | $0.87 |
| Based on Hypothetical 5% Yearly Return | 1,000.00 | 1,024.22 | 0.86 |
1 The calculations are based on expenses incurred in the most recent six-month period. The fund’s annualized six-month expense ratio for that period was 0.17%. The dollar amounts shown as “Expenses Paid” are equal to the annualized expense ratio multiplied by the average account value over the period, multiplied by the number of days in the most recent six-month period, then divided by the number of days in the most recent 12-month period.
33
Glossary
Average Coupon. The average interest rate paid on the fixed income securities held by a fund. It is expressed as a percentage of face value.
Average Duration. An estimate of how much the value of the bonds held by a fund will fluctuate in response to a change in interest rates. To see how the value could change, multiply the average duration by the change in rates. If interest rates rise by 1 percentage point, the value of the bonds in a fund with an average duration of five years would decline by about 5%. If rates decrease by a percentage point, the value would rise by 5%.
Average Effective Maturity. The average length of time until fixed income securities held by a fund reach maturity and are repaid, taking into consideration the possibility that the issuer may call the bond before its maturity date. The figure reflects the proportion of fund assets represented by each security; it also reflects any futures contracts held. In general, the longer the average effective maturity, the more a fund’s share price will fluctuate in response to changes in market interest rates.
Average Quality. An indicator of credit risk, this figure is the average of the ratings assigned to a fund’s holdings by credit-rating agencies. The agencies make their judgment after appraising an issuer’s ability to meet its obligations. Quality is graded on a scale, with Aaa or AAA indicating the most creditworthy bond issuers.
Beta. A measure of the magnitude of a fund’s past share-price fluctuations in relation to the ups and downs of a given market index. The index is assigned a beta of 1.00. Compared with a given index, a fund with a beta of 1.20 typically would have seen its share price rise or fall by 12% when the index rose or fell by 10%. For this report, beta is based on returns over the past 36 months for both the fund and the index. Note that a fund’s beta should be reviewed in conjunction with its R-squared (see definition). The lower the R-squared, the less correlation there is between the fund and the index, and the less reliable beta is as an indicator of volatility.
Expense Ratio. The percentage of a fund’s average net assets used to pay its annual administrative and advisory expenses. These expenses directly reduce returns to investors.
Inception Date. The date on which the assets of a fund (or one of its share classes) are first invested in accordance with the fund’s investment objective. For funds with a subscription period, the inception date is the day after that period ends. Investment performance is measured from the inception date.
R-Squared. A measure of how much of a fund’s past returns can be explained by the returns from the market in general, as measured by a given index. If a fund’s total returns were precisely synchronized with an index’s returns, its R-squared would be 1.00. If the fund’s returns bore no relationship to the index’s returns, its R-squared would be 0. For this report, R-squared is based on returns over the past 36 months for both the fund and the index.
Short-Term Reserves. The percentage of a fund invested in highly liquid, short-term securities that can be readily converted to cash.
34
Yield. A fund’s 30-day SEC yield is derived using a formula specified by the U.S. Securities and Exchange Commission. Under the formula, data related to the fund’s security holdings in the previous 30 days are used to calculate the fund’s hypothetical net income for that period, which is then annualized and divided by the fund’s estimated average net assets over the calculation period. For the purposes of this calculation, a security’s income is based on its current market yield to maturity (in the case of bonds) or its projected dividend yield (for stocks). Because the SEC yield represents hypothetical annualized income, it will differ—at times significantly—from the fund’s actual experience. As a result, the fund’s income distributions may be higher or lower than implied by the SEC yield.
Yield to Maturity. The rate of return an investor would receive if the fixed income securities held by a fund were held to their maturity dates.
35
The People Who Govern Your Fund
The trustees of your mutual fund are there to see that the fund is operated and managed in your best interests since, as a shareholder, you are a part owner of the fund. Your fund’s trustees also serve on the board of directors of The Vanguard Group, Inc., which is owned by the Vanguard funds and provides services to them on an at-cost basis.
A majority of Vanguard’s board members are independent, meaning that they have no affiliation with Vanguard or the funds they oversee, apart from the sizable personal investments they have made as private individuals. The independent board members have distinguished backgrounds in business, academia, and public service. Each of the trustees and executive officers oversees 163 Vanguard funds.
The following table provides information for each trustee and executive officer of the fund. More information about the trustees is in the Statement of Additional Information, which can be obtained, without charge, by contacting Vanguard at 800-662-7447, or online at www.vanguard.com.
| |
| Interested Trustees1 | Emerson U. Fullwood |
| | Born 1948. Trustee Since January 2008. Principal |
| John J. Brennan | Occupation(s) During the Past Five Years: Executive |
| Born 1954. Trustee Since May 1987. Chairman of | Chief Staff and Marketing Officer for North America |
| the Board. Principal Occupation(s) During the Past | and Corporate Vice President (retired 2008) of Xerox |
| Five Years: Chairman of the Board and Director/Trustee | Corporation (photocopiers and printers); Director of |
| of The Vanguard Group, Inc., and of each of the | SPX Corporation (multi-industry manufacturing), the |
| investment companies served by The Vanguard Group; | United Way of Rochester, the Boy Scouts of America, |
| Chief Executive Officer (1996–2008) and President | Amerigroup Corporation (direct health and medical |
| (1989–2008) of The Vanguard Group and of each of the | insurance carriers), and Monroe Community College |
| investment companies served by The Vanguard Group; | Foundation. |
| Chairman of the Financial Accounting Foundation; | |
| Governor of the Financial Industry Regulatory Authority | Rajiv L. Gupta |
| (FINRA); Director of United Way of Southeastern | Born 1945. Trustee Since December 2001.2 Principal |
| Pennsylvania. | Occupation(s) During the Past Five Years: Chairman |
| | and Chief Executive Officer (retired 2009) and President |
| F. William McNabb III | (2006–2008) of Rohm and Haas Co. (chemicals); Board |
| Born 1957. Trustee Since July 2009. Principal | Member of American Chemistry Council; Director of |
| Occupation(s) During the Past Five Years: Director of | Tyco International, Ltd. (diversified manufacturing and |
| The Vanguard Group, Inc., since 2008; Chief Executive | services) and Hewlett-Packard Co. (electronic computer |
| Officer and President of The Vanguard Group and of | manufacturing); Trustee of The Conference Board. |
| each of the investment companies served by The | |
| Vanguard Group since 2008; Director of Vanguard | Amy Gutmann |
| Marketing Corporation; Managing Director of The | Born 1949. Trustee Since June 2006. Principal |
| Vanguard Group (1995–2008). | Occupation(s) During the Past Five Years: President of |
| | the University of Pennsylvania; Christopher H. Browne |
| | Distinguished Professor of Political Science in the School |
| Independent Trustees | of Arts and Sciences with secondary appointments |
| | at the Annenberg School for Communication and the |
| Charles D. Ellis | Graduate School of Education of the University of |
| Born 1937. Trustee Since January 2001. Principal | Pennsylvania; Director of Carnegie Corporation of |
| Occupation(s) During the Past Five Years: Applecore | New York, Schuylkill River Development Corporation, |
| Partners (pro bono ventures in education); Senior | and Greater Philadelphia Chamber of Commerce; |
| Advisor to Greenwich Associates (international business | Trustee of the National Constitution Center. |
| strategy consulting); Successor Trustee of Yale University; | |
| Overseer of the Stern School of Business at New York | |
| University; Trustee of the Whitehead Institute for | |
| Biomedical Research. | |
| | |
| JoAnn Heffernan Heisen | Executive Officers | |
| Born 1950. Trustee Since July 1998. Principal | | |
| Occupation(s) During the Past Five Years: Corporate | Thomas J. Higgins | |
| Vice President and Chief Global Diversity Officer since | Born 1957. Chief Financial Officer Since September |
| 2006 (retired 2008) and Member of the Executive | 2008. Principal Occupation(s) During the Past Five |
| Committee (retired 2008) of Johnson & Johnson | Years: Principal of The Vanguard Group, Inc.; Chief |
| (pharmaceuticals/consumer products); Vice President | Financial Officer of each of the investment companies |
| and Chief Information Officer of Johnson & Johnson | served by The Vanguard Group since 2008; Treasurer |
| (1997–2005); Director of the University Medical Center | of each of the investment companies served by The |
| at Princeton and Women’s Research and Education | Vanguard Group (1998–2008). |
| Institute; Member of the Advisory Board of the Maxwell | | |
| School of Citizenship and Public Affairs at Syracuse | Kathryn J. Hyatt | |
| University. | Born 1955. Treasurer Since November 2008. Principal |
| | Occupation(s) During the Past Five Years: Principal of |
| F. Joseph Loughrey | The Vanguard Group, Inc.; Treasurer of each of the |
| Born 1949. Trustee Since October 2009. Principal | investment companies served by The Vanguard |
| Occupation(s) During the Past Five Years: President and | Group since 2008; Assistant Treasurer of each of the |
| Chief Operating Officer since 2005 (retired 2009) and | investment companies served by The Vanguard Group |
| Vice Chairman of the Board (2008–2009) of Cummins | (1988–2008). | |
| Inc. (industrial machinery); Director of SKF AB (industrial | | |
| machinery), Hillenbrand, Inc. (specialized consumer | Heidi Stam | |
| services), Sauer-Danfoss Inc. (machinery), the Lumina | Born 1956. Secretary Since July 2005. Principal |
| Foundation for Education, and the Columbus Community | Occupation(s) During the Past Five Years: Managing |
| Education Coalition; Chairman of the Advisory Council | Director of The Vanguard Group, Inc., since 2006; |
| for the College of Arts and Letters at the University of | General Counsel of The Vanguard Group since 2005; |
| Notre Dame. | Secretary of The Vanguard Group and of each of the |
| | investment companies served by The Vanguard Group |
| André F. Perold | since 2005; Director and Senior Vice President of |
| Born 1952. Trustee Since December 2004. Principal | Vanguard Marketing Corporation since 2005; Principal |
| Occupation(s) During the Past Five Years: George Gund | of The Vanguard Group (1997–2006). |
| Professor of Finance and Banking, Harvard Business | | |
| School; Chair of the Investment Committee of HighVista | | |
| Strategies LLC (private investment firm). | Vanguard Senior Management Team |
| |
| Alfred M. Rankin, Jr. | R. Gregory Barton | Michael S. Miller |
| Born 1941. Trustee Since January 1993. Principal | Mortimer J. Buckley | James M. Norris |
| Occupation(s) During the Past Five Years: Chairman, | Kathleen C. Gubanich | Glenn W. Reed |
| President, and Chief Executive Officer of NACCO | Paul A. Heller | George U. Sauter |
| Industries, Inc. (forklift trucks/housewares/lignite); | | |
| Director of Goodrich Corporation (industrial products/ | | |
| aircraft systems and services); Deputy Chairman of | | |
| the Federal Reserve Bank of Cleveland; Trustee of | Founder | |
| University Hospitals of Cleveland, The Cleveland | John C. Bogle | |
| Museum of Art, and Case Western Reserve University. | Chairman and Chief Executive Officer, 1974–1996 |
| |
| Peter F. Volanakis | | |
| Born 1955. Trustee Since July 2009. Principal | | |
| Occupation(s) During the Past Five Years: President | | |
| since 2007 and Chief Operating Officer since 2005 | | |
| of Corning Incorporated (communications equipment); | | |
| President of Corning Technologies (2001–2005); Director | | |
| of Corning Incorporated and Dow Corning; Trustee of | | |
| the Corning Incorporated Foundation and the Corning | | |
| Museum of Glass; Overseer of the Amos Tuck School | | |
| of Business Administration at Dartmouth College. | | |
1 These individuals are considered “interested persons,” as defined in the Investment Company Act of 1940, because they are officers of the
Vanguard funds.
2 December 2002 for Vanguard Equity Income Fund, Vanguard Growth Equity Fund, the Vanguard Municipal Bond Funds, and the Vanguard
State Tax-Exempt Funds.

P.O. Box 2600
Valley Forge, PA 19482-2600
Connect with Vanguard® > www.vanguard.com
| |
| Fund Information > 800-662-7447 | All comparative mutual fund data are from Lipper Inc. |
| | or Morningstar, Inc., unless otherwise noted. |
| Direct Investor Account Services > 800-662-2739 | |
| | |
| Institutional Investor Services > 800-523-1036 | You can obtain a free copy of Vanguard’s proxy voting |
| | guidelines by visiting our website, www.vanguard.com, |
| Text Telephone for People | and searching for “proxy voting guidelines,” or by |
| With Hearing Impairment > 800-749-7273 | calling Vanguard at 800-662-2739. The guidelines are |
| | also available from the SEC’s website, www.sec.gov. |
| | In addition, you may obtain a free report on how your |
| | fund voted the proxies for securities it owned during |
| the 12 months ended June 30. To get the report, visit |
| | either www.vanguard.com or www.sec.gov. |
| with the offering of shares of any Vanguard | |
| fund only if preceded or accompanied by | |
| the fund’s current prospectus. | You can review and copy information about your fund |
| | at the SEC’s Public Reference Room in Washington, D.C. |
| CFA® is a trademark owned by CFA Institute. | To find out more about this public service, call the SEC |
| | at 202-551-8090. Information about your fund is also |
| | available on the SEC’s website, and you can receive |
| | copies of this information, for a fee, by sending a |
| | request in either of two ways: via e-mail addressed to |
| | publicinfo@sec.gov or via regular mail addressed to the |
| | Public Reference Section, Securities and Exchange |
| | Commission, Washington, DC 20549-1520. |
© 2010 The Vanguard Group, Inc.
All rights reserved.
Vanguard Marketing Corporation, Distributor.
Q1680 012010
Item 2: Code of Ethics. The Registrant has adopted a code of ethics that applies to the Registrant’s principal executive officer, principal financial officer, principal accounting officer or controller or persons performing similar functions. The Code of Ethics was amended during the reporting period covered by this report to make certain technical, non-material changes.
Item 3: Audit Committee Financial Expert. The following members of the Audit Committee have been determined by the Registrant’s Board of Trustees to be Audit Committee Financial Experts serving on its Audit Committee, and to be independent: Charles D. Ellis, Rajiv L. Gupta, JoAnn Heffernan Heisen, André F. Perold, and Alfred M. Rankin, Jr.
Item 4: Principal Accountant Fees and Services.
(a) Audit Fees.
Audit Fees of the Registrant
Fiscal Year Ended November 30, 2009: $24,000
Fiscal Year Ended November 30, 2008: $23,000
Aggregate Audit Fees of Registered Investment Companies in the Vanguard Group.
Fiscal Year Ended November 30, 2009: $3,354,640
Fiscal Year Ended November 30, 2008: $3,055,590
(b) Audit-Related Fees.
Fiscal Year Ended November 30, 2009: $876,210
Fiscal Year Ended November 30, 2008: $626,240
Includes fees billed in connection with assurance and related services provided to the Registrant, The Vanguard Group, Inc., Vanguard Marketing Corporation, and other registered investment companies in the Vanguard Group.
(c) Tax Fees.
Fiscal Year Ended November 30, 2009: $423,070
Fiscal Year Ended November 30, 2008: $230,400
Includes fees billed in connection with tax compliance, planning and advice services provided to the Registrant, The Vanguard Group, Inc., Vanguard Marketing Corporation, and other registered investment companies in the Vanguard Group and related to income and excise taxes.
(d) All Other Fees.
Fiscal Year Ended November 30, 2009: $0
Fiscal Year Ended November 30, 2008: $0
Includes fees billed for services related to risk management and privacy matters. Services were provided to the Registrant, The Vanguard Group, Inc., Vanguard Marketing Corporation, and other registered investment companies in the Vanguard Group.
(e) (1) Pre-Approval Policies. The policy of the Registrant’s Audit Committee is to consider and, if appropriate, approve before the principal accountant is engaged for such services, all specific audit and non-audit services provided to: (1) the Registrant; (2) The Vanguard Group, Inc.; (3) other entities controlled by The Vanguard Group, Inc. that provide ongoing services to the Registrant; and (4) other registered investment companies in the Vanguard Group. In making a determination, the Audit Committee considers whether the services are consistent with maintaining the principal accountant’s independence.
In the event of a contingency situation in which the principal accountant is needed to provide services in between scheduled Audit Committee meetings, the Chairman of the Audit Committee would be called on to consider and, if appropriate, pre-approve audit or permitted non-audit services in an amount sufficient to complete services through the next Audit Committee meeting, and to determine if such services would be consistent with maintaining the accountant’s independence. At the next scheduled Audit Committee meeting, services and fees would be presented to the Audit Committee for formal consideration, and, if appropriate, approval by the entire Audit Committee. The Audit Committee would again consider whether such services and fees are consistent with maintaining the principal accountant’s independence.
The Registrant’s Audit Committee is informed at least annually of all audit and non-audit services provided by the principal accountant to the Vanguard complex, whether such services are provided to: (1) the Registrant; (2) The Vanguard Group, Inc.; (3) other entities controlled by The Vanguard Group, Inc. that provide ongoing services to the Registrant; or (4) other registered investment companies in the Vanguard Group.
(2) No percentage of the principal accountant’s fees or services were approved pursuant to the waiver provision of paragraph (c)(7)(i)(C) of Rule 2-01 of Regulation S-X.
(f) For the most recent fiscal year, over 50% of the hours worked under the principal accountant’s engagement were not performed by persons other than full-time, permanent employees of the principal accountant.
Doc#0216341
(g) Aggregate Non-Audit Fees.
Fiscal Year Ended November 30, 2009: $423,070
Fiscal Year Ended November 30, 2008: $230,400
Includes fees billed for non-audit services provided to the Registrant, The Vanguard Group, Inc., Vanguard Marketing Corporation, and other registered investment companies in the Vanguard Group.
(h) For the most recent fiscal year, the Audit Committee has determined that the provision of all non-audit services was consistent with maintaining the principal accountant’s independence.
Item 5: Not Applicable.
Item 6: Not Applicable.
Item 7: Not Applicable.
Item 8: Not Applicable.
Item 9: Not Applicable.
Item 10: Not Applicable.
Item 11: Controls and Procedures.
(a) Disclosure Controls and Procedures. The Principal Executive and Financial Officers concluded that the Registrant's Disclosure Controls and Procedures are effective based on their evaluation of the Disclosure Controls and Procedures as of a date within 90 days of the filing date of this report.
(b) Internal Control Over Financial Reporting. There were no significant changes in Registrant’s Internal Control Over Financial Reporting or in other factors that could significantly affect this control subsequent to the date of the evaluation, including any corrective actions with regard to significant deficiencies and material weaknesses.
Item 12: Exhibits.
(a) Code of Ethics.
(b) Certifications.
Pursuant to the requirements of the Securities Exchange Act of 1934 and the Investment Company Act of 1940, the registrant has duly caused this report to be signed on its behalf by the undersigned, thereunto duly authorized.
| |
| | VANGUARD MASSACHUSETTS TAX-EXEMPT FUNDS |
| |
| BY: | /s/ F. WILLIAM MCNABB III* |
| | F. WILLIAM MCNABB III |
| | CHIEF EXECUTIVE OFFICER |
| |
| Date: January 25, 2010 |
Pursuant to the requirements of the Securities Exchange Act of 1934 and the Investment Company Act of 1940, this report has been signed below by the following persons on behalf of the registrant and in the capacities and on the dates indicated.
| |
| | VANGUARD MASSACHUSETTS TAX-EXEMPT FUNDS |
| |
| BY: | /s/ F. WILLIAM MCNABB III* |
| | F. WILLIAM MCNABB III |
| | CHIEF EXECUTIVE OFFICER |
| Date: January 25, 2010 |
| |
| | VANGUARD MASSACHUSETTS TAX-EXEMPT FUNDS |
| |
| BY: | /s/ THOMAS J. HIGGINS* |
| | THOMAS J. HIGGINS |
| | CHIEF FINANCIAL OFFICER |
| Date: January 25, 2010 |
* By: /s/ Heidi Stam
Heidi Stam, pursuant to a Power of Attorney filed on July 24, 2009, see file Number
2-88373, and a Power of Attorney filed on October 16, 2009, see File Number 2-52698,
both Incorporated by Reference.