Filing under Rule 425 under
the U.S. Securities Act of 1933
Filing by: Sankyo Company, Limited
Subject Company: Daiichi Pharmaceutical Co., Ltd.
and Sankyo Company, Limited
SEC File No. 132-02292

Consolidated Financial Results
for Fiscal 2004
(The Fiscal Year Ended March 31, 2005)
This document has been prepared as a guide for non-Japanese investors and contains forward-looking statements that are based on managements’ estimates, assumptions and projections at the time of publication. A number of factors could cause actual results to differ materially from expectations.

Consolidated Financial Results
for Fiscal 2004
(The Fiscal Year Ended March 31, 2005)
Sankyo Co., Ltd.
| Listed exchanges: | Tokyo, Osaka, Nagoya, Fukuoka and Sapporo | |
| Head office: | Tokyo, Japan | |
| Stock code: | 4501 | |
| Homepage: | http://www.sankyo.co.jp | |
| Address: | 3-5-1 Nihonbashi Honcho, Chuo-ku Tokyo 103-8426, Japan | |
| Meeting of Board of Directors for year-end closing: | May 13, 2005 | |
| U.S. accounting standards: | Not adopted | |
| 1. | Consolidated Financial Results for Fiscal 2004 |
(1) Consolidated Financial Results
| Net sales | Operating income | Recurring income | |||||||||||||
| (¥ Million) | % | (¥ Million) | % | (¥ Million) | % | ||||||||||
Fiscal 2004 | 587,830 | (1.4 | ) | 84,925 | (11.1 | ) | 82,506 | (12.2 | ) | ||||||
Fiscal 2003 | 596,345 | 4.6 | 95,555 | 19.7 | 93,975 | 17.1 | |||||||||
| Net income | Net income per share | Fully diluted net income per share | Return on equity (ROE) | |||||||
| (¥ Million) | % | (¥) | (¥) | (%) | ||||||
Fiscal 2004 | 48,282 | 11.2 | 111.78 | 111.74 | 6.9 | |||||
Fiscal 2003 | 43,411 | 28.3 | 98.57 | 98.56 | 6.5 | |||||
Ratio of income to | Ratio of recurring income to net sales | |||
| (%) | (%) | |||
Fiscal 2004 | 8.7 | 14.0 | ||
Fiscal 2003 | 10.2 | 15.8 |
| Notes: | 1. | Gain on investments in subsidiaries and affiliates accounted for by the equity method: | ||||||
Fiscal 2004: | None | |||||||
Fiscal 2003: | None | |||||||
| 2. | Average number of outstanding shares (consolidated) during the period: | |||||||
Fiscal 2004: | 429,527,836 shares | |||||||
Fiscal 2003: | 437,053,274 shares | |||||||
| 3. | Changes in accounting procedures: | Yes | ||||||
| 4. | Percentages for net sales, operating income, recurring income and net income represent year-on-year changes. | |||||||
Page 3
(2) Consolidated Financial Position
| Total assets | Shareholders’ equity | Shareholders’ equity ratio | Shareholders’ equity per share | |||||
| (¥ Million) | (¥ Million) | (%) | (¥) | |||||
Fiscal 2004 | 976,230 | 716,587 | 73.4 | 1,667.76 | ||||
Fiscal 2003 | 927,244 | 682,594 | 73.6 | 1,588.35 | ||||
| Notes: | Outstanding shares (consolidated) at the end of the period: | |||
Fiscal 2004: | 429,508,509 shares | |||
Fiscal 2003: | 429,542,651 shares | |||
(3) Consolidated Cash Flows
| Net cash provided by (used in) operating activities | Net cash provided by (used in) investing activities | Net cash provided by (used in) financing activities | Cash and cash equivalents at the end of period | |||||||
| (¥ Million) | (¥ Million) | (¥ Million) | (¥ Million) | |||||||
Fiscal 2004 | 96,703 | (16,265 | ) | (12,716 | ) | 262,530 | ||||
Fiscal 2003 | 71,207 | (49,168 | ) | (31,657 | ) | 194,789 | ||||
(4) Scope of Consolidation and Application of Equity Method:
Number of consolidated subsidiaries: | 37 | |||||
Number of non-consolidated subsidiaries accounted for by the equity method: | 0 | |||||
Number of affiliates accounted for by the equity method: | 0 | |||||
(5) Changes in Scope of Consolidation and Application of Equity Method:
Consolidated subsidiaries: | (Newly included) | 0 | ||||
| (Excluded) | 1 | |||||
Companies accounted for by the equity method: | (Newly included) | 0 | ||||
| (Excluded) | 0 | |||||
2. Consolidated Results ‘Forecast for Fiscal 2005’
| Net sales | Recurring income | Net income | ||||
| (¥ Million) | (¥ Million) | (¥ Million) | ||||
Interim period of Fiscal 2005 | 279,000 | 36,000 | 23,000 | |||
Fiscal 2005 | 557,000 | 63,000 | 37,000 | |||
(Reference) Projected net income per share for Fiscal 2005: ¥85.52
The forecasts above have been based on the information available to management on the date of their announcement. The results could differ materially from these projections for a wide variety of reasons. For detailed information of ‘Forecast for Fiscal 2005’ please refer page 18,19 and 21 of the attached information.
Page 4
I. State of the Group
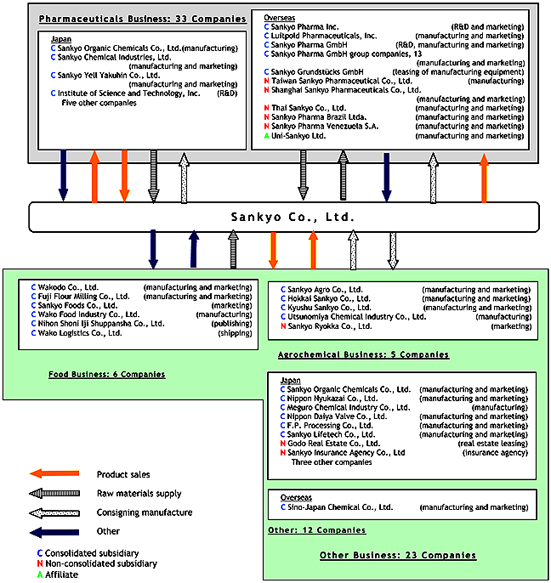
The Sankyo Group consists of Sankyo Co., Ltd. (the “Company”), its 51 subsidiaries, and its three affiliates, for a total of 55 companies. The group’s main operating activities consist of the manufacture and sales of pharmaceuticals, food products, agrochemicals, veterinary drugs and chemical products.
The following chart shows the organization of the Sankyo Group.
Page 5
Consolidated Subsidiaries
Name | Location | Capital/ Investment (Million yen) | Major | Percentage (%) | Details of Relationship | |||||||||||||
Mutual | Capital Support | Operating | Facilities Leased by | Other | ||||||||||||||
| Wakodo Co., Ltd. | Chiyoda-ku, Tokyo | 2,918 | Food | 61.6 (0.7) | Yes | — | Sankyo purchases and markets products | — | — | |||||||||
| Fuji Flour Milling Co., Ltd. | Shizuoka-shi | 500 | Food | 66.6 (0.4) | Yes | Facility-related capital | Sankyo purchases raw materials | Research facilities and warehouses | — | |||||||||
| Sankyo Organic Chemicals Co., Ltd. | Takatsu-ku, Kawasaki-shi | 300 | Pharmaceu-ticals and other | 93.4 | Yes | — | Sankyo purchases raw materials and consigns manufacturing | Manufacturing facilities | — | |||||||||
| Nippon Nyukazai Co., Ltd. | Chuo-ku, Tokyo | 300 | Other | 100.0 | Yes | Loan guarantees | Sankyo purchases raw materials | Land | — | |||||||||
| Nippon Daiya Valve Co., Ltd. | Shinagawa-ku, Tokyo | 96 | Other | 100.0 | Yes | — | Sankyo purchases research and manufacturing facilities | Land and buildings | — | |||||||||
| Sankyo Chemical Industries, Ltd. | Chuo-ku, Tokyo | 65 | Pharmaceu-ticals | 100.0 | Yes | Facility-related and working capital | Sankyo purchases raw materials and consigns manufacturing | — | — | |||||||||
| Hokkai Sankyo Co., Ltd. | Kitahiroshima-shi | 52 | Agrochemi-cals | 96.2 | Yes | — | — | — | — | |||||||||
| Kyushu Sankyo Co., Ltd. | Tosu-shi | 40 | Agrochemi-cals | 100.0 (100.0) | Yes | — | — | — | — | |||||||||
| Meguro Chemical Industry Co., Ltd. | Meguro-ku, Tokyo | 40 | Other | 100.0 | Yes | — | Sankyo purchases materials and consigns manufacturing | Manufacturing facilities | — | |||||||||
| Sankyo Foods Co., Ltd. | Chiyoda-ku, Tokyo | 20 | Food | 100.0 | Yes | — | Sankyo purchases raw materials | Offices | — | |||||||||
| Utsunomiya Chemical Industry Co., Ltd. | Utsunomiya-shi | 20 | Agrochemi-cals | 100.0 (100.0) | Yes | Facility-related capital | — | — | — | |||||||||
| F.P. Processing Co., Ltd. | Ikuno-ku, Osaka-shi | 30 | Other | 100.0 | Yes | Working capital | Sankyo purchases materials | — | — | |||||||||
| Institute of Science and Technology, Inc. | Shinagawa-ku, Tokyo | 20 | Pharmaceu-ticals | 100.0 | Yes | — | Sankyo consigns pharmaceutical testing | Offices | — | |||||||||
| Sankyo Yell Yakuhin Co., Ltd. | Chiyoda-ku, Tokyo | 96 | Pharmaceu-ticals | 100.0 | Yes | Facility-related and working capital | Sankyo purchases products | — | — | |||||||||
| Nihon Shoni Iji Shuppansya Co., Ltd. | Shinjuku-ku, Tokyo | 20 | Food | 100.0 (100.0) | No | — | — | — | — | |||||||||
| Wako Logistics Co., Ltd. | Chofu-shi | 21 | Food | 100.0 (100.0) | No | — | — | — | — | |||||||||
| Wako Food Industry Co., Ltd. | Nagano-shi | 25 | Food | 100.0 (100.0) | Yes | — | — | — | — | |||||||||
| Sankyo Agro Co., Ltd. | Bunkyo-ku, Tokyo | 350 | Agrochemi-cals | 100.0 | Yes | — | Sankyo conducts R&D for the company | Land, buildings and offices | — | |||||||||
| Sankyo Lifetech Co., Ltd. | Bunkyo-ku, Tokyo | 300 | Other | 100.0 | Yes | — | Sankyo conducts R&D and manufacturing for the company | Offices | — | |||||||||
| Sino-Japan Chemical Co., Ltd. | Taipei, Taiwan | 144 million NT$ | Other | 52.0 (3.4) | Yes | — | — | — | — | |||||||||
| Sankyo Pharma Inc. | Parsippany, U.S. | 20.1 million U.S. dollars | Pharmaceu-ticals | 100.0 | Yes | Guarantee for liabilities relating to joint sales promotional contracts, office lease contracts and automotive lease contracts | Sankyo markets products and consigns pharmaceutical-related R&D | — | Sankyo provides pharmaceutical technology | |||||||||
| Luitpold Pharmaceuticals, Inc. | Shirley, U.S. | 0.2 million U.S. dollars | Pharmaceu-ticals | 100.0 (100.0) | Yes | — | — | — | — | |||||||||
| Sankyo Grundstücks GmbH | Munich, Germany | 5.1 million euros | Pharmaceu-ticals | 100.0 | No | — | — | — | — | |||||||||
| Sankyo Pharma GmbH | Munich, Germany | 16.0 million euros | Pharmaceu-ticals | 100.0 | Yes | — | Sankyo markets raw materials and consigns manufacturing and pharmaceutical-related R&D | — | Sankyo provides pharmaceutical technology | |||||||||
| Sankyo Pharma UK Ltd. | Amersham, UK | 19.5 million pounds | Pharmaceu-ticals | 100.0 (100.0) | No | — | — | — | — | |||||||||
| Sankyo Pharma Espana S.A. | Madrid, Spain | 120 thousand euros | Pharmaceu-ticals | 100.0 (100.0) | No | — | — | — | — | |||||||||
| Sankyo Pharma Italia S.p.A. | Rome, Italy | 120 thousand euros | Pharmaceu-ticals | 100.0 (100.0) | No | — | — | — | — | |||||||||
| Sankyo Pharma Portugal Lda. | Porto Salvo, Portugal | 349 thousand euros | Pharmaceu-ticals | 100.0 (100.0) | No | — | — | — | — | |||||||||
| Sankyo Pharmazeutika Austria GmbH | Vienna, Austria | 18 thousand euros | Pharmaceu-ticals | 100.0 (100.0) | No | — | — | — | — | |||||||||
| Sankyo Pharma (Schweiz) AG | Thalwil, Switzerland | 3 million Swiss Francs | Pharmaceu-ticals | 100.0 (100.0) | No | — | — | — | — | |||||||||
| Sankyo Pharma Nederland B.V. | Zwanenburg, the Netherlands | 18 thousand euros | Pharmaceu-ticals | 100.0 (100.0) | No | — | — | — | — | |||||||||
Page 6
Name | Location | Capital/ Investment (Million yen) | Major | Percentage (%) | Details of Relationship | |||||||||||||
Mutual | Capital Support | Operating | Facilities Leased by | Other | ||||||||||||||
| N.V. Sankyo Pharma Belgium S.A. | Louvain-La-Nueve, Belgium | 62 thousand euros | Pharmaceu-ticals | 100.0 (100.0) | No | — | — | — | — | |||||||||
| Oy Sankyo Pharma Finland Ab | Helsinki, Finland | 25 thousand euros | Pharmaceu-ticals | 100.0 (100.0) | No | — | — | — | — | |||||||||
| Sankyo Manufacturing France S.a.r.l. | Altkirch, France | 457 thousand euros | Pharmaceu-ticals | 100.0 (100.0) | No | — | — | — | — | |||||||||
| Dignos-Chemie GmbH | Munich, Germany | 40 thousand euros | Pharmaceu-ticals | 100.0 (100.0) | No | — | — | — | — | |||||||||
| Sankyo Pharma France S.A.S. | Neully-sur-Seine, France | 2,182 thousand euros | Pharmaceu-ticals | 100.0 (100.0) | No | — | — | — | — | |||||||||
| Dismed AG | Zug, Switzerland | 100 thousand Swiss Francs | Pharmaceu-ticals | 100.0 (100.0) | No | — | — | — | — | |||||||||
Notes:
| 1. | The terms used in the ‘Major Operating Activities’ column are the same as those used in the business segment information section. |
| 2. | Those subsidiaries submitting notification or reports relating to securities (‘yukashoken todokedesho’ or ‘yukashoken hokokusyo’) are as follows: Wakodo Co., Ltd. and Fuji Flour Milling Co., Ltd. Both companies are listed, on the Tokyo and Nagoya Stock Exchanges, respectively. |
| 3. | Figures in parentheses under the ‘Percentage of Voting Rights Held’ column represent voting rights owned indirectly and have been included in the respective total. |
| 4. | Sankyo Trading Co., Ltd., which had been a consolidated subsidiary of the Company until the year ended March 31, 2004, has been excluded from the scope of consolidation effective the current period due to sale of the Company’s entire shares in this company. |
| 5. | The Company sold its entire shares of Nippon Daiya Valve Co., Ltd. in April 2005. |
| 6. | Kyushu Sankyo Co., Ltd. was integrated into Sankyo Agro Co., Ltd. and Utsunomiya Chemical Industry Co., Ltd. in April 2005. |
| 7. | Sankyo Foods Co., Ltd. decided that it would transfer its business in July 2005. |
Page 7
II. Management Policies
1. Basic Management Objective
The Sankyo Group’s business philosophy is to “contribute, as a company involved with human life, to healthy and full lives for people around the world by developing innovative pharmaceuticals that are highly appraised internationally.” This philosophy and a firm ethical vision are the foundations upon which the Group intends to fulfill its social mission.
Amid a challenging operating environment marked by intensifying competition in new drug development, the worldwide implementation of measures to curb medical expenses, and the emergence of truly global competition spurred by the increasingly borderless nature of the pharmaceutical market, Sankyo is pushing forward with various restructuring that aim to bolster competitiveness. In addition, on February 25, 2005, Sankyo and Daiichi Pharmaceutical Co., Ltd., entered into a basic agreement to integrate their businesses. This proactive management decision will facilitate the early achievement of Group sales of ¥1 trillion, an operating income ratio of 20% or more, and an ROE of 10% or more by fiscal 2010—targets set out in a management vision.
Sankyo will continue to conduct its business activities in line with its business philosophy to maintain the trust of its stakeholders-shareholders, customers, staff, and society.
2. Profit Distribution
Sankyo, having taken into consideration numerous factors including the Company’s future financial outlook, medium- to long-term financing needs, and financial structure, is working to maintain or enhance retained earnings. At the same time, the Company places considerable importance on distributing profits to shareholders. Sankyo will continue to provide stable dividends while taking a flexible and strategic approach to acquiring treasury stock. Retained earnings are primarily invested in new drug R&D and the globalization of the Group’s sales organization with the objective of boosting corporate value.
3. Reduction of Number of Shares of Common Stock per Unit
On August 1, 2002, Sankyo reduced the size of its stock unit from 1,000 shares to 100 shares of common stock in order to promote the wider circulation of the Company’s stock and expand its shareholder base. Going forward, Sankyo will strive to enhance information provision to individual investors.
4. Medium-to-Long-Term Management Strategies and Goals
Amid increasingly competitive conditions in Japan and overseas spurred by globalization and borderless markets, Sankyo continues to face a challenging operating environment over the medium term, compounded by intensified competition and competition from generic versions of the mainstay product Mevalotin®, an antihyperlipidemic agent, in Japan and the upcoming expiration of the patent for this drug in fiscal 2006 in the United States.
To promote its flexible and appropriate response to the changing global environment, Sankyo completely revamped its management team, including the selection of a new president, in June 2003, forging onward with business reforms under the new regime. In addition, on February 25, 2005, Sankyo and Daiichi entered into the aforementioned agreement to integrate their businesses. This proactive management decision will facilitate the early achievement of Group sales of ¥1 trillion, an operating income ratio of 20% or more, and an ROE of 10% or more by fiscal 2010—targets set out in the management vision.
Page 8
5. Issues to be Addressed
(1) Realizing the Business Integration with Daiichi
On February 25, 2005, Sankyo concluded a basic agreement to integrate the businesses with Daiichi. On May 13, 2005, Sankyo and Daiichi signed a definitive agreement. Subject to approval at Sankyo’s 151st Ordinary General Shareholders Meeting to be held on June 29, 2005, the companies plan to establish the holding company DAIICHI SANKYO COMPANY, LTD., on September 28, 2005. In addition, Sankyo and Daiichi aim to complete the integration of their pharmaceutical operations under the operational holding company by April 2007. We aim to strengthen R&D capabilities, enhance the development pipeline, bolster domestic sales strength, achieve expanded corporate strategy options via increased scale, improve operational efficiency, and enhance human resources through the integration.
(2) Maximizing Sales of the Antihypertensive Agent Olmesartan
Sales of Sankyo’s strategic global product olmesartan, an antihypertensive agent sold as Benicar® in the United States and Olmetec® in Japan and Europe, are showing steady growth. The product was first brought to market in the United States and Germany in 2002 and is currently offered in 27 countries around the world. Olmesartan was launched in Japan on May 11, 2004, and we expect its approval for long-term use to push sales even higher in 2005 and beyond. Sankyo is redoubling its efforts to maximize global sales of olmesartan making use of its own infrastructure and some alliances in sales and promotion.
(3) Reinforcement of the Development Pipeline Management
A robust development pipeline is crucial to emerging as a winner in the face of global competition. Sankyo established three global organizations in fiscal 2003 to bolster pipeline management.
| i) | The Global R&D Management Committee (GRDMC) makes decisions regarding investment and resource allocation within R&D units and prioritizes drugs in the pipeline. |
| ii) | The Global Licensing Committee (GLC) makes decisions regarding policies and strategies for such licensing matters as acquiring and leveraging the resources of other companies. |
| iii) | The Global Marketing Management Committee (GMMC) formulates strategies to extend the life cycles of products on the market and increase sales. |
These three committees all operate from a global perspective and gather at product strategy conferences to ensure that the Sankyo Group’s pipeline is optimized.
Page 9
(4) Putting the Emphasis on Performance and Roles
In fiscal 2003, Sankyo introduced a new personnel system for managerial-level staff to motivate both the individual and the organization. This system clarifies the roles of employees and appropriately links performance to compensation. In October 2004, we expanded this personnel system to include all employees.
We also divided the Company into individual organizational units that are accountable for given functions, for example, marketing, R&D, or supply chain activities, and delegated responsibility and authority for operations in their particular areas to the units. This enables each unit to make autonomous decisions and take swift action. In addition, Sankyo introduced a performance management system to track unit performance to ensure that management resources are effectively invested in units.
(5) Strengthening Group Internal Functions
To heighten the competitiveness of the entire Sankyo Group, we are restructuring functions related to pharmaceutical operations. In April 2004, we established a Supply Chain Management Division to oversee procurement, production, and related functions. We also realigned headquarters functions, establishing a Corporate Division to handle strategic functions and a Business Operation Division to manage routine functions. These initiatives are designed to create an organization that is clearly partitioned by function and to thereby strengthen functions within the Group and enhance cost-competitiveness. In addition, Sankyo has outsourced its information system operations to Hitachi, Ltd., and will establish a joint company with the Hitachi Group for the provision of information system services.
(6) Reexamining Non-Pharmaceutical Operations
In order to concentrate management resources in pharmaceutical operations, we are restructuring our non-pharmaceutical businesses within the Group. In fiscal 2003, we spun off the Crop Protection Division and the Special Merchandise Division and moved forward with the realignment and consolidation of Group companies, withdrawing from operations handling such medical products as diagnostic reagents and medical devices. In addition, in fiscal 2004 Sankyo transferred the stock of Sankyo Trading Co., Ltd., and decided to sell its shares in the consolidated subsidiary Nippon Daiya Valve Co., Ltd., and transfer the business of Sankyo Foods Co., Ltd. Going forward, Sankyo will focus further on its pharmaceutical operations.
Page 10
6. Corporate Governance
In the area of corporate governance, we have structured management to respond to changes in the business environment with greater speed and flexibility and maintain a focus on improving the environment to ensure the transparency of management and maintain the trust of our shareholders. In line with this policy, in June 2003, Sankyo reduced the number of Directors and introduced an Executive Officer System, clarifying Directors’ responsibilities in management decision-making and the auditing of business operations, and executive officers’ responsibilities in business operations as part of efforts to strengthen corporate governance.
(1) Improvement of Management
Sankyo’s Board of Directors is devoted to making decisions related to management strategies and other important issues as well as supervising business operations. To reinforce the supervisory functions of general executive operations, enhance transparency, and create a management framework better equipped to rapidly address global issues, Sankyo appointed one director from the Company’s U.S.-based subsidiary Sankyo Pharma Inc., and two directors from outside the Group to its Board of Directors.
In addition, four corporate auditors, including outside auditors, make up the Board of Corporate Auditors, which audits the legality and soundness of Sankyo’s operations.
(2) Introduction of Corporate Officer System
Corporate Officers are appointed by the Board to perform specific business operations for a period of one year under the supervision of a representative director. This system clarifies Directors’ responsibilities in connection with management decision making and the auditing of business operations and Corporate Officers’ responsibilities in connection with business operations. The executive officers appointed are individuals with outstanding professional skills in the areas of business for which they are responsible and are accorded a status equivalent to that of directors.
(3) Establishment of an Executive Appointment Nomination Committee and a Remuneration Committee
To enhance the transparency of management, Sankyo formed the Executive Appointment Nomination Committee and the Remuneration Committee as ad hoc units. The Executive Appointment Nomination Committee deliberates on matters related to the appointment and removal of Board members and corporate officers as well as promotions and reports its findings to the Board. The Remuneration Committee reviews and establishes individual compensation packages for Board members and corporate officers.
Page 11
(4) Compliance
We introduced the Sankyo Compliance Program and are continuing to educate our directors and employees with the aim of ensuring strict compliance with laws and adherence to corporate ethics. In addition, Sankyo established the Environmental & Compliance Program Management Department in April 2004 as a part of efforts to reinforce the functions of headquarters. As a company involved with human life, we remain committed to maintaining high ethics and building a business culture that emphasizes the corporation’s social responsibilities.
7. Business Risks
Examples of the types of risks that may affect the performance of the Sankyo Group are as follows:
(1) Risks Associated with the Product Qualities and Side Effects
Unanticipated side effects, accidents, or changes in laws and regulations may result in the recall or discontinuation of products. Although every effort is made to ensure the reliability and quality of clinical trials, there is a chance that unanticipated side effects or incidents involving product contamination will arise.
(2) Risks Associated with Legal Regulations and Government Policies
Changes in Pharmaceutical Affairs Law regulations may result in a product no longer complying with regulations or the cancellation of manufacturing or sales approval. Such instances may require product recall or discontinuation, which may affect business performance.
In addition, the Company may be adversely affected by medical policy and health insurance system trends. The Sankyo Group sells pharmaceuticals throughout the world, and, as pharmaceutical prices are strongly influenced by the medical policies and health insurance systems of individual countries, these trends may affect business performance.
(3) Risks Associated with Pharmaceutical R&D
There is a possibility that R&D will not proceed as planned, delaying the launch of potential new products. If a new drug candidate does not meet expectations in terms of efficacy or leaves doubt as to its safety in clinical trials, the development period may be extended or development may be delayed or discontinued and this may affect business performance.
(4) Risks Associated with Exchange Rate Fluctuations
The Company may be adversely affected by exchange rate fluctuations. The Sankyo Group is developing its business globally and is engaged in manufacturing, sales, importing and exporting. Therefore, exchange rate fluctuations may affect its business performance.
Page 12
(5) Other Risks
Economic conditions in various countries, including inflation and interest rate fluctuations, may affect the Sankyo Group’s business performance.
A breakdown of law and order due to war or political upheaval may result in the destruction of or damage to business offices or may force the scaling down or withdrawal from certain businesses, which may affect business performance.
Page 13
III. Results of Operations and Financial Position
I. Results of Operations
1. Overview of Fiscal 2004
(¥ 100 Millions of yen)
| Net sales | Operating income | Recurring income | Net income | ||||||||
Fiscal 2004 | 5,878 | 849 | 825 | 482 | |||||||
Fiscal 2003 | 5,963 | 955 | 939 | 434 | |||||||
Change (%) | (1.4 | ) | (11.1 | ) | (12.2 | ) | 11.2 |
(1) Overview of performance
During the fiscal year under review, the pharmaceutical industry was marked by intense change. Market conditions in Japan are becoming increasingly fierce as the government pushes forward with measures designed to curb medical expenses, including the promotion of generic drug use and the April 2004 national health insurance (NHI) drug price revisions. Overseas, pharmaceutical markets in Europe and the United States continue to expand; however, operating conditions are becoming ever more unpredictable as government plans to contain medical costs gradually take shape. Furthermore, globalization and borderless markets are contributing to an unprecedented pace of change in the business environment.
Against this backdrop, net sales for the fiscal year under review was down a slight 1.4% from the previous fiscal year, to ¥587.8 billion, operating income slid 11.1%, to ¥84.9 billion, and recurring income declined 12.2%, to ¥82.5 billion. Net income rose 11.2%, to ¥48.2 billion.
Sales of the antihypertensive agent olmesartan, which is offered in the United States as Benicar® and in Europe and Japan as Olmetec®, soared on the back of the drug’s strong performance in Europe and the United States and its May 2004 launch in Japan. Nevertheless, lower sales of the flagship antihyperlipidemic agent Mevalotin® and the withdrawal from medical products operations resulted in a decline in net sales. Operating income and ordinary income declined mainly as a result of lower sales and higher selling, general, and administrative expenses stemming from increased investment aimed at enhancing MR forces to maximize sales of olmesartan. Net income, however, rose due to a major increase in extraordinary profits primarily attributable to proceeds from the sale of land on the site of the Company’s former Tanashi Plant and an improvement in the corporate tax rate due to reduced losses at overseas subsidiaries, which more than countered the posting of an impairment loss resulting from the early application of asset impairment accounting as an extraordinary loss.
Page 14
(2) Segment Information
Business Segments
(¥ 100 Millions of yen)
| Net sales | Operating income | |||||||||||||||||||
| Fiscal 2004 | Fiscal 2003 | Change | Change��(%) | Fiscal 2004 | Fiscal 2003 | Change | Change (%) | |||||||||||||
Pharm. | 4,556 | 4,680 | (123 | ) | (2.6 | ) | 774 | 891 | (116 | ) | (13.0 | ) | ||||||||
Other | 1,348 | 1,327 | 20 | 1.6 | 65 | 55 | 10 | 19.6 | ||||||||||||
1) Pharmaceuticals
Sales in the pharmaceuticals segment totaled ¥455.6 billion, a 2.6% decline from the previous fiscal year, and operating income came to ¥77.4 billion, down 13.0%. Despite a strong showing from the antihypertensive agent olmesartan, encouraged by the drug’s May 2004 introduction under the trade name Olmetec®, sales of pharmaceuticals lost ground due to the withdrawal from the medical products business and a substantial decline in sales of the mainstay product Mevalotin®, an antihyperlipidemic agent, owing to the expiration of the patent for this agent in Europe, national health insurance (NHI) drug price revisions, and intensifying competition in Japan and overseas.
Overseas, sales of the antihypertensive agent Benicar® and the diuretic/olmesartan combination Benicar® HCT grew in the United States, thanks to the co-promotion efforts of Sankyo Pharma Inc. (SPI) and Forest Laboratories, Inc. In addition, Luitpold Pharmaceuticals Inc., saw a steady climb in sales of the antianemia agent Venofer®. In Europe, the Sankyo Pharma GmbH (SPG) Group recorded expanded sales of the antihypertensive agent Olmetec®, which the SPG Group has been successively launching throughout Europe, and steady sales of Lopresor® and Lomir®, antihypertensive drugs licensed in from Novartis Pharma Co., Ltd., throughout the fiscal year in France, Italy, Belgium, Switzerland, and Portugal.
Sales of health care products were up, thanks in part to the strong showing of Lamisil® AT, a switched OTC product for the treatment of athlete’s foot and ringworm licensed-in from Novartis Pharma Co., Ltd., in February 2004, in a lackluster market.
Operating income declined, mainly due to lower sales of Mevalotin® and a rise in selling, general and administrative expenses stemming from increased investments aimed at bolstering the sales of SPI and the SPG Group.
2) Other
Sales in this segment climbed 1.6% from the previous fiscal year, to ¥134.8 billion, and operating income jumped 19.6%, to ¥6.5 billion.
Although improved corporate earnings spurred growth in capital investment and consumer spending edged up, market conditions remained tough amid an uncertain economic outlook, skyrocketing oil prices, and increasingly fierce corporate competition. In this setting, Wakodo Co., Ltd., saw an expansion in sales of dried milk for infants and Nippon Nyukazai Co., Ltd., saw a rise in sales of glycol products. In addition, Sankyo Agro Co., Ltd., and Sankyo Lifetech Co., Ltd., which were established on April 1, 2003, following the spin-off of the Crop Protection Company and the Special Merchandise Company, recorded steady growth in sales.
Operating income rose as a result of ongoing efforts to improve operational efficiency through cost control and other measures. In addition, the Company transferred the stock of Sankyo Trading Co., Ltd., and entered into agreements to transfer the stock of Nippon Daiya Valve Co., Ltd., and the business of Sankyo Foods Co., Ltd., as part of initiatives to increase its focus on the pharmaceutical business.
Page 15
Geographic Segments
(¥ 100 Millions of yen)
| Net sales | Operating income | |||||||||||||||||||||
| Fiscal 2004 | Fiscal 2003 | Change | Change (%) | Fiscal 2004 | Fiscal 2003 | Change | Change (%) | |||||||||||||||
Japan | 4,738 | 5,078 | (340 | ) | (6.7 | ) | 733 | 1,005 | (272 | ) | (27.1 | ) | ||||||||||
North America | 803 | 641 | 161 | 25.2 | 131 | 29 | 101 | 345.4 | ||||||||||||||
Other | 526 | 371 | 155 | 41.9 | (13 | ) | (62 | ) | 49 | |||||||||||||
1) Japan
Sales totaled ¥473.8 billion, down 6.7% from the previous fiscal year, and operating income was ¥73.3 billion, falling 27.1%.
A steady climb in sales of Olmetec® following the drug’s May 2004 launch in Japan were countered by the withdrawal from medical products operations and a marked decline in sales of Mevalotin®, resulting in an overall decrease in sales in Japan.
Lower sales and a rise in selling, general, and administrative expenses brought about by such factors as costs related to business reforms, the realignment of Group functions, and the upcoming business integration with Daiichi led to a substantial decline in operating income.
2) North America
Sales rose 25.2% from the previous fiscal year, to ¥80.3 billion, and operating income soared 345.4%, to ¥13.1 billion.
Intensified competition caused sales of the antihyperlipidemic agent WelChol® at Sankyo Pharma Inc. to slip; however, those of Benicar® and Benicar® HCT were up. In addition, Luitpold Pharmaceuticals Inc., continued to see growth in sales of Venofer®.
Operating income rose dramatically, primarily owing to markedly higher net sales that countered an increase sales promotion costs and other selling, general, and administrative costs associated with sales expansion initiatives.
3) Other
Sales rose 41.9%, to ¥52.6 billion, and the operating loss shrank from ¥6.2 billion in the previous fiscal year, to ¥1.3 billion.
Page 16
In Europe, the Sankyo Pharma GmbH (SPG) Group saw growth in sales of Olmetec®, Lopresor®, and Lomir®.
Although increased investment directed at bolstering sales forces and other factors led to higher selling, general, and administrative expenses, the operating loss was reduced, thanks to expanded sales.
(3) Dividends
In the fiscal year under review, the Company paid an interim dividend of ¥15.00 per share. The Company also paid a year-end dividend of ¥25.00 per share, reflecting a ¥10.00 increase from initial projections in light of such factors as an increase in free cash flow due to the sale of land on the site of the Company’s former Tanashi Plant, resulting in a total dividend for the year of ¥40.00 per share.
This increased the dividend payout ratio to 45.9%, and the dividend to shareholders’ equity ratio to 2.4% on a non-consolidated basis.
2. R&D Activities
In the fiscal year under review, research and development costs amounted to ¥86.5 billion, or 14.7% of sales on a consolidated basis.
We have concentrated our management resources on creating and bringing new world-class drugs to market at the earliest possible date, focusing on six key research areas including cardiovascular disease.
As for R&D activities, Sankyo implemented major organizational reform focused on integrating its global R&D organization in October 2003. This reform was based on the successes of the R&D restructuring program that Sankyo launched in July 2002—the R&D ReDesign (RDRD) Project. Sankyo is working to leverage the realignments to achieve the RDRD Project goals of prioritizing drugs in the pipeline, expediting decision-making, and rapidly developing innovative new drugs.
Sankyo’s principal global development products include CS-747 [Phase III (U.S. and Europe); Phase I (Japan)], a treatment for ischemic disease being jointly developed with the Eli Lilly and Company; CS-505 [Phase II/III (U.S. and Europe); Phase I preparations (Japan)], an anti-arteriosclerotic agent being developed in-house; Fidarestat® [Phase III preparations (U.S. and Europe)], a diabetic neuropathy agent being jointly developed with Sanwa Kagaku Kenkyusho; CS-011 [Phase II (U.S. and Europe)], an antidiabetic agent being developed in-house; and CS-917 [Phase II (U.S. and Europe)], an antidiabetic agent being jointly developed with Metabasis.
Sankyo has given top priority to the development of two of these agents—CS-747 and CS-505. In August 2004, Sankyo presented results of Phase II trials of CS-747 (generic name: prasugrel) showing the agent to have a safety profile similar to that of the standard treatment clopidogrel at an European Society of Cardiology meeting in Munich, Germany. In addition, in March 2005, the Company presented data from early phase trials of CS-747 comparing the agent to clopidogrel at an American College of Cardiology meeting in Orlando, Florida. In these trials, CS-747 demonstrated more than ten times greater inhibition of platelet aggregation, quicker onset (more rapid effect), and more consistent action than clopidogrel. On the basis of results obtained to date, we are preparing to enter Phase III trials to demonstrate the superiority of CS-747 over clopidogrel. Turning to CS-505, three clinical trials of this agent are currently in progress. As a first-in-class treatment, CS-505 has great potential provided that these trials produce promising results.
In addition, Sankyo is focusing on the life cycle management of such products as olmesartan and Loxonin®.
Page 17
3. Overseas Deployment
As far as overseas activities are concerned, we have worked actively, considering the global development of the pharmaceuticals business, to select research, development, supply chain, and sales as our top-priority business issues. Above all, we are striving to maximize sales of the antihypertensive agent olmesartan, which is marketed in the United States as Benicar® and in Europe as Olmetec®.
In the United States, Sankyo Pharma Inc. (SPI) began selling Benicar® in May 2002 under a co-romotion agreement with Forest Laboratories, Inc., and, in September 2003, launched the diuretic/olmesartan combination Benicar® HCT. Sales of both these products are showing steady growth.
In Europe, the Sankyo Pharma GmbH (SPG) Group began selling Olmetec® in Germany in October 2002 and currently offers this product in all major European countries, including Britain, France, Spain, and Italy. Furthermore, SPG licensed-in the antihypertensive drugs Lopresor® and Lomir® from Novartis Pharma Co., Ltd., in November 2003. These products are already being sold in some European countries, and we hope to see synergistic effects for Olmetec® sales.
Sankyo aims to make the most of olmesartan not only in Europe and the United States but around the globe. Going forward, Shanghai Sankyo Pharmaceuticals Co., Ltd., Sankyo Pharma Brazil Ltda., and Sankyo Pharma Venezuela S.A., will begin preparing for the market introduction of olmesartan. In addition, Sankyo has selected Pfizer Inc. to co-promote the drug in thirteen other countries in Oceania, Asia, and Latin America and DaeWoong Pharma Co., Ltd., to handle it in the Republic of Korea. Olmesartan is currently available in 27 countries and is experiencing solid sales growth.
Page 18
4. Outlook for Fiscal 2005
(¥ 100 Millions of yen)
| Net sales | Recurring income | Net income | |||||||
Fiscal 2005 | 5,570 | 630 | 370 | ||||||
Fiscal 2004 | 5,878 | 825 | 482 | ||||||
Change (%) | (5.2 | ) | (23.6 | ) | (23.4 | ) |
(1) Overview of performance
We anticipate operating conditions to remain challenging over the next year; however, the Group will continue to work to bolster its operating efficiency and proactively engage in business activities. Our forecast is that net sales will edge down 5.2%, to ¥557.0 billion, recurring income will decline 23.6%, to ¥63.0 billion, and net income will retreat 23.4%, to ¥37.0 billion.
Meanwhile, Nippon Daiya Valve Co., Ltd., the stock of which was transferred to Seika Corporation in April 2005, and Sankyo Foods Co., Ltd., the business of which is slated to be transferred to a joint venture with Oriental Yeast Co., Ltd., in July 2005, will be excluded from the scope of consolidation from fiscal 2005.
(2) Outlook by Segment
Business Segments
1) Pharmaceuticals
We forecast that net sales of pharmaceuticals will decline ¥26.0billion.
Overseas, we anticipate a substantial decline in sales of bulk exports of the antihyperlipidemic agent Mevalotin® to Bristol-Myers Squibb Company due to expiration of the drug’s patent in Europe, competing products in the United States, and other factors. However, we predict that growth in sales of olmesartan, an antihypertensive agent sold in 27 countries, including major European countries and the United States, will lead to a sharp increase in overall sales.
In Japan, we expect to see sales of olmesartan soar with the lifting of restrictions on its period of use in May 2005. However, we anticipate a decline in revenues as a result of the conclusion of a joint sales agreement with Kirin Brewery Co., Ltd., for Espo®, a drug for the treatment of renal anemia, and Gran®, a drug for the treatment of leukopenia, at the end of March 2005 and fiercer competition of our flagship product Mevalotin®.
We forecast that operating income will decline as a result of lower sales, and higher selling, general, and administrative expenses due to a rise in R&D and sales promotion costs.
2) Other
We forecast that net sales in this segment will decline approximately ¥5.0 billion due to the exclusion of Sankyo Foods Co., Ltd., and Nippon Daiya Valve Co., Ltd., from the scope of consolidation.
Page 19
Although we anticipate a decline in sales, we expect operating income to remain at about the same level as in fiscal 2004.
Geographic Segments
1) Japan
Sales in this segment are expected to decline next year. We forecast that nonpharmaceutical sales will decrease approximately ¥5.0 billion and that sales of pharmaceuticals will contract to ¥38.0 billion or more, as reduced exports of the antihyperlipidemic agent Mevalotin® to Bristol-Myers Squibb Company and the conclusion of a joint sales agreement with Kirin Brewery Co., Ltd., for Espo® and Gran® outweigh expanded sales of the antihypertensive agent olmesartan.
We anticipate a decline in operating income, owing to substantially lower sales.
2) North America
Although sales of the antianemia agent Venofer® are projected to decline due to lowering of the drug’s reimbursement price, marked growth in those of the antihypertensive agent Benicar® and its diuretic combination Benicar® HCT are expected to bring about a ¥7.0 billion rise in the segment’s sales.
Operating income is forecast to lose ground due to a rise in sales promotion costs stemming from initiatives to boost Benicar® sales, which is expected to outweigh the increase in sales.
3) Other
We project a ¥1.0 billion increase in this segment’s sales as expanded sales of the antihypertensive agent olmesartan are expected to more than counter a decline in sales of the antihyperlipidemic agent Mevalotin® in Europe.
Although sales are forecast to rise, we expect operating income to decline as a result of higher personnel costs arising from efforts to bolster our global sales framework.
The exchange rates used for translation of revenues and expenses of overseas subsidiaries for fiscal 2004 are as follows:
1 US$ = ¥105.0
1 euro = ¥140.0
Page 20
II. Financial Position
1. Overview of Fiscal 2004
Cash Flow Analysis
(¥ 100 Millions of yen)
| Fiscal 2004 | Fiscal 2003 | Change | ||||||
Net cash provided by (used in) operating activities | 967 | 712 | 254 | |||||
Net cash provided by (used in) investing activities | (162 | ) | (491 | ) | 329 | |||
Net cash provided by (used in) financing activities | (127 | ) | (316 | ) | 189 | |||
Effect of exchange rate changes on cash and cash equivalents | (1 | ) | (8 | ) | 7 | |||
Net increase (decrease) in cash and cash equivalents | 675 | (105 | ) | 781 | ||||
Cash and cash equivalents at the end of period | 2,625 | 1,947 | 677 | |||||
Cash and cash equivalents at the end of fiscal 2004 rose ¥67.7 billion from the previous fiscal year, to ¥262.5 billion. Contributing factors are summarized as follows:
Cash Flows from Operating Activities
Net cash provided by operating activities increased ¥25.4 billion from the corresponding amount for the previous fiscal year, to ¥96.7 billion. This is mainly a result of a ¥12.8 billion reduction in corporate tax payments, which offset a ¥4.9 billion decline in income before income taxes and minority interests that includes an impairment loss of ¥15.8 billion that does not affect cash flows.
Cash Flows from Investing Activities
Net cash used in investing activities declined ¥32.9 billion from the corresponding amount for the previous fiscal year, to ¥16.2 billion, largely as a result of a ¥19.9 billion reduction in expenditure of purchases of intangible fixed assets and a ¥10.2 billion increase in income from the sale of property, plant and equipment.
Cash Flows from Financing Activities
Cash used in financing activities declined ¥18.9 billion from the prior year, to ¥12.7 billion, primarily reflecting a ¥19.9 billion decrease in purchases of treasury stock.
Page 21
Trends in key cash flow indicators are summarized as follows:
| Fiscal 2001 | Fiscal 2002 | Fiscal 2003 | Fiscal 2004 | |||||
Shareholders’ equity ratio (%) | 71.2 | 71.9 | 73.6 | 73.4 | ||||
Fair value shareholders’ equity ratio (%) | 94.2 | 75.3 | 104.9 | 99.4 | ||||
Debt redemption period (year) | 0.6 | 0.4 | 0.3 | 0.2 | ||||
Interest coverage ratio (%) | 77.1 | 157.5 | 212.4 | 269.8 |
Shareholders’ equity ratio: Shareholders’ equity/total assets
Fair value shareholders’ equity ratio: Total fair value of outstanding shares/total assets
Debt redemption period: Interest-bearing debt/cash flows from operating activities
Interest coverage ratio: Cash flows from operating activities/interest payments
Notes:
| 1. | All of the figures in the aforementioned indices were calculated on a consolidated basis. |
| 2. | The total fair value of outstanding shares was calculated by multiplying the closing stock price at the end of the fiscal year by the total number of outstanding shares at the end of the fiscal year (excluding treasury shares). |
| 3. | Cash flows from operating activities represent net cash provided by operating activities in the consolidated statements of cash flows. Interest-bearing debt represents all liabilities subject to the payment of interest in the consolidated balance sheets. In addition, interest payments are reflected as “interest paid” in the consolidated statements of cash flows. |
2. Outlook for Fiscal 2004
Important issues that are likely to impact cash flows over the next year are as follows:
Cash Flows from Operating Activities
We project a ¥11.2 billion decline in net income and a reduction in cash flows from operating activities.
Cash Flows from Investing Activities
We expect a ¥10 billion decrease in income from the sale of tangible fixed assets as compared with fiscal 2004 in which the Company generated substantial income mainly from the sale of the former Tanashi Plant site. Purchases of tangible fixed assets are also anticipated to decline about a ¥9.0 billion.
Cash Flows from Financing Activities
We plan to increase dividend payments by approximately ¥7.5 billion as compared with the corresponding amount in the current fiscal year.
Page 22
IV. Consolidated Financial Statements
1. Consolidated Balance Sheets
(Millions of yen)
| As of March 31, 2004 | As of March 31, 2005 | Change | |||||||||||||
See Note: | Amount | % | Amount | % | Amount | ||||||||||
ASSETS | |||||||||||||||
Current assets | |||||||||||||||
Cash and deposits | 156,660 | 175,960 | 19,299 | ||||||||||||
Trade notes and accounts receivable | 170,468 | 162,442 | (8,026 | ) | |||||||||||
Marketable securities | 93,614 | 146,632 | 53,017 | ||||||||||||
Inventories | 89,945 | 89,979 | 34 | ||||||||||||
Deferred tax assets | 18,100 | 21,832 | 3,732 | ||||||||||||
Other | 9,487 | 9,704 | 216 | ||||||||||||
Allowance for doubtful accounts | (2,460 | ) | (483 | ) | 1,976 | ||||||||||
Total current assets | 535,816 | 57.8 | 606,067 | 62.1 | 70,251 | ||||||||||
Fixed assets | |||||||||||||||
Tangible fixed assets | 1 | ||||||||||||||
Buildings and structures | 2,4 | 107,998 | 111,966 | 3,968 | |||||||||||
Machinery, equipment and vehicles | 2,4 | 36,172 | 31,831 | (4,341 | ) | ||||||||||
Land | 4 | 29,933 | 30,655 | 721 | |||||||||||
Construction in progress | 8,687 | 10,005 | 1,317 | ||||||||||||
Other | 2,4 | 11,735 | 11,980 | 245 | |||||||||||
Total tangible fixed assets | 194,527 | 21.0 | 196,439 | 20.1 | 1,912 | ||||||||||
Intangible fixed assets | |||||||||||||||
Consolidation goodwill | 1,143 | 845 | (298 | ) | |||||||||||
Other | 41,891 | 24,181 | (17,710 | ) | |||||||||||
Total intangible fixed assets | 43,035 | 4.6 | 25,026 | 2.6 | (18,008 | ) | |||||||||
Investments and other assets | |||||||||||||||
Investment securities | 3,4 | 117,891 | 114,480 | (3,411 | ) | ||||||||||
Long-term loans | 5,739 | 5,876 | 137 | ||||||||||||
Deferred tax assets | 13,783 | 14,967 | 1,183 | ||||||||||||
Other | 3 | 17,008 | 13,702 | (3,306 | ) | ||||||||||
Allowance for doubtful accounts | (558 | ) | (329 | ) | 228 | ||||||||||
Total investments and other assets | 153,865 | 16.6 | 148,696 | 15.2 | (5,168 | ) | |||||||||
Total fixed assets | 391,427 | 42.2 | 370,163 | 37.9 | (21,264 | ) | |||||||||
Total assets | 927,244 | 100.0 | 976,230 | 100.0 | 48,986 | ||||||||||
Page 23
(Millions of yen)
| As of March 31, 2004 | As of March 31, 2005 | Change | |||||||||||||||
| See Note: | Amount | % | Amount | % | Amount | ||||||||||||
LIABILITIES | |||||||||||||||||
Current liabilities | |||||||||||||||||
Trade notes and accounts payable | 50,907 | 54,435 | 3,527 | ||||||||||||||
Short-term bank loans | 4 | 15,578 | 16,699 | 1,120 | |||||||||||||
Income taxes payable | 11,564 | 16,904 | 5,340 | ||||||||||||||
Deferred tax liabilities | 544 | 689 | 145 | ||||||||||||||
Accrued bonuses | 13,295 | 13,481 | 186 | ||||||||||||||
Allowance for sales returns | 461 | 476 | 15 | ||||||||||||||
Allowance for sales rebates | 1,004 | 1,022 | 18 | ||||||||||||||
Other | 61,402 | 70,002 | 8,599 | ||||||||||||||
Total current liabilities | 154,758 | 16.7 | 173,712 | 17.8 | 18,954 | ||||||||||||
Long-term liabilities | |||||||||||||||||
Long-term debt | 4 | 4,671 | 3,373 | (1,297 | ) | ||||||||||||
Deferred tax liabilities | 70 | 441 | 371 | ||||||||||||||
Retirement and severance benefits | 70,152 | 66,843 | (3,308 | ) | |||||||||||||
Directors’ retirement and severance benefits | 1,820 | 1,830 | 10 | ||||||||||||||
Other | 4,333 | 4,006 | (327 | ) | |||||||||||||
Total long-term liabilities | 81,048 | 8.7 | 76,495 | 7.8 | (4,552 | ) | |||||||||||
Total liabilities | 235,806 | 25.4 | 250,208 | 25.6 | 14,402 | ||||||||||||
MINORITY INTERESTS | |||||||||||||||||
Minority interests | 8,843 | 1.0 | 9,434 | 1.0 | 591 | ||||||||||||
SHAREHOLDERS’ EQUITY | |||||||||||||||||
Common stock | 8 | 68,793 | 7.4 | 68,793 | 7.0 | — | |||||||||||
Capital surplus | 66,862 | 7.2 | 66,862 | 6.8 | — | ||||||||||||
Retained earnings | 546,422 | 58.9 | 580,514 | 59.5 | 34,091 | ||||||||||||
Valuation difference on other securities | 27,920 | 3.0 | 27,857 | 2.9 | (63 | ) | |||||||||||
Translation adjustments | (7,068 | ) | (0.7 | ) | (7,026 | ) | (0.7 | ) | 41 | ||||||||
Treasury stock | 9 | (20,336 | ) | (2.2 | ) | (20,412 | ) | (2.1 | ) | (76 | ) | ||||||
Total shareholders’ equity | 682,594 | 73.6 | 716,587 | 73.4 | 33,993 | ||||||||||||
Total liabilities, minority interests and shareholders’ equity | 927,244 | 100.0 | 976,230 | 100.0 | 48,986 | ||||||||||||
Page 24
2. Consolidated Statements of Income
(Millions of yen)
| Fiscal 2003 | Fiscal 2004 | Change | ||||||||||||||
| See Note: | Amount | % | Amount | % | Amount | % | ||||||||||
Net sales | 596,345 | 100.0 | 587,830 | 100.0 | (8,515 | ) | (1.4 | ) | ||||||||
Cost of sales | 1 | 221,601 | 37.2 | 213,874 | 36.4 | (7,727 | ) | (3.5 | ) | |||||||
Gross profit | 374,744 | 62.8 | 373,956 | 63.6 | (787 | ) | (0.2 | ) | ||||||||
Provision for sales returns | 51 | 0.0 | 15 | 0.0 | (36 | ) | ||||||||||
Adjusted gross profit | 374,692 | 62.8 | 373,940 | 63.6 | (751 | ) | (0.2 | ) | ||||||||
Selling, general and administrative expenses | 279,137 | 46.8 | 289,015 | 49.2 | 9,877 | 3.5 | ||||||||||
Advertising and promotional expenses | 47,842 | 51,738 | 3,896 | |||||||||||||
Salaries and bonuses | 47,233 | 46,401 | (831 | ) | ||||||||||||
Provision for accrued bonuses | 7,330 | 8,282 | 951 | |||||||||||||
Retirement and severance benefits | 3,979 | 3,976 | (3 | ) | ||||||||||||
Provision for directors’ retirement and severance benefits | 384 | 248 | (136 | ) | ||||||||||||
Provision for doubtful accounts | 83 | — | (83 | ) | ||||||||||||
Research and development costs | 1 | 86,720 | 86,551 | (169 | ) | |||||||||||
Amortization of consolidation goodwill | 305 | 389 | 84 | |||||||||||||
Other | 85,257 | 91,427 | 6,169 | |||||||||||||
Operating income | 95,555 | 16.0 | 84,925 | 14.4 | (10,629 | ) | (11.1 | ) | ||||||||
Non-operating income | 5,122 | 0.9 | 6,425 | 1.1 | 1,302 | 25.4 | ||||||||||
Interest income | 1,060 | 1,178 | 117 | |||||||||||||
Dividend income | 1,370 | 2,126 | 756 | |||||||||||||
Amortization of consolidation goodwill | 2 | 11 | 8 | |||||||||||||
Rent received | 785 | 889 | 104 | |||||||||||||
Other | 1,904 | 2,219 | 315 | |||||||||||||
Non-operating expenses | 6,701 | 1.1 | 8,844 | 1.5 | 2,142 | 32.0 | ||||||||||
Interest expense | 336 | 358 | 22 | |||||||||||||
Loss on disposal of inventories | 2,995 | 3,983 | 987 | |||||||||||||
Charitable donations | 1,173 | 737 | (436 | ) | ||||||||||||
Other | 2,195 | 3,765 | 1,569 | |||||||||||||
Recurring income | 93,975 | 15.8 | 82,506 | 14.0 | (11,469 | ) | (12.2 | ) | ||||||||
Page 25
(Millions of yen)
| Fiscal 2003 | Fiscal 2004 | Change | ||||||||||||||||
| See Note: | Amount | % | Amount | % | Amount | % | ||||||||||||
Extraordinary income | 4,524 | 0.7 | 15,775 | 2.7 | 11,251 | |||||||||||||
Proceeds from sales of fixed assets | 2 | 4,127 | 12,179 | 8,052 | ||||||||||||||
Reversal of allowance for doubtful accounts | — | 2,026 | 2,026 | |||||||||||||||
Proceeds from sales of investment securities | 111 | 983 | 872 | |||||||||||||||
Proceeds from sales of stock in affiliates | 285 | 544 | 258 | |||||||||||||||
Reversal of allowance for directors’ retirement and severance | — | 41 | 41 | |||||||||||||||
Extraordinary losses | 15,908 | 2.7 | 20,603 | 3.5 | 4,695 | |||||||||||||
Loss on disposal of fixed assets | 3 | 1,974 | 2,333 | 359 | ||||||||||||||
Loss on impairment of fixed assets | 4 | — | 15,865 | 15,865 | ||||||||||||||
Loss on valuation of investments in affiliates | — | 1,483 | 1,483 | |||||||||||||||
Additional retirement payment | 3,181 | 662 | (2,518 | ) | ||||||||||||||
Loss on valuation of investments | — | 249 | 249 | |||||||||||||||
Loss on sale of investment securities | 77 | 5 | (71 | ) | ||||||||||||||
Loss on valuation of investment securities | — | 4 | 4 | |||||||||||||||
Loss from termination of distribution agreement for GlucoWatch | 5 | 9,650 | — | (9,650 | ) | |||||||||||||
Loss on restructuring of plants | 6 | 1,024 | — | (1,024 | ) | |||||||||||||
Income before income taxes and minority interests | 82,592 | 13.8 | 77,678 | 13.2 | (4,914 | ) | (5.9 | ) | ||||||||||
Income taxes | 33,110 | 5.5 | 33,224 | 5.7 | 113 | |||||||||||||
Income tax adjustment | 5,554 | 0.9 | (4,550 | ) | (0.8 | ) | (10,104 | ) | ||||||||||
Minority interests | 515 | 0.1 | 722 | 0.1 | 206 | |||||||||||||
Net income | 43,411 | 7.3 | 48,282 | 8.2 | 4,870 | 11.2 | ||||||||||||
Page 26
Consolidated Statements of Retained Earnings
(Millions of yen)
| Fiscal 2003 | Fiscal 2004 | Change | |||||||||||
| See Note: | Amount | Amount | Amount | ||||||||||
CAPITAL SURPLUS | |||||||||||||
Capital surplus at beginning of year | 66,862 | 66,862 | — | ||||||||||
Increase in capital surplus | — | — | — | ||||||||||
Decrease in capital surplus | — | — | — | ||||||||||
Capital surplus at end of year | 66,862 | 66,862 | — | ||||||||||
RETAINED EARNINGS | |||||||||||||
Retained earnings at beginning of year | 532,429 | 546,422 | 13,993 | ||||||||||
Increase in retained earnings | |||||||||||||
Net income | 43,411 | 48,282 | |||||||||||
Increase due to merger with a non-consolidated subsidiary | — | 117 | |||||||||||
Increase due to initial consolidation of subsidiaries | 80 | 43,492 | — | 48,399 | 4,907 | ||||||||
Decrease in retained earnings | |||||||||||||
Cash dividends | 10,983 | 13,959 | |||||||||||
Bonuses to directors | |||||||||||||
Bonuses to directors | 344 | 326 | |||||||||||
Bonuses to statutory auditors | 23 | 21 | |||||||||||
Elimination of treasury stock with earnings | 18,147 | 29,498 | — | 14,308 | (15,190 | ) | |||||||
Retained earnings at end of year | 546,422 | 580,514 | 34,091 | ||||||||||
Page 27
3. Consolidated Statements of Cash Flows
(Millions of yen)
| Fiscal 2003 | Fiscal 2004 | Change | |||||||||
| See Note: | Amount | Amount | Amount | ||||||||
Cash flows from operating activities: | |||||||||||
Income before income taxes and minority interests | 82,592 | 77,678 | (4,914 | ) | |||||||
Depreciation | 27,847 | 28,811 | 963 | ||||||||
Loss on impairment of fixed assets | — | 15,865 | 15,865 | ||||||||
Profit on sale of marketable and investment securities | (322 | ) | (1,064 | ) | (741 | ) | |||||
Loss on valuation of marketable and investment securities | 4 | 1,736 | 1,732 | ||||||||
Amortization of consolidation goodwill | 302 | 378 | 75 | ||||||||
Decrease in allowance for doubtful accounts | (348 | ) | (2,021 | ) | (1,673 | ) | |||||
Increase in retirement and severance benefits | (9,802 | ) | (3,498 | ) | 6,303 | ||||||
Increase in accrued bonuses | 1 | 224 | 222 | ||||||||
Interest and dividend income | (2,430 | ) | (3,304 | ) | (874 | ) | |||||
Interest expense | 336 | 358 | 22 | ||||||||
Gain on sale of fixed assets | (2,536 | ) | (10,731 | ) | (8,194 | ) | |||||
Decrease in trade receivables | 6,355 | 8,147 | 1,791 | ||||||||
Decrease (increase) in inventories | (3,885 | ) | 122 | 4,007 | |||||||
Increase (decrease) in trade payables | (6,528 | ) | 3,473 | 10,001 | |||||||
Other | 19,113 | 6,329 | (12,783 | ) | |||||||
Subtotal | 110,698 | 122,504 | 11,806 | ||||||||
Interest and dividends received | 2,590 | 3,407 | 817 | ||||||||
Interest paid | (335 | ) | (358 | ) | (23 | ) | |||||
Income taxes paid | (41,746 | ) | (28,851 | ) | 12,895 | ||||||
Net cash provided by operating activities | 71,207 | 96,703 | 25,495 | ||||||||
Cash flows from investing activities: | |||||||||||
Purchases of time deposits | (9,604 | ) | (7,889 | ) | 1,714 | ||||||
Refunds of time deposits upon maturity | 9,763 | 10,842 | 1,079 | ||||||||
Purchases of marketable securities | (40,572 | ) | (62,969 | ) | (22,397 | ) | |||||
Proceeds from sale and maturities of marketable securities | 58,103 | 77,786 | 19,683 | ||||||||
Purchases of tangible fixed assets | (26,457 | ) | (27,282 | ) | (825 | ) | |||||
Proceeds from sale of tangible fixed assets | 4,493 | 14,696 | 10,202 | ||||||||
Purchases of intangible fixed assets | (22,399 | ) | (2,439 | ) | 19,959 | ||||||
Purchases of investment securities | (22,779 | ) | (21,704 | ) | 1,075 | ||||||
Proceeds from sale of investment securities | 1,100 | 1,561 | 460 | ||||||||
Proceeds from sale of stock in a consolidated subsidiary | 2 | — | 527 | 527 | |||||||
Payment on loans receivable | (566 | ) | (904 | ) | (338 | ) | |||||
Proceeds from collection of loans | 1,067 | 1,342 | 274 | ||||||||
Other | (1,316 | ) | 169 | 1,486 | |||||||
Net cash used in investing activities | (49,168 | ) | (16,265 | ) | 32,902 | ||||||
Page 28
(Millions of yen)
| Fiscal 2003 | Fiscal 2004 | Change | |||||||||
| See Note: | Amount | Amount | Amount | ||||||||
Cash flows from financing activities: | |||||||||||
Net increase in short-term bank loans | 2,203 | 2,365 | 161 | ||||||||
Proceeds from long-term debt | 29 | 470 | 440 | ||||||||
Repayment of long-term debt | (2,757 | ) | (1,282 | ) | 1,475 | ||||||
Purchases of treasury stock | (20,020 | ) | (76 | ) | 19,943 | ||||||
Dividends paid to shareholders | (10,987 | ) | (13,960 | ) | (2,973 | ) | |||||
Dividends paid to minority interests | (126 | ) | (109 | ) | 17 | ||||||
Other | — | (123 | ) | (123 | ) | ||||||
Net cash used in financing activities | (31,657 | ) | (12,716 | ) | 18,940 | ||||||
Effect of exchange rate changes on cash and cash equivalents | (890 | ) | (123 | ) | 767 | ||||||
Net increase (decrease) in cash and cash equivalents | (10,509 | ) | 67,596 | 78,106 | |||||||
Cash and cash equivalents at beginning of year | 205,050 | 194,789 | (10,260 | ) | |||||||
Increase arising from inclusion in consolidation | 249 | — | (249 | ) | |||||||
Increase due to merger with non-consolidated subsidiary | — | 144 | 144 | ||||||||
Cash and cash equivalents at end of year | 194,789 | 262,530 | 67,740 | ||||||||
Page 29
Significant Items for the Preparation of the Consolidated Financial Statements
| 1. | Scope of Consolidation |
| Consolidated subsidiaries: | 37 |
The names of the consolidated subsidiaries are included in ‘1. State of the Group.’
In addition, Sankyo Trading Co., Ltd., which had been a consolidated subsidiary of the Company until the year ended March 31, 2004, has been excluded from the scope of consolidation effective the current period due to sale of the Company’s entire shares in this company.
| Non-consolidated subsidiaries: | 14 |
| 2. | Application of the Equity Method |
Non-consolidated subsidiaries accounted for by the equity method: | None | |
Affiliated companies accounted for by the equity method: | None | |
Non-consolidated subsidiaries not accounted for by the equity method: | 14 | |
Affiliated companies not accounted for by the equity method: | 3 |
| 3. | Fiscal Year End of Consolidated Subsidiaries |
The fiscal years for 18 of the Company’s overseas consolidated subsidiaries ended on December 31, 2004. Financial statements as of this date were used in the preparation of the consolidated financial statements. However, necessary adjustments were made in those cases where important transactions took place between this date and March 31, 2005.
| 4. | Accounting Principles and Methods |
| (1) | Principles and Methods of Valuation of Important Assets |
Securities: | ||
Held-to-maturity securities | ||
Mainly the amortized cost method (straight-line method) | ||
Other securities | ||
Securities with determinable market value: | ||
Mainly the market value method based on the market value at the end of the fiscal year. Valuation differences are dealt with by means of the direct capital influx method, with the cost of securities sold calculated by the moving average method. | ||
Securities without determinable market value: | ||
Mainly stated at cost based on the moving average method | ||
Derivatives: | Market value method | |
Inventories: | Mainly stated at cost by the weighted average method at the Company and its domestic consolidated subsidiaries. Mainly stated at the lower of cost or market by the weighted average method at the overseas consolidated subsidiaries. | |
| (2) | Depreciation of Important Fixed Assets |
Tangible Fixed Assets
The Company and its domestic consolidated subsidiaries account for property, plant and equipment by the declining balance method. However, buildings (excluding annexes) acquired since April 1, 1998, have been accounted for by the straight-line method. Overseas consolidated subsidiaries account for property, plant and equipment mainly by the straight-line method. The major useful lives are as follows:
Buildings and structures: | 2~60 years | |
Machinery, equipment and vehicles: | 2~17 years |
Intangible Fixed Assets
Computed by the straight-line method. Software for in-house use is amortized over the estimated useful lives (a five-year period) by the straight-line method.
Page 30
| (3) | Recording Methods for Important Allowances |
Allowance for Doubtful Accounts
The Company and its consolidated subsidiaries cover the risk of credit losses by making additions to this allowance on the basis of the actual default rates for standard loans, and on an individual basis for loans considered unlikely to be repaid in full.
Accrued Bonuses
To prepare for accrued bonuses, the Company and the majority of its consolidated subsidiaries make provisions based on a portion of the estimated total amount payable for the fiscal year.
Allowance for Sales Returns
To prepare for sales return losses incurred after the end of the fiscal year, the Company and four of its domestic consolidated subsidiaries make the maximum possible provision calculated by the accounts receivable method as regulated by the Corporate Tax Law in Japan.
Allowance for Sales Rebates
To prepare for future sales rebates, the Company records an amount calculated by multiplying the sales rebate rate for the fiscal year by the wholesaler’s inventory amounts or the accounts receivable at the end of the fiscal year.
Retirement and Severance Benefits
To prepare for retirement and severance benefits, the Company and its domestic consolidated subsidiaries make provisions for the amount based on projected benefit obligation and plan assets at the end of the fiscal year. Provisions are made for six of the Company’s overseas consolidated subsidiaries in accordance with generally accepted accounting principles in the countries in question.
Prior service cost is amortized by the straight-line method over a set time period (five years), which is less than the estimated average remaining years of service of the eligible employees when the prior service cost was recognized.
At the Company itself, actuarial gain and loss are booked when they occur. At the domestic consolidated subsidiaries, the straight-line method is used to calculate an amount to be treated as an expense during the fiscal year after the gain or loss was initially recorded. This calculation is, in turn, based upon a set time period (five years) which is less than the average remaining years of service of the eligible employees when the actuarial gain or loss was recorded.
Directors’ Retirement and Severance Benefits
To prepare for directors’ retirement and severance benefits, the Company and its domestic consolidated subsidiaries make provisions for an amount based on the total benefits required to be paid at the end of the fiscal year in accordance with internal regulations. Two overseas consolidated subsidiaries make provisions for the amount generated by the end of the fiscal year.
Page 31
| (4) | Translation of Assets and Liabilities Denominated in Foreign Currencies into Yen |
Receivables and payables denominated in foreign currencies are converted into yen at the rates of exchange in effect at the end of the fiscal year, with translation differences treated as gains or losses. The assets and liabilities of overseas consolidated subsidiaries are converted into yen at the rates of exchange in effect at their balance sheet dates. Profits and expenses are converted into yen at the average exchange rates in effect over the period in question, with translation differences recorded under translation adjustments in the minority interests and shareholders’ equity section of the balance sheets.
| (5) | Accounting Methods Pertaining to Important Lease Transactions |
The same accounting treatment applied to operating leases is used for financial leases, except for those where the legal title of the underlying property is transferred from the lessor to the lessee.
| (6) | Important Hedge Accounting Methods |
Hedge Accounting Methods
Deferral hedge accounting has been adopted. Forward foreign exchange contracts that meet the criteria are accounted for by the allocation method. Interest rate swaps that meet the criteria are accounted for by the special method, as regulated in the accounting standard, as if the interest rates of the interest rate swaps were originally applied to the underlying borrowings.
Hedge Methods and Hedge Accounts
| Hedge methods: | Forward foreign exchange contracts, interest rate swaps and call option on Sankyo’s common stock | |
| Hedge accounts: | Accounts payable and receivable and anticipated transactions denominated in a foreign currency, loans and stock appreciation rights (SAR) |
Hedge Policy
Certain consolidated subsidiaries hedge against foreign exchange rate fluctuation relating to imports and exports and interest rate risks relating to loans and fluctuations in stock prices relating to SAR. The Company and its consolidated subsidiaries do not enter into speculative derivative transactions.
Methods of Assessing Effectiveness of Hedges
Assessment of the effectiveness of hedges is conducted on the basis of the relationship between cumulative changes in the hedge methods and cumulative changes in the hedge accounts. However, with the important conditions for forward foreign exchange contracts transactions being identical, and interest rate swaps being handled by special methods, the effectiveness of the hedges is extremely high. Thus, an assessment of the effectiveness of these hedges has been omitted.
| (7) | Other Important Items Pertaining to the Consolidated Financial Statements |
Consumption Tax Accounting Methods
Tax-excluded method has been applied.
Page 32
| 5. | Valuation Methods for Assets and Liabilities at Consolidated Subsidiaries |
The total market value method is used to evaluate the assets and liabilities of consolidated subsidiaries.
| 6. | Depreciation of Consolidation Goodwill |
As a general rule, consolidation goodwill is depreciated over a period of five years. However, if the amount in question is minor, it is accounted for currently as a gain or loss.
| 7. | Appropriation of Retained Earnings |
The consolidated statements of retained earnings are based on the appropriation of retained earnings for the period in question.
| 8. | Cash in the Consolidated Statements of Cash Flows |
Cash (cash and cash equivalents) in the consolidated statements of cash flows consists of: cash in hand, deposits which can be withdrawn at any time, and short-term investments that are highly liquid, easily convertible into cash, have little risk of fluctuation in value, and which mature within three months of their dates of acquisition.
Changes in Significant Items for the Preparation of the Consolidated Financial Statements
(Accounting Standards for Impairment of Fixed Assets)
Effective April 1, 2004, the Sankyo Group has adopted accounting standards for impairment of fixed assets (“Opinion Concerning Establishment of Accounting Standards for Impairment of Fixed Assets” issued by the Business Accounting Council of Japan on August 9, 2002) and “Implementation Guidelines for Accounting Standards for Impairment of Fixed Assets” (Financial Accounting Standards Implementation Guidelines No. 6 issued by the Accounting Standards Board of Japan on October 31, 2003), since these standards and guidelines became applicable to the consolidated financial statements for the fiscal year ended March 31, 2004. The effect of this application was to decrease income before income taxes and minority interests by 15,865 million yen.
In accordance with the modification of the Regulations Concerning Consolidated Financial Statements, the accumulated impairment losses are directly deducted from the balances of related fixed assets.
The effect of this treatment on the segment information is described in “Segment Information.”
Supplemental Information
(Presentation of the “pro forma standard taxation” portion of enterprise tax in Consolidated Statements of Income)
In line with announcement of Practice Report No. 12 “Practical Treatment Concerning Presentation of Pro Forma Standard Taxation Portion of Enterprise Tax in Statements of Income” issued by the Accounting Standards Board of Japan on February 13, 2004, enterprise taxes levied in proportion to added value and capital, amounting to 971 million yen, were recognized as ‘Selling, general and administrative expenses’ effective this period under this report.
The effect of this treatment on the segment information is described in “Segment Information.”
Page 33
Notes
Notes to the Consolidated Balance Sheets
Fiscal 2003
(As of March 31, 2004)
| 1) | Accumulated depreciation on tangible fixed assets equals 312,395 million yen. |
| 2) | Idle assets included under tangible fixed assets are as follows: |
(Millions of yen)
Buildings and structures | 1,988 | |
Machinery, equipment and vehicles | 866 | |
Other | 18 |
| 3) | Items relating to non-consolidated subsidiaries and affiliated companies are as follows: |
(Millions of yen)
Investment securities (stock) | 3,778 | |
Other assets under investments and other assets (capital provided) | 6,390 |
| 4) | Pledged assets and secured liabilities |
Assets serving as collateral and secured liabilities are as follows:
Pledged assets
(Millions of yen)
Buildings and structures | 1,983 | (1,615 | ) | ||
Machinery, equipment and vehicles | 2,385 | (2,385 | ) | ||
Land | 277 | (56 | ) | ||
Other tangible fixed assets | 38 | (38 | ) | ||
Investment securities | 462 | (— | ) | ||
Total | 5,147 | (4,095 | ) |
Secured liabilities
(Millions of yen)
Short-term bank loans | 3,442 | (2,960 | ) | ||
Long-term debt | 925 | (422 | ) | ||
Total | 4,368 | (3,382 | ) |
Figures in parentheses indicate factory foundation mortgages and related obligations.
Fiscal 2004
(As of March 31, 2005)
| 1) | Accumulated depreciation on tangible fixed assets equals 322,172 million yen. |
| 2) | — |
| 3) | Items relating to non-consolidated subsidiaries and affiliated companies are as follows: |
(Millions of yen)
Investment securities (stock) | 1,801 | |
Other assets under investments and other assets (capital provided) | 6,598 |
| 4) | Pledged assets and secured liabilities |
Assets serving as collateral and secured liabilities are as follows:
Pledged assets
(Millions of yen)
Buildings and structures | 1,912 | (1,562 | ) | ||
Machinery, equipment and vehicles | 2,087 | (2,087 | ) | ||
Land | 277 | (56 | ) | ||
Other tangible fixed assets | 33 | (33 | ) | ||
Investment securities | 415 | (— | ) | ||
Total | 4,727 | (3,740 | ) |
Secured liabilities
(Millions of yen)
Short-term bank loans | 3,314 | (2,931 | ) | ||
Long-term debt | 622 | (289 | ) | ||
Total | 3,936 | (3,221 | ) |
Figures in parentheses indicate factory foundation mortgages and related obligations.
Page 34
Fiscal 2003
(As of March 31, 2004)
| 5) | Contingencies |
The debts and other obligations of non-consolidated companies and employees from financial institutions are guaranteed. A breakdown of these obligations is as follows:
(Millions of yen)
Saudi Arabian-Japanese Pharmaceutical Co., Ltd. | 352 | |
One other company and employees | 186 | |
Total | 539 |
| 6) | The discounted balance of trade notes receivable equals 526 million yen. |
| 7) | Commitment line (loan framework) contracts |
The Company maintains commitment line contracts with 15 financial institutions in order to allow the efficient procurement of working capital. The balance of loans not yet taken out under these contracts at fiscal year end was as follows:
(Millions of yen)
Total commitments | 30,000 | |
Commitments used | — | |
Commitments unused | 30,000 |
| 8) | Outstanding common stock of the Company at the year end was 439,498,765 shares. |
| 9) | Treasury stock owned by the Company at the year end was 9,956,114 shares of common stock. |
Fiscal 2004
(As of March 31, 2005)
| 5) | Contingencies |
| (1) | The debts and other obligations of non-consolidated companies and employees from financial institutions are guaranteed. A breakdown of these obligations is as follows: |
(Millions of yen)
Saudi Arabian-Japanese Pharmaceutical Co., Ltd. | 366 | |
One other company and employees | 129 | |
Total | 496 |
| (2) | For purchased goods with the minimum volume purchase commitment, the Company is exposed to the risk of evaluation loss due to excess inventory. |
| 6) | The discounted balance of trade notes receivable equals 561 million yen. |
| 7) | Overdraft contracts and commitment line (Loan framework) contracts |
The Company and its consolidated subsidiaries maintain overdraft contracts and commitment line contracts with 16 financial institutions and 15 financial institutions, respectively, in order to allow the efficient procurement of working capital. The balance of loans not yet taken out under these contracts at fiscal year end was as follows:
(Millions of yen)
Overdraft limit and total commitments | 82,679 | |
Overdrafts and commitments used | 10,035 | |
Overdrafts and commitments unused | 72,643 |
| 8) | Outstanding common stock of the Company at the year end was 439,498,765 shares. |
| 9) | Treasury stock owned by the Company at the year end was 9,990,256 shares of common stock. |
Page 35
Notes to the Consolidated Statements of Income
Fiscal 2003
(Year Ended March 31, 2004)
| 1) | Research and development costs included under selling, general and administrative expenses and manufacturing expenses were 86,720 million yen. |
| 2) | Breakdown of proceeds from sales of fixed assets |
(Millions of yen)
Buildings and structures | 6 | |
Machinery, equipment and vehicles | 9 | |
Land | 4,110 | |
Other tangible fixed assets | 1 |
| 3) | Breakdown of loss on disposal of fixed assets |
(Millions of yen)
Buildings and structures | 719 | |
Machinery, equipment and vehicles | 277 | |
Land | 12 | |
Other tangible fixed assets | 192 | |
Other intangible fixed assets | 84 |
In addition, expenses for disposal of fixed assets were 687 million yen.
Fiscal 2004
(Year Ended March 31, 2005)
| 1) | Research and development costs included under selling, general and administrative expenses and manufacturing expenses were 86,551 million yen. |
| 2) | Breakdown of proceeds from sales of fixed assets |
(Millions of yen)
Buildings and structures | 31 | |
Machinery, equipment and vehicles | 14 | |
Land | 12,133 | |
Other tangible fixed assets | 0 |
| 3) | Breakdown of loss on disposal of fixed assets |
(Millions of yen)
Buildings and structures | 455 | |
Machinery, equipment and vehicles | 332 | |
Land | 567 | |
Other tangible fixed assets | 133 | |
Other intangible fixed assets | 300 |
In addition, expenses for disposal of fixed assets were 545 million yen.
Page 36
Fiscal 2003
(Year Ended March 31, 2004)
| 4) | — |
Fiscal 2004
(Year Ended March 31, 2005)
| 4) | Impairment Loss |
The Sankyo Group (the Company and its consolidated subsidiaries) categorizes its assets used for its business operation into groups (e.g., product group) about which separate financial information is regularly identified for the management accounting purpose, whereas the Sankyo Group individually categorizes lease assets and idle assets, which are not directly used for its business operation.
For the period of fiscal 2004, the Sankyo Group recorded impairment losses (15,865 million yen) on the following asset groups.
(1) Assets used for its business operation
With respect to a distribution right of imported goods (13,059 million yen) in the pharmaceutical division, the Company recognized entire impairment loss for the distribution right as extraordinary loss because the Company expects to have negative cash flows from the imported goods due to a decrease in profitability resulting from their sluggish sales.
(2) Lease assets and idle assets
Location | Function | Asset Type | Status | |||
Iwaki, Fukushima | Onahama Plant (manufacturing facilities of pharmaceuticals) | Buildings and structures Machinery, equipment and vehicles | Idle | |||
Yasu, Shiga | Former Yasugawa Plant (manufacturing facilities of agrochemicals) | Buildings | Idle | |||
Shizuoka, etc., Shizuoka | Company dormitory land | Land | Idle | |||
There was no indication of impairment for the assets that are used for the operation of the Sankyo Group’s business. However, since the asset groups shown in the table above were idle and their expected use was uncertain in the foreseeable future, the Sankyo Group reduced their book values to the recoverable amounts and recorded such reduction as impairment loss of 2,806 million yen in extraordinary losses.
These impairment losses consisted of the loss for buildings and structures of 2,159 million yen, for machinery, equipment and vehicles of 525 million yen, for land of 112 million yen, and for other assets of 9 million yen.
The Sankyo Group measures the recoverable amount of such asset groups by net realizable value. More specifically, the Sankyo Group calculates the net realizable value of land based on the valuation amount for the real estate tax purpose, with reasonable adjustments made to it. As to buildings and machinery, equipment and vehicles, the Sankyo Group recognizes their net realizable value as five percent of their acquisition costs.
Page 37
Fiscal 2003
(Year Ended March 31, 2004)
| 5) | Breakdown of loss from termination of distribution agreement for GlucoWatch |
(Millions of yen)
Devaluation of inventories | 2,545 | |
Devaluation of distribution right | 2,577 | |
Devaluation of accounts receivable | 1,047 | |
Settlement payment made to an alliance partner | 3,479 |
| 6) | Breakdown of loss on restructuring of plants is as follows: |
(Millions of yen)
Loss on disposal of fixed assets | 1,024 |
Fiscal 2004
(Year Ended March 31, 2005)
| 5) | — |
| 6) | — |
Page 38
Notes to the Consolidated Statements of Cash Flows
Fiscal 2003
(Year Ended March 31, 2004)
| 1) | Reconciliation of cash and cash equivalents at fiscal year end and balance sheet items |
(Millions of yen)
Cash and deposits | 156,660 | ||
Marketable securities | 93,614 | ||
Time deposits with maturities of over three months | (5,451 | ) | |
Stocks and securities with maturities of over three months | (50,033 | ) | |
Cash and cash equivalents | 194,789 |
| 2) | — |
Fiscal 2004
(Year Ended March 31, 2005)
| 1) | Reconciliation of cash and cash equivalents at fiscal year end and balance sheet items |
(Millions of yen)
Cash and deposits | 175,960 | ||
Marketable securities | 146,632 | ||
Time deposits with maturities of over three months | (2,484 | ) | |
Stocks and securities with maturities of over three months | (57,577 | ) | |
Cash and cash equivalents | 262,530 |
| 2) | Breakdown of major assets and liabilities of consolidated subsidiaries that are no longer consolidated due to the sale of stock |
The following are the breakdown of assets and liabilities of Sankyo Trading Co., Ltd, which is no longer consolidated due to sale of its stocks, and the reconciliation of the sales price of the stock and proceeds from the sale.
(Millions of yen)
Current assets | 466 | ||
Fixed assets | 2,532 | ||
Current liabilities | (1,237 | ) | |
Fixed liabilities | (1,196 | ) | |
Other | (7 | ) | |
Proceeds from sale of stock in affiliate | 86 | ||
Amount of sale of stock in subsidiary | 644 | ||
Cash and cash equivalents in subsidiary | (116 | ) | |
Proceeds from sale of stock in subsidiary | 527 |
Page 39
Segment Information
(1)Business Segments
(Millions of yen)
Fiscal 2003 | Pharmaceuticals | Other | Total | Eliminations & corporate | Consolidated | ||||||
Sales and operating income Sales | |||||||||||
(1) External sales | 466,733 | 129,612 | 596,345 | — | 596,345 | ||||||
(2) Inter-segment sales and transfers | 1,287 | 3,171 | 4,458 | (4,458 | ) | — | |||||
Total | 468,021 | 132,783 | 600,804 | (4,458 | ) | 596,345 | |||||
Operating expenses | 378,907 | 127,277 | 506,184 | (5,393 | ) | 500,790 | |||||
Operating income | 89,114 | 5,506 | 94,620 | 934 | 95,555 | ||||||
Assets, depreciation and capital expenditures | |||||||||||
Assets | 518,432 | 140,649 | 659,081 | 268,162 | 927,244 | ||||||
Depreciation | 23,873 | 3,974 | 27,847 | — | 27,847 | ||||||
Capital expenditures | 42,395 | 4,960 | 47,355 | — | 47,355 | ||||||
Fiscal 2004 | Pharmaceuticals | Other | Total | Eliminations & corporate | Consolidated | ||||||
Sales and operating income Sales | |||||||||||
(1) External sales | 454,710 | 133,120 | 587,830 | — | 587,830 | ||||||
(2) Inter-segment sales and transfers | 922 | 1,723 | 2,646 | (2,646 | ) | — | |||||
Total | 455,633 | 134,843 | 590,476 | (2,646 | ) | 587,830 | |||||
Operating expenses | 378,137 | 128,256 | 506,393 | (3,488 | ) | 502,904 | |||||
Operating income | 77,495 | 6,587 | 84,083 | 842 | 84,925 | ||||||
Assets, depreciation, impairment loss and capital expenditures | |||||||||||
Assets | 512,239 | 146,942 | 659,181 | 317,049 | 976,230 | ||||||
Depreciation | 25,633 | 3,177 | 28,811 | — | 28,811 | ||||||
Impairment loss | 15,853 | 11 | 15,865 | — | 15,865 | ||||||
Capital expenditures | 25,276 | 8,517 | 33,794 | — | 33,794 | ||||||
Notes:
| 1. | Business segmentation |
Segmentation into ‘Pharmaceuticals’ and ‘Other’ is based on consideration of product type, market characteristics and other factors.
| 2. | Main products in each business segment |
Business segments | Main products | |||
| Pharmaceuticals | Ethical drugs and healthcare products | |||
| Food | Food products and additives | |||
| Other | Agrochemicals | Insecticides, herbicides and fungicides | ||
| Other | Chemical products, veterinary drugs and bulbs | |||
| 3. | Out of the assets for the years ended March 31, 2004 and March 31, 2005, those corporate assets included under the category of “Eliminations & corporate” amounted to 269,616 million yen and 318,220 million yen, respectively. These amounts consisted mainly of surplus money (such as cash and marketable securities etc.) and long-term investment assets (investment securities) held at the parent company. |
| 4. | Depreciation includes the depreciation of tangible fixed assets, intangible fixed assets and long-term prepaid expenses. |
| 5. | Capital expenditures include additions to tangible fixed assets, intangible fixed assets and long-term prepaid expenses. |
| 6. | As noted in “Changes in Significant Items for the Preparation of the Consolidated Financial Statements,” the Sankyo Group has adopted accounting standards for impairment of fixed assets for effective this period. |
Page 40
| 7. | As noted in “Supplemental Information,” in line with announcement of “Practical Treatment Concerning Presentation of Pro Forma Standard Taxation Portion of Enterprise Tax in Statements of Income”, enterprise taxes levied in proportion to added value and capital are recognized as ‘Selling, general and administrative expenses’ in the amount of 814 million yen and 157 million yen for the Pharmaceuticals Business and the Other Business segments, respectively, effective this period under this report. |
(2)Geographic Segments
(Millions of yen)
Fiscal 2003 | Japan | North America | Other | Total | Eliminations & corporate | Consolidated | ||||||||
Sales and operating income Sales | ||||||||||||||
(1) External sales | 500,959 | 60,924 | 34,461 | 596,345 | — | 596,345 | ||||||||
(2) Inter-segment sales and transfers | 6,928 | 3,219 | 2,644 | 12,792 | (12,792 | ) | — | |||||||
Total | 507,887 | 64,143 | 37,106 | 609,138 | (12,792 | ) | 596,345 | |||||||
Operating expenses | 407,320 | 61,192 | 43,390 | 511,903 | (11,112 | ) | 500,790 | |||||||
Operating income (loss) | 100,567 | 2,950 | (6,283 | ) | 97,234 | (1,679 | ) | 95,555 | ||||||
Assets | 562,860 | 59,540 | 42,888 | 665,288 | 261,955 | 927,244 | ||||||||
Fiscal 2004 | Japan | North America | Other | Total | Eliminations & corporate | Consolidated | ||||||||
Sales and operating income Sales | ||||||||||||||
(1) External sales | 461,748 | 76,902 | 49,178 | 587,830 | — | 587,830 | ||||||||
(2) Inter-segment sales and transfers | 12,119 | 3,424 | 3,466 | 19,010 | (19,010 | ) | — | |||||||
Total | 473,867 | 80,327 | 52,645 | 606,841 | (19,010 | ) | 587,830 | |||||||
Operating expenses | 400,554 | 67,184 | 53,956 | 521,694 | (18,789 | ) | 502,904 | |||||||
Operating income (loss) | 73,313 | 13,143 | (1,310 | ) | 85,146 | (220 | ) | 84,925 | ||||||
Assets | 543,343 | 76,651 | 46,004 | 665,998 | 310,232 | 976,230 | ||||||||
Notes:
| 1. | Geographic segmentation |
Geographical proximity is the basis for geographic segmentation.
| 2. | Countries and areas included in regions other than Japan |
North America: U.S.
Other areas: Germany, UK, France, Spain, Italy, Taiwan and others
| 3. | Out of the assets for the years ended March 31, 2004 and March 31, 2005, those corporate assets included under the category of “Eliminations & corporate” amounted to 269,616 million yen and 318,220 million yen, respectively. These amounts consisted mainly of surplus money (such as cash and marketable securities etc.) and long-term investment assets (investment securities) held at the parent company. |
| 4. | As noted in “Changes in Significant Items for the Preparation of the Consolidated Financial Statements,” the Sankyo Group has adopted accounting standards for impairment of fixed assets for effective this period. |
| 5. | As noted in “Supplemental Information,” in line with announcement of “Practical Treatment Concerning Presentation of Pro Forma Standard Taxation Portion of Enterprise Tax in Statements of Income”, enterprise taxes levied in proportion to added value and capital are recognized as ‘Selling, general and administrative expenses’ in the amount of 971 million yen for the Japan segment, effective this period under this report. This had no effect on the segment information in the North America and Other segments. |
Page 41
(3)Overseas Sales
(Millions of yen)
Fiscal 2003 | North America | Europe | Other Areas | Total | ||||
Overseas sales | 116,968 | 80,008 | 12,428 | 209,404 | ||||
Consolidated net sales | 596,345 | |||||||
Ratio of overseas sales to consolidated net sales (%) | 19.6 | 13.4 | 2.1 | 35.1 | ||||
Fiscal 2004 | North America | Europe | Other Areas | Total | ||||
Overseas sales | 114,949 | 85,372 | 15,324 | 215,645 | ||||
Consolidated net sales | 587,830 | |||||||
Ratio of overseas sales to consolidated net sales (%) | 19.6 | 14.5 | 2.6 | 36.7 | ||||
Notes:
| 1. | Geographic segmentation |
Geographical proximity is the basis for geographic segmentation.
| 2. | Countries and areas included in each region |
North America: U.S., Canada
Europe: Germany, UK, Spain, Italy, Ireland, France, Switzerland and other countries
Other Areas: Asia, Middle East, Latin America and others
| 3. | Overseas sales are sales of the Company and its consolidated subsidiaries which are transacted in countries or regions other than Japan. |
Lease Transactions
Information on leases has not been presented because the Company discloses its information through EDINET (Electronic Disclosure for Investors’ NETwork).
Transactions with Related Parties
No applicable items.
Page 42
Deferred Tax Accounting
Fiscal 2003
(As of March 31, 2004)
| 1) | Breakdown of deferred tax assets and deferred tax liabilities |
(Millions of yen)
Deferred tax assets | |||
Retirement and severance benefits | 24,313 | ||
Prepaid consignment research and co-development expenses | 13,821 | ||
Net operating loss carryforwards for income tax purposes | 13,736 | ||
Accrued employees’ bonuses | 5,277 | ||
Loss on valuation of inventories | 2,540 | ||
Loss on valuation of investment securities | 2,092 | ||
Excess depreciation of software | 2,001 | ||
Unrealized gain in inventories | 1,815 | ||
Milestone payment received for co-promotion agreement | 1,699 | ||
Accrued enterprise tax | 1,403 | ||
Other | 7,646 | ||
Subtotal | 76,348 | ||
Valuation allowance | (21,392 | ) | |
Total deferred tax assets | 54,955 | ||
Deferred tax liabilities | |||
Valuation difference on other securities | (19,360 | ) | |
Deferred gain on sale of property for income tax purposes | (2,349 | ) | |
Reserve for accelerated depreciation | (1,746 | ) | |
Other | (230 | ) | |
Total deferred tax liabilities | (23,686 | ) | |
Net deferred tax assets (liabilities) | 31,269 | ||
| Note: | Net deferred tax assets are included under the following balance sheet items: |
(Millions of yen)
Current assets – deferred tax assets | 18,100 | ||
Fixed assets – deferred tax assets | 13,783 | ||
Current liabilities – deferred tax liabilities | (544 | ) | |
Fixed liabilities – deferred tax liabilities | (70 | ) |
Fiscal 2004
(As of March 31, 2005)
| 1) | Breakdown of deferred tax assets and deferred tax liabilities |
(Millions of yen)
Deferred tax assets | |||
Retirement and severance benefits | 24,001 | ||
Prepaid consignment research and co-development expenses | 14,775 | ||
Net operating loss carryforwards for income tax purposes | 14,012 | ||
Impairment loss | 6,445 | ||
Accrued employees’ bonuses | 4,898 | ||
Loss on valuation of inventories | 3,350 | ||
Excess depreciation of software | 3,005 | ||
Depreciation | 2,476 | ||
Unrealized gain in inventories | 2,158 | ||
Loss on valuation of investment securities | 1,932 | ||
Milestone payment received for co-promotion agreement | 1,263 | ||
Accrued enterprise tax | 1,161 | ||
Other | 8,557 | ||
Subtotal | 88,040 | ||
Valuation allowance | (24,271 | ) | |
Total deferred tax assets | 63,769 | ||
Deferred tax liabilities | |||
Valuation difference on other securities | (19,264 | ) | |
Deferred gain on sale of property for income tax purposes | (5,954 | ) | |
Reserve for accelerated depreciation | (1,881 | ) | |
Other | (999 | ) | |
Total deferred tax liabilities | (28,100 | ) | |
Net deferred tax assets (liabilities) | 35,668 | ||
| Note: | Net deferred tax assets are included under the following balance sheet items: |
(Millions of yen)
Current assets – deferred tax assets | 21,832 | ||
Fixed assets – deferred tax assets | 14,967 | ||
Current liabilities – deferred tax liabilities | (689 | ) | |
Fixed liabilities – deferred tax liabilities | (441 | ) |
Page 43
Fiscal 2003
(As of March 31, 2004)
| 2) | Breakdown of the major reasons for the difference between the normal tax rate and the effective tax rate as a percentage of income before income taxes and minority interests |
Normal tax rate | 41.9 | % | |
(Reconciliation) | |||
Entertainment expenses and other items not deductible for income tax purposes | 5.3 | ||
Valuation allowance | 7.8 | ||
Dividend income and other items deductible for income tax purposes | (0.5 | ) | |
IT investment tax credit | (1.5 | ) | |
R&D expense tax credit | (5.8 | ) | |
Other | (0.4 | ) | |
Effective tax rate | 46.8 | ||
Fiscal 2004
(As of March 31, 2005)
| 2) | Breakdown of the major reasons for the difference between the normal tax rate and the effective tax rate as a percentage of income before income taxes and minority interests |
Normal tax rate | 40.6 | % | |
(Reconciliation) | |||
Entertainment expenses and other items not deductible for income tax purposes | 5.3 | ||
Valuation allowance | 3.3 | ||
IT investment tax credit | (0.4 | ) | |
Dividend income and other items deductible for income tax purposes | (1.0 | ) | |
R&D expense tax credit | (6.1 | ) | |
Effect of overseas subsidiaries’ effective tax rates | (6.6 | ) | |
Other | 1.8 | ||
Effective tax rate | 36.9 | ||
Page 44
Securities
Fiscal 2003 (as of March 31, 2004)
| 1. | Traded Securities |
No applicable items.
| 2. | Held-to-Maturity Securities with Determinable Market Value |
(Millions of yen)
Type | Carrying amount | Market value | Difference | ||||||
(1) Government and local bonds | 3,519 | 3,523 | 3 | ||||||
Securities whose market value exceeds their carrying value | (2) Corporate bonds | 40,037 | 40,172 | 135 | |||||
(3) Other | — | — | — | ||||||
Subtotal | 43,556 | 43,695 | 139 | ||||||
(1) Government and local bonds | 19,211 | 19,211 | — | ||||||
Securities whose market value does not exceed their carrying value | (2) Corporate bonds | 18,517 | 18,481 | (35 | ) | ||||
(3) Other | — | — | — | ||||||
Subtotal | 37,728 | 37,692 | (35 | ) | |||||
Total | 81,285 | 81,388 | 103 | ||||||
| 3. | Other Securities with Determinable Market Value |
(Millions of yen)
Type | Acquisition cost | Carrying amount | Difference | ||||||
(1) Stocks | 18,868 | 66,568 | 47,699 | ||||||
(2) Bonds | |||||||||
Securities whose carrying value exceeds their acquisition costs | a) Government and local bonds | — | — | — | |||||
b) Corporate bonds | — | — | — | ||||||
c) Other | — | — | — | ||||||
(3) Other | 194 | 218 | 23 | ||||||
Subtotal | 19,063 | 66,786 | 47,723 | ||||||
(1) Stocks | 1,488 | 1,258 | (230 | ) | |||||
(2) Bonds | |||||||||
Securities whose carrying value does not exceed their acquisition costs | a) Government and local bonds | — | — | — | |||||
b) Corporate bonds | — | — | — | ||||||
c) Other | — | — | — | ||||||
(3) Other | 2 | 2 | (0 | ) | |||||
Subtotal | 1,491 | 1,260 | (230 | ) | |||||
Total | 20,554 | 68,047 | 47,492 | ||||||
| Notes: | In cases where the market value of the securities in question dropped 30% or more from the acquisition costs, the securities were classified as having ‘fallen significantly.’ In cases where the securities’ market value dropped 50% or more, the securities were written off. In cases where the market value of securities dropped more than 30% but less than 50%, the likelihood of recovery was estimated on the basis of market value trends and the financial situation of the issuing companies. Write-offs were conducted in all cases other than those for which it was concluded that there was a chance of recovery. |
Page 45
4. Other Securities Sold During Fiscal 2003
(Millions of yen)
Amount sold | Total gain on sale | Total loss on sale | ||
| 712 | 111 | 77 |
5. Major Securities without Determinable Market Value
| (Millions of yen) | ||
| Carrying amount | ||
(1) Held-to-Maturity securities | ||
a) Commercial paper | 9,999 | |
b) Other | 10 | |
(2) Other securities | ||
a) Unlisted stocks (excluding stocks traded on the OTC market) | 13,317 | |
b) Money management funds, etc. | 35,062 | |
c) Other | 5 | |
6. Predicted Future Redemption of Other Securities with Maturity and Held-to-Maturity Securities
(Millions of yen)
| Within one year | Between one and five | Between five and ten | Over ten years | |||||
(1) Bonds | ||||||||
a) Government and local bonds | 21,708 | 1,022 | — | — | ||||
b) Corporate bonds | 26,844 | 31,715 | — | — | ||||
c) Other | — | 10 | — | — | ||||
(2) Other | ||||||||
Commercial paper | 9,999 | — | — | — | ||||
Total | 58,552 | 32,748 | — | — | ||||
Page 46
Fiscal 2004 (as of March 31, 2005)
1. Traded Securities
No applicable items.
2. Held-to-Maturity Securities with Determinable Market Value
(Millions of yen)
Type | Carrying amount | Market value | Difference | ||||||
(1) Government and local bonds | 1,002 | 1,002 | 0 | ||||||
Securities whose market value exceeds their carrying value | (2) Corporate bonds | 39,237 | 39,382 | 144 | |||||
(3) Other | — | — | — | ||||||
| Subtotal | 40,239 | 40,384 | 145 | ||||||
(1) Government and local bonds | 28,088 | 28,088 | — | ||||||
Securities whose market value does not exceed their carrying value | (2) Corporate bonds | 14,987 | 14,974 | (13 | ) | ||||
(3) Other | — | — | — | ||||||
Subtotal | 43,076 | 43,063 | (13 | ) | |||||
Total | 83,316 | 83,448 | 132 | ||||||
3. Other Securities with Determinable Market Value
(Millions of yen)
Type | Acquisition cost | Carrying amount | Difference | ||||||
(1) Stocks | 20,545 | 67,899 | 47,353 | ||||||
(2) Bonds | |||||||||
Securities whose carrying value exceeds their acquisition costs | a) Government and local bonds | — | — | — | |||||
b) Corporate bonds | — | — | — | ||||||
c) Other | — | — | — | ||||||
(3) Other | 220 | 229 | 8 | ||||||
Subtotal | 20,766 | 68,128 | 47,362 | ||||||
(1) Stocks | 7 | 7 | (0 | ) | |||||
(2) Bonds | |||||||||
Securities whose carrying value does not exceed their acquisition costs | a) Government and local bonds | — | — | — | |||||
b) Corporate bonds | — | — | — | ||||||
c) Other | — | — | — | ||||||
(3) Other | 2 | 2 | (0 | ) | |||||
Subtotal | 9 | 9 | (0 | ) | |||||
Total | 20,776 | 68,137 | 47,361 | ||||||
| Notes: | In cases where the market value of the securities in question dropped 30% or more from the acquisition costs, the securities were classified as having ‘fallen significantly.’ In cases where the securities’ market value dropped 50% or more, the securities were written off. In cases where the market value of securities dropped more than 30% but less than 50%, the likelihood of recovery was estimated on the basis of market value trends and the financial situation of the issuing companies. Write-offs were conducted in all cases other than those for which it was concluded that there was a chance of recovery. |
Page 47
4. Other Securities Sold During Fiscal 2004
(Millions of yen)
Amount sold | Total gain on sale | Total loss on sale | ||
1,184 | 983 | 5 |
5. Major Securities without Determinable Market Value
(Millions of yen)
| Carrying amount | ||
(1) Held-to-Maturity securities | ||
a) Commercial paper | 29,998 | |
b) Other | 10 | |
(2) Other securities | ||
a) Unlisted stocks (excluding stocks traded on the OTC market) | 14,416 | |
b) Money management funds, etc. | 60,848 | |
c) Other | 2,583 | |
6. Predicted Future Redemption of Other Securities with Maturity and Held-to-Maturity Securities
(Millions of yen)
| Within one year | Between one and five | Between five and ten | Over ten years | |||||
(1) Bonds | ||||||||
a) Government and local bonds | 29,077 | 13 | — | — | ||||
b) Corporate bonds | 26,707 | 27,517 | — | — | ||||
c) Other | — | 10 | — | — | ||||
(2) Other | ||||||||
Commercial paper | 29,998 | — | — | — | ||||
Total | 85,783 | 27,540 | — | — | ||||
Derivative Transactions
Information on derivative transactions has not been presented because the Company discloses its information through EDINET (Electronic Disclosure for Investors’ NETwork).
Retirement and Severance Benefit
1. Summary of Retirement and Severance Benefit Systems Adopted
The Company has an unfunded retirement and severance plan and contributory pension plan as its defined benefit system.
The Company’s domestic consolidated subsidiaries have unfunded retirement and severance plans and certain domestic consolidated subsidiaries have contributory pension plans. Certain other domestic consolidated subsidiaries participate in a comprehensive establishment-type welfare pension fund system. Overseas consolidated subsidiaries adopt a defined benefit system or a defined contribution system.
Additional retirement payments not part of the numerical calculations in accordance with the retirement and severance benefit accounting standards are occasionally paid to employees upon retirement.
Page 48
2. Retirement and Severance Benefit Obligation | (Millions of yen) |
| As of March 31, 2004 | As of March 31, 2005 | |||||
(1) Projected benefit obligation (Note 1) | (89,999 | ) | (84,085 | ) | ||
(2) Plan assets at fair value (Note 2) | 19,859 | 22,429 | ||||
(3) Projected benefit obligation in excess of plan assets | (70,139 | ) | (61,656 | ) | ||
(1)+(2) | ||||||
(4) Unrecognized loss | 166 | 73 | ||||
(5) Unrecognized prior service costs | (178 | ) | (5,260 | ) | ||
(6) Accrued retirement and severance benefits | (70,152 | ) | (66,843 | ) | ||
(3)+(4) + (5) | ||||||
Notes:
| 1. | Certain consolidated subsidiaries use the simplified method in calculating their retirement and severance benefit obligation. |
| 2. | In addition to the above, the plan assets in the comprehensive establishment-type welfare pension fund for which the amount of the plan assets applying to the companies’ contributions cannot be calculated reasonably totaled 5,197 million yen in fiscal 2003 and 7,923 million yen in fiscal 2004, respectively. This amount has not been included in the plan assets presented above. |
3. Costs of Retirement and Severance Benefits | (Millions of yen) |
| Fiscal 2003 | Fiscal 2004 | |||||
(1) Service cost for benefits earned (Notes 1 and 2) | 6,055 | 6,596 | ||||
(2) Interest expense on projected benefit obligation | 1,944 | 1,844 | ||||
(3) Estimated return on plan assets | (261 | ) | (392 | ) | ||
(4) Amortization of unrecognized actuarial gain or loss | (1,434 | ) | (426 | ) | ||
(5) Amortization of unrecognized prior service costs | (19 | ) | (603 | ) | ||
(6) Additional retirement payment (Note 3) | 3,740 | 693 | ||||
Total | 10,024 | 7,712 | ||||
Notes:
| 1. | Costs of retirement and severance benefits at those consolidated subsidiaries which have adopted the simplified method are included under service cost for benefits earned. |
| 2. | Employees’ contributions to the comprehensive establishment-type welfare pension fund have been deducted. |
| 3. | Of this amount 3,181 million yen in fiscal 2003 and 662 million yen in fiscal 2004 have been included in extraordinary losses, respectively. |
4. Assumptions and Basis for the Calculation of Retirement and Severance Benefits
Fiscal 2003 | Fiscal 2004 | |||
(1) Method of benefit attribution | “Benefit / years of service” approach | “Benefit / years of service” approach | ||
(2) Discount rate | 2.5% | 2.5% | ||
(3) Estimated rate of return on plan assets | 2.5% | 2.5% | ||
(4) Period of amortization of unrecognized actuarial gain or loss | Between one and five years | Between one and five years | ||
(5) Period of amortization of unrecognized prior service costs | five years | five years |
Page 49
V. Production, Orders and Sales
| 1. | Production |
Production by business segment for fiscal 2004 is summarized as follows:
Business Segment | Production (Millions of yen) | Year-on-year changes (%) | ||
Pharmaceuticals | 317,646 | 102.7 | ||
Other | 77,752 | 103.2 | ||
Total | 395,399 | 102.8 |
Notes:
| 1. | Production refers to the value of net sales and after eliminating inter segment sales. |
| 2. | The above amounts are stated exclusive of consumption tax. |
| 2. | Orders |
The Sankyo Group carries out production according to their own production plans, which are primarily based on their sales plans. Order production is carried out at certain subsidiaries; however, the balance of outstanding orders has not been included here as the relevant amounts were insignificant.
| 3. | Sales |
Sales by business segment for fiscal 2004 are as follows:
Business Segment | Sales (Millions of yen) | Year-on-year changes (%) | ||
Pharmaceuticals | 454,710 | 97.4 | ||
Other | 133,120 | 102.7 | ||
Total | 587,830 | 98.6 |
Notes:
| 1. | Amounts represent sales to external customers. |
| 2. | Sales to major customers and percentage of total sales were as follows: |
Customers | Fiscal 2003 | Fiscal 2004 | ||||||
| (Millions of yen) | % | (Millions of yen) | % | |||||
Bristol-Myers Squibb Company | 93,923 | 15.7 | 72,074 | 12.3 | ||||
Alfresa Corporation | — | — | 64,985 | 11.1 | ||||
| 3. | The above amounts are stated exclusive of consumption tax. |
Page 50
Subsequent Events
[Signing of an agreement to integrate businesses by establishing a joint holding company with Daiichi Pharmaceutical Co., Ltd. (“Daiichi”)]
The Company signed an agreement to integrate its businesses with Daiichi through the resolution by the Board of Directors on May 13, 2005. The joint holding company, DAIICHI SANKYO COMPANY, LIMITED, will be established on September 28, 2005 through the approval at the 151st ordinary general shareholders’ meeting to be held on June 29, 2005.
1. Objectives of the Integration
In response to unsatisfied needs from patients and health care professionals, the Company and Daiichi (together, “Both Companies”) will integrate their businesses with an objective to pursue a Japan-based “global pharma-innovator,” who provides innovative products and services continuously and demonstrates a unique competitiveness in the international pharmaceutical market.
2. Business Integration Process
| (1) | A joint holding company will be established in the form of a fully-fledged parent company through stock transfer from Both Companies on September 28, 2005. As a result of the joint stock transfer, common stocks of Both Companies traded on the stock exchanges will be delisted and the new holding company will apply for listing. |
| (2) | The pharmaceutical businesses of Both Companies will be integrated into the joint holding company by April 2007. |
3. Profile of the joint holding company
Company name | : | Daiichi Sankyo Company, Limited | ||
Headquarters | : | 3-5-1 Nihonbashi-honcho, Chuo-ku, Tokyo, Japan | ||
Common stock | : | 50 billion yen |
Page 51
Filings with the U.S. SEC
Daiichi Pharmaceutical Co., Ltd. and Sankyo Company, Limited may file a registration statement on Form F-4 with the U.S. SEC in connection with the proposed business combination of Daiichi and Sankyo under a new holding company by way of a joint share transfer. The Form F-4 (if filed) will contain a prospectus and other documents. If a Form F-4 is filed and declared effective, Daiichi and Sankyo plan to mail the prospectus contained in the Form F-4 to their U.S. shareholders prior to the shareholders meetings at which the share exchange will be voted upon. The Form F-4 (if filed) and prospectus will contain important information about Daiichi and Sankyo, the joint share transfer and related matters. U.S. shareholders of Daiichi and Sankyo are urged to read the Form F-4, the prospectus and the other documents that may be filed with the U.S. SEC in connection with the joint share transfer carefully before they make any decision at the shareholders meeting with respect to the joint share transfer. The Form F-4 (if filed), the prospectus and all other documents filed with the U.S. SEC in connection with the joint share transfer will be available when filed, free of charge, on the U.S. SEC’s web site at www.sec.gov. In addition, the prospectus and all other documents filed with the U.S. SEC in connection with the business combination will be made available to shareholders, free of charge, by calling, writing or e-mailing:
Sankyo Company, Limited Mr. Shigemichi Kondo Corporate Communications Department 3-5-1, Nihonbashi Honcho Chuo-ku, Tokyo 103-8426, Japan Telephone: 81-3-5255-7034 E-mail: shige-k@sankyo.co.jp | Daiichi Pharmaceutical Co., Ltd. Mr. Toshio Takahashi Corporate Communications Department 14-10 Nihonbashi, 3-chome Chuo-ku, Tokyo 103-8234, Japan Telephone: 81-3-3273-7107 E-mail: andokb5o@daiichipharm.co.jp |
You may read and copy any reports and other information filed with, or submitted to, the U.S. SEC at the U.S. SEC’s public reference rooms at 100 F Street, N.E., Washington, D.C. 20549 or at the other public reference rooms in New York, New York and Chicago, Illinois. Please call the U.S. SEC at 1-800-SEC-0330 for further information on public reference rooms. Filings with the U.S. SEC also are available to the public from commercial document-retrieval services and at the web site maintained by the U.S. SEC at http//www.sec.gov.
Forward-Looking Statements
This communication contains forward-looking information and statements about Daiichi and Sankyo and their combined businesses after completion of the joint share transfer. Forward-looking statements are statements that are not historical facts. These statements include financial projections and estimates and their underlying assumptions, statements regarding plans, objectives and expectations with respect to future operations, products and services, and statements regarding future performance. Forward-looking statements are generally identified by the words “expect,” “anticipates,” “believes,” “intends,” “estimates” and similar expressions. Although the management of Daiichi and Sankyo believe that the expectations reflected in such forward-looking statements are reasonable, investors and holders of Daiichi and Sankyo securities are cautioned that forward-looking information and statements are subject to various risks and uncertainties, many of which are difficult to predict and generally beyond the control of Daiichi and Sankyo, that could cause actual results and developments to differ materially from those expressed in, or implied or projected by, the forward-looking information and statements. These risks and uncertainties include those discussed or identified in the public filings with the SEC and the local filings made by Daiichi and Sankyo, including those listed under “Cautionary Statement Concerning Forward-Looking Statements” and “Risk Factors” in the prospectus included in the registration statement on Form F-4 that Daiichi and Sankyo may file with the U.S. SEC. Other than as required by applicable law, neither Daiichi nor Sankyo undertakes any obligation to update or revise any forward-looking information or statements.
Page 52