Filing under Rule 425 under
the U.S. Securities Act of 1933
Filing by: Daiichi Pharmaceutical Co., Ltd.
Subject Company: Daiichi Pharmaceutical Co., Ltd.
and Sankyo Company, Limited
SEC File No. 132-02290
(English translation of previously published information)


This document has been prepared as a guide for non-Japanese investors and contains forward-looking statements that are based on management’s estimates, assumptions and projections at the time of publication. A number of factors could cause actual results to differ materially from expectations.

Daiichi Pharmaceutical Co., Ltd.
FASF
April 27, 2005
Summary of Consolidated Financial Results (Consolidated)
for Fiscal Year 2004, Ended March 31, 2005
(English Translation of “Kessan Tanshin”)
Listed company name: Daiichi Pharmaceutical Co., Ltd.
Stock code number: 4505
Stock listings: Tokyo Stock Exchange, Osaka Securities Exchange
Head office: Tokyo, Japan
URL: http://www.daiichipharm.co.jp/
Representative: Mr. Kiyoshi Morita, President and CEO
Contact: Mr. Toshio Takahashi, General Manager, Corporate Communications Department
Telephone: (03) 3272-0611
Meeting of the Board of Directors held on: April 27, 2005
Application of U.S. GAAP: No
1. Financial results for the fiscal year (April 1, 2004—March 31, 2005)
(1) Consolidated Operating Results
(Figures less than ¥1 million, except per share amounts, have been omitted)
| Net sales (% change from previous year) | Operating income (% change from previous year) | Ordinary income (% change from previous year) | |||||||
| Millions of yen | Millions of yen | Millions of yen | |||||||
Fiscal Year 2004 | 328,534 (1.8 | %) | 56,063 (21.6 | %) | 57,320 (22.7 | %) | |||
Fiscal Year 2003 | 322,767 (0.2 | %) | 46,114 (D12.4 | %) | 46,731 (D13.0 | %) |
| Net income (% change from previous year) | Basic net income per share | Diluted net income per share | Return on equity | Ratio of ordinary income to total assets | Ratio of ordinary income to net sales | ||||||||
| Millions of yen | Yen | Yen | % | % | % | ||||||||
Fiscal Year 2004 | 37,175 (39.4 | %) | 137.95 | 137.90 | 8.5 | 10.7 | 17.4 | ||||||
Fiscal Year 2003 | 26,661 (96.5 | %) | 97.25 | 97.23 | 6.5 | 9.0 | 14.5 |
Notes
1. Investment income (loss) from affiliated companies accounted for using the equity accounting method: | ||||
For the year ended March 31, 2005 | D¥399 million | |||
For the year ended March 31, 2004 | ¥— million | |||
| 2. Weighted -average number of common shares issued and outstanding during the year (consolidated): | ||||
For the year ended March 31, 2005 | 268,481,535 shares | |||
For the year ended March 31, 2004 | 272,515,920 shares | |||
3. Changes in method of accounting presentation: None | ||||
4. Percentages in parentheses under net sales, operating income, ordinary income, and net income indicate changes from the previous fiscal year. | ||||
1
(2) Consolidated Financial Position
| Total assets | Shareholders’ equity | Shareholders’ equity ratio | Shareholders’ equity per share | |||||
| Millions of yen | Millions of yen | % | Yen | |||||
Fiscal Year 2004 | 546,555 | 448,563 | 82.1 | 1,670.71 | ||||
Fiscal Year 2003 | 521,808 | 422,130 | 80.9 | 1,564.59 |
Notes : Total common shares issued and outstanding at end of year (consolidated) | ||||
March 31, 2005: | 268,404,023 shares | |||
March 31, 2004: | 269,700,226 shares | |||
(3) Consolidated Cash Flows
| Cash flows from operating activities | Cash flows from investing activities | Cash flows from financing activities | Cash and cash equivalents at year-end | |||||||
| Millions of yen | Millions of yen | Millions of yen | Millions of yen | |||||||
Fiscal Year 2004 | 35,571 | D | 21,989 | D | 12,369 | 91,571 | ||||
Fiscal Year 2003 | 47,505 | D | 27,419 | D | 18,470 | 90,346 | ||||
| (4) | Notes regarding the scope of consolidation and application of the equity method of accounting |
Consolidated subsidiaries : | 31 | |
Non-consolidated subsidiaries accounted for under the equity method : | 0 | |
Affiliated companies accounted for under the equity method : | 2 |
(5) Changes in the scope of consolidation and application of the equity method of accounting
Consolidated subsidiaries | ||||
(increase) | 3 | |||
(decrease) | 0 | |||
Equity method affiliates | ||||
(increase) | 2 | |||
(decrease) | 0 |
2. Forecasts of Consolidated Results Fiscal Year 2005 (April 1, 2005—March 31, 2006)
| Net sales | Ordinary income | Net income | ||||
| Millions of yen | Millions of yen | Millions of yen | ||||
Interim 6-month period | 159,000 | 22,000 | 12,000 | |||
Full year | 333,000 | 52,000 | 18,000 |
Reference: Forecasted basic net income per share for the year: ¥ 66.55
| * | Note: The forecast figures shown above are based on information that was available at the time of preparation and may contain some uncertainties. Actual performance and other factors may differ from these forecasts due to changes in circumstances and other developments. More information concerning these forecasts can be found in the attached Supplementary Information on page 16-17. |
2
1. State of the Group
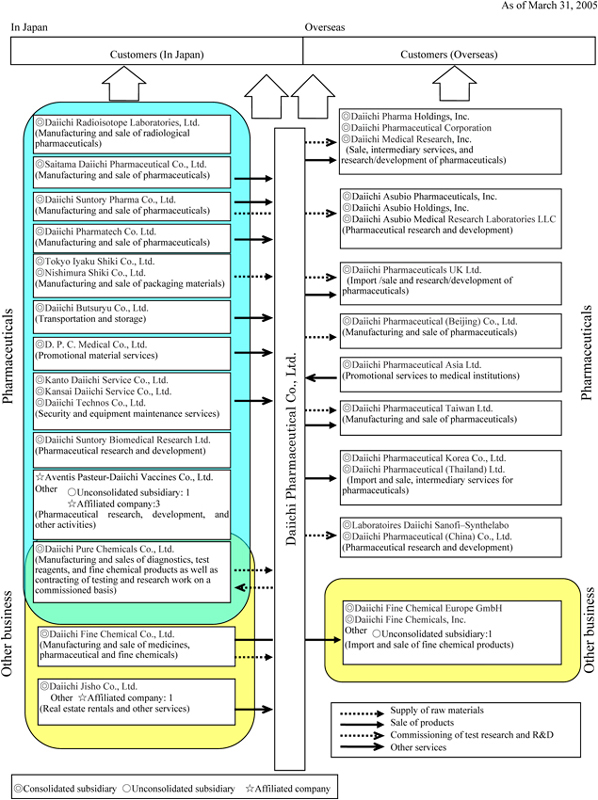
The Company’s corporate Group comprises Daiichi Pharmaceutical Co., Ltd. (the parent Company), its 34 subsidiaries (including 31 consolidated subsidiaries and 3 unconsolidated subsidiaries), and 5 affiliated companies, for a total of 40 Group companies. The principal lines of business of Group companies, the positioning of principal companies within the Group, and the business and geographic segment to which each company belongs are shown below.
Business Classification | Lines of Business | Principal Group Companies | ||
Pharmaceuticals | Japan | |||
Prescription drugs |
Daiichi Pharmaceutical Co., Ltd. | |||
| Daiichi Pure Chemicals Co., Ltd. | ||||
| Diagnostic and radiopharmaceuticals | Daiichi Radioisotope Laboratories, Ltd. | |||
| Daiichi Fine Chemical Co., Ltd. | ||||
| Saitama Daiichi Pharmaceutical Co., Ltd. | ||||
| Daiichi Suntory Pharma Co., Ltd. | ||||
| Daiichi Pharmatech Co., Ltd. | ||||
| OTC drugs | Tokyo Iyaku Shiki Co., Ltd. | |||
| Nishimura Shiki Co., Ltd. | ||||
| Animal drug products | Daiichi Butsuryu Co., Ltd. | |||
| D. P. C. Medical Co., Ltd. | ||||
| Kanto Daiichi Service Co., Ltd. | ||||
| Kansai Daiichi Service Co., Ltd. | ||||
| Daiichi Technos Co., Ltd. | ||||
| Daiichi Suntory Biomedical Research Ltd. | ||||
Unconsolidated subsidiary: 2 company; affiliated companies: 4 | ||||
Total 21 companies | ||||
Overseas
| ||||
| Daiichi Pharma Holdings, Inc. | ||||
| Daiichi Pharmaceutical Corporation | ||||
| Daiichi Medical Research, Inc. | ||||
| Daiichi Pharmaceuticals UK Ltd. | ||||
| Daiichi Pharmaceutical (Beijing) Co., Ltd. | ||||
| Daiichi Pharmaceutical (China) Co., Ltd. | ||||
| Daiichi Pharmaceutical Asia Ltd. | ||||
| Daiichi Pharmaceutical Taiwan Ltd. | ||||
| Daiichi Pharmaceutical Korea Co., Ltd. | ||||
| Daiichi Pharmaceutical (Thailand) Ltd. | ||||
| Laboratoires Daiichi Sanofi–Synthelabo | ||||
| Daiichi Asubio Pharmaceuticals, Inc. | ||||
| Daiichi Asubio Holdings, Inc. | ||||
| Daiichi Asubio Medical Research Laboratories LLC | ||||
Total 14 companies | ||||
Japan
| ||||
Other Business | Fine chemical business | Daiichi Pure Chemicals Co., Ltd. | ||
| Daiichi Fine Chemical Co., Ltd. | ||||
| Daiichi Jisho Co., Ltd. | ||||
| Safety research business |
Other affiliated company: 1 | |||
Total 4 companies | ||||
Overseas
| ||||
| Other business | Daiichi Fine Chemicals, Inc. | |||
| Daiichi Fine Chemical Europe GmbH | ||||
Unconsolidated subsidiary: 1 | ||||
Total 3 companies |
Note
| 1. | The number of companies by business line includes those companies that are engaged in more than one business. |
| 2. | For the fiscal year under review, three newly-established companies have been included in the scope of consolidation: Daiichi Pharmaceutical Corporation, Daiichi Medical Research, Inc., and Daiichi Pharmatech Co., Ltd. |
Also, please note that the former corporate name of Daiichi Pharmaceutical Corporation has been changed to Daiichi Pharma Holdings, Inc. as of April 1, 2004.
| 3. | As of May 7, 2004, the corporate name of Suntory Pharmaceutical Inc. was changed to Daiichi Asubio Pharmaceuticals, Inc.; as of July 30, 2004, the corporate name of Suntory Pharmaceutical Holding Inc. was changed to Daiichi Asubio Holdings, Inc.; and, as of September 14, 2004, the corporate name of Suntory Pharmaceutical Research Laboratories LLC was changed to Daiichi Asubio Medical Research Laboratories LLC. |
3
4
2. Management Policy
1. Basic Policies
With its corporate slogan “Enriching the Quality of Life,” the Daiichi Pharmaceutical Co., Ltd. and its Group companies has adopted the philosophy of contributing to healthier and happier lives globally by developing innovative technologies and providing superior pharmaceutical products.
The Daiichi Group’s GLOBAL 10 long-term vision calls for the Group to become an “R&D-driven global pharmaceutical company” that develops products that meet global standards and provides them throughout the world. To realize this vision, the Group has made proceeded with diverse business reforms, and striven to improve its operations in a manner that accords with its social mission.
However, in view of such worldwide trends as progressive globalization and stepped-up cost-containment measures in the healthcare environment, we recognize that it is crucial to adopt a new corporate strategy that will enable us to build the stronger corporate foundation and management resources needed to overcome global competition.
Sharing in the recognition of the need for this strategy, Daiichi and Sankyo Co., Ltd., on February 25, signed a basic agreement calling for the establishment of a joint holding company to be called DAIICHI SANKYO COMPANY, LIMITED, with the target date for the company’s founding set at October 1, 2005, and the integration of their operations in the prescription drug business scheduled for April, 2007. The goal of integration is to realize the philosophy and vision jointly held by the two companies.
By maximizing synergies generated by the integration, the two companies are aiming to become the Japan-based “global pharma-innovator.” Having outstanding R&D and marketing capabilities competitive in the major world markets, this company will seek to “contribute to better human health throughout the world” on a still-higher level.
2. Basic Policy Regarding Distribution of Profits
Positioning the distribution of profits earned from business activities as one of its most important management tasks, Daiichi emphasizes the distribution of profits to shareholders in a manner that reflects corporate performance. The level of cash dividends is determined in line with this emphasis while reflecting the comprehensive consideration of such factors as the need to bolster internal reserves to build a foundation for corporate growth.
Regarding cash dividends, the Company seeks to maintain stable growth in cash dividends and in the dividend payout ratio while concurrently making flexible and timely moves to repurchase its outstanding shares with the goal of boosting income per share.
Regarding internal reserves, the Company plans to used them to fund such investments as those for engaging in leading-edge research, strengthening the product development pipeline, engaging in corporate alliances, and strengthening the foundations for international operations.
5
3. Policy Regarding the Reduction of the Basic Trading Unit of Shares
Aiming to increase the liquidity of its shares and expand its shareholder base, the Company reduced the trading unit size from 1,000 shares to 100 shares as of August 1, 2002.
4. Management Indicator Performance Goals
The Daiichi Group has set its If consolidated net sales target at ¥345.0 billion for fiscal 2006. A new target and other goals are to be set in light of the basic agreement for integration with Sankyo Co., Ltd.
5. Medium- and Long-Term Strategies and Essential Tasks
Regarding overseas pharmaceutical markets, while the industrialized countries are making sustained efforts to reduce healthcare costs, marketing competition is becoming increasingly intense in the United States and other countries, and development competition in the search for breakthrough products involves the use of leading-edge technologies that are accompanied by increased R&D expenses. These and other factors are making the overseas operating environment more challenging.
In Japan, growth in the pharmaceutical market is being slowed by healthcare system reform measures implemented against the backdrop of demographic graying, and the growing presence of overseas-based companies is contributing to an intensification of competition for market share.
Aiming to use new global development drug candidates to realize its corporate objectives, the Daiichi Group has designated the period through fiscal 2006 for reforms that will create the foundation required for achievement of its corporate objectives. Accordingly, it is taking measures to attain the following management goals.
(1) Expanding Global R&D Operations
Daiichi is giving strategic emphasis to the tasks of building a global R&D system able to create pharmaceutical products in line with global standards, continuously creating high-quality drug development candidates, and strengthening its system for evaluating drug development candidates in line with global standards and from both scientific and business perspectives.
Recognizing the need to transform conventional R&D operations in order to promote the smooth operation of a global R&D system, in October 2004 the Company established a new organizational system within an R&D Division designed to integrate R&D operations. Within the R&D Division system, the Company is working to promote progress in domestic and overseas R&D projects through functional collaboration between its Tokyo Research and Development Center and U.S.-based Daiichi Medical Research, Inc. Through this initiative, the Company is seeking to boost R&D productivity, integrate science and business, and firmly instill global thinking and action mechanisms.
6
Regarding drug discovery research, Daiichi has chosen for four therapeutic domains—infectious diseases, cancer, thrombosis and other cardiovascular diseases, and allergies and other immune system disorders. Research advances are being promoted by augmenting the quality and efficiency of drug discovery system's performance. Competitively superior drug discovery technologies are being implemented by stepping up collaboration with leading-edge research institutions in Japan and overseas as well as with Daiichi Suntory Pharma Co., Ltd., and other Daiichi Group members.
In clinical development operations, Daiichi Medical Research now provides more-sophisticated drug candidate evaluation capabilities. Working in cooperation with the Daiichi Group’s other internal research facilities, the U.S.-based company is now undertaking comprehensive evaluation of a number of promising drug candidates—including such oral antithrombotic agents as DU-176b, an oral factor-Xa inhibitor; such quinolone agents for treating drug-resistant infections as DX-619; such anti-allergy agents as DW-908e; and the anticancer chemotherapeutic agent DJ-927. In preparation for the advance of these candidates to the proof-of-concept (POC) testing stage, the Company is creating systems for performing POC studies in line with global standards.
(2) Strengthening Domestic and Overseas Prescription Drug Business
Amid increasingly intense marketing competition, Daiichi has the policy of working to further reinforce the market positions of its domestic and overseas prescription drug businesses.
In the domestic prescription drug business, the Company is aiming to expand its current market share. To do this, it is striving to increase the number of prescriptions for established drugs—such asCravit, a broad-spectrum oral antibacterial agent;Artist, a long-acting beta-blocker;Sunrythm, an anti-arrhythmic agent; andHANP, an agent for treating acute cardiac insufficiency—while also expeditiously launching and developing the markets for drugs for which applications were already made—such asPlavix (clopidogrel sulfate), a new anti-platelet agent; and KMD-3213 (silodosin), an agent for treating dysuria. The Company is also strengthening its marketing operations aimed at the hospital market while taking steps to respond to such changes in the medical therapy environment as the creation of medical institution networks and the spread of diagnostic and therapeutic guidelines.
In the overseas prescription drug business, the Company is working to ensure that its licensee maintains the top share of the quinolone market in the United States, which is the largest export market for bulk shipments of its mainstay antibacterial agent levofloxacin, by working through the licensee to obtain approval for additional indications and taking other steps to expand sales of products containing levefloxacin in the United States.
(3) Building a Resilient Corporate Structure by Resolutely Implementing Structural Reforms
To transform the entire Daiichi Group into an enterprise featuring high levels of profitability and management efficiency as well as strong overall competitiveness, the Company has established a task force, the Structural Reform Headquarters, that is working to
| 1) | consolidate functions within the Group and integrate and consolidate networks of research, manufacturing, and distribution facilities, |
| 2) | optimize the size of the Group’s workforce, and |
7
| 3) | restructure ancillary businesses. |
Particularly noteworthy among functional and facility consolidation measures was the establishment of Daiichi Pharmatech Co., Ltd., which began operating smoothly in April 2005. Created through the spin-off of three factories from the parent Company and subsequent integration of these factories with two Group manufacturing service companies, Daiichi Pharmatech is working to further increase manufacturing efficiency and strengthen cost-competitiveness.
Other noteworthy measures include the shift of the Tochigi Research Center’s protein research unit and Daiichi Fine Chemical’s drug discovery units to the Tokyo Research and Development Center, in October 2004 and April 2005, respectively. A decision has been made to increase distribution efficiency and cut costs by shifting the functions of distribution centers in Sapporo and Shizuoka to the Tokyo Distribution Center, and the Company is assiduously moving ahead with measures to prepare for the implementation of this decision.
To consolidate planning and administration functions, the Company is proceeding with the consolidation of Group companies’ accounting, personnel, remuneration, and IT units as well as with the introduction of enterprise resource planning (ERP) systems. The personnel and remuneration functions of major Group companies have already been consolidated in the Company’s Business Center facility.
Aiming to optimize the size of the Group’s workforce, steps were taken to hire additional staff to work for Daiichi Medical Research and as the parent Company’s Medical Representatives (sales representatives in the field) in domestic prescription drug marketing. In contrast, at many other Group companies such operational reform measures as those to reevaluate operations, consolidate functions, and introduce electronic information systems have enabled workforce right-sizing.
Regarding the reorganization of non-core businesses, the Company transferred its veterinary and livestock feed products business to Meiji Seika Kaisha, Ltd. This transfer was smoothly implemented in June 2004.
(4) Other Issues
With respect to manufacturing and technology, the Group is striving to upgrade its overall technological strength and thereby boost its cost-competitiveness and provide additional high-value-added products. At the same time, the Group is working to fortify its supply chain management initiative to ensure stable supplies, optimize inventory levels, and enhance its product quality assurance systems in line with global standards.
In the area of post-marketing-surveillance (PMS) and reliability assurance, the Company is taking various measures in accord with the complete implementation of Japan’s amended Pharmaceutical Affairs Law in April 2005, which calls for appropriate responses to new post-manufacturing/marketing safety administration standards and new regulatory responsibility definitions. Organizational restructuring responses include the October 2004 establishment and reorganization of functional units within the newly created and independent PMS Administration and Reliability Assurance Division.
Regarding environmental management, the Company recognizes the importance of conserving the global environment. In line with the Daiichi Environmental Charter, the Group has created an organizational framework for guiding environmental conservation activities, such as the proactive launch of various programs aimed at realizing a recycling-oriented society. These efforts will be made public in the fiscal 2004 edition of the Daiichi Environmental Report.
8
Regarding the issues associated with the alleged formation of a bulk vitamin marketing cartel, settlements were reached with all but a few relevant parties in the United States. In Europe, an appeal was filed in February 2002 in response to a notification of the levying of a fine received from the European Commission.
In the United States, Mylan Laboratories Inc. and other companies have filed applications for permission to manufacture generic versions of products containing of Daiichi’s mainstay product, levofloxacin. Having determined that such applications constitute attempts to infringe Daiichi’s patents, Daiichi and its licensee together filed suit against the Mylan Laboratories-led group in a federal district court, which decided in favor of Daiichi and the licensee in December 2004. However, the Mylan Laboratories-led group was dissatisfied with the decision and has appealed it. Daiichi intends to continue vigorously defending its intellectual property assets.
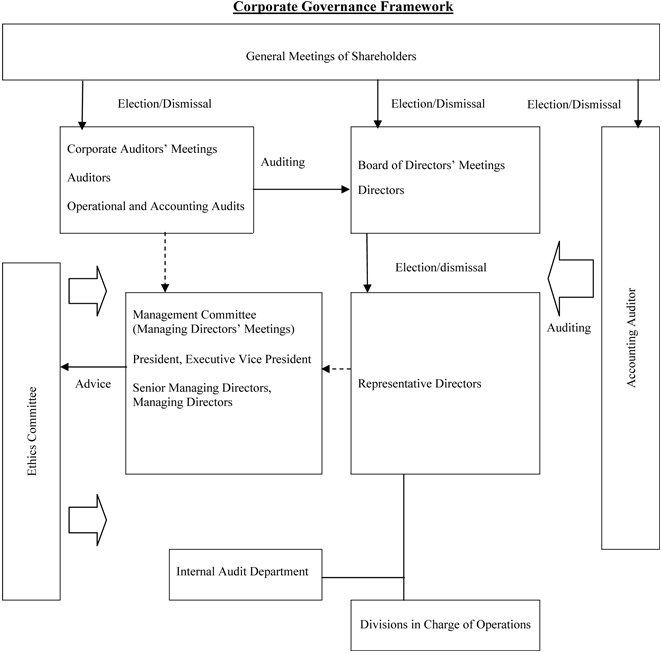
6. Basic Policy Regarding Corporate Governance and Implementation of Related Measures
(1) Basic Policy Regarding Corporate Governance
Recognizing that increasing shareholder value is an important management issue, Daiichi is working to strengthen its capabilities regarding legal compliance, highly transparent management, rapid and appropriate management decision-making, and supervisory systems.
(2) Implementation of Corporate Governance Related Measures
| 1) | Management and Administration Organization System for Decision-Making, Execution, and Supervisory Tasks and Other Corporate Governance Systems |
Held every month in principle are Board of Directors’ Meetings, where directors decide issues related to operational execution and the supervision of the execution of tasks by directors. Serving as a management council or executive board, Managing Directors’ Meetings are held once every week in principle, to discuss operational execution matters and to expedite and ensure the appropriateness of management decision-making. Currently there are no external directors.
Aiming to reinforce corporate governance with particular attention to such goals as increasing management transparency, strengthening decision-making capabilities, and establishing flexible and dynamic operational execution systems, changes will be made to appoint external directors and adopt single-year terms for directors upon approval at the coming 127th Ordinary General Meeting of Shareholders, and the Company is moving ahead with the introduction of an executive officer system and functional reevaluation of the Management Committee.
Directors’ remuneration is determined within a predetermined remuneration framework using a rational method that takes corporate performance into consideration.
Daiichi has adopted an auditor system. To promote the Company’s sound and sustained management, corporate auditors participate and express opinions at Board of Directors’ Meetings and Managing Directors’ Meetings as well as at other important meetings in accordance with regulations for Corporate Auditors’ Meetings and corporate auditor’s execution of duties. In addition, corporate auditors have the task of performing financial and operational audits for the Company and other Group companies. Corporate Auditors’ Meeting is currently composed of four members, including two external corporate auditors
9
Regarding internal control systems, Daiichi is strengthening its Internal Audit Department and other internal auditing units and also conducts audits of its compliance system, risk management system, and other internal control systems.
Daiichi has commissioned KPMG AZSA & CO. as its independent auditor, giving it the role of auditing the Company’s financial statements from an independent standpoint.
Daiichi Group companies make sustained efforts to ensure rigorous legal compliance and have instituted the “Daiichi Conduct Guidelines.” The Company has employee hot-lines and the Ethics Committee that include advisory lawyers and directors as members.
| 2) | External Directors’ and External Auditors’ Personal, Capital, Transactional, or Other Relationships of Vested Interest with the Company |
The external auditors have no vested interest in the Company.
| 3) | Measures Taken During the Past Year to Strengthen Corporate Governance |
To clarify the Group management staff roles of the Company’s planning and administration departments, these departments were reorganized as “corporate” departments, and Group management capabilities were strengthened.
To promote rigorous legal compliance and thorough awareness of the “Daiichi Conduct Guidelines” among all employees, measures were taken, including the organization of training seminars for each management stratum and the implementation of questionnaire-based surveys.
Responding to the full implementation of Japan’s new Personal Information Protection Law in April 2005, the Company has instituted new policies, regulations, and handling standards related to personal information. It has also taken various measures to create a personal information protection system, including the establishment of the Personal Information Protection Committee to act as an operational administrative organ.
Daiichi is continuing efforts to ensure the timely disclosure of information related to changes in the Company’s situation as well as to ensure the transparency of the Company’s management processes.
10
11
3. Results of Operations and Financial Position
| 1. | Results of Operations |
1. Overview of Fiscal Year 2004
(Millions of Yen)
| Net sales | Operating income | Ordinary income | Net income | |||||
Fiscal Year 2003 | 322,767 | 46,114 | 46,731 | 26,661 | ||||
Fiscal Year 2004 | 328,534 | 56,063 | 57,320 | 37,175 | ||||
Change (%) | 1.8 | 21.6 | 22.7 | 39.4 |
(1) Overview of Performance during the Fiscal Year
During the year, overseas pharmaceutical markets were characterized by a further intensification of global competition centered on “global-mega” companies and associated with both new drug-related R&D and marketing activities. The Japanese pharmaceutical market was affected by changes in the healthcare systems—such as the growing scope of application of the comprehensive hospital therapy evaluation system and the conversion of national university hospitals and other national hospitals into independent corporations—and an average 4.2% reduction in National Health Insurance (NHI) drug reimbursement prices was implemented in April 2004.
Against this backdrop, the Daiichi Group worked to expand the markets for its products while emphasizing the promotion of appropriate drug use through the provision of information related to drug efficacy and safety. As a result, higher revenue from domestic sales of prescription drugs and a rise in bulk levofloxacin exports more than offset a revenue decline associated with the transfer of veterinary and livestock feed products business to another company. Consequently, net sales advanced 1.8% from the previous fiscal year, to ¥328,534 million. Reflecting the reduction in cost of sales as well as cost-cutting measures with respect to R&D expenses, operating income totaled ¥56,063 million, up 21.6% from the previous fiscal year, and double-digit growth was achieved in ordinary income, which amounted to ¥57,320 million, up 22.7% from the previous fiscal year. While ¥7.3 billion in extraordinary restructuring expenses associated with the spin-off of the parent Company’s manufacturing operations was recorded, this was more than offset by extraordinary gains of ¥11.7 billion on the return of the substitutional retirement portion of its Employee’s Pension Fund and ¥3.8 billion on the shift to a new retirement payment system. Thus, net income surged 39.4% from the previous fiscal year, to ¥37,175 million.
The share of consolidated net sales derived from overseas operations was 20.9%.
In light of this strong performance, the Company has decided to increase year-end cash dividends by ¥10 per share and disburse total year-end cash dividends of ¥25 per share. As ¥15 per share interim cash dividends have already been disbursed, cash dividends applicable to the fiscal year under review will total ¥40 per share.
The Company intends to keep emphasis on the distribution of profits to shareholders after the integration with Sankyo Co., Ltd. scheduled for October 2005.
12
(2) Overview of Performance by Business Segment
Business segment
(Millions of Yen)
| Net sales | Operating income | |||||||||||||||
Business segment | Fiscal 2003 | Fiscal 2004 | Increase (Decrease) | Fiscal 2003 | Fiscal 2004 | Increase (Decrease) | ||||||||||
Pharmaceutical | 304,564 | 311,844 | 7,280 | 53,126 | 64,096 | 10,969 | ||||||||||
Other | 18,203 | 16,689 | D | 1,513 | 65 | D | 78 | D | 144 | |||||||
Subtotal | 322,767 | 328,534 | 5,766 | 53,192 | 64,017 | 10,824 | ||||||||||
Eliminations | — | — | — | D | 7,077 | D | 7,953 | D | 876 | |||||||
Consolidated | 322,767 | 328,534 | 5,766 | 46,114 | 56,063 | 9,948 | ||||||||||
Note: Sales are the value of sales to external customers.
Pharmaceutical Business
<Prescription Drugs>
Although conditions in the domestic prescription drug market were negatively affected by the April 2004 revision of drug reimbursement prices, sales of the mainstay broad-spectrum oral antibacterial agentCravit were steady, and increased sales were recorded for such products asMobic, a nonsteroidal anti-inflammatory agent marketed in Japan exclusively by Daiichi since July 2004;Artist, a long-acting beta-blocker for treating high blood pressure, angina, and chronic cardiac insufficiency; andZyrtec, an anti-allergy agent. As a result, total domestic prescription drug sales advanced 1.9% from the previous fiscal year, to ¥205,859 million.
Overseas prescription drug sales were negatively affected by a decline in a U.S. subsidiary's sales ofFLOXIN Otic, an antibacterial otic solution for treating ear infections, as well as by the appreciation of the yen. However, the completion of U.S. inventory adjustments for levofloxacin enabled a recovery in bulk sales of this product, and patent licensing royalty income grew. Thus, overseas sales of prescription drugs rose 6.2% from the previous fiscal year, to ¥61,318 million.
<Diagnostics and Radiopharmaceuticals>
Measures aimed at restraining medical costs kept market conditions challenging, and sales of such products as in vivo radiopharmaceuticals for cardiac imaging applications declined. However, strong sales of such in vitro diagnostics products as testing kits for influenza—which was prevalent in Japan during the year under and mainstay cholesterol measuring agents for export boosted total sales of diagnostics and radiopharmaceuticals products 2.1% from the previous fiscal year, to ¥32,923 million.
<OTC Drugs>
Karoyan Gush, a hair-growth accelerator launched in June 2004, made a significant contribution to performance during the year, and sales of such products asPatecs anti-inflammatory analgesic poultices and the vitamin C productCystina C were robust. Accordingly, OTC Drug sales advanced 16.3% from the previous fiscal year, to ¥10,199 million.
13
<Veterinary and Livestock Feed Products>
Reflecting the Company’s June 2004 transfer of its veterinary and livestock feed products business to Meiji Seika Kaisha, Ltd., segment sales dropped 59.1% from the previous fiscal year, to ¥1,544 million.
Other Businesses
Sales of fine chemical products decreased 10.6%, to ¥12,967 million, reflecting drops in sales of such products as calcium pantothenate to customers in North America and Europe. Total sales in the other businesses segment, which includes fine chemicals, declined 8.3%, to ¥16,689 million.
R&D Activities
By conducting research programs that enable the identification of additional drug target molecules and the acquisition of innovative new drug discovery “seeds,” Daiichi is seeking to continuously generate high-quality drug development candidates. Moreover, the Company is proactively undertaking POC testing programs coordinated by Daiichi Medical Research.
Regarding collaborative research initiatives, Daiichi is collaborating with the U.S.-based UCSF Cancer Research Institute and U.S.-based Rigel Pharmaceuticals Inc., in research aimed at developing molecularly-targeted anti-cancer agents and is conducting research related to genomic drug discovery with Japan-based Kazusa DNA Research Institute and Celestar Lexico-Sciences, Inc. All of these research programs are expected to facilitate new drug discovery.
Recognizing the importance of strategies for obtaining additional leading-edge technologies, Daiichi and MediBIC ALLIANCE jointly established a drug development venture investment fund in March 2005. The objectives of this fund are to facilitate the collection of information on drug discovery technologies as well as collaborative research activities.
With respect to drug development operations, Daiichi has applications pending in Japan forPlavix (clopidogrel sulfate), an antiplatelet agent;Sonazoid (DD-723), an ultrasonic contrast medium product; and KMD-3213 (silodosin), an agent for treating dysuria jointly developed with Kissei Pharmaceutical Co., Ltd. In addition, Aventis Pasteur-Daiichi Vaccines Co., Ltd. has an application pending in Japan forActHIB,the first haemophilus influenzae type b conjugate vaccine for pediatric use.
In May 2004, Daiichi submitted a supplemental application for the anticancer agentTopotecin (irinotecan hydrochloride), for the additional indication of pancreatic cancer. In February 2005, the Company submitted a supplemental application for the natural interferon beta agentFeron, for the additional indication of Hepatitis C -induced liver cirrhosis.
In April 2005, approval was received for the anti-spasticity agentGabalonIntrathecal Injection (continuous administration of baclofen into the intrathecal cavity) developed as an orphan drug (an agent for rare diseases). The agent is used with a programmable pump system, which was developed by Medtronic Japan Co., Ltd. and approval was given for the system in March 2005.
Also in April 2005, approval was received forAdenoscan(adenosine), an adjunctive agent for myocardial scintigraphy imaging for which the domestic application was submitted by Daiichi Suntory Pharma.
14
Daiichi decided to discontinue its participation in development for anticancer agent TZT-1027, licensed from TEIKOKU HORMONE MFG. CO., LTD., as a result of its reevaluation of development plans, aimed at and strategy of making selective and concentrated investments of R&D resources.
Other noteworthy products under development include DU-6859a (Gracevit, sitafloxacin), a quinolone antibacterial agent that was discovered and developed in-house, and HGF DNA plasmid, an agent for treating peripheral artery disease and ischemic heart disease for which exclusive marketing rights for Japan, the United States, and Europe have been obtained from AnGes MG, Inc.
Daiichi Suntory Pharma is proceeding with domestic clinical trials of (SUN Y7017 (memantine hydrochloride), an agent for treating Alzheimer’s disease.
Manufacturing and Technologies
Aiming to realize considerable reduction in cost of sales, the Daiichi Group has introduced a new levofloxacin manufacturing method involving a new synthesis technology. The switch to the new manufacturing method has been completed with respect to levofloxacin exported to the United States, which is the principal market for this product.
Daiichi Suntory Pharma began constructing a bio bulk manufacturing facility at its Chiyoda Pharma Factory that is designed to meet needs associated with growing sales ofHANP injectable 1000 as well as newly developed products. This facility is scheduled to be completed in October 2005.
Group-wide Initiatives
Daiichi has undertaken various reforms designed to increase the soundness and stability of its pension system. Along with completing the return of its Employees’ Welfare Pension Fund’s substitutional portion, the Company has undertaken fundamental reform aimed at unification of the pension plans of domestic Group companies. These companies have introduced new pension systems involving defined contributions and benefits.
Regarding moves to introduce and upgrade electronic information systems, the Company is been proceeding with the introduction of enterprise resource planning (ERP) systems at major domestic Group companies. Consolidated accounting, personnel, and remuneration systems have already been inaugurated and the Company is moving forward steadily with the introduction of supply-chain management systems.
2. Forecast for the current Fiscal Year
| (Millions of Yen) | |||||||||||
| Net sales | Operating income | Ordinary income | Net income | ||||||||
Fiscal Year 2004 results | 328,534 | 56,063 | 57,320 | 37,175 | |||||||
Fiscal Year 2005 forecast | 333,000 | 53,000 | 52,000 | 18,000 | |||||||
Change (%) | 1.4 | D | 5.5 | D | 9.3 | D | 51.6 | ||||
15
<Net Sales>
In the domestic prescription drug business, Daiichi projects that it will face a severe operating environment due to such factors as the increasing effect of government measures aimed at restraining medical costs and the rising market share of major global drug companies. Against this backdrop, the Company will concentrate its efforts on maintaining the top market share of its mainstay productCravit, as well as increasing sales of such major products for cardiovascular diseases asArtist,Sunrythm, andHANP. In addition, the Company anticipates the launch of new products during the latter half of the year such asPlavix will help increase net sales in the domestic prescription drug business.
In the overseas prescription drug business, the Company expects that revenues from its mainstay bulk exports of levofloxacin to the United States will continue to increase in light of the favorable growth in sales by its licensee. The Company is basing its projections on the premise that exchange rates during the fiscal year will be approximately US$1=¥105 and 1 Euro=¥130.
Rising sales are projected in OTC drug operations due to such factors as growing sales of the hair-growth acceleratorKaroyan Gush. Sales of diagnostics and radiopharmaceuticals, for which market conditions are severe, are expected to be approximately unchanged.
Consequently, net sales are projected to increase, albeit by a small margin.
<Profitability>
Having started operating Daiichi Pharmatech in April 2005, the Company is further stepping up its efforts to reduce the cost of sales, and it intends to place still greater emphasis on reducing non-strategic expenses. The Company is seeking to restrain R&D expenses by strengthening is capabilities for accurately evaluating drug candidates at early development stages and continuing to concentrate its operations in core therapeutic domains; nevertheless R&D expenses are projected to increase owing to the full-scale start of clinical trial programs in the United States and Europe for DU-176b, an oral factor-Xa inhibitor during the next fiscal year.
While the domestic and overseas operating environments are expected to be more challenging, the Company is doing its utmost to secure the profits required to fund the R&D programs needed to build new corporate growth paths, expeditiously realize the medium-to-long-term corporate growth capabilities that its R&D results make possible, and proceed steadily and quickly with such structural reform measures as those aimed at merging and eliminating certain distribution facilities. The Company plans to implement these strategies in a manner that maximizes the benefits of the upcoming business integration.
Based on the above projections, Daiichi anticipates that it will record higher sales but lower profits during fiscal 2005. Specifically, the Company is aiming to record ¥333.0 billion in consolidated net sales, ¥53.0 billion in operating income, and ¥52.0 billion in ordinary income. After accounting for the effect of converting Daiichi Suntory Pharma into a wholly owned subsidiary, net income is expected to amount to ¥18.0 billion.
16
II . Financial Position
1. Overview of Changes in the Fiscal Year Under Review
<Assets, Liabilities, and Shareholders’ Equity>
At the end of the fiscal year, total assets amounted to ¥546.5 billion, up ¥24.7 billion from the previous fiscal year end. Total current assets were affected by a ¥13.4 billion rise in marketable securities, while long-term assets were affected by a ¥15.4 expense on prepaid pension liabilities that accompanied the return of the substitutional retirement portion of its Welfare Pension Fund.
Regarding liabilities, such factors as the introduction of a specified contribution pension system led to a ¥14.4 billion decrease in reserves for employees’ retirement benefits, and an accompanying ¥9.1 billion increase in deferred income taxes. Shareholders’ equity was affected by a ¥28.2 billion rise in retained earnings.
<Consolidated Cash Flows>
| (Millions of Yen) | |||||||||
Accounting Items | Fiscal Year 2003 | Fiscal Year 2004 | Increase (Decrease) | ||||||
Net cash provided by (used in) operating activities | 47,505 | 35,571 | D | 11,934 | |||||
Net cash provided by (used in) investing activities | D | 27,419 | D | 21,989 | 5,430 | ||||
Net cash provided by (used in) financing activities | D | 18,470 | D | 12,369 | 6,101 | ||||
Effect of exchange rate changes on cash and cash equivalents | D | 207 | 12 | 220 | |||||
Increase (decrease) in cash and cash equivalents | 1,407 | 1,225 | D | 182 | |||||
Cash and cash equivalents at end of year | 90,346 | 91,571 | 1,225 | ||||||
Net cash provided by operating activities amounted to ¥35.6 billion, down ¥11.9 billion from the previous year. Although net income grew ¥17.1 billion, the decrease in net cash provided by operating activities reflected such factors as a decrease in reserves for employees’ retirement benefits as well as such factors increasing accounts receivable and a rise in royalty income.
Net cash used in investing activities totaled ¥22.0 billion, down ¥5.4 billion from the previous year. This decrease mainly reflected a drop in the acquisition of investment securities.
Net cash used in financing activities amounted to ¥12.4 billion, down ¥6.1 billion from the previous year. This decrease mainly reflected a drop in the acquisition of treasury stock.
As a result, total cash and cash equivalents at the end of year were ¥91.6 billion, up ¥1.2 billion from the previous fiscal year.
2. Projection of Changes in the Current Fiscal Year
In the next fiscal year, Daiichi projects that its net sales will increase by a small margin, but the Company also anticipates that profits will decline due to its proactive augmentation of R&D investment. Accordingly, the Company projects that the level of net cash provided by operating activities during the next fiscal year will be lower than that in the year under review.
17
Cash flows from investing activities are expected to be affected by higher spending accompanying the conversion of Daiichi Suntory Pharma into a wholly owned subsidiary, although the levels of cash used to acquire tangible fixed assets and of long-term funds under management are projected to remain approximately unchanged.
Cash flows from financing activities are projected to be affected by a rise in cash dividend payments.
In light of the above factors, the balance of cash and cash equivalents at the end of the next fiscal year is projected to decrease from the level at the end of the year under review.
<Principal Financial Indicators>
| Fiscal Year 2002 | Fiscal Year 2003 | Fiscal Year 2004 | ||||
Shareholders’ equity ratio (%) | 78.4 | 80.9 | 82.1 | |||
Market capitalization ratio (%) | 85.3 | 104.4 | 123.3 | |||
Interest-bearing debt ratio (years) | 0.0 | 0.0 | 0.0 | |||
Interest coverage ratio (times) | 2,040.3 | 48,280.4 | 51,372.9 |
Notes:
| 1. | Shareholders’ equity ratio = total shareholders’ equity/total assets |
| 2. | Market capitalization ratio = total market value (Closing stock prices on balance sheet date x number of outstanding shares at the balance sheet date less the number of treasury shares)/ total assets |
| 3. | Interest-bearing debt ratio = interest-bearing debt/operating cash flow |
| 4. | Interest coverage ratio = operating cash flow/interest paid |
| 5. | All indicators are calculated based on consolidated figures. |
| 6. | Interest-bearing debt includes all consolidated balance sheets liability items on which interest is paid. |
| 7. | Operating cash flow equals the value of operating cash flows in the consolidated statements of cash flows less the value of “interest expense” and “corporate income taxes” (from the consolidated statements of income). |
| 8. | Interest expense equals the “interest expense” item list on the consolidated statements of cash flows. |
18
III. Business Risk and Other Risks
With regard to business activities, financial accounting, and other items described in this report, issues that could potentially exert a large influence on investors’ decisions include those described below the following. Forward-looking statements are based on judgments made by the Group as of March 31, 2005.
(1) R&D Risks
The R&D of new drug development candidates entails large financial expenditures over lengthy time periods. If during those time periods, the expected efficacy of a drug under development cannot be confirmed, there is a possibility that the relevant R&D project will be terminated. Moreover, in the case of cooperative R&D activities in collaboration with other parties, such events as contract changes or annulments could cause a project to fail.
(2) Manufacturing and Procurement Risks
The Group manufactures products at its own factories using its own technologies, and it depends on specific suppliers for a portion of the products and materials used in the manufacture of certain products. Because of this, if for some reason manufacturing or procurement activities are delayed or halted, there is a possibility that such event would affect the Group’s profitability and financial situation.
The Group conducts manufacturing operations in accordance with regulations based on the Pharmaceutical Affairs Law; however, if a product quality problem requiring a product recall or similar event should occur, there is a possibility that it would affect the Group’s profitability and financial situation.
(3) Marketing Risks
In the case of such an event as the occurrence of an unanticipated side effect, the launch by other companies of products that compete in the same therapeutic domains as the Group’s products, or the launch of competing generic versions of the Group’s products after the expiration of relevant patents, there is a possibility that the Group’s sales could be adversely affected and therefore the Group’s profitability and financial situation could also be affected.
In the case of such an event as the expiration or annulment of marketing or technology out-licensing contracts or a change in the terms of such contracts, the Group’s profitability and financial situation could be affected.
Aggregate sales of Cravit,Panaldine, andOmnipaqueaccount for more than 40% of the Group’s consolidated net sales. If side effects or other factors that have the effect of decreasing sales of these products were to arise, there is a possibility that such an event would have a large influence on the Group’s profitability and financial situation.
(4) Legislative, Regulatory, and Government Administration Risks
Prescription drug products in Japan are subject to a variety of regulations and administrative procedures based on the Pharmaceutical Affairs Law. Moreover, trends in other government measures related to healthcare systems and health insurance systems, such as the biannual revision of National Health Insurance (NHI) drug reimbursement prices, may affect the Group’s profitability and financial situation. Similarly, drug-related operations are liable to be affected by diverse regulations in other countries.
19
(5) Intellectual Property Risks
If some of the Group’s business activities are alleged to infringe on the patent rights or other intellectual property rights of another party, there is a possibility that such activities might have to be discontinued or related litigation undertaken. On the other hand, if another party should infringe on the patent rights or other intellectual property rights of the Group, there is a possibility that related litigation might have to be undertaken to defend those rights. These possibilities could affect the Group’s profitability and financial situation.
(6) Environmental Risks
Chemical substances used in drug-related research and manufacturing processes include substances that can affect human health and natural ecosystems. Each of the Group’s facilities is implementing measures to prevent air and water pollution, shifting to the use, where possible, of substances with relatively small environmental impact, and making other environmental conservation efforts. However, in the unlikely case of a determination that it is determined that the Group’s activities have caused serious adverse environmental impact, there is a possibility that the Group’s profitability and financial situation could be affected.
(7) Litigation Risks
In addition to fair trade issues, the Group’s activities have the potential for other difficulties with regard to various other issues—such as drugs side effects, manufacturer’s liability issues, and labor issues—that could become the subject of litigation. There is a possibility that such litigation could affect the Group’s profitability and financial situation.
(8) Currency Exchange Risks
Most of the Group’s overseas sales transactions are conducted in foreign currencies. Moreover, the revenues and assets of overseas subsidiaries are translated into yen for inclusion in the Group’s consolidated accounting items. Because of these circumstances, there is a possibility that changes in currency exchange rates could affect the Group’s profitability and financial situation.
(9) Other Risks
In addition to risks already described, other types of risks that could affect the Group’s profitability and financial situation include those associated with the interruption of business activities due to earthquakes or other large-scale disasters, the interruption of computer system operations due to network viruses or other technical problems, fluctuations in stock prices and interest rates, and the emergence of uncollectible accounts receivable or loans that could follow the deterioration of transactional partners’ financial position or of the state of affairs in a relevant country.
20
4. Consolidated Financial Statements
(1) Consolidated Balance Sheets
(Millions of yen)
See Note | Fiscal Year 2003 (As of March 31, 2004) | Fiscal Year 2004 (As of March 31, 2005) | Change | ||||||||||||||||
| Amount | % | Amount | % | Amount | |||||||||||||||
ASSETS | |||||||||||||||||||
I Current assets: | |||||||||||||||||||
1. Cash and time deposits | 21,977 | 16,395 | |||||||||||||||||
2. Trade notes and accounts receivable | 81,211 | 88,168 | |||||||||||||||||
3. Investment securities | 94,124 | 107,514 | |||||||||||||||||
4. Mortgage-backed securities | 20,000 | 20,000 | |||||||||||||||||
5. Inventories | 39,145 | 40,486 | |||||||||||||||||
6. Deferred tax assets | 16,111 | 13,826 | |||||||||||||||||
7. Other current assets | 10,891 | 13,496 | |||||||||||||||||
Allowance for doubtful accounts | D | 256 | D | 50 | |||||||||||||||
Total current assets | 283,205 | 54.27 | 299,836 | 54.86 | 16,631 | ||||||||||||||
II Non-current assets: | |||||||||||||||||||
1. Property, plant and equipment: | |||||||||||||||||||
(1) Buildings and structures | *1 | 141,605 | 141,983 | ||||||||||||||||
Less accumulated depreciation | 82,945 | 58,660 | 86,013 | 55,969 | |||||||||||||||
(2) Machinery, equipment and vehicles | *1 | 113,440 | 112,430 | ||||||||||||||||
Less accumulated depreciation | 90,465 | 22,975 | 92,724 | 19,705 | |||||||||||||||
(3) Land | *1 | 17,722 | 17,526 | ||||||||||||||||
(4) Construction in progress | 1,244 | 6,029 | |||||||||||||||||
(5) Other fixed assets | *1 | 38,582 | 38,264 | ||||||||||||||||
Less accumulated depreciation | 31,899 | 6,683 | 31,892 | 6,372 | |||||||||||||||
Total property, plant and equipment, net | 107,286 | 20.56 | 105,602 | 19.32 | D | 1,683 | |||||||||||||
2. Intangible assets: | |||||||||||||||||||
Other intangible assets, net | 7,564 | 6,796 | |||||||||||||||||
Total intangible assets, net | 7,564 | 1.45 | 6,796 | 1.24 | D | 768 | |||||||||||||
21
(Millions of yen)
See Note | Fiscal Year 2003 (As of March 31, 2004) | Fiscal Year 2004 (As of March 31, 2005) | Change | ||||||||||||||||
| Amount | % | Amount | % | Amount | |||||||||||||||
3. Investments and other assets: | |||||||||||||||||||
(1) Investment securities | *2 | 112,077 | 105,461 | ||||||||||||||||
(2) Long-term loans | 924 | 763 | |||||||||||||||||
(3) Prepaid pension costs | — | 15,493 | |||||||||||||||||
(4) Deferred tax assets | 3,437 | 3,167 | |||||||||||||||||
(5) Other assets | *2 | 7,375 | 9,756 | ||||||||||||||||
Allowance for doubtful accounts | D | 62 | D | 323 | |||||||||||||||
Total investments and other assets | 123,752 | 23.72 | 134,319 | 24.58 | 10,566 | ||||||||||||||
Total non-current assets | 238,603 | 45.73 | 246,718 | 45.14 | 8,115 | ||||||||||||||
Total assets | 521,808 | 100.00 | 546,555 | 100.00 | 24,746 | ||||||||||||||
LIABILITIES | |||||||||||||||||||
I Current liabilities: | |||||||||||||||||||
1. Trade notes and accounts payable | 14,115 | 17,182 | |||||||||||||||||
2. Short-term bank loans | *1 | 18 | 18 | ||||||||||||||||
3. Income taxes payable | 9,962 | 8,401 | |||||||||||||||||
4. Allowance for sales returns | 491 | 448 | |||||||||||||||||
5. Allowance for sales discounts | 1,488 | 1,421 | |||||||||||||||||
6. Accrued expenses and other current liabilities | 45,460 | 46,867 | |||||||||||||||||
Total current liabilities | 71,536 | 13.71 | 74,339 | 13.60 | 2,803 | ||||||||||||||
II Non-current liabilities: | |||||||||||||||||||
1. Long-term debt | *1 | 23 | 5 | ||||||||||||||||
2. Deferred tax liabilities | 679 | 9,791 | |||||||||||||||||
3. Accrued retirement and severance costs | 19,090 | 4,754 | |||||||||||||||||
4. Accrued directors’ retirement and severance costs | 2,670 | 2,200 | |||||||||||||||||
5. Other non-current liabilities | 717 | 5,318 | |||||||||||||||||
Total non-current liabilities | 23,182 | 4.44 | 22,070 | 4.04 | D | 1,112 | |||||||||||||
Total liabilities | 94,718 | 18.15 | 96,409 | 17.64 | 1,690 | ||||||||||||||
MINORITY INTERESTS | |||||||||||||||||||
Minority Interests | 4,959 | 0.95 | 1,582 | 0.29 | D | 3,377 | |||||||||||||
22
(Millions of yen)
See Note | Fiscal Year 2003 (As of March 31, 2004) | Fiscal Year 2004 (As of March 31, 2005) | Change | ||||||||||||||||||
| Amount | % | Amount | % | Amount | |||||||||||||||||
SHAREHOLDERS’ EQUITY | |||||||||||||||||||||
I Common stock | *4 | 45,246 | 8.67 | 45,246 | 8.28 | — | |||||||||||||||
II Additional paid-in-capital | 48,961 | 9.38 | 49,130 | 8.99 | 169 | ||||||||||||||||
III Retained earnings | 347,973 | 66.69 | 376,144 | 68.82 | 28,170 | ||||||||||||||||
IV Net unrealized gain on investment securities | 17,873 | 3.43 | 18,215 | 3.33 | 342 | ||||||||||||||||
V Foreign currency translation adjustments | D | 1,524 | D | 0.29 | D | 1,305 | D | 0.24 | 218 | ||||||||||||
VI Treasury stock at cost | *5 | D | 36,400 | D | 6.98 | D | 38,867 | D | 7.11 | D | 2,467 | ||||||||||
Total shareholders’ equity | 422,130 | 80.90 | 448,563 | 82.07 | 26,433 | ||||||||||||||||
Total liabilities, minority interests and shareholders’ equity | 521,808 | 100.00 | 546,555 | 100.00 | 24,746 | ||||||||||||||||
23
(2) Consolidated Statements of Income
(Millions of yen)
| Fiscal Year 2003 (For the year ended March 31, 2004) | Fiscal Year 2004 (For the year ended March 31, 2005) | Change | |||||||||||||||
| See Note | Amount | % | Amount | % | Amount | ||||||||||||
I Net sales | 322,767 | 100.00 | 328,534 | 100.00 | 5,766 | ||||||||||||
II Cost of sales | *1 | 103,474 | 32.06 | 100,834 | 30.69 | D | 2,639 | ||||||||||
Gross profit | 219,293 | 67.94 | 227,699 | 69.31 | 8,406 | ||||||||||||
III Selling, general and administrative: | |||||||||||||||||
1. Salaries and bonuses | 37,584 | 38,076 | |||||||||||||||
2. Retirement and severance costs | 4,828 | 3,429 | |||||||||||||||
3. Research and development expenses | *1 | 59,048 | 57,416 | ||||||||||||||
4. Other | 71,716 | 173,178 | 53.65 | 72,713 | 171,636 | 52.24 | D | 1,541 | |||||||||
Operating income | 46,114 | 14.29 | 56,063 | 17.06 | 9,948 | ||||||||||||
IV Non-operating income: | |||||||||||||||||
1. Interest income | 742 | 738 | |||||||||||||||
2. Dividend income | 469 | 735 | |||||||||||||||
3. Foreign exchange gains | — | 297 | |||||||||||||||
4. Other income | 1,168 | 2,380 | 0.74 | 1,023 | 2,795 | 0.85 | 415 | ||||||||||
V Non-operating expenses: | |||||||||||||||||
1. Interest expense | 1 | 1 | |||||||||||||||
2. Loss on disposal and write-down of inventories | 682 | 626 | |||||||||||||||
3. Foreign exchange losses | 568 | — | |||||||||||||||
4. Equity in net losses of affiliated companies | — | 399 | |||||||||||||||
5. Other expenses | 511 | 1,764 | 0.55 | 510 | 1,538 | 0.47 | D | 225 | |||||||||
Ordinary income | 46,731 | 14.48 | 57,320 | 17.45 | 10,589 | ||||||||||||
VI Extraordinary gains: | |||||||||||||||||
1. Realized gain on sale of investment securities | 1,331 | �� | 283 | ||||||||||||||
2. Gain on sale of land | 881 | 384 | |||||||||||||||
3. Gain from the return of the substitutional portion of the employees’ pension fund to the government | — | 11,747 | |||||||||||||||
4. Gain from the transfer to the defined contribution pension plan | — | 3,769 | |||||||||||||||
5. Gain on sale of the veterinary and livestock feed product business | *2 | — | 800 | ||||||||||||||
6. Reversal of allowance for doubtful accounts | 113 | 2,325 | 0.72 | — | 16,983 | 5.17 | 14,657 | ||||||||||
24
(Millions of yen)
| Fiscal Year 2003 (For the year ended March 31, 2004) | Fiscal Year 2004 (For the year ended March 31, 2005) | Change | ||||||||||||||||||
| See Note | Amount | % | Amount | % | Amount | |||||||||||||||
VII Extraordinary losses: | ||||||||||||||||||||
1. Restructuring charge | *3 | — | 7,316 | |||||||||||||||||
2. Impairment of investment securities | 61 | 32 | ||||||||||||||||||
3. Loss on settlement of an employee pension fund plan | *4 | — | 381 | |||||||||||||||||
4. Loss on settlement of vitamin-related anti-trust litigations | *5 | — | 111 | |||||||||||||||||
5. Loss on disposal of fixed assets | *6 | 1,387 | 1,448 | 0.45 | 1,792 | 9,633 | 2.93 | 8,184 | ||||||||||||
Net income before income taxes and minority interests | 47,608 | 14.75 | 64,670 | 19.68 | 17,062 | |||||||||||||||
Income tax expense—current | 21,465 | 17,357 | ||||||||||||||||||
Income tax expense—deferred | 953 | 22,418 | 6.95 | 11,486 | 28,843 | 8.78 | 6,425 | |||||||||||||
Minority interests in net losses of subsidiaries | D | 1,472 | D | 0.46 | D | 1,348 | D | 0.41 | 124 | |||||||||||
Net income | 26,661 | 8.26 | 37,175 | 11.32 | 10,513 | |||||||||||||||
25
(3) Consolidated Statements of Retained Earnings
(Millions of yen)
Fiscal Year 2003 (For the year ended March 31, 2004) | Fiscal Year 2004 (For the year ended March 31, 2005) | Change | ||||||||||
| See Note | Amount | Amount | Amount | |||||||||
ADDITIONAL PAID-IN CAPITAL | ||||||||||||
I Additional paid-in capital, beginning of year | 48,961 | 48,961 | — | |||||||||
II Increase in additional paid-in capital | ||||||||||||
1. Gain on reissuance of treasury stock | — | — | 169 | 169 | 169 | |||||||
III. Additional paid-in capital, end of year | 48,961 | 49,130 | 169 | |||||||||
RETAINED EARNINGS | ||||||||||||
I Retained earnings, beginning of year | 329,730 | 347,973 | 18,243 | |||||||||
II Increase in retained earnings: | ||||||||||||
1. Net income | 26,661 | 26,661 | 37,175 | 37,175 | 10,513 | |||||||
III Decrease in retained earnings: | ||||||||||||
1. Cash dividends | 8,217 | 8,071 | ||||||||||
2. Bonuses to directors | 201 | 160 | ||||||||||
3. Changes in scope of investments accounted for under the equity method | — | 8,418 | 772 | 9,004 | 586 | |||||||
IV Retained earnings, end of year | 347,973 | 376,144 | 28,170 | |||||||||
26
(4) Consolidated Statements of Cash Flows
| (Millions of yen) | |||||||||||
Fiscal Year 2003 March 31, 2004) | Fiscal Year 2004 March 31, 2005) | Change | |||||||||
| See Note | Amount | Amount | Amount | ||||||||
I Cash flows from operating activities: | |||||||||||
Net income before income taxes and minority interests | 47,608 | 64,670 | 17,062 | ||||||||
Depreciation | 17,366 | 15,946 | D | 1,419 | |||||||
Amortization of goodwill | — | 3 | 3 | ||||||||
Decrease in accrued retirement and severance costs | D | 6,003 | D | 14,807 | D | 8,803 | |||||
Increase in prepaid pension costs | — | D | 15,493 | D | 15,493 | ||||||
Interest and dividend income | D | 1,211 | D | 1,474 | D | 262 | |||||
Interest expense | 1 | 1 | 0 | ||||||||
Impairment of investment securities | 62 | 34 | D | 28 | |||||||
Loss on disposal of fixed assets | 1,387 | 1,792 | 404 | ||||||||
Loss on fines, penalties and settlements | — | 111 | 111 | ||||||||
Equity in net losses of affiliated companies | — | 399 | 399 | ||||||||
Decrease (increase) in trade notes and accounts receivable | 7,382 | D | 6,793 | D | 14,175 | ||||||
Decrease (increase) in inventories | 6,607 | D | 1,290 | D | 7,898 | ||||||
Increase (decrease) in trade notes and accounts payable | D | 158 | 3,011 | 3,170 | |||||||
Increase (decrease) in accrued expenses and other liabilities | D | 1,562 | 1,457 | 3,020 | |||||||
Other, net | D | 2,136 | 5,803 | 7,940 | |||||||
Subtotal | 69,344 | 53,373 | D | 15,970 | |||||||
Interest and dividends received | 1,208 | 1,501 | 293 | ||||||||
Interest paid | D | 1 | D | 1 | 0 | ||||||
Fines, penalties and settlements paid | D | 7 | D | 89 | D | 82 | |||||
Income taxes paid | D | 23,038 | D | 19,212 | 3,825 | ||||||
| Net cash provided by operating activities | 47,505 | 35,571 | D | 11,934 | |||||||
27
| (Millions of yen) | |||||||||||||
Fiscal Year 2003 March 31, 2004) | Fiscal Year 2004 March 31, 2005) | Change | |||||||||||
| See Note | Amount | Amount | Amount | ||||||||||
| II | Cash flows from investing activities: | ||||||||||||
Purchases of time deposits | D | 4,088 | D | 7,800 | D | 3,712 | |||||||
Proceeds from sale of time deposits | 150 | 8,267 | 8,117 | ||||||||||
Purchases of investment securities | D | 22,368 | D | 26,601 | D | 4,233 | |||||||
Proceeds from sale of investment securities | 21,682 | 25,210 | 3,527 | ||||||||||
Acquisitions of property, plant and equipment | D | 11,213 | D | 10,753 | 459 | ||||||||
Acquisitions of intangible assets | D | 1,416 | D | 2,546 | D | 1,130 | |||||||
Purchases of non-current investment securities | D | 35,798 | D | 24,443 | 11,354 | ||||||||
Proceeds from sale of non-current investment securities | 24,531 | 22,181 | D | 2,349 | |||||||||
Other, net | 1,102 | D | 5,500 | D | 6,602 | ||||||||
Net cash used in investing activities | D | 27,419 | D | 21,989 | 5,430 | ||||||||
| III | Cash flows from financing activities: | ||||||||||||
Repayment of long-term debt | D | 19 | D | 18 | 0 | ||||||||
Dividends paid | D | 8,217 | D | 8,071 | 145 | ||||||||
Purchases of treasury stock | D | 10,214 | D | 4,263 | 5,951 | ||||||||
Other, net | D | 19 | D | 15 | 3 | ||||||||
Net cash used in financing activities | D | 18,470 | D | 12,369 | 6,101 | ||||||||
| IV | Effect of exchange rate changes on cash and cash equivalents | D | 207 | 12 | 220 | ||||||||
| V | Net increase in cash and cash equivalents | 1,407 | 1,225 | D | 182 | ||||||||
| VI | Cash and cash equivalents, beginning of year | 88,938 | 90,346 | 1,407 | |||||||||
| VII | Cash and cash equivalents, end of year | 90,346 | 91,571 | 1,225 | |||||||||
28
Basis of Presentation and Summary of Significant Accounting Policies
Fiscal Year 2003
(For the year ended March 31, 2004)
1. Scope of consolidation
(1) Consolidated subsidiaries: 28
Principal consolidated subsidiaries:
In Japan
Daiichi Pure Chemicals Co., Ltd.
Daiichi Radioisotope Laboratories, Ltd.
Daiichi Fine Chemical Co., Ltd.
Saitama Daiichi Pharmaceutical Co., Ltd.
Daiichi Suntory Pharma Co., Ltd.
Overseas
Daiichi Pharmaceutical Corporation
Daiichi Pharmaceutical (Beijing) Co., Ltd.
Daiichi Pharmaceutical (China) Co., Ltd.
(2) Non-consolidated subsidiaries: 2
During the fiscal year, the Company excluded one newly established subsidiary from the scope of consolidation, and thereby increased the number of non-consolidated subsidiaries to two. Non-consolidated subsidiaries are small in size and are not material when measured by the amounts of assets, sales, net income (based on the Company’s ownership percentage), retained earnings (based on the Company’s ownership percentage), and other indicators. They have therefore been excluded from the scope of consolidation.
2. Application of the Equity Method
(1) –
(2) For the fiscal year, net income (based on the Company’s equity percentage), retained earnings (based on the Company’s equityownership percentage) and other indicators of the Company’s two non-consolidated subsidiaries and five of its 20%-50% owned affiliated companies (i.e. Aventis Pasteur-Daiichi Vaccine Co., Ltd. and 6 other companies) are not material or significant to the Company as a whole. Therefore, these companies have not been accounted for under the equity method but, rather, are rather reported in the Company’s investment account under the cost method.
(3) —
Fiscal Year 2004
(For the year ended March 31, 2005)
1. Scope of consolidation
(1) Consolidated subsidiaries: 31
Principal consolidated subsidiaries:
In Japan
Daiichi Pure Chemicals Co., Ltd.
Daiichi Radioisotope Laboratories, Ltd.
Daiichi Fine Chemical Co., Ltd.
Saitama Daiichi Pharmaceutical Co., Ltd.
Daiichi Suntory Pharma Co., Ltd.
Overseas
Daiichi Pharmaceutical Corporation
Daiichi Medical Research, Inc.
Daiichi Pharmaceutical (Beijing) Co., Ltd.
Daiichi Pharmaceutical (China) Co., Ltd.
For the fiscal year, three newly-established subsidiaries have been added to the scope of consolidation: Daiichi Pharmaceutical Corporation, Daiichi Medical Research, Inc., and Daiichi Pharmatech, Co., Ltd. Also, during the fiscal year, the former corporate name of Daiichi Pharmaceutical Corporation was changed to Daiichi Pharmaceutical Holdings, Inc.
(2) Non-consolidated subsidiaries: 3
During the fiscal year, the Company excluded one newly established subsidiary from the scope of consolidation, and thereby increased the number of non-consolidated subsidiaries to three. Non-consolidated subsidiaries are small in size and are not material when measured by the amounts of assets, sales, net income (based on the Company’s ownership percentage), retained earnings (based on the Company’s ownership percentage), and other indicators. They have therefore been excluded from the scope of consolidation.
2. Application of the Equity Method
(1) Affiliated companies accounted for under the equity method: 2
Names of principal companies:
Aventis Pasteur Daiichi Vaccine Co., Ltd., plus one other company.
Since the significance of these affiliates to the consolidated financial statements has increased, they are been included in the scope of companies accounted for under the equity method beginning this fiscal year.
(2) For the fiscal year, net income (based on the Company’s equity percentage), retained earnings (based on the Company’s equity percentage) and other indicators of the Company’s three non-consolidated subsidiaries and three of its 20%-50% owned affiliated companies are not material or significant to for the Company as a whole. Therefore, these companies have not been accounted for under the equity method but, rather, are reported in the Company’s investment accounts under the cost method.
(3) The equity method of accounting is applied on the basis of the affiliated companies’ fiscal years. One affiliated company has a fiscal year-end date that is different from the Company’s fiscal year-end.
29
Fiscal Year 2003
(For the year ended March 31, 2004)
3. Fiscal Year-end of Consolidated Subsidiaries
The fiscal year-end of the following consolidated subsidiaries is December 31: Daiichi Pharmaceutical (China) Co., Ltd.; Daiichi Pharmaceutical (Beijing) Co., Ltd.; Suntory Pharmaceutical Inc.; Suntory Pharmaceutical Holdings, Inc.; and Suntory Research Laboratories LLC.
In preparing the consolidated financial statements, the Company uses the financial statements of these companies as of their fiscal year-end. For major intervening transactions that occurred between the fiscal year-end of these companies and March 31, appropriate adjustments have been made in the consolidated financial statements.
4. Summary of Significant Accounting Policies
| (1) | Methods of Valuation of Significant Assets |
(1) Investment securities
Held-to-maturity securities: The Company reports held-to-maturity securities at an amortized cost using the straight-line method of amortization.
Available-for-sale securities
Securities with quoted market value:
The fair value method based on the quoted market value at the end of fiscal year (Unrealized holding gains/losses are reported in a component of stockholder’s equity, with costs of securities sold being calculated using the moving average method.)
Securities with no readily available market value:
Stated at cost based mainly on the moving- average method
(2) Inventories
Inventories are mainly stated at the lower of cost or market, with cost being determined by the average cost method.
| (2) | Depreciation and Amortization of Significant Depreciable Assets |
Property, plant and equipment: The Company and its domestic consolidated subsidiaries account for depreciation of property, plant and equipment based on the declining balance method. Certain overseas consolidated subsidiaries account for depreciation of property, plant and equipment under the straight-line method. The ranges of useful lives are as follows:
Buildings and structures: 38 to 50 years
Machinery, equipment and vehicles: 4 to 7 years
Intangible assets and long-term prepaid assets: The Company accounts for amortization under the straight-line method
| (3) | Method of Accounting for Significant Allowances |
(1) Allowance for Doubtful Accounts
The Company covers the risk of credit losses from potential customer defaults by providing this allowance. For normal accounts, the allowance is computed on the basis of the historical default rates. For specific over-due accounts, the allowance is based on individual account-by-account estimates of the amounts that may not be recoverable.
Fiscal Year 2004
(For the year ended March 31, 2005)
3. Fiscal Year-end of Consolidated Subsidiaries
The fiscal year-end of the following consolidated subsidiaries is December 31: Daiichi Pharmaceutical (China) Co., Ltd.; Daiichi Pharmaceutical (Beijing) Co., Ltd.; Daiichi Asubio Pharmaceuticals, Inc. ; Daiichi Asubio Holdings, Inc. ; Daiichi Asubio Medical Research Laboratories LLC.
In preparing the consolidated financial statements, the Company uses the financial statements of these companies as of their fiscal year-end. For major intervening transactions that occurred between the fiscal year-end of these companies and March 31, appropriate adjustments have been made in the consolidated financial statements.
4. Summary of Significant Accounting Policies
| (1) | Methods of Valuation of Significant Assets |
(1) Investment Securities
Held-to-maturity securities: Same as for the previous year.
Available-for-sale securities
Securities with quoted market value:
Same as for the previous year
Securities with no readily available market value:
Same as for the previous year
(2) Inventories
Same as for the previous year
| (2) | Depreciation and Amortization of Significant Depreciable Assets |
Properly, plant and equipment: Same as for the previous year
Intangible assets and long-term prepaid assets: Same as for the previous year
| (3) | Method of Accounting for Significant Allowances |
(1) Allowance for Doubtful Accounts
Same as for the previous year
30
Fiscal Year 2003
(For the year ended March 31, 2004)
(2) Allowance for Sales Returns
To prepare for losses on potential returns of products after fiscal year-end, the Company provides for an amount equal to the sum of gross profits and inventory losses on such returned products, based on its estimates of possible sales returns.
For the fiscal year, the Company’s sales return provision in the amount of ¥6 million was included in cost of sales.
(3) Allowance for Sales Discounts
To prepare for future sales discounts, the Company provides for this allowance calculated by multiplying an estimated sales discount percentage for the period by the amounts of accounts receivable from and inventories held by wholesalers at fiscal year-end.
(4) Accrued Retirement and Severance Costs
To prepare for future payments of employee retirement and severance benefits, the Company provides for an accrual based on estimated projected benefit obligations and plan assets at the end of fiscal year. Prior service cost is amortized under the straight-line method over a period of 10 years, which is equal to or less than the estimated average remaining years of service of the eligible employees when the prior year service cost was incurred.
Actuarial gains and losses are amortized based on the straight-line method, beginning in the fiscal year following the year in which such gain or loss was initially measured, over a period of 10 years, which is equal to or less than the average remaining years of service of the eligible employees when the actuarial gain or loss occurred.
Supplemental Information
Accompanying the enactment of the Contributed Benefit Pension Law, the Company received an approval of exemption from the Minister of Health, Labor and Welfare, on January 26, 2004, from the obligation for pension payment liabilities related to future employee service with respect to the substitutional portion of its Employees’ Pension Fund.
As of fiscal year-end, the estimated amount to be returned (based the minimum reserve obligations) to the government was ¥20,557 million. Had such amount (based on the minimum reserve obligations) been returned at the end of this fiscal year, in accordance with the provisions of Article 44-2 of the “Practice Guidelines of Accounting for Retirement Benefits” (Interim Report) (Report No. 13 of the Accounting Systems Committee of the Japan Institute of Certified Public Accountants), a gain (extraordinary gain) from the return of the Employees’ Pension Fund amounting to ¥10,995 million would have been recorded.
Fiscal Year 2004
(For the year ended March 31, 2005)
(2) Allowance for Sales Returns
To prepare for losses on potential returns of products after fiscal year-end, the Company provides for an amount equal to the sum of gross profits and inventory losses on such returned products, based on its estimates of possible sales returns.
For the fiscal year, the Company’s reversal of sales return provision in the amount of ¥43 million was deducted from cost of sales.
(3) Allowance for Sales Discounts
Same as for the previous fiscal year
(4) Accrued Retirement and Severance Costs
To prepare for future payments of employee retirement and severance benefits, the Company provides for an accrual based on estimated projected benefit obligations and plan assets at the end of fiscal year.
Prior service cost is amortized under the straight-line method over a period of 10 years, which is equal to or less than the estimated average remaining years of service of the eligible employees when the prior service cost was incurred.
Actuarial gain and loss are amortized based on the straight-line method, beginning in the fiscal year following the year in which such gain or loss was initially measured, over a period of 10 years, which is equal to or less than the average remaining years of service of the eligible employees when the actuarial gain or loss occurred.
Supplementary Information
Accompanying the enactment of the Contribute Benefit Pension Law, the Company received an approval of exemption from the Minister of Health, Labour and Welfare, on January 1, 2005, from the obligation for pension payment liabilities related to past employee service with respect to the substitutional portion of its Employees’ Pension Fund.
For the fiscal year, as a result, the Company recognized an extraordinary gain of ¥11,747 million from the return of the substitutional portion of the employees’ pension fund to the government.
In addition, accompanying the enactment of the Defined Contribution Pension Plans Law, the Company and certain of its domestic consolidated subsidiaries transferred a portion of their lump-sum retirement benefit plans to a defined contribution pension plan, which was accounted for under the provisions of “Accounting for Transitions between Retirement Benefit Plans” (Corporate Accounting Guidelines No. 1).
This change in retirement benefit arrangement resulted in an extraordinary gain of ¥3,769 million for the fiscal year.
31
Fiscal Year 2003
(For the year ended March 31, 2004)
(5) Director’s Retirement and Severance Benefits
To prepare for payments of directors’ retirement and severance benefits, the Company and its domestic consolidated subsidiaries provide for an amount equal to the total benefits that would have been payable at the end of fiscal year, in accordance with the internal guidelines, had all directors resigned voluntarily.
| (4) | Translation of Significant Assets and Liabilities Denominated in Foreign Currencies into Yen |
Receivables and payables denominated in foreign currencies are translated into yen at the exchange rates prevailing at the end of fiscal year, with translation gains or losses currently recognized in earnings. The assets and liabilities of overseas consolidated subsidiaries are translated into yen at the exchange rates prevailing at the balance sheet dates. Income and expenses are translated into yen at the average exchange rates prevailing over the fiscal year, with translation gains or losses recorded in minority interests and foreign currency translation adjustment in the shareholders’ equity section of the balance sheet.
| (5) | Accounting for Significant Lease Transactions |
Finance lease transactions are accounted for using the same method applied to operating lease transactions, with an exception for those finance leases in which the legal title of the underlying property is transferred from the lessor to the lessee.
| (6) | Significant Hedge Accounting Method |
| (a) | Hedge Accounting Method |
The Company employs the deferral method of hedge accounting. Forward foreign exchange contracts that meet certain hedge criteria are accounted for as a hedge of underlying assets and liabilities.
| (b) | Hedging Instruments and Hedged Items |
Hedging Instruments: Forward foreign exchange contracts and other
Hedged Items: Assets denominated in foreign currencies
| (c) | Hedge Policy |
The Company hedges foreign exchange rate fluctuation risks in accordance with its internal policies.
| (d) | Method of Assessing Hedge Effectiveness |
Based on its internal policies, the Company evaluates the effectiveness of hedges by examining the correlations between its hedging instruments and hedged items as a result of fluctuations of foreign currency exchange rates and confirms the effectiveness of its hedge relationship.
| (7) | Consumption Tax Accounting Method |
The tax-exclusion method is used to account for the national and local consumption taxes.
5. Valuation Method for Assets and Liabilities of Acquired in Business Combinations
All assets and liabilities of an acquired business that becomes a consolidated subsidiary are valued on a full fair value basis without taking into account minority interests’ share in such assets and liabilities.
6. Amortization of Goodwill
Goodwill recorded in the consolidated financial statements is generally amortized on a straight-line basis over a period of five years.
Fiscal Year 2004
(For the year ended March 31, 2005)
(5) Director’s Retirement and Severance Benefits
Same as for the previous fiscal year
| (4) | Translation of Significant Assets and Liabilities Denominated in Foreign Currencies into Yen |
Same as for the previous year
| (5) | Accounting for Significant Lease Transactions |
Same as for the previous year
| (6) | Significant Hedge Accounting Method |
(a) Hedge Accounting Method
Same as for the previous year
(b) Hedging Instruments and Hedged Items
Same as for the previous year
(c) Hedge Policy
Same as for the previous year
(d) Method for Assessing Hedge Effectiveness
Same as for the previous year
| (7) | Consumption Tax Accounting Method |
Same as for the previous year
5. Valuation Method for Assets and Liabilities Acquired in Business Combinations
Same as for the previous year
6. Amortization of Goodwill
Same as for the previous year
32
Fiscal Year 2003
(For the year ended March 31, 2004)
7. Appropriations of Retained Earnings
The consolidated statements of retained earnings are prepared based on the appropriations of retained earnings approved during the fiscal year.
8. Definition of Cash and Cash Equivalents in the Consolidated Statements of Cash Flows
Cash and cash equivalents in the consolidated statements of cash flows consists of the following: cash in hand, deposits that can be withdrawn upon demand, and highly liquid short-term investments that are readily convertible to cash with little risk of fluctuation in value, and that mature within three months from the dates of acquisition.
Fiscal Year 2004
(For the year ended March 31, 2005)
7. Appropriations of Retained Earnings
Same as for the previous year
8. Definition of Cash and Cash Equivalents in the Consolidated Statements of Cash Flows
Same as for the previous year
33
Notes to Consolidated Financial Statements
(Notes to Consolidated Balance Sheets)
Fiscal Year 2003
(As of March 31, 2004)
*1. Pledged assets and secured liabilities
Assets pledged as collateral and secured liabilities were as follows:
| (Millions of yen) | |||||
Pledged assets: | |||||
Buildings and structures | 463 | (463 | ) | ||
Machinery, equipment and vehicles | 289 | (289 | ) | ||
Land | 724 | (724 | ) | ||
Other fixed assets | 27 | (27 | ) | ||
Total | 1,505 | (1,505 | ) | ||
Secured liabilities: | |||||
Short-term bank loans | 17 | (17 | ) | ||
Long-term debt | 17 | (17 | ) | ||
Figures in parentheses indicate factory foundation mortgaged assets and related secured borrowings that are included in the figures on the left.
*2. Amounts related to non-consolidated subsidiaries and affiliated companies were as follows:
| (Millions of yen | ) | ||
Investment securities | 438 | ||
3. Contingent Liabilities
(1) The Company guarantees the following debts and other obligations owed to financial institutions | |||
| (Millions of yen | ) | ||
Guarantees provided on employees’ housing loans, etc | 3,326 | ||
(2) Trade export notes receivable discounted | 198 | ||
*4. The Company’s common stock issued at the end of fiscal year was 286,453,235 shares.
*5. Treasury stock owned by the Company at the end of fiscal year was 16,753,009 shares of common stock.
6. Committed Lines of Credit
To facilitate the efficient raising of working capital, the Company maintains committed lines of credit with four financial institutions. The unused balance of credit lines under these commitments at fiscal year-end was as follows:
| (Millions of yen | ) | ||
Total amount of committed credit lines | 30,000 | ||
Less amount borrowed against credit lines | — | ||
Credit lines unused | 30,000 | ||
Fiscal Year 2004
(As of March 31, 2005)
*1. Pledged assets and secured liabilities
Assets pledged as collateral and secured liabilities were as follows:
| (Millions of yen) | |||||
Pledged assets: | |||||
Buildings and structures | 426 | (426 | ) | ||
Machinery, equipment and vehicles | 264 | (264 | ) | ||
Land | 724 | (724 | ) | ||
Other fixed assets | 26 | (26 | ) | ||
Total | 1,441 | (1,441 | ) | ||
Secured liabilities: | |||||
Short-term bank loans | 17 | (17 | ) | ||
Figures in parentheses indicate factory foundation mortgaged assets and related secured borrowings that are included in the figures on the left.
*2. Amounts related to non-consolidated subsidiaries and affiliated companies were as follows:
| (Millions of yen | ) | ||
Investment securities | 87 | ||
Other assets (advances) | 600 | ||
3. Contingent Liabilities
(1) The Company guarantees the following debts and other obligations owed to financial institutions | |||
| (Millions of yen | ) | ||
Guarantees provided on employees housing loans, etc | 2,737 | ||
Aventis Pasteur-Daiichi vaccines Co., Ltd. | 350 | ||
(2) The trade export notes receivable discounted | 78 | ||
*4. The Company’s common stock issued at the end of fiscal was 286,453,235 shares.
*5. Treasury stock owned by the Company at the end of fiscal year was 18,049,212 shares of common stock.
6. Commitment Lines
To facilitate the efficient raising of working capital, the Company maintains committed lines of credit with four financial institutions. The unused balance of credit lines under these commitments at fiscal year-end was as follows:
| (Millions of yen | ) | ||
Total amount of committed credit lines | 30,000 | ||
Less amount borrowed against credit lines | — | ||
Credit lines unused | 30,000 | ||
34
(Notes to Consolidated Statements of Income)
Fiscal Year 2003
(For the year ended March 31, 2004)
*1. Research and development expenses included in selling, general and administrative expenses and manufacturing overhead costs were ¥60,720 million.
*2. –
*3. –
*4. –
*5. –
*6. The breakdown of losses on sale of fixed assets was as follows:
| (Millions of yen | ) | ||
Buildings and structures | 552 | ||
Machinery, equipment and vehicles | 673 | ||
Other fixed assets | 160 | ||
Fiscal Year 2004
(For the year ended March 31, 2005)
*1. Research and development expenses included in selling, general and administrative expenses and manufacturing overhead costs were ¥58,605 million.
*2. A gain on sale of the veterinary and livestock feed product business was recognized as a result of sale of the domestic distribution rights and other intangibles related to its veterinary and livestock feed product business to a third-party.
*3. A restructuring charge was recorded for the one-time termination benefits provided to certain employees who were involuntarily transferred from the Company to a newly established wholly-owned subsidiary, Daiichi Pharmatech Co., Ltd.
*4. The loss on settlement of an employee pension fund represented a one-time payment made by a consolidated subsidiary to settle its participation in a multi-employer Employee Pension Fund plan.
*5. The loss on settlement of vitamin-related anti-trust litigations was related to a settlement of a part of the civil anti-trust class-action damage claims in connection with the Company’s vitamin transactions.
*6. The breakdown of losses on sale of fixed assets was as follows:
| (Millions of yen | ) | ||
Buildings and structures | 884 | ||
Machinery, equipment and vehicles | 267 | ||
Other fixed assets | 639 | ||
(Notes to Consolidated Statements of Cash Flows)
Fiscal Year 2003
(For the year ended March 31, 2004)
*Reconciliation of cash and cash equivalents at fiscal year-end with balance sheet accounts:
| (As of March 31, 2004 | ) | |||
| (Millions of yen) | ||||
Cash and time deposits | 21,977 | |||
Less time deposits with maturities extending over three months | D | 2,513 | ||
Add short-term investments with maturities within three months | 70,881 | |||
Cash and cash equivalents | 90,346 | |||
Fiscal Year 2004
(For the year ended March 31, 2005)
*Reconciliation of cash and cash equivalents at fiscal year-end with balance sheet accounts:
| (As of March 31, 2005 | ) | |||
| (Millions of yen) | ||||
Cash and time deposits | 16,395 | |||
Less time deposits with maturities extending over three months | D | 579 | ||
Add short-term investments with maturities within three months | 75,755 | |||
Cash and cash equivalents | 91,571 | |||
35
Proforma Lease Information
Fiscal Year 2003
(For the year ended March 31, 2004)
Finance lease transactions, excluding those that transfer the legal title to the leased property to the lessee
(1) Amounts representing the acquisition costs of the leased assets, accumulated amortization, and net book value, at the end of the fiscal year, had those leases been accounted for as capital leases
| (Millions of yen) | ||||||
| Acquisition costs | Accumulated amortization | Net book value | ||||
Machinery, equipment and vehicles | 1,045 | 453 | 592 | |||
Other fixed assets | 9,930 | 5,936 | 3,994 | |||
Total | 10,976 | 6,389 | 4,586 | |||
(2) Amounts representing capital lease obligations, at the end of fiscal year, had those leases been accounted for as capital leases
| (Millions of yen) | ||
Due within one year | 2,037 | |
Due after one year | 2,549 | |
Total | 4,586 | |
Note: The Company included an interest component of the lease payments in the amounts representing each of the acquisition costs of the leased assets and the capital lease obligations, since the ratio of the lease obligations at the end of fiscal year to the net book value of capitalized leased assets at the end of fiscal year is low.
(3) Comparison of lease expense recorded in the consolidated statements of income and the depreciation expense that would have been recorded, had those leases been accounted for as capital leases
| (Millions of yen) | ||
Lease expense | 2,192 | |
Depreciation expense | 2,192 | |
(4) Depreciation method for computing the amount representing depreciation expense
The amount representing depreciation expense was computed as if the capitalized leased assets had been amortized on a straight-line basis over the lease terms with no residual value at the end of leases.
Fiscal Year 2004
(For the year ended March 31, 2005)
Finance lease transactions, excluding those that transfer the legal title to the leased property to the lessee
(1) Amounts representing to the acquisition costs of the leased assets, accumulated amortization, and net book value at the end of the fiscal year, had those leases been accounted for as capital leases
| (Millions of yen) | ||||||
| Acquisition costs | Accumulated amortization | Net book value | ||||
Machinery, equipment and vehicles | 1,100 | 506 | 594 | |||
Other fixed assets | 9,711 | 6,232 | 3,478 | |||
Total | 10,811 | 6,738 | 4,073 | |||
(2) Amounts representing capital lease obligations, at the end of fiscal year, had those leases been accounted for as capital leases
| (Millions of yen) | ||
Due within one year | 1,869 | |
Due after one year | 2,204 | |
Total | 4,073 | |
Note: Same as for the previous year.
(3) Comparison of lease expense recorded in the consolidated statements of income and the depreciation expense that would have been recorded, had those leases been accounted for as capital leases
| (Millions of yen) | ||
Lease expense | 2,366 | |
Depreciation expense | 2,366 | |
(4) Depreciation method for computing the amount representing depreciation expense
Same as for the previous year
36
(2) Investment Securities
1. Marketable Held-to-Maturity Securities
| (Millions of yen) | ||||||||||||||
Type of securities | Fiscal Year 2003 (As of March 31, 2004) | Fiscal Year 2004 (As of March 31, 2005) | ||||||||||||
| Carrying value | Market value | Difference | Carrying value | Market value | Difference | |||||||||
Securities with market values greater than balance sheet carrying value | ||||||||||||||
(1) National and local government bonds | 9 | 9 | 0 | — | — | — | ||||||||
(2) Corporate bonds | 21,530 | 21,653 | 123 | 29,332 | 29,492 | 160 | ||||||||
(3) Other securities | — | — | — | — | — | — | ||||||||
Subtotal | 21,540 | 21,663 | 123 | 29,332 | 29,492 | 160 | ||||||||
Securities with market values at or less than balance sheet carrying value | ||||||||||||||
(1) National and local government bonds | — | — | — | — | — | — | ||||||||
(2) Corporate bonds | 46,108 | 45,508 | D | 599 | 39,409 | 39,022 | D | 387 | ||||||
(3) Other securities | — | — | — | — | — | — | ||||||||
Subtotal | 46,108 | 45,508 | D | 599 | 39,409 | 39,022 | D | 387 | ||||||
Total | 67,648 | 67,171 | D | 476 | 68,742 | 68,514 | D | 227 | ||||||
37
2. Marketable Available-for-sale Securities
| (Millions of yen) | ||||||||||||||
| Fiscal Year 2003 (As of March 31, 2004) | Fiscal Year 2004 (As of March 31, 2005) | |||||||||||||
Type of securities | Acquisition cost | Carrying value | Difference | Acquisition cost | Carrying value | Difference | ||||||||
Securities with balance sheet carrying values greater than acquisition cost | ||||||||||||||
(1) Equity securities | 27,486 | 57,733 | 30,247 | 26,285 | 56,955 | 30,669 | ||||||||
(2) Debt securities | ||||||||||||||
(1) National and local government bonds | — | — | — | — | — | — | ||||||||
(2) Corporate bonds | 120 | 133 | 13 | 1,120 | 1,176 | 56 | ||||||||
(3) Other securities | — | — | — | — | — | — | ||||||||
(3) Other | 2,310 | 2,731 | 420 | 2,412 | 2,859 | 446 | ||||||||
Subtotal | 29,916 | 60,598 | 30,681 | 29,818 | 60,990 | 31,172 | ||||||||
Securities with balance sheet carrying values at or less than acquisition cost | ||||||||||||||
(1) Equity securities | 85 | 79 | D | 5 | 606 | 496 | D | 109 | ||||||
(2) Debt securities | ||||||||||||||
(1) National and local government bonds | — | — | — | — | — | — | ||||||||
(2) Corporate bonds | — | — | — | — | — | — | ||||||||
(3) Other securities | — | — | — | — | — | — | ||||||||
(3) Other | 3,405 | 2,918 | D | 486 | 3,260 | 2,840 | D | 419 | ||||||
Subtotal | 3,490 | 2,998 | D | 492 | 3,866 | 3,337 | D | 529 | ||||||
Total | 33,407 | 63,596 | 30,189 | 33,685 | 64,328 | 30,643 | ||||||||
Notes: Impairment losses for marketable available-for-sale securities are classified and computed as follows:
| (1) | An impairment loss is generally recognized on securities whose market value has declined 50% or more from the acquisition cost as of the beginning of fiscal year. Exceptions are allowed when there were justifiable reasons. |
| (2) | For securities whose market value has declined more than 30% but less than 50% from the acquisition cost as of the beginning of fiscal year, after due consideration of the possibility of recovery in market value of individual securities, an impairment loss is recognized on those securities that are not judged likely to recover in value. |
| (3) | An impairment loss is not generally recognized on those securities whose market value has declined less than 30% from the acquisition cost as of the beginning of fiscal year. |
3. Available- for- Sale Securities Sold during the Current Fiscal Year and the Prior Fiscal Year
| (Millions of yen) | ||||||||||
| Fiscal Year 2003 (For the year ended March 31, 2004) | Fiscal Year 2004 (For the year ended March 31, 2005) | |||||||||
| Amount of sale | Amount of gains | Amount of losses | Amount of sale | Amount of gains | Amount of losses | |||||
| 2,793 | 1,331 | — | 1,935 | 283 | 27 | |||||
38
4. Securities with No Readily Available Market Values and Their Carrying Value in the Consolidated Balance Sheets
| (Millions of yen | ) | ||||
| Fiscal Year 2003 (As of March 31, 2004) | Fiscal Year 2004 (As of March 31, 2005) | ||||
| Carrying value | Carrying value | ||||
(1) Held-to-maturity securities | |||||
Certificates of deposit | — | 20,000 | |||
Commercial paper | 46,486 | 47,492 | |||
(2) Available-for-sale securities | |||||
MMF, FFF, and medium-term government bond funds | 24,395 | 8,263 | |||
Foreign fund securities | — | 1,000 | |||
Non-marketable equity securities, excluding OTC traded stocks | 2,636 | 2,061 | |||
Preferred securities | 1,000 | 1,000 | |||
5. Maturity Schedule of Available-for-Sale Securities with Maturity Dates and Held-to-Maturity Securities
| (Millions of yen) | ||||||||||||||||
| Fiscal Year 2003 (As of March 31, 2004) | Fiscal Year 2004 (As of March 31, 2005) | |||||||||||||||
| Within one year | More than one to five years | More than five to 10 years | More than 10 years | Within one year | More than one to five years | More than five to 10 years | More than 10 years | |||||||||
1. Debt securities | ||||||||||||||||
(1) National and local government bonds | 9 | — | — | — | — | — | — | — | ||||||||
(2) Corporate bonds | 23,232 | 23,406 | 13,000 | 8,000 | 31,758 | 22,983 | 14,000 | — | ||||||||
(3) Other | 46,486 | — | — | — | 67,492 | — | — | — | ||||||||
2. Other securities | — | 120 | 2,387 | — | — | 2,359 | — | — | ||||||||
Total | 69,728 | 23,526 | 15,387 | 8,000 | 99,250 | 25,342 | 14,000 | |||||||||
39
(3) Derivative Transactions
Fiscal Year 2003 (For the year ended March 31, 2004)
1. Descriptions of Transactions
The Company does not currently use derivative instruments other than foreign currency forward contracts and currency options entered into for hedging purposes. Foreign currency forward contracts involve risks associated with fluctuations in foreign currency exchange rates. The counterparties to such transactions are all banking institutions with high credit ratings. Accordingly, the risk of nonperformance by counterparties on foreign currency forward contracts is considered virtually nonexistent.
Basic principles regarding the use of derivative instruments have been set by the Board of Directors, and the Company has established the internal policies specifying those officers with authority over derivative transactions and upper limits on such transactions. The Company’s Finance and Accounting Department is responsible for executing and maintaining controls over derivative transactions. The department periodically reports such transactions to the Board of Directors.
Under the Company’s internal policies, the effectiveness of the use of derivatives as a hedge is evaluated by examining the correlations between the hedging instruments and the hedged items due to fluctuations in foreign currency exchange rates.
2. Fair Value of Derivative Transactions
Not applicable, as the Company applies deferred hedge accounting and Derivative transactions directly applied to foreign currency denominated assets are excluded from the disclosure requirements under the “Accounting Standards for Foreign Currency Denominated Transactions.”
Fiscal Year 2004 (For the year ended March 31, 2005)
1. Descriptions of Transactions
Same as for the previous year
2. Fair Value of Derivative Transactions
Same as for the previous year
(4) Retirement Benefit
1. Summary of the Company’s Retirement Benefits Arrangements
Previously, the Company had maintained: an Employees’ Pension Fund plan and a lump-sum retirement benefit plan, both of which were a defined benefit arrangements. However, on January 1, 2005, the Company received an approval of exemption from the Minister of Health, Labour and Welfare from the obligation for retirement benefit payments related to past employee service with respect to the government the substitutional portion of its Employees’ Pension Fund. In addition, domestic consolidated subsidiaries had previously maintained various defined benefit retirement arrangements including Tax Qualified Pension plans (adopted by 10 consolidated subsidiaries) and lump-sum retirement benefit plans.
Daiichi Pharmaceuticals Co., Ltd. and certain domestic group companies (10 consolidated subsidiaries), upon obtaining an approval of exemption from the obligation related to past employee service with respect to the substitutional portion of the Daiichi Pharmaceutical Employees’ Pension Fund, beginning on January 1, 2005, unified their retirement benefit arrangements. With an exception of certain lump-sum retirement benefit plans, the Company’s various retirement benefit arrangements have been transformed into a single group arrangement comprising a Defined Benefit Corporate Pension plan and a Defined Contribution Pension plan.
Also, under certain circumstances, when employees retire or otherwise leave the Company, additional retirement benefits may be paid.
Please note that certain of the Group’s overseas consolidated subsidiaries also maintain defined benefit pension plans.
40
2. Components of Retirement Benefit Obligations
| (Millions of yen | ) | ||||||
| Fiscal Year 2003 As of March 31, 2004 | Fiscal Year 2004 As of March 31, 2005 | ||||||
a. Projected benefit obligations | D | 108,152 | D | 82,986 | |||
b. Fair value of pension plan assets | 74,845 | 83,197 | |||||
c. Under-funded projected benefit obligations (a+b) | D | 33,306 | 210 | ||||
d. Unamortized transition obligations | — | — | |||||
e. Unrecognized actuarial loss | 18,520 | 8,965 | |||||
f. Unrecognized prior service cost (benefit) | D | 4,304 | 1,563 | ||||
g. Net pension liabilities recognized in the consolidated balance sheets (c+d+e+f) | D | 19,090 | 10,739 | ||||
h. Prepaid pension costs | — | 15,493 | |||||
i. Accrued retirement and severance costs (g-h) | D | 19,090 | D | 4,754 | |||
Notes:
| 1. | The above figures include the substitutional portion of the Employees’ Pension Fund. |
| 2. | Certain of the Company’s subsidiaries use the vested benefit method in computing retirement and severance obligations. |
| 3. | The effects of the transfer of a portion of the lump-sum retirement benefit plans to a defined contribution pension plan was as follows: |
| (Millions of yen | ) | |||
Decrease in projected benefit obligations | 11,779 | |||
Unrecognized actuarial loss | D | 1,334 | ||
Unrecognized prior service benefit | 3,852 | |||
Decrease in accrued retirement and severance costs | 14,297 | |||
The transfer of plan assets to be transferred to the defined contribution pension plan amounted to ¥10,528 million. The transfer is scheduled to take place over the next four-year period. The amount of the plan assets not yet transferred was to ¥6,744 million at the end of this fiscal year, which is included in Other Payables (accrued expenses and other current liabilities and Long-term Payables (other non-current liabilities) in the accompanying consolidated balance sheets.
3. Employees’ Retirement and Severance Costs
| (Millions of yen | ) | ||||||
Fiscal Year 2003 (For the year ended March 31, 2004) | Fiscal Year 2004 (For the year ended March 31, 2005) | ||||||
a. Service costs-benefits earned during the year | 4,158 | 3,463 | |||||
b. Interest cost | 2,668 | 2,381 | |||||
c. Expected return on plan assets | D | 1,559 | D | 1,994 | |||
d. Amortization of transition obligations | — | — | |||||
e. Amortization of actuarial loss | 2,977 | 2,156 | |||||
f. Amortization of prior service costs | D | 251 | D | 1,014 | |||
g. Net periodic retirement and severance costs (a+b+c+d+e+f) | 7,992 | 4,993 | |||||
h. Gain from the return of the substitutional portion of the Employees’ Pension Fund to the government | — | D | 11,747 | ||||
i. Loss on settlement of an Employees’ Pension Fund plan | — | 381 | |||||
j. Gain from the transfer to the defined contribution pension plan | — | D | 3,769 | ||||
k. Restructuring charge | — | 7,316 | |||||
l. Other | — | 199 | |||||
Total (g+h+i+j+k+l) | 7,992 | D | 2,625 | ||||
Notes:
| 1. | Employee contributions to the Employees’ Pension Fund are excluded from the above figures. |
| 2. | Retirement and severance costs of consolidated subsidiaries that are computed under the vested benefit method are included in “a. Service costs-benefits earned during the year.” |
| 3. | The Restructuring charge was related to the payments of additional one-time termination benefits to the employees who were transferred to Daiichi Pharmatech Co., Ltd., which was established through a split-off of three domestic manufacturing plants of the Company. |
| 4. | Other represented the Company’s contributions to the defined contribution pension plan and prepayments of retirement benefits to certain employees under the retirement benefit prepayment arrangement. |
41
4. Principal Assumptions for Computing Retirement Benefit Obligations
Fiscal Year 2003 | Fiscal Year 2004 | |||
a. Method for inter-period allocation of expected retirement costs | Straight-line method | Same as for the previous year | ||
b. Discount rate | Mainly 2.5% | Same as for the previous year | ||
c. Expected return on plan assets | Mainly 3.0%
| Same as for the previous year | ||
d. Amortization period of prior service costs | Mainly 10 years (amortized under the straight-line method over a period not exceeding the average remaining years of service of the eligible employees when such prior service cost was incurred) | Same as for the previous year | ||
e. Amortization period of actuarial gain and loss | Mainly 10 years (amortized beginning in the fiscal year following the year in which such actuarial gain or loss was first measured under the straight-line method over a period not exceeding the average remaining years of services of the eligible employees when the actuarial gain or loss occurred) | Same as for the previous year | ||
(5) Deferred Income Taxes
1. Principal Components of Deferred Tax Assets and Liabilities
(Millions of yen)
| Fiscal Year 2003 (As of March 31, 2004) | Fiscal Year 2004 (As of March 31, 2005) | |||||
Deferred tax assets: | ||||||
Depreciation | 9.528 | 11,163 | ||||
Advance payments (for contract research and development, etc.) | 6,791 | 5,435 | ||||
Accrued expenses | 4,282 | 4,544 | ||||
Payables to the defined contribution pension plan | — | 2,626 | ||||
Accrued retirement and severance costs | 5,610 | 1,553 | ||||
Inventories (unrealized profit and valuation losses) | 1,701 | 1,290 | ||||
Impairment losses on investment securities | 1,326 | 776 | ||||
Enterprise taxes payable | 1,015 | 707 | ||||
Other | 5,835 | 7,635 | ||||
Subtotal | 36,092 | 35,731 | ||||
Valuation allowance | D | 2,518 | D | 6,637 | ||
Total deferred tax assets | 33,573 | 29,094 | ||||
Deferred tax liabilities: | ||||||
Unrealized gain on available-for-sale securities | D | 12,225 | D | 12,419 | ||
Prepaid pension costs | — | D | 6,866 | |||
Deferred gain on sale of fixed assets | D | 2,456 | D | 2,588 | ||
Reserve for additional depreciation | D | 23 | D | 17 | ||
Total deferred tax liabilities | D | 14,705 | D | 21,892 | ||
Net deferred tax assets | 18,868 | 7,202 | ||||
Note: Net deferred tax assets are included under the following balance sheet captions:
| Fiscal Year 2003 (As of March 31, 2004) | Fiscal Year 2004 (As of March 31, 2005) | |||||
Current assets-deferred tax assets | 16,111 | 13,826 | ||||
Non-current assets-deferred tax assets | 3,437 | 3,167 | ||||
Current liabilities-deferred tax liabilities | — | — | ||||
Non-current liabilities-deferred tax liabilities | D | 679 | D | 9,791 | ||
42
2. Reconciliation between the statutory tax rate and the Company’s effective tax rates after application of deferred tax accounting
| ( | %) | ||||||
| Fiscal Year 2003 (As of March 31, 2004) | Fiscal Year 2004 (As of March 31, 2005) | ||||||
Statutory tax rate | 41.8 | 40.5 | |||||
(Adjustments) | |||||||
Non-deductible permanent differences including entertainment and other expenses | 4.2 | 3.2 | |||||
Deductible permanent differences including dividend received deductions and other items | D | 0.7 | D | 0.5 | |||
Per capita inhabitants’ taxes | 0.3 | 0.2 | |||||
Tax credit for research and development expenses | D | 6.2 | D | 4.2 | |||
Other | 7.7 | 5.4 | |||||
Effective tax rate | 47.1 | 44.6 | |||||
43
(6) Segment Information
a. Information by Business Segment
Information by business segment on a consolidated basis for the most recent two fiscal years is as follows:
| Fiscal Year 2003 (For the year ended March 31, 2004) | |||||||||||
| Pharmaceutical business (Millions of yen) | Other (Millions of yen) | Total (Millions of yen) | Eliminations and corporate (Millions of yen) | Consolidated (Millions of yen) | |||||||
I. Sales and operating income | |||||||||||
Net sales | |||||||||||
(1) Outside customers | 304,564 | 18,203 | 322,767 | — | 322,767 | ||||||
(2) Inter-segment | 1,301 | 2,452 | 3,753 | (3,753 | ) | — | |||||
Total sales | 305,865 | 20,655 | 326,521 | (3,753 | ) | 322,767 | |||||
Operating expenses | 252,738 | 20,590 | 273,328 | 3,323 | 276,652 | ||||||
Operating income | 53,126 | 65 | 53,192 | (7,077 | ) | 46,114 | |||||
II. Assets, depreciation, and capital expenditures Assets | 270,308 | 29,575 | 299,883 | 221,924 | 521,808 | ||||||
Depreciation | 15,550 | 1,743 | 17,293 | 72 | 17,366 | ||||||
Capital expenditures | 10,899 | 1,347 | 12,247 | 66 | 12,314 | ||||||
Notes:
| 1. | Method of classifying segments |
The business segments of the Company and its consolidated subsidiaries are the pharmaceutical business, which is the principal business of the Company, and other, which is businesses other than the pharmaceutical business.
| 2. | Principal products by business segment |
Business segment | Principal products | |||
| Pharmaceutical business | Pharmaceutical products, diagnostic and radiopharmaceutical products, over-the-counter drugs, and veterinary and livestock feed products | |||
| Fine chemicals | Bulk vitamins, chemical products, industrial chemicals and other | |||
| Other | Safety testing and research | Contract research and development | ||
| Other | Real estate rental and other | |||
| 3. | Included in operating expenses under elimination and corporate was ¥6,975 million that could not be allocated to business segments. These expenses consisted mainly of the expenses of the administrative departments of the parent company. |
| 4. | Included in assets under elimination and corporate was ¥221,214 million in corporate assets. These assets were comprised mainly of excess working capital funds under management of the parent company (cash, short-term investments and other), long-term investments (investment securities) and assets used by the administrative departments of the parent company. |
44
Fiscal Year 2004 (For the year ended March 31, 2005) | ||||||||||||
| Pharmaceutical business (Millions of yen) | Other (Millions of yen) | Total (Millions of yen) | Eliminations and corporate (Millions of yen) | Consolidated (Millions of yen) | ||||||||
I. Sales and operating income | ||||||||||||
Net sales | ||||||||||||
(1) Outside customers | 311,844 | 16,689 | 328,534 | — | 328,534 | |||||||
(2) Inter-segment | 73 | 2,783 | 2,857 | (2,857 | ) | — | ||||||
Total sales | 311,917 | 19,473 | 331,391 | (2,857 | ) | 328,534 | ||||||
Operating expenses | 247,821 | 19,552 | 267,373 | 5,096 | 272,470 | |||||||
Operating income | 64,096 | D | 78 | 64,017 | (7,953 | ) | 56,063 | |||||
II. Assets, depreciation, and capital expenditures | ||||||||||||
Assets | 288,227 | 28,768 | 316,996 | 229,529 | 546,525 | |||||||
Depreciation | 14,342 | 1,518 | 15,861 | 85 | 15,946 | |||||||
Capital expenditures | 12,937 | 1,747 | 14,684 | 113 | 14,798 | |||||||
Notes:
| 1. | Method of classifying segments |
The business segment of the Company and its consolidated subsidiaries are the pharmaceutical business, which is the principal business of the Company, and other, which is businesses other than the pharmaceutical business.
| 2. | Principal products by business segment |
Business segment | Principal products | |||
| Pharmaceutical business | Pharmaceutical products, diagnostic and radiopharmaceutical products, over-the-counter drugs, and veterinary and livestock feed products | |||
| Fine chemicals | Bulk vitamins, chemical products, industrial chemicals and other | |||
| Other | Safety testing and research | Contract research and development | ||
| Other | Real estate rental and other | |||
| 3. | Included in operating expenses under elimination and corporate was ¥7,919 million that could not be allocated to business segments. These expenses consisted mainly of the expenses of the administrative departments of the parent company. |
| 4. | Included in assets under elimination and corporate was ¥231,328 million in corporate assets. These assets were comprised mainly of excess working capital funds under management of the parent company (cash, short-term investments and other), long-term investments (investment securities), and assets used by the administrative departments of the parent company. |
b. Information by Geographic Segment
Fiscal Year 2003: Information by geographic segment has been omitted because more than 90% of total segment sales and segment assets were attributable to Japan.
Fiscal Year 2004: Same as for the previous fiscal year
45
c. Overseas Net Sales
Information about overseas net sales for the two most recent fiscal years is as follows:
| Fiscal Year 2003 | ||||||||
| Americas | Europe | Asia and other | Total | |||||
I Overseas net sales (millions of yen) | 45,157 | 12,403 | 8,602 | 66,163 | ||||
II Consolidated net sales (millions of yen) | 322,767 | |||||||
III Percentage of overseas net sales (%) | 14.0 | 3.8 | 2.7 | 20.5 | ||||
| Fiscal Year 2004 | ||||||||
| Americas | Europe | Asia and other | Total | |||||
I Overseas net sales (millions of yen) | 46,608 | 13,392 | 8,588 | 68,589 | ||||
II Consolidated net sales (millions of yen) | 328,534 | |||||||
III Percentage of overseas net sales (%) | 14.2 | 4.1 | 2.6 | 20.9 | ||||
Notes:
| 1. | Geographic areas are determined by geographic proximity. |
| 2. | Principal countries for each geographic area include the following: |
| (1) Americas: | United States | |
| (2) Europe: | Germany, France, Italy | |
| (3) Asia and other: | China, Taiwan, Korea |
| 3. | Overseas net sales are defined as the net sales of the Company and its consolidated subsidiaries in countries or regions outside Japan. |
(7) Transactions with related parties
Fiscal Year 2003 (For the year ended March 31, 2004)
None applicable
Fiscal Year 2004 (For the year ended March 31, 2005)
None applicable
46
Per Share Information
Fiscal Year 2003 (For the year ended March 31, 2004) | ||
Net assets per share | ¥ | 1,564.59 | |
Net income per share (basic) | ¥ | 97.25 | |
Net income per share (diluted) | ¥ | 97.23 | |
Fiscal Year 2004 (For the year ended March 31, 2005) | ||
Net assets per share | ¥ | 1,670.71 | |
Net income per share (basic) | ¥ | 137.95 | |
Net income per share (diluted) | ¥ | 137.90 | |
Note: Calculations of basic and diluted net income per share were based on the following numerators and denominators:
| Fiscal Year 2003 (For the year ended March 31, 2004) | Fiscal Year 2004: (For the year ended March 31, 2005) | |||||
Net income per share (basic): | ||||||
Net income (millions of yen) | 26,661 | 37,175 | ||||
Amount not available for common shareholders (millions of yen) | 160 | 137 | ||||
(Including directors’ bonuses paid from net income of) (millions of yen) | (160 | ) | (137 | ) | ||
Net income available for dividends on common shares (millions of yen) | 26,501 | 37,037 | ||||
Weighted-average number of common shares outstanding during the year (1,000 shares) | 272,515 | 268,481 | ||||
Net income per share (diluted): | ||||||
Additional dilutive common shares (1,000 shares) | 34 | 111 | ||||
(Including dilutive effect of stock options of) | (34 | ) | (111 | ) | ||
Descriptions of potentially dilutive common shares that were not included in the computation of diluted net income per share because of their anti-dilutive effect | Two share subscription right plans (related to 1,001 thousand shares) and one share purchase option plan (related to 4,090 units of options) | | Same as for the previous year |
Subsequent Events
Fiscal Year 2003 (For the year ended March 31, 2004)
None applicable
Fiscal Year 2004 (For the year ended March 31, 2005)
None applicable
47
5. Production, Orders and Sales
1. Production
(1) Production by business segment
| (Millions of yen) | |||||||||||||||
Fiscal Year 2003 (For the year ended | Fiscal Year 2004 (For the year ended | Change | |||||||||||||
Business segment | Amount | Percentage of total | Amount | Percentage of total | Amount | Percentage of change | |||||||||
Pharmaceutical business | 247,567 | 95.7 | % | 272,132 | 95.9 | % | 24,564 | 9.9 | % | ||||||
Other | 11,072 | 4.3 | % | 11,519 | 4.1 | % | 446 | 4.0 | % | ||||||
Total | 258,640 | 100.0 | % | 283,651 | 100.0 | % | 25,011 | 9.7 | % | ||||||
Note: The above amounts are stated based on selling prices, exclusive of consumption tax.
(2) Procurement by business segment
| (Millions of yen) | |||||||||||||||||
Fiscal Year 2003 (For the year ended | Fiscal Year 2004 (For the year ended | Change | |||||||||||||||
Business segment | Amount | Percentage of total | Amount | Percentage of total | Amount | Percentage of change | |||||||||||
Pharmaceutical business | 30,067 | 91.9 | % | 32,015 | 93.2 | % | 1,948 | 6.5 | % | ||||||||
Other | 2,632 | 8.1 | % | 2,323 | 6.8 | % | D | 309 | D | 11.7 | % | ||||||
Total | 32,700 | 100.0 | % | 34,339 | 100.0 | % | 1,638 | 5.0 | % | ||||||||
Note: The above amounts are stated based on actual purchases, exclusive of consumption tax.
2. Orders
The Company manufactures products according to its production plans based not on advance orders for production but on estimated product demand.
3. Sales
| (Millions of yen) | |||||||||||||||||
Fiscal Year 2003 (For the year ended | Fiscal Year 2004 (For the year ended | Change | |||||||||||||||
Business segment | Amount | Percentage of total | Amount | Percentage of total | Amount | Percentage of change | |||||||||||
Pharmaceutical products | 259,766 | 85.3 | % | 267,177 | 85.7 | % | 7,411 | 2.9 | % | ||||||||
Diagnostic and radiopharmaceuticals | 32,251 | 10.6 | % | 32,923 | 10.5 | % | 671 | 2.1 | % | ||||||||
Over-the-counter drugs | 8,768 | 2.9 | % | 10,199 | 3.3 | % | 1,430 | 16.3 | % | ||||||||
Veterinary and livestock feed products | 3,777 | 1.2 | % | 1,544 | 0.5 | % | D | 2,233 | D | 59.1 | % | ||||||
Pharmaceutical business | 304,564 | 94.4 | % | 311,844 | 94.9 | % | 7,280 | 2.4 | % | ||||||||
Other | 18,203 | 5.6 | % | 16,689 | 5.1 | % | D | 1,513 | D | 8.3 | % | ||||||
Total | 322,767 | 100.0 | % | 328,534 | 100.0 | % | 5,766 | 1.8 | % | ||||||||
Note: The above amounts are stated exclusive of consumption tax.
48
Daiichi Pharmaceutical Co., Ltd.
FASF
April 27, 2005
Summary of Non-Consolidated Financial Results
for Fiscal Year 2004, Ended March 31, 2005
(English Translation of “Kessan Tanshin”)
Listed company name: Daiichi Pharmaceutical Co., Ltd.
Stock code number: 4505
Stock listings: Tokyo Stock Exchange, Osaka Securities Exchange
Head office: Tokyo, Japan
URL: http://www.daiichipharm.co.jp/
Representative: Mr. Kiyoshi Morita, President and CEO
Contact: Mr. Toshio Takahashi, General Manager of Corporate Communications Department
Telephone: (03)3272-0611
Meeting of the Board of Directors held on: April 27, 2005
Scheduled date for commencement of dividend payments: June 30, 2005
Adoption of the unit stock system: Yes (One unit equals 100 shares)
Interim dividend system: Yes
General shareholders meeting held on: June 29, 2005
1. Financial results for the fiscal year 2004 (April 1, 2004—March 31, 2005)
(1) Non-Consolidated Operating Results
(Figures less than ¥1 million, except per share amounts, have been omitted)
| Net sales (% change from previous year) | Operating income (% change from previous year) | Ordinary income (% change from previous year) | |||||||
| Millions of yen | Millions of yen | Millions of yen | |||||||
Fiscal Year 2004 | 259,912 (2.5 | %) | 54,440 (20.0 | %) | 56,322 (21.1 | %) | |||
Fiscal Year 2003 | 253,486 (D0.6 | %) | 45,353 (D6.7 | %) | 46,527 (D8.7 | %) |
Net income (% change from | Basic net income per share | Diluted net income per share | Return on equity | Ratio of ordinary income to total assets | Ratio of ordinary income to net sales | ||||||||
| Millions of yen | Yen | Yen | % | % | % | ||||||||
Fiscal Year 2004 | 19,303 (D31.0 | %) | 71.53 | 71.50 | 4.7 | 11.3 | 21.7 | ||||||
Fiscal Year 2003 | 27,996 (138.6 | %) | 102.29 | 102.28 | 7.1 | 9.6 | 18.4 |
Notes | ||||
| 1. Weighted-average number of common shares issued and outstanding during the year | ||||
For the year ended March 31, 2005: | 268,481,535 shares | |||
For the year ended March 31, 2004: | 272,515,920 shares | |||
| 2. Changes in method of accounting and presentation: None | ||||
3. Percentages in parentheses under net sales, operating income, ordinary income, and net income indicate changes from the previous fiscal year. | ||||
49
(2) Dividends
(Figures less than ¥1 million, except per share amounts, have been omitted)
| Dividends per share | Total dividends for the year | Payout ratio | Dividends as a percentage of total equity | |||||||||
| Interim | Year-end | |||||||||||
| Yen | Yen | Yen | Millions of yen | % | % | |||||||
Fiscal Year 2004 | 40.00 | 15.00 | 25.00 | 10,736 | 55.9 | 2.6 | ||||||
Fiscal Year 2003 | 30.00 | 15.00 | 15.00 | 8,134 | 29.3 | 2.0 | ||||||
(3) Non-Consolidated Financial Position
(Figures less than ¥1 million, except per share amounts, have been omitted)
| Total assets | Shareholders’ equity | Shareholders’ equity ratio | Shareholders’ equity per share | ||||||
| Millions of yen | Millions of yen | % | Yen | ||||||
Fiscal Year 2004 | 508,932 | 415,020 | 81.5 | % | 1,545.88 | ||||
Fiscal Year 2003 | 491,534 | 405,274 | 82.5 | % | 1,502.24 |
| Notes | 1. Total common shares issued at the end of fiscal year | |||
March 31, 2005: | 268,404,023 shares | |||
March 31, 2004: | 269,700,226 shares | |||
| 2. Number of shares of treasury stock at the end of fiscal year | ||||
March 31, 2005: | 18,049,212 shares | |||
March 31, 2004: | 16,753,009 shares | |||
2. Forecasts of Non-Consolidated Operating Results
Fiscal Year 2005 (April 1, 2005—March 31, 2006)
| Cash dividends per share | ||||||||||||
| Net sales | Ordinary income | Net income | Interim | Year-end | ||||||||
| Millions of yen | Millions of yen | Millions of yen | Yen | Yen | Yen | |||||||
Interim 6-month period | 126,000 | 24,000 | 14,000 | 25.00 | — | — | ||||||
Full-year | 262,000 | 54,000 | 33,000 | — | 25.00 | 50.00 | ||||||
Reference: Forecasted basic net income per share for the year: ¥122.58
| * | Note: The forecast figures shown above are based on information that was available at the time of preparation and may contain some uncertainties. Actual performance and other factors may differ from these forecasts due to changes in circumstances and other developments. More information concerning these forecasts can be found in the attached Supplemental Information on page 16~17. |
50
6. Non-Consolidated Financial Statements
(1) Non-Consolidated Balance Sheets
| (Millions of yen) | |||||||||||||
| Fiscal Year 2003 (As of March 31, 2004) | Fiscal Year 2004 (As of March 31, 2005) | Change | |||||||||||
| See Note | Amount | % | Amount | % | Amount | ||||||||
ASSETS | |||||||||||||
I Current assets: | |||||||||||||
1. Cash and time deposits | 6,145 | 6,455 | |||||||||||
2. Trade notes receivable | 7,063 | 6,771 | |||||||||||
3. Accounts receivable | *4 | 59,218 | 63,046 | ||||||||||
4. Investment securities | 94,080 | 107,514 | |||||||||||
5. Mortgage-backed securities | 20,000 | 20,000 | |||||||||||
6. Merchandises | 5,379 | 5,911 | |||||||||||
7. Products | 10,635 | 13,360 | |||||||||||
8. Semi-finished products | 4,942 | 4,816 | |||||||||||
9. Raw materials | 5,972 | 6,222 | |||||||||||
10. Work in process | 1,106 | 1,249 | |||||||||||
11. Prepaid expenses | 188 | 187 | |||||||||||
12. Deferred tax assets | 12,050 | 10,850 | |||||||||||
13. Short-term loans to affiliated companies | 9,825 | 9,715 | |||||||||||
14. Other receivables | 5,517 | 4,277 | |||||||||||
15. Other current assets | 2,616 | 8,806 | |||||||||||
Allowance for doubtful accounts | D | 200 | — | ||||||||||
Total current assets | 244,540 | 49.75 | 269,185 | 52.89 | 24,644 | ||||||||
51
| (Millions of yen) | |||||||||||||||||
| Fiscal Year 2003 (As of March 31, 2004) | Fiscal Year 2004 (As of March 31, 2005) | Change | |||||||||||||||
| See Note | Amount | % | Amount | % | Amount | ||||||||||||
II Non-current assets: | |||||||||||||||||
1. Property, plant and equipment: | |||||||||||||||||
(1) Buildings | 86,478 | 86,374 | |||||||||||||||
Less accumulated depreciation | 50,314 | 36,164 | 52,523 | 33,851 | |||||||||||||
(2) Structures | 8,865 | 8,624 | |||||||||||||||
Less accumulated depreciation | 6,080 | 2,785 | 6,118 | 2,505 | |||||||||||||
(3) Machinery and equipment | 65,800 | 65,274 | |||||||||||||||
Less accumulated depreciation | 53,657 | 12,142 | 55,150 | 10,124 | |||||||||||||
(4) Vehicles and transportation equipment | 499 | 496 | |||||||||||||||
Less accumulated depreciation | 439 | 60 | 449 | 46 | |||||||||||||
(5) Furniture, tools and fixtures | 24,746 | 24,285 | |||||||||||||||
Less accumulated depreciation | 21,356 | 3,390 | 21,195 | 3,090 | |||||||||||||
(6) Land | 7,241 | 7,241 | |||||||||||||||
(7) Construction in progress | 368 | 1,273 | |||||||||||||||
Total property, plant and equipment, net | 62,152 | 12.64 | 58,133 | 11.42 | D | 4,018 | |||||||||||
2. Intangible assets : | |||||||||||||||||
(1) Sales and distribution rights | 1,761 | 2,921 | |||||||||||||||
(2) Patents | 4,781 | 2,975 | |||||||||||||||
(3) Real estate lease rights | 1 | 1 | |||||||||||||||
(4) Trademarks | 78 | 66 | |||||||||||||||
(5) Software | — | 1,873 | |||||||||||||||
(6) Other intangible assets | 882 | 75 | |||||||||||||||
Total intangible assets, net | 7,505 | 1.53 | 7,915 | 1.56 | 409 | ||||||||||||
52
| (Millions of yen) | |||||||||||||||
| Fiscal Year 2003 (As of March 31, 2004) | Fiscal Year 2004 (As of March 31, 2005) | Change | |||||||||||||
| See Note | Amount | % | Amount | % | Amount | ||||||||||
3. Investments and other assets: | |||||||||||||||
(1) Investment securities | 107,693 | 104,045 | |||||||||||||
(2) Stock of affiliated companies | 50,463 | 52,748 | |||||||||||||
(3) Advances to affiliated companies | 7,862 | 8,685 | |||||||||||||
(4) Long-term loans | 4 | — | |||||||||||||
(5) Long-term loans to employees | 11 | 4 | |||||||||||||
(6) Long-term loans to affiliated companies | 5,744 | 5,651 | |||||||||||||
(7) Prepaid pension cost | — | 15,385 | |||||||||||||
(8) Deferred tax assets | 576 | — | |||||||||||||
(9) Other assets | 4,960 | 6,524 | |||||||||||||
Allowance for doubtful accounts | D | 10 | D | 676 | |||||||||||
Allowance Reserve for investment losses | — | D | 18,671 | ||||||||||||
Total investments and other assets | 177,335 | 36.08 | 173,698 | 34.13 | D | 3,637 | |||||||||
Total non-current assets | 246,993 | 50.25 | 239,747 | 47.11 | D | 7,246 | |||||||||
Total assets | 491,534 | 100.00 | 508,932 | 100.00 | 17,398 | ||||||||||
LIABILITIES | |||||||||||||||
I Current liabilities: | |||||||||||||||
1. Accounts payable | *4 | 13,048 | 16,163 | ||||||||||||
2. Other payables | 11,492 | 10,660 | |||||||||||||
3. Accrued expenses | 18,044 | 19,445 | |||||||||||||
4. Income taxes payable | 8,165 | 7,023 | |||||||||||||
5. Consumption taxes payable | 1,262 | 502 | |||||||||||||
6. Advance receipts | 1,799 | 1,546 | |||||||||||||
7. Advances received from affiliated companies | *5 | 17,160 | 22,774 | ||||||||||||
8. Allowance for sales returns | 491 | 448 | |||||||||||||
9. Allowance for sales discounts | 1,448 | 1,421 | |||||||||||||
Total current liabilities | 72,953 | 14.84 | 79,985 | 15.72 | 7,032 | ||||||||||
53
(Millions of yen)
| Fiscal Year 2003 (As of March 31, 2004) | Fiscal Year 2004 (As of March 31, 2005) | Change | |||||||||||||||||||
| See Note | Amount | % | Amount | % | Amount | ||||||||||||||||
II Non-current liabilities: | |||||||||||||||||||||
1. Long-term payables | — | 3,467 | |||||||||||||||||||
2. Deferred tax liabilities | — | 9,035 | |||||||||||||||||||
3. Accrued retirement and severance costs | 11,521 | 213 | |||||||||||||||||||
4. Accrued directors’ retirement and severance costs | 1,785 | 1,208 | |||||||||||||||||||
Total non-current liabilities | 13,306 | 2.71 | 13,926 | 2.74 | 619 | ||||||||||||||||
Total liabilities | 86,259 | 17.55 | 93,912 | 18.46 | 7,652 | ||||||||||||||||
SHAREHOLDERS’ EQUITY | |||||||||||||||||||||
I Common stock | *1 | 45,246 | 9.21 | 45,246 | 8.89 | — | |||||||||||||||
II Additional paid-in-capital: | |||||||||||||||||||||
1. Capital surplus | 48,961 | 48,961 | |||||||||||||||||||
2. Other capital surplus | |||||||||||||||||||||
(1) Gain on reissuance of treasury stock | — | 169 | |||||||||||||||||||
Total additional paid-in-capital | 48,961 | 9.96 | 49,130 | 9.65 | 169 | ||||||||||||||||
III Retained earnings: | |||||||||||||||||||||
1. Legally appropriated retained earnings | 7,599 | 7,599 | |||||||||||||||||||
2. Voluntary retained earnings reserve: | |||||||||||||||||||||
(1) Reserve for reduction in fixed asset (cost basis) | 2,599 | 2,591 | |||||||||||||||||||
(2) Special reserve | 286,762 | 306,762 | |||||||||||||||||||
3. Unappropriated retained earnings | 33,322 | 24,442 | |||||||||||||||||||
Total retained earnings | 330,284 | 67.19 | 341,395 | 67.08 | 11,111 | ||||||||||||||||
IV Net unrealized gain on investment securities | 17,182 | 3.50 | 18,115 | 3.56 | 933 | ||||||||||||||||
V Treasury stock at cost | *2 | D | 36,400 | D | 7.41 | D | 38,867 | D | 7.64 | D | 2,467 | ||||||||||
Total shareholders’ equity | 405,274 | 82.45 | 415,020 | 81.54 | 9,746 | ||||||||||||||||
Total liabilities, and shareholders’ equity | 491,534 | 100.00 | 508,932 | 100.00 | 17,398 | ||||||||||||||||
54
(2) Non-Consolidated Statements of Income
(Millions of yen)
Fiscal Year 2003 (For the year ended March 31, 2004) | Fiscal Year 2004 (For the year ended March 31, 2005) | Change | |||||||||||||||
| See Note | Amount | % | Amount | % | Amount | ||||||||||||
I Net sales: | |||||||||||||||||
1. Sales of products | 174,411 | 175,635 | |||||||||||||||
2. Sales of merchandise | 58,613 | 62,981 | |||||||||||||||
3. Royalty income | 20,462 | 253,486 | 100.00 | 21,296 | 259,912 | 100.00 | 6,426 | ||||||||||
| *1 | |||||||||||||||||
II Cost of sales: | *2 | ||||||||||||||||
| *3 | |||||||||||||||||
1. Product and merchandise inventories, beginning of year | 21,530 | 16,014 | |||||||||||||||
2. Merchandises purchased during the year | 35,873 | 38,519 | |||||||||||||||
3. Costs of products manufactured during the year | 43,537 | 48,130 | |||||||||||||||
Subtotal | 100,942 | 102,663 | |||||||||||||||
4. Less amount transferred to other accounts | 1,514 | 1,343 | |||||||||||||||
5. Less product and merchandise inventories, end of year | 16,014 | 19,272 | |||||||||||||||
Total cost of sales | 17,528 | 83,414 | 32.91 | 20,615 | 82,047 | 31.57 | D | 1,366 | |||||||||
Gross profit on sales | 170,072 | 67.09 | 177,865 | 68.43 | 7,792 | ||||||||||||
Reversal of provision for sales returns | 485 | 0.19 | 491 | 0.19 | 6 | ||||||||||||
Provision for sales returns | 491 | 0.19 | 448 | 0.17 | D | 43 | |||||||||||
Gross profit | 170,066 | 67.09 | 177,908 | 68.45 | 7,841 | ||||||||||||
III Selling, general and administrative: | *3 | ||||||||||||||||
1. Shipping and storage expenses | 1,690 | 1,401 | |||||||||||||||
2. Advertising expenses | 3,508 | 3,686 | |||||||||||||||
3. Sales promotion expenses | 10,199 | 10,229 | |||||||||||||||
4. Royalty expense | 806 | 791 | |||||||||||||||
5. Salaries and bonuses | 24,542 | 25,395 | |||||||||||||||
6. Employee retirement and severance costs | 4,346 | 3,043 | |||||||||||||||
7. Welfare expenses | 3,777 | 3,831 | |||||||||||||||
8. Depreciation expense | 2,772 | 3,035 | |||||||||||||||
9. Rent expenses | 6,176 | 6,298 | |||||||||||||||
10. Travel and transportation expenses | 4,021 | 3,991 | |||||||||||||||
11. Research and development expenses | *1 | 44,311 | 42,698 | ||||||||||||||
12. Other | 18,560 | 124,713 | 49.20 | 19,063 | 123,467 | 47.50 | D | 1,245 | |||||||||
Operating income | 45,353 | 17.89 | 54,440 | 20.95 | 9,087 | ||||||||||||
55
(Millions of yen)
Fiscal Year 2003 (For the year ended March 31, 2004) | Fiscal Year 2004 (For the year ended March 31, 2005) | Change | |||||||||||||||
| See Note | Amount | % | Amount | % | Amount | ||||||||||||
IV Non-operating income: | |||||||||||||||||
1. Interest income | 286 | 287 | |||||||||||||||
2. Interest income from investment securities | 486 | 505 | |||||||||||||||
3. Dividend income | 967 | 1,230 | |||||||||||||||
4. Foreign exchange gains | — | 357 | |||||||||||||||
5. Other income | 508 | 2,248 | 0.88 | 547 | 2,928 | 1.13 | 680 | ||||||||||
V Non-operating expenses: | |||||||||||||||||
1. Loss on disposal and write-down of inventories | *2 | 623 | 384 | ||||||||||||||
2. Foreign exchange losses | 200 | — | |||||||||||||||
3. Other expense | 250 | 1,074 | 0.42 | 661 | 1,046 | 0.40 | D | 28 | |||||||||
Ordinary income | 46,527 | 18.35 | 56,322 | 21.67 | 9,795 | ||||||||||||
VI Extraordinary gains: | |||||||||||||||||
1. Gain from the return of the substitutional portion of the employees’ pension fund to the government | — | 11,747 | |||||||||||||||
2. Gain from the transfer to the defined contribution pension plan | — | 3,073 | |||||||||||||||
3. Gain on sale of the veterinary and livestock feed products business | *4 | — | 679 | ||||||||||||||
4. Realized gain on sale of Investment securities | 1,322 | 20 | |||||||||||||||
5. Reversal of allowance for doubtful accounts | 70 | 1,392 | 0.55 | — | 15,520 | 5.97 | 14,128 | ||||||||||
VII Extraordinary losses: | |||||||||||||||||
1. Provision for allowance for investment losses | — | �� | 18,671 | ||||||||||||||
2. Restructuring charge | *5 | — | 7,042 | ||||||||||||||
3. Loss on settlement of vitamin-related anti-trust litigations | *6 | — | 111 | ||||||||||||||
4. Impairment of investment securities | 61 | 28 | |||||||||||||||
5. Loss on disposal of fixed assets | *7 | 1,081 | 1,143 | 0.45 | 1,124 | 26,978 | 10.38 | 25,835 | |||||||||
Net income before income taxes | 46,776 | 18.45 | 44,865 | 17.26 | D | 1,910 | |||||||||||
Income tax expense-current | 18,410 | 15,400 | |||||||||||||||
Income tax expense-deferred | 370 | 18,780 | 7.41 | 10,161 | 25,561 | 9.83 | 6,781 | ||||||||||
Net income | 27,996 | 11.04 | 19,303 | 7.43 | D | 8,692 | |||||||||||
Unappropriated retained earnings, beginning of year | 9,415 | 9,165 | D | 249 | |||||||||||||
Less interim dividends | 4,089 | 4,026 | D | 62 | |||||||||||||
Unappropriated retained earnings, end of year | 33,322 | 24,442 | D | 8,879 | |||||||||||||
56
(3) Proposal for Appropriations of Retained Earnings
(Millions of yen)
| Fiscal Year 2003 Approved at Annual Shareholders’ Meeting on for June 29, 2004 | Fiscal Year 2004 Approved at Annual Shareholders’ Meeting on for June 29, 2005 | Change | |||||||||||||
| See Note | Amount | Amount | Amount | ||||||||||||
I Unappropriated retained earnings, end of year | 33,332 | 24,442 | D | 8,879 | |||||||||||
II Reversal of voluntary retained earnings reserves: | |||||||||||||||
1. Reserve for reduction in fixed asset (cost basis) | 8 | — | |||||||||||||
2. Special reserve | — | 8 | 40,000 | 40,000 | 39,991 | ||||||||||
Total retained earnings available for appropriation | 33,330 | 64,442 | 31,111 | ||||||||||||
II. Appropriations: | |||||||||||||||
1. Dividends | 4,045 | 6,710 | |||||||||||||
2. Directors’ bonuses | 120 | 100 | |||||||||||||
(Including corporate auditors’ bonuses of) | (20 | ) | (— | ) | |||||||||||
3. Voluntary retained earnings reserve: | |||||||||||||||
(1) Reserve for reduction in fixed asset (cost basis) | — | 48 | |||||||||||||
(2) Special reserve | 20,000 | 24,165 | — | 6,858 | D | 17,307 | |||||||||
IV Unappropriated retained earnings, carried-forward to the next fiscal year | 9,165 | 57,584 | 48,419 | ||||||||||||
57
Significant Accounting Policies
Fiscal Year 2003
(For the year ended March 31, 2004)
| 1. | Methods of Valuation of Investment Securities Held-to-maturity securities: |
Stated at amortized costs (straight-line method)
Stocks of subsidiaries and affiliated companies: Accounted for at moving-average costs
Available-for-sale securities:
With quoted market value: Stated at quoted market value at the balance sheet dates (Unrealized holding gains or losses are reported as a component of shareholders’ equity. Realized gains or losses are computed using the moving-average cost method.)
With no readily available market value: Accounted for at moving-average costs
| 2. | Method of Valuation of Inventories: |
Accounted for at the lower of cost or market, with cost being determined under the average cost method.
| 3. | Methods of Depreciation and Amortization: |
Property, plant and equipment: Depreciation is computed using the declining-balance method.
The ranges of useful lives of principal assets are as follows:
Buildings: | 38 to 50 years | |
Machinery and equipment: | 4 to 7 years |
Intangible assets: Amortization is computed using the straight-line method.
| 4. | Foreign Currency Translation: Foreign currency denominated assets and liabilities are converted into yen at the exchange rates prevailing on the balance sheet dates. Translation gains and losses are recognized currently in earnings. The foreign currency denominated assets that are hedged by specific foreign currency forward contracts are converted into yen based on the relevant contract rates. |
| 5. | Methods of Determining Significant Allowances: |
| (1) | Allowance for Doubtful Accounts: |
The Company covers the risk of credit losses from potential customer defaults by providing this allowance. The allowance is estimated on the basis of historical default rates for normal accounts and individual account-by-account evaluation for specific over-due accounts.
| (2) | ---------------- |
| (3) | Allowance for Sales Return: |
To prepare for losses from potential returns of products after fiscal year-end, the Company provides for an amount equal to the estimated gross profit and inventory losses on sales returns.
| (4) | Allowance for Sales Discounts: |
To prepare for future sales discounts, the Company provides for an estimated amount of discounts calculated by multiplying the sales discount percentage for the period by the amounts of accounts receivable and the wholesaler’s inventories at the end of fiscal year.
Fiscal Year 2004
(For the year ended March 31, 2005)
| 1. | Methods of Valuation of Investment Securities Held-to-maturity debt securities: |
Same as for the previous year
Stock of subsidiaries and affiliated companies:
Same as for the previous year
Available-for-sale securities:
With available fair market value:
Same as for the previous year
With no readily available fair market value:
Same as for the previous year
| 2. | Method of Valuation of Inventories: |
Same as for the previous year
| 3. | Methods of Depreciation: |
Property, plant and equipment:
Same as for the previous year
Intangible assets:
Amortization is computed using the straight-line method. Software that is expected to generate future revenues or to contribute to a future cost reduction is amortized over estimated number of years it will be used internally.
| 4. | Foreign Currency Translation: |
Same as for the previous year
| 5. | Methods off Determining Significant Allowances: |
| (1) | Allowance for Doubtful Accounts: |
Same as for the previous year
| (2) | Allowance for Investment Losses: |
To cover a potential decline in value of the investments in affiliated companies, the Company provides for an allowance based on the financial condition and future prospects for recovery of the affiliated companies.
| (3) | Allowance for Sales Return: |
Same as for the previous year
| (4) | Allowance for Sales Discounts: |
Same as for the previous year
58
Fiscal Year 2003
(For the year ended March 31, 2004)
| (5) | Accrued Retirement and Severance Costs |
To prepare for future payments of retirement and severance benefits, the Company provides for an accrual based on estimated projected benefit obligations and plan assets at the end of fiscal year.
Prior service cost is amortized under the straight-line method over a period of 10 years, which is equal to or less than the estimated average remaining years of service of the eligible employees.
Actuarial gains and losses are amortized based on the straight-line method, beginning in the fiscal year following the year in which such gain or loss was initially measured, over a period of 10 years, which is equal to or less than the average remaining years of service of the eligible employees.
Supplemental Information
Accompanying the enactment of the Contributed Benefit Pension Law, the Company received an approval of exemption from the Minister of Health, Labor and Welfare, on January 26, 2004, from the obligation for pension payment liabilities related to future employee service with respect to the substitutional portion of its Employees’ Pension Fund.
As of fiscal year-end, the estimated amount to be returned (based on the minimum reserve obligations) was ¥20,557 million. Had such amount (based on the minimum reserve obligations) been returned at the end of this fiscal year, in accordance with the provisions of Article 44-2 of the “Practice Guidelines of Accounting for Retirement Benefits” (Interim Report) (Report No. 13 of the Accounting Systems Committee of the Japanese Institute of Certified Public Accountants), a gain (extraordinary gain) from the return of the Employee’ Pension Fund in the amount of ¥10,995 million would have been recorded.
| (6) | Directors’ Retirement and Severance Benefits |
To prepare for payments of directors’ retirement and severance benefits, the Company and its domestic consolidated subsidiaries provide for an amount equal to the total benefits that would have been payable at the end of fiscal year, in accordance with internal guidelines, had all directors resigned voluntarily.
| 6. | Accounting for Significant Lease Transactions |
Finance lease transactions are accounted for using the same method applied to operating lease transactions, with an exception for those finance leases in which the legal title of the underlying property is transferred from the lessor to the lessee.
Fiscal Year 2004
(For the year ended March 31, 2005)
| (5) | Accrued Retirement and Severance Costs |
To prepare for future payments of retirement and severance benefits, the Company provides for an accrual based on estimated projected benefit obligations and plan assets at the end of fiscal year.
Prior service cost is amortized under the straight-line method over a period of 10 years, which is equal to or less than the estimated average remaining years of service of the eligible employees.
Actuarial gains and losses are amortized based on the straight-line method, beginning in the fiscal year following the year in which such gain or loss was initially measured, over a period of 10 years, which is equal to or less than the average remaining years of service of the eligible employees.
Supplemental Information
Accompanying the enactment of the Contributed Benefit Pension Law, the Company received an approval of exemption from the Minister of Health, Labor and Welfare, on January 1, 2005, from the obligation for pension payment liabilities related to past employee service with respect to the substitutional portion of its Employees’ Pension Fund.
For the fiscal year, as a result, the Company recognized this an extraordinary gain of ¥11,747 million from the return of the substitutional portion of the employees’ pension fund to the government.
In addition, accompanying the enactment of the Defined Contribution Pension Plan Laws, the Company and certain of its domestic consolidated subsidiaries transferred a portion of their lump-sum retirement benefit plans to a defined contribution plan, which was accounted for under the provisions of “applied the Accounting Principles for Transitions among Retirement Benefit Plans” (Corporate Accounting Guidelines No. 1).
This change in retirement benefit arrangement resulted in an extraordinary gain of ¥3,073 million for the fiscal year.
| (6) | Directors’ Retirement and Severance Benefits |
Same as for the previous year
| 6. | Accounting for Important Lease Transactions |
Same as for the previous year
59
Fiscal Year 2003
(For the year ended March 31, 2004)
| 7. | Significant Hedge Accounting Method |
| (a) | Hedge Accounting Method |
The Company employs the deferral method of hedge accounting. Forward foreign exchange contracts that meet certain hedge criteria are accounted for as a hedge of underlying assets and liabilities.
| (b) | Hedging Instruments and Hedged Items |
Hedging Instruments: Foreign exchange forward contracts and other Hedged Items:
Assets denominated in foreign currencies.
| (c) | Hedge Policy |
The Company hedges foreign exchange rate fluctuation risks in accordance with its internal policies.
| (d) | Method of Assessing Hedge Effectiveness |
Based on its internal policies, the Company evaluates the effectiveness of hedges by examining the correlations between its hedging instruments and hedged items as a result of fluctuations in foreign currency exchange rates and confirms the effectiveness of its hedge relationship.
| 8. | Other Significant Policies in Preparing the Financial Statements Accounting for Consumption Tax |
The tax-exclusion method is used to account for the national and local consumption taxes.
Fiscal Year 2004
(For the year ended March 31, 2005)
| 7. | Significant Hedge Accounting Method |
| (a) | Hedge Accounting Method |
Same as for the previous year
| (b) | Hedging Instruments and Hedged Items |
Same as for the previous year
| (c) | Hedging Policy |
Same as for the previous year
| (d) | Methods for Assessing Hedge Effectiveness |
Same as for the previous year
| 8. | Other Significant Policies in Preparing the Financial Statements Accounting for Consumption Tax |
Same as for the previous year
60
Notes to Financial Statements
(Notes to Balance Sheets)
Fiscal Year 2003
(As of March 31, 2004)
*1. Authorized shares: | 789,000,000 common shares | |
Issued shares: | 286,453,235 common shares |
| *2. | Treasury stock |
Treasury stock owned by the Company at the end of fiscal year was 16,753,009 shares of common stock.
| 3. | Contingent Liabilities |
| (1) | The Company guarantees the following debts and other obligations owed to financial institutions |
| (Millions of yen | ) | ||
Guarantees provided for employees’ housing loans | 3,037 | ||
Suntory Pharmaceutical | 42 | ||
Research Laboratories LLC | (US$ 400,000 | ) | |
(2) Trade export notes receivable discounted | 198 | ||
| *4. | Assets and liabilities related to affiliated companies were as follows: |
| (Millions of yen | ) | ||
Accounts receivable | 1,235 | ||
Accounts payable | 5,470 | ||
| *5. | The Company holds the excess working capital of its subsidiaries |
| 6. | Committed Lines of Credit |
To facilitate the efficient raising of working capital, the Company maintains committed lines of credit with four financial institutions. The unused balance of credit lines under these commitments at fiscal year-end was as follows:
| (Millions of yen | ) |
Total amount of committed credit lines | 30,000 | |
Less amount borrowed against credit lines | — | |
Credit lines unused | 30,000 | |
| 7. | Limitations on Dividends |
The increase in net assets of the Company, as a result of the mark-to-market adjustment to the assets specified in Article 124-3 of the Commercial Code of Japan, was ¥17,182 million
Fiscal Year 2004
(As of March 31, 2005)
*1. Authorized shares: | 789,000,000 common shares | |
Issued shares: | 286,453,235 common shares |
| *2. | Treasury stock |
Treasury stock owned by the Company at the end of fiscal year was 18,049,212 shares of common stock.
| 3. | Contingent Liabilities |
| (1) | The Company guarantees certain debts and other obligations owed to financial institutions |
| (Millions of yen | ) | ||
Guarantees provided for employees’ (housing loans) | 2,540 | ||
Aventis Pasteur-Daiichi Vaccines Co., Ltd. | 350 | ||
(2) Trade export notes receivable discounted | 78 | ||
| *4. | Assets and liabilities of affiliated companies were as follows: |
| (Millions of yen | ) | ||
Accounts receivable | 831 | ||
Accounts payable | 5,402 | ||
| *5. | Same as for the previous year |
| 6. | Committed Lines of Credit |
To facilitate the efficient raising of working capital, the Company maintains committed lines of credit with four financial institutions. The unused balance of credit lines under these commitments at fiscal year-end was as follows:
| (Millions of yen | ) |
Total amount of committed credit lines | 30,000 | |
Less amount borrowed against credit lines | — | |
Credit lines unused | 30,000 | |
| 7. | Limitations on Dividends |
The increase in the net assets of the Company, as a result of the mark-to-market adjustment to the assets specified in Article 124-3 of the Commercial Code of Japan, was ¥18,115 million.
61
(Notes to Statements of Income)
Fiscal 2003
(For the year ended March 31, 2004)
| *1. | Research and development expenses included in selling, general and administrative expenses and manufacturing overhead costs : |
¥45,983 million
| *2. | (1) Losses from application of the lower of cost or market method to inventories were accounted for at their net amount in non-operating expenses (loss on disposal and write-down of inventories) under the periodic reserve method. |
| (Millions of yen | ) |
Reversal of valuation losses | 351 | |
Provision for valuation losses | 414 | |
Net difference | 63 | |
| (2) | The amount transferred to other accounts included expense items such as sales promotion and valuation losses. |
| *3. | The amount of procurement from affiliated companies included in cost of sales and selling, general and administrative expenses: |
¥35,019 million
| *4. | — |
| *5. | — |
| *6. | — |
| *7. | The breakdown of losses on sale of fixed assets was as follows: |
| (Millions of yen | ) | ||
Buildings | 319 | ||
Machinery, and equipment | 628 | ||
Furniture, tools and fixtures | 133 | ||
Fiscal Year 2004
(As of March 31, 2005)
| *1. | Research and development costs included under selling, general and administrative expenses and manufacturing overhead costs: |
¥43,886 million
| *2. | (1) Losses from application of the lower of cost or market method to inventories were accounted for at their net amount in non-operating expenses (loss on disposal and write-down of inventories) under the periodic reserve method. |
| (Millions of yen | ) |
Reversal of valuation losses | 414 | ||
| Provision for reversal of evaluation losses | 277 | ||
Net difference | D | 137 | |
| (2) | Same as for the previous year |
| *3. | The amount of procurement from affiliated companies included in cost of sale and selling, general and administrative expenses was: |
¥32,945 million
| *4. | A gain on sale of the veterinary and livestock feed product business was recognized as a result of sale of the domestic distribution rights and other intangibles related to its veterinary and livestock feed product business to a third-party. |
| *5. | A restructuring charge was recorded for the one-time termination benefits provided to certain employees who were involuntarily transferred from the Company to a newly established wholly-owned subsidiary, Daiichi Pharmatech Co., Ltd. |
| *6. | The Loss on settlement of vitamin-related anti-trust litigations was related to a settlement of a part of the civil anti-trust class-action damage claims in connection with the Company’s vitamin transactions. |
| *7. | The breakdown of losses on sales of fixed assets was as follows: |
| (Millions of yen | ) | ||
Buildings | 382 | ||
Machinery, and equipment | 132 | ||
Furniture, tools and fixtures | 610 | ||
62
Proforma Lease Information
Fiscal Year 2003
(For the year ended March 31, 2004)
Finance lease transactions, excluding those that transfer the legal title to the leased property to the lessee
| (1) | Amounts representing the acquisition costs of the leased assets, accumulated depreciation, and net book value at the end of fiscal year, had those leases been accounted for as capital leases |
| (Millions of yen) | ||||||
| Acquisition costs | Accumulated depreciation | Net book value | ||||
Vehicles and transportation equipment | 811 | 355 | 455 | |||
Furniture, tools and fixtures fixtures equipment | 5,473 | 3,412 | 2,060 | |||
Total | 6,284 | 3,768 | 2,516 | |||
| (2) | Amount representing the capital lease obligations, at the end of fiscal year, had those leases been accounted for as capital leases |
| (Millions of yen | ) | ||
Due within one year | 1,226 | ||
Due after one year | 1,289 | ||
Total | 2,516 | ||
Note: The Company included an interest component of the lease payments in the amounts representing each of the acquisition costs of the leased assets and the capital lease obligations, since the ratio of the lease obligations at the end of fiscal year to the net book value of capitalized lease assets at the end of fiscal year is low.
(3) Comparison of lease expense recorded in the statements of income and the depreciation expense, that would have been recorded, had those leases been accounted for as capital leases
| (Millions of yen | ) | ||
Lease expense | 1,284 | ||
Depreciation expense | 1,284 | ||
| (4) | Depreciation method for computing the amount representing depreciation expenses. |
The amount representing depreciation expense was computed as if the capitalized lease assets had been amortized on a straight-line basis over the lease terms, with no residual at the end of leases.
Fiscal Year 2004
(For the year ended March 31, 2005)
Finance lease transactions, excluding those that transfer the legal title to the leased item to the lessee
| (1) | Amounts representing the acquisition costs of the leased assets, accumulated depreciation, and net book value at the end of fiscal year, had those leases been accounted for as capital leases |
| (Millions of yen) | ||||||
| Acquisition costs | Accumulated depreciation | Net book value | ||||
Vehicles and transportation equipment | 843 | 395 | 447 | |||
Furniture, tools and fixtures fixtures equipment | 5,057 | 3,607 | 1,449 | |||
Total | 5,900 | 4,002 | 1,897 | |||
| (2) | Amount representing the capital lease obligations, at the end of fiscal year, had those leases been accounted for as capital leases |
| (Millions of yen | ) | ||
Due within one year | 1,034 | ||
Due after one year | 863 | ||
Total | 1,897 | ||
Note: Same as for the previous year.
| (3) | Comparison of lease expense recorded in the statement of income and the depreciation expense that would have been recorded, had those leases been accounted for as capital leases |
| (Millions of yen | ) | ||
Leasing fees payable | 1,399 | ||
Amount corresponding to depreciation | 1,399 | ||
| (4) | Depreciation method for computing the amount representing depreciation expenses |
Same as for the previous year
(2) Investment Securities
| * | There was no quoted market value for stock of subsidiaries and affiliated companies for fiscal year 2003 (For the year ended March 31, 2004) or fiscal year 2004 (For the year ended March 31, 2005) |
63
(3) Deferred Income Taxes
1. Principal Components of Deferred Tax Assets and Liabilities
| (Millions of yen | ) | ||||||
| Fiscal Year 2003 (As of March 31, 2004) | Fiscal Year 2004 (As of March 31, 2005) | ||||||
Deferred tax assets: | |||||||
Depreciation | 8,717 | 9,567 | |||||
Allowance for investment losses on affiliated companies | — | 7,567 | |||||
Advance payments (for contract research and development, etc.) | 5,283 | 3,468 | |||||
Accrued expenses | 2,914 | 3,183 | |||||
Payables to the defined contribution pension plan | — | 2,127 | |||||
Impairment losses on investment securities | 1,100 | 1,005 | |||||
Enterprise taxes payable | 867 | 578 | |||||
Accrued retirement and severance costs | 3,494 | 86 | |||||
Other | 3,744 | 3,706 | |||||
Subtotal | 26,122 | 31,291 | |||||
Valuation allowance | — | D | 8,510 | ||||
Total deferred tax assets | 26,122 | 22,781 | |||||
Deferred tax liabilities: | |||||||
Unrealized gain on available-for-sale securities | D | 11,695 | D | 12,345 | |||
Deferred gain on sale of fixed assets | — | D | 6,822 | ||||
Reserve for additional depreciation | D | 1,800 | D | 1,798 | |||
Total deferred tax liabilities | D | 13,496 | D | 20,967 | |||
Net deferred tax assets | 12,626 | 1,814 | |||||
Note: Net deferred tax assets are included under the following balance sheet captions:
2. Reconciliation between the statutory tax rate and the Company’s effective tax rates after application of deferred tax accounting
| ( | %) | ||||||
| Fiscal Year 2003 (As of March 31, 2004) | Fiscal Year 2004 (As of March 31, 2005) | ||||||
Statutory tax rate | 41.8 | 40.5 | |||||
(Adjustments) | |||||||
Non-deductible permanent differences including entertainment and other expenses. | 3.9 | 3.8 | |||||
Deductible permanent differences including dividend received deductions and other items | D | 0.6 | D | 0.7 | |||
Per capita inhabitants’ taxes | 0.2 | 0.2 | |||||
Tax credit for research and development expenses | D | 5.9 | D | 5.5 | |||
Provision for valuation allowance | — | 19.0 | |||||
Other | 0.7 | D | 0.3 | ||||
Effective tax rate | 40.1 | 57.0 | |||||
64
Per Share Information
Fiscal Year 2003
(For the year ended March 31, 2004)
Net assets per share | ¥ | 1,502.24 | |
Net income per share (basic) | ¥ | 102.29 | |
Net income per share (diluted) | ¥ | 102.28 |
Fiscal Year 2004
(For the year ended March 31, 2005)
Net assets per share | ¥ | 1,545.88 | |
Net income per share (basic) | ¥ | 71.53 | |
Net income per share (diluted) | ¥ | 71.50 |
Note: Calculations of basic and diluted net income per share are based on the following numerators and denominators:
| Fiscal Year 2003 (For the year ended March 31, 2004) | Fiscal Year 2004: (For the year ended March 31, 2005) | |||||
Net income per share (basic): | ||||||
Net income (millions of yen) | 27,996 | 19,303 | ||||
Amount not available for common shareholders (millions of yen) | 120 | 100 | ||||
(Including directors’ bonuses paid from net income of) (millions of yen) | (120 | ) | (100 | ) | ||
Net income available for dividends on common shares (millions of yen) | 27,876 | 19,203 | ||||
Weighted-average number of common shares outstanding during the year (1,000 shares) | 272,515 | 268,481 | ||||
Net income per share (diluted): | ||||||
Additional dilutive common shares (1,000 shares) | 34 | 111 | ||||
(Including dilutive effect of stock options of) | (34 | ) | (111 | ) | ||
| Descriptions of potentially dilutive common shares that were not included in the computation of diluted net income per share because of their anti-dilutive effect. | Two share subscription right plans (related to 1,001 thousand shares) and one share purchase option plan (related to 4,090 units of options). | | Same as for the previous year | |||
Subsequent Events
Fiscal Year 2003 (For the year ended March 31, 2004)
None applicable
Fiscal Year 2004 (For the year ended March 31, 2005)
None applicable
65
7. Proposed Changes in Membership of the Board of Directors
The following changes in executive management responsibilities are anticipated pending approval at the 127th Ordinary General Meeting of Shareholders scheduled to be held on June 29, 2005.
1. Changes in Representative Directors*
(1) Candidate for Election to Representative Director and Senior Managing Director
Kenichi Mizutani (Currently, Senior Managing Director)
(2) Representative Director Scheduled to Retire
Hiroyuki Nagasako (Currently, Representative Director and Executive Vice President)
| * | Representative Directors in Japanese corporations have designated fiduciary responsibilities according to the Japanese Commercial Code. |
2. Changes in Directors
(1) Candidates for Election to Board of Directors
External Director | Teijiro Furukawa (Previously, Deputy Chief Cabinet Secretary, Parliamentary Cabinet Office) | |
External Director | Yoshifumi Nishikawa (Currently, President and CEO of Sumitomo Mitsui Banking Corporation) | |
(2) Directors Scheduled to Retire
Hiroshi Yamamoto (Currently, Senior Managing Director)
Scheduled to become Representative Director and President of Daiichi Pharmatech Co., Ltd.
Atsuo Inoue (Currently, Managing Director)
Scheduled to become Advisor of the Company
Tomomi Chiba (Currently, Director responsible for Medical Information)
Scheduled to become Representative Director and President of D.P.C. Medical Co., Ltd.
Isao Hayakawa (Currently, Director responsible for Drug Discovery Research)
Scheduled to become General Manager responsible for the Drug Discovery Research Office and
Special Corporate Advisor.
Kyohei Nonose (Currently, Director and General Manager of Human Resources Department)
Scheduled to become Senior Corporate Officer
Kazunori Hirokawa (Currently, Director and General Manager of R&D Strategic Planning Department)
Scheduled to become Senior Corporate Officer
66
(3) Promotions of Directors
Senior Managing Director | Tadao Suzuki | (Currently, Managing Director) | ||
Managing Director | Ryuzo Takada | (Currently, Director and General Manager of Marketing & Sales Administration Department) |
3. References
(1) Board of Directors after Changes
| *President and CEO (Representative Director) | Kiyoshi Morita | |
| *Senior Managing Director (Representative Director) | Kenichi Mizutani | |
| *Senior Managing Director | Tadao Suzuki | |
| *Managing Director | Hidetoshi Imaizumi | |
| *Managing Director | Tsutomu Une | |
| *Managing Director | Ryuzo Takada | |
| *Director | Hiroshi Sugiyama | |
| *Director | Teruo Takayanagi | |
| *Director | Toru Kuroda | |
| *Director | Akira Nagano | |
| *Director | George Nakayama | |
| Director | Teijiro Furukawa | |
| Director | Yoshifumi Nishikawa | |
| * | Directors marked with asterisks are scheduled to serve concurrently as Corporate Officers. |
67
(2) Corporate Officers after Changes
| Senior Corporate Officer | Kyohei Nonose | |
| Senior Corporate Officer | Kazunori Hirokawa | |
| Corporate Officer | Toshiro Minotani | |
| Corporate Officer | Koju Ogawa | |
| Corporate Officer | Yusuke Yukimoto | |
| Corporate Officer | Tadashi Horiuchi | |
| Corporate Officer | Masatoshi Sakamoto | |
| Corporate Officer | Osamu Goishihara | |
| Corporate Officer | Shinsei Tamai | |
| Corporate Officer | Yoichi Hara | |
| Corporate Officer | Takao Sato | |
| Corporate Officer | Koichi Masumura | |
| Corporate Officer | Yuichi Kano | |
| Corporate Officer | Toshio Takahashi | |
| Corporate Officer | Manabu Sakai | |
| Corporate Officer | Haruhisa Kubota | |
68
(3) Profile of New Representative Director
Position | Representative Director and Senior Managing Director | |
Name | Kenichi Mizutani | |
Date of birth | February 12, 1941 (64 years old) | |
Education | Graduated from The Faculty of Pharmaceutical Sciences of Nagoya City | |
| University in March 1963 | ||
Work history | ||
April 1963 | Entered the Company | |
April 1990 | General Manager of Drug Marketing Department 2 | |
June 1995 | Director and General Manager of Tokyo Branch 1 | |
October 1998 | Director responsible for Medical Planning and Promotion | |
June 1999 | Managing Director | |
October 2002 | Senior Managing Director | |
69
Filings with the U.S. SEC
Daiichi Pharmaceutical Co., Ltd. and Sankyo Company, Limited may file a registration statement on Form F-4 with the U.S. SEC in connection with the proposed business combination of Daiichi and Sankyo under a new holding company by way of a joint share transfer. The Form F-4 (if filed) will contain a prospectus and other documents. If a Form F-4 is filed and declared effective, Daiichi and Sankyo plan to mail the prospectus contained in the Form F-4 to their U.S. shareholders prior to the shareholders meetings at which the share exchange will be voted upon. The Form F-4 (if filed) and prospectus will contain important information about Daiichi and Sankyo, the joint share transfer and related matters. U.S. shareholders of Daiichi and Sankyo are urged to read the Form F-4, the prospectus and the other documents that may be filed with the U.S. SEC in connection with the joint share transfer carefully before they make any decision at the shareholders meeting with respect to the joint share transfer. The Form F-4 (if filed), the prospectus and all other documents filed with the U.S. SEC in connection with the joint share transfer will be available when filed, free of charge, on the U.S. SEC’s web site at www.sec.gov. In addition, the prospectus and all other documents filed with the U.S. SEC in connection with the business combination will be made available to shareholders, free of charge, by calling, writing or e-mailing:
| Sankyo Company, Limited | Daiichi Pharmaceutical Co., Ltd. | |
| Mr. Shigemichi Kondo | Mr. Toshio Takahashi | |
| Corporate Communications Department | Corporate Communications Department | |
| 3-5-1, Nihonbashi Honcho | 14-10 Nihonbashi, 3-chome | |
| Chuo-ku, Tokyo 103-8426, Japan | Chuo-ku, Tokyo 103-8234, Japan | |
| Telephone: 81-3-5255-7034 | Telephone: 81-3-3273-7107 | |
| E-mail: shige-k@sankyo.co.jp | E-mail: andokb5o@daiichipharm.co.jp |
You may read and copy any reports and other information filed with, or submitted to, the U.S. SEC at the U.S. SEC’s public reference rooms at 100 F Street, N.E., Washington, D.C. 20549 or at the other public reference rooms in New York, New York and Chicago, Illinois. Please call the U.S. SEC at 1-800-SEC-0330 for further information on public reference rooms. Filings with the U.S. SEC also are available to the public from commercial document-retrieval services and at the web site maintained by the U.S. SEC at http//www.sec.gov.
Forward-Looking Statements
This communication contains forward-looking information and statements about Daiichi and Sankyo and their combined businesses after completion of the joint share transfer. Forward-looking statements are statements that are not historical facts. These statements include financial projections and estimates and their underlying assumptions, statements regarding plans, objectives and expectations with respect to future operations, products and services, and statements regarding future performance. Forward-looking statements are generally identified by the words “expect,” “anticipates,” “believes,” “intends,” “estimates” and similar expressions. Although the management of Daiichi and Sankyo believe that the expectations reflected in such forward-looking statements are reasonable, investors and holders of Daiichi and Sankyo securities are cautioned that forward-looking information and statements are subject to various risks and uncertainties, many of which are difficult to predict and generally beyond the control of Daiichi and Sankyo, that could cause actual results and developments to differ materially from those expressed in, or implied or projected by, the forward-looking information and statements. These risks and uncertainties include those discussed or identified in the public filings with the SEC and the local filings made by Daiichi and Sankyo, including those listed under “Cautionary Statement Concerning Forward-Looking Statements” and “Risk Factors” in the prospectus included in the registration statement on Form F-4 that Daiichi and Sankyo may file with the U.S. SEC. Other than as required by applicable law, neither Daiichi nor Sankyo undertakes any obligation to update or revise any forward-looking information or statements.
70