UNITED STATES
SECURITIES AND EXCHANGE COMMISSION
Washington, D.C. 20549
FORM N-CSR
CERTIFIED SHAREHOLDER REPORT
OF
REGISTERED MANAGEMENT INVESTMENT COMPANIES
Investment Company Act file number: 811-00834
Name of Registrant: | | Vanguard Windsor Funds |
Address of Registrant: | | P.O. Box 2600 |
| | Valley Forge, PA 19482 |
| | |
Name and address of agent for service: | | Anne E. Robinson, Esquire |
| | P.O. Box 876 |
| | Valley Forge, PA 19482 |
Registrant’s telephone number, including area code: (610) 669-1000
Date of fiscal year end: October 31
Date of reporting period: November 1, 2018—October 31, 2019
Item 1: Reports to Shareholders

Annual Report | October 31, 2019 Vanguard WindsorTM Fund |
See the inside front cover for important information about access to your fund’s annual and semiannual shareholder reports. |
Important information about access to shareholder reports
Beginning on January 1, 2021, as permitted by regulations adopted by the Securities and Exchange Commission, paper copies of your fund’s annual and semiannual shareholder reports will no longer be sent to you by mail, unless you specifically request them. Instead, you will be notified by mail each time a report is posted on the website and will be provided with a link to access the report.
If you have already elected to receive shareholder reports electronically, you will not be affected by this change and do not need to take any action. You may elect to receive shareholder reports and other communications from the fund electronically by contacting your financial intermediary (such as a broker-dealer or bank) or, if you invest directly with the fund, by calling Vanguard at one of the phone numbers on the back cover of this report or by logging on to vanguard.com.
You may elect to receive paper copies of all future shareholder reports free of charge. If you invest through a financial intermediary, you can contact the intermediary to request that you continue to receive paper copies. If you invest directly with the fund, you can call Vanguard at one of the phone numbers on the back cover of this report or log on to vanguard.com. Your election to receive paper copies will apply to all the funds you hold through an intermediary or directly with Vanguard.
Contents | |
| |
A Note From Our Chairman | 1 |
Your Fund’s Performance at a Glance | 2 |
Advisors’ Report | 3 |
About Your Fund’s Expenses | 7 |
Performance Summary | 9 |
Financial Statements | 11 |
Please note: The opinions expressed in this report are just that—informed opinions. They should not be considered promises or advice. Also, please keep in mind that the information and opinions cover the period through the date on the front of this report. Of course, the risks of investing in your fund are spelled out in the prospectus.
A Note From Our Chairman

Tim Buckley
Chairman and Chief Executive Officer
Dear Shareholder,
Recent volatility in financial markets—affecting stocks, bonds, and commodities—has been a good reminder of the wise old adage, “Never keep all your eggs in one basket.” Maintaining balance and diversification in your investment portfolio can help to both limit risk and set you up for long-term success.
It’s understandable why some investors might become complacent after a long market run-up like the one that lifted stock prices, especially U.S. stock prices, in the years following the global financial crisis. But failing to rebalance regularly can leave a portfolio with a much different mix of assets than intended and, often, more risk than intended.
Balance across and diversification within asset classes are powerful tools for managing risk and achieving your investment goals. A portfolio’s allocation will determine a large portion of its long-term return and also the majority of its volatility risk. A well-diversified portfolio is less vulnerable to significant swings in the performance of any one segment of the asset classes in which it invests.
Balance and diversification will never eliminate the risk of loss, nor will they guarantee positive returns in a declining market. But they should reduce the chance that you’ll suffer disproportionate losses in one particular high-flying asset class or sector when it comes back to earth. And exposure to all key market components should give you at least some participation in the sectors that are performing best at any given time.
Vanguard is committed to helping you achieve balance and diversification in your portfolios to help meet your investment goals. We thank you for your continued loyalty.
Sincerely,

Mortimer J. Buckley
Chairman and Chief Executive Officer
November 18, 2019
1
Your Fund’s Performance at a Glance
· Vanguard Windsor Fund returned 11.59% for Investor Shares and 11.71% for Admiral Shares for the 12 months ended October 31, 2019. The fund’s benchmark, the Russell 1000 Value Index, returned 11.21%.
· The Windsor Fund’s two advisors aim to invest in large- and mid-capitalization stocks they have determined are undervalued by the marketplace.
· The broad U.S. stock market, as measured by the Russell 3000 Index, climbed more than 13% for the year. While stocks endured stretches of volatility at the end of 2018 and during the spring of 2019, their performance was boosted by the Federal Reserve’s accommodative stance and corporate earnings that largely exceeded investor expectations.
· Growth stocks outperformed their value counterparts, while large- and mid-cap stocks surpassed small-caps.
· The advisors’ holdings in information technology, industrials, and materials were the greatest contributors to relative performance. Energy, utilities, and consumer staples detracted the most.
· Over the past decade, the fund’s average return slightly trailed that of its expense-free benchmark.
Market Barometer
| | Average Annual Total Returns | |
| | Periods Ended October 31, 2019 | |
| | One Year | | Three Years | | Five Years | |
Stocks | | | | | | | |
Russell 1000 Index (Large-caps) | | 14.15% | | 14.73% | | 10.55% | |
Russell 2000 Index (Small-caps) | | 4.90 | | 10.96 | | 7.37 | |
Russell 3000 Index (Broad U.S. market) | | 13.49 | | 14.47 | | 10.31 | |
FTSE All-World ex US Index (International) | | 11.52 | | 8.21 | | 4.16 | |
| | | | | | | |
Bonds | | | | | | | |
Bloomberg Barclays U.S. Aggregate Bond Index (Broad taxable market) | | 11.51% | | 3.29% | | 3.24% | |
Bloomberg Barclays Municipal Bond Index (Broad tax-exempt market) | | 9.42 | | 3.62 | | 3.55 | |
FTSE Three-Month U.S. Treasury Bill Index | | 2.35 | | 1.57 | | 0.98 | |
| | | | | | | |
CPI | | | | | | | |
Consumer Price Index | | 1.76% | | 2.11% | | 1.62% | |
2
Advisors’ Report
For the fiscal year ended October 31, 2019, Vanguard Windsor Fund returned 11.59% for Investor Shares and 11.71% for lower-cost Admiral Shares. The fund is managed by two independent advisors, a strategy that enhances its diversification by providing exposure to distinct yet complementary investment approaches. It is not uncommon for different advisors to have different views about individual securities or the broader investment environment.
The advisors, the percentage and amount of fund assets that each manages, and brief descriptions of their investment strategies are presented in the table below. The advisors have also prepared a discussion of the investment environment that existed during the period and of how their portfolio positioning reflects this assessment. These comments were prepared on November 18, 2019.
Wellington Management Company LLP
Portfolio Manager:
David W. Palmer, CFA,
Senior Managing Director
As in recent years, the style factor environment this year was characterized by the outperformance of growth and
Vanguard Windsor Fund Investment Advisors
| | Fund Assets Managed | | |
Investment Advisor | | % | | $ Million | | Investment Strategy |
Wellington Management Company LLP | | 69 | | 13,238 | | Seeks to provide long-term total returns above both the S&P 500 and value-oriented indexes over a complete market cycle through bottom-up, fundamentally driven stock selection focused on undervalued securities. |
Pzena Investment Management, LLC | | 29 | | 5,616 | | Uses a fundamental, bottom-up, deep-value-oriented investment strategy. Seeks to buy good businesses at low prices, focusing exclusively on companies that are underperforming their historically demonstrated earnings power. |
Cash Investments | | 2 | | 342 | | These short-term reserves are invested by Vanguard in equity index products to simulate investment in stocks. Each advisor also may maintain a modest cash position. |
3
momentum and the underperformance of value (most notably book-to-price factor). The fund’s style factors modestly boosted results compared with those of the Russell 1000 Value Index.
We have always believed the best long-term opportunities are in stocks of good companies that have been discarded by other investors for reasons that we feel are temporary. There certainly have been times when the portfolio was out of sync with marketplace fashion. We are confident that if we remain disciplined in our value approach, we will bring compensatory rewards to our shareholders over the long run.
Domestic demand weakened globally in 2019, and U.S. leading metrics moved lower to converge with those of other countries. Wellington’s macroeconomic experts expect central banks to loosen policy as a result. However, they predict this will likely be offset by an overall reduction in economic output as sentiment becomes increasingly cautious. While our team’s approach rests primarily on company-specific assessment, we take a dimmer view of companies that require customer-confidence-driven volume acceleration.
Over the fiscal year, the sectors that performed best in the Russell 1000 Value Index were real estate, utilities, and information technology. Only energy posted a negative return.
Stock selection was the primary driver of our portion of the fund’s results, led by information technology, industrials, and materials. Among the stocks that had an impact of at least 30 basis points (a basis point is one-hundredth of a percentage point) on relative performance, the winners outnumbered the losers by nearly 60%. These top performers were spread over seven of the 11 sectors.
Information technology did best relative to the benchmark. Within the sector, the most notable contributors were KLA, Broadcom, and Marvell Technology Group. Shares of KLA benefited from increased development spending by foundry and logistic customers. We believe the company has the potential to outperform the broader semiconductor equipment industry. KLA continues to invest heavily in R&D and has a strong technical standing.
Marvell Technology had a great run during the year as opportunities in 5G ramped up considerably and investors anticipated a strong growth trajectory. We eliminated our position in favor of more compelling risk/return opportunities trading at what we believe are more reasonable valuations.
Industrials was another solid contributor. L3Harris Technologies gained amid continued integration of the merger between L3 and Harris, completed in June 2019. More broadly, the stock benefited from a bid for the defense
4
sector. Defense companies have put up strong results and shown improving performance throughout the year.
Weak security selection in the energy sector partially offset positive returns elsewhere. Permian Basin producer Concho Resources disappointed with poor second-quarter results in both production and capital efficiency. Concho management, previously acclaimed for its superior operating acumen, confessed to mistakes in field development planning on several key projects. Placing wells too close together reduced production volumes per dollar spent. We have maintained the position as we feel that the market is straightlining this poor efficiency into the future. We believe there is considerable upside potential for new field designs to improve results.
Strength in consumer confidence, labor market, and liquidity measures has largely been offset by a deterioration in export-oriented metrics such as industrials confidence. Heightened volatility has entered the markets along with the deterioration of U.S.-China trade relations and concerns about the U.S. yield curve inversion’s implications for a potential economic recession. We remain focused on finding underperforming companies that we believe have meaningfully undervalued earnings potential, along with balance sheets and business models capable of surviving a potentially choppy economic environment.
Pzena Investment Management, LLC
Portfolio Managers:
Richard S. Pzena, Managing Principal and Co-Chief Investment Officer
John J. Flynn, Principal
Benjamin S. Silver, CFA, CPA, Principal
In a market that favored growth and low volatility over value stocks, our portion of the fund’s holdings in financials contributed to results. Consumer discretionary, information technology, and energy positions underperformed significantly.
Oilfield service leaders Halliburton and National Oilwell Varco were large detractors. Weak oil prices and temporary oversupply masked the fact that oil and gas capital spending must pick up dramatically to offset a looming shortfall in energy supply in the next several years. Oil service companies have been especially pressured as oil companies cut operating costs and capital spending to restore profits and cash flow.
Mylan, the leading generic drug manufacturer, was weak after recent turmoil in the U.S. domestic market. This weighed on shares as two biosimilar drugs faced a prolonged approval process from the FDA, and generic price deflation accelerated. The company recently announced a merger with Pfizer’s Upjohn division. The merger will increase its distribution reach into Asia and provide significant cash flow from Upjohn’s off-patent drug portfolio.
5
The largest individual contributor was insurance company American International Group. It rose on higher net investment income and a lower combined expense ratio, along with a lack of negative reserve developments.
Another contributor was a new holding in pharmaceutical company Bristol-Myers Squibb. We added a position after recent drug trial setbacks and the pending acquisition of Celgene weighed down the stock. The underlying business has performed well, and divestitures from the Celgene transaction seem to be reasonable. Financial services leader Bank of America also reported strong results.
We initiated several new positions this year, including PVH, a global apparel company that derives 90% of its profits from the Calvin Klein and Tommy Hilfiger brands. We bought the stock after recent creative decisions at Calvin Klein by a new creative director won acclaim from critics but did not translate to commercial success. Calvin Klein has now parted ways with that creative director and is returning to its roots. We believe the issues are fixable and are encouraged by the performance of the core brand.
Another new position is Wabtec, a leading manufacturer of railroad equipment that merged its operations with GE Transportation, a top producer of locomotives. The shares have severely underperformed because of investor concerns over acquisition-related risks and cyclically depressed demand for locomotives. Deliveries in 2018 were the lowest on record.
Finally, we added Mohawk Industries, the leading global manufacturer of flooring products. Earnings have recently come under pressure from input cost inflation. Also, consumers have begun replacing traditional flooring products with luxury vinyl tile (LVT), a rapidly growing category in which Mohawk is underrepresented. As Mohawk ramps up its LVT capacity, we expect it to leverage its historical advantages in distribution and manufacturing excellence to successfully navigate this industry transition.
To fund these purchases, our notable sales included pharmaceutical company Merck, advertising agency Omnicom Group, pharmacy benefit manager Express Scripts (which we exited when it was taken over), and integrated oil company BP. We trimmed several positions, including industrial Dover, integrated energy company Royal Dutch Shell, IT software company Oracle, and pharmaceutical company Pfizer.
In our view, the current market environment represents a compelling value opportunity for those investors with a patient, long-term investment horizon. The portfolio remains positioned in economically sensitive areas where we are finding a wide range of good businesses at compelling valuations.
6
About Your Fund’s Expenses
As a shareholder of the fund, you incur ongoing costs, which include costs for portfolio management, administrative services, and shareholder reports (like this one), among others. Operating expenses, which are deducted from a fund’s gross income, directly reduce the investment return of the fund.
A fund’s expenses are expressed as a percentage of its average net assets. This figure is known as the expense ratio. The following examples are intended to help you understand the ongoing costs (in dollars) of investing in your fund and to compare these costs with those of other mutual funds. The examples are based on an investment of $1,000 made at the beginning of the period shown and held for the entire period.
The accompanying table illustrates your fund’s costs in two ways:
· Based on actual fund return. This section helps you to estimate the actual expenses that you paid over the period. The “Ending Account Value” shown is derived from the fund’s actual return, and the third column shows the dollar amount that would have been paid by an investor who started with $1,000 in the fund. You may use the information here, together with the amount you invested, to estimate the expenses that you paid over the period.
To do so, simply divide your account value by $1,000 (for example, an $8,600 account value divided by $1,000 = 8.6), then multiply the result by the number given for your fund under the heading “Expenses Paid During Period.”
· Based on hypothetical 5% yearly return. This section is intended to help you compare your fund’s costs with those of other mutual funds. It assumes that the fund had a yearly return of 5% before expenses, but that the expense ratio is unchanged. In this case—because the return used is not the fund’s actual return—the results do not apply to your investment. The example is useful in making comparisons because the Securities and Exchange Commission requires all mutual funds to calculate expenses based on a 5% return. You can assess your fund’s costs by comparing this hypothetical example with the hypothetical examples that appear in shareholder reports of other funds.
Note that the expenses shown in the table are meant to highlight and help you compare ongoing costs only and do not reflect transaction costs incurred by the fund for buying and selling securities. Further, the expenses do not include any purchase, redemption, or account service fees described in the fund prospectus. If such fees were applied to your account, your costs would be higher. Your fund does not carry a “sales load.”
The calculations assume no shares were bought or sold during the period. Your actual costs may have been higher or lower, depending on the amount of your investment and the timing of any purchases or redemptions.
You can find more information about the fund’s expenses, including annual expense ratios, in the Financial Statements section of this report. For additional information on operating expenses and other shareholder costs, please refer to your fund’s current prospectus.
7
Six Months Ended October 31, 2019
| | Beginning | | Ending | | Expenses |
| | Account Value | | Account Value | | Paid During |
Windsor Fund | | 4/30/2019 | | 10/31/2019 | | Period |
Based on Actual Fund Return | | | | | | |
Investor Shares | | $1,000.00 | | $1,033.81 | | $1.54 |
Admiral™ Shares | | 1,000.00 | | 1,034.48 | | 1.03 |
Based on Hypothetical 5% Yearly Return | | | | | | |
Investor Shares | | $1,000.00 | | $1,023.69 | | $1.53 |
Admiral Shares | | 1,000.00 | | 1,024.20 | | 1.02 |
The calculations are based on expenses incurred in the most recent six-month period. The fund’s annualized six-month expense ratios for that period are 0.30% for Investor Shares and 0.20% for Admiral Shares. The dollar amounts shown as “Expenses Paid” are equal to the annualized expense ratio multiplied by the average account value over the period, multiplied by the number of days in the most recent six-month period, then divided by the number of days in the most recent 12-month period (184/365).
8
Windsor Fund
Performance Summary
All of the returns in this report represent past performance, which is not a guarantee of future results that may be achieved by the fund. (Current performance may be lower or higher than the performance data cited. For performance data current to the most recent month-end, visit our website at vanguard.com/performance.) Note, too, that both investment returns and principal value can fluctuate widely, so an investor’s shares, when sold, could be worth more or less than their original cost. The returns shown do not reflect taxes that a shareholder would pay on fund distributions or on the sale of fund shares.
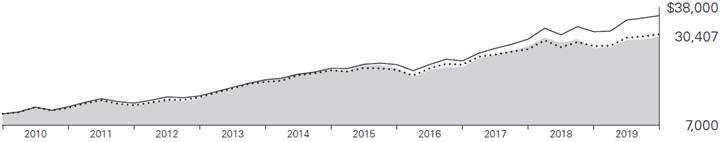
Cumulative Performance: October 31, 2009, Through October 31, 2019
Initial Investment of $10,000
| | Average Annual Total Returns
Periods Ended October 31, 2019 | |
| | | | | Final Value |
| | One | Five | Ten | of a $10,000 |
| | Year | Years | Years | Investment |

| Windsor Fund Investor Shares | 11.59% | 7.08% | 11.76% | $30,407 |

| Russell 1000 Value Index | 11.21 | 7.61 | 11.96 | 30,959 |

| Dow Jones U.S. Total Stock Market Float Adjusted Index | 13.39 | 10.26 | 13.62 | 35,859 |
| | | | | Final Value |
| | One | Five | Ten | of a $50,000 |
| | Year | Years | Years | Investment |
Windsor Fund Admiral Shares | 11.71% | 7.19% | 11.88% | $153,654 |
Russell 1000 Value Index | 11.21 | 7.61 | 11.96 | 154,796 |
Dow Jones U.S. Total Stock Market Float Adjusted Index | 13.39 | 10.26 | 13.62 | 179,296 |
See Financial Highlights for dividend and capital gains information.
9
Windsor Fund
Sector Diversification
As of October 31, 2019
Communication Services | | 8.5% |
Consumer Discretionary | | 7.9 |
Consumer Staples | | 4.8 |
Energy | | 8.2 |
Financials | | 23.4 |
Health Care | | 14.4 |
Industrials | | 11.2 |
Information Technology | | 10.4 |
Materials | | 4.4 |
Other | | 0.0 |
Real Estate | | 4.2 |
Utilities | | 2.6 |
The table reflects the fund’s equity exposure, based on its investments in stocks and stock index futures. Any holdings in short-term reserves are excluded. Sector categories are based on the Global Industry Classification Standard (“GICS”), except for the “Other” category (if applicable), which includes securities that have not been provided a GICS classification as of the effective reporting period.
The Global Industry Classification Standard (“GICS”) was developed by and is the exclusive property and a service mark of MSCI Inc. (“MSCI”) and Standard and Poor’s, a division of McGraw-Hill Companies, Inc. (“S&P”), and is licensed for use by Vanguard. Neither MSCI, S&P nor any third party involved in making or compiling the GICS or any GICS classification makes any express or implied warranties or representations with respect to such standard or classification (or the results to be obtained by the use thereof), and all such parties hereby expressly disclaim all warranties of originality, accuracy, completeness, merchantability or fitness for a particular purpose with respect to any such standard or classification. Without limiting any of the foregoing, in no event shall MSCI, S&P, any of its affiliates or any third party involved in making or compiling the GICS or any GICS classification have any liability for any direct, indirect, special, punitive, consequential or any other damages (including lost profits) even if notified of the possibility of such damages.
10
Windsor Fund
Financial Statements
Statement of Net Assets
As of October 31, 2019
The fund files its complete schedule of portfolio holdings with the Securities and Exchange Commission (SEC) for the first and third quarters of each fiscal year as an exhibit to its reports on Form N-PORT. The fund’s Form N-PORT reports are available on the SEC’s website at www.sec.gov.
| | | | | Market | |
| | | | | Value· | |
| | | Shares | | ($000 | ) |
Common Stocks (97.0%)1 | | | | | |
Communication Services (8.2%) | | | | | |
| Comcast Corp. Class A | | 7,734,392 | | 346,656 | |
| Verizon Communications Inc. | | 4,946,413 | | 299,110 | |
* | Alphabet Inc. Class A | | 167,804 | | 211,232 | |
* | Electronic Arts Inc. | | 1,939,724 | | 186,989 | |
* | Charter Communications Inc. Class A | | 317,465 | | 148,529 | |
* | T-Mobile US Inc. | | 1,676,423 | | 138,573 | |
| Interpublic Group of Cos. Inc. | | 4,983,648 | | 108,394 | |
| Activision Blizzard Inc. | | 1,305,806 | | 73,164 | |
| AT&T Inc. | | 1,666,954 | | 64,161 | |
| | | | | 1,576,808 | |
Consumer Discretionary (7.7%) | | | | | |
| Expedia Group Inc. | | 1,886,940 | | 257,869 | |
| General Motors Co. | | 5,757,814 | | 213,961 | |
| TJX Cos. Inc. | | 2,598,473 | | 149,802 | |
| Ford Motor Co. | | 16,709,926 | | 143,538 | |
| Lear Corp. | | 1,178,179 | | 138,754 | |
| PVH Corp. | | 1,458,199 | | 127,097 | |
| Newell Brands Inc. | | 5,957,934 | | 113,022 | |
* | Mohawk Industries Inc. | | 745,450 | | 106,883 | |
* | Norwegian Cruise Line Holdings Ltd. | | 1,659,891 | | 84,256 | |
| Lennar Corp. Class A | | 1,275,118 | | 75,997 | |
| Gildan Activewear Inc. Class A | | 2,508,866 | | 64,051 | |
| | | | | 1,475,230 | |
Consumer Staples (4.7%) | | | | | |
| Philip Morris International Inc. | | 4,023,092 | | 327,641 | |
| Kroger Co. | | 8,190,607 | | 201,817 | |
| Archer-Daniels-Midland Co. | | 3,413,509 | | 143,504 | |
* | US Foods Holding Corp. | | 2,471,739 | | 98,054 | |
| Walmart Inc. | | 826,339 | | 96,896 | |
| Kellogg Co. | | 432,159 | | 27,455 | |
| | | | | 895,367 | |
Energy (8.0%) | | | | | |
| Halliburton Co. | | 10,733,672 | | 206,623 | |
| Chevron Corp. | | 1,666,868 | | 193,590 | |
| Canadian Natural Resources Ltd. | | 7,147,490 | | 180,260 | |
| National Oilwell Varco Inc. | | 7,634,325 | | 172,688 | |
| Concho Resources Inc. | | 2,306,915 | | 155,763 | |
| Diamondback Energy Inc. | | 1,306,143 | | 112,015 | |
| Enbridge Inc. | | 2,988,940 | | 108,827 | |
| Exxon Mobil Corp. | | 1,472,730 | | 99,512 | |
| Royal Dutch Shell plc ADR | | 1,712,553 | | 99,277 | |
| Baker Hughes Co. Class A | | 3,439,532 | | 73,606 | |
| Encana Corp. | | 17,584,558 | | 69,107 | |
| Cenovus Energy Inc. | | 6,621,254 | | 56,215 | |
| | | | | 1,527,483 | |
Financials (22.6%) | | | | | |
| Bank of America Corp. | | 19,659,777 | | 614,761 | |
| Citigroup Inc. | | 5,303,284 | | 381,094 | |
| MetLife Inc. | | 7,744,855 | | 362,382 | |
| Raymond James Financial Inc. | | 3,275,454 | | 273,468 | |
* | Athene Holding Ltd. Class A | | 4,634,804 | | 200,919 | |
| American International Group Inc. | | 3,671,029 | | 194,418 | |
| TD Ameritrade Holding Corp. | | 4,820,431 | | 185,008 | |
| Wells Fargo & Co. | | 3,377,478 | | 174,379 | |
| Capital One Financial Corp. | | 1,797,232 | | 167,592 | |
| Zions Bancorp NA | | 3,153,334 | | 152,842 | |
| JPMorgan Chase & Co. | | 1,218,510 | | 152,216 | |
| Morgan Stanley | | 3,128,833 | | 144,083 | |
| ING Groep NV ADR | | 10,686,489 | | 121,078 | |
| AXA Equitable Holdings Inc. | | 5,594,427 | | 120,839 | |
| Unum Group | | 4,245,416 | | 116,919 | |
| Assurant Inc. | | 916,466 | | 115,539 | |
11
Windsor Fund
| | | | | Market | |
| | | | | Value· | |
| | | Shares | | ($000 | ) |
| Voya Financial Inc. | | 2,064,001 | | 111,373 | |
| Goldman Sachs Group Inc. | | 493,525 | | 105,308 | |
| London Stock Exchange Group plc | | 1,085,429 | | 97,818 | |
| M&T Bank Corp. | | 608,597 | | 95,264 | |
| Prudential Financial Inc. | | 994,725 | | 90,659 | |
| PNC Financial Services Group Inc. | | 587,758 | | 86,224 | |
| Fifth Third Bancorp | | 2,159,384 | | 62,795 | |
| KKR & Co. Inc. Class A | | 2,130,259 | | 61,415 | |
| KeyCorp | | 3,143,625 | | 56,491 | |
| Axis Capital Holdings Ltd. | | 896,994 | | 53,308 | |
| UBS Group AG | | 2,753,680 | | 32,411 | |
| Invesco Ltd. | | 695,225 | | 11,694 | |
| | | | | 4,342,297 | |
Health Care (13.9%) | | | | | |
| Bristol-Myers Squibb Co. | | 6,687,175 | | 383,643 | |
| CVS Health Corp. | | 5,610,283 | | 372,467 | |
| UnitedHealth Group Inc. | | 1,078,260 | | 272,476 | |
| Medtronic plc | | 2,099,121 | | 228,594 | |
| Koninklijke Philips NV | | 5,064,328 | | 222,195 | |
| Humana Inc. | | 693,064 | | 203,899 | |
| McKesson Corp. | | 1,471,876 | | 195,760 | |
| Gilead Sciences Inc. | | 2,316,400 | | 147,578 | |
| Amgen Inc. | | 677,924 | | 144,567 | |
* | Centene Corp. | | 2,064,697 | | 109,594 | |
| Eli Lilly & Co. | | 856,700 | | 97,621 | |
* | Mylan NV | | 4,389,901 | | 84,067 | |
| Pfizer Inc. | | 1,888,111 | | 72,447 | |
| Cardinal Health Inc. | | 1,260,058 | | 62,310 | |
| Cigna Corp. | | 298,096 | | 53,198 | |
* | Biogen Inc. | | 45,702 | | 13,652 | |
| | | | | 2,664,068 | |
Industrials (10.8%) | | | | | |
| Wabtec Corp. | | 4,831,357 | | 335,151 | |
| L3Harris Technologies Inc. | | 1,263,815 | | 260,738 | |
| Southwest Airlines Co. | | 3,885,171 | | 218,075 | |
| Ferguson plc | | 2,347,724 | | 200,481 | |
| General Electric Co. | | 19,315,466 | | 192,768 | |
| Raytheon Co. | | 793,663 | | 168,423 | |
| Eaton Corp. plc | | 1,675,008 | | 145,910 | |
| Stanley Black & Decker Inc. | | 746,140 | | 112,913 | |
* | Sensata Technologies Holding plc | | 2,022,708 | | 103,542 | |
| JB Hunt Transport Services Inc. | | 827,569 | | 97,289 | |
| Delta Air Lines Inc. | | 1,477,100 | | 81,359 | |
| Honeywell International Inc. | | 456,546 | | 78,859 | |
| Parker-Hannifin Corp. | | 317,760 | | 58,306 | |
| Dover Corp. | | 281,597 | | 29,255 | |
| | | | | 2,083,069 | |
Information Technology (10.0%) | | | | | |
| Intel Corp. | | 6,014,426 | | 339,995 | |
* | Micron Technology Inc. | | 5,436,234 | | 258,493 | |
| KLA Corp. | | 1,431,617 | | 242,001 | |
| Broadcom Inc. | | 561,767 | | 164,513 | |
| SS&C Technologies Holdings Inc. | | 2,698,456 | | 140,347 | |
| Amdocs Ltd. | | 2,087,713 | | 136,119 | |
| Hewlett Packard Enterprise Co. | | 8,187,213 | | 134,352 | |
* | Arrow Electronics Inc. | | 1,597,125 | | 126,620 | |
| Cognizant Technology Solutions Corp. Class A | | 1,962,403 | | 119,589 | |
| Oracle Corp. | | 1,972,134 | | 107,462 | |
| Samsung Electronics Co. Ltd. | | 1,863,975 | | 80,561 | |
| Juniper Networks Inc. | | 1,836,089 | | 45,572 | |
| Cisco Systems Inc. | | 556,397 | | 26,434 | |
| | | | | 1,922,058 | |
Materials (4.2%) | | | | | |
| FMC Corp. | | 2,362,849 | | 216,201 | |
| Celanese Corp. Class A | | 1,600,266 | | 193,872 | |
| Reliance Steel & Aluminum Co. | | 1,501,157 | | 174,194 | |
| PPG Industries Inc. | | 893,438 | | 111,787 | |
| Vulcan Materials Co. | | 683,652 | | 97,673 | |
* | Livent Corp. | | 2,292,561 | | 15,727 | |
| | | | | 809,454 | |
Other (0.3%) | | | | | |
2 | Vanguard Value ETF | | 543,476 | | 61,815 | |
| | | | | | |
Real Estate (4.1%) | | | | | |
| Equinix Inc. | | 425,183 | | 240,985 | |
| Americold Realty Trust | | 5,199,121 | | 208,433 | |
| Host Hotels & Resorts Inc. | | 7,818,719 | | 128,149 | |
| Simon Property Group Inc. | | 709,871 | | 106,963 | |
| American Tower Corp. | | 474,686 | | 103,520 | |
| | | | | 788,050 | |
Utilities (2.5%) | | | | | |
| Edison International | | 1,708,842 | | 107,486 | |
| Exelon Corp. | | 2,239,400 | | 101,871 | |
| Sempra Energy | | 643,131 | | 92,939 | |
| Duke Energy Corp. | | 669,597 | | 63,116 | |
| Avangrid Inc. | | 1,258,907 | | 63,008 | |
| Entergy Corp. | | 367,502 | | 44,644 | |
| | | | | 473,064 | |
Total Common Stocks | | | | | |
(Cost $15,482,817) | | | | 18,618,763 | |
12
Windsor Fund
| | | | | Market | |
| | | | | Value· | |
| | | Shares | | ($000 | ) |
Temporary Cash Investments (3.0%)1 | | | | | |
Money Market Fund (2.1%) | | | | | |
3 | Vanguard Market Liquidity Fund, 1.984% | | 4,151,517 | | 415,193 | |
| | | Face | | | |
| | | Amount | | | |
| | | ($000) | | | |
Repurchase Agreement (0.8%) | | | | | |
| Bank of America Securities, LLC 1.750%, 11/1/19 (Dated 10/31/19, Repurchase Value $146,707,000, collateralized by Government National Mortgage Assn. 3.500%, 3/20/47–4/20/49, with a value of $149,634,000) | | 146,700 | | 146,700 | |
| | | | | | |
U.S. Government and Agency Obligations (0.1%) | | | | | |
4 | United States Treasury Bill, 2.158%, 11/7/19 | | 10,000 | | 9,998 | |
Total Temporary Cash Investments | | | | | |
(Cost $571,874) | | | | 571,891 | |
Total Investments (100.0%) | | | | | |
(Cost $16,054,691) | | | | 19,190,654 | |
| | | | Amount | |
| | | | ($000 | ) |
Other Assets and Liabilities (0.0%) | | | | | |
Other Assets | | | | | |
Investment in Vanguard | | | | 885 | |
Receivables for Investment Securities Sold | | | | 13,559 | |
Receivables for Accrued Income | | | | 23,233 | |
Receivables for Capital Shares Issued | | | | 1,186 | |
Other Assets5 | | | | 2,537 | |
Total Other Assets | | | | 41,400 | |
Liabilities | | | | | |
Payables for Investment Securities Purchased | | | | (4,524 | ) |
Payables for Capital Shares Redeemed | | | | (12,918 | ) |
Payables to Investment Advisor | | | | (2,889 | ) |
Payables to Vanguard | | | | (14,501 | ) |
Variation Margin Payable—Futures Contracts | | | | (1,151 | ) |
Other Liabilities | | | | (9 | ) |
Total Liabilities | | | | (35,992 | ) |
Net Assets (100%) | | | | 19,196,062 | |
At October 31, 2019, net assets consisted of:
| | | | Amount | |
| | | | ($000 | ) |
Paid-in Capital | | | | 14,386,858 | |
Total Distributable Earnings (Loss) | | | | 4,809,204 | |
Net Assets | | | | 19,196,062 | |
| | | | | |
Investor Shares—Net Assets | | | | | |
Applicable to 208,993,799 outstanding $.001 par value shares of beneficial interest (unlimited authorization) | | | | 4,548,724 | |
Net Asset Value Per Share—Investor Shares | | | | $21.76 | |
| | | | | |
Admiral Shares—Net Assets | | | | | |
Applicable to 199,525,133 outstanding $.001 par value shares of beneficial interest (unlimited authorization) | | | | 14,647,338 | |
Net Asset Value Per Share—Admiral Shares | | | | $73.41 | |
· See Note A in Notes to Financial Statements.
* Non-income-producing security.
1 The fund invests a portion of its cash reserves in equity markets through the use of index futures contracts. After giving effect to futures investments, the fund’s effective common stock and temporary cash investment positions represent 98.5% and 1.5%, respectively, of net assets.
2 Considered an affiliated company of the fund as the issuer is another member of The Vanguard Group.
3 Affiliated money market fund available only to Vanguard funds and certain trusts and accounts managed by Vanguard. Rate shown is the 7-day yield.
4 Securities with a value of $9,998,000 have been segregated as initial margin for open futures contracts.
5 Cash of $2,200,000 has been segregated as initial margin for open futures contracts.
ADR—American Depositary Receipt.
13
Windsor Fund
Derivative Financial Instruments Outstanding as of Period End | |
| | | | | |
Futures Contracts | | | | | |
| | | | | ($000) |
| | | | | Value and |
| | Number of | | | Unrealized |
| | Long (Short) | | Notional | Appreciation |
| Expiration | Contracts | | Amount | (Depreciation) |
Long Futures Contracts | | | | | |
E-mini S&P 500 Index | December 2019 | 1,865 | | 283,088 | 323 |
See accompanying Notes, which are an integral part of the Financial Statements.
14
Windsor Fund
Statement of Operations
| | Year Ended | |
| | October 31, 2019 | |
| | ($000 | ) |
Investment Income | | | |
Income | | | |
Dividends—Unaffiliated Issuers1 | | 417,664 | |
Dividends—Affiliated Issuers | | 1,635 | |
Interest—Unaffiliated Issuers | | 4,951 | |
Interest—Affiliated Issuers | | 6,256 | |
Securities Lending—Net | | 1,032 | |
Total Income | | 431,538 | |
Expenses | | | |
Investment Advisory Fees—Note B | | | |
Basic Fee | | 23,528 | |
Performance Adjustment | | (9,853 | ) |
The Vanguard Group—Note C | | | |
Management and Administrative—Investor Shares | | 9,725 | |
Management and Administrative—Admiral Shares | | 17,505 | |
Marketing and Distribution—Investor Shares | | 400 | |
Marketing and Distribution—Admiral Shares | | 515 | |
Custodian Fees | | 99 | |
Auditing Fees | | 42 | |
Shareholders’ Reports—Investor Shares | | 52 | |
Shareholders’ Reports—Admiral Shares | | 66 | |
Trustees’ Fees and Expenses | | 21 | |
Total Expenses | | 42,100 | |
Net Investment Income | | 389,438 | |
Realized Net Gain (Loss) | | | |
Investment Securities Sold—Unaffiliated Issuers | | 1,618,621 | |
Investment Securities Sold—Affiliated Issuers | | 8,257 | |
Futures Contracts | | 8,910 | |
Foreign Currencies | | 131 | |
Realized Net Gain (Loss) | | 1,635,919 | |
Change in Unrealized Appreciation (Depreciation) | | | |
Investment Securities—Unaffiliated Issuers | | 23,304 | |
Investment Securities—Affiliated Issuers | | (3,389 | ) |
Futures Contracts | | 5,658 | |
Foreign Currencies | | 78 | |
Change in Unrealized Appreciation (Depreciation) | | 25,651 | |
Net Increase (Decrease) in Net Assets Resulting from Operations | | 2,051,008 | |
1 Dividends are net of foreign withholding taxes of $5,615,000.
See accompanying Notes, which are an integral part of the Financial Statements.
15
Windsor Fund
Statement of Changes in Net Assets
| | Year Ended October 31, | |
| | 2019 | | 2018 | |
| | ($000 | ) | ($000 | ) |
Increase (Decrease) in Net Assets | | | | | |
Operations | | | | | |
Net Investment Income | | 389,438 | | 367,597 | |
Realized Net Gain (Loss) | | 1,635,919 | | 1,740,492 | |
Change in Unrealized Appreciation (Depreciation) | | 25,651 | | (2,369,959 | ) |
Net Increase (Decrease) in Net Assets Resulting from Operations | | 2,051,008 | | (261,870 | ) |
Distributions | | | | | |
Net Investment Income | | | | | |
Investor Shares | | (88,856 | ) | (80,060 | ) |
Admiral Shares | | (291,650 | ) | (251,761 | ) |
Realized Capital Gain1 | | | | | |
Investor Shares | | (393,302 | ) | (139,411 | ) |
Admiral Shares | | (1,237,338 | ) | (398,253 | ) |
Total Distributions | | (2,011,146 | ) | (869,485 | ) |
Capital Share Transactions | | | | | |
Investor Shares | | 63,089 | | (456,403 | ) |
Admiral Shares | | 678,063 | | 445,731 | |
Net Increase (Decrease) from Capital Share Transactions | | 741,152 | | (10,672 | ) |
Total Increase (Decrease) | | 781,014 | | (1,142,027 | ) |
Net Assets | | | | | |
Beginning of Period | | 18,415,048 | | 19,557,075 | |
End of Period | | 19,196,062 | | 18,415,048 | |
1 Includes fiscal 2019 and 2018 short-term gain distributions totaling $63,362,000 and $73,242,000, respectively. Short-term gain distributions are treated as ordinary income dividends for tax purposes.
See accompanying Notes, which are an integral part of the Financial Statements.
16
Windsor Fund
Financial Highlights
Investor Shares
For a Share Outstanding | | Year Ended October 31, | |
Throughout Each Period | | 2019 | | 2018 | | 2017 | | 2016 | | 2015 | |
Net Asset Value, Beginning of Period | | $22.02 | | $23.38 | | $19.70 | | $21.06 | | $21.98 | |
Investment Operations | | | | | | | | | | | |
Net Investment Income | | .419 | 1 | .417 | 1 | .363 | 1 | .394 | | .356 | 2 |
Net Realized and Unrealized Gain (Loss) on Investments | | 1.700 | | (.753 | ) | 4.345 | | (.168 | ) | .026 | |
Total from Investment Operations | | 2.119 | | (.336 | ) | 4.708 | | .226 | | .382 | |
Distributions | | | | | | | | | | | |
Dividends from Net Investment Income | | (.426 | ) | (.378 | ) | (.433 | ) | (.317 | ) | (.339 | ) |
Distributions from Realized Capital Gains | | (1.953 | ) | (.646 | ) | (.595 | ) | (1.269 | ) | (.963 | ) |
Total Distributions | | (2.379 | ) | (1.024 | ) | (1.028 | ) | (1.586 | ) | (1.302 | ) |
Net Asset Value, End of Period | | $21.76 | | $22.02 | | $23.38 | | $19.70 | | $21.06 | |
| | | | | | | | | | | |
Total Return3 | | 11.59% | | -1.69% | | 24.53% | | 1.27% | | 1.76% | |
| | | | | | | | | | | |
Ratios/Supplemental Data | | | | | | | | | | | |
Net Assets, End of Period (Millions) | | $4,549 | | $4,468 | | $5,191 | | $4,896 | | $5,379 | |
Ratio of Total Expenses to Average Net Assets4 | | 0.30% | | 0.31% | | 0.31% | | 0.30% | | 0.39% | |
Ratio of Net Investment Income to Average Net Assets | | 2.04% | | 1.76% | | 1.66% | | 2.01% | | 1.64%2 | |
Portfolio Turnover Rate | | 39% | | 33% | | 26% | | 26% | | 28% | |
1 Calculated based on average shares outstanding.
2 Net investment income per share and the ratio of net investment income to average net assets include $.052 and 0.24%, respectively, resulting from income received from Covidien Ltd. in January 2015.
3 Total returns do not include account service fees that may have applied in the periods shown. Fund prospectuses provide information about any applicable account service fees.
4 Includes performance-based investment advisory fee increases (decreases) of (0.05%), (0.05%), (0.05%), (0.06%), and 0.03%.
See accompanying Notes, which are an integral part of the Financial Statements.
17
Windsor Fund
Financial Highlights
Admiral Shares
For a Share Outstanding | | Year Ended October 31, | |
Throughout Each Period | | 2019 | | 2018 | | 2017 | | 2016 | | 2015 | |
Net Asset Value, Beginning of Period | | $74.29 | | $78.88 | | $66.48 | | $71.04 | | $74.17 | |
Investment Operations | | | | | | | | | | | |
Net Investment Income | | 1.484 | 1 | 1.484 | 1 | 1.295 | 1 | 1.398 | | 1.291 | 2 |
Net Realized and Unrealized Gain (Loss) on Investments | | 5.735 | | (2.538 | ) | 14.650 | | (.545 | ) | .062 | |
Total from Investment Operations | | 7.219 | | (1.054 | ) | 15.945 | | .853 | | 1.353 | |
Distributions | | | | | | | | | | | |
Dividends from Net Investment Income | | (1.509 | ) | (1.358 | ) | (1.538 | ) | (1.134 | ) | (1.235 | ) |
Distributions from Realized Capital Gains | | (6.590 | ) | (2.178 | ) | (2.007 | ) | (4.279 | ) | (3.248 | ) |
Total Distributions | | (8.099 | ) | (3.536 | ) | (3.545 | ) | (5.413 | ) | (4.483 | ) |
Net Asset Value, End of Period | | $73.41 | | $74.29 | | $78.88 | | $66.48 | | $71.04 | |
| | | | | | | | | | | |
Total Return3 | | 11.71% | | -1.59% | | 24.63% | | 1.41% | | 1.85% | |
| | | | | | | | | | | |
Ratios/Supplemental Data | | | | | | | | | | | |
Net Assets, End of Period (Millions) | | $14,647 | | $13,948 | | $14,366 | | $11,703 | | $12,206 | |
Ratio of Total Expenses to Average Net Assets4 | | 0.20% | | 0.21% | | 0.21% | | 0.20% | | 0.29% | |
Ratio of Net Investment Income to Average Net Assets | | 2.14% | | 1.86% | | 1.76% | | 2.11% | | 1.74%2 | |
Portfolio Turnover Rate | | 39% | | 33% | | 26% | | 26% | | 28% | |
1 Calculated based on average shares outstanding.
2 Net investment income per share and the ratio of net investment income to average net assets include $.177 and 0.24%, respectively, resulting from income received from Covidien Ltd. in January 2015.
3 Total returns do not include account service fees that may have applied in the periods shown. Fund prospectuses provide information about any applicable account service fees.
4 Includes performance-based investment advisory fee increases (decreases) of (0.05%), (0.05%), (0.05%), (0.06%), and 0.03%.
See accompanying Notes, which are an integral part of the Financial Statements.
18
Windsor Fund
Notes to Financial Statements
Vanguard Windsor Fund is registered under the Investment Company Act of 1940 as an open-end investment company, or mutual fund. The fund offers two classes of shares: Investor Shares and Admiral Shares. Each of the share classes has different eligibility and minimum purchase requirements, and is designed for different types of investors.
A. The following significant accounting policies conform to generally accepted accounting principles for U.S. investment companies. The fund consistently follows such policies in preparing its financial statements.
1. Security Valuation: Securities are valued as of the close of trading on the New York Stock Exchange (generally 4 p.m., Eastern time) on the valuation date. Equity securities are valued at the latest quoted sales prices or official closing prices taken from the primary market in which each security trades; such securities not traded on the valuation date are valued at the mean of the latest quoted bid and asked prices. Securities for which market quotations are not readily available, or whose values have been affected by events occurring before the fund’s pricing time but after the close of the securities’ primary markets, are valued at their fair values calculated according to procedures adopted by the board of trustees. These procedures include obtaining quotations from an independent pricing service, monitoring news to identify significant market- or security-specific events, and evaluating changes in the values of foreign market proxies (for example, ADRs, futures contracts, or exchange-traded funds), between the time the foreign markets close and the fund’s pricing time. When fair-value pricing is employed, the prices of securities used by a fund to calculate its net asset value may differ from quoted or published prices for the same securities. Investments in Vanguard Market Liquidity Fund are valued at that fund’s net asset value. Temporary cash investments are valued using the latest bid prices or using valuations based on a matrix system (which considers such factors as security prices, yields, maturities, and ratings), both as furnished by independent pricing services.
2. Foreign Currency: Securities and other assets and liabilities denominated in foreign currencies are translated into U.S. dollars using exchange rates obtained from an independent third party as of the fund’s pricing time on the valuation date. Realized gains (losses) and unrealized appreciation (depreciation) on investment securities include the effects of changes in exchange rates since the securities were purchased, combined with the effects of changes in security prices. Fluctuations in the value of other assets and liabilities resulting from changes in exchange rates are recorded as unrealized foreign currency gains (losses) until the assets or liabilities are settled in cash, at which time they are recorded as realized foreign currency gains (losses).
3. Futures Contracts: The fund uses index futures contracts to a limited extent, with the objective of maintaining full exposure to the stock market while maintaining liquidity. The fund may purchase or sell futures contracts to achieve a desired level of investment, whether to accommodate portfolio turnover or cash flows from capital share transactions. The primary risks associated with the use of futures contracts are imperfect correlation between changes in market values of stocks held by the fund and the prices of futures contracts, and the possibility of an illiquid market. Counterparty risk involving futures is mitigated because a regulated clearinghouse is the counterparty instead of the clearing broker. To further mitigate counterparty risk, the fund trades futures contracts on an exchange, monitors the financial strength of its clearing brokers and clearinghouse, and has entered into clearing agreements with its clearing brokers. The
19
Windsor Fund
clearinghouse imposes initial margin requirements to secure the fund’s performance and requires daily settlement of variation margin representing changes in the market value of each contract. Any assets pledged as initial margin for open contracts are noted in the Statement of Net Assets.
Futures contracts are valued at their quoted daily settlement prices. The notional amounts of the contracts are not recorded in the Statement of Net Assets. Fluctuations in the value of the contracts are recorded in the Statement of Net Assets as an asset (liability) and in the Statement of Operations as unrealized appreciation (depreciation) until the contracts are closed, when they are recorded as realized futures gains (losses).
During the year ended October 31, 2019, the fund’s average investments in long and short futures contracts represented 1% and 0%, respectively, of net assets, based on the average of the notional amounts at each quarter-end during the period.
4. Repurchase Agreements: The fund enters into repurchase agreements with institutional counterparties. Securities pledged as collateral to the fund under repurchase agreements are held by a custodian bank until the agreements mature, and in the absence of a default, such collateral cannot be repledged, resold, or rehypothecated. Each agreement requires that the market value of the collateral be sufficient to cover payments of interest and principal. The fund further mitigates its counterparty risk by entering into repurchase agreements only with a diverse group of prequalified counterparties, monitoring their financial strength, and entering into master repurchase agreements with its counterparties. The master repurchase agreements provide that, in the event of a counterparty’s default (including bankruptcy), the fund may terminate any repurchase agreements with that counterparty, determine the net amount owed, and sell or retain the collateral up to the net amount owed to the fund. Such action may be subject to legal proceedings, which may delay or limit the disposition of collateral.
5. Federal Income Taxes: The fund intends to continue to qualify as a regulated investment company and distribute all of its taxable income. Management has analyzed the fund’s tax positions taken for all open federal income tax years (October 31, 2016–2019), and has concluded that no provision for federal income tax is required in the fund’s financial statements.
6. Distributions: Distributions to shareholders are recorded on the ex-dividend date. Distributions are determined on a tax basis and may differ from net investment income and realized capital gains for financial reporting purposes.
7. Securities Lending: To earn additional income, the fund lends its securities to qualified institutional borrowers. Security loans are subject to termination by the fund at any time, and are required to be secured at all times by collateral in an amount at least equal to the market value of securities loaned. Daily market fluctuations could cause the value of loaned securities to be more or less than the value of the collateral received. When this occurs, the collateral is adjusted and settled before the opening of the market on the next business day. The fund further mitigates its counterparty risk by entering into securities lending transactions only with a diverse group of prequalified counterparties, monitoring their financial strength, and entering into master securities lending agreements with its counterparties. The master securities lending agreements provide that, in the event of a counterparty’s default (including bankruptcy), the fund may terminate any loans with that borrower, determine the net amount owed, and sell or retain the collateral up to the net
20
Windsor Fund
amount owed to the fund; however, such actions may be subject to legal proceedings. While collateral mitigates counterparty risk, in the event of a default, the fund may experience delays and costs in recovering the securities loaned. The fund invests cash collateral received in Vanguard Market Liquidity Fund, and records a liability in the Statement of Net Assets for the return of the collateral, during the period the securities are on loan. Securities lending income represents fees charged to borrowers plus income earned on invested cash collateral, less expenses associated with the loan. During the term of the loan, the fund is entitled to all distributions made on or in respect of the loaned securities.
8. Credit Facility: The fund and certain other funds managed by The Vanguard Group (“Vanguard”) participate in a $4.3 billion committed credit facility provided by a syndicate of lenders pursuant to a credit agreement that may be renewed annually; each fund is individually liable for its borrowings, if any, under the credit facility. Borrowings may be utilized for temporary and emergency purposes, and are subject to the fund’s regulatory and contractual borrowing restrictions. The participating funds are charged administrative fees and an annual commitment fee of 0.10% of the undrawn amount of the facility; these fees are allocated to the funds based on a method approved by the fund’s board of trustees and included in Management and Administrative expenses on the fund’s Statement of Operations. Any borrowings under this facility bear interest at a rate based upon the higher of the one-month London Interbank Offered Rate, federal funds effective rate, or overnight bank funding rate plus an agreed-upon spread.
The fund had no borrowings outstanding at October 31, 2019, or at any time during the period then ended.
9. Other: Dividend income is recorded on the ex-dividend date. Interest income includes income distributions received from Vanguard Market Liquidity Fund and is accrued daily. Premiums and discounts on debt securities purchased are amortized and accreted, respectively, to interest income over the lives of the respective securities. Security transactions are accounted for on the date securities are bought or sold. Costs used to determine realized gains (losses) on the sale of investment securities are those of the specific securities sold.
Each class of shares has equal rights as to assets and earnings, except that each class separately bears certain class-specific expenses related to maintenance of shareholder accounts (included in Management and Administrative expenses) and shareholder reporting. Marketing and distribution expenses are allocated to each class of shares based on a method approved by the board of trustees. Income, other non-class-specific expenses, and gains and losses on investments are allocated to each class of shares based on its relative net assets.
B. The investment advisory firms Wellington Management Company LLP and Pzena Investment Management, LLC, each provide investment advisory services to a portion of the fund for a fee calculated at an annual percentage rate of average net assets managed by the advisor. The basic fee of Wellington Management Company LLP is subject to quarterly adjustments based on performance relative to the S&P 500 Index for the preceding three years. The basic fee of Pzena Investment Management, LLC, is subject to quarterly adjustments based on performance relative to the Russell 1000 Value Index for the preceding three years.
Vanguard manages the cash reserves of the fund as described below.
21
Windsor Fund
For the year ended October 31, 2019, the aggregate investment advisory fee represented an effective annual basic rate of 0.13% of the fund’s average net assets, before a decrease of $9,853,000 (0.05%) based on performance.
C. In accordance with the terms of a Funds’ Service Agreement (the “FSA”) between Vanguard and the fund, Vanguard furnishes to the fund corporate management, administrative, marketing, distribution, and cash management services at Vanguard’s cost of operations (as defined by the FSA). These costs of operations are allocated to the fund based on methods and guidelines approved by the board of trustees. Vanguard does not require reimbursement in the current period for certain costs of operations (such as deferred compensation/benefits and risk/insurance costs); the fund’s liability for these costs of operations is included in Payables to Vanguard on the Statement of Net Assets. All other costs of operations payable to Vanguard are generally settled twice a month.
Upon the request of Vanguard, the fund may invest up to 0.40% of its net assets as capital in Vanguard. At October 31, 2019, the fund had contributed to Vanguard capital in the amount of $885,000, representing less than 0.01% of the fund’s net assets and 0.35% of Vanguard’s capital received pursuant to the FSA. The fund’s trustees and officers are also directors and employees, respectively, of Vanguard.
D. Various inputs may be used to determine the value of the fund’s investments. These inputs are summarized in three broad levels for financial statement purposes. The inputs or methodologies used to value securities are not necessarily an indication of the risk associated with investing in those securities.
Level 1—Quoted prices in active markets for identical securities.
Level 2—Other significant observable inputs (including quoted prices for similar securities, interest rates, prepayment speeds, credit risk, etc.).
Level 3—Significant unobservable inputs (including the fund’s own assumptions used to determine the fair value of investments). Any investments valued with significant unobservable inputs are noted on the Statement of Net Assets.
The following table summarizes the market value of the fund’s investments and derivatives as of October 31, 2019, based on the inputs used to value them:
| | Level 1 | | Level 2 | | Level 3 | |
Investments | | ($000 | ) | ($000 | ) | ($000 | ) |
Common Stocks | | 18,017,709 | | 601,054 | | — | |
Temporary Cash Investments | | 415,193 | | 156,698 | | — | |
Futures Contracts—Liabilities1 | | (1,151 | ) | — | | — | |
Total | | 18,431,751 | | 757,752 | | — | |
1 Represents variation margin on the last day of the reporting period.
22
Windsor Fund
E. Permanent differences between book-basis and tax-basis components of net assets are reclassified among capital accounts in the financial statements to reflect their tax character. These reclassifications have no effect on net assets or net asset value per share. As of period end, permanent differences primarily attributable to the accounting for foreign currency transactions, and distributions in connection with fund share redemptions were reclassified between the following accounts:
| | Amount | |
| | ($000 | ) |
Paid-in Capital | | 94,323 | |
Total Distributable Earnings (Loss) | | (94,323 | ) |
Temporary differences between book-basis and tax-basis components of total distributable earnings (loss) arise when certain items of income, gain, or loss are recognized in different periods for financial statement and tax purposes; these differences will reverse at some time in the future. The differences are primarily related to the tax deferral of losses on wash sales and the realization of unrealized gains or losses on certain futures contracts. As of period end, the tax-basis components of total distributable earnings (loss) are detailed in the table as follows:
| | Amount | |
| | ($000 | ) |
Undistributed Ordinary Income | | 176,763 | |
Undistributed Long-Term Gains | | 1,517,306 | |
Capital Loss Carryforwards (Non-expiring) | | — | |
Net Unrealized Gains (Losses) | | 3,128,772 | |
As of October 31, 2019, gross unrealized appreciation and depreciation for investments and derivatives based on cost for U.S. federal income tax purposes were as follows:
| | Amount | |
| | ($000 | ) |
Tax Cost | | 16,061,916 | |
Gross Unrealized Appreciation | | 4,151,878 | |
Gross Unrealized Depreciation | | (1,023,140 | ) |
Net Unrealized Appreciation (Depreciation) | | 3,128,738 | |
F. During the year ended October 31, 2019, the fund purchased $7,110,135,000 of investment securities and sold $8,099,242,000 of investment securities, other than temporary cash investments.
23
Windsor Fund
G. Capital share transactions for each class of shares were:
| | Year Ended October 31, | |
| | 2019 | | 2018 | |
| | Amount | | Shares | | Amount | | Shares | |
| | ($000 | ) | (000) | | ($000 | ) | (000 | ) |
Investor Shares | | | | | | | | | |
Issued | | 337,518 | | 16,763 | | 404,676 | | 17,238 | |
Issued in Lieu of Cash Distributions | | 468,025 | | 25,211 | | 212,552 | | 9,049 | |
Redeemed | | (742,454 | ) | (35,854) | | (1,073,631 | ) | (45,424 | ) |
Net Increase (Decrease)—Investor Shares | | 63,089 | | 6,120 | | (456,403 | ) | (19,137 | ) |
Admiral Shares | | | | | | | | | |
Issued | | 797,705 | | 11,373 | | 1,253,586 | | 15,730 | |
Issued in Lieu of Cash Distributions | | 1,434,609 | | 22,917 | | 605,854 | | 7,647 | |
Redeemed | | (1,554,251 | ) | (22,522) | | (1,413,709 | ) | (17,752 | ) |
Net Increase (Decrease)—Admiral Shares | | 678,063 | | 11,768 | | 445,731 | | 5,625 | |
H. Transactions during the period in investments where the issuer is another member of The Vanguard Group were as follows:
| | Current Period Transactions | | | |
| Oct. 31, | | Proceeds | Realized | | | | | Oct. 31, | |
| 2018 | | from | Net | Change in | | Capital Gain | | 2019 | |
| Market | Purchases | Securities | Gain | Unrealized | | Distributions | | Market | |
| Value | at Cost | Sold | (Loss) | App. (Dep.) | Income | Received | | Value | |
| ($000) | ($000) | ($000) | ($000) | ($000) | ($000) | ($000 | ) | ($000 | ) |
Vanguard Market Liquidity Fund | 240,417 | NA1 | NA1 | 21 | 12 | 6,256 | — | | 415,193 | |
Vanguard Value ETF | 73,990 | — | 17,010 | 8,236 | (3,401) | 1,635 | — | | 61,815 | |
Total | 314,407 | | | 8,257 | (3,389) | 7,891 | — | | 477,008 | |
1 Not applicable—purchases and sales are for temporary cash investment purposes.
I. Management has determined that no events or transactions occurred subsequent to October 31, 2019, that would require recognition or disclosure in these financial statements.
24
Report of Independent Registered Public Accounting Firm
To the Board of Trustees of Vanguard Windsor Funds and Shareholders of Vanguard Windsor Fund
Opinion on the Financial Statements
We have audited the accompanying statement of net assets of Vanguard Windsor Fund (one of the funds constituting Vanguard Windsor Funds, referred to hereafter as the “Fund”) as of October 31, 2019, the related statement of operations for the year ended October 31, 2019, the statement of changes in net assets for each of the two years in the period ended October 31, 2019, including the related notes, and the financial highlights for each of the five years in the period ended October 31, 2019 (collectively referred to as the “financial statements”). In our opinion, the financial statements present fairly, in all material respects, the financial position of the Fund as of October 31, 2019, the results of its operations for the year then ended, the changes in its net assets for each of the two years in the period ended October 31, 2019 and the financial highlights for each of the five years in the period ended October 31, 2019 in conformity with accounting principles generally accepted in the United States of America.
Basis for Opinion
These financial statements are the responsibility of the Fund’s management. Our responsibility is to express an opinion on the Fund’s financial statements based on our audits. We are a public accounting firm registered with the Public Company Accounting Oversight Board (United States) (“PCAOB”) and are required to be independent with respect to the Fund in accordance with the U.S. federal securities laws and the applicable rules and regulations of the Securities and Exchange Commission and the PCAOB.
We conducted our audits of these financial statements in accordance with the standards of the PCAOB. Those standards require that we plan and perform the audit to obtain reasonable assurance about whether the financial statements are free of material misstatement, whether due to error or fraud.
Our audits included performing procedures to assess the risks of material misstatement of the financial statements, whether due to error or fraud, and performing procedures that respond to those risks. Such procedures included examining, on a test basis, evidence regarding the amounts and disclosures in the financial statements. Our audits also included evaluating the accounting principles used and significant estimates made by management, as well as evaluating the overall presentation of the financial statements. Our procedures included confirmation of securities owned as of October 31, 2019 by correspondence with the custodian, transfer agent and brokers; when replies were not received from brokers, we performed other auditing procedures. We believe that our audits provide a reasonable basis for our opinion.
/s/PricewaterhouseCoopers LLP
Philadelphia, Pennsylvania
December 13, 2019
We have served as the auditor of one or more investment companies in The Vanguard Group of Funds since 1975.
25
Special 2019 tax information (unaudited) for Vanguard Windsor Fund
This information for the fiscal year ended October 31, 2019, is included pursuant to provisions of the Internal Revenue Code.
The fund distributed $1,659,247,000 as capital gain dividends (20% rate gain distributions) to shareholders during the fiscal year.
For nonresident alien shareholders, 100% of short-term capital gain dividends distributed by the fund are qualified short-term capital gains.
The fund distributed $392,247,000 of qualified dividend income to shareholders during the fiscal year.
For corporate shareholders, 79.4% of investment income (dividend income plus short-term gains, if any) qualifies for the dividends-received deduction.
26
The People Who Govern Your Fund
The trustees of your mutual fund are there to see that the fund is operated and managed in your best interests since, as a shareholder, you are a part owner of the fund. Your fund’s trustees also serve on the board of directors of The Vanguard Group, Inc., which is owned by the Vanguard funds and provides services to them.
A majority of Vanguard’s board members are independent, meaning that they have no affiliation with Vanguard or the funds they oversee, apart from the sizable personal investments they have made as private individuals. The independent board members have distinguished backgrounds in business, academia, and public service. Each of the trustees and executive officers oversees 213 Vanguard funds.
Information for each trustee and executive officer of the fund appears below. That information, as well as the Vanguard fund count, is as of the date on the cover of this fund report. The mailing address of the trustees and officers is P.O. Box 876, Valley Forge, PA 19482. More information about the trustees is in the Statement of Additional Information, which can be obtained, without charge, by contacting Vanguard at 800-662-7447, or online at vanguard.com.
Interested Trustee1
Mortimer J. Buckley
Born in 1969. Trustee since January 2018. Principal occupation(s) during the past five years and other experience: chairman of the board (January 2019–present) of Vanguard and of each of the investment companies served by Vanguard; chief executive officer (January 2018–present) of Vanguard; chief executive officer, president, and trustee (January 2018–present) of each of the investment companies served by Vanguard; president and director (2017–present) of Vanguard; and president (February 2018–present) of Vanguard Marketing Corporation. Chief investment officer (2013–2017), managing director (2002–2017), head of the Retail Investor Group (2006–2012), and chief information officer (2001–2006) of Vanguard. Chairman of the board (2011–2017) and trustee (2009–2017) of the Children’s Hospital of Philadelphia; trustee (2018–present) of The Shipley School.
Independent Trustees
Emerson U. Fullwood
Born in 1948. Trustee since January 2008. Principal occupation(s) during the past five years and other experience: executive chief staff and marketing officer for North America and corporate vice president (retired 2008) of Xerox Corporation (document management products and services). Former president of the Worldwide Channels Group, Latin America, and Worldwide Customer Service and executive chief staff officer of Developing Markets of Xerox. Executive in residence and 2009–2010 Distinguished Minett Professor at the Rochester Institute of Technology. Director of SPX FLOW, Inc. (multi-industry manufacturing). Director of the University of Rochester Medical Center, the Monroe Community College Foundation, the United Way of Rochester, North Carolina A&T University, and Roberts Wesleyan College. Trustee of the University of Rochester.
Amy Gutmann
Born in 1949. Trustee since June 2006. Principal occupation(s) during the past five years and other experience: president (2004–present) of the University of Pennsylvania. Christopher H. Browne Distinguished Professor of Political Science, School of Arts and Sciences, and professor of communication, Annenberg School for Communication, with secondary faculty appointments in the Department of Philosophy, School of Arts and Sciences, and at the Graduate School of Education, University of Pennsylvania. Trustee of the National Constitution Center.
F. Joseph Loughrey
Born in 1949. Trustee since October 2009. Principal occupation(s) during the past five years and other experience: president and chief operating officer (retired 2009) and vice chairman of the board (2008–2009) of Cummins Inc. (industrial machinery). Chairman of the board of Hillenbrand, Inc. (specialized consumer services), and the Lumina Foundation.
1 Mr. Buckley is considered an “interested person,” as defined in the Investment Company Act of 1940, because he is an officer of the Vanguard funds.
Director of the V Foundation and Oxfam America. Member of the advisory council for the College of Arts and Letters and chair of the advisory board to the Kellogg Institute for International Studies, both at the University of Notre Dame.
Mark Loughridge
Born in 1953. Trustee since March 2012. Principal occupation(s) during the past five years and other experience: senior vice president and chief financial officer (retired 2013) of IBM (information technology services). Fiduciary member of IBM’s Retirement Plan Committee (2004–2013), senior vice president and general manager (2002–2004) of IBM Global Financing, vice president and controller (1998–2002) of IBM, and a variety of other prior management roles at IBM. Member of the Council on Chicago Booth.
Scott C. Malpass
Born in 1962. Trustee since March 2012. Principal occupation(s) during the past five years and other experience: chief investment officer (1989–present) and vice president (1996–present) of the University of Notre Dame. Assistant professor of finance at the Mendoza College of Business, University of Notre Dame, and member of the Notre Dame 403(b) Investment Committee. Chairman of the board of TIFF Advisory Services, Inc. Member of the board of Catholic Investment Services, Inc. (investment advisors) and the board of superintendence of the Institute for the Works of Religion.
Deanna Mulligan
Born in 1963. Trustee since January 2018. Principal occupation(s) during the past five years and other experience: president (2010–present) and chief executive officer (2011–present) of The Guardian Life Insurance Company of America. Chief operating officer (2010–2011) and executive vice president (2008–2010) of Individual Life and Disability of The Guardian Life Insurance Company of America. Member of the board of The Guardian Life Insurance Company of America, the American Council of Life Insurers, the Partnership for New York City (business leadership), and the Committee Encouraging Corporate Philanthropy. Trustee of the Economic Club of New York and the Bruce Museum (arts and science). Member of the Advisory Council for the Stanford Graduate School of Business.
André F. Perold
Born in 1952. Trustee since December 2004. Principal occupation(s) during the past five years and other experience: George Gund Professor of Finance and Banking, Emeritus at the Harvard Business School (retired 2011). Chief investment officer and co-managing partner of HighVista Strategies (private investment firm). Board of advisors and investment committee member of the Museum of Fine Arts Boston. Board member (2018–present) of RIT Capital Partners (investment firm); investment committee member of Partners Health Care System.
Sarah Bloom Raskin
Born in 1961. Trustee since January 2018. Principal occupation(s) during the past five years and other experience: deputy secretary (2014–2017) of the United States Department of the Treasury. Governor (2010–2014) of the Federal Reserve Board. Commissioner (2007–2010) of financial regulation for the State of Maryland. Member of the board of directors (2012–2014) of Neighborhood Reinvestment Corporation. Director (2017–present) of i(x) Investments; director (2017–present) of Reserve Trust. Rubinstein Fellow (2017–present) of Duke University; trustee (2017–present) of Amherst College.
Peter F. Volanakis
Born in 1955. Trustee since July 2009. Principal occupation(s) during the past five years and other experience: president and chief operating officer (retired 2010) of Corning Incorporated (communications equipment) and director of Corning Incorporated (2000–2010) and Dow Corning (2001–2010). Director (2012) of SPX Corporation (multi-industry manufacturing). Overseer of the Amos Tuck School of Business Administration, Dartmouth College (2001–2013). Chairman of the board of trustees of Colby-Sawyer College. Member of the board of Hypertherm Inc. (industrial cutting systems, software, and consumables).
Executive Officers
John Bendl
Born in 1970. Principal occupation(s) during the past five years and other experience: principal of Vanguard. Chief financial officer (October 2019–present) of each of the investment companies served by Vanguard. Chief accounting officer, treasurer, and controller of Vanguard (2017–present). Partner (2003–2016) at KPMG (audit, tax, and advisory services).
Glenn Booraem
Born in 1967. Principal occupation(s) during the past five years and other experience: principal of Vanguard. Investment stewardship officer (2017–present), treasurer (2015–2017), controller (2010–2015), and assistant controller (2001–2010) of each of the investment companies served by Vanguard.
Christine M. Buchanan
Born in 1970. Principal occupation(s) during the past five years and other experience: principal of Vanguard. Treasurer (2017–present) of each of the investment companies served by Vanguard. Partner (2005–2017) at KPMG (audit, tax, and advisory services).
David Cermak
Born in 1960. Principal occupation(s) during the past five years and other experience: principal of Vanguard. Finance director (October 2019–present) of each of the investment companies served by Vanguard. Managing director and head (2017–present) of Vanguard Investments Singapore. Managing director and head (2017–2019) of Vanguard Investments Hong Kong. Representative director and head (2014–2017) of Vanguard Investments Japan.
Thomas J. Higgins
Born in 1957. Principal occupation(s) during the past five years and other experience: principal of Vanguard. Finance director (October 2019–present), chief financial officer (2008–2019), and treasurer (1998–2008) of each of the investment companies served by Vanguard.
Peter Mahoney
Born in 1974. Principal occupation(s) during the past five years and other experience: principal of Vanguard. Controller (2015–present) of each of the investment companies served by Vanguard. Head of International Fund Services (2008–2014) at Vanguard.
Anne E. Robinson
Born in 1970. Principal occupation(s) during the past five years and other experience: general counsel (2016–present) of Vanguard. Secretary (2016–present) of Vanguard and of each of the investment companies served by Vanguard. Managing director (2016–present) of Vanguard. Managing director and general counsel of Global Cards and Consumer Services (2014–2016) at Citigroup. Counsel (2003–2014) at American Express.
Michael Rollings
Born in 1963. Principal occupation(s) during the past five years and other experience: finance director (2017–present) and treasurer (2017) of each of the investment companies served by Vanguard. Managing director (2016–present) of Vanguard. Chief financial officer (2016–present) of Vanguard. Director (2016–present) of Vanguard Marketing Corporation. Executive vice president and chief financial officer (2006–2016) of MassMutual Financial Group.
John E. Schadl
Born in 1972. Principal occupation(s) during the past five years and other experience: principal of Vanguard. Chief compliance officer (2019–present) of Vanguard and of each of the investment companies served by Vanguard. Assistant vice president (May 2019–present) of Vanguard Marketing Corporation.
Vanguard Senior Management Team
Joseph Brennan | Chris D. McIsaac |
Mortimer J. Buckley | James M. Norris |
Gregory Davis | Thomas M. Rampulla |
John James | Karin A. Risi |
Martha G. King | Anne E. Robinson |
John T. Marcante | Michael Rollings |
| | 
|
| | |
| | P.O. Box 2600 |
| | Valley Forge, PA 19482-2600 |
Connect with Vanguard® > vanguard.com
Fund Information > 800-662-7447
Direct Investor Account Services > 800-662-2739
Institutional Investor Services > 800-523-1036
Text Telephone for People
Who Are Deaf or Hard of Hearing > 800-749-7273
This material may be used in conjunction with the offering of shares of any Vanguard fund only if preceded or accompanied by the fund’s current prospectus.
All comparative mutual fund data are from Morningstar, Inc., unless otherwise noted.
You can obtain a free copy of Vanguard’s proxy voting guidelines by visiting vanguard.com/proxyreporting or by calling Vanguard at 800-662-2739. The guidelines are also available from the SEC’s website, www.sec.gov. In addition, you may obtain a free report on how your fund voted the proxies for securities it owned during the 12 months ended June 30. To get the report, visit either vanguard.com/proxyreporting or www.sec.gov.
You can review information about your fund on the SEC’s website, and you can receive copies of this information, for a fee, by sending a request via email addressed to publicinfo@sec.gov.
Source for Bloomberg Barclays indexes: Bloomberg Index Services Limited. Copyright 2019, Bloomberg. All rights reserved.
CFA® is a registered trademark owned by CFA Institute.
| © 2019 The Vanguard Group, Inc. |
| All rights reserved. |
| Vanguard Marketing Corporation, Distributor. |
| |
| Q220 122019 |

Annual Report | October 31, 2019 Vanguard WindsorTM II Fund |
See the inside front cover for important information about access to your fund’s annual and semiannual shareholder reports. |
Important information about access to shareholder reports
Beginning on January 1, 2021, as permitted by regulations adopted by the Securities and Exchange Commission, paper copies of your fund’s annual and semiannual shareholder reports will no longer be sent to you by mail, unless you specifically request them. Instead, you will be notified by mail each time a report is posted on the website and will be provided with a link to access the report.
If you have already elected to receive shareholder reports electronically, you will not be affected by this change and do not need to take any action. You may elect to receive shareholder reports and other communications from the fund electronically by contacting your financial intermediary (such as a broker-dealer or bank) or, if you invest directly with the fund, by calling Vanguard at one of the phone numbers on the back cover of this report or by logging on to vanguard.com.
You may elect to receive paper copies of all future shareholder reports free of charge. If you invest through a financial intermediary, you can contact the intermediary to request that you continue to receive paper copies. If you invest directly with the fund, you can call Vanguard at one of the phone numbers on the back cover of this report or log on to vanguard.com. Your election to receive paper copies will apply to all the funds you hold through an intermediary or directly with Vanguard.
Contents | |
| |
A Note From Our Chairman | 1 |
Your Fund’s Performance at a Glance | 2 |
Advisors’ Report | 3 |
About Your Fund’s Expenses | 9 |
Performance Summary | 11 |
Financial Statements | 13 |
Please note: The opinions expressed in this report are just that—informed opinions. They should not be considered promises or advice. Also, please keep in mind that the information and opinions cover the period through the date on the front of this report. Of course, the risks of investing in your fund are spelled out in the prospectus.
A Note From Our Chairman

Tim Buckley
Chairman and Chief Executive Officer
Dear Shareholder,
Recent volatility in financial markets—affecting stocks, bonds, and commodities—has been a good reminder of the wise old adage, “Never keep all your eggs in one basket.” Maintaining balance and diversification in your investment portfolio can help to both limit risk and set you up for long-term success.
It’s understandable why some investors might become complacent after a long market run-up like the one that lifted stock prices, especially U.S. stock prices, in the years following the global financial crisis. But failing to rebalance regularly can leave a portfolio with a much different mix of assets than intended and, often, more risk than intended.
Balance across and diversification within asset classes are powerful tools for managing risk and achieving your investment goals. A portfolio’s allocation will determine a large portion of its long-term return and also the majority of its volatility risk. A well-diversified portfolio is less vulnerable to significant swings in the performance of any one segment of the asset classes in which it invests.
Balance and diversification will never eliminate the risk of loss, nor will they guarantee positive returns in a declining market. But they should reduce the chance that you’ll suffer disproportionate losses in one particular high-flying asset class or sector when it comes back to earth. And exposure to all key market components should give you at least some participation in the sectors that are performing best at any given time.
Vanguard is committed to helping you achieve balance and diversification in your portfolios to help meet your investment goals. We thank you for your continued loyalty.
Sincerely,

Mortimer J. Buckley
Chairman and Chief Executive Officer
November 18, 2019
1
Your Fund’s Performance at a Glance
· Vanguard Windsor II Fund returned 10.82% for Investor Shares and 10.93% for Admiral Shares for the 12 months ended October 31, 2019. It slightly lagged its benchmark, the Russell 1000 Value Index, which returned 11.21%.
· Each of the fund’s five advisors uses a value-oriented, long-term strategy focused on large- and mid-capitalization stocks.
· The broad U.S. stock market, as measured by the Russell 3000 Index, climbed more than 13% for the year. While stocks endured stretches of volatility at the end of 2018 and during the spring of 2019, their performance was boosted by the Federal Reserve’s accommodative stance and corporate earnings that largely exceeded investor expectations.
· Growth stocks outperformed their value counterparts, while large- and mid-cap stocks surpassed small-caps.
· The advisors’ holdings in consumer discretionary and information technology were the greatest contributors to relative performance. Consumer staples, real estate, health care, and utilities detracted the most.
· Over the past decade, the fund’s average annualized return trailed that of its expense-free benchmark.
Market Barometer
| | Average Annual Total Returns | |
| | Periods Ended October 31, 2019 | |
| | One Year | | Three Years | | Five Years | |
Stocks | | | | | | | |
Russell 1000 Index (Large-caps) | | 14.15% | | 14.73% | | 10.55% | |
Russell 2000 Index (Small-caps) | | 4.90 | | 10.96 | | 7.37 | |
Russell 3000 Index (Broad U.S. market) | | 13.49 | | 14.47 | | 10.31 | |
FTSE All-World ex US Index (International) | | 11.52 | | 8.21 | | 4.16 | |
| | | | | | | |
Bonds | | | | | | | |
Bloomberg Barclays U.S. Aggregate Bond Index (Broad taxable market) | | 11.51% | | 3.29% | | 3.24% | |
Bloomberg Barclays Municipal Bond Index (Broad tax-exempt market) | | 9.42 | | 3.62 | | 3.55 | |
FTSE Three-Month U.S. Treasury Bill Index | | 2.35 | | 1.57 | | 0.98 | |
| | | | | | | |
CPI | | | | | | | |
Consumer Price Index | | 1.76% | | 2.11% | | 1.62% | |
2
Advisors’ Report
For the 12 months ended October 31, 2019, Vanguard Windsor II Fund returned 10.82% for Investor Shares and 10.93% for Admiral Shares. It trailed the 11.21% performance of its benchmark, the Russell 1000 Value Index. Your fund is managed by five independent advisors, a strategy that enhances its diversification by providing exposure to distinct yet complementary investment approaches. It’s not uncommon for different advisors to have different views about individual securities or the broader investment environment.
The table on page 8 lists the advisors, the amount and percentage of fund assets each manages, and brief descriptions of their investment strategies. The advisors have provided the following assessment of the investment environment during the past 12 months and the notable successes and shortfalls in their portfolios. These comments were prepared on November 18, 2019.
Barrow, Hanley, Mewhinney & Strauss, LLC
Portfolio Managers:
David Ganucheau, CFA,
Managing Director
Mark Giambrone
Managing Director
Over the past year, defensive areas (such as utilities, real estate, and consumer staples) have increasingly driven the market amid fears of a slowing economy, leading to record high valuations in these sectors. We are dramatically underweighted in these areas, having instead found value in companies with stable fundamentals in cyclical sectors of the market.
One example is our consumer discretionary holding Dollar General, whose sales we expect to accelerate in a downturn. We also recently added financial sector stock Berkshire Hathaway. It trades for approximately a 25% discount to intrinsic value before considering its $128 billion of balance-sheet cash that is opportunistically deployed in economic downturns. Berkshire is simply too cheap; our research indicates it is receiving an enormous “Warren Buffett” discount because of succession concerns.
Other significant contributors were Johnson Controls International, American International Group, Air Products & Chemicals, Microsoft, and refiners Phillips 66 and Valero Energy.
The largest detractors from performance were tobacco stocks, which we exited at different points during the past year. Imperial Brands continues to lose market share while elevated balance sheet leverage remains a concern. The expensive acquisition of e-cigarette manufacturer JUUL by Altria Group was seemingly both desperate and risky because of concerns about JUUL’s marketing to teens. Similarly, the attempted takeover of Altria by Philip Morris could indicate that Philip Morris International’s heat-not-burn product, IQOS, is struggling.
3
Lazard Asset Management LLC
Portfolio Managers:
Andrew Lacey, Deputy Chairman
Ronald Temple, Managing Director
The S&P 500 Index rose 14.3% over the 12 months ended October 31, 2019. Following a fourth-quarter 2018 sell-off spurred by increased uncertainty over U.S. trade policy, stocks rallied into the new year. Solid economic data and perceived progress in trade talks encouraged investors. Corporate earnings and other indicators of economic health were largely positive. The majority of companies reported quarterly earnings above expectations, and the economy continued to add jobs at a strong rate.
The unemployment rate reached a 50-year low in September, and GDP growth broadly came in above expectations despite weakness abroad. After raising its benchmark rate in December 2018, the Federal Reserve pulled back and cut rates three times in 2019 in an attempt to keep the U.S. economy on its solid growth trajectory.
Stock selection in the consumer discretionary sector helped performance. Top contributors included Dollar General and eBay. We sold eBay in September as our thesis was broken. Stock selection in consumer staples also bolstered returns; Procter & Gamble was a top contributor.
Stock selection in the energy sector hurt performance. Top detractors were EOG Resources and ConocoPhillips. Stock selection in information technology also lagged; Apple was a notable detractor.
Sanders Capital, LLC
Portfolio Managers:
Lewis A. Sanders, CFA,
Chief Executive Officer and
Co-Chief Investment Officer
John P. Mahedy, CPA,
Director of Research and
Co-Chief Investment Officer
Our portfolio strategy has three themes. The first is investments predicated on innovation (these make up 31% of our total investments). The focus here is on information technology and internet-based service companies. Although it is a diverse group, constituents share two characteristics: dominant positions in their respective markets and exposure to 5G wireless communications protocols, which we expect to highly stimulate growth.
The second theme is investments in health care products and services (19% of total). The global population cohort above 65 years of age is expected to grow at rates above 3% annually and consumes a disproportionate share of health care products and services. Advances in technology promise to add to this growth, particularly in managed medical care services. Fear (we believe exaggerated)
4
of adverse government intervention has depressed stock prices and created an unusual opportunity in this sector.
The third theme is investment in companies with very high cash yields (30% of total). We focus on companies that we believe are vulnerable to depressed interest rates, economic weakness, or market maturity but whose competitive position and underlying profit dynamics are strong enough to sustain current cash flows. Examples include selected banks and integrated oil companies and U.S. housing. The free-cash-flow yield of the firms in this group is near 10%, a rate we believe is durable and thus highly competitive with overall equity returns.
Investment results have been strong year-to-date, nearly matching broad benchmarks and outperforming value-based benchmarks substantially. Returns have been driven by the innovation component of the strategy, but we believe all three themes have considerable potential.
Hotchkis & Wiley Capital Management, LLC
Portfolio Managers:
George H. Davis, Jr.,
Chief Executive Officer
Scott McBride, CFA,
President
Despite concerns about slowing economic growth, geopolitical stability, and trade, the Fed’s accommodative stance along with strong corporate earnings and mostly positive economic data contributed to a rise in equities during the fiscal year. Large-capitalization growth stocks outperformed large-cap value stocks by about 6 percentage points, which widened the valuation gap to near-record levels. We do not believe this dichotomy can persist indefinitely. The timing of a reversion is uncertain, but we believe the portfolio is well-positioned to benefit when market valuations revert toward more normal levels.
Financials and information technology represent our portion of the portfolio’s largest sectors, both in absolute terms and relative to the benchmark. We have identified a disproportionate number of attractive risk-adjusted valuation opportunities in these sectors. In financials, we are partial to competitively advantaged banks with excess capital on their balance sheets trading at low multiples of both current and normal earnings. In technology, our largest positions are in software companies that enjoy significant barriers to entry, have net cash balance sheets, and trade at considerable discounts to the intrinsic value of their respective franchises.
During the period, financials, health care, and consumer staples helped relative performance, while energy, communication services, and consumer discretionary hurt. The largest positive contributors were American International Group, Microsoft, Cummins, Johnson Controls International, and General Electric. The largest detractors were Apache, Marathon Oil, Discovery Communications, Murphy Oil, and CBS.
5
Vanguard Quantitative Equity Group
Portfolio Managers:
James P. Stetler
Binbin Guo, Principal, Head of Alpha Equity Investments
Investment environment
The recent macroeconomic environment—characterized by high economic and policy uncertainty, low economic growth, and low interest rates—contributed to some extraordinary trends in the equity markets during the 12 months ended October 31, 2019. These trends are not unusual at the late stage of a business cycle and include the following:
· Value underperformance. The markets have experienced the longest stretch of value underperformance since the dot-com bubble burst in 2000. Investors have flocked to high-growth-potential companies, hoping for higher returns without necessarily looking at the underlying earnings. Those companies then trade at inflated valuations that increasingly diverge from those of value companies.
· Trading on sentiment. The equity market has been trading mostly on sentiment. Investors have reacted to macroeconomic shocks such as tariffs and Fed rate announcements while largely ignoring fundamentals (such as quality and growth) since the spring of 2018.
· “Junk” rally. A big junk rally, during which stocks with high valuations and low-quality earnings have outperformed, began in January 2019. It has been a risk-on and fundamental-off market, with investors giving up safety to pursue returns.
Investment strategy
While it’s important to understand how overall portfolio performance is affected by the macroeconomic factors described above, our approach to investing focuses on fundamentals—not technical analysis of stock price movements.
We use a strict quantitative approach to evaluate a stock’s attractiveness based on five characteristics: high quality—healthy balance sheets and steady cash-flow generation; management decisions—sound investment policies that favor internal over external funding; consistent earnings growth—the ability to grow earnings year after year; strong market sentiment—market confirmation of our view; and reasonable valuation—we strive to avoid overpriced stocks.
The interaction of these characteristics generates an expected return that seeks to capitalize on investor biases. We then construct our portfolio with the goal of maximizing these expected returns and minimizing exposure to risks that our research indicates do not improve returns, such as industry selection and other risks relative to our benchmark.
6
Portfolio update
Against the fiscal year’s unusual backdrop, market sentiment was the only model that helped our portfolio’s relative performance. Three of its 11 industry sectors—health care, materials, and utilities—contributed on a relative basis. The biggest detractors were energy, industrials, and financials.
The portfolio benefited from under-weighted positions in AbbVie and CVS Health in health care, along with overweighted positions in Ball Corporation and Reliance Steel & Aluminum in materials and FirstEnergy in utilities. Returns were eroded most by overweighted positions in Marathon Oil and Devon Energy in the energy sector, Nielsen Holdings in industrials, and Comerica in financials.
7
Vanguard Windsor II Fund Investment Advisors
| | Fund Assets Managed | | |
Investment Advisor | | % | | $ Million | | Investment Strategy |
Barrow, Hanley, Mewhinney & Strauss, LLC | | 35 | | 16,391 | | Conducts fundamental research on individual stocks exhibiting traditional value characteristics: price/earnings and price/book ratios below the broad market average and dividend yields above the broad market average. |
Lazard Asset Management LLC | | 26 | | 12,111 | | Employs a relative-value approach that seeks a combination of attractive valuation and high financial productivity. The process is research-driven, relying upon bottom-up stock analysis performed by the firm’s global sector analysts. |
Sanders Capital, LLC | | 19 | | 8,607 | | Employs a traditional, bottom-up, fundamental research approach to identifying securities that are undervalued relative to their expected total return. |
Hotchkis and Wiley Capital Management, LLC | | 18 | | 8,136 | | Uses a disciplined investment approach, focusing on such investment parameters as a company’s tangible assets, sustainable cash flow, and potential for improving business performance. |
Vanguard Quantitative Equity Group | | 1 | | 363 | | Employs a quantitative fundamental management approach, using models that assess valuation, market sentiment, earnings quality and growth, and management decisions of companies versus their peers. |
Cash Investments | | 1 | | 533 | | These short-term reserves are invested by Vanguard in equity index products to simulate investment in stocks. Each advisor may also maintain a modest cash position. |
8
About Your Fund’s Expenses
As a shareholder of the fund, you incur ongoing costs, which include costs for portfolio management, administrative services, and shareholder reports (like this one), among others. Operating expenses, which are deducted from a fund’s gross income, directly reduce the investment return of the fund.
A fund’s expenses are expressed as a percentage of its average net assets. This figure is known as the expense ratio. The following examples are intended to help you understand the ongoing costs (in dollars) of investing in your fund and to compare these costs with those of other mutual funds. The examples are based on an investment of $1,000 made at the beginning of the period shown and held for the entire period.
The accompanying table illustrates your fund’s costs in two ways:
· Based on actual fund return. This section helps you to estimate the actual expenses that you paid over the period. The “Ending Account Value” shown is derived from the fund’s actual return, and the third column shows the dollar amount that would have been paid by an investor who started with $1,000 in the fund. You may use the information here, together with the amount you invested, to estimate the expenses that you paid over the period.
To do so, simply divide your account value by $1,000 (for example, an $8,600 account value divided by $1,000 = 8.6), then multiply the result by the number given for your fund under the heading “Expenses Paid During Period.”
· Based on hypothetical 5% yearly return. This section is intended to help you compare your fund’s costs with those of other mutual funds. It assumes that the fund had a yearly return of 5% before expenses, but that the expense ratio is unchanged. In this case—because the return used is not the fund’s actual return—the results do not apply to your investment. The example is useful in making comparisons because the Securities and Exchange Commission requires all mutual funds to calculate expenses based on a 5% return. You can assess your fund’s costs by comparing this hypothetical example with the hypothetical examples that appear in shareholder reports of other funds.
Note that the expenses shown in the table are meant to highlight and help you compare ongoing costs only and do not reflect transaction costs incurred by the fund for buying and selling securities. Further, the expenses do not include any purchase, redemption, or account service fees described in the fund prospectus. If such fees were applied to your account, your costs would be higher. Your fund does not carry a “sales load.”
The calculations assume no shares were bought or sold during the period. Your actual costs may have been higher or lower, depending on the amount of your investment and the timing of any purchases or redemptions.
You can find more information about the fund’s expenses, including annual expense ratios, in the Financial Statements section of this report. For additional information on operating expenses and other shareholder costs, please refer to your fund’s current prospectus.
9
Six Months Ended October 31, 2019
| | Beginning | | Ending | | Expenses |
| | Account Value | | Account Value | | Paid During |
Windsor II Fund | | 4/30/2019 | | 10/31/2019 | | Period |
Based on Actual Fund Return | | | | | | |
Investor Shares | | $1,000.00 | | $1,034.51 | | $1.69 |
Admiral™ Shares | | 1,000.00 | | 1,035.09 | | 1.28 |
Based on Hypothetical 5% Yearly Return | | | | | | |
Investor Shares | | $1,000.00 | | $1,023.54 | | $1.68 |
Admiral Shares | | 1,000.00 | | 1,023.95 | | 1.28 |
The calculations are based on expenses incurred in the most recent six-month period. The fund’s annualized six-month expense ratios for that period are 0.33% for Investor Shares and 0.25% for Admiral Shares. The dollar amounts shown as “Expenses Paid” are equal to the annualized expense ratio multiplied by the average account value over the period, multiplied by the number of days in the most recent six-month period, then divided by the number of days in the most recent 12-month period (184/365).
10
Windsor II Fund
Performance Summary
All of the returns in this report represent past performance, which is not a guarantee of future results that may be achieved by the fund. (Current performance may be lower or higher than the performance data cited. For performance data current to the most recent month-end, visit our website at vanguard.com/performance.) Note, too, that both investment returns and principal value can fluctuate widely, so an investor’s shares, when sold, could be worth more or less than their original cost. The returns shown do not reflect taxes that a shareholder would pay on fund distributions or on the sale of fund shares.
Cumulative Performance: October 31, 2009, Through October 31, 2019
Initial Investment of $10,000
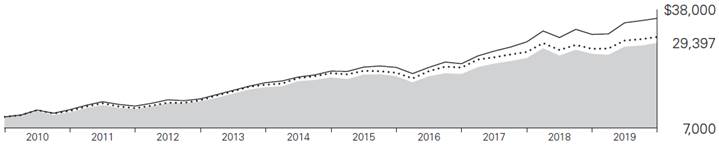
| | Average Annual Total Returns
Periods Ended October 31, 2019 | |
| | | | | Final Value |
| | One | Five | Ten | of a $10,000 |
| | Year | Years | Years | Investment |

| Windsor II Fund Investor Shares | 10.82% | 7.66% | 11.39% | $29,397 |

| Russell 1000 Value Index | 11.21 | 7.61 | 11.96 | 30,959 |

| Dow Jones U.S. Total Stock Market Float Adjusted Index | 13.39 | 10.26 | 13.62 | 35,859 |
| | | | | Final Value |
| | One | Five | Ten | of a $50,000 |
| | Year | Years | Years | Investment |
Windsor II Fund Admiral Shares | 10.93% | 7.74% | 11.47% | $148,142 |
Russell 1000 Value Index | 11.21 | 7.61 | 11.96 | 154,796 |
Dow Jones U.S. Total Stock Market Float Adjusted Index | 13.39 | 10.26 | 13.62 | 179,296 |
See Financial Highlights for dividend and capital gains information.
11
Windsor II Fund
Sector Diversification
As of October 31, 2019
| |
Communication Services | 7.3% |
Consumer Discretionary | 8.8 |
Consumer Staples | 3.8 |
Energy | 8.7 |
Financials | 20.3 |
Health Care | 14.8 |
Industrials | 11.9 |
Information Technology | 16.8 |
Materials | 3.4 |
Other | 0.0 |
Real Estate | 0.6 |
Utilities | 3.6 |
The table reflects the fund’s equity exposure, based on its investments in stocks and stock index futures. Any holdings in short-term reserves are excluded. Sector categories are based on the Global Industry Classification Standard (“GICS”), except for the “Other” category (if applicable), which includes securities that have not been provided a GICS classification as of the effective reporting period.
The Global Industry Classification Standard (“GICS”) was developed by and is the exclusive property and a service mark of MSCI Inc. (“MSCI”) and Standard and Poor’s, a division of McGraw-Hill Companies, Inc. (“S&P”), and is licensed for use by Vanguard. Neither MSCI, S&P nor any third party involved in making or compiling the GICS or any GICS classification makes any express or implied warranties or representations with respect to such standard or classification (or the results to be obtained by the use thereof), and all such parties hereby expressly disclaim all warranties of originality, accuracy, completeness, merchantability or fitness for a particular purpose with respect to any such standard or classification. Without limiting any of the foregoing, in no event shall MSCI, S&P, any of its affiliates or any third party involved in making or compiling the GICS or any GICS classification have any liability for any direct, indirect, special, punitive, consequential or any other damages (including lost profits) even if notified of the possibility of such damages.
12
Windsor II Fund
Financial Statements
Statement of Net Assets
As of October 31, 2019
The fund files its complete schedule of portfolio holdings with the Securities and Exchange Commission (SEC) for the first and third quarters of each fiscal year as an exhibit to its reports on Form N-PORT. The fund’s Form N-PORT reports are available on the SEC’s website at www.sec.gov.
| | | | | Market | |
| | | | | Value· | |
| | | Shares | | ($000 | ) |
Common Stocks (96.1%)1 | | | | | |
Communication Services (6.9%) | | | | | |
| Comcast Corp. Class A | | 15,706,221 | | 703,953 | |
* | Alphabet Inc. Class A | | 527,662 | | 664,221 | |
* | Alphabet Inc. Class C | | 306,573 | | 386,316 | |
* | Facebook Inc. Class A | | 1,294,300 | | 248,053 | |
| Verizon Communications Inc. | | 3,882,550 | | 234,778 | |
| Walt Disney Co. | | 1,764,624 | | 229,260 | |
* | Discovery Communications Inc. | | 6,332,459 | | 159,831 | |
| Vodafone Group plc ADR | | 7,754,936 | | 158,356 | |
| News Corp. Class A | | 8,137,291 | | 111,562 | |
* | Electronic Arts Inc. | | 864,637 | | 83,351 | |
| Activision Blizzard Inc. | | 1,333,569 | | 74,720 | |
| CBS Corp. Class B | | 1,646,100 | | 59,325 | |
| Interpublic Group of Cos. Inc. | | 1,813,400 | | 39,441 | |
| Omnicom Group Inc. | | 510,300 | | 39,390 | |
| AT&T Inc. | | 142,227 | | 5,474 | |
| CenturyLink Inc. | | 145,225 | | 1,879 | |
*,^ | Discovery Communications Inc. Class A | | 64,651 | | 1,743 | |
| News Corp. Class B | | 88,991 | | 1,257 | |
| | | | | 3,202,910 | |
Consumer Discretionary (8.5%) | | | | | |
| Lowe’s Cos. Inc. | | 7,276,980 | | 812,184 | |
| Dollar General Corp. | | 4,878,526 | | 782,223 | |
| McDonald’s Corp. | | 1,889,836 | | 371,731 | |
| Lennar Corp. Class A | | 5,791,553 | | 345,177 | |
| Advance Auto Parts Inc. | | 2,110,558 | | 342,924 | |
| DR Horton Inc. | | 4,966,356 | | 260,088 | |
| General Motors Co. | | 5,834,000 | | 216,791 | |
| Ross Stores Inc. | | 1,549,743 | | 169,960 | |
| Aptiv plc | | 1,734,024 | | 155,282 | |
| Magna International Inc. | | 2,200,500 | | 118,321 | |
* | Alibaba Group Holding Ltd. ADR | | 478,142 | | 84,473 | |
| Goodyear Tire & Rubber Co. | | 4,545,700 | | 72,140 | |
| Genuine Parts Co. | | 563,581 | | 57,812 | |
| Harley-Davidson Inc. | | 1,315,300 | | 51,178 | |
* | Adient plc | | 2,154,606 | | 45,656 | |
| Lennar Corp. Class B | | 47,457 | | 2,231 | |
| Gentex Corp. | | 76,818 | | 2,155 | |
| Autoliv Inc. | | 27,671 | | 2,154 | |
| Aramark | | 46,881 | | 2,052 | |
| Newell Brands Inc. | | 103,444 | | 1,962 | |
| PulteGroup Inc. | | 48,977 | | 1,922 | |
| H&R Block Inc. | | 76,738 | | 1,918 | |
| Target Corp. | | 15,362 | | 1,642 | |
* | Qurate Retail Group Inc. QVC Group Class A | | 157,433 | | 1,502 | |
| Kohl’s Corp. | | 13,858 | | 710 | |
* | Norwegian Cruise Line Holdings Ltd. | | 11,581 | | 588 | |
| Whirlpool Corp. | | 3,695 | | 562 | |
| | | | | 3,905,338 | |
Consumer Staples (3.6%) | | | | | |
| Coca-Cola Co. | | 8,755,510 | | 476,562 | |
| Procter & Gamble Co. | | 2,833,690 | | 352,823 | |
| Mondelez International Inc. Class A | | 3,976,465 | | 208,566 | |
| PepsiCo Inc. | | 1,320,316 | | 181,108 | |
| Kimberly-Clark Corp. | | 1,051,418 | | 139,712 | |
| Nestle SA | | 1,040,100 | | 111,271 | |
| Unilever plc ADR | | 1,776,200 | | 106,767 | |
| Kroger Co. | | 2,457,700 | | 60,558 | |
| Walmart Inc. | | 33,097 | | 3,881 | |
| Philip Morris International Inc. | | 43,274 | | 3,524 | |
| Kraft Heinz Co. | | 83,191 | | 2,689 | |
| Sysco Corp. | | 27,191 | | 2,172 | |
| Coty Inc. Class A | | 174,703 | | 2,042 | |
| Molson Coors Brewing Co. Class B | | 37,910 | | 1,999 | |
| Bunge Ltd. | | 36,722 | | 1,983 | |
| General Mills Inc. | | 18,339 | | 933 | |
| Altria Group Inc. | | 10,337 | | 463 | |
| Spectrum Brands Holdings Inc. | | 970 | | 49 | |
| | | | | 1,657,102 | |
13
Windsor II Fund
| | | | | Market | |
| | | | | Value· | |
| | | Shares | | ($000 | ) |
Energy (8.4%) | | | | | |
| Chevron Corp. | | 6,013,440 | | 698,401 | |
| Phillips 66 | | 4,829,263 | | 564,154 | |
| EOG Resources Inc. | | 6,333,618 | | 438,983 | |
| Valero Energy Corp. | | 4,057,419 | | 393,488 | |
| Hess Corp. | | 4,650,572 | | 305,775 | |
| Suncor Energy Inc. | | 7,226,480 | | 214,554 | |
| BP plc ADR | | 5,327,121 | | 201,951 | |
| ConocoPhillips | | 3,196,844 | | 176,466 | |
| Halliburton Co. | | 8,813,254 | | 169,655 | |
| National Oilwell Varco Inc. | | 6,470,100 | | 146,354 | |
| Marathon Oil Corp. | | 11,470,151 | | 132,251 | |
| Apache Corp. | | 5,536,800 | | 119,927 | |
| Royal Dutch Shell plc ADR | | 2,024,506 | | 117,361 | |
^ | Murphy Oil Corp. | | 4,438,900 | | 91,575 | |
| Marathon Petroleum Corp. | | 1,177,157 | | 75,279 | |
| Kosmos Energy Ltd. | | 5,732,500 | | 35,541 | |
| Exxon Mobil Corp. | | 92,460 | | 6,248 | |
| HollyFrontier Corp. | | 39,936 | | 2,194 | |
| Devon Energy Corp. | | 91,059 | | 1,847 | |
| Plains GP Holdings LP Class A | | 96,578 | | 1,792 | |
| Schlumberger Ltd. | | 6,658 | | 218 | |
| Kinder Morgan Inc. | | 10,095 | | 202 | |
| | | | | 3,894,216 | |
Financials (19.6%) | | | | | |
| Wells Fargo & Co. | | 22,180,383 | | 1,145,173 | |
| Bank of America Corp. | | 35,732,106 | | 1,117,343 | |
| American International Group Inc. | | 14,932,516 | | 790,826 | |
| JPMorgan Chase & Co. | | 5,321,291 | | 664,736 | |
| US Bancorp | | 9,992,695 | | 569,783 | |
| Citigroup Inc. | | 7,518,853 | | 540,305 | |
* | Berkshire Hathaway Inc. Class B | | 2,324,165 | | 494,071 | |
| Intercontinental Exchange Inc. | | 4,763,557 | | 449,299 | |
| Northern Trust Corp. | | 3,402,527 | | 339,164 | |
| American Express Co. | | 2,880,638 | | 337,841 | |
| Goldman Sachs Group Inc. | | 1,102,854 | | 235,327 | |
| Fifth Third Bancorp | | 7,896,556 | | 229,632 | |
| Aon plc | | 1,156,750 | | 223,438 | |
| Bank of New York Mellon Corp. | | 3,508,414 | | 164,018 | |
| Chubb Ltd. | | 1,054,627 | | 160,746 | |
| Capital One Financial Corp. | | 1,705,395 | | 159,028 | |
| Commerce Bancshares Inc. | | 1,989,492 | | 128,044 | |
| State Street Corp. | | 1,832,100 | | 121,047 | |
| Travelers Cos. Inc. | | 915,500 | | 119,985 | |
| Citizens Financial Group Inc. | | 3,411,400 | | 119,945 | |
| AXA Equitable Holdings Inc. | | 5,501,509 | | 118,833 | |
| Navient Corp. | | 7,859,077 | | 108,219 | |
| Morgan Stanley | | 1,770,264 | | 81,521 | |
| Discover Financial Services | | 919,770 | | 73,821 | |
| E*TRADE Financial Corp. | | 1,707,515 | | 71,357 | |
| Barclays plc | | 31,514,564 | | 68,358 | |
| SLM Corp. | | 7,859,007 | | 66,330 | |
| China Construction Bank Corp. | | 78,016,000 | | 62,512 | |
| Industrial & Commercial Bank of China Ltd. | | 71,806,000 | | 51,441 | |
| Synchrony Financial | | 1,432,754 | | 50,676 | |
| Royal Bank of Scotland Group plc | | 15,219,700 | | 42,071 | |
| CIT Group Inc. | | 862,147 | | 36,977 | |
| Sumitomo Mitsui Financial Group Inc. | | 1,036,900 | | 36,813 | |
| Banco de Sabadell SA | | 24,989,467 | | 27,469 | |
| Allstate Corp. | | 27,702 | | 2,948 | |
| MetLife Inc. | | 61,296 | | 2,868 | |
| Aflac Inc. | | 47,381 | | 2,519 | |
| Progressive Corp. | | 35,567 | | 2,479 | |
| Regions Financial Corp. | | 141,983 | | 2,286 | |
| Ally Financial Inc. | | 72,536 | | 2,222 | |
| Zions Bancorp NA | | 42,475 | | 2,059 | |
* | Brighthouse Financial Inc. | | 51,366 | | 1,940 | |
| Ameriprise Financial Inc. | | 12,566 | | 1,896 | |
| Voya Financial Inc. | | 18,906 | | 1,020 | |
* | Arch Capital Group Ltd. | | 23,967 | | 1,001 | |
| Erie Indemnity Co. Class A | | 5,252 | | 968 | |
| Comerica Inc. | | 14,395 | | 942 | |
| PacWest Bancorp | | 22,970 | | 850 | |
| Everest Re Group Ltd. | | 2,453 | | 631 | |
| T. Rowe Price Group Inc. | | 5,053 | | 585 | |
* | Alleghany Corp. | | 735 | | 572 | |
| Unum Group | | 16,482 | | 454 | |
| TCF Financial Corp. | | 6,606 | | 261 | |
* | Athene Holding Ltd. Class A | | 5,241 | | 227 | |
| | | | | 9,034,877 | |
Health Care (14.3%) | | | | | |
| Medtronic plc | | 13,570,988 | | 1,477,881 | |
| Anthem Inc. | | 3,402,321 | | 915,497 | |
| Cigna Corp. | | 2,938,908 | | 524,478 | |
| CVS Health Corp. | | 7,473,451 | | 496,162 | |
| Pfizer Inc. | | 12,139,708 | | 465,801 | |
| Johnson & Johnson | | 2,889,656 | | 381,550 | |
14
Windsor II Fund
| | | | | Market | |
| | | | | Value· | |
| | | Shares | | ($000 | ) |
| Sanofi ADR | | 8,213,647 | | 378,485 | |
| UnitedHealth Group Inc. | | 1,208,300 | | 305,337 | |
| Danaher Corp. | | 1,418,654 | | 195,519 | |
| Gilead Sciences Inc. | | 2,974,783 | | 189,523 | |
| Humana Inc. | | 558,523 | | 164,317 | |
| Zoetis Inc. | | 1,256,827 | | 160,773 | |
| Roche Holding AG | | 505,400 | | 152,103 | |
| Thermo Fisher Scientific Inc. | | 460,702 | | 139,123 | |
| GlaxoSmithKline plc ADR | | 2,717,200 | | 124,448 | |
* | Laboratory Corp. of America Holdings | | 751,430 | | 123,813 | |
* | Elanco Animal Health Inc. | | 2,615,040 | | 70,658 | |
* | Biogen Inc. | | 171,900 | | 51,348 | |
| Merck & Co. Inc. | | 574,478 | | 49,784 | |
* | Centene Corp. | | 905,258 | | 48,051 | |
| AbbVie Inc. | | 594,909 | | 47,325 | |
| Zimmer Biomet Holdings Inc. | | 336,774 | | 46,552 | |
| HCA Healthcare Inc. | | 301,800 | | 40,302 | |
| Abbott Laboratories | | 41,969 | | 3,509 | |
| Bristol-Myers Squibb Co. | | 49,025 | | 2,813 | |
| Eli Lilly & Co. | | 21,358 | | 2,434 | |
| Amgen Inc. | | 10,370 | | 2,211 | |
| Cardinal Health Inc. | | 42,675 | | 2,110 | |
| Universal Health Services Inc. Class B | | 15,303 | | 2,104 | |
* | IQVIA Holdings Inc. | | 13,557 | | 1,958 | |
* | Syneos Health Inc. | | 35,459 | | 1,778 | |
| McKesson Corp. | | 9,923 | | 1,320 | |
| STERIS plc | | 8,344 | | 1,181 | |
| Agilent Technologies Inc. | | 11,072 | | 839 | |
* | United Therapeutics Corp. | | 8,009 | | 720 | |
| | | | | 6,571,807 | |
Industrials (11.4%) | | | | | |
| General Electric Co. | | 86,114,205 | | 859,420 | |
| United Technologies Corp. | | 4,058,676 | | 582,745 | |
| Raytheon Co. | | 2,066,698 | | 438,574 | |
| Caterpillar Inc. | | 2,912,100 | | 401,287 | |
| Honeywell International Inc. | | 2,210,215 | | 381,770 | |
| Wabtec Corp. | | 5,439,877 | | 377,364 | |
| Deere & Co. | | 1,972,924 | | 343,565 | |
| Johnson Controls International plc | | 6,769,007 | | 293,301 | |
| JB Hunt Transport Services Inc. | | 1,588,602 | | 186,756 | |
| Spirit AeroSystems Holdings Inc. Class A | | 2,197,302 | | 179,783 | |
| Norfolk Southern Corp. | | 983,140 | | 178,932 | |
| CNH Industrial NV | | 15,877,300 | | 173,221 | |
| Cummins Inc. | | 963,600 | | 166,202 | |
| General Dynamics Corp. | | 934,433 | | 165,208 | |
| Eaton Corp. plc | | 1,742,740 | | 151,810 | |
| Boeing Co. | | 328,740 | | 111,742 | |
| FedEx Corp. | | 534,500 | | 81,597 | |
| Stanley Black & Decker Inc. | | 488,022 | | 73,852 | |
| PACCAR Inc. | | 660,878 | | 50,266 | |
| Fluor Corp. | | 1,850,000 | | 29,804 | |
| Embraer SA ADR | | 1,339,300 | | 23,264 | |
| WW Grainger Inc. | | 7,557 | | 2,334 | |
* | JetBlue Airways Corp. | | 111,969 | | 2,161 | |
| Nielsen Holdings plc | | 95,690 | | 1,929 | |
| Allison Transmission Holdings Inc. | | 38,634 | | 1,685 | |
| Pentair plc | | 38,737 | | 1,606 | |
| Macquarie Infrastructure Corp. | | 36,667 | | 1,582 | |
| Dover Corp. | | 14,612 | | 1,518 | |
| 3M Co. | | 3,689 | | 609 | |
| KAR Auction Services Inc. | | 11,336 | | 282 | |
* | United Airlines Holdings Inc. | | 2,105 | | 191 | |
| ManpowerGroup Inc. | | 2,093 | | 190 | |
| Jacobs Engineering Group Inc. | | 1,988 | | 186 | |
| | | | | 5,264,736 | |
Information Technology (16.1%) | | | | | |
| Microsoft Corp. | | 13,705,374 | | 1,964,940 | |
| Apple Inc. | | 3,677,533 | | 914,823 | |
| Oracle Corp. | | 13,389,233 | | 729,579 | |
| QUALCOMM Inc. | | 5,537,410 | | 445,429 | |
| Taiwan Semiconductor Manufacturing Co. Ltd. ADR | | 7,567,119 | | 390,690 | |
| Samsung Electronics Co. Ltd. | | 8,124,900 | | 351,157 | |
| Cisco Systems Inc. | | 7,220,868 | | 343,063 | |
| Visa Inc. Class A | | 1,719,230 | | 307,502 | |
| Broadcom Inc. | | 879,024 | | 257,422 | |
| Analog Devices Inc. | | 2,195,264 | | 234,081 | |
| Hewlett Packard Enterprise Co. | | 14,049,300 | | 230,549 | |
| Corning Inc. | | 6,102,800 | | 180,826 | |
| Texas Instruments Inc. | | 1,526,260 | | 180,083 | |
| Accenture plc Class A | | 709,795 | | 131,610 | |
| Fidelity National Information Services Inc. | | 919,680 | | 121,177 | |
* | Palo Alto Networks Inc. | | 508,105 | | 115,538 | |
| Skyworks Solutions Inc. | | 1,104,152 | | 100,544 | |
| Telefonaktiebolaget LM Ericsson ADR | | 9,987,900 | | 87,095 | |
| Motorola Solutions Inc. | | 506,360 | | 84,218 | |
15
Windsor II Fund
| | | | | Market | |
| | | | | Value· | |
| | | Shares | | ($000 | ) |
* | Micron Technology Inc. | | 1,429,400 | | 67,968 | |
* | PTC Inc. | | 882,670 | | 59,060 | |
| TE Connectivity Ltd. | | 623,700 | | 55,821 | |
* | Teradata Corp. | | 800,700 | | 23,965 | |
| Intel Corp. | | 122,009 | | 6,897 | |
| International Business Machines Corp. | | 20,751 | | 2,775 | |
* | Qorvo Inc. | | 26,702 | | 2,159 | |
| Seagate Technology plc | | 37,193 | | 2,158 | |
| Sabre Corp. | | 91,700 | | 2,153 | |
* | ON Semiconductor Corp. | | 105,153 | | 2,145 | |
| HP Inc. | | 111,514 | | 1,937 | |
| Leidos Holdings Inc. | | 20,728 | | 1,787 | |
| Avnet Inc. | | 38,705 | | 1,531 | |
| Teradyne Inc. | | 19,417 | | 1,189 | |
| Lam Research Corp. | | 3,492 | | 947 | |
* | Dell Technologies Inc. | | 5,533 | | 293 | |
| Western Union Co. | | 11,435 | | 287 | |
| Alliance Data Systems Corp. | | 1,680 | | 168 | |
| | | | | 7,403,566 | |
Materials (3.3%) | | | | | |
| Air Products & Chemicals Inc. | | 2,883,815 | | 615,002 | |
| Corteva Inc. | | 14,913,951 | | 393,430 | |
| DuPont de Nemours Inc. | | 4,305,500 | | 283,775 | |
| Vulcan Materials Co. | | 794,283 | | 113,479 | |
| International Paper Co. | | 2,493,840 | | 108,931 | |
| Reliance Steel & Aluminum Co. | | 20,312 | | 2,357 | |
| CF Industries Holdings Inc. | | 45,507 | | 2,064 | |
| Scotts Miracle-Gro Co. | | 19,572 | | 1,965 | |
| Ball Corp. | | 26,772 | | 1,873 | |
| Sealed Air Corp. | | 37,318 | | 1,559 | |
| Dow Inc. | | 17,143 | | 866 | |
| | | | | 1,525,301 | |
Other (0.9%) | | | | | |
| SPDR S&P 500 ETF Trust | | 1,241,743 | | 376,658 | |
2 | Vanguard Value ETF | | 255,823 | | 29,097 | |
| | | | | 405,755 | |
Real Estate (0.5%) | | | | | |
| Prologis Inc. | | 2,620,300 | | 229,958 | |
| Mid-America Apartment Communities Inc. | | 17,850 | | 2,481 | |
| Essex Property Trust Inc. | | 7,380 | | 2,414 | |
| Brixmor Property Group Inc. | | 98,970 | | 2,179 | |
| Park Hotels & Resorts Inc. | | 82,328 | | 1,914 | |
| UDR Inc. | | 31,797 | | 1,598 | |
| Equity Residential | | 16,581 | | 1,470 | |
| Kimco Realty Corp. | | 47,349 | | 1,021 | |
| VEREIT Inc. | | 85,458 | | 841 | |
| Spirit Realty Capital Inc. | | 15,050 | | 750 | |
| Regency Centers Corp. | | 9,909 | | 666 | |
| Alexandria Real Estate Equities Inc. | | 4,021 | | 638 | |
| Ventas Inc. | | 9,561 | | 623 | |
| Simon Property Group Inc. | | 4,096 | | 617 | |
| Iron Mountain Inc. | | 10,234 | | 336 | |
| | | | | 247,506 | |
Utilities (2.6%) | | | | | |
| Dominion Energy Inc. | | 6,473,218 | | 534,364 | |
| Exelon Corp. | | 4,653,253 | | 211,676 | |
| Edison International | | 2,871,726 | | 180,632 | |
| PPL Corp. | | 5,389,130 | | 180,482 | |
| Southern Co. | | 1,371,252 | | 85,923 | |
| FirstEnergy Corp. | | 58,828 | | 2,843 | |
| Vistra Energy Corp. | | 84,440 | | 2,282 | |
| CMS Energy Corp. | | 35,556 | | 2,273 | |
| AES Corp. | | 130,532 | | 2,226 | |
| NRG Energy Inc. | | 48,401 | | 1,942 | |
| Sempra Energy | | 9,226 | | 1,333 | |
| Duke Energy Corp. | | 10,355 | | 976 | |
| NextEra Energy Inc. | | 3,952 | | 942 | |
| Pinnacle West Capital Corp. | | 4,498 | | 423 | |
| Evergy Inc. | | 6,250 | | 399 | |
| | | | | 1,208,716 | |
Total Common Stocks | | | | | |
(Cost $34,161,537) | | | | 44,321,830 | |
Temporary Cash Investments (4.0%)1 | | | | | |
Money Market Fund (3.9%) | | | | | |
3,4 | Vanguard Market Liquidity Fund, 1.984% | | 17,996,801 | | 1,799,860 | |
| | | Face | | | |
| | | Amount | | | |
| | | ($000) | | | |
U.S. Government and Agency Obligations (0.1%) | | | | | |
5 | United States Treasury Bill, 1.957%, 11/7/19 | | 100 | | 100 | |
| United States Treasury Bill, 2.048%, 11/21/19 | | 12,000 | | 11,990 | |
5 | United States Treasury Bill, 2.043%, 11/29/19 | | 40,000 | | 39,954 | |
| | | | | 52,044 | |
Total Temporary Cash Investments | | | | | |
(Cost $1,851,778) | | | | 1,851,904 | |
Total Investments (100.1%) | | | | | |
(Cost $36,013,315) | | | | 46,173,734 | |
16
Windsor II Fund
| | Amount | |
| | ($000 | ) |
Other Assets and Liabilities (-0.1%) | | | |
Other Assets | | | |
Investment in Vanguard | | 2,132 | |
Receivables for Investment Securities Sold | | 72,209 | |
Receivables for Accrued Income | | 46,128 | |
Receivables for Capital Shares Issued | | 7,185 | |
Total Other Assets | | 127,654 | |
Liabilities | | | |
Payables for Investment Securities Purchased | | (22,018 | ) |
Collateral for Securities on Loan | | (3,339 | ) |
Payables to Investment Advisor | | (12,529 | ) |
Payables for Capital Shares Redeemed | | (82,915 | ) |
Payables to Vanguard | | (37,373 | ) |
Variation Margin Payable—Futures Contracts | | (2,314 | ) |
Other Liabilities | | (71 | ) |
Total Liabilities | | (160,559 | ) |
Net Assets (100%) | | 46,140,829 | |
At October 31, 2019, net assets consisted of:
| | Amount | |
| | ($000 | ) |
Paid-in Capital | | 32,169,175 | |
Total Distributable Earnings (Loss) | | 13,971,654 | |
Net Assets | | 46,140,829 | |
| | | |
Investor Shares—Net Assets | | | |
Applicable to 325,578,558 outstanding $.001 par value shares of beneficial interest (unlimited authorization) | | 12,119,212 | |
Net Asset Value Per Share—Investor Shares | | $37.22 | |
| | | |
Admiral Shares—Net Assets | | | |
Applicable to 515,042,627 outstanding $.001 par value shares of beneficial interest (unlimited authorization) | | 34,021,617 | |
Net Asset Value Per Share—Admiral Shares | | $66.06 | |
· See Note A in Notes to Financial Statements.
* Non-income-producing security.
^ Includes partial security positions on loan to broker-dealers. The total value of securities on loan is $3,420,000.
1 The fund invests a portion of its cash reserves in equity markets through the use of index futures contracts. After giving effect to futures investments, the fund’s effective common stock and temporary cash investment positions represent 97.2% and 2.9%, respectively, of net assets.
2 Considered an affiliated company of the fund as the issuer is another member of The Vanguard Group.
3 Affiliated money market fund available only to Vanguard funds and certain trusts and accounts managed by Vanguard. Rate shown is the 7-day yield.
4 Collateral of $3,339,000 was received for securities on loan. The fund received additional collateral of $299,000 on the next business day.
5 Securities with a value of $24,642,000 have been segregated as initial margin for open futures contracts.
ADR—American Depositary Receipt.
17
Windsor II Fund
Derivative Financial Instruments Outstanding as of Period End | |
| | | | | |
Futures Contracts | | | | | |
| | | | | ($000) |
| | | | | Value and |
| | Number of | | | Unrealized |
| | Long (Short) | | Notional | Appreciation |
| Expiration | Contracts | | Amount | (Depreciation) |
Long Futures Contracts | | | | | |
E-mini S&P 500 Index | December 2019 | 3,390 | | 514,568 | 25,114 |
Micro E-mini S&P 500 Index | December 2019 | 47 | | 713 | 11 |
| | | | | 25,125 |
See accompanying Notes, which are an integral part of the Financial Statements.
18
Windsor II Fund
Statement of Operations
| Year Ended |
| October 31, 2019 |
| ($000) |
Investment Income | |
Income | |
Dividends—Unaffiliated Issuers1 | 1,103,003 |
Dividends—Affiliated Issuers | 849 |
Interest—Unaffiliated Issuers | 790 |
Interest—Affiliated Issuers | 38,055 |
Securities Lending—Net | 99 |
Total Income | 1,142,796 |
Expenses | |
Investment Advisory Fees—Note B | |
Basic Fee | 63,293 |
Performance Adjustment | (13,291) |
The Vanguard Group—Note C | |
Management and Administrative—Investor Shares | 24,174 |
Management and Administrative—Admiral Shares | 44,184 |
Marketing and Distribution—Investor Shares | 1,011 |
Marketing and Distribution—Admiral Shares | 1,184 |
Custodian Fees | 288 |
Auditing Fees | 46 |
Shareholders’ Reports—Investor Shares | 433 |
Shareholders’ Reports—Admiral Shares | 278 |
Trustees’ Fees and Expenses | 49 |
Total Expenses | 121,649 |
Net Investment Income | 1,021,147 |
Realized Net Gain (Loss) | |
Investment Securities Sold—Unaffiliated Issuers | 3,836,385 |
Investment Securities Sold—Affiliated Issuers | (179,596) |
Futures Contracts | 92,427 |
Foreign Currencies | (476) |
Realized Net Gain (Loss) | 3,748,740 |
Change in Unrealized Appreciation (Depreciation) | |
Investment Securities—Unaffiliated Issuers | (223,345) |
Investment Securities—Affiliated Issuers | 100,345 |
Futures Contracts | 29,394 |
Foreign Currencies | 159 |
Change in Unrealized Appreciation (Depreciation) | (93,447) |
Net Increase (Decrease) in Net Assets Resulting from Operations | 4,676,440 |
1 Dividends are net of foreign withholding taxes of $12,065,000.
See accompanying Notes, which are an integral part of the Financial Statements.
19
Windsor II Fund
Statement of Changes in Net Assets
| Year Ended October 31, |
| 2019 | 2018 |
| ($000) | ($000) |
Increase (Decrease) in Net Assets | | |
Operations | | |
Net Investment Income | 1,021,147 | 1,029,684 |
Realized Net Gain (Loss) | 3,748,740 | 3,682,687 |
Change in Unrealized Appreciation (Depreciation) | (93,447) | (2,436,557) |
Net Increase (Decrease) in Net Assets Resulting from Operations | 4,676,440 | 2,275,814 |
Distributions | | |
Net Investment Income | | |
Investor Shares | (276,239) | (252,654) |
Admiral Shares | (805,822) | (710,493) |
Realized Capital Gain1 | | |
Investor Shares | (873,499) | (828,642) |
Admiral Shares | (2,466,823) | (2,184,797) |
Total Distributions | (4,422,383) | (3,976,586) |
Capital Share Transactions | | |
Investor Shares | (15,087) | (1,134,007) |
Admiral Shares | (284,508) | (130,763) |
Net Increase (Decrease) from Capital Share Transactions | (299,595) | (1,264,770) |
Total Increase (Decrease) | (45,538) | (2,965,542) |
Net Assets | | |
Beginning of Period | 46,186,367 | 49,151,909 |
End of Period | 46,140,829 | 46,186,367 |
1 Includes fiscal 2019 and 2018 short-term gain distributions totaling $181,005,000 and $190,915,000, respectively. Short-term gain distributions are treated as ordinary income dividends for tax purposes.
See accompanying Notes, which are an integral part of the Financial Statements.
20
Windsor II Fund
Financial Highlights
Investor Shares
For a Share Outstanding | | | Year Ended October 31, |
Throughout Each Period | 2019 | 2018 | 2017 | 2016 | 2015 |
Net Asset Value, Beginning of Period | $37.39 | $38.81 | $35.03 | $36.73 | $39.59 |
Investment Operations | | | | | |
Net Investment Income | .7751 | .7831 | .7501 | .8471 | .809 |
Net Realized and Unrealized Gain (Loss) | | | | | |
on Investments | 2.628 | .950 | 5.847 | .096 | (.229) |
Total from Investment Operations | 3.403 | 1.733 | 6.597 | .943 | .580 |
Distributions | | | | | |
Dividends from Net Investment Income | (.844) | (.740) | (.851) | (.781) | (.827) |
Distributions from Realized Capital Gains | (2.729) | (2.413) | (1.966) | (1.862) | (2.613) |
Total Distributions | (3.573) | (3.153) | (2.817) | (2.643) | (3.440) |
Net Asset Value, End of Period | $37.22 | $37.39 | $38.81 | $35.03 | $36.73 |
| | | | | |
Total Return2 | 10.82% | 4.44% | 19.60% | 2.86% | 1.57% |
| | | | | |
Ratios/Supplemental Data | | | | | |
Net Assets, End of Period (Millions) | $12,119 | $12,061 | $13,638 | $13,773 | $15,397 |
Ratio of Total Expenses to Average Net Assets3 | 0.33% | 0.33% | 0.34% | 0.33% | 0.34% |
Ratio of Net Investment Income to | | | | | |
Average Net Assets | 2.20% | 2.04% | 2.01% | 2.46% | 2.12% |
Portfolio Turnover Rate | 32% | 29% | 32% | 33% | 26% |
1 Calculated based on average shares outstanding.
2 Total returns do not include account service fees that may have applied in the periods shown. Fund prospectuses provide information about any applicable account service fees.
3 Includes performance-based investment advisory fee increases (decreases) of (0.03%), (0.03%), (0.02%), (0.03%), and (0.02%).
See accompanying Notes, which are an integral part of the Financial Statements.
21
Windsor II Fund
Financial Highlights
Admiral Shares
For a Share Outstanding | | | Year Ended October 31, |
Throughout Each Period | 2019 | 2018 | 2017 | 2016 | 2015 |
Net Asset Value, Beginning of Period | $66.35 | $68.88 | $62.18 | $65.20 | $70.27 |
Investment Operations | | | | | |
Net Investment Income | 1.4261 | 1.4431 | 1.3771 | 1.5521 | 1.492 |
Net Realized and Unrealized Gain (Loss) | | | | | |
on Investments | 4.675 | 1.682 | 10.376 | .168 | (.401) |
Total from Investment Operations | 6.101 | 3.125 | 11.753 | 1.720 | 1.091 |
Distributions | | | | | |
Dividends from Net Investment Income | (1.547) | (1.371) | (1.565) | (1.437) | (1.525) |
Distributions from Realized Capital Gains | (4.844) | (4.284) | (3.488) | (3.303) | (4.636) |
Total Distributions | (6.391) | (5.655) | (5.053) | (4.740) | (6.161) |
Net Asset Value, End of Period | $66.06 | $66.35 | $68.88 | $62.18 | $65.20 |
| | | | | |
Total Return2 | 10.93% | 4.52% | 19.68% | 2.94% | 1.66% |
| | | | | |
Ratios/Supplemental Data | | | | | |
Net Assets, End of Period (Millions) | $34,022 | $34,126 | $35,514 | $30,991 | $31,763 |
Ratio of Total Expenses to Average Net Assets3 | 0.25% | 0.25% | 0.26% | 0.25% | 0.26% |
Ratio of Net Investment Income to | | | | | |
Average Net Assets | 2.28% | 2.12% | 2.09% | 2.54% | 2.20% |
Portfolio Turnover Rate | 32% | 29% | 32% | 33% | 26% |
1 Calculated based on average shares outstanding.
2 Total returns do not include account service fees that may have applied in the periods shown. Fund prospectuses provide information about any applicable account service fees.
3 Includes performance-based investment advisory fee increases (decreases) of (0.03%), (0.03%), (0.02%), (0.03%), and (0.02%).
See accompanying Notes, which are an integral part of the Financial Statements.
22
Windsor II Fund
Notes to Financial Statements
Vanguard Windsor II Fund is registered under the Investment Company Act of 1940 as an open-end investment company, or mutual fund. The fund offers two classes of shares: Investor Shares and Admiral Shares. Each of the share classes has different eligibility and minimum purchase requirements, and is designed for different types of investors.
A. The following significant accounting policies conform to generally accepted accounting principles for U.S. investment companies. The fund consistently follows such policies in preparing its financial statements.
1. Security Valuation: Securities are valued as of the close of trading on the New York Stock Exchange (generally 4 p.m., Eastern time) on the valuation date. Equity securities are valued at the latest quoted sales prices or official closing prices taken from the primary market in which each security trades; such securities not traded on the valuation date are valued at the mean of the latest quoted bid and asked prices. Securities for which market quotations are not readily available, or whose values have been affected by events occurring before the fund’s pricing time but after the close of the securities’ primary markets, are valued at their fair values calculated according to procedures adopted by the board of trustees. These procedures include obtaining quotations from an independent pricing service, monitoring news to identify significant market- or security-specific events, and evaluating changes in the values of foreign market proxies (for example, ADRs, futures contracts, or exchange-traded funds), between the time the foreign markets close and the fund’s pricing time. When fair-value pricing is employed, the prices of securities used by a fund to calculate its net asset value may differ from quoted or published prices for the same securities. Investments in Vanguard Market Liquidity Fund are valued at that fund’s net asset value. Temporary cash investments are valued using the latest bid prices or using valuations based on a matrix system (which considers such factors as security prices, yields, maturities, and ratings), both as furnished by independent pricing services.
2. Foreign Currency: Securities and other assets and liabilities denominated in foreign currencies are translated into U.S. dollars using exchange rates obtained from an independent third party as of the fund’s pricing time on the valuation date. Realized gains (losses) and unrealized appreciation (depreciation) on investment securities include the effects of changes in exchange rates since the securities were purchased, combined with the effects of changes in security prices. Fluctuations in the value of other assets and liabilities resulting from changes in exchange rates are recorded as unrealized foreign currency gains (losses) until the assets or liabilities are settled in cash, at which time they are recorded as realized foreign currency gains (losses).
3. Futures Contracts: The fund uses index futures contracts to a limited extent, with the objective of maintaining full exposure to the stock market while maintaining liquidity. The fund may purchase or sell futures contracts to achieve a desired level of investment, whether to accommodate portfolio turnover or cash flows from capital share transactions. The primary risks associated with the use of futures contracts are imperfect correlation between changes in market values of stocks held by the fund and the prices of futures contracts, and the possibility of an illiquid market. Counterparty risk involving futures is mitigated because a regulated clearinghouse is the counterparty instead of the clearing broker. To further mitigate counterparty risk, the fund trades futures contracts on an exchange, monitors the financial strength of its clearing brokers and clearinghouse, and has entered into clearing agreements with its clearing brokers. The clearinghouse imposes initial margin requirements to secure the fund’s performance and requires daily settlement of variation margin representing changes in the market value of each contract. Any assets pledged as initial margin for open contracts are noted in the Statement of Net Assets.
23
Windsor II Fund
Futures contracts are valued at their quoted daily settlement prices. The notional amounts of the contracts are not recorded in the Statement of Net Assets. Fluctuations in the value of the contracts are recorded in the Statement of Net Assets as an asset (liability) and in the Statement of Operations as unrealized appreciation (depreciation) until the contracts are closed, when they are recorded as realized futures gains (losses).
During the year ended October 31, 2019, the fund’s average investments in long and short futures contracts represented 1% and 0% of net assets, respectively, based on the average of the notional amounts at each quarter-end during the period.
4. Federal Income Taxes: The fund intends to continue to qualify as a regulated investment company and distribute all of its taxable income. Management has analyzed the fund’s tax positions taken for all open federal income tax years (October 31, 2016–2019), and has concluded that no provision for federal income tax is required in the fund’s financial statements.
5. Distributions: Distributions to shareholders are recorded on the ex-dividend date. Distributions are determined on a tax basis and may differ from net investment income and realized capital gains for financial reporting purposes.
6. Securities Lending: To earn additional income, the fund lends its securities to qualified institutional borrowers. Security loans are subject to termination by the fund at any time, and are required to be secured at all times by collateral in an amount at least equal to the market value of securities loaned. Daily market fluctuations could cause the value of loaned securities to be more or less than the value of the collateral received. When this occurs, the collateral is adjusted and settled before the opening of the market on the next business day. The fund further mitigates its counterparty risk by entering into securities lending transactions only with a diverse group of prequalified counterparties, monitoring their financial strength, and entering into master securities lending agreements with its counterparties. The master securities lending agreements provide that, in the event of a counterparty’s default (including bankruptcy), the fund may terminate any loans with that borrower, determine the net amount owed, and sell or retain the collateral up to the net amount owed to the fund; however, such actions may be subject to legal proceedings. While collateral mitigates counterparty risk, in the event of a default, the fund may experience delays and costs in recovering the securities loaned. The fund invests cash collateral received in Vanguard Market Liquidity Fund, and records a liability in the Statement of Net Assets for the return of the collateral, during the period the securities are on loan. Securities lending income represents fees charged to borrowers plus income earned on invested cash collateral, less expenses associated with the loan. During the term of the loan, the fund is entitled to all distributions made on or in respect of the loaned securities.
7. Credit Facility: The fund and certain other funds managed by The Vanguard Group (“Vanguard”) participate in a $4.3 billion committed credit facility provided by a syndicate of lenders pursuant to a credit agreement that may be renewed annually; each fund is individually liable for its borrowings, if any, under the credit facility. Borrowings may be utilized for temporary and emergency purposes, and are subject to the fund’s regulatory and contractual borrowing restrictions. The participating funds are charged administrative fees and an annual commitment fee of 0.10% of the undrawn amount of the facility; these fees are allocated to the funds based on a method approved by the fund’s board of trustees and included in Management and Administrative expenses on the fund’s Statement of Operations. Any borrowings under this facility bear interest at a rate based upon the higher of the one-month London Interbank Offered Rate, federal funds effective rate, or overnight bank funding rate plus an agreed-upon spread.
24
Windsor II Fund
The fund had no borrowings outstanding at October 31, 2019, or at any time during the period then ended.
8. Other: Dividend income is recorded on the ex-dividend date. Interest income includes income distributions received from Vanguard Market Liquidity Fund and is accrued daily. Premiums and discounts on debt securities purchased are amortized and accreted, respectively, to interest income over the lives of the respective securities. Security transactions are accounted for on the date securities are bought or sold. Costs used to determine realized gains (losses) on the sale of investment securities are those of the specific securities sold.
Each class of shares has equal rights as to assets and earnings, except that each class separately bears certain class-specific expenses related to maintenance of shareholder accounts (included in Management and Administrative expenses) and shareholder reporting. Marketing and distribution expenses are allocated to each class of shares based on a method approved by the board of trustees. Income, other non-class-specific expenses, and gains and losses on investments are allocated to each class of shares based on its relative net assets.
B. The investment advisory firms Barrow, Hanley, Mewhinney & Strauss, LLC, Lazard Asset Management LLC, Hotchkis and Wiley Capital Management, LLC, and Sanders Capital, LLC, each provide investment advisory services to a portion of the fund for a fee calculated at an annual percentage rate of average net assets managed by the advisor. The basic fee of Barrow, Hanley, Mewhinney & Strauss, LLC, is subject to quarterly adjustments based on performance relative to the MSCI US Prime Market 750 Index for the preceding three years. The basic fee of Lazard Asset Management LLC is subject to quarterly adjustments based on performance relative to the S&P 500 Index for the preceding three years. The basic fee of Hotchkis and Wiley Capital Management, LLC, is subject to quarterly adjustments based on performance relative to the MSCI US Investable Market 2500 Index for the preceding five years. The basic fee of Sanders Capital, LLC, is subject to quarterly adjustments based on performance relative to the Russell 3000 Index for the preceding five years.
Vanguard provides investment advisory services to a portion of the fund as described below; the fund paid Vanguard advisory fees of $643,000 for the year ended October 31, 2019.
For the year ended October 31, 2019, the aggregate investment advisory fee paid to all advisors represented an effective annual basic rate of 0.14% of the fund’s average net assets, before a decrease of $13,291,000 (0.03%) based on performance.
C. In accordance with the terms of a Funds’ Service Agreement (the “FSA”) between Vanguard and the fund, Vanguard furnishes to the fund investment advisory, corporate management, administrative, marketing, and distribution services at Vanguard’s cost of operations (as defined by the FSA). These costs of operations are allocated to the fund based on methods and guidelines approved by the board of trustees. Vanguard does not require reimbursement in the current period for certain costs of operations (such as deferred compensation/benefits and risk/insurance costs); the fund’s liability for these costs of operations is included in Payables to Vanguard on the Statement of Net Assets. All other costs of operations payable to Vanguard are generally settled twice a month.
25
Windsor II Fund
Upon the request of Vanguard, the fund may invest up to 0.40% of its net assets as capital in Vanguard. At October 31, 2019, the fund had contributed to Vanguard capital in the amount of $2,132,000, representing less than 0.01% of the fund’s net assets and 0.85% of Vanguard’s capital received pursuant to the FSA. The fund’s trustees and officers are also directors and employees, respectively, of Vanguard.
D. Various inputs may be used to determine the value of the fund’s investments. These inputs are summarized in three broad levels for financial statement purposes. The inputs or methodologies used to value securities are not necessarily an indication of the risk associated with investing in those securities.
Level 1—Quoted prices in active markets for identical securities.
Level 2—Other significant observable inputs (including quoted prices for similar securities, interest rates, prepayment speeds, credit risk, etc.).
Level 3—Significant unobservable inputs (including the fund’s own assumptions used to determine the fair value of investments). Any investments valued with significant unobservable inputs are noted on the Statement of Net Assets.
The following table summarizes the market value of the fund’s investments and derivatives as of October 31, 2019, based on the inputs used to value them:
| Level 1 | Level 2 | Level 3 |
Investments | ($000) | ($000) | ($000) |
Common Stocks | 43,418,634 | 903,196 | — |
Temporary Cash Investments | 1,799,860 | 52,044 | — |
Futures Contracts—Liabilities1 | (2,314) | — | — |
Total | 45,216,180 | 955,240 | — |
1 Represents variation margin on the last day of the reporting period.
E. Permanent differences between book-basis and tax-basis components of net assets are reclassified among capital accounts in the financial statements to reflect their tax character. These reclassifications have no effect on net assets or net asset value per share. As of period end, permanent differences primarily attributable to the accounting for foreign currency transactions, distributions in connection with fund share redemptions, and redesignation of dividends paid were reclassified between the following accounts:
| Amount |
| ($000) |
Paid-in Capital | 258,374 |
Total Distributable Earnings (Loss) | (258,374) |
26
Windsor II Fund
Temporary differences between book-basis and tax-basis components of total distributable earnings (loss) arise when certain items of income, gain, or loss are recognized in different periods for financial statement and tax purposes; these differences will reverse at some time in the future. The differences are primarily related to the tax deferral of losses on wash sales and the realization of unrealized gains or losses on certain futures contracts. As of period end, the tax-basis components of total distributable earnings (loss) are detailed in the table as follows:
| Amount |
| ($000) |
Undistributed Ordinary Income | 331,096 |
Undistributed Long-Term Gains | 3,547,223 |
Capital Loss Carryforwards (Non-expiring) | — |
Net Unrealized Gains (Losses) | 10,127,875 |
As of October 31, 2019, gross unrealized appreciation and depreciation for investments and derivatives based on cost for U.S. federal income tax purposes were as follows:
| Amount |
| ($000) |
Tax Cost | 36,045,900 |
Gross Unrealized Appreciation | 12,544,650 |
Gross Unrealized Depreciation | (2,416,816) |
Net Unrealized Appreciation (Depreciation) | 10,127,834 |
F. During the year ended October 31, 2019, the fund purchased $13,936,958,000 of investment securities and sold $18,207,407,000 of investment securities, other than temporary cash investments.
G. Capital share transactions for each class of shares were:
| | | | Year Ended October 31, |
| | 2019 | | | 2018 |
| Amount | Shares | | Amount | Shares |
| ($000) | (000) | | ($000) | (000) |
Investor Shares | | | | | |
Issued | 651,279 | 18,910 | | 803,624 | 21,108 |
Issued in Lieu of Cash Distributions | 1,122,692 | 35,211 | | 1,052,733 | 27,845 |
Redeemed | (1,789,058) | (51,114) | | (2,990,364) | (77,778) |
Net Increase (Decrease)—Investor Shares | (15,087) | 3,007 | | (1,134,007) | (28,825) |
Admiral Shares | | | | | |
Issued | 1,513,788 | 24,434 | | 2,416,874 | 35,509 |
Issued in Lieu of Cash Distributions | 3,089,248 | 54,596 | | 2,738,624 | 40,825 |
Redeemed | (4,887,544) | (78,289) | | (5,286,261) | (77,631) |
Net Increase (Decrease)—Admiral Shares | (284,508) | 741 | | (130,763) | (1,297) |
27
Windsor II Fund
H. Certain of the fund’s investments are in companies that are considered to be affiliated companies of the fund because the fund owns more than 5% of the outstanding voting securities of the company or the issuer is another member of The Vanguard Group. Transactions during the period in securities of these companies were as follows:
| | | | | Current Period Transactions | |
| Oct. 31, | | Proceeds | Realized | | | | Oct. 31, |
| 2018 | | from | Net | Change in | | Capital Gain | 2019 |
| Market | Purchases | Securities | Gain | Unrealized | | Distributions | Market |
| Value | at Cost | Sold | (Loss) | App. (Dep.) | Income | Received | Value |
| ($000) | ($000) | ($000) | ($000) | ($000) | ($000) | ($000) | ($000) |
Adient plc | 207,482 | — | 80,401 | (190,058) | 108,633 | — | — | NA1 |
Vanguard Market Liquidity Fund | 1,156,280 | NA2 | NA2 | (328) | 102 | 38,055 | — | 1,799,860 |
Vanguard Value ETF | 46,703 | — | 20,006 | 10,790 | (8,390) | 849 | — | 29,097 |
Total | 1,410,465 | | | (179,596) | 100,345 | 38,904 | — | 1,828,957 |
1 Not applicable—at October 31, 2019, the security was still held, but the issuer was no longer an affiliated company of the fund.
2 Not applicable—purchases and sales are for temporary cash investment purposes.
I. In November 2019, the board of trustees approved changes to the investment advisors of the fund. Aristotle Capital Management, LLC, will join Lazard Asset Management LLC, Hotchkis and Wiley Capital Management, LLC, and Sanders Capital, LLC, as investment advisors to the fund. Barrow, Hanley, Mewhinney & Strauss, LLC, and Vanguard will no longer serve as investment advisors.
Management has determined that no other events or transactions occurred subsequent to October 31, 2019, that would require recognition or disclosure in these financial statements.
28
Report of Independent Registered
Public Accounting Firm
To the Board of Trustees of Vanguard Windsor Funds and Shareholders of Vanguard Windsor II Fund
Opinion on the Financial Statements
We have audited the accompanying statement of net assets of Vanguard Windsor II Fund (one of the funds constituting Vanguard Windsor Funds, referred to hereafter as the “Fund”) as of October 31, 2019, the related statement of operations for the year ended October 31, 2019, the statement of changes in net assets for each of the two years in the period ended October 31, 2019, including the related notes, and the financial highlights for each of the five years in the period ended October 31, 2019 (collectively referred to as the “financial statements”). In our opinion, the financial statements present fairly, in all material respects, the financial position of the Fund as of October 31, 2019, the results of its operations for the year then ended, the changes in its net assets for each of the two years in the period ended October 31, 2019 and the financial highlights for each of the five years in the period ended October 31, 2019 in conformity with accounting principles generally accepted in the United States of America.
Basis for Opinion
These financial statements are the responsibility of the Fund’s management. Our responsibility is to express an opinion on the Fund’s financial statements based on our audits. We are a public accounting firm registered with the Public Company Accounting Oversight Board (United States) (“PCAOB”) and are required to be independent with respect to the Fund in accordance with the U.S. federal securities laws and the applicable rules and regulations of the Securities and Exchange Commission and the PCAOB.
We conducted our audits of these financial statements in accordance with the standards of the PCAOB. Those standards require that we plan and perform the audit to obtain reasonable assurance about whether the financial statements are free of material misstatement, whether due to error or fraud.
Our audits included performing procedures to assess the risks of material misstatement of the financial statements, whether due to error or fraud, and performing procedures that respond to those risks. Such procedures included examining, on a test basis, evidence regarding the amounts and disclosures in the financial statements. Our audits also included evaluating the accounting principles used and significant estimates made by management, as well as evaluating the overall presentation of the financial statements. Our procedures included confirmation of securities owned as of October 31, 2019 by correspondence with the custodian and brokers and by agreement to the underlying ownership records of the transfer agent; when replies were not received from brokers, we performed other auditing procedures. We believe that our audits provide a reasonable basis for our opinion.
/s/PricewaterhouseCoopers LLP
Philadelphia, Pennsylvania
December 13, 2019
We have served as the auditor of one or more investment companies in The Vanguard Group of Funds since 1975.
29
Special 2019 tax information (unaudited) for Vanguard Windsor II Fund
This information for the fiscal year ended October 31, 2019, is included pursuant to provisions of the Internal Revenue Code.
The fund distributed $3,417,797,000 as capital gain dividends (20% rate gain distributions) to shareholders during the fiscal year.
For nonresident alien shareholders, 100% of short-term capital gain dividends distributed by the fund are qualified short-term capital gains.
The fund distributed $1,139,127,000 of qualified dividend income to shareholders during the fiscal year.
For corporate shareholders, 86.6% of investment income (dividend income plus short-term gains, if any) qualifies for the dividends-received deduction.
30
This page intentionally left blank.
This page intentionally left blank.
This page intentionally left blank.
This page intentionally left blank.
The People Who Govern Your Fund
The trustees of your mutual fund are there to see that the fund is operated and managed in your best interests since, as a shareholder, you are a part owner of the fund. Your fund’s trustees also serve on the board of directors of The Vanguard Group, Inc., which is owned by the Vanguard funds and provides services to them.
A majority of Vanguard’s board members are independent, meaning that they have no affiliation with Vanguard or the funds they oversee, apart from the sizable personal investments they have made as private individuals. The independent board members have distinguished backgrounds in business, academia, and public service. Each of the trustees and executive officers oversees 213 Vanguard funds.
Information for each trustee and executive officer of the fund appears below. That information, as well as the Vanguard fund count, is as of the date on the cover of this fund report. The mailing address of the trustees and officers is P.O. Box 876, Valley Forge, PA 19482. More information about the trustees is in the Statement of Additional Information, which can be obtained, without charge, by contacting Vanguard at 800-662-7447, or online at vanguard.com.
Interested Trustee1
Mortimer J. Buckley
Born in 1969. Trustee since January 2018. Principal occupation(s) during the past five years and other experience: chairman of the board (January 2019–present) of Vanguard and of each of the investment companies served by Vanguard; chief executive officer (January 2018–present) of Vanguard; chief executive officer, president, and trustee (January 2018–present) of each of the investment companies served by Vanguard; president and director (2017–present) of Vanguard; and president (February 2018–present) of Vanguard Marketing Corporation. Chief investment officer (2013–2017), managing director (2002–2017), head of the Retail Investor Group (2006–2012), and chief information officer (2001–2006) of Vanguard. Chairman of the board (2011–2017) and trustee (2009–2017) of the Children’s Hospital of Philadelphia; trustee (2018–present) of The Shipley School.
Independent Trustees
Emerson U. Fullwood
Born in 1948. Trustee since January 2008. Principal occupation(s) during the past five years and other experience: executive chief staff and marketing officer for North America and corporate vice president (retired 2008) of Xerox Corporation (document management products and services). Former president of the Worldwide Channels Group, Latin America, and Worldwide Customer Service and executive chief staff officer of Developing Markets of Xerox. Executive in residence and 2009–2010 Distinguished Minett Professor at the Rochester Institute of Technology. Director of SPX FLOW, Inc. (multi-industry manufacturing). Director of the University of Rochester Medical Center, the Monroe Community College Foundation, the United Way of Rochester, North Carolina A&T University, and Roberts Wesleyan College. Trustee of the University of Rochester.
Amy Gutmann
Born in 1949. Trustee since June 2006. Principal occupation(s) during the past five years and other experience: president (2004–present) of the University of Pennsylvania. Christopher H. Browne Distinguished Professor of Political Science, School of Arts and Sciences, and professor of communication, Annenberg School for Communication, with secondary faculty appointments in the Department of Philosophy, School of Arts and Sciences, and at the Graduate School of Education, University of Pennsylvania. Trustee of the National Constitution Center.
F. Joseph Loughrey
Born in 1949. Trustee since October 2009. Principal occupation(s) during the past five years and other experience: president and chief operating officer (retired 2009) and vice chairman of the board (2008–2009) of Cummins Inc. (industrial machinery). Chairman of the board of Hillenbrand, Inc. (specialized consumer services), and the Lumina Foundation.
1 Mr. Buckley is considered an “interested person,” as defined in the Investment Company Act of 1940, because he is an officer of the Vanguard funds.
Director of the V Foundation and Oxfam America. Member of the advisory council for the College of Arts and Letters and chair of the advisory board to the Kellogg Institute for International Studies, both at the University of Notre Dame.
Mark Loughridge
Born in 1953. Trustee since March 2012. Principal occupation(s) during the past five years and other experience: senior vice president and chief financial officer (retired 2013) of IBM (information technology services). Fiduciary member of IBM’s Retirement Plan Committee (2004–2013), senior vice president and general manager (2002–2004) of IBM Global Financing, vice president and controller (1998–2002) of IBM, and a variety of other prior management roles at IBM. Member of the Council on Chicago Booth.
Scott C. Malpass
Born in 1962. Trustee since March 2012. Principal occupation(s) during the past five years and other experience: chief investment officer (1989–present) and vice president (1996–present) of the University of Notre Dame. Assistant professor of finance at the Mendoza College of Business, University of Notre Dame, and member of the Notre Dame 403(b) Investment Committee. Chairman of the board of TIFF Advisory Services, Inc. Member of the board of Catholic Investment Services, Inc. (investment advisors) and the board of superintendence of the Institute for the Works of Religion.
Deanna Mulligan
Born in 1963. Trustee since January 2018. Principal occupation(s) during the past five years and other experience: president (2010–present) and chief executive officer (2011–present) of The Guardian Life Insurance Company of America. Chief operating officer (2010–2011) and executive vice president (2008–2010) of Individual Life and Disability of The Guardian Life Insurance Company of America. Member of the board of The Guardian Life Insurance Company of America, the American Council of Life Insurers, the Partnership for New York City (business leadership), and the Committee Encouraging Corporate Philanthropy. Trustee of the Economic Club of New York and the Bruce Museum (arts and science). Member of the Advisory Council for the Stanford Graduate School of Business.
André F. Perold
Born in 1952. Trustee since December 2004. Principal occupation(s) during the past five years and other experience: George Gund Professor of Finance and Banking, Emeritus at the Harvard Business School (retired 2011). Chief investment officer and co-managing partner of HighVista Strategies (private investment firm). Board of advisors and investment committee member of the Museum of Fine Arts Boston. Board member (2018–present) of RIT Capital Partners (investment firm); investment committee member of Partners Health Care System.
Sarah Bloom Raskin
Born in 1961. Trustee since January 2018. Principal occupation(s) during the past five years and other experience: deputy secretary (2014–2017) of the United States Department of the Treasury. Governor (2010–2014) of the Federal Reserve Board. Commissioner (2007–2010) of financial regulation for the State of Maryland. Member of the board of directors (2012–2014) of Neighborhood Reinvestment Corporation. Director (2017–present) of i(x) Investments; director (2017–present) of Reserve Trust. Rubinstein Fellow (2017–present) of Duke University; trustee (2017–present) of Amherst College.
Peter F. Volanakis
Born in 1955. Trustee since July 2009. Principal occupation(s) during the past five years and other experience: president and chief operating officer (retired 2010) of Corning Incorporated (communications equipment) and director of Corning Incorporated (2000–2010) and Dow Corning (2001–2010). Director (2012) of SPX Corporation (multi-industry manufacturing). Overseer of the Amos Tuck School of Business Administration, Dartmouth College (2001–2013). Chairman of the board of trustees of Colby-Sawyer College. Member of the board of Hypertherm Inc. (industrial cutting systems, software, and consumables).
Executive Officers
John Bendl
Born in 1970. Principal occupation(s) during the past five years and other experience: principal of Vanguard. Chief financial officer (October 2019–present) of each of the investment companies served by Vanguard. Chief accounting officer, treasurer, and controller of Vanguard (2017–present). Partner (2003–2016) at KPMG (audit, tax, and advisory services).
Glenn Booraem
Born in 1967. Principal occupation(s) during the past five years and other experience: principal of Vanguard. Investment stewardship officer (2017–present), treasurer (2015–2017), controller (2010–2015), and assistant controller (2001–2010) of each of the investment companies served by Vanguard.
Christine M. Buchanan
Born in 1970. Principal occupation(s) during the past five years and other experience: principal of Vanguard. Treasurer (2017–present) of each of the investment companies served by Vanguard. Partner (2005–2017) at KPMG (audit, tax, and advisory services).
David Cermak
Born in 1960. Principal occupation(s) during the past five years and other experience: principal of Vanguard. Finance director (October 2019–present) of each of the investment companies served by Vanguard. Managing director and head (2017–present) of Vanguard Investments Singapore. Managing director and head (2017–2019) of Vanguard Investments Hong Kong. Representative director and head (2014–2017) of Vanguard Investments Japan.
Thomas J. Higgins
Born in 1957. Principal occupation(s) during the past five years and other experience: principal of Vanguard. Finance director (October 2019–present), chief financial officer (2008–2019), and treasurer (1998–2008) of each of the investment companies served by Vanguard.
Peter Mahoney
Born in 1974. Principal occupation(s) during the past five years and other experience: principal of Vanguard. Controller (2015–present) of each of the investment companies served by Vanguard. Head of International Fund Services (2008–2014) at Vanguard.
Anne E. Robinson
Born in 1970. Principal occupation(s) during the past five years and other experience: general counsel (2016–present) of Vanguard. Secretary (2016–present) of Vanguard and of each of the investment companies served by Vanguard. Managing director (2016–present) of Vanguard. Managing director and general counsel of Global Cards and Consumer Services (2014–2016) at Citigroup. Counsel (2003–2014) at American Express.
Michael Rollings
Born in 1963. Principal occupation(s) during the past five years and other experience: finance director (2017–present) and treasurer (2017) of each of the investment companies served by Vanguard. Managing director (2016–present) of Vanguard. Chief financial officer (2016–present) of Vanguard. Director (2016–present) of Vanguard Marketing Corporation. Executive vice president and chief financial officer (2006–2016) of MassMutual Financial Group.
John E. Schadl
Born in 1972. Principal occupation(s) during the past five years and other experience: principal of Vanguard. Chief compliance officer (2019–present) of Vanguard and of each of the investment companies served by Vanguard. Assistant vice president (May 2019–present) of Vanguard Marketing Corporation.
Vanguard Senior Management Team
Joseph Brennan | Chris D. McIsaac |
Mortimer J. Buckley | James M. Norris |
Gregory Davis | Thomas M. Rampulla |
John James | Karin A. Risi |
Martha G. King | Anne E. Robinson |
John T. Marcante | Michael Rollings |
| 
|
| P.O. Box 2600 |
| Valley Forge, PA 19482-2600 |
Connect with Vanguard® > vanguard.com
Fund Information > 800-662-7447
Direct Investor Account Services > 800-662-2739
Institutional Investor Services > 800-523-1036
Text Telephone for People
Who Are Deaf or Hard of Hearing > 800-749-7273
This material may be used in conjunction with the offering of shares of any Vanguard fund only if preceded or accompanied by the fund’s current prospectus.
All comparative mutual fund data are from Morningstar, Inc., unless otherwise noted.
You can obtain a free copy of Vanguard’s proxy voting guidelines by visiting vanguard.com/proxyreporting or by calling Vanguard at 800-662-2739. The guidelines are also available from the SEC’s website, www.sec.gov. In addition, you may obtain a free report on how your fund voted the proxies for securities it owned during the 12 months ended June 30. To get the report, visit either vanguard.com/proxyreporting or www.sec.gov.
You can review information about your fund on the SEC’s website, and you can receive copies of this information, for a fee, by sending a request via email addressed to publicinfo@sec.gov.
Source for Bloomberg Barclays indexes: Bloomberg Index Services Limited. Copyright 2019, Bloomberg. All rights reserved.
CFA® is a registered trademark owned by CFA Institute.
| © 2019 The Vanguard Group, Inc. |
| All rights reserved. |
| Vanguard Marketing Corporation, Distributor. |
| |
| Q730 122019 |
Item 2: Code of Ethics. The Registrant has adopted a code of ethics that applies to the Registrant’s principal executive officer, principal financial officer, principal accounting officer or controller or persons performing similar functions. The Code of Ethics was amended during the reporting period covered by this report to make certain technical, non-material changes.
Item 3: Audit Committee Financial Expert. All members of the Audit Committee have been determined by the Registrant’s Board of Trustees to be Audit Committee Financial Experts and to be independent: F. Joseph Loughrey, Mark Loughridge, Sarah Bloom Raskin, and Peter F. Volanakis.
Item 4: Principal Accountant Fees and Services.
(a) Audit Fees.
Audit Fees of the Registrant.
Fiscal Year Ended October 31, 2019: $88,000
Fiscal Year Ended October 31, 2018: $90,000
Aggregate Audit Fees of Registered Investment Companies in the Vanguard Group.
Fiscal Year Ended October 31, 2019: $9,568,215
Fiscal Year Ended October 31, 2018: $9,734,277
Includes fees billed in connection with audits of the Registrant, other registered investment companies in the Vanguard complex, The Vanguard Group, Inc., and Vanguard Marketing Corporation.
(b) Audit-Related Fees.
Fiscal Year Ended October 31, 2019: $3,012,031
Fiscal Year Ended October 31, 2018: $5,581,336
Includes fees billed in connection with assurance and related services provided to the Registrant, other registered investment companies in the Vanguard complex, The Vanguard Group, Inc., and Vanguard Marketing Corporation.
(c) Tax Fees.
Fiscal Year Ended October 31, 2019: $357,238
Fiscal Year Ended October 31, 2018: $347,985
Includes fees billed in connection with tax compliance, planning, and advice services provided to the Registrant, other registered investment companies in the Vanguard complex, The Vanguard Group, Inc., and Vanguard Marketing Corporation.
(d) All Other Fees.
Fiscal Year Ended October 31, 2019: $0
Fiscal Year Ended October 31, 2018: $0
Includes fees billed for services related to tax reported information provided to the Registrant, other registered investment companies in the Vanguard complex, The Vanguard Group, Inc., and Vanguard Marketing Corporation.
(e) (1) Pre-Approval Policies. The policy of the Registrant’s Audit Committee is to consider, and, if appropriate, approve before the principal accountant is engaged for such services, all specific audit and non-audit services provided to: the Registrant, other registered investment companies in the Vanguard complex, The Vanguard Group, Inc., and entities controlled by The Vanguard Group, Inc. that provide ongoing services to the Registrant. In making a determination, the Audit Committee considers whether the services are consistent with maintaining the principal accountant’s independence.
In the event of a contingency situation in which the principal accountant is needed to provide services in between scheduled Audit Committee meetings, the Chairman of the Audit Committee would be called on to consider and, if appropriate, pre-approve audit or permitted non-audit services in an amount sufficient to complete services through the next Audit Committee meeting, and to determine if such services would be consistent with maintaining the accountant’s independence. At the next scheduled Audit Committee meeting, services and fees would be presented to the Audit Committee for formal consideration, and, if appropriate, approval by the entire Audit Committee. The Audit Committee would again consider whether such services and fees are consistent with maintaining the principal accountant’s independence.
The Registrant’s Audit Committee is informed at least annually of all audit and non-audit services provided by the principal accountant to the Vanguard complex, whether such services are provided to: the Registrant, other registered investment companies in the Vanguard complex, The Vanguard Group, Inc., or other entities controlled by The Vanguard Group, Inc. that provide ongoing services to the Registrant.
(2) No percentage of the principal accountant’s fees or services were approved pursuant to the waiver provision of paragraph (c)(7)(i)(C) of Rule 2-01 of Regulation S-X.
(f) For the most recent fiscal year, over 50% of the hours worked under the principal accountant’s engagement were not performed by persons other than full-time, permanent employees of the principal accountant.
(g) Aggregate Non-Audit Fees.
Fiscal Year Ended October 31, 2019: $357,238
Fiscal Year Ended October 31, 2018: $347,985
Includes fees billed for non-audit services provided to the Registrant, other registered investment companies in the Vanguard complex, The Vanguard Group, Inc., and Vanguard Marketing Corporation.
(h) For the most recent fiscal year, the Audit Committee has determined that the provision of all non-audit services was consistent with maintaining the principal accountant’s independence.
Item 5: Audit Committee of Listed Registrants.
The Registrant is a listed issuer as defined in rule 10A-3 under the Securities Exchange Act of 1934 (“Exchange Act”). The Registrant has a separately-designated standing audit committee established in accordance with Section 3(a)(58)(A) of the Exchange Act. The Registrant’s audit committee members are: F. Joseph Loughrey, Mark Loughridge, Sarah Bloom Raskin, and Peter F. Volanakis.
Item 6: Investments.
Not applicable.
Item 7: Disclosure of Proxy Voting Policies and Procedures for Closed-End Management Investment Companies.
Not applicable.
Item 8: Portfolio Managers of Closed-End Management Investment Companies.
Not applicable.
Item 9: Purchase of Equity Securities by Closed-End Management Investment Company and Affiliated Purchasers.
Not applicable.
Item 10: Submission of Matters to a Vote of Security Holders.
Not applicable.
Item 11: Controls and Procedures.
(a) Disclosure Controls and Procedures. The Principal Executive and Financial Officers concluded that the Registrant’s Disclosure Controls and Procedures are effective based on their evaluation of the Disclosure Controls and Procedures as of a date within 90 days of the filing date of this report.
(b) Internal Control Over Financial Reporting. There were no significant changes in Registrant’s Internal Control Over Financial Reporting or in other factors that could significantly affect this control subsequent to the date of the evaluation, including any corrective actions with regard to significant deficiencies and material weaknesses.
Item 12: Disclosure of Securities Lending Activities for Closed-End Management Investment Companies.
Not applicable.
Item 13: Exhibits.
(a) Code of Ethics.
(b) Certifications.
Pursuant to the requirements of the Securities Exchange Act of 1934 and the Investment Company Act of 1940, the registrant has duly caused this report to be signed on its behalf by the undersigned, thereunto duly authorized.
| VANGUARD WINDSOR FUNDS |
| |
BY: | /s/ MORTIMER J. BUCKLEY* | |
| | |
| MORTIMER J. BUCKLEY | |
| CHIEF EXECUTIVE OFFICER | |
Date: December 18, 2019
Pursuant to the requirements of the Securities Exchange Act of 1934 and the Investment Company Act of 1940, this report has been signed below by the following persons on behalf of the registrant and in the capacities and on the dates indicated.
| VANGUARD WINDSOR FUNDS |
| |
BY: | /s/ MORTIMER J. BUCKLEY* | |
| | |
| MORTIMER J. BUCKLEY | |
| CHIEF EXECUTIVE OFFICER | |
|
Date: December 18, 2019 |
|
| VANGUARD WINDSOR FUNDS |
| |
BY: | /s/ JOHN BENDL* | |
| | |
| JOHN BENDL | |
| CHIEF FINANCIAL OFFICER | |
| |
Date: December 18, 2019 | |
* By: /s/ Anne E. Robinson
Anne E. Robinson, pursuant to a Power of Attorney filed on January 18, 2018 (see file Number 33-32216) and a Power of Attorney filed on October 30, 2019 (see file Number 811-02554), Incorporated by Reference.