UNITED STATES
SECURITIES AND EXCHANGE COMMISSION
Washington, D.C. 20549
FORM N-CSR
CERTIFIED SHAREHOLDER REPORT
OF
REGISTERED MANAGEMENT INVESTMENT COMPANIES
| | |
| Investment Company Act file number: | 811-00834 | |
| |
| Name of Registrant: | Vanguard Windsor Funds |
| |
| Address of Registrant: | P.O. Box 2600 |
| | Valley Forge, PA 19482 |
| |
| Name and address of agent for service: | Anne E. Robinson, Esquire |
| | P.O. Box 876 |
| | Valley Forge, PA 19482 |
Registrant’s telephone number, including area code: (610) 669-1000
Date of fiscal year end: October 31
Date of reporting period: November 1, 2015 – October 31, 2016
Item 1: Reports to Shareholders

Annual Report | October 31, 2016
Vanguard Windsor™ Fund
A new format, unwavering commitment
As you begin reading this report, you’ll notice that we’ve made some improvements to the opening sections—based on feedback from you, our clients.
Page 1 starts with a new ”Your Fund’s Performance at a Glance,” a concise, handy summary of how your fund performed during the period.
In the renamed ”Chairman’s Perspective,” Bill McNabb will focus on enduring principles and investment insights.
We’ve modified some tables, and eliminated some redundancy, but we haven’t removed any information.
At Vanguard, we’re always looking for better ways to communicate and to help you make sound investment decisions. Thank you for entrusting your assets to us.
| |
| Contents | |
| Your Fund’s Performance at a Glance. | 1 |
| Chairman’s Perspective. | 3 |
| Advisors’ Report. | 7 |
| Fund Profile. | 12 |
| Performance Summary. | 14 |
| Financial Statements. | 16 |
| Your Fund’s After-Tax Returns. | 30 |
| About Your Fund’s Expenses. | 31 |
| Glossary. | 33 |
Please note: The opinions expressed in this report are just that—informed opinions. They should not be considered promises or advice. Also, please keep in mind that the information and opinions cover the period through the date on the front of this report. Of course, the risks of investing in your fund are spelled out in the prospectus.
See the Glossary for definitions of investment terms used in this report.
About the cover: No matter what language you speak, Vanguard has one consistent message and set of principles. Our primary focus is on you, our clients. We conduct our business with integrity as a faithful steward of your assets. This message is shown translated into seven languages, reflecting our expanding global presence.
Your Fund’s Performance at a Glance
• Vanguard Windsor Fund returned about 1% for the 12 months ended October 31, 2016, behind the 6.37% return of its benchmark and the 3.57% return of its peers.
• Value stocks exceeded their growth brethren, while large- and small-capitalization stocks surpassed mid-caps.
• Windsor Fund’s two advisors aim to invest in large- and mid-cap stocks they have determined are undervalued by the marketplace. The fund’s consumer discretionary, health care, and materials stocks finished with negative returns and lagged their benchmark counterparts. Holdings in financials, the fund’s largest sector allocation, posted a slightly positive result but also came up short against the benchmark.
• Information technology stocks contributed the most to the fund’s return, with energy, consumer staples, and utilities also adding a slight boost.
• Over the past decade, the fund’s average annual return slightly trailed that of its expense-free benchmark and exceeded that of its peers.
| |
| Total Returns: Fiscal Year Ended October 31, 2016 | |
| | Total |
| | Returns |
| Vanguard Windsor Fund | |
| Investor Shares | 1.27% |
| Admiral™ Shares | 1.41 |
| Russell 1000 Value Index | 6.37 |
| Multi-Cap Value Funds Average | 3.57 |
Multi-Cap Value Funds Average: Derived from data provided by Lipper, a Thomson Reuters Company.
Admiral Shares carry lower expenses and are available to investors who meet certain account-balance requirements.
| |
| Total Returns: Ten Years Ended October 31, 2016 | |
| | Average |
| | Annual Return |
| Windsor Fund Investor Shares | 5.09% |
| Russell 1000 Value Index | 5.35 |
| Multi-Cap Value Funds Average | 4.60 |
| Multi-Cap Value Funds Average: Derived from data provided by Lipper, a Thomson Reuters Company. | |
The figures shown represent past performance, which is not a guarantee of future results. (Current performance may be lower or higher than the performance data cited. For performance data current to the most recent month-end, visit our website at vanguard.com/performance.) Note, too, that both investment returns and principal value can fluctuate widely, so an investor’s shares, when sold, could be worth more or less than their original cost.
1
| | | |
| Expense Ratios | | | |
| Your Fund Compared With Its Peer Group | | | |
| | Investor | Admiral | Peer Group |
| | Shares | Shares | Average |
| Windsor Fund | 0.39% | 0.29% | 1.15% |
The fund expense ratios shown are from the prospectus dated February 25, 2016, and represent estimated costs for the current fiscal year. For the fiscal year ended October 31, 2016, the fund’s expense ratios were 0.30% for Investor Shares and 0.20% for Admiral Shares. This decrease from the estimated expense ratio reflects a performance-based investment advisory fee adjustment. When performance adjustment is positive, the funds expenses increase, when it is negative, expenses decrease. The peer-group expense ratio is derived from data provided by Lipper, a Thomson Reuters Company, and captures information through year-end 2015.
Peer group: Multi-Cap Value Funds.
2
Chairman’s Perspective

Bill McNabb
Chairman and Chief Executive Officer
Dear Shareholder,
Over the three years ended August 31, 2016, investors poured more than $1 trillion into index funds. Indexing now accounts for nearly a third of all mutual fund assets—more than double what it did a decade ago and eight times its share two decades ago.1
By contrast, active management’s commercial struggles have reflected its disappointing investment performance. Over the decade ended December 31, 2015, 82% of actively managed stock funds and 81% of active bond funds have either underperformed their benchmarks or shut down.
This subpar performance has fueled the explosion of asset growth in indexing among individual, retirement, and nonprofit investors. So what might the trend mean for the future of actively managed funds?
Our research and experience indicate that active management can survive—and even succeed—but only if it’s offered at much lower expense.
High costs, which limit a manager’s ability to deliver benchmark-beating returns to clients, are the biggest reason why active has lagged. Industrywide as of December 31, 2015, the average expense ratio for all active stock funds is 1.14%, compared with 0.76% for stock index
1 Sources: Wall Street Journal; Morningstar, Inc.; and Investment Company Institute, 2016.
3
funds. And the expense advantage is even wider for bonds; the average expense ratio for an active bond fund is 0.93%, compared with 0.43% for bond index funds.
But even these big differences understate the real gap. These days, it’s not hard to find an index fund that charges maybe 0.05% or 0.10%. So even if you have identified active managers who are skilled at selecting stocks and bonds, to match the return of a comparable (much cheaper) index fund would require significant outperformance. Think about it. Any fund that charges 1.00% in expenses—not even the high end of the range—will find it extraordinarily difficult to overcome the index fund’s head start.
Active management also has taken a hit from a regulatory environment that has been favorable to low-cost strategies. The U.S. Department of Labor several years ago mandated greater disclosure of retirement plan fees. And its new fiduciary rule, which is set to take effect in April, requires financial advisors to demonstrate that their recommendations are aligned with their clients’ best interest. Both changes encourage the use of lower-cost investments, including index funds.
The future of active management
In light of all this, people have been asking me whether active management is “dead.” My response is both yes and no. High-cost active management is dead, and rightly so. It has never been a winning proposition
| | | |
| Market Barometer | | | |
| | | Average Annual Total Returns |
| | | Periods Ended October 31, 2016 |
| | One | Three | Five |
| | Year | Years | Years |
| Stocks | | | |
| Russell 1000 Index (Large-caps) | 4.26% | 8.48% | 13.51% |
| Russell 2000 Index (Small-caps) | 4.11 | 4.12 | 11.51 |
| Russell 3000 Index (Broad U.S. market) | 4.24 | 8.13 | 13.35 |
| FTSE All-World ex US Index (International) | 0.64 | -0.94 | 4.09 |
| |
| Bonds | | | |
| Bloomberg Barclays U.S. Aggregate Bond Index | | | |
| (Broad taxable market) | 4.37% | 3.48% | 2.90% |
| Bloomberg Barclays Municipal Bond Index | | | |
| (Broad tax-exempt market) | 4.06 | 4.89 | 4.34 |
| Citigroup Three-Month U.S. Treasury Bill Index | 0.22 | 0.07 | 0.07 |
| |
| CPI | | | |
| Consumer Price Index | 1.64% | 1.15% | 1.32% |
4
for investors. Low-cost active funds, though, can potentially play an important role for investors who seek to outperform the market.
Paying less for your funds is the only sure-fire way to improve your odds of achieving success in active management. But even if you have found an active manager with low costs, the odds of outperforming the market are still long. You have to be able to identify talented stock and bond portfolio managers with long time horizons and clear investment strategies. Look for managers with consistent track records and the discipline to stick closely to their investment strategy.
Know what you own and why
Despite the well-deserved reputation of indexing and the challenges for active managers, there’s still a place for traditional active strategies that are low-cost, diversified, and highly disciplined, and are run by talented managers who focus on the long term.
Vanguard has always applied these principles to our active strategies, and investors have benefited as a majority of our active funds outperformed their benchmarks and bested their peers’ average annual return over the ten years ended September 30, 2016.
Worried about the election’s impact on your portfolio?
The 2016 presidential election season was one of the most intense and unpredictable in U.S. history. In its aftermath, investors may be left with lingering questions about what the outcome will mean for their portfolios. The answer, based on Vanguard research into decades of historical data, is that presidential elections typically have no long-term effect on market performance.
These findings hold true regardless of the market’s initial reaction. Whether there’s a swoon or bounce immediately after an election, investors shouldn’t extrapolate that performance to the long term.
As you can see in the accompanying chart, data going back to 1853 show that stock market returns are virtually identical no matter which party controls the White House. Although headlines out of Washington at any given time may still cause concern, investors
shouldn’t overreact to short-term events. Instead, it’s best to maintain a balanced and diversified portfolio and stay focused on your long-term goals.
Average annual stock market returns based on party control of the White House (1853–2015)

Sources: Global Financial Data, 1853–1926; Morningstar, Inc.,
and Ibbotson Associates thereafter through 2015.
5
But it’s crucial for investors to be patient. Even active managers with the best track records frequently underperform their benchmarks when their investment styles are out of favor. Such periods, though temporary, can persist. So it’s important when entrusting your assets to an active strategy to be in it for the long haul.
Make sure you know what you’re buying and what the risks are. Active strategies are becoming more complex, so it’s important to clearly understand what the investments in your portfolio are designed to accomplish and why you want to hold them. Otherwise, you run the risk of selecting strategies that don’t fit your needs or objectives.
Keeping these considerations in mind can potentially boost your chances of success in identifying active strategies that may be able to help you reach your goals.
As always, thank you for investing with Vanguard.

F. William McNabb III
Chairman and Chief Executive Officer
November 9, 2016
6
Advisors’ Report
For the fiscal year ended October 31, 2016, Investor Shares of Vanguard Windsor Fund returned 1.27%, and lower-cost Admiral Shares returned 1.41%. Your fund is managed by two independent advisors, a strategy that enhances the fund’s diversification by providing exposure to distinct yet complementary investment approaches. It is not uncommon for different advisors to have different views about individual securities or the broader investment environment.
The advisors, the percentage and amount of fund assets that each manages, and brief descriptions of their investment strategies are presented in the table below. The advisors have also prepared a discussion of the investment environment that existed during the period and of how their portfolio positioning reflects this assessment. These reports were prepared on November 16, 2016.
Wellington Management Company llp
Portfolio Manager:
James N. Mordy, Senior Managing Director
and Equity Portfolio Manager
Although the final results appear tame, markets in the United States experienced significant volatility during the 12 months ended October 31, 2016. The Standard & Poor’s 500 Index fell 11.4% from the start of the fiscal year to its intraday low on February 11. The market clawed back, though, posting a strong 6.8% return in March. It chugged along through September and, despite facing headwinds in October,
| | | |
| Vanguard Windsor Fund Investment Advisors | |
| |
| | Fund Assets Managed | |
| Investment Advisor | % | $ Million | Investment Strategy |
| Wellington Management | 69 | 11,466 | Seeks to provide long-term total returns above both the |
| Company LLP | | | S&P 500 and value-oriented indexes over a complete |
| | | | market cycle through bottom-up, fundamentally driven |
| | | | stock selection focused on undervalued securities. |
| Pzena Investment Management, | 30 | 4,957 | Uses a fundamental, bottom-up, deep-value-oriented |
| LLC | | | investment strategy. Seeks to buy good businesses at |
| | | | low prices, focusing exclusively on companies that are |
| | | | underperforming their historically demonstrated |
| | | | earnings power. |
| Cash Investments | 1 | 176 | These short-term reserves are invested by Vanguard in |
| | | | equity index products to simulate investment in stocks. |
| | | | Each advisor also may maintain a modest cash |
| | | | position. |
7
ended the fiscal year up 4.5%. Global indexes were mixed, with the MSCI World Index returning 1.8% and the MSCI EAFE Index returning –3.23%.
Consumer discretionary was our worst-performing sector, driven largely by adverse selection as our stocks were down roughly 12.5%, versus a 1.7% decline in the index. Top detractors included Norwegian Cruise Line, Delphi Automotive, and Lennar. Norwegian Cruise Line fell nearly 40% after management slashed forward earnings guidance during the third quarter because of weaker demand in Europe (tied to terrorist fears) and its overestimation of pricing power in the Caribbean. Investors were prepared for the first, but not for the second. We continue to hold the stock, which we believe is at a compelling valuation level, given favorable longer-term prospects.
Delphi underperformed on investors’ fear of a maturing global auto cycle. We continue to hold the stock because we believe the company is well-positioned to take advantage of growing demand for safe, green, connected vehicles. Lennar has worked through much of the lower-cost land it had purchased at the bottom of the cycle and is now beginning to turn to more recently purchased, higher-cost parcels. As a result, gross margins are settling back to a more normalized level, which disappointed some investors. We have maintained our position because we believe the U.S. housing cycle has a lot more room to run, and the company’s recently announced acquisition of Florida competitor WCI Communities may be a catalyst for accretive growth.
We also lagged in industrials, due in part to our position in Hertz Global Holdings, which fell about 25% during the fiscal year then dropped further on a major reset of profit expectations. Management has recognized that its turnaround plan will take longer and be more challenging than expected. In hindsight, we were not as skeptical as we should have been about the execution risks, and we placed too much focus on what appeared to be improving industry conditions. We acknowledged our mistake and sold the stock in early November. Other weak holdings in industrials included our positions in Sensata Technologies and Herc Holdings.
Financials was another area of weakness. Our top individual detractor in the sector was Ameriprise Financial, which has been pressured by uncertainty surrounding the Department of Labor’s new fiduciary rules. We also were overweighted in banks and insurance, two industries that would benefit from higher interest rates; this hurt our relative results.
Information technology was our best sector on a relative basis. We owned a number of strong performers, including NXP Semiconductors, Lam Research, and Broadcom. NXP, which has been one of our larger holdings, agreed to a buyout offer from Qualcomm near the end of the period, benefiting the stock. We also captured positive returns in real estate, driven most notably by our position in American Tower, a stock we purchased during the period. American Tower’s growth paused earlier this year, causing skepticism among investors, and a period
8
of underperformance ensued. This gave us the opportunity to initiate a position in a company that we believe has much better growth prospects than other REITs yet sells at a more attractive valuation. (Note that for the attribution analysis, real estate was included in the financial sector through August 31, when a real estate sector was created under the Global Industry Classification Standard, bringing the number of GICS sectors to 11.)
A relative winner among our energy holdings was Pioneer Natural Resources. The company maintained a strong balance sheet through the oil industry downturn, and we believe it is positioned for strong growth with dramatically reduced costs driven by drilling efficiencies.
Our sector positioning has not changed meaningfully over the past year. Our exposure to financials decreased, though this can largely be attributed to the GICS reclassification. The sector remains the portfolio’s largest overweight relative to the S&P 500 Index. We believe our financial holdings are attractive from a valuation standpoint, and many could benefit from an increase in interest rates. As of the end of the fiscal year, we were also overweighted in energy, real estate, materials, health care, and industrials. Consumer staples remained our largest underweight. We were also underweighted in information technology (where we took some profits over the year), telecommunication services, utilities, and consumer discretionary.
Looking forward, we expect the subdued global growth environment to continue. In the United States, the composite Purchasing Managers Index (PMI) has recently firmed, inventories have been pared over the past five quarters, housing remains healthy, and employment continues to grow. On the other hand, election and policy uncertainty weigh on business investment; sluggish productivity, a lift in wages, and tepid revenue growth have pressured corporate profits; and we expect the Federal Reserve to raise short-term interest rates another 25 basis points in December. Europe faces headwinds, but the worst Brexit fears have yet to materialize. Japan has turned on the fiscal spending spigot with “helicopter money.” China has seen a lift in economic activity in response to a stimulus earlier this year, but concern over credit and a property market bubble has grown.
Given these uncertainties, and the economy’s vulnerability to unforeseen shocks, it is difficult to have high conviction in longer-term macroeconomic forecasts. We think our best investments will be in stocks of companies where we can put our confidence behind good management teams to drive value through internal improvements. We expect markets to remain volatile and will endeavor to use swings in investor sentiment to identify new longer-term value opportunities for shareholders.
9
Pzena Investment Management, LLC
Portfolio Managers:
Richard Pzena, Managing Principal
and Co-Chief Investment Officer
John P. Goetz, Managing Principal
and Co-Chief Investment Officer
Benjamin S. Silver, Principal
and Co-Director of Research
U.S. stocks were volatile over the last 12 months, declining significantly through February (coincident with the decline in oil prices) then recovering strongly, with the Russell 1000 Value Index returning 6.37%. We saw a continuation of investors’ flight to safety, with utilities the best-performing sector and energy and financials the weakest.
Financials underperformed, driven by a range of fears and uncertainties, including declining interest rates, increased regulation, and Brexit. Lost in these fears was the strength in capitalization, reduction of costs, and increase in capital returned. We see financials—and money center banks in particular—as offering the most attractive risk/reward opportunity. In consumer discretionary, detractors included Staples, largely due to a judge’s ruling against a planned merger with Office Depot. We had long believed such an outcome was possible and had limited our position size accordingly. We see the stock as very cheap on a standalone basis and continue to hold it in the portfolio.
Energy, led by Exxon Mobil and Royal Dutch Shell, was the most significant contributor. In early 2016, the broader energy sector collapsed when the price of Brent crude dropped to approximately $30 a barrel. Our analysis had suggested that oil prices were not sustainable at those levels as the marginal supplier, U.S. Shale, had high production decline curves and higher marginal cost economics. We added two new positions, Cenovus Energy and ConocoPhillips. Hewlett Packard Enterprise’s disassembly continued as management announced the combination of its enterprise services business with Computer Sciences and, in a separate transaction, the combination of its software business with Micro Focus International. We believe the increased operational focus enabled by its split into two companies will continue to unlock value. Baxter International, the U.S. health care company, and its spin-off Baxalta contributed because of cost cuts at Baxter and a buyout offer of Baxalta from Shire.
Although our sector positioning remains broadly the same, in energy, we sold Apache and trimmed Exxon Mobil and Royal Dutch Shell as oil prices recovered from February lows. In financials we sold out of PNC Financial Services Group and Progressive to initiate a position in Capital One Financial, the nation’s fourth-largest credit card issuer; the industry has a high return on capital due to competitive discipline. In health care, we sold Baxter, Baxalta, and Becton, Dickinson and Co.
10
and bought Merck & Co., a relatively cheap and diversified pharmaceutical company. We sold our position in Masco, as it had reached fair value, and initiated positions in Seagate Technology, a dominant supplier of hard disk drives to cloud and enterprise networks, and Hilton Worldwide Holdings, which continues to reposition its strong portfolio of brands into a franchise model.
Throughout our history we have consistently highlighted the phenomenon of valuation spreads. To put it simply, when spreads are wide, the opportunity for value investing increases. The continued decline in interest rates has created a bifurcation and wide
valuation spreads. We estimate that spreads are wider today than at any point in the last half-century, with the exception of the “tech bubble.” Valuations of the bond proxies such as REITs and dividend-paying stocks are at all-time highs, and banks have been written off as perpetual underperformers, much like the “old economy” stocks in the late 1990s. When spreads are wide, history has shown strong outperformance for deep value over the next three to five years. As such, we see significant opportunities with our portfolio invested across a range of economically sensitive industries, with the largest exposure in financials, energy, and technology.
11
Windsor Fund
Fund Profile
As of October 31, 2016
| | |
| Share-Class Characteristics | |
| |
| | Investor | Admiral |
| | Shares | Shares |
| Ticker Symbol | VWNDX | VWNEX |
| Expense Ratio1 | 0.39% | 0.29% |
| 30-Day SEC | | |
| Yield | 1.77% | 1.81% |
| | |
| Volatility Measures | | |
| | Russell | DJ |
| | 1000 | U.S. Total |
| | Value | Market |
| | Index | FA Index |
| R-Squared | 0.93 | 0.93 |
| Beta | 1.13 | 1.10 |
These measures show the degree and timing of the fund’s
fluctuations compared with the indexes over 36 months.
| | | |
| Portfolio Characteristics | | |
| | | | DJ |
| | | | U.S. |
| | | Russell | Total |
| | | 1000 | Market |
| | | Value | FA |
| | Fund | Index | Index |
| Number of Stocks | 137 | 692 | 3,833 |
| Median Market Cap | $30.8B | $55.7B | $53.5B |
| Price/Earnings Ratio | 22.2x | 21.3x | 23.1x |
| Price/Book Ratio | 1.8x | 1.8x | 2.7x |
| Return on Equity | 14.6% | 12.7% | 16.6% |
| Earnings Growth | | | |
| Rate | 6.8% | 3.0% | 8.4% |
| Dividend Yield | 2.1% | 2.6% | 2.1% |
| Foreign Holdings | 8.4% | 0.0% | 0.0% |
| Turnover Rate | 26% | — | — |
| Short-Term | | | |
| Reserves | 1.4% | — | — |
Ten Largest Holdings (% of total net assets)
| | |
| American International | | |
| Group Inc. | Multi-line Insurance | 2.2% |
| Citigroup Inc. | Diversified Banks | 2.0 |
| MetLife Inc. | Life & Health | |
| | Insurance | 1.9 |
| Bank of America Corp. | Diversified Banks | 1.7 |
| XL Group Ltd. | Property & Casualty | |
| | Insurance | 1.7 |
| Medtronic plc | Health Care | |
| | Equipment | 1.6 |
| Bristol-Myers Squibb Co. Pharmaceuticals | 1.6 |
| Pioneer Natural | Oil & Gas Exploration | |
| Resources Co. | & Production | 1.6 |
| Broadcom Ltd. | Semiconductors | 1.6 |
| Merck & Co. Inc. | Pharmaceuticals | 1.5 |
| Top Ten | | 17.4% |
The holdings listed exclude any temporary cash investments and
equity index products.
1 The expense ratios shown are from the prospectus dated February 25, 2016, and represent estimated costs for the current fiscal year. For the fiscal year ended October 31, 2016, the expense ratios were 0.30% for Investor Shares and 0.20% for Admiral Shares.
12
Windsor Fund
Sector Diversification (% of equity exposure)
| | | |
| | | Russell | DJ |
| | | 1000 | U.S. Total |
| | | Value | Market |
| | Fund | Index | FA Index |
| Consumer | | | |
| Discretionary | 10.8% | 4.6% | 12.6% |
| Consumer Staples | 3.8 | 8.9 | 8.9 |
| Energy | 10.7 | 13.3 | 6.6 |
| Financials | 26.7 | 24.4 | 13.9 |
| Health Care | 13.0 | 11.1 | 13.4 |
| Industrials | 9.6 | 9.8 | 10.5 |
| Information | | | |
| Technology | 16.9 | 9.9 | 21.0 |
| Materials | 3.0 | 2.8 | 3.2 |
| Real Estate | 3.2 | 4.9 | 4.2 |
| Telecommunication | | | |
| Services | 0.2 | 3.7 | 2.3 |
| Utilities | 2.1 | 6.6 | 3.4 |
13
Windsor Fund
Performance Summary
All of the returns in this report represent past performance, which is not a guarantee of future results that may be achieved by the fund. (Current performance may be lower or higher than the performance data cited. For performance data current to the most recent month-end, visit our website at vanguard.com/performance.) Note, too, that both investment returns and principal value can fluctuate widely, so an investor’s shares, when sold, could be worth more or less than their original cost. The returns shown do not reflect taxes that a shareholder would pay on fund distributions or on the sale of fund shares.
Cumulative Performance: October 31, 2006, Through October 31, 2016
Initial Investment of $10,000

| | | | | |
| | Average Annual Total Returns | |
| | Periods Ended October 31, 2016 | |
| | | | | Final Value |
| | One | Five | Ten | of a $10,000 |
| | Year | Years | Years | Investment |
| Windsor Fund*Investor Shares | 1.27% | 12.94% | 5.09% | $16,425 |
| Russell 1000 Value Index | 6.37 | 13.31 | 5.35 | 16,837 |
| Multi-Cap Value Funds Average | 3.57 | 11.26 | 4.60 | 15,676 |
| Dow Jones U.S. Total Stock Market | | | | |
| Float Adjusted Index | 4.21 | 13.29 | 6.87 | 19,436 |
Multi-Cap Value Funds Average: Derived from data provided by Lipper, a Thomson Reuters Company. | | |
| | | | |
| | | | | Final Value |
| | One | Five | Ten | of a $50,000 |
| | Year | Years | Years | Investment |
| Windsor Fund Admiral Shares | 1.41% | 13.06% | 5.20% | $83,028 |
| Russell 1000 Value Index | 6.37 | 13.31 | 5.35 | 84,187 |
| Dow Jones U.S. Total Stock Market Float | | | | |
| Adjusted Index | 4.21 | 13.29 | 6.87 | 97,178 |
See Financial Highlights for dividend and capital gains information.
14
Windsor Fund
Fiscal-Year Total Returns (%): October 31, 2006, Through October 31, 2016

Average Annual Total Returns: Periods Ended September 30, 2016
This table presents returns through the latest calendar quarter—rather than through the end of the fiscal period.
Securities and Exchange Commission rules require that we provide this information.
| | | | |
| | Inception | One | Five | Ten |
| | Date | Year | Years | Years |
| Investor Shares | 10/23/1958 | 10.35% | 16.01% | 5.75% |
| Admiral Shares | 11/12/2001 | 10.50 | 16.12 | 5.86 |
15
Windsor Fund
Financial Statements
Statement of Net Assets
As of October 31, 2016
The fund reports a complete list of its holdings in regulatory filings four times in each fiscal year, at the quarter-ends. For the second and fourth fiscal quarters, the lists appear in the fund’s semiannual and annual reports to shareholders. For the first and third fiscal quarters, the fund files the lists with the Securities and Exchange Commission on Form N-Q. Shareholders can look up the fund’s Forms N-Q on the SEC’s website at sec.gov. Forms N-Q may also be reviewed and copied at the SEC’s Public Reference Room (see the back cover of this report for further information).
| | |
| | | Market |
| | | Value• |
| | Shares | ($000) |
| Common Stocks (98.2%)1 | | |
| Consumer Discretionary (10.6%) | |
| Delphi Automotive plc | 3,029,484 | 197,128 |
| Lennar Corp. Class A | 4,332,120 | 180,606 |
| SES SA Class A | 6,372,349 | 146,604 |
| Newell Brands Inc. | 3,022,730 | 145,151 |
| * Norwegian Cruise Line | | |
| Holdings Ltd. | 3,624,081 | 140,868 |
| DR Horton Inc. | 3,695,400 | 106,538 |
| Ford Motor Co. | 8,944,050 | 105,003 |
| Omnicom Group Inc. | 1,233,100 | 98,426 |
| Hilton Worldwide | | |
| Holdings Inc. | 4,351,550 | 98,345 |
| PulteGroup Inc. | 4,991,166 | 92,836 |
| Ralph Lauren Corp. | | |
| Class A | 927,000 | 90,939 |
| TJX Cos. Inc. | 1,024,187 | 75,534 |
| News Corp. Class A | 5,447,250 | 66,021 |
| Sky plc | 5,852,176 | 58,506 |
| Staples Inc. | 7,849,780 | 58,088 |
| Interpublic Group of Cos. | | |
| Inc. | 2,254,250 | 50,473 |
| Lowe’s Cos. Inc. | 482,500 | 32,159 |
| Kohl’s Corp. | 343,475 | 15,027 |
| | | 1,758,252 |
| Consumer Staples (3.6%) | | |
| British American Tobacco | | |
| plc | 2,633,930 | 150,959 |
| Ingredion Inc. | 965,250 | 126,612 |
| Wal-Mart Stores Inc. | 1,668,375 | 116,820 |
| Coty Inc. Class A | 3,769,618 | 86,663 |
| CVS Health Corp. | 776,125 | 65,272 |
| Kellogg Co. | 625,000 | 46,956 |
| | | 593,282 |
| Energy (10.5%) | | |
| Pioneer Natural | | |
| Resources Co. | 1,508,007 | 269,963 |
| Halliburton Co. | 4,583,746 | 210,852 |
| | | |
| | Anadarko Petroleum | | |
| | Corp. | 3,518,685 | 209,151 |
| | Royal Dutch Shell plc | | |
| | ADR | 3,916,321 | 195,072 |
| * | Concho Resources Inc. | 1,245,675 | 158,126 |
| | Exxon Mobil Corp. | 1,734,725 | 144,537 |
| | BP plc ADR | 3,467,825 | 123,281 |
| | Baker Hughes Inc. | 2,149,025 | 119,056 |
| | ConocoPhillips | 1,850,300 | 80,396 |
| | Canadian Natural | | |
| | Resources Ltd. | 2,018,068 | 63,993 |
| | Cenovus Energy Inc. | 3,809,713 | 55,012 |
| | Murphy Oil Corp. | 1,836,625 | 47,514 |
| | Valero Energy Corp. | 539,800 | 31,978 |
| * | Southwestern Energy Co. | 2,495,500 | 25,928 |
| * | Cobalt International | | |
| | Energy Inc. | 11,783,968 | 11,125 |
| | | | 1,745,984 |
| Financials (26.3%) | | |
| | American International | | |
| | Group Inc. | 6,007,151 | 370,641 |
| | Citigroup Inc. | 6,841,871 | 336,278 |
| | MetLife Inc. | 6,595,175 | 309,709 |
| | Bank of America Corp. | 17,091,297 | 282,006 |
| | XL Group Ltd. | 8,010,875 | 277,977 |
| | Wells Fargo & Co. | 4,717,412 | 217,048 |
| | Comerica Inc. | 3,972,640 | 206,935 |
| | Principal Financial Group | | |
| | Inc. | 3,459,699 | 188,900 |
| | Unum Group | 4,433,869 | 156,959 |
| | JPMorgan Chase & Co. | 2,191,875 | 151,809 |
| | PNC Financial Services | | |
| | Group Inc. | 1,550,332 | 148,212 |
| | Torchmark Corp. | 1,997,800 | 126,681 |
| | Voya Financial Inc. | 3,897,000 | 119,053 |
| | Intercontinental | | |
| | Exchange Inc. | 405,409 | 109,619 |
| | Morgan Stanley | 3,174,691 | 106,574 |
| | Goldman Sachs Group | | |
| | Inc. | 591,250 | 105,384 |
16
| | | |
| Windsor Fund | | |
| |
| |
| |
| | | | Market |
| | | | Value• |
| | | Shares | ($000) |
| | M&T Bank Corp. | 800,508 | 98,246 |
| | Franklin Resources Inc. | 2,793,950 | 94,044 |
| | Regions Financial Corp. | 8,207,325 | 87,901 |
| | Ameriprise Financial Inc. | 959,024 | 84,768 |
| | Capital One Financial | | |
| | Corp. | 1,109,450 | 82,144 |
| | Axis Capital Holdings Ltd. | 1,418,271 | 80,799 |
| | Zions Bancorporation | 2,376,372 | 76,543 |
| | Raymond James | | |
| | Financial Inc. | 1,261,238 | 75,826 |
| | State Street Corp. | 1,071,075 | 75,200 |
| | UBS Group AG | 5,063,558 | 71,244 |
| | Fifth Third Bancorp | 2,857,550 | 62,180 |
| | Citizens Financial Group | | |
| | Inc. | 1,952,875 | 51,439 |
| | Allstate Corp. | 730,297 | 49,587 |
| | KeyCorp | 3,482,075 | 49,167 |
| | Bank of Nova Scotia | 600,600 | 32,276 |
| | Willis Towers Watson plc | 205,562 | 25,880 |
| | Julius Baer Group Ltd. | 540,621 | 21,885 |
| | Invesco Ltd. | 695,225 | 19,529 |
| * | Genworth Financial Inc. | | |
| | Class A | 2,832,750 | 11,728 |
| | | | 4,364,171 |
| Health Care (12.7%) | | |
| | Medtronic plc | 3,309,035 | 271,407 |
| | Bristol-Myers Squibb Co. | 5,307,716 | 270,216 |
| | Merck & Co. Inc. | 4,330,904 | 254,311 |
| | UnitedHealth Group Inc. | 1,623,592 | 229,462 |
| * | Allergan plc | 659,967 | 137,894 |
| * | HCA Holdings Inc. | 1,712,149 | 131,031 |
| | McKesson Corp. | 891,747 | 113,403 |
| | Cigna Corp. | 807,416 | 95,945 |
| | Johnson & Johnson | 799,225 | 92,702 |
| | Aetna Inc. | 759,714 | 81,555 |
| * | Biogen Inc. | 276,829 | 77,562 |
| | Abbott Laboratories | 1,926,310 | 75,588 |
| ^ | AstraZeneca plc ADR | 1,988,565 | 56,316 |
| * | Mylan NV | 1,539,879 | 56,206 |
| | Pfizer Inc. | 1,770,875 | 56,154 |
| | Teva Pharmaceutical | | |
| | Industries Ltd. ADR | 1,290,793 | 55,169 |
| | Eli Lilly & Co. | 710,640 | 52,474 |
| | | | 2,107,395 |
| Industrials (9.3%) | | |
| | Eaton Corp. plc | 3,557,490 | 226,861 |
| | Honeywell International | | |
| | Inc. | 1,973,069 | 216,406 |
| * | IHS Markit Ltd. | 4,332,583 | 159,396 |
| | Parker-Hannifin Corp. | 1,281,150 | 157,261 |
| | Raytheon Co. | 934,347 | 127,641 |
| | Kansas City Southern | 1,373,485 | 120,537 |
| | Stanley Black & Decker | | |
| | Inc. | 991,300 | 112,850 |
| | | |
| | Dover Corp. | 1,685,342 | 112,733 |
| * | Hertz Global Holdings Inc. | 3,110,920 | 103,127 |
| * | Sensata Technologies | | |
| | Holding NV | 2,638,831 | 94,285 |
| | American Airlines Group | | |
| | Inc. | 1,606,054 | 65,206 |
| * | Herc Holdings Inc. | 911,773 | 27,435 |
| | L-3 Communications | | |
| | Holdings Inc. | 166,050 | 22,739 |
| | | | 1,546,477 |
| Information Technology (16.5%) | |
| | Broadcom Ltd. | 1,530,413 | 260,599 |
| * | Arrow Electronics Inc. | 3,832,844 | 234,263 |
| * | NXP Semiconductors NV | 2,168,614 | 216,861 |
| | Cisco Systems Inc. | 6,774,287 | 207,835 |
| | Lam Research Corp. | 1,878,832 | 181,984 |
| | QUALCOMM Inc. | 2,567,850 | 176,463 |
| | Skyworks Solutions Inc. | 2,264,865 | 174,259 |
| | Apple Inc. | 1,467,517 | 166,622 |
| | Harris Corp. | 1,749,015 | 156,030 |
| * | Micron Technology Inc. | 8,817,540 | 151,309 |
| * | Alphabet Inc. Class A | 170,406 | 138,012 |
| | Oracle Corp. | 3,147,525 | 120,928 |
| | Hewlett Packard | | |
| | Enterprise Co. | 4,560,900 | 102,483 |
| | Intel Corp. | 2,816,600 | 98,215 |
| | Microsoft Corp. | 1,343,675 | 80,513 |
| | Seagate Technology plc | 2,101,021 | 72,086 |
| * | CommScope Holding Co. | | |
| | Inc. | 2,192,300 | 66,975 |
| | TE Connectivity Ltd. | 865,010 | 54,383 |
| * | Cognizant Technology | | |
| | Solutions Corp. Class A | 968,550 | 49,735 |
| | HP Inc. | 1,769,375 | 25,638 |
| | | | 2,735,193 |
| Materials (3.0%) | | |
| | Celanese Corp. Class A | 2,427,705 | 177,028 |
| | Methanex Corp. | 3,885,378 | 141,234 |
| | PPG Industries Inc. | 1,125,721 | 104,838 |
| | CF Industries Holdings | | |
| | Inc. | 2,843,799 | 68,280 |
| | | | 491,380 |
| Other (0.4%) | | |
| 2 | Vanguard Value ETF | 703,525 | 60,538 |
| |
| Real Estate (3.1%) | | |
| | American Tower | | |
| | Corporation | 1,635,100 | 191,617 |
| | Weyerhaeuser Co. | 5,051,241 | 151,184 |
| | Public Storage | 533,378 | 113,994 |
| | Boston Properties Inc. | 531,228 | 64,002 |
| | | | 520,797 |
17
Windsor Fund
| | | |
| | | | Market |
| | | | Value• |
| | | Shares | ($000) |
| Telecommunication Services (0.2%) | |
| | AT&T Inc. | 815,225 | 29,992 |
| |
| Utilities (2.0%) | | |
| | PG&E Corp. | 1,904,867 | 118,330 |
| | NextEra Energy Inc. | 803,033 | 102,788 |
| | Edison International | 852,150 | 62,616 |
| | Entergy Corp. | 788,774 | 58,117 |
| | | | 341,851 |
| Total Common Stocks | | |
| (Cost $13,907,961) | | 16,295,312 |
| Temporary Cash Investments (2.2%)1 | |
| Money Market Fund (1.1%) | | |
| 3,4 | Vanguard Market | | |
| | Liquidity Fund, 0.718% | 1,811,175 | 181,136 |
| |
| | | Face | |
| | | Amount | |
| | | ($000) | |
| Repurchase Agreement (0.6%) | |
| | Bank of America | | |
| | Securities, LLC 0.330%, | | |
| | 11/1/16 (Dated 10/31/16, | | |
| | Repurchase Value | | |
| | $110,601,000, collateralized | |
| | by Federal National | | |
| | Mortgage Assn. | | |
| | 3.000%–3.500%, | | |
| | 5/1/45–11/1/45, and | | |
| | Government National | | |
| | Mortgage Assn. 2.500%, | | |
| | 10/20/46, with a value | | |
| | of $112,812,000) | 110,600 | 110,600 |
| |
| U.S. Government and Agency Obligations (0.5%) |
| 5 | Federal Home Loan Bank | | |
| | Discount Notes, | | |
| | 0.345%–0.347%, 12/7/16 | 75,000 | 74,976 |
| 6 | United States Treasury | | |
| | Bill, 0.311%, 12/1/16 | 4,200 | 4,199 |
| 6 | United States Treasury | | |
| | Bill, 0.340%, 12/8/16 | 3,500 | 3,499 |
| | United States Treasury | | |
| | Bill, 0.380%, 3/9/17 | 2,000 | 1,998 |
| | | | 84,672 |
| Total Temporary Cash Investments | |
| (Cost $376,400) | | 376,408 |
| Total Investments (100.4%) | | |
| (Cost $14,284,361) | | 16,671,720 |
| |
| Other Assets and Liabilities (-0.4%) | |
| Other Assets | |
| Investment in Vanguard | 1,296 |
| Receivables for Investment Securities Sold 145,179 |
| Receivables for Accrued Income | 12,446 |
| Receivables for Capital Shares Issued | 2,202 |
| Other Assets | 1,807 |
| Total Other Assets | 162,930 |
| Liabilities | |
| Payables for Investment Securities | |
| Purchased | (171,681) |
| Collateral for Securities on Loan | (21,000) |
| Payables for Capital Shares Redeemed | (12,307) |
| Payables to Investment Advisor | (2,648) |
| Payables to Vanguard | (28,174) |
| Other Liabilities | (239) |
| Total Liabilities | (236,049) |
| Net Assets (100%) | 16,598,601 |
| |
| |
| At October 31, 2016, net assets consisted of: |
| | Amount |
| | ($000) |
| Paid-in Capital | 13,588,847 |
| Undistributed Net Investment Income | 132,516 |
| Accumulated Net Realized Gains | 490,551 |
| Unrealized Appreciation (Depreciation) | |
| Investment Securities | 2,387,359 |
| Futures Contracts | (532) |
| Foreign Currencies | (140) |
| Net Assets | 16,598,601 |
18
| |
| Windsor Fund | |
| |
| |
| |
| |
| | Amount |
| | ($000) |
| Investor Shares—Net Assets | |
| Applicable to 248,445,946 outstanding | |
| $.001 par value shares of beneficial | |
| interest (unlimited authorization) | 4,895,579 |
| Net Asset Value Per Share— | |
| Investor Shares | $19.70 |
| |
| |
| |
| Admiral Shares—Net Assets | |
| Applicable to 176,043,952 outstanding | |
| $.001 par value shares of beneficial | |
| interest (unlimited authorization) | 11,703,022 |
| Net Asset Value Per Share— | |
| Admiral Shares | $66.48 |
• See Note A in Notes to Financial Statements.
* Non-income-producing security.
^ Includes partial security positions on loan to broker-dealers. The total value of securities on loan is $19,824,000.
1 The fund invests a portion of its cash reserves in equity markets through the use of index futures contracts. After giving effect to futures
investments, the fund’s effective common stock and temporary cash investment positions represent 98.9% and 1.5%, respectively,
of net assets.
2 Considered an affiliated company of the fund as the issuer is another member of The Vanguard Group.
3 Affiliated money market fund available only to Vanguard funds and certain trusts and accounts managed by Vanguard. Rate shown is the
7-day yield.
4 Includes $21,000,000 of collateral received for securities on loan.
5 The issuer operates under a congressional charter; its securities are generally neither guaranteed by the U.S. Treasury nor backed by the full
faith and credit of the U.S. government.
6 Securities with a value of $5,699,000 have been segregated as initial margin for open futures contracts.
ADR—American Depositary Receipt.
See accompanying Notes, which are an integral part of the Financial Statements.
19
| |
| Windsor Fund | |
| |
| |
| Statement of Operations | |
| |
| | Year Ended |
| | October 31, 2016 |
| | ($000) |
| Investment Income | |
| Income | |
| Dividends1,2 | 381,197 |
| Interest2 | 1,517 |
| Securities Lending—Net | 1,006 |
| Total Income | 383,720 |
| Expenses | |
| Investment Advisory Fees—Note B | |
| Basic Fee | 21,313 |
| Performance Adjustment | (9,772) |
| The Vanguard Group—Note C | |
| Management and Administrative—Investor Shares | 10,396 |
| Management and Administrative—Admiral Shares | 14,047 |
| Marketing and Distribution—Investor Shares | 914 |
| Marketing and Distribution—Admiral Shares | 765 |
| Custodian Fees | 134 |
| Auditing Fees | 45 |
| Shareholders’ Reports—Investor Shares | 73 |
| Shareholders’ Reports—Admiral Shares | 47 |
| Trustees’ Fees and Expenses | 21 |
| Total Expenses | 37,983 |
| Net Investment Income | 345,737 |
| Realized Net Gain (Loss) | |
| Investment Securities Sold2 | 548,483 |
| Futures Contracts | 14,543 |
| Foreign Currencies | (321) |
| Realized Net Gain (Loss) | 562,705 |
| Change in Unrealized Appreciation (Depreciation) | |
| Investment Securities | (698,012) |
| Futures Contracts | (10,613) |
| Foreign Currencies | (3) |
| Change in Unrealized Appreciation (Depreciation) | (708,628) |
| Net Increase (Decrease) in Net Assets Resulting from Operations | 199,814 |
1 Dividends are net of foreign withholding taxes of $1,627,000.
2 Dividend income, interest income, and realized net gain (loss) from affiliated companies of the fund were $1,524,000, $858,000, and
$17,000, respectively.
See accompanying Notes, which are an integral part of the Financial Statements.
20
| | |
| Windsor Fund | | |
| |
| |
| Statement of Changes in Net Assets | | |
| |
| | Year Ended October 31, |
| | 2016 | 2015 |
| | ($000) | ($000) |
| Increase (Decrease) in Net Assets | | |
| Operations | | |
| Net Investment Income | 345,737 | 312,165 |
| Realized Net Gain (Loss) | 562,705 | 1,182,441 |
| Change in Unrealized Appreciation (Depreciation) | (708,628) | (1,150,369) |
| Net Increase (Decrease) in Net Assets Resulting from Operations | 199,814 | 344,237 |
| Distributions | | |
| Net Investment Income | | |
| Investor Shares | (81,017) | (88,997) |
| Admiral Shares | (198,361) | (207,892) |
| Realized Capital Gain1 | | |
| Investor Shares | (320,822) | (256,420) |
| Admiral Shares | (735,205) | (533,404) |
| Total Distributions | (1,335,405) | (1,086,713) |
| Capital Share Transactions | | |
| Investor Shares | (142,180) | (1,584,067) |
| Admiral Shares | 291,237 | 1,848,612 |
| Net Increase (Decrease) from Capital Share Transactions | 149,057 | 264,545 |
| Total Increase (Decrease) | (986,534) | (477,931) |
| Net Assets | | |
| Beginning of Period | 17,585,135 | 18,063,066 |
| End of Period2 | 16,598,601 | 17,585,135 |
1 Includes fiscal 2016 and 2015 short-term gain distributions totaling $9,986,000 and $0, respectively. Short-term gain distributions are treated as ordinary income dividends for tax purposes.
2 Net Assets—End of Period includes undistributed (overdistributed) net investment income of $132,516,000 and $66,409,000.
See accompanying Notes, which are an integral part of the Financial Statements.
21
| | | | | |
| Windsor Fund | | | | | |
| |
| |
| Financial Highlights | | | | | |
| |
| |
| Investor Shares | | | | | |
| |
| For a Share Outstanding | | | Year Ended October 31, |
| Throughout Each Period | 2016 | 2015 | 2014 | 2013 | 2012 |
| Net Asset Value, Beginning of Period | $21.06 | $21.98 | $19.50 | $14.66 | $12.92 |
| Investment Operations | | | | | |
| Net Investment Income | . 394 | . 3561 | .279 | .255 | .252 |
| Net Realized and Unrealized Gain (Loss) | | | | | |
| on Investments | (.168) | .026 | 2.467 | 4.839 | 1.729 |
| Total from Investment Operations | .226 | .382 | 2.746 | 5.094 | 1.981 |
| Distributions | | | | | |
| Dividends from Net Investment Income | (. 317) | (. 339) | (. 266) | (. 254) | (. 241) |
| Distributions from Realized Capital Gains | (1.269) | (.963) | — | — | — |
| Total Distributions | (1.586) | (1.302) | (.266) | (.254) | (.241) |
| Net Asset Value, End of Period | $19.70 | $21.06 | $21.98 | $19.50 | $14.66 |
| |
| Total Return2 | 1.27% | 1.76% | 14.14% | 35.17% | 15.56% |
| |
| Ratios/Supplemental Data | | | | | |
| Net Assets, End of Period (Millions) | $4,896 | $5,379 | $7,179 | $7,126 | $6,711 |
| Ratio of Total Expenses to Average Net Assets3 | 0.30% | 0.39% | 0.38% | 0.37% | 0.35% |
| Ratio of Net Investment Income to | | | | | |
| Average Net Assets | 2.01% | 1.64%1 | 1.33% | 1.49% | 1.80% |
| Portfolio Turnover Rate | 26% | 28% | 38% | 40% | 68% |
1 Net investment income per share and the ratio of net investment income to average net assets include $.052 and 0.24%, respectively, resulting from income received from Covidien Ltd. in January 2015.
2 Total returns do not include account service fees that may have applied in the periods shown. Fund prospectuses provide information about any applicable account service fees.
3 Includes performance-based investment advisory fee increases (decreases) of (0.06%), 0.03%, 0.03%, 0.02%, and (0.01%).
See accompanying Notes, which are an integral part of the Financial Statements.
22
| | | | | |
| Windsor Fund | | | | | |
| |
| |
| Financial Highlights | | | | | |
| |
| |
| Admiral Shares | | | | | |
| |
| For a Share Outstanding | | | Year Ended October 31, |
| Throughout Each Period | 2016 | 2015 | 2014 | 2013 | 2012 |
| Net Asset Value, Beginning of Period | $71.04 | $74.17 | $65.81 | $49.47 | $43.59 |
| Investment Operations | | | | | |
| Net Investment Income | 1.398 | 1.2911 | 1.016 | .924 | .900 |
| Net Realized and Unrealized Gain (Loss) | | | | | |
| on Investments | (.545) | .062 | 8.314 | 16.329 | 5.844 |
| Total from Investment Operations | .853 | 1.353 | 9.330 | 17.253 | 6.744 |
| Distributions | | | | | |
| Dividends from Net Investment Income | (1.134) | (1.235) | (.970) | (.913) | (.864) |
| Distributions from Realized Capital Gains | (4.279) | (3.248) | — | — | — |
| Total Distributions | (5.413) | (4.483) | (.970) | (.913) | (.864) |
| Net Asset Value, End of Period | $66.48 | $71.04 | $74.17 | $65.81 | $49.47 |
| |
| Total Return2 | 1.41% | 1.85% | 14.24% | 35.32% | 15.71% |
| |
| Ratios/Supplemental Data | | | | | |
| Net Assets, End of Period (Millions) | $11,703 | $12,206 | $10,884 | $9,144 | $5,795 |
| Ratio of Total Expenses to Average Net Assets3 | 0.20% | 0.29% | 0.28% | 0.27% | 0.25% |
| Ratio of Net Investment Income to | | | | | |
| Average Net Assets | 2.11% | 1.74%1 | 1.43% | 1.59% | 1.90% |
| Portfolio Turnover Rate | 26% | 28% | 38% | 40% | 68% |
1 Net investment income per share and the ratio of net investment income to average net assets include $.177 and 0.24%, respectively, resulting from income received from Covidien Ltd. in January 2015.
2 Total returns do not include account service fees that may have applied in the periods shown. Fund prospectuses provide information about any applicable account service fees.
3 Includes performance-based investment advisory fee increases (decreases) of (0.06%), 0.03%, 0.03%, 0.02%, and (0.01%).
See accompanying Notes, which are an integral part of the Financial Statements.
23
Windsor Fund
Notes to Financial Statements
Vanguard Windsor Fund is registered under the Investment Company Act of 1940 as an open-end investment company, or mutual fund. The fund offers two classes of shares: Investor Shares and Admiral Shares. Investor Shares are available to any investor who meets the fund’s minimum purchase requirements. Admiral Shares are designed for investors who meet certain administrative, service, and account-size criteria.
A. The following significant accounting policies conform to generally accepted accounting principles for U.S. investment companies. The fund consistently follows such policies in preparing its financial statements.
1. Security Valuation: Securities are valued as of the close of trading on the New York Stock Exchange (generally 4 p.m., Eastern time) on the valuation date. Equity securities are valued at the latest quoted sales prices or official closing prices taken from the primary market in which each security trades; such securities not traded on the valuation date are valued at the mean of the latest quoted bid and asked prices. Securities for which market quotations are not readily available, or whose values have been affected by events occurring before the fund’s pricing time but after the close of the securities’ primary markets, are valued at their fair values calculated according to procedures adopted by the board of trustees. These procedures include obtaining quotations from an independent pricing service, monitoring news to identify significant market- or security-specific events, and evaluating changes in the values of foreign market proxies (for example, ADRs, futures contracts, or exchange-traded funds), between the time the foreign markets close and the fund’s pricing time. When fair-value pricing is employed, the prices of securities used by a fund to calculate its net asset value may differ from quoted or published prices for the same securities. Investments in Vanguard Market Liquidity Fund are valued at that fund’s net asset value. Temporary cash investments acquired over 60 days to maturity are valued using the latest bid prices or using valuations based on a matrix system (which considers such factors as security prices, yields, maturities, and ratings), both as furnished by independent pricing services. Other temporary cash investments are valued at amortized cost, which approximates market value.
2. Foreign Currency: Securities and other assets and liabilities denominated in foreign currencies are translated into U.S. dollars using exchange rates obtained from an independent third party as of the fund’s pricing time on the valuation date. Realized gains (losses) and unrealized appreciation (depreciation) on investment securities include the effects of changes in exchange rates since the securities were purchased, combined with the effects of changes in security prices. Fluctuations in the value of other assets and liabilities resulting from changes in exchange rates are recorded as unrealized foreign currency gains (losses) until the assets or liabilities are settled in cash, at which time they are recorded as realized foreign currency gains (losses).
3. Futures Contracts: The fund uses index futures contracts to a limited extent, with the objective of maintaining full exposure to the stock market while maintaining liquidity. The fund may purchase or sell futures contracts to achieve a desired level of investment, whether to accommodate portfolio turnover or cash flows from capital share transactions. The primary risks associated with the use of futures contracts are imperfect correlation between changes in market values of stocks held by the fund and the prices of futures contracts, and the possibility of an illiquid market. Counterparty risk involving futures is mitigated because a regulated clearinghouse is the counterparty instead of the clearing broker. To further mitigate counterparty risk, the fund trades futures contracts on an exchange, monitors the financial strength of its clearing brokers and clearinghouse, and has entered into clearing agreements with its clearing brokers. The clearinghouse imposes initial margin requirements to secure the fund’s performance and requires daily settlement of variation margin representing changes in the market value of each contract.
24
Windsor Fund
Futures contracts are valued at their quoted daily settlement prices. The aggregate settlement values of the contracts are not recorded in the Statement of Net Assets. Fluctuations in the value of the contracts are recorded in the Statement of Net Assets as an asset (liability) and in the Statement of Operations as unrealized appreciation (depreciation) until the contracts are closed, when they are recorded as realized futures gains (losses).
During the year ended October 31, 2016, the fund’s average investments in long and short futures contracts represented 1% and 0% of net assets, respectively, based on the average of aggregate settlement values at each quarter-end during the period.
4. Repurchase Agreements: The fund enters into repurchase agreements with institutional counterparties. Securities pledged as collateral to the fund under repurchase agreements are held by a custodian bank until the agreements mature, and in the absence of a default, such collateral cannot be repledged, resold or rehypothecated. Each agreement requires that the market value of the collateral be sufficient to cover payments of interest and principal. The fund further mitigates its counterparty risk by entering into repurchase agreements only with a diverse group of prequalified counterparties, monitoring their financial strength, and entering into master repurchase agreements with its counterparties. The master repurchase agreements provide that, in the event of a counterparty’s default (including bankruptcy), the fund may terminate any repurchase agreements with that counterparty, determine the net amount owed, and sell or retain the collateral up to the net amount owed to the fund. Such action may be subject to legal proceedings, which may delay or limit the disposition of collateral.
5. Federal Income Taxes: The fund intends to continue to qualify as a regulated investment company and distribute all of its taxable income. Management has analyzed the fund’s tax positions taken for all open federal income tax years (October 31, 2013–2016), and has concluded that no provision for federal income tax is required in the fund’s financial statements.
6. Distributions: Distributions to shareholders are recorded on the ex-dividend date.
7. Securities Lending: To earn additional income, the fund lends its securities to qualified institutional borrowers. Security loans are subject to termination by the fund at any time, and are required to be secured at all times by collateral in an amount at least equal to the market value of securities loaned. Daily market fluctuations could cause the value of loaned securities to be more or less than the value of the collateral received. When this occurs, the collateral is adjusted and settled on the next business day. The fund further mitigates its counterparty risk by entering into securities lending transactions only with a diverse group of prequalified counterparties, monitoring their financial strength, and entering into master securities lending agreements with its counterparties. The master securities lending agreements provide that, in the event of a counterparty’s default (including bankruptcy), the fund may terminate any loans with that borrower, determine the net amount owed, and sell or retain the collateral up to the net amount owed to the fund; however, such actions may be subject to legal proceedings. While collateral mitigates counterparty risk, in the absence of a default the fund may experience delays and costs in recovering the securities loaned. The fund invests cash collateral received in Vanguard Market Liquidity Fund, and records a liability in the Statement of Net Assets for the return of the collateral, during the period the securities are on loan. Securities lending income represents fees charged to borrowers plus income earned on invested cash collateral, less expenses associated with the loan. During the term of the loan, the fund is entitled to all distributions made on or in respect of the loaned securities.
25
Windsor Fund
8. Credit Facility: The fund and certain other funds managed by The Vanguard Group (“Vanguard”) participate in a $3.1 billion committed credit facility provided by a syndicate of lenders pursuant to a credit agreement that may be renewed annually; each fund is individually liable for its borrowings, if any, under the credit facility. Borrowings may be utilized for temporary and emergency purposes, and are subject to the fund’s regulatory and contractual borrowing restrictions. The participating funds are charged administrative fees and an annual commitment fee of 0.10% of the undrawn amount of the facility; these fees are allocated to the funds based on a method approved by the fund’s board of trustees and included in Management and Administrative expenses on the fund’s Statement of Operations. Any borrowings under this facility bear interest at a rate based upon the higher of the one-month London Interbank Offered Rate, federal funds effective rate, or overnight bank funding rate plus an agreed-upon spread.
The fund had no borrowings outstanding at October 31, 2016, or at any time during the period then ended.
9. Other: Dividend income is recorded on the ex-dividend date. Interest income includes income distributions received from Vanguard Market Liquidity Fund and is accrued daily. Premiums and discounts on debt securities purchased are amortized and accreted, respectively, to interest income over the lives of the respective securities. Security transactions are accounted for on the date securities are bought or sold. Costs used to determine realized gains (losses) on the sale of investment securities are those of the specific securities sold.
Each class of shares has equal rights as to assets and earnings, except that each class separately bears certain class-specific expenses related to maintenance of shareholder accounts (included in Management and Administrative expenses) and shareholder reporting. Marketing and distribution expenses are allocated to each class of shares based on a method approved by the board of trustees. Income, other non-class-specific expenses, and gains and losses on investments are allocated to each class of shares based on its relative net assets.
B. The investment advisory firms Wellington Management Company LLP, and Pzena Investment Management, LLC, each provide investment advisory services to a portion of the fund for a fee calculated at an annual percentage rate of average net assets managed by the advisor. The basic fee of Wellington Management Company LLP, is subject to quarterly adjustments based on performance relative to the S&P 500 Index for the preceding three years. The basic fee of Pzena Investment Management Company, LLC, is subject to quarterly adjustments based on performance relative to the Russell 1000 Value Index for the preceding three years.
Vanguard manages the cash reserves of the fund as described below.
For the year ended October 31, 2016, the aggregate investment advisory fee represented an effective annual basic rate of 0.13% of the fund’s average net assets, before a decrease of $9,772,000 (0.06%) based on performance.
C. In accordance with the terms of a Funds’ Service Agreement (the “FSA”) between Vanguard and the fund, Vanguard furnishes to the fund corporate management, administrative, marketing, distribution, and cash management services at Vanguard’s cost of operations (as defined by the FSA). These costs of operations are allocated to the fund based on methods and guidelines approved by the board of trustees. Vanguard does not require reimbursement in the current period for certain costs of operations (such as deferred compensation/benefits and risk/insurance costs); the fund’s liability for these costs of operations is included in Payables to Vanguard on the Statement of Net Assets.
26
Windsor Fund
Upon the request of Vanguard, the fund may invest up to 0.40% of its net assets as capital in Vanguard. At October 31, 2016, the fund had contributed to Vanguard capital in the amount of $1,296,000, representing 0.01% of the fund’s net assets and 0.52% of Vanguard’s capitalization. The fund’s trustees and officers are also directors and employees, respectively, of Vanguard.
D. Various inputs may be used to determine the value of the fund’s investments. These inputs are summarized in three broad levels for financial statement purposes. The inputs or methodologies used to value securities are not necessarily an indication of the risk associated with investing in those securities.
Level 1—Quoted prices in active markets for identical securities.
Level 2—Other significant observable inputs (including quoted prices for similar securities, interest rates, prepayment speeds, credit risk, etc.).
Level 3—Significant unobservable inputs (including the fund’s own assumptions used to determine the fair value of investments).
The following table summarizes the market value of the fund’s investments as of October 31, 2016, based on the inputs used to value them:
| | | |
| | Level 1 | Level 2 | Level 3 |
| Investments | ($000) | ($000) | ($000) |
| Common Stocks | 15,917,358 | 377,954 | — |
| Temporary Cash Investments | 181,136 | 195,272 | — |
| Futures Contracts—Assets1 | 18 | — | — |
| Futures Contracts—Liabilities1 | (236) | — | — |
| Total | 16,098,276 | 573,226 | — |
| 1 Represents variation margin on the last day of the reporting period. | | | |
E. At October 31, 2016, the aggregate settlement value of open futures contracts and the related unrealized appreciation (depreciation) were:
| | | | |
| | | | | ($000) |
| | | | Aggregate | |
| | | Number of | Settlement | Unrealized |
| | | Long (Short) | Value | Appreciation |
| Futures Contracts | Expiration | Contracts | Long (Short) | (Depreciation) |
| E-mini S&P 500 Index | December 2016 | 1,131 | 119,892 | (532) |
Unrealized appreciation (depreciation) on open futures contracts is required to be treated as realized gain (loss) for tax purposes.
27
Windsor Fund
F. Distributions are determined on a tax basis and may differ from net investment income and realized capital gains for financial reporting purposes. Differences may be permanent or temporary. Permanent differences are reclassified among capital accounts in the financial statements to reflect their tax character. Temporary differences arise when certain items of income, expense, gain, or loss are recognized in different periods for financial statement and tax purposes. These differences will reverse at some time in the future. Differences in classification may also result from the treatment of short-term gains as ordinary income for tax purposes.
During the year ended October 31, 2016, the fund realized net foreign currency losses of $321,000, which decreased distributable net income for tax purposes; accordingly, such losses have been reclassified from accumulated net realized gains to undistributed net investment income.
The fund used a tax accounting practice to treat a portion of the price of capital shares redeemed during the year as distributions from realized capital gains. Accordingly, the fund has reclassified $48,286,000 from accumulated net realized gains to paid-in capital.
For tax purposes, at October 31, 2016, the fund had $159,427,000 of ordinary income and 492,029,000 of long-term capital gains available for distribution.
At October 31, 2016, the cost of investment securities for tax purposes was $14,286,244,000. Net unrealized appreciation of investment securities for tax purposes was $2,385,476,000, consisting of unrealized gains of $3,501,499,000 on securities that had risen in value since their purchase and $1,116,023,000 in unrealized losses on securities that had fallen in value since their purchase.
G. During the year ended October 31, 2016, the fund purchased $4,269,685,000 of investment securities and sold $4,943,006,000 of investment securities, other than temporary cash investments.
| | | | |
| H. Capital share transactions for each class of shares were: | | | |
| | | | Year Ended October 31, |
| | | 2016 | | 2015 |
| | Amount | Shares | Amount | Shares |
| | ($000) | (000) | ($000) | (000) |
| Investor Shares | | | | |
| Issued | 345,137 | 18,933 | 475,343 | 22,113 |
| Issued in Lieu of Cash Distributions | 390,759 | 20,211 | 336,127 | 15,916 |
| Redeemed | (878,076) | (46,152) | (2,395,537) | (109,171) |
| Net Increase (Decrease)—Investor Shares | (142,180) | (7,008) | (1,584,067) | (71,142) |
| Admiral Shares | | | | |
| Issued | 730,076 | 11,200 | 2,381,431 | 32,225 |
| Issued in Lieu of Cash Distributions | 877,678 | 13,461 | 697,529 | 9,787 |
| Redeemed | (1,316,517) | (20,440) | (1,230,348) | (16,932) |
| Net Increase (Decrease)—Admiral Shares | 291,237 | 4,221 | 1,848,612 | 25,080 |
I. Management has determined that no material events or transactions occurred subsequent to October 31, 2016, that would require recognition or disclosure in these financial statements.
28
Report of Independent Registered Public Accounting Firm
To the Board of Trustees of Vanguard Windsor Funds and the Shareholders of Vanguard Windsor Fund:
In our opinion, the accompanying statement of net assets and the related statements of operations and of changes in net assets and the financial highlights present fairly, in all material respects, the financial position of Vanguard Windsor Fund (constituting a separate portfolio of Vanguard Windsor Funds, hereafter referred to as the “Fund”) at October 31, 2016, the results of its operations for the year then ended, the changes in its net assets for each of the two years in the period then ended, and the financial highlights for each of the five years in the period then ended, in conformity with accounting principles generally accepted in the United States of America. These financial statements and financial highlights (hereafter referred to as “financial statements”) are the responsibility of the Fund’s management. Our responsibility is to express an opinion on these financial statements based on our audits. We conducted our audits of these financial statements in accordance with the standards of the Public Company Accounting Oversight Board (United States). Those standards require that we plan and perform the audit to obtain reasonable assurance about whether the financial statements are free of material misstatement. An audit includes examining, on a test basis, evidence supporting the amounts and disclosures in the financial statements, assessing the accounting principles used and significant estimates made by management, and evaluating the overall financial statement presentation. We believe that our audits, which included confirmation of securities at October 31, 2016 by correspondence with the custodians and brokers and by agreement to the underlying ownership records of the transfer agent, provide a reasonable basis for our opinion.
/s/PricewaterhouseCoopers LLP
Philadelphia, Pennsylvania
December 15, 2016
Special 2016 tax information (unaudited) for Vanguard Windsor Fund
This information for the fiscal year ended October 31, 2016, is included pursuant to provisions of the Internal Revenue Code.
The fund distributed $1,094,328,000 as capital gain dividends (20% rate gain distributions) to shareholders during the fiscal year.
For nonresident alien shareholders, 100% of short-term capital gain dividends distributed by the fund are qualified short-term capital gains.
The fund distributed $279,378,000 of qualified dividend income to shareholders during the fiscal year.
For corporate shareholders, 83.7% of investment income (dividend income plus short-term gains, if any) qualifies for the dividends-received deduction.
29
Your Fund’s After-Tax Returns
This table presents returns for your fund both before and after taxes. The after-tax returns are shown in two ways: (1) assuming that an investor owned the fund during the entire period and paid taxes on the fund’s distributions, and (2) assuming that an investor paid taxes on the fund’s distributions and sold all shares at the end of each period.
Calculations are based on the highest individual federal income tax and capital gains tax rates in effect at the times of the distributions and the hypothetical sales. State and local taxes were not considered. After-tax returns reflect any qualified dividend income, using actual prior-year figures and estimates for 2016. (In the example, returns after the sale of fund shares may be higher than those assuming no sale. This occurs when the sale would have produced a capital loss. The calculation assumes that the investor received a tax deduction for the loss.)
The table shows returns for Investor Shares only; returns for other share classes will differ. Please note that your actual after-tax returns will depend on your tax situation and may differ from those shown. Also note that if you own the fund in a tax-deferred account, such as an individual retirement account or a 401(k) plan, this information does not apply to you. Such accounts are not subject to current taxes.
Finally, keep in mind that a fund’s performance—whether before or after taxes—does not guarantee future results.
Average Annual Total Returns: Windsor Fund Investor Shares
Periods Ended October 31, 2016
| | | |
| | One | Five | Ten |
| | Year | Years | Years |
| Returns Before Taxes | 1.27% | 12.94% | 5.09% |
| Returns After Taxes on Distributions | -0.58 | 12.01 | 4.20 |
| Returns After Taxes on Distributions and Sale of Fund Shares | 2.18 | 10.35 | 4.05 |
30
About Your Fund’s Expenses
As a shareholder of the fund, you incur ongoing costs, which include costs for portfolio management, administrative services, and shareholder reports (like this one), among others. Operating expenses, which are deducted from a fund’s gross income, directly reduce the investment return of the fund.
A fund’s expenses are expressed as a percentage of its average net assets. This figure is known as the expense ratio. The following examples are intended to help you understand the ongoing costs (in dollars) of investing in your fund and to compare these costs with those of other mutual funds. The examples are based on an investment of $1,000 made at the beginning of the period shown and held for the entire period.
The accompanying table illustrates your fund’s costs in two ways:
• Based on actual fund return. This section helps you to estimate the actual expenses that you paid over the period. The ”Ending Account Value“ shown is derived from the fund‘s actual return, and the third column shows the dollar amount that would have been paid by an investor who started with $1,000 in the fund. You may use the information here, together with the amount you invested, to estimate the expenses that you paid over the period.
To do so, simply divide your account value by $1,000 (for example, an $8,600 account value divided by $1,000 = 8.6), then multiply the result by the number given for your fund under the heading ”Expenses Paid During Period.“
• Based on hypothetical 5% yearly return. This section is intended to help you compare your fund‘s costs with those of other mutual funds. It assumes that the fund had a yearly return of 5% before expenses, but that the expense ratio is unchanged. In this case—because the return used is not the fund’s actual return—the results do not apply to your investment. The example is useful in making comparisons because the Securities and Exchange Commission requires all mutual funds to calculate expenses based on a 5% return. You can assess your fund’s costs by comparing this hypothetical example with the hypothetical examples that appear in shareholder reports of other funds.
Note that the expenses shown in the table are meant to highlight and help you compare ongoing costs only and do not reflect transaction costs incurred by the fund for buying and selling securities. Further, the expenses do not include any purchase, redemption, or account service fees described in the fund prospectus. If such fees were applied to your account, your costs would be higher. Your fund does not carry a “sales load.”
The calculations assume no shares were bought or sold during the period. Your actual costs may have been higher or lower, depending on the amount of your investment and the timing of any purchases or redemptions.
You can find more information about the fund’s expenses, including annual expense ratios, in the Financial Statements section of this report. For additional information on operating expenses and other shareholder costs, please refer to your fund’s current prospectus.
31
| | | |
| Six Months Ended October 31, 2016 | | | |
| | Beginning | Ending | Expenses |
| | Account Value | Account Value | Paid During |
| Windsor Fund | 4/30/2016 | 10/31/2016 | Period |
| Based on Actual Fund Return | | | |
| Investor Shares | $1,000.00 | $1,035.32 | $1.48 |
| Admiral Shares | 1,000.00 | 1,036.22 | 0.92 |
| Based on Hypothetical 5% Yearly Return | | | |
| Investor Shares | $1,000.00 | $1,023.68 | $1.48 |
| Admiral Shares | 1,000.00 | 1,024.23 | 0.92 |
The calculations are based on expenses incurred in the most recent six-month period. The fund’s annualized six-month expense ratios for that period are 0.29% for Investor Shares and 0.18% for Admiral Shares. The dollar amounts shown as “Expenses Paid” are equal to the annualized expense ratio multiplied by the average account value over the period, multiplied by the number of days in the most recent six-month period, then divided by the number of days in the most recent 12-month period (184/366).
32
Glossary
30-Day SEC Yield. A fund’s 30-day SEC yield is derived using a formula specified by the U.S. Securities and Exchange Commission. Under the formula, data related to the fund’s security holdings in the previous 30 days are used to calculate the fund’s hypothetical net income for that period, which is then annualized and divided by the fund’s estimated average net assets over the calculation period. For the purposes of this calculation, a security’s income is based on its current market yield to maturity (for bonds), its actual income (for asset-backed securities), or its projected dividend yield (for stocks). Because the SEC yield represents hypothetical annualized income, it will differ—at times significantly—from the fund’s actual experience. As a result, the fund’s income distributions may be higher or lower than implied by the SEC yield.
Beta. A measure of the magnitude of a fund’s past share-price fluctuations in relation to the ups and downs of a given market index. The index is assigned a beta of 1.00. Compared with a given index, a fund with a beta of 1.20 typically would have seen its share price rise or fall by 12% when the index rose or fell by 10%. For this report, beta is based on returns over the past 36 months for both the fund and the index. Note that a fund’s beta should be reviewed in conjunction with its R-squared (see definition). The lower the R-squared, the less correlation there is between the fund and the index, and the less reliable beta is as an indicator of volatility.
Dividend Yield. Dividend income earned by stocks, expressed as a percentage of the aggregate market value (or of net asset value, for a fund). The yield is determined by dividing the amount of the annual dividends by the aggregate value (or net asset value) at the end of the period. For a fund, the dividend yield is based solely on stock holdings and does not include any income produced by other investments.
Earnings Growth Rate. The average annual rate of growth in earnings over the past five years for the stocks now in a fund.
Equity Exposure. A measure that reflects a fund’s investments in stocks and stock futures. Any holdings in short-term reserves are excluded.
Expense Ratio. A fund’s total annual operating expenses expressed as a percentage of the fund’s average net assets. The expense ratio includes management and administrative expenses, but does not include the transaction costs of buying and selling portfolio securities.
Foreign Holdings. The percentage of a fund represented by securities or depositary receipts of companies based outside the United States.
Inception Date. The date on which the assets of a fund (or one of its share classes) are first invested in accordance with the fund’s investment objective. For funds with a subscription period, the inception date is the day after that period ends. Investment performance is measured from the inception date.
Median Market Cap. An indicator of the size of companies in which a fund invests; the midpoint of market capitalization (market price x shares outstanding) of a fund’s stocks, weighted by the proportion of the fund’s assets invested in each stock. Stocks representing half of the fund’s assets have market capitalizations above the median, and the rest are below it.
Price/Book Ratio. The share price of a stock divided by its net worth, or book value, per share. For a fund, the weighted average price/book ratio of the stocks it holds.
33
Price/Earnings Ratio. The ratio of a stock’s current price to its per-share earnings over the past year. For a fund, the weighted average P/E of the stocks it holds. P/E is an indicator of market expectations about corporate prospects; the higher the P/E, the greater the expectations for a company’s future growth.
R-Squared. A measure of how much of a fund’s past returns can be explained by the returns from the market in general, as measured by a given index. If a fund’s total returns were precisely synchronized with an index’s returns, its R-squared would be 1.00. If the fund’s returns bore no relationship to the index’s returns, its R-squared would be 0. For this report, R-squared is based on returns over the past 36 months for both the fund and the index.
Return on Equity. The annual average rate of return generated by a company during the past five years for each dollar of shareholder’s equity (net income divided by shareholder’s equity). For a fund, the weighted average return on equity for the companies whose stocks it holds.
Short-Term Reserves. The percentage of a fund invested in highly liquid, short-term securities that can be readily converted to cash.
Turnover Rate. An indication of the fund’s trading activity. Funds with high turnover rates incur higher transaction costs and may be more likely to distribute capital gains (which may be taxable to investors). The turnover rate excludes in-kind transactions, which have minimal impact on costs.
34
This page intentionally left blank.
The People Who Govern Your Fund
The trustees of your mutual fund are there to see that the fund is operated and managed in your best interests since, as a shareholder, you are a part owner of the fund. Your fund’s trustees also serve on the board of directors of The Vanguard Group, Inc., which is owned by the Vanguard funds and provides services to them on an at-cost basis.
A majority of Vanguard’s board members are independent, meaning that they have no affiliation with Vanguard or the funds they oversee, apart from the sizable personal investments they have made as private individuals. The independent board members have distinguished backgrounds in business, academia, and public service. Each of the trustees and executive officers oversees 198 Vanguard funds.
The following table provides information for each trustee and executive officer of the fund. The mailing address of the trustees and officers is P.O. Box 876, Valley Forge, PA 19482. More information about the trustees is in the Statement of Additional Information, which can be obtained, without charge, by contacting Vanguard at 800-662-7447, or online at vanguard.com.
InterestedTrustee1
F. William McNabb III
Born 1957. Trustee Since July 2009. Chairman of the Board. Principal Occupation(s) During the Past Five Years and Other Experience: Chairman of the Board of The Vanguard Group, Inc., and of each of the investment companies served by The Vanguard Group, since January 2010; Director of The Vanguard Group since 2008; Chief Executive Officer and President of The Vanguard Group, and of each of the investment companies served by The Vanguard Group, since 2008; Director of Vanguard Marketing Corporation; Managing Director of The Vanguard Group (1995–2008).
IndependentTrustees
Emerson U. Fullwood
Born 1948. Trustee Since January 2008. Principal Occupation(s) During the Past Five Years and Other Experience: Executive Chief Staff and Marketing Officer for North America and Corporate Vice President (retired 2008) of Xerox Corporation (document management products and services); Executive in Residence and 2009–2010 Distinguished Minett Professor at the Rochester Institute of Technology; Lead Director of SPX FLOW, Inc. (multi-industry manufacturing); Director of the United Way of Rochester, the University of Rochester Medical Center, Monroe Community College Foundation, North Carolina A&T University, and Roberts Wesleyan College.
Rajiv L. Gupta
Born 1945. Trustee Since December 2001.2 Principal Occupation(s) During the Past Five Years and Other Experience: Chairman and Chief Executive Officer (retired 2009) and President (2006–2008) of Rohm and Haas Co. (chemicals); Director of Tyco International plc (diversified manufacturing and services), HP Inc. (printer and personal computer manufacturing), and Delphi Automotive plc (automotive components); Senior Advisor at New Mountain Capital.
Amy Gutmann
Born 1949. Trustee Since June 2006. Principal Occupation(s) During the Past Five Years and Other Experience: President of the University of Pennsylvania; Christopher H. Browne Distinguished Professor of Political Science, School of Arts and Sciences, and Professor of Communication, Annenberg School for Communication, with secondary faculty appointments in the Department of Philosophy, School of Arts and Sciences, and at the Graduate School of Education, University of Pennsylvania; Trustee of the National Constitution Center; Chair of the Presidential Commission for the Study of Bioethical Issues.
JoAnn Heffernan Heisen
Born 1950. Trustee Since July 1998. Principal Occupation(s) During the Past Five Years and Other Experience: Corporate Vice President and Chief Global Diversity Officer (retired 2008) and Member of the Executive Committee (1997–2008) of Johnson & Johnson (pharmaceuticals/medical devices/consumer products); Director of Skytop Lodge Corporation (hotels) and the Robert Wood Johnson Foundation; Member of the Advisory Board of the Institute for Women’s Leadership at Rutgers University.
F. Joseph Loughrey
Born 1949. Trustee Since October 2009. Principal Occupation(s) During the Past Five Years and Other Experience: President and Chief Operating Officer (retired 2009) of Cummins Inc. (industrial machinery); Chairman of the Board of Hillenbrand, Inc. (specialized consumer services), and of Oxfam America; Director of SKF AB (industrial machinery), Hyster-Yale Materials Handling, Inc. (forklift trucks), the Lumina Foundation for Education, and the V Foundation for Cancer Research; Member of the Advisory Council for the College of Arts and Letters and of the Advisory Board to the Kellogg Institute for International Studies, both at the University of Notre Dame.
Mark Loughridge
Born 1953. Trustee Since March 2012. Principal Occupation(s) During the Past Five Years and Other Experience: Senior Vice President and Chief Financial Officer (retired 2013) at IBM (information technology services); Fiduciary Member of IBM’s Retirement Plan Committee (2004–2013); Director of the Dow Chemical Company; Member of the Council on Chicago Booth.
Scott C. Malpass
Born 1962. Trustee Since March 2012. Principal Occupation(s) During the Past Five Years and Other Experience: Chief Investment Officer and Vice President at the University of Notre Dame; Assistant Professor of Finance at the Mendoza College of Business at Notre Dame; Member of the Notre Dame 403(b) Investment Committee, the Board of Advisors for Spruceview Capital Partners, and the Investment Advisory Committee of Major League Baseball; Board Member of TIFF Advisory Services, Inc., and Catholic Investment Services, Inc. (investment advisors).
André F. Perold
Born 1952. Trustee Since December 2004. Principal Occupation(s) During the Past Five Years and Other Experience: George Gund Professor of Finance and Banking, Emeritus at the Harvard Business School (retired 2011); Chief Investment Officer and Managing Partner of HighVista Strategies LLC (private investment firm); Director of Rand Merchant Bank; Overseer of the Museum of Fine Arts Boston.
Peter F. Volanakis
Born 1955. Trustee Since July 2009. Principal Occupation(s) During the Past Five Years and Other Experience: President and Chief Operating Officer (retired 2010) of Corning Incorporated (communications equipment); Chairman of the Board of Trustees of Colby-Sawyer College; Member of the Advisory Board of the Norris Cotton Cancer Center.
Executive Officers
Glenn Booraem
Born 1967. Treasurer Since May 2015. Principal Occupation(s) During the Past Five Years and Other Experience: Principal of The Vanguard Group, Inc.; Treasurer of each of the investment companies served by The Vanguard Group; Controller of each of the investment companies served by The Vanguard Group (2010–2015); Assistant Controller of each of the investment companies served by The Vanguard Group (2001–2010).
Thomas J. Higgins
Born 1957. Chief Financial Officer Since September 2008. Principal Occupation(s) During the Past Five Years and Other Experience: Principal of The Vanguard Group, Inc.; Chief Financial Officer of each of the investment companies served by The Vanguard Group; Treasurer of each of the investment companies served by The Vanguard Group (1998–2008).
Peter Mahoney
Born 1974. Controller Since May 2015. Principal Occupation(s) During the Past Five Years and Other Experience: Head of Global Fund Accounting at The Vanguard Group, Inc.; Controller of each of the investment companies served by The Vanguard Group; Head of International Fund Services at The Vanguard Group (2008–2014).
Anne E. Robinson
Born 1970. Secretary Since September 2016. Principal Occupation(s) During the Past Five Years and Other Experience: Managing Director of The Vanguard Group, Inc.; General Counsel of The Vanguard Group; Secretary of The Vanguard Group and of each of the investment companies served by The Vanguard Group; Director and Senior Vice President of Vanguard Marketing Corporation; Managing Director and General Counsel of Global Cards and Consumer Services at Citigroup (2014–2016); Counsel at American Express (2003–2014).
Vanguard Senior Management Team
| |
| Mortimer J. Buckley | James M. Norris |
| Kathleen C. Gubanich | Thomas M. Rampulla |
| Martha G. King | Glenn W. Reed |
| John T. Marcante | Karin A. Risi |
| Chris D. McIsaac | Michael Rollings |
Chairman Emeritus and Senior Advisor
John J. Brennan
Chairman, 1996–2009
Chief Executive Officer and President, 1996–2008
Founder
John C. Bogle
Chairman and Chief Executive Officer, 1974–1996
1 Mr. McNabb is considered an “interested person,” as defined in the Investment Company Act of 1940, because he is an officer of the Vanguard funds.
2 December 2002 for Vanguard Equity Income Fund, the Vanguard Municipal Bond Funds, and the Vanguard State Tax-Exempt Funds.

P.O. Box 2600
Valley Forge, PA 19482-2600
| |
| Connect with Vanguard® > vanguard.com | |
| |
| |
| |
| Fund Information > 800-662-7447 | CFA® is a registered trademark owned by CFA Institute. |
| Direct Investor Account Services > 800-662-2739 | |
| Institutional Investor Services > 800-523-1036 | |
| Text Telephone for People | |
| Who Are Deaf or Hard of Hearing> 800-749-7273 | |
| |
| This material may be used in conjunction | |
| with the offering of shares of any Vanguard | |
| fund only if preceded or accompanied by | |
| the fund’s current prospectus. | |
| |
| All comparative mutual fund data are from Lipper, a | |
| Thomson Reuters Company, or Morningstar, Inc., unless | |
| otherwise noted. | |
| |
| You can obtain a free copy of Vanguard’s proxy voting | |
| guidelines by visiting vanguard.com/proxyreporting or by | |
| calling Vanguard at 800-662-2739. The guidelines are | |
| also available from the SEC’s website, sec.gov. In | |
| addition, you may obtain a free report on how your fund | |
| voted the proxies for securities it owned during the 12 | |
| months ended June 30. To get the report, visit either | |
| vanguard.com/proxyreporting or sec.gov. | |
| |
| You can review and copy information about your fund at | |
| the SEC’s Public Reference Room in Washington, D.C. To | |
| find out more about this public service, call the SEC at | |
| 202-551-8090. Information about your fund is also | |
| available on the SEC’s website, and you can receive | |
| copies of this information, for a fee, by sending a | |
| request in either of two ways: via email addressed to | |
| publicinfo@sec.gov or via regular mail addressed to the | |
| Public Reference Section, Securities and Exchange | |
| Commission, Washington, DC 20549-1520. | |
| |
| | © 2016 The Vanguard Group, Inc. |
| | All rights reserved. |
| | Vanguard Marketing Corporation, Distributor. |
| |
| | Q220 122016 |

Annual Report | October 31, 2016
Vanguard Windsor™ II Fund
A new format, unwavering commitment
As you begin reading this report, you’ll notice that we’ve made some improvements to the opening sections—based on feedback from you, our clients.
Page 1 starts with a new ”Your Fund’s Performance at a Glance,” a concise, handy summary of how your fund performed during the period.
In the renamed ”Chairman’s Perspective,” Bill McNabb will focus on enduring principles and investment insights.
We’ve modified some tables, and eliminated some redundancy, but we haven’t removed any information.
At Vanguard, we’re always looking for better ways to communicate and to help you make sound investment decisions. Thank you for entrusting your assets to us.
| |
| Contents | |
| Your Fund’s Performance at a Glance. | 1 |
| Chairman’s Perspective. | 3 |
| Advisors’ Report. | 7 |
| Fund Profile. | 11 |
| Performance Summary. | 12 |
| Financial Statements. | 14 |
| Your Fund’s After-Tax Returns. | 30 |
| About Your Fund’s Expenses. | 31 |
| Glossary. | 33 |
Please note: The opinions expressed in this report are just that—informed opinions. They should not be considered promises or advice. Also, please keep in mind that the information and opinions cover the period through the date on the front of this report. Of course, the risks of investing in your fund are spelled out in the prospectus.
See the Glossary for definitions of investment terms used in this report.
About the cover: No matter what language you speak, Vanguard has one consistent message and set of principles. Our primary focus is on you, our clients. We conduct our business with integrity as a faithful steward of your assets. This message is shown translated into seven languages, reflecting our expanding global presence.
Your Fund’s Performance at a Glance
• Vanguard Windsor II Fund returned almost 3% for the 12 months ended October 31, 2016. The fund’s return trailed the 6.37% return of its benchmark, the Russell 1000 Value Index, and the 3.13% average return of its large-capitalization value fund peers.
• Value stocks surpassed their growth counterparts, while large- and small-cap stocks outpaced mid-caps.
• Each of the fund’s five advisors employs a value-oriented strategy and manages its piece of the portfolio with a long-term focus.
• The fund’s stock selection hurt its performance compared with the benchmark. Health care, consumer discretionary, energy, and financials suffered most.
• The fund posted its highest returns in information technology and industrials, although its IT holdings fell short of those in the benchmark.
• Over the past ten years, the Windsor II Fund’s average annual return was virtually even with that of its benchmark, which has no expenses, and exceeded that of its peers.
| |
| Total Returns: Fiscal Year Ended October 31, 2016 | |
| | Total |
| | Returns |
| Vanguard Windsor II Fund | |
| Investor Shares | 2.86% |
| Admiral™ Shares | 2.94 |
| Russell 1000 Value Index | 6.37 |
| Large-Cap Value Funds Average | 3.13 |
| Large-Cap Value Funds Average: Derived from data provided by Lipper, a Thomson Reuters Company. | |
| Admiral Shares carry lower expenses and are available to investors who meet certain account-balance requirements. | |
| |
| |
| Total Returns: Ten Years Ended October 31, 2016 | |
| | Average |
| | Annual Return |
| Windsor II Fund Investor Shares | 5.38% |
| Russell 1000 Value Index | 5.35 |
| Large-Cap Value Funds Average | 4.51 |
| Large-Cap Value Funds Average: Derived from data provided by Lipper, a Thomson Reuters Company. | |
The figures shown represent past performance, which is not a guarantee of future results. (Current performance may be lower or higher than the performance data cited. For performance data current to the most recent month-end, visit our website at vanguard.com/performance.) Note, too, that both investment returns and principal value can fluctuate widely, so an investor’s shares, when sold, could be worth more or less than their original cost.
1
| | | |
| Expense Ratios | | | |
| Your Fund Compared With Its Peer Group | | | |
| | Investor | Admiral | Peer Group |
| | Shares | Shares | Average |
| Windsor II Fund | 0.34% | 0.26% | 1.10% |
The fund expense ratios shown are from the prospectus dated February 25, 2016, and represent estimated costs for the current fiscal year. For the fiscal year ended October 31, 2016, the fund’s expense ratios were 0.33% for Investor Shares and 0.25% for Admiral Shares. The peer-group expense ratio is derived from data provided by Lipper, a Thomson Reuters Company, and captures information through year-end 2015.
Peer group: Large-Cap Value Funds.
2
Chairman’s Perspective

Bill McNabb
Chairman and Chief Executive Officer
Dear Shareholder,
Over the three years ended August 31, 2016, investors poured more than $1 trillion into index funds. Indexing now accounts for nearly a third of all mutual fund assets—more than double what it did a decade ago and eight times its share two decades ago.1
By contrast, active management’s commercial struggles have reflected its disappointing investment performance. Over the decade ended December 31, 2015, 82% of actively managed stock funds and 81% of active bond funds have either underperformed their benchmarks or shut down.
This subpar performance has fueled the explosion of asset growth in indexing among individual, retirement, and nonprofit investors. So what might the trend mean for the future of actively managed funds?
Our research and experience indicate that active management can survive—and even succeed—but only if it’s offered at much lower expense.
High costs, which limit a manager’s ability to deliver benchmark-beating returns to clients, are the biggest reason why active has lagged. Industrywide as of December 31, 2015, the average expense ratio for all active stock funds is 1.14%, compared with 0.76% for stock index
1 Sources: Wall Street Journal; Morningstar, Inc.; and Investment Company Institute, 2016.
3
funds. And the expense advantage is even wider for bonds; the average expense ratio for an active bond fund is 0.93%, compared with 0.43% for bond index funds.
But even these big differences understate the real gap. These days, it’s not hard to find an index fund that charges maybe 0.05% or 0.10%. So even if you have identified active managers who are skilled at selecting stocks and bonds, to match the return of a comparable (much cheaper) index fund would require significant outperformance. Think about it. Any fund that charges 1.00% in expenses—not even the high end of the range—will find it extraordinarily difficult to overcome the index fund’s head start.
Active management also has taken a hit from a regulatory environment that has been favorable to low-cost strategies. The U.S. Department of Labor several years ago mandated greater disclosure of retirement plan fees. And its new fiduciary rule, which is set to take effect in April, requires financial advisors to demonstrate that their recommendations are aligned with their clients’ best interest. Both changes encourage the use of lower-cost investments, including index funds.
The future of active management
In light of all this, people have been asking me whether active management is “dead.” My response is both yes and no. High-cost active management is dead, and rightly so. It has never been a winning proposition
| | | |
| Market Barometer | | | |
| | | Average Annual Total Returns |
| | | Periods Ended October 31, 2016 |
| | One | Three | Five |
| | Year | Years | Years |
| Stocks | | | |
| Russell 1000 Index (Large-caps) | 4.26% | 8.48% | 13.51% |
| Russell 2000 Index (Small-caps) | 4.11 | 4.12 | 11.51 |
| Russell 3000 Index (Broad U.S. market) | 4.24 | 8.13 | 13.35 |
| FTSE All-World ex US Index (International) | 0.64 | -0.94 | 4.09 |
| |
| Bonds | | | |
| Bloomberg Barclays U.S. Aggregate Bond Index | | | |
| (Broad taxable market) | 4.37% | 3.48% | 2.90% |
| Bloomberg Barclays Municipal Bond Index | | | |
| (Broad tax-exempt market) | 4.06 | 4.89 | 4.34 |
| Citigroup Three-Month U.S. Treasury Bill Index | 0.22 | 0.07 | 0.07 |
| |
| CPI | | | |
| Consumer Price Index | 1.64% | 1.15% | 1.32% |
4
for investors. Low-cost active funds, though, can potentially play an important role for investors who seek to outperform the market.
Paying less for your funds is the only sure-fire way to improve your odds of achieving success in active management. But even if you have found an active manager with low costs, the odds of outperforming the market are still long. You have to be able to identify talented stock and bond portfolio managers with long time horizons and clear investment strategies. Look for managers with consistent track records and the discipline to stick closely to their investment strategy.
Know what you own and why
Despite the well-deserved reputation of indexing and the challenges for active managers, there’s still a place for traditional active strategies that are low-cost, diversified, and highly disciplined, and are run by talented managers who focus on the long term.
Vanguard has always applied these principles to our active strategies, and investors have benefited as a majority of our active funds outperformed their benchmarks and bested their peers’ average annual return over the ten years ended September 30, 2016.
Worried about the election’s impact on your portfolio?
The 2016 presidential election season was one of the most intense and unpredictable in U.S. history. In its aftermath, investors may be left with lingering questions about what the outcome will mean for their portfolios. The answer, based on Vanguard research into decades of historical data, is that presidential elections typically have no long-term effect on market performance.
These findings hold true regardless of the market’s initial reaction. Whether there’s a swoon or bounce immediately after an election, investors shouldn’t extrapolate that performance to the long term.
As you can see in the accompanying chart, data going back to 1853 show that stock market returns are virtually identical no matter which party controls the White House. Although headlines out of Washington at any given time may still cause concern, investors shouldn’t overreact to short-term events. Instead, it’s best to maintain a balanced and diversified portfolio and stay focused on your long-term goals.
Average annual stock market returns based
on party control of the White House
(1853–2015)
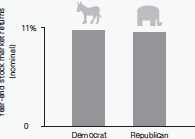
Sources: Global Financial Data, 1853–1926; Morningstar, Inc., and Ibbotson Associates thereafter through 2015.
5
But it’s crucial for investors to be patient. Even active managers with the best track records frequently underperform their benchmarks when their investment styles are out of favor. Such periods, though temporary, can persist. So it’s important when entrusting your assets to an active strategy to be in it for the long haul.
Make sure you know what you’re buying and what the risks are. Active strategies are becoming more complex, so it’s important to clearly understand what the investments in your portfolio are designed to accomplish and why you want to hold them. Otherwise, you run the risk of selecting strategies that don’t fit your needs or objectives.
Keeping these considerations in mind can potentially boost your chances of success in identifying active strategies that may be able to help you reach your goals.
As always, thank you for investing with Vanguard.

F. William McNabb III
Chairman and Chief Executive Officer
November 9, 2016
6
Advisors’ Report
For the 12 months ended October 31, 2016, Vanguard Windsor II Fund returned 2.86% for Investor Shares and 2.94% for Admiral Shares. Your fund is managed by five independent advisors, a strategy that enhances the fund’s diversification by providing exposure to distinct yet complementary investment approaches. It’s not uncommon for different advisors to have different views about individual securities or the broader investment environment.
The table below lists the advisors, the amount and percentage of fund assets each manages, and brief descriptions of their investment strategies. The advisors have provided the following assessment of the investment environment during the past 12 months and the notable successes and shortfalls in their portfolios. These comments were prepared on November 16, 2016.
| | | |
| Vanguard Windsor II Fund Investment Advisors | |
| |
| | Fund Assets Managed | |
| Investment Advisor | % | $ Million | Investment Strategy |
| Barrow, Hanley, Mewhinney & | 55 | 24,561 | Conducts fundamental research on individual stocks |
| Strauss, LLC | | | exhibiting traditional value characteristics: |
| | | | price/earnings and price/book ratios below the broad |
| | | | market average and dividend yields above the broad |
| | | | market average. |
| Lazard Asset Management LLC | 18 | 8,078 | Employs a relative-value approach that seeks a |
| | | | combination of attractive valuation and high financial |
| | | | productivity. The process is research-driven, relying |
| | | | upon bottom-up stock analysis performed by the firm’s |
| | | | global sector analysts. |
| Hotchkis and Wiley Capital | 13 | 5,857 | Uses a disciplined investment approach, focusing on |
| Management, LLC | | | such investment parameters as a company’s tangible |
| | | | assets, sustainable cash flow, and potential for |
| | | | improving business performance. |
| Sanders Capital, LLC | 12 | 5,592 | Employs a traditional, bottom-up, fundamental research |
| | | | approach to identifying securities that are undervalued |
| | | | relative to their expected total return. |
| Vanguard Quantitative Equity | 1 | 269 | Employs a quantitative fundamental management |
| Group | | | approach, using models that assess valuation, market |
| | | | sentiment, earnings quality and growth, and |
| | | | management decisions of companies versus their |
| | | | peers. |
| Cash Investments | 1 | 408 | These short-term reserves are invested by Vanguard in |
| | | | equity index products to simulate investment in stocks. |
| | | | Each advisor may also maintain a modest cash |
| | | | position. |
7
Barrow, Hanley, Mewhinney &
Strauss, LLC
Portfolio Managers:
Jeff Fahrenbruch, CFA,
Managing Director
David Ganucheau, CFA,
Managing Director
Stocks were volatile but ended the 12-month period higher. Though declining commodity prices, currency volatility, and weaker-than-expected economic data led to a sharp decline in early 2016, the broad market indexes rallied by nearly 20% off the February lows when commodity prices and economic data stabilized.
Low interest rates continue to buoy high-dividend but low-growth stocks at high valuations. Portfolio holdings in consumer staples (tobacco companies Altria Group and Philip Morris International) and telecommunication services companies (AT&T and Verizon) did well as long-term rates declined during the period. However, we sold Entergy, a utilities holding, and continue to remain underweighted in these areas in favor of better growth and valuations elsewhere. The portfolio also benefited from strong performance from information technology holdings Qualcomm and Microsoft.
Health care stocks hurt performance during the period as political concerns grew ahead of the U.S. elections, but they appear very attractive at current
valuations, which are well below market average. We believe the political concerns, as well as stock-specific issues, are overshadowing strong long-term fundamentals. We have added Cardinal Health, CVS Health, Express Scripts, and Teva Pharmaceuticals to the portfolio, making health care our largest overweight relative to the value benchmark.
We inherited three new spinoffs from our holdings, and we will evaluate these for long-term value rather than selling into the short-term technical pressure associated with the typical spinoff.
Lazard Asset Management LLC
Portfolio Managers:
Andrew Lacey, Deputy Chairman
Christopher Blake, Managing Director
The S&P 500 Index rose 4.51% during the 12 months. Modest gains in the first half of the period masked significant volatility, as markets were down over 10% in February on the back of concerns about the Chinese economy and commodity price declines. However, markets resumed their rise in the second half of the first quarter. The Federal Reserve’s lowered forecast for 2016, interest rate increases, and a rebound in oil prices all encouraged investors. Markets fell sharply in late June because of the uncertainty caused by the United Kingdom’s vote to leave the European Union. But they recovered in the third quarter, as investors gained
8
more confidence in the U.S. economy’s ability to withstand global geopolitical risks. Economic data were mixed during the period, as employment reports generally exceeded expectations, but the economy continued to grow unevenly, culminating with a strong third-quarter reading of 2.9% in October. In light of an improving employment and inflation picture toward the end of the period, hawkish comments by Federal Open Market Committee officials again raised expectations for a 2016 rate hike.
Stock selection in the health care sector contributed to performance. Top contributors included Zoetis and Baxalta. We sold our position in Baxalta in March, as we saw opportunities with better risk/ reward profiles elsewhere. Stock selection in the consumer staples sector also helped returns. Top contributors included Kellogg and Procter & Gamble.
Stock selection in the consumer discretionary sector detracted from performance. Top detractors included Advance Auto Parts and Norwegian Cruise Line. Stock selection in financials also hurt returns. Top detractors included OneMain and Voya. We sold our position in OneMain in February, as our thesis was broken, and our Voya position in January, as we saw opportunities with better risk/reward profiles elsewhere.
Hotchkis and Wiley Capital
Management, LLC
Portfolio Managers:
George H. Davis, Jr.,
Chief Executive Officer
Sheldon J. Lieberman, Principal
We have observed an unusually wide valuation dichotomy in the market where sectors perceived as safe appear richly valued while more cyclical industries trade at bargain prices. This is reflected in the portfolio’s large valuation discount relative to both the broad and value benchmarks. We believe the portfolio is well positioned to perform when more normal value relationships return. In recent months, we have witnessed early signs of such a reversion but our research suggests there is a long way to go.
Stock selection in energy and utilities detracted from performance. Our energy positions are biased toward upstream exploration and production companies and our utility positions are focused on independent power producers. These industries are more sensitive to commodity prices than the other sectors, which has hurt relative performance as crude oil and natural gas prices remain low. We maintain our positions, believe crude oil prices are unsustainably low, and view recent underperformance as temporary share price volatility rather than a permanent loss of capital. The overweighted position in technology along with positive stock selection in industrials and financials helped relative performance.
9
The largest positive contributors to relative performance were Hewlett-Packard Enterprise, Corning, Cummins, Microsoft, and Regions Financial. The largest detractors were Cobalt International Energy, Ericsson, Calpine, Bed Bath & Beyond, and Sanofi.
Sanders Capital, LLC
Portfolio Managers:
Lewis A. Sanders, CFA,
Chief Executive Officer and
Co-Chief Investment Officer
John P. Mahedy, CPA,
Director of Research and
Co-Chief Investment Officer
Our portfolio is positioned to benefit from sustained economic growth and rising interest rates. Banks, a major area of investment, would benefit most from these developments. However, the portfolio also has investments based on technology-driven innovation in the pharmaceutical, semiconductor, computer, and media industries. New products and services in these industries should produce faster growth even if the economy remains sluggish and interest rates stay low. While our investments in the energy industry remain small, they are focused on U.S. natural gas, a segment for which we see exceptional opportunity. Overall investment returns have trailed the benchmark slightly this year primarily because of our investments in banks. Much of this underperformance can be traced to suppression of interest rates by central banks, which, as noted, we believe will prove transitory.
Vanguard Quantitative Equity Group
Portfolio Managers:
James P. Stetler, Principal
Anatoly Shtekhman, CFA
Binbin Guo, Principal, Head of Equity
Research and Portfolio Strategies
Over the fiscal year, U.S. equities continued to strengthen after recovering from the steep decline in January. The broad U.S. equity market was up 4.24% as measured by the Russell 3000 Index. As measured by other Russell indexes, large- and small-capitalization stocks had similar positive performance and value-oriented stocks outperformed their growth counterparts by more than 4 percentage points.
The quality component of our fundamentally based model aided relative performance, while the sentiment component did not perform as expected. The model’s effectiveness over the annual period across sectors was mixed. We produced positive stock selection results in five of the eleven sectors in the benchmark, benefiting most from strong stock selection within information technology and financials, and in the new real estate sector. Stock selection within industrials, consumer discretionary, and health care detracted from our relative performance.
At the individual stock level, the largest contributions came from overweight positions in NVIDIA, Computer Sciences, and Energen. Unfortunately, we were not able to avoid all poor performers. Overweight positions in HollyFrontier, Ensco, and Santander Consumer USA detracted from our relative performance.
10
Windsor II Fund
Fund Profile
As of October 31, 2016
| | |
| Share-Class Characteristics | |
| | Investor | Admiral |
| | Shares | Shares |
| Ticker Symbol | VWNFX | VWNAX |
| Expense Ratio1 | 0.34% | 0.26% |
| 30-Day SEC Yield | 2.11% | 2.24% |
| | |
| Volatility Measures | | |
| | Russell | DJ |
| | 1000 | U.S. Total |
| | Value | Market |
| | Index | FA Index |
| R-Squared | 0.97 | 0.94 |
| Beta | 1.01 | 0.97 |
| | | |
| Portfolio Characteristics | | |
| | | | DJ |
| | | | U.S. |
| | | Russell | Total |
| | | 1000 | Market |
| | | Value | FA |
| | Fund | Index | Index |
| Number of Stocks | 275 | 692 | 3,833 |
| Median Market Cap | $69.0B | $55.7B | $53.5B |
| Price/Earnings Ratio | 20.4x | 21.3x | 23.1x |
| Price/Book Ratio | 2.0x | 1.8x | 2.7x |
| Return on Equity | 15.2% | 12.7% | 16.6% |
| Earnings Growth | | | |
| Rate | 3.5% | 3.0% | 8.4% |
| Dividend Yield | 2.6% | 2.6% | 2.1% |
| Foreign Holdings | 9.9% | 0.0% | 0.0% |
| Turnover Rate | 33% | — | — |
| Short-Term | | | |
| Reserves | 1.0% | — | — |
These measures show the degree and timing of the fund’s
fluctuations compared with the indexes over 36 months.
Ten Largest Holdings (% of total net assets)
| | |
| Microsoft Corp. | Systems Software | 3.3% |
| Bank of America Corp. | Diversified Banks | 2.8 |
| Pfizer Inc. | Pharmaceuticals | 2.6 |
| JPMorgan Chase & Co. | Diversified Banks | 2.5 |
| Philip Morris | | |
| International Inc. | Tobacco | 2.2 |
| United Technologies | Aerospace & | |
| Corp. | Defense | 2.1 |
| Wells Fargo & Co. | Diversified Banks | 2.1 |
| Citigroup Inc. | Diversified Banks | 2.0 |
| Sanofi | Pharmaceuticals | 2.0 |
| Medtronic plc | Health Care | |
| | Equipment | 2.0 |
| Top Ten | | 23.6% |
The holdings listed exclude any temporary cash investments and equity index products.
Sector Diversification (% of equity exposure)
| | | |
| | | Russell | DJ |
| | | 1000 | U.S. Total |
| | | Value | Market |
| | Fund | Index | FA Index |
| Consumer | | | |
| Discretionary | 8.5% | 4.6% | 12.6% |
| Consumer Staples | 9.4 | 8.9 | 8.9 |
| Energy | 10.3 | 13.3 | 6.6 |
| Financials | 20.8 | 24.4 | 13.9 |
| Health Care | 20.5 | 11.1 | 13.4 |
| Industrials | 9.7 | 9.8 | 10.5 |
| Information | | | |
| Technology | 14.5 | 9.9 | 21.0 |
| Materials | 2.0 | 2.8 | 3.2 |
| Real Estate | 0.2 | 4.9 | 4.2 |
| Telecommunication | | | |
| Services | 3.0 | 3.7 | 2.3 |
| Utilities | 1.1 | 6.6 | 3.4 |
Investment Focus
1 The expense ratios shown are from the prospectus dated February 25, 2016, and represent estimated costs for the current fiscal year. For the fiscal year ended October 31, 2016, the expense ratios were 0.33% for Investor Shares and 0.25% for Admiral Shares.
11
Windsor II Fund
Performance Summary
All of the returns in this report represent past performance, which is not a guarantee of future results that may be achieved by the fund. (Current performance may be lower or higher than the performance data cited. For performance data current to the most recent month-end, visit our website at vanguard.com/performance.) Note, too, that both investment returns and principal value can fluctuate widely, so an investor’s shares, when sold, could be worth more or less than their original cost. The returns shown do not reflect taxes that a shareholder would pay on fund distributions or on the sale of fund shares.
Cumulative Performance: October 31, 2006, Through October 31, 2016
Initial Investment of $10,000

| | | | |
| | Average Annual Total Returns | |
| | Periods Ended October 31, 2016 | |
| | | | | Final Value |
| | One | Five | Ten | of a $10,000 |
| | Year | Years | Years | Investment |
| Windsor II Fund*Investor Shares | 2.86% | 12.01% | 5.38% | $16,892 |
| Russell 1000 Value Index | 6.37 | 13.31 | 5.35 | 16,837 |
| Large-Cap Value Funds Average | 3.13 | 11.50 | 4.51 | 15,538 |
| Dow Jones U.S. Total Stock Market | | | | |
| Float Adjusted Index | 4.21 | 13.29 | 6.87 | 19,436 |
Large-Cap Value Funds Average: Derived from data provided by Lipper, a Thomson Reuters Company.
| | | | |
| | | | | Final Value |
| | One | Five | Ten | of a $50,000 |
| | Year | Years | Years | Investment |
| Windsor II Fund Admiral Shares | 2.94% | 12.10% | 5.47% | $85,194 |
| Russell 1000 Value Index | 6.37 | 13.31 | 5.35 | 84,187 |
| Dow Jones U.S. Total Stock Market Float | | | | |
| Adjusted Index | 4.21 | 13.29 | 6.87 | 97,178 |
See Financial Highlights for dividend and capital gains information.
12
Windsor II Fund
Fiscal-Year Total Returns (%): October 31, 2006, Through October 31, 2016

Average Annual Total Returns: Periods Ended September 30, 2016
This table presents returns through the latest calendar quarter—rather than through the end of the fiscal period.
Securities and Exchange Commission rules require that we provide this information.
| | | | |
| | Inception | One | Five | Ten |
| | Date | Year | Years | Years |
| Investor Shares | 6/24/1985 | 12.11% | 14.72% | 5.78% |
| Admiral Shares | 5/14/2001 | 12.19 | 14.81 | 5.87 |
13
Windsor II Fund
Financial Statements
Statement of Net Assets
As of October 31, 2016
The fund reports a complete list of its holdings in regulatory filings four times in each fiscal year, at the quarter-ends. For the second and fourth fiscal quarters, the lists appear in the fund’s semiannual and annual reports to shareholders. For the first and third fiscal quarters, the fund files the lists with the Securities and Exchange Commission on Form N-Q. Shareholders can look up the fund’s Forms N-Q on the SEC’s website at sec.gov. Forms N-Q may also be reviewed and copied at the SEC’s Public Reference Room (see the back cover of this report for further information).
| | | |
| | | | Market |
| | | | Value• |
| | | Shares | ($000) |
| Common Stocks (97.6%)1 | | |
| Consumer Discretionary (8.3%) | |
| | Ford Motor Co. | 35,937,767 | 421,909 |
| | Carnival Corp. | 8,137,720 | 399,562 |
| | Twenty-First Century | | |
| | Fox Inc. Class A | 11,645,600 | 305,930 |
| | Target Corp. | 4,152,900 | 285,429 |
| | Delphi Automotive plc | 4,001,667 | 260,388 |
| | Omnicom Group Inc. | 2,680,400 | 213,950 |
| | DR Horton Inc. | 5,950,000 | 171,539 |
| * | Madison Square Garden | | |
| | Co. Class A | 743,467 | 123,036 |
| | Advance Auto Parts Inc. | 841,549 | 117,884 |
| * | Adient plc | 2,510,131 | 114,236 |
| | General Motors Co. | 3,466,000 | 109,526 |
| ^,* | Discovery | | |
| | Communications Inc. | | |
| | Class A | 4,020,700 | 104,980 |
| | Bed Bath & Beyond Inc. | 2,494,782 | 100,839 |
| | McDonald’s Corp. | 877,223 | 98,749 |
| | Lennar Corp. Class A | 2,353,181 | 98,104 |
| ^,* | JC Penney Co. Inc. | 9,968,800 | 85,632 |
| | Genuine Parts Co. | 913,881 | 82,789 |
| | Comcast Corp. Class A | 1,186,200 | 73,331 |
| | CBS Corp. Class B | 1,283,100 | 72,649 |
| * | Norwegian Cruise Line | | |
| | Holdings Ltd. | 1,521,776 | 59,151 |
| | Harley-Davidson Inc. | 897,000 | 51,147 |
| | Honda Motor Co. Ltd. | | |
| | ADR | 1,490,900 | 44,474 |
| * | Meritage Homes Corp. | 1,390,408 | 43,033 |
| | Honda Motor Co. Ltd. | 1,407,700 | 42,121 |
| | Renault SA | 472,271 | 41,070 |
| | CalAtlantic Group Inc. | 1,268,190 | 40,988 |
| | Lowe’s Cos. Inc. | 582,000 | 38,790 |
| * | Deckers Outdoor Corp. | 696,800 | 36,366 |
| * | Discovery | | |
| | Communications Inc. | 1,401,900 | 35,202 |
| | | |
| | Magna International Inc. | 735,700 | 30,201 |
| | Lear Corp. | 13,653 | 1,676 |
| | Darden Restaurants Inc. | 25,149 | 1,629 |
| | Whirlpool Corp. | 9,366 | 1,403 |
| | News Corp. Class B | 103,211 | 1,280 |
| | Best Buy Co. Inc. | 29,225 | 1,137 |
| ^ | Nordstrom Inc. | 19,867 | 1,033 |
| | TEGNA Inc. | 28,379 | 557 |
| | Leggett & Platt Inc. | 8,533 | 392 |
| | News Corp. Class A | 10,434 | 126 |
| | | | 3,712,238 |
| Consumer Staples (9.2%) | | |
| | Philip Morris International | | |
| | Inc. | 10,112,788 | 975,277 |
| | CVS Health Corp. | 9,929,925 | 835,107 |
| | Imperial Brands plc ADR | 13,543,550 | 654,831 |
| | Altria Group Inc. | 9,215,532 | 609,331 |
| | Molson Coors Brewing | | |
| | Co. Class B | 2,437,578 | 253,045 |
| | Procter & Gamble Co. | 2,866,655 | 248,826 |
| | Kellogg Co. | 2,152,800 | 161,740 |
| | Walgreens Boots Alliance | | |
| | Inc. | 1,768,600 | 146,316 |
| | Coca-Cola Co. | 2,956,597 | 125,360 |
| | Wal-Mart Stores Inc. | 886,813 | 62,095 |
| | Bunge Ltd. | 371,500 | 23,037 |
| | ConAgra Foods Inc. | 42,454 | 2,045 |
| | PepsiCo Inc. | 17,402 | 1,865 |
| * | Herbalife Ltd. | 24,208 | 1,469 |
| | Ingredion Inc. | 10,905 | 1,430 |
| | JM Smucker Co. | 10,837 | 1,423 |
| * | Edgewell Personal Care | | |
| | Co. | 18,446 | 1,391 |
| | Tyson Foods Inc. Class A | 19,322 | 1,369 |
| | Pilgrim’s Pride Corp. | 49,800 | 1,087 |
| | General Mills Inc. | 8,599 | 533 |
| | Colgate-Palmolive Co. | 2,603 | 186 |
| | | | 4,107,763 |
14
Windsor II Fund
| | | |
| | | | Market |
| | | | Value• |
| | | Shares | ($000) |
| Energy (10.0%) | | |
| | ConocoPhillips | 17,177,503 | 746,363 |
| | Occidental Petroleum | | |
| | Corp. | 8,701,758 | 634,445 |
| | BP plc ADR | 17,245,198 | 613,067 |
| | Phillips 66 | 7,095,169 | 575,773 |
| | Chevron Corp. | 4,072,927 | 426,639 |
| | Marathon Petroleum | | |
| | Corp. | 6,413,759 | 279,576 |
| | Marathon Oil Corp. | 14,826,700 | 195,416 |
| | Range Resources Corp. | 4,513,590 | 152,514 |
| | Hess Corp. | 3,074,700 | 147,493 |
| | Schlumberger Ltd. | 1,785,995 | 139,718 |
| | Cabot Oil & Gas Corp. | 5,554,169 | 115,971 |
| | Royal Dutch Shell plc | | |
| | ADR | 1,934,806 | 96,373 |
| | Pioneer Natural | | |
| | Resources Co. | 478,200 | 85,607 |
| | EOG Resources Inc. | 925,600 | 83,693 |
| | Murphy Oil Corp. | 2,595,800 | 67,153 |
| | Valero Energy Corp. | 939,408 | 55,651 |
| * | Kosmos Energy Ltd. | 5,210,700 | 27,148 |
| * | Cobalt International | | |
| | Energy Inc. | 14,963,900 | 14,127 |
| | Exxon Mobil Corp. | 93,930 | 7,826 |
| | Apache Corp. | 35,029 | 2,084 |
| | Baker Hughes Inc. | 36,151 | 2,003 |
| | Devon Energy Corp. | 45,929 | 1,740 |
| | ONEOK Inc. | 35,647 | 1,726 |
| | Tesoro Corp. | 19,740 | 1,677 |
| | Cimarex Energy Co. | 12,265 | 1,584 |
| | Plains GP Holdings LP | | |
| | Class A | 116,912 | 1,468 |
| | Energen Corp. | 28,821 | 1,445 |
| * | Southwestern Energy Co. | 133,271 | 1,385 |
| | Ensco plc Class A | 174,258 | 1,363 |
| * | Newfield Exploration Co. | 33,556 | 1,362 |
| * | Chesapeake Energy Corp. | 196,098 | 1,080 |
| | Oceaneering International | | |
| | Inc. | 33,216 | 791 |
| | | | 4,484,261 |
| Financials (20.4%) | | |
| | Bank of America Corp. | 77,041,001 | 1,271,176 |
| | JPMorgan Chase & Co. | 15,835,009 | 1,096,733 |
| | Wells Fargo & Co. | 20,023,296 | 921,272 |
| | Citigroup Inc. | 18,604,836 | 914,428 |
| | PNC Financial Services | | |
| | Group Inc. | 8,142,768 | 778,449 |
| | American Express Co. | 9,603,867 | 637,889 |
| | Capital One Financial | | |
| | Corp. | 7,861,636 | 582,075 |
| | State Street Corp. | 5,549,129 | 389,604 |
| | American International | | |
| | Group Inc. | 4,655,438 | 287,240 |
| | | |
| | Navient Corp. | 14,206,240 | 181,556 |
| | Intercontinental Exchange | | |
| | Inc. | 669,400 | 180,999 |
| | Fifth Third Bancorp | 8,316,529 | 180,968 |
| | Goldman Sachs Group Inc. 878,652 | 156,611 |
| | Aon plc | 1,357,900 | 150,496 |
| | BNP Paribas SA | 2,410,164 | 139,750 |
| | MetLife Inc. | 2,922,100 | 137,222 |
| | Charles Schwab Corp. | 4,229,900 | 134,088 |
| | Morgan Stanley | 3,510,400 | 117,844 |
| | Citizens Financial Group | | |
| | Inc. | 4,415,700 | 116,310 |
| * | SLM Corp. | 14,089,352 | 99,330 |
| | Barclays plc | 36,326,564 | 84,162 |
| | KeyCorp | 5,397,400 | 76,211 |
| | Unum Group | 1,990,411 | 70,461 |
| | Regions Financial Corp. | 5,579,196 | 59,753 |
| | Allstate Corp. | 826,800 | 56,140 |
| | CBOE Holdings Inc. | 882,365 | 55,774 |
| | SunTrust Banks Inc. | 1,183,678 | 53,538 |
| | Sumitomo Mitsui Financial | |
| | Group Inc. | 1,449,400 | 50,253 |
| | Lincoln National Corp. | 893,861 | 43,880 |
| | Hartford Financial Services | |
| | Group Inc. | 947,350 | 41,788 |
| | Prudential Financial Inc. | 434,273 | 36,822 |
| | Synchrony Financial | 1,044,121 | 29,851 |
| | Aflac Inc. | 29,411 | 2,025 |
| | Discover Financial Services 35,847 | 2,019 |
| | Everest Re Group Ltd. | 7,752 | 1,578 |
| | Reinsurance Group of | | |
| | America Inc. Class A | 14,180 | 1,529 |
| | Ally Financial Inc. | 81,671 | 1,476 |
| | Assurant Inc. | 18,102 | 1,458 |
| * | Santander Consumer USA | |
| | Holdings Inc. | 111,993 | 1,366 |
| | Voya Financial Inc. | 41,161 | 1,257 |
| | Principal Financial Group | | |
| | Inc. | 22,847 | 1,247 |
| | Bank of New York Mellon | | |
| | Corp. | 15,692 | 679 |
| | US Bancorp | 12,898 | 577 |
| | Ameriprise Financial Inc. | 3,934 | 348 |
| | Torchmark Corp. | 5,213 | 331 |
| | Chubb Ltd. | 1,421 | 180 |
| | | | 9,148,743 |
| Health Care (20.0%) | | |
| | Pfizer Inc. | 36,983,085 | 1,172,733 |
| | Sanofi ADR | 23,432,100 | 911,274 |
| | Medtronic plc | 10,751,313 | 881,823 |
| | Johnson & Johnson | 6,833,970 | 792,672 |
| | Anthem Inc. | 6,426,847 | 783,175 |
| | Cardinal Health Inc. | 11,103,681 | 762,712 |
15
Windsor II Fund
| | | |
| | | | Market |
| | | | Value• |
| | | Shares | ($000) |
| * | Express Scripts Holding | | |
| | Co. | 10,203,600 | 687,723 |
| | Teva Pharmaceutical | | |
| | Industries Ltd. ADR | 14,951,700 | 639,036 |
| | Merck & Co. Inc. | 10,045,323 | 589,861 |
| | Zoetis Inc. | 7,809,597 | 373,299 |
| * | Allergan plc | 1,079,330 | 225,515 |
| | UnitedHealth Group Inc. | 1,292,500 | 182,669 |
| | Cigna Corp. | 1,221,813 | 145,188 |
| | Eli Lilly & Co. | 1,555,021 | 114,823 |
| | Aetna Inc. | 1,038,882 | 111,524 |
| ^ | GlaxoSmithKline plc ADR | 2,591,100 | 103,670 |
| | Stryker Corp. | 866,500 | 99,951 |
| | Roche Holding AG | 362,000 | 83,145 |
| * | Quintiles IMS Holdings | | |
| | Inc. | 955,950 | 68,580 |
| * | Mallinckrodt plc | 1,157,066 | 68,568 |
| * | Biogen Inc. | 171,900 | 48,163 |
| | Zimmer Biomet Holdings | | |
| | Inc. | 349,800 | 36,869 |
| | AbbVie Inc. | 574,077 | 32,022 |
| | Humana Inc. | 169,400 | 29,057 |
| | Baxter International Inc. | 35,215 | 1,676 |
| * | Hologic Inc. | 37,663 | 1,356 |
| | PerkinElmer Inc. | 24,461 | 1,245 |
| | Agilent Technologies Inc. | 19,497 | 849 |
| | Bristol-Myers Squibb Co. | 14,942 | 761 |
| | | | 8,949,939 |
| Industrials (9.4%) | | |
| | United Technologies | | |
| | Corp. | 9,265,872 | 946,972 |
| * | Johnson Controls | | |
| | International plc | 21,593,324 | 870,643 |
| | Honeywell International | | |
| | Inc. | 4,927,761 | 540,477 |
| | General Dynamics Corp. | 2,369,700 | 357,209 |
| | Eaton Corp. plc | 2,799,687 | 178,536 |
| | Cummins Inc. | 1,177,007 | 150,445 |
| | Raytheon Co. | 1,008,183 | 137,728 |
| | Rockwell Automation Inc. | 916,925 | 109,774 |
| | CNH Industrial NV | 11,893,000 | 92,528 |
| | Boeing Co. | 637,800 | 90,842 |
| | Rockwell Collins Inc. | 1,055,100 | 88,966 |
| | Koninklijke Philips NV | 2,783,207 | 83,580 |
| | Union Pacific Corp. | 901,900 | 79,530 |
| | Parker-Hannifin Corp. | 607,000 | 74,509 |
| * | Copart Inc. | 1,378,260 | 72,317 |
| | General Electric Co. | 2,321,133 | 67,545 |
| | Deere & Co. | 716,100 | 63,232 |
| * | Versum Materials Inc. | 2,451,181 | 55,642 |
| * | Kirby Corp. | 760,400 | 44,826 |
| | Stanley Black & Decker | | |
| | Inc. | 295,700 | 33,662 |
| | PACCAR Inc. | 522,783 | 28,711 |
| | Embraer SA ADR | 1,239,800 | 26,519 |
| | | |
| | Chicago Bridge | | |
| | & Iron Co. NV | 52,846 | 1,692 |
| * | Quanta Services Inc. | 56,240 | 1,617 |
| | L-3 Communications | | |
| | Holdings Inc. | 11,404 | 1,562 |
| | ManpowerGroup Inc. | 18,884 | 1,450 |
| | Owens Corning | 29,304 | 1,429 |
| | Alaska Air Group Inc. | 16,405 | 1,185 |
| | Expeditors International | | |
| | of Washington Inc. | 20,058 | 1,032 |
| * | Jacobs Engineering Group | |
| | Inc. | 19,193 | 990 |
| * | Hertz Global Holdings Inc. | 9,307 | 308 |
| | MSC Industrial Direct Co. | | |
| | Inc. Class A | 2,040 | 148 |
| | | | 4,205,606 |
| Information Technology (14.1%) | |
| | Microsoft Corp. | 24,440,753 | 1,464,490 |
| | Oracle Corp. | 20,485,200 | 787,041 |
| | QUALCOMM Inc. | 11,191,232 | 769,061 |
| | Apple Inc. | 3,545,706 | 402,579 |
| * | Alphabet Inc. Class A | 489,418 | 396,380 |
| | Cisco Systems Inc. | 10,469,183 | 321,195 |
| | Samsung Electronics Co. | | |
| | Ltd. | 153,400 | 219,412 |
| | Taiwan Semiconductor | | |
| | Manufacturing Co. Ltd. | | |
| | ADR | 6,498,919 | 202,116 |
| | Visa Inc. Class A | 2,344,900 | 193,478 |
| * | eBay Inc. | 6,728,900 | 191,841 |
| | Corning Inc. | 7,539,300 | 171,218 |
| | Intel Corp. | 4,559,169 | 158,978 |
| * | Alphabet Inc. Class C | 189,826 | 148,926 |
| | Skyworks Solutions Inc. | 1,885,300 | 145,055 |
| | Hewlett Packard | | |
| | Enterprise Co. | 6,171,200 | 138,667 |
| | Telefonaktiebolaget LM | | |
| | Ericsson ADR | 24,303,100 | 118,356 |
| | Applied Materials Inc. | 3,686,400 | 107,201 |
| | Fidelity National | | |
| | Information Services Inc. | 1,340,800 | 99,112 |
| | Motorola Solutions Inc. | 1,293,800 | 93,904 |
| * | Vantiv Inc. Class A | 1,090,100 | 63,618 |
| | TE Connectivity Ltd. | 948,800 | 59,651 |
| * | Teradata Corp. | 1,161,200 | 31,306 |
| | International Business | | |
| | Machines Corp. | 15,684 | 2,411 |
| | HP Inc. | 146,828 | 2,128 |
| | Marvell Technology | | |
| | Group Ltd. | 126,396 | 1,647 |
| | Western Union Co. | 81,333 | 1,632 |
| | Maxim Integrated | | |
| | Products Inc. | 40,929 | 1,622 |
| | Seagate Technology plc | 46,667 | 1,601 |
| | Xerox Corp. | 156,858 | 1,533 |
16
Windsor II Fund
| | | |
| | | | Market |
| | | | Value• |
| | | Shares | ($000) |
| * | NCR Corp. | 43,520 | 1,525 |
| | NVIDIA Corp. | 21,281 | 1,514 |
| | Computer Sciences Corp. | 26,927 | 1,466 |
| | Lam Research Corp. | 13,578 | 1,315 |
| | Avnet Inc. | 29,647 | 1,244 |
| | Leidos Holdings Inc. | 21,045 | 875 |
| * | Arrow Electronics Inc. | 5,298 | 324 |
| | | | 6,304,422 |
| Materials (1.9%) | | |
| | Air Products & Chemicals | | |
| | Inc. | 4,902,462 | 654,087 |
| * | Crown Holdings Inc. | 2,027,750 | 110,005 |
| | International Paper Co. | 1,109,000 | 49,938 |
| | Packaging Corp. of | | |
| | America | 393,102 | 32,431 |
| * | AdvanSix Inc. | 168,346 | 2,687 |
| | LyondellBasell Industries | | |
| | NV Class A | 26,611 | 2,117 |
| * | Freeport-McMoRan Inc. | 143,267 | 1,602 |
| | Steel Dynamics Inc. | 56,669 | 1,556 |
| | Avery Dennison Corp. | 21,295 | 1,486 |
| | Dow Chemical Co. | 19,957 | 1,074 |
| | | | 856,983 |
| Other (0.2%) | | |
| 2 | Vanguard Value ETF | 630,600 | 54,263 |
| | SPDR S&P500 ETF Trust | 197,312 | 41,939 |
| | | | 96,202 |
| Real Estate (0.1%) | | |
| | Host Hotels & Resorts | | |
| | Inc. | 3,505,731 | 54,269 |
| | Omega Healthcare | | |
| | Investors Inc. | 47,633 | 1,516 |
| | VEREIT Inc. | 160,716 | 1,511 |
| | Senior Housing Properties | | |
| | Trust | 70,825 | 1,506 |
| | WP Carey Inc. | 24,646 | 1,497 |
| | Spirit Realty Capital Inc. | 123,569 | 1,471 |
| | DDR Corp. | 85,793 | 1,312 |
| | Hospitality Properties Trust | 19,400 | 531 |
| | HCP Inc. | 15,437 | 529 |
| | | | 64,142 |
| Telecommunication Services (2.9%) | |
| | Verizon Communications | | |
| | Inc. | 14,336,951 | 689,607 |
| | AT&T Inc. | 13,257,185 | 487,732 |
| ^ | Vodafone Group plc ADR | 3,992,236 | 111,144 |
| | CenturyLink Inc. | 64,676 | 1,719 |
| | | | 1,290,202 |
| | | |
| Utilities (1.1%) | | |
| | CenterPoint Energy Inc. | 9,933,076 | 226,474 |
| * | Calpine Corp. | 10,955,200 | 130,367 |
| | NRG Energy Inc. | 4,489,400 | 47,722 |
| | Southern Co. | 535,800 | 27,631 |
| | PPL Corp. | 688,124 | 23,630 |
| | Edison International | 27,267 | 2,004 |
| | FirstEnergy Corp. | 51,477 | 1,765 |
| | Entergy Corp. | 23,329 | 1,719 |
| | MDU Resources Group Inc. 64,443 | 1,689 |
| | AES Corp. | 136,026 | 1,601 |
| | NiSource Inc. | 67,821 | 1,578 |
| | UGI Corp. | 33,602 | 1,555 |
| | National Fuel Gas Co. | 27,284 | 1,429 |
| | Ameren Corp. | 21,641 | 1,081 |
| | DTE Energy Co. | 6,213 | 597 |
| | Duke Energy Corp. | 2,143 | 171 |
| | NextEra Energy Inc. | 1,100 | 141 |
| | | | 471,154 |
| Total Common Stocks | | |
| (Cost $35,280,663) | | 43,691,655 |
| Temporary Cash Investments (1.8%)1 | |
| Money Market Fund (1.7%) | | |
| 3,4 | Vanguard Market Liquidity | | |
| | Fund, 0.718% | 7,779,911 | 778,069 |
| | | |
| | | Face | |
| | | Amount | |
| | | ($000) | |
| U.S. Government and Agency Obligations (0.1%) |
| 5 | United States Treasury Bill, | | |
| | 0.281%, 12/15/16 | 9,300 | 9,298 |
| 5 | United States Treasury Bill, | | |
| | 0.326%, 12/29/16 | 1,300 | 1,299 |
| 5 | United States Treasury Bill, | | |
| | 0.381%, 3/9/17 | 5,000 | 4,994 |
| | United States Treasury Bill, | | |
| | 0.381%, 3/30/17 | 10,000 | 9,984 |
| | | | 25,575 |
| Total Temporary Cash Investments | |
| (Cost $803,607) | | 803,644 |
| Total Investments (99.4%) | | |
| (Cost $36,084,270) | | 44,495,299 |
17
Windsor II Fund
| |
| | Amount |
| | ($000) |
| Other Assets and Liabilities (0.6%) | |
| Other Assets | |
| Investment in Vanguard | 3,481 |
| Receivables for Investment Securities | |
| Sold | 772,275 |
| Receivables for Accrued Income | 51,310 |
| Receivables for Capital Shares Issued | 412,312 |
| Other Assets 6 | 5,501 |
| Total Other Assets | 1,244,879 |
| Liabilities | |
| Payables for Investment Securities | |
| Purchased | (410,331) |
| Collateral for Securities on Loan | (10,693) |
| Payables to Investment Advisor | (12,754) |
| Payables for Capital Shares Redeemed | (424,354) |
| Payables to Vanguard | (72,186) |
| Other Liabilities | (45,349) |
| Total Liabilities | (975,667) |
| Net Assets (100%) | 44,764,511 |
| |
| At October 31, 2016, net assets consisted of: |
| | Amount |
| | ($000) |
| Paid-in Capital | 33,559,959 |
| Undistributed Net Investment Income | 364,457 |
| Accumulated Net Realized Gains | 2,429,515 |
| Unrealized Appreciation (Depreciation) | |
| Investment Securities | 8,411,029 |
| Futures Contracts | (337) |
| Foreign Currencies | (112) |
| Net Assets | 44,764,511 |
| |
| |
| Investor Shares—Net Assets | |
| Applicable to 393,154,373 outstanding | |
| $.001 par value shares of beneficial | |
| interest (unlimited authorization) | 13,773,388 |
| Net Asset Value Per Share— | |
| Investor Shares | $35.03 |
| |
| |
| Admiral Shares—Net Assets | |
| Applicable to 498,429,494 outstanding | |
| $.001 par value shares of beneficial | |
| interest (unlimited authorization) | 30,991,123 |
| Net Asset Value Per Share— | |
| Admiral Shares | $62.18 |
• See Note A in Notes to Financial Statements.
* Non-income-producing security.
^ Includes partial security positions on loan to broker-dealers. The total value of securities on loan is $10,303,000.
1 The fund invests a portion of its cash reserves in equity markets through the use of index futures contracts. After giving effect to futures
investments, the fund’s effective common stock and temporary cash investment positions represent 98.4% and 1.0%, respectively, of
net assets.
2 Considered an affiliated company of the fund as the issuer is another member of The Vanguard Group.
3 Affiliated money market fund available only to Vanguard funds and certain trusts and accounts managed by Vanguard. Rate shown is the
7-day yield.
4 Includes $10,693,000 of collateral received for securities on loan.
5 Securities with a value of $10,697,000 have been segregated as initial margin for open futures contracts.
6 Cash of $5,470,000 has been segregated as initial margin for open futures contracts.
ADR—American Depositary Receipt.
See accompanying Notes, which are an integral part of the Financial Statements.
18
Windsor II Fund
| |
| Statement of Operations | |
| |
| | Year Ended |
| | October 31, 2016 |
| | ($000) |
| Investment Income | |
| Income | |
| Dividends1 | 1,247,532 |
| Interest | 4,747 |
| Securities Lending—Net | 1,989 |
| Total Income | 1,254,268 |
| Expenses | |
| Investment Advisory Fees—Note B | |
| Basic Fee | 63,636 |
| Performance Adjustment | (14,848) |
| The Vanguard Group—Note C | |
| Management and Administrative—Investor Shares | 28,423 |
| Management and Administrative—Admiral Shares | 40,019 |
| Marketing and Distribution—Investor Shares | 2,496 |
| Marketing and Distribution—Admiral Shares | 2,111 |
| Custodian Fees | 375 |
| Auditing Fees | 49 |
| Shareholders’ Reports—Investor Shares | 200 |
| Shareholders’ Reports—Admiral Shares | 206 |
| Trustees’ Fees and Expenses | 56 |
| Total Expenses | 122,723 |
| Expenses Paid Indirectly | (1,681) |
| Net Expenses | 121,042 |
| Net Investment Income | 1,133,226 |
| Realized Net Gain (Loss) | |
| Investment Securities Sold | 2,800,319 |
| Futures Contracts | 20,614 |
| Foreign Currencies | 75 |
| Realized Net Gain (Loss) | 2,821,008 |
| Change in Unrealized Appreciation (Depreciation) | |
| Investment Securities | (2,688,199) |
| Futures Contracts | (1,226) |
| Foreign Currencies | (68) |
| Change in Unrealized Appreciation (Depreciation) | (2,689,493) |
| Net Increase (Decrease) in Net Assets Resulting from Operations | 1,264,741 |
| 1 Dividends are net of foreign withholding taxes of $11,253,000. | |
See accompanying Notes, which are an integral part of the Financial Statements.
19
| | |
| Windsor II Fund | | |
| |
| |
| Statement of Changes in Net Assets | | |
| |
| | Year Ended October 31, |
| | 2016 | 2015 |
| | ($000) | ($000) |
| Increase (Decrease) in Net Assets | | |
| Operations | | |
| Net Investment Income | 1,133,226 | 1,072,069 |
| Realized Net Gain (Loss) | 2,821,008 | 2,378,149 |
| Change in Unrealized Appreciation (Depreciation) | (2,689,493) | (2,599,668) |
| Net Increase (Decrease) in Net Assets Resulting from Operations | 1,264,741 | 850,550 |
| Distributions | | |
| Net Investment Income | | |
| Investor Shares | (322,488) | (358,906) |
| Admiral Shares | (710,701) | (733,475) |
| Realized Capital Gain1 | | |
| Investor Shares | (772,959) | (1,126,628) |
| Admiral Shares | (1,596,656) | (2,171,142) |
| Total Distributions | (3,402,804) | (4,390,151) |
| Capital Share Transactions | | |
| Investor Shares | (908,254) | (726,917) |
| Admiral Shares | 650,239 | 1,217,313 |
| Net Increase (Decrease) from Capital Share Transactions | (258,015) | 490,396 |
| Total Increase (Decrease) | (2,396,078) | (3,049,205) |
| Net Assets | | |
| Beginning of Period | 47,160,589 | 50,209,794 |
| End of Period2 | 44,764,511 | 47,160,589 |
1 Includes fiscal 2016 and 2015 short-term gain distributions totaling $218,890,000 and $362,212,000, respectively. Short-term gain distributions are treated as ordinary income dividends for tax purposes.
2 Net Assets—End of Period includes undistributed (overdistributed) net investment income of $364,457,000 and $264,345,000.
See accompanying Notes, which are an integral part of the Financial Statements.
20
Windsor II Fund
| | | | | |
| Financial Highlights | | | | | |
| |
| |
| Investor Shares | | | | | |
| |
| For a Share Outstanding | | | Year Ended October 31, |
| Throughout Each Period | 2016 | 2015 | 2014 | 2013 | 2012 |
| Net Asset Value, Beginning of Period | $36.73 | $39.59 | $36.19 | $29.33 | $25.68 |
| Investment Operations | | | | | |
| Net Investment Income | . 8471 | .809 | .868 | .740 | .644 |
| Net Realized and Unrealized Gain (Loss) | | | | | |
| on Investments | .096 | (.229) | 4.167 | 6.842 | 3.627 |
| Total from Investment Operations | .943 | .580 | 5.035 | 7.582 | 4.271 |
| Distributions | | | | | |
| Dividends from Net Investment Income | (.781) | (. 827) | (. 838) | (.722) | (. 621) |
| Distributions from Realized Capital Gains | (1.862) | (2.613) | (.797) | — | — |
| Total Distributions | (2.643) | (3.440) | (1.635) | (.722) | (.621) |
| Net Asset Value, End of Period | $35.03 | $36.73 | $39.59 | $36.19 | $29.33 |
| |
| Total Return2 | 2.86% | 1.57% | 14.36% | 26.26% | 16.90% |
| |
| Ratios/Supplemental Data | | | | | |
| Net Assets, End of Period (Millions) | $13,773 | $15,397 | $17,312 | $18,034 | $18,255 |
| Ratio of Total Expenses to Average Net Assets3 | 0.33% | 0.34% | 0.36% | 0.36% | 0.35% |
| Ratio of Net Investment Income to | | | | | |
| Average Net Assets | 2.46% | 2.12% | 2.28% | 2.25% | 2.30% |
| Portfolio Turnover Rate | 33% | 26% | 27% | 27% | 22% |
1 Calculated based on average shares outstanding.
2 Total returns do not include account service fees that may have applied in the periods shown. Fund prospectuses provide information about
any applicable account service fees.
3 Includes performance-based investment advisory fee increases (decreases) of (0.03%), (0.02%), 0.00%, (0.01%), and (0.02%).
See accompanying Notes, which are an integral part of the Financial Statements.
21
Windsor II Fund
| | | | | |
| Financial Highlights | | | | | |
| |
| |
| Admiral Shares | | | | | |
| |
| For a Share Outstanding | | | Year Ended October 31, |
| Throughout Each Period | 2016 | 2015 | 2014 | 2013 | 2012 |
| Net Asset Value, Beginning of Period | $65.20 | $70.27 | $64.23 | $52.06 | $45.59 |
| Investment Operations | | | | | |
| Net Investment Income | 1.5521 | 1.492 | 1.601 | 1.366 | 1.188 |
| Net Realized and Unrealized Gain (Loss) | | | | | |
| on Investments | .168 | (.401) | 7.398 | 12.134 | 6.424 |
| Total from Investment Operations | 1.720 | 1.091 | 8.999 | 13.500 | 7.612 |
| Distributions | | | | | |
| Dividends from Net Investment Income | (1.437) | (1.525) | (1.545) | (1.330) | (1.142) |
| Distributions from Realized Capital Gains | (3.303) | (4.636) | (1.414) | — | — |
| Total Distributions | (4.740) | (6.161) | (2.959) | (1.330) | (1.142) |
| Net Asset Value, End of Period | $62.18 | $65.20 | $70.27 | $64.23 | $52.06 |
| |
| Total Return2 | 2.94% | 1.66% | 14.46% | 26.36% | 16.98% |
| |
| Ratios/Supplemental Data | | | | | |
| Net Assets, End of Period (Millions) | $30,991 | $31,763 | $32,898 | $27,593 | $19,032 |
| Ratio of Total Expenses to Average Net Assets3 | 0.25% | 0.26% | 0.28% | 0.28% | 0.27% |
| Ratio of Net Investment Income to | | | | | |
| Average Net Assets | 2.54% | 2.20% | 2.36% | 2.33% | 2.38% |
| Portfolio Turnover Rate | 33% | 26% | 27% | 27% | 22% |
1 Calculated based on average shares outstanding.
2 Total returns do not include account service fees that may have applied in the periods shown. Fund prospectuses provide information about
any applicable account service fees.
3 Includes performance-based investment advisory fee increases (decreases) of (0.03%), (0.02%), 0.00%, (0.01%), and (0.02%).
See accompanying Notes, which are an integral part of the Financial Statements.
22
Windsor II Fund
Notes to Financial Statements
Vanguard Windsor II Fund is registered under the Investment Company Act of 1940 as an open-end investment company, or mutual fund. The fund offers two classes of shares: Investor Shares and Admiral Shares. Investor Shares are available to any investor who meets the fund’s minimum purchase requirements. Admiral Shares are designed for investors who meet certain administrative, service, and account-size criteria.
A. The following significant accounting policies conform to generally accepted accounting principles for U.S. investment companies. The fund consistently follows such policies in preparing its financial statements.
1. Security Valuation: Securities are valued as of the close of trading on the New York Stock Exchange (generally 4 p.m., Eastern time) on the valuation date. Equity securities are valued at the latest quoted sales prices or official closing prices taken from the primary market in which each security trades; such securities not traded on the valuation date are valued at the mean of the latest quoted bid and asked prices. Securities for which market quotations are not readily available, or whose values have been affected by events occurring before the fund’s pricing time but after the close of the securities’ primary markets, are valued at their fair values calculated according to procedures adopted by the board of trustees. These procedures include obtaining quotations from an independent pricing service, monitoring news to identify significant market- or security-specific events, and evaluating changes in the values of foreign market proxies (for example, ADRs, futures contracts, or exchange-traded funds), between the time the foreign markets close and the fund’s pricing time. When fair-value pricing is employed, the prices of securities used by a fund to calculate its net asset value may differ from quoted or published prices for the same securities. Investments in Vanguard Market Liquidity Fund are valued at that fund’s net asset value. Temporary cash investments acquired over 60 days to maturity are valued using the latest bid prices or using valuations based on a matrix system (which considers such factors as security prices, yields, maturities, and ratings), both as furnished by independent pricing services. Other temporary cash investments are valued at amortized cost, which approximates market value.
2. Foreign Currency: Securities and other assets and liabilities denominated in foreign currencies are translated into U.S. dollars using exchange rates obtained from an independent third party as of the fund’s pricing time on the valuation date. Realized gains (losses) and unrealized appreciation (depreciation) on investment securities include the effects of changes in exchange rates since the securities were purchased, combined with the effects of changes in security prices. Fluctuations in the value of other assets and liabilities resulting from changes in exchange rates are recorded as unrealized foreign currency gains (losses) until the assets or liabilities are settled in cash, at which time they are recorded as realized foreign currency gains (losses).
3. Futures Contracts: The fund uses index futures contracts to a limited extent, with the objective of maintaining full exposure to the stock market while maintaining liquidity. The fund may purchase or sell futures contracts to achieve a desired level of investment, whether to accommodate portfolio turnover or cash flows from capital share transactions. The primary risks associated with the use of futures contracts are imperfect correlation between changes in market values of stocks held by the fund and the prices of futures contracts, and the possibility of an illiquid market. Counterparty risk involving futures is mitigated because a regulated clearinghouse is the counterparty instead of the clearing broker. To further mitigate counterparty risk, the fund trades futures contracts on an exchange, monitors the financial strength of its clearing brokers and clearinghouse, and has entered
23
Windsor II Fund
into clearing agreements with its clearing brokers. The clearinghouse imposes initial margin requirements to secure the fund’s performance and requires daily settlement of variation margin representing changes in the market value of each contract.
Futures contracts are valued at their quoted daily settlement prices. The aggregate settlement values of the contracts are not recorded in the Statement of Net Assets. Fluctuations in the value of the contracts are recorded in the Statement of Net Assets as an asset (liability) and in the Statement of Operations as unrealized appreciation (depreciation) until the contracts are closed, when they are recorded as realized futures gains (losses).
During the year ended October 31, 2016, the fund’s average investments in long and short futures contracts represented less than 1% and 0% of net assets, respectively, based on the average of aggregate settlement values at each quarter-end during the period.
4. Federal Income Taxes: The fund intends to continue to qualify as a regulated investment company and distribute all of its taxable income. Management has analyzed the fund’s tax positions taken for all open federal income tax years (October 31, 2013–2016), and has concluded that no provision for federal income tax is required in the fund’s financial statements.
5. Distributions: Distributions to shareholders are recorded on the ex-dividend date.
6. Securities Lending: To earn additional income, the fund lends its securities to qualified institutional borrowers. Security loans are subject to termination by the fund at any time, and are required to be secured at all times by collateral in an amount at least equal to the market value of securities loaned. Daily market fluctuations could cause the value of loaned securities to be more or less than the value of the collateral received. When this occurs, the collateral is adjusted and settled on the next business day. The fund further mitigates its counterparty risk by entering into securities lending transactions only with a diverse group of prequalified counterparties, monitoring their financial strength, and entering into master securities lending agreements with its counterparties. The master securities lending agreements provide that, in the event of a counterparty’s default (including bankruptcy), the fund may terminate any loans with that borrower, determine the net amount owed, and sell or retain the collateral up to the net amount owed to the fund; however, such actions may be subject to legal proceedings. While collateral mitigates counterparty risk, in the absence of a default the fund may experience delays and costs in recovering the securities loaned. The fund invests cash collateral received in Vanguard Market Liquidity Fund, and records a liability in the Statement of Net Assets for the return of the collateral, during the period the securities are on loan. Securities lending income represents fees charged to borrowers plus income earned on invested cash collateral, less expenses associated with the loan. During the term of the loan, the fund is entitled to all distributions made on or in respect of the loaned securities.
7. Credit Facility: The fund and certain other funds managed by The Vanguard Group (“Vanguard”) participate in a $3.1 billion committed credit facility provided by a syndicate of lenders pursuant to a credit agreement that may be renewed annually; each fund is individually liable for its borrowings, if any, under the credit facility. Borrowings may be utilized for temporary and emergency purposes, and are subject to the fund’s regulatory and contractual borrowing restrictions. The participating funds are charged administrative fees and an annual commitment fee of 0.10% of the undrawn amount of the facility; these fees are allocated to the funds based on a method approved by the fund’s board of trustees and included in Management and Administrative expenses on the fund’s Statement of
24
Windsor II Fund
Operations. Any borrowings under this facility bear interest at a rate based upon the higher of the one-month London Interbank Offered Rate, federal funds effective rate, or overnight bank funding rate plus an agreed-upon spread.
The fund had no borrowings outstanding at October 31, 2016, or at any time during the period then ended.
8. Other: Dividend income is recorded on the ex-dividend date. Interest income includes income distributions received from Vanguard Market Liquidity Fund and is accrued daily. Premiums and discounts on debt securities purchased are amortized and accreted, respectively, to interest income over the lives of the respective securities. Security transactions are accounted for on the date securities are bought or sold. Costs used to determine realized gains (losses) on the sale of investment securities are those of the specific securities sold.
Each class of shares has equal rights as to assets and earnings, except that each class separately bears certain class-specific expenses related to maintenance of shareholder accounts (included in Management and Administrative expenses) and shareholder reporting. Marketing and distribution expenses are allocated to each class of shares based on a method approved by the board of trustees. Income, other non-class-specific expenses, and gains and losses on investments are allocated to each class of shares based on its relative net assets.
B. The investment advisory firms Barrow, Hanley, Mewhinney & Strauss, LLC, Lazard Asset Management LLC, Hotchkis and Wiley Capital Management, LLC, and Sanders Capital, LLC, each provide investment advisory services to a portion of the fund for a fee calculated at an annual percentage rate of average net assets managed by the advisor. The basic fee of Barrow, Hanley, Mewhinney & Strauss, LLC, is subject to quarterly adjustments based on performance relative to the MSCI US Prime Market 750 Index for the preceding three years. The basic fee of Lazard Asset Management LLC is subject to quarterly adjustments based on performance relative to the S&P 500 Index for the preceding three years. The basic fee of Hotchkis and Wiley Capital Management, LLC, is subject to quarterly adjustments based on performance relative to the MSCI US Investable Market 2500 Index for the preceding five years. The basic fee of Sanders Capital, LLC, is subject to quarterly adjustments based on performance relative to the Russell 3000 Index for the preceding five years.
Vanguard provides investment advisory services to a portion of the fund as described below; the fund paid Vanguard advisory fees of $241,000 for the year ended October 31, 2016.
For the year ended October 31, 2016, the aggregate investment advisory fee paid to all advisors represented an effective annual basic rate of 0.13% of the fund’s average net assets, before a decrease of $14,848,000 (0.03%) based on performance.
C. In accordance with the terms of a Funds’ Service Agreement (the “FSA”) between Vanguard and the fund, Vanguard furnishes to the fund investment advisory, corporate management, administrative, marketing, and distribution services at Vanguard’s cost of operations (as defined by the FSA). These costs of operations are allocated to the fund based on methods and guidelines approved by the board of trustees. Vanguard does not require reimbursement in the current period for certain costs of operations (such as deferred compensation/benefits and risk/insurance costs); the fund’s liability for these costs of operations is included in Payables to Vanguard on the Statement of Net Assets.
25
Windsor II Fund
Upon the request of Vanguard, the fund may invest up to 0.40% of its net assets as capital in Vanguard. At October 31, 2016, the fund had contributed to Vanguard capital in the amount of $3,481,000, representing 0.01% of the fund’s net assets and 1.39% of Vanguard’s capitalization. The fund’s trustees and officers are also directors and employees, respectively, of Vanguard.
D. The fund has asked its investment advisors to direct certain security trades, subject to obtaining the best price and execution, to brokers who have agreed to rebate to the fund part of the commissions generated. Such rebates are used solely to reduce the fund’s management and administrative expenses. For the year ended October 31, 2016, these arrangements reduced the fund’s expenses by $1,681,000 (an annual rate of 0.00% of average net assets).
E. Various inputs may be used to determine the value of the fund’s investments. These inputs are summarized in three broad levels for financial statement purposes. The inputs or methodologies used to value securities are not necessarily an indication of the risk associated with investing in those securities.
Level 1—Quoted prices in active markets for identical securities.
Level 2—Other significant observable inputs (including quoted prices for similar securities, interest
rates, prepayment speeds, credit risk, etc.).
Level 3—Significant unobservable inputs (including the fund’s own assumptions used to determine
the fair value of investments).
The following table summarizes the market value of the fund’s investments as of October 31, 2016, based on the inputs used to value them:
| | | |
| | Level 1 | Level 2 | Level 3 |
| Investments | ($000) | ($000) | ($000) |
| Common Stocks | 43,031,742 | 659,913 | — |
| Temporary Cash Investments | 778,069 | 25,575 | — |
| Futures Contracts—Assets1 | 28 | — | — |
| Futures Contracts—Liabilities1 | (671) | — | — |
| Total | 43,809,168 | 685,488 | — |
| 1 Represents variation margin on the last day of the reporting period. | | | |
F. At October 31, 2016, the aggregate settlement value of open futures contracts and the related unrealized appreciation (depreciation) were:
| | | | |
| | | | | ($000) |
| | | | Aggregate | |
| | | Number of | Settlement | Unrealized |
| | | Long (Short) | Value | Appreciation |
| Futures Contracts | Expiration | Contracts | Long (Short) | (Depreciation) |
| E-mini S&P 500 Index | December 2016 | 3,397 | 360,099 | (337) |
Unrealized appreciation (depreciation) on open futures contracts is required to be treated as realized gain (loss) for tax purposes.
26
Windsor II Fund
G. Distributions are determined on a tax basis and may differ from net investment income and realized capital gains for financial reporting purposes. Differences may be permanent or temporary. Permanent differences are reclassified among capital accounts in the financial statements to reflect their tax character. Temporary differences arise when certain items of income, expense, gain, or loss are recognized in different periods for financial statement and tax purposes. These differences will reverse at some time in the future. Differences in classification may also result from the treatment of short-term gains as ordinary income for tax purposes.
During the year ended October 31, 2016, the fund realized net foreign currency gains of $75,000, which increased distributable net income for tax purposes; accordingly, such gains have been reclassified from accumulated net realized gains to undistributed net investment income.
The fund used a tax accounting practice to treat a portion of the price of capital shares redeemed during the year as distributions from realized capital gains. Accordingly, the fund has reclassified $158,665,000 from accumulated net realized gains to paid-in capital.
For tax purposes, at October 31, 2016, the fund had $559,550,000 of ordinary income and $2,308,478,000 of long-term capital gains available for distribution.
At October 31, 2016, the cost of investment securities for tax purposes was $36,090,430,000. Net unrealized appreciation of investment securities for tax purposes was $8,404,869,000, consisting of unrealized gains of $11,482,374,000 on securities that had risen in value since their purchase and $3,077,505,000 in unrealized losses on securities that had fallen in value since their purchase.
H. During the year ended October 31, 2016, the fund purchased $14,629,816,000 of investment securities and sold $16,386,790,000 of investment securities, other than temporary cash investments.
| | | | |
| I. Capital share transactions for each class of shares were: | | | |
| | | | Year Ended October 31, |
| | | 2016 | | 2015 |
| | Amount | Shares | Amount | Shares |
| | ($000) | (000) | ($000) | (000) |
| Investor Shares | | | | |
| Issued | 680,830 | 20,254 | 819,260 | 22,029 |
| Issued in Lieu of Cash Distributions | 1,070,182 | 31,483 | 1,452,867 | 39,652 |
| Redeemed | (2,659,266) | (77,750) | (2,999,044) | (79,782) |
| Net Increase (Decrease)—Investor Shares | (908,254) | (26,013) | (726,917) | (18,101) |
| Admiral Shares | | | | |
| Issued | 2,193,824 | 36,339 | 2,623,185 | 39,268 |
| Issued in Lieu of Cash Distributions | 2,188,705 | 36,288 | 2,766,828 | 42,548 |
| Redeemed | (3,732,290) | (61,400) | (4,172,700) | (62,796) |
| Net Increase (Decrease)—Admiral Shares | 650,239 | 11,227 | 1,217,313 | 19,020 |
27
Windsor II Fund
J. Certain of the fund’s investments are in companies that are considered to be affiliated companies of the fund because the fund owns more than 5% of the outstanding voting securities of the company or the issuer is another member of The Vanguard Group. Transactions during the period in securities of these companies were as follows:
| | | | | | |
| | | | Current Period Transactions | |
| | Oct. 31, | | Proceeds | | | Oct. 31, |
| | 2015 | | from | | Capital Gain | 2016 |
| | Market | Purchases | Securities | | Distributions | Market |
| | Value | at Cost | Sold1 | Income | Received | Value |
| | ($000) | ($000) | ($000) | ($000) | ($000) | ($000) |
| CenterPoint Energy Inc. | 485,793 | 1,537 | 366,700 | 20,677 | — | NA2 |
| Vanguard Market | | | | | | |
| Liquidity Fund | 1,700,854 | NA3 | NA 3 | 4,671 | — | 778,069 |
| Vanguard Value ETF | 104,200 | — | 51,429 | 1,737 | — | 54,263 |
| Total | 2,290,847 | | | 27,085 | — | 832,332 |
1 Includes net realized gain (loss) on affiliated investment securities sold of $135,039,000.
2 Not applicable—at October 31, 2016, the security was still held, but the issuer was no longer an affiliated company of the fund.
3 Not applicable—purchases and sales are for temporary cash investment purposes.
K. Management has determined that no material events or transactions occurred subsequent to October 31, 2016, that would require recognition or disclosure in these financial statements.
28
Report of Independent Registered Public Accounting Firm
To the Board of Trustees of Vanguard Windsor Funds and the Shareholders of Vanguard Windsor II Fund:
In our opinion, the accompanying statement of net assets and the related statements of operations and of changes in net assets and the financial highlights present fairly, in all material respects, the financial position of Vanguard Windsor II Fund (constituting a separate portfolio of Vanguard Windsor Funds, hereafter referred to as the “Fund”) at October 31, 2016, the results of its operations for the year then ended, the changes in its net assets for each of the two years in the period then ended, and the financial highlights for each of the five years in the period then ended, in conformity with accounting principles generally accepted in the United States of America. These financial statements and financial highlights (hereafter referred to as “financial statements”) are the responsibility of the Fund’s management. Our responsibility is to express an opinion on these financial statements based on our audits. We conducted our audits of these financial statements in accordance with the standards of the Public Company Accounting Oversight Board (United States). Those standards require that we plan and perform the audit to obtain reasonable assurance about whether the financial statements are free of material misstatement. An audit includes examining, on a test basis, evidence supporting the amounts and disclosures in the financial statements, assessing the accounting principles used and significant estimates made by management, and evaluating the overall financial statement presentation. We believe that our audits, which included confirmation of securities at October 31, 2016 by correspondence with the custodian and brokers and by agreement to the underlying ownership records of the transfer agent, provide a reasonable basis for our opinion.
/s/PricewaterhouseCoopers LLP
Philadelphia, Pennsylvania
December 15, 2016
Special 2016 tax information (unaudited) for Vanguard Windsor II Fund
This information for the fiscal year ended October 31, 2016, is included pursuant to provisions of the Internal Revenue Code.
The fund distributed $2,301,098,000 as capital gain dividends (20% rate gain distributions) to shareholders during the fiscal year.
For nonresident alien shareholders, 100% of short-term capital gain dividends distributed by the fund are qualified short-term capital gains.
The fund distributed $1,102,972,000 of qualified dividend income to shareholders during the fiscal year.
For corporate shareholders, 75.4% of investment income (dividend income plus short-term gains, if any) qualifies for the dividends-received deduction.
29
Your Fund’s After-Tax Returns
This table presents returns for your fund both before and after taxes. The after-tax returns are shown in two ways: (1) assuming that an investor owned the fund during the entire period and paid taxes on the fund’s distributions, and (2) assuming that an investor paid taxes on the fund’s distributions and sold all shares at the end of each period.
Calculations are based on the highest individual federal income tax and capital gains tax rates in effect at the times of the distributions and the hypothetical sales. State and local taxes were not considered. After-tax returns reflect any qualified dividend income, using actual prior-year figures and estimates for 2016. (In the example, returns after the sale of fund shares may be higher than those assuming no sale. This occurs when the sale would have produced a capital loss. The calculation assumes that the investor received a tax deduction for the loss.)
The table shows returns for Investor Shares only; returns for other share classes will differ. Please note that your actual after-tax returns will depend on your tax situation and may differ from those shown. Also note that if you own the fund in a tax-deferred account, such as an individual retirement account or a 401(k) plan, this information does not apply to you. Such accounts are not subject to current taxes.
Finally, keep in mind that a fund’s performance—whether before or after taxes—does not guarantee future results.
Average Annual Total Returns: Windsor II Fund Investor Shares
Periods Ended October 31, 2016
| | | |
| | One | Five | Ten |
| | Year | Years | Years |
| Returns Before Taxes | 2.86% | 12.01% | 5.38% |
| Returns After Taxes on Distributions | 1.00 | 10.71 | 4.32 |
| Returns After Taxes on Distributions and Sale of Fund Shares | 2.94 | 9.50 | 4.24 |
30
About Your Fund’s Expenses
As a shareholder of the fund, you incur ongoing costs, which include costs for portfolio management, administrative services, and shareholder reports (like this one), among others. Operating expenses, which are deducted from a fund’s gross income, directly reduce the investment return of the fund.
A fund’s expenses are expressed as a percentage of its average net assets. This figure is known as the expense ratio. The following examples are intended to help you understand the ongoing costs (in dollars) of investing in your fund and to compare these costs with those of other mutual funds. The examples are based on an investment of $1,000 made at the beginning of the period shown and held for the entire period.
The accompanying table illustrates your fund’s costs in two ways:
• Based on actual fund return. This section helps you to estimate the actual expenses that you paid over the period. The ”Ending Account Value“ shown is derived from the fund‘s actual return, and the third column shows the dollar amount that would have been paid by an investor who started with $1,000 in the fund. You may use the information here, together with the amount you invested, to estimate the expenses that you paid over the period.
To do so, simply divide your account value by $1,000 (for example, an $8,600 account value divided by $1,000 = 8.6), then multiply the result by the number given for your fund under the heading ”Expenses Paid During Period.“
• Based on hypothetical 5% yearly return. This section is intended to help you compare your fund‘s costs with those of other mutual funds. It assumes that the fund had a yearly return of 5% before expenses, but that the expense ratio is unchanged. In this case—because the return used is not the fund’s actual return—the results do not apply to your investment. The example is useful in making comparisons because the Securities and Exchange Commission requires all mutual funds to calculate expenses based on a 5% return. You can assess your fund’s costs by comparing this hypothetical example with the hypothetical examples that appear in shareholder reports of other funds.
Note that the expenses shown in the table are meant to highlight and help you compare ongoing costs only and do not reflect transaction costs incurred by the fund for buying and selling securities. Further, the expenses do not include any purchase, redemption, or account service fees described in the fund prospectus. If such fees were applied to your account, your costs would be higher. Your fund does not carry a “sales load.”
The calculations assume no shares were bought or sold during the period. Your actual costs may have been higher or lower, depending on the amount of your investment and the timing of any purchases or redemptions.
You can find more information about the fund’s expenses, including annual expense ratios, in the Financial Statements section of this report. For additional information on operating expenses and other shareholder costs, please refer to your fund’s current prospectus.
31
| | | |
| Six Months Ended October 31, 2016 | | | |
| | Beginning | Ending | Expenses |
| | Account Value | Account Value | Paid During |
| Windsor II Fund | 4/30/2016 | 10/31/2016 | Period |
| Based on Actual Fund Return | | | |
| Investor Shares | $1,000.00 | $1,028.73 | $1.68 |
| Admiral Shares | 1,000.00 | 1,029.20 | 1.22 |
| Based on Hypothetical 5% Yearly Return | | | |
| Investor Shares | $1,000.00 | $1,023.48 | $1.68 |
| Admiral Shares | 1,000.00 | 1,023.93 | 1.22 |
The calculations are based on expenses incurred in the most recent six-month period. The fund’s annualized six-month expense ratios for that period are 0.33% for Investor Shares and 0.24% for Admiral Shares. The dollar amounts shown as “Expenses Paid” are equal to the annualized expense ratio multiplied by the average account value over the period, multiplied by the number of days in the most recent six-month period, then divided by the number of days in the most recent 12-month period (184/366).
32
Glossary
30-Day SEC Yield. A fund’s 30-day SEC yield is derived using a formula specified by the U.S. Securities and Exchange Commission. Under the formula, data related to the fund’s security holdings in the previous 30 days are used to calculate the fund’s hypothetical net income for that period, which is then annualized and divided by the fund’s estimated average net assets over the calculation period. For the purposes of this calculation, a security’s income is based on its current market yield to maturity (for bonds), its actual income (for asset-backed securities), or its projected dividend yield (for stocks). Because the SEC yield represents hypothetical annualized income, it will differ—at times significantly—from the fund’s actual experience. As a result, the fund’s income distributions may be higher or lower than implied by the SEC yield.
Beta. A measure of the magnitude of a fund’s past share-price fluctuations in relation to the ups and downs of a given market index. The index is assigned a beta of 1.00. Compared with a given index, a fund with a beta of 1.20 typically would have seen its share price rise or fall by 12% when the index rose or fell by 10%. For this report, beta is based on returns over the past 36 months for both the fund and the index. Note that a fund’s beta should be reviewed in conjunction with its R-squared (see definition). The lower the R-squared, the less correlation there is between the fund and the index, and the less reliable beta is as an indicator of volatility.
Dividend Yield. Dividend income earned by stocks, expressed as a percentage of the aggregate market value (or of net asset value, for a fund). The yield is determined by dividing the amount of the annual dividends by the aggregate value (or net asset value) at the end of the period. For a fund, the dividend yield is based solely on stock holdings and does not include any income produced by other investments.
Earnings Growth Rate. The average annual rate of growth in earnings over the past five years for the stocks now in a fund.
Equity Exposure. A measure that reflects a fund’s investments in stocks and stock futures. Any holdings in short-term reserves are excluded.
Expense Ratio. A fund’s total annual operating expenses expressed as a percentage of the fund’s average net assets. The expense ratio includes management and administrative expenses, but does not include the transaction costs of buying and selling portfolio securities.
Foreign Holdings. The percentage of a fund represented by securities or depositary receipts of companies based outside the United States.
Inception Date. The date on which the assets of a fund (or one of its share classes) are first invested in accordance with the fund’s investment objective. For funds with a subscription period, the inception date is the day after that period ends. Investment performance is measured from the inception date.
Median Market Cap. An indicator of the size of companies in which a fund invests; the midpoint of market capitalization (market price x shares outstanding) of a fund’s stocks, weighted by the proportion of the fund’s assets invested in each stock. Stocks representing half of the fund’s assets have market capitalizations above the median, and the rest are below it.
Price/Book Ratio. The share price of a stock divided by its net worth, or book value, per share. For a fund, the weighted average price/book ratio of the stocks it holds.
33
Price/Earnings Ratio. The ratio of a stock’s current price to its per-share earnings over the past year. For a fund, the weighted average P/E of the stocks it holds. P/E is an indicator of market expectations about corporate prospects; the higher the P/E, the greater the expectations for a company’s future growth.
R-Squared. A measure of how much of a fund’s past returns can be explained by the returns from the market in general, as measured by a given index. If a fund’s total returns were precisely synchronized with an index’s returns, its R-squared would be 1.00. If the fund’s returns bore no relationship to the index’s returns, its R-squared would be 0. For this report, R-squared is based on returns over the past 36 months for both the fund and the index.
Return on Equity. The annual average rate of return generated by a company during the past five years for each dollar of shareholder’s equity (net income divided by shareholder’s equity). For a fund, the weighted average return on equity for the companies whose stocks it holds.
Short-Term Reserves. The percentage of a fund invested in highly liquid, short-term securities that can be readily converted to cash.
Turnover Rate. An indication of the fund’s trading activity. Funds with high turnover rates incur higher transaction costs and may be more likely to distribute capital gains (which may be taxable to investors). The turnover rate excludes in-kind transactions, which have minimal impact on costs.
34
This page intentionally left blank.
The People Who Govern Your Fund
The trustees of your mutual fund are there to see that the fund is operated and managed in your best interests since, as a shareholder, you are a part owner of the fund. Your fund’s trustees also serve on the board of directors of The Vanguard Group, Inc., which is owned by the Vanguard funds and provides services to them on an at-cost basis.
A majority of Vanguard’s board members are independent, meaning that they have no affiliation with Vanguard or the funds they oversee, apart from the sizable personal investments they have made as private individuals. The independent board members have distinguished backgrounds in business, academia, and public service. Each of the trustees and executive officers oversees 198 Vanguard funds.
The following table provides information for each trustee and executive officer of the fund. The mailing address of the trustees and officers is P.O. Box 876, Valley Forge, PA 19482. More information about the trustees is in the Statement of Additional Information, which can be obtained, without charge, by contacting Vanguard at 800-662-7447, or online at vanguard.com.
InterestedTrustee1
F. William McNabb III
Born 1957. Trustee Since July 2009. Chairman of the Board. Principal Occupation(s) During the Past Five Years and Other Experience: Chairman of the Board of The Vanguard Group, Inc., and of each of the investment companies served by The Vanguard Group, since January 2010; Director of The Vanguard Group since 2008; Chief Executive Officer and President of The Vanguard Group, and of each of the investment companies served by The Vanguard Group, since 2008; Director of Vanguard Marketing Corporation; Managing Director of The Vanguard Group (1995–2008).
IndependentTrustees
Emerson U. Fullwood
Born 1948. Trustee Since January 2008. Principal Occupation(s) During the Past Five Years and Other Experience: Executive Chief Staff and Marketing Officer for North America and Corporate Vice President (retired 2008) of Xerox Corporation (document management products and services); Executive in Residence and 2009–2010 Distinguished Minett Professor at the Rochester Institute of Technology; Lead Director of SPX FLOW, Inc. (multi-industry manufacturing); Director of the United Way of Rochester, the University of Rochester Medical Center, Monroe Community College Foundation, North Carolina A&T University, and Roberts Wesleyan College.
Rajiv L. Gupta
Born 1945. Trustee Since December 2001.2 Principal Occupation(s) During the Past Five Years and Other Experience: Chairman and Chief Executive Officer (retired 2009) and President (2006–2008) of Rohm and Haas Co. (chemicals); Director of Tyco International plc (diversified manufacturing and services), HP Inc. (printer and personal computer manufacturing), and Delphi Automotive plc (automotive components); Senior Advisor at New Mountain Capital.
Amy Gutmann
Born 1949. Trustee Since June 2006. Principal Occupation(s) During the Past Five Years and Other Experience: President of the University of Pennsylvania; Christopher H. Browne Distinguished Professor of Political Science, School of Arts and Sciences, and Professor of Communication, Annenberg School for Communication, with secondary faculty appointments in the Department of Philosophy, School of Arts and Sciences, and at the Graduate School of Education, University of Pennsylvania; Trustee of the National Constitution Center; Chair of the Presidential Commission for the Study of Bioethical Issues.
JoAnn Heffernan Heisen
Born 1950. Trustee Since July 1998. Principal Occupation(s) During the Past Five Years and Other Experience: Corporate Vice President and Chief Global Diversity Officer (retired 2008) and Member of the Executive Committee (1997–2008) of Johnson & Johnson (pharmaceuticals/medical devices/consumer products); Director of Skytop Lodge Corporation (hotels) and the Robert Wood Johnson Foundation; Member of the Advisory Board of the Institute for Women’s Leadership at Rutgers University.
F. Joseph Loughrey
Born 1949. Trustee Since October 2009. Principal Occupation(s) During the Past Five Years and Other Experience: President and Chief Operating Officer (retired 2009) of Cummins Inc. (industrial machinery); Chairman of the Board of Hillenbrand, Inc. (specialized consumer services), and of Oxfam America; Director of SKF AB (industrial machinery), Hyster-Yale Materials Handling, Inc. (forklift trucks), the Lumina Foundation for Education, and the V Foundation for Cancer Research; Member of the Advisory Council for the College of Arts and Letters and of the Advisory Board to the Kellogg Institute for International Studies, both at the University of Notre Dame.
Mark Loughridge
Born 1953. Trustee Since March 2012. Principal Occupation(s) During the Past Five Years and Other Experience: Senior Vice President and Chief Financial Officer (retired 2013) at IBM (information technology services); Fiduciary Member of IBM’s Retirement Plan Committee (2004–2013); Director of the Dow Chemical Company; Member of the Council on Chicago Booth.
Scott C. Malpass
Born 1962. Trustee Since March 2012. Principal Occupation(s) During the Past Five Years and Other Experience: Chief Investment Officer and Vice President at the University of Notre Dame; Assistant Professor of Finance at the Mendoza College of Business at Notre Dame; Member of the Notre Dame 403(b) Investment Committee, the Board of Advisors for Spruceview Capital Partners, and the Investment Advisory Committee of Major League Baseball; Board Member of TIFF Advisory Services, Inc., and Catholic Investment Services, Inc. (investment advisors).
André F. Perold
Born 1952. Trustee Since December 2004. Principal Occupation(s) During the Past Five Years and Other Experience: George Gund Professor of Finance and Banking, Emeritus at the Harvard Business School (retired 2011); Chief Investment Officer and Managing Partner of HighVista Strategies LLC (private investment firm); Director of Rand Merchant Bank; Overseer of the Museum of Fine Arts Boston.
Peter F. Volanakis
Born 1955. Trustee Since July 2009. Principal Occupation(s) During the Past Five Years and Other Experience: President and Chief Operating Officer (retired 2010) of Corning Incorporated (communications equipment); Chairman of the Board of Trustees of Colby-Sawyer College; Member of the Advisory Board of the Norris Cotton Cancer Center.
Executive Officers
Glenn Booraem
Born 1967. Treasurer Since May 2015. Principal Occupation(s) During the Past Five Years and Other Experience: Principal of The Vanguard Group, Inc.; Treasurer of each of the investment companies served by The Vanguard Group; Controller of each of the investment companies served by The Vanguard Group (2010–2015); Assistant Controller of each of the investment companies served by The Vanguard Group (2001–2010).
Thomas J. Higgins
Born 1957. Chief Financial Officer Since September 2008. Principal Occupation(s) During the Past Five Years and Other Experience: Principal of The Vanguard Group, Inc.; Chief Financial Officer of each of the investment companies served by The Vanguard Group; Treasurer of each of the investment companies served by The Vanguard Group (1998–2008).
Peter Mahoney
Born 1974. Controller Since May 2015. Principal Occupation(s) During the Past Five Years and Other Experience: Head of Global Fund Accounting at The Vanguard Group, Inc.; Controller of each of the investment companies served by The Vanguard Group; Head of International Fund Services at The Vanguard Group (2008–2014).
Anne E. Robinson
Born 1970. Secretary Since September 2016. Principal Occupation(s) During the Past Five Years and Other Experience: Managing Director of The Vanguard Group, Inc.; General Counsel of The Vanguard Group; Secretary of The Vanguard Group and of each of the investment companies served by The Vanguard Group; Director and Senior Vice President of Vanguard Marketing Corporation; Managing Director and General Counsel of Global Cards and Consumer Services at Citigroup (2014–2016); Counsel at American Express (2003–2014).
| |
Vanguard Senior ManagementTeam |
| Mortimer J. Buckley | James M. Norris |
| Kathleen C. Gubanich | Thomas M. Rampulla |
| Martha G. King | Glenn W. Reed |
| John T. Marcante | Karin A. Risi |
| Chris D. McIsaac | Michael Rollings |
Chairman Emeritus and Senior Advisor
John J. Brennan
Chairman, 1996–2009
Chief Executive Officer and President, 1996–2008
Founder
John C. Bogle
Chairman and Chief Executive Officer, 1974–1996
1 Mr. McNabb is considered an “interested person,” as defined in the Investment Company Act of 1940, because he is an officer of the Vanguard funds.
2 December 2002 for Vanguard Equity Income Fund, the Vanguard Municipal Bond Funds, and the Vanguard State Tax-Exempt Funds.

P.O. Box 2600
Valley Forge, PA 19482-2600
| |
| Connect with Vanguard® > vanguard.com | |
| |
| |
| |
| Fund Information > 800-662-7447 | CFA® is a registered trademark owned by CFA Institute. |
| Direct Investor Account Services > 800-662-2739 | |
| Institutional Investor Services > 800-523-1036 | |
| Text Telephone for People | |
| Who Are Deaf or Hard of Hearing> 800-749-7273 | |
| |
| This material may be used in conjunction | |
| with the offering of shares of any Vanguard | |
| fund only if preceded or accompanied by | |
| the fund’s current prospectus. | |
| |
| All comparative mutual fund data are from Lipper, a | |
| Thomson Reuters Company, or Morningstar, Inc., unless | |
| otherwise noted. | |
| |
| You can obtain a free copy of Vanguard’s proxy voting | |
| guidelines by visiting vanguard.com/proxyreporting or by | |
| calling Vanguard at 800-662-2739. The guidelines are | |
| also available from the SEC’s website, sec.gov. In | |
| addition, you may obtain a free report on how your fund | |
| voted the proxies for securities it owned during the 12 | |
| months ended June 30. To get the report, visit either | |
| vanguard.com/proxyreporting or sec.gov. | |
| |
| You can review and copy information about your fund at | |
| the SEC’s Public Reference Room in Washington, D.C. To | |
| find out more about this public service, call the SEC at | |
| 202-551-8090. Information about your fund is also | |
| available on the SEC’s website, and you can receive | |
| copies of this information, for a fee, by sending a | |
| request in either of two ways: via email addressed to | |
| publicinfo@sec.gov or via regular mail addressed to the | |
| Public Reference Section, Securities and Exchange | |
| Commission, Washington, DC 20549-1520. | |
| |
| | © 2016 The Vanguard Group, Inc. |
| | All rights reserved. |
| | Vanguard Marketing Corporation, Distributor. |
| |
| | Q730 122016 |
Item 2: Code of Ethics. The Registrant has adopted a code of ethics that applies to the Registrant’s principal executive officer, principal financial officer, principal accounting officer or controller or persons performing similar functions. The Code of Ethics was amended during the reporting period covered by this report to make certain technical, non-material changes.
Item 3: Audit Committee Financial Expert. All members of the Audit Committee have been determined by the Registrant’s Board of Trustees to be Audit Committee Financial Experts and to be independent: Rajiv L. Gupta, JoAnn Heffernan Heisen, F. Joseph Loughrey, Mark Loughridge, and Peter F. Volanakis.
Item 4: Principal Accountant Fees and Services.
(a) Audit Fees.
Audit Fees of the Registrant
Fiscal Year Ended October 31, 2016: $94,000
Fiscal Year Ended October 31, 2015: $75,000
Aggregate Audit Fees of Registered Investment Companies in the Vanguard Group.
Fiscal Year Ended October 31, 2016: $9,629,849
Fiscal Year Ended October 31, 2015: $7,000,200
Includes fees billed in connection with audits of the Registrant, other registered investment companies in the Vanguard complex, The Vanguard Group, Inc. and Vanguard Marketing Corporation.
(b) Audit-Related Fees.
Fiscal Year Ended October 31, 2016: $2,717,627
Fiscal Year Ended October 31, 2015: $2,899,096
Includes fees billed in connection with assurance and related services provided to the Registrant, other registered investment companies in the Vanguard complex, The Vanguard Group, Inc., and Vanguard Marketing Corporation.
(c) Tax Fees.
Fiscal Year Ended October 31, 2016: $254,050
Fiscal Year Ended October 31, 2015: $353,389
Includes fees billed in connection with tax compliance, planning, and advice services provided to the Registrant, other registered investment companies in the Vanguard complex, The Vanguard Group, Inc., and Vanguard Marketing Corporation.
0448435, v0.13
(d) All Other Fees.
Fiscal Year Ended October 31, 2016: $214,225
Fiscal Year Ended October 31, 2015: $202,313
Includes fees billed for services related to tax reported information provided to the Registrant, other registered investment companies in the Vanguard complex, The Vanguard Group, Inc., and Vanguard Marketing Corporation.
(e) (1) Pre-Approval Policies. The policy of the Registrant’s Audit Committee is to consider and, if appropriate, approve before the principal accountant is engaged for such services, all specific audit and non-audit services provided to: the Registrant, other registered investment companies in the Vanguard complex, The Vanguard Group, Inc., and entities controlled by The Vanguard Group, Inc. that provide ongoing services to the Registrant. In making a determination, the Audit Committee considers whether the services are consistent with maintaining the principal accountant’s independence.
In the event of a contingency situation in which the principal accountant is needed to provide services in between scheduled Audit Committee meetings, the Chairman of the Audit Committee would be called on to consider and, if appropriate, pre-approve audit or permitted non-audit services in an amount sufficient to complete services through the next Audit Committee meeting, and to determine if such services would be consistent with maintaining the accountant’s independence. At the next scheduled Audit Committee meeting, services and fees would be presented to the Audit Committee for formal consideration, and, if appropriate, approval by the entire Audit Committee. The Audit Committee would again consider whether such services and fees are consistent with maintaining the principal accountant’s independence.
The Registrant’s Audit Committee is informed at least annually of all audit and non-audit services provided by the principal accountant to the Vanguard complex, whether such services are provided to: the Registrant, other registered investment companies in the Vanguard complex, The Vanguard Group, Inc., or other entities controlled by The Vanguard Group, Inc. that provide ongoing services to the Registrant.
(2) No percentage of the principal accountant’s fees or services were approved pursuant to the waiver provision of paragraph (c)(7)(i)(C) of Rule 2-01 of Regulation S-X.
(f) For the most recent fiscal year, over 50% of the hours worked under the principal accountant’s engagement were not performed by persons other than full-time, permanent employees of the principal accountant.
(g) Aggregate Non-Audit Fees.
Fiscal Year Ended October 31, 2016: $468,275
Fiscal Year Ended October 31, 2015: $555,702
Includes fees billed for non-audit services provided to the Registrant, other registered investment companies in the Vanguard complex, The Vanguard Group, Inc., and Vanguard Marketing Corporation.
(h) For the most recent fiscal year, the Audit Committee has determined that the provision of all non-audit services was consistent with maintaining the principal accountant’s independence.
Item 5: Audit Committee of Listed Registrants.
Not Applicable.
Item 6: Investments.
Not Applicable.
Item 7: Disclosure of Proxy Voting Policies and Procedures for Closed-End Management Investment Companies.
Not Applicable.
Item 8: Portfolio Managers of Closed-End Management Investment Companies.
Not Applicable.
Item 9: Purchase of Equity Securities by Closed-End Management Investment Company and Affiliated Purchasers.
Not Applicable.
Item 10: Submission of Matters to a Vote of Security Holders.
Not Applicable.
Item 11: Controls and Procedures.
(a) Disclosure Controls and Procedures. The Principal Executive and Financial Officers concluded that the Registrant’s Disclosure Controls and Procedures are effective based on their evaluation of the Disclosure Controls and Procedures as of a date within 90 days of the filing date of this report.
(b) Internal Control Over Financial Reporting. There were no significant changes in Registrant’s Internal Control Over Financial Reporting or in other factors that could significantly affect this control subsequent to the date of the evaluation, including any corrective actions with regard to significant deficiencies and material weaknesses.
0448435, v0.13
Item 12: Exhibits.
(a) Code of Ethics.
(b) Certifications.
Pursuant to the requirements of the Securities Exchange Act of 1934 and the Investment Company Act of 1940, the registrant has duly caused this report to be signed on its behalf by the undersigned, thereunto duly authorized.
| |
| | VANGUARD WINDSOR FUNDS |
| |
| |
| BY: | /s/ F. WILLIAM MCNABB III* |
| | F. WILLIAM MCNABB III |
| | CHIEF EXECUTIVE OFFICER |
| |
| Date: December 19, 2016 |
Pursuant to the requirements of the Securities Exchange Act of 1934 and the Investment Company Act of 1940, this report has been signed below by the following persons on behalf of the registrant and in the capacities and on the dates indicated.
| |
| | VANGUARD WINDSOR FUNDS |
| |
| BY: | /s/ F. WILLIAM MCNABB III* |
| | F. WILLIAM MCNABB III |
| | CHIEF EXECUTIVE OFFICER |
| Date: December 19, 2016 |
| | VANGUARD WINDSOR FUNDS |
BY: | /s/ THOMAS J. HIGGINS* |
| | THOMAS J. HIGGINS |
| | CHIEF FINANCIAL OFFICER |
| Date: December 19, 2016 |
* By: /s/ Anne E. Robinson
Anne E. Robinson, pursuant to a Power of Attorney filed on October 4, 2016 see file Number
33-32548, Incorporated by Reference.