UNITED STATES
SECURITIES AND EXCHANGE COMMISSION
Washington, D.C. 20549
FORM N-CSR
CERTIFIED SHAREHOLDER REPORT
OF
REGISTERED MANAGEMENT INVESTMENT COMPANIES
| | | |
| Investment Company Act file number: 811-00834 |
| |
Name of Registrant: Vanguard Windsor Funds | |
| |
Address of Registrant: | |
P.O. Box 2600 | |
Valley Forge, PA 19482 | |
| Name and address of agent for service: | |
| Heidi Stam, Esquire | | |
P.O. Box 876 | | |
Valley Forge, PA 19482 | | |
Registrant’s telephone number, including area code: |
(610) 669-1000 |
| Date of fiscal year end: October 31 | |
Date of reporting period: November 1, 2013 – October 31, 2014 |
| Item 1: Reports to Shareholders | |
Annual Report | October 31, 2014
Vanguard Windsor™ Fund
The mission continues
On May 1, 1975, Vanguard began operations, a fledgling company based on the simple but revolutionary idea that a mutual fund company should be managed solely in the interest of its investors.
Four decades later, that revolutionary spirit continues to animate the enterprise. Vanguard remains on a mission to give investors the best chance of investment success.
As we mark our 40th anniversary, we thank you for entrusting your assets to Vanguard and giving us the opportunity to help you reach your financial goals in the decades to come.
| |
| Contents | |
| Your Fund’s Total Returns. | 1 |
| Chairman’s Letter. | 2 |
| Advisors’ Report. | 8 |
| Fund Profile. | 12 |
| Performance Summary. | 14 |
| Financial Statements. | 16 |
| Your Fund’s After-Tax Returns. | 29 |
| About Your Fund’s Expenses. | 30 |
| Glossary. | 32 |
Please note: The opinions expressed in this report are just that—informed opinions. They should not be considered promises or advice. Also, please keep in mind that the information and opinions cover the period through the date on the front of this report. Of course, the risks of investing in your fund are spelled out in the prospectus.
See the Glossary for definitions of investment terms used in this report.
About the cover: Since our founding, Vanguard has drawn inspiration from the enterprise and valor demonstrated by British naval hero Horatio Nelson and his command at the Battle of the Nile in 1798. The photograph displays a replica of a merchant ship from the same era as Nelson’s flagship, the HMS Vanguard.
Your Fund’s Total Returns
| |
| Fiscal Year Ended October 31, 2014 | |
| |
| | Total |
| | Returns |
| Vanguard Windsor Fund | |
| Investor Shares | 14.14% |
| Admiral™ Shares | 14.24 |
| Russell 1000 Value Index | 16.46 |
| Multi-Cap Value Funds Average | 12.18 |
Multi-Cap Value Funds Average: Derived from data provided by Lipper, a Thomson Reuters Company.
Admiral Shares carry lower expenses and are available to investors who meet certain account-balance requirements. |
|
| | | | | |
| Your Fund’s Performance at a Glance | | | | |
| October 31, 2013, Through October 31, 2014 | | | | |
| | | | Distributions Per Share |
| | Starting | Ending | | |
| | Share | Share | Income | Capital |
| | Price | Price | Dividends | Gains |
| Vanguard Windsor Fund | | | | |
| Investor Shares | $19.50 | $21.98 | $0.266 | $0.000 |
| Admiral Shares | 65.81 | 74.17 | 0.970 | 0.000 |
1

Chairman’s Letter
Dear Shareholder,
The U.S. market continued to advance over the 12 months ended October 31, 2014, but large-company growth stocks outperformed their value counterparts, reversing a recent trend. Vanguard Windsor Fund returned more than 14%, a result that was 2 percentage points ahead of the average return of peer funds but fell short of the benchmark Russell 1000 Value Index.
It’s worth noting that the average market capitalization of the stocks in the index is higher than that in Windsor’s portfolio. Large-company stocks easily outperformed small-caps during the period, giving the index a distinct advantage. In other periods, including the previous fiscal year, this divergence has helped the fund outpace the index.
If you own Windsor shares in a taxable account, you may wish to review the fund’s after-tax return presented later in this report.
Their smooth ride turned jagged, but U.S. stocks ended higher
Punctuated by a roller coaster of an October, the broad U.S. stock market returned about 16% for the 12 months ended October 31.
Impressive corporate earnings and various global stimulus measures generally supported stocks against a bleaker backdrop that included tensions in the Middle East and Ukraine as well as international economic concerns. But
over the first two weeks of October, stocks declined sharply as investors reacted to weakness in the global economy, especially the slowdown in China and the threat of deflation in Europe. Reflecting confidence in the U.S. economy, however, the Federal Reserve announced October 29 that it was ending its stimulative bond-buying program as anticipated.
U.S. stocks staged an impressive rebound in the period’s final two weeks, and several major indexes finished at record highs. International stocks didn’t fare as well. Emerging markets posted a modest advance over the 12 months, while stocks from the developed markets of Europe and the Pacific region slipped.
U.S. bonds posted positive returns as already low yields declined
The broad U.S. taxable bond market returned 4.14%. Bond prices, which backtracked at times over the summer, climbed in October as investors sought sanctuary from stock market volatility.
Overall, bond returns have been strong despite many analysts’ expectations that already low yields wouldn’t decline further. Prices rose and yields fell even as the Fed began steadily reducing its bond purchases in January. (Bond prices and yields move in opposite directions.) The yield of the 10-year U.S. Treasury note ended October at 2.31%, down from 2.54% a year earlier.
| | | | |
| Market Barometer | | | |
| |
| | | Average Annual Total Returns |
| | | Periods Ended October 31, 2014 |
| | One | Three | Five |
| | Year | Years | Years |
| Stocks | | | |
| Russell 1000 Index (Large-caps) | 16.78% | 19.90% | 16.98% |
| Russell 2000 Index (Small-caps) | 8.06 | 18.18 | 17.39 |
| Russell 3000 Index (Broad U.S. market) | 16.07 | 19.77 | 17.01 |
| FTSE All-World ex US Index (International) | 0.45 | 8.07 | 6.38 |
| |
| Bonds | | | |
| Barclays U.S. Aggregate Bond Index (Broad taxable market) | 4.14% | 2.73% | 4.22% |
| Barclays Municipal Bond Index (Broad tax-exempt market) | 7.82 | 4.93 | 5.26 |
| Citigroup Three-Month U.S. Treasury Bill Index | 0.04 | 0.04 | 0.06 |
| |
| CPI | | | |
| Consumer Price Index | 1.66% | 1.60% | 1.89% |
3
Municipal bonds returned 7.82%, with tax-exempt issues in high demand even at a time of reduced supply.
International bond markets (as measured by the Barclays Global Aggregate Index ex USD) slid in September and October en route to a –2.53% return for the 12 months.
The Fed’s target for short-term interest rates remained at 0%–0.25%, restraining returns for money market funds and savings accounts.
IT winners couldn’t overcome underperformers in other areas
The Windsor Fund looks for stocks that are underappreciated by the market but are expected to ultimately reward long-term investors. Unlike many value funds that focus primarily on traditional value or defensive sectors such as consumer staples, health care, financials, and utilities, Windsor has often charted its own course, seeking underpriced stocks wherever its advisors think they have found ones with potential to eventually outperform the market.
This strategy was evident in the fund’s portfolio composition over the past 12 months. The two advisors, Wellington Management Company and Pzena Investment Management, invested 17% of fund assets on average in the information technology sector, nearly twice the index’s 9% share. IT typically encompasses faster-growing companies favored by growth
| | | |
| Expense Ratios | | | |
| Your Fund Compared With Its Peer Group | | | |
| | Investor | Admiral | Peer Group |
| | Shares | Shares | Average |
| Windsor Fund | 0.37% | 0.27% | 1.24% |
| The fund expense ratios shown are from the prospectus dated February 26, 2014, and represent estimated costs for the current fiscal year. For the fiscal year ended October 31, 2014, the fund’s expense ratios were 0.38% for Investor Shares and 0.28% for Admiral Shares. The peer-group expense ratio is derived from data provided by Lipper, a Thomson Reuters Company, and captures information through year-end 2013. |
|
|
|
| |
| Peer group: Multi-Cap Value Funds. | | | |
4
funds. The advisors’ overweighting of this sector paid off, as the fund’s IT portfolio returned nearly 37%, 6 percentage points above its counterpart in the index. Semiconductor and hardware stocks posted especially strong results for the fund.
That outperformance was not enough to offset the fund’s subpar returns from nearly every other sector. Energy stocks were among the biggest drags. The advisors overweighted oil and gas exploration companies, which were hurt by falling oil prices. Those lower prices did boost the profit margins of refinery firms, but the fund was underweighted in those, further dampening relative returns. These two decisions resulted in a nearly –4% return for the fund’s energy stocks versus the index sector’s return of more than 4%.
Consumer discretionary was another notable laggard. The fund’s portfolio in this sector returned only about 3%, far below the more than 10% for its benchmark counterpart. Media companies and specialty retail stores particularly crimped relative performance.
Financials, by far the largest sector in both the index and the fund, performed well, but the advisors’ selections trailed those in the index by more than 3 percentage
| | |
| Total Returns | |
| Ten Years Ended October 31, 2014 | |
| | Average |
| | Annual Return |
| Windsor Fund Investor Shares | 7.55% |
| Russell 1000 Value Index | 7.90 |
| Multi-Cap Value Funds Average | 7.01 |
| Multi-Cap Value Funds Average: Derived from data provided by Lipper, a Thomson Reuters Company. |
The figures shown represent past performance, which is not a guarantee of future results. (Current performance may be lower or higher than the performance data cited. For performance data current to the most recent month-end, visit our website at vanguard.com/performance.) Note, too, that both investment returns and principal value can fluctuate widely, so an investor’s shares, when sold, could be worth more or less than their original cost.
5
points. Insurance stocks were among the detractors, and the advisors’ overweighting of that industry further hurt.
For more information about the advisors’ approach and the fund’s positioning during the year, please see the Advisors’ Report that follows this letter.
Over the last ten years, the fund has had a solid record of results
Looking at the Windsor Fund’s longer- term record, performance has been solid compared with its peers. The fund’s 7.55% average annual return for Investor Shares over the ten years ended October 31, 2014, was a bit behind that of its index, which, like all indexes, bears no expenses.
The fund’s returns have been positive in nine of its last ten fiscal years, and usually well above the overall market’s long-term averages. The lone negative fiscal year was 2008, when the financial crisis hammered markets worldwide, with Windsor’s focus on out-of-favor companies particularly hurting relative performance. But over the subsequent years, Windsor outperformed its benchmark by more than 2 percentage points in average annual returns.
When market volatility heats up, the best response is to keep cool
After several years of strength, stocks hit a rough patch toward the close of the fiscal year, as I noted earlier. For the first half of October, global stock markets (as measured by the FTSE Global All Cap Index) returned –5.56%. Even though stocks rebounded in the second half of the month, many investors undoubtedly were left feeling unsettled.
What’s my best advice to anxious shareholders? Remain calm and remember that volatility is a normal part of stock market investing. The value of keeping a cool head is highlighted in a Vanguard research paper that looked at how investors behaved during the financial crisis, when global stocks declined about 58% and U.S. stocks about 55%.
The 2010 paper, Resilience in Volatile Markets: 401(k) Participant Behavior, September 2007–December 2009, examined the behavior of participants in Vanguard-administered retirement plans. During that time, about three-quarters of participants made no changes to their accounts, and only 3% gave up on stocks completely.
As stocks recovered, this discipline yielded big benefits. From the end of 2008 to the end of 2013, the average Vanguard 401(k) portfolio nearly doubled in value, largely because of the surge in stock prices.
I’m pleased that, over time, our clients have demonstrated an impressive ability to remain focused on their long-term goals.
6
They stayed the course through the 1987 correction, the dot-com boom of the 1990s, and the more recent financial crisis, and they continue to do so today.
As always, thank you for investing with Vanguard.
Sincerely,

F. William McNabb III
Chairman and Chief Executive Officer
November 13, 2014
7
Advisors’ Report
For the fiscal year ended October 31, 2014, the Investor Shares of Vanguard Windsor Fund returned 14.14% and the lower-cost Admiral Shares returned 14.24%. Your fund is managed by two independent advisors, a strategy that enhances the fund’s diversification by providing exposure to distinct yet complementary investment approaches. It is not uncommon for different advisors to have different views about individual securities or the broader investment environment.
The advisors, the percentage and amount of fund assets that each manages, and brief descriptions of their investment strategies are presented in the table below. The advisors have also prepared a discussion of the investment environment that existed during the period and of how their portfolio positioning reflects this assessment. These reports were prepared on November 18, 2014.
Wellington Management Company, llp
Portfolio Manager:
James N. Mordy, Senior Vice President
and Equity Portfolio Manager
Equity volatility has increased in recent months as the Federal Reserve wound down its monthly bond purchases. Geopolitical tensions and Ebola have also grabbed investors’ attention. The S&P 500 Index provided strong returns over the fiscal year as U.S. economic momentum recovered from a severe and disruptive winter. With other major economies sputtering, global central bank policies
| | | | | |
| Vanguard Windsor Fund Investment Advisors | | |
| |
| | Fund Assets Managed | | |
| Investment Advisor | % | $ Million | | Investment Strategy |
| Wellington Management | 69 | 12,544 | | Seeks to provide long-term total returns above both the |
| Company, LLP | | | | S&P 500 and value-oriented indexes over a complete |
| | | | | market cycle through bottom-up, fundamentally driven |
| | | | | stock selection focused on undervalued securities. |
| Pzena Investment Management, | 29 | 5,289 | | Uses a fundamental, bottom-up, deep-value-oriented |
| LLC | | | | investment strategy. Seeks to buy good businesses at |
| | | | | low prices, focusing exclusively on companies that are |
| | | | | underperforming their historically demonstrated |
| | | | | earnings power. |
| Cash Investments | 2 | 230 | | These short-term reserves are invested by Vanguard in |
| | | | | equity index products to simulate investment in stocks. |
| | | | | Each advisor also may maintain a modest cash |
| | | | | position. |
8
have diverged. Although yields on longer-term U.S. Treasury bonds have remained lower than we anticipated, the dollar has strengthened, pressuring commodity prices, most prominently crude oil.
Once again, information technology was our best sector relative to the S&P 500 Index. Three semiconductor stocks provided exceptional returns: Avago Technologies, NXP Semiconductors, and Skyworks Solutions. In each case, we were early in identifying specific growth-fueling trends that were largely ignored in the stocks’ low valuations. As each generation of smart-phones increases in complexity, Avago and Skyworks have earned greater revenue per phone. NXP is a major beneficiary of several powerful trends such as credit-card security, near-field communication (short-range wireless technology), and emerging automotive connectivity opportunities.
We also benefited from not owning any stocks in telecommunication services, the second-worst-performing sector in the S&P 500 Index.
Energy was the worst performer in the broad market and our worst-performing sector on a relative basis. Crude oil prices have fallen 25% in recent months as fears of geopolitical disruption in the Middle East have given way to the reality of a temporarily oversupplied global market. U.S. natural gas prices have also softened as storage levels were refilled during a mild summer. Our positioning is somewhat aggressive, as we have favored more volatile exploration and production companies over the major integrated companies. Although this has hurt short-term performance, we believe that low-cost producers such as Pioneer Natural Resources, Concho Resources, and Southwestern Energy will be able to continue to grow profitably in a low-price environment, while the higher-cost major companies will be under more pressure. Furthermore, these stocks trade well below their net asset values, using current commodity prices, which bolsters our conviction. Looking to 2015, we see mounting budgetary pressures on the major OPEC countries to coordinate a cut in output, while most energy companies will have to modestly reduce spending in response to lower cash flow.
We also lagged in industrials. American Airlines was a winner (not surprisingly, given healthy industry fundamentals, declining fuel costs, and the company’s first dividend in 34 years), but we had some disappointments. A year ago we were too optimistic about European growth prospects, which had underpinned our investment case for stocks such as Rexel and SKF. In engineering and construction, KBR underperformed its peers in winning new business, and Eaton, one of our top holdings, had an uneven year at best. We have sold KBR and SKF and significantly reduced our stake in Rexel, and we are now slightly underweighted in this sector (a reversal from a year ago).
The consumer discretionary sector has been difficult for investors as online competition, evolving consumer tastes, and oversupply challenge traditional business models.
We avoided some higher-growth companies that lagged the market (Amazon and Starbucks) but were hurt by health-products retailer GNC as its sales fell well short of
9
expectations. If they can limit the magnitude of discounting, U.S. retailers are set up for a better holiday season, with two million more people employed than a year ago, some wage growth, higher consumer net worth, a windfall from lower gas prices, ample inventories, and an extra shopping day between Thanksgiving and Christmas.
The health care sector led the S&P 500 Index. Although high valuations have generally kept us away from many sizzling biotechnology stocks, we see underappreciated value in the pipelines of many traditional pharmaceutical companies. Wellington’s experienced health care team has been a deep resource for us in identifying opportunities in immuno-oncology, and Bristol-Myers Squibb is now our largest portfolio holding.
Our performance in the financial sector was mixed. We have favored the insurance industry, where most of our companies have improved profitability despite continued low interest rates.
We look for continuing modest GDP expansion both in the United States and globally. Although markets have recently concluded that easing inflationary pressures from food and energy prices will keep the Fed on hold for longer before raising short-term interest rates, we think an uptick in wage pressures will be an increasing part of the conversation in the first half of 2015. An easing of monetary policies in Japan and Europe will be helpful. We have reduced exposure to the more cyclical sectors but remained slightly overweighted at the end of the period. Our transactions over the fiscal year favored the consumer discretionary, health care, and financial sectors at the expense of industrials and information technology.
Despite a rising market for more than five years, we continue to find opportunities to buy good companies at a discount, and we will look to prudently manage our risk in what promises to be a more volatile environment.
Pzena Investment Management, LLC
Portfolio Managers:
Richard Pzena, Managing Principal
and Co-Chief Investment Officer
John P. Goetz, Managing Principal
and Co-Chief Investment Officer
Our portion of the fund benefited from strong performance by our technology holdings, while our consumer discretionary and energy holdings lagged. We have frequently discussed the compellingly cheap valuations applied to “old tech” companies (in contrast to the heady valuations in “new tech”). Recently, companies in the IT hardware, enterprise software, and semiconductor industries have performed well after delivering consensus-beating results, including Hewlett-Packard, Microsoft, and Intel (among the top contributors to performance over the period), and we have pared our exposures. Hewlett-Packard’s share price has risen sharply from its December 2012 low on the back of solid execution and strong cash-flow generation, which are evidence that management is addressing problems. Although we have taken some profits, the shares remain attractively valued.
10
In consumer discretionary, office supply company Staples was a large detractor from portfolio results because of weaker-than-expected revenues and earnings in the retail segment. Staples is the world’s largest business-to-business internet company, and we believe the delivery side is its real asset. While we expect industry revenues to remain weak, we see further cost-cutting opportunities through reduced retail square footage. General Motors shares were also weak after safety-related recalls. Although the recalls are a setback, the market reaction has become another reason to own the stock, as GM shares have fallen in excess of the company’s recall liabilities.
Our energy holdings were driven lower in September and October after Brent Crude prices declined as Saudi Arabia chose not to defend $100-per-barrel oil in the face of strong supply and slightly weakening demand from China.
Financials produced mixed results. Our exposure includes insurance companies, wealth managers, and banks. Our holdings in money-center and investment banks were strong, but their returns were more than offset by lagging performance from our regional banks and insurance holdings.
As a cautious tone persists among many investors, we find value to be in the “high beta” (high volatility) and economically sensitive sectors. As a result, our largest allocations are to financials, technology, and integrated oil companies. Financials constitute the largest part of our portfolio. Much of this exposure is to big money-center banks, reflecting still-depressed valuations driven by the market’s persistent skepticism about a full recovery for these generally strong franchises. But profitability has partly rebounded, and adjustment to the immense changes in the regulatory landscape is progressing. Although the stock prices of the big money-center banks (such as Citigroup, Bank of America, and JPMorgan Chase) almost doubled in the last two years, we believe those achievements have not been fully recognized in banks’ share prices, and we expect the stocks to do well as drags on earnings dissipate over the next few years.
We continue to focus on technology companies that have the potential to benefit from higher future corporate spending on equipment and services. Despite recent declines in oil prices, we have always viewed the current price to be closer to normal for the long term, and we still consider integrated oil companies to be very cheap as investors continue to overpenalize their lack of reserve growth and heightened global political risk. High-dividend-paying companies with less cyclical earnings profiles—such as utilities, real estate investment trusts (REITs), and pharmaceuticals—trade at premium valuations and thus have little representation in our “deep value” portfolio. We expect our portfolio to benefit as this valuation gap normalizes.
11
Windsor Fund
Fund Profile
As of October 31, 2014
| | | |
| Share-Class Characteristics | |
| | Investor | Admiral |
| | Shares | Shares |
| Ticker Symbol | VWNDX | VWNEX |
| Expense Ratio1 | 0.37% | 0.27% |
| 30-Day SEC Yield | 1.40% | 1.50% |
| | | | |
| Portfolio Characteristics | | |
| | | | DJ |
| | | | U.S |
| | | Russell | Total |
| | | 1000 | Market |
| | | Value | FA |
| | Fund | Index | Index |
| Number of Stocks | 139 | 695 | 3,756 |
| Median Market Cap | $29.8B | $58.1B | $47.3B |
| Price/Earnings Ratio | 16.7x | 17.5x | 20.4x |
| Price/Book Ratio | 1.9x | 1.8x | 2.7x |
| Return on Equity | 15.4% | 13.8% | 17.8% |
| Earnings Growth | | | |
| Rate | 15.5% | 13.0% | 15.7% |
| Dividend Yield | 1.8% | 2.3% | 1.9% |
| Foreign Holdings | 13.7% | 0.0% | 0.0% |
| Turnover Rate | 38% | — | — |
| Short-Term Reserves | 1.9% | — | — |
| | | |
| Volatility Measures | | |
| | Russell | DJ |
| | 1000 | U.S. Total |
| | Value | Market |
| | Index | FA Index |
| R-Squared | 0.92 | 0.94 |
| Beta | 1.07 | 1.08 |
| These measures show the degree and timing of the fund’s fluctuations compared with the indexes over 36 months. |
|
| | | |
| Ten Largest Holdings (% of total net assets) |
| American International | | |
| Group Inc. | Multi-line Insurance | 2.1% |
| MetLife Inc. | Life & Health | |
| | Insurance | 2.1 |
| Citigroup Inc. | Diversified Banks | 2.1 |
| Bristol-Myers Squibb Co. | Pharmaceuticals | 2.1 |
| Wells Fargo & Co. | Diversified Banks | 1.8 |
| Aetna Inc. | Managed Health | |
| | Care | 1.6 |
| Ameriprise Financial Inc. | Asset Management | |
| | & Custody Banks | 1.6 |
| NXP Semiconductor NV | Semiconductors | 1.6 |
| Eaton Corp. plc | Electrical | |
| | Components & | |
| | Equipment | 1.6 |
| Bank of America Corp. | Diversified Banks | 1.5 |
| Top Ten | | 18.1% |
| The holdings listed exclude any temporary cash investments and equity index products. |
|
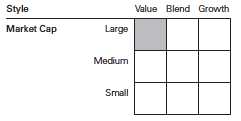
Investment Focus
1 The expense ratios shown are from the prospectus dated February 26, 2014, and represent estimated costs for the current fiscal year. For the fiscal year ended October 31, 2014, the expense ratios were 0.38% for Investor Shares and 0.28% for Admiral Shares.
12
Windsor Fund
| | | | |
| Sector Diversification (% of equity exposure) |
| | | Russell | DJ |
| | | 1000 | U.S. Total |
| | | Value | Market |
| | Fund | Index | FA Index |
| Consumer | | | |
| Discretionary | 11.6% | 6.2% | 12.5% |
| Consumer Staples | 5.0 | 7.1 | 8.3 |
| Energy | 11.6 | 12.2 | 8.5 |
| Financials | 27.7 | 29.5 | 17.7 |
| Health Care | 16.0 | 13.7 | 13.9 |
| Industrials | 8.0 | 10.3 | 11.3 |
| Information | | | |
| Technology | 16.1 | 9.2 | 18.8 |
| Materials | 2.7 | 3.2 | 3.6 |
| Telecommunication | | | |
| Services | 0.0 | 2.2 | 2.2 |
| Utilities | 1.3 | 6.4 | 3.2 |
13
Windsor Fund
Performance Summary
All of the returns in this report represent past performance, which is not a guarantee of future results that may be achieved by the fund. (Current performance may be lower or higher than the performance data cited. For performance data current to the most recent month-end, visit our website at vanguard.com/performance.) Note, too, that both investment returns and principal value can fluctuate widely, so an investor’s shares, when sold, could be worth more or less than their original cost. The returns shown do not reflect taxes that a shareholder would pay on fund distributions or on the sale of fund shares.
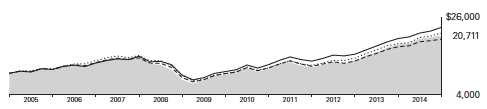
Cumulative Performance: October 31, 2004, Through October 31, 2014
Initial Investment of $10,000
| | | | | |
| | | Average Annual Total Returns | |
| | | Periods Ended October 31, 2014 | |
| | | | | | Final Value |
| | | One | Five | Ten | of a $10,000 |
| | | Year | Years | Years | Investment |
| Windsor Fund*Investor Shares | 14.14% | 16.65% | 7.55% | $20,711 |
| •••••••• | Russell 1000 Value Index | 16.46 | 16.49 | 7.90 | 21,393 |
| – – – – | Multi-Cap Value Funds Average | 12.18 | 14.73 | 7.01 | 19,684 |
| | Dow Jones U.S. Total Stock Market | | | | |
| | Float Adjusted Index | 16.00 | 17.09 | 8.71 | 23,060 |
| Multi-Cap Value Funds Average: Derived from data provided by Lipper, a Thomson Reuters Company. |
| | | | |
| | | | | Final Value |
| | One | Five | Ten | of a $50,000 |
| | Year | Years | Years | Investment |
| Windsor Fund Admiral Shares | 14.24% | 16.77% | 7.67% | $104,651 |
| Russell 1000 Value Index | 16.46 | 16.49 | 7.90 | 106,966 |
| Dow Jones U.S. Total Stock Market Float | | | | |
| Adjusted Index | 16.00 | 17.09 | 8.71 | 115,300 |
See Financial Highlights for dividend and capital gains information.
14
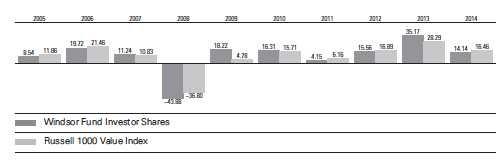
Windsor Fund
Fiscal-Year Total Returns (%): October 31, 2004, Through October 31, 2014
Average Annual Total Returns: Periods Ended September 30, 2014
This table presents returns through the latest calendar quarter—rather than through the end of the fiscal period.
Securities and Exchange Commission rules require that we provide this information.
| | | | |
| | Inception | One | Five | Ten |
| | Date | Year | Years | Years |
| Investor Shares | 10/23/1958 | 17.30% | 15.46% | 7.59% |
| Admiral Shares | 11/12/2001 | 17.39 | 15.56 | 7.71 |
15
Windsor Fund
Financial Statements
Statement of Net Assets
As of October 31, 2014
The fund reports a complete list of its holdings in regulatory filings four times in each fiscal year, at the quarter-ends. For the second and fourth fiscal quarters, the lists appear in the fund’s semiannual and annual reports to shareholders. For the first and third fiscal quarters, the fund files the lists with the Securities and Exchange Commission on Form N-Q. Shareholders can look up the fund’s Forms N-Q on the SEC’s website at sec.gov. Forms N-Q may also be reviewed and copied at the SEC’s Public Reference Room (see the back cover of this report for further information).
| | | |
| | | | Market |
| | | | Value• |
| | | Shares | ($000) |
| Common Stocks (97.5%)1 | | |
| Consumer Discretionary (11.3%) | |
| | Lennar Corp. Class A | 5,181,690 | 223,227 |
| | Newell Rubbermaid Inc. | 6,381,300 | 212,689 |
| | Lowe’s Cos. Inc. | 3,588,500 | 205,262 |
| | Delphi Automotive plc | 2,493,400 | 171,995 |
| | Ralph Lauren Corp. | | |
| | Class A | 951,900 | 156,911 |
| | TJX Cos. Inc. | 2,119,000 | 134,175 |
| * | Toll Brothers Inc. | 3,857,000 | 123,231 |
| | Omnicom Group Inc. | 1,462,125 | 105,068 |
| * | TRW Automotive | | |
| | Holdings Corp. | 1,020,000 | 103,377 |
| | Staples Inc. | 7,100,921 | 90,040 |
| | Nordstrom Inc. | 1,195,700 | 86,820 |
| | General Motors Co. | 2,546,225 | 79,952 |
| | Ford Motor Co. | 5,290,400 | 74,542 |
| | Kohl’s Corp. | 1,303,475 | 70,674 |
| * | News Corp. Class A | 4,426,075 | 68,516 |
| | Comcast Corp. | 1,155,700 | 63,725 |
| | Interpublic Group of | | |
| | Cos. Inc. | 2,732,025 | 52,974 |
| * | News Corp. Class B | 1,469,052 | 22,109 |
| | | | 2,045,287 |
| Consumer Staples (4.8%) | | |
| | BRF SA ADR | 6,760,200 | 176,103 |
| | Ingredion Inc. | 2,248,117 | 173,667 |
| | CVS Health Corp. | 1,882,000 | 161,495 |
| | Japan Tobacco Inc. | 2,937,300 | 101,768 |
| | Wal-Mart Stores Inc. | 1,321,900 | 100,821 |
| | Diageo plc | 2,759,687 | 81,226 |
| | Kellogg Co. | 1,198,425 | 76,651 |
| | | | 871,731 |
| Energy (11.3%) | | |
| | BP plc ADR | 4,856,800 | 211,077 |
| | Royal Dutch Shell plc | | |
| | ADR | 2,891,606 | 207,588 |
| | Baker Hughes Inc. | 3,509,650 | 185,871 |
| | Pioneer Natural | | |
| | Resources Co. | 877,200 | 165,843 |
| | | |
| | | | Market |
| | | | Value• |
| | | Shares | ($000) |
| | Exxon Mobil Corp. | 1,552,175 | 150,111 |
| | Cameco Corp. | 8,344,000 | 145,019 |
| * | Southwestern Energy Co. | 4,454,000 | 144,800 |
| | Canadian Natural | | |
| | Resources Ltd. | 3,718,900 | 129,715 |
| * | Cobalt International | | |
| | Energy Inc. | 10,822,642 | 126,733 |
| | National Oilwell Varco Inc. | 1,472,700 | 106,977 |
| | Anadarko Petroleum Corp. | 1,018,400 | 93,469 |
| | Valero Energy Corp. | 1,710,400 | 85,674 |
| | Halliburton Co. | 1,513,300 | 83,443 |
| | Chevron Corp. | 616,400 | 73,937 |
| * | Concho Resources Inc. | 457,800 | 49,914 |
| | Murphy Oil Corp. | 826,350 | 44,119 |
| | Apache Corp. | 528,575 | 40,806 |
| | | | 2,045,096 |
| Financials (27.0%) | | |
| | American International | | |
| | Group Inc. | 7,212,800 | 386,390 |
| | MetLife Inc. | 7,116,725 | 386,011 |
| | Citigroup Inc. | 7,146,075 | 382,529 |
| | Wells Fargo & Co. | 6,197,050 | 329,001 |
| | Ameriprise Financial Inc. | 2,320,300 | 292,752 |
| | Bank of America Corp. | 15,416,100 | 264,540 |
| | Principal Financial | | |
| | Group Inc. | 4,549,100 | 238,236 |
| | XL Group plc Class A | 6,564,125 | 222,393 |
| | Weyerhaeuser Co. | 5,771,500 | 195,423 |
| | PNC Financial Services | | |
| | Group Inc. | 2,070,250 | 178,849 |
| | Unum Group | 4,937,100 | 165,195 |
| | SL Green Realty Corp. | 1,312,400 | 151,845 |
| | Public Storage | 781,200 | 144,007 |
| | JPMorgan Chase & Co. | 2,330,400 | 140,943 |
| | Zions Bancorporation | 4,609,244 | 133,530 |
| | Goldman Sachs Group Inc. | 638,050 | 121,223 |
| | State Street Corp. | 1,527,775 | 115,286 |
| | Voya Financial Inc. | 2,725,700 | 106,984 |
| | UBS AG | 6,067,175 | 105,448 |
| | Julius Baer Group Ltd. | 2,395,631 | 104,961 |
16
Windsor Fund
| | | |
| | | | Market |
| | | | Value• |
| | | Shares | ($000) |
| | Morgan Stanley | 2,982,366 | 104,234 |
| | Axis Capital Holdings Ltd. | 1,602,221 | 77,131 |
| | Progressive Corp. | 2,074,375 | 54,784 |
| | Hartford Financial | | |
| | Services Group Inc. | 1,382,425 | 54,716 |
| | Comerica Inc. | 1,132,600 | 54,070 |
| | Willis Group Holdings plc | 1,261,950 | 51,147 |
| | Citizens Financial | | |
| | Group Inc. | 2,062,250 | 48,710 |
| | Regions Financial Corp. | 4,739,400 | 47,062 |
| | KeyCorp | 3,482,075 | 45,963 |
| | Fifth Third Bancorp | 2,283,800 | 45,653 |
| * | Genworth Financial Inc. | | |
| | Class A | 2,832,750 | 39,630 |
| | Intercontinental | | |
| | Exchange Inc. | 160,800 | 33,493 |
| | Invesco Ltd. | 695,225 | 28,136 |
| | Franklin Resources Inc. | 453,750 | 25,233 |
| | | | 4,875,508 |
| Health Care (15.6%) | | |
| | Bristol-Myers Squibb Co. | 6,408,400 | 372,905 |
| | Aetna Inc. | 3,590,256 | 296,232 |
| | AstraZeneca plc ADR | 2,830,600 | 206,464 |
| | Medtronic Inc. | 2,634,500 | 179,568 |
| | Roche Holding AG | 530,325 | 156,635 |
| | UnitedHealth Group Inc. | 1,547,100 | 146,990 |
| | Amgen Inc. | 839,400 | 136,134 |
| | Sanofi | 1,331,110 | 123,299 |
| | Eli Lilly & Co. | 1,801,500 | 119,493 |
| | Covidien plc | 1,249,000 | 115,458 |
| | Cigna Corp. | 1,133,675 | 112,880 |
| | Abbott Laboratories | 2,532,575 | 110,395 |
| | Johnson & Johnson | 1,018,700 | 109,795 |
| | Merck & Co. Inc. | 1,622,100 | 93,984 |
| * | Express Scripts | | |
| | Holding Co. | 1,209,700 | 92,929 |
| | Teva Pharmaceutical | | |
| | Industries Ltd. ADR | 1,485,500 | 83,886 |
| | Becton Dickinson and Co. | 613,425 | 78,948 |
| * | Mylan Inc. | 1,446,000 | 77,433 |
| | McKesson Corp. | 364,500 | 74,143 |
| | Baxter International Inc. | 740,613 | 51,947 |
| | Pfizer Inc. | 1,487,900 | 44,563 |
| * | Laboratory Corp. of | | |
| | America Holdings | 251,775 | 27,516 |
| | Quest Diagnostics Inc. | 84,561 | 5,366 |
| | | | 2,816,963 |
| Industrials (7.8%) | | |
| | Eaton Corp. plc | 4,162,200 | 284,653 |
| | Raytheon Co. | 1,836,100 | 190,734 |
| * | Sensata Technologies | | |
| | Holding NV | 3,349,200 | 163,475 |
| | Dover Corp. | 1,663,900 | 132,180 |
| | Norfolk Southern Corp. | 1,191,700 | 131,850 |
| | Parker-Hannifin Corp. | 927,025 | 117,760 |
| | | |
| | | | Market |
| | | | Value• |
| | | Shares | ($000) |
| | Honeywell | | |
| | International Inc. | 1,077,800 | 103,598 |
| | American Airlines | | |
| | Group Inc. | 2,041,700 | 84,424 |
| | Masco Corp. | 3,732,548 | 82,377 |
| | Rexel SA | 2,995,662 | 50,393 |
| | General Dynamics Corp. | 216,500 | 30,258 |
| | L-3 Communications | | |
| | Holdings Inc. | 211,050 | 25,634 |
| | | | 1,397,336 |
| Information Technology (15.6%) | |
| * | NXP Semiconductor NV | 4,202,300 | 288,530 |
| * | Arrow Electronics Inc. | 4,190,050 | 238,246 |
| | Cisco Systems Inc. | 9,049,025 | 221,430 |
| | Lam Research Corp. | 2,774,000 | 215,984 |
| | Avago Technologies Ltd. | | |
| | Class A | 2,247,200 | 193,821 |
| | Hewlett-Packard Co. | 5,372,675 | 192,771 |
| | SanDisk Corp. | 1,989,800 | 187,320 |
| * | Check Point Software | | |
| | Technologies Ltd. | 2,258,300 | 167,679 |
| * | Teradata Corp. | 3,564,440 | 150,847 |
| | Apple Inc. | 1,304,800 | 140,918 |
| | Oracle Corp. | 3,368,700 | 131,548 |
| | Microsoft Corp. | 2,556,500 | 120,028 |
| | Intel Corp. | 3,012,125 | 102,442 |
| | Accenture plc Class A | 1,237,300 | 100,370 |
| | Corning Inc. | 4,130,925 | 84,395 |
| * | Cognizant Technology | | |
| | Solutions Corp. Class A | 1,655,100 | 80,852 |
| | Analog Devices Inc. | 1,204,000 | 59,742 |
| | Maxim Integrated | | |
| | Products Inc. | 1,955,200 | 57,365 |
| | TE Connectivity Ltd. | 865,010 | 52,878 |
| | Skyworks Solutions Inc. | 541,300 | 31,525 |
| | | | 2,818,691 |
| Materials (2.6%) | | |
| | Celanese Corp. Class A | 2,445,100 | 143,601 |
| | Methanex Corp. | 2,142,500 | 127,136 |
| | Reliance Steel & | | |
| | Aluminum Co. | 1,589,700 | 107,273 |
| | LyondellBasell Industries | | |
| | NV Class A | 590,300 | 54,089 |
| * | Owens-Illinois Inc. | 1,570,500 | 40,472 |
| | | | 472,571 |
| Other (0.3%) | | |
| 2 | Vanguard Value ETF | 703,525 | 58,153 |
| |
| Utilities (1.2%) | | |
| | Entergy Corp. | 1,307,873 | 109,887 |
| | PG&E Corp. | 1,899,400 | 95,578 |
| | FirstEnergy Corp. | 189,186 | 7,064 |
| | | | 212,529 |
| Total Common Stocks | | |
| (Cost $13,373,266) | | 17,613,865 |
17
Windsor Fund
| | | |
| | | | Market |
| | | | Value• |
| | | Shares | ($000) |
| Temporary Cash Investments (2.9%)1 | |
| Money Market Fund (1.6%) | | |
| 3 | Vanguard Market Liquidity | | |
| | Fund, 0.114% | 289,984,223 | 289,984 |
| |
| | | Face | |
| | | Amount | |
| | | ($000) | |
| Repurchase Agreement (1.2%) | | |
| | Bank of America Securities, LLC | |
| | 0.090%, 11/3/14 (Dated | | |
| | 10/31/14, Repurchase Value | |
| | $217,802,000, collateralized | | |
| | by Federal Home Loan Mortgage | |
| | Corp. 2.138%–5.968%, | | |
| | 5/1/34–11/1/44, and Federal | | |
| | National Mortgage Assn. | | |
| | 1.953%–4.069%, | | |
| | 11/1/20–10/1/44, with a | | |
| | value of $222,156,000) | 217,800 | 217,800 |
| |
| U.S. Government and Agency Obligations (0.1%) |
| 4,6 | Fannie Mae Discount Notes, | | |
| | 0.080%, 11/5/14 | 3,000 | 3,000 |
| 5,6 | Federal Home Loan Bank | | |
| | Discount Notes, 0.060%, | | |
| | 12/31/14 | 3,500 | 3,500 |
| 5 | Federal Home Loan Bank | | |
| | Discount Notes, 0.080%, | | |
| | 2/20/15 | 2,300 | 2,300 |
| 4,6 | Freddie Mac Discount Notes, | | |
| | 0.050%, 1/14/15 | 4,000 | 3,999 |
| | | | 12,799 |
| Total Temporary Cash Investments | |
| (Cost $520,583) | | 520,583 |
| Total Investments (100.4%) | | |
| (Cost $13,893,849) | | 18,134,448 |
| | |
| | Market |
| | Value• |
| | ($000) |
| Other Assets and Liabilities (-0.4%) | |
| Other Assets | 194,613 |
| Liabilities | (265,995) |
| | (71,382) |
| Net Assets (100%) | 18,063,066 |
| |
| |
| At October 31, 2014, net assets consisted of: |
| | Amount |
| | ($000) |
| Paid-in Capital | 12,982,237 |
| Undistributed Net Investment Income | 52,131 |
| Accumulated Net Realized Gains | 783,014 |
| Unrealized Appreciation (Depreciation) | |
| Investment Securities | 4,240,599 |
| Futures Contracts | 5,285 |
| Foreign Currencies | (200) |
| Net Assets | 18,063,066 |
| |
| Investor Shares—Net Assets | |
| Applicable to 326,596,069 outstanding | |
| $.001 par value shares of beneficial | |
| interest (unlimited authorization) | 7,178,923 |
| Net Asset Value Per Share— | |
| Investor Shares | $21.98 |
| |
| Admiral Shares—Net Assets | |
| Applicable to 146,743,011 outstanding | |
| $.001 par value shares of beneficial | |
| interest (unlimited authorization) | 10,884,143 |
| Net Asset Value Per Share— | |
| Admiral Shares | $74.17 |
• See Note A in Notes to Financial Statements.
* Non-income-producing security.
1 The fund invests a portion of its cash reserves in equity markets through the use of index futures contracts. After giving effect to futures investments, the fund’s effective common stock and temporary cash investment positions represent 98.5% and 1.9%, respectively, of net assets.
2 Considered an affiliated company of the fund as the issuer is another member of The Vanguard Group.
3 Affiliated money market fund available only to Vanguard funds and certain trusts and accounts managed by Vanguard. Rate shown is the 7-day yield.
4 The issuer was placed under federal conservatorship in September 2008; since that time, its daily operations have been managed by the Federal Housing Finance Agency and it receives capital from the U.S. Treasury, as needed to maintain a positive net worth, in exchange for senior preferred stock.
5 The issuer operates under a congressional charter; its securities are generally neither guaranteed by the U.S. Treasury nor backed by the full faith and credit of the U.S. government.
6 Securities with a value of $9,799,000 have been segregated as initial margin for open futures contracts.
ADR—American Depositary Receipt.
See accompanying Notes, which are an integral part of the Financial Statements.
18
Windsor Fund
Statement of Operations
| |
| | Year Ended |
| | October 31, 2014 |
| | ($000) |
| Investment Income | |
| Income | |
| Dividends1,2 | 296,076 |
| Interest2 | 466 |
| Securities Lending | 1,569 |
| Total Income | 298,111 |
| Expenses | |
| Investment Advisory Fees—Note B | |
| Basic Fee | 22,266 |
| Performance Adjustment | 4,612 |
| The Vanguard Group—Note C | |
| Management and Administrative—Investor Shares | 15,317 |
| Management and Administrative—Admiral Shares | 11,699 |
| Marketing and Distribution—Investor Shares | 1,112 |
| Marketing and Distribution—Admiral Shares | 1,391 |
| Custodian Fees | 190 |
| Auditing Fees | 35 |
| Shareholders’ Reports—Investor Shares | 43 |
| Shareholders’ Reports—Admiral Shares | 28 |
| Trustees’ Fees and Expenses | 30 |
| Total Expenses | 56,723 |
| Expenses Paid Indirectly | (231) |
| Net Expenses | 56,492 |
| Net Investment Income | 241,619 |
| Realized Net Gain (Loss) | |
| Investment Securities Sold2 | 1,558,125 |
| Futures Contracts | 38,988 |
| Foreign Currencies | (376) |
| Realized Net Gain (Loss) | 1,596,737 |
| Change in Unrealized Appreciation (Depreciation) | |
| Investment Securities | 454,551 |
| Futures Contracts | (4,373) |
| Foreign Currencies | (284) |
| Change in Unrealized Appreciation (Depreciation) | 449,894 |
| Net Increase (Decrease) in Net Assets Resulting from Operations | 2,288,250 |
1 Dividends are net of foreign withholding taxes of $4,324,000.
2 Dividend income, interest income, and realized net gain (loss) from affiliated companies of the fund were $1,303,000, $362,000, and $17,300,000, respectively.
See accompanying Notes, which are an integral part of the Financial Statements.
19
Windsor Fund
Statement of Changes in Net Assets
| | |
| | Year Ended October 31, |
| | 2014 | 2013 |
| | ($000) | ($000) |
| Increase (Decrease) in Net Assets | | |
| Operations | | |
| Net Investment Income | 241,619 | 221,195 |
| Realized Net Gain (Loss) | 1,596,737 | 1,394,140 |
| Change in Unrealized Appreciation (Depreciation) | 449,894 | 2,680,607 |
| Net Increase (Decrease) in Net Assets Resulting from Operations | 2,288,250 | 4,295,942 |
| Distributions | | |
| Net Investment Income | | |
| Investor Shares | (91,690) | (110,032) |
| Admiral Shares | (139,380) | (110,078) |
| Realized Capital Gain | | |
| Investor Shares | — | — |
| Admiral Shares | — | — |
| Total Distributions | (231,070) | (220,110) |
| Capital Share Transactions | | |
| Investor Shares | (810,259) | (1,629,460) |
| Admiral Shares | 545,483 | 1,318,490 |
| Net Increase (Decrease) from Capital Share Transactions | (264,776) | (310,970) |
| Total Increase (Decrease) | 1,792,404 | 3,764,862 |
| Net Assets | | |
| Beginning of Period | 16,270,662 | 12,505,800 |
| End of Period1 | 18,063,066 | 16,270,662 |
| 1 Net Assets—End of Period includes undistributed net investment income of $52,131,000 and $41,958,000. |
See accompanying Notes, which are an integral part of the Financial Statements.
20
Windsor Fund
Financial Highlights
| | | | | |
| Investor Shares | | | | | |
| |
| For a Share Outstanding | | | Year Ended October 31, |
| Throughout Each Period | 2014 | 2013 | 2012 | 2011 | 2010 |
| Net Asset Value, Beginning of Period | $19.50 | $14.66 | $12.92 | $12.56 | $10.97 |
| Investment Operations | | | | | |
| Net Investment Income | . 279 | .255 | .252 | .184 | .1901 |
| Net Realized and Unrealized Gain (Loss) | | | | | |
| on Investments | 2.467 | 4.839 | 1.729 | . 346 | 1.586 |
| Total from Investment Operations | 2.746 | 5.094 | 1.981 | .530 | 1.776 |
| Distributions | | | | | |
| Dividends from Net Investment Income | (. 266) | (. 254) | (. 241) | (.170) | (.186) |
| Distributions from Realized Capital Gains | — | — | — | — | — |
| Total Distributions | (. 266) | (. 254) | (. 241) | (.170) | (.186) |
| Net Asset Value, End of Period | $21.98 | $19.50 | $14.66 | $12.92 | $12.56 |
| |
| Total Return2 | 14.14% | 35.17% | 15.56% | 4.15% | 16.31% |
| |
| Ratios/Supplemental Data | | | | | |
| Net Assets, End of Period (Millions) | $7,179 | $7,126 | $6,711 | $6,736 | $7,999 |
| Ratio of Total Expenses to Average Net Assets3 | 0.38% | 0.37% | 0.35% | 0.39% | 0.33% |
| Ratio of Net Investment Income to | | | | | |
| Average Net Assets | 1.33% | 1.49% | 1.80% | 1.34% | 1.59%1 |
| Portfolio Turnover Rate | 38% | 40% | 68% | 49% | 50% |
1 Net investment income per share and the ratio of net investment income to average net assets include $.036 and 0.29%, respectively, resulting from a cash payment received in connection with the merger of Schering-Plough Corp. and Merck & Co. in November 2009.
2 Total returns do not include account service fees that may have applied in the periods shown. Fund prospectuses provide information about any applicable account service fees.
3 Includes performance-based investment advisory fee increases (decreases) of 0.03%, 0.02%, (0.01%), 0.03%, and (0.03%). |
|
|
|
|
See accompanying Notes, which are an integral part of the Financial Statements.
21
Windsor Fund
Financial Highlights
| | | | | |
| Admiral Shares | | | | | |
| |
| For a Share Outstanding | | | Year Ended October 31, |
| Throughout Each Period | 2014 | 2013 | 2012 | 2011 | 2010 |
| Net Asset Value, Beginning of Period | $65.81 | $49.47 | $43.59 | $42.37 | $37.01 |
| Investment Operations | | | | | |
| Net Investment Income | 1.016 | . 924 | . 900 | . 664 | . 6851 |
| Net Realized and Unrealized Gain (Loss) | | | | | |
| on Investments | 8.314 | 16.329 | 5.844 | 1.171 | 5.348 |
| Total from Investment Operations | 9.330 | 17.253 | 6.744 | 1.835 | 6.033 |
| Distributions | | | | | |
| Dividends from Net Investment Income | (.970) | (. 913) | (. 864) | (. 615) | (. 673) |
| Distributions from Realized Capital Gains | — | — | — | — | — |
| Total Distributions | (.970) | (. 913) | (. 864) | (. 615) | (. 673) |
| Net Asset Value, End of Period | $74.17 | $65.81 | $49.47 | $43.59 | $42.37 |
| |
| Total Return | 14.24% | 35.32% | 15.71% | 4.26% | 16.44% |
| |
| Ratios/Supplemental Data | | | | | |
| Net Assets, End of Period (Millions) | $10,884 | $9,144 | $5,795 | $4,994 | $4,680 |
| Ratio of Total Expenses to Average Net Assets2 | 0.28% | 0.27% | 0.25% | 0.29% | 0.22% |
| Ratio of Net Investment Income to | | | | | |
| Average Net Assets | 1.43% | 1.59% | 1.90% | 1.44% | 1.70%1 |
| Portfolio Turnover Rate | 38% | 40% | 68% | 49% | 50% |
1 Net investment income per share and the ratio of net investment income to average net assets include $.120 and 0.29%, respectively, resulting from a cash payment received in connection with the merger of Schering-Plough Corp. and Merck & Co. in November 2009.
2 Includes performance-based investment advisory fee increases (decreases) of 0.03%, 0.02%, (0.01%), 0.03%, and (0.03%). |
|
|
See accompanying Notes, which are an integral part of the Financial Statements.
22
Windsor Fund
Notes to Financial Statements
Vanguard Windsor Fund is registered under the Investment Company Act of 1940 as an open-end investment company, or mutual fund. The fund offers two classes of shares: Investor Shares and Admiral Shares. Investor Shares are available to any investor who meets the fund’s minimum purchase requirements. Admiral Shares are designed for investors who meet certain administrative, service, and account-size criteria.
A. The following significant accounting policies conform to generally accepted accounting principles for U.S. investment companies. The fund consistently follows such policies in preparing its financial statements.
1. Security Valuation: Securities are valued as of the close of trading on the New York Stock Exchange (generally 4 p.m., Eastern time) on the valuation date. Equity securities are valued at the latest quoted sales prices or official closing prices taken from the primary market in which each security trades; such securities not traded on the valuation date are valued at the mean of the latest quoted bid and asked prices. Securities for which market quotations are not readily available, or whose values have been affected by events occurring before the fund’s pricing time but after the close of the securities’ primary markets, are valued at their fair values calculated according to procedures adopted by the board of trustees. These procedures include obtaining quotations from an independent pricing service, monitoring news to identify significant market- or security-specific events, and evaluating changes in the values of foreign market proxies (for example, ADRs, futures contracts, or exchange-traded funds), between the time the foreign markets close and the fund’s pricing time. When fair-value pricing is employed, the prices of securities used by a fund to calculate its net asset value may differ from quoted or published prices for the same securities. Investments in Vanguard Market Liquidity Fund are valued at that fund’s net asset value. Temporary cash investments acquired over 60 days to maturity are valued using the latest bid prices or using valuations based on a matrix system (which considers such factors as security prices, yields, maturities, and ratings), both as furnished by independent pricing services. Other temporary cash investments are valued at amortized cost, which approximates market value.
2. Foreign Currency: Securities and other assets and liabilities denominated in foreign currencies are translated into U.S. dollars using exchange rates obtained from an independent third party as of the fund’s pricing time on the valuation date. Realized gains (losses) and unrealized appreciation (depreciation) on investment securities include the effects of changes in exchange rates since the securities were purchased, combined with the effects of changes in security prices. Fluctuations in the value of other assets and liabilities resulting from changes in exchange rates are recorded as unrealized foreign currency gains (losses) until the assets or liabilities are settled in cash, at which time they are recorded as realized foreign currency gains (losses).
3. Futures Contracts: The fund uses index futures contracts to a limited extent, with the objective of maintaining full exposure to the stock market while maintaining liquidity. The fund may purchase or sell futures contracts to achieve a desired level of investment, whether to accommodate portfolio turnover or cash flows from capital share transactions. The primary risks associated with the use of futures contracts are imperfect correlation between changes in market values of stocks held by the fund and the prices of futures contracts, and the possibility of an illiquid market. Counterparty risk involving futures is mitigated because a regulated clearinghouse is the counterparty instead of the clearing broker. To further mitigate counterparty risk, the fund trades futures contracts on an exchange, monitors the financial strength of its clearing brokers and clearinghouse, and has entered into clearing agreements with its clearing brokers. The clearinghouse imposes initial margin requirements to secure the fund’s performance and requires daily settlement of variation margin representing changes in the market value of each contract.
23
Windsor Fund
Futures contracts are valued at their quoted daily settlement prices. The aggregate settlement values of the contracts are not recorded in the Statement of Net Assets. Fluctuations in the value of the contracts are recorded in the Statement of Net Assets as an asset (liability) and in the Statement of Operations as unrealized appreciation (depreciation) until the contracts are closed, when they are recorded as realized futures gains (losses).
During the year ended October 31, 2014, the fund’s average investments in long and short futures contracts represented 1% and 0% of net assets, respectively, based on the average of aggregate settlement values at each quarter-end during the period
4. Repurchase Agreements: The fund enters into repurchase agreements with institutional counterparties. Securities pledged as collateral to the fund under repurchase agreements are held by a custodian bank until the agreements mature. Each agreement requires that the market value of the collateral be sufficient to cover payments of interest and principal. The fund further mitigates its counterparty risk by entering into repurchase agreements only with a diverse group of prequalified counterparties, monitoring their financial strength, and entering into master repurchase agreements with its counterparties. The master repurchase agreements provide that, in the event of a counter-party’s default (including bankruptcy), the fund may terminate any repurchase agreements with that counterparty, determine the net amount owed, and sell or retain the collateral up to the net amount owed to the fund. Such action may be subject to legal proceedings, which may delay or limit the disposition of collateral.
5. Federal Income Taxes: The fund intends to continue to qualify as a regulated investment company and distribute all of its taxable income. Management has analyzed the fund’s tax positions taken for all open federal income tax years (October 31, 2011–2014), and has concluded that no provision for federal income tax is required in the fund’s financial statements.
6. Distributions: Distributions to shareholders are recorded on the ex-dividend date.
7. Securities Lending: To earn additional income, the fund lends its securities to qualified institutional borrowers. Security loans are required to be secured at all times by collateral in an amount at least equal to the market value of securities loaned. Daily market fluctuations could cause the value of loaned securities to be more or less than the value of the collateral received. When this occurs, the collateral is adjusted and settled on the next business day. The fund further mitigates its counterparty risk by entering into securities lending transactions only with a diverse group of prequalified counterparties, monitoring their financial strength, and entering into master securities lending agreements with its counterparties. The master securities lending agreements provide that, in the event of a counterparty’s default (including bankruptcy), the fund may terminate any loans with that borrower, determine the net amount owed, and sell or retain the collateral up to the net amount owed to the fund; however, such actions may be subject to legal proceedings. While collateral mitigates counterparty risk, in the absence of a default the fund may experience delays and costs in recovering the securities loaned. The fund invests cash collateral received in Vanguard Market Liquidity Fund, and records a liability in the Statement of Net Assets for the return of the collateral, during the period the securities are on loan. Securities lending income represents fees charged to borrowers plus income earned on invested cash collateral, less expenses associated with the loan.
8. Credit Facility: The fund and certain other funds managed by The Vanguard Group participate in a $2.89 billion committed credit facility provided by a syndicate of lenders pursuant to a credit agreement that may be renewed annually; each fund is individually liable for its borrowings, if any, under the credit facility. Borrowings may be utilized for temporary and emergency purposes, and are subject to the fund’s regulatory and contractual borrowing restrictions. The participating funds
24
Windsor Fund
are charged administrative fees and an annual commitment fee of 0.06% of the undrawn amount of the facility; these fees are allocated to the funds based on a method approved by the fund’s board of trustees and included in Management and Administrative expenses on the fund’s Statement of Operations. Any borrowings under this facility bear interest at a rate equal to the higher of the federal funds rate or LIBOR reference rate plus an agreed-upon spread.
The fund had no borrowings outstanding at October 31, 2014, or at any time during the period then ended.
9. Other: Dividend income is recorded on the ex-dividend date. Interest income includes income distributions received from Vanguard Market Liquidity Fund and is accrued daily. Premiums and discounts on debt securities purchased are amortized and accreted, respectively, to interest income over the lives of the respective securities. Security transactions are accounted for on the date securities are bought or sold. Costs used to determine realized gains (losses) on the sale of investment securities are those of the specific securities sold.
Each class of shares has equal rights as to assets and earnings, except that each class separately bears certain class-specific expenses related to maintenance of shareholder accounts (included in Management and Administrative expenses) and shareholder reporting. Marketing and distribution expenses are allocated to each class of shares based on a method approved by the board of trustees. Income, other non-class-specific expenses, and gains and losses on investments are allocated to each class of shares based on its relative net assets.
B. Wellington Management Company, LLP, and Pzena Investment Management, LLC, each provide investment advisory services to a portion of the fund for a fee calculated at an annual percentage rate of average net assets managed by the advisor. The basic fee of Wellington Management Company, LLP, is subject to quarterly adjustments based on performance for the preceding three years relative to the S&P 500 Index. The basic fee of Pzena Investment Management, LLC, is subject to quarterly adjustments based on performance since October 31, 2012, relative to the Russell 1000 Value Index.
The Vanguard Group manages the cash reserves of the fund on an at-cost basis.
For the year ended October 31, 2014, the aggregate investment advisory fee represented an effective annual basic rate of 0.13% of the fund’s average net assets, before an increase of $4,612,000 (0.03%) based on performance.
C. The Vanguard Group furnishes at cost corporate management, administrative, marketing, and distribution services. The costs of such services are allocated to the fund based on methods approved by the board of trustees. The fund has committed to invest up to 0.40% of its net assets in Vanguard. At October 31, 2014, the fund had contributed capital of $1,781,000 to Vanguard (included in Other Assets), representing 0.01% of the fund’s net assets and 0.71% of Vanguard’s capitalization. The fund’s trustees and officers are also directors and officers of Vanguard.
D. The fund has asked its investment advisors to direct certain security trades, subject to obtaining the best price and execution, to brokers who have agreed to rebate to the fund part of the commissions generated. Such rebates are used solely to reduce the fund’s management and administrative expenses. For the year ended October 31, 2014, these arrangements reduced the fund’s expenses by $231,000 (an annual rate of 0.00% of average net assets).
E. Various inputs may be used to determine the value of the fund’s investments. These inputs are summarized in three broad levels for financial statement purposes. The inputs or methodologies used to value securities are not necessarily an indication of the risk associated with investing in those securities.
25
Windsor Fund
Level 1—Quoted prices in active markets for identical securities.
Level 2—Other significant observable inputs (including quoted prices for similar securities, interest rates, prepayment speeds, credit risk, etc.).
Level 3—Significant unobservable inputs (including the fund’s own assumptions used to determine the fair value of investments).
| | | |
The following table summarizes the market value of the fund’s investments as of October 31, 2014, based on the inputs used to value them:
|
|
| | Level 1 | Level 2 | Level 3 |
| Investments | ($000) | ($000) | ($000) |
| Common Stocks | 16,995,585 | 618,280 | — |
| Temporary Cash Investments | 289,984 | 230,599 | — |
| Futures Contracts—Assets1 | 2,020 | — | — |
| Futures Contracts—Liabilities1 | (46) | — | — |
| Total | 17,287,543 | 848,879 | — |
| 1 Represents variation margin on the last day of the reporting period. |
F. At October 31, 2014, the aggregate settlement value of open futures contracts and the related unrealized appreciation (depreciation) were:
| | | | |
| | | | | ($000) |
| | | | Aggregate | |
| | | Number of | Settlement | Unrealized |
| | | Long (Short) | Value | Appreciation |
| Futures Contracts | Expiration | Contracts | Long (Short) | (Depreciation) |
| E-mini S&P 500 Index | December 2014 | 1,378 | 138,585 | 4,731 |
| S&P 500 Index | December 2014 | 63 | 31,680 | 554 |
| | | | | 5,285 |
Unrealized appreciation (depreciation) on open futures contracts is required to be treated as realized gain (loss) for tax purposes.
G. Distributions are determined on a tax basis and may differ from net investment income and realized capital gains for financial reporting purposes. Differences may be permanent or temporary. Permanent differences are reclassified among capital accounts in the financial statements to reflect their tax character. Temporary differences arise when certain items of income, expense, gain, or loss are recognized in different periods for financial statement and tax purposes. These differences will reverse at some time in the future. Differences in classification may also result from the treatment of short-term gains as ordinary income for tax purposes.
During the year ended October 31, 2014, the fund realized net foreign currency losses of $376,000, which decreased distributable net income for tax purposes; accordingly, such losses have been reclassified from accumulated net realized gains to undistributed net investment income.
The fund used a tax accounting practice to treat a portion of the price of capital shares redeemed during the year as distributions from realized capital gains. Accordingly, the fund has reclassified $29,704,000 from accumulated net realized gains to paid-in capital.
26
Windsor Fund
The fund used capital loss carryforwards of $774,686,000 to offset taxable capital gains realized during the year ended October 31, 2014, reducing the amount of capital gains that would otherwise be available to distribute to shareholders. For tax purposes, at October 31, 2014, the fund had $80,322,000 of ordinary income and $790,138,000 of long-term capital gains available for distribution.
At October 31, 2014, the cost of investment securities for tax purposes was $13,895,637,000. Net unrealized appreciation of investment securities for tax purposes was $4,238,811,000, consisting of unrealized gains of $4,554,912,000 on securities that had risen in value since their purchase and $316,101,000 in unrealized losses on securities that had fallen in value since their purchase.
H. During the year ended October 31, 2014, the fund purchased $6,368,949,000 of investment securities and sold $6,524,853,000 of investment securities, other than temporary cash investments.
I. Capital share transactions for each class of shares were:
| | | | | |
| | | | | Year Ended October 31, |
| | | 2014 | | | 2013 |
| | Amount | Shares | | Amount | Shares |
| | ($000) | (000) | | ($000) | (000) |
| Investor Shares | | | | | |
| Issued | 534,926 | 25,704 | | 628,746 | 36,860 |
| Issued in Lieu of Cash Distributions | 89,500 | 4,227 | | 107,480 | 6,843 |
| Redeemed | (1,434,685) | (68,755) | | (2,365,686) | (135,989) |
| Net Increase (Decrease)—Investor Shares | (810,259) | (38,824) | | (1,629,460) | (92,286) |
| Admiral Shares | | | | | |
| Issued | 1,389,863 | 19,755 | | 1,967,049 | 33,059 |
| Issued in Lieu of Cash Distributions | 128,650 | 1,799 | | 100,424 | 1,885 |
| Redeemed | (973,030) | (13,763) | | (748,983) | (13,120) |
| Net Increase (Decrease) —Admiral Shares | 545,483 | 7,791 | | 1,318,490 | 21,824 |
J. Management has determined that no material events or transactions occurred subsequent to October 31, 2014, that would require recognition or disclosure in these financial statements.
27
Report of Independent Registered
Public Accounting Firm
To the Board of Trustees of Vanguard Windsor Funds and the Shareholders of Vanguard Windsor Fund:
In our opinion, the accompanying statement of net assets and the related statements of operations and of changes in net assets and the financial highlights present fairly, in all material respects, the financial position of Vanguard Windsor Fund (constituting a separate portfolio of Vanguard Windsor Funds, hereafter referred to as the “Fund”) at October 31, 2014, the results of its operations for the year then ended, the changes in its net assets for each of the two years in the period then ended, and the financial highlights for each of the five years in the period then ended, in conformity with accounting principles generally accepted in the United States of America. These financial statements and financial highlights (hereafter referred to as “financial statements”) are the responsibility of the Fund’s management. Our responsibility is to express an opinion on these financial statements based on our audits. We conducted our audits of these financial statements in accordance with the standards of the Public Company Accounting Oversight Board (United States). Those standards require that we plan and perform the audit to obtain reasonable assurance about whether the financial statements are free of material misstatement. An audit includes examining, on a test basis, evidence supporting the amounts and disclosures in the financial statements, assessing the accounting principles used and significant estimates made by management, and evaluating the overall financial statement presentation. We believe that our audits, which included confirmation of securities at October 31, 2014 by correspondence with the custodians and brokers, by agreement to the underlying ownership records of the transfer agent and the application of alternative auditing procedures where securities purchased had not been received, provide a reasonable basis for our opinion.
/s/PricewaterhouseCoopers LLP
Philadelphia, Pennsylvania
December 11, 2014
| |
| Special 2014 tax information (unaudited) for Vanguard Windsor Fund |
This information for the fiscal year ended October 31, 2014, is included pursuant to provisions of the Internal Revenue Code.
The fund distributed $29,704,000 as capital gain dividends (from net long-term capital gains) to shareholders during the fiscal year.
The fund distributed $231,070,000 of qualified dividend income to shareholders during the fiscal year.
For corporate shareholders, 82.6% of investment income (dividend income plus short-term gains, if any) qualifies for the dividends-received deduction.
28
Your Fund’s After-Tax Returns
This table presents returns for your fund both before and after taxes. The after-tax returns are shown in two ways: (1) assuming that an investor owned the fund during the entire period and paid taxes on the fund’s distributions, and (2) assuming that an investor paid taxes on the fund’s distributions and sold all shares at the end of each period.
Calculations are based on the highest individual federal income tax and capital gains tax rates in effect at the times of the distributions and the hypothetical sales. State and local taxes were not considered. After-tax returns reflect any qualified dividend income, using actual prior-year figures and estimates for 2014. (In the example, returns after the sale of fund shares may be higher than those assuming no sale. This occurs when the sale would have produced a capital loss. The calculation assumes that the investor received a tax deduction for the loss.)
The table shows returns for Investor Shares only; returns for other share classes will differ. Please note that your actual after-tax returns will depend on your tax situation and may differ from those shown. Also note that if you own the fund in a tax-deferred account, such as an individual retirement account or a 401(k) plan, this information does not apply to you. Such accounts are not subject to current taxes.
Finally, keep in mind that a fund’s performance—whether before or after taxes—does not guarantee future results.
| | | | |
| Average Annual Total Returns: Windsor Fund Investor Shares | | | |
| Periods Ended October 31, 2014 | | | |
| |
| | One | Five | Ten |
| | Year | Years | Years |
| Returns Before Taxes | 14.14% | 16.65% | 7.55% |
| Returns After Taxes on Distributions | 13.80 | 16.35 | 6.78 |
| Returns After Taxes on Distributions and Sale of Fund Shares | 8.26 | 13.50 | 6.13 |
29
About Your Fund’s Expenses
As a shareholder of the fund, you incur ongoing costs, which include costs for portfolio management, administrative services, and shareholder reports (like this one), among others. Operating expenses, which are deducted from a fund’s gross income, directly reduce the investment return of the fund.
A fund’s expenses are expressed as a percentage of its average net assets. This figure is known as the expense ratio. The following examples are intended to help you understand the ongoing costs (in dollars) of investing in your fund and to compare these costs with those of other mutual funds. The examples are based on an investment of $1,000 made at the beginning of the period shown and held for the entire period.
The accompanying table illustrates your fund’s costs in two ways:
• Based on actual fund return. This section helps you to estimate the actual expenses that you paid over the period. The ”Ending Account Value“ shown is derived from the fund‘s actual return, and the third column shows the dollar amount that would have been paid by an investor who started with $1,000 in the fund. You may use the information here, together with the amount you invested, to estimate the expenses that you paid over the period.
To do so, simply divide your account value by $1,000 (for example, an $8,600 account value divided by $1,000 = 8.6), then multiply the result by the number given for your fund under the heading ”Expenses Paid During Period.“
• Based on hypothetical 5% yearly return. This section is intended to help you compare your fund‘s costs with those of other mutual funds. It assumes that the fund had a yearly return of 5% before expenses, but that the expense ratio is unchanged. In this case—because the return used is not the fund’s actual return—the results do not apply to your investment. The example is useful in making comparisons because the Securities and Exchange Commission requires all mutual funds to calculate expenses based on a 5% return. You can assess your fund’s costs by comparing this hypothetical example with the hypothetical examples that appear in shareholder reports of other funds.
Note that the expenses shown in the table are meant to highlight and help you compare ongoing costs only and do not reflect transaction costs incurred by the fund for buying and selling securities. Further, the expenses do not include any purchase, redemption, or account service fees described in the fund prospectus. If such fees were applied to your account, your costs would be higher. Your fund does not carry a “sales load.”
The calculations assume no shares were bought or sold during the period. Your actual costs may have been higher or lower, depending on the amount of your investment and the timing of any purchases or redemptions.
You can find more information about the fund’s expenses, including annual expense ratios, in the Financial Statements section of this report. For additional information on operating expenses and other shareholder costs, please refer to your fund’s current prospectus.
30
| | | |
| Six Months Ended October 31, 2014 | | | |
| | Beginning | Ending | Expenses |
| | Account Value | Account Value | Paid During |
| Windsor Fund | 4/30/2014 | 10/31/2014 | Period |
| Based on Actual Fund Return | | | |
| Investor Shares | $1,000.00 | $1,049.54 | $2.01 |
| Admiral Shares | 1,000.00 | 1,049.91 | 1.50 |
| Based on Hypothetical 5% Yearly Return | | | |
| Investor Shares | $1,000.00 | $1,023.24 | $1.99 |
| Admiral Shares | 1,000.00 | 1,023.74 | 1.48 |
The calculations are based on expenses incurred in the most recent six-month period. The fund’s annualized six-month expense ratios for that period are 0.39% for Investor Shares and 0.29% for Admiral Shares. The dollar amounts shown as “Expenses Paid” are equal to the annualized expense ratio multiplied by the average account value over the period, multiplied by the number of days in the most recent six-month period, then divided by the number of days in the most recent 12-month period.
31
Glossary
30-Day SEC Yield. A fund’s 30-day SEC yield is derived using a formula specified by the U.S. Securities and Exchange Commission. Under the formula, data related to the fund’s security holdings in the previous 30 days are used to calculate the fund’s hypothetical net income for that period, which is then annualized and divided by the fund’s estimated average net assets over the calculation period. For the purposes of this calculation, a security’s income is based on its current market yield to maturity (for bonds), its actual income (for asset-backed securities), or its projected dividend yield (for stocks). Because the SEC yield represents hypothetical annualized income, it will differ—at times significantly—from the fund’s actual experience. As a result, the fund’s income distributions may be higher or lower than implied by the SEC yield.
Beta. A measure of the magnitude of a fund’s past share-price fluctuations in relation to the ups and downs of a given market index. The index is assigned a beta of 1.00. Compared with a given index, a fund with a beta of 1.20 typically would have seen its share price rise or fall by 12% when the index rose or fell by 10%. For this report, beta is based on returns over the past 36 months for both the fund and the index. Note that a fund’s beta should be reviewed in conjunction with its R-squared (see definition). The lower the R-squared, the less correlation there is between the fund and the index, and the less reliable beta is as an indicator of volatility.
Dividend Yield. Dividend income earned by stocks, expressed as a percentage of the aggregate market value (or of net asset value, for a fund). The yield is determined by dividing the amount of the annual dividends by the aggregate value (or net asset value) at the end of the period. For a fund, the dividend yield is based solely on stock holdings and does not include any income produced by other investments.
Earnings Growth Rate. The average annual rate of growth in earnings over the past five years for the stocks now in a fund.
Equity Exposure. A measure that reflects a fund’s investments in stocks and stock futures. Any holdings in short-term reserves are excluded.
Expense Ratio. A fund’s total annual operating expenses expressed as a percentage of the fund’s average net assets. The expense ratio includes management and administrative expenses, but does not include the transaction costs of buying and selling portfolio securities.
Foreign Holdings. The percentage of a fund represented by securities or depositary receipts of companies based outside the United States.
Inception Date. The date on which the assets of a fund (or one of its share classes) are first invested in accordance with the fund’s investment objective. For funds with a subscription period, the inception date is the day after that period ends. Investment performance is measured from the inception date.
Median Market Cap. An indicator of the size of companies in which a fund invests; the midpoint of market capitalization (market price x shares outstanding) of a fund’s stocks, weighted by the proportion of the fund’s assets invested in each stock. Stocks representing half of the fund’s assets have market capitalizations above the median, and the rest are below it.
Price/Book Ratio. The share price of a stock divided by its net worth, or book value, per share. For a fund, the weighted average price/book ratio of the stocks it holds.
32
Price/Earnings Ratio. The ratio of a stock’s current price to its per-share earnings over the past year. For a fund, the weighted average P/E of the stocks it holds. P/E is an indicator of market expectations about corporate prospects; the higher the P/E, the greater the expectations for a company’s future growth.
R-Squared. A measure of how much of a fund’s past returns can be explained by the returns from the market in general, as measured by a given index. If a fund’s total returns were precisely synchronized with an index’s returns, its R-squared would be 1.00. If the fund’s returns bore no relationship to the index’s returns, its R-squared would be 0. For this report, R-squared is based on returns over the past 36 months for both the fund and the index.
Return on Equity. The annual average rate of return generated by a company during the past five years for each dollar of shareholder’s equity (net income divided by shareholder’s equity). For a fund, the weighted average return on equity for the companies whose stocks it holds.
Short-Term Reserves. The percentage of a fund invested in highly liquid, short-term securities that can be readily converted to cash.
Turnover Rate. An indication of the fund’s trading activity. Funds with high turnover rates incur higher transaction costs and may be more likely to distribute capital gains (which may be taxable to investors). The turnover rate excludes in-kind transactions, which have minimal impact on costs.
33
This page intentionally left blank.
This page intentionally left blank.
The People Who Govern Your Fund
The trustees of your mutual fund are there to see that the fund is operated and managed in your best interests since, as a shareholder, you are a part owner of the fund. Your fund’s trustees also serve on the board of directors of The Vanguard Group, Inc., which is owned by the Vanguard funds and provides services to them on an at-cost basis.
A majority of Vanguard’s board members are independent, meaning that they have no affiliation with Vanguard or the funds they oversee, apart from the sizable personal investments they have made as private individuals. The independent board members have distinguished backgrounds in business, academia, and public service. Each of the trustees and executive officers oversees 177 Vanguard funds.
The following table provides information for each trustee and executive officer of the fund. More information about the trustees is in the Statement of Additional Information, which can be obtained, without charge, by contacting Vanguard at 800-662-7447, or online at vanguard.com.
| |
| InterestedTrustee1 | and Delphi Automotive LLP (automotive components); |
| | Senior Advisor at New Mountain Capital. |
| F. William McNabb III | |
| Born 1957. Trustee Since July 2009. Chairman of the | Amy Gutmann |
| Board. Principal Occupation(s) During the Past Five | Born 1949. Trustee Since June 2006. Principal |
| Years: Chairman of the Board of The Vanguard Group, | Occupation(s) During the Past Five Years: President of |
| Inc., and of each of the investment companies served | the University of Pennsylvania; Christopher H. Browne |
| by The Vanguard Group, since January 2010; Director | Distinguished Professor of Political Science, School of |
| of The Vanguard Group since 2008; Chief Executive | Arts and Sciences, and Professor of Communication, |
| Officer and President of The Vanguard Group, and of | Annenberg School for Communication, with secondary |
| each of the investment companies served by The | faculty appointments in the Department of Philosophy, |
| Vanguard Group, since 2008; Director of Vanguard | School of Arts and Sciences, and at the Graduate |
| Marketing Corporation; Managing Director of The | School of Education, University of Pennsylvania; |
| Vanguard Group (1995–2008). | Trustee of the National Constitution Center; Chair |
| | of the Presidential Commission for the Study of |
| IndependentTrustees | Bioethical Issues. |
| |
| Emerson U. Fullwood | JoAnn Heffernan Heisen |
| Born 1948. Trustee Since January 2008. Principal | Born 1950. Trustee Since July 1998. Principal |
| Occupation(s) During the Past Five Years: Executive | Occupation(s) During the Past Five Years: Corporate |
| Chief Staff and Marketing Officer for North America | Vice President and Chief Global Diversity Officer |
| and Corporate Vice President (retired 2008) of Xerox | (retired 2008) and Member of the Executive |
| Corporation (document management products and | Committee (1997–2008) of Johnson & Johnson |
| services); Executive in Residence and 2009–2010 | (pharmaceuticals/medical devices/consumer |
| Distinguished Minett Professor at the Rochester | products); Director of Skytop Lodge Corporation |
| Institute of Technology; Director of SPX Corporation | (hotels), the University Medical Center at Princeton, |
| (multi-industry manufacturing), the United Way of | the Robert Wood Johnson Foundation, and the Center |
| Rochester, Amerigroup Corporation (managed health | for Talent Innovation; Member of the Advisory Board |
| care), the University of Rochester Medical Center, | of the Maxwell School of Citizenship and Public Affairs |
| Monroe Community College Foundation, and North | at Syracuse University. |
| Carolina A&T University. | |
| F. Joseph Loughrey |
| Rajiv L. Gupta | Born 1949. Trustee Since October 2009. Principal |
| Born 1945. Trustee Since December 2001.2 | Occupation(s) During the Past Five Years: President |
| Principal Occupation(s) During the Past Five Years: | and Chief Operating Officer (retired 2009) of Cummins |
| Chairman and Chief Executive Officer (retired 2009) | Inc. (industrial machinery); Chairman of the Board |
| and President (2006–2008) of Rohm and Haas Co. | of Hillenbrand, Inc. (specialized consumer services), |
| (chemicals); Director of Tyco International, Ltd. | and of Oxfam America; Director of SKF AB (industrial |
| (diversified manufacturing and services), Hewlett- | machinery), Hyster-Yale Materials Handling, Inc. |
| Packard Co. (electronic computer manufacturing), | (forklift trucks), the Lumina Foundation for Education, |
| |
| | |
| and the V Foundation for Cancer Research; Member | Executive Officers | |
| of the Advisory Council for the College of Arts and | | |
| Letters and of the Advisory Board to the Kellogg | Glenn Booraem | |
| Institute for International Studies, both at the | Born 1967. Controller Since July 2010. Principal |
| University of Notre Dame. | Occupation(s) During the Past Five Years: Principal |
| | of The Vanguard Group, Inc.; Controller of each of |
| Mark Loughridge | the investment companies served by The Vanguard |
| Born 1953. Trustee Since March 2012. Principal | Group; Assistant Controller of each of the investment |
| Occupation(s) During the Past Five Years: Senior Vice | companies served by The Vanguard Group (2001–2010). |
| President and Chief Financial Officer (retired 2013) | | |
| at IBM (information technology services); Fiduciary | Thomas J. Higgins | |
| Member of IBM’s Retirement Plan Committee (2004– | Born 1957. Chief Financial Officer Since September |
| 2013); Member of the Council on Chicago Booth. | 2008. Principal Occupation(s) During the Past Five |
| | Years: Principal of The Vanguard Group, Inc.; Chief |
| Scott C. Malpass | Financial Officer of each of the investment companies |
| Born 1962. Trustee Since March 2012. Principal | served by The Vanguard Group; Treasurer of each of |
| Occupation(s) During the Past Five Years: Chief | the investment companies served by The Vanguard |
| Investment Officer and Vice President at the University | Group (1998–2008). | |
| of Notre Dame; Assistant Professor of Finance at the | | |
| Mendoza College of Business at Notre Dame; Member | Kathryn J. Hyatt | |
| of the Notre Dame 403(b) Investment Committee; | Born 1955. Treasurer Since November 2008. Principal |
| Board Member of TIFF Advisory Services, Inc. | Occupation(s) During the Past Five Years: Principal of |
| (investment advisor); Member of the Investment | The Vanguard Group, Inc.; Treasurer of each of the |
| Advisory Committees of the Financial Industry | investment companies served by The Vanguard |
| Regulatory Authority (FINRA) and of Major League | Group; Assistant Treasurer of each of the investment |
| Baseball. | companies served by The Vanguard Group (1988–2008). |
| |
| André F. Perold | Heidi Stam | |
| Born 1952. Trustee Since December 2004. Principal | Born 1956. Secretary Since July 2005. Principal |
| Occupation(s) During the Past Five Years: George | Occupation(s) During the Past Five Years: Managing |
| Gund Professor of Finance and Banking, Emeritus | Director of The Vanguard Group, Inc.; General Counsel |
| at the Harvard Business School (retired 2011); | of The Vanguard Group; Secretary of The Vanguard |
| Chief Investment Officer and Managing Partner of | Group and of each of the investment companies |
| HighVista Strategies LLC (private investment firm); | served by The Vanguard Group; Director and Senior |
| Director of Rand Merchant Bank; Overseer of the | Vice President of Vanguard Marketing Corporation. |
| Museum of Fine Arts Boston. | | |
| | Vanguard Senior ManagementTeam |
| Alfred M. Rankin, Jr. | | |
| Born 1941. Trustee Since January 1993. Principal | Mortimer J. Buckley | Chris D. McIsaac |
| Occupation(s) During the Past Five Years: Chairman, | Kathleen C. Gubanich | Michael S. Miller |
| President, and Chief Executive Officer of NACCO | Paul A. Heller | James M. Norris |
| Industries, Inc. (housewares/lignite), and of Hyster- | Martha G. King | Glenn W. Reed |
| Yale Materials Handling, Inc. (forklift trucks); Chairman | John T. Marcante | |
| of the Board of University Hospitals of Cleveland. | | |
| Chairman Emeritus and Senior Advisor |
| Peter F. Volanakis | | |
| Born 1955. Trustee Since July 2009. Principal | John J. Brennan | |
| Occupation(s) During the Past Five Years: President | Chairman, 1996–2009 | |
| and Chief Operating Officer (retired 2010) of Corning | Chief Executive Officer and President, 1996–2008 |
| Incorporated (communications equipment); Trustee of | | |
| Colby-Sawyer College; Member of the Advisory Board | Founder | |
| of the Norris Cotton Cancer Center and of the Advisory | | |
| Board of the Parthenon Group (strategy consulting). | John C. Bogle | |
| | Chairman and Chief Executive Officer, 1974–1996 |
| | |
1 Mr. McNabb is considered an “interested person,” as defined in the Investment Company Act of 1940, because he is an officer of the Vanguard funds.
2 December 2002 for Vanguard Equity Income Fund, the Vanguard Municipal Bond Funds, and the Vanguard State Tax-Exempt Funds.
|  |
| | P.O. Box 2600 |
| | Valley Forge, PA 19482-2600 |
| |
| |
| |
| Connect with Vanguard® > vanguard.com | |
| |
| |
| |
| Fund Information > 800-662-7447 | |
| Direct Investor Account Services > 800-662-2739 | |
| Institutional Investor Services > 800-523-1036 | |
| Text Telephone for People | |
| Who Are Deaf or Hard of Hearing> 800-749-7273 | |
| |
| This material may be used in conjunction | |
| with the offering of shares of any Vanguard | |
| fund only if preceded or accompanied by | |
| the fund’s current prospectus. | |
| |
| All comparative mutual fund data are from Lipper, a | |
| Thomson Reuters Company, or Morningstar, Inc., unless | |
| otherwise noted. | |
| |
| You can obtain a free copy of Vanguard’s proxy voting | |
| guidelines by visiting vanguard.com/proxyreporting or by | |
| calling Vanguard at 800-662-2739. The guidelines are | |
| also available from the SEC’s website, sec.gov. In | |
| addition, you may obtain a free report on how your fund | |
| voted the proxies for securities it owned during the 12 | |
| months ended June 30. To get the report, visit either | |
| vanguard.com/proxyreporting or sec.gov. | |
| |
| You can review and copy information about your fund at | |
| the SEC’s Public Reference Room in Washington, D.C. To | |
| find out more about this public service, call the SEC at | |
| 202-551-8090. Information about your fund is also | |
| available on the SEC’s website, and you can receive | |
| copies of this information, for a fee, by sending a | |
| request in either of two ways: via e-mail addressed to | |
| publicinfo@sec.gov or via regular mail addressed to the | |
| Public Reference Section, Securities and Exchange | |
| Commission, Washington, DC 20549-1520. | |
| |
| | © 2014 The Vanguard Group, Inc. |
| | All rights reserved. |
| | Vanguard Marketing Corporation, Distributor. |
| |
| | Q220 122014 |

Annual Report | October 31, 2014
Vanguard Windsor™ II Fund
The mission continues
On May 1, 1975, Vanguard began operations, a fledgling company based on the simple but revolutionary idea that a mutual fund company should be managed solely in the interest of its investors.
Four decades later, that revolutionary spirit continues to animate the enterprise. Vanguard remains on a mission to give investors the best chance of investment success.
As we mark our 40th anniversary, we thank you for entrusting your assets to Vanguard and giving us the opportunity to help you reach your financial goals in the decades to come.
| |
| Contents | |
| Your Fund’s Total Returns. | 1 |
| Chairman’s Letter. | 2 |
| Advisors’ Report. | 8 |
| Fund Profile. | 13 |
| Performance Summary. | 14 |
| Financial Statements. | 16 |
| Your Fund’s After-Tax Returns. | 32 |
| About Your Fund’s Expenses. | 33 |
| Glossary. | 35 |
Please note: The opinions expressed in this report are just that—informed opinions. They should not be considered promises or advice. Also, please keep in mind that the information and opinions cover the period through the date on the front of this report. Of course, the risks of investing in your fund are spelled out in the prospectus.
See the Glossary for definitions of investment terms used in this report.
About the cover: Since our founding, Vanguard has drawn inspiration from the enterprise and valor demonstrated by British naval hero Horatio Nelson and his command at the Battle of the Nile in 1798. The photograph displays a replica of a merchant ship from the same era as Nelson’s flagship, the HMS Vanguard.
Your Fund’s Total Returns
| | |
| Fiscal Year Ended October 31, 2014 | |
| |
| | Total |
| | Returns |
| Vanguard Windsor II Fund | |
| Investor Shares | 14.36% |
| Admiral™ Shares | 14.46 |
| Russell 1000 Value Index | 16.46 |
| Large-Cap Value Funds Average | 14.28 |
Large-Cap Value Funds Average: Derived from data provided by Lipper, a Thomson Reuters Company.
Admiral Shares carry lower expenses and are available to investors who meet certain account-balance requirements. |
|
| | | | | |
| Your Fund’s Performance at a Glance | | | | |
| October 31, 2013, Through October 31, 2014 | | | | |
| | | | Distributions Per Share |
| | Starting | Ending | | |
| | Share | Share | Income | Capital |
| | Price | Price | Dividends | Gains |
| Vanguard Windsor II Fund | | | | |
| Investor Shares | $36.19 | $39.59 | $0.838 | $0.797 |
| Admiral Shares | 64.23 | 70.27 | 1.545 | 1.414 |
1

Chairman’s Letter
Dear Shareholder,
Vanguard Windsor II Fund delivered a double-digit advance for the 2014 fiscal year, but its performance didn’t measure up to that of its benchmark index. The fund returned about 14% as the stock market stayed largely productive despite some choppiness. Although Windsor II’s result trailed the more than 16% gain of the Russell 1000 Value Index, it was in line with the average return of its large-capitalization value fund peers.
The fund posted double-digit returns in seven of ten industry sectors. However, the advisors’ stock decisions created a performance drag relative to the benchmark in multiple areas, most notably energy and health care. Superior choices in the industrial sector weren’t enough to outweigh the shortcomings.
If you hold Windsor II shares in a taxable account, you may wish to review the discussion of after-tax returns for the fiscal year that appears later in this report.
Their smooth ride turned jagged, but U.S. stocks ended higher
Punctuated by a roller coaster of an October, the broad U.S. stock market returned about 16% for the 12 months ended October 31.
Impressive corporate earnings and various global stimulus measures generally supported stocks against a bleaker backdrop that included tensions in the Middle East and Ukraine and other international economic concerns. But over the first two weeks of October, stocks declined sharply as investors reacted to weakness in the global economy, especially the slowdown in China and the threat of deflation in Europe. Reflecting confidence in the U.S. economy, however, the Federal Reserve announced October 29 that it was ending its stimulative bond-buying program as anticipated.
U.S. stocks staged an impressive rebound in the period’s final two weeks, and several major indexes finished at record highs. International stocks didn’t fare as well. Emerging markets posted a modest advance for the 12 months, while stocks from the developed markets of Europe and the Pacific region slipped.
U.S. bonds posted positive results as already low yields declined
The broad U.S. taxable bond market returned 4.14%. Bond prices, which backtracked at times over the summer, climbed in October as investors sought sanctuary from stock market volatility.
| | | | |
| Market Barometer | | | |
| | | Average Annual Total Returns |
| | | Periods Ended October 31, 2014 |
| | One | Three | Five |
| | Year | Years | Years |
| Stocks | | | |
| Russell 1000 Index (Large-caps) | 16.78% | 19.90% | 16.98% |
| Russell 2000 Index (Small-caps) | 8.06 | 18.18 | 17.39 |
| Russell 3000 Index (Broad U.S. market) | 16.07 | 19.77 | 17.01 |
| FTSE All-World ex US Index (International) | 0.45 | 8.07 | 6.38 |
| |
| Bonds | | | |
| Barclays U.S. Aggregate Bond Index (Broad taxable market) | 4.14% | 2.73% | 4.22% |
| Barclays Municipal Bond Index (Broad tax-exempt market) | 7.82 | 4.93 | 5.26 |
| Citigroup Three-Month U.S. Treasury Bill Index | 0.04 | 0.04 | 0.06 |
| |
| CPI | | | |
| Consumer Price Index | 1.66% | 1.60% | 1.89% |
3
Overall, bond returns have been strong despite many analysts’ expectations that already low yields wouldn’t decline further Prices rose and yields fell even as the Fed began steadily reducing its bond purchases in January. (Bond prices and yields move in opposite directions.) The yield of the 10-year U.S. Treasury note ended October at 2.31%, down from 2.54% a year earlier.
Municipal bonds returned 7.82%, with tax-exempt issues in high demand even at a time of reduced supply.
International bond markets (as measured by the Barclays Global Aggregate Index ex USD) slid in September and October en route to a –2.53% return for the 12 months.
The Fed’s target for short-term interest rates remained at 0%–0.25%, restraining returns for money market funds and savings accounts.
Health care and financial stocks affected the fund’s return most
The health care sector stood out over the fiscal year for its impact on the fund’s performance. Windsor II’s health care stocks returned about 19% and accounted for more than 3 percentage points of the fund’s return. Although the advisors’ heavy exposure to the sector proved helpful, their choices within it were not. The health care stocks in the index returned more than 25%.
| | | | |
| Expense Ratios | | | |
| Your Fund Compared With Its Peer Group | | | |
| | Investor | Admiral | Peer Group |
| | Shares | Shares | Average |
| Windsor II Fund | 0.36% | 0.28% | 1.14% |
| The fund expense ratios shown are from the prospectus dated February 26, 2014, and represent estimated costs for the current fiscal year. For the fiscal year ended October 31, 2014, the fund’s expense ratios were 0.36% for Investor Shares and 0.28% for Admiral Shares. The peer-group expense ratio is derived from data provided by Lipper, a Thomson Reuters Company, and captures information through year-end 2013. |
|
|
|
| |
| Peer group: Large-Cap Value Funds. |
4
Overall, the sector benefited as investors anticipated a rise in spending given the aging population and the expanded number of insured under the Affordable Care Act. Windsor II found success among managed health care companies, but that strong showing wasn’t enough to outweigh disappointments in pharmaceuticals.
The fund’s returns were restrained by investments it held and by some it didn’t.
Information technology results also were mixed. Although the fund’s tech stocks returned about 27% and the advisors’ heavier exposure to the sector was advantageous, the tech holdings in the index soared nearly 31%. An excellent performance within software couldn’t compensate for less stellar results for the fund’s internet, IT services, and semiconductor stocks.
Windsor II’s largest sector and greatest contributor was financials, which added nearly 4 percentage points to the fund’s return. Banks, diversified financial services providers, consumer finance companies, and insurance firms all did well, as the long period of low interest rates and strong financial markets boosted balance sheets.
The advisors’ stock picks were most impressive in industrials, where they largely consisted of aerospace and defense companies. Technological innovation, cost-cutting, and a backlog of sales for these companies offset any weakness stemming from federal budget constraints.
| | |
| Total Returns | |
| Ten Years Ended October 31, 2014 | |
| | Average |
| | Annual Return |
| Windsor II Fund Investor Shares | 7.90% |
| Russell 1000 Value Index | 7.90 |
| Large-Cap Value Funds Average | 6.82 |
| Large-Cap Value Funds Average: Derived from data provided by Lipper, a Thomson Reuters Company. |
The figures shown represent past performance, which is not a guarantee of future results. (Current performance may be lower or higher than the performance data cited. For performance data current to the most recent month-end, visit our website at vanguard.com/performance.) Note, too, that both investment returns and principal value can fluctuate widely, so an investor’s shares, when sold, could be worth more or less than their original cost.
5
On the other hand, stock selection was subpar in the consumer staples, consumer discretionary, and energy sectors. The going was especially tough for energy companies, which slumped as oil prices fell. Windsor II’s energy stocks returned about –4%, compared with about a 4% rise for those in the benchmark, as the fund’s oil and gas drillers and equipment and service providers struggled.
You can find more information on the fund’s positioning and performance in the Advisors’ Report that follows this letter.
The fund’s decade-long record surpassed that of its peers
Five advisors are responsible for managing Vanguard Windsor II Fund’s portfolio. The common denominator is large-cap value stocks, but each advisor brings a different investment style and process to the mix. Although these diversified strategies may reduce portfolio volatility and position the fund for potential long-term success, the fund has often struggled to outperform its benchmark when markets are robust. This was the case over the most recent period as the stock market’s recovery from the financial crisis extended into a sixth year.
The fund’s results look better through a long-term lens. Over the decade ended October 31, 2014, Windsor II’s Investor Shares recorded an average annual return of 7.90%, virtually matching that of the fund’s benchmark index and exceeding the peer-group average of 6.82%.
In addition to the experience and skill of its advisors, the fund is helped by its low costs, which allow you to retain a larger share of its return.
When market volatility heats up, the best response is to keep cool
After several years of strength, stocks hit a rough patch toward the close of the fiscal year, as I noted earlier. For the first half of October, global stock markets (as measured by the FTSE Global All Cap Index) returned –5.56%. Even though stocks rebounded in the second half of the month, many investors undoubtedly were left feeling unsettled.
What’s my best advice to anxious shareholders? Remain calm and remember that volatility is a normal part of stock market investing. The value of keeping a cool head is highlighted in a Vanguard research paper that looked at how investors behaved during the financial crisis, when global stocks declined about 58% and U.S. stocks about 55%.
The 2010 paper, Resilience in Volatile Markets: 401(k) Participant Behavior, September 2007–December 2009, examined the behavior of participants in Vanguard-administered retirement plans. During that time, about three-quarters of participants made no changes to their accounts, and only 3% gave up on stocks completely.
6
As stocks recovered, this discipline yielded big benefits. From the end of 2008 to the end of 2013, the average Vanguard 401(k) portfolio nearly doubled in value, largely because of the surge in stock prices.
I’m pleased that, over time, our clients have demonstrated an impressive ability to remain focused on their long-term goals. They stayed the course through the 1987 correction, the dot-com boom of the 1990s, and the more recent financial crisis, and they continue to do so today.
As always, thank you for investing with Vanguard.
Sincerely,

F. William McNabb III
Chairman and Chief Executive Officer
November 13, 2014
7
Advisors’ Report
For the 12 months ended October 31, 2014, Vanguard Windsor II Fund returned about 14%. Your fund is managed by five independent advisors, a strategy that enhances the fund’s diversification by providing exposure to distinct yet complementary investment approaches. It’s not uncommon for different advisors to have different views about individual securities or the broader investment environment.
The table below lists the advisors, the amount and percentage of fund assets each manages, and brief descriptions of their investment strategies. The advisors have provided the following assessment of the investment environment during the past 12 months and the notable successes and shortfalls in their portfolios. These comments were prepared on November 18, 2014.
| | | | |
| Vanguard Windsor II Fund Investment Advisors | | |
| |
| | Fund Assets Managed | | |
| Investment Advisor | % | $ Million | | Investment Strategy |
| Barrow, Hanley, Mewhinney & | 61 | 30,394 | | Conducts fundamental research on individual stocks |
| Strauss, LLC | | | | exhibiting traditional value characteristics: |
| | | | | price/earnings and price/book ratios below the broad |
| | | | | market average and dividend yields above the broad |
| | | | | market average. |
| Lazard Asset Management LLC | 17 | 8,390 | | Employs a relative-value approach that seeks a |
| | | | | combination of attractive valuation and high financial |
| | | | | productivity. The process is research-driven, relying |
| | | | | upon bottom-up stock analysis performed by the firm’s |
| | | | | global sector analysts. |
| Hotchkis and Wiley Capital | 12 | 5,790 | | Uses a disciplined investment approach, focusing on |
| Management, LLC | | | | such investment parameters as a company’s tangible |
| | | | | assets, sustainable cash flow, and potential for |
| | | | | improving business performance. |
| Sanders Capital, LLC | 10 | 5,165 | | Employs a traditional, bottom-up, fundamental research |
| | | | | approach to identifying securities that are undervalued |
| | | | | relative to their expected total return. |
| Vanguard Equity Investment | 0 | 244 | | Employs a quantitative fundamental management |
| Group | | | | approach, using models that assess valuation, market |
| | | | | sentiment, earnings quality and growth, and |
| | | | | management decisions of companies versus their |
| | | | | peers. |
| Cash Investments | 0 | 226 | | These short-term reserves are invested by Vanguard in |
| | | | | equity index products to simulate investment in stocks. |
| | | | | Each advisor may also maintain a modest cash |
| | | | | position. |
8
Barrow, Hanley, Mewhinney & Strauss, LLC
Portfolio Manager:
James P. Barrow, Executive Director
Associate Portfolio Managers:
Jeff Fahrenbruch, CFA,
Managing Director
David Ganucheau, CFA,
Managing Director
The conventional wisdom in early 2014 held that interest rates would rise as the Federal Reserve ended its quantitative easing program and that oil prices would rise given improving economic growth as well as geopolitical tensions.
The 10-year U.S. Treasury yield is now well below that of a year ago. Even though the Fed wound down its bond-buying, pressure on U.S. yields came from the European and Japanese central banks as they intensified their own stimulus efforts. Low interest rates continue to spur investors to take on more risk to achieve higher returns, and dividend-paying stocks generally lagged. This pattern has generally been in place since the Great Recession and has not been favorable for our strategy. However, history shows that these periods do not last forever.
Oil prices declined sharply as growth in Europe and emerging markets disappointed and as fears of geopolitical supply disruptions proved overblown. Lower oil prices should benefit the U.S. economic recovery and provide a lift to consumer spending.
We continue to watch for areas where conventional wisdom may prove incorrect, and we remain steadfast in our belief that buying high-quality businesses at an attractive valuation matters more in the long run than taking on greater risk for higher returns that could reverse in a more normal interest rate environment.
Lazard Asset Management LLC
Portfolio Managers:
Andrew Lacey, Deputy Chairman
Christopher Blake, Managing Director
The Standard & Poor’s 500 Index rose 17.27% over the period. During the last two months of 2013, investors weighed the prospects of improving economic conditions against the likelihood that the Federal Reserve would soon begin tapering its bond-buying program. Ultimately, investors cheered the Fed’s December 2013 announcement that it would start reducing its monthly bond purchases by $10 billion, as the move underscored Fed officials’ belief that the country’s economic recovery was sustainable.
9
Stocks were somewhat volatile in the new year, as some investors speculated that the Fed might begin to raise short-term interest rates sooner than expected. However, much of the volatility seen at the start of calendar 2014 diminished in the second quarter, with the Chicago Board Options Exchange Volatility Index (VIX) hitting lows not reached since 2007. The economy rebounded strongly from a first-quarter contraction, posting annualized gross domestic product (GDP) growth above expectations in the second and third quarters. Markets hit new highs in the final months of the fiscal year as confidence in the U.S. economy allowed investors to largely shrug off widespread geopolitical tensions in Eastern Europe and the Middle East, as well as concerns about slowing growth in European and Asian economies.
The portfolio benefited from stock selection in the consumer discretionary sector, where top contributors included Advance Auto Parts and Norwegian Cruise Lines. Stock selection in consumer staples also helped; top contributors included Molson Coors and Kellogg’s. The Kellogg’s holding was sold in July as the stock approached the portfolio management team’s target valuation.
Selection in both energy and health care hurt performance. In energy, key detractors included Transocean and Anadarko; in health care, they included Pfizer and Gilead Sciences. The Gilead holding was sold in April as the stock approached the team’s target valuation.
Hotchkis and Wiley Capital Management, LLC
Portfolio Managers:
George H. Davis, Jr.,
Chief Executive Officer
Sheldon J. Lieberman, Principal
The S&P 500 Index returned more than 17% for the 12 months, closing at a record high. The U.S. economy has shown signs of improvement, particularly in the housing and labor markets. Strong corporate earnings have also supported the rise in equity prices and kept valuations in check. Concerns about a slowdown in emerging markets or Europe or both, combined with elevated stock prices and geopolitical unrest, have produced a somewhat skittish equity market. The VIX, which has been coined the “fear index,” spiked to 26 in mid-October, just months after reaching a seven-year low in June that approached 10. We had expected bouts of elevated volatility, and they happened more quickly and vigorously than we anticipated. Turmoil overseas could prompt additional bouts of volatility, and we believe we are well-positioned for them; we remain focused on valuation support, strong balance sheets, sustainable cash flows, and prudent capital allocation.
Stock selection in energy and an overweight position in the consumer discretionary sector hurt performance. The largest individual detractors were Cobalt International Energy, Sanofi, and
10
Vodafone. Favorable selection in industrials and an overweight position in information technology contributed to performance. The largest individual contributors were Hewlett-Packard, Microsoft, and WellPoint.
Sanders Capital, LLC
Portfolio Managers:
Lewis A. Sanders, CFA,
Chief Executive Officer and
Co-Chief Investment Officer
John P. Mahedy, CPA,
Director of Research and
Co-Chief Investment Officer
Continuing improvement in the financial condition of U.S. households is expected to lead to faster economic growth and an eventual normalization of interest rates. Our portfolio is positioned to benefit from both trends. Faster growth should translate to improved revenue and earnings for home builders, retailers, and auto-related companies, all of which are important investments. Rising interest rates should enhance the earnings power of the financial stocks in our portfolio. Our investments in information technology companies should benefit from faster growth as well, augmented by new product innovation. Our health care investments remain attractive and offer ballast should the economy not respond as expected.
We have sharply reduced investments in the energy sector, as we expect excess capacity to place considerable pressure on product prices and company earnings. Falling energy prices are not all bad, however, as they will improve consumers’ real spendable income and thus enhance prospects for economic growth. Investment returns for the portfolio are slightly behind the U.S. benchmark so far this year because of holdings in Europe and Asia. These investments are in strong, well-positioned companies whose stocks sell at a large discount to those of similar U.S. companies. Thus, we believe their potential for price appreciation is well above that of our U.S. holdings.
Vanguard Equity Investment Group
Portfolio Managers:
James D. Troyer, CFA, Principal
James P. Stetler, Principal
Michael R. Roach, CFA
Over the 12 months, U.S. equities demonstrated robust performance driven by strong local economic news. GDP has been growing at a steady pace, while unemployment dipped below 6%. Consumer credit has slowly been expanding, while inflation has been below the Fed’s target. The positive economic environment plus decent corporate
11
earnings fueled the U.S. equity market to a 16.07% return as measured by the Russell 3000 Index. Value-oriented stocks lagged growth stocks, while large-capitalization stocks outperformed smaller-caps.
Our valuation, market sentiment, and growth indicators helped performance, while our management decisions and quality indicators detracted from it. Relative to our benchmark, we produced positive excess returns in seven of ten sectors. Company selection in industrials and materials contributed the most to our relative return. In industrials, General Dynamics, Lockheed Martin, and Northrop Grumman added the most to results, as did United States Steel and Westlake Chemical in materials.
Unfortunately, holdings in Autoliv and Staples, both in consumer discretionary, detracted from relative performance.
12
Windsor II Fund
Fund Profile
As of October 31, 2014
| | | |
| Share-Class Characteristics | |
| | Investor | Admiral |
| | Shares | Shares |
| Ticker Symbol | VWNFX | VWNAX |
| Expense Ratio1 | 0.36% | 0.28% |
| 30-Day SEC Yield | 2.20% | 2.28% |
| | | | |
| Portfolio Characteristics | | |
| | | | DJ |
| | | | U.S. |
| | | Russell | Total |
| | | 1000 | Market |
| | | Value | FA |
| | Fund | Index | Index |
| Number of Stocks | 268 | 695 | 3,756 |
| Median Market Cap | $68.1B | $58.1B | $47.3B |
| Price/Earnings Ratio | 16.4x | 17.5x | 20.4x |
| Price/Book Ratio | 2.1x | 1.8x | 2.7x |
| Return on Equity | 17.2% | 13.8% | 17.8% |
| Earnings Growth | | | |
| Rate | 15.8% | 13.0% | 15.7% |
| Dividend Yield | 2.6% | 2.3% | 1.9% |
| Foreign Holdings | 9.5% | 0.0% | 0.0% |
| Turnover Rate | 27% | — | — |
| Short-Term Reserves | 2.6% | — | — |
| | | | |
| Sector Diversification (% of equity exposure) |
| | | Russell | DJ |
| | | 1000 | U.S. Total |
| | | Value | Market |
| | Fund | Index | FA Index |
| Consumer | | | |
| Discretionary | 10.8% | 6.2% | 12.5% |
| Consumer Staples | 9.1 | 7.1 | 8.3 |
| Energy | 10.6 | 12.2 | 8.5 |
| Financials | 22.6 | 29.5 | 17.7 |
| Health Care | 16.2 | 13.7 | 13.9 |
| Industrials | 9.3 | 10.3 | 11.3 |
| Information | | | |
| Technology | 13.8 | 9.2 | 18.8 |
| Materials | 0.7 | 3.2 | 3.6 |
| Telecommunication | | | |
| Services | 2.8 | 2.2 | 2.2 |
| Utilities | 4.1 | 6.4 | 3.2 |
| | | |
| Volatility Measures | | |
| | Russell | DJ |
| | 1000 | U.S. Total |
| | Value | Market |
| | Index | FA Index |
| R-Squared | 0.96 | 0.93 |
| Beta | 0.94 | 0.92 |
| These measures show the degree and timing of the fund’s fluctuations compared with the indexes over 36 months. |
|
| | | |
| Ten Largest Holdings (% of total net assets) |
| Microsoft Corp. | Systems Software | 3.0% |
| JPMorgan Chase & Co. | Diversified Banks | 2.7 |
| Medtronic Inc. | Health Care | |
| | Equipment | 2.5 |
| Wells Fargo & Co. | Diversified Banks | 2.4 |
| Pfizer Inc. | Pharmaceuticals | 2.4 |
| Philip Morris | | |
| International Inc. | Tobacco | 2.3 |
| Citigroup Inc. | Diversified Banks | 2.3 |
| Intel Corp. | Semiconductors | 2.2 |
| General Dynamics Corp. | Aerospace & | |
| | Defense | 2.1 |
| Sanofi | Pharmaceuticals | 2.0 |
| Top Ten | | 23.9% |
| The holdings listed exclude any temporary cash investments and equity index products. |
|
Investment Focus
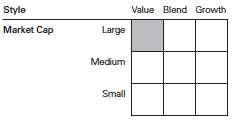
1 The expense ratios shown are from the prospectus dated February 26, 2014, and represent estimated costs for the current fiscal year. For the fiscal year ended October 31, 2014, the expense ratios were 0.36% for Investor Shares and 0.28% for Admiral Shares.
13
Windsor II Fund
Performance Summary
All of the returns in this report represent past performance, which is not a guarantee of future results that may be achieved by the fund. (Current performance may be lower or higher than the performance data cited. For performance data current to the most recent month-end, visit our website at vanguard.com/performance.) Note, too, that both investment returns and principal value can fluctuate widely, so an investor’s shares, when sold, could be worth more or less than their original cost. The returns shown do not reflect taxes that a shareholder would pay on fund distributions or on the sale of fund shares.
Cumulative Performance: October 31, 2004, Through October 31, 2014
Initial Investment of $10,000
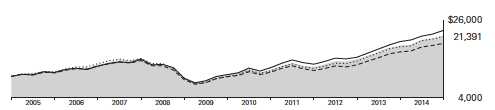
| | | | | |
| | | Average Annual Total Returns | |
| | | Periods Ended October 31, 2014 | |
| | | | | | Final Value |
| | | One | Five | Ten | of a $10,000 |
| | | Year | Years | Years | Investment |
| Windsor II Fund Investor Shares | 14.36% | 15.24% | 7.90% | $21,391 |
| •••••••• | Russell 1000 Value Index | 16.46 | 16.49 | 7.90 | 21,393 |
| – – – – | Large-Cap Value Funds Average | 14.28 | 14.40 | 6.82 | 19,347 |
| | Dow Jones U.S. Total Stock Market | | | | |
| | Float Adjusted Index | 16.00 | 17.09 | 8.71 | 23,060 |
| Large-Cap Value Funds Average: Derived from data provided by Lipper, a Thomson Reuters Company. |
| | | | |
| | | | | Final Value |
| | One | Five | Ten | of a $50,000 |
| | Year | Years | Years | Investment |
| Windsor II Fund Admiral Shares | 14.46% | 15.33% | 8.00% | $107,961 |
| Russell 1000 Value Index | 16.46 | 16.49 | 7.90 | 106,966 |
| Dow Jones U.S. Total Stock Market Float | | | | |
| Adjusted Index | 16.00 | 17.09 | 8.71 | 115,300 |
See Financial Highlights for dividend and capital gains information.
14
Windsor II Fund
Fiscal-Year Total Returns (%): October 31, 2004, Through October 31, 2014
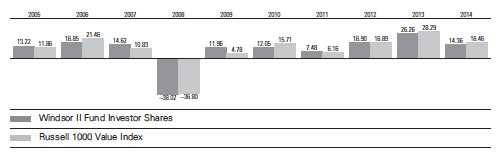
Average Annual Total Returns: Periods Ended September 30, 2014
This table presents returns through the latest calendar quarter—rather than through the end of the fiscal period.
Securities and Exchange Commission rules require that we provide this information.
| | | | |
| | Inception | One | Five | Ten |
| | Date | Year | Years | Years |
| Investor Shares | 6/24/1985 | 17.58% | 14.67% | 7.86% |
| Admiral Shares | 5/14/2001 | 17.67 | 14.77 | 7.96 |
15
Windsor II Fund
Financial Statements
Statement of Net Assets
As of October 31, 2014
The fund reports a complete list of its holdings in regulatory filings four times in each fiscal year, at the quarter-ends. For the second and fourth fiscal quarters, the lists appear in the fund’s semiannual and annual reports to shareholders. For the first and third fiscal quarters, the fund files the lists with the Securities and Exchange Commission on Form N-Q. Shareholders can look up the fund’s Forms N-Q on the SEC’s website at sec.gov. Forms N-Q may also be reviewed and copied at the SEC’s Public Reference Room (see the back cover of this report for further information).
| | | |
| | | | Market |
| | | | Value• |
| | | Shares | ($000) |
| Common Stocks (96.9%)1 | | |
| Consumer Discretionary (10.4%) | |
| | Target Corp. | 13,316,400 | 823,220 |
| | Ford Motor Co. | 53,124,500 | 748,524 |
| | Johnson Controls Inc. | 15,057,700 | 711,476 |
| | Advance Auto Parts Inc. | 2,828,258 | 415,641 |
| | Viacom Inc. Class B | 3,036,000 | 220,656 |
| | Omnicom Group Inc. | 2,743,050 | 197,116 |
| * | Norwegian Cruise Line | | |
| | Holdings Ltd. | 4,942,500 | 192,757 |
| | Comcast Corp. | 3,021,649 | 166,614 |
| | Delphi Automotive plc | 1,767,004 | 121,888 |
| * | Bed Bath & Beyond Inc. | 1,756,082 | 118,255 |
| | McDonald’s Corp. | 1,260,900 | 118,184 |
| | General Motors Co. | 3,614,700 | 113,502 |
| | DR Horton Inc. | 4,937,400 | 112,523 |
| * | Madison Square Garden | | |
| | Co. Class A | 1,402,942 | 106,287 |
| | Genuine Parts Co. | 1,025,181 | 99,525 |
| | Renault SA | 1,043,271 | 77,715 |
| | Time Warner Cable Inc. | 521,600 | 76,785 |
| | Volkswagen AG | | |
| | Preference Shares | 359,620 | 76,692 |
| | Interpublic Group of | | |
| | Cos. Inc. | 3,782,100 | 73,335 |
| | Macy’s Inc. | 1,112,600 | 64,331 |
| | Honda Motor Co. Ltd. | | |
| | ADR | 1,904,300 | 61,166 |
| * | Houghton Mifflin | | |
| | Harcourt Co. | 2,954,900 | 59,128 |
| * | ServiceMaster Global | | |
| | Holdings Inc. | 2,284,400 | 54,780 |
| * | Meritage Homes Corp. | 1,291,708 | 47,522 |
| * | Bloomin’ Brands Inc. | 2,488,700 | 47,061 |
| | Dick’s Sporting Goods | | |
| | Inc. | 1,006,570 | 45,668 |
| | Ryland Group Inc. | 1,244,422 | 44,563 |
| *,^ | JC Penney Co. Inc. | 5,622,400 | 42,786 |
| | Hasbro Inc. | 726,500 | 41,796 |
| | | |
| | | | Market |
| | | | Value• |
| | | Shares | ($000) |
| | Hyundai Motor Co. | 222,182 | 35,435 |
| | Nordstrom Inc. | 440,600 | 31,992 |
| | Lowe’s Cos. Inc. | 543,500 | 31,088 |
| | Carnival Corp. | 758,100 | 30,438 |
| | Hanesbrands Inc. | 14,300 | 1,510 |
| | Best Buy Co. Inc. | 42,300 | 1,444 |
| | Lear Corp. | 15,150 | 1,401 |
| | Expedia Inc. | 16,400 | 1,393 |
| | Cablevision Systems | | |
| | Corp. Class A | 73,100 | 1,361 |
| | Autoliv Inc. | 8,200 | 752 |
| | Foot Locker Inc. | 12,700 | 711 |
| | Royal Caribbean Cruises | | |
| | Ltd. | 8,500 | 578 |
| * | News Corp. Class B | 38,000 | 572 |
| | H&R Block Inc. | 13,800 | 446 |
| | Kohl’s Corp. | 5,100 | 277 |
| | | | 5,218,894 |
| Consumer Staples (8.8%) | | |
| | Philip Morris | | |
| | International Inc. | 12,988,153 | 1,156,075 |
| | Wal-Mart Stores Inc. | 11,781,205 | 898,553 |
| | Imperial Tobacco Group | | |
| | plc ADR | 8,734,425 | 760,943 |
| | Altria Group Inc. | 12,395,632 | 599,205 |
| | Diageo plc ADR | 3,684,120 | 434,616 |
| | Molson Coors Brewing | | |
| | Co. Class B | 3,260,025 | 242,481 |
| | Sysco Corp. | 4,473,656 | 172,415 |
| | Mondelez International | | |
| | Inc. Class A | 1,544,200 | 54,448 |
| | Kellogg Co. | 652,000 | 41,702 |
| | Bunge Ltd. | 358,300 | 31,763 |
| | Procter & Gamble Co. | 72,290 | 6,309 |
| | PepsiCo Inc. | 34,800 | 3,347 |
| | Coca-Cola Co. | 69,800 | 2,923 |
| | Archer-Daniels-Midland | | |
| | Co. | 42,400 | 1,993 |
| | Kimberly-Clark Corp. | 17,400 | 1,988 |
16
Windsor II Fund
| | | |
| | | | Market |
| | | | Value• |
| | | Shares | ($000) |
| | Dr Pepper Snapple | | |
| | Group Inc. | 25,100 | 1,738 |
| | Tyson Foods Inc. Class A | 37,300 | 1,505 |
| * | Pilgrim’s Pride Corp. | 40,300 | 1,145 |
| | Kroger Co. | 16,700 | 930 |
| | Herbalife Ltd. | 2,500 | 131 |
| | | | 4,414,210 |
| Energy (10.2%) | | |
| | ConocoPhillips | 11,932,389 | 860,922 |
| | Phillips 66 | 9,414,426 | 739,033 |
| | Occidental Petroleum | | |
| | Corp. | 8,245,207 | 733,246 |
| | BP plc ADR | 15,549,869 | 675,797 |
| ^ | Seadrill Ltd. | 16,547,907 | 380,602 |
| | Marathon Petroleum | | |
| | Corp. | 3,869,798 | 351,765 |
| | Apache Corp. | 2,334,300 | 180,208 |
| | Royal Dutch Shell plc | | |
| | ADR | 2,247,044 | 161,315 |
| | Devon Energy Corp. | 2,155,600 | 129,336 |
| * | Cobalt International | | |
| | Energy Inc. | 10,981,200 | 128,590 |
| ^ | Transocean Ltd. | 3,672,285 | 109,544 |
| | HollyFrontier Corp. | 2,399,500 | 108,889 |
| | Marathon Oil Corp. | 2,617,700 | 92,667 |
| | CONSOL Energy Inc. | 2,323,020 | 85,487 |
| | EOG Resources Inc. | 861,600 | 81,895 |
| | Murphy Oil Corp. | 1,480,300 | 79,033 |
| | Anadarko Petroleum | | |
| | Corp. | 845,600 | 77,609 |
| | Valero Energy Corp. | 1,253,200 | 62,773 |
| | Chevron Corp. | 362,899 | 43,530 |
| * | Kosmos Energy Ltd. | 3,010,100 | 28,084 |
| | Exxon Mobil Corp. | 119,582 | 11,565 |
| | Gazprom OAO ADR | 1,553,600 | 10,311 |
| | National Oilwell Varco | | |
| | Inc. | 17,900 | 1,300 |
| * | Newfield Exploration Co. | 29,800 | 972 |
| | Hess Corp. | 1,825 | 155 |
| | Superior Energy Services | | |
| | Inc. | 6,000 | 151 |
| | | | 5,134,779 |
| Financials (21.9%) | | |
| | JPMorgan Chase & Co. | 22,507,809 | 1,361,272 |
| | Wells Fargo & Co. | 22,861,273 | 1,213,705 |
| | Citigroup Inc. | 21,163,344 | 1,132,874 |
| | PNC Financial Services | | |
| | Group Inc. | 11,164,068 | 964,464 |
| | Bank of America Corp. | 55,807,826 | 957,662 |
| | American Express Co. | 10,440,896 | 939,159 |
| | Capital One Financial | | |
| | Corp. | 10,237,338 | 847,344 |
| | XL Group plc Class A | 12,711,132 | 430,653 |
| | Navient Corp. | 15,765,352 | 311,839 |
| | | |
| | | | Market |
| | | | Value• |
| | | Shares | ($000) |
| | American International | | |
| | Group Inc. | 4,422,600 | 236,919 |
| | Lincoln National Corp. | 3,280,261 | 179,627 |
| | Intercontinental | | |
| | Exchange Inc. | 817,700 | 170,319 |
| | MetLife Inc. | 2,923,300 | 158,560 |
| | Goldman Sachs | | |
| | Group Inc. | 816,479 | 155,123 |
| | Corrections Corp. of | | |
| | America | 4,161,434 | 153,058 |
| | SLM Corp. | 15,720,252 | 150,128 |
| | SunTrust Banks Inc. | 3,666,167 | 143,494 |
| | Morgan Stanley | 4,087,500 | 142,858 |
| | Hartford Financial | | |
| | Services Group Inc. | 3,589,600 | 142,076 |
| | Regions Financial Corp. | 12,804,000 | 127,144 |
| | CBOE Holdings Inc. | 1,948,300 | 114,833 |
| | Barclays plc | 29,188,345 | 111,885 |
| | BNP Paribas SA | 1,734,985 | 109,408 |
| * | Ally Financial Inc. | 4,463,800 | 101,328 |
| | Aon plc | 1,166,800 | 100,345 |
| | Citizens Financial | | |
| | Group Inc. | 4,208,700 | 99,409 |
| | Allstate Corp. | 1,333,100 | 86,452 |
| | Unum Group | 2,534,500 | 84,804 |
| | Voya Financial Inc. | 1,825,200 | 71,639 |
| | Bank of New York | | |
| | Mellon Corp. | 1,455,300 | 56,349 |
| | Prudential Financial Inc. | 520,837 | 46,115 |
| | Nordea Bank AB | 3,482,300 | 44,658 |
| | US Bancorp | 73,749 | 3,142 |
| | Travelers Cos. Inc. | 22,100 | 2,228 |
| | Discover Financial | | |
| | Services | 27,000 | 1,722 |
| | CIT Group Inc. | 30,900 | 1,512 |
| | KeyCorp | 112,400 | 1,484 |
| | Everest Re Group Ltd. | 8,500 | 1,450 |
| | WR Berkley Corp. | 28,100 | 1,448 |
| | Reinsurance Group of | | |
| | America Inc. Class A | 16,800 | 1,415 |
| | PartnerRe Ltd. | 12,100 | 1,400 |
| | RenaissanceRe | | |
| | Holdings Ltd. | 12,800 | 1,323 |
| | Health Care REIT Inc. | 17,600 | 1,252 |
| | Santander Consumer | | |
| | USA Holdings Inc. | 66,900 | 1,238 |
| | Validus Holdings Ltd. | 29,100 | 1,158 |
| | Host Hotels & Resorts | | |
| | Inc. | 46,200 | 1,077 |
| | Vornado Realty Trust | 9,700 | 1,062 |
| | HCP Inc. | 23,000 | 1,011 |
| | Axis Capital Holdings | | |
| | Ltd. | 18,000 | 866 |
17
Windsor II Fund
| | | |
| | | | Market |
| | | | Value• |
| | | Shares | ($000) |
| | UDR Inc. | 28,200 | 852 |
| | SL Green Realty Corp. | 7,100 | 821 |
| | Hospitality Properties Trust | 25,800 | 764 |
| | Weingarten Realty Investors | 17,900 | 649 |
| | Brixmor Property Group Inc. | 25,600 | 624 |
| | Huntington Bancshares Inc. | 45,400 | 450 |
| | Iron Mountain Inc. | 10,400 | 375 |
| | Public Storage | 1,900 | 350 |
| | Digital Realty Trust Inc. | 1,800 | 124 |
| | Alexandria Real Estate | | |
| | Equities Inc. | 600 | 50 |
| | Kimco Realty Corp. | 100 | 2 |
| | | | 10,975,352 |
| Health Care (15.7%) | | |
| | Medtronic Inc. | 18,266,300 | 1,245,031 |
| | Pfizer Inc. | 40,512,681 | 1,213,355 |
| | Johnson & Johnson | 8,952,891 | 964,943 |
| | Sanofi ADR | 19,404,400 | 897,260 |
| | WellPoint Inc. | 6,595,607 | 835,597 |
| | Merck & Co. Inc. | 10,336,500 | 598,897 |
| | Zoetis Inc. | 10,415,790 | 387,051 |
| | UnitedHealth Group Inc. | 3,867,600 | 367,461 |
| | Baxter International Inc. | 3,957,500 | 277,579 |
| | Eli Lilly & Co. | 3,255,800 | 215,957 |
| | GlaxoSmithKline plc ADR | 2,800,700 | 127,404 |
| | St. Jude Medical Inc. | 1,912,516 | 122,726 |
| | Aetna Inc. | 1,474,500 | 121,661 |
| | Sanofi | 1,296,300 | 120,075 |
| * | Mylan Inc. | 1,505,400 | 80,614 |
| | Humana Inc. | 538,800 | 74,812 |
| * | Express Scripts Holding | | |
| | Co. | 820,000 | 62,992 |
| | AbbVie Inc. | 717,127 | 45,509 |
| | Covidien plc | 379,400 | 35,072 |
| | Zimmer Holdings Inc. | 284,900 | 31,692 |
| | Quest Diagnostics Inc. | 477,400 | 30,296 |
| | GlaxoSmithKline plc | 766,646 | 17,379 |
| | Cardinal Health Inc. | 22,800 | 1,789 |
| | Omnicare Inc. | 21,700 | 1,445 |
| | Cigna Corp. | 13,700 | 1,364 |
| * | Boston Scientific Corp. | 48,500 | 644 |
| * | Quintiles Transnational | | |
| | Holdings Inc. | 8,600 | 503 |
| | Bristol-Myers Squibb Co. | 5,053 | 294 |
| | | | 7,879,402 |
| Industrials (8.9%) | | |
| | General Dynamics Corp. | 7,589,060 | 1,060,647 |
| | Raytheon Co. | 8,150,156 | 846,638 |
| | Honeywell International | | |
| | Inc. | 8,416,761 | 809,019 |
| | Emerson Electric Co. | 9,047,200 | 579,564 |
| 2 | Xylem Inc. | 10,674,199 | 388,114 |
| | Parker-Hannifin Corp. | 798,500 | 101,433 |
| | Cummins Inc. | 663,100 | 96,932 |
| | | |
| | | | Market |
| | | | Value• |
| | | Shares | ($000) |
| | Tyco International Ltd. | 2,118,100 | 90,930 |
| | General Electric Co. | 3,434,754 | 88,651 |
| | Stanley Black & Decker | | |
| | Inc. | 935,600 | 87,610 |
| | American Airlines Group | | |
| | Inc. | 2,038,200 | 84,280 |
| | Boeing Co. | 556,000 | 69,450 |
| | PACCAR Inc. | 881,800 | 57,599 |
| | Northrop Grumman Corp. | 240,376 | 33,162 |
| | Rockwell Collins Inc. | 363,600 | 30,597 |
| | Embraer SA ADR | 747,100 | 28,868 |
| | CNH Industrial NV | 3,133,200 | 25,536 |
| | Illinois Tool Works Inc. | 17,700 | 1,612 |
| | Cintas Corp. | 19,600 | 1,435 |
| | Lockheed Martin Corp. | 7,400 | 1,410 |
| * | Spirit AeroSystems | | |
| | Holdings Inc. Class A | 33,900 | 1,334 |
| | L-3 Communications | | |
| | Holdings Inc. | 5,900 | 717 |
| | 3M Co. | 3,200 | 492 |
| | Waste Management Inc. | 7,800 | 381 |
| | Manpowergroup Inc. | 2,750 | 183 |
| | Dover Corp. | 2,300 | 183 |
| | | | 4,486,777 |
| Information Technology (13.3%) | |
| | Microsoft Corp. | 31,600,145 | 1,483,627 |
| | Intel Corp. | 32,357,700 | 1,100,485 |
| | Oracle Corp. | 21,793,700 | 851,044 |
| | Apple Inc. | 5,081,121 | 548,761 |
| | Cisco Systems Inc. | 13,805,400 | 337,818 |
| | Corning Inc. | 14,609,800 | 298,478 |
| | Xerox Corp. | 17,933,875 | 238,162 |
| | Hewlett-Packard Co. | 5,952,250 | 213,567 |
| | EMC Corp. | 6,220,600 | 178,718 |
| | Visa Inc. Class A | 739,900 | 178,634 |
| | Samsung Electronics | | |
| | Co. Ltd. | 133,900 | 155,118 |
| | International Business | | |
| | Machines Corp. | 929,425 | 152,797 |
| | Teradyne Inc. | 7,099,800 | 130,636 |
| * | NXP Semiconductor NV | 1,375,675 | 94,454 |
| * | Check Point Software | | |
| | Technologies Ltd. | 1,195,600 | 88,773 |
| | QUALCOMM Inc. | 1,106,400 | 86,863 |
| * | Vantiv Inc. Class A | 2,587,000 | 79,990 |
| | Texas Instruments Inc. | 1,352,200 | 67,150 |
| * | Citrix Systems Inc. | 1,007,500 | 64,712 |
| | SanDisk Corp. | 608,700 | 57,303 |
| | Telefonaktiebolaget LM | | |
| | Ericsson ADR | 4,785,700 | 56,663 |
| | Maxim Integrated | | |
| | Products Inc. | 1,891,300 | 55,491 |
| | Taiwan Semiconductor | | |
| | Manufacturing Co. Ltd. | | |
| | ADR | 1,904,500 | 41,937 |
18
Windsor II Fund
| | | |
| | | | Market |
| | | | Value• |
| | | Shares | ($000) |
| * | Google Inc. Class C | 70,925 | 39,653 |
| * | Google Inc. Class A | 69,825 | 39,652 |
| * | Teradata Corp. | 681,700 | 28,850 |
| | TE Connectivity Ltd. | 445,875 | 27,256 |
| | Western Digital Corp. | 18,100 | 1,781 |
| | Computer Sciences Corp. | 23,700 | 1,432 |
| | Skyworks Solutions Inc. | 20,900 | 1,217 |
| * | CommScope Holding Co. | | |
| | Inc. | 55,000 | 1,185 |
| | Harris Corp. | 7,100 | 494 |
| | Marvell Technology Group | |
| | Ltd. | 27,100 | 364 |
| | Western Union Co. | 19,600 | 332 |
| | NVIDIA Corp. | 12,700 | 248 |
| | Symantec Corp. | 8,300 | 206 |
| * | Synopsys Inc. | 200 | 8 |
| | | | 6,703,859 |
| Materials (0.7%) | | |
| | Eastman Chemical Co. | 1,861,270 | 150,353 |
| | International Paper Co. | 2,209,600 | 111,850 |
| | Carpenter Technology | | |
| | Corp. | 1,363,400 | 68,238 |
| | LyondellBasell Industries | | |
| | NV Class A | 24,420 | 2,238 |
| | Dow Chemical Co. | 40,900 | 2,020 |
| | CF Industries Holdings Inc. 6,100 | 1,586 |
| | United States Steel Corp. | 30,600 | 1,225 |
| | Avery Dennison Corp. | 25,700 | 1,204 |
| | Westlake Chemical Corp. | 5,800 | 409 |
| | EI du Pont de Nemours | | |
| | & Co. | 4,750 | 329 |
| | | | 339,452 |
| Other (0.3%) | | |
| 3 | Vanguard Value ETF | 1,261,200 | 104,251 |
| | SPDR S&P 500 ETF Trust | 203,430 | 41,023 |
| | | | 145,274 |
| Telecommunication Services (2.7%) | |
| | Verizon Communications | | |
| | Inc. | 12,574,509 | 631,869 |
| | AT&T Inc. | 16,292,107 | 567,617 |
| | Vodafone Group plc ADR | 4,307,936 | 143,110 |
| | | | 1,342,596 |
| Utilities (4.0%) | | |
| | Public Service Enterprise | | |
| | Group Inc. | 19,537,458 | 807,092 |
| 2 | CenterPoint Energy Inc. | 25,726,413 | 631,584 |
| | Entergy Corp. | 5,432,878 | 456,470 |
| | NRG Energy Inc. | 2,142,800 | 64,241 |
| | | |
| | | | Market |
| | | | Value• |
| | | Shares | ($000) |
| | PPL Corp. | 845,100 | 29,570 |
| * | Calpine Corp. | 418,200 | 9,543 |
| | Southern Co. | 49,700 | 2,304 |
| | Exelon Corp. | 58,600 | 2,144 |
| | American Electric Power | | |
| | Co. Inc. | 35,700 | 2,083 |
| | Edison International | 29,700 | 1,859 |
| | UGI Corp. | 39,150 | 1,476 |
| | Consolidated Edison Inc. | 22,700 | 1,438 |
| | AGL Resources Inc. | 26,600 | 1,434 |
| | Duke Energy Corp. | 1,200 | 99 |
| | | | 2,011,337 |
| Total Common Stocks | | |
| (Cost $34,954,468) | | 48,651,932 |
| Temporary Cash Investments (3.2%)1 | |
| Money Market Fund (3.2%) | | |
| 4,5 | Vanguard Market | | |
| | Liquidity Fund, | | |
| | 0.114% | 1,585,064,000 | 1,585,064 |
| |
| | | Face | |
| | | Amount | |
| | | ($000) | |
| U.S. Government and Agency Obligations (0.0%) |
| 6 | Federal Home Loan | | |
| | Bank Discount Notes, | | |
| | 0.038%, 11/19/14 | 6,000 | 6,000 |
| 6,7 | Federal Home Loan | | |
| | Bank Discount Notes, | | |
| | 0.072%, 11/21/14 | 100 | 100 |
| 6,7 | Federal Home Loan | | |
| | Bank Discount Notes, | | |
| | 0.050%, 12/10/14 | 9,200 | 9,199 |
| | | | 15,299 |
| Total Temporary Cash Investments | |
| (Cost $1,600,364) | | 1,600,363 |
| Total Investments (100.1%) | | |
| (Cost $36,554,832) | | 50,252,295 |
| Other Assets and Liabilities (-0.1%) | |
| Other Assets | | 299,670 |
| Liabilities5 | | (342,171) |
| | | | (42,501) |
| Net Assets (100%) | | 50,209,794 |
19
Windsor II Fund
| |
| At October 31, 2014, net assets consisted of: |
| | Amount |
| | ($000) |
| Paid-in Capital | 32,935,718 |
| Undistributed Net Investment Income | 284,250 |
| Accumulated Net Realized Gains | 3,290,085 |
| Unrealized Appreciation (Depreciation) | |
| Investment Securities | 13,697,463 |
| Futures Contracts | 2,297 |
| Foreign Currencies | (19) |
| Net Assets | 50,209,794 |
| |
| Investor Shares—Net Assets | |
| Applicable to 437,267,711 outstanding | |
| $.001 par value shares of beneficial | |
| interest (unlimited authorization) | 17,311,658 |
| Net Asset Value Per Share— | |
| Investor Shares | $39.59 |
| |
| Admiral Shares—Net Assets | |
| Applicable to 468,182,123 outstanding | |
| $.001 par value shares of beneficial | |
| interest (unlimited authorization) | 32,898,136 |
| Net Asset Value Per Share— | |
| Admiral Shares | $70.27 |
• See Note A in Notes to Financial Statements.
* Non-income-producing security.
^ Includes partial security positions on loan to broker-dealers. The total value of securities on loan is $154,673,000.
1 The fund invests a portion of its cash reserves in equity markets through the use of index futures contracts. After giving effect to futures investments, the fund’s effective common stock and temporary cash investment positions represent 97.2% and 2.9%, respectively, of net assets.
2 Considered an affiliated company of the fund as the fund owns more than 5% of the outstanding voting securities of such company.
3 Considered an affiliated company of the fund as the issuer is another member of The Vanguard Group.
4 Affiliated money market fund available only to Vanguard funds and certain trusts and accounts managed by Vanguard. Rate shown is the 7-day yield.
5 Includes $161,385,000 of collateral received for securities on loan.
6 The issuer operates under a congressional charter; its securities are generally neither guaranteed by the U.S. Treasury nor backed by the full faith and credit of the U.S. government.
7 Securities with a value of $6,899,000 have been segregated as initial margin for open futures contracts.
ADR—American Depositary Receipt.
REIT—Real Estate Investment Trust.
See accompanying Notes, which are an integral part of the Financial Statements.
20
Windsor II Fund
Statement of Operations
| |
| | Year Ended |
| | October 31, 2014 |
| | ($000) |
| Investment Income | |
| Income | |
| Dividends1 | 1,270,804 |
| Interest | 1,422 |
| Securities Lending | 2,846 |
| Total Income | 1,275,072 |
| Expenses | |
| Investment Advisory Fees—Note B | |
| Basic Fee | 68,399 |
| Performance Adjustment | (1,973) |
| The Vanguard Group—Note C | |
| Management and Administrative—Investor Shares | 36,082 |
| Management and Administrative—Admiral Shares | 37,403 |
| Marketing and Distribution—Investor Shares | 2,757 |
| Marketing and Distribution—Admiral Shares | 4,654 |
| Custodian Fees | 409 |
| Auditing Fees | 37 |
| Shareholders’ Reports—Investor Shares | 172 |
| Shareholders’ Reports—Admiral Shares | 177 |
| Trustees’ Fees and Expenses | 81 |
| Total Expenses | 148,198 |
| Expenses Paid Indirectly | (1,207) |
| Net Expenses | 146,991 |
| Net Investment Income | 1,128,081 |
| Realized Net Gain (Loss) | |
| Investment Securities Sold | 3,492,946 |
| Futures Contracts | 30,707 |
| Foreign Currencies | (105) |
| Realized Net Gain (Loss) | 3,523,548 |
| Change in Unrealized Appreciation (Depreciation) | |
| Investment Securities | 1,826,855 |
| Futures Contracts | (7,973) |
| Foreign Currencies | (21) |
| Change in Unrealized Appreciation (Depreciation) | 1,818,861 |
| Net Increase (Decrease) in Net Assets Resulting from Operations | 6,470,490 |
| 1 Dividends are net of foreign withholding taxes of $9,039,000. |
See accompanying Notes, which are an integral part of the Financial Statements.
21
Windsor II Fund
Statement of Changes in Net Assets
| | |
| | Year Ended October 31, |
| | 2014 | 2013 |
| | ($000) | ($000) |
| Increase (Decrease) in Net Assets | | |
| Operations | | |
| Net Investment Income | 1,128,081 | 952,078 |
| Realized Net Gain (Loss) | 3,523,548 | 2,974,152 |
| Change in Unrealized Appreciation (Depreciation) | 1,818,861 | 5,704,925 |
| Net Increase (Decrease) in Net Assets Resulting from Operations | 6,470,490 | 9,631,155 |
| Distributions | | |
| Net Investment Income | | |
| Investor Shares | (395,962) | (420,360) |
| Admiral Shares | (690,363) | (507,947) |
| Realized Capital Gain | | |
| Investor Shares | (385,723) | — |
| Admiral Shares | (613,548) | — |
| Total Distributions | (2,085,596) | (928,307) |
| Capital Share Transactions | | |
| Investor Shares | (2,347,152) | (4,141,562) |
| Admiral Shares | 2,545,234 | 3,777,991 |
| Net Increase (Decrease) from Capital Share Transactions | 198,082 | (363,571) |
| Total Increase (Decrease) | 4,582,976 | 8,339,277 |
| Net Assets | | |
| Beginning of Period | 45,626,818 | 37,287,541 |
| End of Period1 | 50,209,794 | 45,626,818 |
| 1 Net Assets—End of Period includes undistributed (overdistributed) net investment income of $284,250,000 and $242,599,000. |
See accompanying Notes, which are an integral part of the Financial Statements.
22
Windsor II Fund
Financial Highlights
| | | | | |
| Investor Shares | | | | | |
| |
| For a Share Outstanding | | | Year Ended October 31, |
| Throughout Each Period | 2014 | 2013 | 2012 | 2011 | 2010 |
| Net Asset Value, Beginning of Period | $36.19 | $29.33 | $25.68 | $24.37 | $22.22 |
| Investment Operations | | | | | |
| Net Investment Income | . 868 | .740 | .644 | .557 | .495 |
| Net Realized and Unrealized Gain (Loss) | | | | | |
| on Investments | 4.167 | 6.842 | 3.627 | 1.276 | 2.151 |
| Total from Investment Operations | 5.035 | 7.582 | 4.271 | 1.833 | 2.646 |
| Distributions | | | | | |
| Dividends from Net Investment Income | (.838) | (.722) | (. 621) | (. 523) | (. 496) |
| Distributions from Realized Capital Gains | (.797) | — | — | — | — |
| Total Distributions | (1.635) | (.722) | (. 621) | (. 523) | (. 496) |
| Net Asset Value, End of Period | $39.59 | $36.19 | $29.33 | $25.68 | $24.37 |
| |
| Total Return1 | 14.36% | 26.26% | 16.90% | 7.48% | 12.05% |
| |
| Ratios/Supplemental Data | | | | | |
| Net Assets, End of Period (Millions) | $17,312 | $18,034 | $18,255 | $19,010 | $20,921 |
| Ratio of Total Expenses to Average Net Assets2 | 0.36% | 0.36% | 0.35% | 0.35% | 0.35% |
| Ratio of Net Investment Income to | | | | | |
| Average Net Assets | 2.28% | 2.25% | 2.30% | 2.11% | 2.08% |
| Portfolio Turnover Rate | 27% | 27% | 22% | 23% | 29% |
1 Total returns do not include account service fees that may have applied in the periods shown. Fund prospectuses provide information about any applicable account service fees.
2 Includes performance-based investment advisory fee increases (decreases) of 0.00%, (0.01%), (0.02%), (0.01%), and (0.01%). |
|
|
See accompanying Notes, which are an integral part of the Financial Statements.
23
Windsor II Fund
Financial Highlights
| | | | | |
| Admiral Shares | | | | | |
| |
| For a Share Outstanding | | | Year Ended October 31, |
| Throughout Each Period | 2014 | 2013 | 2012 | 2011 | 2010 |
| Net Asset Value, Beginning of Period | $64.23 | $52.06 | $45.59 | $43.26 | $39.46 |
| Investment Operations | | | | | |
| Net Investment Income | 1.601 | 1.366 | 1.188 | 1.025 | .914 |
| Net Realized and Unrealized Gain (Loss) | | | | | |
| on Investments | 7.398 | 12.134 | 6.424 | 2.264 | 3.811 |
| Total from Investment Operations | 8.999 | 13.500 | 7.612 | 3.289 | 4.725 |
| Distributions | | | | | |
| Dividends from Net Investment Income | (1.545) | (1.330) | (1.142) | (.959) | (.925) |
| Distributions from Realized Capital Gains | (1.414) | — | — | — | — |
| Total Distributions | (2.959) | (1.330) | (1.142) | (.959) | (.925) |
| Net Asset Value, End of Period | $70.27 | $64.23 | $52.06 | $45.59 | $43.26 |
| |
| Total Return | 14.46% | 26.36% | 16.98% | 7.56% | 12.12% |
| |
| Ratios/Supplemental Data | | | | | |
| Net Assets, End of Period (Millions) | $32,898 | $27,593 | $19,032 | $14,771 | $13,381 |
| Ratio of Total Expenses to Average Net Assets1 | 0.28% | 0.28% | 0.27% | 0.27% | 0.27% |
| Ratio of Net Investment Income to | | | | | |
| Average Net Assets | 2.36% | 2.33% | 2.38% | 2.19% | 2.16% |
| Portfolio Turnover Rate | 27% | 27% | 22% | 23% | 29% |
| 1 Includes performance-based investment advisory fee increases (decreases) of 0.00%, (0.01%), (0.02%), (0.01%), and (0.01%). |
See accompanying Notes, which are an integral part of the Financial Statements.
24
Windsor II Fund
Notes to Financial Statements
Vanguard Windsor II Fund is registered under the Investment Company Act of 1940 as an open-end investment company, or mutual fund. The fund offers two classes of shares: Investor Shares and Admiral Shares. Investor Shares are available to any investor who meets the fund’s minimum purchase requirements. Admiral Shares are designed for investors who meet certain administrative, service, and account-size criteria.
A. The following significant accounting policies conform to generally accepted accounting principles for U.S. investment companies. The fund consistently follows such policies in preparing its financial statements.
1. Security Valuation: Securities are valued as of the close of trading on the New York Stock Exchange (generally 4 p.m., Eastern time) on the valuation date. Equity securities are valued at the latest quoted sales prices or official closing prices taken from the primary market in which each security trades; such securities not traded on the valuation date are valued at the mean of the latest quoted bid and asked prices. Securities for which market quotations are not readily available, or whose values have been affected by events occurring before the fund’s pricing time but after the close of the securities’ primary markets, are valued at their fair values calculated according to procedures adopted by the board of trustees. These procedures include obtaining quotations from an independent pricing service, monitoring news to identify significant market- or security-specific events, and evaluating changes in the values of foreign market proxies (for example, ADRs, futures contracts, or exchange-traded funds), between the time the foreign markets close and the fund’s pricing time. When fair-value pricing is employed, the prices of securities used by a fund to calculate its net asset value may differ from quoted or published prices for the same securities. Investments in Vanguard Market Liquidity Fund are valued at that fund’s net asset value. Temporary cash investments acquired over 60 days to maturity are valued using the latest bid prices or using valuations based on a matrix system (which considers such factors as security prices, yields, maturities, and ratings), both as furnished by independent pricing services. Other temporary cash investments are valued at amortized cost, which approximates market value.
2. Foreign Currency: Securities and other assets and liabilities denominated in foreign currencies are translated into U.S. dollars using exchange rates obtained from an independent third party as of the fund’s pricing time on the valuation date. Realized gains (losses) and unrealized appreciation (depreciation) on investment securities include the effects of changes in exchange rates since the securities were purchased, combined with the effects of changes in security prices. Fluctuations in the value of other assets and liabilities resulting from changes in exchange rates are recorded as unrealized foreign currency gains (losses) until the assets or liabilities are settled in cash, at which time they are recorded as realized foreign currency gains (losses).
3. Futures Contracts: The fund uses index futures contracts to a limited extent, with the objective of maintaining full exposure to the stock market while maintaining liquidity. The fund may purchase or sell futures contracts to achieve a desired level of investment, whether to accommodate portfolio turnover or cash flows from capital share transactions. The primary risks associated with the use of futures contracts are imperfect correlation between changes in market values of stocks held by the fund and the prices of futures contracts, and the possibility of an illiquid market. Counterparty risk involving futures is mitigated because a regulated clearinghouse is the counterparty instead of the clearing broker. To further mitigate counterparty risk, the fund trades futures contracts on an exchange, monitors the financial strength of its clearing brokers and clearinghouse, and has entered into clearing agreements with its clearing brokers. The clearinghouse imposes initial margin requirements to secure the fund’s performance and requires daily settlement of variation margin representing changes in the market value of each contract.
25
Windsor II Fund
Futures contracts are valued at their quoted daily settlement prices. The aggregate settlement values of the contracts are not recorded in the Statement of Net Assets. Fluctuations in the value of the contracts are recorded in the Statement of Net Assets as an asset (liability) and in the Statement of Operations as unrealized appreciation (depreciation) until the contracts are closed, when they are recorded as realized futures gains (losses).
During the year ended October 31, 2014, the fund’s average investments in long and short futures contracts represented less than 1% and 0% of net assets, respectively, based on the average of aggregate settlement values at each quarter-end during the period.
4. Federal Income Taxes: The fund intends to continue to qualify as a regulated investment company and distribute all of its taxable income. Management has analyzed the fund’s tax positions taken for all open federal income tax years (October 31, 2011–2014), and has concluded that no provision for federal income tax is required in the fund’s financial statements.
5. Distributions: Distributions to shareholders are recorded on the ex-dividend date.
6. Securities Lending: To earn additional income, the fund lends its securities to qualified institutional borrowers. Security loans are required to be secured at all times by collateral in an amount at least equal to the market value of securities loaned. Daily market fluctuations could cause the value of loaned securities to be more or less than the value of the collateral received. When this occurs, the collateral is adjusted and settled on the next business day. The fund further mitigates its counterparty risk by entering into securities lending transactions only with a diverse group of prequalified counter-parties, monitoring their financial strength, and entering into master securities lending agreements with its counterparties. The master securities lending agreements provide that, in the event of a counterparty’s default (including bankruptcy), the fund may terminate any loans with that borrower, determine the net amount owed, and sell or retain the collateral up to the net amount owed to the fund; however, such actions may be subject to legal proceedings. While collateral mitigates counter-party risk, in the absence of a default the fund may experience delays and costs in recovering the securities loaned. The fund invests cash collateral received in Vanguard Market Liquidity Fund, and records a liability in the Statement of Net Assets for the return of the collateral, during the period the securities are on loan. Securities lending income represents fees charged to borrowers plus income earned on invested cash collateral, less expenses associated with the loan.
7. Credit Facility: The fund and certain other funds managed by The Vanguard Group participate in a $2.89 billion committed credit facility provided by a syndicate of lenders pursuant to a credit agreement that may be renewed annually; each fund is individually liable for its borrowings, if any, under the credit facility. Borrowings may be utilized for temporary and emergency purposes, and are subject to the fund’s regulatory and contractual borrowing restrictions. The participating funds are charged administrative fees and an annual commitment fee of 0.06% of the undrawn amount of the facility; these fees are allocated to the funds based on a method approved by the fund’s board of trustees and included in Management and Administrative expenses on the fund’s Statement of Operations. Any borrowings under this facility bear interest at a rate equal to the higher of the federal funds rate or LIBOR reference rate plus an agreed-upon spread.
The fund had no borrowings outstanding at October 31, 2014, or at any time during the period then ended.
26
Windsor II Fund
8. Other: Dividend income is recorded on the ex-dividend date. Interest income includes income distributions received from Vanguard Market Liquidity Fund and is accrued daily. Premiums and discounts on debt securities purchased are amortized and accreted, respectively, to interest income over the lives of the respective securities. Security transactions are accounted for on the date securities are bought or sold. Costs used to determine realized gains (losses) on the sale of investment securities are those of the specific securities sold.
Each class of shares has equal rights as to assets and earnings, except that each class separately bears certain class-specific expenses related to maintenance of shareholder accounts (included in Management and Administrative expenses) and shareholder reporting. Marketing and distribution expenses are allocated to each class of shares based on a method approved by the board of trustees. Income, other non-class-specific expenses, and gains and losses on investments are allocated to each class of shares based on its relative net assets.
B. Barrow, Hanley, Mewhinney & Strauss, LLC; Lazard Asset Management LLC; Hotchkis and Wiley Capital Management, LLC; and Sanders Capital, LLC, each provide investment advisory services to a portion of the fund for a fee calculated at an annual percentage rate of average net assets managed by the advisor. The basic fee of Barrow, Hanley, Mewhinney & Strauss, LLC, is subject to quarterly adjustments based on performance for the preceding three years relative to the MSCI US Prime Market 750 Index. The basic fee of Lazard Asset Management LLC is subject to quarterly adjustments based on performance for the preceding three years relative to the S&P 500 Index. The basic fee of Hotchkis and Wiley Capital Management, LLC, is subject to quarterly adjustments based on performance for the preceding five years relative to the MSCI US Investable Market 2500 Index. The basic fee of Sanders Capital, LLC, is subject to quarterly adjustments based on performance since January 31, 2010, relative to the Russell 3000 Index. Until February 2014, a portion of the fund was managed by Armstrong Shaw Associates Inc. The basic fee paid to Armstrong Shaw Associates Inc. was subject to quarterly adjustments based on performance for the preceding five years relative to the Russell 1000 Value Index.
The Vanguard Group provides investment advisory services to a portion of the fund on an at-cost basis; the fund paid Vanguard advisory fees of $234,000 for the year ended October 31, 2014.
For the year ended October 31, 2014, the aggregate investment advisory fee represented an effective annual basic rate of 0.14% of the fund’s average net assets, before a decrease of $1,973,000 (0.00%) based on performance.
C. The Vanguard Group furnishes at cost corporate management, administrative, marketing, and distribution services. The costs of such services are allocated to the fund based on methods approved by the board of trustees. The fund has committed to invest up to 0.40% of its net assets in Vanguard. At October 31, 2014, the fund had contributed capital of $4,964,000 to Vanguard (included in Other Assets), representing 0.01% of the fund’s net assets and 1.99% of Vanguard’s capitalization. The fund’s trustees and officers are also directors and officers of Vanguard.
D. The fund has asked its investment advisors to direct certain security trades, subject to obtaining the best price and execution, to brokers who have agreed to rebate to the fund part of the commissions generated. Such rebates are used solely to reduce the fund’s management and administrative expenses. For the year ended October 31, 2014, these arrangements reduced the fund’s expenses by $1,207,000 (an annual rate of 0.00% of average net assets).
27
Windsor II Fund
E. Various inputs may be used to determine the value of the fund’s investments. These inputs are summarized in three broad levels for financial statement purposes. The inputs or methodologies used to value securities are not necessarily an indication of the risk associated with investing in those securities.
Level 1—Quoted prices in active markets for identical securities.
Level 2—Other significant observable inputs (including quoted prices for similar securities, interest rates, prepayment speeds, credit risk, etc.).
Level 3—Significant unobservable inputs (including the fund’s own assumptions used to determine the fair value of investments).
The following table summarizes the market value of the fund’s investments as of October 31, 2014, based on the inputs used to value them:
| | | |
| | Level 1 | Level 2 | Level 3 |
| Investments | ($000) | ($000) | ($000) |
| Common Stocks | 47,893,256 | 758,676 | — |
| Temporary Cash Investments | 1,585,064 | 15,299 | — |
| Futures Contracts—Assets1 | 1,847 | — | — |
| Futures Contracts—Liabilities1 | (200) | — | — |
| Total | 49,479,967 | 773,975 | — |
| 1 Represents variation margin on the last day of the reporting period. |
F. At October 31, 2014, the aggregate settlement value of open futures contracts and the related unrealized appreciation (depreciation) were:
| | | | |
| | | | | ($000) |
| | | | Aggregate | |
| | | Number of | Settlement | Unrealized |
| | | Long (Short) | Value | Appreciation |
| Futures Contracts | Expiration | Contracts | Long (Short) | (Depreciation) |
| E-mini S&P 500 Index | December 2014 | 1,268 | 127,523 | 2,288 |
| S&P 500 Index | December 2014 | 1 | 503 | 9 |
| | | | | 2,297 |
Unrealized appreciation (depreciation) on open futures contracts is required to be treated as realized gain (loss) for tax purposes.
G. Distributions are determined on a tax basis and may differ from net investment income and realized capital gains for financial reporting purposes. Differences may be permanent or temporary. Permanent differences are reclassified among capital accounts in the financial statements to reflect their tax character. Temporary differences arise when certain items of income, expense, gain, or loss are recognized in different periods for financial statement and tax purposes. These differences will reverse at some time in the future. Differences in classification may also result from the treatment of short-term gains as ordinary income for tax purposes.
28
Windsor II Fund
During the year ended October 31, 2014, the fund realized net foreign currency losses of $105,000, which decreased distributable net income for tax purposes; accordingly, such losses have been reclassified from accumulated net realized gains to undistributed net investment income.
The fund used a tax accounting practice to treat a portion of the price of capital shares redeemed during the year as distributions from realized capital gains. Accordingly, the fund has reclassified $222,460,000 from accumulated net realized gains to paid-in capital.
For tax purposes, at October 31, 2014, the fund had $716,339,000 of ordinary income and $2,935,979,000 of long-term capital gains available for distribution.
At October 31, 2014, the cost of investment securities for tax purposes was $36,560,619,000. Net unrealized appreciation of investment securities for tax purposes was $13,691,676,000, consisting of unrealized gains of $16,412,963,000 on securities that had risen in value since their purchase and $2,721,287,000 in unrealized losses on securities that had fallen in value since their purchase.
H. During the year ended October 31, 2014, the fund purchased $12,687,394,000 of investment securities and sold $13,436,546,000 of investment securities, other than temporary cash investments.
I. Capital share transactions for each class of shares were:
| | | | | |
| | | | | Year Ended October 31, |
| | | 2014 | | | 2013 |
| | Amount | Shares | | Amount | Shares |
| | ($000) | (000) | | ($000) | (000) |
| Investor Shares | | | | | |
| Issued | 979,531 | 25,949 | | 1,115,392 | 34,532 |
| Issued in Lieu of Cash Distributions | 763,842 | 21,030 | | 410,628 | 13,200 |
| Redeemed | (4,090,525) | (108,094) | | (5,667,582) | (171,744) |
| Net Increase (Decrease)—Investor Shares | (2,347,152) | (61,115) | | (4,141,562) | (124,012) |
| Admiral Shares | | | | | |
| Issued | 4,111,581 | 61,245 | | 5,688,923 | 96,894 |
| Issued in Lieu of Cash Distributions | 1,242,899 | 19,236 | | 480,666 | 8,664 |
| Redeemed | (2,809,246) | (41,910) | | (2,391,598) | (41,495) |
| Net Increase (Decrease)—Admiral Shares | 2,545,234 | 38,571 | | 3,777,991 | 64,063 |
29
Windsor II Fund
J. Certain of the fund’s investments are in companies that are considered to be affiliated companies of the fund because the fund owns more than 5% of the outstanding voting securities of the company or the issuer is another member of The Vanguard Group. Transactions during the period in securities of these companies were as follows:
| | | | | | |
| | | | Current Period Transactions | |
| | Oct. 31, | | Proceeds | | | Oct. 31, |
| | 2013 | | from | | Capital Gain | 2014 |
| | Market | Purchases | Securities | | Distributions | Market |
| | Value | at Cost | Sold1 | Income | Received | Value |
| | ($000) | ($000) | ($000) | ($000) | ($000) | ($000) |
| CenterPoint Energy Inc. | 633,335 | — | 435 | 23,672 | — | 631,584 |
| Xylem Inc. | 333,760 | 36,974 | — | 5,209 | — | 388,114 |
| Vanguard Market Liquidity Fund | 1,597,659 | NA2 | NA 2 | 1,404 | — | 1,585,064 |
| Vanguard Total Stock Market ETF | 292,247 | — | 168,527 | 1,048 | — | — |
| Vanguard Value ETF | 183,292 | — | 32,111 | 2,951 | — | 104,251 |
| Total | 3,040,293 | | | 34,284 | — | 2,709,013 |
| 1 Includes net realized gain (loss) on affiliated investment securities sold of $200,613,000. |
| 2 Not applicable—Purchases and sales are for temporary cash investment purposes. |
K. Management has determined that no material events or transactions occurred subsequent to October 31, 2014, that would require recognition or disclosure in these financial statements.
30
Report of Independent Registered
Public Accounting Firm
To the Board of Trustees of Vanguard Windsor Funds and the Shareholders of Vanguard Windsor II Fund:
In our opinion, the accompanying statement of net assets and the related statements of operations and of changes in net assets and the financial highlights present fairly, in all material respects, the financial position of Vanguard Windsor II Fund (constituting a separate portfolio of Vanguard Windsor Funds, hereafter referred to as the “Fund”) at October 31, 2014, the results of its operations for the year then ended, the changes in its net assets for each of the two years in the period then ended, and the financial highlights for each of the five years in the period then ended, in conformity with accounting principles generally accepted in the United States of America. These financial statements and financial highlights (hereafter referred to as “financial statements”) are the responsibility of the Fund’s management. Our responsibility is to express an opinion on these financial statements based on our audits. We conducted our audits of these financial statements in accordance with the standards of the Public Company Accounting Oversight Board (United States). Those standards require that we plan and perform the audit to obtain reasonable assurance about whether the financial statements are free of material misstatement. An audit includes examining, on a test basis, evidence supporting the amounts and disclosures in the financial statements, assessing the accounting principles used and significant estimates made by management, and evaluating the overall financial statement presentation. We believe that our audits, which included confirmation of securities at October 31, 2014 by correspondence with the custodian and broker, by agreement to the underlying ownership records of the transfer agent and the application of alternative auditing procedures where securities purchased had not been received, provide a reasonable basis for our opinion.
/s/PricewaterhouseCoopers LLP
Philadelphia, Pennsylvania
December 11, 2014
| |
| Special 2014 tax information (unaudited) for Vanguard Windsor II Fund |
This information for the fiscal year ended October 31, 2014, is included pursuant to provisions of the Internal Revenue Code.
The fund distributed $1,197,331,000 as capital gain dividends (from net long-term capital gains) to shareholders during the fiscal year.
The fund distributed $1,086,325,000 of qualified dividend income to shareholders during the fiscal year.
For corporate shareholders, 64.5% of investment income (dividend income plus short-term gains, if any) qualifies for the dividends-received deduction.
31
Your Fund’s After-Tax Returns
This table presents returns for your fund both before and after taxes. The after-tax returns are shown in two ways: (1) assuming that an investor owned the fund during the entire period and paid taxes on the fund’s distributions, and (2) assuming that an investor paid taxes on the fund’s distributions and sold all shares at the end of each period.
Calculations are based on the highest individual federal income tax and capital gains tax rates in effect at the times of the distributions and the hypothetical sales. State and local taxes were not considered. After-tax returns reflect any qualified dividend income, using actual prior-year figures and estimates for 2014. (In the example, returns after the sale of fund shares may be higher than those assuming no sale. This occurs when the sale would have produced a capital loss. The calculation assumes that the investor received a tax deduction for the loss.)
The table shows returns for Investor Shares only; returns for other share classes will differ. Please note that your actual after-tax returns will depend on your tax situation and may differ from those shown. Also note that if you own the fund in a tax-deferred account, such as an individual retirement account or a 401(k) plan, this information does not apply to you. Such accounts are not subject to current taxes.
Finally, keep in mind that a fund’s performance—whether before or after taxes—does not guarantee future results.
| | | | |
| Average Annual Total Returns: Windsor II Fund Investor Shares | | |
| Periods Ended October 31, 2014 | | | |
| |
| | One | Five | Ten |
| | Year | Years | Years |
| Returns Before Taxes | 14.36% | 15.24% | 7.90% |
| Returns After Taxes on Distributions | 13.17 | 14.68 | 7.13 |
| Returns After Taxes on Distributions and Sale of Fund Shares | 8.96 | 12.29 | 6.42 |
32
About Your Fund’s Expenses
As a shareholder of the fund, you incur ongoing costs, which include costs for portfolio management, administrative services, and shareholder reports (like this one), among others. Operating expenses, which are deducted from a fund’s gross income, directly reduce the investment return of the fund.
A fund’s expenses are expressed as a percentage of its average net assets. This figure is known as the expense ratio. The following examples are intended to help you understand the ongoing costs (in dollars) of investing in your fund and to compare these costs with those of other mutual funds. The examples are based on an investment of $1,000 made at the beginning of the period shown and held for the entire period.
The accompanying table illustrates your fund’s costs in two ways:
• Based on actual fund return. This section helps you to estimate the actual expenses that you paid over the period. The ”Ending Account Value“ shown is derived from the fund‘s actual return, and the third column shows the dollar amount that would have been paid by an investor who started with $1,000 in the fund. You may use the information here, together with the amount you invested, to estimate the expenses that you paid over the period.
To do so, simply divide your account value by $1,000 (for example, an $8,600 account value divided by $1,000 = 8.6), then multiply the result by the number given for your fund under the heading ”Expenses Paid During Period.“
• Based on hypothetical 5% yearly return. This section is intended to help you compare your fund‘s costs with those of other mutual funds. It assumes that the fund had a yearly return of 5% before expenses, but that the expense ratio is unchanged. In this case—because the return used is not the fund’s actual return—the results do not apply to your investment. The example is useful in making comparisons because the Securities and Exchange Commission requires all mutual funds to calculate expenses based on a 5% return. You can assess your fund’s costs by comparing this hypothetical example with the hypothetical examples that appear in shareholder reports of other funds.
Note that the expenses shown in the table are meant to highlight and help you compare ongoing costs only and do not reflect transaction costs incurred by the fund for buying and selling securities. Further, the expenses do not include any purchase, redemption, or account service fees described in the fund prospectus. If such fees were applied to your account, your costs would be higher. Your fund does not carry a “sales load.”
The calculations assume no shares were bought or sold during the period. Your actual costs may have been higher or lower, depending on the amount of your investment and the timing of any purchases or redemptions.
You can find more information about the fund’s expenses, including annual expense ratios, in the Financial Statements section of this report. For additional information on operating expenses and other shareholder costs, please refer to your fund’s current prospectus.
33
| | | |
| Six Months Ended October 31, 2014 | | | |
| | Beginning | Ending | Expenses |
| | Account Value | Account Value | Paid During |
| Windsor II Fund | 4/30/2014 | 10/31/2014 | Period |
| Based on Actual Fund Return | | | |
| Investor Shares | $1,000.00 | $1,050.78 | $1.81 |
| Admiral Shares | 1,000.00 | 1,051.27 | 1.40 |
| Based on Hypothetical 5% Yearly Return | | | |
| Investor Shares | $1,000.00 | $1,023.44 | $1.79 |
| Admiral Shares | 1,000.00 | 1,023.84 | 1.38 |
| The calculations are based on expenses incurred in the most recent six-month period. The fund’s annualized six-month expense ratios for that period are 0.35% for Investor Shares and 0.27% for Admiral Shares. The dollar amounts shown as “Expenses Paid” are equal to the annualized expense ratio multiplied by the average account value over the period, multiplied by the number of days in the most recent six-month period, then divided by the number of days in the most recent 12-month period. |
|
|
|
34
Glossary
30-Day SEC Yield. A fund’s 30-day SEC yield is derived using a formula specified by the U.S. Securities and Exchange Commission. Under the formula, data related to the fund’s security holdings in the previous 30 days are used to calculate the fund’s hypothetical net income for that period, which is then annualized and divided by the fund’s estimated average net assets over the calculation period. For the purposes of this calculation, a security’s income is based on its current market yield to maturity (for bonds), its actual income (for asset-backed securities), or its projected dividend yield (for stocks). Because the SEC yield represents hypothetical annualized income, it will differ—at times significantly—from the fund’s actual experience. As a result, the fund’s income distributions may be higher or lower than implied by the SEC yield.
Beta. A measure of the magnitude of a fund’s past share-price fluctuations in relation to the ups and downs of a given market index. The index is assigned a beta of 1.00. Compared with a given index, a fund with a beta of 1.20 typically would have seen its share price rise or fall by 12% when the index rose or fell by 10%. For this report, beta is based on returns over the past 36 months for both the fund and the index. Note that a fund’s beta should be reviewed in conjunction with its R-squared (see definition). The lower the R-squared, the less correlation there is between the fund and the index, and the less reliable beta is as an indicator of volatility.
Dividend Yield. Dividend income earned by stocks, expressed as a percentage of the aggregate market value (or of net asset value, for a fund). The yield is determined by dividing the amount of the annual dividends by the aggregate value (or net asset value) at the end of the period. For a fund, the dividend yield is based solely on stock holdings and does not include any income produced by other investments.
Earnings Growth Rate. The average annual rate of growth in earnings over the past five years for the stocks now in a fund.
Equity Exposure. A measure that reflects a fund’s investments in stocks and stock futures. Any holdings in short-term reserves are excluded.
Expense Ratio. A fund’s total annual operating expenses expressed as a percentage of the fund’s average net assets. The expense ratio includes management and administrative expenses, but does not include the transaction costs of buying and selling portfolio securities.
Foreign Holdings. The percentage of a fund represented by securities or depositary receipts of companies based outside the United States.
Inception Date. The date on which the assets of a fund (or one of its share classes) are first invested in accordance with the fund’s investment objective. For funds with a subscription period, the inception date is the day after that period ends. Investment performance is measured from the inception date.
Median Market Cap. An indicator of the size of companies in which a fund invests; the midpoint of market capitalization (market price x shares outstanding) of a fund’s stocks, weighted by the proportion of the fund’s assets invested in each stock. Stocks representing half of the fund’s assets have market capitalizations above the median, and the rest are below it.
Price/Book Ratio. The share price of a stock divided by its net worth, or book value, per share. For a fund, the weighted average price/book ratio of the stocks it holds.
35
Price/Earnings Ratio. The ratio of a stock’s current price to its per-share earnings over the past year. For a fund, the weighted average P/E of the stocks it holds. P/E is an indicator of market expectations about corporate prospects; the higher the P/E, the greater the expectations for a company’s future growth.
R-Squared. A measure of how much of a fund’s past returns can be explained by the returns from the market in general, as measured by a given index. If a fund’s total returns were precisely synchronized with an index’s returns, its R-squared would be 1.00. If the fund’s returns bore no relationship to the index’s returns, its R-squared would be 0. For this report, R-squared is based on returns over the past 36 months for both the fund and the index.
Return on Equity. The annual average rate of return generated by a company during the past five years for each dollar of shareholder’s equity (net income divided by shareholder’s equity). For a fund, the weighted average return on equity for the companies whose stocks it holds.
Short-Term Reserves. The percentage of a fund invested in highly liquid, short-term securities that can be readily converted to cash.
Turnover Rate. An indication of the fund’s trading activity. Funds with high turnover rates incur higher transaction costs and may be more likely to distribute capital gains (which may be taxable to investors). The turnover rate excludes in-kind transactions, which have minimal impact on costs.
36
This page intentionally left blank.
This page intentionally left blank.
This page intentionally left blank.
The People Who Govern Your Fund
The trustees of your mutual fund are there to see that the fund is operated and managed in your best interests since, as a shareholder, you are a part owner of the fund. Your fund’s trustees also serve on the board of directors of The Vanguard Group, Inc., which is owned by the Vanguard funds and provides services to them on an at-cost basis.
A majority of Vanguard’s board members are independent, meaning that they have no affiliation with Vanguard or the funds they oversee, apart from the sizable personal investments they have made as private individuals. The independent board members have distinguished backgrounds in business, academia, and public service. Each of the trustees and executive officers oversees 177 Vanguard funds.
The following table provides information for each trustee and executive officer of the fund. More information about the trustees is in the Statement of Additional Information, which can be obtained, without charge, by contacting Vanguard at 800-662-7447, or online at vanguard.com.
| |
| InterestedTrustee1 | and Delphi Automotive LLP (automotive components); |
| | Senior Advisor at New Mountain Capital. |
| F. William McNabb III | |
| Born 1957. Trustee Since July 2009. Chairman of the | Amy Gutmann |
| Board. Principal Occupation(s) During the Past Five | Born 1949. Trustee Since June 2006. Principal |
| Years: Chairman of the Board of The Vanguard Group, | Occupation(s) During the Past Five Years: President of |
| Inc., and of each of the investment companies served | the University of Pennsylvania; Christopher H. Browne |
| by The Vanguard Group, since January 2010; Director | Distinguished Professor of Political Science, School of |
| of The Vanguard Group since 2008; Chief Executive | Arts and Sciences, and Professor of Communication, |
| Officer and President of The Vanguard Group, and of | Annenberg School for Communication, with secondary |
| each of the investment companies served by The | faculty appointments in the Department of Philosophy, |
| Vanguard Group, since 2008; Director of Vanguard | School of Arts and Sciences, and at the Graduate |
| Marketing Corporation; Managing Director of The | School of Education, University of Pennsylvania; |
| Vanguard Group (1995–2008). | Trustee of the National Constitution Center; Chair |
| | of the Presidential Commission for the Study of |
| IndependentTrustees | Bioethical Issues. |
| |
| Emerson U. Fullwood | JoAnn Heffernan Heisen |
| Born 1948. Trustee Since January 2008. Principal | Born 1950. Trustee Since July 1998. Principal |
| Occupation(s) During the Past Five Years: Executive | Occupation(s) During the Past Five Years: Corporate |
| Chief Staff and Marketing Officer for North America | Vice President and Chief Global Diversity Officer |
| and Corporate Vice President (retired 2008) of Xerox | (retired 2008) and Member of the Executive |
| Corporation (document management products and | Committee (1997–2008) of Johnson & Johnson |
| services); Executive in Residence and 2009–2010 | (pharmaceuticals/medical devices/consumer |
| Distinguished Minett Professor at the Rochester | products); Director of Skytop Lodge Corporation |
| Institute of Technology; Director of SPX Corporation | (hotels), the University Medical Center at Princeton, |
| (multi-industry manufacturing), the United Way of | the Robert Wood Johnson Foundation, and the Center |
| Rochester, Amerigroup Corporation (managed health | for Talent Innovation; Member of the Advisory Board |
| care), the University of Rochester Medical Center, | of the Maxwell School of Citizenship and Public Affairs |
| Monroe Community College Foundation, and North | at Syracuse University. |
| Carolina A&T University. | |
| F. Joseph Loughrey |
| Rajiv L. Gupta | Born 1949. Trustee Since October 2009. Principal |
| Born 1945. Trustee Since December 2001.2 | Occupation(s) During the Past Five Years: President |
| Principal Occupation(s) During the Past Five Years: | and Chief Operating Officer (retired 2009) of Cummins |
| Chairman and Chief Executive Officer (retired 2009) | Inc. (industrial machinery); Chairman of the Board |
| and President (2006–2008) of Rohm and Haas Co. | of Hillenbrand, Inc. (specialized consumer services), |
| (chemicals); Director of Tyco International, Ltd. | and of Oxfam America; Director of SKF AB (industrial |
| (diversified manufacturing and services), Hewlett- | machinery), Hyster-Yale Materials Handling, Inc. |
| Packard Co. (electronic computer manufacturing), | (forklift trucks), the Lumina Foundation for Education, |
| |
| | |
| and the V Foundation for Cancer Research; Member | Executive Officers | |
| of the Advisory Council for the College of Arts and | | |
| Letters and of the Advisory Board to the Kellogg | Glenn Booraem | |
| Institute for International Studies, both at the | Born 1967. Controller Since July 2010. Principal |
| University of Notre Dame. | Occupation(s) During the Past Five Years: Principal |
| | of The Vanguard Group, Inc.; Controller of each of |
| Mark Loughridge | the investment companies served by The Vanguard |
| Born 1953. Trustee Since March 2012. Principal | Group; Assistant Controller of each of the investment |
| Occupation(s) During the Past Five Years: Senior Vice | companies served by The Vanguard Group (2001–2010). |
| President and Chief Financial Officer (retired 2013) | | |
| at IBM (information technology services); Fiduciary | Thomas J. Higgins | |
| Member of IBM’s Retirement Plan Committee (2004– | Born 1957. Chief Financial Officer Since September |
| 2013); Member of the Council on Chicago Booth. | 2008. Principal Occupation(s) During the Past Five |
| | Years: Principal of The Vanguard Group, Inc.; Chief |
| Scott C. Malpass | Financial Officer of each of the investment companies |
| Born 1962. Trustee Since March 2012. Principal | served by The Vanguard Group; Treasurer of each of |
| Occupation(s) During the Past Five Years: Chief | the investment companies served by The Vanguard |
| Investment Officer and Vice President at the University | Group (1998–2008). | |
| of Notre Dame; Assistant Professor of Finance at the | | |
| Mendoza College of Business at Notre Dame; Member | Kathryn J. Hyatt | |
| of the Notre Dame 403(b) Investment Committee; | Born 1955. Treasurer Since November 2008. Principal |
| Board Member of TIFF Advisory Services, Inc. | Occupation(s) During the Past Five Years: Principal of |
| (investment advisor); Member of the Investment | The Vanguard Group, Inc.; Treasurer of each of the |
| Advisory Committees of the Financial Industry | investment companies served by The Vanguard |
| Regulatory Authority (FINRA) and of Major League | Group; Assistant Treasurer of each of the investment |
| Baseball. | companies served by The Vanguard Group (1988–2008). |
| |
| André F. Perold | Heidi Stam | |
| Born 1952. Trustee Since December 2004. Principal | Born 1956. Secretary Since July 2005. Principal |
| Occupation(s) During the Past Five Years: George | Occupation(s) During the Past Five Years: Managing |
| Gund Professor of Finance and Banking, Emeritus | Director of The Vanguard Group, Inc.; General Counsel |
| at the Harvard Business School (retired 2011); | of The Vanguard Group; Secretary of The Vanguard |
| Chief Investment Officer and Managing Partner of | Group and of each of the investment companies |
| HighVista Strategies LLC (private investment firm); | served by The Vanguard Group; Director and Senior |
| Director of Rand Merchant Bank; Overseer of the | Vice President of Vanguard Marketing Corporation. |
| Museum of Fine Arts Boston. | | |
| | Vanguard Senior ManagementTeam |
| Alfred M. Rankin, Jr. | | |
| Born 1941. Trustee Since January 1993. Principal | Mortimer J. Buckley | Chris D. McIsaac |
| Occupation(s) During the Past Five Years: Chairman, | Kathleen C. Gubanich | Michael S. Miller |
| President, and Chief Executive Officer of NACCO | Paul A. Heller | James M. Norris |
| Industries, Inc. (housewares/lignite), and of Hyster- | Martha G. King | Glenn W. Reed |
| Yale Materials Handling, Inc. (forklift trucks); Chairman | John T. Marcante | |
| of the Board of University Hospitals of Cleveland. | | |
| Chairman Emeritus and Senior Advisor |
| Peter F. Volanakis | | |
| Born 1955. Trustee Since July 2009. Principal | John J. Brennan | |
| Occupation(s) During the Past Five Years: President | Chairman, 1996–2009 | |
| and Chief Operating Officer (retired 2010) of Corning | Chief Executive Officer and President, 1996–2008 |
| Incorporated (communications equipment); Trustee of | | |
| Colby-Sawyer College; Member of the Advisory Board | Founder | |
| of the Norris Cotton Cancer Center and of the Advisory | | |
| Board of the Parthenon Group (strategy consulting). | John C. Bogle | |
| | Chairman and Chief Executive Officer, 1974–1996 |
| | |
1 Mr. McNabb is considered an “interested person,” as defined in the Investment Company Act of 1940, because he is an officer of the Vanguard funds.
2 December 2002 for Vanguard Equity Income Fund, the Vanguard Municipal Bond Funds, and the Vanguard State Tax-Exempt Funds.
|  |
| | P.O. Box 2600 |
| | Valley Forge, PA 19482-2600 |
| |
| |
| |
| Connect with Vanguard® > vanguard.com | |
| |
| |
| |
| Fund Information > 800-662-7447 | CFA® is a registered trademark owned by CFA Institute. |
| Direct Investor Account Services > 800-662-2739 | |
| Institutional Investor Services > 800-523-1036 | |
| Text Telephone for People | |
| Who Are Deaf or Hard of Hearing> 800-749-7273 | |
| |
| This material may be used in conjunction | |
| with the offering of shares of any Vanguard | |
| fund only if preceded or accompanied by | |
| the fund’s current prospectus. | |
| |
| All comparative mutual fund data are from Lipper, a | |
| Thomson Reuters Company, or Morningstar, Inc., unless | |
| otherwise noted. | |
| |
| You can obtain a free copy of Vanguard’s proxy voting | |
| guidelines by visiting vanguard.com/proxyreporting or by | |
| calling Vanguard at 800-662-2739. The guidelines are | |
| also available from the SEC’s website, sec.gov. In | |
| addition, you may obtain a free report on how your fund | |
| voted the proxies for securities it owned during the 12 | |
| months ended June 30. To get the report, visit either | |
| vanguard.com/proxyreporting or sec.gov. | |
| |
| You can review and copy information about your fund at | |
| the SEC’s Public Reference Room in Washington, D.C. To | |
| find out more about this public service, call the SEC at | |
| 202-551-8090. Information about your fund is also | |
| available on the SEC’s website, and you can receive | |
| copies of this information, for a fee, by sending a | |
| request in either of two ways: via e-mail addressed to | |
| publicinfo@sec.gov or via regular mail addressed to the | |
| Public Reference Section, Securities and Exchange | |
| Commission, Washington, DC 20549-1520. | |
| |
| | © 2014 The Vanguard Group, Inc. |
| | All rights reserved. |
| | Vanguard Marketing Corporation, Distributor. |
| |
| | Q730 122014 |
Item 2: Code of Ethics. The Registrant has adopted a code of ethics that applies to the Registrant’s principal executive officer, principal financial officer, principal accounting officer or controller or persons performing similar functions. The Code of Ethics was amended during the reporting period covered by this report to make certain technical, non-material changes.
Item 3: Audit Committee Financial Expert. The following members of the Audit Committee have been determined by the Registrant’s Board of Trustees to be Audit Committee Financial Experts serving on its Audit Committee, and to be independent: Rajiv L. Gupta, Amy Gutmann, JoAnn Heffernan Heisen, F. Joseph Loughrey, Mark Loughridge, Scott C. Malpass, André F. Perold, and Alfred M. Rankin, Jr.
Item 4: Principal Accountant Fees and Services.
(a) Audit Fees.
Audit Fees of the Registrant
Fiscal Year Ended October 31, 2014: $72,000
Fiscal Year Ended October 31, 2013: $64,000
Aggregate Audit Fees of Registered Investment Companies in the Vanguard Group.
Fiscal Year Ended October 31, 2014: $6,605,127
Fiscal Year Ended October 31, 2013: $5,714,113
Includes fees billed in connection with audits of the Registrant, other registered investment companies in the Vanguard complex, The Vanguard Group, Inc. and Vanguard Marketing Corporation.
(b) Audit-Related Fees.
Fiscal Year Ended October 31, 2014: $2,176,479
Fiscal Year Ended October 31, 2013: $1,552,950
Includes fees billed in connection with assurance and related services provided to the Registrant, other registered investment companies in the Vanguard complex, The Vanguard Group, Inc., and Vanguard Marketing Corporation.
(c) Tax Fees.
Fiscal Year Ended October 31, 2014: $316,869
Fiscal Year Ended October 31, 2013: $110,000
Includes fees billed in connection with tax compliance, planning, and advice services provided to the Registrant, other registered investment companies in the Vanguard complex, The Vanguard Group, Inc., and Vanguard Marketing Corporation.
(d) All Other Fees.
Fiscal Year Ended October 31, 2014: $198,163
Fiscal Year Ended October 31, 2013: $132,000
Includes fees billed for services related to tax reported information provided to the Registrant, other registered investment companies in the Vanguard complex, The Vanguard Group, Inc., and Vanguard Marketing Corporation.
(e) (1) Pre-Approval Policies. The policy of the Registrant’s Audit Committee is to consider and, if appropriate, approve before the principal accountant is engaged for such services, all specific audit and non-audit services provided to: the Registrant, other registered investment companies in the Vanguard complex, The Vanguard Group, Inc., and entities controlled by The Vanguard Group, Inc. that provide ongoing services to the Registrant. In making a determination, the Audit Committee considers whether the services are consistent with maintaining the principal accountant’s independence.
In the event of a contingency situation in which the principal accountant is needed to provide services in between scheduled Audit Committee meetings, the Chairman of the Audit Committee would be called on to consider and, if appropriate, pre-approve audit or permitted non-audit services in an amount sufficient to complete services through the next Audit Committee meeting, and to determine if such services would be consistent with maintaining the accountant’s independence. At the next scheduled Audit Committee meeting, services and fees would be presented to the Audit Committee for formal consideration, and, if appropriate, approval by the entire Audit Committee. The Audit Committee would again consider whether such services and fees are consistent with maintaining the principal accountant’s independence.
The Registrant’s Audit Committee is informed at least annually of all audit and non-audit services provided by the principal accountant to the Vanguard complex, whether such services are provided to: the Registrant, other registered investment companies in the Vanguard complex, The Vanguard Group, Inc., or other entities controlled by The Vanguard Group, Inc. that provide ongoing services to the Registrant.
(2) No percentage of the principal accountant’s fees or services were approved pursuant to the waiver provision of paragraph (c)(7)(i)(C) of Rule 2-01 of Regulation S-X.
(f) For the most recent fiscal year, over 50% of the hours worked under the principal accountant’s engagement were not performed by persons other than full-time, permanent employees of the principal accountant.
(g) Aggregate Non-Audit Fees.
Fiscal Year Ended October 31, 2014: $515,032
Fiscal Year Ended October 31, 2013: $242,000
Includes fees billed for non-audit services provided to the Registrant, other registered investment companies in the Vanguard complex, The Vanguard Group, Inc., and Vanguard Marketing Corporation.
(h) For the most recent fiscal year, the Audit Committee has determined that the provision of all non-audit services was consistent with maintaining the principal accountant’s independence.
Item 5: Audit Committee of Listed Registrants.
Not Applicable.
Item 6: Investments.
Not Applicable.
Item 7: Disclosure of Proxy Voting Policies and Procedures for Closed-End Management Investment Companies.
Not Applicable.
Item 8: Portfolio Managers of Closed-End Management Investment Companies.
Not Applicable.
Item 9: Purchase of Equity Securities by Closed-End Management Investment Company and Affiliated Purchasers.
Not Applicable.
Item 10: Submission of Matters to a Vote of Security Holders.
Not Applicable.
Item 11: Controls and Procedures.
(a) Disclosure Controls and Procedures. The Principal Executive and Financial Officers concluded that the Registrant’s Disclosure Controls and Procedures are effective based on their evaluation of the Disclosure Controls and Procedures as of a date within 90 days of the filing date of this report.
(b) Internal Control Over Financial Reporting. There were no significant changes in Registrant’s Internal Control Over Financial Reporting or in other factors that could
significantly affect this control subsequent to the date of the evaluation, including any
corrective actions with regard to significant deficiencies and material weaknesses.
Item 12: Exhibits.
(a) Code of Ethics.
(b) Certifications.
Pursuant to the requirements of the Securities Exchange Act of 1934 and the Investment Company Act of 1940, the registrant has duly caused this report to be signed on its behalf by the undersigned, thereunto duly authorized.
| |
| | VANGUARD WINDSOR FUNDS |
| |
| |
| BY: | /s/ F. WILLIAM MCNABB III* |
| | F. WILLIAM MCNABB III |
| | CHIEF EXECUTIVE OFFICER |
| |
| Date: December 18, 2014 |
Pursuant to the requirements of the Securities Exchange Act of 1934 and the Investment Company Act of 1940, this report has been signed below by the following persons on behalf of the registrant and in the capacities and on the dates indicated.
| |
| | VANGUARD WINDSOR FUNDS |
| |
|
| BY: | /s/ F. WILLIAM MCNABB III* |
| | F. WILLIAM MCNABB III |
| | CHIEF EXECUTIVE OFFICER |
Date: December 18, 2014 |
| | VANGUARD WINDSOR FUNDS |
| |
|
| BY: | /s/ THOMAS J. HIGGINS* |
| | THOMAS J. HIGGINS |
| | CHIEF FINANCIAL OFFICER |
| Date: December 18, 2014 |
* By: /s/ Heidi Stam
Heidi Stam, pursuant to a Power of Attorney filed on April 22, 2014 see file Number
2-17620, Incorporated by Reference.