UNITED STATES
SECURITIES AND EXCHANGE COMMISSION
Washington, D.C. 20549
FORM N-CSR
CERTIFIED SHAREHOLDER REPORT
OF
REGISTERED MANAGEMENT INVESTMENT COMPANIES
Investment Company Act file number: 811-834
Name of Registrant: Vanguard Windsor Funds
Address of Registrant:
P.O. Box 2600
Valley Forge, PA 19482
Name and address of agent for service:
Heidi Stam, Esquire
P.O. Box 876
Valley Forge, PA 19482
Registrant’s telephone number, including area code: (610) 669-1000
Date of fiscal year end: October 31
Date of reporting period: November 1, 2010 – October 31, 2011
Item 1: Reports to Shareholders
 |
|
| Annual Report | October 31, 2011 |
|
| Vanguard WindsorTM Fund |
> Vanguard Windsor Fund returned about 4% for the 12 months ended October 31, 2011. The fund trailed its benchmark and also slightly lagged the average return of peer funds for the period.
> The fund rallied over the first half of the fiscal year but gave up ground in the second half amid widespread concern about the shaky global economy.
> Energy and consumer discretionary holdings were major contributors to the fund’s returns, while materials stocks weighed most on performance.
| |
| Contents | |
| Your Fund’s Total Returns. | 1 |
| Chairman’s Letter. | 2 |
| Advisors’ Report. | 8 |
| Fund Profile. | 12 |
| Performance Summary. | 13 |
| Financial Statements. | 15 |
| Your Fund’s After-Tax Returns. | 29 |
| About Your Fund’s Expenses. | 30 |
| Glossary. | 32 |
Please note: The opinions expressed in this report are just that—informed opinions. They should not be considered promises or advice. Also, please keep in mind that the information and opinions cover the period through the date on the front of this report. Of course, the risks of investing in your fund are spelled out in the prospectus.
See the Glossary for definitions of investment terms used in this report.
About the cover: Vanguard was named for the HMS Vanguard, flagship of British Admiral Horatio Nelson. A ship—whose performance and safety depend on the work of all hands—has served as a fitting metaphor for the Vanguard crew as we strive to help clients reach their financial goals.
Your Fund’s Total Returns
| |
| Fiscal Year Ended October 31, 2011 | |
| |
| | Total |
| | Returns |
| Vanguard Windsor Fund | |
| Investor Shares | 4.15% |
| Admiral™ Shares | 4.26 |
| Russell 1000 Value Index | 6.16 |
| Multi-Cap Value Funds Average | 4.35 |
| Multi-Cap Value Funds Average: Derived from data provided by Lipper Inc. | |
| Admiral Shares carry lower expenses and are available to investors who meet certain account-balance requirements. | |
| | | | |
| Your Fund’s Performance at a Glance | | | | |
| October 31, 2010 , Through October 31, 2011 | | | | |
| | | | Distributions Per Share |
| | Starting | Ending | Income | Capital |
| | Share Price | Share Price | Dividends | Gains |
| Vanguard Windsor Fund | | | | |
| Investor Shares | $12.56 | $12.92 | $0.170 | $0.000 |
| Admiral Shares | 42.37 | 43.59 | 0.615 | 0.000 |
1

Chairman’s Letter
Dear Shareholder,
It was seemingly a tale of two stock markets for Vanguard Windsor Fund in the fiscal year ended October 31, 2011. En route to a return of about 4% for the period, Windsor rallied for the first six months before struggling in the second half amid growing concerns about the economic outlook both nationally and internationally. The fund’s overall performance lagged that of its benchmark, the Russell 1000 Value Index, and also slightly trailed the average return of multi-capitalization value funds.
Windsor wasn’t helped by its value-oriented approach. Growth stocks outpaced their value counterparts over the 12 months as investors favored companies that seemed better positioned to thrive in a period of economic uncertainty. As is sometimes the case with Windsor’s deep-value approach, the advisors’ investment judgments were out of step with the market consensus. Its holdings in all but two sectors trailed those same sectors in the benchmark.
If you own shares of the Windsor Fund in a taxable account, you may wish to review the fund’s after-tax returns presented later in this report.
A positive finish to an anxious 12 months
U.S. stock indexes ended the 12 months with solid returns, though the gains were shadowed by anxiety in a volatile period. This turbulence was so pronounced, in
2
fact, that a one-month change in the start date would have yielded a very different perspective on performance. For the 12 months through October 31, the broad U.S. stock market returned 7.67%. For the 12 months ended September 30, however, the return was a mere 0.31%.
Volatility has been a theme in international markets, too. International stock markets returned a combined –4.66% as stock prices retreated in Europe. Prices also fell in the Pacific region’s developed economies and emerging markets, where growth has moderated.
Unsteady yields reflected fast-changing sentiment
Bonds produced strong returns, though as in the stock market, investor sentiment was volatile. The yield of the 10-year U.S. Treasury note, a benchmark for longer-term interest rates, began the 12 months at 2.61%. Yields drifted higher (and prices lower) as the economic expansion seemed to gather steam, then fluttered lower to close the period at 2.17%. The decline in Treasury yields (and rise in prices) was driven by Europe’s sovereign debt dramas, underwhelming economic reports, and a flight to safety that was prompted, paradoxically, by a rating agency’s decision to downgrade the U.S. government
| | | |
| Market Barometer | | | |
| |
| | | Average Annual Total Returns |
| | | Periods Ended October 31, 2011 |
| | One | Three | Five |
| | Year | Years | Years |
| Stocks | | | |
| Russell 1000 Index (Large-caps) | 8.01% | 12.22% | 0.54% |
| Russell 2000 Index (Small-caps) | 6.71 | 12.87 | 0.68 |
| Dow Jones U.S. Total Stock Market Index | 7.67 | 12.58 | 0.90 |
| MSCI All Country World Index ex USA (International) | -4.66 | 12.92 | -0.37 |
| |
| Bonds | | | |
| Barclays Capital U.S. Aggregate Bond Index (Broad | | | |
| taxable market) | 5.00% | 8.87% | 6.41% |
| Barclays Capital Municipal Bond Index (Broad | | | |
| tax-exempt market) | 3.78 | 8.31 | 4.80 |
| Citigroup Three-Month U.S. Treasury Bill Index | 0.10 | 0.15 | 1.53 |
| |
| CPI | | | |
| Consumer Price Index | 3.53% | 1.49% | 2.33% |
3
debt. Vanguard’s confidence in the full faith and credit of the U.S. Treasury remains unshaken.
Taxable investment-grade bonds returned 5.00% for the full 12 months. It’s important to note, of course, that as yields decline, the opportunity for similarly strong returns diminishes. The broad municipal market returned 3.78%. The returns on money market instruments hovered near 0%, consistent with the Federal Reserve Board’s target for short-term interest rates.
Windsor encounters challenges and inhospitable climate
Vanguard Windsor Fund’s value-oriented holdings produced subpar returns over the 12 months. Although the fund rallied about 12% in the period’s final month, its full-year return didn’t measure up to those of the broad stock market or its comparative standards. Windsor invests in out-of-favor companies its advisors anticipate will post better earnings and attract investor interest as the business cycle progresses, but hopes for improvement dimmed in the latter part of the year. Investors were worried about stubbornly high U.S. unemployment as well as the potential global fallout from the European debt crisis.
The fund’s weak spots were especially evident in the materials sector. The troubled global economy reduced the demand for many commodities, and materials stocks tend to rise and fall
| | | |
| Expense Ratios | | | |
| Your Fund Compared With Its Peer Group | | | |
| | Investor | Admiral | Peer Group |
| | Shares | Shares | Average |
| Windsor Fund | 0.33% | 0.22% | 1.28% |
The fund expense ratios shown are from the prospectus dated February 24, 2011, and represent estimated costs for the current fiscal year. For the fiscal year ended October 31, 2011, the fund’s expense ratios were 0.39% for Investor Shares and 0.29% for Admiral Shares. The increase from the estimated expense ratios reflects a performance-based advisory fee adjustment. When the performance adjustment is positive, the fund’s expenses increase; when it is negative, expenses decrease. The peer-group expense ratio is derived from data provided by Lipper Inc. and captures information through year-end 2010.
Peer group: Multi-Cap Value Funds.
4
according to those business cycles. Although the sector is one of Windsor’s smallest by weight, the fund’s stocks were hit particularly hard. The poorest performance came from the containers and packaging industry, but the paper and forest products, construction materials, metals and mining, and chemicals subsectors were also trouble spots.
Energy stocks made a sizable contribution to Windsor’s result. The fund held several of the major integrated oil and gas firms, albeit at levels below those in the benchmark. These stocks rose, especially in the period’s first few months, as political turmoil in North Africa and the Middle East increased fear of oil shortages and drove up crude prices.
The financial sector––Windsor’s largest––returned –3% as major diversified banks dealt with a seemingly never-ending stream of problems, including mortgage-related defaults, regulatory pressures, and poor investment banking results. Windsor’s insurance holdings posted good results, however, and prevented a worse showing.
Consumer discretionary, health care, information technology, and consumer staples stocks added approximately 1 percentage point each to the fund’s return. Of that group, consumer staples produced the highest return. Tobacco and food products were bright spots for the fund.
| |
| Total Returns | |
| Ten Years Ended October 31, 2011 | |
| | Average |
| | Annual Return |
| Windsor Fund Investor Shares | 3.74% |
| Russell 1000 Value Index | 4.57 |
| Multi-Cap Value Funds Average | 3.93 |
| Multi-Cap Value Funds Average: Derived from data provided by Lipper Inc. | |
The figures shown represent past performance, which is not a guarantee of future results. (Current performance may be lower or higher than the performance data cited. For performance data current to the most recent month-end, visit our website at vanguard.com/performance.) Note, too, that both investment returns and principal value can fluctuate widely, so an investor’s shares, when sold, could be worth more or less than their original cost.
5
You can find more information about Windsor’s performance and positioning in the Advisors’ Report, which follows this letter.
A prior poor year can affect long-term performance
The markets charted a tumultuous course over the past ten years, a period that included the middle of the dot-com bust, several years of economic expansion, the worst financial crisis since the Great Depression, and a gradual recovery that remains shaky. That continued comeback was in jeopardy through the spring and summer as the broad markets fell for five straight months before sprinting ahead again in October.
Over the decade, the Windsor Fund registered an average annual return of 3.74%. This was lower than both the 4.82% average annual gain of the broad market, as measured by the Dow Jones Total Stock Market Index, and the annualized 4.57% result of the fund’s benchmark. It also slightly trailed the 3.93% average annual return of peer funds.
While we counsel investors that it’s wise to evaluate fund performance over the long term, it’s important to note that a fund’s record can be heavily influenced by short-term results. Windsor’s ten-year results are clouded by its –44% return for the 2008 fiscal year, when the financial crisis and poor stock selection took a weighty toll, leaving the fund far behind its benchmark.
Although the recent fiscal year also wasn’t one of the fund’s best, we are confident in the investment strategy and abilities of Windsor’s two advisors. The fund, which was launched in 1958, has experienced market conditions of every sort. Its search for underappreciated stocks can mean success for patient investors willing to endure the markets’ inevitable volatility.
Contrarian approach can result in rewards
The Windsor Fund has built its record and reputation by smartly identifying undervalued companies before the market. Quite often, this contrarian approach can result in outperformance. However, there are also times when the advisors’ beliefs either aren’t embraced or take longer than expected to be rewarded.
While a long-term focus is vital for stock market investing, extra resolve is sometimes required when a fund’s strategy is based on holding out-of-favor stocks. Companies that seem like weeds one year can blossom into roses the next.
Along with encouraging a long view, Vanguard advises building a portfolio that is diversified within and across asset classes and tailored to your unique risk tolerance, goals, and time horizon. Vanguard Windsor
6
Fund, with its experienced advisors and low costs, can play a useful role as an actively managed value fund in such a plan.
Thank you for entrusting your assets to Vanguard.

F. William McNabb III
Chairman and Chief Executive Officer
November 9, 2011
7
Advisors’ Report
For the fiscal year ended October 31, 2011, the Investor Shares of Vanguard Windsor Fund returned 4.15%, while the lower-cost Admiral Shares returned 4.26%. Your fund is managed by two independent advisors, a strategy that enhances the fund’s diversification by providing exposure to distinct, yet complementary, investment approaches. It is not uncommon for different advisors to have different views about individual securities or the broader investment environment.
The advisors, the percentage and amount of fund assets that each manages, and brief descriptions of their investment strategies are presented in the table below. The advisors have also prepared a discussion of the investment environment that existed during the period and of how the portfolio positioning reflects this assessment. These reports were prepared on November 16, 2011.
| | | |
| Vanguard Windsor Fund Investment Advisors | |
| |
| | Fund Assets Managed | |
| Investment Advisor | % | $ Million | Investment Strategy |
| Wellington Management | 69 | 8,148 | Seeks to provide long-term total returns above both the |
| Company, LLP | | | S&P 500 and value-oriented indexes over a complete |
| | | | market cycle through bottom-up, fundamentally driven |
| | | | stock selection focused on deeply undervalued |
| | | | securities. |
| AllianceBernstein L.P. | 29 | 3,353 | A value focus that couples rigorous fundamental |
| | | | company research with quantitative risk controls to |
| | | | capture value opportunities. |
| Cash Investments | 2 | 229 | These short-term reserves are invested by Vanguard in |
| | | | equity index products to simulate investment in stocks. |
| | | | Each advisor also may maintain a modest cash |
| | | | position. |
8
Wellington Management Company, LLP
Portfolio Manager:
James N. Mordy, Senior Vice President and Equity Portfolio Manager
The past year was a volatile one for equities, with a broad advance during the first half followed by a steep drop as adverse macro developments called into question the sustainability of the economic recovery. The market then surged in October on encouraging corporate earnings, slightly better economic data, and some movement toward resolution of the sovereign debt crisis in Europe. The S&P 500 Index returned slightly more than 8% for the period.
Our performance fell short of the index, with most of the underperformance coming during the market’s corrective phase. Much like 2008, this was a period of extreme risk aversion on the part of investors. In such a climate, where no price is too high for safety and investors are unwilling to look past the immediate macro headwinds, our contrarian value investing style can be challenged. We did help cushion the downside by trimming back our cyclical exposure prior to the market slide. As sentiment improves, as we saw in October, we expect our performance relative to the broad market to improve.
For the year, our best-performing sector was consumer staples. Japan Tobacco stood out, advancing more than 66%. Sales volume proved more resilient to tax-driven price hikes than most investors had feared, and the company navigated skillfully through a period of severe disruption caused by the earthquake.
We also had positive results in the health care and consumer discretionary sectors. We overweighted health care, a relatively defensive sector that outperformed the S&P 500 for the period. And we had meaningful gains in our two HMOs, UnitedHealth and CIGNA, where premium increases have more than offset increased costs. The consumer discretionary sector outgained the broad index as consumer spending held up much better than the dismal confidence surveys suggested. Buck Holdings (Dollar General) management continues to execute brilliantly in a challenging retail environment, winning market share and successfully expanding its store base.
Our worst-performing sector was industrials. Delta Air Lines stock dropped, returning –39% on a combination of adverse macro factors, and we trimmed our position size significantly. A swap of our successful John Deere holding into Fiat Industrial, which we believe offers more valuation upside, proved ill-timed given the escalating debt crisis in Europe. Materials was another difficult sector. We ran into a buzz saw with Sino-Forest, the leading forest products company in China, amid questions about the legitimacy of its accounting practices and timberland leases. We await the results of an ongoing independent investigation, which we believe could still validate a significant amount of the asset value. Owens-Illinois stock returned –28% for the year, initially
9
because of sluggish consumption of beverages globally and then because of operating inefficiencies as the company ramped up to meet improved demand.
And finally, we were hurt by underweightings in utilities and REITs (two groups in which many investors have sought higher yields, but where we see little value), an overweighting in U.S. banks (which are in much better shape than they were during the 2008 liquidity crisis but are now at even better valuations), and by our decision not to chase certain fully valued “safety” stocks.
During the year we were net buyers in financials and health care and net sellers in several of the more cyclical sectors, such as consumer discretionary, information technology, and energy. Recently, we have increasingly felt that a lot of bad news was being discounted and have begun to opportunistically push back into some more cyclical fare. Cooper Industries and Eaton Corporation are two diversified industrial companies with exposure to attractive opportunities, such as energy efficiency, power management, and oil and gas infrastructure, that we were able to buy at single-digit multiples of midcycle earnings. Occidental Petroleum had underperformed because of production shortfalls caused by temporary factors but, unlike its peers, it generates significant free cash flow, which allows for a reasonable dividend and some cushion should commodity prices weaken further.
Recent economic data suggest that the U.S. economy continues to expand at a slow pace. This is threatened by the crisis in Europe, where we believe a worst-case outcome will be avoided, but not without more anguish and a long period of fiscal retrenchment. Corporate balance sheets are strong, with high profitability and ample free cash generation. The silver lining in a more subdued outlook for global economic growth is less inflationary pressure.
This should allow many emerging market governments to loosen their monetary policies, which could further stimulate investors’ appetite for risk. We feel that we have tremendous value in our portfolio and that our discipline will produce rewards for shareholders over the long term.
AllianceBernstein L.P.
Portfolio Managers:
Joseph G. Paul, Chief Investment Officer, U.S. Large-Cap Value Equities and North American Value Equities
Gregory L. Powell, Director of Research, U.S. Large-Cap Value Equities
Equities fell over the past 12 months as investors fled risk en masse amid growing fears that the European debt crisis and renewed economic weakness could push the global economy into recession. It was an especially brutal period for value stocks, which suffered one of the worst slumps in the past 40 years, surpassed only by the internet bubble burst and the depths of the 2008 market collapse. Reflecting its exposure to deep-value stocks, our portion of the Windsor Fund declined more than its value benchmark index.
Investors are understandably drawing parallels between the current market turmoil and the global financial crisis of
10
2008. We see significant differences: The U.S. economy is still growing, companies are more profitable, and U.S. banks and households have repaired their balance sheets. Interest rates remain at historic lows, while deferred capital spending has created pent-up demand. We expect the global economic recovery to continue, although growth will be sluggish.
Of course, until improvements materialize, stocks are likely to remain volatile, especially when unpredictable government policies are having such a big influence on macroeconomic outcomes. Nonetheless, we continue to believe that the current conditions are creating exceptional opportunities that will pay off in the long term. After the recent pullback, equities look very attractively valued, particularly versus bonds. The U.S. equity risk premium—the gap between the long-term expected return on stocks and 10-year Treasury yields—now matches the historical peak of early 2009, which turned out to be an excellent year for stocks.
Extreme risk aversion has also created large price distortions—and ripe conditions for stock-picking. By our analysis, the discounts on the cheapest stocks versus the most expensive are on par with the levels of the peak of the financial crisis in early 2009, which marked the beginning of a strong rally in value stocks.
We continued to increase the portfolio’s exposure to the large U.S. value opportunity, taking advantage of the indiscriminate sell-off among economically sensitive stocks to add to our energy, technology, and consumer positions. Our research insights give us a high degree of conviction in our forecasts and, hence, their upside potential. We expect these holdings to perform well even if economic growth remains muted, as these companies continue to benefit from leaner cost structures, solid competitive advantages, and restructuring initiatives that are just beginning to bear fruit.
However, recognizing that markets are likely to remain unusually volatile in the near term, we also continue to emphasize companies with good shock absorbers—namely, strong current profitability and healthy balance sheets. Remarkably, we are finding high-quality stocks trading at similar or bigger discounts than those in early 2009—despite the vast improvement in profitability and balance-sheet quality since then.
We understand that the portfolio’s recent performance is extremely unsettling. But we also strongly believe that when markets stop acting purely on macro concerns and gain the confidence to reward cheap stocks that offer strong cash flows and earnings, the portfolio can achieve the performance that you expect and that it has delivered over the long term.
11
Windsor Fund
Fund Profile
As of October 31, 2011
| | |
| Share-Class Characteristics | |
| | Investor | Admiral |
| | Shares | Shares |
| Ticker Symbol | VWNDX | VWNEX |
| Expense Ratio1 | 0.33% | 0.22% |
| 30-Day SEC Yield | 1.62% | 1.72% |
| | | |
| Portfolio Characteristics | | |
| | | Russell | DJ |
| | | 1000 | U.S. Total |
| | | Value | Market |
| | Fund | Index | Index |
| Number of Stocks | 158 | 656 | 3,749 |
| Median Market Cap | $24.6B | $37.5B | $30.4B |
| Price/Earnings Ratio | 12.8x | 13.0x | 14.9x |
| Price/Book Ratio | 1.6x | 1.4x | 2.1x |
| Return on Equity | 16.1% | 13.7% | 19.1% |
| Earnings Growth Rate | 4.9% | 0.5% | 7.2% |
| Dividend Yield | 2.2% | 2.6% | 2.0% |
| Foreign Holdings | 13.6% | 0.0% | 0.0% |
| Turnover Rate | 49% | — | — |
| Short-Term Reserves | 0.6% | — | — |
| | | |
| Sector Diversification (% of equity exposure) |
| | | Russell | DJ |
| | | 1000 | U.S. Total |
| | | Value | Market |
| | Fund | Index | Index |
| Consumer | | | |
| Discretionary | 13.4% | 8.9% | 12.4% |
| Consumer Staples | 7.4 | 7.8 | 10.1 |
| Energy | 12.5 | 12.5 | 10.7 |
| Financials | 19.9 | 25.3 | 15.1 |
| Health Care | 16.9 | 12.4 | 11.1 |
| Industrials | 7.9 | 9.0 | 10.9 |
| Information | | | |
| Technology | 14.3 | 9.1 | 19.3 |
| Materials | 3.7 | 2.7 | 4.3 |
| Telecommunication | | | |
| Services | 1.1 | 4.7 | 2.6 |
| Utilities | 2.9 | 7.6 | 3.5 |
| | |
| Volatility Measures | | |
| | Russell | DJ |
| | 1000 | U.S. Total |
| | Value | Market |
| | Index | Index |
| R-Squared | 0.97 | 0.98 |
| Beta | 1.03 | 1.10 |
These measures show the degree and timing of the fund’s fluctuations compared with the indexes over 36 months.
| | |
| Ten Largest Holdings (% of total net assets) |
| Wells Fargo & Co. | Diversified Banks | 2.7% |
| Comcast Corp. | Cable & Satellite | 2.6 |
| Pfizer Inc. | Pharmaceuticals | 2.2 |
| UnitedHealth Group Inc. | Managed Health | |
| | Care | 2.0 |
| ACE Ltd. | Property & Casualty | |
| | Insurance | 2.0 |
| Arrow Electronics Inc. | Technology | |
| | Distributors | 2.0 |
| Buck Holdings LP Private | General | |
| Placement | Merchandise Stores | 1.9 |
| JPMorgan Chase & Co. | Diversified Financial | |
| | Services | 1.9 |
| Cisco Systems Inc. | Communications | |
| | Equipment | 1.7 |
| Amgen Inc. | Biotechnology | 1.7 |
| Top Ten | | 20.7% |
The holdings listed exclude any temporary cash investments and equity index products.
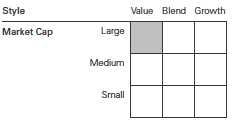
Investment Focus
1 The expense ratios shown are from the prospectus dated February 24, 2011, and represent estimated costs for the current fiscal year. For the fiscal year ended October 31, 2011, the expense ratios were 0.39% for Investor Shares and 0.29% for Admiral Shares.
12
Windsor Fund
Performance Summary
All of the returns in this report represent past performance, which is not a guarantee of future results that may be achieved by the fund. (Current performance may be lower or higher than the performance data cited. For performance data current to the most recent month-end, visit our website at vanguard.com/performance.) Note, too, that both investment returns and principal value can fluctuate widely, so an investor’s shares, when sold, could be worth more or less than their original cost. The returns shown do not reflect taxes that a shareholder would pay on fund distributions or on the sale of fund shares.
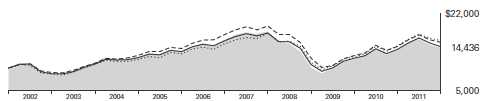
Cumulative Performance: October 31, 2001, Through October 31, 2011
Initial Investment of $10,000
| | | | |
| | Average Annual Total Returns | |
| | Periods Ended October 31, 2011 | |
| | | | | Final Value |
| | One | Five | Ten | of a $10,000 |
| | Year | Years | Years | Investment |
| Windsor Fund Investor Shares | 4.15% | -2.22% | 3.74% | $14,436 |
| Dow Jones U.S. Total Stock Market | | | | |
| Index | 7.67 | 0.90 | 4.82 | 16,011 |
| Russell 1000 Value Index | 6.16 | -2.05 | 4.57 | 15,637 |
| Multi-Cap Value Funds Average | 4.35 | -1.66 | 3.93 | 14,697 |
| Multi-Cap Value Funds Average: Derived from data provided by Lipper Inc. | | | |
| | | | |
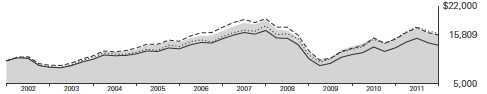
| | | | Since | Final Value |
| | One | Five | Inception | of a $50,000 |
| | Year | Years | (11/12/2001) | Investment |
| Windsor Fund Admiral Shares | 4.26% | -2.11% | 3.47% | $70,236 |
| Dow Jones U.S. Total Stock Market | | | | |
| Index | 7.67 | 0.90 | 4.31 | 76,178 |
| Russell 1000 Value Index | 6.16 | -2.05 | 4.17 | 75,146 |
| "Since Inception" performance is calculated from the Admiral Shares’ inception date for both the fund and its comparative standards. |
See Financial Highlights for dividend and capital gains information.
13
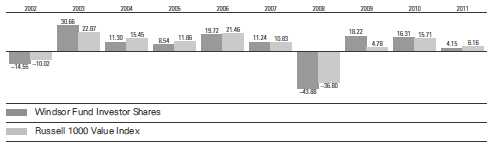
Windsor Fund
Fiscal-Year Total Returns (%): October 31, 2001, Through October 31, 2011
Average Annual Total Returns: Periods Ended September 30, 2011
This table presents returns through the latest calendar quarter—rather than through the end of the fiscal period.
Securities and Exchange Commission rules require that we provide this information.
| | | | |
| | Inception | One | Five | Ten |
| | Date | Year | Years | Years |
| Investor Shares | 10/23/1958 | -3.53% | -3.60% | 2.71% |
| Admiral Shares | 11/12/2001 | -3.42 | -3.50 | 2.291 |
| 1 Return since inception. | | | | |
14
Windsor Fund
Financial Statements
Statement of Net Assets
As of October 31, 2011
The fund reports a complete list of its holdings in regulatory filings four times in each fiscal year, at the quarter-ends. For the second and fourth fiscal quarters, the lists appear in the fund’s semiannual and annual reports to shareholders. For the first and third fiscal quarters, the fund files the lists with the Securities and Exchange Commission on Form N-Q. Shareholders can look up the fund’s Forms N-Q on the SEC’s website at sec.gov. Forms N-Q may also be reviewed and copied at the SEC’s Public Reference Room (see the back cover of this report for further information).
| | | |
| | | | Market |
| | | | Value |
| | | Shares | ($000) |
| Common Stocks (97.8%)1 | | |
| Consumer Discretionary (13.1%) | |
| *,2 | Buck Holdings LP | | |
| | Private Placement | NA | 228,277 |
| | Comcast Corp. | 8,941,200 | 205,648 |
| | Home Depot Inc. | 4,573,100 | 163,717 |
| * | Toll Brothers Inc. | 6,637,800 | 115,763 |
| | Comcast Corp. Class A | 4,090,100 | 95,913 |
| | TJX Cos. Inc. | 1,353,100 | 79,738 |
| | Virgin Media Inc. | 3,132,200 | 76,363 |
| 3 | MDC Holdings Inc. | 2,646,126 | 59,273 |
| | Kohl’s Corp. | 1,100,800 | 58,353 |
| | Viacom Inc. Class B | 1,107,440 | 48,561 |
| | Time Warner Cable Inc. | 693,800 | 44,188 |
| * | General Motors Co. | 1,654,700 | 42,774 |
| | Lowe’s Cos. Inc. | 1,611,900 | 33,882 |
| * | TRW Automotive | | |
| | Holdings Corp. | 735,800 | 30,977 |
| | Lear Corp. | 628,000 | 29,460 |
| * | Ford Motor Co. | 2,363,000 | 27,600 |
| | Macy’s Inc. | 787,900 | 24,055 |
| * | DIRECTV Class A | 527,300 | 23,971 |
| | News Corp. Class A | 1,277,300 | 22,378 |
| | Gannett Co. Inc. | 1,632,909 | 19,089 |
| * | NVR Inc. | 29,370 | 18,878 |
| * | Big Lots Inc. | 456,000 | 17,187 |
| | McGraw-Hill Cos. Inc. | 389,900 | 16,571 |
| * | GameStop Corp. Class A | 481,400 | 12,309 |
| | Foot Locker Inc. | 508,085 | 11,107 |
| | Limited Brands Inc. | 231,900 | 9,905 |
| | Newell Rubbermaid Inc. | 538,540 | 7,970 |
| | CBS Corp. Class B | 306,100 | 7,900 |
| | | | 1,531,807 |
| Consumer Staples (7.2%) | | |
| | Japan Tobacco Inc. | 31,044 | 155,163 |
| | Tyson Foods Inc. Class A | 6,780,300 | 130,860 |
| | Molson Coors Brewing Co. | | |
| | Class B | 3,087,300 | 130,716 |
| | CVS Caremark Corp. | 3,373,500 | 122,458 |
| | | |
| | | | Market |
| | | | Value |
| | | Shares | ($000) |
| | Procter & Gamble Co. | 786,400 | 50,322 |
| | Archer-Daniels-Midland Co. | 1,736,800 | 50,263 |
| | Lorillard Inc. | 450,700 | 49,874 |
| | Altria Group Inc. | 1,764,100 | 48,601 |
| | Kroger Co. | 1,528,900 | 35,440 |
| * | Constellation Brands Inc. | | |
| | Class A | 1,479,000 | 29,905 |
| * | Smithfield Foods Inc. | 723,800 | 16,546 |
| | Reynolds American Inc. | 203,200 | 7,860 |
| | ConAgra Foods Inc. | 250,000 | 6,333 |
| | Philip Morris | | |
| | International Inc. | 83,600 | 5,841 |
| | | | 840,182 |
| Energy (12.2%) | | |
| ^ | Statoil ASA ADR | 5,383,700 | 136,907 |
| * | Southwestern Energy Co. | 3,050,900 | 128,260 |
| | Chevron Corp. | 1,147,800 | 120,576 |
| | Apache Corp. | 1,183,300 | 117,892 |
| | Canadian Natural | | |
| | Resources Ltd. | 2,805,200 | 99,164 |
| | Noble Corp. | 2,737,800 | 98,396 |
| | Inpex Corp. | 14,441 | 95,341 |
| | ConocoPhillips | 1,328,900 | 92,558 |
| | Consol Energy Inc. | 1,949,759 | 83,372 |
| | Occidental Petroleum Corp. | 847,500 | 78,767 |
| | Anadarko Petroleum Corp. | 881,400 | 69,190 |
| | BP plc ADR | 1,493,500 | 65,983 |
| | Marathon Petroleum Corp. | 1,521,750 | 54,631 |
| | Marathon Oil Corp. | 1,643,500 | 42,780 |
| | Devon Energy Corp. | 617,900 | 40,132 |
| | Exxon Mobil Corp. | 480,800 | 37,546 |
| | Transocean Ltd. | 558,100 | 31,895 |
| * | Weatherford | | |
| | International Ltd. | 1,420,300 | 22,015 |
| * | McDermott | | |
| | International Inc. | 952,000 | 10,453 |
| | | | 1,425,858 |
| Exchange-Traded Fund (0.8%) | |
| 4 | Vanguard Value ETF | 1,839,100 | 95,412 |
15
Windsor Fund
| | | |
| | | | Market |
| | | | Value |
| | | Shares | ($000) |
| Financials (19.2%) | | |
| | Wells Fargo & Co. | 12,346,200 | 319,890 |
| | ACE Ltd. | 3,264,200 | 235,512 |
| | JPMorgan Chase & Co. | 6,565,250 | 228,208 |
| | Ameriprise Financial Inc. | 3,327,900 | 155,346 |
| | Unum Group | 6,269,900 | 149,474 |
| | Citigroup Inc. | 3,504,500 | 110,707 |
| | BB&T Corp. | 4,637,000 | 108,228 |
| | BlackRock Inc. | 646,100 | 101,948 |
| | Bank of America Corp. | 14,370,800 | 98,153 |
| | Banco Santander | | |
| | Brasil SA ADR | 10,577,100 | 96,252 |
| | Principal Financial | | |
| | Group Inc. | 3,708,200 | 95,597 |
| | Weyerhaeuser Co. | 5,151,200 | 92,619 |
| | Swiss Re AG | 1,662,031 | 90,744 |
| | Invesco Ltd. | 4,265,754 | 85,614 |
| | Everest Re Group Ltd. | 933,500 | 83,940 |
| | Travelers Cos. Inc. | 1,131,200 | 66,005 |
| * | E*Trade Financial Corp. | 3,039,800 | 32,982 |
| | Moody’s Corp. | 755,000 | 26,795 |
| | Legg Mason Inc. | 702,900 | 19,330 |
| * | Berkshire Hathaway Inc. | | |
| | Class B | 243,600 | 18,967 |
| | PNC Financial Services | | |
| | Group Inc. | 284,300 | 15,270 |
| | Chubb Corp. | 184,900 | 12,397 |
| | US Bancorp | 400,000 | 10,236 |
| | XL Group plc Class A | 170,700 | 3,711 |
| | | | 2,257,925 |
| Health Care (16.4%) | | |
| | Pfizer Inc. | 13,279,900 | 255,771 |
| | UnitedHealth Group Inc. | 4,927,000 | 236,447 |
| | Amgen Inc. | 3,439,400 | 196,974 |
| | Merck & Co. Inc. | 5,031,700 | 173,594 |
| | Medtronic Inc. | 3,483,100 | 121,003 |
| | Daiichi Sankyo Co. Ltd. | 5,796,000 | 112,585 |
| | CIGNA Corp. | 2,526,100 | 112,007 |
| | Roche Holding AG | 680,705 | 111,683 |
| | Johnson & Johnson | 1,702,200 | 109,605 |
| | Covidien plc | 1,777,700 | 83,623 |
| | McKesson Corp. | 997,300 | 81,330 |
| | Teva Pharmaceutical | | |
| | Industries Ltd. ADR | 1,951,800 | 79,731 |
| | WellPoint Inc. | 969,800 | 66,819 |
| | AstraZeneca plc ADR | 1,236,420 | 59,237 |
| * | Gilead Sciences Inc. | 1,224,400 | 51,008 |
| * | HCA Holdings Inc. | 2,121,600 | 49,752 |
| * | Health Net Inc. | 650,000 | 18,063 |
| | Aetna Inc. | 242,700 | 9,650 |
| | | | 1,928,882 |
| Industrials (7.6%) | | |
| | Pentair Inc. | 3,235,000 | 116,298 |
| | Dover Corp. | 2,041,700 | 113,376 |
| | Eaton Corp. | 2,209,000 | 99,007 |
| | Cooper Industries plc | 1,864,000 | 97,785 |
| | | |
| | | | Market |
| | | | Value |
| | | Shares | ($000) |
| * | Delta Air Lines Inc. | 11,112,200 | 94,676 |
| | Honeywell | | |
| | International Inc. | 1,717,700 | 90,008 |
| | General Electric Co. | 4,783,100 | 79,926 |
| | United Parcel Service Inc. | | |
| | Class B | 891,600 | 62,626 |
| * | Fiat Industrial SPA | 6,877,227 | 59,877 |
| | Northrop Grumman Corp. | 594,900 | 34,355 |
| | Ingersoll-Rand plc | 585,700 | 18,233 |
| | Tyco International Ltd. | 258,800 | 11,788 |
| | CSX Corp. | 333,900 | 7,416 |
| | Union Pacific Corp. | 70,000 | 6,970 |
| | | | 892,341 |
| Information Technology (13.9%) | |
| *,3 | Arrow Electronics Inc. | 6,426,550 | 231,677 |
| | Cisco Systems Inc. | 10,712,200 | 198,497 |
| | ASML Holding NV | 3,918,200 | 164,290 |
| | Avago Technologies Ltd. | 4,012,700 | 135,509 |
| | Texas Instruments Inc. | 4,081,100 | 125,412 |
| | Western Union Co. | 6,218,800 | 108,642 |
| | Microsoft Corp. | 3,840,800 | 102,281 |
| | Linear Technology Corp. | 2,709,000 | 87,528 |
| | Oracle Corp. | 2,434,700 | 79,785 |
| | Accenture plc Class A | 1,275,800 | 76,880 |
| | Hewlett-Packard Co. | 2,596,665 | 69,097 |
| | Intel Corp. | 2,508,700 | 61,564 |
| | Corning Inc. | 2,652,500 | 37,904 |
| | Applied Materials Inc. | 2,896,800 | 35,689 |
| * | Flextronics | | |
| | International Ltd. | 5,145,800 | 33,782 |
| * | Lam Research Corp. | 443,900 | 19,083 |
| * | Micron Technology Inc. | 3,037,800 | 16,981 |
| | Visa Inc. Class A | 150,400 | 14,026 |
| * | Dell Inc. | 772,500 | 12,213 |
| | Advanced Semiconductor | | |
| | Engineering Inc. ADR | 1,927,881 | 8,521 |
| | Motorola Solutions Inc. | 169,400 | 7,947 |
| | Seagate Technology plc | 231,331 | 3,736 |
| | | | 1,631,044 |
| Materials (3.6%) | | |
| | Potash Corp. of | | |
| | Saskatchewan Inc. | 1,796,300 | 85,019 |
| | Rexam plc | 14,310,633 | 79,325 |
| * | Owens-Illinois Inc. | 3,916,000 | 78,633 |
| | LyondellBasell | | |
| | Industries NV Class A | 2,123,300 | 69,772 |
| | Agrium Inc. | 577,700 | 47,539 |
| | Incitec Pivot Ltd. | 11,000,000 | 39,844 |
| | Dow Chemical Co. | 655,000 | 18,261 |
| *,^ | Sino-Forest Corp. | 3,223,900 | 3,521 |
| | | | 421,914 |
| Telecommunication Services (1.0%) | |
| | CenturyLink Inc. | 1,749,500 | 61,687 |
| | AT&T Inc. | 1,974,700 | 57,879 |
| | | | 119,566 |
16
Windsor Fund
| | |
| | | Market |
| | | Value |
| | Shares | ($000) |
| Utilities (2.8%) | | |
| PG&E Corp. | 2,610,300 | 111,982 |
| Northeast Utilities | 1,723,900 | 59,595 |
| DTE Energy Co. | 730,000 | 38,041 |
| CMS Energy Corp. | 1,250,398 | 26,033 |
| NV Energy Inc. | 1,580,500 | 25,351 |
| CenterPoint Energy Inc. | 1,022,700 | 21,313 |
| NiSource Inc. | 868,400 | 19,183 |
| Atmos Energy Corp. | 549,700 | 18,866 |
| American Electric | | |
| Power Co. Inc. | 150,000 | 5,892 |
| | | 326,256 |
| Total Common Stocks | | |
| (Cost $10,718,610) | | 11,471,187 |
| Temporary Cash Investments (1.9%)1 | |
| Money Market Fund (0.2%) | | |
| 5,6 Vanguard Market Liquidity | | |
| Fund, 0.128% | 25,271,034 | 25,271 |
| |
| | Face | |
| | Amount | |
| | ($000) | |
| Repurchase Agreement (1.4%) | |
| Bank of America | | |
| Securities, LLC 0.110%, | | |
| 11/1/11 (Dated 10/31/11, | | |
| Repurchase Value | | |
| $167,501,000, | | |
| collateralized by Federal | | |
| Home Loan Mortgage | | |
| Corp. 4.00%, 10/1/41 | | |
| and Federal National | | |
| Mortgage Assn. | | |
| 3.09%, 3/1/41) | 167,500 | 167,500 |
| | | |
| | | Face | Market |
| | | Amount | Value |
| | | ($000) | ($000) |
| U.S. Government and Agency Obligations (0.3%) |
| 7,8 | Federal Home Loan Bank | | |
| | Discount Notes, 0.075%, | | |
| | 11/16/11 | 10,000 | 10,000 |
| 7 | Federal Home Loan Bank | | |
| | Discount Notes, 0.025%, | | |
| | 12/9/11 | 2,500 | 2,500 |
| 8,9 | Freddie Mac | | |
| | Discount Notes, 0.040%, | | |
| | 11/28/11 | 7,500 | 7,500 |
| 8,9 | Freddie Mac | | |
| | Discount Notes, 0.035%, | | |
| | 12/27/11 | 10,000 | 9,998 |
| | | | 29,998 |
| Total Temporary Cash Investments | |
| (Cost $222,770) | | 222,769 |
| Total Investments (99.7%) | | |
| (Cost $10,941,380) | | 11,693,956 |
| Other Assets and Liabilities (0.3%) | |
| Other Assets | | 150,834 |
| Liabilities6 | | (114,643) |
| | | | 36,191 |
| Net Assets (100%) | | 11,730,147 |
17
Windsor Fund
| |
| At October 31, 2011, net assets consisted of: |
| | Amount |
| | ($000) |
| Paid-in Capital | 14,298,090 |
| Undistributed Net Investment Income | 34,419 |
| Accumulated Net Realized Losses | (3,355,002) |
| Unrealized Appreciation (Depreciation) | |
| Investment Securities | 752,576 |
| Futures Contracts | 111 |
| Foreign Currencies | (47) |
| Net Assets | 11,730,147 |
| |
| Investor Shares—Net Assets | |
| Applicable to 521,483,654 outstanding | |
| $.001 par value shares of beneficial | |
| interest (unlimited authorization) | 6,736,142 |
| Net Asset Value Per Share— | |
| Investor Shares | $12.92 |
| |
| Admiral Shares—Net Assets | |
| Applicable to 114,559,478 outstanding | |
| $.001 par value shares of beneficial | |
| interest (unlimited authorization) | 4,994,005 |
| Net Asset Value Per Share— | |
| Admiral Shares | $43.59 |
See Note A in Notes to Financial Statements.
* Non-income-producing security.
^ Part of security position is on loan to broker-dealers. The total value of securities on loan is $9,163,000.
1 The fund invests a portion of its cash reserves in equity markets through the use of index futures contracts. After giving effect to futures investments, the fund’s effective common stock and temporary cash investment positions represent 99.0% and 0.7%, respectively, of net assets.
2 Restricted security represents 1.9% of net assets. Shares not applicable for this private placement.
3 Considered an affiliated company of the fund as the fund owns more than 5% of the outstanding voting securities of such company.
4 Considered an affiliated company of the fund as the issuer is another member of The Vanguard Group.
5 Affiliated money market fund available only to Vanguard funds and certain trusts and accounts managed by Vanguard. Rate shown is the 7-day yield.
6 Includes $12,655,000 of collateral received for securities on loan.
7 The issuer operates under a congressional charter; its securities are not backed by the full faith and credit of the U.S. government.
8 Securities with a value of $24,999,000 have been segregated as initial margin for open futures contracts.
9 The issuer is under federal conservatorship and is dependent upon the continued support of the U.S. Treasury to avoid receivership.
ADR—American Depositary Receipt.
See accompanying Notes, which are an integral part of the Financial Statements.
18
Windsor Fund
| |
| Statement of Operations | |
| |
| | Year Ended |
| | October 31, 2011 |
| | ($000) |
| Investment Income | |
| Income | |
| Dividends1,2 | 223,172 |
| Interest2 | 470 |
| Security Lending | 2,353 |
| Total Income | 225,995 |
| Expenses | |
| Investment Advisory Fees—Note B | |
| Basic Fee | 16,442 |
| Performance Adjustment | 3,901 |
| The Vanguard Group—Note C | |
| Management and Administrative—Investor Shares | 15,594 |
| Management and Administrative—Admiral Shares | 5,915 |
| Marketing and Distribution—Investor Shares | 1,569 |
| Marketing and Distribution—Admiral Shares | 919 |
| Custodian Fees | 263 |
| Auditing Fees | 31 |
| Shareholders’ Reports—Investor Shares | 171 |
| Shareholders’ Reports—Admiral Shares | 80 |
| Trustees’ Fees and Expenses | 28 |
| Total Expenses | 44,913 |
| Expenses Paid Indirectly | (909) |
| Net Expenses | 44,004 |
| Net Investment Income | 181,991 |
| Realized Net Gain (Loss) | |
| Investment Securities Sold2 | 1,131,645 |
| Futures Contracts | 26,190 |
| Foreign Currencies and Forward Currency Contracts | (10,374) |
| Realized Net Gain (Loss) | 1,147,461 |
| Change in Unrealized Appreciation (Depreciation) | |
| Investment Securities | (784,637) |
| Futures Contracts | (3,978) |
| Foreign Currencies | (174) |
| Change in Unrealized Appreciation (Depreciation) | (788,789) |
| Net Increase (Decrease) in Net Assets Resulting from Operations | 540,663 |
1 Dividends are net of foreign withholding taxes of $4,053,000.
2 Dividend income, interest income, and realized net gain (loss) from affiliated companies of the fund were $6,428,000, $271,000, and $51,573,000, respectively.
See accompanying Notes, which are an integral part of the Financial Statements.
19
Windsor Fund
| | |
| Statement of Changes in Net Assets | | |
| |
| |
| | Year Ended October 31, |
| | 2011 | 2010 |
| | ($000) | ($000) |
| Increase (Decrease) in Net Assets | | |
| Operations | | |
| Net Investment Income | 181,991 | 205,559 |
| Realized Net Gain (Loss) | 1,147,461 | 118,095 |
| Change in Unrealized Appreciation (Depreciation) | (788,789) | 1,543,926 |
| Net Increase (Decrease) in Net Assets Resulting from Operations | 540,663 | 1,867,580 |
| Distributions | | |
| Net Investment Income | | |
| Investor Shares | (97,694) | (126,673) |
| Admiral Shares | (73,770) | (75,870) |
| Realized Capital Gain | | |
| Investor Shares | — | — |
| Admiral Shares | — | — |
| Total Distributions | (171,464) | (202,543) |
| Capital Share Transactions | | |
| Investor Shares | (1,510,081) | (684,753) |
| Admiral Shares | 191,699 | (113,168) |
| Net Increase (Decrease) from Capital Share Transactions | (1,318,382) | (797,921) |
| Total Increase (Decrease) | (949,183) | 867,116 |
| Net Assets | | |
| Beginning of Period | 12,679,330 | 11,812,214 |
| End of Period1 | 11,730,147 | 12,679,330 |
| 1 Net Assets—End of Period includes undistributed net investment income of $34,419,000 and $24,065,000. | |
See accompanying Notes, which are an integral part of the Financial Statements.
20
Windsor Fund
Financial Highlights
| | | | | |
| Investor Shares | | | | | |
| |
| For a Share Outstanding | | | Year Ended October 31, |
| Throughout Each Period | 2011 | 2010 | 2009 | 2008 | 2007 |
| Net Asset Value, Beginning of Period | $12.56 | $10.97 | $9.51 | $19.52 | $19.27 |
| Investment Operations | | | | | |
| Net Investment Income | .184 | .1901 | .197 | .279 | .298 |
| Net Realized and Unrealized Gain (Loss) | | | | | |
| on Investments | .346 | 1.586 | 1.486 | (7.985) | 1.782 |
| Total from Investment Operations | .530 | 1.776 | 1.683 | (7.706) | 2.080 |
| Distributions | | | | | |
| Dividends from Net Investment Income | (.170) | (.186) | (.223) | (.289) | (.301) |
| Distributions from Realized Capital Gains | — | — | — | (2.015) | (1.529) |
| Total Distributions | (.170) | (.186) | (.223) | (2.304) | (1.830) |
| Net Asset Value, End of Period | $12.92 | $12.56 | $10.97 | $9.51 | $19.52 |
| |
| Total Return2 | 4.15% | 16.31% | 18.22% | -43.88% | 11.24% |
| |
| Ratios/Supplemental Data | | | | | |
| Net Assets, End of Period (Millions) | $6,736 | $7,999 | $7,610 | $7,041 | $14,490 |
| Ratio of Total Expenses to | | | | | |
| Average Net Assets3 | 0.39% | 0.33% | 0.33% | 0.30% | 0.31% |
| Ratio of Net Investment Income to | | | | | |
| Average Net Assets | 1.34% | 1.59%1 | 2.03% | 1.91% | 1.50% |
| Portfolio Turnover Rate | 49% | 50% | 61%4 | 55% | 40% |
1 Net investment income per share and the ratio of net investment income to average net assets include $.036 and 0.29%, respectively, resulting from a cash payment received in connection with the merger of Schering-Plough Corp. and Merck & Co. in November 2009.
2 Total returns do not include account service fees that may have applied in the periods shown. Fund prospectuses provide information about any applicable account service fees.
3 Includes performance-based investment advisory fee increases (decreases) of 0.03%, (0.03%), (0.05%), (0.03%), and (0.01%).
4 Excludes the value of portfolio securities received or delivered as a result of in-kind purchases or redemptions of the fund’s capital shares.
See accompanying Notes, which are an integral part of the Financial Statements.
21
Windsor Fund
Financial Highlights
| | | | | |
| Admiral Shares | | | | | |
| |
| For a Share Outstanding | | | Year Ended October 31, |
| Throughout Each Period | 2011 | 2010 | 2009 | 2008 | 2007 |
| Net Asset Value, Beginning of Period | $42.37 | $37.01 | $32.08 | $65.90 | $65.04 |
| Investment Operations | | | | | |
| Net Investment Income | .664 | .6851 | .701 | .999 | 1.085 |
| Net Realized and Unrealized Gain (Loss) | | | | | |
| on Investments | 1.171 | 5.348 | 5.020 | (26.974) | 6.019 |
| Total from Investment Operations | 1.835 | 6.033 | 5.721 | (25.975) | 7.104 |
| Distributions | | | | | |
| Dividends from Net Investment Income | (.615) | (.673) | (.791) | (1.047) | (1.085) |
| Distributions from Realized Capital Gains | — | — | — | (6.798) | (5.159) |
| Total Distributions | (.615) | (.673) | (.791) | (7.845) | (6.244) |
| Net Asset Value, End of Period | $43.59 | $42.37 | $37.01 | $32.08 | $65.90 |
| |
| Total Return | 4.26% | 16.44% | 18.38% | -43.85% | 11.38% |
| |
| Ratios/Supplemental Data | | | | | |
| Net Assets, End of Period (Millions) | $4,994 | $4,680 | $4,203 | $4,723 | $9,770 |
| Ratio of Total Expenses to | | | | | |
| Average Net Assets2 | 0.29% | 0.22% | 0.20% | 0.17% | 0.19% |
| Ratio of Net Investment Income to | | | | | |
| Average Net Assets | 1.44% | 1.70%1 | 2.16% | 2.04% | 1.62% |
| Portfolio Turnover Rate | 49% | 50% | 61%3 | 55% | 40% |
1 Net investment income per share and the ratio of net investment income to average net assets include $.120 and 0.29%, respectively, resulting from a cash payment received in connection with the merger of Schering-Plough Corp. and Merck & Co. in November 2009.
2 Includes performance-based investment advisory fee increases (decreases) of 0.03%, (0.03%), (0.05%), (0.03%), and (0.01%).
3 Excludes the value of portfolio securities received or delivered as a result of in-kind purchases or redemptions of the fund’s capital shares.
See accompanying Notes, which are an integral part of the Financial Statements.
22
Windsor Fund
Notes to Financial Statements
Vanguard Windsor Fund is registered under the Investment Company Act of 1940 as an open-end investment company, or mutual fund. The fund offers two classes of shares: Investor Shares and Admiral Shares. Investor Shares are available to any investor who meets the fund’s minimum purchase requirements. Admiral Shares are designed for investors who meet certain administrative, service, and account-size criteria.
A. The following significant accounting policies conform to generally accepted accounting principles for U.S. mutual funds. The fund consistently follows such policies in preparing its financial statements.
1. Security Valuation: Securities are valued as of the close of trading on the New York Stock Exchange (generally 4 p.m., Eastern time) on the valuation date. Equity securities are valued at the latest quoted sales prices or official closing prices taken from the primary market in which each security trades; such securities not traded on the valuation date are valued at the mean of the latest quoted bid and asked prices. Securities for which market quotations are not readily available, or whose values have been affected by events occurring before the fund’s pricing time but after the close of the securities’ primary markets, are valued at their fair values calculated according to procedures adopted by the board of trustees. These procedures include obtaining quotations from an independent pricing service, monitoring news to identify significant market- or security-specific events, and evaluating changes in the values of foreign market proxies (for example, ADRs, futures contracts, or exchange-traded funds), between the time the foreign markets close and the fund’s pricing time. When fair-value pricing is employed, the prices of securities used by a fund to calculate its net asset value may differ from quoted or published prices for the same securities. Investments in Vanguard Market Liquidity Fund are valued at that fund’s net asset value. Temporary cash investments acquired over 60 days to maturity are valued using the latest bid prices or using valuations based on a matrix system (which considers such factors as security prices, yields, maturities, and ratings), both as furnished by independent pricing services. Other temporary cash investments are valued at amortized cost, which approximates market value.
2. Foreign Currency: Securities and other assets and liabilities denominated in foreign currencies are translated into U.S. dollars using exchange rates obtained from an independent third party as of the fund’s pricing time on the valuation date. Realized gains (losses) and unrealized appreciation (depreciation) on investment securities include the effects of changes in exchange rates since the securities were purchased, combined with the effects of changes in security prices. Fluctuations in the value of other assets and liabilities resulting from changes in exchange rates are recorded as unrealized foreign currency gains (losses) until the assets or liabilities are settled in cash, at which time they are recorded as realized foreign currency gains (losses).
3. Futures and Forward Currency Contracts: The fund uses index futures contracts to a limited extent, with the objective of maintaining full exposure to the stock market while maintaining liquidity. The fund may purchase or sell futures contracts to achieve a desired level of investment, whether to accommodate portfolio turnover or cash flows from capital share transactions. The primary risks associated with the use of futures contracts are imperfect correlation between changes in market values of stocks held by the fund and the prices of futures contracts, and the possibility of an illiquid market.
The fund also enters into forward currency contracts to protect the value of securities and related receivables and payables against changes in foreign exchange rates. The primary risk associated with the fund’s use of these contracts is that a counterparty will fail to fulfill its obligation to pay gains due to the fund under the contracts. The fund had no open forward currency contracts at the end of the fiscal year.
23
Windsor Fund
Futures contracts are valued at their quoted daily settlement prices. Forward currency contracts are valued at their quoted daily prices obtained from an independent third party, adjusted for currency risk based on the expiration date of each contract. The aggregate principal amounts of the contracts are not recorded in the Statement of Net Assets. Fluctuations in the value of the contracts are recorded in the Statement of Net Assets as an asset (liability) and in the Statement of Operations as unrealized appreciation (depreciation) until the contracts are closed, when they are recorded as realized gains (losses) on futures or forward currency contracts.
4. Repurchase Agreements: The fund may enter into repurchase agreements. Securities pledged as collateral for repurchase agreements are held by a custodian bank until the agreements mature. Each agreement requires that the market value of the collateral be sufficient to cover payments of interest and principal. In the event of default or bankruptcy by the other party to the agreement, the fund may sell or retain the collateral, however such action may be subject to legal proceedings.
5. Federal Income Taxes: The fund intends to continue to qualify as a regulated investment company and distribute all of its taxable income. Management has analyzed the fund’s tax positions taken for all open federal income tax years (October 31, 2008–2011), and has concluded that no provision for federal income tax is required in the fund’s financial statements.
6. Distributions: Distributions to shareholders are recorded on the ex-dividend date.
7. Security Lending: The fund may lend its securities to qualified institutional borrowers to earn additional income. Security loans are required to be secured at all times by collateral at least equal to the market value of securities loaned. The fund invests cash collateral received in Vanguard Market Liquidity Fund, and records a liability for the return of the collateral, during the period the securities are on loan. Security lending income represents fees charged to borrowers plus income earned on investing cash collateral, less expenses associated with the loan.
8. Other: Dividend income is recorded on the ex-dividend date. Interest income includes income distributions received from Vanguard Market Liquidity Fund and is accrued daily. Security transactions are accounted for on the date securities are bought or sold. Costs used to determine realized gains (losses) on the sale of investment securities are those of the specific securities sold.
Each class of shares has equal rights as to assets and earnings, except that each class separately bears certain class-specific expenses related to maintenance of shareholder accounts (included in Management and Administrative expenses) and shareholder reporting. Marketing and distribution expenses are allocated to each class of shares based on a method approved by the board of trustees. Income, other non-class-specific expenses, and gains and losses on investments are allocated to each class of shares based on its relative net assets.
B. AllianceBernstein L.P. and Wellington Management Company, LLP, each provide investment advisory services to a portion of the fund for a fee calculated at an annual percentage rate of average net assets managed by the advisor. The basic fees of each advisor are subject to quarterly adjustments based on performance for the preceding three years relative to a designated market index: for AllianceBernstein L.P., the Russell 1000 Value Index; and for Wellington Management Company, LLP, the S&P 500 Index.
24
Windsor Fund
The Vanguard Group manages the cash reserves of the fund on an at-cost basis.
For the year ended October 31, 2011, the aggregate investment advisory fee represented an effective annual basic rate of 0.13% of the fund’s average net assets, before an increase of $3,901,000 (0.03%) based on performance.
C. The Vanguard Group furnishes at cost corporate management, administrative, marketing, and distribution services. The costs of such services are allocated to the fund under methods approved by the board of trustees. The fund has committed to provide up to 0.40% of its net assets in capital contributions to Vanguard. At October 31, 2011, the fund had contributed capital of $1,871,000 to Vanguard (included in Other Assets), representing 0.02% of the fund’s net assets and 0.75% of Vanguard’s capitalization. The fund’s trustees and officers are also directors and officers of Vanguard.
D. The fund has asked its investment advisors to direct certain security trades, subject to obtaining the best price and execution, to brokers who have agreed to rebate to the fund part of the commissions generated. Such rebates are used solely to reduce the fund’s management and administrative expenses. The fund’s custodian bank has also agreed to reduce its fees when the fund maintains cash on deposit in the non-interest-bearing custody account. For the year ended October 31, 2011, these arrangements reduced the fund’s management and administrative expenses by $908,000 and custodian fees by $1,000. The total expense reduction represented an effective annual rate of 0.01% of the fund’s average net assets.
E. Various inputs may be used to determine the value of the fund’s investments. These inputs are summarized in three broad levels for financial statement purposes. The inputs or methodologies used to value securities are not necessarily an indication of the risk associated with investing in those securities.
Level 1—Quoted prices in active markets for identical securities.
Level 2—Other significant observable inputs (including quoted prices for similar securities, interest rates, prepayment speeds, credit risk, etc.).
Level 3—Significant unobservable inputs (including the fund’s own assumptions used to determine the fair value of investments). These inputs may include the fund’s cost basis for recently acquired investments, market values of relevant reference assets, and adjustments based on liquidity or estimated disposal costs.
The following table summarizes the fund’s investments as of October 31, 2011, based on the inputs used to value them:
| | | |
| | Level 1 | Level 2 | Level 3 |
| Investments | ($000) | ($000) | ($000) |
| Common Stocks | 10,494,827 | 744,562 | 231,798 |
| Temporary Cash Investments | 25,271 | 197,498 | — |
| Futures Contracts—Liabilities1 | (3,011) | — | — |
| Total | 10,517,087 | 942,060 | 231,798 |
| 1 Represents variation margin on the last day of the reporting period. | | | |
25
Windsor Fund
The following table summarizes changes in investments valued based on Level 3 inputs during the year ended October 31, 2011. Transfers into or out of Level 3 are recognized based on values as of the date of transfer.
| |
| | Investments in |
| | Common Stocks |
| Amount Valued Based on Level 3 Inputs | ($000) |
| Balance as of October 31, 2010 | 206,299 |
| Transfers into Level 3 | 4,462 |
| Transfers out of Level 3 | (53,068) |
| Change in Unrealized Appreciation (Depreciation) | 74,105 |
| Balance as of October 31, 2011 | 231,798 |
F. Realized net gain (loss) on derivatives for the year ended October 31, 2011, was:
| | | |
| | | Foreign | |
| | Equity | Exchange | |
| | Contracts | Contracts | Total |
| Realized Net Gain (Loss) on Derivatives | ($000) | ($000) | ($000) |
| Futures Contracts | 26,190 | — | 26,190 |
| Forward Currency Contracts | — | (10,201) | (10,201) |
| Realized Net Gain (Loss) on Derivatives | 26,190 | (10,201) | 15,989 |
At October 31, 2011, the aggregate settlement value of open futures contracts and the related unrealized appreciation (depreciation) were:
| | | | |
| | | | | ($000) |
| | | | Aggregate | |
| | | Number of | Settlement | Unrealized |
| | | Long (Short) | Value | Appreciation |
| Futures Contracts | Expiration | Contracts | Long (Short) | (Depreciation) |
| E-mini S&P 500 Index | December 2011 | 1,721 | 107,502 | (1,893) |
| E-mini S&P MidCap 400 Index | December 2011 | 335 | 29,684 | 2,004 |
Unrealized appreciation (depreciation) on open futures contracts is required to be treated as realized gain (loss) for tax purposes.
G. Distributions are determined on a tax basis and may differ from net investment income and realized capital gains for financial reporting purposes. Differences may be permanent or temporary. Permanent differences are reclassified among capital accounts in the financial statements to reflect their tax character. Temporary differences arise when certain items of income, expense, gain, or loss are recognized in different periods for financial statement and tax purposes; these differences will reverse at some time in the future. Differences in classification may also result from the treatment of short-term gains as ordinary income for tax purposes.
During the year ended October 31, 2011, the fund realized net foreign currency losses of $173,000, which decreased distributable net income for tax purposes; accordingly, such losses have been reclassified from accumulated net realized losses to undistributed net investment income.
26
Windsor Fund
For tax purposes, at October 31, 2011, the fund had $61,156,000 of ordinary income available for distribution. The fund had available capital loss carryforwards totaling $3,354,840,000 to offset future net capital gains of $1,124,395,000 through October 31, 2016, and $2,230,445,000 through October 31, 2017.
At October 31, 2011, the cost of investment securities for tax purposes was $10,941,380,000. Net unrealized appreciation of investment securities for tax purposes was $752,576,000, consisting of unrealized gains of $1,485,742,000 on securities that had risen in value since their purchase and $733,166,000 in unrealized losses on securities that had fallen in value since their purchase.
H. During the year ended October 31, 2011, the fund purchased $6,249,074,000 of investment securities and sold $7,551,131,000 of investment securities, other than temporary cash investments.
I. Capital share transactions for each class of shares were:
| | | | |
| | | | Year Ended October 31, |
| | | 2011 | | 2010 |
| | Amount | Shares | Amount | Shares |
| | ($000) | (000) | ($000) | (000) |
| Investor Shares | | | | |
| Issued | 733,317 | 55,351 | 749,394 | 62,784 |
| Issued in Lieu of Cash Distributions | 95,561 | 6,994 | 123,675 | 10,531 |
| Redeemed | (2,338,959) | (177,965) | (1,557,822) | (130,102) |
| Net Increase (Decrease)—Investor Shares | (1,510,081) | (115,620) | (684,753) | (56,787) |
| Admiral Shares | | | | |
| Issued | 959,824 | 21,461 | 419,342 | 10,255 |
| Issued in Lieu of Cash Distributions | 66,478 | 1,442 | 67,848 | 1,713 |
| Redeemed | (834,603) | (18,797) | (600,358) | (15,059) |
| Net Increase (Decrease)—Admiral Shares | 191,699 | 4,106 | (113,168) | (3,091) |
J. Certain of the fund’s investments are in companies that are considered to be affiliated companies of the fund because the fund owns more than 5% of the outstanding voting securities of the company. Transactions during the period in securities of these companies were as follows:
| | | | | |
| | | | Current Period Transactions | |
| | Oct. 31, 2010 | | Proceeds from | | Oct. 31, 2011 |
| | Market | Purchases | Securities | Dividend | Market |
| | Value | at Cost | Sold | Income | Value |
| | ($000) | ($000) | ($000) | ($000) | ($000) |
| Arrow Electronics Inc. | 231,114 | 4,119 | 61,598 | — | 231,677 |
| MDC Holdings Inc. | 80,802 | 5,767 | 17,214 | 3,065 | 59,273 |
| | 311,916 | | | 3,065 | 290,950 |
K. In preparing the financial statements as of October 31, 2011, management considered the impact of subsequent events for potential recognition or disclosure in these financial statements.
27
Report of Independent Registered Public Accounting Firm
To the Trustees of Vanguard Windsor Funds and the Shareholders of Vanguard Windsor Fund:
In our opinion, the accompanying statement of net assets and the related statements of operations and of changes in net assets and the financial highlights present fairly, in all material respects, the financial position of Vanguard Windsor Fund (constituting a separate portfolio of Vanguard Windsor Funds, hereafter referred to as the “Fund”) at October 31, 2011, the results of its operations for the year then ended, the changes in its net assets for each of the two years in the period then ended and the financial highlights for each of the five years in the period then ended, in conformity with accounting principles generally accepted in the United States of America. These financial statements and financial highlights (hereafter referred to as “financial statements”) are the responsibility of the Fund’s management; our responsibility is to express an opinion on these financial statements based on our audits. We conducted our audits of these financial statements in accordance with the standards of the Public Company Accounting Oversight Board (United States). Those standards require that we plan and perform the audit to obtain reasonable assurance about whether the financial statements are free of material misstatement. An audit includes examining, on a test basis, evidence supporting the amounts and disclosures in the financial statements, assessing the accounting principles used and significant estimates made by management, and evaluating the overall financial statement presentation. We believe that our audits, which included confirmation of securities at October 31, 2011 by correspondence with the custodians and brokers and by agreement to the underlying ownership records of Vanguard Market Liquidity Fund, provide a reasonable basis for our opinion.
PricewaterhouseCoopers LLP
Philadelphia, Pennsylvania
December 9, 2011
|
| Special 2011 tax information (unaudited) for Vanguard Windsor Fund |
This information for the fiscal year ended October 31, 2011, is included pursuant to provisions of the Internal Revenue Code.
The fund distributed $171,464,000 of qualified dividend income to shareholders during the fiscal year.
For corporate shareholders, 93.1% of investment income (dividend income plus short-term gains, if any) qualifies for the dividends-received deduction.
28
Your Fund’s After-Tax Returns
This table presents returns for your fund both before and after taxes. The after-tax returns are shown in two ways: (1) assuming that an investor owned the fund during the entire period and paid taxes on the fund’s distributions, and (2) assuming that an investor paid taxes on the fund’s distributions and sold all shares at the end of each period.
Calculations are based on the highest individual federal income tax and capital gains tax rates in effect at the times of the distributions and the hypothetical sales. State and local taxes were not considered. After-tax returns reflect any qualified dividend income, using actual prior-year figures and estimates for 2011. (In the example, returns after the sale of fund shares may be higher than those assuming no sale. This occurs when the sale would have produced a capital loss. The calculation assumes that the investor received a tax deduction for the loss.)
The table shows returns for Investor Shares only; returns for other share classes will differ. Please note that your actual after-tax returns will depend on your tax situation and may differ from those shown. Also note that if you own the fund in a tax-deferred account, such as an individual retirement account or a 401(k) plan, this information does not apply to you. Such accounts are not subject to current taxes.
Finally, keep in mind that a fund’s performance—whether before or after taxes—does not guarantee future results.
| | | |
| Average Annual Total Returns: Windsor Fund Investor Shares | | | |
| Periods Ended October 31, 2011 | | | |
| | One | Five | Ten |
| | Year | Years | Years |
| Returns Before Taxes | 4.15% | -2.22% | 3.74% |
| Returns After Taxes on Distributions | 3.96 | -3.07 | 2.94 |
| Returns After Taxes on Distributions and Sale of Fund Shares | 2.98 | -1.85 | 3.16 |
29
About Your Fund’s Expenses
As a shareholder of the fund, you incur ongoing costs, which include costs for portfolio management, administrative services, and shareholder reports (like this one), among others. Operating expenses, which are deducted from a fund’s gross income, directly reduce the investment return of the fund.
A fund’s expenses are expressed as a percentage of its average net assets. This figure is known as the expense ratio. The following examples are intended to help you understand the ongoing costs (in dollars) of investing in your fund and to compare these costs with those of other mutual funds. The examples are based on an investment of $1,000 made at the beginning of the period shown and held for the entire period.
The accompanying table illustrates your fund’s costs in two ways:
• Based on actual fund return. This section helps you to estimate the actual expenses that you paid over the period. The ”Ending Account Value“ shown is derived from the fund‘s actual return, and the third column shows the dollar amount that would have been paid by an investor who started with $1,000 in the fund. You may use the information here, together with the amount you invested, to estimate the expenses that you paid over the period.
To do so, simply divide your account value by $1,000 (for example, an $8,600 account value divided by $1,000 = 8.6), then multiply the result by the number given for your fund under the heading ”Expenses Paid During Period.“
• Based on hypothetical 5% yearly return. This section is intended to help you compare your fund‘s costs with those of other mutual funds. It assumes that the fund had a yearly return of 5% before expenses, but that the expense ratio is unchanged. In this case—because the return used is not the fund’s actual return—the results do not apply to your investment. The example is useful in making comparisons because the Securities and Exchange Commission requires all mutual funds to calculate expenses based on a 5% return. You can assess your fund’s costs by comparing this hypothetical example with the hypothetical examples that appear in shareholder reports of other funds.
Note that the expenses shown in the table are meant to highlight and help you compare ongoing costs only and do not reflect transaction costs incurred by the fund for buying and selling securities. Further, the expenses do not include any purchase, redemption, or account service fees described in the fund prospectus. If such fees were applied to your account, your costs would be higher. Your fund does not carry a “sales load.”
The calculations assume no shares were bought or sold during the period. Your actual costs may have been higher or lower, depending on the amount of your investment and the timing of any purchases or redemptions.
You can find more information about the fund’s expenses, including annual expense ratios, in the Financial Statements section of this report. For additional information on operating expenses and other shareholder costs, please refer to your fund’s current prospectus.
30
| | | |
| Six Months Ended October 31, 2011 | | | |
| | Beginning | Ending | Expenses |
| | Account Value | Account Value | Paid During |
| Windsor Fund | 4/30/2011 | 10/31/2011 | Period |
| Based on Actual Fund Return | | | |
| Investor Shares | $1,000.00 | $885.96 | $1.85 |
| Admiral Shares | 1,000.00 | 886.19 | 1.38 |
| Based on Hypothetical 5% Yearly Return | | | |
| Investor Shares | $1,000.00 | $1,023.24 | $1.99 |
| Admiral Shares | 1,000.00 | 1,023.74 | 1.48 |
The calculations are based on expenses incurred in the most recent six-month period. The fund’s annualized six-month expense ratios for that period are 0.39% for Investor Shares and 0.29% for Admiral Shares. The dollar amounts shown as “Expenses Paid” are equal to the annualized expense ratio multiplied by the average account value over the period, multiplied by the number of days in the most recent six-month period, then divided by the number of days in the most recent 12-month period.
31
Glossary
30-Day SEC Yield. A fund’s 30-day SEC yield is derived using a formula specified by the U.S. Securities and Exchange Commission. Under the formula, data related to the fund’s security holdings in the previous 30 days are used to calculate the fund’s hypothetical net income for that period, which is then annualized and divided by the fund’s estimated average net assets over the calculation period. For the purposes of this calculation, a security’s income is based on its current market yield to maturity (for bonds; excluding inflation for inflation-protected securities), its actual income (for asset-backed securities), or its projected dividend yield (for stocks). Because the SEC yield represents hypothetical annualized income, it will differ—at times significantly—from the fund’s actual experience. As a result, the fund’s income distributions may be higher or lower than implied by the SEC yield.
Beta. A measure of the magnitude of a fund’s past share-price fluctuations in relation to the ups and downs of a given market index. The index is assigned a beta of 1.00. Compared with a given index, a fund with a beta of 1.20 typically would have seen its share price rise or fall by 12% when the index rose or fell by 10%. For this report, beta is based on returns over the past 36 months for both the fund and the index. Note that a fund’s beta should be reviewed in conjunction with its R-squared (see definition). The lower the R-squared, the less correlation there is between the fund and the index, and the less reliable beta is as an indicator of volatility.
Dividend Yield. Dividend income earned by stocks, expressed as a percentage of the aggregate market value (or of net asset value, for a fund). The yield is determined by dividing the amount of the annual dividends by the aggregate value (or net asset value) at the end of the period. For a fund, the dividend yield is based solely on stock holdings and does not include any income produced by other investments.
Earnings Growth Rate. The average annual rate of growth in earnings over the past five years for the stocks now in a fund.
Equity Exposure. A measure that reflects a fund’s investments in stocks and stock futures. Any holdings in short-term reserves are excluded.
Expense Ratio. The percentage of a fund’s average net assets used to pay its annual administrative and advisory expenses. These expenses directly reduce returns to investors.
Foreign Holdings. The percentage of a fund represented by securities or depositary receipts of companies based outside the United States.
Inception Date. The date on which the assets of a fund (or one of its share classes) are first invested in accordance with the fund’s investment objective. For funds with a subscription period, the inception date is the day after that period ends. Investment performance is measured from the inception date.
Median Market Cap. An indicator of the size of companies in which a fund invests; the midpoint of market capitalization (market price x shares outstanding) of a fund’s stocks, weighted by the proportion of the fund’s assets invested in each stock. Stocks representing half of the fund’s assets have market capitalizations above the median, and the rest are below it.
Price/Book Ratio. The share price of a stock divided by its net worth, or book value, per share. For a fund, the weighted average price/book ratio of the stocks it holds.
32
Price/Earnings Ratio. The ratio of a stock’s current price to its per-share earnings over the past year. For a fund, the weighted average P/E of the stocks it holds. P/E is an indicator of market expectations about corporate prospects; the higher the P/E, the greater the expectations for a company’s future growth.
R-Squared. A measure of how much of a fund’s past returns can be explained by the returns from the market in general, as measured by a given index. If a fund’s total returns were precisely synchronized with an index’s returns, its R-squared would be 1.00. If the fund’s returns bore no relationship to the index’s returns, its R-squared would be 0. For this report, R-squared is based on returns over the past 36 months for both the fund and the index.
Return on Equity. The annual average rate of return generated by a company during the past five years for each dollar of shareholder’s equity (net income divided by shareholder’s equity). For a fund, the weighted average return on equity for the companies whose stocks it holds.
Short-Term Reserves. The percentage of a fund invested in highly liquid, short-term securities that can be readily converted to cash.
Turnover Rate. An indication of the fund’s trading activity. Funds with high turnover rates incur higher transaction costs and may be more likely to distribute capital gains (which may be taxable to investors). The turnover rate excludes in-kind transactions, which have minimal impact on costs.
33
This page intentionally left blank.
This page intentionally left blank.
The People Who Govern Your Fund
The trustees of your mutual fund are there to see that the fund is operated and managed in your best interests since, as a shareholder, you are a part owner of the fund. Your fund’s trustees also serve on the board of directors of The Vanguard Group, Inc., which is owned by the Vanguard funds and provides services to them on an at-cost basis.
A majority of Vanguard’s board members are independent, meaning that they have no affiliation with Vanguard or the funds they oversee, apart from the sizable personal investments they have made as private individuals. The independent board members have distinguished backgrounds in business, academia, and public service. Each of the trustees and executive officers oversees 180 Vanguard funds.
The following table provides information for each trustee and executive officer of the fund. More information about the trustees is in the Statement of Additional Information, which can be obtained, without charge, by contacting Vanguard at 800-662-7447, or online at vanguard.com.
| |
| Interested Trustee1 | and President (2006–2008) of Rohm and Haas Co. |
| | (chemicals); Director of Tyco International, Ltd. |
| F. William McNabb III | (diversified manufacturing and services) and Hewlett- |
| Born 1957. Trustee Since July 2009. Chairman of the | Packard Co. (electronic computer manufacturing); |
| Board. Principal Occupation(s) During the Past Five | Senior Advisor at New Mountain Capital; Trustee |
| Years: Chairman of the Board of The Vanguard Group, | of The Conference Board; Member of the Board of |
| Inc., and of each of the investment companies served | Managers of Delphi Automotive LLP (automotive |
| by The Vanguard Group, since January 2010; Director | components). |
| of The Vanguard Group since 2008; Chief Executive | |
| Officer and President of The Vanguard Group and of | Amy Gutmann |
| each of the investment companies served by The | Born 1949. Trustee Since June 2006. Principal |
| Vanguard Group since 2008; Director of Vanguard | Occupation(s) During the Past Five Years: President |
| Marketing Corporation; Managing Director of The | of the University of Pennsylvania; Christopher H. |
| Vanguard Group (1995–2008). | Browne Distinguished Professor of Political Science |
| | in the School of Arts and Sciences with secondary |
| | appointments at the Annenberg School for Commu- |
| Independent Trustees | nication and the Graduate School of Education |
| | of the University of Pennsylvania; Director of |
| Emerson U. Fullwood | Carnegie Corporation of New York, Schuylkill River |
| Born 1948. Trustee Since January 2008. Principal | Development Corporation, and Greater Philadelphia |
| Occupation(s) During the Past Five Years: Executive | Chamber of Commerce; Trustee of the National |
| Chief Staff and Marketing Officer for North America | Constitution Center; Chair of the Presidential |
| and Corporate Vice President (retired 2008) of Xerox | Commission for the Study of Bioethical Issues. |
| Corporation (document management products and | |
| services); Executive in Residence and 2010 | JoAnn Heffernan Heisen |
| Distinguished Minett Professor at the Rochester | Born 1950. Trustee Since July 1998. Principal |
| Institute of Technology; Director of SPX Corporation | Occupation(s) During the Past Five Years: Corporate |
| (multi-industry manufacturing), the United Way of | Vice President and Chief Global Diversity Officer |
| Rochester, Amerigroup Corporation (managed health | (retired 2008) and Member of the Executive |
| care), the University of Rochester Medical Center, | Committee (1997–2008) of Johnson & Johnson |
| Monroe Community College Foundation, and North | (pharmaceuticals/consumer products); Director of |
| Carolina A&T University. | Skytop Lodge Corporation (hotels), the University |
| | Medical Center at Princeton, the Robert Wood |
| Rajiv L. Gupta | Johnson Foundation, and the Center for Work Life |
| Born 1945. Trustee Since December 2001.2 | Policy; Member of the Advisory Board of the |
| Principal Occupation(s) During the Past Five Years: | Maxwell School of Citizenship and Public Affairs |
| Chairman and Chief Executive Officer (retired 2009) | at Syracuse University. |
| | |
| F. Joseph Loughrey | Thomas J. Higgins | |
| Born 1949. Trustee Since October 2009. Principal | Born 1957. Chief Financial Officer Since September |
| Occupation(s) During the Past Five Years: President | 2008. Principal Occupation(s) During the Past Five |
| and Chief Operating Officer (retired 2009) and Vice | Years: Principal of The Vanguard Group, Inc.; Chief |
| Chairman of the Board (2008–2009) of Cummins Inc. | Financial Officer of each of the investment companies |
| (industrial machinery); Director of SKF AB (industrial | served by The Vanguard Group since 2008; Treasurer |
| machinery), Hillenbrand, Inc. (specialized consumer | of each of the investment companies served by The |
| services), the Lumina Foundation for Education, and | Vanguard Group (1998–2008). |
| Oxfam America; Chairman of the Advisory Council | | |
| for the College of Arts and Letters and Member | Kathryn J. Hyatt | |
| of the Advisory Board to the Kellogg Institute for | Born 1955. Treasurer Since November 2008. Principal |
| International Studies at the University of Notre Dame. | Occupation(s) During the Past Five Years: Principal |
| | of The Vanguard Group, Inc.; Treasurer of each of |
| André F. Perold | the investment companies served by The Vanguard |
| Born 1952. Trustee Since December 2004. Principal | Group since 2008; Assistant Treasurer of each of the |
| Occupation(s) During the Past Five Years: George | investment companies served by The Vanguard Group |
| Gund Professor of Finance and Banking at the Harvard | (1988–2008). | |
| Business School (retired July 2011); Chief Investment | | |
| Officer and co-Managing Partner of HighVista | Heidi Stam | |
| Strategies LLC (private investment firm); Director of | Born 1956. Secretary Since July 2005. Principal |
| Rand Merchant Bank; Overseer of the Museum of | Occupation(s) During the Past Five Years: Managing |
| Fine Arts Boston. | Director of The Vanguard Group, Inc., since 2006; |
| | General Counsel of The Vanguard Group since 2005; |
| Alfred M. Rankin, Jr. | Secretary of The Vanguard Group and of each of the |
| Born 1941. Trustee Since January 1993. Principal | investment companies served by The Vanguard Group |
| Occupation(s) During the Past Five Years: Chairman, | since 2005; Director and Senior Vice President of |
| President, and Chief Executive Officer of NACCO | Vanguard Marketing Corporation since 2005; |
| Industries, Inc. (forklift trucks/housewares/lignite); | Principal of The Vanguard Group (1997–2006). |
| Director of Goodrich Corporation (industrial products/ | | |
| aircraft systems and services) and the National | | |
| Association of Manufacturers; Chairman of the | Vanguard Senior Management Team |
| Federal Reserve Bank of Cleveland; Vice Chairman | | |
| of University Hospitals of Cleveland; President of | R. Gregory Barton | Chris D. McIsaac |
| the Board of The Cleveland Museum of Art. | Mortimer J. Buckley | Michael S. Miller |
| | Kathleen C. Gubanich | James M. Norris |
| Peter F. Volanakis | Paul A. Heller | Glenn W. Reed |
| Born 1955. Trustee Since July 2009. Principal | Martha G. King | George U. Sauter |
| Occupation(s) During the Past Five Years: President | | |
| and Chief Operating Officer (retired 2010) of Corning | | |
| Incorporated (communications equipment); Director of | Chairman Emeritus and Senior Advisor |
| Corning Incorporated (2000–2010) and Dow Corning | | |
| (2001–2010); Overseer of the Amos Tuck School of | John J. Brennan | |
| Business Administration at Dartmouth College. | Chairman, 1996–2009 | |
| | Chief Executive Officer and President, 1996–2008 |
| |
| Executive Officers | | |
| | Founder | |
| Glenn Booraem | | |
| Born 1967. Controller Since July 2010. Principal | John C. Bogle | |
| Occupation(s) During the Past Five Years: Principal | Chairman and Chief Executive Officer, 1974–1996 |
| of The Vanguard Group, Inc.; Controller of each of | | |
| the investment companies served by The Vanguard | | |
| Group since 2010; Assistant Controller of each of | | |
| the investment companies served by The Vanguard | | |
| Group (2001–2010). | | |
1 Mr. McNabb is considered an “interested person,” as defined in the Investment Company Act of 1940, because he is an officer of the Vanguard funds.
2 December 2002 for Vanguard Equity Income Fund, Vanguard Growth Equity Fund, the Vanguard Municipal Bond Funds, and the Vanguard State Tax-Exempt Funds.
|  |
| P.O. Box 2600 |
| Valley Forge, PA 19482-2600 |
Connect with Vanguard® > vanguard.com
| |
| Fund Information > 800-662-7447 | |
| Direct Investor Account Services > 800-662-2739 | |
| Institutional Investor Services > 800-523-1036 | |
| Text Telephone for People | |
| With Hearing Impairment > 800-749-7273 | |
| |
| This material may be used in conjunction | |
| with the offering of shares of any Vanguard | |
| fund only if preceded or accompanied by | |
| the fund’s current prospectus. | |
| |
| All comparative mutual fund data are from Lipper Inc. or | |
| Morningstar, Inc., unless otherwise noted. | |
| |
| You can obtain a free copy of Vanguard’s proxy voting | |
| guidelines by visiting vanguard.com/proxyreporting or by | |
| calling Vanguard at 800-662-2739. The guidelines are | |
| also available from the SEC’s website, sec.gov. In | |
| addition, you may obtain a free report on how your fund | |
| voted the proxies for securities it owned during the 12 | |
| months ended June 30. To get the report, visit either | |
| vanguard.com/proxyreporting or sec.gov. | |
| |
| You can review and copy information about your fund at | |
| the SEC’s Public Reference Room in Washington, D.C. To | |
| find out more about this public service, call the SEC at | |
| 202-551-8090. Information about your fund is also | |
| available on the SEC’s website, and you can receive | |
| copies of this information, for a fee, by sending a | |
| request in either of two ways: via e-mail addressed to | |
| publicinfo@sec.gov or via regular mail addressed to the | |
| Public Reference Section, Securities and Exchange | |
| Commission, Washington, DC 20549-1520. | |
| | © 2011 The Vanguard Group, Inc. |
| | All rights reserved. |
| | Vanguard Marketing Corporation, Distributor. |
| |
| | Q220 122011 |
 |
| Annual Report | October 31, 2011 |
|
| Vanguard WindsorTM II Fund |
> For the fiscal year ended October 31, 2011, Vanguard Windsor II Fund returned 7.48% for Investor Shares and 7.56% for Admiral Shares.
> The fund outpaced the return of its benchmark index by more than 1 percentage point and the average return of its large-cap value fund peers by more than 3 percentage points.
> Returns from the financial sector accounted for the lion’s share of the fund’s outperformance. Consumer staples and consumer discretionary holdings also made significant contributions, while information technology detracted.
| |
| Contents | |
| Your Fund’s Total Returns. | 1 |
| Chairman’s Letter. | 2 |
| Advisors’ Report. | 7 |
| Fund Profile. | 12 |
| Performance Summary. | 13 |
| Financial Statements. | 15 |
| Your Fund’s After-Tax Returns. | 30 |
| About Your Fund’s Expenses. | 31 |
| Glossary. | 33 |
Please note: The opinions expressed in this report are just that—informed opinions. They should not be considered promises or advice. Also, please keep in mind that the information and opinions cover the period through the date on the front of this report. Of course, the risks of investing in your fund are spelled out in the prospectus.
See the Glossary for definitions of investment terms used in this report.
About the cover: Vanguard was named for the HMS Vanguard, flagship of British Admiral Horatio Nelson. A ship—whose performance and safety depend on the work of all hands—has served as a fitting metaphor for the Vanguard crew as we strive to help clients reach their financial goals.
Your Fund’s Total Returns
| |
| Fiscal Year Ended October 31, 2011 | |
| |
| | Total |
| | Returns |
| Vanguard Windsor II Fund | |
| Investor Shares | 7.48% |
| Admiral™ Shares | 7.56 |
| Russell 1000 Value Index | 6.16 |
| Large-Cap Value Funds Average | 4.35 |
| Large-Cap Value Funds Average: Derived from data provided by Lipper Inc. | |
| Admiral Shares carry lower expenses and are available to investors who meet certain account-balance requirements. | |
| | | | |
| Your Fund’s Performance at a Glance | | | | |
| October 31, 2010 , Through October 31, 2011 | | | | |
| | | | Distributions Per Share |
| | Starting | Ending | Income | Capital |
| | Share Price | Share Price | Dividends | Gains |
| Vanguard Windsor II Fund | | | | |
| Investor Shares | $24.37 | $25.68 | $0.523 | $0.000 |
| Admiral Shares | 43.26 | 45.59 | 0.959 | 0.000 |
1

Chairman’s Letter
Dear Shareholder,
Vanguard Windsor II Fund’s Investor Shares returned 7.48% for the fiscal year ended October 31, 2011, and Admiral Shares returned 7.56%. The fund outpaced its benchmark, the Russell 1000 Value Index, which returned 6.16%, and handily beat its large-cap value fund peer group, which had an average return of 4.35%.
Energy stocks generated solid returns during the period. Compared with the benchmark, financials were a notable bright spot for the fund, which held some of the sector’s better performers while avoiding its trouble spots. Consumer staples and discretionary stocks were also sources of strength, but information technology stocks detracted.
Note: If you own shares of Windsor II in a taxable account, you may wish to review information about the fund’s after-tax returns later in this report.
A positive finish to an anxious 12 months
U.S. stock indexes ended the 12 months with solid returns, though the gains were shadowed by anxiety in a volatile period. This turbulence was so pronounced, in fact, that a one-month change in the start date would have yielded a very different perspective on performance. For the 12 months through October 31, the broad U.S. stock market returned 7.67%. For the 12 months ended September 30, however, the return was a mere 0.31%.
2
Volatility has been a theme in international markets, too. International stock markets returned a combined –4.66% as stock prices retreated in Europe. Prices also fell in the Pacific region’s developed economies and emerging markets, where growth has moderated.
Unsteady yields reflected fast-changing sentiment
Taxable bonds produced strong returns and municipal bonds solid but unspectacular results, though as in the stock market, investor sentiment was volatile. The yield of the 10-year U.S. Treasury note, a benchmark for longer-term interest rates, began the 12 months at 2.61%, drifted higher as the economic expansion seemed to gather steam, then fluttered lower to close the period at 2.17%. The decline in
Treasury yields (and rise in prices) was driven by Europe’s sovereign-debt dramas, underwhelming economic reports, and a flight to safety that was prompted, paradoxically, by a rating agency’s decision to downgrade U.S. government debt. Vanguard’s confidence in the full faith and credit of the U.S. Treasury remains unshaken.
Taxable investment-grade bonds returned 5% for the full 12 months. It’s important to note, of course, that as yields decline, the opportunity for similarly strong returns diminishes. The broad municipal market returned 3.78%. The returns on money market instruments hovered near 0%, consistent with the Federal Reserve Board’s target for short-term interest rates.
| | | |
| Market Barometer | | | |
| |
| | | Average Annual Total Returns |
| | | Periods Ended October 31, 2011 |
| | One | Three | Five |
| | Year | Years | Years |
| Stocks | | | |
| Russell 1000 Index (Large-caps) | 8.01% | 12.22% | 0.54% |
| Russell 2000 Index (Small-caps) | 6.71 | 12.87 | 0.68 |
| Dow Jones U.S. Total Stock Market Index | 7.67 | 12.58 | 0.90 |
| MSCI All Country World Index ex USA (International) | -4.66 | 12.92 | -0.37 |
| |
| Bonds | | | |
| Barclays Capital U.S. Aggregate Bond Index (Broad | | | |
| taxable market) | 5.00% | 8.87% | 6.41% |
| Barclays Capital Municipal Bond Index (Broad | | | |
| tax-exempt market) | 3.78 | 8.31 | 4.80 |
| Citigroup Three-Month U.S. Treasury Bill Index | 0.10 | 0.15 | 1.53 |
| |
| CPI | | | |
| Consumer Price Index | 3.53% | 1.49% | 2.33% |
3
Advisors’ stock selection drives outperformance
Vanguard Windsor II Fund’s six advisors each have their own distinct investment style, which enhances the fund’s diversification; however, they all focus on bottom-up stock selection, seeking companies with below-average price/earnings ratios and above-average yields.
The fund’s holdings in consumer-oriented sectors held up nicely during the period, given the weakness in the economy. The fund had a large stake in tobacco stocks, which did especially well, and holdings in other areas, such as household products, beverages, and food and staples retailing, also boosted returns. Compared with the benchmark, selections among media and consumer services companies helped significantly.
Energy stocks were also solid performers, especially in the first half of the fiscal year, as a result of higher oil prices stemming from tensions in the Middle East and North Africa as well as increased demand from emerging markets. These pressures eased in the second half of the year, and the price of oil pulled back from its April peak, but energy still generated the highest sector returns for the fund and the benchmark over the full 12 months.
Financial stocks produced a negative return for the fund, but Windsor II’s holdings held up better than their counterparts in the
| | | |
| Expense Ratios | | | |
| Your Fund Compared With Its Peer Group | | | |
| | Investor | Admiral | Peer Group |
| | Shares | Shares | Average |
| Windsor II Fund | 0.35% | 0.27% | 1.27% |
The fund expense ratios shown are from the prospectus dated February 24, 2011, and represent estimated costs for the current fiscal year. For the fiscal year ended October 31, 2011, the fund’s expense ratios were 0.35% for Investor Shares and 0.27% for Admiral Shares. The peer-group expense ratio is derived from data provided by Lipper Inc. and captures information through year-end 2010.
Peer group: Large-Cap Value Funds.
4
index and were the main reason the fund was able to outdistance its large-cap value benchmark. Financial stocks, which account for more than one-quarter of the index, performed poorly overall, as financial firms struggled with bad loans and a tough lending environment. The fund, though, had limited or no exposure to a number of the worst-performing stocks among investment banks, brokerages, and financial services giants during the period. It also got a boost from its investments in credit card companies unscathed by some of the problems plaguing the broader banking industry.
The fund’s heavy exposure to information technology hurt its performance overall and detracted most relative to the benchmark. Over the past few years, once high-flying IT stocks have begun to attract value investors, including the advisors of Windsor II. Many of these companies have strong balance sheets and high barriers to entry in their businesses. During the past 12 months, however, technology stocks continued to struggle as the business climate grew chillier. A few IT services companies managed to perform well, but a number of the fund’s holdings in computer hardware and communications equipment companies dropped sharply.
Still a step ahead of its benchmark after a very trying decade
Vanguard Windsor II’s solid performance over the past decade can be attributed to both its advisors and its strategy. The fund uses a multimanager approach, which includes both fundamental and quantitative
| |
| Total Returns | |
| Ten Years Ended October 31, 2011 | |
| | Average |
| | Annual Return |
| Windsor II Fund Investor Shares | 4.69% |
| Russell 1000 Value Index | 4.57 |
| Large-Cap Value Funds Average | 2.95 |
| Large-Cap Value Funds Average: Derived from data provided by Lipper Inc. | |
The figures shown represent past performance, which is not a guarantee of future results. (Current performance may be lower or higher than the performance data cited. For performance data current to the most recent month-end, visit our website at vanguard.com/performance.) Note, too, that both investment returns and principal value can fluctuate widely, so an investor’s shares, when sold, could be worth more or less than their original cost.
5
techniques and helps bring diversification to the portfolio. Yet all of its advisors are focused on the same goal of identifying and investing in value stocks—stocks with below-average price/earnings ratios and above-average yields.
This strategy has proven itself over time. The last ten years were marked by a succession of challenges, some of which continued to plague the financial markets during the past 12 months. But at the end of an unusually troubled decade, the fund’s Investor Shares nevertheless managed to post an average annualized return of 4.69%, ahead of the fund’s benchmark (4.57%) and well out in front of its large-cap value fund peers (2.95%).
Navigate rough waters with a steady strategy
The recovery, correction, and rally in the stock market over the past 12 months illustrate just how unpredictable the markets can be. Fortunately, successful long-term investing does not involve predicting market movements. Studies have shown that the long-term performance of a portfolio is largely determined by how you allocate your assets, not how well you time the markets.
We believe investors should establish a plan based on their financial goals and risk tolerance that strikes a balance among stocks, bonds, and money market instruments—and should stick with that plan by rebalancing as needed through the markets’ inevitable ups and downs.
With its low costs and broad diversification among large- and mid-cap value stocks, Vanguard Windsor II Fund can play an important role in such an investment plan.
Thank you for entrusting your assets to Vanguard.
Sincerely,

F. William McNabb III
Chairman and Chief Executive Officer
November 9, 2011
6
Advisors’ Report
For the 12 months ended October 31, 2011, Vanguard Windsor II Fund returned more than 7%. Your fund is managed by six independent advisors, a strategy that enhances the fund’s diversification by providing exposure to distinct, yet complementary, investment approaches. It’s not uncommon for different advisors to have different views about individual securities or the broader investment environment.
The table below lists the advisors, the amount and percentage of fund assets each manages, and brief descriptions of their investment strategies. The advisors have provided the following assessment of the investment environment during the past 12 months and the notable successes and shortfalls in their portfolios. These comments were prepared on November 16, 2011.
| | | |
| Vanguard Windsor II Fund Investment Advisors | |
| |
| | Fund Assets Managed | |
| Investment Advisor | % | $ Million | Investment Strategy |
| Barrow, Hanley, Mewhinney & | 61 | 20,550 | Conducts fundamental research on individual stocks |
| Strauss, LLC | | | exhibiting traditional value characteristics: |
| | | | price/earnings and price/book ratios below the broad |
| | | | market average and dividend yields above the broad |
| | | | market average. |
| Lazard Asset Management LLC | 18 | 6,032 | Employs a relative-value approach that seeks a |
| | | | combination of attractive valuation and high financial |
| | | | productivity. The process is research-driven, relying |
| | | | upon bottom-up stock analysis performed by the firm’s |
| | | | global sector analysts. |
| Sanders Capital, LLC | 9 | 3,064 | Employs a traditional, bottom-up, fundamental research |
| | | | approach to identifying securities that are undervalued |
| | | | relative to their expected total return. |
| Hotchkis and Wiley Capital | 6 | 2,019 | Uses a disciplined investment approach, focusing on |
| Management, LLC | | | such investment parameters as a company’s tangible |
| | | | assets, sustainable cash flow, and potential for |
| | | | improving business performance. |
| Armstrong Shaw Associates Inc. | 4 | 1,421 | Uses a bottom-up approach, employing fundamental |
| | | | and qualitative criteria to identify individual companies |
| | | | for potential investment. |
| Vanguard Quantitative Equity | 0 | 134 | Employs a quantitative fundamental management |
| Group | | | approach, using models that assess valuation, market |
| | | | sentiment, earnings quality and growth, and |
| | | | management decisions of companies versus their |
| | | | peers. |
| Cash Investments | 2 | 560 | These short-term reserves are invested by Vanguard in |
| | | | equity index products to simulate investment in stocks. |
| | | | Each advisor may also maintain a modest cash |
| | | | position. |
7
Barrow, Hanley, Mewhinney & Strauss, LLC
Portfolio Manager:
James P. Barrow, Executive Director
Investment environment: During one of the most volatile periods in history, the U.S. equity market and our portfolio posted positive fiscal-year returns, in sharp contrast to the equity markets in most countries. Conventional wisdom (many times wrong) recommended investing in non-U.S. equities, particularly emerging markets and the BRIC countries. That didn’t work during this period. Going forward, we expect our portfolio, with its below-market price/earnings ratio and high relative dividend yield, to generate good performance, the biggest worry being the questions surrounding sovereign debt. While the dollar was weak at the start of the period, it is likely to become the currency of choice.
Successes: Financial stocks were under pressure, but our holdings produced slightly positive relative results. The stock market is a discounting mechanism.
Shortfalls: Technology was the greatest drag on portfolio performance, primarily because of Hewlett-Packard, which fired its CEO over ethics, then also fired his replacement six months later. That sort of instability is hard to forecast.
Lazard Asset Management LLC
Portfolio Managers:
Andrew Lacey, Deputy Chairman
Christopher Blake, Managing Director
Investment environment: The S&P 500 Index increased 8.1% over the last 12 months. The market generally rose from November through April, as the U.S. Federal Reserve instituted a second round of quantitative easing in an effort to improve growth. Conditions were also buoyed by healthy corporate earnings and improved economic growth. However, high levels of macroeconomic uncertainty began to take their toll as concerns over a slowdown in growth and the European debt crisis weighed on investors. Also contributing to the market’s unrest were Standard & Poor’s downgrade of the United States’ long-term credit rating and the downward revision of the nation’s GDP. However, in October the market rallied because of improved U.S. economic reports, continued robust corporate earnings, and optimism that the European Union summit near the end of the month would reduce the risk of a global pullback.
Successes: Stock selection in the consumer discretionary and energy sectors contributed to performance over the last 12 months. In consumer discretionary, shares of Comcast rose as the company continued to execute well. In energy, Conoco Phillips benefited from continued restructuring efforts, which included asset sales, debt reduction, and dividend increases.
8
Shortfalls: Stock selection in the consumer staples sector detracted from performance. Shares of Molson Coors Brewing fell as beer volumes were weaker than expected. The company also faced continued uncertainty about its capital deployment. Holdings in the information technology sector also hurt returns. Shares of Lender Processing Services, a technology services provider to the mortgage industry, declined amid weak mortgage volumes and the mortgage industry’s legal and regulatory overhang. We sold the stock from the portfolio.
Sanders Capital, LLC
Portfolio Managers:
Lewis A. Sanders, CFA
Chief Executive Officer and Co-Chief Investment Officer
John P. Mahedy, CPA
Director of Research and Co-Chief Investment Officer
The European sovereign-debt crisis has emerged as the primary threat to global economic growth. We remain cautiously optimistic that recent actions to contain the crisis will prove effective.
The energy, information technology, and health care sectors compose most of our portfolio, with each accounting for about 20% of total assets. The companies in these sectors are well-suited to the times; their strong balance sheets and above-average profitability gives them some resilience in a turbulent economy. Despite these characteristics, they are priced at a 30% discount to the equity market overall.
Unsurprisingly, the financial sector suffered most during the recent storm but now offers the greatest potential for recovery. Since these investments entail more than average risk, we have confined our total exposure to about 15% of total assets.
Hotchkis and Wiley Capital Management, LLC
Portfolio Managers:
George H. Davis, Jr., Chief Executive Officer
Sheldon J. Lieberman, Principal
Investment environment: The health of corporate America has vastly improved since the financial crisis, but the sovereign-debt situation in Europe has given investors pause. The implementation of Europe’s agreement remains uncertain and is likely to encounter obstacles. Other geopolitical and economic concerns also remain. We believe, however, that the dividends and earnings available to owners of equities are generous for the prices asked and sufficiently compensate investors for the risks at hand.
Successes: Positive stock selection in materials contributed most to our portfolio’s performance.
9
Shortfalls: We paid a penalty because of our overweight position in low-valuation stocks. The lowest-valued quintile of the index, as measured by price-to-book ratio, lagged the highest-valued quintile by nearly 18 percentage points. This dynamic hindered our strategy, which emphasizes attractively valued stocks. Stock selection in financials and technology also detracted.
Armstrong Shaw Associates Inc.
Portfolio Manager:
Jeffrey M. Shaw, Chairman and Chief Investment Officer
Investment environment: The market remains volatile and driven by macro concerns. Political gridlock in Washington, the ongoing European debt crisis, and the potential for a hard landing among emerging world economies all contributed to the global market sell-off this summer, before a sharp rebound in October. We believe that the recovery will survive these challenges and that the current market offers many attractive investment opportunities. We continue to favor companies in corporate America that have global exposure and strong balance sheets and generate high levels of free cash flow.
Successes: The portfolio posted solid returns, driven by a large overweight in energy coupled with strong stock selection. El Paso, our top performer, rose on the announcement of Kinder Morgan’s offer to acquire the company.
Halliburton and Chevron were also standouts. In consumer discretionary, stock selection helped performance, led by Comcast and Wyndham. MasterCard was also a strong performer.
Shortfalls: The largest drag on our relative performance was a lack of exposure to utilities. Despite strong relative returns, our overweight in technology also detracted. Hewlett-Packard fell on negative earnings revisions and concerns about management’s strategy and execution, and we exited the position.
Vanguard Quantitative Equity Group
Portfolio Manager:
James D. Troyer, CFA, Principal
Investment environment: Amid the large- and small-cap value stocks our benchmark focuses on, energy and utilities companies were the best performers, while the results of financial and materials companies were weaker.
Although we experienced two distinct market trends in the first and second halves of the year, our diversified multi-factor stock selection model performed well throughout, with four of our five key model components contributing over the entire period. The portfolio benefited most from the valuation component of our model; factors focusing on quality and management decision signals also produced strong results.
10
Successes: Our stock selection outperformed in seven of ten sectors and was strongest in financials, where underweight positions in Bank of America and Morgan Stanley contributed most to our relative returns.
Shortfalls: Our results were disappointing in industrials, where Hertz Global did not perform as expected, and in energy, where we were underweighted in a solid performer, Williams Co.
11
Windsor II Fund
Fund Profile
As of October 31, 2011
| | |
| Share-Class Characteristics | |
| | Investor | Admiral |
| | Shares | Shares |
| Ticker Symbol | VWNFX | VWNAX |
| Expense Ratio1 | 0.35% | 0.27% |
| 30-Day SEC Yield | 2.29% | 2.37% |
| | | |
| Portfolio Characteristics | | |
| | | Russell | DJ |
| | | 1000 | U.S. Total |
| | | Value | Market |
| | Fund | Index | Index |
| Number of Stocks | 256 | 656 | 3,749 |
| Median Market Cap | $44.6B | $37.5B | $30.4B |
| Price/Earnings Ratio | 12.4x | 13.0x | 14.9x |
| Price/Book Ratio | 1.8x | 1.4x | 2.1x |
| Return on Equity | 20.7% | 13.7% | 19.1% |
| Earnings Growth Rate | 2.4% | 0.5% | 7.2% |
| Dividend Yield | 2.7% | 2.6% | 2.0% |
| Foreign Holdings | 6.7% | 0.0% | 0.0% |
| Turnover Rate | 23% | — | — |
| Short-Term Reserves | 2.7% | — | — |
| | | |
| Sector Diversification (% of equity exposure) |
| | | Russell | DJ |
| | | 1000 | U.S. Total |
| | | Value | Market |
| | Fund | Index | Index |
| Consumer | | | |
| Discretionary | 7.8% | 8.9% | 12.4% |
| Consumer Staples | 11.6 | 7.8 | 10.1 |
| Energy | 13.8 | 12.5 | 10.7 |
| Financials | 18.5 | 25.3 | 15.1 |
| Health Care | 13.6 | 12.4 | 11.1 |
| Industrials | 12.6 | 9.0 | 10.9 |
| Information | | | |
| Technology | 12.3 | 9.1 | 19.3 |
| Materials | 1.8 | 2.7 | 4.3 |
| Telecommunication | | | |
| Services | 3.2 | 4.7 | 2.6 |
| Utilities | 4.8 | 7.6 | 3.5 |
| | |
| Volatility Measures | | |
| | Russell | DJ |
| | 1000 | U.S. Total |
| | Value | Market |
| | Index | Index |
| R-Squared | 0.98 | 0.98 |
| Beta | 0.94 | 1.00 |
These measures show the degree and timing of the fund’s fluctuations compared with the indexes over 36 months.
| | |
| Ten Largest Holdings (% of total net assets) |
| ConocoPhillips | Integrated Oil & | |
| | Gas | 3.5% |
| Pfizer Inc. | Pharmaceuticals | 3.2 |
| International Business | IT Consulting & | |
| Machines Corp. | Other Services | 3.2 |
| Philip Morris | | |
| International Inc. | Tobacco | 2.6 |
| Microsoft Corp. | Systems Software | 2.6 |
| JPMorgan Chase & Co. | Diversified Financial | |
| | Services | 2.5 |
| Wells Fargo & Co. | Diversified Banks | 2.4 |
| Spectra Energy Corp. | Oil & Gas Storage & | |
| | Transportation | 2.4 |
| American Express Co. | Consumer Finance | 2.3 |
| Johnson & Johnson | Pharmaceuticals | 2.3 |
| Top Ten | | 27.0% |
The holdings listed exclude any temporary cash investments and equity index products.
Investment Focus
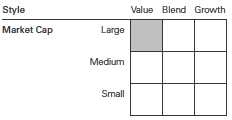
1 The expense ratios shown are from the prospectus dated February 24, 2011, and represent estimated costs for the current fiscal year. For the fiscal year ended October 31, 2011, the expense ratios were 0.35% for Investor Shares and 0.27% for Admiral Shares.
12
Windsor II Fund
Performance Summary
All of the returns in this report represent past performance, which is not a guarantee of future results that may be achieved by the fund. (Current performance may be lower or higher than the performance data cited. For performance data current to the most recent month-end, visit our website at vanguard.com/performance.) Note, too, that both investment returns and principal value can fluctuate widely, so an investor’s shares, when sold, could be worth more or less than their original cost. The returns shown do not reflect taxes that a shareholder would pay on fund distributions or on the sale of fund shares.
Cumulative Performance: October 31, 2001, Through October 31, 2011
Initial Investment of $10,000
| | | | |
| | Average Annual Total Returns | |
| | Periods Ended October 31, 2011 | |
| | | | | Final Value |
| | One | Five | Ten | of a $10,000 |
| | Year | Years | Years | Investment |
| Windsor II Fund Investor Shares | 7.48% | -0.86% | 4.69% | $15,809 |
| Dow Jones U.S. Total Stock Market | | | | |
| Index | 7.67 | 0.90 | 4.82 | 16,011 |
| Russell 1000 Value Index | 6.16 | -2.05 | 4.57 | 15,637 |
| Large-Cap Value Funds Average | 4.35 | -2.05 | 2.95 | 13,374 |
| Large-Cap Value Funds Average: Derived from data provided by Lipper Inc. | | | |
| | | | |
| | | | | Final Value |
| | One | Five | Ten | of a $50,000 |
| | Year | Years | Years | Investment |
| Windsor II Fund Admiral Shares | 7.56% | -0.77% | 4.79% | $79,838 |
| Dow Jones U.S. Total Stock Market | | | | |
| Index | 7.67 | 0.90 | 4.82 | 80,056 |
| Russell 1000 Value Index | 6.16 | -2.05 | 4.57 | 78,185 |
See Financial Highlights for dividend and capital gains information.
13
Windsor II Fund
Fiscal-Year Total Returns (%): October 31, 2001, Through October 31, 2011
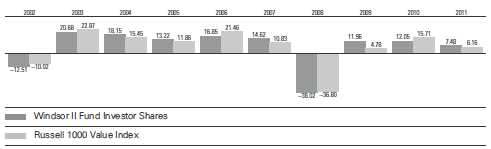
Average Annual Total Returns: Periods Ended September 30, 2011
This table presents returns through the latest calendar quarter—rather than through the end of the fiscal period. Securities and Exchange Commission rules require that we provide this information.
| | | | |
| | Inception | One | Five | Ten |
| | Date | Year | Years | Years |
| Investor Shares | 6/24/1985 | -0.03% | -2.47% | 3.52% |
| Admiral Shares | 5/14/2001 | 0.06 | -2.38 | 3.63 |
14
Windsor II Fund
Financial Statements
Statement of Net Assets
As of October 31, 2011
The fund reports a complete list of its holdings in regulatory filings four times in each fiscal year, at the quarter-ends. For the second and fourth fiscal quarters, the lists appear in the fund’s semiannual and annual reports to shareholders. For the first and third fiscal quarters, the fund files the lists with the Securities and Exchange Commission on Form N-Q. Shareholders can look up the fund’s Forms N-Q on the SEC’s website at sec.gov. Forms N-Q may also be reviewed and copied at the SEC’s Public Reference Room (see the back cover of this report for further information).
| | | |
| | | | Market |
| | | | Value |
| | | Shares | ($000) |
| Common Stocks (96.9%)1 | | |
| Consumer Discretionary (7.4%) | |
| | Carnival Corp. | 9,869,586 | 347,508 |
| | Comcast Corp. | 14,316,753 | 329,285 |
| | CBS Corp. Class B | 8,726,674 | 225,236 |
| | Target Corp. | 4,000,000 | 219,000 |
| 2 | Service Corp. | | |
| | International | 21,527,536 | 215,275 |
| | Lowe’s Cos. Inc. | 5,291,667 | 111,231 |
| | Wyndham | | |
| | Worldwide Corp. | 3,302,890 | 111,208 |
| | Lear Corp. | 2,332,400 | 109,413 |
| | Omnicom Group Inc. | 2,299,300 | 102,273 |
| | Genuine Parts Co. | 1,392,448 | 79,968 |
| * | AutoZone Inc. | 236,003 | 76,368 |
| | Newell Rubbermaid Inc. | 4,485,400 | 66,384 |
| * | Apollo Group Inc. Class A | 1,364,600 | 64,614 |
| | Hyundai Motor Co. | 293,600 | 59,128 |
| | International Game | | |
| | Technology | 2,958,000 | 52,031 |
| | Gap Inc. | 2,638,600 | 49,870 |
| | Viacom Inc. Class B | 933,800 | 40,947 |
| | JC Penney Co. Inc. | 1,147,200 | 36,802 |
| | Kohl’s Corp. | 649,570 | 34,434 |
| | Johnson Controls Inc. | 837,500 | 27,579 |
| | Interpublic Group | | |
| | of Cos. Inc. | 2,458,600 | 23,308 |
| | Magna International Inc. | 600,300 | 22,901 |
| * | General Motors Co. | 827,900 | 21,401 |
| * | Ford Motor Co. | 1,773,995 | 20,720 |
| | Time Warner Cable Inc. | 310,600 | 19,782 |
| | Home Depot Inc. | 542,974 | 19,439 |
| | Volkswagen AG | 107,142 | 16,755 |
| | Macy’s Inc. | 33,050 | 1,009 |
| | Limited Brands Inc. | 21,850 | 933 |
| * | DISH Network Corp. | | |
| | Class A | 26,600 | 643 |
| | Brinker International Inc. | 27,050 | 619 |
| | | |
| | | | Market |
| | | | Value |
| | | Shares | ($000) |
| * | TRW Automotive | | |
| | Holdings Corp. | 12,800 | 539 |
| | Tupperware Brands Corp. | 5,900 | 334 |
| | Foot Locker Inc. | 14,100 | 308 |
| | Harman International | | |
| | Industries Inc. | 5,850 | 253 |
| | Walt Disney Co. | 6,912 | 241 |
| | Time Warner Inc. | 3,799 | 133 |
| * | Liberty Interactive Corp. | | |
| | Class A | 2,700 | 44 |
| | | | 2,507,916 |
| Consumer Staples (11.2%) | | |
| | Philip Morris | | |
| | International Inc. | 12,690,953 | 886,717 |
| | Imperial Tobacco Group | | |
| | plc ADR | 8,778,125 | 641,110 |
| | Diageo plc ADR | 7,279,620 | 603,335 |
| | Wal-Mart Stores Inc. | 7,725,600 | 438,196 |
| | Altria Group Inc. | 12,440,807 | 342,744 |
| | CVS Caremark Corp. | 8,714,430 | 316,334 |
| | Molson Coors | | |
| | Brewing Co. Class B | 3,029,200 | 128,256 |
| * | Energizer Holdings Inc. | 1,318,400 | 97,285 |
| * | Ralcorp Holdings Inc. | 1,005,685 | 81,300 |
| | Sysco Corp. | 2,685,441 | 74,440 |
| | General Mills Inc. | 1,468,700 | 56,589 |
| | Kraft Foods Inc. | 1,480,261 | 52,076 |
| | PepsiCo Inc. | 329,900 | 20,767 |
| | Safeway Inc. | 851,600 | 16,495 |
| | Kimberly-Clark Corp. | 130,700 | 9,111 |
| | Procter & Gamble Co. | 67,890 | 4,344 |
| | Lorillard Inc. | 8,900 | 985 |
| | Reynolds American Inc. | 24,800 | 959 |
| | Coca-Cola | | |
| | Enterprises Inc. | 30,900 | 829 |
| * | Smithfield Foods Inc. | 34,150 | 781 |
| | Tyson Foods Inc. Class A | 16,900 | 326 |
| | Hormel Foods Corp. | 2,100 | 62 |
| | | | 3,773,041 |
15
Windsor II Fund
| | | |
| | | | Market |
| | | | Value |
| | | Shares | ($000) |
| Energy (13.2%) | | |
| | ConocoPhillips | 17,096,489 | 1,190,770 |
| | Spectra Energy Corp. | 27,756,611 | 794,672 |
| | Occidental | | |
| | Petroleum Corp. | 8,029,057 | 746,221 |
| | Chevron Corp. | 2,156,709 | 226,562 |
| | Marathon | | |
| | Petroleum Corp. | 5,506,950 | 197,699 |
| | Marathon Oil Corp. | 6,317,600 | 164,447 |
| | Devon Energy Corp. | 2,007,012 | 130,355 |
| | BP plc ADR | 2,948,170 | 130,250 |
| | Apache Corp. | 1,288,785 | 128,402 |
| | Royal Dutch Shell | | |
| | plc ADR | 1,773,290 | 127,322 |
| | Exxon Mobil Corp. | 1,415,482 | 110,535 |
| | Consol Energy Inc. | 2,347,620 | 100,384 |
| | Halliburton Co. | 2,167,645 | 80,983 |
| | Noble Corp. | 1,825,078 | 65,593 |
| | El Paso Corp. | 2,577,734 | 64,469 |
| | EQT Corp. | 931,700 | 59,163 |
| | Total SA ADR | 1,003,400 | 52,478 |
| * | Cameron | | |
| | International Corp. | 757,469 | 37,222 |
| | Valero Energy Corp. | 1,161,000 | 28,561 |
| | Gazprom OAO ADR | 1,553,600 | 18,010 |
| * | Cobalt International | | |
| | Energy Inc. | 1,283,100 | 13,242 |
| * | Tesoro Corp. | 18,200 | 472 |
| | Chesapeake Energy Corp. | 14,500 | 408 |
| | Patterson-UTI Energy Inc. | 14,700 | 299 |
| | | | 4,468,519 |
| Exchange-Traded Funds (1.0%) | |
| 3 | Vanguard Total Stock | | |
| | Market ETF | 3,197,800 | 205,555 |
| 3 | Vanguard Value ETF | 2,511,200 | 130,281 |
| | | | 335,836 |
| Financials (17.8%) | | |
| | JPMorgan Chase & Co. | 23,952,508 | 832,589 |
| | Wells Fargo & Co. | 31,206,196 | 808,553 |
| | American Express Co. | 15,413,850 | 780,249 |
| | PNC Financial Services | | |
| | Group Inc. | 11,634,281 | 624,877 |
| | Capital One | | |
| | Financial Corp. | 9,474,038 | 432,585 |
| | Citigroup Inc. | 10,077,859 | 318,360 |
| | State Street Corp. | 7,112,200 | 287,262 |
| | XL Group plc Class A | 13,148,132 | 285,840 |
| | Bank of America Corp. | 39,136,075 | 267,299 |
| | SLM Corp. | 19,135,452 | 261,582 |
| | MetLife Inc. | 4,343,278 | 152,710 |
| | Travelers Cos. Inc. | 2,357,700 | 137,572 |
| | Ameriprise Financial Inc. | 2,502,300 | 116,807 |
| | Goldman Sachs | | |
| | Group Inc. | 956,752 | 104,812 |
| | | |
| | | | Market |
| | | | Value |
| | | Shares | ($000) |
| | Prudential Financial Inc. | 1,790,000 | 97,018 |
| | Allstate Corp. | 2,615,700 | 68,898 |
| | Barclays plc | 17,794,000 | 55,161 |
| | Lincoln National Corp. | 2,486,061 | 47,359 |
| | BB&T Corp. | 1,651,500 | 38,546 |
| | American International | | |
| | Group Inc. | 1,534,900 | 37,897 |
| | Unum Group | 1,543,200 | 36,790 |
| | ACE Ltd. | 503,382 | 36,319 |
| | Janus Capital Group Inc. | 4,595,300 | 30,145 |
| | SunTrust Banks Inc. | 1,510,700 | 29,806 |
| | BNP Paribas SA | 635,600 | 28,383 |
| | PartnerRe Ltd. | 419,100 | 26,076 |
| | KeyCorp | 3,010,082 | 21,251 |
| | Morgan Stanley | 1,075,100 | 18,965 |
| * | Genworth Financial Inc. | | |
| | Class A | 899,300 | 5,738 |
| | US Bancorp | 69,849 | 1,787 |
| | Chubb Corp. | 17,099 | 1,146 |
| | Marsh & | | |
| | McLennan Cos. Inc. | 32,600 | 998 |
| | Progressive Corp. | 44,200 | 840 |
| * | Arch Capital Group Ltd. | 22,500 | 809 |
| | Moody’s Corp. | 22,500 | 799 |
| | Torchmark Corp. | 19,400 | 794 |
| | Leucadia National Corp. | 29,100 | 781 |
| * | NASDAQ OMX Group Inc. | 29,200 | 731 |
| | HCP Inc. | 17,700 | 705 |
| | Commerce | | |
| | Bancshares Inc. | 17,200 | 667 |
| | Reinsurance Group of | | |
| | America Inc. Class A | 12,550 | 655 |
| | Vornado Realty Trust | 7,300 | 605 |
| | Health Care REIT Inc. | 10,400 | 548 |
| | Aflac Inc. | 11,000 | 496 |
| | Kimco Realty Corp. | 26,100 | 456 |
| | Rayonier Inc. | 10,650 | 444 |
| | Hospitality | | |
| | Properties Trust | 16,620 | 399 |
| | Piedmont Office Realty | | |
| | Trust Inc. Class A | 22,000 | 374 |
| | Ventas Inc. | 5,912 | 329 |
| * | Berkshire Hathaway Inc. | | |
| | Class B | 4,000 | 311 |
| | NYSE Euronext | 5,100 | 136 |
| | Annaly Capital | | |
| | Management Inc. | 6,500 | 110 |
| | M&T Bank Corp. | 300 | 23 |
| | | | 6,004,392 |
| Health Care (13.1%) | | |
| | Pfizer Inc. | 55,656,768 | 1,071,949 |
| | Johnson & Johnson | 11,967,150 | 770,565 |
| | Baxter International Inc. | 12,620,668 | 693,884 |
| | Medtronic Inc. | 15,204,900 | 528,218 |
16
Windsor II Fund
| | | |
| | | | Market |
| | | | Value |
| | | Shares | ($000) |
| | WellPoint Inc. | 5,891,199 | 405,904 |
| | Merck & Co. Inc. | 5,654,729 | 195,088 |
| | UnitedHealth Group Inc. | 2,474,274 | 118,741 |
| | Abbott Laboratories | 2,159,222 | 116,317 |
| | Amgen Inc. | 1,914,326 | 109,634 |
| | Quest Diagnostics Inc. | 1,809,000 | 100,942 |
| * | Gilead Sciences Inc. | 1,973,000 | 82,195 |
| | Covidien plc | 1,196,481 | 56,283 |
| * | Thermo Fisher | | |
| | Scientific Inc. | 1,001,625 | 50,352 |
| * | Express Scripts Inc. | 702,493 | 32,125 |
| | Eli Lilly & Co. | 761,900 | 28,312 |
| | Sanofi ADR | 698,300 | 24,964 |
| | Novartis AG ADR | 398,500 | 22,503 |
| | Bristol-Myers Squibb Co. | 58,333 | 1,843 |
| | Humana Inc. | 10,310 | 875 |
| | CIGNA Corp. | 18,670 | 828 |
| | AmerisourceBergen Corp. | | |
| | Class A | 16,690 | 681 |
| | Aetna Inc. | 15,600 | 620 |
| * | Forest Laboratories Inc. | 9,200 | 288 |
| * | Charles River Laboratories | |
| | International Inc. | 5,850 | 189 |
| | | | 4,413,300 |
| Industrials (12.1%) | | |
| | Raytheon Co. | 14,850,561 | 656,246 |
| 2 | Cooper Industries plc | 11,605,488 | 608,824 |
| | Honeywell | | |
| | International Inc. | 10,783,211 | 565,040 |
| | General Electric Co. | 32,864,607 | 549,168 |
| | ITT Corp. | 8,813,102 | 401,877 |
| | Illinois Tool Works Inc. | 8,185,730 | 398,072 |
| * | Corrections Corp. of | | |
| | America | 4,590,500 | 102,047 |
| | Lockheed Martin Corp. | 1,330,700 | 101,000 |
| | Boeing Co. | 1,528,200 | 100,540 |
| | Norfolk Southern Corp. | 1,185,200 | 87,693 |
| | Northrop Grumman Corp. | 1,186,776 | 68,536 |
| | General Dynamics Corp. | 864,000 | 55,460 |
| | Dover Corp. | 997,950 | 55,416 |
| | United Parcel Service Inc. | | |
| | Class B | 645,473 | 45,338 |
| | United Technologies Corp. 560,245 | 43,688 |
| | PACCAR Inc. | 915,100 | 39,569 |
| | CSX Corp. | 1,587,130 | 35,250 |
| | FedEx Corp. | 385,500 | 31,546 |
| | Republic Services Inc. | | |
| | Class A | 1,084,700 | 30,871 |
| | Ingersoll-Rand plc | 898,135 | 27,959 |
| | Cummins Inc. | 272,000 | 27,045 |
| | Tyco International Ltd. | 583,248 | 26,567 |
| * | WABCO Holdings Inc. | 311,996 | 15,665 |
| | Embraer SA ADR | 493,200 | 13,721 |
| * | Huntington Ingalls | | |
| | Industries Inc. | 92,550 | 2,730 |
| | | |
| | | | Market |
| | | | Value |
| | | Shares | ($000) |
| | Parker Hannifin Corp. | 9,400 | 767 |
| | KBR Inc. | 19,900 | 555 |
| | 3M Co. | 6,626 | 524 |
| | L-3 Communications | | |
| | Holdings Inc. | 7,650 | 519 |
| * | Hertz Global Holdings Inc. | 33,100 | 384 |
| | Cintas Corp. | 7,700 | 230 |
| | Pitney Bowes Inc. | 6,100 | 124 |
| | | | 4,092,971 |
| Information Technology (11.8%) | |
| | International Business | | |
| | Machines Corp. | 5,788,390 | 1,068,710 |
| | Microsoft Corp. | 32,854,640 | 874,919 |
| | Intel Corp. | 22,649,800 | 555,826 |
| | Oracle Corp. | 8,497,101 | 278,450 |
| | Hewlett-Packard Co. | 9,413,077 | 250,482 |
| | Cisco Systems Inc. | 6,745,200 | 124,989 |
| | Corning Inc. | 8,723,800 | 124,663 |
| * | Google Inc. Class A | 184,780 | 109,508 |
| | Samsung | | |
| | Electronics Co. Ltd. | 110,400 | 95,039 |
| | Texas Instruments Inc. | 2,997,100 | 92,101 |
| * | EMC Corp. | 3,038,300 | 74,469 |
| * | eBay Inc. | 1,929,949 | 61,430 |
| | CA Inc. | 2,453,828 | 53,150 |
| | Mastercard Inc. Class A | 151,375 | 52,564 |
| * | Lexmark International Inc. | | |
| | Class A | 1,551,894 | 49,195 |
| * | Apple Inc. | 77,890 | 31,528 |
| * | Western Digital Corp. | 957,700 | 25,513 |
| * | Dell Inc. | 1,586,600 | 25,084 |
| | TE Connectivity Ltd. | 577,175 | 20,519 |
| | Motorola Solutions Inc. | 19,845 | 931 |
| | Applied Materials Inc. | 67,000 | 825 |
| * | Electronic Arts Inc. | 29,800 | 696 |
| * | LSI Corp. | 94,300 | 589 |
| * | IAC/InterActiveCorp | 11,500 | 470 |
| | Seagate Technology plc | 23,100 | 373 |
| | Jabil Circuit Inc. | 15,800 | 325 |
| * | Avnet Inc. | 5,500 | 167 |
| | | | 3,972,515 |
| Materials (1.7%) | | |
| | EI du Pont de | | |
| | Nemours & Co. | 3,827,438 | 183,985 |
| | Newmont Mining Corp. | 1,824,400 | 121,925 |
| | Monsanto Co. | 998,300 | 72,626 |
| | Ball Corp. | 2,084,591 | 72,064 |
| | Praxair Inc. | 384,428 | 39,085 |
| | Freeport-McMoRan | | |
| | Copper & Gold Inc. | 668,900 | 26,930 |
| | Mosaic Co. | 397,095 | 23,254 |
| | PPG Industries Inc. | 125,400 | 10,836 |
| | Bemis Co. Inc. | 346,351 | 9,736 |
| | International Paper Co. | 32,200 | 892 |
| | Cliffs Natural Resources Inc. | 11,700 | 798 |
17
Windsor II Fund
| | | |
| | | | Market |
| | | | Value |
| | | Shares | ($000) |
| | Eastman Chemical Co. | 16,100 | 633 |
| | Dow Chemical Co. | 20,100 | 560 |
| | | | 563,324 |
| Telecommunication Services (3.0%) | |
| | AT&T Inc. | 14,373,607 | 421,291 |
| | Vodafone Group plc ADR | 13,225,400 | 368,195 |
| | Verizon | | |
| | Communications Inc. | 6,390,409 | 236,317 |
| * | MetroPCS | | |
| | Communications Inc. | 16,720 | 142 |
| | | | 1,025,945 |
| Utilities (4.6%) | | |
| | Dominion Resources Inc. | 10,739,814 | 554,067 |
| 2 | CenterPoint Energy Inc. | 25,894,913 | 539,650 |
| | Entergy Corp. | 2,996,778 | 207,287 |
| | Edison International | 2,003,100 | 81,326 |
| | Exelon Corp. | 1,244,200 | 55,230 |
| | Public Service Enterprise | | |
| | Group Inc. | 1,598,700 | 53,876 |
| | Sempra Energy | 843,700 | 45,332 |
| | PPL Corp. | 619,400 | 18,192 |
| | Duke Energy Corp. | 61,000 | 1,246 |
| | American Electric | | |
| | Power Co. Inc. | 27,200 | 1,068 |
| | CMS Energy Corp. | 39,800 | 829 |
| | DTE Energy Co. | 15,900 | 829 |
| | Northeast Utilities | 23,300 | 805 |
| | Alliant Energy Corp. | 19,100 | 779 |
| | NiSource Inc. | 34,700 | 766 |
| | TECO Energy Inc. | 40,300 | 748 |
| | Ameren Corp. | 11,700 | 373 |
| | Southern Co. | 3,100 | 134 |
| | Consolidated Edison Inc. | 1,600 | 93 |
| | | | 1,562,630 |
| Total Common Stocks | | |
| (Cost $28,937,978) | | 32,720,389 |
| | | |
| | | | Market |
| | | | Value |
| | | Shares | ($000) |
| Temporary Cash Investments (3.3%)1 | |
| Money Market Fund (3.2%) | |
| 4 | Vanguard Market | | |
| | Liquidity Fund, | | |
| | 0.128% | 1,071,949,881 | 1,071,950 |
| |
| | | Face | |
| | | Amount | |
| | | ($000) | |
| U.S. Government and Agency Obligations (0.1%) |
| 5,6 | Fannie Mae | | |
| | Discount Notes, | | |
| | 0.045%, 12/7/11 | 40,000 | 39,997 |
| 5 | Fannie Mae | | |
| | Discount Notes, | | |
| | 0.060%, 12/21/11 | 1,000 | 1,000 |
| 6,7 | Federal Home Loan | | |
| | Bank Discount Notes, | |
| | 0.075%, 11/16/11 | 100 | 100 |
| | | | 41,097 |
| Total Temporary Cash Investments | |
| (Cost $1,113,048) | | 1,113,047 |
| Total Investments (100.2%) | |
| (Cost $30,051,026) | | 33,833,436 |
| Other Assets and Liabilities (-0.2%) | |
| Other Assets | | 185,465 |
| Liabilities | | (238,588) |
| | | | (53,123) |
| Net Assets (100%) | | 33,780,313 |
18
Windsor II Fund
| |
| At October 31, 2011, net assets consisted of: |
| | Amount |
| | ($000) |
| Paid-in Capital | 34,051,722 |
| Undistributed Net Investment Income | 193,112 |
| Accumulated Net Realized Losses | (4,262,270) |
| Unrealized Appreciation (Depreciation) | |
| Investment Securities | 3,782,410 |
| Futures Contracts | 15,331 |
| Foreign Currencies | 8 |
| Net Assets | 33,780,313 |
| |
| Investor Shares—Net Assets | |
| Applicable to 740,188,904 outstanding | |
| $.001 par value shares of beneficial | |
| interest (unlimited authorization) | 19,009,596 |
| Net Asset Value Per Share— | |
| Investor Shares | $25.68 |
| |
| Admiral Shares—Net Assets | |
| Applicable to 323,992,536 outstanding | |
| $.001 par value shares of beneficial | |
| interest (unlimited authorization) | 14,770,717 |
| Net Asset Value Per Share— | |
| Admiral Shares | $45.59 |
See Note A in Notes to Financial Statements.
* Non-income-producing security.
1 The fund invests a portion of its cash reserves in equity markets through the use of index futures contracts. After giving effect to futures investments, the fund’s effective common stock and temporary cash investment positions represent 97.5% and 2.7%, respectively, of net assets.
2 Considered an affiliated company of the fund as the fund owns more than 5% of the outstanding voting securities of such company.
3 Considered an affiliated company of the fund as the issuer is another member of The Vanguard Group.
4 Affiliated money market fund available only to Vanguard funds and certain trusts and accounts managed by Vanguard. Rate shown is the 7-day yield.
5 The issuer is under federal conservatorship and is dependent upon the continued support of the U.S. Treasury to avoid receivership.
6 Securities with a value of $33,097,000 have been segregated as initial margin for open futures contracts.
7 The issuer operates under a congressional charter; its securities are not backed by the full faith and credit of the U.S. government.
ADR—American Depositary Receipt.
REIT—Real Estate Investment Trust.
See accompanying Notes, which are an integral part of the Financial Statements.
19
Windsor II Fund
| |
| Statement of Operations | |
| |
| | Year Ended |
| | October 31, 2011 |
| | ($000) |
| Investment Income | |
| Income | |
| Dividends1,2 | 866,935 |
| Interest2 | 1,742 |
| Security Lending | 2,423 |
| Total Income | 871,100 |
| Expenses | |
| Investment Advisory Fees—Note B | |
| Basic Fee | 52,444 |
| Performance Adjustment | (4,955) |
| The Vanguard Group—Note C | |
| Management and Administrative—Investor Shares | 39,641 |
| Management and Administrative—Admiral Shares | 17,954 |
| Marketing and Distribution—Investor Shares | 4,288 |
| Marketing and Distribution—Admiral Shares | 2,895 |
| Custodian Fees | 443 |
| Auditing Fees | 33 |
| Shareholders’ Reports—Investor Shares | 233 |
| Shareholders’ Reports—Admiral Shares | 82 |
| Trustees’ Fees and Expenses | 74 |
| Total Expenses | 113,132 |
| Expenses Paid Indirectly | (1,836) |
| Net Expenses | 111,296 |
| Net Investment Income | 759,804 |
| Realized Net Gain (Loss) | |
| Investment Securities Sold2 | 1,157,172 |
| Futures Contracts | 28,438 |
| Foreign Currencies | 201 |
| Realized Net Gain (Loss) | 1,185,811 |
| Change in Unrealized Appreciation (Depreciation) | |
| Investment Securities | 607,786 |
| Futures Contracts | 8,967 |
| Foreign Currencies | 8 |
| Change in Unrealized Appreciation (Depreciation) | 616,761 |
| Net Increase (Decrease) in Net Assets Resulting from Operations | 2,562,376 |
1 Dividends are net of foreign withholding taxes of $2,714,000.
2 Dividend income, interest income, and realized net gain (loss) from affiliated companies of the fund were $58,780,000, $1,660,000, and $69,465,000, respectively.
See accompanying Notes, which are an integral part of the Financial Statements.
20
Windsor II Fund
| | |
| Statement of Changes in Net Assets | | |
| |
| | Year Ended October 31, |
| | 2011 | 2010 |
| | ($000) | ($000) |
| Increase (Decrease) in Net Assets | | |
| Operations | | |
| Net Investment Income | 759,804 | 725,398 |
| Realized Net Gain (Loss) | 1,185,811 | (399,047) |
| Change in Unrealized Appreciation (Depreciation) | 616,761 | 3,508,044 |
| Net Increase (Decrease) in Net Assets Resulting from Operations | 2,562,376 | 3,834,395 |
| Distributions | | |
| Net Investment Income | | |
| Investor Shares | (406,021) | (453,946) |
| Admiral Shares | (317,250) | (282,936) |
| Realized Capital Gain | | |
| Investor Shares | — | — |
| Admiral Shares | — | — |
| Total Distributions | (723,271) | (736,882) |
| Capital Share Transactions | | |
| Investor Shares | (3,015,077) | (1,721,406) |
| Admiral Shares | 654,417 | 170,368 |
| Net Increase (Decrease) from Capital Share Transactions | (2,360,660) | (1,551,038) |
| Total Increase (Decrease) | (521,555) | 1,546,475 |
| Net Assets | | |
| Beginning of Period | 34,301,868 | 32,755,393 |
| End of Period1 | 33,780,313 | 34,301,868 |
| 1 Net Assets—End of Period includes undistributed net investment income of $193,112,000 and $156,378,000. | |
See accompanying Notes, which are an integral part of the Financial Statements.
21
Windsor II Fund
Financial Highlights
| | | | | |
| Investor Shares | | | | | |
| |
| For a Share Outstanding | | | Year Ended October 31, |
| Throughout Each Period | 2011 | 2010 | 2009 | 2008 | 2007 |
| Net Asset Value, Beginning of Period | $24.37 | $22.22 | $20.56 | $37.84 | $35.14 |
| Investment Operations | | | | | |
| Net Investment Income | .557 | .495 | .580 | .777 | .803 |
| Net Realized and Unrealized Gain (Loss) | | | | | |
| on Investments | 1.276 | 2.151 | 1.750 | (13.804) | 4.145 |
| Total from Investment Operations | 1.833 | 2.646 | 2.330 | (13.027) | 4.948 |
| Distributions | | | | | |
| Dividends from Net Investment Income | (.523) | (.496) | (.670) | (.799) | (.790) |
| Distributions from Realized Capital Gains | — | — | — | (3.454) | (1.458) |
| Total Distributions | (.523) | (.496) | (.670) | (4.253) | (2.248) |
| Net Asset Value, End of Period | $25.68 | $24.37 | $22.22 | $20.56 | $37.84 |
| |
| Total Return1 | 7.48% | 12.05% | 11.96% | -38.02% | 14.62% |
| |
| Ratios/Supplemental Data | | | | | |
| Net Assets, End of Period (Millions) | $19,010 | $20,921 | $20,695 | $19,400 | $33,821 |
| Ratio of Total Expenses to | | | | | |
| Average Net Assets2 | 0.35% | 0.35% | 0.38% | 0.32% | 0.33% |
| Ratio of Net Investment Income to | | | | | |
| Average Net Assets | 2.11% | 2.08% | 2.96% | 2.66% | 2.19% |
| Portfolio Turnover Rate | 23% | 29% | 41% | 37% | 51% |
1 Total returns do not include account service fees that may have applied in the periods shown. Fund prospectuses provide information about any applicable account service fees.
2 Includes performance-based investment advisory fee increases (decreases) of (0.01)%, (0.01%), (0.01%), (0.01%), and 0.01%.
See accompanying Notes, which are an integral part of the Financial Statements.
22
Windsor II Fund
Financial Highlights
| | | | | |
| Admiral Shares | | | | | |
| |
| For a Share Outstanding | | | Year Ended October 31, |
| Throughout Each Period | 2011 | 2010 | 2009 | 2008 | 2007 |
| Net Asset Value, Beginning of Period | $43.26 | $39.46 | $36.51 | $67.18 | $62.41 |
| Investment Operations | | | | | |
| Net Investment Income | 1.025 | .914 | 1.064 | 1.431 | 1.491 |
| Net Realized and Unrealized Gain (Loss) | | | | | |
| on Investments | 2.264 | 3.811 | 3.112 | (24.497) | 7.348 |
| Total from Investment Operations | 3.289 | 4.725 | 4.176 | (23.066) | 8.839 |
| Distributions | | | | | |
| Dividends from Net Investment Income | (.959) | (.925) | (1.226) | (1.473) | (1.481) |
| Distributions from Realized Capital Gains | — | — | — | (6.131) | (2.588) |
| Total Distributions | (.959) | (.925) | (1.226) | (7.604) | (4.069) |
| Net Asset Value, End of Period | $45.59 | $43.26 | $39.46 | $36.51 | $67.18 |
| |
| Total Return | 7.56% | 12.12% | 12.09% | -37.94% | 14.71% |
| |
| Ratios/Supplemental Data | | | | | |
| Net Assets, End of Period (Millions) | $14,771 | $13,381 | $12,060 | $11,611 | $20,250 |
| Ratio of Total Expenses to | | | | | |
| Average Net Assets1 | 0.27% | 0.27% | 0.27% | 0.22% | 0.23% |
| Ratio of Net Investment Income to | | | | | |
| Average Net Assets | 2.19% | 2.16% | 3.07% | 2.76% | 2.29% |
| Portfolio Turnover Rate | 23% | 29% | 41% | 37% | 51% |
| 1 Includes performance-based investment advisory fee increases (decreases) of (0.01%), (0.01%), (0.01%), (0.01%), and 0.01%. | |
See accompanying Notes, which are an integral part of the Financial Statements.
23
Windsor II Fund
Notes to Financial Statements
Vanguard Windsor II Fund is registered under the Investment Company Act of 1940 as an open-end investment company, or mutual fund. The fund offers two classes of shares: Investor Shares and Admiral Shares. Investor Shares are available to any investor who meets the fund’s minimum purchase requirements. Admiral Shares are designed for investors who meet certain administrative, service, and account-size criteria.
A. The following significant accounting policies conform to generally accepted accounting principles for U.S. mutual funds. The fund consistently follows such policies in preparing its financial statements.
1. Security Valuation: Securities are valued as of the close of trading on the New York Stock Exchange (generally 4 p.m., Eastern time) on the valuation date. Equity securities are valued at the latest quoted sales prices or official closing prices taken from the primary market in which each security trades; such securities not traded on the valuation date are valued at the mean of the latest quoted bid and asked prices. Securities for which market quotations are not readily available, or whose values have been affected by events occurring before the fund’s pricing time but after the close of the securities’ primary markets, are valued at their fair values calculated according to procedures adopted by the board of trustees. These procedures include obtaining quotations from an independent pricing service, monitoring news to identify significant market- or security-specific events, and evaluating changes in the values of foreign market proxies (for example, ADRs, futures contracts, or exchange-traded funds), between the time the foreign markets close and the fund’s pricing time. When fair-value pricing is employed, the prices of securities used by a fund to calculate its net asset value may differ from quoted or published prices for the same securities. Investments in Vanguard Market Liquidity Fund are valued at that fund’s net asset value. Temporary cash investments acquired over 60 days to maturity are valued using the latest bid prices or using valuations based on a matrix system (which considers such factors as security prices, yields, maturities, and ratings), both as furnished by independent pricing services. Other temporary cash investments are valued at amortized cost, which approximates market value.
2. Foreign Currency: Securities and other assets and liabilities denominated in foreign currencies are translated into U.S. dollars using exchange rates obtained from an independent third party as of the fund’s pricing time on the valuation date. Realized gains (losses) and unrealized appreciation (depreciation) on investment securities include the effects of changes in exchange rates since the securities were purchased, combined with the effects of changes in security prices. Fluctuations in the value of other assets and liabilities resulting from changes in exchange rates are recorded as unrealized foreign currency gains (losses) until the assets or liabilities are settled in cash, at which time they are recorded as realized foreign currency gains (losses).
3. Futures Contracts: The fund uses index futures contracts to a limited extent, with the objective of maintaining full exposure to the stock market while maintaining liquidity. The fund may purchase or sell futures contracts to achieve a desired level of investment, whether to accommodate portfolio turnover or cash flows from capital share transactions. The primary risks associated with the use of futures contracts are imperfect correlation between changes in market values of stocks held by the fund and the prices of futures contracts, and the possibility of an illiquid market.
Futures contracts are valued at their quoted daily settlement prices. The aggregate principal amounts of the contracts are not recorded in the Statement of Net Assets. Fluctuations in the value of the contracts are recorded in the Statement of Net Assets as an asset (liability) and in the Statement of Operations as unrealized appreciation (depreciation) until the contracts are closed, when they are recorded as realized futures gains (losses).
24
Windsor II Fund
4. Federal Income Taxes: The fund intends to continue to qualify as a regulated investment company and distribute all of its taxable income. Management has analyzed the fund’s tax positions taken for all open federal income tax years (October 31, 2008–2011), and has concluded that no provision for federal income tax is required in the fund’s financial statements.
5. Distributions: Distributions to shareholders are recorded on the ex-dividend date.
6. Security Lending: The fund may lend its securities to qualified institutional borrowers to earn additional income. Security loans are required to be secured at all times by collateral at least equal to the market value of securities loaned. The fund invests cash collateral received in Vanguard Market Liquidity Fund, and records a liability for the return of the collateral, during the period the securities are on loan. Security lending income represents fees charged to borrowers plus income earned on investing cash collateral, less expenses associated with the loan.
7. Other: Dividend income is recorded on the ex-dividend date. Interest income includes income distributions received from Vanguard Market Liquidity Fund and is accrued daily. Security transactions are accounted for on the date securities are bought or sold. Costs used to determine realized gains (losses) on the sale of investment securities are those of the specific securities sold.
Each class of shares has equal rights as to assets and earnings, except that each class separately bears certain class-specific expenses related to maintenance of shareholder accounts (included in Management and Administrative expenses) and shareholder reporting. Marketing and distribution expenses are allocated to each class of shares based on a method approved by the board of trustees. Income, other non-class-specific expenses, and gains and losses on investments are allocated to each class of shares based on its relative net assets.
B. Barrow, Hanley, Mewhinney & Strauss, LLC; Lazard Asset Management LLC; Hotchkis and Wiley Capital Management, LLC; Armstrong Shaw Associates Inc.; and Sanders Capital, LLC, each provide investment advisory services to a portion of the fund for a fee calculated at an annual percentage rate of average net assets managed by the advisor. The basic fee of Barrow, Hanley, Mewhinney & Strauss, LLC, is subject to quarterly adjustments based on performance for the preceding three years relative to the MSCI US Prime Market 750 Index. The basic fee of Lazard Asset Management LLC is subject to quarterly adjustments based on performance for the preceding three years relative to the S&P 500 Index. The basic fee of Hotchkis and Wiley Capital Management, LLC, is subject to quarterly adjustments based on performance for the preceding five years relative to the MSCI US Investable Market 2500 Index. The basic fee of Armstrong Shaw Associates Inc. is subject to quarterly adjustments based on performance for the preceding five years, relative to the Russell 1000 Value Index. The basic fee of Sanders Capital, LLC, is subject to quarterly adjustments based on performance since January 31, 2010, relative to the Russell 3000 Index.
The Vanguard Group provides investment advisory services to a portion of the fund on an at-cost basis; the fund paid Vanguard advisory fees of $121,000 for the year ended October 31, 2011.
For the year ended October 31, 2011, the aggregate investment advisory fee represented an effective annual basic rate of 0.15% of the fund’s average net assets, before a decrease of $4,955,000 (0.01%) based on performance.
C. The Vanguard Group furnishes at cost corporate management, administrative, marketing, and distribution services. The costs of such services are allocated to the fund under methods approved by the board of trustees. The fund has committed to provide up to 0.40% of its net assets in capital contributions to Vanguard. At October 31, 2011, the fund had contributed capital of $5,314,000 to
25
Windsor II Fund
Vanguard (included in Other Assets), representing 0.02% of the fund’s net assets and 2.13% of Vanguard’s capitalization. The fund’s trustees and officers are also directors and officers of Vanguard.
D. The fund has asked its investment advisors to direct certain security trades, subject to obtaining the best price and execution, to brokers who have agreed to rebate to the fund part of the commissions generated. Such rebates are used solely to reduce the fund’s management and administrative expenses. For the year ended October 31, 2011, these arrangements reduced the fund’s expenses by $1,836,000 (an annual rate of 0.01% of average net assets).
E. Various inputs may be used to determine the value of the fund’s investments. These inputs are summarized in three broad levels for financial statement purposes. The inputs or methodologies used to value securities are not necessarily an indication of the risk associated with investing in those securities.
Level 1—Quoted prices in active markets for identical securities.
Level 2—Other significant observable inputs (including quoted prices for similar securities, interest rates, prepayment speeds, credit risk, etc.).
Level 3—Significant unobservable inputs (including the fund’s own assumptions used to determine the fair value of investments).
The following table summarizes the market value of the fund’s investments as of October 31, 2011, based on the inputs used to value them:
| | | |
| | Level 1 | Level 2 | Level 3 |
| Investments | ($000) | ($000) | ($000) |
| Common Stocks | 32,447,913 | 272,476 | — |
| Temporary Cash Investments | 1,071,950 | 41,097 | — |
| Futures Contracts—Assets1 | 632 | — | — |
| Futures Contracts—Liabilities1 | (6,694) | — | — |
| Total | 33,513,801 | 313,573 | — |
| 1 Represents variation margin on the last day of the reporting period. | | | |
F. At October 31, 2011, the aggregate settlement value of open futures contracts and the related unrealized appreciation (depreciation) were:
| | | | |
| | | | | ($000) |
| | | | Aggregate | |
| | | Number of | Settlement | Unrealized |
| | | Long (Short) | Value | Appreciation |
| Futures Contracts | Expiration | Contracts | Long (Short) | (Depreciation) |
| S&P 500 Index | December 2011 | 678 | 211,756 | 15,617 |
| E-mini S&P 500 Index | December 2011 | 196 | 12,243 | (286) |
Unrealized appreciation (depreciation) on open futures contracts is required to be treated as realized gain (loss) for tax purposes.
26
Windsor II Fund
G. Distributions are determined on a tax basis and may differ from net investment income and realized capital gains for financial reporting purposes. Differences may be permanent or temporary. Permanent differences are reclassified among capital accounts in the financial statements to reflect their tax character. Temporary differences arise when certain items of income, expense, gain, or loss are recognized in different periods for financial statement and tax purposes; these differences will reverse at some time in the future. Differences in classification may also result from the treatment of short-term gains as ordinary income for tax purposes.
For tax purposes, at October 31, 2011, the fund had $248,038,000 of ordinary income available for distribution. The fund had available capital loss carryforwards totaling $4,227,031,000 to offset future net capital gains of $2,413,390,000 through October 31, 2016, $1,639,579,000 through October 31, 2017, and $174,062,000 through October 31, 2018.
At October 31, 2011, the cost of investment securities for tax purposes was $30,068,028,000. Net unrealized appreciation of investment securities for tax purposes was $3,765,408,000, consisting of unrealized gains of $7,867,674,000 on securities that had risen in value since their purchase and $4,102,266,000 in unrealized losses on securities that had fallen in value since their purchase.
H. During the year ended October 31, 2011, the fund purchased $7,809,705,000 of investment securities and sold $10,263,425,000 of investment securities, other than temporary cash investments.
I. Capital share transactions for each class of shares were:
| | | | |
| | | | Year Ended October 31, |
| | | 2011 | | 2010 |
| | Amount | Shares | Amount | Shares |
| | ($000) | (000) | ($000) | (000) |
| Investor Shares | | | | |
| Issued | 1,713,967 | 66,276 | 2,009,504 | 85,359 |
| Issued in Lieu of Cash Distributions | 397,055 | 15,092 | 442,058 | 19,182 |
| Redeemed | (5,126,099) | (199,599) | (4,172,968) | (177,358) |
| Net Increase (Decrease)—Investor Shares | (3,015,077) | (118,231) | (1,721,406) | (72,817) |
| Admiral Shares | | | | |
| Issued | 2,931,963 | 64,388 | 1,630,761 | 38,483 |
| Issued in Lieu of Cash Distributions | 298,134 | 6,381 | 264,736 | 6,476 |
| Redeemed | (2,575,680) | (56,099) | (1,725,129) | (41,294) |
| Net Increase (Decrease)—Admiral Shares | 654,417 | 14,670 | 170,368 | 3,665 |
27
Windsor II Fund
J. Certain of the fund’s investments are in companies that are considered to be affiliated companies of the fund because the fund owns more than 5% of the outstanding voting securities of the company. Transactions during the period in securities of these companies were as follows:
| | | | | |
| | | | Current Period Transactions | |
| | Oct. 31, 2010 | | Proceeds from | | Oct. 31, 2011 |
| | Market | Purchases | Securities | Dividend | Market |
| | Value | at Cost | Sold | Income | Value |
| | ($000) | ($000) | ($000) | ($000) | ($000) |
| Centerpoint Energy Inc. | 385,047 | 55,230 | 8,552 | 19,084 | 539,650 |
| Cooper Industries plc | 632,635 | 23,356 | 57,177 | 12,993 | 608,824 |
| ITT Corp. | 439,950 | — | 25,443 | 8,861 | NA1 |
| Quest Diagnostics Inc. | 460,663 | 98,554 | 531,188 | 1,023 | NA1 |
| Service Corp. International | 182,129 | — | 3,874 | 4,090 | 215,275 |
| Wyndham Worldwide Corp. | 397,614 | 9,796 | 336,266 | 5,449 | NA1 |
| | 2,498,038 | | | 51,500 | 1,363,749 |
| 1 Not applicable—at October 31, 2011, the security was still held, but the issuer was no longer an affiliated company of the fund. |
K. In preparing the financial statements as of October 31, 2011, management considered the impact of subsequent events for potential recognition or disclosure in these financial statements.
28
Report of Independent Registered Public Accounting Firm
To the Trustees of Vanguard Windsor Funds and the Shareholders of Vanguard Windsor II Fund:
In our opinion, the accompanying statement of net assets and the related statements of operations and of changes in net assets and the financial highlights present fairly, in all material respects, the financial position of Vanguard Windsor II Fund (constituting a separate portfolio of Vanguard Windsor Funds, hereafter referred to as the “Fund”) at October 31, 2011, the results of its operations for the year then ended, the changes in its net assets for each of the two years in the period then ended and the financial highlights for each of the five years in the period then ended, in conformity with accounting principles generally accepted in the United States of America. These financial statements and financial highlights (hereafter referred to as “financial statements”) are the responsibility of the Fund’s management; our responsibility is to express an opinion on these financial statements based on our audits. We conducted our audits of these financial statements in accordance with the standards of the Public Company Accounting Oversight Board (United States). Those standards require that we plan and perform the audit to obtain reasonable assurance about whether the financial statements are free of material misstatement. An audit includes examining, on a test basis, evidence supporting the amounts and disclosures in the financial statements, assessing the accounting principles used and significant estimates made by management, and evaluating the overall financial statement presentation. We believe that our audits, which included confirmation of securities at October 31, 2011 by correspondence with the custodian and broker and by agreement to the underlying ownership records of Vanguard Market Liquidity Fund, provide a reasonable basis for our opinion.
PricewaterhouseCoopers LLP
Philadelphia, Pennsylvania
December 9, 2011
|
| Special 2011 tax information (unaudited) for Vanguard Windsor II Fund |
This information for the fiscal year ended October 31, 2011, is included pursuant to provisions of the Internal Revenue Code.
The fund distributed $723,271,000 of qualified dividend income to shareholders during the fiscal year.
For corporate shareholders, 96.8% of investment income (dividend income plus short-term gains, if any) qualifies for the dividends-received deduction.
29
Your Fund’s After-Tax Returns
This table presents returns for your fund both before and after taxes. The after-tax returns are shown in two ways: (1) assuming that an investor owned the fund during the entire period and paid taxes on the fund’s distributions, and (2) assuming that an investor paid taxes on the fund’s distributions and sold all shares at the end of each period.
Calculations are based on the highest individual federal income tax and capital gains tax rates in effect at the times of the distributions and the hypothetical sales. State and local taxes were not considered. After-tax returns reflect any qualified dividend income, using actual prior-year figures and estimates for 2011. (In the example, returns after the sale of fund shares may be higher than those assuming no sale. This occurs when the sale would have produced a capital loss. The calculation assumes that the investor received a tax deduction for the loss.)
The table shows returns for Investor Shares only; returns for other share classes will differ. Please note that your actual after-tax returns will depend on your tax situation and may differ from those shown. Also note that if you own the fund in a tax-deferred account, such as an individual retirement account or a 401(k) plan, this information does not apply to you. Such accounts are not subject to current taxes.
Finally, keep in mind that a fund’s performance—whether before or after taxes—does not guarantee future results.
| | | |
| Average Annual Total Returns: Windsor II Fund Investor Shares | | | |
| Periods Ended October 31, 2011 | | | |
| | One | Five | Ten |
| | Year | Years | Years |
| Returns Before Taxes | 7.48% | -0.86% | 4.69% |
| Returns After Taxes on Distributions | 7.16 | -1.70 | 3.94 |
| Returns After Taxes on Distributions and Sale of Fund Shares | 5.30 | -0.78 | 3.95 |
30
About Your Fund’s Expenses
As a shareholder of the fund, you incur ongoing costs, which include costs for portfolio management, administrative services, and shareholder reports (like this one), among others. Operating expenses, which are deducted from a fund’s gross income, directly reduce the investment return of the fund.
A fund’s expenses are expressed as a percentage of its average net assets. This figure is known as the expense ratio. The following examples are intended to help you understand the ongoing costs (in dollars) of investing in your fund and to compare these costs with those of other mutual funds. The examples are based on an investment of $1,000 made at the beginning of the period shown and held for the entire period.
The accompanying table illustrates your fund’s costs in two ways:
• Based on actual fund return. This section helps you to estimate the actual expenses that you paid over the period. The ”Ending Account Value“ shown is derived from the fund‘s actual return, and the third column shows the dollar amount that would have been paid by an investor who started with $1,000 in the fund. You may use the information here, together with the amount you invested, to estimate the expenses that you paid over the period.
To do so, simply divide your account value by $1,000 (for example, an $8,600 account value divided by $1,000 = 8.6), then multiply the result by the number given for your fund under the heading ”Expenses Paid During Period.“
• Based on hypothetical 5% yearly return. This section is intended to help you compare your fund‘s costs with those of other mutual funds. It assumes that the fund had a yearly return of 5% before expenses, but that the expense ratio is unchanged. In this case—because the return used is not the fund’s actual return—the results do not apply to your investment. The example is useful in making comparisons because the Securities and Exchange Commission requires all mutual funds to calculate expenses based on a 5% return. You can assess your fund’s costs by comparing this hypothetical example with the hypothetical examples that appear in shareholder reports of other funds.
Note that the expenses shown in the table are meant to highlight and help you compare ongoing costs only and do not reflect transaction costs incurred by the fund for buying and selling securities. Further, the expenses do not include any purchase, redemption, or account service fees described in the fund prospectus. If such fees were applied to your account, your costs would be higher. Your fund does not carry a “sales load.”
The calculations assume no shares were bought or sold during the period. Your actual costs may have been higher or lower, depending on the amount of your investment and the timing of any purchases or redemptions.
You can find more information about the fund’s expenses, including annual expense ratios, in the Financial Statements section of this report. For additional information on operating expenses and other shareholder costs, please refer to your fund’s current prospectus.
31
| | | |
| Six Months Ended October 31, 2011 | | | |
| | Beginning | Ending | Expenses |
| | Account Value | Account Value | Paid During |
| Windsor II Fund | 4/30/2011 | 10/31/2011 | Period |
| Based on Actual Fund Return | | | |
| Investor Shares | $1,000.00 | $919.43 | $1.69 |
| Admiral Shares | 1,000.00 | 920.00 | 1.31 |
| Based on Hypothetical 5% Yearly Return | | | |
| Investor Shares | $1,000.00 | $1,023.44 | $1.79 |
| Admiral Shares | 1,000.00 | 1,023.84 | 1.38 |
The calculations are based on expenses incurred in the most recent six-month period. The fund’s annualized six-month expense ratios for that period are 0.35% for Investor Shares and 0.27% for Admiral Shares. The dollar amounts shown as “Expenses Paid” are equal to the annualized expense ratio multiplied by the average account value over the period, multiplied by the number of days in the most recent six-month period, then divided by the number of days in the most recent 12-month period.
32
Glossary
30-Day SEC Yield. A fund’s 30-day SEC yield is derived using a formula specified by the U.S. Securities and Exchange Commission. Under the formula, data related to the fund’s security holdings in the previous 30 days are used to calculate the fund’s hypothetical net income for that period, which is then annualized and divided by the fund’s estimated average net assets over the calculation period. For the purposes of this calculation, a security’s income is based on its current market yield to maturity (for bonds; excluding inflation for inflation-protected securities), its actual income (for asset-backed securities), or its projected dividend yield (for stocks). Because the SEC yield represents hypothetical annualized income, it will differ—at times significantly—from the fund’s actual experience. As a result, the fund’s income distributions may be higher or lower than implied by the SEC yield.
Beta. A measure of the magnitude of a fund’s past share-price fluctuations in relation to the ups and downs of a given market index. The index is assigned a beta of 1.00. Compared with a given index, a fund with a beta of 1.20 typically would have seen its share price rise or fall by 12% when the index rose or fell by 10%. For this report, beta is based on returns over the past 36 months for both the fund and the index. Note that a fund’s beta should be reviewed in conjunction with its R-squared (see definition). The lower the R-squared, the less correlation there is between the fund and the index, and the less reliable beta is as an indicator of volatility.
Dividend Yield. Dividend income earned by stocks, expressed as a percentage of the aggregate market value (or of net asset value, for a fund). The yield is determined by dividing the amount of the annual dividends by the aggregate value (or net asset value) at the end of the period. For a fund, the dividend yield is based solely on stock holdings and does not include any income produced by other investments.
Earnings Growth Rate. The average annual rate of growth in earnings over the past five years for the stocks now in a fund.
Equity Exposure. A measure that reflects a fund’s investments in stocks and stock futures. Any holdings in short-term reserves are excluded.
Expense Ratio. The percentage of a fund’s average net assets used to pay its annual administrative and advisory expenses. These expenses directly reduce returns to investors.
Foreign Holdings. The percentage of a fund represented by securities or depositary receipts of companies based outside the United States.
Inception Date. The date on which the assets of a fund (or one of its share classes) are first invested in accordance with the fund’s investment objective. For funds with a subscription period, the inception date is the day after that period ends. Investment performance is measured from the inception date.
Median Market Cap. An indicator of the size of companies in which a fund invests; the midpoint of market capitalization (market price x shares outstanding) of a fund’s stocks, weighted by the proportion of the fund’s assets invested in each stock. Stocks representing half of the fund’s assets have market capitalizations above the median, and the rest are below it.
Price/Book Ratio. The share price of a stock divided by its net worth, or book value, per share. For a fund, the weighted average price/book ratio of the stocks it holds.
33
Price/Earnings Ratio. The ratio of a stock’s current price to its per-share earnings over the past year. For a fund, the weighted average P/E of the stocks it holds. P/E is an indicator of market expectations about corporate prospects; the higher the P/E, the greater the expectations for a company’s future growth.
R-Squared. A measure of how much of a fund’s past returns can be explained by the returns from the market in general, as measured by a given index. If a fund’s total returns were precisely synchronized with an index’s returns, its R-squared would be 1.00. If the fund’s returns bore no relationship to the index’s returns, its R-squared would be 0. For this report, R-squared is based on returns over the past 36 months for both the fund and the index.
Return on Equity. The annual average rate of return generated by a company during the past five years for each dollar of shareholder’s equity (net income divided by shareholder’s equity). For a fund, the weighted average return on equity for the companies whose stocks it holds.
Short-Term Reserves. The percentage of a fund invested in highly liquid, short-term securities that can be readily converted to cash.
Turnover Rate. An indication of the fund’s trading activity. Funds with high turnover rates incur higher transaction costs and may be more likely to distribute capital gains (which may be taxable to investors). The turnover rate excludes in-kind transactions, which have minimal impact on costs.
34
This page intentionally left blank.
The People Who Govern Your Fund
The trustees of your mutual fund are there to see that the fund is operated and managed in your best interests since, as a shareholder, you are a part owner of the fund. Your fund’s trustees also serve on the board of directors of The Vanguard Group, Inc., which is owned by the Vanguard funds and provides services to them on an at-cost basis.
A majority of Vanguard’s board members are independent, meaning that they have no affiliation with Vanguard or the funds they oversee, apart from the sizable personal investments they have made as private individuals. The independent board members have distinguished backgrounds in business, academia, and public service. Each of the trustees and executive officers oversees 180 Vanguard funds.
The following table provides information for each trustee and executive officer of the fund. More information about the trustees is in the Statement of Additional Information, which can be obtained, without charge, by contacting Vanguard at 800-662-7447, or online at vanguard.com.
| |
| Interested Trustee1 | and President (2006–2008) of Rohm and Haas Co. |
| | (chemicals); Director of Tyco International, Ltd. |
| F. William McNabb III | (diversified manufacturing and services) and Hewlett- |
| Born 1957. Trustee Since July 2009. Chairman of the | Packard Co. (electronic computer manufacturing); |
| Board. Principal Occupation(s) During the Past Five | Senior Advisor at New Mountain Capital; Trustee |
| Years: Chairman of the Board of The Vanguard Group, | of The Conference Board; Member of the Board of |
| Inc., and of each of the investment companies served | Managers of Delphi Automotive LLP (automotive |
| by The Vanguard Group, since January 2010; Director | components). |
| of The Vanguard Group since 2008; Chief Executive | |
| Officer and President of The Vanguard Group and of | Amy Gutmann |
| each of the investment companies served by The | Born 1949. Trustee Since June 2006. Principal |
| Vanguard Group since 2008; Director of Vanguard | Occupation(s) During the Past Five Years: President |
| Marketing Corporation; Managing Director of The | of the University of Pennsylvania; Christopher H. |
| Vanguard Group (1995–2008). | Browne Distinguished Professor of Political Science |
| | in the School of Arts and Sciences with secondary |
| | appointments at the Annenberg School for Commu- |
| Independent Trustees | nication and the Graduate School of Education |
| | of the University of Pennsylvania; Director of |
| Emerson U. Fullwood | Carnegie Corporation of New York, Schuylkill River |
| Born 1948. Trustee Since January 2008. Principal | Development Corporation, and Greater Philadelphia |
| Occupation(s) During the Past Five Years: Executive | Chamber of Commerce; Trustee of the National |
| Chief Staff and Marketing Officer for North America | Constitution Center; Chair of the Presidential |
| and Corporate Vice President (retired 2008) of Xerox | Commission for the Study of Bioethical Issues. |
| Corporation (document management products and | |
| services); Executive in Residence and 2010 | JoAnn Heffernan Heisen |
| Distinguished Minett Professor at the Rochester | Born 1950. Trustee Since July 1998. Principal |
| Institute of Technology; Director of SPX Corporation | Occupation(s) During the Past Five Years: Corporate |
| (multi-industry manufacturing), the United Way of | Vice President and Chief Global Diversity Officer |
| Rochester, Amerigroup Corporation (managed health | (retired 2008) and Member of the Executive |
| care), the University of Rochester Medical Center, | Committee (1997–2008) of Johnson & Johnson |
| Monroe Community College Foundation, and North | (pharmaceuticals/consumer products); Director of |
| Carolina A&T University. | Skytop Lodge Corporation (hotels), the University |
| | Medical Center at Princeton, the Robert Wood |
| Rajiv L. Gupta | Johnson Foundation, and the Center for Work Life |
| Born 1945. Trustee Since December 2001.2 | Policy; Member of the Advisory Board of the |
| Principal Occupation(s) During the Past Five Years: | Maxwell School of Citizenship and Public Affairs |
| Chairman and Chief Executive Officer (retired 2009) | at Syracuse University. |
| | |
| F. Joseph Loughrey | Thomas J. Higgins | |
| Born 1949. Trustee Since October 2009. Principal | Born 1957. Chief Financial Officer Since September |
| Occupation(s) During the Past Five Years: President | 2008. Principal Occupation(s) During the Past Five |
| and Chief Operating Officer (retired 2009) and Vice | Years: Principal of The Vanguard Group, Inc.; Chief |
| Chairman of the Board (2008–2009) of Cummins Inc. | Financial Officer of each of the investment companies |
| (industrial machinery); Director of SKF AB (industrial | served by The Vanguard Group since 2008; Treasurer |
| machinery), Hillenbrand, Inc. (specialized consumer | of each of the investment companies served by The |
| services), the Lumina Foundation for Education, and | Vanguard Group (1998–2008). |
| Oxfam America; Chairman of the Advisory Council | | |
| for the College of Arts and Letters and Member | Kathryn J. Hyatt | |
| of the Advisory Board to the Kellogg Institute for | Born 1955. Treasurer Since November 2008. Principal |
| International Studies at the University of Notre Dame. | Occupation(s) During the Past Five Years: Principal |
| | of The Vanguard Group, Inc.; Treasurer of each of |
| André F. Perold | the investment companies served by The Vanguard |
| Born 1952. Trustee Since December 2004. Principal | Group since 2008; Assistant Treasurer of each of the |
| Occupation(s) During the Past Five Years: George | investment companies served by The Vanguard Group |
| Gund Professor of Finance and Banking at the Harvard | (1988–2008). | |
| Business School (retired July 2011); Chief Investment | | |
| Officer and co-Managing Partner of HighVista | Heidi Stam | |
| Strategies LLC (private investment firm); Director of | Born 1956. Secretary Since July 2005. Principal |
| Rand Merchant Bank; Overseer of the Museum of | Occupation(s) During the Past Five Years: Managing |
| Fine Arts Boston. | Director of The Vanguard Group, Inc., since 2006; |
| | General Counsel of The Vanguard Group since 2005; |
| Alfred M. Rankin, Jr. | Secretary of The Vanguard Group and of each of the |
| Born 1941. Trustee Since January 1993. Principal | investment companies served by The Vanguard Group |
| Occupation(s) During the Past Five Years: Chairman, | since 2005; Director and Senior Vice President of |
| President, and Chief Executive Officer of NACCO | Vanguard Marketing Corporation since 2005; |
| Industries, Inc. (forklift trucks/housewares/lignite); | Principal of The Vanguard Group (1997–2006). |
| Director of Goodrich Corporation (industrial products/ | | |
| aircraft systems and services) and the National | | |
| Association of Manufacturers; Chairman of the | Vanguard Senior Management Team |
| Federal Reserve Bank of Cleveland; Vice Chairman | | |
| of University Hospitals of Cleveland; President of | R. Gregory Barton | Chris D. McIsaac |
| the Board of The Cleveland Museum of Art. | Mortimer J. Buckley | Michael S. Miller |
| | Kathleen C. Gubanich | James M. Norris |
| Peter F. Volanakis | Paul A. Heller | Glenn W. Reed |
| Born 1955. Trustee Since July 2009. Principal | Martha G. King | George U. Sauter |
| Occupation(s) During the Past Five Years: President | | |
| and Chief Operating Officer (retired 2010) of Corning | | |
| Incorporated (communications equipment); Director of | Chairman Emeritus and Senior Advisor |
| Corning Incorporated (2000–2010) and Dow Corning | | |
| (2001–2010); Overseer of the Amos Tuck School of | John J. Brennan | |
| Business Administration at Dartmouth College. | Chairman, 1996–2009 | |
| | Chief Executive Officer and President, 1996–2008 |
| |
| Executive Officers | | |
| | Founder | |
| Glenn Booraem | | |
| Born 1967. Controller Since July 2010. Principal | John C. Bogle | |
| Occupation(s) During the Past Five Years: Principal | Chairman and Chief Executive Officer, 1974–1996 |
| of The Vanguard Group, Inc.; Controller of each of | | |
| the investment companies served by The Vanguard | | |
| Group since 2010; Assistant Controller of each of | | |
| the investment companies served by The Vanguard | | |
| Group (2001–2010). | | |
1 Mr. McNabb is considered an “interested person,” as defined in the Investment Company Act of 1940, because he is an officer of the Vanguard funds.
2 December 2002 for Vanguard Equity Income Fund, Vanguard Growth Equity Fund, the Vanguard Municipal Bond Funds, and the Vanguard State Tax-Exempt Funds.
|  |
| P.O. Box 2600 |
| Valley Forge, PA 19482-2600 |
Connect with Vanguard® > vanguard.com
| |
| Fund Information > 800-662-7447 | CFA® is a trademark owned by CFA Institute. |
| Direct Investor Account Services > 800-662-2739 | |
| Institutional Investor Services > 800-523-1036 | |
| Text Telephone for People | |
| With Hearing Impairment > 800-749-7273 | |
| |
| This material may be used in conjunction | |
| with the offering of shares of any Vanguard | |
| fund only if preceded or accompanied by | |
| the fund’s current prospectus. | |
| |
| All comparative mutual fund data are from Lipper Inc. or | |
| Morningstar, Inc., unless otherwise noted. | |
| |
| You can obtain a free copy of Vanguard’s proxy voting | |
| guidelines by visiting vanguard.com/proxyreporting or by | |
| calling Vanguard at 800-662-2739. The guidelines are | |
| also available from the SEC’s website, sec.gov. In | |
| addition, you may obtain a free report on how your fund | |
| voted the proxies for securities it owned during the 12 | |
| months ended June 30. To get the report, visit either | |
| vanguard.com/proxyreporting or sec.gov. | |
| |
| You can review and copy information about your fund at | |
| the SEC’s Public Reference Room in Washington, D.C. To | |
| find out more about this public service, call the SEC at | |
| 202-551-8090. Information about your fund is also | |
| available on the SEC’s website, and you can receive | |
| copies of this information, for a fee, by sending a | |
| request in either of two ways: via e-mail addressed to | |
| publicinfo@sec.gov or via regular mail addressed to the | |
| Public Reference Section, Securities and Exchange | |
| Commission, Washington, DC 20549-1520. | |
| | © 2011 The Vanguard Group, Inc. |
| | All rights reserved. |
| | Vanguard Marketing Corporation, Distributor. |
| |
| | Q730 122011 |
Item 2: Code of Ethics. The Registrant has adopted a code of ethics that applies to the Registrant’s principal executive officer, principal financial officer, principal accounting officer or controller or persons performing similar functions. The Code of Ethics was amended during the reporting period covered by this report to make certain technical, non-material changes.
Item 3: Audit Committee Financial Expert. The following members of the Audit Committee have been determined by the Registrant’s Board of Trustees to be Audit Committee Financial Experts serving on its Audit Committee, and to be independent: Charles D. Ellis, Rajiv L. Gupta, JoAnn Heffernan Heisen, André F. Perold, and Alfred M. Rankin, Jr.
Item 4: Principal Accountant Fees and Services.
(a) Audit Fees.
Audit Fees of the Registrant
Fiscal Year Ended October 31, 2011: $64,000
Fiscal Year Ended October 31, 2010: $60,000
Aggregate Audit Fees of Registered Investment Companies in the Vanguard Group.
Fiscal Year Ended October 31, 2011: $3,978,540
Fiscal Year Ended October 31, 2010: $3,607,060
(b) Audit-Related Fees.
Fiscal Year Ended October 31, 2011: $1,341,750
Fiscal Year Ended October 31, 2010: $791,350
Includes fees billed in connection with assurance and related services provided to the Registrant, The Vanguard Group, Inc., Vanguard Marketing Corporation, and other registered investment companies in the Vanguard Group.
(c) Tax Fees.
Fiscal Year Ended October 31, 2011: $373,830
Fiscal Year Ended October 31, 2010: $336,090
Includes fees billed in connection with tax compliance, planning and advice services provided to the
Registrant, The Vanguard Group, Inc., Vanguard Marketing Corporation, and other registered investment
companies in the Vanguard Group and related to income and excise taxes.
(d) All Other Fees.
Fiscal Year Ended October 31, 2011: $16,000
Fiscal Year Ended October 31, 2010: $16,000
Includes fees billed for services related to risk management and privacy matters. Services were provided to the Registrant, The Vanguard Group, Inc., Vanguard Marketing Corporation, and other registered investment companies in the Vanguard Group.
(e) (1) Pre-Approval Policies. The policy of the Registrant’s Audit Committee is to consider and, if appropriate, approve before the principal accountant is engaged for such services, all specific audit and non-audit services provided to: (1) the Registrant; (2) The Vanguard Group, Inc.; (3) other entities controlled by The Vanguard Group, Inc. that provide ongoing services to the Registrant; and (4) other registered investment companies in the Vanguard Group. In making a determination, the Audit Committee considers whether the services are consistent with maintaining the principal accountant’s independence.
In the event of a contingency situation in which the principal accountant is needed to provide services in between scheduled Audit Committee meetings, the Chairman of the Audit Committee would be called on to consider and, if appropriate, pre-approve audit or permitted non-audit services in an amount sufficient to complete services through the next Audit Committee meeting, and to determine if such services would be consistent with maintaining the accountant’s independence. At the next scheduled Audit Committee meeting, services and fees would be presented to the Audit Committee for formal consideration, and, if appropriate, approval by the entire Audit Committee. The Audit Committee would again consider whether such services and fees are consistent with maintaining the principal accountant’s independence.
The Registrant’s Audit Committee is informed at least annually of all audit and non-audit services provided by the principal accountant to the Vanguard complex, whether such services are provided to: (1) the Registrant; (2) The Vanguard Group, Inc.; (3) other entities controlled by The Vanguard Group, Inc. that provide ongoing services to the Registrant; or (4) other registered investment companies in the Vanguard Group.
(2) No percentage of the principal accountant’s fees or services were approved pursuant to the waiver provision of paragraph (c)(7)(i)(C) of Rule 2-01 of Regulation S-X.
(f) For the most recent fiscal year, over 50% of the hours worked under the principal accountant’s engagement were not performed by persons other than full-time, permanent employees of the principal accountant.
(g) Aggregate Non-Audit Fees.
Fiscal Year Ended October 31, 2011: $389,830
Fiscal Year Ended October 31, 2010: $352,090
Includes fees billed for non-audit services provided to the Registrant, The Vanguard Group, Inc., Vanguard Marketing Corporation, and other registered investment companies in the Vanguard Group.
(h) For the most recent fiscal year, the Audit Committee has determined that the provision of all non-audit services was consistent with maintaining the principal accountant’s independence.
Item 5: Audit Committee of Listed Registrants.
Not Applicable.
Item 6: Investments.
Not Applicable.
Item 7: Disclosure of Proxy Voting Policies and Procedures for Closed-End Management Investment Companies.
Not Applicable.
Item 8: Portfolio Managers of Closed-End Management Investment Companies.
Not Applicable.
Item 9: Purchase of Equity Securities by Closed-End Management Investment Company and Affiliated Purchasers.
Not Applicable.
Item 10: Submission of Matters to a Vote of Security Holders.
Not Applicable.
Item 11: Controls and Procedures.
(a) Disclosure Controls and Procedures. The Principal Executive and Financial Officers concluded that the Registrant's Disclosure Controls and Procedures are effective based on their evaluation of the Disclosure Controls and Procedures as of a date within 90 days of the filing date of this report.
(b) Internal Control Over Financial Reporting. There were no significant changes in Registrant’s Internal Control Over Financial Reporting or in other factors that could significantly affect this control subsequent to the date of the evaluation, including any corrective actions with regard to significant deficiencies and material weaknesses.
Item 12: Exhibits.
(a) Code of Ethics.
(b) Certifications.
Pursuant to the requirements of the Securities Exchange Act of 1934 and the Investment Company Act of 1940, the registrant has duly caused this report to be signed on its behalf by the undersigned, thereunto duly authorized.
| |
| | VANGUARD WINDSOR FUNDS |
| |
| By: | /s/ F. WILLIAM MCNABB III* |
| | F. WILLIAM MCNABB III |
| | CHIEF EXECUTIVE OFFICER |
| |
| Date: December 20, 2011 |
Pursuant to the requirements of the Securities Exchange Act of 1934 and the Investment Company Act of 1940, this report has been signed below by the following persons on behalf of the registrant and in the capacities and on the dates indicated.
| |
| | VANGUARD WINDSOR FUNDS |
| |
| By: | /s/ F. WILLIAM MCNABB III* |
| | F. WILLIAM MCNABB III |
| | CHIEF EXECUTIVE OFFICER |
| |
| Date: December 20, 2011 |
| |
| | VANGUARD WINDSOR FUNDS |
| |
| By: | /s/ THOMAS J. HIGGINS* |
| | THOMAS J. HIGGINS |
| | CHIEF FINANCIAL OFFICER |
| |
| Date: December 20, 2011 |
* By: /s/ Heidi Stam
Heidi Stam, pursuant to a Power of Attorney filed on November 28, 2011 see file Number 33-23444,
Incorporated by Reference.