UNITED STATES
SECURITIES AND EXCHANGE COMMISSION
Washington, D.C. 20549
FORM N-CSR
CERTIFIED SHAREHOLDER REPORT
OF
REGISTERED MANAGEMENT INVESTMENT COMPANIES
Investment Company Act file number: 811-834
Name of Registrant: Vanguard Windsor Funds
Address of Registrant:
P.O. Box 2600
Valley Forge, PA 19482
Name and address of agent for service:
Heidi Stam, Esquire
P.O. Box 876
Valley Forge, PA 19482
Registrant’s telephone number, including area code: (610) 669-1000
Date of fiscal year end: October 31
Date of reporting period: November 1, 2009 – October 31, 2010
Item 1: Reports to Shareholders
 |
| Vanguard Windsor™ Fund |
| Annual Report |
|
| October 31, 2010 |
|
 |
|
|
|
> Vanguard Windsor Fund returned about 16% for the 12 months ended October 31, 2010, slightly ahead of its benchmark and the average return of peer funds.
> Stock selections in consumer discretionary, industrials, and health care contributed most to the fund’s result.
> For the decade ended October 31, 2010, the fund outperformed its comparative standards.
| |
| Contents | |
| Your Fund’s Total Returns. | 1 |
| Chairman’s Letter. | 2 |
| Advisors’ Report. | 7 |
| Fund Profile. | 12 |
| Performance Summary. | 13 |
| Financial Statements. | 15 |
| Your Fund’s After-Tax Returns. | 29 |
| About Your Fund’s Expenses. | 30 |
| Glossary. | 32 |
The figures shown represent past performance, which is not a guarantee of future results. (Current performance may be lower or higher than the performance data cited. For performance data current to the most recent month-end, visit our website at vanguard.com/performance.)
Please note: The opinions expressed in this report are just that—informed opinions. They should not be considered promises or advice. Also, please keep in mind that the information and opinions cover the period through the date on the front of this report. Of course, the risks of investing in your fund are spelled out in the prospectus.
See the Glossary for definitions of investment terms used in this report.
Cover photograph: Jean Maher.
| | | | |
| Your Fund’s Total Returns | | | | |
| |
| |
| |
| |
| Fiscal Year Ended October 31, 2010 | | | | |
| | | | | Total |
| | | | | Returns |
| Vanguard Windsor Fund | | | | |
| Investor Shares | | | | 16.31% |
| Admiral™ Shares | | | | 16.44 |
| Russell 1000 Value Index | | | | 15.71 |
| Multi-Cap Value Funds Average | | | | 15.97 |
| Multi-Cap Value Funds Average: Derived from data provided by Lipper Inc. | | | |
| Admiral Shares carry lower expenses and are available to investors who meet certain account-balance requirements. | |
| |
| Your Fund’s Performance at a Glance | | | | |
| October 31, 2009, Through October 31, 2010 | | | | |
| | | | Distributions Per Share |
| | Starting | Ending | Income | Capital |
| | Share Price | Share Price | Dividends | Gains |
| Vanguard Windsor Fund | | | | |
| Investor Shares | $10.97 | $12.56 | $0.186 | $0.000 |
| Admiral Shares | 37.01 | 42.37 | 0.673 | 0.000 |
1

Chairman’s Letter
Dear Shareholder,
Vanguard Windsor Fund returned about 16% for the fiscal year ended October 31, 2010, modestly outperforming its benchmark index, the Russell 1000 Value Index, and the average return for multi-capitalization value funds.
The Windsor Fund’s result reflects the U.S. stock market’s bumpy ride during the period. The fund posted strong double-digit gains in the first six months as the stock market continued its path to recovery, but then dipped into negative territory in the second half as a skittish global stock market slid in late spring and continued into the summer. A powerful rally late in the fiscal year and earlier gains lifted the fund’s results for the 12 months.
For the fiscal year, the Windsor Fund’s consumer discretionary, industrial, and health care holdings contributed most to its result. Financials, the fund’s largest holding by sector, posted the weakest return.
If you own shares of the Windsor Fund in a taxable account, you may wish to review the fund’s after-tax returns presented later in this report.
Also, please note that on October 6 Vanguard broadened the availability of our lower-cost Admiral Shares. We reduced the Admiral minimums on most of our actively managed funds to $50,000 from $100,000, as part of our ongoing efforts to lower the cost of investing for our clients.
2
Stock market performance was better than it felt
Global stock prices rallied at the start of the period, but struggled through the spring and summer, weighed down by Europe’s sovereign debt crisis and the slow pace of economic recovery in the United States. In the fiscal year’s final months, the mood turned. Stock prices climbed on continued strength in corporate earnings. In the United States, stocks also seemed to get a boost from the Federal Reserve Board’s hints that it would try to stimulate the economy with a second round of U.S. Treasury bond purchases. (In early November, the Fed announced that it would buy as much as $600 billion in Treasuries.)
For the 12 months, the broad U.S. stock market returned about 19%, a performance that was better than it felt in a year of ups and downs. Small-capitalization stocks did even better. International stocks returned about 13% on the strength of a powerful rally in emerging markets and solid single-digit gains in developed markets in Europe and the Pacific region.
Despite shrinking yields, bonds attracted investor dollars
Although fixed income yields have fallen to generational lows, investors continued to bid up bond prices. The broad U.S. bond market produced a 12-month return of about 8% as the yield of the 10-year U.S. Treasury note fell from 3.39% at the start of the period to 2.61% at the close.
| | | |
| Market Barometer | | | |
| |
| | | Average Annual Total Returns |
| | | Periods Ended October 31, 2010 |
| | One | Three | Five |
| | Year | Years | Years |
| Stocks | | | |
| Russell 1000 Index (Large-caps) | 17.67% | -6.14% | 1.99% |
| Russell 2000 Index (Small-caps) | 26.58 | -3.91 | 3.07 |
| Dow Jones U.S. Total Stock Market Index | 19.04 | -5.55 | 2.52 |
| MSCI All Country World Index ex USA (International) | 13.08 | -7.62 | 6.21 |
| |
| Bonds | | | |
| Barclays Capital U.S. Aggregate Bond Index (Broad | | | |
| taxable market) | 8.01% | 7.23% | 6.45% |
| Barclays Capital Municipal Bond Index (Broad | | | |
| tax-exempt market) | 7.78 | 5.79 | 5.20 |
| Citigroup Three-Month U.S. Treasury Bill Index | 0.12 | 0.89 | 2.41 |
| |
| CPI | | | |
| Consumer Price Index | 1.17% | 1.54% | 1.89% |
3
Tax-exempt municipal bonds also rallied. Bond prices and yields move in opposite directions, of course, so abundant returns built on rising prices could mean leaner pickings in the years ahead.
The yields of money market securities hovered near 0%, consistent with the Federal Reserve Board’s target for short-term rates.
Consumer discretionary and industrials boost performance
The Windsor Fund’s two advisors—Wellington Management Company and Alliance Bernstein—focus on out-of-favor stocks with strong fundamentals and potential for long-term growth. This investment strategy gives the fund leeway to hold proportions of sectors and stocks that differ from those of its benchmark index.
For the fiscal year ended October 31, the fund reported positive returns in all ten stock sectors; eight sectors posted double-digit gains. The consumer discretionary, industrial, and health care sectors, made the most significant contributions to performance.
As the global economy slowly gathered momentum, the fund’s industrial stocks recorded the best results for the period with a return of roughly 40%. A combination of financial discipline and some recovery in travel helped Delta Air Lines, a standout performer with a return of about 94% for the fiscal year. Farm and construction
| | | |
| Expense Ratios | | | |
| Your Fund Compared With Its Peer Group | | | |
| | Investor | Admiral | Peer Group |
| | Shares | Shares | Average |
| Windsor Fund | 0.33% | 0.20% | 1.30% |
The fund expense ratios shown are from the prospectus dated February 25, 2010, and represent estimated costs for the current fiscal year. For the fiscal year ended October 31, 2010, the fund’s expense ratios were 0.33% for Investor Shares and 0.22% for Admiral Shares. The peer-group expense ratio is derived from data provided by Lipper Inc. and captures information through year-end 2009.
Peer group: Multi-Cap Value Funds.
4
equipment manufacturer Deere (+72%) also benefited from increased demand from the United States and abroad.
A modest rebound in consumer confidence lifted a broad cross-section of companies in the consumer discretionary sector, including top-ten holdings Virgin Media and Comcast. Both cable companies earned double-digit gains for the fiscal period thanks in part to growth in their high-speed internet subscriptions.
In health care, managed care companies performed well for the fiscal year. Holdings including CIGNA and UnitedHealth benefited from membership gains and strong revenue growth.
Financials, the fund’s largest sector weighting, was the biggest restraint on the fund’s performance. Some of the fund’s investment and commercial banks produced dismal returns as the companies continued to grapple with the regulatory and financial aftershocks of the markets’ recent downturn. Among the poor performers included TD Ameritrade (–11%) and Wells Fargo (–5%).
Relative to its benchmark, the fund benefited from the advisors’ choices in industrials and energy. In industrials, both the fund and the benchmark held a similar weighting for the period, yet the fund outperformed the benchmark by more than 10 percentage points because of
| |
| Total Returns | |
| Ten Years Ended October 31, 2010 | |
| | Average |
| | Annual Return |
| Windsor Fund Investor Shares | 3.28% |
| Russell 1000 Value Index | 2.64 |
| Multi-Cap Value Funds Average | 2.44 |
| Multi-Cap Value Funds Average: Derived from data provided by Lipper Inc. | |
The figures shown represent past performance, which is not a guarantee of future results. (Current performance may be lower or higher than the performance data cited. For performance data current to the most recent month-end, visit our website at vanguard.com/performance.) Note, too, that both investment returns and principal value can fluctuate widely, so an investor’s shares, when sold, could be worth more or less than their original cost.
5
superior stock selection. Compared with its index, the fund also benefited from its caution about several big energy companies, including Exxon Mobil, which declined for the year.
Advisors’ strategy and talent keep long-term record strong
For the decade ended October 31, 2010, the Windsor Fund posted an average annual return of 3.28% for Investor Shares, ahead of the annualized returns of its benchmark index (+2.64%) and its peer group (+2.44%) for the period.
Despite two severe market downturns—the collapse of the tech bubble earlier in the decade and the recent financial crisis—the fund has managed to outpace its comparative standards. The fund’s market-beating performance over the past ten years is a testament to the fund’s two advisors and their efforts to identify companies that are undergoing short-term challenges yet have superior prospects for long-term growth.
In addition to its expert advisors, the fund’s superior performance over the period is made possible by the fund’s low costs.
A diversified portfolio is key in up and down markets
Although the fund’s 2010 fiscal year ended on a high note, it’s impossible to predict the market’s direction down the road. Seasoned investors understand that coping with the stock market’s ups and downs is an integral part of investing. An inescapable, if unpleasant, reality of investing is that to reap the potential for higher rewards, you must learn to live with greater risks.
Our experience suggests that an effective way to cope with market uncertainty is for investors to focus on the long term and build a diversified, well-balanced portfolio. A portfolio with a mix of stock, bond, and short-term investments can help protect your assets from the markets’ worst outcomes while giving you the opportunity to participate in the best. Investing within and among asset classes can further enhance your diversification.
Vanguard Windsor Fund, with its low costs and talented advisory team, can play an important supporting role in such a balanced portfolio.
Thank you for entrusting your assets to Vanguard.
Sincerely,

F. William McNabb III
Chairman and Chief Executive Officer
November 9, 2010
6
Advisors’ Report
For the fiscal year ended October 31, 2010, the Investor Shares of Vanguard Windsor Fund returned 16.31%, while the lower-cost Admiral Shares returned 16.44%. Your fund is managed by two independent advisors, a strategy that enhances the fund���s diversification by providing exposure to distinct, yet complementary, investment approaches. It is not uncommon for different advisors to have different views about individual securities or the broader investment environment.
The advisors, the percentage and amount of fund assets that each manages, and brief descriptions of their investment strategies are presented in the table below. The advisors have also prepared a discussion of the investment environment that existed during the period and of how the portfolio positioning reflects this assessment. These reports were prepared on November 16, 2010.
| | | |
| Vanguard Windsor Fund Investment Advisors | |
| |
| | Fund Assets Managed | |
| Investment Advisor | % | $ Million | Investment Strategy |
| Wellington Management | 68 | 8,653 | An opportunistic, contrarian investment approach that |
| Company, LLP | | | seeks to identify significantly undervalued securities |
| | | | using bottom-up fundamental analysis. As part of its |
| | | | long-term strategy, the advisor seeks to take |
| | | | advantage of short- and intermediate-term market-price |
| | | | dislocations that result from the market’s shorter-term |
| | | | focus. |
| AllianceBernstein L.P. | 30 | 3,818 | A value focus that couples rigorous fundamental |
| | | | company research with quantitative risk controls to |
| | | | capture value opportunities. |
| Cash Investments | 2 | 208 | These short-term reserves are invested by Vanguard in |
| | | | equity index products to simulate investment in stocks. |
| | | | Each advisor also may maintain a modest cash |
| | | | position. |
7
Wellington Management Company, llp
Portfolio Manager:
James N. Mordy, Senior Vice President and Equity Portfolio Manager Over the past year, our portfolio has held up reasonably well during a period of high market volatility. After a strong run earlier in the period, the S&P 500 peaked in April and then fell about 18% over the next ten weeks as economic momentum stalled and fears of a double dip increased. A vigorous rally then ensued on more encouraging economic data, anticipation of another round of quantitative easing, and the prospects for a change in control of Congress. We have largely maintained an overweighting to some of the more cyclical sectors of the market, which, with the exception of energy and financials, have led the market advance. At the end of the fiscal year, 77% of our portfolio was invested in these sectors (energy, materials, consumer discretionary, information technology, financials, and industrials), which together account for about 71% of the capitalization of the S&P 500 Ind ex and 64% of the Russell 1000 Value Index.
Our best-performing sector for the year was industrials, which was our worst sector last year. Delta Air Lines stock soared as corporate travel demand recovered and the major carriers showed discipline in controlling capacity. Absent a terrorist attack or a sudden spike in oil prices, we believe Delta is now in a period of strong profit recovery. We also notched strong gains in other industrials, such as Deere, Boeing, and Dover.
Despite a challenging environment in terms of high unemployment and an increase in the savings rate, consumers modestly increased spending and consumer discretionary has been the strongest sector of the market over the past 12 months. We were well-positioned as this is our largest overweighting. Highlights included Buck Holdings, which represents the stake we took in Dollar General when that retailer was privatized. Our cable and media holdings also benefited from strong fundamentals and a rebound in advertising spending.
Energy, health care, and materials also provided positive relative performance versus the S&P 500. We underperformed in the technology sector, partly because we don’t own Apple (which is more than 2% of the index’s capitalization), and partly because some of the larger-capitalization names we do own—such as Cisco and Hewlett-Packard—lagged. Another challenging sector was consumer staples, where we made a mistake with leading dairy processor Dean Foods. We underestimated the squeeze on margins from unusually promotional milk pricing by large grocers. In financials, our stocks did only slightly better than the group average. Financials was the worst-performing sector of the S&P 500 and our overweighting of it created a bit of a headwind.
8
During the year, we were net buyers (in order of significance) in the consumer staples, financial, IT, and utility sectors.
We were net sellers in the energy, industrial, consumer discretionary, materials, and health care sectors. Among our largest purchases were Anadarko Petroleum (which was attractive even allowing for significant liability as BP’s 25% partner in the Macondo well); Qualcomm (where sentiment and valuation had sunk after a couple of disappointing quarters, which we viewed as temporary given the company’s strong position in the smart phone market); and additions to our sizable Wells Fargo holding (which we don’t think is getting enough credit for its robust earnings power and lower exposure to mortgage losses compared with some of its peers among the major U.S. banks). Our sector positioning has changed only marginally over the past six months. We reduced industrials to slightly underweight from overweight, and increased our overweighting in materials. Our largest overweighted positions versus the S&P 500 Index remain in financials, consumer di scretionary, and materials. Our largest underweighted positions remain in consumer staples, IT, and telecommunication services.
We continue to see a subdued recovery. Key developments supporting the recovery include decent retail sales, stronger October auto sales, a pickup in the PMI index, a soft landing in China (versus earlier fears of a sharper slowdown), an acceleration in money supply growth,
better equity markets, and a second installment of quantitative easing by the Federal Reserve, which have helped sustain low interest rates and reduced the odds of a double-dip recession. Employment growth is a critical factor that has yet to kick in, though we did see some better numbers in the October report. Further improvement in the employment situation depends on business confidence, which might improve as a result of the midterm election. We are conscious of near-term headwinds as the GDP’s benefit from inventory restocking has largely played out, fiscal restraint seems to be the new mantra in Washington, and any failure to extend the Bush tax cuts before year end will result in higher payroll deductions in early 2011.
Corporations have been able to refinance at low rates and generate record amounts of free cash flow thanks to a historic retrenchment in capital spending. While capital spending is now increasing, we also anticipate a significant amount of merger and acquisition activity in the coming year as corporate managers consider more productive uses for their ample cash balances.
We will remain true to our time-tested value investing principles. Based on consensus analyst expectations, our stocks continue to sell at a discount to the P/E of both the S&P 500 and the Russell 1000 Value Indexes, and have slightly better earnings growth prospects over the next
9
five years. It is classic Windsor math to own companies at discounted valuations that have the potential of producing superior returns over the long run.
AllianceBernstein L.P.
Portfolio Managers:
Joseph G. Paul, Chief Investment Officer of North American Value Equities and Co-Chief Investment Officer of U.S. Large-Cap Value Equities Gregory L. Powell, Portfolio Manager Deep uncertainty among investors has driven the stampede into safe assets over the past year. But while fears of another economic and market slump are understandable, we think investors are underestimating the cost of playing it safe—and the far greater potential for higher returns in equities. Stocks are not only extraordinarily attractive versus bonds; they are also historically cheap, even based on cyclically depressed near-term earnings outlooks.
There is also a big opportunity to add value through stock-picking. With macro worries dominating, investors are ignoring important differences in fundamentals and valuations among companies. The spike in risk aversion this spring and late summer was particularly hard on the portfolio’s performance. But this environment has also led many company stocks to be undervalued and we believe our research-driven value strategy is well-equipped to exploit the opportunities created. Indeed, the valuation spread between the cheapest and most expensive stocks remains well above the historical average, implying significant outperformance potential.
Our portfolio is strongly positioned to take advantage of the compelling value opportunity we see in free cash flows. Investors are reluctant to assign much value to excess cash, reflecting doubts that it can be deployed productively. But our research shows that the corporate cash giveback potential is as great as it has ever been and should drive strong stock gains as managements unlock this value via buybacks, dividends, and acquisitions. We expect holdings as diverse as Garmin, Sara Lee, Gap, and AstraZeneca to generate long-term free cash flows ranging from 50% to 90% of their current stock prices, yet they are trading well below the value benchmark, based on our long-term earnings forecasts.
Additions to our holdings include two leading North American nitrogen-fertilizer producers, Agrium and CF Industries. Our research indicates that the market is underestimating these two companies’ long-term earnings potential resulting from the recent surge in grain prices—which has boosted farmer income and should drive much higher demand for fertilizer—
10
and from the continued price weakness in U.S. natural gas, a major cost input for making nitrogen fertilizer. These savings give the two companies a huge advantage over global competitors, particularly in China and the Ukraine, which depend on more expensive natural gas and coal.
We also recently initiated positions in Marathon Oil and Hess. The stocks have lagged because investors are, in our view, excessively extrapolating weak recent results, which were weighed down by investments that we expect to now begin paying off.
History shows that fundamentals and low valuations drive value stocks over time. As the market’s fixation on macro concerns abates, we are confident that the portfolio can realize its latent potential.
11
| | | |
| Windsor Fund | | |
| |
| |
| Fund Profile | | |
| As of October 31, 2010 | | |
| |
| Share-Class Characteristics | | |
| | | Investor | Admiral |
| | | Shares | Shares |
| Ticker Symbol | | VWNDX | VWNEX |
| Expense Ratio1 | | 0.33% | 0.20% |
| 30-Day SEC Yield | | 0.97% | 1.06% |
| |
| Portfolio Characteristics | | |
| | | Russell | DJ |
| | | 1000 | U.S. Total |
| | | Value | Market |
| | Fund | Index | Index |
| Number of Stocks | 166 | 668 | 3,920 |
| Median Market Cap $21.4B | $31.2B | $28.5B |
| Price/Earnings Ratio | 15.1x | 14.7x | 16.9x |
| Price/Book Ratio | 1.7x | 1.5x | 2.2x |
| Return on Equity | 16.5% | 15.1% | 19.2% |
| Earnings Growth Rate | 3.7% | 0.7% | 6.5% |
| Dividend Yield | 1.6% | 2.3% | 1.8% |
| Foreign Holdings | 10.5% | 0.0% | 0.0% |
| Turnover Rate | 50% | — | — |
| Short-Term Reserves | 0.8% | — | — |
| |
| Sector Diversification (% of equity exposure) |
| | | Russell | DJ |
| | | 1000 | U.S. Total |
| | | Value | Market |
| | Fund | Index | Index |
| Consumer | | | |
| Discretionary | 16.3% | 7.8% | 11.8% |
| Consumer Staples | 8.1 | 10.4 | 10.0 |
| Energy | 11.1 | 11.5 | 9.8 |
| Financials | 19.1 | 26.8 | 16.3 |
| Health Care | 12.8 | 13.3 | 11.0 |
| Industrials | 10.0 | 9.0 | 11.1 |
| Information | | | |
| Technology | 13.3 | 5.7 | 19.4 |
| Materials | 5.3 | 3.0 | 4.4 |
| Telecommunication | | | |
| Services | 1.7 | 5.2 | 2.8 |
| Utilities | 2.3 | 7.3 | 3.4 |
| | | |
| Volatility Measures | | | |
| | | Russell | DJ |
| | | 1000 | U.S. Total |
| | | Value | Market |
| | | Index | Index |
| R-Squared | | 0.96 | 0.97 |
| Beta | | 1.05 | 1.08 |
| These measures show the degree and timing of the fund’s fluctuations compared with the indexes over 36 months. | |
| |
| |
| Ten Largest Holdings (% of total net assets) |
| Wells Fargo & Co. | | Diversified Banks | 3.2% |
| Pfizer Inc. | | Pharmaceuticals | 2.4 |
| Comcast Corp. Class A | | Cable & Satellite | 2.3 |
| Delta Air Lines Inc. | | Airlines | 2.1 |
| ACE Ltd. | | Property & Casualty | |
| | | Insurance | 2.1 |
| JPMorgan Chase & Co. | | Diversified Financial | |
| | | Services | 2.1 |
| Arrow Electronics Inc. | | Technology | |
| | | Distributors | 1.8 |
| Virgin Media Inc. | | Cable & Satellite | 1.7 |
| Cisco Systems Inc. | | Communications | |
| | | Equipment | 1.7 |
| Buck Holdings LP Private | | General | |
| Placement | | Merchandise Stores | 1.6 |
| Top Ten | | | 21.0% |
| The holdings listed exclude any temporary cash investments and equity index products. |
| | | |
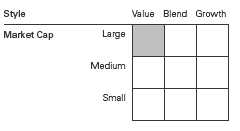
Investment Focus
1 The expense ratios shown are from the prospectus dated February 25, 2010, and represent estimated costs for the current fiscal year. For the fiscal year ended October 31, 2010, the expense ratios were 0.33% for Investor Shares and 0.22% for Admiral Shares.
12
Windsor Fund
Performance Summary
All of the returns in this report represent past performance, which is not a guarantee of future results that may be achieved by the fund. (Current performance may be lower or higher than the performance data cited. For performance data current to the most recent month-end, visit our website at vanguard.com/performance.) Note, too, that both investment returns and principal value can fluctuate widely, so an investor’s shares, when sold, could be worth more or less than their original cost. The returns shown do not reflect taxes that a shareholder would pay on fund distributions or on the sale of fund shares.
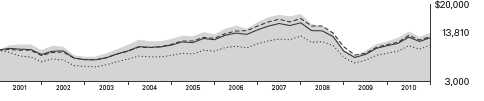
Cumulative Performance: October 31, 2000, Through October 31, 2010
Initial Investment of $10,000
| | | | | |
| | | Average Annual Total Returns | |
| | | Periods Ended October 31, 2010 | |
| | | | | | Final Value |
| | | One | Five | Ten | of a $10,000 |
| | | Year | Years | Years | Investment |
| | Windsor Fund Investor Shares | 16.31% | 0.55% | 3.28% | $13,810 |
| •••••••• | Dow Jones U.S. Total Stock Market | | | | |
| | Index | 19.04 | 2.52 | 1.02 | 11,073 |
| – – – – | Russell 1000 Value Index | 15.71 | 0.62 | 2.64 | 12,983 |
| | Multi-Cap Value Funds Average | 15.97 | 0.72 | 2.44 | 12,729 |
| Multi-Cap Value Funds Average: Derived from data provided by Lipper Inc. | | | |
| |
| |
| | | | | Since | Final Value |
| | | One | Five | Inception | of a $50,000 |
| | | Year | Years | (11/12/2001) | Investment |
| Windsor Fund Admiral Shares | 16.44% | 0.66% | 3.38% | $67,368 |
| Dow Jones U.S. Total Stock Market | | | | |
| Index | | 19.04 | 2.52 | 3.95 | 70,752 |
| Russell 1000 Value Index | 15.71 | 0.62 | 3.95 | 70,785 |
"Since Inception" performance is calculated from the Admiral Shares’ inception date for both the fund and its comparative standards.
See Financial Highlights for dividend and capital gains information.
13
Windsor Fund
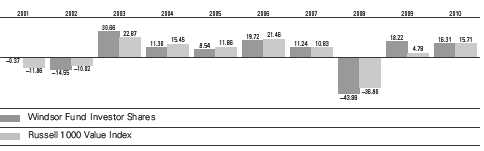
Fiscal-Year Total Returns (%): October 31, 2000, Through October 31, 2010
Average Annual Total Returns: Periods Ended September 30, 2010
This table presents average annual total returns through the latest calendar quarter—rather than through the end of the fiscal period. Securities and Exchange Commission rules require that we provide this information.
| | | | |
| | Inception | One | Five | Ten |
| | Date | Year | Years | Years |
| Investor Shares | 10/23/1958 | 7.84% | -0.76% | 3.10% |
| Admiral Shares | 11/12/2001 | 7.91 | -0.65 | 2.951 |
| 1 Return since inception. | | | | |
14
Windsor Fund
Financial Statements
Statement of Net Assets
As of October 31, 2010
The fund reports a complete list of its holdings in regulatory filings four times in each fiscal year, at the quarter-ends. For the second and fourth fiscal quarters, the lists appear in the fund’s semiannual and annual reports to shareholders. For the first and third fiscal quarters, the fund files the lists with the Securities and Exchange Commission on Form N-Q. Shareholders can look up the fund’s Forms N-Q on the SEC’s website at sec.gov. Forms N-Q may also be reviewed and copied at the SEC’s Public Reference Room (see the back cover of this report for further information).
| | | |
| | | | Market |
| | | | Value |
| | | Shares | ($000) |
| Common Stocks (98.6%)1 | | |
| Consumer Discretionary (16.0%) | |
| | Virgin Media Inc. | 8,589,500 | 218,431 |
| *,2 | Buck Holdings LP Private | | |
| | Placement | NA | 206,299 |
| | Comcast Corp. Class A | | |
| | Special Shares | 8,941,200 | 172,833 |
| | CBS Corp. Class B | 9,426,100 | 159,584 |
| | Home Depot Inc. | 4,282,800 | 132,253 |
| | Comcast Corp. Class A | 5,693,700 | 117,176 |
| * | Toll Brothers Inc. | 5,720,000 | 102,617 |
| | Staples Inc. | 4,700,100 | 96,211 |
| | TJX Cos. Inc. | 1,969,200 | 90,367 |
| 3 | MDC Holdings Inc. | 3,137,926 | 80,802 |
| | Time Warner Cable Inc. | 1,128,400 | 65,301 |
| | News Corp. Class A | 3,765,900 | 54,455 |
| * | Ford Motor Co. | 3,499,300 | 49,445 |
| | Cablevision Systems | | |
| | Corp. Class A | 1,500,000 | 40,110 |
| | Gap Inc. | 2,076,100 | 39,467 |
| | Time Warner Inc. | 1,157,100 | 37,617 |
| | VF Corp. | 427,542 | 35,589 |
| | Ross Stores Inc. | 579,100 | 34,161 |
| * | Kohl’s Corp. | 610,000 | 31,232 |
| ^ | Garmin Ltd. | 850,000 | 27,914 |
| * | Lear Corp. | 314,000 | 27,758 |
| * | Royal Caribbean | | |
| | Cruises Ltd. | 691,500 | 27,342 |
| * | TRW Automotive | | |
| | Holdings Corp. | 549,700 | 25,116 |
| * | DIRECTV Class A | 575,000 | 24,989 |
| * | NVR Inc. | 32,904 | 20,644 |
| | Fortune Brands Inc. | 377,500 | 20,404 |
| | Gannett Co. Inc. | 1,632,909 | 19,350 |
| | DR Horton Inc. | 1,810,295 | 18,899 |
| | Macy’s Inc. | 629,700 | 14,886 |
| | | |
| | | | Market |
| | | | Value |
| | | Shares | ($000) |
| * | Office Depot Inc. | 3,038,600 | 13,643 |
| | Foot Locker Inc. | 750,000 | 11,948 |
| * | Pulte Group Inc. | 1,140,665 | 8,954 |
| * | Jones Group Inc. | 376,300 | 5,441 |
| | | | 2,031,238 |
| Consumer Staples (7.8%) | | |
| | CVS Caremark Corp. | 3,819,100 | 115,031 |
| | Japan Tobacco Inc. | 32,935 | 102,319 |
| | Archer-Daniels- | | |
| | Midland Co. | 3,044,003 | 101,426 |
| | Bunge Ltd. | 1,543,100 | 92,694 |
| | Molson Coors | | |
| | Brewing Co. Class B | 1,770,300 | 83,611 |
| | Procter & Gamble Co. | 1,248,000 | 79,335 |
| | Altria Group Inc. | 2,845,800 | 72,340 |
| | Sysco Corp. | 1,945,000 | 57,300 |
| | Unilever NV | 1,918,766 | 56,982 |
| | BRF - Brasil Foods SA | 3,839,000 | 55,407 |
| | Safeway Inc. | 1,925,000 | 44,083 |
| * | Constellation Brands Inc. | | |
| | Class A | 1,720,060 | 33,937 |
| | Kimberly-Clark Corp. | 490,000 | 31,037 |
| | Sara Lee Corp. | 2,086,800 | 29,904 |
| | BRF - Brasil Foods | | |
| | SA ADR | 1,388,400 | 20,312 |
| * | Smithfield Foods Inc. | 1,150,400 | 19,269 |
| | | | 994,987 |
| Energy (10.8%) | | |
| | Apache Corp. | 1,281,900 | 129,498 |
| | Anadarko Petroleum | | |
| | Corp. | 2,000,000 | 123,140 |
| | Baker Hughes Inc. | 2,496,100 | 115,644 |
| | Chevron Corp. | 1,244,900 | 102,841 |
| * | Southwestern Energy Co. | 2,821,800 | 95,518 |
| * | Weatherford | | |
| | International Ltd. | 5,304,300 | 89,165 |
15
| | | |
| Windsor Fund | | |
| |
| |
| |
| | | | Market |
| | | | Value |
| | | Shares | ($000) |
| | Canadian Natural | | |
| | Resources Ltd. | 2,244,200 | 81,846 |
| | ConocoPhillips | 1,136,900 | 67,532 |
| | Noble Energy Inc. | 763,500 | 62,210 |
| | Marathon Oil Corp. | 1,643,500 | 58,459 |
| | Devon Energy Corp. | 895,932 | 58,253 |
| | Noble Corp. | 1,634,200 | 56,429 |
| | Inpex Corp. | 10,812 | 56,306 |
| | Consol Energy Inc. | 1,292,900 | 47,527 |
| | Ensco PLC ADR | 995,000 | 46,108 |
| | Hess Corp. | 718,055 | 45,259 |
| * | Newfield Exploration Co. | 664,200 | 39,600 |
| | Nexen Inc. | 1,750,000 | 37,258 |
| * | Forest Oil Corp. | 1,154,400 | 35,475 |
| * | Rowan Cos. Inc. | 761,200 | 25,043 |
| | | | 1,373,111 |
| Exchange-Traded Funds (1.1%) | |
| ^,4 | Vanguard Value ETF | 1,689,100 | 84,497 |
| 4 | Vanguard Total Stock | | |
| | Market ETF | 892,000 | 54,118 |
| | | | 138,615 |
| Financials (18.7%) | | |
| | Wells Fargo & Co. | 15,537,900 | 405,228 |
| | ACE Ltd. | 4,445,500 | 264,152 |
| | JPMorgan Chase & Co. | 6,937,250 | 261,049 |
| | Ameriprise Financial Inc. | 3,880,400 | 200,578 |
| | Unum Group | 6,420,700 | 143,952 |
| | Bank of America Corp. | 11,648,300 | 133,257 |
| | Goldman Sachs Group Inc. | 799,900 | 128,744 |
| | Invesco Ltd. | 5,147,554 | 118,394 |
| | Principal Financial | | |
| | Group Inc. | 3,692,100 | 99,096 |
| * | TD Ameritrade | | |
| | Holding Corp. | 4,894,300 | 83,644 |
| | PNC Financial Services | | |
| | Group Inc. | 1,265,600 | 68,216 |
| | Travelers Cos. Inc. | 1,131,200 | 62,442 |
| | Banco Santander | | |
| | Brasil SA ADR | 3,850,000 | 55,440 |
| | Morgan Stanley | 1,776,800 | 44,189 |
| | BB&T Corp. | 1,509,600 | 35,340 |
| * | Berkshire Hathaway Inc. | | |
| | Class B | 435,000 | 34,609 |
| | Fifth Third Bancorp | 2,632,800 | 33,068 |
| | US Bancorp | 1,365,200 | 33,010 |
| * | UBS AG | 1,810,700 | 30,759 |
| | Capital One Financial Corp. | 750,000 | 27,952 |
| | XL Group PLC Class A | 1,290,200 | 27,288 |
| * | Citigroup Inc. | 6,405,000 | 26,709 |
| * | UBS AG | | |
| | (New York Shares) | 1,434,500 | 24,415 |
| | Comerica Inc. | 602,300 | 21,550 |
| | Allstate Corp. | 388,400 | 11,842 |
| | | | 2,374,923 |
| | | |
| | | | Market |
| | | | Value |
| | | Shares | ($000) |
| Health Care (12.5%) | | |
| | Pfizer Inc. | 17,318,700 | 301,345 |
| | UnitedHealth Group Inc. | 4,846,400 | 174,713 |
| * | Amgen Inc. | 2,487,100 | 142,237 |
| | Johnson & Johnson | 2,215,000 | 141,029 |
| * | Gilead Sciences Inc. | 3,487,800 | 138,361 |
| | CIGNA Corp. | 3,377,400 | 118,851 |
| | Medtronic Inc. | 3,193,000 | 112,425 |
| | Roche Holding AG | 708,438 | 104,037 |
| | Daiichi Sankyo Co. Ltd. | 4,671,000 | 98,986 |
| | McKesson Corp. | 1,403,900 | 92,629 |
| | Merck & Co. Inc. | 1,776,766 | 64,461 |
| ^ | AstraZeneca PLC ADR | 934,100 | 47,135 |
| | Covidien plc | 1,102,700 | 43,965 |
| | | | 1,580,174 |
| Industrials (9.7%) | | |
| * | Delta Air Lines Inc. | 19,578,700 | 271,948 |
| | Pentair Inc. | 4,098,800 | 134,154 |
| | Deere & Co. | 1,500,000 | 115,200 |
| | Dover Corp. | 2,072,600 | 110,055 |
| | Textron Inc. | 5,087,400 | 105,920 |
| | United Parcel Service Inc. | | |
| | Class B | 1,072,000 | 72,188 |
| | Honeywell | | |
| | International Inc. | 1,473,900 | 69,435 |
| | General Electric Co. | 4,260,200 | 68,248 |
| | Northrop Grumman Corp. | 828,000 | 52,338 |
| | Ingersoll-Rand plc | 1,045,000 | 41,079 |
| | Parker Hannifin Corp. | 504,700 | 38,635 |
| | Waste Management Inc. | 904,300 | 32,301 |
| * | Thomas & Betts Corp. | 641,600 | 27,942 |
| | SPX Corp. | 318,992 | 21,392 |
| | Raytheon Co. | 442,300 | 20,381 |
| * | Terex Corp. | 883,600 | 19,837 |
| | FedEx Corp. | 218,000 | 19,123 |
| | Eaton Corp. | 77,800 | 6,911 |
| | | | 1,227,087 |
| Information Technology (13.0%) | |
| *,3 | Arrow Electronics Inc. | 7,805,250 | 231,114 |
| * | Cisco Systems Inc. | 9,327,100 | 212,938 |
| | Microsoft Corp. | 5,698,800 | 151,816 |
| | Hewlett-Packard Co. | 3,203,300 | 134,731 |
| | QUALCOMM Inc. | 2,837,800 | 128,070 |
| | Accenture PLC Class A | 2,783,700 | 124,459 |
| | Western Union Co. | 6,725,500 | 118,369 |
| * | Lam Research Corp. | 2,144,500 | 98,197 |
| | Corning Inc. | 5,025,400 | 91,864 |
| * | Check Point Software | | |
| | Technologies Ltd. | 1,964,000 | 83,961 |
| * | Dell Inc. | 5,074,896 | 72,977 |
| * | Flextronics | | |
| | International Ltd. | 7,533,700 | 53,941 |
| | Texas Instruments Inc. | 1,687,600 | 49,902 |
| | Tyco Electronics Ltd. | 1,031,400 | 32,675 |
16
| | | |
| Windsor Fund | | |
| |
| |
| |
| | | | Market |
| | | | Value |
| | | Shares | ($000) |
| | Intel Corp. | 1,142,400 | 22,928 |
| | International Business | | |
| | Machines Corp. | 151,500 | 21,755 |
| * | Motorola Inc. | 2,197,800 | 17,912 |
| | | | 1,647,609 |
| Materials (5.2%) | | |
| * | Owens-Illinois Inc. | 4,074,800 | 114,217 |
| | Agrium Inc. | 1,165,178 | 103,130 |
| | Potash Corp. of | | |
| | Saskatchewan Inc. | 558,800 | 81,076 |
| | Mosaic Co. | 1,031,700 | 75,479 |
| | Rexam plc | 14,262,963 | 72,648 |
| | Monsanto Co. | 1,172,600 | 69,676 |
| | HeidelbergCement AG | 959,009 | 50,076 |
| | CF Industries Holdings Inc. 287,000 | 35,166 |
| | Freeport-McMoRan | | |
| | Copper & Gold Inc. | 290,000 | 27,457 |
| | Commercial Metals Co. | 1,400,000 | 19,432 |
| | Cliffs Natural | | |
| | Resources Inc. | 163,600 | 10,667 |
| | | | 659,024 |
| Telecommunication Services (1.6%) | |
| | AT&T Inc. | 4,083,700 | 116,386 |
| | Vodafone Group PLC ADR 1,206,000 | 33,177 |
| | CenturyLink Inc. | 707,900 | 29,293 |
| | Verizon | | |
| | Communications Inc. | 630,400 | 20,469 |
| * | Sprint Nextel Corp. | 250,048 | 1,030 |
| | | | 200,355 |
| Utilities (2.2%) | | |
| | PG&E Corp. | 2,098,500 | 100,350 |
| | Northeast Utilities | 1,527,100 | 47,768 |
| | Constellation Energy | | |
| | Group Inc. | 1,003,000 | 30,331 |
| | NiSource Inc. | 1,700,200 | 29,430 |
| | UGI Corp. | 711,400 | 21,406 |
| | CMS Energy Corp. | 1,149,000 | 21,119 |
| | Pepco Holdings Inc. | 1,007,700 | 19,408 |
| | Edison International | 150,000 | 5,535 |
| | | | 275,347 |
| Total Common Stocks | | |
| (Cost $10,965,260) | | 12,502,470 |
| Temporary Cash Investments (1.7%)1 | |
| Money Market Fund (0.9%) | | |
| 5,6 | Vanguard Market Liquidity | |
| | Fund, 0.237% | 111,433,774 | 111,434 |
| | |
| | Face | Market |
| | Amount | Value |
| | ($000) | ($000) |
| Repurchase Agreement (0.6%) | |
| Bank of America Securities, LLC | | |
| 0.230%, 11/1/10 | | |
| (Dated 10/29/10, | | |
| Repurchase Value | | |
| $76,401,000, collateralized | |
| by Government | | |
| National Mortgage Assn. | |
| 4.000%-5.206%, | | |
| 1/20/40-9/20/60) | 76,400 | 76,400 |
| |
| U.S. Government and Agency Obligations (0.2%) |
| 7,8 Freddie Mac | | |
| Discount Notes, 0.240%, | |
| 3/14/11 | 25,000 | 24,981 |
| Total Temporary Cash Investments | |
| (Cost $212,812) | | 212,815 |
| Total Investments (100.3%) | | |
| (Cost $11,178,072) | | 12,715,285 |
| Other Assets and Liabilities (-0.3%) | |
| Other Assets | | 104,020 |
| Liabilities6 | | (139,975) |
| | | (35,955) |
| Net Assets (100%) | | 12,679,330 |
17
Windsor Fund
| |
| At October 31, 2010, net assets consisted of: |
| | Amount |
| | ($000) |
| Paid-in Capital | 15,616,472 |
| Undistributed Net Investment Income | 24,065 |
| Accumulated Net Realized Losses | (4,502,636) |
| Unrealized Appreciation (Depreciation) | |
| Investment Securities | 1,537,213 |
| Futures Contracts | 4,089 |
| Foreign Currencies | 127 |
| Net Assets | 12,679,330 |
| |
| |
| Investor Shares—Net Assets | |
| Applicable to 637,103,316 outstanding | |
| $.001 par value shares of beneficial | |
| interest (unlimited authorization) | 7,999,466 |
| Net Asset Value Per Share— | |
| Investor Shares | $12.56 |
| |
| |
| Admiral Shares—Net Assets | |
| Applicable to 110,453,911 outstanding | |
| $.001 par value shares of beneficial | |
| interest (unlimited authorization) | 4,679,864 |
| Net Asset Value Per Share— | |
| Admiral Shares | $42.37 |
See Note A in Notes to Financial Statements.
* Non-income producing security.
^ Part of security position is on loan to broker-dealers. The total value of securities on loan is $36,330,000.
1 The fund invests a portion of its cash reserves in equity markets through the use of index futures contracts. After giving effect to futures investments, the fund’s effective common stock and temporary cash investment positions represent 99.2% and 1.1%, respectively, of net assets.
2 Restricted security represents 1.6% of net assets. Shares not applicable for this private placement.
3 Considered an affiliated company of the fund as the fund owns more than 5% of the outstanding voting securities of such company.
4 Considered an affiliated company of the fund as the issuer is another member of The Vanguard Group.
5 Affiliated money market fund available only to Vanguard funds and certain trusts and accounts managed by Vanguard. Rate shown is the 7-day yield.
6 Includes $37,720,000 of collateral received for securities on loan.
7 Securities with a value of $24,981,000 have been segregated as initial margin for open futures contracts.
8 The issuer operates under a congressional charter; its securities are not backed by the full faith and credit of the U.S. government.
ADR—American Depositary Receipt.
See accompanying Notes, which are an integral part of the Financial Statements.
18
| |
| Windsor Fund | |
| |
| |
| Statement of Operations | |
| |
| | Year Ended |
| | October 31, 2010 |
| | ($000) |
| Investment Income | |
| Income | |
| Dividends1,2 | 238,584 |
| Interest2 | 579 |
| Security Lending | 2,204 |
| Total Income | 241,367 |
| Expenses | |
| Investment Advisory Fees—Note B | |
| Basic Fee | 15,912 |
| Performance Adjustment | (3,830) |
| The Vanguard Group—Note C | |
| Management and Administrative—Investor Shares | 16,502 |
| Management and Administrative—Admiral Shares | 4,887 |
| Marketing and Distribution—Investor Shares | 1,670 |
| Marketing and Distribution—Admiral Shares | 834 |
| Custodian Fees | 266 |
| Auditing Fees | 29 |
| Shareholders’ Reports—Investor Shares | 135 |
| Shareholders’ Reports—Admiral Shares | 20 |
| Trustees’ Fees and Expenses | 23 |
| Total Expenses | 36,448 |
| Expenses Paid Indirectly | (640) |
| Net Expenses | 35,808 |
| Net Investment Income | 205,559 |
| Realized Net Gain (Loss) | |
| Investment Securities Sold2 | 94,156 |
| Futures Contracts | 24,010 |
| Foreign Currencies | (71) |
| Realized Net Gain (Loss) | 118,095 |
| Change in Unrealized Appreciation (Depreciation) | |
| Investment Securities | 1,539,929 |
| Futures Contracts | 3,868 |
| Foreign Currencies | 129 |
| Change in Unrealized Appreciation (Depreciation) | 1,543,926 |
| Net Increase (Decrease) in Net Assets Resulting from Operations | 1,867,580 |
1 Dividends are net of foreign withholding taxes of $2,163,000.
2 Dividend income, interest income, and realized net gain (loss) from affiliated companies of the fund were $6,496,000, $329,000, and ($1,707,000), respectively.
See accompanying Notes, which are an integral part of the Financial Statements.
19
| | |
| Windsor Fund | | |
| |
| |
| Statement of Changes in Net Assets | | |
| |
| | Year Ended October 31, |
| | 2010 | 2009 |
| | ($000) | ($000) |
| Increase (Decrease) in Net Assets | | |
| Operations | | |
| Net Investment Income | 205,559 | 224,781 |
| Realized Net Gain (Loss) | 118,095 | (2,133,452) |
| Change in Unrealized Appreciation (Depreciation) | 1,543,926 | 3,679,831 |
| Net Increase (Decrease) in Net Assets Resulting from Operations | 1,867,580 | 1,771,160 |
| Distributions | | |
| Net Investment Income | | |
| Investor Shares | (126,673) | (159,222) |
| Admiral Shares | (75,870) | (101,534) |
| Realized Capital Gain | | |
| Investor Shares | — | — |
| Admiral Shares | — | — |
| Total Distributions | (202,543) | (260,756) |
| Capital Share Transactions | | |
| Investor Shares | (684,753) | (413,053) |
| Admiral Shares | (113,168) | (1,049,588) |
| Net Increase (Decrease) from Capital Share Transactions | (797,921) | (1,462,641) |
| Total Increase (Decrease) | 867,116 | 47,763 |
| Net Assets | | |
| Beginning of Period | 11,812,214 | 11,764,451 |
| End of Period1 | 12,679,330 | 11,812,214 |
1 Net Assets—End of Period includes undistributed net investment income of $24,065,000 and $21,120,000.
See accompanying Notes, which are an integral part of the Financial Statements.
20
| | | | | |
| Windsor Fund | | | | | |
| |
| |
| Financial Highlights | | | | | |
| |
| Investor Shares | | | | | |
| |
| For a Share Outstanding | | | Year Ended October 31, |
| Throughout Each Period | 2010 | 2009 | 2008 | 2007 | 2006 |
| Net Asset Value, Beginning of Period | $10.97 | $9.51 | $19.52 | $19.27 | $17.81 |
| Investment Operations | | | | | |
| Net Investment Income | .1901 | .197 | .279 | .298 | .277 |
| Net Realized and Unrealized Gain (Loss) | | | | | |
| on Investments | 1.586 | 1.486 | (7.985) | 1.782 | 3.007 |
| Total from Investment Operations | 1.776 | 1.683 | (7.706) | 2.080 | 3.284 |
| Distributions | | | | | |
| Dividends from Net Investment Income | (.186) | (.223) | (.289) | (.301) | (.265) |
| Distributions from Realized Capital Gains | — | — | (2.015) | (1.529) | (1.559) |
| Total Distributions | (.186) | (.223) | (2.304) | (1.830) | (1.824) |
| Net Asset Value, End of Period | $12.56 | $10.97 | $9.51 | $19.52 | $19.27 |
| |
| Total Return2 | 16.31% | 18.22% | -43.88% | 11.24% | 19.72% |
| |
| Ratios/Supplemental Data | | | | | |
| Net Assets, End of Period (Millions) | $7,999 | $7,610 | $7,041 | $14,490 | $14,140 |
| Ratio of Total Expenses to | | | | | |
| Average Net Assets3 | 0.33% | 0.33% | 0.30% | 0.31% | 0.36% |
| Ratio of Net Investment Income to | | | | | |
| Average Net Assets | 1.59%1 | 2.03% | 1.91% | 1.50% | 1.50% |
| Portfolio Turnover Rate | 50% | 61%4 | 55% | 40% | 38% |
1 Net investment income per share and the ratio of net investment income to average net assets include $.036 and 0.29%, respectively, resulting from a cash payment received in connection with the merger of Schering-Plough Corp. and Merck & Co. in November 2009.
2 Total returns do not include account service fees that may have applied in the periods shown. Fund prospectuses provide information about any applicable account service fees.
3 Includes performance-based investment advisory fee increases (decreases) of (0.03%), (0.05%), (0.03%), (0.01%), and 0.02%.
4 Excludes the value of portfolio securities received or delivered as a result of in-kind purchases or redemptions of the fund’s capital shares.
See accompanying Notes, which are an integral part of the Financial Statements.
21
| | | | | |
| Windsor Fund | | | | | |
| |
| |
| Financial Highlights | | | | | |
| |
| Admiral Shares | | | | | |
| |
| For a Share Outstanding | | | Year Ended October 31, |
| Throughout Each Period | 2010 | 2009 | 2008 | 2007 | 2006 |
| Net Asset Value, Beginning of Period | $37.01 | $32.08 | $65.90 | $65.04 | $60.12 |
| Investment Operations | | | | | |
| Net Investment Income | .6851 | .701 | .999 | 1.085 | 1.000 |
| Net Realized and Unrealized Gain (Loss) | | | | | |
| on Investments | 5.348 | 5.020 | (26.974) | 6.019 | 10.150 |
| Total from Investment Operations | 6.033 | 5.721 | (25.975) | 7.104 | 11.150 |
| Distributions | | | | | |
| Dividends from Net Investment Income | (.673) | (.791) | (1.047) | (1.085) | (.970) |
| Distributions from Realized Capital Gains | — | — | (6.798) | (5.159) | (5.260) |
| Total Distributions | (.673) | (.791) | (7.845) | (6.244) | (6.230) |
| Net Asset Value, End of Period | $42.37 | $37.01 | $32.08 | $65.90 | $65.04 |
| |
| Total Return | 16.44% | 18.38% | -43.85% | 11.38% | 19.85% |
| |
| Ratios/Supplemental Data | | | | | |
| Net Assets, End of Period (Millions) | $4,680 | $4,203 | $4,723 | $9,770 | $8,987 |
| Ratio of Total Expenses to Average Net Assets2 | 0.22% | 0.20% | 0.17% | 0.19% | 0.25% |
| Ratio of Net Investment Income to | | | | | |
| Average Net Assets | 1.70%1 | 2.16% | 2.04% | 1.62% | 1.61% |
| Portfolio Turnover Rate | 50% | 61%3 | 55% | 40% | 38% |
1 Net investment income per share and the ratio of net investment income to average net assets include $.120 and 0.29%, respectively, resulting from a cash payment received in connection with the merger of Schering-Plough Corp. and Merck & Co. in November 2009.
2 Includes performance-based investment advisory fee increases (decreases) of (0.03%), (0.05%), (0.03%), (0.01%), and 0.02%.
3 Excludes the value of portfolio securities received or delivered as a result of in-kind purchases or redemptions of the fund’s capital shares.
See accompanying Notes, which are an integral part of the Financial Statements.
22
Windsor Fund
Notes to Financial Statements
Vanguard Windsor Fund is registered under the Investment Company Act of 1940 as an open-end investment company, or mutual fund. The fund offers two classes of shares: Investor Shares and Admiral Shares. Investor Shares are available to any investor who meets the fund’s minimum purchase requirements. Admiral Shares are designed for investors who meet certain administrative, service, and account-size criteria.
A. The following significant accounting policies conform to generally accepted accounting principles for U.S. mutual funds. The fund consistently follows such policies in preparing its financial statements.
1. Security Valuation: Securities are valued as of the close of trading on the New York Stock Exchange (generally 4 p.m., Eastern time) on the valuation date. Equity securities are valued at the latest quoted sales prices or official closing prices taken from the primary market in which each security trades; such securities not traded on the valuation date are valued at the mean of the latest quoted bid and asked prices. Securities for which market quotations are not readily available, or whose values have been affected by events occurring before the fund’s pricing time but after the close of the securities’ primary markets, are valued at their fair values calculated according to procedures adopted by the board of trustees. These procedures include obtaining quotations from an independent pricing service, monitoring news to identify significant market- or security-specific events, and evaluating changes in the values of foreign market proxies (for example, ADRs, futures contracts, or exchange-traded funds), between the time the foreign markets close and the fund’s pricing time. When fair-value pricing is employed, the prices of securities used by a fund to calculate its net asset value may differ from quoted or published prices for the same securities. Investments in Vanguard Market Liquidity Fund are valued at that fund’s net asset value. Temporary cash investments acquired over 60 days to maturity are valued using the latest bid prices or using valuations based on a matrix system (which considers such factors as security prices, yields, maturities, and ratings), both as furnished by independent pricing services. Other temporary cash investments are valued at amortized cost, which approximates market value.
2. Foreign Currency: Securities and other assets and liabilities denominated in foreign currencies are translated into U.S. dollars using exchange rates obtained from an independent third party as of the fund’s pricing time on the valuation date. Realized gains (losses) and unrealized appreciation (depreciation) on investment securities include the effects of changes in exchange rates since the securities were purchased, combined with the effects of changes in security prices. Fluctuations in the value of other assets and liabilities resulting from changes in exchange rates are recorded as unrealized foreign currency gains (losses) until the assets or liabilities are settled in cash, at which time they are recorded as realized foreign currency gains (losses).
3. Futures Contracts: The fund uses index futures contracts to a limited extent, with the objective of maintaining full exposure to the stock market while maintaining liquidity. The fund may purchase or sell futures contracts to achieve a desired level of investment, whether to accommodate portfolio turnover or cash flows from capital share transactions. The primary risks associated with the use of futures contracts are imperfect correlation between changes in market values of stocks held by the fund and the prices of futures contracts, and the possibility of an illiquid market.
Futures contracts are valued at their quoted daily settlement prices. The aggregate principal amounts of the contracts are not recorded in the Statement of Net Assets. Fluctuations in the value of the contracts are recorded in the Statement of Net Assets as an asset (liability) and in the Statement of Operations as unrealized appreciation (depreciation) until the contracts are closed, when they are recorded as realized futures gains (losses).
23
Windsor Fund
4. Repurchase Agreements: The fund invests in repurchase agreements. Securities pledged as collateral for repurchase agreements are held by a custodian bank until the agreements mature. Each agreement requires that the market value of the collateral be sufficient to cover payments of interest and principal; however, in the event of default or bankruptcy by the other party to the agreement, retention of the collateral may be subject to legal proceedings.
5. Federal Income Taxes: The fund intends to continue to qualify as a regulated investment company and distribute all of its taxable income. Management has analyzed the fund’s tax positions taken for all open federal income tax years (October 31, 2007–2010), and has concluded that no provision for federal income tax is required in the fund’s financial statements.
6. Distributions: Distributions to shareholders are recorded on the ex-dividend date.
7. Security Lending: The fund may lend its securities to qualified institutional borrowers to earn additional income. Security loans are required to be secured at all times by collateral at least equal to the market value of securities loaned. The fund invests cash collateral received in Vanguard Market Liquidity Fund, and records a liability for the return of the collateral, during the period the securities are on loan. Security lending income represents fees charged to borrowers plus income earned on investing cash collateral, less expenses associated with the loan.
8. Other: Dividend income is recorded on the ex-dividend date. Interest income includes income distributions received from Vanguard Market Liquidity Fund and is accrued daily. Security transactions are accounted for on the date securities are bought or sold. Costs used to determine realized gains (losses) on the sale of investment securities are those of the specific securities sold.
Each class of shares has equal rights as to assets and earnings, except that each class separately bears certain class-specific expenses related to maintenance of shareholder accounts (included in Management and Administrative expenses) and shareholder reporting. Marketing and distribution expenses are allocated to each class of shares based on a method approved by the board of trustees. Income, other non-class-specific expenses, and gains and losses on investments are allocated to each class of shares based on its relative net assets.
B. AllianceBernstein L.P. and Wellington Management Company, LLP, each provide investment advisory services to a portion of the fund for a fee calculated at an annual percentage rate of average net assets managed by the advisor. The basic fees of each advisor are subject to quarterly adjustments based on performance for the preceding three years relative to a designated market index: for AllianceBernstein L.P., the Russell 1000 Value Index; and for Wellington Management Company, LLP, the S&P 500 Index.
The Vanguard Group manages the cash reserves of the fund on an at-cost basis.
For the year ended October 31, 2010, the aggregate investment advisory fee represented an effective annual basic rate of 0.13% of the fund’s average net assets, before a decrease of $3,830,000 (0.03%) based on performance.
C. The Vanguard Group furnishes at cost corporate management, administrative, marketing, and distribution services. The costs of such services are allocated to the fund under methods approved by the board of trustees. The fund has committed to provide up to 0.40% of its net assets in capital contributions to Vanguard. At October 31, 2010, the fund had contributed capital of $2,202,000 to Vanguard (included in Other Assets), representing 0.02% of the fund’s net assets and 0.88% of Vanguard’s capitalization. The fund’s trustees and officers are also directors and officers of Vanguard.
24
Windsor Fund
D. The fund has asked its investment advisors to direct certain security trades, subject to obtaining the best price and execution, to brokers who have agreed to rebate to the fund part of the commissions generated. Such rebates are used solely to reduce the fund’s management and administrative expenses. For the year ended October 31, 2010, these arrangements reduced the fund’s expenses by $640,000 (an annual rate of 0.01% of average net assets).
E. Various inputs may be used to determine the value of the fund’s investments. These inputs are summarized in three broad levels for financial statement purposes. The inputs or methodologies used to value securities are not necessarily an indication of the risk associated with investing in those securities.
Level 1—Quoted prices in active markets for identical securities.
Level 2—Other significant observable inputs (including quoted prices for similar securities, interest rates, prepayment speeds, credit risk, etc.).
Level 3—Significant unobservable inputs (including the fund’s own assumptions used to determine the fair value of investments).
The following table summarizes the fund’s investments as of October 31, 2010, based on the inputs used to value them:
| | | |
| | Level 1 | Level 2 | Level 3 |
| Investments | ($000) | ($000) | ($000) |
| Common Stocks | 11,724,058 | 572,113 | 206,299 |
| Temporary Cash Investments | 111,434 | 101,381 | — |
| Futures Contracts—Assets1 | 147 | — | — |
| Total | 11,835,639 | 673,494 | 206,299 |
| 1 Represents variation margin on the last day of the reporting period. | | | |
The following table summarizes changes in investments valued based on Level 3 inputs during the year ended October 31, 2010:
| |
| | Investments in |
| | Common Stocks |
| Amount Valued Based on Level 3 Inputs | ($000) |
| Balance as of October 31, 2009 | 124,541 |
| Transfers out of Level 3 | (33,210) |
| Change in Unrealized Appreciation (Depreciation) | 114,968 |
| Balance as of October 31, 2010 | 206,299 |
25
Windsor Fund
F. At October 31, 2010, the aggregate settlement value of open futures contracts and the related unrealized appreciation (depreciation) were:
| | | | |
| | | | | ($000) |
| | | | Aggregate | |
| | | Number of | Settlement | Unrealized |
| | | Long (Short) | Value | Appreciation |
| Futures Contracts | Expiration | Contracts | Long (Short) | (Depreciation) |
| S&P 500 Index | December 2010 | 154 | 45,418 | 2,459 |
| E-mini S&P MidCap 400 Index | December 2010 | 337 | 27,887 | 1,630 |
Unrealized appreciation (depreciation) on open futures contracts is required to be treated as realized gain (loss) for tax purposes.
G. Distributions are determined on a tax basis and may differ from net investment income and realized capital gains for financial reporting purposes. Differences may be permanent or temporary. Permanent differences are reclassified among capital accounts in the financial statements to reflect their tax character. Temporary differences arise when certain items of income, expense, gain, or loss are recognized in different periods for financial statement and tax purposes; these differences will reverse at some time in the future. Differences in classification may also result from the treatment of short-term gains as ordinary income for tax purposes.
During the year ended October 31, 2010, the fund realized net foreign currency losses of $71,000, which decreased distributable net income for tax purposes; accordingly, such losses have been reclassified from accumulated net realized losses to undistributed net investment income.
For tax purposes, at October 31, 2010, the fund had $49,712,000 of ordinary income available for distribution. The fund had available capital loss carryforwards totaling $4,497,216,000 to offset future net capital gains of $2,266,771,000 through October 31, 2016, and $2,230,445,000 through October 31, 2017.
At October 31, 2010, the cost of investment securities for tax purposes was $11,179,352,000. Net unrealized appreciation of investment securities for tax purposes was $1,535,933,000, consisting of unrealized gains of $2,020,947,000 on securities that had risen in value since their purchase and $485,014,000 in unrealized losses on securities that had fallen in value since their purchase.
H. During the year ended October 31, 2010, the fund purchased $6,064,824,000 of investment securities and sold $6,786,232,000 of investment securities, other than temporary cash investments.
26
Windsor Fund
I. Certain of the fund’s investments are in companies that are considered to be affiliated companies of the fund because the fund owns more than 5% of the outstanding voting securities of the company. Transactions during the period in securities of these companies were as follows:
| | | | | |
| | | | Current Period Transactions | |
| October 31, 2009 | Proceeds from | | October 31, 2010 |
| | Market | Purchases | Securities | Dividend | Market |
| | Value | at Cost | Sold | Income | Value |
| | ($000) | ($000) | ($000) | ($000) | ($000) |
| Arrow Electronics Inc. | 205,744 | 2,149 | 11,165 | -— | 231,114 |
| MDC Holdings Inc. | 107,719 | -— | 5,048 | 3,240 | 80,802 |
| | 313,463 | | | 3,240 | 311,916 |
| |
| J. Capital share transactions for each class of shares were: | | | |
| | | | | Year Ended October 31, |
| | | | 2010 | | 2009 |
| | | Amount | Shares | Amount | Shares |
| | | ($000) | (000) | ($000) | (000) |
| Investor Shares | | | | | |
| Issued | | 749,394 | 62,784 | 837,675 | 92,979 |
| Issued in Lieu of Cash Distributions | | 123,675 | 10,531 | 155,346 | 17,218 |
| Redeemed | | (1,557,822) | (130,102) | (1,406,074) | (157,026) |
| Net Increase (Decrease)—Investor Shares | | (684,753) | (56,787) | (413,053) | (46,829) |
| Admiral Shares | | | | | |
| Issued | | 419,342 | 10,255 | 291,226 | 9,177 |
| Issued in Lieu of Cash Distributions | | 67,848 | 1,713 | 91,474 | 3,020 |
| Redeemed | | (600,358) | (15,059) | (1,432,288) | (45,863) |
| Net Increase (Decrease)—Admiral Shares | (113,168) | (3,091) | (1,049,588) | (33,666) |
K. In preparing the financial statements as of October 31, 2010, management considered the impact of subsequent events for potential recognition or disclosure in these financial statements.
27
Report of Independent Registered Public Accounting Firm
To the Trustees of Vanguard Windsor Funds and the Shareholders of Vanguard Windsor Fund:
In our opinion, the accompanying statement of net assets, and the related statements of operations and of changes in net assets and the financial highlights present fairly, in all material respects, the financial position of Vanguard Windsor Fund (constituting a separate portfolio of Vanguard Windsor Funds, hereafter referred to as the “Fund”) at October 31, 2010, the results of its operations for the year then ended, the changes in its net assets for each of the two years in the period then ended and the financial highlights for each of the five years in the period then ended, in conformity with accounting principles generally accepted in the United States of America. These financial statements and financial highlights (hereafter referred to as “financial statements”) are the responsibility of the Fund’s management; our responsibility is to express an opinion on these financial statements based on our audits. We conducted our audit s of these financial statements in accordance with the standards of the Public Company Accounting Oversight Board (United States). Those standards require that we plan and perform the audit to obtain reasonable assurance about whether the financial statements are free of material misstatement. An audit includes examining, on a test basis, evidence supporting the amounts and disclosures in the financial statements, assessing the accounting principles used and significant estimates made by management, and evaluating the overall financial statement presentation. We believe that our audits, which included confirmation of securities at October 31, 2010 by correspondence with the custodians and brokers and by agreement to the underlying ownership records of Vanguard Market Liquidity Fund, provide a reasonable basis for our opinion.
PricewaterhouseCoopers LLP
Philadelphia, Pennsylvania
December 9, 2010
|
| Special 2010 tax information (unaudited) for Vanguard Windsor Fund |
| This information for the fiscal year ended October 31, 2010, is included pursuant to provisions of the Internal Revenue Code. |
| The fund distributed $202,543,000 of qualified dividend income to shareholders during the fiscal year. |
| For corporate shareholders, 100% of investment income (dividend income plus short-term gains, if any) |
| qualifies for the dividends-received deduction. |
28
Your Fund’s After-Tax Returns
This table presents returns for your fund both before and after taxes. The after-tax returns are shown in two ways: (1) assuming that an investor owned the fund during the entire period and paid taxes on the fund’s distributions, and (2) assuming that an investor paid taxes on the fund’s distributions and sold all shares at the end of each period.
Calculations are based on the highest individual federal income tax and capital gains tax rates in effect at the times of the distributions and the hypothetical sales. State and local taxes were not considered. After-tax returns reflect any qualified dividend income , using actual prior-year figures and estimates for 2010. (In the example, returns after the sale of fund shares may be higher than those assuming no sale. This occurs when the sale would have produced a capital loss. The calculation assumes that the investor received a tax deduction for the loss.) The table shows returns for Investor Shares only; returns for other share classes will differ. Please note that your actual after-tax returns will depend on your tax situation and may differ from those shown. Also note that if you own the fund in a tax-deferred account, such as an individual retirement account or a 401(k) plan, this information does not apply to you. Such accounts are not subject to c urrent taxes.
Finally, keep in mind that a fund’s performance—whether before or after taxes—does not guarantee future results.
| | | |
| Average Annual Total Returns: Windsor Fund Investor Shares | | | |
| Periods Ended October 31, 2010 | | | |
| | One | Five | Ten |
| | Year | Years | Years |
| Returns Before Taxes | 16.31% | 0.55% | 3.28% |
| Returns After Taxes on Distributions | 16.04 | -0.62 | 2.20 |
| Returns After Taxes on Distributions and Sale of Fund Shares | 10.93 | 0.48 | 2.63 |
29
About Your Fund’s Expenses
As a shareholder of the fund, you incur ongoing costs, which include costs for portfolio management, administrative services, and shareholder reports (like this one), among others. Operating expenses, which are deducted from a fund’s gross income, directly reduce the investment return of the fund.
A fund’s expenses are expressed as a percentage of its average net assets. This figure is known as the expense ratio. The following examples are intended to help you understand the ongoing costs (in dollars) of investing in your fund and to compare these costs with those of other mutual funds. The examples are based on an investment of $1,000 made at the beginning of the period shown and held for the entire period.
The accompanying table illustrates your fund’s costs in two ways:
• Based on actual fund return. This section helps you to estimate the actual expenses that you paid over the period. The ”Ending Account Value“ shown is derived from the fund‘s actual return, and the third column shows the dollar amount that would have been paid by an investor who started with $1,000 in the fund. You may use the information here, together with the amount you invested, to estimate the expenses that you paid over the period.
To do so, simply divide your account value by $1,000 (for example, an $8,600 account value divided by $1,000 = 8.6), then multiply the result by the number given for your fund under the heading ”Expenses Paid During Period.“
• Based on hypothetical 5% yearly return. This section is intended to help you compare your fund‘s costs with those of other mutual funds. It assumes that the fund had a yearly return of 5% before expenses, but that the expense ratio is unchanged. In this case—because the return used is not the fund’s actual return—the results do not apply to your investment. The example is useful in making comparisons because the Securities and Exchange Commission requires all mutual funds to calculate expenses based on a 5% return. You can assess your fund’s costs by comparing this hypothetical example with the hypothetical examples that appear in shareholder reports of other funds.
Note that the expenses shown in the table are meant to highlight and help you compare ongoing costs only and do not reflect transaction costs incurred by the fund for buying and selling securities. Further, the expenses do not include the transaction fees or the account service fee described in the prospectus. If such fees were applied to your account, your costs would be higher. Your fund does not charge transaction fees, such as purchase or redemption fees, nor does it carry a “sales load.” The calculations assume no shares were bought or sold during the period. Your actual costs may have been higher or lower, depending on the amount of your investment and the timing of any purchases or redemptions.
You can find more information about the fund’s expenses, including annual expense ratios, in the Financial Statements section of this report. For additional information on operating expenses and other shareholder costs, please refer to your fund’s current prospectus.
30
| | | |
| Six Months Ended October 31, 2010 | | | |
| | Beginning | Ending | Expenses |
| | Account Value | Account Value | Paid During |
| Windsor Fund | 4/30/2010 | 10/31/2010 | Period |
| Based on Actual Fund Return | | | |
| Investor Shares | $1,000.00 | $984.48 | $1.55 |
| Admiral Shares | 1,000.00 | 984.68 | 1.15 |
| Based on Hypothetical 5% Yearly Return | | | |
| Investor Shares | $1,000.00 | $1,023.64 | $1.58 |
| Admiral Shares | 1,000.00 | 1,024.05 | 1.17 |
The calculations are based on expenses incurred in the most recent six-month period. The fund’s annualized six-month expense ratios for that period are 0.31% for Investor Shares and 0.23% for Admiral Shares. The dollar amounts shown as “Expenses Paid” are equal to the annualized expense ratio multiplied by the average account value over the period, multiplied by the number of days in the most recent six-month period, then divided by the number of days in the most recent 12-month period.
31
Glossary
30-Day SEC Yield. A fund’s 30-day SEC yield is derived using a formula specified by the U.S. Securities and Exchange Commission. Under the formula, data related to the fund’s security holdings in the previous 30 days are used to calculate the fund’s hypothetical net income for that period, which is then annualized and divided by the fund’s estimated average net assets over the calculation period. For the purposes of this calculation, a security’s income is based on its current market yield to maturity (in the case of bonds) or its projected dividend yield (for stocks). Because the SEC yield represents hypothetical annualized income, it will differ—at times significantly—from the fund’s actual experience. As a result, the fund’s income distributions may be higher or lower than implied by the SEC yield.
Beta. A measure of the magnitude of a fund’s past share-price fluctuations in relation to the ups and downs of a given market index. The index is assigned a beta of 1.00. Compared with a given index, a fund with a beta of 1.20 typically would have seen its share price rise or fall by 12% when the index rose or fell by 10%. For this report, beta is based on returns over the past 36 months for both the fund and the index. Note that a fund’s beta should be reviewed in conjunction with its R-squared (see definition). The lower the R-squared, the less correlation there is between the fund and the index, and the less reliable beta is as an indicator of volatility.
Dividend Yield. Dividend income earned by stocks, expressed as a percentage of the aggregate market value (or of net asset value, for a fund). The yield is determined by dividing the amount of the annual dividends by the aggregate value (or net asset value) at the end of the period. For a fund, the dividend yield is based solely on stock holdings and does not include any income produced by other investments.
Earnings Growth Rate. The average annual rate of growth in earnings over the past five years for the stocks now in a fund.
Equity Exposure. A measure that reflects a fund’s investments in stocks and stock futures. Any holdings in short-term reserves are excluded.
Expense Ratio. The percentage of a fund’s average net assets used to pay its annual administrative and advisory expenses. These expenses directly reduce returns to investors.
Foreign Holdings. The percentage of a fund represented by stocks or depositary receipts of companies based outside the United States.
Inception Date. The date on which the assets of a fund (or one of its share classes) are first invested in accordance with the fund’s investment objective. For funds with a subscription period, the inception date is the day after that period ends. Investment performance is measured from the inception date.
Median Market Cap. An indicator of the size of companies in which a fund invests; the midpoint of market capitalization (market price x shares outstanding) of a fund’s stocks, weighted by the proportion of the fund’s assets invested in each stock. Stocks representing half of the fund’s assets have market capitalizations above the median, and the rest are below it.
Price/Book Ratio. The share price of a stock divided by its net worth, or book value, per share. For a fund, the weighted average price/book ratio of the stocks it holds.
32
Price/Earnings Ratio. The ratio of a stock’s current price to its per-share earnings over the past year. For a fund, the weighted average P/E of the stocks it holds. P/E is an indicator of market expectations about corporate prospects; the higher the P/E, the greater the expectations for a company’s future growth.
R-Squared. A measure of how much of a fund’s past returns can be explained by the returns from the market in general, as measured by a given index. If a fund’s total returns were precisely synchronized with an index’s returns, its R-squared would be 1.00. If the fund’s returns bore no relationship to the index’s returns, its R-squared would be 0. For this report, R-squared is based on returns over the past 36 months for both the fund and the index.
Return on Equity. The annual average rate of return generated by a company during the past five years for each dollar of shareholder’s equity (net income divided by shareholder’s equity). For a fund, the weighted average return on equity for the companies whose stocks it holds.
Short-Term Reserves. The percentage of a fund invested in highly liquid, short-term securities that can be readily converted to cash.
Turnover Rate. An indication of the fund’s trading activity. Funds with high turnover rates incur higher transaction costs and may be more likely to distribute capital gains (which may be taxable to investors). The turnover rate excludes in-kind transactions, which have minimal impact on costs.
33
This page intentionally left blank.
This page intentionally left blank.
The People Who Govern Your Fund
The trustees of your mutual fund are there to see that the fund is operated and managed in your best interests since, as a shareholder, you are a part owner of the fund. Your fund’s trustees also serve on the board of directors of The Vanguard Group, Inc., which is owned by the Vanguard funds and provides services to them on an at-cost basis.
A majority of Vanguard’s board members are independent, meaning that they have no affiliation with Vanguard or the funds they oversee, apart from the sizable personal investments they have made as private individuals. The independent board members have distinguished backgrounds in business, academia, and public service. Each of the trustees and executive officers oversees 178 Vanguard funds.
The following table provides information for each trustee and executive officer of the fund. More information about the trustees is in the Statement of Additional Information, which can be obtained, without charge, by contacting Vanguard at 800-662-7447, or online at vanguard.com.
| |
| Interested Trustee1 | Amy Gutmann |
| | Born 1949. Trustee Since June 2006. Principal |
| F. William McNabb III | Occupation(s) During the Past Five Years: President |
| Born 1957. Trustee Since July 2009. Chairman of the | of the University of Pennsylvania; Christopher H. |
| Board. Principal Occupation(s) During the Past Five | Browne Distinguished Professor of Political Science |
| Years: Chairman of the Board of The Vanguard Group, | in the School of Arts and Sciences with secondary |
| Inc., and of each of the investment companies served | appointments at the Annenberg School for Commu- |
| by The Vanguard Group, since January 2010; Director | nication and the Graduate School of Education |
| of The Vanguard Group since 2008; Chief Executive | of the University of Pennsylvania; Director of |
| Officer and President of The Vanguard Group and of | Carnegie Corporation of New York, Schuylkill River |
| each of the investment companies served by The | Development Corporation, and Greater Philadelphia |
| Vanguard Group since 2008; Director of Vanguard | Chamber of Commerce; Trustee of the National |
| Marketing Corporation; Managing Director of The | Constitution Center; Chair of the Presidential |
| Vanguard Group (1995–2008) . | Commission for the Study of Bioethical Issues. |
| |
| | JoAnn Heffernan Heisen |
| Independent Trustees | Born 1950. Trustee Since July 1998. Principal |
| | Occupation(s) During the Past Five Years: Corporate |
| Emerson U. Fullwood | Vice President and Chief Global Diversity Officer |
| Born 1948. Trustee Since January 2008. Principal | since 2006 (retired 2008) and Member of the |
| Occupation(s) During the Past Five Years: Executive | Executive Committee (retired 2008) of Johnson & |
| Chief Staff and Marketing Officer for North America | Johnson (pharmaceuticals/consumer products); Vice |
| and Corporate Vice President (retired 2008) of Xerox | President and Chief Information Officer of Johnson & |
| Corporation (document management products and | Johnson (1997–2005); Director of the University |
| services); Director of SPX Corporation (multi-industry | Medical Center at Princeton and Women’s Research |
| manufacturing), the United Way of Rochester, | and Education Institute; Member of the Advisory |
| Amerigroup Corporation (managed health care), | Board of the Maxwell School of Citizenship and Public |
| the University of Rochester Medical Center, and | Affairs at Syracuse University. |
| Monroe Community College Foundation. | |
| | F. Joseph Loughrey |
| Rajiv L. Gupta | Born 1949. Trustee Since October 2009. Principal |
| Born 1945. Trustee Since December 2001.2 | Occupation(s) During the Past Five Years: President |
| Principal Occupation(s) During the Past Five Years: | and Chief Operating Officer since 2005 (retired 2009) |
| Chairman and Chief Executive Officer (retired 2009) | and Vice Chairman of the Board (2008–2009) of |
| and President (2006–2008) of Rohm and Haas Co. | Cummins Inc. (industrial machinery); Director of |
| (chemicals); Director of Tyco International, Ltd. | SKF AB (industrial machinery), Hillenbrand, Inc. |
| (diversified manufacturing and services) and Hewlett- | (specialized consumer services), Sauer-Danfoss Inc. |
| Packard Co. (electronic computer manufacturing); | (machinery), the Lumina Foundation for Education, |
| Trustee of The Conference Board; Member of the | and Oxfam America; Chairman of the Advisory |
| Board of Managers of Delphi Automotive LLP | Council for the College of Arts and Letters at the |
| (automotive components) . | University of Notre Dame. |
| | |
| André F. Perold | Kathryn J. Hyatt | |
| Born 1952. Trustee Since December 2004. Principal | Born 1955. Treasurer Since November 2008. Principal |
| Occupation(s) During the Past Five Years: George | Occupation(s) During the Past Five Years: Principal |
| Gund Professor of Finance and Banking at the Harvard | of The Vanguard Group, Inc.; Treasurer of each of |
| Business School; Chair of the Investment Committee | the investment companies served by The Vanguard |
| of HighVista Strategies LLC (private investment firm) . | Group since 2008; Assistant Treasurer of each of the |
| | investment companies served by The Vanguard Group |
| Alfred M. Rankin, Jr. | (1988–2008) . | |
| Born 1941. Trustee Since January 1993. Principal | | |
| Occupation(s) During the Past Five Years: Chairman, | Heidi Stam | |
| President, and Chief Executive Officer of NACCO | Born 1956. Secretary Since July 2005. Principal |
| Industries, Inc. (forklift trucks/housewares/lignite); | Occupation(s) During the Past Five Years: Managing |
| Director of Goodrich Corporation (industrial products/ | Director of The Vanguard Group, Inc., since 2006; |
| aircraft systems and services); Chairman of the | General Counsel of The Vanguard Group since 2005; |
| Federal Reserve Bank of Cleveland; Trustee of The | Secretary of The Vanguard Group and of each of the |
| Cleveland Museum of Art. | investment companies served by The Vanguard Group |
| | since 2005; Director and Senior Vice President of |
| Peter F. Volanakis | Vanguard Marketing Corporation since 2005; |
| Born 1955. Trustee Since July 2009. Principal | Principal of The Vanguard Group (1997–2006). |
| Occupation(s) During the Past Five Years: President | | |
| since 2007 and Chief Operating Officer since 2005 | | |
| of Corning Incorporated (communications equipment); | Vanguard Senior Management Team |
| President of Corning Technologies (2001–2005); | | |
| Director of Corning Incorporated and Dow Corning; | R. Gregory Barton | Michael S. Miller |
| Trustee of the Corning Incorporated Foundation and | Mortimer J. Buckley | James M. Norris |
| the Corning Museum of Glass; Overseer of the | Kathleen C. Gubanich | Glenn W. Reed |
| Amos Tuck School of Business Administration at | Paul A. Heller | George U. Sauter |
| Dartmouth College. | | |
| |
| | Chairman Emeritus and Senior Advisor |
| Executive Officers | | |
| | John J. Brennan | |
| Glenn Booraem | Chairman, 1996–2009 | |
| Born 1967. Controller Since July 2010. Principal | Chief Executive Officer and President, 1996–2008 |
| Occupation(s) During the Past Five Years: Principal | | |
| of The Vanguard Group, Inc.; Controller of each of | | |
| the investment companies served by The Vanguard | Founder | |
| Group since 2010; Assistant Controller of each of | | |
| the investment companies served by The Vanguard | John C. Bogle | |
| Group (2001–2010) . | Chairman and Chief Executive Officer, 1974–1996 |
| |
| Thomas J. Higgins | | |
| Born 1957. Chief Financial Officer Since September | | |
| 2008. Principal Occupation(s) During the Past Five | | |
| Years: Principal of The Vanguard Group, Inc.; Chief | | |
| Financial Officer of each of the investment companies | | |
| served by The Vanguard Group since 2008; Treasurer | | |
| of each of the investment companies served by The | | |
| Vanguard Group (1998–2008) . | | |
1 Mr. McNabb is considered an “interested person,” as defined in the Investment Company Act of 1940, because he is an officer of the Vanguard funds.
2 December 2002 for Vanguard Equity Income Fund, Vanguard Growth Equity Fund, the Vanguard Municipal Bond Funds, and the Vanguard State Tax-Exempt Funds.
|  |
| | P.O. Box 2600 |
| | Valley Forge, PA 19482-2600 |
| |
| |
| |
| Connect with Vanguard® > vanguard.com | |
| |
| |
| |
| Fund Information > 800-662-7447 | |
| Direct Investor Account Services > 800-662-2739 | |
| Institutional Investor Services > 800-523-1036 | |
| Text Telephone for People | |
| With Hearing Impairment > 800-749-7273 | |
| |
| This material may be used in conjunction | |
| with the offering of shares of any Vanguard | |
| fund only if preceded or accompanied by | |
| the fund’s current prospectus. | |
| |
| All comparative mutual fund data are from Lipper Inc. or | |
| Morningstar, Inc., unless otherwise noted. | |
| |
| You can obtain a free copy of Vanguard’s proxy voting | |
| guidelines by visiting vanguard.com/proxyreporting or by | |
| calling Vanguard at 800-662-2739. The guidelines are | |
| also available from the SEC’s website, sec.gov. In | |
| addition, you may obtain a free report on how your fund | |
| voted the proxies for securities it owned during the 12 | |
| months ended June 30. To get the report, visit either | |
| vanguard.com/proxyreporting or sec.gov. | |
| |
| You can review and copy information about your fund at | |
| the SEC’s Public Reference Room in Washington, D.C. To | |
| find out more about this public service, call the SEC at | |
| 202-551-8090. Information about your fund is also | |
| available on the SEC’s website, and you can receive | |
| copies of this information, for a fee, by sending a | |
| request in either of two ways: via e-mail addressed to | |
| publicinfo@sec.gov or via regular mail addressed to the | |
| Public Reference Section, Securities and Exchange | |
| Commission, Washington, DC 20549-1520. | |
| |
| |
| | © 2010 The Vanguard Group, Inc. |
| | All rights reserved. |
| | Vanguard Marketing Corporation, Distributor. |
| |
| | Q220 122010 |
 |
| Vanguard Windsor™ II Fund |
| Annual Report |
|
| October 31, 2010 |
|
 |
|
|
|
|
> For the fiscal year ended October 31, 2010, Vanguard Windsor II Fund returned about 12% for both Investor and Admiral Shares.
> Despite these solid returns, the fund lagged its benchmark, the Russell 1000 Value Index, by more than 3 percentage points.
> The fund turned in positive results from all sectors, but consumer discretionary and industrial stocks were the biggest contributors to performance.
| |
| Contents | |
| Your Fund’s Total Returns. | 1 |
| Chairman’s Letter. | 2 |
| Advisors’ Report. | 7 |
| Fund Profile. | 11 |
| Performance Summary. | 12 |
| Financial Statements. | 14 |
| Your Fund’s After-Tax Returns. | 29 |
| About Your Fund’s Expenses. | 30 |
| Glossary. | 32 |
Please note: The opinions expressed in this report are just that—informed opinions. They should not be considered promises or advice. Also, please keep in mind that the information and opinions cover the period through the date on the front of this report. Of course, the risks of investing in your fund are spelled out in the prospectus.
See the Glossary for definitions of investment terms used in this report.
Cover photograph: Jean Maher.
| | | | |
| Your Fund’s Total Returns | | | | |
| |
| |
| |
| |
| Fiscal Year Ended October 31, 2010 | | | | |
| | | | | Total |
| | | | | Returns |
| Vanguard Windsor II Fund | | | | |
| Investor Shares | | | | 12.05% |
| Admiral™ Shares | | | | 12.12 |
| Russell 1000 Value Index | | | | 15.71 |
| Large-Cap Value Funds Average | | | | 12.94 |
| Large-Cap Value Funds Average: Derived from data provided by Lipper Inc. | | | |
| Admiral Shares carry lower expenses and are available to investors who meet certain account-balance requirements. | |
| |
| Your Fund’s Performance at a Glance | | | | |
| October 31, 2009, Through October 31, 2010 | | | | |
| | | | Distributions Per Share |
| | Starting | Ending | Income | Capital |
| | Share Price | Share Price | Dividends | Gains |
| Vanguard Windsor II Fund | | | | |
| Investor Shares | $22.22 | $24.37 | $0.496 | $0.000 |
| Admiral Shares | 39.46 | 43.26 | 0.925 | 0.000 |
1

Chairman’s Letter
Dear Shareholder,
Vanguard Windsor II Fund turned in strong results for the fiscal year ended October 31, 2010, returning about 12%. Still, the fund fell several points behind its benchmark, the Russell 1000 Value Index, which returned almost 16%. The fund’s return was also slightly lower than the average return for large-cap value funds for the period.
The fund posted positive results in all ten market sectors, benefiting in particular from its holdings in consumer discretionary and industrials. However, poor stock selection in some areas—most notably information technology—hindered the fund’s performance relative to its index.
Please note that on October 6 Vanguard broadened the availability of our lower-cost Admiral Shares. We reduced the Admiral minimums on most of our actively managed funds to $50,000 from $100,000, as part of our ongoing efforts to lower the cost of investing for our clients.
If you hold shares in a taxable account, you may wish to review the table and discussion on after-tax returns for the fiscal year later in this report.
Stock market performance was better than it felt
Global stock prices rallied at the start of the period but struggled through the spring and summer, weighed down by Europe’s sovereign debt crisis and the slow pace of economic recovery in the United States. In the fiscal year’s final months, the mood
2
turned. Stock prices climbed on continued strength in corporate earnings. In the United States, stocks also seemed to get a boost from the Federal Reserve Board’s hints that it would try to stimulate the economy with a second round of U.S. Treasury bond purchases. (In early November, the Fed announced that it would buy as much as $600 billion in Treasuries.)
For the 12 months, the broad U.S. stock market returned about 19%, a performance that was stronger than it felt in a year of ups and downs. Small-capitalization stocks did even better. International stocks returned about 13% on the strength of a powerful rally in emerging markets and solid single-digit gains in developed markets in Europe and the Pacific region.
Despite shrinking yields, bonds attracted investor dollars
Although fixed income yields fell to generational lows, investors continued to bid up bond prices. The broad U.S. bond market produced a 12-month return of about 8% as the yield of the 10-year U.S. Treasury note fell from 3.39% at the start of the period to 2.61% at the close. Tax-exempt municipal bonds also rallied. Bond prices and yields move in opposite directions, of course, so abundant returns built on rising prices could mean leaner pickings in the years ahead.
The yields of money market securities hovered near 0%, consistent with the Federal Reserve Board’s target for short-term rates.
| | | |
| Market Barometer | | | |
| |
| | | Average Annual Total Returns |
| | | Periods Ended October 31, 2010 |
| | One | Three | Five |
| | Year | Years | Years |
| Stocks | | | |
| Russell 1000 Index (Large-caps) | 17.67% | -6.14% | 1.99% |
| Russell 2000 Index (Small-caps) | 26.58 | -3.91 | 3.07 |
| Dow Jones U.S. Total Stock Market Index | 19.04 | -5.55 | 2.52 |
| MSCI All Country World Index ex USA (International) | 13.08 | -7.62 | 6.21 |
| |
| Bonds | | | |
| Barclays Capital U.S. Aggregate Bond Index (Broad | | | |
| taxable market) | 8.01% | 7.23% | 6.45% |
| Barclays Capital Municipal Bond Index (Broad | | | |
| tax-exempt market) | 7.78 | 5.79 | 5.20 |
| Citigroup Three-Month U.S. Treasury Bill Index | 0.12 | 0.89 | 2.41 |
| |
| CPI | | | |
| Consumer Price Index | 1.17% | 1.54% | 1.89% |
3
approach, which includes both fundamental and quantitative techniques, adds diversification to the portfolio. While the fund’s six advisors have individual styles, the overall focus is on stocks with below-average price/earnings ratios and above-average yields.
For the fiscal year, the fund posted positive results in all ten market sectors. The largest contributors to performance included stocks in the consumer discretionary and industrial sectors, as both benefited from a strengthening U.S. economy. Improved
Fund misses its mark despite solid returns
Vanguard Windsor II Fund invests in a broad mix of large- and mid-capitalization value stocks. The fund’s multimanager consumer confidence helped boost consumer stocks across the board, including holdings in media companies, auto manufacturers, and retailers. In industrials, equipment and machinery companies rose on high demand in emerging markets, most notably China.
The advisors’ stock selection in some other sectors hindered the fund’s performance relative to its benchmark. This effect was most notable in information technology. Nokia, which failed to keep up in the fast-paced cell phone market and saw its stock drop 12%, was among the fund’s weakest performers. Microsoft, considered to be “behind the times” in comparison with its rival Apple, was also down for the period.
| | | |
| Expense Ratios | | | |
| Your Fund Compared With Its Peer Group | | | |
| | Investor | Admiral | Peer Group |
| | Shares | Shares | Average |
| Windsor II Fund | 0.38% | 0.27% | 1.28% |
The fund expense ratios shown are from the prospectus dated February 25, 2010, and represent estimated costs for the current fiscal year. For the fiscal year ended October 31, 2010, the fund’s expense ratios were 0.35% for Investor Shares and 0.27% for Admiral Shares. The peer-group expense ratio is derived from data provided by Lipper Inc. and captures information through year-end 2009.
Peer group: Large-Cap Value Funds.
4
The fund’s significant allocation to the tech sector also subtracted from performance relative to the index. In recent years, this sector—whose stocks don’t typically qualify as “value” holdings and therefore have little representation in the Russell 1000 Value Index—has become a large holding for the fund. During the period, tech stocks accounted for about 16% of the fund’s holdings, on average, while the sector made up only about 5% of the index.
Stock selection in health care equipment and providers detracted from returns as well. In the energy sector, the fund was hurt by its significant holdings in BP at the time of the oil spill in the Gulf. Although the fund has since trimmed its exposure to the oil giant, the stock weighed on performance relative to the index, which holds only U.S. firms and so had zero exposure to the company.
In telecommunication services, the fund had modest investments in Verizon and AT&T and largely missed out on their gains; both companies shared in the continued success of smartphones during the period.
The fund did distinguish itself in a few sectors, most notably within financials and materials. For example, the portfolio had a stake in American Express, which benefited from improved optimism about consumer spending. The fund also limited its allocation to some of the hardest-hit
| |
| Total Returns | |
| Ten Years Ended October 31, 2010 | |
| | Average |
| | Annual Return |
| Windsor II Fund Investor Shares | 3.41% |
| Russell 1000 Value Index | 2.64 |
| Large-Cap Value Funds Average | 0.64 |
| Large-Cap Value Funds Average: Derived from data provided by Lipper Inc. | |
The figures shown represent past performance, which is not a guarantee of future results. (Current performance may be lower or higher than the performance data cited. For performance data current to the most recent month-end, visit our website at vanguard.com/performance.) Note, too, that both investment returns and principal value can fluctuate widely, so an investor’s shares, when sold, could be worth more or less than their original cost.
5
companies in financials, including Citigroup, Bank of America, and Goldman Sachs. In materials, chemical and container companies helped boost returns.
Solid long-term results amid difficult times
Despite lagging its benchmark for the 12-month period, the Windsor II Fund continued to outperform over the long term. For the ten years ended October 31, Investor Shares of Vanguard Windsor II Fund had an average annual return of 3.41%, beating the fund’s benchmark index (2.64%) and its large-cap value fund peers (0.64%).
At first glance, the fund’s ten-year performance may not appear all that impressive. However, these returns reflect a decade in which the stock market endured two steep downturns, not to mention the deepest recession since the Great Depression. Over the period, the fund surpassed the broad U.S. stock market, which returned an average of 1.02% per year.
The Windsor II Fund’s solid long-term performance is a tribute to its advisors. The fund’s longest-serving advisor, Jim Barrow, has managed the fund since its 1985 inception, delivering a quarter-century of distinguished service to shareholders. Windsor II Fund’s combination of talented investment managers and low costs remains as compelling today as when it first began operations 25 years ago.
Regardless of market conditions, stay focused on the future
The ups and downs of the stock market seem all too familiar these days. While this can be nerve-wracking, it’s also a good reminder that you shouldn’t let such unpredictability unduly influence your long-term investment strategy.
Vanguard encourages you to create a plan that includes a mix of stocks, bonds, and short-term investments appropriate for your goals and risk tolerance—and to stick with that plan, regardless of market conditions.
A well-balanced portfolio can help cushion some of the market’s downward swings while allowing you to participate in its long-term potential for growth. With its low costs and broad diversification among large- and mid-cap value stocks, Vanguard’s Windsor II Fund can play an important role in such an investment plan.
Thank you for entrusting your assets to Vanguard.
Sincerely,

F. William McNabb III
Chairman and Chief Executive Officer
November 12, 2010
6
Advisors’ Report
For the 12 months ended October 31, 2010, Vanguard Windsor II Fund returned about 12%. Your fund is managed by six independent advisors, a strategy that enhances the fund’s diversification by providing exposure to distinct, yet complementary, investment approaches. It’s not uncommon for different advisors to have different views about individual securities or the broader investment environment.
The table below lists the advisors, the amount and percentage of fund assets each manages, and brief descriptions of their investment strategies. The advisors have provided the following assessment of the investment environment during the past 12 months and the notable successes and shortfalls in their portfolios. These comments were prepared on November 16, 2010.
| | | |
| Vanguard Windsor II Fund Investment Advisors | |
| |
| | Fund Assets Managed | |
| Investment Advisor | % | $ Million | Investment Strategy |
| Barrow, Hanley, Mewhinney & | 61 | 20,807 | Conducts fundamental research on individual stocks |
| Strauss, LLC | | | exhibiting traditional value characteristics: |
| | | | price/earnings and price/book ratios below the broad |
| | | | market average and dividend yields above the broad |
| | | | market average. |
| Lazard Asset Management LLC | 18 | 6,241 | Employs a relative-value approach that seeks a |
| | | | combination of attractive valuation and high financial |
| | | | productivity. The process is research-driven, relying |
| | | | upon bottom-up stock analysis performed by the firm’s |
| | | | global sector analysts. |
| Sanders Capital, LLC | 9 | 2,928 | Employs a traditional, bottom-up, fundamental research |
| | | | approach to identifying securities that are undervalued |
| | | | relative to their expected total return. |
| Hotchkis and Wiley Capital | 6 | 1,971 | Uses a disciplined investment approach, focusing on |
| Management, LLC | | | such investment parameters as a company’s tangible |
| | | | assets, sustainable cash flow, and potential for |
| | | | improving business performance. |
| Armstrong Shaw Associates Inc. | 4 | 1,490 | Uses a bottom-up approach, employing fundamental |
| | | | and qualitative criteria to identify individual companies |
| | | | for potential investment. |
| Vanguard Quantitative Equity | 0 | 119 | Employs a quantitative fundamental management |
| Group | | | approach, using models that assess valuation, market |
| | | | sentiment, earnings quality and growth, and |
| | | | management decisions of companies versus their |
| | | | peers. |
| Cash Investments | 2 | 746 | These short-term reserves are invested by Vanguard in |
| | | | equity index products to simulate investment in stocks. |
| | | | Each advisor may also maintain a modest cash |
| | | | position. |
7
Barrow, Hanley, Mewhinney & Strauss, LLC
Portfolio Manager:
James P. Barrow, Founding Partner
Investment environment: The equity market spent most of the fiscal year in a modest decline. In late August, when it looked as if there would be no double-dip recession, the market took off.
Successes: Consumer discretionary names generally did well for the period, and our “sin stocks” were strong performers.
Shortfalls: We had some bad luck with unforeseen problems with BP and Hewlett-Packard. Foreclosure difficulties and mortgage origination suits bedeviled the banks’ recovery.
For the most part, the underperforming investments seem on the mend to the point that we would add to them in the expectation of a complete fundamental recovery. Since the end of the fiscal year, it looks as if some of the holdings that suspended dividend payments will soon reinstate them.
Lazard Asset Management LLC
Portfolio Managers:
Andrew Lacey, Deputy Chairman Christopher Blake, Managing Director
Investment environment: Despite the extremely volatile year, U.S. equity markets rose overall amid signs of continuing recovery in the global economy and solid corporate earnings results. Over the past year, more cyclical sectors, such as consumer discretionary and industrials, performed well. Telecom services also gained, as the market continued to invest in smartphone adoption and looked for dividend yield. Financials was the worst-performing sector, as investors tried to gauge bank profitability and the effects of increased government regulation.
Successes: During the year, stock selection in the energy and consumer discretionary sectors added to returns. In energy, ConocoPhillips performed well. The U.S. integrated energy company shifted its focus to debt reduction, raised its dividend, and generated strong production growth. In consumer discretionary, shares of AutoZone, a leading auto parts retailer, climbed as the company reported a series of strong quarterly earnings.
Shortfalls: Stock selection in the consumer staples and technology sectors detracted from returns. In consumer staples, shares of Walgreen declined as the U.S. drug-store chain experienced headwinds to earnings growth. In technology, shares of Symantec fell because of various product execution issues. However, we believe the recurring cash flow streams for maintenance and subscriptions remain undervalued.
8
Sanders Capital, LLC
Portfolio Managers: Lewis A. Sanders, CFA
Chief Executive Officer and Co-Chief Investment Officer John P. Mahedy, CPA
Director of Research and Co-Chief Investment Officer
Investment environment: Excessive public and private debt is widely believed to portend an extended period of subpar economic growth. We disagree. The remediation of balance sheets in the corporate and financial sectors is nearly complete. Very low interest rates, especially for home mortgages, have also greatly improved the debt service position of households, a process that is ongoing. Thus, the preconditions for faster economic growth are gradually falling into place.
Successes: Our portfolio is positioned to benefit from these trends, with investments in the technology, energy, banking, and insurance industries. Our investments in the health care and consumer staples sectors bring balance to this pro-cyclical exposure.
Shortfalls: We anticipate that financial strength, which characterizes all of our holdings, will be a favorable attribute as well, in contrast to the superior performance of leveraged companies in the recent past.
Hotchkis and Wiley Capital Management, LLC
Portfolio Managers: George H. Davis, Jr., Chief Executive Officer Sheldon J. Lieberman, Principal
Investment environment: Recent corporate performance has been particularly resilient, largely as a result of the operating leverage created by aggressive cost-cutting during and after the recession. Profit margins and free cash flow margins are near all-time highs. Balance sheets are as pristine as they have been in recent memory. A liquidity release could take several forms, most of which should benefit common equity holders. Currently, the largest risk we see is political; the passage of counterproductive anti-business legislation is always a concern. Nevertheless, valuations and fundamentals both remain compelling for the astute value investor.
Successes: The portfolio performed strongly over the past 12 months because of positive stock selection, particularly in industrials and energy. Cummins, Tyco Electronics, and Limited Brands were the top individual contributors.
Shortfalls: Performance suffered primarily because of stock selection in electric utilities. Exelon was the biggest detractor.
9
Armstrong Shaw Associates Inc.
Portfolio Manager:
Jeffrey M. Shaw, Chairman and Chief Investment Officer
Investment environment: The past year was marked by extreme volatility as the market reacted to macro concerns about the sovereign credit crisis, unemployment, deflation, and the deficit. Still, the risk of a double dip has lessened as the Fed implements policies to fight deflation, and corporate earnings news has been better than expected. That said, the economic recovery remains weak. We continue to believe that we will see a recovery led by corporate profits, not driven by consumers. The portfolio’s overweight positions in technology, industrials, and energy and underweight positions in consumer-oriented sectors reflect this view. We have no exposure to telecom or utilities, given that we see better opportunities elsewhere.
Successes: Our best-performing sector was materials (47%), followed by consumer discretionary (32%) and industrials (23%). Agrium, a materials holding, was our top performer, up 82% on strong earnings, rising commodity prices, and BHP’s bid for Potash Corp.
Shortfalls: Consumer staples was our worst sector, down 9%. CVS fell 14% as the company engaged in a contentious public contract negotiation with Walgreens, which has since been resolved.
Vanguard Quantitative Equity Group
Portfolio Manager:
James D. Troyer, CFA, Principal
Investment environment: The investment environment remained volatile during the year. A strong first half foundered on the European debt crisis and then concerns over future U.S. growth. The Federal Reserve’s quantitative easing program kicked off a strong final two months. Broad, macro themes have been dominating investor behavior, causing rapid swings in returns. Value-oriented stocks in the index lagged growth stocks slightly, while large-capitalization names underperformed smaller-cap companies.
Successes: Our quantitative process was largely successful for the period. Our valuation, market sentiment, and management decision models had positive results.
Shortfalls: Our earnings growth and quality models lagged the market.
10
| | | |
| Windsor II Fund | | |
| |
| |
| Fund Profile | | |
| As of October 31, 2010 | | |
| |
| Share-Class Characteristics | | |
| | Investor | | Admiral |
| | Shares | | Shares |
| Ticker Symbol | VWNFX | | VWNAX |
| Expense Ratio1 | 0.38% | | 0.27% |
| 30-Day SEC Yield | 1.74% | | 1.76% |
| |
| Portfolio Characteristics | | |
| | | Russell | DJ |
| | | 1000 | U.S. Total |
| | | Value | Market |
| | Fund | Index | Index |
| Number of Stocks | 244 | 668 | 3,920 |
| Median Market Cap $42.8B | $31.2B | $28.5B |
| Price/Earnings Ratio | 13.6x | 14.7x | 16.9x |
| Price/Book Ratio | 1.9x | 1.5x | 2.2x |
| Return on Equity | 19.9% | 15.1% | 19.2% |
| Earnings Growth Rate | 3.5% | 0.7% | 6.5% |
| Dividend Yield | 2.4% | 2.3% | 1.8% |
| Foreign Holdings | 6.4% | 0.0% | 0.0% |
| Turnover Rate | 29% | — | — |
| Short-Term Reserves | 1.4% | — | — |
| |
| Sector Diversification (% of equity exposure) |
| | | Russell | DJ |
| | | 1000 | U.S. Total |
| | | Value | Market |
| | Fund | Index | Index |
| Consumer | | | |
| Discretionary | 7.8% | 7.8% | 11.8% |
| Consumer Staples | 11.8 | 10.4 | 10.0 |
| Energy | 11.1 | 11.5 | 9.8 |
| Financials | 18.3 | 26.8 | 16.3 |
| Health Care | 13.3 | 13.3 | 11.0 |
| Industrials | 12.3 | 9.0 | 11.1 |
| Information | | | |
| Technology | 16.2 | 5.7 | 19.4 |
| Materials | 2.9 | 3.0 | 4.4 |
| Telecommunication | | | |
| Services | 2.2 | 5.2 | 2.8 |
| Utilities | 4.1 | 7.3 | 3.4 |
| | | |
| Volatility Measures | | | |
| | | Russell | DJ |
| | | 1000 | U.S. Total |
| | | Value | Market |
| | | Index | Index |
| R-Squared | | 0.97 | 0.97 |
| Beta | | 0.97 | 0.99 |
| These measures show the degree and timing of the fund’s | |
| fluctuations compared with the indexes over 36 months. | |
| |
| Ten Largest Holdings (% of total net assets) |
| International Business | IT Consulting & | |
| Machines Corp. | Other Services | 3.6% |
| ConocoPhillips | Integrated Oil & | |
| | Gas | 3.3 |
| Microsoft Corp. | Systems Software | 2.8 |
| Wells Fargo & Co. | Diversified Banks | 2.8 |
| Pfizer Inc. | Pharmaceuticals | 2.7 |
| JPMorgan Chase & Co. | Diversified Financial | |
| | Services | 2.7 |
| Philip Morris | Tobacco | |
| International Inc. | | 2.3 |
| Bristol-Myers Squibb Co. | Pharmaceuticals | 2.2 |
| Raytheon Co. | Aerospace & | |
| | Defense | 2.1 |
| Imperial Tobacco Group | Tobacco | |
| PLC ADR | | 2.0 |
| Top Ten | | 26.5% |
| The holdings listed exclude any temporary cash investments and |
| equity index products. |
Investment Focus
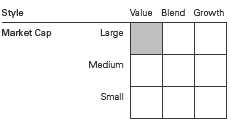
1 The expense ratios shown are from the prospectus dated February 25, 2010, and represent estimated costs for the current fiscal year. For the fiscal year ended October 31, 2010, the expense ratios were 0.35% for Investor Shares and 0.27% for Admiral Shares.
11
Windsor II Fund
Performance Summary
All of the returns in this report represent past performance, which is not a guarantee of future results that may be achieved by the fund. (Current performance may be lower or higher than the performance data cited. For performance data current to the most recent month-end, visit our website at vanguard.com/performance.) Note, too, that both investment returns and principal value can fluctuate widely, so an investor’s shares, when sold, could be worth more or less than their original cost. The returns shown do not reflect taxes that a shareholder would pay on fund distributions or on the sale of fund shares.
Cumulative Performance: October 31, 2000, Through October 31, 2010
Initial Investment of $10,000
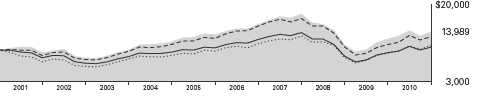
| | | | | |
| | | Average Annual Total Returns | |
| | | Periods Ended October 31, 2010 | |
| | | | | | Final Value |
| | | One | Five | Ten | of a $10,000 |
| | | Year | Years | Years | Investment |
| | Windsor II Fund Investor Shares | 12.05% | 0.81% | 3.41% | $13,989 |
| •••••••• | Dow Jones U.S. Total Stock Market | | | | |
| | Index | 19.04 | 2.52 | 1.02 | 11,073 |
| – – – – | Russell 1000 Value Index | 15.71 | 0.62 | 2.64 | 12,983 |
| | Large-Cap Value Funds Average | 12.94 | 0.33 | 0.64 | 10,664 |
| Large-Cap Value Funds Average: Derived from data provided by Lipper Inc. | | | |
| |
| |
| | | | | Since | Final Value |
| | | One | Five | Inception | of a $50,000 |
| | | Year | Years | (5/14/2001) | Investment |
| Windsor II Fund Admiral Shares | 12.12% | 0.92% | 2.84% | $65,202 |
| Dow Jones U.S. Total Stock Market | | | | |
| Index | | 19.04 | 2.52 | 2.58 | 63,660 |
| Russell 1000 Value Index | 15.71 | 0.62 | 2.73 | 64,525 |
"Since Inception" performance is calculated from the Admiral Shares’ inception date for both the fund and its comparative standards.
See Financial Highlights for dividend and capital gains information.
12
Windsor II Fund
Fiscal-Year Total Returns (%): October 31, 2000, Through October 31, 2010
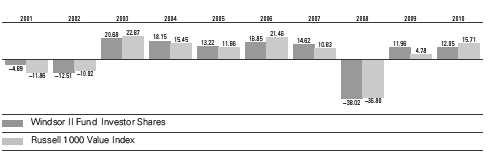
Average Annual Total Returns: Periods Ended September 30, 2010
This table presents average annual total returns through the latest calendar quarter—rather than through the end of the fiscal period. Securities and Exchange Commission rules require that we provide this information.
| | | | |
| | Inception | One | Five | Ten |
| | Date | Year | Years | Years |
| Investor Shares | 6/24/1985 | 7.35% | -0.40% | 3.26% |
| Admiral Shares | 5/14/2001 | 7.46 | -0.31 | 2.521 |
| 1 Return since inception. | | | | |
13
Windsor II Fund
Financial Statements
Statement of Net Assets
As of October 31, 2010
The fund reports a complete list of its holdings in regulatory filings four times in each fiscal year, at the quarter-ends. For the second and fourth fiscal quarters, the lists appear in the fund’s semiannual and annual reports to shareholders. For the first and third fiscal quarters, the fund files the lists with the Securities and Exchange Commission on Form N-Q. Shareholders can look up the fund’s Forms N-Q on the SEC’s website at sec.gov. Forms N-Q may also be reviewed and copied at the SEC’s Public Reference Room (see the back cover of this report for further information).
| | | |
| | | | Market |
| | | | Value |
| | | Shares | ($000) |
| Common Stocks (97.4%)1 | | |
| Consumer Discretionary (7.5%) | |
| 2 | Wyndham | | |
| | Worldwide Corp. | 13,830,062 | 397,614 |
| | Comcast Corp. Class A | | |
| | Special Shares | 18,841,498 | 364,206 |
| | Carnival Corp. | 8,423,086 | 363,625 |
| | CBS Corp. Class B | 14,763,374 | 249,944 |
| 2 | Service Corp. | | |
| | International | 21,996,236 | 182,129 |
| * | AutoZone Inc. | 648,700 | 154,151 |
| | Gap Inc. | 6,083,948 | 115,656 |
| | Omnicom Group Inc. | 2,337,200 | 102,743 |
| | Mattel Inc. | 3,740,398 | 87,264 |
| | Stanley Black & | | |
| | Decker Inc. | 1,098,200 | 68,055 |
| | Genuine Parts Co. | 1,392,448 | 66,643 |
| | McDonald’s Corp. | 645,600 | 50,208 |
| | Newell Rubbermaid Inc. | 2,659,400 | 46,938 |
| | Darden Restaurants Inc. | 990,000 | 45,253 |
| | JC Penney Co. Inc. | 1,308,000 | 40,783 |
| * | Ford Motor Co. | 2,572,400 | 36,348 |
| | Lowe’s Cos. Inc. | 1,694,800 | 36,150 |
| | Home Depot Inc. | 1,019,024 | 31,468 |
| * | Apollo Group Inc. Class A | 737,000 | 27,623 |
| | Johnson Controls Inc. | 656,800 | 23,067 |
| * | NVR Inc. | 35,382 | 22,199 |
| | Time Warner Cable Inc. | 367,000 | 21,238 |
| * | Interpublic Group of | | |
| | Cos. Inc. | 1,830,600 | 18,947 |
| * | Pulte Group Inc. | 1,573,900 | 12,355 |
| | Time Warner Inc. | 42,799 | 1,391 |
| | Comcast Corp. Class A | 57,100 | 1,175 |
| | Limited Brands Inc. | 27,300 | 802 |
| | Hasbro Inc. | 15,000 | 694 |
| | Gannett Co. Inc. | 49,800 | 590 |
| | Whirlpool Corp. | 7,000 | 531 |
| | |
| | | Market |
| | | Value |
| | Shares | ($000) |
| Viacom Inc. Class B | 12,600 | 486 |
| Walt Disney Co. | 10,312 | 372 |
| Macy’s Inc. | 10,350 | 245 |
| | | 2,570,893 |
| Consumer Staples (11.4%) | | |
| Philip Morris | | |
| International Inc. | 13,559,653 | 793,240 |
| Imperial Tobacco Group | | |
| plc ADR | 10,632,625 | 680,488 |
| Diageo plc ADR | 7,690,320 | 569,084 |
| Wal-Mart Stores Inc. | 6,228,400 | 337,392 |
| Altria Group Inc. | 12,706,307 | 322,994 |
| CVS Caremark Corp. | 9,594,794 | 288,995 |
| Walgreen Co. | 6,441,739 | 218,246 |
| Sysco Corp. | 5,541,918 | 163,265 |
| Molson Coors | | |
| Brewing Co. Class B | 2,458,300 | 116,106 |
| Avon Products Inc. | 2,771,495 | 84,392 |
| Kraft Foods Inc. | 2,421,561 | 78,144 |
| Procter & Gamble Co. | 1,185,220 | 75,344 |
| PepsiCo Inc. | 1,075,700 | 70,243 |
| General Mills Inc. | 1,734,600 | 65,117 |
| Safeway Inc. | 1,111,700 | 25,458 |
| Lorillard Inc. | 118,500 | 10,113 |
| JM Smucker Co. | 11,300 | 726 |
| Dr Pepper Snapple Group Inc. | 17,900 | 654 |
| Tyson Foods Inc. Class A | 41,100 | 639 |
| Hormel Foods Corp. | 13,300 | 611 |
| Hershey Co. | 10,500 | 520 |
| * Smithfield Foods Inc. | 13,000 | 218 |
| Reynolds American Inc. | 900 | 58 |
| | | 3,902,047 |
| Energy (10.7%) | | |
| ConocoPhillips | 19,069,089 | 1,132,704 |
| Spectra Energy Corp. | 28,360,911 | 674,139 |
| Occidental | | |
| Petroleum Corp. | 7,735,157 | 608,215 |
14
Windsor II Fund
| | | |
| | | | Market |
| | | | Value |
| | | Shares | ($000) |
| | Chevron Corp. | 2,554,299 | 211,011 |
| | Royal Dutch Shell | | |
| | plc ADR | 2,267,690 | 145,858 |
| | BP plc ADR | 2,948,170 | 120,374 |
| | Exxon Mobil Corp. | 1,524,182 | 101,312 |
| | Apache Corp. | 987,681 | 99,776 |
| | Devon Energy Corp. | 1,337,940 | 86,993 |
| | Halliburton Co. | 2,508,900 | 79,934 |
| | Chesapeake Energy Corp. | 3,200,800 | 69,457 |
| | EQT Corp. | 1,687,300 | 63,172 |
| | Noble Corp. | 1,607,178 | 55,496 |
| | Valero Energy Corp. | 3,087,200 | 55,415 |
| | El Paso Corp. | 4,077,850 | 54,072 |
| | Massey Energy Co. | 965,985 | 40,639 |
| * | Transocean Ltd. | 640,797 | 40,601 |
| | Marathon Oil Corp. | 745,200 | 26,507 |
| * | Cameron International Corp. | 156,200 | 6,834 |
| * | Newfield Exploration Co. | 14,000 | 835 |
| | Cimarex Energy Co. | 9,800 | 752 |
| | Sunoco Inc. | 5,500 | 206 |
| | QEP Resources Inc. | 3,400 | 112 |
| | | | 3,674,414 |
| Exchange-Traded Funds (0.9%) | |
| ^,3 | Vanguard Total | | |
| | Stock Market ETF | 3,197,800 | 194,010 |
| ^,3 | Vanguard Value ETF | 2,511,200 | 125,623 |
| | | | 319,633 |
| Financials (17.8%) | | |
| | Wells Fargo & Co. | 36,258,477 | 945,621 |
| | JPMorgan Chase & Co. | 24,461,809 | 920,498 |
| | PNC Financial Services | | |
| | Group Inc. | 12,095,581 | 651,952 |
| | American Express Co. | 14,471,150 | 599,974 |
| | Bank of America Corp. | 37,587,405 | 430,000 |
| | State Street Corp. | 9,063,800 | 378,504 |
| | Capital One | | |
| | Financial Corp. | 9,794,738 | 365,050 |
| * | Citigroup Inc. | 73,466,202 | 306,354 |
| | XL Group plc Class A | 12,919,632 | 273,250 |
| * | SLM Corp. | 18,562,952 | 220,899 |
| | Travelers Cos. Inc. | 3,104,848 | 171,388 |
| | Goldman Sachs Group Inc. | 873,289 | 140,556 |
| | MetLife Inc. | 3,471,232 | 139,995 |
| | Ameriprise Financial Inc. | 2,514,700 | 129,985 |
| | NYSE Euronext | 2,170,243 | 66,496 |
| | Chubb Corp. | 947,999 | 55,003 |
| | Lincoln National Corp. | 2,050,261 | 50,190 |
| | Allstate Corp. | 1,526,600 | 46,546 |
| | ACE Ltd. | 699,480 | 41,563 |
| | Unum Group | 1,507,500 | 33,798 |
| | PartnerRe Ltd. | 419,100 | 33,243 |
| * | Genworth Financial Inc. | | |
| | Class A | 2,462,600 | 27,926 |
| | Prudential Financial Inc. | 300,300 | 15,790 |
| | | |
| | | | Market |
| | | | Value |
| | | Shares | ($000) |
| | KeyCorp | 1,712,982 | 14,029 |
| | Hartford Financial | | |
| | Services Group Inc. | 446,000 | 10,695 |
| | SunTrust Banks Inc. | 403,800 | 10,103 |
| * | Berkshire Hathaway Inc. | | |
| | Class B | 23,600 | 1,878 |
| | Vornado Realty Trust | 9,800 | 856 |
| | Ventas Inc. | 15,100 | 809 |
| | SL Green Realty Corp. | 11,400 | 749 |
| | AvalonBay Communities Inc. | 6,800 | 723 |
| | Torchmark Corp. | 12,000 | 687 |
| | Assurant Inc. | 16,300 | 645 |
| | RenaissanceRe Holdings Ltd. | 10,600 | 639 |
| | M&T Bank Corp. | 8,400 | 628 |
| | US Bancorp | 25,449 | 615 |
| | New York Community | | |
| | Bancorp Inc. | 34,239 | 580 |
| | American Financial Group Inc. | 17,400 | 532 |
| | BOK Financial Corp. | 10,600 | 490 |
| | Aflac Inc. | 6,100 | 341 |
| * | Arch Capital Group Ltd. | 3,700 | 320 |
| | Fifth Third Bancorp | 20,000 | 251 |
| | Morgan Stanley | 5,885 | 146 |
| | Raymond James | | |
| | Financial Inc. | 5,000 | 141 |
| | Bank of New York | | |
| | Mellon Corp. | 4,033 | 101 |
| | Equity Residential | 400 | 20 |
| | | | 6,090,559 |
| Health Care (12.8%) | | |
| | Pfizer Inc. | 53,841,868 | 936,848 |
| | Bristol-Myers Squibb Co. | 28,283,839 | 760,835 |
| | Baxter International Inc. | 11,611,568 | 591,029 |
| 2 | Quest Diagnostics Inc. | 9,374,502 | 460,663 |
| | Johnson & Johnson | 7,025,300 | 447,301 |
| * | WellPoint Inc. | 5,681,599 | 308,738 |
| | Merck & Co. Inc. | 5,292,129 | 191,998 |
| | Abbott Laboratories | 2,602,800 | 133,576 |
| * | Amgen Inc. | 2,071,410 | 118,464 |
| | Medtronic Inc. | 3,358,500 | 118,253 |
| | Covidien plc | 1,795,250 | 71,577 |
| | UnitedHealth Group Inc. | 1,955,001 | 70,478 |
| * | Gilead Sciences Inc. | 1,575,600 | 62,504 |
| * | Forest Laboratories Inc. | 1,528,400 | 50,514 |
| | Eli Lilly & Co. | 1,241,100 | 43,687 |
| * | Thermo Fisher | | |
| | Scientific Inc. | 729,530 | 37,512 |
| * | Humana Inc. | 14,700 | 857 |
| * | Cephalon Inc. | 7,400 | 492 |
| | AmerisourceBergen Corp. | | |
| | Class A | 7,690 | 252 |
| | CIGNA Corp. | 5,600 | 197 |
| | | | 4,405,775 |
15
| | | |
| Windsor II Fund | | |
| |
| |
| |
| | | | Market |
| | | | Value |
| | | Shares | ($000) |
| Industrials (11.9%) | | |
| | Raytheon Co. | 15,891,161 | 732,265 |
| 2 | Cooper Industries plc | 12,068,588 | 632,635 |
| | General Electric Co. | 34,190,107 | 547,725 |
| | Honeywell | | |
| | International Inc. | 11,477,661 | 540,713 |
| 2 | ITT Corp. | 9,322,952 | 439,950 |
| | Illinois Tool Works Inc. | 6,796,130 | 310,583 |
| | Lockheed Martin Corp. | 1,354,800 | 96,584 |
| * | Corrections Corp. | | |
| | of America | 2,858,500 | 73,378 |
| | Norfolk Southern Corp. | 1,106,100 | 68,014 |
| | Dover Corp. | 1,153,000 | 61,224 |
| | Caterpillar Inc. | 768,628 | 60,414 |
| | General Dynamics Corp. | 864,000 | 58,856 |
| | CSX Corp. | 898,330 | 55,202 |
| | United Technologies Corp. | 721,360 | 53,936 |
| | Emerson Electric Co. | 914,100 | 50,184 |
| | Ingersoll-Rand plc | 1,123,040 | 44,147 |
| | United Parcel Service Inc. | | |
| | Class B | 584,380 | 39,352 |
| | Northrop Grumman Corp. | 571,076 | 36,098 |
| | PACCAR Inc. | 685,500 | 35,139 |
| | Rockwell Collins Inc. | 578,300 | 34,993 |
| | FedEx Corp. | 381,300 | 33,448 |
| | Tyco International Ltd. | 725,075 | 27,756 |
| | Empresa Brasileira de | | |
| | Aeronautica SA ADR | 675,700 | 19,494 |
| | Cummins Inc. | 209,200 | 18,430 |
| | Boeing Co. | 139,900 | 9,882 |
| | 3M Co. | 20,426 | 1,720 |
| | Eaton Corp. | 10,100 | 897 |
| | Rockwell Automation Inc. | 11,200 | 699 |
| | Parker Hannifin Corp. | 9,000 | 689 |
| | Southwest Airlines Co. | 46,800 | 644 |
| | Avery Dennison Corp. | 16,700 | 607 |
| | Republic Services Inc. | | |
| | Class A | 16,500 | 492 |
| | RR Donnelley & Sons Co. | 24,500 | 452 |
| | Joy Global Inc. | 6,255 | 444 |
| * | United Continental | | |
| | Holdings Inc. | 6,100 | 177 |
| * | Owens Corning | 5,800 | 157 |
| | SPX Corp. | 750 | 50 |
| | | | 4,087,430 |
| Information Technology (15.6%) | |
| | International Business | | |
| | Machines Corp. | 8,559,150 | 1,229,094 |
| | Microsoft Corp. | 35,593,640 | 948,215 |
| | Hewlett-Packard Co. | 15,910,167 | 669,182 |
| | Intel Corp. | 32,170,200 | 645,656 |
| | Nokia Oyj ADR | 37,755,673 | 403,231 |
| | | |
| | | | Market |
| | | | Value |
| | | Shares | ($000) |
| | Oracle Corp. | 8,961,290 | 263,462 |
| | Xerox Corp. | 20,079,600 | 234,931 |
| * | Cisco Systems Inc. | 9,598,060 | 219,124 |
| | Mastercard Inc. Class A | 498,400 | 119,646 |
| * | eBay Inc. | 3,829,800 | 114,166 |
| * | Google Inc. Class A | 151,080 | 92,610 |
| | Corning Inc. | 4,673,500 | 85,432 |
| | CA Inc. | 3,009,128 | 69,842 |
| * | Symantec Corp. | 3,911,100 | 63,282 |
| * | EMC Corp. | 2,402,200 | 50,470 |
| * | Western Digital Corp. | 1,410,100 | 45,151 |
| | Tyco Electronics Ltd. | 1,110,575 | 35,183 |
| * | AOL Inc. | 1,219,500 | 32,536 |
| * | Dell Inc. | 1,524,000 | 21,915 |
| | Accenture plc Class A | 226,100 | 10,109 |
| * | Motorola Inc. | 95,800 | 781 |
| * | Micron Technology Inc. | 73,900 | 611 |
| * | Lexmark International Inc. | | |
| | Class A | 15,700 | 597 |
| * | IAC/InterActiveCorp | 21,300 | 594 |
| * | Advanced Micro Devices Inc. | 78,700 | 577 |
| | Applied Materials Inc. | 22,900 | 283 |
| | | | 5,356,680 |
| Materials (2.7%) | | |
| | EI du Pont de | | |
| | Nemours & Co. | 10,311,138 | 487,511 |
| | Ball Corp. | 2,790,563 | 179,601 |
| | Monsanto Co. | 1,014,800 | 60,299 |
| | Nucor Corp. | 1,485,900 | 56,791 |
| | Dow Chemical Co. | 1,494,600 | 46,078 |
| | Praxair Inc. | 406,980 | 37,174 |
| | PPG Industries Inc. | 387,000 | 29,683 |
| | Mosaic Co. | 370,600 | 27,113 |
| | Celanese Corp. Class A | 217,900 | 7,768 |
| | Compass Minerals | | |
| | International Inc. | 90,600 | 7,146 |
| | Lubrizol Corp. | 5,780 | 592 |
| | Eastman Chemical Co. | 4,550 | 357 |
| | Ashland Inc. | 6,500 | 336 |
| | Walter Energy Inc. | 1,600 | 141 |
| | | | 940,590 |
| Telecommunication Services (2.1%) | |
| | Vodafone Group | | |
| | plc ADR | 9,657,100 | 265,667 |
| | AT&T Inc. | 7,887,207 | 224,785 |
| | Verizon | | |
| | Communications Inc. | 6,522,709 | 211,792 |
| | Qwest Communications | | |
| | International Inc. | 32,200 | 213 |
| * | MetroPCS | | |
| | Communications Inc. | 17,520 | 182 |
| | | | 702,639 |
16
| | | |
| Windsor II Fund | | |
| |
| |
| |
| | | | Market |
| | | | Value |
| | | Shares | ($000) |
| Utilities (4.0%) | | |
| | Dominion Resources Inc. | 12,126,214 | 527,005 |
| 2 | CenterPoint Energy Inc. | 23,251,613 | 385,047 |
| | Entergy Corp. | 3,225,278 | 240,380 |
| | Edison International | 2,148,600 | 79,283 |
| | Exelon Corp. | 1,407,217 | 57,443 |
| | Sempra Energy | 843,700 | 45,121 |
| | NextEra Energy Inc. | 399,100 | 21,966 |
| | DTE Energy Co. | 16,100 | 753 |
| | NiSource Inc. | 41,550 | 719 |
| | Ameren Corp. | 24,500 | 710 |
| | CMS Energy Corp. | 37,600 | 691 |
| | Pepco Holdings Inc. | 34,300 | 661 |
| | Integrys Energy Group Inc. | 12,300 | 654 |
| | Pinnacle West Capital Corp. | 15,100 | 621 |
| | DPL Inc. | 17,500 | 457 |
| | Duke Energy Corp. | 7,500 | 137 |
| | Southern Co. | 500 | 19 |
| | | | 1,361,667 |
| Total Common Stocks | | |
| (Cost $30,237,716) | | 33,412,327 |
| Temporary Cash Investments (2.9%)1 | |
| Money Market Fund (2.7%) | | |
| 4,5 | Vanguard Market | | |
| | Liquidity Fund, | | |
| | 0.237% | 932,091,014 | 932,091 |
| |
| | | Face | |
| | | Amount | |
| | | ($000) | |
| U.S. Government and Agency Obligations (0.2%) |
| 6,7 | Freddie Mac | | |
| | Discount Notes, | | |
| | 0.280%, 2/1/11 | 70,000 | 69,963 |
| 6,7 | Freddie Mac | | |
| | Discount Notes, | | |
| | 0.240%, 3/14/11 | 75 | 75 |
| | | | 70,038 |
| Total Temporary Cash Investments | |
| (Cost $1,002,116) | | 1,002,129 |
| Total Investments (100.3%) | | |
| (Cost $31,239,832) | | 34,414,456 |
| Other Assets and Liabilities (-0.3%) | |
| Other Assets | | 165,880 |
| Liabilities5 | | (278,468) |
| | | | (112,588) |
| Net Assets (100%) | | 34,301,868 |
| |
| | Market |
| | Value |
| | ($000) |
| Statement of Assets and Liabilities | |
| Assets | |
| Investments in Securities, at Value | 34,414,456 |
| Receivables for Investment | |
| Securities Sold | 97,752 |
| Other Assets | 68,128 |
| Total Assets | 34,580,336 |
| Liabilities | |
| Payables for Investment | |
| Securities Purchased | 163,181 |
| Other Liabilities5 | 115,287 |
| Total Liabilities | 278,468 |
| Net Assets | 34,301,868 |
17
Windsor II Fund
| |
| At October 31, 2010, net assets consisted of: |
| | Amount |
| | ($000) |
| Paid-in Capital | 36,412,382 |
| Undistributed Net Investment Income | 156,378 |
| Accumulated Net Realized Losses | (5,447,880) |
| Unrealized Appreciation (Depreciation) | |
| Investment Securities | 3,174,624 |
| Futures Contracts | 6,364 |
| Net Assets | 34,301,868 |
| |
| |
| Investor Shares—Net Assets | |
| Applicable to 858,419,908 outstanding | |
| $.001 par value shares of beneficial | |
| interest (unlimited authorization) | 20,921,358 |
| Net Asset Value Per Share— | |
| Investor Shares | $24.37 |
| |
| |
| Admiral Shares—Net Assets | |
| Applicable to 309,322,833 outstanding | |
| $.001 par value shares of beneficial | |
| interest (unlimited authorization) | 13,380,510 |
| Net Asset Value Per Share— | |
| Admiral Shares | $43.26 |
See Note A in Notes to Financial Statements.
* Non-income-producing security.
^ Part of security position is on loan to broker-dealers. The total value of securities on loan is $18,796,000.
1 The fund invests a portion of its cash reserves in equity markets through the use of index futures contracts. After giving effect to futures investments, the fund’s effective common stock and temporary cash investment positions represent 98.7% and 1.6%, respectively, of net assets.
2 Considered an affiliated company of the fund as the fund owns more than 5% of the outstanding voting securities of such company.
3 Considered an affiliated company of the fund as the issuer is another member of The Vanguard Group.
4 Affiliated money market fund available only to Vanguard funds and certain trusts and accounts managed by Vanguard. Rate shown is the 7-day yield.
5 Includes $19,495,000 of collateral received for securities on loan.
6 The issuer operates under a congressional charter; its securities are not backed by the full faith and credit of the U.S. government.
7 Securities with a value of $70,038,000 have been segregated as initial margin for open futures contracts.
ADR—American Depositary Receipt.
See accompanying Notes, which are an integral part of the Financial Statements.
18
| |
| Windsor II Fund | |
| |
| |
| Statement of Operations | |
| |
| | Year Ended |
| | October 31, 2010 |
| | ($000) |
| Investment Income | |
| Income | |
| Dividends1,2 | 829,348 |
| Interest2 | 2,527 |
| Security Lending | 3,266 |
| Total Income | 835,141 |
| Expenses | |
| Investment Advisory Fees—Note B | |
| Basic Fee | 50,757 |
| Performance Adjustment | (4,126) |
| The Vanguard Group—Note C | |
| Management and Administrative—Investor Shares | 41,436 |
| Management and Administrative—Admiral Shares | 14,834 |
| Marketing and Distribution—Investor Shares | 4,634 |
| Marketing and Distribution—Admiral Shares | 2,617 |
| Custodian Fees | 405 |
| Auditing Fees | 31 |
| Shareholders’ Reports—Investor Shares | 516 |
| Shareholders’ Reports—Admiral Shares | 166 |
| Trustees’ Fees and Expenses | 62 |
| Total Expenses | 111,332 |
| Expenses Paid Indirectly | (1,589) |
| Net Expenses | 109,743 |
| Net Investment Income | 725,398 |
| Realized Net Gain (Loss) | |
| Investment Securities Sold2 | (494,491) |
| Futures Contracts | 95,444 |
| Realized Net Gain (Loss) | (399,047) |
| Change in Unrealized Appreciation (Depreciation) | |
| Investment Securities | 3,499,989 |
| Futures Contracts | 8,055 |
| Change in Unrealized Appreciation (Depreciation) | 3,508,044 |
| Net Increase (Decrease) in Net Assets Resulting from Operations | 3,834,395 |
1 Dividends are net of foreign withholding taxes of $3,473,000.
2 Dividend income, interest income, and realized net gain (loss) from affiliated companies of the fund were $93,392,000, $2,320,000, and ($266,153,000), respectively.
See accompanying Notes, which are an integral part of the Financial Statements.
19
| | |
| Windsor II Fund | | |
| |
| |
| Statement of Changes in Net Assets | | |
| |
| | Year Ended October 31, |
| | 2010 | 2009 |
| | ($000) | ($000) |
| Increase (Decrease) in Net Assets | | |
| Operations | | |
| Net Investment Income | 725,398 | 869,871 |
| Realized Net Gain (Loss) | (399,047) | (1,405,457) |
| Change in Unrealized Appreciation (Depreciation) | 3,508,044 | 3,981,516 |
| Net Increase (Decrease) in Net Assets Resulting from Operations | 3,834,395 | 3,445,930 |
| Distributions | | |
| Net Investment Income | | |
| Investor Shares | (453,946) | (629,788) |
| Admiral Shares | (282,936) | (381,680) |
| Realized Capital Gain | | |
| Investor Shares | — | — |
| Admiral Shares | — | — |
| Total Distributions | (736,882) | (1,011,468) |
| Capital Share Transactions | | |
| Investor Shares | (1,721,406) | (286,176) |
| Admiral Shares | 170,368 | (404,419) |
| Net Increase (Decrease) from Capital Share Transactions | (1,551,038) | (690,595) |
| Total Increase (Decrease) | 1,546,475 | 1,743,867 |
| Net Assets | | |
| Beginning of Period | 32,755,393 | 31,011,526 |
| End of Period1 | 34,301,868 | 32,755,393 |
1 Net Assets—End of Period includes undistributed net investment income of $156,378,000 and $167,862,000.
See accompanying Notes, which are an integral part of the Financial Statements.
20
| | | | | |
| Windsor II Fund | | | | | |
| |
| |
| Financial Highlights | | | | | |
| |
| Investor Shares | | | | | |
| |
| For a Share Outstanding | | | Year Ended October 31, |
| Throughout Each Period | 2010 | 2009 | 2008 | 2007 | 2006 |
| Net Asset Value, Beginning of Period | $22.22 | $20.56 | $37.84 | $35.14 | $31.61 |
| Investment Operations | | | | | |
| Net Investment Income | .495 | .580 | .777 | .803 | .760 |
| Net Realized and Unrealized Gain (Loss) | | | | | |
| on Investments | 2.151 | 1.750 | (13.804) | 4.145 | 4.368 |
| Total from Investment Operations | 2.646 | 2.330 | (13.027) | 4.948 | 5.128 |
| Distributions | | | | | |
| Dividends from Net Investment Income | (.496) | (.670) | (.799) | (.790) | (.720) |
| Distributions from Realized Capital Gains | — | — | (3.454) | (1.458) | (.878) |
| Total Distributions | (.496) | (.670) | (4.253) | (2.248) | (1.598) |
| Net Asset Value, End of Period | $24.37 | $22.22 | $20.56 | $37.84 | $35.14 |
| |
| Total Return1 | 12.05% | 11.96% | -38.02% | 14.62% | 16.85% |
| |
| Ratios/Supplemental Data | | | | | |
| Net Assets, End of Period (Millions) | $20,921 | $20,695 | $19,400 | $33,821 | $30,790 |
| Ratio of Total Expenses to | | | | | |
| Average Net Assets2 | 0.35% | 0.38% | 0.32% | 0.33% | 0.34% |
| Ratio of Net Investment Income to | | | | | |
| Average Net Assets | 2.08% | 2.96% | 2.66% | 2.19% | 2.28% |
| Portfolio Turnover Rate | 29% | 41% | 37% | 51% | 34% |
1 Total returns do not include account service fees that may have applied in the periods shown. Fund prospectuses provide information about any applicable account service fees.
2 Includes performance-based investment advisory fee increases (decreases) of (0.01%), (0.01%), (0.01%), 0.01%, and 0.01%.
See accompanying Notes, which are an integral part of the Financial Statements.
21
| | | | | |
| Windsor II Fund | | | | | |
| |
| |
| Financial Highlights | | | | | |
| |
| Admiral Shares | | | | | |
| |
| For a Share Outstanding | | | Year Ended October 31, |
| Throughout Each Period | 2010 | 2009 | 2008 | 2007 | 2006 |
| Net Asset Value, Beginning of Period | $39.46 | $36.51 | $67.18 | $62.41 | $56.13 |
| Investment Operations | | | | | |
| Net Investment Income | .914 | 1.064 | 1.431 | 1.491 | 1.402 |
| Net Realized and Unrealized Gain (Loss) | | | | | |
| on Investments | 3.811 | 3.112 | (24.497) | 7.348 | 7.782 |
| Total from Investment Operations | 4.725 | 4.176 | (23.066) | 8.839 | 9.184 |
| Distributions | | | | | |
| Dividends from Net Investment Income | (.925) | (1.226) | (1.473) | (1.481) | (1.346) |
| Distributions from Realized Capital Gains | — | — | (6.131) | (2.588) | (1.558) |
| Total Distributions | (.925) | (1.226) | (7.604) | (4.069) | (2.904) |
| Net Asset Value, End of Period | $43.26 | $39.46 | $36.51 | $67.18 | $62.41 |
| |
| Total Return | 12.12% | 12.09% | -37.94% | 14.71% | 17.01% |
| |
| Ratios/Supplemental Data | | | | | |
| Net Assets, End of Period (Millions) | $13,381 | $12,060 | $11,611 | $20,250 | $15,934 |
| Ratio of Total Expenses to | | | | | |
| Average Net Assets1 | 0.27% | 0.27% | 0.22% | 0.23% | 0.23% |
| Ratio of Net Investment Income to | | | | | |
| Average Net Assets | 2.16% | 3.07% | 2.76% | 2.29% | 2.39% |
| Portfolio Turnover Rate | 29% | 41% | 37% | 51% | 34% |
1 Includes performance-based investment advisory fee increases (decreases) of (0.01%), (0.01%), (0.01%), 0.01%, and 0.01%.
See accompanying Notes, which are an integral part of the Financial Statements.
22
Windsor II Fund
Notes to Financial Statements
Vanguard Windsor II Fund is registered under the Investment Company Act of 1940 as an open-end investment company, or mutual fund. The fund offers two classes of shares: Investor Shares and Admiral Shares. Investor Shares are available to any investor who meets the fund’s minimum purchase requirements. Admiral Shares are designed for investors who meet certain administrative, service, and account-size criteria.
A. The following significant accounting policies conform to generally accepted accounting principles for U.S. mutual funds. The fund consistently follows such policies in preparing its financial statements.
1. Security Valuation: Securities are valued as of the close of trading on the New York Stock Exchange (generally 4 p.m., Eastern time) on the valuation date. Equity securities are valued at the latest quoted sales prices or official closing prices taken from the primary market in which each security trades; such securities not traded on the valuation date are valued at the mean of the latest quoted bid and asked prices. Securities for which market quotations are not readily available, or whose values have been affected by events occurring before the fund’s pricing time but after the close of the securities’ primary markets, are valued at their fair values calculated according to procedures adopted by the board of trustees. These procedures include obtaining quotations from an independent pricing service, monitoring news to identify significant market- or security-specific events, and evaluating changes in the values of foreign market proxies (for example, ADRs, futures contracts, or exchange-traded funds), between the time the foreign markets close and the fund’s pricing time. When fair-value pricing is employed, the prices of securities used by a fund to calculate its net asset value may differ from quoted or published prices for the same securities. Investments in Vanguard Market Liquidity Fund are valued at that fund’s net asset value. Temporary cash investments acquired over 60 days to maturity are valued using the latest bid prices or using valuations based on a matrix system (which considers such factors as security prices, yields, maturities, and ratings), both as furnished by independent pricing services. Other temporary cash investments are valued at amortized cost, which approximates market value.
2. Futures Contracts: The fund uses index futures contracts to a limited extent, with the objective of maintaining full exposure to the stock market while maintaining liquidity. The fund may purchase or sell futures contracts to achieve a desired level of investment, whether to accommodate portfolio turnover or cash flows from capital share transactions. The primary risks associated with the use of futures contracts are imperfect correlation between changes in market values of stocks held by the fund and the prices of futures contracts, and the possibility of an illiquid market.
Futures contracts are valued at their quoted daily settlement prices. The aggregate principal amounts of the contracts are not recorded in the Statement of Net Assets. Fluctuations in the value of the contracts are recorded in the Statement of Net Assets as an asset (liability) and in the Statement of Operations as unrealized appreciation (depreciation) until the contracts are closed, when they are recorded as realized futures gains (losses).
3. Federal Income Taxes: The fund intends to continue to qualify as a regulated investment company and distribute all of its taxable income. Management has analyzed the fund’s tax positions taken for all open federal income tax years (October 31, 2007–2010), and has concluded that no provision for federal income tax is required in the fund’s financial statements.
4. Distributions: Distributions to shareholders are recorded on the ex-dividend date.
5. Security Lending: The fund may lend its securities to qualified institutional borrowers to earn additional income. Security loans are required to be secured at all times by collateral at least equal to the market value of securities loaned. The fund invests cash collateral received in Vanguard Market
23
Windsor II Fund
Liquidity Fund, and records a liability for the return of the collateral, during the period the securities are on loan. Security lending income represents fees charged to borrowers plus income earned on investing cash collateral, less expenses associated with the loan.
6. Other: Dividend income is recorded on the ex-dividend date. Interest income includes income distributions received from Vanguard Market Liquidity Fund and is accrued daily. Security transactions are accounted for on the date securities are bought or sold. Costs used to determine realized gains (losses) on the sale of investment securities are those of the specific securities sold.
Each class of shares has equal rights as to assets and earnings, except that each class separately bears certain class-specific expenses related to maintenance of shareholder accounts (included in Management and Administrative expenses) and shareholder reporting. Marketing and distribution expenses are allocated to each class of shares based on a method approved by the board of trustees. Income, other non-class-specific expenses, and gains and losses on investments are allocated to each class of shares based on its relative net assets.
B. Barrow, Hanley, Mewhinney & Strauss, LLC; Lazard Asset Management LLC; Hotchkis and Wiley Capital Management, LLC; Armstrong Shaw Associates Inc.; and beginning in January 2010, Sanders Capital, LLC, each provide investment advisory services to a portion of the fund for a fee calculated at an annual percentage rate of average net assets managed by the advisor. The basic fee of Barrow, Hanley, Mewhinney & Strauss, LLC, is subject to quarterly adjustments based on performance for the preceding three years relative to the MSCI US Prime Market 750 Index. The basic fee of Lazard Asset Management LLC is subject to quarterly adjustments based on performance for the preceding three years relative to the S&P 500 Index. The basic fee of Hotchkis and Wiley Capital Management, LLC, is subject to quarterly adjustments based on performance for the preceding five years relative to the MSCI US Investable Market 2500 Index. The basic fee of Armstrong Shaw Associates Inc. is subject to quarterly adjustments based on performance since January 31, 2006, relative to the Russell 1000 Value Index. In accordance with the advisory contract entered into with Sanders Capital, LLC, in January 2010, beginning November 1, 2010, the investment advisory fee will be subject to quarterly adjustments based on performance since January 31, 2010, relative to the Russell 3000 Index.
The Vanguard Group provides investment advisory services to a portion of the fund on an at-cost basis; the fund paid Vanguard advisory fees of $147,000 for the year ended October 31, 2010.
For the year ended October 31, 2010, the aggregate investment advisory fee represented an effective annual basic rate of 0.15% of the fund’s average net assets, before a decrease of $4,126,000 (0.01%) based on performance.
C. The Vanguard Group furnishes at cost corporate management, administrative, marketing, and distribution services. The costs of such services are allocated to the fund under methods approved by the board of trustees. The fund has committed to provide up to 0.40% of its net assets in capital contributions to Vanguard. At October 31, 2010, the fund had contributed capital of $6,018,000 to Vanguard (included in Other Assets), representing 0.02% of the fund’s net assets and 2.41% of Vanguard’s capitalization. The fund’s trustees and officers are also directors and officers of Vanguard.
D. The fund has asked its investment advisors to direct certain security trades, subject to obtaining the best price and execution, to brokers who have agreed to rebate to the fund part of the commissions generated. Such rebates are used solely to reduce the fund’s management and administrative expenses. For the year ended October 31, 2010, these arrangements reduced the fund’s expenses by $1,589,000 (an annual rate of 0.00% of average net assets).
24
Windsor II Fund
E. Various inputs may be used to determine the value of the fund’s investments. These inputs are summarized in three broad levels for financial statement purposes. The inputs or methodologies used to value securities are not necessarily an indication of the risk associated with investing in those securities.
Level 1—Quoted prices in active markets for identical securities.
Level 2—Other significant observable inputs (including quoted prices for similar securities, interest rates, prepayment speeds, credit risk, etc.).
Level 3—Significant unobservable inputs (including the fund’s own assumptions used to determine the fair value of investments).
The following table summarizes the fund’s investments as of October 31, 2010, based on the inputs used to value them:
| | | |
| | Level 1 | Level 2 | Level 3 |
| Investments | ($000) | ($000) | ($000) |
| Common Stocks | 33,412,327 | — | — |
| Temporary Cash Investments | 932,091 | 70,038 | — |
| Futures Contracts—Assets1 | 147 | — | — |
| Total | 34,344,565 | 70,038 | — |
| 1 Represents variation margin on the last day of the reporting period. | | | |
The following table summarizes changes in investments valued based on Level 3 inputs during the year ended October 31, 2010:
| |
| | Investments in |
| | Common Stocks |
| Amount Valued Based on Level 3 Inputs | ($000) |
| Balance as of October 31, 2009 | 59 |
| Transfers out of Level 3 | (59) |
| Balance as of October 31, 2010 | — |
F. At October 31, 2010, the aggregate settlement value of open futures contracts and the related unrealized appreciation (depreciation) were:
| | | | |
| | | | | ($000) |
| | | | Aggregate | |
| | | Number of | Settlement | Unrealized |
| | | Long (Short) | Value | Appreciation |
| Futures Contracts | Expiration | Contracts | Long (Short) | (Depreciation) |
| E-mini S&P 500 Index | December 2010 | 6,505 | 383,697 | 3,713 |
| S&P 500 Index | December 2010 | 166 | 48,958 | 2,651 |
Unrealized appreciation (depreciation) on open futures contracts is required to be treated as realized gain (loss) for tax purposes.
25
Windsor II Fund
G. Distributions are determined on a tax basis and may differ from net investment income and realized capital gains for financial reporting purposes. Differences may be permanent or temporary. Permanent differences are reclassified among capital accounts in the financial statements to reflect their tax character. Temporary differences arise when certain items of income, expense, gain, or loss are recognized in different periods for financial statement and tax purposes; these differences are primarily attributed to tax deferral of losses on wash sales and will reverse at some time in the future. Differences in classification may also result from the treatment of short-term gains as ordinary income for tax purposes.
For tax purposes, at October 31, 2010, the fund had $214,041,000 of ordinary income available for distribution. The fund had available capital loss carryforwards totaling $5,197,281,000 to offset future net capital gains of $3,383,640,000 through October 31, 2016, $1,639,579,000 through October 31, 2017, and $174,062,000 through October 31, 2018.
At October 31, 2010, the cost of investment securities for tax purposes was $31,484,652,000. Net unrealized appreciation of investment securities for tax purposes was $2,929,804,000, consisting of unrealized gains of $6,927,497,000 on securities that had risen in value since their purchase and $3,997,693,000 in unrealized losses on securities that had fallen in value since their purchase.
H. During the year ended October 31, 2010, the fund purchased $9,568,406,000 of investment securities and sold $10,372,065,000 of investment securities, other than temporary cash investments.
| | | | |
| I. Capital share transactions for each class of shares were: | | | |
| | | | Year Ended October 31, |
| | | 2010 | | 2009 |
| | Amount | Shares | Amount | Shares |
| | ($000) | (000) | ($000) | (000) |
| Investor Shares | | | | |
| Issued | 2,009,504 | 85,359 | 2,238,808 | 120,849 |
| Issued in Lieu of Cash Distributions | 442,058 | 19,182 | 611,735 | 32,569 |
| Redeemed | (4,172,968) | (177,358) | (3,136,719) | (165,583) |
| Net Increase (Decrease)—Investor Shares | (1,721,406) | (72,817) | (286,176) | (12,165) |
| Admiral Shares | | | | |
| Issued | 1,630,761 | 38,483 | 1,115,935 | 33,223 |
| Issued in Lieu of Cash Distributions | 264,736 | 6,476 | 354,517 | 10,636 |
| Redeemed | (1,725,129) | (41,294) | (1,874,871) | (56,220) |
| Net Increase (Decrease)—Admiral Shares | 170,368 | 3,665 | (404,419) | (12,361) |
26
Windsor II Fund
J. Certain of the fund’s investments are in companies that are considered to be affiliated companies of the fund because the fund owns more than 5% of the outstanding voting securities of the company. Transactions during the period in securities of these companies were as follows:
| | | | | |
| | | | Current Period Transactions | |
| | Oct. 31, 2009 | | Proceeds from | | Oct. 31, 2010 |
| | Market | Purchases | Securities | Dividend | Market |
| | Value | at Cost | Sold | Income | Value |
| | ($000) | ($000) | ($000) | ($000) | ($000) |
| CenterPoint Energy Inc. | 303,817 | 105,563 | 120,377 | 17,469 | 385,047 |
| Constellation Energy Group Inc. | 341,085 | 41,113 | 420,912 | 2,777 | — |
| Cooper Industries plc | 532,398 | 94,729 | 168,299 | 13,216 | 632,635 |
| ITT Corp. | 558,776 | 83,128 | 165,439 | 9,657 | 439,950 |
| Quest Diagnostics Inc. | 536,553 | 148,580 | 163,109 | 3,762 | 460,663 |
| Service Corp. International | 172,300 | 109,775 | 134,322 | 3,615 | 182,129 |
| Spectra Energy Corp. | 618,285 | 176,855 | 260,301 | 29,362 | NA1 |
| Wyndham Worldwide Corp. | 320,505 | 109,955 | 231,043 | 6,523 | 397,614 |
| | 3,383,719 | | | 86,381 | 2,498,038 |
1 Not applicable—At October 31, 2010, the security was still held, but the issuer was no longer an affiliated company of the fund.
K. In preparing the financial statements as of October 31, 2010, management considered the impact of subsequent events for potential recognition or disclosure in these financial statements.
27
Report of Independent Registered Public Accounting Firm
To the Trustees of Vanguard Windsor Funds and the Shareholders of Vanguard Windsor II Fund: In our opinion, the accompanying statement of net assets and statement of assets and liabilities, and the related statements of operations and of changes in net assets and the financial highlights present fairly, in all material respects, the financial position of Vanguard Windsor II Fund (constituting a separate portfolio of Vanguard Windsor Funds, hereafter referred to as the “Fund”) at October 31, 2010, the results of its operations for the year then ended, the changes in its net assets for each of the two years in the period then ended and the financial highlights for each of the five years in the period then ended, in conformity with accounting principles generally accepted in the United States of America. These financial statements and financial highlights (hereafter referred to as “financial statements”) are the responsibility of the Fund&# 146;s management; our responsibility is to express an opinion on these financial statements based on our audits. We conducted our audits of these financial statements in accordance with the standards of the Public Company Accounting Oversight Board (United States). Those standards require that we plan and perform the audit to obtain reasonable assurance about whether the financial statements are free of material misstatement. An audit includes examining, on a test basis, evidence supporting the amounts and disclosures in the financial statements, assessing the accounting principles used and significant estimates made by management, and evaluating the overall financial statement presentation. We believe that our audits, which included confirmation of securities at October 31, 2010 by correspondence with the custodian and broker and by agreement to the underlying ownership records of Vanguard Market Liquidity Fund, provide a reasonable basis for our opinion.
PricewaterhouseCoopers LLP
Philadelphia, Pennsylvania
December 9, 2010
|
| Special 2010 tax information (unaudited) for Vanguard Windsor II Fund |
| This information for the fiscal year ended October 31, 2010, is included pursuant to provisions of the Internal Revenue Code. |
| The fund distributed $736,882,000 of qualified dividend income to shareholders during the fiscal year. |
| For corporate shareholders, 97.0% of investment income (dividend income plus short-term gains, if any) |
| qualifies for the dividends-received deduction. |
28
Your Fund’s After-Tax Returns
This table presents returns for your fund both before and after taxes. The after-tax returns are shown in two ways: (1) assuming that an investor owned the fund during the entire period and paid taxes on the fund’s distributions, and (2) assuming that an investor paid taxes on the fund’s distributions and sold all shares at the end of each period.
Calculations are based on the highest individual federal income tax and capital gains tax rates in effect at the times of the distributions and the hypothetical sales. State and local taxes were not considered. After-tax returns reflect any qualified dividend income , using actual prior-year figures and estimates for 2010. (In the example, returns after the sale of fund shares may be higher than those assuming no sale. This occurs when the sale would have produced a capital loss. The calculation assumes that the investor received a tax deduction for the loss.) The table shows returns for Investor Shares only; returns for other share classes will differ. Please note that your actual after-tax returns will depend on your tax situation and may differ from those shown. Also note that if you own the fund in a tax-deferred account, such as an individual retirement account or a 401(k) plan, this information does not apply to you. Such accounts are not subject to c urrent taxes.
Finally, keep in mind that a fund’s performance—whether before or after taxes—does not guarantee future results.
| | | |
| Average Annual Total Returns: Windsor II Fund Investor Shares | | |
| Periods Ended October 31, 2010 | | | |
| | One | Five | Ten |
| | Year | Years | Years |
| Returns Before Taxes | 12.05% | 0.81% | 3.41% |
| Returns After Taxes on Distributions | 11.69 | -0.14 | 2.53 |
| Returns After Taxes on Distributions and Sale of Fund Shares | 8.27 | 0.68 | 2.75 |
29
About Your Fund’s Expenses
As a shareholder of the fund, you incur ongoing costs, which include costs for portfolio management, administrative services, and shareholder reports (like this one), among others. Operating expenses, which are deducted from a fund’s gross income, directly reduce the investment return of the fund.
A fund’s expenses are expressed as a percentage of its average net assets. This figure is known as the expense ratio. The following examples are intended to help you understand the ongoing costs (in dollars) of investing in your fund and to compare these costs with those of other mutual funds. The examples are based on an investment of $1,000 made at the beginning of the period shown and held for the entire period.
The accompanying table illustrates your fund’s costs in two ways:
• Based on actual fund return. This section helps you to estimate the actual expenses that you paid over the period. The ”Ending Account Value“ shown is derived from the fund‘s actual return, and the third column shows the dollar amount that would have been paid by an investor who started with $1,000 in the fund. You may use the information here, together with the amount you invested, to estimate the expenses that you paid over the period.
To do so, simply divide your account value by $1,000 (for example, an $8,600 account value divided by $1,000 = 8.6), then multiply the result by the number given for your fund under the heading ”Expenses Paid During Period.“
• Based on hypothetical 5% yearly return. This section is intended to help you compare your fund‘s costs with those of other mutual funds. It assumes that the fund had a yearly return of 5% before expenses, but that the expense ratio is unchanged. In this case—because the return used is not the fund’s actual return—the results do not apply to your investment. The example is useful in making comparisons because the Securities and Exchange Commission requires all mutual funds to calculate expenses based on a 5% return. You can assess your fund’s costs by comparing this hypothetical example with the hypothetical examples that appear in shareholder reports of other funds.
Note that the expenses shown in the table are meant to highlight and help you compare ongoing costs only and do not reflect transaction costs incurred by the fund for buying and selling securities. Further, the expenses do not include the transaction fees or the account service fee described in the prospectus. If such fees were applied to your account, your costs would be higher. Your fund does not charge transaction fees, such as purchase or redemption fees, nor does it carry a “sales load.” The calculations assume no shares were bought or sold during the period. Your actual costs may have been higher or lower, depending on the amount of your investment and the timing of any purchases or redemptions.
You can find more information about the fund’s expenses, including annual expense ratios, in the Financial Statements section of this report. For additional information on operating expenses and other shareholder costs, please refer to your fund’s current prospectus.
30
| | | |
| Six Months Ended October 31, 2010 | | | |
| | Beginning | Ending | Expenses |
| | Account Value | Account Value | Paid During |
| Windsor II Fund | 4/30/2010 | 10/31/2010 | Period |
| Based on Actual Fund Return | | | |
| Investor Shares | $1,000.00 | $977.13 | $1.59 |
| Admiral Shares | 1,000.00 | 977.48 | 1.45 |
| Based on Hypothetical 5% Yearly Return | | | |
| Investor Shares | $1,000.00 | $1,023.59 | $1.63 |
| Admiral Shares | 1,000.00 | 1,023.74 | 1.48 |
The calculations are based on expenses incurred in the most recent six-month period. The fund’s annualized six-month expense ratios for that period are 0.32% for Investor Shares and 0.29% for Admiral Shares. The dollar amounts shown as “Expenses Paid” are equal to the annualized expense ratio multiplied by the average account value over the period, multiplied by the number of days in the most recent six-month period, then divided by the number of days in the most recent 12-month period.
31
Glossary
30-Day SEC Yield. A fund’s 30-day SEC yield is derived using a formula specified by the U.S. Securities and Exchange Commission. Under the formula, data related to the fund’s security holdings in the previous 30 days are used to calculate the fund’s hypothetical net income for that period, which is then annualized and divided by the fund’s estimated average net assets over the calculation period. For the purposes of this calculation, a security’s income is based on its current market yield to maturity (in the case of bonds) or its projected dividend yield (for stocks). Because the SEC yield represents hypothetical annualized income, it will differ—at times significantly—from the fund’s actual experience. As a result, the fund’s income distributions may be higher or lower than implied by the SEC yield.
Beta. A measure of the magnitude of a fund’s past share-price fluctuations in relation to the ups and downs of a given market index. The index is assigned a beta of 1.00. Compared with a given index, a fund with a beta of 1.20 typically would have seen its share price rise or fall by 12% when the index rose or fell by 10%. For this report, beta is based on returns over the past 36 months for both the fund and the index. Note that a fund’s beta should be reviewed in conjunction with its R-squared (see definition). The lower the R-squared, the less correlation there is between the fund and the index, and the less reliable beta is as an indicator of volatility.
Dividend Yield. Dividend income earned by stocks, expressed as a percentage of the aggregate market value (or of net asset value, for a fund). The yield is determined by dividing the amount of the annual dividends by the aggregate value (or net asset value) at the end of the period. For a fund, the dividend yield is based solely on stock holdings and does not include any income produced by other investments.
Earnings Growth Rate. The average annual rate of growth in earnings over the past five years for the stocks now in a fund.
Equity Exposure. A measure that reflects a fund’s investments in stocks and stock futures. Any holdings in short-term reserves are excluded.
Expense Ratio. The percentage of a fund’s average net assets used to pay its annual administrative and advisory expenses. These expenses directly reduce returns to investors.
Foreign Holdings. The percentage of a fund represented by stocks or depositary receipts of companies based outside the United States.
Inception Date. The date on which the assets of a fund (or one of its share classes) are first invested in accordance with the fund’s investment objective. For funds with a subscription period, the inception date is the day after that period ends. Investment performance is measured from the inception date.
Median Market Cap. An indicator of the size of companies in which a fund invests; the midpoint of market capitalization (market price x shares outstanding) of a fund’s stocks, weighted by the proportion of the fund’s assets invested in each stock. Stocks representing half of the fund’s assets have market capitalizations above the median, and the rest are below it.
Price/Book Ratio. The share price of a stock divided by its net worth, or book value, per share. For a fund, the weighted average price/book ratio of the stocks it holds.
32
Price/Earnings Ratio. The ratio of a stock’s current price to its per-share earnings over the past year. For a fund, the weighted average P/E of the stocks it holds. P/E is an indicator of market expectations about corporate prospects; the higher the P/E, the greater the expectations for a company’s future growth.
R-Squared. A measure of how much of a fund’s past returns can be explained by the returns from the market in general, as measured by a given index. If a fund’s total returns were precisely synchronized with an index’s returns, its R-squared would be 1.00. If the fund’s returns bore no relationship to the index’s returns, its R-squared would be 0. For this report, R-squared is based on returns over the past 36 months for both the fund and the index.
Return on Equity. The annual average rate of return generated by a company during the past five years for each dollar of shareholder’s equity (net income divided by shareholder’s equity). For a fund, the weighted average return on equity for the companies whose stocks it holds.
Short-Term Reserves. The percentage of a fund invested in highly liquid, short-term securities that can be readily converted to cash.
Turnover Rate. An indication of the fund’s trading activity. Funds with high turnover rates incur higher transaction costs and may be more likely to distribute capital gains (which may be taxable to investors). The turnover rate excludes in-kind transactions, which have minimal impact on costs.
33
This page intentionally left blank.
This page intentionally left blank.
The People Who Govern Your Fund
The trustees of your mutual fund are there to see that the fund is operated and managed in your best interests since, as a shareholder, you are a part owner of the fund. Your fund’s trustees also serve on the board of directors of The Vanguard Group, Inc., which is owned by the Vanguard funds and provides services to them on an at-cost basis.
A majority of Vanguard’s board members are independent, meaning that they have no affiliation with Vanguard or the funds they oversee, apart from the sizable personal investments they have made as private individuals. The independent board members have distinguished backgrounds in business, academia, and public service. Each of the trustees and executive officers oversees 178 Vanguard funds.
The following table provides information for each trustee and executive officer of the fund. More information about the trustees is in the Statement of Additional Information, which can be obtained, without charge, by contacting Vanguard at 800-662-7447, or online at vanguard.com.
| |
| Interested Trustee1 | Amy Gutmann |
| | Born 1949. Trustee Since June 2006. Principal |
| F. William McNabb III | Occupation(s) During the Past Five Years: President |
| Born 1957. Trustee Since July 2009. Chairman of the | of the University of Pennsylvania; Christopher H. |
| Board. Principal Occupation(s) During the Past Five | Browne Distinguished Professor of Political Science |
| Years: Chairman of the Board of The Vanguard Group, | in the School of Arts and Sciences with secondary |
| Inc., and of each of the investment companies served | appointments at the Annenberg School for Commu- |
| by The Vanguard Group, since January 2010; Director | nication and the Graduate School of Education |
| of The Vanguard Group since 2008; Chief Executive | of the University of Pennsylvania; Director of |
| Officer and President of The Vanguard Group and of | Carnegie Corporation of New York, Schuylkill River |
| each of the investment companies served by The | Development Corporation, and Greater Philadelphia |
| Vanguard Group since 2008; Director of Vanguard | Chamber of Commerce; Trustee of the National |
| Marketing Corporation; Managing Director of The | Constitution Center; Chair of the Presidential |
| Vanguard Group (1995–2008) . | Commission for the Study of Bioethical Issues. |
| |
| | JoAnn Heffernan Heisen |
| Independent Trustees | Born 1950. Trustee Since July 1998. Principal |
| | Occupation(s) During the Past Five Years: Corporate |
| Emerson U. Fullwood | Vice President and Chief Global Diversity Officer |
| Born 1948. Trustee Since January 2008. Principal | since 2006 (retired 2008) and Member of the |
| Occupation(s) During the Past Five Years: Executive | Executive Committee (retired 2008) of Johnson & |
| Chief Staff and Marketing Officer for North America | Johnson (pharmaceuticals/consumer products); Vice |
| and Corporate Vice President (retired 2008) of Xerox | President and Chief Information Officer of Johnson & |
| Corporation (document management products and | Johnson (1997–2005); Director of the University |
| services); Director of SPX Corporation (multi-industry | Medical Center at Princeton and Women’s Research |
| manufacturing), the United Way of Rochester, | and Education Institute; Member of the Advisory |
| Amerigroup Corporation (managed health care), | Board of the Maxwell School of Citizenship and Public |
| the University of Rochester Medical Center, and | Affairs at Syracuse University. |
| Monroe Community College Foundation. | |
| | F. Joseph Loughrey |
| Rajiv L. Gupta | Born 1949. Trustee Since October 2009. Principal |
| Born 1945. Trustee Since December 2001.2 | Occupation(s) During the Past Five Years: President |
| Principal Occupation(s) During the Past Five Years: | and Chief Operating Officer since 2005 (retired 2009) |
| Chairman and Chief Executive Officer (retired 2009) | and Vice Chairman of the Board (2008–2009) of |
| and President (2006–2008) of Rohm and Haas Co. | Cummins Inc. (industrial machinery); Director of |
| (chemicals); Director of Tyco International, Ltd. | SKF AB (industrial machinery), Hillenbrand, Inc. |
| (diversified manufacturing and services) and Hewlett- | (specialized consumer services), Sauer-Danfoss Inc. |
| Packard Co. (electronic computer manufacturing); | (machinery), the Lumina Foundation for Education, |
| Trustee of The Conference Board; Member of the | and Oxfam America; Chairman of the Advisory |
| Board of Managers of Delphi Automotive LLP | Council for the College of Arts and Letters at the |
| (automotive components) . | University of Notre Dame. |
| | |
| André F. Perold | Kathryn J. Hyatt | |
| Born 1952. Trustee Since December 2004. Principal | Born 1955. Treasurer Since November 2008. Principal |
| Occupation(s) During the Past Five Years: George | Occupation(s) During the Past Five Years: Principal |
| Gund Professor of Finance and Banking at the Harvard | of The Vanguard Group, Inc.; Treasurer of each of |
| Business School; Chair of the Investment Committee | the investment companies served by The Vanguard |
| of HighVista Strategies LLC (private investment firm) . | Group since 2008; Assistant Treasurer of each of the |
| | investment companies served by The Vanguard Group |
| Alfred M. Rankin, Jr. | (1988–2008) . | |
| Born 1941. Trustee Since January 1993. Principal | | |
| Occupation(s) During the Past Five Years: Chairman, | Heidi Stam | |
| President, and Chief Executive Officer of NACCO | Born 1956. Secretary Since July 2005. Principal |
| Industries, Inc. (forklift trucks/housewares/lignite); | Occupation(s) During the Past Five Years: Managing |
| Director of Goodrich Corporation (industrial products/ | Director of The Vanguard Group, Inc., since 2006; |
| aircraft systems and services); Chairman of the | General Counsel of The Vanguard Group since 2005; |
| Federal Reserve Bank of Cleveland; Trustee of The | Secretary of The Vanguard Group and of each of the |
| Cleveland Museum of Art. | investment companies served by The Vanguard Group |
| | since 2005; Director and Senior Vice President of |
| Peter F. Volanakis | Vanguard Marketing Corporation since 2005; |
| Born 1955. Trustee Since July 2009. Principal | Principal of The Vanguard Group (1997–2006). |
| Occupation(s) During the Past Five Years: President | | |
| since 2007 and Chief Operating Officer since 2005 | | |
| of Corning Incorporated (communications equipment); | Vanguard Senior Management Team |
| President of Corning Technologies (2001–2005); | | |
| Director of Corning Incorporated and Dow Corning; | R. Gregory Barton | Michael S. Miller |
| Trustee of the Corning Incorporated Foundation and | Mortimer J. Buckley | James M. Norris |
| the Corning Museum of Glass; Overseer of the | Kathleen C. Gubanich | Glenn W. Reed |
| Amos Tuck School of Business Administration at | Paul A. Heller | George U. Sauter |
| Dartmouth College. | | |
| |
| | Chairman Emeritus and Senior Advisor |
| Executive Officers | | |
| | John J. Brennan | |
| Glenn Booraem | Chairman, 1996–2009 | |
| Born 1967. Controller Since July 2010. Principal | Chief Executive Officer and President, 1996–2008 |
| Occupation(s) During the Past Five Years: Principal | | |
| of The Vanguard Group, Inc.; Controller of each of | | |
| the investment companies served by The Vanguard | Founder | |
| Group since 2010; Assistant Controller of each of | | |
| the investment companies served by The Vanguard | John C. Bogle | |
| Group (2001–2010) . | Chairman and Chief Executive Officer, 1974–1996 |
| |
| Thomas J. Higgins | | |
| Born 1957. Chief Financial Officer Since September | | |
| 2008. Principal Occupation(s) During the Past Five | | |
| Years: Principal of The Vanguard Group, Inc.; Chief | | |
| Financial Officer of each of the investment companies | | |
| served by The Vanguard Group since 2008; Treasurer | | |
| of each of the investment companies served by The | | |
| Vanguard Group (1998–2008) . | | |
1 Mr. McNabb is considered an “interested person,” as defined in the Investment Company Act of 1940, because he is an officer of the Vanguard funds.
2 December 2002 for Vanguard Equity Income Fund, Vanguard Growth Equity Fund, the Vanguard Municipal Bond Funds, and the Vanguard State Tax-Exempt Funds.
|  |
| | P.O. Box 2600 |
| | Valley Forge, PA 19482-2600 |
| |
| |
| |
| Connect with Vanguard® > vanguard.com | |
| |
| |
| |
| Fund Information > 800-662-7447 | CFA® is a trademark owned by CFA Institute. |
| Direct Investor Account Services > 800-662-2739 | |
| Institutional Investor Services > 800-523-1036 | |
| Text Telephone for People | |
| With Hearing Impairment > 800-749-7273 | |
| |
| This material may be used in conjunction | |
| with the offering of shares of any Vanguard | |
| fund only if preceded or accompanied by | |
| the fund’s current prospectus. | |
| |
| All comparative mutual fund data are from Lipper Inc. or | |
| Morningstar, Inc., unless otherwise noted. | |
| |
| You can obtain a free copy of Vanguard’s proxy voting | |
| guidelines by visiting vanguard.com/proxyreporting or by | |
| calling Vanguard at 800-662-2739. The guidelines are | |
| also available from the SEC’s website, sec.gov. In | |
| addition, you may obtain a free report on how your fund | |
| voted the proxies for securities it owned during the 12 | |
| months ended June 30. To get the report, visit either | |
| vanguard.com/proxyreporting or sec.gov. | |
| |
| You can review and copy information about your fund at | |
| the SEC’s Public Reference Room in Washington, D.C. To | |
| find out more about this public service, call the SEC at | |
| 202-551-8090. Information about your fund is also | |
| available on the SEC’s website, and you can receive | |
| copies of this information, for a fee, by sending a | |
| request in either of two ways: via e-mail addressed to | |
| publicinfo@sec.gov or via regular mail addressed to the | |
| Public Reference Section, Securities and Exchange | |
| Commission, Washington, DC 20549-1520. | |
| |
| |
| | © 2010 The Vanguard Group, Inc. |
| | All rights reserved. |
| | Vanguard Marketing Corporation, Distributor. |
| |
| | Q730 122010 |
Item 2: Code of Ethics. The Registrant has adopted a code of ethics that applies to the Registrant’s principal executive officer, principal financial officer, principal accounting officer or controller or persons performing similar functions. The Code of Ethics was amended during the reporting period covered by this report to make certain technical, non-material changes.
Item 3: Audit Committee Financial Expert. The following members of the Audit Committee have been determined by the Registrant’s Board of Trustees to be Audit Committee Financial Experts serving on its Audit Committee, and to be independent: Charles D. Ellis, Rajiv L. Gupta, JoAnn Heffernan Heisen, André F. Perold, and Alfred M. Rankin, Jr.
Item 4: Principal Accountant Fees and Services.
(a) Audit Fees.
Audit Fees of the Registrant
Fiscal Year Ended October 31, 2010: $60,000
Fiscal Year Ended October 31, 2009: $54,000
Aggregate Audit Fees of Registered Investment Companies in the Vanguard Group.
Fiscal Year Ended October 31, 2010: $3,607,060
Fiscal Year Ended October 31, 2009: $3,354,640
(b) Audit-Related Fees.
Fiscal Year Ended October 31, 2010: $791,350
Fiscal Year Ended October 31, 2009: $876,210
Includes fees billed in connection with assurance and related services provided to the Registrant, The Vanguard Group, Inc., Vanguard Marketing Corporation, and other registered investment companies in the Vanguard Group.
(c) Tax Fees.
Fiscal Year Ended October 31, 2010: $336,090
Fiscal Year Ended October 31, 2009: $423,070
Includes fees billed in connection with tax compliance, planning and advice services provided to the Registrant, The Vanguard Group, Inc., Vanguard Marketing Corporation, and other registered investment companies in the Vanguard Group and related to income and excise taxes.
(d) All Other Fees.
Fiscal Year Ended October 31, 2010: $16,000
Fiscal Year Ended October 31, 2009: $0
Includes fees billed for services related to risk management and privacy matters. Services were provided to the Registrant, The Vanguard Group, Inc., Vanguard Marketing Corporation, and other registered investment companies in the Vanguard Group.
(e) (1) Pre-Approval Policies. The policy of the Registrant’s Audit Committee is to consider and, if appropriate, approve before the principal accountant is engaged for such services, all specific audit and non-audit services provided to: (1) the Registrant; (2) The Vanguard Group, Inc.; (3) other entities controlled by The Vanguard Group, Inc. that provide ongoing services to the Registrant; and (4) other registered investment companies in the Vanguard Group. In making a determination, the Audit Committee considers whether the services are consistent with maintaining the principal accountant’s independence.
In the event of a contingency situation in which the principal accountant is needed to provide services in between scheduled Audit Committee meetings, the Chairman of the Audit Committee would be called on to consider and, if appropriate, pre-approve audit or permitted non-audit services in an amount sufficient to complete services through the next Audit Committee meeting, and to determine if such services would be consistent with maintaining the accountant’s independence. At the next scheduled Audit Committee meeting, services and fees would be presented to the Audit Committee for formal consideration, and, if appropriate, approval by the entire Audit Committee. The Audit Committee would again consider whether such services and fees are consistent with maintaining the principal accountant’s independence.
The Registrant’s Audit Committee is informed at least annually of all audit and non-audit services provided by the principal accountant to the Vanguard complex, whether such services are provided to: (1) the Registrant; (2) The Vanguard Group, Inc.; (3) other entities controlled by The Vanguard Group, Inc. that provide ongoing services to the Registrant; or (4) other registered investment companies in the Vanguard Group.
(2) No percentage of the principal accountant’s fees or services were approved pursuant to the waiver provision of paragraph (c)(7)(i)(C) of Rule 2-01 of Regulation S-X.
(f) For the most recent fiscal year, over 50% of the hours worked under the principal accountant’s engagement were not performed by persons other than full-time, permanent employees of the principal accountant.
(g) Aggregate Non-Audit Fees.
Fiscal Year Ended October 31, 2010: $352,090
Fiscal Year Ended October 31, 2009: $423,070
Includes fees billed for non-audit services provided to the Registrant, The Vanguard Group, Inc., Vanguard Marketing Corporation, and other registered investment companies in the Vanguard Group.
(h) For the most recent fiscal year, the Audit Committee has determined that the provision of all non-audit services was consistent with maintaining the principal accountant’s independence.
Item 5: Audit Committee of Listed Registrants.
Not Applicable.
Item 6: Investments.
Not Applicable.
Item 7: Disclosure of Proxy Voting Policies and Procedures for Closed-End Management Investment Companies.
Not Applicable.
Item 8: Portfolio Managers of Closed-End Management Investment Companies.
Not Applicable.
Item 9: Purchase of Equity Securities by Closed-End Management Investment Company and Affiliated Purchasers.
Not Applicable.
Item 10: Submission of Matters to a Vote of Security Holders.
Not Applicable.
Item 11: Controls and Procedures.
(a) Disclosure Controls and Procedures. The Principal Executive and Financial Officers concluded that the Registrant's Disclosure Controls and Procedures are effective based on their evaluation of the Disclosure Controls and Procedures as of a date within 90 days of the filing date of this report.
(b) Internal Control Over Financial Reporting. There were no significant changes in Registrant’s Internal Control Over Financial Reporting or in other factors that could significantly affect this control subsequent to the date of the evaluation, including any corrective actions with regard to significant deficiencies and material weaknesses.
Item 12: Exhibits.
(a) Code of Ethics.
(b) Certifications.
Pursuant to the requirements of the Securities Exchange Act of 1934 and the Investment Company Act of 1940, the registrant has duly caused this report to be signed on its behalf by the undersigned, thereunto duly authorized.
| |
| | VANGUARD WINDSOR FUNDS |
| |
| By: | /s/ F. WILLIAM MCNABB III* |
| | F. WILLIAM MCNABB III |
| | CHIEF EXECUTIVE OFFICER |
| |
| Date: December 20, 2010 |
Pursuant to the requirements of the Securities Exchange Act of 1934 and the Investment Company Act of 1940, this report has been signed below by the following persons on behalf of the registrant and in the capacities and on the dates indicated.
| |
| | VANGUARD WINDSOR FUNDS |
| By: | /s/ F. WILLIAM MCNABB III* |
| | F. WILLIAM MCNABB III |
| | CHIEF EXECUTIVE OFFICER |
| Date: December 20, 2010 |
| |
| | VANGUARD WINDSOR FUNDS |
| By: | /s/ THOMAS J. HIGGINS* |
| | THOMAS J. HIGGINS |
| | CHIEF FINANCIAL OFFICER |
| Date: December 20, 2010 |
* By: /s/ Heidi Stam
Heidi Stam, pursuant to a Power of Attorney filed on April 26, 2010, see file Number 33-53683, Incorporated by Reference.