UNITED STATES |
SECURITIES AND EXCHANGE COMMISSION |
Washington, D.C. 20549 |
|
FORM N-CSR |
|
CERTIFIED SHAREHOLDER REPORT |
OF |
REGISTERED MANAGEMENT INVESTMENT COMPANIES |
|
Investment Company Act file number: 811-834 |
|
Name of Registrant: Vanguard Windsor Funds |
|
Address of Registrant: P.O. Box 2600 |
Valley Forge, PA 19482 |
|
Name and address of agent for service: Heidi Stam, Esquire |
P.O. Box 876 |
Valley Forge, PA 19482 |
|
Registrant’s telephone number, including area code: (610) 669-1000 |
|
Date of fiscal year end: October 1 |
|
Date of reporting period: November 1, 2006–October 31, 2007 |
Item 1: Reports to Shareholders |
> | The Windsor Fund’s Investor Shares gained 11.2% for the year ended October 31, 2007, as the fund recovered nicely from a turbulent summer. Windsor’s return put it ahead of the performance of its benchmark index and the average return among peer funds. |
> | The fund achieved its strongest gains among companies benefiting from global growth, such as those related to energy, metals, mining, machinery, and food. |
> | The fund’s largest sector, financials, produced a negative return for the period. Compared with its benchmark, however, the fund had significantly less exposure to this poorly performing sector, which helped keep the fund’s return a few steps ahead of the index’s. |
Contents | |
| |
Your Fund’s Total Returns | 1 |
Chairman’s Letter | 2 |
Advisors’ Report | 7 |
Fund Profile | 11 |
Performance Summary | 12 |
Financial Statements | 14 |
Your Fund’s After-Tax Returns | 28 |
About Your Fund’s Expenses | 29 |
Glossary | 31 |
Please note: The opinions expressed in this report are just that—informed opinions. They should not be considered promises or advice. Also, please keep in mind that the information and opinions cover the period through the date on the cover of this report. Of course, the risks of investing in your fund are spelled out in the prospectus.
Your Fund’s Total Returns
Fiscal Year Ended October 31, 2007 | | |
| Ticker | Total |
| Symbol | Returns |
Vanguard Windsor Fund | | |
Investor Shares | VWNDX | 11.2% |
Admiral™ Shares1 | VWNEX | 11.4 |
Russell 1000 Value Index | | 10.8 |
Average Multi-Cap Value Fund2 | | 10.9 |
Your Fund’s Performance at a Glance | | | | |
October 31, 2006–October 31, 2007 | | | | |
| | | Distributions Per Share |
| Starting | Ending | Income | Capital |
| Share Price | Share Price | Dividends | Gains |
Vanguard Windsor Fund | | | | |
Investor Shares | $19.27 | $19.52 | $0.301 | $1.529 |
Admiral Shares | 65.04 | 65.90 | 1.085 | 5.159 |
1 A lower-cost class of shares available to many longtime shareholders and to those with significant investments in the fund.
2 Derived from data provided by Lipper Inc.
1

Chairman’s Letter
Dear Shareholder,
After years of relative calm, volatility in stock and bond markets spiked during the fiscal year that ended October 31, as investors worried about economic issues including housing prices and the fallout from mounting mortgage delinquencies. Despite the turmoil—and steep declines in the fund’s returns during June and July—Vanguard Windsor Fund ended the year with gains of 11.2% for Investor Shares and 11.4% for Admiral Shares. The performance put the fund ahead of its benchmark and its peer group.
Significant contributions to the fund’s return came from energy, materials, and industrials companies with global reach—all beneficiaries of rapid development in emerging economies, most notably China. The fund continued to benefit from a large commitment to the information technology sector, which was buoyed by expanding Internet use, particularly for videos and other forms of entertainment.
Windsor’s SEC dividend yield ended the period at 1.41% for Investor Shares, compared with 1.43% a year earlier. If you hold the Windsor Fund in a taxable account, you may wish to review our report on the fund’s after-tax returns on page 28.
2
Stocks rode a bumpy path to impressive results
Despite some volatility, the U.S. stock market produced strong results during the fund’s fiscal year. Ongoing problems with low-quality mortgage loans (an unpleasant postscript to the housing downturn) rattled financial markets in the spring and summer, and continued to make investors skittish through the close of the fiscal period. At the end of October, crude oil prices touched historic highs, while the U.S. dollar dipped to record lows versus other major currencies.
Still, the broad U.S. stock market returned an impressive 15.3%. Large-capitalization stocks outperformed small-caps, and growth stocks outperformed value stocks—both continuing recent months’ reversals of longer-term trends.
International companies performed even better than domestic issues. Stocks in emerging markets fared particularly well, followed by European and Pacific region stocks (Japan was a notable laggard). The weak U.S. dollar boosted foreign stock returns for U.S.-based investors.
Bond investors converged on high-quality issues
As troubles in the subprime credit markets rippled across the financial markets, bond investors sought the relative safety of U.S. Treasury bonds. This “flight to quality” drove prices for Treasuries higher and yields lower, and widened the spread
Market Barometer | |
| Average Annual Total Returns |
| Periods Ended October 31, 2007 |
| One Year | Three Years | Five Years |
Stocks | | | |
Russell 1000 Index (Large-caps) | 15.0% | 13.8% | 14.5% |
Russell 2000 Index (Small-caps) | 9.3 | 13.7 | 18.7 |
Dow Jones Wilshire 5000 Index (Entire market) | 15.3 | 14.2 | 15.3 |
MSCI All Country World Index ex USA (International) | 33.0 | 27.4 | 26.4 |
| | | |
Bonds | | | |
Lehman U.S. Aggregate Bond Index (Broad taxable market) | 5.4% | 3.9% | 4.4% |
Lehman Municipal Bond Index | 2.9 | 3.7 | 4.5 |
Citigroup 3-Month Treasury Bill Index | 5.0 | 4.1 | 2.9 |
| | | |
CPI | | | |
Consumer Price Index | 3.5% | 3.1% | 2.9% |
3
between Treasury yields and the much higher yields demanded by investors for riskier bonds. Declines in Treasury yields were steepest at the short end of the maturity spectrum, aided by the actions of the Federal Reserve Board. The central bank lowered the target for short-term interest rates to 4.50% in two separate rate cuts (a half-percentage-point in September and a quarter-point on October 31). The yield of the 3-month Treasury bill finished the fiscal period at 3.92%, after spending much of the year near 5%; the 10-year Treasury note ended at 4.47%.
For the year, the broad taxable bond market returned 5.4%. Returns from tax-exempt bonds were lower, as these issues did not benefit from the late-summer rally in Treasuries.
Information technology remains fertile ground for fund’s advisors
The theme for much of the year in the stock and bond markets was an aversion to risk, as investors steered away from companies whose prices suddenly looked high, given that earnings could falter in a housing-led economic slowdown. This favored the largest growth stocks, although your fund’s managers found many strong performers that also met Windsor’s mandate to own high-quality companies that trade at prices substantially below their estimated values.
Many of the top contributors to the fund’s gains were companies whose fortunes were tied to rapid rates of growth in countries around the globe. Examples include food products company Bunge
Expense Ratios1 | | | |
Your fund compared with its peer group | | | |
| | | Average |
| Investor | Admiral | Multi-Cap |
| Shares | Shares | Value Fund |
Windsor Fund | 0.31% | 0.19% | 1.31% |
1 Fund expense ratios reflect the 12 months ended October 31, 2007. Peer-group expense ratio is derived from data provided by Lipper Inc. and captures information through year-end 2006.
4
(+81%), agricultural giant Deere (+85%), aluminum manufacturer Alcoa (+40%), and glass bottle maker Owens-Illinois (+168%).
Windsor’s advisors also selected well within two of the fund’s better-performing sectors, energy and information technology. Significant weightings in communications equipment and software companies meant that information technology made by far the single biggest contribution to the fund’s performance, an unusual feat within the world of value investing. Cisco Systems, which is benefiting from the increased use of videos on the Internet, has been the fund’s top performer two years running; Microsoft again was close behind.
The fund’s worst-performing sector, and its largest, was financials, where companies are under a magnifying glass as investors seek to uncover exposure to the troubled mortgage sector. The fund also took a hit from its consumer discretionary holdings. The largest detractor was Comcast, whose subscriber growth slowed during the year. Office Depot and Circuit City were also large detractors.
For more information on the fund’s positioning during the fiscal year, see the Advisors’ Report on page 7.
Total Returns | |
Ten Years Ended October 31, 2007 | |
| Average |
| Annual Return |
Windsor Fund Investor Shares | 8.5% |
Russell 1000 Value Index | 9.1 |
Average Multi-Cap Value Fund1 | 7.8 |
The figures shown represent past performance, which is not a guarantee of future results. (Current performance may be lower or higher than the performance data cited. For performance data current to the most recent month-end, visit our website at www.vanguard.com/performance.) Note, too, that both investment returns and principal value can fluctuate widely, so an investor’s shares, when sold, could be worth more or less than their original cost.
1 Derived from data provided by Lipper Inc.
5
Fund’s long-term performance is steady amid market cycles
The past ten years have included the pinnacle of the dot-com boom, the bust that followed, and a period of prolonged economic expansion. Windsor investors along for the entire ride achieved an average annual return of 8.5%. This return was higher than the 7.4% gain of the broad market over the decade, as measured by the Dow Jones Wilshire 5000 Index; higher than the 7.8% average gain among peer funds; and lower than the 9.1% gain of the fund’s benchmark index.
In volatile markets, diversification and long-term perspective are key
The sharp increase in stock market volatility in recent months was a jolt to many investors. While we at Vanguard always encourage shareholders to invest with a long-term view, to diversify within and across asset classes, and to pay attention to costs, these bedrock principles are even more important during periods of market turbulence.
The Windsor Fund embodies many of these key principles. It offers diversification across holdings and investment strategies, at a low cost. Its advisors focus on attractively valued companies with long-term growth potential. In addition, many of these stocks have above-average dividend yields, which can help to provide a cushion for portfolio returns. Windsor can play a valuable role in helping you to build and maintain a broadly diversified portfolio of stocks and fixed income investments in proportions consistent with your goals, risk tolerance, and time horizon.
Thank you for investing your assets with Vanguard.
Sincerely,

John J. Brennan
Chairman and Chief Executive Officer
November 12, 2007
6
Advisors’ Report
During the 12 months ended October 31, 2007, Investor Shares of Vanguard Windsor Fund returned 11.2%, and the lower-cost Admiral Shares returned 11.4%. This performance reflected the combined efforts of your fund’s two independent advisors. The use of two advisors provides exposure to distinct, yet complementary, investment approaches, enhancing the fund’s diversification.
The advisors, the percentage of fund assets each manages, and brief descriptions of their investment strategies are presented in the table below. The advisors have also prepared a discussion of the investment environment that existed during the 2007 fiscal year and of how their portfolio positioning reflects this assessment. These comments were prepared on November 16, 2007.
Wellington Management Company, LLP
Portfolio Manager:
David R. Fassnacht, CFA, Senior Vice President and Partner
After nine months of solid results, we ran into a market buzz saw during the final quarter of the fiscal year, resulting in disappointing relative performance. Although the subprime mortgage credit crisis was hardly a surprise, its rapid onset coupled with its depth and breadth was quite impressive. This shock to the
Vanguard Windsor Fund Investment Advisors | |
| | | |
| Fund Assets Managed | |
Investment Advisor | % | $ Million | Investment Strategy |
Wellington Management | 67 | 16,469 | An opportunistic, contrarian investment approach that |
Company, LLP | | | seeks to identify significantly undervalued securities |
| | | utilizing bottom-up fundamental analysis. As part of |
| | | its long-term strategy, the advisor seeks to take |
| | | advantage of short- and intermediate-term market- |
| | | price dislocations that result from the market’s |
| | | shorter-term focus. |
AllianceBernstein L.P. | 30 | 7,168 | A value focus that couples rigorous fundamental |
| | | company research with quantitative risk controls |
| | | to capture value opportunities. |
Cash Investments1 | 3 | 622 | — |
1 These short-term reserves are invested by Vanguard in equity index products to simulate investment in stocks. Each advisor also may maintain a modest cash position.
7
financial system caused a rapid flight from risk in the stock market, making valuation metrics irrelevant.
In the minds of investors today, growth is most assured from companies hitched to the emerging-markets train; hence, energy and materials were the past year’s best-performing sectors. The greatest uncertainties lie with companies dependent on the beleaguered U.S. economy; for example, firms in the financials, consumer discretionary, health care, and consumer staples sectors—the four worst-performing groups in the S&P 500 Index. Given our contrarian nature and focus on underlying value, it is these four underperforming sectors that have drawn our attention, and we see in them a growing list of very attractively valued companies.
Most of our big winners this year did benefit from strength in emerging markets; examples are Cisco Systems, Goodrich, Alcoa, Petróleo Brasileiro, Deere & Co., and Bunge. A portion of our underperformance in the later months resulted from our attempts to catch a number of “falling knives” in the consumer and financial services sectors.
Additionally, there was broad pressure on valuations of companies with perceived problems—the universe of stocks we typically traffic in—regardless of how undervalued they were to begin with.
Wall Street’s refrain regarding many of these companies has been “Yes, the stock is very cheap, but there isn’t a catalyst.” While that may be true in the near term, over the long run these very cheap stocks will be revalued upward, and we remain focused on building up the underlying value of the stocks we hold in the fund.
U.S. economic activity is clearly softening, sapped by very weak residential construction and pressure on consumers to increase savings to offset the wealth destruction that is occurring in their real estate assets. This will weigh on consumer spending for at least the next several quarters, and we anticipate that the Federal Reserve will respond with additional interest rate cuts. Although our base case is not a U.S. recession, the possibility of one occurring, particularly if the Fed is overly cautious, is growing.
We anticipate continued choppiness in the markets and challenges for contrarian value investors over the next year; nonetheless, we remain confident in the attractiveness of the underlying value of the stocks in our portfolio and the rewards that should accrue to Windsor Fund shareholders when the market pendulum swings back and valuation matters once again.
8
AllianceBernstein L.P.
Portfolio Managers:
Marilyn G. Fedak, CFA,
Chief Investment Officer and Chair of the U.S. Equity Investment Policy Group
John D. Phillips, Jr., CFA, Senior Portfolio Manager
After several years of tranquility, volatility returned with a vengeance to the global capital markets in 2007, as the worsening distress of the U.S. subprime mortgage market set off a worldwide credit crisis and raised uncertainties about economic growth. Despite successive central bank actions, confidence has remained fragile and risk premiums are higher across the world’s financial markets.
U.S. equity market volatility may remain elevated, a situation with important implications for our portfolio positioning. For the past several years, investor complacency and tight stock-valuation spreads have limited deep-value opportunities. We therefore kept the portfolio broadly diversified to ensure that our risk-taking remained commensurate with the return potential we identified. However, if valuation spreads continue to widen as they have recently, we are likely to adopt more concentrated positions in undervalued industries and companies. Our research will guide our actions as market developments unfold.
Mega-cap stocks, including such prominent names as Altria, American International Group, and IBM, remain the dominant value theme in the portfolio. These equities have underperformed smaller, more cyclical and commodity-driven companies since the market rally began in late 2002. Over the past year, however, the 50 largest S&P 500 stocks began to outperform, as their earnings growth held up while growth slowed dramatically for the next 450 companies. Even so, these mega-cap stocks continue to trade at a significant discount to their smaller counterparts, versus a historical premium.
Our research continues to identify attractive value opportunities among financial services stocks. Given that the sector makes up roughly 30% of our portion of the Windsor Fund, assessing the potential earnings impact of the recent market stress on these holdings is a top research priority. Early in the calendar year, it became evident that lax underwriting standards and weakness in home prices were leading to rising delinquencies among less credit-worthy borrowers. We closely reviewed our forecasts and made appropriately cautious assumptions, incorporating the likelihood of significantly elevated credit losses and reductions in fee income generated by mortgage and other lending activity. Our earnings estimates for most banks and insurers anticipated declining returns and
9
little-to-no earnings growth over the entire five-year forecast horizon. On this basis, the stocks appeared attractively valued.
In light of the reduced value opportunity and increased uncertainty, we did not take concentrated positions. Instead, we have positions in many different financial services firms, diversified by geography, lines of business, and potential risks. In recent months, we have made modest changes to our financials positioning, selling or trimming holdings of mortgage lenders, commercial banks, and government-sponsored enterprises and using the proceeds to further diversify our exposure to investment banks, which our research suggests were oversold amid the credit-market fallout. All told, our financials exposure remains underweighted in comparison with the Russell 1000 Value Index and overweighted in comparison with the broad market.
From our perspective as value managers, anxiety ultimately creates opportunity. It is our charge to remain unemotional in the face of this anxiety, to use our research to identify potential value opportunities, and to take on increased risk proportional to the increased opportunities we see. We will continue to make measured adjustments to portfolio exposures based on our research.
10
Fund Profile
As of October 31, 2007
Portfolio Characteristics | | | |
| | Comparative | Broad |
| Fund | Index1 | Index2 |
Number of Stocks | 148 | 618 | 4,870 |
Median Market Cap | $53.3B | $55.3B | $36.8B |
Price/Earnings Ratio | 16.9x | 14.6x | 18.2x |
Price/Book Ratio | 2.2x | 2.1x | 2.9x |
Yield | | 2.5% | 1.7% |
Investor Shares | 1.4% | | |
Admiral Shares | 1.5% | | |
Return on Equity | 17.1% | 17.9% | 18.9% |
Earnings Growth Rate | 23.2% | 20.7% | 21.3% |
Foreign Holdings | 19.9% | 0.0% | 0.0% |
Turnover Rate | 40% | — | — |
Expense Ratio | | — | — |
Investor Shares | 0.31% | | |
Admiral Shares | 0.19% | | |
Short-Term Reserves | 1.2% | — | — |
Sector Diversification (% of equity exposure) |
| | Comparative | Broad |
| Fund | Index1 | Index2 |
Consumer Discretionary | 13.5% | 7.7% | 10.1% |
Consumer Staples | 7.8 | 8.0 | 8.3 |
Energy | 9.8 | 14.8 | 11.3 |
Financials | 19.4 | 31.2 | 19.3 |
Health Care | 12.8 | 7.1 | 11.7 |
Industrials | 8.0 | 10.5 | 11.7 |
Information Technology | 16.5 | 3.5 | 16.7 |
Materials | 5.8 | 4.2 | 3.9 |
Telecommunication | | | |
Services | 5.2 | 6.7 | 3.4 |
Utilities | 1.2 | 6.3 | 3.6 |
Volatility Measures3 | |
| Fund Versus | Fund Versus |
| Comparative Index1 | Broad Index2 |
R-Squared | 0.86 | 0.89 |
Beta | 1.02 | 1.01 |
Ten Largest Holdings4 (% of total net assets) | |
| | |
Microsoft Corp. | systems software | 3.7% |
Wyeth | pharmaceuticals | 3.5 |
Sanofi-Aventis | pharmaceuticals | 3.5 |
Comcast Corp. | broadcasting and cable TV | 3.2 |
Cisco Systems, Inc. | communications equipment | 2.9 |
Sprint Nextel Corp. | wireless telecommunication services | 2.9 |
UBS AG (New York Shares) | diversified capital markets | 2.7 |
Bank of America Corp. | diversified financial services | 2.1 |
ExxonMobil Corp. | integrated oil and gas | 2.0 |
Japan Tobacco, Inc. | tobacco | 1.7 |
Top Ten | | 28.2% |
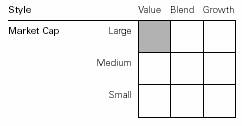
Investment Focus
1 Russell 1000 Value Index.
2 Dow Jones Wilshire 5000 Index.
3 For an explanation of R-squared, beta, and other terms used here, see the Glossary on page 31.
4 “Ten Largest Holdings” excludes any temporary cash investments and equity index products.
11
Performance Summary
All of the returns in this report represent past performance, which is not a guarantee of future results that may be achieved by the fund. (Current performance may be lower or higher than the performance data cited. For performance data current to the most recent month-end, visit our website at www.vanguard.com/performance.) Note, too, that both investment returns and principal value can fluctuate widely, so an investor’s shares, when sold, could be worth more or less than their original cost. The returns shown do not reflect taxes that a shareholder would pay on fund distributions or on the sale of fund shares.
Cumulative Performance: October 31, 1997–October 31, 2007
Initial Investment of $10,000
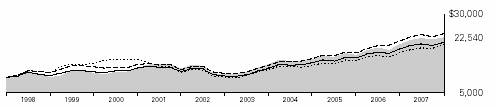
| Average Annual Total Returns | Final Value |
| Periods Ended October 31, 2007 | of a $10,000 |
| One Year | Five Years | Ten Years | Investment |
Windsor Fund Investor Shares1 | 11.24% | 16.02% | 8.47% | $22,540 |
Dow Jones Wilshire 5000 Index | 15.28 | 15.31 | 7.44 | 20,495 |
Russell 1000 Value Index | 10.83 | 16.39 | 9.11 | 23,920 |
Average Multi-Cap Value Fund2 | 10.94 | 15.32 | 7.79 | 21,178 |
| | | | Final Value |
| | | Since | of a $100,000 |
| One Year | Five Years | Inception3 | Investment |
Windsor Fund Admiral Shares | 11.38% | 16.14% | 9.74% | $174,082 |
Dow Jones Wilshire 5000 Index | 15.28 | 15.31 | 9.08 | 167,943 |
Russell 1000 Value Index | 10.83 | 16.39 | 10.83 | 184,751 |
1 Total returns do not include the account service fee that may be applicable to certain accounts with balances below $10,000.
2 Derived from data provided by Lipper Inc.
3 Performance for the Admiral Shares and the comparative standards is calculated since the share-class inception: November 12, 2001.
12
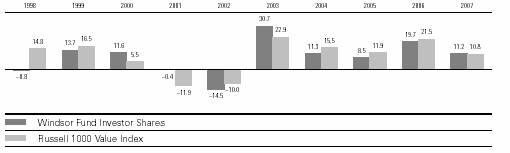
Fiscal-Year Total Returns (%): October 31, 1997–October 31, 2007
Average Annual Total Returns: Periods Ended September 30, 2007
This table presents average annual total returns through the latest calendar quarter—rather than through the end of the fiscal period. Securities and Exchange Commission rules require that we provide this information.
| Inception Date | One Year | Five Years | Ten Years |
Investor Shares1 | 10/23/1958 | 15.60% | 17.85% | 7.76% |
Admiral Shares | 11/12/2001 | 15.71 | 17.97 | 9.752 |
1 Total returns do not include the account service fee that may be applicable to certain accounts with balances below $10,000.
2 Return since inception.
Note: See Financial Highlights tables on pages 20 and 21 for dividend and capital gains information.
13
Financial Statements
Statement of Net Assets
As of October 31, 2007
The fund provides a complete list of its holdings four times in each fiscal year, at the quarter-ends. For the second and fourth fiscal quarters, the lists appear in the fund’s semiannual and annual reports to shareholders. For the first and third fiscal quarters, the fund files the lists with the Securities and Exchange Commission on Form N-Q. Shareholders can look up the fund’s Forms N-Q on the SEC’s website at www.sec.gov. Forms N-Q may also be reviewed and copied at the SEC’s Public Reference Room (see the back cover of this report for further information).
| | | Market |
| | | Value• |
| | Shares | ($000) |
Common Stocks (97.2%)1 | | |
Consumer Discretionary (13.1%) | | |
* | Comcast Corp. Special Class A | 21,612,700 | 451,057 |
| Home Depot, Inc. | 10,258,800 | 323,255 |
*2 | R.H. Donnelley Corp. | 5,882,513 | 322,656 |
* | Comcast Corp. Class A | 15,322,500 | 322,539 |
* | Ford Motor Co. | 35,057,700 | 310,962 |
| Virgin Media Inc. | 8,391,900 | 185,545 |
* | Office Depot, Inc. | 9,140,022 | 171,467 |
* | Viacom Inc. Class B | 3,509,700 | 144,916 |
| McDonald’s Corp. | 2,240,000 | 133,728 |
| CBS Corp. | 3,215,000 | 92,271 |
*† | Buck Holdings, LP, Private Placement Shares | 89,488,365 | 89,488 |
* | Toll Brothers, Inc. | 3,535,000 | 80,987 |
| Clear Channel Communications, Inc. | 2,034,500 | 76,843 |
2 | Circuit City Stores, Inc. | 8,884,800 | 70,456 |
| Time Warner, Inc. | 3,785,000 | 69,114 |
| Macy’s Inc. | 1,600,000 | 51,248 |
| General Motors Corp. | 1,289,900 | 50,551 |
| BorgWarner, Inc. | 468,800 | 49,556 |
| VF Corp. | 528,836 | 46,077 |
| WABCO Holdings Inc. | 900,366 | 45,757 |
| Autoliv, Inc. | 600,000 | 37,908 |
| Black & Decker Corp. | 394,177 | 35,440 |
| KB Home | 425,000 | 11,747 |
| | | 3,173,568 |
Consumer Staples (7.6%) | | |
| Japan Tobacco, Inc. | 69,175 | 403,197 |
| Unilever NV | 9,090,839 | 295,886 |
| Bunge Ltd. | 1,513,400 | 174,329 |
| Altria Group, Inc. | 2,049,800 | 149,492 |
| Wal-Mart Stores, Inc. | 2,661,400 | 120,322 |
* | Marine Harvest | 106,456,000 | 108,678 |
| Safeway, Inc. | 2,891,600 | 98,314 |
| The Kroger Co. | 3,291,350 | 96,733 |
| Sara Lee Corp. | 4,450,000 | 73,603 |
| The Procter & Gamble Co. | 879,000 | 61,108 |
| | | Market |
| | | Value• |
| | Shares | ($000) |
| Dean Foods Co. | 2,190,900 | 60,841 |
| Avon Products, Inc. | 1,292,700 | 52,975 |
* | Cosan Ltd. | 3,659,800 | 46,479 |
| The Clorox Co. | 600,000 | 37,542 |
| Unilever NV ADR | 1,110,800 | 36,057 |
| Molson Coors Brewing Co. Class B | 270,000 | 15,452 |
| Kraft Foods Inc. | 51,010 | 1,704 |
| | | 1,832,712 |
Energy (9.4%) | | |
| ExxonMobil Corp. | 5,269,008 | 484,696 |
| BP PLC ADR | 3,625,000 | 282,714 |
| Chevron Corp. | 2,818,478 | 257,919 |
| ConocoPhillips Co. | 2,458,798 | 208,899 |
* | Newfield Exploration Co. | 2,954,300 | 159,060 |
| Petroleo Brasileiro Series A ADR | 1,668,600 | 138,811 |
| EnCana Corp. | 1,958,238 | 136,489 |
| Total SA ADR | 1,567,800 | 126,380 |
| Petroleo Brasileiro SA ADR | 1,129,600 | 108,024 |
| Petro-Canada | 1,662,900 | 95,833 |
| Arch Coal, Inc. | 2,094,000 | 85,854 |
| GlobalSantaFe Corp. | 958,800 | 77,692 |
| Petro-Canada | 1,330,000 | 76,732 |
| Royal Dutch Shell PLC ADR Class A | 350,000 | 30,629 |
| | | 2,269,732 |
Financials (18.8%) | | |
| Capital Markets (5.6%) | | |
| UBS AG (New York Shares) | 12,196,300 | 654,819 |
| Merrill Lynch & Co., Inc. | 3,012,500 | 198,885 |
* | E*TRADE Financial Corp. | 14,439,700 | 160,858 |
| Morgan Stanley | 2,025,000 | 136,202 |
| Invesco PLC | 7,087,191 | 108,483 |
| The Goldman Sachs Group, Inc. | 335,000 | 83,053 |
* | Deutsche Bank AG | 170,000 | 22,739 |
14
| | | Market |
| | | Value• |
| | Shares | ($000) |
| Commercial Banks (0.9%) | | |
| Commerce Bancorp, Inc. | 2,567,500 | 104,626 |
| SunTrust Banks, Inc. | 830,000 | 60,258 |
| Wells Fargo & Co. | 1,020,000 | 34,690 |
| Wachovia Corp. | 487,162 | 22,278 |
| | | |
| Consumer Finance (0.9%) | | |
| Capital One Financial Corp. | 3,443,600 | 225,866 |
| | | |
| Diversified Financial Services (4.6%) | | |
| Bank of America Corp. | 10,399,798 | 502,102 |
| Citigroup, Inc. | 6,979,127 | 292,425 |
| JPMorgan Chase & Co. | 4,903,100 | 230,446 |
| CIT Group Inc. | 2,545,200 | 89,693 |
| | | |
| Insurance (5.5%) | | |
| American International Group, Inc. | 6,102,700 | 385,202 |
| ACE Ltd. | 4,931,100 | 298,874 |
| MetLife, Inc. | 1,773,100 | 122,078 |
| PartnerRe Ltd. | 1,405,600 | 117,016 |
| The Travelers Cos., Inc. | 2,066,917 | 107,914 |
| XL Capital Ltd. Class A | 980,000 | 70,511 |
| The Hartford Financial Services Group Inc. | 566,200 | 54,938 |
| Genworth Financial Inc. | 1,910,000 | 52,143 |
| The Allstate Corp. | 925,000 | 48,470 |
| RenaissanceRe Holdings Ltd. | 657,250 | 38,344 |
| MBIA, Inc. | 550,000 | 23,672 |
| Fidelity National Financial, Inc. Class A | 975,000 | 15,005 |
| | | |
| Thrifts & Mortgage Finance (1.2%) | | |
| Countrywide Financial Corp. | 7,562,200 | 117,365 |
| Freddie Mac | 1,650,000 | 86,180 |
| Fannie Mae | 1,169,000 | 66,680 |
| Washington Mutual, Inc. | 1,100,500 | 30,682 |
* | Dime Bancorp Inc.–Litigation Tracking Warrants | 7,457,300 | 1,347 |
| | | 4,563,844 |
Health Care (12.3%) | | |
| Wyeth | 17,609,700 | 856,360 |
| Sanofi-Aventis ADR | 10,575,000 | 465,406 |
| Sanofi-Aventis | 4,259,623 | 374,693 |
| Astellas Pharma Inc. | 6,386,300 | 283,497 |
| Pfizer Inc. | 10,255,000 | 252,376 |
| Bristol-Myers Squibb Co. | 6,768,900 | 202,999 |
| Aetna Inc. | 2,601,700 | 146,137 |
| Merck & Co., Inc. | 1,747,300 | 101,798 |
| Covidien Ltd. | 2,032,275 | 84,543 |
| McKesson Corp. | 1,210,000 | 79,981 |
| AmerisourceBergen Corp. | 1,359,800 | 64,060 |
| Daiichi Sankyo Co., Ltd. | 1,554,400 | 44,204 |
| Johnson & Johnson | 550,000 | 35,844 |
| | | 2,991,898 |
| | | Market |
| | | Value• |
| | Shares | ($000) |
Industrials (7.6%) | | |
| Deere & Co. | 1,947,500 | 301,668 |
| General Electric Co. | 6,980,000 | 287,297 |
* | UAL Corp. | 5,618,700 | 269,136 |
*2 | Northwest Airlines Corp. | 12,456,100 | 231,061 |
| Goodrich Corp. | 1,817,000 | 126,572 |
* | US Airways Group Inc. | 4,466,900 | 123,554 |
| American Standard Cos., Inc. | 2,701,100 | 100,670 |
| Northrop Grumman Corp. | 1,160,000 | 96,999 |
| Tyco International, Ltd. | 2,032,275 | 83,669 |
| Ingersoll-Rand Co. | 1,635,000 | 82,322 |
| SPX Corp. | 564,012 | 57,134 |
| Eaton Corp. | 537,800 | 49,790 |
| Parker Hannifin Corp. | 322,500 | 25,919 |
* | Terex Corp. | 210,000 | 15,586 |
| | | 1,851,377 |
Information Technology (16.0%) | | |
| Microsoft Corp. | 24,283,300 | 893,868 |
* | Cisco Systems, Inc. | 21,639,700 | 715,408 |
*2 | Arrow Electronics, Inc. | 8,795,367 | 351,639 |
* | Flextronics International Ltd. | 26,161,764 | 322,051 |
| Seagate Technology | 9,751,581 | 271,484 |
| QUALCOMM Inc. | 6,066,500 | 259,222 |
| LM Ericsson Telephone Co. ADR Class B | 6,678,900 | 200,701 |
* | Symantec Corp. | 10,600,000 | 199,068 |
| Corning, Inc. | 7,578,200 | 183,923 |
| International Business Machines Corp. | 980,000 | 113,798 |
| Texas Instruments, Inc. | 3,309,700 | 107,896 |
* | Nortel Networks Corp. | 6,006,500 | 96,885 |
| Nokia Corp. ADR | 1,550,000 | 61,566 |
| KLA-Tencor Corp. | 620,900 | 32,690 |
| Accenture Ltd. | 700,000 | 27,335 |
* | Sanmina-SCI Corp. | 8,423,608 | 18,616 |
| Tyco Electronics Ltd. | 425,000 | 15,160 |
| | | 3,871,310 |
Materials (5.6%) | | |
| E.I. du Pont de Nemours & Co. | 7,975,500 | 394,867 |
| Rexam PLC | 16,827,952 | 190,174 |
* | Owens-Illinois, Inc. | 4,223,300 | 187,599 |
^ | Arcelor Mittal Class A New York Registered Shares | 1,640,000 | 131,118 |
* | Smurfit-Stone Container Corp. | 10,678,463 | 129,316 |
| Alcoa Inc. | 2,317,800 | 91,762 |
| Dow Chemical Co. | 1,997,500 | 89,967 |
| Chemtura Corp. | 7,697,300 | 71,739 |
| Celanese Corp. Series A | 1,669,450 | 70,050 |
| | | 1,356,592 |
15
| | | Market |
| | | Value• |
| | Shares | ($000) |
Telecommunication Services (5.0%) | | |
| Sprint Nextel Corp. | 41,673,382 | 712,615 |
| AT&T Inc. | 5,835,717 | 243,875 |
| Verizon Communications Inc. | 3,170,442 | 146,062 |
| Vodafone Group PLC ADR | 2,358,875 | 92,633 |
| Embarq Corp. | 317,309 | 16,792 |
| | | 1,211,977 |
Utilities (1.0%) | | |
| Entergy Corp. | 1,009,600 | 121,021 |
| Constellation Energy Group, Inc. | 831,425 | 78,736 |
| American Electric Power Co., Inc. | 1,055,300 | 50,876 |
| | | 250,633 |
Exchange-Traded Funds (0.8%) | | |
3 | Vanguard Value ETF | 1,689,100 | 120,669 |
3 | Vanguard Total Stock Market ETF | 446,000 | 68,376 |
| | | 189,045 |
Total Common Stocks | | |
(Cost $19,423,515) | | 23,562,688 |
Temporary Cash Investments (3.1%)1 | | |
Money Market Fund (2.0%) | | |
4 | Vanguard Market Liquidity Fund, 4.955% | 469,292,210 | 469,292 |
4 | Vanguard Market Liquidity Fund, 4.955%—Note G | 19,593,900 | 19,594 |
| | Face | Market |
| | Amount | Value• |
| | ($000) | ($000) |
Repurchase Agreement (1.1%) | | |
| Credit Suisse First Boston LLC 4.960%, 11/1/07 | | |
| (Dated 10/31/07,Repurchase Value | | |
| $241,033,000,collateralized by | | |
| Federal Home Loan Mortgage Corp. | | |
| 4.500%–7.500%,6/1/19–10/1/37 and | | |
| Federal National Mortgage Assn. | | |
| 4.000%–7.000%,10/1/17–10/1/37) | 241,000 | 241,000 |
| | | |
U.S. Agency Obligation (0.0%) | | |
5 | Federal Home Loan Bank | | |
6 | 4.563%, 2/8/08 | 30,000 | 29,633 |
Total Temporary Cash Investments | | |
(Cost $759,516) | | 759,519 |
Total Investments (100.3%) | | |
(Cost $20,183,031) | | 24,322,207 |
Other Assets and Liabilities (–0.3%) | | |
Other Assets—Note C | | 122,165 |
Liabilities—Note G | | (185,010) |
| | | (62,845) |
Net Assets (100%) | | 24,259,362 |
16
At October 31, 2007, net assets consisted of:7 |
| Amount |
| ($000) |
Paid-in Capital | 17,573,282 |
Undistributed Net Investment Income | 70,835 |
Accumulated Net Realized Gains | 2,472,948 |
Unrealized Appreciation | |
Investment Securities | 4,139,176 |
Futures Contracts | 3,012 |
Foreign Currencies | 109 |
Net Assets | 24,259,362 |
| |
Investor Shares—Net Assets | |
Applicable to 742,272,004 outstanding | |
$.001 par value shares of beneficial | |
interest (unlimited authorization) | 14,489,778 |
Net Asset Value Per Share— | |
Investor Shares | $19.52 |
| |
Admiral Shares—Net Assets | |
Applicable to 148,255,478 outstanding | |
$.001 par value shares of beneficial | |
interest (unlimited authorization) | 9,769,584 |
Net Asset Value Per Share— | |
Admiral Shares | $65.90 |
• | See Note A in Notes to Financial Statements. |
* | Non-income-producing security. |
† Restricted security represents 0.4% of net assets.
^ | Part of security position is on loan to broker-dealers. See Note G in Notes to Financial Statements. |
1 The fund invests a portion of its cash reserves in equity markets through the use of index futures contracts. After giving effect to futures investments, the fund’s effective common stock and temporary cash investment positions represent 98.9% and 1.4%, respectively, of net assets. See Note E in Notes to Financial Statements.
2 Considered an affiliated company of the fund as the fund owns more than 5% of the outstanding voting securities of such company. See Note I in Notes to Financial Statements.
3 Considered an affiliated company of the fund as the issuer is another member of The Vanguard Group.
4 Affiliated money market fund available only to Vanguard funds and certain trusts and accounts managed by Vanguard. Rate shown is the 7-day yield.
5 The issuer operates under a congressional charter; its securities are neither issued nor guaranteed by the U.S. government. If needed, access to additional funding from the U.S. Treasury (beyond the issuer’s line of credit) would require congressional action.
6 Securities with a value of $29,633,000 have been segregated as initial margin for open futures contracts.
7 See Note E in Notes to Financial Statements for the tax-basis components of net assets.
ADR—American Depositary Receipt .
17
Statement of Operations
| Year Ended |
| October 31, 2007 |
| ($000) |
Investment Income | |
Income | |
Dividends1,2 | 402,961 |
Interest2 | 36,903 |
Security Lending | 4,565 |
Total Income | 444,429 |
Expenses | |
Investment Advisory Fees—Note B | |
Basic Fee | 29,641 |
Performance Adjustment | (1,519) |
The Vanguard Group—Note C | |
Management and Administrative—Investor Shares | 26,370 |
Management and Administrative—Admiral Shares | 6,102 |
Marketing and Distribution—Investor Shares | 2,484 |
Marketing and Distribution—Admiral Shares | 1,447 |
Custodian Fees | 213 |
Auditing Fees | 26 |
Shareholders’ Reports—Investor Shares | 212 |
Shareholders’ Reports—Admiral Shares | 43 |
Trustees’ Fees and Expenses | 31 |
Total Expenses | 65,050 |
Expenses Paid Indirectly—Note D | (967) |
Net Expenses | 64,083 |
Net Investment Income | 380,346 |
Realized Net Gain (Loss) | |
Investment Securities Sold2 | 2,615,470 |
Futures Contracts | 60,378 |
Foreign Currencies | 409 |
Realized Net Gain (Loss) | 2,676,257 |
Change in Unrealized Appreciation (Depreciation) | |
Investment Securities | (462,647) |
Futures Contracts | (17,235) |
Foreign Currencies | 136 |
Change in Unrealized Appreciation (Depreciation) | (479,746) |
Net Increase (Decrease) in Net Assets Resulting from Operations | 2,576,857 |
1 Dividends are net of foreign withholding taxes of $12,335,000.
2 Dividend income, interest income, and realized net gain (loss) from affiliated companies of the fund were $11,603,000, $19,839,000, and $275,777,000, respectively.
18
Statement of Changes in Net Assets
| Year Ended October 31, |
| 2007 | 2006 |
| ($000) | ($000) |
Increase (Decrease) in Net Assets | | |
Operations | | |
Net Investment Income | 380,346 | 337,353 |
Realized Net Gain (Loss) | 2,676,257 | 1,980,297 |
Change in Unrealized Appreciation (Depreciation) | (479,746) | 1,604,186 |
Net Increase (Decrease) in Net Assets Resulting from Operations | 2,576,857 | 3,921,836 |
Distributions | | |
Net Investment Income | | |
Investor Shares | (222,495) | (192,991) |
Admiral Shares | (157,242) | (128,970) |
Realized Capital Gain1 | | |
Investor Shares | (1,110,084) | (1,113,365) |
Admiral Shares | (719,706) | (659,656) |
Total Distributions | (2,209,527) | (2,094,982) |
Capital Share Transactions—Note H | | |
Investor Shares | 119,548 | 147,757 |
Admiral Shares | 645,687 | 730,142 |
Net Increase (Decrease) from Capital Share Transactions | 765,235 | 877,899 |
Total Increase (Decrease) | 1,132,565 | 2,704,753 |
Net Assets | | |
Beginning of Period | 23,126,797 | 20,422,044 |
End of Period2 | 24,259,362 | 23,126,797 |
1 Includes fiscal 2007 and 2006 short-term gain distributions totaling $0 and $226,319,000, respectively. Short-term gain distributions are treated as ordinary income dividends for tax purposes.
2 Net Assets—End of Period includes undistributed net investment income of $70,835,000 and $69,817,000.
19
Financial Highlights
Investor Shares | | | | | |
| | | | | |
For a Share Outstanding | Year Ended October 31, |
Throughout Each Period | 2007 | 2006 | 2005 | 2004 | 2003 |
Net Asset Value, Beginning of Period | $19.27 | $17.81 | $16.75 | $15.23 | $11.81 |
Investment Operations | | | | | |
Net Investment Income | .298 | .277 | .2651 | .214 | .17 |
Net Realized and Unrealized Gain (Loss) | | | | | |
on Investments | 1.782 | 3.007 | 1.163 | 1.501 | 3.42 |
Total from Investment Operations | 2.080 | 3.284 | 1.428 | 1.715 | 3.59 |
Distributions | | | | | |
Dividends from Net Investment Income | (.301) | (.265) | (.280) | (.195) | (.17) |
Distributions from Realized Capital Gains | (1.529) | (1.559) | (.088) | — | — |
Total Distributions | (1.830) | (1.824) | (.368) | (.195) | (.17) |
Net Asset Value, End of Period | $19.52 | $19.27 | $17.81 | $16.75 | $15.23 |
| | | | | |
Total Return2 | 11.24% | 19.72% | 8.54% | 11.30% | 30.66% |
| | | | | |
Ratios/Supplemental Data | | | | | |
Net Assets, End of Period (Millions) | $14,490 | $14,140 | $12,871 | $15,130 | $13,733 |
Ratio of Total Expenses to | | | | | |
Average Net Assets3 | 0.31% | 0.36% | 0.37% | 0.39% | 0.48% |
Ratio of Net Investment Income to | | | | | |
Average Net Assets | 1.50% | 1.50% | 1.47%1 | 1.32% | 1.27% |
Portfolio Turnover Rate | 40% | 38% | 32% | 28% | 23% |
| | | | | | |
1 Net investment income per share and the ratio of net investment income to average net assets include $0.03 and 0.17%, respectively, resulting from a special dividend from Microsoft Corp. in November 2004.
2 Total returns do not reflect the account service fee that may be applicable to certain accounts with balances below $10,000.
3 Includes performance-based investment advisory fee increases (decreases) of (0.01%), 0.02%, 0.04%, 0.04%, and 0.08%.
20
Admiral Shares | | | | | |
| | | | | |
For a Share Outstanding | Year Ended October 31, |
Throughout Each Period | 2007 | 2006 | 2005 | 2004 | 2003 |
Net Asset Value, Beginning of Period | $65.04 | $60.12 | $56.56 | $51.41 | $39.88 |
Investment Operations | | | | | |
Net Investment Income | 1.085 | 1.00 | .9681 | .787 | .605 |
Net Realized and Unrealized Gain (Loss) | | | | | |
on Investments | 6.019 | 10.15 | 3.896 | 5.082 | 11.537 |
Total from Investment Operations | 7.104 | 11.15 | 4.864 | 5.869 | 12.142 |
Distributions | | | | | |
Dividends from Net Investment Income | (1.085) | (.97) | (1.007) | (.719) | (.612) |
Distributions from Realized Capital Gains | (5.159) | (5.26) | (.297) | — | — |
Total Distributions | (6.244) | (6.23) | (1.304) | (.719) | (.612) |
Net Asset Value, End of Period | $65.90 | $65.04 | $60.12 | $56.56 | $51.41 |
| | | | | |
Total Return | 11.38% | 19.85% | 8.62% | 11.46% | 30.72% |
| | | | | |
Ratios/Supplemental Data | | | | | |
Net Assets, End of Period (Millions) | $9,770 | $8,987 | $7,551 | $4,195 | $3,321 |
Ratio of Total Expenses to | | | | | |
Average Net Assets2 | 0.19% | 0.25% | 0.27% | 0.28% | 0.37% |
Ratio of Net Investment Income to | | | | | |
Average Net Assets | 1.62% | 1.61% | 1.57%1 | 1.43% | 1.36% |
Portfolio Turnover Rate | 40% | 38% | 32% | 28% | 23% |
1 Net investment income per share and the ratio of net investment income to average net assets include $0.110 and 0.17%, respectively, resulting from a special dividend from Microsoft Corp. in November 2004.
2 Includes performance-based investment advisory fee increases (decreases) of (0.01%), 0.02%, 0.04%, 0.04%, and 0.08%. See accompanying Notes, which are an integral part of the Financial Statements.
21
Notes to Financial Statements
Vanguard Windsor Fund is registered under the Investment Company Act of 1940 as an open-end investment company, or mutual fund. The fund files reports with the SEC under the company name Vanguard Windsor Funds. The fund offers two classes of shares, Investor Shares and Admiral Shares. Investor Shares are available to any investor who meets the fund’s minimum purchase requirements. Admiral Shares are designed for investors who meet certain administrative, service, tenure, and account-size criteria.
A. The following significant accounting policies conform to generally accepted accounting principles for U.S. mutual funds. The fund consistently follows such policies in preparing its financial statements.
1. Security Valuation: Securities are valued as of the close of trading on the New York Stock Exchange (generally 4 p.m., Eastern time) on the valuation date. Equity securities are valued at the latest quoted sales prices or official closing prices taken from the primary market in which each security trades; such securities not traded on the valuation date are valued at the mean of the latest quoted bid and asked prices. Securities for which market quotations are not readily available, or whose values have been affected by events occurring before the fund’s pricing time but after the close of the securities’ primary markets, are valued at their fair values calculated according to procedures adopted by the board of trustees. These procedures include obtaining quotations from an independent pricing service, monitoring news to identify significant market- or security-specific events, and evaluating changes in the values of foreign market proxies (for example, ADRs, futures contracts, or exchange-traded funds), between the time the foreign markets close and the fund’s pricing time. When fair-value pricing is employed, the prices of securities used by a fund to calculate its net asset value may differ from quoted or published prices for the same securities. Investments in Vanguard Market Liquidity Fund are valued at that fund’s net asset value. Temporary cash investments acquired over 60 days to maturity are valued using the latest bid prices or using valuations based on a matrix system (which considers such factors as security prices, yields, maturities, and ratings), both as furnished by independent pricing services. Other temporary cash investments are valued at amortized cost, which approximates market value.
2. Foreign Currency: Securities and other assets and liabilities denominated in foreign currencies are translated into U.S. dollars using exchange rates obtained from an independent third party as of the fund’s pricing time on the valuation date. Realized gains (losses) and unrealized appreciation (depreciation) on investment securities include the effects of changes in exchange rates since the securities were purchased, combined with the effects of changes in security prices. Fluctuations in the value of other assets and liabilities resulting from changes in exchange rates are recorded as unrealized foreign currency gains (losses) until the assets or liabilities are settled in cash, at which time they are recorded as realized foreign currency gains (losses).
3. Futures Contracts: The fund uses index futures contracts to a limited extent, with the objective of maintaining full exposure to the stock market while maintaining liquidity. The fund may purchase or sell futures contracts to achieve a desired level of investment, whether to accommodate portfolio turnover or cash flows from capital share transactions. The primary risks associated with the use of futures contracts are imperfect correlation between changes in market values of stocks held by the fund and the prices of futures contracts, and the possibility of an illiquid market.
22
Futures contracts are valued at their quoted daily settlement prices. The aggregate principal amounts of the contracts are not recorded in the Statement of Net Assets. Fluctuations in the value of the contracts are recorded in the Statement of Net Assets as an asset (liability) and in the Statement of Operations as unrealized appreciation (depreciation) until the contracts are closed, when they are recorded as realized futures gains (losses).
4. Repurchase Agreements: The fund may invest in repurchase agreements. Securities pledged as collateral for repurchase agreements are held by a custodian bank until the agreements mature. Each agreement requires that the market value of the collateral be sufficient to cover payments of interest and principal; however, in the event of default or bankruptcy by the other
party to the agreement, retention of the collateral may be subject to legal proceedings.
5. Federal Income Taxes: The fund intends to continue to qualify as a regulated investment company and distribute all of its taxable income. Accordingly, no provision for federal income taxes is required in the financial statements.
6. Distributions: Distributions to shareholders are recorded on the ex-dividend date.
7. Security Lending: The fund may lend its securities to qualified institutional borrowers to earn additional income. Security loans are required to be secured at all times by collateral at least equal to the market value of securities loaned. The fund invests cash collateral received in Vanguard Market Liquidity Fund, and records a liability for the return of the collateral, during the period the securities are on loan. Security lending income represents the income earned on investing cash collateral, less expenses associated with the loan.
8. Other: Dividend income is recorded on the ex-dividend date. Interest income includes income distributions received from Vanguard Market Liquidity Fund and is accrued daily. Security transactions are accounted for on the date securities are bought or sold. Costs used to determine realized gains (losses) on the sale of investment securities are those of the specific securities sold.
Each class of shares has equal rights as to assets and earnings, except that each class separately bears certain class-specific expenses related to maintenance of shareholder accounts (included in Management and Administrative expenses) and shareholder reporting. Marketing and distribution expenses are allocated to each class of shares based on a method approved by the board of trustees. Income, other non-class-specific expenses, and gains and losses on investments are allocated to each class of shares based on its relative net assets.
B. AllianceBernstein L.P. and Wellington Management Company, LLP, each provide investment advisory services to a portion of the fund for a fee calculated at an annual percentage rate of average net assets managed by the advisor. The basic fees of each advisor are subject to quarterly adjustments based on performance for the preceding three years relative to a designated market index: for AllianceBernstein L.P., the Russell 1000 Value Index; and for Wellington Management Company, LLP, the S&P 500 Index.
The Vanguard Group manages the cash reserves of the fund on an at-cost basis.
For the year ended October 31, 2007, the aggregate investment advisory fee represented an effective annual basic rate of 0.12% of the fund’s average net assets before a decrease of $1,519,000 (0.01%) based on performance.
23
C. The Vanguard Group furnishes at cost corporate management, administrative, marketing, and distribution services. The costs of such services are allocated to the fund under methods approved by the board of trustees. The fund has committed to provide up to 0.40% of its net assets in capital contributions to Vanguard. At October 31, 2007, the fund had contributed capital of $2,046,000 to Vanguard (included in Other Assets), representing 0.01% of the fund’s net assets and 2.05% of Vanguard’s capitalization. The fund’s trustees and officers are also directors and officers of Vanguard.
D. The fund has asked its investment advisors to direct certain security trades, subject to obtaining the best price and execution, to brokers who have agreed to rebate to the fund part of the commissions generated. Such rebates are used solely to reduce the fund’s management and administrative expenses. The fund’s custodian bank has also agreed to reduce its fees when the fund maintains cash on deposit in the non-interest-bearing custody account. For the year ended October 31, 2007, these arrangements reduced the fund’s management and administrative expenses by $930,000 and custodian fees by $37,000.
E. Distributions are determined on a tax basis and may differ from net investment income and realized capital gains for financial reporting purposes. Differences may be permanent or temporary. Permanent differences are reclassified among capital accounts in the financial statements to reflect their tax character. Temporary differences arise when certain items of income, expense, gain, or loss are recognized in different periods for financial statement and tax purposes; these differences will reverse at some time in the future. Differences in classification may also result from the treatment of short-term gains as ordinary income for tax purposes.
During the year ended October 31, 2007, the fund realized net foreign currency gains of $409,000, which increased distributable net income for tax purposes; accordingly, such gains have been reclassified from accumulated net realized gains to undistributed net investment income.
The fund used a tax accounting practice to treat a portion of the price of capital shares redeemed during the year as distributions from realized capital gains. Accordingly, the fund has reclassified $180,771,000 from accumulated net realized gains to paid-in capital.
For tax purposes, at October 31, 2007, the fund had $332,043,000 of ordinary income and $2,252,691,000 of long-term capital gains available for distribution.
At October 31, 2007, the cost of investment securities for tax purposes was $20,183,031,000. Net unrealized appreciation of investment securities for tax purposes was $4,139,176,000, consisting of unrealized gains of $5,328,578,000 on securities that had risen in value since their purchase and $1,189,402,000 in unrealized losses on securities that had fallen in value since their purchase.
At October 31, 2007, the aggregate settlement value of open futures contracts expiring in December 2007 and the related unrealized appreciation (depreciation) were:
| | | ($000) |
| | Aggregate | Unrealized |
| Number of | Settlement | Appreciation |
Futures Contracts | Long Contracts | Value | (Depreciation) |
E-mini S&P 500 Index | 4,532 | 352,340 | 949 |
E-mini S&P MidCap 400 Index | 800 | 72,968 | 1,383 |
S&P MidCap 400 Index | 30 | 13,682 | 680 |
24
Unrealized appreciation (depreciation) on open futures contracts is required to be treated as realized gain (loss) for tax purposes.
F. During the year ended October 31, 2007, the fund purchased $9,497,690,000 of investment securities and sold $10,218,017,000 of investment securities, other than temporary cash investments.
G. The market value of securities on loan to broker-dealers at October 31, 2007, was $19,340,000, for which the fund received cash collateral of $19,594,000.
H. Capital share transactions for each class of shares were:
| | | Year Ended October 31, |
| | 2007 | | 2006 |
| Amount | Shares | Amount | Shares |
| ($000) | (000) | ($000) | (000) |
Investor Shares | | | | |
Issued | 1,256,372 | 65,122 | 1,159,762 | 64,777 |
Issued in Lieu of Cash Distributions | 1,295,835 | 69,016 | 1,264,434 | 73,315 |
Redeemed | (2,432,659) | (125,656) | (2,276,439) | (126,975) |
Net Increase (Decrease)—Investor Shares | 119,548 | 8,482 | 147,757 | 11,117 |
Admiral Shares | | | | |
Issued | 1,108,469 | 16,923 | 1,018,466 | 16,817 |
Issued in Lieu of Cash Distributions | 800,310 | 12,629 | 716,143 | 12,308 |
Redeemed | (1,263,092) | (19,470) | (1,004,467) | (16,557) |
Net Increase (Decrease)—Admiral Shares | 645,687 | 10,082 | 730,142 | 12,568 |
I. Certain of the fund’s investments are in companies that are considered to be affiliated companies of the fund because the fund owns more than 5% of the outstanding voting securities of the company. Transactions during the period in securities of these companies were as follows:
| | | Current Period Transactions | |
| Oct. 31, 2006 | | Proceeds from | | Oct. 31, 2007 |
| Market | Purchases | Securities | Dividend | Market |
| Value | at Cost | Sold | Income | Value |
| ($000) | ($000) | ($000) | ($000) | ($000) |
Arrow Electronics, Inc. | 371,949 | — | 147,050 | — | 351,639 |
Circuit City Stores, Inc. | NA1 | 163,617 | 2,767 | 1,004 | 70,456 |
Goodrich Corp. | 360,819 | 17,280 | 424,432 | 5,836 | NA2 |
Lear Corp. | 186,399 | — | 233,935 | — | — |
Northwest Airlines Corp. | NA1 | 272,478 | — | — | 231,061 |
R.H. Donnelley Corp. | 347,867 | 48,062 | 51,835 | — | 322,656 |
UAL Corp. | 307,686 | 76,513 | 208,754 | — | NA2 |
| 1,574,720 | | | 6,840 | 975,812 |
1 At October 31, 2006, the issuer was not an affiliated company of the fund.
2 At October 31, 2007, the security is still held but the issuer is no longer an affiliated company of the fund.
25
J. In June 2006, the Financial Accounting Standards Board issued Interpretation No. 48 (“FIN 48”), “Accounting for Uncertainty in Income Taxes.” FIN 48 establishes the minimum threshold for recognizing, and a system for measuring, the benefits of tax-return positions in financial statements, and is effective for the fund’s fiscal year beginning November 1, 2007. Management has analyzed the fund’s tax positions taken on federal income tax returns for all open tax years (tax years ended October 31, 2004–2007) for purposes of implementing FIN 48, and has concluded that as of October 31, 2007, no provision for income tax would be required in the fund's financial statements.
26
Report of Independent Registered Public Accounting Firm
To the Trustees of Vanguard Windsor Funds and the Shareholders of Vanguard Windsor Fund:
In our opinion, the accompanying statement of net assets and the related statements of operations and of changes in net assets and the financial highlights present fairly, in all material respects, the financial position of Vanguard Windsor Fund (the “Fund”) at October 31, 2007, the results of its operations for the year then ended, the changes in its net assets for each of the two years in the period then ended and the financial highlights for each of the five years in the period then ended, in conformity with accounting principles generally accepted in the United States of America. These financial statements and financial highlights (hereafter referred to as “financial statements”) are the responsibility of the Fund’s management; our responsibility is to express an opinion on these financial statements based on our audits. We conducted our audits of these financial statements in accordance with the standards of the Public Company Accounting Oversight Board (United States). Those standards require that we plan and perform the audit to obtain reasonable assurance about whether the financial statements are free of material misstatement. An audit includes examining, on a test basis, evidence supporting the amounts and disclosures in the financial statements, assessing the accounting principles used and significant estimates made by management, and evaluating the overall financial statement presentation. We believe that our audits, which included confirmation of securities at October 31, 2007 by correspondence with the custodians and brokers, and by agreement to the underlying ownership records for Vanguard Market Liquidity Fund, provide a reasonable basis for our opinion.
PricewaterhouseCoopers LLP
Philadelphia, Pennsylvania
December 6, 2007
Special 2007 tax information (unaudited) for Vanguard Windsor Fund
This information for the fiscal year ended October 31, 2007, is included pursuant to provisions of the Internal Revenue Code.
The fund distributed $1,994,311,000 as capital gain dividends (from net long-term capital gains) to shareholders during the fiscal year.
The fund distributed $379,737,000 of qualified dividend income to shareholders during the fiscal year.
For corporate shareholders, 48.4% of investment income (dividend income plus short-term gains, if any) qualifies for the dividends-received deduction.
27
Your Fund’s After-Tax Returns
This table presents returns for your fund both before and after taxes. The after-tax returns are shown in two ways: (1) assuming that an investor owned the fund during the entire period and paid taxes on the fund’s distributions, and (2) assuming that an investor paid taxes on the fund’s distributions and sold all shares at the end of each period.
Calculations are based on the highest individual federal income tax and capital gains tax rates in effect at the times of the distributions and the hypothetical sales. State and local taxes were not considered. After-tax returns reflect any qualified dividend income, using actual prior-year figures and estimates for 2007. (In the example, returns after the sale of fund shares may be higher than those assuming no sale. This occurs when the sale would have produced a capital loss. The calculation assumes that the investor received a tax deduction for the loss.)
The table shows returns for Investor Shares only; returns for other share classes will differ. Please note that your actual after-tax returns will depend on your tax situation and may differ from those shown. Also note that if you own the fund in a tax-deferred account, such as an individual retirement account or a 401(k) plan, this information does not apply to you. Such accounts are not subject to current taxes.
Finally, keep in mind that a fund’s performance—whether before or after taxes—does not guarantee future results.
Average Annual Total Returns: Windsor Fund Investor Shares1 |
Periods Ended October 31, 2007 | | | |
| One | Five | Ten |
| Year | Years | Years |
Returns Before Taxes | 11.24% | 16.02% | 8.47% |
Returns After Taxes on Distributions | 9.74 | 15.12 | 6.52 |
Returns After Taxes on Distributions and Sale of Fund Shares | 9.17 | 13.91 | 6.39 |
1 Total returns do not include the account service fee that may be applicable to certain accounts with balances below $10,000.
28
About Your Fund’s Expenses
As a shareholder of the fund, you incur ongoing costs, which include costs for portfolio management, administrative services, and shareholder reports (like this one), among others. Operating expenses, which are deducted from a fund’s gross income, directly reduce the investment return of the fund.
A fund’s expenses are expressed as a percentage of its average net assets. This figure is known as the expense ratio. The following examples are intended to help you understand the ongoing costs (in dollars) of investing in your fund and to compare these costs with those of other mutual funds. The examples are based on an investment of $1,000 made at the beginning of the period shown and held for the entire period.
The table below illustrates your fund’s costs in two ways:
• Based on actual fund return. This section helps you to estimate the actual expenses that you paid over the period. The “Ending Account Value” shown is derived from the fund’s actual return, and the third column shows the dollar amount that would have been paid by an investor who started with $1,000 in the fund. You may use the information here, together with the amount you invested, to estimate the expenses that you paid over the period.
To do so, simply divide your account value by $1,000 (for example, an $8,600 account value divided by $1,000 = 8.6), then multiply the result by the number given for your fund under the heading “Expenses Paid During Period.”
• Based on hypothetical 5% yearly return. This section is intended to help you compare your fund’s costs with those of other mutual funds. It assumes that the fund had a yearly return of 5% before expenses, but that the expense ratio is unchanged. In this case—because the return used is not the fund’s actual return—the results do not apply to your investment. The example is useful in making comparisons because the Securities and Exchange Commission requires all mutual funds to calculate expenses based on a 5% return. You can assess your fund’s costs by comparing this hypothetical example with the hypothetical examples that appear in shareholder reports of other funds.
Six Months Ended October 31, 2007 | | | |
| Beginning | Ending | Expenses |
| Account Value | Account Value | Paid During |
Windsor Fund | 4/30/2007 | 10/31/2007 | Period1 |
Based on Actual Fund Return | | | |
Investor Shares | $1,000.00 | $1,010.18 | $1.57 |
Admiral Shares | 1,000.00 | 1,010.95 | 0.86 |
Based on Hypothetical 5% Yearly Return | | | |
Investor Shares | $1,000.00 | $1,023.64 | $1.58 |
Admiral Shares | 1,000.00 | 1,024.35 | 0.87 |
1 The calculations are based on expenses incurred in the most recent six-month period. The fund’s annualized six-month expense ratios for that period are 0.31% for Investor Shares and 0.17% for Admiral Shares. The dollar amounts shown as “Expenses Paid” are equal to the annualized expense ratio multiplied by the average account value over the period, multiplied by the number of days in the most recent six-month period, then divided by the number of days in the most recent 12-month period.
29
Note that the expenses shown in the table are meant to highlight and help you compare ongoing costs only and do not reflect transaction costs incurred by the fund for buying and selling securities. Further, the expenses do not include the account service fee described in the prospectus. If such a fee were applied to your account, your costs would be higher. Your fund does not charge transaction fees, such as purchase or redemption fees, nor does it carry a “sales load.”
The calculations assume no shares were bought or sold during the period. Your actual costs may have been higher or lower, depending on the amount of your investment and the timing of any purchases or redemptions.
You can find more information about the fund’s expenses, including annual expense ratios, in the Financial Statements section of this report. For additional information on operating expenses and other shareholder costs, please refer to your fund’s current prospectus.
30
Glossary
Beta. A measure of the magnitude of a fund’s past share-price fluctuations in relation to the ups and downs of a given market index. The index is assigned a beta of 1.00. Compared with a given index, a fund with a beta of 1.20 typically would have seen its share price rise or fall by 12% when the index rose or fell by 10%. A fund’s beta should be reviewed in conjunction with its R-squared (see definition below). The lower the R-squared, the less correlation there is between the fund and the index, and the less reliable beta is as an indicator of volatility.
Earnings Growth Rate. The average annual rate of growth in earnings over the past five years for the stocks now in a fund.
Equity Exposure. A measure that reflects a fund’s investments in stocks and stock futures. Any holdings in short-term reserves are excluded.
Expense Ratio. The percentage of a fund’s average net assets used to pay its annual administrative and advisory expenses. These expenses directly reduce returns to investors.
Foreign Holdings. The percentage of a fund represented by stocks or depositary receipts of companies based outside the United States.
Inception Date. The date on which the assets of a fund (or one of its share classes) are first invested in accordance with the fund’s investment objective. For funds with a subscription period, the inception date is the day after that period ends. Investment performance is measured from the inception date.
Median Market Cap. An indicator of the size of companies in which a fund invests; the midpoint of market capitalization (market price x shares outstanding) of a fund’s stocks, weighted by the proportion of the fund’s assets invested in each stock. Stocks representing half of the fund’s assets have market capitalizations above the median, and the rest are below it.
Price/Book Ratio. The share price of a stock divided by its net worth, or book value, per share. For a fund, the weighted average price/book ratio of the stocks it holds.
Price/Earnings Ratio. The ratio of a stock’s current price to its per-share earnings over the past year. For a fund, the weighted average P/E of the stocks it holds. P/E is an indicator of market expectations about corporate prospects; the higher the P/E, the greater the expectations for a company’s future growth.
R-Squared. A measure of how much of a fund’s past returns can be explained by the returns from the market in general, as measured by a given index. If a fund’s total returns were precisely synchronized with an index’s returns, its R-squared would be 1.00. If the fund’s returns bore no relationship to the index’s returns, its R-squared would be 0.
Return on Equity. The annual average rate of return generated by a company during the past five years for each dollar of shareholder’s equity (net income divided by shareholder’s equity). For a fund, the weighted average return on equity for the companies whose stocks it holds.
Short-Term Reserves. The percentage of a fund invested in highly liquid, short-term securities that can be readily converted to cash.
Turnover Rate. An indication of the fund’s trading activity. Funds with high turnover rates incur higher transaction costs and may be more likely to distribute capital gains (which may be taxable to investors). The turnover rate excludes in-kind transactions, which have minimal impact on costs.
Yield. A snapshot of a fund’s income from interest and dividends. The yield, expressed as a percentage of the fund’s net asset value, is based on income earned over the past 30 days and is annualized, or projected forward for the coming year. The index yield is based on the current annualized rate of income provided by securities in the index.
The People Who Govern Your Fund
The trustees of your mutual fund are there to see that the fund is operated and managed in your best interests since, as a shareholder, you are a part owner of the fund. Your fund’s trustees also serve on the board of directors of The Vanguard Group, Inc., which is owned by the Vanguard funds and provides services to them on an at-cost basis.
A majority of Vanguard’s board members are independent, meaning that they have no affiliation with Vanguard or the funds they oversee, apart from the sizable personal investments they have made as private individuals.
Our independent board members bring distinguished backgrounds in business, academia, and public service to their task of working with Vanguard officers to establish the policies and oversee the activities of the funds. Among board members’ responsibilities are selecting investment advisors for the funds; monitoring fund operations, performance, and costs; reviewing contracts; nominating and selecting new trustees/directors; and electing Vanguard officers.
Each trustee serves a fund until its termination; or until the trustee’s retirement, resignation, or death; or otherwise as specified in the fund’s organizational documents. Any trustee may be removed at a shareholders’ meeting by a vote representing two-thirds of the net asset value of all shares of the fund together with shares of other Vanguard funds organized within the same trust. The table on these two pages shows information for each trustee and executive officer of the fund. The mailing address of the trustees and officers is P.O. Box 876, Valley Forge, PA 19482.
Chairman of the Board, Chief Executive Officer, and Trustee |
| |
John J. Brennan1 | |
Born 1954 | Principal Occupation(s) During the Past Five Years: Chairman of the Board, Chief Executive |
Trustee since May 1987; | Officer, and Director/Trustee of The Vanguard Group, Inc., and of each of the investment |
Chairman of the Board and | companies served by The Vanguard Group. |
Chief Executive Officer | |
148 Vanguard Funds Overseen | |
| |
Independent Trustees | |
| |
Charles D. Ellis | |
Born 1937 | Principal Occupation(s) During the Past Five Years: Applecore Partners (pro bono ventures |
Trustee since January 2001 | in education); Senior Advisor to Greenwich Associates (international business strategy |
148 Vanguard Funds Overseen | consulting); Successor Trustee of Yale University; Overseer of the Stern School of Business |
| at New York University; Trustee of the Whitehead Institute for Biomedical Research. |
| |
Rajiv L. Gupta | |
Born 1945 | Principal Occupation(s) During the Past Five Years: Chairman, President, and |
Trustee since December 20012 | Chief Executive Officer of Rohm and Haas Co. (chemicals); Board Member of |
148 Vanguard Funds Overseen | the American Chemistry Council; Director of Tyco International, Ltd. (diversified |
| manufacturing and services) since 2005; Trustee of Drexel University and of the |
| Chemical Heritage Foundation. |
| |
Amy Gutmann | |
Born 1949 | Principal Occupation(s) During the Past Five Years: President of the University of |
Trustee since June 2006 | Pennsylvania since 2004; Professor in the School of Arts and Sciences, Annenberg School |
148 Vanguard Funds Overseen | for Communication, and Graduate School of Education of the University of Pennsylvania |
| since 2004; Provost (2001–2004) and Laurance S. Rockefeller Professor of Politics and |
| the University Center for Human Values (1990–2004), Princeton University; Director of |
| Carnegie Corporation of New York since 2005 and of Schuylkill River Development |
| Corporation and Greater Philadelphia Chamber of Commerce since 2004. |
JoAnn Heffernan Heisen | |
Born 1950 | Principal Occupation(s) During the Past Five Years: Corporate Vice President and |
Trustee since July 1998 | Chief Global Diversity Officer since 2006, Vice President and Chief Information |
148 Vanguard Funds Overseen | Officer (1997–2005), and Member of the Executive Committee of Johnson & |
| Johnson (pharmaceuticals/consumer products); Director of the University Medical |
| Center at Princeton and Women’s Research and Education Institute. |
| |
André F. Perold | |
Born 1952 | Principal Occupation(s) During the Past Five Years: George Gund Professor of Finance |
Trustee since December 2004 | and Banking, Harvard Business School; Senior Associate Dean, Director of Faculty |
148 Vanguard Funds Overseen | Recruiting, and Chair of Finance Faculty, Harvard Business School; Director and Chairman |
| of UNX, Inc. (equities trading firm) since 2003; Chair of the Investment Committee of |
| HighVista Strategies LLC (private investment firm) since 2005. |
| |
Alfred M. Rankin, Jr. | |
Born 1941 | Principal Occupation(s) During the Past Five Years: Chairman, President, Chief Executive |
Trustee since January 1993 | Officer, and Director of NACCO Industries, Inc. (forklift trucks/housewares/lignite); Director |
148 Vanguard Funds Overseen | of Goodrich Corporation (industrial products/aircraft systems and services). |
| |
| |
J. Lawrence Wilson | |
Born 1936 | Principal Occupation(s) During the Past Five Years: Retired Chairman and Chief Executive |
Trustee since April 1985 | Officer of Rohm and Haas Co. (chemicals); Director of Cummins Inc. (diesel engines) and |
148 Vanguard Funds Overseen | AmerisourceBergen Corp. (pharmaceutical distribution); Trustee of Vanderbilt University |
| and of Culver Educational Foundation. |
| |
Executive Officers1 | |
| |
Thomas J. Higgins | |
Born 1957 | Principal Occupation(s) During the Past Five Years: Principal of The Vanguard Group, Inc.; |
Treasurer since July 1998 | Treasurer of each of the investment companies served by The Vanguard Group. |
148 Vanguard Funds Overseen | |
| |
| |
Heidi Stam | |
Born 1956 | Principal Occupation(s) During the Past Five Years: Managing Director of The Vanguard |
Secretary since July 2005 | Group, Inc., since 2006; General Counsel of The Vanguard Group since 2005; Secretary of |
148 Vanguard Funds Overseen | The Vanguard Group, and of each of the investment companies served by The Vanguard |
| Group, since 2005; Principal of The Vanguard Group (1997–2006). |
Vanguard Senior Management Team | | |
| | | |
R. Gregory Barton | Kathleen C. Gubanich | F. William McNabb, III | Ralph K. Packard |
Mortimer J. Buckley | Paul A. Heller | Michael S. Miller | George U. Sauter |
Founder |
|
John C. Bogle |
Chairman and Chief Executive Officer, 1974–1996 |
1 Officers of the funds are “interested persons” as defined in the Investment Company Act of 1940.
2 December 2002 for Vanguard Equity Income Fund, Vanguard Growth Equity Fund, the Vanguard Municipal Bond Funds, and the Vanguard State Tax-Exempt Funds.
More information about the trustees is in the Statement of Additional Information, available from The Vanguard Group.
| 
|
| P.O. Box 2600 |
| Valley Forge, PA 19482-2600 |
Connect with Vanguard® > www.vanguard.com
Fund Information > 800-662-7447 | Vanguard, Admiral, Connect with Vanguard, Windsor, and |
| the ship logo are trademarks of The Vanguard Group, Inc. |
Direct Investor Account Services > 800-662-2739 | |
| |
Institutional Investor Services > 800-523-1036 | All other marks are the exclusive property of their |
| respective owners. |
Text Telephone for People | |
With Hearing Impairment > 800-952-3335 | |
| All comparative mutual fund data are from Lipper Inc. |
| or Morningstar, Inc., unless otherwise noted. |
| |
| |
| You can obtain a free copy of Vanguard’s proxy voting |
This material may be used in conjunction | guidelines by visiting our website, www.vanguard.com, |
with the offering of shares of any Vanguard | and searching for “proxy voting guidelines,” or by |
fund only if preceded or accompanied by | calling Vanguard at 800-662-2739. The guidelines are |
the fund’s current prospectus. | also available from the SEC’s website, www.sec.gov. |
| In addition, you may obtain a free report on how your |
| fund voted the proxies for securities it owned during |
| the 12 months ended June 30. To get the report, visit |
| either www.vanguard.com or www.sec.gov. |
| |
| |
| You can review and copy information about your fund |
| at the SEC’s Public Reference Room in Washington, D.C. |
| To find out more about this public service, call the SEC |
| at 202-551-8090. Information about your fund is also |
| available on the SEC’s website, and you can receive |
| copies of this information, for a fee, by sending a |
| request in either of two ways: via e-mail addressed to |
| publicinfo@sec.gov or via regular mail addressed to the |
| Public Reference Section, Securities and Exchange |
| Commission, Washington, DC 20549-0102. |
| |
| |
| |
| |
| |
| © 2007 The Vanguard Group, Inc. |
| All rights reserved. |
| Vanguard Marketing Corporation, Distributor. |
| |
| Q220 122007 |


> | For the fiscal year ended October 31, 2007, Windsor II’s Investor Shares |
| returned 14.6% and the Admiral Shares returned 14.7%, outperforming |
| both the fund’s benchmark and peer-group average. |
| |
| |
> | More than half of the fund’s total return came from three sectors: energy, |
| consumer staples, and industrials. |
| |
| |
> | Windsor II’s advisors added value to its Russell 1000 Value Index benchmark |
| in seven out of ten sectors, most notably in financials, consumer staples, |
| and information technology. |
Contents | |
| |
Your Fund’s Total Returns | 1 |
Chairman’s Letter | 2 |
Advisors’ Report | 6 |
Fund Profile | 11 |
Performance Summary | 12 |
Financial Statements | 14 |
Your Fund’s After-Tax Returns | 29 |
About Your Fund’s Expenses | 30 |
Glossary | 32 |
Please note: The opinions expressed in this report are just that—informed opinions. They should not be considered promises or advice. Also, please keep in mind that the information and opinions cover the period through the date on the cover of this report. Of course, the risks of investing in your fund are spelled out in the prospectus.
Your Fund’s Total Returns
Fiscal Year Ended October 31, 2007 | | |
| Ticker | Total |
| Symbol | Returns |
Vanguard Windsor II Fund | | |
Investor Shares | VWNFX | 14.6% |
Admiral™ Shares1 | VWNAX | 14.7 |
Russell 1000 Value Index | | 10.8 |
Average Large-Cap Value Fund2 | | 12.2 |
Your Fund’s Performance at a Glance | | | |
October 31, 2006–October 31, 2007 | | | | |
| | | Distributions Per Share |
| Starting | Ending | Income | Capital |
| Share Price | Share Price | Dividends | Gains |
Vanguard Windsor II Fund | | | | |
Investor Shares | $35.14 | $37.84 | $0.790 | $1.458 |
Admiral Shares | 62.41 | 67.18 | 1.481 | 2.588 |
1 A lower-cost class of shares available to many longtime shareholders and to those with significant investments in the fund.
2 Derived from data provided by Lipper Inc.
1

Chairman’s Letter
Dear Shareholder,
For the fiscal year ended October 31, 2007, the Investor Shares of Vanguard Windsor II Fund returned 14.6% and the lower-cost Admiral Shares returned 14.7%. The fund outperformed its benchmark and the average return for its peer funds.
Slightly more than half of the fund’s total return came from the energy, consumer staples, and industrials sectors, which were also among the market’s strongest performers. The advisors’ sector positioning and stock picking added value relative to the benchmark in seven out of ten sectors, a notable accomplishment in an overall robust market.
Stocks rode a bumpy path to impressive results
Despite some volatility, the U.S. stock market produced strong results during the fund’s fiscal year. Ongoing problems with low-quality mortgage loans (an unpleasant postscript to the housing downturn) rattled financial markets in the spring and summer, and continued to make investors skittish through the close of the fiscal period. At the end of October, crude oil prices touched historic highs, while the U.S. dollar dipped to record lows versus other major currencies.
Still, the broad U.S. stock market returned an impressive 15.3%. Large-capitalization stocks outperformed small-caps, and growth stocks outperformed value stocks—both continuing recent months’ reversals of longer-term trends.
2
International companies performed even better than domestic issues. Stocks in emerging markets fared particularly well, followed by European and Pacific region stocks (Japan was a notable laggard). The weak U.S. dollar boosted foreign stock returns for U.S.-based investors.
Bond investors converged on high-quality issues
As troubles in the subprime credit markets rippled across the financial markets, bond investors sought the relative safety of U.S. Treasury bonds. This “flight to quality” drove prices for Treasuries higher and yields lower, and widened the spread between Treasury yields and the much higher yields demanded by investors for riskier bonds. Declines in Treasury yields were steepest at the short end of the maturity spectrum, aided by the actions of the
Federal Reserve Board. The central bank lowered the target for short-term interest rates to 4.50% in two separate rate cuts (a half-percentage-point in September and a quarter-point on October 31). The yield of the 3-month Treasury bill finished the fiscal period at 3.92%, after spending much of the year near 5%; the 10-year Treasury note ended at 4.47%.
For the year, the broad taxable bond market returned 5.4%. Returns from tax-exempt bonds were lower, as these issues did not benefit from the late-summer rally in Treasuries.
Focus on value drives superior returns
Vanguard Windsor II Fund delivered an impressive 14.6% return for Investor Shares in fiscal year 2007. The advisors’ focus on underappreciated and deeply
Market Barometer | | | |
| Average Annual Total Returns |
| Periods Ended October 31, 2007 |
| One Year | Three Years | Five Years |
Stocks | | | |
Russell 1000 Index (Large-caps) | 15.0% | 13.8% | 14.5% |
Russell 2000 Index (Small-caps) | 9.3 | 13.7 | 18.7 |
Dow Jones Wilshire 5000 Index (Entire market) | 15.3 | 14.2 | 15.3 |
MSCI All Country World Index ex USA (International) | 33.0 | 27.4 | 26.4 |
| | | |
| | | |
Bonds | | | |
Lehman U.S. Aggregate Bond Index (Broad taxable market) | 5.4% | 3.9% | 4.4% |
Lehman Municipal Bond Index | 2.9 | 3.7 | 4.5 |
Citigroup 3-Month Treasury Bill Index | 5.0 | 4.1 | 2.9 |
| | | |
| | | |
CPI | | | |
Consumer Price Index | 3.5% | 3.1% | 2.9% |
| | | | | |
3
discounted stocks served investors well, even though growth stocks surged ahead of value stocks.
The fund notched significant gains in most sectors, led by energy; consumer staples such as tobacco and beverage companies; and industrials conglomerates such as Honeywell, General Electric, and Illinois Tool Works. In energy, two of the fund’s largest holdings, ConocoPhillips and Occidental Petroleum, were also among its top performers; however, the portfolio’s relatively light commitment to energy stocks put a brake on performance, as the sector was the market’s best performer.
By contrast, the fund’s below-benchmark exposure to financials spared the portfolio some damage as banks, brokerage firms, and mortgage companies lost ground in the wake of the mortgage meltdown and weak housing market. This is a reversal from recent years, when the fund’s below-benchmark weighting led it to miss some gains among real estate investment trusts and investment banks. The advisors’ stock selection among financials also significantly boosted relative performance. For example, Manulife Financial, a Canadian-based financial services company, was one of the fund’s top contributors.
The fund’s superior relative performance also reflected astute stock selection in consumer staples, such as Altria Group and Kraft Foods, and information technology, including Hewlett-Packard and Microsoft. The selective addition of international stocks further enhanced performance, although the fund typically does not make significant international
Expense Ratios1 | | | |
Your fund compared with its peer group | | | |
| | | Average |
| Investor | Admiral | Large-Cap |
| Shares | Shares | Value Fund |
Windsor II Fund | 0.33% | 0.23% | 1.35% |
Total Returns | |
Ten Years Ended October 31, 2007 | |
| Average |
| Annual Return |
Windsor II Fund Investor Shares | 8.9% |
Russell 1000 Value Index | 9.1 |
Average Large-Cap Value Fund2 | 7.7 |
The figures shown represent past performance, which is not a guarantee of future results. (Current |
performance may be lower or higher than the performance data cited. For performance data current to the |
most recent month-end, visit our website at www.vanguard.com/performance.) Note, too, that both |
investment returns and principal value can fluctuate widely, so an investor’s shares, when sold, could be |
worth more or less than their original cost. |
1 Fund expense ratios reflect the 12 months ended October 31, 2007. Peer-group expense ratio is derived from data provided by Lipper Inc. and captures information through year-end 2006.
2 Derived from data provided by Lipper Inc. investments. For example, Imperial Tobacco Group, Hanson (a London-based building materials company), Nokia, and Diageo (London-based beverage brands) joined Manulife among the fund’s major performers.
4
Please note: In January 2007, Lazard Asset Management LLC joined Windsor II’s team of advisors. The five managers responsible for Windsor II (see the table on page 6) have been assembled to represent different, yet complementary, investment strategies that we believe will continue to provide competitive long-term performance.
For more details on the fund’s positioning and performance during the year, please see the Advisor’s Report, which begins on page 6.
Over time, your fund has continued to outpace its peer group
If you had invested $10,000 in the Investor Shares of Windsor II Fund ten years ago, your initial investment would have grown to $23,503 by October 31, 2007—an average annual return of 8.9%. Equal hypothetical investments in the Russell 1000 Value Index and the average large-cap value fund would have grown to $23,920 and $20,904, respectively, during the period. Your fund’s ten-year average annual return slightly trailed that of its unmanaged benchmark index (which bears no expenses), but was more than a full percentage point ahead of the average yearly return of the fund’s competitors.
In volatile markets, diversification and a long-term view are key
The sharp increase in stock market volatility in recent months was a jolt to many investors. Vanguard always encourages shareholders to invest with a long-term view, to diversify within and across asset classes, and to pay attention to costs—bedrock principles that are even more important during periods of market turbulence.
The Windsor II Fund embodies many of these key principles. It offers diversification across managers, holdings, and active investment strategies, at a low cost. Its advisors adhere to a core focus on attractively valued companies with seemingly attractive long-term growth potential. In addition, many of these stocks have above-average dividend yields, which can provide a cushion for portfolio returns. Windsor II can play a valuable role in helping you build and maintain a broadly diversified portfolio of stocks and fixed income investments in proportions consistent with your goals, risk tolerance, and time horizon.
Thank you for entrusting your assets to Vanguard.
Sincerely,

John J. Brennan
Chairman and Chief Executive Officer
November 12, 2007
5
Advisors’ Report
During the fiscal year ended October 31, 2007, the Investor Shares of Vanguard Windsor II Fund returned 14.6%, while the lower-cost Admiral Shares returned 14.7%. This performance reflects the combined efforts of your fund’s five independent advisors. The use of multiple advisors provides exposure to distinct, yet complementary, investment approaches, enhancing the fund’s diversification.
The advisors, the amount and percentage of fund assets each manages, and a brief description of their investment strategies are presented in the table below. Each advisor has also provided a discussion of the investment environment that existed during the fiscal year and how portfolio positioning reflects this assessment. These comments were prepared on November 16, 2007.
Barrow, Hanley, Mewhinney & Strauss, Inc.
Portfolio Manager:
James P. Barrow, Founding Partner
It is curious that financial businesses are in such disarray and yet the equity market is near record levels. Historically high
Vanguard Windsor II Fund Investment Advisors | |
| | | |
Fund Assets Managed | |
Investment Advisor | | % | $ Million | Investment Strategy |
Barrow, Hanley, Mewhinney & | 60 | 32,467 | Conducts fundamental research on individual |
Strauss, Inc. | | | stocks exhibiting traditional value characteristics: |
| | | price/earnings and price/book ratios below the |
| | | broad market average and dividend yields above |
| | | the broad market average. |
Lazard Asset Management LLC | 15 | 7,980 | Employs a relative-value approach that seeks a |
| | | combination of attractive valuation and high |
| | | financial productivity. The process is research- |
| | | driven, relying upon bottom-up stock analysis |
| | | performed by the firm’s global sector analysts. |
Vanguard Quantitative Equity Group | 14 | 7,665 | Employs a quantitative fundamental management |
| | | approach, using models that assess valuation, |
| | | market sentiment, and earnings quality of |
| | | companies versus their peers. |
Hotchkis and Wiley Capital | 5 | 2,634 | Uses a disciplined investment approach, focusing |
Management, LLC | | | on such investment parameters as a company’s |
| | | tangible assets, sustainable cash flow, and |
| | | potential for improving business performance. |
Armstrong Shaw Associates Inc. | 4 | 2,055 | Uses a bottom-up approach, employing |
| | | fundamental and qualitative criteria to identify |
| | | individual companies for potential investment. |
Cash Investments1 | 2 | 1,271 | — |
| | | | |
1 These short-term reserves are invested by Vanguard in equity index products to simulate investment in stocks. Each advisor may also maintain a modest cash position.
6
profit margins in industrial and commodity companies, along with what to us seems ample liquidity provided by the Federal Reserve Board, seem to override most concerns about an economic slowdown. The housing bubble is being burst, but not just because of credit constraints. We are beginning to find that the game of subprime-mortgage pools has lots of “Old Maids.” The banking system is desperately seeking the liquidity to escape ill-fated investments, but at prices near original cost to try to minimize losses.
Our portfolio’s lack of energy investments, based on an expectation of an increase in supply, penalized performance during the fiscal year, as did our low weighting in information technology (a high-price/ earnings, low-yield sector).
Could the subprime-mortgage crisis and the assault on the dollar cause a recession? Yes, but given reasonable inflation, a decline in commodity prices, and respectable earnings in 2008, we expect good relative performance. We have limited exposure to the vulnerable parts of the market.
While remaining true to the value investment style, we plan to keep the portfolio concentrated in those market groups able to put up good earnings performance. The portfolio’s overriding characteristics will continue to be low price/earnings ratios, low price/book ratios, and reasonable current dividend yield.
Lazard Asset Management LLC
Portfolio Managers:
Andrew Lacey, Deputy Chairman
Christopher Blake, Managing Director
Turmoil in the credit markets triggered significant volatility in equities during recent months, with stocks falling sharply in the third quarter before rebounding to record levels. After an extended period of easily available credit, increasing defaults among borrowers with subprime U.S. mortgages have led to a sharp rise in the credit spreads above Treasuries.
Financial stocks have been among the worst performers because of uncertainty about the magnitude of their investment losses and the impact of higher costs for short-term financing. Consumer discretionary stocks were also weak, a result of investors’ concern that consumer spending would be hurt by the decline in housing prices. Conversely, more cyclical areas of the market, such as materials, energy, industrials, and information technology, outperformed.
Over the 12 months ended October 31, our portfolio’s performance was aided by stock selection in consumer staples, where shares of Constellation Brands, CVS Caremark, and Coca-Cola Enterprises performed well. In the information technology sector, many of our larger-capitalization holdings, such as Microsoft, IBM, EMC, and Intel, provided a boost as they continued to generate remarkable levels of free cash flow.
7
In the consumer discretionary sector, holdings such as Liz Claiborne, Foot Locker, and J.C. Penney declined, hurt by the widespread worries about consumer spending. Stock selection in health care also detracted from returns, as shares of Sepracor fell.
Vanguard Quantitative Equity Group
Portfolio Manager: James D. Troyer, Principal
Our process begins by evaluating each stock in the benchmark index relative to its peers based on our model’s three component measures: valuation, market sentiment, and earnings quality. From the most attractive stocks identified by the model, we construct a portfolio that matches the benchmark’s exposure to industry, market capitalization, and other risk factors. Relative to the benchmark, the stocks in our portfolio generally have a lower P/E ratio, a slightly higher return on equity, and a similar dividend yield. We attempt to add value by taking many small positions across several hundred stocks, without tilting toward specific industries or seeking to time changes in market leadership.
During the fiscal year ended October 31, energy and materials were the best-performing sectors in the benchmark. Within the energy group, our best stock was Tesoro Petroleum, which returned 90% for the year. Offsetting that, our position in Cimarex Energy gained only 1%. In materials, United States Steel rose 61% for the year, but Nucor returned –6%. The index’s financials sector suffered a –5% decline for the fiscal period; our model performed well in that sector, preferring Bank of New York Mellon while underweighting Citigroup.
Across the portfolio, our model was modestly successful for the fiscal year. Among the model’s three components, our value indicator had a slightly negative impact, while our sentiment and earnings-quality indicators were slightly positive. Over the long run, our process has demonstrated its ability to add value. We believe that our combination of reasonable valuations, high earnings quality, market acceptance, and disciplined risk control will continue to create an effective portfolio for the Windsor II Fund.
Hotchkis and Wiley Capital Management, LLC
Portfolio Managers: George H. Davis, Jr., Chief Executive Officer
Sheldon J. Lieberman, Principal
The past 12 months were an unusually challenging period for us, with very disappointing results. Our portfolio exposures are a result of a rigorous, bottom-up review of individual stocks. We make a long-term assessment of what the underlying companies should produce in earnings and cash flow over several years, and we evaluate the price that the market is asking for the stock.
8
Often, the stocks that we find most attractive are struggling with current earnings, and the sentiment surrounding them can be negative. On the other hand, we typically become suspicious of companies and industries that are performing particularly well at the moment, finding it hard to believe that high returns are sustainable indefinitely. Over the long term, economic principles support this value-oriented approach. However, over shorter periods, sentiment and momentum can overwhelm the core tendencies.
The third calendar quarter of 2007 was one of the strongest price-momentum periods since the 1950s (the 1999 tech bubble still holds the record). Stocks that were performing well at the start of the quarter continued to climb higher, and the laggards trailed farther. With respect to valuation, the highest price/book quintile of large-cap stocks outperformed the lowest quintile by more than 20%. Our portfolio naturally underperforms in such an environment.
The recent period has seemed to be a tale of two markets. Money has been funneling into two general areas. First, there are the hot dots on the technological edge (think Apple, Google, and Amazon.com). Then, more thematically, there are the companies and industries associated with global growth (think China and India), which have been attracting capital. Commodities, including energy, and global industrials have performed particularly well. Conversely, money is fleeing from companies exposed to the U.S. consumer and, more recently, to the mortgage and credit markets. The homebuilding, retailing, and banking industries are under duress and have created market dislocations. In an effort to raise liquidity, other areas have been sold down. For instance, we have recently been finding value in large pharmaceuticals.
Our commitment to value investing is unwavering. In times of stress, it is critical to continually evaluate financial strength. Companies must be strong enough to survive big storms and make it to the other side of tough business cycles. In our opinion, the portfolio is currently positioned in companies that will survive and indeed thrive again. The upside to current valuations is particularly exciting.
Armstrong Shaw Associates Inc.
Portfolio Manager:
Jeffrey M. Shaw, Chairman and Chief Investment Officer
During the past 12 months, the overall market displayed surprising resilience, delivering double-digit returns despite the severe U.S. housing slump, the related credit-market turmoil, and the concerns about consumers’ financial health. These problems are real and, with no easy solutions, market volatility will be with us for a while.
9
Our portfolio’s strongest returns have been in utilities and energy, both up more than 40%, and in consumer staples, up 27%. On the other hand, our consumer discretionary investments hurt performance, returning –11%. In this sector, both our stock selection and our relative overweighting, particularly in cable stocks, were negative factors. Financials were the next-weakest sector in the portfolio, down nearly –8%, but fortunately we were underweighted in the group relative to the benchmark index.
We have taken advantage of the turbulent markets to upgrade the quality of the portfolio and to alter our sector weightings. On one hand, we have positioned ourselves more defensively by purchasing shares of less economically sensitive companies, such as Kraft, Procter & Gamble, and Johnson & Johnson. At the same time, we have increased our emphasis on multinational companies that are poised to benefit from the weaker dollar and the faster-growing economies of the emerging markets and Europe. Nearly 70% of our holdings either have a multinational flavor (deriving above 40% of their revenues from outside the United States) or display defensive characteristics to brace against domestic economic weakness. Finally, given the uncertainty surrounding the fallout from the subprime mortgage crisis, we have reduced our exposure to financials.
With large-cap stocks trading at an attractive price/earnings multiple relative to historical levels and to other market-cap segments, we believe that our portfolio is set up to benefit from a market rotation into larger-cap multinational companies with significant overseas earnings and revenue streams that are more diverse.
10
Fund Profile
As of October 31, 2007
Portfolio Characteristics | | |
| Comparative | Broad |
| Fund | Index1 | Index2 |
Number of Stocks | 275 | 618 | 4,870 |
Median Market Cap | $55.3B | $55.3B | $36.8B |
Price/Earnings Ratio | 15.3x | 14.6x | 18.2x |
Price/Book Ratio | 2.4x | 2.1x | 2.9x |
Yield | | 2.5% | 1.7% |
Investor Shares | 2.2% | | |
Admiral Shares | 2.3% | | |
Return on Equity | 19.8% | 17.9% | 18.9% |
Earnings Growth Rate | 18.0% | 20.7% | 21.3% |
Foreign Holdings | 7.0% | 0.0% | 0.0% |
Turnover Rate | 51% | — | — |
Expense Ratio | | — | — |
Investor Shares | 0.33% | | |
Admiral Shares | 0.23% | | |
Short-Term Reserves | 1.5% | — | — |
Sector Diversification (% of equity exposure) |
| Comparative | Broad |
| Fund | Index1 | Index2 |
Consumer Discretionary | 8.3% | 7.7% | 10.1% |
Consumer Staples | 11.2 | 8.0 | 8.3 |
Energy | 10.5 | 14.8 | 11.3 |
Financials | 24.5 | 31.2 | 19.3 |
Health Care | 12.1 | 7.1 | 11.7 |
Industrials | 9.9 | 10.5 | 11.7 |
Information Technology | 8.3 | 3.5 | 16.7 |
Materials | 2.9 | 4.2 | 3.9 |
Telecommunication Services | 5.7 | 6.7 | 3.4 |
Utilities | 6.6 | 6.3 | 3.6 |
Volatility Measures3 | |
| Fund Versus | Fund Versus |
| Comparative Index1 | Broad Index2 |
R-Squared | 0.93 | 0.78 |
Beta | 0.90 | 0.80 |
Ten Largest Holdings4(% of total net assets) | |
| | |
Bank of America Corp. | diversified | |
| financial services | 2.6% |
Altria Group, Inc. | tobacco | 2.6 |
Occidental Petroleum Corp. | integrated | |
| oil and gas | 2.6 |
Imperial Tobacco Group | | |
ADR | tobacco | 2.6 |
Verizon | integrated | |
Communications Inc. | telecommunication | |
| services | 2.5 |
AT&T Inc. | integrated | |
| telecommunication | |
| services | 2.5 |
ConocoPhillips Co. | integrated | |
| oil and gas | 2.4 |
Pfizer Inc. | pharmaceuticals | 2.2 |
JPMorgan Chase & Co. | diversified | |
| financial services | 2.2 |
Bristol-Myers Squibb Co. | pharmaceuticals | 2.2 |
Top Ten | | 24.4% |
| | | |
Investment Focus
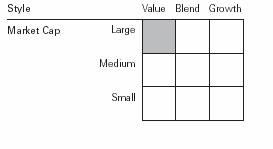
1 Russell 1000 Value Index.
2 Dow Jones Wilshire 5000 Index.
3 For an explanation of R-squared, beta, and other terms used here, see the Glossary on page 32.
4 “Ten Largest Holdings” excludes any temporary cash investments and equity index products.
11
Performance Summary
All of the returns in this report represent past performance, which is not a guarantee of future results that may be achieved by the fund. (Current performance may be lower or higher than the performance data cited. For performance data current to the most recent month-end, visit our website at www.vanguard.com/performance.) Note, too, that both investment returns and principal value can fluctuate widely, so an investor’s shares, when sold, could be worth more or less than their original cost. The returns shown do not reflect taxes that a shareholder would pay on fund distributions or on the sale of fund shares.
Cumulative Performance: October 31, 1997–October 31, 2007
Initial Investment of $10,000
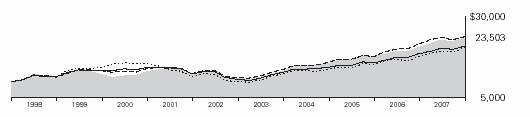
| | | |
| | | | |
| Average Annual Total Returns | Final Value |
| Periods Ended October 31, 2007 | of a $10,000 |
| One Year | Five Years | Ten Years | Investment |
Windsor II Fund Investor Shares1 | 14.62% | 16.67% | 8.92% | $23,503 |
Dow Jones Wilshire 5000 Index | 15.28 | 15.31 | 7.44 | 20,495 |
Russell 1000 Value Index | 10.83 | 16.39 | 9.11 | 23,920 |
Average Large-Cap Value Fund2 | 12.21 | 14.32 | 7.65 | 20,904 |
| | | | Final Value |
| | | Since | of a $100,000 |
| One Year | Five Years | Inception3 | Investment |
Windsor II Fund Admiral Shares | 14.71% | 16.80% | 8.27% | $167,203 |
Dow Jones Wilshire 5000 Index | 15.28 | 15.31 | 6.59 | 151,108 |
Russell 1000 Value Index | 10.83 | 16.39 | 8.40 | 168,411 |
1 Total returns do not include the account service fee that may be applicable to certain accounts with balances below $10,000.
2 Derived from data provided by Lipper Inc.
3 Performance for the fund’s Admiral Shares and comparative standards is calculated since the Admiral Shares’ inception: May 14, 2001.
12
Fiscal-Year Total Returns (%): October 31, 1997–October 31, 2007
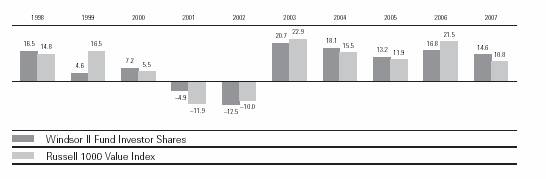
Average Annual Total Returns: Periods Ended September 30, 2007 | | |
This table presents average annual total returns through the latest calendar quarter—rather than through the |
end of the fiscal period. Securities and Exchange Commission rules require that we provide this information. |
| | | | |
| Inception Date | One Year | Five Years | Ten Years |
Investor Shares1 | 6/24/1985 | 16.02% | 17.49% | 8.55% |
Admiral Shares | 5/14/2001 | 16.12 | 17.62 | 8.212 |
1 Total returns do not include the account service fee that may be applicable to certain accounts with balances below $10,000.
2 Return since inception.
Note: See Financial Highlights tables on pages 21 and 22 for dividend and capital gains information.
13
Financial Statements
Statement of Net Assets
As of October 31, 2007
The fund provides a complete list of its holdings four times in each fiscal year, at the quarter-ends. For the second and fourth fiscal quarters, the lists appear in the fund’s semiannual and annual reports to shareholders. For the first and third fiscal quarters, the fund files the lists with the Securities and Exchange Commission on Form N-Q. Shareholders can look up the fund’s Forms N-Q on the SEC’s website at www.sec.gov. Forms N-Q may also be reviewed and copied at the SEC’s Public Reference Room (see the back cover of this report for further information).
| | | Market |
| | | Value• |
| | Shares | ($000) |
Common Stocks (97.3%)1 | | |
Consumer Discretionary (8.0%) | |
| Carnival Corp. | 17,870,300 | 857,417 |
2 | Sherwin-Williams Co. | 8,633,900 | 551,879 |
2 | Wyndham | | |
| Worldwide Corp. | 16,764,274 | 550,371 |
2 | Service Corp. | | |
| International | 26,080,100 | 377,379 |
| Time Warner, Inc. | 14,476,599 | 264,343 |
* | Comcast Corp. Special | | |
| Class A | 11,604,740 | 242,191 |
* | R.H. Donnelley Corp. | 2,411,000 | 132,243 |
| Liz Claiborne, Inc. | 4,312,683 | 122,782 |
| Idearc Inc. | 4,247,007 | 114,584 |
| News Corp., Class A | 4,791,000 | 103,821 |
| Centex Corp. | 4,000,700 | 100,258 |
| J.C. Penney Co., Inc. | | |
| (Holding Co.) | 1,694,800 | 95,316 |
| Foot Locker, Inc. | 5,697,600 | 84,837 |
| The Stanley Works | 1,376,500 | 79,218 |
| Home Depot, Inc. | 2,414,729 | 76,088 |
| Lowe’s Cos., Inc. | 2,359,900 | 63,458 |
| McDonald’s Corp. | 968,106 | 57,796 |
| The Gap, Inc. | 2,917,600 | 55,143 |
* | Interpublic Group of | | |
| Cos., Inc. | 5,080,300 | 52,581 |
| Pulte Homes, Inc. | 3,179,100 | 47,178 |
| D. R. Horton, Inc. | 3,522,200 | 44,697 |
| CBS Corp. | 1,441,783 | 41,379 |
| Lennar Corp. Class A | 1,389,200 | 31,743 |
* | Mohawk Industries, Inc. | 343,500 | 29,314 |
| Whirlpool Corp. | 334,900 | 26,517 |
| Brinker International, Inc. | 975,800 | 24,776 |
| Leggett & Platt, Inc. | 1,088,180 | 21,143 |
| VF Corp. | 203,500 | 17,731 |
| General Motors Corp. | 449,767 | 17,626 |
| Autoliv, Inc. | 269,532 | 17,029 |
| RadioShack Corp. | 823,100 | 16,972 |
| Limited Brands, Inc. | 381,800 | 8,403 |
| | | | |
| | | Market |
| | | Value• |
| | Shares | ($000) |
| Darden Restaurants Inc. | 45,500 | 1,957 |
| Washington Post Co. | | |
| Class B | 1,400 | 1,189 |
| Family Dollar Stores, Inc. | 5,600 | 142 |
| Regal Entertainment Group | | |
| Class A | 5,300 | 120 |
* | Liberty Media Corp.-Capital | | |
| Series A | 500 | 62 |
* | AutoNation, Inc. | 1,300 | 23 |
| | | 4,329,706 |
Consumer Staples (10.8%) | | |
| Altria Group, Inc. | 19,391,099 | 1,414,193 |
| Imperial Tobacco Group | | |
| ADR | 13,840,000 | 1,406,698 |
| Kraft Foods Inc. | 27,862,232 | 930,877 |
| Diageo PLC ADR | 7,768,500 | 712,760 |
| Wal-Mart Stores, Inc. | 5,057,100 | 228,631 |
| CVS/Caremark Corp. | 5,366,700 | 223,577 |
| Kimberly-Clark Corp. | 2,968,877 | 210,464 |
| Coca-Cola Enterprises, Inc. | 6,469,760 | 166,985 |
| Reynolds American Inc. | 1,995,200 | 128,551 |
| The Coca-Cola Co. | 1,414,699 | 87,372 |
* | Smithfield Foods, Inc. | 3,027,400 | 86,796 |
| The Procter & Gamble Co. | 847,100 | 58,890 |
| General Mills, Inc. | 751,085 | 43,360 |
| Molson Coors Brewing Co. | | |
| Class B | 603,700 | 34,550 |
| Safeway, Inc. | 822,300 | 27,958 |
| Tyson Foods, Inc. | 1,568,400 | 24,781 |
| The Kroger Co. | 823,900 | 24,215 |
* | Constellation Brands, Inc. | | |
| Class A | 872,800 | 21,925 |
| Carolina Group | 112,700 | 9,667 |
| PepsiAmericas, Inc. | 243,002 | 8,680 |
| | | 5,850,930 |
Energy (10.0%) | | |
| Occidental | | |
| Petroleum Corp. | 20,465,900 | 1,413,170 |
| ConocoPhillips Co. | 15,195,857 | 1,291,040 |
14
| | | Market |
| | | Value• |
| | Shares | ($000) |
| Spectra Energy Corp. | 31,337,100 | 814,138 |
| ExxonMobil Corp. | 5,964,894 | 548,711 |
| Chevron Corp. | 4,338,729 | 397,037 |
| Hess Corp. | 2,026,400 | 145,111 |
2 | Massey Energy Co. | 4,306,300 | 136,424 |
| Arch Coal, Inc. | 2,373,200 | 97,301 |
| Devon Energy Corp. | 981,352 | 91,658 |
| Valero Energy Corp. | 1,289,000 | 90,784 |
| BJ Services Co. | 3,498,800 | 88,135 |
| Royal Dutch Shell PLC ADR | | |
| Class B | 675,800 | 58,964 |
| Marathon Oil Corp. | 874,200 | 51,691 |
| Baker Hughes, Inc. | 465,000 | 40,325 |
| Noble Energy, Inc. | 523,500 | 40,069 |
| Apache Corp. | 260,770 | 27,071 |
| Sunoco, Inc. | 357,800 | 26,334 |
| Anadarko Petroleum Corp. | 348,500 | 20,568 |
| El Paso Corp. | 741,500 | 13,095 |
| Chesapeake Energy Corp. | 249,100 | 9,834 |
| Murphy Oil Corp. | 123,000 | 9,056 |
| Tesoro Corp. | 144,500 | 8,747 |
| Cimarex Energy Co. | 800 | 32 |
| | | 5,419,295 |
Financials (23.7%) | | |
| Capital Markets (3.3%) | | |
2 | Bear Stearns Co., Inc. | 8,358,352 | 949,509 |
| Bank of New York | | |
| Mellon Corp. | 6,683,410 | 326,485 |
| Merrill Lynch & Co., Inc. | 3,981,300 | 262,845 |
| Lehman Brothers | | |
| Holdings, Inc. | 979,000 | 62,010 |
| Morgan Stanley | 890,685 | 59,907 |
| The Goldman Sachs | | |
| Group, Inc. | 169,100 | 41,923 |
| Ameriprise Financial, Inc. | 605,792 | 38,153 |
| American Capital | | |
| Strategies, Ltd. | 715,500 | 31,060 |
| Janus Capital Group Inc. | 797,100 | 27,508 |
| | | |
| Commercial Banks (2.5%) | | |
| Wells Fargo & Co. | 21,467,023 | 730,093 |
| Wachovia Corp. | 4,095,940 | 187,307 |
| U.S. Bancorp | 2,079,622 | 68,960 |
| Huntington Bancshares Inc. | 3,582,600 | 64,164 |
| Comerica, Inc. | 1,064,894 | 49,709 |
| KeyCorp | 1,571,228 | 44,701 |
| UnionBanCal Corp. | 683,989 | 36,942 |
| National City Corp. | 1,450,900 | 35,184 |
| SunTrust Banks, Inc. | 460,300 | 33,418 |
| BB&T Corp. | 761,240 | 28,143 |
| Colonial BancGroup, Inc. | 1,248,479 | 23,946 |
| PNC Financial | | |
| Services Group | 255,500 | 18,437 |
| | | Market |
| | | Value• |
| | Shares | ($000) |
| Commerce | | |
| Bancshares, Inc. | 225,450 | 10,634 |
| Fifth Third Bancorp | 328,699 | 10,282 |
| M & T Bank Corp. | 51,500 | 5,123 |
| | | |
| Consumer Finance (2.6%) | | |
2 | SLM Corp. | 21,180,600 | 998,877 |
| Capital One Financial Corp. | 5,131,220 | 336,557 |
| American Express Co. | 881,710 | 53,740 |
| Discover Financial Services | 1,175,800 | 22,693 |
| | | |
| Diversified Financial Services (7.0%) | |
| Bank of America Corp. | 29,566,541 | 1,427,473 |
| JPMorgan Chase & Co. | 25,344,623 | 1,191,197 |
| Citigroup, Inc. | 27,989,141 | 1,172,745 |
| | | |
| Insurance (6.6%) | | |
| Manulife Financial Corp. | 24,406,830 | 1,132,233 |
2 | XL Capital Ltd. Class A | 13,065,800 | 940,084 |
| American International | | |
| Group, Inc. | 5,517,200 | 348,246 |
| The Allstate Corp. | 6,481,201 | 339,615 |
| The Travelers Cos., Inc. | 2,375,000 | 123,999 |
| MetLife, Inc. | 1,621,100 | 111,613 |
| Marsh & | | |
| McLennan Cos., Inc. | 3,947,345 | 102,197 |
| PartnerRe Ltd. | 859,100 | 71,520 |
| Genworth Financial Inc. | 2,529,800 | 69,064 |
| Unum Group | 2,075,800 | 48,449 |
| The Hartford Financial | | |
| Services Group Inc. | 392,849 | 38,118 |
| Everest Re Group, Ltd. | 293,900 | 31,312 |
| The Chubb Corp. | 574,804 | 30,666 |
| Loews Corp. | 613,200 | 30,102 |
| Safeco Corp. | 474,388 | 27,467 |
* | Arch Capital Group Ltd. | 365,843 | 27,354 |
| Nationwide Financial | | |
| Services, Inc. | 489,000 | 26,235 |
| RenaissanceRe | | |
| Holdings Ltd. | 438,000 | 25,553 |
| Cincinnati Financial Corp. | 619,216 | 24,632 |
* | Conseco, Inc. | 1,515,500 | 23,930 |
| Axis Capital Holdings Ltd. | 432,600 | 17,192 |
| Prudential Financial, Inc. | 166,300 | 16,085 |
| ACE Ltd. | 91,500 | 5,546 |
| | | |
| Real Estate Investment Trusts (0.6%) | |
| CBL & Associates | | |
| Properties, Inc. REIT | 2,396,100 | 79,335 |
| Public Storage, Inc. REIT | 706,300 | 57,189 |
| Simon Property Group, Inc. | | |
| REIT | 229,600 | 23,904 |
| Vornado Realty Trust REIT | 162,000 | 18,099 |
| HCP, Inc. REIT | 469,600 | 15,985 |
15
| | | Market |
| | | Value• |
| | Shares | ($000) |
| SL Green Realty Corp. | | |
| REIT | 126,804 | 15,300 |
| The Macerich Co. REIT | 166,900 | 14,305 |
| Ventas, Inc. REIT | 316,100 | 13,558 |
| Apartment Investment & | | |
| Management Co. | | |
| Class A REIT | 276,300 | 12,912 |
| Federal Realty | | |
| Investment Trust REIT | 143,700 | 12,677 |
| Host Hotels & | | |
| Resorts Inc. REIT | 561,799 | 12,449 |
| Hospitality Properties Trust | | |
| REIT | 291,000 | 11,524 |
| Camden Property Trust | | |
| REIT | 179,900 | 11,217 |
| Equity Residential REIT | 118,800 | 4,963 |
| Avalonbay | | |
| Communities, Inc. REIT | 19,000 | 2,330 |
| Kimco Realty Corp. REIT | 50,600 | 2,101 |
| Plum Creek Timber Co. Inc. | | |
| REIT | 33,600 | 1,501 |
| Boston Properties, Inc. | | |
| REIT | 7,123 | 772 |
| CapitalSource Inc. REIT | 8,200 | 149 |
| | | |
| Real Estate Management & Development (0.1%) |
| ^The St. Joe Co. | 946,300 | 32,042 |
| Forest City Enterprise | | |
| Class A | 156,970 | 8,935 |
| | | |
| Thrifts & Mortgage Finance (1.0%) | |
| Washington Mutual, Inc. | 11,821,895 | 329,594 |
| Freddie Mac | 1,887,900 | 98,605 |
| Fannie Mae | 1,149,700 | 65,579 |
| Sovereign Bancorp, Inc. | 1,784,100 | 25,745 |
| Countrywide Financial Corp. | 220,628 | 3,424 |
| ^Radian Group, Inc. | 85,000 | 1,070 |
| | | 12,836,201 |
Health Care (11.7%) | | |
| Pfizer Inc. | 48,541,900 | 1,194,616 |
| Bristol-Myers Squibb Co. | 39,199,700 | 1,175,599 |
| Wyeth | 19,509,900 | 948,766 |
* | WellPoint Inc. | 9,214,800 | 730,089 |
| Baxter International, Inc. | 11,082,900 | 665,085 |
| Quest Diagnostics, Inc. | 6,746,800 | 358,795 |
| Johnson & Johnson | 5,139,520 | 334,943 |
| Merck & Co., Inc. | 2,404,100 | 140,063 |
| Eli Lilly & Co. | 2,193,900 | 118,800 |
* | Boston Scientific Corp. | 8,200,000 | 113,734 |
* | Barr Pharmaceuticals Inc. | 1,789,200 | 102,557 |
| Abbott Laboratories | 1,871,600 | 102,227 |
| Covidien Ltd. | 2,218,125 | 92,274 |
| UnitedHealth Group Inc. | 1,317,000 | 64,731 |
* | Sepracor Inc. | 1,530,763 | 42,157 |
| | | Market |
| | | Value• |
| | Shares | ($000) |
| AstraZeneca Group | | |
| PLC ADR | 777,700 | 38,185 |
| CIGNA Corp. | 555,200 | 29,142 |
* | Biogen Idec Inc. | 305,600 | 22,749 |
| AmerisourceBergen Corp. | 477,500 | 22,495 |
* | King Pharmaceuticals, Inc. | 1,943,800 | 20,604 |
* | Watson | | |
| Pharmaceuticals, Inc. | 183,000 | 5,592 |
| | | 6,323,203 |
Industrials (9.4%) | | |
| Honeywell | | |
| International Inc. | 15,880,888 | 959,364 |
| General Electric Co. | 22,328,600 | 919,045 |
| Illinois Tool Works, Inc. | 16,025,700 | 917,632 |
2 | Cooper Industries, Inc. | | |
| Class A | 11,257,600 | 589,786 |
| ITT Industries, Inc. | 8,563,000 | 573,036 |
| United Technologies Corp. | 2,042,400 | 156,427 |
| Tyco International, Ltd. | 3,053,475 | 125,712 |
| Pitney Bowes, Inc. | 3,000,000 | 120,120 |
| Textron, Inc. | 1,642,010 | 113,644 |
| Northrop Grumman Corp. | 1,163,721 | 97,310 |
| Masco Corp. | 3,099,500 | 74,636 |
| United Parcel Service, Inc. | 806,180 | 60,544 |
*^USG Corp. | 1,424,700 | 56,632 |
| Union Pacific Corp. | 337,499 | 43,213 |
| Parker Hannifin Corp. | 498,550 | 40,068 |
| R.R. Donnelley & Sons Co. | 852,250 | 34,337 |
| SPX Corp. | 318,500 | 32,264 |
| Raytheon Co. | 434,000 | 27,607 |
| Embraer-Empresa Brasileira | | |
| de Aeronautica SA ADR | 540,600 | 26,365 |
| Ingersoll-Rand Co. | 475,100 | 23,921 |
| Deere & Co. | 135,900 | 21,051 |
| PACCAR, Inc. | 370,545 | 20,587 |
| Flowserve Corp. | 253,300 | 20,001 |
| Manpower Inc. | 263,600 | 19,701 |
| Emerson Electric Co. | 256,000 | 13,381 |
| CSX Corp. | 156,900 | 7,024 |
* | UAL Corp. | 108,000 | 5,173 |
* | Allied Waste Industries, Inc. | 5,462 | 69 |
| Waste Management, Inc. | 1,700 | 62 |
| | | 5,098,712 |
Information Technology (7.8%) | | |
| International Business | | |
| Machines Corp. | 9,628,000 | 1,118,003 |
| Hewlett-Packard Co. | 13,040,672 | 673,942 |
| Microsoft Corp. | 15,384,400 | 566,300 |
| Nokia Corp. ADR | 5,711,900 | 226,877 |
| Intel Corp. | 7,421,600 | 199,641 |
* | Oracle Corp. | 8,746,160 | 193,902 |
* | Cisco Systems, Inc. | 5,103,300 | 168,715 |
| CA, Inc. | 5,351,728 | 141,553 |
16
| | | Market |
| | | Value• |
| | Shares | ($000) |
* | Flextronics | | |
| International Ltd. | 10,692,340 | 131,623 |
| Motorola, Inc. | 6,627,600 | 124,533 |
| Electronic Data | | |
| Systems Corp. | 5,289,200 | 114,194 |
| Tyco Electronics Ltd. | 3,171,775 | 113,137 |
* | Yahoo! Inc. | 3,631,900 | 112,952 |
* | Dell Inc. | 3,175,500 | 97,170 |
* | Sun Microsystems, Inc. | 14,496,200 | 82,773 |
* | Symantec Corp. | 3,929,300 | 73,792 |
* | Computer Sciences Corp. | 598,300 | 34,935 |
| Seagate Technology | 525,700 | 14,635 |
| Intersil Corp. | 403,400 | 12,239 |
* | Novellus Systems, Inc. | 180,499 | 5,128 |
* | Vishay Intertechnology, Inc. | 353,500 | 4,451 |
| Fidelity National | | |
| Information Services, Inc. | 25,000 | 1,153 |
* | Xerox Corp. | 56,800 | 991 |
| | | 4,212,639 |
Materials (2.8%) | | |
| E.I. du Pont de | | |
| Nemours & Co. | 14,281,600 | 707,082 |
| Dow Chemical Co. | 3,469,500 | 156,266 |
| Newmont Mining Corp. | | |
| (Holding Co.) | 2,571,400 | 130,781 |
| Alcoa Inc. | 2,672,600 | 105,808 |
| Louisiana-Pacific Corp. | 4,800,951 | 79,024 |
| Ball Corp. | 1,410,631 | 69,939 |
* | Cemex SAB de CV ADR | 1,554,943 | 47,690 |
| International Paper Co. | 1,097,000 | 40,545 |
| United States Steel Corp. | 362,700 | 39,135 |
| Air Products & | | |
| Chemicals, Inc. | 389,500 | 38,113 |
| Celanese Corp. Series A | 784,900 | 32,934 |
| Eastman Chemical Co. | 444,900 | 29,626 |
| Freeport-McMoRan | | |
| Copper & Gold, Inc. | | |
| Class B | 224,700 | 26,443 |
| Steel Dynamics, Inc. | 83,000 | 4,417 |
| | | 1,507,803 |
Telecommunication Services (5.5%) | |
| Verizon | | |
| Communications Inc. | 29,884,154 | 1,376,763 |
| AT&T Inc. | 31,745,275 | 1,326,635 |
| Sprint Nextel Corp. | 12,069,300 | 206,385 |
* | Windstream Corp. | 1,740,347 | 23,408 |
| Alltel Corp. | 254,406 | 18,101 |
| Embarq Corp. | 124,100 | 6,567 |
| | | 2,957,859 |
Utilities (6.4%) | | |
| Exelon Corp. | 10,539,825 | 872,487 |
| Entergy Corp. | 5,739,300 | 687,970 |
| Dominion Resources, Inc. | 6,643,420 | 608,737 |
| | | Market |
| | | Value• |
| | Shares | ($000) |
| Duke Energy Corp. | 28,808,300 | 552,255 |
2 | CenterPoint Energy Inc. | 18,711,100 | 313,598 |
| FirstEnergy Corp. | 679,300 | 47,347 |
| PPL Corp. | 882,000 | 45,599 |
| Edison International | 751,200 | 43,637 |
| Sempra Energy | 668,100 | 41,095 |
| Consolidated Edison Inc. | 779,600 | 36,711 |
| Progress Energy, Inc. | 756,600 | 36,317 |
| FPL Group, Inc. | 465,400 | 31,843 |
| Public Service | | |
| Enterprise Group, Inc. | 249,200 | 23,824 |
| Southern Co. | 581,509 | 21,318 |
* | SCANA Corp. | 475,500 | 19,301 |
| Alliant Energy Corp. | 422,500 | 16,900 |
| Northeast Utilities | 504,900 | 15,566 |
| PG&E Corp. | 310,200 | 15,178 |
* | Mirant Corp. | 242,000 | 10,251 |
* | Pepco Holdings, Inc. | 9,100 | 259 |
| | | 3,440,193 |
Exchange-Traded Funds (1.2%) | |
3 | Vanguard Total Stock | | |
| Market ETF | 3,098,900 | 475,092 |
3 | Vanguard Value ETF | 2,511,200 | 179,400 |
| | | 654,492 |
Total Common Stocks | | |
(Cost $39,592,213) | | 52,631,033 |
Temporary Cash Investments (3.0%)1 | |
Money Market Fund (2.9%) | | |
4 | Vanguard Market Liquidity | | |
| Fund, 4.955% | 1,509,160,468 | 1,509,160 |
4 | Vanguard Market Liquidity | | |
| Fund, 4.955%—Note G | 48,809,900 | 48,810 |
| | | 1,557,970 |
| | Face | |
| | Amount | |
| | ($000) | |
U.S. Agency Obligations (0.1%) | | |
5 | Federal Home Loan Bank | | |
6 | 5.144%, 1/22/08 | 20,000 | 19,795 |
6 | 4.511%, 1/23/08 | 2,000 | 1,979 |
6 | 4.563%, 2/8/08 | 38,700 | 38,226 |
| | | 60,000 |
Total Temporary Cash Investments | |
(Cost $1,617,942) | | 1,617,970 |
Total Investments (100.3%) | | |
(Cost $41,210,155) | | 54,249,003 |
Other Assets and Liabilities— | | |
Net (–0.3%) | | (177,380) |
Net Assets (100%) | | 54,071,623 |
| | | | |
17
| Market |
| Value• |
| ($000) |
Statement of Assets and Liabilities | |
Assets | |
Investment in Securities, at Value | 54,249,003 |
Receivables for Investment | |
Securities Sold | 86,141 |
Receivables for Capital Shares Issued | 26,947 |
Other Assets—Note C | 79,281 |
Total Assets | 54,441,372 |
Liabilities | |
Payables for Investment | |
Securities Purchased | 176,625 |
Security Lending Collateral | |
Payable to Brokers—Note G | 48,810 |
Payables for Capital Shares Redeemed | 55,612 |
Other Liabilities | 88,702 |
Total Liabilities | 369,749 |
Net Assets (100%) | 54,071,623 |
At October 31, 2007, net assets consisted of:7 |
| Amount |
| ($000) |
Paid-in Capital | 35,797,321 |
Undistributed Net Investment Income | 325,087 |
Accumulated Net Realized Gains | 4,885,096 |
Unrealized Appreciation | |
Investment Securities | 13,038,848 |
Futures Contracts | 25,271 |
Net Assets | 54,071,623 |
| |
| |
Investor Shares—Net Assets | |
Applicable to 893,804,383 outstanding | |
$.001 par value shares of beneficial | |
interest (unlimited authorization) | 33,821,201 |
Net Asset Value Per Share— | |
Investor Shares | $37.84 |
| |
| |
Admiral Shares—Net Assets | |
Applicable to 301,414,389 outstanding | |
$.001 par value shares of beneficial | |
interest (unlimited authorization) | 20,250,422 |
Net Asset Value Per Share— | |
Admiral Shares | $67.18 |
• See Note A in Notes to Financial Statements.
* Non-income-producing security.
^ Part of security position is on loan to broker-dealers. See Note G in Notes to Financial Statements.
1 The fund invests a portion of its cash reserves in equity markets through the use of index futures contracts. After giving effect to futures investments, the fund’s effective common stock and temporary cash investment positions represent 98.5% and 1.8%, respectively, of net assets. See Note E in Notes to Financial Statements.
2 Considered an affiliated company of the fund as the fund owns more than 5% of the outstanding voting securities of such company. See Note I in Notes to Financial Statements.
3 Considered an affiliated company of the fund as the issuer is another member of The Vanguard Group.
4 Affiliated money market fund available only to Vanguard funds and certain trusts and accounts managed by Vanguard. Rate shown is the 7-day yield.
5 The issuer operates under a congressional charter; its securities are neither issued nor guaranteed by the U.S. government. If needed, access to additional funding from the U.S. Treasury (beyond the issuer’s line of credit) would require congressional action.
6 Securities with a value of $60,000,000 have been segregated as initial margin for open futures contracts.
7 See Note E in Notes to Financial Statements for the tax-basis components of net assets.
ADR—American Depositary Receipt.
REIT—Real Estate Investment Trust.
18
Statement of Operations
| Year Ended |
| October 31, 2007 |
| ($000) |
Investment Income | |
Income | |
Dividends1, 2 | 1,192,818 |
Interest2 | 97,102 |
Security Lending | 4,982 |
Total Income | 1,294,902 |
Expenses | |
Investment Advisory Fees—Note B | |
Basic Fee | 62,621 |
Performance Adjustment | 5,292 |
The Vanguard Group—Note C | |
Management and Administrative | |
Investor Shares | 56,432 |
Admiral Shares | 14,239 |
Marketing and Distribution | |
Investor Shares | 6,408 |
Admiral Shares | 3,173 |
Custodian Fees | 405 |
Auditing Fees | 31 |
Shareholders’ Reports | |
Investor Shares | 572 |
Admiral Shares | 170 |
Trustees’ Fees and Expenses | 67 |
Total Expenses | 149,410 |
Expenses Paid Indirectly—Note D | (1,771) |
Net Expenses | 147,639 |
Net Investment Income | 1,147,263 |
Realized Net Gain (Loss) | |
Investment Securities Sold2 | 5,232,347 |
Futures Contracts | 61,433 |
Realized Net Gain (Loss) | 5,293,780 |
Change in Unrealized Appreciation (Depreciation) | |
Investment Securities | 456,499 |
Futures Contracts | 6,707 |
Change in Unrealized Appreciation (Depreciation) | 463,206 |
Net Increase (Decrease) in Net Assets Resulting from Operations | 6,904,249 |
1 Dividends are net of foreign withholding taxes of $3,967,000.
2 Dividend income, interest income, and realized net gain (loss) from affiliated companies of the fund were $106,822,000, $93,037,000, and $1,084,490,000, respectively.
19
Statement of Changes in Net Assets
| Year Ended October 31, |
| 2007 | 2006 |
| ($000) | ($000) |
Increase (Decrease) in Net Assets | | |
Operations | | |
Net Investment Income | 1,147,263 | 1,011,048 |
Realized Net Gain (Loss) | 5,293,780 | 2,126,784 |
Change in Unrealized Appreciation (Depreciation) | 463,206 | 3,639,947 |
Net Increase (Decrease) in Net Assets Resulting from Operations | 6,904,249 | 6,777,779 |
Distributions | | |
Net Investment Income | | |
Investor Shares | (694,907) | (636,172) |
Admiral Shares | (415,089) | (313,576) |
Realized Capital Gain1 | | |
Investor Shares | (1,263,004) | (782,678) |
Admiral Shares | (676,757) | (343,927) |
Total Distributions | (3,049,757) | (2,076,353) |
Capital Share Transactions—Note H | | |
Investor Shares | 560,388 | (564,170) |
Admiral Shares | 2,932,482 | 2,396,256 |
Net Increase (Decrease) from Capital Share Transactions | 3,492,870 | 1,832,086 |
Total Increase (Decrease) | 7,347,362 | 6,533,512 |
Net Assets | | |
Beginning of Period | 46,724,261 | 40,190,749 |
End of Period2 | 54,071,623 | 46,724,261 |
1 Includes fiscal 2007 and 2006 short-term gain distributions totaling $134,373,000 and $0, respectively. Short-term gain distributions are treated as ordinary income dividends for tax purposes.
2 Net Assets—End of Period includes undistributed net investment income of $325,087,000 and $287,820,000.
20
Financial Highlights
Investor Shares | | | | | |
| | | | | |
| | | | | |
| | | | |
For a Share Outstanding | | | Year Ended October 31, |
Throughout Each Period | 2007 | 2006 | 2005 | 2004 | 2003 |
Net Asset Value, Beginning of Period | $35.14 | $31.61 | $28.49 | $24.61 | $20.87 |
Investment Operations | | | | | |
Net Investment Income | .803 | .760 | .65 | .56 | .51 |
Net Realized and Unrealized Gain (Loss) | | | | | |
on Investments | 4.145 | 4.368 | 3.10 | 3.87 | 3.75 |
Total from Investment Operations | 4.948 | 5.128 | 3.75 | 4.43 | 4.26 |
Distributions | | | | | |
Dividends from Net Investment Income | (.790) | (.720) | (.63) | (.55) | (.52) |
Distributions from Realized Capital Gains | (1.458) | (.878) | — | — | — |
Total Distributions | (2.248) | (1.598) | (.63) | (.55) | (.52) |
Net Asset Value, End of Period | $37.84 | $35.14 | $31.61 | $28.49 | $24.61 |
| | | | | |
| | | | | |
Total Return1 | 14.62% | 16.85% | 13.22% | 18.15% | 20.68% |
| | | | | |
| | | | | |
Ratios/Supplemental Data | | | | | |
Net Assets, End of Period (Millions) | $33,821 | $30,790 | $28,199 | $26,232 | $20,843 |
Ratio of Total Expenses to | | | | | |
Average Net Assets2 | 0.33% | 0.34% | 0.35% | 0.37% | 0.43% |
Ratio of Net Investment Income to | | | | | |
Average Net Assets | 2.19% | 2.28% | 2.14% | 2.07% | 2.31% |
Portfolio Turnover Rate | 51% | 34% | 28% | 22% | 29% |
| | | | | | | |
1 Total returns do not include the account service fee that may be applicable to certain accounts with balances below $10,000.
2 Includes performance-based investment advisory fee increases (decreases) of 0.01%, 0.01%, 0.01%, 0.02%, and 0.03%.
21
Admiral Shares | | | | | |
| | | | | |
| | | | | |
| | | |
For a Share Outstanding | | Year Ended October 31, |
Throughout Each Period | 2007 | 2006 | 2005 | 2004 | 2003 |
Net Asset Value, Beginning of Period | $62.41 | $56.13 | $50.59 | $43.69 | $37.05 |
Investment Operations | | | | | |
Net Investment Income | 1.491 | 1.402 | 1.224 | 1.043 | .95 |
Net Realized and Unrealized Gain (Loss) | | | | | |
on Investments | 7.348 | 7.782 | 5.493 | 6.885 | 6.65 |
Total from Investment Operations | 8.839 | 9.184 | 6.717 | 7.928 | 7.60 |
Distributions | | | | | |
Dividends from Net Investment Income | (1.481) | (1.346) | (1.177) | (1.028) | (.96) |
Distributions from Realized Capital Gains | (2.588) | (1.558) | — | — | — |
Total Distributions | (4.069) | (2.904) | (1.177) | (1.028) | (.96) |
Net Asset Value, End of Period | $67.18 | $62.41 | $56.13 | $50.59 | $43.69 |
| | | | | |
| | | | | |
Total Return | 14.71% | 17.01% | 13.34% | 18.30% | 20.79% |
| | | | | |
| | | | | |
Ratios/Supplemental Data | | | | | |
Net Assets, End of Period (Millions) | $20,250 | $15,934 | $11,992 | $4,849 | $3,412 |
Ratio of Total Expenses to | | | | | |
Average Net Assets1 | 0.23% | 0.23% | 0.22% | 0.26% | 0.32% |
Ratio of Net Investment Income to | | | | | |
Average Net Assets | 2.29% | 2.39% | 2.25% | 2.17% | 2.41% |
Portfolio Turnover Rate | 51% | 34% | 28% | 22% | 29% |
1 Includes performance-based investment advisory fee increases (decreases) of 0.01%, 0.01%, 0.01%, 0.02%, and 0.03%.
See accompanying Notes, which are an integral part of the Financial Statements.
22
Notes to Financial Statements
Vanguard Windsor II Fund is registered under the Investment Company Act of 1940 as an open-end investment company, or mutual fund. The fund files reports with the SEC under the company name Vanguard Windsor Funds. The fund offers two classes of shares, Investor Shares and Admiral Shares. Investor Shares are available to any investor who meets the fund’s minimum purchase requirements. Admiral Shares are designed for investors who meet certain administrative, service, tenure, and account-size criteria.
A. The following significant accounting policies conform to generally accepted accounting principles for U.S. mutual funds. The fund consistently follows such policies in preparing its financial statements.
1. Security Valuation: Securities are valued as of the close of trading on the New York Stock Exchange (generally 4 p.m., Eastern time) on the valuation date. Equity securities are valued at the latest quoted sales prices or official closing prices taken from the primary market in which each security trades; such securities not traded on the valuation date are valued at the mean of the latest quoted bid and asked prices. Securities for which market quotations are not readily available, or whose values have been affected by events occurring before the fund’s pricing time but after the close of the securities’ primary markets, are valued at their fair values calculated according to procedures adopted by the board of trustees. These procedures include obtaining quotations from an independent pricing service, monitoring news to identify significant market- or security-specific events, and evaluating changes in the values of foreign market proxies (for example, ADRs, futures contracts, or exchange-traded funds), between the time the foreign markets close and the fund’s pricing time. When fair-value pricing is employed, the prices of securities used by a fund to calculate its net asset value may differ from quoted or published prices for the same securities. Investments in Vanguard Market Liquidity Fund are valued at that fund’s net asset value. Temporary cash investments acquired over 60 days to maturity are valued using the latest bid prices or using valuations based on a matrix system (which considers such factors as security prices, yields, maturities, and ratings), both as furnished by independent pricing services. Other temporary cash investments are valued at amortized cost, which approximates market value.
2. Futures Contracts: The fund uses index futures contracts to a limited extent, with the objective of maintaining full exposure to the stock market while maintaining liquidity. The fund may purchase or sell futures contracts to achieve a desired level of investment, whether to accommodate portfolio turnover or cash flows from capital share transactions. The primary risks associated with the use of futures contracts are imperfect correlation between changes in market values of stocks held by the fund and the prices of futures contracts, and the possibility of an illiquid market.
Futures contracts are valued at their quoted daily settlement prices. The aggregate principal amounts of the contracts are not recorded in the Statement of Net Assets. Fluctuations in the value of the contracts are recorded in the Statement of Net Assets as an asset (liability) and in the Statement of Operations as unrealized appreciation (depreciation) until the contracts are closed, when they are recorded as realized futures gains (losses).
3. Federal Income Taxes: The fund intends to continue to qualify as a regulated investment company and distribute all of its taxable income. Accordingly, no provision for federal income taxes is required in the financial statements.
4. Distributions: Distributions to shareholders are recorded on the ex-dividend date.
23
5. Security Lending: The fund may lend its securities to qualified institutional borrowers to earn additional income. Security loans are required to be secured at all times by collateral at least equal to the market value of securities loaned. The fund invests cash collateral received in Vanguard Market Liquidity Fund, and records a liability for the return of the collateral, during the period the securities are on loan. Security lending income represents the income earned on investing cash collateral, less expenses associated with the loan.
6. Other: Dividend income is recorded on the ex-dividend date. Interest income includes income distributions received from Vanguard Market Liquidity Fund and is accrued daily. Security transactions are accounted for on the date securities are bought or sold. Costs used to determine realized gains (losses) on the sale of investment securities are those of the specific securities sold.
Each class of shares has equal rights as to assets and earnings, except that each class separately bears certain class-specific expenses related to maintenance of shareholder accounts (included in Management and Administrative expenses) and shareholder reporting. Marketing and distribution expenses are allocated to each class of shares based on a method approved by the board of trustees. Income, other non-class-specific expenses, and gains and losses on investments are allocated to each class of shares based on its relative net assets.
B. Armstrong Shaw Associates Inc.; Barrow, Hanley, Mewhinney & Strauss, Inc.; Hotchkis and Wiley Capital Management, LLC; and beginning January 9, 2007, Lazard Asset Management LLC each provide investment advisory services to a portion of the fund for a fee calculated at an annual percentage rate of average net assets managed by the advisor. The basic fee of Armstrong Shaw Associates Inc. is subject to quarterly adjustments based on performance since January 31, 2006, relative to the Russell 1000 Value Index. The basic fee of Barrow, Hanley, Mewhinney & Strauss, Inc., is subject to quarterly adjustments based on performance for the preceding three years relative to the S&P 500/Barra Value Index for periods prior to May 1, 2006, and the new benchmark, the MSCI US Prime Market 750 Index, beginning May 1, 2006. The benchmark change will be fully phased in by April 2009. The basic fee of Hotchkis and Wiley Capital Management, LLC, is subject to quarterly adjustments based on performance since January 31, 2004, relative to the MSCI US Investable Market 2500 Index. In accordance with the advisory contract entered into with Lazard Asset Management LLC in January 2007, beginning in November 2007, the investment advisory fee will be subject to quarterly adjustments based on performance since January 31, 2007, relative to the S&P 500 Index.
The Vanguard Group provides investment advisory services to a portion of the fund on an at-cost basis; the fund paid Vanguard advisory fees of $1,609,000 for the year ended October 31, 2007.
For the year ended October 31, 2007, the aggregate investment advisory fee represented an effective annual basic rate of 0.12% of the fund’s average net assets before an increase of $5,292,000 (0.01%) based on performance.
C. The Vanguard Group furnishes at cost corporate management, administrative, marketing, and distribution services. The costs of such services are allocated to the fund under methods approved by the board of trustees. The fund has committed to provide up to 0.40% of its net assets in capital contributions to Vanguard. At October 31, 2007, the fund had contributed capital of $4,527,000 to Vanguard (included in Other Assets), representing 0.01% of the fund’s net assets and 4.53% of Vanguard’s capitalization. The fund’s trustees and officers are also directors and officers of Vanguard.
24
D. The fund has asked its investment advisors to direct certain security trades, subject to obtaining the best price and execution, to brokers who have agreed to rebate to the fund part of the commissions generated. Such rebates are used solely to reduce the fund’s management and administrative expenses. The fund’s custodian bank has also agreed to reduce its fees when the fund maintains cash on deposit in the non-interest-bearing custody account. For the year ended October 31, 2007, these arrangements reduced the fund’s management and administrative expenses by $1,725,000 and custodian fees by $46,000.
E. Distributions are determined on a tax basis and may differ from net investment income and realized capital gains for financial reporting purposes. Differences may be permanent or temporary. Permanent differences are reclassified among capital accounts in the financial statements to reflect their tax character. Temporary differences arise when certain items of income, expense, gain, or loss are recognized in different periods for financial statement and tax purposes; these differences will reverse at some time in the future. Differences in classification may also result from the treatment of short-term gains as ordinary income for tax purposes.
The fund used a tax accounting practice to treat a portion of the price of capital shares redeemed during the year as distributions from realized capital gains. Accordingly, the fund has reclassified $387,469,000 from accumulated net realized gains to paid-in capital.
For tax purposes, at October 31, 2007, the fund had $1,126,360,000 of ordinary income and $4,196,065,000 of long-term capital gains available for distribution.
At October 31, 2007, the cost of investment securities for tax purposes was $41,227,962,000. Net unrealized appreciation of investment securities for tax purposes was $13,021,041,000, consisting of unrealized gains of $14,364,308,000 on securities that had risen in value since their purchase and $1,343,267,000 in unrealized losses on securities that had fallen in value since their purchase.
At October 31, 2007, the aggregate settlement value of open futures contracts expiring in December 2007 and the related unrealized appreciation (depreciation) were:
| | | ($000) |
| | Aggregate | Unrealized |
| Number of | Settlement | Appreciation |
Futures Contracts | Long Contracts | Value | (Depreciation) |
S&P 500 Index | 1,605 | 623,904 | 25,236 |
E-mini S&P 500 Index | 39 | 3,032 | 35 |
Unrealized appreciation (depreciation) on open futures contracts is required to be treated as realized gain (loss) for tax purposes.
F. During the year ended October 31, 2007, the fund purchased $26,545,015,000 of investment securities and sold $25,048,681,000 of investment securities, other than temporary cash investments.
G. The market value of securities on loan to broker-dealers at October 31, 2007, was $47,288,000, for which the fund received cash collateral of $48,810,000.
25
H. Capital share transactions for each class of shares were:
| | | Year Ended October 31, |
| | 2007 | | 2006 |
| Amount | Shares | Amount | Shares |
| ($000) | (000) | ($000) | (000) |
Investor Shares | | | | |
Issued | 4,380,015 | 120,782 | 4,035,614 | 123,796 |
Issued in Lieu of Cash Distributions | 1,911,239 | 54,285 | 1,378,672 | 43,697 |
Redeemed | (5,730,866) | (157,390) | (5,978,456) | (183,528) |
Net Increase (Decrease)—Investor Shares | 560,388 | 17,677 | (564,170) | (16,035) |
Admiral Shares | | | | |
Issued | 4,143,312 | 64,275 | 3,485,256 | 60,101 |
Issued in Lieu of Cash Distributions | 1,020,200 | 16,296 | 605,081 | 10,803 |
Redeemed | (2,231,030) | (34,474) | (1,694,081) | (29,219) |
Net Increase (Decrease)—Admiral Shares | 2,932,482 | 46,097 | 2,396,256 | 41,685 |
I. Certain of the fund’s investments are in companies that are considered to be affiliated companies of the fund because the fund owns more than 5% of the outstanding voting securities of the company. Transactions during the period in securities of these companies were as follows:
| | | Current Period Transactions | |
| Oct. 31, 2006 | | Proceeds from | | Oct. 31, 2007 |
| Market | Purchases | Securities | Dividend | Market |
| Value | at Cost | Sold | Income | Value |
| ($000) | ($000) | ($000) | ($000) | ($000) |
Bear Stearns Co., Inc. | NA1 | 1,199,664 | 78,108 | 4,871 | 949,509 |
CenterPoint Energy Inc. | 367,821 | 7,737 | 90,225 | 13,308 | 313,598 |
Cooper Industries, Inc. Class A | 563,607 | 111,550 | 199,124 | 10,078 | 589,786 |
Hanson PLC ADR | 558,114 | — | 864,048 | 12,229 | — |
Lyondell Chemical Co. | 572,238 | 19,018 | 1,003,549 | 15,182 | — |
Massey Energy Co. | NA1 | 106,337 | 11,050 | 559 | 136,424 |
Service Corp. International | 237,851 | 35,154 | 36,623 | 3,228 | 377,379 |
Sherwin-Williams Co. | 544,105 | 19,263 | 58,448 | 10,931 | 551,879 |
SLM Corp. | NA1 | 237,906 | — | 8,880 | 998,877 |
Wyndham Worldwide Corp. | NA1 | 553,354 | 68,713 | 598 | 550,371 |
XL Capital Ltd. Class A | 637,970 | 323,783 | 24,396 | 14,642 | 940,084 |
| 3,481,706 | | | 94,506 | 5,407,907 |
1 At October 31, 2006, the issuer was not an affiliated company of the fund.
26
J. In June 2006, the Financial Accounting Standards Board issued Interpretation No. 48 (“FIN 48”), “Accounting for Uncertainty in Income Taxes.” FIN 48 establishes the minimum threshold for recognizing, and a system for measuring, the benefits of tax-return positions in financial statements, and is effective for the fund’s fiscal year beginning November 1, 2007. Management has analyzed the fund’s tax positions taken on federal income tax returns for all open tax years (tax years ended October 31, 2004–2007) for purposes of implementing FIN 48, and has concluded that as of October 31, 2007, no provision for income tax would be required in the fund’s financial statements.
27
Report of Independent Registered Public Accounting Firm
To the Trustees of Vanguard Windsor Funds and the Shareholders of Vanguard Windsor II Fund:
In our opinion, the accompanying statement of net assets and statement of assets and liabilities and the related statements of operations and of changes in net assets and the financial highlights present fairly, in all material respects, the financial position of Vanguard Windsor II Fund (the “Fund”) at October 31, 2007, the results of its operations for the year then ended, the changes in its net assets for each of the two years in the period then ended and the financial highlights for each of the five years in the period then ended, in conformity with accounting principles generally accepted in the United States of America. These financial statements and financial highlights (hereafter referred to as “financial statements”) are the responsibility of the Fund’s management; our responsibility is to express an opinion on these financial statements based on our audits. We conducted our audits of these financial statements in accordance with the standards of the Public Company Accounting Oversight Board (United States). Those standards require that we plan and perform the audit to obtain reasonable assurance about whether the financial statements are free of material misstatement. An audit includes examining, on a test basis, evidence supporting the amounts and disclosures in the financial statements, assessing the accounting principles used and significant estimates made by management, and evaluating the overall financial statement presentation. We believe that our audits, which included confirmation of securities at October 31, 2007 by correspondence with the custodian and broker, and by agreement to the underlying ownership records for Vanguard Market Liquidity Fund, provide a reasonable basis for our opinion.
PricewaterhouseCoopers LLP
Philadelphia, Pennsylvania
December 6, 2007
Special 2007 tax information (unaudited) for Vanguard Windsor II Fund |
|
This information for the fiscal year ended October 31, 2007, is included pursuant to provisions |
of the Internal Revenue Code. |
|
The fund distributed $2,135,295,000 as capital gain dividends (from net long-term capital gains) |
to shareholders during the fiscal year. |
|
The fund distributed $1,137,112,000 of qualified dividend income to shareholders during the |
fiscal year. |
|
For corporate shareholders, 54.8% of investment income (dividend income plus short-term gains, |
if any) qualifies for the dividends-received deduction. |
28
Your Fund’s After-Tax Returns
This table presents returns for your fund both before and after taxes. The after-tax returns are shown in two ways: (1) assuming that an investor owned the fund during the entire period and paid taxes on the fund’s distributions, and (2) assuming that an investor paid taxes on the fund’s distributions and sold all shares at the end of each period.
Calculations are based on the highest individual federal income tax and capital gains tax rates in effect at the times of the distributions and the hypothetical sales. State and local taxes were not considered. After-tax returns reflect any qualified dividend income, using actual prior-year figures and estimates for 2007. (In the example, returns after the sale of fund shares may be higher than those assuming no sale. This occurs when the sale would have produced a capital loss. The calculation assumes that the investor received a tax deduction for the loss.)
The table shows returns for Investor Shares only; returns for other share classes will differ. Please note that your actual after-tax returns will depend on your tax situation and may differ from those shown. Also note that if you own the fund in a tax-deferred account, such as an individual retirement account or a 401(k) plan, this information does not apply to you. Such accounts are not subject to current taxes.
Finally, keep in mind that a fund’s performance—whether before or after taxes—does not guarantee future results.
Average Annual Total Returns: Windsor II Fund Investor Shares1 | | | |
Periods Ended October 31, 2007 | | | |
| One | Five | Ten |
| Year | Years | Years |
Returns Before Taxes | 14.62% | 16.67% | 8.92% |
Returns After Taxes on Distributions | 13.52 | 15.99 | 7.37 |
Returns After Taxes on Distributions and Sale of Fund Shares | 10.69 | 14.51 | 6.98 |
1 Total returns do not include the account service fee that may be applicable to certain accounts with balances below $10,000.
29
About Your Fund’s Expenses
As a shareholder of the fund, you incur ongoing costs, which include costs for portfolio management, administrative services, and shareholder reports (like this one), among others. Operating expenses, which are deducted from a fund’s gross income, directly reduce the investment return of the fund.
A fund’s expenses are expressed as a percentage of its average net assets. This figure is known as the expense ratio. The following examples are intended to help you understand the ongoing costs (in dollars) of investing in your fund and to compare these costs with those of other mutual funds. The examples are based on an investment of $1,000 made at the beginning of the period shown and held for the entire period.
The table below illustrates your fund’s costs in two ways:
• Based on actual fund return. This section helps you to estimate the actual expenses that you paid over the period. The “Ending Account Value” shown is derived from the fund’s actual return, and the third column shows the dollar amount that would have been paid by an investor who started with $1,000 in the fund. You may use the information here, together with the amount you invested, to estimate the expenses that you paid over the period.
To do so, simply divide your account value by $1,000 (for example, an $8,600 account value divided by $1,000 = 8.6), then multiply the result by the number given for your fund under the heading “Expenses Paid During Period.”
• Based on hypothetical 5% yearly return. This section is intended to help you compare your fund’s costs with those of other mutual funds. It assumes that the fund had a yearly return of 5% before expenses, but that the expense ratio is unchanged. In this case—because the return used is not the fund’s actual return—the results do not apply to your investment. The example is useful in making comparisons because the Securities and Exchange Commission requires all mutual funds to calculate expenses based on a 5% return. You can assess your fund’s costs by comparing this hypothetical example with the hypothetical examples that appear in shareholder reports of other funds.
Six Months Ended October 31, 2007 | | | |
| Beginning | Ending | Expenses |
| Account Value | Account Value | Paid During |
Windsor II Fund | 4/30/2007 | 10/31/2007 | Period1 |
Based on Actual Fund Return | | | |
Investor Shares | $1,000.00 | $1,033.61 | $1.64 |
Admiral Shares | 1,000.00 | 1,034.07 | 1.18 |
Based on Hypothetical 5% Yearly Return | | | |
Investor Shares | $1,000.00 | $1,023.59 | $1.63 |
Admiral Shares | 1,000.00 | 1,024.05 | 1.17 |
1 The calculations are based on expenses incurred in the most recent six-month period. The fund’s annualized six-month expense ratios for that period are 0.32% for Investor Shares and 0.23% for Admiral Shares. The dollar amounts shown as “Expenses Paid” are equal to the annualized expense ratio multiplied by the average account value over the period, multiplied by the number of days in the most recent six-month period, then divided by the number of days in the most recent 12-month period.
30
Note that the expenses shown in the table on page 30 are meant to highlight and help you compare ongoing costs only and do not reflect transaction costs incurred by the fund for buying and selling securities. Further, the expenses do not include the account service fee described in the prospectus. If such a fee were applied to your account, your costs would be higher. Your fund does not charge transaction fees, such as purchase or redemption fees, nor does it carry a “sales load.”
The calculations assume no shares were bought or sold during the period. Your actual costs may have been higher or lower, depending on the amount of your investment and the timing of any purchases or redemptions.
You can find more information about the fund’s expenses, including annual expense ratios, in the Financial Statements section of this report. For additional information on operating expenses and other shareholder costs, please refer to your fund’s current prospectus.
31
Glossary
Beta. A measure of the magnitude of a fund’s past share-price fluctuations in relation to the ups and downs of a given market index. The index is assigned a beta of 1.00. Compared with a given index, a fund with a beta of 1.20 typically would have seen its share price rise or fall by 12% when the index rose or fell by 10%. A fund’s beta should be reviewed in conjunction with its R-squared (see definition below). The lower the R-squared, the less correlation there is between the fund and the index, and the less reliable beta is as an indicator of volatility.
Earnings Growth Rate. The average annual rate of growth in earnings over the past five years for the stocks now in a fund.
Equity Exposure. A measure that reflects a fund’s investments in stocks and stock futures. Any holdings in short-term reserves are excluded.
Expense Ratio. The percentage of a fund’s average net assets used to pay its annual administrative and advisory expenses. These expenses directly reduce returns to investors.
Foreign Holdings. The percentage of a fund represented by stocks or depositary receipts of companies based outside the United States.
Inception Date. The date on which the assets of a fund (or one of its share classes) are first invested in accordance with the fund’s investment objective. For funds with a subscription period, the inception date is the day after that period ends. Investment performance is measured from the inception date.
Median Market Cap. An indicator of the size of companies in which a fund invests; the midpoint of market capitalization (market price x shares outstanding) of a fund’s stocks, weighted by the proportion of the fund’s assets invested in each stock. Stocks representing half of the fund’s assets have market capitalizations above the median, and the rest are below it.
Price/Book Ratio. The share price of a stock divided by its net worth, or book value, per share. For a fund, the weighted average price/book ratio of the stocks it holds.
Price/Earnings Ratio. The ratio of a stock’s current price to its per-share earnings over the past year. For a fund, the weighted average P/E of the stocks it holds. P/E is an indicator of market expectations about corporate prospects; the higher the P/E, the greater the expectations for a company’s future growth.
R-Squared. A measure of how much of a fund’s past returns can be explained by the returns from the market in general, as measured by a given index. If a fund’s total returns were precisely synchronized with an index’s returns, its R-squared would be 1.00. If the fund’s returns bore no relationship to the index’s returns, its R-squared would be 0.
Return on Equity. The annual average rate of return generated by a company during the past five years for each dollar of shareholder’s equity (net income divided by shareholder’s equity). For a fund, the weighted average return on equity for the companies whose stocks it holds.
Short-Term Reserves. The percentage of a fund invested in highly liquid, short-term securities that can be readily converted to cash.
Turnover Rate. An indication of the fund’s trading activity. Funds with high turnover rates incur higher transaction costs and may be more likely to distribute capital gains (which may be taxable to investors). The turnover rate excludes in-kind transactions, which have minimal impact on costs.
Yield. A snapshot of a fund’s income from interest and dividends. The yield, expressed as a percentage of the fund’s net asset value, is based on income earned over the past 30 days and is annualized, or projected forward for the coming year. The index yield is based on the current annualized rate of income provided by securities in the index.
32
This page intentionally left blank.
This page intentionally left blank.
The People Who Govern Your Fund
The trustees of your mutual fund are there to see that the fund is operated and managed in your best interests since, as a shareholder, you are a part owner of the fund. Your fund’s trustees also serve on the board of directors of The Vanguard Group, Inc., which is owned by the Vanguard funds and provides services to them on an at-cost basis.
A majority of Vanguard’s board members are independent, meaning that they have no affiliation with Vanguard or the funds they oversee, apart from the sizable personal investments they have made as private individuals.
Our independent board members bring distinguished backgrounds in business, academia, and public service to their task of working with Vanguard officers to establish the policies and oversee the activities of the funds. Among board members’ responsibilities are selecting investment advisors for the funds; monitoring fund operations, performance, and costs; reviewing contracts; nominating and selecting new trustees/directors; and electing Vanguard officers.
Each trustee serves a fund until its termination; or until the trustee’s retirement, resignation, or death; or otherwise as specified in the fund’s organizational documents. Any trustee may be removed at a shareholders’ meeting by a vote representing two-thirds of the net asset value of all shares of the fund together with shares of other Vanguard funds organized within the same trust. The table on these two pages shows information for each trustee and executive officer of the fund. The mailing address of the trustees and officers is P.O. Box 876, Valley Forge, PA 19482.
Chairman of the Board, Chief Executive Officer, and Trustee |
| |
John J. Brennan1 | |
Born 1954 | Principal Occupation(s) During the Past Five Years: Chairman of the Board, |
Trustee since May 1987; | Chief Executive Officer, and Director/Trustee of The Vanguard Group, Inc., and |
Chairman of the Board and | of each of the investment companies served by The Vanguard Group. |
Chief Executive Officer | |
148 Vanguard Funds Overseen | |
| |
Independent Trustees | |
| |
Charles D. Ellis | |
Born 1937 | Principal Occupation(s) During the Past Five Years: Applecore Partners (pro |
Trustee since January 2001 | bono ventures in education); Senior Advisor to Greenwich Associates |
148 Vanguard Funds Overseen | (international business strategy consulting); Successor Trustee of Yale |
| University; Overseer of the Stern School of Business at New York University; |
| Trustee of the Whitehead Institute for Biomedical Research. |
| |
Rajiv L. Gupta | |
Born 1945 | Principal Occupation(s) During the Past Five Years: Chairman, President, and |
Trustee since December 20012 | Chief Executive Officer of Rohm and Haas Co. (chemicals); Board Member of |
148 Vanguard Funds Overseen | the American Chemistry Council; Director of Tyco International, Ltd. (diversified |
| manufacturing and services) since 2005; Trustee of Drexel University and of the |
| Chemical Heritage Foundation. |
| |
Amy Gutmann | |
Born 1949 | Principal Occupation(s) During the Past Five Years: President of the University |
Trustee since June 2006 | of Pennsylvania since 2004; Professor in the School of Arts and Sciences, |
148 Vanguard Funds Overseen | Annenberg School for Communication, and Graduate School of Education of the |
| University of Pennsylvania since 2004; Provost (2001–2004) and Laurance S. |
| Rockefeller Professor of Politics and the University Center for Human Values |
| (1990–2004), Princeton University; Director of Carnegie Corporation of New |
| York since 2005 and of Schuylkill River Development Corporation and Greater |
| Philadelphia Chamber of Commerce since 2004. |
JoAnn Heffernan Heisen | |
Born 1950 | Principal Occupation(s) During the Past Five Years: Corporate Vice President |
Trustee since July 1998 | and Chief Global Diversity Officer since 2006, Vice President and Chief |
148 Vanguard Funds Overseen | Information Officer (1997–2005), and Member of the Executive Committee of |
| Johnson &Johnson (pharmaceuticals/consumer products); Director of the |
| University Medical Center at Princeton and Women’s Research and Education |
| Institute. |
| |
André F. Perold | |
Born 1952 | Principal Occupation(s) During the Past Five Years: George Gund Professor of |
Trustee since December 2004 | Finance and Banking, Harvard Business School; Senior Associate Dean, Director |
148 Vanguard Funds Overseen | of Faculty Recruiting, and Chair of Finance Faculty, Harvard Business School; |
| Director and Chairman of UNX, Inc. (equities trading firm) since 2003; Chair of |
| the Investment Committee of HighVista Strategies LLC (private investment firm) |
| since 2005. |
| |
Alfred M. Rankin, Jr. | |
Born 1941 | Principal Occupation(s) During the Past Five Years: Chairman, President, Chief |
Trustee since January 1993 | Executive Officer, and Director of NACCO Industries, Inc. (forklift |
148 Vanguard Funds Overseen | trucks/housewares/lignite); Director of Goodrich Corporation (industrial |
| products/aircraft systems and services). |
| |
| |
J. Lawrence Wilson | |
Born 1936 | Principal Occupation(s) During the Past Five Years: Retired Chairman and Chief |
Trustee since April 1985 | Executive Officer of Rohm and Haas Co. (chemicals); Director of Cummins Inc. |
148 Vanguard Funds Overseen | (diesel engines) and AmerisourceBergen Corp. (pharmaceutical distribution); |
| Trustee of Vanderbilt University and of Culver Educational Foundation. |
| |
Executive Officers1 | |
| |
Thomas J. Higgins | |
Born 1957 | Principal Occupation(s) During the Past Five Years: Principal of The Vanguard |
Treasurer since July 1998 | Group, Inc.;Treasurer of each of the investment companies served by The |
148 Vanguard Funds Overseen | Vanguard Group. |
| |
| |
Heidi Stam | |
Born 1956 | Principal Occupation(s) During the Past Five Years: Managing Director of The |
Secretary since July 2005 | Vanguard Group, Inc., since 2006; General Counsel of The Vanguard Group |
148 Vanguard Funds Overseen | since 2005; Secretary of The Vanguard Group, and of each of the investment |
| companies served by The Vanguard Group, since 2005; Principal of The |
| Vanguard Group (1997–2006). |
Vanguard Senior Management Team | | |
| | | |
R. Gregory Barton | Kathleen C. Gubanich | F. William McNabb, III | Ralph K. Packard |
Mortimer J. Buckley | Paul A. Heller | Michael S. Miller | George U. Sauter |
Founder |
|
John C. Bogle |
Chairman and Chief Executive Officer, 1974–1996 |
1 Officers of the funds are “interested persons” as defined in the Investment Company Act of 1940.
2 December 2002 for Vanguard Equity Income Fund, Vanguard Growth Equity Fund, the Vanguard Municipal Bond Funds, and the Vanguard State Tax-Exempt Funds.
More information about the trustees is in the Statement of Additional Information, available from The Vanguard Group.

P.O. Box 2600
Valley Forge, PA 19482-2600
Connect with Vanguard® | > | www.vanguard.com |
Fund Information > 800-662-7447 | Vanguard, Admiral, Connect with Vanguard, Windsor, |
| and the ship logo are trademarks of The Vanguard |
Direct Investor Account Services > 800-662-2739 | Group, Inc. |
| |
Institutional Investor Services > 800-523-1036 | All other marks are the exclusive property of their |
| respective owners. |
| |
Text Telephone for People | All comparative mutual fund data are from Lipper Inc. |
With Hearing Impairment > 800-952-3335 | or Morningstar, Inc., unless otherwise noted. |
| |
| |
This material may be used in conjunction | You can obtain a free copy of Vanguard’s proxy voting |
with the offering of shares of any Vanguard | guidelines by visiting our website, www.vanguard.com, |
fund only if preceded or accompanied by | and searching for “proxy voting guidelines,” or by |
the fund’s current prospectus. | calling Vanguard at 800-662-2739. The guidelines are |
| also available from the SEC’s website, www.sec.gov. |
| In addition, you may obtain a free report on how your |
| fund voted the proxies for securities it owned during |
| the 12 months ended June 30. To get the report, visit |
| either www.vanguard.com or www.sec.gov. |
| |
| You can review and copy information about your fund |
| at the SEC’s Public Reference Room in Washington, |
| D.C.To find out more about this public service, call the |
| SEC at 202-551-8090. Information about your fund is |
| also available on the SEC’s website, and you can receive |
| copies of this information, for a fee, by sending a |
| request in either of two ways: via e-mail addressed to |
| publicinfo@sec.gov or via regular mail addressed to the |
| Public Reference Section, Securities and Exchange |
| Commission, Washington, DC 20549-0102. |
| |
| |
| |
| |
| |
| © 2007 The Vanguard Group, Inc. |
| All rights reserved. |
| Vanguard Marketing Corporation, Distributor. |
| |
| Q730 122007 |
Item 2: Code of Ethics. The Registrant has adopted a code of ethics that applies to the Registrant’s principal executive officer, principal financial officer, principal accounting officer or controller or persons performing similar functions. The Code of Ethics was amended during the reporting period covered by this report to make certain technical, non-material changes.
Item 3: Audit Committee Financial Expert. The following members of the Audit Committee have been determined by the Registrant’s Board of Trustees to be Audit Committee Financial Experts serving on its Audit Committee, and to be independent: Charles D. Ellis, Rajiv L. Gupta, JoAnn Heffernan Heisen, André F. Perold, Alfred M. Rankin, Jr., and J. Lawrence Wilson.
Item 4: Principal Accountant Fees and Services.
Audit Fees of the Registrant
Fiscal Year Ended October 31, 2007: $57,000
Fiscal Year Ended October 31, 2006: $47,000
Aggregate Audit Fees of Registered Investment Companies in the Vanguard Group.
Fiscal Year Ended October 31, 2007: $2,835,320
Fiscal Year Ended October 31, 2006: $2,347,620
Fiscal Year Ended October 31, 2007: $630,400
Fiscal Year Ended October 31, 2006: $530,000
Includes fees billed in connection with assurance and related services provided to the Registrant, The Vanguard Group, Inc., Vanguard Marketing Corporation, and other registered investment companies in the Vanguard Group.
Fiscal Year Ended October 31, 2007: $215,900
Fiscal Year Ended October 31, 2006: $101,300
Includes fees billed in connection with tax compliance, planning and advice services provided to the Registrant, The Vanguard Group, Inc., Vanguard Marketing Corporation, and other registered investment companies in the Vanguard Group and related to income and excise taxes.
Fiscal Year Ended October 31, 2007: $0
Fiscal Year Ended October 31, 2006: $0
Includes fees billed for services related to risk management and privacy matters. Services were provided to the Registrant, The Vanguard Group, Inc., Vanguard Marketing Corporation, and other registered investment companies in the Vanguard Group.
(e) (1) Pre-Approval Policies. The policy of the Registrant’s Audit Committee is to consider and, if appropriate, approve before the principal accountant is engaged for such services, all specific audit and non-audit services provided to: (1) the Registrant; (2) The Vanguard Group, Inc.; (3) other entities controlled by The Vanguard Group, Inc. that provide ongoing services to the Registrant; and (4) other registered investment companies in the Vanguard Group. In making a determination, the Audit Committee considers whether the services are consistent with maintaining the principal accountant’s independence.
In the event of a contingency situation in which the principal accountant is needed to provide services in between scheduled Audit Committee meetings, the Chairman of the Audit Committee would be called on to consider and, if appropriate, pre-approve audit or permitted non-audit services in an amount sufficient to complete services through the next Audit Committee meeting, and to determine if such services would be consistent with maintaining the accountant’s independence. At the next scheduled Audit Committee meeting, services and fees would be presented to the Audit Committee for formal consideration, and, if appropriate, approval by the entire Audit Committee. The Audit Committee would again
consider whether such services and fees are consistent with maintaining the principal accountant’s independence.
The Registrant’s Audit Committee is informed at least annually of all audit and non-audit services provided by the principal accountant to the Vanguard complex, whether such services are provided to: (1) the Registrant; (2) The Vanguard Group, Inc.; (3) other entities controlled by The Vanguard Group, Inc. that provide ongoing services to the Registrant; or (4) other registered investment companies in the Vanguard Group.
(2) No percentage of the principal accountant’s fees or services were approved pursuant to the waiver provision of paragraph (c)(7)(i)(C) of Rule 2-01 of Regulation S-X.
(f) For the most recent fiscal year, over 50% of the hours worked under the principal accountant’s engagement were not performed by persons other than full-time, permanent employees of the principal accountant.
(g) | Aggregate Non-Audit Fees. |
Fiscal Year Ended October 31, 2007: $215,900
Fiscal Year Ended October 31, 2006: $101,300
Includes fees billed for non-audit services provided to the Registrant, The Vanguard Group, Inc., Vanguard Marketing Corporation, and other registered investment companies in the Vanguard Group.
(h) For the most recent fiscal year, the Audit Committee has determined that the provision of all non-audit services was consistent with maintaining the principal accountant’s independence.
Item 5: Not Applicable.
Item 6: Not Applicable.
Item 7: Not Applicable.
Item 8: Not Applicable.
Item 9: Not Applicable.
Item 10: Not Applicable.
Item 11: Controls and Procedures.
(a) Disclosure Controls and Procedures. The Principal Executive and Financial Officers concluded that the Registrant's Disclosure Controls and Procedures are effective based on their evaluation of the Disclosure Controls and Procedures as of a date within 90 days of the filing date of this report.
(b) Internal Control Over Financial Reporting. There were no significant changes in Registrant’s Internal Control Over Financial Reporting or in other factors that could
significantly affect this control subsequent to the date of the evaluation, including any corrective actions with regard to significant deficiencies and material weaknesses.
Item 12: Exhibits.
Pursuant to the requirements of the Securities Exchange Act of 1934 and the Investment Company Act of 1940, the registrant has duly caused this report to be signed on its behalf by the undersigned, thereunto duly authorized.
VANGUARD WINDSOR FUNDS |
|
BY:_____________(signature)________________ |
(HEIDI STAM) |
JOHN J. BRENNAN* |
CHIEF EXECUTIVE OFFICER |
Date: December 11, 2007
Pursuant to the requirements of the Securities Exchange Act of 1934 and the Investment Company Act of 1940, this report has been signed below by the following persons on behalf of the registrant and in the capacities and on the dates indicated.
VANGUARD WINDSOR FUNDS |
|
BY:_____________(signature)________________ |
(HEIDI STAM) |
JOHN J. BRENNAN* |
CHIEF EXECUTIVE OFFICER |
Date: December 11, 2007
VANGUARD WINDSOR FUNDS |
|
BY:_____________(signature)________________ |
(HEIDI STAM) |
THOMAS J. HIGGINS* |
TREASURER |
Date: December 11, 2007
*By Power of Attorney. See File Number 333-145624, filed on August 22, 2007. Incorporated by Reference.