UNITED STATES
SECURITIES AND EXCHANGE COMMISSION
Washington, D.C. 20549
FORM N-CSR
CERTIFIED SHAREHOLDER REPORT
OF
REGISTERED MANAGEMENT INVESTMENT COMPANIES
Investment Company Act file number: 811-834
Name of Registrant: Vanguard Windsor Funds
Address of Registrant:
P.O. Box 2600
Valley Forge, PA 19482
Name and address of agent for service:
Heidi Stam, Esquire
P.O. Box 876
Valley Forge, PA 19482
Registrant’s telephone number, including area code: (610) 669-1000
Date of fiscal year end: October 31
Date of reporting period: November 1, 2007–October 31, 2008
Item 1: Reports to Shareholders
> Vanguard Windsor Fund returned about –44% for the 12 months ended October 31, 2008, trailing the negative returns of its comparative standards.
> The stock market reached a record high shortly before the fiscal year began, then began a volatile slide that ended the year with a particularly severe drop.
> The fund’s performance reflected both the market’s distress and disappointing stock choices, especially in the financial, information technology, and consumer discretionary sectors.
Contents | |
| |
Your Fund’s Total Returns | 1 |
President’s Letter | 2 |
Advisors’ Report | 7 |
Fund Profile | 11 |
Performance Summary | 12 |
Financial Statements | 14 |
Your Fund’s After-Tax Returns | 28 |
About Your Fund’s Expenses | 29 |
Glossary | 31 |
Please note: The opinions expressed in this report are just that—informed opinions. They should not be considered promises or advice. Also, please keep in mind that the information and opinions cover the period through the date on the front of this report. Of course, the risks of investing in your fund are spelled out in the prospectus.
Your Fund’s Total Returns
Fiscal Year Ended October 31, 2008 | | |
| Ticker | Total |
| Symbol | Returns |
Vanguard Windsor Fund | | |
Investor Shares | VWNDX | –43.88% |
Admiral™ Shares1 | VWNEX | –43.85 |
Russell 1000 Value Index | | –36.80 |
Average Multi-Cap Value Fund2 | | –38.75 |
Your Fund’s Performance at a Glance |
October 31, 2007–October 31, 2008 |
| | | Distributions Per Share |
| Starting | Ending | Income | Capital |
| Share Price | Share Price | Dividends | Gains |
Vanguard Windsor Fund | | | | |
Investor Shares | $19.52 | $9.51 | $0.289 | $2.015 |
Admiral Shares | 65.90 | 32.08 | 1.047 | 6.798 |
1 A lower-cost class of shares available to many longtime shareholders and to those with significant investments in the fund.
2 Derived from data provided by Lipper Inc.
1

President’s Letter
Dear Shareholder,
The past year has been a particularly difficult time for the financial markets, and this is reflected in Windsor Fund’s –43.88% return (Investor Shares). By comparison, the fund’s benchmark, the Russell 1000 Value Index, plummeted –36.80% for the 12 months ended October 31, 2008, and the average return of peer-group mutual funds fell –38.75%.
While the general stock market took its toll on almost every stock in the portfolio during the past 12 months, the fund paid a heavy price for its sizable investment in financial stocks. If you own shares of the Windsor Fund in a taxable account, you may wish to review our report of the fund’s after-tax returns on page 28.
Stock prices fell sharply in global upheaval
Global stock markets started the 12-month period near all-time highs, but then declined sharply, laid low by the financial crisis that originated in the fixed income markets. The descent traced a series of jagged ups and downs. During the week ended October 10, for example, the U.S. stock market returned about –18%. When Wall Street opened the following Monday, stocks surged, returning more than 10% over the next six and a half hours.
For the full 12 months, the broad U.S. stock market returned –36.43%; international stocks returned –48.27%. The pain was especially acute in emerging markets—
2
among the strongest performers in recent years—as investors became increasingly risk-averse.
Bond market averages masked disparate returns
The broad U.S. taxable bond market registered an unremarkable return of 0.30% for the 12 months, but by its own typically sedate standards, the dislocations were extreme. The strong performance of U.S. Treasury and government securities was offset by double-digit declines in the corporate bond market. These dynamics led to unusually large differences between the yields of Treasuries and their corresponding private sector securities—both a reflection and a cause of the credit market’s distress. Despite their generally high creditworthiness, municipal bonds also fell in price, with the broad tax-exempt market registering a 12-month return of –3.30%.
The U.S. Federal Reserve Board responded to the turmoil with new lending programs and a dramatic easing of monetary policy. Over the full 12 months, the Fed reduced its target for the federal funds rate from 4.50% to 1.00%.
Financial sector leads the decline during a general stock downturn
Like all equity funds, Windsor Fund faced gale-force headwinds during the past 12 months. The fund’s performance, despite some bright spots in its portfolio, also reflected some disappointing stock choices.
Market Barometer | | | |
| Average Annual Total Returns |
| Periods Ended October 31, 2008 |
| One Year | Three Years | Five Years |
Stocks | | | |
Russell 1000 Index (Large-caps) | –36.80% | –5.51% | 0.37% |
Russell 2000 Index (Small-caps) | –34.16 | –4.79 | 1.57 |
Dow Jones Wilshire 5000 Index (Entire market) | –36.43 | –5.10 | 0.81 |
MSCI All Country World Index ex USA (International) | –48.27 | –3.93 | 5.05 |
| | | |
| | | |
Bonds | | | |
Lehman U.S. Aggregate Bond Index (Broad taxable market) | 0.30% | 3.60% | 3.48% |
Lehman Municipal Bond Index | –3.30 | 1.71 | 2.73 |
Citigroup 3-Month Treasury Bill Index | 2.31 | 3.93 | 3.10 |
| | | |
| | | |
CPI | | | |
Consumer Price Index | 3.66% | 2.83% | 3.20% |
3
Given the global financial crisis, it’s not surprising that Windsor Fund’s financial stocks were among its worst performers, accounting for more than one-quarter of the fund’s 12-month decline. Notably weak performers included headline-making banks, insurance company American International Group (AIG), and government-sponsored Fannie Mae and Freddie Mac. A handful of stocks contributed positively to returns, however: ACE Ltd., a rival of AIG, and JP Morgan Chase, both top-10 stocks, as well as M&T Bank Corp., a regional New York state bank.
The fund’s holdings in the information technology and consumer discretionary sectors together accounted for a quarter of its negative return, although some stocks ran counter to the trend, such as chip-maker QUALCOMM. Companies in these sectors are facing a growing slowdown in corporate and consumer spending worldwide. Particularly hard-hit in the consumer discretionary sector were R.H. Donnelley, the telephone directory firm, and Ford Motor Co., which also faces a longer-term competitive challenge.
Don’t lose sight of the long term during short-term ups and downs
Windsor Fund’s aggressive strategy can make for sharp contrasts in year-to-year performance. When we reported to you 12 months ago, the fund’s Investor Shares had posted a return of 11.24% for the 2007 fiscal year, which seems light-years away from the –43.88% reported for the 2008 fiscal year.
Expense Ratios1 | | | |
Your Fund Compared With Its Peer Group |
| | | Average |
| Investor | Admiral | Multi-Cap |
| Shares | Shares | Value Fund |
Windsor Fund | 0.31% | 0.19% | 1.30% |
1 The fund expense ratios shown are from the prospectus dated February 27, 2008. For the fiscal year ended October 31, 2008, the fund’s expense ratios were 0.30% for Investor Shares and 0.17% for Admiral Shares. The peer-group expense ratio is derived from data provided by Lipper Inc. and captures information through year-end 2007.
4
As Vanguard has long advised investors, an assessment of longer-term performance provides a sensible approach to evaluating an investment. Such an assessment can help you put short-term swings (especially downward swings) in perspective—a particularly valuable vantage point in trying times like these. However, an investment’s long-term record can be skewed, for better or worse, by the most recent short-term results. A year ago, for example, Windsor reported an average annual return over the previous decade of 8.47%; as of October 2008, that ten-year figure stood at 2.46%, a reflection of the past year’s struggle.
Of course, Windsor’s recent reversal is a clear disappointment. But our confidence in the fund’s ability to generate wealth for its investors rests not on the past 12 months or even the past decade.
Windsor recently celebrated its 50th anniversary. The fund began operations on October 23, 1958. In the past half-century, it has faced a variety of financial, economic, and political conditions. Despite occasional setbacks, Windsor has demonstrated its value as a long-term investment vehicle. Since its inception, Windsor has returned an average of 10.94% a year. Over that same period, the Standard & Poor’s 500 Index generated an average annual return that was about 1.5 percentage points less.
Total Returns | |
Ten Years Ended October 31, 2008 | |
| Average |
| Annual Return |
Windsor Fund Investor Shares | 2.46% |
Russell 1000 Value Index | 2.79 |
Average Multi-Cap Value Fund1 | 2.16 |
The figures shown represent past performance, which is not a guarantee of future results. (Current performance may be lower or higher than the performance data cited. For performance data current to the most recent month-end, visit our website at www.vanguard.com/performance.) Note, too, that both investment returns and principal value can fluctuate widely, so an investor’s shares, when sold, could be worth more or less than their original cost.
1 Derived from data provided by Lipper Inc.
5
Some principles of investing never go out of style
Over the past year, global financial markets have experienced an unnerving confluence of events. As experienced investors know, selling in a panic, or letting your emotions drive your investment decisions, is often a recipe for disappointment.
Instead, it’s important to focus on the time-tested principles of balance and diversification, both within and across asset classes. That is why we always encourage you to choose a mix of stock, bond, and money market funds that is consistent with your goals, time horizon, and tolerance for the markets’ inevitable ups and downs—and then try to stick with it. Windsor Fund can be an important element of such a diversified portfolio.
Of course, even balanced portfolios of stocks and bonds have faced tough times during the past 12 months. But history suggests that these principles can put you in a good position to achieve long-term investment success.
In closing, I’d like to announce that James N. Mordy, senior vice president and partner of Wellington Management Company, LLP, one of the fund’s two advisors, has assumed portfolio management responsibilities for Windsor Fund. Jim has served on the Windsor team for nearly 25 years, working alongside the fund’s previous three managers, John Neff, Charles Freeman, and, more recently, Dave Fassnacht.
Thank you for your confidence in Vanguard.
Sincerely,

F. William McNabb III
President and Chief Executive Officer
November 12, 2008
6
Advisors’ Report
For the fiscal year ended October 31, 2008, the Investor Shares of Vanguard Windsor Fund returned –43.88%; the Admiral Shares returned –43.85%. Your fund is managed by two independent advisors. This provides exposure to distinct, yet complementary, investment approaches, enhancing the fund’s diversification.
The advisors, the percentage of fund assets each manages, and brief descriptions of their investment strategies are presented in the table below. The advisors have also prepared a discussion of the investment environment that existed during the fiscal period and of how their portfolio positioning reflects this assessment. These reports were prepared on November 12, 2008.
Wellington Management Company, LLP
Portfolio Manager:
James N. Mordy, Senior Vice President and Partner
Despite an investment climate that continues to be very challenging, our core value investment philosophy remains constant: We take a contrarian approach to stock selection, seeking to own companies with reasonable prospects, but which sell at discounted valuations because of either neglect or investors’ concerns over well-recognized issues.
We are willing to accept a prudent amount of business risk with our companies, if we limit valuation risk and can see a path to improving fundamentals and higher stock valuations. We continue to focus our
Vanguard Windsor Fund Investment Advisors | |
| | | |
| Fund Assets Managed | |
Investment Advisor | % | $ Million | Investment Strategy |
Wellington Management | 65 | 7,599 | An opportunistic, contrarian investment approach that |
Company, LLP | | | seeks to identify significantly undervalued securities |
| | | using bottom-up fundamental analysis. As part of its |
| | | long-term strategy, the advisor seeks to take |
| | | advantage of short- and intermediate-term market- |
| | | price dislocations that result from the market’s shorter- |
| | | term focus. |
AllianceBernstein L.P. | 33 | 3,908 | A value focus that couples rigorous fundamental |
| | | company research with quantitative risk controls to |
| | | capture value opportunities. |
Cash Investments | 2 | 257 | These short-term reserves are invested by Vanguard |
| | | in equity index products to simulate investment in |
| | | stocks. Each advisor also may maintain a modest |
| | | cash position. |
7
research efforts on anticipating how forces affecting our companies might change over the intermediate term, but certainly with a heightened sense that liquidity and balance sheet strength buy time in a period of tremendous uncertainty.
During the five months that I have managed the portfolio, the market environment has been brutal. What was first perceived as a credit crunch affecting a relatively small number of players became a full-blown credit crisis. Investor confidence, and thus any appetite for risk, has vanished. We are now witnessing the immediate fallout on the real economy, and we believe a relatively severe global recession is unavoidable. The mistakes that we have made in both stock selection and positioning have largely been because we did not anticipate the pace and severity at which these market events unfolded, and because we chose not to stray from our value discipline and pay what we considered to be excessive premiums for “safety.”
While we continue to keep many of our top holdings, we have been busy since the June transition adding and eliminating many names. We have increased our exposure to the energy, industrials, and materials sectors, while we have been net sellers of health care, technology, and consumer discretionary stocks. We have relatively outperformed in two sectors: industrials, largely because of our airline holdings, which are benefitting from lower jet fuel costs as well as massive capacity cuts in anticipation of softer demand; and financials, where we have increased our exposure to stronger players like ACE and JPMorgan Chase, while selling AIG and Fannie Mae prior to their complete implosion.
Sectors that hindered relative performance over the past five months include consumer staples, where stocks like Marine Harvest, Carlsberg, and Perdigao have been anything but defensive; energy, where our efforts to take advantage of some low valuations and to narrow our underweighting have been premature; and technology, where holdings such as Flextronics, Arrow Electronics, and Corning have come under considerable pressure amid slowing demand.
In summary, we do not know when the investment climate will improve, though it is hard to imagine sentiment being much worse. We endeavor to prudently manage risk without significantly diminishing our upside. At the end of October, using consensus numbers (only to indicate relative value) our portfolio sells at a 17% price/earnings discount to the S&P 500 Index, and a 22% price/book discount to the index, despite our portfolio’s slightly better five-year earnings growth expectations. This is consistent with our historical Windsor value proposition.
8
AllianceBernstein L.P.
Portfolio Managers:
Marilyn G. Fedak, CFA, Co-Chief
Investment Officer and Head—
Bernstein Global Value Equities
John P. Mahedy, CPA, Co-Chief Investment
Officer and Director of Research—
U.S. Value Equities
As in past market shocks, the recent massive flight from risk has challenged equity investors overall and particularly deep-value managers such as our firm. Our forecasts of companies’ operations—the bedrock of our successful stock selection throughout our history—proved ineffective in an environment where heightened uncertainty and panic drove extraordinary (and often unpredictable) events. Indeed, financial holdings at the center of the recent capital-market turmoil contributed considerably to the portfolio’s underperformance over the last 12 months.
But history shows that value strategies rebound strongly once crises ease and investors begin to act more rationally. We also draw great confidence from today’s fertile value environment, which has enabled us to build portfolios with powerful long-term potential. Value stocks are currently trading at some of the deepest discounts on record.
Given the breadth of risk aversion among investors, value opportunities are much more diverse, and our portfolio reflects this diversity. Roughly 25% of the portfolio is invested in insurance, banking, and diversified financial services companies. While we recognize the near-term risks, we are confident that these investments offer tremendous long-term potential. We maintain small positions in some firms vulnerable to liquidity issues plaguing the industry, namely Goldman Sachs, Morgan Stanley, and Deutsche Bank—although at less than half the market multiple on our normalized forecasts, we view them as deeply undervalued. We firmly believe that the balance of our financial holdings may ultimately benefit considerably from the industry consolidation that is under way.
The remaining 75% of our holdings are nonfinancial companies with solid fundamental prospects and balance sheets. We find exceptional value among our energy, telecommunications, and pharmaceutical holdings, which together make up 40% of the portfolio.
Energy stocks collapsed with the recent correction in oil prices. But we believe investors are overlooking the rising costs of developing new resources that should keep oil prices well above historical averages. On that basis, we find many integrated energy companies attractively
9
valued. In telecommunications, we think that investor worries about AT&T’s consumer wireline business have overshadowed the strong potential of the company’s fast-growing and profitable wireless operation, as well as its expansion into new services. Shares of drug giant Pfizer became depressed on concerns about its new drug pipeline and patent expirations on blockbuster drugs. But management has aggressively cut costs and rationalized research and development spending.
Meanwhile, investors are paid handsomely for holding the stock, with dividends and planned stock buybacks equivalent to a 13% cash yield.
As we know from successfully managing portfolios through past crises, if we remain dispassionate in our analysis, continue to balance opportunity against risk, and apply our time-tested portfolio-management techniques, we are confident that our value strategy will once again deliver superior results to our clients.
10
Windsor Fund
Fund Profile
As of October 31, 2008
Portfolio Characteristics | | |
| Comparative | Broad |
| Fund | Index1 | Index2 |
Number of Stocks | 153 | 659 | 4,647 |
Median Market Cap | $27.5B | $37.3B | $27.5B |
Price/Earnings Ratio | 10.7x | 11.9x | 12.8x |
Price/Book Ratio | 1.4x | 1.4x | 1.8x |
Yield3 | | 3.6% | 2.6% |
Investor Shares | 2.2% | | |
Admiral Shares | 2.3% | | |
Return on Equity | 19.2% | 18.8% | 20.4% |
Earnings Growth Rate | 22.4% | 13.8% | 17.8% |
Foreign Holdings | 16.1% | 0.0% | 0.0% |
Turnover Rate | 55% | — | — |
Expense Ratio | | | |
(10/31/2007)4 | | — | — |
Investor Shares | 0.31% | | |
Admiral Shares | 0.19% | | |
Short-Term Reserves | 2.0% | — | — |
Sector Diversification (% of equity exposure) |
| | Comparative | Broad |
| Fund | Index1 | Index2 |
Consumer Discretionary | 12.1% | 8.2% | 8.8% |
Consumer Staples | 10.1 | 9.7 | 11.1 |
Energy | 15.1 | 16.2 | 12.5 |
Financials | 18.4 | 25.9 | 16.7 |
Health Care | 16.4 | 12.6 | 13.7 |
Industrials | 9.7 | 9.1 | 11.1 |
Information Technology | 10.5 | 2.7 | 15.6 |
Materials | 4.0 | 3.4 | 3.4 |
Telecommunication | | | |
Services | 2.3 | 5.7 | 3.0 |
Utilities | 1.4 | 6.5 | 4.1 |
Volatility Measures5 | | |
| Fund Versus | Fund Versus |
| Comparative Index1 | Broad Index2 |
R-Squared | 0.94 | 0.94 |
Beta | 1.07 | 1.04 |
Ten Largest Holdings6(% of total net assets) |
| | |
JPMorgan Chase & Co. | diversified | |
| financial services | 3.6% |
Ace Ltd. | property and | |
| casualty insurance | 3.0 |
Wyeth | pharmaceuticals | 2.8 |
Comcast Corp. | cable and | |
| satellite | 2.8 |
Delta Air Lines Inc. | airlines | 2.7 |
Schering-Plough Corp. | pharmaceuticals | 2.6 |
Bank of America Corp. | diversified | |
| financial services | 2.4 |
General Electric Co. | industrial | |
| conglomerate | 2.3 |
Japan Tobacco, Inc. | tobacco | 2.2 |
ExxonMobil Corp. | integrated oil | |
| and gas | 2.1 |
Top Ten | | 26.5% |
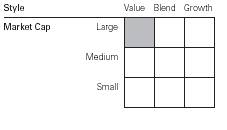
Investment Focus
1 Russell 1000 Value Index.
2 Dow Jones Wilshire 5000 Index.
3 30-day SEC yield for the fund; annualized dividend yield for the indexes. See the Glossary.
4 The expense ratios shown are from the prospectus dated February 27, 2008. For the fiscal year ended October 31, 2008, the expense ratios were 0.30% for Investor Shares and 0.17% for Admiral Shares.
5 For an explanation of R-squared, beta, and other terms used here, see the Glossary.
6 The holdings listed exclude any temporary cash investments and equity index products.
11
Windsor Fund
Performance Summary
All of the returns in this report represent past performance, which is not a guarantee of future results that may be achieved by the fund. (Current performance may be lower or higher than the performance data cited. For performance data current to the most recent month-end, visit our website at www.vanguard.com/performance.) Note, too, that both investment returns and principal value can fluctuate widely, so an investor’s shares, when sold, could be worth more or less than their original cost. The returns shown do not reflect taxes that a shareholder would pay on fund distributions or on the sale of fund shares.
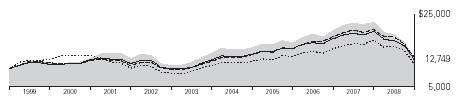
Cumulative Performance: October 31, 1998–October 31, 2008
Initial Investment of $10,000
| Average Annual Total Returns | Final Value |
| Periods Ended October 31, 2008 | of a $10,000 |
| One Year | Five Years | Ten Years | Investment |
Windsor Fund Investor Shares1 | –43.88% | –2.02% | 2.46% | $12,749 |
Dow Jones Wilshire 5000 Index | –36.43 | 0.81 | 1.27 | 11,350 |
Russell 1000 Value Index | –36.80 | 1.90 | 2.79 | 13,166 |
Average Multi-Cap Value Fund2 | –38.75 | 0.04 | 2.16 | 12,377 |
| | | | Final Value |
| | | Since | of a $100,000 |
| One Year | Five Years | Inception3 | Investment |
Windsor Fund Admiral Shares | –43.85% | –1.92% | –0.33% | $97,747 |
Dow Jones Wilshire 5000 Index | –36.43 | 0.81 | 0.94 | 106,766 |
Russell 1000 Value Index | –36.80 | 1.90 | 2.25 | 116,767 |
1 Total returns do not include the account service fee that may be applicable to certain accounts with balances below $10,000.
2 Derived from data provided by Lipper Inc.
3 Performance for the fund’s Admiral Shares and comparative standards is calculated since the Admiral Shares’ inception: November 12, 2001.
12
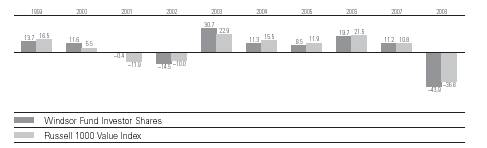
Windsor Fund
Fiscal-Year Total Returns (%): October 31, 1998–October 31, 2008
Average Annual Total Returns: Periods Ended September 30, 2008
This table presents average annual total returns through the latest calendar quarter—rather than through the end of the fiscal period. Securities and Exchange Commission rules require that we provide this information.
| Inception Date | One Year | Five Years | Ten Years |
Investor Shares1 | 10/23/1958 | –31.57% | 3.11% | 5.34% |
Admiral Shares | 11/12/2001 | –31.50 | 3.22 | 2.492 |
1 Total returns do not include the account service fee that may be applicable to certain accounts with balances below $10,000.
2 Return since inception.
Note: See Financial Highlights tables for dividend and capital gains information.
13
Windsor Fund
Financial Statements
Statement of Net Assets
As of October 31, 2008
The fund provides a complete list of its holdings four times in each fiscal year, at the quarter-ends. For the second and fourth fiscal quarters, the lists appear in the fund’s semiannual and annual reports to shareholders. For the first and third fiscal quarters, the fund files the lists with the Securities and Exchange Commission on Form N-Q. Shareholders can look up the fund’s Forms N-Q on the SEC’s website at www.sec.gov. Forms N-Q may also be reviewed and copied at the SEC’s Public Reference Room (see the back cover of this report for further information).
| | | Market |
| | | Value• |
| | Shares | ($000) |
Common Stocks (97.1%)1 | | |
Consumer Discretionary (11.6%) | | |
| Comcast Corp. Special | | |
| Class A | 10,694,600 | 164,911 |
| Comcast Corp. Class A | 10,385,000 | 163,668 |
| Home Depot, Inc. | 6,216,100 | 146,638 |
* | Toll Brothers, Inc. | 4,683,800 | 108,289 |
*,† | Buck Holdings, LP, Private | | |
| Placement Shares | 89,488,365 | 94,849 |
| VF Corp. | 1,694,500 | 93,367 |
2 | MDC Holdings, Inc. | 2,769,126 | 93,126 |
| Staples, Inc. | 4,683,100 | 90,993 |
| Virgin Media Inc. | 13,087,200 | 75,382 |
| TJX Cos., Inc. | 2,632,800 | 70,454 |
* | Viacom Inc. Class B | 2,745,100 | 55,506 |
| Time Warner, Inc. | 4,785,000 | 48,281 |
| CBS Corp. | 3,215,000 | 31,218 |
| Macy’s Inc. | 2,066,474 | 25,397 |
| Lowe’s Cos., Inc. | 1,000,000 | 21,700 |
| Black & Decker Corp. | 394,177 | 19,953 |
| J.C. Penney Co., Inc. | | |
| (Holding Co.) | 650,000 | 15,548 |
* | Magna International, Inc. | | |
| Class A | 430,800 | 14,565 |
| Autoliv, Inc. | 600,000 | 12,816 |
| Gannett Co., Inc. | 1,150,000 | 12,650 |
| KB Home | 425,000 | 7,093 |
| Centex Corp. | 490,500 | 6,009 |
* | R.H. Donnelley Corp. | 398,679 | 339 |
| | | 1,372,752 |
Consumer Staples (9.7%) | | |
| Japan Tobacco, Inc. | 73,620 | 261,180 |
| The Kroger Co. | 6,065,050 | 166,546 |
| Wal-Mart Stores, Inc. | 2,312,400 | 129,055 |
| Unilever NV | 4,528,992 | 109,146 |
* | Dean Foods Co. | 3,841,684 | 83,979 |
| Philip Morris | | |
| International Inc. | 1,899,800 | 82,584 |
| The Procter & Gamble Co. | 879,000 | 56,731 |
| Safeway, Inc. | 2,578,900 | 54,853 |
| Altria Group, Inc. | 2,049,800 | 39,336 |
| Sara Lee Corp. | 2,950,000 | 32,981 |
*,^ | Perdigao SA ADR | 1,077,700 | 31,523 |
| Perdigao SA | 2,039,900 | 29,640 |
| SuperValu Inc. | 1,811,900 | 25,801 |
* | Marine Harvest | 122,620,000 | 19,806 |
| Molson Coors Brewing | | |
| Co. Class B | 270,000 | 10,087 |
* | Cosan Ltd. | 1,986,995 | 5,325 |
| Tyson Foods, Inc. | 453,100 | 3,960 |
| | | 1,142,533 |
Energy (14.5%) | | |
| ExxonMobil Corp. | 3,394,008 | 251,564 |
| Chevron Corp. | 2,818,478 | 210,258 |
| BP PLC ADR | 3,576,900 | 177,772 |
| Apache Corp. | 1,710,900 | 140,858 |
| ConocoPhillips Co. | 2,458,798 | 127,907 |
| Total SA ADR | 1,836,900 | 101,838 |
| EnCana Corp. | 1,922,038 | 97,851 |
| Noble Energy, Inc. | 1,864,400 | 96,613 |
* | Newfield Exploration Co. | 3,749,500 | 86,164 |
| Baker Hughes, Inc. | 2,249,100 | 78,606 |
| Canadian Natural | | |
| Resources Ltd. | 1,445,100 | 73,006 |
| Devon Energy Corp. | 886,132 | 71,653 |
* | Transocean, Inc. | 671,001 | 55,244 |
| Royal Dutch Shell PLC | | |
| ADR Class A | 880,000 | 49,113 |
| Talisman Energy, Inc. | 4,194,300 | 42,279 |
| Petroleo Brasileiro SA | | |
| Series A ADR | 1,518,400 | 33,511 |
| Petroleo Brasileiro | | |
| SA ADR | 473,200 | 12,724 |
| | | 1,706,961 |
Exchange-Traded Funds (1.0%) | | |
3 | Vanguard Value ETF | 1,689,100 | 74,168 |
3 | Vanguard Total Stock | | |
| Market ETF | 892,000 | 42,923 |
| | | 117,091 |
14
Windsor Fund
| | | Market | |
| | | Value• | |
| | Shares | ($000) | |
Financials (17.7%) | | | |
| Capital Markets (3.3%) | | | |
| The Goldman Sachs | | | |
| Group, Inc. | 989,400 | 91,520 | |
* | TD Ameritrade | | | |
| Holding Corp. | 5,657,400 | 75,187 | |
* | UBS AG (New York Shares) | 4,417,910 | 74,663 | |
| Invesco, Ltd. | 3,218,954 | 47,995 | |
| Morgan Stanley | 2,375,000 | 41,491 | |
| Ameriprise Financial, Inc. | 1,427,000 | 30,823 | |
| Deutsche Bank AG | 545,000 | 20,699 | |
| | | | |
| Commercial Banks (0.6%) | | | |
| SunTrust Banks, Inc. | 830,000 | 33,316 | |
| Wells Fargo & Co. | 620,000 | 21,111 | |
| Fifth Third Bancorp | 1,512,900 | 16,415 | |
| | | | |
| Consumer Finance (0.2%) | | | |
| Capital One Financial Corp. | 751,300 | 29,391 | |
| | | | |
| Diversified Financial Services (6.8%) | |
| JPMorgan Chase & Co. | 10,381,450 | 428,235 | |
| Bank of America Corp. | 11,482,209 | 277,525 | |
| Citigroup, Inc. | 6,991,981 | 95,441 | |
| | | | |
| Insurance (6.2%) | | | |
| Ace Ltd. | 6,082,600 | 348,898 | |
| PartnerRe Ltd. | 1,618,400 | 109,550 | |
| The Travelers Cos., Inc. | 2,066,917 | 87,947 | |
| MetLife, Inc. | 1,523,100 | 50,597 | |
| The Allstate Corp. | 1,825,000 | 48,162 | |
| RenaissanceRe | | | |
| Holdings Ltd. | 657,250 | 30,168 | |
| XL Capital Ltd. Class A | 1,430,000 | 13,871 | |
| The Hartford Financial | | | |
| Services Group Inc. | 1,131,200 | 11,674 | |
| Genworth Financial Inc. | 1,910,000 | 9,244 | |
| Fidelity National Financial, | | | |
| Inc. Class A | 975,000 | 8,785 | |
| American International | | | |
| Group, Inc. | 4,407,800 | 8,419 | |
| | | | |
| Real Estate Investment Trusts (0.6%) | |
| Annaly Mortgage | | | |
| Management Inc. REIT | 4,779,500 | 66,435 | |
| | | | |
| Thrifts & Mortgage Finance (0.0%) | |
* | Dime Bancorp Inc.—Litigation | | | |
| Tracking Warrants | 6,716,867 | 605 | |
| | | 2,078,167 | |
Health Care (15.8%) | | | |
| Biotechnology (1.8%) | | | |
* | Amgen, Inc. | 3,501,800 | 209,723 | |
| Health Care Equipment & Supplies (0.8%) | |
| Covidien Ltd. | 2,143,775 | 94,948 | |
| | | | |
| | | | | |
| Health Care Providers & Services (3.7%) | |
| UnitedHealth Group Inc. | 5,721,700 | 135,776 |
* | Humana Inc. | 2,758,300 | 81,618 |
* | Laboratory Corp. of | | |
| America Holdings | 840,600 | 51,688 |
| McKesson Corp. | 1,097,900 | 40,392 |
| Aetna Inc. | 1,619,900 | 40,287 |
| Cardinal Health, Inc. | 1,043,000 | 39,843 |
| CIGNA Corp. | 1,793,000 | 29,226 |
| AmerisourceBergen Corp. | 496,600 | 15,529 |
| | | |
| Pharmaceuticals (9.5%) | | |
| Wyeth | 10,276,400 | 330,695 |
| Schering-Plough Corp. | 20,877,509 | 302,515 |
| Pfizer Inc. | 10,255,000 | 181,616 |
| Merck & Co., Inc. | 2,834,600 | 87,731 |
| Johnson & Johnson | 1,415,000 | 86,796 |
| Astellas Pharma Inc. | 1,205,500 | 48,556 |
| Sanofi-Aventis ADR | 1,313,100 | 41,520 |
| Sanofi-Aventis | 570,212 | 36,127 |
| | | 1,854,586 |
Industrials (9.3%) | | |
*,^,2 | Delta Air Lines Inc. | 29,017,700 | 318,614 |
| General Electric Co. | 13,744,000 | 268,145 |
| Deere & Co. | 2,981,900 | 114,982 |
| Lockheed Martin Corp. | 1,273,100 | 108,277 |
| Waste Management, Inc. | 3,229,800 | 100,867 |
| Dover Corp. | 2,251,900 | 71,543 |
| Pentair, Inc. | 2,527,400 | 69,857 |
| Caterpillar, Inc. | 390,000 | 14,886 |
| Tyco International, Ltd. | 425,000 | 10,744 |
| Northrop Grumman Corp. | 216,600 | 10,156 |
| Ryder System, Inc. | 208,713 | 8,269 |
| | | 1,096,340 |
Information Technology (10.1%) ` | |
* | Cisco Systems, Inc. | 13,742,000 | 244,195 |
| Microsoft Corp. | 8,791,700 | 196,319 |
*,2 | Arrow Electronics, Inc. | 8,525,367 | 148,768 |
| Applied Materials, Inc. | 7,597,900 | 98,089 |
* | SAIC, Inc. | 5,255,400 | 97,067 |
| Corning, Inc. | 8,802,700 | 95,333 |
* | Flextronics | | |
| International Ltd. | 22,249,562 | 93,003 |
| Seagate Technology | 6,186,100 | 41,880 |
* | Western Digital Corp. | 1,825,000 | 30,113 |
| International Business | | |
| Machines Corp. | 312,700 | 29,072 |
| LM Ericsson Telephone Co. | | |
| ADR Class B | 3,000,000 | 21,210 |
* | NVIDIA Corp. | 2,313,405 | 20,265 |
* | Dell Inc. | 1,475,000 | 17,921 |
| Nokia Corp. ADR | 1,175,000 | 17,837 |
| Motorola, Inc. | 3,300,000 | 17,721 |
15
Windsor Fund
| | | Market |
| | | Value• |
| | Shares | ($000) |
| Tyco Electronics Ltd. | 425,000 | 8,262 |
* | Sanmina-SCI Corp. | 8,113,056 | 6,085 |
* | Avnet, Inc. | 189,600 | 3,174 |
| | | 1,186,314 |
Materials (3.9%) | | |
| Rexam PLC | 15,511,823 | 93,471 |
* | Owens-Illinois, Inc. | 3,917,200 | 89,626 |
| Dow Chemical Co. | 1,540,300 | 41,080 |
| Syngenta AG ADR | 1,047,300 | 39,148 |
| Agrium, Inc. | 940,500 | 35,720 |
| Companhia Vale do Rio | | |
| Doce ADR | 2,646,800 | 34,726 |
| Celanese Corp. Series A | 2,072,150 | 28,720 |
| Alcoa Inc. | 1,583,600 | 18,227 |
| Eastman Chemical Co. | 446,000 | 18,014 |
| Arcelor Mittal Class A New | | |
| York Registered Shares | 625,000 | 16,406 |
| The Mosaic Co. | 394,200 | 15,535 |
* | Smurfit-Stone | | |
| Container Corp. | 9,939,456 | 13,418 |
| E.I. du Pont de | | |
| Nemours & Co. | 370,000 | 11,840 |
| | | 455,931 |
Telecommunication Services (2.2%) | | |
| AT&T Inc. | 6,260,717 | 167,599 |
| Verizon | | |
| Communications Inc. | 1,677,000 | 49,757 |
| Sprint Nextel Corp. | 11,690,398 | 36,591 |
| | | 253,947 |
Utilities (1.3%) | | |
| PG&E Corp. | 1,220,000 | 44,737 |
| Northeast Utilities | 1,882,200 | 42,462 |
| American Electric | | |
| Power Co., Inc. | 1,055,300 | 34,434 |
| Dominion Resources, Inc. | 509,700 | 18,492 |
| Entergy Corp. | 124,600 | 9,725 |
* | Reliant Energy, Inc. | 700,000 | 3,675 |
| | | 153,525 |
Total Common Stocks | | |
(Cost $15,070,760) | | 11,418,147 |
| | Face | Market |
| | Amount | Value• |
| | ($000) | ($000) |
Corporate Bond (0.0%) | | |
Consumer Discretionary (0.0%) | | |
| R.H. Donnelley Corp. | | |
| 8.875%, 1/15/16 | | |
| (Cost $7,598) | 12,270 | 2,699 |
| | | |
| | Shares | |
Temporary Cash Investments (2.9%)1 | | |
Money Market Fund (1.8%) | | |
4,5 | Vanguard Market | | |
| Liquidity Fund, 2.217% | 214,090,077 | 214,090 |
| | | |
| | Face | |
| | Amount | |
| | ($000) | |
| | | |
| | | |
Repurchase Agreement (0.8%) | | |
| Bank of America, N.A. | | |
| 0.2500%, 11/3/08 | | |
| (Dated 10/31/08, | | |
| Repurchase Value | | |
| $98,502,000, collateralized | | |
| by Federal National | | |
| Mortgage Assn. 6.000%, | | |
| 8/1/38) | 98,500 | 98,500 |
| | | |
U.S. Government Agency Obligation (0.3%) | |
6 | Federal Home Loan Bank | | |
7 | 2.433%, 11/6/08 | 30,000 | 29,995 |
Total Temporary Cash Investments | | |
(Cost $342,580) | | 342,585 |
Total Investments (100.0%) | | |
(Cost $15,420,938) | | 11,763,431 |
Other Assets and Liabilities—Net (0.0%) | 1,020 |
Net Assets (100%) | | 11,764,451 |
16
Windsor Fund
| Market |
| Value• |
| ($000) |
Statement of Assets and Liabilities | |
Assets | |
Investment in Securities, at Value | 11,763,431 |
Receivables for Investment Securities Sold | 113,124 |
Receivables for Capital Shares Issued | 9,249 |
Other Assets | 19,736 |
Total Assets | 11,905,540 |
Liabilities | |
Payables for Investment | |
Securities Purchased | 69,299 |
Security Lending Collateral | |
Payable to Brokers | 18,268 |
Payables for Capital Shares Redeemed | 9,538 |
Other Liabilities | 43,984 |
Total Liabilities | 141,089 |
Net Assets (100%) | 11,764,451 |
At October 31, 2008, net assets consisted of: |
| Amount |
| ($000) |
Paid-in Capital | 17,770,969 |
Undistributed Net Investment Income | 56,583 |
Accumulated Net Realized Losses | (2,380,773) |
Unrealized Appreciation (Depreciation) | |
Investment Securities | (3,657,507) |
Futures Contracts | (25,352) |
Foreign Currencies | 531 |
Net Assets | 11,764,451 |
| |
| |
Investor Shares—Net Assets | |
Applicable to 740,719,623 outstanding | |
$.001 par value shares of beneficial | |
interest (unlimited authorization) | 7,041,340 |
Net Asset Value Per Share— | |
Investor Shares | $9.51 |
| |
| |
Admiral Shares—Net Assets | |
Applicable to 147,210,814 outstanding | |
$.001 par value shares of beneficial | |
interest (unlimited authorization) | 4,723,111 |
Net Asset Value Per Share— | |
Admiral Shares | $32.08 |
• See Note A in Notes to Financial Statements.
* Non-income-producing security.
† Restricted security represents 0.81% of net assets.
^ Part of security position is on loan to broker-dealers. The total value of securities on loan is $16,715,000.
1 The fund invests a portion of its cash reserves in equity markets through the use of index futures contracts. After giving effect to futures investments, the fund’s effective common stock and temporary cash investment positions represent 98.2% and 1.8%, respectively, of net assets.
2 Considered an affiliated company of the fund as the fund owns more than 5% of the outstanding voting securities of such company.
3 Considered an affiliated company of the fund as the issuer is another member of The Vanguard Group.
4 Affiliated money market fund available only to Vanguard funds and certain trusts and accounts managed by Vanguard. Rate shown is the 7-day yield.
5 Includes $18,268,000 of collateral received for securities on loan.
6 The issuer operates under a congressional charter; its securities are neither issued nor guaranteed by the U.S. government.
7 Securities with a value of $29,995,000 have been segregated as initial margin for open futures contracts.
ADR—American Depositary Receipt.
REIT—Real Estate Investment Trust.
See accompanying Notes, which are an integral part of the Financial Statements.
17
Windsor Fund
Statement of Operations
| Year Ended |
| October 31, 2008 |
| ($000) |
Investment Income | |
Income | |
Dividends1,2 | 380,660 |
Interest2 | 19,087 |
Security Lending | 6,030 |
Total Income | 405,777 |
Expenses | |
Investment Advisory Fees—Note B | |
Basic Fee | 22,705 |
Performance Adjustment | (5,351) |
The Vanguard Group—Note C | |
Management and Administrative—Investor Shares | 19,200 |
Management and Administrative—Admiral Shares | 4,346 |
Marketing and Distribution—Investor Shares | 2,389 |
Marketing and Distribution—Admiral Shares | 1,363 |
Custodian Fees | 347 |
Auditing Fees | 26 |
Shareholders’ Reports—Investor Shares | 230 |
Shareholders’ Reports—Admiral Shares | 28 |
Trustees’ Fees and Expenses | 27 |
Total Expenses | 45,310 |
Expenses Paid Indirectly | (750) |
Net Expenses | 44,560 |
Net Investment Income | 361,217 |
Realized Net Gain (Loss) | |
Investment Securities Sold2 | (2,269,536) |
Futures Contracts | (108,175) |
Foreign Currencies | 454 |
Realized Net Gain (Loss) | (2,377,257) |
Change in Unrealized Appreciation (Depreciation) | |
Investment Securities | (7,796,683) |
Futures Contracts | (28,364) |
Foreign Currencies | 422 |
Change in Unrealized Appreciation (Depreciation) | (7,824,625) |
Net Increase (Decrease) in Net Assets Resulting from Operations | (9,840,665) |
1 Dividends are net of foreign withholding taxes of $8,343,000.
2 Dividend income, interest income, and realized net gain (loss) from affiliated companies of the fund were $4,810,000, $11,771,000, and ($476,696,000), respectively.
See accompanying Notes, which are an integral part of the Financial Statements.
18
Windsor Fund
Statement of Changes in Net Assets
| Year Ended October 31, |
| 2008 | 2007 |
| ($000) | ($000) |
Increase (Decrease) in Net Assets | | |
Operations | | |
Net Investment Income | 361,217 | 380,346 |
Realized Net Gain (Loss) | (2,377,257) | 2,676,257 |
Change in Unrealized Appreciation (Depreciation) | (7,824,625) | (479,746) |
Net Increase (Decrease) in Net Assets Resulting from Operations | (9,840,665) | 2,576,857 |
Distributions | | |
Net Investment Income | | |
Investor Shares | (218,586) | (222,495) |
Admiral Shares | (157,337) | (157,242) |
Realized Capital Gain1 | | |
Investor Shares | (1,480,134) | (1,110,084) |
Admiral Shares | (995,876) | (719,706) |
Total Distributions | (2,851,933) | (2,209,527) |
Capital Share Transactions | | |
Investor Shares | 137,492 | 119,548 |
Admiral Shares | 60,195 | 645,687 |
Net Increase (Decrease) from Capital Share Transactions | 197,687 | 765,235 |
Total Increase (Decrease) | (12,494,911) | 1,132,565 |
Net Assets | | |
Beginning of Period | 24,259,362 | 23,126,797 |
End of Period2 | 11,764,451 | 24,259,362 |
1 Includes fiscal 2008 and 2007 short-term gain distributions totaling $223,640,000 and $0, respectively. Short-term gain distributions are treated as ordinary income dividends for tax purposes.
2 Net Assets—End of Period includes undistributed net investment income of $56,583,000 and $70,835,000. See accompanying Notes, which are an integral part of the Financial Statements.
19
Windsor Fund
Financial Highlights
Investor Shares | | | | | |
| | | | | |
| | | | | |
| | | | |
For a Share Outstanding | Year Ended October 31, |
Throughout Each Period | 2008 | 2007 | 2006 | 2005 | 2004 |
Net Asset Value, Beginning of Period | $19.52 | $19.27 | $17.81 | $16.75 | $15.23 |
Investment Operations | | | | | |
Net Investment Income | .279 | .298 | .277 | .2651 | .214 |
Net Realized and Unrealized Gain (Loss) | | | | | |
on Investments | (7.985) | 1.782 | 3.007 | 1.163 | 1.501 |
Total from Investment Operations | (7.706) | 2.080 | 3.284 | 1.428 | 1.715 |
Distributions | | | | | |
Dividends from Net Investment Income | (.289) | (.301) | (.265) | (.280) | (.195) |
Distributions from Realized Capital Gains | (2.015) | (1.529) | (1.559) | (.088) | — |
Total Distributions | (2.304) | (1.830) | (1.824) | (.368) | (.195) |
Net Asset Value, End of Period | $9.51 | $19.52 | $19.27 | $17.81 | $16.75 |
| | | | | |
| | | | | |
Total Return2 | –43.88% | 11.24% | 19.72% | 8.54% | 11.30% |
| | | | | |
| | | | | |
Ratios/Supplemental Data | | | | | |
Net Assets, End of Period (Millions) | $7,041 | $14,490 | $14,140 | $12,871 | $15,130 |
Ratio of Total Expenses to | | | | | |
Average Net Assets3 | 0.30% | 0.31% | 0.36% | 0.37% | 0.39% |
Ratio of Net Investment Income to | | | | | |
Average Net Assets | 1.91% | 1.50% | 1.50% | 1.47%1 | 1.32% |
Portfolio Turnover Rate | 55% | 40% | 38% | 32% | 28% |
1 Net investment income per share and the ratio of net investment income to average net assets include $0.03 and 0.17%, respectively, resulting from a special dividend from Microsoft Corp. in November 2004.
2 Total returns do not reflect the account service fee that may be applicable to certain accounts with balances below $10,000.
3 Includes performance-based investment advisory fee increases (decreases) of (0.03%), (0.01%), 0.02%, 0.04%, and 0.04%. See accompanying Notes, which are an integral part of the Financial Statements.
20
Windsor Fund
Financial Highlights
Admiral Shares | | | | | |
| | | | | |
| | | | | |
| | | | |
For a Share Outstanding | Year Ended October 31, |
Throughout Each Period | 2008 | 2007 | 2006 | 2005 | 2004 |
Net Asset Value, Beginning of Period | $65.90 | $65.04 | $60.12 | $56.56 | $51.41 |
Investment Operations | | | | | |
Net Investment Income | .999 | 1.085 | 1.00 | .9681 | .787 |
Net Realized and Unrealized Gain (Loss) | | | | | |
on Investments | (26.974) | 6.019 | 10.15 | 3.896 | 5.082 |
Total from Investment Operations | (25.975) | 7.104 | 11.15 | 4.864 | 5.869 |
Distributions | | | | | |
Dividends from Net Investment Income | (1.047) | (1.085) | (.97) | (1.007) | (.719) |
Distributions from Realized Capital Gains | (6.798) | (5.159) | (5.26) | (.297) | — |
Total Distributions | (7.845) | (6.244) | (6.23) | (1.304) | (.719) |
Net Asset Value, End of Period | $32.08 | $65.90 | $65.04 | $60.12 | $56.56 |
| | | | | |
| | | | | |
Total Return | –43.85% | 11.38% | 19.85% | 8.62% | 11.46% |
| | | | | |
| | | | | |
Ratios/Supplemental Data | | | | | |
Net Assets, End of Period (Millions) | $4,723 | $9,770 | $8,987 | $7,551 | $4,195 |
Ratio of Total Expenses to | | | | | |
Average Net Assets2 | 0.17% | 0.19% | 0.25% | 0.27% | 0.28% |
Ratio of Net Investment Income to | | | | | |
Average Net Assets | 2.04% | 1.62% | 1.61% | 1.57%1 | 1.43% |
Portfolio Turnover Rate | 55% | 40% | 38% | 32% | 28% |
1 Net investment income per share and the ratio of net investment income to average net assets include $0.110 and 0.17%, respectively, resulting from a special dividend from Microsoft Corp. in November 2004.
2 Includes performance-based investment advisory fee increases (decreases) of (0.03%), (0.01%), 0.02%, 0.04%, and 0.04%. See accompanying Notes, which are an integral part of the Financial Statements.
21
Windsor Fund
Notes to Financial Statements
Vanguard Windsor Fund is registered under the Investment Company Act of 1940 as an open-end investment company, or mutual fund. The fund offers two classes of shares, Investor Shares and Admiral Shares. Investor Shares are available to any investor who meets the fund’s minimum purchase requirements. Admiral Shares are designed for investors who meet certain administrative, service, tenure, and account-size criteria.
A. The following significant accounting policies conform to generally accepted accounting principles for U.S. mutual funds. The fund consistently follows such policies in preparing its financial statements.
1. Security Valuation: Securities are valued as of the close of trading on the New York Stock Exchange (generally 4 p.m., Eastern time) on the valuation date. Equity securities are valued at the latest quoted sales prices or official closing prices taken from the primary market in which each security trades; such securities not traded on the valuation date are valued at the mean of the latest quoted bid and asked prices. Securities for which market quotations are not readily available, or whose values have been affected by events occurring before the fund’s pricing time but after the close of the securities’ primary markets, are valued at their fair values calculated according to procedures adopted by the board of trustees. These procedures include obtaining quotations from an independent pricing service, monitoring news to identify significant market- or security-specific events, and evaluating changes in the values of foreign market proxies (for example, ADRs, futures contracts, or exchange-traded funds), between the time the foreign markets close and the fund’s pricing time. When fair-value pricing is employed, the prices of securities used by a fund to calculate its net asset value may differ from quoted or published prices for the same securities. Investments in Vanguard Market Liquidity Fund are valued at that fund’s net asset value. Temporary cash investments acquired over 60 days to maturity are valued using the latest bid prices or using valuations based on a matrix system (which considers such factors as security prices, yields, maturities, and ratings), both as furnished by independent pricing services. Other temporary cash investments are valued at amortized cost, which approximates market value.
2. Foreign Currency: Securities and other assets and liabilities denominated in foreign currencies are translated into U.S. dollars using exchange rates obtained from an independent third party as of the fund’s pricing time on the valuation date. Realized gains (losses) and unrealized appreciation (depreciation) on investment securities include the effects of changes in exchange rates since the securities were purchased, combined with the effects of changes in security prices. Fluctuations in the value of other assets and liabilities resulting from changes in exchange rates are recorded as unrealized foreign currency gains (losses) until the assets or liabilities are settled in cash, at which time they are recorded as realized foreign currency gains (losses).
3. Futures Contracts: The fund uses index futures contracts to a limited extent, with the objective of maintaining full exposure to the stock market while maintaining liquidity. The fund may purchase or sell futures contracts to achieve a desired level of investment, whether to accommodate portfolio turnover or cash flows from capital share transactions. The primary risks associated with the use of futures contracts are imperfect correlation between changes in market values of stocks held by the fund and the prices of futures contracts, and the possibility of an illiquid market.
Futures contracts are valued based upon their quoted daily settlement prices. The aggregate principal amounts of the contracts are not recorded in the Statement of Net Assets. Fluctuations in the value of the contracts are recorded in the Statement of Net Assets as an asset (liability) and in the Statement of Operations as unrealized appreciation (depreciation) until the contracts are closed, when they are recorded as realized futures gains (losses).
22
Windsor Fund
4. Repurchase Agreements: The fund may invest in repurchase agreements. Securities pledged as collateral for repurchase agreements are held by a custodian bank until the agreements mature. Each agreement requires that the market value of the collateral be sufficient to cover payments of interest and principal; however, in the event of default or bankruptcy by the other party to the agreement, retention of the collateral may be subject to legal proceedings.
5. Federal Income Taxes: The fund intends to continue to qualify as a regulated investment company and distribute all of its taxable income. Management has analyzed the fund’s tax positions taken on federal income tax returns for all open tax years (tax years ended October 31, 2005–2008), and has concluded that no provision for federal income taxes is required in the fund’s financial statements.
6. Distributions: Distributions to shareholders are recorded on the ex-dividend date.
7. Security Lending: The fund may lend its securities to qualified institutional borrowers to earn additional income. Security loans are required to be secured at all times by collateral at least equal to the market value of securities loaned. The fund invests cash collateral received in Vanguard Market Liquidity Fund, and records a liability for the return of the collateral, during the period the securities are on loan. Security lending income represents the income earned on investing cash collateral, less expenses associated with the loan.
8. Other: Dividend income is recorded on the ex-dividend date. Interest income includes income distributions received from Vanguard Market Liquidity Fund and is accrued daily. Security transactions are accounted for on the date securities are bought or sold. Costs used to determine realized gains (losses) on the sale of investment securities are those of the specific securities sold.
Each class of shares has equal rights as to assets and earnings, except that each class separately bears certain class-specific expenses related to maintenance of shareholder accounts (included in Management and Administrative expenses) and shareholder reporting. Marketing and distribution expenses are allocated to each class of shares based on a method approved by the board of trustees. Income, other non-class-specific expenses, and gains and losses on investments are allocated to each class of shares based on its relative net assets.
B. AllianceBernstein L.P. and Wellington Management Company, LLP , each provide investment advisory services to a portion of the fund for a fee calculated at an annual percentage rate of average net assets managed by the advisor. The basic fees of each advisor are subject to quarterly adjustments based on performance for the preceding three years relative to a designated market index: for AllianceBernstein L.P., the Russell 1000 Value Index; and for Wellington Management Company, LLP, the S&P 500 Index.
The Vanguard Group manages the cash reserves of the fund on an at-cost basis.
For the year ended October 31, 2008, the aggregate investment advisory fee represented an effective annual basic rate of 0.12% of the fund’s average net assets before a decrease of $5,351,000 (0.03%) based on performance.
C. The Vanguard Group furnishes at cost corporate management, administrative, marketing, and distribution services. The costs of such services are allocated to the fund under methods approved by the board of trustees. The fund has committed to provide up to 0.40% of its net assets in capital contributions to Vanguard. At October 31, 2008, the fund had contributed capital of $1,336,000 to Vanguard (included in Other Assets), representing 0.01% of the fund’s net assets and 1.34% of Vanguard’s capitalization. The fund’s trustees and officers are also directors and officers of Vanguard.
23
Windsor Fund
D. The fund has asked its investment advisors to direct certain security trades, subject to obtaining the best price and execution, to brokers who have agreed to rebate to the fund part of the commissions generated. Such rebates are used solely to reduce the fund’s management and administrative expenses. The fund’s custodian bank has also agreed to reduce its fees when the fund maintains cash on deposit in the non-interest-bearing custody account. For the year ended October 31, 2008, these arrangements reduced the fund’s management and administrative expenses by $728,000 and custodian fees by $22,000. The total expense reduction represented an effective annual rate of 0.00% of the fund’s average net assets.
E. Distributions are determined on a tax basis and may differ from net investment income and realized capital gains for financial-reporting purposes. Differences may be permanent or temporary. Permanent differences are reclassified among capital accounts in the financial statements to reflect their tax character. Temporary differences arise when certain items of income, expense, gain, or loss are recognized in different periods for financial statement and tax purposes; these differences will reverse at some time in the future. Differences in classification may also result from the treatment of short-term gains as ordinary income for tax purposes.
For tax purposes, at October 31, 2008, the fund had $97,243,000 of ordinary income available for distribution. The fund had available realized losses of $2,383,312,000 to offset future net capital gains through October 31, 2016.
During the year ended October 31, 2008, the fund realized net foreign currency gains of $454,000, which increased distributable net income for tax purposes; accordingly, such gains have been reclassified from accumulated net realized losses to undistributed net investment income.
At October 31, 2008, the cost of investment securities for tax purposes was $15,443,658,000. Net unrealized depreciation of investment securities for tax purposes was $3,680,227,000, consisting of unrealized gains of $825,665,000 on securities that had risen in value since their purchase and $4,505,892,000 in unrealized losses on securities that had fallen in value since their purchase.
At October 31, 2008, the aggregate settlement value of open futures contracts expiring in December 2008 and the related unrealized appreciation (depreciation) were:
| | | ($000) |
| Number of | Aggregate | Unrealized |
| Long (Short) | Settlement | Appreciation |
Futures Contracts | Contracts | Value | (Depreciation) |
S&P 500 Index | 385 | 93,103 | (22,524) |
E-mini S&P 500 Index | 670 | 32,405 | 1,131 |
S&P MidCap 400 Index | 42 | 11,936 | (3,959) |
Unrealized appreciation (depreciation) on open futures contracts is required to be treated as realized gain (loss) for tax purposes.
F. During the year ended October 31, 2008, the fund purchased $9,906,055,000 of investment securities and sold $11,971,902,000 of investment securities, other than temporary cash investments.
24
Windsor Fund
G. Capital share transactions for each class of shares were:
| | | Year Ended October 31, |
| | 2008 | | | 2007 | |
| Amount | Shares | | Amount | Shares | |
| ($000) | (000) | | ($000) | (000) | |
Investor Shares | | | | | | |
Issued | 1,320,658 | 96,832 | | 1,256,372 | 65,122 | |
Issued in Lieu of Cash Distributions | 1,656,282 | 108,083 | | 1,295,835 | 69,016 | |
Redeemed | (2,839,448) | (206,467) | | (2,432,659) | (125,656) | |
Net Increase (Decrease)—Investor Shares | 137,492 | (1,552) | | 119,548 | 8,482 | |
Admiral Shares | | | | | | |
Issued | 397,018 | 8,532 | | 1,108,469 | 16,923 | |
Issued in Lieu of Cash Distributions | 1,059,372 | 20,503 | | 800,310 | 12,629 | |
Redeemed | (1,396,195) | (30,080) | | (1,263,092) | (19,470) | |
Net Increase (Decrease)—Admiral Shares | 60,195 | (1,045) | | 645,687 | 10,082 | |
| | | | | | | | |
H. Certain of the fund’s investments are in companies that are considered to be affiliated companies of the fund because the fund owns more than 5% of the outstanding voting securities of the company. Transactions during the period in securities of these companies were as follows:
| | | Current Period Transactions | |
| Oct. 31, 2007 | | Proceeds from | Dividend/ | Oct. 31, 2008 |
| Market | Purchases | Securities | Interest | Market |
| Value | at Cost | Sold | Income | Value |
| ($000) | ($000) | ($000) | ($000) | ($000) |
Arrow Electronics, Inc. | 351,639 | 5,735 | 12,950 | — | 148,768 |
Circuit City Stores, Inc. | 70,456 | — | 54,661 | — | — |
Delta Air Lines Inc. | — | 241,930 | 9,353 | — | 318,6141 |
MDC Holdings, Inc. | — | 111,076 | — | 491 | 93,126 |
Northwest Airlines Corp. | 231,061 | 15,903 | 10,060 | — | —1 |
R.H. Donnelley Corp. | 322,656 | — | 22,686 | — | NA2 |
R.H. Donnelley Corp. | | | | | |
8.875%, 1/15/16 | — | 16,391 | 7,132 | 1,242 | NA2 |
| 975,812 | | | 1,733 | 560,508 |
I. In September 2006, the Financial Accounting Standards Board issued Statement of Financial Accounting Standards No. 157 (“FAS 157”), “Fair Value Measurements.” FAS 157 establishes a framework for measuring fair value and expands disclosures about fair value measurements in financial statements.
1 In October 2008, Northwest Airlines Corp. merged with Delta Air Lines Inc. Purchases and sales do not reflect the merger.
2 At October 31, 2008, the security is still held but the issuer is no longer an affiliated company of the fund.
25
Windsor Fund
The various inputs that may be used to determine the value of the fund’s investments are summarized in three broad levels. The inputs or methodologies used for valuing securities are not necessarily an indication of the risk associated with investing in those securities.
Level 1—Quoted prices in active markets for identical securities.
Level 2—Other significant observable inputs (including quoted prices for similar securities, interest rates, prepayment speeds, credit risk, etc.).
Level 3—Significant unobservable inputs (including the fund’s own assumptions used to determine the fair value of investments).
The following table summarizes the fund’s investments as of October 31, 2008, based on the inputs used to value them:
| Investments | Futures |
| in Securities | Contracts |
Valuation Inputs | ($000) | ($000) |
Level 1—Quoted prices | 10,969,101 | (25,352) |
Level 2—Other significant observable inputs | 699,481 | — |
Level 3—Significant unobservable inputs | 94,849 | — |
Total | 11,763,431 | (25,352) |
The following table summarizes changes in investments valued based on Level 3 inputs during the year ended October 31, 2008:
| Investments |
| in Securities |
Amount Valued Based on Level 3 Inputs | ($000) |
Balance as of October 31, 2007 | 89,488 |
Change in Unrealized Appreciation (Depreciation) | 5,361 |
Balance as of October 31, 2008 | 94,849 |
26
Report of Independent Registered
Public Accounting Firm
To the Trustees of Vanguard Windsor Funds and the Shareholders of Vanguard Windsor Fund:
In our opinion, the accompanying statement of net assets and statement of assets and liabilities, and the related statements of operations and of changes in net assets and the financial highlights present fairly, in all material respects, the financial position of Vanguard Windsor Fund (the “Fund”) at October 31, 2008, the results of its operations for the year then ended, the changes in its net assets for each of the two years in the period then ended and the financial highlights for each of the five years in the period then ended, in conformity with accounting principles generally accepted in the United States of America. These financial statements and financial highlights (hereafter referred to as “financial statements”) are the responsibility of the Fund’s management; our responsibility is to express an opinion on these financial statements based on our audits. We conducted our audits of these financial statements in accordance with the standards of the Public Company Accounting Oversight Board (United States). Those standards require that we plan and perform the audit to obtain reasonable assurance about whether the financial statements are free of material misstatement. An audit includes examining, on a test basis, evidence supporting the amounts and disclosures in the financial statements, assessing the accounting principles used and significant estimates made by management, and evaluating the overall financial statement presentation. We believe that our audits, which included confirmation of securities at October 31, 2008 by correspondence with the custodians and brokers, and by agreement to the underlying ownership records for Vanguard Market Liquidity Fund, provide a reasonable basis for our opinion.
PricewaterhouseCoopers LLP
Philadelphia, Pennsylvania
December 19, 2008
Special 2008 tax information (unaudited) for Vanguard Windsor Fund
This information for the fiscal year ended October 31, 2008, is included pursuant to provisions of the Internal Revenue Code.
The fund distributed $2,252,691,000 as capital gain dividends (from net long-term capital gains) to shareholders during the fiscal year.
For nonresident alien shareholders, 100% of short-term capital gain dividends distributed by the fund are qualified short-term capital gains.
The fund distributed $375,087,000 of qualified dividend income to shareholders during the fiscal year.
For corporate shareholders, 74.9% of investment income (dividend income plus short-term gains, if any) qualifies for the dividends-received deduction.
27
Your Fund’s After-Tax Returns
This table presents returns for your fund both before and after taxes. The after-tax returns are shown in two ways: (1) assuming that an investor owned the fund during the entire period and paid taxes on the fund’s distributions, and (2) assuming that an investor paid taxes on the fund’s distributions and sold all shares at the end of each period.
Calculations are based on the highest individual federal income tax and capital gains tax rates in effect at the times of the distributions and the hypothetical sales. State and local taxes were not considered. After-tax returns reflect any qualified dividend income, using actual prior-year figures and estimates for 2008. (In the example, returns after the sale of fund shares may be higher than those assuming no sale. This occurs when the sale would have produced a capital loss. The calculation assumes that the investor received a tax deduction for the loss.)
The table shows returns for Investor Shares only; returns for other share classes will differ. Please note that your actual after-tax returns will depend on your tax situation and may differ from those shown. Also note that if you own the fund in a tax-deferred account, such as an individual retirement account or a 401(k) plan, this information does not apply to you. Such accounts are not subject to current taxes.
Finally, keep in mind that a fund’s performance—whether before or after taxes—does not guarantee future results.
Average Annual Total Returns: Windsor Fund Investor Shares1 | | | |
Periods Ended October 31, 2008 | | | |
| One | Five | Ten |
| Year | Years | Years |
Returns Before Taxes | –43.88% | –2.02% | 2.46% |
Returns After Taxes on Distributions | –45.12 | –3.14 | 0.89 |
Returns After Taxes on Distributions and Sale of Fund Shares | –25.85 | –1.09 | 2.02 |
1 Total returns do not include the account service fee that may be applicable to certain accounts with balances below $10,000.
28
About Your Fund’s Expenses
As a shareholder of the fund, you incur ongoing costs, which include costs for portfolio management, administrative services, and shareholder reports (like this one), among others. Operating expenses, which are deducted from a fund’s gross income, directly reduce the investment return of the fund.
A fund’s expenses are expressed as a percentage of its average net assets. This figure is known as the expense ratio. The following examples are intended to help you understand the ongoing costs (in dollars) of investing in your fund and to compare these costs with those of other mutual funds. The examples are based on an investment of $1,000 made at the beginning of the period shown and held for the entire period.
The accompanying table illustrates your fund’s costs in two ways:
• Based on actual fund return. This section helps you to estimate the actual expenses that you paid over the period. The “Ending Account Value” shown is derived from the fund’s actual return, and the third column shows the dollar amount that would have been paid by an investor who started with $1,000 in the fund. You may use the information here, together with the amount you invested, to estimate the expenses that you paid over the period.
To do so, simply divide your account value by $1,000 (for example, an $8,600 account value divided by $1,000 = 8.6), then multiply the result by the number given for your fund under the heading “Expenses Paid During Period.”
• Based on hypothetical 5% yearly return. This section is intended to help you compare your fund’s costs with those of other mutual funds. It assumes that the fund had a yearly return of 5% before expenses, but that the expense ratio is unchanged. In this case—because the return used is not the fund’s actual return—the results do not apply to your investment. The example is useful in making comparisons because the Securities and Exchange Commission requires all mutual funds to calculate expenses based on a 5% return. You can assess your fund’s costs by comparing this hypothetical example with the hypothetical examples that appear in shareholder reports of other funds.
Six Months Ended October 31, 2008 | | | |
| Beginning | Ending | Expenses |
| Account Value | Account Value | Paid During |
Windsor Fund | 4/30/2008 | 10/31/2008 | Period1 |
Based on Actual Fund Return | | | |
Investor Shares | $1,000.00 | $658.85 | $1.17 |
Admiral Shares | 1,000.00 | 658.79 | 0.67 |
Based on Hypothetical 5% Yearly Return | | | |
Investor Shares | $1,000.00 | $1,023.79 | $1.43 |
Admiral Shares | 1,000.00 | 1,024.40 | 0.82 |
1 The calculations are based on expenses incurred in the most recent six-month period. The fund’s annualized six-month expense ratios for that period are 0.28% for Investor Shares and 0.16% for Admiral Shares. The dollar amounts shown as “Expenses Paid” are equal to the annualized expense ratio multiplied by the average account value over the period, multiplied by the number of days in the most recent six-month period, then divided by the number of days in the most recent 12-month period.
29
Note that the expenses shown in the table are meant to highlight and help you compare ongoing costs only and do not reflect transaction costs incurred by the fund for buying and selling securities. Further, the expenses do not include the account service fee described in the prospectus. If such a fee were applied to your account, your costs would be higher. Your fund does not charge transaction fees, such as purchase or redemption fees, nor does it carry a “sales load.”
The calculations assume no shares were bought or sold during the period. Your actual costs may have been higher or lower, depending on the amount of your investment and the timing of any purchases or redemptions.
You can find more information about the fund’s expenses, including annual expense ratios, in the Financial Statements section of this report. For additional information on operating expenses and other shareholder costs, please refer to your fund’s current prospectus.
30
Glossary
Beta. A measure of the magnitude of a fund’s past share-price fluctuations in relation to the ups and downs of a given market index. The index is assigned a beta of 1.00. Compared with a given index, a fund with a beta of 1.20 typically would have seen its share price rise or fall by 12% when the index rose or fell by 10%. For this report, beta is based on returns over the past 36 months for both the fund and the index. Note that a fund’s beta should be reviewed in conjunction with its R-squared (see definition). The lower the R-squared, the less correlation there is between the fund and the index, and the less reliable beta is as an indicator of volatility.
Earnings Growth Rate. The average annual rate of growth in earnings over the past five years for the stocks now in a fund.
Equity Exposure. A measure that reflects a fund’s investments in stocks and stock futures. Any holdings in short-term reserves are excluded.
Expense Ratio. The percentage of a fund’s average net assets used to pay its annual administrative and advisory expenses. These expenses directly reduce returns to investors.
Foreign Holdings. The percentage of a fund represented by stocks or depositary receipts of companies based outside the United States.
Inception Date. The date on which the assets of a fund (or one of its share classes) are first invested in accordance with the fund’s investment objective. For funds with a subscription period, the inception date is the day after that period ends. Investment performance is measured from the inception date.
Median Market Cap. An indicator of the size of companies in which a fund invests; the midpoint of market capitalization (market price x shares outstanding) of a fund’s stocks, weighted by the proportion of the fund’s assets invested in each stock. Stocks representing half of the fund’s assets have market capitalizations above the median, and the rest are below it.
Price/Book Ratio. The share price of a stock divided by its net worth, or book value, per share. For a fund, the weighted average price/book ratio of the stocks it holds.
Price/Earnings Ratio. The ratio of a stock’s current price to its per-share earnings over the past year. For a fund, the weighted average P/E of the stocks it holds. P/E is an indicator of market expectations about corporate prospects; the higher the P/E, the greater the expectations for a company’s future growth.
R-Squared. A measure of how much of a fund’s past returns can be explained by the returns from the market in general, as measured by a given index. If a fund’s total returns were precisely synchronized with an index’s returns, its R-squared would be 1.00. If the fund’s returns bore no relationship to the index’s returns, its R-squared would be 0. For this report, R-squared is based on returns over the past 36 months for both the fund and the index.
Return on Equity. The annual average rate of return generated by a company during the past five years for each dollar of shareholder’s equity (net income divided by shareholder’s equity). For a fund, the weighted average return on equity for the companies whose stocks it holds.
Short-Term Reserves. The percentage of a fund invested in highly liquid, short-term securities that can be readily converted to cash.
31
Turnover Rate. An indication of the fund’s trading activity. Funds with high turnover rates incur higher transaction costs and may be more likely to distribute capital gains (which may be taxable to investors). The turnover rate excludes in-kind transactions, which have minimal impact on costs.
Yield. A fund’s 30-day SEC yield is derived using a formula specified by the U.S. Securities and Exchange Commission. Under the formula, data related to the fund’s security holdings in the previous 30 days are used to calculate the fund’s hypothetical net income for that period, which is then annualized and divided by the fund’s estimated average net assets over the calculation period. For the purposes of this calculation, a security’s income is based on its current market yield to maturity (in the case of bonds) or its projected dividend yield (for stocks). Because the SEC yield represents hypothetical annualized income, it will differ—at times significantly—from the fund’s actual experience. As a result, the fund’s income distributions may be higher or lower than implied by the SEC yield.
32
This page intentionally left blank.
This page intentionally left blank.
This page intentionally left blank.
The People Who Govern Your Fund
The trustees of your mutual fund are there to see that the fund is operated and managed in your best interests since, as a shareholder, you are a part owner of the fund. Your fund’s trustees also serve on the board of directors of The Vanguard Group, Inc., which is owned by the Vanguard funds and provides services to them on an at-cost basis.
A majority of Vanguard’s board members are independent, meaning that they have no affiliation with Vanguard or the funds they oversee, apart from the sizable personal investments they have made as private individuals.
Our independent board members bring distinguished backgrounds in business, academia, and public service to their task of working with Vanguard officers to establish the policies and oversee the activities of the funds. Among board members’ responsibilities are selecting investment advisors for the funds; monitoring fund operations, performance, and costs; reviewing contracts; nominating and selecting new trustees/directors; and electing Vanguard officers.
Each trustee serves a fund until its termination; or until the trustee’s retirement, resignation, or death; or otherwise as specified in the fund’s organizational documents. Any trustee may be removed at a shareholders’ meeting by a vote representing two-thirds of the net asset value of all shares of the fund together with shares of other Vanguard funds organized within the same trust. The table on these two pages shows information for each trustee and executive officer of the fund. The mailing address of the trustees and officers is P.O. Box 876, Valley Forge, PA 19482.
Chairman of the Board and Trustee
John J. Brennan1
Born 1954 Principal Occupation(s) During the Past Five Years: Chairman of the Board and Director/ Trustee Since May 1987; Trustee of The Vanguard Group, Inc., and of each of the investment companies served Chairman of the Board by The Vanguard Group; Chief Executive Officer and President of The Vanguard Group 156 Vanguard Funds Overseen and of each of the investment companies served by The Vanguard Group (1996–2008).
Independent Trustees
Charles D. Ellis
Born 1937 Principal Occupation(s) During the Past Five Years: Applecore Partners (pro bono ventures Trustee Since January 2001 in education); Senior Advisor to Greenwich Associates (international business strategy 156 Vanguard Funds Overseen consulting); Successor Trustee of Yale University; Overseer of the Stern School of Business at New York University; Trustee of the Whitehead Institute for Biomedical Research.
Emerson U. Fullwood
Born 1948 Principal Occupation(s) During the Past Five Years: Executive Chief Staff and Marketing Trustee Since January 2008 Officer for North America since 2004 and Corporate Vice President of Xerox Corporation 156 Vanguard Funds Overseen (photocopiers and printers); Director of SPX Corporation (multi-industry manufacturing), of the United Way of Rochester, and of the Boy Scouts of America.
Rajiv L. Gupta
Born 1945 Principal Occupation(s) During the Past Five Years: Chairman, President, and Trustee Since December 20012 Chief Executive Officer of Rohm and Haas Co. (chemicals); Board Member of 156 Vanguard Funds Overseen the American Chemistry Council; Director of Tyco International, Ltd. (diversified manufacturing and services), since 2005.
Amy Gutmann
Born 1949 Principal Occupation(s) During the Past Five Years: President of the University of
Trustee Since June 2006 Pennsylvania since 2004; Professor in the School of Arts and Sciences, Annenberg School 156 Vanguard Funds Overseen for Communication, and Graduate School of Education of the University of Pennsylvania since 2004; Provost (2001–2004) and Laurance S. Rockefeller Professor of Politics and the University Center for Human Values (1990–2004), Princeton University; Director of Carnegie Corporation of New York since 2005 and of Schuylkill River Development Corporation and Greater Philadelphia Chamber of Commerce since 2004; Trustee of the National Constitution Center since 2007.
JoAnn Heffernan Heisen
Born 1950 Principal Occupation(s) During the Past Five Years: Corporate Vice President and Trustee Since July 1998 Chief Global Diversity Officer since 2006, Vice President and Chief Information 156 Vanguard Funds Overseen Officer (1997–2005), and Member of the Executive Committee of Johnson & Johnson (pharmaceuticals/consumer products); Director of the University Medical Center at Princeton and Women’s Research and Education Institute.
André F. Perold
Born 1952 Principal Occupation(s) During the Past Five Years: George Gund Professor of Finance Trustee Since December 2004 and Banking, Harvard Business School; Senior Associate Dean and Director of Faculty 156 Vanguard Funds Overseen Recruiting, Harvard Business School; Director and Chairman of UNX, Inc. (equities trading firm); Chair of the Investment Committee of HighVista Strategies LLC (private investment firm) since 2005.
Alfred M. Rankin, Jr.
Born 1941 Principal Occupation(s) During the Past Five Years: Chairman, President, Chief Executive Trustee Since January 1993 Officer, and Director of NACCO Industries, Inc. (forklift trucks/housewares/lignite); Director 156 Vanguard Funds Overseen of Goodrich Corporation (industrial products/aircraft systems and services).
J. Lawrence Wilson
Born 1936 Principal Occupation(s) During the Past Five Years: Retired Chairman and Chief Executive Trustee Since April 1985 Officer of Rohm and Haas Co. (chemicals); Director of Cummins Inc. (diesel engines) and 156 Vanguard Funds Overseen AmerisourceBergen Corp. (pharmaceutical distribution); Trustee of Vanderbilt University and of Culver Educational Foundation.
Executive Officers1
Thomas J. Higgins
Born 1957 Principal Occupation(s) During the Past Five Years: Principal of The Vanguard Group, Inc.; Chief Financial Officer Treasurer of each of the investment companies served by The Vanguard Group; Chief Since September 2008 Financial Officer of each of the investment companies served by The Vanguard Treasurer Since July 1998 Group since 2008. 156 Vanguard Funds Overseen
F. William McNabb III
Born 1957 Principal Occupation(s) During the Past Five Years: Chief Executive Officer, Director, Chief Executive Officer and President of The Vanguard Group, Inc., since 2008; Chief Executive Officer and Since August 31, 2008 President of each of the investment companies served by The Vanguard Group since President Since March 2008 2008; Director of Vanguard Marketing Corporation; Managing Director of The Vanguard 156 Vanguard Funds Overseen Group (1995–2008).
Heidi Stam
Born 1956 Principal Occupation(s) During the Past Five Years: Managing Director of The Vanguard Secretary Since July 2005 Group, Inc., since 2006; General Counsel of The Vanguard Group since 2005; Secretary of 156 Vanguard Funds Overseen The Vanguard Group and of each of the investment companies served by The Vanguard Group since 2005; Director and Senior Vice President of Vanguard Marketing Corporation since 2005; Principal of The Vanguard Group (1997–2006).
Vanguard Senior Management Team | | | |
| | | | |
R. Gregory Barton | Kathleen C. Gubanich | Michael S. Miller | Ralph K. Packard | George U. Sauter |
Mortimer J. Buckley | Paul A. Heller | James M. Norris | Glenn W. Reed | |
| | | | | | | | |
Founder
John C. Bogle
Chairman and Chief Executive Officer, 1974–1996
1 These individuals are “interested persons” as defined in the Investment Company Act of 1940.
2 December 2002 for Vanguard Equity Income Fund, Vanguard Growth Equity Fund, the Vanguard Municipal Bond Funds, and the Vanguard State Tax-Exempt Funds.
More information about the trustees is in the Statement of Additional Information, available from The Vanguard Group.

| P.O. Box 2600 |
| Valley Forge, PA 19482-2600 |
Connect with Vanguard®> www.vanguard.com | |
| |
| |
| |
| |
Fund Information > 800-662-7447 | All comparative mutual fund data are from Lipper Inc. |
| or Morningstar, Inc., unless otherwise noted. |
Direct Investor Account Services> 800-662-2739 | You can obtain a free copy of Vanguard’s proxy voting |
| guidelines by visiting our website, www.vanguard.com, |
Institutional Investor Services > 800-523-1036 | and searching for “proxy voting guidelines,” or by |
| calling Vanguard at 800-662-2739. The guidelines are |
Text Telephone for People | also available from the SEC’s website, www.sec.gov. |
With Hearing Impairment > 800-952-3335 | In addition, you may obtain a free report on how your |
| fund voted the proxies for securities it owned during |
| the 12 months ended June 30. To get the report, visit |
| either www.vanguard.com or www.sec.gov. |
This material may be used in conjunction | |
with the offering of shares of any Vanguard | |
fund only if preceded or accompanied by | |
the fund’s current prospectus. | |
| |
CFA® is a trademark owned by CFA Institute. | You can review and copy information about your fund |
| |
| at the SEC’s Public Reference Room in Washington, D.C. |
The funds or securities referred to herein are not | To find out more about this public service, call the SEC |
sponsored, endorsed, or promoted by MSCI, and MSCI | at 202-551-8090. Information about your fund is also |
bears no liability with respect to any such funds or | available on the SEC’s website, and you can receive |
securities. For any such funds or securities, the | copies of this information, for a fee, by sending a |
prospectus or the Statement of Additional Information | request in either of two ways: via e-mail addressed to |
contains a more detailed description of the limited | publicinfo@sec.gov or via regular mail addressed to the |
relationship MSCI has with The Vanguard Group and | Public Reference Section, Securities and Exchange |
any related funds. | Commission, Washington, DC 20549-0102. |
| |
| |
Russell is a trademark of The Frank Russell Company | |
S&P 500® and 500 are trademarks of The McGraw-Hill | |
Companies, Inc., and have been licensed for use by The | |
Vanguard Group, Inc. Vanguard mutual funds are not | |
sponsored, endorsed, sold, or promoted by Standard & | |
Poor’s, and Standard & Poor’s makes no representation | |
regarding the advisability of investing in the funds. | |
. | |
| |
| © 2008 The Vanguard Group, Inc. |
| All rights reserved. |
| Vanguard Marketing Corporation, Distributor. |
| |
| |
| Q220 122008 |

> For fiscal year 2008, Vanguard Windsor II Fund returned about –38% for Investor and Admiral Shares, a disappointing result that reflected the broad stock market’s fall.
> All sectors posted double-digit declines as stocks globally suffered their worst losses since the 2000–2002 bear market.
> The battered financial sector accounted for about one-third of the fund’s decline.
Contents | |
| |
Your Fund’s Total Returns | 1 |
President’s Letter | 2 |
Advisors’ Report | 7 |
Fund Profile | 13 |
Performance Summary | 14 |
Financial Statements | 16 |
Your Fund’s After-Tax Returns | 32 |
About Your Fund’s Expenses | 33 |
Glossary | 35 |
Please note: The opinions expressed in this report are just that—informed opinions. They should not be considered promises or advice. Also, please keep in mind that the information and opinions cover the period through the date on the front of this report. Of course, the risks of investing in your fund are spelled out in the prospectus.
Your Fund’s Total Returns
Fiscal Year Ended October 31, 2008 | | |
| Ticker | Total |
| Symbol | Returns |
Vanguard Windsor II Fund | | |
Investor Shares | VWNFX | –38.02% |
Admiral™ Shares1 | VWNAX | –37.94 |
Russell 1000 Value Index | | –36.80 |
Average Large-Cap Value Fund2 | | –37.28 |
Your Fund’s Performance at a Glance |
October 31, 2007–October 31, 2008 | | | | |
| | | Distributions Per Share |
| Starting | Ending | Income | Capital |
| Share Price | Share Price | Dividends | Gains |
Vanguard Windsor II Fund | | | | |
Investor Shares | $37.84 | $20.56 | $0.799 | $3.454 |
Admiral Shares | 67.18 | 36.51 | 1.473 | 6.131 |
1 A lower-cost class of shares available to many longtime shareholders and to those with significant investments in the fund.
2 Derived from data provided by Lipper Inc.
1

President’s Letter
Dear Shareholder,
For the fiscal year ended October 31, 2008, the Investor Shares of Vanguard Windsor II Fund returned –38.02%, and the lower-cost Admiral Shares returned –37.94%. Although these results are disappointing, they are consistent with the returns of the fund’s comparative standards.
Over the past 12 months, anxious investors punished equities across the board. For Windsor II, the advisors’ focus on stocks that appear to be underpriced and to have good long-term growth prospects provided little shelter, as both growth- and value-oriented large-capitalization stocks delivered similar returns.
If you own shares of the fund in a taxable account, see page 32 for a report on after-tax returns for the 12 months, based on the highest tax bracket.
Stock prices fell sharply in a global upheaval
Global stock markets started the 12-month period near all-time highs, but then declined sharply, laid low by the financial crisis that originated in the U.S. subprime mortgage market. The descent traced a series of jagged ups and downs. During the week ended October 10, for example, the U.S. stock market returned about –18%. When Wall Street opened the following Monday, stocks surged, returning more than 10% over the next six and a half hours.
2
For the full 12 months, the broad U.S. stock market returned –36.43%; international stocks returned –48.27%. The pain was especially acute in emerging markets—among the strongest performers in recent years—as investors became increasingly risk-averse.
Bond market averages masked disparate returns
The broad U.S. taxable bond market registered an unremarkable return of 0.30% for the 12 months, but by its own typically sedate standards, the dislocations were extreme. The strong performance of U.S. Treasury and government securities was offset by double-digit declines in the corporate bond market. These dynamics led to unusually large differences between the yields of Treasuries and their corresponding private-sector securities—both a reflection and a cause of the credit market’s distress. Despite their generally high credit-worthiness, municipal bonds also fell in price, with the broad tax-exempt market registering a 12-month return of –3.30%.
The U.S. Federal Reserve Board responded to the turmoil with new lending programs and a dramatic easing of monetary policy. Over the full 12 months, the Fed reduced its target for the federal funds rate from 4.50% to 1.00%.
Market Barometer | | | |
| | Average Annual Total Returns |
| | Periods Ended October 31, 2008 |
| One Year | Three Years | Five Years |
Stocks | | | |
Russell 1000 Index (Large-caps) | –36.80% | –5.51% | 0.37% |
Russell 2000 Index (Small-caps) | –34.16 | –4.79 | 1.57 |
Dow Jones Wilshire 5000 Index (Entire market) | –36.43 | –5.10 | 0.81 |
MSCI All Country World Index ex USA (International) | –48.27 | –3.93 | 5.05 |
| | | |
| | | |
Bonds | | | |
Lehman U.S. Aggregate Bond Index (Broad taxable market) | 0.30% | 3.60% | 3.48% |
Lehman Municipal Bond Index | –3.30 | 1.71 | 2.73 |
Citigroup 3-Month Treasury Bill Index | 2.31 | 3.93 | 3.10 |
| | | |
| | | |
CPI | | | |
Consumer Price Index | 3.66% | 2.83% | 3.20% |
3
In the face of stiff headwinds, stock selection had mixed results
Given the global financial crisis, it’s not surprising that Windsor II’s financial stocks were among its worst performers. With a –57% return, the fund’s largest sector—averaging 21% of the portfolio during the year—accounted for about one-third of the overall decline. Notably poor performers included fallen investment bank Bear Stearns, Citigroup, reinsurer XL Capital, and diversified insurer Manulife Financial—one of last year’s winners.
As investors reacted to the likelihood of slower economic growth, they punished two other sectors as well: industrials (–43%) and consumer discretionary (–49%), which together shaved almost
9 percentage points from the fund’s total return. The waning of the global boom in construction and infrastructure development weakened the performance of several industrial stalwarts, including three of last year’s best performers: Honeywell (aerospace products and technology services), General Electric, and Illinois Tool Works (engineered products and equipment).
As household budgets were pinched by tight credit and soaring prices for gasoline and food, consumers cut back their discretionary spending on vacations and big-ticket purchases. A variety of the fund’s holdings struggled, including cruise operator Carnival and Wyndham Worldwide hotels.
Expense Ratios1 | | | |
Your Fund Compared With Its Peer Group | | | |
| | | Average |
| Investor | Admiral | Large-Cap |
| Shares | Shares | Value Fund |
Windsor II Fund | 0.33% | 0.23% | 1.28% |
1 The fund expense ratios shown are from the prospectus dated February 27, 2008. For the fiscal year ended October 31, 2008, the fund’s expense ratios were 0.32% for Investor Shares and 0.22% for Admiral Shares. The peer-group expense ratio is derived from data provided by Lipper Inc. and captures information through year-end 2007.
4
Two relative bright spots were information technology and energy. Superior stock selection paid off in the tech sector, where the fund’s holdings declined considerably less than those in the benchmark. In energy, the fund has been underrepre-sented since 2005, partly because of the advisors’ concern about speculative oil demand. When oil prices abruptly reversed course in July, heading down from record highs, fund investors were spared some of the damage to oil-related stocks.
For more details on the fund’s positioning and performance during the year, please see the Advisors’ Report, which begins on page 7.
Risk/reward trade-offs are always part of investing
In the wake of the 2008 bear market, it’s hard to feel enthusiastic about the ten-year records of most stock funds. Windsor II’s is no exception. Your fund’s 2.26% average annual return for the past decade trailed that of its unmanaged benchmark index (which bears no expenses) by about half a percentage point. The fund’s modest expense ratio helped it return almost a full percentage point more than the peer group’s average return.
As shareholders, you know that Vanguard encourages investors not to evaluate a fund based on its short-term results, which can be much more volatile. But even long-
Total Returns | |
Ten Years Ended October 31, 2008 | |
| Average |
| Annual Return |
Windsor II Fund Investor Shares | 2.26% |
Russell 1000 Value Index | 2.79 |
Average Large-Cap Value Fund1 | 1.38 |
The figures shown represent past performance, which is not a guarantee of future results. (Current performance may be lower or higher than the performance data cited. For performance data current to the most recent month-end, visit our website at www.vanguard.com/performance.) Note, too, that both investment returns and principal value can fluctuate widely, so an investor’s shares, when sold, could be worth more or less than their original cost.
1 Derived from data provided by Lipper Inc.
5
term results can vary widely depending on when measurement begins and ends. Seemingly small shifts in starting and ending dates can produce significant changes in returns.
The decade through October 2008 is a case in point. The 2008 bear market has joined the 2000–2002 bear market in the ten-year calculation. At the other end, gone from the calculation is fiscal year 1998, which saw strong fund performance on the heels of the 1995–1997 bull market. The impact is significant. For example, for the ten years ended October 31, 2004—which captured the exceptional returns of the mid 1990s—Windsor II’s average annual return was 12.3%.
Some have dubbed the past ten years a “lost decade,” because bonds significantly outperformed stocks, and many have noted the similarities with the decade ended in 1979. Such periods serve as an uncomfortable but useful reminder that, while in theory stocks should outperform less-risky asset classes over time, they do not always do so in reality. Nevertheless, we believe that the case for long-term equity investing remains sound, and that recent experience should not fundamentally alter an investor’s long-term asset allocation target.
Although the stock market’s occasional rough patches can shake an investor’s confidence, history suggests that following the time-tested principles of diversification and balance among the major asset classes can put you in a good position to benefit from the market’s long-term opportunities. By providing diversification across managers, large-cap value-oriented holdings, and active investment strategies, Vanguard Windsor II Fund can play a valuable role in a well-designed portfolio.
Thank you for entrusting your assets to Vanguard.
Sincerely,

F. William McNabb III
President and Chief Executive Officer
November 12, 2008
6
Advisors’ Report
For the fiscal year ended October 31, 2008, Vanguard Windsor II Fund returned –38.02% for Investor Shares and –37.94% for Admiral Shares. Your fund is managed by five independent advisors. This provides exposure to distinct, yet complementary, investment approaches, enhancing the fund’s diversification.
The advisors, the percentage of fund assets each manages, the amount, and brief descriptions of their investment strategies are presented in the table below. The advisors have also provided a discussion of the investment environment that existed during the fiscal year and of how portfolio positioning reflects this assessment. These comments were prepared on November 11, 2008.
Barrow, Hanley, Mewhinney &
Strauss, Inc.
Portfolio Manager:
James P. Barrow, Founding Partner
This shareholder letter is difficult to write, as we have to deal with poor results and serious economic problems. The subprime mortgage mess has been with us for at least 15 months, and only recently have
Vanguard Windsor II Fund Investment Advisors | |
| | | |
| Fund Assets Managed | |
Investment Advisor | % | $ Million | Investment Strategy |
Barrow, Hanley, Mewhinney | 64 | 20,025 | Conducts fundamental research on individual |
& Strauss, Inc. | | | stocks exhibiting traditional value characteristics: |
| | | price/earnings and price/book ratios below the broad |
| | | market average and dividend yields above the broad |
| | | market average. |
Lazard Asset Management LLC | 17 | 5,154 | Employs a relative-value approach that seeks a |
| | | combination of attractive valuation and high financial |
| | | productivity. The process is research-driven, relying |
| | | upon bottom-up stock analysis performed by the |
| | | firm’s global sector analysts. |
Vanguard Quantitative | 7 | 2,297 | Employs a quantitative fundamental management |
Equity Group | | | approach, using models that assess valuation, market |
| | | sentiment, and earnings quality of companies versus |
| | | their peers. |
Hotchkis and Wiley | 5 | 1,413 | Uses a disciplined investment approach, focusing on |
Capital Management, LLC | | | such investment parameters as a company’s tangible |
| | | assets, sustainable cash flow, and potential for |
| | | improving business performance. |
Armstrong Shaw Associates Inc. | 4 | 1,336 | Uses a bottom-up approach, employing fundamental |
| | | and qualitative criteria to identify individual companies |
| | | for potential investment. |
Cash Investments | 3 | 786 | These short-term reserves are invested by Vanguard |
| | | in equity index products to simulate investment in |
| | | stocks. Each advisor may also maintain a modest |
| | | cash position. |
7
federal officials tried to limit its scope. None of us knew how deeply the brokers, banks, and insurance companies were invested in these “AAA” instruments.
In earlier letters, we have shared our views about speculative bubbles—and the dislocations they can cause when they collapse—with regard to housing, industrial and agricultural commodities, and markets in less-developed countries. These are all collapsing simultaneously (Murphy’s Law).
Fear over subprime loans sucked the liquidity out of world financial markets and threatens a significant recession. Volatility has never been higher, and consumer confidence has slipped to record low levels. Banks will not lend to each other, and we have had short Treasury bills yielding 0.001%—quite a premium for liquidity. Some large companies are experiencing extreme difficulty in accessing the credit markets even though they have the highest ratings.
We are often asked, “Have you ever seen anything like this?” The answer is yes, but not exactly. In 1974, at the end of a two-year bear market—when interest rates were above 10%, inflation was high, confidence was low, and Watergate caused a presidential resignation—the market was down by about the same percentage as it has been in 2008. In 1987, we experienced a few months of huge volatility when “portfolio insurance” not only failed to work but drove stocks down more than –30%. That Wall Street “panic” had limited impact on Main Street. The 1998 meltdown of the capital markets caused by a Russian default and the excessive leverage at hedge fund Long-Term Capital Management sparked a credit correction, but banks, brokers, and the Fed bought the fund and controlled its liquidation. This destroyed the lower-quality bond market for a few years. In all cases, we eventually recovered and the markets moved on.
Now what happens? In time, the steps taken by central banks will calm the short-term bank-to-bank loan markets. When the government buys high-quality but illiquid short-term notes, it doesn’t need to perform mark-to-market accounting. (Also, while it is a well-kept secret, many of the purchased assets are likely worth much more than their current depressed values.) Technically, we will see the London InterBank Offered Rate (LIBOR) decline.
After that, liquidity will improve in the secondary fixed income market, and lending will increase. This will eventually allow borrowers with less than the highest credit standing to access the bond and commercial paper markets. We will be well on the way to melting the freeze. And as the banks “right-size” their portfolios and adjust their balance sheets, highly leveraged borrowers such as hedge funds and private equity firms will likely be forced to liquidate their positions.
8
Lazard Asset Management LLC
Portfolio Managers:
Andrew Lacey, Deputy Chairman
Christopher Blake, Managing Director
The largest contributor to our 12-month returns was stock selection in financials combined with an underweighted position there. Despite the sector’s volatility, we were able to improve performance by avoiding the companies most affected by the credit crisis and focusing on those, such as JPMorgan Chase, with large deposit bases that should help them weather the current crisis. Insurance companies PartnerRe and Marsh & McLennan held up well relative to others. Also performing well was real estate investment trust Public Storage, which reported better-than-expected earnings results more than once.
Another contributor was an overweighted position in consumer staples, which served well as a defensive sector amid the market turmoil, although less-than-successful stock selection diminished this benefit. Stock selection in the energy sector benefited performance, however; holdings such as Massey Energy and Arch Coal rose sharply as the price of coal climbed owing to strong global demand for the fuel to be used in steelmaking and power plants. We sold shares of these companies at higher prices before they pulled back in the face of mounting concerns about a global economic slowdown.
Stock selection in the consumer discretionary sector detracted from returns. Shares of R.H. Donnelley and Idearc, publishers of the Yellow Pages directories, fell sharply during the first calendar quarter. R.H. Donnelley reported lower-than-expected revenues and reduced expectations for the next year. We sold both positions in view of a greater-than-expected slowdown in sales and its potential impact on the companies’ relatively high debt levels. Holdings in retailers such as Liz Claiborne and J.C. Penney and restaurant operator Brinker International also detracted from performance. Brinker shares fell steeply after lower customer traffic and increasing margin pressures caused the company’s earnings to drop below expectations.
Stock selection in the industrial sector also hurt our overall return. Textron remained under pressure from concern about the prospects for business jet sales and about the ability of its finance subsidiary to roll over commercial paper. However, the company continues to have access to the commercial paper market and has lines of credit to support it. While demand for business jets could weaken in the current economic environment, the company’s backlog of orders is large and diverse, and its helicopter business continues to benefit from structural demand from the military and the energy industry.
9
Vanguard Quantitative Equity Group
Portfolio Manager:
James D. Troyer, CFA, Principal
Quantitative management, as we implement it, is similar to traditional stock selection, although we pick stocks with computer models. We attempt to identify attributes that may indicate that a stock’s price in the market is too high or too low relative to the company’s fundamentals. We test our investment theses using simulations based on historical information to determine if those characteristics do identify stocks that consistently outperformed their peers.
We try to find several hundred stocks that individually, and as a group, will achieve such outperformance. This contrasts with a traditional stock-picking approach, which typically focuses on spotting a small number of stocks that will outperform. However, the resulting characteristics of our quantitative portfolio are similar to those of a traditional portfolio. Our typical portfolio has a growth rate that is similar to the overall market rate but that we have purchased at a lower multiple of earnings. Both our investment judgment and our simulations tell us that buying the same or a higher growth rate at a discount is an attractive long-run proposition.
Of the three factors that our models examine, the market sentiment factor contributed the most to the return of our portfolio during the 12 months. Our best performance was in energy, with Hess as our model’s best pick. In the financial sector, our model underweighted troubled insurer AIG, which helped produce relatively strong results in the insurance segment. Our worst-performing sector was consumer staples, where agribusiness company Bunge was our worst pick.
As disappointed as we are with the stock market’s performance, we are confident that equities will have worthwhile returns for long-term investors in the future and that our focus on value and sentiment will reward patience. We thank you for continuing to entrust your investment dollars to us, and we look forward to the future.
Hotchkis and Wiley Capital Management, LLC
Portfolio Managers:
George H. Davis, Jr.,
Chief Executive Officer
Sheldon J. Lieberman, Principal
The past 12 months have been a challenging period for us, with very disappointing results. Extreme fear, along with ambiguity, sparked a panic in the U.S. financial sector during the latter part of the period. As investors alongside our clients, it is our task to learn from the current market dynamics and recover the losses incurred. We will work toward this through determined, patient application of time-tested investment discipline together with an enhanced awareness of current market forces and sentiment.
10
The performance of our portion of the portfolio was hurt by three stocks targeted for government intervention. Freddie Mac was placed into conservatorship by the Federal Housing Finance Agency despite having complied with its long-established capital requirements. Washington Mutual was seized by the Federal Deposit Insurance Corporation following rapid withdrawals by depositors, many of whom were fully insured. And Wachovia experienced regulatory pressure to sell itself quickly at a price well below our assessment of franchise value.
Certain large financial conglomerates in our portfolio were able to exploit their balance-sheet strength by purchasing assets of troubled companies at fire-sale prices. That should help future returns.
In sectors other than financials, the portfolio has added value above the benchmark returns. We have sizable positions in pharmaceuticals and information technology. By and large these holdings have fortress-like balance sheets with little or no net debt, and are returning valuable cash to shareholders. The portfolio remains underweighted in the energy and materials sectors.
In the aftermath of market declines, equity valuations have become more and more compelling even as the economic outlook has weakened. Valuation spreads among sectors have widened, and within sectors dramatic variances exist among individual stock valuations. This creates opportunity for the astute long-term investor. Our research-driven investment process seeks to take advantage of these challenging times.
Armstrong Shaw Associates Inc.
Portfolio Manager:
Jeffrey M. Shaw, Chairman and
Chief Investment Officer
What started as a financial and liquidity crisis during the summer of 2007 evolved into a global recession and bear market, creating turmoil that touched all asset classes and equity styles. Although unprecedented actions have been taken to stem the current crisis, we still face an uncertain outlook for the credit markets and worsening conditions in the economy. There is no quick fix to the process of deleveraging that is taking place across global markets.
In this challenging environment, health care was our best-performing sector, down less than –1% compared with a decline of almost –25% for the benchmark sector. Covidien, Thermo Fisher, Abbott Labs, Amgen, and Johnson & Johnson were among our top performers. We also achieved positive relative returns in information technology, industrials, and telecommunication services. In addition, our meaningful underweighting in financial stocks was beneficial given the index sector’s decline of almost –50%. Hurting performance were our weak relative returns in materials and energy.
11
We have continued to focus on managing a diversified portfolio of high-quality, large-cap stocks with earnings stability that should be rewarded over time as the market recognizes the underlying fundamentals of the companies we own. Our underweighting in financials has become less pronounced, as we have been selectively adding non-credit-sensitive companies such as ACE, MetLife, and Bank of New York Mellon.
Our largest overweighting is in technology, where our holdings include high-quality, dominant franchises with strong balance sheets, prodigious cash-flow generation, and recurring revenue, such as Hewlett-Packard, IBM, Oracle, and Cisco. Our balanced portfolio seems well-positioned for the risks and opportunities ahead: It has above-average market capitalization and expected three-year growth rates in earnings per share, with an attractive forward price/earnings ratio.
12
Windsor II Fund
Fund Profile
As of October 31, 2008
Portfolio Characteristics | | |
| | Comparative | Broad |
| Fund | Index1 | Index2 |
Number of Stocks | 283 | 659 | 4,647 |
Median Market Cap | $40.7B | $37.3B | $27.5B |
Price/Earnings Ratio | 11.0x | 11.9x | 12.8x |
Price/Book Ratio | 1.6x | 1.4x | 1.8x |
Yield3 | | 3.6% | 2.6% |
Investor Shares | 3.4% | | |
Admiral Shares | 3.4% | | |
Return on Equity | 19.9% | 18.8% | 20.4% |
Earnings Growth Rate | 14.2% | 13.8% | 17.8% |
Foreign Holdings | 5.8% | 0.0% | 0.0% |
Turnover Rate | 37% | — | — |
Expense Ratio | | | |
(10/31/2007)4 | | — | — |
Investor Shares | 0.33% | | |
Admiral Shares | 0.23% | | |
Short-Term Reserves | 2.0% | — | — |
Sector Diversification (% of equity exposure) |
| | Comparative | Broad |
| Fund | Index1 | Index2 |
Consumer Discretionary | 6.8% | 8.2% | 8.8% |
Consumer Staples | 14.0 | 9.7 | 11.1 |
Energy | 11.6 | 16.2 | 12.5 |
Financials | 17.7 | 25.9 | 16.7 |
Health Care | 15.0 | 12.6 | 13.7 |
Industrials | 9.5 | 9.1 | 11.1 |
Information Technology | 10.2 | 2.7 | 15.6 |
Materials | 2.1 | 3.4 | 3.4 |
Telecommunication | | | |
Services | 5.4 | 5.7 | 3.0 |
Utilities | 7.7 | 6.5 | 4.1 |
Volatility Measures5 | |
| Fund Versus | Fund Versus |
| Comparative Index1 | Broad Index2 |
R-Squared | 0.97 | 0.92 |
Beta | 0.98 | 0.94 |
Ten Largest Holdings6 (% of total net assets) |
| | |
JPMorgan Chase & Co. | diversified financial | |
| services | 3.2% |
Occidental | integrated oil | |
Petroleum Corp. | and gas | 2.8 |
Philip Morris | | |
International Inc. | tobacco | 2.8 |
International Business | computer | |
Machines Corp. | hardware | 2.7 |
AT&T Inc. | integrated | |
| telecommunication | |
| services | 2.6 |
Bristol-Myers Squibb Co. | pharmaceuticals | 2.6 |
Verizon | integrated | |
Communications Inc. | telecommunication | |
| services | 2.5 |
ConocoPhillips Co. | integrated oil | |
| and gas | 2.5 |
Pfizer Inc. | pharmaceuticals | 2.4 |
Imperial Tobacco | | |
Group ADR | tobacco | 2.4 |
Top Ten | | 26.5% |
Investment Focus
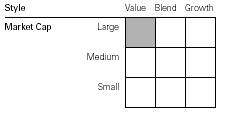
1 Russell 1000 Value Index.
2 Dow Jones Wilshire 5000 Index.
3 30-day SEC yield for the fund; annualized dividend yield for the indexes. See the Glossary.
4 The expense ratios shown are from the prospectus dated February 27, 2008. For the fiscal year ended October 31, 2008, the expense ratios were 0.32% for Investor Shares and 0.22% for Admiral Shares.
5 For an explanation of R-squared, beta, and other terms used here, see the Glossary.
6 The holdings listed exclude any temporary cash investments and equity index products.
13
Windsor II Fund
Performance Summary
All of the returns in this report represent past performance, which is not a guarantee of future results that may be achieved by the fund. (Current performance may be lower or higher than the performance data cited. For performance data current to the most recent month-end, visit our website at www.vanguard.com/performance.) Note, too, that both investment returns and principal value can fluctuate widely, so an investor’s shares, when sold, could be worth more or less than their original cost. The returns shown do not reflect taxes that a shareholder would pay on fund distributions or on the sale of fund shares.
Cumulative Performance: October 31, 1998–October 31, 2008
Initial Investment of $10,000
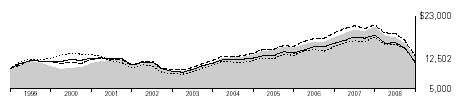
| | | |
| | | | |
| Average Annual Total Returns | Final Value |
| Periods Ended October 31, 2008 | of a $10,000 |
| One Year | Five Years | Ten Years | Investment |
Windsor II Fund Investor Shares1 | –38.02% | 2.12% | 2.26% | $12,502 |
Dow Jones Wilshire 5000 Index | –36.43 | 0.81 | 1.27 | 11,350 |
Russell 1000 Value Index | –36.80 | 1.90 | 2.79 | 13,166 |
Average Large-Cap Value Fund2 | –37.28 | 0.29 | 1.38 | 11,464 |
| | | | | | | | | | | |
| | | | Final Value |
| | | Since | of a $100,000 |
| One Year | Five Years | Inception3 | Investment |
Windsor II Fund Admiral Shares | –37.94% | 2.24% | 0.50% | $103,759 |
Dow Jones Wilshire 5000 Index | –36.43 | 0.81 | –0.54 | 96,064 |
Russell 1000 Value Index | –36.80 | 1.90 | 0.84 | 106,439 |
1 Total returns do not include the account service fee that may be applicable to certain accounts with balances below $10,000.
2 Derived from data provided by Lipper Inc.
3 Performance for the fund’s Admiral Shares and comparative standards is calculated since the Admiral Shares’ inception: May 14, 2001.
14
Windsor II Fund
Fiscal-Year Total Returns (%): October 31, 1998–October 31, 2008
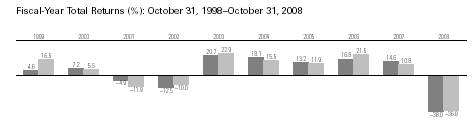
Average Annual Total Returns: Periods Ended September 30, 2008
This table presents average annual total returns through the latest calendar quarter—rather than through the end of the fiscal period. Securities and Exchange Commission rules require that we provide this information.
| Inception Date | One Year | Five Years | Ten Years |
Investor Shares | 6/24/1985 | –24.14% | 7.07% | 5.03% |
Admiral Shares | 5/14/2001 | –24.07 | 7.18 | 3.141 |
1 Return since inception.
Note: See Financial Highlights tables for dividend and capital gains information.
15
Windsor II Fund
Financial Statements
Statement of Net Assets
As of October 31, 2008
The fund provides a complete list of its holdings four times in each fiscal year, at the quarter-ends. For the second and fourth fiscal quarters, the lists appear in the fund’s semiannual and annual reports to shareholders. For the first and third fiscal quarters, the fund files the lists with the Securities and Exchange Commission on Form N-Q. Shareholders can look up the fund’s Forms N-Q on the SEC’s website at www.sec.gov. Forms N-Q may also be reviewed and copied at the SEC’s Public Reference Room (see the back cover of this report for further information).
| | | Market |
| | | Value• |
| | Shares | ($000) |
Common Stocks (96.3%)1 | | |
Consumer Discretionary (6.4%) | | |
| Carnival Corp. | 17,515,200 | 444,886 |
2 | Sherwin-Williams Co. | 7,071,400 | 402,433 |
| Comcast Corp. | | |
| Special Class A | 11,381,740 | 175,506 |
2 | Service Corp. | | |
| International | 25,080,100 | 173,053 |
| CBS Corp. | 15,203,883 | 147,630 |
2 | Wyndham | | |
| Worldwide Corp. | 17,776,774 | 145,592 |
| Home Depot, Inc. | 3,117,529 | 73,542 |
| The Gap, Inc. | 4,459,600 | 57,707 |
| Lowe’s Cos., Inc. | 2,359,900 | 51,210 |
| Brinker International, Inc. | 4,698,700 | 43,698 |
| J.C. Penney Co., Inc. | | |
| (Holding Co.) | 1,778,900 | 42,551 |
* | Starbucks Corp. | 3,138,900 | 41,214 |
| Tiffany & Co. | 1,406,400 | 38,606 |
| Liz Claiborne, Inc. | 3,183,083 | 25,942 |
| The Walt Disney Co. | 807,900 | 20,925 |
| Time Warner, Inc. | 2,017,699 | 20,359 |
* | Interpublic Group | | |
| of Cos., Inc. | 3,467,100 | 17,994 |
| McDonald’s Corp. | 239,506 | 13,875 |
| Limited Brands, Inc. | 1,030,200 | 12,342 |
| Black & Decker Corp. | 172,800 | 8,747 |
| Pulte Homes, Inc. | 634,700 | 7,071 |
| Autoliv, Inc. | 300,532 | 6,419 |
| The Stanley Works | 163,600 | 5,356 |
| New York Times Co. | | |
| Class A | 394,300 | 3,943 |
| H & R Block, Inc. | 198,400 | 3,912 |
| Genuine Parts Co. | 81,000 | 3,187 |
| Ross Stores, Inc. | 93,000 | 3,040 |
| Whirlpool Corp. | 60,600 | 2,827 |
| Royal Caribbean | | |
| Cruises, Ltd. | 204,200 | 2,769 |
| Family Dollar Stores, Inc. | 65,700 | 1,768 |
| Advance Auto Parts, Inc. | 52,300 | 1,632 |
| Macy’s Inc. | 101,200 | 1,244 |
| RadioShack Corp. | 61,700 | 781 |
| WABCO Holdings Inc. | 41,200 | 757 |
| Hasbro, Inc. | 6,300 | 183 |
| | | 2,002,701 |
Consumer Staples (13.4%) | | |
| Philip Morris | | |
| International Inc. | 20,085,299 | 873,108 |
| Imperial Tobacco Group | | |
| ADR | 13,840,000 | 735,596 |
| Kraft Foods Inc. | 20,211,023 | 588,949 |
| Diageo PLC ADR | 7,768,500 | 483,123 |
| Altria Group, Inc. | 22,503,799 | 431,848 |
| CVS Caremark Corp. | 5,123,580 | 157,038 |
| Kimberly-Clark Corp. | 2,398,877 | 147,027 |
| Wal-Mart Stores, Inc. | 2,317,400 | 129,334 |
| Reynolds American Inc. | 2,161,732 | 105,838 |
| The Kroger Co. | 3,621,300 | 99,441 |
| The Procter & Gamble Co. | 1,415,900 | 91,382 |
| The Coca-Cola Co. | 2,012,199 | 88,658 |
| Molson Coors | | |
| Brewing Co. Class B | 2,300,144 | 85,933 |
| Safeway, Inc. | 1,520,500 | 32,341 |
* | Smithfield Foods, Inc. | 2,395,300 | 25,199 |
| General Mills, Inc. | 270,300 | 18,310 |
| ConAgra Foods, Inc. | 634,200 | 11,048 |
| Campbell Soup Co. | 269,600 | 10,231 |
| Anheuser-Busch Cos., Inc. | 157,400 | 9,764 |
| Bunge Ltd. | 228,700 | 8,784 |
| The Pepsi Bottling | �� | |
| Group, Inc. | 362,800 | 8,388 |
| SuperValu Inc. | 524,700 | 7,472 |
* | Unilever PLC ADR | 286,300 | 6,459 |
* | Ralcorp Holdings, Inc. | 64,413 | 4,359 |
| The Clorox Co. | 26,000 | 1,581 |
| H.J. Heinz Co. | 16,800 | 736 |
| | | 4,161,947 |
16
Windsor II Fund
| | | Market |
| | | Value• |
| | Shares | ($000) |
Energy (11.0%) | | |
| Occidental | | |
| Petroleum Corp. | 15,905,800 | 883,408 |
| ConocoPhillips Co. | 14,757,657 | 767,693 |
2 | Spectra Energy Corp. | 32,337,100 | 625,076 |
| ExxonMobil Corp. | 5,666,094 | 419,971 |
| Chevron Corp. | 3,399,129 | 253,575 |
| Royal Dutch Shell | | |
| PLC ADR Class B | 1,430,200 | 79,076 |
| Apache Corp. | 812,370 | 66,882 |
| Devon Energy Corp. | 785,002 | 63,475 |
| Marathon Oil Corp. | 2,028,700 | 59,035 |
| El Paso Corp. | 4,088,850 | 39,662 |
| BJ Services Co. | 2,933,100 | 37,690 |
| Hess Corp. | 555,800 | 33,465 |
| Massey Energy Co. | 1,305,000 | 30,133 |
| Baker Hughes Inc. | 465,000 | 16,252 |
| Anadarko Petroleum Corp. | 251,000 | 8,860 |
* | Plains Exploration & | | |
| Production Co. | 309,600 | 8,731 |
| Pioneer Natural | | |
| Resources Co. | 274,000 | 7,625 |
| Sunoco, Inc. | 200,000 | 6,100 |
| Cimarex Energy Co. | 88,700 | 3,589 |
| Valero Energy Corp. | 61,600 | 1,268 |
| Patterson-UTI Energy, Inc. | 65,200 | 865 |
* | Forest Oil Corp. | 6,800 | 199 |
| | | 3,412,630 |
Exchange-Traded Funds (0.8%) | | |
3 | Vanguard Total Stock | | |
| Market ETF | 3,197,800 | 153,878 |
3 | Vanguard Value ETF | 2,511,200 | 110,267 |
| | | 264,145 |
Financials (17.0%) | | |
| JPMorgan Chase & Co. | 23,979,403 | 989,150 |
| Bank of America Corp. | 29,480,600 | 712,546 |
| Citigroup Inc. | 39,978,383 | 545,705 |
| Wells Fargo & Co. | 13,600,745 | 463,105 |
| American Express Co. | 15,045,310 | 413,746 |
| Capital One | | |
| Financial Corp. | 9,569,600 | 374,363 |
| Manulife Financial Corp. | 13,680,530 | 274,842 |
* | SLM Corp. | 21,128,300 | 225,439 |
| XL Capital Ltd. Class A | 15,606,900 | 151,387 |
| Merrill Lynch & Co., Inc. | 5,793,664 | 107,704 |
| The Travelers Cos., Inc. | 2,005,100 | 85,317 |
| Public Storage, Inc. REIT | 914,000 | 74,491 |
| MetLife, Inc. | 2,039,457 | 67,751 |
| PartnerRe Ltd. | 989,900 | 67,006 |
| The Allstate Corp. | 2,391,015 | 63,099 |
| Marsh & McLennan | | |
| Cos., Inc. | 2,010,645 | 58,952 |
| Wachovia Corp. | 7,516,540 | 48,181 |
| Hudson City Bancorp, Inc. | 2,461,700 | 46,305 |
| PNC Financial | | |
| Services Group | 569,928 | 37,997 |
| Ace Ltd. | 647,400 | 37,135 |
| Ameriprise Financial, Inc. | 1,561,792 | 33,735 |
| Bank of New York | | |
| Mellon Corp. | 1,009,800 | 32,919 |
| National City Corp. | 10,495,200 | 28,337 |
| U.S. Bancorp | 941,922 | 28,079 |
| KeyCorp | 1,638,582 | 20,040 |
| BB&T Corp. | 486,840 | 17,453 |
| The Chubb Corp. | 329,104 | 17,054 |
| The Goldman | | |
| Sachs Group, Inc. | 172,406 | 15,948 |
| SunTrust Banks, Inc. | 348,900 | 14,005 |
| Aon Corp. | 308,900 | 13,066 |
| Genworth Financial Inc. | 2,574,300 | 12,460 |
| Unum Group | 715,700 | 11,272 |
| Discover Financial Services | 884,100 | 10,830 |
| Prudential Financial, Inc. | 310,900 | 9,327 |
| Progressive Corp. of Ohio | 638,800 | 9,116 |
^ | MBIA, Inc. | 912,400 | 8,969 |
| Northern Trust Corp. | 156,800 | 8,829 |
| Morgan Stanley | 492,985 | 8,612 |
*,^ | Reinsurance Group of | | |
| America, Inc. Class A | 217,900 | 8,136 |
| Loews Corp. | 241,600 | 8,023 |
| Equity Residential REIT | 205,000 | 7,161 |
| Vornado Realty Trust REIT | 98,000 | 6,914 |
| Sovereign Bancorp, Inc. | 2,175,700 | 6,309 |
| Comerica, Inc. | 217,700 | 6,006 |
| Assurant, Inc. | 217,900 | 5,552 |
| Plum Creek Timber Co. Inc. | |
| REIT | 145,100 | 5,409 |
| State Street Corp. | 122,300 | 5,302 |
| Host Hotels & Resorts Inc. | | |
| REIT | 512,399 | 5,298 |
| Lincoln National Corp. | 239,800 | 4,134 |
| UDR, Inc. REIT | 184,200 | 3,640 |
*,^ | The St. Joe Co. | 110,500 | 3,417 |
| Liberty Property Trust REIT | 128,500 | 3,065 |
| Axis Capital Holdings Ltd. | 106,700 | 3,039 |
* | Reinsurance Group of | | |
| America, Inc. Group-B | 81,477 | 3,018 |
| National City Corp. | 1,052,900 | 2,843 |
* | Conseco, Inc. | 1,515,500 | 2,819 |
| Apartment Investment & | | |
| Management Co. | | |
| Class A REIT | 167,507 | 2,451 |
| CapitalSource Inc. REIT | 329,000 | 2,435 |
| Hospitality Properties Trust | | |
| REIT | 231,100 | 2,346 |
| Health Care Inc. REIT | 51,800 | 2,306 |
| General Growth | | |
| Properties Inc. REIT | 533,100 | 2,207 |
| Simon Property Group, Inc. | | |
| REIT | 27,300 | 1,830 |
| BOK Financial Corp. | 36,500 | 1,746 |
17
Windsor II Fund
| | | Market |
| | | Value• |
| | Shares | ($000) |
| HCP, Inc. REIT | 53,800 | 1,610 |
| RenaissanceRe | | |
| Holdings Ltd. | 30,300 | 1,391 |
| Huntington Bancshares Inc. | 129,600 | 1,225 |
| Annaly Mortgage | | |
| Management Inc. REIT | 73,800 | 1,026 |
| Kimco Realty Corp. REIT | 36,500 | 824 |
| Leucadia National Corp. | 28,700 | 770 |
| Avalonbay Communities, Inc. | |
| REIT | 10,800 | 767 |
| The Hartford Financial | | |
| Services Group Inc. | 71,249 | 735 |
| Allied Capital Corp. | 90,100 | 658 |
| American | | |
| International Group, Inc. | 227,200 | 434 |
| Ventas, Inc. REIT | 11,400 | 411 |
| Washington Mutual Inc. | 5,856,328 | 363 |
| Fifth Third Bancorp | 32,100 | 348 |
| Regions Financial Corp. | 27,100 | 301 |
| Protective Life Corp. | 33,800 | 282 |
| | | 5,260,823 |
Health Care (14.4%) | | |
| Bristol-Myers Squibb Co. | 38,679,200 | 794,858 |
| Pfizer Inc. | 42,256,200 | 748,357 |
| Wyeth | 21,752,800 | 700,005 |
| Baxter International, Inc. | 8,825,200 | 533,836 |
| Johnson & Johnson | 7,075,320 | 434,000 |
* | WellPoint Inc. | 9,328,000 | 362,579 |
| Quest Diagnostics, Inc. | 6,993,400 | 327,291 |
| Merck & Co., Inc. | 4,429,900 | 137,105 |
| Abbott Laboratories | 1,630,700 | 89,933 |
| Covidien Ltd. | 1,253,700 | 55,526 |
| Eli Lilly & Co. | 1,477,600 | 49,972 |
| UnitedHealth Group Inc. | 2,100,000 | 49,833 |
| Schering-Plough Corp. | 3,392,700 | 49,160 |
| Medtronic, Inc. | 1,181,500 | 47,650 |
* | Amgen Inc. | 411,320 | 24,634 |
* | Thermo Fisher | | |
| Scientific, Inc. | 472,300 | 19,175 |
| Aetna Inc. | 397,100 | 9,876 |
* | Cephalon, Inc. | 128,000 | 9,180 |
| CIGNA Corp. | 419,600 | 6,840 |
| AmerisourceBergen Corp. | 112,400 | 3,515 |
* | WellCare Health Plans Inc. | 109,500 | 2,647 |
| Omnicare, Inc. | 84,900 | 2,341 |
* | Forest Laboratories, Inc. | 64,800 | 1,505 |
* | Lincare Holdings, Inc. | 51,100 | 1,347 |
* | Invitrogen Corp. | 46,300 | 1,333 |
| Applied Biosystems Inc. | 21,300 | 657 |
| Cardinal Health, Inc. | 9,600 | 367 |
* | Hospira, Inc. | 6,600 | 184 |
| | | 4,463,706 |
Industrials (9.0%) | | |
| Illinois Tool Works, Inc. | 16,170,300 | 539,926 |
| Honeywell | | |
| International Inc. | 15,399,700 | 468,921 |
2 | ITT Industries, Inc. | 9,131,700 | 406,361 |
2 | Cooper Industries, Inc. | | |
| Class A | 12,724,500 | 393,823 |
| General Electric Co. | 15,135,600 | 295,296 |
| United Parcel | | |
| Service, Inc. | 1,833,880 | 96,792 |
| The Boeing Co. | 1,579,400 | 82,555 |
| Dover Corp. | 2,017,100 | 64,083 |
| Parker Hannifin Corp. | 1,539,250 | 59,677 |
| Pitney Bowes, Inc. | 2,021,300 | 50,088 |
| United Technologies Corp. | 903,000 | 49,629 |
| Deere & Co. | 1,228,300 | 47,363 |
| Northrop Grumman Corp. | 924,721 | 43,360 |
| Textron, Inc. | 2,081,100 | 36,836 |
| Tyco International, Ltd. | 1,171,875 | 29,625 |
* | Corrections Corp. | | |
| of America | 1,350,700 | 25,812 |
| PACCAR, Inc. | 707,400 | 20,684 |
| Union Pacific Corp. | 245,098 | 16,365 |
| Waste Management, Inc. | 486,072 | 15,180 |
| Norfolk Southern Corp. | 244,200 | 14,637 |
| Embraer-Empresa | | |
| Brasileira de Aeronautica | | |
| SA ADR | 615,200 | 12,870 |
| Goodrich Corp. | 269,000 | 9,835 |
| Equifax, Inc. | 163,200 | 4,256 |
| Ingersoll-Rand Co. | 156,400 | 2,886 |
* | Allied Waste Industries, Inc. | 192,562 | 2,007 |
| Ryder System, Inc. | 28,400 | 1,125 |
| | | 2,789,992 |
Information Technology (9.6%) | |
| International Business | | |
| Machines Corp. | 9,076,750 | 843,865 |
| Hewlett-Packard Co. | 17,504,750 | 670,082 |
| Intel Corp. | 22,100,700 | 353,611 |
| Microsoft Corp. | 14,942,300 | 333,662 |
* | Oracle Corp. | 8,925,860 | 163,254 |
* | Cisco Systems, Inc. | 6,109,560 | 108,567 |
* | eBay Inc. | 5,023,700 | 76,712 |
| Nokia Corp. ADR | 5,011,900 | 76,081 |
| CA, Inc. | 4,272,728 | 76,055 |
* | Google Inc. | 147,400 | 52,970 |
| Analog Devices, Inc. | 2,342,300 | 50,031 |
| Tyco Electronics Ltd. | 2,235,575 | 43,460 |
* | Symantec Corp. | 2,785,100 | 35,036 |
| Visa Inc. | 469,800 | 26,003 |
* | Flextronics | | |
| International Ltd. | 6,025,226 | 25,185 |
* | Alcatel-Lucent ADR | 6,352,400 | 16,326 |
| Texas Instruments, Inc. | 791,300 | 15,478 |
18
Windsor II Fund
| | | Market |
| | | Value• |
| | Shares | ($000) |
* | Western Digital Corp. | 418,100 | 6,899 |
* | Computer Sciences Corp. | 212,000 | 6,394 |
* | LSI Corp. | 1,410,200 | 5,429 |
| Xilinx, Inc. | 219,000 | 4,034 |
| Motorola, Inc. | 695,700 | 3,736 |
* | Lexmark International, Inc. | 47,100 | 1,217 |
| Lender Processing | | |
| Services, Inc. | 48,000 | 1,107 |
* | NCR Corp. | 53,900 | 985 |
| | | 2,996,179 |
Materials (2.0%) | | |
| E.I. du Pont de Nemours | | |
| & Co. | 7,314,600 | 234,067 |
| Dow Chemical Co. | 4,059,500 | 108,267 |
| Air Products & | | |
| Chemicals, Inc. | 1,527,500 | 88,794 |
| Ball Corp. | 1,847,263 | 63,176 |
| Freeport-McMoRan | | |
| Copper & Gold, Inc. | | |
| Class B | 1,234,201 | 35,915 |
| Alcoa Inc. | 2,190,900 | 25,217 |
| Cemex SAB de CV ADR | 1,611,337 | 12,182 |
| Eastman Chemical Co. | 280,700 | 11,338 |
| International Paper Co. | 567,200 | 9,767 |
| Lubrizol Corp. | 198,600 | 7,463 |
| Reliance Steel & | | |
| Aluminum Co. | 281,600 | 7,051 |
| Celanese Corp. Series A | 425,900 | 5,903 |
| Airgas, Inc. | 36,900 | 1,416 |
| | | 610,556 |
Telecommunication Services (5.2%) | |
| AT&T Inc. | 30,080,975 | 805,268 |
| Verizon | | |
| Communications Inc. | 26,308,854 | 780,583 |
| Embarq Corp. | 260,068 | 7,802 |
| Windstream Corp. | 581,500 | 4,367 |
| Sprint Nextel Corp. | 817,800 | 2,560 |
| FairPoint | | |
| Communications, Inc. | 464,249 | 1,848 |
* | Level 3 | | |
| Communications, Inc. | 383,900 | 403 |
| | | 1,602,831 |
Utilities (7.5%) | | |
| Entergy Corp. | 6,627,900 | 517,308 |
| Dominion | | |
| Resources, Inc. | 12,757,140 | 462,829 |
| Duke Energy Corp. | 24,802,856 | 406,271 |
| Exelon Corp. | 6,959,835 | 377,501 |
2 | CenterPoint Energy Inc. | 18,711,100 | 215,552 |
| Constellation | | |
| Energy Group, Inc. | 4,265,600 | 103,270 |
| American Electric | | |
| Power Co., Inc. | 2,967,900 | 96,843 |
| FPL Group, Inc. | 660,800 | 31,216 |
| Edison International | 374,000 | 13,311 |
| Sempra Energy | 301,100 | 12,824 |
| Progress Energy, Inc. | 311,100 | 12,248 |
| Southern Co. | 347,864 | 11,946 |
| Pepco Holdings, Inc. | 459,400 | 9,487 |
| Questar Corp. | 260,600 | 8,980 |
| CMS Energy Corp. | 838,000 | 8,589 |
| MDU Resources | | |
| Group, Inc. | 456,600 | 8,315 |
| Energen Corp. | 206,400 | 6,929 |
| ONEOK, Inc. | 191,700 | 6,115 |
| Consolidated Edison Inc. | 88,000 | 3,812 |
| Pinnacle West Capital Corp. | 49,800 | 1,576 |
| FirstEnergy Corp. | 19,600 | 1,022 |
| PG&E Corp. | 20,000 | 733 |
| Public Service | | |
| Enterprise Group, Inc. | 8,900 | 250 |
| | | 2,316,927 |
Total Common Stocks | | |
(Cost $34,181,249) | | 29,882,437 |
Temporary Cash Investments (4.0%)1 | |
Money Market Fund (3.7%) | | |
4,5 | Vanguard Market | | |
| Liquidity Fund, | | |
| 2.217% | 1,160,043,000 | 1,160,043 |
| | | |
| | | |
| | Face | |
| | Amount | |
| | ($000) | |
U.S. Agency Obligations (0.3%) | | |
6,7 | Federal Home Loan Bank, | | |
| 2.433%, 11/6/08 | 26,500 | 26,496 |
6,7 | Federal Home Loan Bank, | | |
| 2.576%, 11/24/08 | 20,000 | 19,978 |
6,7 | Federal National | | |
| Mortgage Assn., | | |
| 2.289%, 2/24/09 | 4,000 | 3,969 |
6,7 | Federal Home Loan Bank, | | |
| 2.574%, 2/27/09 | 25,000 | 24,805 |
| | | 75,248 |
Total Temporary Cash Investments | |
(Cost $1,235,263) | | 1,235,291 |
Total Investments (100.3%) | | |
(Cost $35,416,512) | | 31,117,728 |
Other Assets and Liabilities— | | |
Net (–0.3%) | | (106,202) |
Net Assets (100%) | | 31,011,526 |
19
Windsor II Fund
| Market |
| Value• |
| ($000) |
Statement of Assets and Liabilities | |
Assets | |
Investments in Securities, at Value | 31,117,728 |
Receivables for Investment | |
Securities Sold | 273,492 |
Receivables for Capital Shares Issued | 25,765 |
Other Assets | 69,976 |
Total Assets | 31,486,961 |
Liabilities | |
Payables for Investment | |
Securities Purchased | 348,807 |
Payables for Capital Shares Redeemed | 24,664 |
Security Lending Collateral | |
Payable to Brokers | 10,233 |
Other Liabilities | 91,731 |
Total Liabilities | 475,435 |
Net Assets | 31,011,526 |
At October 31, 2008, net assets consisted of: |
| Amount |
| ($000) |
Paid-in Capital | 38,654,015 |
Undistributed Net Investment Income | 309,459 |
Accumulated Net Realized Losses | (3,643,376) |
Unrealized Appreciation (Depreciation) | |
Investment Securities | (4,298,784) |
Futures Contracts | (9,788) |
Net Assets | 31,011,526 |
| |
| |
Investor Shares—Net Assets | |
Applicable to 943,401,729 outstanding | |
$.001 par value shares of beneficial | |
interest (unlimited authorization) | 19,400,295 |
Net Asset Value Per Share— | |
Investor Shares | $20.56 |
| |
| |
Admiral Shares—Net Assets | |
Applicable to 318,018,869 outstanding | |
$.001 par value shares of beneficial | |
interest (unlimited authorization) | 11,611,231 |
Net Asset Value Per Share— | |
Admiral Shares | $36.51 |
• See Note A in Notes to Financial Statements.
* Non-income-producing security.
^ Part of security position is on loan to broker-dealers. The total value of securities on loan is $10,101,000.
1 The fund invests a portion of its cash reserves in equity markets through the use of index futures contracts. After giving effect to futures investments, the fund’s effective common stock and temporary cash investment positions represent 98.0% and 2.3%, respectively, of net assets.
2 Considered an affiliated company of the fund as the fund owns more than 5% of the outstanding voting securities of such company.
3 Considered an affiliated company of the fund as the issuer is another member of The Vanguard Group.
4 Affiliated money market fund available only to Vanguard funds and certain trusts and accounts managed by Vanguard. Rate shown is the 7-day yield.
5 Includes $10,233,000 of collateral received for securities on loan.
6 The issuer operates under a congressional charter; its securities are neither issued nor guaranteed by the U.S. government.
7 Securities with a value of $75,248,000 have been segregated as initial margin for open futures contracts.
ADR—American Depositary Receipt.
REIT—Real Estate Investment Trust.
See accompanying Notes, which are an integral part of the Financial Statements.
20
Windsor II Fund
Statement of Operations
| Year Ended |
| October 31, 2008 |
| ($000) |
Investment Income | |
Income | |
Dividends1,2 | 1,254,850 |
Interest2 | 41,893 |
Security Lending | 8,060 |
Total Income | 1,304,803 |
Expenses | |
Investment Advisory Fees—Note B | |
Basic Fee | 56,125 |
Performance Adjustment | (3,620) |
The Vanguard Group—Note C | |
Management and Administrative—Investor Shares | 47,127 |
Management and Administrative—Admiral Shares | 12,164 |
Marketing and Distribution—Investor Shares | 6,017 |
Marketing and Distribution—Admiral Shares | 3,554 |
Custodian Fees | 506 |
Auditing Fees | 28 |
Shareholders’ Reports—Investor Shares | 682 |
Shareholders’ Reports—Admiral Shares | 197 |
Trustees’ Fees and Expenses | 64 |
Total Expenses | 122,844 |
Expenses Paid Indirectly | (2,239) |
Net Expenses | 120,605 |
Net Investment Income | 1,184,198 |
Realized Net Gain (Loss) | |
Investment Securities Sold2 | (3,408,281) |
Futures Contracts | (192,601) |
Realized Net Gain (Loss) | (3,600,882) |
Change in Unrealized Appreciation (Depreciation) | |
Investment Securities | (17,337,632) |
Futures Contracts | (35,059) |
Change in Unrealized Appreciation (Depreciation) | (17,372,691) |
Net Increase (Decrease) in Net Assets Resulting from Operations | (19,789,375) |
1 Dividends are net of foreign withholding taxes of $4,036,000.
2 Dividend income, interest income, and realized net gain (loss) from affiliated companies of the fund were $120,821,000, $40,217,000, and ($1,681,712,000), respectively.
See accompanying Notes, which are an integral part of the Financial Statements.
21
Windsor II Fund
Statement of Changes in Net Assets
| Year Ended October 31, |
| 2008 | 2007 |
| ($000) | ($000) |
Increase (Decrease) in Net Assets | | |
Operations | | |
Net Investment Income | 1,184,198 | 1,147,263 |
Realized Net Gain (Loss) | (3,600,882) | 5,293,780 |
Change in Unrealized Appreciation (Depreciation) | (17,372,691) | 463,206 |
Net Increase (Decrease) in Net Assets Resulting from Operations | (19,789,375) | 6,904,249 |
Distributions | | |
Net Investment Income | | |
Investor Shares | (736,648) | (694,907) |
Admiral Shares | (463,178) | (415,089) |
Realized Capital Gain1 | | |
Investor Shares | (3,062,841) | (1,263,004) |
Admiral Shares | (1,864,749) | (676,757) |
Total Distributions | (6,127,416) | (3,049,757) |
Capital Share Transactions | | |
Investor Shares | 1,720,177 | 560,388 |
Admiral Shares | 1,136,517 | 2,932,482 |
Net Increase (Decrease) from Capital Share Transactions | 2,856,694 | 3,492,870 |
Total Increase (Decrease) | (23,060,097) | 7,347,362 |
Net Assets | | |
Beginning of Period | 54,071,623 | 46,724,261 |
End of Period2 | 31,011,526 | 54,071,623 |
1 Includes fiscal 2008 and 2007 short-term gain distributions totaling $731,863,000 and $134,373,000, respectively. Short-term gain distributions are treated as ordinary income dividends for tax purposes.
2 Net Assets—End of Period includes undistributed net investment income of $309,459,000 and $325,087,000. See accompanying Notes, which are an integral part of the Financial Statements.
22
Windsor II Fund
Financial Highlights
Investor Shares | | | | | |
| | | | | |
| | | | | |
| | | | |
For a Share Outstanding | Year Ended October 31, |
Throughout Each Period | 2008 | 2007 | 2006 | 2005 | 2004 |
Net Asset Value, Beginning of Period | $37.84 | $35.14 | $31.61 | $28.49 | $24.61 |
Investment Operations | | | | | |
Net Investment Income | .777 | .803 | .760 | .650 | .560 |
Net Realized and Unrealized Gain (Loss) | | | | | |
on Investments | (13.804) | 4.145 | 4.368 | 3.100 | 3.870 |
Total from Investment Operations | (13.027) | 4.948 | 5.128 | 3.750 | 4.430 |
Distributions | | | | | |
Dividends from Net Investment Income | (.799) | (.790) | (.720) | (.630) | (.550) |
Distributions from Realized Capital Gains | (3.454) | (1.458) | (.878) | — | — |
Total Distributions | (4.253) | (2.248) | (1.598) | (.630) | (.550) |
Net Asset Value, End of Period | $20.56 | $37.84 | $35.14 | $31.61 | $28.49 |
| | | | | |
| | | | | |
Total Return1 | –38.02% | 14.62% | 16.85% | 13.22% | 18.15% |
| | | | | |
| | | | | |
Ratios/Supplemental Data | | | | | |
Net Assets, End of Period (Millions) | $19,400 | $33,821 | $30,790 | $28,199 | $26,232 |
Ratio of Total Expenses to | | | | | |
Average Net Assets2 | 0.32% | 0.33% | 0.34% | 0.35% | 0.37% |
Ratio of Net Investment Income to | | | | | |
Average Net Assets | 2.66% | 2.19% | 2.28% | 2.14% | 2.07% |
Portfolio Turnover Rate | 37% | 51% | 34% | 28% | 22% |
1 Total returns do not include the account service fee that may be applicable to certain accounts with balances below $10,000.
2 Includes performance-based investment advisory fee increases (decreases) of (0.01%), 0.01%, 0.01%, 0.01%, and 0.02%.
See accompanying Notes, which are an integral part of the Financial Statements.
23
Windsor II Fund
Financial Highlights
Admiral Shares | | | | | |
| | | | | |
| | | | | |
| | | | |
For a Share Outstanding | Year Ended October 31, |
Throughout Each Period | 2008 | 2007 | 2006 | 2005 | 2004 |
Net Asset Value, Beginning of Period | $67.18 | $62.41 | $56.13 | $50.59 | $43.69 |
Investment Operations | | | | | |
Net Investment Income | 1.431 | 1.491 | 1.402 | 1.224 | 1.043 |
Net Realized and Unrealized Gain (Loss) | | | | | |
on Investments | (24.497) | 7.348 | 7.782 | 5.493 | 6.885 |
Total from Investment Operations | 9.184 | (23.066) | 8.839 | 6.717 | 7.928 |
Distributions | | | | | |
Dividends from Net Investment Income | (1.473) | (1.481) | (1.346) | (1.177) | (1.028) |
Distributions from Realized Capital Gains | (6.131) | (2.588) | (1.558) | — | — |
Total Distributions | (7.604) | (4.069) | (2.904) | (1.177) | (1.028) |
Net Asset Value, End of Period | $36.51 | $67.18 | $62.41 | $56.13 | $50.59 |
| | | | | |
| | | | | |
Total Return | –37.94% | 14.71% | 17.01% | 13.34% | 18.30% |
| | | | | |
| | | | | |
Ratios/Supplemental Data | | | | | |
Net Assets, End of Period (Millions) | $11,611 | $20,250 | $15,934 | $11,992 | $4,849 |
Ratio of Total Expenses to | | | | | |
Average Net Assets1 | 0.22% | 0.23% | 0.23% | 0.22% | 0.26% |
Ratio of Net Investment Income to | | | | | |
Average Net Assets | 2.76% | 2.29% | 2.39% | 2.25% | 2.17% |
Portfolio Turnover Rate | 37% | 51% | 34% | 28% | 22% |
| | | | | | |
1 Includes performance-based investment advisory fee increases (decreases) of (0.01%), 0.01%, 0.01%, 0.01%, and 0.02%. See accompanying Notes, which are an integral part of the Financial Statements.
24
Windsor II Fund
Notes to Financial Statements
Vanguard Windsor II Fund is registered under the Investment Company Act of 1940 as an open-end investment company, or mutual fund. The fund offers two classes of shares, Investor Shares and Admiral Shares. Investor Shares are available to any investor who meets the fund’s minimum purchase requirements. Admiral Shares are designed for investors who meet certain administrative, service, tenure, and account-size criteria.
A. The following significant accounting policies conform to generally accepted accounting principles for U.S. mutual funds. The fund consistently follows such policies in preparing its financial statements.
1. Security Valuation: Securities are valued as of the close of trading on the New York Stock Exchange (generally 4 p.m., Eastern time) on the valuation date. Equity securities are valued at the latest quoted sales prices or official closing prices taken from the primary market in which each security trades; such securities not traded on the valuation date are valued at the mean of the latest quoted bid and asked prices. Securities for which market quotations are not readily available, or whose values have been affected by events occurring before the fund's pricing time but after the close of the securities’ primary markets, are valued at their fair values calculated according to procedures adopted by the board of trustees. These procedures include obtaining quotations from an independent pricing service, monitoring news to identify significant market- or security-specific events, and evaluating changes in the values of foreign market proxies (for example, ADRs, futures contracts, or exchange-traded funds), between the time the foreign markets close and the fund's pricing time. When fair-value pricing is employed, the prices of securities used by a fund to calculate its net asset value may differ from quoted or published prices for the same securities. Investments in Vanguard Market Liquidity Fund are valued at that fund’s net asset value. Temporary cash investments acquired over 60 days to maturity are valued using the latest bid prices or using valuations based on a matrix system (which considers such factors as security prices, yields, maturities, and ratings), both as furnished by independent pricing services. Other temporary cash investments are valued at amortized cost, which approximates market value.
2. Futures Contracts: The fund uses index futures contracts to a limited extent, with the objective of maintaining full exposure to the stock market while maintaining liquidity. The fund may purchase or sell futures contracts to achieve a desired level of investment, whether to accommodate portfolio turnover or cash flows from capital share transactions. The primary risks associated with the use of futures contracts are imperfect correlation between changes in market values of stocks held by the fund and the prices of futures contracts, and the possibility of an illiquid market.
Futures contracts are valued at their quoted daily settlement prices. The aggregate principal amounts of the contracts are not recorded in the Statement of Net Assets. Fluctuations in the value of the contracts are recorded in the Statement of Net Assets as an asset (liability) and in the Statement of Operations as unrealized appreciation (depreciation) until the contracts are closed, when they are recorded as realized futures gains (losses).
3. Federal Income Taxes: The fund intends to continue to qualify as a regulated investment company and distribute all of its taxable income. Management has analyzed the fund's tax positions taken on federal income tax returns for all open tax years (tax years ended October 31, 2005–2008), and has concluded that no provision for federal income tax is required in the fund’s financial statements.
25
Windsor II Fund
4. Distributions: Distributions to shareholders are recorded on the ex-dividend date.
5. Security Lending: The fund may lend its securities to qualified institutional borrowers to earn additional income. Security loans are required to be secured at all times by collateral at least equal to the market value of securities loaned. The fund invests cash collateral received in Vanguard Market Liquidity Fund, and records a liability for the return of the collateral, during the period the securities are on loan. Security lending income represents the income earned on investing cash collateral, less expenses associated with the loan.
6. Other: Dividend income is recorded on the ex-dividend date. Interest income includes income distributions received from Vanguard Market Liquidity Fund and is accrued daily. Security transactions are accounted for on the date securities are bought or sold. Costs used to determine realized gains (losses) on the sale of investment securities are those of the specific securities sold.
Each class of shares has equal rights as to assets and earnings, except that each class separately bears certain class-specific expenses related to maintenance of shareholder accounts (included in Management and Administrative expenses) and shareholder reporting. Marketing and distribution expenses are allocated to each class of shares based on a method approved by the board of trustees. Income, other non-class-specific expenses, and gains and losses on investments are allocated to each class of shares based on its relative net assets.
B. Armstrong Shaw Associates Inc.; Barrow, Hanley, Mewhinney & Strauss, Inc.; Hotchkis and Wiley Capital Management, LLC; and Lazard Asset Management LLC each provide investment advisory services to a portion of the fund for a fee calculated at an annual percentage rate of average net assets managed by the advisor. The basic fee of Armstrong Shaw Associates Inc. is subject to quarterly adjustments based on performance since January 31, 2006, relative to the Russell 1000 Value Index. The basic fee of Barrow, Hanley, Mewhinney & Strauss, Inc., is subject to quarterly adjustments based on performance for the preceding three years relative to the S&P 500/Barra Value Index for periods prior to May 1, 2006, and the new benchmark, the MSCI US Prime Market 750 Index, beginning May 1, 2006. The benchmark change will be fully phased in by April 2009. The basic fee of Hotchkis and Wiley Capital Management, LLC, is subject to quarterly adjustments based on performance since January 31, 2004, relative to the MSCI US Investable Market 2500 Index. The basic fee of Lazard Asset Management LLC is subject to quarterly adjustments based on performance since January 31, 2007, relative to the S&P 500 Index.
The Vanguard Group provides investment advisory services to a portion of the fund on an at-cost basis; the fund paid Vanguard advisory fees of $978,000 for the year ended October 31, 2008.
For the year ended October 31, 2008, the aggregate investment advisory fee represented an effective annual basic rate of 0.13% of the fund’s average net assets, before a decrease of $3,620,000 (0.01%) based on performance.
26
Windsor II Fund
C. The Vanguard Group furnishes at cost corporate management, administrative, marketing, and distribution services. The costs of such services are allocated to the fund under methods approved by the board of trustees. The fund has committed to provide up to 0.40% of its net assets in capital contributions to Vanguard. At October 31, 2008, the fund had contributed capital of $3,504,000 to Vanguard (included in Other Assets), representing 0.01% of the fund’s net assets and 3.50% of Vanguard’s capitalization. The fund’s trustees and officers are also directors and officers of Vanguard.
D. The fund has asked its investment advisors to direct certain security trades, subject to obtaining the best price and execution, to brokers who have agreed to rebate to the fund part of the commissions generated. Such rebates are used solely to reduce the fund’s management and administrative expenses. The fund’s custodian bank has also agreed to reduce its fees when the fund maintains cash on deposit in the non-interest-bearing custody account. For the year ended October 31, 2008, these arrangements reduced the fund’s management and administrative expenses by $2,160,000 and custodian fees by $79,000. The total expense reduction represented an effective annual rate of 0.01% of the fund’s average net assets.
E. Distributions are determined on a tax basis and may differ from net investment income and realized capital gains for financial reporting purposes. Differences may be permanent or temporary. Permanent differences are reclassified among capital accounts in the financial statements to reflect their tax character. Temporary differences arise when certain items of income, expense, gain, or loss are recognized in different periods for financial statement and tax purposes; these differences will reverse at some time in the future. Differences in classification may also result from the treatment of short-term gains as ordinary income for tax purposes.
For tax purposes, at October 31, 2008, the fund had $388,615,000 of ordinary income available for distribution. The fund had available realized losses of $3,384,640,000 to offset future net capital gains through October 31, 2016.
At October 31, 2008, the cost of investment securities for tax purposes was $35,686,622,000. Net unrealized depreciation of investment securities for tax purposes was $4,568,894,000, consisting of unrealized gains of $4,746,995,000 on securities that had risen in value since their purchase and $9,315,889,000 in unrealized losses on securities that had fallen in value since their purchase.
At October 31, 2008, the aggregate settlement value of open futures contracts expiring in December 2008 and the related unrealized appreciation (depreciation) were:
| | | ($000) |
| Number of | Aggregate | Unrealized |
| Long (Short) | Settlement | Appreciation |
Futures Contracts | Contracts | Value | (Depreciation) |
E-mini S&P 500 Index | 10,412 | 503,577 | (3,957) |
S&P 500 Index | 78 | 18,862 | (5,831) |
Unrealized appreciation (depreciation) on open futures contracts is required to be treated as realized gain (loss) for tax purposes.
27
Windsor II Fund
F. During the year ended October 31, 2008, the fund purchased $15,958,698,000 of investment securities and sold $17,923,275,000 of investment securities, other than temporary cash investments.
G. Capital share transactions for each class of shares were:
| | | Year Ended October 31, |
| | 2008 | | 2007 |
| Amount | Shares | | Amount | Shares |
| ($000) | (000) | | ($000) | (000) |
Investor Shares | | | | | |
Issued | 3,499,635 | 123,646 | | 4,380,015 | 120,782 |
Issued in Lieu of Cash Distributions | 3,715,460 | 121,524 | | 1,911,239 | 54,285 |
Redeemed | (5,494,918) | (195,573) | | (5,730,866) | (157,390) |
Net Increase (Decrease)—Investor Shares | 1,720,177 | 49,597 | | 560,388 | 17,677 |
Admiral Shares | | | | | |
Issued | 2,041,071 | 39,062 | | 4,143,312 | 64,275 |
Issued in Lieu of Cash Distributions | 2,193,289 | 40,423 | | 1,020,200 | 16,296 |
Redeemed | (3,097,843) | (62,881) | | (2,231,030) | (34,474) |
Net Increase (Decrease)—Admiral Shares | 1,136,517 | 16,604 | | 2,932,482 | 46,097 |
| | | | | | |
28
Windsor II Fund
H. Certain of the fund’s investments are in companies that are considered to be affiliated companies of the fund because the fund owns more than 5% of the outstanding voting securities of the company. Transactions during the period in securities of these companies were as follows:
| | | Current Period Transactions | |
| Oct. 31, 2007 | | Proceeds from | | Oct. 31, 2008 |
| Market | Purchases | Securities | Dividend | Market |
| Value | at Cost | Sold | Income | Value |
| ($000) | ($000) | ($000) | ($000) | ($000) |
Bear Stearns Co., Inc. | 949,509 | — | 233,790 | 2,518 | — |
CenterPoint Energy Inc. | 313,598 | — | — | 13,425 | 215,552 |
Cooper Industries, Inc. Class A | 589,786 | 85,055 | 24,721 | 11,497 | 393,823 |
ITT Industries, Inc. | NA1 | 24,044 | — | 5,694 | 406,361 |
Liz Claiborne, Inc. | NA2 | 16,818 | 18,016 | 1,108 | NA2 |
Massey Energy Co. | 136,424 | — | 157,182 | 513 | NA3 |
Service Corp. International | 377,379 | — | 13,773 | 4,013 | 173,053 |
Sherwin-Williams Co. | 551,879 | — | 85,227 | 11,365 | 402,433 |
SLM Corp. | 998,877 | — | 1,964 | — | NA3 |
Spectra Energy Corp. | NA1 | 24,743 | 49 | 29,854 | 625,076 |
Washington Mutual, Inc. | NA2 | 675,353 | 181,772 | 7,481 | NA2,4 |
Washington Mutual, Inc. Cvt. Pfd. | | | | | |
Private Placement | NA2 | 44,900 | — | 51 | —2,4 |
Wyndham Worldwide Corp. | 550,371 | 37,056 | 14,141 | 2,815 | 145,592 |
XL Capital Ltd. Class A | 940,084 | 101,709 | 27,577 | 18,593 | NA3 |
| 5,407,907 | | | 108,927 | 2,361,890 |
1 At October 31, 2007, the issuer was not an affiliated company of the fund.
2 Security not affiliated at October 31, 2007, and October 31, 2008, but affiliated during the period.
3 At October 31, 2008, the security is still held but the issuer is no longer an affiliated company of the fund.
4 Washington Mutual, Inc. Cvt. Pfd. Private Placement was converted to common shares in June 2008. Purchases and sales do not reflect the conversion.
29
Windsor II Fund
I. In September 2006, the Financial Accounting Standards Board issued Statement of Financial Accounting Standards No. 157 (“FAS 157”), “Fair Value Measurements.” FAS 157 establishes a framework for measuring fair value and expands disclosures about fair value measurements in financial statements.
The various inputs that may be used to determine the value of the fund’s investments are summarized in three broad levels. The inputs or methodologies used for valuing securities are not necessarily an indication of the risk associated with investing in those securities.
Level 1—Quoted prices in active markets for identical securities.
Level 2—Other significant observable inputs (including quoted prices for similar securities, interest rates, prepayment speeds, credit risk, etc.).
Level 3—Significant unobservable inputs (including the fund’s own assumptions used to determine the fair value of investments).
The following table summarizes the fund’s investments as of October 31, 2008, based on the inputs used to value them:
| Investments | Futures |
| in Securities | Contracts |
Valuation Inputs | ($000) | ($000) |
Level 1—Quoted prices | 31,042,480 | (9,788) |
Level 2—Other significant observable inputs | 75,248 | — |
Level 3—Significant unobservable inputs | — | — |
Total | 31,117,728 | (9,788) |
30
Report of Independent Registered
Public Accounting Firm
To the Trustees of Vanguard Windsor Funds and the Shareholders of Vanguard Windsor II Fund:
In our opinion, the accompanying statement of net assets and statement of assets and liabilities, and the related statements of operations and of changes in net assets and the financial highlights present fairly, in all material respects, the financial position of Vanguard Windsor II Fund (the “Fund”) at October 31, 2008, the results of its operations for the year then ended, the changes in its net assets for each of the two years in the period then ended and the financial highlights for each of the five years in the period then ended, in conformity with accounting principles generally accepted in the United States of America. These financial statements and financial highlights (hereafter referred to as “financial statements”) are the responsibility of the Fund’s management; our responsibility is to express an opinion on these financial statements based on our audits. We conducted our audits of these financial statements in accordance with the standards of the Public Company Accounting Oversight Board (United States). Those standards require that we plan and perform the audit to obtain reasonable assurance about whether the financial statements are free of material misstatement. An audit includes examining, on a test basis, evidence supporting the amounts and disclosures in the financial statements, assessing the accounting principles used and significant estimates made by management, and evaluating the overall financial statement presentation. We believe that our audits, which included confirmation of securities at October 31, 2008 by correspondence with the custodian and broker, and by agreement to the underlying ownership records for Vanguard Market Liquidity Fund, provide a reasonable basis for our opinion.
PricewaterhouseCoopers LLP
Philadelphia, Pennsylvania
December 19, 2008
Special 2008 tax information (unaudited) for Vanguard Windsor II Fund
This information for the fiscal year ended October 31, 2008, is included pursuant to provisions of the Internal Revenue Code.
The fund distributed $4,196,065,000 as capital gain dividends (from net long-term capital gains) to shareholders during the fiscal year.
For non-resident alien shareholders, 100% of short-term capital gain dividends distributed by the fund are qualified short-term capital gains.
The fund distributed $1,199,899,000 of qualified dividend income to shareholders during the fiscal year.
For corporate shareholders, 88.8% of investment income (dividend income plus short-term gains, if any) qualifies for the dividends-received deduction.
31
Your Fund’s After-Tax Returns
This table presents returns for your fund both before and after taxes. The after-tax returns are shown in two ways: (1) assuming that an investor owned the fund during the entire period and paid taxes on the fund’s distributions, and (2) assuming that an investor paid taxes on the fund’s distributions and sold all shares at the end of each period.
Calculations are based on the highest individual federal income tax and capital gains tax rates in effect at the times of the distributions and the hypothetical sales. State and local taxes were not considered. After-tax returns reflect any qualified dividend income, using actual prior-year figures and estimates for 2008. (In the example, returns after the sale of fund shares may be higher than those assuming no sale. This occurs when the sale would have produced a capital loss. The calculation assumes that the investor received a tax deduction for the loss.)
The table shows returns for Investor Shares only; returns for other share classes will differ. Please note that your actual after-tax returns will depend on your tax situation and may differ from those shown. Also note that if you own the fund in a tax-deferred account, such as an individual retirement account or a 401(k) plan, this information does not apply to you. Such accounts are not subject to current taxes.
Finally, keep in mind that a fund’s performance—whether before or after taxes—does not guarantee future results.
Average Annual Total Returns: Windsor II Fund Investor Shares1
Periods Ended October 31, 2008
| One | Five | Ten |
| Year | Years | Years |
Returns Before Taxes | –38.02% | 2.12% | 2.26% |
Returns After Taxes on Distributions | –39.36 | 1.20 | 0.86 |
Returns After Taxes on Distributions and Sale of Fund Shares | –22.31 | 2.20 | 1.65 |
1 Total returns do not include the account service fee that may be applicable to certain accounts with balances below $10,000.
32
About Your Fund’s Expenses
As a shareholder of the fund, you incur ongoing costs, which include costs for portfolio management, administrative services, and shareholder reports (like this one), among others. Operating expenses, which are deducted from a fund’s gross income, directly reduce the investment return of the fund.
A fund’s expenses are expressed as a percentage of its average net assets. This figure is known as the expense ratio. The following examples are intended to help you understand the ongoing costs (in dollars) of investing in your fund and to compare these costs with those of other mutual funds. The examples are based on an investment of $1,000 made at the beginning of the period shown and held for the entire period.
The accompanying table illustrates your fund’s costs in two ways:
• Based on actual fund return. This section helps you to estimate the actual expenses that you paid over the period. The “Ending Account Value” shown is derived from the fund’s actual return, and the third column shows the dollar amount that would have been paid by an investor who started with $1,000 in the fund. You may use the information here, together with the amount you invested, to estimate the expenses that you paid over the period.
To do so, simply divide your account value by $1,000 (for example, an $8,600 account value divided by $1,000 = 8.6), then multiply the result by the number given for your fund under the heading “Expenses Paid During Period.”
• Based on hypothetical 5% yearly return. This section is intended to help you compare your fund’s costs with those of other mutual funds. It assumes that the fund had a yearly return of 5% before expenses, but that the expense ratio is unchanged. In this case—because the return used is not the fund’s actual return—the results do not apply to your investment. The example is useful in making comparisons because the Securities and Exchange Commission requires all mutual funds to calculate expenses based on a 5% return. You can assess your fund’s costs by comparing this hypothetical example with the hypothetical examples that appear in shareholder reports of other funds.
Six Months Ended October 31, 2008 | | | |
| Beginning | Ending | Expenses |
| Account Value | Account Value | Paid During |
Windsor II Fund | 4/30/2008 | 10/31/2008 | Period1 |
Based on Actual Fund Return | | | |
Investor Shares | $1,000.00 | $710.04 | $1.38 |
Admiral Shares | 1,000.00 | 710.68 | 0.99 |
Based on Hypothetical 5% Yearly Return | | | |
Investor Shares | $1,000.00 | $1,023.59 | $1.63 |
Admiral Shares | 1,000.00 | 1,024.05 | 1.17 |
1 The calculations are based on expenses incurred in the most recent six-month period. The fund’s annualized six-month expense ratios for that period are 0.32% for Investor Shares and 0.23% for Admiral Shares. The dollar amounts shown as “Expenses Paid” are equal to the annualized expense ratio multiplied by the average account value over the period, multiplied by the number of days in the most recent six-month period, then divided by the number of days in the most recent 12-month period.
33
Note that the expenses shown in the table are meant to highlight and help you compare ongoing costs only and do not reflect transaction costs incurred by the fund for buying and selling securities. Further, the expenses do not include the account service fee described in the prospectus. If such a fee were applied to your account, your costs would be higher. Your fund does not charge transaction fees, such as purchase or redemption fees, nor does it carry a “sales load.”
The calculations assume no shares were bought or sold during the period. Your actual costs may have been higher or lower, depending on the amount of your investment and the timing of any purchases or redemptions.
You can find more information about the fund’s expenses, including annual expense ratios, in the Financial Statements section of this report. For additional information on operating expenses and other shareholder costs, please refer to your fund’s current prospectus.
34
Glossary
Beta. A measure of the magnitude of a fund’s past share-price fluctuations in relation to the ups and downs of a given market index. The index is assigned a beta of 1.00. Compared with a given index, a fund with a beta of 1.20 typically would have seen its share price rise or fall by 12% when the index rose or fell by 10%. For this report, beta is based on returns over the past 36 months for both the fund and the index. Note that a fund’s beta should be reviewed in conjunction with its R-squared (see definition). The lower the R-squared, the less correlation there is between the fund and the index, and the less reliable beta is as an indicator of volatility.
Earnings Growth Rate. The average annual rate of growth in earnings over the past five years for the stocks now in a fund.
Equity Exposure. A measure that reflects a fund’s investments in stocks and stock futures. Any holdings in short-term reserves are excluded.
Expense Ratio. The percentage of a fund’s average net assets used to pay its annual administrative and advisory expenses. These expenses directly reduce returns to investors.
Foreign Holdings. The percentage of a fund represented by stocks or depositary receipts of companies based outside the United States.
Inception Date. The date on which the assets of a fund (or one of its share classes) are first invested in accordance with the fund’s investment objective. For funds with a subscription period, the inception date is the day after that period ends. Investment performance is measured from the inception date.
Median Market Cap. An indicator of the size of companies in which a fund invests; the midpoint of market capitalization (market price x shares outstanding) of a fund’s stocks, weighted by the proportion of the fund’s assets invested in each stock. Stocks representing half of the fund’s assets have market capitalizations above the median, and the rest are below it.
Price/Book Ratio. The share price of a stock divided by its net worth, or book value, per share. For a fund, the weighted average price/book ratio of the stocks it holds.
Price/Earnings Ratio. The ratio of a stock’s current price to its per-share earnings over the past year. For a fund, the weighted average P/E of the stocks it holds. P/E is an indicator of market expectations about corporate prospects; the higher the P/E, the greater the expectations for a company’s future growth.
R-Squared. A measure of how much of a fund’s past returns can be explained by the returns from the market in general, as measured by a given index. If a fund’s total returns were precisely synchronized with an index’s returns, its R-squared would be 1.00. If the fund’s returns bore no relationship to the index’s returns, its R-squared would be 0. For this report, R-squared is based on returns over the past 36 months for both the fund and the index.
Return on Equity. The annual average rate of return generated by a company during the past five years for each dollar of shareholder’s equity (net income divided by shareholder’s equity). For a fund, the weighted average return on equity for the companies whose stocks it holds.
Short-Term Reserves. The percentage of a fund invested in highly liquid, short-term securities that can be readily converted to cash.
Turnover Rate. An indication of the fund’s trading activity. Funds with high turnover rates incur higher transaction costs and may be more likely to distribute capital gains (which may be taxable to investors). The turnover rate excludes in-kind transactions, which have minimal impact on costs.
35
Yield. A fund’s 30-day SEC yield is derived using a formula specified by the U.S. Securities and Exchange Commission. Under the formula, data related to the fund’s security holdings in the previous 30 days are used to calculate the fund’s hypothetical net income for that period, which is then annualized and divided by the fund’s estimated average net assets over the calculation period. For the purposes of this calculation, a security’s income is based on its current market yield to maturity (in the case of bonds) or its projected dividend yield (for stocks). Because the SEC yield represents hypothetical annualized income, it will differ—at times significantly—from the fund’s actual experience. As a result, the fund’s income distributions may be higher or lower than implied by the SEC yield.
36
This page intentionally left blank.
This page intentionally left blank.
This page intentionally left blank.
The People Who Govern Your Fund
The trustees of your mutual fund are there to see that the fund is operated and managed in your best interests since, as a shareholder, you are a part owner of the fund. Your fund’s trustees also serve on the board of directors of The Vanguard Group, Inc., which is owned by the Vanguard funds and provides services to them on an at-cost basis.
A majority of Vanguard’s board members are independent, meaning that they have no affiliation with Vanguard or the funds they oversee, apart from the sizable personal investments they have made as private individuals.
Our independent board members bring distinguished backgrounds in business, academia, and public service to their task of working with Vanguard officers to establish the policies and oversee the activities of the funds. Among board members’ responsibilities are selecting investment advisors for the funds; monitoring fund operations, performance, and costs; reviewing contracts; nominating and selecting new trustees/directors; and electing Vanguard officers.
Each trustee serves a fund until its termination; or until the trustee’s retirement, resignation, or death; or otherwise as specified in the fund’s organizational documents. Any trustee may be removed at a shareholders’ meeting by a vote representing two-thirds of the net asset value of all shares of the fund together with shares of other Vanguard funds organized within the same trust. The table on these two pages shows information for each trustee and executive officer of the fund. The mailing address of the trustees and officers is P.O. Box 876, Valley Forge, PA 19482.
Chairman of the Board and Trustee
John J. Brennan1
Born 1954 Principal Occupation(s) During the Past Five Years: Chairman of the Board and Director/ Trustee Since May 1987; Trustee of The Vanguard Group, Inc., and of each of the investment companies served Chairman of the Board by The Vanguard Group; Chief Executive Officer and President of The Vanguard Group 156 Vanguard Funds Overseen and of each of the investment companies served by The Vanguard Group (1996–2008).
Independent Trustees
Charles D. Ellis
Born 1937 Principal Occupation(s) During the Past Five Years: Applecore Partners (pro bono ventures Trustee Since January 2001 in education); Senior Advisor to Greenwich Associates (international business strategy 156 Vanguard Funds Overseen consulting); Successor Trustee of Yale University; Overseer of the Stern School of Business at New York University; Trustee of the Whitehead Institute for Biomedical Research.
Emerson U. Fullwood
Born 1948 Principal Occupation(s) During the Past Five Years: Executive Chief Staff and Marketing Trustee Since January 2008 Officer for North America since 2004 and Corporate Vice President of Xerox Corporation 156 Vanguard Funds Overseen (photocopiers and printers); Director of SPX Corporation (multi-industry manufacturing), of the United Way of Rochester, and of the Boy Scouts of America.
Rajiv L. Gupta
Born 1945 Principal Occupation(s) During the Past Five Years: Chairman, President, and Trustee Since December 20012 Chief Executive Officer of Rohm and Haas Co. (chemicals); Board Member of 156 Vanguard Funds Overseen the American Chemistry Council; Director of Tyco International, Ltd. (diversified manufacturing and services), since 2005.
Amy Gutmann
Born 1949 Principal Occupation(s) During the Past Five Years: President of the University of
Trustee Since June 2006 Pennsylvania since 2004; Professor in the School of Arts and Sciences, Annenberg School 156 Vanguard Funds Overseen for Communication, and Graduate School of Education of the University of Pennsylvania since 2004; Provost (2001–2004) and Laurance S. Rockefeller Professor of Politics and the University Center for Human Values (1990–2004), Princeton University; Director of Carnegie Corporation of New York since 2005 and of Schuylkill River Development Corporation and Greater Philadelphia Chamber of Commerce since 2004; Trustee of the National Constitution Center since 2007.
JoAnn Heffernan Heisen
Born 1950 Principal Occupation(s) During the Past Five Years: Corporate Vice President and Trustee Since July 1998 Chief Global Diversity Officer since 2006, Vice President and Chief Information 156 Vanguard Funds Overseen Officer (1997–2005), and Member of the Executive Committee of Johnson & Johnson (pharmaceuticals/consumer products); Director of the University Medical Center at Princeton and Women’s Research and Education Institute.
André F. Perold
Born 1952 Principal Occupation(s) During the Past Five Years: George Gund Professor of Finance Trustee Since December 2004 and Banking, Harvard Business School; Senior Associate Dean and Director of Faculty 156 Vanguard Funds Overseen Recruiting, Harvard Business School; Director and Chairman of UNX, Inc. (equities trading firm); Chair of the Investment Committee of HighVista Strategies LLC (private investment firm) since 2005.
Alfred M. Rankin, Jr.
Born 1941 Principal Occupation(s) During the Past Five Years: Chairman, President, Chief Executive Trustee Since January 1993 Officer, and Director of NACCO Industries, Inc. (forklift trucks/housewares/lignite); Director 156 Vanguard Funds Overseen of Goodrich Corporation (industrial products/aircraft systems and services).
J. Lawrence Wilson
Born 1936 Principal Occupation(s) During the Past Five Years: Retired Chairman and Chief Executive Trustee Since April 1985 Officer of Rohm and Haas Co. (chemicals); Director of Cummins Inc. (diesel engines) and 156 Vanguard Funds Overseen AmerisourceBergen Corp. (pharmaceutical distribution); Trustee of Vanderbilt University and of Culver Educational Foundation.
Executive Officers1
Thomas J. Higgins
Born 1957 Principal Occupation(s) During the Past Five Years: Principal of The Vanguard Group, Inc.; Chief Financial Officer Treasurer of each of the investment companies served by The Vanguard Group; Chief Since September 2008 Financial Officer of each of the investment companies served by The Vanguard Treasurer Since July 1998 Group since 2008. 156 Vanguard Funds Overseen
F. William McNabb III
Born 1957 Principal Occupation(s) During the Past Five Years: Chief Executive Officer, Director, Chief Executive Officer and President of The Vanguard Group, Inc., since 2008; Chief Executive Officer and Since August 31, 2008 President of each of the investment companies served by The Vanguard Group since President Since March 2008 2008; Director of Vanguard Marketing Corporation; Managing Director of The Vanguard 156 Vanguard Funds Overseen Group (1995–2008).
Heidi Stam
Born 1956 Principal Occupation(s) During the Past Five Years: Managing Director of The Vanguard Secretary Since July 2005 Group, Inc., since 2006; General Counsel of The Vanguard Group since 2005; Secretary of 156 Vanguard Funds Overseen The Vanguard Group and of each of the investment companies served by The Vanguard Group since 2005; Director and Senior Vice President of Vanguard Marketing Corporation since 2005; Principal of The Vanguard Group (1997–2006).
Vanguard Senior Management Team | | | |
| | | | |
R. Gregory Barton | Kathleen C. Gubanich | Michael S. Miller | Ralph K. Packard | George U. Sauter |
Mortimer J. Buckley | Paul A. Heller | James M. Norris | Glenn W. Reed | |
Founder
John C. Bogle
Chairman and Chief Executive Officer, 1974–1996
1 These individuals are “interested persons” as defined in the Investment Company Act of 1940.
2 December 2002 for Vanguard Equity Income Fund, Vanguard Growth Equity Fund, the Vanguard Municipal Bond Funds, and the Vanguard State Tax-Exempt Funds.
More information about the trustees is in the Statement of Additional Information, available from The Vanguard Group.

| P.O. Box 2600 |
| Valley Forge, PA 19482-2600 |
| |
| |
| |
| |
| |
| |
Connect with Vanguard®> www.vanguard.com |
| |
| |
| |
| |
Fund Information > 800-662-7447 | All comparative mutual fund data are from Lipper Inc. |
| or Morningstar, Inc., unless otherwise noted. |
Direct Investor Account Services > 800-662-2739 | |
| You can obtain a free copy of Vanguard’s proxy voting |
Institutional Investor Services > 800-523-1036 | guidelines by visiting our website, www.vanguard.com, |
| and searching for “proxy voting guidelines,” or by |
Text Telephone for People | calling Vanguard at 800-662-2739. The guidelines are |
With Hearing Impairment > 800-952-3335 | also available from the SEC’s website, www.sec.gov. |
| In addition, you may obtain a free report on how your |
| fund voted the proxies for securities it owned during |
| the 12 months ended June 30. To get the report, visit |
This material may be used in conjunction | either www.vanguard.com or www.sec.gov. |
with the offering of shares of any Vanguard | |
fund only if preceded or accompanied by | |
the fund’s current prospectus. | |
| |
| You can review and copy information about your fund |
| at the SEC’s Public Reference Room in Washington, D.C. |
| To find out more about this public service, call the SEC |
CFA® is a trademark owned by CFA Institute. | at 202-551-8090. Information about your fund is also |
| available on the SEC’s website, and you can receive |
The funds or securities referred to herein are not | copies of this information, for a fee, by sending a |
sponsored, endorsed, or promoted by MSCI, and MSCI | request in either of two ways: via e-mail addressed to |
bears no liability with respect to any such funds or | publicinfo@sec.gov or via regular mail addressed to the |
securities. For any such funds or securities, the | Public Reference Section, Securities and Exchange |
prospectus or the Statement of Additional Information | Commission, Washington, DC 20549-0102. |
contains a more detailed description of the limited | |
relationship MSCI has with The Vanguard Group and | |
any related funds. | |
| |
| |
Russell is a trademark of The Frank Russell Company. | |
| |
S&P 500® is a trademark of The McGraw-Hill | |
Companies, Inc., and has been licensed for use by | |
The Vanguard Group, Inc. Vanguard mutual funds are | |
not sponsored, endorsed, sold, or promoted by Standard | |
& Poor’s, and Standard & Poor’s makes no representation | |
regarding the advisability of investing in the funds. | |
| © 2008 The Vanguard Group, Inc. |
| All rights reserved. |
| Vanguard Marketing Corporation, Distributor. |
| |
Item 2: Code of Ethics. The Registrant has adopted a code of ethics that applies to the Registrant’s principal executive officer, principal financial officer, principal accounting officer or controller or persons performing similar functions. The Code of Ethics was amended during the reporting period covered by this report to make certain technical, non-material changes.
Item 3: Audit Committee Financial Expert. The following members of the Audit Committee have been determined by the Registrant’s Board of Trustees to be Audit Committee Financial Experts serving on its Audit Committee, and to be independent: Charles D. Ellis, Rajiv L. Gupta, JoAnn Heffernan Heisen, André F. Perold, Alfred M. Rankin, Jr., and J. Lawrence Wilson.
Item 4: Principal Accountant Fees and Services.
(a) Audit Fees.
Audit Fees of the Registrant
Fiscal Year Ended October 31, 2008: $54,000
Fiscal Year Ended October 31, 2007: $57,000
Aggregate Audit Fees of Registered Investment Companies in the Vanguard Group.
Fiscal Year Ended October 31, 2008: $3,055,590
Fiscal Year Ended October 31, 2007: $2,835,320
(b) Audit-Related Fees.
Fiscal Year Ended October 31, 2008: $626,240
Fiscal Year Ended October 31, 2007: $630,400
Includes fees billed in connection with assurance and related services provided to the Registrant, The Vanguard Group, Inc., Vanguard Marketing Corporation, and other registered investment companies in the Vanguard Group.
(c) Tax Fees.
Fiscal Year Ended October 31, 2008: $230,400
Fiscal Year Ended October 31, 2007: $215,900
Includes fees billed in connection with tax compliance, planning and advice services provided to the Registrant, The Vanguard Group, Inc., Vanguard Marketing Corporation, and other registered investment companies in the Vanguard Group and related to income and excise taxes.
(d) All Other Fees.
Fiscal Year Ended October 31, 2008: $0
Fiscal Year Ended October 31, 2007: $0
Includes fees billed for services related to risk management and privacy matters. Services were provided to the Registrant, The Vanguard Group, Inc., Vanguard Marketing Corporation, and other registered investment companies in the Vanguard Group.
(e) (1) Pre-Approval Policies. The policy of the Registrant’s Audit Committee is to consider and, if appropriate, approve before the principal accountant is engaged for such services, all specific audit and non-audit services provided to: (1) the Registrant; (2) The Vanguard Group, Inc.; (3) other entities controlled by The Vanguard Group, Inc. that provide ongoing services to the Registrant; and (4) other registered investment companies in the Vanguard Group. In making a determination, the Audit Committee considers whether the services are consistent with maintaining the principal accountant’s independence.
In the event of a contingency situation in which the principal accountant is needed to provide services in between scheduled Audit Committee meetings, the Chairman of the Audit Committee would be called on to consider and, if appropriate, pre-approve audit or permitted non-audit services in an amount sufficient to complete services through the next Audit Committee meeting, and to determine if such services would be consistent with maintaining the accountant’s independence. At the next scheduled Audit Committee meeting, services and fees would be presented to the Audit Committee for formal consideration, and, if appropriate, approval by the entire Audit Committee. The Audit Committee would again consider whether such services and fees are consistent with maintaining the principal accountant’s independence.
The Registrant’s Audit Committee is informed at least annually of all audit and non-audit services provided by the principal accountant to the Vanguard complex, whether such services are provided to: (1) the Registrant; (2) The Vanguard Group, Inc.; (3) other entities controlled by The Vanguard Group, Inc. that provide ongoing services to the Registrant; or (4) other registered investment companies in the Vanguard Group.
(2) No percentage of the principal accountant’s fees or services were approved pursuant to the waiver provision of paragraph (c)(7)(i)(C) of Rule 2-01 of Regulation S-X.
(f) For the most recent fiscal year, over 50% of the hours worked under the principal accountant’s engagement were not performed by persons other than full-time, permanent employees of the principal accountant.
(g) Aggregate Non-Audit Fees.
Fiscal Year Ended October 31, 2008: $230,400
Fiscal Year Ended October 31, 2007: $215,900
Includes fees billed for non-audit services provided to the Registrant, The Vanguard Group, Inc., Vanguard Marketing Corporation, and other registered investment companies in the Vanguard Group.
(h) For the most recent fiscal year, the Audit Committee has determined that the provision of all non-audit services was consistent with maintaining the principal accountant’s independence.
Item 5: Not Applicable.
Item 6: Not Applicable.
Item 7: Not Applicable.
Item 8: Not Applicable.
Item 9: Not Applicable.
Item 10: Not Applicable.
Item 11: Controls and Procedures.
(a) Disclosure Controls and Procedures. The Principal Executive and Financial Officers concluded that the Registrant's Disclosure Controls and Procedures are effective based on their evaluation of the Disclosure Controls and Procedures as of a date within 90 days of the filing date of this report.
(b) Internal Control Over Financial Reporting. There were no significant changes in Registrant’s Internal Control Over Financial Reporting or in other factors that could significantly affect this control subsequent to the date of the evaluation, including any corrective actions with regard to significant deficiencies and material weaknesses.
Item 12: Exhibits.
(a) Code of Ethics.
(b) Certifications.
Pursuant to the requirements of the Securities Exchange Act of 1934 and the Investment Company Act of 1940, the registrant has duly caused this report to be signed on its behalf by the undersigned, thereunto duly authorized.
| VANGUARD WINDSOR FUNDS |
| |
BY: | /s/ F. WILLIAM MCNABB III* |
| F. WILLIAM MCNABB III |
| CHIEF EXECUTIVE OFFICER |
Date: December 16, 2008
Pursuant to the requirements of the Securities Exchange Act of 1934 and the Investment Company Act of 1940, this report has been signed below by the following persons on behalf of the registrant and in the capacities and on the dates indicated.
| VANGUARD WINDSOR FUNDS |
| |
BY: | /s/ F. WILLIAM MCNABB III* |
| F. WILLIAM MCNABB III |
| CHIEF EXECUTIVE OFFICER |
Date: December 16, 2008
| VANGUARD WINDSOR FUNDS |
| |
BY: | /s/ THOMAS J. HIGGINS * |
| THOMAS J. HIGGINS |
| CHIEF FINANCIAL OFFICER |
Date: December 16, 2008
* By: /s/ Heidi Stam
Heidi Stam, pursuant to a Power of Attorney filed on January 18, 2008, see file Number 2-29601, Incorporated by Reference; and pursuant to a Power of Attorney filed on September 26, 2008, see File Number 2-47371, Incorporated by Reference.