UNITED STATES
SECURITIES AND EXCHANGE COMMISSION
Washington, D.C. 20549
FORM N-CSR
CERTIFIED SHAREHOLDER REPORT
OF
REGISTERED MANAGEMENT INVESTMENT COMPANIES
| | |
| Investment Company Act file number: 811-00834 |
Name of Registrant: | Vanguard Windsor Funds |
Address of Registrant: | P.O. Box 2600 |
| | Valley Forge, PA 19482 |
Name and address of agent for service: | Heidi Stam, Esquire |
| | P.O. Box 876 |
| | Valley Forge, PA 19482 |
Registrant’s telephone number, including area code: (610) 669-1000 |
Date of fiscal year end: October 31 | |
Date of reporting period: November 1, 2012 – October 31, 2013 |
Item 1: Reports to Shareholders | |

Annual Report | October 31, 2013
Vanguard Windsor™ Fund

Vanguard’s Principles for Investing Success
We want to give you the best chance of investment success. These principles, grounded in Vanguard’s research and experience, can put you on the right path.
Goals. Create clear, appropriate investment goals.
Balance. Develop a suitable asset allocation using broadly diversified funds. Cost. Minimize cost.
Discipline. Maintain perspective and long-term discipline.
A single theme unites these principles: Focus on the things you can control.
We believe there is no wiser course for any investor.
| |
| Contents | |
| Your Fund’s Total Returns. | 1 |
| Chairman’s Letter. | 2 |
| Advisors’ Report. | 7 |
| Fund Profile. | 11 |
| Performance Summary. | 12 |
| Financial Statements. | 14 |
| Your Fund’s After-Tax Returns. | 27 |
| About Your Fund’s Expenses. | 28 |
| Glossary. | 30 |
Please note: The opinions expressed in this report are just that—informed opinions. They should not be considered promises or advice. Also, please keep in mind that the information and opinions cover the period through the date on the front of this report. Of course, the risks of investing in your fund are spelled out in the prospectus.
See the Glossary for definitions of investment terms used in this report.
About the cover: The ship's wheel represents leadership and guidance, essential qualities in navigating difficult seas. This one is a replica based on an 18th-century British vessel. The HMS Vanguard, another ship of that era, served as the flagship for Admiral Horatio Nelson when he defeated a French fleet at the Battle of the Nile.
Your Fund’s Total Returns
| |
| Fiscal Year Ended October 31, 2013 | |
| |
| | Total |
| | Returns |
| Vanguard Windsor Fund | |
| Investor Shares | 35.17% |
| Admiral™ Shares | 35.32 |
| Russell 1000 Value Index | 28.29 |
| Multi-Cap Value Funds Average | 30.08 |
| Multi-Cap Value Funds Average: Derived from data provided by Lipper, a Thomson Reuters Company. |
Admiral Shares carry lower expenses and are available to investors who meet certain account-balance requirements.
| | | | |
| Your Fund’s Performance at a Glance | | | | |
| October 31, 2012, Through October 31, 2013 | | | | |
| | | | Distributions Per Share |
| | Starting | Ending | | |
| | Share | Share | Income | Capital |
| | Price | Price | Dividends | Gains |
| Vanguard Windsor Fund | | | | |
| Investor Shares | $14.66 | $19.50 | $0.254 | $0.000 |
| Admiral Shares | 49.47 | 65.81 | 0.913 | 0.000 |
1

Chairman’s Letter
Dear Shareholder,
The U.S. stock market’s strong and steady climb during the past 12 months has certainly helped Vanguard Windsor Fund to record robust performance. But Windsor had an extra edge: Its advisors’ security selection, especially among financial stocks, boosted the fund to a return well beyond the market’s strong result.
Because of this, Windsor Fund posted its highest fiscal-year gain in more than two decades. The fund’s Investor Shares returned 35.17% and its Admiral Shares 35.32%. By comparison, the fund’s benchmark index returned 28.29%, and the average return produced by competing funds was 30.08%.
If you own Windsor shares in a taxable account, you may wish to review the fund’s after-tax returns presented later in this report.
Amid uncertainties, U.S. stocks found a path to strong returns
U.S. stocks faced several challenges en route to an impressive result for the 12-month period—challenges that, as it turned out, propelled both large-cap value and growth stocks to return about 29% (as measured by the Russell 1000 Indexes). Investors’ growing appetite for risk drove the general rise in stocks, as corporate profit growth, on the whole, wasn’t particularly tantalizing.
2
Although the end of the fiscal year was notable for the budget impasse that resulted in October’s 16-day partial federal government shutdown, the period as a whole was marked by uncertainties about Federal Reserve monetary policy and concern about the economy’s patchy growth. Vanguard’s chief economist, Joe Davis, recently noted that “as was the case at the start of the year, the U.S. economy continues to expand at a modest and uneven pace.”
The disparity between the performance of the U.S. economy and U.S. stocks may seem surprising, but Vanguard research has shown that over the long term, a nation’s economic growth has a weak relationship with its stock returns. (You
can read more in The Outlook for Emerging Market Stocks in a Lower-Growth World, available at vanguard.com/research.)
Outside of the United States, stocks returned about 20%. The developed markets of Europe and the Pacific region delivered robust gains; emerging-market stocks failed to keep pace.
Bond returns suffered as investors kept an eye on the Fed
With investors fretting over the Fed’s next move in its stimulative bond-buying program, bonds recorded negative results for the 12 months. The broad U.S. taxable bond market returned –1.08%. The yield of the 10-year Treasury note closed at 2.54%, down from 2.63% at September’s close,
| | | |
| Market Barometer | | | |
| |
| | | Average Annual Total Returns |
| | | Periods Ended October 31, 2013 |
| | One | Three | Five |
| | Year | Years | Years |
| Stocks | | | |
| Russell 1000 Index (Large-caps) | 28.40% | 16.83% | 15.84% |
| Russell 2000 Index (Small-caps) | 36.28 | 17.69 | 17.04 |
| Russell 3000 Index (Broad U.S. market) | 28.99 | 16.89 | 15.94 |
| MSCI All Country World Index ex USA (International) | 20.29 | 6.04 | 12.48 |
| |
| Bonds | | | |
| Barclays U.S. Aggregate Bond Index (Broad taxable market) | -1.08% | 3.02% | 6.09% |
| Barclays Municipal Bond Index (Broad tax-exempt market) | -1.72 | 3.60 | 6.37 |
| Citigroup Three-Month U.S. Treasury Bill Index | 0.06 | 0.07 | 0.12 |
| |
| CPI | | | |
| Consumer Price Index | 0.96% | 2.21% | 1.52% |
3
but up from 1.69% at the end of the last fiscal year. (Bond yields and prices move in opposite directions.)
Municipal bonds returned –1.72%, and international bonds returned –1.95% (as measured by the Barclays Global Aggregate Index ex USD).
The Fed’s target for short-term interest rates remained at 0%–0.25%, severely limiting returns of money market funds and savings accounts.
Financial stock selections boosted the fund’s performance
Windsor Fund’s strategy is to search for large-capitalization stocks that are temporarily out of favor and will eventually rebound. As Windsor’s former long-serving portfolio manager John Neff, once put it: “To us, ugly stocks were often beautiful.”
The fund has now practiced its strategy for 55 years, since before Vanguard’s founding. Clearly Windsor’s strategy has stood the test of time, but we should note that its short-term volatility often produces results that fall far short or well ahead of its benchmark. Thus, investors in the fund should have a long-term time horizon.
During the fiscal year, the advisors’ approach was particularly profitable within the financial sector. Indeed, eight of the fund’s 20 top-performing stocks were from the sector. Windsor’s financial stocks represented almost a quarter of its
| | | |
| Expense Ratios | | | |
| Your Fund Compared With Its Peer Group | | | |
| | Investor | Admiral | Peer Group |
| | Shares | Shares | Average |
| Windsor Fund | 0.41% | 0.31% | 1.25% |
The fund expense ratios shown are from the prospectus dated February 27, 2013, and represent estimated costs for the current fiscal year.
For the fiscal year ended October 31, 2013, the fund’s expense ratios were 0.37% for Investor Shares and 0.27% for Admiral Shares. The
peer-group expense ratio is derived from data provided by Lipper, a Thomson Reuters Company, and captures information through year-end
2012.
Peer group: Multi-Cap Value Funds.
4
holdings at the fiscal-year-end, and they provided around a third of its 12-month return. Insurance stocks—life, property-casualty, and diversified “multi-line” firms—were the largest contributors in the group, followed by diversified banking companies and asset-management firms.
Another third of the fund’s return, roughly speaking, came from its holdings of information technology and industrial stocks.
As is usual, not every stock selection did well in the period. About 5% of the fund’s holdings detracted from its fiscal-year return; these detractors came from industries as varied as fertilizer production and retailing.
A 5-, 10-, and 55-year look at Windsor Fund’s solid returns
A review of its performance over the past decade shows Windsor Fund producing solidly competitive returns overall. The fund’s returns for Investor Shares averaged 7.28% a year, a step behind the 7.81% of its benchmark index, but ahead of the 7.05% average for peer-group funds.
The ten-year performance results for Windsor and most other stock funds are still burdened by the declines that world stock markets took in the financial crisis: Windsor’s benchmark dropped almost 37% in fiscal-year 2008, and the fund itself plummeted 44%. The fund’s willingness to make large commitments to out-of-favor companies can make for
| |
| Total Returns | |
| Ten Years Ended October 31, 2013 | |
| | Average |
| | Annual Return |
| Windsor Fund Investor Shares | 7.28% |
| Russell 1000 Value Index | 7.81 |
| Multi-Cap Value Funds Average | 7.05 |
| Multi-Cap Value Funds Average: Derived from data provided by Lipper, a Thomson Reuters Company. |
The figures shown represent past performance, which is not a guarantee of future results. (Current performance may be
lower or higher than the performance data cited. For performance data current to the most recent month-end, visit our
website at vanguard.com/performance.) Note, too, that both investment returns and principal value can fluctuate widely, so
an investor’s shares, when sold, could be worth more or less than their original cost.
5
sharp contrasts in yearly performance, but the crisis period was clearly extraordinary. In the five fiscal years since then, stocks have recovered. The benchmark has climbed by 14.06% a year, on average; Windsor, by 17.47% a year.
This year the Windsor Fund celebrates its 55th birthday. Financial crises aside, the fund has experienced a wide variety of economic and market conditions, and unexpected and unsettling uncertainties of one kind or another. With the help of its skilled advisors, Windsor has generated an average annual return of 11.52% since its inception in 1958. We believe that the fund’s strategy can continue to serve long-term investors well in the years to come.
The twin benefits of combining low costs and diversity of thought
Investors sometimes ask why Vanguard uses a multi-advisor approach for many of its actively managed equity funds. Just as we recommend diversification within and across asset classes for an investor’s overall portfolio, we think significant benefits can accrue from using multiple advisory firms for a single fund: diversity of investment process and style, thought, and holdings.
All of these elements can lead to less risk and better results. Because not all investment managers invest the same way, their returns relative to the benchmark don’t move in lockstep.
As with many investment topics, however, there are some misconceptions about the benefits of using a multi-manager approach. For example, it is often suggested that the best ideas of the advisors are diluted when they are combined in one portfolio. Recent Vanguard research has found otherwise.
Conventional wisdom also suggests that multi-manager funds tend to be expensive. At Vanguard, this is not the case: Low costs are a hallmark of all our offerings. And Vanguard research indicates that low costs can contribute greatly to investing success, helping investors keep more of a portfolio’s return. (You can read more in Analyzing Multi-Manager Funds: Does Management Structure Affect Performance? at vanguard.com/research.)
As always, thank you for investing with Vanguard.
Sincerely,

F. William McNabb III
Chairman and Chief Executive Officer
November 12, 2013
6
Advisors’ Report
For the fiscal year ended October 31, 2013, the Investor Shares of Vanguard Windsor Fund returned 35.17%, while the lower-cost Admiral Shares returned 35.32%. Your fund is managed by two independent advisors, a strategy that enhances the fund’s diversification by providing exposure to distinct, yet complementary, investment approaches. It is not uncommon for different advisors to have different views about individual securities or the broader investment environment.
The advisors, the percentage and amount of fund assets that each manages, and brief descriptions of their investment strategies are presented in the table below. The advisors have also prepared a discussion of the investment environment that existed during the period and of how their portfolio positioning reflects this assessment. These reports were prepared on November 12, 2013.
Wellington Management Company, llp
Portfolio Manager:
James N. Mordy, Senior Vice President
and Equity Portfolio Manager
Equity markets shook off many challenges during the year, including sequestration, the U.S. government shutdown, higher long-term interest rates, and some slowing in emerging market economies. As the Federal Reserve continued to hold down rates through quantitative easing, the Standard & Poor’s 500 Index returned more than 27%.
| | | |
| Vanguard Windsor Fund Investment Advisors | |
| |
| | Fund Assets Managed | |
| Investment Advisor | % | $ Million | Investment Strategy |
| Wellington Management | 69 | 11,253 | Seeks to provide long-term total returns above both the |
| Company, LLP | | | S&P 500 and value-oriented indexes over a complete |
| | | | market cycle through bottom-up, fundamentally driven |
| | | | stock selection focused on undervalued securities. |
| Pzena Investment Management, | 28 | 4,618 | Uses a fundamental, bottom-up, deep-value-oriented |
| LLC | | | investment strategy. Seeks to buy good businesses at |
| | | | low prices, focusing exclusively on companies that are |
| | | | underperforming their historically demonstrated |
| | | | earnings power. |
| Cash Investments | 3 | 400 | These short-term reserves are invested by Vanguard in |
| | | | equity index products to simulate investment in stocks. |
| | | | Each advisor also may maintain a modest cash |
| | | | position. |
7
We now expect corporate earnings will prove to have grown by only about 5% in 2013, which means that the market advance can be attributed mostly to investors’ willingness to pay a higher price/earnings multiple. It was a good environment for playing offense rather than defense, as the more volatile stocks did well while the higher-yielding, “safer” stocks lagged. Given our tilt toward the more cyclical sectors of the market, we were well-positioned.
Partly because we significantly underweighted Apple, our best relative sector performance came from information technology. We further benefited from a large position in semiconductor and related stocks, including ASML Holding, SanDisk, and Avago Technologies, all of which provided very strong returns.
Financial holdings, which remain the largest group in our portfolio, also delivered excellent performance. We favored insurance stocks and notched outsized gains from Ameriprise Financial, Principal Financial Group, Unum Group, and American International Group. Stocks of these companies benefited from a combination of overall market strength, higher interest rates, and management’s internal efforts to improve profitability.
Two other sectors where we had excellent stock selection were industrials and energy. Delta Air Lines stood out; not only do airline fundamentals remain strong, but the company announced plans to return capital to shareholders—something heretofore unimaginable in the industry. Also within
industrials, Pentair and Dover were fruitful holdings, as both companies have a self-help dimension that provides an extra boost to earnings in a slow-growth economy: Pentair will realize significant synergies from its merger with Tyco’s flow-control business, and Dover has made a number of prudent decisions to prune its portfolio of businesses and become a more focused company.
In energy, we maintained our relatively aggressive positioning, favoring exploration and production companies and service firms over the larger integrated oil companies, and our performance bounced back from fiscal 2012.
Our worst sector was consumer discretionary, which we underweighted; buoyed by rising equity markets and home prices, it turned out to be a top-performing sector. We underestimated how resilient the consumer would be in a very challenging macro environment. We should have eliminated, instead of merely reducing, our home-builder position. With hindsight, the stocks had run up ahead of fundamentals in 2012, and they lagged the market in 2013. We also made a mistake with Kohl’s, as several initiatives from management to kick-start the business proved ineffective.
Materials was the only other sector in which our relative performance lagged. Our fertilizer stocks took a hit when a Russian-Belarusian potash cartel collapsed. A brief contrarian move into Barrick Gold was quite poorly timed, as the price of gold remained under intense selling pressure.
8
One of the year’s more notable market developments was the rise in the yield of 10-year U.S. Treasury notes after the Fed first suggested that it might begin tapering its quantitative easing program. Higher rates seemed inevitable to us, and this was one of the reasons we underweighted the more interest-sensitive sectors, such as utilities and telecommunications. Like many, we were surprised at the Fed’s September decision not to taper; still, if the economic data are supportive, the process should begin in 2014.
Although major uncertainties remain concerning future government policy, we are reasonably optimistic about the economic outlook. In the coming year, we should see less fiscal drag on the U.S. economy from the public sector, a modest pickup in Europe, stabilization of growth in China, and, possibly, some acceleration in Japan. With that in mind, we are slightly more overweight in the cyclical sectors than we were a year ago. This modest growth outlook is certainly vulnerable to unforeseen shocks, however, and we recognize that the upward trend in corporate profits appears to be more dependent on revenue growth than it was in the first four years of the economic recovery.
During the fiscal year we favored the information technology, industrial, and energy sectors for net new purchases. We were net sellers within financials, consumer discretionary, and consumer staples. Our two largest portfolio additions were Bristol-Myers Squibb, which has emerged as a leader in new therapies
that could revolutionize cancer treatment, and MetLife, which would be a prime beneficiary of higher interest rates.
We will continue to look for opportunities to prudently buy good companies at discount prices, as we believe that this is the best way to create value for Windsor shareholders over the long run.
Pzena Investment Management, LLC
Portfolio Managers:
Richard Pzena, Managing Principal
and co-Chief Investment Officer
John P. Goetz, Managing Principal
and co-Chief Investment Officer
Antonio DeSpirito, Managing Principal
Our portfolio’s performance over the fiscal year was driven in large part by financial and information technology stocks—the largest allocations on both an absolute and relative basis.
Hewlett-Packard was the largest contributor. Although we expect revenues to remain weak, HP has a compelling valuation, and management is taking thoughtful steps to prune businesses, cut costs, and invest in product development. The result is a company that is positioned for earnings recovery, with strong free cash flow above earnings. HP continues to be one of our largest positions, and it trades at 5.8 times our estimate of normalized earnings. Among other large contributors was TE Connectivity, which returned approximately 63% on strong volume growth and margin improvement.
9
Outside financials and tech, another major contributor was Delphi Automotive. Its shares have risen by more than 80% over the fiscal year thanks to a resurgent U.S. auto market and nascent signs of a European recovery. At the other extreme, the utilities and consumer staples sectors contributed least; our portfolio has very little exposure to these two sectors because of their high relative valuations. Our principal utility holding, Entergy, has been especially weak recently, as earnings were affected by unfavorable weather, low electricity prices, and unplanned outages in the nuclear fleet. The company maintained its earnings guidance for the year.
Based on our ongoing review of fundamentals and valuations, we believe we remain firmly in the midst of a value cycle. Many of the companies that hit our research screens are on solid financial footing, generating significant amounts of free cash flow and positioned to fare well even in a low-growth environment.
The combination of high expected returns and deeply discounted valuations has given rise to some very attractive investment opportunities, making this an exciting time to be constructing value portfolios. Cyclical stocks, which have been dominated by financials, old-line technology, and, to a growing extent, energy, continue to be attractively valued, and they remain our largest exposures. High-dividend-paying sectors with noncyclical earnings profiles (such as utilities, consumer staples, REITs, and pharmaceuticals) continue to trade at premium valuations and have little or no representation in our portfolio.
Most recently, we have modestly increased our weightings in the consumer discretionary, health care, and energy sectors, while trimming our financial services and defense stocks because of price appreciation.
10
Windsor Fund
Fund Profile
As of October 31, 2013
| | |
| Share-Class Characteristics | |
| | Investor | Admiral |
| | Shares | Shares |
| Ticker Symbol | VWNDX | VWNEX |
| Expense Ratio1 | 0.41% | 0.31% |
| 30-Day SEC Yield | 1.30% | 1.40% |
| | | |
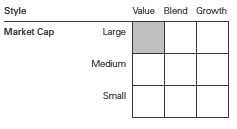
| Portfolio Characteristics | | |
| | | | DJ U.S. |
| | | Russell | Total |
| | | 1000 | Market |
| | | Value | FA |
| | Fund | Index | Index |
| Number of Stocks | 128 | 653 | 3,612 |
| Median Market Cap | $27.1B | $50.6B | $41.6B |
| Price/Earnings Ratio | 18.4x | 16.7x | 19.8x |
| Price/Book Ratio | 1.9x | 1.7x | 2.5x |
| Return on Equity | 12.4% | 12.5% | 16.5% |
| Earnings Growth | | | |
| Rate | 7.6% | 6.6% | 10.6% |
| Dividend Yield | 1.7% | 2.3% | 1.9% |
| Foreign Holdings | 15.1% | 0.0% | 0.0% |
| Turnover Rate | 40% | — | — |
| Short-Term Reserves | 1.7% | — | — |
| | | |
| Sector Diversification (% of equity exposure) |
| | | Russell | DJ U.S. |
| | | 1000 | Total |
| | | Value | Market |
| | Fund | Index | FA Index |
| Consumer | | | |
| Discretionary | 10.1% | 6.6% | 13.3% |
| Consumer Staples | 4.9 | 6.0 | 8.8 |
| Energy | 13.1 | 15.0 | 9.7 |
| Financials | 24.2 | 28.7 | 17.3 |
| Health Care | 13.5 | 12.9 | 12.5 |
| Industrials | 12.0 | 10.2 | 11.5 |
| Information | | | |
| Technology | 16.9 | 8.8 | 17.7 |
| Materials | 3.9 | 2.9 | 3.8 |
| Telecommunication | | | |
| Services | 0.3 | 2.7 | 2.2 |
| Utilities | 1.1 | 6.2 | 3.2 |
| | |
| Volatility Measures | | |
| | Russell | |
| | 1000 | DJ U.S. |
| | Value | Total Market |
| | Index | FA Index |
| R-Squared | 0.96 | 0.97 |
| Beta | 1.07 | 1.11 |
| These measures show the degree and timing of the fund’s fluctuations compared with the indexes over 36 months. |
| | |
| Ten Largest Holdings (% of total net assets) |
| American International | | |
| Group Inc. | Multi-line Insurance | 2.2% |
| Citigroup Inc. | Diversified Financial | |
| | Services | 2.0 |
| Wells Fargo & Co. | Diversified Banks | 2.0 |
| Baker Hughes Inc. | Oil & Gas Equipment | |
| | & Services | 1.9 |
| Eaton Corp. plc | Electrical | |
| | Components & | |
| | Equipment | 1.8 |
| MetLife Inc. | Life & Health | |
| | Insurance | 1.6 |
| Ameriprise Financial Inc. Asset Management | |
| | & Custody Banks | 1.5 |
| Roche Holding AG | Pharmaceuticals | 1.5 |
| Cisco Systems Inc. | Communications | |
| | Equipment | 1.4 |
| Avago Technologies Ltd. Semiconductors | 1.4 |
| Top Ten | | 17.3% |
| The holdings listed exclude any temporary cash investments and equity index products. |
Investment Focus
1 The expense ratios shown are from the prospectus dated February 27, 2013, and represent estimated costs for the current fiscal year. For
the fiscal year ended October 31, 2013, the expense ratios were 0.37% for Investor Shares and 0.27% for Admiral Shares.
11
Windsor Fund
Performance Summary
All of the returns in this report represent past performance, which is not a guarantee of future results that may be achieved by the fund. (Current performance may be lower or higher than the performance data cited. For performance data current to the most recent month-end, visit our website at vanguard.com/performance.) Note, too, that both investment returns and principal value can fluctuate widely, so an investor’s shares, when sold, could be worth more or less than their original cost. The returns shown do not reflect taxes that a shareholder would pay on fund distributions or on the sale of fund shares.
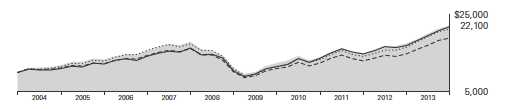
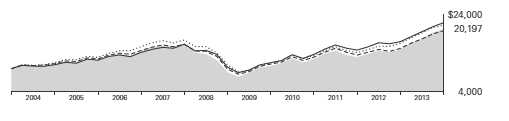
Cumulative Performance: October 31, 2003, Through October 31, 2013
Initial Investment of $10,000
| | | | | |
| | | Average Annual Total Returns | |
| | | Periods Ended October 31, 2013 | |
| | | | | | Final Value |
| | | One | Five | Ten | of a $10,000 |
| | | Year | Years | Years | Investment |
| | Windsor Fund*Investor Shares | 35.17% | 17.47% | 7.28% | $20,197 |
| •••••••• | Russell 1000 Value Index | 28.29 | 14.06 | 7.81 | 21,209 |
| – – – – | Multi-Cap Value Funds Average | 30.08 | 14.87 | 7.05 | 19,773 |
| | Dow Jones U.S. Total Stock Market | | | | |
| | Float Adjusted Index | 28.86 | 16.01 | 8.13 | 21,850 |
| Multi-Cap Value Funds Average: Derived from data provided by Lipper, a Thomson Reuters Company. |
| | | | |
| | | | | Final Value |
| | One | Five | Ten | of a $50,000 |
| | Year | Years | Years | Investment |
| Windsor Fund Admiral Shares | 35.32% | 17.61% | 7.40% | $102,106 |
| Russell 1000 Value Index | 28.29 | 14.06 | 7.81 | 106,044 |
| Dow Jones U.S. Total Stock Market Float | | | | |
| Adjusted Index | 28.86 | 16.01 | 8.13 | 109,248 |
See Financial Highlights for dividend and capital gains information.
12
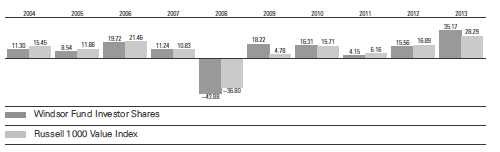
Windsor Fund
Fiscal-Year Total Returns (%): October 31, 2003, Through October 31, 2013
Average Annual Total Returns: Periods Ended September 30, 2013
This table presents returns through the latest calendar quarter—rather than through the end of the fiscal period.
Securities and Exchange Commission rules require that we provide this information.
| | | | |
| | Inception | One | Five | Ten |
| | Date | Year | Years | Years |
| Investor Shares | 10/23/1958 | 29.31% | 12.08% | 7.51% |
| Admiral Shares | 11/12/2001 | 29.49 | 12.21 | 7.62 |
13
Windsor Fund
Financial Statements
Statement of Net Assets
As of October 31, 2013
The fund reports a complete list of its holdings in regulatory filings four times in each fiscal year, at the quarter-ends. For the second and fourth fiscal quarters, the lists appear in the fund’s semiannual and annual reports to shareholders. For the first and third fiscal quarters, the fund files the lists with the Securities and Exchange Commission on Form N-Q. Shareholders can look up the fund’s Forms N-Q on the SEC’s website at sec.gov. Forms N-Q may also be reviewed and copied at the SEC’s Public Reference Room (see the back cover of this report for further information).
| | | |
| | | | Market |
| | | | Value |
| | | Shares | ($000) |
| Common Stocks (96.9%)1 | | |
| Consumer Discretionary (9.7%) | |
| | Lowe’s Cos. Inc. | 3,535,600 | 176,002 |
| | GNC Holdings Inc. | | |
| | Class A | 2,656,200 | 156,238 |
| | Nordstrom Inc. | 2,413,100 | 145,920 |
| | Staples Inc. | 7,966,725 | 128,424 |
| | Newell Rubbermaid Inc. | 4,151,700 | 123,015 |
| | Omnicom Group Inc. | 1,759,100 | 119,812 |
| * | Toll Brothers Inc. | 3,392,300 | 111,539 |
| | Ford Motor Co. | 6,444,900 | 110,272 |
| | Comcast Corp. | 2,105,400 | 97,480 |
| * | TRW Automotive | | |
| | Holdings Corp. | 930,800 | 69,913 |
| * | General Motors Co. | 1,888,700 | 69,788 |
| | Lennar Corp. Class A | 1,564,200 | 55,607 |
| | TJX Cos. Inc. | 812,600 | 49,398 |
| | Delphi Automotive plc | 819,425 | 46,871 |
| | Kohl’s Corp. | 786,975 | 44,700 |
| * | News Corp. Class A | 2,365,125 | 41,626 |
| * | News Corp. Class B | 1,469,052 | 26,340 |
| | | | 1,572,945 |
| Consumer Staples (4.6%) | | |
| | Japan Tobacco Inc. | 5,601,600 | 202,687 |
| | Bunge Ltd. | 2,294,500 | 188,447 |
| | CVS Caremark Corp. | 2,021,900 | 125,884 |
| | Ingredion Inc. | 1,764,500 | 116,034 |
| | Wal-Mart Stores Inc. | 906,625 | 69,583 |
| | Molson Coors Brewing | | |
| | Co. Class B | 761,800 | 41,137 |
| | | | 743,772 |
| Energy (12.6%) | | |
| | Baker Hughes Inc. | 5,398,925 | 313,624 |
| * | Cobalt International | | |
| | Energy Inc. | 8,775,500 | 203,679 |
| | Pioneer Natural | | |
| | Resources Co. | 961,200 | 196,835 |
| | BP plc ADR | 4,170,900 | 193,947 |
| | | |
| | Royal Dutch Shell | | |
| | plc ADR | 2,677,744 | 178,498 |
| | Halliburton Co. | 2,919,400 | 154,816 |
| | Anadarko Petroleum Corp. | 1,594,500 | 151,940 |
| * | Southwestern Energy Co. | 3,993,700 | 148,645 |
| | Canadian Natural | | |
| | Resources Ltd. | 4,185,100 | 132,877 |
| | National Oilwell Varco Inc. | 1,591,800 | 129,222 |
| | Exxon Mobil Corp. | 1,182,925 | 106,014 |
| | Apache Corp. | 786,475 | 69,839 |
| | Valero Energy Corp. | 1,028,500 | 42,343 |
| | Inpex Corp. | 2,818,400 | 32,558 |
| | | | 2,054,837 |
| Exchange-Traded Fund (0.6%) | |
| 2 | Vanguard Value ETF | 1,410,525 | 102,954 |
| |
| Financials (23.5%) | | |
| | American International | | |
| | Group Inc. | 6,912,800 | 357,046 |
| | Citigroup Inc. | 6,737,950 | 328,677 |
| | Wells Fargo & Co. | 7,542,200 | 321,977 |
| | MetLife Inc. | 5,600,825 | 264,975 |
| | Ameriprise Financial Inc. | 2,412,900 | 242,593 |
| | Unum Group | 6,648,800 | 211,033 |
| | Bank of America Corp. | 14,548,000 | 203,090 |
| | PNC Financial Services | | |
| | Group Inc. | 2,277,900 | 167,494 |
| | Principal Financial | | |
| | Group Inc. | 3,451,400 | 163,803 |
| | XL Group plc Class A | 4,754,500 | 145,345 |
| | Weyerhaeuser Co. | 4,093,800 | 124,452 |
| | JPMorgan Chase & Co. | 2,110,150 | 108,757 |
| * | IntercontinentalExchange | | |
| | Inc. | 561,200 | 108,160 |
| | Morgan Stanley | 3,274,691 | 94,082 |
| | Willis Group Holdings plc | 2,013,100 | 90,730 |
| | Goldman Sachs Group Inc. | 561,175 | 90,271 |
| | UBS AG | 4,251,875 | 82,316 |
| | ACE Ltd. | 857,100 | 81,802 |
14
Windsor Fund
| | | |
| | | | Market |
| | | | Value |
| | | Shares | ($000) |
| | Axis Capital Holdings Ltd. | 1,602,221 | 75,977 |
| | KeyCorp | 5,830,900 | 73,061 |
| | Comerica Inc. | 1,672,700 | 72,428 |
| | ING US Inc. | 2,175,350 | 67,479 |
| | Invesco Ltd. | 1,902,750 | 64,218 |
| | Franklin Resources Inc. | 918,225 | 49,456 |
| | Hartford Financial | | |
| | Services Group Inc. | 1,382,425 | 46,588 |
| | State Street Corp. | 664,850 | 46,586 |
| | Regions Financial Corp. | 4,739,400 | 45,640 |
| | Allstate Corp. | 824,000 | 43,721 |
| | Fifth Third Bancorp | 2,283,800 | 43,461 |
| | | | 3,815,218 |
| Health Care (13.0%) | | |
| | Roche Holding AG | 874,675 | 241,879 |
| | Bristol-Myers Squibb Co. | 3,996,300 | 209,886 |
| | Cigna Corp. | 2,684,500 | 206,653 |
| | UnitedHealth Group Inc. | 2,996,400 | 204,534 |
| | Medtronic Inc. | 2,932,700 | 168,337 |
| | Sanofi | 1,303,448 | 138,978 |
| | Covidien plc | 2,116,900 | 135,714 |
| | Eli Lilly & Co. | 2,641,375 | 131,593 |
| | McKesson Corp. | 749,200 | 117,130 |
| | Daiichi Sankyo Co. Ltd. | 5,361,400 | 99,405 |
| | Abbott Laboratories | 2,532,575 | 92,566 |
| | Becton Dickinson and Co. | 820,275 | 86,236 |
| | Johnson & Johnson | 741,425 | 68,663 |
| | Quest Diagnostics Inc. | 1,113,601 | 66,716 |
| * | Mylan Inc. | 1,555,400 | 58,903 |
| * | Laboratory Corp. of | | |
| | America Holdings | 446,125 | 45,014 |
| | Aetna Inc. | 709,656 | 44,495 |
| | | | 2,116,702 |
| Industrials (11.6%) | | |
| | Eaton Corp. plc | 4,116,600 | 290,467 |
| | Dover Corp. | 1,794,700 | 164,735 |
| | Pentair Ltd. | 2,302,400 | 154,468 |
| | Rexel SA | 5,965,079 | 149,383 |
| | KBR Inc. | 4,269,802 | 147,479 |
| * | CNH Industrial NV | 11,990,517 | 141,800 |
| | Chicago Bridge & Iron | | |
| | Co. NV | 1,881,600 | 139,408 |
| | SKF AB | 4,523,777 | 119,696 |
| | Norfolk Southern Corp. | 1,355,300 | 116,583 |
| | Honeywell International | | |
| | Inc. | 1,169,100 | 101,396 |
| | Masco Corp. | 4,535,948 | 95,845 |
| | Parker Hannifin Corp. | 657,950 | 76,796 |
| | L-3 Communications | | |
| | Holdings Inc. | 733,375 | 73,668 |
| * | Hertz Global Holdings Inc. | 2,847,900 | 65,388 |
| | General Dynamics Corp. | 549,600 | 47,612 |
| | | | 1,884,724 |
| | | |
| Information Technology (16.3%) | |
| | Cisco Systems Inc. | 9,921,400 | 223,232 |
| | Avago Technologies Ltd. | | |
| | Class A | 4,901,700 | 222,684 |
| * | Arrow Electronics Inc. | 4,504,850 | 216,323 |
| | Hewlett-Packard Co. | 8,413,975 | 205,049 |
| | SanDisk Corp. | 2,763,200 | 192,042 |
| | ASML Holding NV | 1,971,304 | 186,564 |
| * | NXP Semiconductor NV | 3,887,692 | 163,750 |
| * | Lam Research Corp. | 2,764,300 | 149,908 |
| * | Check Point Software | | |
| | Technologies Ltd. | 2,491,000 | 144,528 |
| | Oracle Corp. | 4,208,150 | 140,973 |
| | Microsoft Corp. | 3,548,075 | 125,424 |
| | Analog Devices Inc. | 2,232,900 | 110,082 |
| | Maxim Integrated | | |
| | Products Inc. | 3,390,300 | 100,692 |
| | Apple Inc. | 186,400 | 97,366 |
| * | Skyworks Solutions Inc. | 3,713,500 | 95,734 |
| | EMC Corp. | 3,828,300 | 92,147 |
| | Accenture plc Class A | 854,100 | 62,776 |
| | Intel Corp. | 1,927,925 | 47,099 |
| | TE Connectivity Ltd. | 865,010 | 44,539 |
| * | Google Inc. Class A | 34,125 | 35,169 |
| | | | 2,656,081 |
| Materials (3.8%) | | |
| | International Paper Co. | 4,243,600 | 189,307 |
| | Celanese Corp. Class A | 2,185,800 | 122,427 |
| | LyondellBasell Industries | | |
| | NV Class A | 1,357,400 | 101,262 |
| * | Owens-Illinois Inc. | 2,437,300 | 77,482 |
| | Dow Chemical Co. | 1,544,200 | 60,949 |
| | Rexam plc | 7,264,155 | 60,490 |
| | | | 611,917 |
| Other (0.0%) | | |
| *,3 | Buck Holdings LP Private | | |
| | Placement | NA | 6,384 |
| |
| Telecommunication Services (0.2%) | |
| * | T-Mobile US Inc. | 1,033,250 | 28,652 |
| |
| Utilities (1.0%) | | |
| | PG&E Corp. | 2,190,800 | 91,685 |
| | Entergy Corp. | 1,168,925 | 75,653 |
| | | | 167,338 |
| Total Common Stocks | | |
| (Cost $11,975,472) | | 15,761,524 |
15
Windsor Fund
| | | |
| | | | Market |
| | | | Value |
| | | Shares | ($000) |
| Temporary Cash Investments (3.6%)1 | |
| Money Market Fund (2.5%) | | |
| 4 | Vanguard Market Liquidity | |
| | Fund, 0.120% | 412,514,634 | 412,515 |
| |
| | | Face | |
| | | Amount | |
| | | ($000) | |
| Repurchase Agreement (1.0%) | |
| | Bank of America Securities, | |
| | LLC 0.100%, 11/1/13 | | |
| | (Dated 10/31/13, Repurchase | |
| | Value $155,700,000, | | |
| | collateralized by Federal | |
| | Home Loan Mortgage Corp. | |
| | 3.500%, 7/1/42, and Federal | |
| | National Mortgage Assn. | |
| | 2.152%-4.500%, | | |
| | 7/1/41-11/1/43, with a | | |
| | value of $158,814,000) | 155,700 | 155,700 |
| |
| U.S. Government and Agency Obligations (0.1%) |
| 5,6 | Fannie Mae Discount Notes, | |
| | 0.050%, 1/22/14 | 500 | 500 |
| 6,7 | Federal Home Loan | | |
| | Bank Discount Notes, | | |
| | 0.080%, 12/26/13 | 300 | 300 |
| 5,6 | Freddie Mac Discount Notes, | |
| | 0.073%, 11/12/13 | 1,500 | 1,500 |
| 5,6 | Freddie Mac Discount Notes, | |
| | 0.150%, 2/3/14 | 300 | 300 |
| 5,6 | Freddie Mac Discount Notes, | |
| | 0.063%, 3/17/14 | 11,700 | 11,693 |
| | | | 14,293 |
| Total Temporary Cash Investments | |
| (Cost $582,512) | | 582,508 |
| Total Investments (100.5%) | | |
| (Cost $12,557,984) | | 16,344,032 |
| |
| Other Assets and Liabilities (-0.5%) | |
| Other Assets | 31,901 |
| Liabilities | (105,271) |
| | (73,370) |
| Net Assets (100%) | 16,270,662 |
| |
| |
| At October 31, 2013, net assets consisted of: |
| | Amount |
| | ($000) |
| Paid-in Capital | 13,217,309 |
| Undistributed Net Investment Income | 41,958 |
| Accumulated Net Realized Losses | (784,395) |
| Unrealized Appreciation (Depreciation) | |
| Investment Securities | 3,786,048 |
| Futures Contracts | 9,658 |
| Foreign Currencies | 84 |
| Net Assets | 16,270,662 |
| |
| |
| Investor Shares—Net Assets | |
| Applicable to 365,419,587 outstanding | |
| $.001 par value shares of beneficial | |
| interest (unlimited authorization) | 7,126,491 |
| Net Asset Value Per Share— | |
| Investor Shares | $19.50 |
| |
| |
| Admiral Shares—Net Assets | |
| Applicable to 138,952,202 outstanding | |
| $.001 par value shares of beneficial | |
| interest (unlimited authorization) | 9,144,171 |
| Net Asset Value Per Share— | |
| Admiral Shares | $65.81 |
See Note A in Notes to Financial Statements.
* Non-income-producing security.
1 The fund invests a portion of its cash reserves in equity markets through the use of index futures contracts. After giving effect to futures
investments, the fund’s effective common stock and temporary cash investment positions represent 98.7% and 1.8%, respectively, of
net assets.
2 Considered an affiliated company of the fund as the issuer is another member of The Vanguard Group.
3 Restricted security represents 0.0% of net assets. Shares not applicable for this private placement.
4 Affiliated money market fund available only to Vanguard funds and certain trusts and accounts managed by Vanguard. Rate shown is the
7-day yield.
5 The issuer was placed under federal conservatorship in September 2008; since that time, its daily operations have been managed by the
Federal Housing Finance Agency and it receives capital from the U.S. Treasury, as needed to maintain a positive net worth, in exchange for
senior preferred stock.
6 Securities with a value of $14,293,000 have been segregated as initial margin for open futures contracts.
7 The issuer operates under a congressional charter; its securities are generally neither guaranteed by the U.S. Treasury nor backed by the full
faith and credit of the U.S. government.
ADR—American Depositary Receipt.
See accompanying Notes, which are an integral part of the Financial Statements.
16
Windsor Fund
Statement of Operations
| |
| | Year Ended |
| | October 31, 2013 |
| | ($000) |
| Investment Income | |
| Income | |
| Dividends1,2 | 265,123 |
| Interest2 | 512 |
| Securities Lending | 2,151 |
| Total Income | 267,786 |
| Expenses | |
| Investment Advisory Fees—Note B | |
| Basic Fee | 18,506 |
| Performance Adjustment | 2,314 |
| The Vanguard Group—Note C | |
| Management and Administrative—Investor Shares | 15,114 |
| Management and Administrative—Admiral Shares | 8,213 |
| Marketing and Distribution—Investor Shares | 1,116 |
| Marketing and Distribution—Admiral Shares | 950 |
| Custodian Fees | 186 |
| Auditing Fees | 31 |
| Shareholders’ Reports—Investor Shares | 89 |
| Shareholders’ Reports—Admiral Shares | 33 |
| Trustees’ Fees and Expenses | 39 |
| Total Expenses | 46,591 |
| Net Investment Income | 221,195 |
| Realized Net Gain (Loss) | |
| Investment Securities Sold2 | 1,361,619 |
| Futures Contracts | 33,050 |
| Foreign Currencies | (529) |
| Realized Net Gain (Loss) | 1,394,140 |
| Change in Unrealized Appreciation (Depreciation) | |
| Investment Securities | 2,667,096 |
| Futures Contracts | 13,269 |
| Foreign Currencies | 242 |
| Change in Unrealized Appreciation (Depreciation) | 2,680,607 |
| Net Increase (Decrease) in Net Assets Resulting from Operations | 4,295,942 |
| 1 Dividends are net of foreign withholding taxes of $4,931,000. |
| 2 Dividend income, interest income, and realized net gain (loss) from affiliated companies of the fund were $3,101,000, $327,000, and $66,522,000, respectively. |
See accompanying Notes, which are an integral part of the Financial Statements.
17
Windsor Fund
Statement of Changes in Net Assets
| | |
| | Year Ended October 31, |
| | 2013 | 2012 |
| | ($000) | ($000) |
| Increase (Decrease) in Net Assets | | |
| Operations | | |
| Net Investment Income | 221,195 | 225,936 |
| Realized Net Gain (Loss) | 1,394,140 | 1,175,592 |
| Change in Unrealized Appreciation (Depreciation) | 2,680,607 | 362,543 |
| Net Increase (Decrease) in Net Assets Resulting from Operations | 4,295,942 | 1,764,071 |
| Distributions | | |
| Net Investment Income | | |
| Investor Shares | (110,032) | (118,284) |
| Admiral Shares | (110,078) | (100,323) |
| Realized Capital Gain | | |
| Investor Shares | — | — |
| Admiral Shares | — | — |
| Total Distributions | (220,110) | (218,607) |
| Capital Share Transactions | | |
| Investor Shares | (1,629,460) | (881,080) |
| Admiral Shares | 1,318,490 | 111,269 |
| Net Increase (Decrease) from Capital Share Transactions | (310,970) | (769,811) |
| Total Increase (Decrease) | 3,764,862 | 775,653 |
| Net Assets | | |
| Beginning of Period | 12,505,800 | 11,730,147 |
| End of Period1 | 16,270,662 | 12,505,800 |
| 1 Net Assets—End of Period includes undistributed net investment income of $41,958,000 and $41,402,000. |
See accompanying Notes, which are an integral part of the Financial Statements.
18
Windsor Fund
Financial Highlights
| | | | | |
| Investor Shares | | | | | |
| |
| For a Share Outstanding | Year Ended October 31, |
| Throughout Each Period | 2013 | 2012 | 2011 | 2010 | 2009 |
| Net Asset Value, Beginning of Period | $14.66 | $12.92 | $12.56 | $10.97 | $9.51 |
| Investment Operations | | | | | |
| Net Investment Income | . 255 | . 252 | .184 | .1901 | .197 |
| Net Realized and Unrealized Gain (Loss) | | | | | |
| on Investments | 4.839 | 1.729 | . 346 | 1.586 | 1.486 |
| Total from Investment Operations | 5.094 | 1.981 | .530 | 1.776 | 1.683 |
| Distributions | | | | | |
| Dividends from Net Investment Income | (.254) | (.241) | (.170) | (.186) | (. 223) |
| Distributions from Realized Capital Gains | — | — | — | — | — |
| Total Distributions | (.254) | (.241) | (.170) | (.186) | (. 223) |
| Net Asset Value, End of Period | $19.50 | $14.66 | $12.92 | $12.56 | $10.97 |
| |
| Total Return2 | 35.17% | 15.56% | 4.15% | 16.31% | 18.22% |
| |
| Ratios/Supplemental Data | | | | | |
| Net Assets, End of Period (Millions) | $7,126 | $6,711 | $6,736 | $7,999 | $7,610 |
| Ratio of Total Expenses to | | | | | |
| Average Net Assets3 | 0.37% | 0.35% | 0.39% | 0.33% | 0.33% |
| Ratio of Net Investment Income to | | | | | |
| Average Net Assets | 1.49% | 1.80% | 1.34% | 1.59%1 | 2.03% |
| Portfolio Turnover Rate | 40% | 68% | 49% | 50% | 61% 4 |
1 Net investment income per share and the ratio of net investment income to average net assets include $.036 and 0.29%, respectively,
resulting from a cash payment received in connection with the merger of Schering-Plough Corp. and Merck & Co. in November 2009.
2 Total returns do not include account service fees that may have applied in the periods shown. Fund prospectuses provide information about
any applicable account service fees.
3 Includes performance-based investment advisory fee increases (decreases) of 0.02%, (0.01%), 0.03%, (0.03%), and (0.05%).
4 Excludes the value of portfolio securities received or delivered as a result of in-kind purchases or redemptions of the fund’s capital shares.
See accompanying Notes, which are an integral part of the Financial Statements.
19
Windsor Fund
Financial Highlights
| | | | | |
| Admiral Shares | | | | | |
| |
| For a Share Outstanding | Year Ended October 31, |
| Throughout Each Period | 2013 | 2012 | 2011 | 2010 | 2009 |
| Net Asset Value, Beginning of Period | $49.47 | $43.59 | $42.37 | $37.01 | $32.08 |
| Investment Operations | | | | | |
| Net Investment Income | . 924 | .900 | .664 | .6851 | .701 |
| Net Realized and Unrealized Gain (Loss) | | | | | |
| on Investments | 16.329 | 5.844 | 1.171 | 5.348 | 5.020 |
| Total from Investment Operations | 17.253 | 6.744 | 1.835 | 6.033 | 5.721 |
| Distributions | | | | | |
| Dividends from Net Investment Income | (.913) | (.864) | (. 615) | (. 673) | (.791) |
| Distributions from Realized Capital Gains | — | — | — | — | — |
| Total Distributions | (.913) | (.864) | (. 615) | (. 673) | (.791) |
| Net Asset Value, End of Period | $65.81 | $49.47 | $43.59 | $42.37 | $37.01 |
| |
| Total Return | 35.32% | 15.71% | 4.26% | 16.44% | 18.38% |
| |
| Ratios/Supplemental Data | | | | | |
| Net Assets, End of Period (Millions) | $9,144 | $5,795 | $4,994 | $4,680 | $4,203 |
| Ratio of Total Expenses to | | | | | |
| Average Net Assets2 | 0.27% | 0.25% | 0.29% | 0.22% | 0.20% |
| Ratio of Net Investment Income to | | | | | |
| Average Net Assets | 1.59% | 1.90% | 1.44% | 1.70%1 | 2.16% |
| Portfolio Turnover Rate | 40% | 68% | 49% | 50% | 61% 3 |
1 Net investment income per share and the ratio of net investment income to average net assets include $.120 and 0.29%, respectively,
resulting from a cash payment received in connection with the merger of Schering-Plough Corp. and Merck & Co. in November 2009.
2 Includes performance-based investment advisory fee increases (decreases) of 0.02%, (0.01%), 0.03%, (0.03%), and (0.05%).
3 Excludes the value of portfolio securities received or delivered as a result of in-kind purchases or redemptions of the fund’s capital shares.
See accompanying Notes, which are an integral part of the Financial Statements.
20
Windsor Fund
Notes to Financial Statements
Vanguard Windsor Fund is registered under the Investment Company Act of 1940 as an open-end investment company, or mutual fund. The fund offers two classes of shares: Investor Shares and Admiral Shares. Investor Shares are available to any investor who meets the fund’s minimum purchase requirements. Admiral Shares are designed for investors who meet certain administrative, service, and account-size criteria.
A. The following significant accounting policies conform to generally accepted accounting principles for U.S. mutual funds. The fund consistently follows such policies in preparing its financial statements.
1. Security Valuation: Securities are valued as of the close of trading on the New York Stock Exchange (generally 4 p.m., Eastern time) on the valuation date. Equity securities are valued at the latest quoted sales prices or official closing prices taken from the primary market in which each security trades; such securities not traded on the valuation date are valued at the mean of the latest quoted bid and asked prices. Securities for which market quotations are not readily available, or whose values have been affected by events occurring before the fund’s pricing time but after the close of the securities’ primary markets, are valued at their fair values calculated according to procedures adopted by the board of trustees. These procedures include obtaining quotations from an independent pricing service, monitoring news to identify significant market- or security-specific events, and evaluating changes in the values of foreign market proxies (for example, ADRs, futures contracts, or exchange-traded funds), between the time the foreign markets close and the fund’s pricing time. When fair-value pricing is employed, the prices of securities used by a fund to calculate its net asset value may differ from quoted or published prices for the same securities. Investments in Vanguard Market Liquidity Fund are valued at that fund’s net asset value. Temporary cash investments acquired over 60 days to maturity are valued using the latest bid prices or using valuations based on a matrix system (which considers such factors as security prices, yields, maturities, and ratings), both as furnished by independent pricing services. Other temporary cash investments are valued at amortized cost, which approximates market value.
2. Foreign Currency: Securities and other assets and liabilities denominated in foreign currencies are translated into U.S. dollars using exchange rates obtained from an independent third party as of the fund’s pricing time on the valuation date. Realized gains (losses) and unrealized appreciation (depreciation) on investment securities include the effects of changes in exchange rates since the securities were purchased, combined with the effects of changes in security prices. Fluctuations in the value of other assets and liabilities resulting from changes in exchange rates are recorded as unrealized foreign currency gains (losses) until the assets or liabilities are settled in cash, at which time they are recorded as realized foreign currency gains (losses).
3. Futures Contracts: The fund may use index futures contracts to a limited extent, with the objective of maintaining full exposure to the stock market while maintaining liquidity. The fund may purchase or sell futures contracts to achieve a desired level of investment, whether to accommodate portfolio turnover or cash flows from capital share transactions. The primary risks associated with the use of futures contracts are imperfect correlation between changes in market values of stocks held by the fund and the prices of futures contracts, and the possibility of an illiquid market. Counterparty risk involving futures is mitigated because a regulated clearinghouse is the counterparty instead of the clearing broker. To further mitigate counterparty risk, the fund trades futures contracts on an exchange, monitors the financial strength of its clearing brokers and clearinghouse, and has entered into clearing agreements with its clearing brokers. The clearinghouse imposes initial margin requirements to secure the fund’s performance and requires daily settlement of variation margin representing changes in the market value of each contract.
21
Windsor Fund
Futures contracts are valued at their quoted daily settlement prices. The aggregate notional amounts of the contracts are not recorded in the Statement of Net Assets. Fluctuations in the value of the contracts are recorded in the Statement of Net Assets as an asset (liability) and in the Statement of Operations as unrealized appreciation (depreciation) until the contracts are closed, when they are recorded as realized futures gains (losses).
During the year ended October 31, 2013, the fund’s average investments in long and short futures contracts represented 1% and 0% of net assets, respectively, based on quarterly average aggregate settlement values.
4. Repurchase Agreements: The fund may enter into repurchase agreements with institutional counterparties. Securities pledged as collateral to the fund under repurchase agreements are held by a custodian bank until the agreements mature. Each agreement requires that the market value of the collateral be sufficient to cover payments of interest and principal. The fund further mitigates its counterparty risk by entering into repurchase agreements only with a diverse group of prequalified counterparties, monitoring their financial strength, and entering into master repurchase agreements with its counterparties. The master repurchase agreements provide that, in the event of a counterparty’s default (including bankruptcy), the fund may terminate any repurchase agreements with that counterparty, determine the net amount owed, and sell or retain the collateral up to the net amount owed to the fund. Such action may be subject to legal proceedings, which may delay or limit the disposition of collateral.
5. Federal Income Taxes: The fund intends to continue to qualify as a regulated investment company and distribute all of its taxable income. Management has analyzed the fund’s tax positions taken for all open federal income tax years (October 31, 2010–2013), and has concluded that no provision for federal income tax is required in the fund’s financial statements.
6. Distributions: Distributions to shareholders are recorded on the ex-dividend date.
7. Securities Lending: To earn additional income, the fund may lend its securities to qualified institutional borrowers. Security loans are required to be secured at all times by collateral in an amount at least equal to the market value of securities loaned. Daily market fluctuations could cause the value of loaned securities to be more or less than the value of the collateral received. When this occurs, the collateral is adjusted and settled on the next business day. The fund further mitigates its counterparty risk by entering into securities lending transactions only with a diverse group of prequalified counterparties, monitoring their financial strength, and entering into master securities lending agreements with its counterparties. The master securities lending agreements provide that, in the event of a counterparty’s default (including bankruptcy), the fund may terminate any loans with that borrower, determine the net amount owed, and sell or retain the collateral up to the net amount owed to the fund; however, such actions may be subject to legal proceedings. While collateral mitigates counterparty risk, in the absence of a default the fund may experience delays and costs in recovering the securities loaned. The fund invests cash collateral received in Vanguard Market Liquidity Fund, and records a liability for the return of the collateral, during the period the securities are on loan. Securities lending income represents fees charged to borrowers plus income earned on invested cash collateral, less expenses associated with the loan.
8. Other: Dividend income is recorded on the ex-dividend date. Interest income includes income distributions received from Vanguard Market Liquidity Fund and is accrued daily. Premiums and discounts on debt securities purchased are amortized and accreted, respectively, to interest income
22
Windsor Fund
over the lives of the respective securities. Security transactions are accounted for on the date securities are bought or sold. Costs used to determine realized gains (losses) on the sale of investment securities are those of the specific securities sold.
Each class of shares has equal rights as to assets and earnings, except that each class separately bears certain class-specific expenses related to maintenance of shareholder accounts (included in Management and Administrative expenses) and shareholder reporting. Marketing and distribution expenses are allocated to each class of shares based on a method approved by the board of trustees. Income, other non-class-specific expenses, and gains and losses on investments are allocated to each class of shares based on its relative net assets.
B. Wellington Management Company, LLP, and Pzena Investment Management, LLC, each provide investment advisory services to a portion of the fund for a fee calculated at an annual percentage rate of average net assets managed by the advisor. The basic fee of Wellington Management Company, LLP, is subject to quarterly adjustments based on performance for the preceding three years relative to the S&P 500 Index. The basic fee of Pzena Investment Management, LLC, is subject to quarterly adjustments based on performance since October 31, 2012, relative to the Russell 1000 Value Index.
The Vanguard Group manages the cash reserves of the fund on an at-cost basis.
For the year ended October 31, 2013, the aggregate investment advisory fee represented an effective annual basic rate of 0.13% of the fund’s average net assets, before an increase of $2,314,000 (0.02%) based on performance.
C. The Vanguard Group furnishes at cost corporate management, administrative, marketing, and distribution services. The costs of such services are allocated to the fund under methods approved by the board of trustees. The fund has committed to provide up to 0.40% of its net assets in capital contributions to Vanguard. At October 31, 2013, the fund had contributed capital of $1,842,000 to Vanguard (included in Other Assets), representing 0.01% of the fund’s net assets and 0.74% of Vanguard’s capitalization. The fund’s trustees and officers are also directors and officers of Vanguard.
D. Various inputs may be used to determine the value of the fund’s investments. These inputs are summarized in three broad levels for financial statement purposes. The inputs or methodologies used to value securities are not necessarily an indication of the risk associated with investing in those securities.
Level 1—Quoted prices in active markets for identical securities.
Level 2—Other significant observable inputs (including quoted prices for similar securities, interest rates, prepayment speeds, credit risk, etc.).
Level 3—Significant unobservable inputs (including the fund’s own assumptions used to determine the fair value of investments).
The following table summarizes the market value of the fund’s investments as of October 31, 2013, based on the inputs used to value them:
| | | |
| | Level 1 | Level 2 | Level 3 |
| Investments | ($000) | ($000) | ($000) |
| Common Stocks | 14,568,264 | 1,186,876 | 6,384 |
| Temporary Cash Investments | 412,515 | 169,993 | — |
| Futures Contracts—Liabilities1 | (1,646) | — | — |
| Total | 14,979,133 | 1,356,869 | 6,384 |
| 1 Represents variation margin on the last day of the reporting period. |
23
Windsor Fund
E. At October 31, 2013, the aggregate settlement value of open futures contracts and the related unrealized appreciation (depreciation) were:
| | | | |
| | | | ($000) |
| | | | Aggregate | |
| | | Number of | Settlement | Unrealized |
| | | Long (Short) | Value | Appreciation |
| Futures Contracts | Expiration | Contracts | Long (Short) | (Depreciation) |
| S&P 500 Index | December 2013 | 595 | 260,461 | 8,335 |
| E-mini S&P 500 Index | December 2013 | 455 | 39,836 | 1,323 |
Unrealized appreciation (depreciation) on open futures contracts is required to be treated as realized gain (loss) for tax purposes.
F. Distributions are determined on a tax basis and may differ from net investment income and realized capital gains for financial reporting purposes. Differences may be permanent or temporary. Permanent differences are reclassified among capital accounts in the financial statements to reflect their tax character. Temporary differences arise when certain items of income, expense, gain, or loss are recognized in different periods for financial statement and tax purposes; these differences will reverse at some time in the future. Differences in classification may also result from the treatment of short-term gains as ordinary income for tax purposes.
During the year ended October 31, 2013, the fund realized net foreign currency losses of $529,000, which decreased distributable net income for tax purposes; accordingly, such losses have been reclassified from accumulated net realized losses to undistributed net investment income.
For tax purposes, at October 31, 2013, the fund had $70,035,000 of ordinary income available for distribution. The fund used capital loss carryforwards of $1,407,873,000 to offset taxable capital gains realized during the year ended October 31, 2013. At October 31, 2013, the fund had available capital losses totaling $774,686,000 to offset future net capital gains through October 31, 2017.
At October 31, 2013, the cost of investment securities for tax purposes was $12,557,984,000. Net unrealized appreciation of investment securities for tax purposes was $3,786,048,000, consisting of unrealized gains of $3,892,528,000 on securities that had risen in value since their purchase and $106,480,000 in unrealized losses on securities that had fallen in value since their purchase.
G. During the year ended October 31, 2013, the fund purchased $5,578,938,000 of investment securities and sold $5,984,559,000 of investment securities, other than temporary cash investments.
24
Windsor Fund
H. Capital share transactions for each class of shares were:
| | | | |
| | Year Ended October 31, |
| | 2013 | 2012 |
| | Amount | Shares | Amount | Shares |
| | ($000) | (000) | ($000) | (000) |
| Investor Shares | | | | |
| Issued | 628,746 | 36,860 | 416,456 | 30,475 |
| Issued in Lieu of Cash Distributions | 107,480 | 6,843 | 115,463 | 8,790 |
| Redeemed | (2,365,686) | (135,989) | (1,412,999) | (103,043) |
| Net Increase (Decrease)—Investor Shares | (1,629,460) | (92,286) | (881,080) | (63,778) |
| Admiral Shares | | | | |
| Issued | 1,967,049 | 33,059 | 680,468 | 14,748 |
| Issued in Lieu of Cash Distributions | 100,424 | 1,885 | 90,751 | 2,045 |
| Redeemed | (748,983) | (13,120) | (659,950) | (14,224) |
| Net Increase (Decrease) —Admiral Shares | 1,318,490 | 21,824 | 111,269 | 2,569 |
I. The fund had invested in a company that was considered to be an affiliated company of the fund because the fund owned more than 5% of the outstanding voting securities of the company. Transactions during the period in securities of this company were as follows:
| | | | | |
| | | Current Period Transactions | |
| | Oct. 31, 2012 | | Proceeds from | | Oct. 31, 2013 |
| | Market | Purchases | Securities | Dividend | Market |
| | Value | at Cost | Sold | Income | Value |
| | ($000) | ($000) | ($000) | ($000) | ($000) |
| Arrow Electronics Inc. | 243,462 | 4,589 | 105,632 | — | NA1 |
| 1 Not applicable — At October 31, 2013, the security was still held, but the issuer was no longer an affiliated company of the fund. |
J. Management has determined that no material events or transactions occurred subsequent to October 31, 2013, that would require recognition or disclosure in these financial statements.
25
Report of Independent Registered
Public Accounting Firm
To the Trustees of Vanguard Windsor Funds and the Shareholders of Vanguard Windsor Fund:
In our opinion, the accompanying statement of net assets and the related statements of operations and of changes in net assets and the financial highlights present fairly, in all material respects, the financial position of Vanguard Windsor Fund (constituting a separate portfolio of Vanguard Windsor Funds, hereafter referred to as the “Fund”) at October 31, 2013, the results of its operations for the year then ended, the changes in its net assets for each of the two years in the period then ended, and the financial highlights for each of the five years in the period then ended, in conformity with accounting principles generally accepted in the United States of America. These financial statements and financial highlights (hereafter referred to as “financial statements”) are the responsibility of the Fund’s management; our responsibility is to express an opinion on these financial statements based on our audits. We conducted our audits of these financial statements in accordance with the standards of the Public Company Accounting Oversight Board (United States). Those standards require that we plan and perform the audit to obtain reasonable assurance about whether the financial statements are free of material misstatement. An audit includes examining, on a test basis, evidence supporting the amounts and disclosures in the financial statements, assessing the accounting principles used and significant estimates made by management, and evaluating the overall financial statement presentation. We believe that our audits, which included confirmation of securities at October 31, 2013 by correspondence with the custodians and brokers and by agreement to the underlying ownership records of the transfer agent, provide a reasonable basis for our opinion.
/s/PricewaterhouseCoopers LLP
Philadelphia, Pennsylvania
December 12, 2013
Special 2013 tax information (unaudited) for Vanguard Windsor Fund
This information for the fiscal year ended October 31, 2013, is included pursuant to provisions of the
Internal Revenue Code.
The fund distributed $220,110,000 of qualified dividend income to shareholders during the fiscal year.
For corporate shareholders, 77.0% of investment income (dividend income plus short-term gains, if
any) qualifies for the dividends-received deduction.
26
Your Fund’s After-Tax Returns
This table presents returns for your fund both before and after taxes. The after-tax returns are shown in two ways: (1) assuming that an investor owned the fund during the entire period and paid taxes on the fund’s distributions, and (2) assuming that an investor paid taxes on the fund’s distributions and sold all shares at the end of each period.
Calculations are based on the highest individual federal income tax and capital gains tax rates in effect at the times of the distributions and the hypothetical sales. State and local taxes were not considered. After-tax returns reflect any qualified dividend income, using actual prior-year figures and estimates for 2013. (In the example, returns after the sale of fund shares may be higher than those assuming no sale. This occurs when the sale would have produced a capital loss. The calculation assumes that the investor received a tax deduction for the loss.)
The table shows returns for one share class only; returns for other share classes will differ. Please note that your actual after-tax returns will depend on your tax situation and may differ from those shown. Also note that if you own the fund in a tax-deferred account, such as an individual retirement account or a 401(k) plan, this information does not apply to you. Such accounts are not subject to current taxes.
Finally, keep in mind that a fund’s performance—whether before or after taxes—does not guarantee future results.
Average Annual Total Returns: Windsor Fund Investor Shares
Periods Ended October 31, 2013
| | | |
| | One | Five | Ten |
| | Year | Years | Years |
| Returns Before Taxes | 35.17% | 17.47% | 7.28% |
| Returns After Taxes on Distributions | 34.80 | 17.16 | 6.53 |
| Returns After Taxes on Distributions and Sale of Fund Shares | 20.32 | 14.20 | 5.98 |
27
About Your Fund’s Expenses
As a shareholder of the fund, you incur ongoing costs, which include costs for portfolio management, administrative services, and shareholder reports (like this one), among others. Operating expenses, which are deducted from a fund’s gross income, directly reduce the investment return of the fund.
A fund’s expenses are expressed as a percentage of its average net assets. This figure is known as the expense ratio. The following examples are intended to help you understand the ongoing costs (in dollars) of investing in your fund and to compare these costs with those of other mutual funds. The examples are based on an investment of $1,000 made at the beginning of the period shown and held for the entire period.
The accompanying table illustrates your fund’s costs in two ways:
• Based on actual fund return. This section helps you to estimate the actual expenses that you paid over the period. The ”Ending Account Value“ shown is derived from the fund‘s actual return, and the third column shows the dollar amount that would have been paid by an investor who started with $1,000 in the fund. You may use the information here, together with the amount you invested, to estimate the expenses that you paid over the period.
To do so, simply divide your account value by $1,000 (for example, an $8,600 account value divided by $1,000 = 8.6), then multiply the result by the number given for your fund under the heading ”Expenses Paid During Period.“
• Based on hypothetical 5% yearly return. This section is intended to help you compare your fund‘s costs with those of other mutual funds. It assumes that the fund had a yearly return of 5% before expenses, but that the expense ratio is unchanged. In this case—because the return used is not the fund’s actual return—the results do not apply to your investment. The example is useful in making comparisons because the Securities and Exchange Commission requires all mutual funds to calculate expenses based on a 5% return. You can assess your fund’s costs by comparing this hypothetical example with the hypothetical examples that appear in shareholder reports of other funds.
Note that the expenses shown in the table are meant to highlight and help you compare ongoing costs only and do not reflect transaction costs incurred by the fund for buying and selling securities. Further, the expenses do not include any purchase, redemption, or account service fees described in the fund prospectus. If such fees were applied to your account, your costs would be higher. Your fund does not carry a “sales load.”
The calculations assume no shares were bought or sold during the period. Your actual costs may have been higher or lower, depending on the amount of your investment and the timing of any purchases or redemptions.
You can find more information about the fund’s expenses, including annual expense ratios, in the Financial Statements section of this report. For additional information on operating expenses and other shareholder costs, please refer to your fund’s current prospectus.
28
| | | |
| Six Months Ended October 31, 2013 | | | |
| | Beginning | Ending | Expenses |
| | Account Value | Account Value | Paid During |
| Windsor Fund | 4/30/2013 | 10/31/2013 | Period |
| Based on Actual Fund Return | | | |
| Investor Shares | $1,000.00 | $1,146.52 | $2.06 |
| Admiral Shares | 1,000.00 | 1,147.16 | 1.52 |
| Based on Hypothetical 5% Yearly Return | | | |
| Investor Shares | $1,000.00 | $1,023.29 | $1.94 |
| Admiral Shares | 1,000.00 | 1,023.79 | 1.43 |
The calculations are based on expenses incurred in the most recent six-month period. The fund’s annualized six-month expense ratios for that
period are 0.38% for Investor Shares and 0.28% for Admiral Shares. The dollar amounts shown as “Expenses Paid” are equal to the
annualized expense ratio multiplied by the average account value over the period, multiplied by the number of days in the most recent
six-month period, then divided by the number of days in the most recent 12-month period.
29
Glossary
30-Day SEC Yield. A fund’s 30-day SEC yield is derived using a formula specified by the U.S. Securities and Exchange Commission. Under the formula, data related to the fund’s security holdings in the previous 30 days are used to calculate the fund’s hypothetical net income for that period, which is then annualized and divided by the fund’s estimated average net assets over the calculation period. For the purposes of this calculation, a security’s income is based on its current market yield to maturity (for bonds), its actual income (for asset-backed securities), or its projected dividend yield (for stocks). Because the SEC yield represents hypothetical annualized income, it will differ—at times significantly—from the fund’s actual experience. As a result, the fund’s income distributions may be higher or lower than implied by the SEC yield.
Beta. A measure of the magnitude of a fund’s past share-price fluctuations in relation to the ups and downs of a given market index. The index is assigned a beta of 1.00. Compared with a given index, a fund with a beta of 1.20 typically would have seen its share price rise or fall by 12% when the index rose or fell by 10%. For this report, beta is based on returns over the past 36 months for both the fund and the index. Note that a fund’s beta should be reviewed in conjunction with its R-squared (see definition). The lower the R-squared, the less correlation there is between the fund and the index, and the less reliable beta is as an indicator of volatility.
Dividend Yield. Dividend income earned by stocks, expressed as a percentage of the aggregate market value (or of net asset value, for a fund). The yield is determined by dividing the amount of the annual dividends by the aggregate value (or net asset value) at the end of the period. For a fund, the dividend yield is based solely on stock holdings and does not include any income produced by other investments.
Earnings Growth Rate. The average annual rate of growth in earnings over the past five years for the stocks now in a fund.
Equity Exposure. A measure that reflects a fund’s investments in stocks and stock futures. Any holdings in short-term reserves are excluded.
Expense Ratio. A fund’s total annual operating expenses expressed as a percentage of the fund’s average net assets. The expense ratio includes management and administrative expenses, but does not include the transaction costs of buying and selling portfolio securities.
Foreign Holdings. The percentage of a fund represented by securities or depositary receipts of companies based outside the United States.
Inception Date. The date on which the assets of a fund (or one of its share classes) are first invested in accordance with the fund’s investment objective. For funds with a subscription period, the inception date is the day after that period ends. Investment performance is measured from the inception date.
Median Market Cap. An indicator of the size of companies in which a fund invests; the midpoint of market capitalization (market price x shares outstanding) of a fund’s stocks, weighted by the proportion of the fund’s assets invested in each stock. Stocks representing half of the fund’s assets have market capitalizations above the median, and the rest are below it.
Price/Book Ratio. The share price of a stock divided by its net worth, or book value, per share. For a fund, the weighted average price/book ratio of the stocks it holds.
30
Price/Earnings Ratio. The ratio of a stock’s current price to its per-share earnings over the past year. For a fund, the weighted average P/E of the stocks it holds. P/E is an indicator of market expectations about corporate prospects; the higher the P/E, the greater the expectations for a company’s future growth.
R-Squared. A measure of how much of a fund’s past returns can be explained by the returns from the market in general, as measured by a given index. If a fund’s total returns were precisely synchronized with an index’s returns, its R-squared would be 1.00. If the fund’s returns bore no relationship to the index’s returns, its R-squared would be 0. For this report, R-squared is based on returns over the past 36 months for both the fund and the index.
Return on Equity. The annual average rate of return generated by a company during the past five years for each dollar of shareholder’s equity (net income divided by shareholder’s equity). For a fund, the weighted average return on equity for the companies whose stocks it holds.
Short-Term Reserves. The percentage of a fund invested in highly liquid, short-term securities that can be readily converted to cash.
Turnover Rate. An indication of the fund’s trading activity. Funds with high turnover rates incur higher transaction costs and may be more likely to distribute capital gains (which may be taxable to investors). The turnover rate excludes in-kind transactions, which have minimal impact on costs.
31
The People Who Govern Your Fund
The trustees of your mutual fund are there to see that the fund is operated and managed in your best interests since, as a shareholder, you are a part owner of the fund. Your fund’s trustees also serve on the board of directors of The Vanguard Group, Inc., which is owned by the Vanguard funds and provides services to them on an at-cost basis.
A majority of Vanguard’s board members are independent, meaning that they have no affiliation with Vanguard or the funds they oversee, apart from the sizable personal investments they have made as private individuals. The independent board members have distinguished backgrounds in business, academia, and public service. Each of the trustees and executive officers oversees 181 Vanguard funds.
The following table provides information for each trustee and executive officer of the fund. More information about the trustees is in the Statement of Additional Information, which can be obtained, without charge, by contacting Vanguard at 800-662-7447, or online at vanguard.com.
| |
| InterestedTrustee1 | and Delphi Automotive LLP (automotive components); |
| | Senior Advisor at New Mountain Capital; Trustee of |
| F. William McNabb III | The Conference Board. |
| Born 1957. Trustee Since July 2009. Chairman of the | |
| Board. Principal Occupation(s) During the Past Five | Amy Gutmann |
| Years: Chairman of the Board of The Vanguard Group, | Born 1949. Trustee Since June 2006. Principal |
| Inc., and of each of the investment companies served | Occupation(s) During the Past Five Years: President |
| by The Vanguard Group, since January 2010; Director | of the University of Pennsylvania; Christopher H. |
| of The Vanguard Group since 2008; Chief Executive | Browne Distinguished Professor of Political Science |
| Officer and President of The Vanguard Group and of | in the School of Arts and Sciences with secondary |
| each of the investment companies served by The | appointments at the Annenberg School for |
| Vanguard Group since 2008; Director of Vanguard | Communication and the Graduate School of Education |
| Marketing Corporation; Managing Director of The | of the University of Pennsylvania; Member of the |
| Vanguard Group (1995–2008). | National Commission on the Humanities and Social |
| | Sciences; Trustee of Carnegie Corporation of New |
| IndependentTrustees | York and of the National Constitution Center; Chair |
| of the U.S. Presidential Commission for the Study |
| Emerson U. Fullwood | of Bioethical Issues. |
| Born 1948. Trustee Since January 2008. Principal | |
| Occupation(s) During the Past Five Years: Executive | JoAnn Heffernan Heisen |
| Chief Staff and Marketing Officer for North America | Born 1950. Trustee Since July 1998. Principal |
| and Corporate Vice President (retired 2008) of Xerox | Occupation(s) During the Past Five Years: Corporate |
| Corporation (document management products and | Vice President and Chief Global Diversity Officer |
| services); Executive in Residence and 2010 | (retired 2008) and Member of the Executive |
| Distinguished Minett Professor at the Rochester | Committee (1997–2008) of Johnson & Johnson |
| Institute of Technology; Director of SPX Corporation | (pharmaceuticals/medical devices/consumer |
| (multi-industry manufacturing), the United Way of | products); Director of Skytop Lodge Corporation |
| Rochester, Amerigroup Corporation (managed health | (hotels), the University Medical Center at Princeton, |
| care), the University of Rochester Medical Center, | the Robert Wood Johnson Foundation, and the Center |
| Monroe Community College Foundation, and North | for Talent Innovation; Member of the Advisory Board |
| Carolina A&T University. | of the Maxwell School of Citizenship and Public Affairs |
| | at Syracuse University. |
| Rajiv L. Gupta | |
| Born 1945. Trustee Since December 2001.2 | F. Joseph Loughrey |
| Principal Occupation(s) During the Past Five Years: | Born 1949. Trustee Since October 2009. Principal |
| Chairman and Chief Executive Officer (retired 2009) | Occupation(s) During the Past Five Years: President |
| and President (2006–2008) of Rohm and Haas Co. | and Chief Operating Officer (retired 2009) of Cummins |
| (chemicals); Director of Tyco International, Ltd. | Inc. (industrial machinery); Chairman of the Board of |
| (diversified manufacturing and services), Hewlett- | Hillenbrand, Inc. (specialized consumer services) and |
| Packard Co. (electronic computer manufacturing), | of Oxfam America; Director of SKF AB (industrial |
| | |
| machinery), Hyster-Yale Materials Handling, Inc. | Executive Officers | |
| (forklift trucks), and the Lumina Foundation for | | |
| Education; Member of the Advisory Council for the | Glenn Booraem | |
| College of Arts and Letters and of the Advisory Board | Born 1967. Controller Since July 2010. Principal |
| to the Kellogg Institute for International Studies, both | Occupation(s) During the Past Five Years: Principal |
| at the University of Notre Dame. | of The Vanguard Group, Inc.; Controller of each of |
| | the investment companies served by The Vanguard |
| Mark Loughridge | Group; Assistant Controller of each of the investment |
| Born 1953. Trustee Since March 2012. Principal | companies served by The Vanguard Group (2001–2010). |
| Occupation(s) During the Past Five Years: Senior Vice | | |
| President and Chief Financial Officer at IBM (information | Thomas J. Higgins | |
| technology services); Fiduciary Member of IBM’s | Born 1957. Chief Financial Officer Since September |
| Retirement Plan Committee. | 2008. Principal Occupation(s) During the Past Five |
| | Years: Principal of The Vanguard Group, Inc.; Chief |
| Scott C. Malpass | Financial Officer of each of the investment companies |
| Born 1962. Trustee Since March 2012. Principal | served by The Vanguard Group; Treasurer of each of |
| Occupation(s) During the Past Five Years: Chief | the investment companies served by The Vanguard |
| Investment Officer and Vice President at the University | Group (1998–2008). | |
| of Notre Dame; Assistant Professor of Finance at the | | |
| Mendoza College of Business at Notre Dame; Member | Kathryn J. Hyatt | |
| of the Notre Dame 403(b) Investment Committee; | Born 1955. Treasurer Since November 2008. Principal |
| Director of TIFF Advisory Services, Inc. (investment | Occupation(s) During the Past Five Years: Principal of |
| advisor); Member of the Investment Advisory | The Vanguard Group, Inc.; Treasurer of each of the |
| Committees of the Financial Industry Regulatory | investment companies served by The Vanguard |
| Authority (FINRA) and of Major League Baseball. | Group; Assistant Treasurer of each of the investment |
| | companies served by The Vanguard Group (1988–2008). |
| André F. Perold | | |
| Born 1952. Trustee Since December 2004. Principal | Heidi Stam | |
| Occupation(s) During the Past Five Years: George | Born 1956. Secretary Since July 2005. Principal |
| Gund Professor of Finance and Banking at the Harvard | Occupation(s) During the Past Five Years: Managing |
| Business School (retired 2011); Chief Investment | Director of The Vanguard Group, Inc.; General Counsel |
| Officer and Managing Partner of HighVista Strategies | of The Vanguard Group; Secretary of The Vanguard |
| LLC (private investment firm); Director of Rand | Group and of each of the investment companies |
| Merchant Bank; Overseer of the Museum of Fine | served by The Vanguard Group; Director and Senior |
| Arts Boston. | Vice President of Vanguard Marketing Corporation. |
| |
| | |
| Alfred M. Rankin, Jr. | Vanguard Senior ManagementTeam |
| Born 1941. Trustee Since January 1993. Principal | | |
| Occupation(s) During the Past Five Years: Chairman, | Mortimer J. Buckley | Chris D. McIsaac |
| President, and Chief Executive Officer of NACCO | Kathleen C. Gubanich | Michael S. Miller |
| Industries, Inc. (housewares/lignite) and of Hyster-Yale | Paul A. Heller | James M. Norris |
| Materials Handling, Inc. (forklift trucks); Director of | Martha G. King | Glenn W. Reed |
| the National Association of Manufacturers; Chairman | John T. Marcante | |
| of the Board of University Hospitals of Cleveland; | | |
| Advisory Chairman of the Board of The Cleveland | | |
| Museum of Art. | Chairman Emeritus and Senior Advisor |
| | | |
| John J. Brennan | |
| Peter F. Volanakis | Chairman, 1996–2009 | |
| Born 1955. Trustee Since July 2009. Principal | Chief Executive Officer and President, 1996–2008 |
| Occupation(s) During the Past Five Years: President | | |
| and Chief Operating Officer (retired 2010) of Corning | | |
| Incorporated (communications equipment); Director | Founder | |
| of SPX Corporation (multi-industry manufacturing); | John C. Bogle | |
| Overseer of the Amos Tuck School of Business | Chairman and Chief Executive Officer, 1974–1996 |
| Administration at Dartmouth College; Advisor to the | | |
| Norris Cotton Cancer Center. | |
1 Mr. McNabb is considered an “interested person,” as defined in the Investment Company Act of 1940, because he is an officer of the
Vanguard funds.
2 December 2002 for Vanguard Equity Income Fund, Vanguard Growth Equity Fund, the Vanguard Municipal Bond Funds, and the Vanguard
State Tax-Exempt Funds.
|  |
| | P.O. Box 2600 |
| | Valley Forge, PA 19482-2600 |
| |
| |
| |
| Connect with Vanguard® > vanguard.com | |
| |
| |
| |
| Fund Information > 800-662-7447 | |
| Direct Investor Account Services > 800-662-2739 | |
| Institutional Investor Services > 800-523-1036 | |
| Text Telephone for People | |
| With Hearing Impairment > 800-749-7273 | |
| |
| This material may be used in conjunction | |
| with the offering of shares of any Vanguard | |
| fund only if preceded or accompanied by | |
| the fund’s current prospectus. | |
| |
| All comparative mutual fund data are from Lipper, a | |
| Thomson Reuters Company, or Morningstar, Inc., unless | |
| otherwise noted. | |
| |
| You can obtain a free copy of Vanguard’s proxy voting | |
| guidelines by visiting vanguard.com/proxyreporting or by | |
| calling Vanguard at 800-662-2739. The guidelines are | |
| also available from the SEC’s website, sec.gov. In | |
| addition, you may obtain a free report on how your fund | |
| voted the proxies for securities it owned during the 12 | |
| months ended June 30. To get the report, visit either | |
| vanguard.com/proxyreporting or sec.gov. | |
| |
| You can review and copy information about your fund at | |
| the SEC’s Public Reference Room in Washington, D.C. To | |
| find out more about this public service, call the SEC at | |
| 202-551-8090. Information about your fund is also | |
| available on the SEC’s website, and you can receive | |
| copies of this information, for a fee, by sending a | |
| request in either of two ways: via e-mail addressed to | |
| publicinfo@sec.gov or via regular mail addressed to the | |
| Public Reference Section, Securities and Exchange | |
| Commission, Washington, DC 20549-1520. | |
| |
| | © 2013 The Vanguard Group, Inc. |
| | All rights reserved. |
| | Vanguard Marketing Corporation, Distributor. |
| |
| | Q220 122013 |

Annual Report | October 31, 2013
Vanguard Windsor™ II Fund

Vanguard’s Principles for Investing Success
We want to give you the best chance of investment success. These principles, grounded in Vanguard’s research and experience, can put you on the right path.
Goals. Create clear, appropriate investment goals.
Balance. Develop a suitable asset allocation using broadly diversified funds. Cost. Minimize cost.
Discipline. Maintain perspective and long-term discipline.
A single theme unites these principles: Focus on the things you can control.
We believe there is no wiser course for any investor.
| |
| Contents | |
| Your Fund’s Total Returns. | 1 |
| Chairman’s Letter. | 2 |
| Advisors’ Report. | 8 |
| Fund Profile. | 12 |
| Performance Summary. | 13 |
| Financial Statements. | 15 |
| Your Fund’s After-Tax Returns. | 30 |
| About Your Fund’s Expenses. | 31 |
| Glossary. | 33 |
Please note: The opinions expressed in this report are just that—informed opinions. They should not be considered promises or advice. Also, please keep in mind that the information and opinions cover the period through the date on the front of this report. Of course, the risks of investing in your fund are spelled out in the prospectus.
See the Glossary for definitions of investment terms used in this report.
About the cover: The ship's wheel represents leadership and guidance, essential qualities in navigating difficult seas. This one is a replica based on an 18th-century British vessel. The HMS Vanguard, another ship of that era, served as the flagship for Admiral Horatio Nelson when he defeated a French fleet at the Battle of the Nile.
Your Fund’s Total Returns
| |
| Fiscal Year Ended October 31, 2013 | |
| |
| | Total |
| | Returns |
| Vanguard Windsor II Fund | |
| Investor Shares | 26.26% |
| Admiral™ Shares | 26.36 |
| Russell 1000 Value Index | 28.29 |
| Large-Cap Value Funds Average | 27.63 |
| Large-Cap Value Funds Average: Derived from data provided by Lipper, a Thomson Reuters Company. |
| Admiral Shares carry lower expenses and are available to investors who meet certain account-balance requirements. |
| | | | |
| Your Fund’s Performance at a Glance | | | |
| October 31, 2012, Through October 31, 2013 | | |
| | | | Distributions Per Share |
| | Starting | Ending | | |
| | Share | Share | Income | Capital |
| | Price | Price | Dividends | Gains |
| Vanguard Windsor II Fund | | | | |
| Investor Shares | $29.33 | $36.19 | $0.722 | $0.000 |
| Admiral Shares | 52.06 | 64.23 | 1.330 | 0.000 |
1

Chairman’s Letter
Dear Shareholder,
With U.S. equity markets delivering spirited results, Vanguard Windsor II Fund produced a respectable showing for the fiscal year ended October 31, 2013. Stocks of all sizes and styles contributed to the success, but value stocks slightly lagged their growth counterparts while small- and mid-cap stocks handily surpassed large-caps.
The fund returned about 26%, trailing its benchmark, the Russell 1000 Value Index, by about two percentage points and the average return of its large-cap value peers by more than one percentage point. Windsor II recorded gains in all ten industry sectors. However, poor stock selection in the information technology, consumer discretionary, and consumer staples sectors held back its overall returns.
If you hold Windsor II shares in a taxable account, you may wish to review the discussion of after-tax returns for the fiscal year that appears later in this report.
Amid uncertainties, U.S. stocks found a path to strong returns
U.S. stocks faced several challenges en route to an impressive overall return of about 29% for the 12 months ended October 31, 2013. Investors’ growing appetite for risk drove the rise in stocks, as corporate profit growth, on the whole, wasn’t particularly tantalizing.
Although the end of the fiscal year was notable for the budget impasse that resulted in October’s 16-day partial
2
shutdown of the federal government, the period as a whole was marked by uncertainties about Federal Reserve monetary policy and concern about the economy’s patchy growth. Vanguard’s chief economist, Joe Davis, recently noted that “as was the case at the start of the year, the U.S. economy continues to expand at a modest and uneven pace.”
The disparity between the performances of the U.S. economy and U.S. stocks may seem surprising—but Vanguard research has shown that over the long term, a nation’s economic growth has a weak relationship with its stock returns. (You can read more in The Outlook for Emerging Market Stocks in a Lower-Growth World, available at vanguard.com/research.)
Outside of the United States, stocks returned about 20%. The developed markets of Europe and the Pacific region delivered robust gains; emerging-market stocks failed to keep pace.
Bond returns suffered as investors kept an eye on the Fed
With investors fretting over the Fed’s next move for its stimulative bond-buying program, bonds recorded negative results for the 12 months. The broad U.S. taxable bond market returned –1.08%. The yield of the 10-year Treasury note closed at 2.54%, down from 2.63% at September’s close, but up from 1.69% at the end of the last fiscal year. (Bond yields and prices move in opposite directions.) Municipal bonds returned –1.72%.
| | | |
| Market Barometer | | | |
| |
| | Average Annual Total Returns |
| | Periods Ended October 31, 2013 |
| | One | Three | Five |
| | Year | Years | Years |
| Stocks | | | |
| Russell 1000 Index (Large-caps) | 28.40% | 16.83% | 15.84% |
| Russell 2000 Index (Small-caps) | 36.28 | 17.69 | 17.04 |
| Russell 3000 Index (Broad U.S. market) | 28.99 | 16.89 | 15.94 |
| MSCI All Country World Index ex USA (International) | 20.29 | 6.04 | 12.48 |
| |
| Bonds | | | |
| Barclays U.S. Aggregate Bond Index (Broad taxable market) | -1.08% | 3.02% | 6.09% |
| Barclays Municipal Bond Index (Broad tax-exempt market) | -1.72 | 3.60 | 6.37 |
| Citigroup Three-Month U.S. Treasury Bill Index | 0.06 | 0.07 | 0.12 |
| |
| CPI | | | |
| Consumer Price Index | 0.96% | 2.21% | 1.52% |
3
Outside of the United States, bond markets (as measured by the Barclays Global Aggregate Index ex USD) returned –1.95%.
The Fed’s target for short-term interest rates remained at 0%–0.25%, severely limiting returns of money market funds and savings accounts.
Although gains were strong, shortfalls curbed performance
Large-cap value stocks, despite their sharp rise, weren’t stock market leaders for the fiscal year. Dividend payers—a value-style domain and a Windsor II mainstay—didn’t perform as well as they had in previous periods. This was in part because as investors gained confidence, they focused less on steady payouts and more on a stock’s potential for growth.
The fund outperformed its benchmark in financials, health care, industrials, and energy—all traditionally rich sources of value-oriented stocks. On a less positive note, the advisors’ selections in the information technology, consumer discretionary, and consumer staples sectors posted returns that, while in the double digits, still fell well short of those posted by their counterparts in the benchmark.
Windsor II’s largest sector, financials, returned almost 35% and was responsible for more than one-quarter of the fund’s return. A rosier investing climate, fewer
| | | |
| Expense Ratios | | | |
| Your Fund Compared With Its Peer Group | | | |
| | Investor | Admiral | Peer Group |
| | Shares | Shares | Average |
| Windsor II Fund | 0.35% | 0.27% | 1.19% |
The fund expense ratios shown are from the prospectus dated February 27, 2013, and represent estimated costs for the current fiscal year.
For the fiscal year ended October 31, 2013, the fund’s expense ratios were 0.36% for Investor Shares and 0.28% for Admiral Shares. The
peer-group expense ratio is derived from data provided by Lipper, a Thomson Reuters Company, and captures information through year-end
2012.
Peer group: Large-Cap Value Funds.
4
insurance claims, firmer corporate balance sheets, improved lending conditions, and stronger housing and labor markets all helped the sector. Particularly notable gains came from diversified financial services giants, commercial banks, consumer finance companies, insurance firms, and asset managers. In addition, the fund’s advisors pinpointed the few real estate investment trusts (REITs) that outperformed, for the most part avoiding the majority that stalled after a few years of solid growth.
Within health care, strong pipelines for new medicines and favorable rulings from the Food and Drug Administration lifted pharmaceuticals, and the aging population’s increased need for services and managed care boosted equipment and supply firms, as well as service companies and providers.
In industrials, strength came from the aerospace and defense industry, where technological improvements and cost management have helped some companies counteract a reduction in government spending. The fund led the index in the energy sector largely because the advisors steered clear of Exxon, which suffered as low natural gas prices weighed on profitability.
Although Windsor II doesn’t have great exposure to the IT, consumer discretionary, and consumer staples sectors, its holdings in them lagged far enough to curtail the fund’s overall performance relative to its
| |
| Total Returns | |
| Ten Years Ended October 31, 2013 | |
| | Average |
| | Annual Return |
| Windsor II Fund Investor Shares | 8.25% |
| Russell 1000 Value Index | 7.81 |
| Large-Cap Value Funds Average | 6.57 |
| Large-Cap Value Funds Average: Derived from data provided by Lipper, a Thomson Reuters Company. |
The figures shown represent past performance, which is not a guarantee of future results. (Current performance may be
lower or higher than the performance data cited. For performance data current to the most recent month-end, visit our
website at vanguard.com/performance.) Note, too, that both investment returns and principal value can fluctuate widely, so
an investor’s shares, when sold, could be worth more or less than their original cost.
5
benchmark. Within IT, the fund’s software, hardware, and computer equipment stocks didn’t keep pace with their counterparts in the benchmark. In consumer discretionary, the fund was hurt by missed opportunities among media companies, as well as by heavy allocations to a cruise line and some struggling retailers. As for consumer staples, the fund’s tobacco stocks, which had turned in impressive returns in previous years, slumped a bit owing to the trend away from dividend-paying stocks.
You can find more information on the fund’s positioning and performance in the Advisors’ Report that follows this letter.
Windsor II’s strengths were evident over the past decade
Over the course of its nearly 30 years of existence, Vanguard Windsor II Fund has earned a reputation for effectively investing in stocks that others have discarded, rejected, or replaced. The fund’s six advisors maintain strict standards and harvest from a field of quality companies that generally pay dividends and that have solid balance sheets.
With large-cap value stocks as their common denominator, the fund’s advisors create a diversified investment strategy through their different techniques and methods. Some take a traditional approach, some a quantitative one, and the overall long-term results have been favorable. For the ten years ended October 31, 2013, the fund’s Investor Shares posted an average annual return of 8.25%. The fund’s benchmark index returned 7.81% a year on average; the peer group, 6.57%.
George H. Davis, Jr., and Sheldon J. Lieberman of Hotchkis and Wiley Capital Management, LLC, have been integral to Windsor II’s success over the past decade. On behalf of Vanguard, I’d like to thank Mr. Davis, the firm’s CEO, and Mr. Lieberman, a principal, who marked their tenth year of service to the fund on October 21.
Combining diversity of thought with low costs brings benefits
Investors sometimes ask why Vanguard uses a multi-advisor approach for many of its actively managed equity funds. Just as we recommend diversification within and across asset classes for an investor’s overall portfolio, we think significant benefits can accrue from using multiple advisory firms for a single fund: diversity of investment process and style, thought, and holdings.
As we’ve seen in the case of Windsor II, all of these elements can lead to strong performance. Because not all investment managers invest the same way, their returns relative to the benchmark don’t move in lockstep.
As with many investment topics, however, there are some misconceptions about the benefits of using a multi-manager approach. For example, it is often suggested that the
6
best ideas of the advisors are diluted when they are combined in one portfolio. Recent Vanguard research has found otherwise.
Conventional wisdom also suggests that multi-manager funds tend to be expensive. At Vanguard, this is not the case: Low costs are a hallmark of all our offerings. And Vanguard research indicates that low costs can contribute greatly to investing success, helping investors keep more of a portfolio’s return. (You can read more in Analyzing Multi-Manager Funds: Does Management Structure Affect Performance?, at vanguard.com/research). As for Windsor II, I invite you to revisit page 4 for a look at how your fund’s cost stacks up against the competition.
As always, thank you for investing with Vanguard.
Sincerely,

F. William McNabb III
Chairman and Chief Executive Officer
November 12, 2013
7
Advisors’ Report
For the 12 months ended October 31, 2013, Vanguard Windsor II Fund returned about 26%. Your fund is managed by six independent advisors, a strategy that enhances the fund’s diversification by providing exposure to distinct, yet complementary, investment approaches. It’s not uncommon for different advisors to have different views about individual securities or the broader investment environment.
The table below lists the advisors, the amount and percentage of fund assets each manages, and brief descriptions of their investment strategies. The advisors have provided the following assessment of the investment environment during the past 12 months and the notable successes and shortfalls in their portfolios. These comments were prepared on November 18, 2013.
| | | |
| Vanguard Windsor II Fund Investment Advisors | |
| |
| | Fund Assets Managed | |
| Investment Advisor | % | $ Million | Investment Strategy |
| Barrow, Hanley, Mewhinney & | 60 | 27,460 | Conducts fundamental research on individual stocks |
| Strauss, LLC | | | exhibiting traditional value characteristics: |
| | | | price/earnings and price/book ratios below the broad |
| | | | market average and dividend yields above the broad |
| | | | market average. |
| Lazard Asset Management LLC | 16 | 7,526 | Employs a relative-value approach that seeks a |
| | | | combination of attractive valuation and high financial |
| | | | productivity. The process is research-driven, relying |
| | | | upon bottom-up stock analysis performed by the firm’s |
| | | | global sector analysts. |
| Sanders Capital, LLC | 10 | 4,536 | Employs a traditional, bottom-up, fundamental research |
| | | | approach to identifying securities that are undervalued |
| | | | relative to their expected total return. |
| Hotchkis and Wiley Capital | 7 | 3,158 | Uses a disciplined investment approach, focusing on |
| Management, LLC | | | such investment parameters as a company’s tangible |
| | | | assets, sustainable cash flow, and potential for |
| | | | improving business performance. |
| Armstrong Shaw Associates Inc. | 4 | 1,876 | Uses a bottom-up approach, employing fundamental |
| | | | and qualitative criteria to identify individual companies |
| | | | for potential investment. |
| Vanguard Equity Investment | 0 | 206 | Employs a quantitative fundamental management |
| Group | | | approach, using models that assess valuation, market |
| | | | sentiment, earnings quality and growth, and |
| | | | management decisions of companies versus their |
| | | | peers. |
| Cash Investments | 3 | 865 | These short-term reserves are invested by Vanguard in |
| | | | equity index products to simulate investment in stocks. |
| | | | Each advisor may also maintain a modest cash |
| | | | position. |
8
Barrow, Hanley, Mewhinney &
Strauss, LLC
Portfolio Manager:
James P. Barrow, Executive Director
Associate Portfolio Managers:
Jeff Fahrenbruch, CFA,
Managing Director
David Ganucheau, CFA,
Managing Director
Although absolute returns were high for the fiscal year, the fund underperformed its comparative standards. Regarding our portfolio, our comments on the first half of the period, made in the April 30 semiannual report, strike us as a good description of the year as a whole.
Performance was penalized by two issues we held that were not in the benchmark, namely Imperial Tobacco Group and Carnival Cruise Lines. We were also hurt by our underweighting of information technology stocks, which generally do not meet our requirements for value. The broad equity advance was led by companies with the lowest dividend yields, a significant headwind. Capitalization was a rank-order determinant of price movement, with the largest quartile underperforming the smallest by nine percentage points.
Equity performance over the past year has been supported by the Federal Reserve’s quantitative easing program. When short-term interest rates remain near zero for a substantial time, savings are forced into the stock market—first into dividend-paying stocks, later not so much.
We are seeing some signs of “dot.com disease.” For example, large market values are being given to trendy companies with no earnings—and in some cases with no revenue. We are far from a full-blown epidemic, but early signs are there.
Lazard Asset Management LLC
Portfolio Managers:
Andrew Lacey, Deputy Chairman
Christopher Blake, Managing Director
The Standard & Poor’s 500 Index returned about 27% for the fiscal year as investors responded to ongoing accommodative global monetary policy; encouraging, albeit slow, progress in the U.S. economic recovery; and signs that the European economy has stabilized. During the period, markets met and exceeded highs last seen in 2007, as house prices continued to rebound, household assets and net worth rose, and federal fiscal deficits declined. Uncertainty about Fed policy contributed to market volatility over the period.
Our portfolio benefited from stock selection in information technology, where top contributors included Apple and Cisco Systems. Stock selection in health care, along with an overweighting of the sector, also helped returns. Top contributors included Gilead Sciences and McKesson.
Performance was hurt by selection in two sectors, consumer discretionary and energy. In the former, top detractors included American Eagle Outfitters and J.C. Penney; in the latter, they included Transocean and Consol Energy.
9
Sanders Capital, LLC
Portfolio Managers:
Lewis A. Sanders, CFA,
Chief Executive Officer and
Co-Chief Investment Officer
John P. Mahedy, CPA,
Director of Research and
Co-Chief Investment Officer
Global economic growth should accelerate in 2014 as headwinds from fiscal consolidation and deleveraging fade in both the United States and Europe. Relatively strong growth in China is expected as well. Quantitative easing and interest rate repression will no longer be needed, and will likely give way to a multiyear period of global interest rate normalization.
These developments could give a boost to our investments in the financial sector, which remain our largest commitment, and to our holdings in information technology, autos, and retailing. Also beneficial should be the stimulative effects of new product innovation, especially in mobile computing devices and accessories. Our large investments in health care may serve as a stabilizer if faster growth does not materialize. Overall, the portfolio remains attractively valued, with earnings and free cash flow yields about 45% higher than the market average.
Hotchkis and Wiley Capital
Management, LLC
Portfolio Managers:
George H. Davis, Jr.,
Chief Executive Officer
Sheldon J. Lieberman, Principal
Equity markets shrugged off incessant political stalemates during the fiscal year and even climbed when the federal government shut down for 16 days in October. Meanwhile, robust corporate earnings growth kept valuations in check despite the appreciation in stock prices. At current prices, the S&P 500 Index’s price/earnings ratio based on consensus fiscal-year earnings is in line with its 15-year median, yet the 10-year Treasury yield is 2.5%, well below its 15-year median.
Financials, telecommunication services, and energy were the leading sectors for our portfolio. Hewlett-Packard, Johnson Controls, and Boeing were the largest individual contributors. Our main detractors were a modest cash position and stock selection in utilities. Among individual holdings, performance was hurt most by Exelon, J.C. Penney, and Royal Dutch Shell.
10
Armstrong Shaw Associates Inc.
Portfolio Manager:
Jeffrey M. Shaw, Chairman and
Chief Investment Officer
The U.S. stock market has more than doubled during the past five years, and it closed the third quarter of 2013 at near-record levels. As of this writing, the S&P 500 Index trades at 14.5 times next year’s projected earnings, more than 350 basis points higher than at its most recent low point, in September 2011.
Clearly, the lion’s share of the market’s near-term gains has come from price/ earnings expansion. We think it is likely that future equity returns will stem more from earnings and dividend growth than from further upward revaluation. The tide that has lifted all boats will give way to a market that will disproportionately reward those businesses that can execute while also meeting or beating their financial targets. We remain positive on the prospects for the U.S. stock market and continue to focus on companies with dominant franchises, strong balance sheets, and strong generation of free cash flow.
Nine of our ten largest positions outpaced the overall gain of the benchmark, and two of these stocks (American International Group and Ford) posted returns that were more than double the benchmark’s. Our portfolio also benefited from an underweighting of utilities and from good stock selection in energy. Consumer discretionary, consumer staples, and financials were our top-performing sectors.
The portfolio’s relative performance was pulled down by weak returns in the index’s top-performing sector, information technology, and by poor stock selection in industrials.
Vanguard Equity Investment Group
Portfolio Managers:
James D. Troyer, CFA, Principal
James P. Stetler, Principal
Michael R. Roach, CFA
Our diversified, multi-factor model produced satisfying results for the fiscal year. The model focuses on fundamental conditions and attributes that we believe give investors the best chance of success over the long term. Our growth, management decisions, sentiment, and quality indicators contributed positively, while our yields indicator slightly detracted.
Selection within industrials, energy, and information technology contributed most to our relative returns. In industrials, overweighted positions in Delta Air Lines and Towers Watson led results. In energy, Hess and Valero Energy were strong contributors, while Western Digital and Seagate Technology helped returns in information technology.
An underweighting of some companies that were not singled out by the fundamental criteria in our model—notably Walgreens and Bristol-Myers Squibb—held back our overall performance relative to the benchmark.
11
Windsor II Fund
Fund Profile
As of October 31, 2013
| | |
| Share-Class Characteristics | |
| | Investor | Admiral |
| | Shares | Shares |
| Ticker Symbol | VWNFX | VWNAX |
| Expense Ratio1 | 0.35% | 0.27% |
| 30-Day SEC Yield | 2.16% | 2.24% |
| | | |
| Portfolio Characteristics | | |
| | | | DJ U.S. |
| | | Russell | Total |
| | | 1000 | Market |
| | | Value | FA |
| | Fund | Index | Index |
| Number of Stocks | 278 | 653 | 3,612 |
| Median Market Cap | $58.3B | $50.6B | $41.6B |
| Price/Earnings Ratio | 16.7x | 16.7x | 19.8x |
| Price/Book Ratio | 2.0x | 1.7x | 2.5x |
| Return on Equity | 15.5% | 12.5% | 16.5% |
| Earnings Growth | | | |
| Rate | 7.4% | 6.6% | 10.6% |
| Dividend Yield | 2.6% | 2.3% | 1.9% |
| Foreign Holdings | 10.0% | 0.0% | 0.0% |
| Turnover Rate | 27% | — | — |
| Short-Term Reserves | 2.6% | — | — |
| | | |
| Sector Diversification (% of equity exposure) |
| | | Russell | DJ U.S. |
| | | 1000 | Total |
| | | Value | Market |
| | Fund | Index | FA Index |
| Consumer | | | |
| Discretionary | 7.8% | 6.6% | 13.3% |
| Consumer Staples | 9.8 | 6.0 | 8.8 |
| Energy | 13.6 | 15.0 | 9.7 |
| Financials | 21.7 | 28.7 | 17.3 |
| Health Care | 18.1 | 12.9 | 12.5 |
| Industrials | 11.8 | 10.2 | 11.5 |
| Information | | | |
| Technology | 8.6 | 8.8 | 17.7 |
| Materials | 1.5 | 2.9 | 3.8 |
| Telecommunication | | | |
| Services | 3.0 | 2.7 | 2.2 |
| Utilities | 4.1 | 6.2 | 3.2 |
| | |
| Volatility Measures | | |
| | Russell | |
| | 1000 | DJ U.S. |
| | Value | Total Market |
| | Index | FA Index |
| R-Squared | 0.98 | 0.97 |
| Beta | 0.94 | 0.95 |
| These measures show the degree and timing of the fund’s fluctuations compared with the indexes over 36 months. |
| | |
| Ten Largest Holdings (% of total net assets) |
| Pfizer Inc. | Pharmaceuticals | 2.7% |
| JPMorgan Chase & Co. | Diversified Financial | |
| | Services | 2.5 |
| Philip Morris | | |
| International Inc. | Tobacco | 2.5 |
| Microsoft Corp. | Systems Software | 2.4 |
| Raytheon Co. | Aerospace & | |
| | Defense | 2.4 |
| WellPoint Inc. | Managed Health | |
| | Care | 2.4 |
| American Express Co. | Consumer Finance | 2.4 |
| Wells Fargo & Co. | Diversified Banks | 2.3 |
| Johnson & Johnson | Pharmaceuticals | 2.3 |
| Medtronic Inc. | Health Care | |
| | Equipment | 2.3 |
| Top Ten | | 24.2% |
| The holdings listed exclude any temporary cash investments and equity index products. |
Investment Focus
1 The expense ratios shown are from the prospectus dated February 27, 2013, and represent estimated costs for the current fiscal year. For
the fiscal year ended October 31, 2013, the expense ratios were 0.36% for Investor Shares and 0.28% for Admiral Shares.
12
Windsor II Fund
Performance Summary
All of the returns in this report represent past performance, which is not a guarantee of future results that may be achieved by the fund. (Current performance may be lower or higher than the performance data cited. For performance data current to the most recent month-end, visit our website at vanguard.com/performance.) Note, too, that both investment returns and principal value can fluctuate widely, so an investor’s shares, when sold, could be worth more or less than their original cost. The returns shown do not reflect taxes that a shareholder would pay on fund distributions or on the sale of fund shares.
Cumulative Performance: October 31, 2003, Through October 31, 2013
Initial Investment of $10,000
| | | | | |
| | | Average Annual Total Returns | |
| | | Periods Ended October 31, 2013 | |
| | | | | | Final Value |
| | | One | Five | Ten | of a $10,000 |
| | | Year | Years | Years | Investment |
| | Windsor II Fund*Investor Shares | 26.26% | 14.76% | 8.25% | $22,100 |
| •••••••• | Russell 1000 Value Index | 28.29 | 14.06 | 7.81 | 21,209 |
| – – – – | Large-Cap Value Funds Average | 27.63 | 13.30 | 6.57 | 18,893 |
| | Dow Jones U.S. Total Stock Market | | | | |
| | Float Adjusted Index | 28.86 | 16.01 | 8.13 | 21,850 |
| Large-Cap Value Funds Average: Derived from data provided by Lipper, a Thomson Reuters Company. |
| | | | |
| | | | | Final Value |
| | One | Five | Ten | of a $50,000 |
| | Year | Years | Years | Investment |
| Windsor II Fund Admiral Shares | 26.36% | 14.85% | 8.36% | $111,583 |
| Russell 1000 Value Index | 28.29 | 14.06 | 7.81 | 106,044 |
| Dow Jones U.S. Total Stock Market Float | | | | |
| Adjusted Index | 28.86 | 16.01 | 8.13 | 109,248 |
See Financial Highlights for dividend and capital gains information.
13
Windsor II Fund
Fiscal-Year Total Returns (%): October 31, 2003, Through October 31, 2013
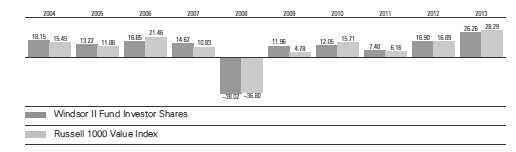
Average Annual Total Returns: Periods Ended September 30, 2013
This table presents returns through the latest calendar quarter—rather than through the end of the fiscal period.
Securities and Exchange Commission rules require that we provide this information.
| | | | |
| | Inception | One | Five | Ten |
| | Date | Year | Years | Years |
| Investor Shares | 6/24/1985 | 20.78% | 9.52% | 8.29% |
| Admiral Shares | 5/14/2001 | 20.84 | 9.61 | 8.39 |
14
Windsor II Fund
Financial Statements
Statement of Net Assets
As of October 31, 2013
The fund reports a complete list of its holdings in regulatory filings four times in each fiscal year, at the quarter-ends. For the second and fourth fiscal quarters, the lists appear in the fund’s semiannual and annual reports to shareholders. For the first and third fiscal quarters, the fund files the lists with the Securities and Exchange Commission on Form N-Q. Shareholders can look up the fund’s Forms N-Q on the SEC’s website at sec.gov. Forms N-Q may also be reviewed and copied at the SEC’s Public Reference Room (see the back cover of this report for further information).
| | | |
| | | | Market |
| | | | Value |
| | | Shares | ($000) |
| Common Stocks (96.5%)1 | | |
| Consumer Discretionary (7.3%) | |
| | Target Corp. | 12,076,000 | 782,404 |
| | Carnival Corp. | 11,974,486 | 414,916 |
| | Viacom Inc. Class B | 2,939,300 | 244,814 |
| | Advance Auto Parts Inc. | 2,393,400 | 237,377 |
| | Comcast Corp. | 5,048,084 | 233,726 |
| | Omnicom Group Inc. | 2,299,300 | 156,605 |
| | Delphi Automotive plc | 2,043,404 | 116,883 |
| | Genuine Parts Co. | 1,285,848 | 101,363 |
| | American Eagle | | |
| | Outfitters Inc. | 6,314,998 | 97,819 |
| * | General Motors Co. | 2,334,205 | 86,249 |
| | Macy’s Inc. | 1,824,700 | 84,137 |
| | Renault SA | 944,271 | 82,388 |
| | Johnson Controls Inc. | 1,658,300 | 76,531 |
| * | AutoZone Inc. | 170,862 | 74,272 |
| | Ford Motor Co. | 3,622,659 | 61,984 |
| | Lowe’s Cos. Inc. | 1,188,791 | 59,178 |
| | Expedia Inc. | 948,200 | 55,830 |
| | Hyundai Motor Co. | 222,182 | 52,934 |
| | Wyndham Worldwide Corp. 783,211 | 52,005 |
| | Volkswagen AG | 204,523 | 50,015 |
| | Time Warner Cable Inc. | 383,700 | 46,102 |
| | Volkswagen AG Prior Pfd. | 161,020 | 40,836 |
| | Interpublic Group of | | |
| | Cos. Inc. | 2,341,000 | 39,329 |
| | Hasbro Inc. | 702,737 | 36,296 |
| *,^ | JC Penney Co. Inc. | 2,637,500 | 19,781 |
| | Magna International Inc. | 184,700 | 15,644 |
| * | Bed Bath & Beyond Inc. | 142,482 | 11,017 |
| | Time Warner Inc. | 30,699 | 2,110 |
| | Whirlpool Corp. | 7,000 | 1,022 |
| | Gannett Co. Inc. | 32,700 | 905 |
| | Best Buy Co. Inc. | 15,300 | 655 |
| | H&R Block Inc. | 14,300 | 407 |
| | Starwood Hotels & Resorts | |
| | Worldwide Inc. | 5,200 | 383 |
| | |
| International Game | | |
| Technology | 16,000 | 301 |
| Tupperware Brands Corp. | 2,900 | 260 |
| Staples Inc. | 5,500 | 89 |
| | | 3,336,567 |
| Consumer Staples (9.4%) | | |
| Philip Morris | | |
| International Inc. | 12,627,653 | 1,125,377 |
| Diageo plc ADR | 5,253,620 | 670,309 |
| Imperial Tobacco Group | | |
| plc ADR | 8,734,425 | 654,995 |
| Wal-Mart Stores Inc. | 8,249,405 | 633,142 |
| Altria Group Inc. | 12,400,432 | 461,668 |
| Molson Coors Brewing | | |
| Co. Class B | 6,760,835 | 365,085 |
| CVS Caremark Corp. | 2,983,193 | 185,734 |
| Sysco Corp. | 2,333,746 | 75,473 |
| Mondelez International | | |
| Inc. Class A | 1,441,861 | 48,504 |
| Kellogg Co. | 384,700 | 24,332 |
| PepsiCo Inc. | 215,200 | 18,096 |
| Procter & Gamble Co. | 53,990 | 4,360 |
| Kimberly-Clark Corp. | 16,500 | 1,782 |
| Kraft Foods Group Inc. | 32,700 | 1,778 |
| Kroger Co. | 34,500 | 1,478 |
| JM Smucker Co. | 11,800 | 1,312 |
| Tyson Foods Inc. Class A | 32,500 | 899 |
| Energizer Holdings Inc. | 8,700 | 854 |
| Walgreen Co. | 9,000 | 533 |
| Archer-Daniels-Midland Co. 11,100 | 454 |
| Herbalife Ltd. | 2,500 | 162 |
| Lorillard Inc. | 900 | 46 |
| | | 4,276,373 |
| Energy (13.0%) | | |
| ConocoPhillips | 11,927,889 | 874,314 |
| Phillips 66 | 12,304,394 | 792,772 |
| Occidental Petroleum | | |
| Corp. | 8,223,307 | 790,095 |
15
Windsor II Fund
| | | |
| | | | Market |
| | | | Value |
| | | Shares | ($000) |
| | BP plc ADR | 15,549,869 | 723,069 |
| | Seadrill Ltd. | 10,969,707 | 511,408 |
| | Marathon | | |
| | Petroleum Corp. | 3,893,548 | 279,012 |
| | Apache Corp. | 3,141,800 | 278,992 |
| | Chevron Corp. | 1,530,510 | 183,600 |
| | CONSOL Energy Inc. | 4,587,020 | 167,426 |
| ^ | Transocean Ltd. | 3,217,115 | 151,430 |
| | Anadarko | | |
| | Petroleum Corp. | 1,577,100 | 150,282 |
| | Devon Energy Corp. | 2,240,550 | 141,648 |
| ^ | Total SA ADR | 1,680,100 | 102,789 |
| | Royal Dutch Shell | | |
| | plc ADR | 1,429,500 | 99,379 |
| | HollyFrontier Corp. | 2,012,600 | 92,700 |
| | Valero Energy Corp. | 1,835,500 | 75,568 |
| * | Cobalt International | | |
| | Energy Inc. | 3,065,800 | 71,157 |
| | Ensco plc Class A | 1,230,971 | 70,966 |
| | Noble Corp. | 1,825,078 | 68,805 |
| | Halliburton Co. | 1,099,120 | 58,286 |
| * | Weatherford | | |
| | International Ltd. | 3,145,069 | 51,705 |
| | Kinder Morgan Inc. | 1,067,552 | 37,695 |
| * | Cameron | | |
| | International Corp. | 519,439 | 28,496 |
| | Marathon Oil Corp. | 788,500 | 27,803 |
| * | Dresser-Rand Group Inc. | 373,678 | 22,708 |
| | Murphy Oil Corp. | 342,300 | 20,648 |
| | Royal Dutch Shell plc | | |
| | ADR (New York Shares) | 232,905 | 15,525 |
| | Gazprom OAO ADR | 1,553,600 | 14,522 |
| * | Kosmos Energy Ltd. | 832,400 | 8,873 |
| | Exxon Mobil Corp. | 96,882 | 8,683 |
| | Hess Corp. | 20,250 | 1,644 |
| | Helmerich & Payne Inc. | 17,700 | 1,373 |
| * | Ultra Petroleum Corp. | 49,100 | 901 |
| | Cimarex Energy Co. | 1,700 | 179 |
| | | | 5,924,453 |
| Exchange-Traded Funds (1.2%) | |
| 2 | Vanguard Total Stock | | |
| | Market ETF | 3,197,800 | 292,247 |
| 2 | Vanguard Value ETF | 2,511,200 | 183,292 |
| | SPDR S&P 500 ETF Trust | 545,000 | 95,773 |
| | | | 571,312 |
| Financials (20.8%) | | |
| | JPMorgan Chase & Co. | 22,098,082 | 1,138,935 |
| | American Express Co. | 13,281,296 | 1,086,410 |
| | Wells Fargo & Co. | 24,751,341 | 1,056,635 |
| | Citigroup Inc. | 19,098,744 | 931,637 |
| | Bank of America Corp. | 60,799,795 | 848,765 |
| | PNC Financial Services | | |
| | Group Inc. | 11,163,568 | 820,857 |
| | | | | |
| | Capital One | | | | |
| | Financial Corp. | 10,835,906 | 744,102 |
| | SLM Corp. | 15,720,252 | 398,823 |
| | XL Group plc Class A | 12,748,832 | 389,732 |
| | MetLife Inc. | | 4,279,079 | 202,443 |
| | American International | | | | |
| | Group Inc. | | 3,638,664 | 187,937 |
| | Corrections Corp. | | | | |
| | of America | | 4,134,499 | 152,977 |
| | Lincoln National Corp. | | 3,285,361 | 149,188 |
| | Goldman Sachs | | | | |
| | Group Inc. | | | 876,699 | 141,026 |
| | SunTrust Banks Inc. | | 3,714,467 | 124,955 |
| | Hartford Financial | | | | |
| | Services Group Inc. | | 3,342,000 | 112,625 |
| | BNP Paribas SA | | 1,523,400 | 112,387 |
| | Barclays plc | 24,726,145 | 104,035 |
| | Morgan Stanley | | 3,383,200 | 97,199 |
| * | IntercontinentalExchange | | | | |
| | Inc. | | | 471,900 | 90,949 |
| | Vornado Realty Trust | | | 973,200 | 86,673 |
| | Regions Financial Corp. | | 8,684,000 | 83,627 |
| | Lexington Realty Trust | | 5,863,600 | 68,604 |
| | Allstate Corp. | | 1,274,700 | 67,636 |
| | Prudential Financial Inc. | | | 785,200 | 63,907 |
| | ACE Ltd. | | | 571,722 | 54,565 |
| | Unum Group | | 1,696,900 | 53,860 |
| | Nordea Bank AB | | 3,611,800 | 46,200 |
| * | Realogy Holdings Corp. | | | 845,503 | 34,784 |
| | Bank of New York | | | | |
| | Mellon Corp. | | 1,017,100 | 32,344 |
| | State Street Corp. | | | 26,600 | 1,864 |
| | Travelers Cos. Inc. | | | 21,100 | 1,821 |
| | Ameriprise Financial Inc. | | | 15,000 | 1,508 |
| | Fifth Third Bancorp | | | 77,200 | 1,469 |
| | US Bancorp | | | 37,049 | 1,384 |
| | Everest Re Group Ltd. | | | 8,600 | 1,322 |
| | American Financial | | | | |
| | Group Inc. | | | 20,300 | 1,142 |
| | Host Hotels & Resorts Inc. | | 44,600 | 827 |
| | Ventas Inc. | | | 12,000 | 783 |
| | BlackRock Inc. | | | 2,600 | 782 |
| | Aflac Inc. | | | 11,725 | 762 |
| | Plum Creek Timber Co. Inc. | 15,000 | 681 |
| | Kimco Realty Corp. | | | 31,500 | 677 |
| | UDR Inc. | | | 25,900 | 643 |
| | Hospitality Properties Trust | | 20,700 | 608 |
| | Apartment Investment & | | | | |
| | Management Co. Class A | | 21,000 | 588 |
| | Weingarten Realty Investors | 17,900 | 568 |
| | Regency Centers Corp. | | | 10,900 | 563 |
| | Comerica Inc. | | | 13,000 | 563 |
| | Simon Property Group Inc. | | 3,100 | 479 |
| | Discover Financial Services | | 7,900 | 410 |
| | Chubb Corp. | | | 3,500 | 322 |
16
Windsor II Fund
| | | |
| | | | Market |
| | | | Value |
| | | Shares | ($000) |
| | Cole Real Estate | | |
| | Investment Inc. | 11,400 | 162 |
| | KeyCorp | 5,300 | 66 |
| | Invesco Ltd. | 1,600 | 54 |
| | | | 9,503,865 |
| Health Care (17.4%) | | |
| | Pfizer Inc. | 40,687,696 | 1,248,298 |
| | WellPoint Inc. | 12,925,624 | 1,096,093 |
| | Johnson & Johnson | 11,161,550 | 1,033,671 |
| | Medtronic Inc. | 17,969,600 | 1,031,455 |
| | Sanofi ADR | 13,177,800 | 704,749 |
| | Merck & Co. Inc. | 14,929,200 | 673,158 |
| | UnitedHealth Group Inc. | 4,707,598 | 321,341 |
| | Zoetis Inc. | 8,265,290 | 261,679 |
| * | CareFusion Corp. | 6,008,995 | 232,969 |
| | Baxter International Inc. | 3,416,900 | 225,071 |
| * | Gilead Sciences Inc. | 2,318,900 | 164,619 |
| | McKesson Corp. | 942,735 | 147,387 |
| | Sanofi | 1,296,300 | 138,216 |
| | St. Jude Medical Inc. | 1,892,216 | 108,594 |
| | AbbVie Inc. | 1,589,591 | 77,016 |
| | Covidien plc | 1,190,672 | 76,334 |
| | Aetna Inc. | 1,171,800 | 73,472 |
| * | Express Scripts | | |
| | Holding Co. | 936,653 | 58,559 |
| | Thermo Fisher | | |
| | Scientific Inc. | 544,524 | 53,244 |
| | AstraZeneca plc ADR | 901,500 | 47,653 |
| | Amgen Inc. | 340,499 | 39,498 |
| | Humana Inc. | 362,700 | 33,423 |
| | Novartis AG ADR | 413,100 | 32,036 |
| | Quest Diagnostics Inc. | 296,800 | 17,781 |
| | Zimmer Holdings Inc. | 186,000 | 16,269 |
| | Eli Lilly & Co. | 43,200 | 2,152 |
| * | Endo Health Solutions Inc. | 24,700 | 1,080 |
| | Omnicare Inc. | 18,500 | 1,020 |
| | Bristol-Myers Squibb Co. | 18,253 | 959 |
| | Cigna Corp. | 10,900 | 839 |
| * | Charles River Laboratories | |
| | International Inc. | 13,850 | 682 |
| * | Boston Scientific Corp. | 46,100 | 539 |
| * | Covance Inc. | 2,900 | 259 |
| | Universal Health Services | | |
| | Inc. Class B | 1,500 | 121 |
| * | Quintiles Transnational | | |
| | Holdings Inc. | 900 | 38 |
| | HealthSouth Corp. | 746 | 26 |
| | | | 7,920,300 |
| Industrials (11.2%) | | |
| | Raytheon Co. | 13,344,956 | 1,099,224 |
| | Honeywell | | |
| | International Inc. | 10,659,110 | 924,465 |
| | Emerson Electric Co. | 11,178,800 | 748,644 |
| | General Dynamics Corp. | 8,343,587 | 722,805 |
| | | | |
| 3 | Xylem Inc. | 9,674,199 | 333,760 |
| | Illinois Tool Works Inc. | 3,504,465 | 276,117 |
| | Tyco International Ltd. | 5,810,127 | 212,360 |
| | General Electric Co. | 3,458,304 | 90,400 |
| | Republic Services Inc. | | | |
| | Class A | 2,148,200 | 71,900 |
| * | Terex Corp. | 1,961,700 | 68,561 |
| | Joy Global Inc. | 1,031,500 | 58,538 |
| | ADT Corp. | 1,347,236 | 58,430 |
| | Cummins Inc. | | 409,300 | 51,989 |
| | FedEx Corp. | | 361,500 | 47,357 |
| * | Clean Harbors Inc. | | 719,805 | 44,448 |
| * | Sensata Technologies | | | |
| | Holding NV | 1,111,341 | 41,820 |
| | Lockheed Martin Corp. | | 310,000 | 41,335 |
| | United Technologies Corp. | 372,209 | 39,547 |
| | Boeing Co. | | 301,900 | 39,398 |
| | PACCAR Inc. | | 699,800 | 38,909 |
| | Stanley Black & Decker Inc. | 406,300 | 32,134 |
| * | WABCO Holdings Inc. | | 305,405 | 26,167 |
| | KAR Auction Services Inc. | | 665,336 | 19,774 |
| | Northrop Grumman Corp. | | 162,976 | 17,522 |
| | Embraer SA ADR | | 463,600 | 13,625 |
| | L-3 Communications | | | |
| | Holdings Inc. | | 13,600 | 1,366 |
| | Towers Watson & Co. | | | |
| | Class A | | 11,300 | 1,297 |
| | Delta Air Lines Inc. | | 44,900 | 1,185 |
| | United Parcel Service Inc. | | | |
| | Class B | | 8,300 | 815 |
| | CSX Corp. | | 17,400 | 453 |
| | Waste Management Inc. | | 4,800 | 209 |
| | Dover Corp. | | 1,900 | 174 |
| | Rockwell Collins Inc. | | 1,800 | 126 |
| | Manpowergroup Inc. | | 1,200 | 94 |
| | | | | 5,124,948 |
| Information Technology (8.0%) | | |
| | Microsoft Corp. | 31,350,145 | 1,108,228 |
| | Intel Corp. | 18,935,200 | 462,587 |
| | Apple Inc. | | 574,404 | 300,040 |
| | Cisco Systems Inc. | 12,112,500 | 272,531 |
| | EMC Corp. | 8,547,779 | 205,745 |
| | Corning Inc. | 11,445,200 | 195,599 |
| | Samsung Electronics | | | |
| | Co. Ltd. | | 123,700 | 170,590 |
| | Hewlett-Packard Co. | 6,750,450 | 164,509 |
| | International Business | | | |
| | Machines Corp. | | 870,455 | 155,994 |
| | QUALCOMM Inc. | 2,141,300 | 148,756 |
| | Oracle Corp. | 3,475,396 | 116,426 |
| * | Google Inc. Class A | | 93,525 | 96,385 |
| | Texas Instruments Inc. | 2,230,500 | 93,859 |
| * | Check Point Software | | | |
| | Technologies Ltd. | 1,351,300 | 78,402 |
| | SanDisk Corp. | | 695,900 | 48,365 |
17
Windsor II Fund
| | | |
| | | | Market |
| | | | Value |
| | | Shares | ($000) |
| | TE Connectivity Ltd. | 465,275 | 23,957 |
| | Seagate Technology plc | 31,450 | 1,531 |
| | Western Digital Corp. | 21,500 | 1,497 |
| | Computer Sciences Corp. | 24,200 | 1,192 |
| | Applied Materials Inc. | 55,900 | 998 |
| | Fidelity National Information | |
| | Services Inc. | 16,700 | 814 |
| * | ON Semiconductor Corp. | 97,600 | 689 |
| | Harris Corp. | 4,800 | 297 |
| | CA Inc. | 4,700 | 149 |
| | Xerox Corp. | 13,800 | 137 |
| | Maxim Integrated | | |
| | Products Inc. | 3,000 | 89 |
| | | | 3,649,366 |
| Materials (1.4%) | | |
| | EI du Pont de Nemours | | |
| | & Co. | 5,324,588 | 325,865 |
| | Eastman Chemical Co. | 2,055,270 | 161,935 |
| | Carpenter | | |
| | Technology Corp. | 1,243,200 | 73,759 |
| | Mosaic Co. | 842,010 | 38,606 |
| | Praxair Inc. | 227,426 | 28,362 |
| | LyondellBasell Industries | | |
| | NV Class A | 24,820 | 1,852 |
| | Dow Chemical Co. | 33,100 | 1,307 |
| * | Owens-Illinois Inc. | 38,700 | 1,230 |
| | Westlake Chemical Corp. | 10,400 | 1,117 |
| | Avery Dennison Corp. | 23,600 | 1,112 |
| | Rock Tenn Co. Class A | 9,800 | 1,049 |
| | International Paper Co. | 20,700 | 923 |
| | | | 637,117 |
| Telecommunication Services (2.9%) | |
| | AT&T Inc. | 16,309,207 | 590,393 |
| | Verizon | | |
| | Communications Inc. | 10,853,209 | 548,196 |
| | Vodafone Group plc ADR | 2,761,800 | 101,689 |
| | CenturyLink Inc. | 2,435,800 | 82,476 |
| | United States Cellular Corp. | 3,200 | 155 |
| | | | 1,322,909 |
| Utilities (3.9%) | | |
| 3 | CenterPoint Energy Inc. | 25,745,343 | 633,335 |
| | Public Service | | |
| | Enterprise Group Inc. | 17,985,158 | 602,503 |
| | Entergy Corp. | 5,412,378 | 350,289 |
| | Exelon Corp. | 2,558,900 | 73,031 |
| * | Calpine Corp. | 2,811,933 | 56,717 |
| | NRG Energy Inc. | 1,538,000 | 43,879 |
| | Edison International | 418,700 | 20,529 |
| | AES Corp. | 91,900 | 1,295 |
| | Wisconsin Energy Corp. | 30,000 | 1,263 |
| | AGL Resources Inc. | 25,100 | 1,201 |
| | UGI Corp. | 28,600 | 1,183 |
| | Pinnacle West Capital Corp. | 20,600 | 1,154 |
| | DTE Energy Co. | 13,020 | 900 |
| | | | |
| | PG&E Corp. | | 17,900 | 749 |
| | NV Energy Inc. | | 31,050 | 737 |
| | Ameren Corp. | | 5,600 | 203 |
| | PPL Corp. | | 5,600 | 172 |
| | Duke Energy Corp. | 2,200 | 158 |
| | | | | 1,789,298 |
| Total Common Stocks | | |
| (Cost $32,185,891) | | | 44,056,508 |
| Temporary Cash Investments (3.6%)1 | |
| Money Market Fund (3.5%) | | |
| 4,5 | Vanguard Market | | | |
| | Liquidity Fund, | | | |
| | 0.120% | 1,597,658,684 | 1,597,659 |
| |
| | | | Face | |
| | | | Amount | |
| | | | ($000) | |
| U.S. Government and Agency Obligations (0.1%) |
| 6,7 | Federal Home | | | |
| | Loan Bank | | | |
| | Discount | | | |
| | Notes, 0.070%, 3/12/14 | 100 | 100 |
| 7,8 | Freddie Mac | | | |
| | Discount Notes, | | | |
| | 0.063%, 3/17/14 | 26,000 | 25,985 |
| | | | | 26,085 |
| Total Temporary Cash Investments | |
| (Cost $1,623,753) | | | 1,623,744 |
| Total Investments (100.1%) | | |
| (Cost $33,809,644) | | | 45,680,252 |
| Other Assets and Liabilities (-0.1%) | |
| Other Assets | | | 309,420 |
| Liabilities5 | | | (362,854) |
| | | | | (53,434) |
| Net Assets (100%) | | | 45,626,818 |
18
Windsor II Fund
| |
| At October 31, 2013, net assets consisted of: |
| | Amount |
| | ($000) |
| Paid-in Capital | 32,515,176 |
| Undistributed Net Investment Income | 242,599 |
| Accumulated Net Realized Gains | 988,163 |
| Unrealized Appreciation (Depreciation) | |
| Investment Securities | 11,870,608 |
| Futures Contracts | 10,270 |
| Foreign Currencies | 2 |
| Net Assets | 45,626,818 |
| |
| |
| Investor Shares—Net Assets | |
| Applicable to 498,383,000 outstanding | |
| $.001 par value shares of beneficial | |
| interest (unlimited authorization) | 18,034,011 |
| Net Asset Value Per Share— | |
| Investor Shares | $36.19 |
| |
| |
| Admiral Shares—Net Assets | |
| Applicable to 429,610,657 outstanding | |
| $.001 par value shares of beneficial | |
| interest (unlimited authorization) | 27,592,807 |
| Net Asset Value Per Share— | |
| Admiral Shares | $64.23 |
See Note A in Notes to Financial Statements.
* Non-income-producing security.
^ Includes partial security positions on loan to broker-dealers. The total value of securities on loan is $64,354,000.
1 The fund invests a portion of its cash reserves in equity markets through the use of index futures contracts. After giving effect to futures
investments, the fund’s effective common stock and temporary cash investment positions represent 97.4% and 2.7%, respectively,
of net assets.
2 Considered an affiliated company of the fund as the issuer is another member of The Vanguard Group.
3 Considered an affiliated company of the fund as the fund owns more than 5% of the outstanding voting securities of such company.
4 Affiliated money market fund available only to Vanguard funds and certain trusts and accounts managed by Vanguard. Rate shown is
the 7-day yield.
5 Includes $66,909,000 of collateral received for securities on loan.
6 The issuer operates under a congressional charter; its securities are generally neither guaranteed by the U.S. Treasury nor backed by the
full faith and credit of the U.S. government.
7 Securities with a value of $16,990,000 have been segregated as initial margin for open futures contracts.
8 The issuer was placed under federal conservatorship in September 2008; since that time, its daily operations have been managed by the
Federal Housing Finance Agency and it receives capital from the U.S. Treasury, as needed to maintain a positive net worth, in exchange for
senior preferred stock.
ADR—American Depositary Receipt.
See accompanying Notes, which are an integral part of the Financial Statements.
19
Windsor II Fund
Statement of Operations
| |
| | Year Ended |
| | October 31, 2013 |
| | ($000) |
| Investment Income | |
| Income | |
| Dividends1,2 | 1,076,361 |
| Interest2 | 1,945 |
| Securities Lending | 2,861 |
| Total Income | 1,081,167 |
| Expenses | |
| Investment Advisory Fees—Note B | |
| Basic Fee | 59,942 |
| Performance Adjustment | (2,534) |
| The Vanguard Group—Note C | |
| Management and Administrative—Investor Shares | 37,239 |
| Management and Administrative—Admiral Shares | 28,002 |
| Marketing and Distribution—Investor Shares | 3,030 |
| Marketing and Distribution—Admiral Shares | 3,488 |
| Custodian Fees | 314 |
| Auditing Fees | 33 |
| Shareholders’ Reports—Investor Shares | 232 |
| Shareholders’ Reports—Admiral Shares | 176 |
| Trustees’ Fees and Expenses | 111 |
| Total Expenses | 130,033 |
| Expenses Paid Indirectly | (944) |
| Net Expenses | 129,089 |
| Net Investment Income | 952,078 |
| Realized Net Gain (Loss) | |
| Investment Securities Sold2 | 2,888,398 |
| Futures Contracts | 85,354 |
| Foreign Currencies | 400 |
| Realized Net Gain (Loss) | 2,974,152 |
| Change in Unrealized Appreciation (Depreciation) | |
| Investment Securities | 5,689,061 |
| Futures Contracts | 15,860 |
| Foreign Currencies | 4 |
| Change in Unrealized Appreciation (Depreciation) | 5,704,925 |
| Net Increase (Decrease) in Net Assets Resulting from Operations | 9,631,155 |
| 1 Dividends are net of foreign withholding taxes of $2,965,000. |
| 2 Dividend income, interest income, and realized net gain (loss) from affiliated companies of the fund were $41,258,000, $1,908,000, and $239,023,000, respectively. |
See accompanying Notes, which are an integral part of the Financial Statements.
20
Windsor II Fund
Statement of Changes in Net Assets
| | |
| | Year Ended October 31, |
| | 2013 | 2012 |
| | ($000) | ($000) |
| Increase (Decrease) in Net Assets | | |
| Operations | | |
| Net Investment Income | 952,078 | 837,220 |
| Realized Net Gain (Loss) | 2,974,152 | 2,325,818 |
| Change in Unrealized Appreciation (Depreciation) | 5,704,925 | 2,378,206 |
| Net Increase (Decrease) in Net Assets Resulting from Operations | 9,631,155 | 5,541,244 |
| Distributions | | |
| Net Investment Income | | |
| Investor Shares | (420,360) | (425,313) |
| Admiral Shares | (507,947) | (386,642) |
| Realized Capital Gain | | |
| Investor Shares | — | — |
| Admiral Shares | — | — |
| Total Distributions | (928,307) | (811,955) |
| Capital Share Transactions | | |
| Investor Shares | (4,141,562) | (3,249,876) |
| Admiral Shares | 3,777,991 | 2,027,815 |
| Net Increase (Decrease) from Capital Share Transactions | (363,571) | (1,222,061) |
| Total Increase (Decrease) | 8,339,277 | 3,507,228 |
| Net Assets | | |
| Beginning of Period | 37,287,541 | 33,780,313 |
| End of Period1 | 45,626,818 | 37,287,541 |
| 1 Net Assets—End of Period includes undistributed net investment income of $242,599,000 and $218,428,000. |
See accompanying Notes, which are an integral part of the Financial Statements.
21
Windsor II Fund
Financial Highlights
| | | | | |
| Investor Shares | | | | | |
| |
| For a Share Outstanding | Year Ended October 31, |
| Throughout Each Period | 2013 | 2012 | 2011 | 2010 | 2009 |
| Net Asset Value, Beginning of Period | $29.33 | $25.68 | $24.37 | $22.22 | $20.56 |
| Investment Operations | | | | | |
| Net Investment Income | .740 | . 644 | . 557 | . 495 | . 580 |
| Net Realized and Unrealized Gain (Loss) | | | | | |
| on Investments | 6.842 | 3.627 | 1.276 | 2.151 | 1.750 |
| Total from Investment Operations | 7.582 | 4.271 | 1.833 | 2.646 | 2.330 |
| Distributions | | | | | |
| Dividends from Net Investment Income | (.722) | (. 621) | (. 523) | (. 496) | (. 670) |
| Distributions from Realized Capital Gains | — | — | — | — | — |
| Total Distributions | (.722) | (. 621) | (. 523) | (. 496) | (. 670) |
| Net Asset Value, End of Period | $36.19 | $29.33 | $25.68 | $24.37 | $22.22 |
| |
| Total Return1 | 26.26% | 16.90% | 7.48% | 12.05% | 11.96% |
| |
| Ratios/Supplemental Data | | | | | |
| Net Assets, End of Period (Millions) | $18,034 | $18,255 | $19,010 | $20,921 | $20,695 |
| Ratio of Total Expenses to Average Net Assets2 | 0.36% | 0.35% | 0.35% | 0.35% | 0.38% |
| Ratio of Net Investment Income to | | | | | |
| Average Net Assets | 2.25% | 2.30% | 2.11% | 2.08% | 2.96% |
| Portfolio Turnover Rate | 27% | 22% | 23% | 29% | 41% |
| 1 Total returns do not include account service fees that may have applied in the periods shown. Fund prospectuses provide information about |
| any applicable account service fees. |
| 2 Includes performance-based investment advisory fee increases (decreases) of (0.01%), (0.02%), (0.01%), (0.01%), and (0.01%). |
See accompanying Notes, which are an integral part of the Financial Statements.
22
Windsor II Fund
Financial Highlights
| | | | | |
| Admiral Shares | | | | | |
| |
| For a Share Outstanding | Year Ended October 31, |
| Throughout Each Period | 2013 | 2012 | 2011 | 2010 | 2009 |
| Net Asset Value, Beginning of Period | $52.06 | $45.59 | $43.26 | $39.46 | $36.51 |
| Investment Operations | | | | | |
| Net Investment Income | 1.366 | 1.188 | 1.025 | .914 | 1.064 |
| Net Realized and Unrealized Gain (Loss) | | | | | |
| on Investments | 12.134 | 6.424 | 2.264 | 3.811 | 3.112 |
| Total from Investment Operations | 13.500 | 7.612 | 3.289 | 4.725 | 4.176 |
| Distributions | | | | | |
| Dividends from Net Investment Income | (1.330) | (1.142) | (.959) | (.925) | (1.226) |
| Distributions from Realized Capital Gains | — | — | — | — | — |
| Total Distributions | (1.330) | (1.142) | (.959) | (.925) | (1.226) |
| Net Asset Value, End of Period | $64.23 | $52.06 | $45.59 | $43.26 | $39.46 |
| |
| Total Return | 26.36% | 16.98% | 7.56% | 12.12% | 12.09% |
| |
| Ratios/Supplemental Data | | | | | |
| Net Assets, End of Period (Millions) | $27,593 | $19,032 | $14,771 | $13,381 | $12,060 |
| Ratio of Total Expenses to Average Net Assets1 | 0.28% | 0.27% | 0.27% | 0.27% | 0.27% |
| Ratio of Net Investment Income to | | | | | |
| Average Net Assets | 2.33% | 2.38% | 2.19% | 2.16% | 3.07% |
| Portfolio Turnover Rate | 27% | 22% | 23% | 29% | 41% |
| 1 Includes performance-based investment advisory fee increases (decreases) of (0.01%), (0.02%), (0.01%), (0.01%), and (0.01%). |
See accompanying Notes, which are an integral part of the Financial Statements.
23
Windsor II Fund
Notes to Financial Statements
Vanguard Windsor II Fund is registered under the Investment Company Act of 1940 as an open-end investment company, or mutual fund. The fund offers two classes of shares: Investor Shares and Admiral Shares. Investor Shares are available to any investor who meets the fund’s minimum purchase requirements. Admiral Shares are designed for investors who meet certain administrative, service, and account-size criteria.
A. The following significant accounting policies conform to generally accepted accounting principles for U.S. mutual funds. The fund consistently follows such policies in preparing its financial statements.
1. Security Valuation: Securities are valued as of the close of trading on the New York Stock Exchange (generally 4 p.m., Eastern time) on the valuation date. Equity securities are valued at the latest quoted sales prices or official closing prices taken from the primary market in which each security trades; such securities not traded on the valuation date are valued at the mean of the latest quoted bid and asked prices. Securities for which market quotations are not readily available, or whose values have been affected by events occurring before the fund’s pricing time but after the close of the securities’ primary markets, are valued at their fair values calculated according to procedures adopted by the board of trustees. These procedures include obtaining quotations from an independent pricing service, monitoring news to identify significant market- or security-specific events, and evaluating changes in the values of foreign market proxies (for example, ADRs, futures contracts, or exchange-traded funds), between the time the foreign markets close and the fund’s pricing time. When fair-value pricing is employed, the prices of securities used by a fund to calculate its net asset value may differ from quoted or published prices for the same securities. Investments in Vanguard Market Liquidity Fund are valued at that fund’s net asset value. Temporary cash investments acquired over 60 days to maturity are valued using the latest bid prices or using valuations based on a matrix system (which considers such factors as security prices, yields, maturities, and ratings), both as furnished by independent pricing services. Other temporary cash investments are valued at amortized cost, which approximates market value.
2. Foreign Currency: Securities and other assets and liabilities denominated in foreign currencies are translated into U.S. dollars using exchange rates obtained from an independent third party as of the fund’s pricing time on the valuation date. Realized gains (losses) and unrealized appreciation (depreciation) on investment securities include the effects of changes in exchange rates since the securities were purchased, combined with the effects of changes in security prices. Fluctuations in the value of other assets and liabilities resulting from changes in exchange rates are recorded as unrealized foreign currency gains (losses) until the assets or liabilities are settled in cash, at which time they are recorded as realized foreign currency gains (losses).
3. Futures Contracts: The fund may use index futures contracts to a limited extent, with the objective of maintaining full exposure to the stock market while maintaining liquidity. The fund may purchase or sell futures contracts to achieve a desired level of investment, whether to accommodate portfolio turnover or cash flows from capital share transactions. The primary risks associated with the use of futures contracts are imperfect correlation between changes in market values of stocks held by the fund and the prices of futures contracts, and the possibility of an illiquid market. Counterparty risk involving futures is mitigated because a regulated clearinghouse is the counterparty instead of the clearing broker. To further mitigate counterparty risk, the fund trades futures contracts on an exchange, monitors the financial strength of its clearing brokers and clearinghouse, and has entered into clearing agreements with its clearing brokers. The clearinghouse imposes initial margin requirements to secure the fund’s performance and requires daily settlement of variation margin representing changes in the market value of each contract.
24
Windsor II Fund
Futures contracts are valued at their quoted daily settlement prices. The aggregate notional amounts of the contracts are not recorded in the Statement of Net Assets. Fluctuations in the value of the contracts are recorded in the Statement of Net Assets as an asset (liability) and in the Statement of Operations as unrealized appreciation (depreciation) until the contracts are closed, when they are recorded as realized futures gains (losses).
During the year ended October 31, 2013, the fund’s average investments in long and short futures contracts represented less than 1% and 0% of net assets, respectively, based on quarterly average aggregate settlement values.
4. Federal Income Taxes: The fund intends to continue to qualify as a regulated investment company and distribute all of its taxable income. Management has analyzed the fund’s tax positions taken for all open federal income tax years (October 31, 2010–2013), and has concluded that no provision for federal income tax is required in the fund’s financial statements.
5. Distributions: Distributions to shareholders are recorded on the ex-dividend date.
6. Securities Lending: To earn additional income, the fund may lend its securities to qualified institutional borrowers. Security loans are required to be secured at all times by collateral in an amount at least equal to the market value of securities loaned. Daily market fluctuations could cause the value of loaned securities to be more or less than the value of the collateral received. When this occurs, the collateral is adjusted and settled on the next business day. The fund further mitigates its counterparty risk by entering into securities lending transactions only with a diverse group of prequalified counterparties, monitoring their financial strength, and entering into master securities lending agreements with its counterparties. The master securities lending agreements provide that, in the event of a counterparty’s default (including bankruptcy), the fund may terminate any loans with that borrower, determine the net amount owed, and sell or retain the collateral up to the net amount owed to the fund; however, such actions may be subject to legal proceedings. While collateral mitigates counterparty risk, in the absence of a default the fund may experience delays and costs in recovering the securities loaned. The fund invests cash collateral received in Vanguard Market Liquidity Fund, and records a liability for the return of the collateral, during the period the securities are on loan. Securities lending income represents fees charged to borrowers plus income earned on invested cash collateral, less expenses associated with the loan.
7. Other: Dividend income is recorded on the ex-dividend date. Interest income includes income distributions received from Vanguard Market Liquidity Fund and is accrued daily. Premiums and discounts on debt securities purchased are amortized and accreted, respectively, to interest income over the lives of the respective securities. Security transactions are accounted for on the date securities are bought or sold. Costs used to determine realized gains (losses) on the sale of investment securities are those of the specific securities sold.
Each class of shares has equal rights as to assets and earnings, except that each class separately bears certain class-specific expenses related to maintenance of shareholder accounts (included in Management and Administrative expenses) and shareholder reporting. Marketing and distribution expenses are allocated to each class of shares based on a method approved by the board of trustees. Income, other non-class-specific expenses, and gains and losses on investments are allocated to each class of shares based on its relative net assets.
B. Barrow, Hanley, Mewhinney & Strauss, LLC; Lazard Asset Management LLC; Hotchkis and Wiley Capital Management, LLC; Armstrong Shaw Associates Inc.; and Sanders Capital, LLC, each provide investment advisory services to a portion of the fund for a fee calculated at an annual percentage rate of average net assets managed by the advisor. The basic fee of Barrow, Hanley, Mewhinney &
25
Windsor II Fund
Strauss, LLC, is subject to quarterly adjustments based on performance for the preceding three years relative to the MSCI US Prime Market 750 Index. The basic fee of Lazard Asset Management LLC is subject to quarterly adjustments based on performance for the preceding three years relative to the S&P 500 Index. The basic fee of Hotchkis and Wiley Capital Management, LLC, is subject to quarterly adjustments based on performance for the preceding five years relative to the MSCI US Investable Market 2500 Index. The basic fee of Armstrong Shaw Associates Inc. is subject to quarterly adjustments based on performance for the preceding five years relative to the Russell 1000 Value Index. The basic fee of Sanders Capital, LLC, is subject to quarterly adjustments based on performance since January 31, 2010, relative to the Russell 3000 Index.
The Vanguard Group provides investment advisory services to a portion of the fund on an at-cost basis; the fund paid Vanguard advisory fees of $147,000 for the year ended October 31, 2013.
For the year ended October 31, 2013, the aggregate investment advisory fee represented an effective annual basic rate of 0.14% of the fund’s average net assets, before a decrease of $2,534,000 (0.01%) based on performance.
C. The Vanguard Group furnishes at cost corporate management, administrative, marketing, and distribution services. The costs of such services are allocated to the fund under methods approved by the board of trustees. The fund has committed to provide up to 0.40% of its net assets in capital contributions to Vanguard. At October 31, 2013, the fund had contributed capital of $5,171,000 to Vanguard (included in Other Assets), representing 0.01% of the fund’s net assets and 2.07% of Vanguard’s capitalization. The fund’s trustees and officers are also directors and officers of Vanguard.
D. The fund has asked its investment advisors to direct certain security trades, subject to obtaining the best price and execution, to brokers who have agreed to rebate to the fund part of the commissions generated. Such rebates are used solely to reduce the fund’s management and administrative expenses. For the year ended October 31, 2013, these arrangements reduced the fund’s expenses by $944,000 (an annual rate of 0.00% of average net assets).
E. Various inputs may be used to determine the value of the fund’s investments. These inputs are summarized in three broad levels for financial statement purposes. The inputs or methodologies used to value securities are not necessarily an indication of the risk associated with investing in those securities.
Level 1—Quoted prices in active markets for identical securities.
Level 2—Other significant observable inputs (including quoted prices for similar securities, interest rates, prepayment speeds, credit risk, etc.).
Level 3—Significant unobservable inputs (including the fund’s own assumptions used to determine the fair value of investments).
The following table summarizes the market value of the fund’s investments as of October 31, 2013, based on the inputs used to value them:
| | | |
| | Level 1 | Level 2 | Level 3 |
| Investments | ($000) | ($000) | ($000) |
| Common Stocks | 43,244,385 | 812,123 | — |
| Temporary Cash Investments | 1,597,659 | 26,085 | — |
| Futures Contracts—Liabilities1 | (1,938) | — | — |
| Total | 44,840,106 | 838,208 | — |
| 1 Represents variation margin on the last day of the reporting period. |
26
Windsor II Fund
F. At October 31, 2013, the aggregate settlement value of open futures contracts and the related unrealized appreciation (depreciation) were:
| | | | |
| | | | ($000) |
| | | | Aggregate | |
| | | Number of | Settlement | Unrealized |
| Futures Contracts | | Long (Short) | Value | Appreciation |
| | Expiration | Contracts | Long (Short) | (Depreciation) |
| S&P 500 Index | December 2013 | 674 | 295,044 | 9,111 |
| E-mini S&P 500 Index | December 2013 | 1,051 | 92,015 | 1,159 |
Unrealized appreciation (depreciation) on open futures contracts is required to be treated as realized gain (loss) for tax purposes.
G. Distributions are determined on a tax basis and may differ from net investment income and realized capital gains for financial reporting purposes. Differences may be permanent or temporary. Permanent differences are reclassified among capital accounts in the financial statements to reflect their tax character. Temporary differences arise when certain items of income, expense, gain, or loss are recognized in different periods for financial statement and tax purposes; these differences will reverse at some time in the future. Differences in classification may also result from the treatment of short-term gains as ordinary income for tax purposes.
During the year ended October 31, 2013, the fund realized net foreign currency gains of $400,000, which increased distributable net income for tax purposes; accordingly, such gains have been reclassified from accumulated net realized gains to undistributed net investment income.
The fund used a tax accounting practice to treat a portion of the price of capital shares redeemed during the year as distributions from realized capital gains. Accordingly, the fund has reclassified $49,086,000 from accumulated net realized gains to paid-in capital.
The fund used a capital loss carryforward of $1,941,763,000 to offset taxable capital gains realized during the year ended October 31, 2013, reducing the amount of capital gains that would otherwise be available to distribute to shareholders. For tax purposes, at October 31, 2013, the fund had $311,422,000 of ordinary income and $999,938,000 of long-term capital gains available for distribution.
At October 31, 2013, the cost of investment securities for tax purposes was $33,811,734,000. Net unrealized appreciation of investment securities for tax purposes was $11,868,518,000, consisting of unrealized gains of $14,349,053,000 on securities that had risen in value since their purchase and $2,480,535,000 in unrealized losses on securities that had fallen in value since their purchase.
H. During the year ended October 31, 2013, the fund purchased $10,821,327,000 of investment securities and sold $11,689,031,000 of investment securities, other than temporary cash investments.
27
Windsor II Fund
I. Capital share transactions for each class of shares were:
| | | | |
| | Year Ended October 31, |
| | 2013 | 2012 |
| | Amount | Shares | Amount | Shares |
| | ($000) | (000) | ($000) | (000) |
| Investor Shares | | | | |
| Issued | 1,115,392 | 34,532 | 1,360,965 | 49,432 |
| Issued in Lieu of Cash Distributions | 410,628 | 13,200 | 415,018 | 15,662 |
| Redeemed | (5,667,582) | (171,744) | (5,025,859) | (182,888) |
| Net Increase (Decrease)—Investor Shares | (4,141,562) | (124,012) | (3,249,876) | (117,794) |
| Admiral Shares | | | | |
| Issued | 5,688,923 | 96,894 | 3,988,960 | 81,728 |
| Issued in Lieu of Cash Distributions | 480,666 | 8,664 | 364,718 | 7,738 |
| Redeemed | (2,391,598) | (41,495) | (2,325,863) | (47,911) |
| Net Increase (Decrease)—Admiral Shares | 3,777,991 | 64,063 | 2,027,815 | 41,555 |
J. Certain of the fund’s investments are in companies that are considered to be affiliated companies of the fund because the fund owns more than 5% of the outstanding voting securities of the company. Transactions during the period in securities of these companies were as follows:
| | | | | |
| | | Current Period Transactions | |
| | Oct. 31, 2012 | | Proceeds from | | Oct. 31, 2013 |
| | Market | Purchases | Securities | Dividend | Market |
| | Value | at Cost | Sold | Income | Value |
| | ($000) | ($000) | ($000) | ($000) | ($000) |
| CenterPoint Energy Inc. | 557,491 | 952 | 469 | 21,240 | 633,335 |
| Exelis Inc. | 136,271 | — | 190,471 | 4,793 | — |
| Service Corp. International | 292,496 | — | 337,191 | 2,515 | — |
| Xylem Inc. | 241,399 | 87,025 | 96,205 | 4,012 | 333,760 |
| | 1,227,657 | | | 32,560 | 967,095 |
K. Management has determined that no material events or transactions occurred subsequent to October 31, 2013, that would require recognition or disclosure in these financial statements.
28
Report of Independent Registered
Public Accounting Firm
To the Trustees of Vanguard Windsor Funds and the Shareholders of Vanguard Windsor II Fund:
In our opinion, the accompanying statement of net assets and the related statements of operations and of changes in net assets and the financial highlights present fairly, in all material respects, the financial position of Vanguard Windsor II Fund (constituting a separate portfolio of Vanguard Windsor Funds, hereafter referred to as the “Fund”) at October 31, 2013, the results of its operations for the year then ended, the changes in its net assets for each of the two years in the period then ended, and the financial highlights for each of the five years in the period then ended, in conformity with accounting principles generally accepted in the United States of America. These financial statements and financial highlights (hereafter referred to as “financial statements”) are the responsibility of the Fund’s management; our responsibility is to express an opinion on these financial statements based on our audits. We conducted our audits of these financial statements in accordance with the standards of the Public Company Accounting Oversight Board (United States). Those standards require that we plan and perform the audit to obtain reasonable assurance about whether the financial statements are free of material misstatement. An audit includes examining, on a test basis, evidence supporting the amounts and disclosures in the financial statements, assessing the accounting principles used and significant estimates made by management, and evaluating the overall financial statement presentation. We believe that our audits, which included confirmation of securities at October 31, 2013 by correspondence with the custodian and broker and by agreement to the underlying ownership records of the transfer agent, provide a reasonable basis for our opinion.
/s/PricewaterhouseCoopers LLP
Philadelphia, Pennsylvania
December 12, 2013
Special 2013 tax information (unaudited) for Vanguard Windsor II Fund
This information for the fiscal year ended October 31, 2013, is included pursuant to provisions of the
Internal Revenue Code.
The fund distributed $49,086,000 as capital gain dividends (from net long-term capital gains) to
shareholders during the fiscal year.
The fund distributed $928,307,000 of qualified dividend income to shareholders during the fiscal year.
For corporate shareholders, 92.7% of investment income (dividend income plus short-term gains, if
any) qualifies for the dividends-received deduction.
29
Your Fund’s After-Tax Returns
This table presents returns for your fund both before and after taxes. The after-tax returns are shown in two ways: (1) assuming that an investor owned the fund during the entire period and paid taxes on the fund’s distributions, and (2) assuming that an investor paid taxes on the fund’s distributions and sold all shares at the end of each period.
Calculations are based on the highest individual federal income tax and capital gains tax rates in effect at the times of the distributions and the hypothetical sales. State and local taxes were not considered. After-tax returns reflect any qualified dividend income, using actual prior-year figures and estimates for 2013. (In the example, returns after the sale of fund shares may be higher than those assuming no sale. This occurs when the sale would have produced a capital loss. The calculation assumes that the investor received a tax deduction for the loss.)
The table shows returns for one share class only; returns for other share classes will differ. Please note that your actual after-tax returns will depend on your tax situation and may differ from those shown. Also note that if you own the fund in a tax-deferred account, such as an individual retirement account or a 401(k) plan, this information does not apply to you. Such accounts are not subject to current taxes.
Finally, keep in mind that a fund’s performance—whether before or after taxes—does not guarantee future results.
Average Annual Total Returns: Windsor II Fund Investor Shares
Periods Ended October 31, 2013
| | | |
| | One | Five | Ten |
| | Year | Years | Years |
| Returns Before Taxes | 26.26% | 14.76% | 8.25% |
| Returns After Taxes on Distributions | 25.71 | 14.32 | 7.56 |
| Returns After Taxes on Distributions and Sale of Fund Shares | 15.42 | 11.92 | 6.81 |
30
About Your Fund’s Expenses
As a shareholder of the fund, you incur ongoing costs, which include costs for portfolio management, administrative services, and shareholder reports (like this one), among others. Operating expenses, which are deducted from a fund’s gross income, directly reduce the investment return of the fund.
A fund’s expenses are expressed as a percentage of its average net assets. This figure is known as the expense ratio. The following examples are intended to help you understand the ongoing costs (in dollars) of investing in your fund and to compare these costs with those of other mutual funds. The examples are based on an investment of $1,000 made at the beginning of the period shown and held for the entire period.
The accompanying table illustrates your fund’s costs in two ways:
• Based on actual fund return. This section helps you to estimate the actual expenses that you paid over the period. The ”Ending Account Value“ shown is derived from the fund‘s actual return, and the third column shows the dollar amount that would have been paid by an investor who started with $1,000 in the fund. You may use the information here, together with the amount you invested, to estimate the expenses that you paid over the period.
To do so, simply divide your account value by $1,000 (for example, an $8,600 account value divided by $1,000 = 8.6), then multiply the result by the number given for your fund under the heading ”Expenses Paid During Period.“
• Based on hypothetical 5% yearly return. This section is intended to help you compare your fund‘s costs with those of other mutual funds. It assumes that the fund had a yearly return of 5% before expenses, but that the expense ratio is unchanged. In this case—because the return used is not the fund’s actual return—the results do not apply to your investment. The example is useful in making comparisons because the Securities and Exchange Commission requires all mutual funds to calculate expenses based on a 5% return. You can assess your fund’s costs by comparing this hypothetical example with the hypothetical examples that appear in shareholder reports of other funds.
Note that the expenses shown in the table are meant to highlight and help you compare ongoing costs only and do not reflect transaction costs incurred by the fund for buying and selling securities. Further, the expenses do not include any purchase, redemption, or account service fees described in the fund prospectus. If such fees were applied to your account, your costs would be higher. Your fund does not carry a “sales load.”
The calculations assume no shares were bought or sold during the period. Your actual costs may have been higher or lower, depending on the amount of your investment and the timing of any purchases or redemptions.
You can find more information about the fund’s expenses, including annual expense ratios, in the Financial Statements section of this report. For additional information on operating expenses and other shareholder costs, please refer to your fund’s current prospectus.
31
| | | |
| Six Months Ended October 31, 2013 | | | |
| | Beginning | Ending | Expenses |
| | Account Value | Account Value | Paid During |
| Windsor II Fund | 4/30/2013 | 10/31/2013 | Period |
| Based on Actual Fund Return | | | |
| Investor Shares | $1,000.00 | $1,104.06 | $1.91 |
| Admiral Shares | 1,000.00 | 1,104.56 | 1.49 |
| Based on Hypothetical 5% Yearly Return | | | |
| Investor Shares | $1,000.00 | $1,023.39 | $1.84 |
| Admiral Shares | 1,000.00 | 1,023.79 | 1.43 |
The calculations are based on expenses incurred in the most recent six-month period. The fund’s annualized six-month expense ratios for that
period are 0.36% for Investor Shares and 0.28% for Admiral Shares. The dollar amounts shown as “Expenses Paid” are equal to the
annualized expense ratio multiplied by the average account value over the period, multiplied by the number of days in the most recent
six-month period, then divided by the number of days in the most recent 12-month period.
32
Glossary
30-Day SEC Yield. A fund’s 30-day SEC yield is derived using a formula specified by the U.S. Securities and Exchange Commission. Under the formula, data related to the fund’s security holdings in the previous 30 days are used to calculate the fund’s hypothetical net income for that period, which is then annualized and divided by the fund’s estimated average net assets over the calculation period. For the purposes of this calculation, a security’s income is based on its current market yield to maturity (for bonds), its actual income (for asset-backed securities), or its projected dividend yield (for stocks). Because the SEC yield represents hypothetical annualized income, it will differ—at times significantly—from the fund’s actual experience. As a result, the fund’s income distributions may be higher or lower than implied by the SEC yield.
Beta. A measure of the magnitude of a fund’s past share-price fluctuations in relation to the ups and downs of a given market index. The index is assigned a beta of 1.00. Compared with a given index, a fund with a beta of 1.20 typically would have seen its share price rise or fall by 12% when the index rose or fell by 10%. For this report, beta is based on returns over the past 36 months for both the fund and the index. Note that a fund’s beta should be reviewed in conjunction with its R-squared (see definition). The lower the R-squared, the less correlation there is between the fund and the index, and the less reliable beta is as an indicator of volatility.
Dividend Yield. Dividend income earned by stocks, expressed as a percentage of the aggregate market value (or of net asset value, for a fund). The yield is determined by dividing the amount of the annual dividends by the aggregate value (or net asset value) at the end of the period. For a fund, the dividend yield is based solely on stock holdings and does not include any income produced by other investments.
Earnings Growth Rate. The average annual rate of growth in earnings over the past five years for the stocks now in a fund.
Equity Exposure. A measure that reflects a fund’s investments in stocks and stock futures. Any holdings in short-term reserves are excluded.
Expense Ratio. A fund’s total annual operating expenses expressed as a percentage of the fund’s average net assets. The expense ratio includes management and administrative expenses, but does not include the transaction costs of buying and selling portfolio securities.
Foreign Holdings. The percentage of a fund represented by securities or depositary receipts of companies based outside the United States.
Inception Date. The date on which the assets of a fund (or one of its share classes) are first invested in accordance with the fund’s investment objective. For funds with a subscription period, the inception date is the day after that period ends. Investment performance is measured from the inception date.
Median Market Cap. An indicator of the size of companies in which a fund invests; the midpoint of market capitalization (market price x shares outstanding) of a fund’s stocks, weighted by the proportion of the fund’s assets invested in each stock. Stocks representing half of the fund’s assets have market capitalizations above the median, and the rest are below it.
Price/Book Ratio. The share price of a stock divided by its net worth, or book value, per share. For a fund, the weighted average price/book ratio of the stocks it holds.
33
Price/Earnings Ratio. The ratio of a stock’s current price to its per-share earnings over the past year. For a fund, the weighted average P/E of the stocks it holds. P/E is an indicator of market expectations about corporate prospects; the higher the P/E, the greater the expectations for a company’s future growth.
R-Squared. A measure of how much of a fund’s past returns can be explained by the returns from the market in general, as measured by a given index. If a fund’s total returns were precisely synchronized with an index’s returns, its R-squared would be 1.00. If the fund’s returns bore no relationship to the index’s returns, its R-squared would be 0. For this report, R-squared is based on returns over the past 36 months for both the fund and the index.
Return on Equity. The annual average rate of return generated by a company during the past five years for each dollar of shareholder’s equity (net income divided by shareholder’s equity). For a fund, the weighted average return on equity for the companies whose stocks it holds.
Short-Term Reserves. The percentage of a fund invested in highly liquid, short-term securities that can be readily converted to cash.
Turnover Rate. An indication of the fund’s trading activity. Funds with high turnover rates incur higher transaction costs and may be more likely to distribute capital gains (which may be taxable to investors). The turnover rate excludes in-kind transactions, which have minimal impact on costs.
34
This page intentionally left blank.
The People Who Govern Your Fund
The trustees of your mutual fund are there to see that the fund is operated and managed in your best interests since, as a shareholder, you are a part owner of the fund. Your fund’s trustees also serve on the board of directors of The Vanguard Group, Inc., which is owned by the Vanguard funds and provides services to them on an at-cost basis.
A majority of Vanguard’s board members are independent, meaning that they have no affiliation with Vanguard or the funds they oversee, apart from the sizable personal investments they have made as private individuals. The independent board members have distinguished backgrounds in business, academia, and public service. Each of the trustees and executive officers oversees 181 Vanguard funds.
The following table provides information for each trustee and executive officer of the fund. More information about the trustees is in the Statement of Additional Information, which can be obtained, without charge, by contacting Vanguard at 800-662-7447, or online at vanguard.com.
| |
| InterestedTrustee1 | and Delphi Automotive LLP (automotive components); |
| | Senior Advisor at New Mountain Capital; Trustee of |
| F. William McNabb III | The Conference Board. |
| Born 1957. Trustee Since July 2009. Chairman of the | |
| Board. Principal Occupation(s) During the Past Five | Amy Gutmann |
| Years: Chairman of the Board of The Vanguard Group, | Born 1949. Trustee Since June 2006. Principal |
| Inc., and of each of the investment companies served | Occupation(s) During the Past Five Years: President |
| by The Vanguard Group, since January 2010; Director | of the University of Pennsylvania; Christopher H. |
| of The Vanguard Group since 2008; Chief Executive | Browne Distinguished Professor of Political Science |
| Officer and President of The Vanguard Group and of | in the School of Arts and Sciences with secondary |
| each of the investment companies served by The | appointments at the Annenberg School for |
| Vanguard Group since 2008; Director of Vanguard | Communication and the Graduate School of Education |
| Marketing Corporation; Managing Director of The | of the University of Pennsylvania; Member of the |
| Vanguard Group (1995–2008). | National Commission on the Humanities and Social |
| | Sciences; Trustee of Carnegie Corporation of New |
| IndependentTrustees | York and of the National Constitution Center; Chair |
| of the U.S. Presidential Commission for the Study |
| Emerson U. Fullwood | of Bioethical Issues. |
| Born 1948. Trustee Since January 2008. Principal | |
| Occupation(s) During the Past Five Years: Executive | JoAnn Heffernan Heisen |
| Chief Staff and Marketing Officer for North America | Born 1950. Trustee Since July 1998. Principal |
| and Corporate Vice President (retired 2008) of Xerox | Occupation(s) During the Past Five Years: Corporate |
| Corporation (document management products and | Vice President and Chief Global Diversity Officer |
| services); Executive in Residence and 2010 | (retired 2008) and Member of the Executive |
| Distinguished Minett Professor at the Rochester | Committee (1997–2008) of Johnson & Johnson |
| Institute of Technology; Director of SPX Corporation | (pharmaceuticals/medical devices/consumer |
| (multi-industry manufacturing), the United Way of | products); Director of Skytop Lodge Corporation |
| Rochester, Amerigroup Corporation (managed health | (hotels), the University Medical Center at Princeton, |
| care), the University of Rochester Medical Center, | the Robert Wood Johnson Foundation, and the Center |
| Monroe Community College Foundation, and North | for Talent Innovation; Member of the Advisory Board |
| Carolina A&T University. | of the Maxwell School of Citizenship and Public Affairs |
| | at Syracuse University. |
| |
| Rajiv L. Gupta | F. Joseph Loughrey |
| Born 1945. Trustee Since December 2001.2 | Born 1949. Trustee Since October 2009. Principal |
| Principal Occupation(s) During the Past Five Years: | Occupation(s) During the Past Five Years: President |
| Chairman and Chief Executive Officer (retired 2009) | and Chief Operating Officer (retired 2009) of Cummins |
| and President (2006–2008) of Rohm and Haas Co. | Inc. (industrial machinery); Chairman of the Board of |
| (chemicals); Director of Tyco International, Ltd. | Hillenbrand, Inc. (specialized consumer services) and |
| (diversified manufacturing and services), Hewlett- | of Oxfam America; Director of SKF AB (industrial |
| Packard Co. (electronic computer manufacturing), | |
| | |
| machinery), Hyster-Yale Materials Handling, Inc. | Executive Officers | |
| (forklift trucks), and the Lumina Foundation for | | |
| Education; Member of the Advisory Council for the | Glenn Booraem | |
| College of Arts and Letters and of the Advisory Board | Born 1967. Controller Since July 2010. Principal |
| to the Kellogg Institute for International Studies, both | Occupation(s) During the Past Five Years: Principal |
| at the University of Notre Dame. | of The Vanguard Group, Inc.; Controller of each of |
| | the investment companies served by The Vanguard |
| Mark Loughridge | Group; Assistant Controller of each of the investment |
| Born 1953. Trustee Since March 2012. Principal | companies served by The Vanguard Group (2001–2010). |
| Occupation(s) During the Past Five Years: Senior Vice | | |
| President and Chief Financial Officer at IBM (information | Thomas J. Higgins | |
| technology services); Fiduciary Member of IBM’s | Born 1957. Chief Financial Officer Since September |
| Retirement Plan Committee. | 2008. Principal Occupation(s) During the Past Five |
| | Years: Principal of The Vanguard Group, Inc.; Chief |
| Scott C. Malpass | Financial Officer of each of the investment companies |
| Born 1962. Trustee Since March 2012. Principal | served by The Vanguard Group; Treasurer of each of |
| Occupation(s) During the Past Five Years: Chief | the investment companies served by The Vanguard |
| Investment Officer and Vice President at the University | Group (1998–2008). | |
| of Notre Dame; Assistant Professor of Finance at the | | |
| Mendoza College of Business at Notre Dame; Member | Kathryn J. Hyatt | |
| of the Notre Dame 403(b) Investment Committee; | Born 1955. Treasurer Since November 2008. Principal |
| Director of TIFF Advisory Services, Inc. (investment | Occupation(s) During the Past Five Years: Principal of |
| advisor); Member of the Investment Advisory | The Vanguard Group, Inc.; Treasurer of each of the |
| Committees of the Financial Industry Regulatory | investment companies served by The Vanguard |
| Authority (FINRA) and of Major League Baseball. | Group; Assistant Treasurer of each of the investment |
| | companies served by The Vanguard Group (1988–2008). |
| André F. Perold | | |
| Born 1952. Trustee Since December 2004. Principal | Heidi Stam | |
| Occupation(s) During the Past Five Years: George | Born 1956. Secretary Since July 2005. Principal |
| Gund Professor of Finance and Banking at the Harvard | Occupation(s) During the Past Five Years: Managing |
| Business School (retired 2011); Chief Investment | Director of The Vanguard Group, Inc.; General Counsel |
| Officer and Managing Partner of HighVista Strategies | of The Vanguard Group; Secretary of The Vanguard |
| LLC (private investment firm); Director of Rand | Group and of each of the investment companies |
| Merchant Bank; Overseer of the Museum of Fine | served by The Vanguard Group; Director and Senior |
| Arts Boston. | Vice President of Vanguard Marketing Corporation. |
| |
| | |
| Alfred M. Rankin, Jr. | Vanguard Senior ManagementTeam |
| Born 1941. Trustee Since January 1993. Principal | | |
| Occupation(s) During the Past Five Years: Chairman, | Mortimer J. Buckley | Chris D. McIsaac |
| President, and Chief Executive Officer of NACCO | Kathleen C. Gubanich | Michael S. Miller |
| Industries, Inc. (housewares/lignite) and of Hyster-Yale | Paul A. Heller | James M. Norris |
| Materials Handling, Inc. (forklift trucks); Director of | Martha G. King | Glenn W. Reed |
| the National Association of Manufacturers; Chairman | John T. Marcante | |
| of the Board of University Hospitals of Cleveland; | | |
| Advisory Chairman of the Board of The Cleveland | Chairman Emeritus and Senior Advisor | |
| Museum of Art. | |
| | John J. Brennan | |
| Peter F. Volanakis | Chairman, 1996–2009 | |
| Born 1955. Trustee Since July 2009. Principal | Chief Executive Officer and President, 1996–2008 |
| Occupation(s) During the Past Five Years: President | | |
| and Chief Operating Officer (retired 2010) of Corning | | |
| Incorporated (communications equipment); Director | Founder | |
| of SPX Corporation (multi-industry manufacturing); | John C. Bogle | |
| Overseer of the Amos Tuck School of Business | Chairman and Chief Executive Officer, 1974–1996 |
| Administration at Dartmouth College; Advisor to the | |
| Norris Cotton Cancer Center. | | |
1 Mr. McNabb is considered an “interested person,” as defined in the Investment Company Act of 1940, because he is an officer of the
Vanguard funds.
2 December 2002 for Vanguard Equity Income Fund, Vanguard Growth Equity Fund, the Vanguard Municipal Bond Funds, and the Vanguard
State Tax-Exempt Funds.
|  |
| | P.O. Box 2600 |
| | Valley Forge, PA 19482-2600 |
| |
| |
| |
| Connect with Vanguard® > vanguard.com | |
| |
| |
| |
| Fund Information > 800-662-7447 | CFA® is a trademark owned by CFA Institute. |
| Direct Investor Account Services > 800-662-2739 | |
| Institutional Investor Services > 800-523-1036 | |
| Text Telephone for People | |
| With Hearing Impairment > 800-749-7273 | |
| |
| This material may be used in conjunction | |
| with the offering of shares of any Vanguard | |
| fund only if preceded or accompanied by | |
| the fund’s current prospectus. | |
| |
| All comparative mutual fund data are from Lipper, a | |
| Thomson Reuters Company, or Morningstar, Inc., unless | |
| otherwise noted. | |
| |
| You can obtain a free copy of Vanguard’s proxy voting | |
| guidelines by visiting vanguard.com/proxyreporting or by | |
| calling Vanguard at 800-662-2739. The guidelines are | |
| also available from the SEC’s website, sec.gov. In | |
| addition, you may obtain a free report on how your fund | |
| voted the proxies for securities it owned during the 12 | |
| months ended June 30. To get the report, visit either | |
| vanguard.com/proxyreporting or sec.gov. | |
| |
| You can review and copy information about your fund at | |
| the SEC’s Public Reference Room in Washington, D.C. To | |
| find out more about this public service, call the SEC at | |
| 202-551-8090. Information about your fund is also | |
| available on the SEC’s website, and you can receive | |
| copies of this information, for a fee, by sending a | |
| request in either of two ways: via e-mail addressed to | |
| publicinfo@sec.gov or via regular mail addressed to the | |
| Public Reference Section, Securities and Exchange | |
| Commission, Washington, DC 20549-1520. | |
| |
| | © 2013 The Vanguard Group, Inc. |
| | All rights reserved. |
| | Vanguard Marketing Corporation, Distributor. |
| |
| | Q730 122013 |
Item 2: Code of Ethics. The Registrant has adopted a code of ethics that applies to the Registrant’s principal executive officer, principal financial officer, principal accounting officer or controller or persons performing similar functions. The Code of Ethics was amended during the reporting period covered by this report to make certain technical, non-material changes.
Item 3: Audit Committee Financial Expert. The following members of the Audit Committee have been determined by the Registrant’s Board of Trustees to be Audit Committee Financial Experts serving on its Audit Committee, and to be independent: Rajiv L. Gupta, Amy Gutmann, JoAnn Heffernan Heisen, F. Joseph Loughrey, Mark Loughridge, Scott C. Malpass, André F. Perold, and Alfred M. Rankin, Jr.
Item 4: Principal Accountant Fees and Services.
(a) Audit Fees.
Audit Fees of the Registrant
Fiscal Year Ended October 31, 2013: $64,000
Fiscal Year Ended October 31, 2012: $64,000
Aggregate Audit Fees of Registered Investment Companies in the Vanguard Group.
Fiscal Year Ended October 31, 2013: $5,714,113
Fiscal Year Ended October 31, 2012: $4,809,780
Includes fees billed in connection with audits of the Registrant and other registered investment companies in the Vanguard complex. Also includes fees billed in connection with audits of The Vanguard Group, Inc. and Vanguard Marketing Corporation for Fiscal Year Ended October 31, 2013.
(b) Audit-Related Fees.
Fiscal Year Ended October 31, 2013: $1,552,950
Fiscal Year Ended October 31, 2012: $1,812,565
Includes fees billed in connection with assurance and related services provided to the Registrant, other registered investment companies in the Vanguard complex, The Vanguard Group, Inc., and Vanguard Marketing Corporation.
(c) Tax Fees.
Fiscal Year Ended October 31, 2013: $110,000
Fiscal Year Ended October 31, 2012: $490,518
Includes fees billed in connection with tax compliance, planning, and advice services provided to the Registrant, other registered investment companies in the Vanguard complex,
The Vanguard Group, Inc., and Vanguard Marketing Corporation. Also includes fees billed in connection with certain tax services related to audits of the Registrant and other registered investment companies in the Vanguard complex for Fiscal Year Ended October 31, 2012.
(d) All Other Fees.
Fiscal Year Ended October 31, 2013: $132,000
Fiscal Year Ended October 31, 2012: $16,000
Includes fees billed in connection with tax compliance, planning, and advice services provided to the Registrant, other registered investment companies in the Vanguard complex, The Vanguard Group, Inc., and Vanguard Marketing Corporation.
(e) (1) Pre-Approval Policies. The policy of the Registrant’s Audit Committee is to consider and, if appropriate, approve before the principal accountant is engaged for such services, all specific audit and non-audit services provided to: the Registrant, other registered investment companies in the Vanguard complex, The Vanguard Group, Inc., and entities controlled by The Vanguard Group, Inc. that provide ongoing services to the Registrant. In making a determination, the Audit Committee considers whether the services are consistent with maintaining the principal accountant’s independence.
In the event of a contingency situation in which the principal accountant is needed to provide services in between scheduled Audit Committee meetings, the Chairman of the Audit Committee would be called on to consider and, if appropriate, pre-approve audit or permitted non-audit services in an amount sufficient to complete services through the next Audit Committee meeting, and to determine if such services would be consistent with maintaining the accountant’s independence. At the next scheduled Audit Committee meeting, services and fees would be presented to the Audit Committee for formal consideration, and, if appropriate, approval by the entire Audit Committee. The Audit Committee would again consider whether such services and fees are consistent with maintaining the principal accountant’s independence.
The Registrant’s Audit Committee is informed at least annually of all audit and non-audit services provided by the principal accountant to the Vanguard complex, whether such services are provided to: the Registrant, other registered investment companies in the Vanguard complex, The Vanguard Group, Inc., or other entities controlled by The Vanguard Group, Inc. that provide ongoing services to the Registrant.
(2) No percentage of the principal accountant’s fees or services were approved pursuant to the waiver provision of paragraph (c)(7)(i)(C) of Rule 2-01 of Regulation S-X.
(f) For the most recent fiscal year, over 50% of the hours worked under the principal accountant’s engagement were not performed by persons other than full-time, permanent employees of the principal accountant.
(g) Aggregate Non-Audit Fees.
Fiscal Year Ended October 31, 2013: $242,000
Fiscal Year Ended October 31, 2012: $506,518
Includes fees billed for non-audit services provided to the Registrant, other registered investment companies in the Vanguard complex, The Vanguard Group, Inc., and Vanguard Marketing Corporation.
(h) For the most recent fiscal year, the Audit Committee has determined that the provision of all non-audit services was consistent with maintaining the principal accountant’s independence.
Item 5: Audit Committee of Listed Registrants.
Not Applicable.
Item 6: Investments.
Not Applicable.
Item 7: Disclosure of Proxy Voting Policies and Procedures for Closed-End Management
Investment Companies.
Not Applicable.
Item 8: Portfolio Managers of Closed-End Management Investment Companies.
Not Applicable.
Item 9: Purchase of Equity Securities by Closed-End Management Investment Company and
Affiliated Purchasers.
Not Applicable.
Item 10: Submission of Matters to a Vote of Security Holders.
Not Applicable.
Item 11: Controls and Procedures.
(a) Disclosure Controls and Procedures. The Principal Executive and Financial Officers concluded that the Registrant’s Disclosure Controls and Procedures are effective based on their evaluation of the Disclosure Controls and Procedures as of a date within 90 days of the filing date of this report.
(b) Internal Control Over Financial Reporting. There were no significant changes in Registrant’s Internal Control Over Financial Reporting or in other factors that could significantly affect this control subsequent to the date of the evaluation, including any corrective actions with regard to significant deficiencies and material weaknesses.
Item 12: Exhibits.
(a) Code of Ethics.
(b) Certifications.
Pursuant to the requirements of the Securities Exchange Act of 1934 and the Investment Company Act of 1940, the registrant has duly caused this report to be signed on its behalf by the undersigned, thereunto duly authorized.
| |
| | VANGUARD WINDSOR FUNDS |
| |
| |
| BY: | /s/ F. WILLIAM MCNABB III* |
| | F. WILLIAM MCNABB III |
| | CHIEF EXECUTIVE OFFICER |
| |
| Date: December 19, 2013 |
Pursuant to the requirements of the Securities Exchange Act of 1934 and the Investment Company Act of 1940, this report has been signed below by the following persons on behalf of the registrant and in the capacities and on the dates indicated.
| |
| | VANGUARD WINDSOR FUNDS |
| |
BY: | /s/ F. WILLIAM MCNABB III* |
| | F. WILLIAM MCNABB III |
| | CHIEF EXECUTIVE OFFICER |
Date: December 19, 2013 |
| | VANGUARD WINDSOR FUNDS |
| |
BY: | /s/ THOMAS J. HIGGINS* |
| | THOMAS J. HIGGINS |
| | CHIEF FINANCIAL OFFICER |
Date: December 19, 2013 |
* By: /s/ Heidi Stam
Heidi Stam, pursuant to a Power of Attorney filed on March 27, 2012 see file Number 2-11444, Incorporated by Reference.