UNITED STATES
SECURITIES AND EXCHANGE COMMISSION
Washington, D.C. 20549
FORM N-CSR
CERTIFIED SHAREHOLDER REPORT
OF
REGISTERED MANAGEMENT INVESTMENT COMPANIES
| | |
| Investment Company Act file number: 811-00834 |
Name of Registrant: | Vanguard Windsor Funds |
Address of Registrant: | P.O. Box 2600 |
| | Valley Forge, PA 19482 |
Name and address of agent for service: | Heidi Stam, Esquire |
| | P.O. Box 876 |
| | Valley Forge, PA 19482 |
Registrant’s telephone number, including area code: (610) 669-1000 |
Date of fiscal year end: October 31 | |
Date of reporting period: November 1, 2011 – October 31, 2012 |
Item 1: Reports to Shareholders | |

Annual Report | October 31, 2012
Vanguard WindsorTM Fund

> Vanguard Windsor Fund returned nearly 16% for the 12 months ended
October 31, 2012. The fund trailed its benchmark index, but outpaced the
average return of peer funds.
> Value stocks, the focus of the fund, outperformed their growth counterparts.
> Holdings among banks and home builders helped results, while setbacks for the
fund’s technology and energy stocks hurt performance.
| |
| Contents | |
| Your Fund’s Total Returns. | 1 |
| Chairman’s Letter. | 2 |
| Advisors’ Report. | 8 |
| Fund Profile. | 13 |
| Performance Summary. | 14 |
| Financial Statements. | 16 |
| Your Fund’s After-Tax Returns. | 29 |
| About Your Fund’s Expenses. | 30 |
| Trustees Approve Advisory Agreement. | 32 |
| Glossary. | 34 |
Please note: The opinions expressed in this report are just that—informed opinions. They should not be considered promises or advice.
Also, please keep in mind that the information and opinions cover the period through the date on the front of this report. Of course, the
risks of investing in your fund are spelled out in the prospectus.
See the Glossary for definitions of investment terms used in this report.
About the cover: Our cover photograph shows rigging on the HMSSurprise, a replica of an 18th-century Royal Navy frigate. It
was featured in the 2003 movie Master and Commander: The Far Side of the World, which was based on Patrick O’Brian’s sea
novels, set amid the Napoleonic Wars. Vanguard was named for another ship of that era, the HMSVanguard, which was the
flagship of British Admiral Horatio Nelson at the Battle of the Nile.
Your Fund’s Total Returns
| |
| Fiscal Year Ended October 31, 2012 | |
| |
| | Total |
| | Returns |
| Vanguard Windsor Fund | |
| Investor Shares | 15.56% |
| Admiral™ Shares | 15.71 |
| Russell 1000 Value Index | 16.89 |
| Multi-Cap Value Funds Average | 12.55 |
| Multi-Cap Value Funds Average: Derived from data provided by Lipper Inc. |
| Admiral Shares carry lower expenses and are available to investors who meet certain account-balance requirements. |
| | | | |
| Your Fund’s Performance at a Glance | | | | |
| October 31, 2011, Through October 31, 2012 | | | | |
| | | | Distributions Per Share |
| | Starting | Ending | Income | Capital |
| | Share Price | Share Price | Dividends | Gains |
| Vanguard Windsor Fund | | | | |
| Investor Shares | $12.92 | $14.66 | $0.241 | $0.000 |
| Admiral Shares | 43.59 | 49.47 | 0.864 | 0.000 |
1

Chairman’s Letter
Dear Shareholder,
In a strong period for U.S. stocks, especially value stocks, Vanguard Windsor™ Fund returned nearly 16% for the 12 months ended October 31, 2012. The fund’s performance lagged that of its benchmark, the Russell 1000 Value Index, but outpaced the average return of peer funds by more than 3 percentage points.
In August, the fund’s trustees restructured its advisory arrangement, removing AllianceBernstein L.P. Pzena Investment Management, llc, was added as a new advisor for the Windsor Fund, joining Wellington Management Company, llp, which has advised the fund since its inception in 1958.
Pzena has had a relationship with Vanguard since 2005, when the firm was selected to manage Vanguard U.S. Fundamental Value Fund, which is available only to non-U.S. investors. Pzena has also managed a portion of Vanguard Emerging Markets Select Stock Fund since that fund’s launch in June 2011.
If you own shares of the Windsor™ Fund in a taxable account, you may wish to review the fund’s after-tax returns presented later in this report.
2
U.S. stocks led the advance for global equity markets
U.S. stocks returned about 14% for the 12 months ended October 31, putting domestic equities ahead of their international counterparts. Stocks in Europe and Asia, meanwhile, posted modestly positive results.
The advances came amid moves by U.S. and European central bankers to manage risks to the U.S. economy and the finances of European governments and banks. The president of the European Central Bank declared in July that policymakers would do whatever was needed to preserve the euro common currency.
Although investors’ worries have eased, Europe’s financial troubles are by no means resolved. Vanguard economists believe the most likely scenario is that the Eurozone will “muddle through” for several years, with occasional spikes in market volatility, as fiscal tightening persists in the face of weak economic growth.
Bonds continued their march, but leaner times may lie ahead
The broad U.S. taxable bond market returned about 5% for the 12 months. Municipal bonds delivered a robust performance, returning 9%.
| | | |
| Market Barometer | | | |
| |
| | Average Annual Total Returns |
| | Periods Ended October 31, 2012 |
| | One | Three | Five |
| | Year | Years | Years |
| Stocks | | | |
| Russell 1000 Index (Large-caps) | 14.97% | 13.48% | 0.53% |
| Russell 2000 Index (Small-caps) | 12.08 | 14.82 | 1.19 |
| Dow Jones U.S. Total Stock Market Index | 14.45 | 13.62 | 0.75 |
| MSCI All Country World Index ex USA (International) | 3.98 | 3.74 | -5.08 |
| |
| Bonds | | | |
| Barclays U.S. Aggregate Bond Index (Broad taxable market) | 5.25% | 6.08% | 6.38% |
| Barclays Municipal Bond Index (Broad tax-exempt market) | 9.03 | 6.84 | 6.02 |
| Citigroup Three-Month U.S. Treasury Bill Index | 0.06 | 0.08 | 0.56 |
| |
| CPI | | | |
| Consumer Price Index | 2.16% | 2.28% | 2.06% |
3
As bond prices rose, the yield of the 10-year U.S. Treasury note fell to a record low in July, closing below 1.5%. (Bond yields and prices move in opposite directions.) By the end of the period, the yield had climbed, but it still remained exceptionally low by historical standards.
Bondholders have enjoyed years of healthy returns. But as Tim Buckley, our incoming chief investment officer, has noted, investors shouldn’t be surprised if future results are much more modest. As yields remain low, the opportunity for similarly strong returns diminishes.
The Federal Reserve announced on September 13 that it would continue to hold its target for short-term interest rates between 0% and 0.25% at least through mid-2015. The exceptionally low rates, in place since late 2008, kept a tight lid on returns from money market funds and savings accounts.
A recovery in financial stocks helped propel Windsor’s performance
Throughout its 50-plus-year history, Windsor Fund has specialized in investing in stocks that are temporarily out of favor, but that the fund’s advisors believe will
| | | |
| Expense Ratios | | | |
| Your Fund Compared With Its Peer Group | | | |
| | Investor | Admiral | Peer Group |
| | Shares | Shares | Average |
| Windsor Fund | 0.41% | 0.31% | 1.24% |
The fund expense ratios shown are from the prospectus dated October 12, 2012, and represent estimated costs for the current fiscal year. For the fiscal year ended October 31, 2012, the fund’s expense ratios were 0.35% for Investor Shares and 0.25% for Admiral Shares. The peer-group expense ratio is derived from data provided by Lipper Inc. and captures information through year-end 2011.
Peer group: Multi-Cap Value Funds.
4
eventually prove superior investments. This contrarian approach can lead to greater short-term volatility because it may take time for the market to recognize a stock’s value.
In fiscal year 2011, the fund’s holdings in the battered financial sector hurt performance. For the 2012 fiscal year, however, the fund’s bank shares posted outsized gains as investors seemed more confident that lenders were getting past the lingering effects of mortgage defaults associated with the U.S. housing downturn.
Financial stocks have been a traditional focus for practitioners of value-style investing, such as the advisors of your fund. During the 12 months under review, financial stocks made up more than a fifth of Windsor’s assets, on average, while the benchmark index had an even higher allocation to financial stocks (more than a quarter of its capitalization, on average).
Stock selection was strong in consumer discretionary, which was the top contributor for the fund. The fund’s housing-related holdings were standouts.
| |
| Total Returns | |
| Ten Years Ended October 31, 2012 | |
| | Average |
| | Annual Return |
| Windsor Fund Investor Shares | 6.92% |
| Russell 1000 Value Index | 7.34 |
| Multi-Cap Value Funds Average | 6.61 |
| Multi-Cap Value Funds Average: Derived from data provided by Lipper Inc. |
The figures shown represent past performance, which is not a guarantee of future results. (Current performance may be lower or higher than the performance data cited. For performance data current to the most recent month-end, visit our website at vanguard.com/performance.) Note, too, that both investment returns and principal value can fluctuate widely, so an investor’s shares, when sold, could be worth more or less than their original cost.
5
Windsor Fund did have its share of disappointments, including negative returns in the energy sector. Its performance also suffered because of holdings in technology firms that were, at least temporarily, out of favor with investors.
The Advisors’ Report that follows this letter provides additional details about the management of the fund during the year.
Fund confronted challenges during a volatile decade
For the decade ended October 31, 2012, the Windsor Fund registered an average annual return of 6.92%. This was slightly lower than the 7.34% average annual return of the fund’s benchmark index but better than the 6.61% average annual return of peer funds.
Of course, the fund’s goal is to outperform both its benchmark and peers over time. Still, given the challenges of the past decade, Windsor Fund delivered a solid performance. The decade began with the aftermath of the bursting of the dot-com bubble and, more recently, was marked by the 2008–2009 financial crisis. We remain confident in the long-term value of Windsor’s investment strategy. The fund has experienced market conditions of every sort, and its search for underappreciated stocks can reward patient investors.
How our core purpose informs our approach to active management
At Vanguard, we sum up our core purpose this way: To take a stand for all investors, to treat them fairly, and to give them the best chance for investment success. When it comes to our actively managed funds, such as the Windsor Fund, this commitment to investors is reflected both in our rigorous process for selecting fund advisors and in our ongoing efforts to keep the costs of our funds low. We believe our approach gives investors the opportunity to outperform market indexes over the long term.
But make no mistake: Outperformance is hard to come by. For one thing, competition among investors is fierce. Charles Ellis, author of one of my favorite books on investing, Winning the Loser’s Game, points out that the competition is not between the skilled and the inept. It’s between the skilled and the skilled. “It’s like the Williams sisters playing tennis against each other,” as he put it in a recent Vanguard webcast.
Because we recognize the challenges inherent in active management, Vanguard has offered, and advocated for, index funds for more than 35 years. By seeking to track—rather than beat—market returns, index funds provide several benefits: low costs, diversification across a market, and limited deviation from the performance of market benchmarks.
6
Still, the case for indexing doesn’t preclude the potential for skilled, seasoned managers to deliver outperformance. And the chances for success can increase if those managers deliver their services at low cost, allowing investors to keep more of their returns.
As always, thank you for entrusting your assets to Vanguard.
Sincerely,

F. William McNabb III
Chairman and Chief Executive Officer
November 12, 2012
Advisors’ Report
For the fiscal year ended October 31, 2012, the Investor Shares of Vanguard Windsor Fund returned 15.56%, while the lower-cost Admiral Shares returned 15.71%. Your fund is managed by two independent advisors, a strategy that enhances the fund’s diversification by providing exposure to distinct, yet complementary, investment approaches. It is not uncommon for different advisors to have different views about individual securities or the broader investment environment.
The advisors, the percentage and amount of fund assets that each manages, and brief descriptions of their investment strategies are presented in the table below. The advisors have also prepared a discussion of the investment environment that existed during the period and of how the portfolio
positioning reflects this assessment. These reports were prepared on November 14, 2012.
Wellington Management Company, llp
Portfolio Manager:
James N. Mordy, Senior Vice President and Equity Portfolio Manager Despite many lingering macroeconomic uncertainties, equities have enjoyed a strong advance over the past year, fueled by a continued recovery in corporate profits and important stimulative policy actions globally. The Fed’s announcement of open-ended quantitative easing, and the more aggressive posture by the European Central Bank, encouraged investors to become somewhat more risk-tolerant.
| | | |
| Vanguard Windsor Fund Investment Advisors | |
| |
| | Fund Assets Managed | |
| Investment Advisor | % | $ Million | Investment Strategy |
| Wellington Management | 71 | 8,904 | Seeks to provide long-term total returns above both the |
| Company, LLP | | | S&P 500 and value-oriented indexes over a complete |
| | | | market cycle through bottom-up, fundamentally driven |
| | | | stock selection focused on undervalued securities. |
| Pzena Investment Management, | 27 | 3,347 | Uses a fundamental, bottom-up, deep-value-oriented |
| LLC | | | investment strategy. Seeks to buy good businesses at |
| | | | low prices, focusing exclusively on companies that are |
| | | | underperforming their historically demonstrated |
| | | | earnings power. |
| Cash Investments | 2 | 255 | These short-term reserves are invested by Vanguard in |
| | | | equity index products to simulate investment in stocks. |
| | | | Each advisor also may maintain a modest cash |
| | | | position. |
8
Among our best sectors relative to the benchmark was consumer discretionary, where we had excellent stock selection. We were well positioned for the initial turn in the U.S. housing market, as homebuilders Toll Brothers and Lennar had outsized moves. Comcast also had a strong advance; fundamentals remain strong and management has returned significant excess capital to the shareholders.
In financials, Weyerhaeuser, a timber and wood products REIT, returned 58% during the period. It is the only REIT we own, and, unlike most of its peers, it still sells below its net asset value. Our largest bank holding, Wells Fargo, returned over 33%. The company enjoyed an improvement in credit metrics and strength in the mortgage business. In the insurance subsector, Unum’s return of –13% was a drag on performance. The company has had to increase reserves to reflect the impact of low interest rates on its long-term care policies.
Two other good sectors for us were industrials and materials. Cooper Industries agreed to a buyout offer from Eaton, another of our holdings. Eaton will have increased exposure to electrical equipment as a result, which should command a higher price-to-earnings multiple.
Chemicals producer LyondellBasell returned over 90% during the period.
Energy was our worst sector because of poor stock selection within the exploration and production group. We purchased Cobalt International Energy, a pure exploration company, early in the year after the company announced a very promising discovery off the coast of Angola. While we believe that this discovery has unlocked a path to much higher asset value, developments over the remainder of the year were disappointing, with a dry hole in the Gulf of Mexico and equipment problems that prevented a follow-up test of the Angolan discovery.
Consumer staples and information technology were two other sectors where we underperformed. In consumer staples, Molson Coors, Energizer, and Danone lagged for fundamental reasons. We sold the first two and trimmed our holdings of Danone. In technology we were hurt by our underweighting of Apple, although we did complete a short-term, opportunistic investment in the stock leading up to the launch of the iPhone 5. We have been overweight in semiconductors and related equipment, and our holdings in Arrow Electronics and Avago Technologies were hurt by macro uncertainties.
9
While the U.S. elections are now behind us, we continue to face a number of major uncertainties, with the most pressing being the possibility of a fiscal cliff that could throw the country back into recession. CEOs need clarity to move forward with investment and hiring decisions. Our “most likely” scenario is a bipartisan agreement resulting in a 1–1.5% drag on gross domestic product, as there seems to be room for compromise. Economic growth has been tepid and corporate profit expectations are being lowered.
There are bright spots, such as a recovering U.S. housing market and an improvement in consumer net worth and confidence. Europe should see less fiscal drag next year, and we are more optimistic about prospects in China given the leadership change now under way. Any meaningful progress on long-term fiscal reform could be quite positive for equity valuations.
Transactions over the past year have led us to a bit more procyclical stance, with additions to energy, materials, and industrials stocks and reductions to consumer discretionary, health care, and financials. We believe many of our larger purchases, such as International Paper, AIG, SanDisk, Cobalt International Energy, Baker Hughes, and Citigroup, do not depend solely on robust economic growth to be successful stocks. The portfolio in aggregate continues to feature healthy companies with good
or improving prospects that sell at a meaningful valuation discount to the S&P 500 Index.
Pzena Investment Management, LLC
Portfolio Managers:
Richard Pzena, Managing Principal
and co-Chief Investment Officer
John P. Goetz, Managing Principal
and co-Chief Investment Officer
Antonio DeSpirito, Managing Principal
U.S. equity markets performed well for the year ended October 31, 2012, capping off the period with a solid performance for the final three months. Value stocks were notably strong for both the 12-month period (the Russell 1000 Value Index rose 16.89%, while the S&P 500 Index was up 15.21%) and the final quarter of the fiscal year (the Russell 1000 Value Index was up 4.90%, while the S&P 500 Index rose 2.96%). The ride for the year, however, was not smooth. Economic uncertainty and good corporate profitability were the two forces that drove this volatile pattern, much as they have been for the last few years.
The final three months of the year saw continued improvement in investor sentiment, as better economic data from the housing sector and employment was complemented by still-rising corporate profits, setting a positive tone. The effect of all this in the closing quarter was that cyclicals broadly led the way in U.S. equity markets; consumer discretionary and
10
financials were the top two performers, with materials not too far behind. Despite the latest strength in equities, the outlook for future returns remains more attractive than that for bonds; the 10-year U.S. Treasury note ended October at a near record low yield of 1.69%.
Pzena began management of its portfolio at the beginning of August 2012. Overall performance for this period was driven largely by financials, both in terms of our stock selection and our overweighting of the sector. At the same time, our selections in technology, though a mixed bag, proved on balance to be our biggest detractor to performance. UBS, a global leader in wealth management, and our single largest contributor, rose sharply in the period, initially on speculation of a major restructuring involving the shedding of around one-sixth of their workforce.
The restructuring was validated at the end of October, when the company reported good earnings for the third quarter of 2012. Central to this plan was management’s decision to undertake a decisive restructuring of its investment banking business, essentially reducing its fixed income division to a small core. This action will leave UBS with a higher quality wealth and asset management focus. The stock trades at a very inexpensive five times our estimate of normal earnings. Citigroup similarly did well as the banking sector continued to rally and it also remains very cheap, at a little over four times normal earnings.
In the tech sector, Computer Science Corporation was our third-largest contributor to performance as the company reported good quarterly results and increased full-year earnings guidance. The new CEO, Mike Lawrie, confirmed that the company is seeing early signs of improving financial performance as it recovers from a health-contract dispute in the United Kingdom.
On the negative side, Hewlett-Packard was the portfolio’s main detractor as management reduced guidance for near-term earnings while the company executes its major restructuring effort. The longer-term impact of this plan, however, is beneficial for the company and leaves our estimate of normal earnings intact. Strong free cash flow, a solid balance sheet, and the stock’s nearly unprecedented cheapness of less than four times normal earnings keep us confident in HP’s unusual value, so we have used the stock’s weakness to top up our position.
Overall our portfolio remains well positioned to exploit the still-persistent valuation gap between cyclical companies and those with either perceived stable earnings or high dividend yields. As reflected in our discussion above about HP, companies with weak revenues have been particularly punished with extremely low valuations. Most notably, this fact has also affected our positions in Staples, Apollo Group, and Dell. Their valuations, along with that of HP, are among the
11
most deeply depressed as the market extrapolates current trends and prices in what we believe is the worst case for future earnings. Yet each of these businesses possesses strong, sustainable franchises that for the most part include business scale advantages that their competitors will be hard-pressed to compete with, especially in a weak economic environment. In addition their balance sheets, cash flows, and flexible cost structures give them a measure of downside protection that many more highly valued companies may not enjoy.
Since we have only been managing the portfolio for a short while, there were a limited number of changes to the portfolio. We did initiate two new, but relatively small, positions in health care in the quarter—Hospira (generic injectable drugs) and Aetna (health insurance).
We also exited positions in Valero, CA Technologies, and J.C. Penney, all with strong short-term gains.
12
Windsor Fund
Fund Profile
As of October 31, 2012
| | |
| Share-Class Characteristics | |
| | Investor | Admiral |
| | Shares | Shares |
| Ticker Symbol | VWNDX | VWNEX |
| Expense Ratio1 | 0.41% | 0.31% |
| 30-Day SEC Yield | 1.71% | 1.81% |
| | | |
| Portfolio Characteristics | | |
| | | Russell | DJ |
| | | 1000 | U.S. Total |
| | | Value | Market |
| | Fund | Index | Index |
| Number of Stocks | 127 | 694 | 3,636 |
| Median Market Cap | $21.8B | $34.9B | $34.8B |
| Price/Earnings Ratio | 13.6x | 14.1x | 16.3x |
| Price/Book Ratio | 1.5x | 1.5x | 2.1x |
| Return on Equity | 13.3% | 13.0% | 17.6% |
| Earnings Growth Rate | 4.7% | 2.6% | 10.0% |
| Dividend Yield | 2.0% | 2.5% | 2.1% |
| Foreign Holdings | 15.8% | 0.0% | 0.0% |
| Turnover Rate | 68% | — | — |
| Short-Term Reserves | 1.8% | — | — |
| | | |
| Sector Diversification (% of equity exposure) |
| | | Russell | DJ |
| | | 1000 | U.S. Total |
| | | Value | Market |
| | Fund | Index | Index |
| Consumer Discretionary | 11.3% | 8.0% | 12.1% |
| Consumer Staples | 5.3 | 7.3 | 9.5 |
| Energy | 12.3 | 16.6 | 10.4 |
| Financials | 25.6 | 27.0 | 16.6 |
| Health Care | 12.5 | 11.8 | 11.9 |
| Industrials | 9.7 | 9.0 | 10.8 |
| Information Technology | 16.0 | 6.0 | 18.3 |
| Materials | 5.0 | 3.9 | 3.9 |
| Telecommunication | | | |
| Services | 0.1 | 3.5 | 2.8 |
| Utilities | 2.2 | 6.9 | 3.7 |
| | |
| Volatility Measures | | |
| | Russell | DJ |
| | 1000 | U.S. Total |
| | Value | Market |
| | Index | Index |
| R-Squared | 0.98 | 0.98 |
| Beta | 1.10 | 1.09 |
| These measures show the degree and timing of the fund’s fluctuations compared with the indexes over 36 months. |
| | |
| Ten Largest Holdings (% of total net assets) |
| Wells Fargo & Co. | Diversified Banks | 2.4% |
| Bank of America Corp. | Diversified Financial | |
| | Services | 2.2 |
| Arrow Electronics Inc. | Technology | |
| | Distributors | 1.9 |
| Comcast Corp. | Cable & Satellite | 1.9 |
| Citigroup Inc. | Diversified Financial | |
| | Services | 1.8 |
| Oracle Corp. | Systems Software | 1.7 |
| American International | | |
| Group Inc. | Multi-line Insurance | 1.7 |
| Baker Hughes Inc. | Oil & Gas Equipment | |
| | & Services | 1.6 |
| Eaton Corp. | Industrial Machinery | 1.6 |
| Lowe's Cos. Inc. | Home Improvement | |
| | Retail | 1.5 |
| Top Ten | | 18.3% |
| The holdings listed exclude any temporary cash investments and equity index products. |
Investment Focus

1 The expense ratios shown are from the prospectus dated October 12, 2012, and represent estimated costs for the current fiscal year. For the
fiscal year ended October 31, 2012, the expense ratios were 0.35% for Investor Shares and 0.25% for Admiral Shares.
13
Windsor Fund
Performance Summary
All of the returns in this report represent past performance, which is not a guarantee of future results that may be achieved by the fund. (Current performance may be lower or higher than the performance data cited. For performance data current to the most recent month-end, visit our website at vanguard.com/performance.) Note, too, that both investment returns and principal value can fluctuate widely, so an investor’s shares, when sold, could be worth more or less than their original cost. The returns shown do not reflect taxes that a shareholder would pay on fund distributions or on the sale of fund shares.
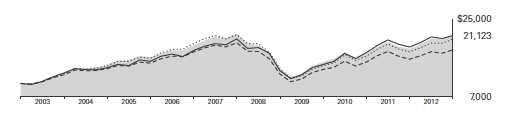
Cumulative Performance: October 31, 2002, Through October 31, 2012
Initial Investment of $10,000
| | | | | |
| | | Average Annual Total Returns | |
| | | Periods Ended October 31, 2012 | |
| | | | | | Final Value |
| | | One | Five | Ten | of a $10,000 |
| | | Year | Years | Years | Investment |
| | Windsor Fund Investor Shares | 15.56% | -1.47% | 6.92% | $19,522 |
| •••••••• | Russell 1000 Value Index | 16.89 | -1.00 | 7.34 | 20,314 |
| – – – – | Multi-Cap Value Funds Average | 12.55 | -1.34 | 6.61 | 18,961 |
| | Dow Jones U.S. Total Stock Market | | | | |
| | Index | 14.45 | 0.75 | 7.78 | 21,163 |
| Multi-Cap Value Funds Average: Derived from data provided by Lipper Inc. |
| | | | |
| | | | | Final Value |
| | One | Five | Ten | of a $50,000 |
| | Year | Years | Years | Investment |
| Windsor Fund Admiral Shares | 15.71% | -1.36% | 7.03% | $98,636 |
| Russell 1000 Value Index | 16.89 | -1.00 | 7.34 | 101,569 |
| Dow Jones U.S. Total Stock Market Index | 14.45 | 0.75 | 7.78 | 105,815 |
See Financial Highlights for dividend and capital gains information.
14
Windsor Fund
Fiscal-Year Total Returns (%): October 31, 2002, Through October 31, 2012

Average Annual Total Returns: Periods Ended September 30, 2012
This table presents returns through the latest calendar quarter—rather than through the end of the fiscal period.
Securities and Exchange Commission rules require that we provide this information.
| | | | |
| | Inception | One | Five | Ten |
| | Date | Year | Years | Years |
| Investor Shares | 10/23/1958 | 30.00% | -1.31% | 7.84% |
| Admiral Shares | 11/12/2001 | 30.09 | -1.21 | 7.96 |
15
Windsor Fund
Financial Statements
Statement of Net Assets
As of October 31, 2012
The fund reports a complete list of its holdings in regulatory filings four times in each fiscal year, at the quarter-ends. For the second and fourth fiscal quarters, the lists appear in the fund’s semiannual and annual reports to shareholders. For the first and third fiscal quarters, the fund files the lists with the Securities and Exchange Commission on Form N-Q. Shareholders can look up the fund’s Forms N-Q on the SEC’s website at sec.gov. Forms N-Q may also be reviewed and copied at the SEC’s Public Reference Room (see the back cover of this report for further information).
| | | |
| | | | Market |
| | | | Value |
| | | Shares | ($000) |
| Common Stocks (97.6%)1 | | |
| Consumer Discretionary (11.0%) | |
| | Comcast Corp. | 6,404,400 | 233,376 |
| | Lowe’s Cos. Inc. | 5,612,800 | 181,743 |
| | Kohl’s Corp. | 3,054,100 | 162,722 |
| | Staples Inc. | 12,173,900 | 140,182 |
| * | Toll Brothers Inc. | 3,687,000 | 121,708 |
| | Lennar Corp. Class A | 2,683,500 | 100,551 |
| *,2 | Buck Holdings LP Private | | |
| | Placement | NA | 86,270 |
| | Virgin Media Inc. | 2,403,600 | 78,694 |
| * | Delphi Automotive plc | 2,317,400 | 72,859 |
| | Omnicom Group Inc. | 1,313,400 | 62,925 |
| * | General Motors Co. | 2,199,250 | 56,081 |
| * | Apollo Group Inc. Class A | 2,426,325 | 48,721 |
| | TJX Cos. Inc. | 683,000 | 28,433 |
| | | | 1,374,265 |
| Consumer Staples (5.1%) | | |
| | Japan Tobacco Inc. | 5,556,500 | 153,650 |
| | Bunge Ltd. | 1,979,300 | 140,590 |
| | Ingredion Inc. | 1,651,600 | 101,507 |
| | CVS Caremark Corp. | 1,830,500 | 84,935 |
| | Danone SA | 934,835 | 57,500 |
| | Dr Pepper Snapple | | |
| | Group Inc. | 1,086,400 | 46,552 |
| | Molson Coors Brewing | | |
| | Co. Class B | 761,800 | 32,864 |
| | Avon Products Inc. | 1,068,151 | 16,546 |
| | | | 634,144 |
| Energy (11.9%) | | |
| | Baker Hughes Inc. | 4,653,275 | 195,298 |
| * | Southwestern Energy Co. | 4,526,600 | 157,073 |
| | Royal Dutch Shell plc ADR | 2,162,879 | 148,114 |
| | BP plc ADR | 3,155,850 | 135,354 |
| | Anadarko Petroleum Corp. | 1,887,300 | 129,865 |
| | Canadian Natural | | |
| | Resources Ltd. | 4,127,600 | 124,654 |
| | | |
| * | Cobalt International | | |
| | Energy Inc. | 5,313,300 | 110,570 |
| | Halliburton Co. | 3,261,800 | 105,324 |
| | CONSOL Energy Inc. | 2,554,559 | 89,818 |
| | Exxon Mobil Corp. | 731,100 | 66,654 |
| | Valero Energy Corp. | 2,027,400 | 58,997 |
| | Statoil ASA ADR | 1,997,400 | 49,036 |
| | Inpex Corp. | 6,994 | 39,844 |
| | Noble Corp. | 1,032,100 | 38,952 |
| | Apache Corp. | 382,550 | 31,656 |
| | | | 1,481,209 |
| Exchange-Traded Fund (0.9%) | |
| 3 | Vanguard Value ETF | 1,839,100 | 107,569 |
| |
| Financials (24.8%) | | |
| | Wells Fargo & Co. | 8,975,100 | 302,371 |
| | Bank of America Corp. | 29,104,300 | 271,252 |
| | Citigroup Inc. | 6,126,575 | 229,073 |
| * | American International | | |
| | Group Inc. | 6,077,400 | 212,284 |
| | Ameriprise Financial Inc. | 3,006,800 | 175,507 |
| | Weyerhaeuser Co. | 5,693,200 | 157,645 |
| | ACE Ltd. | 1,747,900 | 137,472 |
| | Invesco Ltd. | 5,596,704 | 136,112 |
| | Unum Group | 6,705,800 | 135,994 |
| | Swiss Re AG | 1,636,753 | 113,259 |
| | Principal Financial Group | | |
| | Inc. | 3,676,000 | 101,237 |
| | XL Group plc Class A | 3,930,000 | 97,228 |
| | UBS AG | 5,918,700 | 88,899 |
| | JPMorgan Chase & Co. | 2,110,150 | 87,951 |
| | Allstate Corp. | 1,922,925 | 76,879 |
| | MetLife Inc. | 2,047,900 | 72,680 |
| | Goldman Sachs Group | | |
| | Inc. | 588,500 | 72,026 |
| | State Street Corp. | 1,517,400 | 67,631 |
| | Everest Re Group Ltd. | 591,100 | 65,642 |
| | Franklin Resources Inc. | 416,800 | 53,267 |
16
Windsor Fund
| | | |
| | | | Market |
| | | | Value |
| | | Shares | ($000) |
| | NYSE Euronext | 2,146,800 | 53,155 |
| | Axis Capital Holdings Ltd. | 1,456,304 | 52,747 |
| | Willis Group Holdings plc | 1,345,000 | 45,286 |
| | PNC Financial Services | | |
| | Group Inc. | 771,000 | 44,864 |
| | Morgan Stanley | 2,378,600 | 41,340 |
| | Hartford Financial | | |
| | Services Group Inc. | 1,613,650 | 35,032 |
| | KeyCorp | 3,984,500 | 33,549 |
| | Fifth Third Bancorp | 2,283,800 | 33,184 |
| | Torchmark Corp. | 611,000 | 30,910 |
| | Regions Financial Corp. | 4,739,400 | 30,901 |
| | Comerica Inc. | 1,010,100 | 30,111 |
| | BlackRock Inc. | 109,377 | 20,747 |
| | | | 3,106,235 |
| Health Care (12.1%) | | |
| | Merck & Co. Inc. | 3,822,000 | 174,398 |
| | UnitedHealth Group Inc. | 2,956,400 | 165,558 |
| | Roche Holding AG | 848,560 | 163,454 |
| | Medtronic Inc. | 3,504,400 | 145,713 |
| | Cigna Corp. | 2,600,300 | 132,615 |
| | Covidien plc | 2,151,100 | 118,203 |
| | Sanofi | 1,177,183 | 103,390 |
| | Becton Dickinson and Co. | 1,117,775 | 84,593 |
| | Eisai Co. Ltd. | 1,774,000 | 78,928 |
| | McKesson Corp. | 799,000 | 74,555 |
| | Daiichi Sankyo Co. Ltd. | 4,742,600 | 72,590 |
| | HCA Holdings Inc. | 1,646,200 | 46,769 |
| | Aetna Inc. | 757,875 | 33,119 |
| | Abbott Laboratories | 478,900 | 31,378 |
| * | Hospira Inc. | 1,020,850 | 31,330 |
| * | Forest Laboratories Inc. | 890,000 | 30,002 |
| | Quest Diagnostics Inc. | 516,300 | 29,801 |
| | | | 1,516,396 |
| Industrials (9.4%) | | |
| | Eaton Corp. | 4,113,000 | 194,216 |
| | Pentair Ltd. | 3,332,000 | 140,744 |
| | Dover Corp. | 2,143,300 | 124,783 |
| | Honeywell International | | |
| | Inc. | 2,010,100 | 123,098 |
| | Lockheed Martin Corp. | 1,175,400 | 110,100 |
| | FedEx Corp. | 953,100 | 87,676 |
| | Northrop Grumman Corp. | 1,209,900 | 83,108 |
| | Fiat Industrial SPA | 7,600,935 | 82,387 |
| * | Delta Air Lines Inc. | 7,986,900 | 76,914 |
| | L-3 Communications | | |
| | Holdings Inc. | 881,400 | 65,047 |
| | Masco Corp. | 3,729,198 | 56,273 |
| | General Dynamics Corp. | 477,600 | 32,515 |
| | | | 1,176,861 |
| | | |
| Information Technology (15.5%) | |
| *,4 | Arrow Electronics Inc. | 6,910,650 | 243,462 |
| | Oracle Corp. | 6,973,350 | 216,523 |
| | Cisco Systems Inc. | 10,407,200 | 178,379 |
| | ASML Holding NV | 3,205,200 | 176,190 |
| * | Google Inc. Class A | 250,800 | 170,486 |
| | Hewlett-Packard Co. | 11,720,875 | 162,334 |
| | Avago Technologies Ltd. | 4,686,700 | 154,802 |
| | Microsoft Corp. | 4,586,300 | 130,870 |
| * | SanDisk Corp. | 2,702,100 | 112,840 |
| | TE Connectivity Ltd. | 2,853,585 | 91,828 |
| | Analog Devices Inc. | 1,992,900 | 77,942 |
| | Accenture plc Class A | 1,051,500 | 70,882 |
| * | Check Point Software | | |
| | Technologies Ltd. | 1,499,900 | 66,791 |
| | Dell Inc. | 3,596,900 | 33,199 |
| | Computer Sciences Corp. | 897,971 | 27,343 |
| | Western Union Co. | 1,728,263 | 21,949 |
| | | | 1,935,820 |
| Materials (4.8%) | | |
| | International Paper Co. | 5,064,100 | 181,447 |
| | LyondellBasell Industries | | |
| | NV Class A | 1,477,600 | 78,889 |
| | Mosaic Co. | 1,394,100 | 72,967 |
| | Potash Corp. of | | |
| | Saskatchewan Inc. | 1,410,300 | 56,934 |
| * | Owens-Illinois Inc. | 2,751,153 | 53,620 |
| | Agrium Inc. | 502,200 | 53,002 |
| | Rexam plc | 6,317,694 | 45,618 |
| | PPG Industries Inc. | 293,500 | 34,363 |
| | Incitec Pivot Ltd. | 8,797,250 | 28,813 |
| *,^ | Sino-Forest Corp. | 3,223,900 | — |
| | | | 605,653 |
| Utilities (2.1%) | | |
| | PG&E Corp. | 2,277,700 | 96,848 |
| | Entergy Corp. | 966,875 | 70,176 |
| | Edison International | 1,191,400 | 55,924 |
| | Northeast Utilities | 1,039,500 | 40,852 |
| | | | 263,800 |
| Total Common Stocks | | |
| (Cost $11,083,000) | | 12,201,952 |
17
Windsor Fund
| | |
| | | Market |
| | | Value• |
| | Shares | ($000) |
| Temporary Cash Investments (3.0%)1 | |
| Money Market Fund (1.3%) | |
| 5,6 Vanguard Market Liquidity | |
| Fund, 0.167% | 162,486,044 | 162,486 |
| |
| | Face | |
| | Amount | |
| | ($000) | |
| Repurchase Agreement (1.6%) | |
| Bank of America Securities, | |
| LLC 0.300%, 11/1/12 | |
| (Dated 10/31/12, | | |
| Repurchase Value | | |
| $208,402,000, | | |
| collateralized by Federal | |
| Home Loan Mortgage | |
| Corp. 2.789%, 4/1/42, | |
| and Federal National | |
| Mortgage Assn. | | |
| 3.000%-3.500%, | | |
| 7/1/27–1/1/40) | 208,400 | 208,400 |
| |
| U.S. Government and Agency Obligations (0.1%) |
| United States Treasury | |
| Note/Bond, 0.625%, | |
| 12/31/12 | 13,000 | 13,010 |
| Total Temporary Cash Investments | |
| (Cost $383,896) | | 383,896 |
| Total Investments (100.6%) | |
| (Cost $11,466,896) | | 12,585,848 |
| Other Assets and Liabilities (-0.6%) | |
| Other Assets7 | | 71,240 |
| Liabilities6 | | (151,288) |
| | | (80,048) |
| Net Assets (100%) | | 12,505,800 |
| |
| At October 31, 2012, net assets consisted of: |
| | Amount |
| | ($000) |
| Paid-in Capital | 13,528,279 |
| Undistributed Net Investment Income | 41,402 |
| Accumulated Net Realized Losses | (2,179,064) |
| Unrealized Appreciation (Depreciation) | |
| Investment Securities | 1,118,952 |
| Futures Contracts | (3,611) |
| Foreign Currencies | (158) |
| Net Assets | 12,505,800 |
| |
| |
| Investor Shares—Net Assets | |
| Applicable to 457,705,259 outstanding | |
| $.001 par value shares of beneficial | |
| interest (unlimited authorization) | 6,710,912 |
| Net Asset Value Per Share— | |
| Investor Shares | $14.66 |
| |
| |
| Admiral Shares—Net Assets | |
| Applicable to 117,128,263 outstanding | |
| $.001 par value shares of beneficial | |
| interest (unlimited authorization) | 5,794,888 |
| Net Asset Value Per Share— | |
| Admiral Shares | $49.47 |
• See Note A in Notes to Financial Statements.
* Non-income-producing security.
^ Part of security position is on loan to broker-dealers. The total value of securities on loan is less than $1,000.
1 The fund invests a portion of its cash reserves in equity markets through the use of index futures contracts. After giving effect to futures
investments, the fund’s effective common stock and temporary cash investment positions represent 98.8% and 1.8%, respectively, of net
assets.
2 Restricted security represents 0.7% of net assets. Shares not applicable for this private placement.
3 Considered an affiliated company of the fund as the issuer is another member of The Vanguard Group.
4 Considered an affiliated company of the fund as the fund owns more than 5% of the outstanding voting securities of such company.
5 Affiliated money market fund available only to Vanguard funds and certain trusts and accounts managed by Vanguard. Rate shown is the
7-day yield.
6 Includes $3,217,000 of collateral received for securities on loan.
7 Cash of $9,650,000 has been segregated as initial margin for open futures contracts.
ADR—American Depositary Receipt.
See accompanying Notes, which are an integral part of the Financial Statements.
18
Windsor Fund
Statement of Operations
| |
| | Year Ended |
| | October 31, 2012 |
| | ($000) |
| Investment Income | |
| Income | |
| Dividends1,2 | 258,920 |
| Interest2 | 523 |
| Security Lending | 2,449 |
| Total Income | 261,892 |
| Expenses | |
| Investment Advisory Fees—Note B | |
| Basic Fee | 15,405 |
| Performance Adjustment | (1,293) |
| The Vanguard Group—Note C | |
| Management and Administrative—Investor Shares | 14,068 |
| Management and Administrative—Admiral Shares | 6,017 |
| Marketing and Distribution—Investor Shares | 1,299 |
| Marketing and Distribution—Admiral Shares | 859 |
| Custodian Fees | 217 |
| Auditing Fees | 31 |
| Shareholders’ Reports—Investor Shares | 64 |
| Shareholders’ Reports—Admiral Shares | 16 |
| Trustees’ Fees and Expenses | 27 |
| Total Expenses | 36,710 |
| Expenses Paid Indirectly | (754) |
| Net Expenses | 35,956 |
| Net Investment Income | 225,936 |
| Realized Net Gain (Loss) | |
| Investment Securities Sold2 | 1,142,119 |
| Futures Contracts | 33,819 |
| Foreign Currencies | (346) |
| Realized Net Gain (Loss) | 1,175,592 |
| Change in Unrealized Appreciation (Depreciation) | |
| Investment Securities | 366,376 |
| Futures Contracts | (3,722) |
| Foreign Currencies | (111) |
| Change in Unrealized Appreciation (Depreciation) | 362,543 |
| Net Increase (Decrease) in Net Assets Resulting from Operations | 1,764,071 |
| 1 Dividends are net of foreign withholding taxes of $6,657,000. |
| 2 Dividends income, interest income, and realized net gain (loss) from affiliated companies of the fund were $3,395,000, $228,000, |
| and ($55,604,000), respectively. |
See accompanying Notes, which are an intergral part of the Financial Statements.
19
Windsor Fund
Statement of Changes in Net Assets
| | |
| | Year Ended October 31, |
| | 2012 | 2011 |
| | ($000) | ($000) |
| Increase (Decrease) in Net Assets | | |
| Operations | | |
| Net Investment Income | 225,936 | 181,991 |
| Realized Net Gain (Loss) | 1,175,592 | 1,147,461 |
| Change in Unrealized Appreciation (Depreciation) | 362,543 | (788,789) |
| Net Increase (Decrease) in Net Assets Resulting from Operations | 1,764,071 | 540,663 |
| Distributions | | |
| Net Investment Income | | |
| Investor Shares | (118,284) | (97,694) |
| Admiral Shares | (100,323) | (73,770) |
| Realized Capital Gain | | |
| Investor Shares | — | — |
| Admiral Shares | — | — |
| Total Distributions | (218,607) | (171,464) |
| Capital Share Transactions | | |
| Investor Shares | (881,080) | (1,510,081) |
| Admiral Shares | 111,269 | 191,699 |
| Net Increase (Decrease) from Capital Share Transactions | (769,811) | (1,318,382) |
| Total Increase (Decrease) | 775,653 | (949,183) |
| Net Assets | | |
| Beginning of Period | 11,730,147 | 12,679,330 |
| End of Period1 | 12,505,800 | 11,730,147 |
| 1 Net Assets - End of Period includes undistributed net investment income of $41,402,000 and $34,419,000. |
See accompanying Notes, which are an integral part of the Financial Statements.
20
Windsor Fund
Financial Highlights
| | | | | |
| Investor Shares | | | | | |
| |
| |
| For a Share Outstanding | Year Ended October 31, |
| Throughout Each Period | 2012 | 2011 | 2010 | 2009 | 2008 |
| Net Asset Value, Beginning of Period | $12.92 | $12.56 | $10.97 | $9.51 | $19.52 |
| Investment Operations | | | | | |
| Net Investment Income | .252 | .184 | .1901 | .197 | .279 |
| Net Realized and Unrealized Gain (Loss) | | | | | |
| on Investments | 1.729 | .346 | 1.586 | 1.486 | (7.985) |
| Total from Investment Operations | 1.981 | .530 | 1.776 | 1.683 | (7.706) |
| Distributions | | | | | |
| Dividends from Net Investment Income | (.241) | (.170) | (.186) | (.223) | (.289) |
| Distributions from Realized Capital Gains | — | — | — | — | (2.015) |
| Total Distributions | (.241) | (.170) | (.186) | (.223) | (2.304) |
| Net Asset Value, End of Period | $14.66 | $12.92 | $12.56 | $10.97 | $9.51 |
| |
| Total Return2 | 15.56% | 4.15% | 16.31% | 18.22% | -43.88% |
| |
| Ratios/Supplemental Data | | | | | |
| Net Assets, End of Period (Millions) | $6,711 | $6,736 | $7,999 | $7,610 | $7,041 |
| Ratio of Total Expenses to | | | | | |
| Average Net Assets3 | 0.35% | 0.39% | 0.33% | 0.33% | 0.30% |
| Ratio of Net Investment Income to | | | | | |
| Average Net Assets | 1.80% | 1.34% | 1.59%1 | 2.03% | 1.91% |
| Portfolio Turnover Rate | 68% | 49% | 50% | 61%4 | 55% |
1 Net investment income per share and the ratio of net investment income to average net assets include $0.36 and 0.29%, respectively, resulting from a
cash payment receivedin connection with the merger of Schering-Plough Corp. and Merck & Co. in November 2009.
2 Total returns do not include account service fees that may have applied in the periods shown. Fund prospectuses provide infomation about any applicable
account service fees.
3 Includes performance-based investment advisory fee increases (decreases) of (0.01%), 0.03%, (0.03%), (0.05%), and (0.03%).
4 Excludes the value of portfolio securties received or delivered as a result of in-kind purchases or redemptions of the fund's capital shares.
See accompanying Notes, which are an integral part of the Financial Statements.
21
Windsor Fund
Financial Highlights
| | | | | |
| Admiral Shares | | | | | |
| |
| |
| For a Share Outstanding | Year Ended October 31, |
| Throughout Each Period | 2012 | 2011 | 2010 | 2009 | 2008 |
| Net Asset Value, Beginning of Period | $43.59 | $42.37 | $37.01 | $32.08 | $65.90 |
| Investment Operations | | | | | |
| Net Investment Income | .900 | .664 | .6851 | .701 | .999 |
| Net Realized and Unrealized Gain (Loss) | | | | | |
| on Investments | 5.844 | 1.171 | 5.348 | 5.020 | (26.974) |
| Total from Investment Operations | 6.744 | 1.835 | 6.033 | 5.721 | (25.975) |
| Distributions | | | | | |
| Dividends from Net Investment Income | (.864) | (.615) | (.673) | (.791) | (1.047) |
| Distributions from Realized Capital Gains | — | — | — | — | (6.798) |
| Total Distributions | (.864) | (.615) | (.673) | (.791) | (7.845) |
| Net Asset Value, End of Period | $49.47 | $43.59 | $42.37 | $37.01 | $32.08 |
| |
| Total Return2 | 15.71% | 4.26% | 16.44% | 18.38% | -43.85% |
| |
| Ratios/Supplemental Data | | | | | |
| Net Assets, End of Period (Millions) | $5,795 | $4,994 | $4,680 | $4,203 | $4,723 |
| Ratio of Total Expenses to | | | | | |
| Average Net Assets3 | 0.25% | 0.29% | 0.22% | 0.20% | 0.17% |
| Ratio of Net Investment Income to | | | | | |
| Average Net Assets | 1.90% | 1.44% | 1.70%1 | 2.16% | 2.04% |
| Portfolio Turnover Rate | 68% | 49% | 50% | 61%4 | 55% |
1 Net Investment income per share and the ratio of net investment income to average nets assets include $.120 and 0.29%, respectively, resulting from a cash
payment received in connection with the merger of Schering-Plough Corp. and Merck & Co. in November 2009.
2 Total returns do not include account service fees that may have applied in the periods shown. Fund prospectuses provide information about any applicable
account service fees.
3 Includes performance-based investment advisory fee increases (decreases) of (0.01%), 0.03%, (0.03%), (0.05%), and (0.03%).
4 Excludes the value of portfolio securities received or delivered as a result of in-kind purchases or redemptions of the fund's capital shares.
See accompanying Notes, which are an integral part of the Financial Statements.
22
Windsor Fund
Notes to Financial Statements
Vanguard Windsor Fund is registered under the Investment Company Act of 1940 as an open-end investment company, or mutual fund. The fund offers two classes of shares: Investor Shares and Admiral Shares. Investor Shares are available to any investor who meets the fund’s minimum purchase requirements. Admiral Shares are designed for investors who meet certain administrative, service, and account-size criteria.
A. The following significant accounting policies conform to generally accepted accounting principles for U.S. mutual funds. The fund consistently follows such policies in preparing its financial statements.
1. Security Valuation: Securities are valued as of the close of trading on the New York Stock Exchange (generally 4 p.m., Eastern time) on the valuation date. Equity securities are valued at the latest quoted sales prices or official closing prices taken from the primary market in which each security trades; such securities not traded on the valuation date are valued at the mean of the latest quoted bid and asked prices. Securities for which market quotations are not readily available, or whose values have been affected by events occurring before the fund’s pricing time but after the close of the securities’ primary markets, are valued at their fair values calculated according to procedures adopted by the board of trustees. These procedures include obtaining quotations from an independent pricing service, monitoring news to identify significant market- or security-specific events, and evaluating changes in the values of foreign market proxies (for example, ADRs, futures contracts, or exchange-traded funds), between the time the foreign markets close and the fund’s pricing time. When fair-value pricing is employed, the prices of securities used by a fund to calculate its net asset value may differ from quoted or published prices for the same securities. Investments in Vanguard Market Liquidity Fund are valued at that fund’s net asset value. Temporary cash investments acquired over 60 days to maturity are valued using the latest bid prices or using valuations based on a matrix system (which considers such factors as security prices, yields, maturities, and ratings), both as furnished by independent pricing services. Other temporary cash investments are valued at amortized cost, which approximates market value.
2. Foreign Currency: Securities and other assets and liabilities denominated in foreign currencies are translated into U.S. dollars using exchange rates obtained from an independent third party as of the fund’s pricing time on the valuation date. Realized gains (losses) and unrealized appreciation (depreciation) on investment securities include the effects of changes in exchange rates since the securities were purchased, combined with the effects of changes in security prices. Fluctuations in the value of other assets and liabilities resulting from changes in exchange rates are recorded as unrealized foreign currency gains (losses) until the assets or liabilities are settled in cash, at which time they are recorded as realized foreign currency gains (losses).
3. Futures Contracts: The fund uses index futures contracts to a limited extent, with the objective of maintaining full exposure to the stock market while maintaining liquidity. The fund may purchase or sell futures contracts to achieve a desired level of investment, whether to accommodate portfolio turnover or cash flows from capital share transactions. The primary risks associated with the use of futures contracts are imperfect correlation between changes in market values of stocks held by the fund and the prices of futures contracts, and the possibility of an illiquid market.
Futures contracts are valued at their quoted daily settlement prices. The aggregate principal amounts of the contracts are not recorded in the Statement of Net Assets. Fluctuations in the value of the contracts are recorded in the Statement of Net Assets as an asset (liability) and in the Statement of Operations as unrealized appreciation (depreciation) until the contracts are closed, when they are recorded as realized futures gains (losses).
23
Windsor Fund
During the year ended October 31, 2012, the fund’s average investment in futures contracts represented 1% of net assets, based on quarterly average aggregate settlement values.
4. Repurchase Agreements: The fund may enter into repurchase agreements. Securities pledged as collateral for repurchase agreements are held by a custodian bank until the agreements mature. Each agreement requires that the market value of the collateral be sufficient to cover payments of interest and principal. In the event of default or bankruptcy by the other party to the agreement, the fund may sell or retain the collateral; however, such action may be subject to legal proceedings.
5. Federal Income Taxes: The fund intends to continue to qualify as a regulated investment company and distribute all of its taxable income. Management has analyzed the fund’s tax positions taken for all open federal income tax years (October 31, 2009–2012), and has concluded that no provision for federal income tax is required in the fund’s financial statements.
6. Distributions: Distributions to shareholders are recorded on the ex-dividend date.
7. Security Lending: The fund may lend its securities to qualified institutional borrowers to earn additional income. Security loans are required to be secured at all times by collateral at least equal to the market value of securities loaned. The fund invests cash collateral received in Vanguard Market Liquidity Fund, and records a liability for the return of the collateral, during the period the securities are on loan. Security lending income represents fees charged to borrowers plus income earned on investing cash collateral, less expenses associated with the loan.
8. Other: Dividend income is recorded on the ex-dividend date. Interest income includes income distributions received from Vanguard Market Liquidity Fund and is accrued daily. Security transactions are accounted for on the date securities are bought or sold. Costs used to determine realized gains (losses) on the sale of investment securities are those of the specific securities sold.
Each class of shares has equal rights as to assets and earnings, except that each class separately bears certain class-specific expenses related to maintenance of shareholder accounts (included in Management and Administrative expenses) and shareholder reporting. Marketing and distribution expenses are allocated to each class of shares based on a method approved by the board of trustees. Income, other non-class-specific expenses, and gains and losses on investments are allocated to each class of shares based on its relative net assets.
B. Wellington Management Company, LLP, and beginning August 2012, Pzena Investment Management, LLC, each provide investment advisory services to a portion of the fund for a fee calculated at an annual percentage rate of average net assets managed by the advisor. The basic fee of Wellington Management Company, LLP, is subject to quarterly adjustments based on performance for the preceding three years relative to the S&P 500 Index. In accordance with the advisory contract entered into with Pzena Investment Management, LLC, beginning August 1, 2013, the investment advisory fee will be subject to quarterly adjustments based on performance since October 31, 2012, relative to the Russell 1000 Value Index. Until August 2012, a portion of the fund was managed by AllianceBernstein L.P. The basic fee paid to AllianceBernstein L.P. was subject to quarterly adjustments based on performance for the preceding three years relative to the Russell 1000 Value Index.
The Vanguard Group manages the cash reserves of the fund on an at-cost basis.
For the year ended October 31, 2012, the aggregate investment advisory fee represented an effective annual basic rate of 0.13% of the fund’s average net assets, before a decrease of $1,293,000 (0.01%) based on performance.
24
Windsor Fund
C. The Vanguard Group furnishes at cost corporate management, administrative, marketing, and distribution services. The costs of such services are allocated to the fund under methods approved by the board of trustees. The fund has committed to provide up to 0.40% of its net assets in capital contributions to Vanguard. At October 31, 2012, the fund had contributed capital of $1,748,000 to Vanguard (included in Other Assets), representing 0.01% of the fund’s net assets and 0.70% of Vanguard’s capitalization. The fund’s trustees and officers are also directors and officers of Vanguard.
D. The fund has asked its investment advisors to direct certain security trades, subject to obtaining the best price and execution, to brokers who have agreed to rebate to the fund part of the commissions generated. Such rebates are used solely to reduce the fund’s management and administrative expenses. For the year ended October 31, 2012, these arrangements reduced the fund’s expenses by $754,000 (an annual rate of 0.01% of average net assets).
E. Various inputs may be used to determine the value of the fund’s investments. These inputs are summarized in three broad levels for financial statement purposes. The inputs or methodologies used to value securities are not necessarily an indication of the risk associated with investing in those securities.
Level 1—Quoted prices in active markets for identical securities.
Level 2—Other significant observable inputs (including quoted prices for similar securities, interest
rates, prepayment speeds, credit risk, etc.).
Level 3—Significant unobservable inputs (including the fund’s own assumptions used to determine
the fair value of investments).
The following table summarizes the market value of the fund’s investments as of October 31, 2012, based on the inputs used to value them:
| | | |
| | Level 1 | Level 2 | Level 3 |
| Investments | ($000) | ($000) | ($000) |
| Common Stocks | 11,176,249 | 939,433 | 86,270 |
| Temporary Cash Investments | 162,486 | 221,410 | — |
| Futures Contracts—Assets1 | 90 | — | — |
| Futures Contracts—Liabilities1 | (84) | — | — |
| Total | 11,338,741 | 1,160,843 | 86,270 |
| 1 Represents variation margin on the last day of the reporting period. |
The determination of Level 3 fair value measurements is governed by documented policies and procedures adopted by the board of trustees. The board has designated a pricing review committee, as an agent of the board, to ensure the timely analysis and valuation of Level 3 securities held by the fund in accordance with established policies and procedures. The pricing review committee employs various methods for calibrating valuation approaches, including a regular review of key inputs and assumptions, transactional back-testing or disposition analysis, and reviews of any related market activity. All valuation decisions made by the pricing review committee are reported to the board on a quarterly basis for review and ratification. The board reviews the adequacy of the fair value measurement policies and procedures in place on an annual basis.
25
Windsor Fund
The following table summarizes changes in investments valued based on Level 3 inputs during the year ended October 31, 2012. Transfers into or out of Level 3 are recognized based on values as of the date of transfer.
| |
| | Investments in |
| | Common Stocks |
| Amount Valued Based on Level 3 Inputs | ($000) |
| Balance as of October 31, 2011 | 231,798 |
| Transfers out of Level 3 | (197,465) |
| Change in Unrealized Appreciation (Depreciation) | 51,937 |
| Balance as of October 31, 2012 | 86,270 |
Net change in unrealized appreciation (depreciation) from investments still held as of October 31, 2012 was $51,937,000. Transfers out of Level 3
represent a reduction in the fund's investment and realized gains from a private placement security.
F. At October 31, 2012, the aggregate settlement value of open futures contracts and the related unrealized appreciation (depreciation) were:
| | | | |
| | | | ($000) |
| | | | Aggregate | |
| | | Number of | Settlement | Unrealized |
| | | Long (Short) | Value | Appreciation |
| Futures Contracts | Expiration | Contracts | Long (Short) | (Depreciation) |
| E-mini S&P 500 Index | December 2012 | 985 | 69,285 | (813) |
| S&P 500 Index | December 2012 | 191 | 67,175 | (2,210) |
| E-mini S&P MidCap 400 Index | December 2012 | 168 | 16,432 | (588) |
Unrealized appreciation (depreciation) on open futures contracts is required to be treated as realized gain (loss) for tax purposes.
G. Distributions are determined on a tax basis and may differ from net investment income and realized capital gains for financial reporting purposes. Differences may be permanent or temporary. Permanent differences are reclassified among capital accounts in the financial statements to reflect their tax character. Temporary differences arise when certain items of income, expense, gain, or loss are recognized in different periods for financial statement and tax purposes; these differences will reverse at some time in the future. Differences in classification may also result from the treatment of short-term gains as ordinary income for tax purposes.
During the year ended October 31, 2012, the fund realized net foreign currency losses of $346,000, which decreased distributable net income for tax purposes; accordingly, such losses have been reclassified from accumulated net realized losses to undistributed net investment income.
For tax purposes, at October 31, 2012, the fund had $69,090,000 of ordinary income available for distribution. The fund used capital loss carryforwards of $1,172,281,000 to offset taxable capital gains realized during the year ended October 31, 2012. At October 31, 2012, the fund had available capital losses totaling $2,182,559,000 to offset future net capital gains through October 31, 2017.
At October 31, 2012, the cost of investment securities for tax purposes was $11,466,962,000. Net unrealized appreciation of investment securities for tax purposes was $1,118,886,000, consisting of unrealized gains of $1,626,257,000 on securities that had risen in value since their purchase and $507,371,000 in unrealized losses on securities that had fallen in value since their purchase.
26
Windsor Fund
H. During the year ended October 31, 2012, the fund purchased $8,117,662,000 of investment securities and sold $8,833,760,000 of investment securities, other than temporary cash investments.
I. Capital share transactions for each class of shares were:
| | | | |
| | Year Ended October 31, |
| | 2012 | 2011 |
| | Amount | Shares | Amount | Shares |
| | ($000) | (000) | ($000) | (000) |
| Investor Shares | | | | |
| Issued | 416,456 | 30,475 | 733,317 | 55,351 |
| Issued in Lieu of Cash Distributions | 115,463 | 8,790 | 95,561 | 6,994 |
| Redeemed | (1,412,999) | (103,043) | (2,338,959) | (177,965) |
| Net Increase (Decrease) —Investor Shares | (881,080) | (63,778) | (1,510,081) | (115,620) |
| Admiral Shares | | | | |
| Issued | 680,468 | 14,748 | 959,824 | 21,461 |
| Issued in Lieu of Cash Distributions | 90,751 | 2,045 | 66,478 | 1,442 |
| Redeemed | (659,950) | (14,224) | (834,603) | (18,797) |
| Net Increase (Decrease)—Admiral Shares | 111,269 | 2,569 | 191,699 | 4,106 |
J. Certain of the fund’s investments are in companies that are considered to be affiliated companies of the fund because the fund owns more than 5% of the outstanding voting securities of the company. Transactions during the period in securities of these companies were as follows:
| | | | | |
| | | Current Period Transactions | |
| | Oct. 31, 2011 | | Proceeds from | | Oct. 31, 2012 |
| | Market | Purchases | Securities | Dividend | Market |
| | Value | at Cost | Sold | Income | Value |
| | ($000) | ($000) | ($000) | ($000) | ($000) |
| Arrow Electronics Inc. | 231,677 | 19,653 | 2,667 | — | 243,462 |
| MDC Holdings Inc. | 59,273 | — | 47,898 | 588 | — |
| | 290,950 | | | 588 | 243,462 |
K. In preparing the financial statements as of October 31, 2012, management considered the impact of subsequent events for potential recognition or disclosure in these financial statements.
27
Report of Independent Registered
Public Accounting Firm
To the Trustees of Vanguard Windsor Funds and the Shareholders of Vanguard Windsor Fund:
In our opinion, the accompanying statement of net assets and the related statements of operations and of changes in net assets and the financial highlights present fairly, in all material respects, the financial position of Vanguard Windsor Fund (constituting a separate portfolio of Vanguard Windsor Funds, hereafter referred to as the “Fund”) at October 31, 2012, the results of its operations for the year then ended, the changes in its net assets for each of the two years in the period then ended and the financial highlights for each of the five years in the period then ended, in conformity with accounting principles generally accepted in the United States of America. These financial statements and financial highlights (hereafter referred to as “financial statements”) are the responsibility of the Fund’s management; our responsibility is to express an opinion on these financial statements based on our audits. We conducted our audits of these financial statements in accordance with the standards of the Public Company Accounting Oversight Board (United States). Those standards require that we plan and perform the audit to obtain reasonable assurance about whether the financial statements are free of material misstatement. An audit includes examining, on a test basis, evidence supporting the amounts and disclosures in the financial statements, assessing the accounting principles used and significant estimates made by management, and evaluating the overall financial statement presentation. We believe that our audits, which included confirmation of securities at October 31, 2012 by correspondence with the custodians and brokers and by agreement to the underlying ownership records of the transfer agent, provide a reasonable basis for our opinion.
PricewaterhouseCoopers LLP
Philadelphia, Pennsylvania
December 11, 2012

Special 2012 tax information (unaudited) for Vanguard Windsor Fund
This information for the fiscal year ended October 31, 2012, is included pursuant to provisions of the
Internal Revenue Code.
The fund distributed $218,607,000 of qualified dividend income to shareholders during the fiscal year.
For corporate shareholders, 82.8% of investment income (dividend income plus short-term gains,
if any) qualifies for the dividends-received deduction.
28
Your Fund’s After-Tax Returns
This table presents returns for your fund both before and after taxes. The after-tax returns are shown in two ways: (1) assuming that an investor owned the fund during the entire period and paid taxes on the fund’s distributions, and (2) assuming that an investor paid taxes on the fund’s distributions and sold all shares at the end of each period.
Calculations are based on the highest individual federal income tax and capital gains tax rates in effect at the times of the distributions and the hypothetical sales. State and local taxes were not considered. After-tax returns reflect any qualified dividend income, using actual prior-year figures and estimates for 2012. (In the example, returns after the sale of fund shares may be higher than those assuming no sale. This occurs when the sale would have produced a capital loss. The calculation assumes that the investor received a tax deduction for the loss.)
The table shows returns for Investor Shares only; returns for other share classes will differ. Please note that your actual after-tax returns will depend on your tax situation and may differ from those shown. Also note that if you own the fund in a tax-deferred account, such as an individual retirement account or a 401(k) plan, this information does not apply to you. Such accounts are not subject to current taxes.
Finally, keep in mind that a fund’s performance—whether before or after taxes—does not guarantee future results.
Average Annual Total Returns: Windsor Fund Investor Shares
Periods Ended October 31, 2012
| | | |
| | One | Five | Ten |
| | Year | Years | Years |
| Returns Before Taxes | 15.56% | -1.47% | 6.92% |
| Returns After Taxes on Distributions | 15.24 | -2.11 | 6.16 |
| Returns After Taxes on Distributions and Sale of Fund Shares | 10.46 | -1.34 | 5.98 |
29
About Your Fund’s Expenses
As a shareholder of the fund, you incur ongoing costs, which include costs for portfolio management, administrative services, and shareholder reports (like this one), among others. Operating expenses, which are deducted from a fund’s gross income, directly reduce the investment return of the fund.
A fund’s expenses are expressed as a percentage of its average net assets. This figure is known as the expense ratio. The following examples are intended to help you understand the ongoing costs (in dollars) of investing in your fund and to compare these costs with those of other mutual funds. The examples are based on an investment of $1,000 made at the beginning of the period shown and held for the entire period.
The accompanying table illustrates your fund’s costs in two ways:
• Based on actual fund return. This section helps you to estimate the actual expenses that you paid over the period. The ”Ending Account Value“ shown is derived from the fund‘s actual return, and the third column shows the dollar amount that would have been paid by an investor who started with $1,000 in the fund. You may use the information here, together with the amount you invested, to estimate the expenses that you paid over the period.
To do so, simply divide your account value by $1,000 (for example, an $8,600 account value divided by $1,000 = 8.6), then multiply the result by the number given for your fund under the heading ”Expenses Paid During Period.“
• Based on hypothetical 5% yearly return. This section is intended to help you compare your fund‘s costs with those of other mutual funds. It assumes that the fund had a yearly return of 5% before expenses, but that the expense ratio is unchanged. In this case—because the return used is not the fund’s actual return—the results do not apply to your investment. The example is useful in making comparisons because the Securities and Exchange Commission requires all mutual funds to calculate expenses based on a 5% return. You can assess your fund’s costs by comparing this hypothetical example with the hypothetical examples that appear in shareholder reports of other funds.
Note that the expenses shown in the table are meant to highlight and help you compare ongoing costs only and do not reflect transaction costs incurred by the fund for buying and selling securities. Further, the expenses do not include any purchase, redemption, or account service fees described in the fund prospectus. If such fees were applied to your account, your costs would be higher. Your fund does not carry a “sales load.”
The calculations assume no shares were bought or sold during the period. Your actual costs may have been higher or lower, depending on the amount of your investment and the timing of any purchases or redemptions.
You can find more information about the fund’s expenses, including annual expense ratios, in the Financial Statements section of this report. For additional information on operating expenses and other shareholder costs, please refer to your fund’s current prospectus.
30
| | | |
| Six Months Ended October 31, 2012 | | | |
| | Beginning | Ending | Expenses |
| | Account Value | Account Value | Paid During |
| Windsor Fund | 4/30/2012 | 10/31/2012 | Period |
| Based on Actual Fund Return | | | |
| Investor Shares | $1,000.00 | $1,026.17 | $1.63 |
| Admiral Shares | 1,000.00 | 1,026.79 | 1.12 |
| Based on Hypothetical 5% Yearly Return | | | |
| Investor Shares | $1,000.00 | $1,023.59 | $1.63 |
| Admiral Shares | 1,000.00 | 1,024.10 | 1.12 |
The calculations are based on expenses incurred in the most recent six-month period. The fund’s annualized six-month expense ratios for that
period are 0.32% for Investor Shares and 0.22% for Admiral Shares. The dollar amounts shown as “Expenses Paid” are equal to the
annualized expense ratio multiplied by the average account value over the period, multiplied by the number of days in the most recent
six-month period, then divided by the number of days in the most recent 12-month period.
31
Trustees Approve Advisory Agreement
The board of trustees of Vanguard Windsor Fund added Pzena Investment Management, LLC, to the fund’s investment advisory team and removed AllianceBernstein L.P. in August 2012. The board had previously renewed the fund’s investment advisory agreement with Wellington Management Company, llp. Please see the fund’s semiannual report dated April 30, 2012, for more information about the board’s approval of the agreement with Wellington Management.
The board decided to approve the agreement with Pzena based upon an evaluation of the advisor’s investment staff, portfolio management process, and performance. The trustees considered the factors discussed below, among others. However, no single factor determined whether the board approved the agreement. Rather, it was the totality of the circumstances that drove the board’s decision.
Nature, extent, and quality of services
The board considered the quality of the advisor’s investment management, and took into account the organizational depth and stability of the advisor. The board noted that Pzena, founded in 1995, is a global investment management firm that utilizes a fundamental, bottom-up, deep-value-oriented investment strategy to identify good businesses at low prices, focusing exclusively on companies that are underperforming their historically demonstrated earnings power. Pzena conducts intensive fundamental research, buying companies only when all three of the following criteria are met: (1) the problems are judged to be temporary, (2) management has a viable strategy to generate earnings recovery, and (3) there is meaningful downside protection in case earnings do not recover.
The board concluded that the advisor’s experience, stability, depth, and performance, among other factors, warranted approval of the advisory agreement.
Investment performance
The board considered the performance of Pzena’s U.S. large-cap value portfolio. The portfolio incorporates a substantially similar strategy to that which Pzena will employ when managing assets for the Windsor Fund. The board concluded that, over the long term, the portfolio’s performance slightly trailed that of the benchmark but has been competitive with the average return of peer funds, outperforming it over the 3- and 10-year periods and slightly trailing it over the 5-year period. The board further concluded that adding Pzena as an advisor would allow the fund to retain its character as an aggressive large-capitalization value offering while continuing to benefit from multiple differential active managers.
Cost
The board considered the cost of services to be provided including consideration of competitive fee rates. The board concluded that the addition of Pzena would result in a modest increase in the fund’s aggregate investment advisory fees, but that after implementation of the agreement with Pzena, the fund’s advisory fee rate and expense ratio would remain substantially below the fund’s peer-group average. Information about the fund’s expenses appears in the About Your Fund’s Expenses section of this report as well as in the Financial Statements section, which also includes information about the fund’s advisory fee rate.
32
The board did not consider profitability of Pzena in determining whether to approve the advisory fee, because the firm is independent of Vanguard and the advisory fee is the result of arm’s length negotiations.
The benefit of economies of scale
The board concluded that the fund’s shareholders will benefit from economies of scale because of breakpoints in the advisory fee schedule for Pzena. The breakpoints reduce the effective rate of the fee as the fund’s assets managed by the advisor increase.
The board will consider whether to renew the advisory agreement again after a one-year period.
33
Glossary
30-Day SEC Yield. A fund’s 30-day SEC yield is derived using a formula specified by the U.S. Securities and Exchange Commission. Under the formula, data related to the fund’s security holdings in the previous 30 days are used to calculate the fund’s hypothetical net income for that period, which is then annualized and divided by the fund’s estimated average net assets over the calculation period. For the purposes of this calculation, a security’s income is based on its current market yield to maturity (for bonds), its actual income (for asset-backed securities), or its projected dividend yield (for stocks). Because the SEC yield represents hypothetical annualized income, it will differ—at times significantly—from the fund’s actual experience. As a result, the fund’s income distributions may be higher or lower than implied by the SEC yield.
Beta. A measure of the magnitude of a fund’s past share-price fluctuations in relation to the ups and downs of a given market index. The index is assigned a beta of 1.00. Compared with a given index, a fund with a beta of 1.20 typically would have seen its share price rise or fall by 12% when the index rose or fell by 10%. For this report, beta is based on returns over the past 36 months for both the fund and the index. Note that a fund’s beta should be reviewed in conjunction with its R-squared (see definition). The lower the R-squared, the less correlation there is between the fund and the index, and the less reliable beta is as an indicator of volatility.
Dividend Yield. Dividend income earned by stocks, expressed as a percentage of the aggregate market value (or of net asset value, for a fund). The yield is determined by dividing the amount of the annual dividends by the aggregate value (or net asset value) at the end of the period. For a fund, the dividend yield is based solely on stock holdings and does not include any income produced by other investments.
Earnings Growth Rate. The average annual rate of growth in earnings over the past five years for the stocks now in a fund.
Equity Exposure. A measure that reflects a fund’s investments in stocks and stock futures. Any holdings in short-term reserves are excluded.
Expense Ratio. A fund’s total annual operating expenses expressed as a percentage of the fund’s average net assets. The expense ratio includes management and administrative expenses, but does not include the transaction costs of buying and selling portfolio securities.
Foreign Holdings. The percentage of a fund represented by securities or depositary receipts of companies based outside the United States.
Inception Date. The date on which the assets of a fund (or one of its share classes) are first invested in accordance with the fund’s investment objective. For funds with a subscription period, the inception date is the day after that period ends. Investment performance is measured from the inception date.
Median Market Cap. An indicator of the size of companies in which a fund invests; the midpoint of market capitalization (market price x shares outstanding) of a fund’s stocks, weighted by the proportion of the fund’s assets invested in each stock. Stocks representing half of the fund’s assets have market capitalizations above the median, and the rest are below it.
Price/Book Ratio. The share price of a stock divided by its net worth, or book value, per share. For a fund, the weighted average price/book ratio of the stocks it holds.
34
Price/Earnings Ratio. The ratio of a stock’s current price to its per-share earnings over the past year. For a fund, the weighted average P/E of the stocks it holds. P/E is an indicator of market expectations about corporate prospects; the higher the P/E, the greater the expectations for a company’s future growth.
R-Squared. A measure of how much of a fund’s past returns can be explained by the returns from the market in general, as measured by a given index. If a fund’s total returns were precisely synchronized with an index’s returns, its R-squared would be 1.00. If the fund’s returns bore no relationship to the index’s returns, its R-squared would be 0. For this report, R-squared is based on returns over the past 36 months for both the fund and the index.
Return on Equity. The annual average rate of return generated by a company during the past five years for each dollar of shareholder’s equity (net income divided by shareholder’s equity). For a fund, the weighted average return on equity for the companies whose stocks it holds.
Short-Term Reserves. The percentage of a fund invested in highly liquid, short-term securities that can be readily converted to cash.
Turnover Rate. An indication of the fund’s trading activity. Funds with high turnover rates incur higher transaction costs and may be more likely to distribute capital gains (which may be taxable to investors). The turnover rate excludes in-kind transactions, which have minimal impact on costs.
35
The People Who Govern Your Fund
The trustees of your mutual fund are there to see that the fund is operated and managed in your best interests since, as a shareholder, you are a part owner of the fund. Your fund’s trustees also serve on the board of directors of The Vanguard Group, Inc., which is owned by the Vanguard funds and provides services to them on an at-cost basis.
A majority of Vanguard’s board members are independent, meaning that they have no affiliation with Vanguard or the funds they oversee, apart from the sizable personal investments they have made as private individuals. The independent board members have distinguished backgrounds in business, academia, and public service. Each of the trustees and executive officers oversees 180 Vanguard funds.
The following table provides information for each trustee and executive officer of the fund. More information about the trustees is in the Statement of Additional Information, which can be obtained, without charge, by contacting Vanguard at 800-662-7447, or online at vanguard.com.
| |
| InterestedTrustee1 | and Delphi Automotive LLP (automotive components); |
| | Senior Advisor at New Mountain Capital; Trustee of |
| F. William McNabb III | The Conference Board. |
| Born 1957. Trustee Since July 2009. Chairman of the | |
| Board. Principal Occupation(s) During the Past Five | Amy Gutmann |
| Years: Chairman of the Board of The Vanguard Group, | Born 1949. Trustee Since June 2006. Principal |
| Inc., and of each of the investment companies served | Occupation(s) During the Past Five Years: President |
| by The Vanguard Group, since January 2010; Director | of the University of Pennsylvania; Christopher H. |
| of The Vanguard Group since 2008; Chief Executive | Browne Distinguished Professor of Political Science |
| Officer and President of The Vanguard Group and of | in the School of Arts and Sciences with secondary |
| each of the investment companies served by The | appointments at the Annenberg School for |
| Vanguard Group since 2008; Director of Vanguard | Communication and the Graduate School of Education |
| Marketing Corporation; Managing Director of The | of the University of Pennsylvania; Member of the |
| Vanguard Group (1995–2008). | National Commission on the Humanities and Social |
| | Sciences; Trustee of Carnegie Corporation of New |
| | York and of the National Constitution Center; Chair |
| of the U. S. Presidential Commission for the Study |
| IndependentTrustees | of Bioethical Issues. |
| |
| Emerson U. Fullwood | |
| Born 1948. Trustee Since January 2008. Principal | JoAnn Heffernan Heisen |
| Occupation(s) During the Past Five Years: Executive | Born 1950. Trustee Since July 1998. Principal |
| Chief Staff and Marketing Officer for North America | Occupation(s) During the Past Five Years: Corporate |
| and Corporate Vice President (retired 2008) of Xerox | Vice President and Chief Global Diversity Officer |
| Corporation (document management products and | (retired 2008) and Member of the Executive |
| services); Executive in Residence and 2010 | Committee (1997–2008) of Johnson & Johnson |
| Distinguished Minett Professor at the Rochester | (pharmaceuticals/medical devices/consumer |
| Institute of Technology; Director of SPX Corporation | products); Director of Skytop Lodge Corporation |
| (multi-industry manufacturing), the United Way of | (hotels), the University Medical Center at Princeton, |
| Rochester, Amerigroup Corporation (managed health | the Robert Wood Johnson Foundation, and the Center |
| care), the University of Rochester Medical Center, | for Talent Innovation; Member of the Advisory Board |
| Monroe Community College Foundation, and North | of the Maxwell School of Citizenship and Public Affairs |
| Carolina A&T University. | at Syracuse University. |
| |
| Rajiv L. Gupta | F. Joseph Loughrey |
| Born 1945. Trustee Since December 2001.2 | Born 1949. Trustee Since October 2009. Principal |
| Principal Occupation(s) During the Past Five Years: | Occupation(s) During the Past Five Years: President |
| Chairman and Chief Executive Officer (retired 2009) | and Chief Operating Officer (retired 2009) of Cummins |
| and President (2006–2008) of Rohm and Haas Co. | Inc. (industrial machinery); Director of SKF AB |
| (chemicals); Director of Tyco International, Ltd. | (industrial machinery), Hillenbrand, Inc. (specialized |
| (diversified manufacturing and services), Hewlett- | consumer services), the Lumina Foundation for |
| Packard Co. (electronic computer manufacturing), | |
| | |
| Education, and Oxfam America; Chairman of the | Executive Officers | |
| Advisory Council for the College of Arts and Letters | | |
| and Member of the Advisory Board to the Kellogg | Glenn Booraem | |
| Institute for International Studies at the University | Born 1967. Controller Since July 2010. Principal |
| of Notre Dame. | Occupation(s) During the Past Five Years: Principal |
| | of The Vanguard Group, Inc.; Controller of each of |
| Mark Loughridge | the investment companies served by The Vanguard |
| Born 1953. Trustee Since March 2012. Principal | Group; Assistant Controller of each of the investment |
| Occupation(s) During the Past Five Years: Senior Vice | companies served by The Vanguard Group (2001–2010). |
| President and Chief Financial Officer at IBM (information | | |
| technology services); Fiduciary Member of IBM’s | Thomas J. Higgins | |
| Retirement Plan Committee. | Born 1957. Chief Financial Officer Since September |
| | 2008. Principal Occupation(s) During the Past Five |
| Scott C. Malpass | Years: Principal of The Vanguard Group, Inc.; Chief |
| Born 1962. Trustee Since March 2012. Principal | Financial Officer of each of the investment companies |
| Occupation(s) During the Past Five Years: Chief | served by The Vanguard Group; Treasurer of each of |
| Investment Officer and Vice President at the University | the investment companies served by The Vanguard |
| of Notre Dame; Assistant Professor of Finance at the | Group (1998–2008). | |
| Mendoza College of Business at Notre Dame; Member | | |
| of the Notre Dame 403(b) Investment Committee; | Kathryn J. Hyatt | |
| Director of TIFF Advisory Services, Inc. (investment | Born 1955. Treasurer Since November 2008. Principal |
| advisor); Member of the Investment Advisory | Occupation(s) During the Past Five Years: Principal of |
| Committees of the Financial Industry Regulatory | The Vanguard Group, Inc.; Treasurer of each of the |
| Authority (FINRA) and of Major League Baseball. | investment companies served by The Vanguard |
| | Group; Assistant Treasurer of each of the investment |
| André F. Perold | companies served by The Vanguard Group (1988–2008). |
| Born 1952. Trustee Since December 2004. Principal | | |
| Occupation(s) During the Past Five Years: George | Heidi Stam | |
| Gund Professor of Finance and Banking at the Harvard | Born 1956. Secretary Since July 2005. Principal |
| Business School (retired 2011); Chief Investment | Occupation(s) During the Past Five Years: Managing |
| Officer and Managing Partner of HighVista Strategies | Director of The Vanguard Group, Inc.; General Counsel |
| LLC (private investment firm); Director of Rand | of The Vanguard Group; Secretary of The Vanguard |
| Merchant Bank; Overseer of the Museum of Fine | Group and of each of the investment companies |
| Arts Boston. | served by The Vanguard Group; Director and Senior |
| | Vice President of Vanguard Marketing Corporation. |
| | |
| Alfred M. Rankin, Jr. | | |
| Born 1941. Trustee Since January 1993. Principal | Vanguard Senior ManagementTeam |
| Occupation(s) During the Past Five Years: Chairman, | | |
| President, and Chief Executive Officer of NACCO | Mortimer J. Buckley | Michael S. Miller |
| Industries, Inc. (forklift trucks/housewares/lignite); | Kathleen C. Gubanich | James M. Norris |
| Director of Goodrich Corporation (industrial products/ | Paul A. Heller | Glenn W. Reed |
| aircraft systems and services) and the National | Martha G. King | George U. Sauter |
| Association of Manufacturers; Chairman of the Board | Chris D. McIsaac | |
| of the Federal Reserve Bank of Cleveland and of | | |
| University Hospitals of Cleveland; Advisory Chairman | | |
| of the Board of The Cleveland Museum of Art. | Chairman Emeritus and Senior Advisor |
| | |
| | John J. Brennan | |
| Peter F. Volanakis | Chairman, 1996–2009 | |
| Born 1955. Trustee Since July 2009. Principal | Chief Executive Officer and President, 1996–2008 |
| Occupation(s) During the Past Five Years: President | | |
| and Chief Operating Officer (retired 2010) of Corning | | |
| Incorporated (communications equipment); Director | Founder | |
| of SPX Corporation (multi-industry manufacturing); | John C. Bogle | |
| Overseer of the Amos Tuck School of Business | Chairman and Chief Executive Officer, 1974–1996 |
| Administration at Dartmouth College; Advisor to the | | |
| Norris Cotton Cancer Center. | | |
1 Mr. McNabb is considered an “interested person,” as defined in the Investment Company Act of 1940, because he is an officer of the
Vanguard funds.
2 December 2002 for Vanguard Equity Income Fund, Vanguard Growth Equity Fund, the Vanguard Municipal Bond Funds, and the Vanguard
State Tax-Exempt Funds.

| |
| | P.O. Box 2600 |
| | Valley Forge, PA 19482-2600 |
| |
| |
| |
| Connect with Vanguard® > vanguard.com | |
| |
| |
| |
| Fund Information > 800-662-7447 | |
| Direct Investor Account Services > 800-662-2739 | |
| Institutional Investor Services > 800-523-1036 | |
| Text Telephone for People | |
| With Hearing Impairment > 800-749-7273 | |
| |
| This material may be used in conjunction | |
| with the offering of shares of any Vanguard | |
| fund only if preceded or accompanied by | |
| the fund’s current prospectus. | |
| |
| All comparative mutual fund data are from Lipper Inc. or | |
| Morningstar, Inc., unless otherwise noted. | |
| |
| You can obtain a free copy of Vanguard’s proxy voting | |
| guidelines by visiting vanguard.com/proxyreporting or by | |
| calling Vanguard at 800-662-2739. The guidelines are | |
| also available from the SEC’s website, sec.gov. In | |
| addition, you may obtain a free report on how your fund | |
| voted the proxies for securities it owned during the 12 | |
| months ended June 30. To get the report, visit either | |
| vanguard.com/proxyreporting or sec.gov. | |
| |
| You can review and copy information about your fund at | |
| the SEC’s Public Reference Room in Washington, D.C. To | |
| find out more about this public service, call the SEC at | |
| 202-551-8090. Information about your fund is also | |
| available on the SEC’s website, and you can receive | |
| copies of this information, for a fee, by sending a | |
| request in either of two ways: via e-mail addressed to | |
| publicinfo@sec.gov or via regular mail addressed to the | |
| Public Reference Section, Securities and Exchange | |
| Commission, Washington, DC 20549-1520. | |
| |
| |
| | © 2012 The Vanguard Group, Inc. |
| | All rights reserved. |
| | Vanguard Marketing Corporation, Distributor. |
| |
| | Q220 122012 |

Annual Report | October 31, 2012
Vanguard WindsorTM II Fund

> For the 12 months ended October 31, 2012, Vanguard Windsor II fund returned
nearly 17%, equaling the return of its benchmark and surpassing that of its
large-capitalization value peers.
> Despite stumbling in the fiscal year’s final month, the broad U.S. stock market
returned about 14%.
> The fund’s largest sector, financials, contributed the most to its result; only the
materials sector detracted.
| |
| Contents | |
| Your Fund’s Total Returns. | 1 |
| Chairman’s Letter. | 2 |
| Advisors’ Report. | 7 |
| Fund Profile. | 11 |
| Performance Summary. | 12 |
| Financial Statements. | 14 |
| Your Fund’s After-Tax Returns. | 29 |
| About Your Fund’s Expenses. | 30 |
| Glossary. | 32 |
Please note: The opinions expressed in this report are just that—informed opinions. They should not be considered promises or advice.
Also, please keep in mind that the information and opinions cover the period through the date on the front of this report. Of course, the
risks of investing in your fund are spelled out in the prospectus.
See the Glossary for definitions of investment terms used in this report.
About the cover: Our cover photograph shows rigging on the HMSSurprise, a replica of an 18th-century Royal Navy frigate. It
was featured in the 2003 movie Master and Commander: The Far Side of the World, which was based on Patrick O’Brian’s sea
novels, set amid the Napoleonic Wars. Vanguard was named for another ship of that era, the HMSVanguard, which was the
flagship of British Admiral Horatio Nelson at the Battle of the Nile.
Your Fund’s Total Returns
| |
| Fiscal Year Ended October 31, 2012 | |
| |
| | Total |
| | Returns |
| Vanguard Windsor II Fund | |
| Investor Shares | 16.90% |
| Admiral™ Shares | 16.98 |
| Russell 1000 Value Index | 16.89 |
| Large-Cap Value Funds Average | 14.00 |
| Large-Cap Value Funds Average: Derived from data provided by Lipper Inc. |
| Admiral Shares carry lower expenses and are available to investors who meet certain account-balance requirements. |
| | | | |
| Your Fund’s Performance at a Glance | | | | |
| October 31, 2011, Through October 31, 2012 | | | | |
| | | | Distributions Per Share |
| | Starting | Ending | Income | Capital |
| | Share Price | Share Price | Dividends | Gains |
| Vanguard Windsor II Fund | | | | |
| Investor Shares | $25.68 | $29.33 | $0.621 | $0.000 |
| Admiral Shares | 45.59 | 52.06 | 1.142 | 0.000 |
1

Chairman’s Letter
Dear Shareholder,
Fueled by a stock market that was generally robust though at times inconsistent, Vanguard Windsor II Fund returned almost 17% for the fiscal year ended October 31, 2012. The fund’s result was nearly identical to that of its benchmark, the Russell 1000 Value Index, and nearly three percentage points ahead of its large-cap value fund peers.
Nine of the fund’s ten industry sectors finished with positive returns. Financials, consumer staples, and industrials––in which the advisors’ choices were particularly successful––boosted performance. Only the materials sector––to which the fund had a relatively small allocation––detracted from results.
If you hold shares in a taxable account, you may wish to review the table and discussion on after-tax returns for the fiscal year later in this report.
U.S. stocks led the advance for global equity markets
U.S. stocks returned about 14% for the 12 months ended October 31, putting domestic equities ahead of their international counterparts. Stocks in Europe and Asia posted modestly positive results.
The advances came amid moves by U.S. and European central bankers to manage risks to the U.S. economy and the finances of European governments and banks. The president of the European Central Bank
2
declared in July that policymakers would do whatever was needed to preserve the euro common currency.
Although investors’ worries have eased, Europe’s financial troubles are by no means resolved. Vanguard economists believe the most likely scenario is that the Eurozone will “muddle through” for several years, with occasional spikes in market volatility, as fiscal tightening persists in the face of weak economic growth.
Bonds continued their march, but leaner times may lie ahead
The broad U.S. taxable bond market returned about 5% for the 12 months. Municipal bonds delivered a robust performance, returning 9%.
As bond prices rose, the yield of the 10-year U.S. Treasury note fell to a record low in July, closing below 1.5%. (Bond yields and prices move in opposite directions.) By the end of the period, the yield had climbed, but it still remained exceptionally low by historical standards.
Bondholders have enjoyed years of healthy returns. But as Tim Buckley, our incoming chief investment officer, has noted, investors shouldn’t be surprised if future results are much more modest. As yields remain low, the opportunity for similarly strong returns diminishes.
The Federal Reserve announced on September 13 that it would continue to hold its target for short-term interest rates between 0% and 0.25% at least through
| | | |
| Market Barometer | | | |
| |
| | Average Annual Total Returns |
| | Periods Ended October 31, 2012 |
| | One | Three | Five |
| | Year | Years | Years |
| Stocks | | | |
| Russell 1000 Index (Large-caps) | 14.97% | 13.48% | 0.53% |
| Russell 2000 Index (Small-caps) | 12.08 | 14.82 | 1.19 |
| Dow Jones U.S. Total Stock Market Index | 14.45 | 13.62 | 0.75 |
| MSCI All Country World Index ex USA (International) | 3.98 | 3.74 | -5.08 |
| |
| Bonds | | | |
| Barclays U.S. Aggregate Bond Index (Broad taxable market) | 5.25% | 6.08% | 6.38% |
| Barclays Municipal Bond Index (Broad tax-exempt market) | 9.03 | 6.84 | 6.02 |
| Citigroup Three-Month U.S. Treasury Bill Index | 0.06 | 0.08 | 0.56 |
| |
| CPI | | | |
| Consumer Price Index | 2.16% | 2.28% | 2.06% |
3
mid-2015. The exceptionally low rates, in place since late 2008, kept a tight lid on returns from money market funds and savings accounts.
Value trumped growth, but stock choices were mixed
Value stocks, the focus of your fund, outpaced their growth-oriented brethren for the year as investors found the lower valuations and higher dividends of many high-quality companies attractive.
Financial stocks, a traditional source of opportunities and dividends for value-oriented investors, helped drive Windsor II’s performance. Improvement in the labor market has led to better credit trends, and the advisors made some successful stock decisions in the consumer finance industry.
Choices were also solid among diversified financial services giants, which benefited from higher capital levels, improved lending conditions, global opportunities, and the recovery of the U.S. housing market.
The advisors’ choices were strongest in the consumer staples sector, where investors turned for dividends and stability as the market appeared uncertain at times. Brewers and tobacco companies excelled; they not only pay generous dividends but also present growth opportunities as consumers in emerging markets tend to buy more alcohol and cigarettes when their incomes rise above sustenance levels.
Industrial stocks benefited from business expansion and an increase in manufacturing as the economy slowly improved; the
| | | |
| Expense Ratios | | | |
| Your Fund Compared With Its Peer Group | | | |
| | Investor | Admiral | Peer Group |
| | Shares | Shares | Average |
| Windsor II Fund | 0.35% | 0.27% | 1.23% |
The fund expense ratios shown are from the prospectus dated February 27, 2012, and represent estimated costs for the current fiscal year.
For the fiscal year ended October 31, 2012, the fund’s expense ratios were 0.35% for Investor Shares and 0.27% for Admiral Shares. The
peer-group expense ratio is derived from data provided by Lipper Inc. and captures information through year-end 2011.
Peer group: Large-Cap Value Funds.
4
advisors’ decisions within the sector also lifted performance. Mergers and acquisitions among electrical equipment firms and strength in the aerospace and defense industry helped as well.
Although the consumer discretionary sector enjoyed a strong rise because of greater spending by consumers and corporations, Windsor II’s stocks didn’t measure up to those of the benchmark. The fund lacked some major media and entertainment companies whose revenues rose amid large advertising expenditures from political candidates and automobile manufacturers.
The materials sector was the fund’s smallest, but the advisors’ limited holdings retreated nearly 11% while the benchmark’s rose about 11%. Most of the shortfall occurred in the chemicals industry, where the fund had no exposure to the top performers and a heavier allocation to stocks that declined.
For more details on the fund’s positioning and performance during the year, please see the Advisors’ Report that follows this letter.
Ten-year performance held up versus peers
Vanguard Windsor II Fund’s six advisors take a bottom-up approach to stock selection, focusing on specific companies that offer compelling yields and valuations. Because they don’t always use the same techniques––some favor fundamental
| |
| Total Returns | |
| Ten Years Ended October 31, 2012 | |
| | Average |
| | Annual Return |
| Windsor II Fund Investor Shares | 7.76% |
| Russell 1000 Value Index | 7.34 |
| Large-Cap Value Funds Average | 5.95 |
| Large-Cap Value Funds Average: Derived from data provided by Lipper Inc. |
The figures shown represent past performance, which is not a guarantee of future results. (Current performance may be
lower or higher than the performance data cited. For performance data current to the most recent month-end, visit our
website at vanguard.com/performance.) Note, too, that both investment returns and principal value can fluctuate widely, so
an investor’s shares, when sold, could be worth more or less than their original cost.
5
methods and some quantitative––the resulting portfolio is diversified but entrenched in the large-cap value arena.
The fund has generated a commendable result over a decade—a period marked by one of the nation’s worst financial crises. For the ten years ended October 31, 2012, Windsor II’s Investor Shares posted an average annualized return of 7.76%. The fund’s benchmark index (which bears no expenses) returned 7.34% and the peer group 5.95%.
Along with its six advisors’ deep experience and knowledge, Windsor II is served by its low costs, which can help you put more of the fund’s return in your pocket.
How our core purpose informs our approach to active management
At Vanguard, we sum up our core purpose this way: to take a stand for all investors, treat them fairly, and give them the best chance for investment success. When it comes to our actively managed funds, such as the Windsor II Fund, this commitment is reflected both in our rigorous process for selecting fund advisors and in our ongoing efforts to keep costs low. We believe our approach gives investors the opportunity to outperform market indexes over the long term.
But make no mistake: Outperformance is hard to come by. For one thing, competition among investors is fierce. Charles Ellis, author of one of my favorite books on investing, Winning the Loser’s Game, points out that the competition is not between the skilled and the inept. It’s between the skilled and the skilled.
“It’s like the Williams sisters playing tennis against each other,” as he put it in a recent Vanguard webcast.
Because we recognize the challenges inherent in active management, Vanguard has offered and advocated for index funds for more than 35 years. By seeking to track—rather than beat—market returns, these funds provide several benefits: low costs, diversification across a market, and limited deviation from the performance of market benchmarks.
Still, the case for indexing doesn’t preclude the potential for skilled, seasoned managers to deliver outperformance. And the chances for success can increase if those managers deliver their services at low cost, allowing investors to keep more of their returns.
As always, thank you for entrusting your assets to Vanguard.
Sincerely,

F. William McNabb III
Chairman and Chief Executive Officer
November 12, 2012
6
Advisors’ Report
For the 12 months ended October 31, 2012, Vanguard Windsor II Fund returned almost 17%. Your fund is managed by six independent advisors, a strategy that enhances the fund’s diversification by providing exposure to distinct yet complementary investment approaches. It’s not uncommon for different advisors to have different views about individual securities or the broader investment environment.
The table below lists the advisors, the amount and percentage of fund assets each manages, and brief descriptions of their investment strategies. The advisors have provided the following assessment of the investment environment during the past 12 months and the notable successes and shortfalls in their portfolios. These comments were prepared on November 16, 2012.
| | | |
| Vanguard Windsor II Fund Investment Advisors | |
| |
| | Fund Assets Managed | |
| Investment Advisor | % | $ Million | Investment Strategy |
| Barrow, Hanley, Mewhinney & | 62 | 22,974 | Conducts fundamental research on individual stocks |
| Strauss, LLC | | | exhibiting traditional value characteristics: |
| | | | price/earnings and price/book ratios below the broad |
| | | | market average and dividend yields above the broad |
| | | | market average. |
| Lazard Asset Management LLC | 17 | 6,354 | Employs a relative-value approach that seeks a |
| | | | combination of attractive valuation and high financial |
| | | | productivity. The process is research-driven, relying |
| | | | upon bottom-up stock analysis performed by the firm’s |
| | | | global sector analysts. |
| Sanders Capital, LLC | 9 | 3,451 | Employs a traditional, bottom-up, fundamental research |
| | | | approach to identifying securities that are undervalued |
| | | | relative to their expected total return. |
| Hotchkis and Wiley Capital | 6 | 2,342 | Uses a disciplined investment approach, focusing on |
| Management, LLC | | | such investment parameters as a company’s tangible |
| | | | assets, sustainable cash flow, and potential for |
| | | | improving business performance. |
| Armstrong Shaw Associates Inc. | 4 | 1,477 | Uses a bottom-up approach, employing fundamental |
| | | | and qualitative criteria to identify individual companies |
| | | | for potential investment. |
| Vanguard Equity Investment | — | 160 | Employs a quantitative fundamental management |
| Group | | | approach, using models that assess valuation, market |
| | | | sentiment, earnings quality and growth, and |
| | | | management decisions of companies versus their |
| | | | peers. |
| Cash Investments | 2 | 530 | These short-term reserves are invested by Vanguard in |
| | | | equity index products to simulate investment in stocks. |
| | | | Each advisor may also maintain a modest cash |
| | | | position. |
7
Barrow, Hanley, Mewhinney &
Strauss, LLC
Portfolio Manager:
James P. Barrow, Executive Director
Investment environment: In the second half of fiscal 2012, we managed to add to our first-half gains. For the 12 months ended October 31, the U.S. equity market returned about 14%. The dollar was stronger, but commodities were down about 5%. The MSCI EAFE Index had a 5% total return for the period, despite continued worries about the Eurozone. Our portfolio’s dividend yield significantly exceeds that of the market, and its price/ earnings ratio is lower than the market average. We believe we can outperform based on these favorable valuations.
Successes: Our strongest sectors were industrials, consumer staples (especially tobacco), consumer discretionary, and financials (particularly consumer credit).
Shortfalls: Materials, information
technology, and utilities lagged.
Lazard Asset Management LLC
Portfolio Managers:
Andrew Lacey, Deputy Chairman
Christopher Blake, Managing Director
Investment environment: The Russell 1000 Value Index rose 16.89% over the last 12 months. The U.S. market was buoyed by strengthening economic indicators in general and by housing in particular. Corporate earnings continued to be another bright spot, as companies
have been aggressively reducing costs and capital expenditures to ensure strong profitability and cash generation in a lackluster economic environment.
Much of the index’s advance was also due to continued loose monetary policy. The U.S. Federal Reserve extended Operation Twist in an effort to lower long-term interest rates through year-end and announced a third round of quantitative easing. The European Central Bank implemented a second round of its Long Term Refinancing Operation (LTRO), which provides low-cost funds to European banks to bolster their liquidity. It also announced it would begin purchasing sovereign debt in the secondary market alongside the European Stability Mechanism for countries that agreed to certain conditions.
The market benefited further from upbeat sentiment in the Eurozone, as the European Union made more progress toward restructuring Greece’s debt. In an effort to spur fiscal integration, the EU agreed to substantial policy changes, including creation of a Central Bank regulator.
Successes: An overweight position and strong stock picks in health care, particularly Pfizer and Gilead Sciences, boosted portfolio results. Stock selection in the consumer discretionary sector, most notably Comcast and Lowe’s, also helped.
Shortfalls: In information technology, stock selections including Cisco Systems detracted from performance. Choices in the materials sector, especially Newmont Mining and Walter Energy, hurt as well.
8
Sanders Capital, LLC
Portfolio Managers:
Lewis A. Sanders, CFA
Chief Executive Officer and
Co-Chief Investment Officer
John P. Mahedy, CPA
Director of Research and
Co-Chief Investment Officer
Although global economic growth is sluggish, the world’s leading central banks are making considerable efforts to stimulate an upturn. Along with progress in resolving the European debt crisis, this should precipitate faster economic growth in 2013 and beyond.
In response, we have increased our investments in the financial sector, where valuations remain depressed despite improvements in earnings and balance-sheet metrics. Information technology and health care companies compose most of the remainder of our portfolio. These investments are predicated on accelerating new product development, which is not fully reflected in stock valuations.
We have reduced our investments in energy as rapid growth in U.S. output is expected to increase pressure on oil prices. Our overall portfolio valuation remains attractive, with earnings and free-cash-flow yields about 50% higher than the market average.
Hotchkis and Wiley Capital
Management, LLC
Portfolio Managers:
George H. Davis, Jr.,
Chief Executive Officer
Sheldon J. Lieberman, Principal
Investment environment: The newly elected government is confronted with taxing budgetary decisions (pun intended). The big question is whether compromise is viable after the combative partisanship of recent years. The opaque nature of the political landscape has given investors pause. Meanwhile, U.S. companies are producing compelling results—most have continued to exceed earnings expectations, generate strong cash flows, and return considerable capital to shareholders. These characteristics, along with improved balance sheets and attractive valuations, will provide solace should a slow growth economy transpire.
Successes: Overall stock selection was positive for the period. Choices in financials, energy, and consumer staples contributed the most.
Shortfalls: An overweight position and stock selection in the information technology sector weighed on performance. Telecommunications and utilities picks also hurt returns.
9
Armstrong Shaw Associates Inc.
Portfolio Manager:
Jeffrey M. Shaw, Chairman and
Chief Investment Officer
Investment environment: Recent action by policymakers has supported asset values but has yet to result in accelerating economic growth. The private sector, both household and corporate, still views the situation cautiously. Meanwhile, debt levels are stable-to-declining, and cash balances are growing. We believe this is slowly but surely improving the economy’s ability to navigate an uncertain landscape and has been a key contributor to the market’s resiliency over the last 12 months. Although there is no short-term fix for the fiscal pressures in the United States or abroad, monetary policy and a stable housing market should counterbalance uncertainty as the U.S. economy continues its slow growth.
Successes: Positive stock selection helped the portfolio perform strongly. Seven of our ten largest positions outpaced the index, two of them—Wyndham Worldwide and Comcast—by more than double. Our standout sectors were consumer discretionary and consumer staples. Comcast was our best performer, driven by better-than-expected fundamentals in the cable business and improving prospects at NBC Universal. Our stock picks were strongest in consumer discretionary, information technology, and health care.
Shortfalls: Despite positive stock
selection, an overweight position in energy
detracted from relative performance. Weak
relative returns in industrials also had a
negative effect.
Vanguard Equity Investment Group
Portfolio Managers:
James D. Troyer, CFA, Principal
James P. Stetler, Principal
Michael R. Roach, CFA
Investment environment: Although the challenges and complexities of the broader macro environment affect overall portfolio performance, our approach to investing focuses on specific stock fundamentals. Our diversified, multifactor model performed well over the fiscal year. Our valuation, growth, management decisions, and quality indicators contributed positively, but our market sentiment indicator detracted. Relative to our benchmark, our positive stock selection results in eight of ten sectors added value.
Successes: Company selections within energy and materials contributed the most to our relative returns. In energy, positions in Marathon Petroleum, Tesoro, and Exxon Mobil added the most; LyondellBasell and CF Industries did best in materials.
Shortfalls: Unfortunately, we were not able to avoid all poor performers, particularly in health care, where our holdings in Humana and Medtronic detracted.
10
Windsor II Fund
Fund Profile
As of October 31, 2012
| | |
| Share-Class Characteristics | |
| | Investor | Admiral |
| | Shares | Shares |
| Ticker Symbol | VWNFX | VWNAX |
| Expense Ratio1 | 0.35% | 0.27% |
| 30-Day SEC Yield | 2.35% | 2.43% |
| | | |
| Portfolio Characteristics | | |
| | | Russell | DJ |
| | | 1000 | U.S. Total |
| | | Value | Market |
| | Fund | Index | Index |
| Number of Stocks | 269 | 694 | 3,636 |
| Median Market Cap $43.1B | $34.9B | $34.8B |
| Price/Earnings Ratio | 13.8x | 14.1x | 16.3x |
| Price/Book Ratio | 1.8x | 1.5x | 2.1x |
| Return on Equity | 17.1% | 13.0% | 17.6% |
| Earnings Growth Rate | 6.4% | 2.6% | 10.0% |
| Dividend Yield | 2.8% | 2.5% | 2.1% |
| Foreign Holdings | 7.1% | 0.0% | 0.0% |
| Turnover Rate | 22% | — | — |
| Short-Term Reserves | 2.1% | — | — |
| | | |
| Sector Diversification (% of equity exposure) |
| | | Russell | DJ |
| | | 1000 | U.S. Total |
| | | Value | Market |
| | Fund | Index | Index |
| Consumer Discretionary | 8.0% | 8.0% | 12.1% |
| Consumer Staples | 10.7 | 7.3 | 9.5 |
| Energy | 13.0 | 16.6 | 10.4 |
| Financials | 19.9 | 27.0 | 16.6 |
| Health Care | 16.2 | 11.8 | 11.9 |
| Industrials | 12.1 | 9.0 | 10.8 |
| Information Technology | 10.2 | 6.0 | 18.3 |
| Materials | 1.3 | 3.9 | 3.9 |
| Telecommunication | | | |
| Services | 3.3 | 3.5 | 2.8 |
| Utilities | 5.3 | 6.9 | 3.7 |
| | |
| Volatility Measures | | |
| | Russell | DJ |
| | 1000 | U.S. Total |
| | Value | Market |
| | Index | Index |
| R-Squared | 0.98 | 0.97 |
| Beta | 0.99 | 0.97 |
| These measures show the degree and timing of the fund’s fluctuations compared with the indexes over 36 months. |
| | |
| Ten Largest Holdings (% of total net assets) |
| Pfizer Inc. | Pharmaceuticals | 3.3% |
| Philip Morris | | |
| International Inc. | Tobacco | 3.0 |
| Johnson & Johnson | Pharmaceuticals | 2.5 |
| JPMorgan Chase & Co. | Diversified Financial | |
| | Services | 2.4 |
| Microsoft Corp. | Systems Software | 2.4 |
| American Express Co. | Consumer Finance | 2.3 |
| Baxter International Inc. | Health Care | |
| | Equipment | 2.3 |
| Wells Fargo & Co. | Diversified Banks | 2.2 |
| ConocoPhillips | Oil & Gas Exploration | |
| | & Production | 2.2 |
| Raytheon Co. | Aerospace & | |
| | Defense | 2.1 |
| Top Ten | | 24.7% |
| The holdings listed exclude any temporary cash investments and equity index products. |
Investment Focus

1 The expense ratios shown are from the prospectus dated February 27, 2012, and represent estimated costs for the current fiscal year. For
the fiscal year ended October 31, 2012, the expense ratios were 0.35% for Investor Shares and 0.27% for Admiral Shares.
11
Windsor II Fund
Performance Summary
All of the returns in this report represent past performance, which is not a guarantee of future results that may be achieved by the fund. (Current performance may be lower or higher than the performance data cited. For performance data current to the most recent month-end, visit our website at vanguard.com/performance.) Note, too, that both investment returns and principal value can fluctuate widely, so an investor’s shares, when sold, could be worth more or less than their original cost. The returns shown do not reflect taxes that a shareholder would pay on fund distributions or on the sale of fund shares.
Cumulative Performance: October 31, 2002, Through October 31, 2012
| | | | | |
| | | | Average Annual Total Returns | |
| | | Periods Ended October 31, 2012 | |
| |
| | | | | | Final Value |
| | | One | Five | Ten | of a $10,000 |
| | | Year | Years | Years | Investment |
| |
| | Windsor II Fund Investor Shares | 16.90% | -0.47% | 7.76% | $21,123 |
| |
| •••••••• | Russell 1000 Value Index | 16.89 | -1.00 | 7.34 | 20,314 |
| |
| |
| – – – – | Large-Cap Value Funds Average | 14.00 | -1.74 | 5.95 | 17,829 |
| | Dow Jones U.S. Total Stock Market | | | | |
| | Index | 14.45 | 0.75 | 7.78 | 21,163 |
| Large-Cap Value Funds Average: Derived from data provided by Lipper Inc. |
| | | | |
| | | | | Final Value |
| | One | Five | Ten | of a $50,000 |
| | Year | Years | Years | Investment |
| Windsor II Fund Admiral Shares | 16.98% | -0.38% | 7.87% | $106,668 |
| Russell 1000 Value Index | 16.89 | -1.00 | 7.34 | 101,569 |
| Dow Jones U.S. Total Stock Market Index | 14.45 | 0.75 | 7.78 | 105,815 |
See Financial Highlights for dividend and capital gains information.
12
Windsor II Fund
Fiscal-Year Total Returns (%): October 31, 2002, Through October 31, 2012

Average Annual Total Returns: Periods Ended September 30, 2012
This table presents returns through the latest calendar quarter—rather than through the end of the fiscal period.
Securities and Exchange Commission rules require that we provide this information.
| | | | |
| | Inception | One | Five | Ten |
| | Date | Year | Years | Years |
| Investor Shares | 6/24/1985 | 30.10% | -0.21% | 8.28% |
| Admiral Shares | 5/14/2001 | 30.21 | -0.11 | 8.39 |
13
Windsor II Fund
Financial Statements
Statement of Net Assets
As of October 31, 2012
The fund reports a complete list of its holdings in regulatory filings four times in each fiscal year, at the quarter-ends. For the second and fourth fiscal quarters, the lists appear in the fund’s semiannual and annual reports to shareholders. For the first and third fiscal quarters, the fund files the lists with the Securities and Exchange Commission on Form N-Q. Shareholders can look up the fund’s Forms N-Q on the SEC’s website at sec.gov. Forms N-Q may also be reviewed and copied at the SEC’s Public Reference Room (see the back cover of this report for further information).
| | | |
| | | | Market |
| | | | Value |
| | | Shares | ($000) |
| Common Stocks (97.6%)1 | | |
| Consumer Discretionary (7.7%) | |
| | Carnival Corp. | 10,944,686 | 414,585 |
| | Target Corp. | 5,980,100 | 381,231 |
| | Comcast Corp. | 9,626,235 | 350,780 |
| 2 | Service Corp. | | |
| | International | 20,833,046 | 292,496 |
| | Viacom Inc. Class B | 3,187,300 | 163,413 |
| | Lowe’s Cos. Inc. | 4,533,142 | 146,783 |
| | Omnicom Group Inc. | 2,299,300 | 110,159 |
| | American Eagle | | |
| | Outfitters Inc. | 4,704,605 | 98,185 |
| | Lear Corp. | 2,088,447 | 88,968 |
| | Genuine Parts Co. | 1,285,348 | 80,437 |
| | Macy’s Inc. | 1,967,150 | 74,889 |
| * | AutoZone Inc. | 194,062 | 72,773 |
| | Newell Rubbermaid Inc. | 3,321,800 | 68,562 |
| | Wyndham Worldwide | | |
| | Corp. | 987,558 | 49,773 |
| * | Delphi Automotive plc | 1,477,454 | 46,451 |
| | Volkswagen AG | 226,980 | 44,388 |
| | Johnson Controls Inc. | 1,719,300 | 44,272 |
| | Ford Motor Co. | 3,579,059 | 39,942 |
| * | Big Lots Inc. | 1,311,400 | 38,201 |
| | Renault SA | 776,810 | 34,832 |
| | Magna International Inc. | 768,900 | 34,147 |
| | JC Penney Co. Inc. | 1,417,500 | 34,034 |
| | Kohl’s Corp. | 613,848 | 32,706 |
| | Hasbro Inc. | 842,000 | 30,304 |
| | Interpublic Group of | | |
| | Cos. Inc. | 2,806,900 | 28,350 |
| * | General Motors Co. | 1,105,000 | 28,177 |
| | Hyundai Motor Co. | 116,182 | 23,877 |
| | Time Warner Cable Inc. | 217,000 | 21,507 |
| | Virgin Media Inc. | 31,275 | 1,024 |
| | Foot Locker Inc. | 22,300 | 747 |
| | Brinker International Inc. | 23,150 | 713 |
| | Walt Disney Co. | 8,412 | 413 |
| | Time Warner Inc. | 2,599 | 113 |
| | | |
| | Whirlpool Corp. | 1,000 | 98 |
| | Garmin Ltd. | 1,700 | 65 |
| | | | 2,877,395 |
| Consumer Staples (10.3%) | | |
| | Philip Morris | | |
| | International Inc. | 12,627,653 | 1,118,305 |
| | Imperial Tobacco Group | | |
| | plc ADR | 8,734,425 | 659,973 |
| | Diageo plc ADR | 5,253,620 | 600,173 |
| | Wal-Mart Stores Inc. | 5,266,100 | 395,063 |
| | Altria Group Inc. | 12,421,007 | 394,988 |
| | CVS Caremark Corp. | 5,601,693 | 259,919 |
| | Molson Coors | | |
| | Brewing Co. Class B | 3,282,000 | 141,585 |
| | Sysco Corp. | 4,089,441 | 127,059 |
| * | Ralcorp Holdings Inc. | 641,690 | 46,324 |
| | PepsiCo Inc. | 375,000 | 25,965 |
| | Mondelez | | |
| | International Inc. Class A | 827,961 | 21,974 |
| | General Mills Inc. | 447,800 | 17,948 |
| | Church & Dwight Co. Inc. | 292,687 | 14,857 |
| * | Kraft Foods Group Inc. | 109,553 | 4,982 |
| | Procter & Gamble Co. | 50,590 | 3,503 |
| | Kimberly-Clark Corp. | 17,800 | 1,485 |
| | Reynolds American Inc. | 24,300 | 1,012 |
| | Campbell Soup Co. | 28,000 | 988 |
| | Ingredion Inc. | 15,100 | 928 |
| * | Dean Foods Co. | 49,850 | 839 |
| | | | 3,837,870 |
| Energy (12.5%) | | |
| | ConocoPhillips | 14,076,289 | 814,313 |
| | Spectra Energy Corp. | 22,709,611 | 655,626 |
| | Occidental Petroleum | | |
| | Corp. | 8,263,157 | 652,459 |
| | Phillips 66 | 12,553,444 | 592,020 |
| | Seadrill Ltd. | 6,172,107 | 248,983 |
| | Chevron Corp. | 2,147,810 | 236,710 |
| | Marathon Petroleum | | |
| | Corp. | 3,652,916 | 200,655 |
14
Windsor II Fund
| | | |
| | | | Market |
| | | | Value |
| | | Shares | ($000) |
| | Marathon Oil Corp. | 5,426,100 | 163,109 |
| | Devon Energy Corp. | 2,485,794 | 144,698 |
| | BP plc ADR | 2,948,170 | 126,447 |
| | CONSOL Energy Inc. | 3,121,620 | 109,756 |
| | Halliburton Co. | 3,281,490 | 105,959 |
| | Apache Corp. | 1,273,870 | 105,413 |
| | Noble Corp. | 1,825,078 | 68,878 |
| | Total SA ADR | 1,219,100 | 61,443 |
| * | Cobalt International | | |
| | Energy Inc. | 2,505,400 | 52,137 |
| | Royal Dutch Shell | | |
| | plc ADR | 677,200 | 47,831 |
| | Kinder Morgan Inc. | 1,354,225 | 47,005 |
| * | Cameron International | | |
| | Corp. | 891,189 | 45,130 |
| | Royal Dutch Shell plc | | |
| | ADR (New York Shares) | 556,844 | 38,133 |
| | Valero Energy Corp. | 1,186,700 | 34,533 |
| * | Dresser-Rand Group Inc. | 668,158 | 34,430 |
| | Ensco plc Class A | 497,171 | 28,746 |
| | Murphy Oil Corp. | 300,100 | 18,006 |
| | Hess Corp. | 332,300 | 17,366 |
| | Gazprom OAO ADR | 1,553,600 | 14,270 |
| | Exxon Mobil Corp. | 115,882 | 10,565 |
| | Tesoro Corp. | 24,000 | 905 |
| | HollyFrontier Corp. | 2,400 | 93 |
| * | Energy Transfer | | |
| | Partners LP | 786 | 34 |
| | | | 4,675,653 |
| Exchange-Traded Funds (1.1%) | |
| 3 | Vanguard Total Stock | | |
| | Market ETF | 3,197,800 | 231,265 |
| ^,3 | Vanguard Value ETF | 2,511,200 | 146,880 |
| | SPDR S&P 500 ETF Trust | 201,700 | 28,476 |
| | | | 406,621 |
| Financials (19.3%) | | |
| | JPMorgan Chase & Co. | 21,850,553 | 910,731 |
| | American Express Co. | 15,560,550 | 870,924 |
| | Wells Fargo & Co. | 24,536,441 | 826,633 |
| | Citigroup Inc. | 17,776,959 | 664,680 |
| | PNC Financial Services | | |
| | Group Inc. | 11,403,881 | 663,592 |
| | Capital One Financial | | |
| | Corp. | 10,540,738 | 634,236 |
| | Bank of America Corp. | 50,114,495 | 467,067 |
| | XL Group plc Class A | 13,178,032 | 326,025 |
| | State Street Corp. | 6,572,600 | 292,941 |
| | SLM Corp. | 15,720,252 | 276,362 |
| | MetLife Inc. | 4,909,381 | 174,234 |
| | Goldman Sachs | | |
| | Group Inc. | 953,844 | 116,741 |
| | Ameriprise Financial Inc. | 1,692,100 | 98,768 |
| | SunTrust Banks Inc. | 3,502,867 | 95,278 |
| | Prudential Financial Inc. | 1,655,200 | 94,429 |
| | | |
| * | American International | | |
| | Group Inc. | 2,686,500 | 93,839 |
| | Lincoln National Corp. | 3,272,461 | 81,124 |
| | Unum Group | 3,809,300 | 77,253 |
| | Travelers Cos. Inc. | 966,000 | 68,528 |
| | Barclays plc | 17,794,000 | 65,798 |
| | Allstate Corp. | 1,456,500 | 58,231 |
| | Janus Capital Group Inc. | 6,075,415 | 51,641 |
| | BNP Paribas SA | 1,013,000 | 51,101 |
| | ACE Ltd. | 475,422 | 37,392 |
| | Hartford Financial | | |
| | Services Group Inc. | 1,457,300 | 31,638 |
| | Morgan Stanley | 1,705,100 | 29,635 |
| | KeyCorp | 2,098,482 | 17,669 |
| | Bank of New York | | |
| | Mellon Corp. | 512,500 | 12,664 |
| | US Bancorp | 66,349 | 2,203 |
| | Shinhan Financial | | |
| | Group Co. Ltd. | 52,430 | 1,800 |
| | Discover Financial | | |
| | Services | 34,200 | 1,402 |
| | Fifth Third Bancorp | 76,500 | 1,112 |
| | Moody’s Corp. | 22,500 | 1,084 |
| | PartnerRe Ltd. | 12,000 | 972 |
| | Invesco Ltd. | 39,000 | 948 |
| | Torchmark Corp. | 18,600 | 941 |
| | Everest Re Group Ltd. | 8,300 | 922 |
| | HCP Inc. | 18,200 | 806 |
| | Assurant Inc. | 21,300 | 805 |
| | Prologis Inc. | 22,300 | 765 |
| | BB&T Corp. | 25,900 | 750 |
| | NASDAQ OMX Group Inc. | 28,500 | 679 |
| | Kimco Realty Corp. | 29,000 | 566 |
| | Macerich Co. | 9,600 | 547 |
| | Piedmont Office Realty | | |
| | Trust Inc. Class A | 27,100 | 482 |
| | Duke Realty Corp. | 32,600 | 472 |
| | Host Hotels & | | |
| | Resorts Inc. | 31,800 | 460 |
| | Weingarten Realty | | |
| | Investors | 16,100 | 435 |
| | Digital Realty Trust Inc. | 6,600 | 405 |
| | HCC Insurance | | |
| | Holdings Inc. | 9,500 | 339 |
| * | Berkshire Hathaway Inc. | | |
| | Class B | 3,700 | 319 |
| | Aflac Inc. | 3,725 | 185 |
| | Regency Centers Corp. | 1,600 | 77 |
| | Huntington | | |
| | Bancshares Inc. | 11,100 | 71 |
| | Validus Holdings Ltd. | 1,800 | 64 |
| | Regions Financial Corp. | 8,000 | 52 |
| | Ventas Inc. | 800 | 51 |
| | | | 7,208,868 |
15
Windsor II Fund
| | | |
| | | | Market |
| | | | Value |
| | | Shares | ($000) |
| Health Care (15.7%) | | |
| | Pfizer Inc. | 49,876,868 | 1,240,438 |
| | Johnson & Johnson | 13,275,450 | 940,167 |
| | Baxter International Inc. | 13,434,968 | 841,432 |
| | WellPoint Inc. | 11,586,299 | 710,008 |
| | Medtronic Inc. | 16,689,800 | 693,962 |
| | Merck & Co. Inc. | 5,072,729 | 231,469 |
| | UnitedHealth Group Inc. | 4,089,899 | 229,034 |
| | McKesson Corp. | 1,852,500 | 172,857 |
| * | CareFusion Corp. | 5,055,900 | 134,285 |
| | Abbott Laboratories | 1,576,891 | 103,318 |
| * | Gilead Sciences Inc. | 1,493,900 | 100,330 |
| | Covidien plc | 1,512,341 | 83,103 |
| | St. Jude Medical Inc. | 1,892,216 | 72,396 |
| | Thermo Fisher | | |
| | Scientific Inc. | 839,332 | 51,250 |
| * | Express Scripts | | |
| | Holding Co. | 671,653 | 41,334 |
| | Aetna Inc. | 934,300 | 40,829 |
| | Sanofi ADR | 776,600 | 34,054 |
| | Amgen Inc. | 340,499 | 29,469 |
| | Novartis AG ADR | 413,100 | 24,976 |
| | Quest Diagnostics Inc. | 296,800 | 17,131 |
| | Eli Lilly & Co. | 307,000 | 14,929 |
| | Zimmer Holdings Inc. | 186,000 | 11,943 |
| | AstraZeneca plc ADR | 254,400 | 11,804 |
| | Omnicare Inc. | 15,500 | 535 |
| | Bristol-Myers Squibb Co. | 14,333 | 477 |
| * | Charles River Laboratories | |
| | International Inc. | 5,850 | 218 |
| | | | 5,831,748 |
| Industrials (11.7%) | | |
| | Raytheon Co. | 13,859,040 | 783,867 |
| | General Electric Co. | 32,714,407 | 688,965 |
| | Honeywell | | |
| | International Inc. | 10,863,187 | 665,262 |
| | Illinois Tool Works Inc. | 6,605,130 | 405,093 |
| | Emerson Electric Co. | 7,983,000 | 386,617 |
| 2 | Xylem Inc. | 9,950,502 | 241,399 |
| 2 | Exelis Inc. | 12,321,102 | 136,271 |
| | Boeing Co. | 1,649,200 | 116,170 |
| | General Dynamics Corp. | 1,567,500 | 106,715 |
| | Parker Hannifin Corp. | 1,177,100 | 92,591 |
| | ITT Corp. | 4,384,551 | 91,199 |
| | Tyco International Ltd. | 3,292,339 | 88,465 |
| * | ADT Corp. | 2,129,058 | 88,377 |
| | Corrections Corp. of | | |
| | America | 1,817,400 | 61,156 |
| | Caterpillar Inc. | 605,400 | 51,344 |
| | Lockheed Martin Corp. | 452,100 | 42,348 |
| | United Parcel Service Inc. | | |
| | Class B | 508,589 | 37,254 |
| | United Technologies Corp. 459,985 | 35,952 |
| | Cummins Inc. | 377,300 | 35,308 |
| | | |
| | Republic Services Inc. | | |
| | Class A | 1,153,200 | 32,693 |
| | Rockwell Collins Inc. | 601,800 | 32,244 |
| | PACCAR Inc. | 738,000 | 31,985 |
| | FedEx Corp. | 275,200 | 25,316 |
| * | WABCO Holdings Inc. | 305,405 | 17,888 |
| | CSX Corp. | 724,447 | 14,829 |
| | Embraer SA ADR | 493,200 | 13,765 |
| | Northrop Grumman Corp. | 188,176 | 12,926 |
| | Pentair Ltd. | 248,782 | 10,509 |
| * | Delta Air Lines Inc. | 102,300 | 985 |
| * | Hertz Global Holdings Inc. | 26,200 | 348 |
| | Cintas Corp. | 7,700 | 322 |
| | Timken Co. | 5,400 | 213 |
| | RR Donnelley & Sons Co. | 14,250 | 143 |
| | Equifax Inc. | 2,100 | 105 |
| | Hubbell Inc. Class B | 900 | 75 |
| | | | 4,348,699 |
| Information Technology (9.8%) | |
| | Microsoft Corp. | 30,886,540 | 881,347 |
| | International Business | | |
| | Machines Corp. | 3,840,645 | 747,121 |
| | Intel Corp. | 18,462,100 | 399,243 |
| | Cisco Systems Inc. | 15,067,300 | 258,254 |
| | Oracle Corp. | 6,561,536 | 203,736 |
| | Apple Inc. | 230,603 | 137,232 |
| | Samsung | | |
| | Electronics Co. Ltd. | 110,400 | 132,484 |
| | Corning Inc. | 10,933,300 | 128,466 |
| * | Google Inc. Class A | 188,342 | 128,029 |
| * | EMC Corp. | 4,976,453 | 121,525 |
| | Texas Instruments Inc. | 2,969,100 | 83,402 |
| | Hewlett-Packard Co. | 5,820,900 | 80,619 |
| | QUALCOMM Inc. | 1,206,200 | 70,653 |
| * | BMC Software Inc. | 1,600,400 | 65,136 |
| | Lexmark International Inc. | | |
| | Class A | 1,642,794 | 34,926 |
| | Western Digital Corp. | 978,800 | 33,504 |
| | Mastercard Inc. Class A | 68,052 | 31,367 |
| | TE Connectivity Ltd. | 913,975 | 29,412 |
| * | SanDisk Corp. | 695,900 | 29,061 |
| | CA Inc. | 881,528 | 19,852 |
| | Dell Inc. | 1,940,400 | 17,910 |
| | Seagate Technology plc | 36,400 | 994 |
| | Computer Sciences Corp. | 27,800 | 847 |
| | KLA-Tencor Corp. | 18,100 | 842 |
| * | LSI Corp. | 115,300 | 790 |
| | Jabil Circuit Inc. | 35,200 | 610 |
| | IAC/InterActiveCorp | 6,100 | 295 |
| * | Flextronics | | |
| | International Ltd. | 28,100 | 162 |
| * | Avnet Inc. | 5,500 | 158 |
| | Total System Services Inc. 4,000 | 90 |
| | | | 3,638,067 |
16
Windsor II Fund
| | | |
| | | | Market |
| | | | Value |
| | | Shares | ($000) |
| Materials (1.2%) | | |
| | EI du Pont de | | |
| | Nemours & Co. | 5,938,638 | 264,388 |
| | Mosaic Co. | 1,940,675 | 101,575 |
| | Walter Energy Inc. | 1,031,200 | 36,051 |
| | Praxair Inc. | 304,444 | 32,335 |
| | Eastman Chemical Co. | 17,500 | 1,037 |
| | CF Industries | | |
| | Holdings Inc. | 5,000 | 1,026 |
| | PPG Industries Inc. | 8,700 | 1,019 |
| | Huntsman Corp. | 60,200 | 905 |
| | Valspar Corp. | 15,750 | 882 |
| | LyondellBasell Industries | | |
| | NV Class A | 12,720 | 679 |
| | Dow Chemical Co. | 1,700 | 50 |
| | | | 439,947 |
| Telecommunication Services (3.2%) | |
| | AT&T Inc. | 14,305,207 | 494,817 |
| | Vodafone Group | | |
| | plc ADR | 13,561,100 | 369,133 |
| | Verizon | | |
| | Communications Inc. | 7,361,709 | 328,627 |
| | | | 1,192,577 |
| Utilities (5.1%) | | |
| | Public Service Enterprise | | |
| | Group Inc. | 18,032,258 | 577,754 |
| 2 | CenterPoint Energy Inc. | 25,726,413 | 557,491 |
| | Entergy Corp. | 5,427,878 | 393,955 |
| | Dominion Resources Inc. | 3,011,850 | 158,966 |
| | Sempra Energy | 843,700 | 58,848 |
| | Exelon Corp. | 1,560,200 | 55,824 |
| * | Calpine Corp. | 2,605,043 | 45,849 |
| | NRG Energy Inc. | 1,451,400 | 31,292 |
| | Edison International | 525,100 | 24,648 |
| | American Electric | | |
| | Power Co. Inc. | 29,600 | 1,315 |
| | Consolidated Edison Inc. | 19,600 | 1,184 |
| | DTE Energy Co. | 17,300 | 1,074 |
| | Ameren Corp. | 30,400 | 1,000 |
| | NV Energy Inc. | 49,300 | 937 |
| | Pinnacle West Capital | | |
| | Corp. | 17,100 | 906 |
| | American Water | | |
| | Works Co. Inc. | 18,300 | 672 |
| | NextEra Energy Inc. | 5,600 | 392 |
| | Duke Energy Corp. | 5,400 | 355 |
| | PPL Corp. | 7,100 | 210 |
| | Southern Co. | 2,100 | 98 |
| | PG&E Corp. | 1,000 | 43 |
| | | | 1,912,813 |
| Total Common Stocks | | |
| (Cost $30,188,710) | | 36,370,258 |
| | | |
| Temporary Cash Investments (2.7%)1 | |
| Money Market Fund (2.6%) | | |
| 4,5 | Vanguard Market | | |
| | Liquidity Fund, | | |
| | 0.167% | 988,641,404 | 988,641 |
| |
| | | Face | |
| | | Amount | |
| | | ($000) | |
| U.S. Government and Agency Obligations (0.1%) |
| 6,7 | Fannie Mae | | |
| | Discount Notes, | | |
| | 0.135%, 12/12/12 | 18,000 | 17,997 |
| 7,8 | Federal Home Loan | | |
| | Bank Discount Notes, | | |
| | 0.130%, 12/26/12 | 100 | 100 |
| 7 | United States | | |
| | Treasury Note/Bond, | | |
| | 0.625%, 12/31/12 | 9,000 | 9,007 |
| | | | 27,104 |
| Total Temporary Cash Investments | |
| (Cost $1,015,746) | | 1,015,745 |
| Total Investments (100.3%) | | |
| (Cost $31,204,456) | | 37,386,003 |
| Other Assets and Liabilities (-0.3%) | |
| Other Assets | | 65,159 |
| Liabilities5 | | (163,621) |
| | | | (98,462) |
| Net Assets (100%) | | 37,287,541 |
17
Windsor II Fund
| |
| At October 31, 2012, net assets consisted of: |
| | Amount |
| | ($000) |
| Paid-in Capital | 32,829,661 |
| Undistributed Net Investment Income | 218,428 |
| Accumulated Net Realized Losses | (1,936,503) |
| Unrealized Appreciation (Depreciation) | |
| Investment Securities | 6,181,547 |
| Futures Contracts | (5,590) |
| Foreign Currencies | (2) |
| Net Assets | 37,287,541 |
| |
| |
| Investor Shares—Net Assets | |
| Applicable to 622,395,336 outstanding | |
| $.001 par value shares of beneficial | |
| interest (unlimited authorization) | 18,255,343 |
| Net Asset Value Per Share— | |
| Investor Shares | $29.33 |
| |
| |
| Admiral Shares—Net Assets | |
| Applicable to 365,547,902 outstanding | |
| $.001 par value shares of beneficial | |
| interest (unlimited authorization) | 19,032,198 |
| Net Asset Value Per Share— | |
| Admiral Shares | $52.06 |
See Note A in Notes to Financial Statements.
* Non-income-producing security.
^ Part of security position is on loan to broker-dealers. The total value of securities on loan is $76,000.
1 The fund invests a portion of its cash reserves in equity markets through the use of index futures contracts. After giving effect to futures
investments, the fund’s effective common stock and temporary cash investment positions represent 98.0% and 2.3%, respectively, of
net assets.
2 Considered an affiliated company of the fund as the fund owns more than 5% of the outstanding voting securities of such company.
3 Considered an affiliated company of the fund as the issuer is another member of The Vanguard Group.
4 Affiliated money market fund available only to Vanguard funds and certain trusts and accounts managed by Vanguard. Rate shown is the
7-day yield.
5 Includes $78,000 of collateral received for securities on loan.
6 The issuer was placed under federal conservatorship in September 2008; since that time, its daily operations have been managed by the
Federal Housing Finance Agency and it receives capital from the U.S. Treasury, as needed to maintain a positive net worth, in exchange
for senior preferred stock.
7 Securities with a value of $12,606,000 have been segregated as initial margin for open futures contracts.
8 The issuer operates under a congressional charter; its securities are generally neither guaranteed by the U.S. Treasury nor backed by the
full faith and credit of the U.S. government.
ADR—American Depositary Receipt.
See accompanying Notes, which are an integral part of the Financial Statements.
18
Windsor II Fund
Statement of Operations
| |
| | Year Ended |
| | October 31, 2012 |
| | ($000) |
| Investment Income | |
| Income | |
| Dividends1,2 | 945,439 |
| Interest2 | 1,407 |
| Security Lending | 908 |
| Total Income | 947,754 |
| Expenses | |
| Investment Advisory Fees—Note B | |
| Basic Fee | 52,899 |
| Performance Adjustment | (6,420) |
| The Vanguard Group—Note C | |
| Management and Administrative—Investor Shares | 36,641 |
| Management and Administrative—Admiral Shares | 20,488 |
| Marketing and Distribution—Investor Shares | 3,663 |
| Marketing and Distribution—Admiral Shares | 3,002 |
| Custodian Fees | 432 |
| Auditing Fees | 33 |
| Shareholders’ Reports—Investor Shares | 379 |
| Shareholders’ Reports—Admiral Shares | 113 |
| Trustees’ Fees and Expenses | 76 |
| Total Expenses | 111,306 |
| Expenses Paid Indirectly | (772) |
| Net Expenses | 110,534 |
| Net Investment Income | 837,220 |
| Realized Net Gain (Loss) | |
| Investment Securities Sold2 | 2,245,319 |
| Futures Contracts | 80,448 |
| Foreign Currencies | 51 |
| Realized Net Gain (Loss) | 2,325,818 |
| Change in Unrealized Appreciation (Depreciation) | |
| Investment Securities | 2,399,137 |
| Futures Contracts | (20,921) |
| Foreign Currencies | (10) |
| Change in Unrealized Appreciation (Depreciation) | 2,378,206 |
| Net Increase (Decrease) in Net Assets Resulting from Operations | 5,541,244 |
| 1 Dividends are net of foreign withholding taxes of $1,836,000. |
| 2 Dividend income, interest income, and realized net gain (loss) from affiliated companies of the fund were $53,301,000, $1,381,000, and |
| $601,736,000, respectively. |
See accompanying Notes, which are an integral part of the Financial Statements.
19
Windsor II Fund
Statement of Changes in Net Assets
| | |
| | Year Ended October 31, |
| | 2012 | 2011 |
| | ($000) | ($000) |
| Increase (Decrease) in Net Assets | | |
| Operations | | |
| Net Investment Income | 837,220 | 759,804 |
| Realized Net Gain (Loss) | 2,325,818 | 1,185,811 |
| Change in Unrealized Appreciation (Depreciation) | 2,378,206 | 616,761 |
| Net Increase (Decrease) in Net Assets Resulting from Operations | 5,541,244 | 2,562,376 |
| Distributions | | |
| Net Investment Income | | |
| Investor Shares | (425,313) | (406,021) |
| Admiral Shares | (386,642) | (317,250) |
| Realized Capital Gain | | |
| Investor Shares | — | — |
| Admiral Shares | — | — |
| Total Distributions | (811,955) | (723,271) |
| Capital Share Transactions | | |
| Investor Shares | (3,249,876) | (3,015,077) |
| Admiral Shares | 2,027,815 | 654,417 |
| Net Increase (Decrease) from Capital Share Transactions | (1,222,061) | (2,360,660) |
| Total Increase (Decrease) | 3,507,228 | (521,555) |
| Net Assets | | |
| Beginning of Period | 33,780,313 | 34,301,868 |
| End of Period1 | 37,287,541 | 33,780,313 |
| 1 Net Assets—End of Period includes undistributed net investment income of $218,428,000 and $193,112,000. |
See accompanying Notes, which are an integral part of the Financial Statements.
20
Windsor II Fund
Financial Highlights
| | | | | |
| Investor Shares | | | | | |
| |
| |
| For a Share Outstanding | Year Ended October 31, |
| Throughout Each Period | 2012 | 2011 | 2010 | 2009 | 2008 |
| Net Asset Value, Beginning of Period | $25.68 | $24.37 | $22.22 | $20.56 | $37.84 |
| Investment Operations | | | | | |
| Net Investment Income | .644 | .557 | .495 | .580 | .777 |
| Net Realized and Unrealized Gain (Loss) | | | | | |
| on Investments | 3.627 | 1.276 | 2.151 | 1.750 | (13.804) |
| Total from Investment Operations | 4.271 | 1.833 | 2.646 | 2.330 | (13.027) |
| Distributions | | | | | |
| Dividends from Net Investment Income | (.621) | (.523) | (.496) | (.670) | (.799) |
| Distributions from Realized Capital Gains | — | — | — | — | (3.454) |
| Total Distributions | (.621) | (.523) | (.496) | (.670) | (4.253) |
| Net Asset Value, End of Period | $29.33 | $25.68 | $24.37 | $22.22 | $20.56 |
| |
| Total Return1 | 16.90% | 7.48% | 12.05% | 11.96% | -38.02% |
| |
| Ratios/Supplemental Data | | | | | |
| Net Assets, End of Period (Millions) | $18,255 | $19,010 | $20,921 | $20,695 | $19,400 |
| Ratio of Total Expenses to | | | | | |
| Average Net Assets2 | 0.35% | 0.35% | 0.35% | 0.38% | 0.32% |
| Ratio of Net Investment Income to | | | | | |
| Average Net Assets | 2.30% | 2.11% | 2.08% | 2.96% | 2.66% |
| Portfolio Turnover Rate | 22% | 23% | 29% | 41% | 37% |
| 1 Total returns do not include account service fees that may have applied in the periods shown. Fund prospectuses provide information about |
| any applicable account service fees. |
| 2 Includes performance-based investment advisory fee increases (decreases) of (0.02%), (0.01%), (0.01%), (0.01%), and (0.01%). |
See accompanying Notes, which are an integral part of the Financial Statements.
21
Windsor II Fund
Financial Highlights
| | | | | |
| Admiral Shares | | | | | |
| |
| |
| For a Share Outstanding | Year Ended October 31, |
| Throughout Each Period | 2012 | 2011 | 2010 | 2009 | 2008 |
| Net Asset Value, Beginning of Period | $45.59 | $43.26 | $39.46 | $36.51 | $67.18 |
| Investment Operations | | | | | |
| Net Investment Income | 1.188 | 1.025 | .914 | 1.064 | 1.431 |
| Net Realized and Unrealized Gain (Loss) | | | | | |
| on Investments | 6.424 | 2.264 | 3.811 | 3.112 | (24.497) |
| Total from Investment Operations | 7.612 | 3.289 | 4.725 | 4.176 | (23.066) |
| Distributions | | | | | |
| Dividends from Net Investment Income | (1.142) | (.959) | (.925) | (1.226) | (1.473) |
| Distributions from Realized Capital Gains | — | — | — | — | (6.131) |
| Total Distributions | (1.142) | (.959) | (.925) | (1.226) | (7.604) |
| Net Asset Value, End of Period | $52.06 | $45.59 | $43.26 | $39.46 | $36.51 |
| |
| Total Return1 | 16.98% | 7.56% | 12.12% | 12.09% | -37.94% |
| |
| Ratios/Supplemental Data | | | | | |
| Net Assets, End of Period (Millions) | $19,032 | $14,771 | $13,381 | $12,060 | $11,611 |
| Ratio of Total Expenses to | | | | | |
| Average Net Assets2 | 0.27% | 0.27% | 0.27% | 0.27% | 0.22% |
| Ratio of Net Investment Income to | | | | | |
| Average Net Assets | 2.38% | 2.19% | 2.16% | 3.07% | 2.76% |
| Portfolio Turnover Rate | 22% | 23% | 29% | 41% | 37% |
| 1 Total returns do not include account service fees that may have applied in the periods shown. Fund prospectuses provide information about |
| any applicable account service fees. |
| 2 Includes performance-based investment advisory fee increases (decreases) of (0.02%), (0.01%), (0.01%), (0.01%), and (0.01%). |
See accompanying Notes, which are an integral part of the Financial Statements.
22
Windsor II Fund
Notes to Financial Statements
Vanguard Windsor II Fund is registered under the Investment Company Act of 1940 as an open-end investment company, or mutual fund. The fund offers two classes of shares: Investor Shares and Admiral Shares. Investor Shares are available to any investor who meets the fund’s minimum purchase requirements. Admiral Shares are designed for investors who meet certain administrative, service, and account-size criteria.
A. The following significant accounting policies conform to generally accepted accounting principles for U.S. mutual funds. The fund consistently follows such policies in preparing its financial statements.
1. Security Valuation: Securities are valued as of the close of trading on the New York Stock Exchange (generally 4 p.m., Eastern time) on the valuation date. Equity securities are valued at the latest quoted sales prices or official closing prices taken from the primary market in which each security trades; such securities not traded on the valuation date are valued at the mean of the latest quoted bid and asked prices. Securities for which market quotations are not readily available, or whose values have been affected by events occurring before the fund’s pricing time but after the close of the securities’ primary markets, are valued at their fair values calculated according to procedures adopted by the board of trustees. These procedures include obtaining quotations from an independent pricing service, monitoring news to identify significant market- or security-specific events, and evaluating changes in the values of foreign market proxies (for example, ADRs, futures contracts, or exchange-traded funds), between the time the foreign markets close and the fund’s pricing time. When fair-value pricing is employed, the prices of securities used by a fund to calculate its net asset value may differ from quoted or published prices for the same securities. Investments in Vanguard Market Liquidity Fund are valued at that fund’s net asset value. Temporary cash investments acquired over 60 days to maturity are valued using the latest bid prices or using valuations based on a matrix system (which considers such factors as security prices, yields, maturities, and ratings), both as furnished by independent pricing services. Other temporary cash investments are valued at amortized cost, which approximates market value.
2. Foreign Currency: Securities and other assets and liabilities denominated in foreign currencies are translated into U.S. dollars using exchange rates obtained from an independent third party as of the fund’s pricing time on the valuation date. Realized gains (losses) and unrealized appreciation (depreciation) on investment securities include the effects of changes in exchange rates since the securities were purchased, combined with the effects of changes in security prices. Fluctuations in the value of other assets and liabilities resulting from changes in exchange rates are recorded as unrealized foreign currency gains (losses) until the assets or liabilities are settled in cash, at which time they are recorded as realized foreign currency gains (losses).
3. Futures Contracts: The fund uses index futures contracts to a limited extent, with the objective of maintaining full exposure to the stock market while maintaining liquidity. The fund may purchase or sell futures contracts to achieve a desired level of investment, whether to accommodate portfolio turnover or cash flows from capital share transactions. The primary risks associated with the use of futures contracts are imperfect correlation between changes in market values of stocks held by the fund and the prices of futures contracts, and the possibility of an illiquid market.
Futures contracts are valued at their quoted daily settlement prices. The aggregate principal amounts of the contracts are not recorded in the Statement of Net Assets. Fluctuations in the value of the contracts are recorded in the Statement of Net Assets as an asset (liability) and in the Statement of Operations as unrealized appreciation (depreciation) until the contracts are closed, when they are recorded as realized futures gains (losses).
23
Windsor II Fund
During the year ended October 31, 2012, the fund’s average investment in futures contracts represented less than 1% of net assets, based on quarterly average aggregate settlement values.
4. Federal Income Taxes: The fund intends to continue to qualify as a regulated investment company and distribute all of its taxable income. Management has analyzed the fund’s tax positions taken for all open federal income tax years (October 31, 2009–2012), and has concluded that no provision for federal income tax is required in the fund’s financial statements.
5. Distributions: Distributions to shareholders are recorded on the ex-dividend date.
6. Security Lending: The fund may lend its securities to qualified institutional borrowers to earn additional income. Security loans are required to be secured at all times by collateral at least equal to the market value of securities loaned. The fund invests cash collateral received in Vanguard Market Liquidity Fund, and records a liability for the return of the collateral, during the period the securities are on loan. Security lending income represents fees charged to borrowers plus income earned on investing cash collateral, less expenses associated with the loan.
7. Other: Dividend income is recorded on the ex-dividend date. Interest income includes income distributions received from Vanguard Market Liquidity Fund and is accrued daily. Security transactions are accounted for on the date securities are bought or sold. Costs used to determine realized gains (losses) on the sale of investment securities are those of the specific securities sold.
Each class of shares has equal rights as to assets and earnings, except that each class separately bears certain class-specific expenses related to maintenance of shareholder accounts (included in Management and Administrative expenses) and shareholder reporting. Marketing and distribution expenses are allocated to each class of shares based on a method approved by the board of trustees. Income, other non-class-specific expenses, and gains and losses on investments are allocated to each class of shares based on its relative net assets.
B. Barrow, Hanley, Mewhinney & Strauss, LLC; Lazard Asset Management LLC; Hotchkis and Wiley Capital Management, LLC; Armstrong Shaw Associates Inc.; and Sanders Capital, LLC, each provide investment advisory services to a portion of the fund for a fee calculated at an annual percentage rate of average net assets managed by the advisor. The basic fee of Barrow, Hanley, Mewhinney & Strauss, LLC, is subject to quarterly adjustments based on performance for the preceding three years relative to the MSCI US Prime Market 750 Index. The basic fee of Lazard Asset Management LLC is subject to quarterly adjustments based on performance for the preceding three years relative to the S&P 500 Index. The basic fee of Hotchkis and Wiley Capital Management, LLC, is subject to quarterly adjustments based on performance for the preceding five years relative to the MSCI US Investable Market 2500 Index. The basic fee of Armstrong Shaw Associates Inc. is subject to quarterly adjustments based on performance for the preceding five years relative to the Russell 1000 Value Index. The basic fee of Sanders Capital, LLC, is subject to quarterly adjustments based on performance since January 31, 2010, relative to the Russell 3000 Index.
The Vanguard Group provides investment advisory services to a portion of the fund on an at-cost basis; the fund paid Vanguard advisory fees of $140,000 for the year ended October 31, 2012.
For the year ended October 31, 2012, the aggregate investment advisory fee represented an effective annual basic rate of 0.15% of the fund’s average net assets, before a decrease of $6,420,000 (0.02%) based on performance.
24
Windsor II Fund
C. The Vanguard Group furnishes at cost corporate management, administrative, marketing, and distribution services. The costs of such services are allocated to the fund under methods approved by the board of trustees. The fund has committed to provide up to 0.40% of its net assets in capital contributions to Vanguard. At October 31, 2012, the fund had contributed capital of $5,235,000 to Vanguard (included in Other Assets), representing 0.01% of the fund’s net assets and 2.09% of Vanguard’s capitalization. The fund’s trustees and officers are also directors and officers of Vanguard.
D. The fund has asked its investment advisors to direct certain security trades, subject to obtaining the best price and execution, to brokers who have agreed to rebate to the fund part of the commissions generated. Such rebates are used solely to reduce the fund’s management and administrative expenses. For the year ended October 31, 2012, these arrangements reduced the fund’s expenses by $772,000 (an annual rate of 0.00% of average net assets).
E. Various inputs may be used to determine the value of the fund’s investments. These inputs are summarized in three broad levels for financial statement purposes. The inputs or methodologies used to value securities are not necessarily an indication of the risk associated with investing in those securities.
Level 1—Quoted prices in active markets for identical securities.
Level 2—Other significant observable inputs (including quoted prices for similar securities, interest
rates, prepayment speeds, credit risk, etc.).
Level 3—Significant unobservable inputs (including the fund’s own assumptions used to determine
the fair value of investments).
The following table summarizes the market value of the fund’s investments as of October 31, 2012, based on the inputs used to value them:
| | | |
| | Level 1 | Level 2 | Level 3 |
| Investments | ($000) | ($000) | ($000) |
| Common Stocks | 36,001,709 | 368,549 | — |
| Temporary Cash Investments | 988,641 | 27,104 | — |
| Futures Contracts—Assets1 | 14 | — | — |
| Futures Contracts—Liabilities1 | (117) | — | — |
| Total | 36,990,247 | 395,653 | — |
| 1 Represents variation margin on the last day of the reporting period. |
F. At October 31, 2012, the aggregate settlement value of open futures contracts and the related unrealized appreciation (depreciation) were:
| | | | |
| | | | ($000) |
| | | | Aggregate | |
| | | Number of | Settlement | Unrealized |
| | | Long (Short) | Value | Appreciation |
| Futures Contracts | Expiration | Contracts | Long (Short) | (Depreciation) |
| S&P 500 Index | December 2012 | 461 | 162,134 | (5,572) |
| E-mini S&P 500 Index | December 2012 | 23 | 1,618 | (18) |
Unrealized appreciation (depreciation) on open futures contracts is required to be treated as realized gain (loss) for tax purposes.
25
Windsor II Fund
G. Distributions are determined on a tax basis and may differ from net investment income and realized capital gains for financial reporting purposes. Differences may be permanent or temporary. Permanent differences are reclassified among capital accounts in the financial statements to reflect their tax character. Temporary differences arise when certain items of income, expense, gain, or loss are recognized in different periods for financial statement and tax purposes; these differences will reverse at some time in the future. Differences in classification may also result from the treatment of short-term gains as ordinary income for tax purposes.
During the year ended October 31, 2012, the fund realized net foreign currency gains of $51,000, which increased distributable net income for tax purposes; accordingly, such gains have been reclassified from accumulated net realized gains to undistributed net investment income.
For tax purposes, at October 31, 2012, the fund had $284,392,000 of ordinary income available for distribution. The fund used capital loss carryforwards of $2,285,268,000 to offset taxable capital gains realized during the year ended October 31, 2012. At October 31, 2012, the fund had available capital losses totaling $1,941,763,000 to offset future net capital gains of $128,122,000 through October 31, 2016, $1,639,579,000 through October 31, 2017, and $174,062,000 through October 31, 2018.
At October 31, 2012, the cost of investment securities for tax purposes was $31,205,372,000.
Net unrealized appreciation of investment securities for tax purposes was $6,180,631,000, consisting of unrealized gains of $9,583,646,000 on securities that had risen in value since their purchase and $3,403,015,000 in unrealized losses on securities that had fallen in value since their purchase.
H. During the year ended October 31, 2012, the fund purchased $7,610,142,000 of investment securities and sold $8,591,624,000 of investment securities, other than temporary cash investments.
I. Capital share transactions for each class of shares were:
| | | | |
| | Year Ended October 31, |
| | 2012 | 2011 |
| | Amount | Shares | Amount | Shares |
| | ($000) | (000) | ($000) | (000) |
| Investor Shares | | | | |
| Issued | 1,360,965 | 49,432 | 1,713,967 | 66,276 |
| Issued in Lieu of Cash Distributions | 415,018 | 15,662 | 397,055 | 15,092 |
| Redeemed | (5,025,859) | (182,888) | (5,126,099) | (199,599) |
| Net Increase (Decrease)—Investor Shares | (3,249,876) | (117,794) | (3,015,077) | (118,231) |
| Admiral Shares | | | | |
| Issued | 3,988,960 | 81,728 | 2,931,963 | 64,388 |
| Issued in Lieu of Cash Distributions | 364,718 | 7,738 | 298,134 | 6,381 |
| Redeemed | (2,325,863) | (47,911) | (2,575,680) | (56,099) |
| Net Increase (Decrease)—Admiral Shares | 2,027,815 | 41,555 | 654,417 | 14,670 |
26
Windsor II Fund
J. Certain of the fund’s investments are in companies that are considered to be affiliated companies of the fund because the fund owns more than 5% of the outstanding voting securities of the company. Transactions during the period in securities of these companies were as follows:
| | | | | |
| | | Current Period Transactions | |
| | Oct. 31, 2011 | | Proceeds from | | Oct. 31, 2012 |
| | Market | Purchases | Securities | Dividend | Market |
| | Value | at Cost | Sold | Income | Value |
| | ($000) | ($000) | ($000) | ($000) | ($000) |
| CenterPoint Energy Inc. | 539,650 | — | 3,435 | 20,762 | 557,491 |
| Cooper Industries plc | 608,824 | — | 817,330 | 10,860 | — |
| Exelis Inc. | — | 64,197 | 400 | 4,044 | 136,271 |
| Service Corp. International | 215,275 | — | 9,473 | 4,712 | 292,496 |
| Xylem Inc. | — | 97,873 | 1,147 | 4,681 | 241,399 |
| | 1,363,749 | | | | 1,227,657 |
K. In preparing the financial statements as of October 31, 2012, management considered the impact of subsequent events for potential recognition or disclosure in these financial statements.
27
Report of Independent Registered
Public Accounting Firm
To the Trustees of Vanguard Windsor Funds and the Shareholders of Vanguard Windsor II Fund:
In our opinion, the accompanying statement of net assets and the related statements of operations and of changes in net assets and the financial highlights present fairly, in all material respects, the financial position of Vanguard Windsor II Fund (constituting a separate portfolio of Vanguard Windsor Funds, hereafter referred to as the “Fund”) at October 31, 2012, the results of its operations for the year then ended, the changes in its net assets for each of the two years in the period then ended and the financial highlights for each of the five years in the period then ended, in conformity with accounting principles generally accepted in the United States of America. These financial statements and financial highlights (hereafter referred to as “financial statements”) are the responsibility of the Fund’s management; our responsibility is to express an opinion on these financial statements based on our audits. We conducted our audits of these financial statements in accordance with the standards of the Public Company Accounting Oversight Board (United States). Those standards require that we plan and perform the audit to obtain reasonable assurance about whether the financial statements are free of material misstatement. An audit includes examining, on a test basis, evidence supporting the amounts and disclosures in the financial statements, assessing the accounting principles used and significant estimates made by management, and evaluating the overall financial statement presentation. We believe that our audits, which included confirmation of securities at October 31, 2012 by correspondence with the custodian and broker and by agreement to the underlying ownership records of the transfer agent, provide a reasonable basis for our opinion.
PricewaterhouseCoopers LLP
Philadelphia, Pennsylvania
December 11, 2012

Special 2012 tax information (unaudited) for Vanguard Windsor II Fund
This information for the fiscal year ended October 31, 2012, is included pursuant to provisions of the
Internal Revenue Code.
The fund distributed $811,955,000 of qualified dividend income to shareholders during the fiscal year.
For corporate shareholders, 95.7% of investment income (dividend income plus short-term gains, if
any) qualifies for the dividends-received deduction.
28
Your Fund’s After-Tax Returns
This table presents returns for your fund both before and after taxes. The after-tax returns are shown in two ways: (1) assuming that an investor owned the fund during the entire period and paid taxes on the fund’s distributions, and (2) assuming that an investor paid taxes on the fund’s distributions and sold all shares at the end of each period.
Calculations are based on the highest individual federal income tax and capital gains tax rates in effect at the times of the distributions and the hypothetical sales. State and local taxes were not considered. After-tax returns reflect any qualified dividend income, using actual prior-year figures and estimates for 2012. (In the example, returns after the sale of fund shares may be higher than those assuming no sale. This occurs when the sale would have produced a capital loss. The calculation assumes that the investor received a tax deduction for the loss.)
The table shows returns for Investor Shares only; returns for other share classes will differ. Please note that your actual after-tax returns will depend on your tax situation and may differ from those shown. Also note that if you own the fund in a tax-deferred account, such as an individual retirement account or a 401(k) plan, this information does not apply to you. Such accounts are not subject to current taxes.
Finally, keep in mind that a fund’s performance—whether before or after taxes—does not guarantee future results.
Average Annual Total Returns: Windsor II Fund Investor Shares
Periods Ended October 31, 2012
| | | |
| | One | Five | Ten |
| | Year | Years | Years |
| Returns Before Taxes | 16.90% | -0.47% | 7.76% |
| Returns After Taxes on Distributions | 16.50 | -1.19 | 7.05 |
| Returns After Taxes on Distributions and Sale of Fund Shares | 11.45 | -0.53 | 6.71 |
29
About Your Fund’s Expenses
As a shareholder of the fund, you incur ongoing costs, which include costs for portfolio management, administrative services, and shareholder reports (like this one), among others. Operating expenses, which are deducted from a fund’s gross income, directly reduce the investment return of the fund.
A fund’s expenses are expressed as a percentage of its average net assets. This figure is known as the expense ratio. The following examples are intended to help you understand the ongoing costs (in dollars) of investing in your fund and to compare these costs with those of other mutual funds. The examples are based on an investment of $1,000 made at the beginning of the period shown and held for the entire period.
The accompanying table illustrates your fund’s costs in two ways:
• Based on actual fund return. This section helps you to estimate the actual expenses that you paid over the period. The ”Ending Account Value“ shown is derived from the fund‘s actual return, and the third column shows the dollar amount that would have been paid by an investor who started with $1,000 in the fund. You may use the information here, together with the amount you invested, to estimate the expenses that you paid over the period.
To do so, simply divide your account value by $1,000 (for example, an $8,600 account value divided by $1,000 = 8.6), then multiply the result by the number given for your fund under the heading ”Expenses Paid During Period.“
• Based on hypothetical 5% yearly return. This section is intended to help you compare your fund‘s costs with those of other mutual funds. It assumes that the fund had a yearly return of 5% before expenses, but that the expense ratio is unchanged. In this case—because the return used is not the fund’s actual return—the results do not apply to your investment. The example is useful in making comparisons because the Securities and Exchange Commission requires all mutual funds to calculate expenses based on a 5% return. You can assess your fund’s costs by comparing this hypothetical example with the hypothetical examples that appear in shareholder reports of other funds.
Note that the expenses shown in the table are meant to highlight and help you compare ongoing costs only and do not reflect transaction costs incurred by the fund for buying and selling securities. Further, the expenses do not include any purchase, redemption, or account service fees described in the fund prospectus. If such fees were applied to your account, your costs would be higher. Your fund does not carry a “sales load.”
The calculations assume no shares were bought or sold during the period. Your actual costs may have been higher or lower, depending on the amount of your investment and the timing of any purchases or redemptions.
You can find more information about the fund’s expenses, including annual expense ratios, in the Financial Statements section of this report. For additional information on operating expenses and other shareholder costs, please refer to your fund’s current prospectus.
30
| | | |
| Six Months Ended October 31, 2012 | | | |
| | Beginning | Ending | Expenses |
| | Account Value | Account Value | Paid During |
| Windsor II Fund | 4/30/2012 | 10/31/2012 | Period |
| Based on Actual Fund Return | | | |
| Investor Shares | $1,000.00 | $1,035.26 | $1.80 |
| Admiral Shares | 1,000.00 | 1,035.58 | 1.39 |
| Based on Hypothetical 5% Yearly Return | | | |
| Investor Shares | $1,000.00 | $1,023.44 | $1.79 |
| Admiral Shares | 1,000.00 | 1,023.84 | 1.38 |
The calculations are based on expenses incurred in the most recent six-month period. The fund’s annualized six-month expense ratios for that
period are 0.35% for Investor Shares and 0.27% for Admiral Shares. The dollar amounts shown as “Expenses Paid” are equal to the
annualized expense ratio multiplied by the average account value over the period, multiplied by the number of days in the most recent
six-month period, then divided by the number of days in the most recent 12-month period.
31
Glossary
30-Day SEC Yield. A fund’s 30-day SEC yield is derived using a formula specified by the U.S. Securities and Exchange Commission. Under the formula, data related to the fund’s security holdings in the previous 30 days are used to calculate the fund’s hypothetical net income for that period, which is then annualized and divided by the fund’s estimated average net assets over the calculation period. For the purposes of this calculation, a security’s income is based on its current market yield to maturity (for bonds), its actual income (for asset-backed securities), or its projected dividend yield (for stocks). Because the SEC yield represents hypothetical annualized income, it will differ—at times significantly—from the fund’s actual experience. As a result, the fund’s income distributions may be higher or lower than implied by the SEC yield.
Beta. A measure of the magnitude of a fund’s past share-price fluctuations in relation to the ups and downs of a given market index. The index is assigned a beta of 1.00. Compared with a given index, a fund with a beta of 1.20 typically would have seen its share price rise or fall by 12% when the index rose or fell by 10%. For this report, beta is based on returns over the past 36 months for both the fund and the index. Note that a fund’s beta should be reviewed in conjunction with its R-squared (see definition). The lower the R-squared, the less correlation there is between the fund and the index, and the less reliable beta is as an indicator of volatility.
Dividend Yield. Dividend income earned by stocks, expressed as a percentage of the aggregate market value (or of net asset value, for a fund). The yield is determined by dividing the amount of the annual dividends by the aggregate value (or net asset value) at the end of the period. For a fund, the dividend yield is based solely on stock holdings and does not include any income produced by other investments.
Earnings Growth Rate. The average annual rate of growth in earnings over the past five years for the stocks now in a fund.
Equity Exposure. A measure that reflects a fund’s investments in stocks and stock futures. Any holdings in short-term reserves are excluded.
Expense Ratio. A fund’s total annual operating expenses expressed as a percentage of the fund’s average net assets. The expense ratio includes management and administrative expenses, but does not include the transaction costs of buying and selling portfolio securities.
Foreign Holdings. The percentage of a fund represented by securities or depositary receipts of companies based outside the United States.
Inception Date. The date on which the assets of a fund (or one of its share classes) are first invested in accordance with the fund’s investment objective. For funds with a subscription period, the inception date is the day after that period ends. Investment performance is measured from the inception date.
Median Market Cap. An indicator of the size of companies in which a fund invests; the midpoint of market capitalization (market price x shares outstanding) of a fund’s stocks, weighted by the proportion of the fund’s assets invested in each stock. Stocks representing half of the fund’s assets have market capitalizations above the median, and the rest are below it.
Price/Book Ratio. The share price of a stock divided by its net worth, or book value, per share. For a fund, the weighted average price/book ratio of the stocks it holds.
32
Price/Earnings Ratio. The ratio of a stock’s current price to its per-share earnings over the past year. For a fund, the weighted average P/E of the stocks it holds. P/E is an indicator of market expectations about corporate prospects; the higher the P/E, the greater the expectations for a company’s future growth.
R-Squared. A measure of how much of a fund’s past returns can be explained by the returns from the market in general, as measured by a given index. If a fund’s total returns were precisely synchronized with an index’s returns, its R-squared would be 1.00. If the fund’s returns bore no relationship to the index’s returns, its R-squared would be 0. For this report, R-squared is based on returns over the past 36 months for both the fund and the index.
Return on Equity. The annual average rate of return generated by a company during the past five years for each dollar of shareholder’s equity (net income divided by shareholder’s equity). For a fund, the weighted average return on equity for the companies whose stocks it holds.
Short-Term Reserves. The percentage of a fund invested in highly liquid, short-term securities that can be readily converted to cash.
Turnover Rate. An indication of the fund’s trading activity. Funds with high turnover rates incur higher transaction costs and may be more likely to distribute capital gains (which may be taxable to investors). The turnover rate excludes in-kind transactions, which have minimal impact on costs.
33
This page intentionally left blank.
This page intentionally left blank.
The People Who Govern Your Fund
The trustees of your mutual fund are there to see that the fund is operated and managed in your best interests since, as a shareholder, you are a part owner of the fund. Your fund’s trustees also serve on the board of directors of The Vanguard Group, Inc., which is owned by the Vanguard funds and provides services to them on an at-cost basis.
A majority of Vanguard’s board members are independent, meaning that they have no affiliation with Vanguard or the funds they oversee, apart from the sizable personal investments they have made as private individuals. The independent board members have distinguished backgrounds in business, academia, and public service. Each of the trustees and executive officers oversees 180 Vanguard funds.
The following table provides information for each trustee and executive officer of the fund. More information about the trustees is in the Statement of Additional Information, which can be obtained, without charge, by contacting Vanguard at 800-662-7447, or online at vanguard.com.
| |
| InterestedTrustee1 | and Delphi Automotive LLP (automotive components); |
| | Senior Advisor at New Mountain Capital; Trustee of |
| F. William McNabb III | The Conference Board. |
| Born 1957. Trustee Since July 2009. Chairman of the | |
| Board. Principal Occupation(s) During the Past Five | Amy Gutmann |
| Years: Chairman of the Board of The Vanguard Group, | Born 1949. Trustee Since June 2006. Principal |
| Inc., and of each of the investment companies served | Occupation(s) During the Past Five Years: President |
| by The Vanguard Group, since January 2010; Director | of the University of Pennsylvania; Christopher H. |
| of The Vanguard Group since 2008; Chief Executive | Browne Distinguished Professor of Political Science |
| Officer and President of The Vanguard Group and of | in the School of Arts and Sciences with secondary |
| each of the investment companies served by The | appointments at the Annenberg School for |
| Vanguard Group since 2008; Director of Vanguard | Communication and the Graduate School of Education |
| Marketing Corporation; Managing Director of The | of the University of Pennsylvania; Member of the |
| Vanguard Group (1995–2008). | National Commission on the Humanities and Social |
| | Sciences; Trustee of Carnegie Corporation of New |
| | York and of the National Constitution Center; Chair |
| IndependentTrustees | of the U. S. Presidential Commission for the Study |
| | of Bioethical Issues. |
| Emerson U. Fullwood | |
| Born 1948. Trustee Since January 2008. Principal | |
| Occupation(s) During the Past Five Years: Executive | JoAnn Heffernan Heisen |
| Chief Staff and Marketing Officer for North America | Born 1950. Trustee Since July 1998. Principal |
| and Corporate Vice President (retired 2008) of Xerox | Occupation(s) During the Past Five Years: Corporate |
| Corporation (document management products and | Vice President and Chief Global Diversity Officer |
| services); Executive in Residence and 2010 | (retired 2008) and Member of the Executive |
| Distinguished Minett Professor at the Rochester | Committee (1997–2008) of Johnson & Johnson |
| Institute of Technology; Director of SPX Corporation | (pharmaceuticals/medical devices/consumer |
| (multi-industry manufacturing), the United Way of | products); Director of Skytop Lodge Corporation |
| Rochester, Amerigroup Corporation (managed health | (hotels), the University Medical Center at Princeton, |
| care), the University of Rochester Medical Center, | the Robert Wood Johnson Foundation, and the Center |
| Monroe Community College Foundation, and North | for Talent Innovation; Member of the Advisory Board |
| Carolina A&T University. | of the Maxwell School of Citizenship and Public Affairs |
| | at Syracuse University. |
| Rajiv L. Gupta | |
| Born 1945. Trustee Since December 2001.2 | F. Joseph Loughrey |
| Principal Occupation(s) During the Past Five Years: | Born 1949. Trustee Since October 2009. Principal |
| Chairman and Chief Executive Officer (retired 2009) | Occupation(s) During the Past Five Years: President |
| and President (2006–2008) of Rohm and Haas Co. | and Chief Operating Officer (retired 2009) of Cummins |
| (chemicals); Director of Tyco International, Ltd. | Inc. (industrial machinery); Director of SKF AB |
| (diversified manufacturing and services), Hewlett- | (industrial machinery), Hillenbrand, Inc. (specialized |
| Packard Co. (electronic computer manufacturing), | consumer services), the Lumina Foundation for |
| | |
| Education, and Oxfam America; Chairman of the | Executive Officers | |
| Advisory Council for the College of Arts and Letters | | |
| and Member of the Advisory Board to the Kellogg | Glenn Booraem | |
| Institute for International Studies at the University | Born 1967. Controller Since July 2010. Principal |
| of Notre Dame. | Occupation(s) During the Past Five Years: Principal |
| | of The Vanguard Group, Inc.; Controller of each of |
| Mark Loughridge | the investment companies served by The Vanguard |
| Born 1953. Trustee Since March 2012. Principal | Group; Assistant Controller of each of the investment |
| Occupation(s) During the Past Five Years: Senior Vice | companies served by The Vanguard Group (2001–2010). |
| President and Chief Financial Officer at IBM (information | | |
| technology services); Fiduciary Member of IBM’s | Thomas J. Higgins | |
| Retirement Plan Committee. | Born 1957. Chief Financial Officer Since September |
| | 2008. Principal Occupation(s) During the Past Five |
| Scott C. Malpass | Years: Principal of The Vanguard Group, Inc.; Chief |
| Born 1962. Trustee Since March 2012. Principal | Financial Officer of each of the investment companies |
| Occupation(s) During the Past Five Years: Chief | served by The Vanguard Group; Treasurer of each of |
| Investment Officer and Vice President at the University | the investment companies served by The Vanguard |
| of Notre Dame; Assistant Professor of Finance at the | Group (1998–2008). | |
| Mendoza College of Business at Notre Dame; Member | | |
| of the Notre Dame 403(b) Investment Committee; | Kathryn J. Hyatt | |
| Director of TIFF Advisory Services, Inc. (investment | Born 1955. Treasurer Since November 2008. Principal |
| advisor); Member of the Investment Advisory | Occupation(s) During the Past Five Years: Principal of |
| Committees of the Financial Industry Regulatory | The Vanguard Group, Inc.; Treasurer of each of the |
| Authority (FINRA) and of Major League Baseball. | investment companies served by The Vanguard |
| | Group; Assistant Treasurer of each of the investment |
| André F. Perold | companies served by The Vanguard Group (1988–2008). |
| Born 1952. Trustee Since December 2004. Principal | | |
| Occupation(s) During the Past Five Years: George | Heidi Stam | |
| Gund Professor of Finance and Banking at the Harvard | Born 1956. Secretary Since July 2005. Principal |
| Business School (retired 2011); Chief Investment | Occupation(s) During the Past Five Years: Managing |
| Officer and Managing Partner of HighVista Strategies | Director of The Vanguard Group, Inc.; General Counsel |
| LLC (private investment firm); Director of Rand | of The Vanguard Group; Secretary of The Vanguard |
| Merchant Bank; Overseer of the Museum of Fine | Group and of each of the investment companies |
| Arts Boston. | served by The Vanguard Group; Director and Senior |
| | Vice President of Vanguard Marketing Corporation. |
| | |
| Alfred M. Rankin, Jr. | | |
| Born 1941. Trustee Since January 1993. Principal | Vanguard Senior ManagementTeam |
| Occupation(s) During the Past Five Years: Chairman, | | |
| President, and Chief Executive Officer of NACCO | Mortimer J. Buckley | Michael S. Miller |
| Industries, Inc. (forklift trucks/housewares/lignite); | Kathleen C. Gubanich | James M. Norris |
| Director of Goodrich Corporation (industrial products/ | Paul A. Heller | Glenn W. Reed |
| aircraft systems and services) and the National | Martha G. King | George U. Sauter |
| Association of Manufacturers; Chairman of the Board | Chris D. McIsaac | |
| of the Federal Reserve Bank of Cleveland and of | | |
| University Hospitals of Cleveland; Advisory Chairman | | |
| of the Board of The Cleveland Museum of Art. | |
| Chairman Emeritus and Senior Advisor |
| | | |
| Peter F. Volanakis | John J. Brennan | |
| Born 1955. Trustee Since July 2009. Principal | Chairman, 1996–2009 | |
| Occupation(s) During the Past Five Years: President | Chief Executive Officer and President, 1996–2008 |
| and Chief Operating Officer (retired 2010) of Corning | | |
| Incorporated (communications equipment); Director | Founder | |
| of SPX Corporation (multi-industry manufacturing); | John C. Bogle | |
| Overseer of the Amos Tuck School of Business | Chairman and Chief Executive Officer, 1974–1996 |
| Administration at Dartmouth College; Advisor to the | | |
| Norris Cotton Cancer Center. | | |
1 Mr. McNabb is considered an “interested person,” as defined in the Investment Company Act of 1940, because he is an officer of the
Vanguard funds.
2 December 2002 for Vanguard Equity Income Fund, Vanguard Growth Equity Fund, the Vanguard Municipal Bond Funds, and the Vanguard
State Tax-Exempt Funds.

P.O. Box 2600
Valley Forge, PA 19482-2600
| |
| Connect with Vanguard® > vanguard.com | |
| |
| |
| |
| Fund Information > 800-662-7447 | CFA® is a trademark owned by CFA Institute. |
| Direct Investor Account Services > 800-662-2739 | |
| Institutional Investor Services > 800-523-1036 | |
| Text Telephone for People | |
| With Hearing Impairment > 800-749-7273 | |
| |
| This material may be used in conjunction | |
| with the offering of shares of any Vanguard | |
| fund only if preceded or accompanied by | |
| the fund’s current prospectus. | |
| |
| All comparative mutual fund data are from Lipper Inc. or | |
| Morningstar, Inc., unless otherwise noted. | |
| |
| You can obtain a free copy of Vanguard’s proxy voting | |
| guidelines by visiting vanguard.com/proxyreporting or by | |
| calling Vanguard at 800-662-2739. The guidelines are | |
| also available from the SEC’s website, sec.gov. In | |
| addition, you may obtain a free report on how your fund | |
| voted the proxies for securities it owned during the 12 | |
| months ended June 30. To get the report, visit either | |
| vanguard.com/proxyreporting or sec.gov. | |
| |
| You can review and copy information about your fund at | |
| the SEC’s Public Reference Room in Washington, D.C. To | |
| find out more about this public service, call the SEC at | |
| 202-551-8090. Information about your fund is also | |
| available on the SEC’s website, and you can receive | |
| copies of this information, for a fee, by sending a | |
| request in either of two ways: via e-mail addressed to | |
| publicinfo@sec.gov or via regular mail addressed to the | |
| Public Reference Section, Securities and Exchange | |
| Commission, Washington, DC 20549-1520. | |
| |
| |
| | © 2012 The Vanguard Group, Inc. |
| | All rights reserved. |
| | Vanguard Marketing Corporation, Distributor. |
| |
| | Q730 122012 |
Item 2: Code of Ethics. The Registrant has adopted a code of ethics that applies to the Registrant’s principal executive officer, principal financial officer, principal accounting officer or controller or persons performing similar functions. The Code of Ethics was amended during the reporting period covered by this report to make certain technical, non-material changes.
Item 3: Audit Committee Financial Expert. The following members of the Audit Committee have been determined by the Registrant’s Board of Trustees to be Audit Committee Financial Experts serving on its Audit Committee, and to be independent: Rajiv L. Gupta, Amy Gutmann, JoAnn Heffernan Heisen, F. Joseph Loughrey, Mark Loughridge, Scott C. Malpass, André F. Perold, and Alfred M. Rankin, Jr.
Item 4: Principal Accountant Fees and Services.
(a) Audit Fees.
Audit Fees of the Registrant
Fiscal Year Ended October 31, 2012: $64,000
Fiscal Year Ended October 31, 2011: $64,000
Aggregate Audit Fees of Registered Investment Companies in the Vanguard Group.
Fiscal Year Ended October 31, 2012: $4,809,780
Fiscal Year Ended October 31, 2011: $3,978,540
(b) Audit-Related Fees.
Fiscal Year Ended October 31, 2012: $1,812,565
Fiscal Year Ended October 31, 2011: $1,341,750
Includes fees billed in connection with assurance and related services provided to the Registrant, The Vanguard Group, Inc., Vanguard Marketing Corporation, and other registered investment companies in the Vanguard Group.
(c) Tax Fees.
Fiscal Year Ended October 31, 2012: $490,518
Fiscal Year Ended October 31, 2011: $373,830
Includes fees billed in connection with tax compliance, planning and advice services provided to the Registrant, The Vanguard Group, Inc., Vanguard Marketing Corporation, and other registered investment companies in the Vanguard Group and related to income and excise taxes.
(d) All Other Fees.
Fiscal Year Ended October 31, 2012: $16,000
Fiscal Year Ended October 31, 2011: $16,000
Includes fees billed for services related to risk management and privacy matters. Services were provided to the Registrant, The Vanguard Group, Inc., Vanguard Marketing Corporation, and other registered investment companies in the Vanguard Group.
(e) (1) Pre-Approval Policies. The policy of the Registrant’s Audit Committee is to consider and, if appropriate, approve before the principal accountant is engaged for such services, all specific audit and non-audit services provided to: (1) the Registrant; (2) The Vanguard Group, Inc.; (3) other entities controlled by The Vanguard Group, Inc. that provide ongoing services to the Registrant; and (4) other registered investment companies in the Vanguard Group. In making a determination, the Audit Committee considers whether the services are consistent with maintaining the principal accountant’s independence.
In the event of a contingency situation in which the principal accountant is needed to provide services in between scheduled Audit Committee meetings, the Chairman of the Audit Committee would be called on to consider and, if appropriate, pre-approve audit or permitted non-audit services in an amount sufficient to complete services through the next Audit Committee meeting, and to determine if such services would be consistent with maintaining the accountant’s independence. At the next scheduled Audit Committee meeting, services and fees would be presented to the Audit Committee for formal consideration, and, if appropriate, approval by the entire Audit Committee. The Audit Committee would again consider whether such services and fees are consistent with maintaining the principal accountant’s independence.
The Registrant’s Audit Committee is informed at least annually of all audit and non-audit services provided by the principal accountant to the Vanguard complex, whether such services are provided to: (1) the Registrant; (2) The Vanguard Group, Inc.; (3) other entities controlled by The Vanguard Group, Inc. that provide ongoing services to the Registrant; or (4) other registered investment companies in the Vanguard Group.
(2) No percentage of the principal accountant’s fees or services were approved pursuant to the waiver provision of paragraph (c)(7)(i)(C) of Rule 2-01 of Regulation S-X.
(f) For the most recent fiscal year, over 50% of the hours worked under the principal accountant’s engagement were not performed by persons other than full-time, permanent employees of the principal accountant.
(g) Aggregate Non-Audit Fees.
Fiscal Year Ended October 31, 2012: $506,518
Fiscal Year Ended October 31, 2011: $389,830
Includes fees billed for non-audit services provided to the Registrant, The Vanguard Group, Inc., Vanguard Marketing Corporation, and other registered investment companies in the Vanguard Group.
(h) For the most recent fiscal year, the Audit Committee has determined that the provision of all non-audit services was consistent with maintaining the principal accountant’s independence.
Item 5: Audit Committee of Listed Registrants.
Not Applicable.
Item 6: Investments.
Not Applicable.
Item 7: Disclosure of Proxy Voting Policies and Procedures for Closed-End Management
Investment Companies.
Not Applicable.
Item 8: Portfolio Managers of Closed-End Management Investment Companies.
Not Applicable.
Item 9: Purchase of Equity Securities by Closed-End Management Investment Company and
Affiliated Purchasers.
Not Applicable.
Item 10: Submission of Matters to a Vote of Security Holders.
Not Applicable.
Item 11: Controls and Procedures.
(a) Disclosure Controls and Procedures. The Principal Executive and Financial Officers concluded that the Registrant's Disclosure Controls and Procedures are effective based on their evaluation of the Disclosure Controls and Procedures as of a date within 90 days of the filing date of this report.
(b) Internal Control Over Financial Reporting. There were no significant changes in Registrant’s Internal Control Over Financial Reporting or in other factors that could significantly affect this control subsequent to the date of the evaluation, including any corrective actions with regard to significant deficiencies and material weaknesses.
Item 12: Exhibits.
(a) Code of Ethics.
(b) Certifications.
Pursuant to the requirements of the Securities Exchange Act of 1934 and the Investment Company Act of 1940, the registrant has duly caused this report to be signed on its behalf by the undersigned, thereunto duly authorized.
| |
| | VANGUARD WINDSOR FUNDS |
| |
| |
| BY: | /s/ F. WILLIAM MCNABB III* |
| | F. WILLIAM MCNABB III |
| | CHIEF EXECUTIVE OFFICER |
| |
| Date: December 19, 2012 |
Pursuant to the requirements of the Securities Exchange Act of 1934 and the Investment Company Act of 1940, this report has been signed below by the following persons on behalf of the registrant and in the capacities and on the dates indicated.
| |
| | VANGUARD WINDSOR FUNDS |
BY: | /s/ F. WILLIAM MCNABB III* |
| | F. WILLIAM MCNABB III |
| | CHIEF EXECUTIVE OFFICER |
Date: December 19, 2012 |
| VANGUARD WINDSOR FUNDS |
BY: | /s/ THOMAS J. HIGGINS* |
| | THOMAS J. HIGGINS |
| | CHIEF FINANCIAL OFFICER |
Date: December 19, 2012 |
* By: /s/ Heidi Stam
Heidi Stam, pursuant to a Power of Attorney filed on March 27, 2012 see file Number
2-11444, Incorporated by Reference.