UNITED STATES
SECURITIES AND EXCHANGE COMMISSION
Washington, D.C. 20549
FORM N-CSR
CERTIFIED SHAREHOLDER REPORT
OF
REGISTERED MANAGEMENT INVESTMENT COMPANIES
| | |
| Investment Company Act file number: | 811-00834 |
Name of Registrant: | Vanguard Windsor Funds |
Address of Registrant: | P.O. Box 2600 |
| | Valley Forge, PA 19482 |
Name and address of agent for service: | Anne E. Robinson, Esquire |
| | P.O. Box 876 |
| | Valley Forge, PA 19482 |
Registrant’s telephone number, including area code: (610) 669-1000 |
Date of fiscal year end: October 31 | |
Date of reporting period: November 1, 2016 – October 31, 2017 |
Item 1: Reports to Shareholders | |

Annual Report | October 31, 2017
Vanguard Windsor™ Fund
Vanguard’s Principles for Investing Success
We want to give you the best chance of investment success. These principles, grounded in Vanguard’s research and experience, can put you on the right path.
Goals. Create clear, appropriate investment goals.
Balance. Develop a suitable asset allocation using broadly diversified funds.
Cost. Minimize cost.
Discipline. Maintain perspective and long-term discipline.
A single theme unites these principles: Focus on the things you can control.
We believe there is no wiser course for any investor.
| |
| Contents | |
| Your Fund’s Performance at a Glance. | 1 |
| Chairman’s Perspective. | 3 |
| Advisors’ Report. | 6 |
| Fund Profile. | 11 |
| Performance Summary. | 13 |
| Financial Statements. | 15 |
| Your Fund’s After-Tax Returns. | 31 |
| About Your Fund’s Expenses. | 32 |
| Glossary. | 34 |
Please note: The opinions expressed in this report are just that—informed opinions. They should not be considered promises
or advice. Also, please keep in mind that the information and opinions cover the period through the date on the front of this
report. Of course, the risks of investing in your fund are spelled out in the prospectus.
See the Glossary for definitions of investment terms used in this report.
About the cover: Nautical images have been part of Vanguard’s rich heritage since its start in 1975. For an
incoming ship, a lighthouse offers a beacon and safe path to shore. You can similarly depend on Vanguard to put
you first––and light the way––as you strive to meet your financial goals. Our client focus and low costs,
stemming from our unique ownership structure, assure that your interests are paramount.
Your Fund’s Performance at a Glance
• Vanguard Windsor Fund returned more than 24% for the 12 months ended October 31, 2017, exceeding the return of its benchmark, the Russell 1000 Value Index, and the average return of its peers.
• Growth stocks surpassed their value counterparts for the fiscal year, while small-capitalization stocks outpaced large-caps.
• The Windsor Fund’s two advisors aim to invest in large- and mid-cap stocks they have determined are undervalued by the marketplace. The fund posted positive returns in all of its industry sectors.
• The fund’s information technology stocks were among the top performers, returning about 40%, well ahead of those in the benchmark. They also were one of the largest contributors to performance. Financial stocks contributed most, although their returns slightly lagged those of the benchmark. Industrial stocks also performed well.
• Over the past decade, the fund’s average annual return slightly exceeded that of its expense-free benchmark and its peers.
| |
| Total Returns: Fiscal Year Ended October 31, 2017 | |
| | Total |
| | Returns |
| Vanguard Windsor Fund | |
| Investor Shares | 24.53% |
| Admiral™ Shares | 24.63 |
| Russell 1000 Value Index | 17.78 |
| Multi-Cap Value Funds Average | 19.76 |
| Multi-Cap Value Funds Average: Derived from data provided by Lipper, a Thomson Reuters Company. | |
| Admiral Shares carry lower expenses and are available to investors who meet certain account-balance requirements. | |
| |
| |
| Total Returns: Ten Years Ended October 31, 2017 | |
| | Average |
| | Annual Return |
| Windsor Fund Investor Shares | 6.28% |
| Russell 1000 Value Index | 5.99 |
| Multi-Cap Value Funds Average | 5.42 |
| Multi-Cap Value Funds Average: Derived from data provided by Lipper, a Thomson Reuters Company. | |
The figures shown represent past performance, which is not a guarantee of future results. (Current
performance may be lower or higher than the performance data cited. For performance data current to the
most recent month-end, visit our website at vanguard.com/performance.) Note, too, that both investment
returns and principal value can fluctuate widely, so an investor’s shares, when sold, could be worth more
or less than their original cost.
1
| | | |
| Expense Ratios | | | |
| Your Fund Compared With Its Peer Group | | | |
| | Investor | Admiral | Peer Group |
| | Shares | Shares | Average |
| Windsor Fund | 0.30% | 0.20% | 1.10% |
The fund expense ratios shown are from the prospectus dated February 23, 2017, and represent estimated costs for the current fiscal year.
For the fiscal year ended October 31, 2017, the fund’s expense ratios were 0.31% for Investor Shares and 0.21% for Admiral Shares. The
peer-group expense ratio is derived from data provided by Lipper, a Thomson Reuters Company, and captures information through
year-end 2016.
Peer group: Multi-Cap Value Funds.
2
Chairman’s Perspective

Bill McNabb
Chairman and Chief Executive Officer
Dear Shareholder,
When I find outstanding products or services, I’m likely to be loyal to them. And my loyalty usually gets rewarded as I experience consistently high quality––whether it’s from a favorite restaurant or a favorite author. What’s past, in most cases, is prologue.
As tempting as it is to apply this rationale to investing—for example, if technology stocks have done well this year, they’re bound to do well the next—it’s not all that helpful and can actually be counterproductive. You’ve heard it many times: Past performance cannot be used to predict future returns.
Taking a new approach
The caution about past performance is so familiar that investors are apt to treat it as mere background noise. That’s why past-performance bias merited a fresh look from Vanguard’s Investment Strategy Group, which tackled the issue last year in a research paper. (I encourage you to read the full paper, Reframing Investor Choices: Right Mindset, Wrong Market, at vanguard.com/research.)
Our strategists were hardly the first to delve into the topic, but they approached it in a new way. They started with the premise that it’s perfectly understandable for investors to lean heavily on past performance, because that works well in many areas of life. After all, as the paper describes, in lots of other industries and realms, performance from one time period
3
to another is extremely consistent. The researchers looked at everything from cars to fine restaurants to heart surgeons, and in all these examples, past performance was a good predictor of later outcomes.
It’s different with investing
In a nutshell, our brains typically are rewarded and our satisfaction is boosted when we use past performance as a guide for navigating decisions, big and small. But when applied to investing, this method breaks down.
Why? Among other reasons, top-performing asset classes one year tend not to repeat as leaders the next. Strong past performance leads to higher valuations, making an investment, all else being equal, less attractive in the future. The data are quite overwhelming in this regard.
By allowing past performance to inform their decisions, individual and institutional investors inadvertently end up as momentum investors, putting them on a treadmill of buying high and selling low.
A path to better decision-making
Of course, many investors are already aware of the pitfalls of projecting past performance into the future. The real question is, what can we all do about it? What does it take to go from having a general awareness to actually changing our behavior?
| | | |
| Market Barometer | | | |
| | | Average Annual Total Returns |
| | | Periods Ended October 31, 2017 |
| | One Year | Three Years | Five Years |
| Stocks | | | |
| Russell 1000 Index (Large-caps) | 23.67% | 10.58% | 15.18% |
| Russell 2000 Index (Small-caps) | 27.85 | 10.12 | 14.49 |
| Russell 3000 Index (Broad U.S. market) | 23.98 | 10.53 | 15.12 |
| FTSE All-World ex US Index (International) | 23.48 | 6.12 | 7.67 |
| |
| Bonds | | | |
| Bloomberg Barclays U.S. Aggregate Bond Index | | | |
| (Broad taxable market) | 0.90% | 2.40% | 2.04% |
| Bloomberg Barclays Municipal Bond Index | | | |
| (Broad tax-exempt market) | 2.19 | 3.04 | 3.00 |
| Citigroup Three-Month U.S. Treasury Bill Index | 0.71 | 0.31 | 0.20 |
| CPI | | | |
| Consumer Price Index | 2.04% | 1.28% | 1.29% |
4
Acknowledging that such change isn’t easy, our strategists offered a few ideas for reframing how investors approach their decisions. These recommendations were targeted at advisors working with clients, but they apply equally to individuals and institutions:
• Educate yourself. The more investors understand why a method that works so well in other areas of life—relying on past performance to drive decisions—doesn’t carry over to investing, the better off they’ll be.
• Be disciplined. The bias toward past performance is ingrained in everybody, professionals included, and shifting away from it can be difficult. But the long-term benefits make the effort worthwhile.
• Focus on what you can control. It’s always most constructive for investors to concentrate on what’s actually within their control, such as setting goals, following long-term portfolio construction principles, selecting low-cost investments, and rebalancing periodically.
Here’s to keeping the past in the rearview mirror. And, as always, thank you for investing with Vanguard.
Sincerely,

F. William McNabb III
Chairman and Chief Executive Officer
November 14, 2017
5
Advisors’ Report
For the fiscal year ended October 31, 2017, Investor Shares of Vanguard Windsor Fund returned 24.53%, and lower-cost Admiral Shares returned 24.63%. Your fund is managed by two independent advisors, a strategy that enhances the fund’s diversification by providing exposure to distinct yet complementary investment approaches. It is not uncommon for different advisors to have different views about individual securities or the broader investment environment.
The advisors, the percentage and amount of fund assets that each manages, and brief descriptions of their investment strategies are presented in the table below. The advisors have also prepared a discussion of the investment environment that existed during the period and of how their portfolio positioning reflects this assessment. These comments were prepared on November 16, 2017.
Wellington Management Company LLP
Portfolio Manager:
James N. Mordy, Senior Managing
Director and Equity Portfolio Manager
In a year where investors preferred growth stocks to value stocks, our portfolio was at its strongest in the first month of the fiscal year, immediately after the U.S. presidential election.
The initial “Trump bump,” which brought a surge in domestic small-capitalization stocks, value stocks, 10-year U.S. Treasury yields, and the value of the U.S. dollar,
| | | |
| Vanguard Windsor Fund Investment Advisors | | |
| |
| | Fund Assets Managed | |
| Investment Advisor | % | $ Million | Investment Strategy |
| Wellington Management | 69 | 13,529 | Seeks to provide long-term total returns above |
| Company LLP | | | both the S&P 500 and value-oriented indexes |
| | | | over a complete market cycle through |
| | | | bottom-up, fundamentally driven stock |
| | | | selection focused on undervalued securities. |
| Pzena Investment Management, | 30 | 5,748 | Uses a fundamental, bottom-up, |
| LLC | | | deep-value-oriented investment strategy. Seeks |
| | | | to buy good businesses at low prices, focusing |
| | | | exclusively on companies that are |
| | | | underperforming their historically demonstrated |
| | | | earnings power. |
| Cash Investments | 1 | 280 | These short-term reserves are invested by |
| | | | Vanguard in equity index products to simulate |
| | | | investment in stocks. Each advisor also may |
| | | | maintain a modest cash position. |
6
was not sustained throughout the year. The inability of Congress to overhaul the Affordable Care Act was one major reason investors began to discount much of the Trump agenda.
Continued global economic growth and higher corporate earnings provided support for markets, which avoided any damaging trade or geopolitical events. Oil prices firmed toward the end of the fiscal year as global inventories began to decline on healthy demand growth. The Federal Open Market Committee raised the target for the federal funds rate three times during the 12 months and began a period of gradual tightening by reducing its balance sheet.
All 11 sectors of the Standard & Poor’s 500 Index had positive returns, though there was wide dispersion. Information technology, financials, and materials each returned over 30%, while energy, consumer staples, real estate, and telecommunication services lagged with single-digit returns.
Sector allocation was positive. We benefited from an overweight allocation to financials and an underweight to consumer staples. This more than offset the adverse effects of an underweight in technology, overweights in energy and real estate, and some drag from our cash position. We thought we might have the opportunity to put some cash to work on any correction, but remarkably, the biggest pullback during the fiscal year amounted to less than 3% during March and part of April.
Stock selection was strongest in information technology and materials. Our semiconductor and semiconductor equipment stocks, notably Micron Technologies and Lam Research, drove positive relative results in technology. Within materials, chemicals producer Celanese was the largest contributor; it continues to grow earnings at a rate of more than 10%. The company was managed effectively through hurricane disruption in the fall, saw good opportunities to reinvest in its business at high returns, and announced a joint venture for its least attractive business (acetate tow) that will produce synergies and generate a large cash payment back to Celanese.
We had weaker selection in health care and energy. Our top detractors in health care included Teva, a relatively small position that dropped 57%, and Allergan, a larger position that fell almost 15%. We eliminated Teva at a loss, though the stock has since halved again. We underappreci-ated the Food and Drug Administration’s desire to accelerate new generic approvals, which disproportionately benefited Teva’s competitors.
Allergan is more perplexing. Not only do we believe that a significant portion of its base business is relatively insulated from severe price competition, but we also see substantial value in the company’s pipeline that is not reflected in the stock. We have been adding on weakness. HCA Health-care also underperformed. Industry volumes have disappointed all year, even before any hurricane disruption.
7
Our small overweight to energy, which was the worst-performing sector in the broad market, weighed on relative results. To make matters worse, our holdings failed to keep up with the sector’s modest return in the index. Pioneer Natural Resources, our largest energy holding, was negatively affected by unforeseen pressure changes in some of its Permian Basin oil wells. To remedy this, the company had to add an additional casing string at a substantial cost per well. Although this isn’t a game changer, it has dented Pioneer’s reputation with investors.
During the fiscal year, we were net buyers in the consumer staples, telecommunication services, and utilities sectors; we were net sellers in financials, health care, consumer discretionary, and information technology. In the last six months we have added to the energy sector on weakness as investors became impatient with rising global oil inventories. At the end of the period we were modestly overweighted in the more cyclical sectors (energy, materials, consumer discretionary, information technology, financials, and industrials) in aggregate, which together account for almost 70% of the S&P 500. This is a bit less overweighted than we were a year ago, as we have leaned against groups such as financials and technology, which have led the market’s advance.
U.S. economic growth has firmed following another sluggish start to the year. The hurricanes have added some volatility to recent data, but the Purchasing Managers Indexes have remained strong, and unemployment has ticked down. Global indicators have also remained at healthy levels. Wellington’s macroeconomists continue to expect GDP growth in 2018, with some pickup in wages and inflation. Productivity trends need improvement to keep the Fed from tightening more aggressively, and the Federal Reserve’s balance sheet runoff should lead to higher rates and increased volatility. Our macro group suggests healthy GDP growth and fiscal stimulus from a reduction in federal taxes seem likely, although the timing is obviously uncertain while Congress debates the details.
Although we do not expect to see returns over 20% in the year ahead, we believe our portfolio still offers relatively compelling value. Our portion of the fund nearly matches the market in terms of yield, while maintaining its traditional valuation discount and growth potential. On the whole, we own well-managed companies with reasonable growth prospects. If we have done our homework right, we believe Windsor Fund shareholders will be rewarded. As always, we thank you for your confidence in our management of your assets.
8
Pzena Investment Management, LLC
Portfolio Managers:
Richard Pzena, Managing Principal and
Co-Chief Investment Officer
John J. Flynn, Principal
Benjamin S. Silver, CFA, CPA, Principal
Stock markets continued to hit record highs this year, driven by continued strength in emerging markets, strong U.S. growth, and a recovery in Europe. The Russell 1000 Value Index was up 17.8%, led by financials and information technology; energy and telecommunication services detracted most. Our portfolio benefited from a significant overweight allocation to financials, as well as strong stock selection in energy and industrials.
Financials was led by our holdings in money center banks and investment banks. These institutions passed the Federal Reserve’s “stress tests” and were allowed to return capital to shareholders, sometimes in excess of earnings. In energy, Royal Dutch Shell benefited from recovering oil prices that allowed it to sell more than $20 billion in assets to pay down debt and cover its dividend in cash. Within health care, Cigna contributed to results after the termination of a merger with Anthem enabled a massive stock buyback.
Our largest detractors included global advertising firm Omnicom Group; Cenovus Energy, a leading Canadian oil sands company; and QUALCOMM, one of the world’s largest semiconductor designers and manufacturers. Omnicom declined amid continued slow organic growth across the industry; cost cutting by its largest consumer product clients hurt revenue. Cenovus shares were weak as the company continued to digest an acquisition in its oil sands joint venture, and QUALCOMM was hurt by its ongoing legal dispute with Apple, one of its clients. We added to Cenovus and Omnicom, as we believe our investment thesis remains intact despite near-term challenges.
The most significant changes in the portfolio were an increase in health care exposure and a decrease in industrial exposure. In health care, pricing pressures affected both pharmaceutical manufacturers and distributors, causing problems across the supply chain. These names became inexpensive by our measure, and our research led us to Mylan, one of the world’s largest manufacturers of generic drugs, whose stock fell as its EpiPen product came under scrutiny for aggressive pricing actions; McKesson, the largest U.S. distributor of pharmaceuticals and medical supplies, which experienced margin pressure compounded by aggressive pricing competition; and Express Scripts, a leading pharmacy benefits manager, which weakened on news that its largest customer was suing the company and would not renew its contract.
9
We also built up a position in Cognizant, a U.S.-listed Indian IT services company, on fears of an industry slowdown. To fund these purchases, we reduced our exposure to Parker Hannifin and Stanley Black & Decker as they hit fair value, and we trimmed our financial holdings on strength.
The portfolio’s largest exposures are in the financial, information technology, energy, health care, and consumer discretionary sectors. At almost 40% of the portfolio’s weight, financials continue to be our largest exposure, as we see these businesses offering the best risk/ reward trade-off in our investment universe. Our information technology exposure includes a mix of incumbent enterprise, software, and services companies adapting to the world of cloud computing. Consumer discretionary holdings are mainly in advertising and media and autos, while our energy holdings are tilted toward integrated energy companies.
Global economic growth appears to have become more synchronous and, on balance, corporate profits announcements have surprised on the upside. We believe this combination of wide valuation spreads and improving fundamentals provides significant opportunity for value stocks, and we believe our portfolio allows for attractive returns in an increasingly pricey market.
10
Windsor Fund
Fund Profile
As of October 31, 2017
| | |
| Share-Class Characteristics | |
| | Investor | Admiral |
| | Shares | Shares |
| Ticker Symbol | VWNDX | VWNEX |
| Expense Ratio1 | 0.30% | 0.20% |
| 30-Day SEC Yield | 1.58% | 1.68% |
| | | |
| Portfolio Characteristics | | |
| | | | DJ |
| | | | U.S. |
| | | Russell | Total |
| | | 1000 | Market |
| | | Value | FA |
| | Fund | Index | Index |
| Number of Stocks | 140 | 714 | 3,787 |
| Median Market Cap | $34.1B | $62.0B | $62.0B |
| Price/Earnings Ratio | 19.2x | 18.9x | 22.0x |
| Price/Book Ratio | 2.0x | 2.0x | 2.9x |
| Return on Equity | 12.4% | 11.5% | 15.1% |
| Earnings Growth | | | |
| Rate | 7.6% | 6.4% | 9.8% |
| Dividend Yield | 1.9% | 2.4% | 1.8% |
| Foreign Holdings | 6.1% | 0.0% | 0.0% |
| Turnover Rate | 26% | — | — |
| Short-Term Reserves | 1.1% | — | — |
| | | |
| Sector Diversification (% of equity exposure) |
| | | Russell | DJ |
| | | 1000 | U.S. Total |
| | | Value | Market |
| | Fund | Index | FA Index |
| Consumer Discretionary | 9.1% | 6.7% | 12.2% |
| Consumer Staples | 4.9 | 8.4 | 7.1 |
| Energy | 8.8 | 10.7 | 5.6 |
| Financials | 25.1 | 26.6 | 15.1 |
| Health Care | 12.0 | 13.7 | 13.5 |
| Industrials | 9.0 | 8.4 | 10.7 |
| Information Technology | 19.1 | 8.6 | 23.5 |
| Materials | 3.4 | 2.9 | 3.5 |
| Real Estate | 3.8 | 4.8 | 3.9 |
| Telecommunication | | | |
| Services | 1.9 | 2.8 | 1.7 |
| Utilities | 2.9 | 6.4 | 3.2 |
Sector categories are based on the Global Industry Classification
Standard (“GICS”), except for the “Other” category (if applicable),
which includes securities that have not been provided a GICS
classification as of the effective reporting period.
| | |
| Volatility Measures | | |
| | Russell | DJ |
| | 1000 | U.S. Total |
| | Value | Market |
| | Index | FA Index |
| R-Squared | 0.92 | 0.92 |
| Beta | 1.14 | 1.14 |
These measures show the degree and timing of the fund’s
fluctuations compared with the indexes over 36 months.
1 The expense ratios shown are from the prospectus dated February 23, 2017, and represent estimated costs for the current fiscal year. For the
fiscal year ended October 31, 2017, the expense ratios were 0.31% for Investor Shares and 0.21% for Admiral Shares.
11
Windsor Fund
Ten Largest Holdings (% of total net assets)
| | |
| Bank of America Corp. | Diversified Banks | 2.3% |
| Citigroup Inc. | Diversified Banks | 2.3 |
| American International | | |
| Group Inc. | Multi-line Insurance | 2.0 |
| Bristol-Myers Squibb Co. | Pharmaceuticals | 1.9 |
| Broadcom Ltd. | Semiconductors | 1.8 |
| XL Group Ltd. | Property & Casualty | |
| | Insurance | 1.7 |
| MetLife Inc. | Life & Health | |
| | Insurance | 1.7 |
| Arrow Electronics Inc. | Technology | |
| | Distributors | 1.6 |
| Lam Research Corp. | Semiconductors | 1.6 |
| QUALCOMM Inc. | Semiconductors | 1.5 |
| Top Ten | | 18.4% |
The holdings listed exclude any temporary cash investments and
equity index products.
Investment Focus

12
Windsor Fund
Performance Summary
All of the returns in this report represent past performance, which is not a guarantee of future results that may be achieved by the fund. (Current performance may be lower or higher than the performance data cited. For performance data current to the most recent month-end, visit our website at vanguard.com/performance.) Note, too, that both investment returns and principal value can fluctuate widely, so an investor’s shares, when sold, could be worth more or less than their original cost. The returns shown do not reflect taxes that a shareholder would pay on fund distributions or on the sale of fund shares.
Cumulative Performance: October 31, 2007, Through October 31, 2017
Initial Investment of $10,000
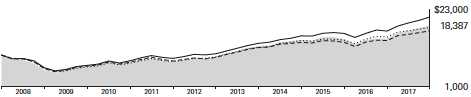
| | | | | |
| | Average Annual Total Returns | |
| | Periods Ended October 31, 2017 | |
| | | | | Final Value |
| | One | Five | Ten | of a $10,000 |
| | | Year | Years | Years | Investment |
 | Windsor Fund Investor Shares | 24.53% | 14.64% | 6.28% | $18,387 |
 | Russell 1000 Value Index | 17.78 | 13.48 | 5.99 | 17,893 |
 | Multi-Cap Value Funds Average | 19.76 | 12.65 | 5.42 | 16,956 |
 | Dow Jones U.S. Total Stock Market | | | | |
| | Float Adjusted Index | 23.96 | 15.05 | 7.67 | 20,939 |
Multi-Cap Value Funds Average: Derived from data provided by Lipper, a Thomson Reuters Company.
| | | | |
| | | | | Final Value |
| | One | Five | Ten | of a $50,000 |
| | Year | Years | Years | Investment |
| Windsor Fund Admiral Shares | 24.63% | 14.75% | 6.39% | $92,902 |
| Russell 1000 Value Index | 17.78 | 13.48 | 5.99 | 89,464 |
| Dow Jones U.S. Total Stock Market Float | | | | |
| Adjusted Index | 23.96 | 15.05 | 7.67 | 104,695 |
See Financial Highlights for dividend and capital gains information.
13
Windsor Fund
Fiscal-Year Total Returns (%): October 31, 2007, Through October 31, 2017

| | |
 | Windsor Fund Investor Shares |
 | Russell 1000 Value Index |
Average Annual Total Returns: Periods Ended September 30, 2017
This table presents returns through the latest calendar quarter—rather than through the end of the fiscal period.
Securities and Exchange Commission rules require that we provide this information.
| | | | |
| | Inception | One | Five | Ten |
| | Date | Year | Years | Years |
| Investor Shares | 10/23/1958 | 20.31% | 14.22% | 6.17% |
| Admiral Shares | 11/12/2001 | 20.42 | 14.34 | 6.28 |
14
Windsor Fund
Financial Statements
Statement of Net Assets
As of October 31, 2017
The fund reports a complete list of its holdings in regulatory filings four times in each fiscal year, at the quarter-ends. For the second and fourth fiscal quarters, the lists appear in the fund’s semiannual and annual reports to shareholders. For the first and third fiscal quarters, the fund files the lists with the Securities and Exchange Commission on Form N-Q. Shareholders can look up the fund’s Forms N-Q on the SEC’s website at sec.gov. Forms N-Q may also be reviewed and copied at the SEC’s Public Reference Room (see the back cover of this report for further information).
| | | |
| | | | Market |
| | | | Value• |
| | | Shares | ($000) |
| Common Stocks (97.9%)1 | | |
| Consumer Discretionary (8.9%) | |
| | DR Horton Inc. | 4,360,000 | 192,756 |
| | Newell Brands Inc. | 3,920,930 | 159,896 |
| * | Norwegian Cruise Line | | |
| | Holdings Ltd. | 2,751,956 | 153,422 |
| | Ford Motor Co. | 9,896,973 | 121,436 |
| | SES SA Class A | 7,193,853 | 117,002 |
| | Omnicom Group Inc. | 1,662,541 | 111,706 |
| | Goodyear Tire & Rubber | | |
| | Co. | 3,516,600 | 107,573 |
| | Hilton Worldwide | | |
| | Holdings Inc. | 1,450,516 | 104,843 |
| | Expedia Inc. | 774,866 | 96,595 |
| | Toll Brothers Inc. | 1,905,500 | 87,729 |
| | TJX Cos. Inc. | 1,153,062 | 80,484 |
| | Delphi Automotive plc | 779,889 | 77,505 |
| | Lennar Corp. Class A | 1,209,518 | 67,334 |
| | VF Corp. | 957,339 | 66,679 |
| | News Corp. Class A | 4,001,857 | 54,665 |
| | Interpublic Group of | | |
| | Cos. Inc. | 2,254,250 | 43,394 |
| | General Motors Co. | 990,700 | 42,580 |
| | Lowe’s Cos. Inc. | 485,000 | 38,776 |
| | Kohl’s Corp. | 343,475 | 14,343 |
| | | | 1,738,718 |
| Consumer Staples (4.8%) | | |
| | British American | | |
| | Tobacco plc | 3,521,979 | 227,557 |
| | Wal-Mart Stores Inc. | 1,856,423 | 162,084 |
| | Ingredion Inc. | 1,272,450 | 159,502 |
| * | Post Holdings Inc. | 1,699,630 | 140,950 |
| | Coty Inc. Class A | 6,705,918 | 103,271 |
| | Kroger Co. | 2,887,700 | 59,775 |
| | CVS Health Corp. | 688,190 | 47,162 |
| | Kellogg Co. | 625,000 | 39,081 |
| | | | 939,382 |
| | | |
| | | | Market |
| | | | Value• |
| | | Shares | ($000) |
| Energy (8.7%) | | |
| | Royal Dutch Shell plc | | |
| | ADR | 4,201,850 | 264,843 |
| | Pioneer Natural | | |
| | Resources Co. | 1,548,807 | 231,810 |
| | Halliburton Co. | 4,762,612 | 203,554 |
| * | Concho Resources Inc. | 1,260,375 | 169,155 |
| | Anadarko Petroleum | | |
| | Corp. | 3,055,385 | 150,844 |
| | Exxon Mobil Corp. | 1,713,960 | 142,858 |
| | BP plc ADR | 3,467,825 | 141,036 |
| | Cimarex Energy Co. | 616,900 | 72,134 |
| | Canadian Natural | | |
| | Resources Ltd. | 1,882,368 | 65,695 |
| | Cenovus Energy Inc. | 6,621,254 | 64,359 |
| | HollyFrontier Corp. | 1,556,600 | 57,516 |
| | Murphy Oil Corp. | 1,836,625 | 49,130 |
| | Valero Energy Corp. | 482,200 | 38,041 |
| | ConocoPhillips | 623,317 | 31,883 |
| | Baker Hughes a GE Co. | 404,150 | 12,702 |
| | | | 1,695,560 |
| Financials (24.7%) | | |
| | Bank of America Corp. | 16,654,057 | 456,155 |
| | Citigroup Inc. | 6,096,114 | 448,064 |
| | American International | | |
| | Group Inc. | 6,030,951 | 389,660 |
| | XL Group Ltd. | 8,345,811 | 337,755 |
| | MetLife Inc. | 6,175,575 | 330,887 |
| | Wells Fargo & Co. | 4,920,755 | 276,251 |
| | Unum Group | 4,304,869 | 224,025 |
| | PNC Financial Services | | |
| | Group Inc. | 1,402,732 | 191,880 |
| | JPMorgan Chase & Co. | 1,854,541 | 186,585 |
| | Comerica Inc. | 2,347,935 | 184,477 |
| | Arthur J Gallagher & Co. | 2,391,500 | 151,454 |
| | Principal Financial Group | | |
| | Inc. | 2,139,573 | 140,891 |
15
| | | |
| Windsor Fund | | |
| |
| |
| |
| | | | Market |
| | | | Value• |
| | | Shares | ($000) |
| | Intercontinental | | |
| | Exchange Inc. | 1,995,245 | 131,886 |
| | Capital One Financial | | |
| | Corp. | 1,315,719 | 121,283 |
| | Morgan Stanley | 2,395,936 | 119,797 |
| | Goldman Sachs Group | | |
| | Inc. | 493,525 | 119,670 |
| | Voya Financial Inc. | 2,893,875 | 116,218 |
| | Franklin Resources Inc. | 2,695,150 | 113,547 |
| | State Street Corp. | 1,023,350 | 94,148 |
| | Regions Financial Corp. | 5,913,150 | 91,535 |
| | UBS Group AG | 5,063,558 | 86,131 |
| | Axis Capital Holdings | | |
| | Ltd. | 1,418,271 | 77,140 |
| | Allstate Corp. | 711,097 | 66,744 |
| | M&T Bank Corp. | 383,853 | 64,015 |
| | Fifth Third Bancorp | 2,159,384 | 62,406 |
| | Citizens Financial Group | | |
| | Inc. | 1,542,220 | 58,620 |
| | KeyCorp | 3,143,625 | 57,371 |
| | Zions Bancorporation | 853,160 | 39,638 |
| | Willis Towers Watson plc | 205,562 | 33,112 |
| * | Brighthouse Financial Inc. | 491,642 | 30,570 |
| | Invesco Ltd. | 695,225 | 24,882 |
| | | | 4,826,797 |
| Health Care (11.7%) | | |
| | Bristol-Myers Squibb | | |
| | Co. | 5,924,316 | 365,293 |
| | UnitedHealth Group Inc. | 1,364,192 | 286,781 |
| * | Mylan NV | 6,853,178 | 244,727 |
| | Medtronic plc | 2,953,095 | 237,783 |
| | McKesson Corp. | 1,207,827 | 166,535 |
| | Allergan plc | 837,267 | 148,389 |
| | Merck & Co. Inc. | 2,653,695 | 146,192 |
| | Cigna Corp. | 671,247 | 132,383 |
| * | HCA Healthcare Inc. | 1,635,349 | 123,714 |
| * | Biogen Inc. | 375,329 | 116,975 |
| | Pfizer Inc. | 3,236,417 | 113,469 |
| * | Express Scripts Holding | | |
| | Co. | 1,328,137 | 81,402 |
| | Eli Lilly & Co. | 899,440 | 73,700 |
| | Cardinal Health Inc. | 822,527 | 50,914 |
| | | | 2,288,257 |
| Industrials (8.7%) | | |
| | Eaton Corp. plc | 3,415,629 | 273,319 |
| | Honeywell International | | |
| | Inc. | 1,423,134 | 205,159 |
| * | IHS Markit Ltd. | 4,143,283 | 176,545 |
| | Raytheon Co. | 932,147 | 167,973 |
| | Dover Corp. | 1,596,742 | 152,473 |
| * | Sensata Technologies | | |
| | Holding NV | 2,859,531 | 139,860 |
| | JB Hunt Transport | | |
| | Services Inc. | 1,177,100 | 125,232 |
| | | |
| | | | Market |
| | | | Value• |
| | | Shares | ($000) |
| | Parker-Hannifin Corp. | 551,185 | 100,652 |
| | Stanley Black & Decker | | |
| | Inc. | 579,053 | 93,546 |
| * | Knight-Swift | | |
| | Transportation | | |
| | Holdings Inc. | 1,864,984 | 77,304 |
| | American Airlines | | |
| | Group Inc. | 1,443,582 | 67,588 |
| | Schneider National Inc. | | |
| | Class B | 2,348,600 | 61,510 |
| | Kansas City Southern | 380,698 | 39,676 |
| | L3 Technologies Inc. | 166,050 | 31,081 |
| | | | 1,711,918 |
| Information Technology (18.6%) | |
| | Broadcom Ltd. | 1,340,259 | 353,708 |
| * | Arrow Electronics Inc. | 3,777,344 | 315,748 |
| | Lam Research Corp. | 1,463,999 | 305,346 |
| | QUALCOMM Inc. | 5,701,307 | 290,824 |
| | Harris Corp. | 1,870,115 | 260,544 |
| * | Micron Technology Inc. | 5,022,807 | 222,561 |
| | Apple Inc. | 1,316,317 | 222,510 |
| | Cisco Systems Inc. | 5,267,987 | 179,902 |
| | Oracle Corp. | 3,473,300 | 176,791 |
| ^,* | VeriSign Inc. | 1,592,242 | 171,198 |
| | Skyworks Solutions Inc. | 1,377,465 | 156,838 |
| * | Keysight Technologies | | |
| | Inc. | 3,381,000 | 151,029 |
| | KLA-Tencor Corp. | 1,290,646 | 140,539 |
| * | CommScope Holding | | |
| | Co. Inc. | 4,107,039 | 132,000 |
| | Hewlett Packard | | |
| | Enterprise Co. | 9,133,464 | 127,138 |
| | Cognizant Technology | | |
| | Solutions Corp. | | |
| | Class A | 1,364,386 | 103,243 |
| | Microsoft Corp. | 1,222,875 | 101,719 |
| | TE Connectivity Ltd. | 721,024 | 65,592 |
| ^ | Seagate Technology plc | 1,297,862 | 47,982 |
| * | Alphabet Inc. Class A | 45,706 | 47,216 |
| | Micro Focus | | |
| | International plc ADR | 1,254,263 | 43,811 |
| * | NXP Semiconductors NV | 186,262 | 21,802 |
| | | | 3,638,041 |
| Materials (3.4%) | | |
| | Celanese Corp. Class A | 2,178,482 | 227,237 |
| | International Paper Co. | 3,037,700 | 173,969 |
| | PPG Industries Inc. | 1,272,021 | 147,860 |
| * | Alcoa Corp. | 2,293,800 | 109,598 |
| | | | 658,664 |
| Other (0.3%) | | |
| 2 | Vanguard Value ETF | 703,525 | 71,513 |
16
| | |
| Windsor Fund | | |
| |
| |
| |
| | | Market |
| | | Value• |
| | Shares | ($000) |
| Real Estate (3.4%) | | |
| American Tower Corp. | 1,687,065 | 242,380 |
| Weyerhaeuser Co. | 6,113,841 | 219,548 |
| Public Storage | 588,978 | 122,066 |
| Boston Properties Inc. | 625,028 | 75,741 |
| | | 659,735 |
| Telecommunication Services (1.8%) | |
| Verizon Communications | | |
| Inc. | 3,500,304 | 167,560 |
| Nippon Telegraph & | | |
| Telephone Corp. | 3,341,700 | 161,563 |
| AT&T Inc. | 815,225 | 27,432 |
| | | 356,555 |
| Utilities (2.9%) | | |
| NextEra Energy Inc. | 1,210,920 | 187,777 |
| Sempra Energy | 918,100 | 107,877 |
| PG&E Corp. | 1,761,148 | 101,742 |
| Edison International | 852,150 | 68,129 |
| Avangrid Inc. | 1,258,907 | 65,123 |
| Entergy Corp. | 367,502 | 31,701 |
| | | 562,349 |
| Total Common Stocks | | |
| (Cost $13,674,682) | | 19,147,489 |
| Temporary Cash Investments (2.3%)1 | |
| Money Market Fund (1.3%) | | |
| 3,4 Vanguard Market | | |
| Liquidity Fund, | | |
| 1.246% | 2,412,406 | 241,265 |
| |
| | Face | |
| | Amount | |
| | ($000) | |
| Repurchase Agreement (0.6%) | |
| Bank of America | | |
| Securities, LLC 1.070%, | | |
| 11/1/17 (Dated 10/31/17, | | |
| Repurchase Value | | |
| $122,204,000, | | |
| collateralized by | | |
| Government National | | |
| Mortgage Assn. | | |
| 3.500%–4.000%, | | |
| 9/20/44–7/20/46, | | |
| with a value of | | |
| $124,644,000) | 122,200 | 122,200 |
| | | |
| | | Face | Market |
| | | Amount | Value • |
| | | ($000) | ($000) |
| U.S. Government and Agency Obligations (0.4%) |
| 5 | Fannie Mae Discount | | |
| | Notes, 1.012%, 12/18/17 | 75,000 | 74,899 |
| 6 | United States Cash | | |
| | Management Bill, | | |
| | 1.048%, 1/2/18 | 2,000 | 1,996 |
| 6 | United States Treasury Bill, | | |
| | 1.056%, 11/24/17 | 5,000 | 4,997 |
| 6 | United States Treasury Bill, | | |
| | 1.108%, 2/1/18 | 1,500 | 1,496 |
| | | | 83,388 |
| Total Temporary Cash Investments | |
| (Cost $446,869) | | 446,853 |
| Total Investments (100.2%) | | |
| (Cost $14,121,551) | | 19,594,342 |
| |
| | | | Amount |
| | | | ($000) |
| Other Assets and Liabilities (-0.2%) | |
| Other Assets | | |
| Investment in Vanguard | | 1,190 |
| Receivables for Investment Securities Sold 52,593 |
| Receivables for Accrued Income | 14,032 |
| Receivables for Capital Shares Issued | 3,404 |
| Variation Margin Receivable – | | |
| | Futures Contracts | | 363 |
| Unrealized Appreciation – | | |
| | Forwards Contracts | | 4,883 |
| Other Assets | | 264 |
| Total Other Assets | | 76,729 |
| Liabilities | | |
| Payables for Investment Securities | |
| | Purchased | | (61,971) |
| Collateral for Securities on Loan | | (12,996) |
| Payables for Capital Shares Redeemed | (7,793) |
| Payables to Vanguard | | (30,956) |
| Other Liabilities | | (280) |
| Total Liabilities | | (113,996) |
| Net Assets (100%) | | 19,557,075 |
17
Windsor Fund
| |
| At October 31, 2017, net assets consisted of: |
| | Amount |
| | ($000) |
| Paid-in Capital | 13,468,704 |
| Undistributed Net Investment Income | 77,872 |
| Accumulated Net Realized Gains | 529,871 |
| Unrealized Appreciation (Depreciation) | |
| Investment Securities | 5,472,791 |
| Futures Contracts | 2,980 |
| Forward Currency Contracts | 4,883 |
| Foreign Currencies | (26) |
| Net Assets | 19,557,075 |
| |
| |
| Investor Shares—Net Assets | |
| Applicable to 222,010,953 outstanding |
| $.001 par value shares of beneficial | |
| interest (unlimited authorization) | 5,190,930 |
| Net Asset Value Per Share— | |
| Investor Shares | $23.38 |
| |
| | Amount |
| | ($000) |
| Admiral Shares—Net Assets | |
| Applicable to 182,131,530 outstanding | |
| $.001 par value shares of beneficial | |
| interest (unlimited authorization) | 14,366,145 |
| Net Asset Value Per Share— | |
| Admiral Shares | $78.88 |
• See Note A in Notes to Financial Statements.
^ Includes partial security positions on loan to broker-dealers.
The total value of securities on loan is $12,676,000.
* Non-income-producing security.
1 The fund invests a portion of its cash reserves in equity
markets through the use of index futures contracts. After
giving effect to futures investments, the fund’s effective
common stock and temporary cash investment positions
represent 99.0% and 1.2%, respectively, of net assets.
2 Considered an affiliated company of the fund as the issuer
is another member of The Vanguard Group.
3 Affiliated money market fund available only to Vanguard funds
and certain trusts and accounts managed by Vanguard. Rate
shown is the 7-day yield.
4 Includes $12,996,000 of collateral received for securities
on loan.
5 The issuer operates under a congressional charter; its
securities are generally neither guaranteed by the U.S.
Treasury nor backed by the full faith and credit of the
U.S. government.
6 Securities with a value of $7,890,000 have been segregated
as initial margin for open futures contracts.
ADR—American Depositary Receipt.
| | | | |
| Derivative Financial Instruments Outstanding as of Period End | | |
| |
| Futures Contracts | | | | |
| | | | | ($000) |
| | | | | Value and |
| | | Number of | | Unrealized |
| | | Long (Short) | Notional | Appreciation |
| | Expiration | Contracts | Amount | (Depreciation) |
| Long Futures Contracts | | | | |
| E-mini S&P 500 Index | December 2017 | 1,652 | 212,505 | 2,980 |
Unrealized appreciation (depreciation) on open futures contracts is required to be treated as realized
gain (loss) for tax purposes.
18
| | | | | |
| Windsor Fund | | | | | |
| |
| |
| |
| Forward Currency Contracts | | | | | |
| | | | | | Unrealized |
| | Contract | | | | Appreciation |
| | Settlement | | | Contract Amount (000) | (Depreciation) |
| Counterparty | Date | | Receive | Deliver | ($000) |
| Barclays Bank | 12/20/17 | USD | 149,183 | JPY | 16,364,746 | 4,883 |
| JPY—Japanese yen. | | | | | |
| USD—U.S. dollar. | | | | | |
Unrealized appreciation (depreciation) on open forward currency contracts is treated as realized gain
(loss) for tax purposes.
See accompanying Notes, which are an integral part of the Financial Statements.
19
Windsor Fund
Statement of Operations
| |
| | Year Ended |
| | October 31, 2017 |
| | ($000) |
| Investment Income | |
| Income | |
| Dividends1,2 | 358,704 |
| Interest 2 | 3,705 |
| Securities Lending—Net | 478 |
| Total Income | 362,887 |
| Expenses | |
| Investment Advisory Fees—Note B | |
| Basic Fee | 23,478 |
| Performance Adjustment | (8,480) |
| The Vanguard Group—Note C | |
| Management and Administrative—Investor Shares | 10,884 |
| Management and Administrative—Admiral Shares | 16,063 |
| Marketing and Distribution—Investor Shares | 654 |
| Marketing and Distribution—Admiral Shares | 690 |
| Custodian Fees | 160 |
| Auditing Fees | 47 |
| Shareholders’ Reports and Proxy—Investor Shares | 347 |
| Shareholders’ Reports and Proxy—Admiral Shares | 152 |
| Trustees’ Fees and Expenses | 33 |
| Total Expenses | 44,028 |
| Net Investment Income | 318,859 |
| Realized Net Gain (Loss) | |
| Investment Securities Sold 2 | 531,696 |
| Futures Contracts | 26,517 |
| Foreign Currencies and Forward Currency Contracts | (1,406) |
| Realized Net Gain (Loss) | 556,807 |
| Change in Unrealized Appreciation (Depreciation) | |
| Investment Securities 2 | 3,085,432 |
| Futures Contracts | 3,512 |
| Foreign Currencies and Forward Currency Contracts | 4,997 |
| Change in Unrealized Appreciation (Depreciation) | 3,093,941 |
| Net Increase (Decrease) in Net Assets Resulting from Operations | 3,969,607 |
1 Dividends are net of foreign withholding taxes of $3,044,000.
2 Dividend income, interest income, realized net gain (loss), and change in unrealized appreciation (depreciation) from affiliated
companies of the fund were $1,748,000, $1,927,000, $1,000, and $10,956,000, respectively.
See accompanying Notes, which are an integral part of the Financial Statements.
20
Windsor Fund
Statement of Changes in Net Assets
| | |
| | Year Ended October 31, |
| | 2017 | 2016 |
| | ($000) | ($000) |
| Increase (Decrease) in Net Assets | | |
| Operations | | |
| Net Investment Income | 318,859 | 345,737 |
| Realized Net Gain (Loss) | 556,807 | 562,705 |
| Change in Unrealized Appreciation (Depreciation) | 3,093,941 | (708,628) |
| Net Increase (Decrease) in Net Assets Resulting from Operations | 3,969,607 | 199,814 |
| Distributions | | |
| Net Investment Income | | |
| Investor Shares | (103,547) | (81,017) |
| Admiral Shares | (270,719) | (198,361) |
| Realized Capital Gain1 | | |
| Investor Shares | (142,531) | (320,822) |
| Admiral Shares | (349,849) | (735,205) |
| Total Distributions | (866,646) | (1,335,405) |
| Capital Share Transactions | | |
| Investor Shares | (587,639) | (142,180) |
| Admiral Shares | 443,152 | 291,237 |
| Net Increase (Decrease) from Capital Share Transactions | (144,487) | 149,057 |
| Total Increase (Decrease) | 2,958,474 | (986,534) |
| Net Assets | | |
| Beginning of Period | 16,598,601 | 17,585,135 |
| End of Period2 | 19,557,075 | 16,598,601 |
1 Includes fiscal 2017 and 2016 short-term gain distributions totaling $0 and $9,986,000, respectively. Short-term gain distributions
are treated as ordinary income dividends for tax purposes.
2 Net Assets—End of Period includes undistributed (overdistributed) net investment income of $77,872,000 and $132,516,000.
See accompanying Notes, which are an integral part of the Financial Statements.
21
Windsor Fund
Financial Highlights
| | | | | |
| Investor Shares | | | | | |
| | | | | |
| For a Share Outstanding | | | Year Ended October 31, |
| Throughout Each Period | 2017 | 2016 | 2015 | 2014 | 2013 |
| Net Asset Value, Beginning of Period | $19.70 | $21.06 | $21.98 | $19.50 | $14.66 |
| Investment Operations | | | | | |
| Net Investment Income | . 3631 | .394 | .3562 | .279 | .255 |
| Net Realized and Unrealized Gain (Loss) | | | | | |
| on Investments | 4.345 | (.168) | .026 | 2.467 | 4.839 |
| Total from Investment Operations | 4.708 | .226 | .382 | 2.746 | 5.094 |
| Distributions | | | | | |
| Dividends from Net Investment Income | (. 433) | (. 317) | (. 339) | (. 266) | (. 254) |
| Distributions from Realized Capital Gains | (.595) | (1.269) | (.963) | — | — |
| Total Distributions | (1.028) | (1.586) | (1.302) | (.266) | (.254) |
| Net Asset Value, End of Period | $23.38 | $19.70 | $21.06 | $21.98 | $19.50 |
| Total Return3 | 24.53% | 1.27% | 1.76% | 14.14% | 35.17% |
| Ratios/Supplemental Data | | | | | |
| Net Assets, End of Period (Millions) | $5,191 | $4,896 | $5,379 | $7,179 | $7,126 |
| Ratio of Total Expenses to Average Net Assets4 | 0.31% | 0.30% | 0.39% | 0.38% | 0.37% |
| Ratio of Net Investment Income | | | | | |
| to Average Net Assets | 1.66% | 2.01% | 1.64%2 | 1.33% | 1.49% |
| Portfolio Turnover Rate | 26% | 26% | 28% | 38% | 40% |
1 Calculated based on average shares outstanding.
2 Net investment income per share and the ratio of net investment income to average net assets include $.052 and 0.24%, respectively,
resulting from income received from Covidien Ltd. in January 2015.
3 Total returns do not include account service fees that may have applied in the periods shown. Fund prospectuses provide information
about any applicable account service fees.
4 Includes performance-based investment advisory fee increases (decreases) of (0.05%), (0.06%), 0.03%, 0.03%, and 0.02%.
See accompanying Notes, which are an integral part of the Financial Statements.
22
| | | | | |
| Windsor Fund | | | | | |
| |
| |
| Financial Highlights | | | | | |
| |
| |
| Admiral Shares | | | | | |
| | | | | |
| For a Share Outstanding | | | Year Ended October 31, |
| Throughout Each Period | 2017 | 2016 | 2015 | 2014 | 2013 |
| Net Asset Value, Beginning of Period | $66.48 | $71.04 | $74.17 | $65.81 | $49.47 |
| Investment Operations | | | | | |
| Net Investment Income | 1.2951 | 1.398 | 1.2912 | 1.016 | .924 |
| Net Realized and Unrealized Gain (Loss) | | | | | |
| on Investments | 14.650 | (.545) | .062 | 8.314 | 16.329 |
| Total from Investment Operations | 15.945 | .853 | 1.353 | 9.330 | 17.253 |
| Distributions | | | | | |
| Dividends from Net Investment Income | (1.538) | (1.134) | (1.235) | (.970) | (.913) |
| Distributions from Realized Capital Gains | (2.007) | (4.279) | (3.248) | — | — |
| Total Distributions | (3.545) | (5.413) | (4.483) | (.970) | (.913) |
| Net Asset Value, End of Period | $78.88 | $66.48 | $71.04 | $74.17 | $65.81 |
| Total Return3 | 24.63% | 1.41% | 1.85% | 14.24% | 35.32% |
| Ratios/Supplemental Data | | | | | |
| Net Assets, End of Period (Millions) | $14,366 | $11,703 | $12,206 | $10,884 | $9,144 |
| Ratio of Total Expenses to Average Net Assets4 | 0.21% | 0.20% | 0.29% | 0.28% | 0.27% |
| Ratio of Net Investment Income | | | | | |
| to Average Net Assets | 1.76% | 2.11% | 1.74%2 | 1.43% | 1.59% |
| Portfolio Turnover Rate | 26% | 26% | 28% | 38% | 40% |
1 Calculated based on average shares outstanding.
2 Net investment income per share and the ratio of net investment income to average net assets include $.177 and 0.24%, respectively,
resulting from income received from Covidien Ltd. in January 2015.
3 Total returns do not include account service fees that may have applied in the periods shown. Fund prospectuses provide information
about any applicable account service fees.
4 Includes performance-based investment advisory fee increases (decreases) of (0.05%), (0.06%), 0.03%, 0.03%, and 0.02%.
See accompanying Notes, which are an integral part of the Financial Statements.
23
Windsor Fund
Notes to Financial Statements
Vanguard Windsor Fund is registered under the Investment Company Act of 1940 as an open-end investment company, or mutual fund. The fund offers two classes of shares: Investor Shares and Admiral Shares. Investor Shares are available to any investor who meets the fund’s minimum purchase requirements. Admiral Shares are designed for investors who meet certain administrative, service, and account-size criteria.
A. The following significant accounting policies conform to generally accepted accounting principles for U.S. investment companies. The fund consistently follows such policies in preparing its financial statements.
1. Security Valuation: Securities are valued as of the close of trading on the New York Stock Exchange (generally 4 p.m., Eastern time) on the valuation date. Equity securities are valued at the latest quoted sales prices or official closing prices taken from the primary market in which each security trades; such securities not traded on the valuation date are valued at the mean of the latest quoted bid and asked prices. Securities for which market quotations are not readily available, or whose values have been affected by events occurring before the fund’s pricing time but after the close of the securities’ primary markets, are valued at their fair values calculated according to procedures adopted by the board of trustees. These procedures include obtaining quotations from an independent pricing service, monitoring news to identify significant market-or security-specific events, and evaluating changes in the values of foreign market proxies (for example, ADRs, futures contracts, or exchange-traded funds), between the time the foreign markets close and the fund’s pricing time. When fair-value pricing is employed, the prices of securities used by a fund to calculate its net asset value may differ from quoted or published prices for the same securities. Investments in Vanguard Market Liquidity Fund are valued at that fund’s net asset value. Temporary cash investments are valued using the latest bid prices or using valuations based on a matrix system (which considers such factors as security prices, yields, maturities, and ratings), both as furnished by independent pricing services.
2. Foreign Currency: Securities and other assets and liabilities denominated in foreign currencies are translated into U.S. dollars using exchange rates obtained from an independent third party as of the fund’s pricing time on the valuation date. Realized gains (losses) and unrealized appreciation (depreciation) on investment securities include the effects of changes in exchange rates since the securities were purchased, combined with the effects of changes in security prices. Fluctuations in the value of other assets and liabilities resulting from changes in exchange rates are recorded as unrealized foreign currency gains (losses) until the assets or liabilities are settled in cash, at which time they are recorded as realized foreign currency gains (losses).
3. Futures Contracts: The fund uses index futures contracts to a limited extent, with the objective of maintaining full exposure to the stock market while maintaining liquidity. The fund may purchase or sell futures contracts to achieve a desired level of investment, whether to accommodate portfolio turnover or cash flows from capital share transactions. The primary risks associated with the use of futures contracts are imperfect correlation between changes in market values of stocks held by the fund and the prices of futures contracts, and the possibility of an illiquid market. Counterparty risk involving futures is mitigated because a regulated clearinghouse is the counterparty instead of the clearing broker. To further mitigate counterparty risk, the fund trades futures contracts on an exchange, monitors the financial strength of its clearing brokers and clearinghouse, and has entered into clearing agreements with its clearing brokers. The clearinghouse imposes initial margin requirements to secure the fund’s performance and requires daily settlement of variation margin representing changes in the market value of each contract.
24
Windsor Fund
Futures contracts are valued at their quoted daily settlement prices. The notional amounts of the contracts are not recorded in the Statement of Net Assets. Fluctuations in the value of the contracts are recorded in the Statement of Net Assets as an asset (liability) and in the Statement of Operations as unrealized appreciation (depreciation) until the contracts are closed, when they are recorded as realized futures gains (losses).
During the year ended October 31, 2017, the fund’s average investments in long and short futures contracts represented less than 1% and 0% of net assets, respectively, based on the average of the notional amounts at each quarter-end during the period.
4. Forward Currency Contracts: The fund enters into forward currency contracts to protect the value of securities and related receivables and payables against changes in future foreign exchange rates. The fund’s risks in using these contracts include movement in the values of the foreign currencies relative to the U.S. dollar and the ability of the counterparties to fulfill their obligations under the contracts. The fund mitigates its counterparty risk by entering into forward currency contracts only with a diverse group of prequalified counterparties, monitoring their financial strength, entering into master netting arrangements with its counterparties, and requiring its counterparties to transfer collateral as security for their performance. In the absence of a default, the collateral pledged or received by the fund cannot be repledged, resold, or rehypothecated. The master netting arrangements provide that, in the event of a counterparty’s default (including bankruptcy), the fund may terminate the forward currency contracts, determine the net amount owed by either party in accordance with its master netting arrangements, and sell or retain any collateral held up to the net amount owed to the fund under the master netting arrangements. The forward currency contracts contain provisions whereby a counterparty may terminate open contracts if the fund’s net assets decline below a certain level, triggering a payment by the fund if the fund is in a net liability position at the time of the termination. The payment amount would be reduced by any collateral the fund has pledged. Any assets pledged as collateral for open contracts are noted in the Statement of Net Assets. The value of collateral received or pledged is compared daily to the value of the forward currency contracts exposure with each counterparty, and any difference, if in excess of a specified minimum transfer amount, is adjusted and settled within two business days.
Forward currency contracts are valued at their quoted daily prices obtained from an independent third party, adjusted for currency risk based on the expiration date of each contract. The notional amounts of the contracts are not recorded in the Statement of Net Assets. Fluctuations in the value of the contracts are recorded in the Statement of Net Assets as an asset (liability) and in the Statement of Operations as unrealized appreciation (depreciation) until the contracts are closed, when they are recorded as realized forward currency contract gains (losses).
During the year ended October 31, 2017, the fund’s average investment in forward currency contracts represented less than 1% of net assets, based on the average of notional amounts at each quarter-end during the period.
5. Repurchase Agreements: The fund enters into repurchase agreements with institutional counterparties. Securities pledged as collateral to the fund under repurchase agreements are held by a custodian bank until the agreements mature, and in the absence of a default, such collateral cannot be repledged, resold, or rehypothecated. Each agreement requires that the market value of the collateral be sufficient to cover payments of interest and principal. The fund further mitigates its counterparty risk by entering into repurchase agreements only with a diverse group of prequalified counterparties, monitoring their financial strength, and entering into master repurchase agreements with its counterparties. The master repurchase agreements provide that,
25
Windsor Fund
in the event of a counterparty’s default (including bankruptcy), the fund may terminate any repurchase agreements with that counterparty, determine the net amount owed, and sell or retain the collateral up to the net amount owed to the fund. Such action may be subject to legal proceedings, which may delay or limit the disposition of collateral.
6. Federal Income Taxes: The fund intends to continue to qualify as a regulated investment company and distribute all of its taxable income. Management has analyzed the fund’s tax positions taken for all open federal income tax years (October 31, 2014–2017), and has concluded that no provision for federal income tax is required in the fund’s financial statements.
7. Distributions: Distributions to shareholders are recorded on the ex-dividend date.
8. Securities Lending: To earn additional income, the fund lends its securities to qualified institutional borrowers. Security loans are subject to termination by the fund at any time, and are required to be secured at all times by collateral in an amount at least equal to the market value of securities loaned. Daily market fluctuations could cause the value of loaned securities to be more or less than the value of the collateral received. When this occurs, the collateral is adjusted and settled on the next business day. The fund further mitigates its counterparty risk by entering into securities lending transactions only with a diverse group of prequalified counterparties, monitoring their financial strength, and entering into master securities lending agreements with its counterparties. The master securities lending agreements provide that, in the event of a counterparty’s default (including bankruptcy), the fund may terminate any loans with that borrower, determine the net amount owed, and sell or retain the collateral up to the net amount owed to the fund; however, such actions may be subject to legal proceedings. While collateral mitigates counterparty risk, in the event of a default, the fund may experience delays and costs in recovering the securities loaned. The fund invests cash collateral received in Vanguard Market Liquidity Fund, and records a liability in the Statement of Net Assets for the return of the collateral, during the period the securities are on loan. Securities lending income represents fees charged to borrowers plus income earned on invested cash collateral, less expenses associated with the loan. During the term of the loan, the fund is entitled to all distributions made on or in respect of the loaned securities.
9. Credit Facility: The fund and certain other funds managed by The Vanguard Group (“Vanguard”) participate in a $3.1 billion committed credit facility provided by a syndicate of lenders pursuant to a credit agreement that may be renewed annually; each fund is individually liable for its borrowings, if any, under the credit facility. Borrowings may be utilized for temporary and emergency purposes, and are subject to the fund’s regulatory and contractual borrowing restrictions. The participating funds are charged administrative fees and an annual commitment fee of 0.10% of the undrawn amount of the facility; these fees are allocated to the funds based on a method approved by the fund’s board of trustees and included in Management and Administrative expenses on the fund’s Statement of Operations. Any borrowings under this facility bear interest at a rate based upon the higher of the one-month London Interbank Offered Rate, federal funds effective rate, or overnight bank funding rate plus an agreed-upon spread.
The fund had no borrowings outstanding at October 31, 2017, or at any time during the period then ended.
10. Other: Dividend income is recorded on the ex-dividend date. Interest income includes income distributions received from Vanguard Market Liquidity Fund and is accrued daily. Premiums and discounts on debt securities purchased are amortized and accreted, respectively, to interest income
26
Windsor Fund
over the lives of the respective securities. Security transactions are accounted for on the date securities are bought or sold. Costs used to determine realized gains (losses) on the sale of investment securities are those of the specific securities sold.
Each class of shares has equal rights as to assets and earnings, except that each class separately bears certain class-specific expenses related to maintenance of shareholder accounts (included in Management and Administrative expenses), shareholder reporting, and the proxy. Marketing and distribution expenses are allocated to each class of shares based on a method approved by the board of trustees. Income, other non-class-specific expenses, and gains and losses on investments are allocated to each class of shares based on its relative net assets.
B. The investment advisory firms Wellington Management Company LLP and Pzena Investment Management, LLC, each provide investment advisory services to a portion of the fund for a fee calculated at an annual percentage rate of average net assets managed by the advisor. The basic fee of Wellington Management Company LLP is subject to quarterly adjustments based on performance relative to the S&P 500 Index for the preceding three years. The basic fee of Pzena Investment Management Company, LLC, is subject to quarterly adjustments based on performance relative to the Russell 1000 Value Index for the preceding three years.
Vanguard manages the cash reserves of the fund as described below.
For the year ended October 31, 2017, the aggregate investment advisory fee represented an effective annual basic rate of 0.13% of the fund’s average net assets, before a decrease of $8,480,000 (0.05%) based on performance.
C. In accordance with the terms of a Funds’ Service Agreement (the “FSA”) between Vanguard and the fund, Vanguard furnishes to the fund corporate management, administrative, marketing, distribution, and cash management services at Vanguard’s cost of operations (as defined by the FSA). These costs of operations are allocated to the fund based on methods and guidelines approved by the board of trustees. Vanguard does not require reimbursement in the current period for certain costs of operations (such as deferred compensation/benefits and risk/insurance costs); the fund’s liability for these costs of operations is included in Payables to Vanguard on the Statement of Net Assets.
Upon the request of Vanguard, the fund may invest up to 0.40% of its net assets as capital in Vanguard. At October 31, 2017, the fund had contributed to Vanguard capital in the amount of $1,190,000, representing 0.01% of the fund’s net assets and 0.48% of Vanguard’s capitalization. The fund’s trustees and officers are also directors and employees, respectively, of Vanguard.
27
Windsor Fund
D. Various inputs may be used to determine the value of the fund’s investments. These inputs are summarized in three broad levels for financial statement purposes. The inputs or methodologies used to value securities are not necessarily an indication of the risk associated with investing in those securities.
Level 1—Quoted prices in active markets for identical securities.
Level 2—Other significant observable inputs (including quoted prices for similar securities, interest
rates, prepayment speeds, credit risk, etc.).
Level 3—Significant unobservable inputs (including the fund’s own assumptions used to determine
the fair value of investments). Any investments valued with significant unobservable inputs are
noted on the Statement of Net Assets.
The following table summarizes the market value of the fund’s investments as of October 31, 2017, based on the inputs used to value them:
| | | |
| | Level 1 | Level 2 | Level 3 |
| Investments | ($000) | ($000) | ($000) |
| Common Stocks | 18,641,367 | 506,122 | — |
| Temporary Cash Investments | 241,265 | 205,588 | — |
| Futures Contracts—Assets1 | 363 | — | — |
| Forward Currency Contracts—Assets | — | 4,883 | — |
| Total | 18,882,995 | 716,593 | — |
| 1 Represents variation margin on the last day of the reporting period. | | | |
E. Distributions are determined on a tax basis and may differ from net investment income and realized capital gains for financial reporting purposes. Differences may be permanent or temporary. Permanent differences are reclassified among capital accounts in the financial statements to reflect their tax character. Temporary differences arise when certain items of income, expense, gain, or loss are recognized in different periods for financial statement and tax purposes. These differences will reverse at some time in the future. Differences in classification may also result from the treatment of short-term gains as ordinary income for tax purposes.
The fund used a tax accounting practice to treat a portion of the price of capital shares redeemed during the year as distributions from realized capital gains. Accordingly, the fund has reclassified $24,113,000 from accumulated net realized gains to paid-in capital.
For tax purposes, at October 31, 2017, the fund had $176,825,000 of ordinary income and $464,378,000 of long-term capital gains available for distribution.
At October 31, 2017, the cost of investment securities for tax purposes was $14,121,551,000. Net unrealized appreciation of investment securities for tax purposes was $5,472,791,000, consisting of unrealized gains of $5,920,202,000 on securities that had risen in value since their purchase and $447,411,000 in unrealized losses on securities that had fallen in value since their purchase.
F. During the year ended October 31, 2017, the fund purchased $4,633,915,000 of investment securities and sold $5,385,438,000 of investment securities, other than temporary cash investments.
28
Windsor Fund
| | | | |
| G. Capital share transactions for each class of shares were: | | | |
| | | | Year Ended October 31, |
| | | 2017 | | 2016 |
| | Amount | Shares | Amount | Shares |
| | ($000) | (000) | ($000) | (000) |
| Investor Shares | | | | |
| Issued | 334,841 | 15,378 | 345,137 | 18,933 |
| Issued in Lieu of Cash Distributions | 238,948 | 11,375 | 390,759 | 20,211 |
| Redeemed | (1,161,428) | (53,188) | (878,076) | (46,152) |
| Net Increase (Decrease)—Investor Shares | (587,639) | (26,435) | (142,180) | (7,008) |
| Admiral Shares | | | | |
| Issued | 1,102,106 | 14,835 | 730,076 | 11,200 |
| Issued in Lieu of Cash Distributions | 579,577 | 8,179 | 877,678 | 13,461 |
| Redeemed | (1,238,531) | (16,927) | (1,316,517) | (20,440) |
| Net Increase (Decrease)—Admiral Shares | 443,152 | 6,087 | 291,237 | 4,221 |
H. Management has determined that no material events or transactions occurred subsequent to October 31, 2017, that would require recognition or disclosure in these financial statements.
29
Report of Independent Registered Public Accounting Firm
To the Board of Trustees of Vanguard Windsor Funds and the Shareholders of Vanguard Windsor Fund
In our opinion, the accompanying statement of net assets and the related statements of operations and of changes in net assets and the financial highlights present fairly, in all material respects, the financial position of Vanguard Windsor Fund (constituting a separate portfolio of Vanguard Windsor Funds, hereafter referred to as the “Fund”) as of October 31, 2017, the results of its operations for the year then ended, the changes in its net assets for each of the two years in the period then ended and the financial highlights for each of the five years in the period then ended, in conformity with accounting principles generally accepted in the United States of America. These financial statements and financial highlights (hereafter referred to as “financial statements”) are the responsibility of the Fund’s management. Our responsibility is to express an opinion on these financial statements based on our audits. We conducted our audits of these financial statements in accordance with the standards of the Public Company Accounting Oversight Board (United States). Those standards require that we plan and perform the audit to obtain reasonable assurance about whether the financial statements are free of material misstatement. An audit includes examining, on a test basis, evidence supporting the amounts and disclosures in the financial statements, assessing the accounting principles used and significant estimates made by management, and evaluating the overall financial statement presentation. We believe that our audits, which included confirmation of securities as of October 31, 2017 by correspondence with the custodians and brokers and by agreement to the underlying ownership records of the transfer agent, provide a reasonable basis for our opinion.
/s/PricewaterhouseCoopers LLP
Philadelphia, Pennsylvania
December 13, 2017
Special 2017 tax information (unaudited) for Vanguard Windsor Fund
This information for the fiscal year ended October 31, 2017, is included pursuant to provisions of the
Internal Revenue Code.
The fund distributed $513,199,000 as capital gain dividends (20% rate gain distributions) to
shareholders during the fiscal year.
For nonresident alien shareholders, 100% of short-term capital gain dividends distributed by the
fund are qualified short-term capital gains.
The fund distributed $374,266,000 of qualified dividend income to shareholders during the
fiscal year.
For corporate shareholders, 64.9% of investment income (dividend income plus short-term gains,
if any) qualifies for the dividends-received deduction.
30
Your Fund’s After-Tax Returns
This table presents returns for your fund both before and after taxes. The after-tax returns are shown in two ways: (1) assuming that an investor owned the fund during the entire period and paid taxes on the fund’s distributions, and (2) assuming that an investor paid taxes on the fund’s distributions and sold all shares at the end of each period.
Calculations are based on the highest individual federal income tax and capital gains tax rates in effect at the times of the distributions and the hypothetical sales. State and local taxes were not considered. After-tax returns reflect any qualified dividend income, using actual prior-year figures and estimates for 2017. (In the example, returns after the sale of fund shares may be higher than those assuming no sale. This occurs when the sale would have produced a capital loss. The calculation assumes that the investor received a tax deduction for the loss.)
The table shows returns for Investor Shares only; returns for other share classes will differ. Please note that your actual after-tax returns will depend on your tax situation and may differ from those shown. Also note that if you own the fund in a tax-deferred account, such as an individual retirement account or a 401(k) plan, this information does not apply to you. Such accounts are not subject to current taxes.
Finally, keep in mind that a fund’s performance—whether before or after taxes—does not guarantee future results.
| | | |
| Average Annual Total Returns: Windsor Fund Investor Shares | | | |
| Periods Ended October 31, 2017 | | | |
| | One | Five | Ten |
| | Year | Years | Years |
| Returns Before Taxes | 24.53% | 14.64% | 6.28% |
| Returns After Taxes on Distributions | 23.13 | 13.51 | 5.41 |
| Returns After Taxes on Distributions and Sale of Fund Shares | 14.83 | 11.60 | 4.90 |
31
About Your Fund’s Expenses
As a shareholder of the fund, you incur ongoing costs, which include costs for portfolio management, administrative services, and shareholder reports (like this one), among others. Operating expenses, which are deducted from a fund’s gross income, directly reduce the investment return of the fund.
A fund’s expenses are expressed as a percentage of its average net assets. This figure is known as the expense ratio. The following examples are intended to help you understand the ongoing costs (in dollars) of investing in your fund and to compare these costs with those of other mutual funds. The examples are based on an investment of $1,000 made at the beginning of the period shown and held for the entire period.
The accompanying table illustrates your fund’s costs in two ways:
• Based on actual fund return. This section helps you to estimate the actual expenses that you paid over the period. The ”Ending Account Value“ shown is derived from the fund‘s actual return, and the third column shows the dollar amount that would have been paid by an investor who started with $1,000 in the fund. You may use the information here, together with the amount you invested, to estimate the expenses that you paid over the period.
To do so, simply divide your account value by $1,000 (for example, an $8,600 account value divided by $1,000 = 8.6), then multiply the result by the number given for your fund under the heading ”Expenses Paid During Period.“
• Based on hypothetical 5% yearly return. This section is intended to help you compare your fund‘s costs with those of other mutual funds. It assumes that the fund had a yearly return of 5% before expenses, but that the expense ratio is unchanged. In this case—because the return used is not the fund’s actual return—the results do not apply to your investment. The example is useful in making comparisons because the Securities and Exchange Commission requires all mutual funds to calculate expenses based on a 5% return. You can assess your fund’s costs by comparing this hypothetical example with the hypothetical examples that appear in shareholder reports of other funds.
Note that the expenses shown in the table are meant to highlight and help you compare ongoing costs only and do not reflect transaction costs incurred by the fund for buying and selling securities. Further, the expenses do not include any purchase, redemption, or account service fees described in the fund prospectus. If such fees were applied to your account, your costs would be higher. Your fund does not carry a “sales load.”
The calculations assume no shares were bought or sold during the period. Your actual costs may have been higher or lower, depending on the amount of your investment and the timing of any purchases or redemptions.
You can find more information about the fund’s expenses, including annual expense ratios, in the Financial Statements section of this report. For additional information on operating expenses and other shareholder costs, please refer to your fund’s current prospectus.
32
| | | |
| Six Months Ended October 31, 2017 | | | |
| | Beginning | Ending | Expenses |
| | Account Value | Account Value | Paid During |
| Windsor Fund | 4/30/2017 | 10/31/2017 | Period |
| Based on Actual Fund Return | | | |
| Investor Shares | $1,000.00 | $1,084.04 | $1.68 |
| Admiral Shares | 1,000.00 | 1,084.93 | 1.16 |
| Based on Hypothetical 5% Yearly Return | | | |
| Investor Shares | $1,000.00 | $1,023.59 | $1.63 |
| Admiral Shares | 1,000.00 | 1,024.10 | 1.12 |
The calculations are based on expenses incurred in the most recent six-month period. The fund’s annualized six-month expense ratios for
that period are 0.32% for Investor Shares and 0.22% for Admiral Shares. The dollar amounts shown as “Expenses Paid” are equal to the
annualized expense ratio multiplied by the average account value over the period, multiplied by the number of days in the most recent
six-month period, then divided by the number of days in the most recent 12-month period (184/365).
33
Glossary
30-Day SEC Yield. A fund’s 30-day SEC yield is derived using a formula specified by the U.S. Securities and Exchange Commission. Under the formula, data related to the fund’s security holdings in the previous 30 days are used to calculate the fund’s hypothetical net income for that period, which is then annualized and divided by the fund’s estimated average net assets over the calculation period. For the purposes of this calculation, a security’s income is based on its current market yield to maturity (for bonds), its actual income (for asset-backed securities), or its projected dividend yield (for stocks). Because the SEC yield represents hypothetical annualized income, it will differ—at times significantly—from the fund’s actual experience. As a result, the fund’s income distributions may be higher or lower than implied by the SEC yield.
Beta. A measure of the magnitude of a fund’s past share-price fluctuations in relation to the ups and downs of a given market index. The index is assigned a beta of 1.00. Compared with a given index, a fund with a beta of 1.20 typically would have seen its share price rise or fall by 12% when the index rose or fell by 10%. For this report, beta is based on returns over the past 36 months for both the fund and the index. Note that a fund’s beta should be reviewed in conjunction with its R-squared (see definition). The lower the R-squared, the less correlation there is between the fund and the index, and the less reliable beta is as an indicator of volatility.
Dividend Yield. Dividend income earned by stocks, expressed as a percentage of the aggregate market value (or of net asset value, for a fund). The yield is determined by dividing the amount of the annual dividends by the aggregate value (or net asset value) at the end of the period. For a fund, the dividend yield is based solely on stock holdings and does not include any income produced by other investments.
Earnings Growth Rate. The average annual rate of growth in earnings over the past five years for the stocks now in a fund.
Equity Exposure. A measure that reflects a fund’s investments in stocks and stock futures. Any holdings in short-term reserves are excluded.
Expense Ratio. A fund’s total annual operating expenses expressed as a percentage of the fund’s average net assets. The expense ratio includes management and administrative expenses, but does not include the transaction costs of buying and selling portfolio securities.
Foreign Holdings. The percentage of a fund represented by securities or depositary receipts of companies based outside the United States.
Inception Date. The date on which the assets of a fund (or one of its share classes) are first invested in accordance with the fund’s investment objective. For funds with a subscription period, the inception date is the day after that period ends. Investment performance is measured from the inception date.
Median Market Cap. An indicator of the size of companies in which a fund invests; the midpoint of market capitalization (market price x shares outstanding) of a fund’s stocks, weighted by the proportion of the fund’s assets invested in each stock. Stocks representing half of the fund’s assets have market capitalizations above the median, and the rest are below it.
Price/Book Ratio. The share price of a stock divided by its net worth, or book value, per share. For a fund, the weighted average price/book ratio of the stocks it holds.
34
Price/Earnings Ratio. The ratio of a stock’s current price to its per-share earnings over the past year. For a fund, the weighted average P/E of the stocks it holds. P/E is an indicator of market expectations about corporate prospects; the higher the P/E, the greater the expectations for a company’s future growth.
R-Squared. A measure of how much of a fund’s past returns can be explained by the returns from the market in general, as measured by a given index. If a fund’s total returns were precisely synchronized with an index’s returns, its R-squared would be 1.00. If the fund’s returns bore no relationship to the index’s returns, its R-squared would be 0. For this report, R-squared is based on returns over the past 36 months for both the fund and the index.
Return on Equity. The annual average rate of return generated by a company during the past five years for each dollar of shareholder’s equity (net income divided by shareholder’s equity). For a fund, the weighted average return on equity for the companies whose stocks it holds.
Short-Term Reserves. The percentage of a fund invested in highly liquid, short-term securities that can be readily converted to cash.
Turnover Rate. An indication of the fund’s trading activity. Funds with high turnover rates incur higher transaction costs and may be more likely to distribute capital gains (which may be taxable to investors). The turnover rate excludes in-kind transactions, which have minimal impact on costs.
35
The Global Industry Classification Standard (“GICS”) was developed by and is the exclusive property and a service mark of MSCI Inc. (“MSCI”) and Standard and Poor’s, a division of McGraw-Hill Companies, Inc. (“S&P”), and is licensed for use by Vanguard. Neither MSCI, S&P nor any third party involved in making or compiling the GICS or any GICS classification makes any express or implied warranties or representations with respect to such standard or classification (or the results to be obtained by the use thereof), and all such parties hereby expressly disclaim all warranties of originality, accuracy, completeness, merchantability or fitness for a particular purpose with respect to any such standard or classification. Without limiting any of the foregoing, in no event shall MSCI, S&P, any of its affiliates or any third party involved in making or compiling the GICS or any GICS classification have any liability for any direct, indirect, special, punitive, consequential or any other damages (including lost profits) even if notified of the possibility of such damages.
36
This page intentionally left blank.
This page intentionally left blank.
The People Who Govern Your Fund
The trustees of your mutual fund are there to see that the fund is operated and managed in your best interests since, as a shareholder, you are a part owner of the fund. Your fund’s trustees also serve on the board of directors of The Vanguard Group, Inc., which is owned by the Vanguard funds and provides services to them on an at-cost basis.
A majority of Vanguard’s board members are independent, meaning that they have no affiliation with Vanguard or the funds they oversee, apart from the sizable personal investments they have made as private individuals. The independent board members have distinguished backgrounds in business, academia, and public service. Each of the trustees and executive officers oversees 200 Vanguard funds.
Information for each trustee and executive officer of the fund appears below. The mailing address of the trustees and officers is P.O. Box 876, Valley Forge, PA 19482. More information about the trustees is in the Statement of Additional Information, which can be obtained, without charge, by contacting Vanguard at 800-662-7447, or online at vanguard.com.
Interested Trustee1
F. William McNabb III
Born 1957. Trustee Since July 2009. Chairman of the Board. Principal Occupation(s) During the Past Five Years and Other Experience: Chairman of the Board of The Vanguard Group, Inc., and of each of the investment companies served by The Vanguard Group, since January 2010; Chief Executive Officer and Director of The Vanguard Group and President and Chief Executive Officer of each of the investment companies served by The Vanguard Group, since 2008; Director of Vanguard Marketing Corporation; President of The Vanguard Group (2008–2017); Managing Director of The Vanguard Group (1995–2008).
Independent Trustees
Emerson U. Fullwood
Born 1948. Trustee Since January 2008. Principal Occupation(s) During the Past Five Years and Other Experience: Executive Chief Staff and Marketing Officer for North America and Corporate Vice President (retired 2008) of Xerox Corporation (document management products and services); Executive in Residence and 2009–2010 Distinguished Minett Professor at the Rochester Institute of Technology; Lead Director of SPX FLOW, Inc. (multi-industry manufacturing); Director of the United Way of Rochester, the University of Rochester Medical Center, Monroe Community College Foundation, North Carolina A&T University, and Roberts Wesleyan College; Trustee of the University of Rochester.
Rajiv L. Gupta
Born 1945. Trustee Since December 2001.2 Principal Occupation(s) During the Past Five Years and Other Experience: Chairman and Chief Executive Officer (retired 2009) and President (2006–2008) of Rohm and Haas Co. (chemicals); Director of Arconic Inc. (diversified manufacturer), HP Inc. (printer and personal computer manufacturing), and Delphi Automotive plc (automotive components); Senior Advisor at New Mountain Capital.
Amy Gutmann
Born 1949. Trustee Since June 2006. Principal Occupation(s) During the Past Five Years and Other Experience: President of the University of Pennsylvania; Christopher H. Browne
1 Mr. McNabb is considered an “interested person,” as defined in the Investment Company Act of 1940, because he is an officer of the
Vanguard funds.
2 December 2002 for Vanguard Equity Income Fund, the Vanguard Municipal Bond Funds, and the Vanguard State Tax-Exempt Funds.
Distinguished Professor of Political Science, School of Arts and Sciences, and Professor of Communication, Annenberg School for Communication, with secondary faculty appointments in the Department of Philosophy, School of Arts and Sciences, and at the Graduate School of Education, University of Pennsylvania; Trustee of the National Constitution Center.
JoAnn Heffernan Heisen
Born 1950. Trustee Since July 1998. Principal Occupation(s) During the Past Five Years and Other Experience: Corporate Vice President and Member of the Executive Committee (1997–2008), Chief Global Diversity Officer (retired 2008), Vice President and Chief Information Officer (1997–2006), Controller (1995–1997), Treasurer (1991–1995), and Assistant Treasurer (1989–1991) of Johnson & Johnson (pharmaceuticals/medical devices/ consumer products); Director of Skytop Lodge Corporation (hotels) and the Robert Wood Johnson Foundation; Member of the Advisory Board of the Institute for Women’s Leadership at Rutgers University.
F. Joseph Loughrey
Born 1949. Trustee Since October 2009. Principal Occupation(s) During the Past Five Years and Other Experience: President and Chief Operating Officer (retired 2009) of Cummins Inc. (industrial machinery); Chairman of the Board of Hillenbrand, Inc. (specialized consumer services), Oxfam America, and the Lumina Foundation for Education; Director of the V Foundation for Cancer Research; Member of the Advisory Council for the College of Arts and Letters and Chair of the Advisory Board to the Kellogg Institute for International Studies, both at the University of Notre Dame.
Mark Loughridge
Born 1953. Trustee Since March 2012. Principal Occupation(s) During the Past Five Years and Other Experience: Senior Vice President and Chief Financial Officer (retired 2013) at IBM (information technology services); Fiduciary Member of IBM’s Retirement Plan Committee (2004–2013); Member of the Council on Chicago Booth.
Scott C. Malpass
Born 1962. Trustee Since March 2012. Principal Occupation(s) During the Past Five Years and Other Experience: Chief Investment Officer and Vice President at the University of Notre Dame; Assistant Professor of Finance at the Mendoza College of Business at Notre Dame; Member of the Notre Dame 403(b) Investment Committee, the Board of Advisors for Spruceview Capital Partners, the Board of Catholic Investment Services, Inc. (investment advisor), and the Board of Superintendence of the Institute for the Works of Religion; Chairman of the Board of TIFF Advisory Services, Inc. (investment advisor).
André F. Perold
Born 1952. Trustee Since December 2004. Principal Occupation(s) During the Past Five Years and Other Experience: George Gund Professor of Finance and Banking, Emeritus at the Harvard Business School (retired 2011); Chief Investment Officer and Co-Managing Partner of HighVista Strategies LLC (private investment firm); Overseer of the Museum of Fine Arts Boston.
Peter F. Volanakis
Born 1955. Trustee Since July 2009. Principal Occupation(s) During the Past Five Years and Other Experience: President and Chief Operating Officer (retired 2010) of Corning Incorporated (communications equipment); Chairman of the Board of Trustees of Colby-Sawyer College; Member of the Board of Hypertherm, Inc. (industrial cutting systems, software, and consumables).
Executive Officers
Glenn Booraem
Born 1967. Investment Stewardship Officer Since February 2017. Principal Occupation(s) During the Past Five Years and Other Experience: Principal of The Vanguard Group, Inc.; Treasurer (2015–2017), Controller (2010–2015), and Assistant Controller (2001–2010) of each of the investment companies served by The Vanguard Group.
Thomas J. Higgins
Born 1957. Chief Financial Officer Since September 2008. Principal Occupation(s) During the Past Five Years and Other Experience: Principal of The Vanguard Group, Inc.; Chief Financial Officer of each of the investment companies served by The Vanguard Group; Treasurer of each of the investment companies served by The Vanguard Group (1998–2008).
Peter Mahoney
Born 1974. Controller Since May 2015. Principal Occupation(s) During the Past Five Years and Other Experience: Principal of The Vanguard Group, Inc.; Controller of each of the investment companies served by The Vanguard Group; Head of International Fund Services at The Vanguard Group (2008–2014).
Anne E. Robinson
Born 1970. Secretary Since September 2016. Principal Occupation(s) During the Past Five Years and Other Experience: Managing Director of The Vanguard Group, Inc.; General Counsel of The Vanguard Group; Secretary of The Vanguard Group and of each of the investment companies served by The Vanguard Group; Director and Senior Vice President of Vanguard Marketing Corporation; Managing Director and General Counsel of Global Cards and Consumer Services at Citigroup (2014–2016); Counsel at American Express (2003–2014).
Michael Rollings
Born 1963. Treasurer Since February 2017. Principal Occupation(s) During the Past Five Years and Other Experience: Managing Director of The Vanguard Group, Inc.; Treasurer of each of the investment companies served by The Vanguard Group; Director of Vanguard Marketing Corporation; Executive Vice President and Chief Financial Officer of MassMutual Financial Group (2006–2016).
| |
| Vanguard Senior Management Team |
| |
| Mortimer J. Buckley | Chris D. McIsaac |
| Gregory Davis | James M. Norris |
| John James | Thomas M. Rampulla |
| Martha G. King | Karin A. Risi |
| John T. Marcante | |
Chairman Emeritus and Senior Advisor
John J. Brennan
Chairman, 1996–2009
Chief Executive Officer and President, 1996–2008
Founder
John C. Bogle
Chairman and Chief Executive Officer, 1974–1996
|  |
| | P.O. Box 2600 |
| | Valley Forge, PA 19482-2600 |
| |
| |
| |
| Connect with Vanguard® > vanguard.com |
| |
| |
| |
| Fund Information > 800-662-7447 | CFA® is a registered trademark owned by CFA Institute. |
| Direct Investor Account Services > 800-662-2739 |
| Institutional Investor Services > 800-523-1036 |
| Text Telephone for People | |
| Who Are Deaf or Hard of Hearing> 800-749-7273 |
| |
| This material may be used in conjunction |
| with the offering of shares of any Vanguard |
| fund only if preceded or accompanied by |
| the fund’s current prospectus. | |
| |
| All comparative mutual fund data are from Lipper, a |
| Thomson Reuters Company, or Morningstar, Inc., unless |
| otherwise noted. | |
| |
| You can obtain a free copy of Vanguard’s proxy voting |
| guidelines by visiting vanguard.com/proxyreporting or by |
| calling Vanguard at 800-662-2739. The guidelines are |
| also available from the SEC’s website, sec.gov. In |
| addition, you may obtain a free report on how your fund |
| voted the proxies for securities it owned during the 12 |
| months ended June 30. To get the report, visit either |
| vanguard.com/proxyreporting or sec.gov. |
| |
| You can review and copy information about your fund at |
| the SEC’s Public Reference Room in Washington, D.C. To |
| find out more about this public service, call the SEC at |
| 202-551-8090. Information about your fund is also |
| available on the SEC’s website, and you can receive |
| copies of this information, for a fee, by sending a |
| request in either of two ways: via email addressed to |
| publicinfo@sec.gov or via regular mail addressed to the |
| Public Reference Section, Securities and Exchange |
| Commission, Washington, DC 20549-1520. |
| | © 2017 The Vanguard Group, Inc. |
| | All rights reserved. |
| | Vanguard Marketing Corporation, Distributor. |
| |
| | Q220 122017 |

Annual Report | October 31, 2017
Vanguard Windsor™ II Fund
Vanguard’s Principles for Investing Success
We want to give you the best chance of investment success. These principles, grounded in Vanguard’s research and experience, can put you on the right path.
Goals. Create clear, appropriate investment goals.
Balance. Develop a suitable asset allocation using broadly diversified funds.
Cost. Minimize cost.
Discipline. Maintain perspective and long-term discipline.
A single theme unites these principles: Focus on the things you can control.
We believe there is no wiser course for any investor.
| |
| Contents | |
| Your Fund’s Performance at a Glance. | 1 |
| Chairman’s Perspective. | 3 |
| Advisors’ Report. | 6 |
| Fund Profile. | 11 |
| Performance Summary. | 13 |
| Financial Statements. | 15 |
| Your Fund’s After-Tax Returns. | 31 |
| About Your Fund’s Expenses. | 32 |
| Glossary. | 34 |
Please note: The opinions expressed in this report are just that—informed opinions. They should not be considered promises
or advice. Also, please keep in mind that the information and opinions cover the period through the date on the front of this
report. Of course, the risks of investing in your fund are spelled out in the prospectus.
See the Glossary for definitions of investment terms used in this report.
About the cover: Nautical images have been part of Vanguard’s rich heritage since its start in 1975. For an
incoming ship, a lighthouse offers a beacon and safe path to shore. You can similarly depend on Vanguard to put
you first––and light the way––as you strive to meet your financial goals. Our client focus and low costs,
stemming from our unique ownership structure, assure that your interests are paramount.
Your Fund’s Performance at a Glance
• Vanguard Windsor II Fund returned about 20% for the year ended October 31, 2017, ahead of its benchmark, the Russell 1000 Value Index, but slightly behind the average return of its large-capitalization value fund peers. For the year, growth stocks surpassed their value counterparts, while small-cap stocks outpaced mid- and large-caps.
• Each of the fund’s five advisors uses a value-oriented strategy and manages its portfolio with a long-term focus.
• All but one of the fund’s 11 industry sectors had positive returns. Financials and information technology contributed most. Selection hindered relative performance in consumer staples (the only sector with a negative return) and health care.
• For the ten years ended October 31, 2017, Windsor II Fund’s average annual return was a bit behind that of its expense-free benchmark and exceeded that of its peers.
| |
| Total Returns: Fiscal Year Ended October 31, 2017 | |
| | Total |
| | Returns |
| Vanguard Windsor II Fund | |
| Investor Shares | 19.60% |
| Admiral™ Shares | 19.68 |
| Russell 1000 Value Index | 17.78 |
| Large-Cap Value Funds Average | 20.30 |
| Large-Cap Value Funds Average: Derived from data provided by Lipper, a Thomson Reuters Company. | |
| Admiral Shares carry lower expenses and are available to investors who meet certain account-balance requirements. | |
| |
| |
| Total Returns: Ten Years Ended October 31, 2017 | |
| | Average |
| | Annual Return |
| Windsor II Fund Investor Shares | 5.83% |
| Russell 1000 Value Index | 5.99 |
| Large-Cap Value Funds Average | 5.23 |
| Large-Cap Value Funds Average: Derived from data provided by Lipper, a Thomson Reuters Company. | |
The figures shown represent past performance, which is not a guarantee of future results. (Current
performance may be lower or higher than the performance data cited. For performance data current to the
most recent month-end, visit our website at vanguard.com/performance.) Note, too, that both investment
returns and principal value can fluctuate widely, so an investor’s shares, when sold, could be worth more
or less than their original cost.
1
| | | |
| Expense Ratios | | | |
| Your Fund Compared With Its Peer Group | | | |
| | Investor | Admiral | Peer Group |
| | Shares | Shares | Average |
| Windsor II Fund | 0.33% | 0.25% | 1.09% |
The fund expense ratios shown are from the prospectus dated February 23, 2017, and represent estimated costs for the current fiscal year.
For the fiscal year ended October 31, 2017, the fund’s expense ratios were 0.34% for Investor Shares and 0.26% for Admiral Shares. The
peer-group expense ratio is derived from data provided by Lipper, a Thomson Reuters Company, and captures information through
year-end 2016.
Peer group: Large-Cap Value Funds.
2
Chairman’s Perspective

Bill McNabb
Chairman and Chief Executive Officer
Dear Shareholder,
When I find outstanding products or services, I’m likely to be loyal to them. And my loyalty usually gets rewarded as I experience consistently high quality––whether it’s from a favorite restaurant or a favorite author. What’s past, in most cases, is prologue.
As tempting as it is to apply this rationale to investing—for example, if technology stocks have done well this year, they’re bound to do well the next—it’s not all that helpful and can actually be counterproductive. You’ve heard it many times: Past performance cannot be used to predict future returns.
Taking a new approach
The caution about past performance is so familiar that investors are apt to treat it as mere background noise. That’s why past-performance bias merited a fresh look from Vanguard’s Investment Strategy Group, which tackled the issue last year in a research paper. (I encourage you to read the full paper, Reframing Investor Choices: Right Mindset, Wrong Market, at vanguard.com/research.)
Our strategists were hardly the first to delve into the topic, but they approached it in a new way. They started with the premise that it’s perfectly understandable for investors to lean heavily on past performance, because that works well in many areas of life. After all, as the paper describes, in lots of other industries and realms, performance from one time period
3
to another is extremely consistent. The researchers looked at everything from cars to fine restaurants to heart surgeons, and in all these examples, past performance was a good predictor of later outcomes.
It’s different with investing
In a nutshell, our brains typically are rewarded and our satisfaction is boosted when we use past performance as a guide for navigating decisions, big and small. But when applied to investing, this method breaks down.
Why? Among other reasons, top-performing asset classes one year tend not to repeat as leaders the next. Strong past performance leads to higher valuations, making an investment, all else being equal, less attractive in the future. The data are quite overwhelming in this regard.
By allowing past performance to inform their decisions, individual and institutional investors inadvertently end up as momentum investors, putting them on a treadmill of buying high and selling low.
A path to better decision-making
Of course, many investors are already aware of the pitfalls of projecting past performance into the future. The real question is, what can we all do about it? What does it take to go from having a general awareness to actually changing our behavior?
| | | |
| Market Barometer | | | |
| | | Average Annual Total Returns |
| | | Periods Ended October 31, 2017 |
| | One Year | Three Years | Five Years |
| Stocks | | | |
| Russell 1000 Index (Large-caps) | 23.67% | 10.58% | 15.18% |
| Russell 2000 Index (Small-caps) | 27.85 | 10.12 | 14.49 |
| Russell 3000 Index (Broad U.S. market) | 23.98 | 10.53 | 15.12 |
| FTSE All-World ex US Index (International) | 23.48 | 6.12 | 7.67 |
| |
| Bonds | | | |
| Bloomberg Barclays U.S. Aggregate Bond Index | | | |
| (Broad taxable market) | 0.90% | 2.40% | 2.04% |
| Bloomberg Barclays Municipal Bond Index | | | |
| (Broad tax-exempt market) | 2.19 | 3.04 | 3.00 |
| Citigroup Three-Month U.S. Treasury Bill Index | 0.71 | 0.31 | 0.20 |
| |
| CPI | | | |
| Consumer Price Index | 2.04% | 1.28% | 1.29% |
4
Acknowledging that such change isn’t easy, our strategists offered a few ideas for reframing how investors approach their decisions. These recommendations were targeted at advisors working with clients, but they apply equally to individuals and institutions:
• Educate yourself. The more investors understand why a method that works so well in other areas of life—relying on past performance to drive decisions—doesn’t carry over to investing, the better off they’ll be.
• Be disciplined. The bias toward past performance is ingrained in everybody, professionals included, and shifting away from it can be difficult. But the long-term benefits make the effort worthwhile.
• Focus on what you can control. It’s always most constructive for investors to concentrate on what’s actually within their control, such as setting goals, following long-term portfolio construction principles, selecting low-cost investments, and rebalancing periodically.
Here’s to keeping the past in the rearview mirror. And, as always, thank you for investing with Vanguard.
Sincerely,

F. William McNabb III
Chairman and Chief Executive Officer
November 14, 2017
5
Advisors’ Report
For the 12 months ended October 31, 2017, Vanguard Windsor II Fund returned 19.60% for Investor Shares and 19.68% for Admiral Shares. Your fund is managed by five independent advisors, a strategy that enhances the fund’s diversification by providing exposure to distinct yet complementary investment approaches. It’s not uncommon for different advisors to have different views about individual securities or the broader investment environment.
The table on page 10 lists the advisors, the amount and percentage of fund assets each manages, and brief descriptions of their investment strategies. The advisors have provided the following assessment of the investment environment during the past 12 months and the notable successes and shortfalls in their portfolios. These comments were prepared on November 16, 2017.
Barrow, Hanley, Mewhinney &
Strauss, LLC
Portfolio Managers:
Jeff Fahrenbruch, CFA,
Managing Director
David Ganucheau, CFA,
Managing Director
The recovery in global economic growth helped stocks over the last year despite significant geopolitical risks and Washington policy failures. Value stocks lagged growth stocks but were still up about 18% for the fiscal year, as measured by the Russell 1000 Value Index. Investors are now left wondering if better economic growth is sustainable, if geopolitical concerns such as North Korea will derail the recovery, and if Washington can pass tax reform after failing to reform the Affordable Care Act. As always, we remain focused on finding good companies trading at valuations below the broad market for reasons that we believe are temporary or overblown in nature.
Stock selection in health care detracted most from performance. We believe the stocks will recover, with the exception of Teva Pharmaceutical, where a poorly executed large acquisition destroyed significant shareholder value and compelled us to sell. Although there are concerns over product pricing and government regulation, health care stock valuations are attractive and the sector enjoys many long-term tailwinds, including demographics. Our tobacco holdings also hurt results as the Food and Drug Administration evaluated lowering nicotine levels in cigarettes.
An underweight allocation to—and strong selection within—the energy sector boosted performance. Our holdings are making solid progress in reducing cost structures to improve cash flows regardless of the oil price environment. The portfolio’s underweight to areas of the market where investors have bid up valuations in their search for yield in a low interest rate environment also helped, as interest rates increased during the year.
6
Lazard Asset Management LLC
Portfolio Managers:
Andrew Lacey, Deputy Chairman
Christopher Blake, Managing Director
The Standard & Poor’s 500 Index returned roughly 24% for the 12 months. Markets rallied toward the end of 2016 as investors gained more confidence in the U.S. economy’s ability to withstand global geopolitical risks and optimism rose that the Trump administration would decrease regulation and work with Congress to lower corporate taxes and increase defense and infrastructure spending. However, the pace of the rally was tempered in the new year by the failure of a proposed health care bill to gain congressional approval.
Economic data were generally strong, as employment reports generally exceeded expectations and the economy posted GDP growth of at least 3.0% in the final two quarters of the fiscal year. Investors also gained confidence in the Republican Party’s proposed tax reform plan, details of which began to emerge toward the end of the period. In light of an improving employment and inflation picture, the Federal Reserve raised interest rates in December, March, and June, with indications that a fourth hike could come before the end of 2017.
Stock selection within, and an underweight allocation to, the real estate sector boosted the portfolio’s performance. Top contributors included Host Hotels & Resorts and Prologis. We sold our position in Host Hotels & Resorts in April, as we saw opportunities with better risk/reward profiles elsewhere. Our lack of exposure to the poorly performing utilities sector also helped returns.
Stock selection in consumer staples hindered relative performance; top detractors included Molson Coors Brewing and Kellogg. Stock selection in health care also hurt returns. Top detractors included Pfizer and Allergan. We sold our position in Allergan in October as our investment thesis no longer held up.
Hotchkis and Wiley Capital
Management, LLC
Portfolio Managers:
George H. Davis, Jr.,
Chief Executive Officer
Sheldon J. Lieberman, Principal
Equity markets performed strongly over the fiscal year, and the Standard & Poor’s 500 Index returned about 24% for the 12 months. Growth stocks outperformed value stocks, with the Russell 1000 Growth Index outperforming the Russell 1000 Value Index by about 12 percentage
7
points. Investors have shown an insatiable appetite for companies that have produced healthy top-line growth in an economy that is growing at a modest pace. The result is a large valuation gap between the value and growth indexes. We believe investors are viewing select growth companies through rose-colored glasses, and that their highly optimistic expectations are pushing up valuations of growth stocks.
In our experience, it is difficult for companies to live up to such enthusiasm. Accordingly, we view such highly valued stocks among the market’s most notable risks. We focus on stocks that the market is less enamored of but that we believe are worth more than their current market price. We consider valuation support an important risk control, as a company can meet or exceed low expectations more easily than it can high expectations. On this basis, we have identified opportunities in financials, technology, and energy disproportionately; these are currently our most heavily weighted sectors.
Relative to the Russell 1000 Value Index, our stock selection was positive or neutral in ten of the 11 sectors. Being overweight in technology and underweight in consumer staples also helped. Stock selection in, and an overweight allocation to, consumer discretionary detracted modestly. We remain optimistic regarding the risk/return profile of the portfolio and are reassured by its large valuation discount relative to the market.
Sanders Capital, LLC
Portfolio Managers:
Lewis A. Sanders, CFA,
Chief Executive Officer and
Co-Chief Investment Officer
John P. Mahedy, CPA,
Director of Research and
Co-Chief Investment Officer
Our portfolio is positioned to benefit from sustained economic growth, rising interest rates, and technology-driven innovation. Banks, a major area of investment, have already been helped by the Federal Reserve’s moves to increase interest rates. Home builders, which have benefited from strong demand for new single family homes, contributed substantially to returns.
The portfolio also has investments in pharmaceutical, semiconductor, smartphone, and media industries––all industries where new products and services promise to stimulate faster growth. These trends have produced solid returns, especially in semiconductors, and we anticipate further gains. Strong gains in equity markets overall and in some of our major investments have prompted us to take actions to reduce risk, harvesting gains in volatile segments such as banks and housing and adding to investments in low-volatility industries such as food and beverages.
8
Vanguard Quantitative Equity Group
Portfolio Managers:
James P. Stetler
Binbin Guo, Principal, Head of
Alpha Equity Investments
Global economic growth, while uncertain and mixed at times, combined with rising corporate earnings to support a strong performance by the U.S. stock market for the fiscal year. Stock valuations also climbed as investors embraced risk. U.S. economic fundamentals remained firm amid favorable consumer confidence, unemployment, and GDP data. The Federal Reserve acknowledged the economy’s strength, raising the target for the federal funds rate to 1%–1.25% during the 12 months.
Although our overall performance is affected by the macroeconomic factors we’ve described, our approach to investing focuses on specific stock fundamentals that we believe are more likely to produce outperformance over the long run. Those fundamentals include high quality, management decisions, consistent earnings growth, strong market sentiment, and reasonable valuation.
The results from our combined model were positive, driven primarily by our sentiment component. Results exceeded those of the benchmark in eight of 11 sectors and were strongest in information technology, followed by health care and consumer discretionary. Our energy holdings hurt relative performance the most. Real estate and telecommunication services also lagged the benchmark.
In information technology, NVIDIA and DXC Technology contributed the most to relative performance; Owens Corning did the same in industrials. Our underweighting of QUALCOMM in information technology and Schlumberger in energy also lifted relative performance. Disappointments included Southwestern Energy, Chesapeake Energy, and Newfield Exploration in energy and Spirit Realty in real estate. A lack of exposure to CSX in industrials also hurt relative performance.
9
| | | |
| Vanguard Windsor II Fund Investment Advisors | |
| |
| | Fund Assets Managed | |
| Investment Advisor | % | $ Million | Investment Strategy |
| Barrow, Hanley, Mewhinney & | 48 | 23,768 | Conducts fundamental research on individual stocks |
| Strauss, LLC | | | exhibiting traditional value characteristics: |
| | | | price/earnings and price/book ratios below the broad |
| | | | market average and dividend yields above the broad |
| | | | market average. |
| Lazard Asset Management LLC | 20 | 9,746 | Employs a relative-value approach that seeks a |
| | | | combination of attractive valuation and high financial |
| | | | productivity. The process is research-driven, relying |
| | | | upon bottom-up stock analysis performed by the |
| | | | firm’s global sector analysts. |
| Hotchkis and Wiley Capital | 15 | 7,495 | Uses a disciplined investment approach, focusing on |
| Management, LLC | | | such investment parameters as a company’s tangible |
| | | | assets, sustainable cash flow, and potential for |
| | | | improving business performance. |
| Sanders Capital, LLC | 15 | 7,450 | Employs a traditional, bottom-up, fundamental |
| | | | research approach to identifying securities that are |
| | | | undervalued relative to their expected total return. |
| Vanguard Quantitative Equity | 1 | 324 | Employs a quantitative fundamental management |
| Group | | | approach, using models that assess valuation, market |
| | | | sentiment, earnings quality and growth, and |
| | | | management decisions of companies versus their |
| | | | peers. |
| Cash Investments | 1 | 369 | These short-term reserves are invested by Vanguard |
| | | | in equity index products to simulate investment in |
| | | | stocks. Each advisor may also maintain a modest |
| | | | cash position. |
10
Windsor II Fund
Fund Profile
As of October 31, 2017
| | |
| Share-Class Characteristics | |
| | Investor | Admiral |
| | Shares | Shares |
| Ticker Symbol | VWNFX | VWNAX |
| Expense Ratio1 | 0.33% | 0.25% |
| 30-Day SEC Yield | 1.96% | 2.04% |
| | | |
| Portfolio Characteristics | | |
| | | | DJ |
| | | | U.S. |
| | | Russell | Total |
| | | 1000 | Market |
| | | Value | FA |
| | Fund | Index | Index |
| Number of Stocks | 278 | 714 | 3,787 |
| Median Market Cap | $90.6B | $62.0B | $62.0B |
| Price/Earnings Ratio | 18.2x | 18.9x | 22.0x |
| Price/Book Ratio | 2.2x | 2.0x | 2.9x |
| Return on Equity | 14.3% | 11.5% | 15.1% |
| Earnings Growth | | | |
| Rate | 5.6% | 6.4% | 9.8% |
| Dividend Yield | 2.3% | 2.4% | 1.8% |
| Foreign Holdings | 9.1% | 0.0% | 0.0% |
| Turnover Rate | 32% | — | — |
| Short-Term Reserves | 1.8% | — | — |
| | | |
| Sector Diversification (% of equity exposure) |
| | | Russell | DJ |
| | | 1000 | U.S. Total |
| | | Value | Market |
| | Fund | Index | FA Index |
| Consumer Discretionary | 9.8% | 6.7% | 12.2% |
| Consumer Staples | 8.8 | 8.4 | 7.1 |
| Energy | 9.8 | 10.7 | 5.6 |
| Financials | 19.4 | 26.6 | 15.1 |
| Health Care | 16.4 | 13.7 | 13.5 |
| Industrials | 10.1 | 8.4 | 10.7 |
| Information Technology | 18.6 | 8.6 | 23.5 |
| Materials | 3.9 | 2.9 | 3.5 |
| Real Estate | 0.3 | 4.8 | 3.9 |
| Telecommunication | | | |
| Services | 2.6 | 2.8 | 1.7 |
| Utilities | 0.3 | 6.4 | 3.2 |
Sector categories are based on the Global Industry Classification
Standard (“GICS”), except for the “Other” category (if applicable),
which includes securities that have not been provided a GICS
classification as of the effective reporting period.
| | |
| Volatility Measures | | |
| | Russell | DJ |
| | 1000 | U.S. Total |
| | Value | Market |
| | Index | FA Index |
| R-Squared | 0.96 | 0.93 |
| Beta | 1.01 | 1.00 |
| These measures show the degree and timing of the fund’s |
| fluctuations compared with the indexes over 36 months. |
1 The expense ratios shown are from the prospectus dated February 23, 2017, and represent estimated costs for the current fiscal year. For the
fiscal year ended October 31, 2017, the expense ratios were 0.34% for Investor Shares and 0.26% for Admiral Shares.
11
Windsor II Fund
| | |
| Ten Largest Holdings (% of total net assets) |
| Microsoft Corp. | Systems Software | 3.6% |
| Citigroup Inc. | Diversified Banks | 2.9 |
| Pfizer Inc. | Pharmaceuticals | 2.7 |
| Medtronic plc | Health Care | |
| | Equipment | 2.7 |
| Bank of America Corp. | Diversified Banks | 2.5 |
| JPMorgan Chase & Co. | Diversified Banks | 2.4 |
| Oracle Corp. | Systems Software | 2.3 |
| Wells Fargo & Co. | Diversified Banks | 2.3 |
| United Technologies | Aerospace & | |
| Corp. | Defense | 2.0 |
| Johnson Controls | | |
| International plc | Building Products | 2.0 |
| Top Ten | | 25.4% |
The holdings listed exclude any temporary cash investments and
equity index products.
Investment Focus
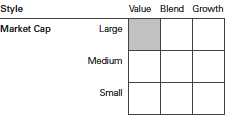
12
Windsor II Fund
Performance Summary
All of the returns in this report represent past performance, which is not a guarantee of future results that may be achieved by the fund. (Current performance may be lower or higher than the performance data cited. For performance data current to the most recent month-end, visit our website at vanguard.com/performance.) Note, too, that both investment returns and principal value can fluctuate widely, so an investor’s shares, when sold, could be worth more or less than their original cost. The returns shown do not reflect taxes that a shareholder would pay on fund distributions or on the sale of fund shares.
Cumulative Performance: October 31, 2007, Through October 31, 2017
Initial Investment of $10,000
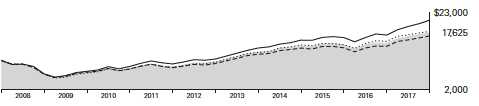
| | | | | |
| | Average Annual Total Returns | |
| | Periods Ended October 31, 2017 | |
| | | | | Final Value |
| | One | Five | Ten | of a $10,000 |
| | | Year | Years | Years | Investment |
 | Windsor II Fund Investor Shares | 19.60% | 12.53% | 5.83% | $17,625 |
 | Russell 1000 Value Index | 17.78 | 13.48 | 5.99 | 17,893 |
 | Large-Cap Value Funds Average | 20.30 | 12.70 | 5.23 | 16,655 |
| Dow Jones U.S. Total Stock Market | | | | |
 | Float Adjusted Index | 23.96 | 15.05 | 7.67 | 20,939 |
Large-Cap Value Funds Average: Derived from data provided by Lipper, a Thomson Reuters Company.
| | | | |
| | | | | Final Value |
| | One | Five | Ten | of a $50,000 |
| | Year | Years | Years | Investment |
| Windsor II Fund Admiral Shares | 19.68% | 12.62% | 5.92% | $88,881 |
| Russell 1000 Value Index | 17.78 | 13.48 | 5.99 | 89,464 |
| Dow Jones U.S. Total Stock Market Float | | | | |
| Adjusted Index | 23.96 | 15.05 | 7.67 | 104,695 |
See Financial Highlights for dividend and capital gains information.
13
Windsor II Fund
Fiscal-Year Total Returns (%): October 31, 2007, Through October 31, 2017
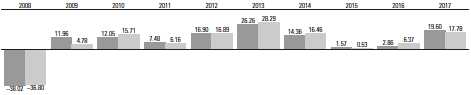
| | |
 | Windsor II Fund Investor Shares |
 | Russell 1000 Value Index |
Average Annual Total Returns: Periods Ended September 30, 2017
This table presents returns through the latest calendar quarter—rather than through the end of the fiscal period.
Securities and Exchange Commission rules require that we provide this information.
| | | | |
| | Inception | One | Five | Ten |
| | Date | Year | Years | Years |
| Investor Shares | 6/24/1985 | 16.54% | 12.22% | 5.83% |
| Admiral Shares | 5/14/2001 | 16.63 | 12.31 | 5.91 |
14
Windsor II Fund
Financial Statements
Statement of Net Assets
As of October 31, 2017
The fund reports a complete list of its holdings in regulatory filings four times in each fiscal year, at the quarter-ends. For the second and fourth fiscal quarters, the lists appear in the fund’s semiannual and annual reports to shareholders. For the first and third fiscal quarters, the fund files the lists with the Securities and Exchange Commission on Form N-Q. Shareholders can look up the fund’s Forms N-Q on the SEC’s website at sec.gov. Forms N-Q may also be reviewed and copied at the SEC’s Public Reference Room (see the back cover of this report for further information).
| | | |
| | | | Market |
| | | | Value• |
| | | Shares | ($000) |
| Common Stocks (97.7%)1 | | |
| Consumer Discretionary (9.5%) | |
| | Dollar General Corp. | 7,782,700 | 629,153 |
| | Lowe’s Cos. Inc. | 7,823,501 | 625,489 |
| | Twenty-First Century | | |
| | Fox Inc. Class A | 23,597,400 | 617,072 |
| | Comcast Corp. Class A | 9,036,000 | 325,567 |
| | Adient plc | 2,939,096 | 247,942 |
| | Delphi Automotive plc | 1,870,026 | 185,843 |
| | Omnicom Group Inc. | 2,680,400 | 180,096 |
| | DR Horton Inc. | 3,837,656 | 169,663 |
| | McDonald’s Corp. | 1,013,400 | 169,147 |
| | General Motors Co. | 3,054,242 | 131,271 |
| * | AutoZone Inc. | 213,570 | 125,900 |
| *,^ | Discovery | | |
| | Communications Inc. | | |
| | Class A | 6,197,800 | 117,014 |
| * | Madison Square | | |
| | Garden Co. Class A | 504,267 | 112,295 |
| | Carter’s Inc. | 968,500 | 93,683 |
| | Lennar Corp. Class A | 1,666,781 | 92,790 |
| | CBS Corp. Class B | 1,488,200 | 83,518 |
| * | Lululemon Athletica Inc. | 1,218,450 | 74,947 |
| | Goodyear Tire & | | |
| | Rubber Co. | 2,297,700 | 70,287 |
| | Magna International Inc. | 1,273,100 | 69,448 |
| * | Meritage Homes Corp. | 1,345,510 | 65,526 |
| | CalAtlantic Group Inc. | 1,297,087 | 63,998 |
| * | Discovery | | |
| | Communications Inc. | 3,044,900 | 54,230 |
| * | Dollar Tree Inc. | 564,800 | 51,538 |
| | Genuine Parts Co. | 563,581 | 49,725 |
| | Publicis Groupe SA | 687,520 | 44,753 |
| | Honda Motor Co. Ltd. | 1,390,321 | 43,569 |
| | Hyundai Motor Co. | 263,261 | 37,874 |
| | Target Corp. | 590,013 | 34,834 |
| ^ | Harley-Davidson Inc. | 727,400 | 34,435 |
| | Honda Motor Co. Ltd. | | |
| | ADR | 1,091,200 | 33,925 |
| | | |
| | | | Market |
| | | | Value• |
| | | Shares | ($000) |
| | Bed Bath & Beyond Inc. | 1,630,200 | 32,441 |
| | Lear Corp. | 12,115 | 2,127 |
| | Best Buy Co. Inc. | 37,457 | 2,097 |
| * | Tapestry Inc. | 48,199 | 1,974 |
| | Royal Caribbean | | |
| | Cruises Ltd. | 15,344 | 1,899 |
| | Carnival Corp. | 26,331 | 1,748 |
| * | Liberty Global plc | | |
| | Class A | 49,874 | 1,539 |
| | Ralph Lauren Corp. | | |
| | Class A | 12,213 | 1,092 |
| | Hasbro Inc. | 4,780 | 443 |
| | News Corp. Class B | 24,011 | 334 |
| | Toll Brothers Inc. | 2,173 | 100 |
| | H&R Block Inc. | 3,429 | 85 |
| | Las Vegas Sands Corp. | 1,170 | 74 |
| | | | 4,681,485 |
| Consumer Staples (8.5%) | | |
| | Philip Morris | | |
| | International Inc. | 8,586,966 | 898,540 |
| | Altria Group Inc. | 10,394,832 | 667,556 |
| ^ | Imperial Brands plc | | |
| | ADR | 15,372,750 | 635,509 |
| | CVS Health Corp. | 9,050,948 | 620,261 |
| | Coca-Cola Co. | 8,950,147 | 411,528 |
| | Molson Coors | | |
| | Brewing Co. Class B | 3,172,878 | 256,591 |
| | Kellogg Co. | 3,391,075 | 212,044 |
| | PepsiCo Inc. | 1,792,721 | 197,612 |
| | Nestle SA | 1,448,100 | 121,841 |
| | Kroger Co. | 3,822,300 | 79,122 |
| | Wal-Mart Stores Inc. | 891,006 | 77,794 |
| | Procter & Gamble Co. | 89,037 | 7,687 |
| | Conagra Brands Inc. | 57,714 | 1,972 |
| | Bunge Ltd. | 20,416 | 1,404 |
| | Campbell Soup Co. | 20,834 | 987 |
| | Kimberly-Clark Corp. | 1,672 | 188 |
| | | | 4,190,636 |
15
| | | |
| Windsor II Fund | | |
| |
| |
| |
| | | | Market |
| | | | Value• |
| | | Shares | ($000) |
| Energy (9.6%) | | |
| | ConocoPhillips | 17,278,311 | 883,786 |
| | Occidental Petroleum | | |
| | Corp. | 11,000,757 | 710,319 |
| | BP plc ADR | 15,766,049 | 641,205 |
| | Phillips 66 | 6,009,950 | 547,386 |
| | Chevron Corp. | 2,316,078 | 268,410 |
| | Cabot Oil & Gas Corp. | 7,483,823 | 207,302 |
| | Marathon Oil Corp. | 13,871,900 | 197,258 |
| | Apache Corp. | 4,177,800 | 172,836 |
| | Hess Corp. | 3,305,500 | 145,971 |
| | Schlumberger Ltd. | 2,204,600 | 141,094 |
| | EOG Resources Inc. | 1,294,550 | 129,287 |
| | Royal Dutch Shell plc | | |
| | ADR | 1,934,806 | 121,951 |
| | Murphy Oil Corp. | 3,654,100 | 97,747 |
| | Pioneer Natural | | |
| | Resources Co. | 596,912 | 89,340 |
| | Andeavor | 761,125 | 80,862 |
| | Range Resources Corp. | 4,260,227 | 77,153 |
| | National Oilwell Varco | | |
| | Inc. | 2,236,300 | 76,459 |
| | Cimarex Energy Co. | 466,680 | 54,569 |
| *,^ | Kosmos Energy Ltd. | 5,732,500 | 44,026 |
| | Exxon Mobil Corp. | 111,067 | 9,257 |
| | Valero Energy Corp. | 35,435 | 2,795 |
| | Williams Cos. Inc. | 66,802 | 1,904 |
| | Devon Energy Corp. | 43,279 | 1,597 |
| | Marathon Petroleum | | |
| | Corp. | 25,162 | 1,503 |
| * | Chesapeake Energy | | |
| | Corp. | 255,387 | 996 |
| *,^ | Cobalt International | | |
| | Energy Inc. | 997,592 | 968 |
| | HollyFrontier Corp. | 19,583 | 724 |
| * | Newfield Exploration Co. | 19,325 | 595 |
| | Targa Resources Corp. | 1,457 | 60 |
| | | | 4,707,360 |
| Financials (18.8%) | | |
| | Citigroup Inc. | 19,439,323 | 1,428,790 |
| | Bank of America Corp. | 45,230,391 | 1,238,860 |
| | JPMorgan Chase & Co. | 11,893,009 | 1,196,556 |
| | Wells Fargo & Co. | 20,143,596 | 1,130,862 |
| | American International | | |
| | Group Inc. | 13,549,824 | 875,454 |
| | American Express Co. | 8,096,910 | 773,417 |
| | Citizens Financial | | |
| | Group Inc. | 6,360,008 | 241,744 |
| | Intercontinental | | |
| | Exchange Inc. | 3,347,000 | 221,237 |
| | Fifth Third Bancorp | 7,437,771 | 214,952 |
| | Morgan Stanley | 4,208,660 | 210,433 |
| | Capital One Financial | | |
| | Corp. | 2,059,300 | 189,826 |
| | | |
| | | | Market |
| | | | Value• |
| | | Shares | ($000) |
| | SunTrust Banks Inc. | 2,878,950 | 173,342 |
| | BNP Paribas SA | 2,121,364 | 165,573 |
| | Navient Corp. | 12,014,941 | 149,706 |
| | Aon plc | 901,250 | 129,266 |
| * | SLM Corp. | 11,928,052 | 126,318 |
| | Discover Financial | | |
| | Services | 1,761,600 | 117,199 |
| | Travelers Cos. Inc. | 842,400 | 111,576 |
| | Goldman Sachs | | |
| | Group Inc. | 408,474 | 99,047 |
| | Barclays plc | 36,326,564 | 89,644 |
| | State Street Corp. | 777,674 | 71,546 |
| | Ally Financial Inc. | 2,626,384 | 68,627 |
| | Banco de Sabadell SA | 24,989,467 | 50,035 |
| | Sumitomo Mitsui | | |
| | Financial Group Inc. | 1,036,900 | 41,541 |
| | Bank of New York | | |
| | Mellon Corp. | 775,395 | 39,894 |
| | CIT Group Inc. | 821,600 | 38,303 |
| | Synchrony Financial | 1,044,121 | 34,059 |
| | PNC Financial Services | | |
| | Group Inc. | 25,074 | 3,430 |
| | Allstate Corp. | 27,702 | 2,600 |
| | Aflac Inc. | 30,344 | 2,546 |
| | Regions Financial Corp. | 148,691 | 2,302 |
| | Ameriprise Financial Inc. | 14,414 | 2,256 |
| | Lincoln National Corp. | 29,213 | 2,214 |
| | Progressive Corp. | 44,698 | 2,175 |
| | Comerica Inc. | 26,867 | 2,111 |
| | T. Rowe Price Group Inc. | 22,197 | 2,062 |
| | Unum Group | 39,080 | 2,034 |
| | Everest Re Group Ltd. | 8,230 | 1,954 |
| | Zions Bancorporation | 41,702 | 1,937 |
| | Reinsurance Group of | | |
| | America Inc. Class A | 11,918 | 1,780 |
| | US Bancorp | 15,698 | 854 |
| | FNF Group | 21,717 | 813 |
| | Chubb Ltd. | 1,421 | 214 |
| | American Financial | | |
| | Group Inc. | 646 | 68 |
| | | | 9,259,157 |
| Health Care (15.9%) | | |
| | Pfizer Inc. | 38,123,339 | 1,336,604 |
| | Medtronic plc | 16,377,219 | 1,318,694 |
| | Johnson & Johnson | 6,843,613 | 954,068 |
| | Sanofi ADR | 16,064,900 | 759,549 |
| * | Express Scripts | | |
| | Holding Co. | 11,858,657 | 726,817 |
| | Cardinal Health Inc. | 9,569,281 | 592,339 |
| | Merck & Co. Inc. | 6,042,392 | 332,875 |
| | Anthem Inc. | 1,487,865 | 311,276 |
| | UnitedHealth Group Inc. | 1,292,500 | 271,709 |
| | Cigna Corp. | 945,355 | 186,443 |
| | Gilead Sciences Inc. | 2,006,142 | 150,380 |
16
| | | | |
| Windsor II Fund | | | |
| |
| |
| |
| | | | | Market |
| | | | | Value• |
| | | | Shares | ($000) |
| | Koninklijke Philips NV | 3,571,814 | 145,694 |
| | Zoetis Inc. | 2,223,547 | 141,907 |
| * | Biogen Inc. | | 426,705 | 132,987 |
| ^ | GlaxoSmithKline plc | | | |
| | ADR | 3,083,700 | 112,339 |
| | Roche Holding AG | | 362,000 | 83,670 |
| | Humana Inc. | | 326,800 | 83,448 |
| | Stryker Corp. | | 511,250 | 79,177 |
| | AbbVie Inc. | | 615,772 | 55,574 |
| | Zimmer Biomet | | | |
| | Holdings Inc. | | 325,300 | 39,563 |
| | Aetna Inc. | | 18,998 | 3,230 |
| | Eli Lilly & Co. | | 36,882 | 3,022 |
| | Amgen Inc. | | 12,391 | 2,171 |
| | Agilent Technologies Inc. | 31,405 | 2,137 |
| | Quest Diagnostics Inc. | | 17,469 | 1,638 |
| * | Quintiles IMS Holdings Inc. | 9,700 | 1,049 |
| | Abbott Laboratories | | 16,412 | 890 |
| | Baxter International Inc. | | 8,407 | 542 |
| * | INC Research Holdings | | | |
| | Inc. Class A | | 8,161 | 466 |
| | Allergan plc | | 1,598 | 283 |
| | PerkinElmer Inc. | | 911 | 66 |
| | | | | 7,830,607 |
| Industrials (9.8%) | | | |
| | United Technologies | | | |
| | Corp. | 8,285,550 | 992,277 |
| | Johnson Controls | | | |
| | International plc | 23,853,674 | 987,304 |
| | General Electric Co. | 37,610,294 | 758,223 |
| | General Dynamics Corp. | 2,006,200 | 407,218 |
| | United Parcel Service | | | |
| | Inc. Class B | 2,436,700 | 286,385 |
| | Eaton Corp. plc | 3,069,900 | 245,653 |
| | Raytheon Co. | 1,008,183 | 181,675 |
| | Cummins Inc. | | 958,931 | 169,616 |
| | CNH Industrial NV | 11,893,000 | 151,041 |
| | Honeywell International | | | |
| | Inc. | | 721,400 | 103,997 |
| | Rockwell Collins Inc. | | 753,400 | 102,161 |
| | Deere & Co. | | 736,848 | 97,912 |
| | Stanley Black & Decker | | | |
| | Inc. | | 488,022 | 78,840 |
| | Parker-Hannifin Corp. | | 306,900 | 56,043 |
| * | Copart Inc. | 1,451,450 | 52,673 |
| * | Kirby Corp. | | 561,850 | 39,807 |
| | PACCAR Inc. | | 496,900 | 35,643 |
| ^ | Wabtec Corp. | | 450,675 | 34,477 |
| | Embraer SA ADR | 1,339,300 | 25,634 |
| | Caterpillar Inc. | | 29,844 | 4,053 |
| | 3M Co. | | 13,420 | 3,089 |
| | Allison Transmission | | | |
| | Holdings Inc. | | 49,407 | 2,099 |
| | | |
| | | | Market |
| | | | Value• |
| | | Shares | ($000) |
| | American Airlines | | |
| | Group Inc. | 44,402 | 2,079 |
| | Owens Corning | 24,336 | 2,012 |
| | Rockwell Automation Inc. | 9,715 | 1,951 |
| | ManpowerGroup Inc. | 12,181 | 1,502 |
| * | JetBlue Airways Corp. | 60,469 | 1,158 |
| | L3 Technologies Inc. | 5,191 | 972 |
| | Norfolk Southern Corp. | 5,059 | 665 |
| | Waste Management Inc. | 3,853 | 317 |
| | | | 4,826,476 |
| Information Technology (18.1%) | |
| | Microsoft Corp. | 21,266,311 | 1,768,932 |
| | Oracle Corp. | 22,313,000 | 1,135,732 |
| | QUALCOMM Inc. | 12,806,703 | 653,270 |
| | Apple Inc. | 3,858,456 | 652,233 |
| * | Alphabet Inc. Class A | 458,898 | 474,060 |
| * | Alphabet Inc. Class C | 396,656 | 403,256 |
| | Samsung Electronics | | |
| | Co. Ltd. | 153,400 | 378,147 |
| * | eBay Inc. | 9,724,684 | 366,037 |
| | Cisco Systems Inc. | 10,471,107 | 357,588 |
| | Hewlett Packard | | |
| | Enterprise Co. | 25,095,100 | 349,324 |
| | Taiwan Semiconductor | | |
| | Manufacturing Co. | | |
| | Ltd. ADR | 7,567,119 | 320,316 |
| | Intel Corp. | 5,822,221 | 264,853 |
| | Visa Inc. Class A | 2,281,800 | 250,952 |
| | Motorola Solutions Inc. | 2,658,505 | 240,701 |
| | Corning Inc. | 6,656,500 | 208,415 |
| | Skyworks Solutions Inc. | 1,823,500 | 207,624 |
| ^ | Telefonaktiebolaget | | |
| | LM Ericsson ADR | 32,531,200 | 203,320 |
| | DXC Technology Co. | 1,464,572 | 134,038 |
| * | Vantiv Inc. Class A | 1,345,100 | 94,157 |
| | Applied Materials Inc. | 1,480,450 | 83,542 |
| | Cypress Semiconductor | | |
| | Corp. | 5,080,750 | 80,581 |
| * | Palo Alto Networks Inc. | 542,800 | 79,900 |
| * | CoreLogic Inc. | 1,657,050 | 77,716 |
| | TE Connectivity Ltd. | 434,900 | 39,563 |
| * | Teradata Corp. | 1,161,200 | 38,842 |
| | HP Inc. | 132,449 | 2,854 |
| | Western Digital Corp. | 26,898 | 2,401 |
| | International Business | | |
| | Machines Corp. | 14,055 | 2,165 |
| | NVIDIA Corp. | 9,119 | 1,886 |
| | Teradyne Inc. | 42,226 | 1,811 |
| * | Dell Technologies Inc. | | |
| | Class V | 21,820 | 1,806 |
| | Marvell Technology | | |
| | Group Ltd. | 94,345 | 1,743 |
| | Western Union Co. | 59,647 | 1,185 |
| | Seagate Technology plc | 31,723 | 1,173 |
17
| | | |
| Windsor II Fund | | |
| |
| |
| |
| | | | Market |
| | | | Value• |
| | | Shares | ($000) |
| * | NCR Corp. | 27,975 | 898 |
| | Avnet Inc. | 13,200 | 525 |
| | Leidos Holdings Inc. | 7,106 | 444 |
| | Xerox Corp. | 2,740 | 83 |
| | | | 8,882,073 |
| Materials (3.8%) | | |
| | Air Products & | | |
| | Chemicals Inc. | 5,077,162 | 809,452 |
| | DowDuPont Inc. | 7,627,810 | 551,567 |
| * | Crown Holdings Inc. | 3,316,200 | 199,536 |
| | Steel Dynamics Inc. | 2,397,150 | 89,198 |
| | PPG Industries Inc. | 702,300 | 81,635 |
| | International Paper Co. | 988,300 | 56,600 |
| ^ | Agrium Inc. | 474,750 | 51,710 |
| | LyondellBasell Industries | | |
| | NV Class A | 26,940 | 2,789 |
| | Albemarle Corp. | 14,893 | 2,098 |
| * | Freeport-McMoRan Inc. | 114,659 | 1,603 |
| | Newmont Mining Corp. | 35,479 | 1,283 |
| | Packaging Corp. of | | |
| | America | 8,219 | 955 |
| | Avery Dennison Corp. | 3,052 | 324 |
| | Eastman Chemical Co. | 3,542 | 322 |
| | WestRock Co. | 3,359 | 206 |
| | | | 1,849,278 |
| Other (0.5%) | | |
| | SPDR S&P500 ETF Trust | 737,143 | 189,556 |
| 2 | Vanguard Value ETF | 630,600 | 64,101 |
| | | | 253,657 |
| Real Estate (0.3%) | | |
| | Prologis Inc. | 2,058,650 | 132,948 |
| | Gaming and Leisure | | |
| | Properties Inc. | 49,345 | 1,803 |
| | Host Hotels & Resorts | | |
| | Inc. | 87,896 | 1,719 |
| | Omega Healthcare | | |
| | Investors Inc. | 55,481 | 1,601 |
| | Senior Housing | | |
| | Properties Trust | 86,485 | 1,591 |
| | Park Hotels & Resorts Inc. | 33,048 | 951 |
| | Forest City Realty Trust | | |
| | Inc. Class A | 32,931 | 811 |
| | Hospitality Properties | | |
| | Trust | 19,400 | 554 |
| | WP Carey Inc. | 8,019 | 547 |
| | Uniti Group Inc. | 20,393 | 357 |
| | Essex Property Trust Inc. | 787 | 207 |
| | Iron Mountain Inc. | 3,231 | 129 |
| | | | 143,218 |
| | | |
| | | | Market |
| | | | Value• |
| | | Shares | ($000) |
| Telecommunication Services (2.6%) | |
| | Verizon | | |
| | Communications Inc. | 13,872,306 | 664,067 |
| | AT&T Inc. | 12,795,471 | 430,568 |
| | Vodafone Group plc | | |
| | ADR | 5,525,636 | 160,133 |
| * | Sprint Corp. | 144,691 | 946 |
| | | | 1,255,714 |
| Utilities (0.3%) | | |
| * | Calpine Corp. | 3,742,300 | 55,910 |
| | Southern Co. | 535,800 | 27,969 |
| | PPL Corp. | 661,300 | 24,838 |
| | NextEra Energy Inc. | 23,773 | 3,687 |
| | Entergy Corp. | 25,280 | 2,181 |
| | PG&E Corp. | 37,001 | 2,138 |
| | FirstEnergy Corp. | 63,322 | 2,086 |
| | Ameren Corp. | 33,622 | 2,084 |
| | CenterPoint Energy Inc. | 68,778 | 2,034 |
| | NRG Energy Inc. | 68,589 | 1,715 |
| | AES Corp. | 146,149 | 1,554 |
| | National Fuel Gas Co. | 26,382 | 1,531 |
| | DTE Energy Co. | 8,238 | 910 |
| | Avangrid Inc. | 9,404 | 486 |
| | Xcel Energy Inc. | 3,609 | 179 |
| | Eversource Energy | 2,072 | 130 |
| | | | 129,432 |
| Total Common Stocks | | |
| (Cost $35,294,216) | | 48,009,093 |
| Temporary Cash Investments (2.5%)1 | |
| Money Market Fund (2.4%) | |
| 3,4 | Vanguard Market | | |
| | Liquidity Fund, | | |
| | 1.246% | 12,403,154 | 1,240,439 |
| |
| | | Face | |
| | | Amount | |
| | | ($000) | |
| U.S. Government and Agency Obligations (0.1%) |
| 5 | United States Cash | | |
| | Management Bill, | | |
| | 1.048%, 1/2/18 | 25,000 | 24,955 |
| 5 | United States Treasury | | |
| | Bill, 1.169%, 3/22/18 | 100 | 100 |
| | | | 25,055 |
| Total Temporary Cash Investments | |
| (Cost $1,265,505) | | 1,265,494 |
| Total Investments (100.2%) | |
| (Cost $36,559,721) | | 49,274,587 |
18
| |
| Windsor II Fund | |
| |
| |
| |
| |
| | Amount |
| | ($000) |
| Other Assets and Liabilities (-0.2%) | |
| Other Assets | |
| Investment in Vanguard | 3,015 |
| Receivables for Investment Securities | |
| Sold | 12,235 |
| Receivables for Accrued Income | 48,953 |
| Variation Margin Receivable | 611 |
| Receivables for Capital Shares Issued | 5,840 |
| Other Assets | 4,416 |
| Total Other Assets | 75,070 |
| Liabilities | |
| Payables for Investment Securities | |
| Purchased | (29,995) |
| Collateral for Securities on Loan | (61,324) |
| Payables to Investment Advisor | (14,349) |
| Payables for Capital Shares Redeemed | (22,871) |
| Payables to Vanguard | (69,209) |
| Total Liabilities | (197,748) |
| Net Assets (100%) | 49,151,909 |
At October 31, 2017, net assets consisted of:
| |
| | Amount |
| | ($000) |
| Paid-in Capital | 33,266,823 |
| Undistributed Net Investment Income | 250,774 |
| Accumulated Net Realized Gains | 2,918,723 |
| Unrealized Appreciation (Depreciation) | |
| Investment Securities | 12,714,866 |
| Futures Contracts | 743 |
| Foreign Currencies | (20) |
| Net Assets | 49,151,909 |
| |
| | Amount |
| | ($000) |
| Investor Shares—Net Assets | |
| Applicable to 351,397,454 outstanding | |
| $.001 par value shares of beneficial | |
| interest (unlimited authorization) | 13,637,701 |
| Net Asset Value Per Share— | |
| Investor Shares | $38.81 |
| |
| |
| Admiral Shares—Net Assets | |
| Applicable to 515,599,445 outstanding | |
| $.001 par value shares of beneficial | |
| interest (unlimited authorization) | 35,514,208 |
| Net Asset Value Per Share— | |
| Admiral Shares | $68.88 |
• See Note A in Notes to Financial Statements.
* Non-income-producing security.
^ Includes partial security positions on loan to broker-dealers.
The total value of securities on loan is $57,649,000.
1 The fund invests a portion of its cash reserves in equity
markets through the use of index futures contracts. After
giving effect to futures investments, the fund’s effective
common stock and temporary cash investment positions
represent 98.3% and 1.9%, respectively, of net assets.
2 Considered an affiliated company of the fund as the issuer is
another member of The Vanguard Group.
3 Affiliated money market fund available only to Vanguard funds
and certain trusts and accounts managed by Vanguard. Rate
shown is the 7-day yield.
4 Includes $61,324,000 of collateral received for securities
on loan.
5 Securities with a value of $12,253,000 have been segregated
as initial margin for open futures contracts.
ADR—American Depositary Receipt.
19
| | | | |
| Windsor II Fund | | | | |
| |
| |
| Derivative Financial Instruments Outstanding as of Period End | | |
| Futures Contracts | | | | |
| | | | | ($000) |
| | | | | Value and |
| | | Number of | | Unrealized |
| | | Long (Short) | Notional | Appreciation |
| | Expiration | Contracts | Amount | (Depreciation) |
| Long Futures Contracts | | | | |
| E-mini S&P 500 Index | December 2017 | 2,447 | 314,770 | 743 |
Unrealized appreciation (depreciation) on open futures contracts is required to be treated as realized
gain (loss) for tax purposes.
See accompanying Notes, which are an integral part of the Financial Statements.
20
| |
| Windsor II Fund | |
| |
| |
| Statement of Operations | |
| |
| | Year Ended |
| | October 31, 2017 |
| | ($000) |
| Investment Income | |
| Income | |
| Dividends1,2 | 1,113,862 |
| Interest 2 | 13,037 |
| Securities Lending—Net | 1,681 |
| Total Income | 1,128,580 |
| Expenses | |
| Investment Advisory Fees—Note B | |
| Basic Fee | 67,179 |
| Performance Adjustment | (10,379) |
| The Vanguard Group—Note C | |
| Management and Administrative—Investor Shares | 28,431 |
| Management and Administrative—Admiral Shares | 44,091 |
| Marketing and Distribution—Investor Shares | 1,945 |
| Marketing and Distribution—Admiral Shares | 1,755 |
| Custodian Fees | 459 |
| Auditing Fees | 51 |
| Shareholders’ Reports and Proxy—Investor Shares | 771 |
| Shareholders’ Reports and Proxy—Admiral Shares | 576 |
| Trustees’ Fees and Expenses | 84 |
| Total Expenses | 134,963 |
| Expenses Paid Indirectly | (1,723) |
| Net Expenses | 133,240 |
| Net Investment Income | 995,340 |
| Realized Net Gain (Loss) | |
| Investment Securities Sold 2 | 3,164,618 |
| Futures Contracts | 32,520 |
| Foreign Currencies | (31) |
| Realized Net Gain (Loss) | 3,197,107 |
| Change in Unrealized Appreciation (Depreciation) | |
| Investment Securities 2 | 4,303,837 |
| Futures Contracts | 1,080 |
| Foreign Currencies | 92 |
| Change in Unrealized Appreciation (Depreciation) | 4,305,009 |
| Net Increase (Decrease) in Net Assets Resulting from Operations | 8,497,456 |
1 Dividends are net of foreign withholding taxes of $15,616,000.
2 Dividend income, interest income, realized net gain (loss), and change in unrealized appreciation (depreciation) from affiliated
companies of the fund were $1,567,000, $12,892,000, $27,000, and $9,790,000, respectively.
See accompanying Notes, which are an integral part of the Financial Statements.
21
| | |
| Windsor II Fund | | |
| |
| |
| Statement of Changes in Net Assets | | |
| |
| | Year Ended October 31, |
| | 2017 | 2016 |
| | ($000) | ($000) |
| Increase (Decrease) in Net Assets | | |
| Operations | | |
| Net Investment Income | 995,340 | 1,133,226 |
| Realized Net Gain (Loss) | 3,197,107 | 2,821,008 |
| Change in Unrealized Appreciation (Depreciation) | 4,305,009 | (2,689,493) |
| Net Increase (Decrease) in Net Assets Resulting from Operations | 8,497,456 | 1,264,741 |
| Distributions | | |
| Net Investment Income | | |
| Investor Shares | (328,011) | (322,488) |
| Admiral Shares | (780,981) | (710,701) |
| Realized Capital Gain1 | | |
| Investor Shares | (754,617) | (772,959) |
| Admiral Shares | (1,716,810) | (1,596,656) |
| Total Distributions | (3,580,419) | (3,402,804) |
| Capital Share Transactions | | |
| Investor Shares | (1,593,453) | (908,254) |
| Admiral Shares | 1,063,814 | 650,239 |
| Net Increase (Decrease) from Capital Share Transactions | (529,639) | (258,015) |
| Total Increase (Decrease) | 4,387,398 | (2,396,078) |
| Net Assets | | |
| Beginning of Period | 44,764,511 | 47,160,589 |
| End of Period2 | 49,151,909 | 44,764,511 |
1 Includes fiscal 2017 and 2016 short-term gain distributions totaling $129,480,000 and $218,890,000, respectively. Short-term gain
distributions are treated as ordinary income dividends for tax purposes.
2 Net Assets—End of period includes undistributed (overdistributed) net investment income of $250,774,000 and $364,457,000.
See accompanying Notes, which are an integral part of the Financial Statements.
22
| | | | | |
| Windsor II Fund | | | | | |
| |
| |
| Financial Highlights | | | | | |
| |
| |
| Investor Shares | | | | | |
| |
| For a Share Outstanding | | | Year Ended October 31, |
| Throughout Each Period | 2017 | 2016 | 2015 | 2014 | 2013 |
| Net Asset Value, Beginning of Period | $35.03 | $36.73 | $39.59 | $36.19 | $29.33 |
| Investment Operations | | | | | |
| Net Investment Income | .7501 | .8471 | .809 | .868 | .740 |
| Net Realized and Unrealized Gain (Loss) | | | | | |
| on Investments | 5.847 | .096 | (.229) | 4.167 | 6.842 |
| Total from Investment Operations | 6.597 | .943 | .580 | 5.035 | 7.582 |
| Distributions | | | | | |
| Dividends from Net Investment Income | (.851) | (.781) | (.827) | (.838) | (.722) |
| Distributions from Realized Capital Gains | (1.966) | (1.862) | (2.613) | (.797) | — |
| Total Distributions | (2.817) | (2.643) | (3.440) | (1.635) | (.722) |
| Net Asset Value, End of Period | $38.81 | $35.03 | $36.73 | $39.59 | $36.19 |
| Total Return2 | 19.60% | 2.86% | 1.57% | 14.36% | 26.26% |
| Ratios/Supplemental Data | | | | | |
| Net Assets, End of Period (Millions) | $13,638 | $13,773 | $15,397 | $17,312 | $18,034 |
| Ratio of Total Expenses to Average Net Assets3 | 0.34% | 0.33% | 0.34% | 0.36% | 0.36% |
| Ratio of Net Investment Income to | | | | | |
| Average Net Assets | 2.01% | 2.46% | 2.12% | 2.28% | 2.25% |
| Portfolio Turnover Rate | 32% | 33% | 26% | 27% | 27% |
1 Calculated based on average shares outstanding.
2 Total returns do not include account service fees that may have applied in the periods shown. Fund prospectuses provide information
about any applicable account service fees.
3 Includes performance-based investment advisory fee increases (decreases) of (0.02%), (0.03%), (0.02%), 0.00%, and (0.01%).
See accompanying Notes, which are an integral part of the Financial Statements.
23
| | | | | |
| Windsor II Fund | | | | | |
| |
| |
| Financial Highlights | | | | | |
| |
| |
| Admiral Shares | | | | | |
| |
| For a Share Outstanding | | | Year Ended October 31, |
| Throughout Each Period | 2017 | 2016 | 2015 | 2014 | 2013 |
| Net Asset Value, Beginning of Period | $62.18 | $65.20 | $70.27 | $64.23 | $52.06 |
| Investment Operations | | | | | |
| Net Investment Income | 1.3771 | 1.5521 | 1.492 | 1.601 | 1.366 |
| Net Realized and Unrealized Gain (Loss) | | | | | |
| on Investments | 10.376 | .168 | (.401) | 7.398 | 12.134 |
| Total from Investment Operations | 11.753 | 1.720 | 1.091 | 8.999 | 13.500 |
| Distributions | | | | | |
| Dividends from Net Investment Income | (1.565) | (1.437) | (1.525) | (1.545) | (1.330) |
| Distributions from Realized Capital Gains | (3.488) | (3.303) | (4.636) | (1.414) | — |
| Total Distributions | (5.053) | (4.740) | (6.161) | (2.959) | (1.330) |
| Net Asset Value, End of Period | $68.88 | $62.18 | $65.20 | $70.27 | $64.23 |
| Total Return2 | 19.68% | 2.94% | 1.66% | 14.46% | 26.36% |
| Ratios/Supplemental Data | | | | | |
| Net Assets, End of Period (Millions) | $35,514 | $30,991 | $31,763 | $32,898 | $27,593 |
| Ratio of Total Expenses to Average Net Assets3 | 0.26% | 0.25% | 0.26% | 0.28% | 0.28% |
| Ratio of Net Investment Income to | | | | | |
| Average Net Assets | 2.09% | 2.54% | 2.20% | 2.36% | 2.33% |
| Portfolio Turnover Rate | 32% | 33% | 26% | 27% | 27% |
1 Calculated based on average shares outstanding.
2 Total returns do not include account service fees that may have applied in the periods shown. Fund prospectuses provide information
about any applicable account service fees.
3 Includes performance-based investment advisory fee increases (decreases) of (0.02%), (0.03%), (0.02%), 0.00%, and (0.01%).
See accompanying Notes, which are an integral part of the Financial Statements.
24
Windsor II Fund
Notes to Financial Statements
Vanguard Windsor II Fund is registered under the Investment Company Act of 1940 as an open-end investment company, or mutual fund. The fund offers two classes of shares: Investor Shares and Admiral Shares. Investor Shares are available to any investor who meets the fund’s minimum purchase requirements. Admiral Shares are designed for investors who meet certain administrative, service, and account-size criteria.
A. The following significant accounting policies conform to generally accepted accounting principles for U.S. investment companies. The fund consistently follows such policies in preparing its financial statements.
1. Security Valuation: Securities are valued as of the close of trading on the New York Stock Exchange (generally 4 p.m., Eastern time) on the valuation date. Equity securities are valued at the latest quoted sales prices or official closing prices taken from the primary market in which each security trades; such securities not traded on the valuation date are valued at the mean of the latest quoted bid and asked prices. Securities for which market quotations are not readily available, or whose values have been affected by events occurring before the fund’s pricing time but after the close of the securities’ primary markets, are valued at their fair values calculated according to procedures adopted by the board of trustees. These procedures include obtaining quotations from an independent pricing service, monitoring news to identify significant market-or security-specific events, and evaluating changes in the values of foreign market proxies (for example, ADRs, futures contracts, or exchange-traded funds), between the time the foreign markets close and the fund’s pricing time. When fair-value pricing is employed, the prices of securities used by a fund to calculate its net asset value may differ from quoted or published prices for the same securities. Investments in Vanguard Market Liquidity Fund are valued at that fund’s net asset value. Temporary cash investments are valued using the latest bid prices or using valuations based on a matrix system (which considers such factors as security prices, yields, maturities, and ratings), both as furnished by independent pricing services.
2. Foreign Currency: Securities and other assets and liabilities denominated in foreign currencies are translated into U.S. dollars using exchange rates obtained from an independent third party as of the fund’s pricing time on the valuation date. Realized gains (losses) and unrealized appreciation (depreciation) on investment securities include the effects of changes in exchange rates since the securities were purchased, combined with the effects of changes in security prices. Fluctuations in the value of other assets and liabilities resulting from changes in exchange rates are recorded as unrealized foreign currency gains (losses) until the assets or liabilities are settled in cash, at which time they are recorded as realized foreign currency gains (losses).
3. Futures Contracts: The fund uses index futures contracts to a limited extent, with the objective of maintaining full exposure to the stock market while maintaining liquidity. The fund may purchase or sell futures contracts to achieve a desired level of investment, whether to accommodate portfolio turnover or cash flows from capital share transactions. The primary risks associated with the use of futures contracts are imperfect correlation between changes in market values of stocks held by the fund and the prices of futures contracts, and the possibility of an illiquid market. Counterparty risk involving futures is mitigated because a regulated clearinghouse is the counterparty instead of the clearing broker. To further mitigate counterparty risk, the fund trades futures contracts on an exchange, monitors the financial strength of its clearing brokers and clearinghouse, and has entered into clearing agreements with its clearing brokers. The clearinghouse imposes initial margin requirements to secure the fund’s performance and requires daily settlement of variation margin representing changes in the market value of each contract.
25
Windsor II Fund
Futures contracts are valued at their quoted daily settlement prices. The notional amounts of the contracts are not recorded in the Statement of Net Assets. Fluctuations in the value of the contracts are recorded in the Statement of Net Assets as an asset (liability) and in the Statement of Operations as unrealized appreciation (depreciation) until the contracts are closed, when they are recorded as realized futures gains (losses).
During the year ended October 31, 2017, the fund’s average investments in long and short futures contracts represented less than 1% and 0% of net assets, respectively, based on the average of the notional amounts at each quarter-end during the period 4. Federal Income Taxes: The fund intends to continue to qualify as a regulated investment company and distribute all of its taxable income. Management has analyzed the fund’s tax positions taken for all open federal income tax years (October 31, 2014–2017), and has concluded that no provision for federal income tax is required in the fund’s financial statements.
5. Distributions: Distributions to shareholders are recorded on the ex-dividend date.
6. Securities Lending: To earn additional income, the fund lends its securities to qualified institutional borrowers. Security loans are subject to termination by the fund at any time, and are required to be secured at all times by collateral in an amount at least equal to the market value of securities loaned. Daily market fluctuations could cause the value of loaned securities to be more or less than the value of the collateral received. When this occurs, the collateral is adjusted and settled on the next business day. The fund further mitigates its counterparty risk by entering into securities lending transactions only with a diverse group of prequalified counterparties, monitoring their financial strength, and entering into master securities lending agreements with its counterparties. The master securities lending agreements provide that, in the event of a counterparty’s default (including bankruptcy), the fund may terminate any loans with that borrower, determine the net amount owed, and sell or retain the collateral up to the net amount owed to the fund; however, such actions may be subject to legal proceedings. While collateral mitigates counterparty risk, in the event of a default, the fund may experience delays and costs in recovering the securities loaned. The fund invests cash collateral received in Vanguard Market Liquidity Fund, and records a liability in the Statement of Net Assets for the return of the collateral, during the period the securities are on loan. Securities lending income represents fees charged to borrowers plus income earned on invested cash collateral, less expenses associated with the loan. During the term of the loan, the fund is entitled to all distributions made on or in respect of the loaned securities.
7. Credit Facility: The fund and certain other funds managed by The Vanguard Group (“Vanguard”) participate in a $3.1 billion committed credit facility provided by a syndicate of lenders pursuant to a credit agreement that may be renewed annually; each fund is individually liable for its borrowings, if any, under the credit facility. Borrowings may be utilized for temporary and emergency purposes, and are subject to the fund’s regulatory and contractual borrowing restrictions. The participating funds are charged administrative fees and an annual commitment fee of 0.10% of the undrawn amount of the facility; these fees are allocated to the funds based on a method approved by the fund’s board of trustees and included in Management and Administrative expenses on the fund’s Statement of Operations. Any borrowings under this facility bear interest at a rate based upon the higher of the one-month London Interbank Offered Rate, federal funds effective rate, or overnight bank funding rate plus an agreed-upon spread.
26
Windsor II Fund
The fund had no borrowings outstanding at October 31, 2017, or at any time during the period then ended.
8. Other: Dividend income is recorded on the ex-dividend date. Interest income includes income distributions received from Vanguard Market Liquidity Fund and is accrued daily. Premiums and discounts on debt securities purchased are amortized and accreted, respectively, to interest income over the lives of the respective securities. Security transactions are accounted for on the date securities are bought or sold. Costs used to determine realized gains (losses) on the sale of investment securities are those of the specific securities sold.
Each class of shares has equal rights as to assets and earnings, except that each class separately bears certain class-specific expenses related to maintenance of shareholder accounts (included in Management and Administrative expenses), shareholder reporting, and the proxy. Marketing and distribution expenses are allocated to each class of shares based on a method approved by the board of trustees. Income, other non-class-specific expenses, and gains and losses on investments are allocated to each class of shares based on its relative net assets.
B. The investment advisory firms Barrow, Hanley, Mewhinney & Strauss, LLC, Lazard Asset Management LLC, Hotchkis and Wiley Capital Management, LLC, and Sanders Capital, LLC, each provide investment advisory services to a portion of the fund for a fee calculated at an annual percentage rate of average net assets managed by the advisor. The basic fee of Barrow, Hanley, Mewhinney & Strauss, LLC, is subject to quarterly adjustments based on performance relative to the MSCI US Prime Market 750 Index for the preceding three years. The basic fee of Lazard Asset Management LLC, is subject to quarterly adjustments based on performance relative to the S&P 500 Index for the preceding three years. The basic fee of Hotchkis and Wiley Capital Management, LLC, is subject to quarterly adjustments based on performance relative to the MSCI US Investable Market 2500 Index for the preceding five years. The basic fee of Sanders Capital, LLC, is subject to quarterly adjustments based on performance relative to the Russell 3000 Index for the preceding five years.
Vanguard provides investment advisory services to a portion of the fund as described below; the fund paid Vanguard advisory fees of $397,000 for the year ended October 31, 2017.
For the year ended October 31, 2017, the aggregate investment advisory fee paid to all advisors represented an effective annual basic rate of 0.14% of the fund’s average net assets, before a decrease of $10,379,000 (0.02%) based on performance.
C. In accordance with the terms of a Funds’ Service Agreement (the “FSA”) between Vanguard and the fund, Vanguard furnishes to the fund investment advisory, corporate management, administrative, marketing, and distribution services at Vanguard’s cost of operations (as defined by the FSA). These costs of operations are allocated to the fund based on methods and guidelines approved by the board of trustees. Vanguard does not require reimbursement in the current period for certain costs of operations (such as deferred compensation/benefits and risk/insurance costs); the fund’s liability for these costs of operations is included in Payables to Vanguard on the Statement of Net Assets.
Upon the request of Vanguard, the fund may invest up to 0.40% of its net assets as capital in Vanguard. At October 31, 2017, the fund had contributed to Vanguard capital in the amount of $3,015,000, representing 0.01% of the fund’s net assets and 1.21% of Vanguard’s capitalization. The fund’s trustees and officers are also directors and employees, respectively, of Vanguard.
27
Windsor II Fund
D. The fund has asked its investment advisors to direct certain security trades, subject to obtaining the best price and execution, to brokers who have agreed to rebate to the fund part of the commissions generated. Such rebates are used solely to reduce the fund’s management and administrative expenses. The fund’s custodian bank has also agreed to reduce its fees when the fund maintains cash on deposit in the non-interest-bearing custody account. For the year ended October 31, 2017, these arrangements reduced the fund’s management and administrative expenses by $1,722,000 and custodian fees by $1,000. The total expense reduction represented an effective annual rate of 0.00% of the fund’s average net assets.
E. Various inputs may be used to determine the value of the fund’s investments. These inputs are summarized in three broad levels for financial statement purposes. The inputs or methodologies used to value securities are not necessarily an indication of the risk associated with investing in those securities.
Level 1—Quoted prices in active markets for identical securities.
Level 2—Other significant observable inputs (including quoted prices for similar securities, interest
rates, prepayment speeds, credit risk, etc.).
Level 3—Significant unobservable inputs (including the fund’s own assumptions used to determine
the fair value of investments). Any investments valued with significant unobservable inputs are
noted on the Statement of Net Assets.
The following table summarizes the market value of the fund’s investments as of October 31, 2017, based on the inputs used to value them:
| | | |
| | Level 1 | Level 2 | Level 3 |
| Investments | ($000) | ($000) | ($000) |
| Common Stocks | 46,952,446 | 1,056,647 | — |
| Temporary Cash Investments | 1,240,439 | 25,055 | — |
| Futures Contracts—Assets1 | 611 | — | — |
| Total | 48,193,496 | 1,081,702 | — |
| 1 Represents variation margin on the last day of the reporting period. | | | |
F. Distributions are determined on a tax basis and may differ from net investment income and realized capital gains for financial reporting purposes. Differences may be permanent or temporary. Permanent differences are reclassified among capital accounts in the financial statements to reflect their tax character. Temporary differences arise when certain items of income, expense, gain, or loss are recognized in different periods for financial statement and tax purposes. These differences will reverse at some time in the future. Differences in classification may also result from the treatment of short-term gains as ordinary income for tax purposes.
The fund used a tax accounting practice to treat a portion of the price of capital shares redeemed during the year as distributions from realized capital gains. Accordingly, the fund has reclassified $235,575,000 from accumulated net realized gains to paid-in capital.
For tax purposes, at October 31, 2017, the fund had $506,613,000 of ordinary income and $2,823,429,000 of long-term capital gains available for distribution.
28
Windsor II Fund
At October 31, 2017, the cost of investment securities for tax purposes was $36,654,694,000. Net unrealized appreciation of investment securities for tax purposes was $12,619,893,000, consisting of unrealized gains of $14,780,129,000 on securities that had risen in value since their purchase and $2,160,236,000 in unrealized losses on securities that had fallen in value since their purchase.
G. During the year ended October 31, 2017, the fund purchased $14,696,581,000 of investment securities and sold $17,840,412,000 of investment securities, other than temporary cash investments.
| | | | |
| H. Capital share transactions for each class of shares were: | | | |
| | | | Year Ended October 31, |
| | | 2017 | | 2016 |
| | Amount | Shares | Amount | Shares |
| | ($000) | (000) | ($000) | (000) |
| Investor Shares | | | | |
| Issued | 649,950 | 17,561 | 680,830 | 20,254 |
| Issued in Lieu of Cash Distributions | 1,057,833 | 29,591 | 1,070,182 | 31,483 |
| Redeemed | (3,301,236) | (88,909) | (2,659,266) | (77,750) |
| Net Increase (Decrease) —Investor Shares | (1,593,453) | (41,757) | (908,254) | (26,013) |
| Admiral Shares | | | | |
| Issued | 3,043,402 | 46,187 | 2,193,824 | 36,339 |
| Issued in Lieu of Cash Distributions | 2,363,797 | 37,258 | 2,188,705 | 36,288 |
| Redeemed | (4,343,385) | (66,275) | (3,732,290) | (61,400) |
| Net Increase (Decrease) —Admiral Shares | 1,063,814 | 17,170 | 650,239 | 11,227 |
I. Management has determined that no material events or transactions occurred subsequent to
October 31, 2017, that would require recognition or disclosure in these financial statements.
29
Report of Independent Registered Public Accounting Firm
To the Board of Trustees of Vanguard Windsor Funds and the Shareholders of Vanguard Windsor II Fund
In our opinion, the accompanying statement of net assets and the related statements of operations and of changes in net assets and the financial highlights present fairly, in all material respects, the financial position of Vanguard Windsor II Fund (constituting a separate portfolio of Vanguard Windsor Funds, hereafter referred to as the “Fund”) as of October 31, 2017, the results of its operations for the year then ended, the changes in its net assets for each of the two years in the period then ended and the financial highlights for each of the five years in the period then ended, in conformity with accounting principles generally accepted in the United States of America. These financial statements and financial highlights (hereafter referred to as “financial statements”) are the responsibility of the Fund’s management. Our responsibility is to express an opinion on these financial statements based on our audits. We conducted our audits of these financial statements in accordance with the standards of the Public Company Accounting Oversight Board (United States). Those standards require that we plan and perform the audit to obtain reasonable assurance about whether the financial statements are free of material misstatement. An audit includes examining, on a test basis, evidence supporting the amounts and disclosures in the financial statements, assessing the accounting principles used and significant estimates made by management, and evaluating the overall financial statement presentation. We believe that our audits, which included confirmation of securities as of October 31, 2017 by correspondence with the custodian and brokers and by agreement to the underlying ownership records of the transfer agent, provide a reasonable basis for our opinion.
/s/PricewaterhouseCoopers LLP
Philadelphia, Pennsylvania
December 13, 2017
Special 2017 tax information (unaudited) for Vanguard Windsor II Fund
This information for the fiscal year ended October 31, 2017, is included pursuant to provisions
of the Internal Revenue Code.
The fund distributed $2,562,292,000 as capital gain dividends (20% rate gain distributions)
to shareholders during the fiscal year.
For nonresident alien shareholders, 100% of short-term capital gain dividends distributed
by the fund are qualified short-term capital gains.
The fund distributed $1,183,184,000 of qualified dividend income to shareholders during the
fiscal year.
For corporate shareholders, 68.1% of investment income (dividend income plus short-term gains,
if any) qualifies for the dividends-received deduction.
30
Your Fund’s After-Tax Returns
This table presents returns for your fund both before and after taxes. The after-tax returns are shown in two ways: (1) assuming that an investor owned the fund during the entire period and paid taxes on the fund’s distributions, and (2) assuming that an investor paid taxes on the fund’s distributions and sold all shares at the end of each period.
Calculations are based on the highest individual federal income tax and capital gains tax rates in effect at the times of the distributions and the hypothetical sales. State and local taxes were not considered. After-tax returns reflect any qualified dividend income, using actual prior-year figures and estimates for 2017. (In the example, returns after the sale of fund shares may be higher than those assuming no sale. This occurs when the sale would have produced a capital loss. The calculation assumes that the investor received a tax deduction for the loss.) The table shows returns for Investor Shares only; returns for other share classes will differ. Please note that your actual after-tax returns will depend on your tax situation and may differ from those shown. Also note that if you own the fund in a tax-deferred account, such as an individual retirement account or a 401(k) plan, this information does not apply to you. Such accounts are not subject to current taxes.
Finally, keep in mind that a fund’s performance—whether before or after taxes—does not guarantee future results.
| | | |
| Average Annual Total Returns: Windsor II Fund Investor Shares | | | |
| Periods Ended October 31, 2017 | | | |
| | One | Five | Ten |
| | Year | Years | Years |
| Returns Before Taxes | 19.60% | 12.53% | 5.83% |
| Returns After Taxes on Distributions | 17.46 | 10.89 | 4.67 |
| Returns After Taxes on Distributions and Sale of Fund Shares | 12.55 | 9.73 | 4.47 |
31
About Your Fund’s Expenses
As a shareholder of the fund, you incur ongoing costs, which include costs for portfolio management, administrative services, and shareholder reports (like this one), among others. Operating expenses, which are deducted from a fund’s gross income, directly reduce the investment return of the fund.
A fund’s expenses are expressed as a percentage of its average net assets. This figure is known as the expense ratio. The following examples are intended to help you understand the ongoing costs (in dollars) of investing in your fund and to compare these costs with those of other mutual funds. The examples are based on an investment of $1,000 made at the beginning of the period shown and held for the entire period.
The accompanying table illustrates your fund’s costs in two ways:
• Based on actual fund return. This section helps you to estimate the actual expenses that you paid over the period. The ”Ending Account Value“ shown is derived from the fund‘s actual return, and the third column shows the dollar amount that would have been paid by an investor who started with $1,000 in the fund. You may use the information here, together with the amount you invested, to estimate the expenses that you paid over the period.
To do so, simply divide your account value by $1,000 (for example, an $8,600 account value divided by $1,000 = 8.6), then multiply the result by the number given for your fund under the heading ”Expenses Paid During Period.“
• Based on hypothetical 5% yearly return. This section is intended to help you compare your fund‘s costs with those of other mutual funds. It assumes that the fund had a yearly return of 5% before expenses, but that the expense ratio is unchanged. In this case—because the return used is not the fund’s actual return—the results do not apply to your investment. The example is useful in making comparisons because the Securities and Exchange Commission requires all mutual funds to calculate expenses based on a 5% return. You can assess your fund’s costs by comparing this hypothetical example with the hypothetical examples that appear in shareholder reports of other funds.
Note that the expenses shown in the table are meant to highlight and help you compare ongoing costs only and do not reflect transaction costs incurred by the fund for buying and selling securities. Further, the expenses do not include any purchase, redemption, or account service fees described in the fund prospectus. If such fees were applied to your account, your costs would be higher. Your fund does not carry a “sales load.”
The calculations assume no shares were bought or sold during the period. Your actual costs may have been higher or lower, depending on the amount of your investment and the timing of any purchases or redemptions.
You can find more information about the fund’s expenses, including annual expense ratios, in the Financial Statements section of this report. For additional information on operating expenses and other shareholder costs, please refer to your fund’s current prospectus.
32
| | | |
| Six Months Ended October 31, 2017 | | | |
| | Beginning | Ending | Expenses |
| | Account Value | Account Value | Paid During |
| Windsor II Fund | 4/30/2017 | 10/31/2017 | Period |
| Based on Actual Fund Return | | | |
| Investor Shares | $1,000.00 | $1,060.60 | $1.77 |
| Admiral Shares | 1,000.00 | 1,060.99 | 1.35 |
| Based on Hypothetical 5% Yearly Return | | | |
| Investor Shares | $1,000.00 | $1,023.49 | $1.73 |
| Admiral Shares | 1,000.00 | 1,023.89 | 1.33 |
The calculations are based on expenses incurred in the most recent six-month period. The fund’s annualized six-month expense ratios for
that period are 0.34% for Investor Shares and 0.26% for Admiral Shares. The dollar amounts shown as “Expenses Paid” are equal to the
annualized expense ratio multiplied by the average account value over the period, multiplied by the number of days in the most recent
six-month period, then divided by the number of days in the most recent 12-month period (184/365).
33
Glossary
30-Day SEC Yield. A fund’s 30-day SEC yield is derived using a formula specified by the U.S. Securities and Exchange Commission. Under the formula, data related to the fund’s security holdings in the previous 30 days are used to calculate the fund’s hypothetical net income for that period, which is then annualized and divided by the fund’s estimated average net assets over the calculation period. For the purposes of this calculation, a security’s income is based on its current market yield to maturity (for bonds), its actual income (for asset-backed securities), or its projected dividend yield (for stocks). Because the SEC yield represents hypothetical annualized income, it will differ—at times significantly—from the fund’s actual experience. As a result, the fund’s income distributions may be higher or lower than implied by the SEC yield.
Beta. A measure of the magnitude of a fund’s past share-price fluctuations in relation to the ups and downs of a given market index. The index is assigned a beta of 1.00. Compared with a given index, a fund with a beta of 1.20 typically would have seen its share price rise or fall by 12% when the index rose or fell by 10%. For this report, beta is based on returns over the past 36 months for both the fund and the index. Note that a fund’s beta should be reviewed in conjunction with its R-squared (see definition). The lower the R-squared, the less correlation there is between the fund and the index, and the less reliable beta is as an indicator of volatility.
Dividend Yield. Dividend income earned by stocks, expressed as a percentage of the aggregate market value (or of net asset value, for a fund). The yield is determined by dividing the amount of the annual dividends by the aggregate value (or net asset value) at the end of the period. For a fund, the dividend yield is based solely on stock holdings and does not include any income produced by other investments.
Earnings Growth Rate. The average annual rate of growth in earnings over the past five years for the stocks now in a fund.
Equity Exposure. A measure that reflects a fund’s investments in stocks and stock futures. Any holdings in short-term reserves are excluded.
Expense Ratio. A fund’s total annual operating expenses expressed as a percentage of the fund’s average net assets. The expense ratio includes management and administrative expenses, but does not include the transaction costs of buying and selling portfolio securities.
Foreign Holdings. The percentage of a fund represented by securities or depositary receipts of companies based outside the United States.
Inception Date. The date on which the assets of a fund (or one of its share classes) are first invested in accordance with the fund’s investment objective. For funds with a subscription period, the inception date is the day after that period ends. Investment performance is measured from the inception date.
Median Market Cap. An indicator of the size of companies in which a fund invests; the midpoint of market capitalization (market price x shares outstanding) of a fund’s stocks, weighted by the proportion of the fund’s assets invested in each stock. Stocks representing half of the fund’s assets have market capitalizations above the median, and the rest are below it.
Price/Book Ratio. The share price of a stock divided by its net worth, or book value, per share. For a fund, the weighted average price/book ratio of the stocks it holds.
34
Price/Earnings Ratio. The ratio of a stock’s current price to its per-share earnings over the past year. For a fund, the weighted average P/E of the stocks it holds. P/E is an indicator of market expectations about corporate prospects; the higher the P/E, the greater the expectations for a company’s future growth.
R-Squared. A measure of how much of a fund’s past returns can be explained by the returns from the market in general, as measured by a given index. If a fund’s total returns were precisely synchronized with an index’s returns, its R-squared would be 1.00. If the fund’s returns bore no relationship to the index’s returns, its R-squared would be 0. For this report, R-squared is based on returns over the past 36 months for both the fund and the index.
Return on Equity. The annual average rate of return generated by a company during the past five years for each dollar of shareholder’s equity (net income divided by shareholder’s equity). For a fund, the weighted average return on equity for the companies whose stocks it holds.
Short-Term Reserves. The percentage of a fund invested in highly liquid, short-term securities that can be readily converted to cash.
Turnover Rate. An indication of the fund’s trading activity. Funds with high turnover rates incur higher transaction costs and may be more likely to distribute capital gains (which may be taxable to investors). The turnover rate excludes in-kind transactions, which have minimal impact on costs.
35
The Global Industry Classification Standard (“GICS”) was developed by and is the exclusive property and a service mark
of MSCI Inc. (“MSCI”) and Standard and Poor’s, a division of McGraw-Hill Companies, Inc. (“S&P”), and is licensed for use
by Vanguard. Neither MSCI, S&P nor any third party involved in making or compiling the GICS or any GICS classification
makes any express or implied warranties or representations with respect to such standard or classification (or the results
to be obtained by the use thereof), and all such parties hereby expressly disclaim all warranties of originality, accuracy,
completeness, merchantability or fitness for a particular purpose with respect to any such standard or classification.
Without limiting any of the foregoing, in no event shall MSCI, S&P, any of its affiliates or any third party involved in
making or compiling the GICS or any GICS classification have any liability for any direct, indirect, special, punitive,
consequential or any other damages (including lost profits) even if notified of the possibility of such damages.
36
This page intentionally left blank.
This page intentionally left blank.
The People Who Govern Your Fund
The trustees of your mutual fund are there to see that the fund is operated and managed in your best interests since, as a shareholder, you are a part owner of the fund. Your fund’s trustees also serve on the board of directors of The Vanguard Group, Inc., which is owned by the Vanguard funds and provides services to them on an at-cost basis.
A majority of Vanguard’s board members are independent, meaning that they have no affiliation with Vanguard or the funds they oversee, apart from the sizable personal investments they have made as private individuals. The independent board members have distinguished backgrounds in business, academia, and public service. Each of the trustees and executive officers oversees 200 Vanguard funds.
Information for each trustee and executive officer of the fund appears below. The mailing address of the trustees and officers is P.O. Box 876, Valley Forge, PA 19482. More information about the trustees is in the Statement of Additional Information, which can be obtained, without charge, by contacting Vanguard at 800-662-7447, or online at vanguard.com.
Interested Trustee1
F. William McNabb III
Born 1957. Trustee Since July 2009. Chairman of the Board. Principal Occupation(s) During the Past Five Years and Other Experience: Chairman of the Board of The Vanguard Group, Inc., and of each of the investment companies served by The Vanguard Group, since January 2010; Chief Executive Officer and Director of The Vanguard Group and President and Chief Executive Officer of each of the investment companies served by The Vanguard Group, since 2008; Director of Vanguard Marketing Corporation; President of The Vanguard Group (2008–2017); Managing Director of The Vanguard Group (1995–2008).
Independent Trustees
Emerson U. Fullwood
Born 1948. Trustee Since January 2008. Principal Occupation(s) During the Past Five Years and Other Experience: Executive Chief Staff and Marketing Officer for North America and Corporate Vice President (retired 2008) of Xerox Corporation (document management products and services); Executive in Residence and 2009–2010 Distinguished Minett Professor at the Rochester Institute of Technology; Lead Director of SPX FLOW, Inc. (multi-industry manufacturing); Director of the United Way of Rochester, the University of Rochester Medical Center, Monroe Community College Foundation, North Carolina A&T University, and Roberts Wesleyan College; Trustee of the University of Rochester.
Rajiv L. Gupta
Born 1945. Trustee Since December 2001.2 Principal Occupation(s) During the Past Five Years and Other Experience: Chairman and Chief Executive Officer (retired 2009) and President (2006–2008) of Rohm and Haas Co. (chemicals); Director of Arconic Inc. (diversified manufacturer), HP Inc. (printer and personal computer manufacturing), and Delphi Automotive plc (automotive components); Senior Advisor at New Mountain Capital.
Amy Gutmann
Born 1949. Trustee Since June 2006. Principal Occupation(s) During the Past Five Years and Other Experience: President of the University of Pennsylvania; Christopher H. Browne
1 Mr. McNabb is considered an “interested person,” as defined in the Investment Company Act of 1940, because he is an officer of the
Vanguard funds.
2 December 2002 for Vanguard Equity Income Fund, the Vanguard Municipal Bond Funds, and the Vanguard State Tax-Exempt Funds.
Distinguished Professor of Political Science, School of Arts and Sciences, and Professor of Communication, Annenberg School for Communication, with secondary faculty appointments in the Department of Philosophy, School of Arts and Sciences, and at the Graduate School of Education, University of Pennsylvania; Trustee of the National Constitution Center.
JoAnn Heffernan Heisen
Born 1950. Trustee Since July 1998. Principal Occupation(s) During the Past Five Years and Other Experience: Corporate Vice President and Member of the Executive Committee (1997–2008), Chief Global Diversity Officer (retired 2008), Vice President and Chief Information Officer (1997–2006), Controller (1995–1997), Treasurer (1991–1995), and Assistant Treasurer (1989–1991) of Johnson & Johnson (pharmaceuticals/medical devices/ consumer products); Director of Skytop Lodge Corporation (hotels) and the Robert Wood Johnson Foundation; Member of the Advisory Board of the Institute for Women’s Leadership at Rutgers University.
F. Joseph Loughrey
Born 1949. Trustee Since October 2009. Principal Occupation(s) During the Past Five Years and Other Experience: President and Chief Operating Officer (retired 2009) of Cummins Inc. (industrial machinery); Chairman of the Board of Hillenbrand, Inc. (specialized consumer services), Oxfam America, and the Lumina Foundation for Education; Director of the V Foundation for Cancer Research; Member of the Advisory Council for the College of Arts and Letters and Chair of the Advisory Board to the Kellogg Institute for International Studies, both at the University of Notre Dame.
Mark Loughridge
Born 1953. Trustee Since March 2012. Principal Occupation(s) During the Past Five Years and Other Experience: Senior Vice President and Chief Financial Officer (retired 2013) at IBM (information technology services); Fiduciary Member of IBM’s Retirement Plan Committee (2004–2013); Member of the Council on Chicago Booth.
Scott C. Malpass
Born 1962. Trustee Since March 2012. Principal Occupation(s) During the Past Five Years and Other Experience: Chief Investment Officer and Vice President at the University of Notre Dame; Assistant Professor of Finance at the Mendoza College of Business at Notre Dame; Member of the Notre Dame 403(b) Investment Committee, the Board of Advisors for Spruceview Capital Partners, the Board of Catholic Investment Services, Inc. (investment advisor), and the Board of Superintendence of the Institute for the Works of Religion; Chairman of the Board of TIFF Advisory Services, Inc. (investment advisor).
André F. Perold
Born 1952. Trustee Since December 2004. Principal Occupation(s) During the Past Five Years and Other Experience: George Gund Professor of Finance and Banking, Emeritus at the Harvard Business School (retired 2011); Chief Investment Officer and Co-Managing Partner of HighVista Strategies LLC (private investment firm); Overseer of the Museum of Fine Arts Boston.
Peter F. Volanakis
Born 1955. Trustee Since July 2009. Principal Occupation(s) During the Past Five Years and Other Experience: President and Chief Operating Officer (retired 2010) of Corning Incorporated (communications equipment); Chairman of the Board of Trustees of Colby-Sawyer College; Member of the Board of Hypertherm, Inc. (industrial cutting systems, software, and consumables).
Executive Officers
Glenn Booraem
Born 1967. Investment Stewardship Officer Since February 2017. Principal Occupation(s) During the Past Five Years and Other Experience: Principal of The Vanguard Group, Inc.; Treasurer (2015–2017), Controller (2010–2015), and Assistant Controller (2001–2010) of each of the investment companies served by The Vanguard Group.
Thomas J. Higgins
Born 1957. Chief Financial Officer Since September 2008. Principal Occupation(s) During the Past Five Years and Other Experience: Principal of The Vanguard Group, Inc.; Chief Financial Officer of each of the investment companies served by The Vanguard Group; Treasurer of each of the investment companies served by The Vanguard Group (1998–2008).
Peter Mahoney
Born 1974. Controller Since May 2015. Principal Occupation(s) During the Past Five Years and Other Experience: Principal of The Vanguard Group, Inc.; Controller of each of the investment companies served by The Vanguard Group; Head of International Fund Services at The Vanguard Group (2008–2014).
Anne E. Robinson
Born 1970. Secretary Since September 2016. Principal Occupation(s) During the Past Five Years and Other Experience: Managing Director of The Vanguard Group, Inc.; General Counsel of The Vanguard Group; Secretary of The Vanguard Group and of each of the investment companies served by The Vanguard Group; Director and Senior Vice President of Vanguard Marketing Corporation; Managing Director and General Counsel of Global Cards and Consumer Services at Citigroup (2014–2016); Counsel at American Express (2003–2014).
Michael Rollings
Born 1963. Treasurer Since February 2017. Principal Occupation(s) During the Past Five Years and Other Experience: Managing Director of The Vanguard Group, Inc.; Treasurer of each of the investment companies served by The Vanguard Group; Director of Vanguard Marketing Corporation; Executive Vice President and Chief Financial Officer of MassMutual Financial Group (2006–2016).
| |
| Vanguard Senior Management Team |
| |
| Mortimer J. Buckley | Chris D. McIsaac |
| Gregory Davis | James M. Norris |
| John James | Thomas M. Rampulla |
| Martha G. King | Karin A. Risi |
| John T. Marcante | |
Chairman Emeritus and Senior Advisor
John J. Brennan
Chairman, 1996–2009
Chief Executive Officer and President, 1996–2008
Founder
John C. Bogle
Chairman and Chief Executive Officer, 1974–1996
|  |
| | P.O. Box 2600 |
| | Valley Forge, PA 19482-2600 |
| |
| |
| |
| Connect with Vanguard® > vanguard.com |
| |
| |
| |
| Fund Information > 800-662-7447 | CFA® is a registered trademark owned by CFA Institute. |
| Direct Investor Account Services > 800-662-2739 |
| Institutional Investor Services > 800-523-1036 |
| Text Telephone for People | |
| Who Are Deaf or Hard of Hearing> 800-749-7273 |
| |
| This material may be used in conjunction |
| with the offering of shares of any Vanguard |
| fund only if preceded or accompanied by |
| the fund’s current prospectus. | |
| |
| All comparative mutual fund data are from Lipper, a |
| Thomson Reuters Company, or Morningstar, Inc., unless |
| otherwise noted. | |
| |
| You can obtain a free copy of Vanguard’s proxy voting |
| guidelines by visiting vanguard.com/proxyreporting or by |
| calling Vanguard at 800-662-2739. The guidelines are |
| also available from the SEC’s website, sec.gov. In |
| addition, you may obtain a free report on how your fund |
| voted the proxies for securities it owned during the 12 |
| months ended June 30. To get the report, visit either |
| vanguard.com/proxyreporting or sec.gov. |
| |
| You can review and copy information about your fund at |
| the SEC’s Public Reference Room in Washington, D.C. To |
| find out more about this public service, call the SEC at |
| 202-551-8090. Information about your fund is also |
| available on the SEC’s website, and you can receive |
| copies of this information, for a fee, by sending a |
| request in either of two ways: via email addressed to |
| publicinfo@sec.gov or via regular mail addressed to the |
| Public Reference Section, Securities and Exchange |
| Commission, Washington, DC 20549-1520. |
| | © 2017 The Vanguard Group, Inc. |
| | All rights reserved. |
| | Vanguard Marketing Corporation, Distributor. |
| |
| | Q730 122017 |
Item 2: Code of Ethics. The Registrant has adopted a code of ethics that applies to the Registrant’s principal executive officer, principal financial officer, principal accounting officer or controller or persons performing similar functions. The Code of Ethics was amended during the reporting period covered by this report to make certain technical, non-material changes.
Item 3: Audit Committee Financial Expert. All members of the Audit Committee have been determined by the Registrant’s Board of Trustees to be Audit Committee Financial Experts and to be independent: Rajiv L. Gupta, JoAnn Heffernan Heisen, F. Joseph Loughrey, Mark Loughridge, and Peter F. Volanakis.
Item 4: Principal Accountant Fees and Services.
(a) Audit Fees.
Audit Fees of the Registrant
Fiscal Year Ended October 31, 2017: $98,000
Fiscal Year Ended October 31, 2016: $94,000
Aggregate Audit Fees of Registered Investment Companies in the Vanguard Group.
Fiscal Year Ended October 31, 2017: $8,424,459
Fiscal Year Ended October 31, 2016: $9,629,849
Includes fees billed in connection with audits of the Registrant, other registered investment companies in the Vanguard complex, The Vanguard Group, Inc. and Vanguard Marketing Corporation.
(b) Audit-Related Fees.
Fiscal Year Ended October 31, 2017: $3,194,093
Fiscal Year Ended October 31, 2016: $2,717,627
Includes fees billed in connection with assurance and related services provided to the Registrant, other registered investment companies in the Vanguard complex, The Vanguard Group, Inc., and Vanguard Marketing Corporation.
(c) Tax Fees.
Fiscal Year Ended October 31, 2017: $274,313
Fiscal Year Ended October 31, 2016: $254,050
Includes fees billed in connection with tax compliance, planning, and advice services provided to the Registrant, other registered investment companies in the Vanguard complex, The Vanguard Group, Inc., and Vanguard Marketing Corporation.
(d) All Other Fees.
Fiscal Year Ended October 31, 2017: $0
Fiscal Year Ended October 31, 2016: $214,225
Includes fees billed for services related to tax reported information provided to the Registrant, other registered investment companies in the Vanguard complex, The Vanguard Group, Inc., and Vanguard Marketing Corporation.
(e) (1) Pre-Approval Policies. The policy of the Registrant’s Audit Committee is to consider and, if appropriate, approve before the principal accountant is engaged for such services, all specific audit and non-audit services provided to: the Registrant, other registered investment companies in the Vanguard complex, The Vanguard Group, Inc., and entities controlled by The Vanguard Group, Inc. that provide ongoing services to the Registrant. In making a determination, the Audit Committee considers whether the services are consistent with maintaining the principal accountant’s independence.
In the event of a contingency situation in which the principal accountant is needed to provide services in between scheduled Audit Committee meetings, the Chairman of the Audit Committee would be called on to consider and, if appropriate, pre-approve audit or permitted non-audit services in an amount sufficient to complete services through the next Audit Committee meeting, and to determine if such services would be consistent with maintaining the accountant’s independence. At the next scheduled Audit Committee meeting, services and fees would be presented to the Audit Committee for formal consideration, and, if appropriate, approval by the entire Audit Committee. The Audit Committee would again consider whether such services and fees are consistent with maintaining the principal accountant’s independence.
The Registrant’s Audit Committee is informed at least annually of all audit and non-audit services provided by the principal accountant to the Vanguard complex, whether such services are provided to: the Registrant, other registered investment companies in the Vanguard complex, The Vanguard Group, Inc., or other entities controlled by The Vanguard Group, Inc. that provide ongoing services to the Registrant.
(2) No percentage of the principal accountant’s fees or services were approved pursuant to the waiver provision of paragraph (c)(7)(i)(C) of Rule 2-01 of Regulation S-X.
(f) For the most recent fiscal year, over 50% of the hours worked under the principal accountant’s engagement were not performed by persons other than full-time, permanent employees of the principal accountant.
(g) Aggregate Non-Audit Fees.
Fiscal Year Ended October 31, 2017: $274,313
Fiscal Year Ended October 31, 2016: $468,275
Includes fees billed for non-audit services provided to the Registrant, other registered investment companies in the Vanguard complex, The Vanguard Group, Inc., and Vanguard Marketing Corporation.
(h) For the most recent fiscal year, the Audit Committee has determined that the provision of all non-audit services was consistent with maintaining the principal accountant’s independence.
Item 5: Audit Committee of Listed Registrants.
Not Applicable.
Item 6: Investments.
Not Applicable.
Item 7: Disclosure of Proxy Voting Policies and Procedures for Closed-End Management
Investment Companies.
Not Applicable.
Item 8: Portfolio Managers of Closed-End Management Investment Companies.
Not Applicable.
Item 9: Purchase of Equity Securities by Closed-End Management Investment Company and
Affiliated Purchasers.
Not Applicable.
Item 10: Submission of Matters to a Vote of Security Holders.
Not Applicable.
Item 11: Controls and Procedures.
(a) Disclosure Controls and Procedures. The Principal Executive and Financial Officers concluded that the Registrant’s Disclosure Controls and Procedures are effective based on their evaluation of the Disclosure Controls and Procedures as of a date within 90 days of the filing date of this report.
(b) Internal Control Over Financial Reporting. There were no significant changes in Registrant’s Internal Control Over Financial Reporting or in other factors that could significantly affect this control subsequent to the date of the evaluation, including any corrective actions with regard to significant deficiencies and material weaknesses.
Item 12: Disclosure of Securities Lending Activities for Closed-End Management
Investment Companies.
Not Applicable.
Item 13: Exhibits.
(a) Code of Ethics.
(b) Certifications.
Pursuant to the requirements of the Securities Exchange Act of 1934 and the Investment Company Act of 1940, the registrant has duly caused this report to be signed on its behalf by the undersigned, thereunto duly authorized.
| |
| | VANGUARD WINDSOR FUNDS |
| |
| |
| BY: | /s/ F. WILLIAM MCNABB III* |
| | F. WILLIAM MCNABB III |
| | CHIEF EXECUTIVE OFFICER |
| |
| Date: December 21, 2017 |
Pursuant to the requirements of the Securities Exchange Act of 1934 and the Investment Company Act of 1940, this report has been signed below by the following persons on behalf of the registrant and in the capacities and on the dates indicated.
| |
| | VANGUARD WINDSOR FUNDS |
| |
| BY: | /s/ F. WILLIAM MCNABB III* |
| | F. WILLIAM MCNABB III |
| | CHIEF EXECUTIVE OFFICER |
| Date: December 21, 2017 |
| | VANGUARD WINDSOR FUNDS |
| |
| BY: | /s/ THOMAS J. HIGGINS* |
| | THOMAS J. HIGGINS |
| | CHIEF FINANCIAL OFFICER |
| Date: December 21, 2017 |
* By: /s/ Anne E. Robinson
Anne E. Robinson, pursuant to a Power of Attorney filed on October 4, 2016 see file Number
33-32548, Incorporated by Reference.