Investor Presentation
July 2008
1

Certain of the statements set forth in this presentation constitute "Forward looking statements" within the
meaning of the Private Securities Litigation Reform Act of 1995. We have included and from time to time
may make in our public filings, press releases or other public statements, certain forward-looking
statements. In some cases these statements are identifiable through the use of words such as
"anticipate," "believe," "estimate," "expect," "intend," "plan," "project," "target," "can," "could," "may,"
"should," "will," "would" or words or expressions of similar meaning. You are cautioned not to place undue
reliance on these forward- looking statements. In addition, our management may make forward-looking
statements to analysts, investors, representatives of the media and others. These forward-looking
statements are not historical facts and represent only our beliefs regarding future events, many of which,
by their nature, are inherently uncertain and beyond our control. There can be no assurance that such
forward-looking statements will prove to be accurate and China 3C Group undertakes no obligation to
update any forward-looking statements or to announce revisions to any of the forward-looking statements.
Safe Harbor
2

China 3C is a leading wholesale distributor and retailer of 3C merchandise: computers,
communication products and consumer electronics. The Company specializes in wholesale
distribution and retail sales of 3C products in Eastern China, focusing on products that make
life more comfortable, convenient and connected. The Company's goal is to become the
number one retailer of 3C products in China.
Stock Price Information
Ticker: CHCG (OTC)
Current Price: $1.91
52 Week Range: $1.10-$7.45
TSO: 53.1 million
Avg. Daily Trading Volume: 208,339
Market Cap: $101.4 million
Fiscal Year End: Dec. 31st
Cash (as of 3/31/08): $23.4 million
Debt: $0
Financial Overview
2Q08E Revenue: $81.5-$82.5 mm
2Q08E Net Income: $7.3-$7.4 mm
Estimated Diluted EPS: $0.14
1Q08 Revenue: $68.2 mm
1Q08 Net Income: $5.8 mm / $0.11 EPS
FY07 Revenue: $276.0 mm
FY07 Net Income: $22.9 mm / $0.44 EPS
Company Overview
3

China’s largest “store-in-store” Electronics Retailer
Over 1,000 locations in the large and fast growing Huadong region of China
Operating in multiple product categories allows 3C to more broadly penetrate retail chain partners
Large retail footprint allows company to negotiate better terms and prices from suppliers who are interested in
dealing in larger volumes
Enjoys significant advantages relative to its competition in China including size, customer and supplier relationships,
product breadth and selection, and pricing
Wholesale business provides complimentary advantages to operating model
Economies of scale which improves pricing and the relationships with suppliers
Provides 3C with broader market intelligence that allows company to make better decisions relative to retail
operations (product selection, pricing and store locations)
Compelling “Store-within-Store” Operating Performance
High level of inventory turns
Low Accounts Receivable
Strong Balance Sheet
No debt
Strong and growing cash position
Strong platform for future growth—organic and through acquisition
Corporate Summary
4

Operations
5

China 3C Group main competitiveness: precise market position, efficient
sales networking and rapid logistic system.
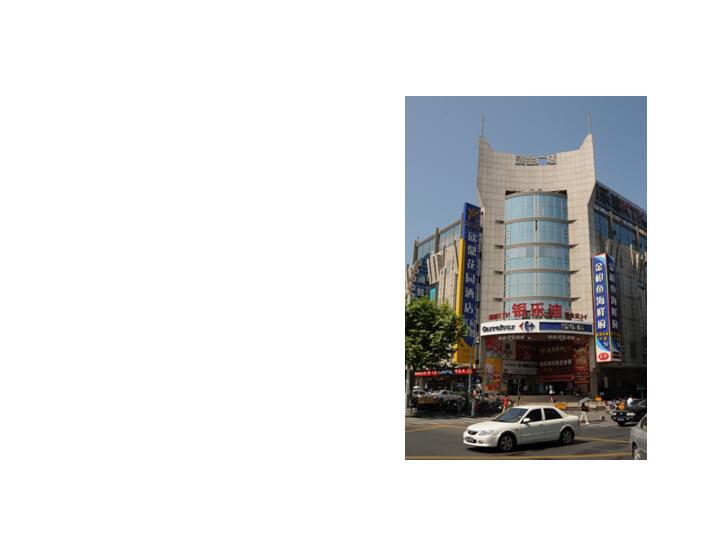
China 3C Group has more than 1000 retail spots – store within store. The
business model is to operate professional product terminals in mega
chain stores, electronic store, supermarket and department stores.
Operations
6

“Store within Store” Business Model
Under this model, companies such as China 3C lease their own outlets
within the larger stores, and by doing so are able to avoid the capital cost,
general management cost, and most financial and operational aspects of
running retail stores. Our retail partners, such as the department stores,
are then compensated via a management fee based on a percentage of our
gross sales in their stores.
7

How China 3C “store-in-store” concessionaire
model differs to the U.S. retail model
3C decreases the financial risk for its retail partners by assuming
responsibility for inventory and working capital associated with
distributing its products.
3C decreases operational risk for its retail partners by hiring and
managing employees and entering the logistics issues such as wholesale
purchasing, delivery, returns, and after sales service.
3C decreases merchandising risks for its retail partners by bringing
product expertise and specific market knowledge that is difficult for large
retailers to develop on their own across a broad range of product
categories.
China’s size, regional differences, logistical difficulties, managerial
challenges, underdeveloped credit market, and rapid growth rate all
increase the risk for retailers
Foreign retailers in China such as Best Buy and Walmart are adjusting their
business models and are embracing the concessionaire model
8

“Store within Store” Model
This operating model fits Chinese consumer traits and business developing
models. It connects both suppliers and mega retailers to form strategic
partnerships. This model decreases operating risks and allows for rapid scale
development.
9

Wholesale / Retail Distribution Mix
2005 2006 2007
Wholesale $13.3 $39.5 $96.1
% of growth 10% 198% 143%
Retail $19.3 $108.7* $179.9
% of growth 52% 462% 66%
Total $32.6 $148.2 $276.0
In USD $ millions
* China 3C made acquisition in 2006
10

In USD $ millions
Wholesale / Retail Gross Profit Mix
2005 2006 2007
Wholesale $1.1 $4.7 $13.5
Gross Profit 8.4% 11.9% 14%
Retail $3.2 $18.1 $35.9
Gross Profit 16.3% �� 16.7% 20.0%
Total Gross Profit $4.3 $22.8 $49.4
% of Sales 13.1% 15.4% 17.9%
11

Company current total store count 1001,
including:
Operating networking
Shanghai area 435 stores,
43% in total store count;
ZheJiang area 356 stores,
36% in total store count;
JianSu area 181 stores,
18% in total store count;
AnHui 29 stores,
3% in total store count
12

Number of Retail Locations
2005 2006 2007 2008E
Beginning of Year 207 439 826908
Acquisition of Stores 0 324 0 0
Stores Opened 259 84 156 138
Stores Closed (27) (21) (74) (26)
End of Year 439 826 908 1020
Total Locations
13

Strong Store Retail Distribution
Gome
Suning
China 3C enjoys strong distribution in leading retailers throughout the Eastern China
region
TrustMart SuperMarket Chain
Vanguard SuperMarket Chain
14

Number of Retail Locations
By Store Type
2005 2006 2007 2008E
Large Hypermarkets
Carrefour 0 13 27 27
Trustmart 26 58 65 65
Walmart 0 0 0 6
Large Electronic Chains
Suning 33 72 97 94
Gome 52 87 108 106
Yongle 0 53 58 88
Supermarkets 67 185 220 248
Independent/
Regional Chain Stores 261 358 333 386
Total: 439 826 908 1020
15

Number of Retail Locations
By Division
2005 2006 2007 2008E
WangDa 175 214 237 265
(cell phones, accessories)
YongXin 264 288 274 300
(fax machines)
SanHe 0 165 211 230
(home electronics)
Joy & Harmony
(consumer electronics) 0 159 186 225
Total: 439 826 908 1020
16
Stores mainly are within:
GoMe, SuNinG, YongLe, TrustMart,
Lotour, Auchan,CenturyMart,
Vanguard … mega chain store systems
Subsidiaries store count:
Joy&Harmony 221 stores
WangDa 254 stores
SanHe 227 stores
YongXin 299 stores.
Key Customers & Subsidiary Information
17
2007 Four Subsidiaries Revenue Breakdown
Subsidiaries
Appliances
Consumer Electronics
Cell Phones
Comm./
Office
revenue ( million USD)
67.15
63.98
83.5
61.38
total group revenue
24.33%
23.18%
30.25%
22.24%
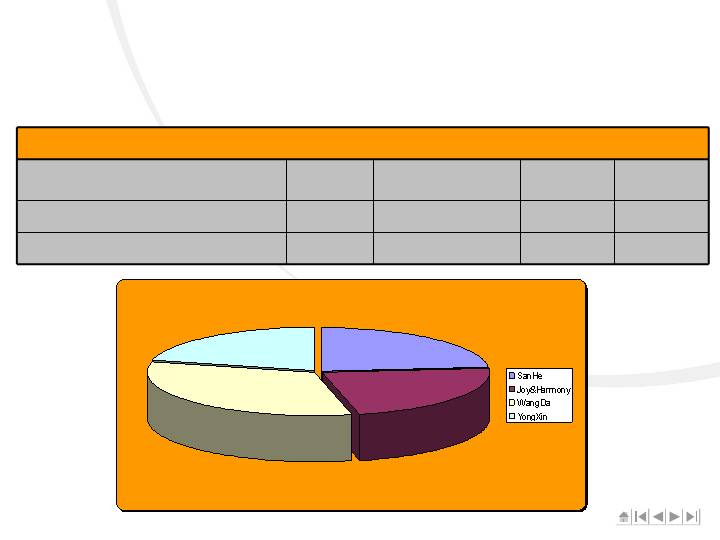
Revenue Breakdown of Four Subsidiaries
2007
SanHe 07 revenue: $67.15 million USD, 24.33% of total group revenue.
Joy&Harmony 07 revenue: $63.98 million USD, 23.18% of total group revenue.
WangDa 07 revenue $83.5 million USD, 30.25% of total group revenue.
YongXin 07 revenue $61.38 million USD, 22.24% of total group revenue.
18
Revenue Breakdown of Four Subsidiaries
2008 Q1-Q2
2008 Q1-Q2 Four Subsidiaries Revenue Breakdown (estimate)
Subsidiaries
Appliances
Consumer
Electronics
Cell Phones
Comm./
Office
target revenue( million USD)
35.38
34.32
48.68
31.65
total group revenue
23.58%
22.88%
32.45%
21.10%
YongXin, $31.7 mm
SanHe, $35.38 mm
WangDa, $48.7 mm
Joy & Harmony, $34.3 mm
19

Single Store Analysis
2007 Total store count: 908
Store per month average revenue $16,400 USD.
2008 Current total store count 1001;
Target store per month average revenue 17,500 USD.
2008 Focus on internal growth. Store count won’t increase as dramatically
as in prior years. Focus on adjustments to eliminate inefficient and low
profit stores and to increase high quality store efficiencies.
20

Store Prototype
Average Size: 126 sq. ft
Avg. Sales per square foot: $1,480
Average Sales per store (annual): $182,000
Average Capital Expenditure $1,690
Average Inventory $8,270
Inventory Turn 22-24x
Average Investment $9,960
Average Store Income (annual) $17,500
Store Costs
Merchandise $150,000 / 82-83%
Lease Cost $ 9,000 / 5%
Other Store Costs $ 5,500 / 3%
21

Supplier Relationships
China 3C Group partners with well known consumer electronic brands in China.
With win win strategy and collaboration concept, we have experienced rapid
growing era. China 3C group appreciates the quality services and brands from
all suppliers.
2007 : there were 4,100 total products offered by China 3C including 600 in
office communication category; 1100 in mobile phones; 1800 in consumer
digital category; 600 in home appliances category.
2008: we plan to adjust product mix to introduce new categories and eliminate
old fashioned ones. 2008 target for total products offered by China 3C is 2,800
including 600 in office communication category; 600 in mobile phones,
1000 in consumer digital category; 600 in home appliances category.
22

Brands and Services
Current leading product brands include: Toshiba, Samsung, Brothers, Philips,
FongDa, TCL, Apple, Motorola, Nokia, Galanz
23
Current leading mega chain stores include: TrustMart, GoMe, Suning,
Best Buy, Walmart, Carrefour
Distribution
24
Wholesale clients
2005 wholesale client count: ~700
2006 wholesale client count: ~900
2007 wholesale client count: ~1300
2008 Q1-Q2 wholesale client count: 920
(total count decrease from 2007 due to company
strategy to focus on mega store customers. Increase single store revenue )
Company’s strategy is to shift focus to larger store chains and away from small
mom & pops
25
China 3C Group Financials
26

2005 Revenue: $32.6million USD, Profit: $1.5million USD, EPS: $0.04
2006 Revenue: $148.2million USD, Profit: $11.3million USD, EPS: $0.24
2007 Revenue: $276.0 million USD, Profit: $22.9 million USD, EPS $0.44
Financial Performance
27
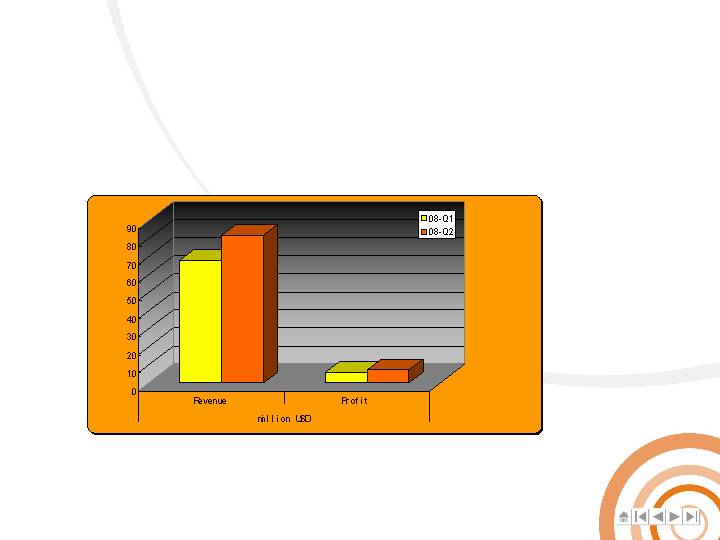
1Q08 Revenue: $68.2 million USD, Profit $5.8 million USD, EPS: $0.11
2Q08E Revenue: $81.5-$82.5 million USD, Profit: $7.3-$7.4 million USD, EPS: $0.14
Financial Performance
28
Strong Balance Sheet
(1Q08 vs. 4Q07)
ASSETS
Current Assets
Cash and cash equivalents
$
23,421,645
$
24,952,614
Accounts receivable, net
14,804,457
8,077,533
Inventory
10,977,257
6,725,371
Advance to supplier
1,645,508
2,572,285
Prepaid expenses
264,625
382,769
Total Current Assets
51,113,492
42,710,572
Property & equipment, net
85,763
89,414
Goodwill
20,348,278
20,348,278
Refundable deposits
54,468
48,541
Total Assets
$
71,602,001
$
63,196,805
LIABILITIES AND STOCKHOLDERS' EQUITY
Current Liabilities
Accounts payable and accrued expenses
$
4,977,584
$
3,108,235
Income tax payable
1,847,239
2,684,487
Total Current Liabilities
6,824,823
5,792,722
Total Stockholders' Equity
64,777,178
57,404,083
Total Liabilities and Stockholders' Equity
$
71,602,001
$
63,196,805
1Q08 4Q07
29

With rapid economic growth, China has become the second largest
consumer electronic market after US. In 2007, total sales for 3C goods
(computers, communications productions, consumer electronics)
exceeded $113 billion USD. In 2008, the estimated size of the 3C market is
expected to be approximately $150 billion USD, representing annual growth
exceeding 30%.
0.7%
In 2007, China 3C Group achieved a revenue of $276.03 million, accounting
for 0.7% of the Eastern China market and only 0.26% of the country. We will
take advantage of the great potential and develop our company to become
the No.1 retailer of 3C products in China.
30%
It is estimated that the sales of 3C products in China will reach $150 billion in
2008, of which 30% will be in the region of Eastern China.
In 2007, China 3C Group achieved revenue of $276.0 million USD, which
represents 0.7% of the market in Eastern China and approximately 0.26% in
all of China. We still have a strong opportunity to grow our business and plan
to capture additional market share through improvements to our operating
structure, enhanced logistic integration and quality additions to our
management team. Our goal is to be a leading 3C retailer in China.
Market Opportunity for China 3C Group
30
China’s largest “store-in-store” Electronics Retailer
Over 1,000 locations in the large and fast growing Huadong region of China
Operating in multiple product categories allows 3C to more broadly penetrate retail chain partners
Large retail footprint allows company to negotiate better terms and prices from suppliers who are interested in
dealing in larger volumes
Enjoys significant advantages relative to its competition in China including size, customer and supplier relationships,
product breadth and selection, and pricing
Wholesale business provides complimentary advantages to operating model
Economies of scale which improves pricing and the relationships with suppliers
Provides 3C with broader market intelligence that allows company to make better decisions relative to retail
operations (product selection, pricing and store locations)
Compelling “Store-within-Store” Operating Performance
High level of inventory turns
Low Accounts Receivable
Strong Balance Sheet
No debt
Strong and growing cash position
Strong platform for future growth—organic and through acquisition
Corporate Summary
31

THANK
YOU

Appendix

China 3C Group enjoys strong relationships and has a great reputation with
suppliers and customers. The company is proud to be the recipient of many
notable awards.
outstanding retailer for Panasonic, Samsung
and Brother
focus partner for Philips, CJT and FengDa
special retailer for Motorola and Nokia
special retailer for apple digital product
awarded enterprise by I Wu Commerce Bureau
AAA credential enterprise by Shanghai Bank
Awards